annual report 2014 - 2015 - estia health · annual report 2014 - 2015. we make time to listen...
TRANSCRIPT
Annual Report 2014 - 2015

We make time to listen because we care.
Chairman’s Message 4
CEO’s Message 7
Key Highlights 11
Operating and Financial Review 14
Board of Directors 20
Executive Team 22
Corporate Governance 25
Shareholder Information 31
Financial Report 32
Glossary 109
Our Estia Code 114
CONTENTS
3Left: Ian and Leila, Estia Health CoolarooCover: Shelley and Pat, Estia Health Coolaroo

We do our best to make a difference every day.
CHAIRMAN’S MESSAGE
It is a pleasure to present to Estia Health shareholders the company’s full-year annual report, our first since debuting on the Australian Securities Exchange on 5 December 2014.
Since the public listing of Estia Health, the company continues to provide consistent, quality levels of care, maintaining a philosophy and way of doing business which will always be at the core of Estia’s operations.
LOOKING AHEADIt is genuinely exciting to be part of a newly formed business that has so much potential in a market that is only going to grow, due to the ageing demographics of Australia’s population and the expected demand for quality aged care facilities.
The aged care sector touches the lives of millions of Australians and the Commonwealth Government’s commitment to older people who need care is demonstrated through the Living Longer, Living Better aged care reforms. As the strong demand for specialised healthcare services increases, Estia is extremely well positioned. We are unique in the market in that 94% of our beds are much sought after single rooms. We have robust systems and networks of facilities already in place to accelerate integration for new acquisitions and manage significant expected growth.
Already, we are a much larger group than initially outlined in the company’s Prospectus. An additional 12 facilities with a total of 1,124 operational places have been acquired since the acquisition of Padman Health Care and Cook Care, taking our total number of operational places to 4,441, as at 12 August 2015.
The company’s medium term plan is to grow the business to 10,000 places by 2020 through acquisition and organic growth. We have a dedicated and skilled workforce of more than 4,700 who have the talent, energy and enthusiasm to reach this goal. As Chairman of a
young company in a fast growing and competitive industry, I look forward to reporting back to shareholders on our progress.
FINANCIAL HIGHLIGHTSWe have experienced a successful first 7 months since listing, and we generated $44.6 million pro forma net profit after tax exceeding our key financial metrics for the financial year ended 30 June 2015.
The Board is pleased to have declared a maiden fully franked dividend of 13.6 cents per share for the financial year ended 30 June 2015, payable on 26 October 2015.
THE BOARD
Your Board is fully committed to the success of Estia Health and to ensuring that business is conducted within the highest standards of corporate governance. We recognise the importance of governance, ethical and social matters, even more so in an industry where the highest quality of resident care goes to the very heart of our existence.
We welcome shareholder questions in writing in advance of our Annual General Meeting on 22 September 2015. I would like to thank all of our people for their daily dedication to providing invaluable care services to the loved ones of so many Australian families.
Pat Grier, Chairman
4 Right: Liu, Estia Health Coolaroo

CEO’S MESSAGE
Undoubtedly, 2014-15 has been an extremely productive period for Estia Health. The highlight was the public listing of the company in December 2014, when we welcomed a number of new investors as shareholders. Since this time, we have acquired a number of new facilities as we progress confidently towards our ambition of reaching 10,000 beds by 2020.
As of 30 June 2015, we have a total of 48 facilities and 4,010 operational places. 94% of these places are single rooms, the most important factor by some margin when it comes to choosing aged care as evidenced through our independent research. As a result, demand for places grew from 92.4% in August 2014 through to 93.6% occupancy level at year end.
Our rapid growth continues: at the time of print, our footprint had increased to 54 facilities and 4,441 operational places.
We are proud to come together as one Estia family. Our ambition is to become ‘the family you choose’.
7
We are one family where everyone belongs.
Left: Enid with Chiko the dog, Estia Health Coolaroo
CEO’S MESSAGE cont.
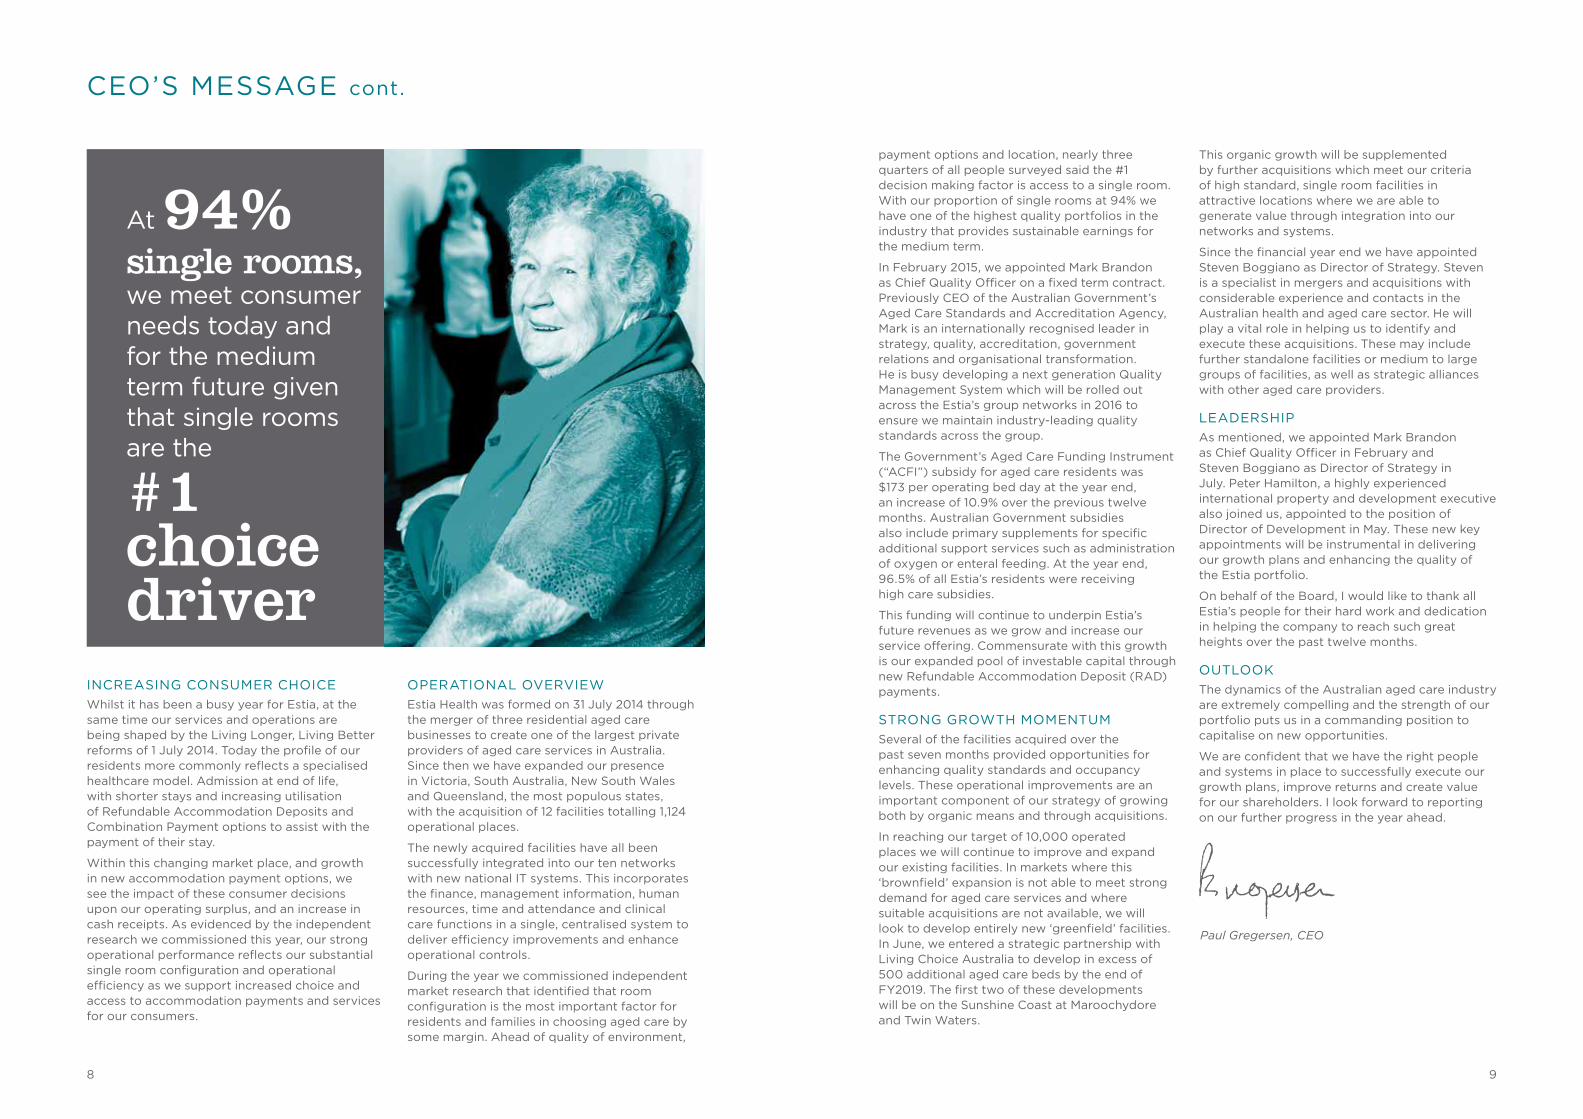
payment options and location, nearly three quarters of all people surveyed said the #1 decision making factor is access to a single room. With our proportion of single rooms at 94% we have one of the highest quality portfolios in the industry that provides sustainable earnings for the medium term.
In February 2015, we appointed Mark Brandon as Chief Quality Officer on a fixed term contract. Previously CEO of the Australian Government’s Aged Care Standards and Accreditation Agency, Mark is an internationally recognised leader in strategy, quality, accreditation, government relations and organisational transformation. He is busy developing a next generation Quality Management System which will be rolled out across the Estia’s group networks in 2016 to ensure we maintain industry-leading quality standards across the group.
The Government’s Aged Care Funding Instrument (“ACFI”) subsidy for aged care residents was $173 per operating bed day at the year end, an increase of 10.9% over the previous twelve months. Australian Government subsidies also include primary supplements for specific additional support services such as administration of oxygen or enteral feeding. At the year end, 96.5% of all Estia’s residents were receiving high care subsidies.
This funding will continue to underpin Estia’s future revenues as we grow and increase our service offering. Commensurate with this growth is our expanded pool of investable capital through new Refundable Accommodation Deposit (RAD) payments.
STRONG GROWTH MOMENTUMSeveral of the facilities acquired over the past seven months provided opportunities for enhancing quality standards and occupancy levels. These operational improvements are an important component of our strategy of growing both by organic means and through acquisitions.
In reaching our target of 10,000 operated places we will continue to improve and expand our existing facilities. In markets where this ‘brownfield’ expansion is not able to meet strong demand for aged care services and where suitable acquisitions are not available, we will look to develop entirely new ‘greenfield’ facilities. In June, we entered a strategic partnership with Living Choice Australia to develop in excess of 500 additional aged care beds by the end of FY2019. The first two of these developments will be on the Sunshine Coast at Maroochydore and Twin Waters.
This organic growth will be supplemented by further acquisitions which meet our criteria of high standard, single room facilities in attractive locations where we are able to generate value through integration into our networks and systems.
Since the financial year end we have appointed Steven Boggiano as Director of Strategy. Steven is a specialist in mergers and acquisitions with considerable experience and contacts in the Australian health and aged care sector. He will play a vital role in helping us to identify and execute these acquisitions. These may include further standalone facilities or medium to large groups of facilities, as well as strategic alliances with other aged care providers.
LEADERSHIPAs mentioned, we appointed Mark Brandon as Chief Quality Officer in February and Steven Boggiano as Director of Strategy in July. Peter Hamilton, a highly experienced international property and development executive also joined us, appointed to the position of Director of Development in May. These new key appointments will be instrumental in delivering our growth plans and enhancing the quality of the Estia portfolio.
On behalf of the Board, I would like to thank all Estia’s people for their hard work and dedication in helping the company to reach such great heights over the past twelve months.
OUTLOOKThe dynamics of the Australian aged care industry are extremely compelling and the strength of our portfolio puts us in a commanding position to capitalise on new opportunities.
We are confident that we have the right people and systems in place to successfully execute our growth plans, improve returns and create value for our shareholders. I look forward to reporting on our further progress in the year ahead.
Paul Gregersen, CEO
INCREASING CONSUMER CHOICEWhilst it has been a busy year for Estia, at the same time our services and operations are being shaped by the Living Longer, Living Better reforms of 1 July 2014. Today the profile of our residents more commonly reflects a specialised healthcare model. Admission at end of life, with shorter stays and increasing utilisation of Refundable Accommodation Deposits and Combination Payment options to assist with the payment of their stay.
Within this changing market place, and growth in new accommodation payment options, we see the impact of these consumer decisions upon our operating surplus, and an increase in cash receipts. As evidenced by the independent research we commissioned this year, our strong operational performance reflects our substantial single room configuration and operational efficiency as we support increased choice and access to accommodation payments and services for our consumers.
OPERATIONAL OVERVIEWEstia Health was formed on 31 July 2014 through the merger of three residential aged care businesses to create one of the largest private providers of aged care services in Australia. Since then we have expanded our presence in Victoria, South Australia, New South Wales and Queensland, the most populous states, with the acquisition of 12 facilities totalling 1,124 operational places.
The newly acquired facilities have all been successfully integrated into our ten networks with new national IT systems. This incorporates the finance, management information, human resources, time and attendance and clinical care functions in a single, centralised system to deliver efficiency improvements and enhance operational controls.
During the year we commissioned independent market research that identified that room configuration is the most important factor for residents and families in choosing aged care by some margin. Ahead of quality of environment,
At 94%single rooms, we meet consumer needs today and for the medium term future given that single rooms are the
#1choice driver
8 9

$297.5mREVENUEFY15 forecast $296.4m (100.4%)
$69.7mEBITDAFY15 forecast $70.2m (99.3%)
$61.8mEBITFY15 forecast $60.6m (102.0%)
$44.6mNPATFY15 forecast $42.6m (104.7%)
$0.136DIVIDEND PER SHAREFY15 forecast $0.127 (107.1%)
$0.32EPSFY15 forecast $0.31 (103.2%)
Over 20%NPAT growth rate
FY16
KEY HIGHLIGHTS
Estia Health is one of the largest private providers of residential aged care services in Australia with 48 facilities, 4,010 operating places and more than 4,700 employees across Victoria, South Australia, New South Wales and Queensland. As at 12 August 2015, this number had increased to 54 facilities and 4,441 operating places.
Estia Health aims to provide its residents with the highest standards of aged care in a supportive and caring environment. It is focused on improving and expanding its portfolio to meet the growing demand for residential aged care services in Australia, underpinned by an ageing population and increasing demand for higher care services.
11Left: Sheila with Sox the rabbit, Estia Health Coolaroo
We make magical moments happen, in small and special ways.

SA14 facilities1,133 places
VIC19 facilities1,541 places
NSW10 facilities898 places
QLD5 facilities438 places
AS AT 30 JUNE 2015
No. of Facilities
No. of Operational Places48 4,010
KEY HIGHLIGHTS cont.
GROWTH STRATEGY
GROWTH STRATEGY cont.
SINGLE SITES: 500 – 1,000 places per annum
GROUP: 1+ medium/large sized group in period
GREENFIELD: 500 – 1,000 places in period
BROWNFIELD: 300+ places in period
ORGANIC
ACQUISITION
Operating place per Prospectus 3,613
New acquisitions above Prospectus (CY15) 921
Closure of nursing home wing at Mudgeeraba for redevelopment June 2015 (55)
Offline places (26)
Places under redevelopment at Craigmore (12)
Forecast operating places October 2015 4,441
FY16 Acquisitions
49 KEYSBOROUGH 60 places July 15
50 BENDIGO 73 places Sept 15
51 KEILOR 60 places Sept 15
52 ACQUISITION 1 70 places Sept 15
53 BANNOCKBURN 120 places Oct 15
54 ACQUISITION 2 48 places Oct 15
431 places
TOTAL OF 4,441 OPERATIONAL PLACES
1312
Estia Health aims to reach
10,000 places
by FY2020through a combination of acquisitions and organic growth.

OPERATING AND FINANCIAL REVIEW
OVERVIEW OF THE GROUPEstia Health is one of the largest providers of residential aged care services in Australia with a portfolio of 48 facilities and 4,010 operating places (as at 30 June 2015) from which it provides residents with high quality clinical care services, daily living services, accommodation services and extra services. With facilities across Victoria, South Australia, New South Wales and Queensland, the company is predominantly focused on self-funded residents in metropolitan areas with above average socio-economic backgrounds.
Estia’s facilities are supported by a variety of functions (Finance & Commercial, Risk & Quality, Strategy & Development and People & Communications) both at the facility level and through a range of centralised national, state and regional functions. These functions enable each facility to focus on providing better quality care and operating more places efficiently. It also enables Estia to better manage operational risks and its financial performance as well as achieve its growth strategy.
PRINCIPAL ACTIVITIESSignificant changes in the state of affairs On 5 December 2014 the Company successfully listed on the Australian Securities Exchange. A total of 126,087,759 shares were issued in the float with total gross proceeds of $725,004,614.
On 9 December 2014 the proceeds raised from the listing were used to repay in full the funding provided under existing senior debt and mezzanine facilities, vendor and shareholder loans.
SERVICE OFFERINGEstia provides consistent, high levels of clinical care services and offers a wide range of services to its residents. Estia also provides additional amenities to its residents.
The company provides the following services:
– Clinical care services: Estia provides 24-hour nursing care, personal care, wound management, administering pharmaceuticals, physiotherapy and occupational therapy, and arranging on-site visits from external medical practitioners.
– Daily living services: At each of its facilities, Estia provides residents with a range of daily living services such as laundry, meals, recreational activities, emotional support and cleaning.
– Accommodation services: Estia provides its residents with modern, high quality accommodation services.
– Extra services: Estia provides extra services to residents in Dedicated Extra Service places, and additional optional services to residents that do not hold a Dedicated Extra Service place.
FINANCIAL PERFORMANCEEstia’s pro forma net profit after tax of $44.6 million exceeded pro forma forecast by $2.0 million or 4.7%.
Estia’s statutory loss after tax of $22.5 million for the year ended 30 June 2015 was $16.8 million (294.7%) above Prospectus forecast. A summary pro forma and statutory income statement in line with the Estia’s Prospectus lodged 3 December 2014 is reflected in the following tables:
Summary of pro forma income statement($ million)
Actual2 2015
Forecast1 2015
Total revenue 297.5 296.4EBITDA3 69.7 70.2
EBIT4 61.8 60.6
NPAT 44.6 42.6
EPS (cents) 32.2 30.8
Summary of statutory income statement($ million)
Actual
2015Forecast1
2015
Total revenue 284.5 283.9EBITDA3 30.8 35.6
EBIT4 23.4 26.6
NPAT (22.5) (5.7)
EPS (cents) (16.3) (4.0)
1 Pro Forma Forecast Financial Information is consistent with the information disclosed in the Prospectus lodged 3 December 2014.2 Pro Forma Actual has been prepared consistent with the assumptions set out in the Prospectus lodged 3 December 2014.3 Earnings before Interest, Tax, Depreciation and Amortisation (“EBITDA”) has been prepared consistent with the assumptions set out in the Prospectus lodged 3 December 2014.4 Earnings before Interest and Tax (‘EBIT”) has been prepared consistent with the assumptions set out in the Prospectus lodged 3 December 2014.
EARNINGS PER SHARE
The Group’s pro forma earnings per share (EPS) in FY15 were 32.2 cents (FY15 forecast: 30.8 cents). EPS in the current period was impacted by the issue of new shares from the entitlement offer equity raising undertaken in 2014.
FINANCIAL PERFORMANCE OVERVIEWThe Group uses earnings before interest, income tax expense, depreciation and amortisation (EBITDA) in combination with other financial measures to evaluate the Group’s operating performance. The Company believes that EBITDA is a relevant and useful financial measure used by management to measure the Company’s operating performance. EBITDA reflects the profit for the year prior to including the effect of net finance costs, income taxes, depreciation and amortisation. Depreciation and amortisation are calculated in accordance with AASB 116: “Property, Plant and Equipment” and AASB 138: “Intangible Assets”, respectively.
Adjusting for acquisition transaction costs incurred in purchasing the Padman and Cook Care Groups and additional facilities, the Estia Health Group achieved an EBITDA for the year ended 30 June 2015 of $61,501,183. This includes several other non-recurring expenses incurred as part of those acquisitions and restructure of the Group.
Estia Health’s FY2015 Pro Forma NPAT was $44.6m. Pro Forma EBIT of $61.8m and Revenue of $297.5m were led by total occupancy levels increasing to 93.6% in June 2015, and 96.5% of residents receiving higher care subsidies. Occupancy levels for FY2015 were at 93.6%, above 89.3% in FY2014.
Estia also performed strongly on two other key operating metrics with Aged Care Funding Instruments (ACFI) subsidies increasing to $172.81 per day in June 2015, and $170.42 for FY2015, and average equivalent new RAD of $343,683, above FY2015 forecast of $238,000.
Estia maintained an industry leading figure of 94% single beds across the Company’s portfolio of 48 homes with 4,010 operational places.
Post the acquisition of Padman Health Care and Cook Care, during the year, Estia completed 12 acquisitions, adding a total 1,124 operational available places, 550 more places than forecast in the prospectus.
In addition to the strong financial result, the Estia Health Group maintained accreditations at all of its facilities and invested in capital works to improve the standard of each facility operated by the Group.
Future strategic initiatives for the Estia Health Group include the following:
– Continued growth through acquisitions, brownfield and greenfield developments and partnering with suitable organisations to provide aged care services;
– Maintaining and enhancing the skills and expertise of Estia Health Group’s employees to enhance the services provided to residents; and
– Introducing uniform procedures, software systems and infrastructure across the Estia Health Group to underpin the continued growth of the Group and to enhance the financial performance of the Group.
GROWTH STRATEGY Estia aspires to reach 10,000 operating places by the end of FY2020. Estia intends to supplement organic growth with acquisitions, brownfield developments, corporate partnerships and greenfield developments.
Acquisitions During the year the Estia Health Group successfully acquired the Padman and Cook Care Group operations as at 31 July 2014, operating in South Australia, New South Wales and Queensland. Since the formation of the company on 31 July 2014, Estia acquired the following facilities:
– Freehold of another Victorian-based facility on 29 September 2014;
– Two facilities in Victoria and one in New South Wales on 1 October, 2014;
– Two facilities in Victoria and one in South Australia on 1 December 2014;
– One facility in Victoria on 1 February 2015;
– One facility in South Australia on 1 April 2015;
– Three facilities in New South Wales on 6 May, 2015; and
– One facility in Queensland on 1 June 2015.
Since their acquisition, Estia has been focused on implementing operational improvements to increase occupancy levels, improve resident care needs and enhance operating efficiencies.
Estia aims to grow its operating places by 500 – 1,000 per annum through single site acquisitions. This may also be supplemented by the acquisition of a medium or large sized group operator.
Brownfield Developments Estia also aims to expand the number of its facilities to meet growing demand for residential aged care services through brownfield developments. Estia has an active brownfield development program where there is the potential to increase earnings from existing facilities, increase the overall level of RAD funding and provide attractive returns on capital.
14 15
OPERATING AND FINANCIAL REVIEW cont.
Estia aims to increase its operating places by more than 300 through brownfield developments by FY2020.
Greenfield Developments Where brownfield expansion is unable to meet the growing demand for services and acquisitions are not available or do not meet Estia’s requirements, Estia may consider the development of new greenfield facilities. Estia has entered into strategic alliances and corporate partnerships with developers of residential aged care facilities to grow the number of places it operates.
On 25 June 2015, Estia entered into a strategic partnership with Living Choice to build 500 residential aged care places by end FY2019, beginning with two facilities on the Sunshine Coast in Maroochydore and Twin Waters.
Estia aims to increase its operating places by 500 – 1,000 through greenfield developments by FY2020.
KEY BUSINESS RISKS Changes to regulatory frameworkThe Australian aged care industry is highly regulated and subject to change. The way that the industry is regulated and funded by the Australian Government has a fundamental influence on Estia’s business model. Funding from the Australian Government contributed approximately 70% of Estia’s revenues in FY2015.
Estia is a member of the Aged Care Guild (the ‘Guild’) which represents for-profit aged care providers in Australia. The Guild meets with the Department of Social Services three times a year and is proactive in addressing issues that would impact the current industry business model.
Refundable accommodation bonds/RADsEstia is exposed to risks associated with the repayment of accommodation bonds and RADs. If a larger than expected number of bond/RAD paying residents were to leave Estia’s aged care facilities, Estia would be required to repay a large sum of accommodation bonds/RADs. Estia is also exposed to risks that may adversely affect the future value of Estia’s total accommodation bonds/RADs.
Estia has a Liquidity Management Strategy to ensure RADs are paid when due, which includes a $20,000,000 debt facility available for working capital requirements centred on refunding RADs.
Occupancy levels may fallEstia’s occupancy levels may fall below expectations as a result of factors such as increased competition in the residential aged care industry, specific issues arising at any of Estia’s facilities which adversely impact its
reputation and/or perceptions of the quality of clinical care provided, any trend towards home and community care, a deterioration in general economic and housing market conditions, or a decline in referrals from hospitals and other referral sources.
Estia aims to be the first choice in residential aged care for consumers. Estia’s Client Relations Team proactively builds strong relationships with local referral teams and monitors competitors, working with a dedicated Property Team to drive capital improvements to maintain a strong competitive position. Estia holds a strong portfolio with 94% single rooms, which remains the number one choice for consumers.
Reputational damage
Estia’s reputation could be adversely impacted if it, or the aged care sector generally, suffers from any adverse publicity. Any such adverse publicity could result in existing residents transferring away from Estia’s facilities to competitor aged care facilities or reduce Estia’s ability to attract new residents to its facilities, both of which could adversely impact Estia’s financial performance and position and future prospects.
Estia maintains robust systems and stringent quality control across all facilities to minimise risks that may result in adverse publicity. Through the establishment of regional networks, Estia has implemented strong support systems between facilities to address any potential adverse events at any one home.
AcquisitionsEstia has acquired a number of aged care facilities as part of its growth strategy. At the time each aged care facility was acquired, Estia conducted due diligence enquiries. Notwithstanding this due diligence, it is possible that one or more material issues or liabilities may not have been identified, or are of an amount that is greater than expected. Such issues or liabilities could adversely affect Estia’s financial performance and position and future prospects.
Estia engages independent financial and legal advisors to assist with due diligence on the acquisition of three or more facilities as well as conducting thorough due diligence on smaller single entity facilities internally. Financial projections in modelling acquisitions are benchmarked against existing Estia facilities.
Growth strategy Estia’s ability to meet its growth targets is dependent on its ability to identify and acquire suitable facilities. In particular, the success of Estia’s acquisition strategy will be dependent on a number of factors, including:
– the level of RADs held by Estia to fund such acquisitions;
– the availability of debt and equity funding and the suitability of the terms of such funding;
– the availability of suitable facilities at an acceptable price to Estia; and
– the number and resources of any of Estia’s competitors bidding for any target acquisition.
Estia’s ability to meet its growth targets is also dependent on its ability to identify existing sites on which to develop or expand new brownfield facilities or acquire attractive sites on which to develop new greenfield facilities. Given Estia’s strategy to operate in metropolitan areas of major Australian capital cities, there is no assurance that Estia will be able to develop new brownfields sites or secure new greenfield sites, on favourable economic terms or at all.
Estia has a balanced strategy for growth which includes acquisitions, brownfield and greenfield developments. Estia works with various agents to identify acquisitions. In addition, Estia has entered into a partnership for turnkey greenfield developments in Queensland and seeks to identify further partnerships to cover other eastern Australia states.
Loss of key personnelEstia relies on a high quality management team with significant aged care industry experience. The loss of key personnel could undermine Estia’s ability to operate its facilities and its business to the current standard, and to effectively comply with regulations. This may, in turn, result in a reduction in demand for Estia’s aged care services from new and existing residents and could adversely impact Estia’s financial performance and position and future prospects.
To attract and maintain key personnel, leaders are incentivised through short term incentives based on financial and non financial metrics.
Shortage of skilled employeesEstia’s business depends on a specialised health and aged care workforce. There is a risk that Estia may not be able to retain or expand a workforce that is appropriately skilled and trained to meet the existing or future demands of residents at its facilities and/or a risk that a shortage of employees leads to upward wage pressure which may adversely affect Estia’s business, financial performance and position and future prospects.
A Graduate Nursing Program to recruit and develop highly talented nursing staff will roll out in January 2016. In addition, ongoing training is provided to ensure employees maintain up to date knowledge to care for residents in Estia homes.
Availability of funding Estia may require funding or working capital in the future in order to pursue its growth strategy. Given the nature of Estia’s revenue profile and the potentially capital intensive nature of its business, there is no assurance that any such additional capital or funding will be available on favourable terms or at all and that Estia will be able to comply with the terms of such facilities. If adequate funds are not available, Estia may not be able to achieve its growth targets or respond to competitive pressures.
A new debt facility was agreed in July 2015 resulting in an extension to December 2018 and the addition of an accordion facility of $150,000,000 for capital investments and acquisitions. In total, Estia’s debt facility for funding growth is $280,000,000.
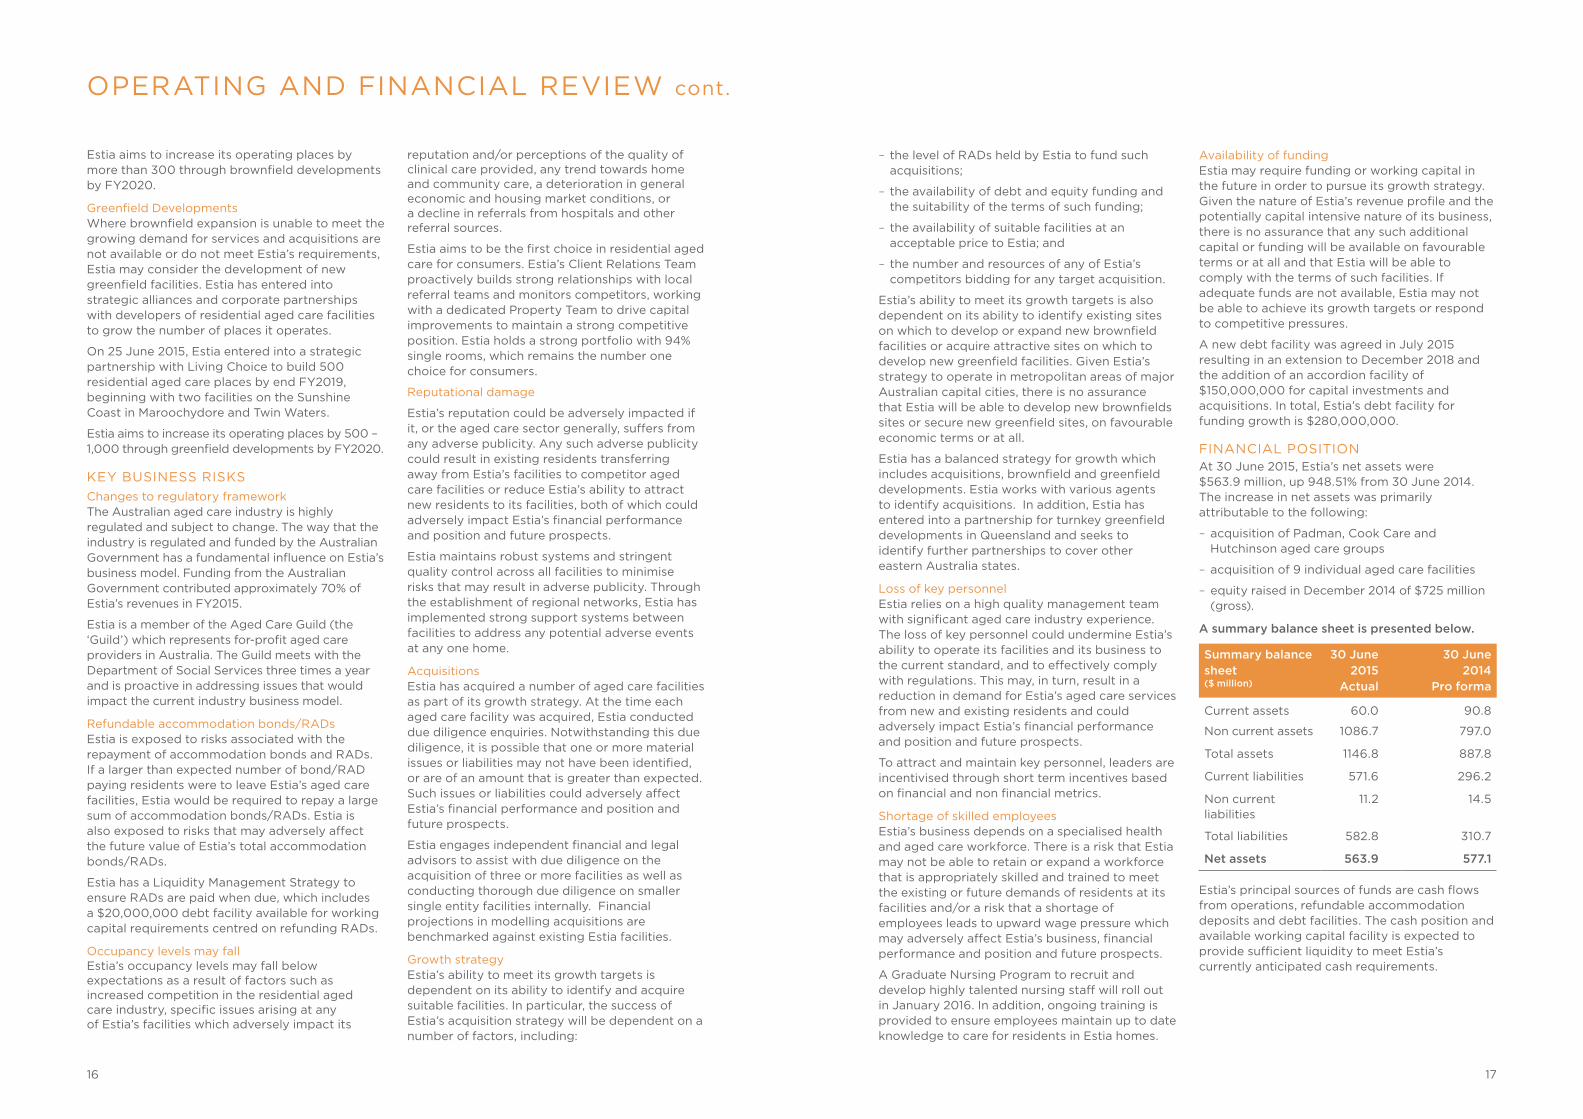
FINANCIAL POSITION At 30 June 2015, Estia’s net assets were $563.9 million, up 948.51% from 30 June 2014. The increase in net assets was primarily attributable to the following:
– acquisition of Padman, Cook Care and Hutchinson aged care groups
– acquisition of 9 individual aged care facilities
– equity raised in December 2014 of $725 million (gross).
A summary balance sheet is presented below.
Summary balance sheet ($ million)
30 June 2015
Actual
30 June 2014
Pro forma
Current assets 60.0 90.8
Non current assets 1086.7 797.0
Total assets 1146.8 887.8
Current liabilities 571.6 296.2
Non current liabilities
11.2 14.5
Total liabilities 582.8 310.7
Net assets 563.9 577.1
Estia’s principal sources of funds are cash flows from operations, refundable accommodation deposits and debt facilities. The cash position and available working capital facility is expected to provide sufficient liquidity to meet Estia’s currently anticipated cash requirements.
1716

OPERATING AND FINANCIAL REVIEW cont.
On 4 November 2014 the Company entered into a banking facility amounting to $150,000,000. These facilities have a maturity date of December 2017 and interest is calculated at BBSY plus a margin ranging from 1.0% to 1.4%. On 4 August 2015, the company refinanced the banking facility with two major lenders and i) extended the term to December 2018, ii) added a $150,000,000 accordion facility and iii) reduced the unused line fees from a rate of 0.45% to 0.40%. The new banking facilities will be used to fund acquisitions, capital expenditure and working capital.
Debt funding is utilised from time to time to finance acquisition of residential aged care businesses whilst seeking to maintain gearing within prudent levels.
The gearing ratio is calculated as a percentage of Net Debt/Total Equity. Net Debt is the total financial liabilities (including accommodation bonds / RADS) less cash on hand. Total Equity is as presented on the statement of financial position. For more information on capital management, see Note 29 of the financial statements.
RADs provide Estia with capital funding to support growth through capital investment in existing and new facilities as well as through acquisitions. RADs have contributed $88.5 million to net cash flows, $55.3 million in excess of forecast. Both an increase in the average accommodation price and an increase in the RAD penetration have contributed to the strong net RAD receipts.
A summary pro forma cash flow as at 30 June 2015 is presented below.
Summary of pro forma cash flow ($ million)
Actual2
2015Forecast1
2015
Net accommodation bonds / Refundable accommodation deposits
88.5 32.7
Other operating cash flows
62.0 66.6
Net cash flow from operations
150.5 99.3
Net cash flow from investing activities
(172.9) (99.6)
Net cash flow from financing activities
35.9 (18.0)
Net cash flows 13.5 (18.3)
A summary statutory cash flow as at 30 June 2015 is presented below.
Summary of statutory cash flow ($ million)
Actual
2015Forecast3
2015
Net accommodation bonds / Refundable accommodation deposits
84.1 32.7
Other operating cash flows
20.2 42.1
Net cash flow from operations
104.3 74.8
Net cash flow from investing activities
(520.9) (419.0)
Net cash flow from financing activities
459.2 386.6
Net cash flows 42.6 42.4
1. Pro Forma Forecast Financial Information is consistent with the information disclosed in the Prospectus lodged 3 December 2014. 2. Pro Forma Actual have been prepared consistent with the basis set out in the Prospectus lodged 3 December 2014.3. Statutory Forecast Financial Information is consistent with the information disclosed in the Prospectus lodged 3 December 2014.
DIVIDEND REINVESTMENT PLAN (DRP) On 15 July 2015, Estia introduced a DRP. The DRP was introduced after a period of significant company growth, to allow all shareholders participants to reinvest their dividends into acquiring additional Estia shares without incurring any brokerage or handling costs. To elect to participate in the Company’s DRP shareholders can use the online share registry facility or contact the share registry, Link Market Services. Please refer to estiahealth.com.au/investor-centre for the plan booklet and forms.
DIVIDENDSA final dividend of 13.6 cents per share (2014: nil) or $24,575,540 (2014: nil) is recommended for payment on ordinary shares. The tax rate at which recommended dividends will be franked is 30%. Estia’s Dividend Reinvestment Plan will apply to the dividend.
PERFORMANCE RIGHTSAt the date of this report, there were 22,890 performance rights under the Long Term Incentive Plan that are yet to vest. Refer to the Remuneration Report and Note 25 of the financial statements for further details of any rights outstanding as at 30 June 2015.
SIGNIFICANT EVENTS AFTER THE REPORTING DATEOn 13 July 2015, Estia entered into an agreement to refinance its existing debt facility to improve the ability to fund future growth. As part of the refinancing, Estia reduced the number of participants in the syndicated debt facility to include Westpac Banking Corporation and Commonwealth Bank of Australia. The amendments to the existing debt facility include an extension to 10 December 2018, a reduction in the unused line fee from 0.45% to 0.40% and the addition of a revolving $150,000,000 accordion facility. The refinancing became effective 4 August 2015.
In July 2015:
– Estia acquired a 60 bed facility in Keysborough, Victoria
– a strategic partnership agreement was entered into with developers to build four residential aged facilities which will add 500 places over 18 months to June 2017 with an option to build a further 500 places
– Estia entered into agreements to purchase two residential aged care facilities (133 places) in Victoria to be completed in September 2015 and one residential aged care facility (120 places) in regional Victoria to be completed in October 2015.
In August 2015, Estia entered into agreements to purchase:
- a 70 bed facility in metropolitan Melbourne, to be completed in September 2015
- a 48 bed facility in metropolitan Melbourne, to be completed in October 2015.
Other than those mentioned, no matters or circumstances have arisen since the end of the reporting period which significantly affected or may significantly affect the operations of the Group, the results of those operations, or the state of affairs of the Group in future financial years.
OUTLOOK Estia expects to generate over 20% NPAT growth against current year pro forma NPAT as the full earnings potential of acquisitions completed during FY15 begin to be realised and growth through further acquisitions in FY16 continues. Coupled with NPAT growth will be continued growth in cash from net RAD receipts and incremental growth on accommodation pricing for new residents. The continued positive cash flows will provide capital to fund FY16 acquisitions and will contribute to the achievement of long term returns greater than 15% on net capital employed.
The Board and Executive team are confident in delivering further growth through both acquisitions and organic development to achieve Estia’s vision of 10,000 beds by 2020.
19Right: Erna and Ann-Mari, Estia Health Coolaroo18

PATRICK GRIER, AM
Non-executive Director and Chairman, BSc; AO
Patrick was MD and CEO of Ramsay Health Care Limited for 14 years. Under his leadership, Patrick grew the Ramsay group from 7 hospitals to an ASX listed organisation operating over 100 hospitals in Australia and overseas, with an annual turnover of almost $3 billion and employing 25,000 people. He remains on the board of Ramsay as a non-executive director. Prior to this role, he was with Hospital Corporation Australia.
Patrick also served as both President and Chairman of the Australian Private Hospitals Association for over 10 years. In 2010, he was awarded the Order of Australia for his leadership and contribution to the Australian health care sector. He was previously the Chairman of the Opal Aged Care group and Chairman of the Australian Healthcare Workforce Institute. Patrick is a member of the Skin Cancer Network Advisory Board.
PAUL GREGERSEN
Managing Director and CEO, BEng (Hons); MBA (Distinction) and graduate of Wharton Business School’s Advanced Management Programme
Paul holds extensive experience and knowledge in the health care and financial services sectors. He has delivered outstanding performance in a variety of leadership roles around the globe, with particular expertise in the funding and provision of private health care.
Paul was MD of Bupa Aged Care Services Australia for five years and has over 24 years of general management experience, including roles across the United Kingdom, Singapore, Australia and China. Through his position as the inaugural chair of The Aged Care Guild, Paul advised the Australian Government on the Living Longer, Living Better aged care reforms in Australia. In 2012, the Cabinet of the Australian Government appointed Paul as an independent expert for the Aged Care Financing Authority to assist in the reform of Australia’s aged care system.
PETER ARVANITIS
Non-executive Director
Peter is the founder and former CEO of Estia. Peter founded Estia as Lasting Changes in 2005, having identified a need for improving the quality and consistency of residential aged care in Australia, both at the corporate and facility level. Under Peter’s leadership, Estia expanded successfully from its first aged care home to 39 facilities. As CEO, Peter led the acquisition of Padman, Cook Care and 17 individual facilities.
Prior to Estia, Peter had successfully founded, operated and disposed of a number of businesses in transport, agriculture, residential and commercial property.
NORAH BARLOW
Non-executive Director, BCA; ACA; ONZM
Norah has an extensive background in business leadership and management, strategy, corporate finance, governance, tax and accounting. Formerly the CEO of Summerset New Zealand, she remains on the board as a non-executive director and is director across a number of organisations.
A member of the National Advisory Council on the Employment of Women and the National Taskforce on Allied Health Workers governance committee, she was President of the Retirement Villages Association (NZ) for seven years and made an Officer of the New Zealand Order of Merit for services to business in 2014.
ANDREW HARRISON
Non-executive Director, BEc; MBA; CA
Andrew is an experienced company director and corporate adviser. He is currently a non-executive director of Burson Group Limited. He has previously held executive and non-executive directorships with public, private and private equity owned companies, including as CFO of Seven Group Holdings, Group Finance Director of Landis + Gyr. and CFO and a director of Alesco.
Andrew was previously a Senior Manager at Ernst & Young (Sydney and London) and Gresham Partners Limited, and an Associate at Chase Manhattan Bank (New York).
MARCUS DARVILLE
Non-executive Dircector, MA (Hons), MBA
Marcus has over 20 years of private equity experience starting in the UK with NatWest Ventures (now Bridgepoint). He joined AMP in 1994 as Joint Head of Private Equity where he completed several major buyouts including Tasman Building Products.
Marcus joined Quadrant Private Equity in March 2006 and is a member of the Quadrant Investment Committee, a Director of Quadrant investees Super A-Mart/Barbeques Galore, Estia Health and ICON Cancer Care.
BOARD OF DIRECTORS
2120

STEVEN BOGGIANO
Strategy Director
Steven is a highly experienced executive with an extensive track record in banking, private equity and mergers and acquisitions. Steven was Managing Director and Head of Asia for Healthcare, Consumer, Retail & Real Estate at Barclays Investment Bank, Australia. He played an integral role in the formation of Estia Health including advising the company on the initial acquisition of Estia Health by Quadrant Private Equity and the subsequent acquisition of the Cook Care Group.
As Strategy Director, Steven’s role is to apply his considerable mergers and acquisitions experience to help deliver Estia’s ambitious expansion and growth agenda.
PAUL GREGERSEN
Managing Director and Chief Executive Officer
Paul holds extensive experience and knowledge in the health care and financial services sectors. He has delivered outstanding performance in a variety of leadership roles around the globe, with particular expertise in the funding and provision of private health care.
Formerly MD of Bupa Care Services, Paul has over 24 years of general management experience, including roles across the United Kingdom, Singapore, Australia and China. He has successfully developed and delivered propositions in health funding, primary care, hospitals and aged care to deliver superior performance.
KATE SELLICK
People and Communications Director
Formerly the HR and Corporate Affairs Director at Bupa Care Services from 2007 to 2012, Kate also completed a number of strategic consulting roles during 2013 and 2014 at Opal, Uniting Care Ageing and Pulse Health, prior to joining Estia Health in October 2014.
Kate has 20 years HR experience across a range of government, not for profit and private industries including from start up to global in education, defence, telecoms, retail, health, aged care and disability.
As People and Communications Director, Kate is integral to the growth, connectivity and interrelationships of Estia’s talented people, residents, families, volunteers and communities.
JOE GENOVA
Chief Financial Officer
Previously Director of Finance at Bupa Care Services and Director of Health, Ageing and Human Services sector at KPMG, with over 20 years of experience in management, finance and leadership roles in Australia and Canada.
Joe plays an important role in shaping the strategy and growth of Estia Health, bringing a wealth of residential aged care and financial management experience to the executive team. He has an integral role in development of new systems and processes and oversight of Estia’s mergers and acquisition activities of behalf of the Group.
PETER HAMILTON
Development Director
Previously, Peter was GM Property and Capital Works at HammondCare for 7 years, where he led all capital works projects, including the refurbishment and upgrade of existing residential aged care facilities and hospitals. He has 35 years’ experience in a range of executive management roles in aged care, construction and finance sectors across Australia, the UK and South Africa.
As Development Director, Peter will lead facility redevelopments and best-practice design principles across our homes, and assist in land acquisition and plan next-phase and future redevelopment priorities for the Group.
MARK BRANDON
Chief Quality Officer
Mark is an internationally recognised thought leader and expert on strategy, health and aged care quality and accreditation, government relations and organisation transformation. Mark held the CEO position at the Australian government’s Aged Care Standards and Accreditation Agency from 2002 to 2013.
Mark was awarded an Order of Australia (OAM) Medal in June 2015, in recognition of his contribution to health and aged standards.
Mark’s pivotal role is to guide the group to embed a next generation Quality Management System to deliver excellence in care, and enhance service quality for our residents and families.
EXECUTIVE TEAM
2322

CORPORATE GOVERNANCE
The Board is responsible for the overall corporate governance of Estia. The Board monitors the operational and financial position and performance of Estia and oversees its business strategy, including approving the strategic goals of Estia and considering and approving an annual business plan, including a budget.
The Board is committed to maximising performance, generating appropriate levels of shareholder value and financial return, and sustaining the growth and success of Estia. In conducting Estia’s business with these objectives, the Board seeks to ensure that Estia is properly managed to protect and enhance shareholder interests, and that Estia, its Directors, officers and personnel operate in an appropriate environment of corporate governance.
Accordingly, the Board has created a framework for managing Estia, including adopting relevant internal controls, risk management processes and corporate governance policies and practices which it believes are appropriate for Estia’s business and which are designed to promote the responsible management and conduct of Estia.
25
We challenge ourselves and inspire others.
Left: Melissa and Heather, Estia Health Yarra Valley

CORPORATE GOVERNANCE cont.
THE BOARD OF DIRECTORSThe Board of Directors comprises five non-executive Directors (three of whom are independent, including the Chairman), and one executive Director, being the Managing Director and CEO.
The board charter adopted by the Board sets out guidelines and thresholds of materiality for the purpose of determining independence of Directors in accordance with the ASX Recommendations, and has adopted a definition of independence that is based on the ASX Corporate Governance Principles and Recommendations (3rd Edition).
BOARD CHARTER The Board Charter sets out:
– the roles and responsibilities of the Board including to provide overall strategic guidance for Estia and effective oversight of management, oversight of Estia’s financial and capital management, management and review of Estia’s compliance with its disclosure obligations and the disclosure and communication policy, promotion of effective engagement with security holders, oversight of policies between Estia and other stakeholders, ethical and responsible decision making along with compliance and risk management;
– the role and responsibilities of the Chairman and company secretary;
– the delegations of authority of the Board to both committees of the Board, the CEO and other management of Estia;
– the membership of the Board, including in relation to the Board’s composition and size and the process of selection and re-election of Directors, independence of Directors and conduct of individual Directors;
– Board process, including how the Board meets; and
– the Board’s performance evaluation processes, including in respect of its own performance, and the performance of the Board committees, individual Directors and senior executives.
BOARD COMMITTEESThe Board may from time to time establish appropriate committees to assist in the discharge of its responsibilities. The Board has established the Audit and Risk Committee and the Nomination and Remuneration Committee.
The role of the Audit and Risk Committee is to assist the Board in carrying out its accounting,
auditing and financial reporting responsibilities including oversight of:
– the integrity of Estia’s external financial reporting and financial statements;
– the appointment, remuneration, independence and competence of Estia’s external auditors;
– the performance of the internal and external audit function and review of their audits;
– the effectiveness of Estia’s system of risk management and internal controls; and
– Estia’s systems and procedures for compliance with applicable legal regulatory requirements.
The role of the Nomination and Remuneration Committee is to assist and advise the Board on the following nomination related matters:
– appointment and re-election of directors;
– induction and continuing professional development programs for directors;
– development and implementation of processes for evaluating the performance of the Board, its committees and directors;
– processes for recruiting new directors (including evaluation of skills, independence and experience);
– the appointment and re-election of directors; and
– succession planning for the Board, the Chief Executive Officer and other senior executives, to ensure that the Board is of a size and composition conducive to making appropriate decisions, with the benefit of a variety of perspectives and skills and in the best interests of Estia as a whole.
The Nomination and Remuneration Committee also assists and advises the Board on remuneration policies and practices for the Board, the CEO, the CFO, other senior executives and other persons whose activities, individually or collectively, affect the financial soundness of Estia. In accordance with the ASX Recommendations, the Audit and Risk Committee and the Nomination and Remuneration Committee each comprise at least three non-executive directors (a majority of whom are independent), and an independent chair who is not the Chairman of the Board. The Audit and Risk Committee comprises Andrew Harrison (Chair), Patrick Grier and Norah Barlow. The Nomination and Remuneration Committee comprises Norah Barlow (Chair), Patrick Grier and Peter Arvanitis. Other committees may be established by the Board as and when required to consider other matters of special importance.
SKILLS Skills, experience and expertise of the Board is set out below: – Strategy – Accounting and financial reporting – Risk and compliance oversight – Organisational culture and leadership – Government relations / political advisory – Corporate governance – Aged care management – Broad health sector experience – Listed company experience
– Global business operational experience.
DIVERSITY POLICY The Board has adopted a diversity policy which sets out Estia’s commitment to diversity and inclusion in the workplace at all levels. The diversity policy provides a framework to achieve Estia’s diversity goals and commitment to creating a diverse work environment where everyone is treated fairly and with respect and where everyone feels responsible for the reputation and performance of Estia.
DISCLOSURE AND COMMUNICATION POLICY The Board has adopted a written policy, which establishes procedures which are aimed at ensuring that Directors and management are aware of and fulfill their obligations in relation to the timely disclosure of material price-sensitive information. Under the disclosure and communication policy, the Board is responsible for managing Estia’s compliance with its continuous disclosure obligations.
SECURITIES TRADING POLICYThe Board has adopted a securities trading policy which sets out the restrictions that apply to dealing with shares including “prohibited periods”, during which certain designated persons are generally not permitted to deal with shares along with a procedure under which certain persons are required to submit prior notification and obtain written confirmation prior to dealing in shares outside the prohibited periods.
CODE OF CONDUCT In addition, many governance elements are contained in the Constitution. Estia’s code of conduct sets out the values, commitments, ethical standards and policies of Estia and outlines the standards of conduct expected of Estia’s business and people in a range of circumstances. In particular, the code requires awareness of, and compliance with, Estia’s other policies
and procedures. Details of Estia’s key policies and practices and the charters for the Board and each of its committees are available at estiahealth.com.au
VOTING RIGHTSShareholders (whether residents or non-residents of Australia) may vote at a meeting of shareholders in person, directly or by proxy, attorney or representative, depending on whether the shareholder is an individual or a company.
Subject to any rights or restrictions attaching to our shares, on a show of hands each shareholder present in person or by proxy, attorney or representative has one vote and, on a poll, has one vote for each fully paid share held. Presently, we have only one class of fully paid ordinary shares and these do not have any voting restrictions. If shares are not fully paid, on a poll the number of votes attaching to the shares is pro-rated accordingly.
SUSTAINABILITY Sustainability forms part of our everyday activities, and is a major driver of our acquisition and growth strategy to achieve operational efficiency and economic sustainability. Sustainability is achieved through meeting the needs of our residents and by each and every one of our facilities becoming an accepted part of their local communities.
Since the merger of the three residential aged care businesses on 31 July 2014, Estia has focused on the integration of these three operations and subsequent acquisitions.
Meeting both the care and social inclusion needs of our residents is important. Our residents are supported to remain involved in their local communities through varied programs including intergenerational activities, playgroups and school groups, gender specific programs targeted at male residents, and social networking tools including Skype, Facebook and emails.
Both social and economic sustainability will benefit enormously by future practices aimed at environmental sustainability as this will target our environmental footprint as we grow.
Estia is committed to being an active and valued member of its local communities. Part of our integration involves being environmentally sustainable, making as small an environmental footprint as we can, whilst still providing the exceptional levels of care our residents expect. Environmental sustainability can encompass many things, and as we enter our second year, we will focus on understanding those environmental issues that are important to Estia and our relationship with our communities.
2726
CORPORATE GOVERNANCE cont.
ESTIA HEALTH PURPOSE AND VALUESEstia Health’s purpose is to be one family, where everyone belongs. This reflects Estia’s intent to build inclusive and diverse workplaces where everyone is treated equally.
Estia Health’s purpose is supported by its values statement called the Estia Code. The Estia Code is our five behaviours that guide our employees in the delivery of care and services for residents, families, local communities and each other.
The Estia Code is:
1. Always approachable – we take time to listen because we care.
2. My daily best – we do our best to make a difference every day.
3. Creating happiness – we make magical moments happen in small and special ways.
4. Pushing our limits – we challenge ourselves and inspire others.
5. See something, say something – we pay attention and are quick to act.
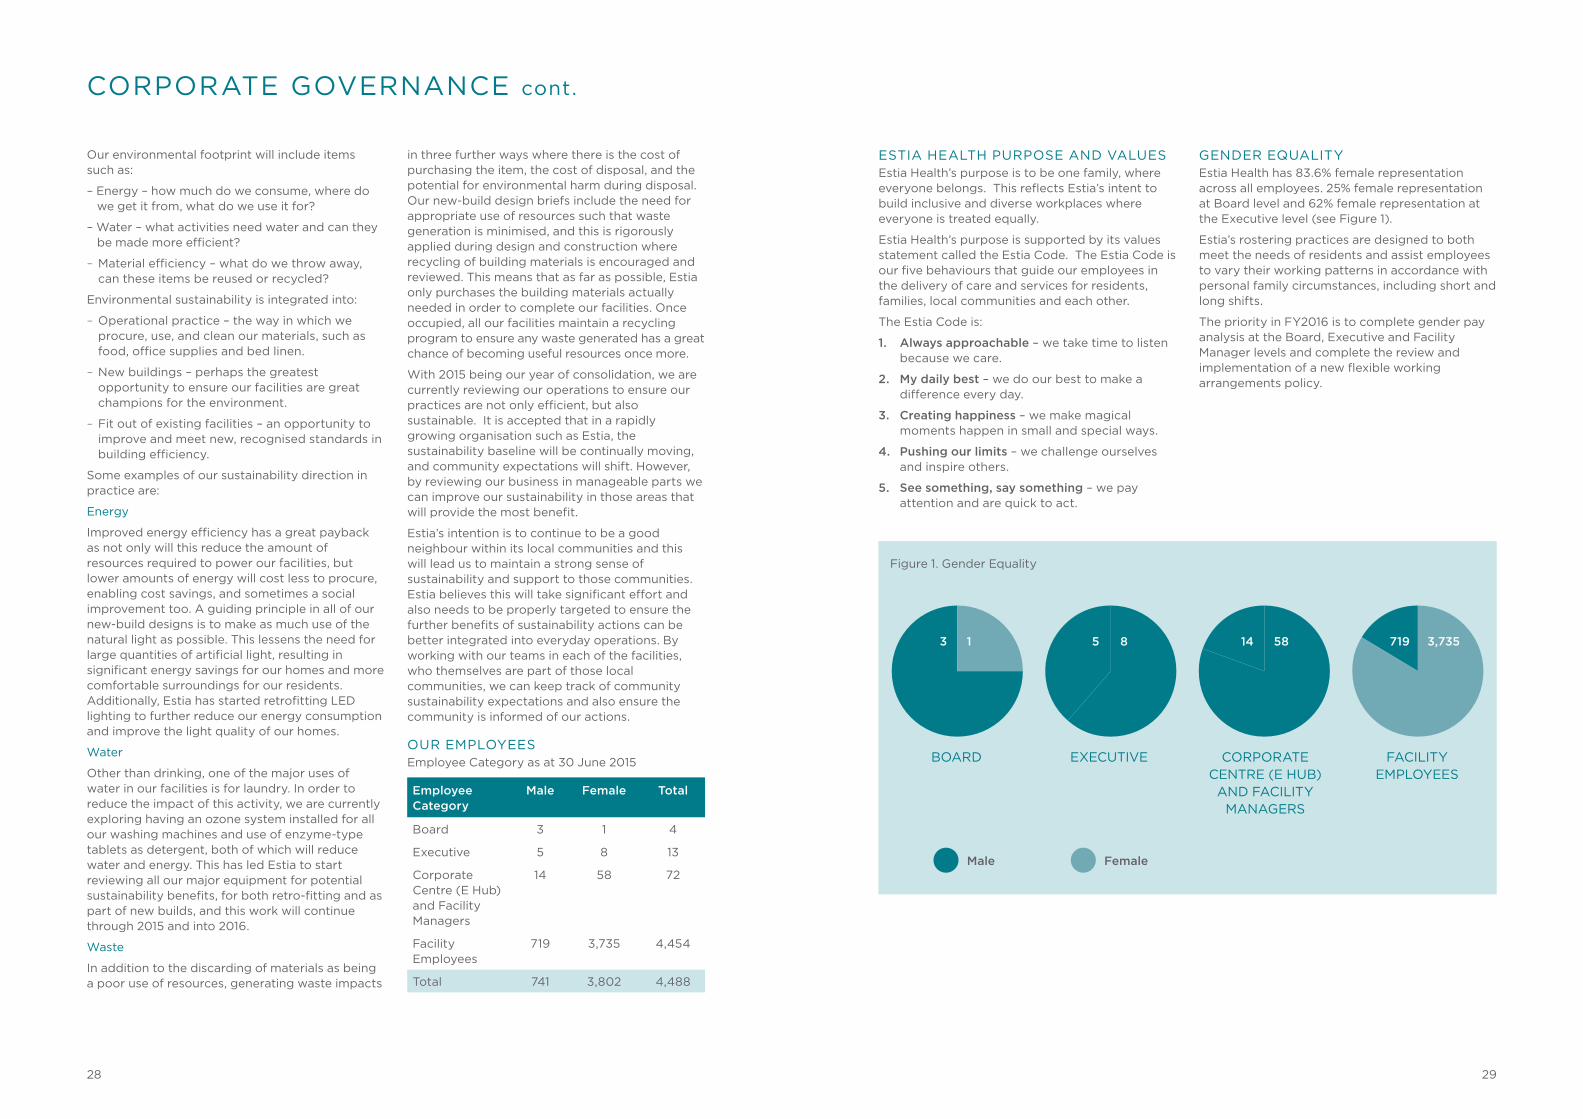
GENDER EQUALITYEstia Health has 83.6% female representation across all employees. 25% female representation at Board level and 62% female representation at the Executive level (see Figure 1).
Estia’s rostering practices are designed to both meet the needs of residents and assist employees to vary their working patterns in accordance with personal family circumstances, including short and long shifts.
The priority in FY2016 is to complete gender pay analysis at the Board, Executive and Facility Manager levels and complete the review and implementation of a new flexible working arrangements policy.
Our environmental footprint will include items such as:
– Energy – how much do we consume, where do we get it from, what do we use it for?
– Water – what activities need water and can they be made more efficient?
– Material efficiency – what do we throw away, can these items be reused or recycled?
Environmental sustainability is integrated into:
– Operational practice – the way in which we procure, use, and clean our materials, such as food, office supplies and bed linen.
– New buildings – perhaps the greatest opportunity to ensure our facilities are great champions for the environment.
– Fit out of existing facilities – an opportunity to improve and meet new, recognised standards in building efficiency.
Some examples of our sustainability direction in practice are:
Energy
Improved energy efficiency has a great payback as not only will this reduce the amount of resources required to power our facilities, but lower amounts of energy will cost less to procure, enabling cost savings, and sometimes a social improvement too. A guiding principle in all of our new-build designs is to make as much use of the natural light as possible. This lessens the need for large quantities of artificial light, resulting in significant energy savings for our homes and more comfortable surroundings for our residents. Additionally, Estia has started retrofitting LED lighting to further reduce our energy consumption and improve the light quality of our homes.
Water
Other than drinking, one of the major uses of water in our facilities is for laundry. In order to reduce the impact of this activity, we are currently exploring having an ozone system installed for all our washing machines and use of enzyme-type tablets as detergent, both of which will reduce water and energy. This has led Estia to start reviewing all our major equipment for potential sustainability benefits, for both retro-fitting and as part of new builds, and this work will continue through 2015 and into 2016.
Waste
In addition to the discarding of materials as being a poor use of resources, generating waste impacts
in three further ways where there is the cost of purchasing the item, the cost of disposal, and the potential for environmental harm during disposal. Our new-build design briefs include the need for appropriate use of resources such that waste generation is minimised, and this is rigorously applied during design and construction where recycling of building materials is encouraged and reviewed. This means that as far as possible, Estia only purchases the building materials actually needed in order to complete our facilities. Once occupied, all our facilities maintain a recycling program to ensure any waste generated has a great chance of becoming useful resources once more.
With 2015 being our year of consolidation, we are currently reviewing our operations to ensure our practices are not only efficient, but also sustainable. It is accepted that in a rapidly growing organisation such as Estia, the sustainability baseline will be continually moving, and community expectations will shift. However, by reviewing our business in manageable parts we can improve our sustainability in those areas that will provide the most benefit.
Estia’s intention is to continue to be a good neighbour within its local communities and this will lead us to maintain a strong sense of sustainability and support to those communities. Estia believes this will take significant effort and also needs to be properly targeted to ensure the further benefits of sustainability actions can be better integrated into everyday operations. By working with our teams in each of the facilities, who themselves are part of those local communities, we can keep track of community sustainability expectations and also ensure the community is informed of our actions.
OUR EMPLOYEESEmployee Category as at 30 June 2015
Employee Category
Male Female Total
Board 3 1 4
Executive 5 8 13
Corporate Centre (E Hub) and Facility Managers
14 58 72
Facility Employees
719 3,735 4,454
Total 741 3,802 4,488
Figure 1. Gender Equality
BOARD EXECUTIVE CORPORATE CENTRE (E HUB)
AND FACILITY MANAGERS
FACILITY EMPLOYEES
13 5 14 7198 58 3,735
Male Female
28 29

SHAREHOLDER INFORMATION
Distribution of shares
Range No. of shareholders
% Securities %
100,001 and Over 66 1.60 155,489,489 85.96
10,001 to 100,000 581 14.08 13,320,522 7.36
5,001 to 10,000 776 18.81 5,723,791 3.16
1,001 to 5,000 2,081 50.44 5,980,485 3.31
1 to 1,000 622 15.08 371,293 0.21
Total 4,126 100.00 180,885,580 100.00
Twenty largest shareholders
Name Shares held % of issued shares
HSBC CUSTODY NOMINEES (AUSTRALIA) LIMITED 20,197,935 11.17
J P MORGAN NOMINEES AUSTRALIA LIMITED 19,145,387 10.58
NATIONAL NOMINEES LIMITED 14,419,172 7.97
AGED SERVICES VICTORIA PTY LTD 13,876,200 7.67
CITICORP NOMINEES PTY LIMITED 12,037,017 6.65
QUADRANT PRIVATE EQUITY NO. 3, LP 11,388,507 6.30
QUADRANT PRIVATE EQUITY NO. 3D PTY LIMITED 11,076,291 6.12
MCF 4 LIMITED 7,551,488 4.17
QUADRANT PRIVATE EQUITY NO. 3C PTY LIMITED 6,167,200 3.41
UBS WEALTH MANAGEMENT AUSTRALIA NOMINEES PTY LTD 4,094,971 2.26
BNP PARIBAS NOMS (NZ) LTD 4,068,745 2.25
BNP PARIBAS NOMS PTY LTD 2,961,425 1.64
MR PETER ARVANITIS & MRS ARETI ARVANITIS 2,813,100 1.56
CUSTODIAL SERVICES LIMITED 2,249,386 1.24
HSBC CUSTODY NOMINEES (AUSTRALIA) LIMITED - A/C 3 2,023,367 1.12
HSBC CUSTODY NOMINEES (AUSTRALIA) LIMITED - A/C 2 1,708,296 0.94
QUADRANT PRIVATE EQUITY NO. 3A PTY LIMITED 1,653,334 0.91
CARPE DIEM ASSET MANAGEMENT PTY LTD 1,173,913 0.65
MR VINCENT MICHAEL O'SULLIVAN 1,151,000 0.64
AVANTEOS INVESTMENTS LIMITED 1,060,294 0.59
Total for top 20 shareholders 140,817,028 77.85
FOR THE YEAR ENDED 30 JUNE 2015
30 31
We pay attention and are quick to act.
Left: Donald and Rosario, Estia Health Yarra Valley
For information on shareholder voting rights, please refer to page 27.

Annual Report 2014 - 2015
Annual Financial Report FOR THE YEAR ENDED 30 JUNE 2015 ESTIA HEALTH LIMITED ABN 37 160 986 201
33ESTIA HEALTH ANNUAL REPORT 2014-2015 33
FINANCIAL REPORT
Estia Health Annual Report 2014-2015 33
Estia Health LimitedABN 37 160 986 201
Contents to financial report
Corporate information 34
Directors’ report 35
Auditor’s independence declaration 57
Consolidated statement of profit or loss and other comprehensive income 58
Consolidated statement of financial position 59
Consolidated statement of changes in equity 60
Consolidated statement of cash flows 61
Notes to the financial statements 62
Directors’ declaration 106
Auditor’s report 107

34 ESTIA HEALTH ANNUAL REPORT 2014-2015 35ESTIA HEALTH ANNUAL REPORT 2014-2015
CORPORATE INFORMATION
Estia Health Annual Report 2014-2015 34
ABN 37 160 986 201
DirectorsPaul Gregersen (Managing Director) Appointed 17 November 2014Patrick Grier (Non-executive Chairman) Appointed 17 November 2014Andrew Harrison (Non-executive Director) Appointed 17 November 2014Norah Barlow (Non-executive Director) Appointed 17 November 2014Peter Arvanitis (Non-executive Director)*Marcus Darville (Non-executive Director) Resigned 17 November 2014, re-appointed 15 July 2015Chris Hadley (Non-executive Director) Resigned 10 October 2014Clark Perkins (Non-executive Director) Appointed 30 July 2014, resigned 17 November 2014Jonathan Pearce (Non-executive Director) Resigned 17 November 2014Nick Yannopoulos (Executive Director) Resigned 17 November 2014
* Peter Arvanitis was Chief Executive Officer until 31 August 2014
Company SecretarySuzy Watson Appointed 5 December 2014Nick Yannopoulos Appointed 26 September 2014, resigned 5 December 2014Stuart Whipp Resigned 26 September 2014
Registered office357 Camberwell RoadCamberwell VIC 3124
Principal place of business357 Camberwell RoadCamberwell VIC 3124
SolicitorsKing & Wood MallesonsGovernor Phillip Tower1 Farrer PlaceSydney NSW 2000
BankersWestpac Banking Corporation275 Kent StreetSydney NSW 2000
AuditorsErnst & Young8 Exhibition StreetMelbourne VIC 3000
DIRECTORS’ REPORT
Estia Health Annual Report 2014-2015 35
Your directors submit their report for the yearended 30 June 2015.
DirectorsThe names and details of the Group’s directors inoffice during the financial year and until the date ofthis report are as follows. Directors were in officefor the entire period unless otherwise stated. Moredetail on the current directors can be found onpages 20 and 21 of this Annual Report.
Paul Gregersen (Managing Director)Paul joined Estia on 1 August 2014 as ChiefExecutive Officer and was then appointed as aManaging Director on 17 November 2014.
Paul holds a Bachelor in Engineering from theUniversity of Wales, a Master in BusinessAdministration from the University of Bradford andis also a graduate of the Wharton BusinessSchool’s Advanced Management Programme.
Patrick GrierPatrick was appointed to the board in November2014 as Chairman and independent non-executive director.
Patrick holds a Bachelor of Science and aDiploma in Education from Capetown University.
Patrick has also been a director of Ramsay HealthCare Limited since 25 June 1997 and PrimeMedia Group Limited between 6 June 2008 and20 November 2014.
Andrew HarrisonAndrew was appointed to the Board in November2014 as an independent non-executive director.
Andrew holds a Bachelor of Economics from theUniversity of Sydney and a Master of BusinessAdministration from the Wharton School at theUniversity of Pennsylvania, and is a CharteredAccountant.
Norah BarlowNorah was appointed to the Board in November2014 as an independent non-executive director.
Norah holds a Bachelor of Commerce andAdministration from Victoria University and is anAssociate Chartered Accountant.
Norah has also served as a director of IngeniaCommunities Group since 31 March 2014, EvolveEducation Group since 13 November 2014, andSummerset Group Holdings Limited since 26March 2009.
Peter ArvanitisPeter is the founding director and former CEO ofEstia and has been a non-independent non-executive director since 1 September 2014.
Marcus DarvilleMarcus was reappointed as a non-independentnon-executive director in July 2015 after heresigned in November 2014.
Marcus was also a director of Isentia GroupLimited between 14 January 2014 and 9 May2014, Virtus Health Limited between 11 February2008 and 7 October 2014, and Summerset GroupHoldings Limited between 17 April 2009 and 21October 2013.
Chris HadleyChris is the Managing Director of QuadrantPrivate Equity. He is one of the longest servingexecutives in the Australian Private Equityindustry and was one of the founding councilmembers of AVCAL. Chris has led and manageda number of Quadrant investments and has beena director on many investee boards.
Chris is a Chartered Accountant and is a memberof Financial Services International (Australia).
Chris has also been a director of APN OutdoorGroup Limited between 1 May 2012 and 17October 2014, Burson Group Limited between 17October 2011 and 31 March 2014, Isentia GroupLimited between 14 January 2014 and 9 May2015, and Summerset Group Holdings Limitedbetween 17 April 2009 and 21 October 2013.
Chris resigned from the Board in October 2014.
Clark PerkinsClark is the CEO of Mercury Capital and has morethan 25 years’ experience in the investmentbanking, private equity and financial servicesindustry.
Clark holds a Bachelor of Commerce from theUniversity of Auckland.
Clark resigned from the Board in November 2014.
Jonathan PearceJonathan joined Quadrant Private Equity inJanuary 2012 as an Investment Director. Prior tothis Jonathan was a Director ofPricewaterhouseCoopers, where he wasresponsible for advising on private equity andcorporate mergers and acquisitions acrossEurope, the US and Asia.
Jonathan holds a Bachelor of Commerce and is aChartered Accountant.
Jonathan resigned from the Board in November2014.
36 ESTIA HEALTH ANNUAL REPORT 2014-2015 37ESTIA HEALTH ANNUAL REPORT 2014-2015
DIRECTORS’ REPORT
Estia Health Annual Report 2014-2015 36
Nick YannopoulosNick joined Estia Health Group from a backgroundin sales, property and management roles. Nickplayed an integral part in improving anddeveloping new systems and processesthroughout the Group. He also played a major rolein the Group's recent expansion and in particularensuring that all acquisitions have transitionedsmoothly into the Estia Health Group.
Nick resigned from the Board in November 2014and as Company Secretary in December 2014.
Company Secretary
Suzy WatsonSuzy was appointed as Company Secretary andGeneral Counsel in December 2014.
Suzy was previously in-house counsel at BUPA inboth Sydney and the UK. She holds a B.A Hons(Law and Government), an LLM in InternationalEconomic Law (Distinction) and is studying for anLLM (Applied Law) in In-House Practice. Suzy is aqualified Solicitor in England and Wales and inAustralia, a member of the Law Society ofVictoria, a member of the Australian CorporateLawyers Association and a member of theGovernance Institute of Australia.
Dividends
The Directors propose a final cash dividend for theyear ended 30 June 2015 of 13.6 cents per share(2014: nil) totalling $24,575,540 (2014: nil).Proposed dividends on ordinary shares aresubject to approval at the annual general meetingand are not recognised as a liability at 30 June2015.
Principal activities
The principal activities of the Estia Health Groupduring the year ended 30 June 2015 included theoperating and developing of owned and leasedresidential aged care facilities throughoutAustralia.
Operating and financial review
Information on the operations and financialposition for the Group is set out in our Operatingand Financial Review (OFR) from page 14 of thisfinancial report.
Significant changes in the state of affairs
On 5 December 2014 the Group successfullylisted on the Australian Stock Exchange. A total of126,087,759 shares were issued in the float withtotal gross proceeds of $725,004,614.
On 9 December 2014 the proceeds raised fromthe listing were used to repay in full the fundingprovided under existing senior debt andmezzanine facilities, vendor and shareholderloans.
Significant events after the balance dateOn 13 July 2015, Estia refinanced its existing debtfacility to improve the ability to fund future growth.As part of the refinancing, Estia reduced thenumber of participants in the syndicated debtfacility to include Westpac Banking Corporationand Commonwealth Bank of Australia. Theamendments to the existing debt facility include anextension to 10 December 2018, a reduction inthe unused line fee from 0.45% to 0.40% and theaddition of a revolving $150,000,000 accordionfacility. The new facility was utilised on 4 August2015 to repay the existing debt facility drawdownof $54,250,000.In July 2015:
• Estia acquired a 60 bed facility inKeysborough, Victoria;
• a strategic partnership agreement wasentered into with developers to build fourresidential aged facilities which will add500 places over 18 months to June 2017with an option to build a further 500places; and
• Estia entered into agreements topurchase two residential aged carefacilities (133 places) in Victoria to becompleted in September 2015 and oneresidential aged care facility (120 places)in regional Victoria, to be completed inOctober 2015.
In August 2015, Estia entered into an agreementto purchase a 70 bed facility, to be completed inSeptember 2015 and a 48 bed facility to becompleted in October 2015, both in metropolitanMelbourne.
Total committed gross consideration for theseacquisitions is $90,800,000.
Other than those mentioned above, no matters orcircumstances have arisen since the end of thereporting period which significantly affected ormay significantly affect the operations of theGroup, the results of those operations, or the stateof affairs of the Group in future financial years.
DIRECTORS’ REPORT
Estia Health Annual Report 2014-2015 37
Likely developments and expected results
The Group’s growth strategy centres onincreasing the size of its aged care portfoliothrough the acquisition of additional aged carefacilities and the developments of greenfield andbrownfield projects.
Other than the likely developments disclosedabove and elsewhere in this report, no matters orcircumstances have arisen which significantlyaffected or may significantly affect the operationsof the Group, the results of those operations, orthe state of the affairs of the Group in futurefinancial years.
Environmental regulation and performance
The Group is not subject to significantenvironmental legislation under eitherCommonwealth or State legislation.
Indemnification and insurance of directors andofficers
The Group has agreed to indemnify all thedirectors and executive officers for any breach ofenvironmental or discrimination laws by the Groupfor which they may be held personally liable. Theagreement provides for the Group to pay anamount provided that:
(a) The liability does not arise out of conductinvolving a lack of good faith; and
(b) The liability is for costs and expensesincurred by the director or officer in defendingproceedings in which judgement is given intheir favour or in which they are acquitted.
During or since the financial year, the Group haspaid premiums in respect of a contract insuring allthe directors of Estia Health Ltd against legalcosts incurred in defending proceedings forconduct other than:
(a) A wilful breach of duty; or
(b) A contravention of sections 182 or 183 of theCorporations Act 2001, as permitted by section199B of the Corporations Act 2001.
The total amount of insurance contract premiumspaid was $272,500.
Indemnification of auditors
To the extent permitted by law, the Group hasagreed to indemnify its auditors, Ernst & YoungAustralia, as part of the terms of its auditengagement agreement against claims by thirdparties arising from the audit (for an unspecifiedamount). No payment has been made toindemnify Ernst & Young during or since thefinancial year.
Rounding
The amounts contained in this report and in thefinancial report have been rounded to the nearest$1 (where rounding is applicable) and wherenoted ($) under the option available to the Groupunder ASIC CO 98/0100. Estia Health Ltd is anentity to which the class order applies.
Committee membership
As at the date of this report, the Group had aNomination and Remuneration Committeecomprising of Norah Barlow (chairperson), PatrickGrier and Peter Arvanitis, and an Audit and RiskCommittee comprising of Andrew Harrison(chairperson), Norah Barlow (chairperson) andPatrick Grier.

38 ESTIA HEALTH ANNUAL REPORT 2014-2015 39ESTIA HEALTH ANNUAL REPORT 2014-2015
DIRECTORS’ REPORT
Estia Health Annual Report 2014-2015 38
Directors' meetings
The number of meetings of directors (including meetings of committees of directors) held during the yearand the number of meetings attended by each director were as follows:
Directors’meetings
Nomination andremuneration
committee
Audit and riskcommittee
No. of meetings held: 10 2 3
Eligible Attended Eligible Attended Eligible AttendedPaul Gregersen 10 10 - - - -Patrick Grier 10 10 2 2 3 3Andrew Harrison 10 10 - - 3 3Norah Barlow 10 10 2 2 3 3Peter Arvanitis 10 9 2 2 - -Marcus Darville 1 1 - - - -Chris Hadley 1 - - - - -Clark Perkins 1 - - - - -Jonathan Pearce 1 1 - - - -Nick Yannopoulos 1 - - - - -
DIRECTORS’ REPORT
39Estia Health Annual Report 2014-2015
Remuneration report –auditedFY2015 was an exciting year for Estia Health withthe successful listing of the company on theAustralian Securities Exchange on 5 December2014.
The Prospectus lodged on 3 December 2014contained an outline of the remuneration of KeyManagement Personnel (KMP) who have directauthority and responsibility for planning, directingand controlling the activities of Estia. In FY2015,no changes were made to the remunerationframework, however, the Board proposes to makeminor adjustments to the framework in FY2016.
Estia’s remuneration policy is aimed at ensuringthe remuneration outcomes are linked to theGroup’s performance and align the interests ofmanagement with the interests of shareholders.The principles that underpin the remunerationframework support and drive the achievement ofEstia’s business strategy and seek to attract,retain and motivate senior management.
Summary of remuneration framework
In FY2015, the executive remuneration frameworkcomprised a mix of fixed annual remuneration,and short and long-term performance-linkedincentive plans as follows:
• Fixed remuneration: Base salary andsuperannuation set with reference to role,market and experience of the employee andset with reference to external benchmarkingdata. Group and individual performance areconsidered during the annual remunerationreview.
• Variable remuneration:
- Short-term element awarded in cashbased on the achievement of financialobjectives with a deferral for KMP; and
- Long-term element dependent on totalshareholder return (TSR) performancerelative to peer groups and awarded inthe form of performance rights.
Management Equity Plan (MEP) loan plan
The MEP is a legacy plan which was approved bythe Board and implemented prior to listing. Detailsof the MEP are included in section 7 of thisReport. The MD acquired shares under the MEPat the time of IPO and did not receive any otherlong-term incentive in FY2015.
The Board has decided that no new offers will bemade under the MEP going forward.
Proposed changes in FY2016
The Board is currently undertaking a review of theremuneration policy and has engaged KPMG, anindependent advisor, to ensure that theremuneration of KMP is competitive, linked toachievement of the business strategy, and alignsthe interests of management with shareholders.The performance measures in the STI will bereviewed to include key financial and non-financialmeasures that link directly to the businessstrategy.
Details of any changes to the remunerationframework will be disclosed in the FY2016remuneration report.
Conclusion
FY2015 marks the first year that Estia hasreported on the remuneration of KMP. The Boardare committed to engaging with shareholders andensuring the remuneration framework istransparent and linked to the business strategy.
On behalf of the Board, we are pleased to presentto you the FY2015 Remuneration Report for Estia.
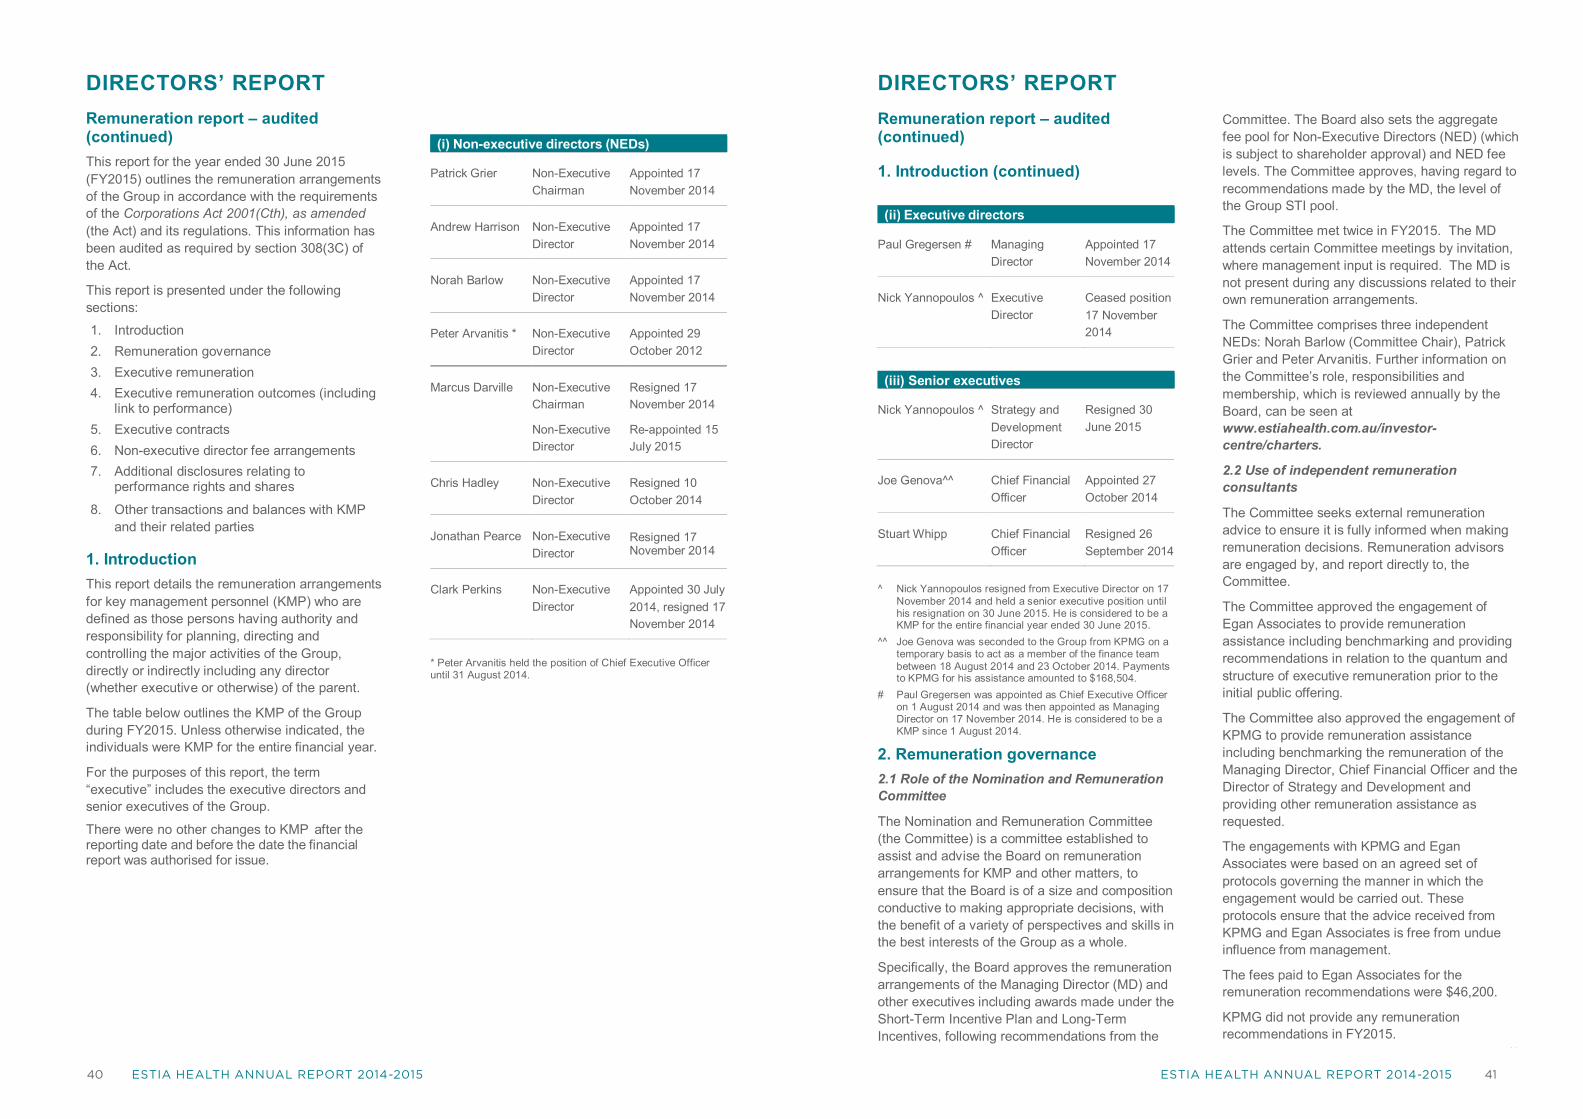
40 ESTIA HEALTH ANNUAL REPORT 2014-2015 41ESTIA HEALTH ANNUAL REPORT 2014-2015
DIRECTORS’ REPORT
40Estia Health Annual Report 2014-2015
Remuneration report – audited(continued)This report for the year ended 30 June 2015(FY2015) outlines the remuneration arrangementsof the Group in accordance with the requirementsof the Corporations Act 2001(Cth), as amended(the Act) and its regulations. This information hasbeen audited as required by section 308(3C) ofthe Act.
This report is presented under the followingsections:
1. Introduction2. Remuneration governance3. Executive remuneration4. Executive remuneration outcomes (including
link to performance)5. Executive contracts6. Non-executive director fee arrangements7. Additional disclosures relating to
performance rights and shares
8. Other transactions and balances with KMPand their related parties
1. IntroductionThis report details the remuneration arrangementsfor key management personnel (KMP) who aredefined as those persons having authority andresponsibility for planning, directing andcontrolling the major activities of the Group,directly or indirectly including any director(whether executive or otherwise) of the parent.
The table below outlines the KMP of the Groupduring FY2015. Unless otherwise indicated, theindividuals were KMP for the entire financial year.
For the purposes of this report, the term“executive” includes the executive directors andsenior executives of the Group.
There were no other changes to KMP after thereporting date and before the date the financialreport was authorised for issue.
(i) Non-executive directors (NEDs)
Patrick Grier Non-ExecutiveChairman
Appointed 17November 2014
Andrew Harrison Non-ExecutiveDirector
Appointed 17November 2014
Norah Barlow Non-ExecutiveDirector
Appointed 17November 2014
Peter Arvanitis * Non-ExecutiveDirector
Appointed 29October 2012
Marcus Darville Non-ExecutiveChairman
Non-ExecutiveDirector
Resigned 17November 2014
Re-appointed 15July 2015
Chris Hadley Non-ExecutiveDirector
Resigned 10October 2014
Jonathan Pearce Non-ExecutiveDirector
Resigned 17November 2014
Clark Perkins Non-ExecutiveDirector
Appointed 30 July2014, resigned 17November 2014
* Peter Arvanitis held the position of Chief Executive Officeruntil 31 August 2014.
DIRECTORS’ REPORT
41Estia Health Annual Report 2014-2015
Remuneration report – audited(continued)
1. Introduction (continued)
(ii) Executive directors
Paul Gregersen # ManagingDirector
Appointed 17November 2014
Nick Yannopoulos ^ ExecutiveDirector
Ceased position17 November2014
(iii) Senior executives
Nick Yannopoulos ^ Strategy andDevelopmentDirector
Resigned 30June 2015
Joe Genova^^ Chief FinancialOfficer
Appointed 27October 2014
Stuart Whipp Chief FinancialOfficer
Resigned 26September 2014
^ Nick Yannopoulos resigned from Executive Director on 17November 2014 and held a senior executive position untilhis resignation on 30 June 2015. He is considered to be aKMP for the entire financial year ended 30 June 2015.
^^ Joe Genova was seconded to the Group from KPMG on atemporary basis to act as a member of the finance teambetween 18 August 2014 and 23 October 2014. Paymentsto KPMG for his assistance amounted to $168,504.
# Paul Gregersen was appointed as Chief Executive Officeron 1 August 2014 and was then appointed as ManagingDirector on 17 November 2014. He is considered to be aKMP since 1 August 2014.
2. Remuneration governance2.1 Role of the Nomination and RemunerationCommittee
The Nomination and Remuneration Committee(the Committee) is a committee established toassist and advise the Board on remunerationarrangements for KMP and other matters, toensure that the Board is of a size and compositionconductive to making appropriate decisions, withthe benefit of a variety of perspectives and skills inthe best interests of the Group as a whole.
Specifically, the Board approves the remunerationarrangements of the Managing Director (MD) andother executives including awards made under theShort-Term Incentive Plan and Long-TermIncentives, following recommendations from the
Committee. The Board also sets the aggregatefee pool for Non-Executive Directors (NED) (whichis subject to shareholder approval) and NED feelevels. The Committee approves, having regard torecommendations made by the MD, the level ofthe Group STI pool.
The Committee met twice in FY2015. The MDattends certain Committee meetings by invitation,where management input is required. The MD isnot present during any discussions related to theirown remuneration arrangements.
The Committee comprises three independentNEDs: Norah Barlow (Committee Chair), PatrickGrier and Peter Arvanitis. Further information onthe Committee’s role, responsibilities andmembership, which is reviewed annually by theBoard, can be seen atwww.estiahealth.com.au/investor-centre/charters.
2.2 Use of independent remunerationconsultants
The Committee seeks external remunerationadvice to ensure it is fully informed when makingremuneration decisions. Remuneration advisorsare engaged by, and report directly to, theCommittee.
The Committee approved the engagement ofEgan Associates to provide remunerationassistance including benchmarking and providingrecommendations in relation to the quantum andstructure of executive remuneration prior to theinitial public offering.
The Committee also approved the engagement ofKPMG to provide remuneration assistanceincluding benchmarking the remuneration of theManaging Director, Chief Financial Officer and theDirector of Strategy and Development andproviding other remuneration assistance asrequested.
The engagements with KPMG and EganAssociates were based on an agreed set ofprotocols governing the manner in which theengagement would be carried out. Theseprotocols ensure that the advice received fromKPMG and Egan Associates is free from undueinfluence from management.
The fees paid to Egan Associates for theremuneration recommendations were $46,200.
KPMG did not provide any remunerationrecommendations in FY2015.

42 ESTIA HEALTH ANNUAL REPORT 2014-2015 43ESTIA HEALTH ANNUAL REPORT 2014-2015
DIRECTORS’ REPORT
42Estia Health Annual Report 2014-2015
Remuneration report – audited (continued)
3. Executive remuneration3.1 Remuneration principles and strategyThe Board’s remuneration strategy supports and drives the achievement of Estia’s business strategy. It aimsto ensure that remuneration outcomes are linked to the Group’s performance and aligned with shareholderoutcomes.
Estia is also committed to creating and ensuring a diverse work environment in which everyone is treatedfairly and with respect and where everyone feels responsible for the reputation and performance of theGroup. The Board believes that Estia’s commitment to this policy contributes to achieving the Group’scorporate objectives and embeds the importance and value of diversity within the culture of the Group.Diversity can broaden the pool for recruitment of high quality employees, enhance employee retention,improve the Group’s corporate image and reputation and foster a closer connection with and betterunderstanding of customers.
The Board is regularly reviewing the remuneration framework against the evolving business strategy and inthe context of the commercial environment to ensure that it remains relevant. The following illustrates howthe Group’s remuneration strategy aligns with its strategic direction:
Business strategy To be the leader in providing high quality residential aged care facilities inAustralia
RemunerationStrategy
Align the interests of executives withachievement of business strategic
objectives
Attract, motivate and retain highperforming individuals from the widest
possible pool of talent
Short and long-term incentives are basedon performance measures designed todrive sustainable value creation forshareholders.
Competitive remuneration packages withlonger-term incentives that attract highcalibre employees from a diverse pool oftalent and encourage retention and multi-year performance focus.
RemunerationFramework
Fixed remuneration Variable ‘at risk’ remuneration
The Board hasregard forcomparatorremuneration levels,consideration ofexecutives’ actualperformance andincreasingshareholder returns.
Fixed AnnualRemuneration (FAR)
Set with reference torole, market andexperience of theemployee and setwith reference toexternalbenchmarking data.
Group and individualperformance areconsidered during theannual remunerationreview.
Short-Term Incentive Plan(STIP)
Aligned to the achievementof Estia’s businessobjectives measured overthe short term.
Focused on financialobjectives measured byEBITDA.
Awarded in cash, with adeferral element in somecases.
Long-Term Incentives (LTI)
Aligned to the achievement ofincreased shareholder wealthover the long-term, it consistsof: Long-Term Incentive Plan(LTIP) and Management EquityPlan (MEP).
LTIP is dependent on totalshareholder return (TSR)performance relative to peergroups and is awarded inperformance rights.
MEP is awarded in shares inEstia at a subscription price.*
* Note: The MEP is a legacy plan which was approved by the Board and implemented prior to listing. All MEP offers were made prior to
listing and no new MEP offers were made since or are expected to be made going forward.
DIRECTORS’ REPORT
43Estia Health Annual Report 2014-2015
Remuneration report – audited (continued)
3. Executive remuneration (continued)3.2 Approach to setting remunerationIn FY2015, the executive remuneration framework comprised a mix of fixed annual remuneration, and shortand long-term performance-linked incentive plans. The Group aims to reward executives with a level and mixof remuneration appropriate to their position and responsibilities, while being market competitive.
Total remuneration levels are reviewed annually by the Committee and the Board through a process thatensures that KMP’s fixed remuneration remains competitive with the market and reflects their skills,experience, accountability and general performance. In undertaking the review, the Committee benchmarksthe remuneration of the current KMP against a group of companies which operate within the same industryas Estia and with which Estia competes for key executive talent. The comparator group comprises entitieswithin 50% and 200% of Estia’s market capitalisation.
3.3 Detail of remuneration structure
Total target remuneration
The FY2015 target remuneration mix awarded for each KMP is presented in the following table. The fixed and“at risk” variable remuneration is displayed as a percentage of total target annual remuneration.
FIXED VARIABLE
FAR STIP LTI ^
Managing Director 28% 14% 58% *
Other Senior Executives 65-77% 19-23% 0-16%
^ LTI refers to Long-Term Incentives and includes the LTIP and MEP.
* This represents the MEP awarded to the MD in FY2015. No LTIP has been awarded to the MD in the current period but it will beawarded to him in FY2016 subject to the Nomination and Remuneration Committee’s approval. The MD participated in the MEP atthe time of listing with the relevant details disclosed in the Prospectus. Details of the MD’s participation in the MEP are disclosedat sections 3.3, 4 and 7.5 of this Report.
KMP target remuneration for FY2016 is outlined below. The remuneration framework for FY2016 is currentlyunder review by the Nomination and Remuneration Committee and any changes will be disclosed in theFY2016 remuneration report.
Name FAR ^ STIP ^^ LTIP ^^^
Paul Gregersen* $600,000 50% -
Joe Genova** $400,000 30% -
^ Excluding superannuation.
^^ Shown as a percentage of FAR.
^^^ LTIP includes the Long-Term Incentive Plan only and excludes the MEP legacy plan.
* Paul Gregersen will be granted performance rights under the LTIP in FY2016, subject to approval by the Nomination andRemuneration Committee.
** Joe Genova’s FAR was increased from 1 July 2015 to $400,000 excluding superannuation.

44 ESTIA HEALTH ANNUAL REPORT 2014-2015 45ESTIA HEALTH ANNUAL REPORT 2014-2015
DIRECTORS’ REPORT
44Estia Health Annual Report 2014-2015
Remuneration report – audited (continued)
3. Executive remuneration (continued)
3.3 Detail of remuneration structure (continued)Fixed Annual RemunerationFAR includes base salary, non-cash benefits such as travelling allowances (including any fringe benefitstax), as well as leave entitlements and superannuation contributions. Each KMP’s FAR is reviewed annuallyby the Committee. In addition, the Committee may from time to time engage external consultants to provideanalysis and advice to ensure the KMP’s compensation is competitive in comparison to comparator groups.This provides flexibility to recognise capability, contribution, value to the organisation and performance ofindividuals, while maintaining remuneration at a competitive level necessary to retain and motivate KMP.Offer bonusUpon the successful listing of the Group on the Australian Securities Exchange, a number of KMP received aone-off offer bonus in recognition of their contribution to the success of the Estia Group to date culminating inthe successful Initial Public Offering.Short-Term Incentive PlanThe Group operates an annual STIP available to executives and awards a cash incentive subject to theattainment of clearly defined Group measures.
Participation Senior executives who are employed for the full financial year and continue to beemployed at the normal time for the payment of the STIP.
STIP value The MD has a maximum STIP opportunity of 50% of FAR and other seniorexecutives have a maximum STIP opportunity of 30% of FAR. This is set annually.
Assessment ofperformance
Actual STIP payments awarded to each executive depend on the extent to whichspecific targets set at the beginning of the financial year are met.
The targets may consist of a number of key performance indicators (KPIs)covering financial and non-financial, Group and business unit measures ofperformance.
Estia has chosen to use a single financial performance measure in FY2015. TheFY2015 financial measure is a comparison of the Group’s actual pro formaEBITDA in FY2015 against the Group’s forecasted EBITDA.
The use of a single financial hurdle for STIP creates a clear line of sight for seniorexecutives and transparency for shareholders as to the determination of STIPpayments.
EBITDA was chosen as the financial measure because the Board believes that iteffectively aligns rewards for senior executives with the Group’s strategic focuson delivering strong earnings throughout the business cycle.
A mix of non-financial and financial performance measures will be used inFY2016 and onwards.
Payment of STIP Performance against the financial and non-financial measures is tested annuallyafter the end of the financial year. All payments under the STIP are determined bythe Committee and the Board.
STIP payments will be made in cash immediately after the release of the full yearfinancial statements to the ASX. For certain senior executives, including the MD,25% of any payment will be deferred for a period of 12 months.
DIRECTORS’ REPORT
45Estia Health Annual Report 2014-2015
Remuneration report – audited (continued)
3. Executive remuneration (continued)
3.3 Detail of remuneration structure (continued)
Cessation ofemployment
For “Bad Leavers” (defined by the Group as resignation or termination for cause),any STI is forfeited, unless otherwise determined by the Board.
For any other reason, the Board has discretion to award STI on a pro-rata basistaking into account time and the current level of performance against performancehurdles.
Long-Term Incentives
The Group has established two long-term incentive plans:
i) Management Equity Plan; and
ii) Long-Term Incentive Plan.
Management Equity Plan
The MEP is a legacy plan which was approved by the Board and implemented prior to listing and other thanto existing holders, it is no longer offered. All MEP offers were made prior to listing and no new MEP offerswere made since. No new MEP offers will be made going forward as this plan has been replaced with theLTIP (refer below).
The purpose of the MEP was to assist in the attraction, retention and motivation of Estia’s seniormanagement by providing them with an opportunity to acquire an ownership interest in Estia. Under the plan,certain directors and employees of the Estia Group (as determined by the Board) were invited to subscribefor shares on the terms specified in the MEP rules. A number of MEP participants were also offered a 10year limited recourse loan to subscribe for MEP shares.
The MD was offered a 10 year limited recourse loan with a face value of $5 million under the MEP on 5December 2014. The MEP loan was offered to subscribe for 869,565 MEP shares at the offer price of $5.75and is interest free and repayable by 5 December 2024. The shares are held under an escrow agreementuntil the first business day following the release of the financial results for the half year ending 31 December2015.
The former Chief Financial Officer (CFO), Stuart Whipp, was offered a 10 year limited recourse and interestfree loan with a face value of $250,000 under the MEP on 2 April 2014. The MEP loan was offered to partlyfund the subscription for 500,000 MEP shares at the offer price of $1, with the remaining $250,000 fundeddirectly by the former CFO. On 7 November 2014, 400,000 of these shares were bought back by Estia at $2each for a purchase price of $800,000, with $250,000 being set off against the outstanding MEP loan amountand the remaining $550,000 being paid in cash. This buy-back of 400,000 shares consists of 250,000 MEPshares (transaction value of $500,000) which was originally financed by an MEP loan, and the remaining150,000 shares (transaction value of $300,000) that were previously fully funded by the former CFO. The$250,000 difference between the original MEP loan amount of $250,000 and the buy-back transaction valueof the MEP shares of $500,000 is disclosed as “termination payments” in the table at section 4.3 of thisReport. The remaining 100,000 shares continue to be held nominally by Stuart following his resignation.
Patrick Grier and Norah Barlow subscribed to shares under the MEP rules. These shares were self-fundedand therefore they are fully issued and paid for without a corresponding MEP loan. These shares are heldunder an escrow agreement until 5 December 2017.
Details of the MEP shares and MEP loans have been outlined at section 7 of this Report.
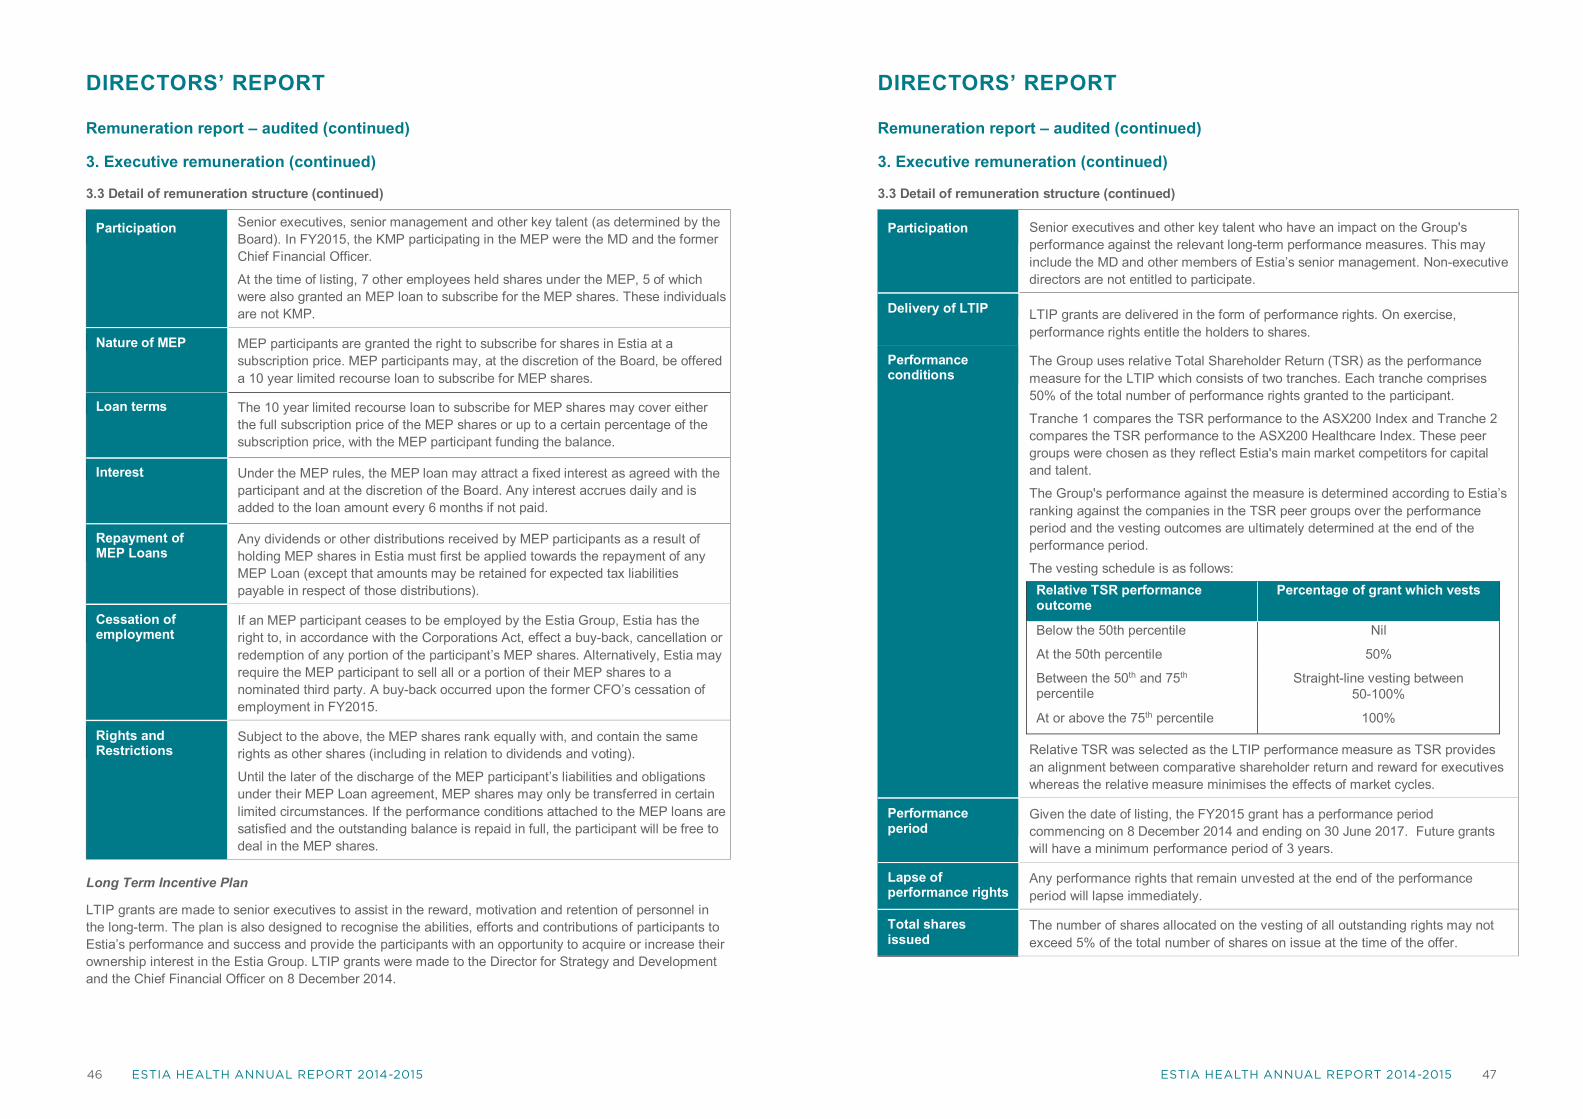
46 ESTIA HEALTH ANNUAL REPORT 2014-2015 47ESTIA HEALTH ANNUAL REPORT 2014-2015
DIRECTORS’ REPORT
46Estia Health Annual Report 2014-2015
Remuneration report – audited (continued)
3. Executive remuneration (continued)
3.3 Detail of remuneration structure (continued)
Participation Senior executives, senior management and other key talent (as determined by theBoard). In FY2015, the KMP participating in the MEP were the MD and the formerChief Financial Officer.
At the time of listing, 7 other employees held shares under the MEP, 5 of whichwere also granted an MEP loan to subscribe for the MEP shares. These individualsare not KMP.
Nature of MEP MEP participants are granted the right to subscribe for shares in Estia at asubscription price. MEP participants may, at the discretion of the Board, be offereda 10 year limited recourse loan to subscribe for MEP shares.
Loan terms The 10 year limited recourse loan to subscribe for MEP shares may cover eitherthe full subscription price of the MEP shares or up to a certain percentage of thesubscription price, with the MEP participant funding the balance.
Interest Under the MEP rules, the MEP loan may attract a fixed interest as agreed with theparticipant and at the discretion of the Board. Any interest accrues daily and isadded to the loan amount every 6 months if not paid.
Repayment ofMEP Loans
Any dividends or other distributions received by MEP participants as a result ofholding MEP shares in Estia must first be applied towards the repayment of anyMEP Loan (except that amounts may be retained for expected tax liabilitiespayable in respect of those distributions).
Cessation ofemployment
If an MEP participant ceases to be employed by the Estia Group, Estia has theright to, in accordance with the Corporations Act, effect a buy-back, cancellation orredemption of any portion of the participant’s MEP shares. Alternatively, Estia mayrequire the MEP participant to sell all or a portion of their MEP shares to anominated third party. A buy-back occurred upon the former CFO’s cessation ofemployment in FY2015.
Rights andRestrictions
Subject to the above, the MEP shares rank equally with, and contain the samerights as other shares (including in relation to dividends and voting).
Until the later of the discharge of the MEP participant’s liabilities and obligationsunder their MEP Loan agreement, MEP shares may only be transferred in certainlimited circumstances. If the performance conditions attached to the MEP loans aresatisfied and the outstanding balance is repaid in full, the participant will be free todeal in the MEP shares.
Long Term Incentive Plan
LTIP grants are made to senior executives to assist in the reward, motivation and retention of personnel inthe long-term. The plan is also designed to recognise the abilities, efforts and contributions of participants toEstia’s performance and success and provide the participants with an opportunity to acquire or increase theirownership interest in the Estia Group. LTIP grants were made to the Director for Strategy and Developmentand the Chief Financial Officer on 8 December 2014.
DIRECTORS’ REPORT
47Estia Health Annual Report 2014-2015
Remuneration report – audited (continued)
3. Executive remuneration (continued)
3.3 Detail of remuneration structure (continued)
Participation Senior executives and other key talent who have an impact on the Group'sperformance against the relevant long-term performance measures. This mayinclude the MD and other members of Estia’s senior management. Non-executivedirectors are not entitled to participate.
Delivery of LTIP LTIP grants are delivered in the form of performance rights. On exercise,performance rights entitle the holders to shares.
Performanceconditions
The Group uses relative Total Shareholder Return (TSR) as the performancemeasure for the LTIP which consists of two tranches. Each tranche comprises50% of the total number of performance rights granted to the participant.
Tranche 1 compares the TSR performance to the ASX200 Index and Tranche 2compares the TSR performance to the ASX200 Healthcare Index. These peergroups were chosen as they reflect Estia's main market competitors for capitaland talent.
The Group's performance against the measure is determined according to Estia’sranking against the companies in the TSR peer groups over the performanceperiod and the vesting outcomes are ultimately determined at the end of theperformance period.
The vesting schedule is as follows:Relative TSR performanceoutcome
Percentage of grant which vests
Below the 50th percentile Nil
At the 50th percentile 50%
Between the 50th and 75th
percentileStraight-line vesting between
50-100%
At or above the 75th percentile 100%
Relative TSR was selected as the LTIP performance measure as TSR providesan alignment between comparative shareholder return and reward for executiveswhereas the relative measure minimises the effects of market cycles.
Performanceperiod
Given the date of listing, the FY2015 grant has a performance periodcommencing on 8 December 2014 and ending on 30 June 2017. Future grantswill have a minimum performance period of 3 years.
Lapse ofperformance rights
Any performance rights that remain unvested at the end of the performanceperiod will lapse immediately.
Total sharesissued
The number of shares allocated on the vesting of all outstanding rights may notexceed 5% of the total number of shares on issue at the time of the offer.
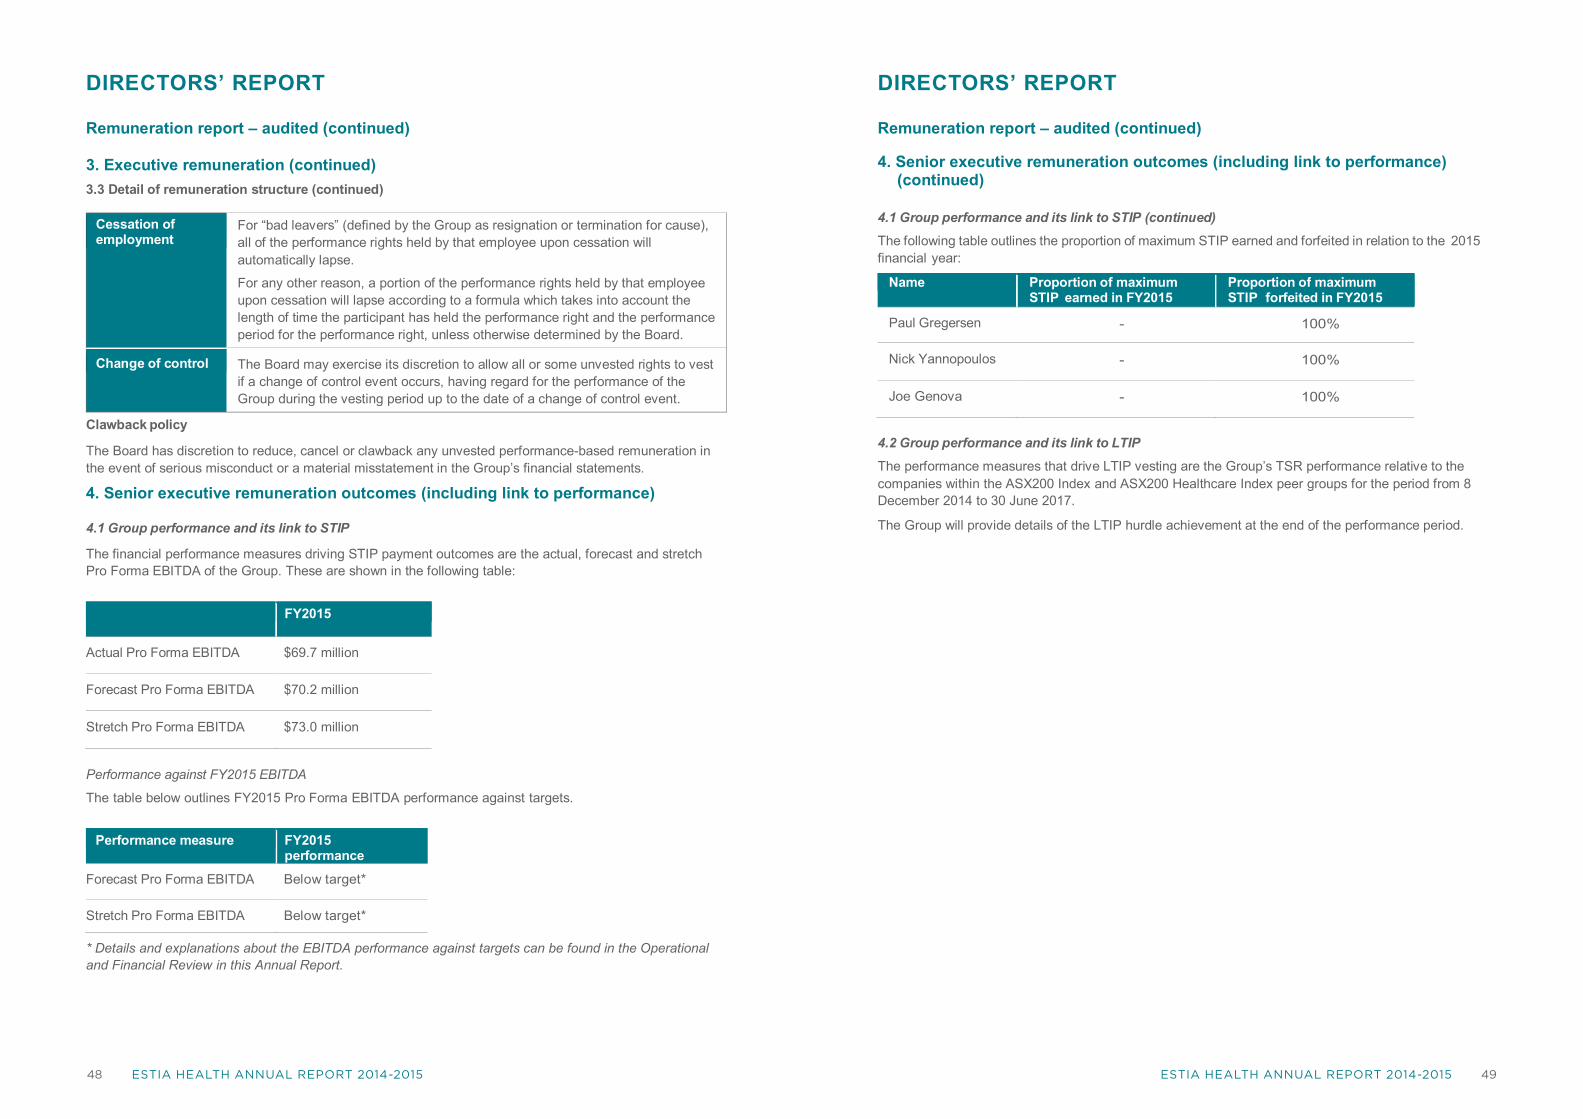
48 ESTIA HEALTH ANNUAL REPORT 2014-2015 49ESTIA HEALTH ANNUAL REPORT 2014-2015
DIRECTORS’ REPORT
48Estia Health Annual Report 2014-2015
Remuneration report – audited (continued)
3. Executive remuneration (continued)3.3 Detail of remuneration structure (continued)
Cessation ofemployment
For “bad leavers” (defined by the Group as resignation or termination for cause),all of the performance rights held by that employee upon cessation willautomatically lapse.
For any other reason, a portion of the performance rights held by that employeeupon cessation will lapse according to a formula which takes into account thelength of time the participant has held the performance right and the performanceperiod for the performance right, unless otherwise determined by the Board.
Change of control The Board may exercise its discretion to allow all or some unvested rights to vestif a change of control event occurs, having regard for the performance of theGroup during the vesting period up to the date of a change of control event.
Clawback policy
The Board has discretion to reduce, cancel or clawback any unvested performance-based remuneration inthe event of serious misconduct or a material misstatement in the Group’s financial statements.
4. Senior executive remuneration outcomes (including link to performance)
4.1 Group performance and its link to STIP
The financial performance measures driving STIP payment outcomes are the actual, forecast and stretchPro Forma EBITDA of the Group. These are shown in the following table:
FY2015
Actual Pro Forma EBITDA $69.7 million
Forecast Pro Forma EBITDA $70.2 million
Stretch Pro Forma EBITDA $73.0 million
Performance against FY2015 EBITDA
The table below outlines FY2015 Pro Forma EBITDA performance against targets.
Performance measure FY2015performanceversus targetsForecast Pro Forma EBITDA Below target*
Stretch Pro Forma EBITDA Below target*
* Details and explanations about the EBITDA performance against targets can be found in the Operationaland Financial Review in this Annual Report.
DIRECTORS’ REPORT
49Estia Health Annual Report 2014-2015
Remuneration report – audited (continued)
4. Senior executive remuneration outcomes (including link to performance)(continued)
4.1 Group performance and its link to STIP (continued)The following table outlines the proportion of maximum STIP earned and forfeited in relation to the 2015financial year:
Name Proportion of maximumSTIP earned in FY2015
Proportion of maximumSTIP forfeited in FY2015
Paul Gregersen - 100%
Nick Yannopoulos - 100%
Joe Genova - 100%
4.2 Group performance and its link to LTIPThe performance measures that drive LTIP vesting are the Group’s TSR performance relative to thecompanies within the ASX200 Index and ASX200 Healthcare Index peer groups for the period from 8December 2014 to 30 June 2017.
The Group will provide details of the LTIP hurdle achievement at the end of the performance period.

50 ESTIA HEALTH ANNUAL REPORT 2014-2015 51ESTIA HEALTH ANNUAL REPORT 2014-2015
DIRECTORS’ REPORT
51Estia Health Annual Report 2014-2015
Remuneration report – audited (continued)
5. Executive contractsRemuneration arrangements for executives are formalised in employment agreements. Key conditionsfor executives are outlined below:
Name Agreementcommence
Agreement expire Notice of terminationby Group
Employeenotice
Paul Gregersen 1 August 2014 No expiry, continuousagreement
6 months (or payment inlieu of notice)
6 months
Nick Yannopoulos* 29 October 2012 Ended on 30 June 2015upon resignation
12 months (or paymentin lieu of notice)
12 months
Joe Genova 27 October 2014 No expiry, continuousagreement
6 months (or payment inlieu of notice)
6 months
Stuart Whipp 6 September 2013 Ended on 26 September2014 upon resignation
3 months (or payment inlieu of notice)
3 months
* Nick Yannopoulos still holds a number of performance rights under the LTIP, as noted in section 7.2 inthis report.
6. Non-executive director fee arrangements6.1 Determination of fees and maximum aggregate fee pool
The Board seeks to set NED fees at a level which provides the Group with the ability to attract and retainNEDs of the highest calibre, whilst incurring a cost which is acceptable to shareholders.
The maximum aggregate fee pool and the fee structure are reviewed annually against fees paid toNEDs of comparable companies (typically ASX200 listed companies with market capitalisation of 50%to 200% of the Group, as well as similar sized industry comparators). The Board considers advice fromexternal advisors when undertaking a periodic review process.
The Group’s constitution and the ASX listing rules specify the NED maximum aggregate fee pool shallbe determined from time to time by a general meeting. The NED fee pool has been fixed by Estia at$900,000 for FY2015 (including superannuation contributions as required by law).
The Board will not seek any increase for the NED maximum aggregate fee pool at the 22 September2015 AGM.
6.2 Fee Structure
NEDs received fixed fees only consisting of base fees. The Chair of the Board attends all Committeemeetings but does not receive any additional Committee fees in addition to base fees. NEDs may bereimbursed for expenses reasonably incurred in attending to the Group’s affairs. NEDs do not receiveretirement benefits, nor do they participate in any incentive programs. The table below summarises theannual NED fees, inclusive of superannuation:
Position Board fees
Chairman $250,000Directors $100,000
The Board has confirmed there will be no increases in Board or Committee fees for FY2016.
DIR
EC
TOR
S’R
EP
OR
T
50Es
tiaH
ealth
Annu
alR
epor
t201
4-20
15
Rem
uner
atio
nre
port
–au
dite
d(c
ontin
ued)
4.Se
nior
exec
utiv
ere
mun
erat
ion
outc
omes
(incl
udin
glin
kto
perf
orm
ance
)(co
ntin
ued)
4.3
Exec
utiv
ere
mun
erat
ion
fort
heye
arfr
om1
July
2014
to30
June
2015
Shor
t-ter
mbe
nefit
sPo
st-
empl
oym
ent
bene
fits
Long
-term
bene
fits
Tota
lfix
edre
mun
erat
ion
“Atr
isk”
Tota
lfix
edan
d“a
tris
k”re
mun
erat
ion
Term
inat
ion
paym
ents
Perf
orm
ance
rela
ted
rem
uner
atio
n
Sala
ryan
dfe
esO
fferb
onus
Non-
mon
etar
ybe
nefit
s
Supe
r-an
nuat
ion
bene
fits
Long
serv
ice
leav
een
title
men
ts
Shor
t-ter
min
cent
ive
(STI
P)
Shar
e-ba
sed
paym
ents
–LT
IP^
$$
$$
$$
$$
$$
%
Exec
utiv
edi
rect
orP
aulG
rege
rsen
*86
9,28
222
8,31
1-
52,7
63-
1,15
0,35
6-
69,8
611,
220,
217
-6%
Seni
orex
ecut
ives
Nic
kY
anno
poul
os34
4,51
1-
-31
,383
-37
5,89
4-
4,38
438
0,27
8-
1%
Joe
Gen
ova
251,
272
45,6
62-
23,6
87-
320,
621
-17
,804
338,
425
-5%
Form
er
Stua
rtW
hipp
246,
324
50,0
00-
36,4
55-
332,
779
21,6
99-
354,
478
250,
000
6%
Tota
lexe
cutiv
es1,
711,
389
323,
973
-14
4,28
8-
2,17
9,65
021
,699
92,0
492,
293,
398
250,
000
^In
acco
rdan
cew
ithA
AS
B2
Sha
re-B
ased
Pay
men
ts,t
heva
lues
prov
ided
have
been
calc
ulat
edus
ing
acce
pted
optio
nva
luat
ion
met
hodo
logi
esan
din
clud
essh
are-
base
dpa
ymen
tsun
dert
heLT
IPan
dM
EP
(see
sect
ions
3.3
and
7of
this
repo
rtfo
rfur
ther
deta
ils).
*P
aulG
rege
rsen
was
appo
inte
das
Chi
efE
xecu
tive
Offi
cer
on1
Aug
ust2
014
and
was
then
appo
inte
das
Man
agin
gD
irect
oron
17N
ovem
ber
2014
.He
isco
nsid
ered
tobe
aK
MP
sinc
e1
Aug
ust2
014.
Incl
uded
with
inhi
ssa
lary
and
fees
isa
one-
offs
ign-
onbo
nus
of$3
97,9
57.
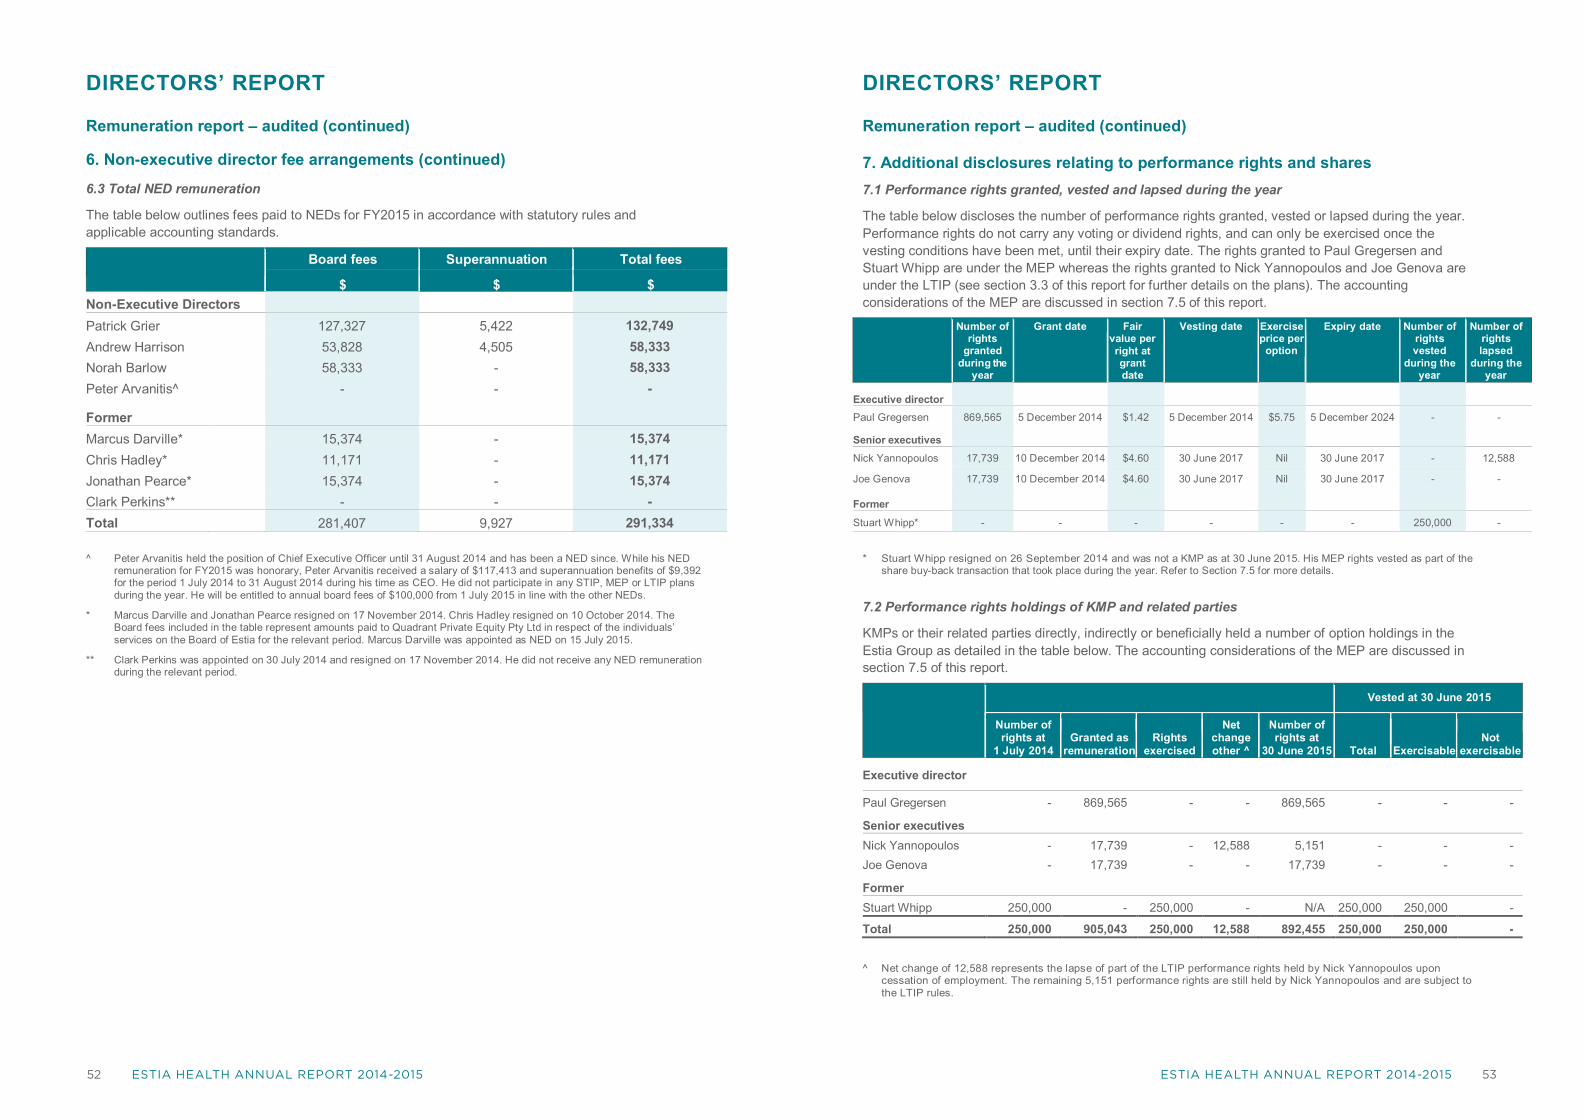
52 ESTIA HEALTH ANNUAL REPORT 2014-2015 53ESTIA HEALTH ANNUAL REPORT 2014-2015
DIRECTORS’ REPORT
52Estia Health Annual Report 2014-2015
Remuneration report – audited (continued)
6. Non-executive director fee arrangements (continued)
6.3 Total NED remuneration
The table below outlines fees paid to NEDs for FY2015 in accordance with statutory rules andapplicable accounting standards.
Board fees Superannuation Total fees
$ $ $Non-Executive DirectorsPatrick Grier 127,327 5,422 132,749Andrew Harrison 53,828 4,505 58,333Norah Barlow 58,333 - 58,333Peter Arvanitis^ - - -
FormerMarcus Darville* 15,374 - 15,374Chris Hadley* 11,171 - 11,171Jonathan Pearce* 15,374 - 15,374Clark Perkins** - - -Total 281,407 9,927 291,334
^ Peter Arvanitis held the position of Chief Executive Officer until 31 August 2014 and has been a NED since. While his NEDremuneration for FY2015 was honorary, Peter Arvanitis received a salary of $117,413 and superannuation benefits of $9,392for the period 1 July 2014 to 31 August 2014 during his time as CEO. He did not participate in any STIP, MEP or LTIP plansduring the year. He will be entitled to annual board fees of $100,000 from 1 July 2015 in line with the other NEDs.
* Marcus Darville and Jonathan Pearce resigned on 17 November 2014. Chris Hadley resigned on 10 October 2014. TheBoard fees included in the table represent amounts paid to Quadrant Private Equity Pty Ltd in respect of the individuals’services on the Board of Estia for the relevant period. Marcus Darville was appointed as NED on 15 July 2015.
** Clark Perkins was appointed on 30 July 2014 and resigned on 17 November 2014. He did not receive any NED remunerationduring the relevant period.
DIRECTORS’ REPORT
53Estia Health Annual Report 2014-2015
Remuneration report – audited (continued)
7. Additional disclosures relating to performance rights and shares7.1 Performance rights granted, vested and lapsed during the year
The table below discloses the number of performance rights granted, vested or lapsed during the year.Performance rights do not carry any voting or dividend rights, and can only be exercised once thevesting conditions have been met, until their expiry date. The rights granted to Paul Gregersen andStuart Whipp are under the MEP whereas the rights granted to Nick Yannopoulos and Joe Genova areunder the LTIP (see section 3.3 of this report for further details on the plans). The accountingconsiderations of the MEP are discussed in section 7.5 of this report.
Number ofrights
grantedduring the
year
Grant date Fairvalue perright atgrantdate
Vesting date Exerciseprice per
option
Expiry date Number ofrightsvested
during theyear
Number ofrightslapsed
during theyear
Executive directorPaul Gregersen 869,565 5 December 2014 $1.42 5 December 2014 $5.75 5 December 2024 - -
Senior executivesNick Yannopoulos 17,739 10 December 2014 $4.60 30 June 2017 Nil 30 June 2017 - 12,588
Joe Genova 17,739 10 December 2014 $4.60 30 June 2017 Nil 30 June 2017 - -
Former
Stuart Whipp* - - - - - - 250,000 -
* Stuart Whipp resigned on 26 September 2014 and was not a KMP as at 30 June 2015. His MEP rights vested as part of theshare buy-back transaction that took place during the year. Refer to Section 7.5 for more details.
7.2 Performance rights holdings of KMP and related parties
KMPs or their related parties directly, indirectly or beneficially held a number of option holdings in theEstia Group as detailed in the table below. The accounting considerations of the MEP are discussed insection 7.5 of this report.
Vested at 30 June 2015
Number ofrights at
1 July 2014Granted as
remunerationRights
exercised
Netchangeother ^
Number ofrights at
30 June 2015 Total ExercisableNot
exercisable
Executive director
Paul Gregersen - 869,565 - - 869,565 - - -
Senior executivesNick Yannopoulos - 17,739 - 12,588 5,151 - - -Joe Genova - 17,739 - - 17,739 - - -
FormerStuart Whipp 250,000 - 250,000 - N/A 250,000 250,000 -
Total 250,000 905,043 250,000 12,588 892,455 250,000 250,000 -
^ Net change of 12,588 represents the lapse of part of the LTIP performance rights held by Nick Yannopoulos uponcessation of employment. The remaining 5,151 performance rights are still held by Nick Yannopoulos and are subject tothe LTIP rules.
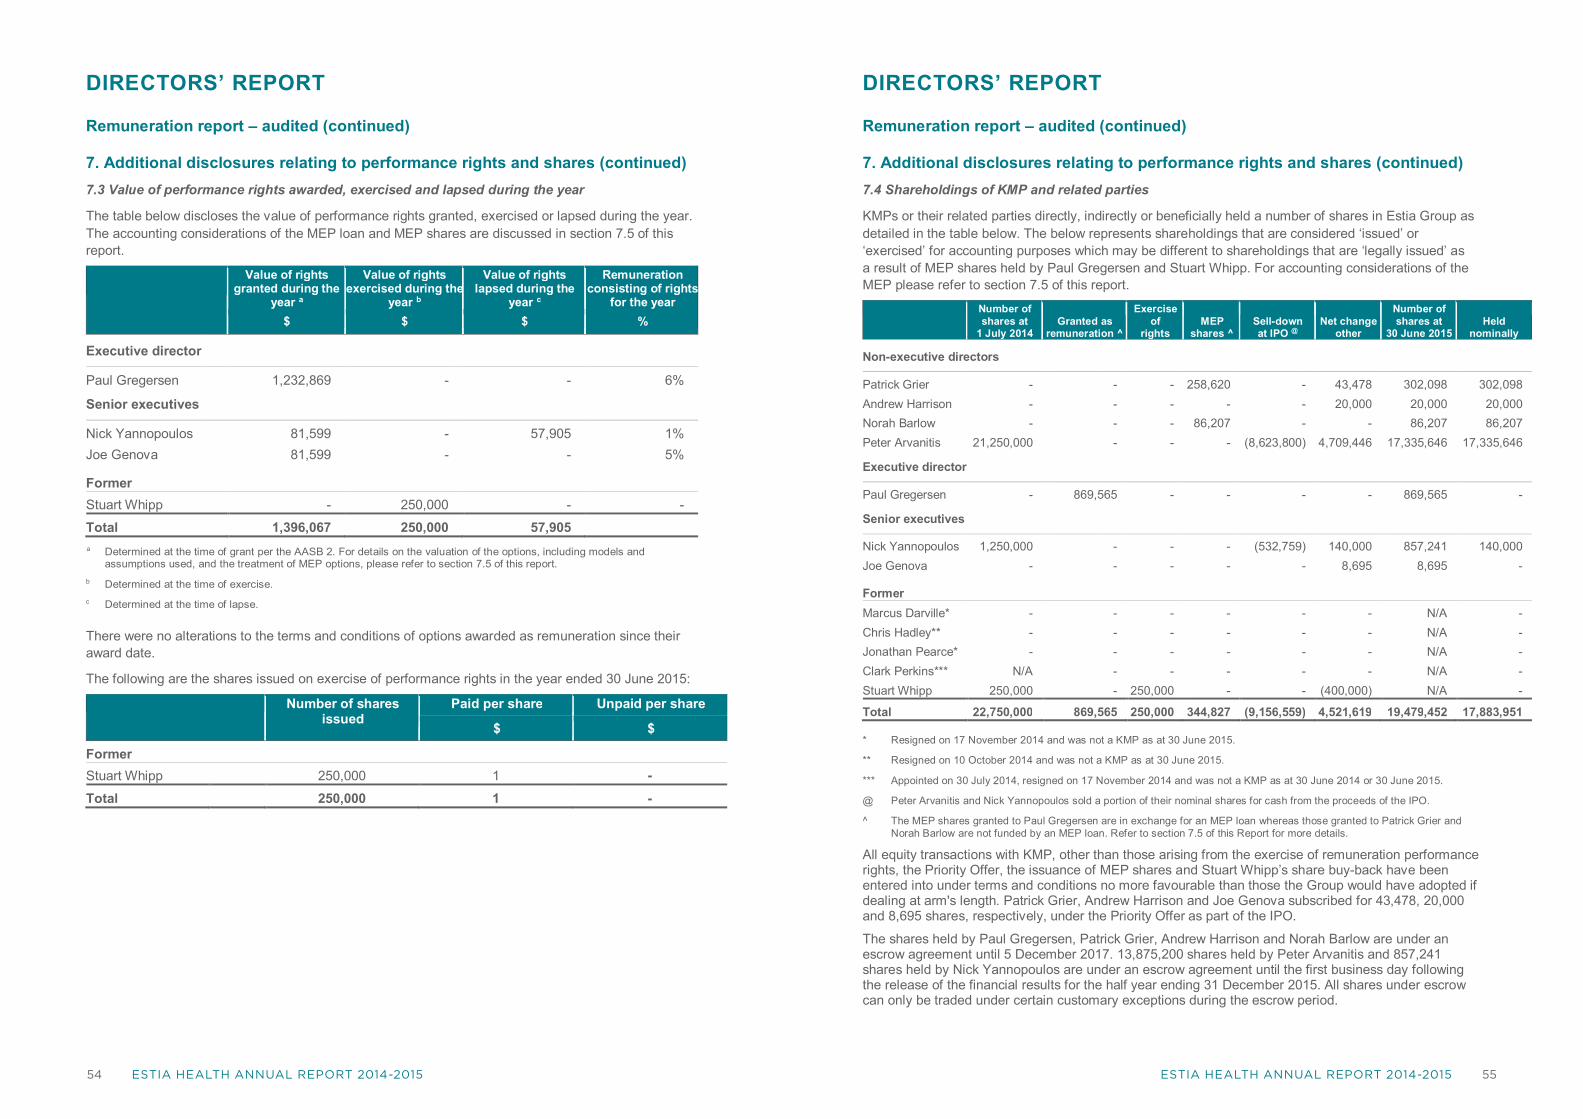
54 ESTIA HEALTH ANNUAL REPORT 2014-2015 55ESTIA HEALTH ANNUAL REPORT 2014-2015
DIRECTORS’ REPORT
54Estia Health Annual Report 2014-2015
Remuneration report – audited (continued)
7. Additional disclosures relating to performance rights and shares (continued)7.3 Value of performance rights awarded, exercised and lapsed during the year
The table below discloses the value of performance rights granted, exercised or lapsed during the year.The accounting considerations of the MEP loan and MEP shares are discussed in section 7.5 of thisreport.
Value of rightsgranted during the
year a
Value of rightsexercised during the
year b
Value of rightslapsed during the
year c
Remunerationconsisting of rights
for the year$ $ $ %
Executive director
Paul Gregersen 1,232,869 - - 6%
Senior executives
Nick Yannopoulos 81,599 - 57,905 1%Joe Genova 81,599 - - 5%
FormerStuart Whipp - 250,000 - -
Total 1,396,067 250,000 57,905a Determined at the time of grant per the AASB 2. For details on the valuation of the options, including models and
assumptions used, and the treatment of MEP options, please refer to section 7.5 of this report.b Determined at the time of exercise.c Determined at the time of lapse.
There were no alterations to the terms and conditions of options awarded as remuneration since theiraward date.
The following are the shares issued on exercise of performance rights in the year ended 30 June 2015:
Number of sharesissued
Paid per share Unpaid per share
$ $
FormerStuart Whipp 250,000 1 -Total 250,000 1 -
DIRECTORS’ REPORT
55Estia Health Annual Report 2014-2015
Remuneration report – audited (continued)
7. Additional disclosures relating to performance rights and shares (continued)7.4 Shareholdings of KMP and related parties
KMPs or their related parties directly, indirectly or beneficially held a number of shares in Estia Group asdetailed in the table below. The below represents shareholdings that are considered ‘issued’ or‘exercised’ for accounting purposes which may be different to shareholdings that are ‘legally issued’ asa result of MEP shares held by Paul Gregersen and Stuart Whipp. For accounting considerations of theMEP please refer to section 7.5 of this report.
Number ofshares at
1 July 2014Granted as
remuneration ^
Exerciseof
rightsMEP
shares ^Sell-downat IPO @
Net changeother
Number ofshares at
30 June 2015Held
nominally
Non-executive directors
Patrick Grier - - - 258,620 - 43,478 302,098 302,098Andrew Harrison - - - - - 20,000 20,000 20,000Norah Barlow - - - 86,207 - - 86,207 86,207Peter Arvanitis 21,250,000 - - - (8,623,800) 4,709,446 17,335,646 17,335,646
Executive director
Paul Gregersen - 869,565 - - - - 869,565 -
Senior executives
Nick Yannopoulos 1,250,000 - - - (532,759) 140,000 857,241 140,000Joe Genova - - - - - 8,695 8,695 -
FormerMarcus Darville* - - - - - - N/A -Chris Hadley** - - - - - - N/A -Jonathan Pearce* - - - - - - N/A -Clark Perkins*** N/A - - - - - N/A -Stuart Whipp 250,000 - 250,000 - - (400,000) N/A -
Total 22,750,000 869,565 250,000 344,827 (9,156,559) 4,521,619 19,479,452 17,883,951
* Resigned on 17 November 2014 and was not a KMP as at 30 June 2015.
** Resigned on 10 October 2014 and was not a KMP as at 30 June 2015.
*** Appointed on 30 July 2014, resigned on 17 November 2014 and was not a KMP as at 30 June 2014 or 30 June 2015.
@ Peter Arvanitis and Nick Yannopoulos sold a portion of their nominal shares for cash from the proceeds of the IPO.
^ The MEP shares granted to Paul Gregersen are in exchange for an MEP loan whereas those granted to Patrick Grier andNorah Barlow are not funded by an MEP loan. Refer to section 7.5 of this Report for more details.
All equity transactions with KMP, other than those arising from the exercise of remuneration performancerights, the Priority Offer, the issuance of MEP shares and Stuart Whipp’s share buy-back have beenentered into under terms and conditions no more favourable than those the Group would have adopted ifdealing at arm's length. Patrick Grier, Andrew Harrison and Joe Genova subscribed for 43,478, 20,000and 8,695 shares, respectively, under the Priority Offer as part of the IPO.
The shares held by Paul Gregersen, Patrick Grier, Andrew Harrison and Norah Barlow are under anescrow agreement until 5 December 2017. 13,875,200 shares held by Peter Arvanitis and 857,241shares held by Nick Yannopoulos are under an escrow agreement until the first business day followingthe release of the financial results for the half year ending 31 December 2015. All shares under escrowcan only be traded under certain customary exceptions during the escrow period.

56 ESTIA HEALTH ANNUAL REPORT 2014-2015 57ESTIA HEALTH ANNUAL REPORT 2014-2015
DIRECTORS’ REPORT
56Estia Health Annual Report 2014-2015
Remuneration report – audited (continued)
7. Additional disclosures relating to performance rights and shares (continued)7.5 Accounting considerations of MEP loansIn accordance with AASB2 Share-based payments, the granting of shares in exchange for a limitedrecourse loan is effectively the same as granting a share option as it gives the MEP participant the right,but not the obligation, to subscribe to Estia’s shares at a fixed price for a specified period of time. Eventhough Estia records the MEP shares as issued for legal purposes, they are not considered to be issuedfor accounting purposes. When issues relating to the MEP plan are made, limited recourse loans toassist in the purchase of the shares are recognised in equity as a debit to share capital. As the MEPholder repays the loan through the application of dividends and/or instalments, those payments areaccounted for as partly paid capital. Effectively, the grant of MEP shares and limited recourse loan areset off against each other in equity.The grants of MEP loans are accounted for as an option and the fair value at grant date is independentlydetermined using the binomial options pricing model that takes into account the discount to market priceat grant date, the expected life/term of the loan and its limited recourse nature, the vesting terms, theexpected price volatility, the expected dividend yield and the risk-free interest rate for the term.The option fair value is recognised to profit or loss on a straight-line basis over the expected vestingperiod (i.e. 10 years) with a credit to the share option reserve in equity. Loan payments received arecredited to issued capital.In case where MEP loans are not granted to assist in the purchase of MEP shares, such as in the caseof Patrick Grier and Norah Barlow, the MEP shares are fully self-funded and are therefore treated asissued for accounting purposes which is no different to legal purposes.
8. Other transactions and balances with KMP and their related parties8.1 Details and terms and conditions of other transactions with KMP and their related parties
Loans from KMP
(i) Details of loans from KMP and their related parties
Balance at1 July 2014
Advancesby KMP
Interestcharged
Interestnot
charged
Amountsrepaid to
KMPBalance at
30 June 2015
Highestbalance
during year$ $ $ $ $ $ $
Patrick Grier - 300,000 11,040 - 311,040 - 311,040
Norah Barlow - 100,000 2,795 - 102,795 - 102,795
Peter Arvanitis - 1,250,000 68,724 - 1,318,724 - 1,318,724
Nick Yannopoulos - 140,000 7,697 - 147,697 - 147,697
Total - 1,790,000 90,256 - 1,880,256 - 1,880,256
(ii) Terms and conditions
The loans bear interest at 15% and were repaid during the year.
8.2 Amounts recognised at the reporting date in relation to other transactionsThere were no other transactions with KMP and their related parties during the year.
Signed in accordance with a resolution of the directors on 17 August 2015.
Patrick GrierChairman
AUDITOR’S INDEPENDENCE DECLARATION
57Estia Health Annual Report 2014-2015
Ernst & Young 8 Exhibition Street Melbourne VIC 3000 Australia GPO Box 67 Melbourne VIC 3001
Tel: +61 3 9288 8000 Fax: +61 3 8650 7777 ey.com/au
57
Auditor’s Independence Declaration to the Directors of Estia Health Limited In relation to our audit of the financial report of Estia Health Limited for the financial year ended 30 June 2015, to the best of my knowledge and belief, there have been no contraventions of the auditor independence requirements of the Corporations Act 2001 or any applicable code of professional conduct.
Ernst & Young
Rodney Piltz
Partner
Melbourne
17 August 2015
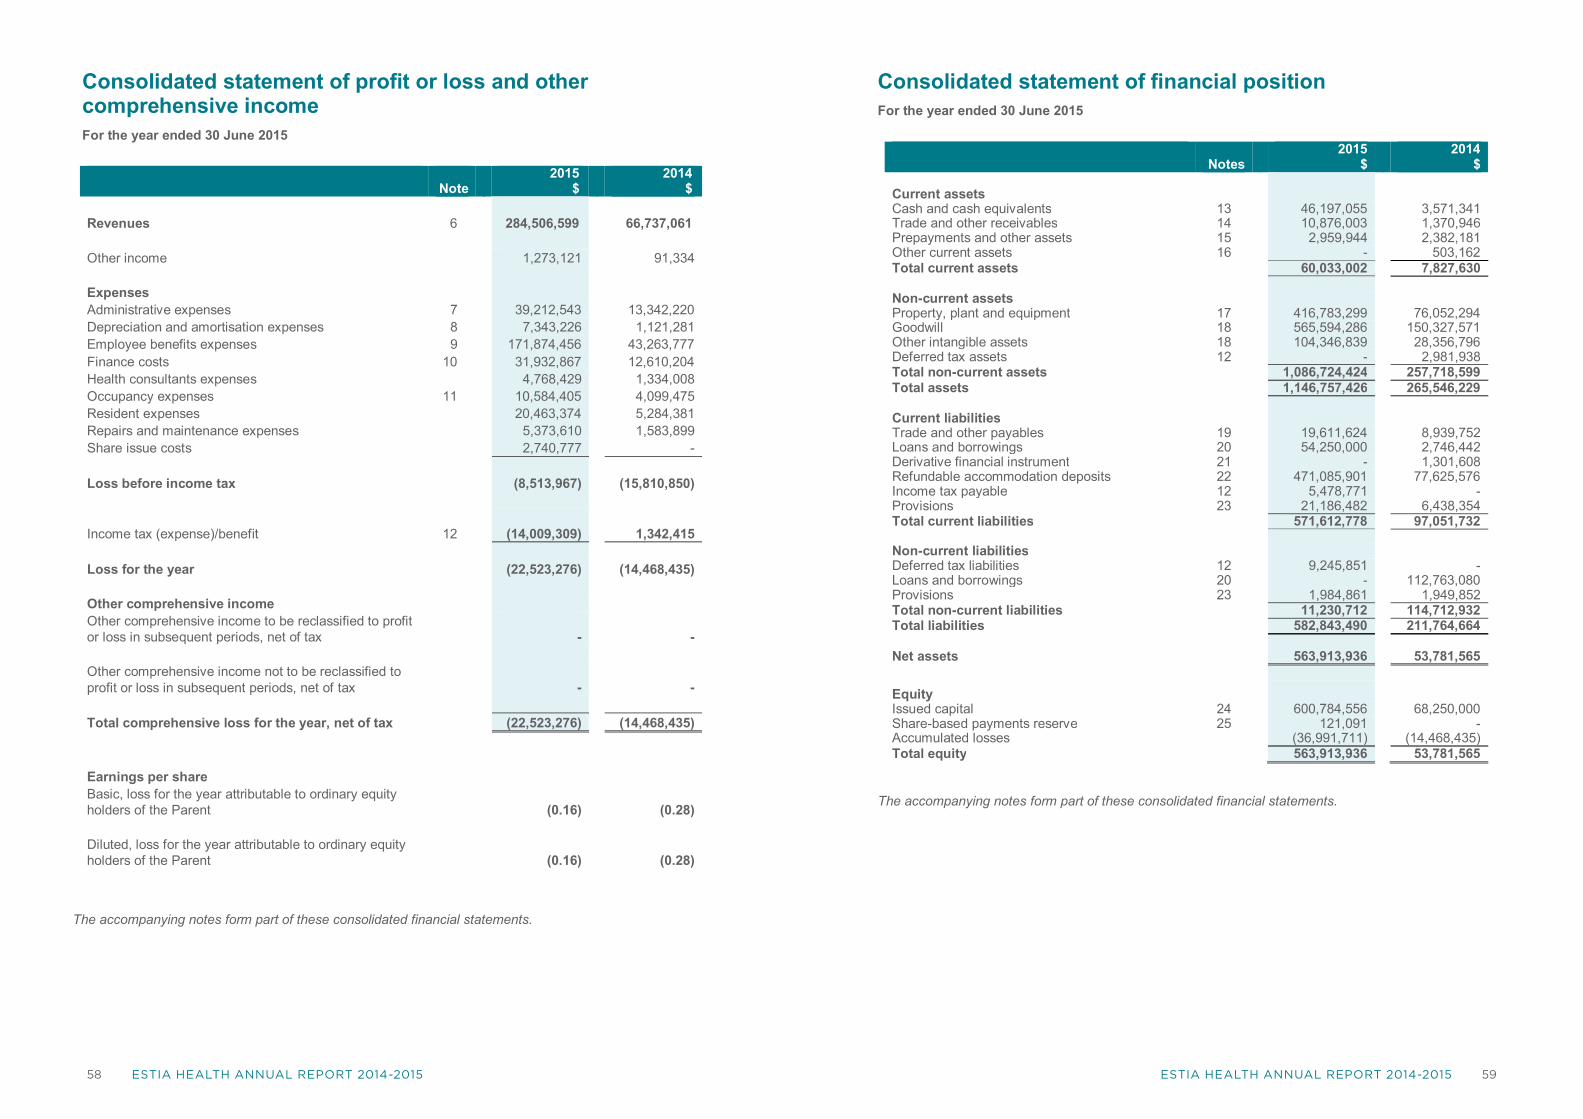
58 ESTIA HEALTH ANNUAL REPORT 2014-2015 59ESTIA HEALTH ANNUAL REPORT 2014-2015
58Estia Health Annual Report 2014-2015
Consolidated statement of profit or loss and othercomprehensive incomeFor the year ended 30 June 2015
Note2015
$2014
$
Revenues 6 284,506,599 66,737,061
Other income 1,273,121 91,334
ExpensesAdministrative expenses 7 39,212,543 13,342,220Depreciation and amortisation expenses 8 7,343,226 1,121,281Employee benefits expenses 9 171,874,456 43,263,777Finance costs 10 31,932,867 12,610,204Health consultants expenses 4,768,429 1,334,008Occupancy expenses 11 10,584,405 4,099,475Resident expenses 20,463,374 5,284,381Repairs and maintenance expenses 5,373,610 1,583,899Share issue costs 2,740,777 -
Loss before income tax (8,513,967) (15,810,850)
Income tax (expense)/benefit 12 (14,009,309) 1,342,415
Loss for the year (22,523,276) (14,468,435)
Other comprehensive incomeOther comprehensive income to be reclassified to profitor loss in subsequent periods, net of tax - -
Other comprehensive income not to be reclassified toprofit or loss in subsequent periods, net of tax - -
Total comprehensive loss for the year, net of tax (22,523,276) (14,468,435)
Earnings per shareBasic, loss for the year attributable to ordinary equityholders of the Parent (0.16) (0.28)
Diluted, loss for the year attributable to ordinary equityholders of the Parent (0.16) (0.28)
The accompanying notes form part of these consolidated financial statements.
59Estia Health Annual Report 2014-2015
Consolidated statement of financial positionFor the year ended 30 June 2015
Notes2015
$2014
$
Current assetsCash and cash equivalents 13 46,197,055 3,571,341Trade and other receivables 14 10,876,003 1,370,946Prepayments and other assets 15 2,959,944 2,382,181Other current assets 16 - 503,162Total current assets 60,033,002 7,827,630
Non-current assetsProperty, plant and equipment 17 416,783,299 76,052,294Goodwill 18 565,594,286 150,327,571Other intangible assets 18 104,346,839 28,356,796Deferred tax assets 12 - 2,981,938Total non-current assets 1,086,724,424 257,718,599Total assets 1,146,757,426 265,546,229
Current liabilitiesTrade and other payables 19 19,611,624 8,939,752Loans and borrowings 20 54,250,000 2,746,442Derivative financial instrument 21 - 1,301,608Refundable accommodation deposits 22 471,085,901 77,625,576Income tax payable 12 5,478,771 -Provisions 23 21,186,482 6,438,354Total current liabilities 571,612,778 97,051,732
Non-current liabilitiesDeferred tax liabilities 12 9,245,851 -Loans and borrowings 20 - 112,763,080Provisions 23 1,984,861 1,949,852Total non-current liabilities 11,230,712 114,712,932Total liabilities 582,843,490 211,764,664
Net assets 563,913,936 53,781,565
EquityIssued capital 24 600,784,556 68,250,000Share-based payments reserve 25 121,091 -Accumulated losses (36,991,711) (14,468,435)Total equity 563,913,936 53,781,565
The accompanying notes form part of these consolidated financial statements.
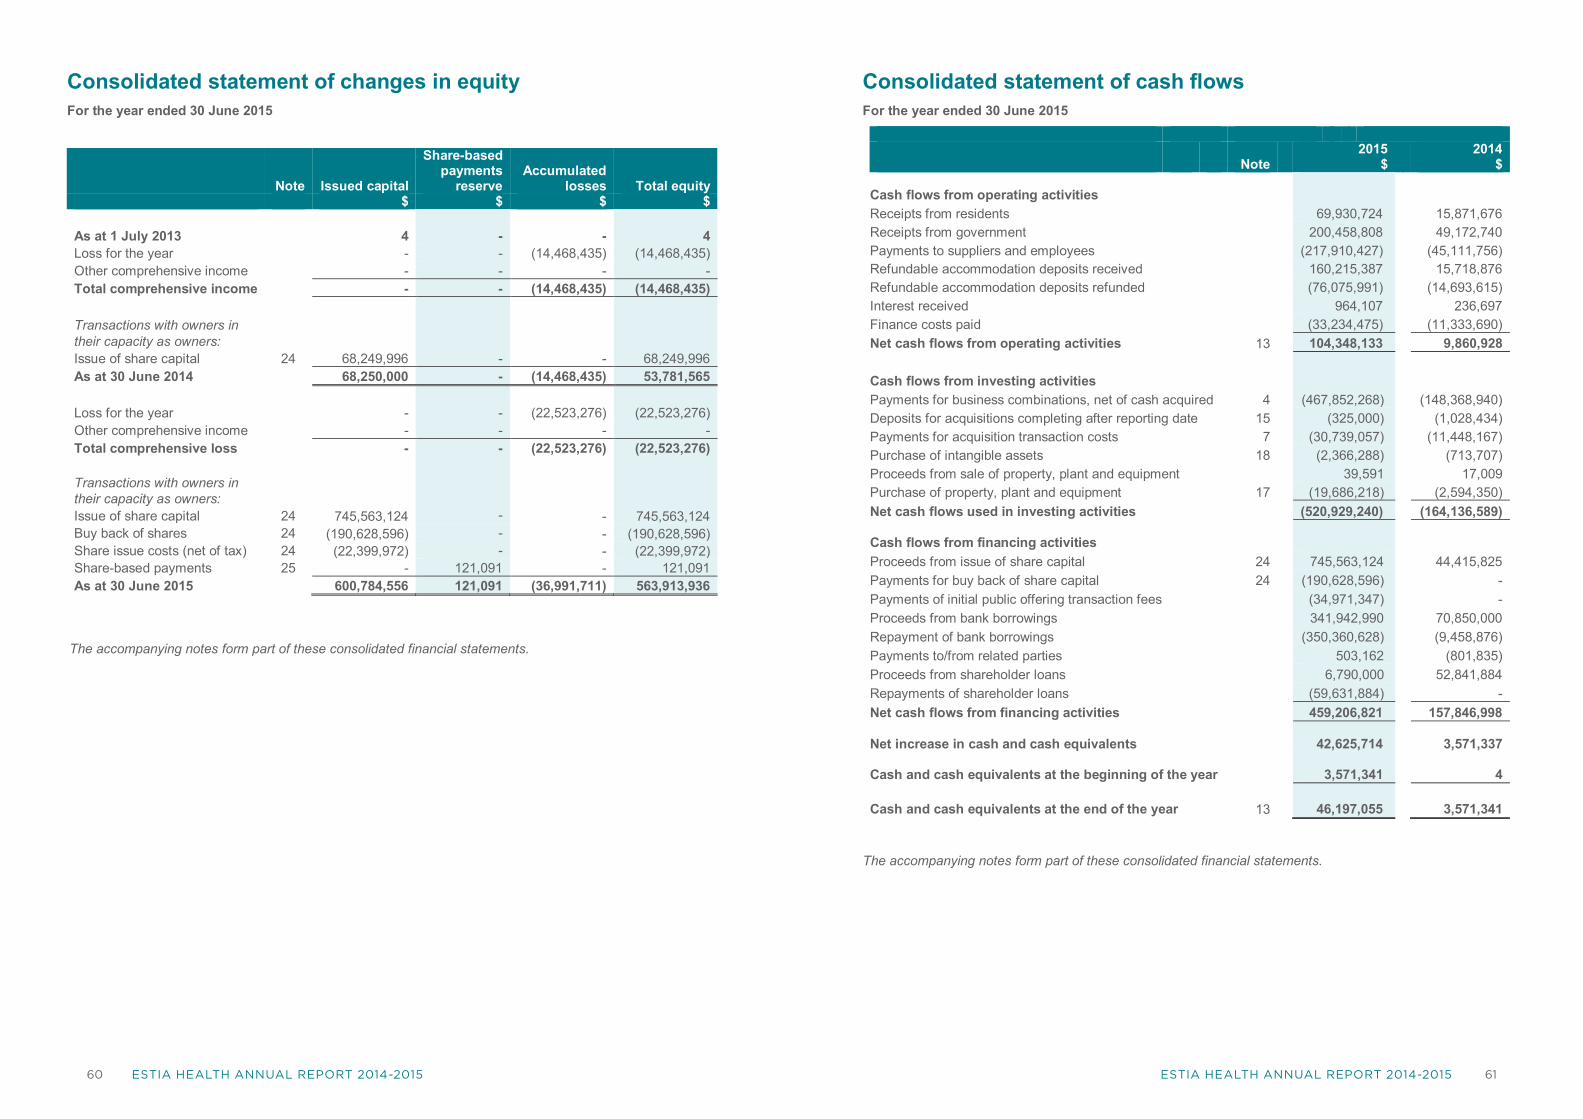
60 ESTIA HEALTH ANNUAL REPORT 2014-2015 61ESTIA HEALTH ANNUAL REPORT 2014-2015
60Estia Health Annual Report 2014-2015
Consolidated statement of changes in equityFor the year ended 30 June 2015
Note Issued capital
Share-basedpayments
reserveAccumulated
losses Total equity$ $ $ $
As at 1 July 2013 4 - - 4Loss for the year - - (14,468,435) (14,468,435)Other comprehensive income - - - -Total comprehensive income - - (14,468,435) (14,468,435)
Transactions with owners intheir capacity as owners:Issue of share capital 24 68,249,996 - - 68,249,996As at 30 June 2014 68,250,000 - (14,468,435) 53,781,565
Loss for the year - - (22,523,276) (22,523,276)Other comprehensive income - - - -Total comprehensive loss - - (22,523,276) (22,523,276)
Transactions with owners intheir capacity as owners:Issue of share capital 24 745,563,124 - - 745,563,124Buy back of shares 24 (190,628,596) - - (190,628,596)Share issue costs (net of tax) 24 (22,399,972) - - (22,399,972)Share-based payments 25 - 121,091 - 121,091As at 30 June 2015 600,784,556 121,091 (36,991,711) 563,913,936
The accompanying notes form part of these consolidated financial statements.
61Estia Health Annual Report 2014-2015
Consolidated statement of cash flowsFor the year ended 30 June 2015
Note2015
$2014
$
Cash flows from operating activitiesReceipts from residents 69,930,724 15,871,676Receipts from government 200,458,808 49,172,740Payments to suppliers and employees (217,910,427) (45,111,756)Refundable accommodation deposits received 160,215,387 15,718,876Refundable accommodation deposits refunded (76,075,991) (14,693,615)Interest received 964,107 236,697Finance costs paid (33,234,475) (11,333,690)Net cash flows from operating activities 13 104,348,133 9,860,928
Cash flows from investing activitiesPayments for business combinations, net of cash acquired 4 (467,852,268) (148,368,940)Deposits for acquisitions completing after reporting date 15 (325,000) (1,028,434)Payments for acquisition transaction costs 7 (30,739,057) (11,448,167)Purchase of intangible assets 18 (2,366,288) (713,707)Proceeds from sale of property, plant and equipment 39,591 17,009Purchase of property, plant and equipment 17 (19,686,218) (2,594,350)Net cash flows used in investing activities (520,929,240) (164,136,589)
Cash flows from financing activitiesProceeds from issue of share capital 24 745,563,124 44,415,825Payments for buy back of share capital 24 (190,628,596) -Payments of initial public offering transaction fees (34,971,347) -Proceeds from bank borrowings 341,942,990 70,850,000Repayment of bank borrowings (350,360,628) (9,458,876)Payments to/from related parties 503,162 (801,835)Proceeds from shareholder loans 6,790,000 52,841,884Repayments of shareholder loans (59,631,884) -Net cash flows from financing activities 459,206,821 157,846,998
Net increase in cash and cash equivalents 42,625,714 3,571,337
Cash and cash equivalents at the beginning of the year 3,571,341 4
Cash and cash equivalents at the end of the year 13 46,197,055 3,571,341
The accompanying notes form part of these consolidated financial statements.
62 ESTIA HEALTH ANNUAL REPORT 2014-2015 63ESTIA HEALTH ANNUAL REPORT 2014-2015
NOTES TO THE FINANCIAL STATEMENTSFOR THE YEAR ENDED 30 JUNE 2015
62Estia Health Annual Report 2014-2015
1. Corporate Information
The consolidated financial statements of EstiaHealth Ltd and its subsidiaries (collectively, the“Group”) for the year ended 30 June 2015 wereauthorised for issue in accordance with aresolution of the directors on 17 August 2015.
Estia Health Ltd (the “Company” or the “parent”) isa public company incorporated in Australia and islisted on the Australian Securities Exchange.
The nature of the operations and principalactivities of the Group are described in theDirectors’ Report.
2. Summary of significantaccounting policies
(a) Basis of preparation
The financial report is a general purpose financialreport which has been prepared in accordancewith the requirements of the Corporations Act2001, Australian Accounting Standards and otherauthoritative pronouncements of the AustralianAccounting Standards Board. The financial reporthas also been prepared on a historical cost basis,except for land and buildings and derivativefinancial instruments which have been measuredat fair value.
The financial report is presented in Australiandollars and all values are rounded to the nearestdollar ($) unless otherwise stated.
The financial report has been prepared on a goingconcern basis which assumes that the Group willbe able to meet its obligations as and when theyfall due. The Group’s current liabilities exceedcurrent assets by $511,579,776 as at 30 June2015 (2014: $89,224,102). This mainly arisesbecause of the requirement to classify refundableaccommodation deposits of $471,085,901 (2014:$77,625,576) as current liabilities (refer note 22for further details).
(b) Statement of compliance
The financial report also complies withInternational Financial Reporting Standards(IFRS) as issued by the International AccountingStandards Board.
(c) New accounting standards andinterpretations
(i) Changes in accounting policy, disclosures,standards and interpretations
New and amended standards and interpretations
The Group has adopted the following new andamended Australian Accounting Standards andAASB Interpretations as of 1 July 2014:
• Amendments to Australian AccountingStandards – Offsetting Financial Assets andFinancial Liabilities;
• AASB 1031 Materiality; and
• Improvements to AASBs 2011-2013 Cycle.
The application of these new standards andamendments did not materially impact theconsolidated financial statements of the Group.
The accounting policies adopted are consistentwith those of the previous financial reportingperiod.
(ii) Accounting Standards and Interpretationsissued but not yet effective
Australian Accounting Standards andInterpretations that have recently been issued oramended but are not yet effective and have notbeen adopted by the Group for the annualreporting period ending 30 June 2015, areoutlined in the following table:
NO
TES
TOTH
EFI
NA
NC
IAL
STA
TEM
EN
TSFO
RTH
EYE
AR
END
ED30
JUN
E20
15
2.Su
mm
ary
ofsi
gnifi
cant
acco
untin
gpo
licie
s(c
ontin
ued)
Estia
Hea
lthAn
nual
Rep
ort2
014-
2015
63
REF
EREN
CE
TITL
EIM
PAC
TO
NG
RO
UP
FIN
AN
CIA
LR
EPO
RT
APP
LIC
ATIO
ND
ATE
OF
STA
ND
ARD
APP
LIC
ATIO
ND
ATE
FOR
GR
OU
P
AA
SB
9/I
FRS
9Fi
nanc
ialI
nstru
men
tsTh
efin
alve
rsio
nof
AA
SB
9in
trodu
ces
ane
wex
pect
ed-lo
ssim
pairm
entm
odel
that
will
requ
irem
ore
timel
yre
cogn
ition
ofex
pect
edcr
edit
loss
es.S
peci
fical
ly,t
hene
wS
tand
ard
requ
ires
entit
ies
toac
coun
tfor
expe
cted
cred
itlo
sses
from
whe
nfin
anci
alin
stru
men
tsar
efir
stre
cogn
ised
and
tore
cogn
ise
full
lifet
ime
expe
cted
loss
eson
am
ore
timel
yba
sis.
AA
SB
9in
clud
esre
quire
men
tsfo
rasi
mpl
erap
proa
chfo
rcla
ssifi
catio
nan
dm
easu
rem
ento
ffin
anci
alas
sets
com
pare
dw
ithth
ere
quire
men
tsof
AA
SB
139.
The
mai
nch
ange
sar
ede
scrib
edbe
low
.
a.Fi
nanc
iala
sset
sth
atar
ede
btin
stru
men
tsw
illbe
clas
sifie
dba
sed
on(1
)the
obje
ctiv
eof
the
entit
y's
busi
ness
mod
elfo
rman
agin
gth
efin
anci
alas
sets
;(2)
the
char
acte
ristic
sof
the
cont
ract
ualc
ash
flow
s.
b.A
llow
san
irrev
ocab
leel
ectio
non
initi
alre
cogn
ition
topr
esen
tgai
nsan
dlo
sses
onin
vest
men
tsin
equi
tyin
stru
men
tsth
atar
eno
thel
dfo
rtra
ding
inot
herc
ompr
ehen
sive
inco
me.
Div
iden
dsin
resp
ect
ofth
ese
inve
stm
ents
that
are
are
turn
onin
vest
men
tcan
bere
cogn
ised
inpr
ofit
orlo
ssan
dth
ere
isno
impa
irmen
torr
ecyc
ling
ondi
spos
alof
the
inst
rum
ent.
c.Fi
nanc
iala
sset
sca
nbe
desi
gnat
edan
dm
easu
red
atfa
irva
lue
thro
ugh
prof
itor
loss
atin
itial
reco
gniti
onif
doin
gso
elim
inat
esor
sign
ifica
ntly
redu
ces
am
easu
rem
ento
rrec
ogni
tion
inco
nsis
tenc
yth
atw
ould
aris
efr
omm
easu
ring
asse
tsor
liabi
litie
s,or
reco
gnis
ing
the
gain
san
dlo
sses
onth
em,o
ndi
ffere
ntba
ses.
Whe
reth
efa
irva
lue
optio
nis
used
forf
inan
cial
liabi
litie
sth
ech
ange
infa
irva
lue
isto
beac
coun
ted
fora
sfo
llow
s:
-Th
ech
ange
attri
buta
ble
toch
ange
sin
cred
itris
kar
epr
esen
ted
inot
herc
ompr
ehen
sive
inco
me
(OC
I)
-Th
ere
mai
ning
chan
geis
pres
ente
din
prof
itor
loss
d.A
AS
B9
also
rem
oves
the
vola
tility
inpr
ofit
orlo
ssth
atw
asca
used
bych
ange
sin
the
cred
itris
kof
liabi
litie
sel
ecte
dto
bem
easu
red
atfa
irva
lue.
This
chan
gein
acco
untin
gm
eans
that
gain
sca
used
byth
ede
terio
ratio
nof
anen
tity’
sow
ncr
edit
risk
onsu
chlia
bilit
ies
are
nolo
nger
reco
gnis
edin
prof
itor
loss
.
e.C
onse
quen
tiala
men
dmen
tsw
ere
also
mad
eto
othe
rsta
ndar
dsas
are
sult
ofA
AS
B9,
intro
duce
dby
AA
SB
2009
-11
and
supe
rsed
edby
AA
SB
2010
-7,A
AS
B20
10-1
0an
dA
AS
B20
14-1
–P
artE
.
1Ja
nuar
y20
181
July
2018

64 ESTIA HEALTH ANNUAL REPORT 2014-2015 65ESTIA HEALTH ANNUAL REPORT 2014-2015
NO
TES
TOTH
EFI
NA
NC
IAL
STA
TEM
EN
TSFO
RTH
EYE
AR
END
ED30
JUN
E20
15
2.Su
mm
ary
ofsi
gnifi
cant
acco
untin
gpo
licie
s(c
ontin
ued)
Estia
Hea
lthAn
nual
Rep
ort2
014-
2015
64
REF
EREN
CE
TITL
EIM
PAC
TO
NG
RO
UP
FIN
AN
CIA
LR
EPO
RT
APP
LIC
ATIO
ND
ATE
OF
STA
ND
ARD
APP
LIC
ATIO
ND
ATE
FOR
GR
OU
P
Am
endm
ents
toA
AS
B11
6an
dA
AS
B13
8
Cla
rific
atio
nof
Acc
epta
ble
Met
hods
ofD
epre
ciat
ion
and
Am
ortis
atio
nA
AS
B11
6an
dA
AS
B13
8bo
thes
tabl
ish
the
prin
cipl
efo
rthe
basi
sof
depr
ecia
tion
and
amor
tisat
ion
asbe
ing
the
expe
cted
patte
rnof
cons
umpt
ion
ofth
efu
ture
econ
omic
bene
fits
ofan
asse
t.
The
IAS
Bha
scl
arifi
edth
atth
eus
eof
reve
nue-
base
dm
etho
dsto
calc
ulat
eth
ede
prec
iatio
nof
anas
seti
sno
tapp
ropr
iate
beca
use
reve
nue
gene
rate
dby
anac
tivity
that
incl
udes
the
use
ofan
asse
tgen
eral
lyre
flect
sfa
ctor
sot
hert
han
the
cons
umpt
ion
ofth
eec
onom
icbe
nefit
sem
bodi
edin
the
asse
t.
The
amen
dmen
tals
ocl
arifi
edth
atre
venu
eis
gene
rally
pres
umed
tobe
anin
appr
opria
teba
sis
for
mea
surin
gth
eco
nsum
ptio
nof
the
econ
omic
bene
fits
embo
died
inan
inta
ngib
leas
set.
This
pres
umpt
ion,
how
ever
,can
bere
butte
din
certa
inlim
ited
circ
umst
ance
s.
1Ja
nuar
y20
161
July
2016
AA
SB
15/I
FRS
15R
even
uefr
omC
ontra
cts
with
Cus
tom
ers
IFR
S15
esta
blis
hes
prin
cipl
esfo
rrep
ortin
gus
eful
info
rmat
ion
tous
ers
offin
anci
alst
atem
ents
abou
tthe
natu
re,a
mou
nt,t
imin
gan
dun
certa
inty
ofre
venu
ean
dca
shflo
ws
aris
ing
from
anen
tity’
sco
ntra
cts
with
cust
omer
s.
IFR
S15
supe
rsed
es:
(a)I
AS
11C
onst
ruct
ion
Con
tract
s(b
)IA
S18
Rev
enue
(c)I
FRIC
13C
usto
mer
Loya
ltyP
rogr
amm
es(d
)IFR
IC15
Agr
eem
ents
fort
heC
onst
ruct
ion
ofR
ealE
stat
e(e
)IFR
IC18
Tran
sfer
sof
Ass
ets
from
Cus
tom
ers
(f)S
IC-3
1R
even
ue—
Bar
terT
rans
actio
nsIn
volv
ing
Adv
ertis
ing
Ser
vice
s
The
core
prin
cipl
eof
IFR
S15
isth
atan
entit
yre
cogn
ises
reve
nue
tode
pict
the
trans
fero
fpro
mis
edgo
ods
orse
rvic
esto
cust
omer
sin
anam
ount
that
refle
cts
the
cons
ider
atio
nto
whi
chth
een
tity
expe
cts
tobe
entit
led
inex
chan
gefo
rtho
sego
ods
orse
rvic
es.A
nen
tity
reco
gnis
esre
venu
ein
acco
rdan
cew
ithth
atco
repr
inci
ple
byap
plyi
ngth
efo
llow
ing
step
s:
(a)S
tep
1:Id
entif
yth
eco
ntra
ct(s
)with
acu
stom
er(b
)Ste
p2:
Iden
tify
the
perf
orm
ance
oblig
atio
nsin
the
cont
ract
(c)S
tep
3:D
eter
min
eth
etra
nsac
tion
pric
e(d
)Ste
p4:
Allo
cate
the
trans
actio
npr
ice
toth
epe
rfor
man
ceob
ligat
ions
inth
eco
ntra
ct(e
)Ste
p5:
Rec
ogni
sere
venu
ew
hen
(ora
s)th
een
tity
satis
fies
ape
rform
ance
oblig
atio
n.
1Ju
ly20
181
July
2018
NO
TES
TOTH
EFI
NA
NC
IAL
STA
TEM
EN
TSFO
RTH
EYE
AR
END
ED30
JUN
E20
15
2.Su
mm
ary
ofsi
gnifi
cant
acco
untin
gpo
licie
s(c
ontin
ued)
Estia
Hea
lthAn
nual
Rep
ort2
014-
2015
65
REF
EREN
CE
TITL
EIM
PAC
TO
NG
RO
UP
FIN
AN
CIA
LR
EPO
RT
APP
LIC
ATIO
ND
ATE
OF
STA
ND
ARD
APP
LIC
ATIO
ND
ATE
FOR
GR
OU
P
AA
SB
2015
-1A
men
dmen
tsto
Aus
tralia
nA
ccou
ntin
gS
tand
ards
–A
nnua
lIm
prov
emen
tsto
Aus
tralia
nA
ccou
ntin
gS
tand
ards
2012
-20
14C
ycle
AA
SB
7Fi
nanc
ialI
nstru
men
ts:D
iscl
osur
es:
App
licab
ility
ofth
eam
endm
ents
toA
AS
B7
toco
nden
sed
inte
rimfin
anci
alst
atem
ents
-cla
rify
that
the
addi
tiona
ldis
clos
ure
requ
ired
byth
eam
endm
ents
toA
AS
B7
Dis
clos
ure–
Offs
ettin
gFi
nanc
ialA
sset
san
dFi
nanc
ialL
iabi
litie
sis
nots
peci
fical
lyre
quire
dfo
rall
inte
rimpe
riods
.How
ever
,the
addi
tiona
ldis
clos
ure
isre
quire
dto
begi
ven
inco
nden
sed
inte
rimfin
anci
alst
atem
ents
that
are
prep
ared
inac
cord
ance
with
AA
SB
134
Inte
rimFi
nanc
ialR
epor
ting
whe
nits
incl
usio
nw
ould
bere
quire
dby
the
requ
irem
ents
ofA
AS
B13
4.
AA
SB
119
Em
ploy
eeB
enef
its:
Dis
coun
trat
e:re
gion
alm
arke
tiss
ue-c
larif
ies
that
the
high
qual
ityco
rpor
ate
bond
sus
edto
estim
ate
the
disc
ount
rate
forp
ost-e
mpl
oym
entb
enef
itob
ligat
ions
shou
ldbe
deno
min
ated
inth
esa
me
curr
ency
asth
elia
bilit
y.Fu
rther
itcl
arifi
esth
atth
ede
pth
ofth
em
arke
tfor
high
qual
ityco
rpor
ate
bond
ssh
ould
beas
sess
edat
the
curr
ency
leve
l.
AA
SB
134
Inte
rimFi
nanc
ialR
epor
ting:
Dis
clos
ure
ofin
form
atio
n‘e
lsew
here
inth
ein
terim
finan
cial
repo
rt’-a
men
dsA
AS
B13
4to
clar
ifyth
em
eani
ngof
disc
losu
reof
info
rmat
ion
‘els
ewhe
rein
the
inte
rimfin
anci
alre
port’
and
tore
quire
the
incl
usio
nof
acr
oss-
refe
renc
efro
mth
ein
terim
finan
cial
stat
emen
tsto
the
loca
tion
ofth
isin
form
atio
n.
1Ja
nuar
y20
161
July
2016
Am
endm
ents
toA
AS
B10
1A
men
dmen
tsto
Aus
tralia
nA
ccou
ntin
gS
tand
ards
–D
iscl
osur
eIn
itiat
ive
The
Sta
ndar
dm
akes
amen
dmen
tsto
AA
SB
101
Pre
sent
atio
nof
Fina
ncia
lSta
tem
ents
aris
ing
from
the
IAS
B’s
Dis
clos
ure
Initi
ativ
epr
ojec
t.Th
eam
endm
ents
are
desi
gned
tofu
rther
enco
urag
eco
mpa
nies
toap
ply
prof
essi
onal
judg
men
tin
dete
rmin
ing
wha
tinf
orm
atio
nto
disc
lose
inth
efin
anci
alst
atem
ents
.Fo
rex
ampl
e,th
eam
endm
ents
mak
ecl
eart
hatm
ater
ialit
yap
plie
sto
the
who
leof
finan
cial
stat
emen
tsan
dth
atth
ein
clus
ion
ofim
mat
eria
linf
orm
atio
nca
nin
hibi
tthe
usef
ulne
ssof
finan
cial
disc
losu
res.
The
amen
dmen
tsal
socl
arify
that
com
pani
essh
ould
use
prof
essi
onal
judg
men
tin
dete
rmin
ing
whe
rean
din
wha
tord
erin
form
atio
nis
pres
ente
din
the
finan
cial
disc
losu
res.
1Ja
nuar
y20
161
July
2016
AA
SB
1031
Mat
eria
lity
The
Sta
ndar
dco
mpl
etes
the
AA
SB
’spr
ojec
tto
rem
ove
Aus
tralia
ngu
idan
ceon
mat
eria
lity
from
Aus
tralia
nA
ccou
ntin
gS
tand
ards
.1
Janu
ary
2015
1Ju
ly20
15

66 ESTIA HEALTH ANNUAL REPORT 2014-2015 67ESTIA HEALTH ANNUAL REPORT 2014-2015
NOTES TO THE FINANCIAL STATEMENTSFOR THE YEAR ENDED 30 JUNE 2015
Estia Health Annual Report 2014-201566
2. Summary of significantaccounting policies (continued)
(d) Basis of consolidation
The consolidated financial statements comprisethe financial statements of the Group and itssubsidiaries as at 30 June 2015. Control isachieved when the Group is exposed, or hasrights, to the variable returns from its involvementwith the investee and has the ability to affect thosereturns through its power over the investee.Specifically, the Group controls an investee if andonly if the Group has:
• Power over the investee (i.e. existingrights that give it the current ability todirect the relevant activities of theinvestee);
• Exposures, or rights, to variable returnsfrom its involvement with the investee;and
• The ability to use its power over theinvestee to affect its returns.
When the Group has less than a majority of thevoting or similar rights of an investee, the Groupconsiders all relevant facts and circumstances inassessing whether it has power over an investee,including:
• The contractual arrangement with theother vote holders of the investee;
• Rights arising from other contractualarrangements; and
• The Group’s voting rights and potentialvoting rights.
The Group re-assesses whether or not it controlsan investee if facts and circumstances indicatethat there are changes to one or more of the threeelements of control. Consolidation of a subsidiarybegins when the Group obtains control over thesubsidiary and ceases when the Group losescontrol of the subsidiary. Assets, liabilities, incomeand expenses of a subsidiary acquired ordisposed of during the year are included in thestatement of profit or loss and othercomprehensive income from the date the Group
gains control until the date the Group ceases tocontrol the subsidiary.
(e) Business combinations and goodwill
Business combinations are accounted for usingthe acquisition method. The cost of an acquisitionis measured as the aggregate of the considerationtransferred measured at acquisition date fair valueand the amount of any non-controlling interests inthe acquiree. For each business combination, theGroup elects whether to measure the non-controlling interests in the acquiree at fair value orat the proportionate share of the acquiree’sidentifiable net assets. Acquisition-related costsare expensed as incurred and included inadministrative expenses.
When the Group acquires a business, it assessesthe financial assets and liabilities assumed forappropriate classification and designation inaccordance with the contractual terms, economiccircumstances and pertinent conditions as at theacquisition date. This includes the separation ofembedded derivatives in host contracts by theacquiree.
If the business combination is achieved in stages,any previously held equity interest is remeasuredat its acquisition date fair value and any resultinggain or loss is recognised in profit or loss.
Any contingent consideration to be transferred bythe acquirer will be recognised at fair value at theacquisition date. Contingent considerationclassified as an asset or liability that is a financialinstrument and within the scope of AASB 139Financial Instruments: Recognition andMeasurement, is measured at fair value withchanges in fair value recognised either in profit orloss or as a change to Other ComprehensiveIncome (OCI). If the contingent consideration isnot within the scope of AASB 139, it is measuredin accordance with the appropriate AustralianAccounting Standard. Contingent considerationthat is classified as equity is not re-measured andsubsequent settlement is accounted for withinequity.
NOTES TO THE FINANCIAL STATEMENTSFOR THE YEAR ENDED 30 JUNE 2015
Estia Health Annual Report 2014-201567
2. Summary of significantaccounting policies (continued)
(e) Business combinations and goodwill(continued)
Goodwill is initially measured at cost, being theexcess of the aggregate of the considerationtransferred and the amount recognised for non-controlling interests, and any previous interestheld, over the net identifiable assets acquired andliabilities assumed. If the fair value of the netassets acquired is in excess of the aggregateconsideration transferred, the Group re-assesseswhether it has correctly identified all of the assetsacquired and all of the liabilities assumed andreviews the procedures used to measure theamounts to be recognised at the acquisition date.If the re-assessment still results in an excess ofthe fair value of net assets acquired over theaggregate consideration transferred, then the gainis recognised in profit or loss.
After initial recognition, goodwill is measured atcost less any accumulated impairment losses. Forthe purpose of impairment testing, goodwillacquired in a business combination is, from theacquisition date, allocated to each of the Group’scash-generating units that are expected to benefitfrom the combination, irrespective of whetherother assets or liabilities of the acquiree areassigned to those units.
Where goodwill has been allocated to a cash-generating unit and part of the operation withinthat unit is disposed of, the goodwill associatedwith the disposed operation is included in thecarrying amount of the operation whendetermining the gain or loss on disposal. Goodwilldisposed in these circumstances is measuredbased on the relative values of the disposedoperation and the portion of the cash-generatingunit retained.
(f) Current versus non-current classification
The Group presents assets and liabilities in thestatement of financial position based on current/non-current classification.
An asset is current when it is:
• Expected to be realised or intended to besold or consumed in the normal operatingcycle;
• Held primarily for the purpose of trading;
• Expected to be realised within twelvemonths after the reporting period; or
• Cash or cash equivalents unless restrictedfrom being exchanged or used to settle aliability for at least twelve months after thereporting period.
All other assets are classified as non-current.
A liability is current when:
• It is expected to be settled in the normaloperating cycle;
• It is held primarily for the purpose oftrading;
• It is due to be settled within twelve monthsafter the reporting period; or
• There is no unconditional right to defer thesettlement of the liability for at least twelvemonths after the reporting period.
The Group classifies all other liabilities as non-current.
Deferred tax assets and liabilities are classified asnon-current assets and liabilities.
(g) Revenue recognition
Revenue is recognised to the extent that it isprobable that the economic benefits will flow to theGroup and the revenue can be reliably measured,regardless of when the payment is being made.Revenue is measured at the fair value of theconsideration received or receivable, taking intoaccount contractually defined terms of paymentand excluding taxes or duty.
Rendering of services
Revenue from the rendering of services isrecognised upon the delivery of the service to theresidents.
68 ESTIA HEALTH ANNUAL REPORT 2014-2015 69ESTIA HEALTH ANNUAL REPORT 2014-2015
NOTES TO THE FINANCIAL STATEMENTSFOR THE YEAR ENDED 30 JUNE 2015
Estia Health Annual Report 2014-201568
2. Summary of significantaccounting policies (continued)
(g) Revenue recognition (continued)
Interest income
Revenue is recognised when the Group controlsthe right to receive the interest payment.
(h) Taxes
Current income tax
Current income tax assets and liabilities for thecurrent period are measured at the amountexpected to be recovered from or paid to thetaxation authorities. The tax rates and tax lawsused to compute the amount are those that areenacted or substantively enacted at the reportingdate.
Deferred tax
Deferred tax is provided using the liability methodon temporary differences between the tax basesof assets and liabilities and their carrying amountsfor financial reporting purposes at the reportingdate.
Deferred income tax liabilities are recognised forall taxable temporary differences except:
• When the deferred income tax liabilityarises from the initial recognition ofgoodwill or of an asset or liability in atransaction that is not a businesscombination and that, at the time of thetransaction, affects neither the accountingprofit nor taxable profit or loss; and
• In respect of taxable temporarydifferences associated with investments insubsidiaries, associates and interests injoint ventures, when the timing of thereversal of the temporary differences canbe controlled and it is probable that thetemporary differences will not reverse inthe foreseeable future.
Deferred tax assets are recognised for alldeductible temporary differences, the carryforward of unused tax credits and any unused taxlosses. Deferred tax assets are recognised to theextent that it is probable that taxable profit will be
available against which the deductible temporarydifferences, and the carry forward of unused taxcredits and unused tax losses can be utilised,except:
• When the deferred tax asset relating tothe deductible temporary difference arisesfrom the initial recognition of an asset orliability in a transaction that is not abusiness combination and, at the time ofthe transaction, affects neither theaccounting profit nor taxable profit or loss;and
• In respect of deductible temporarydifferences associated with investments insubsidiaries, associates and interests injoint ventures, deferred tax assets arerecognised only to the extent that it isprobable that the temporary differenceswill reverse in the foreseeable future andtaxable profit will be available againstwhich the temporary differences can beutilised.
The carrying amount of deferred tax assets isreviewed at each reporting date and reduced tothe extent that it is no longer probable thatsufficient taxable profit will be available to allow allor part of the deferred tax asset to be utilised.Unrecognised deferred tax assets are re-assessed at each reporting date and arerecognised to the extent that it has becomeprobable that future taxable profits will allow thedeferred tax asset to be recovered.
Deferred tax assets and liabilities are measured atthe tax rates that are expected to apply in the yearwhen the asset is realised or the liability is settled,based on tax rates (and tax laws) that have beenenacted or substantively enacted at the reportingdate.
Deferred tax relating to items recognised outsideprofit or loss is recognised outside profit or loss.Deferred tax items are recognised in correlation tothe underlying transaction either in OCI or directlyin equity.
NOTES TO THE FINANCIAL STATEMENTSFOR THE YEAR ENDED 30 JUNE 2015
Estia Health Annual Report 2014-201569
2. Summary of significantaccounting policies (continued)
(h) Taxes (continued)
Deferred tax assets and deferred tax liabilities areoffset if a legally enforceable right exists to set offcurrent tax assets against current income taxliabilities and the deferred taxes relate to the sametaxable entity and the same taxation authority.
Tax benefits acquired as part of a businesscombination, but not satisfying the criteria forseparate recognition at that date, are recognisedsubsequently if new information about facts andcircumstances change. The adjustment is eithertreated as a reduction to goodwill (as long as itdoes not exceed goodwill) if it was incurred duringthe measurement period or recognised in profit orloss.
Tax consolidation legislation
Estia Health Ltd and its wholly-owned Australiancontrolled entities implemented the taxconsolidation legislation as of 19 June 2013.
The head entity, Estia Health Ltd and thecontrolled entities in the tax consolidated groupcontinue to account for their own current anddeferred tax amounts. The Group has applied theGroup allocation approach in determining theappropriate amount of current taxes and deferredtaxes to allocate to members of the taxconsolidated group.
In addition to its own current and deferred taxamounts, Estia Health Ltd also recognises thecurrent tax liabilities (or assets) and the deferredtax assets arising from unused tax losses andunused tax credits assumed from controlledentities in the tax consolidated group.
Assets or liabilities arising under tax fundingagreements with the tax consolidated entities arerecognised as amounts receivable from orpayable to other entities in the Group. Details ofthe tax funding agreement are disclosed in Note12.
Any difference between the amounts assumedand amounts receivable or payable under the taxfunding agreement are recognised as a
contribution to (or distribution from) wholly-ownedtax consolidated entities.
Goods and services tax (GST)
Revenues, expenses and assets are recognisednet of the amount of GST, except:
• When the GST incurred on a purchase ofassets or services is not recoverable fromthe taxation authority, in which case theGST is recognised as part of the cost ofacquisition of the asset or as part of theexpense item, as applicable; and
• When receivables and payables arestated with the amount of GST included.
The net amount of GST recoverable from, orpayable to, the taxation authority is included aspart of receivables or payables in the statement offinancial position. Commitments andcontingencies are disclosed net of the amount ofGST recoverable from, or payable to, the taxationauthority.
Cash flows are included in the statement of cashflows on a gross basis and the GST component ofcash flows arising from investing and financingactivities, which is recoverable from, or payable to,the taxation authority are classified as part ofoperating cash flows.
(i) Cash and cash equivalents
Cash and cash equivalents in the statement offinancial position comprise cash at bank and inhand and short-term deposits with an originalmaturity of three months or less that are readilyconvertible to known amounts of cash and whichare subject to an insignificant risk of changes invalue.
For the purposes of the consolidated statement ofcash flows, cash and cash equivalents consists ofcash and cash equivalents as defined above, netof outstanding bank overdrafts.
70 ESTIA HEALTH ANNUAL REPORT 2014-2015 71ESTIA HEALTH ANNUAL REPORT 2014-2015
NOTES TO THE FINANCIAL STATEMENTSFOR THE YEAR ENDED 30 JUNE 2015
Estia Health Annual Report 2014-201570
2. Summary of significantaccounting policies (continued)
(j) Trade and other receivables
Trade receivables are recognised and carried atoriginal invoice amount less an allowance for anyuncollectible amounts.
An estimate of doubtful debts is made whencollection of the full amount is no longer probable.Bad debts are written off when identified.
Receivables from related parties are recognisedand carried at the nominal amount due. Interest istaken up as income on an accrual basis.
(k) Property, plant and equipment
Property, plant and equipment transferred fromvendors are initially measured at fair value at thedate on which control is obtained.
Plant and equipment is stated at cost, net ofaccumulated depreciation and accumulatedimpairment losses, if any. Such cost includes thecost of replacing part of the plant and equipment.When significant parts of plant and equipment arerequired to be replaced at intervals, the Grouprecognises such parts as individual assets withspecific useful lives and depreciates themaccordingly. All other repair and maintenancecosts are recognised in profit or loss as incurred.
Following initial recognition at cost, land andbuildings are measured at fair value using therevaluation model, less accumulated depreciationon buildings and impairment losses recognised atthe date of revaluation. Independent experts’valuations are obtained every three years. Inaddition, valuations are performed internally on anannual basis to ensure that the carrying amount ofa revalued asset does not differ materially from itsfair value.
A revaluation surplus is recorded in OCI andcredited to the asset revaluation reserve in equity.However, to the extent that it reverses arevaluation deficit of the same asset previouslyrecognised in profit or loss, the increase isrecognised in profit and loss. A revaluation deficitis recognised in the statement of profit or loss,except to the extent that it offsets an existing
surplus on the same asset recognised in the assetrevaluation reserve.
An annual transfer from the asset revaluationreserve to retained earnings is made for thedifference between depreciation based on therevalued carrying amount of the asset anddepreciation based on the asset’s original cost.Upon disposal, any amount in the revaluationreserve relating to the particular asset being soldis transferred to retained earnings.
Depreciation is calculated on either a straight-lineor written down value basis over the estimateduseful life of the asset as follows:
• Buildings and property improvements60 years;
• Furniture, fixtures and equipment4 - 15 years; and
• Motor vehicles4 years.
An item of property, plant and equipment and anysignificant part initially recognised is derecognisedupon disposal or when no future economicbenefits are expected from its use or disposal.Any gain or loss arising on derecognition of theasset (calculated as the difference between thenet disposal proceeds and the carrying amount ofthe asset) is included in the statement of profit orloss when the asset is derecognised.
The residual values, useful lives and methods ofdepreciation of property, plant and equipment arereviewed at each financial year end and adjustedprospectively, if appropriate.
(l) Leases
The determination of whether an arrangement is,or contains, a lease is based on the substance ofthe arrangement at the inception of the lease. Thearrangement is, or contains, a lease if fulfilment ofthe arrangement is dependent on the use of aspecific asset or assets or the arrangementconveys a right to use the asset or assets, even ifthat right is not explicitly specified in anarrangement.
NOTES TO THE FINANCIAL STATEMENTSFOR THE YEAR ENDED 30 JUNE 2015
Estia Health Annual Report 2014-201571
2. Summary of significantaccounting policies (continued)
(l) Leases (continued)
Group as a lessee
A lease is classified at the inception date as afinance lease or an operating lease. A lease thattransfers substantially all the risks and rewardsincidental to ownership to the Group is classifiedas a finance lease. An operating lease is a leaseother than a finance lease.
Finance leases are capitalised at thecommencement of the lease at the inception dateat fair value of the leased property or, if lower, atthe present value of the minimum lease payments.Lease payments are apportioned between financecharges and reduction of the lease liability so asto achieve a constant rate of interest on theremaining balance of the liability. Finance chargesare recognised in finance costs in the statement ofprofit or loss.
A leased asset is depreciated over the useful lifeof the asset. However, if there is no reasonablecertainty that the Group will obtain ownership bythe end of the lease term, the asset is depreciatedover the shorter of the estimated useful life of theasset and the lease term.
Operating lease payments are recognised as anoperating expense in the statement of profit orloss on a straight-line basis over the lease term.
(m) Borrowing costs
Borrowing costs directly attributable to theacquisition, construction or production of an assetthat necessarily takes a substantial period of timeto get ready for its intended use or sale arecapitalised as part of the cost of the asset. Allother borrowing costs are expensed in the periodin which they occur. Borrowing costs consist ofinterest and other costs that an entity incurs inconnection with the borrowing of funds.
(n) Intangible assets
Intangible assets acquired separately aremeasured on initial recognition at cost. The cost ofintangible assets acquired in a businesscombination is their fair value at the date of
acquisition. Following initial recognition, intangibleassets are carried at cost less any accumulatedamortisation and accumulated impairment losses.Internally generated intangibles, excludingcapitalised development costs, are not capitalisedand the related expenditure is reflected as a profitor loss in the period in which the expenditure isincurred.
The useful lives of intangible assets are assessedas either finite or indefinite.
Intangible assets with finite lives are amortisedover the useful economic life and assessed forimpairment whenever there is an indication thatthe intangible asset may be impaired. Theamortisation period and the amortisation methodfor an intangible asset with a finite useful life arereviewed at the end of each reporting period.Changes in the expected useful life or theexpected pattern of consumption of futureeconomic benefits embodied in the asset areconsidered to modify the amortisation period ormethod, as appropriate, and are treated aschanges in accounting estimates and adjusted ona prospective basis. The amortisation expense onintangible assets with finite lives is recognised inthe statement of profit or loss as the expensecategory that is consistent with the function of theintangible assets.
Intangible assets with indefinite useful lives arenot amortised, but are tested for impairmentannually, at the cash-generating unit level. Theassessment of indefinite life is reviewed annuallyto determine whether the indefinite life continuesto be supportable. If not, the change in useful lifefrom indefinite to finite is made on a prospectivebasis.
Gains or losses arising from derecognition of anintangible asset are measured as the differencebetween the net disposal proceeds and thecarrying amount of the asset and are recognisedin the statement of profit or loss when the asset isderecognised.

72 ESTIA HEALTH ANNUAL REPORT 2014-2015 73ESTIA HEALTH ANNUAL REPORT 2014-2015
NOTES TO THE FINANCIAL STATEMENTSFOR THE YEAR ENDED 30 JUNE 2015
Estia Health Annual Report 2014-201572
2. Summary of significantaccounting policies (continued)
(n) Intangible assets (continued)
Bed licences
Bed licences for the Group’s aged care facilitiesare initially carried at historical cost.
Bed licences acquired through a businesscombination are valued at fair value at the date ofacquisition in accordance with AASB 3 BusinessCombinations in the consolidated accounts. Thebed licences continue to be carried at cost in theaccounts of the individual acquired entities withinthe Group.
No amortisation has been provided as the Groupbelieves the useful lives of these assets areindefinite.
Goodwill
Goodwill is tested for impairment annually as at 30June and when circumstances indicate that thecarrying value may be impaired.
Impairment is determined for goodwill byassessing the recoverable amount of the cashgenerating unit (CGU) to which the goodwillrelates. When the recoverable amount of the CGUis less than its carrying amount, an impairmentloss is recognised. Impairment losses relating togoodwill cannot be reversed in future periods.
(o) Financial instruments
A financial instrument is any contract that givesrise to a financial asset of one entity and afinancial liability or equity instrument of anotherentity.
Financial assets
Initial recognition and measurement
Financial assets are classified, at initialrecognition, as financial assets at fair valuethrough profit or loss, loans and receivables, held-to-maturity investments, available-for-salefinancial assets, or as derivatives designated ashedging instruments in an effective hedge, asappropriate.
All financial assets are recognised initially at fairvalue plus, in the case of financial assets notrecorded at fair value through profit or loss,transaction costs that are attributable to theacquisition of the financial asset.
Purchases or sales of financial assets that requiredelivery of assets within a time frame establishedby regulation or convention in the market place(regular way trades) are recognised on the tradedate, i.e., the date that the Group commits topurchase or sell the asset.
Subsequent measurement
The measurement of financial assets depends ontheir classification, as described below:
Financial assets at fair value through profit or loss
Financial assets at fair value through profit or lossinclude financial assets held for trading andfinancial assets designated upon initial recognitionat fair value through profit or loss. Financial assetsare classified as held for trading if they areacquired for the purpose of selling or repurchasingin the near term. Derivatives, including separatedembedded derivatives are also classified as heldfor trading unless they are designated as effectivehedging instruments as defined by AASB 139.The Group has not designated any financialassets at fair value through profit or loss. Financialassets at fair value through profit or loss arecarried in the statement of financial position at fairvalue with net changes in fair value presented asfinance costs (negative net changes in fair value)or finance income (positive net changes in fairvalue) in the statement of profit or loss.
Derivatives embedded in host contracts areaccounted for as separate derivatives andrecorded at fair value if their economiccharacteristics and risks are not closely related tothose of the host contracts and the host contractsare not held for trading or designated at fair valuethough profit or loss. These embedded derivativesare measured at fair value with changes in fairvalue recognised in profit and loss.
NOTES TO THE FINANCIAL STATEMENTSFOR THE YEAR ENDED 30 JUNE 2015
Estia Health Annual Report 2014-201573
2. Summary of significantaccounting policies (continued)
(o) Financial instruments (continued)
Re-assessment only occurs if there is either achange in the terms of the contract thatsignificantly modifies the cash flows that wouldotherwise be required or a reclassification of afinancial asset out of the fair value through profitor loss.
Loans and receivables
This category is the most relevant to the Group.Loans and receivables are non-derivative financialassets with fixed or determinable payments thatare not quoted in an active market. After initialmeasurement, such financial assets aresubsequently measured at amortised cost usingthe effective interest rate (EIR) method, lessimpairment. Amortised cost is calculated by takinginto account any discount or premium onacquisition and fees or costs that are an integralpart of the EIR. The EIR amortisation is includedin finance income in the statement of profit or loss.The losses arising from impairment arerecognised in the statement of profit or loss infinance costs for loans and in cost of sales orother operating expenses for receivables.
Derecognition
A financial asset (or, where applicable, a part of afinancial asset or part of a group of similarfinancial assets) is primarily de-recognised (i.e.removed from the group’s consolidated statementof financial position) when:
• The rights to receive cash flows from theasset have expired; or
• The Group has transferred its rights toreceive cash flows from the asset or hasassumed an obligation to pay the receivedcash flows in full without material delay toa third party under a ”pass-through”arrangement; and either (a) the Group hastransferred substantially all the risks andrewards of the asset, or (b) the Group hasneither transferred nor retainedsubstantially all the risks and rewards of
the asset, but has transferred control ofthe asset.
Impairment of financial assets
The Group assesses, at each reporting date,whether there is objective evidence that a financialasset or a group of financial assets is impaired. Animpairment exists if one or more events that hasoccurred since the initial recognition of the asset(an incurred ‘loss event’) has an impact on theestimated future cash flows of the financial assetor the group of financial assets that can be reliablyestimated. Evidence of impairment may includeindications that the debtors or a group of debtorsis experiencing significant financial difficulty,default or delinquency in interest or principalpayments, the probability that they will enterbankruptcy or other financial reorganisation andobservable data indicating that there is ameasureable decrease in the estimated futurecash flows, such as changes in arrears oreconomic conditions that correlate with defaults.
Financial assets carried at amortised cost
For financial assets carried at amortised cost, theGroup first assesses whether impairment existsindividually for financial assets that areindividually significant, or collectively for financialassets that are not individually significant. If theGroup determines that no objective evidence ofimpairment exists for an individually assessedfinancial asset, whether significant or not, itincludes the asset in a group of financial assetswith similar credit risk characteristics andcollectively assesses them for impairment.
Assets that are individually assessed forimpairment and for which an impairment loss is,or continues to be, recognised are not included ina collective assessment of impairment.
The amount of any impairment loss identified ismeasured as the difference between the asset’scarrying amount and the present value ofestimated future cash flows (excluding futureexpected credit losses that have not yet beenincurred). The present value of the estimatedfuture cash flows is discounted at the financialasset’s original EIR.

74 ESTIA HEALTH ANNUAL REPORT 2014-2015 75ESTIA HEALTH ANNUAL REPORT 2014-2015
NOTES TO THE FINANCIAL STATEMENTSFOR THE YEAR ENDED 30 JUNE 2015
Estia Health Annual Report 2014-201574
2. Summary of significantaccounting policies (continued)
(o) Financial instruments (continued)The carrying amount of the asset is reducedthrough the use of an allowance account and theloss is recognised in the statement of profit orloss.
Financial liabilities
Initial recognition and measurement
Financial liabilities are classified, at initialrecognition, as financial liabilities at fair valuethrough profit or loss, loans and borrowings,payables, or as derivatives designated as hedginginstruments in an effective hedge, as appropriate.All financial liabilities are recognised initially at fairvalue and, in the case of loans and borrowingsand payables, net of directly attributabletransaction costs.
The Group’s financial liabilities include trade andother payables, loans and borrowings, includingbank overdrafts, financial guarantee contracts,and derivative financial instruments.
Subsequent measurement
The measurement of financial liabilities dependson their classification, as described below:
Financial liabilities at fair value through profit orloss
Financial liabilities at fair value through profit orloss include financial liabilities held for trading andfinancial liabilities designated upon initialrecognition as at fair value through profit or loss.
Financial liabilities are classified as held fortrading if they are acquired or incurred for thepurpose of selling or repurchasing in the nearterm. This category also includes derivativefinancial instruments entered into by the Groupthat are not designated as hedging instruments inhedge relationships as defined by AASB 139.Separated embedded derivatives are alsoclassified as held for trading unless they aredesignated as effective hedging instruments.
Gains or losses on liabilities held for trading arerecognised in the statement of profit or loss. AASB
139.55(a) Financial liabilities designated uponinitial recognition at fair value through profit or lossare designated at the initial date of recognition,and only if the criteria in AASB 139 are satisfied.The Group has not designated any financialliability as at fair value through profit or loss.
Loans and borrowings
This is the category most relevant to the Group.After initial recognition, interest-bearing loans andborrowings are subsequently measured atamortised cost using the EIR method. Gains andlosses are recognised in profit or loss when theliabilities are de-recognised as well as through theEIR amortisation process. Amortised cost iscalculated by taking into account any discount orpremium on acquisition and fees or costs that arean integral part of the EIR. The EIR amortisation isincluded in finance costs in the statement of profitor loss. This category generally applies to interest-bearing loans and borrowings. For moreinformation refer Note 20.
Derecognition
A financial liability is de-recognised when theobligation under the liability is discharged,cancelled, or expires. When an existing financialliability is replaced by another from the samelender on substantially different terms, or theterms of an existing liability are substantiallymodified, such an exchange or modification istreated as the de-recognition of the original liabilityand the recognition of a new liability. Thedifference in the respective carrying amounts isrecognised in the statement or profit or loss.
Offsetting of financial instruments
Financial assets and financial liabilities are offsetand the net amount is reported in the consolidatedstatement of financial position if there is acurrently enforceable legal right to offset therecognised amounts and there is an intention tosettle on a net basis, to realise the assets andsettle the liabilities simultaneously.
NOTES TO THE FINANCIAL STATEMENTSFOR THE YEAR ENDED 30 JUNE 2015
Estia Health Annual Report 2014-201575
2. Summary of significantaccounting policies (continued)
(p) Derivative financial instruments
Initial recognition and subsequentmeasurement
The Group uses derivative financial instruments,such as interest rate swaps, to hedge its interestrate risks. Such derivative financial instrumentsare initially recognised at fair value on the date onwhich a derivative contract is entered into and aresubsequently re-measured at fair value.Derivatives are carried as financial assets whenthe fair value is positive and as financial liabilitieswhen the fair value is negative. Any gains orlosses arising from changes in the fair value ofderivatives are taken directly to profit or loss,except for the effective portion of cash flowhedges, which is recognised in OCI and laterreclassified to profit or loss when the hedge itemaffects profit or loss. No derivative financialinstruments were designated for hedgeaccounting.
(q) Impairment of non-financial assets
The Group assesses, at each reporting date,whether there is an indication that an asset maybe impaired. If any indication exists, or whenannual impairment testing for an asset is required,the Group estimates the asset’s recoverableamount. An asset’s recoverable amount is thehigher of an asset’s or cash-generating unit’s(CGU) fair value less costs of disposal and itsvalue in use. Recoverable amount is determinedfor an individual asset, unless the asset does notgenerate cash inflows that are largely independentof those from other assets or groups of assets.
When the carrying amount of an asset or CGUexceeds its recoverable amount, the asset isconsidered impaired and is written down to itsrecoverable amount.
In assessing value in use, the estimated futurecash flows are discounted to their present valueusing a pre-tax discount rate that reflects currentmarket assessments of the time value of moneyand the risks specific to the asset. In determiningfair value less costs of disposal, recent market
transactions are taken into account. If no suchtransactions can be identified, an appropriatevaluation model is used. These calculations arecorroborated by valuation multiples, quoted shareprices for publicly traded companies or otheravailable fair value indicators.
The Group bases its impairment calculation ondetailed budgets and forecast calculations, whichare prepared separately for each of the Group’sCGUs to which the individual assets are allocated.These budgets and forecast calculations generallycover a period of five years. For longer periods, along-term growth rate is calculated and applied toproject future cash flows after the fifth year.
For assets excluding goodwill, an assessment ismade at each reporting date to determine whetherthere is an indication that previously recognisedimpairment losses no longer exist or havedecreased. If such indication exists, the Groupestimates the asset’s or CGU’s recoverableamount. A previously recognised impairment lossis reversed only if there has been a change in theassumptions used to determine the asset’srecoverable amount since the last impairment losswas recognised. The reversal is limited so that thecarrying amount of the asset does not exceed itsrecoverable amount, nor exceed the carryingamount that would have been determined, net ofdepreciation, had no impairment loss beenrecognised for the asset in prior years. Suchreversal is recognised in the statement of profit orloss unless the asset is carried at a revaluedamount, in which case, the reversal is treated as arevaluation increase.
Goodwill is tested for impairment annually as at 30June and when circumstances indicate that thecarrying value may be impaired.
Impairment is determined for goodwill byassessing the recoverable amount of each CGU(or group of CGUs) to which the goodwill relates.When the recoverable amount of the CGU is lessthan its carrying amount, an impairment loss isrecognised in the statement of profit or loss.Impairment losses relating to goodwill cannot bereversed in future periods.
76 ESTIA HEALTH ANNUAL REPORT 2014-2015 77ESTIA HEALTH ANNUAL REPORT 2014-2015
NOTES TO THE FINANCIAL STATEMENTSFOR THE YEAR ENDED 30 JUNE 2015
Estia Health Annual Report 2014-201576
2. Summary of significantaccounting policies (continued)
(q) Impairment of non-financial assets(continued)
Intangible assets with indefinite useful lives aretested for impairment annually as at 30 June atthe CGU level, as appropriate, and whencircumstances indicate that the carrying valuemay be impaired.
(r) Provisions
General
Provisions are recognised when the Group has apresent obligation (legal or constructive) as aresult of a past event, it is probable that an outflowof resources embodying economic benefits will berequired to settle the obligation and a reliableestimate can be made of the amount of theobligation. When the Group expects some or all ofa provision to be reimbursed, for example, underan insurance contract, the reimbursement isrecognised as a separate asset, but only when thereimbursement is virtually certain. The expenserelating to a provision is presented in thestatement of profit or loss net of anyreimbursement.
If the effect of the time value of money ismaterial, provisions are discounted using acurrent pre-tax rate that reflects, whenappropriate, the risks specific to the liability.When discounting is used, the increase in theprovision due to the passage of time isrecognised as a finance cost.
Wages, salaries, and sick leave
Liabilities for wages and salaries, including non-monetary benefits, and sick leave acquiredthrough business combinations are recognised inrespect of employees' services up to the reportingdate. They are measured at the amountsexpected to be paid when the liabilities are settled.
Long service leave and annual leave
The Group does not expect its long service leaveor annual leave benefits to be settled wholly within12 months of each reporting date. The liability forlong service leave and annual leave is recognised
and measured as the present value of expectedfuture payments to be made in respect of servicesprovided by employees up to the reporting dateusing the projected unit credit method.Consideration is given to expected future wageand salary levels, experience of employeedepartures, and periods of service. Expectedfuture payments are discounted using marketyields at the reporting date on national corporatebonds with terms to maturity and currencies thatmatch, as closely as possible, the estimated futurecash outflows.
Contingent liabilities recognised in a businesscombination
A contingent liability recognised in a businesscombination is initially measured at its fair value.Subsequently, it is measured at the higher of theamount that would be recognised in accordancewith the requirements for provisions above or theamount initially recognised less, whenappropriate, cumulative amortisation recognised inaccordance with the requirements for revenuerecognition.
(s) Share-based payments
Employees (including senior executives) of theGroup receive remuneration in the form of share-based payments, whereby employees renderservices as consideration for equity instruments(equity-settled transactions).
No expense is recognised for awards that do notultimately vest, except for equity-settledtransactions for which vesting is conditional upona market or non-vesting condition. These aretreated as vesting irrespective of whether or notthe market or non-vesting condition is satisfied,provided that all other performance and/or serviceconditions are satisfied.
When the terms of an equity-settled award aremodified, the minimum expense recognised is theexpense had the terms not been modified, if theoriginal terms of the award are met. An additionalexpense is recognised for any modification thatincreases the total fair value of the share-basedpayment transaction, or is otherwise beneficial tothe employee as measured at the date ofmodification.
NOTES TO THE FINANCIAL STATEMENTSFOR THE YEAR ENDED 30 JUNE 2015
Estia Health Annual Report 2014-201577
2. Summary of significantaccounting policies (continued)
(s) Share-based payments (continued)
The dilutive effect of outstanding options isreflected as additional share dilution in thecomputation of diluted earnings per share.
(t) Fair value measurement
The Group measures financial instruments suchas derivatives, at fair value at each balance sheetdate. Also, fair values of financial instrumentsmeasured at amortised cost are disclosed in Note29.
Fair value is the price that would be received uponselling an asset or paid to transfer a liability in anorderly transaction between market participants atthe measurement date.
The fair value measurement is based on thepresumption that the transaction to sell the assetor transfer the liability takes place either:
• In the principal market for the asset orliability; or
• In the absence of a principal market, inthe most advantageous market for theasset or liability.
The principal or the most advantageous marketmust be accessible by the Group. The fair value ofan asset or a liability is measured using theassumptions that market participants would usewhen pricing the asset or liability, assuming thatmarket participants act in their economic bestinterest.
A fair value measurement of a non-financial assettakes into account a market participant's ability togenerate economic benefits by using the asset inits highest and best use or by selling it to anothermarket participant that would use the asset in itshighest and best use.
The Group uses valuation techniques that areappropriate in the circumstances and for whichsufficient data are available to measure fair value,maximising the use of relevant observable inputsand minimising the use of unobservable inputs.
All assets and liabilities for which fair value ismeasured or disclosed in the financial statementsare categorised within the fair value hierarchy,described as follows, based on the lowest levelinput that is significant to the fair valuemeasurement as a whole:
• Level 1 — Quoted (unadjusted) marketprices in active markets for identicalassets or liabilities;
• Level 2 — Valuation techniques for whichthe lowest level input that is significant tothe fair value measurement is directly orindirectly observable; and
• Level 3 — Valuation techniques for whichthe lowest level input that is significant tothe fair value measurement isunobservable.
For assets and liabilities that are recognised in thefinancial statements on a recurring basis, theGroup determines whether transfers haveoccurred between levels in the hierarchy by re-assessing categorisation (based on the lowestlevel input that is significant to the fair valuemeasurement as a whole) at the end of eachreporting period.
(u) Operating cash flow
Daily inflows and outflows of refundableaccommodation deposits are considered by theGroup to be a normal part of the operations of thebusiness and are utilised at the discretion of theGroup within the guidelines set out by thePrudential Compliance Standards and aretherefore classified as an operating activity.
78 ESTIA HEALTH ANNUAL REPORT 2014-2015 79ESTIA HEALTH ANNUAL REPORT 2014-2015
NOTES TO THE FINANCIAL STATEMENTSFOR THE YEAR ENDED 30 JUNE 2015
Estia Health Annual Report 2014-201578
3. Significant accountingjudgements, estimates andassumptions
The preparation of the Group’s consolidatedfinancial statements requires management tomake judgements, estimates and assumptionsthat affect the reported amounts of revenues,expenses, assets and liabilities, and theaccompanying disclosures, and the disclosure ofcontingent liabilities. Uncertainty about theseassumptions and estimates could result inoutcomes that require a material adjustment to thecarrying amount of assets or liabilities affected infuture periods.
Use of judgements, estimates andassumptions
Estimates and underlying assumptions arereviewed on an ongoing basis. Revisions toaccounting estimates are recognisedprospectively. The key assumptions concerningthe future and other key sources of estimationuncertainty at the reporting date, that have asignificant risk of causing a material adjustment tothe carrying amounts of assets and liabilitieswithin the next financial year, are described below.The Group based its assumptions and estimateson parameters available when the consolidatedfinancial statements were prepared. Existingcircumstances and assumptions about futuredevelopments, however, may change due tomarket changes or circumstances arising beyondthe control of the Group. Such changes arereflected in the assumptions when they occur.
Information about critical judgements,assumptions and estimation uncertainties thathave a significant risk of resulting in a materialadjustment within the year ended 30 June 2015are included in the following notes:
• Note 4 – Business Combinations: fairvalue measured on a provisional basis;
• Note 12 – Income Taxes recognition ofdeferred tax assets: availability of futuretaxable profit;
• Note 18 – Intangible assets impairmenttest: key assumptions underlyingrecoverable amounts; and
• Note 24 – Share-based payments:measurement of equity-settledtransactions.
Fair value of financial instruments
When the fair values of financial assets andfinancial liabilities recorded in the statement offinancial position cannot be measured based onquoted prices in active markets, their fair value ismeasured using valuation techniques includingthe discounted cash flow (DCF) model. The inputsto these models are taken from observablemarkets where possible, but where this is notfeasible, a degree of judgement is required inestablishing fair values. Judgements includeconsiderations of inputs such as liquidity risk,credit risk and volatility. Changes in assumptionsin relation to these factors could affect thereported fair value of financial instruments. SeeNote 29 for further disclosures.
NOTES TO THE FINANCIAL STATEMENTSFOR THE YEAR ENDED 30 JUNE 2015
Estia Health Annual Report 2014-201579
4. Business combinationsAcquisitions in 2015
During the year ended 30 June 2015, the Group successfully acquired:
• The Padman and Cook Care Group operations as at 31 July 2014, operating in South Australia,New South Wales and Queensland;
• Three companies from Hutchinson Healthcare Group operating in New South Wales on 6 May 2015;and
• The following businesses:
1 October 2014 1 December 2014 OtherEstia Albury, NSW Estia Salisbury, SA Estia Grovedale, VIC - 1 February 2015Estia Wodonga, VIC Estia Prahran, VIC Estia Burton, SA - 1 April 2015Estia Leopold, VIC Estia Wattle Glen, VIC Estia Mount Coolum, QLD - 1 June 2015
The acquisition of the Padman Aged Care Group business and assets consisted of the acquisition of 13aged care facilities with 12 located in South Australia and 1 located in Queensland. All facilities wereacquired outright with no facilities being subject to a lease. The acquisition of the Cook Care Aged CareGroup business and assets consisted of the acquisition of 9 aged care facilities with 6 located in NewSouth Wales and 3 located in Queensland. All facilities were acquired outright with no facilities beingsubject to a lease. The net proceeds paid for the acquisition of the Padman Aged Care Group and theCook Care Aged Care Group excluding transaction costs was $167,820,065 and $149,453,721respectively.
Estia Investments Pty Ltd also acquired 100% of the shares in Darvelan Pty Ltd, Poinseter Pty Ltd andKoorabri Pty Ltd from Hutchinson Healthcare Group on 6 May 2015 for net proceeds of $53,106,466excluding transaction costs. These companies are aged care providers that fit into Estia’s growthstrategy towards operating 10,000 places by 2020. The approved aged care provider status of eachentity has been transferred to Estia Investments Pty Ltd from 30 June 2015 and therefore the threecomponent entities are in the process of being deregistered.
In addition, the Estia Group acquired the aged care business and net assets for net proceeds paid of$101,144,028, excluding transaction costs, for the remaining facilities listed above.
The goodwill recognised on these acquisitions is primarily attributed to the expected synergies and otherbenefits from combining the assets and activities with those of the Group. The goodwill is not deductiblefor income tax purposes.
80 ESTIA HEALTH ANNUAL REPORT 2014-2015 81ESTIA HEALTH ANNUAL REPORT 2014-2015
NOTES TO THE FINANCIAL STATEMENTSFOR THE YEAR ENDED 30 JUNE 2015
Estia Health Annual Report 2014-201580
4. Business combinations (continued)The fair values of the identifiable assets and liabilities at the date of acquisition were:
PadmanGroup
Cook CareGroup
Otheracquisitions Total
AssetsLand and buildingsPlant and equipmentBed licensesCash and cash equivalentsOther assetsDeferred tax assets
Liabilities
112,350,0005,167,230
25,440,000--
1,379,731144,336,961
90,999,0004,842,113
21,490,000-
896,361855,438
119,082,912
107,469,7067,058,981
27,216,0002,872,9561,716,8583,458,465
149,792,966
310,818,70617,068,32574,146,000
2,872,9562,613,2195,693,633
413,212,839
Refundable accommodation depositsEmployee entitlementsOther liabilitiesDeferred tax liability
98,393,0904,599,1024,254,9849,612,950
116,860,126
99,586,0842,851,4602,894,1784,648,780
109,980,502
116,262,7784,878,2164,013,9004,959,752
130,114,646
314,241,95212,328,77811,163,06219,221,482
356,955,274Total fair value of net assetsacquired 27,476,834 9,102,411 19,678,320 56,257,565Goodwill on acquisition 140,343,231 140,351,310 134,572,174 415,266,715
Purchase considerationtransferred 167,820,065 149,453,721 154,250,494 471,524,280
Cash flow on acquisitionVendor loan and deferredconsideration 25,000,000 27,500,000 799,056 53,299,056Cash paid 142,820,065 121,953,721 153,451,437 418,225,224Total consideration paid 167,820,065 149,453,721 154,250,493 471,524,280
Cash acquired (2,872,956)Deferred consideration (799,056)Purchase consideration paid during year, net of cash acquired 467,852,268
On 9 December 2014, the vendor loan and deferred consideration for Padman and Cook Care Acquisitionsamounting to $52,500,000 was repaid, in addition to accrued interest of $1,910,743 at a fixed rate of 10%.
All fair values of identifiable assets and liabilities at the date of acquisition are final, except for the followingacquisitions for which fair values are still provisional as at 30 June 2015:
• Hutchinson Group Entities• Estia Mount Coolum• Estia Burton• Estia Grovedale• Estia Salisbury
NOTES TO THE FINANCIAL STATEMENTSFOR THE YEAR ENDED 30 JUNE 2015
Estia Health Annual Report 2014-201581
4. Business combinations (continued)The consolidated statement of profit or loss and other comprehensive income includes the followingrevenue and net profit before tax for the year ended 30 June 2015. These exclude one-off acquisitionrelated costs equating to $30,739,057.
PadmanGroup
Cook CareGroup
Otheracquisitions Total
Revenue 85,200,224 61,349,861 34,379,587 180,929,672Net profit before tax 24,885,201 17,154,283 6,469,666 48,509,150
If the acquisitions had taken place at the beginning of the year, the following revenue and net profit beforetax would have been included. These exclude one-off acquisition related costs equating to $30,739,057.
PadmanGroup
Cook CareGroup
Otheracquisitions Total
Revenue 93,387,633 67,245,343 87,740,683 248,573,659Net profit before tax 27,276,572 18,802,743 17,409,903 63,489,218
Acquisition related costs incurred in total relating to all acquisitions to 30 June 2015 have been expensedand are presented as transaction costs in the consolidated statement of profit or loss and othercomprehensive income.
5. Information relating to subsidiariesThe consolidated financial statements of the Group include:
Name Principal Activities Country ofIncorporation
% Equity Interest2015 2014
Estia Finance Pty Ltd Employer of keymanagement personnel andborrower of bank loans
Australia 100% 100%
Estia Investments Pty Ltd Accredited provider of agedcare facilities
Australia 100% 100%
Estia Mezzco Pty Ltd Borrower of financingfacilities
Australia 100% 100%
Estia Midco Pty Ltd Holding company Australia 100% 100%Darvelan Pty Ltd Accredited provider of aged
care facilitiesAustralia 100% -
Poinseter Pty Ltd Accredited provider of agedcare facilities
Australia 100% -
Koorabri Pty Ltd Accredited provider of agedcare facilities
Australia 100% -

82 ESTIA HEALTH ANNUAL REPORT 2014-2015 83ESTIA HEALTH ANNUAL REPORT 2014-2015
NOTES TO THE FINANCIAL STATEMENTSFOR THE YEAR ENDED 30 JUNE 2015
Estia Health Annual Report 2014-201582
6. Revenues2015
$2014
$Government funding 202,572,483 50,064,998Resident funding 67,307,436 13,016,471Accommodation funding 13,662,573 3,418,895Finance income 964,107 236,697Total revenues 284,506,599 66,737,061
7. Administrative expenses2015
$2014
$Acquisition related costs 30,739,057 11,448,167Advertising and marketing expenses 513,100 73,967Telephone and communication expenses 1,111,515 189,701Travelling expenses 1,591,754 75,347Printing and stationery expenses 782,237 289,710Professional services expenses 1,255,402 751,527Doubtful debts 442,837 178,000Other administrative expenses 2,776,641 335,801Total administrative expenses 39,212,543 13,342,220
8. Depreciation and amortisation expenses
Note 2015$
2014$
Depreciation expense 17 6,820,981 1,116,370Amortisation expense 18 522,245 4,911Total depreciation and amortisation expenses 7,343,226 1,121,281
9. Employee benefits expenses2015
$2014
$Wages and salaries costs 157,720,776 36,823,891Superannuation costs 13,323,806 5,899,478Share-based payment expense 121,091 -Other employment expenses 708,783 540,408Total employee benefits expenses 171,874,456 43,263,777
NOTES TO THE FINANCIAL STATEMENTSFOR THE YEAR ENDED 30 JUNE 2015
Estia Health Annual Report 2014-201583
10. Finance costs2015
$2014
$Interest expense on bank loans 10,929,569 4,773,188Interest expense on shareholder loans 6,601,625 5,341,884Net loss from revaluation of interest rate swap 655,662 1,276,514Borrowing costs 13,746,011 1,218,618Total finance costs 31,932,867 12,610,204
11. Occupancy expenses2015
$2014
$Rents and outgoings 9,010,265 3,944,878Other occupancy expenses 1,574,140 154,597Total occupancy expenses 10,584,405 4,099,475
12. Income taxThe major components of income tax expense/(benefit) for the years ended 30 June 2015 and 2014 are:
Consolidated statement of profit or loss and other comprehensive income2015
$2014
$Current income tax:
Current income tax expense/(benefit) 5,478,771 (2,209,930)Deferred income tax:
Relating to origination and reversal of temporary differences 8,091,112 867,515Adjustments in respect of income tax of previous year 439,426 -
Income tax expense/(benefit) reported in the consolidatedstatement of profit or loss and other comprehensive income 14,009,309 (1,342,415)
Reconciliation of income tax expense/(benefit) and the accounting loss:2015
$2014
$Accounting loss before income tax (8,513,967) (15,810,850)At the Australian statutory income tax rate of 30% (2014: 30%) (2,554,190) (4,743,255)Adjustments in respect of income tax of previous year 439,426 -Expenditure not allowable for income tax purposes
- Acquisition related costs for current year business combinations 9,230,363 3,400,840- Acquisition related costs for previous year business combinations 6,893,710 -
Income tax expense/(benefit) 14,009,309 (1,342,415)

84 ESTIA HEALTH ANNUAL REPORT 2014-2015 85ESTIA HEALTH ANNUAL REPORT 2014-2015
NOTES TO THE FINANCIAL STATEMENTSFOR THE YEAR ENDED 30 JUNE 2015
Estia Health Annual Report 2014-201584
12. Income Tax (continued)Deferred taxes relate to the following:
Consolidated statement offinancial position
Consolidated statement ofprofit or loss and othercomprehensive income
2015 2014 2015 2014$ $ $ $
Accelerated depreciation (27,620,101) (772,427) (7,017,394) 1,256IPO transaction fees 8,522,265 - (1,308,333) -Other - (20,479) (12,107) (20,479)Tax losses 1,995,000 504,901 (270,245) -Derivatives - 382,954 (382,954) 382,954Share-based payments 36,327 - 36,327 -Provisions and accruals 7,820,658 2,886,989 863,594 503,784Deferred tax expense (8,091,112) 867,515Deferred tax assets/(liabilities), net (9,245,851) 2,981,938
Reflected in the statement of financial position as follows:Deferred tax assets 18,974,250 3,754,365Deferred tax liabilities (28,220,101) (772,427)Deferred tax assets/(liabilities), net (9,245,851) 2,981,938
Reconciliation of deferred tax liabilities, net:2015
$2014
$As of 1 July 2,981,938 -Tax income/(expense) during the year recognised in profit or loss (8,091,112) 867,515Adjustments in respect of income tax of previous year (439,426) -Deferred taxes recognised in equity 9,830,598 -Net deferred taxes acquired in business combinations (13,527,849) 2,114,423As at 30 June (9,245,851) 2,981,938
The Group offsets tax assets and liabilities if, and only if, it has a legally enforceable right to set off currenttax assets and current tax liabilities and the deferred tax assets and deferred tax liabilities relate to incometaxes levied by the same tax authority.
The Group has tax losses which arose in Australia of $11,219,216 that were transferred to Estia Health aspart of the acquisition of the Hutchinson component entities during the year. These are subject to anavailable fraction which determines the annual rate at which the losses may be recouped. Tax losses whicharose in 2014 of $1,683,003 were fully utilised during the year.
NOTES TO THE FINANCIAL STATEMENTSFOR THE YEAR ENDED 30 JUNE 2015
Estia Health Annual Report 2014-201585
12. Income Tax (continued)Tax consolidation(i) Members of the income tax consolidated group and the tax sharing arrangement
Estia Health Ltd and its subsidiaries formed an income tax consolidated group with effect from 19 June2013. The Hutchinson entities joined the income tax consolidated group with effect from 6 May 2015. EstiaHealth Ltd is the head entity of the income tax consolidated group. Members of the Group have enteredinto a tax sharing agreement that provides for the allocation of income tax liabilities between the entitiesshould the head entity default on its tax payment obligations. No amounts have been recognised in thefinancial statements in respect of this agreement on the basis that the possibility of default is remote.
(ii) Tax effect accounting by members of the income tax consolidated groupMeasurement method adopted under AASB Interpretation 1052 Tax Consolidation Accounting
The head entity and the controlled entities in the income tax consolidated group continue to account fortheir own current and deferred tax amounts. The Group has applied The Group allocation approach indetermining the appropriate amount of current taxes and deferred taxes to allocate to members of theincome tax consolidated group. The current and deferred tax amounts are measured in a systematicmanner that is consistent with the broad principles in AASB 112 Income Taxes. The nature of the taxfunding agreement is discussed further below. In addition to its own current and deferred tax amounts, thehead entity also recognises current tax liabilities (or assets) and the deferred tax assets arising fromunused tax losses and unused tax credits assumed from controlled entities in the income tax consolidatedgroup.
Nature of the tax funding agreementMembers of the income tax consolidated group have entered into a tax funding agreement. Under thefunding agreement the funding of tax within the Group is based on accounting profit, which is not anacceptable method of allocation under AASB Interpretation 1052. The tax funding agreement requirespayments to/from the head entity to be recognised via an inter-entity receivable (payable) which is at call.To the extent that there is a difference between the amount charged under the tax funding agreement andthe allocation under AASB Interpretation 1052, the head entity accounts for these as equity transactionswith the subsidiaries. The amounts receivable or payable under the tax funding agreement are due uponreceipt of the funding advice from the head entity, which is issued as soon as practicable after the end ofeach financial year. The head entity may also require payment of interim funding amounts to assist with itsobligations to pay tax instalments.
The benefit of the tax losses is recognised on the basis that the Company to which it relates will generatetaxable income within the next four years, against which the tax losses will be utilised.

86 ESTIA HEALTH ANNUAL REPORT 2014-2015 87ESTIA HEALTH ANNUAL REPORT 2014-2015
NOTES TO THE FINANCIAL STATEMENTSFOR THE YEAR ENDED 30 JUNE 2015
Estia Health Annual Report 2014-201586
13. Cash and cash equivalents
(a) Reconciliation of cash2015 2014
$ $Cash balance comprises:
Cash at banks 46,100,346 3,567,681Cash on hand 96,709 3,660
46,197,055 3,571,341
Cash at banks earns interest at floating rates based on daily bank deposit rates.
At 30 June 2015, the Group had available $95,750,000 (2014: $114,150,000) of undrawn committed borrowingfacilities. Refer to Note 20 for further details.
2015$
2014$
(b) Cash flow reconciliationReconciliation of net loss after income tax to net cash flowsfrom operations:Loss after income tax (22,523,276) (14,468,435)
Adjustments to reconcile loss after income tax to netcash flows:Depreciation of property, plant and equipment 6,820,981 1,116,370Amortisation of intangibles 522,245 4,911Net loss on disposal of property, plant and equipment (18,328) 1,664Bond retention revenue (4,921,024) -Doubtful debts 442,837 178,000Share-based payments 121,091 -Stepped lease costs 143,608 322,003Acquisition related transaction costs 30,739,057 -Share issue costs 2,740,777 -Fair value loss of derivative financial instrument (1,301,608) 1,276,514
Changes in assets and liabilitiesIncrease in trade and other receivables (9,947,894) (1,548,946)Decrease/(Increase) in prepayments and other assets 1,561,400 (2,382,181)Decrease/(Increase) in deferred tax assets 2,981,938 (2,981,938)Increase in deferred tax liabilities 5,548,600 -Increase in current tax payable 5,478,771 -(Decrease)/Increase in trade and other payables (491,189) 26,215,105Increase in provisions 2,310,751 1,102,600Increase in refundable accommodation deposits 84,139,396 1,025,261
104,348,133 9,860,928
NOTES TO THE FINANCIAL STATEMENTSFOR THE YEAR ENDED 30 JUNE 2015
Estia Health Annual Report 2014-201587
14. Trade and other receivables2015
$2014
$Trade receivables 6,709,567 773,277Other receivables 4,166,436 597,669
10,876,003 1,370,946
a) Allowance for impairment lossAn allowance for impairment loss is recognised when there is objective evidence that an individual tradereceivable is impaired. As at 30 June 2015, trade receivables of an initial value of $1,017,429 (2014:$178,000) were impaired and fully provided for. The movements in the allowance for impairment loss was asfollows:
2015$
2014$
At 1 July 178,000 -Charge for the year 442,837 178,000Increase through business combinations 396,592 -Utilised - -Unused amounts reversed - -At 30 June 1,017,429 178,000
As at 30 June, the ageing analysis of trade receivables is as follows:
Past due but not impaired
Total
Neither pastdue nor
impaired <30 days 30-60 days 61-90 days > 90 days
Past dueand
impaired2015 7,726,996 3,477,889 1,207,718 626,676 618,017 1,796,696 1,017,4292014 951,277 746,299 132,246 72,732 - - 178,000
See Note 29 on credit risk which discusses how the Group manages and measures credit quality of tradereceivables that are neither past due nor impaired.
b) Terms and conditions and allowances for impairment loss(i) Trade debtors are non-interest bearing and generally on 30 day terms.(ii) Sundry debtors and other receivables are non-interest bearing.

88 ESTIA HEALTH ANNUAL REPORT 2014-2015 89ESTIA HEALTH ANNUAL REPORT 2014-2015
NOTES TO THE FINANCIAL STATEMENTSFOR THE YEAR ENDED 30 JUNE 2015
88Estia Health Annual Report 2014-2015
15. Prepayments and other assets2015
$2014
$Deposits 1,220,127 2,081,117Prepayments 1,266,858 301,064Other assets 472,959 -
2,959,944 2,382,181
Deposits as at 30 June 2015 include payments of $325,000 (2014: $1,028,434) made on settlement contracts foracquisition of aged care facilities.
16. Other current assets2015 2014
$ $Loan to Midsummer House Trust - 253,383Loan to Green Hills Trust - 250,000Loan to Lasting Changes Trust - (221)Total other current assets - 503,162
The loan to Green Hills Trust was made by Estia Finance Pty Ltd for the purpose of purchasing shares in EstiaHealth Ltd under a Management Equity Plan (refer to Note 25). Interest is charged at the rate of 5.95% p.a.capitalised every 6 months. The loan is repayable at the earlier of an exit event or on the 10 year anniversary of theloan, being 23 October 2014.
Other current assets consist of loans to related parties. The loan to Midsummer House Trust was interest free andwas repaid during the year. The loan to Lasting Changes Trust was interest free and during the year the directorswaived the debt being repaid.
NO
TES
TOTH
EFI
NA
NC
IAL
STA
TEM
EN
TSFO
RTH
EYE
AR
END
ED30
JUN
E20
15
Estia
Hea
lthAn
nual
Rep
ort2
014-
2015
89
17.
Prop
erty
,pla
ntan
deq
uipm
ent
Rec
onci
liatio
nof
prop
erty
,pla
ntan
deq
uipm
ent
Note
Land $
Build
ings
$
Prop
erty
impr
ovem
ents
$
Furn
iture
,fix
ture
s&
equi
pmen
t$
Mot
orve
hicl
es$
Con
stru
ctio
nin
prog
ress
$To
tal
$C
ost
Bal
ance
at1
July
2013
--
--
--
-A
cqui
sitio
nsth
roug
hbu
sine
ssco
mbi
natio
ns18
,763
,000
52,5
55,3
50-
3,24
1,73
432
,903
-74
,592
,987
Add
ition
s99
5,00
0-
329,
103
1,26
5,39
74,
850
-2,
594,
350
Dis
posa
ls-
--
(15,
921)
(3,2
29)
-(1
9,15
0)B
alan
ceat
30Ju
ne20
1419
,758
,000
52,5
55,3
5032
9,10
34,
491,
210
34,5
24-
77,1
68,1
87
Acq
uisi
tions
thro
ugh
busi
ness
com
bina
tions
472
,007
,900
238,
810,
806
-16
,457
,268
611,
057
-32
7,88
7,03
1A
dditi
ons
1,83
8,27
05,
278,
000
1,63
7,05
35,
334,
969
34,4
325,
563,
494
19,6
86,2
18D
ispo
sals
--
(2,2
73)
(21,
274)
-(2
3,54
7)B
alan
ceat
30Ju
ne20
1593
,604
,170
296,
644,
156
1,96
6,15
626
,281
,174
658,
739
5,56
3,49
442
4,71
7,88
9
Acc
umul
ated
depr
ecia
tion
Bal
ance
at1
July
2013
--
--
--
-D
epre
ciat
ion
expe
nse
-54
2,60
69,
921
557,
531
6,31
2-
1,11
6,37
0D
ispo
sals
--
-(1
12)
(365
)-
(477
)B
alan
ceat
30Ju
ne20
14-
542,
606
9,92
155
7,41
95,
947
-1,
115,
893
Dep
reci
atio
nex
pens
e8
-3,
907,
996
61,5
462,
713,
290
138,
149
-6,
820,
981
Dis
posa
ls-
--
-(2
,284
)-
(2,2
84)
Bal
ance
at30
June
2015
-4,
450,
602
71,4
673,
270,
709
141,
812
-7,
934,
590
Net
book
valu
eA
sat
30Ju
ne20
1419
,758
,000
52,0
12,7
4431
9,18
23,
933,
791
28,5
77-
76,0
52,2
94As
at30
June
2015
93,6
04,1
7029
2,19
3,55
41,
894,
689
23,0
10,4
6551
6,92
75,
563,
494
416,
783,
299
90 ESTIA HEALTH ANNUAL REPORT 2014-2015 91ESTIA HEALTH ANNUAL REPORT 2014-2015
NOTES TO THE FINANCIAL STATEMENTSFOR THE YEAR ENDED 30 JUNE 2015
Estia Health Annual Report 2014-201590
18. Intangible assets
Goodwill$
Bed licences$
Software costs$
Total$
CostBalance at 1 July 2013 - - - -Additions - - 713,707 713,707Acquisitions through businesscombinations 150,327,571 27,648,000 - 177,975,571Balance at 30 June 2014 150,327,571 27,648,000 713,707 178,689,278
Additions - - 2,366,288 2,366,288Acquisitions through businesscombinations 415,266,715 74,146,000 - 489,412,715Balance at 30 June 2015 565,594,286 101,794,000 3,079,995 670,468,281
Accumulated amortisationBalance at 1 July 2013 - - (4,911) (4,911)Amortisation expense - - - -Balance at 30 June 2014 - - (4,911) (4,911)
Amortisation expense - - (522,245) (522,245)Impairment - - - -Balance at 30 June 2015 - - (527,156) (527,156)
Net book valueAs at 30 June 2014 150,327,571 27,648,000 708,796 178,684,367As at 30 June 2015 565,594,286 101,794,000 2,552,839 669,941,125
(a) Bed LicencesBed licences acquired through a business combination are assessed at fair value at the date ofacquisition in accordance with AASB 3 Business combinations in the consolidated accounts.
(b) Impairment of intangible assetsIntangible assets with an indefinite useful life form part of one CGU for impairment testing purposes,which is consistent with the operating segment identified in Note 33.
Goodwill and bed licenses acquired through business combinations were tested for impairment at thereporting date. The recoverable amount of the cash generating unit was assessed by reference to thecash generating unit’s value in use based on financial forecasts approved by the Board covering a fiveyear period (2016 to 2020) and a terminal value. The cash flow projections assumed a growth rate of3.0% between financial years 2016 to 2020 on EBITDA remaining stable over the projected period and aterminal value growth rate of 2.1% has been applied.
A post-tax discount rate of 10.5% (2014: 10.5%) was applied in the value in use model, which wasdetermined based on the specific circumstances of the Group and is derived from its weighted averagecost of capital (WACC). The WACC takes into account both debt and equity. The cost of equity is derivedfrom the expected return on investment by the Group’s investors. The cost of debt is based on theinterest-bearing borrowings the Group is obliged to service. Market-specific risk is incorporated byapplying individual beta factors which are evaluated annually based on publicly available market data.
NOTES TO THE FINANCIAL STATEMENTSFOR THE YEAR ENDED 30 JUNE 2015
Estia Health Annual Report 2014-201591
18. Intangible assets (continued)
Adjustments to the discount rate are made to factor in the specific amount of the future tax flows in orderto reflect a pre-tax discount rate of 11.81%. The recoverable amount was determined to be higher thanthe carrying amount and therefore the directors determined that the intangible assets with an indefiniteuseful life were not impaired.
No amortisation has been provided as the Group believes the useful lives of these assets are indefinite.
As impairment testing is based on assumptions and judgements, the Directors have considered changesin key assumptions that they believe to be reasonably possible. The recoverable amount exceeds thecarrying amount when testing for reasonably possible changes in key assumptions.
19. Trade and other payables2015
$2014
$Trade creditors 2,970,785 1,370,407Payroll liabilities 6,510,456 1,387,644Sundry creditors and accruals 9,331,327 6,134,885Deferred consideration on acquisition 799,056 -Deferred income - 46,816
19,611,624 8,939,752
20. Loans and borrowings2015
$2014
$Current loans and borrowingsBank loans, secured 54,250,000 2,746,442Total current loans and borrowings 54,250,000 2,746,442
Non-current loans and borrowingsBank loans, secured - 59,921,196Shareholder loans, unsecured - 52,841,884Total non-current loans and borrowings - 112,763,080Total loans and borrowings 54,250,000 115,509,522
Terms and conditions of loansAt 30 June 2014, the bank loans were a mix of senior debt and mezzanine facilities with a maturity inOctober 2018. Interest was calculated by reference to the bank bill swap bid rate (“BBSY”) plus a marginbetween 1.0% and 4.0%. As part of the acquisition of Padman and Cook Care, the Company providedvendor loans bearing interest at a fixed rate of 15%. Bank, vendor and shareholder loans, includingaccrued interest, were repaid on 9 December 2014 from the initial public offering proceeds.
The Group entered into a three year bullet revolving cash advance facility (the “Facility”) of $150,000,000available from completion of the initial public offering on 5 December 2014. The Facility may be used forgeneral corporate purposes including funding acquisitions, capital expenditure, working capitalrequirements and bond liquidity to redeem refundable accommodation deposits. An amount of$54,250,000 was withdrawn in May 2015 to fund the acquisition of the Hutchinson entities. As at 30June 2015, an amount of $95,750,000 remains undrawn.
92 ESTIA HEALTH ANNUAL REPORT 2014-2015 93ESTIA HEALTH ANNUAL REPORT 2014-2015
NOTES TO THE FINANCIAL STATEMENTSFOR THE YEAR ENDED 30 JUNE 2015
Estia Health Annual Report 2014-201592
20. Loans and borrowings (continued)
The Facility attracts a commitment fee on the undrawn portion of the facility and when drawn, will includea variable interest rate based on the BBSY plus a margin between 1.0% and 1.4%. The Facility issecured by real property mortgages over all freehold property, security over material leases, crossguarantees and indemnities from the Group and first ranking fixed and floating charges over the assetsand undertakings of the Group.
On 13 July 2015, Estia entered into an agreement to refinance the Facility with two lenders, WestpacBanking Corporation (Westpac) and Commonwealth Bank of Australia. The Facility was extended to 10December 2018 and includes the addition of a $150,000,000 accordion facility to be used for acquisitionsand capital investment. In addition, the rate for the unused line fee was reduced from 0.45% to 0.40%.There were no significant changes to other terms and conditions. The new facility was utilised on 4August 2015 to repay the current debt facility drawdown of $54,250,000.
21. Derivative financial instrument2015
$2014
$Interest rate swap contracts - 1,301,608
At 30 June 2014, interest bearing loans of the Group bore an interest rate calculated by reference toBBSY plus a margin between 1.0% and 4.0%. In order to protect against rising interest rates, the Groupentered into three separate interest rate swap contracts, one with National Australia Bank, one withWestpac and the other with Investec. These contracts had a fixed interest rate of 3.58%. Cover for theinterest rate swap contracts extended through until October 2018 for varying amounts originallydetermined to equate to a minimum of 75% of the Group’s forecast borrowings. All interest rate swapswere repaid in December 2014 as part of the initial public offering and no interest rate swap contractsexist at 30 June 2015.
22. Refundable accommodation deposits2015
$2014
$Refundable accommodation deposits – amounts received 471,085,901 77,625,576
Terms and conditions relating to refundable accommodation deposits (RADs)RADs are paid by residents upon their admission to facilities and are settled after a resident vacates thepremises in accordance with the Aged Care Act 1997. Providers must pay a base interest rate on allrefunds on RADs within legislated time frames and must pay a penalty on refunds made outsidelegislated time frames. RAD balances held prior to 1 July 2014 are reduced by annual retention feescharged in accordance with the Aged Care Act 1997.
RAD refunds are guaranteed by the Government under the prudential standards legislation. Providersare required to have sufficient liquidity to ensure that they can refund bond balances as they fall due inthe following twelve months. Providers are also required to implement and maintain a liquiditymanagement strategy. This is updated on a quarterly basis.
While refundable accommodation deposits are classified as a current liability given the possibletimeframe for repayment of an individual RAD, it is unlikely that the RAD liability will be significantlyreduced over the next twelve months. However, as the entity does not have an unconditional right todefer settlement for at least twelve months after the reporting date, it is classified as a current liability inaccordance with the accounting standard AASB 101 Presentation of Financial Statements.
NOTES TO THE FINANCIAL STATEMENTSFOR THE YEAR ENDED 30 JUNE 2015
Estia Health Annual Report 2014-201593
22. Refundable accommodation deposits (continued)
The RAD liability is spread across a large portion of the Group’s resident population and therefore therepayment of individual balances that make up the current balance will be dependent upon the actualtenure of individual residents. Tenure can be more than ten years but averages approximately 2.5 years.
Usually, but not always, when an existing refundable accommodation deposit is repaid it is replaced by anew RAD paid by the new incoming resident. Since the introduction of RADs (previously known asaccommodation bonds) in 1997 the trend within the Group and the aged care industry has been that thecash received in relation to the new RAD has been greater than the cash paid out in relation to theprevious deposit.
23. Provisions2015
$2014
$CurrentEmployee benefits 20,720,871 6,116,351Stepped lease provision 465,611 322,003Total current provisions 21,186,482 6,438,354
Non-currentEmployee benefits 1,984,861 1,949,852Total non-current provisions 1,984,861 1,949,852Total provisions 23,171,343 8,388,206
Movements in each class of provision, except employee benefits, are set out below:
SteppedLease
Provision$
Balance at 1 July 2013 -Acquisitions through business combinations -Expense during the year 322,003Balance at 30 June 2014 322,003
Acquisitions through business combinations -Expense during the year 143,608Balance at 30 June 2015 465,611
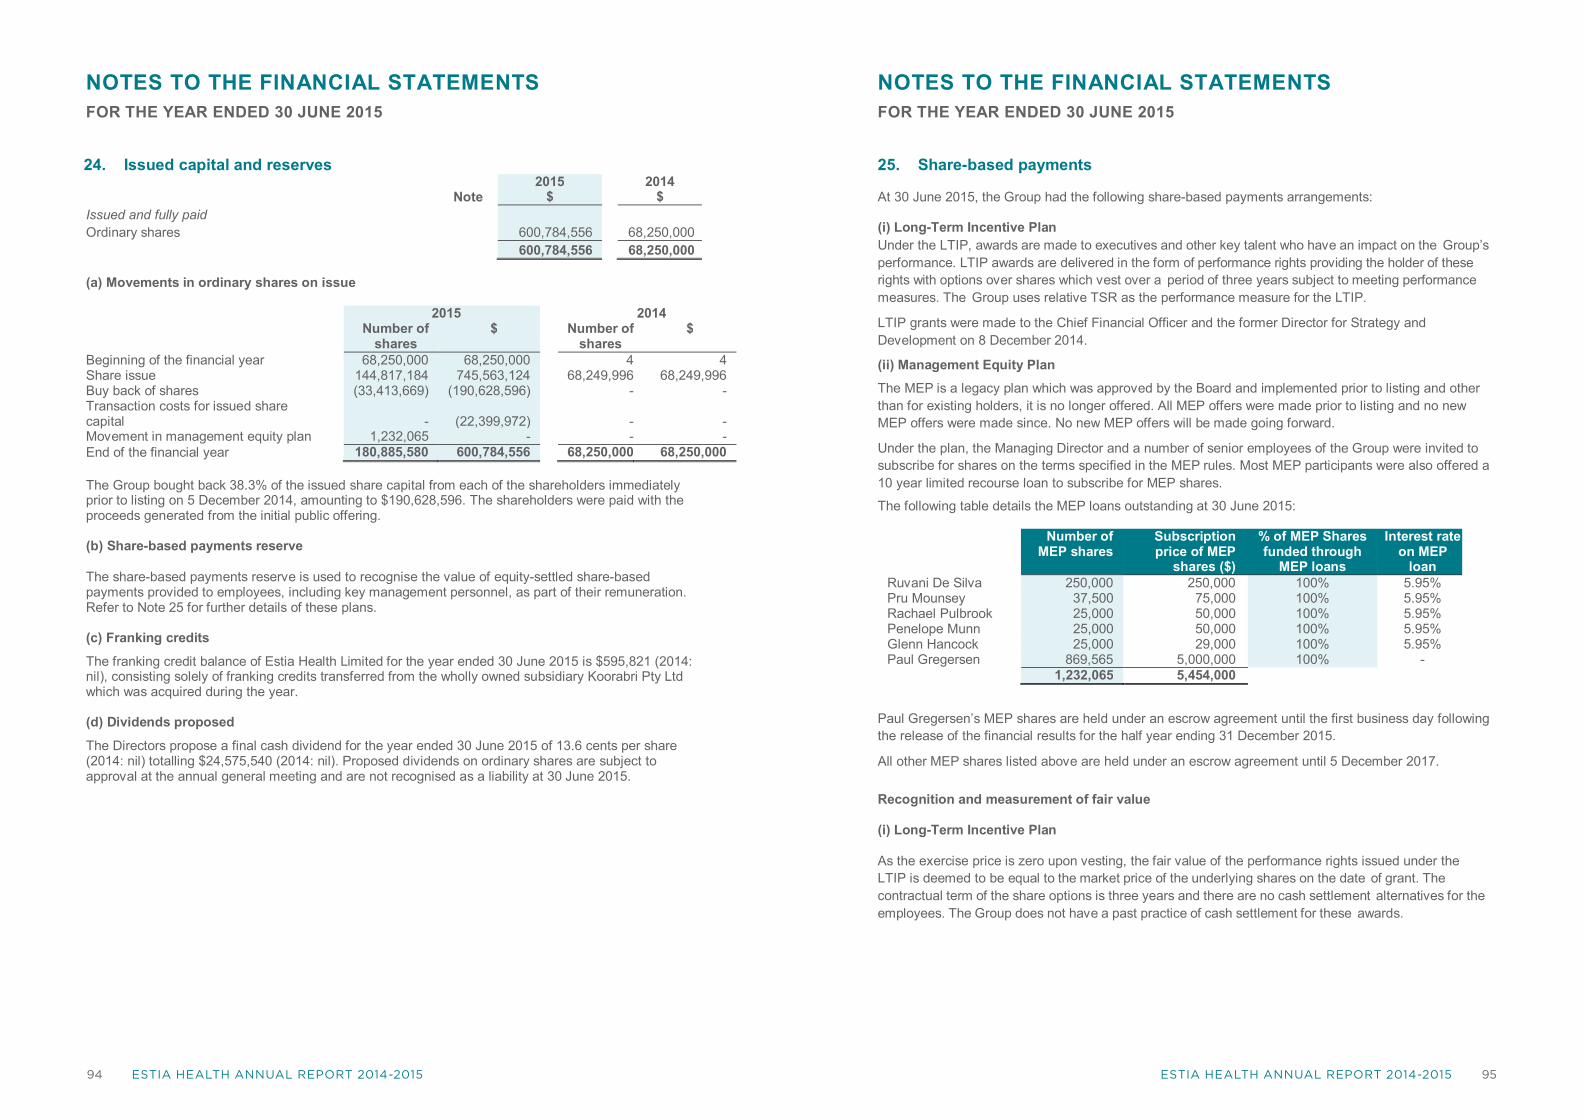
94 ESTIA HEALTH ANNUAL REPORT 2014-2015 95ESTIA HEALTH ANNUAL REPORT 2014-2015
NOTES TO THE FINANCIAL STATEMENTSFOR THE YEAR ENDED 30 JUNE 2015
Estia Health Annual Report 2014-201594
24. Issued capital and reserves
Note2015
$2014
$Issued and fully paidOrdinary shares 600,784,556 68,250,000
600,784,556 68,250,000
(a) Movements in ordinary shares on issue
2015 2014Number of
shares$ Number of
shares$
Beginning of the financial year 68,250,000 68,250,000 4 4Share issue 144,817,184 745,563,124 68,249,996 68,249,996Buy back of shares (33,413,669) (190,628,596) - -Transaction costs for issued sharecapital - (22,399,972) - -Movement in management equity plan 1,232,065 - - -End of the financial year 180,885,580 600,784,556 68,250,000 68,250,000
The Group bought back 38.3% of the issued share capital from each of the shareholders immediatelyprior to listing on 5 December 2014, amounting to $190,628,596. The shareholders were paid with theproceeds generated from the initial public offering.
(b) Share-based payments reserve
The share-based payments reserve is used to recognise the value of equity-settled share-basedpayments provided to employees, including key management personnel, as part of their remuneration.Refer to Note 25 for further details of these plans.
(c) Franking credits
The franking credit balance of Estia Health Limited for the year ended 30 June 2015 is $595,821 (2014:nil), consisting solely of franking credits transferred from the wholly owned subsidiary Koorabri Pty Ltdwhich was acquired during the year.
(d) Dividends proposed
The Directors propose a final cash dividend for the year ended 30 June 2015 of 13.6 cents per share(2014: nil) totalling $24,575,540 (2014: nil). Proposed dividends on ordinary shares are subject toapproval at the annual general meeting and are not recognised as a liability at 30 June 2015.
NOTES TO THE FINANCIAL STATEMENTSFOR THE YEAR ENDED 30 JUNE 2015
Estia Health Annual Report 2014-201595
25. Share-based payments
At 30 June 2015, the Group had the following share-based payments arrangements:
(i) Long-Term Incentive PlanUnder the LTIP, awards are made to executives and other key talent who have an impact on the Group’sperformance. LTIP awards are delivered in the form of performance rights providing the holder of theserights with options over shares which vest over a period of three years subject to meeting performancemeasures. The Group uses relative TSR as the performance measure for the LTIP.
LTIP grants were made to the Chief Financial Officer and the former Director for Strategy andDevelopment on 8 December 2014.
(ii) Management Equity PlanThe MEP is a legacy plan which was approved by the Board and implemented prior to listing and otherthan for existing holders, it is no longer offered. All MEP offers were made prior to listing and no newMEP offers were made since. No new MEP offers will be made going forward.
Under the plan, the Managing Director and a number of senior employees of the Group were invited tosubscribe for shares on the terms specified in the MEP rules. Most MEP participants were also offered a10 year limited recourse loan to subscribe for MEP shares.
The following table details the MEP loans outstanding at 30 June 2015:
Number ofMEP shares
Subscriptionprice of MEP
shares ($)
% of MEP Sharesfunded through
MEP loans
Interest rateon MEP
loanRuvani De Silva 250,000 250,000 100% 5.95%Pru Mounsey 37,500 75,000 100% 5.95%Rachael Pulbrook 25,000 50,000 100% 5.95%Penelope Munn 25,000 50,000 100% 5.95%Glenn Hancock 25,000 29,000 100% 5.95%Paul Gregersen 869,565 5,000,000 100% -
1,232,065 5,454,000
Paul Gregersen’s MEP shares are held under an escrow agreement until the first business day followingthe release of the financial results for the half year ending 31 December 2015.
All other MEP shares listed above are held under an escrow agreement until 5 December 2017.
Recognition and measurement of fair value
(i) Long-Term Incentive Plan
As the exercise price is zero upon vesting, the fair value of the performance rights issued under theLTIP is deemed to be equal to the market price of the underlying shares on the date of grant. Thecontractual term of the share options is three years and there are no cash settlement alternatives for theemployees. The Group does not have a past practice of cash settlement for these awards.
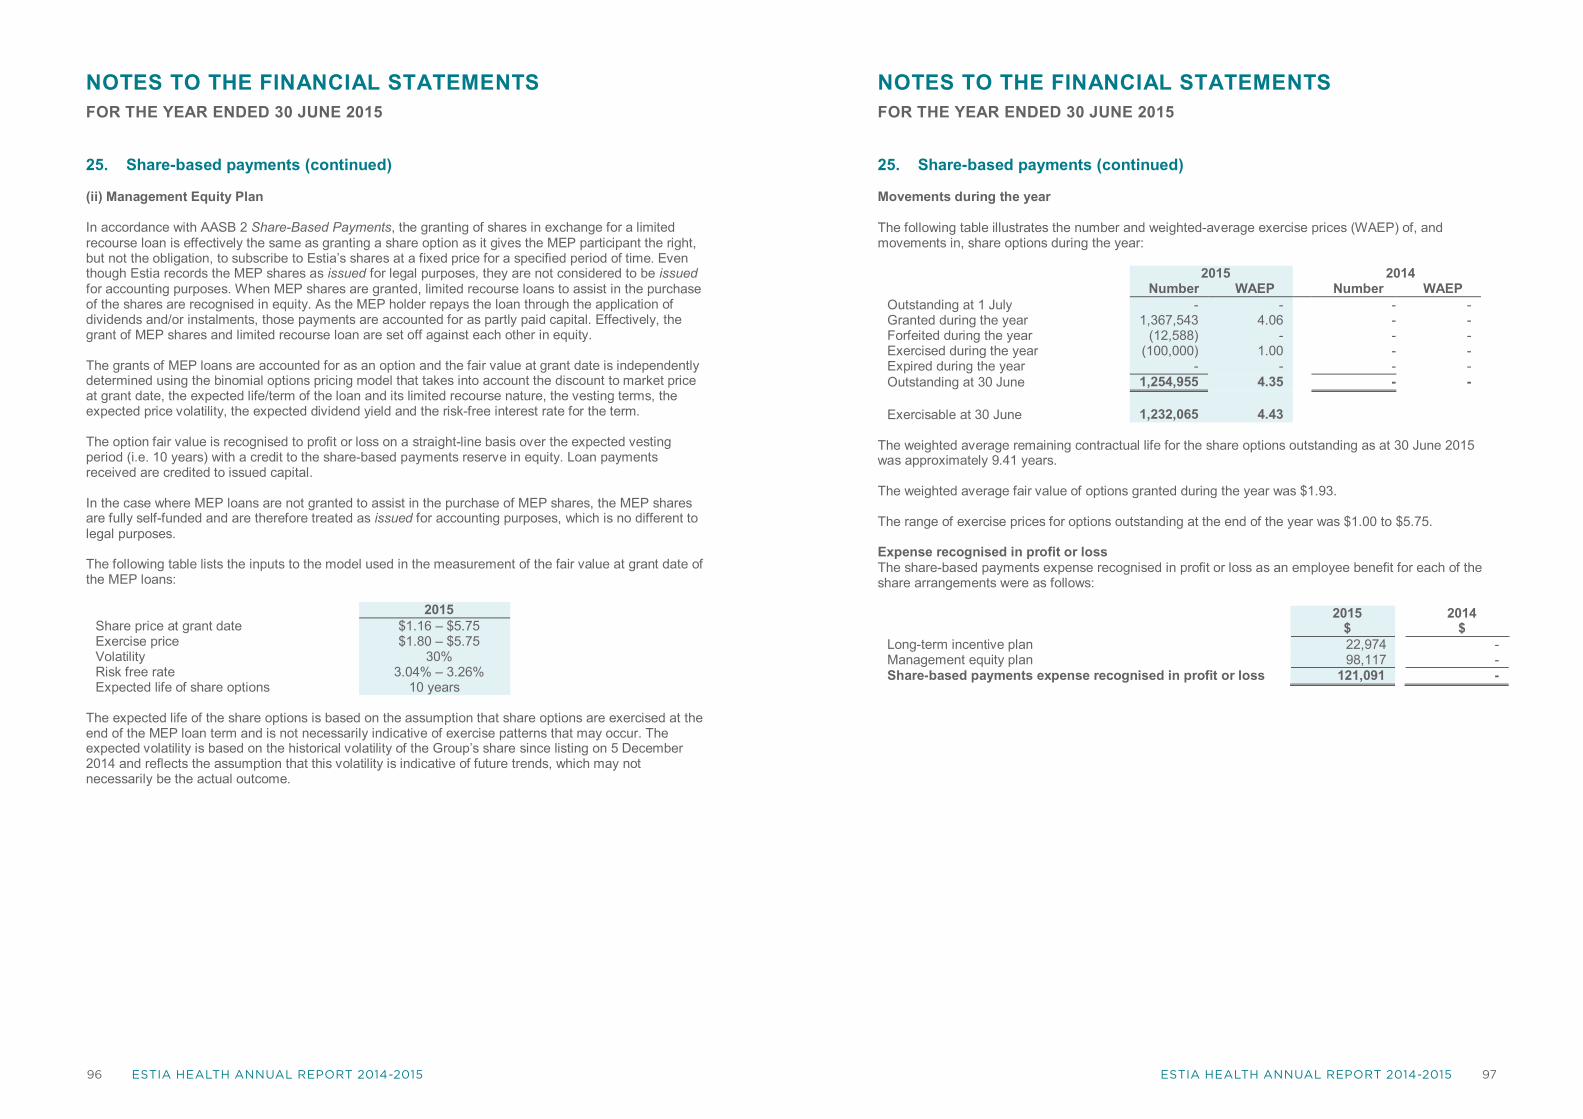
96 ESTIA HEALTH ANNUAL REPORT 2014-2015 97ESTIA HEALTH ANNUAL REPORT 2014-2015
NOTES TO THE FINANCIAL STATEMENTSFOR THE YEAR ENDED 30 JUNE 2015
Estia Health Annual Report 2014-201596
25. Share-based payments (continued)
(ii) Management Equity Plan
In accordance with AASB 2 Share-Based Payments, the granting of shares in exchange for a limitedrecourse loan is effectively the same as granting a share option as it gives the MEP participant the right,but not the obligation, to subscribe to Estia’s shares at a fixed price for a specified period of time. Eventhough Estia records the MEP shares as issued for legal purposes, they are not considered to be issuedfor accounting purposes. When MEP shares are granted, limited recourse loans to assist in the purchaseof the shares are recognised in equity. As the MEP holder repays the loan through the application ofdividends and/or instalments, those payments are accounted for as partly paid capital. Effectively, thegrant of MEP shares and limited recourse loan are set off against each other in equity.
The grants of MEP loans are accounted for as an option and the fair value at grant date is independentlydetermined using the binomial options pricing model that takes into account the discount to market priceat grant date, the expected life/term of the loan and its limited recourse nature, the vesting terms, theexpected price volatility, the expected dividend yield and the risk-free interest rate for the term.
The option fair value is recognised to profit or loss on a straight-line basis over the expected vestingperiod (i.e. 10 years) with a credit to the share-based payments reserve in equity. Loan paymentsreceived are credited to issued capital.
In the case where MEP loans are not granted to assist in the purchase of MEP shares, the MEP sharesare fully self-funded and are therefore treated as issued for accounting purposes, which is no different tolegal purposes.
The following table lists the inputs to the model used in the measurement of the fair value at grant date ofthe MEP loans:
2015Share price at grant date $1.16 – $5.75Exercise price $1.80 – $5.75Volatility 30%Risk free rate 3.04% – 3.26%Expected life of share options 10 years
The expected life of the share options is based on the assumption that share options are exercised at theend of the MEP loan term and is not necessarily indicative of exercise patterns that may occur. Theexpected volatility is based on the historical volatility of the Group’s share since listing on 5 December2014 and reflects the assumption that this volatility is indicative of future trends, which may notnecessarily be the actual outcome.
NOTES TO THE FINANCIAL STATEMENTSFOR THE YEAR ENDED 30 JUNE 2015
Estia Health Annual Report 2014-201597
25. Share-based payments (continued)
Movements during the year
The following table illustrates the number and weighted-average exercise prices (WAEP) of, andmovements in, share options during the year:
2015 2014Number WAEP Number WAEP
Outstanding at 1 July - - - -Granted during the year 1,367,543 4.06 - -Forfeited during the year (12,588) - - -Exercised during the year (100,000) 1.00 - -Expired during the year - - - -Outstanding at 30 June 1,254,955 4.35 - -
Exercisable at 30 June 1,232,065 4.43
The weighted average remaining contractual life for the share options outstanding as at 30 June 2015was approximately 9.41 years.
The weighted average fair value of options granted during the year was $1.93.
The range of exercise prices for options outstanding at the end of the year was $1.00 to $5.75.
Expense recognised in profit or lossThe share-based payments expense recognised in profit or loss as an employee benefit for each of theshare arrangements were as follows:
2015$
2014$
Long-term incentive plan 22,974 -Management equity plan 98,117 -Share-based payments expense recognised in profit or loss 121,091 -
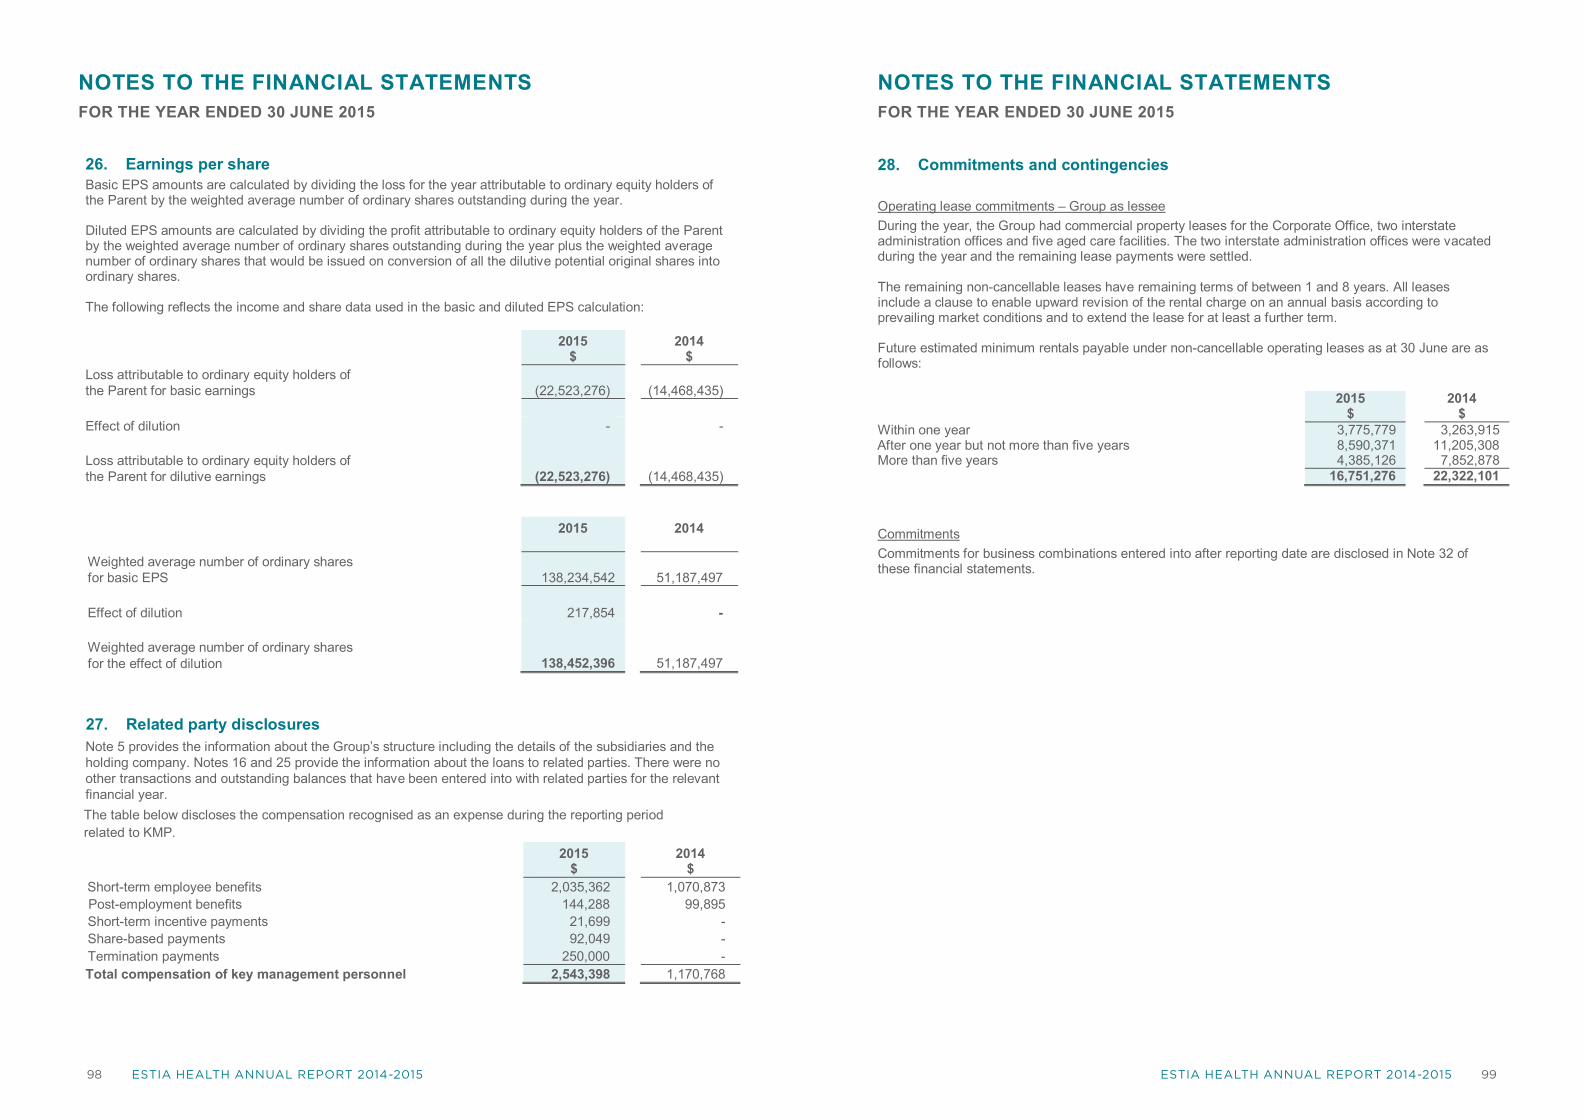
98 ESTIA HEALTH ANNUAL REPORT 2014-2015 99ESTIA HEALTH ANNUAL REPORT 2014-2015
NOTES TO THE FINANCIAL STATEMENTSFOR THE YEAR ENDED 30 JUNE 2015
Estia Health Annual Report 2014-201598
26. Earnings per shareBasic EPS amounts are calculated by dividing the loss for the year attributable to ordinary equity holders ofthe Parent by the weighted average number of ordinary shares outstanding during the year.
Diluted EPS amounts are calculated by dividing the profit attributable to ordinary equity holders of the Parentby the weighted average number of ordinary shares outstanding during the year plus the weighted averagenumber of ordinary shares that would be issued on conversion of all the dilutive potential original shares intoordinary shares.
The following reflects the income and share data used in the basic and diluted EPS calculation:
2015$
2014$
Loss attributable to ordinary equity holders ofthe Parent for basic earnings (22,523,276) (14,468,435)
Effect of dilution - -
Loss attributable to ordinary equity holders ofthe Parent for dilutive earnings (22,523,276) (14,468,435)
2015 2014
Weighted average number of ordinary sharesfor basic EPS 138,234,542 51,187,497
Effect of dilution 217,854 -
Weighted average number of ordinary sharesfor the effect of dilution 138,452,396 51,187,497
27. Related party disclosuresNote 5 provides the information about the Group’s structure including the details of the subsidiaries and theholding company. Notes 16 and 25 provide the information about the loans to related parties. There were noother transactions and outstanding balances that have been entered into with related parties for the relevantfinancial year.The table below discloses the compensation recognised as an expense during the reporting periodrelated to KMP.
2015$
2014$
Short-term employee benefits 2,035,362 1,070,873Post-employment benefits 144,288 99,895Short-term incentive payments 21,699 -Share-based payments 92,049 -Termination payments 250,000 -Total compensation of key management personnel 2,543,398 1,170,768
NOTES TO THE FINANCIAL STATEMENTSFOR THE YEAR ENDED 30 JUNE 2015
Estia Health Annual Report 2014-201599
28. Commitments and contingencies
Operating lease commitments – Group as lesseeDuring the year, the Group had commercial property leases for the Corporate Office, two interstateadministration offices and five aged care facilities. The two interstate administration offices were vacatedduring the year and the remaining lease payments were settled.
The remaining non-cancellable leases have remaining terms of between 1 and 8 years. All leasesinclude a clause to enable upward revision of the rental charge on an annual basis according toprevailing market conditions and to extend the lease for at least a further term.
Future estimated minimum rentals payable under non-cancellable operating leases as at 30 June are asfollows:
2015 2014$ $
Within one year 3,775,779 3,263,915After one year but not more than five years 8,590,371 11,205,308More than five years 4,385,126 7,852,878
16,751,276 22,322,101
CommitmentsCommitments for business combinations entered into after reporting date are disclosed in Note 32 ofthese financial statements.

100 ESTIA HEALTH ANNUAL REPORT 2014-2015 101ESTIA HEALTH ANNUAL REPORT 2014-2015
NOTES TO THE FINANCIAL STATEMENTSFOR THE YEAR ENDED 30 JUNE 2015
Estia Health Annual Report 2014-2015100
29. Financial risk management objectives and policies
The Group’s principal financial liabilities, other than derivatives, comprise of interest-bearing loans andborrowings, and trade and other payables. The main purpose of these financial liabilities is to finance theGroup’s operations and to provide guarantees to support its operations. The Group’s principal financialassets include loans, trade and other receivables, and cash and short-term deposits that derive directlyfrom its operations. The Group also enters into derivative transactions.
The Group is exposed to market risk, credit risk and liquidity risk. The Group’s senior managementoversees the management of these risks. It is the Group’s policy that no trading in derivatives forspeculative purposes may be undertaken. The Board reviews and agrees policies for managing each ofthese risks, which are summarised below.
Market riskMarket risk is the risk that the fair value of future cash flows of a financial instrument will fluctuatebecause of changes in market prices. Market risk comprise three types of risk: interest rate risk, currencyrisk and other price risk, such as equity price risk and commodity risk. Financial instruments affected bymarket risk include loans and borrowings, deposits and derivative financial instruments.
The sensitivity analyses in the following sections relate to the position as at 30 June 2015 and 30 June2014.
The sensitivity analyses have been prepared on the basis that the amount of net debt and the ratio offixed to floating interest rates of the debt and derivatives are all constant and on the basis of the hedgedesignations in place at 30 June 2015 and 30 June 2014.
The following assumptions have been made in calculating the sensitivity analyses:
• The statement of financial position sensitivity relates to derivatives; and• The sensitivity of the relevant statement of profit or loss item is the effect of the assumed
changes in respective market risks. This is based on the financial assets and financial liabilitiesheld at 30 June 2015 and 30 June 2014.
Interest rate riskInterest rate risk is the risk that the fair value or future cash flows of a financial instrument will fluctuatebecause of changes in market interest rates. The Group’s exposure to the risk of changes in marketinterest rates relates primarily to the Group’s cash and cash equivalents and long-term debt obligationswith floating interest rates.
The Group’s exposure to interest rate risk and the effective interest rate of financial assets and liabilitiesboth recognised and unrecognised at the reporting date are as follows:
Weighted averageeffective interest rates Fixed or
Floating2015%
2014%
Cash and liquid assets 1.8 2.5 FloatingBank loans 3.2 6.4 FloatingShareholder loans - 15.0 Fixed
All other financial assets and liabilities are non-interest bearing.
The details of debt are disclosed in Note 20 to the financial statements.
NOTES TO THE FINANCIAL STATEMENTSFOR THE YEAR ENDED 30 JUNE 2015
Estia Health Annual Report 2014-2015101
29. Financial risk management objectives and policies (continued)Interest rate sensitivityThe following table demonstrates the sensitivity to a reasonably possible change in interest rates on thatportion of cash and cash equivalents and loans and borrowings affected. With all other variables heldconstant, the Group’s profit before tax and equity are affected through the impact on floating ratefinancial instruments existing at the end of the respective period, as follows:
Effect on profit before tax Effect on equityHigher/(lower) Higher/(lower)
2015 2014 2015 2014+ 0.25% (25 basis points) (17,740) (299,745) (12,418) (209,821)- 0.25% (25 basis points) 17,740 299,745 12,418 209,821
Foreign currency riskForeign currency risk is the risk that the fair value or future cash flows of an exposure will fluctuatebecause of changes in foreign exchange rates. The Group does not carry out any transactions orbusiness that would give rise to foreign currency risk.
Credit riskCredit risk is the risk that a counterparty will not meet its obligations under a financial instrument orcustomer contract, leading to a financial loss. The Group is exposed to credit risk from its operatingactivities (primarily trade receivables) and from its financing activities, including deposits with banks andfinancial institutions and other financial instruments.
The Group’s exposure to credit risk arises from potential default of the counter party, with a maximumexposure equal to the carrying amount of the assets.
Approximately 71% of the revenue of the Group is obtained from Commonwealth Government funding byway of payments for residential aged care residents. This funding is maintained for providers as long asthey continue to comply with Accreditation standards and other requirements per the Aged Care Act1997.
Customer credit risk is managed subject to the Group’s established policy, procedures and controlsrelating to customer credit risk management. Outstanding customer receivables are regularly monitoredand any outstanding balances regularly followed up.
An impairment analysis is performed at each reporting date on an individual basis for each resident andother major debtors. The ability of residents and other debtors to pay their debts is based on paymenthistory including amounts on deposit through an accommodation bond for residents and other debtorspecific circumstances.
The maximum exposure to credit risk at the reporting date is the carrying value of each class of financialasset. There is no concentration of credit risk with respect to trade receivables.In addition, receivables balances are monitored on an ongoing basis with the result that the Group’sexposure to bad debts is not significant.
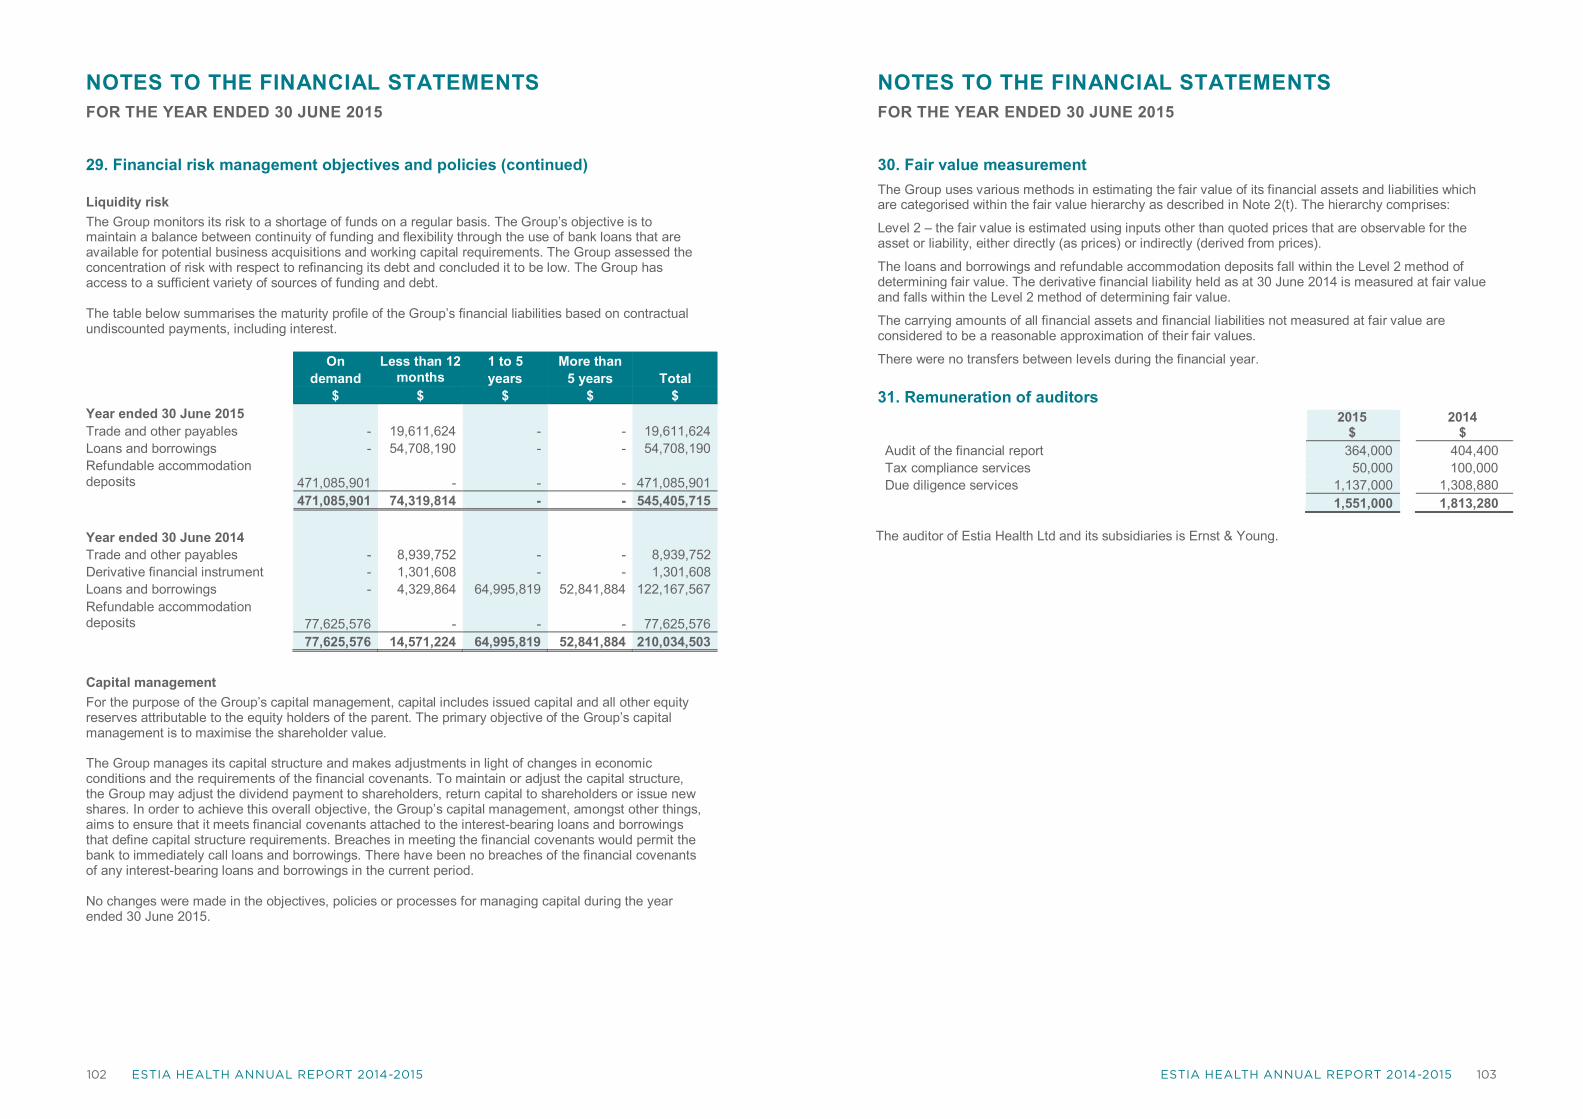
102 ESTIA HEALTH ANNUAL REPORT 2014-2015 103ESTIA HEALTH ANNUAL REPORT 2014-2015
NOTES TO THE FINANCIAL STATEMENTSFOR THE YEAR ENDED 30 JUNE 2015
Estia Health Annual Report 2014-2015102
29. Financial risk management objectives and policies (continued)
Liquidity riskThe Group monitors its risk to a shortage of funds on a regular basis. The Group’s objective is tomaintain a balance between continuity of funding and flexibility through the use of bank loans that areavailable for potential business acquisitions and working capital requirements. The Group assessed theconcentration of risk with respect to refinancing its debt and concluded it to be low. The Group hasaccess to a sufficient variety of sources of funding and debt.
The table below summarises the maturity profile of the Group’s financial liabilities based on contractualundiscounted payments, including interest.
Ondemand
Less than 12months
1 to 5years
More than5 years Total
$ $ $ $ $Year ended 30 June 2015Trade and other payables - 19,611,624 - - 19,611,624Loans and borrowings - 54,708,190 - - 54,708,190Refundable accommodationdeposits 471,085,901 - - - 471,085,901
471,085,901 74,319,814 - - 545,405,715
Year ended 30 June 2014Trade and other payables - 8,939,752 - - 8,939,752Derivative financial instrument - 1,301,608 - - 1,301,608Loans and borrowings - 4,329,864 64,995,819 52,841,884 122,167,567Refundable accommodationdeposits 77,625,576 - - - 77,625,576
77,625,576 14,571,224 64,995,819 52,841,884 210,034,503
Capital managementFor the purpose of the Group’s capital management, capital includes issued capital and all other equityreserves attributable to the equity holders of the parent. The primary objective of the Group’s capitalmanagement is to maximise the shareholder value.
The Group manages its capital structure and makes adjustments in light of changes in economicconditions and the requirements of the financial covenants. To maintain or adjust the capital structure,the Group may adjust the dividend payment to shareholders, return capital to shareholders or issue newshares. In order to achieve this overall objective, the Group’s capital management, amongst other things,aims to ensure that it meets financial covenants attached to the interest-bearing loans and borrowingsthat define capital structure requirements. Breaches in meeting the financial covenants would permit thebank to immediately call loans and borrowings. There have been no breaches of the financial covenantsof any interest-bearing loans and borrowings in the current period.
No changes were made in the objectives, policies or processes for managing capital during the yearended 30 June 2015.
NOTES TO THE FINANCIAL STATEMENTSFOR THE YEAR ENDED 30 JUNE 2015
Estia Health Annual Report 2014-2015103
30. Fair value measurementThe Group uses various methods in estimating the fair value of its financial assets and liabilities whichare categorised within the fair value hierarchy as described in Note 2(t). The hierarchy comprises:
Level 2 – the fair value is estimated using inputs other than quoted prices that are observable for theasset or liability, either directly (as prices) or indirectly (derived from prices).
The loans and borrowings and refundable accommodation deposits fall within the Level 2 method ofdetermining fair value. The derivative financial liability held as at 30 June 2014 is measured at fair valueand falls within the Level 2 method of determining fair value.
The carrying amounts of all financial assets and financial liabilities not measured at fair value areconsidered to be a reasonable approximation of their fair values.
There were no transfers between levels during the financial year.
31. Remuneration of auditors2015
$2014
$Audit of the financial report 364,000 404,400Tax compliance services 50,000 100,000Due diligence services 1,137,000 1,308,880
1,551,000 1,813,280
The auditor of Estia Health Ltd and its subsidiaries is Ernst & Young.
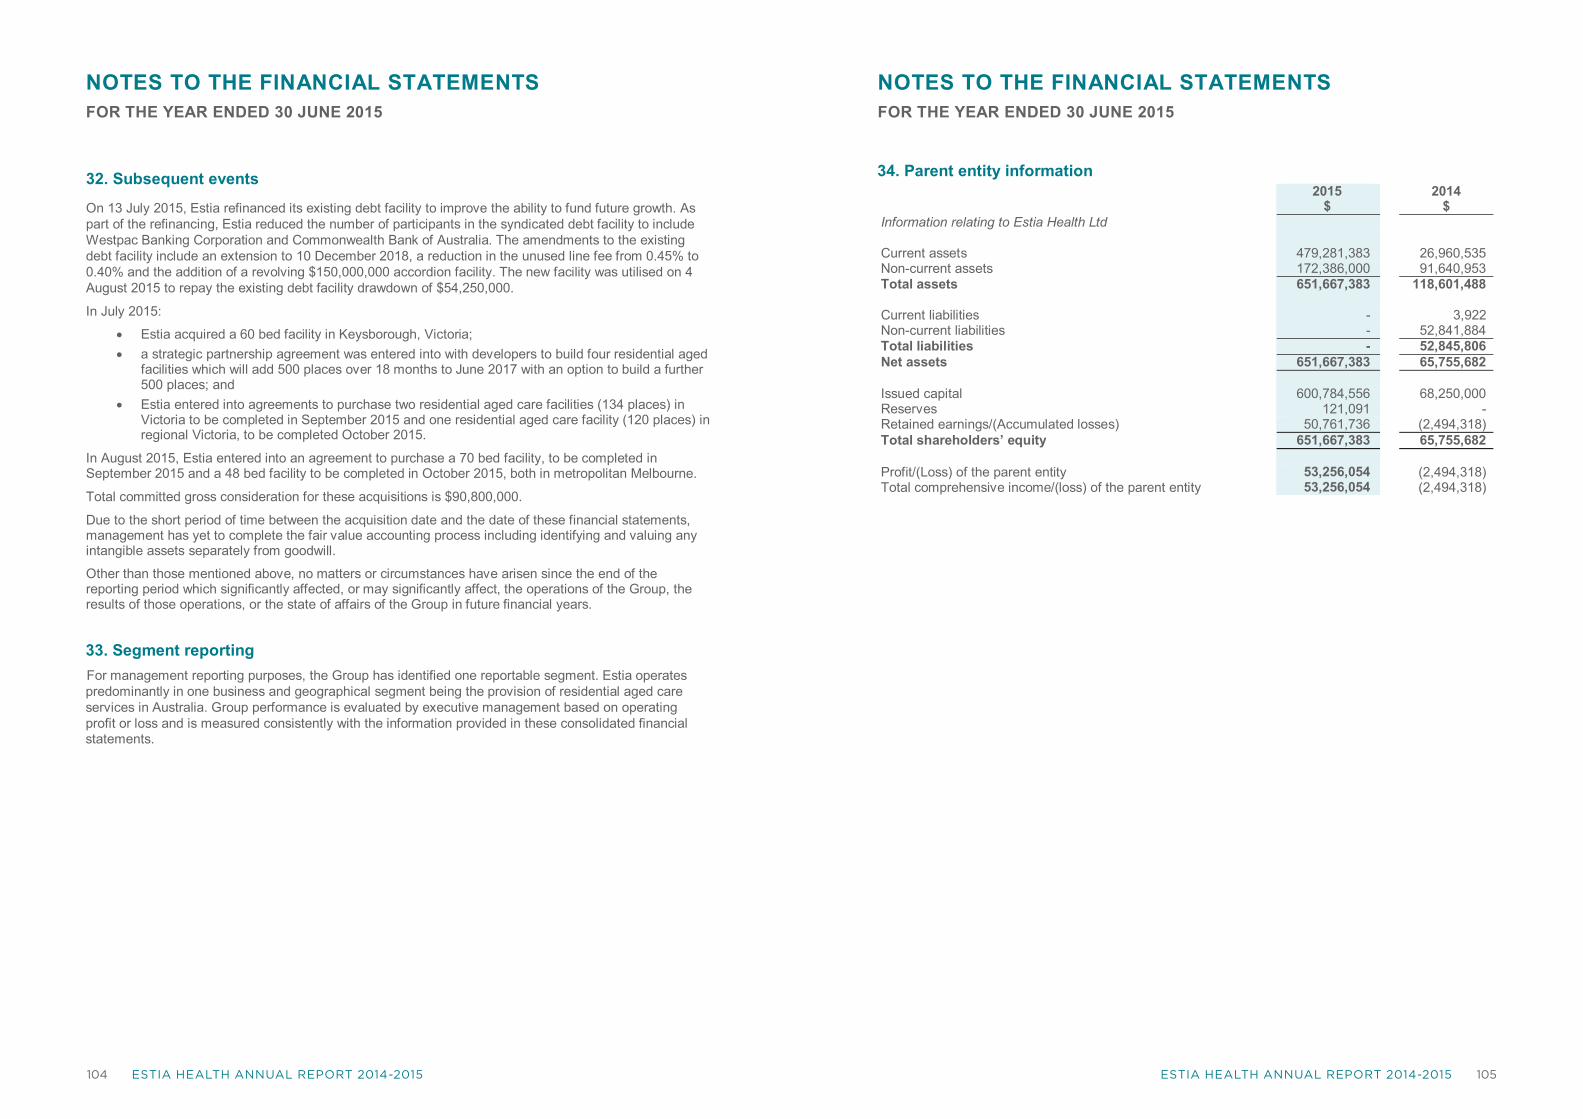
104 ESTIA HEALTH ANNUAL REPORT 2014-2015 105ESTIA HEALTH ANNUAL REPORT 2014-2015
NOTES TO THE FINANCIAL STATEMENTSFOR THE YEAR ENDED 30 JUNE 2015
Estia Health Annual Report 2014-2015104
32. Subsequent events
On 13 July 2015, Estia refinanced its existing debt facility to improve the ability to fund future growth. Aspart of the refinancing, Estia reduced the number of participants in the syndicated debt facility to includeWestpac Banking Corporation and Commonwealth Bank of Australia. The amendments to the existingdebt facility include an extension to 10 December 2018, a reduction in the unused line fee from 0.45% to0.40% and the addition of a revolving $150,000,000 accordion facility. The new facility was utilised on 4August 2015 to repay the existing debt facility drawdown of $54,250,000.
In July 2015:
• Estia acquired a 60 bed facility in Keysborough, Victoria;• a strategic partnership agreement was entered into with developers to build four residential aged
facilities which will add 500 places over 18 months to June 2017 with an option to build a further500 places; and
• Estia entered into agreements to purchase two residential aged care facilities (134 places) inVictoria to be completed in September 2015 and one residential aged care facility (120 places) inregional Victoria, to be completed October 2015.
In August 2015, Estia entered into an agreement to purchase a 70 bed facility, to be completed inSeptember 2015 and a 48 bed facility to be completed in October 2015, both in metropolitan Melbourne.
Total committed gross consideration for these acquisitions is $90,800,000.
Due to the short period of time between the acquisition date and the date of these financial statements,management has yet to complete the fair value accounting process including identifying and valuing anyintangible assets separately from goodwill.
Other than those mentioned above, no matters or circumstances have arisen since the end of thereporting period which significantly affected, or may significantly affect, the operations of the Group, theresults of those operations, or the state of affairs of the Group in future financial years.
33. Segment reportingFor management reporting purposes, the Group has identified one reportable segment. Estia operatespredominantly in one business and geographical segment being the provision of residential aged careservices in Australia. Group performance is evaluated by executive management based on operatingprofit or loss and is measured consistently with the information provided in these consolidated financialstatements.
NOTES TO THE FINANCIAL STATEMENTSFOR THE YEAR ENDED 30 JUNE 2015
Estia Health Annual Report 2014-2015105
34. Parent entity information2015
$2014
$Information relating to Estia Health Ltd
Current assets 479,281,383 26,960,535Non-current assets 172,386,000 91,640,953Total assets 651,667,383 118,601,488
Current liabilities - 3,922Non-current liabilities - 52,841,884Total liabilities - 52,845,806Net assets 651,667,383 65,755,682
Issued capital 600,784,556 68,250,000Reserves 121,091 -Retained earnings/(Accumulated losses) 50,761,736 (2,494,318)Total shareholders’ equity 651,667,383 65,755,682
Profit/(Loss) of the parent entity 53,256,054 (2,494,318)Total comprehensive income/(loss) of the parent entity 53,256,054 (2,494,318)

106 ESTIA HEALTH ANNUAL REPORT 2014-2015 107ESTIA HEALTH ANNUAL REPORT 2014-2015
DIRECTORS’ DECLARATION
Estia Health Annual Report 2014-2015106
In accordance with a resolution of the directors of Estia Health Ltd, I state that:
In the opinion of the directors:
(a) The financial statements and notes of the consolidated entity are in accordance with theCorporations Act 2001, including:
i. Giving a true and fair view of the consolidated entity’s financial position as at 30 June 2015and of its performance for the year ended on that date; and
ii. Complying with Australian Accounting Standards (including the Australian AccountingInterpretations) and the Corporations Regulations 2001.
(b) There are reasonable grounds to believe that the Company will be able to pay its debts as and whenthey become due and payable.
On behalf of the Board
Patrick GrierChairman
17 August 2015
AUDITOR’S REPORT
Estia Health Annual Report 2014-2015107
Ernst & Young 8 Exhibition Street Melbourne VIC 3000 Australia GPO Box 67 Melbourne VIC 3001
Tel: +61 3 9288 8000 Fax: +61 3 8650 7777 ey.com/au
107
A member firm of Ernst & Young Global Limited Liability limited by a scheme approved under Professional Standards Legislation
Independent auditor's report to the members of Estia Health Limited
Report on the financial report
We have audited the accompanying financial report of Estia Health Limited, which comprises the consolidated statement of financial position as at 30 June 2015, the consolidated statement of comprehensive income, the consolidated statement of changes in equity and the consolidated statement of cash flows for the year then ended, notes comprising a summary of significant accounting policies and other explanatory information, and the directors' declaration of the consolidated entity comprising the company and the entities it controlled at the year's end or from time to time during the financial year.
Directors' Responsibility for the financial report
The directors of the company are responsible for the preparation of the financial report that gives a true and fair view in accordance with Australian Accounting Standards and the Corporations Act 2001 and for such internal controls as the directors determine are necessary to enable the preparation of the financial report that is free from material misstatement, whether due to fraud or error.
Auditor's responsibility
Our responsibility is to express an opinion on the financial report based on our audit. We conducted our audit in accordance with Australian Auditing Standards. Those standards require that we comply with relevant ethical requirements relating to audit engagements and plan and perform the audit to obtain reasonable assurance about whether the financial report is free from material misstatement.
An audit involves performing procedures to obtain audit evidence about the amounts and disclosures in the financial report. The procedures selected depend on the auditor's judgment, including the assessment of the risks of material misstatement of the financial report, whether due to fraud or error. In making those risk assessments, the auditor considers internal controls relevant to the entity's preparation and fair presentation of the financial report in order to design audit procedures that are appropriate in the circumstances, but not for the purpose of expressing an opinion on the effectiveness of the entity's internal controls. An audit also includes evaluating the appropriateness of accounting policies used and the reasonableness of accounting estimates made by the directors, as well as evaluating the overall presentation of the financial report.
We believe that the audit evidence we have obtained is sufficient and appropriate to provide a basis for our audit opinion.
Independence
In conducting our audit we have complied with the independence requirements of the Corporations Act 2001. We have given to the directors of the company a written Auditor’s Independence Declaration, a copy of which follows the directors’ report.

108 ESTIA HEALTH ANNUAL REPORT 2014-2015 109ESTIA HEALTH ANNUAL REPORT 2014-2015
AUDITOR’S REPORT
Estia Health Annual Report 2014-2015108
GLOSSARY
Estia Health Annual Report 2014-2015109
Term Meaning
AAS Australian Accounting Standards and other authoritative pronouncementsissued by the AASB and Urgent Issues Group interpretations
AASB Australian Accounting Standards Board
ABN Australian Business Number
ACN Australian Company Number
ACFI Aged Care Funding Instrument
Aged Care Act Aged Care Act 1997 (Cth)
ApprovedProvider
An aged care provider as approved by the Department of Social Services underthe Aged Care Act
ASIC Australian Securities and Investments Commission
ASX Australian Securities Exchange
Audit and RiskCommittee
The Committee described in Section 2.1 of the Directors’ Report
Auditor Ernst & Young
Board The board of directors of EHL
CAGR Compound Annual Growth Rate
CEO Chief Executive Officer
CFO Chief Financial Officer
CGT Capital Gains Tax
CGU Cash Generating Unit
Constitution The Constitution of EHL
Cook Care The residential aged care assets of the business that was operated under theCook Care brand prior to the acquisition by Estia Investments
108
A member firm of Ernst & Young Global Limited Liability limited by a scheme approved under Professional Standards Legislation
Opinion In our opinion:
a. the financial report of Estia Health Limited is in accordance with the Corporations Act 2001, including:
i giving a true and fair view of the consolidated entity's financial position as at 30 June 2015 and of its performance for the year ended on that date; and
ii complying with Australian Accounting Standards and the Corporations Regulations 2001; and
b. the financial report also complies with International Financial Reporting Standards as disclosed in Note 2.
Report on the remuneration report
We have audited the Remuneration Report included in page 39 - 56 of the directors' report for the year ended 30 June 2015. The directors of the company are responsible for the preparation and presentation of the Remuneration Report in accordance with section 300A of the Corporations Act 2001. Our responsibility is to express an opinion on the Remuneration Report, based on our audit conducted in accordance with Australian Auditing Standards.
Opinion In our opinion, the Remuneration Report of Estia Health Limited for the year ended 30 June 2015, complies with section 300A of the Corporations Act 2001.
Ernst & Young
Rodney Piltz Partner Melbourne 17 August 2015

110 ESTIA HEALTH ANNUAL REPORT 2014-2015 111ESTIA HEALTH ANNUAL REPORT 2014-2015
GLOSSARY
Estia Health Annual Report 2014-2015110
Term Meaning
CorporationsAct
Corporations Act 2001 (Cth)
Director andManagementShareholders
Peter Arvanitis, Norah Barlow, Patrick Grier, Andrew Harrison, Paul GregersenJoe Genova, Nick Yannopoulos, Ruvani De Silva and other managementshareholders (holding Shares directly or through controlled entities)
EBIT Earnings Before Interest and Tax
EBITDA Earnings Before Interest, Tax, Depreciation and Amortisation
EHL Estia Health Limited (ACN 160 986 20)
EIR Effective Interest Rate
EPS Earnings Per Share
EscrowedShareholders
The Existing Shareholder and Director and Management Shareholders who holdShares at Completion of the Offer
Estia The business carried on by Estia Health
Estia Group orGroup
EHL and each of its controlled entities
FAR Fixed Annual Remuneration
GST Goods and Services Tax
IFRS International Financial Reporting Standards, as issued by the InternationalAccounting Standards Board
IPO Initial Public Offering
KMP Key Management Personnel
LastingChanges orLastingChanges Group
The residential aged care business that operated under the Lasting Changes andEstia brands prior to the acquisition by Estia Investments, which consists of fourtrusts: the Idrousa Family Trust, the Lasting Standards Trust, the Heritage LakesTrust and the Melton Unit Trust
LTIP Long-Term Incentive Plan
GLOSSARY
Estia Health Annual Report 2014-2015111
Term Meaning
ManagementEquity Plan orMEP
Estia’s existing incentive plan known as the Estia Health Management EquityPlan for directors and senior management.
MD Managing Director
MEP Loan A limited recourse loan offered by EHL (through Estia Finance) to MEPParticipants to subscribe to MEP Shares.
MPIR Maximum Permissible Interest Rate, as determined by the AustralianGovernment in accordance with Fees and Payments Principles 2014 (No. 2)
Nomination andRemunerationCommittee
The Committee described Section 2.1 of the Directors’ Report
NED Non-Executive Director
NPAT Net Profit After Tax
OCI Other Comprehensive Income
OFR Operating and Financial Review
Padman HealthCare or Padman
The residential aged care assets of the business that was operated under thePadman Health Care brand prior to the acquisition by Estia Investments
Place An allocated place under the Aged Care Act, being a place that (when operationaland occupied) is capable of attracting the residential care subsidy on a perresident per day basis
Prospectus Prospectus dated 3 December 2014 (including the electronic form of theProspectus)
RADs Refundable Accommodation Deposits
RedeemablePreferenceShare
A fully paid redeemable preference share in the capital of EHL issued to Mercury
S&P/ASX 200Index
Standard & Poor’s stock market index comprising the 200 largest and most liquidstocks listed on the ASX
112 ESTIA HEALTH ANNUAL REPORT 2014-2015 113ESTIA HEALTH ANNUAL REPORT 2014-2015
GLOSSARY
Estia Health Annual Report 2014-2015112
Term Meaning
Share Registry Link Market Services Limited (ACN 083 214 537)
STIP Short-Term Incentive Plan
TSR Total Shareholder Return
WACC Weighted-Average Cost of Capital
WAEP Weighted-Average Exercise Price
This page has been left blank intentionally

Right: Grace and Samuel, Estia Health Yarra Valley
OUR ESTIA CODE
Always ApproachableWe make time to listen because we care.
My Daily BestWe do our best to make a difference, every day.
Creating HappinessWe make magical moments happen, in small and special ways.
See Something, Say SomethingWe pay attention and are quick to act.
Pushing Our LimitsWe challenge ourselves and inspire others.
114

HEAD OFFICE 357 Camberwell Road, Camberwell VIC 3124 estiahealth.com.au
For company related requirements, please contact: Matthew Gregorowski T (02) 8234 0105 M 0422 534 755 E [email protected]
For general shareholder enquiries, please contact: Link Market Services T +61 1300 554 474