annual report 2014 - maruchan · was ¥206 million (a segment loss of ... expand sales of the...
TRANSCRIPT

ANNUAL REPORT 2014YEAR ENDED MARCH 31, 2014

“Food that brings smiles to faces”—is the message of the Maruchan logo and what the Toyo Suisan Group is all about:delivering the �nest quality, best-tasting food to dining tables everywhere.Delicious food that brings smiles to faces, and with the same assurance of qualityevery time.“Smiles for All.” — in everything we do. That's the Toyo Suisan way.
About the Maruchan logo
TO OUR SHAREHOLDERS /CONSOLIDATED FINANCIAL HIGHLIGHTS
REVIEW OF OPERATIONS
FEATURE
CORPORATE GOVERNANCE /BOARD OF DIRECTORS AND CORPORATE AUDITORS
CONSOLIDATED BALANCE SHEETS
CONSOLIDATED STATEMENTS OF INCOME
CONSOLIDATED STATEMENT OF COMPREHENSIVE INCOME
CONSOLIDATED STATEMENTS OF CHANGES IN NET ASSETS
CONSOLIDATED STATEMENTS OF CASH FLOWS
NOTES TO CONSOLIDATED FINANCIAL STATEMENTS
INDEPENDENT AUDITOR’ S REPORT
CORPORATE DATA
Since its debut in 1962, the Maruchan logo has become widely recognized and loved as the symbol for Toyo Suisan’s processed foods among every Japanese age group ranging from small children to the elderly. In 1972, Toyo Suisan established a local subsidiary in the United States and began manufacturing and selling products for North America. Accordingly, products featuring the Maruchan label are highly acclaimed for their flavor both domestically and overseas.
Forward-looking Statements
In this annual report, statements other than historical facts are forward-looking statements that re�ect our plans and expectations. These forward-looking statements involverisks, uncertainties and other factors that may cause our actual results and achievements to differ materially from those anticipated in these statements.
01 09
10
11
12
34
35
02
04
05
06
08
CONTENTS

TOYO SUISAN ANNUAL REPORT 2014 1
TO OUR SHAREHOLDERS
Operating results for the year ended March 2014
During the consolidated fiscal year ended March 31, 2014, economic conditions in Japan
have gradually recovered as a result of the correction of the strong yen and the effects of various policies. However, there
still remained downside risks, such as the slowdown of overseas economies and a slump in demand following the last-
minute demand ahead of the rise of the consumption tax rate.
Under these circumstances, the Toyo Suisan Group has remained committed to its mission “to contribute to society
through foods” and “to provide safe and secure foods and services to customers” under the corporate slogan of “Smiles
for All.” The Group continued to implement cost reductions and promoted aggressive sales activities in its efforts to face
an increasingly competitive sales environment.
As a result, net sales were ¥372,232 million (+8.0% year on year), operating income was ¥30,596 million (+3.3% year on
year), ordinary income was ¥32,243 million (+0.8% year on year), and net income was ¥22,723 million (+31.5% year on
year) for the term under review.
June 2014
Masanari Imamura
President
TOYO SUISAN KAISHA, LTD. AND ITS SUBSIDIARIES
Consolidated Financial HighlightsYEARS ENDED MARCH 31, 2013 AND 2014
Millions of yenThousands of
U.S. dollars (Note 1)
2013 2014 2014
For the year: Net sales ¥344,528 ¥372,232 $3,618,118
Operating income 29,624 30,596 297,395
Net income 17,280 22,723 220,869
At year-end: Total assets ¥274,890 ¥308,787 $3,001,429
Total net assets 209,173 236,936 2,303,033
Per share of common stock: Net income ¥169.1 ¥222.4 $2.16
(in yen and U.S. dollars) Cash dividends 50.0 50.0 0.49
Dollar amounts represent translations at the rate of ¥102.88 = US$1, the rate prevailing on March 31, 2014.
I would like to begin by expressing my sincere appreciation for our shareholders’
continued support. We are pleased to report the business results for Toyo Suisan
Kaisha, Ltd., for fiscal 2014, ended March 31, 2014.
In a severe operating environment, the Toyo Suisan Group seeks to enhance its
competitiveness for continued development and to carry out swift reforms. We will
also strive to maintain the support and trust of our customers, improve corporate
value, and boost shareholder value.
“Food that brings smiles to faces”—is the message of the Maruchan logo and what the Toyo Suisan Group is all about:delivering the �nest quality, best-tasting food to dining tables everywhere.Delicious food that brings smiles to faces, and with the same assurance of qualityevery time.“Smiles for All.” — in everything we do. That's the Toyo Suisan way.
About the Maruchan logo
TO OUR SHAREHOLDERS /CONSOLIDATED FINANCIAL HIGHLIGHTS
REVIEW OF OPERATIONS
FEATURE
CORPORATE GOVERNANCE /BOARD OF DIRECTORS AND CORPORATE AUDITORS
CONSOLIDATED BALANCE SHEETS
CONSOLIDATED STATEMENTS OF INCOME
CONSOLIDATED STATEMENT OF COMPREHENSIVE INCOME
CONSOLIDATED STATEMENTS OF CHANGES IN NET ASSETS
CONSOLIDATED STATEMENTS OF CASH FLOWS
NOTES TO CONSOLIDATED FINANCIAL STATEMENTS
INDEPENDENT AUDITOR’ S REPORT
CORPORATE DATA
Since its debut in 1962, the Maruchan logo has become widely recognized and loved as the symbol for Toyo Suisan’s processed foods among every Japanese age group ranging from small children to the elderly. In 1972, Toyo Suisan established a local subsidiary in the United States and began manufacturing and selling products for North America. Accordingly, products featuring the Maruchan label are highly acclaimed for their flavor both domestically and overseas.
Forward-looking Statements
In this annual report, statements other than historical facts are forward-looking statements that re�ect our plans and expectations. These forward-looking statements involverisks, uncertainties and other factors that may cause our actual results and achievements to differ materially from those anticipated in these statements.
01 09
10
11
12
34
35
02
04
05
06
08
CONTENTS
TOYO SUISAN ANNUAL REPORT 20142
33,456
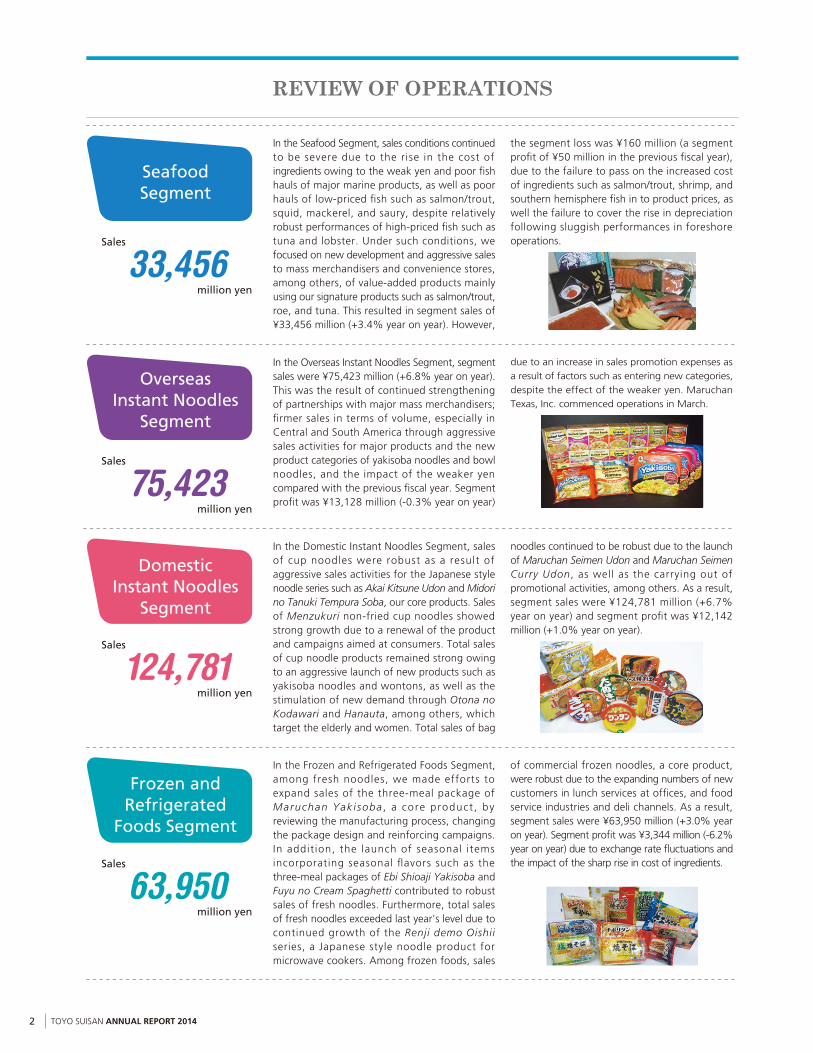
In the Seafood Segment, sales conditions continued to be severe due to the rise in the cost of ingredients owing to the weak yen and poor �sh hauls of major marine products, as well as poor hauls of low-priced �sh such as salmon/trout, squid, mackerel, and saury, despite relatively robust performances of high-priced �sh such as tuna and lobster. Under such conditions, we focused on new development and aggressive sales to mass merchandisers and convenience stores, among others, of value-added products mainly using our signature products such as salmon/trout, roe, and tuna. This resulted in segment sales of ¥33,456 million (+3.4% year on year). However,
the segment loss was ¥160 million (a segment pro�t of ¥50 million in the previous �scal year), due to the failure to pass on the increased cost of ingredients such as salmon/trout, shrimp, and southern hemisphere �sh in to product prices, as well the failure to cover the rise in depreciation following sluggish performances in foreshore operations.Sales
million yen
SeafoodSegment
In the Processed Foods Segment, sales of rice products increased on the back of expanded sales of existing items. Sales of freeze-dried products were strong mainly in the �ve-meal packages of core products. Sales volumes of Japanese �sh loaf and sausage increased but sales dropped due to a reduction in wholesale prices. Sales of seasonings and dried bonito �akes dropped owing in part to a sluggish market. As a result, segment sales were ¥18,456 million (+4.0% year on year) and segment pro�t
was ¥206 million (a segment loss of ¥86 million in the previous �scal year).
18,456
ProcessedFoods
Segment
Sales
Net Sales by Segment
Seafood Segment
Overseas Instant Noodles Segment
Domestic Instant Noodles Segment
Frozen and Refrigerated Foods Segment
Processed Foods Segment
Cold-Storage Segment
Other Business Segments
8.98% 33,456 million yen
20.26% 75,423 million yen
33.52% 124,781 million yen
17.18% 63,950 million yen
4.96% 18,456 million yen
4.10% 15,259 million yen
11.00% 40,935 million yen
124,781
In the Domestic Instant Noodles Segment, sales of cup noodles were robust as a result of aggressive sales activities for the Japanese style noodle series such as Akai Kitsune Udon and Midori no Tanuki Tempura Soba, our core products. Sales of Menzukuri non-fried cup noodles showed strong growth due to a renewal of the product and campaigns aimed at consumers. Total sales of cup noodle products remained strong owing to an aggressive launch of new products such as yakisoba noodles and wontons, as well as the stimulation of new demand through Otona no Kodawari and Hanauta, among others, which target the elderly and women. Total sales of bag
noodles continued to be robust due to the launch of Maruchan Seimen Udon and Maruchan Seimen Curry Udon, as well as the carrying out of promotional activities, among others. As a result, segment sales were ¥124,781 million (+6.7% year on year) and segment pro�t was ¥12,142 million (+1.0% year on year).
DomesticInstant Noodles
Segment
Sales
million yen
In the Frozen and Refrigerated Foods Segment, among fresh noodles, we made efforts to expand sales of the three-meal package of Maruchan Yak isoba , a core product , by reviewing the manufacturing process, changing the package design and reinforcing campaigns. In addit ion, the launch of seasonal items incorporating seasonal �avors such as the three-meal packages of Ebi Shioaji Yakisoba and Fuyu no Cream Spaghetti contributed to robust sales of fresh noodles. Furthermore, total sales of fresh noodles exceeded last year's level due to continued growth of the Renji demo Oishii series, a Japanese style noodle product for microwave cookers. Among frozen foods, sales
of commercial frozen noodles, a core product, were robust due to the expanding numbers of new customers in lunch services at of�ces, and food service industries and deli channels. As a result, segment sales were ¥63,950 million (+3.0% year on year). Segment pro�t was ¥3,344 million (-6.2% year on year) due to exchange rate �uctuations and the impact of the sharp rise in cost of ingredients.
63,950
Frozen andRefrigerated
Foods Segment
Sales
million yen
In the Overseas Instant Noodles Segment, segment sales were ¥75,423 million (+6.8% year on year). This was the result of continued strengthening of partnerships with major mass merchandisers; �rmer sales in terms of volume, especially in Central and South America through aggressive sales activities for major products and the new product categories of yakisoba noodles and bowl noodles, and the impact of the weaker yen compared with the previous �scal year. Segment pro�t was ¥13,128 million (-0.3% year on year)
due to an increase in sales promotion expenses as a result of factors such as entering new categories, despite the effect of the weaker yen. Maruchan Texas, Inc. commenced operations in March.
75,423
OverseasInstant Noodles
Segment
Sales
million yen
In the Cold-Storage Segment, sales were ¥15,259 million (+2.3% year on year) as a result of robust volumes of frozen foods in particular, although the storage volume of imported ingredients was low due to various effects, including the weaker yen. Despite the burden of higher power costs caused by a r ise in electricity prices, segment pro�t was ¥1,224 million (+6.8% year on year) as we carried out a review of storage fees as well as energy-saving efforts.
15,259Sales
million yen
million yen
Cold-StorageSegment
The Other Business Segment consists of mainly the packed lunch/deli food business. Segment sales were ¥40,935 million (+37.7% year on year), while segment pro�t was ¥1,303 million (-4.6% year on year).
40,935Sales
million yen
Other BusinessSegments
1
2
3
4
5
6
7
TOTAL
372,232million yen
REVIEW OF OPERATIONS

TOYO SUISAN ANNUAL REPORT 2014 3
33,456
In the Seafood Segment, sales conditions continued to be severe due to the rise in the cost of ingredients owing to the weak yen and poor �sh hauls of major marine products, as well as poor hauls of low-priced �sh such as salmon/trout, squid, mackerel, and saury, despite relatively robust performances of high-priced �sh such as tuna and lobster. Under such conditions, we focused on new development and aggressive sales to mass merchandisers and convenience stores, among others, of value-added products mainly using our signature products such as salmon/trout, roe, and tuna. This resulted in segment sales of ¥33,456 million (+3.4% year on year). However,
the segment loss was ¥160 million (a segment pro�t of ¥50 million in the previous �scal year), due to the failure to pass on the increased cost of ingredients such as salmon/trout, shrimp, and southern hemisphere �sh in to product prices, as well the failure to cover the rise in depreciation following sluggish performances in foreshore operations.Sales
million yen
SeafoodSegment
In the Processed Foods Segment, sales of rice products increased on the back of expanded sales of existing items. Sales of freeze-dried products were strong mainly in the �ve-meal packages of core products. Sales volumes of Japanese �sh loaf and sausage increased but sales dropped due to a reduction in wholesale prices. Sales of seasonings and dried bonito �akes dropped owing in part to a sluggish market. As a result, segment sales were ¥18,456 million (+4.0% year on year) and segment pro�t
was ¥206 million (a segment loss of ¥86 million in the previous �scal year).
18,456
ProcessedFoods
Segment
Sales
Net Sales by Segment
Seafood Segment
Overseas Instant Noodles Segment
Domestic Instant Noodles Segment
Frozen and Refrigerated Foods Segment
Processed Foods Segment
Cold-Storage Segment
Other Business Segments
8.98% 33,456 million yen
20.26% 75,423 million yen
33.52% 124,781 million yen
17.18% 63,950 million yen
4.96% 18,456 million yen
4.10% 15,259 million yen
11.00% 40,935 million yen
124,781
In the Domestic Instant Noodles Segment, sales of cup noodles were robust as a result of aggressive sales activities for the Japanese style noodle series such as Akai Kitsune Udon and Midori no Tanuki Tempura Soba, our core products. Sales of Menzukuri non-fried cup noodles showed strong growth due to a renewal of the product and campaigns aimed at consumers. Total sales of cup noodle products remained strong owing to an aggressive launch of new products such as yakisoba noodles and wontons, as well as the stimulation of new demand through Otona no Kodawari and Hanauta, among others, which target the elderly and women. Total sales of bag
noodles continued to be robust due to the launch of Maruchan Seimen Udon and Maruchan Seimen Curry Udon, as well as the carrying out of promotional activities, among others. As a result, segment sales were ¥124,781 million (+6.7% year on year) and segment pro�t was ¥12,142 million (+1.0% year on year).
DomesticInstant Noodles
Segment
Sales
million yen
In the Frozen and Refrigerated Foods Segment, among fresh noodles, we made efforts to expand sales of the three-meal package of Maruchan Yak isoba , a core product , by reviewing the manufacturing process, changing the package design and reinforcing campaigns. In addit ion, the launch of seasonal items incorporating seasonal �avors such as the three-meal packages of Ebi Shioaji Yakisoba and Fuyu no Cream Spaghetti contributed to robust sales of fresh noodles. Furthermore, total sales of fresh noodles exceeded last year's level due to continued growth of the Renji demo Oishii series, a Japanese style noodle product for microwave cookers. Among frozen foods, sales
of commercial frozen noodles, a core product, were robust due to the expanding numbers of new customers in lunch services at of�ces, and food service industries and deli channels. As a result, segment sales were ¥63,950 million (+3.0% year on year). Segment pro�t was ¥3,344 million (-6.2% year on year) due to exchange rate �uctuations and the impact of the sharp rise in cost of ingredients.
63,950
Frozen andRefrigerated
Foods Segment
Sales
million yen
In the Overseas Instant Noodles Segment, segment sales were ¥75,423 million (+6.8% year on year). This was the result of continued strengthening of partnerships with major mass merchandisers; �rmer sales in terms of volume, especially in Central and South America through aggressive sales activities for major products and the new product categories of yakisoba noodles and bowl noodles, and the impact of the weaker yen compared with the previous �scal year. Segment pro�t was ¥13,128 million (-0.3% year on year)
due to an increase in sales promotion expenses as a result of factors such as entering new categories, despite the effect of the weaker yen. Maruchan Texas, Inc. commenced operations in March.
75,423
OverseasInstant Noodles
Segment
Sales
million yen
In the Cold-Storage Segment, sales were ¥15,259 million (+2.3% year on year) as a result of robust volumes of frozen foods in particular, although the storage volume of imported ingredients was low due to various effects, including the weaker yen. Despite the burden of higher power costs caused by a r ise in electricity prices, segment pro�t was ¥1,224 million (+6.8% year on year) as we carried out a review of storage fees as well as energy-saving efforts.
15,259Sales
million yen
million yen
Cold-StorageSegment
The Other Business Segment consists of mainly the packed lunch/deli food business. Segment sales were ¥40,935 million (+37.7% year on year), while segment pro�t was ¥1,303 million (-4.6% year on year).
40,935Sales
million yen
Other BusinessSegments
1
2
3
4
5
6
7
TOTAL
372,232million yen

TOYO SUISAN ANNUAL REPORT 20144
1 According to a survey of the period between December 2012 to November 2013 based on price, conducted by KSP-SP Co., Ltd. Published in the January 15, 2014 issue of Chain Store Age.2 Total number of items shipped of Sauce-aji since its launch in November 1975 until March 2013
Original packaging
Maruchan Yakisoba was developed to transform yakisoba, which had previously been a dish that could be enjoyed only at food stalls and restaurants, into something that can easily be made at home by anyone. It was launched as three meals in one pack 39 years ago, when the average number of persons per household was 3.27. Three meals were also just the right amount to �t onto an average frying pan used at home (diameter of 26 cm to 28 cm).
Born in 1975, Maruchan marks its 39th anniversary!Rediscovered!
Since each package contains three meals, the 12.6 billion noodle dishes that have been shipped so far can be recalculated to total 4.2 billion packs. The length of one package is about 30 cm, so the total combined length would be about 1.26 million km, which is roughly 30 times the circumference of the Earth.
More than 12.6 billion noodle dishes shipped! Top selling item!Rediscovered!
The noodles come apart more easily now. Compared to earlier products, cooking the noodles is easier because they can be loosened with less effort and are less prone to breaking apart, allowing them to be more readily mixed together with the powdered sauce. The noodles also do not stick together as much as before when picked up with chopsticks, making them even more delightful to eat.
Easier to pull apart and tastier too!Rediscovered!
We established August 8 as Maruchan Yakisoba Day with the hope that more people will enjoy our yakisoba.
August 8 is Maruchan Yakisoba DayRediscovered!
Ever since Shio Yakisoba was launched in 2002, we have increased the ways to enjoy yakisoba by adding new �avors to our lineup, including Tarako-aji and Okonomi Sauce-aji. Curry Yakisoba is also being offered, and is available only during the summer season.
A �avor for every mood!Rediscovered!
Maruchan Yakisoba rediscovered!Maruchan Yakisoba was born in 1975 and marks its 39th anniversary this year. Thanks to all of our stakeholders, including customers, Maruchan Yakisoba has grown to become the top-selling product1 in the chilled noodles market. The number of items shipped has surpassed 12 billion noodle dishes2, and it has become a familiar food item on the tables of Japanese households. To express our thanks for the last 39 years and ful�ll our wish to have everyone enjoy Maruchan Yakisoba even more, we are implementing a number of initiatives under the theme of “Maruchan Yakisoba rediscovered!”
Reasons for making August 8 the Maruchan Yakisoba Day
88August
・ Because there are a greater number of occasions to eat yakisoba in summer.
・ Because the number 8 contains two ○ (a circle is maru in Japanese), thus alluding to the name Maruchan.
・ Because the syllable “ya” in yakisoba is also connected to the number 8 (which is sometimes pronounced “ya” in Japanese).
FEATURE

TOYO SUISAN ANNUAL REPORT 2014 5
CORPORATE GOVERNANCE
BOARD OF DIRECTORS AND CORPORATE AUDITORSAs of June 27, 2014
Toyo Suisan is highly cognizant of the impact that accurate and
rapid decision-making will have on the future growth potential of
the Company. Subsequently, management believes that there is a
need for clarifying the responsibilities of directors as well as the lines
of accountability within each business. In the future, Toyo Suisan
plans to develop a more transparent and fluid form of corporate
governance to address this need.
Chairman Tadasu Tsutsumi
President Masanari Imamura
Senior Managing Hiroji Yoshino
Director
Executive Directors Kazuo Yamamoto
Hiroyuki Minami
Noritaka Sumimoto
Toyo Suisan employs the auditor system. The managerial decision-
making body is the Board of Directors, which comprises 15
members, including one outside director. There are also four
Corporate Auditors, two of whom are selected from outside the
Company, who provide advice and counsel to the Board of
Directors.
Toyo Suisan’s Basic Stance Concerning
Corporate Governance
Gains in Implementing Corporate
Governance
Directors Masaharu Oikawa
Tadashi Fujiya
Hitoshi Oki
Tsutomu Toyoda
Rieko Makiya
Kiyoshi Takahashi
Katsuhiko Ishiguro
Tadashi Sumi
Outside Director Tomoko Hamada
Corporate Auditors Toru Yamashita
Moriyuki Minami
Akira Takara
Isamu Mori

TOYO SUISAN ANNUAL REPORT 20146
Millions of yenThousands of
U.S. dollars (Note 1)
2013 2014 2014
Current assets:
Cash on hand and at banks (Notes 3 and 4) ¥ 50,497 ¥ 54,082 $ 525,680
Notes and accounts receivable-
Trade (Note 4) 45,897 48,946 475,758
Unconsolidated subsidiaries and affiliates 240 300 2,916
Other 1,275 767 7,456
Less: Allowance for doubtful accounts (507) (501) (4,870)
46,905 49,512 481,260
Securities (Notes 3, 4 and 5) 27,501 34,200 332,426
Inventories 20,175 23,087 224,407
Deferred tax assets (Note 12) 1,737 1,823 17,720
Other current assets 2,547 2,201 21,394
Total current assets 149,362 164,905 1,602,887
Property, plant and equipment (Notes 7, 8, 11 ,16 and 19):
Buildings and structures 112,565 126,841 1,232,902
Machinery and equipment 95,026 106,008 1,030,404
Leased assets 654 4,641 45,111
208,245 237,490 2,308,417
Less: Accumulated depreciation (138,612) (153,390) (1,490,960)
69,633 84,100 817,457
Land 28,996 32,090 311,917
Construction in progress 3,634 2,990 29,063
Total property, plant and equipment 102,263 119,180 1,158,437
Intangible assets 2,350 2,408 23,406
Investments and other assets:
Investments in unconsolidated subsidiaries and affiliates (Note 4) 4,202 3,569 34,691
Investments in securities (Notes 4 and 5) 14,184 16,546 160,828
Deferred tax assets (Note 12) 1,818 1,352 13,142
Asset for retirement benefit (Note 9) — 82 797
Other 711 745 7,241
Total investments and other assets 20,915 22,294 216,699
Total assets ¥274,890 ¥308,787 $3,001,429
The accompanying notes are an integral part of these consolidated financial statements.
ASSETS
TOYO SUISAN KAISHA, LTD. AND ITS SUBSIDIARIES
CONSOLIDATED BALANCE SHEETSAS OF MARCH 31, 2013 AND 2014
TOYO SUISAN ANNUAL REPORT 2014 7
Millions of yenThousands of
U.S. dollars (Note 1)
2013 2014 2014
Current liabilities:
Short-term loans (Notes 4 and 8) ¥ 213 ¥ 202 $ 1,963
Current portion of long-term debt (Notes 4 and 8) — 85 826
Lease obligations (Notes 4 and 8) 119 237 2,304
Notes and accounts payable-
Trade (Note 4) 20,994 23,517 228,587
Unconsolidated subsidiaries and affiliates 717 814 7,912
Other 2,072 2,617 25,437
23,783 26,948 261,936
Deferred tax liabilities (Note 12) 4 5 49
Income taxes payable 4,109 2,875 27,945
Accrued expenses 17,706 19,378 188,355
Provision for removal cost of property, plant and equipment 172 — —
Other current liabilities 1,061 940 9,137
Total current liabilities 47,167 50,670 492,515
Long-term liabilities:
Long-term debt (Notes 4 and 8) — 30 292
Lease obligations (Notes 4 and 8) 208 3,916 38,064
Deferred tax liabilities (Note 12) 1,177 3,653 35,507
Reserve for retirement benefits
— for employees (Note 9) 16,232 — —
— for officers 141 271 2,634
Liability for retirement benefit (Note 9) — 12,650 122,959
Negative goodwill 225 75 729
Asset retirement obligations 309 316 3,072
Other 258 270 2,624
Total Long-term liabilities 18,550 21,181 205,881
Total liabilities 65,717 71,851 698,396
Contingent liabilities (Note 17)
Net assets (Notes 13 and 14):
Shareholders’ equity:
Common stock-
Authorized: 427,000,000 shares in 2013 and 2014
Issued: 110,881,044 shares in 2013 and 2014 18,969 18,969 184,380
Capital surplus 22,517 22,517 218,867
Retained earnings 171,246 189,405 1,841,028
Treasury stock at cost
Held by the Company:
8,678,089 shares in 2013, 8,697,803 shares in 2014
Owned by consolidated subsidiaries and affiliates:
46,886 shares in 2013 and 2014 (8,146) (8,208) (79,782)
Total shareholders’ equity 204,586 222,683 2,164,493
Accumulated other comprehensive income:
Net unrealized gain on investment in securities, net of taxes (Note 5) 2,186 3,281 31,891
Net unrealized gain on hedging derivatives, net of taxes (Note 6) 33 11 107
Adjustment on foreign currency translation (8,120) (2,800) (27,216)
Accumulated adjustments for retirement benefit (Note 9) — 390 3,791
Total accumulated other comprehensive income (5,901) 882 8,573
Minority interests in consolidated subsidiaries 10,488 13,371 129,967
Total net assets 209,173 236,936 2,303,033
Total liabilities and net assets ¥274,890 ¥308,787 $3,001,429
The accompanying notes are an integral part of these consolidated financial statements.
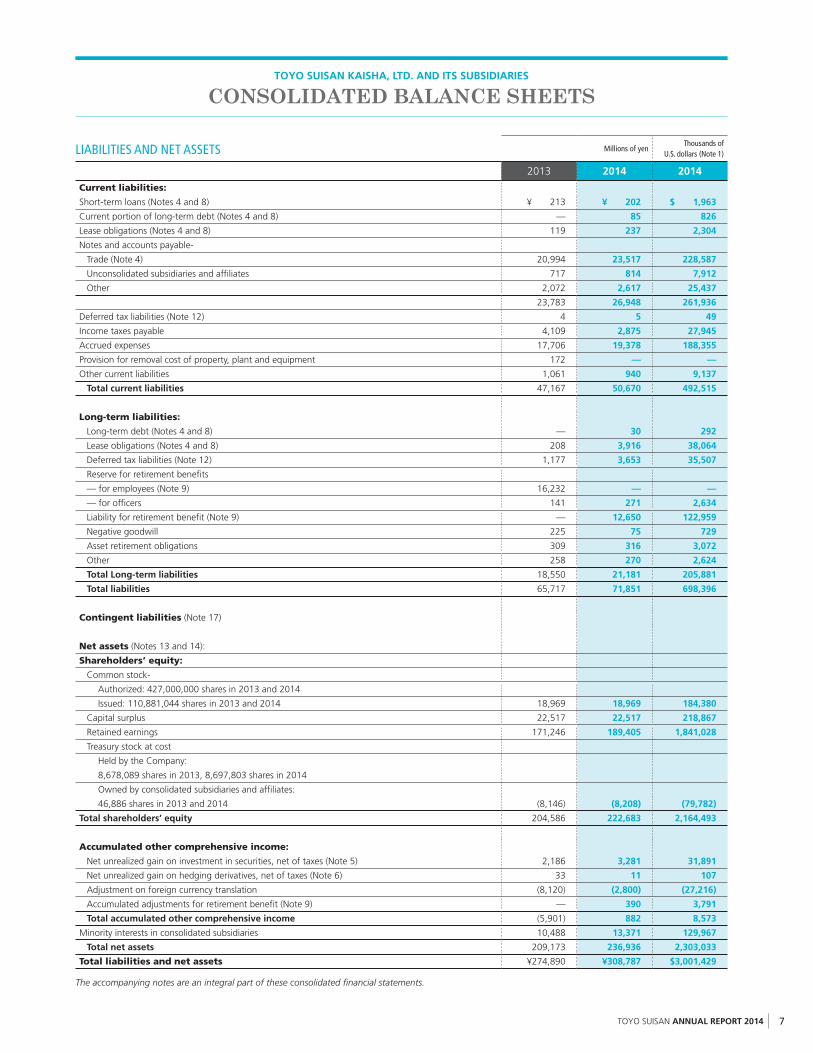
LIABILITIES AND NET ASSETS
TOYO SUISAN KAISHA, LTD. AND ITS SUBSIDIARIES
CONSOLIDATED BALANCE SHEETS

TOYO SUISAN ANNUAL REPORT 20148
TOYO SUISAN KAISHA, LTD. AND ITS SUBSIDIARIES
CONSOLIDATED STATEMENTS OF INCOMEFOR THE YEARS ENDED MARCH 31, 2013 AND 2014
Millions of yenThousands of
U.S. dollars (Note 1)
2013 2014 2014
Net sales (Note 19) ¥344,528 ¥372,232 $3,618,118
Cost of sales (Note 10) 214,909 230,221 2,237,762
Gross profit 129,619 142,011 1,380,356
Selling, general and administrative expenses (Note 10) 99,995 111,415 1,082,961
Operating income (Note 19) 29,624 30,596 297,395
Non-operating income (expenses):
Interest and dividends income 653 601 5,842
Interest expenses (5) (4) (39)
Currency exchange gain, net 772 132 1,283
Compensation expenses (14) (87) (846)
Gain (Loss) on sales or disposal of property, plant and equipment, net (743) 1,795 17,448
Write-down of investments in securities (514) (11) (107)
Impairment losses on fixed assets (Notes 11 and 19) (1,706) (177) (1,720)
Subsidy received 70 1,699 16,514
Gain on bargain purchase — 641 6,231
Compensation income 43 — —
Provision for removal cost of property, plant and equipment (172) — —
Other, net 929 1,119 10,876
Income before income taxes and minority interests 28,937 36,304 352,877
Income taxes (Note 12):
Current 12,204 10,782 104,802
Deferred (1,033) 2,242 21,792
11,171 13,024 126,594
Income before minority interests 17,766 23,280 226,283
Minority interests in subsidiaries 486 557 5,414
Net income ¥ 17,280 ¥ 22,723 $ 220,869
Yen U.S. dollars (Note 1)
2013 2014 2014
Amounts per share of common stock (Note 15):
Net income ¥169.1 ¥222.4 $2.16
Cash dividends applicable to the year 50.0 50.0 0.49
The accompanying notes are an integral part of these consolidated financial statements.

TOYO SUISAN ANNUAL REPORT 2014 9
TOYO SUISAN KAISHA, LTD. AND ITS SUBSIDIARIES
CONSOLIDATED STATEMENTS OF COMPREHENSIVE INCOMEFOR THE YEARS ENDED MARCH 31, 2013 AND 2014
Millions of yenThousands of
U.S. dollars (Note 1)
2013 2014 2014
Income before minority interests ¥17,766 ¥23,280 $226,283
Other comprehensive income (Note 18):
Net unrealized gain on investment in securities, net of taxes 1,886 1,117 10,857
Net unrealized loss on hedging derivatives, net of taxes (226) (22) (214)
Adjustment on foreign currency translation 7,358 5,320 51,711
Share of other comprehensive income of the affiliate accounted for using equity method 36 31 302
Total other comprehensive income 9,054 6,446 62,656
Comprehensive income ¥26,820 ¥29,726 $288,939
Total comprehensive income attributable to:
Owners of parent ¥26,274 ¥29,117 $283,019
Minority shareholders 546 609 5,920
The accompanying notes are an integral part of these consolidated financial statements.
TOYO SUISAN ANNUAL REPORT 201410
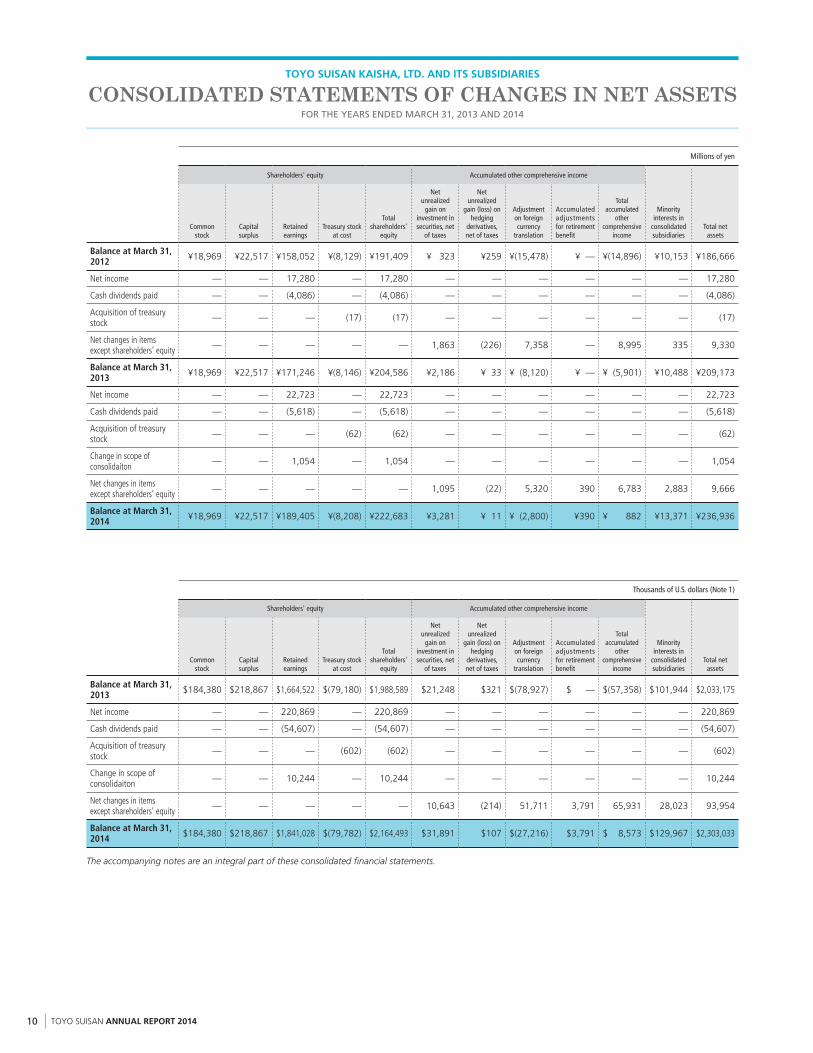
TOYO SUISAN KAISHA, LTD. AND ITS SUBSIDIARIES
CONSOLIDATED STATEMENTS OF CHANGES IN NET ASSETSFOR THE YEARS ENDED MARCH 31, 2013 AND 2014
Millions of yen
Shareholders' equity Accumulated other comprehensive income
Minority interests in
consolidated subsidiaries
Total net assets
Common stock
Capital surplus
Retained earnings
Treasury stock at cost
Total shareholders'
equity
Net unrealized
gain on investment in securities, net
of taxes
Net unrealized
gain (loss) on hedging
derivatives, net of taxes
Adjustment on foreign currency
translation
Accumulated adjustments for retirement benefit
Total accumulated
other comprehensive
income
Balance at March 31, 2012 ¥18,969 ¥22,517 ¥158,052 ¥(8,129) ¥191,409 ¥ 323 ¥259 ¥(15,478) ¥ — ¥(14,896) ¥10,153 ¥186,666
Net income — — 17,280 — 17,280 — — — — — — 17,280
Cash dividends paid — — (4,086) — (4,086) — — — — — — (4,086)
Acquisition of treasury stock — — — (17) (17) — — — — — — (17)
Net changes in items except shareholders’ equity — — — — — 1,863 (226) 7,358 — 8,995 335 9,330
Balance at March 31, 2013 ¥18,969 ¥22,517 ¥171,246 ¥(8,146) ¥204,586 ¥2,186 ¥ 33 ¥ (8,120) ¥ — ¥ (5,901) ¥10,488 ¥209,173
Net income — — 22,723 — 22,723 — — — — — — 22,723
Cash dividends paid — — (5,618) — (5,618) — — — — — — (5,618)
Acquisition of treasury stock — — — (62) (62) — — — — — — (62)
Change in scope of consolidaiton — — 1,054 — 1,054 — — — — — — 1,054
Net changes in items except shareholders’ equity — — — — — 1,095 (22) 5,320 390 6,783 2,883 9,666
Balance at March 31, 2014 ¥18,969 ¥22,517 ¥189,405 ¥(8,208) ¥222,683 ¥3,281 ¥ 11 ¥ (2,800) ¥390 ¥ 882 ¥13,371 ¥236,936
Thousands of U.S. dollars (Note 1)
Shareholders' equity Accumulated other comprehensive income
Minority interests in
consolidated subsidiaries
Total net assets
Common stock
Capital surplus
Retained earnings
Treasury stock at cost
Total shareholders'
equity
Net unrealized
gain on investment in securities, net
of taxes
Net unrealized
gain (loss) on hedging
derivatives, net of taxes
Adjustment on foreign currency
translation
Accumulated adjustments for retirement benefit
Total accumulated
other comprehensive
income
Balance at March 31, 2013 $184,380 $218,867 $1,664,522 $(79,180) $1,988,589 $21,248 $321 $(78,927) $ — $(57,358) $101,944 $2,033,175
Net income — — 220,869 — 220,869 — — — — — — 220,869
Cash dividends paid — — (54,607) — (54,607) — — — — — — (54,607)
Acquisition of treasury stock — — — (602) (602) — — — — — — (602)
Change in scope of consolidaiton — — 10,244 — 10,244 — — — — — — 10,244
Net changes in items except shareholders' equity — — — — — 10,643 (214) 51,711 3,791 65,931 28,023 93,954
Balance at March 31, 2014 $184,380 $218,867 $1,841,028 $(79,782) $2,164,493 $31,891 $107 $(27,216) $3,791 $ 8,573 $129,967 $2,303,033
The accompanying notes are an integral part of these consolidated financial statements.

TOYO SUISAN ANNUAL REPORT 2014 11
TOYO SUISAN KAISHA, LTD. AND ITS SUBSIDIARIES
CONSOLIDATED STATEMENTS OF CASH FLOWSFOR THE YEARS ENDED MARCH 31, 2013 AND 2014
Millions of yenThousands of
U.S. dollars (Note 1)
2013 2014 2014Cash flows from operating activities:
Income before income taxes and minority interests ¥28,937 ¥36,304 $352,877
Depreciation and amortization 10,945 10,616 103,188
Impairment losses on fixed assets 1,706 177 1,720
Amortization of negative goodwill (150) (150) (1,458)
Gain on bargain purchase — (641) (6,231)
Equity in gain under the equity method (17) (34) (330)
Write-down of investments in securities 514 11 107
Increase in reserve for retirement benefits 617 38 369
Increase (Decrease) in allowance for bonus to officers 42 (23) (224)
Decrease in allowance for doubtful accounts (5) (23) (224)
Decrease in liability for retirement benefit — (3,106) (30,190)
Interest and dividends income (653) (601) (5,842)
Interest expenses 5 4 39
Currency exchange gain, net (772) (132) (1,283)
Loss (Gain) on sales or disposal of property, plant and equipment, net 743 (1,795) (17,448)
Provision for removal cost of property, plant and equipment 172 — —
Decrease (Increase) in notes and accounts receivable, trade 3,108 (556) (5,404)
Decrease (Increase) in inventories 1,085 (1,749) (17,000)
Increase (Decrease) in notes and accounts payable, trade (544) 1,225 11,907
Increase in accrued expenses 384 599 5,823
Other, net (388) 913 8,875
Sub total 45,729 41,077 399,271
Interest and dividends income received 661 584 5,677
Interest expenses paid (5) (4) (39)
Income taxes paid (13,017) (12,279) (119,353)
Net cash provided by operating activities 33,368 29,378 285,556
Cash flows from investing activities:
Payment for time deposits (22,536) (24,515) (238,287)
Proceeds from maturities of time deposits 19,656 29,698 288,666
Purchase of securities — (69,199) (672,619)
Proceeds from sales and redemption of securities — 52,500 510,303
Payment for purchase of property, plant and equipment (15,503) (19,891) (193,342)
Proceeds from sales of property, plant and equipment 66 2,649 25,748
Payment for purchase of intangible assets (866) (676) (6,571)
Purchase of investments in securities (1,179) (29) (282)
Proceeds from sales of investments in securities 37 35 340
Proceeds from purchase of shares of a subsidiary resulting in change in scope of consolidation — 810 7,873
Payment for loans receivable (2,063) (2,081) (20,227)
Collection of loans receivable 2,276 2,188 21,268
Other, net 153 (11) (106)
Net cash used in investing activities (19,959) (28,522) (277,236)
Cash flows from financing activities:
Proceeds from short-term loans 1,311 930 9,040
Repayment of short-term loans (1,431) (941) (9,147)
Repayment of long-term debt (12) (149) (1,448)
Cash dividends paid (4,086) (5,615) (54,578)
Other, net (347) (463) (4,501)
Net cash used in financing activities (4,565) (6,238) (60,634)
Effect of exchange rate changes on cash and cash equivalents 3,094 1,462 14,211
Net increase (decrease) in cash and cash equivalents 11,938 (3,920) (38,103)
Cash and cash equivalents at beginning of year 39,403 51,341 499,038
Cash and cash equivalents at end of year (Note 3) ¥51,341 ¥47,421 $460,935
The accompanying notes are an integral part of these consolidated financial statements.

TOYO SUISAN ANNUAL REPORT 201412
TOYO SUISAN KAISHA, LTD. AND ITS SUBSIDIARIES
NOTES TO CONSOLIDATED FINANCIAL STATEMENTS
The accompanying consolidated financial statements of Toyo Suisan
Kaisha, Ltd. (“the Company”) and its consolidated subsidiaries have
been prepared in accordance with the provisions set forth in the
Japanese Financial Instruments and Exchange Act and its related
accounting regulations, and in conformity with accounting
principles generally accepted in Japan (“Japanese GAAP”), which
are different in certain respects as to application and disclosure
requirements from International Financial Reporting Standards.
The accompanying consolidated financial statements have been
restructured and translated into English from the consolidated
financial statements of the Company prepared in accordance with
Japanese GAAP and filed with the appropriate Local Finance Bureau
of the Ministry of Finance as required by the Japanese Financial
Instruments and Exchange Act. Certain supplementary information
included in the statutory Japanese language consolidated financial
(1) Scope of consolidation —The Company has 26 and 27 subsidiaries as of March 31, 2013 and
2014, respectively. The accompanying consolidated financial
statements include the accounts of the Company and its 21 and 22
subsidiaries as of March 31, 2013 and 2014, respectively. The
subsidiaries that are significant and substantially controlled by the
Company are consolidated.
Consolidated subsidiaries as of March 31, 2013 and 2014 are listed
as follows:Equity ownership percentage
Name of subsidiary 2013 2014Hachinohe Toyo Co., Ltd. 100.0% 100.0%Kofu Toyo Co., Ltd. 100.0 100.0Fukushima Foods Co., Ltd. 100.0 100.0Miyagi Toyo Kaisha, Ltd. 100.0 100.0Shuetsu Co., Ltd. 100.0 100.0Shinto Corporation 100.0 100.0Imari Toyo Co., Ltd. 100.0 100.0Fresh Diner Corporation 100.0 100.0Tokyo Commercial Co., Ltd 100.0 100.0Choshi Toyo Kaisha, Ltd. 100.0 100.0Yutaka Foods Corporation 40.3 40.3Mitsuwa Daily Co., Ltd 100.0 100.0Saihoku Toyo Kaisha, Ltd. 100.0 100.0Shonan Toyo Kaisha, Ltd. 100.0 100.0Suruga Toyo Kaisha, Ltd. 100.0 100.0Maruchan, Inc. (*2) 100.0 100.0Maruchan Virginia, Inc. (*2) 100.0 100.0Maruchan Texas, Inc. (*2) 100.0 100.0Maruchan de Mexico, S.A. de C.V. (*3) 100.0 100.0Sanmaru de Mexico, S.A.de C.V. (*3) 100.0 100.0Pac-Maru, Inc. (*2) 100.0 100.0Shimaya Co.,Ltd. (*1) — 51.0
(*1) Shimaya Co.,Ltd. which was an affiliate of the Company, was newly included in the scope of consolidation from the fiscal year ended March 31, 2014 since the Company acquired additional equity in the company.
(*2) Incorporated in the U.S.A.(*3) Incorporated in United Mexican States
statements is not presented in the accompanying consolidated
financial statements.
In preparing the consolidated financial statements, certain
reclassifications and rearrangements have been made to the
consolidated financial statements issued in Japan in order to present
them in a form that is more familiar to readers outside Japan.
Certain financial statement items of prior fiscal period were
reclassified to conform to the presentation for current fiscal year.
The translation of the Japanese yen amounts into U.S. dollar is
included solely for the convenience of readers outside Japan, using
the prevailing exchange rate at March 31, 2014, which was
¥102.88 to U.S. $1. The convenience translation should not be
construed as representations that the Japanese yen amounts have
been, could have been, or could in the future be, converted into
U.S. dollar at this or any other rate of exchange.
The remaining 5 unconsolidated subsidiaries as of March 31, 2013
and 2014 whose combined assets, net sales, net income and
retained earnings in the aggregate are not significant compared to
those of the consolidated financial statements of the Company and
its consolidated subsidiaries, therefore, have not been consolidated
with the Company.
Main unconsolidated subsidiaries as of March 31, 2013 and 2014
are listed as follows:
Yaizu Shinto Co., Ltd.
Towa Estate Co., Ltd.
(2) Accounting for investments in unconsolidated subsidiaries and affiliates —
The Company has 5 and 4 affiliates as of March 31, 2013 and
2014, respectivley.
The affiliate to which the equity method has been applied for the
fiscal years ended March 31, 2013 and 2014 is listed as follows:
Equity ownership percentage
Name of affiliate 2013 2014Semba Tohka Industries Co., Ltd. 26.4% 26.4%
The investments in the 5 unconsolidated subsidiaries as of March 31,
2013 and 2014, and 4 affiliates (Shimodatousui Corp., Irago Institute
Co., Ltd., Higashimaru International Corporation and Shimaya Co.,
Ltd.) and 3 affiliates (Shimodatousui Corp., Irago Institute Co., Ltd.,
and Higashimaru International Corporation) as of March 31, 2013 and
2014, respectively, are carried at cost since applying the equity method
of accounting to these companies would not have had any material
effect on net income and retained earnings of the consolidated
financial statements of the Company and its consolidated subsidiaries.
1 Basis of presenting the consolidated financial statements:
2 Summary of significant accounting policies:
TOYO SUISAN ANNUAL REPORT 2014 13
(3) Consolidation principles —The closing dates of all consolidated subsidiaries and the affiliate to
which the equity method has been applied are March 31, which is
in agreement with the fiscal year end of the Company.
All significant intercompany transactions and account balances
are eliminated in consolidation.
Unrealized intercompany profits are entirely eliminated, and the
portion thereof attributable to minority interests is charged to
minority interests.
Any differences excluding negative goodwill arising after the
adoption of the “Accounting standard for Business Combinations”
(Accounting Standard Board of Japan (“ASBJ”) Statement No. 21,
issued on December 26, 2008), which may arise on the acquisition
date in elimination of cost of an investment in a subsidiary, and in
the application of the equity method, are deferred and amortized
on a straight-line basis over a period of five years from the date of
acquisition.
(4) Foreign currency translation —Foreign currency monetary assets and liabilities are translated into
Japanese yen at the exchange rates prevailing at the balance sheet
date. Resulting gains and losses are included in net profit or loss for
the period.
In addition, the assets and liabilities of foreign subsidiaries are
translated into Japanese yen at the exchange rates prevailing at the
balance sheet date. The shareholders’ equity except for net income
of the current year is translated into Japanese yen at the historical
rates. Profit and loss accounts for the year are translated into
Japanese yen using the exchange rates prevailing at the balance
sheet date. Differences in yen amounts arising from the use of
different rates are presented as adjustment on foreign currency
translation in the net assets.
(5) Cash and cash equivalents —Cash and cash equivalents in consolidated statements of cash flows
consist of cash on hand and at banks able to be withdrawn on
demand and short-term investments with an original maturity of
three months or less and, which hold a minor risk of fluctuations in
value.
(6) Securities —Available-for-sale securities with fair market value are stated at fair
market value. Available-for-sale securities without fair market value
are mainly stated at moving-average cost.
(7) Derivative financial instruments —Gains or losses arising from changes in the fair value of those
derivatives designated as ‘hedging instruments’ are deferred in the
net assets section, and charged to income when the gains and
losses on the hedged items or transactions are recognized.
The Company and its consolidated subsidiaries hold derivative
financial instruments in the forms of foreign exchange forward
contracts to hedge against fluctuations in foreign currency exchange
rates. The Company and its consolidated subsidiaries do not hold
derivatives for trading purposes and it is the Company’s policy to
use derivatives only for the purpose of mitigating market risk and
financing costs in accordance with internal criteria.
The Company and its consolidated subsidiaries do not anticipate
any losses resulting from default by the counter-parties, as these are
limited to major domestic financial institutions with sound
operational foundations.
In line with internal risk management policies, for receivables
and payables denominated in foreign currencies, the Company and
its consolidated subsidiaries enter into forward exchange contracts
denominated in the same currency, in the same amount and
executed on the same execution day. The hedging relationships
between the derivative financial instruments and the hedged items
are highly effective in offsetting changes in currency exchange rates.
(8) Accrued officers’ bonuses —The Company and its domestic consolidated subsidiaries recognize
officers’ bonuses as expenses when incurred.
(9) Allowance for doubtful accounts —The allowance for doubtful accounts is mainly calculated based on
the aggregate amount of estimated credit losses on doubtful
receivables, plus an amount for receivables other than doubtful
receivables calculated using a historical write-off ratio during certain
prior periods.
(10) Inventories —Inventories are stated at the lower of principally the monthly
moving-average cost or the net realizable value.
(11) Property, plant and equipment —Depreciation of property, plant and equipment is computed mainly
by the declining-balance method at rates based on the estimated
useful lives of assets. Buildings excluding leasehold improvement
and auxiliary facilities attached to buildings acquired on and after
April 1, 1998 owned by the Company and its domestic consolidated
subsidiaries are depreciated using the straight-line method.
The ranges of useful lives are summarized as follows:
Buildings and structures 15-50 yearsMachinery and equipment 4-12 years
The costs of property, plant and equipment retired or otherwise
disposed of and accumulated depreciation in respect thereof are
eliminated from the related accounts, and the resulting gain or loss
is reflected in income.
Normal repairs and maintenance, including minor renewals and
improvements, are charged to income as incurred.
(12) Intangible assets —Amortization of intangible assets is mainly computed by the
straight-line method based on the estimated useful lives of the
assets. Software for internal use owned by the Company and its
domestic consolidated subsidiaries is amortized over its expected
useful life (5 years) by the straight-line method.
(13) Accounting for leases —Leased property under finance lease arrangements which transfer
ownership of the leased property to the lessee is depreciated in the
same method as the one applied to property, plant and equipment
owned by the Company.

TOYO SUISAN ANNUAL REPORT 201414
Leased property under finance lease arrangements which do not
transfer ownership of the leased property to the lessee is capitalized
to recognize leased assets and lease obligations in the balance
sheets and depreciated over the lease term of the respective assets.
Finance leases which commenced prior to April 1, 2008 and do
not transfer ownership of the leased property are accounted for as
operating leases, with disclosure of certain “as if capitalized”
information as permitted under the accounting standard.
(14) Reserve for retirement benefits and pension plan —(a) Retirement benefits for employees
The straight-line method is used as a method of attributing
retirement benefit obligations to the period through the end of the
fiscal year. The past service costs that are yet to be recognized are
amortized mainly over ten years, which is within the average
remaining service period, using the straight-line method from the
time when the difference was generated. The actual gains and
losses that are yet to be recognized are amortized using the straight-
line method mainly over ten years from the next year of the year in
which they arise. Certain domestic consolidated subsidiaries apply
the simplified method in calculating retirement benefit obligations.
(b) Retirement benefits for officers
The Company’s certain domestic consolidated subsidiaries accrue
the liabilities for retirement benefits to officers based on an amount
equivalent to 100% of such benefits the subsidiaries would be
required to pay if all eligible officers retired at the year-end date.
The payments of retirement benefits to officers are subject to
approval of shareholders’ meetings.
(15) Net income and cash dividends per share of common stock —
Net income per share of common stock is based on the weighted
average number of shares of common stock outstanding during
each year. Cash dividends per share represent dividends declared as
applicable to the respective period.
(16) Accounting for consumption tax —Consumption tax is levied at the flat rate of 5% on all domestic
consumption of goods and services (with certain exemptions). The
consumption tax withheld or paid by the Company and its domestic
consolidated subsidiaries on its sales and purchases is not included
in the amounts of the respective accounts in the consolidated
statements of income, but is recorded as an asset or a liability as the
case may be, and the net balance is included in other current
liabilities on the consolidated balance sheets.
(17) Change in accounting policies —(Adoption of Accounting Standard for Retirement Benefits)
Effective from the fiscal year ended March 31, 2014, the Company
and its domestic consolidated subsidiaries have applied the
“Accounting Standard for Retirement Benefits” (ASBJ Statement
No. 26, May 17, 2012 (hereinafter, the “Statement No.26”)) and
“Guidance on Accounting Standard for Retirement Benefits” (ASBJ
Guidance No. 25, May 17, 2012 (hereinafter, the “Guidance
No.25”)) (except the article 35 of the Statement No.26 and the
article 67 of the Guidance No.25 and actuarial gains and losses and
past service costs that are yet to be recognized have been
recognized) and the difference between retirement benefit
obligations and plan assets has been recognized as liability for
retirement benefit.
In accordance with the article 37 of the Statement No.26, the
effect of the change in accounting policies arising from initial
application has been recognized in accumulated adjustments for
retirement benefit in accumulated other comprehensive income.
As a result, as of March 31, 2014, ¥82 million ($797 thousand)
and ¥12,650 million ($122,959 thousand) are recorded as asset for
retirement benefit and liability for retirement benefit, respectively.
Also, for the fiscal year ended March 31, 2014, deferred tax
assets and minority interests in consolidated subsidiaries decreased
by ¥238 million ($2,313 thousand) and ¥116 million ($1,128
thousand), respectively, and deferred tax liabilities and accumulated
other comprehensive income increased by ¥13 million ($126
thousand) and ¥390 million ($3,791 thousand), respectively.
(18) Accounting standard issued but not yet adopted —Accounting Standard for Retirement Benefits (ASBJ Statement No.
26, May 17, 2012), and Guidance on Accounting Standard for
Retirement Benefits (ASBJ Guidance No. 25, May 17, 2012)
(a) Summary
This accounting standard was revised mainly focusing on the
treatment of actuarial gains and losses and past service costs that
are yet to be recognized, the calculation method of retirement
benefit obligations and current service costs, and enhancement of
disclosures.
(b) Effective dates
Amendments relating to determination of retirement benefit
obligations and current service costs are effective from the
beginning of fiscal year ending March 31, 2015. The adjustments
are not made retroactively to the prior periods based on transitional
measures.
(c) Effect of application of this standard
Due to the amendments, operating income and income before
income taxes and minority interests are expected to decrease by
¥137 million ($1,332 thousand), for the fiscal year ending March
31, 2015.
(19) Changes in presentation method(Consolidated balance sheets)
(a) Leased assets
“Lease assets” was included in “Machinery and equipment”
account of “Property, plant and equipment” for the fiscal year
ended March 31, 2013, but because its amount exceeded 1% of
total assets for the fiscal year ended March 31, 2014, it was
changed to be presented as a separate account. In order to reflect
this change in presentation method, the consolidated financial
statement of the fiscal year ended March 31, 2013 has been
reclassified.
As a result, in the consolidated balance sheet as of March 31,
2013, ¥95,680 million in “Machinery and equipment” has been
reclassified as ¥654 million in “Lease assets” and ¥95,026 million in
“Machinery and equipment”.

TOYO SUISAN ANNUAL REPORT 2014 15
Cash and cash equivalents as of March 31, 2013 and 2014 are as follows:
Millions of yenThousands of
U.S. dollars
2013 2014 2014Cash on hand and at banks ¥50,497 ¥54,082 $525,680Securities with an original maturity of 3 months or less 27,500 17,500 170,101Time deposits with deposit term of over 3 months (26,656) (24,161) (234,846)Cash and cash equivalents ¥51,341 ¥47,421 $460,935
(1) Outline of financial instruments(a) Policy for financial instruments
The Company and its consolidated subsidiaries limit its financial
investment only to short-term deposits and short-term loans
receivable among group companies (cash management system), or
similar items. In addition, it has a policy to manage cashflow
primarily through short-term borrowings from group companies
(cash management system). Derivatives transactions are used for the
purpose of hedging against the risks of future fluctuations in foreign
exchange rates associated with monetary claims and obligations
denominated in foreign currencies. The Company and its
consolidated subsidiaries do not hold derivatives for speculative
purposes.
(b) Details of financial instruments and related risk
Receivables such as trade notes and trade accounts are exposed to
customer credit risk. The securities comprise domestic certificates of
deposits with short-term maturities. Investment securities are
exposed to the market price fluctuation risk.
Payment terms of notes and accounts payable are mostly less
than one year. All the short-term loans are short-term loans
between Group companies (cash management system). Long-term
debt and leased obligations on finance lease are mainly for the
purpose of financing for capital investments.
Derivatives transactions are foreign exchange forward contracts
for the purpose of hedging against the foreign currency exchange
fluctuation risk associated with trade payables denominated in
foreign currencies. Information concerning hedge accounting is in
“(7) Derivative financial instruments” under “2.Summary of
significant accounting policies”.
(c) Risk management system for financial instruments
a. Credit Risk Management (customers’ default risk)
The Company aims to identify and mitigate the default risk of
customers due to deterioration of their financial conditions or other
factors in the early stage, through bi-annually monitoring principal
customers’ financial conditions and managing the payment dates
and outstanding balances of each customer’s trade receivables in
accordance with internal regulations. The Company’s consolidated
subsidiaries follow the same procedures in conformity with the
Company’s internal regulations.
The Company and its consolidated subsidiaries enter into
derivative contracts only with high credit rated financial institutions,
in order to reduce the risk of counterparty default on these
contracts.
b. Market Risk Management (foreign currency exchange and
market price fluctuation risks)
The Company and part of its consolidated subsidiaries enter into
foreign exchange forward contracts for the purpose of hedging
against the foreign currency exchange fluctuation risk of their trade
payables denominated in foreign currencies. With respect to
investment securities, the Company is periodically monitoring fair
values and financial positions of the related issuers.
3 Cash flow information:
4 Financial instruments:
(b) Lease obligations
“Lease obligations” were included in “Other current liabilities”
account of “Current liabilities” and “Other” account of “Long-term
liabilities” for the fiscal year ended March 31, 2013, but because
their amounts exceeded 1% of total liabilities and net assets for the
fiscal year ended March 31, 2014, they were changed to be
presented as separate accounts. In order to reflect this change in
presentation method, the consolidated financial statement of the
fiscal year ended March 31, 2013 has been reclassified.
As a result, in the consolidated balance sheet as of March 31,
2013, ¥1,180 million in “Other current liabilities” account of
“Current liabilities” and ¥466 million in “Other” account of “Long-
term liabilities” for the fiscal year ended March 31, 2013 have been
reclassified as ¥119 million in “Lease obligations” and ¥1,061
million in “Other current liabilities” and ¥208 million in “Lease
obligations” and ¥258 million in “Other”, respectively.
(Consolidated statements of income)
“Compensation expenses” was included in “Other, net” account of
“Non-operating income (expenses)” for the fiscal year ended March
31, 2013, but because its amount exceeded 10% of total non-
operating income (expenses) for the fiscal year ended March 31,
2014, it was changed to be presented as a separate account. In
order to reflect this change in presentation method, the
consolidated financial statements of the fiscal year ended March 31,
2013 have been reclassified.
As a result, in the consolidated statement of income for the
fiscal year ended March 31, 2013, ¥915 million in “Other, net”
account of “Non-operating income (expenses)” for the fiscal year
ended March 31, 2013 has been reclassified as (¥14) million in
“Compensation expenses” and ¥929 million in “Other, net”.

TOYO SUISAN ANNUAL REPORT 201416
2013 Millions of yen
Carrying amount Fair value Unrealized gain (loss)
(1) Cash on hand and at banks ¥ 50,497 ¥ 50,497 ¥ —
(2) Notes and accounts receivable - trade 45,897 45,897 —
(3) Securities 27,501 27,501 —
(4) Investments in unconsolidated subsidiaries and affiliates 2,075 986 (1,089)
(5) Investments in securities
Available-for-sale securities 13,681 13,681 —
Assets total ¥139,651 ¥138,562 ¥(1,089)
(1) Notes and accounts payable - trade ¥ 20,994 ¥ 20,994 ¥—
(2) Short-term loans 213 213 —
(3) Lease obligations (*1) 327 323 (4)
Liabilities total ¥ 21,534 ¥ 21,530 ¥ (4)
Derivative transactions (*2) ¥ 53 ¥ 6 ¥ (47)
2014 Millions of yen
Carrying amount Fair value Unrealized gain (loss)
(1) Cash on hand and at banks ¥ 54,082 ¥ 54,082 ¥ —
(2) Notes and accounts receivable – trade 48,946 48,946 —
(3) Securities 34,200 34,200 —
(4) Investments in unconsolidated subsidiaries and affiliates 2,121 914 (1,207)
(5) Investments in securities
Available-for-sale securities 15,988 15,988 —
Assets total ¥155,337 ¥154,130 ¥(1,207)
(1) Notes and accounts payable – trade ¥ 23,517 ¥ 23,517 ¥ —
(2) Short-term loans 202 202 —
(3) Long-term debt (*3) 115 116 1
(4) Lease obligations (*1) 4,153 4,148 (5)
Liabilities total ¥ 27,987 ¥ 27,983 ¥ (4)
Derivative transactions (*2) ¥ 18 ¥ 18 ¥ —
In accordance with the Company’s internal regulations, each
derivatives transaction is conducted by the business unit which
needs the relevant transaction: the business unit reviews information
regarding transactions such as contractual coverage and balances,
and reports it to the general manager of accounting department.
Part of the Company’s consolidated subsidiaries conduct the same
procedures in accordance with the Company’s internal regulations.
c. Liquidity Risk Management on Fund Raising
The Company manages its liquidity risk mainly through accounting
department’s timely short and long-term cash flow projections
based on the reports submitted by each business unit, and
maintaining sufficient liquidity in hand and others. Its consolidated
subsidiaries have implemented the cash management system to
facilitate efficient fund administration. This system assists them in
controlling the liquidity risk.
(d) Supplementary explanation concerning fair values of
financial instruments
The fair values of financial instruments include market prices or
reasonably estimated values in case there are no market prices.
Because estimation of fair values incorporates variable factors,
adopting different assumptions could result in the different values.
The contract amounts and other information described in the note
of “6.Derivative financial instruments” do not indicate the market
risk amounts of derivative transactions.
(e) Concentration of credit risk
The trade receivables from the Company’s particularly major
customer accounted for 31.1% and 32.7% as of March 31, 2013
and 2014, respectively.
(2) Fair values of financial instrumentsCarrying amount of the financial instruments included in the consolidated balance sheets and their fair values as of March 31, 2013 and 2014
are as follows
Certain financial instruments are excluded from the following table as the fair values are not available.

TOYO SUISAN ANNUAL REPORT 2014 17
Notes:
(a) Calculation method of fair values of financial instruments and securities, derivative transactions
Assets:
(1) Cash on hand and at banks, (2) Notes and accounts receivable – trade and (3) Securities
The carrying amounts approximate the fair values because of short-term maturities of these instruments. The securities mainly comprise
domestic certificates of deposits with short-term maturities.
(4) Investments in unconsolidated subsidiaries and affiliates and (5) Investments in securities
The fair value of marketable equity securities is measured at the quoted market price of stock exchange.
Liabilities:
(1) Notes and accounts payable – trade and (2) Short-term loans
The carrying amounts approximate the fair values because of short-term maturities of these instruments.
(3) Long-term debt and (4) Lease obligations
The fair values of long-term debt and lease obligations are determined by discounting the aggregated values of the principal and interest
using an assumed interest rate of similar type of new borrowings and lease transactions.
Derivative financial instruments:
See the note on “6. Derivative financial instruments”.
(b) Financial instruments with no available fair values
These items are not included in “(4) Investments in unconsolidated subsidiaries and affiliates and (5) Investments in securities – Available–
for–sale securities”, because there is no market price and it is very difficult to measure the fair values of these instruments.
2014 Thousands of U.S. dollars
Carrying amount Fair value Unrealized gain (loss)
(1) Cash on hand and at banks $ 525,680 $ 525,680 $ —
(2) Notes and accounts receivable – trade 475,758 475,758 —
(3) Securities 332,426 332,426 —
(4) Investments in unconsolidated subsidiaries and affiliates 20,616 8,884 (11,732)
(5) Investments in securities
Available-for-sale securities 155,404 155,404 —
Assets total $1,509,884 $1,498,152 $(11,732)
(1) Notes and accounts payable – trade $ 228,587 $ 228,587 $ —
(2) Short-term loans 1,963 1,963 —
(3) Long-term debt (*3) 1,118 1,128 10
(4) Lease obligations (*1) 40,368 40,319 (49)
Liabilities total $ 272,036 $ 271,997 $ (39)
Derivative transactions (*2) $ 175 $ 175 $ —
(*1) Current portion of lease obligations is included in (3) Lease obligations in 2013 and (4) Lease obligations in 2014.(*2) Receivables/payables arising from derivative transactions are disclosed as the net amount, and the net payable is shown in parenthesis.(*3) Current portion of long-term debt is included in (3) Long-term debt.
Millions of yenThousands of
U.S. dollars
2013 2014 2014
Unlisted equity securities ¥ 503 ¥ 558 $ 5,424
Investments in unconsolidated subsidiaries and affiliates 2,127 1,448 14,075

TOYO SUISAN ANNUAL REPORT 201418
2013 Millions of yen
Carrying amount Fair value Difference
Securities with fair value exceeding carrying amount:Bonds
¥— ¥— ¥—
Securities with fair value not exceeding carrying amount:Bonds
1 1 —
¥1 ¥1 ¥—
2013 Millions of yen
Carrying amount Acquisition cost Difference
Securities with carrying amount (fair value) exceeding acquisition costs:Equity securities
¥12,558 ¥ 9,246 ¥3,312
Securities with carrying amount (fair value) not exceeding acquisition costs:Equity securities
1,123 1,263 (140)
Other 27,500 27,500 —
¥41,181 ¥38,009 ¥3,172
5 Securities:
2013 Millions of yen
Within one year One to five years Over five to ten years Over ten years
Cash on hand and at banks ¥ 50,497 ¥— ¥— ¥—
Notes and accounts receivable - trade 45,897 — — —
Securities
Certificates of deposits 27,500 — — —
Available-for-sale securities with contractual maturities (bonds) 1 — — —
Total ¥123,895 ¥— ¥— ¥—
2014 Millions of yen
Within one year One to five years Over five to ten years Over ten years
Cash on hand and at banks ¥ 54,082 ¥— ¥— ¥—
Notes and accounts receivable - trade 48,946 — — —
Securities
Certificates of deposits 34,200 — — —
Total ¥137,228 ¥— ¥— ¥—
2014 Thousands of U.S. dollars
Within one year One to five years Over five to ten years Over ten years
Cash on hand and at banks $ 525,680 $— $— $—
Notes and accounts receivable - trade 475,758 — — —
Securities
Certificates of deposits 332,426 — — —
Total $1,333,864 $— $— $—
(c) The redemption schedule for financial assets with maturity dates subsequent to March 31, 2013 and 2014
(d) The redemption schedule for lease obligations with maturity dates subsequent to March 31, 2014
See the note on “8.Short-term loans, long-term debt and lease obligations”.
(1) Held-to-maturity securities as of March 31, 2013 and 2014 are as follows: There was no held-to-maturity security as of March 31, 2014.
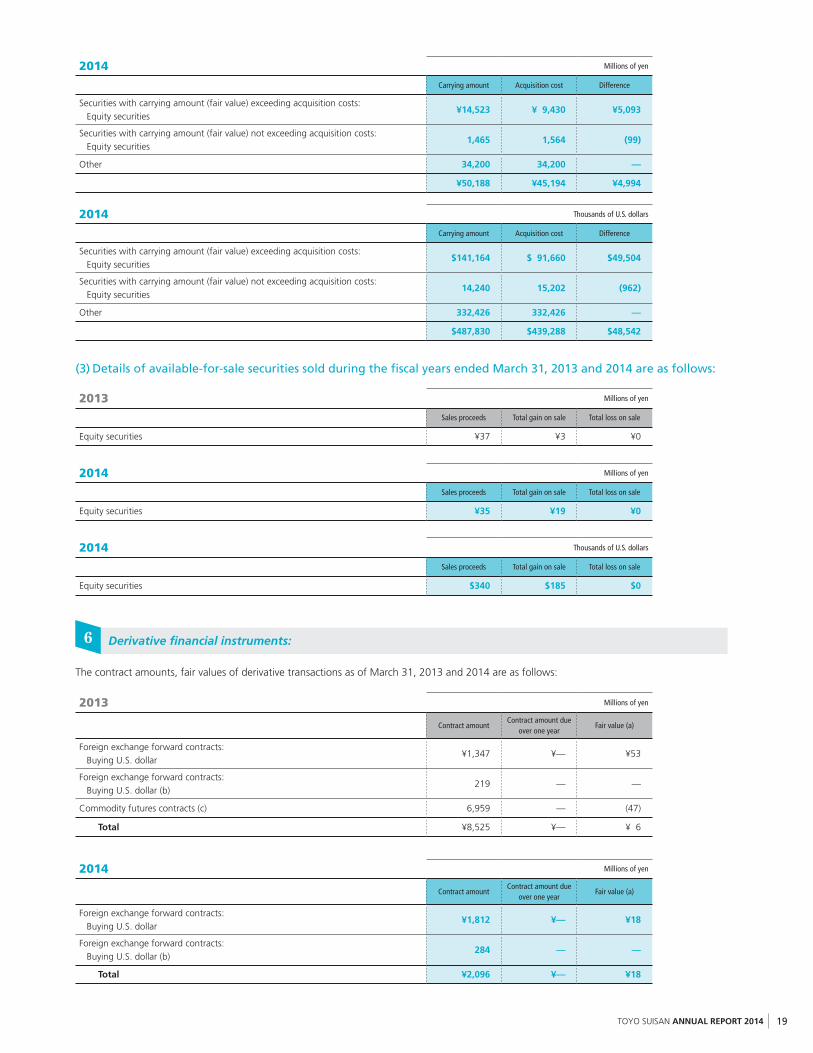
(2) Available-for-sale securities with fair market value as of March 31, 2013 and 2014 are as follows:
TOYO SUISAN ANNUAL REPORT 2014 19
2013 Millions of yen
Contract amountContract amount due
over one yearFair value (a)
Foreign exchange forward contracts:Buying U.S. dollar
¥1,347 ¥— ¥53
Foreign exchange forward contracts:Buying U.S. dollar (b)
219 — —
Commodity futures contracts (c) 6,959 — (47)
Total ¥8,525 ¥— ¥ 6
2014 Millions of yen
Contract amountContract amount due
over one yearFair value (a)
Foreign exchange forward contracts:Buying U.S. dollar
¥1,812 ¥— ¥18
Foreign exchange forward contracts:Buying U.S. dollar (b)
284 — —
Total ¥2,096 ¥— ¥18
2013 Millions of yen
Sales proceeds Total gain on sale Total loss on sale
Equity securities ¥37 ¥3 ¥0
2014 Millions of yen
Sales proceeds Total gain on sale Total loss on sale
Equity securities ¥35 ¥19 ¥0
2014 Thousands of U.S. dollars
Sales proceeds Total gain on sale Total loss on sale
Equity securities $340 $185 $0
2014 Millions of yen
Carrying amount Acquisition cost Difference
Securities with carrying amount (fair value) exceeding acquisition costs:Equity securities
¥14,523 ¥ 9,430 ¥5,093
Securities with carrying amount (fair value) not exceeding acquisition costs:Equity securities
1,465 1,564 (99)
Other 34,200 34,200 —
¥50,188 ¥45,194 ¥4,994
2014 Thousands of U.S. dollars
Carrying amount Acquisition cost Difference
Securities with carrying amount (fair value) exceeding acquisition costs:Equity securities
$141,164 $ 91,660 $49,504
Securities with carrying amount (fair value) not exceeding acquisition costs:Equity securities
14,240 15,202 (962)
Other 332,426 332,426 —
$487,830 $439,288 $48,542
6 Derivative financial instruments:
(3) Details of available-for-sale securities sold during the fiscal years ended March 31, 2013 and 2014 are as follows:
The contract amounts, fair values of derivative transactions as of March 31, 2013 and 2014 are as follows:

TOYO SUISAN ANNUAL REPORT 201420
7 Investments and rental property:
Millions of yen
Book value Fair Value
Balance at March 31, 2012 Increase / (Decrease) Balance at March 31, 2013 Balance at March 31, 2013
¥1,296 ¥718 ¥2,014 ¥4,999
Millions of yen
Book value Fair Value
Balance at March 31, 2013 Increase / (Decrease) Balance at March 31, 2014 Balance at March 31, 2014
¥2,014 (¥485) ¥1,529 ¥4,445
Thousands of U.S. dollars
Book value Fair Value
Balance at March 31, 2013 Increase / (Decrease) Balance at March 31, 2014 Balance at March 31, 2014
$19,576 ($4,714) $14,862 $43,206
2014 Thousands of U.S. dollars
Contract amountContract amount due
over one yearFair value (a)
Foreign exchange forward contracts:Buying U.S. dollar
$17,613 $— $175
Foreign exchange forward contracts:Buying U.S. dollar (b)
2,760 — —
Total $20,373 $— $175
Notes:
(a) The fair values of derivative transactions are prices provided by applicable financial institutions.
(b) When forward foreign exchange contracts meet certain conditions, their corresponding hedged items are stated at the forward exchange contract rates. Such
items are accounts receivable or payable and their fair values are included in those of their hedged items on the notes of “4. Financial Instruments”.
(c) The U.S. consolidated subsidiaries account for commodity futures contracts in accordance with the Financial Accounting Standards Board Accounting Standards
Codification 815.
Notes:
(a) Book value is acquisition cost less accumulated depreciation and accumulated impairment losses, if any.
(b) The fair values of properties are mainly calculated internally based on the main-street land prices on a tax basis.
The Company and certain subsidiaries hold some rental properties and idle properties in Tokyo and other areas. Profit from those properties for
the fiscal years ended March 31, 2013 and 2014 were ¥212 million and ¥151 million ($1,468 thousand), respectively. Impairment losses for the
fiscal year ended March 31, 2013 were ¥31 million.
In addition, the book value, net changes during the fiscal year and the fair values of such properties as of March 31, 2013 and 2014 are as
follows:

TOYO SUISAN ANNUAL REPORT 2014 21
8 Short-term loans, long-term debt and lease obligations:
2014 Millions of yenThousands of
U.S. dollars
Loans from banks and other financial institutions due from 2014 to 2015 with mortgages and collateral, at interest rates ranging from 1.186% to 1.284%
¥115 $1,118
Less current portion (85) (826)
Long-term debt ¥ 30 $ 292
2014 Millions of yenThousands of
U.S. dollars
Property, plant and equipment, net of accumulated depreciation:Buildings and structures
¥ 195 $ 1,895
Land 263 2,556
Total ¥458 $ 4,451
Maximum amount of a revolving mortgage ¥1,200 $11,664
Millions of yenThousands of U.S.
dollars
2015 ¥ 85 $ 826
2016 30 292
2017 — —
2018 — —
2019 and thereafter — —
Total ¥115 $1,118
Millions of yenThousands of
U.S. dollars
2015 ¥ 237 $ 2,304
2016 239 2,323
2017 164 1,594
2018 137 1,332
2019 and thereafter 3,376 32,815
Total ¥4,153 $40,368
The average annual interest rate on short-term loans is 0.579% and 0.546% as of March 31, 2013 and 2014, respectively.
There was no long-term debt as of March 31, 2013.
Long-term debt as of March 31, 2014 consists of the following:
There were no assets pledged as collateral and collective mortgages for long-term debt including current portion as of March 31, 2013.
The assets pledged as collateral and collective mortgages for long-term debt including current portion as of March 31, 2014 are as follows:
The aggregate annual maturities of long-term debt as of March 31, 2014 are as follows:
The aggregate annual maturities of lease obligations as of March 31, 2014 are as follows:

TOYO SUISAN ANNUAL REPORT 201422
9 Reserve for retirement benefits and pension plan:
2013 Millions of yen
Retirement benefit obligations ¥31,643
Plan assets (12,022)
19,621
Actuarial gains and losses that are yet to be recognized (3,556)
Past service costs that are yet to be recognized 117
Prepaid pension costs 50
Reserve for retirement benefits ¥16,232
2013 Millions of yen
Service cost ¥1,506
Interest cost 430
Expected return on plan assets (2)
Net actuarial loss amortization 869
Past service costs amortization (154)
Net pension costs ¥2,649
2013
Discount rate 1.5%
Expected rate of return 0.0%—1.0%
Amortization of actuarial gains and losses that are yet to be recognized 10 years
Amortization of past service costs that are yet to be recognized 10 years
For the fiscal year ended March 31, 2013The Company and some of its domestic consolidated subsidiaries had defined benefit pension plans and lump-sum severance payment plans as
defined benefit retirement plans covering substantially all employees. Moreover, the premium retirement payments are sometime paid for the
employees who retire under certain circumstances.
The retirement benefit obligations as of March 31, 2013 were as follows:
Net costs related to the retirement benefit plans for the fiscal year ended March 31, 2013 were as follows:
The assumptions used in accounting for the above plans for the fiscal year ended March 31, 2013 were as follows:
The estimated amount of all retirement benefits to be paid at the future retirement dates is allocated equally to each service year using the
estimated number of total service years.
For the fiscal year ended March 31, 2014The Company and its consolidated subsidiaries have funded and unfunded defined benefit plans as defined benefit retirement plans covering
substantially all employees.
Defined benefit pension plans (all funded) are lump-sum or pension payment based on salary and service period of employees. Lump-sum
severance payment plans (all unfunded) are lump-sum payment based on a point-based plan. Certain consolidated subsidiaries apply the
simplified method in computing liability for retirement benefit and retirement benefit costs for their defined benefit pension plans and lump-
sum severance payment plans. The tables below include plans to which the simplified method is applied.

TOYO SUISAN ANNUAL REPORT 2014 23
2014 Millions of yenThousands of
U.S. dollars
Balance at beginning of the fiscal year ¥31,643 $307,572
Service cost 1,428 13,880
Interest cost 427 4,150
Actuarial loss (gain) (23) (224)
Benefits paid (1,429) (13,890)
Past service costs (3,497) (33,991)
Increase due to business combination 1,328 12,909
Balance at end of the fiscal year ¥29,877 $290,406
2014 Millions of yenThousands of
U.S. dollars
Service cost ¥1,428 $13,880
Interest cost 427 4,150
Expected return on plan assets (2) (19)
Net actuarial loss amortization 721 7,009
Past service costs amortization (183) (1,779)
Total retirement benefit costs for the fiscal year ended March 31, 2014 ¥2,391 $23,241
2014 Millions of yenThousands of
U.S. dollars
Actuarial gains and losses that are yet to be recognized ¥(3,431) $(33,350)
Past service costs that are yet to be recognized 2,908 28,266
Total ¥ (523) $ (5,084)
2014 Millions of yenThousands of
U.S. dollars
Balance at beginning of the fiscal year ¥12,022 $116,854
Expected return on plan assets 2 19
Actuarial loss (gain) (103) (1,001)
Contributions paid by the employer 5,084 49,417
Benefits paid (1,049) (10,196)
Increase due to business combination 1,353 13,151
Balance at end of the fiscal year ¥17,309 $168,244
2014 Millions of yenThousands of
U.S. dollars
Funded retirement benefit obligations ¥23,130 $224,825
Plan assets (17,309) (168,244)
5,821 56,581
Unfunded retirement benefit obligations 6,747 65,581
Total net liability (asset) for retirement
benefits on the consolidated balance sheets ¥12,568 $122,162
Liability for retirement benefit ¥12,650 $122,959
Asset for retirement benefit (82) (797)
Total net liability (asset) for retirement
benefits on the consolidated balance sheets ¥12,568 $122,162
Movement in plan assets at beginning of the fiscal year and at end of the fiscal year is as follows:
Movement in retirement benefit obligations at beginning of the fiscal year and at end of the fiscal year is as follows:
Reconciliation from retirement benefit obligations and plan assets to liability (asset) for retirement benefits is as follows:
Retirement benefit costs for the fiscal year ended March 31, 2014 are as follows.
The components of accumulated adjustments for retirement benefit (before applicable income tax effects) for the fiscal year ended March 31,
2014 are as follows.

TOYO SUISAN ANNUAL REPORT 201424
2014
Cash on hand and at banks 86%
Life insurance general accounts 14
Other 0
Total 100%
2014
Discount rate 1.5%
Long-term expected rate of return 0—1.0%
The components of plan assets for the fiscal year ended March 31, 2014 are as follows.
Research and development expenses for the fiscal years ended March 31, 2013 and 2014 were ¥1,426 million and ¥1,496 ($14,541 thousand),
respectively.
For the fiscal years ended March 31, 2013 and 2014, the Company and its consolidated subsidiaries recognized impairment losses on fixed
assets on the following groups of assets.
The income taxes applicable to the Company and its domestic consolidated subsidiaries include (1) corporation taxes, (2) enterprise taxes
(excluding the part attributed to added value and capital) and (3) inhabitants’ taxes which, in the aggregate, result in the statutory tax rate
equal to approximately 38.0 % for the fiscal years ended March 31, 2013 and 2014.
Method for determining long-term expected rate of return
The long-term expected rate of return on plan asset is determined considering current and expected distribution of plan assets and long-term
rate of return derived from various components of the plan assets.
Assumptions used in determining the retirement benefit obligations for the fiscal year ended March 31, 2014 are as follows:
The Company and its consolidated subsidiaries classify their fixed assets into groups by the type of respective operations based on the business
segment. Their idle properties are individually considered.
The book values of impaired business properties were reduced to recoverable amounts due to lowered profitability. The recoverable value
was measured as the higher of (1) their net realizable value based on amounts mainly determined by valuation made in accordance with real
estate appraisal standards or the value assessed for property tax purpose or (2) the present value of the expected cash flows from the ongoing
utilization and subsequent disposition of the assets discounted at 5% in 2013 and 8% in 2014, respectively.
The book values of idle properties were reduced to recoverable amounts which were based on net selling prices.
10 Research and development expenses:
11 Impairment losses on fixed assets:
Millions of yenThousands of
U.S. dollars
Use Type of Assets 2013 2014 2014
Business property Buildings, machinery and equipment ¥1,648 ¥172 $1,672
Idle property Buildings, machinery and equipment 58 5 48
¥1,706 ¥177 $1,720
12 Income taxes:

TOYO SUISAN ANNUAL REPORT 2014 25
The main components of deferred tax assets and liabilities as of March 31, 2013 and 2014 are as follows:
The “Act on Partial Revision of the Income Tax Act” (Act No. 10 of 2014) was promulgated on March 31, 2014 and the special reconstruction
surtax will no longer be imposed from fiscal years beginning on or after April 1, 2014. Accordingly, the statutory tax rate used to calculate
deferred tax assets and deferred tax liabilities is reduced from 38.0% to 35.6% in connection with temporary differences in assets or liabilities
which are expected to be released in the fiscal years beginning on or after April 1, 2014.
As a result, deferred tax assets, net of deferred tax liabilities, decreased by ¥100 million ($972 thousand) and income taxes - deferred and
net unrealized gain on hedging derivatives, net of taxes, increased by ¥101 million ($982 thousand) and ¥0 million ($0 thousand), respectively.
Millions of yenThousands of
U.S. dollars
2013 2014 2014
Deferred tax assets:
Reserve for retirement benefits ¥ 5,706 ¥ — $ —
Liability for retirement benefit — 4,459 43,342
Impairment losses on fixed assets 2,218 2,070 20,121
Tax loss carryforwards 1,197 1,160 11,275
Accrued bonuses 756 852 8,281
Write-down of investments in securities 490 502 4,879
Write-down of investments in unconsolidated subsidiaries and affiliates 484 484 4,705
Other 2,018 1,669 16,223
Gross deferred tax assets 12,869 11,196 108,826
Less: valuation allowance (4,320) (4,316) (41,952)
Total deferred tax assets 8,549 6,880 66,874
Deferred tax liabilities:
Special reserves for deferred gains on fixed assets 3,505 3,782 36,761
Net unrealized gain on investment in securities 964 1,453 14,123
Reserve for special depreciation 474 961 9,341
Depreciation at overseas consolidated subsidiaries 1,059 906 8,806
Valuation differences of subsidiaries’ assets in consolidation 125 125 1,215
Other 48 136 1,323
Total deferred tax liabilities 6,175 7,363 71,569
Net deferred tax assets (liabilities) ¥ 2,374 ¥ (483) $ (4,695)
The main differences between the statutory tax rate and the effective tax rate for the fiscal year ended March 31, 2013 are not disclosed
because the total difference is less than 5% of the statutory tax rate.
The following table summarizes the main differences between the statutory tax rate and the effective tax rate for the fiscal year ended
March 31, 2014.
2014
Statutory tax rate 38.0%
Permanently nondeductible expenses, including entertainment expenses 0.4
Permanently nontaxable income, including dividends income (0.2)
Gain on bargain purchase (0.7)
Difference in income tax rates applied to overseas consolidated subsidiaries (2.0)
Decrease of deferred tax assets due to income tax rates change 0.3
Other – net 0.1
Effective tax rate 35.9%

TOYO SUISAN ANNUAL REPORT 201426
13 Net assets:
Under Japanese Corporate law (“the law”), the entire amount paid for new shares is required to be designated as common stock. However, a
company may, by a resolution of the Board of Directors, designate an amount not exceeding one-half of the price of the new shares as
additional paid-in capital, which is included in capital surplus.
The law requires that an amount equal to 10% of dividends must be appropriate as a legal earnings reserve (a component of retained
earnings) or as additional paid-in capital (a component of capital surplus), depending on the equity account charged upon payment of such
dividends, until the aggregate amount of the legal earnings reserve and additional paid-in capital equals 25% of common stock.
All additional paid-in-capital and all legal earnings reserve may be transferred to other capital surplus and retained earnings, respectively,
which are potentially available for dividends upon resolution of the shareholders.
The maximum amount that the company can distribute as dividends is calculated based on the non-consolidated financial statements of the
company in accordance with Japanese laws and regulations.
At the annual shareholders’ meeting held on June 27, 2014, the shareholders approved cash dividends amounting to ¥2,555 million ($24,835
thousand). Such appropriations have not been accrued in the consolidated financial statements as of March 31, 2014. Such appropriations are
recognized in the period in which they are approved by the shareholders.
14 Notes to the consolidated statement of changes in net assets:
Thousands of shares
Common stock outstanding 2013 2014
Balance at beginning of the fiscal year 110,881 110,881
Balance at end of the fiscal year 110,881 110,881
(1) Type and number of shares issued and outstanding for the fiscal years ended March 31, 2013 and 2014
(2) Dividends(a) Dividends whose record date is attributable to the fiscal year ended March 31, 2013 but to be effective after the fiscal year
The Company resolved approval at the general meeting of shareholders held on June 27, 2013 as follows:
Dividends on Common stock
a. Total amount of dividends ……………… ¥3,066 million
b. Funds for dividends ……………………… Retained earnings
c. Dividends per share ……………………… ¥30.0
d. Record date ……………………………… March 31, 2013
e. Effective date ……………………………… June 28, 2013
(b) Dividends whose record date is attributable to the fiscal year ended March 31, 2014 but to be effective after the fiscal year
The Company resolved approval at the general meeting of shareholders held on June 27, 2014 as follows:
Dividends on Common stock
a. Total amount of dividends ……………… ¥2,555 million
……………………………………………… ($24,835 thousand)
b. Funds for dividends ……………………… Retained earnings
c. Dividends per share ……………………… ¥25.0
……………………………………………… ($0.24)
d. Record date ……………………………… March 31, 2014
e. Effective date ……………………………… June 30, 2014
Thousands of shares
Treasury stock outstanding 2013 2014
Balance at beginning of the fiscal year 8,718 8,725
Increase due to purchase of odd stock 7 20
Balance at end of the fiscal year 8,725 8,745

TOYO SUISAN ANNUAL REPORT 2014 27
Millions of yenThousands of
U.S. dollars
2013 2014 2014
Net income ¥ 17,280 ¥ 22,723 $220,869
Net income attributable to common stock 17,280 22,723 220,869
Weighted-average amount of common stock (unit: thousands of shares) 102,161 102,144
15 Per share information:
The basis of the calculation of per share data is as follows:
(1) Finance leases(a) Finance leases which transfer ownership of leased assets to lessees
Leased assets are property, plant and equipment, which consists of warehouse facilities (buildings, machinery and equipment) for cold storage.
(b) Finance leases which do not transfer ownership of leased assets to lessees
Leased assets are property, plant and equipment, which mainly consists of communication devices and office equipment.
As discussed in Note 2 (13), finance leases commenced prior to April 1, 2008 which do not transfer ownership of leased assets to lessees are
accounted for as operating leases.
Assumed amounts of acquisition cost, accumulated depreciation and book value as of March 31, 2013 and 2014 are as follows:
Millions of yenThousands of
U.S. dollars
2013 2014 2014
Due within one year ¥ 5 ¥ 4 $ 39
Due after one year 12 8 78
¥17 ¥12 $117
2013 Millions of yen
Acquisition costAccumulated depreciation
Book value
Machinery and equipment ¥64 ¥49 ¥15
Other 20 18 2
¥84 ¥67 ¥17
2014 Millions of yen Thousands of U.S. dollars
Acquisition costAccumulated depreciation
Book value Acquisition costAccumulated depreciation
Book value
Machinery and equipment ¥33 ¥22 ¥11 $321 $214 $107
Other 7 6 1 68 58 10
¥40 ¥28 ¥12 $389 $272 $117
The future minimum payments as of March 31, 2013 and 2014 are summarized as follows:
16 Leases:

TOYO SUISAN ANNUAL REPORT 201428
Millions of yen Thousands of U.S. dollars
2013 2014 2014
Lease expenses ¥11 ¥4 $39
Millions of yen Thousands of U.S. dollars
2013 2014 2014
Assumed amounts of depreciation ¥11 ¥4 $39
Millions of yen Thousands of U.S. dollars
2013 2014 2014
Due within one year ¥ 47 ¥ 75 $ 729
Due after one year 60 429 4,170
¥107 ¥504 $4,899
Lease expenses and assumed amounts of depreciation on such finance lease contracts without ownership-transfer for the fiscal years ended
March 31, 2013 and 2014 are as follows:
(1) Reclassification adjustments on other comprehensive income for the fiscal years ended March 31, 2013 and 2014 are as follows:
Contingent liabilities as of March 31, 2013 and 2014 are as follows:
Assumed amounts of depreciation are calculated using the straight-line method over the lease terms of the leased assets, assuming no residual
value except in cases where the residual value is guaranteed in the lease contract.
(2) Operating leasesThe minimum commitments under noncancelable operating leases as of March 31, 2013 and 2014 are as follows:
Millions of yen Thousands of U.S. dollars
2013 2014 2014
Guarantees of indebtedness for employees ¥80 ¥67 $651
17 Contingent liabilities:
Millions of yenThousands of
U.S. dollars
2013 2014 2014
Net unrealized gain (loss) on investment in securities:
Gains (losses) arising during the year ¥2,268 ¥1,509 $14,667
Reclassification adjustments 511 (9) (87)
2,779 1,500 14,580
Net unrealized gain (loss) on hedging derivatives:
Gains (losses) arising during the year (365) (35) (340)
(365) (35) (340)
Adjustment on foreign currency translation:
Adjustments arising during the year 7,358 5,320 51,711
7,358 5,320 51,711
Share of other comprehensive income of the affiliate accounted for using equity method:
Gains (losses) arising during the year 36 31 302
36 31 302
Amount before income tax effects 9,808 6,816 66,253
Income tax effects (754) (370) (3,597)
Total other comprehensive income, net of taxes ¥9,054 ¥6,446 $62,656
18 Comprehensive income:

TOYO SUISAN ANNUAL REPORT 2014 29
(1) General information about reportable segmentsReportable segments of the Company are the business units for which separate financial information is available. They are reviewed regularly at
the Board of Directors’ meeting in order to determine distribution of management resources and evaluate business performance results.
The Company and its consolidated subsidiaries have business headquarters based on the type of products and services, and each business
headquarters plans a comprehensive strategy and engages in business activities relating to the products and services it trades. “Overseas Instant
Noodles” business headquarters is composed of overseas subsidiaries that plan a comprehensive strategy and engage in business activities
relating to the products and services it handles.
Accordingly, the Company and its consolidated subsidiaries consist of segments classified by product and region based on business
headquarters and overseas subsidiaries. The Company has six reportable segments; “Seafood”, “Overseas Instant Noodles”, “Domestic Instant
Noodles”, “Frozen and Refrigerated Foods”, “Processed Foods”, and “Cold-Storage”.
“Seafood” processes and sells seafood. “Overseas Instant Noodles” manufactures and sells instant noodles overseas. “Domestic Instant
Noodles” manufactures and sells instant noodles in Japan. “Frozen and Refrigerated Foods” manufactures and sells frozen and chilled foods.
“Processed Foods” manufactures and sells processed foods (excluding instant noodles, frozen and chilled foods). “Cold-Storage” freezes and
stores food in cold warehouses.
(2) Basis of measurement about reported net sales, segment income and other material itemsAccounting policies of the reportable segments are almost the same as those described in the notes of “2. Summary of significant accounting
policies”. Income by the reportable segment is based on operating income.
(2) Income tax effects on other comprehensive income for the fiscal years ended March 31, 2013 and 2014 are as follows:
Millions of yenThousands of
U.S. dollars
2013 2014 2014
Net unrealized gain on investment in securities:
Amount before income tax effects ¥2,779 ¥1,500 $14,580
Income tax effects (893) (383) (3,723)
Amount, net of taxes 1,886 1,117 10,857
Net unrealized gain (loss) on hedging derivatives:
Amount before income tax effects (365) (35) (340)
Income tax effects 139 13 126
Amount, net of taxes (226) (22) (214)
Adjustment on foreign currency translation:
Amount before income tax effects 7,358 5,320 51,711
Income tax effects — — —
Amount, net of taxes 7,358 5,320 51,711
Share of other comprehensive income of the affiliate accounted for using equity method:
Amount before income tax effects 36 31 302
Income tax effects — — —
Amount, net of taxes 36 31 302
Total other comprehensive income
Amount before incometax effects 9,808 6,816 66,253
Income tax effects (754) (370) (3,597)
Amount, net of taxes ¥9,054 ¥6,446 $62,656
19 Segment information:

TOYO SUISAN ANNUAL REPORT 201430
2013 Millions of yen
Reportable segment
Other Total Adjustments ConsolidatedSeafood
Overseas Instant Noodles
Domestic InstantNoodles
Frozen and Refrigerated
FoodsProcessed
Foods Cold-Storage Total
Net sales:
Outside customer ¥32,362 ¥70,650 ¥116,975 ¥62,070 ¥17,747 ¥14,918 ¥314,722 ¥29,726 ¥344,448 ¥ 80 ¥344,528
Intersegment 737 — 20 — 0 923 1,680 563 2,243 (2.243) —
Total ¥33,099 ¥70,650 ¥116,995 ¥62,070 ¥17,747 ¥15,841 ¥316,402 ¥30,289 ¥346,691 ¥(2,163) ¥344,528
Segment income (loss) ¥ 50 ¥13,163 ¥ 12,022 ¥ 3,567 ¥ (86) ¥ 1,147 ¥ 29,863 ¥ 1,366 ¥ 31,229 ¥(1,605) ¥ 29,624
Segment assets ¥19,428 ¥60,815 ¥ 55,196 ¥23,757 ¥10,422 ¥27,351 ¥196,969 ¥12,395 ¥209,364 ¥65,526 ¥274,890
Other items:
Depreciation and amortization ¥ 249 ¥ 921 ¥ 4,252 ¥ 1,826 ¥ 585 ¥ 1,859 ¥ 9,692 ¥ 853 ¥ 10,545 ¥ 400 ¥ 10,945
Increase in property, plant and equipment and intangible assets
2,392 4,643 5,677 1,183 760 1,710 16,365 828 17,193 350 17,543
2014 Millions of yen
Reportable segment
Other Total Adjustments ConsolidatedSeafood
Overseas Instant
Noodles
Domestic Instant Noodles
Frozen and Refrigerated
FoodsProcessed
Foods Cold-Storage Total
Net sales:
Outside customer ¥33,456 ¥75,423 ¥124,781 ¥63,950 ¥18,456 ¥15,259 ¥331,325 ¥40,935 ¥372,260 ¥ (28) ¥372,232
Intersegment 775 — 19 — 0 896 1,690 516 2,206 (2.206) —
Total ¥34,231 ¥75,423 ¥124,800 ¥63,950 ¥18,456 ¥16,155 ¥333,015 ¥41,451 ¥374,466 ¥(2,234) ¥372,232
Segment income (loss) ¥ (160) ¥13,128 ¥ 12,142 ¥ 3,344 ¥ 206 ¥ 1,224 ¥ 29,884 ¥ 1,303 ¥ 31,187 ¥ (591) ¥ 30,596
Segment assets ¥21,090 ¥73,228 ¥ 54,385 ¥22,495 ¥10,473 ¥31,446 ¥213,117 ¥20,633 ¥233,750 ¥75,037 ¥308,787
Other items:
Depreciation and amortization ¥ 458 ¥ 1,032 ¥ 4,042 ¥ 1,605 ¥ 305 ¥ 1,857 ¥ 9,299 ¥ 931 ¥ 10,230 ¥ 386 ¥ 10,616
Increase in property, plant and equipment and intangible assets
591 12,703 1,153 917 489 6,263 22,116 2,221 24,337 285 24,622
2014 Thousands of U.S. dollars
Reportable segment
Other Total Adjustments ConsolidatedSeafood
Overseas Instant Noodles
Domestic Instant Noodles
Frozen and Refrigerated
FoodsProcessed
Foods Cold-Storage Total
Net sales:
Outside customer $325,194 $733,116 $1,212,879 $621,598 $179,393 $148,319 $3,220,499 $397,891 $3,618,390 $ (272) $3,618,118
Intersegment 7,533 — 185 — 0 8,709 16,427 5,015 21,442 (21,442) —
Total $332,727 $733,116 $1,213,064 $621,598 $179,393 $157,028 $3,236,926 $402,906 $3,639,832 $(21,714) $3,618,118
Segment income (loss) $ (1,555) $127,605 $ 118,021 $ 32,504 $ 2,002 $ 11,897 $ 290,474 $ 12,665 $ 303,139 $ (5,744) $ 297,395
Segment assets $204,996 $711,781 $ 528,626 $218,653 $101,798 $305,657 $2,071,511 $200,554 $2,272,065 $729,364 $3,001,429
Other items:
Depreciation and amortization $ 4,452 $ 10,031 $ 39,288 $ 15,601 $ 2,965 $ 18,050 $ 90,387 $ 9,049 $ 99,436 $ 3,752 $ 103,188
Increase in property, plant and equipment and intangible assets
5,745 123,474 11,207 8,913 4,753 60,877 214,969 21,588 236,557 2,770 239,327
(3) Information about reported net sales, segment income and other material items

TOYO SUISAN ANNUAL REPORT 2014 31
Notes:
(a) “Other” incorporates operations not included in reportable segments, mainly including packed lunches/deli foods.
(b) The details of “Adjustments” are as follows:
1) The amounts of ¥80 million and ¥(28) million ($(272) thousand) in net sales for the fiscal years ended March 31, 2013 and 2014,
respectively, were due to differences in elimination methods used by the reportable segments and the financial statements.
2) The amounts of ¥(1,605) million and ¥(591) million ($(5,744) thousand) in segment income for the fiscal years ended March 31, 2013 and
2014 include companywide expenses of ¥(940) million and ¥(840) million ($(8,165) thousand), respectively, which cannot be allocated to
each reportable segment. The companywide expenses are mainly general and administrative expenses which are not attributable to any
reportable segment. Other adjustments are mainly foreign currency translation adjustments resulting from eliminations with overseas
subsidiaries in consolidation procedures for the fiscal year ended March 31, 2013 and elimination of know-how payments from overseas
subsidiaries for the fiscal year ended March 31, 2014.
3) The amount of ¥65,526 million and ¥75,037 million ($729,364 thousand) in segment assets as of March 31, 2013 and 2014 include
corporate assets of ¥64,766 million and ¥74,344 million ($722,628 thousand) respectively which cannot be allocated to each reportable
segment. Corporate assets are mainly long-term investments (investments in securities) of the Company and assets for administrative
departments. Other adjustments are mainly due to application of the equity method.
4) The amounts of ¥400 million and ¥386 million ($3,752 thousand) in depreciation and amortization for the fiscal years ended March 31,
2013 and 2014 include companywide expenses of ¥263 million and ¥320 million ($3,110 thousand), respectively.
5) The amounts of ¥350 million and ¥285 million ($2,770 thousand) in increase in property, plant, and equipment and intangible assets for
the fiscal years ended March 31, 2013 and 2014, respectively, are corporate assets which cannot be allocated to each reportable segment.
(c) Segment income is reconciled with operating income on the consolidated statements of income.
(4) Information about geographic areas(a) Net sales
Note:
1) Net sales are classified by countries or regions based on location of customers.
2) The major countries or regions in each classification are as follows:
Americas ………………… U.S.A., United Mexican States
Others …………………… People’s Republic of China, Taiwan, Republic of Korea
(b) Property, plant and equipment
2013 Millions of yen
Japan Americas Other Consolidated
Net sales ¥273,720 ¥70,651 ¥157 ¥344,528
2013 Millions of yen
Japan Americas Consolidated
Property, plant and equipment ¥89,195 ¥13,068 ¥102,263
2014 Millions of yen
Japan Americas Other Consolidated
Net sales ¥296,336 ¥75,425 ¥471 ¥372,232
2014 Millions of yen
Japan Americas Consolidated
Property, plant and equipment ¥93,670 ¥25,510 ¥119,180
2014 Thousands of U.S. dollars
Japan Americas Other Consolidated
Net sales $2,880,404 $733,136 $4,578 $3,618,118

TOYO SUISAN ANNUAL REPORT 201432
2014 Thousands of U.S. dollars
Japan Americas Consolidated
Property, plant and equipment $910,478 $247,959 $1,158,437
(5) Information about major customers
(6) Information about impairment
(7) Information about amortization and unamortized balance of goodwill and negative goodwill by reportable segment
Sales
2013 Millions of yen
Name of major customers Related reportable segment
MITSUI & CO., LTD. ¥89,494 Domestic Instant Noodles Segment
Sales
2014 Millions of yenThousands of
U.S. dollars
Name of major customers Related reportable segment
MITSUI & CO., LTD. ¥95,632 $929,549 Domestic Instant Noodles Segment
2013 Millions of yen
Reportable segment
Other Adjustments ConsolidatedSeafood
Overseas Instant
Noodles
Domestic InstantNoodles
Frozen and Refrigerated
FoodsProcessed
Foods Cold-Storage
Impairment loss ¥— ¥— ¥— ¥70 ¥1,262 ¥374 ¥— ¥— ¥1,706
2013 Millions of yen
Reportable segment
Other Adjustments ConsolidatedSeafood
Overseas InstantNoodles
Domestic InstantNoodles
Frozen and Refrigerated
FoodsProcessed
Foods Cold-Storage
Negative goodwill:
Amortization ¥— ¥— ¥— ¥— ¥— ¥— ¥— ¥150 ¥150
Unamortized balance ¥— ¥— ¥— ¥— ¥— ¥— ¥— ¥225 ¥225
2014 Millions of yen
Reportable segment
Other Adjustments ConsolidatedSeafood
Overseas InstantNoodles
Domestic InstantNoodles
Frozen and Refrigerated
FoodsProcessed
Foods Cold-Storage
Impairment loss ¥— ¥— ¥— ¥39 ¥138 ¥0 ¥— ¥— ¥177
2014 Thousands of U.S. dollars
Reportable segment
Other Adjustments ConsolidatedSeafood
Overseas InstantNoodles
Domestic InstantNoodles
Frozen and Refrigerated
FoodsProcessed
Foods Cold-Storage
Impairment loss $— $— $— $379 $1,341 $0 $— $— $1,720
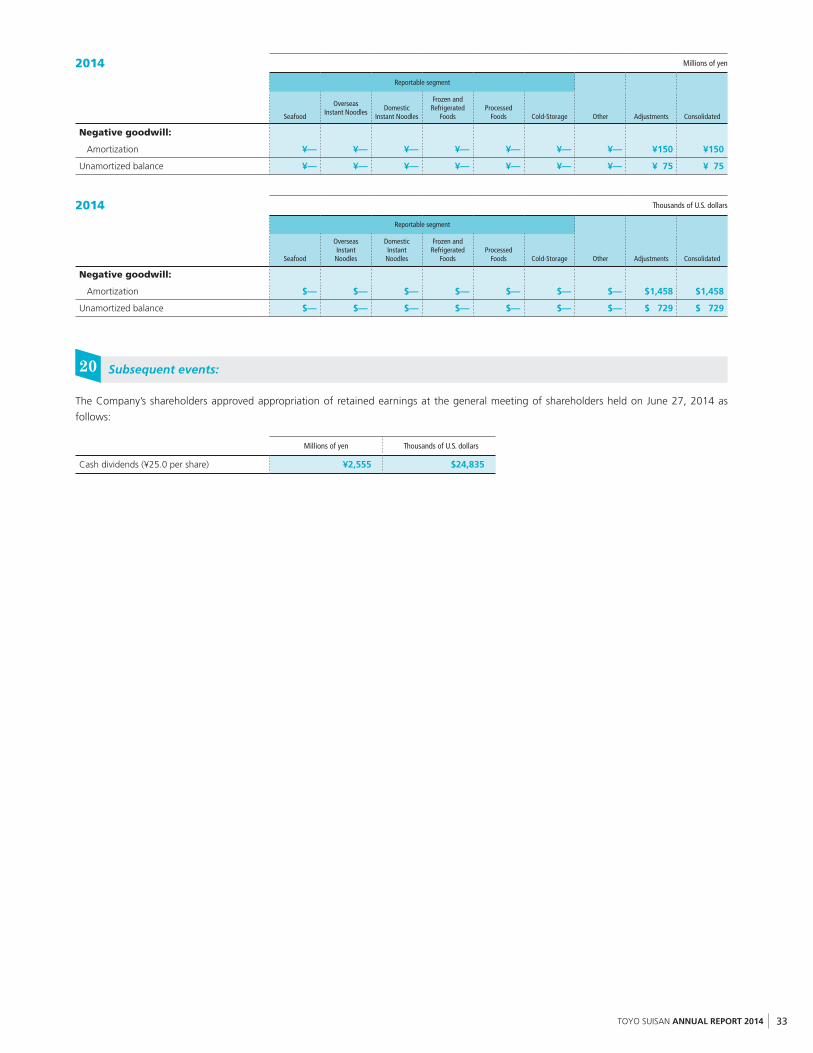
TOYO SUISAN ANNUAL REPORT 2014 33
2014 Millions of yen
Reportable segment
Other Adjustments ConsolidatedSeafood
Overseas Instant Noodles
Domestic Instant Noodles
Frozen and Refrigerated
FoodsProcessed
Foods Cold-Storage
Negative goodwill:
Amortization ¥— ¥— ¥— ¥— ¥— ¥— ¥— ¥150 ¥150
Unamortized balance ¥— ¥— ¥— ¥— ¥— ¥— ¥— ¥ 75 ¥ 75
2014 Thousands of U.S. dollars
Reportable segment
Other Adjustments ConsolidatedSeafood
Overseas InstantNoodles
Domestic InstantNoodles
Frozen and Refrigerated
FoodsProcessed
Foods Cold-Storage
Negative goodwill:
Amortization $— $— $— $— $— $— $— $1,458 $1,458
Unamortized balance $— $— $— $— $— $— $— $ 729 $ 729
Millions of yen Thousands of U.S. dollars
Cash dividends (¥25.0 per share) ¥2,555 $24,835
20 Subsequent events:
The Company’s shareholders approved appropriation of retained earnings at the general meeting of shareholders held on June 27, 2014 as
follows:

TOYO SUISAN ANNUAL REPORT 201434
INDEPENDENT AUDITOR’S REPORT

TOYO SUISAN ANNUAL REPORT 2014 35
CORPORATE DATAAs of March 31, 2014
Head Office 13-40, Konan 2-chome, Minato-ku, Tokyo 108-8501, Japan
Tel.: +81-3-3458-5111
Date of Establishment March 25, 1953
Number of Plants 8
Number of Sales Offices 28
Number of Refrigerated Warehouses 15
Number of Subsidiaries and Affiliates 31
Number of Employees 2,137
Common Stock Total Number of Shares Issuable: 427,000,000 shares
Total Number of Shares Issued and Outstanding: 110,881,044 shares
Paid-in Capital: ¥18,969 million
Number of Shareholders 5,249
Stock Exchange Listing Tokyo (#2875)
Stock Transfer Agent Sumitomo Mitsui Trust Bank, Limited, in Tokyo
Annual Meeting The annual meeting of shareholders
is usually held before the end of June in Tokyo.
Common Stock Price Range and Trading Volume
CORPORATE PROFILE
Toyo Suisan Kaisha, Ltd. (“the Company”), was established in 1953
as a seafood exporter, domestic buyer and distributor. The Company
entered the cold-storage business in 1955 and began producing
and selling such processed seafood products as fish sausage in
1956.
Toyo Suisan and its consolidated subsidiaries (“the Group”)
subsequently expanded operations into such other business fields as
instant noodles, fresh noodles and frozen foods. At present, besides
consumer foods for home use, we also provide a diverse range of
delicious, easy preparation food products for the commercial food
service industry, including restaurants, specialty stores and industrial
food services.
Based on Toyo Suisan’s corporate stance of “striving to deliver
the most wholesome bounty of the earth to the dining table,” the
Company undertakes to ensure careful selection of only the choicest
foods and to create products that preserve the flavor of the
ingredients. We are also striving to build an optimally functional
logistics system, achieve consistent quality and sanitation controls
and undertake R&D efforts to develop new flavors in response to
next-generation needs.
(Trading volume)(thousand shares)
20,000
10,000
5,000
0
15,000
(Yen)
2,000
1,500
4,000
3,500
3,000
2,500
1,000
42012 2013 2014
5 6 7 8 9 10 11 12 1 2 3 4 5 6 8 9 10 11 12 1 2 37

ANNUAL REPORT 2014YEAR ENDED MARCH 31, 2014