annual report 2014 - berkeley group€¦ · about this report welcome to the annual report of the...
TRANSCRIPT

ANNUAL REPORT 2014

ABOUT THIS REPORT
Welcome to the Annual Report of The Berkeley Group Holdings plc (“the Berkeley Group” or “Berkeley”), a publicly owned company, listed on the London Stock Exchange within the FTSE 250. The Strategic Report explains Berkeley’s strategy, business model, performance and outlook. The Governance section covers the role and activities of the Board in running the business and their remuneration. The detailed Financials, accompanied by a report from the Group’s auditors, complete the Annual Report.
STRATEGIC REPORT
Business model 4Performance highlights 5Chairman’s statement 6Managing Director’s statement 7What we do 10Where we operate 16How we operate: managing risk 20How we operate: Our Vision 27Trading and financial review and outlook 38 GOVERNANCE
Board of Directors 48Corporate governance report 50Audit Committee report 54Directors’ remuneration report 56Directors’ report 81
FINANCIALS
Independent Auditors’ report on the consolidated financial statements 86Consolidated income statement 89Consolidated statement of comprehensive income 89Consolidated statement of financial position 90Consolidated statement of changes in equity 91Consolidated cash flow statement 92Notes to the consolidated financial statements 93Company balance sheet 115Notes to the Company financial statements 116Five year summary and definitions 120Shareholder information 121
Berkeley builds homes and neighbourhoods in its core markets of London and the
South of England. Its knowledge, expertise and proven track record, with over thirty years of experience in this market, gives it an unrivalled ability to deliver new homes and communities.
Berkeley will continue to forward sell its developments wherever possible, maintaining
a strong balance sheet and keeping financial risk low in order to mitigate the operating risks of delivery. It will carefully allocate capital to the right projects at the right time, matching supply
to demand wherever it can.
STRATEGIC
REPORT
THE BERKELEYGROUP
Proud to be a member of the Berkeley Group of Companies
THE CORNICHE, ALBERT EMBANKMENT (COMPUTER GENERATED IMAGE)COVER: EMERALD SQUARE, ROEHAMPTON
The Berkeley Group is honoured this year to have been awarded the UK’s highest accolade for business success – the Queen’s Award for Sustainable Development 2014. This is the second time the group has been recognised having previously
won the award in 2008, the first housebuilder to have achieved this.
01
BERKELEY ANNUAL REPORT 2014BERKELEY ANNUAL REPORT 2014

LONG-TERM THINKING AT THE HEART OF OUR SUCCESS
STRATEGIC
REPORT
STRATEGIC REPORT
Imag
e sh
own
is c
ompu
ter g
ener
ated
and
indi
cativ
e on
ly.
ROYAL ARSENAL RIVERSIDE (COMPUTER GENERATED IMAGE)
BERKELEY ANNUAL REPORT 2014 / STRATEGIC REPORTBERKELEY ANNUAL REPORT 2014 / STRATEGIC REPORT
02 03

BERKELEY ANNUAL REPORT 2014 / STRATEGIC REPORT
04
BUSINESS MODEL 2014 PERFORMANCE HIGHLIGHTS
STRATEGY
STRATEGIC
REPORT
CYCLICAL MARKET We recognise that the property market is inherently cyclical.
UNDERSTANDING RISK �We�understand�that�there�are�significant�operational risks in successfully identifying, designing, building and selling homes and creating new places.
KNOWING OUR MARKET We operate in London and the South of England, markets that we know and understand. Given the importance of relationships and local knowledge we believe that this gives us a competitive advantage and enables us to deliver new places which are socially, environmentally and economically successful.
SOUND FINANCIALSWe�aim�to�keep�financial�risk�low,�by�maintaining a strong balance sheet, forward selling new homes where possible and carefully allocating funds to the right projects at the right time.
AUTONOMYWe have recognised brands and autonomous operational teams who carefully manage each individual scheme, regardless of size, to a bespoke design, and embrace Berkeley’s core values in their approach.
OUTLOOK
PERFORMANCE
OUTPUTS
SHAREHOLDERSWe have a clear plan to return £13 per share (over £1.7 billion) by 2021 and to retain a successful, sustainable business thereafter. Our 2014 Performance Highlights opposite show that we are on track to achieve this.
SOCIETY We are building new homes to help the country meet the housing shortfall and creating places characterised by the quality of their design, public realm, transport and access to jobs and amenities.
PEOPLE Our approach creates jobs�in�our�offices,�on�our�developments and in our supply chain, some 4.5 for every new home built. We have engaged a loyal and dedicated workforce within Berkeley.
PLACES We aim to deliver sustainable communities which endure long after our work is complete, and our engagement with local people through the Berkeley Foundation supports this.
OUR VISION
“Our Vision” is Berkeley’s framework designed to implement this strategy and help all of our people contribute to the success of the business by giving them a clear set of commitments in every area of the business.
This is explained in more detail on pages 27 to 37 of the Strategic Report.
Berkeley has committed to return £13 per share to shareholders by September 2021. 164 pence per share (£215 million) has already been paid, a further 90 pence per share (£122 million) has been declared for payment in September 2014, leaving 180 pence per share (£243 million) to return
by the first milestone of 434 pence by September 2015.
The Berkeley Group builds homes and neighbourhoods.
We seek to create beautiful, successful places. These places range in size from a few homes in market towns to complex, mixed-use urban regeneration schemes of
over 4,000 homes all built with safety, sustainability and quality at their heart. Berkeley aims to run the business for long-term success. Its strategy rests
on five key principles, with four clear outputs:
NET ASSET VALUE PER SHARE
1,066 pence
RETURN ON EQUITY
27.5%
EARNINGS PER SHARE
221.8 pence
PROFIT BEFORE TAX
£380.0 million
GROSS MARGIN IN LAND HOLDINGS
£3,014 million
CASH DUE ON FORWARD SALES
£2,274 million
2010 £110.3m2011 £136.2m201220132014
£214.8m£270.7m£380.0m
2010 60.0p2011 72.1p201220132014
121.0p160.0p221.8p
2010 13.3%2011 15.3%201220132014
21.2%22.4%27.5%
2010 637p2011 709p201220132014
839p1,009p1,066p
2010 £648m2011 £814m201220132014
£1,056m£1,453m£2,274m
2010 £2,038m2011 £2,304m201220132014
£2,580m£2,852m£3,014m
BERKELEY ANNUAL REPORT 2014 / STRATEGIC REPORT
05

BERKELEY ANNUAL REPORT 2014 / STRATEGIC REPORTBERKELEY ANNUAL REPORT 2014 / STRATEGIC REPORT
06 07
STRATEGIC
REPORT
Berkeley’s vision is to be a world-class business generating
long-term value by creating successful, sustainable places
where people aspire to live
I am proud of the role that Berkeley has played in
generating economic growth and its wider contribution
to our society
Commenting on the results, Managing Director Rob Perrins said:
“Berkeley has built and sold 3,742 new homes this year at an average selling price of £423,000, driving a 40.4% increase in�pre-tax�profits�to�£380.0�million�and� a rise in pre-tax return on equity from 22.4% to 27.5%.
The Group remained ungeared throughout the year, with net cash rising from £44.7 million to £129.2 million after paying £195.2 million of dividends to shareholders and investing further in new land and construction. This investment and a favourable market have enabled us to build and sell over 15,000 new homes in London and the South of England over the last five�years,�during�which�period�we�have�delivered some 10% of both the total private and affordable homes built in London.
Berkeley’s vision is to be a world-class business generating long-term value by creating successful, sustainable places where people aspire to live. These results are due to a unique combination of an entrepreneurial approach to land buying, a track record of working in partnership with local authorities to create great places, strong�financial�discipline,�autonomous�management teams and above all a passion for proving how good new housing can be.
With cash due on forward sales now approaching £2.3 billion and estimated gross margin in its land holdings now in excess of £3 billion, the Board has visibility over its commitment to meet the remaining�180�pence�of�the�first�milestone�through regular dividends. The land and planning now in place has extended this visibility to delivery of the second milestone payment of 433 pence by September 2018 and Berkeley has made substantial inroads into the planning requirement on the land required to cover the third milestone payment of a further 433 pence by September 2021.
Looking forwards, we continue to see opportunities to acquire land that meet our hurdle returns. This will typically be characterised by long-term and complex development sites to which Berkeley can bring its expertise. The land already in our pipeline comprises a number of sites that match these criteria and the ongoing operational focus is to deliver this over the�next�five�years.�If�this�is�achieved,� it has the potential to enhance the existing gross margin in the land bank by some £1.5 billion and help build a sustainable business.
Berkeley�has�finished�the�year�well,�delivering�a�strong�cash�flow�performance,�growing its unrivalled land holdings through acquisition and optimisation, continuing to invest in inventory and securing additional forward sales. This gives�the�Board�the�confidence�to�continue to invest and add value whilst never underestimating the risks inherent in a cyclical market.
Over the remainder of the current plan, the Board aims to deliver the targeted dividends from earnings while maintaining the balance sheet at least at its current level and the value in its land holdings above £3 billion.”
Commenting on the results, Chairman Tony Pidgley said:
“These�are�strong�results�which�reflect�the�current market conditions and Berkeley’s bold strategy to invest at the right point in the economic and housing cycle. Basic earnings per share have grown by 38.6% to 221.8 pence, of which 149 pence has been paid to shareholders as dividends in the year, and the estimated value of gross margin in our land holdings is now in excess of £3 billion.
The Board has declared a further interim dividend of 90 pence per share (£122 million), payable on 26 September 2014 to shareholders on the register on 22 August 2014. This means that 254 pence per share has been paid or committed to date, and leaves a further 180 pence per share in order�to�meet�the�first�milestone�of�paying�434 pence per share by September 2015. The Board considers that the Group is currently on track to achieve this target and is well positioned to meet the remaining milestones by September 2021.
The last year has seen a surge of confidence�within�the�UK�economy.�Housebuilders have been at the forefront of the return to growth, creating a feelgood�factor�which�benefits�everyone.�Their investment has underpinned the delivery of affordable homes and infrastructure for our communities. This is a result of a stable economic and political environment and strong inward investment. London in particular competes on a global stage and the strength of the market here is vitally important for maintaining momentum in the wider domestic market.
Looking to the future the housebuilding industry, supported by the stimulus of the Help to Buy scheme, has the capacity to increase further the supply of new homes across the country.
Forward sales are critical to enable the�industry�to�commit�the�significant�capital necessary to do this. Berkeley is building on all of its sites that have an implementable planning consent and we are employing over 11,000 people directly on our sites sustaining a further 10,000 jobs indirectly in the supply chain. This year we have completed some 30% more homes than at the peak of the market in 2007,�and�I�am�proud�of�the�role�Berkeley�has played in generating economic growth and its wider contribution to our society through the homes and places we create.
Berkeley’s achievements are testament to the skill and dedication of our employees, and to the commitment of our partners on our schemes and in the supply chain, and�I�would�like�to�express�my�thanks�to�all�of�them.�I�am�delighted�that�the�Group�has been recently awarded the Queen’s Award for Enterprise for Sustainable Development 2014. This award recognises Berkeley’s approach to running its business for the long-term, to help ensure a better quality of life for everyone, now and for generations to come.
The�Board�is�confident�that�Berkeley�has the right plan to deliver long-term sustainable success, but remains alert to the inherently cyclical nature of the property market and the uncertainty surrounding future tax policy and political decision-making. Monetary policy and the�financial�stability�of�banks,�which�is�currently a concern of regulators, are both factors�influencing�the�housing�market�in the long-term. Provided any future increases in interest rates or regulation of mortgages are matched with future wages growth as the economy expands, the prospects for the housing market remain positive.”
ROB PERRINS MANAGING�DIRECTORTONY PIDGLEY CBE CHAIRMAN
MANAGING DIRECTOR’S STATEMENTCHAIRMAN’S STATEMENT
PERFORMANCE
Profit�before�tax�up�
40.4% in the year
DIVIDEND
Further interim dividend of
90p per share payable in Sep 2014
OUTLOOK
Estimated gross margin in land holdings
£3,014 million at year end
LONG-TERM STRATEGY
To return
£1.7 billion in cash to shareholders

STRATEGIC
REPORT
375 KENSINGTON HIGH STREET
BERKELEY ANNUAL REPORT 2014 / STRATEGIC REPORT
09
BERKELEY ANNUAL REPORT 2014 / STRATEGIC REPORT
08

BERKELEY ANNUAL REPORT 2014 / STRATEGIC REPORT
11
WHAT WE DO
1 IDENTIFYING AND ACQUIRING LAND
2 DESIGNING AND PLANNING NEW HOMES AND PLACES
3 BUILDING NEW HOMES AND PLACES
4 MARKETING AND SELLING HOMES
5 CUSTOMER SERVICE AND STEWARDSHIP
STRATEGIC
REPORT
“The Berkeley Group builds homes and neighbourhoods. We seek to create beautiful, successful places.
These places range in size from a few homes in market towns to complex, mixed-use urban regeneration schemes of over 4,000 homes,
all built with safety, sustainability and quality at their heart.”
WHAT WE DO:1: IDENTIFYING AND ACQUIRING LAND
Berkeley has invested over £1.5 billion in new land since 2009 when it set out a clear strategy to acquire land at the right point in the cycle.
EXPERIENCEExperienced land teams across the business understand the Group’s focus on investing selectively in the right locations in our core markets of London and the South of England where there is underlying demand for new homes, good transport links and the scope to create successful new places.
POTENTIALThe Group thrives on taking on complex, challenging,�brownfield�land�which�others�shy away from, but only where there are the right commercial fundamentals, the potential to add value and where we have the vision to create something special through the development process.
CAREFUL APPRAISALWe undertake a rigorous internal appraisal process to assess the opportunities and risks of potential acquisitions and deliver pre-authorisation at Board level of all land offers and again prior to exchange of contracts.
AN ENTREPRENEURIAL APPROACHAn entrepreneurial approach, our financial�strength�and�a�flat�management�structure enable Berkeley to reach purchase decisions quickly and decisively, which�gives�confidence�that�we�will�deliver�on these decisions. We understand the varying requirements of vendors and landowners, whilst also considering innovative approaches to accessing new land such as joint ventures as in the case of St Edward, a partnership with Prudential.
1 The Corniche and Merano Residences, Albert Embankment
2 Demolition�works�at�Kidbooke�Village3 Construction works at Royal Arsenal Riverside
2 3
NEW LAND
Berkeley has invested
£1.5 billion in new land since 2009
3
1
2
BERKELEY ANNUAL REPORT 2014 / STRATEGIC REPORT
10

BERKELEY ANNUAL REPORT 2014 / STRATEGIC REPORTBERKELEY ANNUAL REPORT 2014 / STRATEGIC REPORT
12 13
PLACEMAKING
We aim to create places characterised
by the quality of design, public realm, transport and access to jobs and amenities.
BUILDING
Berkeley is currently building on every
one of its 65 schemes that has an implementable planning consent.
STRATEGIC
REPORT
WHAT WE DO:3: BUILDING NEW HOMES AND PLACES
WHAT WE DO:2: DESIGNING AND PLANNING
NEW HOMES AND PLACES
Our business is about placemaking, not just housebuilding.
We aim to create places characterised by the quality of their design, public realm, transport links and access to jobs and amenities.
CONSULTATIONWe use professional architects and leading consultants and engineers to design every new scheme individually, whether it consists of four or four thousand new homes, in consultation with local communities, and strive to deliver schemes which are of high quality, sensitive to their heritage and surroundings and meet the aspirations of our customers and local and national stakeholders.
SOCIAL AND ENVIRONMENTAL SUSTAINABILITYWe have addressed the challenge of understanding what makes a successful place by implementing a framework to promote quality of life and strength of community, which we now apply to our schemes. We have led the way in delivering environmentally sustainable living on large-scale developments.
PARTNERSHIPSWe engage closely with our partners in the local authorities and communities surrounding each of our sites to understand stakeholders’�needs,�reflecting�these�in�our designs, and want to cement our reputation for quality and for delivering on our promises.
Berkeley is currently building on every one of its schemes that has an implementable planning consent.
INTENSIVE MANAGEMENTEach of our developments is led by a dedicated project team responsible for all aspects of detailed design, quality, delivery, health and safety, commercial and technical works on their project.
The coordination of professional teams of consultants and subcontractors and strong communication throughout are critical in ensuring the smooth delivery of every project.
HEALTH AND SAFETYBerkeley’s approach prioritises the health, safety and wellbeing of our people and our subcontractor teams on site with dedicated Health and Safety managers overseeing all of our developments.
CONSIDERATE CONSTRUCTIONOur reputation relies on all of our project teams engaging with surrounding communities, being a responsible and considerate neighbour, and working with our suppliers and contractors to complete our schemes on time and budget.
21
3
1 Planning meeting at Abell & Cleland2 Construction progress of Riverlight 3� CGI�of�Riverlight

BERKELEY ANNUAL REPORT 2014 / STRATEGIC REPORTBERKELEY ANNUAL REPORT 2014 / STRATEGIC REPORT
14 15
CUSTOMER JOURNEY
Dedicated Customer Managers look after
every stage of the customer journey across
all of our schemes.
SELLING
Berkeley strives to ensure that its customers receive an unparalleled service when buying
from Berkeley.
STRATEGIC
REPORT
WHAT WE DO:5: CUSTOMER SERVICE AND STEWARDSHIP
WHAT WE DO:4: MARKETING AND SELLING HOMES
Whether�first-time�buyers,�families,�experienced investors, retailers, our partners in housing associations or providers of student accommodation, Berkeley strives to ensure that its customers receive an unparalleled service when buying from Berkeley.
CUSTOMER FOCUSSales teams across the business help our�customers�find�the�right�home�to� suit their needs and have the knowledge and understanding to explain the intricacies of every development.
ASPIRATIONAL HOMESWe aim to forward sell our homes where possible to ensure that what we are�building�reflects�the�demand�from� our customers and we have the flexibility�to�evolve�our�product�to� meet their aspirations.
Customer satisfaction is the crucial measure of whether our homes and our service meet the aspirations of our customers.
CUSTOMER JOURNEYDedicated Customer Relationship Managers look after every stage of the customer journey and provide a level of care and service after completion which we expect to match the quality of our product across all of our schemes.
ESTATE MANAGEMENTSuccessful places need the right long- term management strategy and we work closely with appointed managing agents to set the right tone for our schemes long after they have been completed.

“We operate in London and the South of England, markets that we know and understand. Given the importance of relationships and local knowledge, we believe that this gives us
a competitive advantage to enable us to deliver new places which are socially, environmentally and economically successful.”
WHERE WE OPERATE
NEW LAND
6new sites acquired
in 2014
NEW LAND
3new sites acquired
in 2014
SITES IN CONSTRUCTION
80%39 sites with planning and in construction
SITES IN CONSTRUCTION
93%26 sites with planning and in construction
LONDON SOUTH OF ENGLAND
LONDON UNDER CONSTRUCTION OUT OF LONDON UNDER CONSTRUCTION
1 190 Strand2 375 Kensington High Street
(including Homebase and Telereal)3 Abell & Cleland House, Westminster4 Battersea Reach5 Beaufort Park, Hendon 6 Brewery Wharf, Twickenham7 Chambers Wharf, Southwark8 Chelsea Creek / Imperial Wharf9 The Corniche, Albert Embankment
10 Dickens Yard, Ealing11 Durham Road, Wimbledon12 Ebury Square, Belgravia13 Fulham Reach, Hammersmith14 Goodman’s Fields, Aldgate15 High Road, Finchley16 Hurlingham Gate, Fulham17 Kew Bridge Road 18 Kew Bridge West, Brentford
19 Kidbrooke Village20 Langham Square, Putney21 Marine Wharf, Deptford22 Marryat Place, Wimbledon23 Merano, Albert Embankment24 One Blackfriars, Southwark25 One Tower Bridge26 One Victoria Road, Acton27 Queen Mary’s Place, Roehampton28 Riverlight, Battersea29 Roman House, City of London30 Royal Arsenal Riverside31 Saffron Square, Croydon32 Sir Alexander Close, Acton33 Sovereign Court, Hammersmith34 St Josephs, Mill Hill35 Stanmore Place36 The Avenue, Finchley37 Vista, Battersea*
38 Wimbledon Hill Park39 Woodberry Park
1 22-26 Albert Embankment*2 Barnes, Richmond*3 City Forum, City of London4 Hogarth, Chiswick5 Latchmere House, Richmond6 London Dock, Wapping7 Old Isleworth*8 Prince Consort House, Albert Embankment*9 South Quay Plaza, Docklands
10 White City*
LONDON FUTURE SITES
* Sites purchased during the year
* Sites purchased during the year
1 Ascot (2 sites)2 Barns Green*3 Bath*4 Beaconsfield (2 sites)5 Cambridge6 Canterbury7 Caterham8 Cheltenham9 Cirencester
10 Fleet11 Gillingham12 Gosport
13 High Wycombe14 Holborough15 Horsham16 North Bersted17 Oxshott18 Reading19 Sevenoaks20 Shalford21 St Albans22 Tadworth23 Tunbridge Wells24 Worcester
1 Maidenhead2 Taplow*
OUT OF LONDON FUTURE SITES
3
10
62
11
4
7
33
39
5
35 34
15 36
19
30
31
2238
420
27
18 17
10 3226
13 8 2837
312
21
9239
7 2425
16
21
1429
18
5
6GLOUCESTERSHIRE
LONDON
WILTSHIRE
HAMPSHIRE
WEST SUSSEX
SURREY
EAST SUSSEX
KENT
ESSEX
WARWICKSHIRE
HERTFORDSHIRE
BEDF
ORD
SHIR
E
BUCKING
HAMSHIRE
NO
RTHAM
PTONSHIRE
WORCESTERSHIRE
CAMBRIDGESHIRE
SOMERSET
BERKSHIRE
OXFORDSHIRE
23
1920
1
6
1114
72217
152
1612
10
181
2
13 4
219
8
245
3
STRATEGIC
REPORT
BERKELEY ANNUAL REPORT 2014 / STRATEGIC REPORTBERKELEY ANNUAL REPORT 2014 / STRATEGIC REPORT
16 17

BERKSHIRE
LONDON
SURREYKENT
8
10
51 3
6
7
11 12
4 13
9
2
*�Includes�sites�contracted�during�the�year
THE PIPELINE
1 Battersea Gardens* 2 Bracknell* 3 Chambers Wharf, Southwark 4 Hornsey* 5 Kidbrooke Village
6 Kingston* 7 Ockham* 8 Orpington* 9 Royal Arsenal Riverside
10 Sevenoaks*
11 Southall* 12 Westminster* 13 Woodberry Park
Berkeley’s pipeline now comprises some 11,000 plots on 13 sites where delivery is dependent on resolving technical constraints, challenges surrounding
vacant possession and/or securing planning consent.
SOUTHALLThe former Southall Gas Works is an 84 acre brownfield site with outline planning permission for redevelopment to create 3,750 new homes alongside a school, shops and offices, and is adjacent to a Crossrail station due to open in 2019.
PIPELINE
WHERE WE OPERATE continued
STRATEGIC
REPORT
BERKELEY ANNUAL REPORT 2014 / STRATEGIC REPORTBERKELEY ANNUAL REPORT 2014 / STRATEGIC REPORT
18 19

BERKELEY ANNUAL REPORT 2014 / STRATEGIC REPORTBERKELEY ANNUAL REPORT 2014 / STRATEGIC REPORT
20 21
STRATEGIC
REPORT
HOW WE OPERATE: MANAGING RISK
“There are significant operational risks in successfully identifying, designing, building and selling new homes and creating new places. To provide the best platform for the business to meet these challenges, we aim to keep financial risk low, by maintaining
a strong balance sheet, forward selling new homes where possible and carefully allocating funds to the right projects at the right time.”
“Berkeley’s approach allows management to focus on taking the right decisions to deliver long-term success, and retain the flexibility to take advantage
of any opportunities which arise in the short and medium term.”
In�light�of�these�operating�risks,�Berkeley�aims�to�keep�financial�risk�low,�and�finances�its operations through shareholder equity and�has�significant�undrawn�facilities�available. The Group’s operations are in�sterling,�and�so�there�is�no�significant�direct�currency�risk.�Its�main�financial�risks�are primarily:
LIQUIDITY RISKThe risk that suitable funding for the Group’s activities may not be available to it.
MARKET CREDIT RISKThe risk that counterparties (mainly customers) will default on their contractual obligations resulting in a loss to the Group. The Group’s exposure to credit risk is comprised of cash and cash equivalents and trade and other receivables.
MARKET INTEREST RATE RISKThe�risk�that�Group�financing�activities� are�affected�by�fluctuations�in�market�interest rates.
The Board approves treasury policy and senior management control day-to-day operations. Relationships with banks and cash management are co-ordinated centrally.
The treasury policy is intended to maintain an appropriate capital structure to�manage�the�financial�risks�identified� and provide the right platform for the business to manage its operating risks.
Risk management is embedded in the organisation at operating company, divisional and Group levels, with different types of risk requiring different levels and types of management response.
Berkeley’s framework for internal control,�the�context�for�the�identification,�control and monitoring of risks faced by the Group, is set out within the Corporate Governance Report on page 52.
The principal operating risks and our approach to mitigating them are described in more detail on pages 22 and 23.
The principal operating risks faced by the Group include:
OPERATING RISK FINANCIAL RISK
Winter Garden at Goodman’s Fields
LAND AVAILABILITY
SECURING SALES
RETAINING PEOPLE
REGULATION PLANNING PROCESS
ECONOMIC CONDITIONS
HEALTH AND SAFETY
ENVIRONMENTAL AND SOCIAL
SUSTAINABILITY
MORTGAGE AVAILABILITY
BUILD COST AND PROGRAMME
PRODUCT QUALITY

BERKELEY ANNUAL REPORT 2014 / STRATEGIC REPORTBERKELEY ANNUAL REPORT 2014 / STRATEGIC REPORT
22 23
STRATEGIC
REPORT
HOW WE OPERATE: MANAGING RISK continued
RISK DESCRIPTION MITIGATION
ECONOMIC CONDITIONSAs a property developer Berkeley’s business, in the context of the wider housing market, is sensitive to changes in interest rates, unemployment and general consumer�confidence.�Some�of�its�customers�are�also�sensitive to changes in the sterling exchange rate.
Changes�to�economic�conditions�in�the�UK,�Europe�and worldwide may lead to a reduction in demand for housing which could impact on the Group’s ability to deliver its corporate strategy.
Berkeley’s�business�strategy�reflects�the�cyclical�nature�of�property�development.
Funds are carefully targeted at investing only in land which is underpinned by demand fundamentals that support a solid viability case even when markets are uncertain.
Levels of committed expenditure are carefully monitored against forward sales secured and�bank�facilities�available,�with�the�objective�of�keeping�financial�risk�low�to�mitigate� the operating risks of delivery in uncertain markets.
The business is committed to operating at an optimal size, with a strong balance sheet, to�maintain�the�flexibility�to�react�swiftly,�when�necessary,�to�changes�in�market�conditions.
REGULATIONAdverse changes to Government policy on areas such as taxation, housing and environmental matters could restrict the ability of the Group to deliver its strategy.
Failure to comply with laws and regulations could expose the Group to penalties and reputational damage.
The effects of changes to Government policies at all levels are closely monitored and representations made where appropriate.
Berkeley’s experienced teams are well placed to interpret and implement new regulation at the appropriate time through direct lines of communication across the Group. Detailed policies and procedures are in place and these are communicated to all staff.
PLANNING PROCESSDelays or refusals in obtaining commercially viable planning permissions on the Group’s land holdings could result in the Group being unable to develop the land it has purchased.
This could have a direct impact on the Group’s ability�to�deliver�its�product�and�on�its�profitability.
Full detailed planning and risk assessments are performed and monitored for each site without planning permission, both before and after purchase.
The planning status of all sites is reviewed at monthly divisional Board meetings and Main Board meetings.
The Group works closely with local communities in respect of planning proposals and strong�local�relationships�are�maintained�with�local�authorities�and�planning�officers.
The Group is focused on the markets of London and the South of England in a planning environment which it understands and where it believes it therefore has a competitive advantage.
RETAINING PEOPLEAn inability to attract, develop, motivate and retain talented employees could have an impact on the Group’s ability to deliver its strategic priorities.
Failure to consider the retention and succession of key management could result in a loss of knowledge and competitive advantage.
Remuneration packages are constantly benchmarked against the industry to ensure they remain competitive.
Succession planning is regularly reviewed at both divisional and Main Board level.
Close relationships and dialogue are maintained with key personnel.
SECURING SALESAn inability to match supply to demand in terms of product, location and price could result in missed sales targets and / or high levels of completed stock which in turn could impact on the Group’s ability to deliver its corporate strategy.
Detailed market demand assessments of each site are undertaken before acquisition, and regularly during delivery of each scheme, to ensure that supply is matched to demand in each location.
Design, product type and product quality are all assessed on a site-by-site basis to ensure that they meet the target market and customer aspirations in that location.
The Group has a diverse range of developments with homes available at a broad range of property prices to appeal to a wide market. Forward sales are used to take the risk out of�the�development�cycle�where�possible,�thereby�justifying�the�financial�investment�in�each of the Group’s sites.
Completed stock levels are reviewed and debated at monthly divisional Board meetings and quarterly Main Board meetings.
MORTGAGE AVAILABILITYMortgage providers have been negatively impacted by�the�financial�crisis�and�this�has�reduced�their�ability� to provide mortgages to potential purchasers.
An�inability�of�customers�to�secure�sufficient� mortgage�finance�could�have�a�direct�impact� on the Group’s transaction levels.
Berkeley has a broad product mix and customer base which reduces the reliance on mortgage availability across its portfolio.
The Group is participating in the Government backed mortgage indemnity scheme, NewBuy, on a number of its schemes and on the Government’s new Help to Buy scheme.
Deposits�are�taken�on�all�sales�to�mitigate�the�financial�impact�on�the�Group�in�the� event that sales do not complete due to a lack of mortgage availability.
RISK DESCRIPTION MITIGATION
ENVIRONMENTAL AND SOCIAL SUSTAINABILITYBerkeley is hugely aware of the environmental and social impact of the homes and communities that it builds, both during the construction phase and on occupation by its customers.
Failure to address sustainability issues could affect the Group’s ability to acquire land, gain planning permission, manage sites effectively and respond to increasing customer demand for sustainable homes.
Our Vision provides the framework under which the Group’s approach to running a sustainable business is formalised. This provides a framework under which detailed commitments are set out to be adopted and embraced by all staff.
The Board has the responsibility of setting the Group’s direction in this area, to ensure that it is aligned with the Group’s strategy.
Specific�commitments�to�deliver�sustainable�communities,�minimise�the�impact�of�the�homes that Berkeley builds and to manage the environmental and social impacts of Berkeley’s business form the bedrock of this approach. Environmental and Social Sustainability assessments are built into land purchases and planning applications.
Sustainability commitments during delivery include the use of environmental performance methodology,�a�focus�on�brownfield�development�and�the�monitoring�of�carbon�emissions,�amongst others.
HEALTH AND SAFETYBerkeley’s operations have a direct impact on the health and safety of its people, contractors and members of the public. Berkeley considers this to be an area of critical importance.
A lack of adequate procedures and systems to reduce the dangers inherent in the construction process increases the risk of accidents or site- related�catastrophes,�including�fire�and�flood,� which could result in serious injury or loss of life leading�to�reputational�damage,�financial� penalties and disruption to operations.
The Board has the responsibility of setting the Group’s Health and Safety strategy.
Dedicated�Health�and�Safety�teams�are�in�place�in�each�division�and�at�Head�Office.�Procedures, training and reporting are all regularly reviewed to ensure high standards are maintained, and comprehensive accident investigation procedures are in place.
The Group has implemented a number of initiatives to improve Health and Safety standards on site, with workshops held with contractors during the year.
Our Vision incorporates commitments in the area of Health and Safety which reinforce the Group’s focus on this. Adequate insurance is held to cover the risks inherent in large-scale construction projects.
LAND AVAILABILITYAn inability to source suitable land to maintain the Group’s land bank at appropriate margins in a highly competitive market could impact on the Group’s ability to deliver its corporate strategy.
Berkeley’s strategy is to acquire land opportunistically, where it meets its internal criteria for purchase.
Land acquisition is focused on Berkeley’s core markets of London and the South of England, markets which it understands and where it believes that the demand fundamentals are strong and hence it stands the best chance of securing viable planning consent.
Each land acquisition is subject to formal internal appraisal and approval processes both prior to the submission of a bid and again prior to exchange of contracts to give the Group the best chance to secure targeted land.
The�Group�maintains�its�land�holdings�to�mitigate�against�significant�impacts�from�market�changes or delayed build activity. Berkeley has experienced land teams with strong market knowledge in its areas of focus.
The�Group�keeps�financial�risk�low�and�maintains�the�liquidity�to�enable�it�to�remain�competitive when it bids for new land.
BUILD COST AND PROGRAMMEBuild costs are affected by the availability of skilled labour and the price and availability of materials, supplies and subcontractors. Changes to these prices and availability could impact�on�the�profitability�of�each�scheme.
A procurement and programming strategy for each development is agreed by the divisional Board before site acquisition.
A further assessment of procurement and programming is undertaken and agreed by the divisional Board prior to the commencement of construction.
Build cost reconciliations and build programme dates are presented and reviewed in detail at divisional cost review meetings each month.
PRODUCT QUALITYBerkeley has a reputation for the high standards of�quality�of�its�product.�If�the�Group�fails�to� deliver against these standards and its wider development obligations, it could be exposed to reputational damage, as well as reduced sales and increased cost.
Detailed reviews are undertaken of the product on each scheme both during the acquisition of the site and throughout the build process to ensure that the quality of the product is maintained.
Customer Satisfaction surveys are undertaken on the handover of all private apartments, and�feedback�incorporated�in�shaping�the�specification�and�quality�of�subsequent�schemes.
The Group monitors its development obligations and recognises any associated liabilities which arise.

BERKELEY ANNUAL REPORT 2014 / STRATEGIC REPORT
25
CASE STUDY – THE ‘BERKELEY DIFFERENCE’ AT:
GOODMAN’S FIELDS, ALDGATE
“Our vision for Goodman’s Fields is to create a new modern urban quarter for the City of London, with innovative architecture which is sensitive to the history of the area and the amenities that will make this a great place to live.”
A competition of over 40 artists secured the commission for a series of sculptures to really bring the place to life. The winning artist chose horses as his subject matter to serve as a visual reminder of the leading role that horses have played in London’s rich history.
NUMBER OF HOMES
1,400LENGTH OF SCHEME
10 years
DEVELOPMENT TYPES
Private, affordable and student homes, hotel, shops,
restaurants and offices
LOCATION
INVESTMENT IN ART
STRATEGIC
REPORT
An experienced team of planners and landscape architects, and a development plan to service homes, shops and restaurants from underground, has created high quality open spaces on over two acres of the seven-acre scheme, which beautify and complement the make-up of the site.
PUBLIC REALM
On buying the land in 2010 with planning consent, Berkeley chose to completely redesign the scheme with a focus on opening up the site by developing a series of serene open spaces for the community to enjoy and so reintroducing a lost quarter of the City.
REINTEGRATION
BERKELEY�ANNUAL�REPORT�2014��/��STRATEGIC�REPORTBERKELEY�ANNUAL�REPORT�2014��/��STRATEGIC�REPORT
24 25

BERKELEY ANNUAL REPORT 2014 / STRATEGIC REPORT
27
STRATEGIC
REPORT
“We have recognised brands and autonomous operational teams who carefully manage each individual scheme, regardless of size, to a bespoke design, and embrace Berkeley’s core values in their approach.
“Our Vision” is Berkeley’s framework designed to help all of our people contribute to the success of the business by giving them a clear set of commitments in every area of the business.”
For Berkeley to achieve long-term success, the skills, commitment and approach of our people throughout the business are crucial. Berkeley needs to ensure that everyone has the right tools to enable them to work towards a common set of goals.
This year we have developed and evolved our business framework, “Our Vision” (previously Vision2020). Our Vision sets out our company values and provides an operational framework with�five�key�focus�areas�and�a�series�of�clear�strategic commitments to help empower our people and give them clear direction across every discipline of the business.
Berkeley’s culture informs the way we work, the way we lead the business, and what we deliver to our customers. This year we have reviewed and tested our values and defined�the�behaviours�that�bring�them�alive. These help explain to both new and existing employees what Berkeley expects of them and what they can expect of Berkeley.
In�May�2014�we�launched�a�new�set�of�stretching commitments to achieve by April 2016. These were determined based on input from an external stakeholder panel and issues review, together with
consultation with each of our autonomous companies and specialist committees.
We�expand�on�each�of�the�five�focus�areas�of Our Vision over the next few pages.
HOW WE OPERATE:OUR VISION
OUR PEOPLEDevelop a highly skilled workforce who run autonomous businesses, operate in a safe
and supportive working environment, and contribute to wider society.
FIVE FOCUS AREAS
HOMESDevelop individually
designed, high quality homes with low
environmental impact.
PLACESCreate great places
where residents enjoy a good quality of life, now
and in the future.
OPERATIONS Make the right long-term
decisions whilst running the business�efficiently�and�working�
with our supply chain.
CUSTOMERSProvide exceptional service to all of our customers and
put them at the heart of our decisions.
OUR VISIONTo be a world class business generating long-term value by
creating successful, sustainable places where people aspire to live.
375 KENSINGTON HIGH STREET
BERKELEY ANNUAL REPORT 2014 / STRATEGIC REPORT
26

BERKELEY ANNUAL REPORT 2014 / STRATEGIC REPORTBERKELEY ANNUAL REPORT 2014 / STRATEGIC REPORT
28 29
STRATEGIC
REPORT
HOW WE OPERATE: OUR VISION continued
Provide exceptional service to all of our customers and put them at the heart of our decisions.
OUR APPROACH
Our customers are at the heart of all our decisions. We aim to understand their needs and consistently meet or exceed their expectations. The service we�provide�is�professional,�efficient�and�helpful�to�make the home buying process as straightforward and enjoyable as possible. Our levels of customer service aim to be comparable to other top brands. All our customers are provided with a commitment that when they buy a new home from Berkeley they can be safe in the knowledge that it is built to very high standards of design and quality, has low environmental impact and that they will enjoy an exceptional customer experience. Each customer receives tailored information relating to their purchase and has a dedicated point of contact throughout the customer journey.
OUR HEADLINE COMMITMENTS FOR 2014 – 2016
We have set three stretching commitments in the area of Customers to further improve our approach:
– Deliver world-class customer service measured though the Net Promoter Score
– Launch an interactive way of communicating with our customers, ‘My Home Plus’
–� Market�all�our�developments�in�the�UK�first
CUSTOMER SERVICE
1st housebuilder to achieve
Institute�of�Customer�Service’s�ServiceMark (St James)
RECOMMENDATIONS
98% of customers would recommend us to
a friend
TRAINING
105 accredited�Institute� of Customer Service
courses for staff
Achieved Partially achieved Not achieved
OUR PROGRESS IN 2012 – 2014
COMMITMENT PROGRESS
Provide every customer with a Berkeley Customer Satisfaction Commitment
Provide user-friendly ‘quick start’ instructions and guides for running a home
Survey every customer to measure satisfaction and target that at least 95% of our customers would recommend us to a friend
Train�sales�staff�in�sustainability�so�that�they�are�able�to�sell�the�benefits�to�customers
Produce a Berkeley Sustainable Living Guide in conjunction with NGOs for use in sales & marketing suites, at handover, as well as an interactive version of the Guide for our website
INSTITUTE OF CUSTOMER SERVICEThe�Group�joined�the�Institute�of�Customer�Service�(ICS)�during�2014�to�further improve service and to enable benchmarking of performance. A survey of our employees and some recent customers was undertaken, with Berkeley performing above�the�benchmark�set�by�ICS�and�achieving its highest score for friendliness of staff. Several of our businesses have since�implemented�accredited�ICS�training�focusing on customer service for all employees. To date around 105 training courses have been delivered covering more than 500 staff and extending beyond just customer-facing employees. We are delighted that our St James business became�the�first�housebuilder�to�achieve�ServiceMark accreditation.
TRAININGAn intensive ‘Let’s Talk Sales’ training programme took place for all sales staff in summer 2013 and a number of online training modules were also launched. Along with training of existing employees, we have also run our second Sales Academy. This aims to bring talented individuals from other industries into the business and provides them with a structured training programme before they are placed in a role.
UK FIRSTThis year we have opened new overseas sales�offices�in�Beijing�and�Dubai.�Whilst�overseas customers are important, bringing�inward�investment�into�the�UK,�we�recognise�that�UK�purchasers�should�have the opportunity to buy our homes. In�August�2013,�ahead�of�the�Mayoral�Concordat, we made a pledge to offer all�developments�in�the�UK�before�marketing overseas.
CUSTOMER SURVEYSWe use customer satisfaction surveys undertaken by an independent external agency to measure how well we are meeting our customers’ expectations. All of our private purchasers are asked to complete a survey, and this year 98% of our customers reported that they would recommend Berkeley to a friend (2013: 98%). We will begin to use the Net Promoter Score (NPS) as an indicator of customer satisfaction and will publish this in future years to benchmark ourselves out of sector against world-class companies.
SUSTAINABLE LIVINGWe have a role to play in promoting sustainable lifestyles to residents and helping them to operate their home efficiently�and�make�the�best�use�of�local facilities. We also believe that this is something our customers want; in our 2014 Customer Sustainability Survey it was�highlighted�that�energy�efficiency,�running costs and open spaces are important factors when customers are buying their new home. All developments now have a ‘Helping Create a Better Future: Our Guide to More Sustainable Living’ brochure which includes an insert�showing�site-specific�sustainability�features. An interactive version of the brochure is available online to show what we incorporate into our developments and suggest ways that customers can live more sustainably.
i Learn more about Customers at berkeleygroup.co.uk/our-vision
CUSTOMERS
1 Sales staff at Goodman’s Fields2 Highwood, Horsham
2
1

BERKELEY ANNUAL REPORT 2014 / STRATEGIC REPORTBERKELEY ANNUAL REPORT 2014 / STRATEGIC REPORT
30 31
STRATEGIC
REPORT
BESPOKE DESIGNThere is no generic Berkeley scheme. Every design is bespoke and we use architects on every project, something which is uncommon within the industry. Our designers range from world-famous architects like Foster + Partners working on The Corniche on Albert Embankment, to smaller practices like BHP Harwood producing an intelligent design�to�restore�a�magnificent�Grade�II�listed building at St Joseph’s Gate in Mill Hill. We continue to promote good urban design across the industry through sponsorship of the London Festival of Architecture.
PRE-PLANNINGThe design of each project is scrutinised intensely at all stages. We have regular project design meetings to review the specification�involving�each�relevant�team�at every level of the business. We use focus�groups�to�influence�future�schemes�by asking potential residents about the design�features�and�level�of�specification�they would require. Whilst the key measure of�successful�design�is�satisfied�customers,�we are proud to have been awarded a
number of design awards to corroborate our�approach.�The�five�storey,�five�bedroom home at Lime Grove Mews won the coveted Grand Prix Award and the Best Family Home Award in the London Evening Standard’s 2013 Awards for its thoughtful�design�and�flexible�interiors.�
ATTENTION TO DETAILThe quality which we demand in our new homes requires a skilled workforce and attention to detail. We use our marketing suites as the benchmark for build quality and�finish�in�each�individual�home.�Every area is thoroughly checked before handover to ensure that high standards are maintained. Electronic systems to manage post-handover maintenance have been introduced in areas of the business to assist with this process to ensure good record keeping and timely close-out. We have also undertaken studies of occupied homes to investigate aspects such as air quality with specialist monitoring equipment and air leakage through thermal imaging.
ENVIRONMENTAL PERFORMANCEIn�the�last�twelve�months,�more�stringent�building regulations for energy have been introduced, but we are awaiting the implementation�of�significant�changes�arising from the Government’s Housing Standards Review. The Group provided a response to the consultation in autumn 2013 supporting the intention to simplify the large and complex range of local and national standards, rules and codes that housebuilders face. On a site-by-site basis, we continue to reach high environmental standards. For example, some of the deepest ground source heat pump boreholes in London will provide up to 60% of the heating demand at Riverlight in Nine Elms.
i Learn more about Homes at berkeleygroup.co.uk/our-vision
HOMES
Develop individually designed, high quality homes with low environmental impact.
OUR APPROACH
Each of our homes and developments is bespoke and�we�use�qualified�architects�to�design�each�scheme. Attention to detail in design is paramount to ensure homes meet the needs of our customers and�our�specifications�are�planned�to�meet�the�varied needs of all types of homebuyers, from luxurious houses to key worker apartments. The impact on the environment throughout the lifetime of the home is considered during its design with an aim to minimise impacts and provide home owners with the opportunity to live more sustainably. The high�quality�finish�which�we�demand�in�our�new�homes requires a skilled workforce and thorough checks before handover.
OUR HEADLINE COMMITMENTS FOR 2014 – 2016
We have set three stretching commitments in the area of Homes to continue to improve our approach:
–� �Enable�fibre�broadband�on�all�our�new�homes� and provide community Wi-Fi
– Guarantee space standards for all new homes
– Launch a new R&D programme to utilise customer feedback and drive innovation through improved design
RECYCLING
93% completed homes provided
with recycling facilities
SUSTAINABILITY
100% new�homes�to�be�certified�
to at least Code Level 3
HOME WORKING
100% new homes designed
for home working
OUR PROGRESS IN 2012 – 2014
COMMITMENT PROGRESS
Develop minimum design standards on all Berkeley homes including standards for sound insulation, space, storage and overheating
Carry out post-occupancy monitoring of electricity, water and gas/heat consumption in order to measure�the�success�of�our�designs�and�to�influence�the�design�of�future�schemes
Undertake�R&D�to�understand�the�implications�of�the�Government’s�proposed�zero�carbon�standard on our future developments
Design all new homes to achieve at least Level 3 of the Code for Sustainable Homes
Achieved Partially achieved Not achieved
HOW WE OPERATE: OUR VISION continued
1 Lime Grove Mews2 Roehampton House3 Wimbledon Hill Park
2
1 3

BERKELEY ANNUAL REPORT 2014 / STRATEGIC REPORTBERKELEY ANNUAL REPORT 2014 / STRATEGIC REPORT
32 33
STRATEGIC
REPORTPLACES
Create great places where people enjoy a good quality of life, now and in the future. SOCIAL SUSTAINABILITY During 2014 we have further developed and launched our framework for creating successful places. This sets out a structured approach to placemaking and applying the main ideas behind social sustainability to new housing and mixed-use developments. The�criteria�reflect�issues�which�are�important to people and communities, such as links with neighbours, access to transport, feelings of safety, positive local identity�and�the�ability�to�influence�what�goes on. The framework is now used in the design of all our new schemes, and those of 100 homes or more conduct formal workshops to debate and prioritise the key issues. Results from residents at our longer-term developments have been positive; at�Woodberry�Park�90%�feel�satisfied�with their life overall (compared to 60% nationally) and at Royal Arsenal Riverside 84% plan to remain in the neighbourhood (compared to 68% nationally). We are proud to have won ‘Property Company of�the�Year�–�Residential’�at�the�Estates�Gazette Awards 2013.
PARTNERSHIPSWe have a commitment to genuine partnership working. Partnership arrangements need to be tailored to suit each project, skillfully co-ordinating the investment and ambitions of Berkeley, the local authority, residents, Registered Social Landlords and other stakeholders. We listen to what local people and other partners want and incorporate this into the design wherever possible.
COMMUNITY ENGAGEMENTOur Community Engagement Strategy was�updated�in�2014�to�reflect�current�best practice and is referred to for all new schemes. The type of engagement varies depending on the scheme and location. Many of our schemes adopt community planning strategies where local people are involved in the design, and at London Dock additional outreach events were held to engage parts of the community which were under-represented during the engagement programme, such as young people, older people and ethnic minorities.
Other opportunities may arise for the community�to�get�involved�in�the�final�scheme, such as a competition at the Phoenix School local to White City to design an area of proposed public space.
ECOLOGY AND CLIMATE CHANGEWe continue to seek advice from ecologists on each scheme, incorporate living roofs and build sites well-connected for public transport. Our approach to ecology was noted as part of our achievement of the Queen’s Award for Enterprise in Sustainable Development.�In�2014�we�completed�a�piece of research on climate change adaptation measures to be incorporated in developments, and to be considered during our own operations. 77% of new developments between 2012 and 2014 were designed to incorporate adaptation measures.�It�is�one�of�our�headline�commitments for 2014 to 2016 to incorporate measures on all schemes.
i Learn more about Places at berkeleygroup.co.uk/our-vision
OUR APPROACH
We create well-designed, high quality, safe and sustainable places which will endure as settled, vibrant communities long into the future. These are places where people choose to live, work and spend their time, that directly encourage people’s wellbeing and quality of life, and offer them a space and�a�base�from�which�to�lead�safe�and�fulfilling�lives. Through our ability both to collaborate and to deliver, we aim to be the developer of choice for local authorities and existing communities. We believe that appreciating the needs of our customers and wider stakeholders before, during and after the delivery of our schemes and what makes them thrive as a community, is the right model for a truly successful and sustainable business in our sector.
OUR HEADLINE COMMITMENTS FOR 2014 – 2016
We have set three stretching commitments in the area of Places to continue to improve our approach:
– Measure and increase people’s quality of life by applying a framework for social sustainability
– Adapt all developments to climate change through�measures�on�flooding,�overheating� and water shortage
– Test new forms of estate management and community governance
CYCLE STORAGE
92% new sites designed to
incorporate cycle storage
S106
£333m S106 contributions over
the�last�five�years
SOCIAL SUSTAINABILITY
20 assessments completed
under our new social sustainability framework
OUR PROGRESS IN 2012 – 2014
COMMITMENT PROGRESS
Work with experts to develop metrics to assess the social sustainability of our developments and pilot the metrics on at least one completed development
Conduct post-occupancy evaluation to assess the in-use success of community facilities (e.g. sports facilities, public realm, open space, children’s activities)
Work with residents, commercial occupiers, local businesses and the local community on at least one mixed-use development to promote local employment opportunities
Put in place adaptation measures on all developments to address future climate change risks
Achieved Partially achieved Not achieved
HOW WE OPERATE: OUR VISION continued
1 Cornerstone Café, Royal Arsenal Riverside 2 Dial Arch Pub, Royal Arsenal Riverside
21

BERKELEY ANNUAL REPORT 2014 / STRATEGIC REPORTBERKELEY ANNUAL REPORT 2014 / STRATEGIC REPORT
34 35
STRATEGIC
REPORT
SUPPLY CHAINOnce schemes are in production, the support of a reliable and competent supply chain is critical to success. Engagement with our suppliers is key to remaining a client of choice and achieving high quality outcomes, on time and on budget. Supply chain conferences were held by several of our operating companies during 2014 and a supply chain task force was established. Risks in the supply chain have been assessed based on current and future market conditions and feedback requested from more than 100 of our suppliers; 75% said that working with the Group allowed their business to improve its own value.
In�2015�we�plan�to�further�strengthen�our�relationships with the supply chain through a new supplier engagement programme. An innovation fund of up to £2 million will be made available to support our supply chain, and particularly small businesses, in targeting health and safety performance across the industry.
APPRENTICESHIPS AND TRAININGThe Construction 2025 strategy set out a number of challenges for industry and Government, including invigorating the industry’s image, particularly to young people, and increasing capability in the workforce. Spot checks indicate that nearly 10% of our workforce of 11,000 contractors on our sites is in formal training, including 2% currently working as an apprentice. Within St George, training has been boosted through the employment of workplace co-ordinators; 74 apprentices have been working across 11 sites during the year. Alongside our efforts with apprentices and training, we also aim to encourage young people into the industry through a series of talks and events with schools and colleges.
CONSIDERATE CONSTRUCTIONAll of our construction sites are registered under the voluntary Considerate Constructors Scheme (CCS) and its Code of Practice. Our average audit score of 40.6/50 is far in excess of the industry average of 35.5.
We were delighted that one third of our schemes were recognised at the 2014 National Site Awards, including two which achieved Most Considerate Site Runner-Up�status�which�ranks�them�in�the�top 27 construction sites in the country.
ENVIRONMENTAL MANAGEMENTSite carbon emissions per person have reduced by 17%, with total emissions of 16,908 tonnes CO2e from site activities in 2014. During the same period our water consumption has increased by 3%;�principally�this�was�due�to�significant�demolition operations requiring dust suppression and landscaping works. Our waste recycling rate has increased to 94% (2013: 93%). Further information on carbon emissions is set out within the Directors’ report on page 82.
i Learn more about Operations at berkeleygroup.co.uk/our-vision
OPERATIONS
Make the right long-term decisions whilst running the business efficiently and working with our supply chain.
OUR APPROACH
Through recognition that the property market is inherently cyclical we make decisions with a focus on the long-term. We understand the operational risks in trying to successfully identify, design, build and sell homes and create new places. We aspire to maintain excellent partnerships with our supply chain to ensure that high quality services and materials are consistently provided and we are a client of choice. We support and engage with our supply chain and, through our supply chain, we help to provide employment and support to young people. We conduct our day-to-day operations in�an�environmentally�efficient�manner�and�with�consideration to our neighbours.
OUR HEADLINE COMMITMENTS FOR 2014 – 2016
We have set ourselves three stretching commitments in the area of Operations to further improve our approach:
– Achieve a 50% increase in site-based apprenticeships and training
– Launch a £2 million fund for the supply chain to support innovation in health and safety
– Map our supply chain risks and develop�a�sustainable�specification� and procurement strategy
ENERGY
17% reduction in operational carbon
emissions per site operative
CONSIDERATE CONSTRUCTORS
40.6/50 average Considerate
Constructors Scheme score
FEEDBACK
100 suppliers contacted to obtain feedback on our role as client
OUR PROGRESS IN 2012 – 2014
COMMITMENT PROGRESS
Integrate�an�assessment�of�the�sustainability�of�products,�suppliers�and�contractors�into�the� formal selection process
Register all sites with the Considerate Constructors Scheme and achieve a minimum of 35 points out of 50 in site audits (32 out of 40 prior to January 2013)
Reduce average site carbon dioxide emissions by 3% per site operative by May 2014
Reduce average site water consumption by 3% per site operative by May 2014
Re-use or recycle over 85% of construction, demolition and excavation waste
Achieved Partially achieved Not achieved
HOW WE OPERATE: OUR VISION continued
1 Royal Arsenal Riverside 2 Roman House
2
1

BERKELEY ANNUAL REPORT 2014 / STRATEGIC REPORTBERKELEY ANNUAL REPORT 2014 / STRATEGIC REPORT
36 37
STRATEGIC
REPORTOUR PEOPLE
Develop a highly skilled workforce who run autonomous businesses, operate in a safe and supportive working environment, and contribute to wider society.
EMPLOYEE DIVERSITY
FEMALE MALE TOTAL
Total Employees
697 1,171 1,868
Senior Management
1 5 6
Board of Directors
3 11 14
LOYALTY AND DIVERSITYOur business continues to grow; we now have over 1,850 direct employees who are central to our success. We are mindful of the need to attract, retain and promote a talented and diverse group of professionals�at�every�level.�In�a�recent�staff survey undertaken by St James, 90% of employees were proud to work for St James. The business also retained its Investors�in�People�accreditation.�Across�the Group, nearly 40% of employees are female as are over 20% of our Main Board directors. Coming second across all industries for ‘Britain’s Most Admired Company’ was testament to our ability to attract talent, as well as our business performance and social responsibility.
TRAININGTraining is provided to all employees based on job roles. We also operate formal training schemes for graduates, as well as a sales academy and production academy. Skills for effective communication, working together and empowering others formed a�key�part�of�the�Institute�of�Customer�Service training already undertaken across some of the Group and planned for further rollout in 2015.
In�line�with�this�theme,�a�‘Working�Together’ conference in early May 2014 brought together 250 people from across the business to share information.
EMPLOYMENTIn�addition�to�our�direct�employees,�we�also support a large workforce through our contractors; in April 2014 around 11,000 people were working on our sites. In�fact�Berkeley�is�directly�or�indirectly�supporting�around�21,000�jobs�in�the�UK.
HEALTH AND SAFETYOur�Accident�Incident�Rate�(AIR)�remains�better than the industry average at 2.92 (2013: 2.99). There has been an increased focus on high risk activities across the Group in the past 18 months in response to the dramatic increase in production, growth in workforce and higher proportion of more complex developments under construction. We have doubled our team of dedicated health and safety staff as well as introducing new Group Health and Safety Standards and revised safety management systems.
THE BERKELEY FOUNDATIONThe Berkeley Foundation is now a registered charity which has committed or invested almost £5 million to the lives of young people and their families over the past three years. Two thirds of our employees were involved during the year 2013, whether by fundraising, volunteering or payroll giving and we are aiming to increase this to 100% over the next two years. The Job Creation Programme launched in 2013 has so far enabled more than 60 unemployed people to get into work.�A�new�five-year�strategic�plan�has�been published to take the Foundation to 2019. For more information see berkeleyfoundation.org.uk.
i Learn more about Our People at berkeleygroup.co.uk/our-vision
At 30 April 2014. *The�figures�for�the�Board�of�Directors�is�based�on�the�Board on the date of signing these accounts, including one director appointed on 1 May 2014.
OUR APPROACH
A devolved business structure is at the heart of our strategy. Our recognised brands and autonomous operational teams carefully manage each individual scheme to ensure that the entrepreneurial spirit of the business continues. Recruiting and retaining a high calibre workforce is crucial to our approach. We must support both our direct employees and the wider workforce of the contractors working on our sites. We are proud to be safe; safety continues to be a key focus area across all of our operations, in addition to enhancing health and wellbeing. We also aim to have a positive impact on society and enable young people to get into work through our support of the Berkeley Foundation.
OUR HEADLINE COMMITMENTS FOR 2014 - 2016
We have set ourselves four stretching commitments in the area of Our People to continue to improve our approach:
– Pay at least the living wage to all direct employees
– Reduce energy costs by up to £500,000, investing 50% of the saving in new health and wellbeing initiatives
– Encourage and support every member of staff to be involved with the Berkeley Foundation each year
– Launch a talent management programme which develops new ideas to enhance the business
THE BERKELEY FOUNDATION
£5m funds committed to
good causes through the Berkeley Foundation
HEALTH AND SAFETY
2.92 per 1,000 employees
and operatives (2013: 2.99) Accident�Incident�Rate
APPRENTICES
115 apprentices worked on
our sites in 2014
OUR PROGRESS IN 2012 – 2014
COMMITMENT PROGRESS
Measure staff retention rates and workforce diversity and benchmark performance
Ensure that a minimum of 5% of our own staff and those working on our construction sites are employed in an apprenticeship or training role
Continue�to�achieve�a�RIDDOR�reportable�Accident�Incident�Rate�(AIR)�of�less�than� 3.5 incidents per 1,000 employees and subcontractors
Further enhance the Group’s ‘Good Work’ health and safety programme through active engagement with contractors’ operatives on all our projects
Raise £250,000 annually for the Berkeley Foundation through employee fundraising and donations
Achieved Partially achieved Not achieved
HOW WE OPERATE: OUR VISION continued

BERKELEY ANNUAL REPORT 2014 / STRATEGIC REPORTBERKELEY ANNUAL REPORT 2014 / STRATEGIC REPORT
38 39
STRATEGIC
REPORT
TRADING AND FINANCIAL REVIEW AND OUTLOOK
OVERVIEWBerkeley has built and sold 3,742 new homes this year at an average selling price of £423,000, driving a 40.4% increase in�pre-tax�profits�to�£380.0�million�and� a rise in return on shareholders’ equity from 22.4% to 27.5%.
Basic earnings per share have grown by 38.6% to 221.8 pence, of which 149 pence has been paid to shareholders as dividends in the year, and the estimated value of gross margin in the Group’s land holdings is now in excess of £3 billion.
The Group remained ungeared throughout the year, with net cash rising from £44.7 million to £129.2 million after paying £195.2 million of dividends to shareholders and investing further in new land and construction.
HOUSING MARKETDomestic demand in the housing market in London and the South of England has been strong throughout the year, above all�for�places�benefiting�from�quality�of�design, public realm, transport links and access to jobs and amenities. The market has�benefited�from�a�stable�social�and�political environment, low interest rates, and a return to growth in the economy.
London’s standing as a global city continues to drive demand and attract investment�from�within�the�UK�and�overseas. London’s success is crucial to economic growth and a plentiful supply of good quality new homes and places is essential to supporting this. Berkeley understands the importance of enabling those people who live and work here�to�find�a�home,�and�maintains�its�commitment to offer all of its schemes to�the�UK�market�first.
Berkeley’s experience is that prices for its properties have increased in line with those reported in the market more generally.
Whilst the Government’s Help to Buy scheme has been helpful in bringing home ownership to within the reach of many more people, it has had limited benefit�to�Berkeley�as�a�whole�due�to�the�proportion of its sales which are off-plan. On the 17 schemes where qualifying properties were available, it has supported some 36% of sales in the year, a total of 159 sales over the last twelve months.
Cancellation rates in the year were approximately 8%. These remain low compared to normal historical ranges and reflect�the�stronger�market�both�inside�and�outside�London.�This�is�also�reflected�in historically low completed stock levels at 30 April 2014, at which date Berkeley held 39 such properties in inventories compared to 140 at 30 April 2013.
LAND HOLDINGSBerkeley has unconditionally acquired nine new sites in the year, investing a further £353 million in land to secure some 2,500 plots into its land holdings. These include six London schemes, comprising a 10 acre redevelopment site in White City, a site in Battersea with a detailed planning consent for 456 apartments, two sites on the Albert Embankment and two sites in West London. Three sites have been secured outside London in Bath, Barns Green in West Sussex and Taplow in Berkshire.
The Group has continued to add value to its land holdings during the year. Berkeley has secured a number of new planning consents in the year, including a former convent in Mill Hill, housing schemes in Finchley and Maidenhead, mixed-use schemes in Hammersmith and Twickenham, and a student development in�Bath.�In�addition,�some�10%�of�value�has been added to the Group’s land holdings through optimisation of the future phases of existing schemes and updates to price and cost valuations. At 30 April 2014, 65 of Berkeley’s 77 sites have an implementable planning consent, all of which are in construction, whilst the remainder are in the planning process.
The Group’s land holdings now include 24,006 plots (30 April 2013: 25,684) with an estimated future gross margin of £3,014 million (30 April 2013: £2,852 million) and an average selling price of £419,000 (30�April�2013:�£378,000).�This�reflects� the increased London weighting of Berkeley’s schemes.
PIPELINE OF FUTURE LANDIn�addition�to�its�land�holdings,�the�Group’s pipeline of future land now comprises over 11,000 plots with a potential gross margin of some £1.5 billion. These are schemes which cannot be delivered at the current time as they do not have an implementable planning consent and are dependent on resolving practical technical constraints and challenges surrounding vacant possession. Accordingly, these sites have been differentiated from Berkeley’s land�holdings�as�they�require�significant�further investment in land, planning and infrastructure. The Group is aiming to�unlock�these�sites�over�the�next�five�years to support the business beyond the conclusion of the current plan. Nine new sites have been added to the pipeline in the year, including six in London at Southall,�Kingston,�Westminster,�Hornsey,�Battersea and Orpington and three outside London in Bracknell, Ockham and Sevenoaks.
The pipeline provides a transparent source of land for future development beyond 2021 which is not dependent on buying land in the open market.
APRIL 2014 CHANGE APRIL 2013
Owned 23,486 -1,569 25,055
Contracted 520 -109 629
Plots 24,006 -1,678 25,684
Sales value £10,062m +£355m £9,707m
Average selling price £419k +£41k £378k
Average plot cost £72k +£10k £62k
Land cost 17.3% +0.7% 16.5%
Gross margin £3,014m +£162m £2,852m
Gross margin (%) 30.0% +0.6% 29.4%
NEW LAND
Berkeley committed
£353 million to acquire new land
in 2014
“We have a clear plan to ensure that shareholders benefit from this success by returning £13 per share (over £1.7 billion) by 2021 and
retaining a successful, sustainable business thereafter.”
2014 2013 CHANGE CHANGE YEAR ENDED 30 APRIL £’MILLION £’MILLION £’MILLION %
Revenue 1,620.6 1,372.6 +248.0 +18.1%
� Operating�profit� 374.8� 280.1� +94.7� +33.8%� Net�finance�costs� (6.9)� (8.1)� +1.2 Share of joint ventures result 12.1 (1.3) +13.4
� Profit�before�tax� 380.0� 270.7� +109.3� +40.4% Taxation (87.1) (61.0) -26.1
� Profit�after�tax� 292.9� 209.7� +83.2� +39.7%
EPS Basic 221.8p 160.0p +61.8p +38.6% ROE 27.5% 22.4% +5.1%
Homes sold 3,742 3,712 Average selling price £423,000 £354,000

BERKELEY ANNUAL REPORT 2014 / STRATEGIC REPORTBERKELEY ANNUAL REPORT 2014 / STRATEGIC REPORT
40 41
STRATEGIC
REPORT
TRADING AND FINANCIAL REVIEW AND OUTLOOK continued
APRIL 2014 CHANGE APRIL 2013 ANALYSIS OF CAPITAL EMPLOYED £’MILLION £’MILLION £’MILLION
� Investment�properties�� � 7.2� -19.3� 26.5
Assets held for resale - -75.8 75.8
Other non-current assets 172.7 +38.4 134.3
� Inventories� � 2,481.2� +414.5� 2,066.7
Trade and other receivables 159.0 +32.2 126.8
Trade and other payables
- Deposits and on account receipts (741.6) -315.5 (426.1)
- Other trade payables (625.6) -30.3 (595.3)
Current tax liabilities (83.7) +18.3 (102.0)
Provisions (57.1) -28.1 (29.0)
Capital employed 1,312.1 +34.4 1,277.7
APRIL 2014 CHANGE APRIL 2013 ANALYSIS OF INVENTORIES £’MILLION £’MILLION £’MILLION
Land not under development 492.4 +182.4 310.0
Work in progress: land cost 786.1 -74.6 860.7
1,278.5 +107.8 1,170.7
Work in progress: build cost 1,180.3 +329.3 851.0
Completed units 22.4 -22.6 45.0
2,481.2 +414.5 2,066.7
2014 2013 CASH FLOW £’MILLION £’MILLION
� Profit�before�tax�� � � �380.0� 270.7
� Increase�in�inventories� � � (414.5)� (215.0)
Other working capital movements 336.6 112.2
Tax paid (92.4) (69.2)
Other movements 70.0 23.6
� Cash�inflow�before�dividends� � � 279.7� 122.3
Dividends (195.2) (19.7)
� Increase�in�net�cash� � � 84.5� 102.6
Opening net cash/(debt) 44.7 (57.9)
Closing net cash 129.2 44.7
TRADING ANALYSISRevenue of £1,620.6 million this year (2013: £1,372.6 million) mainly comprised £1,605.0 million of residential revenue from the sale of new homes in London and the South of England (2013: £1,337.9 million). The remainder was commercial revenue of £15.6 million (2013: £26.4 million). There were no land sales in the year (2013: £8.3 million).
The residential revenue resulted from the sale of 3,742 new homes (2013: 3,712) on Berkeley’s private, affordable and student schemes at an average selling price of £423,000 (2013: £354,000). This includes the disposal of 534 properties from Berkeley’s rental fund to M&G Investments.�The�increase�in�average�selling price is consistent with successful delivery of sites acquired in London since 2009, with the mix of schemes now in construction weighted towards a lower volume of higher value properties.
Revenue of £15.6 million from commercial activities (2013: £26.4 million) included the sale of retail space across a number of the Group’s developments including Marine Wharf in Deptford, Goodman’s Fields in Aldgate, Fulham Reach in Hammersmith and�Imperial�Wharf�in�Fulham.
PROFIT BEFORE TAXOperating margin has increased from 20.4%�to�23.1%.�This�reflects�the�benefit�of operational gearing and the change of mix of residential properties sold, which includes completions at the St George Wharf Tower in the second half of the year, offset by an increase in overheads by £10.8 million to £134.1 million (2013: £123.3 million) which have reduced as a percentage of revenue from 9.0% to 8.3%.
The Group’s share of the results of joint ventures�was�a�profit�of�£12.1�million�(2013:�loss�of�£1.3�million)�which�reflects�completions at both Stanmore Place and 375�Kensington�High�Street�in�the�year.
Net�finance�costs�have�decreased�by� £1.2 million from £8.1 million to £6.9 million. The Group started and ended the year in a net cash position, and so generated some income from its cash holdings. This was more than offset by the amortisation of facility fees�and�other�finance�income�and�costs�including imputed interest on land creditors.
Pre-tax return on equity has increased from 22.4% to 27.5% and measures underlying performance from the operational business.
Profit�before�tax�has�increased�by�£109.3�million from £270.7 million to £380.0 million. Basic earnings per share, which reflects�the�prevailing�UK�corporation�tax�rate and the issue of 4.3 million shares in January to satisfy share awards, has increased by 38.6% from 160.0 pence to 221.8 pence.
£’MILLION
Profit�before�tax:�2013� 270.7
Increase�in�gross�margin� +105.5
Increase�in�overheads� -10.8
Decrease�in�net�finance�costs� +1.2
Increase�in�result�from�joint�ventures�� +13.4
Profit�before�tax:�2014� 380.0
FINANCIAL POSITIONInventories�have�increased�from�£2,066.7�million at 30 April 2013 to £2,481.2 million at 30 April 2014 which demonstrates the continued steady investment in the business.�Inventories�include�£492.4�million of land not under development (30 April 2013: £310.0 million), £1,966.4 million of work in progress (30 April 2013: £1,711.7 million) and £22.4 million of completed stock (30 April 2013: £45.0 million).
Within work in progress, Berkeley’s investment in construction has risen by £329.3 million to £1,180.3 million at 30 April 2014, supported by a 57% increase in cash due on forward sales. By taking the opportunity to forward sell, Berkeley has secured certainty over its sales prices�to�give�it�the�confidence�to�grow�its construction activities, but is mindful that�build�cost�inflation�is�a�risk�to�future�margins.�Upward�pressure�on�build�costs and the more restricted availability of materials and skilled labour within the supply chain have been prevalent, although in the current market the impact of this has been broadly mitigated by house price increases.
Trade and other payables are £1,367.2 million at 30 April 2014 (£1,021.4 million at 30 April 2013). These include £741.6 million of on account receipts from customers (30 April 2013: £426.1 million) and land creditors of £210.0 million (30 April 2013: £180.9 million). The increase in land creditors relates to the purchase of a site in White City in the year on deferred terms before payments made against existing land creditors at Wapping. Provisions of £57.1 million (30 April 2013: £29.0 million) include £53.3 million in respect of post completion development obligations (30 April 2013: £23.6 million) and £3.8 million of other provisions arising in the ordinary course of business (30 April 2013: £5.4 million).
During the year, £337.6 million of cash was generated from operations (2013: £291.8 million). This is before a net investment in working capital of £77.9 million (2013: £102.8 million), where the increase in the investment in construction has been matched by the increase in customer deposits, proceeds from the disposal of rental fund properties of £138.2 million (2013: £12.6 million), tax�and�other�cash�outflows�of�£118.2�million (2013: £79.3 million) and dividends of £195.2 million (2013: £19.7 million). A net increase in net cash of £84.5 million, together with a £34.4 million increase in capital employed in the balance sheet, has resulted in a £118.9 million rise in net assets from £1,322.4 million at 30 April 2013 to £1,441.3 million at 30 April 2014.

BERKELEY ANNUAL REPORT 2014 / STRATEGIC REPORTBERKELEY ANNUAL REPORT 2014 / STRATEGIC REPORT
42 43
STRATEGIC
REPORT
TRADING AND FINANCIAL REVIEW AND OUTLOOK continued
BANKING FACILITIESAt 30 April 2014, and throughout the financial�year,�the�Group�was�ungeared.�Committed corporate banking facilities remain at £525 million. Of this, £250 million matures in April 2018 and £275 million in May 2018, providing good visibility and headroom within the Group’s business plan.
JOINT VENTURESInvestments�accounted�for�using�the�equity method have increased from £44.1 million at 30 April 2013 to £61.4 million at 30 April 2014. This relates almost exclusively to Berkeley’s investment in St Edward, a joint venture with Prudential.
St Edward has three schemes currently in development at Stanmore Place, 375 Kensington�High�Street�and�190�Strand.�203 homes were sold in the year at an average selling price of £1,235,000 (2013: 66�at�£277,000),�an�increase�which�reflects�the change of mix in properties sold.
1,389 plots in Berkeley’s land holdings relate to St Edward schemes (30 April 2013: 1,592), and St Edward is continuing to identify opportunities to develop the joint venture through further sites to which it can add value. This includes a commercial site in Westminster which is conditional on vacant possession and so is included in the land pipeline. The joint venture is partly funded by a £60 million bank facility which was undrawn at year end (30 April 2013: £34 million drawn).
TAXATIONThe Group’s policy is to pay the amount of tax legally due and to observe all applicable rules and regulations. At the same time we have an obligation to maximise shareholder value and to manage�financial�and�reputational�risk.�This includes minimising and controlling our tax costs, as we look to do for all costs of our business. Factors that may affect the Group’s tax charge include changes in legislation, the impact of corporate activity (restructuring, acquisitions, disposals, etc), the resolution of open tax issues from prior years and planning opportunities. The Group makes provision for potential tax liabilities that may arise, however the amount ultimately paid may differ from the amount accrued.
RENTAL FUNDBerkeley’s private rental fund held 729 properties at a historic cost of £102.3 million at 30 April 2013. 534 of the properties were held at £75.8 million as ‘Non-current�assets�classified�as�held�for�resale’, and the remaining 195 properties were�held�in�‘Investment�properties’�at�£26.5 million.
The sale of the 534 properties held for resale�to�M&G�Investments�completed�on 5 June 2013 for an aggregate price of £105.4 million included in revenue. After repayment of £17.4 million of funding from the Homes and Communities Agency, and re-investment of £10 million for a minority stake�in�the�M&G�Investment�Fund,�the�net�proceeds of sale were £75.2 million and a�profit�of�£29.6�million�was�recognised�within�operating�profit�in�the�year.
54 properties from Berkeley’s rental fund remain�held�in�Investment�properties� at £7.2 million at 30 April 2014 (195 at £26.5 million at 30 April 2013). This follows the disposal in the year of 141 properties for�£32.8�million�of�revenue�and�a�profit�of £13.6 million where market conditions have supported their sale.
GROUND RENTSOn 30 May 2014, the Group exchanged contracts for the sale of a portfolio of ground rent assets for £99.8 million. The sale is expected to give rise to a non-recurring profit�on�disposal�of�approximately�£80�million�after�transaction�costs�in�the�first� half of the year ending 30 April 2015.
LONG-TERM STRATEGIC PLANBerkeley has a long-term strategic plan to return £13 per share to shareholders by 30 September 2021, broken down into three milestones of 434 pence by September 2015, 433 pence by September 2018 and 433 pence by September 2021.
The Board has considered the results of the Group and determined that it is appropriate to propose a further interim dividend of 90 pence per share, payable on 26 September 2014 to shareholders on the register on 22 August 2014. With this, the Group has now paid or committed to pay a total of 254 pence per share under its long-term plan to return 1,300 pence per share to shareholders by 2021, and it leaves 180 pence per share to return to meet�the�first�milestone�of�434�pence�per�share by September 2015.
RETURNS TO PENCE SHAREHOLDERS PER £’MILLION SHAREPaid in year ended April 2013 19.7 15
Paid in year ended April 2014 195.2 149
Interim�dividend�declared for payment in September 2014 121.8 90
Balance to be paid by 30 September 2015 (first�milestone)�*� 243.6�� 180
By 30 September 2018 (second milestone)* 585.8 433
By 30 September 2021 (third milestone)* 585.8 433
1,751.9 1,300 * Based on 135.3 million shares currently in issue
OUTLOOKThese results demonstrate that Berkeley is well placed and, although earnings remain sensitive to the timing of delivery of some of its larger developments, the Board currently expects underlying full year earnings in 2015 to be in line with current market expectations�before�the�one-off�benefit�of the sale of the ground rent assets. The Group remains alert to the uncertainty which will arise from changes to the economic and political landscape in the run-up to a 2015 General Election and may impact the business and the market more generally.
Berkeley understands the industry and the inherently cyclical market in which it operates, and has the right strategy, people and framework to deliver long-term sustainable success. The Group is on course to meet its commitment to return over £1.7 billion to shareholders by 2021 and, with the visibility provided by the land pipeline, provide a sustainable business thereafter.
AWARDSThe Berkeley Group is proud to have been awarded the Queen’s Award for Enterprise for Sustainable Development this�year�for�the�second�time,�the�first�housebuilder to achieve this.
For the third time, we have been recognised by Management Today as one of Britain’s Most Admired Companies, recognised as the leading housebuilder and ranked second alongside some of the country’s most successful and respected businesses.
For the eighth year running we were ranked as the top homebuilder in the 2013 NextGeneration benchmarking initiative. The benchmark ranks the UK’s�25�largest�homebuilders�according� to their sustainability, strategy and performance.
ROB PERRINSMANAGING DIRECTOR11 JULY 2014
QUEEN’S AWARD FOR SUSTAINABLE DEVELOPMENT 2014
These are strong results which reflect the current market
conditions and Berkeley’s bold strategy to invest at the right point in the economic and
housing cycle
BRITAIN’S MOST ADMIRED COMPANY 2013
Ranked second across businesses from all sectors
NEXT GENERATION BENCHMARK 2013
Ranked as the most sustainable homebuilder for
the 8th successive yearFirst housebuilder to win the award for the second time

BERKELEY ANNUAL REPORT 2014 / STRATEGIC REPORT
45
STRATEGIC
REPORT
CASE STUDY – THE ‘BERKELEY DIFFERENCE’ AT:
ROYAL ARSENAL RIVERSIDE
“Our vision for Royal Arsenal Riverside is to transform a derelict industrial munitions site into a beautiful, Thame-side destination with�a�flourishing�community�and�first-class�transport�links.”
Already home to over 4,500 residents, Berkeley focused on the early delivery of what�was�required�to�serve�a�flourishing�riverside community. Residents currently benefit�from�a�Tesco�Express,�Doctors,�Dentist and nursery as well as a health and well-being centre and the Dial Arch gastro pub.
With a concierge, residents gym and a swimming pool, the Waterfront will offer London city living in Woolwich. Berkeley will be implementing the highest level of specification�befitting�of�a�central�London�luxury development, setting itself apart from all competition in the area.
Berkeley invested and built the Crossrail station box to ensure that Royal Arsenal Riverside is one of the best connected sites in London. With the arrival of Crossrail in 2019, central London and the West End will be only minutes away.
NUMBER OF HOMES
4,961LENGTH OF SCHEME
20 years
DEVELOPMENT TYPES
New homes, luxury apartments, retail and leisure facilities and
transport links
LOCATION
PLACEMAKING WATERFRONT TRANSPORT LINKS
BERKELEY�ANNUAL�REPORT�2014��/��STRATEGIC�REPORTBERKELEY�ANNUAL�REPORT�2014��/��STRATEGIC�REPORT
44 45

AN EXPERIENCED AND ACTIVE BOARD COMMITTED TO MAINTAINING A HIGH
STANDARD OF CORPORATE GOVERNANCE
GOVERNANCE GO
VERN
AN
CE
CHELSEA CREEK (COMPUTER GENERATED IMAGE)
46 47
BERKELEY ANNUAL REPORT 2014 / GOVERNANCEBERKELEY ANNUAL REPORT 2014 / GOVERNANCE

48 49
BERKELEY�ANNUAL�REPORT�2014��/��GOVERNANCE BERKELEY�ANNUAL�REPORT�2014��/��GOVERNANCE
BOARD OF DIRECTORS
TONY PIDGLEY CBE N
Co-founder of the Company in 1976 with Jim Farrer. He was appointed Group Chairman on 9 September 2009, having previously been the Group Managing Director since the formation of the Group in 1976. He is Chairman of the Nomination Committee.
ROB PERRINS BSC (Hons) FCAJoined the Company in 1994 having�qualified�as�a�chartered�accountant�with�Ernst�&�Young�in 1991. He was appointed to the Group Main Board on 1 May 2001 on becoming Managing Director of Berkeley Homes plc. He became Group Finance Director on 2 November 2001, moving to his current role as Group Managing Director on 9 September 2009.
NICK SIMPKIN ACAJoined Berkeley in 2002 and has held a number of senior finance�positions�including�Finance Director of St James and Head of Finance for Berkeley Group. He joined the Board and became Group Finance Director on 10 September 2009.
KARL WHITEMANJoined Berkeley in 1996 as a Construction Director and currently leads the Berkeley Homes East Thames division. He joined the Board on 10 September 2009 as a Divisional Executive Director.
SEAN ELLIS BSC (Hons)Joined Berkeley in 2004 with an expertise in land and is currently Chairman of St James Group and the Berkeley Homes Eastern Counties Division. He joined the Group Main Board on 9 September 2010 as a Divisional Executive Director.
GREG FRY FCAJoined the Group in 1982 and is currently Chairman of St George, having been a Director since its inception in 1986. He was reappointed to the Group Main Board on 5 September 2011 as a Divisional Executive Director, having previously been a member of the Group Main Board from 1 May 1996 to 22 July 2010.
SIR JOHN ARMITT N R
Appointed a Non-executive Director on 1 October 2007 and became Deputy Chairman on 5 September 2012. He is currently Chairman of the Olympic Delivery Authority, Chairman of National Express Group PLC, Chairman of City and Guilds and is a member of the Transport for London Board. He was Chairman of the Engineering and Physical Science Research Council until 31 March 2012. From 2001 to 2007, he was Chief Executive of Network Rail and its predecessor, Railtrack. Sir John is the Senior Independent�Director.
DAVID HOWELL FCA N A
Appointed a Non-executive Director on 25 February 2004. David is currently a Non-executive Director of two private companies and Copthorne Holdings Ltd, the parent company of Countryside Properties plc as well as being Treasurer and a Trustee of British Red Cross. He was previously a Main Board Director of lastminute.com plc, Group Finance Director of First Choice Holidays plc, Executive Chairman of Western and Oriental plc, Chairman of EBTM plc (Everything but the Music) and a Non-executive Director of Nestor Healthcare Group plc. He chairs the Audit Committee. David will stand down from the Board at the AGM on 1 September 2014.
ADRIAN LIAppointed a Non-executive Director on 2 September 2013. He is currently Deputy Chief Executive of The Bank of East Asia, Ltd., with responsibility for�the�bank’s�Hong�Kong�business.�He�is�an�Independent�Non-executive Director of Sino Land Company Ltd., Tsim Sha Tsui Properties Ltd., Sino Hotels (Holdings) Ltd., China State Construction�International�Holdings�Ltd.,�COSCO�Pacific�Ltd. and Shanghai Fosun Pharmaceutical (Group) Co. Ltd. He is a member of the International�Advisory�Board� of�Abertis�Infraestructuras,�S.A,�and is an Alternate Director of San�Miguel�Brewery�Hong�Kong�Ltd�and�AFFIN�Holdings�Berhad.
ALISON NIMMO CBE A
Appointed a Non-executive Director on 5 September 2011, Alison is Chief Executive of The Crown Estate. Prior to that she led the design and delivery of the London 2012 Olympic and Paralympic venues as Director of Regeneration and Design at the Olympic Delivery Authority.
VERONICA WADLEY N A
Appointed a Non-executive Director on 3 January 2012. She is currently Chair of the Arts Council London, a Senior Adviser to the Mayor of London and a National Council member of Arts Council England. Previously Editor of The Evening Standard, she is also an Independent�Director�of�Times�Newspapers Holdings Ltd.
GLYN BARKER BSC (Hons) FCA A R
Appointed a Non-executive Director on 3 January 2012 following a 35 year career with PwC, most recently as its�UK�Vice�Chairman.�He�previously held a number of senior posts within PwC including Managing Partner and Head of Assurance and also established and ran their Transactions Services business. Glyn is a Non-executive Director of Aviva plc and Transocean Limited, Chairman of�the�law�firm�Irwin�Mitchell�and a Director of the English National Opera Company. He is Chairman of the Remuneration Committee.
ANDY MYERS BEng ACA A R
Appointed a Non-executive Director on 6 December 2013, he is currently Chief Financial Officer�at�McLaren�Group�Limited, having previously held�senior�finance�roles�in� Rolls Royce plc and BMW/Rover Group.
DIANA BRIGHTMORE- ARMOUR FCCA, MCTAppointed as a Non-executive Director on 1 May 2014, Diana is�currently�the�UK�CEO�of�The�Australia and New Zealand Banking Group Ltd and previously held the position of CEO, Corporate Banking at Lloyds Banking Group (2004-2012). Diana has 30 years of international experience in banking,�corporate�finance,�financial�management,�treasury�and audit.
COMPANY SECRETARYE A Driver
HONORARY LIFE PRESIDENTJim�Farrer�MRICS,�along�with�Tony�Pidgley�a co-founder of Berkeley, he was Group Chairman until his retirement in 1992. At that time he was appointed Honorary Life President.
KEY
N Nomination CommitteeA Audit CommitteeR Remuneration Committee
CHAIRMAN AND EXECUTIVE DIRECTORS
NON-EXECUTIVE DIRECTORS
GO
VERN
AN
CE

BERKELEY ANNUAL REPORT 2014 / GOVERNANCEBERKELEY ANNUAL REPORT 2014 / GOVERNANCE
50 51
GO
VERN
AN
CE
The Company is committed to maintaining a high standard of corporate governance in respect of leadership, effectiveness, accountability, remuneration and relationships with our shareholders as identified by the UK Corporate Governance Code 2012 (the Code). In the year to 30 April 2014, the revised principles and provisions of the Code (published In September 2012 by the Financial Reporting Council (FRC) applied to the Company.
This section, including the Audit Committee Report and the Remuneration Report detail how the Company has applied the principles and provisions of the Code. The Company’s business model is explained in the Strategic Report. It is the Board’s view that it has been fully compliant with the Code throughout the 2013/14 financial year other than in respect of the composition of the Remuneration Committee on which there were two rather than three independent Non-executive Directors between 2 September 2013 and 30 April 2014. The Group has been fully compliant since 1 May 2014 when Andy Myers was appointed to the committee. A copy of the Code is available on the Financial Reporting Council’s website www.frc.org.uk
THE BOARDROLEThe Board has a collective responsibility for promoting the long term success of the Company in a safe and sustainable manner in order to create shareholder value. The Board provides leadership and sets the Company’s strategic long-term objectives.
Its duties are set out in a formal schedule of matters specifically reserved for decision by the Board, which include:
– Overall management of the Group, its strategy and long-term objectives;
– Approval of corporate plans;
– Approval of all corporate transactions;
– Changes to the Group’s capital structure;
– Approval of the Group’s treasury policy;
– Approval of the Group’s interim and annual results, dividend policy and shareholder distributions;
– Reviewing the Group’s risks and system of internal control;
– Changes to the Board and other senior executive roles;
– Corporate Governance arrangements and the Board evaluation; and
– Approval of policies in key areas including Sustainability, Health & Safety and Business Ethics.
COMPOSITION, DIVERSITY ANDINDEPENDENCEAt the date of this report the Board comprises fourteen Directors; the Chairman, five Executive Directors and eight independent Non-executive Directors. The biographies of these directors are set out on page 48.
During the year, Alan Coppin stepped down from the Board and Adrian Li was appointed as an Independent Non-executive Director at the Annual General Meeting on 2 September 2013. On 6 December 2013, Andy Myers was also appointed as an Independent Non-executive Director. On 1 May 2014, Diana Brightmore-Armour was appointed as an Independent Non-executive Director.
The Board has evolved over recent years to put in place the succession planning that all successful organisations require and the composition of the Board continues to be reviewed on a regular basis to ensure that an appropriate balance of skills is maintained. The Board has chosen not to set specific representation targets for women at Board level at this time. However, it recognises that the benefits of diversity, including gender diversity, will continue to be an active consideration when further changes to the Board’s composition are considered.
The Board considers that all of the current Non-executive Directors were independent throughout the year. David Howell joined the Board in February 2004 and has now served more than nine years on the Board. At the Annual General Meeting on 1 September 2014, David Howell will step down from the Board. The Non-executive Directors, led by the Senior Independent Director Sir John Armitt, have the skills, experience, independence and knowledge of the Company to enable them to discharge their respective duties and responsibilities effectively.
The Group Executive Directors do not hold any Non-executive Director appointments or commitments required to be disclosed under the Code.
CHAIRMAN AND MANAGING DIRECTORThe roles of Group Chairman and Group Managing Director are separately held and there are clear written guidelines to support the division of responsibility between them. The Group Chairman is responsible for the effective conduct of the Board and shareholder meetings and
for ensuring that each Director contributes to effective decision-making. The Group Managing Director has day-to-day executive responsibility for the running of the Group’s businesses. His role is to develop and deliver the strategy to enable the Group to meet its objectives.
MEETINGSThe Board met five times during 2013/14 and there were no absences.
In addition to the above formal meetings of the whole Board, the Non-executive Directors meet with the Group Chairman. The Group Managing Director and Group Finance Director are invited to attend these meetings in part, to provide an update on the business activities of the Group. The Non-executive Directors meet at least annually without the Group Chairman present, chaired by the Senior Independent Director.
Board papers and agendas are sent out in the week prior to each meeting, thus allowing sufficient time for detailed review and consideration of the documents beforehand. In addition, the Board is supplied with comprehensive management information on a regular basis.
ELECTION AND RE-ELECTION OF DIRECTORSThe Articles of Association of the Company include the requirement for Directors to submit themselves to shareholders for re-election every three years. In addition, all Directors are subject to election by shareholders at the first opportunity after their appointment and thereafter at intervals of no more than three years.
However, in accordance with the requirements of the Code, all Directors offer themselves for re-election at the Annual General Meeting on 1 September 2014, other than David Howell who is standing down from the Board.
INDUCTION AND DEVELOPMENTOn appointment, Non-executive Directors are provided with a detailed induction programme. This covers an overview of the Group’s operations and its policies, corporate responsibility and corporate affairs issues, legal matters, and the opportunity to meet with Directors and key staff and to visit the Group’s sites.
No training needs were identified this year, although ongoing training is available to all Directors to meet their individual needs. Board members also receive guidance on regulatory matters and the corporate governance framework that the Group operates under.
Members of the Audit and Remuneration Committees received briefings from our auditors and remuneration advisers respectively to ensure they remain up to date with current regulations and developments.
All Directors have access to advice from the Company Secretary and independent professional advisers, at the Company’s expense, where specific expertise is required in the course of their duties.
BOARD EVALUATIONThe Code requires that the Board undertakes an annual evaluation of its own performance and that of its committees and individual directors with an externally facilitated evaluation conducted every three years. Having sought the services of an independent externally facilitated third party for the 2013 evaluation, the Board evaluation for 2014 was carried out by the Group Solicitor and covered:
• Strategic matters
• Board structure, committees and their operation
• Succession planning
• Induction and development
• Assessment of the performance of individual committees and the Chairman
• Shareholder communication
The unanimous outcome of the review was that the Board works very well and that all the Directors are passionate about the business, and that they enjoy their role on the Board.
The Board has a pivotal role in preserving the organisation’s culture and ultimately its success. In line with all successful organisations, succession planning is seen as a key focus for the Company and the Board continues to evolve to address this issue. The autonomous structure of the Group also provides strength in depth which further mitigates this risk.
An action plan has been agreed by the Board to address the recommendations made from the review.
CONFLICTS OF INTERESTIn accordance with the Companies Act 2006, the Company’s Articles of Association allow the Board to authorise potential conflicts of interest that may arise and to impose such limits or conditions as it thinks fit. The decision to authorise a conflict of interest can only be made by non-conflicted Directors (those who have no interest in the matter being considered) and in making such a decision the Directors must act in a way they
consider in good faith will be most likely to promote the Company’s success.
The Company has established a procedure whereby actual and potential conflicts of interest of current and proposed roles to be undertaken by Directors of the Board with other organisations are regularly reviewed in respect of both the nature of those roles, and their time commitment, and for proper authorisation to be sought prior to the appointment of any new director. The Board consider these procedures to be working effectively.
INSURANCEThe Company had in place at 30 April 2014 an appropriate policy which insures Directors against certain liabilities, including legal costs, which they may incur in carrying out their duties. This remains in place.
BOARD COMMITTEES The Board has delegated certain matters to individual Executives and to the specific committees of the Board; audit, remuneration and nomination. The main three Board Committees operate within clearly defined Terms of Reference pursuant to the provisions of the Code. The Terms of Reference can be downloaded from the section dealing with Investor Relations on the Berkeley website (www.berkeleygroup.co.uk). Copies are also available to shareholders on application to the Company Secretary.
The responsibilities of the key Board committees are described below.
EXECUTIVE COMMITTEE The Executive Committee meets monthly and reviews the financial and operating performance of all Group divisions and companies. The Group Managing Director, Rob Perrins, chairs this Committee and other members comprise, Tony Pidgley, Nick Simpkin, Karl Whiteman, Sean Ellis and Greg Fry alongside other senior management.
AUDIT COMMITTEE The Audit Committee is responsible for monitoring and reviewing the financial reporting and accounting policies of the Company, reviewing the adequacy of internal controls and the activities of the Group’s internal audit function and overseeing the relationship with the external auditor. The Audit Committee comprises five independent Non-executive Directors. The Committee is chaired by David Howell and the other members at 30 April 2014 were Alison Nimmo, Andy Myers, Glyn Barker and Veronica Wadley.
David Howell, Andy Myers and Glyn Barker are all considered to have recent and relevant experience. David Howell is qualified as a chartered accountant and was the Chief Financial Officer and a Main Board Director of lastminute.com plc; Andy Myers is qualified as a chartered accountant and is currently Chief Financial Officer at McLaren Group Limited; and Glyn Barker is also qualified as a chartered accountant, having previously held a number of senior posts within PwC including Managing Partner and Head of Assurance. Upon David Howell’s retirement from the Board at the Annual General Meeting on 1 September 2014, the Committee will be chaired by Andy Myers.
The Committee met formally on three occasions during the year to 30 April 2014 with no absences.
An explanation of the role and activities of the Audit committee during the year is contained in the Audit Committee report on pages 54 to 55.
REMUNERATION COMMITTEE The Remuneration Committee is responsible for determining the Company’s policy for Executive remuneration and the precise terms of employment and remuneration of the Executive Directors.
At 30 April 2014, the Committee comprised Glyn Barker and Sir John Armitt who are both independent Non-executive Directors. The Committee was chaired by Glyn Barker. On 1 May 2014 Andy Myers was appointed to the Committee.
The Committee met formally on two occasions during the year to April 2014 with no absences.
No Director is involved in deciding his or her remuneration. The Executive Directors decide the remuneration of the Non-executive Directors and the Committee takes into consideration the recommendations of the Group Managing Director and Group Finance Director regarding the remuneration of their Executive colleagues.
The principles and details of Directors’ remuneration are contained in the Remuneration Report on pages 56 to 80.
NOMINATION COMMITTEE The Nomination Committee ensures that the membership and composition of the Board, including the balance of skills, is appropriate, as well as giving full consideration to succession planning on a regular basis.
The Committee is chaired by the Group Chairman, Tony Pidgley and the Independent Non-executive members at 30 April 2014
CORPORATE GOVERNANCE REPORT

BERKELEY ANNUAL REPORT 2014 / GOVERNANCEBERKELEY ANNUAL REPORT 2014 / GOVERNANCE
52 53
GO
VERN
AN
CE
were David Howell, Sir John Armitt and Veronica Wadley. David Howell will step down from the Committee on 1 September 2014.
The Committee met formally on two occasions during the year to 30 April 2014 with no absences.
During the year, the activities of the Committee included considering and making recommendations to the Board regarding the membership of the Board committees and reviewing succession plans for the Executive team.
The process for identifying and recommending new appointments includes a combination of discussions and consultations, in addition to formal interviews, utilising the services of independent recruitment specialists, as appropriate.
KEY RISKS AND INTERNAL CONTROL The Board acknowledges that it has overall responsibility for ensuring that the Group’s system of internal control comply with the UK Corporate Governance Code 2012 and for reviewing its effectiveness, at least annually.
Internal control procedures are designed to manage rather than eliminate the risk of failure to achieve business objectives, and can only provide reasonable and not absolute assurance against material misstatement or loss.
There are ongoing processes and procedures for identifying, evaluating and managing the significant risks faced by the Group. These processes and procedures were in place from the start of the financial year to the date on which the 2014 Annual Report and Accounts were approved and accord with the Turnbull guidance issued in 2005.
The processes are regularly reviewed by the Board and include an annual review by the Directors of the operation and effectiveness of the system of internal control as part of its year end procedures. The key features of the system of internal control include:
CLEAR ORGANISATIONAL STRUCTURE The Group operates through autonomous divisions and operating companies, each with its own board. Operating company boards meet on a weekly basis and divisional boards on a monthly basis, and comprehensive information is prepared for such meetings on a standardised basis to cover all aspects of the business. Formal reporting lines and delegated levels of authority exist within this structure and the review of risk and performance occurs at multiple levels
throughout the operating companies, divisions and at Group.
RISK ASSESSMENT Risk reporting is embedded within ongoing management reporting throughout the Group. At operating company and divisional level, Board meeting agendas and packs are structured around the key risks facing the Group. These risks include health and safety, sales, production (build cost and programme), land and planning, economic, regulatory and site specific matters.
In addition, there is a formalised process whereby each division produces quarterly risks and control reports that identify significant risks, the potential impact and the actions being taken to mitigate the risks. These risk reports are reviewed and updated regularly.
A Group Risk Management Report is presented at each Group Main Board Meeting, setting out the current factors affecting the risk profile of the Group, the mitigation of these risks and the key changes to this risk profile since the last report.
FINANCIAL REPORTING A comprehensive budgeting and real-time forecasting system, covering both profit and cash, operates within the Group. This enables executive management to view key financial and operating data on a daily basis. On a weekly and monthly basis more formal reporting up to the Group Executives is prepared. The results of all operating units are reported monthly and compared to budget and forecast.
There is a consolidation process in place which ensures that there is an audit trail between the Group’s financial reporting system and the Group’s statutory financial statements.
INVESTMENT AND CONTRACTING CONTROLS The Group has clearly defined guidelines for the purchase and sale of land within the Group, which include detailed environmental, planning and financial appraisal and are subject to executive authorisation. Rigorous procedures are also followed for the selection of consultants and contractors. The review and monitoring of all build programmes and budgets are a fundamental element of the Company’s financial reporting cycle.
POLICIES AND PROCEDURES Policies and procedures, including operating and financial controls, are detailed in policies and procedures manuals that are refreshed and improved as appropriate. Training to staff is given where necessary.
CENTRAL FUNCTIONS Strong central functions, including Legal, Health & Safety and Company Secretarial, provide support and consistency to the rest of the Group. In addition, the principal treasury-related risks, decisions and control processes are managed by the Group Finance function, under the direction of the Group Finance Director.
INTERNAL AUDIT Internal auditors are in place at divisional and Group level to provide assurance on the operation of the Group’s control framework.
WHISTLEBLOWING The Group has a whistleblowing policy which has been communicated to all staff, where Directors, management and staff can report in confidence any concerns they may have of malpractice, financial irregularity, breaches of any Group procedures, or other matters.
BRIBERY ACT The Board has responsibility for complying with the requirements of the Bribery Act 2010 and is charged with overseeing the development and implementation of the Group’s policies and procedures and monitoring ongoing compliance.
RELATIONS WITH SHAREHOLDERSThe Company encourages active dialogue with its current and prospective shareholders through ongoing meetings with institutional investors. Major shareholders have the opportunity to meet all Directors after the Annual General Meeting in addition to individual meetings with the Company.
Shareholders are also kept up to date with the Company’s activities through the Annual and Interim Reports and Interim Management Statements. In addition, the corporate website gives information on the Group and latest news, including regulatory announcements. The presentations made after the announcement of the preliminary and interim results are also available on the website.
The Board is kept informed of the views of the shareholders through periodic reports from the Company’s broker UBS. Additionally, the Non-executive Directors have the opportunity to attend the bi-annual analyst presentations.
The Senior Independent Director is available to shareholders if they have concerns where contact through the normal channels has failed or when such contact is inappropriate.
ANNUAL GENERAL MEETING All shareholders are invited to participate in the Annual General Meeting (“AGM”) where
the Group Chairman, the Group Managing Director and the Chairmen of the Audit, Remuneration and Nomination Committees will be available to answer questions and will also be available for discussions with shareholders both prior to and after the meeting.
In accordance with the Code, the Company arranges for the Annual Report and Accounts and related papers to be posted to shareholders so as to allow at least 20 working days for consideration prior to the AGM.
The Company complies with the provisions of the Code relating to the disclosure of proxy votes, which, including abstentions, are declared at the AGM after each resolution has been dealt with on a show of hands and are announced to the Stock Exchange shortly after the close of the meeting. The Company also complies with the requirements of the Code with the separation of resolutions and the attendance of the Chairmen of the Board Committees.
The terms and conditions of appointment for the Non-executive Directors, which set out their expected time commitment, in addition to the service contracts for the Executive Directors, are available for inspection at the AGM and during normal business hours at the Company’s registered office.
CORPORATE GOVERNANCE REPORT continued

BERKELEY ANNUAL REPORT 2014 / GOVERNANCEBERKELEY ANNUAL REPORT 2014 / GOVERNANCE
54 55
GO
VERN
AN
CE
AUDIT COMMITTEE REPORT
The Board of Directors presents its Audit Committee Report for the year ended 30 April 2014 which has been prepared on the recommendation of the Audit Committee (“the Committee”).
The report has been prepared in accordance with the requirements of the UK Corporate Governance Code, Schedule 8 of the Large & Medium-Sized Companies and Groups (Accounts and Reports) Regulations 2008, and the Listing Rules of the Financial Conduct Authority.
Details of the composition, experience and the number of meetings of the Committee are reported on page 51 of the Corporate Governance Report.
ROLE AND RESPONSIBILITIES OF THE AUDITCOMMITTEEThe Committee has formal Terms of Reference which set out its role and the authority delegated to it by the Board. The key responsibilities of the Committee are as follows:
• Financial Reporting Monitoringtheintegrityofthefinancialreporting of the Company and reviewing significantfinancialreportingissuesandaccounting policies;
• Internal Control and Internal Audit Reviewing the adequacy and effectiveness of the Group’s internal control and risk management systems and monitoring the effectiveness of the Group’s internal audit function; and
• External Audit Overseeing the relationship with the external auditor, including appointment, removal and fees, and ensuring the auditor’s independence and the effectiveness of the audit process.
This report considers each of these responsibilities in turn, and how the Committee has discharged them during the year.
FINANCIAL REPORTINGAt each of the Audit Committee meetings, the Group Finance Director Nick Simpkin presented, and the Committee debated, the results and business plan of the Group and anysignificantfinancialreportingjudgementsrelevant to this.
The Committee reviewed, prior to their publication,thefinancialdisclosuresinthe Group’s Annual Report and Accounts, Preliminary Announcement, Interim Report and the contents of interim management statements issued during the year.
The Committee’s review incorporated consideration of the appropriateness of the relevantaccountingpoliciesandfinancialreportingjudgementsadoptedtherein.
The Committee’s review of the Annual Report concentrated on whether, taken as a whole, it was fair, balanced and understandable and provided the information necessary for users of the Annual Report to assess the Group’s business strategy and performance.
The views of the Group’s auditor, which was in attendance at each meeting of the Committee during the year, were taken into account in reaching its conclusions on these matters.
ThesignificantmattersconsideredbytheCommittee in 2014 included:
• Carrying value of inventories and margin recognition Inventories comprise land not under development, work in progress and completed units, which are held in the balance sheet at the lower of cost and net realisable value. This demands a periodic assessment by the management team of each of Berkeley’s sites which is sensitive to assumptions in terms of future sales prices and construction costs and recognises the inherently cyclical nature of the property market and the risks of delivery. These assumptions are also relevant to the determination of profitrecognisedonpropertiessold.The conclusions of this assessment were reported by exception to the Committee inafinancialoverviewpaperpriortorelease of the Group’s annual and interim results.
• Provisions The Committee recognises that accounting for provisions relies on managementjudgementinestimatingthequantumandtimingofoutflowsofresources to settle any associated legal or constructive obligations. The Group holds provisions for post-completion development obligations, onerous lease and estate liabilities. The basis for determining these provisions was presented to the Committee for their consideration. The Committee reviewed the relevant papers and discussed the assumptions underlying this determination with management and the Group’s external auditor and concluded that it was satisfiedthattheassumptionsadoptedwere appropriate. A table of movements in provisions over the period is included in note18tothefinancialstatements.
• Revenue recognition The Committee recognises that the Group’s accounting policy for revenue recognition, namely that properties are treatedassoldandprofitsarerecognisedwhen contracts are exchanged and building work is physically complete, involvesanelementofjudgementindetermining the point at which building work is physically complete. The Committee reviewed the quantum of properties not yet legally completed at eachbalancesheetdateinconjunctionwith the review undertaken by the Group’s external auditor and concluded that the judgementswereappropriate.
Other matters considered by the Committee included management’s assessment of the going concern status of the Group at the balance sheet date and the accounting for share-based payments, although no new share options have been granted in the year. The Committee concurred with management’s adopted approach on all of these matters.
Since the year end, the Committee has completed its review of the 2014 Annual ReportandhasconfirmedtotheBoardthat it considers it to be fair, balanced and understandable.
INTERNAL CONTROL AND INTERNAL AUDITThe Committee undertook its annual review of the Group’s Internal Control Framework during the year. This review focused on the system of risk management and internal control in place which is explained in more detail on page 52 of the Corporate Governance Report, and covered:
– the key risks facing the Group;
– the key elements of the Group’s control processes to mitigate these risks;
– the operations and effectiveness of internal audit.
A paper was also presented to the Committee which summarised the Group’s consideration, controls and monitoring of fraud risk across its activities.
The Committee also considered any internal control recommendations raised by the Group’s auditors during the course of the external audit and the company’s response to dealing with such recommendations.
A report summarising the recent activities of the Internal Audit function within Berkeley was presented to each of the Committee meetings during the year. These reports covered:
– asummaryofthekeyfindingsarisingfromthe most recent formal internal audits undertaken;
– management responses to any control weaknessesidentified,theclosureofanyopen items and any recurring themes;
– the outcome of other operational review work undertaken by the internal audit function;
– the internal audit plan for the coming year, for debate with and the approval of the Committee.
TheCommitteewassatisfiedthatthescope,extent and effectiveness of the Internal Audit function are appropriate for the Group.
EXTERNAL AUDITDuring the year, in accordance with evolving best practice, the Committee undertook a competitive tender process for the audit of the Company and its subsidiaries for the year ended 30 April 2014. PricewaterhouseCoopers LLP (“PwC”) and its predecessorfirmhadbeenBerkeley’sauditorsincetheCompanyfirstlistedin1984.
The tender process sought to assess a combination of the tendering parties’ understanding of the business, industry and related risks, their intended approach, the skills and experience of the proposed team and a comprehensive plan to manage a successful transition.
Following this process, KPMG LLP (“KPMG”) wasappointedtofillacasualvacancyinaccordance with the Companies Act 2006.
APPROACHKPMG presented its audit strategy at the firstAuditCommitteemeetingfollowingtheir appointment. The strategy document identifieditsassessmentofthekeyrisksofthe business for the purpose of the audit, the scope of their work and updated the Committee on regulatory changes for the current year. KPMG also updated the Committee on its interaction with PwC in respect of the handover of the external audit.
KPMG reported to the Committee at the year end, prior to the public announcement of the Company’s results, in which it set out itsassessmentoftheCompany’sjudgementsand estimates in respect of these risks and anyotherfindingsarisingfromitswork.Its work also included a review of the adequacy of Berkeley’s external reporting for compliance with prevailing regulations.
The external auditors have open recourse to the Non-executive Directors should they consider it necessary. There is private
dialogue between the Chairman of the Audit Committee and the external auditors prior to each Audit Committee meeting and, after each meeting, the opportunity for the Committee to meet with the external auditors without the Executive Directors and management present.
INDEPENDENCE OF THE EXTERNALAUDITORSAs part of its audit strategy presentation, and through the audit tender process, KPMG identifiedthesafeguardsinplacewithinitsinternal processes and procedures to protect, in respect of its own role, the independence of its audit.
The Committee has a policy on the use of the auditors for non-audit services in order to safeguard auditor independence and the ratio of audit fees (including the fees for the Interim Review) to non-audit fees should be no greater than 1:1. The ratio for the year ended 30 April 2014 was within the limits of this ratio. Audit and non-audit fee disclosures are set out in Note 4 of the Consolidated Financial Statements.
Any departure from this ratio will only be as a consequence of transactional work, where the Committee considers it is right for the auditors to undertake such work where the reasons for doing so are compelling, such as where:
i) it is proprietary to them;
ii) they have pre-existing knowledge and experience that precludes the use of alternativefirms;
iii) the nature of the transaction is such that the Group’s auditors are the only practical solution.
Non-audit work carried out by all accounting firms,includingtheauditors,isformallyreported to the Audit Committee at each meeting. There is open dialogue between KPMGandtheCompany’sseniorfinanceteam to monitor any proposed new instructions.
The Committee has concluded that it is comfortable that the auditors are independent.
APPOINTMENT OF KPMGOn completion of the audit, the Committee reviewed the performance and effectiveness of KPMG with feedback from executive management. The Committee has resolved to propose KPMG’s appointment at the 2014 Annual General Meeting.
In deciding to tender the audit this year, the Committee was mindful of evolving
best practice under the UK Corporate Governance Code 2012, and will monitor the proposals of the Financial Reporting Council and the European Union in determining its future approach to re-tendering.
D HOWELLCHAIRMAN, AUDIT COMMITTEE11 JULY 2014

BERKELEY ANNUAL REPORT 2014 / GOVERNANCEBERKELEY ANNUAL REPORT 2014 / GOVERNANCE
56 57
GO
VERN
AN
CE
DIRECTORS’ REMUNERATION REPORT
GO
VERN
AN
CE
ANNUAL STATEMENT FROM CHAIRMAN OF REMUNERATION COMMITTEE
Dear Shareholder
This Remuneration Report is split into two parts:
• TheDirectors’RemunerationPolicysetsoutBerkeley’spolicyandthekeyfactorsthatweretakenintoaccountinsettingthepolicy.TheDirectors’RemunerationPolicywillbesubjecttoabindingvoteattheAGMinSeptember2014andwillapplyforaperiodofthreeyears.
• TheAnnualReportonRemunerationsetsoutpaymentsandawardsmadetotheDirectorsanddetailsthelinkbetweenCompanyperformanceandremunerationforthe2013/14financialyear.TheAnnualReportonRemunerationtogetherwiththisletterissubjecttoanadvisoryshareholdervoteattheAGMinSeptember2014.Thesectionsofthisreportthathavebeensubjecttoauditarelabelledaccordingly.
CORPORATE PERFORMANCEBerkeleyhasdeliveredstrongperformanceandgrowthduring2013/14,withthekeyhighlightsbeing:
• Pre-taxreturnonshareholders’equityof27.5%(2013:22.4%)
• Dividendspaidtoshareholdersof£195million(2013:£20million)
• Futureanticipatedgrossmargininthelandbankup5.7%to£3,014million(2013:£2,852million)
• Basicearningspershareincreasedby38.6%to221.8pence(2013:160.0pence)
• Netassetvaluepershareincreasedby5.6%to1,065.6pence(2013:1,009.1pence)
TheresultsunderlinetheGroup’saimofbalancingearningsintheneartermandcreatingasustainablebusiness,deliveringvaluetoshareholdersoverthelongterm.
Berkeley’sReturnonEquitycomparedwiththesectoroverthelastsixyearsillustratestherelativeperformanceoftheCompany:
ReturnonEquityCompany 2008/09 2009/10 2010/11 2011/12 2012/13 2013/14Berkeley 16.2% 13.3% 15.3% 21.2% 22.4% 27.5%Sectorhighest 16.2% 13.3% 15.3% 21.2% 22.4% 27.5%Sectorlowest (73.4%) (44.2%) (6.2%) (0.4%) 3.4% 3.5%Sectoraverage(excludingBerkeley) (26.0%) (18.1%) 1.0% 4.8% 8.5% 11.4%
Berkeley’sremunerationpolicyaimstoencourage,rewardandretaintheExecutivesandensurethattheiractionsarealignedwiththeCompany’sstrategy.
Inparticular,theemphasisonperformancerelatedpayalignstheExecutiveswiththeperformanceofthebusinesswhichiscoupledwithlongtermincentivesthatlockintheExecutiveteamforupto10yearswhichisfarlongerthanistypicalinmostpubliclylistedcompanies.
INCENTIVE OUTCOMES IN 2013/14Thekeyincentiveoutcomesfromtheperformancethisyearare:
• EachExecutiveDirectorearnedthemaximumannualcontributionundertheBonusPlan;
• TheawardsunderPartAofthe2009LTIPvestedduringtheyear.Theexerciseoftheseawardsresultedinanincreaseinshareholdingfor AWPidgley,RCPerrinsandGJFry.
OPERATION OF POLICY IN 2014/15Therearenochangestotheoperationofthepolicyfor2014/15.
TheExecutiveDirectorshavereceivedsalaryincreasesfor2014/15ofapproximately3%,comparedtoaveragesalaryincreasesacrosstheGroupof6.1%.
NEW BONUS PLAN FOR 2015/16TheCommitteeisseekingshareholderapprovalforanewBonusPlanattheSeptember2014AGMwhichwillformpartofthepolicyforthefinancialyear2015/16andsubsequentyears.DetailsofthenewBonusPlanaresetoutintheNoticeofAGManditisproposedthatthePlanwilloperateonthesameprinciplesastheexistingBonusPlan.
IN CONCLUSIONIlookforwardtoreceivingyoursupportfortheresolutionseekingapprovaloftheAnnualReportonRemunerationatourforthcomingAGMaswellasontheRemunerationPolicyapplicabletoourDirectorswhichwillapplyfromtheforthcomingAGMinSeptember2014.
GLYN BARKERCHAIRMAN, REMUNERATION COMMITTEE
DIRECTORS’ REMUNERATION POLICY
ThissectionoftheRemunerationReportcontainsdetailsoftheCompany’sDirectors’RemunerationPolicythatwillgoverntheCompany’sfutureremunerationpayments.ThepolicydescribedinthispartisintendedtoapplyforthreeyearsandwillbeapplicablefromtheCompany’sAGMinSeptember2014subjecttoapprovalbyshareholdersattheAGM.ThepolicypartwillbedisplayedontheCompany’swebsite,intheinvestorrelationsarea,immediatelyafterthe2014AGM.
TheCommitteehasestablishedthepolicyontheremunerationoftheExecutiveDirectors;theBoardhasestablishedapolicyontheremunerationoftheNon-executiveDirectors.
REMUNERATION POLICYTheobjectiveofBerkeley’sremunerationpolicyistoencourage,rewardandretainthecurrentExecutivesandensuretheiractionsarealignedwiththeCompany’sstrategy.Thecorephilosophiesofthepolicyare:
• Fixed remuneration:TheCommitteesetssalariesfortheExecutiveDirectorsbasedontheirexperience,role,individualandcorporateperformance.SalariesonappointmenttotheBoardaresetatalowerquartilelevelofthecomparatorgroupwhich,basedonappropriatelevelsofindividualandcorporateperformance,willbeincreasedwithexperiencegainedovertime.
• Annual performance related pay:TheCommitteebelievesthatshareholders’interestsarebestservedbyremunerationpackagesthathavealargeemphasisonperformance-relatedpaywhichencouragetheExecutiveDirectorstofocusondeliveringthebusinessstrategy.
• Long-term sustainable performance:Thelong-termincentiveswhichextendto2021havebeendesignedtolockintheExecutiveteamforafarlongerperiodthanistypicalinmostpubliclylistedcompanies.ThishelpstoensurethattheExecutiveteamarefocusedongeneratinglong-termsustainablevalueforshareholders,notjustonmeetingshorttermperformancetargets.
• Substantial equity holdings:InordertoaligntheinterestsofExecutiveDirectorsandshareholders,therewardstrategyisdesignedsothat,providedperformanceisdelivered,theExecutiveteambecomematerial(inrelationtotheiroverallcompensation)shareholdersin theCompany.
REMUNERATION POSITIONING ThepolicyistosetthemainelementsoftheExecutiveDirectors’remunerationpackageagainstthefollowingquartilesintheCompany’scomparatorgroup:
Base salary Benefits Pension Annual Bonus Long-term Incentives
Experience&Role Marketpractice Lowerquartile Upperdecile Upperdecile
ForthepurposesofbenchmarkingremunerationtheCommitteeusedthefollowingcomparatorgroupofcompaniesforthe2014/15 financialyear.
AmecPLC BellwayPLC MarshallsPLC TaylorWimpeyPLC
BalfourBeattyPLC BovisHomesGroupPLC PersimmonPLC TravisPerkinsPLC
BarrattDevelopmentsPLC CarillionPLC RedrowPLC
TheCommitteealsoconsiderstheremunerationintheFTSE250asanadditionalbenchmarktothemaincomparatorgroupsetoutaboveduetoitsrelativelysmallnumberofconstituentcompanies.OnanannualbasistheCommitteewillreviewthecomparatorgroupstoensurethattheyremainappropriate.
REMUNERATION POLICY DISCRETIONTheCommitteehasdiscretioninseveralareasofpolicyassetoutinthisreport.TheCommitteemayalsoexerciseoperationalandadministrativediscretionsunderrelevantplanrulesapprovedbyshareholders.Inaddition,theCommitteehasthediscretiontoamendpolicywithregardtominororadministrativematterswhereitwouldbe,intheopinionoftheCommittee,disproportionatetoseekorawaitshareholderapproval.
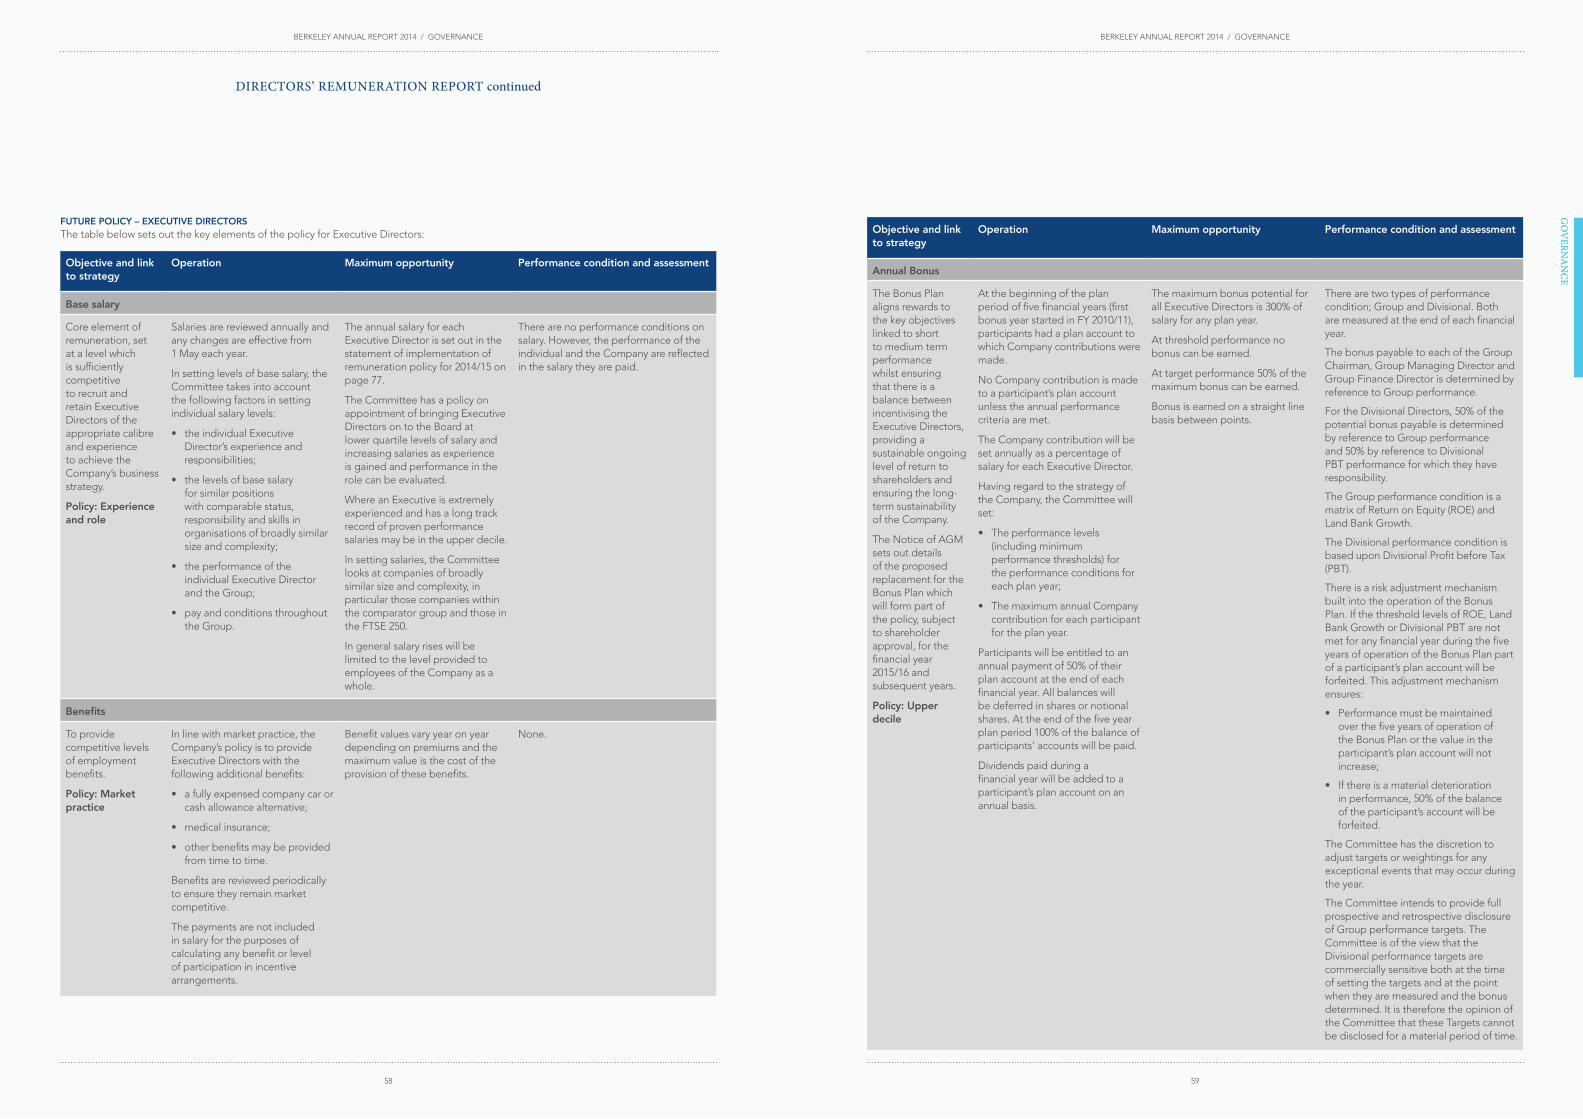
BERKELEY ANNUAL REPORT 2014 / GOVERNANCEBERKELEY ANNUAL REPORT 2014 / GOVERNANCE
58 59
GO
VERN
AN
CE
GO
VERN
AN
CE
DIRECTORS’ REMUNERATION REPORT continued
FUTURE POLICY – EXECUTIVE DIRECTORS ThetablebelowsetsoutthekeyelementsofthepolicyforExecutiveDirectors:
Objective and link to strategy
Operation Maximum opportunity Performance condition and assessment
Base salary
Coreelementofremuneration,setatalevelwhichissufficientlycompetitivetorecruitandretainExecutiveDirectorsoftheappropriatecalibreandexperiencetoachievetheCompany’sbusinessstrategy.
Policy: Experience and role
Salariesarereviewedannuallyandanychangesareeffectivefrom 1Mayeachyear.
Insettinglevelsofbasesalary,theCommitteetakesintoaccountthefollowingfactorsinsettingindividualsalarylevels:
• theindividualExecutiveDirector’sexperienceandresponsibilities;
• thelevelsofbasesalaryforsimilarpositionswithcomparablestatus,responsibilityandskillsinorganisationsofbroadlysimilarsizeandcomplexity;
• theperformanceoftheindividualExecutiveDirectorandtheGroup;
• payandconditionsthroughouttheGroup.
TheannualsalaryforeachExecutiveDirectorissetoutinthestatementofimplementationofremunerationpolicyfor2014/15onpage77.
TheCommitteehasapolicyonappointmentofbringingExecutiveDirectorsontotheBoardatlowerquartilelevelsofsalaryandincreasingsalariesasexperienceisgainedandperformanceintherolecanbeevaluated.
WhereanExecutiveisextremelyexperiencedandhasalongtrackrecordofprovenperformancesalariesmaybeintheupperdecile.
Insettingsalaries,theCommitteelooksatcompaniesofbroadlysimilarsizeandcomplexity,inparticularthosecompanieswithinthecomparatorgroupandthoseintheFTSE250.
IngeneralsalaryriseswillbelimitedtothelevelprovidedtoemployeesoftheCompanyasawhole.
Therearenoperformanceconditionsonsalary.However,theperformanceoftheindividualandtheCompanyarereflectedinthesalarytheyarepaid.
Benefits
Toprovidecompetitivelevelsofemploymentbenefits.
Policy: Market practice
Inlinewithmarketpractice,theCompany’spolicyistoprovideExecutiveDirectorswiththefollowingadditionalbenefits:
• afullyexpensedcompanycarorcashallowancealternative;
• medicalinsurance;
• otherbenefitsmaybeprovidedfromtimetotime.
Benefitsarereviewedperiodicallytoensuretheyremainmarketcompetitive.
Thepaymentsarenotincludedinsalaryforthepurposesofcalculatinganybenefitorlevelofparticipationinincentivearrangements.
Benefitvaluesvaryyearonyeardependingonpremiumsandthemaximumvalueisthecostoftheprovisionofthesebenefits.
None.
Objective and link to strategy
Operation Maximum opportunity Performance condition and assessment
Annual Bonus
TheBonusPlanalignsrewardstothekeyobjectiveslinkedtoshortto medium term performancewhilstensuringthat there is a balancebetweenincentivisingtheExecutiveDirectors,providingasustainableongoinglevelofreturntoshareholders and ensuringthelong-termsustainabilityoftheCompany.
TheNoticeofAGMsets out details oftheproposedreplacementfortheBonusPlanwhichwillformpartofthepolicy,subjectto shareholder approval,forthefinancialyear2015/16andsubsequentyears.
Policy: Upper decile
Atthebeginningoftheplanperiodoffivefinancialyears(firstbonusyearstartedinFY2010/11),participantshadaplanaccounttowhichCompanycontributionsweremade.
NoCompanycontributionismadetoaparticipant’splanaccountunlesstheannualperformancecriteriaaremet.
TheCompanycontributionwillbesetannuallyasapercentageofsalaryforeachExecutiveDirector.
HavingregardtothestrategyoftheCompany,theCommitteewillset:
• Theperformancelevels(includingminimumperformancethresholds)fortheperformanceconditionsforeachplanyear;
• ThemaximumannualCompanycontributionforeachparticipantfortheplanyear.
Participantswillbeentitledtoanannualpaymentof50%oftheirplanaccountattheendofeachfinancialyear.Allbalanceswillbedeferredinsharesornotionalshares.Attheendofthefiveyearplanperiod100%ofthebalanceofparticipants’accountswillbepaid.
Dividendspaidduringafinancialyearwillbeaddedtoaparticipant’splanaccountonanannualbasis.
ThemaximumbonuspotentialforallExecutiveDirectorsis300%ofsalaryforanyplanyear.
Atthresholdperformancenobonuscanbeearned.
Attargetperformance50%ofthemaximumbonuscanbeearned.
Bonusisearnedonastraightlinebasisbetweenpoints.
Therearetwotypesofperformancecondition;GroupandDivisional.Botharemeasuredattheendofeachfinancialyear.
ThebonuspayabletoeachoftheGroupChairman,GroupManagingDirectorandGroupFinanceDirectorisdeterminedbyreferencetoGroupperformance.
FortheDivisionalDirectors,50%ofthepotentialbonuspayableisdeterminedbyreferencetoGroupperformanceand50%byreferencetoDivisionalPBTperformanceforwhichtheyhaveresponsibility.
TheGroupperformanceconditionisamatrixofReturnonEquity(ROE)andLandBankGrowth.
TheDivisionalperformanceconditionisbaseduponDivisionalProfitbeforeTax(PBT).
ThereisariskadjustmentmechanismbuiltintotheoperationoftheBonusPlan.IfthethresholdlevelsofROE,LandBankGrowthorDivisionalPBTarenotmetforanyfinancialyearduringthefiveyearsofoperationoftheBonusPlanpartofaparticipant’splanaccountwillbeforfeited.Thisadjustmentmechanismensures:
• PerformancemustbemaintainedoverthefiveyearsofoperationoftheBonusPlanorthevalueintheparticipant’splanaccountwillnotincrease;
• Ifthereisamaterialdeteriorationinperformance,50%ofthebalanceoftheparticipant’saccountwillbeforfeited.
TheCommitteehasthediscretiontoadjusttargetsorweightingsforanyexceptionaleventsthatmayoccurduringtheyear.
TheCommitteeintendstoprovidefullprospectiveandretrospectivedisclosureofGroupperformancetargets.TheCommitteeisoftheviewthattheDivisionalperformancetargetsarecommerciallysensitivebothatthetimeofsettingthetargetsandatthepointwhentheyaremeasuredandthebonusdetermined.ItisthereforetheopinionoftheCommitteethattheseTargetscannotbedisclosedforamaterialperiodoftime.

BERKELEY ANNUAL REPORT 2014 / GOVERNANCEBERKELEY ANNUAL REPORT 2014 / GOVERNANCE
60 61
GO
VERN
AN
CE
DIRECTORS’ REMUNERATION REPORT continued
Objective and link to strategy
Operation Maximum opportunity Performance condition and assessment
Long-Term Incentive Plan
NoPlanavailablefornewgrantsduringthePolicyPeriod.
Policy: Upper decile
ThemaximumnumberofsharesapprovedbyshareholdersunderTheBerkeleyGroupHoldingsplc2011Long-TermIncentivePlanhasbeengranted.Therefore,noadditionalawardscanbemadeunderthisPlan(unlessoncessationofemploymentbyanexistingparticipantsharesbecomeavailable).
NootherLongTermIncentivePlanarrangementwillbeimplementedbytheCompanyduringthePolicyPeriod.
Pension
Toprovidecompetitivelevelsofretirementbenefit.
Policy: Lower quartile
TheCompany’spolicyiseithertoprovideacontributiontoapensionarrangementorprovidepaymentsinlieuofpension.
MessrsPidgley,Perrins,FryandWhitemancurrentlyreceivepaymentsinlieuofpension.
MessrsSimpkinandElliscurrentlyreceiveapensioncontribution.
Allpaymentsinlieuofpensionaresubjecttoincometaxandnationalinsurance.
Pensionisnotincludedinsalaryfiguresforthepurposesofdetermininganyotherbenefitentitlement.
Themaximumcontributionorpaymentinlieuis25%ofsalary.
TheannualrateforeachExecutiveDirectorissetoutinthestatementofimplementationofremunerationpolicyfor2014/15onpage77.
None.
Shareholding requirement
To ensure that ExecutiveDirectors’interestsarealignedwiththoseofshareholdersoveralongertimehorizon.
Policy: Market practice
TheCommitteeoperatesasystemofshareholderguidelinestoencouragelong-termshareownershipbytheExecutiveDirectors.
ThisshouldbeachievedwithinfiveyearsofappointmentforExecutiveDirectors.
InthecaseoftheGroupChairmanthisis400%ofbasesalary,forotherExecutiveDirectors200%ofbasesalary.TheCommitteeretainsthediscretiontoincreaseshareholdingrequirements.
Shareholdingsasat30April2014areprovidedonpage75.
None.
NOTES TO THE FUTURE POLICY TABLERATIONALE BEHIND SELECTION OF PERFORMANCE MEASURES AND TARGETS FOR BONUS PLANTheannualbonusplanmeasuresprovidedirectalignmentwiththeshorttomedium-termstrategicobjectivesoftheCompany:
Two Group performance targets–Thebalanceofoperatingareturnbasedmeasure(ROE)andavaluebasedmeasure(LandBankGrowth)shouldensurethatthereisabalancebetweenincentivisingtheExecutiveDirectorstoprovideasustainableongoinglevelofreturntoshareholderswhilstensuringthelong-termsustainabilityoftheCompany,asfollows:
• theBonusPlanincentivisesthedeliveryofincreasedprofitsinordertoachieveROEatthesametimeasgrowingthelandbank.ItshouldbenotedthattheROEwillbesetfromachallengingbaseastheCompanyhasnottakenanylandwritedownsasisthecasewiththemajorityofitscompetitors;
• ROEisacompoundmeasureandthereforeifshareholderfundsarereinvestedandnotpaidasdividends,earningsgrowthwillbecompoundedtoachievethetargets;
• thefactthattheBonusPlantargetsalsoincludegrowthinthelandbankvalue,meansthatExecutiveDirectorsareencouragedtoacquirelandinthecurrentmarketonfavourabletermsaswellasmaximisesustainableprofitgrowth;
• ROEasameasurehighlightstheinefficiencyofretainingsurpluscashonthebalancesheet.Inordertodeliverthetargetedlevelofreturns,thiswillencouragetheCompanytoinvestorreturncashtoshareholders.
Level of targets–TheCommitteewishestoincentivisetheExecutiveDirectorstoachieveagoodlevelofreturnstoshareholderswhilstensuringthelong-termsustainabilityoftheCompany.Thereforethetargetssethavetotakeintoaccountanappropriatelevelofrisk.TheBonusPlanallowsaclosetailoringbytheCommitteeoftheperformanceconditionstothebudgetandperformanceoftheCompanyforeachfinancialyear.
Divisional PBT targets –TheDivisionaltargetswerechosentoensuretheDivisionalDirectorsareappropriatelyfocusedontheprofitabilityoftheirrespectiveDivisionswhichultimatelyenhancethedeliveryofreturnstoshareholders.ThetargetsaresetbytheCommitteeatthebeginningofthefinancialyearatalevelwhichischallengingtakingintoaccountthepotentiallevelofbonuspayments,themarket,developmentavailabilityandotherrelevantissues.
RECOVERY PROVISIONSUnderthetermsoftheBonusPlan,thereisariskadjustmentmechanismbuiltinsothatshouldthresholdlevelsofperformancenotbeachieved,50%ofthebalanceoftheparticipant’saccountwillbeforfeited.
Norecoveryprovisionsapplytosalary,benefitsandpension.
CHANGES TO REMUNERATION POLICY FROM PREVIOUS POLICYTherehavebeennochangestotheoperation,maximumopportunityorperformancemeasuresinrelationtothesalary,annualbonus,pensionandotherbenefits.
DIFFERENCES IN REMUNERATION POLICY FOR ALL EMPLOYEESTheGroupseekstoestablishremunerationpackagesthatwillattract,retainandmotivatehighqualityemployees.Salaryandbenefitpackagesforallemployeesarelinkedtobothindividualandbusinessperformance.
TheCompany’sbusinesscomprisesofanumberofoperatingDivisions.TheannualandlongertermcashbasedcompensationarrangementsfortheseothersenioremployeesoftheCompanyarethereforelinkedtotheperformanceoftherelevantDivisionforwhichtheywork.Someelementsofthecashbonusplansareannualwhileotherelementsaredeferredtoensurelong-termconsistentdeliverybyeachDivision.ItistheviewofboththeCommitteeandtheBoardasawholethatthesearrangementsareveryeffectiveatensuringthedeliveryofDivisionalperformanceforwhichthesesenioremployeesareresponsible.
Allothereligibleemployeesparticipateinbonusplans,which,togetherwithsalaryreviewslinkedtobusinessperformance,enableallemployeestoshareinthesuccessoftheGroup.
ELEMENTS OF PREVIOUS POLICY THAT WILL CONTINUE TO APPLYThefollowingsubsistingawardswillcontinuetooperateonthetermsandconditionssetoutintherelevantplanrules,asapprovedbyshareholdersinrelationtothe2009LTIPand2011LTIP.Fulldetailsofthesubsistingawardsaresetoutinpreviousyear’sCommitteeReports.
Awardsunderthesearrangementsdonotformpartoftheongoingremunerationpolicy;howeverpaymentsmaybemadeinthefuturesubjecttotheachievementoftherelevantperformanceconditions.
Objective and link to strategy
Operation Maximum opportunity Performance condition and assessment
Awards granted under the Berkeley Group Holdings plc 2009 Long-Term Incentive Plan (2009 LTIP)
The2009LTIPalignsExecutiveDirectorinterests with those ofshareholdersbyfocusingondeliveringsustainablesuperior returns to shareholders.
Approvedbyshareholders at the2009EGMandamended at the 2011AGM.
Furtherdetailsonthe2009LTIParesetoutinthe2009NoticeofEGMand2011NoticeofAGM.
Followingshareholderapprovalon15April2009,amaximumof7,100,000shareswerecapableofbeinggrantedunderPartBofthe2009LTIP.
ThegrantsunderPartBofthe2009LTIPwillvestintwotranches,subjecttocertainconditions:
• 50%on15April2015;
• 50%on15April2016.
Shareholderapprovalwasreceivedatthe2011AGMtoamendtherulesofthe2009LTIP(coveringbothPartAandPartB)sothatthetermsofexistingoptionsgrantedcanbeadjustedintheeventofthepaymentofacashdividendordividendinspecie.Thisprovidesthatwheresuchadividendispaidtheadjustmentwillbeareductionintheexercisepriceofanoptionbytheamountorvalueofthedividendprovidedthattheexercisepricecanneverbelessthanzeroandareductionwillonlybemadetotheexercisepriceofanoptionthatisnotthencapableofexercise.
AwardsunderPartAofthe2009LTIPwereallexercisedinJanuary2014.
Atotalof6,090,000optionsareoutstandingunderPartBofthe2009LTIP(heldbyExecutiveDirectorsandothersenioremployees)andnonewawardswillbegranted.
ThegrantsunderPartBofthe2009LTIPareoptionswhichwillvestsubjectto:
• continuedemploymenttotherelevantvestingdate;
• thesatisfactionoftheunderpinconditionthatNetAssetsPerShareareatleast£9.00ateachofthevestingdates.TheCommitteedeterminedtoincreasetheNetAssetPerShareunderpinforthevestingofoptionsfrom£5.94setatthedateofgrantto£9.00andtorequirethatthisunderpinbemetateachofthevestingdates.

BERKELEY ANNUAL REPORT 2014 / GOVERNANCEBERKELEY ANNUAL REPORT 2014 / GOVERNANCE
62 63
GO
VERN
AN
CE
DIRECTORS’ REMUNERATION REPORT continued
Objective and link to strategy
Operation Maximum opportunity Performance condition and assessment
Deferred balances under the Berkeley Group Holdings plc Bonus Plan (the Bonus Plan)
Provideslong-term shareholder alignmentforExecutiveDirectorsbydeferringaproportionoftheannual award under theBonusPlan.
Participantsareentitledtoanannualpaymentof50%oftheirplanaccountattheendofeachfinancialyear.
Allbalanceswillbedeferredinsharesornotionalshares.Attheendofthefiveyearplanperiod100%ofthebalanceofparticipants’accountswillbepaid.
SeeAnnualBonusPlanonpage71forfurtherdetails.
DeferredawardsundertheBonusPlanfrompreviousfinancialyearswillbepartoftheCompany’songoingarrangements.
Fulldetailsofthesubsistingawardsaresetoutinpreviousyear’sCommitteeReports.
Seepages71to73.
Awards granted under the Berkeley Group Holdings plc 2011 Long-Term Incentive Plan (2011 LTIP)
The2011LTIPalignsExecutiveDirectorinterests with those ofshareholdersbyfocusingoncreatingsustainablesuperior returns to shareholdersovera10yearperiod.
Approvedbyshareholders at the2011AGMandamended at the 2012AGM.
Furtherdetailsonthe2011LTIParesetoutinthe2011NoticeofAGMand2012NoticeofAGM.
The2011LTIPisatenyearplanwhichsupportstheCompany’slongtermplantomakeapriorityreturnofapproximately£1.7billiontoshareholders,representing183%oftheNetAssetsperShareat30April2011(£7.09/share),throughacombinationofdividendsandsharebuy-backs,bySeptember2021.
Theplanaimstomakethereturnstoshareholdersincashoverasustainedperiod,ensuringtheGroupremainsattherightsizeandbalancesinvestmentandreturnstoshareholders.
IftheCompanyreturns£1.7billiontoshareholdersoveratenyearperiodviaaseriesofdividendpayments(£13/share)andsharebuy-backsbythedatesreferredtointhefootnotetothistable,participantswillbeentitledtoexerciseoptionsandreceiveanumberofordinarysharesintheresidualcapitaloftheCompanyattheendofthetenyearperiodafterthereturnshavebeendistributed.
Theexercisepriceofoptionsgrantedunderthe2011LTIPwillbe£13persharelessanamountequaltothevalueofalldividendspaidbetweenthedateofapprovalofthe2011LTIPand30September2021,providedtheexercisepricecannotbelessthanzero.
Themaximumnumberofsharescapableofbeingearnedbyallparticipantsis19,616,503shares,being13%ofthefullydilutedsharecapitaloftheCompanyatthedateofapprovaloftheplan.
TheawardsforeachExecutiveDirectoraresetoutbelow:
Executive Director
Number of shares
A W Pidgley 5,000,000
R C Perrins 5,000,000
N G Simpkin 3,250,000
S Ellis 2,250,000
K Whiteman 1,000,000
G J Fry 1,866,503
IncludingawardstoothersenioremployeesoftheCompany,optionsoveratotalof19,616,503sharesareoutstanding.
Nonewawardswillbegrantedunderthe2011LTIPtothecurrentExecutiveDirectors.
Performancewillbemeasuredagainstcumulativedistributiontargets.
Thenotestothistablesetoutthecumulativedistributionsrequiredbytherelevantdatesandtheconsequencesoffailingtodeliverthesedistributions.
NOTES TO ELEMENTS OF PREVIOUS POLICY THAT WILL CONTINUE TO APPLY
RATIONALE BEHIND SELECTION OF PERFORMANCE MEASURES AND TARGETSThe2009LTIPand2011LTIPmeasureswereselectedastheCommitteebelievestheyprovidedirectalignmentwiththelong-termstrategicobjectivesoftheCompanyandshareholders.The2011LTIPplanaimstomaximisereturnswithinagivenlevelofrisk,discipliningthebusinesstomakesignificantreturnstoshareholdersincashoverasustainedperiodandbalancesinvestmentandreturnstoshareholders.
2011 LTIP PERFORMANCE TARGETSThefollowingtablesetsoutthecumulativedistributions,therelevantdatesandtheconsequencesoffailingtodeliverthesedistributionsbytheserelevantdates:
Required date Cumulative distribution (on or before required date)
Consequences of failing to make the cumulative distributions on or before the required date
30September2015 £568.7m Optionslapse,nosharesvestand2011LTIPterminateson1October2015.
30September2018 £1,136.1m Wherethecumulativedistributionsonorbefore30September2018islessthan£1,136.1m,thefollowingprocessdeterminesthenumberofsharesvesting:-
1Thenumberofsharescapableofvestingiscalculatedonthelevelofdividendpaidandcapableofbeingpaidasat30September2018.
2Theexercisepriceofthesharescapableofvestingissetbyreducingtheoriginalexercisepriceof£13bythelevelofcumulativedividendactuallypaidonorbefore30September2021.
3Noshareswillvestuntiltheendofthe2011LTIPperiodon30September2021subjecttotheparticipant’scontinuedemploymentatthisdate.
30September2021 £1,703.6m Theprocessisthesameasabovewiththerelevantdatebeing 30September2021.
£1,703.6mpaidinfullpriorto30September2021(including£13/shareindividends)
£1,703.6m Incircumstanceswhere£1,703.6mofcumulativedistributions(including£13/shareindividends)aremadepriorto30September2021awardsshallvestinfull.
Participantswillbeabletoexercisetheirawardsofoptionsfromthedatethiscumulativetargetismetandmayalsosellanysharesnecessarytopaytheirtaxliabilityonexercise.
Inrespectofthebalanceoftheirsharesparticipantsshallonlybeabletosellamaximumof10%p.a.ofthisbalanceuntil30September2021atwhichdatethesalerestrictionsshalllapse.

BERKELEY ANNUAL REPORT 2014 / GOVERNANCEBERKELEY ANNUAL REPORT 2014 / GOVERNANCE
64 65
GO
VERN
AN
CE
DIRECTORS’ REMUNERATION REPORT continued
ILLUSTRATIONS OF APPLICATION OF REMUNERATION POLICYThegraphsbelowseektodemonstratehowpayvarieswithperformancefortheExecutiveDirectorsbasedonourstatedremuneration policyfor2014/15financialyear.Whilstthehistoriclong-termincentiveplansdonotformpartofthefutureremunerationpolicyfor2014/15,theExecutiveDirectorsareworkingtowardstheachievementoftherelevanttargetsandtheyhavethereforebeenincludedinthe illustrationsbelow.
Assumptionsusedindeterminingthelevelofpay-outundergivenscenariosareasfollows:
Element Minimum On-target Maximum
Fixed Elements Fixedelementsdonotvarywithperformanceandcomprise:
• 2014/15basesalary
• Estimatedbenefitsfor2014/15
• Pension(orcashinlieuof)contributions.
Annual Variable Element
Bonus Plan
Annualcashelementwhereperformancemeasuresrelatetoonefinancialyear
0% 25%ofmaximumaward1,2 50%maximumaward1
Multiple Reporting Period Elements
Bonus Plan
Deferredelementwhereperformancemeasuresrelatetomorethanonefinancialyear
0% 25%ofmaximumaward1,2 50%maximumaward1
2011 LTIP 0% 50%vesting3 100%vesting3
2009 LTIP Part B 0% 50%vesting4 100%vesting4
Notes
1. ThetotalunderallelementsoftheBonusPlanisamaximumof175%-300%ofsalaryp.a.dependentuponExecutiveDirector.
2. Alevelof50%vestingfor‘on-target’performancereflectsthemid-pointoftheperformancerangeundertheBonusPlanGroupperformancematrixandPBTDivisionaltargets.Seepage78formoredetails.
3. The2011LTIPisaone-offawardgrantedovera10yearperiodthereforewehaveusedonetenthoftheIFRS2fairvalueoftheoptionsatthedateofgrantastheMaximumand50%ofthisvalueforOn-Target.
4. The2009LTIPPartBisaone-offawardwhichvestsover6and7years(50%in2015and50%in2016).ThereforewehaveusedonesixthandoneseventhofIFRS2fairvaluesoftheoptionsatthedateofgrantastheMaximumand50%ofthisvalueforOn-Target.
5. InaccordancewiththeRegulations,noallowancehasbeenmadeforsharepriceappreciation.
FUTURE POLICY – NON-EXECUTIVE DIRECTORSThetablebelowsetsoutthekeyelementsofthepolicyforNon-executiveDirectors:
Objective and link to strategy
Operation Maximum Performance conditions and assessment
ToattractNon-executiveDirectorswiththerequisiteskillsandexperiencetocontributetothestrategyoftheCompanyandtoreviewitsimplementation.
AllNon-executiveDirectorshavespecifictermsofengagementandtheirremunerationisdeterminedbytheBoardwithinthelimitssetbytheArticlesofAssociation.
EachNon-executiveDirectorreceivesafeewhichrelatestomembershipoftheBoardandadditionalfeesarepaidforCommitteeChairmanship.
Inexceptionalcircumstances,feesmayalsobepaidforadditionaltimespentontheCompany’sbusinessoutsideofthenormalduties.
TheBoardreviewsthefeesoftheNon-executiveDirectorsannuallytakingintoaccountthefollowingfactors:
• theworkloadandlevelofresponsibilityoftheNon-executiveDirectorsunderthechangingcorporategovernanceexpectationsofshareholdersandtheirrepresentativebodies;
• thecurrentmarketrateforfeesforNon-executiveDirectorsbasedonthecomparatorsusedfortheExecutiveDirectors.
Changesareeffectivefrom1Mayeachyear.
TheCompanyhasashareholdingrequirementforNon-executiveDirectors,linkedtonetfeetheyreceivefromtheCompany.Thisisequalto100%ofnetfees.ThisshouldbeachievedwithinthreeyearsofappointmentforNon-executiveDirectors.
Currentfeelevelsaresetoutinthestatementofimplementationofremunerationpolicyonpage79.
IngeneralfeeriseswillbelimitedtothelevelprovidedtoemployeesoftheCompanyasawhole.
Insettingfees,theBoardlooksattheupperquartilefeelevelsofcompaniesofbroadlysimilarsizeandcomplexity,inparticularthosecompanieswithinthecomparatorgroupandthoseintheFTSE250.
OnanannualbasistheBoardwillreviewthecomparatorgroupstoensuretheyappropriatelyreflecttheCompany’ssize,operationsandbusinesscomplexities.
N/A
Non-executiveDirectorscannotparticipateinanyoftheCompany’sshareincentiveplansorperformancebasedplansandarenoteligibletojointheCompany’spensionscheme.
APPROACH TO RECRUITMENT REMUNERATIONTheCommittee’sapproachtorecruitmentremunerationistopaynomorethanisnecessarytoattractcandidatesoftheappropriatecalibreandexperienceneededfortherole.TheremunerationpackageforanynewrecruitwouldbeassessedfollowingthesameprinciplesasforthecurrentExecutiveDirectors.
TheCommitteeismindfulthatitwishestoavoidpayingmorethanitconsidersnecessarytosecurethepreferredcandidateandisawareofguidelinesandshareholdersentimentregardingone-offorenhancedshortorlong-termincentivepaymentsmadeonrecruitmentandtheappropriatenessofanyperformanceconditionsassociatedwithanaward.
A W Pidgley (£000)
R C Perrins(£000)
617
2,297
3,977
100% 27%16%
57%
16%
19%
66%
1,013
Minimum On-target Maximum Minimum On-target Maximum Minimum On-target Maximum
3,318
5,623
100% 31%
19%
51%
18%
22%
60%
Minimum On-target Maximum Minimum On-target Maximum Minimum On-target Maximum
G J Fry(£000)
FixedKey: Annual variable Multiple reporting period
424
1,112
1,801
100% 38%14%
48%
23%
17%
60%
N G Simpkin(£000)
403
1,329
2,254
100% 30%14%
56%
18%
16%
66%
K Whiteman (£000)
S Ellis(£000)
399
1,144
1,890
100% 35%15%
50%
21%
19%
60%
396
884
1,372
100% 45%
16%
39%
29%
21%
50%
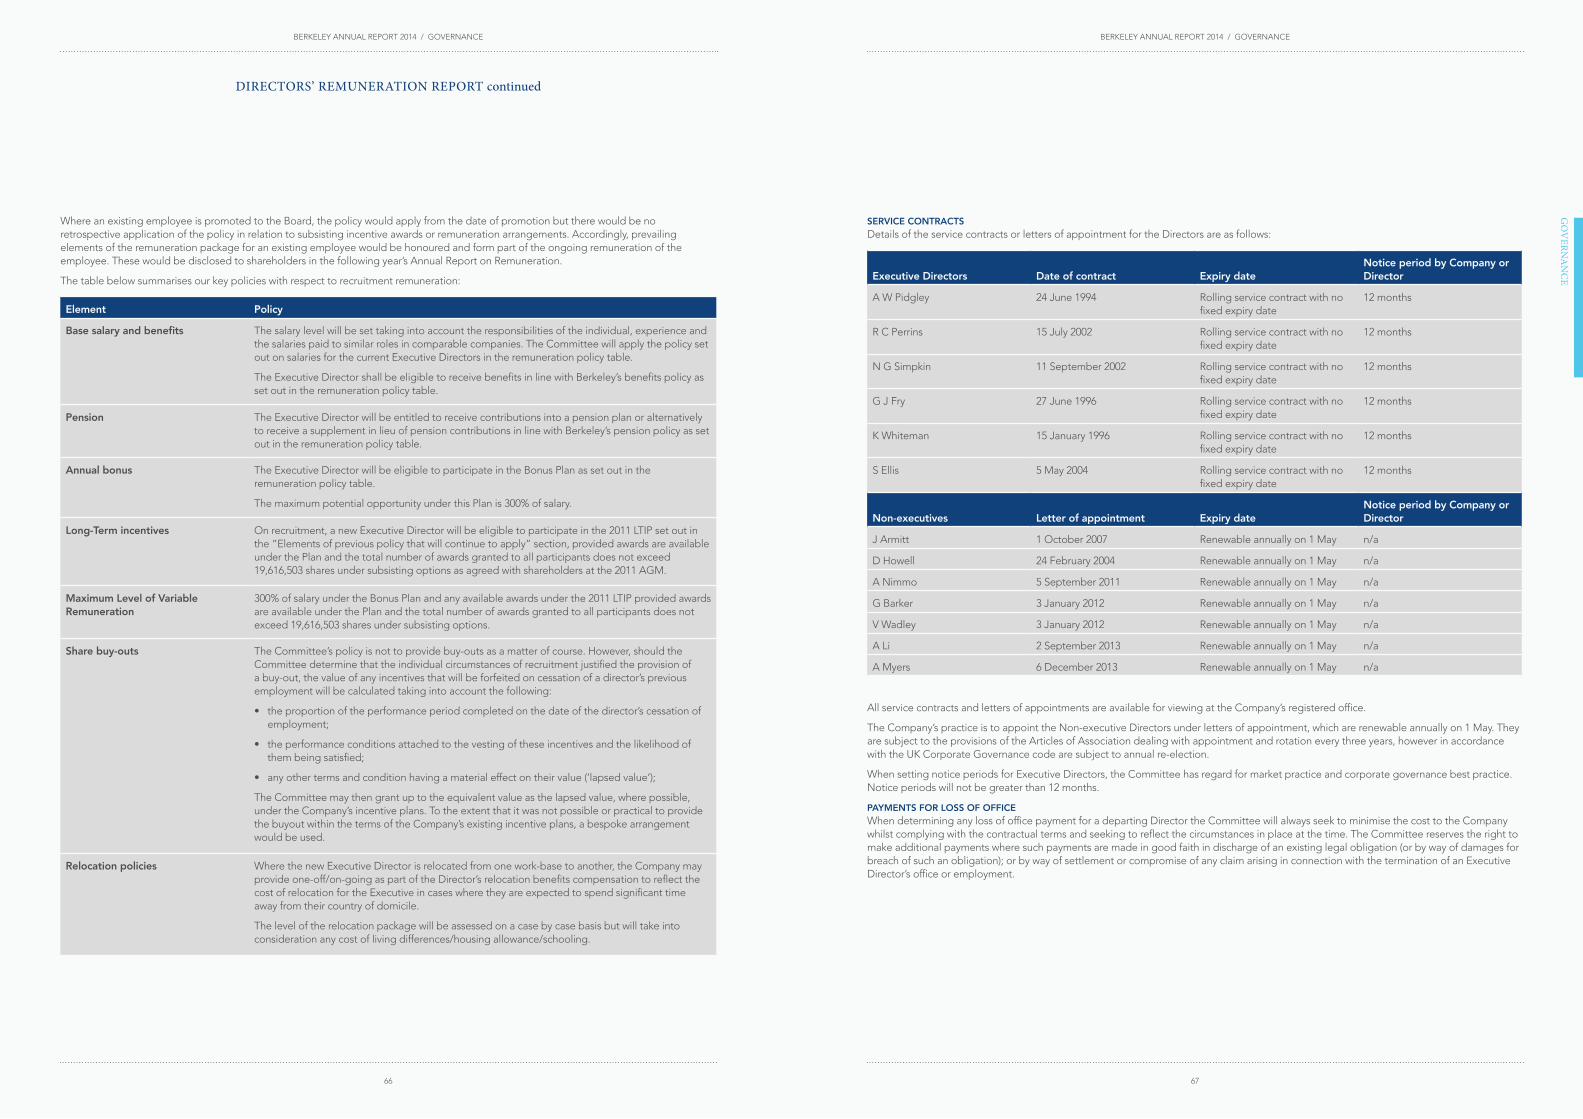
BERKELEY ANNUAL REPORT 2014 / GOVERNANCEBERKELEY ANNUAL REPORT 2014 / GOVERNANCE
66 67
GO
VERN
AN
CE
DIRECTORS’ REMUNERATION REPORT continued
WhereanexistingemployeeispromotedtotheBoard,thepolicywouldapplyfromthedateofpromotionbuttherewouldbenoretrospectiveapplicationofthepolicyinrelationtosubsistingincentiveawardsorremunerationarrangements.Accordingly,prevailingelementsoftheremunerationpackageforanexistingemployeewouldbehonouredandformpartoftheongoingremunerationoftheemployee.Thesewouldbedisclosedtoshareholdersinthefollowingyear’sAnnualReportonRemuneration.
Thetablebelowsummarisesourkeypolicieswithrespecttorecruitmentremuneration:
Element Policy
Base salary and benefits Thesalarylevelwillbesettakingintoaccounttheresponsibilitiesoftheindividual,experienceandthesalariespaidtosimilarrolesincomparablecompanies.TheCommitteewillapplythepolicysetoutonsalariesforthecurrentExecutiveDirectorsintheremunerationpolicytable.
TheExecutiveDirectorshallbeeligibletoreceivebenefitsinlinewithBerkeley’sbenefitspolicyassetoutintheremunerationpolicytable.
Pension TheExecutiveDirectorwillbeentitledtoreceivecontributionsintoapensionplanoralternativelytoreceiveasupplementinlieuofpensioncontributionsinlinewithBerkeley’spensionpolicyassetoutintheremunerationpolicytable.
Annual bonus TheExecutiveDirectorwillbeeligibletoparticipateintheBonusPlanassetoutintheremunerationpolicytable.
ThemaximumpotentialopportunityunderthisPlanis300%ofsalary.
Long-Term incentives Onrecruitment,anewExecutiveDirectorwillbeeligibletoparticipateinthe2011LTIPsetoutinthe“Elementsofpreviouspolicythatwillcontinuetoapply”section,providedawardsareavailableunderthePlanandthetotalnumberofawardsgrantedtoallparticipantsdoesnotexceed19,616,503sharesundersubsistingoptionsasagreedwithshareholdersatthe2011AGM.
Maximum Level of Variable Remuneration
300%ofsalaryundertheBonusPlanandanyavailableawardsunderthe2011LTIPprovidedawardsareavailableunderthePlanandthetotalnumberofawardsgrantedtoallparticipantsdoesnotexceed19,616,503sharesundersubsistingoptions.
Share buy-outs TheCommittee’spolicyisnottoprovidebuy-outsasamatterofcourse.However,shouldtheCommitteedeterminethattheindividualcircumstancesofrecruitmentjustifiedtheprovisionofabuy-out,thevalueofanyincentivesthatwillbeforfeitedoncessationofadirector’spreviousemploymentwillbecalculatedtakingintoaccountthefollowing:
• theproportionoftheperformanceperiodcompletedonthedateofthedirector’scessationofemployment;
• theperformanceconditionsattachedtothevestingoftheseincentivesandthelikelihoodofthembeingsatisfied;
• anyothertermsandconditionhavingamaterialeffectontheirvalue(‘lapsedvalue’);
TheCommitteemaythengrantuptotheequivalentvalueasthelapsedvalue,wherepossible,undertheCompany’sincentiveplans.TotheextentthatitwasnotpossibleorpracticaltoprovidethebuyoutwithinthetermsoftheCompany’sexistingincentiveplans,abespokearrangementwouldbeused.
Relocation policies WherethenewExecutiveDirectorisrelocatedfromonework-basetoanother,theCompanymayprovideone-off/on-goingaspartoftheDirector’srelocationbenefitscompensationtoreflectthecostofrelocationfortheExecutiveincaseswheretheyareexpectedtospendsignificanttimeawayfromtheircountryofdomicile.
Theleveloftherelocationpackagewillbeassessedonacasebycasebasisbutwilltakeintoconsiderationanycostoflivingdifferences/housingallowance/schooling.
SERVICE CONTRACTSDetailsoftheservicecontractsorlettersofappointmentfortheDirectorsareasfollows:
Executive Directors Date of contract Expiry dateNotice period by Company or Director
AWPidgley 24June1994 Rollingservicecontractwithnofixedexpirydate
12months
RCPerrins 15July2002 Rollingservicecontractwithnofixedexpirydate
12months
NGSimpkin 11September2002 Rollingservicecontractwithnofixedexpirydate
12months
GJFry 27June1996 Rollingservicecontractwithnofixedexpirydate
12months
KWhiteman 15January1996 Rollingservicecontractwithnofixedexpirydate
12months
SEllis 5May2004 Rollingservicecontractwithnofixedexpirydate
12months
Non-executives Letter of appointment Expiry dateNotice period by Company or Director
JArmitt 1October2007 Renewableannuallyon1May n/a
DHowell 24February2004 Renewableannuallyon1May n/a
ANimmo 5September2011 Renewableannuallyon1May n/a
GBarker 3January2012 Renewableannuallyon1May n/a
VWadley 3January2012 Renewableannuallyon1May n/a
ALi 2September2013 Renewableannuallyon1May n/a
AMyers 6December2013 Renewableannuallyon1May n/a
AllservicecontractsandlettersofappointmentsareavailableforviewingattheCompany’sregisteredoffice.
TheCompany’spracticeistoappointtheNon-executiveDirectorsunderlettersofappointment,whicharerenewableannuallyon1May.TheyaresubjecttotheprovisionsoftheArticlesofAssociationdealingwithappointmentandrotationeverythreeyears,howeverinaccordancewiththeUKCorporateGovernancecodearesubjecttoannualre-election.
WhensettingnoticeperiodsforExecutiveDirectors,theCommitteehasregardformarketpracticeandcorporategovernancebestpractice.Noticeperiodswillnotbegreaterthan12months.
PAYMENTS FOR LOSS OF OFFICE WhendetermininganylossofofficepaymentforadepartingDirectortheCommitteewillalwaysseektominimisethecosttotheCompanywhilstcomplyingwiththecontractualtermsandseekingtoreflectthecircumstancesinplaceatthetime.TheCommitteereservestherighttomakeadditionalpaymentswheresuchpaymentsaremadeingoodfaithindischargeofanexistinglegalobligation(orbywayofdamagesforbreachofsuchanobligation);orbywayofsettlementorcompromiseofanyclaimarisinginconnectionwiththeterminationofanExecutiveDirector’sofficeoremployment.

BERKELEY ANNUAL REPORT 2014 / GOVERNANCEBERKELEY ANNUAL REPORT 2014 / GOVERNANCE
68 69
GO
VERN
AN
CE
DIRECTORS’ REMUNERATION REPORT continued
ThetablebelowsetsouttheCompany’sterminationpolicyinrespectofExecutiveDirectorcontractsforeachelementoftotalremuneration.ForeachelementthetablealsosetsouttheboundariesofCommitteediscretiontoapplyflexibilitytothedefaultposition.
Element Approach Application of Committee discretion
Base salary and benefits IntheeventofterminationbytheCompany,therewillbenocompensationforlossofofficeduetomisconductornormalresignation.
Inothercircumstances,ExecutiveDirectorsmaybeentitledtoreceivecompensationforlossofofficewhichwillbeamaximumoftwelvemonthssalary.
SuchpaymentswillbeequivalenttothemonthlysalaryandbenefitsthattheexecutivewouldhavereceivedifstillinemploymentwiththeCompany.ExecutiveDirectorswillbeexpectedtomitigatetheirlosswithinatwelvemonthperiodoftheirdeparturefromtheCompany.
TheCommitteehasdiscretiontomakealumpsumpaymentinlieu.
Pension Pensioncontributionsorpaymentsinlieuofpensioncontributionwillbemadeduringthenoticeperiod.Noadditionalpaymentswillbemadeinrespectofpensioncontributionsforlossofoffice.
TheCommitteehasdiscretiontomakealumpsumpaymentinlieu.
Annual bonus
ThetreatmentoftheBonusPlanisgovernedbytherulesoftheplan.
Cessation of employment
IfaparticipantceasestobeemployedbyaGroupCompanyforanyreasonanawardthathasnotvestedshalllapseunlesstheCommitteeinitsabsolutediscretiondeterminesotherwisefor‘goodleaver’reasons(including,butnotlimitedto,injury,disability,illhealth,retirement,redundancyortransferofthebusiness).
IftheCommittee,determinesthatdeferredawardsheldinaparticipantsplanaccountshallnotlapseoncessationofemployment,alldeferredawardsheldintheparticipant’splanaccountshallvestimmediatelyandtheCommitteeshalldetermine:
(a)whetherthemeasurementdateforthatplanyearisbroughtforwardtothedateofcessationorremainsattheendoftheplanyear;
(b)whetherareductionisappliedtothepaymenttotakeaccounttheproportionoftheplanyearelapsedandthecontributiontotheGroup.
IftheCommitteedeterminesthatthemeasurementdateisthedateofcessation,theCommitteeshallpro-ratetheperformanceconditionstothedateofcessation.
TheCommitteehasthediscretiontodeterminethatanExecutiveDirectorisagoodleaver.
TheCommitteeretainsdiscretiontosetthemeasurementdateforthepurposesofdeterminingperformancemeasurementandwhethertopro-ratethecontributionforthatplanyear.
ItshouldbenotedthatitistheCommittee’spolicyonlytoapplysuchdiscretionsifthecircumstancesatthetimeare,initsopinion,sufficientlyexceptional,andtoprovideafullexplanationtoshareholderswherediscretionisexercised.
Change of control
Onachangeofcontrol,alldeferredawardsheldinaparticipant’splanaccountshallvestimmediatelyandtheCommitteeshalldetermine:
(a)thatthemeasurementdateisthedateofthechangeofcontrol;
(b)whetherareductionisappliedtothepaymenttotakeaccounttheproportionoftheplanyearelapsedandtheparticipant’scontributiontotheGroup.
TheCommitteeshallpro-ratetheperformanceconditionstothemeasurementdate.
Intheeventofaninternalreorganisation,theCommitteemaydeterminethatawardsarereplacedbyequivalentawards.
TheCommitteeretainsdiscretiontopro-ratethecontributionforthatplanyear.
ItistheCommittee’spolicyinnormalcircumstancestopro-ratetotime;however,inexceptionalcircumstanceswherethenatureofthetransactionproducesexceptionalvalueforshareholdersandprovidedtheperformancetargetsaremettheCommitteewillconsiderwhetherpro-ratingisequitable.
2009 LTIP Part B
Thetreatmentof2009LTIPPartBawardsisgovernedbytherulesoftheplan,asapprovedbyshareholdersatthe2009EGMandtheamendmentapprovedatthe2011AGM.
Cessation of employment
IfaparticipantceasestobeemployedbyaGroupCompanyforanyreasonotherthandeath,injury,ill-health,disability,retirement,theemployingCompanyceasingtobeaGroupCompanyoratransferofthebusinessoranyotherreasondeterminedbytheCommittee,theparticipant’soptionshalllapse.
For‘goodleaver’reasonsnotedabove,thenumberofsharesunderoptioncapableofvestingwillbecalculatedbypro-ratingtotheamountoftherelevantvestingperiodcompletedonthedateofcessationofemployment.Awardswillonlyvestattheendoftherelevantvestingperiodsubjecttothesatisfactionoftheperformancecondition.
Theexercisepriceshallbeadjustedforthepaymentofanycashdividendordividendinspecieinaccordancewiththeplanrules.
TheCommitteehasthediscretiontodeterminethatanExecutiveDirectorisagoodleaver.
TheCommitteewillonlyuseitsgeneraldiscretiontodeterminethatanExecutiveDirectorisagoodleaverinexceptionalcircumstancesandwillprovideafullexplanationtoshareholders,ifpossibleinadvance,ofthebasisforitsdetermination.
Element Approach Application of Committee discretion
2009 LTIP Part B continued Change of control
OnachangeofcontroloftheCompanyorCourtsanctionofaschemeofarrangement,alloptionsshallbeexercisable.Thenumberofsharesunderoptionexercisableonachangeofcontrolwillbedeterminedbypro-ratingthetimeelapsedfromthedateofgranttothedateofthechangeofcontrolcomparedtotheoriginalvestingperiodandsubjecttothesatisfaction(asdeterminedbytheCommitteeinitsabsolutediscretion)oftheperformanceconditionatthedateofthechangeofcontrol.
Theexercisepriceshallbeadjustedforthepaymentofanycashdividendordividendinspecietothedateoftherelevanttransactioninaccordancewiththeplanrules.
Intheeventofaninternalreorganisation,optionsshallnotvestunlesstheBoardconsentsandtheBoardmaydeterminethatoptionsareexchangedforanoptionoverasuccessorcompany’sshares.
TheCommitteehavethediscretiontodeterminehowtheperformanceconditiontakenintoaccountonachangeofcontrol.TheBoardwillonlyusethisdiscretioninexceptionalcircumstancesandwillprovideafullexplanationtoshareholders,ifpossibleinadvance,ofthebasisforitsdetermination.
2011 LTIP
Thetreatmentof2011LTIPawardsisgovernedbytherulesoftheplan,asapprovedbyshareholdersatthe2011AGMMeetingandtheamendmentapprovedatthe2012AGM.
Cessation of employment
IfaparticipantceasestobeemployedbyaGroupCompanyforanyreasonotherthandeath,injury,ill-health,disability,redundancy,retirement,theemployingCompanyceasingtobeaGroupCompanyoratransferofthebusinessoranyotherreasondeterminedbytheCommittee,theparticipant’soptionshalllapse.
For‘goodleaver’reasonsnotedabove,theCommitteewilldeterminethenumberofsharescapableofvestingtakingintoaccountdividendspaidpershareandsharebuy-backsasattheterminationdateandthenumberofsharesunderoptionheldbytheparticipant.
Theexercisepriceshallbeadjustedforanydividendspaidinaccordancewiththeplanrules.
TheCommitteehasthediscretiontodeterminethatanExecutiveDirectorisagoodleaver.
TheCommitteewillonlyuseitsgeneraldiscretiontodeterminethatanExecutiveDirectorisagoodleaverinexceptionalcircumstancesandwillprovideafullexplanationtoshareholders,ifpossibleinadvance,ofthebasisforitsdetermination.
Change of control
AnoptionwillbecomeexercisableinfullimmediatelypriortoachangeofcontroloftheCompany,Courtsanctionofaschemeofarrangementorthedisposalofall,orsubstantiallyall,oftheassetsoftheCompanyanditssubsidiaries.
Theexercisepriceshallbeadjustedforanydividendsmadetothedateoftherelevanttransactioninaccordancewiththeplanrules.
Intheeventofaninternalreorganisation,optionsshallnotvestunlesstheCommitteeconsentsandtheCommitteemaydeterminethatoptionsareexchangedforanoptionoverasuccessorcompany’sshares.
ConsiderationshallbegivenbytheCommittee,inconsultationwiththeparticipants,astowhetherthetypeortimingofanyconsiderationreceivablebyshareholdersshouldaffecteitherthetimingoftheexerciseofoptionsand/oralterthecalculationoftheexercisepricesuchthattheparticipantsdonotreceiveagreaterorlesserbenefitfromthetransactionthantheshareholdersbeyondtheabilitytoexercisetheiroptions.
Other contractual obligations
Nocontractualprovisionagreedpriorto27thJune2012thatcouldimpactquantumofthepayment.
None.
CONSIDERATION OF EMPLOYMENT CONDITIONS ELSEWHERE IN THE COMPANY InmakingannualpaydecisionstheCommitteealsogivesconsiderationtopayandemploymentconditionsintherestoftheGroup,includinganybasesalaryincreasesawarded.TheCommitteeisprovidedwithdataontheremunerationstructureformanagementleveltiersbelowtheExecutiveDirectors,andusesthisinformationtoensureconsistencyofapproachthroughouttheCompany.Nocomparisonmetricswereused.
AlthoughtheCommitteetakesintoaccountthepayandconditionsofotheremployees,theCompanydidnotconsultwithemployeeswhendrawingupthepolicyreport.
CONSIDERATION OF SHAREHOLDER VIEWS TheCommitteetakestheviewsoftheshareholdersseriouslyandtheseviewsaretakenintoaccountinshapingremunerationpolicyandpractice.ShareholderviewsareconsideredwhenevaluatingandsettingremunerationstrategyandtheCommitteecommitstoconsultingwithkeyshareholderspriortoanysignificantchangestoitsremunerationpolicy.

BERKELEY ANNUAL REPORT 2014 / GOVERNANCEBERKELEY ANNUAL REPORT 2014 / GOVERNANCE
70 71
GO
VERN
AN
CE
DIRECTORS’ REMUNERATION REPORT continued
ANNUAL REPORT ON REMUNERATION
ThissectionoftheremunerationreportcontainsdetailsofhowtheCompany’s2013/14remunerationpolicyforDirectorswasimplementedduringthefinancialyearendingon30April2014.AnadvisoryresolutiontoapprovethisreportwillbeputtoshareholdersattheAGM.
SINGLE TOTAL FIGURE OF REMUNERATION (AUDITED)ThetablebelowsetsoutthesingletotalfigureofremunerationandbreakdownforeachExecutiveDirectorpaidinthe2013/14financialyear.Comparativefiguresfor2012/13havealsobeenprovided.FiguresprovidedhavebeencalculatedinaccordancewiththeRegulations.
Executive Director
Salary Benefits Annual bonus
Multi-year performance
incentive Pensions Total
2014£’000
2013£’000
2014£’000
2013£’000
2014£’000
2013£’000
2014£’000
2013£’000
2014£’000
2013£’000
2014£’000
2013£’000
AWPidgley 800 780 47 39 1,200 1,170 1,574 1,516 136 133 3,757 3,638
RCPerrins 484 470 32 31 726 705 947 912 82 80 2,271 2,198
NGSimpkin 321 312 23 21 353 343 424 380 48 47 1,169 1,103
GJFry 334 325 28 31 292 284 359 329 50 49 1,063 1,018
KWhiteman 314 305 24 21 275 200 294 302 47 46 954 874
SEllis 314 305 27 26 275 267 333 302 47 46 996 946
2,567 2,497 181 169 3,121 2,969 3,931 3,741 410 401 10,210 9,777
Notes
1. 2013/14and2012/13multiyearperformanceincentive–theamountsrelatetoawardsthatwerereleasedundertheAnnualBonusPlan.
2. Benefitsincludeafullyexpensedcompanycarorcashallowancealternativeandmedicalinsurance.
ThetablebelowsetsoutthesingletotalfigureofremunerationandbreakdownforeachNon-executiveDirector.FiguresprovidedhavebeencalculatedinaccordancewiththeRegulations.
Non-executive Director
Basic fees Additional fees (4) Total fees
2014£’000
2013£’000
2014£’000
2013£’000
2014£’000
2013£’000
JArmitt 103 93 – – 103 93
DHowell 56.5 55 12.5 12.5 69 67.5
ACoppin(1) 19 55 – 12.5 19 67.5
ANimmo 56.5 55 – – 56.5 55
GBarker 56.5 55 12.5 – 69 55
VWadley 56.5 55 – – 56.5 55
ALi(2) 38 – – – 38 N/A
AMyers(3) 23 – – – 23 N/A
409 368 25 25 434 393
Notes
1. ResignedfromtheBoardon2September2013.
2. AppointedtotheBoardon2September2013.
3. AppointedtotheBoardon6December2013.
4. AdditionalfeesrepresentfeespaidfortheroleofCommitteeChairmanship.
Non-executiveDirectorsdonotparticipateinanyoftheCompany’sincentivearrangementsnordotheyreceiveanybenefits.
ADDITIONAL DETAILS IN RESPECT OF SINGLE TOTAL FIGURE TABLE (AUDITED)Themainelementsoftheremunerationoutcomesfor2013/14aresetoutbelow.
TAXABLE BENEFITSTaxablebenefitscompriseafullyexpensedcompanycarorcashallowancealternativeandmedicalinsurance.
ANNUAL BONUSInrespectoftheyearunderreview,theExecutiveDirectors’performancewascarefullyreviewedbytheCommitteeandperformanceagainsttheBonusPlantargetsissummarisedbelow:
Executive DirectorMaximum Annual
Bonus
Weighting – % of maximum paid for
Group Performance
Weighting – % of maximum paid for
Divisional Performance
Annual Bonus Contribution to Plan Account for 2013/14
£’000
Annual Bonus Contribution to Plan Account for 2013/14
% of maximum
AWPidgley 300% 100% 0% 2,400 100%
RCPerrins 300% 100% 0% 1,452 100%
NGSimpkin 220% 100% 0% 706 100%
GJFry 175% 50% 50% 585 100%
KWhiteman 175% 50% 50% 550 100%
SEllis 175% 50% 50% 550 100%
Assessment of Group performance condition Thematrixoftargetsagainstwhichperformancehasbeenassessedforthecurrentyeararesetoutbelow:
Performance Requirement Matrix
Land Bank Growth
<1% 1% 2% 3% 4% 5%
0.0% 50.0% 62.5% 75.0% 87.5% 100.0%
Retu
rn o
n Eq
uity
<15.0% 0%BonusPlanDeduction 0% 0% 0% 0% 0%
15.0% 50% 0% 25% 31% 38% 44% 50%
16.0% 60% 0% 30% 38% 45% 53% 60%
17.0% 70% 0% 35% 44% 53% 61% 70%
18.0% 80% 0% 40% 50% 60% 70% 80%
19.0% 90% 0% 45% 56% 68% 79% 90%
20.0% 100% 0% 50% 63% 75% 88% 100%
Notes
1. Thematrixshowsthepercentageofeachoftheperformancerequirementsforagivenlevelofperformanceandthecorrespondingpercentageofthetargetedmaximumannualbonuspotentialthatcouldbeearnedfor2013/14.
2. Straightlinebonusvestingbetweenpoints.
3. ReturnonEquity(ROE)isdefinedasprofitbeforetaxdividedbyaverageshareholders’funds.
4. LandBankGrowthisdefinedastheannualpercentageincreaseinthedevelopmentmargininthelandbank.

BERKELEY ANNUAL REPORT 2014 / GOVERNANCEBERKELEY ANNUAL REPORT 2014 / GOVERNANCE
72 73
GO
VERN
AN
CE
Actualperformanceagainstthemaximumtargetsfor2013/14aresetoutbelow,alongwiththetargetsandactualperformancefortheprecedingthreeyearsofthefiveyearplan:
Bonus Plan year
Return on Equity Land Bank Growth
Maximum Target Actual Maximum Target Actual
2013/14 20.0% 27.5% 5.0% 5.7%
2012/13 18.5% 22.4% 10.0% 10.5%
2011/12 16.5% 21.2% 8.0% 12.0%
2010/11 13.5% 15.3% 10.0% 13.1%
Forthe2013/14financialyear,theannualBonusPlancontributionbasedonperformanceagainsttheGroupperformancetargetsmatrixequatedto100%ofthemaximumannualbonussubjecttothiscondition.
Assessment of Divisional PBT performance condition
Division Percentage of bonus element paid for threshold
performance
Percentage of bonus element paid for maximum
performance
Level of actual performance as a percentage of the
maximum performance target
Percentage of bonus element earned following
assessment against the performance target
StGeorge 0% 100% 100% 100%
BerkeleyHomesUrbanRenaissance
0% 100% 100% 100%
StJamesGroup 0% 100% 100% 100%
TheDivisionalPBTtargetsaresetatthebeginningofthefinancialyearatalevelwhichischallengingtakingintoaccountthepotentiallevelofbonuspayments,themarket,thedevelopmentsundermanagementandotherrelevantissues.DisclosureofPBTtargetsareconsideredtobecommerciallysensitiveasthedisclosureofsuchdetailscouldbedetrimentaltotheCompany’sfuturestrategicplans.
Forthe2013/14financialyear,theannualBonusPlancontributionbasedonperformanceagainsttheDivisionalPBTtargetsequatedto100%ofmaximumannualbonussubjecttothiscondition.
TheCommitteeexercisednodiscretionindeterminingincentiveoutcomesfortheyearended30April2014.
Bonus earned but deferred under the Bonus Plan UndertheBonusPlan,theearnedbonusfortheyearisaddedtoeachindividualDirector’splanaccount.50%ofthebalanceontheplanaccountattheendofthefinancialyearisreleasedand50%deferred.Seeremunerationpolicytableonpage59fordetailsontheoperationoftheBonusPlan.
ThedeferredbalancesoneachDirector’splanaccountaresetoutbelow.
Executive Director
a. Plan account brought forward
b. Plan account brought
forward (1)
c. Contribution
into plan account for
the financial year 2013/14
d. Plan account balance
following contribution for financial
year 2013/14
e. Amount released
following contribution for financial
year 2013/14
f. Amount released - annual
bonus (50% of column c)
g. Amount released
- multiyear (column e
less column f)
h. Plan account carried
forward
i. Plan account carried
forward (2)
Shares £’000 £’000 £’000 £’000 £’000 £’000 £’000 Shares
AWPidgley 128,835 3,147 2,400 5,547 2,774 1,200 1,574 2,774 120,912
RCPerrins 77,563 1,895 1,452 3,347 1,673 726 947 1,673 72,948
NGSimpkin 34,669 847 706 1,553 777 353 424 777 33,853
GJFry 29,406 718 585 1,303 651 292 359 651 28,398
KWhiteman 24,084 588 550 1,138 569 275 294 569 24,801
SEllis 27,284 666 550 1,216 608 275 333 608 26,505
321,841 7,861 6,243 14,104 7,052 3,121 3,931 7,052 307,417
Notes
1. Convertedatasharepriceof£22.94at30April2014plus£0.59dividendpaid27September2013plus£0.90dividendpaid17January2014.
2. Convertedatasharepriceof£22.94at30April2014.
ThereisariskadjustmentmechanismbuiltintotheoperationoftheBonusPlan.IfthethresholdlevelsofROE,LandBankGrowthorDivisionalPBTarenotmetforanyfinancialyearduringthefiveyearsofoperationoftheBonusPlanpartofaparticipantsplanaccountwillbeforfeited.
LONG-TERM INCENTIVESNoLTIPswithperformanceconditionsrelatedtothe2013/14financialyearvestedduringtheyear.
TOTAL PENSION ENTITLEMENTS (AUDITED)NoExecutiveDirectorsparticipateinanydefinedbenefitarrangements.Forreference,NickSimpkinandSeanEllisaremembersofadefinedcontributionscheme,andGregFrywasuntilJune2013.Theyreceivedcontributionsequalto15%ofsalary.
NoamountswerepaidintopensionarrangementsinrespectofTonyPidgley,RobPerrinsandKarlWhitemanduringtheyearended 30April2014,whoinsteadreceivedpaymentsinlieuofapensioncontributionfromtheCompanyduringtheyear(2013/14:percentagesofsalary17%,17%and15%respectively).GregFryreceivedpaymentsinlieuofapensioncontributionfromtheCompanyfromJune2013onwardsat15%ofsalary.
SCHEME INTERESTS AWARDED IN 2013/14 FINANCIAL YEAR (AUDITED)NoawardsweremadetotheExecutiveDirectorsintheyearundertheincentivearrangements.
PAYMENTS TO PAST DIRECTORS (AUDITED)NopaymentstopastDirectorsweremadeduringtheyear.
PAYMENTS FOR LOSS OF OFFICE (AUDITED)Nopaymentsforlossofofficeweremadeduringtheyear.
DIRECTORS’ REMUNERATION REPORT continued

BERKELEY ANNUAL REPORT 2014 / GOVERNANCEBERKELEY ANNUAL REPORT 2014 / GOVERNANCE
74 75
GO
VERN
AN
CE
DIRECTORS’ SHAREHOLDING AND SHARE INTERESTS (AUDITED)TheCompanyhasashareholdingrequirementforbothExecutiveandNon-executiveDirectors,linkedtobasesalaryornetfeetheyreceivefromtheCompany.InthecaseoftheGroupChairmanthisis400%ofbasesalary,forotherExecutiveDirectors200%ofbasesalaryandfortheNon-executiveDirectors100%ofnetfees.ThisshouldbeachievedwithinfiveyearsofappointmentforExecutiveDirectorsandthreeyearsofappointmentforNon-executiveDirectors.
UsingtheCompany’sclosingsharepriceof£22.94on30April2014,compliancewiththeserequirementswasasfollows:
DirectorObligation
(% base salary/NED net fees)% base salary/NED net fees at
30 April 2014 Achievement at 30 April 2014
Executive Director
AWPidgley 400% 19,445% √
RCPerrins 200% 7,344% √
NGSimpkin 200% 193% x
GJFry 200% 7,972% √
KWhiteman 200% 262% √
SEllis 200% 89% x
Non-executive Director
JArmitt 100% 350% √
DHowell 100% 495% √
ANimmo 100% 140% √
GBarker 100% 447% √
VWadley 100% 455% √
ALi 100% 700% √
AMyers 100% 46% x
ThetablebelowsummarisestheDirectors’interestsinshares:
Director Shares1
Scheme interests – Options and awards over shares
Option interests subject to conditions2
Total Interests held 2009 LTIP Part B 2011 LTIP
Executive Director
AWPidgley 6,781,124 1,500,000 5,000,000 6,500,000
RCPerrins 1,549,405 750,000 5,000,000 5,750,000
NGSimpkin 27,000 250,000 3,250,000 3,500,000
GJFry 1,160,746 500,000 1,866,503 2,366,503
KWhiteman 35,815 250,000 1,000,000 1,250,000
SEllis 12,212 175,000 2,250,000 2,425,000
Non-executive Director
JArmitt 9,112 – – –
DHowell 8,631 – – –
ANimmo 2,000 – – –
GBarker 7,800 – – –
VWadley 6,500 – – –
ALi 10,000 – – –
AMyers 650 – – –
Notes
1. Beneficialinterestsincludeshareshelddirectlyorindirectlybyconnectedpersons.
2. Pleaseseethedescriptionof2009LTIPPartBand2011LTIPawardsinthe‘elementsofpreviouspolicythatwillcontinuetoapply’sectiononpages61to62.
3. 2009LTIPPartBoptionexerciseprice£6.76at30April2014.
4. 2011LTIPoptionexerciseprice£11.36at30April2014.
2009 LTIP PART AThebalanceofthesharesoriginallyawardedunderthe2004(b)LTIP(i.e.3/12oftheshares),totalling5,330,340shares,werereplacedbyoptionswithanexercisepriceof£3.00persharegrantedunderthe2009LTIP.ThisnewoptionwasidentifiedasPartAofthe2009LTIP.Theseoptionswereawardedon29June2009,atwhichtimetheElement2awardsunderthe2004(b)LTIPweresurrendered.
Duringtheyear,the4,441,950optionsoutstandingunderthe2009LTIPPartAvestedandwereexercisedon31January2014byAWPidgley,RCPerrinsandGJFry,assetoutbelow.
TheseoptionsrepresentanincentiveearnedbytheExecutiveDirectorsoverthelast10years(2004–2014).
Executive Director Type of awardNumber of Options
Over SharesExercise Price of
Exercised OptionsShare Price on
Date of ExerciseGain on Exercise
£’000
AWPidgley 2009LTIPPartA 2,842,848 £1.36 £25.83 69,564
RCPerrins 2009LTIPPartA 1,066,068 £1.36 £25.83 26,087
GJFry 2009LTIPPartA 533,034 £1.36 £25.83 13,043
Notes
1. Theoriginalexercisepricewasadjustedfrom£3.00to£1.36toreflectthepaymentofdividendsduringthevestingperiod.
Therearenooptionsvestedbutunexercisedat30April2014.
DILUTION The2009LTIPand2011LTIPwerespecialarrangements,approvedbyshareholdersattheEGMinApril2009andAGMinSeptember2011respectively.Inconsideringdilutionunderthe2011LTIPtheCommitteetookaccountofthelongtermnatureoftheplanwhichextendsbeyondthelengthofnormalincentiveplans.
Inaddition,theCommitteetookintoaccount,afterthepriorityreturnof£1.7billion(£13pershare),representing183%ofNetAssetsat 30April2011,thatthedilutiononexistingshareholdersuntilthehurdlereturnhasbeenachievedwillhavenoeffectandthedilutionwillonlyhaveeffectonthevaluecreatedabovethepriorityreturnof£1.7billion.
DIRECTORS’ REMUNERATION REPORT continued

BERKELEY ANNUAL REPORT 2014 / GOVERNANCEBERKELEY ANNUAL REPORT 2014 / GOVERNANCE
76 77
GO
VERN
AN
CE
PERFORMANCE AND PAYThegraphbelowshowstheCompany’sperformance,measuredbytotalshareholderreturn(TSR),comparedwiththeperformanceoftheFTSE250,theFTSEAllShareandtheCompany’sremunerationcomparatorgroupTheCompanyconsidersthesethemostrelevantindicesfortotalshareholderreturndisclosurerequiredundertheseRegulations.
Notes
1. Totalshareholderreturn(“TSR”)isameasureshowingthereturnoninvestinginoneshareoftheCompanyoverthemeasurementperiod(thereturnisthevalueofthecapitalgainandreinvesteddividends).Thiscalculationisthencarriedoutfortherelevantindicesandconstituentsofthecomparatorgroup.
GROUP CHAIRMAN AND MANAGING DIRECTOR REMUNERATION OVER PAST 5 YEARSThetablebelowshowstheremunerationoftheGroupChairmanandManagingDirectorforeachofthefinancialyearsshownabove. GiventhenatureoftherolesofAWPidgleyandRCPerrins,thetablebelowprovidesthisinformationforbothindividuals.
Year
Single figure of total remuneration (£’000)
Annual bonus pay-out (as % maximum opportunity)
Multiyear incentive vesting awards (as % maximum
opportunity)Group
ChairmanManaging
Director
2013/14 3,757 2,271 100%
SeeNote32012/13 3,638 2,198 100%
2011/12 2,799 1,692 100%
2010/11 2,033 1,226 100% n/a
2009/10 2,406 1,127 100% n/a
Notes
1. SinglefigureoftotalremunerationforeachyearhasbeencalculatedinaccordancewiththeRegulations.
2. From2010/11onwardstheannualbonuspay-outfiguresrepresentannualCompanycontributionsundertheBonusPlan.
3. 2011/12,2012/13and2013/14multiyearvestingawardsrepresentdeferredawardsthatwerereleasedduringtheyearundertheBonusPlan.InaccordancewiththeBonusPlanrulestheCompany’scontributionisearnedbasedonthesatisfactionoftheannualperformanceconditions.PartoftheCompanycontributionisprovidedasadeferredaward.100%ofthesedeferredawardswillbepaidoutunlesstherehasbeenforfeitureduringthedeferralperiodandsubjecttocontinuedemploymentatthedateofrelease.Attheyearended30April2014therehasnotbeenaforfeitureeventundertheBonusPlan.
PERCENTAGE CHANGE IN GROUP CHAIRMAN’S AND THE MANAGING DIRECTOR’S REMUNERATION ThetablebelowcomparesthepercentageincreaseintheGroupChairman’sandManagingDirector’spay(includingsalary,taxablebenefitsandannualbonus)between2012/13and2013/14,withtheaveragechangeforthewideremployeepopulation.TheCompanyconsidersthefull-timeemployeepopulation,excludingtheMainBoard,tobeanappropriatecomparatorgroupandthemoststablepointofcomparison:
2012/13 to 2013/14 year on year change (%)
Group Chairman Managing Director Group employees
Basesalary 2.6% 3.0% 5.3%
Taxablebenefits 22.4% 2.9% 4.6%
Annualbonus 2.6% 3.0% 3.6%
RELATIVE IMPORTANCE OF SPEND ON PAY Thetablebelowsetsouttherelativeimportanceofspendonpayinthe2013/14and2012/13financialyearscomparedwithdistributionstoshareholders.
Item2013/14
(£m)2012/13
(£m) % change
RemunerationofGroupemployees(includingDirectors)
142 97 46%
Distributionstoshareholders 195 20 875%
STATEMENT OF IMPLEMENTATION OF REMUNERATION POLICY IN THE FOLLOWING FINANCIAL YEAR
EXECUTIVE DIRECTORSTheremunerationpolicyanditsimplementationfortheforthcomingfinancialyearissummarisedbelow:
SALARYThesalariesfor2014/15aresetoutbelow:
Executive Director2013/14 Salary
£’0002014/2015 Salary
£’000 % change
FTSE 250 £’000
Lower Quartile Median Upper Quartile
AWPidgley 800 825 3.1 424 502 590
RCPerrins 484 500 3.3 436 507 587
NGSimpkin 321 331 3.1 284 334 391
GJFry 334 344 3.0 255 327 375
KWhiteman 314 324 3.2 255 327 375
SEllis 314 324 3.2 255 327 375
TheincreasesagreedbytheCommitteefortheExecutiveDirectorsreflectstheCommittee’spolicyofincreasingindividualDirector’ssalariesovertimetoreflecttheirexperience,performanceandtheperformanceoftheGroup.InreviewingthesalariesoftheExecutiveDirectors,theCommitteehasalsotakenaccountoftheemploymentconditionsandsalaryincreasesawardedtoemployeesthroughouttheGroup,whichwereonaverage6.1%thisyear.
BENEFITS AND PENSIONNochangesareproposedtobenefitsorpensionin2014/15.
DIRECTORS’ REMUNERATION REPORT continued
Berkeley Group Holdings plcFTSE 250 IndexFTSE All Share IndexComparator Group
100
150
200
250
300
50
02009 2010 2011 2012 2013 2014
Total shareholder return from 30 April 2009 (%)

BERKELEY ANNUAL REPORT 2014 / GOVERNANCEBERKELEY ANNUAL REPORT 2014 / GOVERNANCE
78 79
GO
VERN
AN
CE
BONUS PLANThemaximumbonuspotentialsfortheyearending30April2015aresetoutbelow:
Executive Director A W Pidgley R C Perrins N G Simpkin G J Fry K Whiteman S Ellis
MaximumBonus(%ofsalary)
300% 300% 220% 175% 175% 220%
Key features of the Bonus Plan Seeremunerationpolicytableonpage59fordetailsontheoperationoftheBonusPlan.
Performance conditions ThebonuspayabletoeachoftheGroupChairman,GroupManagingDirectorandGroupFinanceDirectorwillbedeterminedbyreferencetotheGroupperformancecondition.FortheDivisionalDirectors,50%ofthepotentialbonuspayablewillbedeterminedbyreferencetotheGroupperformanceconditionand50%byreferencetotheDivisionalPBTperformancecondition.
Group performance condition TheROEmaximumperformanceconditionfortheyearending30April2015hasbeenincreasedfrom20%to25%.Themaximumperformanceconditionforlandbankgrowthremainsat5%.
ThefollowingtablesetsouttheperformanceconditionsfortheBonusPlanfortheyearended30April2015:
Performance Requirement Matrix
Land Bank Growth
<0% 0.0% 1.0% 2.0% 3.0% 4.0% 5.0%
0.0% 50.0% 60.0% 70.0% 80.0% 90.0% 100.0%
Retu
rn o
n Eq
uity
<20.0% 0%BonusPlanDeduction 0% 0% 0% 0% 0% 0%
20.0% 50% 0% 25% 30% 35% 40% 45% 50%
21.0% 60% 0% 30% 36% 42% 48% 54% 60%
22.0% 70% 0% 35% 42% 49% 56% 63% 70%
23.0% 80% 0% 40% 48% 56% 64% 72% 80%
24.0% 90% 0% 45% 54% 63% 72% 81% 90%
25.0% 100% 0% 50% 60% 70% 80% 90% 100%
Notes
1. Thematrixshowsthepercentageofeachoftheperformancerequirementsforagivenlevelofperformanceandthecorrespondingpercentageofthetargetedmaximumannualbonuspotentialthatcouldbeearnedfor2014/15.
2. Straightlinebonusvestingbetweenpoints.
3. ReturnonEquity(ROE)isdefinedasprofitbeforetaxdividedbyaverageshareholders’funds.
4. LandBankGrowthisdefinedastheannualpercentageincreaseinthedevelopmentmargininthelandbank.
Divisional PBT performance condition TheDivisionalPBTtargetsaresetatthebeginningofthefinancialyearatalevelwhichischallengingtakingintoaccountthepotentiallevelofbonuspayments,themarket,developmentavailabilityandotherrelevantissues.ItistheviewoftheCommitteethatthedisclosureofthesetargetsinadvancewouldprovidetheCompany’scompetitorswithanunfairadvantage.HowevertheCommitteemayinthefutureprovideretrospectivedisclosuretoallowshareholderstojudgethelevelofbonusactuallyearnedagainsttherelevantDivision’sperformance.
LONG-TERM INCENTIVESNochangesareproposedtotheCompany’slong-termincentivearrangementsin2014/15.Theoperationofthehistoric2009and2011LTIParrangementsaresetoutintheDirector’sRemunerationPolicysectiononpages61to62.
NON-EXECUTIVE DIRECTORSThefollowingtablesetsoutthefeeratesfortheNon-executiveDirectorsintheyearended30April2014andthoserateswhichwillapplyintheyearending30April2015:
2013/14 2014/15 % change
DeputyChairmanandSIDfees £103,000 £106,000 2.9%
BasicFee £56,500 £58,500 3.5%
AdditionalfeeforchairmanshipofAuditandRemunerationCommittee £12,500 £12,500 –
CONSIDERATION BY THE DIRECTORS OF MATTERS RELATING TO DIRECTOR’S REMUNERATION
MEMBERS OF THE COMMITTEEThecommitteecurrentlycomprisesthreeIndependentNon-executiveDirectors,GlynBarker(Chairman),SirJohnArmittandAndyMyers.
GlynBarker(Chairman)andSirJohnArmittweremembersofthecommitteeat30April2014andAndyMyerswasappointedtotheCommitteeon1May2014.
ThemembersoftheCommitteehavenopersonalfinancialinterestotherthanasshareholdersinmatterstobedecided,nopotentialconflictsofinterestarisingfromcrossDirectorshipsandnoday-to-dayinvolvementintherunningofthebusiness.
Director Number of meetings during financial year Number of meetings attended
GlynBarker 2 2
SirJohnArmitt 2 2
ROLE OF THE COMMITTEE AND ACTIVITIESThekeyresponsibilitiesoftheCommitteeareto:
• determineandagreewiththeBoardthebroadpolicyfortheremunerationoftheExecutiveDirectors.Thisincludessalary,bonusplans,shareoptions,othersharebasedincentivesandpensions;
• determinetheperformanceconditionsfortheBonusPlanoperatedbytheCompanyandapprovethetotalannualpaymentsmadeunderthisPlan;
• determineallshareincentiveplansforapprovalbytheBoardandshareholders;
• takeintoaccounttheviewsofshareholderswhendeterminingplansundertheremunerationpolicy;
• ensurethatthecontractualtermsontermination,andanypaymentsmade,arefairtotheindividualandtheCompanyandthatfailureisnotrewarded;
• noteannuallytheremunerationtrendsandanymajorchangesinemployeebenefitstructuresacrosstheCompanyorGroup.
TheCommitteehasformaltermsofreferencewhichdescribesitsfullremit.ThiscanbedownloadedfromthesectiondealingwithInvestorRelationsontheBerkeleywebsite(www.berkeleygroup.co.uk).
TheCommittee’sactivitiesduringthe2013/14financialyearincluded:
Meeting Items discussed
June2013 DraftRemunerationReportfortheyearended30thApril2013
PayreviewfortheGroupfortheyearended30thApril2013
March2014 ExecutiveRemunerationBenchmarkingreport
NewDirectorsRemunerationregulationsandchangestoRemunerationReport
DIRECTORS’ REMUNERATION REPORT continued

BERKELEY ANNUAL REPORT 2014 / GOVERNANCE
80
ADVISORS TO THE COMMITTEETheCommitteeisabletoseekindependentadviceattheexpenseoftheCompany;noadvicehasbeensoughtbytheCommitteeduringtheyearunderreview.
IndeterminingtheExecutiveDirectors’remunerationfortheyear,theCommitteeconsultedwiththeGroupChairman,TonyPidgley,theGroupManagingDirector,RobPerrinsandtheGroupFinanceDirector,NickSimpkin.NoDirectorplayedapartinanydiscussionabouthisownremuneration.
Inaddition,theCommitteehadaccesstoinformationonexecutiverewardprovidedtotheBoardbyPricewaterhouseCoopersLLP(PwC).PwCisamemberofRemunerationConsultantsGroupand,assuch,voluntarilyoperatesunderthecodeofconductinrelationtoexecutiveremunerationconsultingintheUK.
Duringtheyear,theCompanypaidaretainerfeeof£50,000toPwCforservicesinrelationtoadviceprovidedtotheBoardthatwasalsousedbytheCommittee.
KPMGhavebeentheCompany’sauditorssinceDecember2013andhavethereforeauditedthesefinancialstatements.PriortothisPwCweretheCompany’sauditorsandtheBoardreviewedthenatureoftheservicesprovidedduringthistimeandwassatisfiedthatnoconflictofinterestexistedintheprovisionoftheseservices.
STATEMENT OF VOTING AT GENERAL MEETINGThetablebelowshowstheadvisoryvoteonthe2012/13RemunerationReportattheAGMheldon2ndSeptember2013.
Votes for % Votes against % Votes withheld
2012/13RemunerationReport 85,537,828 89.57% 9,955,633 10.42% 216,649
PleasenotethatthefirstvotesontheAnnualReportonRemunerationandtheDirector’sRemunerationPolicyareduetotakeplaceatthe2014AGM.
TheDirectors’RemunerationReporthasbeenapprovedbytheBoard.
ByOrderoftheBoard
GLYN BARKERCHAIRMAN OF THE REMUNERATION COMMITTEE11 JULY 2014
DIRECTORS’ REMUNERATION REPORT continued
BERKELEYANNUALREPORT2014/GOVERNANCE
81
GO
VERN
AN
CE
TheDirectorssubmittheirreporttogetherwiththeauditedconsolidatedandcompanyfinancialstatementsfortheyearended 30April2014.
PRINCIPAL ACTIVITIES AND REVIEW OF THEBUSINESS TheCompanyistheUKholdingcompanyofaGroupengagedinresidential-ledpropertydevelopmentfocusingonurbanregenerationandmixed-usedevelopments.TheCompanyisincorporatedanddomiciledinEnglandandWalesandisquotedontheLondonStockExchange.
TheinformationthatfulfilstherequirementsoftheStrategicreportcanbefoundonpages3to45oftheAnnualReportwhichprovidemoredetailedcommentariesonthebusinessperformanceduringtheyeartogetherwiththeoutlookforthefuture.Inaddition,informationinrespectoftheprincipalfinancialandoperatingrisksof thebusinessissetoutonpages20to23 oftheStrategicReport.
TRADING RESULTS AND DIVIDENDS TheGroup’sconsolidatedprofitaftertaxationforthefinancialyearwas£292.9m(2013:£209.7m).TheGroup’sjointventurescontributedaprofitaftertaxationof£12.1m(2013:lossof£1.3m).
Aninterimdividendof90ppersharewaspaidtoshareholderson17January2014. Afurtherinterimdividendof90ppershareisproposed,payableon26September2014toshareholdersontheregisteron22August2014.
POST BALANCE SHEET EVENTOn30May2014,theGroupexchangedcontractsforthesaleofaportfolioofgroundrentassetsfor£99.8million.Thesaleisexpectedtogiverisetoanon-recurringprofitondisposalofapproximately£80millionaftertransactioncostsintheyearending30April2015.
SHARE CAPITAL TheCompanyhad135,357,183ordinarysharesinissueat30April2014(2013:134,857,183).Nosharesareheldintreasury.AuthoritywillbesoughtfromshareholdersattheforthcomingAnnualGeneralMeetingtorenewtheauthoritygivenatthe2013AnnualGeneralMeetingforafurtheryear,permittingtheCompanytopurchaseitsownsharesinthemarketuptoalimitof10%ofitsissuedsharecapital.
MovementsintheCompany’ssharecapitalareshowninnote20totheconsolidatedfinancialstatements.
InformationontheGroup’sshareoptionschemesissetoutinnote5totheconsolidatedfinancialstatements.DetailsoftheLong-TermIncentiveSchemesandLong-TermIncentivePlansforkeyexecutivesaresetoutintheRemunerationReportonpages56to80.
ARTICLES OF ASSOCIATION TheArticlesofAssociationsetoutthebasicmanagementandadministrativestructureoftheCompany.TheyregulatetheinternalaffairsoftheCompanyandcoversuchmattersastheissueandtransferofshares,Boardandshareholdermeetings,powersanddutiesofDirectorsandborrowingpowers.InaccordancewiththeArticlesofAssociation,Directorscanbeappointedorremovedbyshareholdersinageneralmeeting.
TheArticlesmayonlybeamendedbyspecialresolutionatageneralmeetingofshareholders.CopiesareavailablebywritingtotheCompanySecretaryandarealsoopentoinspectionatCompaniesHouse.
DIRECTORS TheDirectorsoftheCompanyandtheirprofilesaredetailedonpages48and49.AlloftheseDirectorsservedthroughouttheyearunderreviewwiththeexceptionofAdrianLi,whowasappointedon2September2013,andAndyMyers,whowasappointedon 6December2013.AlanCoppinstooddownfromtheBoardon2September2013.
TheArticlesofAssociationoftheCompanyrequireDirectorstosubmitthemselvesforre-electioneverythreeyears.InadditionallDirectorsaresubjecttoelectionatthefirstopportunityaftertheirappointmenttotheBoard.However,inaccordancewiththeUKCorporateGovernanceCodealltheDirectorswillofferthemselvesforre-electionattheforthcomingAnnualGeneralMeeting,otherthanDavidHowell,whoisstandingdownfromtheBoard.
TheDirectors’interestsinthesharecapitaloftheCompanyanditssubsidiariesareshown
intheRemunerationReportonpage75.At30April2014eachoftheExecutiveDirectorsweredeemedtohaveanon-beneficialinterestin106,799(2013:237,363)ordinarysharesheldbytheTrusteesofTheBerkeleyGroupEmployeeBenefitTrust.ThetrusteeoftheBerkeleyGroupHoldingsEmployeeBenefitTrust(“EBT”)hasagreednotto voteonanysharesheldintheEBTatanygeneralmeeting.
Therewerenocontractsofsignificanceduring,orattheendof,thefinancialyearinwhichaDirectoroftheCompanyis,orwas,materiallyinterested,otherthanthosesetoutinnote27totheconsolidatedfinancialstatements,thecontractsofemploymentoftheExecutiveDirectors,whichareterminablewithinoneyear,andtheappointmenttermsoftheNon-executiveDirectors,whicharerenewableannuallyandterminableononemonth’snotice.
DIRECTORS’ INDEMNITIES TheCompany’spracticehasalwaysbeentoindemnifyitsDirectorsinaccordancewiththeCompany’sArticlesofAssociationandtothemaximumextentpermittedbylaw.Qualifyingthirdpartyindemnities,underwhichtheCompanyhasagreedtoindemnifytheDirectors,wereinforceduringthefinancialyearandatthedateofapprovalofthefinancialstatements,inaccordancewiththeCompany’sArticlesofAssociationandtothemaximumextentpermittedbylaw,inrespectofallcosts,charges,expenses,lossesandliabilities,whichtheymayincurinorabouttheexecutionoftheirdutiestotheCompany,oranyentitywhichisanassociatedcompany(asdefinedinSection256oftheCompaniesAct2006),orasaresultofdutiesperformedbytheDirectorsonbehalfoftheCompanyoranysuchassociatedcompany.
SUBSTANTIAL SHAREHOLDERS TheCompanyhasbeennotifiedofthefollowinginterests,pursuanttoRule5oftheDisclosureRulesandTransparencyRules,asat11July2014:
DIRECTORS’ REPORT
NUMBER OF ORDINARY SHARES HELD
% OF ISSUED CAPITAL
NATURE OF HOLDING
FirstEagleInvestment Management,LLC
13,092,232 9.67% Indirect
AnthonyWilliamPidgley 6,781,124 5.01% Direct
AberdeenAssetManagers 6,719,188 4.96% Indirect
BlackRockInc. 6,699,472 4.95% Indirect
StandardLifeInvestmentsLtd 6,599,895 4.88% Indirect/Direct
WilliamBlair 6,553,042 4.84% Direct

BERKELEY ANNUAL REPORT 2014 / GOVERNANCEBERKELEY ANNUAL REPORT 2014 / GOVERNANCE
82 83
GO
VERN
AN
CE
DONATIONS The Group made no political contributions (2013: £nil) during the year.
EMPLOYMENT POLICY The Group’s policy of operating through autonomous subsidiaries has ensured close consultation with employees on matters likely to affect their interests. The Group is firmly committed to the continuation and strengthening of communication lines with all its employees.
An Equal Opportunities Policy was introduced in 2001. Following periodic reviews (the most recent in September 2010) the policy is now an Equality and Diversity Policy with the aim of ensuring that all employees, potential employees and other individuals receive equal treatment (including access to employment, training and opportunity for promotion) regardless of their age, disability, gender reassignment, marriage and civil partnership, pregnancy and maternity, race, religion or belief (including lack of belief), sex and sexual orientation. It is the policy of the Group to support the employment of people with disabilities wherever practicable and to ensure, as far as possible, the training, career development and promotion opportunities are available to all employees. This policy includes employees who become disabled whilst employed by the Group.
All disclosures concerning diversity of the Group’s Directors, senior management and employees (as required under the Companies Act 2006 (Strategic Report and Directors’ Report) Regulations 2013) are contained within the Strategic Report on pages 36 to 37.
SUSTAINABILITY The Group considers its approach to sustainability, defined as the effective management of environmental, social and economic risks and opportunities facing the company, to be an integral part of managing its business. Our framework for the business, Our Vision, sets out our integrated approach to managing sustainability within the context of the wider aims for the business. This approach is outlined within the Strategic Report and more extensive information is available on Berkeley’s website. We believe that this integrated approach demonstrates how sustainability is embedded within the day-to-day operations of our business.
We remain committed to enhancing the Group’s high standards through continuous improvement. Our Sustainability Governance
Committee is responsible for setting the strategic objectives and the Main Board continues to monitor strategic development and progress against commitments and Key Performance Indicators. The Sustainability Working Group, comprising divisional executives and managers, is responsible for delivering these objectives and reviewing progress against targets.
GREENHOUSE GAS EMISSIONS 2014
Scope 1 (tCO2e) 1,941
Scope 2 (tCO2e) 10,221
Scope 3 (tCO2e) 9,662
Total (tCO2e) 21,824
Emissions intensity (tCO2e/person) 2.5
The Group has reported on greenhouse gas emissions for which it is responsible, as required under the Companies Act 2006 (Strategic Report and Directors’ Reports) Regulations 2013. The emissions disclosed are aligned to the Group’s financial reporting year, are considered material to its business and have the following parameters:
Scope 1 – direct emissions relating to office, sales and development site activities; and work-related travel in company owned vehicles;
Scope 2 – indirect emissions from electricity consumed for office, sales and development site activities;
Scope 3 – other indirect emissions relating to office, sales and development site activities; work related travel in leased and employee owned vehicles; business air travel; transmission and distribution losses of purchased electricity; and upstream emissions
Emissions include 50% of those resulting from the Group’s joint ventures on the basis of its equity share.
The intensity ratio has been calculated using the total number of direct employees across the Group and the number of contractors working on our sites.
The GHG Protocol Corporate Accounting and Reporting Standard (revised edition), UK Government Environmental Reporting Guidelines 2013 and UK Government GHG Conversion Factors for Company Reporting 2013 have been used to calculate and report the Group’s greenhouse gas emissions.
Further details on the methodology adopted can be found at berkeleygroup.co.uk/
sustainability/reports-and-opinions, and other environmental key performance indicators (KPIs) can be found at berkeleygroup.co.uk/our-vision/performance-2012-2014.
HEALTH AND SAFETY The Group considers the effective management of health and safety to be an integral part of managing its business. Accordingly, the Group Main Board continues to monitor the strategic development and audit the implementation by all divisions of their Occupational Health & Safety Management Systems to ensure that, both at Group and divisional level, they remain compliant with recognised established standards.
We remain committed to enhancing the Group’s high standards through continuous improvement. Our Health & Safety Committee is responsible for setting the strategic objectives of the Group, and the Health & Safety Working Group, comprising divisional executives and managers, is responsible for delivering these objectives and reviewing progress against targets set for our established key performance indicators, reporting this quarterly to the Group Main Board.
TAKEOVER DIRECTIVE – AGREEMENTS Pursuant to the Companies Act 2006, the Company is required to disclose whether there are any significant agreements that take effect, alter or terminate upon a change of control.
Change of control provisions are included as standard in many types of commercial agreement, notably bank facility agreements and joint venture shareholder agreements, for the protection of both parties. Such standard terms are included in Berkeley’s bank facility agreement which contains provisions that give the banks certain rights upon a change of control of the Company. Similarly, in certain circumstances, a change of control may give Berkeley’s joint venture partner, Prudential Assurance Company Limited, the ability to exercise certain rights under the shareholder agreement in relation to its St Edward Homes joint venture.
In addition, the Company’s share schemes contain provisions which take effect upon change of control. These do not entitle the participants to a greater interest in the shares of the Company than that created by the initial grant of the award. The Company does not have any arrangements with any Director that provide compensation for loss of office or employment resulting from a takeover.
The remaining information required to be disclosed under the Takeover Directive can be found within notes 5 and 20 to the consolidated financial statements.
INDEPENDENT AUDITORS AND DISCLOSUREOF INFORMATION TO AUDITORS Each of the persons who is a Director at the date of approval of this Annual Report confirms that:
• So far as the Director is aware, there is no relevant audit information of which the Company’s auditors are unaware; and
• The Director has taken all the steps that he/she ought to have taken as a Director in order to make himself/herself aware of any relevant audit information and to establish that the Company’s auditors are aware of that information.
This confirmation is given and should be interpreted in accordance with the provisions of Section 418 of the Companies Act 2006.
A resolution to appoint KPMG LLP as auditors to the Company will be proposed at the Annual General Meeting.
ANNUAL GENERAL MEETING The Annual General Meeting of the Company is to be held at the Woodlands Park Hotel, Woodlands Lane, Stoke D’Abernon, Cobham, Surrey KT11 3QB at 11.00am on 1 September 2014. The Notice of Meeting, which is contained in a separate letter from the Group Chairman accompanying this report, includes a commentary on the business to be transacted at the Annual General Meeting.
SHARE CAPITAL STRUCTURE The Company is compliant with DTR 7.2.6. and the information relating to the Company’s share capital structure is included in the Directors’ Report on page 81.
STATEMENT OF DIRECTORS’ RESPONSIBILITIESIN RESPECT OF THE ANNUAL REPORT ANDTHE FINANCIAL STATEMENTS The Directors are responsible for preparing the Annual Report, the Remuneration Report and the financial statements in accordance with applicable law and regulations.
Company law requires the Directors to prepare financial statements for each financial year. Under that law the Directors have prepared the Group Financial Statements in accordance with International Financial Reporting Standards (IFRSs) as adopted by the European Union, and have prepared the Parent Company Financial Statements in accordance with United Kingdom Accounting Standards (United
Kingdom Generally Accepted Accounting Practice) and applicable law.
Under company law the Directors must not approve the financial statements unless they are satisfied that they give a true and fair view of the state of affairs of the Group and the Company and of the profit or loss of the Group for that period.
In preparing these financial statements, the Directors are required to:
• select suitable accounting policies and then apply them consistently;
• make judgements and estimates that are reasonable and prudent;
• state whether IFRS as adopted by the European Union and applicable UK accounting standards have been followed, subject to any material departures disclosed and explained in the Group and Parent Company Financial Statements respectively; and
• prepare financial statements on the going concern basis unless it is inappropriate to presume that the Group will continue in business.
The Directors are responsible for keeping adequate accounting records that are sufficient to show and explain the Company’s transactions and disclose with reasonable accuracy at any time the financial position of the Company and the Group and to enable them to ensure that the financial statements and the Remuneration Report comply with the Companies Act 2006 and, as regards the Group financial statements, Article 4 of the IAS Regulation. They are also responsible for safeguarding the assets of the Company and the Group and hence for taking reasonable steps for the prevention and detection of fraud and other irregularities.
The Directors are responsible for the maintenance and integrity of the Company’s website. Legislation in the United Kingdom governing the preparation and dissemination of financial statements may differ from legislation in other jurisdictions.
DIRECTORS’ RESPONSIBILITY STATEMENT Each of the Directors, whose names and functions are listed on pages 48 to 49 confirm that, to the best of each person’s knowledge:
a. the Group financial statements, which have been prepared in accordance with IFRS’s as adopted by the European Union, give a true and fair view of the assets, liabilities, financial position and profit of the Group; and
b. the Strategic Report, together with the Directors’ report, includes a fair review of the development and performance of the business and the position of the Group, together with a description of the principal risks and uncertainties that it faces.
c. The Annual Report, taken as a whole, is fair, balanced and understandable and provides the information necessary for shareholders to assess the Company’s performance, business model and strategy.
GOING CONCERN The Group’s business activities together with the factors likely to affect its future development performance and position are set out in the Strategic Report. The financial position of the Group, its cash flows, liquidity position and borrowing facilities are all described in the Trading and Financial Review on pages 38 to 43.
The Group has significant financial resources and the Directors have assessed the future funding requirements of the Group, including the repayment of £1.7 billion to shareholders by 2021, and compared this to the level of committed loan facilities and cash resources over the medium term. In making this assessment consideration has been given to the uncertainty inherent in future financial forecasts and where applicable reasonable sensitivities have been applied to the key factors affecting the financial performance of the Group.
The Directors have a reasonable expectation that the Company has adequate resources to continue its operational existence for the foreseeable future. For this reason they continue to adopt the going concern basis of accounting in preparing the annual financial statements.
By order of the Board
EA DRIVERCOMPANY SECRETARYTHE BERKELEY GROUP HOLDINGS PLCREGISTERED NUMBER: 517258611 JULY 2014
DIRECTORS’ REPORT continued

FINANCIALS
FINA
NC
IALS
ON TRACK TO MEET OUR AMBITIOUS TEN YEAR PLAN
84 85
BERKELEY ANNUAL REPORT 2014 / FINANCIALSBERKELEY ANNUAL REPORT 2014 / FINANCIALS

BERKELEY ANNUAL REPORT 2014 / FINANCIALSBERKELEY ANNUAL REPORT 2014 / FINANCIALS
86 87
FINA
NC
IALS
INDEPENDENT AUDITORS’ REPORT TO THE MEMBERS OF THE BERKELEY GROUP HOLDINGS PLC
OPINIONS AND CONCLUSIONS ARISING FROM OUR AUDIT
1) OUR OPINION ON THE FINANCIAL STATEMENTS IS UNMODIFIED We have audited the financial statements of The Berkeley Group Holdings plc for the year ended 30 April 2014 set out on pages 89 to 119. In our opinion:
• the financial statements give a true and fair view of the state of the Group’s and of the parent company’s affairs as at 30 April 2014 and of the Group’s profit for the year then ended;
• the Group financial statements have been properly prepared in accordance with International Financial Reporting Standards as adopted by the European Union;
• the parent company financial statements have been properly prepared in accordance with UK Accounting Standards; and
• the financial statements have been prepared in accordance with the requirements of the Companies Act 2006 and, as regards the Group financial statements, Article 4 of the IAS Regulation.
2) OUR ASSESSMENT OF RISKS OF MATERIAL MISSTATEMENT In arriving at our audit opinion above on the financial statements the risks of material misstatement that had the greatest effect on our audit were as follows:
Carrying value of inventories and profit recognition (inventories: £2,481.2m, gross profit: £508.9m) Refer to page 54 (Audit Committee statement), page 96 (accounting policy) and page 106 (financial disclosures)
The risk: The Group recognises profit on each sale by reference to the overall site margin, which is the forecast profit percentage for a site that may comprise multiple phases and can last a number of years. The recognition of profit is therefore dependent on the Group’s estimate of future selling prices and build costs, which form the basis of the site forecast. Inventory represents the costs of land, materials, design and related production and site costs to date. It is held at the lower of cost and net realisable value, the latter also being based on the forecast for the site. As such errors in these forecasts can impact the assessment over the carrying value of inventories and gross profit.
Future selling prices are dependent on market conditions, which can be difficult to predict. Future build costs are subject to a number of variables including the accuracy of designs, market conditions in respect of materials and sub-contractor cost and construction issues. There is a risk that the actual revenue and costs are different to those forecast resulting in material misstatement of inventory and gross profit.
There is also a risk that costs are inappropriately recognised within inventories or the allocation of costs that relate to the whole site, such as land and infrastructure, is inappropriate across development phases, resulting in a material misstatement of inventory or gross profit.
Our response: Our audit procedures performed in this area included, amongst others:
Testing the Group’s controls by checking approvals over reviewing and updating selling price and cost forecasts, setting budgets and authorising and recording of costs. We attended a selection of management’s cost review meetings, to check that they are effectively challenging the costs incurred and forecast.
We inspected the site forecasts, on a sample basis, and challenged the assumptions for future costs and sales. This included comparing sales forecasts to sales made to date and to prices achieved on comparable local sales. We compared actual margins achieved to forecasts, to check the accuracy of the Group’s forecasting process. We corroborated a sample of cost forecasts back to supplier agreements or tenders and considered allowance for cost increase included in these forecasts. We also agreed a sample of costs incurred to date to invoice and/or payment, including checking that they were allocated to the appropriate site and development phase, and met the definition of inventory costs.
For all significant new land acquisitions and a sample of other land acquisitions we inspected purchase contracts to understand the terms and any deferred or contingent payments. We re-performed the calculation of such amounts to check the amounts recorded. We considered any previous acquisitions to establish any changes in amounts recorded for related deferred or contingent payments and assessed the accuracy of these. Where a site was pre-development, we evaluated the reliance on planning and other third party actions to achieve the forecast, and considered the impact on carrying values.
We checked that the margin recognised in the year on any units sold was in line with the forecast site margin. We evaluated the sensitivity of the margin to a change in sales prices and costs and considered whether this indicated a risk of impairment.
We considered the adequacy of the Group’s disclosures over inventory and the degree of judgement and estimation involved in arriving at the forecast and resultant profit.
Provisions (£57.1m) Refer to page 54 (Audit Committee statement), page 96 (accounting policy) and page 107 (financial disclosures)
The risk: The Group holds provisions in respect of construction related liabilities that have arisen, or that prior claims experience indicates may arise, subsequent to the completion of certain developments. The determination and valuation of provisions is judgmental by its nature and there is a risk that the estimate is incorrect and the provision is materially misstated.
Our response: Our audit procedures in respect of this area included, amongst others:
Enquiring of management and inspecting board minutes and the risk register for actual and potential claims arising in the year, and challenging whether provisions are required for these claims. For all significant known issues and claims provided for we inspected third party correspondence where available and compared it to the provision held. We also discussed claims with legal counsel.
We inspected the calculation of the provision held. For known issues we challenged the cost forecast for work to be undertaken and, where possible, compared these to quotes to undertake the remediation. For claims that history indicated may arise, we evaluated settled issues and considered any differences in the development portfolio then and now, such as increasing complexity of construction, as evidence for the calculation of the provision.
We assessed each provision against the requirements of the relevant accounting standards and the Group’s policy and assessed whether the Group’s disclosures adequately disclose the potential liabilities of the Group.
Revenue recognition (£1,620.6m) Refer to page 54 (Audit Committee statement), page 94 and 96 (accounting policy) and page 89 (financial disclosures)
The risk: It is the Group’s policy to recognise 100% of revenue on property units when contracts are exchanged and the building work is physically complete, being the point at which the Group is satisfied it has discharged its obligations to the buyer. Contract exchange, including the payment of a deposit, may have occurred sometime in the past. However, the legal completion of the sale remains dependent on the receipt of final payment. The recognition of revenue is generally before legal completion, being the point at which the balance of the sale is paid for and title transfers, and as such is potentially more subjective than recognising at the latter point.
The risk is that the unit is not physically complete or that the buyer does not complete the purchase, as should either of these be the case the revenue should not be recognised.
Our response: Our audit procedures on these areas included, among others;
Detailed testing of controls over sales approval and sample testing of sales in the year with a particular focus on significant sales recorded close to the year-end where the final payment was not yet received.
We inspected the internal sign-off sheets to check that sales recorded in the year had gone through the Group’s approval process for sale of properties and the paperwork provided by third parties who approve the sale of newly constructed buildings, including the Council of Mortgage Lender approval, which is required to sell new build properties.
For a sample of sales made in the year that were not legally complete at the year-end, we visited the sites around the year-end date to assess by physical inspection the extent to which building work was complete and the property was physically ready to be handed over to a buyer. After the year end, and up to the date of signing the audit report, we assessed whether final payments from buyers had been made and appeared as receipts in the bank statements. Where amounts were still outstanding we considered other information, such as correspondence agreeing later payments and reasons for this, in evaluating the recoverability of these amounts and appropriateness of related revenue recognition.
We have also considered the adequacy of the Group’s disclosures in respect of the judgements taken in recognising revenue for property units prior to legal completion.
3) OUR APPLICATION OF MATERIALITY AND AN OVERVIEW OF THE SCOPE OF OUR AUDIT The materiality for the Group financial statements as a whole was set at £18.0m, calculated using a benchmark of Group profit before taxation (of which it represents 4.7%) which we believe is the key benchmark used by members of the company in assessing financial performance.
We agreed with the audit committee to report to it all corrected and uncorrected misstatements we identified through our audit with a value in excess of £0.9m, in addition to other audit misstatements below that threshold that we believe warranted reporting on qualitative grounds.
Audits for Group reporting purposes were performed at key reporting components covering 93% of Group revenue; 95% of Group profit before taxation and 93% of Group total assets. Desktop reviews were performed on the remaining components.
The audits undertaken for Group reporting purposes at the key reporting components of the company were all performed to local materiality levels, which were set individually for each subsidiary and ranged from £2.6 million to £14.1 million. These audits were completed by the Group audit team.
4) OPINION ON OTHER MATTERS PRESCRIBED BY THE COMPANIES ACT 2006 In our opinion:
• the part of the Directors’ Remuneration Report to be audited has been properly prepared in accordance with the Companies Act 2006; and
• the information given in the Strategic Report and the Directors’ Report for the financial year for which the financial statements are prepared is consistent with the financial statements.

BERKELEY ANNUAL REPORT 2014 / FINANCIALS
88
INDEPENDENT AUDITORS’ REPORT TO THE MEMBERS OF THE BERKELEY GROUP HOLDINGS PLC continued
5) WE HAVE NOTHING TO REPORT IN RESPECT OF THE MATTERS ON WHICH WE ARE REQUIRED TO REPORT BY EXCEPTION Under ISAs (UK and Ireland) we are required to report to you if, based on the knowledge we acquired during our audit, we have identified other information in the annual report that contains a material inconsistency with either that knowledge or the financial statements, a material misstatement of fact, or that is otherwise misleading.
In particular, we are required to report to you if:
• we have identified material inconsistencies between the knowledge we acquired during our audit and the directors’ statement that they consider that the annual report and financial statements taken as a whole is fair, balanced and understandable and provides the information necessary for shareholders to assess the Group’s performance, business model and strategy; or
• the Audit Committee Report does not appropriately address matters communicated by us to the audit committee.
Under the Companies Act 2006 we are required to report to you if, in our opinion:
• adequate accounting records have not been kept by the parent company, or returns adequate for our audit have not been received from branches not visited by us; or
• the parent company financial statements and the part of the Directors’ Remuneration Report to be audited are not in agreement with the accounting records and returns; or
• certain disclosures of directors’ remuneration specified by law are not made; or
• we have not received all the information and explanations we require for our audit.
Under the Listing Rules we are required to review:
• the directors’ statement, set out on page 83, in relation to going concern; and
• the part of the Corporate Governance Statement on pages 50 to 53 relating to the company’s compliance with the nine provisions of the 2010 UK Corporate Governance Code specified for our review.
We have nothing to report in respect of the above responsibilities.
SCOPE OF REPORT AND RESPONSIBILITIES As explained more fully in the Directors’ Responsibilities Statement set out on page 83, the directors are responsible for the preparation of the financial statements and for being satisfied that they give a true and fair view. A description of the scope of an audit of accounts is provided on the Financial Reporting Council’s website at www.frc.org.uk/auditscopeukprivate. This report is made solely to the Company’s members as a body and subject to important explanations and disclaimers regarding our responsibilities, published on our website at www.kpmg.com/uk/auditscopeukco2013a which are incorporated into this report as if set out in full and should be read to provide an understanding of the purpose of this report, the work we have undertaken and the basis of our opinions.
SEAN MCCALLION (SENIOR STATUTORY AUDITOR)FOR AND ON BEHALF OF KPMG LLP, STATUTORY AUDITORCHARTERED ACCOUNTANTS 15 CANADA SQUARELONDON, E14 5GL11 JULY 2014
BERKELEY ANNUAL REPORT 2014 / FINANCIALS
89
FINA
NC
IALS
CONSOLIDATED INCOME STATEMENT
2014 2013 For the year ended 30 April Notes £m £m
Revenue 1,620.6 1,372.6
Cost of sales (1,111.7) (969.2)
Gross profit 508.9 403.4
Net operating expenses (134.1) (123.3)
Operating profit 374.8 280.1
Finance income 3 3.4 1.5
Finance costs 3 (10.3) (9.6)
Share of results of joint ventures using the equity method 10 12.1 (1.3)
Profit before taxation for the year 2, 4 380.0 270.7
Income tax expense 6 (87.1) (61.0)
Profit after taxation for the year 292.9 209.7
Earnings per ordinary share:
Basic 7 221.8p 160.0p
Diluted 7 188.4p 140.3p
2014 2013 For the year ended 30 April Notes £m £m
Profit after taxation for the year 292.9 209.7
Other comprehensive expense:
Items that will not be reclassified to profit or loss
Actuarial loss recognised in the pension scheme 5 (0.6) (0.8)
Deferred tax on actuarial loss recognised in the pension scheme 6 0.1 0.2
Total items that will not be reclassified to profit or loss (0.5) (0.6)
Items that may be reclassified subsequently to profit or loss
Change in value of other investments 11 1.0 –
Total items that may be reclassified subsequently to profit or loss 1.0 –
Other comprehensive income/(expense) for the year 0.5 (0.6)
Total comprehensive income for the year 293.4 209.1
CONSOLIDATED STATEMENT OF COMPREHENSIVE INCOME

BERKELEY ANNUAL REPORT 2014 / FINANCIALSBERKELEY ANNUAL REPORT 2014 / FINANCIALS
90 91
FINA
NC
IALS
CONSOLIDATED STATEMENT OF CHANGES IN EQUITY
Capital Share Share redemption Other Revaluation Retained capital premium reserve reserve reserve earnings Total Notes £m £m £m £m £m £m £m
At 1 May 2013 6.7 49.3 24.5 (961.3) 4.0 2,199.2 1,322.4
Profit after taxation for the year – – – – – 292.9 292.9
Other comprehensive income for the year – – – – – 0.5 0.5
Total comprehensive income for the year – – – – – 293.4 293.4
Reserves transfer from revaluation reserve 21 – – – – 0.1 (0.1) –
Issue of ordinary shares 20 0.1 – – – – – 0.1
Transactions with shareholders:
Credit in respect of employee share schemes 5 – – – – – 3.3 3.3
Deferred tax in respect of employee share schemes 6 – – – – – 17.3 17.3
Dividends to equity holders of the Company 22 – – – – – (195.2) (195.2)
At 30 April 2014 6.8 49.3 24.5 (961.3) 4.1 2,317.9 1,441.3
Capital Share Share redemption Other Revaluation Retained capital premium reserve reserve reserve earnings Total Notes £m £m £m £m £m £m £m
At 1 May 2012 6.7 49.3 24.5 (961.3) 3.4 1,977.2 1,099.8
Profit after taxation for the year – – – – – 209.7 209.7
Other comprehensive expense for the year – – – – – (0.6) (0.6)
Total comprehensive income for the year – – – – – 209.1 209.1
Reserves transfer from revaluation reserve 21 – – – – 0.6 (0.6) –
Transactions with shareholders:
Credit in respect of employee share schemes 5 – – – – – 11.8 11.8
Deferred tax in respect of employee share schemes 6 – – – – – 21.4 21.4
Dividends to equity holders of the Company 22 – – – – – (19.7) (19.7)
At 30 April 2013 6.7 49.3 24.5 (961.3) 4.0 2,199.2 1,322.4
CONSOLIDATED STATEMENT OF FINANCIAL POSITION
2014 2013 As at 30 April Notes £m £m
Assets
Non-current assets
Intangible assets 8 17.2 17.2
Property, plant and equipment 9 22.0 16.3
Investment properties 9 7.2 26.5
Investments accounted for using the equity method 10 61.4 44.1
Other investments 11 11.0 –
Deferred tax assets 19 61.1 56.7
179.9 160.8
Current assets
Inventories 12 2,481.2 2,066.7
Trade and other receivables 13 159.0 126.8
Cash and cash equivalents 14, 25 130.2 66.8
2,770.4 2,260.3
Non-current assets classified as held for sale 15 – 75.8
2,770.4 2,336.1
Total assets 2,950.3 2,496.9
LiabilitiesNon-current liabilitiesTrade and other payables 17 (148.6) (115.5)
Provisions for other liabilities and charges 18 (48.5) (27.9)
(197.1) (143.4)
Current liabilitiesBorrowings 16 (1.0) (22.1)
Trade and other payables 17 (1,218.6) (905.9)
Current tax liabilities (83.7) (102.0)
Provisions for other liabilities and charges 18 (8.6) (1.1)
(1,311.9) (1,031.1)
Total liabilities (1,509.0) (1,174.5)
Total net assets 1,441.3 1,322.4
Equity Shareholders’ EquityShare capital 20 6.8 6.7
Share premium 20 49.3 49.3
Capital redemption reserve 21 24.5 24.5
Other reserve 21 (961.3) (961.3)
Revaluation reserve 21 4.1 4.0
Retained profit 21 2,317.9 2,199.2
Total equity 1,441.3 1,322.4
The financial statements on pages 89 to 114 were approved by the board of directors on 11 July 2014 and were signed on its behalf by:
N G SIMPKINFINANCE DIRECTOR

BERKELEY ANNUAL REPORT 2014 / FINANCIALS
92
CONSOLIDATED CASH FLOW STATEMENT
2014 2013 For the year ended 30 April Notes £m £m
Cash flows from operating activitiesCash generated from operations 25 259.7 189.0
Interest received 2.7 1.2
Interest paid (5.0) (5.9)
Income tax paid (92.4) (69.2)
Net cash flow from operating activities 165.0 115.1
Cash flows from investing activitiesPurchase of property, plant and equipment 9 (8.9) (6.6)
Purchase of financial assets (10.0) –
Proceeds on disposal of property, plant and equipment 0.6 0.1
Proceeds from sale of investment properties 138.2 12.6
Movements in loans with joint ventures 10 (5.2) 1.1
Net cash flow from investing activities 114.7 7.2
Cash flows from financing activitiesRepayment of borrowings (21.1) (38.5)
Dividends paid to Company’s shareholders 22 (195.2) (19.7)
Net cash flow from financing activities (216.3) (58.2)
Net increase in cash and cash equivalents 63.4 64.1
Cash and cash equivalents at the start of the financial year 66.8 2.7
Cash and cash equivalents at the end of the financial year 14, 25 130.2 66.8
BERKELEY ANNUAL REPORT 2014 / FINANCIALS
93
FINA
NC
IALS
NOTES TO THE CONSOLIDATED FINANCIAL STATEMENTS
1 ACCOUNTING POLICIES GENERAL INFORMATIONThe Berkeley Group Holdings plc (the “Company”) is a public limited company incorporated and domiciled in the United Kingdom. The address of its registered office is Berkeley House, 19 Portsmouth Road, Cobham, Surrey, KT11 1JG. The Company and its subsidiaries (together the “Group”) are engaged in residential-led, mixed-use property development. Further information about the nature of the Group’s operations and its principal activities are set out in the Directors’ Report on page 81.
BASIS OF PREPARATIONThese Consolidated Financial Statements have been prepared in accordance with European Union endorsed International Financial Reporting Standards (“IFRSs”), IFRS-IC interpretations and with those parts of the Companies Act 2006 applicable to companies reporting under IFRS. The Consolidated Financial Statements have been prepared under the historical cost convention and on the going concern basis. Historical cost is generally based on the fair value of the consideration given in exchange for the assets.
The preparation of financial statements in conformity with IFRS requires the use of certain critical accounting estimates. It also requires management to exercise its judgement in the process of applying the Group’s accounting policies. The areas involving a higher degree of judgement or complexity, or areas where assumptions and estimates are significant to the Consolidated Financial Statements, are disclosed on page 96.
The following new standards, amendments to standards and interpretations are applicable to the Group and are mandatory for the first time for the financial year beginning 1 May 2013: IAS 12 (Amendment) “Income Taxes”; IAS 19 (Revised 2011) “Employee Benefits”; IAS 1 (Amendment) “Presentation of Items of Other Comprehensive Income”; IFRS 13 (Amendment) “Fair Value Measurement”; and Annual improvements to IFRSs 2009 - 2011 Cycle.
The adoption by the Company of IAS 19 Employee Benefits did not have a material effect on the consolidated financial statements for the year ended 30 April 2013 (the effect being less than £0.2 million) which have not therefore been restated. The adoption of IAS 19 has resulted in the replacement of the interest cost on the defined benefit obligation and the expected return on plan assets with a net interest cost based on the net defined benefit asset or liability and the discount rate, measured at the start of the year.
The other standards have not had a material impact on the results of the Company for the year ended 30 April 2014.
The following new standards, amendments to standards and interpretations have been issued, but are not yet effective for the financial year ending 30 April 2014 and have not been adopted early: IFRS 10 Consolidated Financial Statements; IFRS 11 Joint Arrangements; IFRS 12 Disclosure of Interest in Other Entities; and IAS 28 (Amendment) Investments in Associates and Joint Ventures.
These standards are not expected to have a significant impact on the Consolidated Financial Statements.
The Group has significant financial resources and the Directors have assessed the future funding requirements of the Group and compared this to the level of committed loan facilities and cash resources over the medium term. In making this assessment, consideration has been given to the uncertainty inherent in future financial forecasts and where applicable, reasonable sensitivities have been applied to the key factors affecting the financial performance of the Group. The Directors have a reasonable expectation that the Group has adequate resources to continue its operational existence for the foreseeable future. For this reason they continue to adopt the going concern basis of accounting in preparing its consolidated financial statements.
BASIS OF CONSOLIDATION(a) Subsidiaries
The Consolidated Financial Statements comprise the financial statements of the Parent Company and all its subsidiary undertakings. The accounting date for subsidiary undertakings is 30 April.
Subsidiary undertakings are entities that are directly or indirectly controlled by the Group. Control exists where the Group has the power to govern the financial and operating policies of the entity so as to obtain the benefits from its activities.
Subsidiaries are fully consolidated from the date on which control is transferred to the Group. They are de-consolidated from the date that control ceases.
The purchase method of accounting is used to account for the acquisition of subsidiary undertakings by the Group. The cost of an acquisition is measured as the fair value of the assets given, equity instruments issued and liabilities incurred or assumed at the date of exchange, plus costs directly attributable to the acquisition. Identifiable assets acquired and liabilities and contingent liabilities assumed in a business combination are measured initially at their fair values at the acquisition date, irrespective of the extent of any non-controlling interest. The excess of cost of acquisition over the fair value of the Group’s share of identifiable net assets acquired is recorded as goodwill. If the cost of the acquisition is less than the fair value of the net assets of the subsidiary acquired, the difference is recognised directly in the income statement.
Where necessary, adjustments are made to the financial statements of subsidiaries to bring the accounting policies used into line with those used by the Group.
All intra-Group transactions, balances, income and expenses are eliminated on consolidation. Acquisition-related costs are expensed as incurred.
(b) Joint ventures
Entities which are jointly controlled with another party or parties (“joint ventures”) are accounted for using the equity method of accounting. The results attributable to the Group’s holding in joint ventures are shown separately in the consolidated income statement. The amount included in the consolidated statement of financial position is the Group’s share of the net assets of the joint ventures plus net loans receivable. Goodwill arising on the acquisition of joint ventures is accounted for in accordance with the policy set out above. The carrying value of goodwill is included in the carrying value of the investment in joint ventures. On transfer of land and/or work in progress to joint ventures, the Group recognises only its share of any profits or losses, namely that proportion sold outside the Group.
SEGMENTAL REPORTINGOperating segments are identified in a manner consistent with the internal reporting provided to the chief operating decision-maker. The Group determines its reportable segments having regard to permitted aggregation criteria with the principal condition being that the operating segments should have similar economic characteristics.
The Group is predominantly engaged in residential-led, mixed-use property development, comprising residential revenue, revenue from land sales and commercial revenue.
For the purposes of determining its operating segments, the chief operating decision-maker has been identified as the Executive Committee of the Board.
This committee approves investment decisions, allocates the Group’s resources and reviews the internal reporting in order to assess performance.

BERKELEY ANNUAL REPORT 2014 / FINANCIALSBERKELEY ANNUAL REPORT 2014 / FINANCIALS
94 95
FINA
NC
IALS
1 ACCOUNTING POLICIES CONTINUED The Group has determined that its operating segments are the management teams that report into the Executive Committee of the Board. These management teams are all engaged in residential-led, mixed-use development in the United Kingdom and, having regard to the aggregation criteria in IFRS 8, the Group has one reportable operating segment.
In addition to its development activities, the Group holds certain residential properties for investment purposes. These investment activities represent a separate segment which is included within “Other activities”, as they do not meet the size thresholds to be disclosed as a separate reportable segment.
REVENUERevenue represents the amounts receivable from the sale of properties and investment properties during the year and other income directly associated with property development. Properties are treated as sold and profits are recognised when contracts are exchanged and the building work is physically complete.
Rental income is recognised in the income statement on a straight line basis over the life of the lease. Any lease incentives are recognised as an integral part of the total rental income.
EXPENDITUREExpenditure recorded in inventory is expensed through cost of sales at the time of the related property sale. Net operating expenditure is recognised in respect of goods and services received when supplied in accordance with contractual terms. Provision is made when an obligation exists for a future liability in respect of a past event and where the amount of the obligation can be reliably estimated. See Accounting estimates and judgements below for further disclosures on cost recognition.
TAXATIONThe taxation expense represents the sum of the current tax payable and deferred tax. Current tax, including UK corporation tax, is provided at the amounts expected to be paid (or received) using the tax rules and laws that have been enacted, or substantively enacted, by the reporting date.
Deferred taxation is the tax expected to be payable or recoverable on differences between the carrying amounts of assets and liabilities in the financial statements and corresponding tax bases used in the computation of taxable profit, and is accounted for using the balance sheet liability method. Deferred tax liabilities are generally recognised on all taxable temporary differences. Deferred tax assets are recognised to the extent that it is probable that taxable profits will be available against which deductible temporary differences can be utilised. Such assets and liabilities are not recognised if the temporary difference arises from goodwill, or from the initial recognition (except in a business combination) of other assets and liabilities in a transaction that affects neither the taxable profit nor the accounting profit, or from differences relating to investments in subsidiaries to the extent that it is probable that they will not reverse in the foreseeable future.
Deferred taxation is calculated at the tax rates that are expected to apply in the period when the liability is settled or the asset is realised based on tax laws and rates that have been enacted or substantively enacted at the balance sheet date. The carrying value of deferred tax assets is reviewed at each balance sheet date and reduced to the extent that it is no longer probable that sufficient taxable profits will be available against which taxable temporary differences can be utilised. Deferred taxation is charged or credited to the income statement, except when it relates to items charged or credited directly to reserves, in which case the deferred taxation is also dealt with in reserves.
Deferred taxation assets and liabilities are offset when there is a legally enforceable right to offset current tax assets against current tax liabilities and when the deferred taxation assets and liabilities relate to income taxes levied by the same taxation authority on either the taxable entity or different taxable entities where there is an intention to settle the balances on a net basis.
INTANGIBLE ASSETSWhere the cost of acquiring new and additional interests in subsidiaries, joint ventures and businesses exceeds the fair value of the net assets acquired, the resulting premium on acquisition (goodwill) is capitalised and its subsequent measurement is based on annual impairment reviews and impairment reviews performed where an impairment indicator exists, with any impairment losses recognised immediately in the income statement. Goodwill is allocated to cash-generating units for the purpose of impairment testing. The allocation is made to those cash-generating units or groups of cash-generating units that are expected to benefit from the business combination in which the goodwill arose.
PROPERTY, PLANT AND EQUIPMENTProperty, plant and equipment is carried at historic purchase cost less accumulated depreciation. Cost includes the original purchase price of the asset and the costs attributable to bringing the asset to its working condition for its intended use. Depreciation is provided to write off the cost of the assets on a straight line basis to their residual value over their estimated useful lives at the following annual rates:
Freehold buildings 2% Fixtures and fittings 15% / 20%
Motor vehicles 25% Computer equipment 33 1/3 %
Freehold property disclosed in the notes to the consolidated financial statements consists of both freehold land and freehold buildings. No depreciation is provided on freehold land. Computer equipment is included within fixtures and fittings. The assets’ residual values, carrying values and useful lives are reviewed on an annual basis and adjusted if appropriate at each balance sheet date. Where an impairment is identified, the recoverable amount of the asset is identified and an impairment loss, where appropriate, is recognised in the income statement.
Subsequent costs are included in the assets’ carrying amount or recognised as a separate asset, as appropriate, only when it is probable that future economic benefits associated with the item will flow to the Group and the cost of the item can be measured reliably. The carrying amount of the replaced part is derecognised. All other repairs and maintenance are charged to the income statement during the financial period in which they are incurred.
Gains and losses on disposals are determined by comparing the proceeds with the carrying amount and are recognised within net operating expenses in the income statement.
INVESTMENT PROPERTIESInvestment properties, which are properties held to earn rental income, are recognised using the “cost model” and are carried in the statement of financial position at historic cost less accumulated depreciation.
Depreciation is provided to write off the element of the cost of the assets that relates to buildings at 2% per annum on a straight line basis. No depreciation is charged on the element of the cost of the assets that relates to land.
Sales of investment properties are recognised in revenue and cost sales. These are considered to be similar in nature to the underlying property sales of the Group.
NOTES TO THE CONSOLIDATED FINANCIAL STATEMENTS continued
INVENTORIESProperty in the course of development and completed units are valued at the lower of cost and net realisable value. Direct cost comprises the cost of land, raw materials and development costs but excludes indirect overheads. Provision is made, where appropriate, to reduce the value of inventories and work in progress to their net realisable value.
Land purchased for development, including land in the course of development, is initially recorded at cost. Where such land is purchased on deferred settlement terms, and the cost differs from the amount that will subsequently be paid in settling the liability, this difference is charged as a finance cost in the income statement over the period to settlement.
TRADE AND OTHER RECEIVABLESTrade receivables are recognised initially at fair value and subsequently measured at amortised cost using the effective interest method, less provision for impairment. A provision for impairment of trade receivables is established when there is objective evidence that the Group will not be able to collect all amounts due according to the original terms of the receivables. The amount of the provision is the difference between the asset’s carrying amount and the present value of estimated future cash flows, discounted at the original effective interest rate. The carrying amount of the asset is reduced through the use of an allowance account, and the amount of the loss is recognised in the income statement within net operating expenses. When a trade receivable is uncollectible, it is written off against the allowance account for trade receivables. Subsequent recoveries of amounts previously written off are credited against net operating expense in the income statement.
CASH AND CASH EQUIVALENTSCash and cash equivalents comprises cash balances in hand and at the bank, including bank overdrafts repayable on demand which form part of the Group’s cash management, for which offset arrangements across Group businesses have been applied where appropriate.
SHARE CAPITALOrdinary shares are classified as equity.
Incremental costs directly attributable to the issue of new shares or options are shown in equity as a deduction, net of tax, from the proceeds.
Where any Group company purchases the Company’s equity share capital (treasury shares), the consideration paid, including any directly attributable incremental costs (net of income taxes) is deducted from equity attributable to the Company’s equity holders until the shares are cancelled, sold or reissued. Where such shares are subsequently sold or reissued, any consideration received, net of any directly attributable incremental transaction costs and the related income tax effects, is included in equity attributable to the Company’s equity holders.
BORROWINGSBorrowings are recognised initially at fair value, net of transaction costs incurred. Any difference between the proceeds (net of transaction costs) and the redemption value is recognised in the income statement over the period of the borrowings using the effective interest method.
TRADE AND OTHER PAYABLESTrade and other payables on normal terms are not interest bearing and are stated at their nominal value which is considered to be their fair value. Trade payables on extended terms are recorded at their fair value at the date of acquisition of the asset to which they relate. The discount to nominal value is amortised over the period of the credit term and charged to finance costs.
PROVISIONSProvisions are recognised when the Group has a present legal or constructive obligation as a result of past events, and it is probable that an outflow of resources will be required to settle that obligation, and the amount has been reliably estimated.
DEPOSITSNew property deposits and on account contract receipts are held within current trade and other payables.
EMPLOYEE BENEFITS(a) Pensions
The Group accounts for pensions under IAS 19 “Employee benefits”. The Group has both defined benefit and defined contribution plans. The defined benefit plan was closed to future accrual with effect from 1 April 2007.
For the defined benefit scheme, the obligations are measured using the projected unit method. The calculation of the net obligation is performed by a qualified actuary. The operating and financing costs of these plans are recognised separately in the income statement; service costs are set annually on the basis of actuarial valuations of the scheme and financing costs are recognised in the period in which they arise. Actuarial gains and losses are recognised immediately in the statement of comprehensive income. In accordance with IAS 19 the Group does not recognise on the statement of financial position any surplus in the scheme.
Pension contributions under defined contribution schemes are charged to the income statement as they fall due.
(b) Share-based payments
Where the Company operates equity-settled, share-based compensation plans, the fair value of the employee services received in exchange for the grant of the options is recognised as an expense. The total amount to be expensed over the vesting period is determined by reference to the fair value of the options granted. At each balance sheet date, the Group revises its estimates of the number of options that are expected to vest. It recognises the impact of the revision to original estimates, if any, in the income statement, with a corresponding adjustment to equity.
The proceeds received net of any directly attributable transaction costs are credited to share capital (nominal value) and share premium when the options are exercised.
DIVIDENDSDividend distributions to shareholders are recognised as a liability in the period in which the dividends are appropriately authorised and approved for payout and are no longer at the discretion of the Company. Unpaid dividends that do not meet these criteria are disclosed in the notes to the financial statements.
LEASING AGREEMENTSPayments and receipts under operating lease agreements are charged or credited against profit on a straight line basis over the life of the lease.

BERKELEY ANNUAL REPORT 2014 / FINANCIALSBERKELEY ANNUAL REPORT 2014 / FINANCIALS
96 97
FINA
NC
IALS
NOTES TO THE CONSOLIDATED FINANCIAL STATEMENTS continued
3 NET FINANCE COSTS 2014 2013 £m £m
Finance income 3.4 1.5
Finance costs:
Interest payable on bank loans and non-utilisation fees (5.1) (4.8)
Amortisation of facility fees (1.3) (0.9)
Other finance costs (3.9) (3.9)
(10.3) (9.6)
Net finance costs (6.9) (8.1)
Finance income predominantly represents interest earned on cash deposits.
Other finance costs represent imputed interest on taxation and on land purchased on deferred settlement terms.
4 PROFIT BEFORE TAXATIONProfit before taxation is stated after charging/(crediting) the following amounts:
2014 2013 £m £m
Staff costs (note 5) 177.3 138.2
Depreciation of property, plant and equipment (note 9) 1.9 1.8
Loss on sale of fixed assets 0.7 –
Profit on sale of investment properties (43.2) (3.6)
Rental income from investment properties (0.9) (8.1)
Direct operating expense in relation to investment properties including depreciation 0.2 4.8
Operating lease costs 2.7 1.9
Fees paid and payable to the Company’s previous auditor for the audit of the Parent Company – 0.2
and consolidated financial statements
Fees paid and payable to the Company’s previous auditor for other services:
– Audit of the Company’s subsidiaries – 0.1
– Audit related assurance services 0.1 0.1
– Taxation compliance services – 0.1
– All other non-audit services – 0.2
Fees paid and payable to the Company’s current auditor for the audit of the Parent Company 0.2 –
and consolidated financial statements
Fees paid and payable to the Company’s current auditor for other services:
– Audit of the Company’s subsidiaries 0.1 –
– Taxation compliance services 0.1 –
The value of inventories expensed and included in the cost of sales is £1,032.9m (2013: £895.3m).
In addition to the above services, the Group’s current auditor has been asked to act as auditor to The Berkeley Final Salary Plan. The appointment of auditors to the Group’s pension scheme and the fees paid in respect of the audit are agreed by the trustees of the scheme, who act independently of the management of the Group. The fees paid to the Group’s auditors for audit services to the pension scheme during the year were £nil (2013: £nil).
Fees paid and payable to the Company’s current auditor for other services disclosed in the table above relate only to the period from the date of appointment of 6 December 2013. Fees paid in respect of the full year ended 30 April 2014 were £0.1 for taxation compliance services and £0.1 for all other non-audit services.
Remuneration paid to the Company’s previous auditors in respect of audit related assurance services relates to the interim review.
1 ACCOUNTING POLICIES CONTINUED ACCOUNTING ESTIMATES AND JUDGEMENTSManagement applies the Group’s accounting policies as described above when making critical accounting judgements, of which no individual judgement is deemed to have a significant impact upon the financial statements, apart from those involving estimations, which are detailed below.
(a) Carrying value of land and work in progress and estimation of costs to complete
The Group holds inventories stated at the lower of cost and net realisable value. Such inventories include land, work in progress and completed units. As residential development is largely speculative by nature, not all inventories are covered by forward sales contracts. Furthermore due to the nature of the Group’s activity and, in particular the scale of its developments and the length of the development cycle, the Group has to allocate site-wide development costs between units being built and/or completed in the current year and those for future years. It also has to forecast the costs to complete on such developments.
In making such assessments and allocations, there is a degree of inherent estimation uncertainty. The Group has established internal controls designed to effectively assess and centrally review inventory carrying values and ensure the appropriateness of the estimates made.
(b) Provisions
The Group makes assumptions to determine the timing and its best estimate of the quantum of its construction and other liabilities for which provisions are held.
(c) Revenue recognition
Assumptions are made which complement external certifications to assess whether the building work for properties sold is physically complete and hence whether the Group’s revenue recognition criteria have been satisfied.
(d) Share-based payments
Assumptions are made in determining the fair value of employee services received in exchange for the grant of options under share-based payment awards at the date of grant.
2 SEGMENTAL DISCLOSUREFor the purposes of determining its operating segments, the chief operating decision-maker has been identified as the Executive Committee of the Board.
This committee approves investment decisions, allocates the Group’s resources and reviews the internal reporting in order to assess performance.
The Group has determined that its operating segments are the management teams that report into the Executive Committee of the Board. These management teams are all engaged in residential-led, mixed-use development in the United Kingdom and, having regard to the aggregation criteria in IFRS 8, the Group has one reportable operating segment.
In addition to its development activities, the Group holds certain residential properties for investment purposes. These investment activities represent a separate segment which is included within other activities as it does not meet the size thresholds to be disclosed as separate reportable segments. Revenue and operating profit for the year ended 30 April 2014 include £105.4 million and £29.6 million, respectively, on the sale of 534 properties to M&G Investments and £32.8 million and £13.6 million, respectively, on the sale of 141 other investment properties.
Segment results 2014 2013 £m £m
Profit before tax
Residential-led mixed-use development 379.7 269.7
Other activities 0.3 1.0
380.0 270.7
Segment profit before tax represents the profit before tax allocated to each segment. This is the measure reported to the Executive Committee of the Board for the purpose of resource allocation and assessment of segment performance.
Segment assets 2014 2013 £m £m
Assets
Residential-led mixed-use development 2,943.1 2,394.6
Other activities 7.2 102.3
2,950.3 2,496.9
For the purpose of monitoring segment performance and allocating resources between segments all assets are considered to be attributable to residential-led mixed-use development with the exception of investment properties which are held for the Group’s investing activities and have therefore been allocated to other activities.

BERKELEY ANNUAL REPORT 2014 / FINANCIALSBERKELEY ANNUAL REPORT 2014 / FINANCIALS
98 99
FINA
NC
IALS
NOTES TO THE CONSOLIDATED FINANCIAL STATEMENTS continued
The fair value of the options granted during that year, determined using the current market pricing model, was £3.17 for options which vest on 30 September 2021. The inputs into the current market option pricing model were:
Inputs
Grant date 5 September 2011
Vesting date 30 September 2021
Share price at grant date (p) 1,236
Exercise price (p) nil
Discount rate 6.3%
In 2014, 1,250,000 of the 19,616,503 options over shares were surrendered by one Executive Director. These have now been reallocated to a wider pool of the Group’s senior management team. No existing beneficiaries of the Plan received any additional options over shares. All other conditions of the Plan remained unchanged.
The discount rate was determined by calculating the Group’s expected cost of capital over the vesting period at the grant date.
CASH-SETTLED SHARE BASED PAYMENTSBonus Banking Plan. Under the Bonus Banking Plan, discussed in the Directors’ Remuneration page on page 59, 50% of the balance on the plan account at the end of the financial year is deferred in notional shares in the Company. The notional shares can be settled in equity or cash at the discretion of the Company. In prior periods, the plan has been accounted for as equity-settled. At the end of year, the plan is expected to be settled in cash, which has been accounted for as a modification to the plan.
The liability is accrued over the vesting period. The income statement is charged with an estimate for the vesting of notional shares awarded subject to service and non-market performance conditions. The charge for 2014 was £10.8m (2013: £5.8m), of which £4.6m relates to the modification to cash-settlement.
The total carring amount of liabilities for the Bonus Plan at the end of the year was £11.4m (2013: £1.6m)
Senior Management share appreciation rights Certain key members of senior management have been awarded cash bonuses deferred in notional shares in the Company. The notional shares have a contractual life of five years after the bonus is allocted, and are settled in cash subject to continued employment by the Company and individual and divisional performance criteria.
The liability is accrued over the vesting period. The income statement is charged with an estimate for the vesting of notional shares awarded subject to service and non-market performance conditions. The charge for 2014 was £6.9m (2013: £4.5m).
The total carrying amount of liabilities for share appreciation rights at the end of the year was £13.0m (2013: £6.1m)
PENSIONSDuring the year, two principal pension schemes were in place for employees. The Berkeley Group plc Group Personal Pension Plan and the St George PLC Group Personal Pension Plan are defined contribution schemes. The assets of these schemes were held in separate trustee administered funds.
The Berkeley Final Salary Plan is a defined benefit scheme which was closed to future accrual with effect from 1 April 2007.
DEFINED CONTRIBUTION PLANContributions amounting to £3.3m (2013: £2.7m) were paid into the defined contribution schemes during the year.
DEFINED BENEFIT PLANAs at 30 April 2014, the Group operated one defined benefit pension scheme which was closed to future accrual with effect from 1 April 2007. This is a separate trustee administered fund holding the pension plan assets to meet long term pension liabilities for some 335 past employees. The level of retirement benefit is principally based on salary earned in the last three years of employment prior to leaving active service and is linked to changes in inflation up to retirement.
The Berkeley Final Salary Plan is subject to an independent actuarial valuation at least every three years. The most recently finalised valuation was carried out as at 1 May 2013 and finalised in December 2013. The method adopted in the 2013 valuation was the projected unit method, which assumed a return on investment both prior to and after retirement of 4.00% per annum and pension increases of 3.25% per annum. The market value of the Berkeley Final Salary Plan assets as at 1 May 2013 was £16.2m and covered 97% of the scheme’s liabilities. Following the finalisation of the 2007 valuation, with effect from 1 July 2008, employer’s required regular contributions were reduced to zero. Following the finalisation of the 2013 valuation, the Group agreed with the Trustees of the Scheme to make additional contributions to the Scheme of £0.2m for the remainder of the year (1 December 2013 to 30 April 2014) to address the Scheme’s deficit after which required contributions were reduced to zero. The Group made total contributions of £0.6m during the year (2013: £0.6m).
For the purposes of IAS 19, the 2013 valuation was updated for 30 April 2014.
The most significant risks to which the plan exposes the group are:
Inflation risk: A rise in inflation rates will lead to higher plan liabilities as a large proportion of the defined benefit obligation is indexed in line with price inflation. This effect will be limited due to caps on inflationary increases to protect the plan against extreme inflation.
Interest rate risk: A decrease in corporate bond yields would result in an increase to plan liabilities although this effect would be partially offset by an increase in the value of the plan’s bond holdings.
Mortality risk: An increase in life expectancy would result in an increase to plan liabilities as a significant proportion of the Pension Schemes’ obligations are to provide benefits for the life of the member.
5 DIRECTORS AND EMPLOYEES 2014 2013 £m £m
Staff costs
Wages and salaries 141.8 97.4
Social security costs 28.5 26.0
Share-based payments 3.3 11.8
Pension costs 3.7 3.0
177.3 138.2
The average monthly number of persons employed by the Group during the year was 1,647 (2013: 1,326).
KEY MANAGEMENT COMPENSATIONKey management comprises the Main Board, as the Directors are considered to have the authority and responsibility for planning, directing and controlling the activities of the Group. Details of Directors’ emoluments are set out in the Remuneration Report on pages 56 to 80.
EQUITY-SETTLED SHARE-BASED PAYMENTSThe Group operates three equity-settled share based payments schemes. The charge to the income statement in respect of share-based payments in the year relating to grants of share options awarded under the 2009 Long-Term Incentive Plan and the 2011 Long-Term Incentive Plan was £9.0m (2013: £11.8m). The charge to the income statement attributable to key management is £2.3m (2013: £10.9m).
There were no exercisable share options at the end of the year.
2009 Long-Term Incentive Plan Part A
On 29 June 2009 the balance of the shares originally awarded under the 2004(b) Long-Term Incentive Plan, totalling 5,330,340 shares, were replaced by options under Part A of the 2009 Long-Term Incentive Scheme, with an exercise price of £1.36 per share, in accordance with the shareholder approval obtained at the Extraordinary General Meeting on 15 April 2009. During the year, no options lapsed, leaving 4,441,950 outstanding. These became exercisable by the relevant Executive Directors on 31 January 2014. As a result, 4,208,071 shares were issued to the participants, representing 4,441,950 options that vested under 2009 LTIP Part A, less 233,879 of shares equivalent to the exercise price on vesting of £1.36 per share. The share price at the date of vesting was £22.83.
Part B
Part B of the 2009 Long-Term Incentive Plan covers 6,830,000 share options with an exercise price of £6.76. Vesting of the options is in two tranches: 50% on 15 April 2015 and 50% on 15 April 2016. The options are conditional on continued employment at the relevant vesting date and the satisfaction of the underpin condition that Net Assets per Share are at least £9.00 at 15 April 2015 and 15 April 2016. During the year, 30,000 options lapsed on the departure of employees (2013: 180,000) leaving 6,090,000 options outstanding (2013: 6,120,000).
2011 Long-Term Incentive Plan The Company announced in June 2011 as part of a strategic review of the business a long term plan to return approximately £1.7 billion to shareholders over the next 10 years. The rules were subsequently amended and approved at the 2012 Annual General Meeting to allow the returns to be made through a combination of dividends (£13 per share) and share buy backs (‘distributions’). The cumulative distributions required by the plan on or before the relative milestone dates are set out below:
Cumulative distributions
30 September 2015 £4.34 per share
30 September 2018 £4.33 per share
30 September 2021 £4.33 per share
A long term remuneration plan was proposed to support this strategy, the 2011 Long Term Incentive Plan (“2011 LTIP”), which was approved by
shareholders at the Annual General Meeting on 5 September 2011 and the amendment at the Annual General Meeting on 5 September 2012. The key
features of the 2011 LTIP are:
– if the Company returns £1.7 billion to shareholders over a ten year period via a series of dividend payments (£13 per share) and share buy backs by the milestone dates referred to above, participants will be entitled to exercise options and receive a number of ordinary shares in the capital of the Company at the end of the ten year period.
– the maximum number of shares capable of being earned by all participants are 19,616,503 shares, being 13% of the fully diluted share capital of the Company at the date of approval of the plan.
– the exercise price of options granted under the 2011 LTIP will be £13 per share less an amount equal to the value of all dividends paid between the date of approval of the 2011 LTIP and 30 September 2021, provided the exercise price cannot be less than zero.

BERKELEY ANNUAL REPORT 2014 / FINANCIALSBERKELEY ANNUAL REPORT 2014 / FINANCIALS
100 101
FINA
NC
IALS
NOTES TO THE CONSOLIDATED FINANCIAL STATEMENTS continued
The fair value of the assets were as follows:
30 April 2014 30 April 2013
Long-term Long-term Value Value £m £m
UK Equities 0.8 1.2
Global Equities 3.0 2.9
Emerging Market Equities 0.7 1.2
Emerging Market Debt 1.3 1.6
High Yield Bonds 0.9 0.8
Diversified Growth Fund 2.9 2.9
Property 1.5 1.3
Government Bonds (over 15 years) 1.6 0.8
Government Bonds (5 to 15 years) 0.8 0.8
Corporate Bonds 2.3 2.4
Cash 0.2 0.1
Fair value of plan assets 16.0 16.0
All equity securities and government bonds have quoted prices in active markets. All government bonds are issued by European governments and are AAA- or AA- rated. All other plan assets are not quoted in an active market.
History of asset values
30 April 30 April 30 April 30 April 30 April 2014 2013 2012 2011 2010 £m £m £m £m £m
Fair value of scheme assets 16.0 16.0 14.0 12.8 11.5
Present value of scheme liabilities (14.8) (14.6) (13.3) (12.4) (11.4)
Net surplus in the plan 1.2 1.4 0.7 0.4 0.1
Actuarial assumptions The major assumptions used by the actuary for the 30 April 2014 valuation were:
30 April 30 April Valuation at: 2014 2013
Discount rate 4.30% 4.30%
Inflation assumption (RPI) 3.40% 3.25%
Inflation assumption (CPI) 2.50% 2.50%
Rate of increase in pensions in payment post-97 (Pre-97 receive 3% p.a. increases) 3.40% 3.25%
The mortality assumptions are the standard S1PA CMI_2013_X [1.0%] (2013: S1PA CMI_2009_X [1.0%]) base table for males and females, both adjusted for each individual’s year of birth to allow for future improvements in mortality rates. The life expectancy of male and female pensioners (now aged 65) retiring at age 65 on the balance sheet date is 22.0 years and 24.2 years respectively (2013: 22.0 and 24.0). The life expectancy of male and female deferred pensioners (now aged 50) retiring at age 65 after the balance sheet date is 23.0 years and 25.3 years respectively (2013: 23.0 and 25.2).
Sensitivity Analysis The calculation of the defined benefit obligation is sensitive to the assumptions set out above. The following table summarises how the impact on the defined benefit obligation at the end of the reporting period would have increased as a result of a change in the respective assumptions.
Change in Change in defined Assumption benefit obligation
Discount rate -0.25% p.a +4.2%
Rate of inflation +0.25% p.a +2.9%
Rate of mortality + 1 year +2.6%
These calculations provide an approximate guide to the sensitivity of results and may not be as accurate as a full valuation carried out on these assumptions. In practice, changes in some of the assumptions are correlated and so each assumption change is unlikely to occur in isolation, as shown above.
Funding The Group expects to pay £0.6m in contributions to its defined benefit plan in the year ending 30 April 2015 (i.e. the next annual reporting period).
5 DIRECTORS AND EMPLOYEES CONTINUEDThe amounts recognised in the statement of financial position are determined as follows:
2014 2013 £m £m
Present value of defined benefit obligations (14.8) (14.6)
Fair value of plan assets 16.0 16.0
Net surplus 1.2 1.4
Effect of the asset ceiling (1.2) (1.4)
Net amount recognised on the statement of financial position – –
Movement in net defined benefit asset:
Defined Benefit Obligation Fair Value Plan Assets Net Defined Benefit Asset
2014 2013 2014 2013 2014 2013 £m £m £m £m £m £m
Balance at 1 May (14.6) (13.3) 16.0 14.0 1.4 0.7
Included in income statement
Net interest (0.6) (0.6) 0.6 0.8 – 0.2
Included in other comprehensive income
Remeasurements:
Actuarial (loss)/gain arising from:
– demographic assumptions – – – – – –
– financial assumptions (0.1) (1.1) – – (0.1) (1.1)
– experience adjustments 0.1 – – – 0.1 –
Return on plan assets – – (0.8) 1.0 (0.8) 1.0 (excluding interest income)
Other
Contributions by the employer – – 0.6 0.6 0.6 0.6
Benefits paid out 0.4 0.4 (0.4) (0.4) – –
Balance at 30 April (14.8) (14.6) 16.0 16.0 1.2 1.4
Cumulative actuarial gains and losses recognised in equity:
2014 2013 £m £m
Cumulative amounts of losses recognised in the statement of comprehensive income at 1 May (4.4) (3.6)
Net actuarial losses recognised in the year (0.8) (0.1)
Change in the effect of the asset ceiling 0.2 (0.7)
Cumulative amounts of losses recognised in the statement of comprehensive income at 30 April (5.0) (4.4)

BERKELEY ANNUAL REPORT 2014 / FINANCIALSBERKELEY ANNUAL REPORT 2014 / FINANCIALS
102 103
FINA
NC
IALS
NOTES TO THE CONSOLIDATED FINANCIAL STATEMENTS continued
7 EARNINGS PER ORDINARY SHAREBasic earnings per ordinary share is calculated as profit for the financial year attributable to shareholders of the Group divided by the weighted average number of shares in issue during the year.
2014 2013
Profit attributable to shareholders (£m) 292.9 209.7
Weighted average number of shares (m) 132.1 131.0
Basic earnings per ordinary share (p) 221.8 160.0
For diluted earnings per ordinary share, the weighted average number of shares in issue is adjusted to assume the conversion of all potentially dilutive ordinary shares. At 30 April 2014, the Group had three (2013: four) categories of potentially dilutive ordinary shares: 5.9 million £6.76 share options under the 2009 LTIP Part B and 19.6 million £nil share options under the 2011 LTIP. 4.4 million share options vested on 31 January 2014 under the 2009 LTIP Part A scheme.
A calculation is done to determine the number of shares that could have been acquired at fair value based on the aggregate of the exercise price of each share option and the fair value of future services to be supplied to the Group which is the unamortised share-based payments charge. The difference between the number of shares that could have been acquired at fair value and the total number of options is used in the diluted earnings per share calculation.
2014 2013
Profit used to determine diluted EPS (£m) 292.9 209.7
Weighted average number of shares (m) 132.1 131.0
Adjustments for:
Share options – 2009 LTIP Part A (m) 3.0 3.6
Share options – 2009 LTIP Part B (m) 4.0 2.6
Share options – 2011 LTIP (m) 16.4 11.9
Bonus plan shares (m) – 0.3
Shares used to determine diluted EPS (m) 155.5 149.4
Diluted earnings per ordinary share (p) 188.4 140.3
8 INTANGIBLE ASSETS Goodwill £m
Cost
At 1 May 2013 and 30 April 2014 17.2
Accumulated impairment
At 1 May 2013 and at 30 April 2014 –
Net book value
At 1 May 2013 and at 30 April 2014 17.2
Cost
At 1 May 2012 and 30 April 2013 17.2
Accumulated impairment
At 1 May 2012 and at 30 April 2013 –
Net book value
At 1 May 2012 and at 30 April 2013 17.2
The goodwill balance relates solely to the acquisition of the 50% of the ordinary share capital of St James Group Limited, completed on 7 November 2006, that was not already owned by the Group. The goodwill balance is tested annually for impairment. The recoverable amount has been determined on the basis of the value in use of the business using the current five year pre-tax forecasts. Key assumptions are as follows:
(i) Cash flows beyond a five year period are not extrapolated;
(ii) A pre-tax discount rate of 13.21% (2013: 11.62%) based on the Group’s weighted average cost of capital.
The Directors have identified no reasonably possible change in a key assumption which would give rise to an impairment charge.
6 TAXATIONThe tax charge for the year is as follows:
2014 2013 £m £m
Current tax
UK corporation tax payable (94.3) (77.7)
Adjustments in respect of previous years (4.0) 7.0
(98.3) (70.7)
Deferred tax at 23% (note 19) (2013: 24%) 16.5 10.8
Adjustment in respect of change of tax rate from 23% to 21%/20% (note 19) (2013: 24% to 23%) (5.3) (1.1)
(87.1) (61.0)
Tax on items recognised directly in other comprehensive income is as follows:
2014 2013 £m £m
Deferred tax on actuarial loss recognised in the pension scheme (note 19) 0.1 0.2
Tax on items recognised directly in equity is as follows:
2014 2013 £m £m
Deferred tax in respect of employee share schemes (note 19) 17.3 21.4
Current tax in respect of employee share schemes (note 19) (23.1) –
(5.8) 21.4
The tax charge assessed for the year differs from the standard rate of UK corporation tax of 22.84% (2013: 23.92%). The differences are explained below:
2014 2013 £m £m
Profit before tax 380.0 270.7
Tax on profit at standard UK corporation tax rate 86.8 64.7
Effects of:
Expenses not deductible for tax purposes 0.5 0.9
Tax effect of share of results of joint ventures 0.1 0.4
Adjustments in respect of previous periods – current tax 4.0 (7.0)
Adjustments in respect of deferred tax change of rate from 23% to 21%/20% (2013: 24% to 23%) 5.3 1.1
Utilisation of losses (0.8) –
Other (8.8) 0.9
Tax charge 87.1 61.0
The statutory tax rate in 2014 was at 22.84% (11 months at 23%, 1 month at 21%)
The adjustments in respect of previous years includes items such as contaminated land relief, research and development relief and other timing differences that are not individually significant and have not therefore been separately disclosed.
The other adjustment predominantly relates to the deferred tax effect of the external sale of certain properties from subsidiaries incorporated in overseas tax jurisdictions with different rates to the UK on which tax has been paid in previous years (£8.2m).

BERKELEY ANNUAL REPORT 2014 / FINANCIALSBERKELEY ANNUAL REPORT 2014 / FINANCIALS
104 105
FINA
NC
IALS
NOTES TO THE CONSOLIDATED FINANCIAL STATEMENTS continued
10 INVESTMENTS 2014 2013 £m £m
Unlisted shares at cost 12.1 13.7
Loans 41.9 35.1
Share of post-acquisition reserves 7.9 (4.2)
Elimination of profit on transfer of inventory to joint ventures (0.5) (0.5)
61.4 44.1
Details of the principal joint ventures are provided in note 29.
The movement on the investment in joint ventures during the year is as follows:
2014 2013 £m £m
At 1 May 44.1 46.5
Profit/(loss) after tax for the year 12.1 (1.3)
Net increase/(decrease) in loans to joint ventures 5.2 (1.1)
At 30 April 61.4 44.1
Net increase/(decrease) in loans to joint ventures includes movements in unlisted shares at cost.
The Group’s share of joint ventures’ net assets, income and expenses is made up as follows:
2014 2013 £m £m
Current assets 180.4 161.9
Current liabilities (82.5) (86.4)
Non-current liabilities (36.5) (31.4)
61.4 44.1
Revenue 125.6 9.4
Costs (112.1) (8.7)
Operating profit 13.5 0.7
Interest charges (1.2) (1.9)
Profit/(loss) before taxation 12.3 (1.2)
Tax charge (0.2) (0.1)
Share of post tax profit/(loss) of joint ventures 12.1 (1.3)
11 OTHER INVESTMENTSOther investments comprise available-for-sale financial assets.
2014 2013 £m £m
At 1 May – –
Additions 10.0 –
Fair value adjustment taken through other comprehensive income 1.0 –
At 30 April 11.0 –
During the year, the Group sold 534 rental properties to a fund owned and controlled by M&G Investments (Note 15). Following this sale, as agreed with M&G Investments, the Group invested £10.0 million into the fund to acquire 100,000 units at an average price of £100 per unit. As at 30 April 2014, the Group held 100,000 units. In accordance with IFRS 7 ‘Financial Instruments: Disclosures’, these financial assets have been classified as Level 2 within the fair value hierarchy. Level 2 fair value measurements are those that are derived from inputs other than quoted prices included within level 1 that are observable for the asset (that is, as prices) or indirectly (that is, derived from prices).
On 30 April 2014, based on inputs other than quoted prices, the units had a market value of £11.0m. A gain of £1.0m has been recognised in the consolidated statement of comprehensive income for the year ended 30 April 2014.
Further disclosures relating to financial assets are set out in note 26.
9 PROPERTY, PLANT AND EQUIPMENT AND INVESTMENT PROPERTY
Property, plant and equipment
Freehold Fixtures and Motor Investment property fittings vehicles Total properties £m £m £m £m £m
Cost
At 1 May 2013 11.1 8.8 3.5 23.4 27.4
Additions 5.2 2.2 1.5 8.9 –
Disposals – (5.0) (1.0) (6.0) (19.9)
At 30 April 2014 16.3 6.0 4.0 26.3 7.5Accumulated Depreciation
At 1 May 2013 0.5 5.3 1.3 7.1 0.9
Charge for the year 0.2 1.1 0.6 1.9 0.1
Disposals – (4.1) (0.6) (4.7) (0.7)
At 30 April 2014 0.7 2.3 1.3 4.3 0.3Net book value
At 1 May 2013 10.6 3.5 2.2 16.3 26.5
At 30 April 2014 15.6 3.7 2.7 22.0 7.2
Property, plant and equipment
Freehold Fixtures and Motor Investment property fittings vehicles Total properties £m £m £m £m £m
Cost
At 1 May 2012 8.0 6.8 2.9 17.7 84.6
Additions 3.1 2.6 0.9 6.6 29.5
Disposals – (0.6) (0.3) (0.9) (9.2)
Transfer to held for sale (Note 15) – – – – (77.5)
At 30 April 2013 11.1 8.8 3.5 23.4 27.4
Accumulated Depreciation
At 1 May 2012 0.3 4.8 1.0 6.1 1.1
Charge for the year 0.2 1.1 0.5 1.8 1.7
Disposals – (0.6) (0.2) (0.8) (0.2)
Transfer to held for sale (Note 15) – – – – (1.7)
At 30 April 2013 0.5 5.3 1.3 7.1 0.9
Net book value
At 1 May 2012 7.7 2.0 1.9 11.6 83.5
At 30 April 2013 10.6 3.5 2.2 16.3 26.5
Additions to investment property in 2013 represented the value at cost of completed properties transferred from the Group’s inventory to be held for rental purposes. The market value of the properties held at 30 April 2014 is £10.3m (30 April 2013: £43.9m) as determined by the Directors taking into account all relevant factors including their nature and location. No independent valuation was undertaken.

BERKELEY ANNUAL REPORT 2014 / FINANCIALSBERKELEY ANNUAL REPORT 2014 / FINANCIALS
106 107
FINA
NC
IALS
NOTES TO THE CONSOLIDATED FINANCIAL STATEMENTS continued
18 PROVISIONS FOR OTHER LIABILITIES AND CHARGES Construction liabilities Other Total £m £m £m
At 1 May 2013 (23.6) (5.4) (29.0)
Utilised 1.6 0.9 2.5
Released – 1.2 1.2
Charged to the income statement (31.2) (0.6) (31.8)
At 30 April 2014 (53.2) (3.9) (57.1)
Construction liabilities Other Total £m £m £m
At 1 May 2012 – – –
Reclassified from accruals (16.5) (7.3) (23.8)
Utilised – 0.7 0.7
Released 6.6 1.2 7.8
Charged to the income statement (13.7) – (13.7)
At 30 April 2013 (23.6) (5.4) (29.0)
Analysis of total provisions:
2014 2013 £m £m
Non-current 48.5 27.9
Current 8.6 1.1
Total 57.1 29.0
a) Construction liabilities
The Group holds provisions for a best estimate of certain post-completion development obligations in respect of the construction of its portfolio of complex mixed-use developments which are expected to be incurred in the ordinary course of business, based on historic experience, but which are uncertain in terms of timing and quantum.
b) Other
Other provisions include onerous lease provisions for properties leased by the Group and provisions for the Group’s exposure to specific estate liabilities on historic sites developed by the Group.
19 DEFERRED TAXThe movement on the deferred tax account is as follows:
Accelerated Retirement short-term capital benefit timing allowances obligation differences Total £m £m £m £m
At 1 May 2013 0.3 – 56.4 56.7
Transfer to corporation tax receivable – – (1.1) (1.1)
(Charged)/credited to the income statement at 23% (note 6) – (0.1) 16.6 16.5
Adjustment in respect of change of tax rate from 23% to 21%/20% (note 6) – – (5.3) (5.3)
(Charged)/credited to the income statement in year – (0.1) 11.3 11.2
Credited to equity at 23% – 0.1 21.2 21.3
Adjustment in respect of change of tax rate from 23% to 21%/20% – – (3.9) (3.9)
Realisation of deferred tax asset on vesting of employee share scheme – – (23.1) (23.1)
Credited to equity in year (note 6) – 0.1 (5.8) (5.7)
At 30 April 2014 0.3 – 60.8 61.1
12 INVENTORIES 2014 2013 £m £m
Land not under development 492.4 310.0
Work in progress 1,966.4 1,711.7
Completed units 22.4 45.0
2,481.2 2,066.7
13 TRADE AND OTHER RECEIVABLES 2014 2013 £m £m
Trade receivables 134.0 105.9
Other receivables 15.3 11.8
Prepayments and accrued income 9.7 9.1
159.0 126.8
Further disclosures relating to trade receivables are set out in note 26.
14 CASH AND CASH EQUIVALENTS 2014 2013 £m £m
Cash and cash equivalents 130.2 66.8
15 NON-CURRENT ASSETS HELD FOR SALEDuring the year, on 5 June 2013, Berkeley sold 534 Homes and Community Agency funded residential properties within its rental fund to a fund owned and controlled by M&G Investments for £105.4 million, which was recognised as revenue. In the prior year, these properties were held in the balance sheet as Non-current assets held for sale of £75.8 million.
16 BORROWINGS 2014 2013 £m £m
Current
Bank loans (1.0) (4.7)
Other loans – (17.4)
(1.0) (22.1)
Further disclosures relating to current and non-current loans are set out in note 26.
17 TRADE AND OTHER PAYABLES 2014 2013 £m £m
Current
Trade payables (346.7) (381.1)
Deposits and on account contract receipts (741.6) (426.1)
Loans from joint ventures (0.1) (0.1)
Other taxes and social security (39.4) (26.6)
Accruals and deferred income (90.8) (72.0)
(1,218.6) (905.9)
Non-current
Trade payables (148.6) (115.5)
Total trade and other payables (1,367.2) (1,021.4)
All amounts included above are unsecured. The total of £39.4m (2013: £26.6m) for other taxes and social security includes £29.5m (2013: £22.0m) for Employer’s National Insurance provision in respect of share-based payments.
Further disclosures relating to current trade and non-current trade payables are set out in note 26.

BERKELEY ANNUAL REPORT 2014 / FINANCIALSBERKELEY ANNUAL REPORT 2014 / FINANCIALS
108 109
FINA
NC
IALS
NOTES TO THE CONSOLIDATED FINANCIAL STATEMENTS continued
21 RESERVESThe movement in reserves is set out in the Consolidated Statement of Changes in Equity on page 91.
OTHER RESERVEThe other reserve of negative £961.3m (2013: negative £961.3m) arose from the application of merger accounting principles to the financial statements on implementation of the capital reorganisation of the Group, incorporating a Scheme of Arrangement, in the year ended 30 April 2005.
REVALUATION RESERVEThe revaluation reserve consists of balances in relation to two separate transactions.
The first element arose following the acquisition on 7 November 2006 of the 50% of the ordinary share capital of St James Group Limited not already owned. A revaluation reserve of £20,297,000 was originally created in accordance with IFRS 3 through fair value adjustments to the 50% of the net assets of St James Group Limited owned by the Group prior to 7 November 2006. Transfers of £54,000 in the year (2013: £929,000) out of retained earnings was recognised as the associated fair value adjustments. At 30 April 2014 the balance in the revaluation reserve relating to the acquisition of St James Group Limited is £3,877,000 (2013: £3,823,000).
The second element arose in 2010 following the acquisition on 23 July 2009 of the shares owned by Saad Investments Company Limited and the outstanding shareholder loans in five joint ventures which became fully owned subsidiaries from this date. A revaluation reserve of £560,000 was created in accordance with IFRS 3 through fair value adjustments to the 50% of the net assets of the joint ventures owned by the Group prior to 23 July 2009. Transfers of £36,000 in the year (2013: £304,000) out of retained earnings were recognised as the associated fair value adjustments. At 30 April 2014 the balance in the revaluation reserve relating to the acquisition of the five entities that were previously joint ventures with Saad Investments Company Limited is £213,000 (2013: £177,000).
CAPITAL REDEMPTION RESERVEThe capital redemption reserve was created to maintain the capital of the Company following the redemption of the B Shares associated with the Scheme of Arrangement created in 2004 which completed on 10 September 2009 with the re-designation of the unissued B shares as ordinary shares.
RETAINED EARNINGSThe Company and the Company’s Employee Benefit Trust acquired none (2013: none) of its own shares through purchases on the London Stock Exchange in the year.
22 DIVIDENDS PER SHAREThe dividends paid in 2014 were a total of £195.2 million, £77.2 million in September 2013 (59 pence per share) and £118.0 million in January 2014 (90 pence per share) (2013: £19.7 million, 15 pence per share). A further interim dividend of £121.7 million (90 pence per share) has been declared for payment on 26 September 2014. These financial statements do not reflect this further interim dividend.
23 CONTINGENT LIABILITIES The Group has guaranteed road and performance agreements in the ordinary course of business of £15.0m (2013: £15.7m).
24 OPERATING LEASES – MINIMUM LEASE PAYMENTSThe total future aggregate minimum lease payments of the Group under non-cancellable operating leases are set out below:
2014 2013 £m £m
Amounts due within:
Within one year 1.9 1.5
Between one and five years 4.4 3.9
After five years 2.4 3.0
8.7 8.4
19 DEFERRED TAX CONTINUED Accelerated Retirement Short-term capital benefit timing allowances obligation differences Total £m £m £m £m
At 1 May 2012 0.4 – 24.6 25.0
Transfer from corporation tax receivable – – 0.4 0.4
(Charged)/credited to the income statement at 24% (note 6) (0.1) (0.2) 11.1 10.8
Adjustment in respect of change of tax rate from 24% to 23% (note 6) – – (1.1) (1.1)
(Charged)/credited to the income statement in year (0.1) (0.2) 10.0 9.7
Credited to equity at 24% – 0.2 22.7 22.9
Adjustment in respect of change of tax rate from 24% to 23% – – (1.3) (1.3)
Credited to equity in year (note 6) – 0.2 21.4 21.6
At 30 April 2013 0.3 – 56.4 56.7
Deferred tax is calculated in full on temporary differences under the liability method using a tax rate of 21% or 20% (2013: 23%). There is no unprovided deferred tax (2013: nil).
All of the deferred tax assets were available for offset against deferred tax liabilities and hence the net deferred tax asset at 30 April 2014 was £61.1m (2013: £56.7m).
Deferred tax assets of £58.3m (2013: £33.9m) are expected to be recovered after more than one year.
The Autumn Statement (December 2013) and the draft Finance Bill 2014 included legislation to reduce the main rate of corporation tax to 21% for the financial year commencing 1 April 2014 and 20% for the financial year commencing 1 April 2015. The change had been substantively enacted at the balance sheet date and, therefore, has been reflected in these financial statements.
The deferred tax credited to equity during the year was as follows:
2014 2013 £m £m
Deferred tax on actuarial loss recognised in the pension scheme (note 6) 0.1 0.2
Deferred tax in respect of employee share schemes (note 6) (5.8) 21.4
Movement in the year (5.7) 21.6
Cumulative deferred tax credited to equity at 1 May 32.7 11.1
Cumulative deferred tax credited to equity at 30 April 27.0 32.7
20 SHARE CAPITAL AND SHARE PREMIUMThe movements on allotted and fully paid share capital for the Company in the year were as follows:
Ordinary shares Share Capital Share Premium 2014 2013 2014 2013 2014 2013 No ‘000 No ‘000 £m £m £m £m
Issued
At start of year 134,857 134,857 6.7 6.7 49.3 49.3
Issued in year 500 – 0.1 – – –
At end of year 135,357 134,857 6.8 6.7 49.3 49.3
Each ordinary share of 5p is a voting share in the capital of the Company, is entitled to participate in the profits of the Company and on a winding-up is entitled to participate in the assets of the Company.
On 29 January 2014, the company transferred 3.6 million shares (2013: nil), held as ‘treasury shares’, to the Employee Benefit Trust.
On 31 January 2014, 0.5 million ordinary shares (2013: nil) were allotted and issued to the Employee Benefit Trust.
On 31 January 2014, 4.2 million ordinary shares (2013: nil) were transferred from the Employee Benefit Trust to Executive Directors to satisfy the exercise of options under the 2009 Long Term Incentive Plan Part A.
At 30 April 2014 there were no shares held as ‘treasury shares’ (2013: 3.6m).
At 30 April 2014 there were 0.1m shares held in trust (2013: 0.2m). The market value of these shares at 30 April 2014 was £2.4m (2013: £4.9m).

BERKELEY ANNUAL REPORT 2014 / FINANCIALSBERKELEY ANNUAL REPORT 2014 / FINANCIALS
110 111
FINA
NC
IALS
NOTES TO THE CONSOLIDATED FINANCIAL STATEMENTS continued
FINANCIAL INSTRUMENTS: FINANCIAL ASSETSThe Group’s financial assets can be summarised as follows:
2014 2013 £m £m
Current
Trade receivables 134.0 105.9
Cash and cash equivalents 130.2 66.8
264.2 172.7
Non-current
Available-for-sale financial assets 11.0 –
11.0 –
Total financial assets 275.2 172.7
Trade receivables and available-for-sale financial assets are non-interest bearing. Of the current trade receivables balance of £134.0m (30 April 2013: £105.9m), £127.3m (30 April 2013: £87.8m) was not past due, with £6.7m being 0–30 days past due (30 April 2013: £6.6m, 0–30 days past due, £5.8m, 31 to 60 days, £5.7m over 60 days).
Cash and cash equivalents are short-term deposits held at either floating rates linked to LIBOR or fixed rates.
The table below analyses financial instruments carried at fair value, by valuation method. The different levels have been defined as follows:
– Quoted prices (unadjusted) in active markets for identical assets or liabilities (level 1).
– Inputs other than quoted prices included within level 1 that are observable for the asset or liability, either directly (that is, as prices) or indirectly (that is, derived from prices) (level 2).
– Inputs for the asset or liability that are not based on observable market data (that is, unobservable inputs) (level 3).
The following table presents the group’s assets that are measured at fair value at 30 April 2014.
Level 1 Level 2 Level 3 Total Notes £m £m £m £m
Assets
Available-for-sale financial assets 11 – 11.0 – 11.0
Total assets – 11.0 – 11.0
The available-for-sale financial asset was acquired in the year (Note 11) therefore there is no prior year comparative.
FINANCIAL INSTRUMENTS: FINANCIAL LIABILITIESThe Group’s financial liabilities can be summarised as follows:
2014 2013 £m £m
Current
Bank loans (1.0) (4.7)
Trade payables (346.7) (381.1)
Deposits and on account contract receipts (741.6) (426.1)
Loans from joint ventures (0.1) (0.1)
Accruals and deferred income (90.8) (72.0)
Other loans – (17.4)
(1,180.2) (901.4)
Non-current
Trade payables (148.6) (115.5)
(148.6) (115.5)
Total financial liabilities (1,328.8) (1,016.9)
All amounts included above are unsecured.
Current bank loans have term expiry dates within twelve months of the balance sheet date and are held at floating interest rates linked to LIBOR. Trade payables and other current liabilities are non-interest bearing.
In the prior year, other loans represented a loan from the Homes and Communities Agency on which interest was payable based on a proportionate share of the net rental income arising from the properties to which the loan related. This loan was repaid following completion of the sale of 534 HCA funded residential properties on 5 June 2014 (see note 15).
25 NOTES TO THE CONSOLIDATED CASH FLOW STATEMENTReconciliation of profit after taxation for the year to cash generated from operations:
2014 2013 £m £m
Profit after taxation for the year 292.9 209.7
Adjustments for:
– Taxation 87.1 61.0
– Depreciation 2.0 3.5
– Loss on sale of fixed assets 0.7 –
– Profit on sale of investment properties (43.2) (3.6)
– Finance income (3.4) (1.5)
– Finance costs 10.3 9.6
– Share of results of joint ventures after tax (12.1) 1.3
– Non-cash charge in respect of share-based payments 3.3 11.8
Changes in working capital:
– Increase in inventories (414.5) (244.5)
– Increase in trade and other receivables (33.6) (12.2)
– Increase in trade and other payables 370.8 154.5
– Decrease in employee benefit obligations (0.6) (0.6)
Cash generated from operations 259.7 189.0
Reconciliation of net cash flow to net cash:
2014 2013 £m £m
Net increase in cash and cash equivalents, including bank overdraft 63.4 64.1
Net cash outflow from decrease in borrowings 21.1 38.5
Movement in net cash/(debt) in the year 84.5 102.6
Opening net cash/(debt) 44.7 (57.9)
Closing net cash 129.2 44.7
Net cash:
2014 2013 As at 30 April £m £m
Cash and cash equivalents 130.2 66.8
Current borrowings (1.0) (22.1)
Net cash 129.2 44.7
26 CAPITAL MANAGEMENT, FINANCIAL INSTRUMENTS AND FINANCIAL RISK MANAGEMENTThe Group finances its operations by a combination of shareholders’ funds, working capital and, where appropriate, borrowings. The Group’s objective when managing capital is to maintain an appropriate capital structure in the business to allow management to focus on creating sustainable long-term value for its shareholders, with flexibility to take advantage of opportunities as they arise in the short and medium term. This allows the Group to take advantage of prevailing market conditions by investing in land and work in progress at the right point in the cycle or delivering returns to shareholders through dividends or share buy backs. Last year the Group put in place a long-term strategic plan to see £13 per share returned to shareholders over the next 10 years. This plan, reported in more detail in the Trading and Financial Review on pages 38 to 42, ensures there is sufficient working capital retained in the business to continue investing selectively in new land opportunities as they arise.
The Group monitors capital levels principally by monitoring net cash/debt levels, cash flow forecasts and return on average capital employed. The Group considers capital employed to be net assets adjusted for net cash/debt. Capital employed at 30 April 2014 was £1,312.1m (2013: £1,277.7m). The increase in capital employed in the year of £34.4m reflects further investment in land and work in progress during the year.
The Group’s financial instruments comprise financial assets being: trade receivables and cash and cash equivalents and financial liabilities being: bank loans, trade payables, deposits and on account receipts, loans from joint ventures and accruals. Cash and cash equivalents and borrowings are the principal financial instruments used to finance the business. The other financial instruments highlighted arise in the ordinary course of business.
As all of the operations carried out by the Group are in sterling there is no direct currency risk, and therefore the Group’s main financial risks are primarily:
– liquidity risk – the risk that suitable funding for the Group’s activities may not be available;
– market interest rate risk – the risk that Group financing activities are adversely affected by fluctuation in market interest rates; and
– credit risk – the risk that a counterparty will default on their contractual obligations resulting in a loss to the Group.

BERKELEY ANNUAL REPORT 2014 / FINANCIALSBERKELEY ANNUAL REPORT 2014 / FINANCIALS
112 113
FINA
NC
IALS
COMMITTED BORROWING FACILITIESThe Group has committed borrowing facilities as follows:
2014 2013 Available Drawn Undrawn Termination Available Drawn Undrawn Termination £m £m £m date £m £m £m date
Revolving credit facility one 275 – 275 May-18 275 – 275 May-17
Revolving credit facility two 250 – 250 Apr-18 250 – 250 Apr-18
525 – 525 525 – 525
At 30 April 2014 the total drawn down balance across both facilities was £nil (2013: £nil). In addition, at 30 April 2014 there were bank bonds in issue of £0.2m (2013: £0.2m).
A one year extension was granted on 24 May 2013 for revolving credit facility one, which extended the maturity date on this facility until May 2018.
The revolving credit facilities are secured by debentures provided by certain Group holding companies over their assets. The facility agreement contains financial covenants, which is normal for such agreements, all of which the Group is in compliance with.
27 RELATED PARTY TRANSACTIONSThe Group has entered into the following related party transactions:
TRANSACTIONS WITH DIRECTORSIn terms of new transactions in the 2014 financial year:
i) Mr A W Pidgley paid £440,052 to Berkeley Homes plc for works carried out at his home under the Group’s own build scheme (2013: Mr A W Pidgley £20,156). This is a scheme whereby eligible employees may enter into an arrangement, at commercial rates, with the Group for the construction or renovation of their own home. There were no balances outstanding at the year end.
ii) Mr G Fry, a Director of the Company, contracted to purchase an apartment at Sovereign Court, Hammersmith, London for £819,950 on 10 September 2013 from St George West London Limited, a wholly owned subsidiary of the Company. Mr Fry is also a Director of St George West London Limited. The agreement between St George West London Limited and Mr Fry is a standard form sale and purchase agreement used by the Company on its development, save that it is conditional upon the agreement of shareholders. As this transaction is in excess of £100,000, it constitutes a substantial property transaction with a Director of the Company under sections 190 and 191 of the Companies Act 2006 and is therefore conditional on the approval of shareholders, which will be sought at the Annual General Meeting on 1 September 2014. Mr Fry paid a ten per cent deposit on exchange of contracts which will only be returned to him in the event that shareholders do not approve the transaction.
In terms of transactions previously disclosed, the purchases of an apartment by Mr G Fry at Chelsea Creek for £725,000 in 2012, by Mr A W Pidgley at Ebury Square for £10,500,000 in 2013 and by Mr R C Perrins at 190 Strand for £2,100,000 in 2013 all received shareholder approval. As at 30 April 2014, any contractual deposits due to date had been paid to the Group, there were no current balances outstanding and the properties were still under construction and so the sales had not yet completed.
TRANSACTIONS WITH JOINT VENTURESDuring the financial year there were no transactions with joint ventures other than movements in loans. In 2009 inventory was sold to St Edward Homes Limited for £17,411,000 being the share of the transaction attributable to the other venturer in the joint venture. At 30 April 2014 an amount of £16,219,000 was outstanding and included within trade receivables (2013: £21,319,000). Loans with joint ventures are disclosed in note 10.
28 EVENTS AFTER THE REPORTING PERIODOn 30 May 2014, the Group exchanged contracts for the sale of a portfolio of ground rent assets for £99.8 million. The sale is expected to give rise to a non-recurring profit on disposal of approximately £80 million after transaction costs in the year ending 30 April 2015.
NOTES TO THE CONSOLIDATED FINANCIAL STATEMENTS continued
26 CAPITAL MANAGEMENT, FINANCIAL INSTRUMENTS AND FINANCIAL RISK MANAGEMENT CONTINUEDThe maturity profile of the Group’s non-current financial liabilities, all of which are held at amortised cost, is as follows:
2014 2013 £m £m
In more than one year but not more than two years (54.3) (27.7)
In more than two years but not more than five years (93.3) (87.8)
In more than five years (1.0) –
(148.6) (115.5)
The carrying amounts of the Group’s financial assets and financial liabilities approximate to fair value.
Current trade receivables and current trade and other payables approximate to their fair value as the transactions which give rise to these balances arise in the normal course of trade and, where relevant, with industry standard payment terms and have a short period to maturity (less than one year).
Current trade receivables include £16.2m relating to amounts owed by St Edward Homes Limited in respect of the inventory sold by the Group in 2009 (Note 27). This is held at its discounted present value (calculated by discounting expected future cash flows at prevailing interest rates and yields as appropriate). The discount rate applied reflects the nominal, risk-free pre-tax rate at the balance sheet date, applied to the maturity profile. At 30 April 2014 a rate of 1.08% was applied (2013: 0.43%).
Non-current trade payables comprise long-term land payables, which are held at their discounted present value (calculated by discounting expected future cash flows at prevailing interest rates and yields as appropriate). The discount rate applied reflects the nominal, risk-free pre-tax rate at the balance sheet date, applied to the maturity profile of the individual land creditors within the total. At 30 April 2014 a rate of 1.08% was applied (2013: 0.43%). Non-current loans approximate to fair value as they are held at variable market interest rates linked to LIBOR.
LIQUIDITY RISKThis is the risk that suitable funding for the Group’s activities may not be available. Group management addresses this risk through review of rolling cash flow forecasts throughout the year to assess and monitor the current and forecast availability of funding, and to ensure sufficient headroom against facility limits and compliance with banking covenants. The committed borrowing facilities are set out below.
The contractual undiscounted maturity profile of the Group’s financial liabilities, included at their carrying value in the preceding tables, is as follows:
2014 2013 £m £m
In less than one year (1,183.1) (901.4)
In more than one year but not more than two years (55.0) (27.9)
In more than two years but not more than five years (96.0) (89.0)
In more than five years (1.0) –
(1,335.1) (1,018.3)
MARKET INTEREST RATE RISKThe Group’s cash and cash equivalents and bank loans expose the Group to cash flow interest rate risk.
The Group’s rolling cash flow forecasts incorporate appropriate interest assumptions, and management carefully assesses expected activity levels and associated funding requirements in the prevailing and forecast interest rate environment to ensure that this risk is managed.
If interest rates on the Group’s cash/debt balances had been 50 basis points higher throughout the year ended 30 April 2014, profit after tax for the year would have been £483,000 (2013: £26,000 higher). This calculation is based on the monthly closing net cash/debt balance throughout the year. A 50 basis point increase in interest rate represents management’s assessment of a reasonably possible change for the year ended 30 April 2014.
CREDIT RISKThe Group’s exposure to credit risk encompasses the financial assets being: trade receivables and cash and cash equivalents.
Trade receivables are spread across a wide number of customers, with no significant concentration of credit risk in one area. There has been no impairment of trade receivables during the year (2013: £nil), nor are there any provisions held against trade receivables (2013: £nil), and no trade receivables are past their due date (2013: £nil).
The credit risk on cash and cash equivalents is limited because counterparties are leading international banks with long-term A credit-ratings assigned by international credit agencies.

BERKELEY ANNUAL REPORT 2014 / FINANCIALS
114
29 SUBSIDIARIES AND JOINT VENTURES(a) Subsidiaries
At 30 April 2014 the Company had the following principal subsidiary undertakings which have all been consolidated, are registered and operate in England and Wales, are all 100% owned and for which 100% of voting rights are held except where stated:
Residential led mixed-use development and ancillary activities
Berkeley Commercial Developments Limited Berkeley Homes Public Limited Company
Berkeley First Limited (1) Berkeley Partnership Homes Limited (1)
Berkeley Homes (Capital) plc (1) Berkeley Ryewood Limited
Berkeley Homes (Carmelite) Limited Berkeley Strategic Land Limited
Berkeley Homes (Central London) Limited (1) BH (City Forum) Limited
Berkeley Homes (East Thames) Limited (1) St George Battersea Reach Limited (Jersey)
Berkeley Homes (Eastern Counties) Limited (1) St George Blackfriars Limited
Berkeley Homes (Eastern) Limited (1) St George Central London Limited (2)
Berkeley Homes (Fleet) Limited St George North London Limited (2)
Berkeley Homes (Hampshire) Limited (1) St George PLC
Berkeley Homes (North East London) Limited (1) St George South London Limited (2)
Berkeley Homes (Oxford & Chiltern) Limited (1) St George West London Limited (2)
Berkeley Homes (PCL) Limited St James (Grosvenor Dock) Limited
Berkeley Homes (South East London) Limited (1) St James Group Limited
Berkeley Homes (Southern) Limited (1) St James Homes Limited
Berkeley Homes (Three Valleys) Limited (1) St James (West London) Limited
Berkeley Homes (Urban Renaissance) Limited (1) The Berkeley Group plc (3)
Berkeley Homes (West London) Limited (1) The Tower, One St George Wharf Limited
(1) Agency companies of Berkeley Homes plc
(2) Agency companies of St George PLC
(3) The Berkeley Group plc is the only direct subsidiary of the Parent Company and is an intermediate holding company
Other activities
BRP Investments No.1 Limited (Jersey)
BRP Investments No.2 Limited (Jersey)
(b) Joint Ventures
At 30 April 2014 the Group had an interest in the following joint ventures which have been equity accounted to 30 April, have an accounting date of 30 April and are registered and operate in England and Wales and which are 50% owned:
Principal activity
St Edward Homes Limited Residential-led mixed-use development
St Edward Homes Partnership Residential-led mixed-use development
The St Edward (Strand) Partnership Residential-led mixed-use development
NOTES TO THE CONSOLIDATED FINANCIAL STATEMENTS continued
BERKELEY ANNUAL REPORT 2014 / FINANCIALS
115
FINA
NC
IALS
COMPANY BALANCE SHEET
2014 2013 As at 30 April Notes £m £m
Fixed assetsInvestments C5 1,397.0 1,395.1
1,397.0 1,395.1
Current assetsDebtors C6 6.0 8.3
Cash at bank and in hand 0.9 0.9
6.9 9.2
Current liabilitiesCreditors (amounts falling due within one year) C7 (622.9) (680.4)
Net current liabilities (616.0) (671.2)
Total assets less current liabilities and net assets 781.0 723.9
Capital and reservesCalled-up share capital C8 6.8 6.7
Share premium account C9 49.3 49.3
Capital redemption reserve C9 24.5 24.5
Profit and loss account C9 700.4 643.4
Total shareholders’ funds C10 781.0 723.9
The financial statements on pages 115 to 119 were approved by the board of directors on 11 July 2014 and were signed on its behalf by:
N G SIMPKINFINANCE DIRECTOR

BERKELEY ANNUAL REPORT 2014 / FINANCIALSBERKELEY ANNUAL REPORT 2014 / FINANCIALS
116 117
FINA
NC
IALS
C3 DIRECTORS AND EMPLOYEES 2014 2013 £m £m
Staff costs
Wages and salaries 15.0 4.5
Social security costs 10.0 10.2
Share-based payments 1.4 7.8
26.4 22.5
The average monthly number of persons employed by the company during the year was 9, all of whom are Directors (2013: 9).
DIRECTORSDetails of Directors’ emoluments are set out in the Remuneration Report on pages 56 to 80.
PENSIONSDuring the year, the Company participated in one of the Group’s pension schemes, The Berkeley Group plc Group Personal Pension Plan. Further details on this scheme are set out in note 5 of the Consolidated Financial Statements. Contributions amounting to £48,150 (2013: £46,800) were paid into the defined contribution scheme during the year.
SHARE-BASED PAYMENTSThe charge to the income statement in respect of share-based payments in the year, relating to grants of shares; share options and notional shares awarded under the 2009 Long-Term Incentive Plan and the 2011 Long-Term Incentive Plan was £1.4m (2013: £7.8m). Further information on the Company’s share incentive schemes are included in the Remuneration Report on pages 56 to 80 as well as note 5 to the Consolidated Financial Statements.
C4 THE BERKELEY GROUP HOLDINGS PLC PROFIT AND LOSS ACCOUNTThe profit for the year in the Company is £248.9m (2013: loss of £39.4m).
C5 INVESTMENTS 2014 2013 £m £m
Investments in shares of subsidiary undertaking at cost at 1 May 1,395.1 1,391.3
Additions 1.9 3.8
Investment in shares of subsidiary undertaking at cost at 30 April 1,397.0 1,395.1
Additions in the year relate to company contributions to the Berkeley Group plc for employee services to be settled through the issue of shares on the vesting of the Berkeley Group Holdings plc 2009 Part (a), 2009 Part (b) and 2011 Long Term Incentive Plan awards for the benefit of executive directors of its subsidiaries.
The directors believe that the carrying value of the investments is supported by their underlying net assets.
Details of principal subsidiaries are given within note 28 of the Consolidated Financial Statements.
C6 DEBTORS 2014 2013 £m £m
Current
Deferred tax 6.0 8.3
The movements on the deferred tax asset are as follows:
2014 2013 £m £m
At 1 May 8.3 4.5
Deferred tax in respect of employee share schemes credited to reserves 1.1 3.8
Realisation of deferred tax asset on vesting of employee share scheme (3.4) –
At 30 April 6.0 8.3
Deferred tax is calculated in full on temporary differences under the liability method using a tax rate of 21% or 20% (2013: 23%). There is no unprovided deferred tax (2013: nil).
The deferred tax asset of £6.0m relates to short-term timing differences (2013: £8.3m).
The Autumn Statement (December 2013) and the draft Finance Bill 2014 include legislation to reduce the main rate of corporation tax to 21% for the financial year commencing 1 April 2015. The charge has been substantively enacted at the balance sheet date and, therefore, has been reflected in the financial statements.
NOTES TO THE COMPANY FINANCIAL STATEMENTS
C1 ACCOUNTING POLICIESBASIS OF PREPARATIONThese financial statements have been prepared under the historical cost convention and in accordance with the Companies Act 2006, where applicable, and applicable accounting standards in the United Kingdom (United Kingdom Generally Accepted Accounting Practice) and on the going concern basis. The principal accounting policies are set out below and have been applied consistently throughout the year.
The principal activity of The Berkeley Group Holdings plc (“the Company”) is to act as a holding company.
The Company has not presented its own profit and loss account as permitted by Section 408 of the Companies Act 2006.
The Company has not presented its own statement of total recognised gains and losses for the year as there are no separate gains or losses arising in the year.
GOING CONCERNThe Group’s business activities together with the factors likely to affect its future development performance and position are set out in the Business Review. The financial position of the Group, its cash flows, liquidity position and borrowing facilities are all described in the Trading and Financial Reviews on pages 38 to 42.
The Group has significant financial resources and the Directors have assessed the future funding requirements of the Group, including the repayment of £1.7 billion to shareholders by 2021, and compared this to the level of committed loan facilities and cash resources over the medium term. In making this assessment consideration has been given to the uncertainty inherent in future financial forecasts and where applicable reasonable sensitivities have been applied to the key factors affecting the financial performance of the Group.
Based on the financial performance of the Group, the Directors have a reasonable expectation that the Company has adequate resources to continue its operational existence for the foreseeable future, notwithstanding its net current liability position of £616.0m (30 April 2013: £671.2m). For this reason they continue to adopt the going concern basis of accounting in preparing the annual financial statements.
EXPENDITUREExpenditure is recognised in respect of goods and services received when supplied in accordance with contractual terms. Provision is made when an obligation exists for a future liability in respect of a past event and where the amount of the obligation can be reliably estimated.
PENSIONSPension contributions under defined contribution schemes are charged to the income statement as they fall due.
INVESTMENTSInvestments in subsidiary undertakings are included in the balance sheet at cost less provision for any impairment.
DEFERRED TAXATIONDeferred tax is recognised in respect of all timing differences that have originated but not reversed at the balance sheet date, where transactions or events that result in an obligation to pay more tax in the future or a right to pay less tax in the future have occurred at the balance sheet date.
A net deferred tax asset is recognised as recoverable and therefore recognised only when, on the basis of all available evidence, it can be regarded as more likely than not that there will be suitable taxable profits against which to recover carried forward tax losses and from which the future reversal of underlying timing differences can be deducted.
Deferred tax is measured at the average tax rates that are expected to apply in the periods in which the timing differences are expected to reverse, based on tax rates and laws that have been enacted or substantively enacted by the balance sheet date. Deferred tax is measured on an undiscounted basis.
SHARE-BASED PAYMENTSThe Company operates three equity-settled, share-based compensation plans. The fair value of the employee services received in exchange for the grant of the options is recognised as an expense. The total amount to be expensed over the vesting period is determined by reference to the fair value of the options granted. At each balance sheet date, the Company revises its estimates of the number of options that are expected to vest. It recognises the impact of the revision to original estimates, if any, in the profit and loss account, with a corresponding adjustment to equity.
The proceeds received net of any directly attributable transaction costs are credited to share capital (nominal value) and share premium when the options are exercised.
DIVIDENDSDividend distributions to shareholders are recognised as a liability in the period in which the dividends are appropriately authorised and approved for payout and are no longer at the discretion of the Company. Unpaid dividends that do not meet these criteria are disclosed in the notes to the financial statements.
C2 PROFIT/(LOSS) ON ORDINARY ACTIVITIES BEFORE TAXATIONProfit/(loss) on ordinary activities before taxation is stated after charging the following amounts:
2014 2013 £m £m
Previous auditors’ remuneration – audit fees – 0.1
Current auditors’ remuneration – audit fees 0.1 –
No disclosure of other non-audit services has been made as this is included within note 4 of the consolidated financial statements.

BERKELEY ANNUAL REPORT 2014 / FINANCIALSBERKELEY ANNUAL REPORT 2014 / FINANCIALS
118 119
FINA
NC
IALS
C10 RECONCILIATION OF MOVEMENTS IN SHAREHOLDERS’ FUNDS 2014 2013 £m £m
Profit/(loss) for the financial year 248.9 (39.4)
Dividends paid (195.2) (19.7)
Equity settlement of employee share schemes 0.1 –
Credit in respect of employee share scheme 3.3 11.7
57.1 (47.4)
Opening equity shareholders’ funds 723.9 771.3
Closing equity shareholders’ funds 781.0 723.9
C11 DIVIDENDS PER SHAREThe dividends paid in 2014 were a total of £195.2 million, £77.2 million in September 2013 (59 pence per share) and £118.0 million in January 2014 (90 pence per share) (2013: £19.7 million, 15 pence per share). A further interim dividend of £121.7 million (90 pence per share) has been declared for payment on 26 September 2014. These financial statements do not reflect this further interim dividend.
C12 RELATED PARTY TRANSACTIONSThe Company is exempt under the terms of Financial Reporting Standard 8 “Related party disclosures” from disclosing related party transactions with entities that are part of The Berkeley Group Holdings plc or investees of The Berkeley Group Holdings plc.
NOTES TO THE COMPANY FINANCIAL STATEMENTS continued
C7 CREDITORS: AMOUNTS FALLING DUE WITHIN ONE YEAR 2014 2013 £m £m
Amounts owed to subsidiary undertakings (612.7) (666.1)
Other taxation and social security (10.2) (14.3)
(622.9) (680.4)
All amounts included above are unsecured. The interest rate on £601m (2013: £601m) of the balance owed to subsidiary undertakings is 4.0% (2013: 4.0%). At 30 April 2014 all other amounts owed to subsidiary undertakings are at floating rates linked to LIBOR and have no fixed repayment date.
C8 CALLED-UP SHARE CAPITAL The authorised share capital of the Company in the year was as follows:
2014 2013 Number ‘000 Number ‘000
At 30 April
Ordinary share capital 925,000 925,000
Redeemable preference shares of £1 each 50 50
Each ordinary share of 5p is a voting share in the capital of the Company, is entitled to participate in the profits of the Company and on a winding-up is entitled to participate in the assets of the Company.
The movements on allotted and fully paid share capital for the Company in the year were as follows:
Ordinary shares Share Capital Share Premium 2014 2013 2014 2013 2014 2013 No ‘000 No ‘000 £m £m £m £m
Issued
At start of year 134,857 134,857 6.7 6.7 49.3 49.3
Issued in year 500 – 0.1 – – –
At end of year 135,357 134,857 6.8 6.7 49.3 49.3
Each ordinary share of 5p is a voting share in the capital of the Company, is entitled to participate in the profits of the Company and on a winding-up is entitled to participate in the assets of the Company.
On 29 January 2014, the company transferred 3.6 million shares (2013: nil), held as ‘treasury shares’, to the Employee Benefit Trust.
On 31 January 2014, 0.5 million ordinary shares (2013: nil) were allotted and issued to the Employee Benefit Trust.
On 31 January 2014, 4.2 million ordinary shares (2013: nil) were transferred from the Employee Benefit Trust to Executive Directors to satisfy the exercise of options under the 2009a Long Term Incentive Plan.
At 30 April 2014 there were no shares held as ‘treasury shares’ (2013: 3.6m).
At 30 April 2014 there were 0.1m shares held in trust (2013: 0.2m). The market value of these shares at 30 April 2014 was £2.4m (2013: £4.9m).
The movements in the year are disclosed in note 20 of the Consolidated Financial Statements.
C9 RESERVES Capital Share redemption Profit and premium account reserve loss account Total £m £m £m £m
At 1 May 2013 49.3 24.5 643.4 717.2
Profit for the financial year – – 248.9 248.9
Dividends paid – – (195.2) (195.2)
Credit in respect of employee share schemes – – 3.3 3.3
At 30 April 2014 49.3 24.5 700.4 774.2

120 121
REGISTERED OFFICE AND PRINCIPAL PLACE OF BUSINESS Berkeley House 19 Portsmouth Road Cobham Surrey KT11 1JG Registered number: 5172586
REGISTRARS Capita Registrars The Registry 40 Dukes Place London EC3A 7NH Tel: 0870 162 3100
CORPORATE BROKER AND FINANCIAL ADVISOR UBS Investment Bank
SHARE PRICE INFORMATION The Company’s share capital is listed on the London Stock Exchange. The latest share price is available via the Company’s website at www.berkeleygroup.co.uk
SOLICITORS Herbert Smith Freehills LLP
BANKERS Barclays Bank PLC Lloyds TSB Bank plc Santander UK plc Svenska Handelsbanken AB (Publ) The Royal Bank of Scotland Plc
AUDITORS KPMG LLP
REGISTERED OFFICE AND ADVISORS
FINANCIAL DIARY
Annual General Meeting and Interim Management Statement 1 September 2014
Half Year End 31 October 2014
Interim Results Announcement for the six months ending 31 October 2014 5 December 2014
Interim Management Statement March 2015
Year End 30 April 2015
Preliminary Announcement of Results for the year ending 30 April 2015 June 2015
Publication of 2015 Annual Report August 2015
TO BE REPLACED WITH TP PAGE
BERKELEY ANNUAL REPORT 2014 / FINANCIALSBERKELEY ANNUAL REPORT 2014 / FINANCIALS
120 121
FINA
NC
IALS
Annual General Meeting and Interim Management Statement 1 September 2014
Half Year End 31 October 2014
Interim Results Announcement for the six months ending 31 October 2014 5 December 2014
Interim Management Statement March 2015
Year End 30 April 2015
Preliminary Announcement of Results for the year ending 30 April 2015 June 2015
Publication of 2015 Annual Report August 2015
REGISTERED OFFICE AND PRINCIPAL PLACE OF BUSINESSBerkeley House 19 Portsmouth Road Cobham Surrey KT11 1JG Registered number: 5172586
REGISTRARSCapita Registrars The Registry 40 Dukes Place London EC3A 7NH Tel: 0870 162 3100
CORPORATE BROKER AND FINANCIAL ADVISORUBS Investment Bank
SHARE PRICE INFORMATIONThe Company’s share capital is listed on the London Stock Exchange. The latest share price is available via the Company’s website at www.berkeleygroup.co.uk
SOLICITORSHerbert Smith Freehills LLP
BANKERSBarclays Bank PLC Lloyds TSB Bank plc Santander UK plc Svenska Handelsbanken AB (Publ) The Royal Bank of Scotland Plc
AUDITORSKPMG LLP
FINANCIAL DIARY
REGISTERED OFFICE AND ADVISORS
2014 2013 2012 2011 2010 Years ended 30 April £m £m £m £m £m
Income statementRevenue 1,620.6 1,372.6 1,041.1 742.6 615.3
Operating profit 374.8 280.1 226.4 135.7 106.2
Share of results of joint ventures 12.1 (1.3) (2.2) 2.1 (0.2)
Net finance (costs)/income (6.9) (8.1) (9.4) (1.5) 4.4
Profit before taxation 380.0 270.7 214.8 136.3 110.4
Taxation (87.1) (61.0) (56.7) (41.8) (30.8)
Profit after taxation 292.9 209.7 158.1 94.5 79.6
Profit attributable to:
Shareholders 292.9 209.7 158.5 95.1 79.7
Non-controlling interest – – (0.4) (0.6) (0.1)
292.9 209.7 158.1 94.5 79.6
Basic earnings per ordinary share 221.8p 160.0p 121.0p 72.1p 60.0p
Statement of financial positionCapital employed 1,312.1 1,277.7 1,157.7 891.8 545.4
Net cash/(debt) 129.2 44.7 (57.9) 42.0 316.9
Net assets 1,441.3 1,322.4 1,099.8 933.8 862.3
Non-controlling interest – – – (4.4) (3.7)
Shareholders’ funds 1,441.3 1,322.4 1,099.8 929.4 858.6
Net assets per share attributable to shareholders (1) 1,066p 1,009p 839p 709p 637p
Ratios and statistics
Return on capital employed (2) 29.9% 22.9% 21.9% 19.2% 20.1%
Return on equity after tax (3) 21.2% 17.3% 15.6% 10.6% 9.6%
Return on equity before tax (4) 27.5% 22.4% 21.2% 15.3% 13.3%
Units sold (5) 3,742 3,712 3,565 2,544 2,201
(1) Net assets attributable to shareholders divided by the number of shares in issue excluding shares held in treasury and shares held by the employee benefit trust.
(2) Calculated as profit before interest and taxation (including joint venture (loss)/profit before tax) divided by the average net assets adjusted for (debt)/cash.
(3) Calculated as profit after taxation attributable to shareholders as a percentage of the average of opening and closing shareholders’ funds.
(4) Calculated as profit before taxation attributable to shareholders as a percentage of the average of opening and closing shareholders’ funds.
(5) The number of units completed and taken to sales in the year excluding joint ventures.
FIVE YEAR SUMMARY
BERKELEY ANNUAL REPORT 2014 / FINANCIALS