annual report 2014 - yit celtniecība · yit reding receives an award ... shops, pharmacies, a...
TRANSCRIPT
TILINPÄÄTÖSVUOSI 2014 LIIKETOIMINTA HALLINNOINTI GRI-TAULUKKO
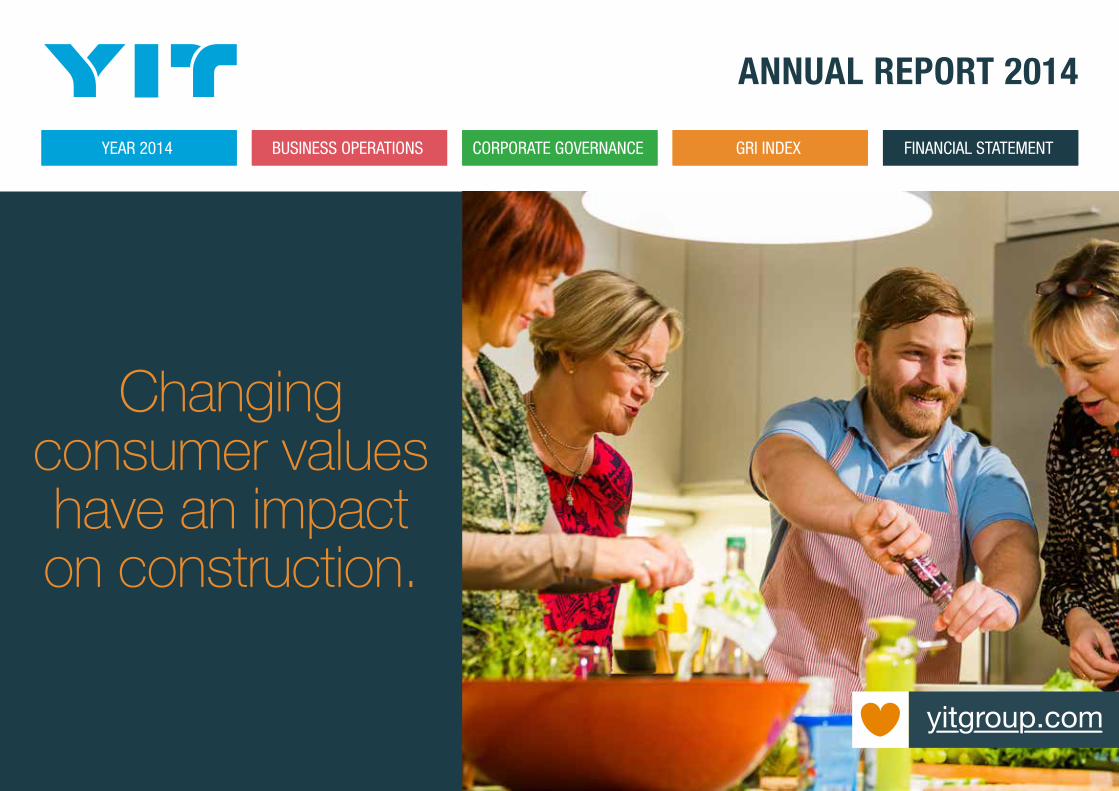
Changingconsumer valueshave an impacton construction.
ANNUAL REPORT 2014
FINANCIAL STATEMENTYEAR 2014 BUSINESS OPERATIONS CORPORATE GOVERNANCE GRI INDEX
FINANCIAL STATEMENTYEAR 2014 BUSINESS OPERATIONS CORPORATE GOVERNANCE GRI INDEX
2
YIT ANNUAL REPORT 2014
Estonia
St. PetersburgFinland
Latvia
Lithuania
The Czech RepublicSlovakia
Moscow
Kazan
Yekaterinburg
Tyumen
Rostov-on-Don
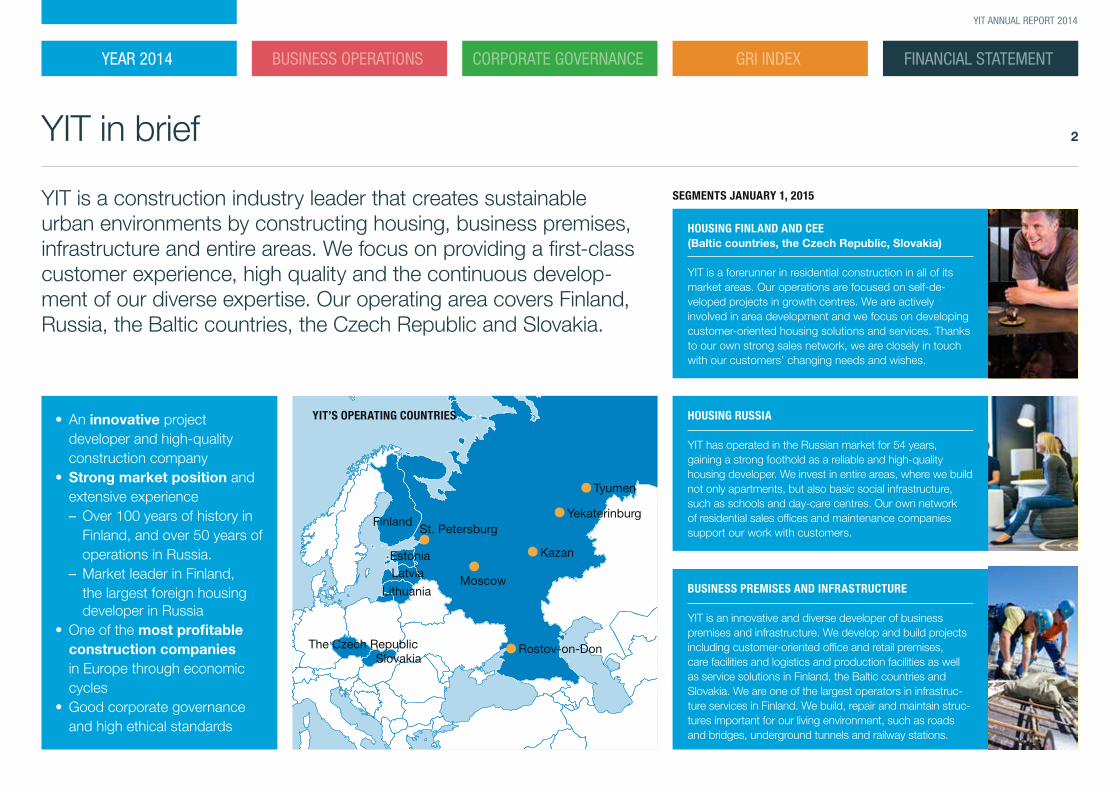
YIT is a construction industry leader that creates sustainable urban environments by constructing housing, business premises, infrastructure and entire areas. We focus on providing a first-class customer experience, high quality and the continuous develop-ment of our diverse expertise. Our operating area covers Finland, Russia, the Baltic countries, the Czech Republic and Slovakia.
YIT’S OPERATING COUNTRIES
HOUSING FINLAND AND CEE (Baltic countries, the Czech Republic, Slovakia)
YIT is a forerunner in residential construction in all of its market areas. Our operations are focused on self-de-veloped projects in growth centres. We are actively involved in area development and we focus on developing customer-oriented housing solutions and services. Thanks to our own strong sales network, we are closely in touch with our customers’ changing needs and wishes.
• An innovative project developer and high-quality construction company
• Strong market position and extensive experience – Over 100 years of history in Finland, and over 50 years of operations in Russia.
– Market leader in Finland, the largest foreign housing developer in Russia
• One of the most profitable construction companies in Europe through economic cycles
• Good corporate governance and high ethical standards
YIT in brief
SEGMENTS JANUARY 1, 2015
BUSINESS PREMISES AND INFRASTRUCTURE
YIT is an innovative and diverse developer of business premises and infrastructure. We develop and build projects including customer-oriented office and retail premises, care facilities and logistics and production facilities as well as service solutions in Finland, the Baltic countries and Slovakia. We are one of the largest operators in infrastruc-ture services in Finland. We build, repair and maintain struc-tures important for our living environment, such as roads and bridges, underground tunnels and railway stations.
HOUSING RUSSIA
YIT has operated in the Russian market for 54 years, gaining a strong foothold as a reliable and high-quality housing developer. We invest in entire areas, where we build not only apartments, but also basic social infrastructure, such as schools and day-care centres. Our own network of residential sales offices and maintenance companies support our work with customers.

FINANCIAL STATEMENTYEAR 2014 BUSINESS OPERATIONS CORPORATE GOVERNANCE GRI INDEX
3
YIT ANNUAL REPORT 2014
“Attractive areas attract skilled workers and investments.”
JUHA KOSTIAINEN, SENIOR VICE PRESIDENT, URBAN DEVELOPMENT, YIT
5 Key figures
6 Highlights of the year
10 President and CEO’s review
11 Review of business operations
15 Strategy
17 YIT’s business model
21 Housing
25 Business Premises and Infrastructure
29 Changes in society and values have an impact in construction
33 Sustainable urban environments make daily life convenient
36 Professional skill is key
40 Corporate Governance
47 Risk management
49 Board of Directors
50 Management Board
52 Responsibility Reporting
53 GRI Index
63 Report of the Board of Directors
82 Consolidated financial statements
132 Parent company financial statement
144 Board of Directors’ proposal for the distribution of distributable equity
145 Auditor’s report
146 Key financial figures
152 Investor relations
154 Information for shareholders
YOU CAN NAVIGATE BY CLICKING THE
HEADLINES
Contents
CORPORATE RESPONSIBILITY IS AN IMPORTANT PART OF OUR BUSINESS OPERATIONS, AND HENCE, IT IS INTEGRATED IN THE ANNUAL REPORT.
FINANCIAL STATEMENT
YEAR 2014 BUSINESS OPERATIONS
CORPORATE GOVERNANCE
GRI INDEX
YIT ANNUAL REPORT 2014
FINANCIAL STATEMENTYEAR 2014 BUSINESS OPERATIONS CORPORATE GOVERNANCE GRI INDEX
4
YIT ANNUAL REPORT 2014
Respublikanskaya St. Petersburg, Russia
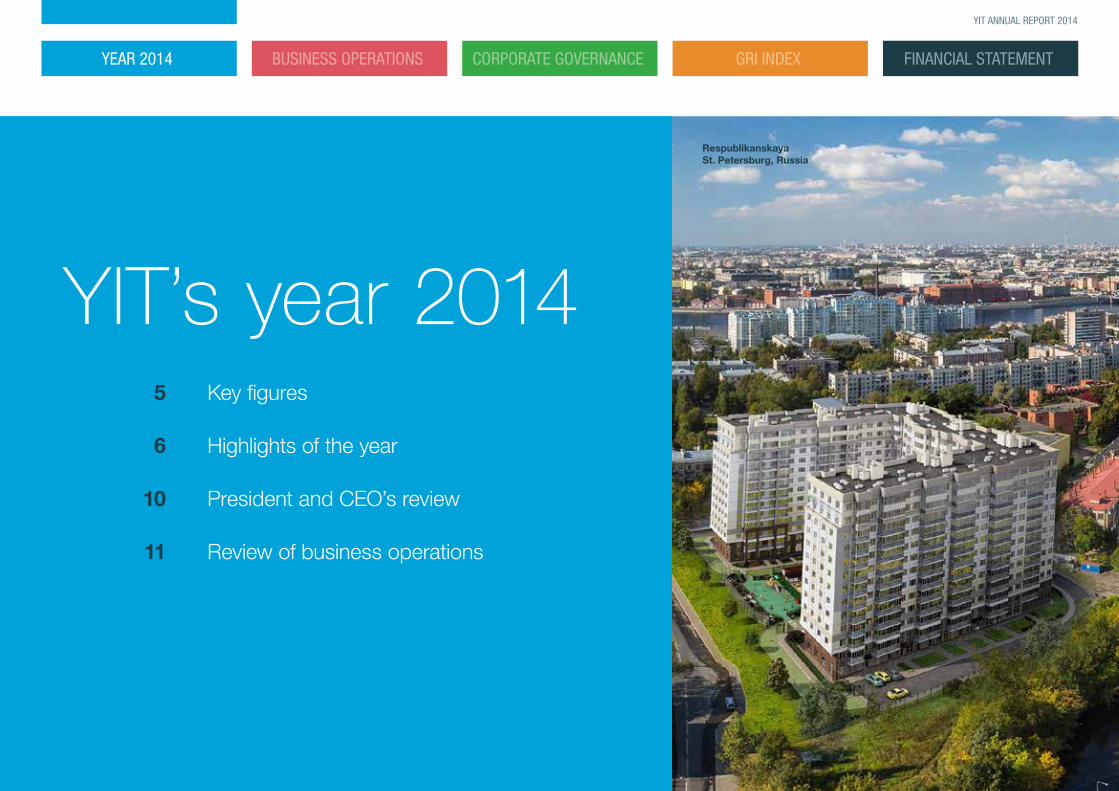
YIT’s year 2014
5 Key figures
6 Highlights of the year
10 President and CEO’s review
11 Review of business operations
FINANCIAL STATEMENTYEAR 2014 BUSINESS OPERATIONS CORPORATE GOVERNANCE GRI INDEX
5
YIT ANNUAL REPORT 2014
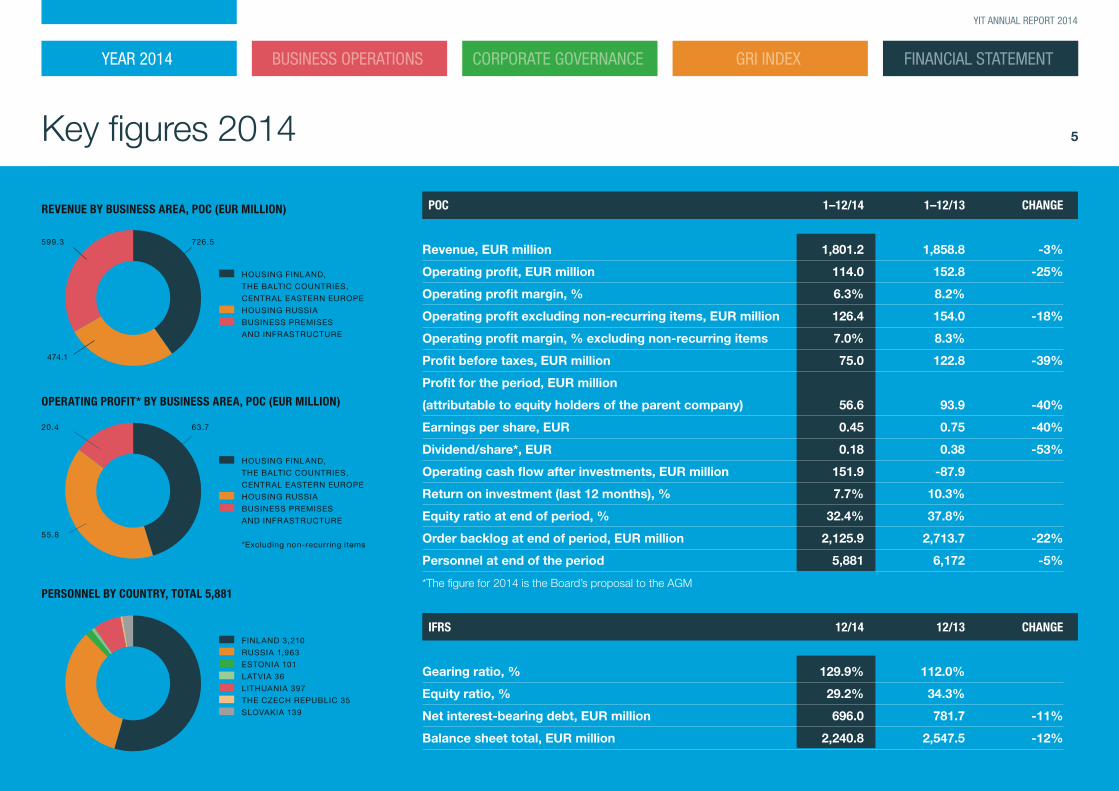
Key figures 2014
FINLAND 3,210
RUSSIA 1,963
ESTONIA 101
LATVIA 36
LITHUANIA 397
THE CZECH REPUBLIC 35
SLOVAKIA 139
PERSONNEL BY COUNTRY, TOTAL 5,881
HOUSING FINLAND,
THE BALTIC COUNTRIES,
CENTRAL EASTERN EUROPE
HOUSING RUSSIA
BUSINESS PREMISES
AND INFRASTRUCTURE
*Excluding non-recurring items
OPERATING PROFIT* BY BUSINESS AREA, POC (EUR MILLION)
63.7
55.8
20.4
REVENUE BY BUSINESS AREA, POC (EUR MILLION)
HOUSING FINLAND,
THE BALTIC COUNTRIES,
CENTRAL EASTERN EUROPE
HOUSING RUSSIA
BUSINESS PREMISES
AND INFRASTRUCTURE
726.5
474.1
599.3
POC 1–12/14 1–12/13 CHANGE
Revenue, EUR million 1,801.2 1,858.8 -3%
Operating profit, EUR million 114.0 152.8 -25%
Operating profit margin, % 6.3% 8.2%
Operating profit excluding non-recurring items, EUR million 126.4 154.0 -18%
Operating profit margin, % excluding non-recurring items 7.0% 8.3%
Profit before taxes, EUR million 75.0 122.8 -39%
Profit for the period, EUR million
(attributable to equity holders of the parent company) 56.6 93.9 -40%
Earnings per share, EUR 0.45 0.75 -40%
Dividend/share*, EUR 0.18 0.38 -53%
Operating cash flow after investments, EUR million 151.9 -87.9
Return on investment (last 12 months), % 7.7% 10.3%
Equity ratio at end of period, % 32.4% 37.8%
Order backlog at end of period, EUR million 2,125.9 2,713.7 -22%
Personnel at end of the period 5,881 6,172 -5%
*The figure for 2014 is the Board’s proposal to the AGM
IFRS 12/14 12/13 CHANGE
Gearing ratio, % 129.9% 112.0%
Equity ratio, % 29.2% 34.3%
Net interest-bearing debt, EUR million 696.0 781.7 -11%
Balance sheet total, EUR million 2,240.8 2,547.5 -12%
FINANCIAL STATEMENTYEAR 2014 BUSINESS OPERATIONS CORPORATE GOVERNANCE GRI INDEX
6
YIT ANNUAL REPORT 2014
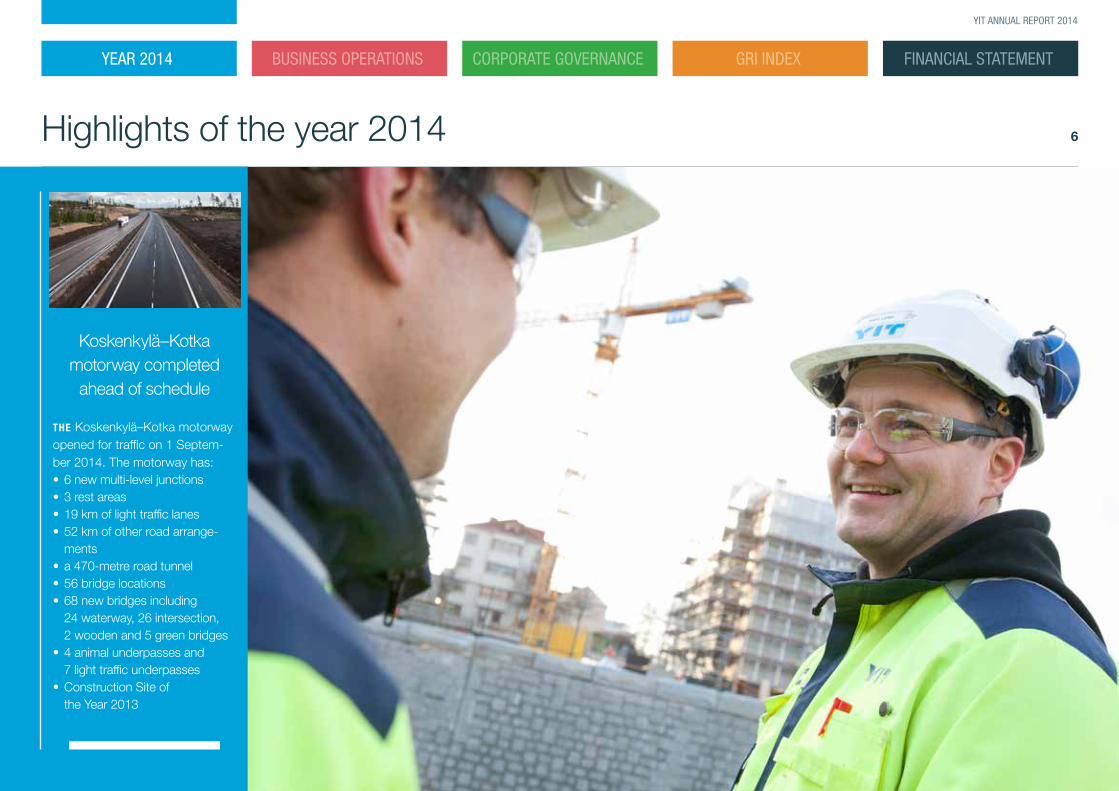
Highlights of the year 2014
Koskenkylä–Kotka motorway completed
ahead of schedule
THE Koskenkylä–Kotka motorway opened for traffic on 1 Septem-ber 2014. The motorway has: • 6 new multi-level junctions• 3 rest areas• 19 km of light traffic lanes• 52 km of other road arrange-
ments• a 470-metre road tunnel• 56 bridge locations• 68 new bridges including
24 waterway, 26 intersection, 2 wooden and 5 green bridges
• 4 animal underpasses and 7 light traffic underpasses
• Construction Site of the Year 2013
FINANCIAL STATEMENTYEAR 2014 BUSINESS OPERATIONS CORPORATE GOVERNANCE GRI INDEX
7
YIT ANNUAL REPORT 2014
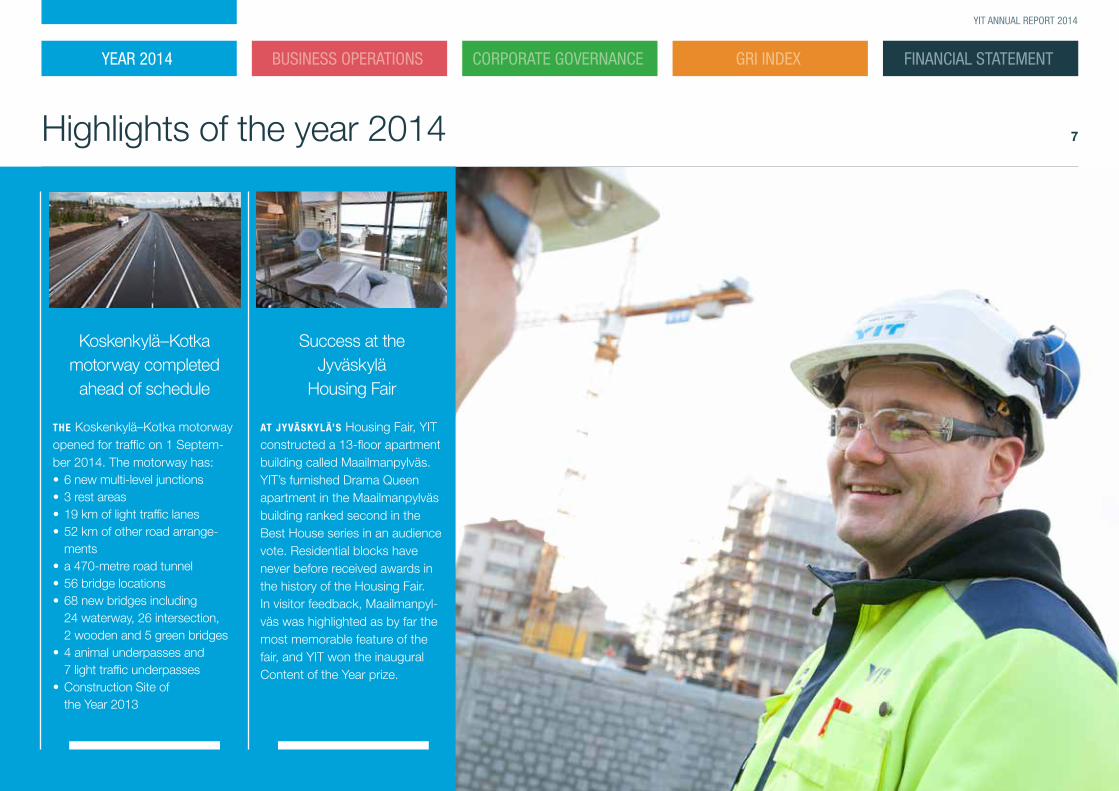
Highlights of the year 2014
Koskenkylä–Kotka motorway completed
ahead of schedule
THE Koskenkylä–Kotka motorway opened for traffic on 1 Septem-ber 2014. The motorway has: • 6 new multi-level junctions• 3 rest areas• 19 km of light traffic lanes• 52 km of other road arrange-
ments• a 470-metre road tunnel• 56 bridge locations• 68 new bridges including
24 waterway, 26 intersection, 2 wooden and 5 green bridges
• 4 animal underpasses and 7 light traffic underpasses
• Construction Site of the Year 2013
Success at the Jyväskylä
Housing Fair
AT JYVÄSKYLÄ’S Housing Fair, YIT constructed a 13-floor apartment building called Maailmanpylväs. YIT’s furnished Drama Queen apartment in the Maailmanpylväs building ranked second in the Best House series in an audience vote. Residential blocks have never before received awards in the history of the Housing Fair. In visitor feedback, Maailmanpyl-väs was highlighted as by far the most memorable feature of the fair, and YIT won the inaugural Content of the Year prize.

FINANCIAL STATEMENTYEAR 2014 BUSINESS OPERATIONS CORPORATE GOVERNANCE GRI INDEX
8
YIT ANNUAL REPORT 2014
Highlights of the year 2014
Koskenkylä–Kotka motorway completed
ahead of schedule
THE Koskenkylä–Kotka motorway opened for traffic on 1 Septem-ber 2014. The motorway has: • 6 new multi-level junctions• 3 rest areas• 19 km of light traffic lanes• 52 km of other road arrange-
ments• a 470-metre road tunnel• 56 bridge locations• 68 new bridges including
24 waterway, 26 intersection, 2 wooden and 5 green bridges
• 4 animal underpasses and 7 light traffic underpasses
• Construction Site of the Year 2013
YIT Reding receives an award
in Slovakia
IN SLOVAKIA, YIT’s subsidiary YIT Reding won the main prizes at two esteemed construction industry gala events in 2014.At the ASB Gala, YIT Reding was selected as the construction company and real estate develo-per of the year. At the CIJ Awards Slovakia gala, the company won the award for best property deve-loper for the second consecu-tive year. In addition, YIT project Byty Villinki was awarded the Best Housing Project 2014 prize. YIT Reding sold a record high of almost 200 apartments in the Bratislava area in 2014.
Success at the Jyväskylä
Housing Fair
AT JYVÄSKYLÄ’S Housing Fair, YIT constructed a 13-floor apartment building called Maailmanpylväs. YIT’s furnished Drama Queen apartment in the Maailmanpylväs building ranked second in the Best House series in an audience vote. Residential blocks have never before received awards in the history of the Housing Fair. In visitor feedback, Maailmanpyl-väs was highlighted as by far the most memorable feature of the fair, and YIT won the inaugural Content of the Year prize.

FINANCIAL STATEMENTYEAR 2014 BUSINESS OPERATIONS CORPORATE GOVERNANCE GRI INDEX
9
YIT ANNUAL REPORT 2014
Highlights of the year 2014
Novo Orlovsky creates a better living environment in St. Petersburg
THE NOVO ORLOVSKY project in Russia fulfils customer wis-hes of high-quality housing. The 46-hectare plot of land will see the construction of nearly 10,000 apartments, several car parks, five daycare centres, two schools, shops, pharmacies, a sports and leisure centre, as well as other business premises and services. The architectu-ral and district plans for the site are the work of the Spa-nish architects office Taller de Arquitectura. The project is located in North St. Petersburg with excellent transport links and services right on the doorstep.
Koskenkylä–Kotka motorway completed
ahead of schedule
THE Koskenkylä–Kotka motorway opened for traffic on 1 Septem-ber 2014. The motorway has: • 6 new multi-level junctions• 3 rest areas• 19 km of light traffic lanes• 52 km of other road arrange-
ments• a 470-metre road tunnel• 56 bridge locations• 68 new bridges including
24 waterway, 26 intersection, 2 wooden and 5 green bridges
• 4 animal underpasses and 7 light traffic underpasses
• Construction Site of the Year 2013
YIT Reding receives an award
in Slovakia
IN SLOVAKIA, YIT’s subsidiary YIT Reding won the main prizes at two esteemed construction industry gala events in 2014.At the ASB Gala, YIT Reding was selected as the construction company and real estate develo-per of the year. At the CIJ Awards Slovakia gala, the company won the award for best property deve-loper for the second consecu-tive year. In addition, YIT project Byty Villinki was awarded the Best Housing Project 2014 prize. YIT Reding sold a record high of almost 200 apartments in the Bratislava area in 2014.
Success at the Jyväskylä
Housing Fair
AT JYVÄSKYLÄ’S Housing Fair, YIT constructed a 13-floor apartment building called Maailmanpylväs. YIT’s furnished Drama Queen apartment in the Maailmanpylväs building ranked second in the Best House series in an audience vote. Residential blocks have never before received awards in the history of the Housing Fair. In visitor feedback, Maailmanpyl-väs was highlighted as by far the most memorable feature of the fair, and YIT won the inaugural Content of the Year prize.
FINANCIAL STATEMENTYEAR 2014 BUSINESS OPERATIONS CORPORATE GOVERNANCE GRI INDEX
10
YIT ANNUAL REPORT 2014
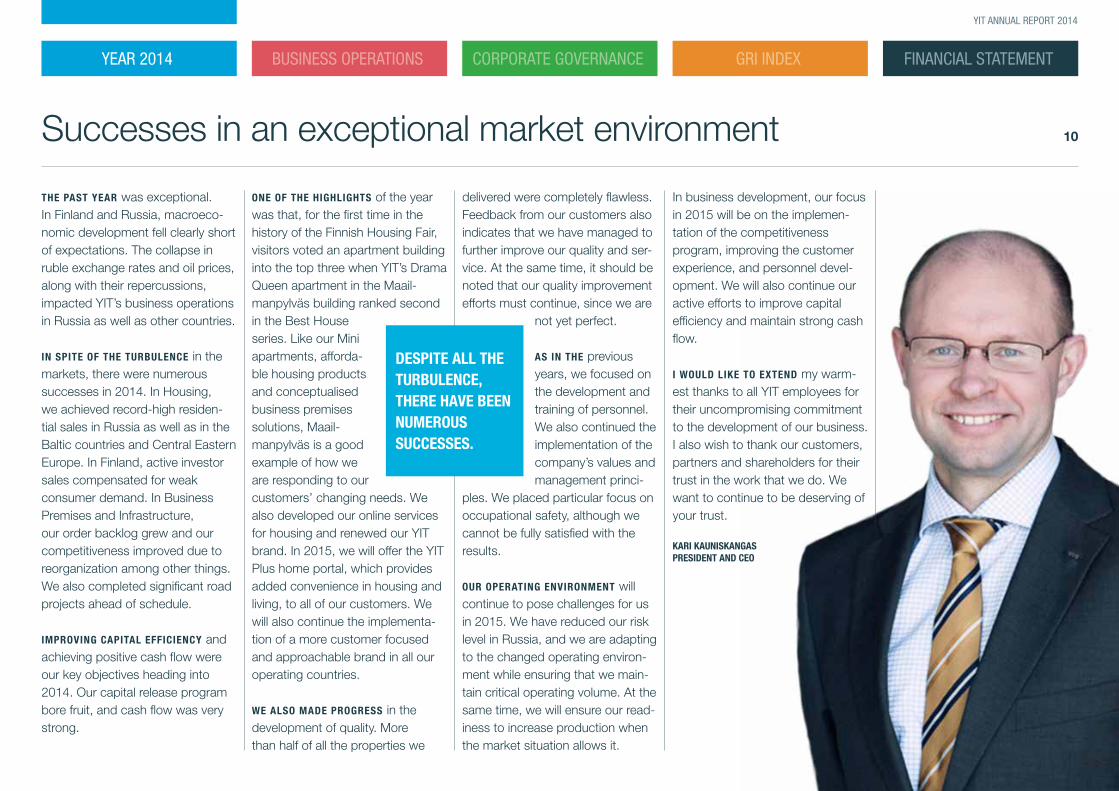
Successes in an exceptional market environment
THE PAST YEAR was exceptional. In Finland and Russia, macroeco-nomic development fell clearly short of expectations. The collapse in ruble exchange rates and oil prices, along with their repercussions, impacted YIT’s business operations in Russia as well as other countries.
IN SPITE OF THE TURBULENCE in the markets, there were numerous successes in 2014. In Housing, we achieved record-high residen-tial sales in Russia as well as in the Baltic countries and Central Eastern Europe. In Finland, active investor sales compensated for weak consumer demand. In Business Premises and Infrastructure, our order backlog grew and our competitiveness improved due to reorganization among other things. We also completed significant road projects ahead of schedule.
IMPROVING CAPITAL EFFICIENCY and achieving positive cash flow were our key objectives heading into 2014. Our capital release program bore fruit, and cash flow was very strong.
ONE OF THE HIGHLIGHTS of the year was that, for the first time in the history of the Finnish Housing Fair, visitors voted an apartment building into the top three when YIT’s Drama Queen apartment in the Maail-manpylväs building ranked second in the Best House series. Like our Mini apartments, afforda-ble housing products and conceptualised business premises solutions, Maail-manpylväs is a good example of how we are responding to our customers’ changing needs. We also developed our online services for housing and renewed our YIT brand. In 2015, we will offer the YIT Plus home portal, which provides added convenience in housing and living, to all of our customers. We will also continue the implementa-tion of a more customer focused and approachable brand in all our operating countries.
WE ALSO MADE PROGRESS in the development of quality. More than half of all the properties we
delivered were completely flawless. Feedback from our customers also indicates that we have managed to further improve our quality and ser-vice. At the same time, it should be noted that our quality improvement efforts must continue, since we are
not yet perfect.
AS IN THE previous years, we focused on the development and training of personnel. We also continued the implementation of the company’s values and management princi-
ples. We placed particular focus on occupational safety, although we cannot be fully satisfied with the results.
OUR OPERATING ENVIRONMENT will continue to pose challenges for us in 2015. We have reduced our risk level in Russia, and we are adapting to the changed operating environ-ment while ensuring that we main-tain critical operating volume. At the same time, we will ensure our read-iness to increase production when the market situation allows it.
In business development, our focus in 2015 will be on the implemen-tation of the competitiveness program, improving the customer experience, and personnel devel-opment. We will also continue our active efforts to improve capital efficiency and maintain strong cash flow.
I WOULD LIKE TO EXTEND my warm-est thanks to all YIT employees for their uncompromising commitment to the development of our business. I also wish to thank our customers, partners and shareholders for their trust in the work that we do. We want to continue to be deserving of your trust.
KARI KAUNISKANGAS PRESIDENT AND CEO
DESPITE ALL THE TURBULENCE, THERE HAVE BEEN NUMEROUS SUCCESSES.
FINANCIAL STATEMENTYEAR 2014 BUSINESS OPERATIONS CORPORATE GOVERNANCE GRI INDEX
11
YIT ANNUAL REPORT 2014
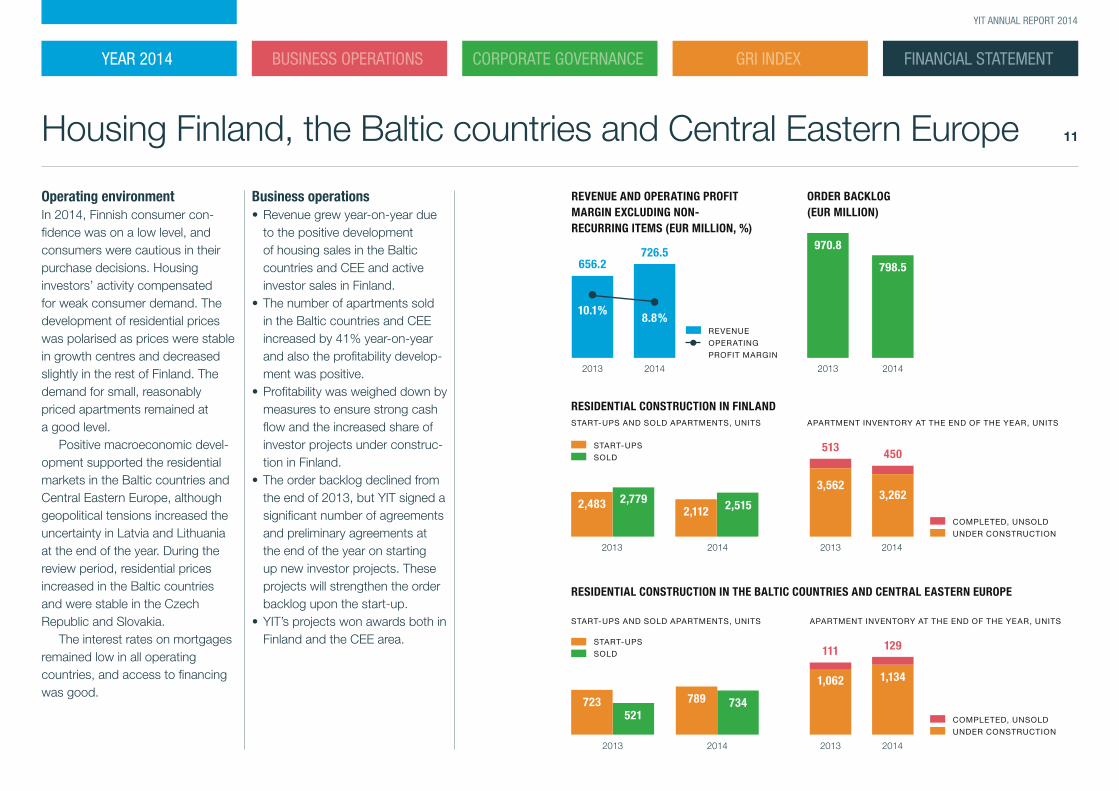
Housing Finland, the Baltic countries and Central Eastern Europe
Operating environmentIn 2014, Finnish consumer con-fidence was on a low level, and consumers were cautious in their purchase decisions. Housing investors’ activity compensated for weak consumer demand. The development of residential prices was polarised as prices were stable in growth centres and decreased slightly in the rest of Finland. The demand for small, reasonably priced apartments remained at a good level.
Positive macroeconomic devel-opment supported the residential markets in the Baltic countries and Central Eastern Europe, although geopolitical tensions increased the uncertainty in Latvia and Lithuania at the end of the year. During the review period, residential prices increased in the Baltic countries and were stable in the Czech Republic and Slovakia.
The interest rates on mortgages remained low in all operating countries, and access to financing was good.
Business operations• Revenue grew year-on-year due
to the positive development of housing sales in the Baltic countries and CEE and active investor sales in Finland.
• The number of apartments sold in the Baltic countries and CEE increased by 41% year-on-year and also the profitability develop-ment was positive.
• Profitability was weighed down by measures to ensure strong cash flow and the increased share of investor projects under construc-tion in Finland.
• The order backlog declined from the end of 2013, but YIT signed a significant number of agreements and preliminary agreements at the end of the year on starting up new investor projects. These projects will strengthen the order backlog upon the start-up.
• YIT’s projects won awards both in Finland and the CEE area.
REVENUE AND OPERATING PROFIT MARGIN EXCLUDING NON-RECURRING ITEMS (EUR MILLION, %)
ORDER BACKLOG (EUR MILLION)
START-UPS AND SOLD APARTMENTS, UNITS
RESIDENTIAL CONSTRUCTION IN FINLAND
RESIDENTIAL CONSTRUCTION IN THE BALTIC COUNTRIES AND CENTRAL EASTERN EUROPE
APARTMENT INVENTORY AT THE END OF THE YEAR, UNITS
START-UPS AND SOLD APARTMENTS, UNITS APARTMENT INVENTORY AT THE END OF THE YEAR, UNITS
COMPLETED, UNSOLD
UNDER CONSTRUCTION
COMPLETED, UNSOLD
UNDER CONSTRUCTION
2014
798.5
2013
970.8
2013
3,562
513
2014
3,262
450
2013
1,062
111
1,134
129
2014
2013
656.2
2014
START-UPS
SOLD
10.1%
726.5
8.8% REVENUE
OPERATING
PROFIT MARGIN
2013 2014
2,483 2,7792,112 2,515
2013
521723
2014
734789
START-UPS
SOLD
FINANCIAL STATEMENTYEAR 2014 BUSINESS OPERATIONS CORPORATE GOVERNANCE GRI INDEX
12
YIT ANNUAL REPORT 2014
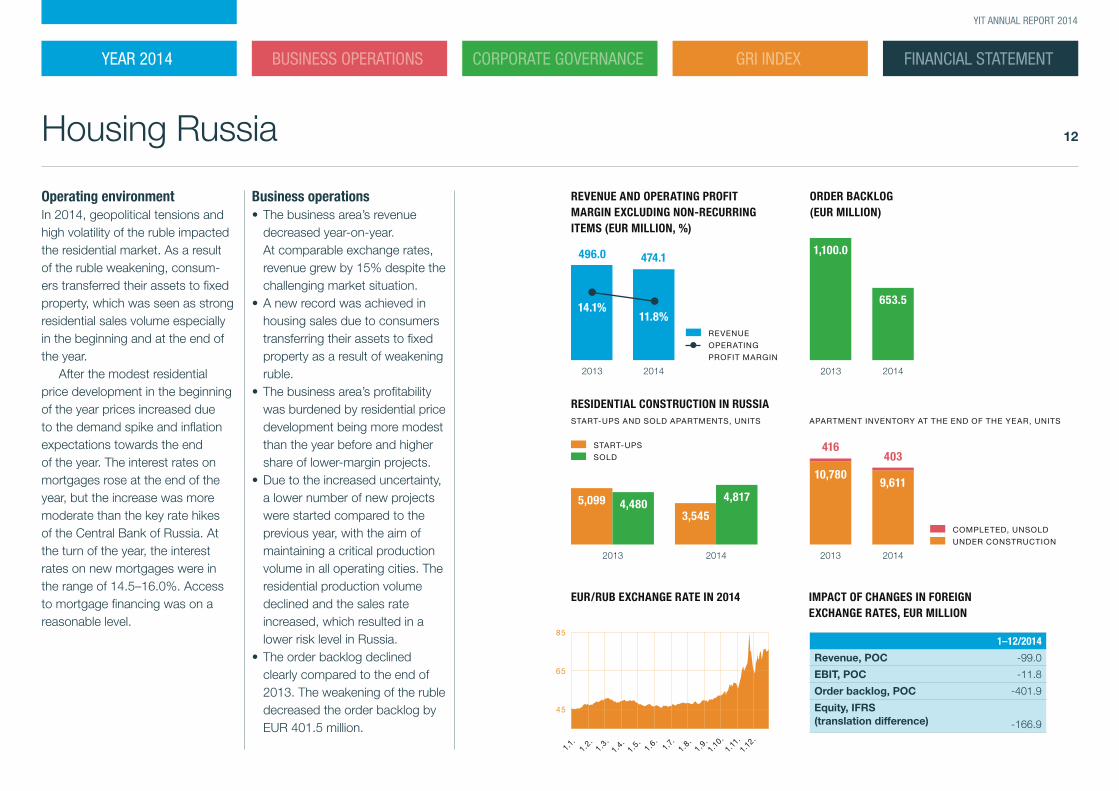
Business operations• The business area’s revenue
decreased year-on-year. At comparable exchange rates, revenue grew by 15% despite the challenging market situation.
• A new record was achieved in housing sales due to consumers transferring their assets to fixed property as a result of weakening ruble.
• The business area’s profitability was burdened by residential price development being more modest than the year before and higher share of lower-margin projects.
• Due to the increased uncertainty, a lower number of new projects were started compared to the previous year, with the aim of maintaining a critical production volume in all operating cities. The residential production volume declined and the sales rate increased, which resulted in a lower risk level in Russia.
• The order backlog declined clearly compared to the end of 2013. The weakening of the ruble decreased the order backlog by EUR 401.5 million.
Housing Russia
Operating environmentIn 2014, geopolitical tensions and high volatility of the ruble impacted the residential market. As a result of the ruble weakening, consum-ers transferred their assets to fixed property, which was seen as strong residential sales volume especially in the beginning and at the end of the year.
After the modest residential price development in the beginning of the year prices increased due to the demand spike and inflation expectations towards the end of the year. The interest rates on mortgages rose at the end of the year, but the increase was more moderate than the key rate hikes of the Central Bank of Russia. At the turn of the year, the interest rates on new mortgages were in the range of 14.5–16.0%. Access to mortgage financing was on a reasonable level.
1–12/2014
Revenue, POC -99.0
EBIT, POC -11.8
Order backlog, POC -401.9
Equity, IFRS (translation difference) -166.9
IMPACT OF CHANGES IN FOREIGN EXCHANGE RATES, EUR MILLION
2013
416
10,780
2014
403
9,611
EUR/RUB EXCHANGE RATE IN 2014
2013
1,100.0
2014
653.5
1.1.
1.2.
1.3.
1.4.
1.5.
1.6.
1.7.
1.8.
1.9.
1.10
.1.
11.1.
12.
REVENUE AND OPERATING PROFIT MARGIN EXCLUDING NON-RECURRING ITEMS (EUR MILLION, %)
ORDER BACKLOG (EUR MILLION)
COMPLETED, UNSOLD
UNDER CONSTRUCTION
RESIDENTIAL CONSTRUCTION IN RUSSIASTART-UPS AND SOLD APARTMENTS, UNITS APARTMENT INVENTORY AT THE END OF THE YEAR, UNITS
65
45
85
2014
474.1
11.8%
2013
496.0
14.1%
3,545
4,817
20142013
5,099 4,480
START-UPS
SOLD
REVENUE
OPERATING
PROFIT MARGIN
FINANCIAL STATEMENTYEAR 2014 BUSINESS OPERATIONS CORPORATE GOVERNANCE GRI INDEX
13
YIT ANNUAL REPORT 2014
Business Premises and Infrastructure
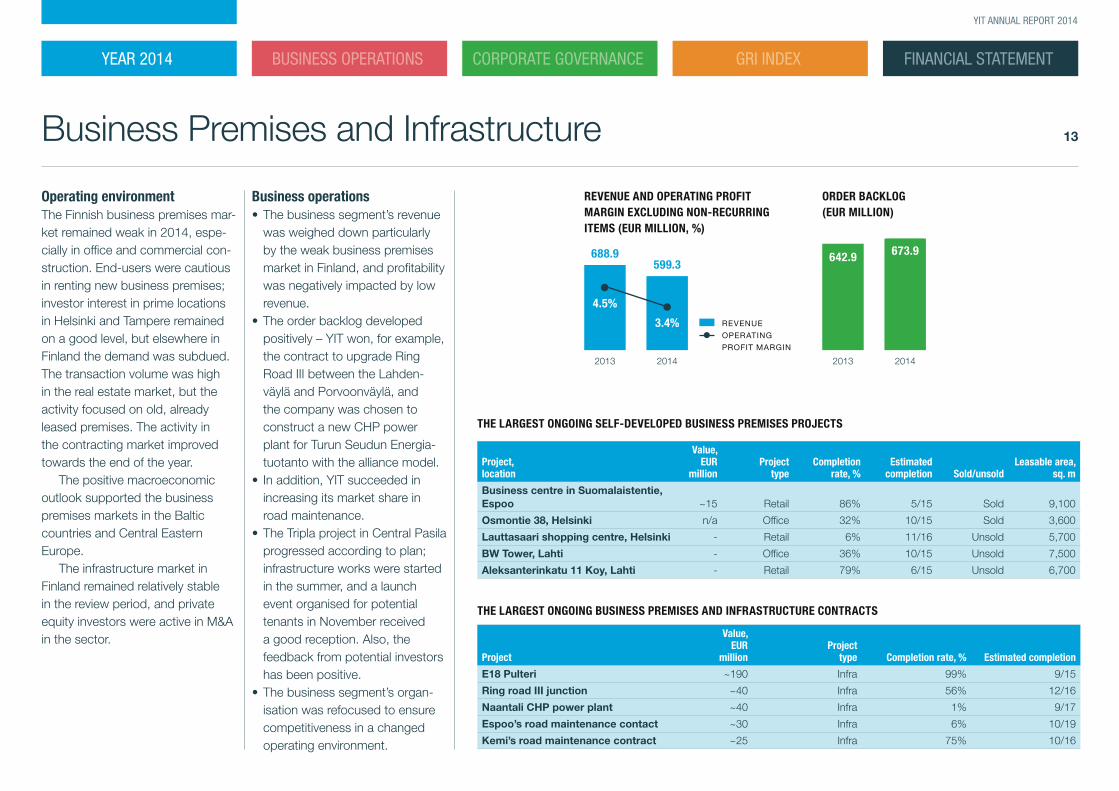
Operating environmentThe Finnish business premises mar-ket remained weak in 2014, espe-cially in office and commercial con-struction. End-users were cautious in renting new business premises; investor interest in prime locations in Helsinki and Tampere remained on a good level, but elsewhere in Finland the demand was subdued. The transaction volume was high in the real estate market, but the activity focused on old, already leased premises. The activity in the contracting market improved towards the end of the year.
The positive macroeconomic outlook supported the business premises markets in the Baltic countries and Central Eastern Europe.
The infrastructure market in Finland remained relatively stable in the review period, and private equity investors were active in M&A in the sector.
Business operations• The business segment’s revenue
was weighed down particularly by the weak business premises market in Finland, and profitability was negatively impacted by low revenue.
• The order backlog developed positively – YIT won, for example, the contract to upgrade Ring Road III between the Lahden-väylä and Porvoonväylä, and the company was chosen to construct a new CHP power plant for Turun Seudun Energia-tuotanto with the alliance model.
• In addition, YIT succeeded in increasing its market share in road maintenance.
• The Tripla project in Central Pasila progressed according to plan; infrastructure works were started in the summer, and a launch event organised for potential tenants in November received a good reception. Also, the feedback from potential investors has been positive.
• The business segment’s organ-isation was refocused to ensure competitiveness in a changed operating environment.
THE LARGEST ONGOING SELF-DEVELOPED BUSINESS PREMISES PROJECTS
THE LARGEST ONGOING BUSINESS PREMISES AND INFRASTRUCTURE CONTRACTS
Project, location
Value, EUR
millionProject
typeCompletion
rate, %Estimated
completion Sold/unsoldLeasable area,
sq. m
Business centre in Suomalaistentie, Espoo ~15 Retail 86% 5/15 Sold 9,100
Osmontie 38, Helsinki n/a Office 32% 10/15 Sold 3,600
Lauttasaari shopping centre, Helsinki - Retail 6% 11/16 Unsold 5,700
BW Tower, Lahti - Office 36% 10/15 Unsold 7,500
Aleksanterinkatu 11 Koy, Lahti - Retail 79% 6/15 Unsold 6,700
Project
Value, EUR
millionProject
type Completion rate, % Estimated completion
E18 Pulteri ~190 Infra 99% 9/15
Ring road III junction ~40 Infra 56% 12/16
Naantali CHP power plant ~40 Infra 1% 9/17
Espoo’s road maintenance contact ~30 Infra 6% 10/19
Kemi’s road maintenance contract ~25 Infra 75% 10/16
2013 2014
642.9 673.9
REVENUE AND OPERATING PROFIT MARGIN EXCLUDING NON-RECURRING ITEMS (EUR MILLION, %)
ORDER BACKLOG (EUR MILLION)
2013
688.9
4.5%
2014
599.3
3.4% REVENUE
OPERATING
PROFIT MARGIN

FINANCIAL STATEMENTYEAR 2014 BUSINESS OPERATIONS CORPORATE GOVERNANCE GRI INDEX
14
YIT ANNUAL REPORT 2014
Business operations
15 YIT’s strategy creates a strong foundation for future growth
17 YIT’s business model
21 Housing
25 Business Premises and Infrastucture
29 Changes in society and values have an impact in construction
33 Sustainable urban environments make daily life convenient
36 Professional skill is key
FINANCIAL STATEMENTYEAR 2014 BUSINESS OPERATIONS CORPORATE GOVERNANCE GRI INDEX
15
YIT ANNUAL REPORT 2014
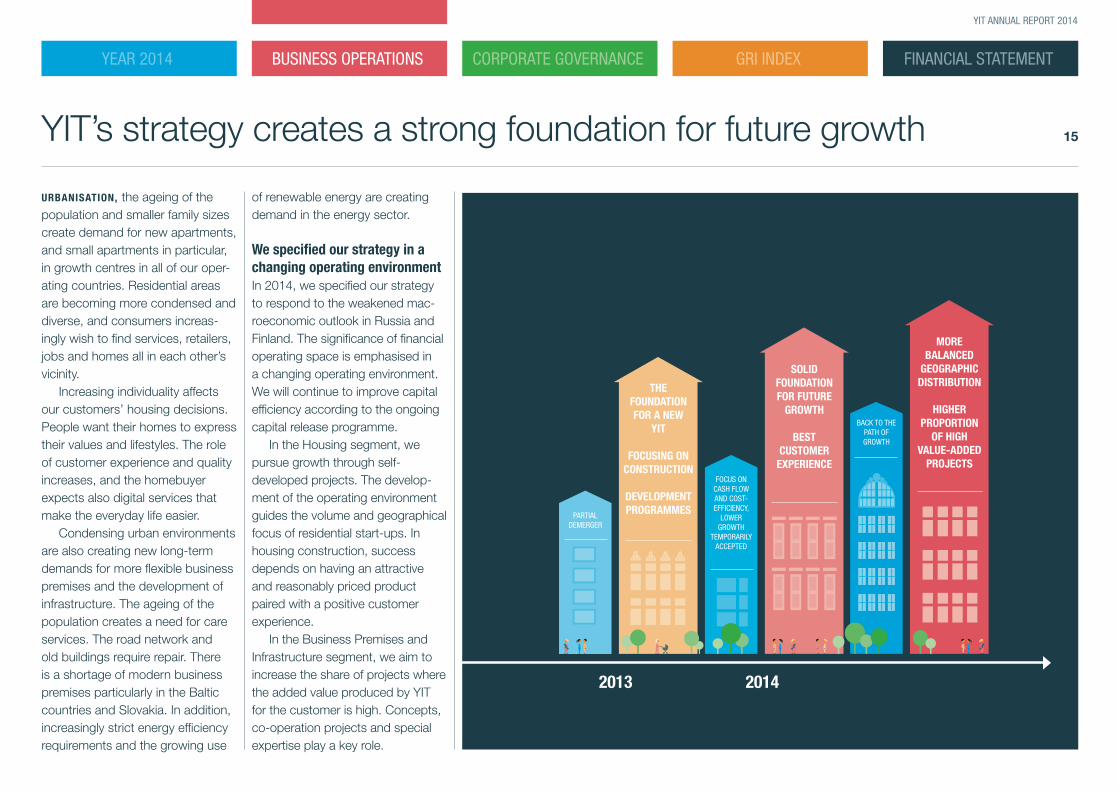
YIT’s strategy creates a strong foundation for future growth
URBANISATION, the ageing of the population and smaller family sizes create demand for new apartments, and small apartments in particular, in growth centres in all of our oper-ating countries. Residential areas are becoming more condensed and diverse, and consumers increas-ingly wish to find services, retailers, jobs and homes all in each other’s vicinity.
Increasing individuality affects our customers’ housing decisions. People want their homes to express their values and lifestyles. The role of customer experience and quality increases, and the homebuyer expects also digital services that make the everyday life easier.
Condensing urban environments are also creating new long-term demands for more flexible business premises and the development of infrastructure. The ageing of the population creates a need for care services. The road network and old buildings require repair. There is a shortage of modern business premises particularly in the Baltic countries and Slovakia. In addition, increasingly strict energy efficiency requirements and the growing use
of renewable energy are creating demand in the energy sector.
We specified our strategy in a changing operating environmentIn 2014, we specified our strategy to respond to the weakened mac-roeconomic outlook in Russia and Finland. The significance of financial operating space is emphasised in a changing operating environment. We will continue to improve capital efficiency according to the ongoing capital release programme.
In the Housing segment, we pursue growth through self- developed projects. The develop-ment of the operating environment guides the volume and geographical focus of residential start-ups. In housing construction, success depends on having an attractive and reasonably priced product paired with a positive customer experience.
In the Business Premises and Infrastructure segment, we aim to increase the share of projects where the added value produced by YIT for the customer is high. Concepts, co-operation projects and special expertise play a key role.
MORE BALANCED
GEOGRAPHIC DISTRIBUTION
HIGHER PROPORTION
OF HIGH VALUE-ADDED
PROJECTS
SOLID FOUNDATION FOR FUTURE
GROWTH
BEST CUSTOMER
EXPERIENCE
2014
THE FOUNDATION FOR A NEW
YIT
FOCUSING ON CONSTRUCTION
DEVELOPMENT PROGRAMMES
2013
FOCUS ON CASH FLOW AND COST- EFFICIENCY,
LOWER GROWTH
TEMPORARILY ACCEPTED
PARTIAL DEMERGER
BACK TO THE PATH OF GROWTH
FINANCIAL STATEMENTYEAR 2014 BUSINESS OPERATIONS CORPORATE GOVERNANCE GRI INDEX
16
YIT ANNUAL REPORT 2014
In order to even out cyclicality, we will increase the weighting of Central Eastern Europe as the third geographic pillar in parallel with Finland and Russia.
We will support the implemen-tation of strategy and the achievement of financial targets by a Group-wide competitive-ness programme. The programme’s goals are higher project profitability, streamlining operating methods and strong cash flow.
Key measures in the implemen-tation of strategy in 2014Active sales work produced results in all of our operating countries, particularly in Russia. At the same time we reduced our risk related to Russian operations by decreasing plot investments and residential start-ups, to customer demand. In Finland, we targeted our inves-tor sales at residential property funds and the production of rental apartments. In addition, we improved capital efficiency through plot co-operation and by divesting slow-moving assets.
We started several alliance projects: Lahti Travel Centre, the Naantali CHP power plant and the Pakila maintenance contract. Fur-thermore, we started the preparatory work of Tripla project in Central
Pasila, Helsinki, Finland. When launched, the Tripla project will result in a substantial increase in revenue from 2016 onwards.
We started the construction of the Laut-
tasaari hybrid project that combines housing and business. We also developed concepts and special expertise: the sixth Motorcenter was completed in Espoo, and we started several care projects.
During the year, we focused on differentiation and improving the customer experience. We are particularly proud of our apartment building project’s success at the Jyväskylä Housing Fair. In addition, we developed the YIT Plus online service to make the interaction between the homeowners of a housing corporation easier and to make services related to living more accessible. We responded to the
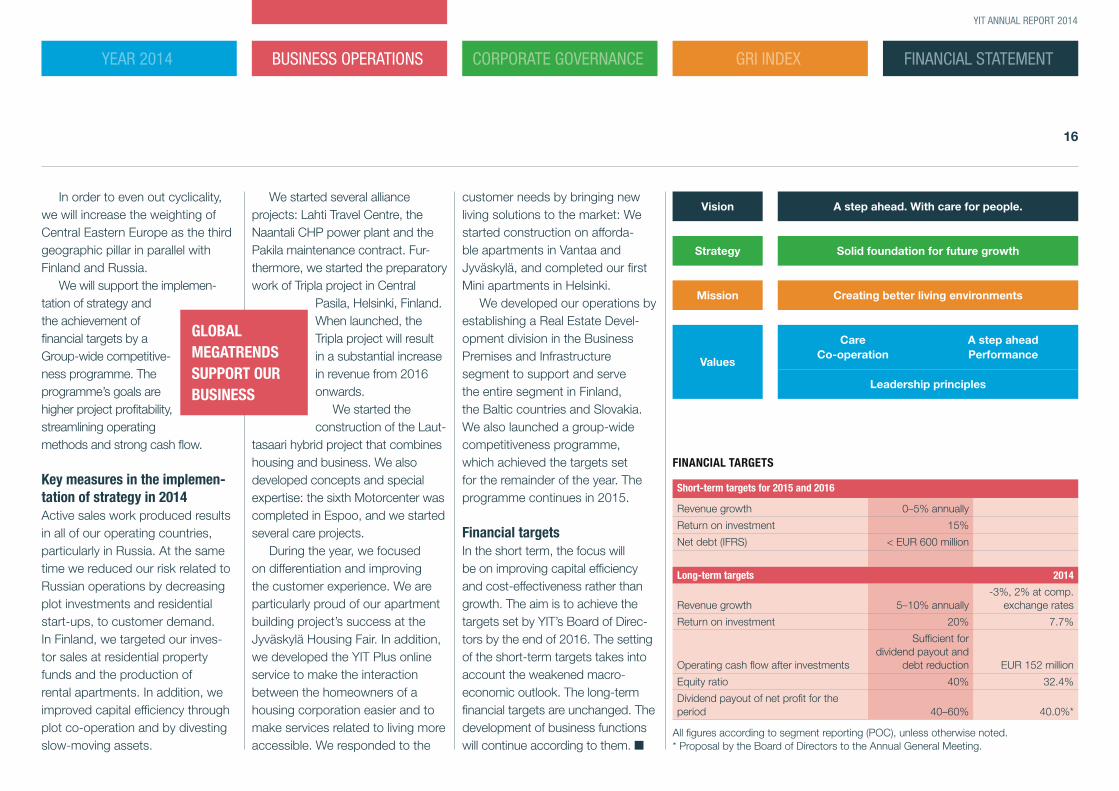
Vision
Strategy
Mission
Values
A step ahead. With care for people.
Solid foundation for future growth
Creating better living environments
Leadership principles
CareCo-operation
A step aheadPerformance
customer needs by bringing new living solutions to the market: We started construction on afforda-ble apartments in Vantaa and Jyväskylä, and completed our first Mini apartments in Helsinki.
We developed our operations by establishing a Real Estate Devel-opment division in the Business Premises and Infrastructure segment to support and serve the entire segment in Finland, the Baltic countries and Slovakia. We also launched a group-wide competitiveness programme, which achieved the targets set for the remainder of the year. The programme continues in 2015.
Financial targets In the short term, the focus will be on improving capital efficiency and cost-effectiveness rather than growth. The aim is to achieve the targets set by YIT’s Board of Direc-tors by the end of 2016. The setting of the short-term targets takes into account the weakened macro-economic outlook. The long-term financial targets are unchanged. The development of business functions will continue according to them. ■
Short-term targets for 2015 and 2016
Revenue growth 0–5% annually
Return on investment 15%
Net debt (IFRS) < EUR 600 million
Long-term targets 2014
Revenue growth 5–10% annually-3%, 2% at comp.
exchange rates
Return on investment 20% 7.7%
Operating cash flow after investments
Sufficient for dividend payout and
debt reduction EUR 152 million
Equity ratio 40% 32.4%
Dividend payout of net profit for the period 40–60% 40.0%*
GLOBAL MEGATRENDS SUPPORT OUR BUSINESS
FINANCIAL TARGETS
All figures according to segment reporting (POC), unless otherwise noted. * Proposal by the Board of Directors to the Annual General Meeting.
FINANCIAL STATEMENTYEAR 2014 BUSINESS OPERATIONS CORPORATE GOVERNANCE GRI INDEX
17
YIT ANNUAL REPORT 2014
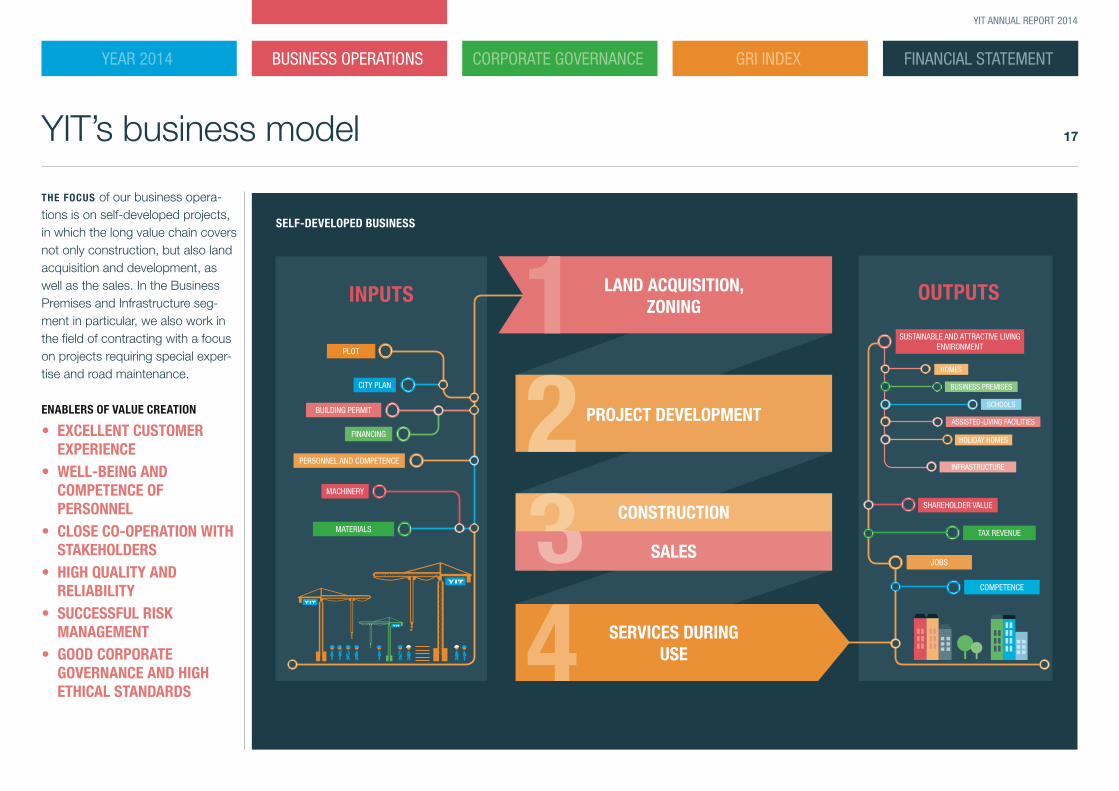
YIT’s business model
THE FOCUS of our business opera-tions is on self-developed projects, in which the long value chain covers not only construction, but also land acquisition and development, as well as the sales. In the Business Premises and Infrastructure seg-ment in particular, we also work in the field of contracting with a focus on projects requiring special exper-tise and road maintenance.
ENABLERS OF VALUE CREATION
• EXCELLENT CUSTOMER EXPERIENCE
• WELL-BEING AND COMPETENCE OF PERSONNEL
• CLOSE CO-OPERATION WITH STAKEHOLDERS
• HIGH QUALITY AND RELIABILITY
• SUCCESSFUL RISK MANAGEMENT
• GOOD CORPORATE GOVERNANCE AND HIGH ETHICAL STANDARDS
PLOT
CITY PLAN
BUILDING PERMIT
FINANCING
PERSONNEL AND COMPETENCE
MACHINERY
MATERIALS
SERVICES DURING USE
PROJECT DEVELOPMENT
INPUTS
CONSTRUCTION
SALES
LAND ACQUISITION,ZONING
TAX REVENUE
COMPETENCE
SUSTAINABLE AND ATTRACTIVE LIVING ENVIRONMENT
JOBS
SHAREHOLDER VALUE
OUTPUTS
HOMES
BUSINESS PREMISES
INFRASTRUCTURE
HOLIDAY HOMES
ASSISTED-LIVING FACILITIES
SCHOOLS
SELF-DEVELOPED BUSINESS
FINANCIAL STATEMENTYEAR 2014 BUSINESS OPERATIONS CORPORATE GOVERNANCE GRI INDEX
18
YIT ANNUAL REPORT 2014
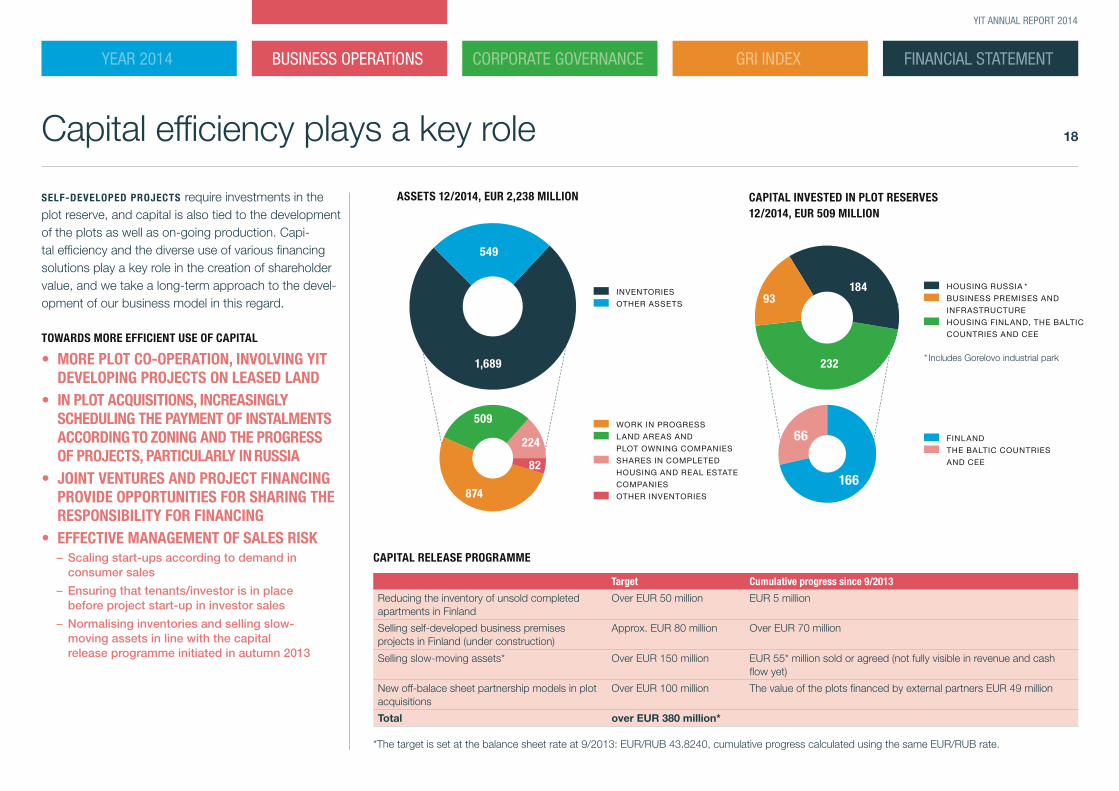
SELF-DEVELOPED PROJECTS require investments in the plot reserve, and capital is also tied to the development of the plots as well as on-going production. Capi-tal efficiency and the diverse use of various financing solutions play a key role in the creation of shareholder value, and we take a long-term approach to the devel-opment of our business model in this regard.
TOWARDS MORE EFFICIENT USE OF CAPITAL
• MORE PLOT CO-OPERATION, INVOLVING YIT DEVELOPING PROJECTS ON LEASED LAND
• IN PLOT ACQUISITIONS, INCREASINGLY SCHEDULING THE PAYMENT OF INSTALMENTS ACCORDING TO ZONING AND THE PROGRESS OF PROJECTS, PARTICULARLY IN RUSSIA
• JOINT VENTURES AND PROJECT FINANCING PROVIDE OPPORTUNITIES FOR SHARING THE RESPONSIBILITY FOR FINANCING
• EFFECTIVE MANAGEMENT OF SALES RISK – Scaling start-ups according to demand in consumer sales
– Ensuring that tenants/investor is in place before project start-up in investor sales
– Normalising inventories and selling slow- moving assets in line with the capital release programme initiated in autumn 2013
Capital efficiency plays a key role
CAPITAL RELEASE PROGRAMME
Target Cumulative progress since 9/2013
Reducing the inventory of unsold completed apartments in Finland
Over EUR 50 million EUR 5 million
Selling self-developed business premises projects in Finland (under construction)
Approx. EUR 80 million Over EUR 70 million
Selling slow-moving assets* Over EUR 150 million EUR 55* million sold or agreed (not fully visible in revenue and cash flow yet)
New off-balace sheet partnership models in plot acquisitions
Over EUR 100 million The value of the plots financed by external partners EUR 49 million
Total over EUR 380 million*
*The target is set at the balance sheet rate at 9/2013: EUR/RUB 43.8240, cumulative progress calculated using the same EUR/RUB rate.
ASSETS 12/2014, EUR 2,238 MILLION
WORK IN PROGRESS
LAND AREAS AND
PLOT OWNING COMPANIES
SHARES IN COMPLETED
HOUSING AND REAL ESTATE
COMPANIES
OTHER INVENTORIES
1,689
549
509
224
874
82
CAPITAL INVESTED IN PLOT RESERVES 12/2014, EUR 509 MILLION
FINLAND
THE BALTIC COUNTRIES
AND CEE
18493
232
166
66
INVENTORIES
OTHER ASSETS
HOUSING RUSSIA *
BUSINESS PREMISES AND
INFRASTRUCTURE
HOUSING FINLAND, THE BALTIC
COUNTRIES AND CEE
* Includes Gorelovo industrial park
FINANCIAL STATEMENTYEAR 2014 BUSINESS OPERATIONS CORPORATE GOVERNANCE GRI INDEX
19
YIT ANNUAL REPORT 2014
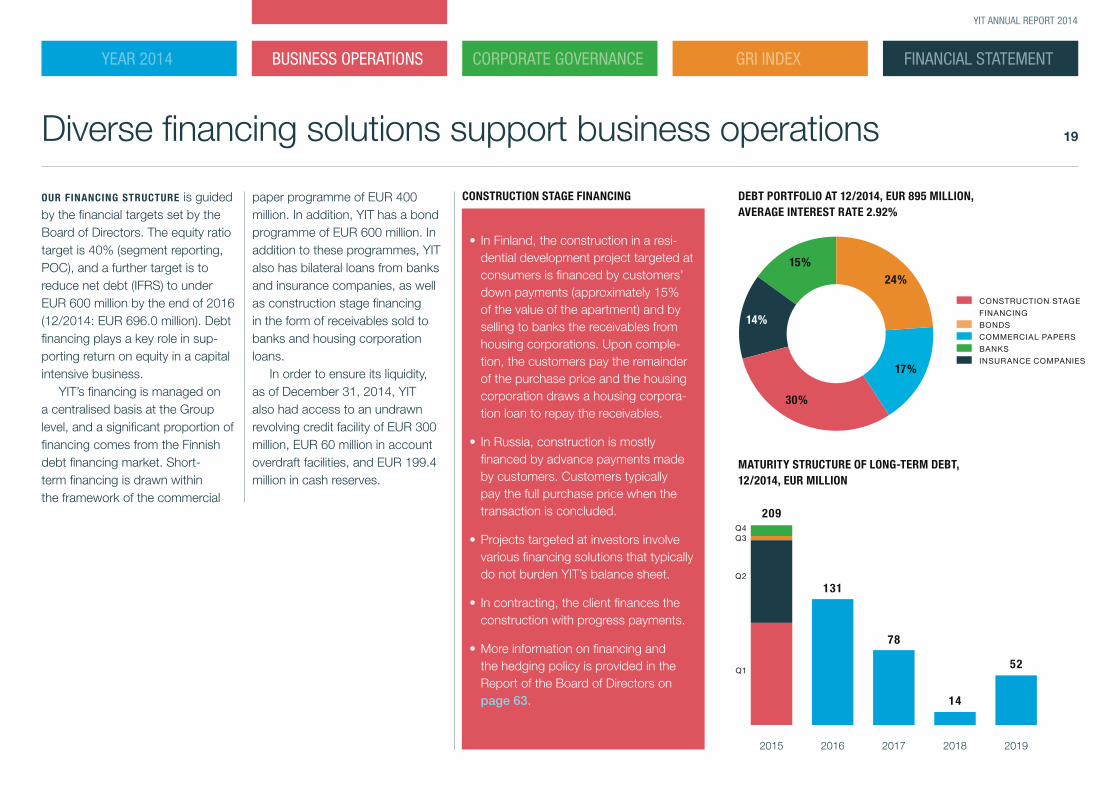
Diverse financing solutions support business operations
OUR FINANCING STRUCTURE is guided by the financial targets set by the Board of Directors. The equity ratio target is 40% (segment reporting, POC), and a further target is to reduce net debt (IFRS) to under EUR 600 million by the end of 2016 (12/2014: EUR 696.0 million). Debt financing plays a key role in sup-porting return on equity in a capital intensive business.
YIT’s financing is managed on a centralised basis at the Group level, and a significant proportion of financing comes from the Finnish debt financing market. Short-term financing is drawn within the framework of the commercial
paper programme of EUR 400 million. In addition, YIT has a bond programme of EUR 600 million. In addition to these programmes, YIT also has bilateral loans from banks and insurance companies, as well as construction stage financing in the form of receivables sold to banks and housing corporation loans.
In order to ensure its liquidity, as of December 31, 2014, YIT also had access to an undrawn revolving credit facility of EUR 300 million, EUR 60 million in account overdraft facilities, and EUR 199.4 million in cash reserves.
CONSTRUCTION STAGE FINANCING
• In Finland, the construction in a resi-dential development project targeted at consumers is financed by customers’ down payments (approximately 15% of the value of the apartment) and by selling to banks the receivables from housing corporations. Upon comple-tion, the customers pay the remainder of the purchase price and the housing corporation draws a housing corpora-tion loan to repay the receivables.
• In Russia, construction is mostly financed by advance payments made by customers. Customers typically pay the full purchase price when the transaction is concluded.
• Projects targeted at investors involve various financing solutions that typically do not burden YIT’s balance sheet.
• In contracting, the client finances the construction with progress payments.
• More information on financing and the hedging policy is provided in the Report of the Board of Directors on page 63.
DEBT PORTFOLIO AT 12/2014, EUR 895 MILLION, AVERAGE INTEREST RATE 2.92%
CONSTRUCTION STAGE
FINANCING
BONDS
COMMERCIAL PAPERS
BANKS
INSURANCE COMPANIES
30%
24%
17%
15%
14%
MATURITY STRUCTURE OF LONG-TERM DEBT, 12/2014, EUR MILLION
209
131
78
14
52
2015 2016 2017 2018 2019
Q1
Q2
Q3Q4
FINANCIAL STATEMENTYEAR 2014 BUSINESS OPERATIONS CORPORATE GOVERNANCE GRI INDEX
20
YIT ANNUAL REPORT 2014
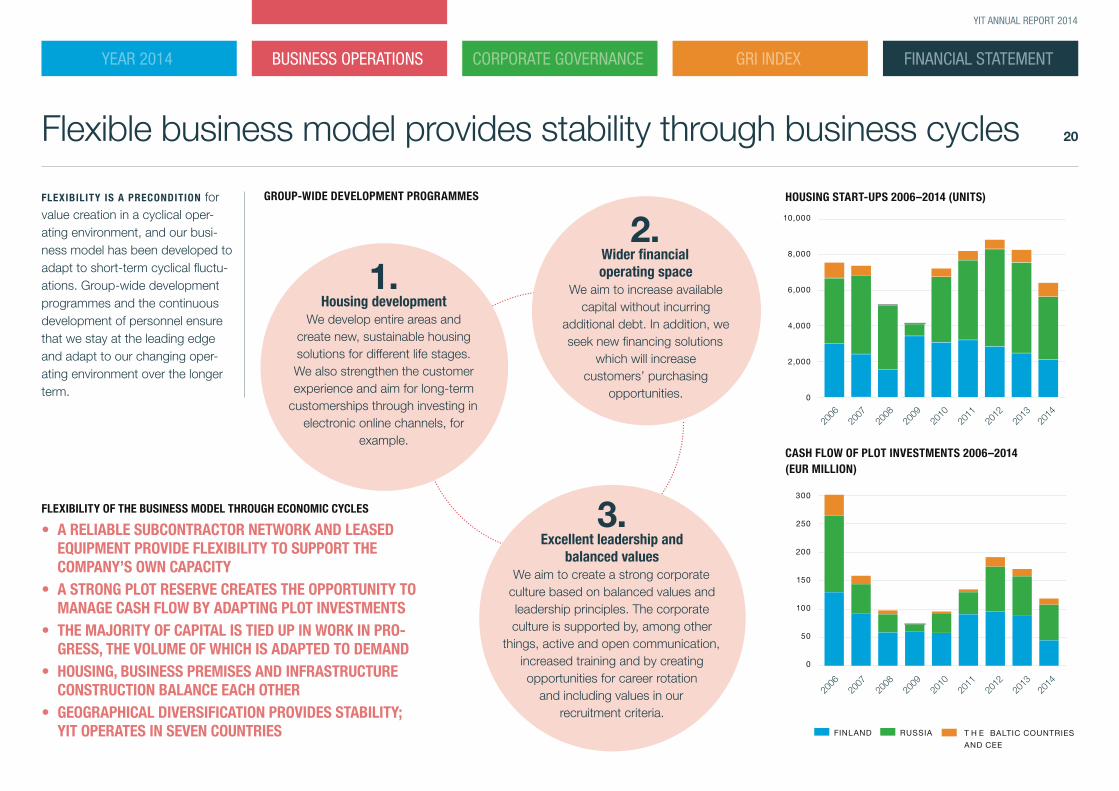
Flexible business model provides stability through business cycles
FLEXIBILITY IS A PRECONDITION for value creation in a cyclical oper-ating environment, and our busi-ness model has been developed to adapt to short-term cyclical fluctu-ations. Group-wide development programmes and the continuous development of personnel ensure that we stay at the leading edge and adapt to our changing oper-ating environment over the longer term.
GROUP-WIDE DEVELOPMENT PROGRAMMES
1. Housing development
We develop entire areas and create new, sustainable housing solutions for different life stages. We also strengthen the customer experience and aim for long-term
customerships through investing in electronic online channels, for
example.
2. Wider financial operating space
We aim to increase available capital without incurring
additional debt. In addition, we seek new financing solutions
which will increase customers’ purchasing
opportunities.
3. Excellent leadership and
balanced valuesWe aim to create a strong corporate
culture based on balanced values and leadership principles. The corporate culture is supported by, among other
things, active and open communication, increased training and by creating opportunities for career rotation
and including values in our recruitment criteria.
FLEXIBILITY OF THE BUSINESS MODEL THROUGH ECONOMIC CYCLES
• A RELIABLE SUBCONTRACTOR NETWORK AND LEASED EQUIPMENT PROVIDE FLEXIBILITY TO SUPPORT THE COMPANY’S OWN CAPACITY
• A STRONG PLOT RESERVE CREATES THE OPPORTUNITY TO MANAGE CASH FLOW BY ADAPTING PLOT INVESTMENTS
• THE MAJORITY OF CAPITAL IS TIED UP IN WORK IN PRO-GRESS, THE VOLUME OF WHICH IS ADAPTED TO DEMAND
• HOUSING, BUSINESS PREMISES AND INFRASTRUCTURE CONSTRUCTION BALANCE EACH OTHER
• GEOGRAPHICAL DIVERSIFICATION PROVIDES STABILITY; YIT OPERATES IN SEVEN COUNTRIES
CASH FLOW OF PLOT INVESTMENTS 2006–2014 (EUR MILLION)
HOUSING START-UPS 2006–2014 (UNITS)
2006
2014
6,000
4,000
8,000
10,000
2,000
0
2010
2007
2008
2009
2011
2012
2013
250
200
300
150
100
50
0
2006
2014
2010
2007
2008
2009
2011
2012
2013
FINLAND RUSSIA T H E BALTIC COUNTRIES
AND CEE
FINANCIAL STATEMENTYEAR 2014 BUSINESS OPERATIONS CORPORATE GOVERNANCE GRI INDEX
21
YIT ANNUAL REPORT 2014
Housing
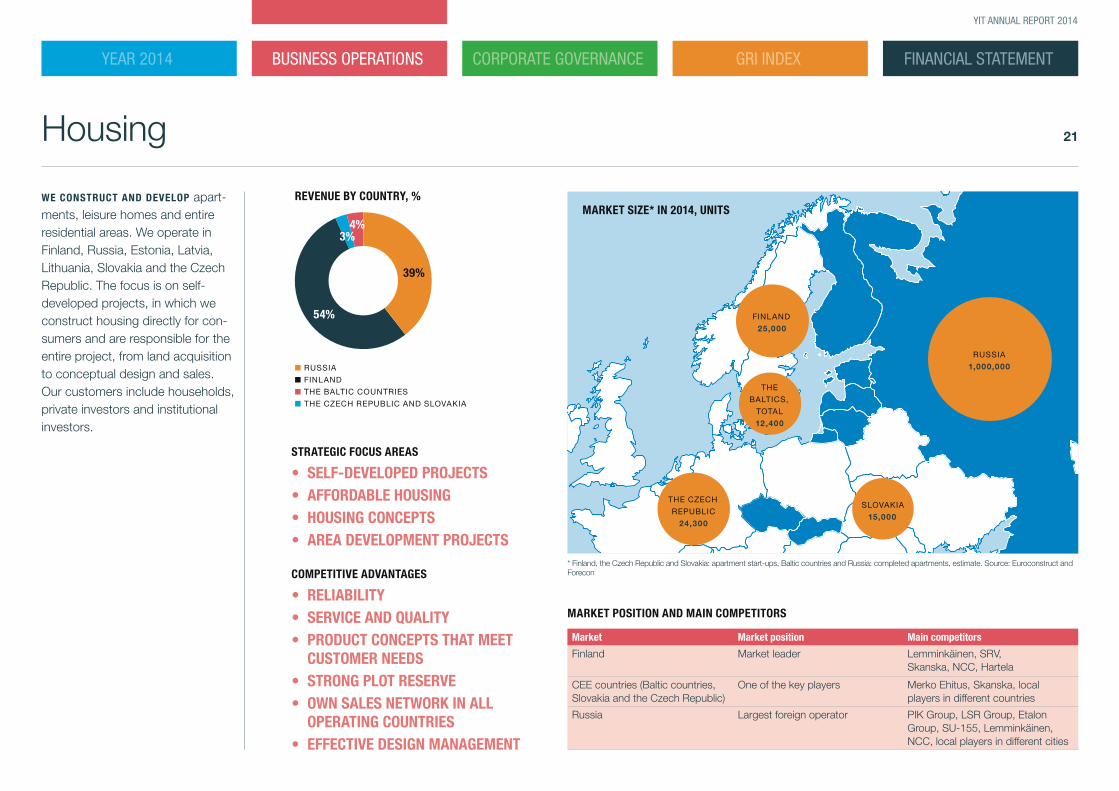
WE CONSTRUCT AND DEVELOP apart-ments, leisure homes and entire residential areas. We operate in Finland, Russia, Estonia, Latvia, Lithuania, Slovakia and the Czech Republic. The focus is on self- developed projects, in which we construct housing directly for con-sumers and are responsible for the entire project, from land acquisition to conceptual design and sales. Our customers include households, private investors and institutional investors.
MARKET SIZE* IN 2014, UNITS
MARKET POSITION AND MAIN COMPETITORS
Market Market position Main competitors
Finland Market leader Lemminkäinen, SRV, Skanska, NCC, Hartela
CEE countries (Baltic countries, Slovakia and the Czech Republic)
One of the key players Merko Ehitus, Skanska, local players in different countries
Russia Largest foreign operator PIK Group, LSR Group, Etalon Group, SU-155, Lemminkäinen, NCC, local players in different cities
* Finland, the Czech Republic and Slovakia: apartment start-ups, Baltic countries and Russia: completed apartments, estimate. Source: Euroconstruct and Forecon
THE CZECH
REPUBLIC
24,300
THE
BALTICS,
TOTAL
12,400
REVENUE BY COUNTRY, %
■ RUSSIA
■ FINLAND
■ THE BALTIC COUNTRIES
■ THE CZECH REPUBLIC AND SLOVAKIA
STRATEGIC FOCUS AREAS
• SELF-DEVELOPED PROJECTS• AFFORDABLE HOUSING• HOUSING CONCEPTS• AREA DEVELOPMENT PROJECTS
COMPETITIVE ADVANTAGES
• RELIABILITY• SERVICE AND QUALITY• PRODUCT CONCEPTS THAT MEET
CUSTOMER NEEDS• STRONG PLOT RESERVE• OWN SALES NETWORK IN ALL
OPERATING COUNTRIES• EFFECTIVE DESIGN MANAGEMENT
39%
54%
3%4%
FINLAND
25,000
SLOVAKIA
15,000
RUSSIA
1,000,000
FINANCIAL STATEMENTYEAR 2014 BUSINESS OPERATIONS CORPORATE GOVERNANCE GRI INDEX
22
YIT ANNUAL REPORT 2014
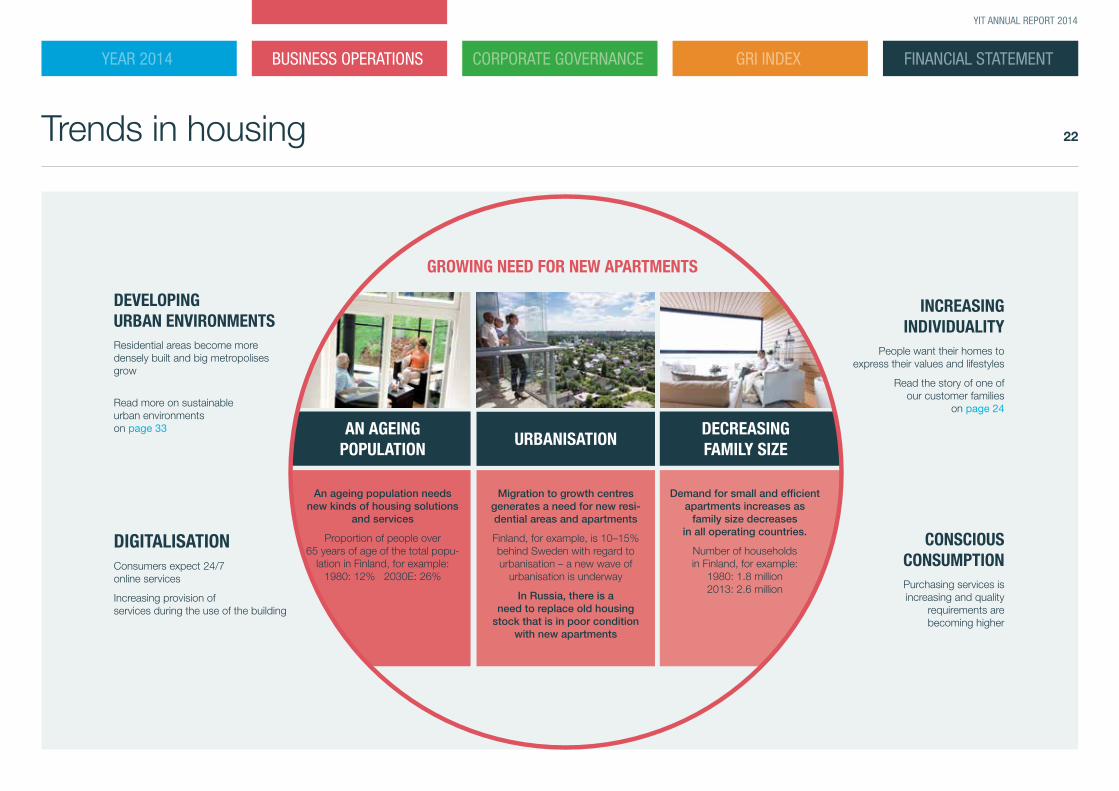
Trends in housing
INCREASING INDIVIDUALITY
People want their homes to
express their values and lifestyles
Read the story of one of our customer families
on page 24
DEVELOPING URBAN ENVIRONMENTS Residential areas become more densely built and big metropolises grow
Read more on sustainable urban environments on page 33
CONSCIOUS CONSUMPTION
Purchasing services is increasing and quality
requirements are becoming higher
DIGITALISATION Consumers expect 24/7 online services
Increasing provision of services during the use of the building
GROWING NEED FOR NEW APARTMENTS
Migration to growth centres generates a need for new resi-dential areas and apartments
Finland, for example, is 10–15% behind Sweden with regard to urbanisation – a new wave of
urbanisation is underway
In Russia, there is a need to replace old housing
stock that is in poor condition with new apartments
URBANISATION
An ageing population needs new kinds of housing solutions
and services
Proportion of people over 65 years of age of the total popu-
lation in Finland, for example: 1980: 12% 2030E: 26%
AN AGEING POPULATION
Demand for small and efficient apartments increases as
family size decreases in all operating countries.
Number of households in Finland, for example:
1980: 1.8 million 2013: 2.6 million
DECREASINGFAMILY SIZE
FINANCIAL STATEMENTYEAR 2014 BUSINESS OPERATIONS CORPORATE GOVERNANCE GRI INDEX
23
YIT ANNUAL REPORT 2014
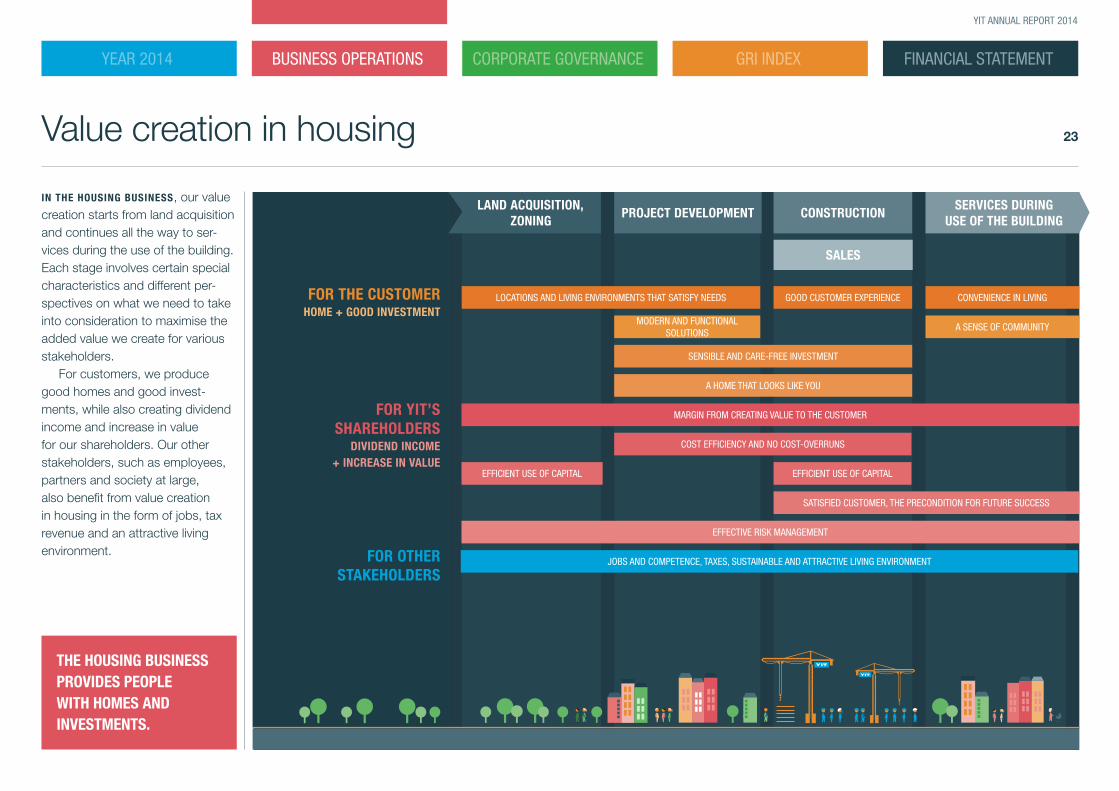
Value creation in housing
THE HOUSING BUSINESS PROVIDES PEOPLE WITH HOMES AND INVESTMENTS.
IN THE HOUSING BUSINESS, our value creation starts from land acquisition and continues all the way to ser-vices during the use of the building. Each stage involves certain special characteristics and different per-spectives on what we need to take into consideration to maximise the added value we create for various stakeholders.
For customers, we produce good homes and good invest-ments, while also creating dividend income and increase in value for our shareholders. Our other stakeholders, such as employees, partners and society at large, also benefit from value creation in housing in the form of jobs, tax revenue and an attractive living environment.
FOR THE CUSTOMER HOME + GOOD INVESTMENT
FOR OTHER STAKEHOLDERS
JOBS AND COMPETENCE, TAXES, SUSTAINABLE AND ATTRACTIVE LIVING ENVIRONMENT
LAND ACQUISITION,ZONING
PROJECT DEVELOPMENT CONSTRUCTIONSERVICES DURING
USE OF THE BUILDING
SALES
SENSIBLE AND CARE-FREE INVESTMENT
A HOME THAT LOOKS LIKE YOU
MODERN AND FUNCTIONAL SOLUTIONS
A SENSE OF COMMUNITY
LOCATIONS AND LIVING ENVIRONMENTS THAT SATISFY NEEDS GOOD CUSTOMER EXPERIENCE CONVENIENCE IN LIVING
FOR YIT’S SHAREHOLDERS
DIVIDEND INCOME + INCREASE IN VALUE
COST EFFICIENCY AND NO COST-OVERRUNS
EFFICIENT USE OF CAPITAL EFFICIENT USE OF CAPITAL
SATISFIED CUSTOMER, THE PRECONDITION FOR FUTURE SUCCESS
EFFECTIVE RISK MANAGEMENT
MARGIN FROM CREATING VALUE TO THE CUSTOMER
FINANCIAL STATEMENTYEAR 2014 BUSINESS OPERATIONS CORPORATE GOVERNANCE GRI INDEX
24
YIT ANNUAL REPORT 2014
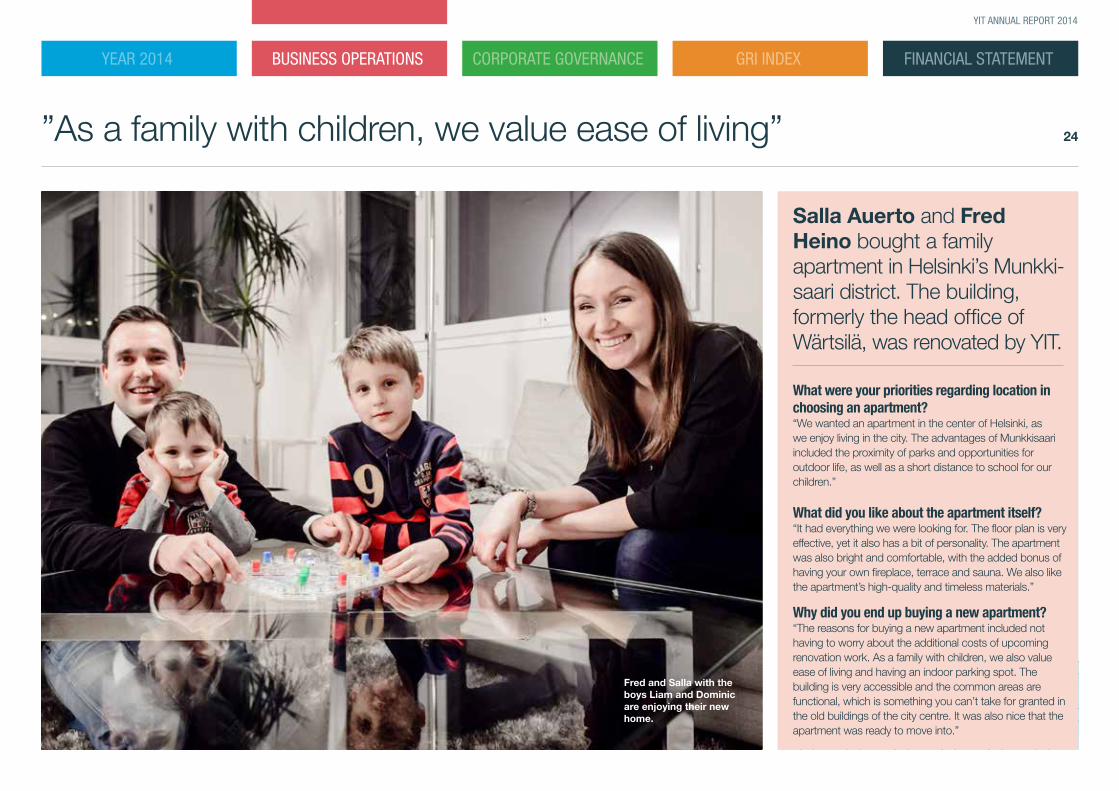
Salla Auerto and Fred Heino bought a family apartment in Helsinki’s Munkki-saari district. The building, formerly the head office of Wärtsilä, was renovated by YIT. What were your priorities regarding location in choosing an apartment?“We wanted an apartment in the center of Helsinki, as we enjoy living in the city. The advantages of Munkkisaari included the proximity of parks and opportunities for outdoor life, as well as a short distance to school for our children.”
What did you like about the apartment itself?“It had everything we were looking for. The floor plan is very effective, yet it also has a bit of personality. The apartment was also bright and comfortable, with the added bonus of having your own fireplace, terrace and sauna. We also like the apartment’s high-quality and timeless materials.”
Why did you end up buying a new apartment?“The reasons for buying a new apartment included not having to worry about the additional costs of upcoming renovation work. As a family with children, we also value ease of living and having an indoor parking spot. The building is very accessible and the common areas are functional, which is something you can’t take for granted in the old buildings of the city centre. It was also nice that the apartment was ready to move into.”
Fred and Salla with the boys Liam and Dominic are enjoying their new home.
”As a family with children, we value ease of living”
FINANCIAL STATEMENTYEAR 2014 BUSINESS OPERATIONS CORPORATE GOVERNANCE GRI INDEX
25
YIT ANNUAL REPORT 2014
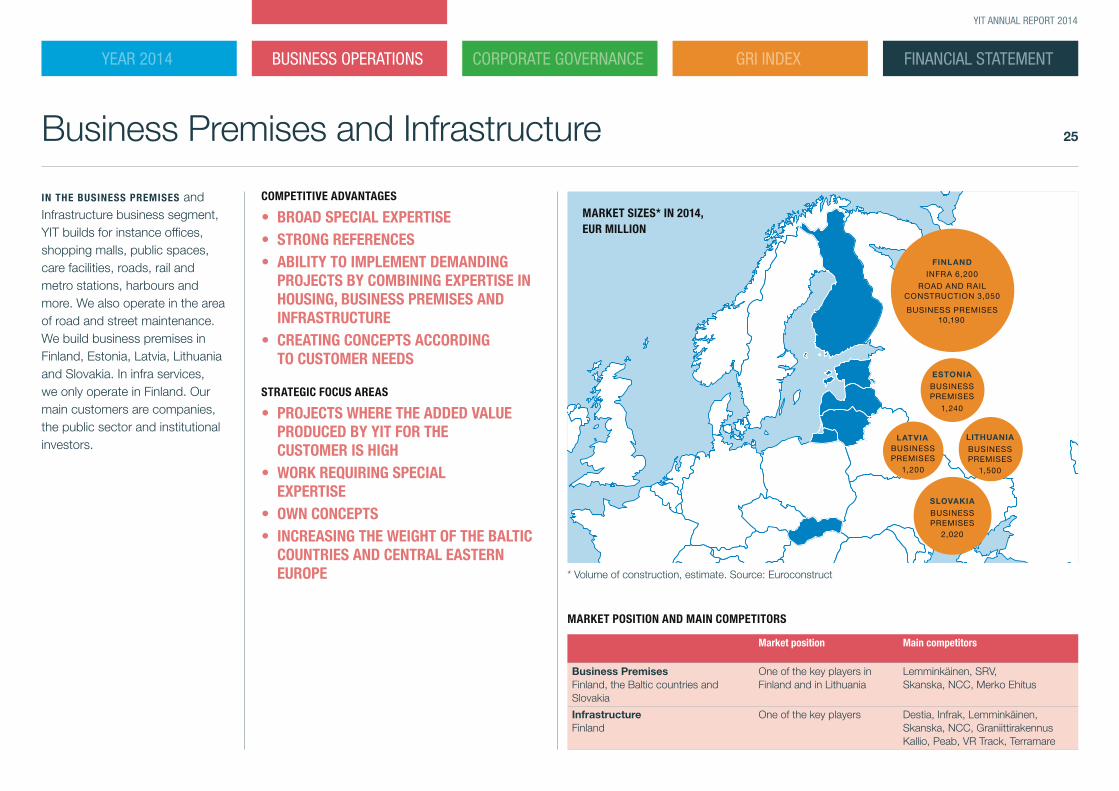
Business Premises and Infrastructure
IN THE BUSINESS PREMISES and Infrastructure business segment, YIT builds for instance offices, shopping malls, public spaces, care facilities, roads, rail and metro stations, harbours and more. We also operate in the area of road and street maintenance. We build business premises in Finland, Estonia, Latvia, Lithuania and Slovakia. In infra services, we only operate in Finland. Our main customers are companies, the public sector and institutional investors.
MARKET POSITION AND MAIN COMPETITORS
Market position Main competitors
Business PremisesFinland, the Baltic countries and Slovakia
One of the key players in Finland and in Lithuania
Lemminkäinen, SRV, Skanska, NCC, Merko Ehitus
InfrastructureFinland
One of the key players Destia, Infrak, Lemminkäinen, Skanska, NCC, Graniittirakennus Kallio, Peab, VR Track, Terramare
COMPETITIVE ADVANTAGES
• BROAD SPECIAL EXPERTISE• STRONG REFERENCES• ABILITY TO IMPLEMENT DEMANDING
PROJECTS BY COMBINING EXPERTISE IN HOUSING, BUSINESS PREMISES AND INFRASTRUCTURE
• CREATING CONCEPTS ACCORDING TO CUSTOMER NEEDS
STRATEGIC FOCUS AREAS
• PROJECTS WHERE THE ADDED VALUE PRODUCED BY YIT FOR THE CUSTOMER IS HIGH
• WORK REQUIRING SPECIAL EXPERTISE
• OWN CONCEPTS• INCREASING THE WEIGHT OF THE BALTIC
COUNTRIES AND CENTRAL EASTERN EUROPE
MARKET SIZES* IN 2014, EUR MILLION
FINLAND
INFRA 6,200
ROAD AND RAIL CONSTRUCTION 3,050
BUSINESS PREMISES 10,190
LATVIABUSINESS PREMISES
1,200
SLOVAKIA
BUSINESS PREMISES
2,020
LITHUANIA
BUSINESS PREMISES
1,500
ESTONIA
BUSINESS PREMISES
1,240
* Volume of construction, estimate. Source: Euroconstruct

FINANCIAL STATEMENTYEAR 2014 BUSINESS OPERATIONS CORPORATE GOVERNANCE GRI INDEX
26
YIT ANNUAL REPORT 2014
Trends in business premises and infrastructure construction
AGEING POPULATION
Share of people over 65 years of age of the total population
in Finland, for example 1980: 12%
2030E: 26%
Growing need for care services
Need for more flexible premises
Increasingly strict energy efficiency requirements
CHANGING NEEDS FOR BUSINESS PREMISES
People living in cities, in Finland for example
1980: 3.0 million 2014E: 3.9 million
The condensing of urban structure creates a need for new infrastructure
and hybrid construction.
Apartments, retail space and other services are combined in a single
project.
DEVELOPMENT OF THE URBAN ENVIRONMENT
Share of renewable energy in Finland, for example
2020E: 38%
The importance of the security of supply is growing
DEVELOPMENT OF THE ENERGY SECTOR
Buildings and the road network are in need of repair
Opportunities also in change of purpose
SUBSTANTIAL MAINTENANCE
BACKLOG IN FINLAND
LOW STOCK OF BUSINESS PREMISES IN THE CEE
COUNTRIES
Business premises stock per capita, sq.m
0
1
2
3
4
5
6
7
8
PRAGUEBRATISLAVAVILNIUSRIGATALLINNHELSINKI
OFFICE RETAIL
FINANCIAL STATEMENTYEAR 2014 BUSINESS OPERATIONS CORPORATE GOVERNANCE GRI INDEX
27
YIT ANNUAL REPORT 2014
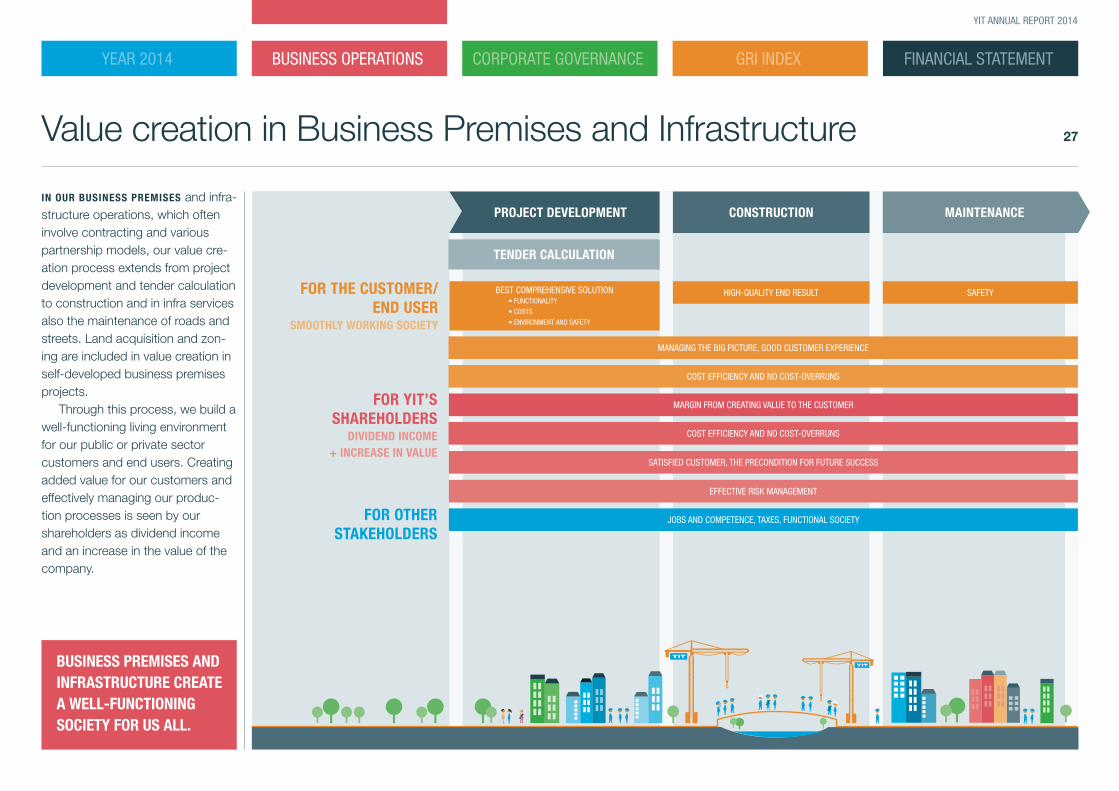
Value creation in Business Premises and Infrastructure
IN OUR BUSINESS PREMISES and infra-structure operations, which often involve contracting and various partnership models, our value cre-ation process extends from project development and tender calculation to construction and in infra services also the maintenance of roads and streets. Land acquisition and zon-ing are included in value creation in self-developed business premises projects.
Through this process, we build a well-functioning living environment for our public or private sector customers and end users. Creating added value for our customers and effectively managing our produc-tion processes is seen by our shareholders as dividend income and an increase in the value of the company.
BUSINESS PREMISES AND INFRASTRUCTURE CREATE A WELL-FUNCTIONING SOCIETY FOR US ALL.
FOR OTHER STAKEHOLDERS
JOBS AND COMPETENCE, TAXES, FUNCTIONAL SOCIETY
CONSTRUCTION MAINTENANCE
TENDER CALCULATION
FOR YIT’S SHAREHOLDERS
DIVIDEND INCOME + INCREASE IN VALUE
COST EFFICIENCY AND NO COST-OVERRUNS
SATISFIED CUSTOMER, THE PRECONDITION FOR FUTURE SUCCESS
EFFECTIVE RISK MANAGEMENT
MARGIN FROM CREATING VALUE TO THE CUSTOMER
FOR THE CUSTOMER/ END USER
SMOOTHLY WORKING SOCIETY
MANAGING THE BIG PICTURE, GOOD CUSTOMER EXPERIENCE
COST EFFICIENCY AND NO COST-OVERRUNS
HIGH-QUALITY END RESULT SAFETYBEST COMPREHENSIVE SOLUTION• FUNCTIONALITY
• COSTS
• ENVIRONMENT AND SAFETY
PROJECT DEVELOPMENT

FINANCIAL STATEMENTYEAR 2014 BUSINESS OPERATIONS CORPORATE GOVERNANCE GRI INDEX
28
YIT ANNUAL REPORT 2014
Tapani Bastaman in a meeting concerning the alliance.
CHP power plant for TSE using the alliance model
The CHP power plant under construction for TSE is Finland’s first industrial construction project imple-mented using the alliance model.
THE ALLIANCE, NAMED POLTE, consists of YIT, Turun Seudun Energiantuotanto Oy (TSE), A-Insinöörit and Ax-LVI Consulting. The project’s development stage began in October 2014 and the construction of the power plant will start in spring 2015. Located in Naantali, the power plant will be completed in autumn 2017.
The project’s total value is approximately EUR 260 million, of which YIT’s share is over EUR 40 million. When the power plant is completed, the domestic acquisition of biofuel will create an estimated 250 new permanent jobs.
“We decided to implement the project with the alliance model based on co-operation between the parties. In the alliance model, the communication between the parties is effective and the costs and schedules are transparent and available for all. I believe that in this way we achieve maximal cost efficiency”, says Tapani Bastman, CEO of Turun Seudun Ener-giantuotanto Oy.
“I value the expertise of YIT and its partners in both design and construction. This group exudes alliance competence and a spirit of co-operation. We have the best possible team, which enables innovative solutions during the development and implementation stages and achieves the best result after the completion of the project.”
FINANCIAL STATEMENTYEAR 2014 BUSINESS OPERATIONS CORPORATE GOVERNANCE GRI INDEX
29
YIT ANNUAL REPORT 2014
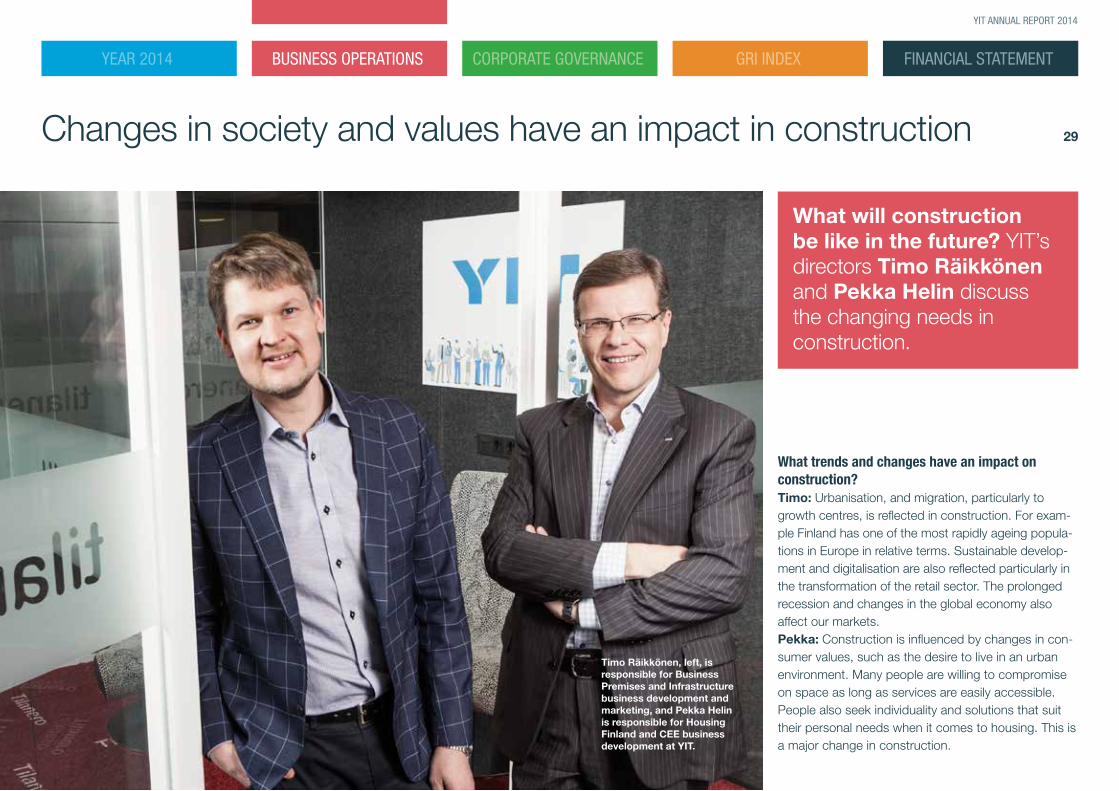
Changes in society and values have an impact in construction
What will construction be like in the future? YIT’s directors Timo Räikkönen and Pekka Helin discuss the changing needs in construction.
What trends and changes have an impact on construction?Timo: Urbanisation, and migration, particularly to growth centres, is reflected in construction. For exam-ple Finland has one of the most rapidly ageing popula-tions in Europe in relative terms. Sustainable develop-ment and digitalisation are also reflected particularly in the transformation of the retail sector. The prolonged recession and changes in the global economy also affect our markets.Pekka: Construction is influenced by changes in con-sumer values, such as the desire to live in an urban environment. Many people are willing to compromise on space as long as services are easily accessible. People also seek individuality and solutions that suit their personal needs when it comes to housing. This is a major change in construction.
Timo Räikkönen, left, is responsible for Business Premises and Infrastructure business development and marketing, and Pekka Helin is responsible for Housing Finland and CEE business development at YIT.
FINANCIAL STATEMENTYEAR 2014 BUSINESS OPERATIONS CORPORATE GOVERNANCE GRI INDEX
30
YIT ANNUAL REPORT 2014
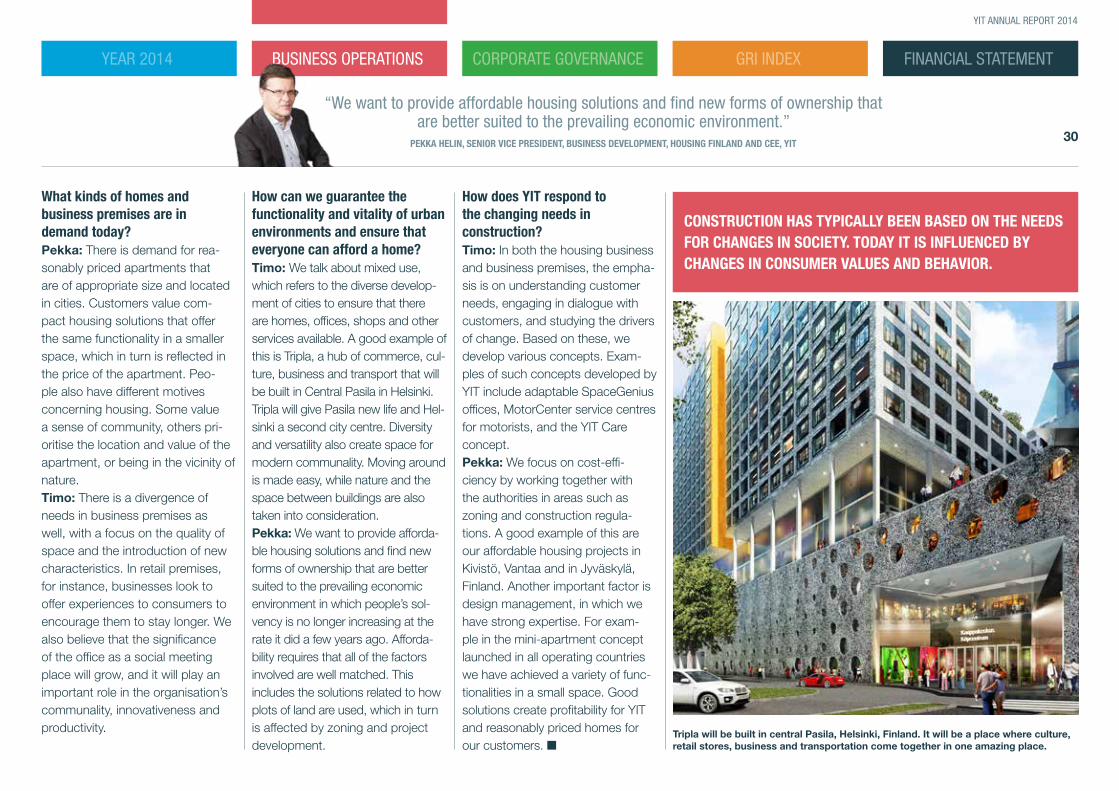
What kinds of homes and business premises are in demand today?Pekka: There is demand for rea-sonably priced apartments that are of appropriate size and located in cities. Customers value com-pact housing solutions that offer the same functionality in a smaller space, which in turn is reflected in the price of the apartment. Peo-ple also have different motives concerning housing. Some value a sense of community, others pri-oritise the location and value of the apartment, or being in the vicinity of nature. Timo: There is a divergence of needs in business premises as well, with a focus on the quality of space and the introduction of new characteristics. In retail premises, for instance, businesses look to offer experiences to consumers to encourage them to stay longer. We also believe that the significance of the office as a social meeting place will grow, and it will play an important role in the organisation’s communality, innovativeness and productivity.
CONSTRUCTION HAS TYPICALLY BEEN BASED ON THE NEEDS FOR CHANGES IN SOCIETY. TODAY IT IS INFLUENCED BY CHANGES IN CONSUMER VALUES AND BEHAVIOR.
How does YIT respond to the changing needs in construction?Timo: In both the housing business and business premises, the empha-sis is on understanding customer needs, engaging in dialogue with customers, and studying the drivers of change. Based on these, we develop various concepts. Exam-ples of such concepts developed by YIT include adaptable Space Genius offices, MotorCenter service centres for motorists, and the YIT Care concept. Pekka: We focus on cost-effi-ciency by working together with the authorities in areas such as zoning and construction regula-tions. A good example of this are our affordable housing projects in Kivistö, Vantaa and in Jyväskylä, Finland. Another important factor is design management, in which we have strong expertise. For exam-ple in the mini-apartment concept launched in all operating countries we have achieved a variety of func-tionalities in a small space. Good solutions create profitability for YIT and reasonably priced homes for our customers. ■
“We want to provide affordable housing solutions and find new forms of ownership that are better suited to the prevailing economic environment.”
PEKKA HELIN, SENIOR VICE PRESIDENT, BUSINESS DEVELOPMENT, HOUSING FINLAND AND CEE, YIT
How can we guarantee the functionality and vitality of urban environments and ensure that everyone can afford a home?Timo: We talk about mixed use, which refers to the diverse develop-ment of cities to ensure that there are homes, offices, shops and other services available. A good example of this is Tripla, a hub of commerce, cul-ture, business and transport that will be built in Central Pasila in Helsinki. Tripla will give Pasila new life and Hel-sinki a second city centre. Diversity and versatility also create space for modern communality. Moving around is made easy, while nature and the space between buildings are also taken into consideration. Pekka: We want to provide afforda-ble housing solutions and find new forms of ownership that are better suited to the prevailing economic environment in which people’s sol-vency is no longer increasing at the rate it did a few years ago. Afforda-bility requires that all of the factors involved are well matched. This includes the solutions related to how plots of land are used, which in turn is affected by zoning and project development.
Tripla will be built in central Pasila, Helsinki, Finland. It will be a place where culture, retail stores, business and transportation come together in one amazing place.

FINANCIAL STATEMENTYEAR 2014 BUSINESS OPERATIONS CORPORATE GOVERNANCE GRI INDEX
31
YIT ANNUAL REPORT 2014
Soile and Olavi Grönman found a home in an apartment building that was completed in early 2014 in central Tikkurila.
“LOCATION WAS THE FIRST PRIORITY. Here we have all the services we need.”
The nearest services are on the street level of the building itself, including a hair salon, a women’s clothing store and a café. The couple is looking forward to the May Day opening of the local market square, which they can see right from their balcony. The comfortable 22-square-metre glazed balcony has a stationary bicycle they can ride while enjoying views of daily life in Tikkurila. After exercise they can relax in their own sauna.
The building is less than a hundred metres from Tikkurila station. Helsinki is only 14 minutes away by train, which makes it easier to visit for example the theatres. Once the Ring Rail Line is opened next summer, Tikkurila will have even more convenient connections to the airport.
The Grönmans wanted a new apartment where they need not worry about upcoming renovation work. They also needed a building with a lift, something their previous building did not have. They were particularly pleased that the apartment has two bathrooms, which was a key factor in their decision. They also value having two balconies facing two different directions.
“We lived at this same spot at the turn of the 1970s–80s. For us, this move meant coming back home. We have many dear memories from this place.”
The Grönmans found a home in central Tikkurila
Olavi and Soile Grönman have now room for all their books in their new home.
FINANCIAL STATEMENTYEAR 2014 BUSINESS OPERATIONS CORPORATE GOVERNANCE GRI INDEX
32
YIT ANNUAL REPORT 2014
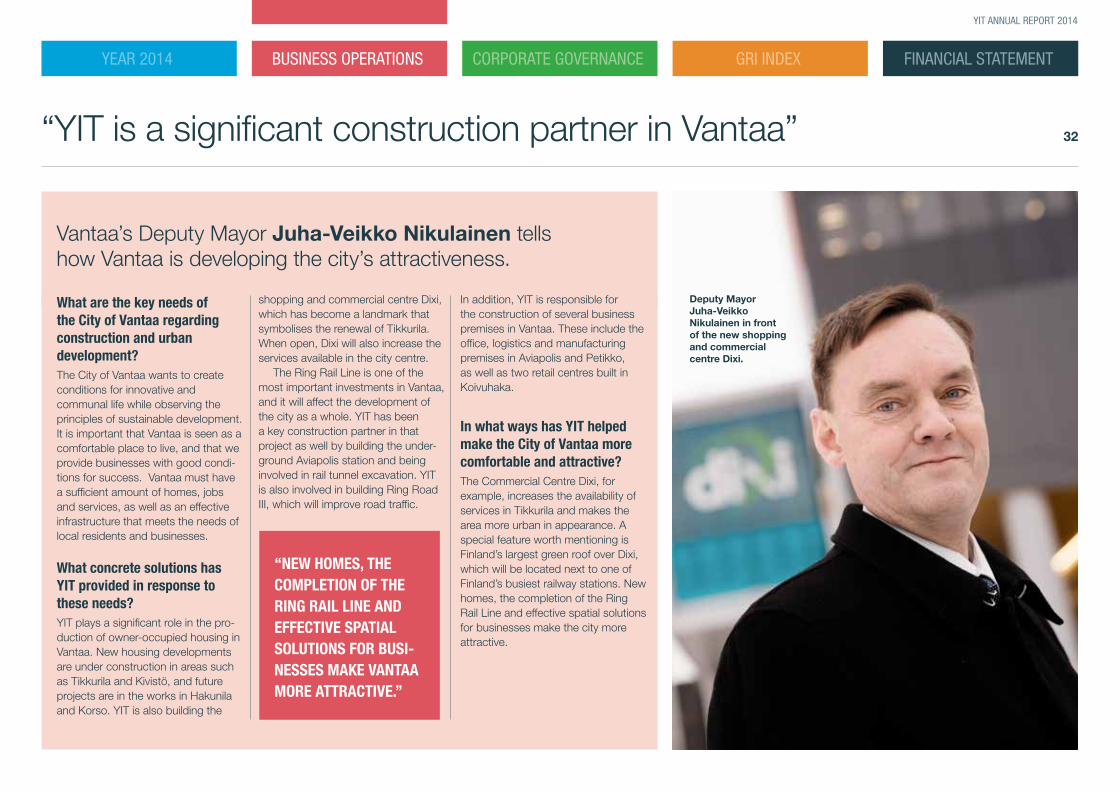
Vantaa’s Deputy Mayor Juha-Veikko Nikulainen tells how Vantaa is developing the city’s attractiveness.
Deputy Mayor Juha-Veikko Nikulainen in front of the new shopping and commercial centre Dixi.
What are the key needs of the City of Vantaa regarding construction and urban development?The City of Vantaa wants to create conditions for innovative and communal life while observing the principles of sustainable development. It is important that Vantaa is seen as a comfortable place to live, and that we provide businesses with good condi-tions for success. Vantaa must have a sufficient amount of homes, jobs and services, as well as an effective infrastructure that meets the needs of local residents and businesses.
What concrete solutions has YIT provided in response to these needs? YIT plays a significant role in the pro-duction of owner-occupied housing in Vantaa. New housing developments are under construction in areas such as Tikkurila and Kivistö, and future projects are in the works in Hakunila and Korso. YIT is also building the
shopping and commercial centre Dixi, which has become a landmark that symbolises the renewal of Tikkurila. When open, Dixi will also increase the services available in the city centre.
The Ring Rail Line is one of the most important investments in Vantaa, and it will affect the development of the city as a whole. YIT has been a key construction partner in that project as well by building the under-ground Aviapolis station and being involved in rail tunnel excavation. YIT is also involved in building Ring Road III, which will improve road traffic.
In addition, YIT is responsible for the construction of several business premises in Vantaa. These include the office, logistics and manufacturing premises in Aviapolis and Petikko, as well as two retail centres built in Koivuhaka.
In what ways has YIT helped make the City of Vantaa more comfortable and attractive?The Commercial Centre Dixi, for example, increases the availability of services in Tikkurila and makes the area more urban in appearance. A special feature worth mentioning is Finland’s largest green roof over Dixi, which will be located next to one of Finland’s busiest railway stations. New homes, the completion of the Ring Rail Line and effective spatial solutions for businesses make the city more attractive.
“YIT is a significant construction partner in Vantaa”
“NEW HOMES, THE COMPLETION OF THE RING RAIL LINE AND EFFECTIVE SPATIAL SOLUTIONS FOR BUSI-NESSES MAKE VANTAA MORE ATTRACTIVE.”

FINANCIAL STATEMENTYEAR 2014 BUSINESS OPERATIONS CORPORATE GOVERNANCE GRI INDEX
33
YIT ANNUAL REPORT 2014
Sustainable urban environments make daily life convenient
Urban lifestyles are deve-loping and people want their urban environment to be of increasingly high quality while also being interesting and offering surprises.
Konepaja area in Helsinki, Finland is an inspiring combination of urban city life, new architecture and old industrial history.
TRADITIONALLY, one of the key starting points of urban planning has been to locate various functions — such as industry, retail, services, housing and hobbies — apart from each another. It has meant that people need to have their own car to get through daily life.
As the economy has developed and the nature of work has become more competence-based, there is no longer a need to keep various functions apart. We are coming back to the original idea of a city: a place where everything is near.
Competence-based functions are located close to each other and centralised in cities, at the same time creating new and more spe-cialised services around them. Urban
FINANCIAL STATEMENTYEAR 2014 BUSINESS OPERATIONS CORPORATE GOVERNANCE GRI INDEX
34
YIT ANNUAL REPORT 2014
lifestyles are developing and people want their urban environment to be of increasingly high quality while also offering surprises.
To mitigate climate change, we must find new solutions for transportation, energy production and energy distribution, as well as housing, and in general living a more low-carbon life. In the big picture, environmental problems are solved in cities.
For these reasons, sustainable urban environments are crucial in urban development.
Housing to suit an urban lifestyleA sustainable urban environment can mean many things. Ecologi-cal sustainability means accessible public transport, the use of renewa-ble energy sources, effective waste management, energy-efficient build-ings and increasingly straightforward ways to monitor and influence your own energy consumption.
The proximity of services, the human scale, living streets, safety and local identity are elements
of social sustainability. Digital services associated with the sharing economy support peer production and the building of social relationships, while also making the range of services available more diverse in an environmentally friendly manner. Environmental art creates attachment between people and their residential area, provides
aesthetic experiences and inspires people to look after their local environment. In Russia, area devel-opment also involves the building of social infrastructure, such
as day-care centres and schools, in each area.
From the economic perspective, sustainability means making the area more attractive in the long term, while preserving and increasing property values. Cost-efficient and systematic maintenance contributes to the development of property values. Good examples of increasing the value of an area include the Konepaja district in Helsinki and the Rifei area development project in Yekaterinburg, Russia.
“The key aspects of housing solutions for the elderly are to take their own resources into consideration and support the kind of everyday life that suits them.”
SANNA MÄKINEN, EXECUTIVE MANAGER OF LAHTI PENSIONER HOUSING FUND
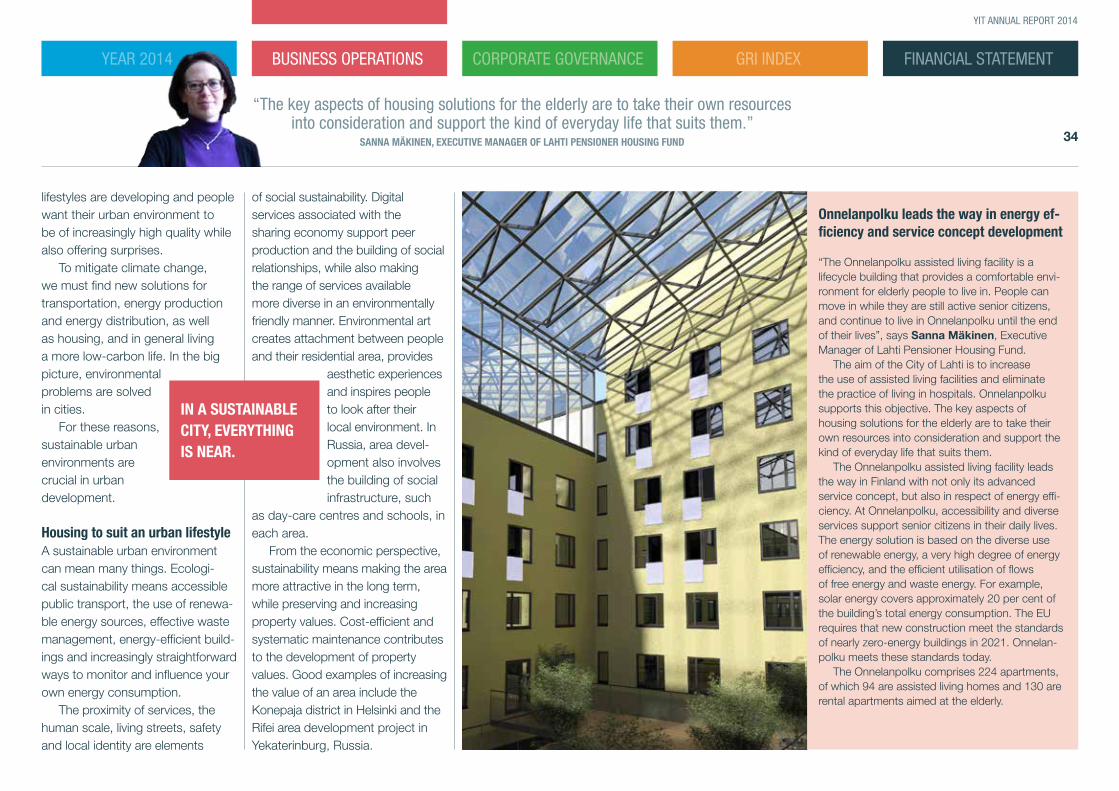
Onnelanpolku leads the way in energy ef-ficiency and service concept development
“The Onnelanpolku assisted living facility is a lifecycle building that provides a comfortable envi-ronment for elderly people to live in. People can move in while they are still active senior citizens, and continue to live in Onnelanpolku until the end of their lives”, says Sanna Mäkinen, Executive Manager of Lahti Pensioner Housing Fund.
The aim of the City of Lahti is to increase the use of assisted living facilities and eliminate the practice of living in hospitals. Onnelanpolku supports this objective. The key aspects of housing solutions for the elderly are to take their own resources into consideration and support the kind of everyday life that suits them.
The Onnelanpolku assisted living facility leads the way in Finland with not only its advanced service concept, but also in respect of energy effi-ciency. At Onnelanpolku, accessibility and diverse services support senior citizens in their daily lives. The energy solution is based on the diverse use of renewable energy, a very high degree of energy efficiency, and the efficient utilisation of flows of free energy and waste energy. For example, solar energy covers approximately 20 per cent of the building’s total energy consumption. The EU requires that new construction meet the standards of nearly zero-energy buildings in 2021. Onnelan-polku meets these standards today.
The Onnelanpolku comprises 224 apartments, of which 94 are assisted living homes and 130 are rental apartments aimed at the elderly.
IN A SUSTAINABLE CITY, EVERYTHING IS NEAR.
FINANCIAL STATEMENTYEAR 2014 BUSINESS OPERATIONS CORPORATE GOVERNANCE GRI INDEX
35
YIT ANNUAL REPORT 2014
“Low-threshold art creates an identity, a sense of community and economic sustainability.”
TUULA ISOHANNI, DOCTOR OF ARTS
In Joensuu, there is an ambitious residential development project underway in Penttilänranta. The old sawmill district will have a new identity as an art district.
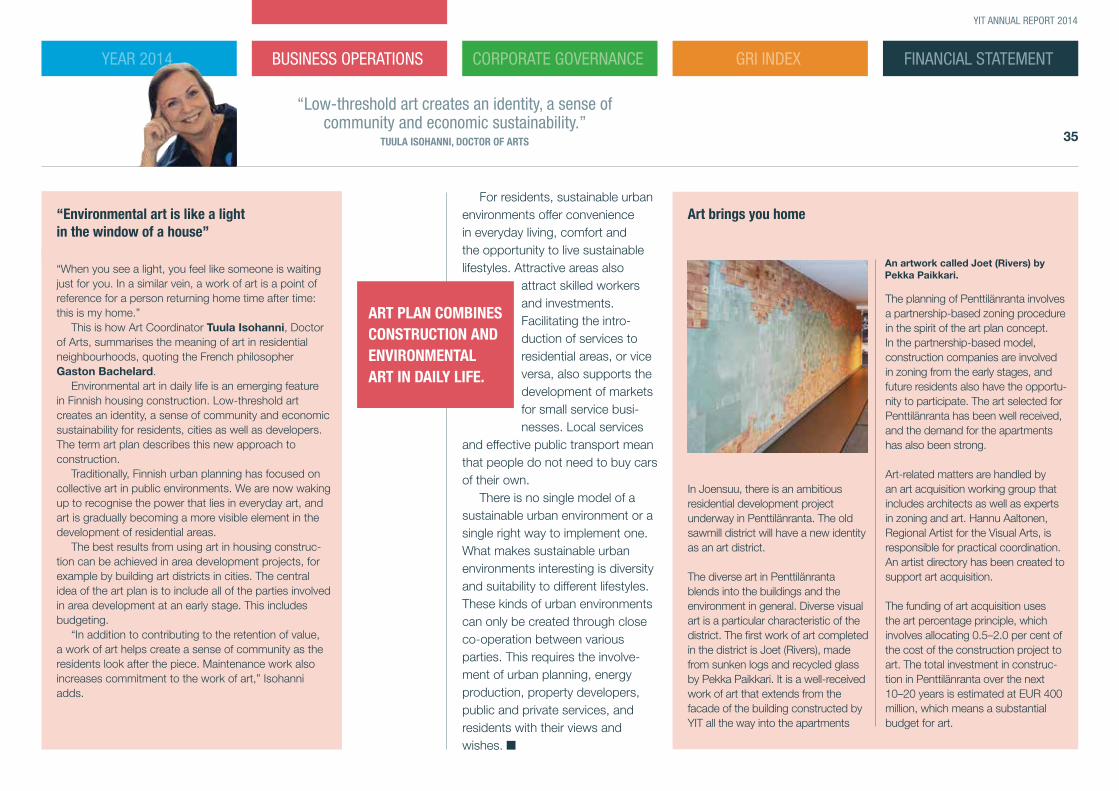
The diverse art in Penttilänranta blends into the buildings and the environment in general. Diverse visual art is a particular characteristic of the district. The first work of art completed in the district is Joet (Rivers), made from sunken logs and recycled glass by Pekka Paikkari. It is a well-received work of art that extends from the facade of the building constructed by YIT all the way into the apartments
The planning of Penttilänranta involves a partnership-based zoning procedure in the spirit of the art plan concept. In the partnership-based model, construction companies are involved in zoning from the early stages, and future residents also have the opportu-nity to participate. The art selected for Penttilänranta has been well received, and the demand for the apartments has also been strong.
Art-related matters are handled by an art acquisition working group that includes architects as well as experts in zoning and art. Hannu Aaltonen, Regional Artist for the Visual Arts, is responsible for practical coordination. An artist directory has been created to support art acquisition.
The funding of art acquisition uses the art percentage principle, which involves allocating 0.5–2.0 per cent of the cost of the construction project to art. The total investment in construc-tion in Penttilänranta over the next 10–20 years is estimated at EUR 400 million, which means a substantial budget for art.
For residents, sustainable urban environments offer convenience in everyday living, comfort and the opportunity to live sustainable lifestyles. Attractive areas also
attract skilled workers and investments. Facilitating the intro-duction of services to residential areas, or vice versa, also supports the development of markets for small service busi-nesses. Local services
and effective public transport mean that people do not need to buy cars of their own.
There is no single model of a sustainable urban environment or a single right way to implement one. What makes sustainable urban environments interesting is diversity and suitability to different lifestyles. These kinds of urban environments can only be created through close co-operation between various parties. This requires the involve-ment of urban planning, energy production, property developers, public and private services, and residents with their views and wishes. ■
“When you see a light, you feel like someone is waiting just for you. In a similar vein, a work of art is a point of reference for a person returning home time after time: this is my home.”
This is how Art Coordinator Tuula Isohanni, Doctor of Arts, summarises the meaning of art in residential neighbourhoods, quoting the French philosopher Gaston Bachelard.
Environmental art in daily life is an emerging feature in Finnish housing construction. Low-threshold art creates an identity, a sense of community and economic sustainability for residents, cities as well as developers. The term art plan describes this new approach to construction.
Traditionally, Finnish urban planning has focused on collective art in public environments. We are now waking up to recognise the power that lies in everyday art, and art is gradually becoming a more visible element in the development of residential areas.
The best results from using art in housing construc-tion can be achieved in area development projects, for example by building art districts in cities. The central idea of the art plan is to include all of the parties involved in area development at an early stage. This includes budgeting.
“In addition to contributing to the retention of value, a work of art helps create a sense of community as the residents look after the piece. Maintenance work also increases commitment to the work of art,” Isohanni adds.
“Environmental art is like a light in the window of a house”
Art brings you home
An artwork called Joet (Rivers) by Pekka Paikkari.
ART PLAN COMBINES CONSTRUCTION AND ENVIRONMENTAL ART IN DAILY LIFE.
FINANCIAL STATEMENTYEAR 2014 BUSINESS OPERATIONS CORPORATE GOVERNANCE GRI INDEX
36
YIT ANNUAL REPORT 2014
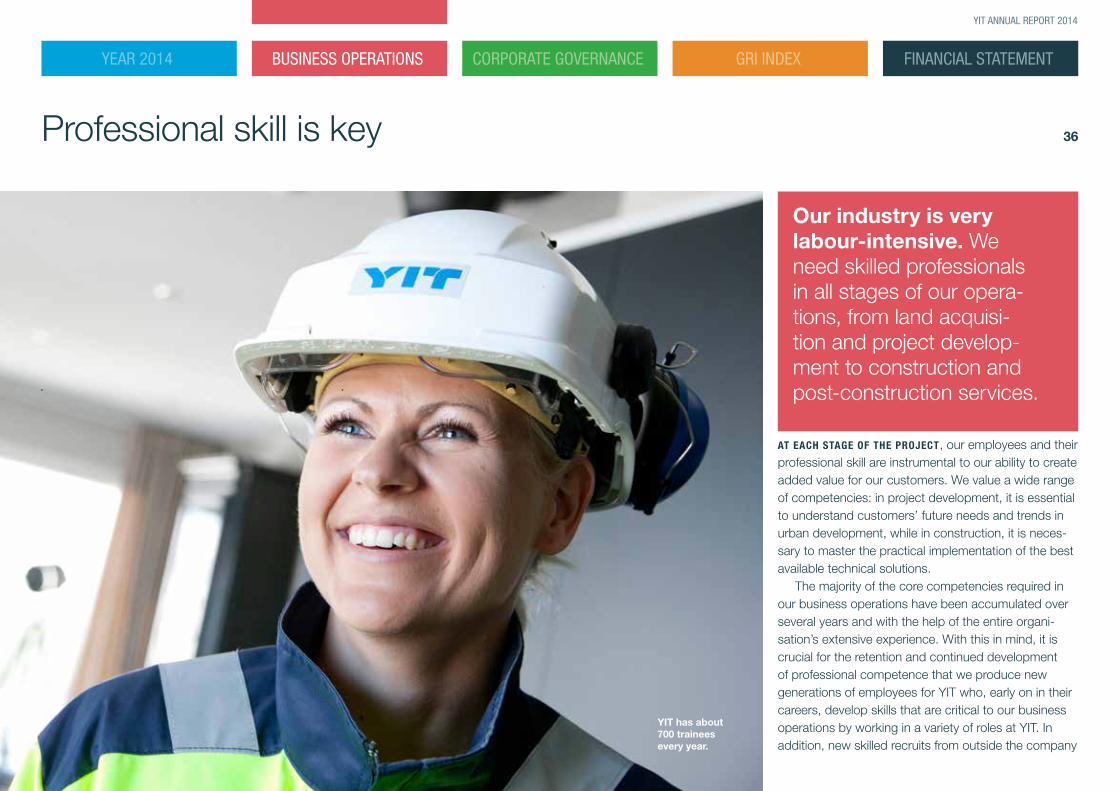
Professional skill is key
Our industry is very labour-intensive. We need skilled professionals in all stages of our opera-tions, from land acquisi-tion and project develop-ment to construction and post-construction services.
AT EACH STAGE OF THE PROJECT, our employees and their professional skill are instrumental to our ability to create added value for our customers. We value a wide range of competencies: in project development, it is essential to understand customers’ future needs and trends in urban development, while in construction, it is neces-sary to master the practical implementation of the best available technical solutions.
The majority of the core competencies required in our business operations have been accumulated over several years and with the help of the entire organi-sation’s extensive experience. With this in mind, it is crucial for the retention and continued development of professional competence that we produce new generations of employees for YIT who, early on in their careers, develop skills that are critical to our business operations by working in a variety of roles at YIT. In addition, new skilled recruits from outside the company
YIT has about 700 trainees every year.

FINANCIAL STATEMENTYEAR 2014 BUSINESS OPERATIONS CORPORATE GOVERNANCE GRI INDEX
37
YIT ANNUAL REPORT 2014
Quality Manager Jere Ritari:“Good quality is created through co-operation”
In spring 2010, Jere Ritari, who at the time was studying to become a Master Builder, joined YIT as a super-visor trainee. His first assignment was the renovation of the bathrooms in an old school building in Turku that was protected by the National Board of Antiquities. Not one to fear hard work and challenges, Jere did an exemplary job of managing the site and also worked on smaller projects on the side.
His studies continued in the autumn, but Jere found time to also work at YIT as a supervisor in annual repair projects in the Turku region. Jere graduated as a Master Builder in spring 2011, six months ahead of schedule, and stayed on at YIT. In autumn 2012, he applied for the position of Quality Inspector in YIT’s Building Construction division and was accepted. Less than a year later, he was promoted to Quality Manager.
In his new position, Jere focused on flawless handovers and began to create tools and measurements for the final inspection of apartments.
“As construction professionals, it is our job to notice defects. The product must be flawless right from the first inspection by the resident.
The apartment must meet the customer’s expectations,” Jere says.
Quality inspection operations are now performed at YIT for the second year as an internal inspection that covers all YIT apartments in the latter stages of the project. This ensures the consistent quality of apartments throughout Finland.
In spring 2015, YIT will implement quality management indicators during construction, which are based on quality indicators developed by Aalto University. Pilot projects are already underway in Prague and Bratislava.
“Quality is a broad concept and there is no single solution that covers all of it. When it comes to construction quality, our best chance of influencing things is before work begins.”
Jere’s favourite aspects of his job are a straightforward framework and clear targets. He enjoys having the freedom to create new things. He also likes the fact that he is trusted and given responsibility.
“I like being able to question things and develop them further. It is rewarding to see other people’s attitudes and ideas change. The development of openness and co-operation is important to me.”
are brought in to challenge and question established operating practices and introduce new perspectives and critical thinking.
We offer opportunities for deve-lopmentWe have engaged in very system-atic co-operation with educational institutions for decades, particularly in Finland, but increasingly in our other operating countries as well. For example, about 700 trainees participate yearly in our trainee pro-grammes. A significant number of them continue in our programme to the next phase and after graduation they will find employment at YIT. In addition, we hire new trainees every year. This allows us to take a long-term approach to retaining the best employees and top-class expertise in our organisation.
Our internal job rotation is very active, and we offer our employees new opportunities for development and learning within the organisation. In 2014, for instance, we filled nearly 70 open positions through internal job rotation. According to the results of our annual personnel survey, our employees are very
“It is crucial for YIT to produce new generations of employees who challenge established operating practices and introduce new perspectives and critical thinking.”
PII RAULO, SENIOR VICE PRESIDENT, HR, YIT
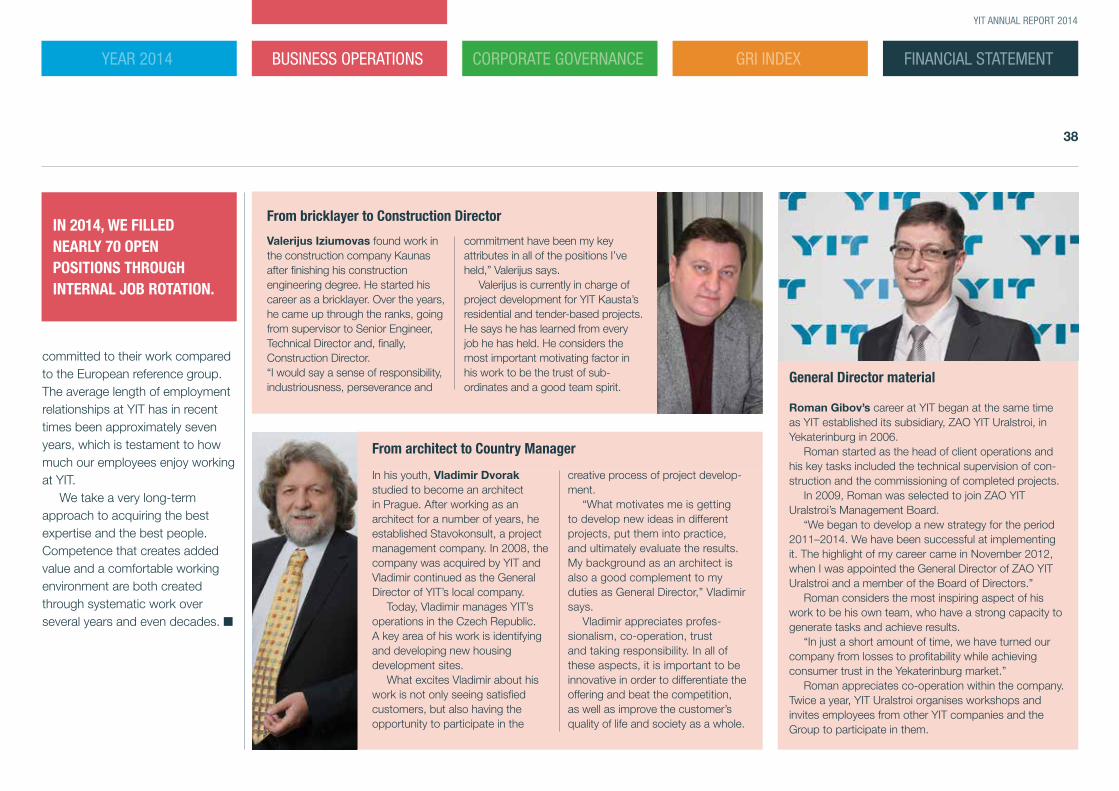
FINANCIAL STATEMENTYEAR 2014 BUSINESS OPERATIONS CORPORATE GOVERNANCE GRI INDEX
38
YIT ANNUAL REPORT 2014
committed to their work compared to the European reference group. The average length of employment relationships at YIT has in recent times been approximately seven years, which is testament to how much our employees enjoy working at YIT.
We take a very long-term approach to acquiring the best expertise and the best people. Competence that creates added value and a comfortable working environment are both created through systematic work over several years and even decades. ■
General Director material
Roman Gibov’s career at YIT began at the same time as YIT established its subsidiary, ZAO YIT Uralstroi, in Yekaterinburg in 2006.
Roman started as the head of client operations and his key tasks included the technical supervision of con-struction and the commissioning of completed projects.
In 2009, Roman was selected to join ZAO YIT Uralstroi’s Management Board.
“We began to develop a new strategy for the period 2011–2014. We have been successful at implementing it. The highlight of my career came in November 2012, when I was appointed the General Director of ZAO YIT Uralstroi and a member of the Board of Directors.”
Roman considers the most inspiring aspect of his work to be his own team, who have a strong capacity to generate tasks and achieve results.
“In just a short amount of time, we have turned our company from losses to profitability while achieving consumer trust in the Yekaterinburg market.”
Roman appreciates co-operation within the company. Twice a year, YIT Uralstroi organises workshops and invites employees from other YIT companies and the Group to participate in them.
From bricklayer to Construction Director
From architect to Country Manager
Valerijus Iziumovas found work in the construction company Kaunas after finishing his construction engineering degree. He started his career as a bricklayer. Over the years, he came up through the ranks, going from supervisor to Senior Engineer, Technical Director and, finally, Construction Director. “I would say a sense of responsibility, industriousness, perseverance and
commitment have been my key attributes in all of the positions I’ve held,” Valerijus says.
Valerijus is currently in charge of project development for YIT Kausta’s residential and tender-based projects. He says he has learned from every job he has held. He considers the most important motivating factor in his work to be the trust of sub-ordinates and a good team spirit.
In his youth, Vladimir Dvorak studied to become an architect in Prague. After working as an architect for a number of years, he established Stavokonsult, a project management company. In 2008, the company was acquired by YIT and Vladimir continued as the General Director of YIT’s local company.
Today, Vladimir manages YIT’s operations in the Czech Republic. A key area of his work is identifying and developing new housing development sites.
What excites Vladimir about his work is not only seeing satisfied customers, but also having the opportunity to participate in the
creative process of project develop-ment.
“What motivates me is getting to develop new ideas in different projects, put them into practice, and ultimately evaluate the results. My background as an architect is also a good complement to my duties as General Director,” Vladimir says.
Vladimir appreciates profes-sionalism, co-operation, trust and taking responsibility. In all of these aspects, it is important to be innovative in order to differentiate the offering and beat the competition, as well as improve the customer’s quality of life and society as a whole.
IN 2014, WE FILLED NEARLY 70 OPEN POSITIONS THROUGH INTERNAL JOB ROTATION.

FINANCIAL STATEMENTYEAR 2014 BUSINESS OPERATIONS CORPORATE GOVERNANCE GRI INDEX
39
YIT ANNUAL REPORT 2014
Corporate Governance
40 Corporate Governance
47 Risk management
49 Board of Directors
50 Management Board
FINANCIAL STATEMENTYEAR 2014 BUSINESS OPERATIONS CORPORATE GOVERNANCE GRI INDEX
40
YIT ANNUAL REPORT 2014
Governing bodiesYIT Corporation’s highest deci-sion-making body is the Annual General Meeting, which is com-posed of the company’s share-holders. Board of Directors and the
President and CEO are responsible for the management of the com-pany. Other management personnel assist and support the President and CEO in his tasks. The Board of Directors decides on the Group’s
governance system and ensures that the company complies with good corporate governance prin-ciples.
Annual General MeetingThe Annual General Meeting is the Group’s highest decision -making body, where the shareholders participate in the supervision and control of the company and exer-cise their rights to speak and vote. The Annual General Meeting is held each year by the end of March on a date determined by the Board of Directors. Extraordinary General Meetings can be held when the Board of Directors considers it necessary to do so or when required by legislation.
The Annual General Meeting takes decisions on matters falling within its competence by virtue of the Limited Liability Companies Act and the Articles of Association, such as:• approving the financial state-
ments• distribution of profits• discharging the members of the
Board of Directors and the CEO from liability
• the election of the Chairman, Vice Chairman and members of the Board and the remuneration paid to them
• the election of the auditors and the remuneration to be paid for the audit
• amendments to the Articles of Association
• decisions leading to changes in the share capital
• share repurchase and convey-ance of the company’s own shares
• decisions on share options and share-based remuneration
The Chairman of the Board of Directors, a sufficient number of members of the Board of Directors, the external auditor and President and CEO are all present at the meeting. Persons nominated for the first time to seats on the Board of Directors always participate in the General Meeting deciding on the election unless there are justified reasons for their absence.
The rights of shareholdersEvery YIT shareholder has the right to participate in a General Meet-
ing. Participation requires that the shareholder is registered in the shareholder register on the Gen-eral Meeting’s record date, which is eight working days prior to the meeting, and that the shareholder registers for the meeting not later than on the day mentioned in the notice of the meeting.
One share confers one vote at the General Meeting. Shareholders have the right to have matters falling within the competence of the general meeting by virtue of the Limited Liability Companies Act included on the agenda, provided they demand, in writing, the Board of Directors to do so early enough so that the item can be included in the notice of meeting.
The notice of meeting is published no later than three weeks before the meeting on our website. The notice contains the agenda, the names of the persons nominated to seats on the Board of Directors and the nominated auditor. The minutes of the General Meeting with voting results are available no later than two weeks after the General Meeting on our website.
Corporate Governance
YIT aims for open, transparent and respon-sible corporate governance. We are committed to good corporate governance through compliance with laws and regula-tions and implementing best practices. We comply with all of the recommendations of the Finnish Corporate Governance Code issued by the Securities Market Association.
Additional information on the Internet• Limited Liability Companies Act: www.finlex.fi/en• Rules of NASDAQ OMX Helsinki: www.nasdaqomx.com• Finnish Corporate Governance Code: www.cgfinland.fi/en/
Additional information on YIT’s website www.yitgroup.com/corporategovernance
Investor information pursuant to recommendation 55 of the Finnish Corporate Governance Code, including, among other things, the Corporate Governance Statement and the Remuneration Statement for 2014.• Articles of Association • YIT Business Principles
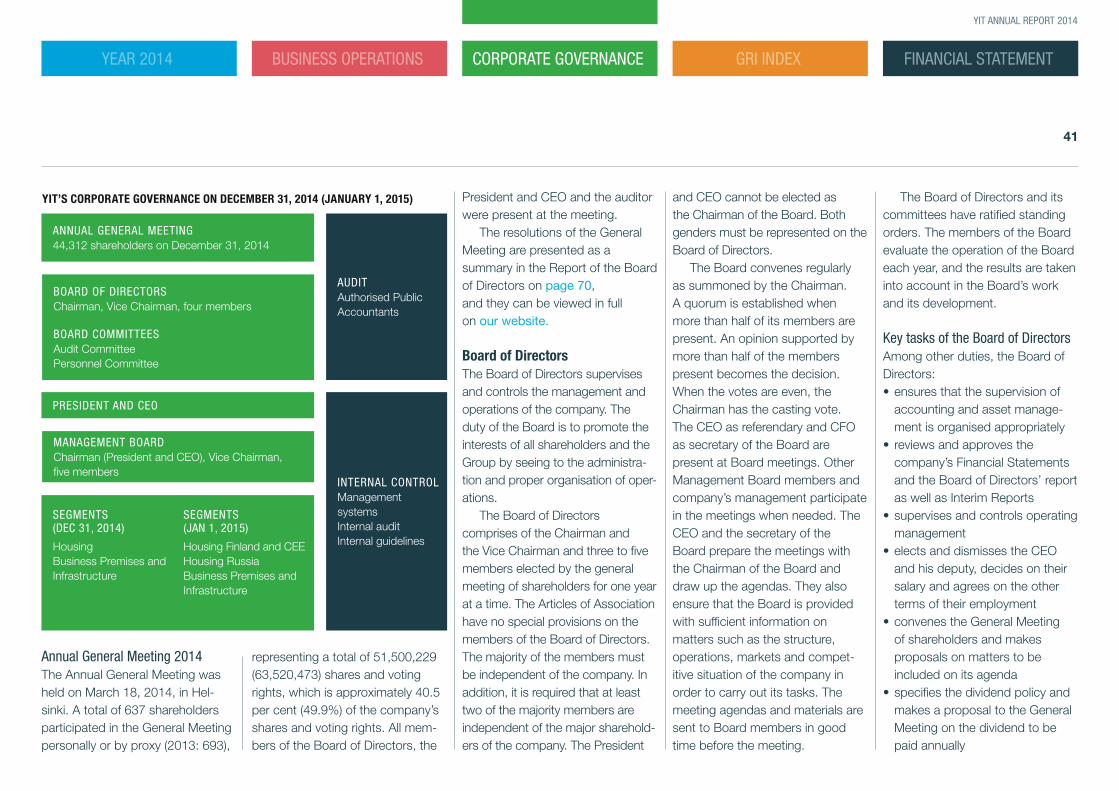
FINANCIAL STATEMENTYEAR 2014 BUSINESS OPERATIONS CORPORATE GOVERNANCE GRI INDEX
41
YIT ANNUAL REPORT 2014
Annual General Meeting 2014The Annual General Meeting was held on March 18, 2014, in Hel-sinki. A total of 637 shareholders participated in the General Meeting personally or by proxy (2013: 693),
INTERNAL CONTROLManagement systemsInternal auditInternal guidelines
AUDITAuthorised Public Accountants
ANNUAL GENERAL MEETING 44,312 shareholders on December 31, 2014
BOARD OF DIRECTORSChairman, Vice Chairman, four members
BOARD COMMITTEESAudit Committee Personnel Committee
MANAGEMENT BOARDChairman (President and CEO), Vice Chairman, five members
PRESIDENT AND CEO
SEGMENTS (DEC 31, 2014)
HousingBusiness Premises and Infrastructure
SEGMENTS (JAN 1, 2015)
Housing Finland and CEEHousing RussiaBusiness Premises and Infrastructure
representing a total of 51,500,229 (63,520,473) shares and voting rights, which is approximately 40.5 per cent (49.9%) of the company’s shares and voting rights. All mem-bers of the Board of Directors, the
President and CEO and the auditor were present at the meeting.
The resolutions of the General Meeting are presented as a summary in the Report of the Board of Directors on page 70, and they can be viewed in full on our website.
Board of DirectorsThe Board of Directors supervises and controls the management and operations of the company. The duty of the Board is to promote the interests of all shareholders and the Group by seeing to the administra-tion and proper organisation of oper-ations.
The Board of Directors comprises of the Chairman and the Vice Chairman and three to five members elected by the general meeting of shareholders for one year at a time. The Articles of Association have no special provisions on the members of the Board of Directors. The majority of the members must be independent of the company. In addition, it is required that at least two of the majority members are independent of the major sharehold-ers of the company. The President
and CEO cannot be elected as the Chairman of the Board. Both genders must be represented on the Board of Directors.
The Board convenes regularly as summoned by the Chairman. A quorum is established when more than half of its members are present. An opinion supported by more than half of the members present becomes the decision. When the votes are even, the Chairman has the casting vote. The CEO as referendary and CFO as secretary of the Board are present at Board meetings. Other Management Board members and company’s management participate in the meetings when needed. The CEO and the secretary of the Board prepare the meetings with the Chairman of the Board and draw up the agendas. They also ensure that the Board is provided with sufficient information on matters such as the structure, operations, markets and compet-itive situation of the company in order to carry out its tasks. The meeting agendas and materials are sent to Board members in good time before the meeting.
The Board of Directors and its committees have ratified standing orders. The members of the Board evaluate the operation of the Board each year, and the results are taken into account in the Board’s work and its development.
Key tasks of the Board of DirectorsAmong other duties, the Board of Directors:• ensures that the supervision of
accounting and asset manage-ment is organised appropriately
• reviews and approves the company’s Financial Statements and the Board of Directors’ report as well as Interim Reports
• supervises and controls operating management
• elects and dismisses the CEO and his deputy, decides on their salary and agrees on the other terms of their employment
• convenes the General Meeting of shareholders and makes proposals on matters to be included on its agenda
• specifies the dividend policy and makes a proposal to the General Meeting on the dividend to be paid annually
YIT’S CORPORATE GOVERNANCE ON DECEMBER 31, 2014 (JANUARY 1, 2015)
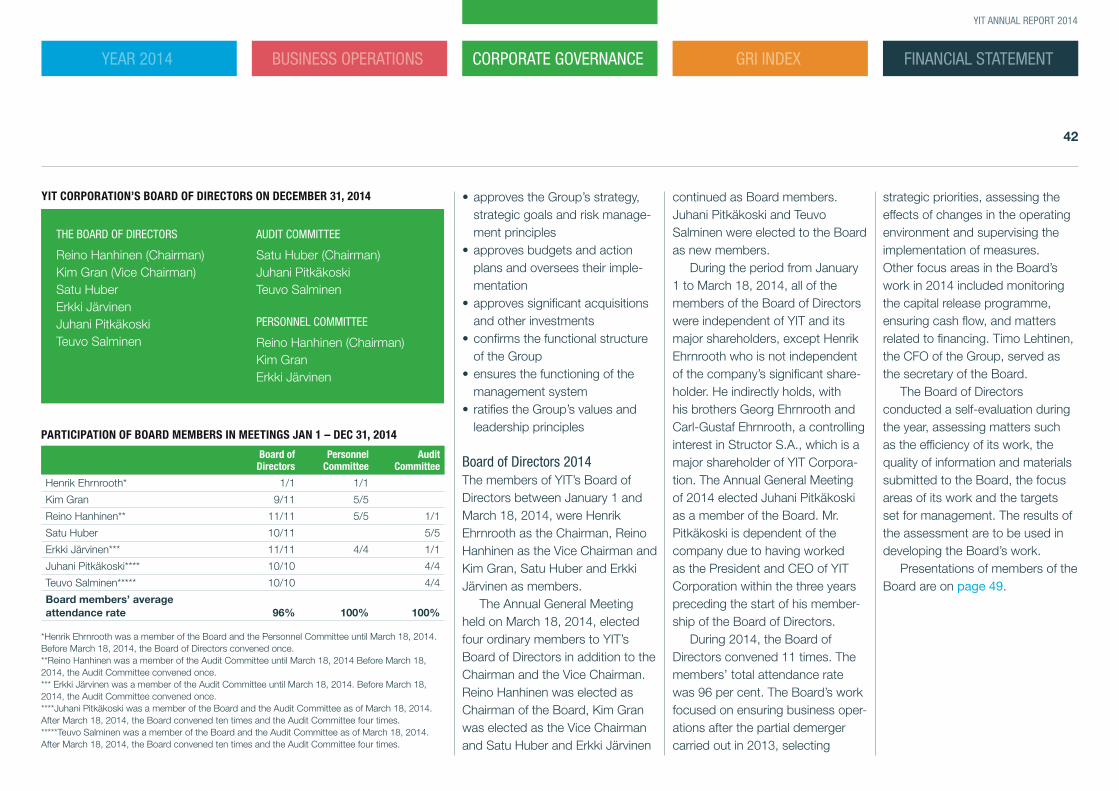
FINANCIAL STATEMENTYEAR 2014 BUSINESS OPERATIONS CORPORATE GOVERNANCE GRI INDEX
42
YIT ANNUAL REPORT 2014
• approves the Group’s strategy, strategic goals and risk manage-ment principles
• approves budgets and action plans and oversees their imple-mentation
• approves significant acquisitions and other investments
• confirms the functional structure of the Group
• ensures the functioning of the management system
• ratifies the Group’s values and leadership principles
Board of Directors 2014 The members of YIT’s Board of Directors between January 1 and March 18, 2014, were Henrik Ehrnrooth as the Chairman, Reino Hanhinen as the Vice Chairman and Kim Gran, Satu Huber and Erkki Järvinen as members.
The Annual General Meeting held on March 18, 2014, elected four ordinary members to YIT’s Board of Directors in addition to the Chairman and the Vice Chairman. Reino Hanhinen was elected as Chairman of the Board, Kim Gran was elected as the Vice Chairman and Satu Huber and Erkki Järvinen
continued as Board members. Juhani Pitkäkoski and Teuvo Salminen were elected to the Board as new members.
During the period from January 1 to March 18, 2014, all of the members of the Board of Directors were independent of YIT and its major shareholders, except Henrik Ehrnrooth who is not independent of the company’s significant share-holder. He indirectly holds, with his brothers Georg Ehrnrooth and Carl-Gustaf Ehrnrooth, a controlling interest in Structor S.A., which is a major shareholder of YIT Corpora-tion. The Annual General Meeting of 2014 elected Juhani Pitkäkoski as a member of the Board. Mr. Pitkäkoski is dependent of the company due to having worked as the President and CEO of YIT Corporation within the three years preceding the start of his member-ship of the Board of Directors.
During 2014, the Board of Directors convened 11 times. The members’ total attendance rate was 96 per cent. The Board’s work focused on ensuring business oper-ations after the partial demerger carried out in 2013, selecting
strategic priorities, assessing the effects of changes in the operating environment and supervising the implementation of measures. Other focus areas in the Board’s work in 2014 included monitoring the capital release programme, ensuring cash flow, and matters related to financing. Timo Lehtinen, the CFO of the Group, served as the secretary of the Board.
The Board of Directors conducted a self-evaluation during the year, assessing matters such as the efficiency of its work, the quality of information and materials submitted to the Board, the focus areas of its work and the targets set for management. The results of the assessment are to be used in developing the Board’s work.
Presentations of members of the Board are on page 49.
Board of
DirectorsPersonnel
CommitteeAudit
Committee
Henrik Ehrnrooth* 1/1 1/1
Kim Gran 9/11 5/5
Reino Hanhinen** 11/11 5/5 1/1
Satu Huber 10/11 5/5
Erkki Järvinen*** 11/11 4/4 1/1
Juhani Pitkäkoski**** 10/10 4/4
Teuvo Salminen***** 10/10 4/4
Board members’ average attendance rate 96% 100% 100%
*Henrik Ehrnrooth was a member of the Board and the Personnel Committee until March 18, 2014. Before March 18, 2014, the Board of Directors convened once.**Reino Hanhinen was a member of the Audit Committee until March 18, 2014 Before March 18, 2014, the Audit Committee convened once. *** Erkki Järvinen was a member of the Audit Committee until March 18, 2014. Before March 18, 2014, the Audit Committee convened once. ****Juhani Pitkäkoski was a member of the Board and the Audit Committee as of March 18, 2014. After March 18, 2014, the Board convened ten times and the Audit Committee four times.*****Teuvo Salminen was a member of the Board and the Audit Committee as of March 18, 2014. After March 18, 2014, the Board convened ten times and the Audit Committee four times.
PARTICIPATION OF BOARD MEMBERS IN MEETINGS JAN 1 – DEC 31, 2014
THE BOARD OF DIRECTORS
Reino Hanhinen (Chairman)Kim Gran (Vice Chairman)Satu HuberErkki JärvinenJuhani PitkäkoskiTeuvo Salminen
AUDIT COMMITTEE
Satu Huber (Chairman) Juhani Pitkäkoski Teuvo Salminen
PERSONNEL COMMITTEE
Reino Hanhinen (Chairman)Kim GranErkki Järvinen
YIT CORPORATION’S BOARD OF DIRECTORS ON DECEMBER 31, 2014

FINANCIAL STATEMENTYEAR 2014 BUSINESS OPERATIONS CORPORATE GOVERNANCE GRI INDEX
43
YIT ANNUAL REPORT 2014
Proposal on composition of Board of Directors in 2015The Board of Directors proposes on the recommendation of the Person-nel Committee that four members be elected to the Board in addi-tion to the Chairman and the Vice Chairman. The Board of Directors proposes on the recommendation of the Personnel Committee that Reino Hanhinen is elected as the Chairman of the Board, Kim Gran as Vice Chairman and Satu Huber, Erkki Järvinen, Juhani Pitkäkoski and Teuvo Salminen as members. All candidates have given their permission to be elected and are presented on the our website.
Committees for the Board of DirectorsThe Board of Directors has two committees: the Personnel Com-mittee and the Audit Committee.
The Board of Directors elects the members and Chairmen of the Committees of its members at its organisational meeting following the Annual General Meeting. All Committees have written standing orders ratified by the Board of Directors. The Committees report
to the Board of Directors on the matters dealt with by them and the required actions on a regular basis at the Board meeting following each Committee meeting.
Personnel CommitteeThe task of the Personnel Commit-tee is to assist the Board in matters related to appointing and rewarding key personnel. Among other things, the Personnel Committee prepares proposals for the development of the Group’s corporate culture and HR policy, remuneration and incen-tive schemes, the rules for perfor-mance-based bonuses, and the performance-based bonuses paid to the management. In addition, identifying talents, the development of key personnel and planning for management replacements fall under the preparation responsibility of the Committee.
The Committee has a minimum of three and a maximum of five members, who have knowledge of our business operations and business segments as well as HR and reward-related matters. We require that the members of the Committee are independent of
the company as stated in the Finnish Corporate Governance Code. The Committee convenes as necessary and as summoned by the Chairman. The Senior Vice President, Human Resources, serves as the Committee’s secretary.
Personnel Committee in 2014The members of the Personnel Committee between January 1 and March 18, 2014, were Henrik Ehrnrooth as the Chairman and Kim Gran and Reino Hanhinen as mem-bers. At its organisational meeting on March 18, 2014, the Board elected Reino Hanhinen as Chair-man and Kim Gran and Erkki Järvinen as members of the Per-sonnel Committee. Pii Raulo, Senior Vice President, Human Resources, served as the secretary of the Com-mittee.
The Committee convened a total of five times in 2014. The members’ total attendance rate was 100 per cent. The main tasks of the Personnel Committee in 2014 were to prepare rules for performance-based bonuses and the terms, structure and
key personnel categories of the long-term incentive scheme. The Personnel Committee also followed the implementation of the HR plan in accordance with strategy, monitored the remuneration levels of senior management and, in conjunction with organisational changes, presented appointments of key personnel for confirmation by the Board of Directors.
Audit CommitteeThe Audit Committee assists the Board of Directors in the supervi-sion of the Group’s reporting and accounting processes. Its tasks include overseeing the financial reporting process of the company, the effectiveness of internal control, internal audit and risk management systems, as well as monitoring and assessing the audit. The Committee participates in the preparation of the Group’s financing policy, financ-ing plan and financing arrange-ments. The Committee reviews the company’s Financial Statements and Interim Reports and monitors auditing. It evaluates compliance with laws and regulations and fol-lows the Group’s financial position.
The Audit Committee comprises three members independent of the company. In addition, it is required that at least one of the members is independent of major shareholders. Persons who have extensive knowledge of the Group’s business operations and business segments and sufficient knowledge of accounting and accounting principles are elected as members. The Committee convenes four to five times per year. The Group’s CFO acts as the secretary of the Audit Committee.
Audit Committee in 2014The members of the Audit Commit-tee between January 1 and March 18, 2014, were Reino Hanhinen as the Chairman and Satu Huber and Erkki Järvinen as members. At its organisational meeting on March 18, 2014, the Board of Directors elected Satu Huber as the Chair-man and Juhani Pitkäkoski and Teuvo Salminen as members of the Audit Committee.
In 2014, Recommendation 26 (Independence of the members of the audit committee) of the Finnish Corporate Governance Code was
FINANCIAL STATEMENTYEAR 2014 BUSINESS OPERATIONS CORPORATE GOVERNANCE GRI INDEX
44
YIT ANNUAL REPORT 2014
deviated from in the election of the members of the company’s Audit Committee, when Juhani Pitkäkoski, who is not independent of the company, was elected as a member of the Audit Committee. Mr. Pitkäkoski was elected as a member of the Audit Committee due to his extensive knowledge of the company’s business and finances as well as management, supervision and control systems as the company’s former CEO.
The Audit Committee convened a total of five times in 2014. The members’ total attendance rate was 100 per cent. Group CFO Timo Lehtinen served as the secretary of the Committee. President and CEO Kari Kauni-skangas also participated in the meetings of the Committee. In addition, Ari Ladvelin, head of internal audit, participated in the meetings. The chief auditor, Heikki Lassila (PricewaterhouseCoopers), also attended the meetings, as did members of the company’s man-agement and experts, depending on the matters dealt with by the meeting.
During the financial period, the Audit Committee focused on areas such as monitoring the capital release programme, the preparation of financing arrangements, and risk management. In conjunction with discussing Interim Reports, the Audit Committee expressed its views on management estimates, monitored the progress of disputes and legal proceedings, and discussed the Group’s deci-sion-making authorisations.
President and CEOThe President and CEO attends to the day-to-day administration of the company in accordance with the instructions and regula-tions laid down by the Board of Directors. The Board of Directors appoints and discharges the CEO and supervises his operation. The Board of Directors also decides on the CEO’s salary and fees and other terms of employment. The CEO ensures that the company’s accounting is lawful and asset management is organised reliably, and also serves as the Chairman of the Group Management Board.
Management Board and Group Investment BoardThe President and CEO and other members appointed by the Board of Directors make up the Group’s Management Board. The Presi-dent and CEO appoints the Man-agement Board’s secretary. The Group’s Management Board, which meets on a regular basis, approx-imately once a month, assists the Group CEO with operational plan-ning and management and pre-pares matters that are to be pro-cessed by the Board of Directors. Among other duties, the Manage-ment Board formulates and coor-dinates the Group’s strategic and annual planning and supervises the implementation of plans and finan-cial reporting. The Management Board actively monitors changes in the operating environment and in the market and the competitor field. Development of cooperation within the Group and promoting common development projects are also among the Management Board’s key duties. In addition to the Management Board, a separate Group Investment Board assists the President and CEO in the planning
of capital use, investments and the preparation of acquisitions.
The President and CEO is responsible for the decisions made by the Management Board and the Group Investment Board. The task of the members of the Management Board and the Group Investment Board is to implement the decisions in their own areas of responsibility. The Management Board and Group Investment Board have standing orders ratified by the Board of Directors.
Management Board in 2014Kari Kauniskangas served as YIT’s President and CEO.
The Group Management Board as of January 1, 2014:• Kari Kauniskangas, Chairman,
President and CEO of YIT Corpo-ration, Head of Housing segment
• Tero Kiviniemi, Vice Chairman, YIT Corporation’s Executive Vice President, Head of Business Premises and Infrastructure segment
• Timo Lehtinen, Chief Financial Officer
• Teemu Helppolainen, Head of business area Russia
• Juhani Nummi, Senior Vice President, Business Development
• Pii Raulo, Senior Vice President, Human Resources
In addition to the members of the Management Board, the extended Management Board also includes as of January 1, 2014: • Yuri Belomestnov, General
Director of YIT Moskovia (until February 7, 2014)
• Jouni Forsman, Head of Infra Services division
• Harri Isoviita, Head of Residen-tial Construction division
• Matti Koskela, Head of Building Construction division
• Timo Lehmus, Head of Business Premises division
• Tom Sandvik, Head of Central Eastern Europe division
• Mikhail Voziyanov, General Director of YIT Lentek
The Management Board convened 12 times during the year, of which three times were extended Man-agement Board meetings. The focus areas of the Management
FINANCIAL STATEMENTYEAR 2014 BUSINESS OPERATIONS CORPORATE GOVERNANCE GRI INDEX
45
YIT ANNUAL REPORT 2014
Board’s work included the planning and development of strategy and controlling the capital release pro-gramme and the competitiveness programme launched in August. Key themes included customer ori-entation, cost-efficiency, cash flow and capital efficiency. In addition to controlling common develop-ment programmes, the Manage-ment Board led the development of quality and occupational safety. The Management Board also continued to promote YIT’s values and leader-ship principles.
Management board in 2015Members are presented on page 50.
Internal audit YIT Group’s internal audit organisa-tion supports the management in the development and supervision of risk management, internal control and good corporate governance. The focus of the work of the internal audit is on operational auditing, with a particular emphasis on project risk management and international operations. The work is coordinated with the audit and the internal audit
also works closely together with the Group’s corporate security organi-sation. The internal audit reports to the Audit Committee of the Board of Directors and administratively to YIT’s President and CEO.
Internal audit in 2014The focus areas of the internal audit were project management, project risks, procurement, reporting in foreign operations and the man-agement of misconduct risks. The internal audit participated regularly in the work of the Group’s Ethics Committee.
AuditAccording to the Articles of Associ-ation, YIT has one auditor that must be a firm of auditors approved by the Central Chamber of Commerce. The Annual General Meeting elects the auditor based on the proposal of the Audit Committee of the Board of Directors.
The auditor audits the company’s accounting, Board of Directors’ report, Financial Statements and administration for the financial year. The parent company’s auditor must also audit
the consolidated financial state-ments and other mutual relations between the Group companies. The auditor reports regularly to the Board of Directors and gives YIT’s shareholders an Auditor’s Report as required by law.
The auditor’s fee is paid as per invoice.
Audit in 2014The Annual General Meeting in 2014 elected Pricewaterhouse-Coopers Oy, Authorised Public Accountants, as the auditor. The auditor with main responsibility was Heikki Lassila, Authorised Public Accountant, who has been the company’s chief auditor since 2008. The Auditor’s Report for the financial year 2014 is presented in
the Financial Statements section of the Annual Review.
Insider administration YIT Group has Guidelines for Insiders that follow the Guidelines for Insiders approved by NASDAQ OMX Helsinki for listed companies. Permanent insiders may not trade in securities issued by YIT during the periods between the end of review periods and the publication of financial statements or interim reports (closed window).
For the statutory insiders (insiders with duty to declare) and their close associates, the ownership of YIT shares is public. Statutory insiders include the members and secretary of the Board of Directors, the President and CEO or his Deputy, the Executive Vice President, the audit organisation employee with the main responsibility for the audit of the company and the members and secretary of the Group’s Man-agement Board. In addition, YIT has permanent company-specific insiders and in special projects separately named project-specific insiders whose holdings are not
public. YIT’s company-specific insiders are the persons who regularly receive insider informa-tion based on their position or duties or whom the company has determined to be company-spe-cific insiders. Company-specific insiders include separately specified management and key personnel of the Group, the members of the extended Management Board, the President and CEO’s secretary, the deputy to YIT’s Executive Vice President or President and CEO, the Chief Financial Officer’s secretary, and other specified persons.
In total, the Group had 58 permanent insiders at the end of 2014. The Group maintains a register of its insiders subject to a disclosure requirement in Euroclear Finland Ltd’s system.
Up-to-date ownership and trading information on insiders on our website.
AUDIT FEES
EUR mill. 2014 2013
Audit 0.8 0.8
Certificates and statements 0.0 0.2
Tax advice 0.1 0.0
Other fees 0.1 0.8
Total 1.0 1.8
FINANCIAL STATEMENTYEAR 2014 BUSINESS OPERATIONS CORPORATE GOVERNANCE GRI INDEX
46
YIT ANNUAL REPORT 2014
Operating principles and control systemsYIT complies with the legislation of Finland and its operating coun-tries as well as the regulations and guidelines for listed companies in all of its operations. Operations are also guided by the company’s val-ues and business principles, which all of the employees must comply with at all times. The company has ratified the following guidelines and policies, among others: YIT Business Principles, YIT’s values and leadership principles, standing orders of YIT Group and adminis-trative bodies, guidelines for insid-ers, the Group’s financing policy, guidelines on the accounting and reporting policies, risk management policy, corporate security policy, disclosure policy, investment guide-lines and guidelines for acquisitions.
YIT Business Principles YIT’s mission, vision and values are the foundation of YIT’s operations and ways of working. Management at YIT is also based on transpar-ency and trust, which are founded on YIT’s values. Commitment to the values promotes the long-
term success of business, which enables the creation of value for various stakeholders, from custom-ers to shareholders. YIT Business Principles guide YIT’s operations in relation to customers, employees, shareholders, business partners, competitors, society and the envi-ronment. Every employee is, for his or her part, responsible for comply-ing with YIT Business Principles.
Internal control and risk ma-nagement connected with the financial reporting process Financial reporting and supervision are based on the strategy updated annually, budgets drafted every six months and monthly performance reporting. The most significant part of the accounting material is generated in projects, the result,
cash flow and capital forecasts of which are updated on a monthly basis. The financial units of busi-ness units are responsible for reporting in their respective areas of responsibility in accordance with the accounting principles defined by the Group. The reporting carried out by segments and divisions is supported by such functions as Group accounting, IT and financ-ing. The CFO is a member of the Group’s Management Board, and he serves as the secretary of the Audit Committee.
The representatives of cen-tralised financial functions and the financial management of the segments convene on a monthly basis to review matters that concern the segments, the most significant development projects
and topical special issues concern-ing financial administration.
YIT’s accounting processes have been further clarified as a result of comprehensive accounting systems implemented following the partial demerger in 2013. There are also significant information system projects underway in areas such as project management as well as planning and reporting.
The risks of financial reporting are assessed annually. In 2014, particular attention was paid to resource allocation for accounting and the effectiveness of the calcu-lation and reporting processes, for example by improving the effec-tiveness of the use of information systems. Other key topics included issues related to inventory valuation and project forecasting.
The internal control and risk management systems connected with the financial reporting process are described in more detail in YIT Corporation Corporate Governance Statement 2014 on our website. We also publish the Remuneration Statement according to Finnish Corporate Governance Code 2010, Chapter 7 (Remuneration). The
statement contains a description of the main principles of YIT’s remu-neration policy as well as informa-tion concerning remuneration of the members of the Board of Directors, President and CEO and Group Management Board. YIT Corpora-tion Remuneration Statement 2014 on our website. ■
Key external regulations
• Limited Liability Companies Act
• Rules of NASDAQ OMX Helsinki
• Finnish Corporate Governance Code
Key internal regulations
• Articles of Association• YIT Group’s standing orders• Standing orders of the Board
of Directors, its committees and the Management Boards
• YIT Business Principles
FINANCIAL STATEMENTYEAR 2014 BUSINESS OPERATIONS CORPORATE GOVERNANCE GRI INDEX
47
YIT ANNUAL REPORT 2014
Risk management
YIT’S RISK MANAGEMENT policy aims to identify major risk factors and manage these factors so that the company achieves its strategic and financial objectives responsi-bly. The starting point is to manage the Group’s total risk exposure, not merely the management of individ-ual risk factors. The aim is to both identify risks and opportunities and to actively take advantage of them.
Risk management is an integral part of business control, monitoring, reporting and continuous devel-opment under the management system. Risk management covers the identification and assessment of risks and contingency plans for strategic, operational, financial and event risks.
After the partial demerger of 2013, YIT’s business operations are more capital intensive and sensitive to economic cycles. At the same time, the partial demerger has allowed the company to better focus on the development of risk management in project activities.
Risk management proceduresA STRATEGIC RISK ASSESSMENT is carried out at Group level once a year. As a
result of the assessment, the major Group-level risks, and the risks of segments and Corporate Services are compiled in a risk register and classified into a risk matrix based on their likelihood of occurrence and possible impacts. The risk reports are reviewed by YIT’s Board of Directors, the Group’s Management Board and the Management Boards of the business segments.
YIT’s ability to manage cyclicality is improved by striving to achieve a geographical balance and balance between business ideas, so that economic fluctuations impact oper-ations at different times in different markets. Geographical balance in operations also mitigates the impact of changes in consumer confidence and reduced purchasing power caused by geopolitical tension. Large area development projects and tender-based projects also enable planned flexibility in different market situations. In operations subject to sales risk, the key is to ensure an attractive offering, taking different customer segments into consideration. Agility in switching between different methods of implementation is important.
As part of annual planning, the risk tolerance and risk appetite is defined for key financial indicators and indicators of the sales risk position in accordance with the anticipated operating environment. The risk position and its develop-ment forecast, which is adjusted as part of monthly reporting on results, is used to support the decision making of the Group’s Investment Board. The financial consequences of risks are analysed using simula-tion models.
OPERATIONAL RISKS AND EVENT RISKS are assessed monthly as part of normal management. Risk man-agement is an inseparable part of the preparation and implementa-tion of projects and their phases. The management of large pro-jects is supported by applying a suitable method of organisation. Steering group work, procedures related to decision making and systematic risk analyses are part of established operational activities. The responsible operating model takes economic, social as well as environmental perspectives into consideration.
The profitability, cash flow and risks of self-developed housing production is managed by a phased gate model, in which the decision points involve specifically created control tools, decision making authorisations and criteria. The implementation of area devel-opment projects is based on a concept that involves a systematic analysis of factors such as the market, the optimisation of building rights, the planning solution and spatial programme, the project size, and its phasing. Co-operation and communication with the authorities and other third parties is aimed at ensuring the undisturbed refining of the building rights and the progress of the construction process.
To support management based on business intelligence, a planning and analysis solution has been developed for comprehensive implementation in 2015. The Group will also implement an information system for project management to improve the steerability and trans-parency of business operations. Once implemented, the entire Group will have common tools for project management. The solutions
and the production know-how contained in them will be used to manage project profitability and cashflow. The transparent control of volumes, work quantities and unit prices will ensure the cost manage-ment of projects.
Event risks include damage to and accidents involving personnel, property and information security, sudden damage to project sites, business premises and other property, such as fire, collapse and theft. The primary objective of the management of event risks is the prevention of damage. Event risks are additionally managed through contingency plans as well as a Group-wide insurance policy and programmes. Insurance needs are separately assessed for projects that are large in relation to the overall scale of operations.
YIT has a Group-wide security policy that covers employee security, information security and the security of business premises, as well as crisis management and crisis communications. Extensive training is provided in the area of occupational safety, and its development is monitored
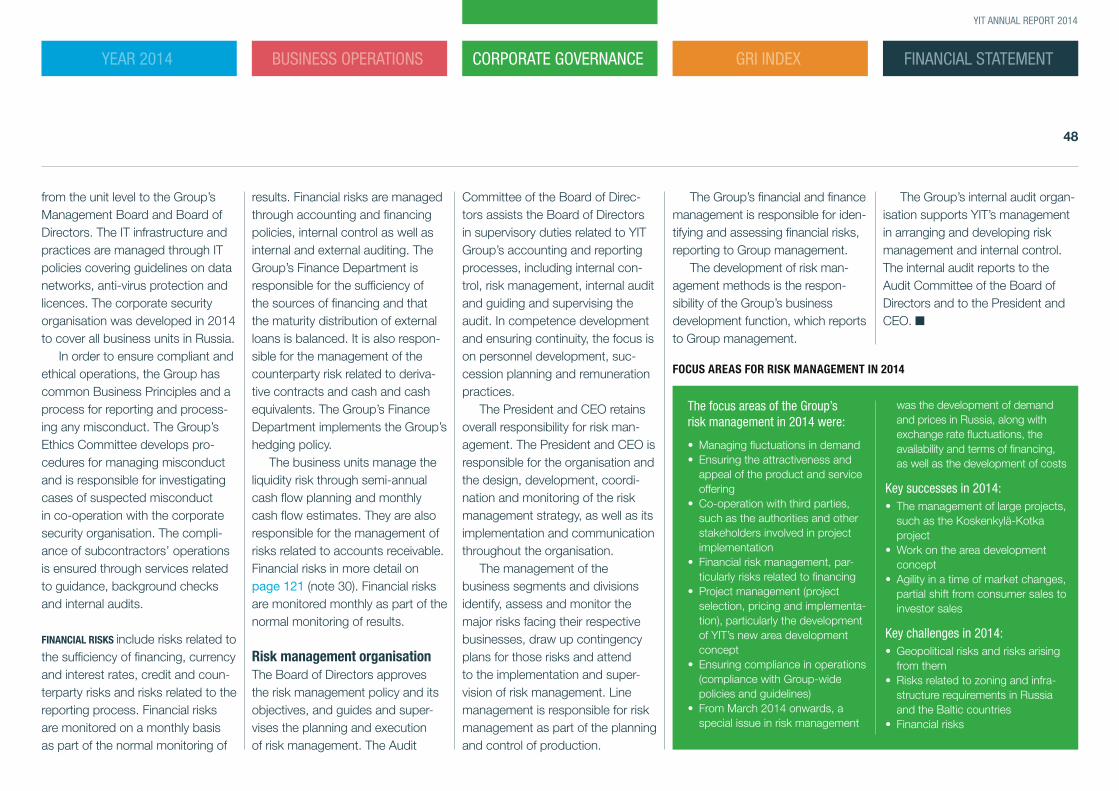
FINANCIAL STATEMENTYEAR 2014 BUSINESS OPERATIONS CORPORATE GOVERNANCE GRI INDEX
48
YIT ANNUAL REPORT 2014
from the unit level to the Group’s Management Board and Board of Directors. The IT infrastructure and practices are managed through IT policies covering guidelines on data networks, anti-virus protection and licences. The corporate security organisation was developed in 2014 to cover all business units in Russia.
In order to ensure compliant and ethical operations, the Group has common Business Principles and a process for reporting and process-ing any misconduct. The Group’s Ethics Committee develops pro-cedures for managing misconduct and is responsible for investigating cases of suspected misconduct in co-operation with the corporate security organisation. The compli-ance of subcontractors’ operations is ensured through services related to guidance, background checks and internal audits.
FINANCIAL RISKS include risks related to the sufficiency of financing, currency and interest rates, credit and coun-terparty risks and risks related to the reporting process. Financial risks are monitored on a monthly basis as part of the normal monitoring of
results. Financial risks are managed through accounting and financing policies, internal control as well as internal and external auditing. The Group’s Finance Department is responsible for the sufficiency of the sources of financing and that the maturity distribution of external loans is balanced. It is also respon-sible for the management of the counterparty risk related to deriva-tive contracts and cash and cash equivalents. The Group’s Finance Department implements the Group’s hedging policy.
The business units manage the liquidity risk through semi-annual cash flow planning and monthly cash flow estimates. They are also responsible for the management of risks related to accounts receivable. Financial risks in more detail on page 121 (note 30). Financial risks are monitored monthly as part of the normal monitoring of results.
Risk management organisationThe Board of Directors approves the risk management policy and its objectives, and guides and super-vises the planning and execution of risk management. The Audit
Committee of the Board of Direc-tors assists the Board of Directors in supervisory duties related to YIT Group’s accounting and reporting processes, including internal con-trol, risk management, internal audit and guiding and supervising the audit. In competence development and ensuring continuity, the focus is on personnel development, suc-cession planning and remuneration practices.
The President and CEO retains overall responsibility for risk man-agement. The President and CEO is responsible for the organisation and the design, development, coordi-nation and monitoring of the risk management strategy, as well as its implementation and communication throughout the organisation.
The management of the business segments and divisions identify, assess and monitor the major risks facing their respective businesses, draw up contingency plans for those risks and attend to the implementation and super-vision of risk management. Line management is responsible for risk management as part of the planning and control of production.
The Group’s financial and finance management is responsible for iden-tifying and assessing financial risks, reporting to Group management.
The development of risk man-agement methods is the respon-sibility of the Group’s business development function, which reports to Group management.
The Group’s internal audit organ-isation supports YIT’s management in arranging and developing risk management and internal control. The internal audit reports to the Audit Committee of the Board of Directors and to the President and CEO. ■
FOCUS AREAS FOR RISK MANAGEMENT IN 2014
The focus areas of the Group’s risk management in 2014 were:
• Managing fluctuations in demand• Ensuring the attractiveness and
appeal of the product and service offering
• Co-operation with third parties, such as the authorities and other stakeholders involved in project implementation
• Financial risk management, par-ticularly risks related to financing
• Project management (project selection, pricing and implementa-tion), particularly the development of YIT’s new area development concept
• Ensuring compliance in operations (compliance with Group-wide policies and guidelines)
• From March 2014 onwards, a special issue in risk management
was the development of demand and prices in Russia, along with exchange rate fluctuations, the availability and terms of financing, as well as the development of costs
Key successes in 2014: • The management of large projects,
such as the Koskenkylä-Kotka project
• Work on the area development concept
• Agility in a time of market changes, partial shift from consumer sales to investor sales
Key challenges in 2014:• Geopolitical risks and risks arising
from them • Risks related to zoning and infra-
structure requirements in Russia and the Baltic countries
• Financial risks
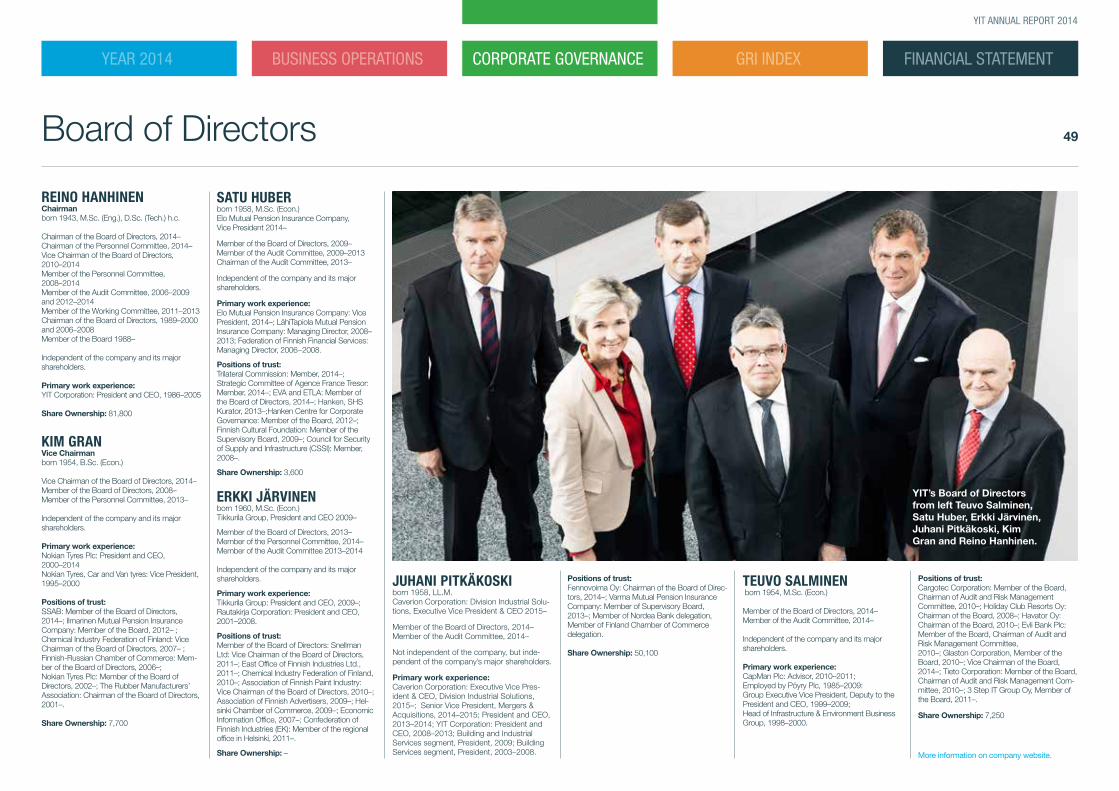
FINANCIAL STATEMENTYEAR 2014 BUSINESS OPERATIONS CORPORATE GOVERNANCE GRI INDEX
49
YIT ANNUAL REPORT 2014
Board of Directors
REINO HANHINENChairman born 1943, M.Sc. (Eng.), D.Sc. (Tech.) h.c.
Chairman of the Board of Directors, 2014– Chairman of the Personnel Committee, 2014– Vice Chairman of the Board of Directors, 2010–2014 Member of the Personnel Committee, 2008–2014 Member of the Audit Committee, 2006–2009 and 2012–2014 Member of the Working Committee, 2011–2013 Chairman of the Board of Directors, 1989–2000 and 2006–2008 Member of the Board 1988–
Independent of the company and its major shareholders.
Primary work experience: YIT Corporation: President and CEO, 1986–2005 Share Ownership: 81,800
KIM GRANVice Chairman born 1954, B.Sc. (Econ.) Vice Chairman of the Board of Directors, 2014– Member of the Board of Directors, 2008– Member of the Personnel Committee, 2013– Independent of the company and its major shareholders.
Primary work experience:Nokian Tyres Plc: President and CEO, 2000–2014Nokian Tyres, Car and Van tyres: Vice President, 1995–2000
Positions of trust:SSAB: Member of the Board of Directors, 2014–; Ilmarinen Mutual Pension Insurance Company: Member of the Board, 2012– ; Chemical Industry Federation of Finland: Vice Chairman of the Board of Directors, 2007– ; Finnish-Russian Chamber of Commerce: Mem-ber of the Board of Directors, 2006–; Nokian Tyres Plc: Member of the Board of Directors, 2002–; The Rubber Manufacturers’ Association: Chairman of the Board of Directors, 2001–.
Share Ownership: 7,700
SATU HUBERborn 1958, M.Sc. (Econ.) Elo Mutual Pension Insurance Company, Vice President 2014– Member of the Board of Directors, 2009– Member of the Audit Committee, 2009–2013 Chairman of the Audit Committee, 2013– Independent of the company and its major shareholders.
Primary work experience:Elo Mutual Pension Insurance Company: Vice President, 2014–; LähiTapiola Mutual Pension Insurance Company: Managing Director, 2008–2013; Federation of Finnish Financial Services: Managing Director, 2006−2008. Positions of trust:Trilateral Commission: Member, 2014–; Strategic Committee of Agence France Tresor: Member, 2014–; EVA and ETLA: Member of the Board of Directors, 2014–; Hanken, SHS Kurator, 2013–;Hanken Centre for Corporate Governance: Member of the Board, 2012–; Finnish Cultural Foundation: Member of the Supervisory Board, 2009–; Council for Security of Supply and Infrastructure (CSSI): Member, 2008–. Share Ownership: 3,600
ERKKI JÄRVINEN born 1960, M.Sc. (Econ.)Tikkurila Group, President and CEO 2009–
Member of the Board of Directors, 2013– Member of the Personnel Committee, 2014– Member of the Audit Committee 2013–2014 Independent of the company and its major shareholders. Primary work experience:Tikkurila Group: President and CEO, 2009–; Rautakirja Corporation: President and CEO, 2001–2008.
Positions of trust: Member of the Board of Directors: Snellman Ltd: Vice Chairman of the Board of Directors, 2011–; East Office of Finnish Industries Ltd., 2011–; Chemical Industry Federation of Finland, 2010–; Association of Finnish Paint Industry: Vice Chairman of the Board of Directors, 2010–; Association of Finnish Advertisers, 2009–; Hel-sinki Chamber of Commerce, 2009–; Economic Information Office, 2007–; Confederation of Finnish Industries (EK): Member of the regional office in Helsinki, 2011–. Share Ownership: –
JUHANI PITKÄKOSKIborn 1958, LL.M. Caverion Corporation: Division Industrial Solu-tions, Executive Vice President & CEO 2015–
Member of the Board of Directors, 2014–Member of the Audit Committee, 2014–
Not independent of the company, but inde-pendent of the company’s major shareholders.
Primary work experience: Caverion Corporation: Executive Vice Pres-ident & CEO, Division Industrial Solutions, 2015–; Senior Vice President, Mergers & Acquisitions, 2014–2015; President and CEO, 2013–2014; YIT Corporation: President and CEO, 2008–2013; Building and Industrial Services segment, President, 2009; Building Services segment, President, 2003–2008.
Positions of trust: Fennovoima Oy: Chairman of the Board of Direc-tors, 2014–; Varma Mutual Pension Insurance Company: Member of Supervisory Board, 2013–; Member of Nordea Bank delegation, Member of Finland Chamber of Commerce delegation. Share Ownership: 50,100
TEUVO SALMINEN born 1954, M.Sc. (Econ.) Member of the Board of Directors, 2014– Member of the Audit Committee, 2014–
Independent of the company and its major shareholders.
Primary work experience:CapMan Plc: Advisor, 2010–2011; Employed by Pöyry Plc, 1985–2009: Group Executive Vice President, Deputy to the President and CEO, 1999–2009; Head of Infrastructure & Environment Business Group, 1998–2000.
Positions of trust:Cargotec Corporation: Member of the Board, Chairman of Audit and Risk Management Committee, 2010–; Holiday Club Resorts Oy: Chairman of the Board, 2008–; Havator Oy: Chairman of the Board, 2010–; Evli Bank Plc: Member of the Board, Chairman of Audit and Risk Management Committee, 2010–; Glaston Corporation, Member of the Board, 2010–; Vice Chairman of the Board, 2014–; Tieto Corporation: Member of the Board, Chairman of Audit and Risk Management Com-mittee, 2010–; 3 Step IT Group Oy, Member of the Board, 2011–. Share Ownership: 7,250
More information on company website.
YIT’s Board of Directors from left Teuvo Salminen, Satu Huber, Erkki Järvinen, Juhani Pitkäkoski, Kim Gran and Reino Hanhinen.

FINANCIAL STATEMENTYEAR 2014 BUSINESS OPERATIONS CORPORATE GOVERNANCE GRI INDEX
50
YIT ANNUAL REPORT 2014
Management Board January 1, 2015
KARI KAUNISKANGASPresident and CEOborn 1974, M.Sc. (Eng.), B.Sc. (Econ.) In the Group’s employ 1997 Primary working experience: YIT Corporation: President and CEO 2013–, Executive Vice President and deputy to the President and CEO, 2008–2013; YIT Construction Ltd: Man-aging Director, 2009–; Head of International Construction Services, 2008–2013; Business Premises, Head of Division, Senior vice president, 2005–2007; Building Construction Oulu Region, Area Manager, 2001–2005; Sonera Living Oy: Product Group Manager, 2000–2001; and other positions at YIT since 1997.Positions of trust: East Office of Finnish Industries, Mem-ber of the Board, 2013–.Share ownership: 17,624
JUHANI NUMMISenior Vice President, Business Developmentborn 1967, M.Sc. (Eng.) In the Group’s employ 1998–2001 and 2003 Primary working experience: YIT Corporation: Senior Vice President, Business Development, 2013–; YIT Con-struction Ltd: Senior Vice President, Business Development, Construction Services Finland, 2006–2013; Development Manager, 2003–2006. Proha Oyj / Artemis Finland Oy: Prod-uct Manager, 2001–2003. Positions of trust:- Share ownership: 2,499
TERO KIVINIEMIExecutive Vice PresidentHead of Business Premises and Infrastructure segmentborn 1971, M.Sc. (Eng.), Executive MBA In the Group’s employ 1996 Primary working experience: YIT Corporation: Executive Vice President, 2013–; Head of Business Premises and Infrastructure segment 2014–; YIT Construction: Head of YIT’s Construction Services Finland segment, 2009–2013; Infraservices: Division Manager, 2008–2009 and other posi-tions at YIT since 1996.Positions of trust: Confederation of Finnish Construc-tion Industries RT (CFCI): Chairman of the Board 2015–; Confederation of Finnish Industries EK: Member of the Board 2015–; Etera Mutual Pension Insurance Company: Member of the Board 2014–; Construction pool: Chairman, 2010–.Share ownership: 10,692
TEEMU HELPPOLAINENHead of Housing Russia segment born 1962, M.Sc. (Econ.) In the Group’s employ 2008 Primary working experience: YIT Corporation: Head of Housing Russia segment, 2015– ; Head of business area Russia, 2013–2015; International Construction Services, Senior Vice President, Moscow and Russian Regions, 2009–2013; Senior Vice President, Moscow Region, 2008–2009; Raisio Nutrition Ltd: Director, Russian and Ukrainian operations 2005–2008; Huurre Group Ltd: Director for the former Soviet Union excl. The Baltics, 2002–2005. Positions of trust:– Share ownership: 4,800
ANTTI INKILÄHead of Housing Finland and CEE segment born 1969, M.Sc. (Tech.)In the Group’s employ 1994–2001 and 2002
Primary working experience:YIT Corporation: Head of Housing Finland and CEE seg-ment, 2015–; YIT Construction Ltd: Head of the Apartment Houses Metropolitan Area unit, 2008–2014; Head of Business Unit, Asuintalot Uusimaa, 2008; Chief of Developer Contracting, Apartment Houses Metropolitan Area, 2006–2008; Production Manager, Apartment Houses Metropolitan Area, 2002–2006.Positions of trust: Confederation of Finnish Construction Industries, District of Metropolitan Area, Vice member of the Board 2012–; The Construction Quality Association (RALA): Vice member of the Board, 2014–.Share ownership: 4,085
TIMO LEHTINENChief Financial Officer born 1964, M.Sc. (Econ.), Executive MBA In the Group’s employ 2006 Primary working experience: YIT Corporation: Chief Financial Officer, 2009–; YIT Construction Ltd: Senior Vice President, Finance; 2006–2009, responsible for financial administration of both the Construction Services Finland and International Construction Services segments; Affecto Plc: CFO, 2006. Saunalahti Group Oyj: CFO, 2003–2006; Auria Oy: Senior Vice President, Administration, Deputy to the President and CEO, 2001–2003. Positions of trust:Elo Mutual Pension Insurance Company, Member of the Supervisory Board, 2010–.Share ownership: 8,550
PII RAULOSenior Vice President, Human Resources born 1967, M.Sc. (Econ.) In the Group’s employ 2004
Primary working experience: YIT Corporation: Senior Vice President, Human Resources, 2011–; YIT Construction Services Finland: HR Director 2008–2011, Personnel Manager, 2004–2007; McKinsey & Company: Manager of Administration 1997-2004.Positions of trust: Etera Mutual Pension Insurance Com-pany: Member of the Supervisory Board 2014 –.Share ownership: 5,240
THE EXTENDED GROUP MANAGEMENT BOARD CONSISTS ALSO OF THE HEADS OF BUSINESS DIVISIONS
KARI ALAVILLAMOHead of Business Premises business division
JOUNI FORSMANHead of Infra Services business division
HARRI ISOVIITAHead of Residential Construction business division
PAVEL KOCHEREZHKINGeneral Director of YIT Moskovia
MATTI KOSKELAHead of Residential and Business Premises Construction business division
TIMO LEHMUSHead of Real Estate Development business division
TOM SANDVIKHead of The Baltic Countries and CEE business division
MIKHAIL VOZIYANOVGeneral Director of YIT St Petersburg
More information on company website.
YIT ANNUAL REPORT 2014
GRI Index 52 YIT is developing its
responsibility reporting
53 GRI Index
In the GRI Index you’ll find information of corporate responsibility in a condensed form.
51
FINANCIAL STATEMENTYEAR 2014 BUSINESS OPERATIONS CORPORATE GOVERNANCE GRI INDEX
YIT ANNUAL REPORT 2014
YIT is developing its responsibility reporting
This year, YIT’s Annual Report is prepared under the integrated reporting framework. The Annual Report aims to provide a clearer description of how YIT creates added value for customers, shareholders and other stakeholders, as well as shed light on the factors that are critical to this process of value creation. The Annual Report also has a more future-oriented perspective instead of focusing on past events.
The relevant economic, social and environmental aspects of responsibility are presented throughout the Annual Report in accordance with the concept of integrated reporting. For this reason, YIT no longer publishes a separate corporate responsibility report.
Nevertheless, this section reports on responsibility using the GRI G4 guidelines for readers interested in more detailed information on YIT’s corporate responsibility. The content has a focus on issues deemed material by YIT. The materiality analysis was updated in late 2014 in cooperation with YIT’s key stakeholders.More information on integrated reporting and GRI G4:www.theiirc.orgwww.globalreporting.org
52
FINANCIAL STATEMENTYEAR 2014 BUSINESS OPERATIONS CORPORATE GOVERNANCE GRI INDEX
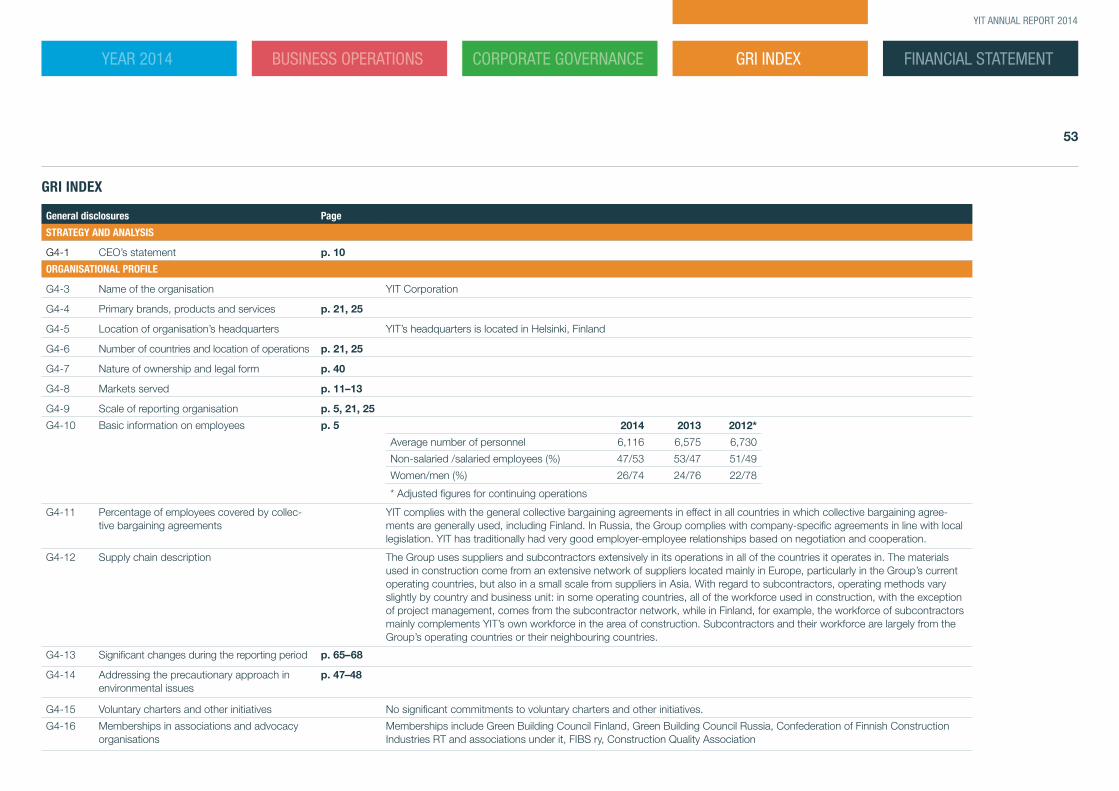
YIT ANNUAL REPORT 2014
GRI INDEX
General disclosures Page
STRATEGY AND ANALYSIS
G4-1 CEO’s statement p. 10
ORGANISATIONAL PROFILE
G4-3 Name of the organisation YIT Corporation
G4-4 Primary brands, products and services p. 21, 25
G4-5 Location of organisation’s headquarters YIT’s headquarters is located in Helsinki, Finland
G4-6 Number of countries and location of operations p. 21, 25
G4-7 Nature of ownership and legal form p. 40
G4-8 Markets served p. 11–13
G4-9 Scale of reporting organisation p. 5, 21, 25
G4-10 Basic information on employees p. 5 2014 2013 2012*
Average number of personnel 6,116 6,575 6,730
Non-salaried /salaried employees (%) 47/53 53/47 51/49
Women/men (%) 26/74 24/76 22/78
* Adjusted figures for continuing operations
G4-11 Percentage of employees covered by collec-tive bargaining agreements
YIT complies with the general collective bargaining agreements in effect in all countries in which collective bargaining agree-ments are generally used, including Finland. In Russia, the Group complies with company-specific agreements in line with local legislation. YIT has traditionally had very good employer-employee relationships based on negotiation and cooperation.
G4-12 Supply chain description The Group uses suppliers and subcontractors extensively in its operations in all of the countries it operates in. The materials used in construction come from an extensive network of suppliers located mainly in Europe, particularly in the Group’s current operating countries, but also in a small scale from suppliers in Asia. With regard to subcontractors, operating methods vary slightly by country and business unit: in some operating countries, all of the workforce used in construction, with the exception of project management, comes from the subcontractor network, while in Finland, for example, the workforce of subcontractors mainly complements YIT’s own workforce in the area of construction. Subcontractors and their workforce are largely from the Group’s operating countries or their neighbouring countries.
G4-13 Significant changes during the reporting period p. 65–68
G4-14 Addressing the precautionary approach in environmental issues
p. 47–48
G4-15 Voluntary charters and other initiatives No significant commitments to voluntary charters and other initiatives.
G4-16 Memberships in associations and advocacy organisations
Memberships include Green Building Council Finland, Green Building Council Russia, Confederation of Finnish Construction Industries RT and associations under it, FIBS ry, Construction Quality Association
53
FINANCIAL STATEMENTYEAR 2014 BUSINESS OPERATIONS CORPORATE GOVERNANCE GRI INDEX
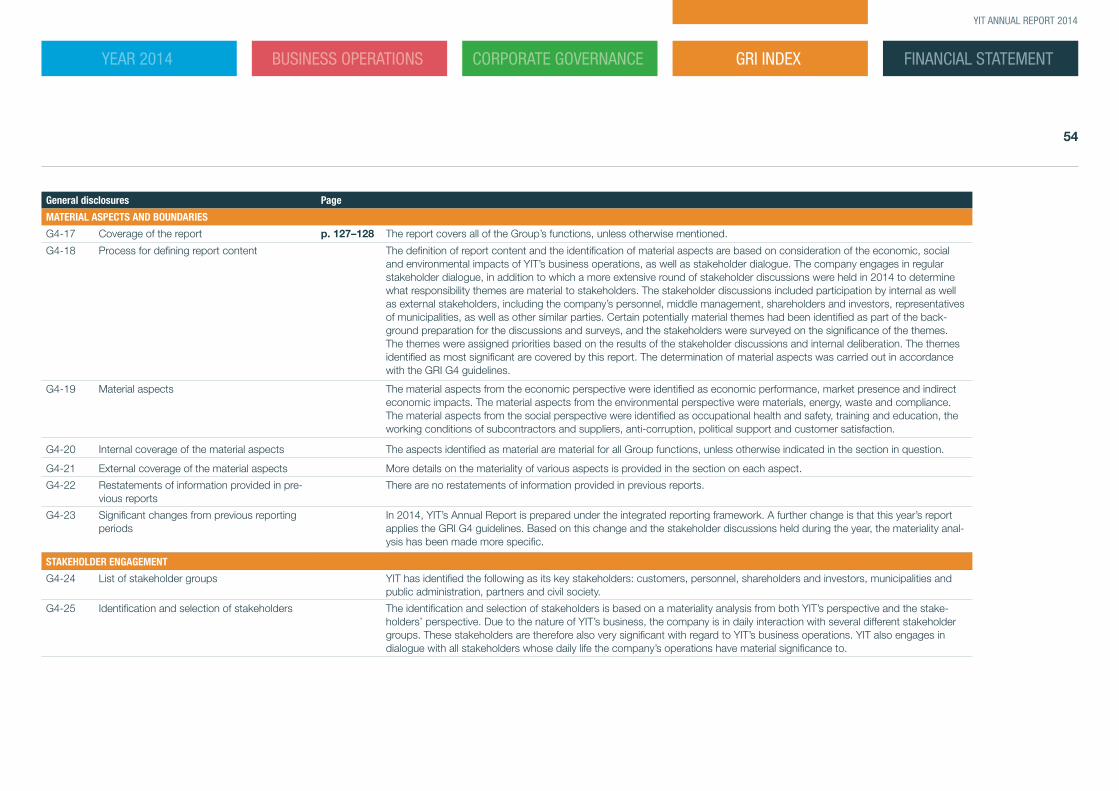
YIT ANNUAL REPORT 2014
General disclosures Page
MATERIAL ASPECTS AND BOUNDARIES
G4-17 Coverage of the report p. 127–128 The report covers all of the Group’s functions, unless otherwise mentioned.
G4-18 Process for defining report content The definition of report content and the identification of material aspects are based on consideration of the economic, social and environmental impacts of YIT’s business operations, as well as stakeholder dialogue. The company engages in regular stakeholder dialogue, in addition to which a more extensive round of stakeholder discussions were held in 2014 to determine what responsibility themes are material to stakeholders. The stakeholder discussions included participation by internal as well as external stakeholders, including the company’s personnel, middle management, shareholders and investors, representatives of municipalities, as well as other similar parties. Certain potentially material themes had been identified as part of the back-ground preparation for the discussions and surveys, and the stakeholders were surveyed on the significance of the themes. The themes were assigned priorities based on the results of the stakeholder discussions and internal deliberation. The themes identified as most significant are covered by this report. The determination of material aspects was carried out in accordance with the GRI G4 guidelines.
G4-19 Material aspects The material aspects from the economic perspective were identified as economic performance, market presence and indirect economic impacts. The material aspects from the environmental perspective were materials, energy, waste and compliance. The material aspects from the social perspective were identified as occupational health and safety, training and education, the working conditions of subcontractors and suppliers, anti-corruption, political support and customer satisfaction.
G4-20 Internal coverage of the material aspects The aspects identified as material are material for all Group functions, unless otherwise indicated in the section in question.
G4-21 External coverage of the material aspects More details on the materiality of various aspects is provided in the section on each aspect.
G4-22 Restatements of information provided in pre-vious reports
There are no restatements of information provided in previous reports.
G4-23 Significant changes from previous reporting periods
In 2014, YIT’s Annual Report is prepared under the integrated reporting framework. A further change is that this year’s report applies the GRI G4 guidelines. Based on this change and the stakeholder discussions held during the year, the materiality anal-ysis has been made more specific.
STAKEHOLDER ENGAGEMENT
G4-24 List of stakeholder groups YIT has identified the following as its key stakeholders: customers, personnel, shareholders and investors, municipalities and public administration, partners and civil society.
G4-25 Identification and selection of stakeholders The identification and selection of stakeholders is based on a materiality analysis from both YIT’s perspective and the stake-holders’ perspective. Due to the nature of YIT’s business, the company is in daily interaction with several different stakeholder groups. These stakeholders are therefore also very significant with regard to YIT’s business operations. YIT also engages in dialogue with all stakeholders whose daily life the company’s operations have material significance to.
54
FINANCIAL STATEMENTYEAR 2014 BUSINESS OPERATIONS CORPORATE GOVERNANCE GRI INDEX
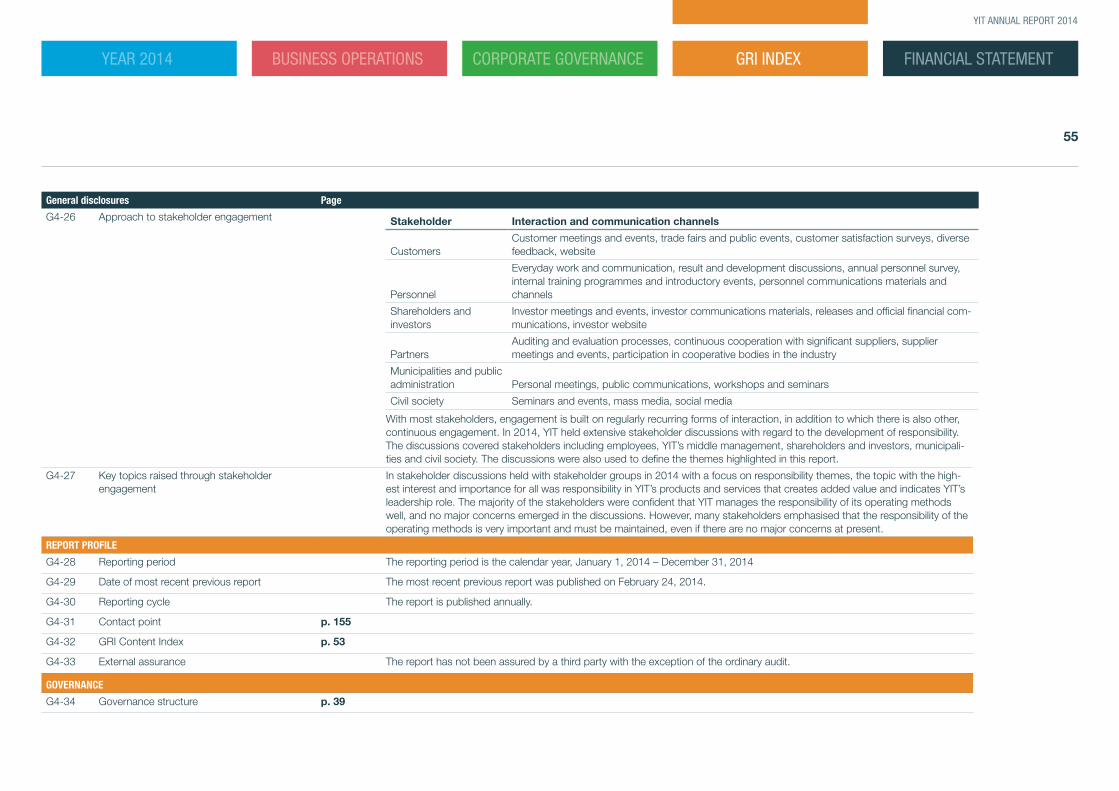
YIT ANNUAL REPORT 2014
REPORT PROFILE
G4-28 Reporting period The reporting period is the calendar year, January 1, 2014 – December 31, 2014
G4-29 Date of most recent previous report The most recent previous report was published on February 24, 2014.
G4-30 Reporting cycle The report is published annually.
G4-31 Contact point p. 155
G4-32 GRI Content Index p. 53
G4-33 External assurance The report has not been assured by a third party with the exception of the ordinary audit.
GOVERNANCE
G4-34 Governance structure p. 39
G4-26 Approach to stakeholder engagement Stakeholder Interaction and communication channels
CustomersCustomer meetings and events, trade fairs and public events, customer satisfaction surveys, diverse feedback, website
Personnel
Everyday work and communication, result and development discussions, annual personnel survey, internal training programmes and introductory events, personnel communications materials and channels
Shareholders and investors
Investor meetings and events, investor communications materials, releases and official financial com-munications, investor website
PartnersAuditing and evaluation processes, continuous cooperation with significant suppliers, supplier meetings and events, participation in cooperative bodies in the industry
Municipalities and public administration Personal meetings, public communications, workshops and seminars
Civil society Seminars and events, mass media, social media With most stakeholders, engagement is built on regularly recurring forms of interaction, in addition to which there is also other, continuous engagement. In 2014, YIT held extensive stakeholder discussions with regard to the development of responsibility. The discussions covered stakeholders including employees, YIT’s middle management, shareholders and investors, municipali-ties and civil society. The discussions were also used to define the themes highlighted in this report.
G4-27 Key topics raised through stakeholder engagement
In stakeholder discussions held with stakeholder groups in 2014 with a focus on responsibility themes, the topic with the high-est interest and importance for all was responsibility in YIT’s products and services that creates added value and indicates YIT’s leadership role. The majority of the stakeholders were confident that YIT manages the responsibility of its operating methods well, and no major concerns emerged in the discussions. However, many stakeholders emphasised that the responsibility of the operating methods is very important and must be maintained, even if there are no major concerns at present.
General disclosures Page
55
FINANCIAL STATEMENTYEAR 2014 BUSINESS OPERATIONS CORPORATE GOVERNANCE GRI INDEX
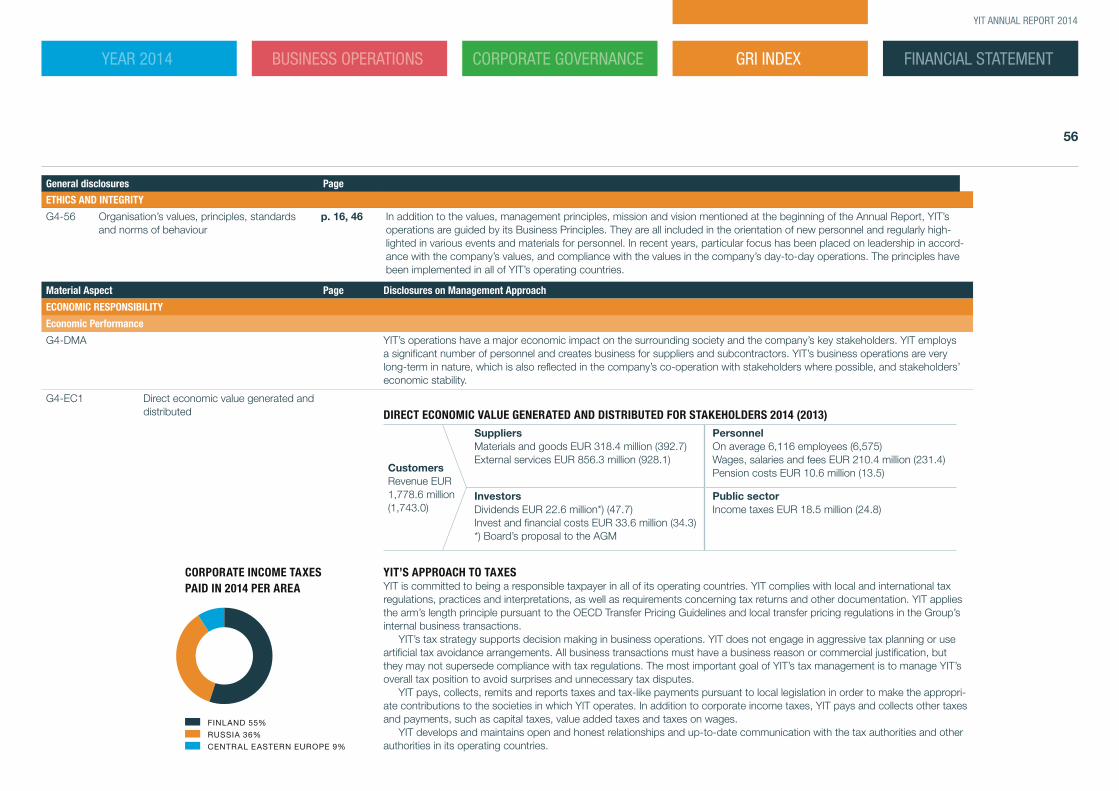
YIT ANNUAL REPORT 2014
ETHICS AND INTEGRITY
G4-56 Organisation’s values, principles, standards and norms of behaviour
p. 16, 46 In addition to the values, management principles, mission and vision mentioned at the beginning of the Annual Report, YIT’s operations are guided by its Business Principles. They are all included in the orientation of new personnel and regularly high-lighted in various events and materials for personnel. In recent years, particular focus has been placed on leadership in accord-ance with the company’s values, and compliance with the values in the company’s day-to-day operations. The principles have been implemented in all of YIT’s operating countries.
Material Aspect Page Disclosures on Management Approach
ECONOMIC RESPONSIBILITY
Economic Performance
G4-DMA YIT’s operations have a major economic impact on the surrounding society and the company’s key stakeholders. YIT employs a significant number of personnel and creates business for suppliers and subcontractors. YIT’s business operations are very long-term in nature, which is also reflected in the company’s co-operation with stakeholders where possible, and stakeholders’ economic stability.
G4-EC1 Direct economic value generated and distributed DIRECT ECONOMIC VALUE GENERATED AND DISTRIBUTED FOR STAKEHOLDERS 2014 (2013)
CustomersRevenue EUR 1,778.6 million (1,743.0)
SuppliersMaterials and goods EUR 318.4 million (392.7)External services EUR 856.3 million (928.1)
PersonnelOn average 6,116 employees (6,575)Wages, salaries and fees EUR 210.4 million (231.4)Pension costs EUR 10.6 million (13.5)
InvestorsDividends EUR 22.6 million*) (47.7)Invest and financial costs EUR 33.6 million (34.3)*) Board’s proposal to the AGM
Public sectorIncome taxes EUR 18.5 million (24.8)
YIT’S APPROACH TO TAXESYIT is committed to being a responsible taxpayer in all of its operating countries. YIT complies with local and international tax regulations, practices and interpretations, as well as requirements concerning tax returns and other documentation. YIT applies the arm’s length principle pursuant to the OECD Transfer Pricing Guidelines and local transfer pricing regulations in the Group’s internal business transactions.
YIT’s tax strategy supports decision making in business operations. YIT does not engage in aggressive tax planning or use artificial tax avoidance arrangements. All business transactions must have a business reason or commercial justification, but they may not supersede compliance with tax regulations. The most important goal of YIT’s tax management is to manage YIT’s overall tax position to avoid surprises and unnecessary tax disputes.
YIT pays, collects, remits and reports taxes and tax-like payments pursuant to local legislation in order to make the appropri-ate contributions to the societies in which YIT operates. In addition to corporate income taxes, YIT pays and collects other taxes and payments, such as capital taxes, value added taxes and taxes on wages.
YIT develops and maintains open and honest relationships and up-to-date communication with the tax authorities and other authorities in its operating countries.
FINLAND 55%
RUSSIA 36%
CENTRAL EASTERN EUROPE 9%
CORPORATE INCOME TAXES PAID IN 2014 PER AREA
General disclosures Page
56
FINANCIAL STATEMENTYEAR 2014 BUSINESS OPERATIONS CORPORATE GOVERNANCE GRI INDEX
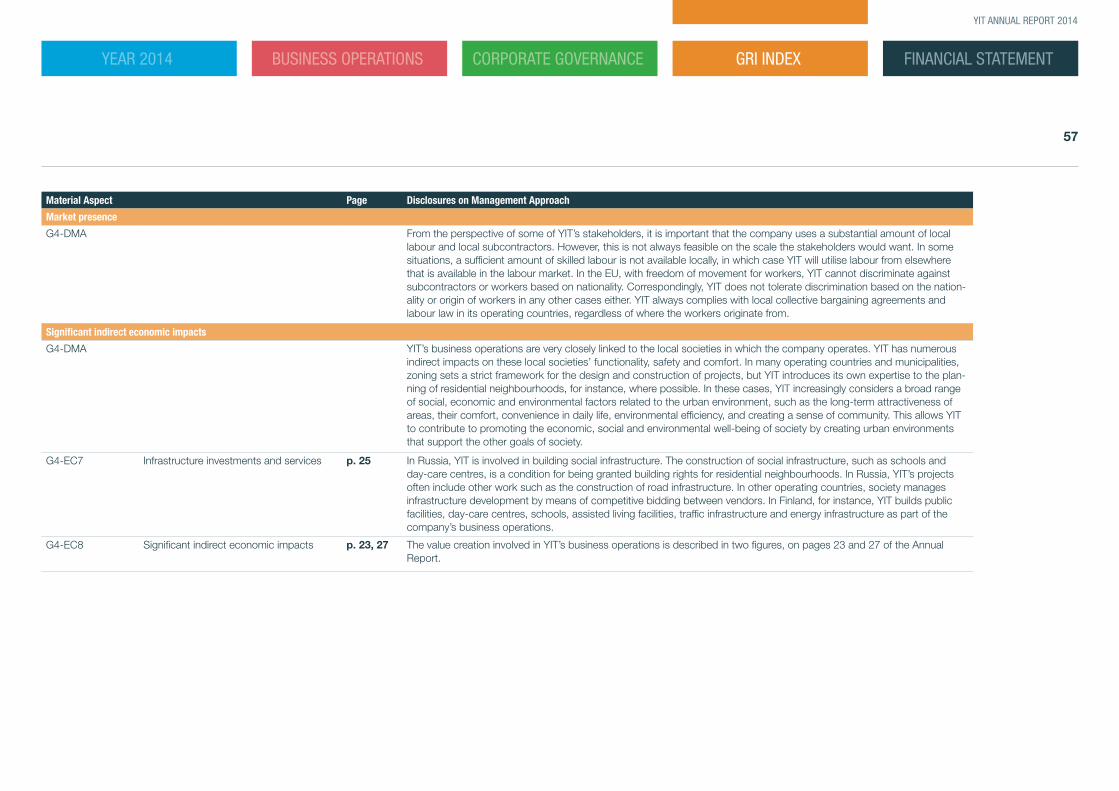
YIT ANNUAL REPORT 2014
Material Aspect Page Disclosures on Management Approach
Market presence
G4-DMA From the perspective of some of YIT’s stakeholders, it is important that the company uses a substantial amount of local labour and local subcontractors. However, this is not always feasible on the scale the stakeholders would want. In some situations, a sufficient amount of skilled labour is not available locally, in which case YIT will utilise labour from elsewhere that is available in the labour market. In the EU, with freedom of movement for workers, YIT cannot discriminate against subcontractors or workers based on nationality. Correspondingly, YIT does not tolerate discrimination based on the nation-ality or origin of workers in any other cases either. YIT always complies with local collective bargaining agreements and labour law in its operating countries, regardless of where the workers originate from.
Significant indirect economic impacts
G4-DMA YIT’s business operations are very closely linked to the local societies in which the company operates. YIT has numerous indirect impacts on these local societies’ functionality, safety and comfort. In many operating countries and municipalities, zoning sets a strict framework for the design and construction of projects, but YIT introduces its own expertise to the plan-ning of residential neighbourhoods, for instance, where possible. In these cases, YIT increasingly considers a broad range of social, economic and environmental factors related to the urban environment, such as the long-term attractiveness of areas, their comfort, convenience in daily life, environmental efficiency, and creating a sense of community. This allows YIT to contribute to promoting the economic, social and environmental well-being of society by creating urban environments that support the other goals of society.
G4-EC7 Infrastructure investments and services p. 25 In Russia, YIT is involved in building social infrastructure. The construction of social infrastructure, such as schools and day-care centres, is a condition for being granted building rights for residential neighbourhoods. In Russia, YIT’s projects often include other work such as the construction of road infrastructure. In other operating countries, society manages infrastructure development by means of competitive bidding between vendors. In Finland, for instance, YIT builds public facilities, day-care centres, schools, assisted living facilities, traffic infrastructure and energy infrastructure as part of the company’s business operations.
G4-EC8 Significant indirect economic impacts p. 23, 27 The value creation involved in YIT’s business operations is described in two figures, on pages 23 and 27 of the Annual Report.
57
FINANCIAL STATEMENTYEAR 2014 BUSINESS OPERATIONS CORPORATE GOVERNANCE GRI INDEX
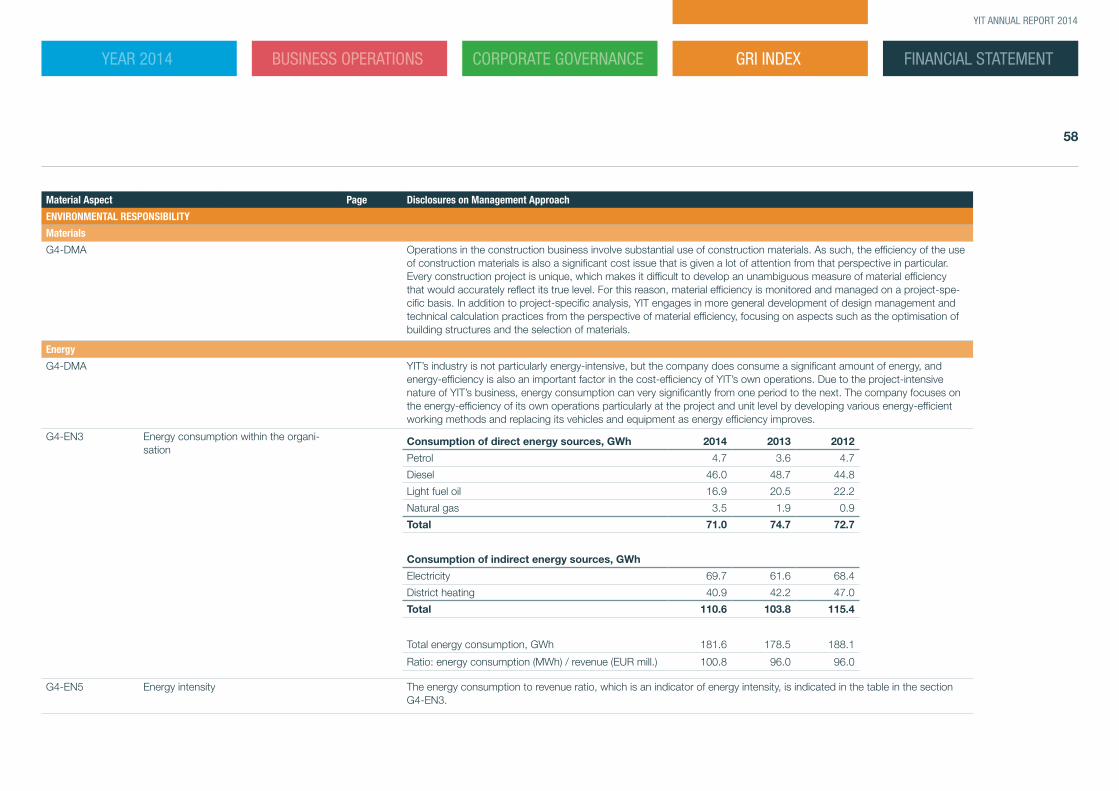
YIT ANNUAL REPORT 2014
Material Aspect Page Disclosures on Management Approach
ENVIRONMENTAL RESPONSIBILITY
Materials
G4-DMA Operations in the construction business involve substantial use of construction materials. As such, the efficiency of the use of construction materials is also a significant cost issue that is given a lot of attention from that perspective in particular. Every construction project is unique, which makes it difficult to develop an unambiguous measure of material efficiency that would accurately reflect its true level. For this reason, material efficiency is monitored and managed on a project-spe-cific basis. In addition to project-specific analysis, YIT engages in more general development of design management and technical calculation practices from the perspective of material efficiency, focusing on aspects such as the optimisation of building structures and the selection of materials.
Energy
G4-DMA YIT’s industry is not particularly energy-intensive, but the company does consume a significant amount of energy, and energy-efficiency is also an important factor in the cost-efficiency of YIT’s own operations. Due to the project-intensive nature of YIT’s business, energy consumption can very significantly from one period to the next. The company focuses on the energy-efficiency of its own operations particularly at the project and unit level by developing various energy-efficient working methods and replacing its vehicles and equipment as energy efficiency improves.
G4-EN3 Energy consumption within the organi-sation
Consumption of direct energy sources, GWh 2014 2013 2012
Petrol 4.7 3.6 4.7
Diesel 46.0 48.7 44.8
Light fuel oil 16.9 20.5 22.2
Natural gas 3.5 1.9 0.9
Total 71.0 74.7 72.7
Consumption of indirect energy sources, GWh
Electricity 69.7 61.6 68.4
District heating 40.9 42.2 47.0
Total 110.6 103.8 115.4
Total energy consumption, GWh 181.6 178.5 188.1
Ratio: energy consumption (MWh) / revenue (EUR mill.) 100.8 96.0 96.0
G4-EN5 Energy intensity The energy consumption to revenue ratio, which is an indicator of energy intensity, is indicated in the table in the section G4-EN3.
58
FINANCIAL STATEMENTYEAR 2014 BUSINESS OPERATIONS CORPORATE GOVERNANCE GRI INDEX
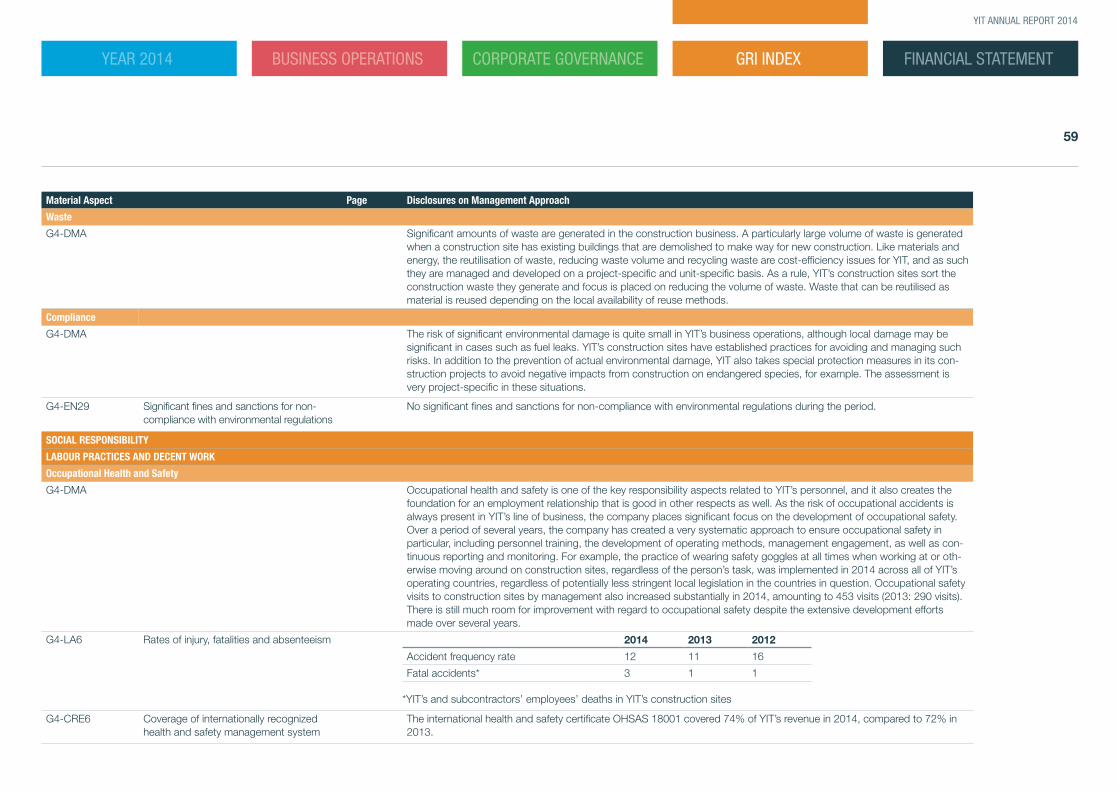
YIT ANNUAL REPORT 2014
Material Aspect Page Disclosures on Management Approach
Waste
G4-DMA Significant amounts of waste are generated in the construction business. A particularly large volume of waste is generated when a construction site has existing buildings that are demolished to make way for new construction. Like materials and energy, the reutilisation of waste, reducing waste volume and recycling waste are cost-efficiency issues for YIT, and as such they are managed and developed on a project-specific and unit-specific basis. As a rule, YIT’s construction sites sort the construction waste they generate and focus is placed on reducing the volume of waste. Waste that can be reutilised as material is reused depending on the local availability of reuse methods.
Compliance
G4-DMA The risk of significant environmental damage is quite small in YIT’s business operations, although local damage may be significant in cases such as fuel leaks. YIT’s construction sites have established practices for avoiding and managing such risks. In addition to the prevention of actual environmental damage, YIT also takes special protection measures in its con-struction projects to avoid negative impacts from construction on endangered species, for example. The assessment is very project-specific in these situations.
G4-EN29 Significant fines and sanctions for non- compliance with environmental regulations
No significant fines and sanctions for non-compliance with environmental regulations during the period.
SOCIAL RESPONSIBILITY
LABOUR PRACTICES AND DECENT WORK
Occupational Health and Safety
G4-DMA Occupational health and safety is one of the key responsibility aspects related to YIT’s personnel, and it also creates the foundation for an employment relationship that is good in other respects as well. As the risk of occupational accidents is always present in YIT’s line of business, the company places significant focus on the development of occupational safety. Over a period of several years, the company has created a very systematic approach to ensure occupational safety in particular, including personnel training, the development of operating methods, management engagement, as well as con-tinuous reporting and monitoring. For example, the practice of wearing safety goggles at all times when working at or oth-erwise moving around on construction sites, regardless of the person’s task, was implemented in 2014 across all of YIT’s operating countries, regardless of potentially less stringent local legislation in the countries in question. Occupational safety visits to construction sites by management also increased substantially in 2014, amounting to 453 visits (2013: 290 visits). There is still much room for improvement with regard to occupational safety despite the extensive development efforts made over several years.
G4-LA6 Rates of injury, fatalities and absenteeism 2014 2013 2012
Accident frequency rate 12 11 16
Fatal accidents* 3 1 1 *YIT’s and subcontractors’ employees’ deaths in YIT’s construction sites
G4-CRE6 Coverage of internationally recognized health and safety management system
The international health and safety certificate OHSAS 18001 covered 74% of YIT’s revenue in 2014, compared to 72% in 2013.
59
FINANCIAL STATEMENTYEAR 2014 BUSINESS OPERATIONS CORPORATE GOVERNANCE GRI INDEX
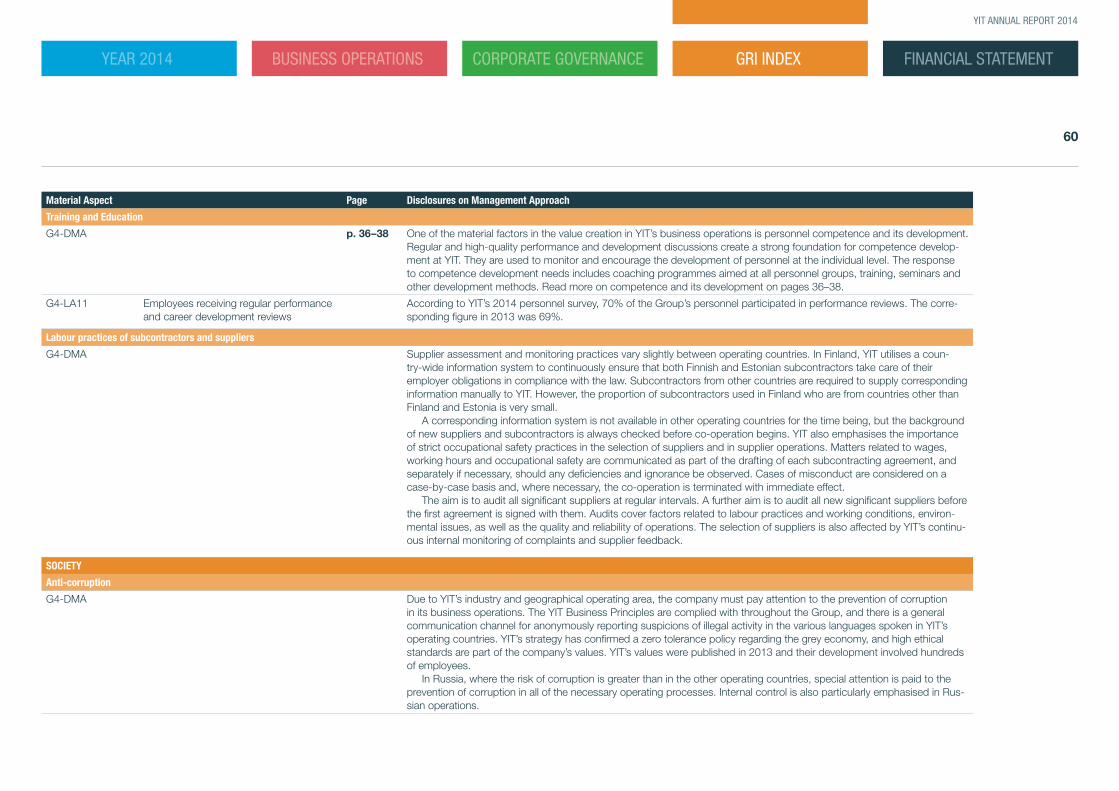
YIT ANNUAL REPORT 2014
Material Aspect Page Disclosures on Management Approach
Training and Education
G4-DMA p. 36–38 One of the material factors in the value creation in YIT’s business operations is personnel competence and its development. Regular and high-quality performance and development discussions create a strong foundation for competence develop-ment at YIT. They are used to monitor and encourage the development of personnel at the individual level. The response to competence development needs includes coaching programmes aimed at all personnel groups, training, seminars and other development methods. Read more on competence and its development on pages 36–38.
G4-LA11 Employees receiving regular performance and career development reviews
According to YIT’s 2014 personnel survey, 70% of the Group’s personnel participated in performance reviews. The corre-sponding figure in 2013 was 69%.
Labour practices of subcontractors and suppliers
G4-DMA Supplier assessment and monitoring practices vary slightly between operating countries. In Finland, YIT utilises a coun-try-wide information system to continuously ensure that both Finnish and Estonian subcontractors take care of their employer obligations in compliance with the law. Subcontractors from other countries are required to supply corresponding information manually to YIT. However, the proportion of subcontractors used in Finland who are from countries other than Finland and Estonia is very small.
A corresponding information system is not available in other operating countries for the time being, but the background of new suppliers and subcontractors is always checked before co-operation begins. YIT also emphasises the importance of strict occupational safety practices in the selection of suppliers and in supplier operations. Matters related to wages, working hours and occupational safety are communicated as part of the drafting of each subcontracting agreement, and separately if necessary, should any deficiencies and ignorance be observed. Cases of misconduct are considered on a case-by-case basis and, where necessary, the co-operation is terminated with immediate effect.
The aim is to audit all significant suppliers at regular intervals. A further aim is to audit all new significant suppliers before the first agreement is signed with them. Audits cover factors related to labour practices and working conditions, environ-mental issues, as well as the quality and reliability of operations. The selection of suppliers is also affected by YIT’s continu-ous internal monitoring of complaints and supplier feedback.
SOCIETY
Anti-corruption
G4-DMA Due to YIT’s industry and geographical operating area, the company must pay attention to the prevention of corruption in its business operations. The YIT Business Principles are complied with throughout the Group, and there is a general communication channel for anonymously reporting suspicions of illegal activity in the various languages spoken in YIT’s operating countries. YIT’s strategy has confirmed a zero tolerance policy regarding the grey economy, and high ethical standards are part of the company’s values. YIT’s values were published in 2013 and their development involved hundreds of employees.
In Russia, where the risk of corruption is greater than in the other operating countries, special attention is paid to the prevention of corruption in all of the necessary operating processes. Internal control is also particularly emphasised in Rus-sian operations.
60
FINANCIAL STATEMENTYEAR 2014 BUSINESS OPERATIONS CORPORATE GOVERNANCE GRI INDEX
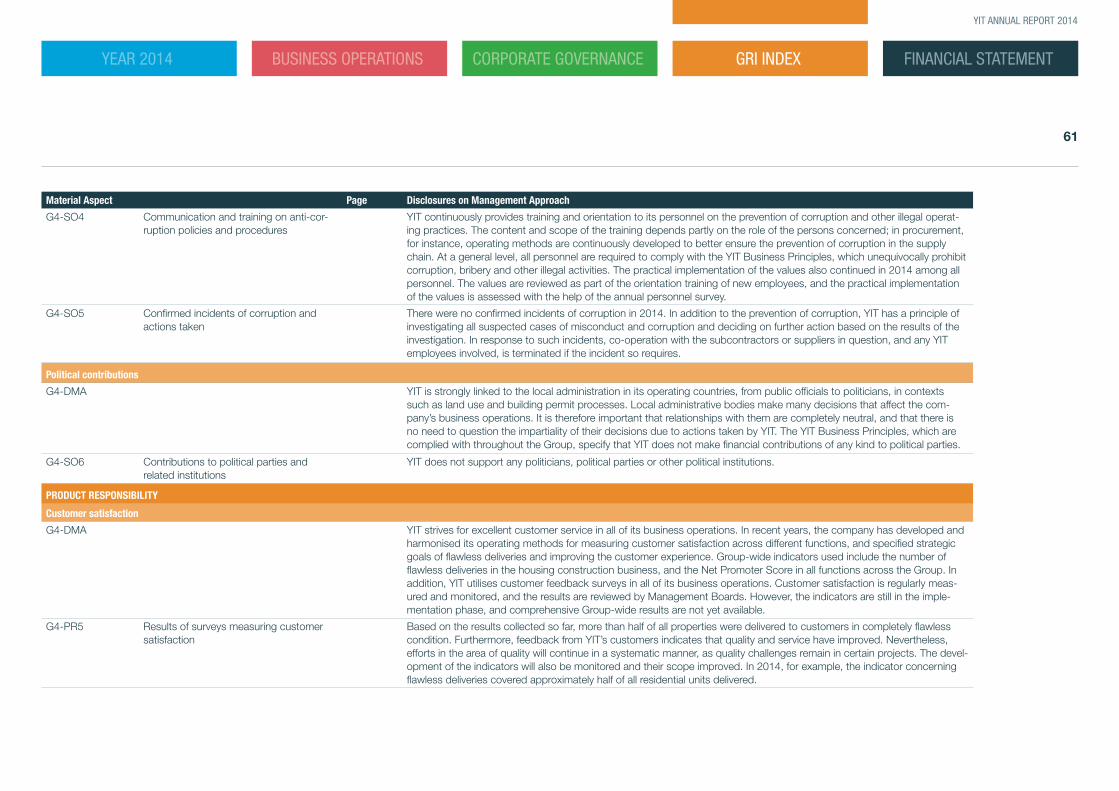
YIT ANNUAL REPORT 2014
Material Aspect Page Disclosures on Management Approach
G4-SO4 Communication and training on anti-cor-ruption policies and procedures
YIT continuously provides training and orientation to its personnel on the prevention of corruption and other illegal operat-ing practices. The content and scope of the training depends partly on the role of the persons concerned; in procurement, for instance, operating methods are continuously developed to better ensure the prevention of corruption in the supply chain. At a general level, all personnel are required to comply with the YIT Business Principles, which unequivocally prohibit corruption, bribery and other illegal activities. The practical implementation of the values also continued in 2014 among all personnel. The values are reviewed as part of the orientation training of new employees, and the practical implementation of the values is assessed with the help of the annual personnel survey.
G4-SO5 Confirmed incidents of corruption and actions taken
There were no confirmed incidents of corruption in 2014. In addition to the prevention of corruption, YIT has a principle of investigating all suspected cases of misconduct and corruption and deciding on further action based on the results of the investigation. In response to such incidents, co-operation with the subcontractors or suppliers in question, and any YIT employees involved, is terminated if the incident so requires.
Political contributions
G4-DMA YIT is strongly linked to the local administration in its operating countries, from public officials to politicians, in contexts such as land use and building permit processes. Local administrative bodies make many decisions that affect the com-pany’s business operations. It is therefore important that relationships with them are completely neutral, and that there is no need to question the impartiality of their decisions due to actions taken by YIT. The YIT Business Principles, which are complied with throughout the Group, specify that YIT does not make financial contributions of any kind to political parties.
G4-SO6 Contributions to political parties and related institutions
YIT does not support any politicians, political parties or other political institutions.
PRODUCT RESPONSIBILITY
Customer satisfaction
G4-DMA YIT strives for excellent customer service in all of its business operations. In recent years, the company has developed and harmonised its operating methods for measuring customer satisfaction across different functions, and specified strategic goals of flawless deliveries and improving the customer experience. Group-wide indicators used include the number of flawless deliveries in the housing construction business, and the Net Promoter Score in all functions across the Group. In addition, YIT utilises customer feedback surveys in all of its business operations. Customer satisfaction is regularly meas-ured and monitored, and the results are reviewed by Management Boards. However, the indicators are still in the imple-mentation phase, and comprehensive Group-wide results are not yet available.
G4-PR5 Results of surveys measuring customer satisfaction
Based on the results collected so far, more than half of all properties were delivered to customers in completely flawless condition. Furthermore, feedback from YIT’s customers indicates that quality and service have improved. Nevertheless, efforts in the area of quality will continue in a systematic manner, as quality challenges remain in certain projects. The devel-opment of the indicators will also be monitored and their scope improved. In 2014, for example, the indicator concerning flawless deliveries covered approximately half of all residential units delivered.
61
FINANCIAL STATEMENTYEAR 2014 BUSINESS OPERATIONS CORPORATE GOVERNANCE GRI INDEX
Financial Statements
63 Report of the Board of Directors
82 Consolidated financial statements
132 Parent company financial statements
144 Board of Directors’ proposal for the distribution of distributable equity
145 Auditor’s report
146 Key financial figures
152 Investor relations
154 Information for shareholders
FINANCIAL STATEMENT
YIT ANNUAL REPORT 2014
YEAR 2014 BUSINESS OPERATIONS CORPORATE GOVERNANCE GRI INDEX
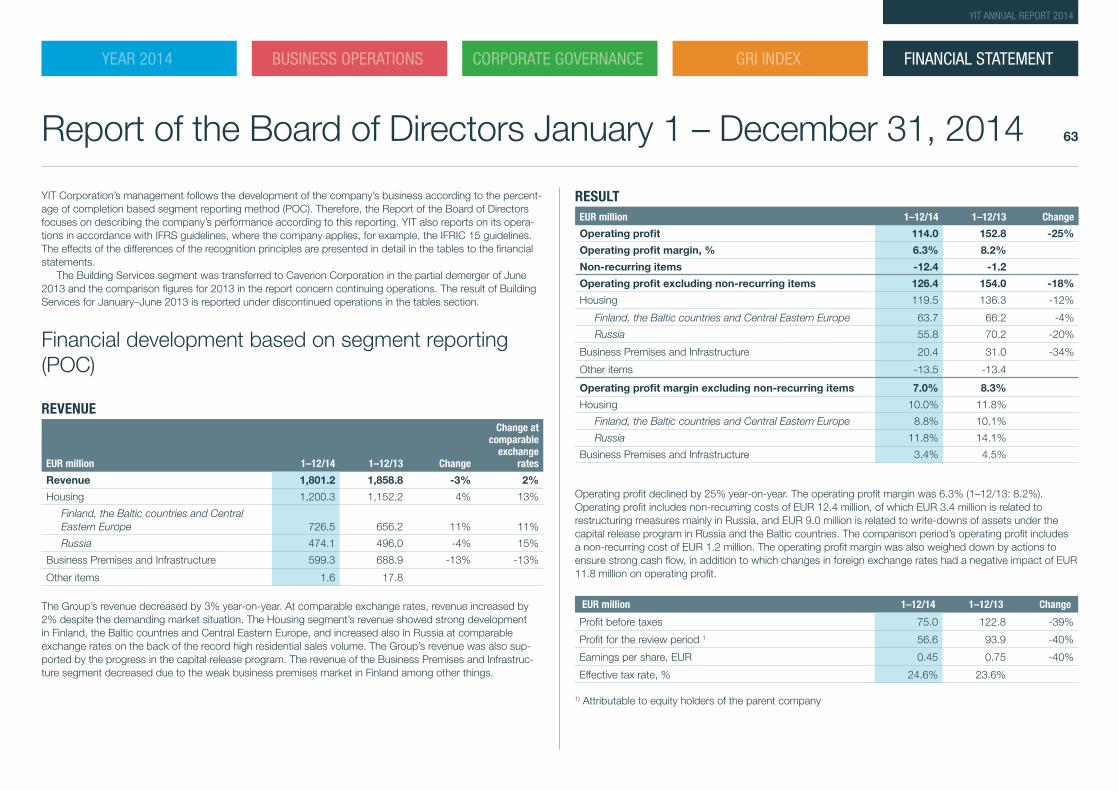
RESULTEUR million 1–12/14 1–12/13 Change
Operating profit 114.0 152.8 -25%
Operating profit margin, % 6.3% 8.2%
Non-recurring items -12.4 -1.2
Operating profit excluding non-recurring items 126.4 154.0 -18%
Housing 119.5 136.3 -12%
Finland, the Baltic countries and Central Eastern Europe 63.7 66.2 -4%
Russia 55.8 70.2 -20%
Business Premises and Infrastructure 20.4 31.0 -34%
Other items -13.5 -13.4
Operating profit margin excluding non-recurring items 7.0% 8.3%
Housing 10.0% 11.8%
Finland, the Baltic countries and Central Eastern Europe 8.8% 10.1%
Russia 11.8% 14.1%
Business Premises and Infrastructure 3.4% 4.5%
Operating profit declined by 25% year-on-year. The operating profit margin was 6.3% (1–12/13: 8.2%).Operating profit includes non-recurring costs of EUR 12.4 million, of which EUR 3.4 million is related to restructuring measures mainly in Russia, and EUR 9.0 million is related to write-downs of assets under the capital release program in Russia and the Baltic countries. The comparison period’s operating profit includes a non-recurring cost of EUR 1.2 million. The operating profit margin was also weighed down by actions to ensure strong cash flow, in addition to which changes in foreign exchange rates had a negative impact of EUR 11.8 million on operating profit.
EUR million 1–12/14 1–12/13 Change
Profit before taxes 75.0 122.8 -39%
Profit for the review period 1 56.6 93.9 -40%
Earnings per share, EUR 0.45 0.75 -40%
Effective tax rate, % 24.6% 23.6%
1) Attributable to equity holders of the parent company
Report of the Board of Directors January 1 – December 31, 2014
YIT Corporation’s management follows the development of the company’s business according to the percent-age of completion based segment reporting method (POC). Therefore, the Report of the Board of Directors focuses on describing the company’s performance according to this reporting. YIT also reports on its opera-tions in accordance with IFRS guidelines, where the company applies, for example, the IFRIC 15 guidelines. The effects of the differences of the recognition principles are presented in detail in the tables to the financial statements.
The Building Services segment was transferred to Caverion Corporation in the partial demerger of June 2013 and the comparison figures for 2013 in the report concern continuing operations. The result of Building Services for January–June 2013 is reported under discontinued operations in the tables section.
Financial development based on segment reporting (POC)
REVENUE
EUR million 1–12/14 1–12/13 Change
Change at comparable
exchange rates
Revenue 1,801.2 1,858.8 -3% 2%
Housing 1,200.3 1,152.2 4% 13%
Finland, the Baltic countries and Central Eastern Europe 726.5 656.2 11% 11%
Russia 474.1 496.0 -4% 15%
Business Premises and Infrastructure 599.3 688.9 -13% -13%
Other items 1.6 17.8
The Group’s revenue decreased by 3% year-on-year. At comparable exchange rates, revenue increased by 2% despite the demanding market situation. The Housing segment’s revenue showed strong development in Finland, the Baltic countries and Central Eastern Europe, and increased also in Russia at comparable exchange rates on the back of the record high residential sales volume. The Group’s revenue was also sup-ported by the progress in the capital release program. The revenue of the Business Premises and Infrastruc-ture segment decreased due to the weak business premises market in Finland among other things.
FINANCIAL STATEMENT
63
YIT ANNUAL REPORT 2014
YEAR 2014 BUSINESS OPERATIONS CORPORATE GOVERNANCE GRI INDEX
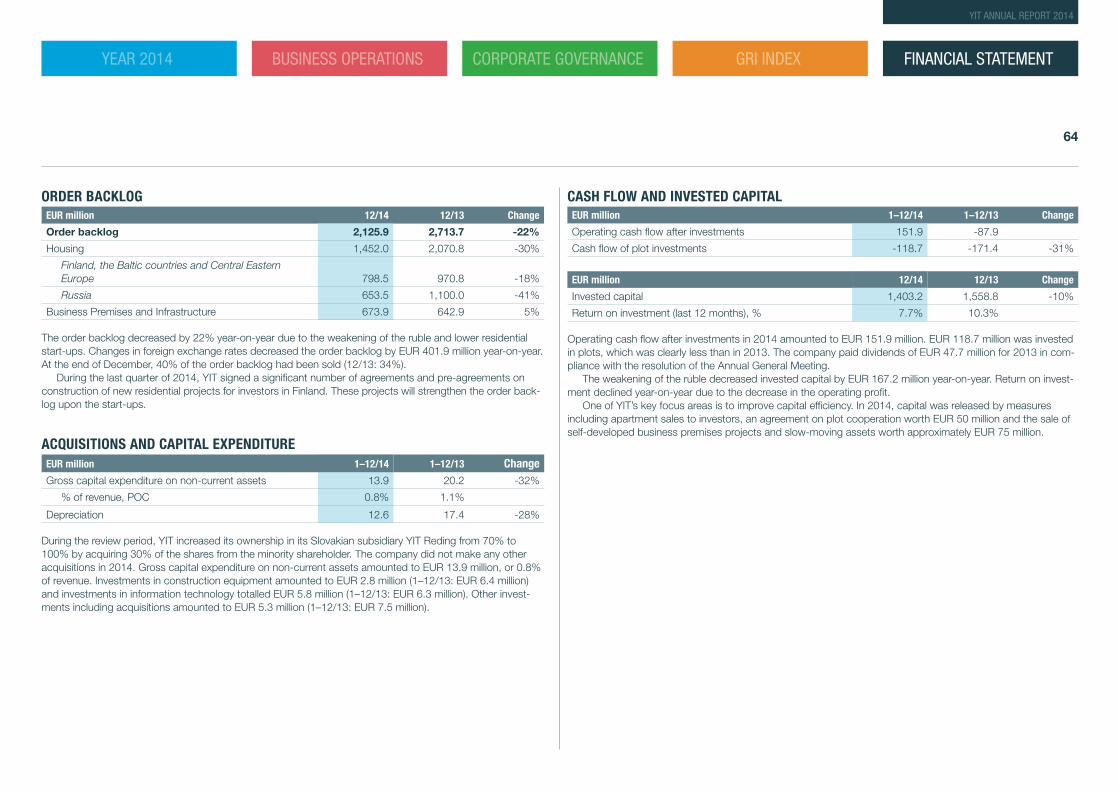
ORDER BACKLOGEUR million 12/14 12/13 Change
Order backlog 2,125.9 2,713.7 -22%
Housing 1,452.0 2,070.8 -30%
Finland, the Baltic countries and Central Eastern Europe 798.5 970.8 -18%
Russia 653.5 1,100.0 -41%
Business Premises and Infrastructure 673.9 642.9 5%
The order backlog decreased by 22% year-on-year due to the weakening of the ruble and lower residential start-ups. Changes in foreign exchange rates decreased the order backlog by EUR 401.9 million year-on-year. At the end of December, 40% of the order backlog had been sold (12/13: 34%).
During the last quarter of 2014, YIT signed a significant number of agreements and pre-agreements on construction of new residential projects for investors in Finland. These projects will strengthen the order back-log upon the start-ups.
ACQUISITIONS AND CAPITAL EXPENDITUREEUR million 1–12/14 1–12/13 ChangeGross capital expenditure on non-current assets 13.9 20.2 -32%
% of revenue, POC 0.8% 1.1%
Depreciation 12.6 17.4 -28%
During the review period, YIT increased its ownership in its Slovakian subsidiary YIT Reding from 70% to 100% by acquiring 30% of the shares from the minority shareholder. The company did not make any other acquisitions in 2014. Gross capital expenditure on non-current assets amounted to EUR 13.9 million, or 0.8% of revenue. Investments in construction equipment amounted to EUR 2.8 million (1–12/13: EUR 6.4 million) and investments in information technology totalled EUR 5.8 million (1–12/13: EUR 6.3 million). Other invest-ments including acquisitions amounted to EUR 5.3 million (1–12/13: EUR 7.5 million).
CASH FLOW AND INVESTED CAPITALEUR million 1–12/14 1–12/13 Change
Operating cash flow after investments 151.9 -87.9
Cash flow of plot investments -118.7 -171.4 -31%
EUR million 12/14 12/13 Change
Invested capital 1,403.2 1,558.8 -10%
Return on investment (last 12 months), % 7.7% 10.3%
Operating cash flow after investments in 2014 amounted to EUR 151.9 million. EUR 118.7 million was invested in plots, which was clearly less than in 2013. The company paid dividends of EUR 47.7 million for 2013 in com-pliance with the resolution of the Annual General Meeting.
The weakening of the ruble decreased invested capital by EUR 167.2 million year-on-year. Return on invest-ment declined year-on-year due to the decrease in the operating profit.
One of YIT’s key focus areas is to improve capital efficiency. In 2014, capital was released by measures including apartment sales to investors, an agreement on plot cooperation worth EUR 50 million and the sale of self-developed business premises projects and slow-moving assets worth approximately EUR 75 million.
FINANCIAL STATEMENT
64
YIT ANNUAL REPORT 2014
YEAR 2014 BUSINESS OPERATIONS CORPORATE GOVERNANCE GRI INDEX
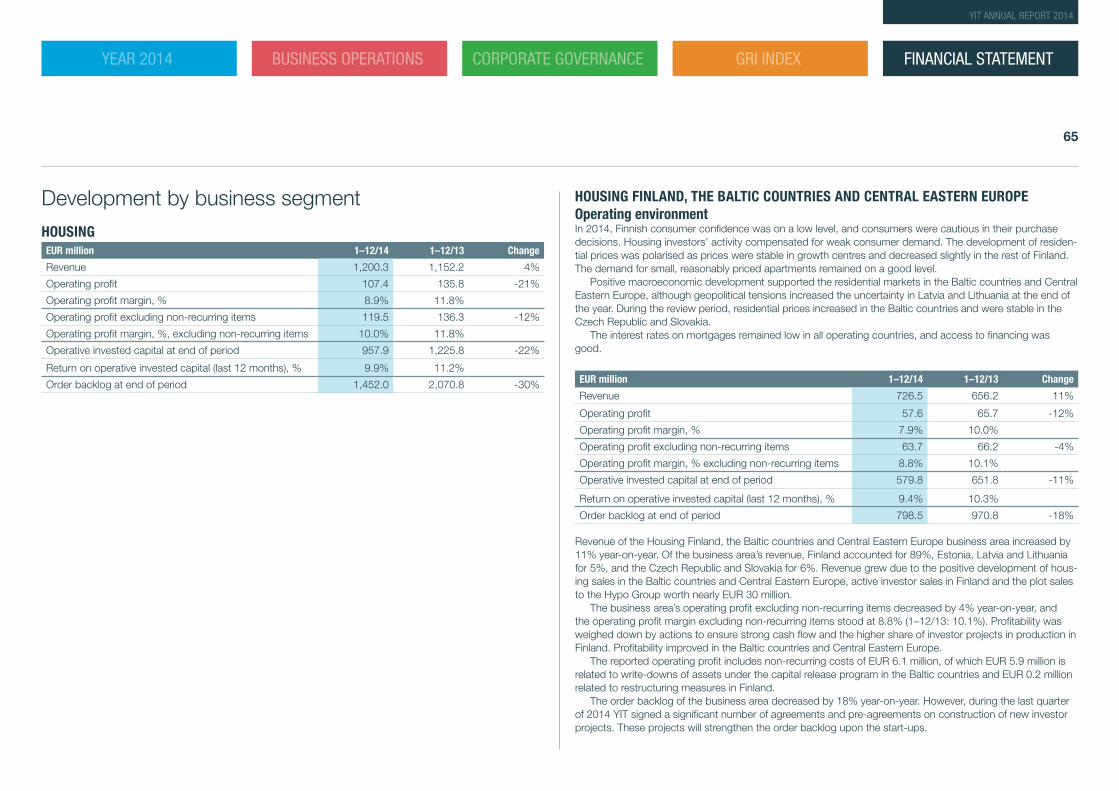
Development by business segmentHOUSINGEUR million 1–12/14 1–12/13 Change
Revenue 1,200.3 1,152.2 4%
Operating profit 107.4 135.8 -21%
Operating profit margin, % 8.9% 11.8%
Operating profit excluding non-recurring items 119.5 136.3 -12%
Operating profit margin, %, excluding non-recurring items 10.0% 11.8%
Operative invested capital at end of period 957.9 1,225.8 -22%
Return on operative invested capital (last 12 months), % 9.9% 11.2%
Order backlog at end of period 1,452.0 2,070.8 -30%
HOUSING FINLAND, THE BALTIC COUNTRIES AND CENTRAL EASTERN EUROPEOperating environmentIn 2014, Finnish consumer confidence was on a low level, and consumers were cautious in their purchase decisions. Housing investors’ activity compensated for weak consumer demand. The development of residen-tial prices was polarised as prices were stable in growth centres and decreased slightly in the rest of Finland. The demand for small, reasonably priced apartments remained on a good level.
Positive macroeconomic development supported the residential markets in the Baltic countries and Central Eastern Europe, although geopolitical tensions increased the uncertainty in Latvia and Lithuania at the end of the year. During the review period, residential prices increased in the Baltic countries and were stable in the Czech Republic and Slovakia.
The interest rates on mortgages remained low in all operating countries, and access to financing was good.
EUR million 1–12/14 1–12/13 Change
Revenue 726.5 656.2 11%
Operating profit 57.6 65.7 -12%
Operating profit margin, % 7.9% 10.0%
Operating profit excluding non-recurring items 63.7 66.2 -4%
Operating profit margin, % excluding non-recurring items 8.8% 10.1%
Operative invested capital at end of period 579.8 651.8 -11%
Return on operative invested capital (last 12 months), % 9.4% 10.3%
Order backlog at end of period 798.5 970.8 -18%
Revenue of the Housing Finland, the Baltic countries and Central Eastern Europe business area increased by 11% year-on-year. Of the business area’s revenue, Finland accounted for 89%, Estonia, Latvia and Lithuania for 5%, and the Czech Republic and Slovakia for 6%. Revenue grew due to the positive development of hous-ing sales in the Baltic countries and Central Eastern Europe, active investor sales in Finland and the plot sales to the Hypo Group worth nearly EUR 30 million.
The business area’s operating profit excluding non-recurring items decreased by 4% year-on-year, and the operating profit margin excluding non-recurring items stood at 8.8% (1–12/13: 10.1%). Profitability was weighed down by actions to ensure strong cash flow and the higher share of investor projects in production in Finland. Profitability improved in the Baltic countries and Central Eastern Europe.
The reported operating profit includes non-recurring costs of EUR 6.1 million, of which EUR 5.9 million is related to write-downs of assets under the capital release program in the Baltic countries and EUR 0.2 million related to restructuring measures in Finland.
The order backlog of the business area decreased by 18% year-on-year. However, during the last quarter of 2014 YIT signed a significant number of agreements and pre-agreements on construction of new investor projects. These projects will strengthen the order backlog upon the start-ups.
FINANCIAL STATEMENT
65
YIT ANNUAL REPORT 2014
YEAR 2014 BUSINESS OPERATIONS CORPORATE GOVERNANCE GRI INDEX
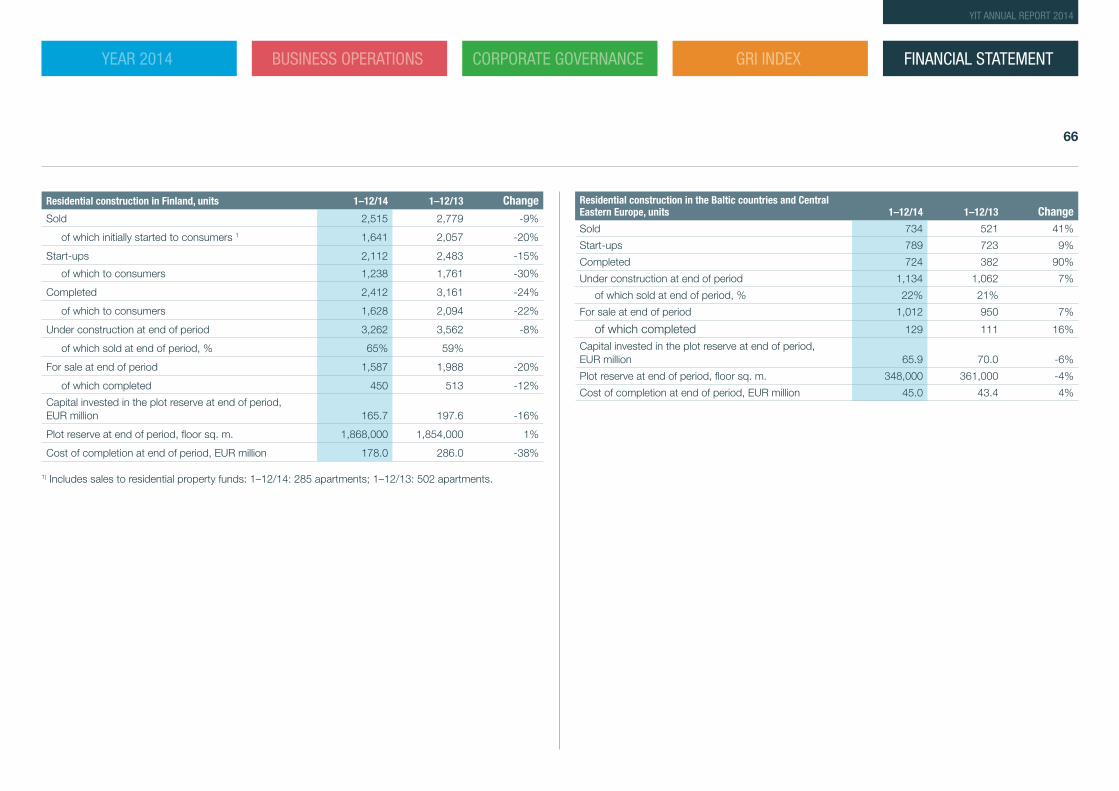
Residential construction in Finland, units 1–12/14 1–12/13 ChangeSold 2,515 2,779 -9%
of which initially started to consumers 1 1,641 2,057 -20%
Start-ups 2,112 2,483 -15%
of which to consumers 1,238 1,761 -30%
Completed 2,412 3,161 -24%
of which to consumers 1,628 2,094 -22%
Under construction at end of period 3,262 3,562 -8%
of which sold at end of period, % 65% 59%
For sale at end of period 1,587 1,988 -20%
of which completed 450 513 -12%
Capital invested in the plot reserve at end of period, EUR million 165.7 197.6 -16%
Plot reserve at end of period, floor sq. m. 1,868,000 1,854,000 1%
Cost of completion at end of period, EUR million 178.0 286.0 -38%
1) Includes sales to residential property funds: 1–12/14: 285 apartments; 1–12/13: 502 apartments.
Residential construction in the Baltic countries and Central Eastern Europe, units 1–12/14 1–12/13 ChangeSold 734 521 41%
Start-ups 789 723 9%
Completed 724 382 90%
Under construction at end of period 1,134 1,062 7%
of which sold at end of period, % 22% 21%
For sale at end of period 1,012 950 7%
of which completed 129 111 16%
Capital invested in the plot reserve at end of period, EUR million 65.9 70.0 -6%
Plot reserve at end of period, floor sq. m. 348,000 361,000 -4%
Cost of completion at end of period, EUR million 45.0 43.4 4%
FINANCIAL STATEMENT
66
YIT ANNUAL REPORT 2014
YEAR 2014 BUSINESS OPERATIONS CORPORATE GOVERNANCE GRI INDEX
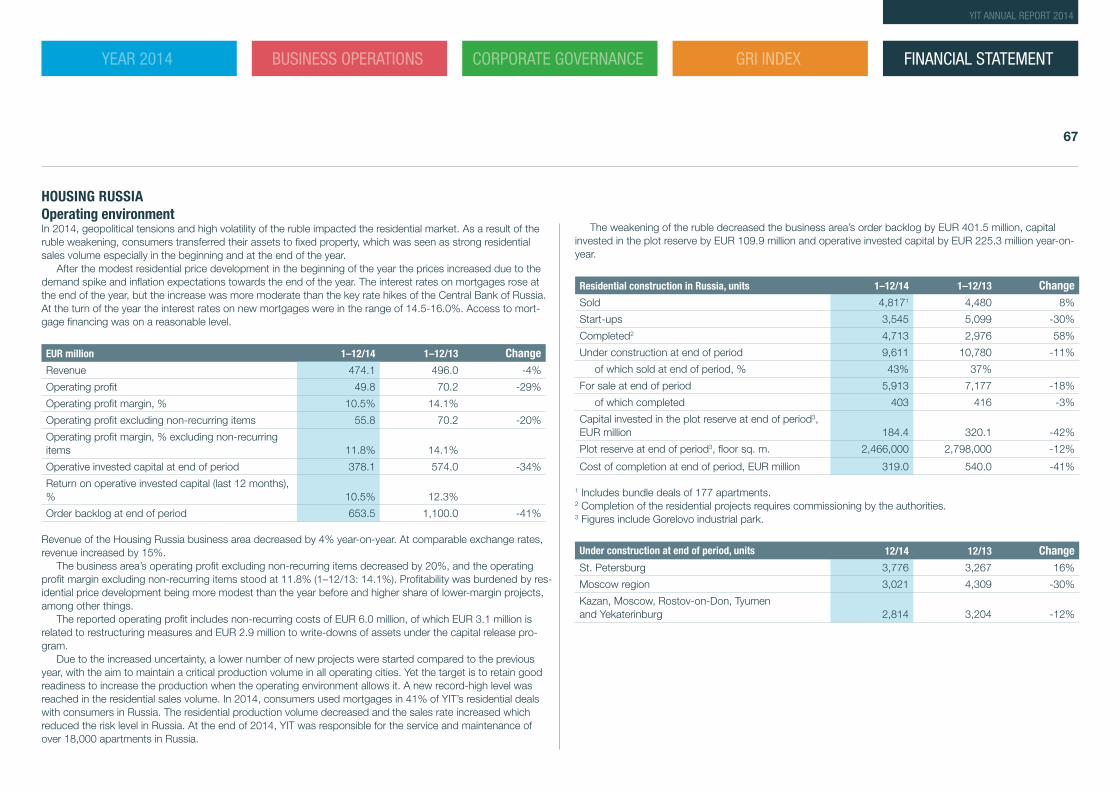
HOUSING RUSSIAOperating environmentIn 2014, geopolitical tensions and high volatility of the ruble impacted the residential market. As a result of the ruble weakening, consumers transferred their assets to fixed property, which was seen as strong residential sales volume especially in the beginning and at the end of the year.
After the modest residential price development in the beginning of the year the prices increased due to the demand spike and inflation expectations towards the end of the year. The interest rates on mortgages rose at the end of the year, but the increase was more moderate than the key rate hikes of the Central Bank of Russia. At the turn of the year the interest rates on new mortgages were in the range of 14.5-16.0%. Access to mort-gage financing was on a reasonable level.
EUR million 1–12/14 1–12/13 ChangeRevenue 474.1 496.0 -4%
Operating profit 49.8 70.2 -29%
Operating profit margin, % 10.5% 14.1%
Operating profit excluding non-recurring items 55.8 70.2 -20%
Operating profit margin, % excluding non-recurring items 11.8% 14.1%
Operative invested capital at end of period 378.1 574.0 -34%
Return on operative invested capital (last 12 months), % 10.5% 12.3%
Order backlog at end of period 653.5 1,100.0 -41%
Revenue of the Housing Russia business area decreased by 4% year-on-year. At comparable exchange rates, revenue increased by 15%.
The business area’s operating profit excluding non-recurring items decreased by 20%, and the operating profit margin excluding non-recurring items stood at 11.8% (1–12/13: 14.1%). Profitability was burdened by res-idential price development being more modest than the year before and higher share of lower-margin projects, among other things.
The reported operating profit includes non-recurring costs of EUR 6.0 million, of which EUR 3.1 million is related to restructuring measures and EUR 2.9 million to write-downs of assets under the capital release pro-gram.
Due to the increased uncertainty, a lower number of new projects were started compared to the previous year, with the aim to maintain a critical production volume in all operating cities. Yet the target is to retain good readiness to increase the production when the operating environment allows it. A new record-high level was reached in the residential sales volume. In 2014, consumers used mortgages in 41% of YIT’s residential deals with consumers in Russia. The residential production volume decreased and the sales rate increased which reduced the risk level in Russia. At the end of 2014, YIT was responsible for the service and maintenance of over 18,000 apartments in Russia.
The weakening of the ruble decreased the business area’s order backlog by EUR 401.5 million, capital invested in the plot reserve by EUR 109.9 million and operative invested capital by EUR 225.3 million year-on-year.
Residential construction in Russia, units 1–12/14 1–12/13 ChangeSold 4,8171 4,480 8%
Start-ups 3,545 5,099 -30%
Completed2 4,713 2,976 58%
Under construction at end of period 9,611 10,780 -11%
of which sold at end of period, % 43% 37%
For sale at end of period 5,913 7,177 -18%
of which completed 403 416 -3%
Capital invested in the plot reserve at end of period3, EUR million 184.4 320.1 -42%
Plot reserve at end of period3, floor sq. m. 2,466,000 2,798,000 -12%
Cost of completion at end of period, EUR million 319.0 540.0 -41%
1 Includes bundle deals of 177 apartments. 2 Completion of the residential projects requires commissioning by the authorities.3 Figures include Gorelovo industrial park.
Under construction at end of period, units 12/14 12/13 ChangeSt. Petersburg 3,776 3,267 16%
Moscow region 3,021 4,309 -30%
Kazan, Moscow, Rostov-on-Don, Tyumen and Yekaterinburg 2,814 3,204 -12%
FINANCIAL STATEMENT
67
YIT ANNUAL REPORT 2014
YEAR 2014 BUSINESS OPERATIONS CORPORATE GOVERNANCE GRI INDEX
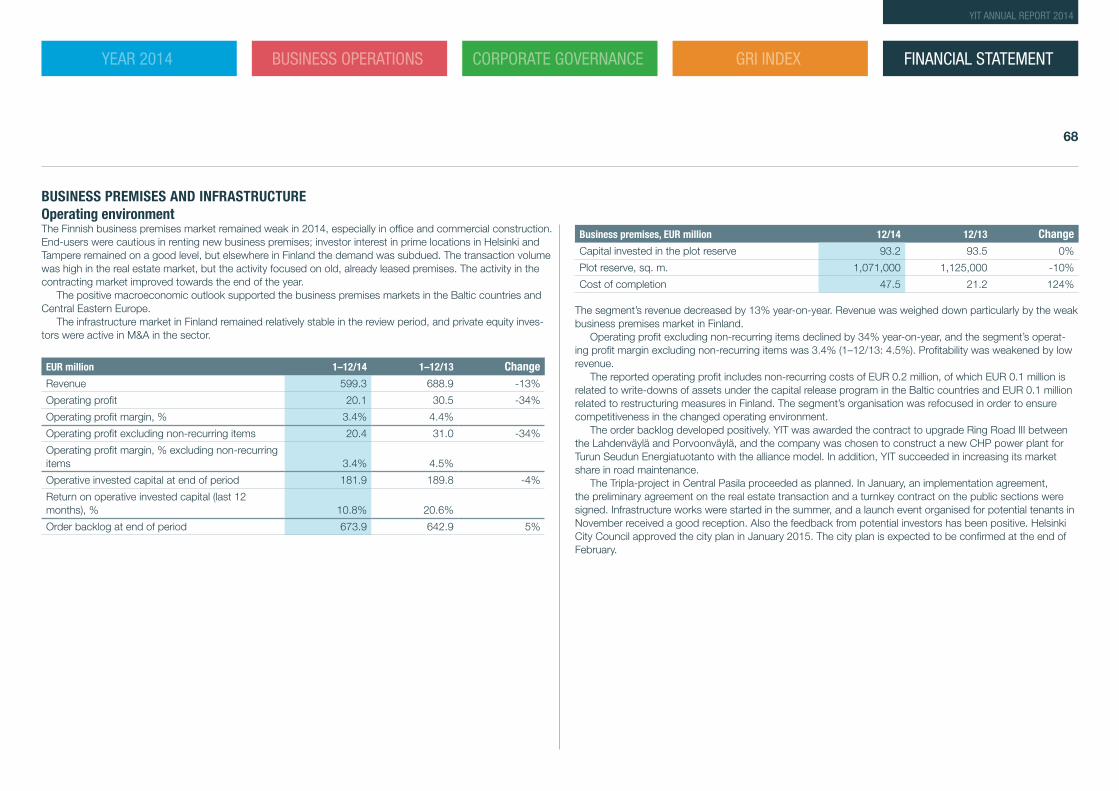
BUSINESS PREMISES AND INFRASTRUCTUREOperating environmentThe Finnish business premises market remained weak in 2014, especially in office and commercial construction. End-users were cautious in renting new business premises; investor interest in prime locations in Helsinki and Tampere remained on a good level, but elsewhere in Finland the demand was subdued. The transaction volume was high in the real estate market, but the activity focused on old, already leased premises. The activity in the contracting market improved towards the end of the year.
The positive macroeconomic outlook supported the business premises markets in the Baltic countries and Central Eastern Europe.
The infrastructure market in Finland remained relatively stable in the review period, and private equity inves-tors were active in M&A in the sector.
EUR million 1–12/14 1–12/13 ChangeRevenue 599.3 688.9 -13%
Operating profit 20.1 30.5 -34%
Operating profit margin, % 3.4% 4.4%
Operating profit excluding non-recurring items 20.4 31.0 -34%
Operating profit margin, % excluding non-recurring items 3.4% 4.5%
Operative invested capital at end of period 181.9 189.8 -4%
Return on operative invested capital (last 12 months), % 10.8% 20.6%
Order backlog at end of period 673.9 642.9 5%
Business premises, EUR million 12/14 12/13 ChangeCapital invested in the plot reserve 93.2 93.5 0%
Plot reserve, sq. m. 1,071,000 1,125,000 -10%
Cost of completion 47.5 21.2 124%
The segment’s revenue decreased by 13% year-on-year. Revenue was weighed down particularly by the weak business premises market in Finland.
Operating profit excluding non-recurring items declined by 34% year-on-year, and the segment’s operat-ing profit margin excluding non-recurring items was 3.4% (1–12/13: 4.5%). Profitability was weakened by low revenue.
The reported operating profit includes non-recurring costs of EUR 0.2 million, of which EUR 0.1 million is related to write-downs of assets under the capital release program in the Baltic countries and EUR 0.1 million related to restructuring measures in Finland. The segment’s organisation was refocused in order to ensure competitiveness in the changed operating environment.
The order backlog developed positively. YIT was awarded the contract to upgrade Ring Road III between the Lahdenväylä and Porvoonväylä, and the company was chosen to construct a new CHP power plant for Turun Seudun Energiatuotanto with the alliance model. In addition, YIT succeeded in increasing its market share in road maintenance.
The Tripla-project in Central Pasila proceeded as planned. In January, an implementation agreement, the preliminary agreement on the real estate transaction and a turnkey contract on the public sections were signed. Infrastructure works were started in the summer, and a launch event organised for potential tenants in November received a good reception. Also the feedback from potential investors has been positive. Helsinki City Council approved the city plan in January 2015. The city plan is expected to be confirmed at the end of February.
FINANCIAL STATEMENT
68
YIT ANNUAL REPORT 2014
YEAR 2014 BUSINESS OPERATIONS CORPORATE GOVERNANCE GRI INDEX
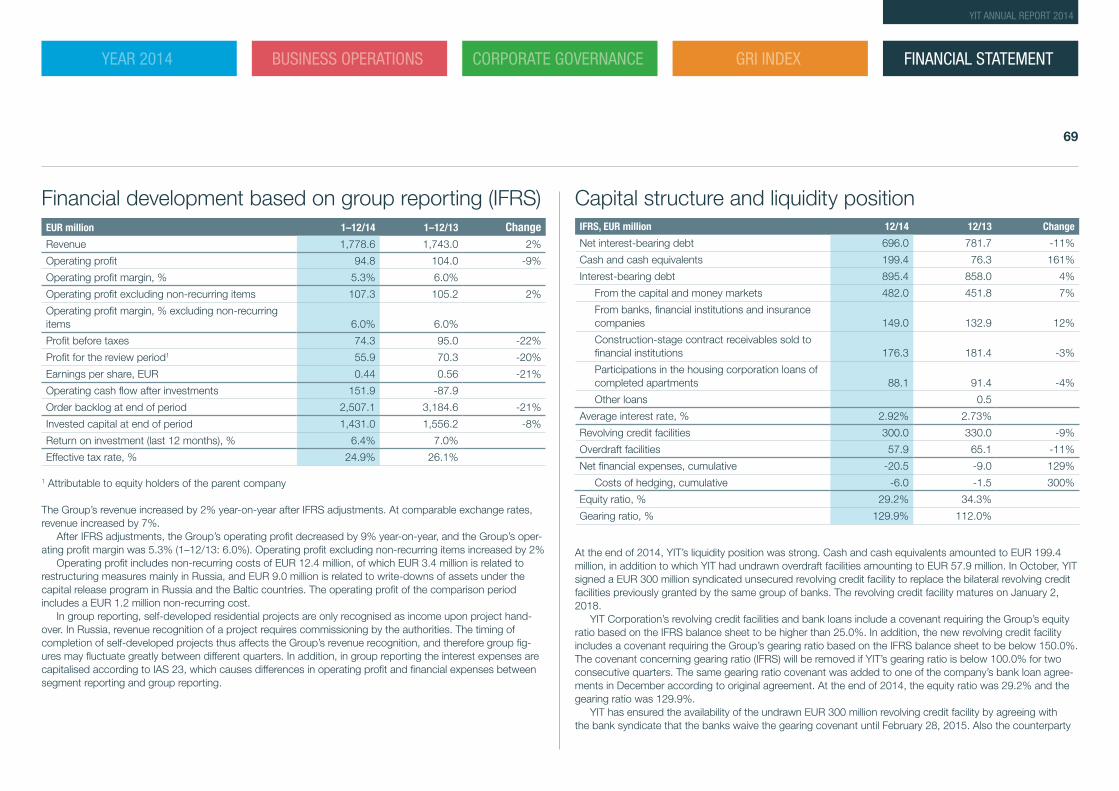
Financial development based on group reporting (IFRS)EUR million 1–12/14 1–12/13 ChangeRevenue 1,778.6 1,743.0 2%
Operating profit 94.8 104.0 -9%
Operating profit margin, % 5.3% 6.0%
Operating profit excluding non-recurring items 107.3 105.2 2%
Operating profit margin, % excluding non-recurring items 6.0% 6.0%
Profit before taxes 74.3 95.0 -22%
Profit for the review period1 55.9 70.3 -20%
Earnings per share, EUR 0.44 0.56 -21%
Operating cash flow after investments 151.9 -87.9
Order backlog at end of period 2,507.1 3,184.6 -21%
Invested capital at end of period 1,431.0 1,556.2 -8%
Return on investment (last 12 months), % 6.4% 7.0%
Effective tax rate, % 24.9% 26.1%
1 Attributable to equity holders of the parent company
The Group’s revenue increased by 2% year-on-year after IFRS adjustments. At comparable exchange rates, revenue increased by 7%.
After IFRS adjustments, the Group’s operating profit decreased by 9% year-on-year, and the Group’s oper-ating profit margin was 5.3% (1–12/13: 6.0%). Operating profit excluding non-recurring items increased by 2%
Operating profit includes non-recurring costs of EUR 12.4 million, of which EUR 3.4 million is related to restructuring measures mainly in Russia, and EUR 9.0 million is related to write-downs of assets under the capital release program in Russia and the Baltic countries. The operating profit of the comparison period includes a EUR 1.2 million non-recurring cost.
In group reporting, self-developed residential projects are only recognised as income upon project hand-over. In Russia, revenue recognition of a project requires commissioning by the authorities. The timing of completion of self-developed projects thus affects the Group’s revenue recognition, and therefore group fig-ures may fluctuate greatly between different quarters. In addition, in group reporting the interest expenses are capitalised according to IAS 23, which causes differences in operating profit and financial expenses between segment reporting and group reporting.
Capital structure and liquidity position IFRS, EUR million 12/14 12/13 Change
Net interest-bearing debt 696.0 781.7 -11%
Cash and cash equivalents 199.4 76.3 161%
Interest-bearing debt 895.4 858.0 4%
From the capital and money markets 482.0 451.8 7%
From banks, financial institutions and insurance companies 149.0 132.9 12%
Construction-stage contract receivables sold to financial institutions 176.3 181.4 -3%
Participations in the housing corporation loans of completed apartments 88.1 91.4 -4%
Other loans 0.5
Average interest rate, % 2.92% 2.73%
Revolving credit facilities 300.0 330.0 -9%
Overdraft facilities 57.9 65.1 -11%
Net financial expenses, cumulative -20.5 -9.0 129%
Costs of hedging, cumulative -6.0 -1.5 300%
Equity ratio, % 29.2% 34.3%
Gearing ratio, % 129.9% 112.0%
At the end of 2014, YIT’s liquidity position was strong. Cash and cash equivalents amounted to EUR 199.4 million, in addition to which YIT had undrawn overdraft facilities amounting to EUR 57.9 million. In October, YIT signed a EUR 300 million syndicated unsecured revolving credit facility to replace the bilateral revolving credit facilities previously granted by the same group of banks. The revolving credit facility matures on January 2, 2018.
YIT Corporation’s revolving credit facilities and bank loans include a covenant requiring the Group’s equity ratio based on the IFRS balance sheet to be higher than 25.0%. In addition, the new revolving credit facility includes a covenant requiring the Group’s gearing ratio based on the IFRS balance sheet to be below 150.0%. The covenant concerning gearing ratio (IFRS) will be removed if YIT’s gearing ratio is below 100.0% for two consecutive quarters. The same gearing ratio covenant was added to one of the company’s bank loan agree-ments in December according to original agreement. At the end of 2014, the equity ratio was 29.2% and the gearing ratio was 129.9%.
YIT has ensured the availability of the undrawn EUR 300 million revolving credit facility by agreeing with the bank syndicate that the banks waive the gearing covenant until February 28, 2015. Also the counterparty
FINANCIAL STATEMENT
69
YIT ANNUAL REPORT 2014
YEAR 2014 BUSINESS OPERATIONS CORPORATE GOVERNANCE GRI INDEX
bank of the bank loan agreement waived the gearing covenant until the above-mentioned date. The reason for the temporary amendment of the terms was the remarkable volatility of the ruble exchange rate in December.
The total amount of interest-bearing debt was EUR 895.4 million at the end of 2014 and net interest-bear-ing debt decreased to EUR 696.0 million thanks to strong cash flow. A total of EUR 208.6 million of long-term loans will mature in 2015.
Net financial expenses increased year-on-year and amounted to EUR 20.5 million (1–12/13: EUR 9.0 million). Interest expenses at the amount of EUR 18.5 million (1–12/13: EUR 21.0 million) were capitalized in accordance with IAS 23.
The interests on participations in housing corporation loans are included in housing corporation charges and are thus booked in project expenses. Interests on the participations amounted to EUR 3.3 million in 2014 (1–12/13: EUR 2.9 million).
At the end of 2014, EUR 70.9 million of the capital invested in Russia was comprised of debt investments (12/13: EUR 139.4 million) and EUR 246.0 million was equity investments or similar permanent net invest-ments (12/13: EUR 407.7 million). In accordance with YIT’s hedging policy, the debt investments are hedged against exchange rate risk, while equity investments are not hedged due to their permanent nature. In 2014, changes in foreign exchange rates decreased the Group’s equity by EUR 166.9 million through translation difference.
Research and developmentIn 2014, YIT engaged in active development work through development projects on themes derived from the strategy, and as part of the development of self-developed projects.The three Group-wide development programs launched in 2013 continued. The aim of the Best Living Experi-ence programme is to support the forerunner position and profitability in the Housing segment in all operating countries. Efficient capital allocation, fast capital turnover and working capital management are the key areas of development within the Increasing Financial Flexibility programme. The Excellent Leadership and Balanced Values programme progressed also according to plan.
YIT engaged in the development of affordable and accessible product concepts in all business areas. The development and implementation of the area development concept was a common focus area in the Housing segment. Concept development in the housing maintenance business and development of the Safe Home concept continued in Russia. The first low-rise apartment building projects in Russia were successful.
YIT Plus, a new online service for customers who have bought a YIT Home, was launched in autumn 2014. YIT Plus makes the daily life easier through services for residents as well as housing companies. New infor-mation management solutions were developed for business planning and analysis as well as project manage-ment. The solutions will be implemented during 2015.
Other Group-wide development themes in 2014 were occupational safety, quality and responsibility. YIT’s brand renewal reached the implementation stage.
The Group’s research and development costs in 2014 amounted to EUR 14.5 million (1–12/2013: EUR 15.0 million), representing 0.8% (1–12/2013: 0.9%) of the revenue based on group reporting.
Resolutions passed at the Annual General MeetingThe Annual General Meeting of YIT Corporation was arranged on March 18, 2014. The Annual General Meet-ing adopted the 2013 financial statements and discharged the members of the Board of Directors and the President and CEO from liability. The Annual General Meeting decided on the dividend payout, composition of the Board of Directors, the election of the auditor and its fees as well as authorising the Board of Directors to decide on the purchase of company shares.
It was decided that a dividend of EUR 0.38 be paid per share, or a total of EUR 47.7 million, as proposed by the Board of Directors, and that the remainder of the earnings be retained in distributable equity. The right to a dividend rested with a shareholder who, by the record date of March 21, 2014, was entered as a share-holder in the company’s shareholder register maintained by Euroclear Finland Ltd. It was decided that the dividend be paid on March 28, 2014. No dividend was paid on treasury shares.
The Annual General Meeting resolved to elect a Chairman, Vice Chairman and four ordinary members to the Board of Directors, namely: Reino Hanhinen as Chairman, Kim Gran as Vice Chairman and Satu Huber, Erkki Järvinen, Juhani Pitkäkoski and Teuvo Salminen as members.
It was resolved to pay the Board of Directors remuneration as follows: the Chairman EUR 6,600 per month (EUR 79,200 per year), the Vice Chairman EUR 5,000 per month (EUR 60,000 per year) and the Board mem-bers EUR 3,900 per month (EUR 46,800 per year), as well as an attendance fee of EUR 550 per meeting. In addition, the members of Board Committees are paid an attendance fee of EUR 550 for each committee meeting. Per diems for trips in Finland and abroad are paid in accordance with the state’s travel compensation regulations.
PricewaterhouseCoopers, Authorised Public Accountants, was elected as the company’s auditor, with Heikki Lassila, Authorised Public Accountant, as chief auditor. The auditor’s fees will be paid against the invoices approved by the company.
The Annual General Meeting authorised the Board of Directors to decide on the purchase of company shares as proposed by the Board of Directors. The authorisation covers the purchasing of a maximum of 10,760,000 company shares using the company’s unrestricted equity. The authorisation is valid until March 31, 2015. The authorisation reversed the authorisation to purchase the company’s own shares issued by the Annual General Meeting on March 15, 2013.
YIT published stock exchange releases on the resolutions passed at the Annual General Meeting and the organisation of the Board of Directors on March 18, 2014. The stock exchange releases and a presentation of the members of the Board of Directors are available on our website.
FINANCIAL STATEMENT
70
YIT ANNUAL REPORT 2014
YEAR 2014 BUSINESS OPERATIONS CORPORATE GOVERNANCE GRI INDEX
Organisation of the Board of DirectorsYIT Corporation’s Board of Directors held its organizational meeting on March 18, 2014. In the meeting the Board decided on the composition of the Personnel Committee and the Audit Committee.
From among its number, the Board elected Reino Hanhinen as chairman and Kim Gran and Erkki Järvinen as members of the Personnel Committee. From among its number, the Board elected Satu Huber as chair-man and Teuvo Salminen and Juhani Pitkäkoski as members of the Audit Committee.
Recommendation 26 (Independence of the members of the audit committee) of the Finnish Corporate Governance Code was deviated from in the election of the members of the company’s Audit Committee, when Juhani Pitkäkoski, who is not independent of the company, was elected as a member of the Audit Com-mittee. Pitkäkoski was elected as a member of the Audit Committee due to his extensive knowledge of the company’s business and finances as well as management, supervision and control systems as the company’s former CEO.
Organisational changes and changes in company management
AS OF JANUARY 1, 2014, THE GROUP MANAGEMENT BOARD COMPRISED OF:
• Kari Kauniskangas, Chairman, President and CEO of YIT Corporation, Head of the Housing segment• Tero Kiviniemi, Vice Chairman, YIT Corporation’s Executive Vice President,
Head of Business Premises and Infrastructure segment• Timo Lehtinen, Chief Financial Officer• Teemu Helppolainen, Head of business area Russia• Juhani Nummi, Senior Vice President, Business Development• Pii Raulo, Senior Vice President, Human Resources
IN ADDITION TO THE MEMBERS OF THE MANAGEMENT BOARD, THE EXTENDED MANAGEMENT BOARD ALSO INCLUDED, AS OF JANUARY 1, 2014:• Yuri Belomestnov, General Director of YIT Moskovia (until February 7, 2014)• Jouni Forsman, Head of Infra Services division• Harri Isoviita, Head of Residential Construction division• Matti Koskela, Head of Building Construction division• Timo Lehmus, Head of Business Premises division• Tom Sandvik, Head of Central Eastern Europe division• Mikhail Voziyanov, General Director of YIT Lentek
In the spring of 2014, Pavel Kocherezhkin was appointed the General Director of YIT Moskovia and a member of the extended Management Board.
The competitiveness of the Business Premises and Infrastructure segment was strengthened with the organ-isational change carried out in the autumn of 2014, in which business units focused on real estate development were centralised to better serve the entire segment, with the aim of further developing co-operation and strength-ening expertise in real estate development. In the organisational change, the Real Estate Development division was established and Timo Lehmus appointed as its Head. The Business Premises division that focuses more on construction is led by Kari Alavillamo, who was also appointed a member of the extended Management Board.
In the autumn of 2014, YIT announced that it would change its segment structure and the composition of the Group Management Board from the beginning of 2015. The Housing segment was split into Housing Finland and CEE and Housing Russia segments. The Housing Finland and CEE segment is equivalent to the former Housing Finland, the Baltic countries and Central Eastern Europe business area. The Business Prem-ises and Infrastructure segment remained as before. In connection with the change in the segment structure, Teemu Helppolainen was appointed Head of the Housing Russia segment. He was previously responsible for the corresponding business area. Antti Inkilä was appointed Head of the Housing Finland and CEE segment and a member of the Group Management Board.
FINANCIAL STATEMENT
71
YIT ANNUAL REPORT 2014
YEAR 2014 BUSINESS OPERATIONS CORPORATE GOVERNANCE GRI INDEX
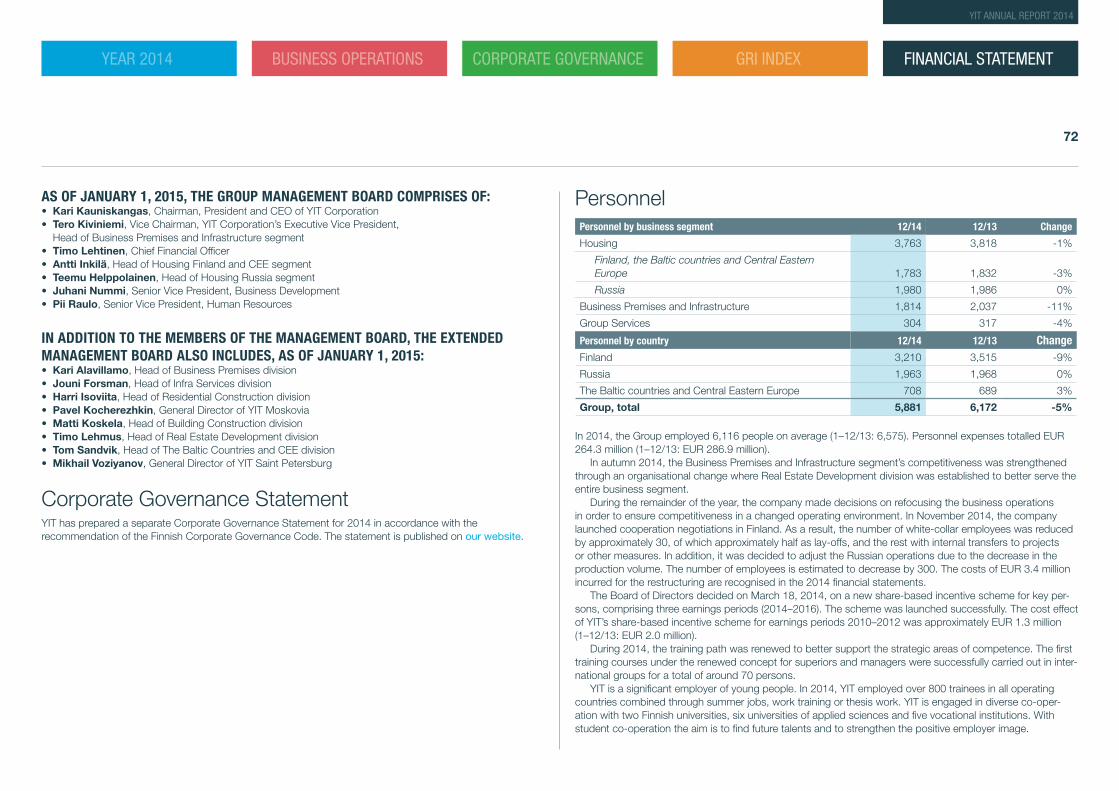
AS OF JANUARY 1, 2015, THE GROUP MANAGEMENT BOARD COMPRISES OF:• Kari Kauniskangas, Chairman, President and CEO of YIT Corporation• Tero Kiviniemi, Vice Chairman, YIT Corporation’s Executive Vice President,
Head of Business Premises and Infrastructure segment• Timo Lehtinen, Chief Financial Officer• Antti Inkilä, Head of Housing Finland and CEE segment• Teemu Helppolainen, Head of Housing Russia segment• Juhani Nummi, Senior Vice President, Business Development• Pii Raulo, Senior Vice President, Human Resources
IN ADDITION TO THE MEMBERS OF THE MANAGEMENT BOARD, THE EXTENDED MANAGEMENT BOARD ALSO INCLUDES, AS OF JANUARY 1, 2015:• Kari Alavillamo, Head of Business Premises division• Jouni Forsman, Head of Infra Services division• Harri Isoviita, Head of Residential Construction division• Pavel Kocherezhkin, General Director of YIT Moskovia• Matti Koskela, Head of Building Construction division• Timo Lehmus, Head of Real Estate Development division• Tom Sandvik, Head of The Baltic Countries and CEE division• Mikhail Voziyanov, General Director of YIT Saint Petersburg
Corporate Governance StatementYIT has prepared a separate Corporate Governance Statement for 2014 in accordance with the recommendation of the Finnish Corporate Governance Code. The statement is published on our website.
PersonnelPersonnel by business segment 12/14 12/13 Change
Housing 3,763 3,818 -1%
Finland, the Baltic countries and Central Eastern Europe 1,783 1,832 -3%
Russia 1,980 1,986 0%
Business Premises and Infrastructure 1,814 2,037 -11%
Group Services 304 317 -4%
Personnel by country 12/14 12/13 ChangeFinland 3,210 3,515 -9%
Russia 1,963 1,968 0%
The Baltic countries and Central Eastern Europe 708 689 3%
Group, total 5,881 6,172 -5%
In 2014, the Group employed 6,116 people on average (1–12/13: 6,575). Personnel expenses totalled EUR 264.3 million (1–12/13: EUR 286.9 million).
In autumn 2014, the Business Premises and Infrastructure segment’s competitiveness was strengthened through an organisational change where Real Estate Development division was established to better serve the entire business segment.
During the remainder of the year, the company made decisions on refocusing the business operations in order to ensure competitiveness in a changed operating environment. In November 2014, the company launched cooperation negotiations in Finland. As a result, the number of white-collar employees was reduced by approximately 30, of which approximately half as lay-offs, and the rest with internal transfers to projects or other measures. In addition, it was decided to adjust the Russian operations due to the decrease in the production volume. The number of employees is estimated to decrease by 300. The costs of EUR 3.4 million incurred for the restructuring are recognised in the 2014 financial statements.
The Board of Directors decided on March 18, 2014, on a new share-based incentive scheme for key per-sons, comprising three earnings periods (2014–2016). The scheme was launched successfully. The cost effect of YIT’s share-based incentive scheme for earnings periods 2010–2012 was approximately EUR 1.3 million (1–12/13: EUR 2.0 million).
During 2014, the training path was renewed to better support the strategic areas of competence. The first training courses under the renewed concept for superiors and managers were successfully carried out in inter-national groups for a total of around 70 persons.
YIT is a significant employer of young people. In 2014, YIT employed over 800 trainees in all operating countries combined through summer jobs, work training or thesis work. YIT is engaged in diverse co-oper-ation with two Finnish universities, six universities of applied sciences and five vocational institutions. With student co-operation the aim is to find future talents and to strengthen the positive employer image.
FINANCIAL STATEMENT
72
YIT ANNUAL REPORT 2014
YEAR 2014 BUSINESS OPERATIONS CORPORATE GOVERNANCE GRI INDEX
Occupational safety was a key focus area for YIT in 2014. The level of the company’s occupational safety is monitored by the same indicators in all countries, and occupational safety co-operation is tight. “Stop - Shape Up” discussions were carried out by widely engaging personnel. In Finland, accident frequency (accidents per million hours worked) decreased after the campaign during the fourth quarter to a record-low level. In 2014, the Group’s accident frequency was 12 (1–12/13: 11).
Matters related to well-being at work developed positively. The average retirement age has increased and the number of new long-term (over 30 days) sick leaves has decreased in Finland.
Corporate responsibilityIn 2014, the company engaged in extensive discussions with different stakeholders to survey their views regarding YIT’s business operations and their responsibility. As a result of these discussions, the company’s approach to responsibility was developed and the themes identified as material were emphasised further.
A particular area of focus in responsibility development efforts throughout the year was the perspective of producing added value, or the Sustainable urban environments approach, which was also identified by stake-holders as the most important component of responsibility. In business operations, this means applying the principles of sustainable development in construction projects in order to promote environmental, social and economic sustainability in the urban environment. In practice, the company seeks to develop convenience and comfort in everyday living in residential neighbourhoods, as well as to utilise new and more environmentally friendly energy and waste solutions.
The comfort of residential neighbourhoods can be increased by public art, for example. In Joensuu’s Pent-tilänranta district, YIT implemented an “artistic project” when the facade, lobby and balconies of an apartment building were utilised to make art part of the building. Meanwhile in Mikkeli, the company is involved in Fin-land’s first BREEAM area development project in co-operation with the city. The project takes the principles of sustainable development into consideration in a unique way, starting from zoning.
The company has developed its responsibility reporting in the direction of integrated reporting, emphasis-ing value creation and a future-oriented perspective.
Strategic objectives and the outcome in 2014At its meeting on September 11, 2014, YIT Corporation’s Board of Directors decided to keep the company’s strategic focus areas unchanged. The weakened macroeconomic outlook in Russia and Finland underlines the importance of sufficient financial operating space. In the Housing segment, YIT pursues growth through self-developed projects. In the Business Premises and Infrastructure segment, the aim is to increase the share of projects where the added value produced by YIT for the customer is as high as possible. In order to even out cyclicality, the weighting of Central Eastern Europe will be increased as the third geographic pillar in paral-lel with Finland and Russia.
The implementation of the strategy and reaching the financial targets is supported by the launch of a Group-wide competitiveness program, under which short-term targets have been defined for 2015 and 2016. The long-term financial targets remain unchanged.
YIT’s strategy and financial targets were described at YIT’s Capital Markets Day on September 25, 2014, in Helsinki, Finland. The presentation materials and recordings from the Capital Markets Day are available at www.yitgroup.com/investors.
In 2014, cash flow exceeded the targeted level clearly and also the proposed dividend payout is in line with the dividend policy. However, in the demanding market environment, the targets for revenue growth, return on investment and equity ratio were not reached.
YIT’s long-term financial targets Target level
Revenue growth 5–10% annually on average
Return on investment 20%
Operating cash flow after investments Sufficient for dividend payout and reduction of debt
Equity ratio 40%
Dividend payout 40–60% of net profit for the period
YIT’s short-term targets for years 2015 and 2016 Target level
Revenue growth 0–5% annually on average
Return on investment 15%
Net debt (IFRS) Below EUR 600 million
The target levels excluding the net debt target are based on segment reporting method (POC).
FINANCIAL STATEMENT
73
YIT ANNUAL REPORT 2014
YEAR 2014 BUSINESS OPERATIONS CORPORATE GOVERNANCE GRI INDEX
Most significant short-term business risks and risk managementRisk management is an integral part of business control, monitoring, reporting and continuous development under YIT’s management system. Risk management covers the identification and assessment of risks and contingency plans for strategic, operational, financial and event risks. A strategic risk assessment is carried out at Group level once a year in connection with the review of the strategy. The nature and probability of stra-tegic risks is continuously monitored and reported on.
Changes in economic, demographic, technological and political factors have an effect on YIT’s business. Changes in consumer and business confidence and the availability of mortgages and real estate financing are key risks related to the demand for apartments and business premises. YIT aims to mitigate political risk and to manage cyclicality through geographical diversification. Large area development projects and tender-based projects also enable planned flexibility in different market situations. In operations subject to sales risk, it is key to ensure that the offering matches demand, taking different customer segments into consideration. Agility in moving between different project types is also crucial.
YIT’s typical operational risks include risks related to plot investments, the sales risk of self-developed residential and business premises projects, and risks related to contract tenders, service agreements, project management and personnel. In project management, the key considerations are the accuracy of estimated costs and schedules, as well as competence in pricing. Third-party decisions regarding matters such as legislation, norms, zoning and construction permits also constitute a key operational risk. YIT manages sales risk by engaging in active pre-marketing, adjusting the number of residential start-ups according to estimated residential demand and the number of unsold apartments, and by typically securing anchor tenants prior to starting a business premises project and the investor in an early phase of construction. Risk management is an inseparable part of the preparation and implementation of projects and their phases. The management of large projects is supported by control practices including the method of organisation. Proactive communica-tion with various stakeholders improves the predictability of projects and promotes smooth co-operation.
One of YIT’s strategic focus areas is increasing financial flexibility, and targets pertaining to the release of capital have been set accordingly. Measures to release capital in a challenging market situation involve the risk of financial losses.
Financial risks include risks related to the sufficiency of financing, currency and interest rates, credit and counterparty risks and risks related to the reporting process. The Group’s most significant currency risk is related to ruble-denominated investments. Financial risks are managed through accounting and treasury policies, internal control as well as internal and external auditing. More information on financial risks and their management is provided in Note 30 to the financial statements.
Possible event risks include personal damage, property damage and damage pertaining to information security, environmental damage and accidents, as well as sudden and unforeseen damage to property and premises related to project sites and other property, such as fire, collapse or theft. The primary objective of the management of event risks is the prevention of damage. Event risks are additionally managed through contin-gency plans as well as a Group-wide insurance policy and programmes. YIT also complies with a Group-wide security policy covering the different areas of security. Extensive training is provided for occupational safety-re-lated matters, and its development is monitored from unit level to the Group’s Management Board and Board
of Directors. The IT infrastructure and practices are managed through IT policies. In order to ensure compliant and ethical operations, the Group has common Business Principles and effective methods for reporting and processing any misdemeanours. The Business Principles are reviewed on a regular basis, and compliance is supervised by means of internal and external auditing. The compliance of subcontractors’ operations is ensured through services related to guidance and internal audits.
Shares and shareholdersThe company has one series of shares. Each share carries one vote and confers an equal right to a dividend.
SHARE CAPITAL AND NUMBER OF SHARESYIT Corporation’s share capital and the number of shares outstanding did not change during the review period. YIT Corporation’s share capital was EUR 149,216,748.22 at the end of 2014 (2013: EUR 149,216,748.22), and the number of shares outstanding was 127,223,422 (2013: 127,223,422).
TREASURY SHARES AND AUTHORISATIONS OF THE BOARD OF DIRECTORS The Annual General Meeting of YIT Corporation resolved on March 18, 2014, to authorise the Board of Direc-tors to purchase the company’s shares as proposed by the Board of Directors. In addition to this, the Board of Directors maintains a valid share issue authorisation issued by YIT’s Annual General Meeting on March 10, 2010. The authorisation is valid for five years after the date it was granted. The share issue authorisation also includes an authorisation to decide on the conveyance of treasury shares.
YIT Corporation held 1,633,286 treasury shares at the beginning of the review period purchased on the basis of the authorisation given by the General Meeting of October 6, 2008. During the review period, 6,144 shares were returned to the company in accordance with the terms and conditions of the share-based incen-tive scheme, after which the company held 1,639,430 treasury shares at the end of the year.
TRADING IN SHARESThe price of YIT’s share was EUR 10.17 at the beginning of the year. The closing price of the share on the last trading day of the review period on December 30, 2014, was EUR 4.27. YIT’s share price decreased by approximately 58% during the review period. The highest price of the share during the review period was EUR 10.70, the lowest EUR 4.17 and the average price was EUR 7.35. Share turnover on Nasdaq Helsinki during the review period was approximately 144 million shares. The value of the share turnover was approximately EUR 1,029 million.
During the review period, approximately 99 million YIT Corporation shares changed hands in alternative market places, corresponding to approximately 41% of the total share trade, source: Fidessa Fragmentation Index.
YIT Corporation’s market capitalisation on the last day of the year, was EUR 536.2 million. The market cap-italisation has been calculated excluding the shares held by the company.
FINANCIAL STATEMENT
74
YIT ANNUAL REPORT 2014
YEAR 2014 BUSINESS OPERATIONS CORPORATE GOVERNANCE GRI INDEX
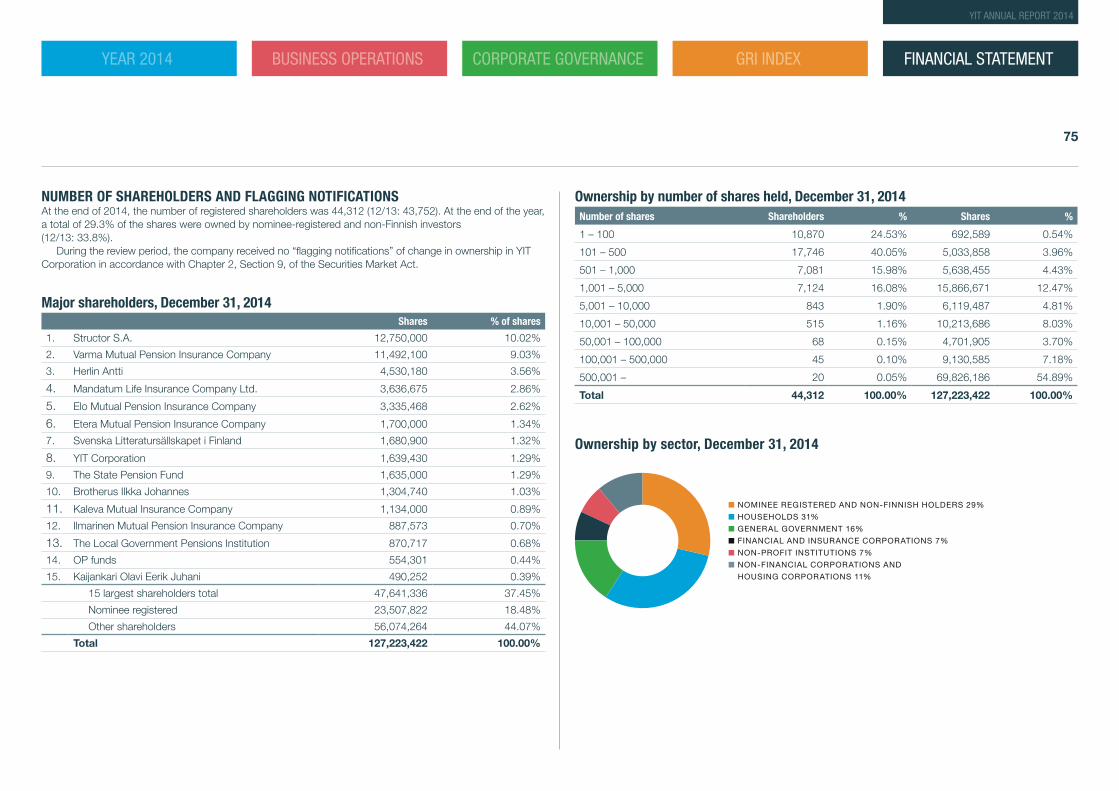
NUMBER OF SHAREHOLDERS AND FLAGGING NOTIFICATIONS At the end of 2014, the number of registered shareholders was 44,312 (12/13: 43,752). At the end of the year, a total of 29.3% of the shares were owned by nominee-registered and non-Finnish investors (12/13: 33.8%).
During the review period, the company received no “flagging notifications” of change in ownership in YIT Corporation in accordance with Chapter 2, Section 9, of the Securities Market Act.
Major shareholders, December 31, 2014Shares % of shares
1. Structor S.A. 12,750,000 10.02%
2. Varma Mutual Pension Insurance Company 11,492,100 9.03%
3. Herlin Antti 4,530,180 3.56%
4. Mandatum Life Insurance Company Ltd. 3,636,675 2.86%
5. Elo Mutual Pension Insurance Company 3,335,468 2.62%
6. Etera Mutual Pension Insurance Company 1,700,000 1.34%
7. Svenska Litteratursällskapet i Finland 1,680,900 1.32%
8. YIT Corporation 1,639,430 1.29%
9. The State Pension Fund 1,635,000 1.29%
10. Brotherus Ilkka Johannes 1,304,740 1.03%
11. Kaleva Mutual Insurance Company 1,134,000 0.89%
12. Ilmarinen Mutual Pension Insurance Company 887,573 0.70%
13. The Local Government Pensions Institution 870,717 0.68%
14. OP funds 554,301 0.44%
15. Kaijankari Olavi Eerik Juhani 490,252 0.39%
15 largest shareholders total 47,641,336 37.45%
Nominee registered 23,507,822 18.48%
Other shareholders 56,074,264 44.07%
Total 127,223,422 100.00%
Ownership by number of shares held, December 31, 2014Number of shares Shareholders % Shares %
1 – 100 10,870 24.53% 692,589 0.54%
101 – 500 17,746 40.05% 5,033,858 3.96%
501 – 1,000 7,081 15.98% 5,638,455 4.43%
1,001 – 5,000 7,124 16.08% 15,866,671 12.47%
5,001 – 10,000 843 1.90% 6,119,487 4.81%
10,001 – 50,000 515 1.16% 10,213,686 8.03%
50,001 – 100,000 68 0.15% 4,701,905 3.70%
100,001 – 500,000 45 0.10% 9,130,585 7.18%
500,001 – 20 0.05% 69,826,186 54.89%
Total 44,312 100.00% 127,223,422 100.00%
Ownership by sector, December 31, 2014
■ NOMINEE REGISTERED AND NON-FINNISH HOLDERS 29%
■ HOUSEHOLDS 31%
■ GENERAL GOVERNMENT 16%
■ FINANCIAL AND INSURANCE CORPORATIONS 7%
■ NON-PROFIT INSTITUTIONS 7%
■ NON-FINANCIAL CORPORATIONS AND
HOUSING CORPORATIONS 11%
FINANCIAL STATEMENT
75
YIT ANNUAL REPORT 2014
YEAR 2014 BUSINESS OPERATIONS CORPORATE GOVERNANCE GRI INDEX
Board of Directors’ and management’s shareholding, December 31, 2014
Shares% of share
capital
Board of Directors 150,450 0.12%
President and CEO 17,624 0.01%
Deputy to the President and CEO 10,692 0.01%
The Group’s Management Board excluding the President and CEO and his deputy 21,089 0.02%
Total 199,855 0.16%
The information is based on the shareholder register maintained by Euroclear Finland Ltd. Each nominee-reg-istered shareholder is recorded in the share register as a single shareholder. The ownership of many investors can be managed through one nominee-registered shareholder.
Other important events during the review periodYIT lowered its guidance for 2014 on October 14, 2014. According to the updated guidance, the Group rev-enue based on segment reporting was estimated to grow by 0–5% at comparable exchange rates, and the operating profit margin to be in the range of 6.5–7.3% excluding non-recurring items. Previously, the company had estimated the operating profit margin to be in the range of 7.5–8.0% excluding non-recurring items.
The reason for the lowered guidance was that the sales volume in 2014 was estimated to fall below the previously projected level in business area Housing Russia. In addition, actions that ensure strong cash flow were estimated to weigh on the operating profit margin.
Events after the review periodYIT changed its segment structure as of the beginning of 2015. The former Housing segment was split into Housing Finland and CEE and Housing Russia segments. The Housing Finland and CEE segment is equiva-lent to the former Housing Finland, the Baltic countries and Central Eastern Europe business area. The Busi-ness Premises and Infrastructure segment remained as before.
Reporting under the new segment structure will begin from the January–March 2015 interim report. The 2014 comparison figures for the new segment structure will be published in March 2015.
In January, YIT sold to consumers around 80 apartments in Finland, around 40 apartments in CEE and around 370 apartments in Russia. The strong sales in January in Russia is a result of consumers’ transferring assets to fixed property due to increased uncertainty.
Outlook for 2015GUIDANCE (SEGMENT REPORTING, POC)The Group revenue growth is estimated to be in the range of -5–5% at comparable exchange rates.
The operating profit margin excluding non-recurring items is estimated to be below the level of 2014.In addition to the market outlook, the guidance is based on the following factors: At the end of 2014,
40% of YIT’s order backlog was sold, in addition to which the company has signed a significant number of pre-agreements. Projects already sold and signed pre-agreements are estimated to contribute over one third of the total revenue in 2015. The rest of the revenue estimate is based on the 2015 sales volume estimate and capital release actions.
Operating profit margin excluding non-recurring items will be burdened by the following factors, in addition to the demanding market situation: The share of Housing Russia segment of the Group revenue is estimated to decrease due to the weakening of the ruble and the decline in the production volume, which will impact the operating profit margin negatively. In addition, investor sales which has lower margin than consumer sales and contracting are estimated to increase their share of revenue in Finland. Approximately half of the over EUR 380 million capital release program, started in autumn 2013, was carried out by the end of 2014. The execution of the program will be continued actively in 2015, and the capital release actions are estimated to have a nega-tive effect on the operating profit margin.
MARKET OUTLOOKFinlandIn Finland, the macroeconomic uncertainty is estimated to affect the residential and business premises mar-kets also in 2015.
Consumers are cautious, and the demand is expected to focus on small apartments in growth centres, whereas the investor demand is expected to remain good. Residential price development is estimated to be polarized especially between small and large apartments. Access to mortgage financing is estimated to remain good.
In Finland, the demand for business premises is estimated to remain modest and the real estate investors’ interest to focus on prime locations in the capital region. Tendering process is ongoing in several major route projects, and opportunities are also seen in business premises contracting.
RussiaThe visibility is exceptionally weak in Russia. Economic uncertainty is estimated to have a negative impact also on the residential market. Consumers’ purchasing power is estimated to weaken, and the increasing inflation to increase the construction costs. At the same time, residential prices are expected to increase along with inflation. The demand is estimated to focus especially on small, either close to completion or completed apart-ments.
Access to mortgage financing is estimated to weaken, but the mortgage rates are expected to remain stable.
FINANCIAL STATEMENT
76
YIT ANNUAL REPORT 2014
YEAR 2014 BUSINESS OPERATIONS CORPORATE GOVERNANCE GRI INDEX
CEE-countriesIn CEE-countries the residential and business premises markets are expected to be supported by the improved economic situation. However, the geopolitical tensions may have a negative impact especially in Latvia and Lithuania.
Access to mortgage financing is estimated to remain good and residential prices to increase moderately.
Board of Directors’ proposal for the distribution of distributable equityThe parent company’s distributable equity on December 31, 2014 is EUR 321,945,443.39, of which the net loss for the financial year is EUR 467,226.57.
The Board of Directors proposes to the Annual General Meeting that a dividend of EUR 0.18 per share be paid, resulting in a total amount of proposed dividends of EUR 22,605,118.56.
After the distribution of dividends, the remaining profits will be left in the company’s distributable assets.No significant changes have taken place in the company’s financial position after the end of the financial
year. The company’s liquidity is good and, in the view of the Board of Directors, the proposed dividend payout does not jeopardise the company’s solvency.
Annual General Meeting 2015YIT Corporation’s Annual General Meeting will be held on Wednesday, March 18, 2015 starting at 10 a.m. in the congress wing of Finlandia Hall, Helsinki.
The notice of the General Meeting, which contains the Board of Directors’ proposals to the Annual General Meeting, was published in its entirety as a separate stock exchange release on February 5, 2015.
FINANCIAL STATEMENT
77
YIT ANNUAL REPORT 2014
YEAR 2014 BUSINESS OPERATIONS CORPORATE GOVERNANCE GRI INDEX
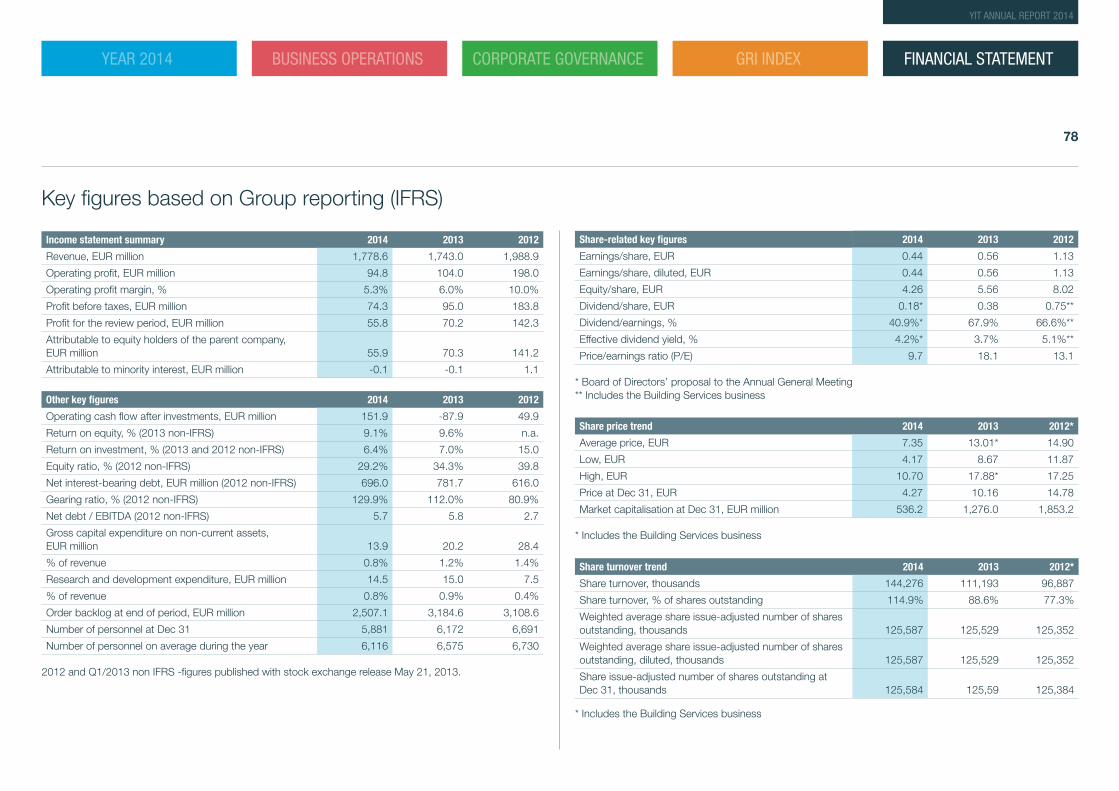
Key figures based on Group reporting (IFRS)
Income statement summary 2014 2013 2012
Revenue, EUR million 1,778.6 1,743.0 1,988.9
Operating profit, EUR million 94.8 104.0 198.0
Operating profit margin, % 5.3% 6.0% 10.0%
Profit before taxes, EUR million 74.3 95.0 183.8
Profit for the review period, EUR million 55.8 70.2 142.3
Attributable to equity holders of the parent company, EUR million 55.9 70.3 141.2
Attributable to minority interest, EUR million -0.1 -0.1 1.1
Other key figures 2014 2013 2012
Operating cash flow after investments, EUR million 151.9 -87.9 49.9
Return on equity, % (2013 non-IFRS) 9.1% 9.6% n.a.
Return on investment, % (2013 and 2012 non-IFRS) 6.4% 7.0% 15.0
Equity ratio, % (2012 non-IFRS) 29.2% 34.3% 39.8
Net interest-bearing debt, EUR million (2012 non-IFRS) 696.0 781.7 616.0
Gearing ratio, % (2012 non-IFRS) 129.9% 112.0% 80.9%
Net debt / EBITDA (2012 non-IFRS) 5.7 5.8 2.7
Gross capital expenditure on non-current assets, EUR million 13.9 20.2 28.4
% of revenue 0.8% 1.2% 1.4%
Research and development expenditure, EUR million 14.5 15.0 7.5
% of revenue 0.8% 0.9% 0.4%
Order backlog at end of period, EUR million 2,507.1 3,184.6 3,108.6
Number of personnel at Dec 31 5,881 6,172 6,691
Number of personnel on average during the year 6,116 6,575 6,730 2012 and Q1/2013 non IFRS -figures published with stock exchange release May 21, 2013.
Share-related key figures 2014 2013 2012
Earnings/share, EUR 0.44 0.56 1.13
Earnings/share, diluted, EUR 0.44 0.56 1.13
Equity/share, EUR 4.26 5.56 8.02
Dividend/share, EUR 0.18* 0.38 0.75**
Dividend/earnings, % 40.9%* 67.9% 66.6%**
Effective dividend yield, % 4.2%* 3.7% 5.1%**
Price/earnings ratio (P/E) 9.7 18.1 13.1
* Board of Directors’ proposal to the Annual General Meeting** Includes the Building Services business
Share price trend 2014 2013 2012*
Average price, EUR 7.35 13.01* 14.90
Low, EUR 4.17 8.67 11.87
High, EUR 10.70 17.88* 17.25
Price at Dec 31, EUR 4.27 10.16 14.78
Market capitalisation at Dec 31, EUR million 536.2 1,276.0 1,853.2
* Includes the Building Services business
Share turnover trend 2014 2013 2012*
Share turnover, thousands 144,276 111,193 96,887
Share turnover, % of shares outstanding 114.9% 88.6% 77.3%
Weighted average share issue-adjusted number of shares outstanding, thousands 125,587 125,529 125,352
Weighted average share issue-adjusted number of shares outstanding, diluted, thousands 125,587 125,529 125,352
Share issue-adjusted number of shares outstanding at Dec 31, thousands 125,584 125,59 125,384
* Includes the Building Services business
FINANCIAL STATEMENT
78
YIT ANNUAL REPORT 2014
YEAR 2014 BUSINESS OPERATIONS CORPORATE GOVERNANCE GRI INDEX
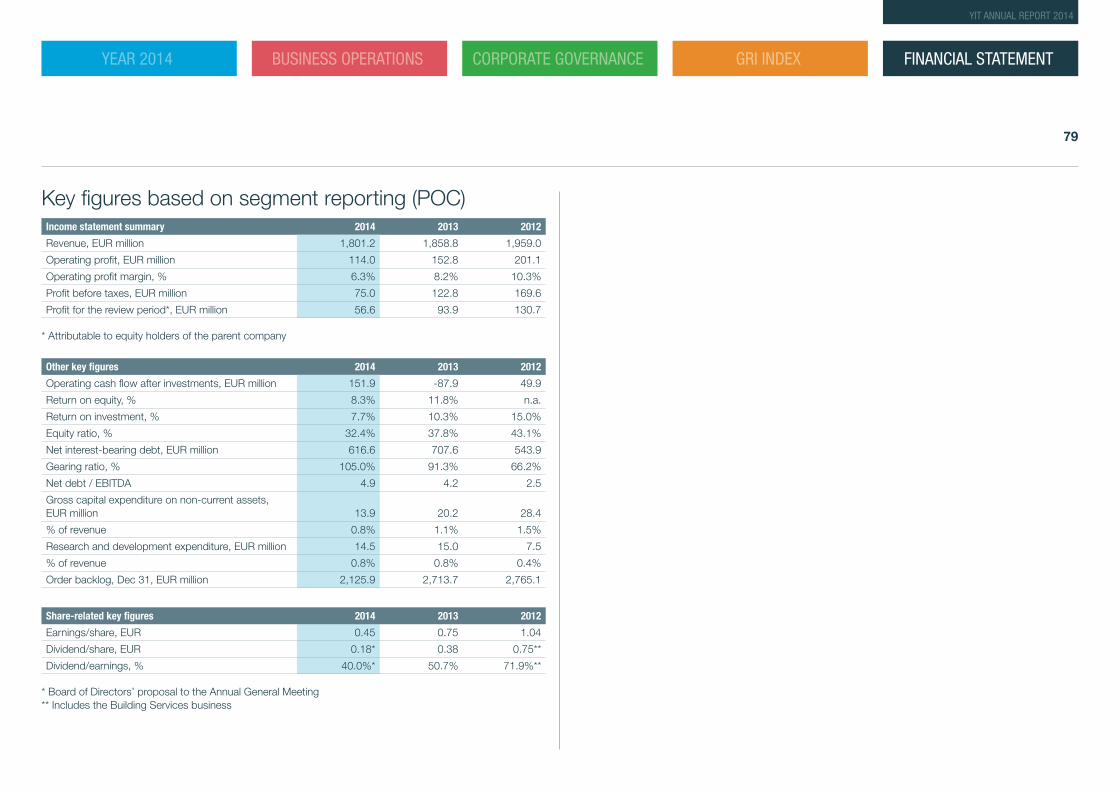
Key figures based on segment reporting (POC)Income statement summary 2014 2013 2012
Revenue, EUR million 1,801.2 1,858.8 1,959.0
Operating profit, EUR million 114.0 152.8 201.1
Operating profit margin, % 6.3% 8.2% 10.3%
Profit before taxes, EUR million 75.0 122.8 169.6
Profit for the review period*, EUR million 56.6 93.9 130.7
* Attributable to equity holders of the parent company
Other key figures 2014 2013 2012
Operating cash flow after investments, EUR million 151.9 -87.9 49.9
Return on equity, % 8.3% 11.8% n.a.
Return on investment, % 7.7% 10.3% 15.0%
Equity ratio, % 32.4% 37.8% 43.1%
Net interest-bearing debt, EUR million 616.6 707.6 543.9
Gearing ratio, % 105.0% 91.3% 66.2%
Net debt / EBITDA 4.9 4.2 2.5
Gross capital expenditure on non-current assets, EUR million 13.9 20.2 28.4
% of revenue 0.8% 1.1% 1.5%
Research and development expenditure, EUR million 14.5 15.0 7.5
% of revenue 0.8% 0.8% 0.4%
Order backlog, Dec 31, EUR million 2,125.9 2,713.7 2,765.1
Share-related key figures 2014 2013 2012
Earnings/share, EUR 0.45 0.75 1.04
Dividend/share, EUR 0.18* 0.38 0.75**
Dividend/earnings, % 40.0%* 50.7% 71.9%**
* Board of Directors’ proposal to the Annual General Meeting** Includes the Building Services business
FINANCIAL STATEMENT
79
YIT ANNUAL REPORT 2014
YEAR 2014 BUSINESS OPERATIONS CORPORATE GOVERNANCE GRI INDEX
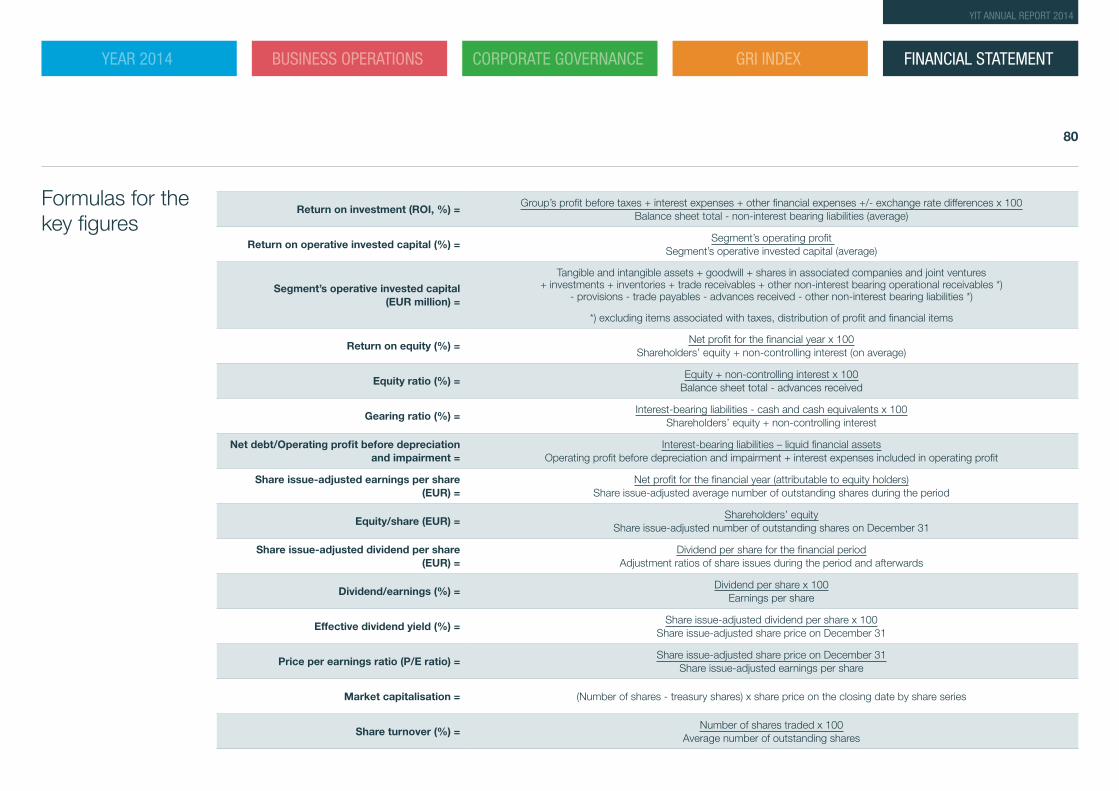
Formulas for the key figures
Return on investment (ROI, %) =Group’s profit before taxes + interest expenses + other financial expenses +/- exchange rate differences x 100
Balance sheet total - non-interest bearing liabilities (average)
Return on operative invested capital (%) =Segment’s operating profit
Segment’s operative invested capital (average)
Segment’s operative invested capital (EUR million) =
Tangible and intangible assets + goodwill + shares in associated companies and joint ventures + investments + inventories + trade receivables + other non-interest bearing operational receivables *)
- provisions - trade payables - advances received - other non-interest bearing liabilities *)
*) excluding items associated with taxes, distribution of profit and financial items
Return on equity (%) =Net profit for the financial year x 100
Shareholders’ equity + non-controlling interest (on average)
Equity ratio (%) =Equity + non-controlling interest x 100
Balance sheet total - advances received
Gearing ratio (%) =Interest-bearing liabilities - cash and cash equivalents x 100
Shareholders’ equity + non-controlling interest
Net debt/Operating profit before depreciation and impairment =
Interest-bearing liabilities – liquid financial assets Operating profit before depreciation and impairment + interest expenses included in operating profit
Share issue-adjusted earnings per share (EUR) =
Net profit for the financial year (attributable to equity holders) Share issue-adjusted average number of outstanding shares during the period
Equity/share (EUR) =Shareholders’ equity
Share issue-adjusted number of outstanding shares on December 31
Share issue-adjusted dividend per share (EUR) =
Dividend per share for the financial period Adjustment ratios of share issues during the period and afterwards
Dividend/earnings (%) =Dividend per share x 100
Earnings per share
Effective dividend yield (%) =Share issue-adjusted dividend per share x 100
Share issue-adjusted share price on December 31
Price per earnings ratio (P/E ratio) =Share issue-adjusted share price on December 31
Share issue-adjusted earnings per share
Market capitalisation = (Number of shares - treasury shares) x share price on the closing date by share series
Share turnover (%) =Number of shares traded x 100
Average number of outstanding shares
FINANCIAL STATEMENT
80
YIT ANNUAL REPORT 2014
YEAR 2014 BUSINESS OPERATIONS CORPORATE GOVERNANCE GRI INDEX
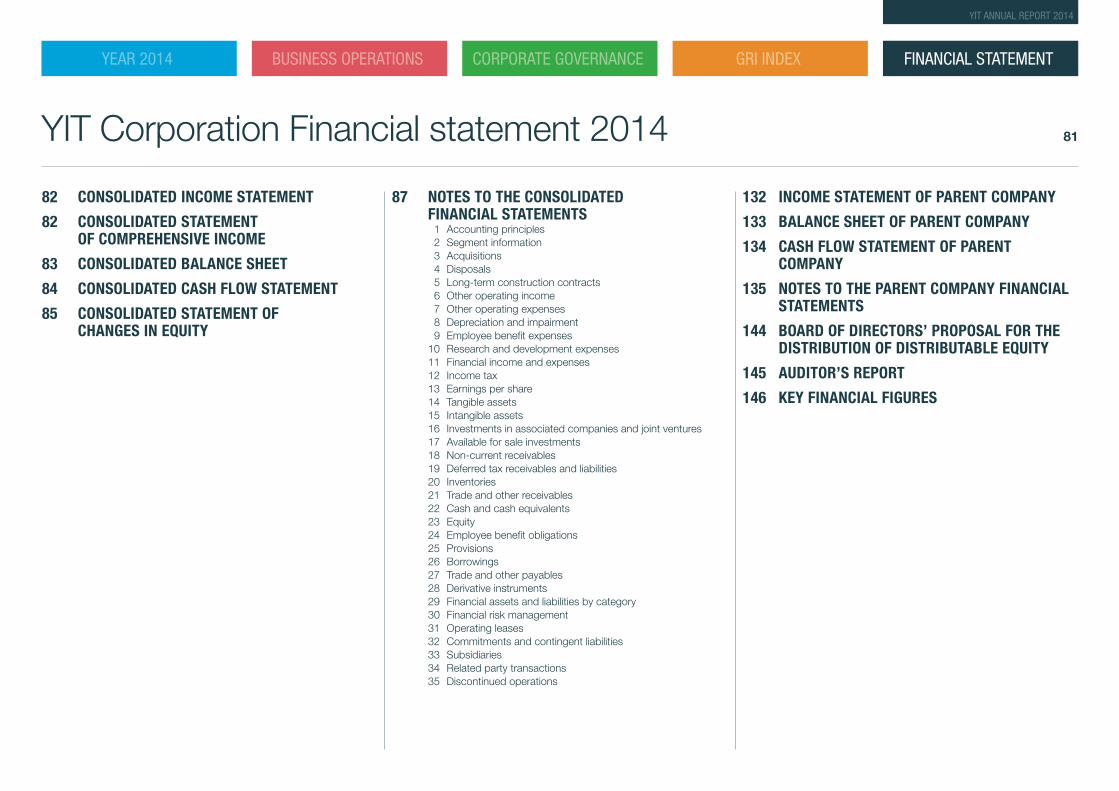
YIT Corporation Financial statement 2014
82 CONSOLIDATED INCOME STATEMENT
82 CONSOLIDATED STATEMENT OF COMPREHENSIVE INCOME
83 CONSOLIDATED BALANCE SHEET
84 CONSOLIDATED CASH FLOW STATEMENT
85 CONSOLIDATED STATEMENT OF CHANGES IN EQUITY
87 NOTES TO THE CONSOLIDATED FINANCIAL STATEMENTS 1 Accounting principles 2 Segment information 3 Acquisitions 4 Disposals 5 Long-term construction contracts 6 Other operating income 7 Other operating expenses 8 Depreciation and impairment 9 Employee benefit expenses10 Research and development expenses11 Financial income and expenses12 Income tax13 Earnings per share14 Tangible assets15 Intangible assets16 Investments in associated companies and joint ventures17 Available for sale investments18 Non-current receivables19 Deferred tax receivables and liabilities20 Inventories21 Trade and other receivables22 Cash and cash equivalents23 Equity24 Employee benefit obligations25 Provisions26 Borrowings27 Trade and other payables28 Derivative instruments29 Financial assets and liabilities by category30 Financial risk management31 Operating leases32 Commitments and contingent liabilities33 Subsidiaries34 Related party transactions35 Discontinued operations
132 INCOME STATEMENT OF PARENT COMPANY
133 BALANCE SHEET OF PARENT COMPANY
134 CASH FLOW STATEMENT OF PARENT COMPANY
135 NOTES TO THE PARENT COMPANY FINANCIAL STATEMENTS
144 BOARD OF DIRECTORS’ PROPOSAL FOR THE DISTRIBUTION OF DISTRIBUTABLE EQUITY
145 AUDITOR’S REPORT
146 KEY FINANCIAL FIGURES
FINANCIAL STATEMENT
81
YIT ANNUAL REPORT 2014
YEAR 2014 BUSINESS OPERATIONS CORPORATE GOVERNANCE GRI INDEX
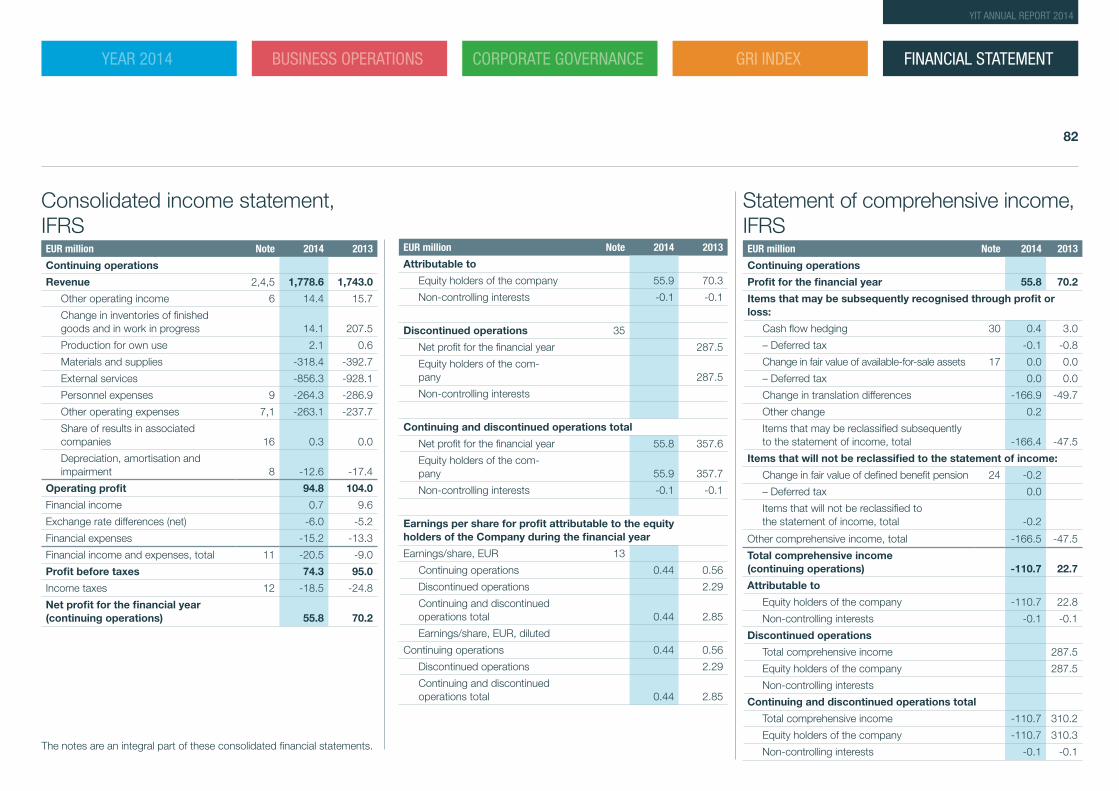
Consolidated income statement, IFRSEUR million Note 2014 2013
Continuing operations
Revenue 2,4,5 1,778.6 1,743.0
Other operating income 6 14.4 15.7
Change in inventories of finished goods and in work in progress 14.1 207.5
Production for own use 2.1 0.6
Materials and supplies -318.4 -392.7
External services -856.3 -928.1
Personnel expenses 9 -264.3 -286.9
Other operating expenses 7,1 -263.1 -237.7
Share of results in associated companies 16 0.3 0.0
Depreciation, amortisation and impairment 8 -12.6 -17.4
Operating profit 94.8 104.0
Financial income 0.7 9.6
Exchange rate differences (net) -6.0 -5.2
Financial expenses -15.2 -13.3
Financial income and expenses, total 11 -20.5 -9.0
Profit before taxes 74.3 95.0
Income taxes 12 -18.5 -24.8
Net profit for the financial year (continuing operations) 55.8 70.2
Statement of comprehensive income, IFRSEUR million Note 2014 2013
Continuing operations
Profit for the financial year 55.8 70.2
Items that may be subsequently recognised through profit or loss:
Cash flow hedging 30 0.4 3.0
– Deferred tax -0.1 -0.8
Change in fair value of available-for-sale assets 17 0.0 0.0
– Deferred tax 0.0 0.0
Change in translation differences -166.9 -49.7
Other change 0.2
Items that may be reclassified subsequently to the statement of income, total -166.4 -47.5
Items that will not be reclassified to the statement of income:
Change in fair value of defined benefit pension 24 -0.2
– Deferred tax 0.0
Items that will not be reclassified to the statement of income, total -0.2
Other comprehensive income, total -166.5 -47.5
Total comprehensive income (continuing operations) -110.7 22.7
Attributable to
Equity holders of the company -110.7 22.8
Non-controlling interests -0.1 -0.1
Discontinued operations
Total comprehensive income 287.5
Equity holders of the company 287.5
Non-controlling interests
Continuing and discontinued operations total
Total comprehensive income -110.7 310.2
Equity holders of the company -110.7 310.3
Non-controlling interests -0.1 -0.1
EUR million Note 2014 2013
Attributable to
Equity holders of the company 55.9 70.3
Non-controlling interests -0.1 -0.1
Discontinued operations 35
Net profit for the financial year 287.5
Equity holders of the com-pany 287.5
Non-controlling interests
Continuing and discontinued operations total
Net profit for the financial year 55.8 357.6
Equity holders of the com-pany 55.9 357.7
Non-controlling interests -0.1 -0.1
Earnings per share for profit attributable to the equity holders of the Company during the financial year
Earnings/share, EUR 13
Continuing operations 0.44 0.56
Discontinued operations 2.29
Continuing and discontinued operations total 0.44 2.85
Earnings/share, EUR, diluted
Continuing operations 0.44 0.56
Discontinued operations 2.29
Continuing and discontinued operations total 0.44 2.85
The notes are an integral part of these consolidated financial statements.
FINANCIAL STATEMENT
82
YIT ANNUAL REPORT 2014
YEAR 2014 BUSINESS OPERATIONS CORPORATE GOVERNANCE GRI INDEX
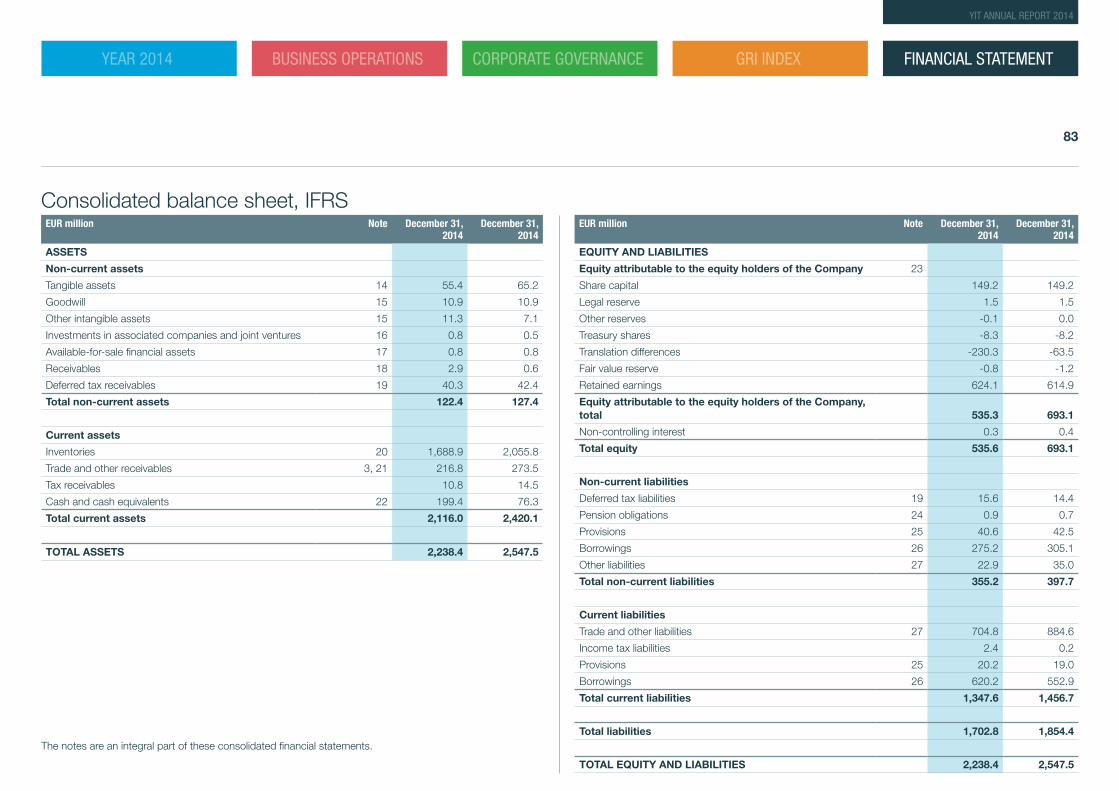
Consolidated balance sheet, IFRSEUR million Note December 31,
2014December 31,
2014
ASSETS
Non-current assets
Tangible assets 14 55.4 65.2
Goodwill 15 10.9 10.9
Other intangible assets 15 11.3 7.1
Investments in associated companies and joint ventures 16 0.8 0.5
Available-for-sale financial assets 17 0.8 0.8
Receivables 18 2.9 0.6
Deferred tax receivables 19 40.3 42.4
Total non-current assets 122.4 127.4
Current assets
Inventories 20 1,688.9 2,055.8
Trade and other receivables 3, 21 216.8 273.5
Tax receivables 10.8 14.5
Cash and cash equivalents 22 199.4 76.3
Total current assets 2,116.0 2,420.1
TOTAL ASSETS 2,238.4 2,547.5
The notes are an integral part of these consolidated financial statements.
EUR million Note December 31, 2014
December 31, 2014
EQUITY AND LIABILITIES
Equity attributable to the equity holders of the Company 23
Share capital 149.2 149.2
Legal reserve 1.5 1.5
Other reserves -0.1 0.0
Treasury shares -8.3 -8.2
Translation differences -230.3 -63.5
Fair value reserve -0.8 -1.2
Retained earnings 624.1 614.9
Equity attributable to the equity holders of the Company, total 535.3 693.1
Non-controlling interest 0.3 0.4
Total equity 535.6 693.1
Non-current liabilities
Deferred tax liabilities 19 15.6 14.4
Pension obligations 24 0.9 0.7
Provisions 25 40.6 42.5
Borrowings 26 275.2 305.1
Other liabilities 27 22.9 35.0
Total non-current liabilities 355.2 397.7
Current liabilities
Trade and other liabilities 27 704.8 884.6
Income tax liabilities 2.4 0.2
Provisions 25 20.2 19.0
Borrowings 26 620.2 552.9
Total current liabilities 1,347.6 1,456.7
Total liabilities 1,702.8 1,854.4
TOTAL EQUITY AND LIABILITIES 2,238.4 2,547.5
FINANCIAL STATEMENT
83
YIT ANNUAL REPORT 2014
YEAR 2014 BUSINESS OPERATIONS CORPORATE GOVERNANCE GRI INDEX
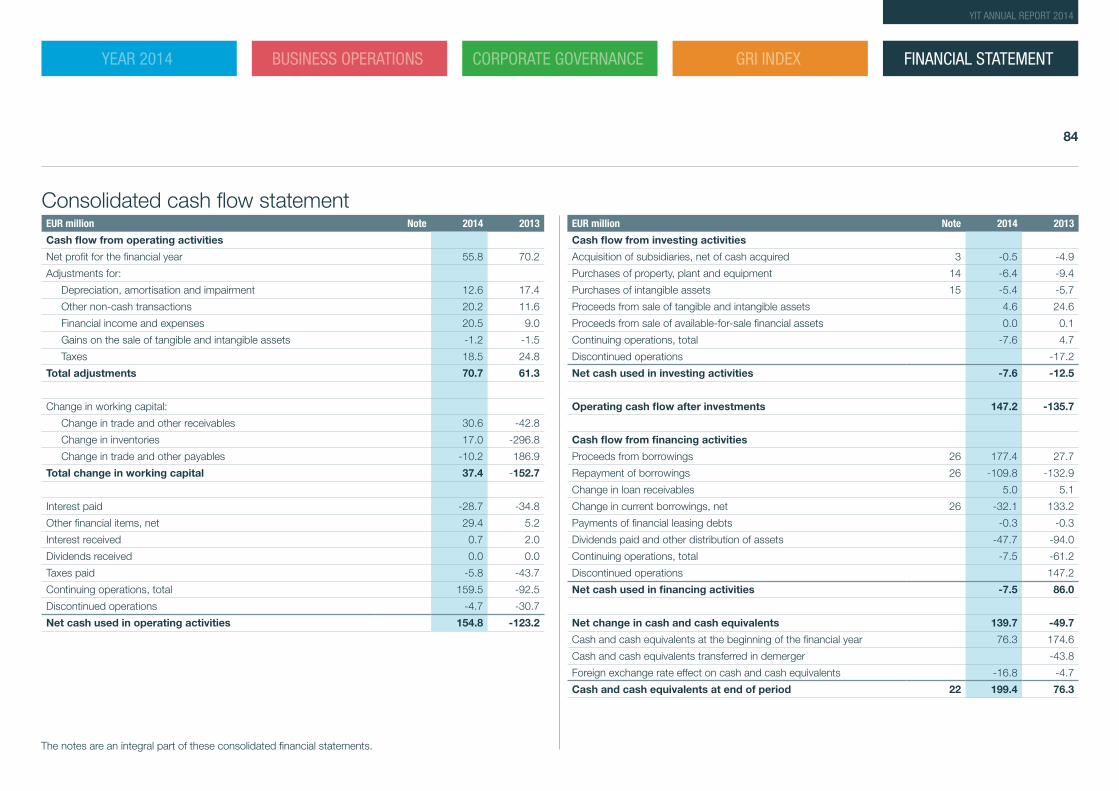
Consolidated cash flow statementEUR million Note 2014 2013
Cash flow from operating activities
Net profit for the financial year 55.8 70.2
Adjustments for:
Depreciation, amortisation and impairment 12.6 17.4
Other non-cash transactions 20.2 11.6
Financial income and expenses 20.5 9.0
Gains on the sale of tangible and intangible assets -1.2 -1.5
Taxes 18.5 24.8
Total adjustments 70.7 61.3
Change in working capital:
Change in trade and other receivables 30.6 -42.8
Change in inventories 17.0 -296.8
Change in trade and other payables -10.2 186.9
Total change in working capital 37.4 -152.7
Interest paid -28.7 -34.8
Other financial items, net 29.4 5.2
Interest received 0.7 2.0
Dividends received 0.0 0.0
Taxes paid -5.8 -43.7
Continuing operations, total 159.5 -92.5
Discontinued operations -4.7 -30.7
Net cash used in operating activities 154.8 -123.2
EUR million Note 2014 2013
Cash flow from investing activities
Acquisition of subsidiaries, net of cash acquired 3 -0.5 -4.9
Purchases of property, plant and equipment 14 -6.4 -9.4
Purchases of intangible assets 15 -5.4 -5.7
Proceeds from sale of tangible and intangible assets 4.6 24.6
Proceeds from sale of available-for-sale financial assets 0.0 0.1
Continuing operations, total -7.6 4.7
Discontinued operations -17.2
Net cash used in investing activities -7.6 -12.5
Operating cash flow after investments 147.2 -135.7
Cash flow from financing activities
Proceeds from borrowings 26 177.4 27.7
Repayment of borrowings 26 -109.8 -132.9
Change in loan receivables 5.0 5.1
Change in current borrowings, net 26 -32.1 133.2
Payments of financial leasing debts -0.3 -0.3
Dividends paid and other distribution of assets -47.7 -94.0
Continuing operations, total -7.5 -61.2
Discontinued operations 147.2
Net cash used in financing activities -7.5 86.0
Net change in cash and cash equivalents 139.7 -49.7
Cash and cash equivalents at the beginning of the financial year 76.3 174.6
Cash and cash equivalents transferred in demerger -43.8
Foreign exchange rate effect on cash and cash equivalents -16.8 -4.7
Cash and cash equivalents at end of period 22 199.4 76.3
The notes are an integral part of these consolidated financial statements.
FINANCIAL STATEMENT
84
YIT ANNUAL REPORT 2014
YEAR 2014 BUSINESS OPERATIONS CORPORATE GOVERNANCE GRI INDEX
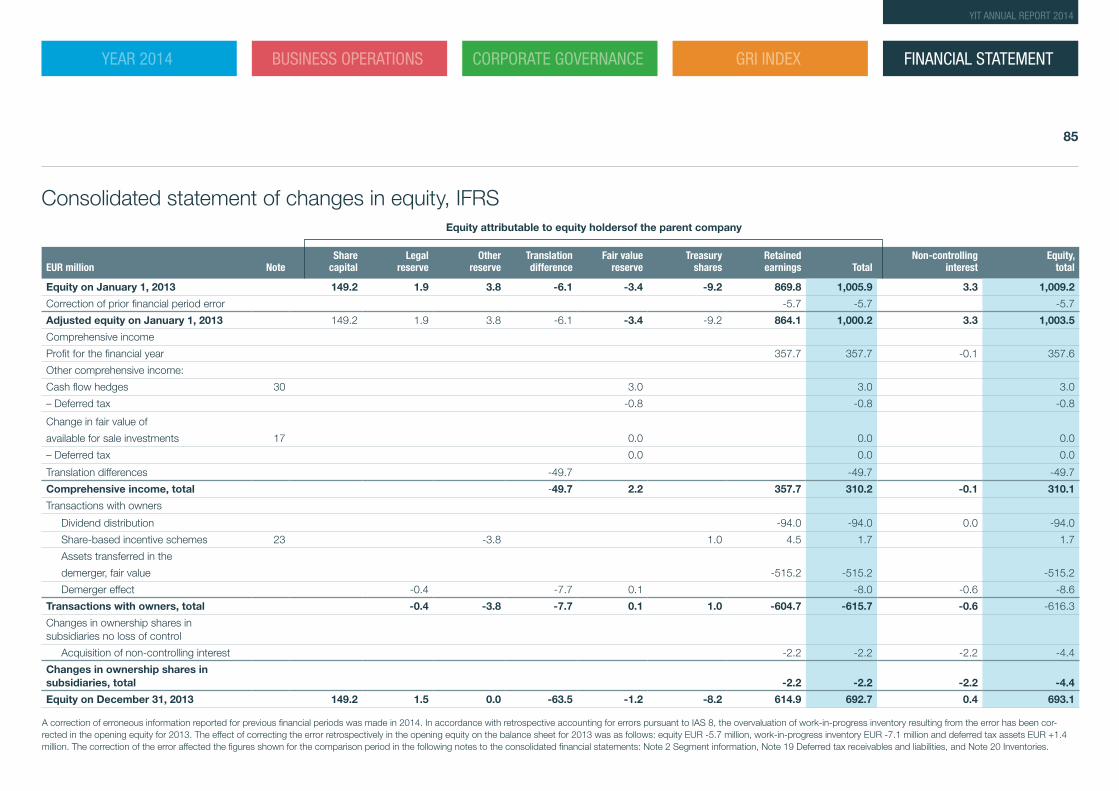
EUR million NoteShare
capitalLegal
reserveOther
reserveTranslation difference
Fair value reserve
Treasury shares
Retained earnings Total
Non-controlling interest
Equity, total
Equity on January 1, 2013 149.2 1.9 3.8 -6.1 -3.4 -9.2 869.8 1,005.9 3.3 1,009.2
Correction of prior financial period error -5.7 -5.7 -5.7
Adjusted equity on January 1, 2013 149.2 1.9 3.8 -6.1 -3.4 -9.2 864.1 1,000.2 3.3 1,003.5
Comprehensive income
Profit for the financial year 357.7 357.7 -0.1 357.6
Other comprehensive income:
Cash flow hedges 30 3.0 3.0 3.0
– Deferred tax -0.8 -0.8 -0.8
Change in fair value of
available for sale investments 17 0.0 0.0 0.0
– Deferred tax 0.0 0.0 0.0
Translation differences -49.7 -49.7 -49.7
Comprehensive income, total -49.7 2.2 357.7 310.2 -0.1 310.1
Transactions with owners
Dividend distribution -94.0 -94.0 0.0 -94.0
Share-based incentive schemes 23 -3.8 1.0 4.5 1.7 1.7
Assets transferred in the
demerger, fair value -515.2 -515.2 -515.2
Demerger effect -0.4 -7.7 0.1 -8.0 -0.6 -8.6
Transactions with owners, total -0.4 -3.8 -7.7 0.1 1.0 -604.7 -615.7 -0.6 -616.3
Changes in ownership shares in subsidiaries no loss of control
Acquisition of non-controlling interest -2.2 -2.2 -2.2 -4.4
Changes in ownership shares in subsidiaries, total -2.2 -2.2 -2.2 -4.4
Equity on December 31, 2013 149.2 1.5 0.0 -63.5 -1.2 -8.2 614.9 692.7 0.4 693.1
A correction of erroneous information reported for previous financial periods was made in 2014. In accordance with retrospective accounting for errors pursuant to IAS 8, the overvaluation of work-in-progress inventory resulting from the error has been cor-rected in the opening equity for 2013. The effect of correcting the error retrospectively in the opening equity on the balance sheet for 2013 was as follows: equity EUR -5.7 million, work-in-progress inventory EUR -7.1 million and deferred tax assets EUR +1.4 million. The correction of the error affected the figures shown for the comparison period in the following notes to the consolidated financial statements: Note 2 Segment information, Note 19 Deferred tax receivables and liabilities, and Note 20 Inventories.
Equity attributable to equity holdersof the parent company
Consolidated statement of changes in equity, IFRS
FINANCIAL STATEMENT
85
YIT ANNUAL REPORT 2014
YEAR 2014 BUSINESS OPERATIONS CORPORATE GOVERNANCE GRI INDEX
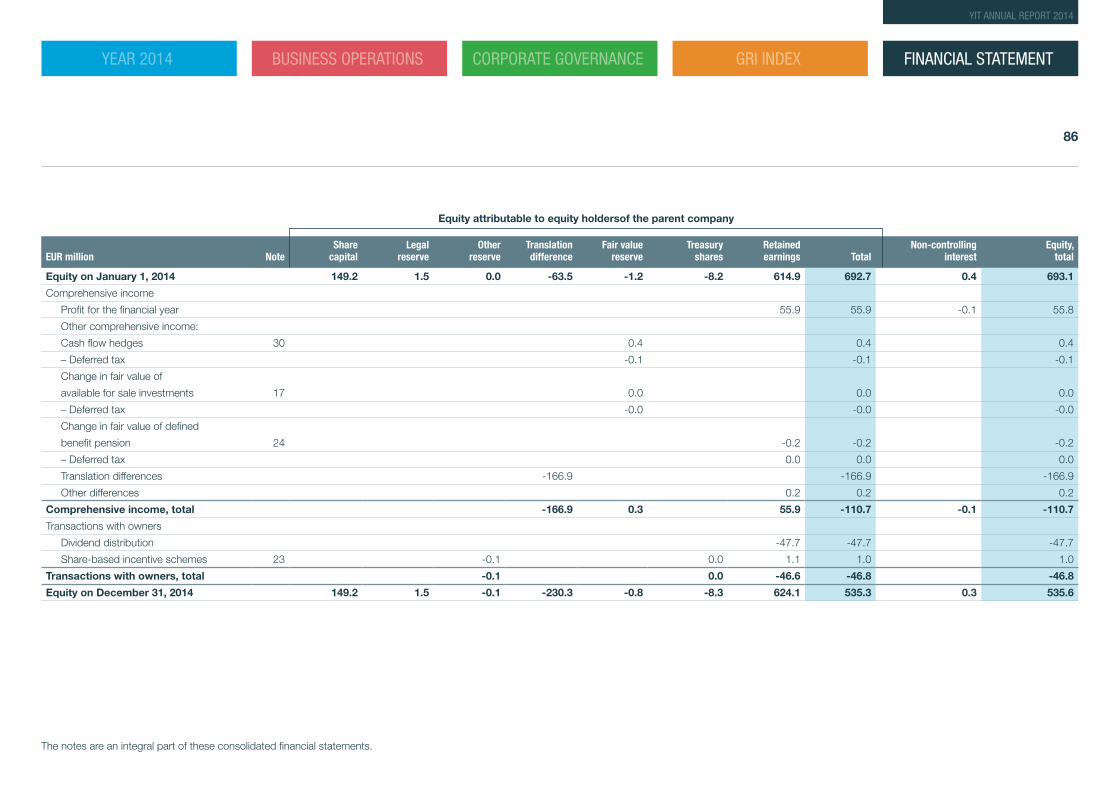
EUR million NoteShare
capitalLegal
reserveOther
reserveTranslation difference
Fair value reserve
Treasury shares
Retained earnings Total
Non-controlling interest
Equity, total
Equity on January 1, 2014 149.2 1.5 0.0 -63.5 -1.2 -8.2 614.9 692.7 0.4 693.1
Comprehensive income
Profit for the financial year 55.9 55.9 -0.1 55.8
Other comprehensive income:
Cash flow hedges 30 0.4 0.4 0.4
– Deferred tax -0.1 -0.1 -0.1
Change in fair value of
available for sale investments 17 0.0 0.0 0.0
– Deferred tax -0.0 -0.0 -0.0
Change in fair value of defined
benefit pension 24 -0.2 -0.2 -0.2
– Deferred tax 0.0 0.0 0.0
Translation differences -166.9 -166.9 -166.9
Other differences 0.2 0.2 0.2
Comprehensive income, total -166.9 0.3 55.9 -110.7 -0.1 -110.7
Transactions with owners
Dividend distribution -47.7 -47.7 -47.7
Share-based incentive schemes 23 -0.1 0.0 1.1 1.0 1.0
Transactions with owners, total -0.1 0.0 -46.6 -46.8 -46.8
Equity on December 31, 2014 149.2 1.5 -0.1 -230.3 -0.8 -8.3 624.1 535.3 0.3 535.6
Equity attributable to equity holdersof the parent company
The notes are an integral part of these consolidated financial statements.
FINANCIAL STATEMENT
86
YIT ANNUAL REPORT 2014
YEAR 2014 BUSINESS OPERATIONS CORPORATE GOVERNANCE GRI INDEX
Notes to the consolidated financial statements, IFRS
1 Accounting principles of the financial statement
GENERAL INFORMATIONYIT Group provides services for the construction sector. The services provided by the Group companies include construction services for the industrial and public sectors, residential construction services for con-sumers and road maintenance services in Finland. Furthermore, in Russia the Group provides after-sales service and maintenance for consumer customers’ new homes. The main market areas are Finland, Russia, the Baltic countries, the Czech Republic and Slovakia. The Group has two segments: Housing and Business Premises and Infrastructure.
YIT’s partial demerger was implemented on June 30, 2013. In the partial demerger, the assets and liabilities related to YIT’s Building Services business were transferred to Caverion Corporation. Until the execution date of the partial demerger (June 30, 2013), the transactions included in YIT’s Building Services business transferred to Caverion Cor-poration are presented on a separate line in discontinued operations in the comparison data in YIT’s income statement and cash flow statement.
The Group’s parent company is YIT Corporation. The parent company is domiciled in Helsinki, and its registered address is Panuntie 11, 00620 Helsinki, Finland. The parent company’s shares have been listed on Nas-daq OMX Helsinki Oy Helsinki stock exchange since 1995.
Copies of the consolidated financial statements are available at www.yitgroup.com or the parent company’s head office, address Panuntie 11, 00620 Helsinki, Finland. YIT Corporation’s Board of Directors approved these consolidated financial statements for publication in its meeting held on 5 February 2014. In accordance with the Finnish Companies Act, shareholders may approve or reject the financial statements in an Annual General Meeting held after their release. The General Meeting also has the right to pass a resolution on changing the financial statements.
SUMMARY OF SIGNIFICANT ACCOUNTING POLICIESBasis of preparationThe consolidated financial statements have been prepared in accordance with the International Financial Reporting Standards (IFRS). All of the IAS/IFRS standards and SIC/IFRIC interpretations approved by the EU Commission by December 31, 2013 have been complied with. Interna-tional Financial Reporting Standards refer to the Finnish Accounting Act
and related legal code based on EU regulation 1606/2002 concerning the adoption of IFRS standards and interpretations in the EU. The notes to the consolidated financial statements also comply with the Finnish GAAP and the Companies Act that complement the IFRS standards. The figures in the financial statements are presented in thousands of euro. In the Annual Report the figures are presented in million euros doing the roundings on each line, which may cause some rounding inaccuracies in column and total sums.
The consolidated financial statements have been prepared under the historic cost convention, as modified by revaluation of available-for-sale investments, financial assets and liabilities at fair value through profit and loss and derivative instruments at fair value. Share-based payments are measured at fair value at the time of granting.
In the 2014 financial statements, an error pertaining to previous financial periods was corrected. The error was due to the incorrect processing of value added tax in the project reporting of one of YIT’s Russian subsidiaries. In accordance with retrospective accounting for errors pursuant to IAS 8, the overvaluation of work-in-progress inventory resulting from the error has been corrected in the opening equity on the balance sheet for 2013. The effect of correcting the error retrospectively in the opening equity for 2013 was as follows: work-in-progress inventory EUR -7.1 million, deferred tax assets EUR +1.4 million, and equity EUR -5.7 million. The error did not have any effect on the result for 2013 and 2014, nor did it have any cash flow effect. Correcting the error has only a minor effect on the key figures for previous periods presented in the financial statements dated December 31, 2014, and they have therefore not been adjusted.
Application of revised standards and interpretations as from January 1, 2014The effects of other standards and interpretations adopted on January 1, 2014 on the reporting period have been as follows:
• IFRS10 Consolidated Financial Statements: The standard defines principles applied to the preparation and presentation of consolidated financial statements when the entity has control in one or several entities. The standard specifies the principle of control, and control is defined as grounds for consolidation. The standard provides guidelines on the application of the concept of control in determining whether the investor has control and must therefore consolidate the investee in its consolidated financial statements. The standard also includes
requirements for the procedure of preparing consolidated financial statements. The standard has not had an impact on the financial statements.
• IFRS11 Joint Arrangements: The standard affected the presentation of joint arrangements in the financial statements. In accordance with the standard, the focus is on the rights and obligations of the arrangement rather than its legal form. There are two types of joint arrangement: joint operations and joint ventures. Joint operations arise where a joint operator has rights to the assets and obligations and accounts for its interest in assets, liabilities, revenue and expenses. Joint ventures arise when a joint venturer has rights to the net assets of the arrangement and accounts for its interest using the equity method. Proportional consolidation of joint ventures is no longer allowed. Based on an assessment of the Group’s joint arrangements, the joint arrangements are classified as joint ventures and the standard has therefore had no impact on the figures presented in the financial statements.
• IFRS 12 Disclosures of Interests in Other Entities: IFRS 12 includes all of the disclosure requirements for all types of interests. It applies to joint arrangements, associates, special purpose vehicles and other off-balance sheet vehicles. The information required by the standard has been added to the notes to the consolidated financial statements.
• IAS 28 (revised in 2011) Shares in associated companies and joint ventures: The revised standard outlines the accounting for investments in associates and joint ventures. As a result of the publication of IFRS 11, the equity method is applied to both. The revision of the standard did not have any impact on the consolidated financial statements.
• Amendment regarding the offsetting of financial assets and liabilities in IAS 32 “Financial Instruments: Presentation”: The amendments are related to the guidance on the application of IAS 32. They clarify certain requirements concerning the offsetting of financial assets and liabilities on the balance sheet. The amendment did not have any impact on the information presented in the consolidated financial statements.
• Amendment regarding the novation of derivatives in IAS 39 “Financial Instruments – Recognition and Measurement”: The amendment provides for an easement according to which hedge accounting can be continued under certain criteria when a derivative instrument is novated to a central counterparty. The amendment did not have any impact on the information presented in the consolidated financial statements.
FINANCIAL STATEMENT
87
YIT ANNUAL REPORT 2014
YEAR 2014 BUSINESS OPERATIONS CORPORATE GOVERNANCE GRI INDEX
CONSOLIDATIONSubsidiariesSubsidiaries are all companies (including structured entities) in which the Group exercises control. The criteria for control are fulfilled when the Group is exposed, or has rights, to variable returns from its involvement with the company and has the ability to affect those returns through its power over the company. Subsidiaries are consolidated in the consoli-dated financial statements from the date when the Group obtains control, while subsidiaries divested are consolidated up to the date when control ceases.
The Group applies the acquisition method to account for business combinations. The consideration transferred for the acquisition of a sub-sidiary is the fair values of the assets transferred, the liabilities incurred to the former owners of the acquiree and the equity interests issued by the Group. The consideration transferred includes the fair value of any asset or liability resulting from a contingent consideration arrangement. Iden-tifiable assets acquired and liabilities and contingent liabilities assumed in a business combination are measured initially at their fair values at the acquisition date. The Group recognises any non-controlling interest in the acquiree on an acquisition-by-acquisition basis, either at fair value or at the non-controlling interest’s proportionate share of the recognised amounts of acquiree’s identifiable net assets.
Acquisition-related costs are expensed as incurred. If the business combination is achieved in stages, the acquisition
date carrying value of the acquirer’s previously held equity interest in the acquiree is re-measured to fair value at the acquisition date; any gains or losses arising from such re-measurement are recognised in profit or loss.
Any contingent consideration to be transferred by the Group is recog-nised at fair value at the acquisition date. Subsequent changes to the fair value of the contingent consideration that is deemed to be an asset or liability is recognised in accordance with IAS 39 either in profit or loss or as a change to other comprehensive income. Contingent consideration that is classified as equity is not re-measured, and its subsequent settle-ment is accounted for within equity.
Inter-company transactions, balances and unrealised gains on trans-actions between Group companies are eliminated. Unrealised losses are also eliminated. When necessary, amounts reported by subsidiaries have been adjusted to conform with the Group’s accounting policies.
Associated companies The consolidated financial statements include associated companies in which the YIT Group has a significant influence but not a controlling interest. Generally, this accompanies a shareholding of between 20% and 50% of the voting rights. Associated companies have been consoli-dated using the equity method. If the Group’s share of associates’ losses exceeds the carrying amount, losses in excess of the carrying amount are not consolidated unless the Group has committed itself to fulfilling the obligations of the associates. Unrealised profits between the Group and associates have been eliminated in accordance with the Group’s holding. An investment in an associate includes the goodwill arising from acquisi-tion, which has been tested for impairment.
Joint ventures The Group applies IFRS 11 to all joint arrangements. Under IFRS 11 investments in joint arrangements are classified as either joint operations or joint ventures depending on the contractual rights and obligations each investor. The Group’s management has assessed the nature of its joint arrangements and determined them to be joint ventures. Joint ven-tures are accounted for using the equity method.
Under the equity method of accounting, interests in joint ventures are initially recognised at cost and adjusted thereafter to recognise the Group’s share of the post-acquisition profits or losses and movements in other comprehensive income. When the Group’s share of losses in a joint venture equals or exceeds its interests in the joint ventures (which includes any long-term interests that, in substance, form part of the Group’s net investment in the joint ventures), the Group does not recog-nise further losses, unless it has incurred obligations or made payments on behalf of the joint ventures.
Unrealised gains on transactions between the Group and its joint ventures are eliminated to the extent of the Group’s interest in the joint ventures. Unrealised losses are also eliminated unless the transaction provides evidence of an impairment of the asset transferred. Account-ing policies of the joint ventures have been changed where necessary to ensure consistency with the policies adopted by the Group.
Transactions with non-controlling interestsThe Group treats transactions with non-controlling interests as trans-actions with equity owners. When the Group purchases from non-con-trolling interests, the difference between any consideration paid and the relevant share acquired of the carrying value of net assets of the subsid-iary is recorded in equity. Gains or losses on disposals to non-controlling interests are also recorded in equity.
When the Group ceases to have control, any remaining interest in the entity is re-measured at fair value on the date control ceases, with the change in the carrying amount recognised through profit or loss. In addition, any amounts previously recognised in other comprehensive income in respect of that entity are accounted for as realised and booked to income statement. If the interest is reduced but control is retained, only a proportionate share of the amounts previously recognised in other comprehensive income are booked to non-controlling interest in equity.
FOREIGN CURRENCY TRANSLATIONThe financial statement items of each Group company are measured using the currency of its business environment (functional currency). The consolidated financial statements are presented in euro, which is the Group’s functional and reporting currency.
Foreign currency transactionsForeign currency transactions are translated into the functional currency using the exchange rates prevailing on the date of transaction or valu-ation, where items are re-measured. Foreign exchange rate gains and losses resulting from the settlement of such transactions and from the translation at year-end exchange rates of monetary assets and liabilities denominated in foreign currencies are recognised in the income state-ment. Foreign exchange gains and losses that relate to borrowings and cash and cash equivalents are presented in the income statement within “Finance income and costs”. All other foreign exchange gains and losses are presented in the income statement above operating profit. Non-mon-etary items are mainly valued at the transaction date’s foreign exchange rates. The foreign exchange rate gains or losses related to non-monetary items valued at fair value are included in the change of the fair value.
FINANCIAL STATEMENT
88
YIT ANNUAL REPORT 2014
YEAR 2014 BUSINESS OPERATIONS CORPORATE GOVERNANCE GRI INDEX
Translation of financial statements of foreign Group companiesThe income statements of foreign Group companies have been trans-lated to euro using the average exchange rate quoted for the calendar months of the reporting period. The balance sheets have been translated using the rates on the closing date. The translation of the result for the period using different exchange rates in the income statement and bal-ance sheet results in a translation difference, which is entered in equity in the retained earnings.
Translation differences arising from the elimination of the acquisi-tion cost of foreign subsidiaries and items classified to be a part of net investments and the hedging result of these net investment are entered in shareholders’ equity. When a foreign subsidiary is disposed of or sold, exchange differences that were recorded in equity are recognised in the income statement as part of the gain or loss on sale. Translation differ-ences arising before January 1, 2004, are recorded in the retained earn-ings at the transition to IFRS and they will not be entered in the income statement in the event of the sale of a subsidiary.
Both the goodwill arising from the acquisition of a foreign unit and the adjustments of acquired assets and liabilities to their fair values have been treated as the assets and liabilities of the foreign unit in question and translated at the rate on the closing date. The goodwill and fair value adjustments related to acquisitions before January 1, 2004, have been denominated in euro.
CURRENCY EXCHANGE RATES USED IN YIT CONSOLIDATED FINANCIAL STATEMENTS:
Income statement Jan-Dec
2014
Income statement
Jan-Dec 2013
Balance sheet
31.12.2014
Balance sheet
31.12.2013
1 EUR = CZK 27.5364 25.9904 27.7350 27.4270
PLN 4.1843 4.1971 4.2732 4.1543
RUB 51.0378 42.3362 72.3370 45.3246
LVL 0.7015 0.7028
LTL 3.4528 3.4528 3.4528 3.4528
TANGIBLE ASSETS Tangible asset are stated at historical cost less depreciation and impair-ment.
Depreciation on tangible assets is calculated using the straight-line method to allocate the cost to over their estimated useful lives. Land is not depreciated. The estimated useful lives of tangible assets are the following:
Buildings 40 yearsConstructions 5-10 yearsProductive machinery and equipment 10 yearsOffice furniture 5 yearsComputers and computer supplies 3-5 yearsCars and trasferable vehicles 3-8 yearsOther property, plant and equipment 10-40 years
The residual values and economic lifetimes of assets are assessed in each closing. If necessary, they are adjusted to reflect the changes in expected financial benefits. Capital gains or losses on the sale of prop-erty, plant and equipment are included in other operating income or losses.
GOVERNMENT GRANTSGovernment grants are recognised as decreases in the carrying amount of property, plant and equipment. Grants are recognised as revenue through smaller depreciations over the economic life of an asset. Govern-ment grants relating to costs are recognised in the income statement in the same period when the costs are expensed.
INVESTMENT PROPERTY YIT Group has no assets that are classified as investment properties.
GOODWILL Goodwill represents the excess of the cost of an acquisition over the fair value of the Group’s share of the net identifiable assets of the acquired subsidiary on the date of acquisition. The net identifiable assets include the assets and liabilities acquired and the liabilities assumed as well as the contingent liabilities. The acquisition cost is valued at fair value. Goodwill on the consolidation of business functions before January 1, 2004, corresponds to the carrying amount as per the previously employed accounting standards, which has been used as the deemed cost in the IFRS transition. Goodwill is subjected to an annual impairment
test. To this end, goodwill is allocated to cash-generating units. Goodwill is measured at the original acquisition cost less impairment. Impairment is expensed directly in the income statement. Gains and losses on the disposal of an entity include the carrying amount of goodwill relating to the entity sold.
OTHER INTANGIBLE ASSETSAn intangible asset is initially entered in the balance sheet at acquisition cost when the acquisition cost can be reliably determined and the intan-gible asset is expected to yield economic benefit to the Group. Intangible assets with a known or estimated limited economic lifetime are expensed in the income statement on a straight-line basis over their economic life-time. Intangible assets with an unlimited economic lifetime are not depre-ciated, but are instead subjected to an impairment test annually.
Other intangible assets acquired in connection with business acqui-sitions are recognised separately from goodwill if they fulfil the definition of an asset: they can be specified or are based on agreements or legal rights. Intangible assets recognised in connection with business acqui-sitions include the value of customer agreements and associated cus-tomer relationships, prohibition of competition agreements, and the value of acquired technology and industry-related process competence. The value of customer agreements and associated customer relationships and industry-related process competence is defined on the basis of cash flows estimated according to the durability and duration of the assumed customer relations.
Acquired computer software and licences are capitalised on the basis of the costs incurred to acquire and bring to use the specific software. The acquisition cost is amortised on a straight-line basis over the esti-mated useful life. Computer maintenance costs are expensed as they are incurred. In IT projects that are classified as strategic, own work is capitalised in the balance sheet insofar as the capitalisation criteria are met in respect of cost monitoring, etc. Amortisation begins when the IT project is ready for use.
Research expenditure is expensed in the income statement. Expend-iture on the design of new or more advanced products is capitalised as intangible assets in the balance sheet as from the date when the product is technically feasible, can be utilised commercially and is expected to yield future financial benefits. Capitalised development expenditure is amortised over the economic life. Amortisation begins when the asset is ready for use. Incomplete assets are tested annually for impairment. Development expenses that are not expected to yield financial benefits
FINANCIAL STATEMENT
89
YIT ANNUAL REPORT 2014
YEAR 2014 BUSINESS OPERATIONS CORPORATE GOVERNANCE GRI INDEX
are expensed in the income statement. To date, the Group’s research and development expenditure has not met capitalisation criteria.
The amortisation periods of other intangible assets are as follows:Customer relations and contract bases 3 - 5 yearsUnpatented technology 3 - 5 yearsComputer software and other items 2 - 5 yearsProhibition of competition 2 - 3 years
IMPAIRMENT OF TANGIBLE AND INTANGIBLE ASSETS At each closing date, YIT Group evaluates whether there are indications of impairment in any asset item. If impairment is indicated, the recov-erable amount of said asset is estimated. In addition, the recoverable amount is assessed annually for each of the following asset items regard-less of whether impairment is indicated: goodwill, intangible assets with an unlimited economic lifetime and incomplete intangible assets. The need for impairment is assessed at the level of cash-generating units.
The recoverable amount is the fair value of the asset item less the higher of selling costs or the value in use. The value in use is determined based on the discounted future net cash flows estimated to be recover-able from the assets in question or cash-generating units. The discount rate used is a pre-tax rate that reflects current market assessments of the time value of money and the risks specific to the asset items. An impairment loss is recognised if the carrying amount of the asset item is higher than its recoverable amount. The impairment loss is entered directly in the income statement and is initially allocated to the goodwill allocated to the cash-generating unit and thereafter equally to other asset items. An impairment loss is reversed when the situation changes and the amount recoverable from the asset item has changed since the date when the impairment loss was recorded. However, impairment losses are not reversed beyond the carrying amount of the asset exclusive of impairment losses. Impairment losses on goodwill are never reversed. The calculation of recoverable amounts requires the use of estimates. For more information on impairment testing, see note 15.
INVENTORIES Inventories are measured either at the lower of acquisition cost or net realisable value. The acquisition cost of materials and supplies is deter-mined using the weighted average price method. The acquisition cost of work in progress and shares in completed housing and real estate companies comprises the value of the plot and other raw materials, plan-ning costs, direct costs of labour, other direct costs and the appropriate portion of the variable general costs of manufacture and fixed overhead. The net realisable value is the estimated selling price in ordinary business operations less the estimated expenditure on product completion and sales. In estimating the net realisable value of shares in completed hous-ing and real estate companies, the available market information and the level of the yield on the properties are taken into account. In assessing the net realisable value of plots of land, their intended use is taken into account. In the valuation of plots of land used for construction, the com-pleted products in which they will be included are taken into consider-ation. The carrying amount of plots of land is decreased only when the completed products are expected to be sold at a price lower than the acquisition cost. The net realisable value of other plots of land is based on the market price of the land.
LEASE AGREEMENTSGroup as lesseeLease agreements concerning assets in which the Group holds a mate-rial share of the risks and benefits of ownership are classified as financial lease agreements. A financial lease agreement is entered in the balance sheet at the lower of the fair value of the leased asset on the starting date of the lease agreement or the current value of the minimum rents. Assets acquired under financial lease agreements are depreciated over their economic lifetime or the period of lease, whichever is shorter. Each lease payment is allocated between the liability and finance charges so as to achieve a constant rate on the finance balance outstanding per financial period. The lease commitments of financial lease agreements are included in the financial liabilities.
Lease agreements in which the risks and benefits of ownership are retained by the lessor are treated as other lease agreements. Rents paid on other lease agreements are expensed in even instalments in the income statement over the duration of the rental period. Incentives received are deducted from the rents paid on the basis of the time pat-tern of the benefit.
NON-CURRENT ASSETS AND DISCONTINUED OPERA-TIONS HELD FOR SALE Non-current assets or assets related to discontinued operations are classified as assets held for sale when their carrying amount is to be recovered principally through a sale or disposal transfer transaction. An asset is to be classified as held for sale when the sale or disposal is highly probable, the asset is available for sale in its present condition and on customary terms, the management is committed to sell the asset and the sale is expected to be completed within one year from the date of classification. Assets held for sale are valued at the lower of their carrying amount or fair value less costs to sell. The depreciation of these assets will be discontinued at the time of reclassification.
The disposal group includes assets, which do not fall within the scope of IFRS 5, while liabilities are measured in accordance with the applicable IFRS standards also after the classification.
A discontinued operation is a component of the Group that either has been disposed of or is classified as held of sale and meets the following conditions:• It represents a separate major line of business or geographical area of
operations• It is part of a single coordinated plan to dispose of a separate major
line of business or geographical area of operations• It is a subsidiary acquired exclusively with a view to resale.
Revenue from discontinued operations is presented as a separate item in the Group’s OCI. Assets held for sale, disposal groups, items related to the assets held for sale and recognised directly in the share-holders’ equity, and liabilities related to the disposal group are presented separately from other assets in the balance sheet.
EMPLOYEE BENEFITSPension liabilitiesThe Group has different defined contribution and defined benefit pension plans in its various operating areas. The local regulations and practices of the countries in question are applied in these plans. Contributions to defined contribution pension plans are entered in the income statement in the financial period during which the charge applies.
The Group has defined benefit pension plans in Finland. Obligations connected with the Group’s defined benefit plans are calculated by independent actuaries. The discount rate used in calculating the present value of the pension liability is the market rate of high-quality corporate
FINANCIAL STATEMENT
90
YIT ANNUAL REPORT 2014
YEAR 2014 BUSINESS OPERATIONS CORPORATE GOVERNANCE GRI INDEX
bonds or the interest rate of treasury notes. The maturity of the reference rate substantially corresponds to the maturity of the calculated pension liability. The liability recognised on the balance sheet in respect of defined benefit pension plans is the present value of the defined benefit obliga-tion at the end of the reporting period less the fair value of plan assets. Defined benefit pension plan expenses comprise expenses based on employee service, which is recognised in personnel expenses, and net interest cost, which is also recognised in personnel expenses. Actuarial gains and losses are charged or credited to equity in other comprehen-sive income in the period in which they arise.
Share-based paymentsPossible rewards under the share-based incentive scheme are paid as a combination of YIT Corporation shares and cash settlement, or fully in cash, based on achieved financial target levels. The cost effect of equi-ty-settled share is recognised as personnel expenses and equity reserve. The cost is based on the market price of the YIT Corporation share at the grant date and it will be expensed over the vesting period. The cash-set-tled reward is based on the market value of YIT’s share at the balance sheet date and it is expensed to personnel expenses and current liabili-ties until the settlement date.
Termination benefitsTermination benefits are payable when employment is terminated by the Group before normal retirement. The Group recognises termination benefits when it is committed to terminating the employment of current employees according to a detailed formal plan without possibility of withdrawal. In addition, benefits that the Group has offered in connec-tion with terminations to encourage voluntary redundancy are expensed. Benefits falling due more than 12 months after the balance sheet date are discounted to present value. Other possible liabilities arising from the termination of employees in different legislations are assessed at the closing date and recognised as an expense and liability.
PROVISIONS Provisions are recorded when the Group has a legal or constructive obli-gation on the basis of a prior event, the materialisation of the payment obligation is probable and the size of the obligation can be reliably esti-mated. Provisions are valued at the current value of the costs required to cover the obligation. If compensation for a share of the obligation can be received from a third party, the compensation is recorded as a separate asset item, but only when it is practically certain that said compensa-tion will be received. Provisions are booked for loss-making agreements
when the obligatory expenditure required to meet obligations exceeds the benefits yielded by the agreement. The amount of the guarantee and Finnish 10-year provisions for commitments in the construction industry provision is set on the basis of experience of the materialisa-tion of these commitments. Provisions for restructuring are recognised when the Group has made a detailed restructuring plan and initiated the implementation of the plan or has communicated about it. Provisions are not recognised for the continuing operations of the Group. A contingent liability is an obligation that has possibly arisen as a result of past events and whose existence is confirmed only when the uncertain event that is beyond the Group’s control is realised. In addition, an existing obligation that probably does not require the fulfilment of debt or whose amount cannot be reliably assessed is considered a contingent liability. Contin-gent liabilities are presented in the notes.
INCOME TAXESTax expenses in the income statement comprise taxes on the taxa-ble income for the financial period and deferred tax liabilities. Taxes are entered in the income statement except when they are associated with items recognised under shareholders’ equity. Taxes on the taxable income for the financial period are calculated on the taxable income on the basis of the tax rate stipulated for each country by the balance sheet date. Taxes are adjusted for the taxes of previous financial periods, if applicable. The management evaluates positions taken in tax returns with respect to situations in which applicable tax regulation is subject to interpretation. The tax provisions entered in such situations are based on evaluations by the management.
Deferred taxes are calculated on all temporary differences between the carrying amount and taxable value. No deferred taxes are calculated on goodwill impairment that is not deductible in taxation and no deferred taxes are recognised on the undistributed profits of subsidiaries to the extent that the difference is unlikely to be discharged in the foreseeable future. Deferred taxes have been calculated using the statutory tax rates or the tax rates whose confirmed content has been announced by the closing date. Deferred tax assets have been recognised to the extent that it is probable that taxable income against which the temporary difference can be applied will materialise in the future. The most significant tempo-rary differences arise from differences of the partial debiting and taxable income of long-term projects, depreciation differences of property, plant and equipment, defined benefit pension plans, provisions deductible at a later date, measurement at fair value in connection with acquisitions, unused tax losses and voluntary provisions.
Deferred income tax assets and liabilities are offset when there is a legally enforceable right to offset current tax assets against current tax liabilities and when the deferred income tax assets and liabilities relate to income taxes levied by the same taxation authority on either the same taxable entity or different taxable entities where there is an intention to settle the balances on a net basis.
FINANCIAL ASSETS AND LIABILITIESClassification and entry of financial assetsThe Group records financial assets at the settlement day. Financial assets are derecognised from the balance sheet when the right to cash flows from an item included in financial assets ends or when control over said cash flows has been assigned outside the Group with the related risks and revenue.
The fair values of the financial assets are market rates if one has been reliably available, or otherwise discounted values or accounting values if this is reasonably close to the fair value. The discount rate used is the rate at which the Group could possibly sell a corresponding batch on the closing date.
The Group has, at the initial recognition, classified its financial assets into the following categories on the basis of the purpose for which they have been acquired:
Financial assets originally measured at fair value through profit and lossFinancial assets measured at fair value through profit and loss are finan-cial assets or derivatives held for trading that do not meet the criteria for hedge accounting according to IAS 39. Currency forward contracts and interest rate swaps associated with business operations and financing to which IAS 39-compliant hedging is not applied have been classi-fied into this category. Derivatives are originally measured at fair value when the Group becomes a contractual party to an agreement and are subsequently measured at fair value. Currency forward contracts are used for hedging against the currency exposure of exchange rates and resulting changes in fair value are entered in other operating income and expenses or financial income and expenses based on their nature in the financial period in which they were incurred. Interest rate swaps are used to hedge against changes in market interest rates, and changes in the fair value of interest rate swaps are entered in financing income or expenses in the financial period in which they were incurred. Deriva-tives are non-current assets when their maturity is more than 12 months (Receivables) and current assets (Trade and other receivables) when
FINANCIAL STATEMENT
91
YIT ANNUAL REPORT 2014
YEAR 2014 BUSINESS OPERATIONS CORPORATE GOVERNANCE GRI INDEX
the remaining maturity is less than 12 months. Derivatives may also be liabilities; their accounting principles are specified below under “Financial liabilities.”
Loans and receivablesLoans and receivables consist of loan receivables, trade receivables and certain other receivables.
Loan receivables are current if the maturity date is within 12 months after the closing date, otherwise they are non-current. They are initially measured at fair value and subsequently valued at the periodised acqui-sition costs using the effective yield method less any impairment. The changes are recognised in the income statement under financial income or expenses.
Trade and other receivables are current if the maturity date is within 12 months after the closing date, otherwise they are non-current. They are initially measured at fair value and subsequently valued at the periodised acquisition costs using the effective yield method less any impairment. The changes are recognised under other operating income or expenses.
Available-for-sale financial assetsAvailable-for-sale financial assets not falling into the categories presented above. They are non-current financial assets that the Group will not actively dispose of in the short-term. Available-for-sale financial assets primarily comprise shares and participations acquired to support busi-ness operations, e.g. in local telecom, water and environment service companies. They are not primarily quoted in well-functioning markets and they are measured at acquisition cost less any impairment. Quoted shares are measured at fair value and others, when the fair value cannot be evaluated reliably, at the original acquisition cost. When fair value can be evaluated reliably, the changes in fair value are entered in the compre-hensive income statement and are presented in the fair value reserves in shareholders’ equity, taking the tax impact into consideration. Changes in fair value are transferred from the fair value reserve to financing income or expenses when the Group disposes of an available-for-sale financial asset or its value has declined such that an impairment loss must be rec-ognised on it. Impairment of an equity investment classified as an availa-ble-for-sale financial asset is not derecognised through profit or loss.
Cash and cash equivalentsCash and cash equivalents include cash, bank deposits withdraw able on demand and liquid short-term investments whose original maturity is no more than three months. They are recorded in the balance sheet at
the original acquisition cost and the yield under financing income. The available overdraft facilities are included in current liabilities in the balance sheet and netted as the Group has a contractual offsetting right to exe-cute the net amount to the creditor.
Impairment of financial assetsAssessment as to whether there is objective evidence of an impairment of an item included in the financial assets occurs on the closing date. An impairment loss is recognised if the carrying amount of the asset item is higher than its recoverable amount. An impairment loss is reversed if the recoverable amount has changed from the date it was recognised due to a change in circumstances.
The fair value of available-for-sale financial assets is considered decreased when their value has decreased significantly over a longer term. In this case, changes to the fair value are entered from sharehold-ers’ equity to the income statement. Impairment losses to equity invest-ments classified as available-for-sale financial assets are not derecog-nised through profit or loss.
The value of loan and trade receivables in other receivables is con-sidered to have decreased when it is apparent that the Group will not be able to collect the receivable in accordance with the original terms and conditions. The Group recognises the impairment loss concerning sales receivables immediately when there is objective evidence that the receivable cannot be collected in full. In addition, delay or default on a payment by the debtor or known financial difficulties of the debtor are considered additional factors indicative of an impairment of trade receiv-ables. According to the Group’s principle concerning the valuation of trade receivables, 50% of unsecured and uncertain receivables overdue more than 180 days and 100% of those overdue more than 360 days is recognised as an expense. Due to the application of the percentage of completion method, part of the items considered write-downs is included in the project cost estimate and taken into consideration as weakened margin forecast. Write-downs on loss-making projects are included in the provisions for losses.
Financial liabilitiesFinancial liabilities are recorded in the balance sheet at the settlement day and derecognised from the balance sheet when the related obliga-tions expire or transfer outside the Group in accordance with the agree-ments.
The Group has classified its financial liabilities into the following categories:
Financial liabilities at periodised acquisition cost using the effective interest rate method
These are originally measured at fair value. Transaction costs arising in connection with taking out the loan have been included in the origi-nal carrying amount. Financial liabilities may be current or non-current. Financial liabilities are later valued at the periodised acquisition cost using the effective interest rate method. Borrowing costs arising as a result of the acquisition, construction or manufacturing of a qualifying asset are capitalised as part of the acquisition cost of the asset in question when it is probable that they will produce future financial benefit and can be relia-bly determined. Other borrowing costs are expensed in the period during which they emerged. Fees paid on the establishment of loan facilities are recognised as expenses over the period of the facility to which it relates.
Developer contracting-related debts from contract receivables sold to financing companies are also presented in financial liabilities. The receiv-ables sold to financing companies are included in the current borrowings during the loan period to the extent they are related to housing produc-tion or commercial real estates recognised as revenue upon completion. Loans from external financial institutions drawn down by housing corpo-rations have been accounted for as liabilities to the extent that they apply to unsold shares.
The Group has applied from January 1, 2010 the IFRIC15 inter-pretation, according to which sold residential units in own residential development projects are recognised when projects are complete. As a result, all construction-stage contract receivables related to residential housing production or business premises recognised as revenue upon completion must be reported as part of the interest-bearing liabilities on the balance sheet. Previously, this part of the construction-stage contract receivables was reported as an off-balance sheet item.
The fair values of the financial liabilities are market rates if one has been reliably available, or otherwise discounted values or accounting values if this is reasonably close to the fair value. The discount rate used is the rate at which the Group could possibly buy a corresponding item on the closing date.
Financial liabilities measured at fair value Currency forward contracts and interest rate swaps associated with busi-ness operations and financing to which IAS 39 compliant hedging is not
FINANCIAL STATEMENT
92
YIT ANNUAL REPORT 2014
YEAR 2014 BUSINESS OPERATIONS CORPORATE GOVERNANCE GRI INDEX
applied have been classified into this category. Derivatives are originally measured at fair value when the Group becomes party to an agreement and is subsequently measured at fair value. Currency forward contracts are used for hedging against the currency exposure of exchange rates and resulting changes in fair value are entered in other operating income and expenses or financial income and expenses in the financial period in which they were incurred. Interest rate swaps are used to hedge against changes in market interest rates, and changes in the fair value of interest rate swaps are entered in financing income or expenses in the financial period in which they were incurred. Derivatives are non-current liabilities when their maturity is more than 12 months (Other liabilities) and current liabilities when the remaining maturity is less than 12 months (Trade and other payables).
Fair value of derivative instruments and hedge accountingThe fair value of derivative instruments equals the value the Group would receive or pay if the derivative contract were transferred. The fair value of exchange rate forward agreements has been assessed by using the market prices at the closing day. These quoted prices for interest rate swap agreements are derived from the discounted future cash flows, and the quoted prices for other agreements are based on general market conditions and common pricing models. The fair value of commodity derivatives is based on average market price on the balance sheet date.
Derivative instruments used in hedge accounting that meet the hedge accounting criteria under IAS 39 are entered in the balance sheet at fair value on the day that the Group becomes counterpart to the agreement. The Group has applied hedge accounting for hedging against the refer-ence rate of floating rate loans (cash flow hedging). The Group docu-ments the relationship between the target and the hedging instruments and assesses the effectiveness of the hedging ratio. The effectiveness of hedging is evaluated in connection with the preparation of each financial statement, at minimum. Changes in the fair value of the effective part of derivative instruments meeting the criteria for cash flow hedging are entered in the fair value reserves in shareholders’ equity, taking the tax impact into consideration. Gains and losses recognised in shareholders’ equity are transferred to financial income or expenses within the same financial periods as the items of the hedging target. When a hedging instrument acquired to hedge cash flow matures or is sold, or when the criteria of hedging accounting are no longer satisfied, the profit or loss accrued from the hedging instrument remains in equity until the forecasted transaction is realised. Nevertheless, if the forecasted hedged transaction is no longer expected to be implemented, the profit or loss accrued in equity is recognised immediately in the income statement.
TREASURY SHARESIf a Group company acquires YIT Corporation shares, the consideration paid for the shares and acquisition-related costs are decreased from shareholders’ equity until the shares are nullified or re-circulated. When the company sells its own shares, the direct transaction costs can be decreased from the consideration received, which is then entered in shareholders’ equity.
INCOME RECOGNITION Income from product and service sales is recorded as revenue at fair value with the indirect taxes, discounts.
Goods and services soldYIT Group designs, constructs and sells residential units and business premises and develops and maintains living infrastructure. Furthermore, in Russia, the Group provides after-sales service and maintenance for consumer customers’ new homes. Income from sales of products is recorded when the significant risks, benefits and control associated with the ownership of the goods have transferred to the buyer. Income from short-term services is recorded when the service has been performed.
Long-term service agreements and construction contractsLong-term service agreements and construction contracts are recorded as revenue on the basis of the degree of completion when the end result of the project can be estimated reliably. The degree of completion of long-term service agreements is calculated on the basis of the share of the estimated total cost of a contract represented by the costs realised at the time of assessment. The revenue from developer contracting is recognised on the basis of the percentage of degree of completion and the degree of sale. Costs in excess of the degree of completion are cap-italised in work in progress included in inventories. Revenue from con-struction projects including leasing liabilities is recognised as revenue on the basis of the percentage of degree of completion, degree of sale and occupancy rate. Leasing liabilities are treated as contract expenses. A provision for leasing liabilities is made if the remaining unrecognised mar-gin of the construction project is lower than the amount of the remaining leasing liability.
The Group may also carry out a certain construction contract or long-term service agreement through a construction consortium. A construc-tion consortium is not an independent legal unit; instead the contracting parties are directly responsible for its operations and liabilities. Construc-
tion contracts and long-term service agreements carried out through a consortium are included in the relevant Group company’s reporting and are recorded as revenue on the basis of the degree of completion and the Group’s share in the consortium.
Own residential and commercial real estate development projectsFrom January 1, 2010, the revenue generated by YIT’s own residen-tial development projects is recognised when the project is complete i.e. when the residential units are ready to be handed over to the client. Revenue recognition of completed projects is based on degree of sale. Under the old practice, the revenue was recognised during the construc-tion phase based on the percentage of degree of completion and the degree of sale.
In the case of YIT’s commercial real estate development projects, the recognition practice will be evaluated on a case-by-case basis and in accordance with the terms and conditions of each contract. These projects will be recognised when the construction work has started or when the project is complete. The share of income and expenses to be recognised is calculated by using the formula percentage of completion multiplied by the percentage of sale multiplied by the occupancy rate. YIT normally secures the key tenants prior to starting a business premises project and the investor at the early stage of construction of the project.
If it is probable that the total expenditure required to complete a con-tract will exceed the total income from the project, the expected loss is expensed immediately in all circumstances. Revenue recognition on the basis of the degree of completion related to long-term service agree-ments and construction contracts is based on estimates. If the estimates of the end result of a contract change, the sales and profits recognised are adjusted in the reporting period when the change first becomes known and can be evaluated.
Interest and dividendsInterest income is recognised using the effective yield method and divi-dend income when the right to dividend has materialised.
NON-RECURRING ITEMSNon-recurring items are presented in the Notes to the Consolidated Financial Statements. The Group treats as non-recurring items items that have a material impact on the quarterly result that help understand the formation of the Group’s financial result. The Group treats as non-recur-
FINANCIAL STATEMENT
93
YIT ANNUAL REPORT 2014
YEAR 2014 BUSINESS OPERATIONS CORPORATE GOVERNANCE GRI INDEX
ring items items such as the following, when their impact on the quarterly result is material: • Gains or losses arising from the divestment of a business or part of a
business• Write-down of goodwill• Provisions made on the basis of statutory personnel negotiations and
adaptation measures• Costs associated with acquisitions• Impairment of fixed asset items• Impairment of plots of land• Material effect on profit/loss from disputes based on a decision by a
court or arbitration proceedings• Any other extraordinary items that have a material impact on the
quarterly result
CRITICAL ACCOUNTING ESTIMATES AND JUDGEMENTSWhen financial statements are prepared in accordance with IFRS, the Group management must make estimates and exercise judgement in the application of the accounting policies. Estimates and assumptions have an effect on the amounts of assets, liabilities and contingent liabilities in the balance sheet of the financial statements and the final actual results may differ from the estimates. The following presents the critical account-ing estimates and judgements included in the financial statements:
Estimated impairment of goodwillGoodwill is tested for any impairment annually in accordance with the accounting policy stated in note 15. The recoverable amounts of cash-generating units have been determined based on value-in-use calculations. The cash flows in the value-in-use calculations are based on the management’s best estimate of market development for the subse-quent years.
The cash flows in the value-in-use calculations reflect the best esti-mate for different time period, and the sensitivity analysis for discount rate, profitability as well as terminal value have been made. On Decem-ber 31, 2014, goodwill amounted to EUR 10.9 million.
Percentage of completion revenue recognition of long-term projectsDue to estimates included in the revenue recognition of long-term ser-vice agreement and construction projects, revenue and profit presented by financial period only rarely correspond to the equal distribution of the total profit over the duration of the project. When revenue recogni-tion from long-term projects is based on the percentage of completion
method, the final result of the projects is regularly and reliably estimated. Calculation of the total income of projects includes estimates on the total expenditure required to complete the project as well as the development of sales prices. If the estimates of the end result of a contract change, the sales and profits recognised are adjusted in the reporting period when the change first becomes known and can be evaluated. If it is probable that the total expenditure required to complete a contract will exceed the total income from the project, the expected loss is expensed immediately. In 2014, revenue recognition through percentage of comple-tion method amounted to EUR 1,225.8 million, representing 69 percent of the Group’s revenue (Note 5).
Income taxesThe Group is subject to income taxes in several countries. Evaluating the total amount of income taxes at the Group level requires significant con-sideration, so the amount of total tax includes uncertainty. On December 31, 2014, deferred tax receivables amounted to EUR 40.3 million and deferred tax liabilities amounted to EUR 15.6 million (Note 19).
ProvisionsThe recognition of provisions is associated with estimates concerning probability and quantity. Provisions are booked for loss-making agree-ments when the obligatory expenditure required to meet obligations exceeds the benefits yielded by the agreement. A guarantee provision and Finnish 10-year provisions for commitments are recorded when a project is recognised in the income statement. The amount of the guar-antee and Finnish 10-year provisions for commitments in the construc-tion industry provision is set on the basis of experience of the materi-alisation of these commitments. On December 31, 2014, provisions amounted to EUR 60.9 million (Note 25).
Pension benefitsThe current value of pension obligations depends on various actuarial factors and the discount rate used. Changes in the assumptions and discount rate have an effect on the carrying amount of pension liabilities. The discount rate used is the market rate of high-quality corporate bonds or the interest rate of treasury notes for the currency in which the benefits will be realised. The maturity of the reference rate used corresponds sub-stantially to the maturity of the calculated pension liability. Other assump-tions are based on actuarial statistics and prevailing market conditions. On December 31, 2014, pension liabilities amounted to EUR 0.9 million (Note 24).
InventoriesOn each closing date, the Group assesses the valuing of inventory and possible decrease in value based on its best estimate. The estimates are based on systematic and continuous monitoring. Plot reserves are measured at acquisition cost and the value is impaired only when it is estimated that the building being constructed on the plot will be sold at a price lower than the sum of the price of the plot and the construction costs. The valuing of plot reserves has been made by using time period of 3-4 years. On December 31, 2014, work in progress amounted to EUR 874.0 million, completed housing units amounted to EUR 223.8 million and plot reserves amounted to EUR 509.1 million (Note 20).
Trade receivablesThe Group books write-offs or provision on receivables when it is evident that no payment can be expected. Group adopts its policy of valuing trade receivables and the bookings include estimates and critical judge-ments. The estimates are based on experience on realised write-offs in previous years, empirical knowledge of debt collecting, analysis made by clients and general market situation at the time. On December 31, 2014, trade receivables amounted to EUR 118.1 million (Note 21).
EVALUATION OF THE FUTURE IMPACT OF NEW STAN-DARDS AND INTERPRETATIONSIASB has published the following new or amended standards and inter-pretations, which group has not applied for or EU commission has not approved yet. YIT Group will adopt them in the financial statements for the year 2015 or later.
• IAS 19 Employee benefits: The amendment applies to contributions from employees or third parties to defined benefit plans and clarifies the treatment of such contributions. The amendment distinguishes between contributions that are linked to service only in the period in which they arise and those linked to service in more than one period. The objective of the amendment is to simplify the accounting for contributions that are independent of the number of years of employee service, for example employee contributions that are calculated according to a fixed percentage of salary. Entities with plans that require contributions that vary with service will be required to recognise the benefit of those contributions over employee’s working lives. The Group management is assessing the impact of the standard on the financial statements of the Group.
FINANCIAL STATEMENT
94
YIT ANNUAL REPORT 2014
YEAR 2014 BUSINESS OPERATIONS CORPORATE GOVERNANCE GRI INDEX
• IFRIC 21 Levies: This is an interpretation of IAS 37, ‘Provisions, contingent liabilities and contingent assets.’ IAS 37 sets out criteria for the recognition of a liability, one of which is the requirement for the entity to have a present obligation as a result of a past event (known as an obligating event). The interpretation addresses what the obligating event is that gives rise to the payment of a levy and when a liability should be recognised.
• Amendment to IFRS 11, ‘Joint arrangements: This amendment provides new guidance on how to account for the acquisition of an interest in a joint venture operation that constitutes a business. The amendments require an investor to apply the principles of business combination accounting when it acquires an interest in a joint operation that constitutes a ‘business.’ The amendments are applicable to both the acquisition of the initial interest in a joint operation and the acquisition of additional interest in the same joint operation. However, a previously held interest is not re-measured when the acquisition of an additional interest in the same joint operation results in retaining joint control.
• Amendment to IAS 16 Property, plant and equipment and IAS 38, Intangible assets regarding depreciation and amortisation: This amendment clarifies that the use of revenue-based methods to calculate the depreciation of an asset is not appropriate because revenue generated by an activity that includes the use of an asset generally reflects factors other than the consumption of the economic benefits embodied in the asset. This has also clarified that revenue is generally presumed to be an inappropriate basis for measuring the consumption of the economic benefits embodied in an intangible asset. The presumption may only be rebutted in certain limited circumstances. These are where the intangible asset is expressed as a measure of revenue; or where it can be demonstrated that revenue and the consumption of the economic benefits of the intangible asset are highly correlated.
• Amendments to IAS 16, ‘Property, plant and equipment’ and IAS 41, ‘Agriculture’ regarding bearer plants: These amendments change the reporting for bearer plants, such as grape vines, rubber trees and oil palms. Bearer plants should be accounted for in the same way as property, plant and equipment because their operation is similar to that of manufacturing. The amendments include them in the scope of IAS 16 rather than IAS 41. The produce on bearer plants will remain in
the scope of IAS 41. The Group management has assessed that the standard has no impact on the financial statements of the Group.
• Amendments to IFRS 10 and IAS 28 regarding the sale or contribution of as-sets between an investor and its associate or joint venture: These amendments address an inconsistency between IFRS 10 and IAS 28 in the sale or contribution of assets between an investor and its associate or joint venture. A full gain or loss is recognised when a transaction involves a business. A partial gain or loss is recognised when a transaction involves assets that do not constitute a business, even if those assets are in a subsidiary. The Group management is assessing the impact of the standard on the financial statements of the Group.
• Amendment to IAS 27 Separate financial statements: The amendment allow entities to use the equity method to account for investments in subsidiaries, joint ventures and associates in their separate financial statements. The Group management has assessed that the standard has no impact on the financial statements of the Group.
• IFRS 14 Regulatory deferral accounts: This standard permits first-time adopters of IFRS to continue to recognise amounts related to rate regulation in accordance with their previous GAAP requirements when they adopt IFRS. How-ever, to enhance comparability with entities that already apply IFRS and do not recognise such amounts, the standard requires that the effect of rate regulation must be presented separately from other items.The Group management has assessed that the standard has no impact on the financial statements of the Group.
• IFRS 15 Revenue from con-tracts with customers: This is the converged standard on revenue recognition. It replaces IAS 11, ‘Construction contracts,’ IAS 18,’Revenue’ and related interpretations. Revenue is recognised when a customer obtains control of a good or service. A customer obtains control when it has the ability to direct the use of and obtain the benefits from the good or service. The core principle of IFRS 15 is that an entity recognises revenue to depict the transfer of promised goods or services to customers in an amount that reflects the consideration to which the entity expects to be entitled in exchange for those goods or services. An entity recognises revenue in accordance with that core principle by applying the following steps:
– Step 1: Identify the contract(s) with a customer – Step 2: Identify the performance obligations in the contract
– Step 3: Determine the transaction price – Step 4: Allocate the transaction price to the performance
obligations in the contract – Step 5: Recognise revenue when (or as) the entity satisfies a
performance obligation
• IFRS 15 also includes a cohesive set of disclosure requirements that will result in an entity providing users of financial statements with comprehensive information about the nature, amount, timing and uncertainty of revenue and cash flows arising from the entity’s contracts with customers.
• IFRS 9 Financial instruments: The complete version of IFRS 9 replaces most of the guidance in IAS 39. IFRS 9 retains but simplifies the mixed measurement model and establishes three primary measurement categories for financial assets: amortised cost, fair value through OCI and fair value through P&L. The basis of classification depends on the entity’s business model and the contractual cash flow characteristics of the financial asset. Investments in equity instruments are required to be measured at fair value through profit or loss with the irrevocable option at inception to present changes in fair value in OCI. There is now a new expected credit losses model that replaces the incurred loss impairment model used in IAS 39.
• For financial liabilities there were no changes to classification and measurement except for the recognition of changes in own credit risk in other comprehensive income, for liabilities designated at fair value, through profit or loss.
• IFRS 9 relaxes the requirements for hedge effectiveness by replacing the bright line hedge effectiveness tests. It requires an economic relationship between the hedged item and hedging instrument and for the ‘hedged ratio’ to be the same as the one management actually use for risk management purposes. Contemporaneous documentation is still required but is different to that currently prepared under IAS 39.
• The Group management is assessing the impact of the standard on the financial statements of the Group.
• IAS 19 Employee benefits: Employee contributions to defined benefit plans: The amendment allows contributions associated with employee service and whose amount does not vary based on the
FINANCIAL STATEMENT
95
YIT ANNUAL REPORT 2014
YEAR 2014 BUSINESS OPERATIONS CORPORATE GOVERNANCE GRI INDEX
employee’s period of employment to be deducted from the costs of benefits earned during which the services are rendered. The Group management is assessing the impact of the standard on the financial statements of the Group.
• Annual improvements 2012: These annual improvements amend standards from the 2010–2012 reporting cycle. It includes changes to:
– IFRS 2 Share based payments – IFRS 3 Business combinations – IFRS 8 Operating segments – IFRS 13 Fair value – IAS 16 Property, plant and equipment and IAS 38 Intangible assets – IAS 24 Related party disclosures
The Group management is assessing the impact of the standard on the financial statements of the Group.
• Annual improvements 2013: These annual improvements amend standards from the 2011–2013 reporting cycle. It includes changes to:
– IFRS 3 Business combinations – IFRS 13 Fair value measurement – IAS 40 Investment property
The Group management is assessing the impact of the standard on the financial statements of the Group.
• Annual improvements 2014: These annual improvements amend standards from the 2012–2014 reporting cycle. It includes changes to:
– IFRS 5 Non-current assets held for sale and discontinued operations
– IFRS 7 Financial instruments: Disclosures – IAS 19 Emplyee benefits – IAS 34 Interim financial reporting
The Group management is assessing the impact of the standard on the financial statements of the Group.
2. Segment informationThe possible restatements made in the previous year’s figures are only done in order to remain the comparability with the actual year’s figures.
YIT Corporation’s segment structure changed from the beginning of 2014. As of January 1, 2014, the Group’s two reportable segments are 1) Housing and 2) Business Premises and Infrastructure. The Business Premises and Infrastructure segment comprises business premises con-struction in Finland, the Baltic countries and Central Eastern Europe, as well as infrastructure services in Finland.
The reason for the change from the previous geographical business segment structure was YIT’s aim to revise its business segment structure to better correspond to the company’s new management structure and business areas.
HOUSING• Development and construction of housing, holiday homes and entire
residential areas, with an emphasis on own developments• Property maintenance in Russia
BUSINESS PREMISES AND INFRASTRUCTURE• Development and construction of offices, shopping malls, public
facilities, assisted living facilities and other business premises• Renovation projects• Construction of roads, bridges, tunnels, rail and metro stations, ports
and power plants
• Road and street maintenance
OTHER ITEMSOther items include Group internal services, rental revenue from external customers and Group level unallocated costs.
ACCOUNTING PRINCIPLES IN SEGMENT REPORTINGIn the Group’s segments’ reporting to the management, the revenue from own residential and commercial development projects is recog-nised by multiplying the degree of completion and the degree of sale, i.e. according to the percentage of completion method, which does not fully comply with the Group’s IFRS accounting principles. According to the Group’s IFRS accounting principles, revenue from our own residen-tial construction projects is recognised on completion and in commercial development projects the recognition practice will be evaluated on a case-by-case basis and in accordance with the terms and conditions of
each contract. The share of income and expenses to be recognised is calculated by multiplying the percentage of completion by the percentage of sale multiplied by the occupancy rate. YIT usually sells own commer-cial development projects to investors either prior to construction or during an early phase. The impact of the difference in reporting principles is shown in the line IFRS adjustment. As a result of the accounting policy, Group figures can fluctuate greatly between quarters.
In addition to group reporting, the interest expenses are capitalized according to IAS 23 standard, which causes differences in operating profit and financial expenses between segment reporting and group reporting. The chief operating decision-maker is the YIT Group’s Man-agement Board, which reviews the Group’s internal reporting in order to assess performance and allocate resources to the segments.The operative invested capital and return on operative invested capital (%) are included in the reports regularly reviewed by the YIT Group’s Man-agement Board. These key indicators are reported regularly to Group’s Management. Operative invested capital is determined as follows:
+ Tangible and intangible assets+ Goodwill+ Investments in associates and joint ventures + Inventories+ Trade receivables and other non-interest-bearing receivables (excl.
items related to taxes, interests and distribution of assets)= Segments’ assets- Provisions- Trade payables- Advances received- Other non-interest-bearing liabilities (excl. items related to taxes, inter-
ests and distribution of assets)= Segments’ liabilities
Operative invested capital = Segment’s assets - Segment’s liabilities
Return on operative invested capital %
Segment’s operating profit =
Operative invested capital (average) *100
FINANCIAL STATEMENT
96
YIT ANNUAL REPORT 2014
YEAR 2014 BUSINESS OPERATIONS CORPORATE GOVERNANCE GRI INDEX
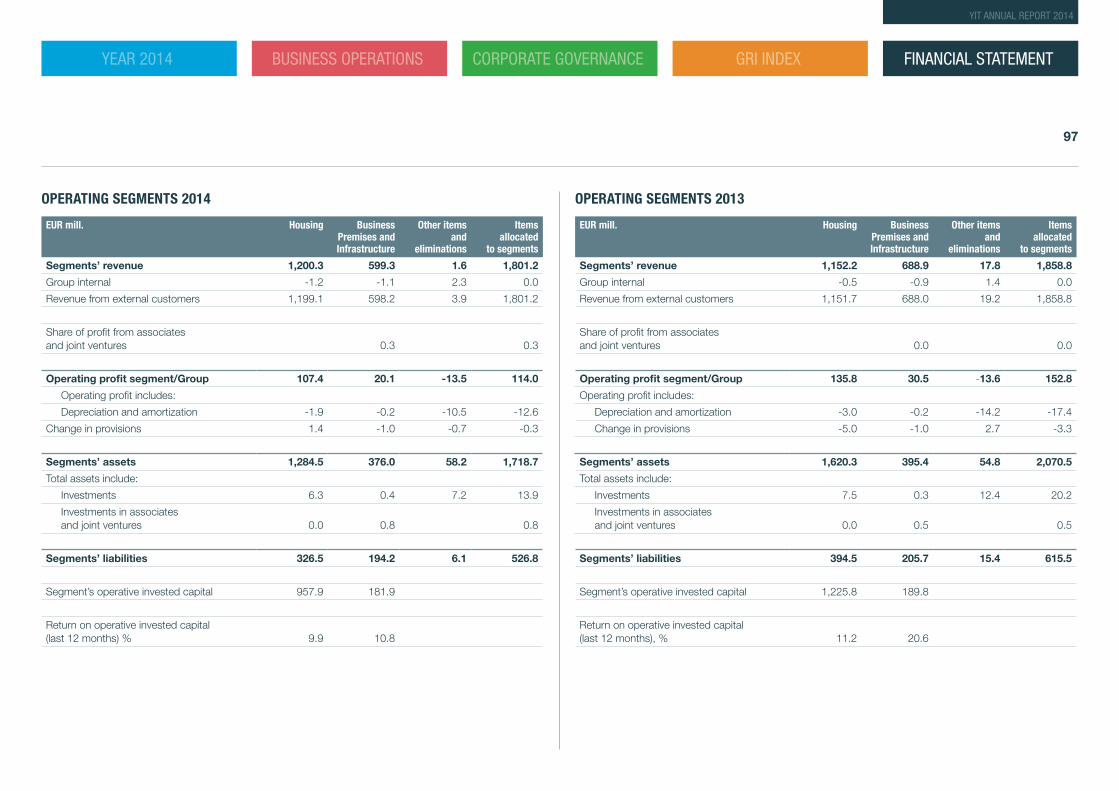
FINANCIAL STATEMENT
97
YIT ANNUAL REPORT 2014
YEAR 2014 BUSINESS OPERATIONS CORPORATE GOVERNANCE GRI INDEX
OPERATING SEGMENTS 2014
EUR mill. Housing Business Premises and Infrastructure
Other items and
eliminations
Items allocated
to segments
Segments’ revenue 1,200.3 599.3 1.6 1,801.2
Group internal -1.2 -1.1 2.3 0.0
Revenue from external customers 1,199.1 598.2 3.9 1,801.2
Share of profit from associates and joint ventures 0.3 0.3
Operating profit segment/Group 107.4 20.1 -13.5 114.0
Operating profit includes:
Depreciation and amortization -1.9 -0.2 -10.5 -12.6
Change in provisions 1.4 -1.0 -0.7 -0.3
Segments’ assets 1,284.5 376.0 58.2 1,718.7
Total assets include:
Investments 6.3 0.4 7.2 13.9
Investments in associates and joint ventures 0.0 0.8 0.8
Segments’ liabilities 326.5 194.2 6.1 526.8
Segment’s operative invested capital 957.9 181.9
Return on operative invested capital (last 12 months) % 9.9 10.8
OPERATING SEGMENTS 2013
EUR mill. Housing Business Premises and Infrastructure
Other items and
eliminations
Items allocated
to segments
Segments’ revenue 1,152.2 688.9 17.8 1,858.8
Group internal -0.5 -0.9 1.4 0.0
Revenue from external customers 1,151.7 688.0 19.2 1,858.8
Share of profit from associates and joint ventures 0.0 0.0
Operating profit segment/Group 135.8 30.5 -13.6 152.8
Operating profit includes:
Depreciation and amortization -3.0 -0.2 -14.2 -17.4
Change in provisions -5.0 -1.0 2.7 -3.3
Segments’ assets 1,620.3 395.4 54.8 2,070.5
Total assets include:
Investments 7.5 0.3 12.4 20.2
Investments in associates and joint ventures 0.0 0.5 0.5
Segments’ liabilities 394.5 205.7 15.4 615.5
Segment’s operative invested capital 1,225.8 189.8
Return on operative invested capital (last 12 months), % 11.2 20.6
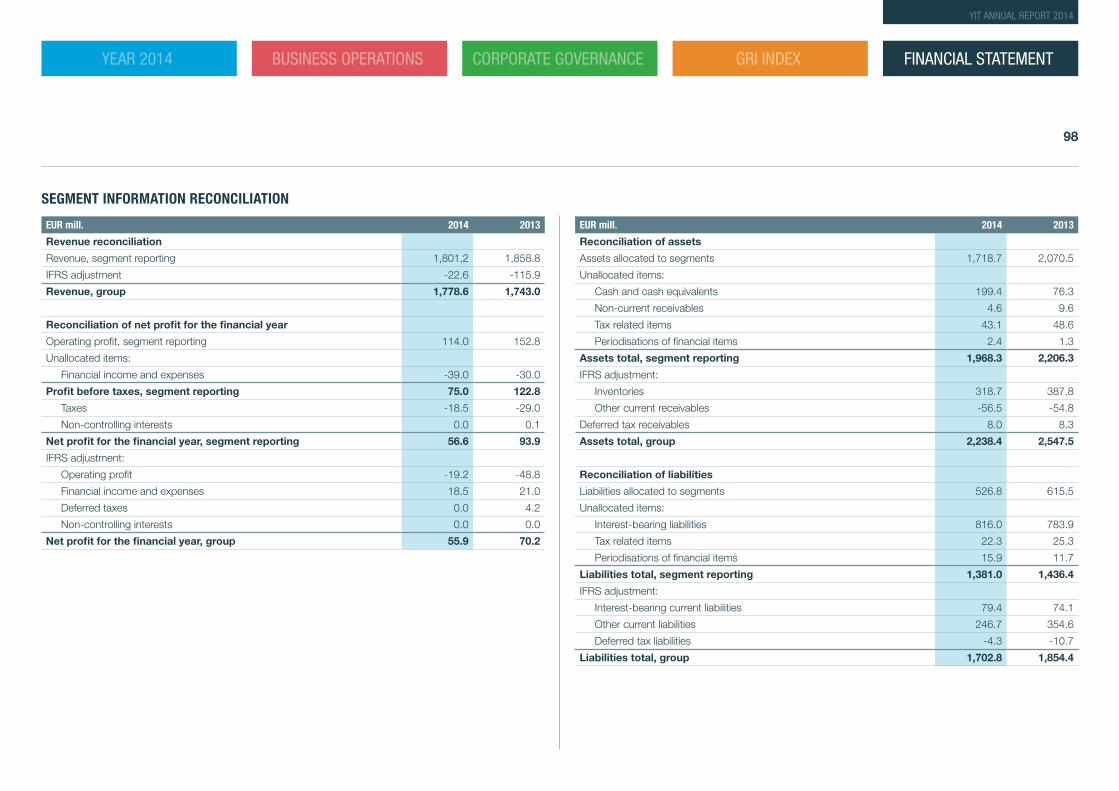
FINANCIAL STATEMENT
98
YIT ANNUAL REPORT 2014
YEAR 2014 BUSINESS OPERATIONS CORPORATE GOVERNANCE GRI INDEX
SEGMENT INFORMATION RECONCILIATION
EUR mill. 2014 2013
Revenue reconciliation
Revenue, segment reporting 1,801,2 1,858.8
IFRS adjustment -22.6 -115.9
Revenue, group 1,778.6 1,743.0
Reconciliation of net profit for the financial year
Operating profit, segment reporting 114.0 152.8
Unallocated items:
Financial income and expenses -39.0 -30.0
Profit before taxes, segment reporting 75.0 122.8
Taxes -18.5 -29.0
Non-controlling interests 0.0 0.1
Net profit for the financial year, segment reporting 56.6 93.9
IFRS adjustment:
Operating profit -19.2 -48.8
Financial income and expenses 18.5 21.0
Deferred taxes 0.0 4.2
Non-controlling interests 0.0 0.0
Net profit for the financial year, group 55.9 70.2
EUR mill. 2014 2013
Reconciliation of assets
Assets allocated to segments 1,718.7 2,070.5
Unallocated items:
Cash and cash equivalents 199.4 76.3
Non-current receivables 4.6 9.6
Tax related items 43.1 48.6
Periodisations of financial items 2.4 1.3
Assets total, segment reporting 1,968.3 2,206.3
IFRS adjustment:
Inventories 318.7 387.8
Other current receivables -56.5 -54.8
Deferred tax receivables 8.0 8.3
Assets total, group 2,238.4 2,547.5
Reconciliation of liabilities
Liabilities allocated to segments 526.8 615.5
Unallocated items:
Interest-bearing liabilities 816.0 783.9
Tax related items 22.3 25.3
Periodisations of financial items 15.9 11.7
Liabilities total, segment reporting 1,381.0 1,436.4
IFRS adjustment:
Interest-bearing current liabilities 79.4 74.1
Other current liabilities 246.7 354.6
Deferred tax liabilities -4.3 -10.7
Liabilities total, group 1,702.8 1,854.4
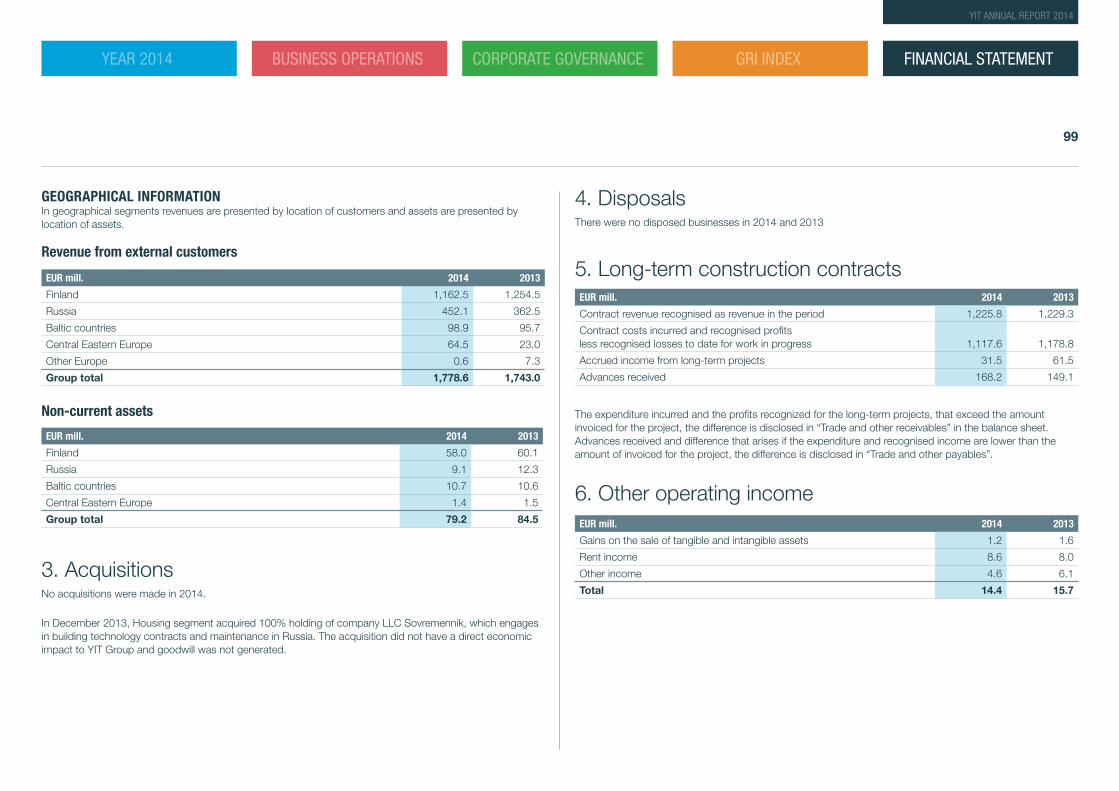
GEOGRAPHICAL INFORMATIONIn geographical segments revenues are presented by location of customers and assets are presented by location of assets.
Revenue from external customers
EUR mill. 2014 2013
Finland 1,162.5 1,254.5
Russia 452.1 362.5
Baltic countries 98.9 95.7
Central Eastern Europe 64.5 23.0
Other Europe 0.6 7.3
Group total 1,778.6 1,743.0
Non-current assets
EUR mill. 2014 2013
Finland 58.0 60.1
Russia 9.1 12.3
Baltic countries 10.7 10.6
Central Eastern Europe 1.4 1.5
Group total 79.2 84.5
3. AcquisitionsNo acquisitions were made in 2014.
In December 2013, Housing segment acquired 100% holding of company LLC Sovremennik, which engages in building technology contracts and maintenance in Russia. The acquisition did not have a direct economic impact to YIT Group and goodwill was not generated.
4. DisposalsThere were no disposed businesses in 2014 and 2013
5. Long-term construction contractsEUR mill. 2014 2013
Contract revenue recognised as revenue in the period 1,225.8 1,229.3
Contract costs incurred and recognised profits less recognised losses to date for work in progress 1,117.6 1,178.8
Accrued income from long-term projects 31.5 61.5
Advances received 168.2 149.1
The expenditure incurred and the profits recognized for the long-term projects, that exceed the amount invoiced for the project, the difference is disclosed in “Trade and other receivables” in the balance sheet. Advances received and difference that arises if the expenditure and recognised income are lower than the amount of invoiced for the project, the difference is disclosed in “Trade and other payables”.
6. Other operating incomeEUR mill. 2014 2013
Gains on the sale of tangible and intangible assets 1.2 1.6
Rent income 8.6 8.0
Other income 4.6 6.1
Total 14.4 15.7
FINANCIAL STATEMENT
99
YIT ANNUAL REPORT 2014
YEAR 2014 BUSINESS OPERATIONS CORPORATE GOVERNANCE GRI INDEX
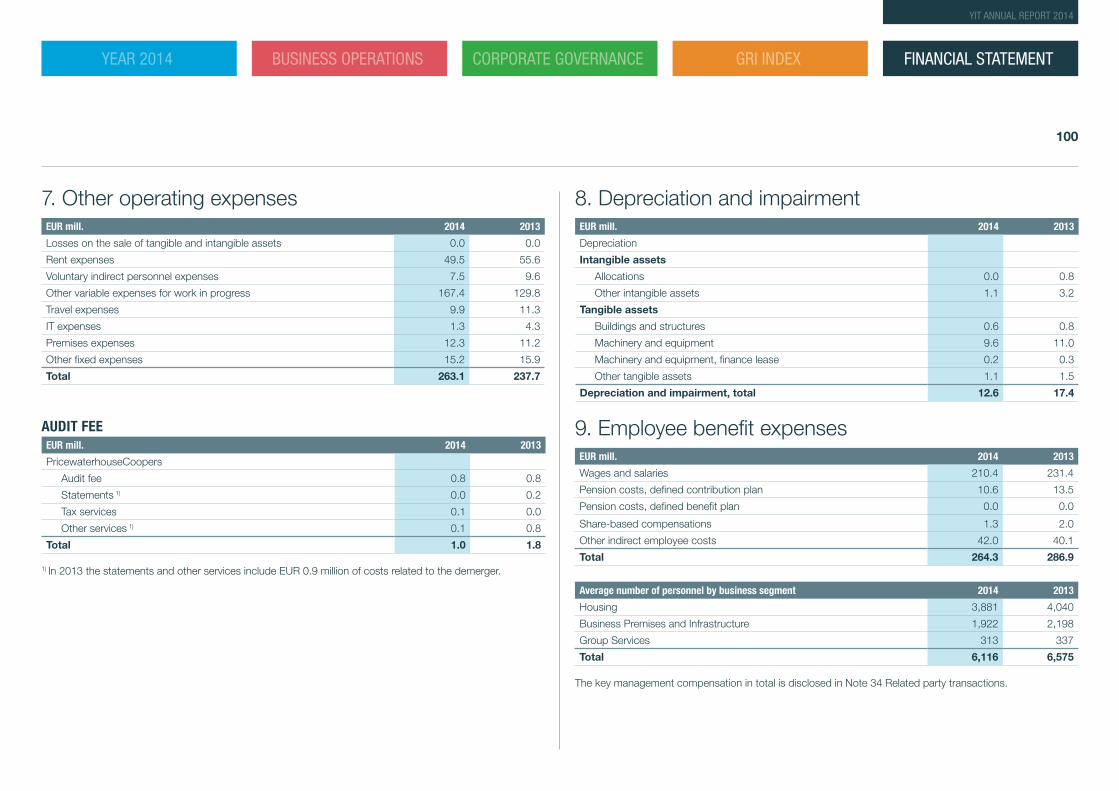
7. Other operating expensesEUR mill. 2014 2013
Losses on the sale of tangible and intangible assets 0.0 0.0
Rent expenses 49.5 55.6
Voluntary indirect personnel expenses 7.5 9.6
Other variable expenses for work in progress 167.4 129.8
Travel expenses 9.9 11.3
IT expenses 1.3 4.3
Premises expenses 12.3 11.2
Other fixed expenses 15.2 15.9
Total 263.1 237.7
AUDIT FEEEUR mill. 2014 2013
PricewaterhouseCoopers
Audit fee 0.8 0.8
Statements 1) 0.0 0.2
Tax services 0.1 0.0
Other services 1) 0.1 0.8
Total 1.0 1.8
1) In 2013 the statements and other services include EUR 0.9 million of costs related to the demerger.
8. Depreciation and impairment EUR mill. 2014 2013
Depreciation
Intangible assets
Allocations 0.0 0.8
Other intangible assets 1.1 3.2
Tangible assets
Buildings and structures 0.6 0.8
Machinery and equipment 9.6 11.0
Machinery and equipment, finance lease 0.2 0.3
Other tangible assets 1.1 1.5
Depreciation and impairment, total 12.6 17.4
9. Employee benefit expensesEUR mill. 2014 2013
Wages and salaries 210.4 231.4
Pension costs, defined contribution plan 10.6 13.5
Pension costs, defined benefit plan 0.0 0.0
Share-based compensations 1.3 2.0
Other indirect employee costs 42.0 40.1
Total 264.3 286.9
Average number of personnel by business segment 2014 2013
Housing 3,881 4,040
Business Premises and Infrastructure 1,922 2,198
Group Services 313 337
Total 6,116 6,575
The key management compensation in total is disclosed in Note 34 Related party transactions.
FINANCIAL STATEMENT
100
YIT ANNUAL REPORT 2014
YEAR 2014 BUSINESS OPERATIONS CORPORATE GOVERNANCE GRI INDEX
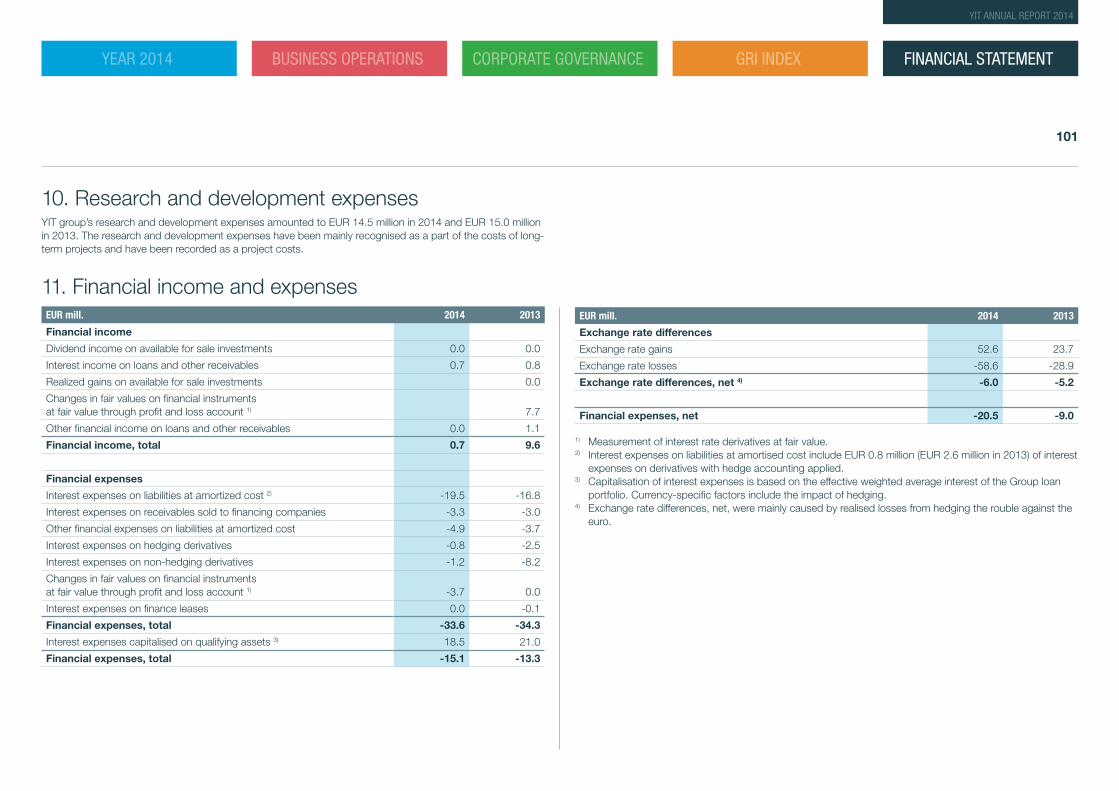
10. Research and development expensesYIT group’s research and development expenses amounted to EUR 14.5 million in 2014 and EUR 15.0 million in 2013. The research and development expenses have been mainly recognised as a part of the costs of long-term projects and have been recorded as a project costs.
11. Financial income and expensesEUR mill. 2014 2013
Financial income
Dividend income on available for sale investments 0.0 0.0
Interest income on loans and other receivables 0.7 0.8
Realized gains on available for sale investments 0.0
Changes in fair values on financial instruments at fair value through profit and loss account 1) 7.7
Other financial income on loans and other receivables 0.0 1.1
Financial income, total 0.7 9.6
Financial expenses
Interest expenses on liabilities at amortized cost 2) -19.5 -16.8
Interest expenses on receivables sold to financing companies -3.3 -3.0
Other financial expenses on liabilities at amortized cost -4.9 -3.7
Interest expenses on hedging derivatives -0.8 -2.5
Interest expenses on non-hedging derivatives -1.2 -8.2
Changes in fair values on financial instruments at fair value through profit and loss account 1) -3.7 0.0
Interest expenses on finance leases 0.0 -0.1
Financial expenses, total -33.6 -34.3
Interest expenses capitalised on qualifying assets 3) 18.5 21.0
Financial expenses, total -15.1 -13.3
EUR mill. 2014 2013
Exchange rate differences
Exchange rate gains 52.6 23.7
Exchange rate losses -58.6 -28.9
Exchange rate differences, net 4) -6.0 -5.2
Financial expenses, net -20.5 -9.0
1) Measurement of interest rate derivatives at fair value.2) Interest expenses on liabilities at amortised cost include EUR 0.8 million (EUR 2.6 million in 2013) of interest
expenses on derivatives with hedge accounting applied.3) Capitalisation of interest expenses is based on the effective weighted average interest of the Group loan
portfolio. Currency-specific factors include the impact of hedging.4) Exchange rate differences, net, were mainly caused by realised losses from hedging the rouble against the
euro.
FINANCIAL STATEMENT
101
YIT ANNUAL REPORT 2014
YEAR 2014 BUSINESS OPERATIONS CORPORATE GOVERNANCE GRI INDEX
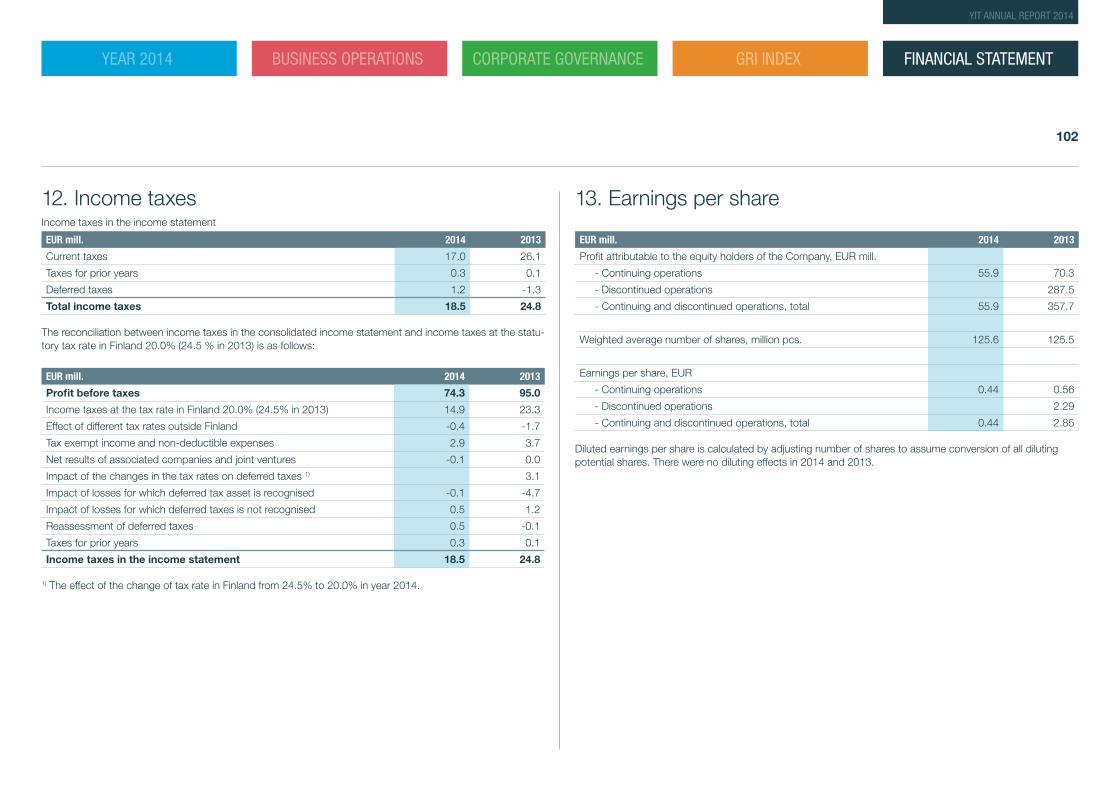
12. Income taxesIncome taxes in the income statement
EUR mill. 2014 2013
Current taxes 17.0 26.1
Taxes for prior years 0.3 0.1
Deferred taxes 1.2 -1.3
Total income taxes 18.5 24.8
The reconciliation between income taxes in the consolidated income statement and income taxes at the statu-tory tax rate in Finland 20.0% (24.5 % in 2013) is as follows:
EUR mill. 2014 2013
Profit before taxes 74.3 95.0
Income taxes at the tax rate in Finland 20.0% (24.5% in 2013) 14.9 23.3
Effect of different tax rates outside Finland -0.4 -1.7
Tax exempt income and non-deductible expenses 2.9 3.7
Net results of associated companies and joint ventures -0.1 0.0
Impact of the changes in the tax rates on deferred taxes 1) 3.1
Impact of losses for which deferred tax asset is recognised -0.1 -4.7
Impact of losses for which deferred taxes is not recognised 0.5 1.2
Reassessment of deferred taxes 0.5 -0.1
Taxes for prior years 0.3 0.1
Income taxes in the income statement 18.5 24.8
1) The effect of the change of tax rate in Finland from 24.5% to 20.0% in year 2014.
13. Earnings per share
EUR mill. 2014 2013
Profit attributable to the equity holders of the Company, EUR mill.
- Continuing operations 55.9 70.3
- Discontinued operations 287.5
- Continuing and discontinued operations, total 55.9 357.7
Weighted average number of shares, million pcs. 125.6 125.5
Earnings per share, EUR
- Continuing operations 0.44 0.56
- Discontinued operations 2.29
- Continuing and discontinued operations, total 0.44 2.85
Diluted earnings per share is calculated by adjusting number of shares to assume conversion of all diluting potential shares. There were no diluting effects in 2014 and 2013.
FINANCIAL STATEMENT
102
YIT ANNUAL REPORT 2014
YEAR 2014 BUSINESS OPERATIONS CORPORATE GOVERNANCE GRI INDEX
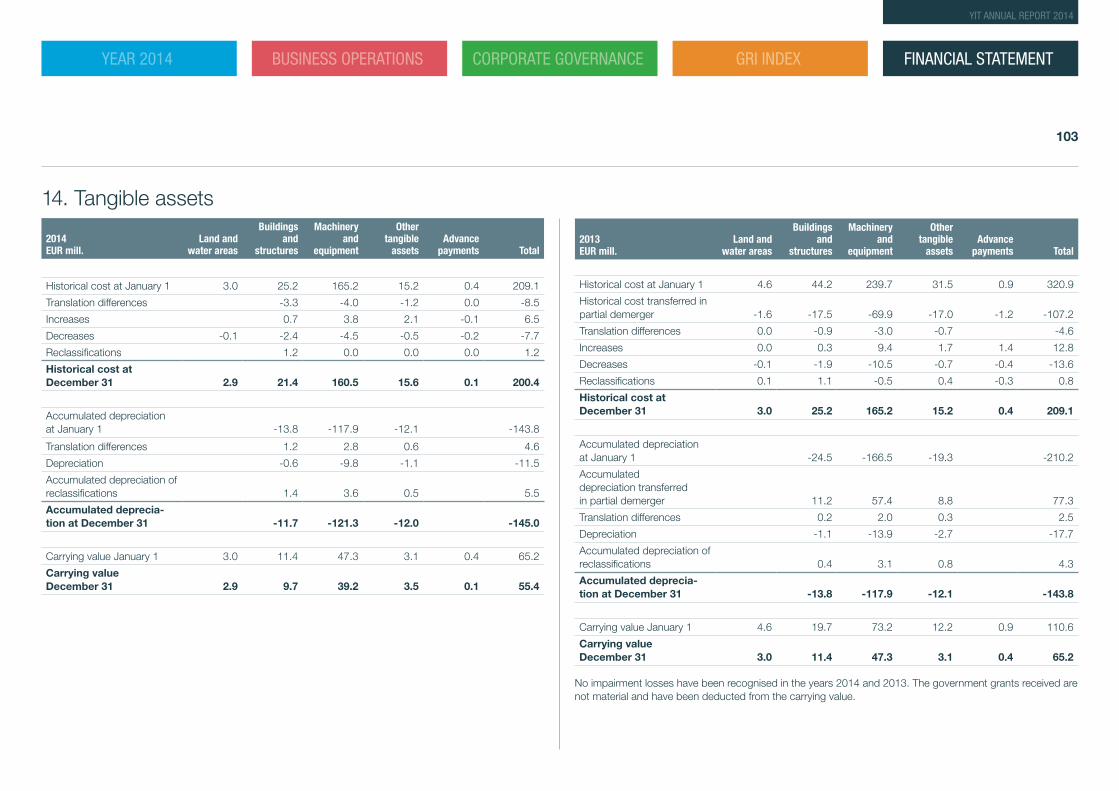
14. Tangible assets
2014EUR mill.
Land and water areas
Buildings and
structures
Machinery and
equipment
Other tangible
assetsAdvance
payments Total
Historical cost at January 1 3.0 25.2 165.2 15.2 0.4 209.1
Translation differences -3.3 -4.0 -1.2 0.0 -8.5
Increases 0.7 3.8 2.1 -0.1 6.5
Decreases -0.1 -2.4 -4.5 -0.5 -0.2 -7.7
Reclassifications 1.2 0.0 0.0 0.0 1.2
Historical cost at December 31 2.9 21.4 160.5 15.6 0.1 200.4
Accumulated depreciation at January 1 -13.8 -117.9 -12.1 -143.8
Translation differences 1.2 2.8 0.6 4.6
Depreciation -0.6 -9.8 -1.1 -11.5
Accumulated depreciation of reclassifications 1.4 3.6 0.5 5.5
Accumulated deprecia-tion at December 31 -11.7 -121.3 -12.0 -145.0
Carrying value January 1 3.0 11.4 47.3 3.1 0.4 65.2
Carrying value December 31 2.9 9.7 39.2 3.5 0.1 55.4
2013EUR mill.
Land and water areas
Buildings and
structures
Machinery and
equipment
Other tangible
assetsAdvance
payments Total
Historical cost at January 1 4.6 44.2 239.7 31.5 0.9 320.9
Historical cost transferred in partial demerger -1.6 -17.5 -69.9 -17.0 -1.2 -107.2
Translation differences 0.0 -0.9 -3.0 -0.7 -4.6
Increases 0.0 0.3 9.4 1.7 1.4 12.8
Decreases -0.1 -1.9 -10.5 -0.7 -0.4 -13.6
Reclassifications 0.1 1.1 -0.5 0.4 -0.3 0.8
Historical cost at December 31 3.0 25.2 165.2 15.2 0.4 209.1
Accumulated depreciation at January 1 -24.5 -166.5 -19.3 -210.2
Accumulated depreciation transferred in partial demerger 11.2 57.4 8.8 77.3
Translation differences 0.2 2.0 0.3 2.5
Depreciation -1.1 -13.9 -2.7 -17.7
Accumulated depreciation of reclassifications 0.4 3.1 0.8 4.3
Accumulated deprecia-tion at December 31 -13.8 -117.9 -12.1 -143.8
Carrying value January 1 4.6 19.7 73.2 12.2 0.9 110.6
Carrying value December 31 3.0 11.4 47.3 3.1 0.4 65.2
No impairment losses have been recognised in the years 2014 and 2013. The government grants received are not material and have been deducted from the carrying value.
FINANCIAL STATEMENT
103
YIT ANNUAL REPORT 2014
YEAR 2014 BUSINESS OPERATIONS CORPORATE GOVERNANCE GRI INDEX
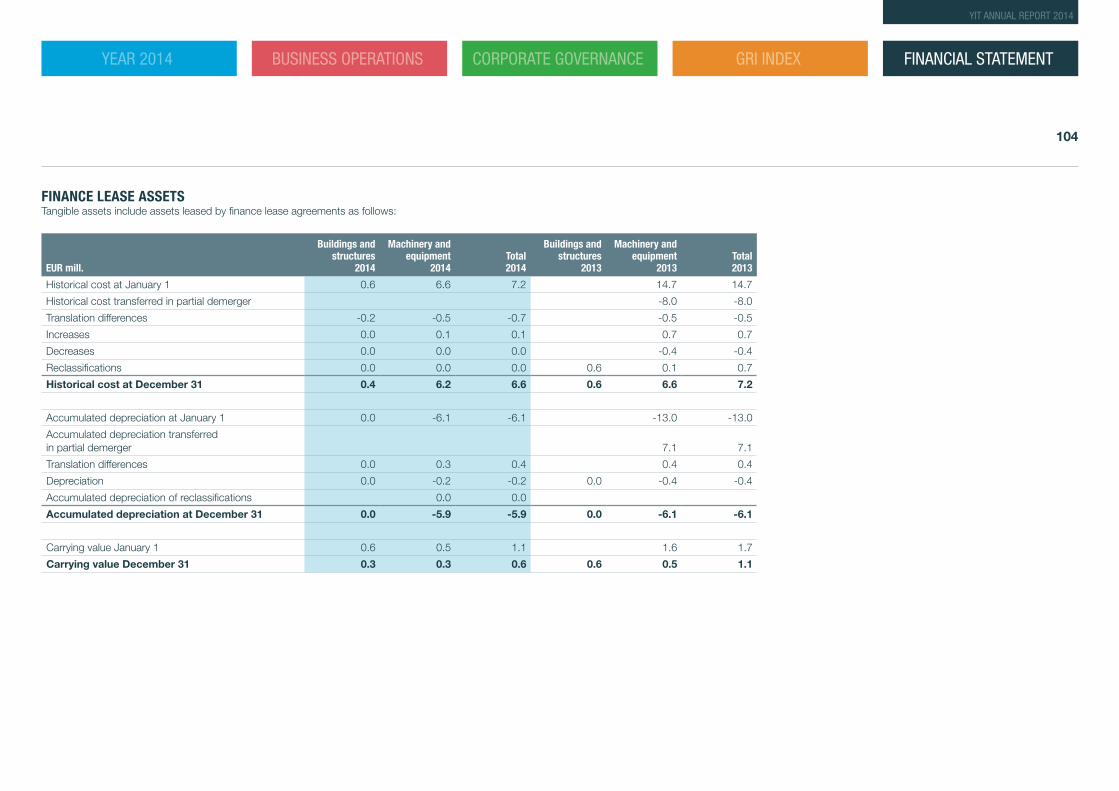
FINANCE LEASE ASSETSTangible assets include assets leased by finance lease agreements as follows:
EUR mill.
Buildings and structures
2014
Machinery and equipment
2014Total 2014
Buildings and structures
2013
Machinery and equipment
2013Total 2013
Historical cost at January 1 0.6 6.6 7.2 14.7 14.7
Historical cost transferred in partial demerger -8.0 -8.0
Translation differences -0.2 -0.5 -0.7 -0.5 -0.5
Increases 0.0 0.1 0.1 0.7 0.7
Decreases 0.0 0.0 0.0 -0.4 -0.4
Reclassifications 0.0 0.0 0.0 0.6 0.1 0.7
Historical cost at December 31 0.4 6.2 6.6 0.6 6.6 7.2
Accumulated depreciation at January 1 0.0 -6.1 -6.1 -13.0 -13.0
Accumulated depreciation transferred in partial demerger 7.1 7.1
Translation differences 0.0 0.3 0.4 0.4 0.4
Depreciation 0.0 -0.2 -0.2 0.0 -0.4 -0.4
Accumulated depreciation of reclassifications 0.0 0.0
Accumulated depreciation at December 31 0.0 -5.9 -5.9 0.0 -6.1 -6.1
Carrying value January 1 0.6 0.5 1.1 1.6 1.7
Carrying value December 31 0.3 0.3 0.6 0.6 0.5 1.1
FINANCIAL STATEMENT
104
YIT ANNUAL REPORT 2014
YEAR 2014 BUSINESS OPERATIONS CORPORATE GOVERNANCE GRI INDEX
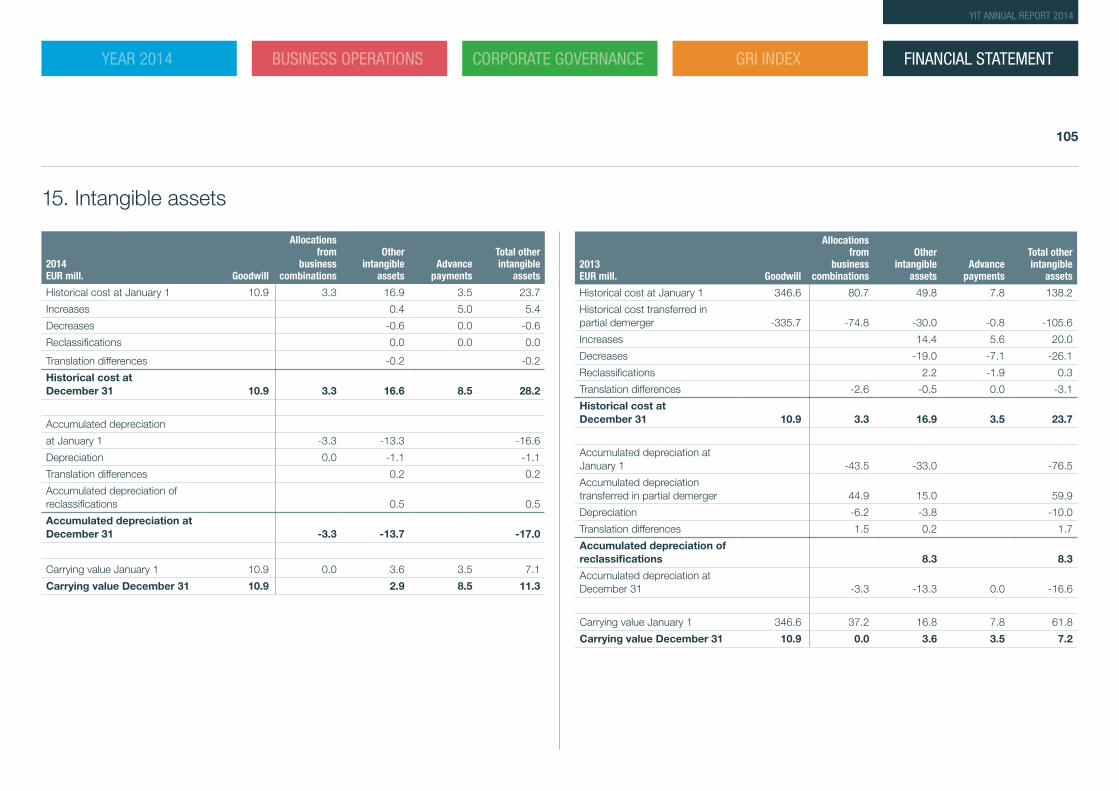
15. Intangible assets
2014EUR mill. Goodwill
Allocations from
business combinations
Other intangible
assetsAdvance
payments
Total other intangible
assets
Historical cost at January 1 10.9 3.3 16.9 3.5 23.7
Increases 0.4 5.0 5.4
Decreases -0.6 0.0 -0.6
Reclassifications 0.0 0.0 0.0
Translation differences -0.2 -0.2
Historical cost at December 31 10.9 3.3 16.6 8.5 28.2
Accumulated depreciation
at January 1 -3.3 -13.3 -16.6
Depreciation 0.0 -1.1 -1.1
Translation differences 0.2 0.2
Accumulated depreciation of reclassifications 0.5 0.5
Accumulated depreciation at December 31 -3.3 -13.7 -17.0
Carrying value January 1 10.9 0.0 3.6 3.5 7.1
Carrying value December 31 10.9 2.9 8.5 11.3
2013EUR mill. Goodwill
Allocations from
business combinations
Other intangible
assetsAdvance
payments
Total other intangible
assets
Historical cost at January 1 346.6 80.7 49.8 7.8 138.2
Historical cost transferred in partial demerger -335.7 -74.8 -30.0 -0.8 -105.6
Increases 14.4 5.6 20.0
Decreases -19.0 -7.1 -26.1
Reclassifications 2.2 -1.9 0.3
Translation differences -2.6 -0.5 0.0 -3.1
Historical cost at December 31 10.9 3.3 16.9 3.5 23.7
Accumulated depreciation at January 1 -43.5 -33.0 -76.5
Accumulated depreciation transferred in partial demerger 44.9 15.0 59.9
Depreciation -6.2 -3.8 -10.0
Translation differences 1.5 0.2 1.7
Accumulated depreciation of reclassifications 8.3 8.3
Accumulated depreciation at December 31 -3.3 -13.3 0.0 -16.6
Carrying value January 1 346.6 37.2 16.8 7.8 61.8
Carrying value December 31 10.9 0.0 3.6 3.5 7.2
FINANCIAL STATEMENT
105
YIT ANNUAL REPORT 2014
YEAR 2014 BUSINESS OPERATIONS CORPORATE GOVERNANCE GRI INDEX
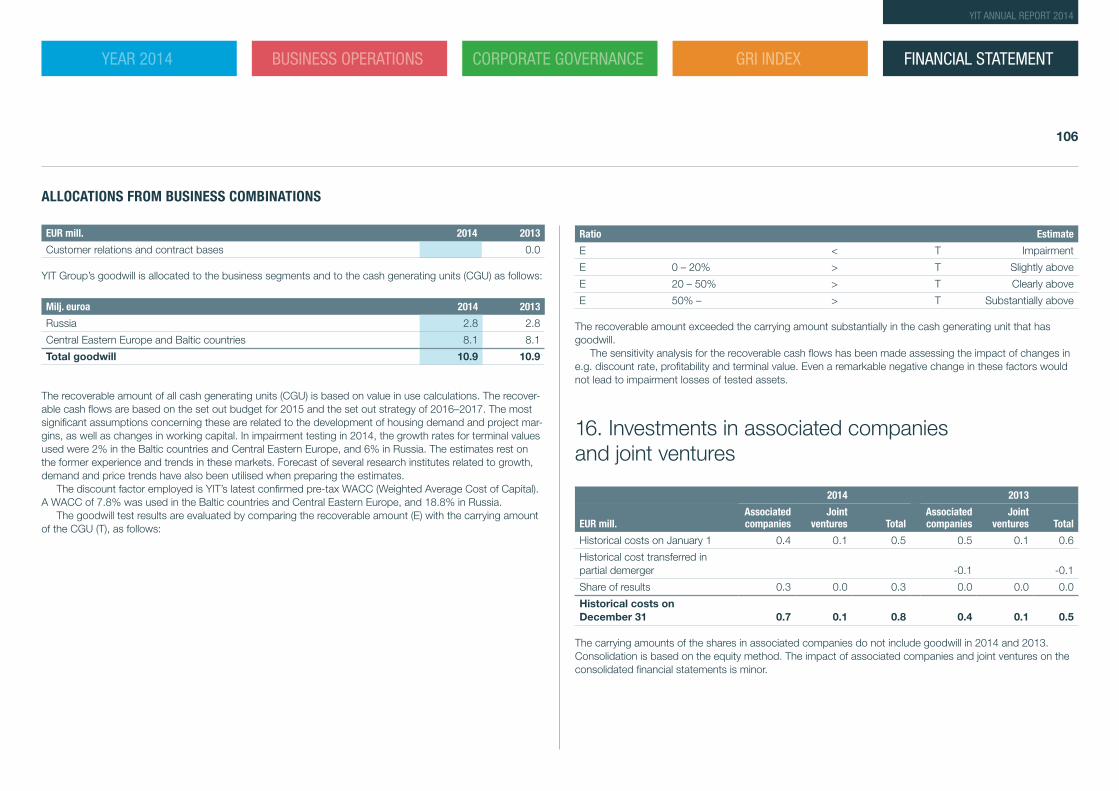
ALLOCATIONS FROM BUSINESS COMBINATIONS
EUR mill. 2014 2013
Customer relations and contract bases 0.0
YIT Group’s goodwill is allocated to the business segments and to the cash generating units (CGU) as follows:
Milj. euroa 2014 2013
Russia 2.8 2.8
Central Eastern Europe and Baltic countries 8.1 8.1
Total goodwill 10.9 10.9
The recoverable amount of all cash generating units (CGU) is based on value in use calculations. The recover-able cash flows are based on the set out budget for 2015 and the set out strategy of 2016–2017. The most significant assumptions concerning these are related to the development of housing demand and project mar-gins, as well as changes in working capital. In impairment testing in 2014, the growth rates for terminal values used were 2% in the Baltic countries and Central Eastern Europe, and 6% in Russia. The estimates rest on the former experience and trends in these markets. Forecast of several research institutes related to growth, demand and price trends have also been utilised when preparing the estimates.
The discount factor employed is YIT’s latest confirmed pre-tax WACC (Weighted Average Cost of Capital). A WACC of 7.8% was used in the Baltic countries and Central Eastern Europe, and 18.8% in Russia.
The goodwill test results are evaluated by comparing the recoverable amount (E) with the carrying amount of the CGU (T), as follows:
Ratio Estimate
E < T Impairment
E 0 – 20% > T Slightly above
E 20 – 50% > T Clearly above
E 50% – > T Substantially above
The recoverable amount exceeded the carrying amount substantially in the cash generating unit that has goodwill.
The sensitivity analysis for the recoverable cash flows has been made assessing the impact of changes in e.g. discount rate, profitability and terminal value. Even a remarkable negative change in these factors would not lead to impairment losses of tested assets.
16. Investments in associated companies and joint ventures
2014 2013
EUR mill.Associatedcompanies
Jointventures Total
Associatedcompanies
Jointventures Total
Historical costs on January 1 0.4 0.1 0.5 0.5 0.1 0.6
Historical cost transferred in partial demerger -0.1 -0.1
Share of results 0.3 0.0 0.3 0.0 0.0 0.0
Historical costs on December 31 0.7 0.1 0.8 0.4 0.1 0.5
The carrying amounts of the shares in associated companies do not include goodwill in 2014 and 2013. Consolidation is based on the equity method. The impact of associated companies and joint ventures on the consolidated financial statements is minor.
FINANCIAL STATEMENT
106
YIT ANNUAL REPORT 2014
YEAR 2014 BUSINESS OPERATIONS CORPORATE GOVERNANCE GRI INDEX
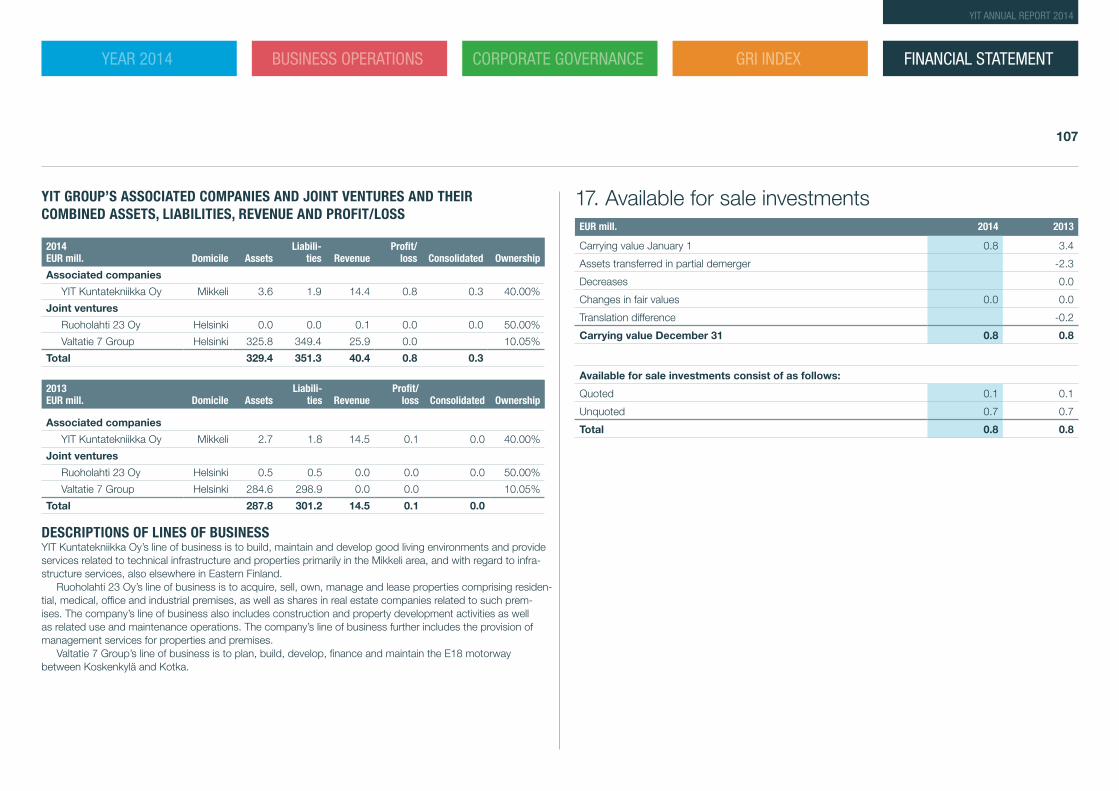
YIT GROUP’S ASSOCIATED COMPANIES AND JOINT VENTURES AND THEIR COMBINED ASSETS, LIABILITIES, REVENUE AND PROFIT/LOSS
2014 EUR mill. Domicile Assets
Liabili-ties Revenue
Profit/loss Consolidated Ownership
Associated companies
YIT Kuntatekniikka Oy Mikkeli 3.6 1.9 14.4 0.8 0.3 40.00%
Joint ventures
Ruoholahti 23 Oy Helsinki 0.0 0.0 0.1 0.0 0.0 50.00%
Valtatie 7 Group Helsinki 325.8 349.4 25.9 0.0 10.05%
Total 329.4 351.3 40.4 0.8 0.3
2013 EUR mill. Domicile Assets
Liabili-ties Revenue
Profit/loss Consolidated Ownership
Associated companies
YIT Kuntatekniikka Oy Mikkeli 2.7 1.8 14.5 0.1 0.0 40.00%
Joint ventures
Ruoholahti 23 Oy Helsinki 0.5 0.5 0.0 0.0 0.0 50.00%
Valtatie 7 Group Helsinki 284.6 298.9 0.0 0.0 10.05%
Total 287.8 301.2 14.5 0.1 0.0
DESCRIPTIONS OF LINES OF BUSINESSYIT Kuntatekniikka Oy’s line of business is to build, maintain and develop good living environments and provide services related to technical infrastructure and properties primarily in the Mikkeli area, and with regard to infra-structure services, also elsewhere in Eastern Finland.
Ruoholahti 23 Oy’s line of business is to acquire, sell, own, manage and lease properties comprising residen-tial, medical, office and industrial premises, as well as shares in real estate companies related to such prem-ises. The company’s line of business also includes construction and property development activities as well as related use and maintenance operations. The company’s line of business further includes the provision of management services for properties and premises.
Valtatie 7 Group’s line of business is to plan, build, develop, finance and maintain the E18 motorway between Koskenkylä and Kotka.
17. Available for sale investmentsEUR mill. 2014 2013
Carrying value January 1 0.8 3.4
Assets transferred in partial demerger -2.3
Decreases 0.0
Changes in fair values 0.0 0.0
Translation difference -0.2
Carrying value December 31 0.8 0.8
Available for sale investments consist of as follows:
Quoted 0.1 0.1
Unquoted 0.7 0.7
Total 0.8 0.8
FINANCIAL STATEMENT
107
YIT ANNUAL REPORT 2014
YEAR 2014 BUSINESS OPERATIONS CORPORATE GOVERNANCE GRI INDEX
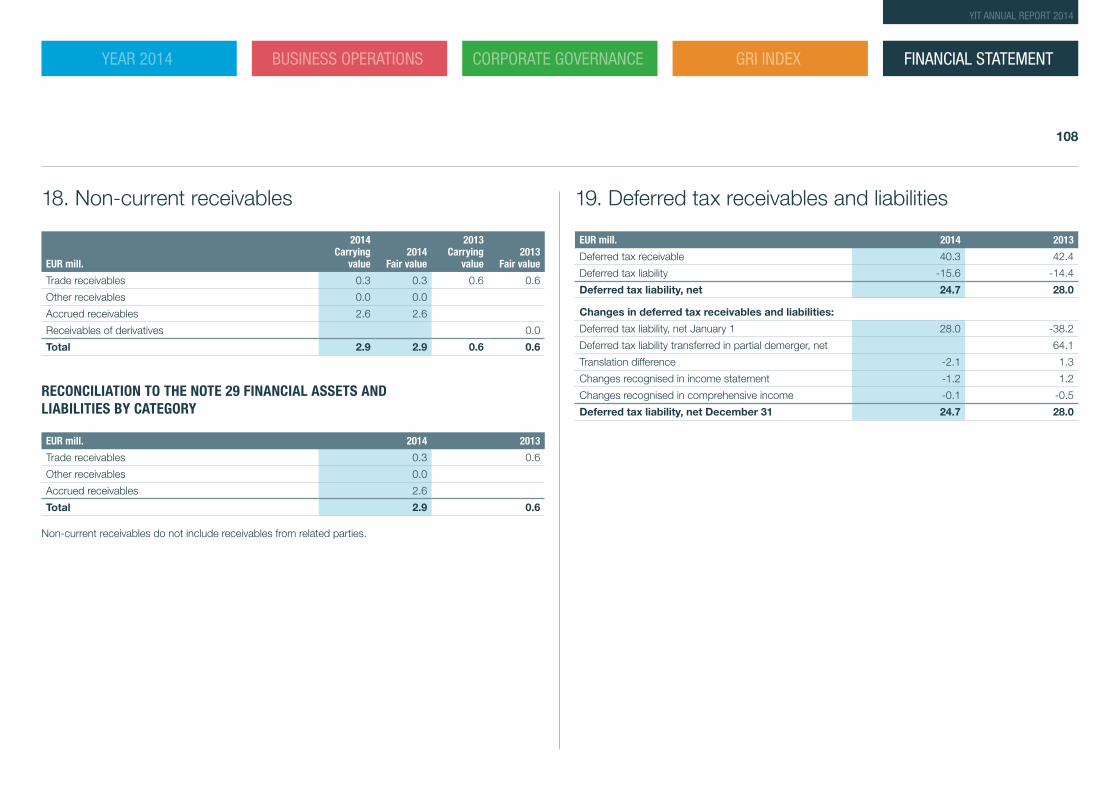
18. Non-current receivables
EUR mill.
2014 Carrying
value 2014
Fair value
2013 Carrying
value2013
Fair value
Trade receivables 0.3 0.3 0.6 0.6
Other receivables 0.0 0.0
Accrued receivables 2.6 2.6
Receivables of derivatives 0.0
Total 2.9 2.9 0.6 0.6
RECONCILIATION TO THE NOTE 29 FINANCIAL ASSETS AND LIABILITIES BY CATEGORY
EUR mill. 2014 2013
Trade receivables 0.3 0.6
Other receivables 0.0
Accrued receivables 2.6
Total 2.9 0.6
Non-current receivables do not include receivables from related parties.
19. Deferred tax receivables and liabilities
EUR mill. 2014 2013
Deferred tax receivable 40.3 42.4
Deferred tax liability -15.6 -14.4
Deferred tax liability, net 24.7 28.0
Changes in deferred tax receivables and liabilities:
Deferred tax liability, net January 1 28.0 -38.2
Deferred tax liability transferred in partial demerger, net 64.1
Translation difference -2.1 1.3
Changes recognised in income statement -1.2 1.2
Changes recognised in comprehensive income -0.1 -0.5
Deferred tax liability, net December 31 24.7 28.0
FINANCIAL STATEMENT
108
YIT ANNUAL REPORT 2014
YEAR 2014 BUSINESS OPERATIONS CORPORATE GOVERNANCE GRI INDEX
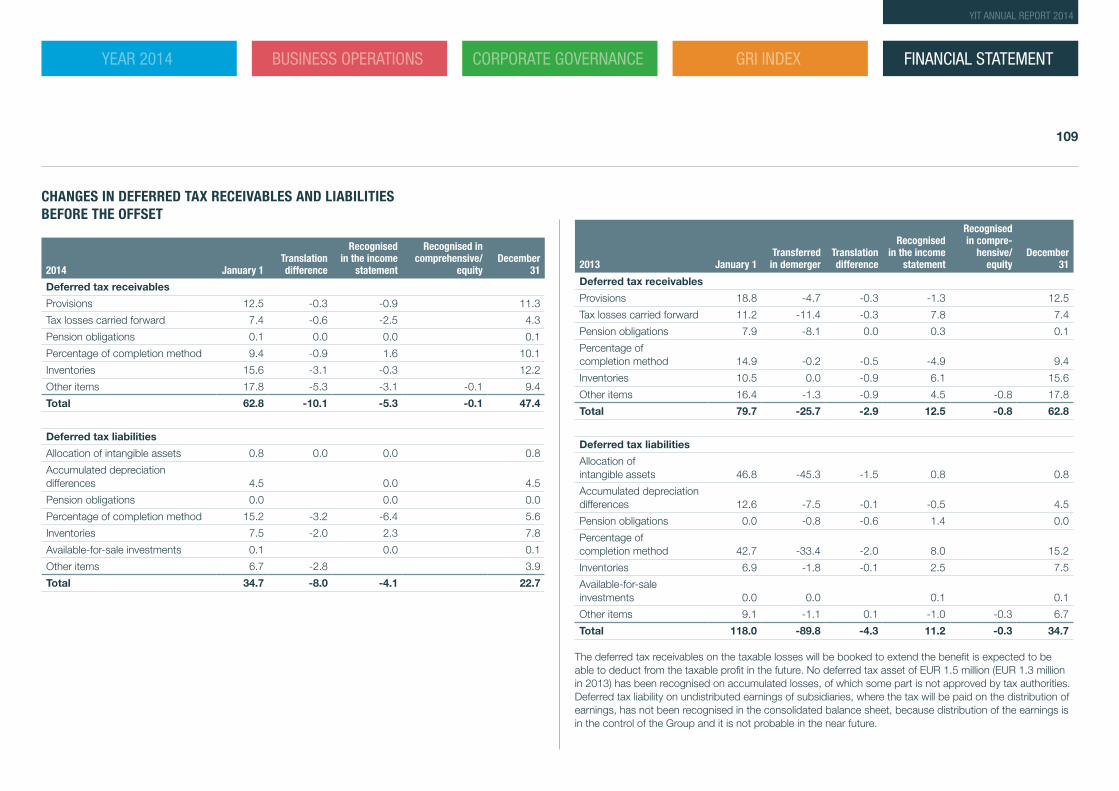
CHANGES IN DEFERRED TAX RECEIVABLES AND LIABILITIES BEFORE THE OFFSET
2014 January 1Translation difference
Recognised in the income
statement
Recognised in comprehensive/
equityDecember
31
Deferred tax receivables
Provisions 12.5 -0.3 -0.9 11.3
Tax losses carried forward 7.4 -0.6 -2.5 4.3
Pension obligations 0.1 0.0 0.0 0.1
Percentage of completion method 9.4 -0.9 1.6 10.1
Inventories 15.6 -3.1 -0.3 12.2
Other items 17.8 -5.3 -3.1 -0.1 9.4
Total 62.8 -10.1 -5.3 -0.1 47.4
Deferred tax liabilities
Allocation of intangible assets 0.8 0.0 0.0 0.8
Accumulated depreciation differences 4.5 0.0 4.5
Pension obligations 0.0 0.0 0.0
Percentage of completion method 15.2 -3.2 -6.4 5.6
Inventories 7.5 -2.0 2.3 7.8
Available-for-sale investments 0.1 0.0 0.1
Other items 6.7 -2.8 3.9
Total 34.7 -8.0 -4.1 22.7
2013 January 1Transferred
in demergerTranslation difference
Recognised in the income
statement
Recognised in compre-
hensive/ equity
December 31
Deferred tax receivables
Provisions 18.8 -4.7 -0.3 -1.3 12.5
Tax losses carried forward 11.2 -11.4 -0.3 7.8 7.4
Pension obligations 7.9 -8.1 0.0 0.3 0.1
Percentage of completion method 14.9 -0.2 -0.5 -4.9 9.4
Inventories 10.5 0.0 -0.9 6.1 15.6
Other items 16.4 -1.3 -0.9 4.5 -0.8 17.8
Total 79.7 -25.7 -2.9 12.5 -0.8 62.8
Deferred tax liabilities
Allocation of intangible assets 46.8 -45.3 -1.5 0.8 0.8
Accumulated depreciation differences 12.6 -7.5 -0.1 -0.5 4.5
Pension obligations 0.0 -0.8 -0.6 1.4 0.0
Percentage of completion method 42.7 -33.4 -2.0 8.0 15.2
Inventories 6.9 -1.8 -0.1 2.5 7.5
Available-for-sale investments 0.0 0.0 0.1 0.1
Other items 9.1 -1.1 0.1 -1.0 -0.3 6.7
Total 118.0 -89.8 -4.3 11.2 -0.3 34.7
The deferred tax receivables on the taxable losses will be booked to extend the benefit is expected to be able to deduct from the taxable profit in the future. No deferred tax asset of EUR 1.5 million (EUR 1.3 million in 2013) has been recognised on accumulated losses, of which some part is not approved by tax authorities. Deferred tax liability on undistributed earnings of subsidiaries, where the tax will be paid on the distribution of earnings, has not been recognised in the consolidated balance sheet, because distribution of the earnings is in the control of the Group and it is not probable in the near future.
FINANCIAL STATEMENT
109
YIT ANNUAL REPORT 2014
YEAR 2014 BUSINESS OPERATIONS CORPORATE GOVERNANCE GRI INDEX
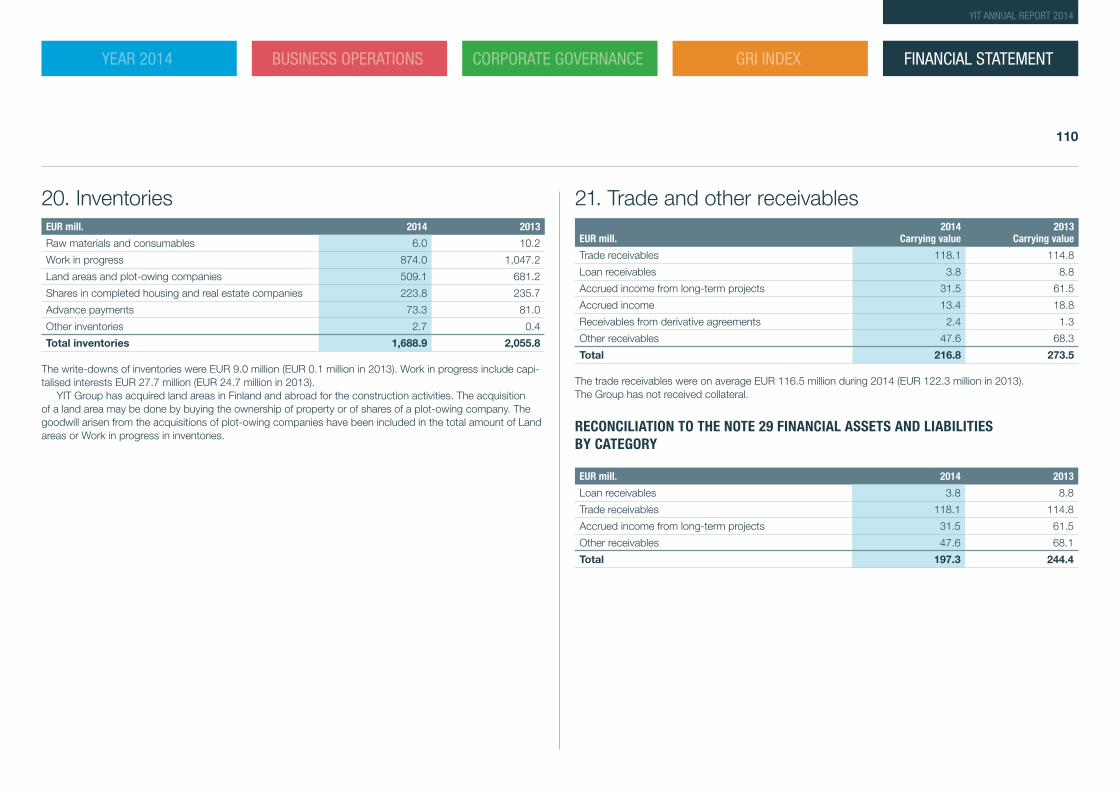
20. InventoriesEUR mill. 2014 2013
Raw materials and consumables 6.0 10.2
Work in progress 874.0 1,047.2
Land areas and plot-owing companies 509.1 681.2
Shares in completed housing and real estate companies 223.8 235.7
Advance payments 73.3 81.0
Other inventories 2.7 0.4
Total inventories 1,688.9 2,055.8
The write-downs of inventories were EUR 9.0 million (EUR 0.1 million in 2013). Work in progress include capi-talised interests EUR 27.7 million (EUR 24.7 million in 2013).
YIT Group has acquired land areas in Finland and abroad for the construction activities. The acquisition of a land area may be done by buying the ownership of property or of shares of a plot-owing company. The goodwill arisen from the acquisitions of plot-owing companies have been included in the total amount of Land areas or Work in progress in inventories.
21. Trade and other receivables
EUR mill.2014
Carrying value2013
Carrying value
Trade receivables 118.1 114.8
Loan receivables 3.8 8.8
Accrued income from long-term projects 31.5 61.5
Accrued income 13.4 18.8
Receivables from derivative agreements 2.4 1.3
Other receivables 47.6 68.3
Total 216.8 273.5
The trade receivables were on average EUR 116.5 million during 2014 (EUR 122.3 million in 2013). The Group has not received collateral.
RECONCILIATION TO THE NOTE 29 FINANCIAL ASSETS AND LIABILITIES BY CATEGORY
EUR mill. 2014 2013
Loan receivables 3.8 8.8
Trade receivables 118.1 114.8
Accrued income from long-term projects 31.5 61.5
Other receivables 47.6 68.1
Total 197.3 244.4
FINANCIAL STATEMENT
110
YIT ANNUAL REPORT 2014
YEAR 2014 BUSINESS OPERATIONS CORPORATE GOVERNANCE GRI INDEX
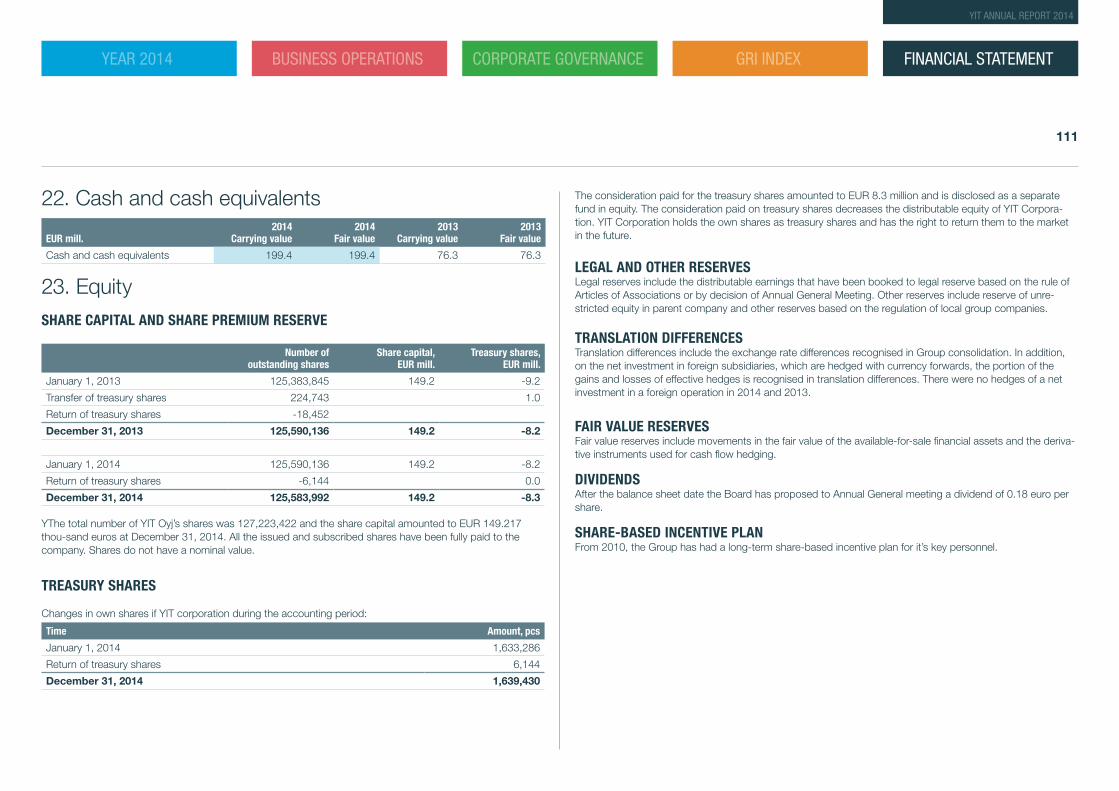
22. Cash and cash equivalents
EUR mill.2014
Carrying value2014
Fair value2013
Carrying value2013
Fair value
Cash and cash equivalents 199.4 199.4 76.3 76.3
23. EquitySHARE CAPITAL AND SHARE PREMIUM RESERVE
Number of outstanding shares
Share capital, EUR mill.
Treasury shares, EUR mill.
January 1, 2013 125,383,845 149.2 -9.2
Transfer of treasury shares 224,743 1.0
Return of treasury shares -18,452
December 31, 2013 125,590,136 149.2 -8.2
January 1, 2014 125,590,136 149.2 -8.2
Return of treasury shares -6,144 0.0
December 31, 2014 125,583,992 149.2 -8.3
YThe total number of YIT Oyj’s shares was 127,223,422 and the share capital amounted to EUR 149.217 thou-sand euros at December 31, 2014. All the issued and subscribed shares have been fully paid to the company. Shares do not have a nominal value.
TREASURY SHARES
Changes in own shares if YIT corporation during the accounting period:
Time Amount, pcs
January 1, 2014 1,633,286
Return of treasury shares 6,144
December 31, 2014 1,639,430
The consideration paid for the treasury shares amounted to EUR 8.3 million and is disclosed as a separate fund in equity. The consideration paid on treasury shares decreases the distributable equity of YIT Corpora-tion. YIT Corporation holds the own shares as treasury shares and has the right to return them to the market in the future.
LEGAL AND OTHER RESERVESLegal reserves include the distributable earnings that have been booked to legal reserve based on the rule of Articles of Associations or by decision of Annual General Meeting. Other reserves include reserve of unre-stricted equity in parent company and other reserves based on the regulation of local group companies.
TRANSLATION DIFFERENCESTranslation differences include the exchange rate differences recognised in Group consolidation. In addition, on the net investment in foreign subsidiaries, which are hedged with currency forwards, the portion of the gains and losses of effective hedges is recognised in translation differences. There were no hedges of a net investment in a foreign operation in 2014 and 2013.
FAIR VALUE RESERVESFair value reserves include movements in the fair value of the available-for-sale financial assets and the deriva-tive instruments used for cash flow hedging.
DIVIDENDSAfter the balance sheet date the Board has proposed to Annual General meeting a dividend of 0.18 euro per share.
SHARE-BASED INCENTIVE PLANFrom 2010, the Group has had a long-term share-based incentive plan for it’s key personnel.
FINANCIAL STATEMENT
111
YIT ANNUAL REPORT 2014
YEAR 2014 BUSINESS OPERATIONS CORPORATE GOVERNANCE GRI INDEX
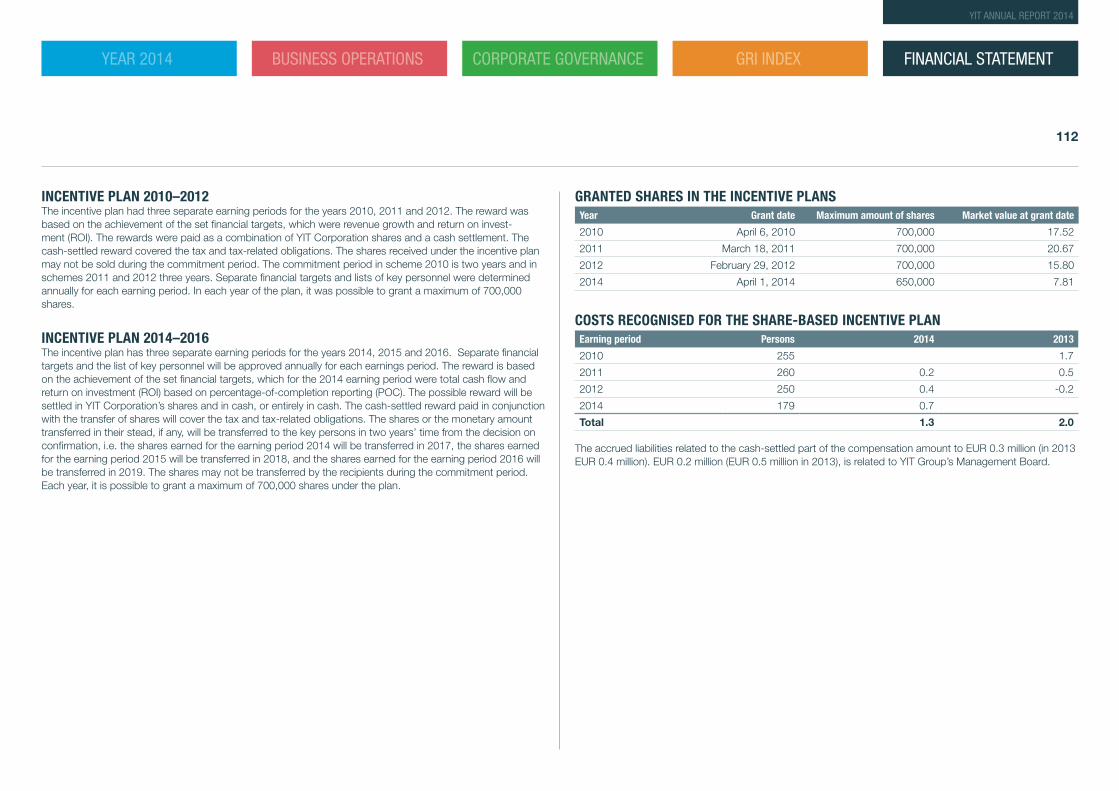
INCENTIVE PLAN 2010–2012The incentive plan had three separate earning periods for the years 2010, 2011 and 2012. The reward was based on the achievement of the set financial targets, which were revenue growth and return on invest-ment (ROI). The rewards were paid as a combination of YIT Corporation shares and a cash settlement. The cash-settled reward covered the tax and tax-related obligations. The shares received under the incentive plan may not be sold during the commitment period. The commitment period in scheme 2010 is two years and in schemes 2011 and 2012 three years. Separate financial targets and lists of key personnel were determined annually for each earning period. In each year of the plan, it was possible to grant a maximum of 700,000 shares.
INCENTIVE PLAN 2014–2016The incentive plan has three separate earning periods for the years 2014, 2015 and 2016. Separate financial targets and the list of key personnel will be approved annually for each earnings period. The reward is based on the achievement of the set financial targets, which for the 2014 earning period were total cash flow and return on investment (ROI) based on percentage-of-completion reporting (POC). The possible reward will be settled in YIT Corporation’s shares and in cash, or entirely in cash. The cash-settled reward paid in conjunction with the transfer of shares will cover the tax and tax-related obligations. The shares or the monetary amount transferred in their stead, if any, will be transferred to the key persons in two years’ time from the decision on confirmation, i.e. the shares earned for the earning period 2014 will be transferred in 2017, the shares earned for the earning period 2015 will be transferred in 2018, and the shares earned for the earning period 2016 will be transferred in 2019. The shares may not be transferred by the recipients during the commitment period. Each year, it is possible to grant a maximum of 700,000 shares under the plan.
GRANTED SHARES IN THE INCENTIVE PLANSYear Grant date Maximum amount of shares Market value at grant date
2010 April 6, 2010 700,000 17.52
2011 March 18, 2011 700,000 20.67
2012 February 29, 2012 700,000 15.80
2014 April 1, 2014 650,000 7.81
COSTS RECOGNISED FOR THE SHARE-BASED INCENTIVE PLANEarning period Persons 2014 2013
2010 255 1.7
2011 260 0.2 0.5
2012 250 0.4 -0.2
2014 179 0.7
Total 1.3 2.0
The accrued liabilities related to the cash-settled part of the compensation amount to EUR 0.3 million (in 2013 EUR 0.4 million). EUR 0.2 million (EUR 0.5 million in 2013), is related to YIT Group’s Management Board.
FINANCIAL STATEMENT
112
YIT ANNUAL REPORT 2014
YEAR 2014 BUSINESS OPERATIONS CORPORATE GOVERNANCE GRI INDEX
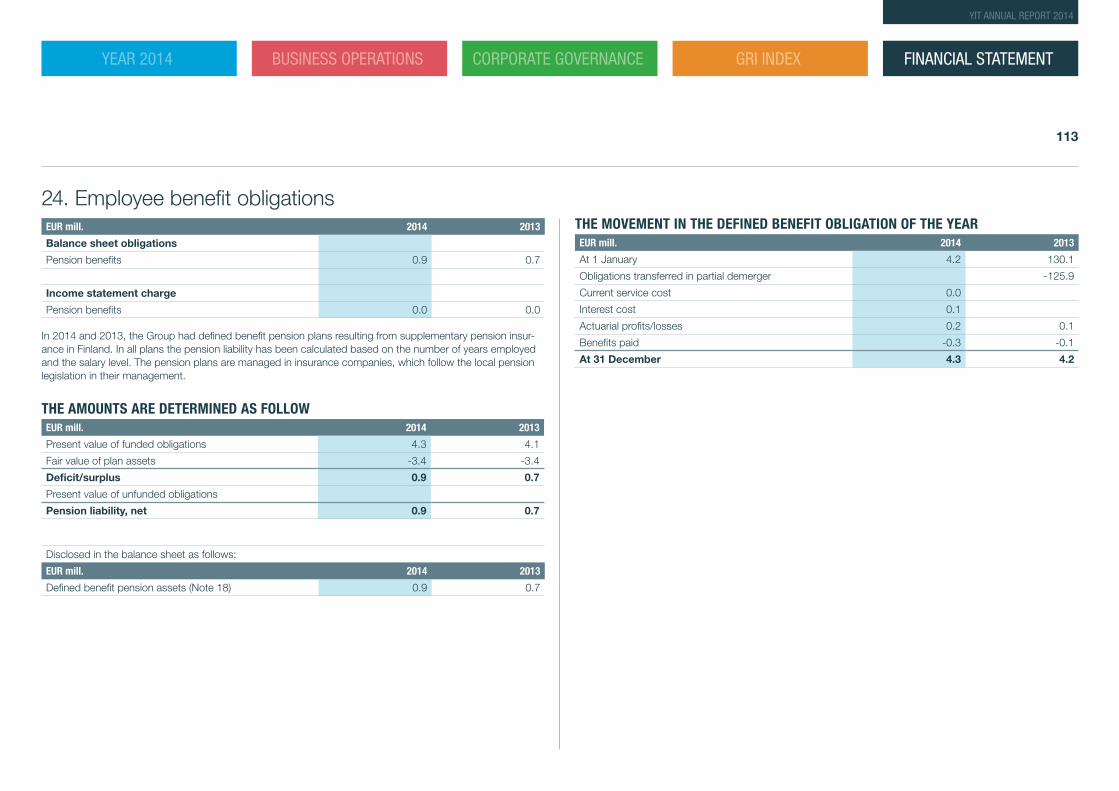
24. Employee benefit obligationsEUR mill. 2014 2013
Balance sheet obligations
Pension benefits 0.9 0.7
Income statement charge
Pension benefits 0.0 0.0
In 2014 and 2013, the Group had defined benefit pension plans resulting from supplementary pension insur-ance in Finland. In all plans the pension liability has been calculated based on the number of years employed and the salary level. The pension plans are managed in insurance companies, which follow the local pension legislation in their management.
THE AMOUNTS ARE DETERMINED AS FOLLOWEUR mill. 2014 2013
Present value of funded obligations 4.3 4.1
Fair value of plan assets -3.4 -3.4
Deficit/surplus 0.9 0.7
Present value of unfunded obligations
Pension liability, net 0.9 0.7
Disclosed in the balance sheet as follows:
EUR mill. 2014 2013
Defined benefit pension assets (Note 18) 0.9 0.7
THE MOVEMENT IN THE DEFINED BENEFIT OBLIGATION OF THE YEAREUR mill. 2014 2013
At 1 January 4.2 130.1
Obligations transferred in partial demerger -125.9
Current service cost 0.0
Interest cost 0.1
Actuarial profits/losses 0.2 0.1
Benefits paid -0.3 -0.1
At 31 December 4.3 4.2
FINANCIAL STATEMENT
113
YIT ANNUAL REPORT 2014
YEAR 2014 BUSINESS OPERATIONS CORPORATE GOVERNANCE GRI INDEX
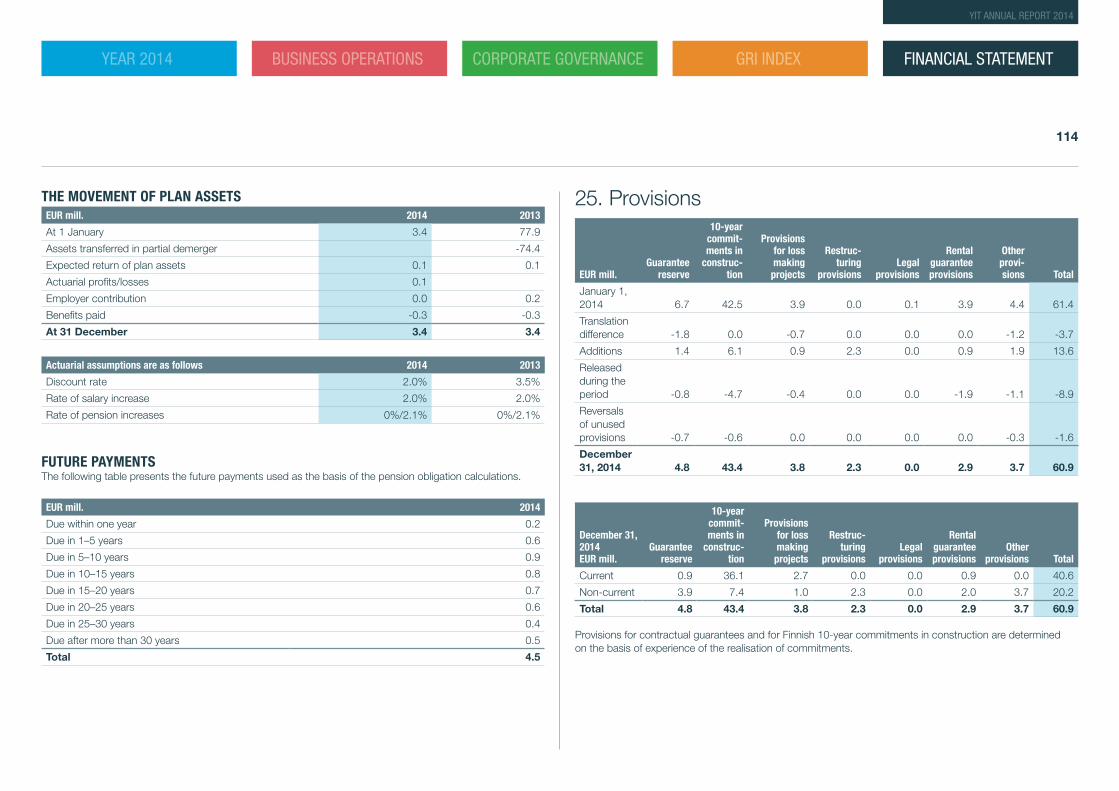
THE MOVEMENT OF PLAN ASSETSEUR mill. 2014 2013
At 1 January 3.4 77.9
Assets transferred in partial demerger -74.4
Expected return of plan assets 0.1 0.1
Actuarial profits/losses 0.1
Employer contribution 0.0 0.2
Benefits paid -0.3 -0.3
At 31 December 3.4 3.4
Actuarial assumptions are as follows 2014 2013
Discount rate 2.0% 3.5%
Rate of salary increase 2.0% 2.0%
Rate of pension increases 0%/2.1% 0%/2.1%
FUTURE PAYMENTSThe following table presents the future payments used as the basis of the pension obligation calculations.
EUR mill. 2014
Due within one year 0.2
Due in 1–5 years 0.6
Due in 5–10 years 0.9
Due in 10–15 years 0.8
Due in 15–20 years 0.7
Due in 20–25 years 0.6
Due in 25–30 years 0.4
Due after more than 30 years 0.5
Total 4.5
25. Provisions
EUR mill.Guarantee
reserve
10-year commit-ments in
construc-tion
Provisions for loss making projects
Restruc-turing
provisionsLegal
provisions
Rental guarantee provisions
Other provi-sions Total
January 1, 2014 6.7 42.5 3.9 0.0 0.1 3.9 4.4 61.4
Translation difference -1.8 0.0 -0.7 0.0 0.0 0.0 -1.2 -3.7
Additions 1.4 6.1 0.9 2.3 0.0 0.9 1.9 13.6
Released during the period -0.8 -4.7 -0.4 0.0 0.0 -1.9 -1.1 -8.9
Reversals of unused provisions -0.7 -0.6 0.0 0.0 0.0 0.0 -0.3 -1.6
December 31, 2014 4.8 43.4 3.8 2.3 0.0 2.9 3.7 60.9
December 31, 2014 EUR mill.
Guarantee reserve
10-year commit-ments in
construc-tion
Provisions for loss making projects
Restruc-turing
provisionsLegal
provisions
Rental guarantee provisions
Other provisions Total
Current 0.9 36.1 2.7 0.0 0.0 0.9 0.0 40.6
Non-current 3.9 7.4 1.0 2.3 0.0 2.0 3.7 20.2
Total 4.8 43.4 3.8 2.3 0.0 2.9 3.7 60.9
Provisions for contractual guarantees and for Finnish 10-year commitments in construction are determined on the basis of experience of the realisation of commitments.
FINANCIAL STATEMENT
114
YIT ANNUAL REPORT 2014
YEAR 2014 BUSINESS OPERATIONS CORPORATE GOVERNANCE GRI INDEX
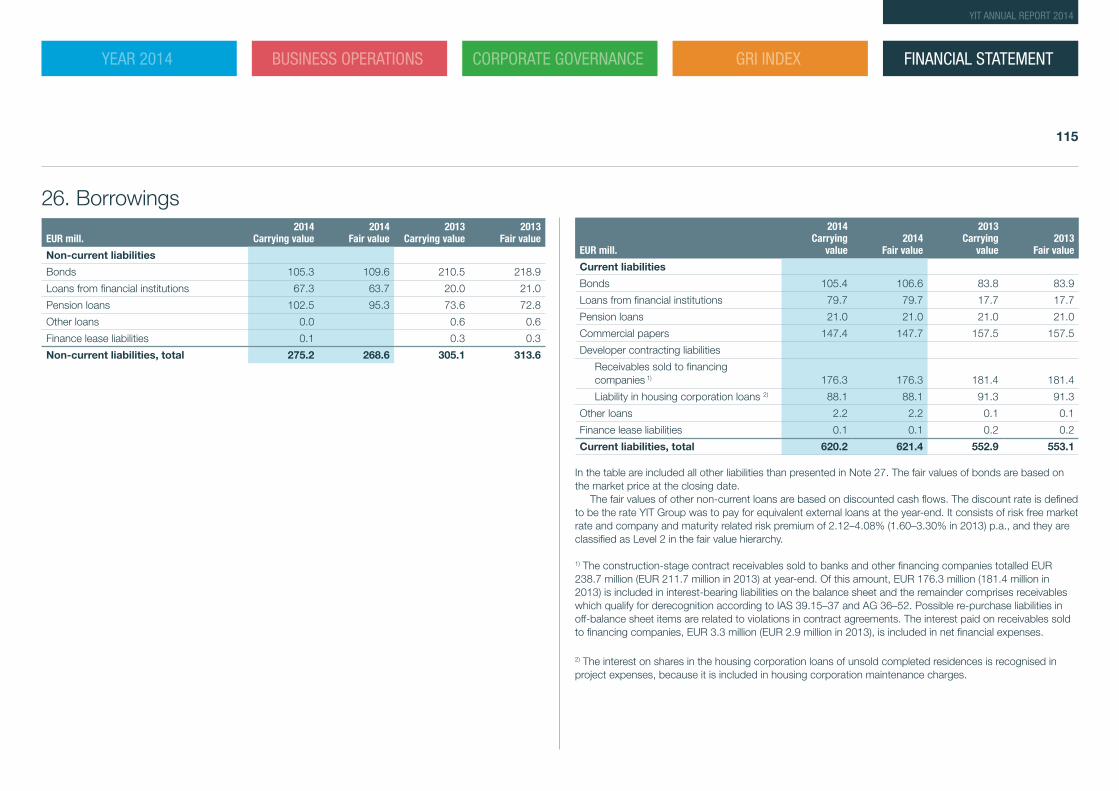
26. Borrowings
EUR mill.2014
Carrying value2014
Fair value2013
Carrying value2013
Fair value
Non-current liabilities
Bonds 105.3 109.6 210.5 218.9
Loans from financial institutions 67.3 63.7 20.0 21.0
Pension loans 102.5 95.3 73.6 72.8
Other loans 0.0 0.6 0.6
Finance lease liabilities 0.1 0.3 0.3
Non-current liabilities, total 275.2 268.6 305.1 313.6
EUR mill.
2014Carrying
value2014
Fair value
2013 Carrying
value2013
Fair value
Current liabilities
Bonds 105.4 106.6 83.8 83.9
Loans from financial institutions 79.7 79.7 17.7 17.7
Pension loans 21.0 21.0 21.0 21.0
Commercial papers 147.4 147.7 157.5 157.5
Developer contracting liabilities
Receivables sold to financing companies 1) 176.3 176.3 181.4 181.4
Liability in housing corporation loans 2) 88.1 88.1 91.3 91.3
Other loans 2.2 2.2 0.1 0.1
Finance lease liabilities 0.1 0.1 0.2 0.2
Current liabilities, total 620.2 621.4 552.9 553.1
In the table are included all other liabilities than presented in Note 27. The fair values of bonds are based on the market price at the closing date.
The fair values of other non-current loans are based on discounted cash flows. The discount rate is defined to be the rate YIT Group was to pay for equivalent external loans at the year-end. It consists of risk free market rate and company and maturity related risk premium of 2.12–4.08% (1.60–3.30% in 2013) p.a., and they are classified as Level 2 in the fair value hierarchy.
1) The construction-stage contract receivables sold to banks and other financing companies totalled EUR 238.7 million (EUR 211.7 million in 2013) at year-end. Of this amount, EUR 176.3 million (181.4 million in 2013) is included in interest-bearing liabilities on the balance sheet and the remainder comprises receivables which qualify for derecognition according to IAS 39.15–37 and AG 36–52. Possible re-purchase liabilities in off-balance sheet items are related to violations in contract agreements. The interest paid on receivables sold to financing companies, EUR 3.3 million (EUR 2.9 million in 2013), is included in net financial expenses.
2) The interest on shares in the housing corporation loans of unsold completed residences is recognised in project expenses, because it is included in housing corporation maintenance charges.
FINANCIAL STATEMENT
115
YIT ANNUAL REPORT 2014
YEAR 2014 BUSINESS OPERATIONS CORPORATE GOVERNANCE GRI INDEX
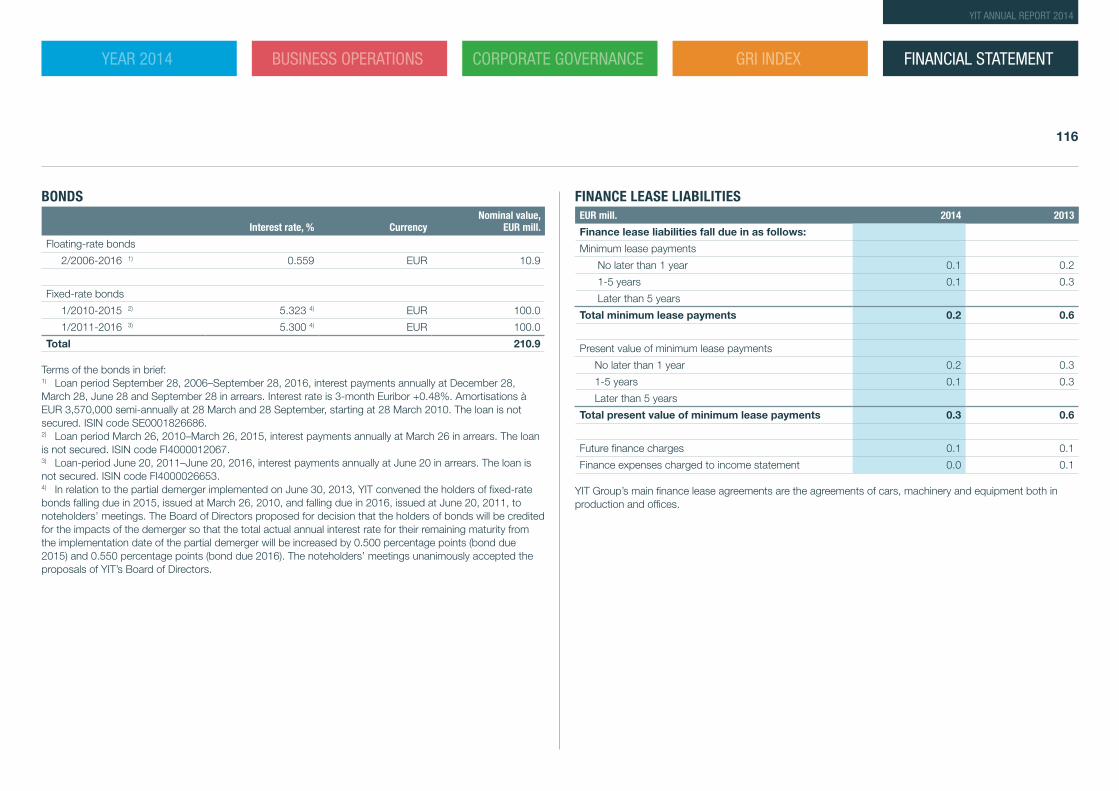
BONDS
Interest rate, % Currency Nominal value,
EUR mill.
Floating-rate bonds
2/2006-2016 1) 0.559 EUR 10.9
Fixed-rate bonds
1/2010-2015 2) 5.323 4) EUR 100.0
1/2011-2016 3) 5.300 4) EUR 100.0
Total 210.9
Terms of the bonds in brief:1) Loan period September 28, 2006–September 28, 2016, interest payments annually at December 28, March 28, June 28 and September 28 in arrears. Interest rate is 3-month Euribor +0.48%. Amortisations à EUR 3,570,000 semi-annually at 28 March and 28 September, starting at 28 March 2010. The loan is not secured. ISIN code SE0001826686. 2) Loan period March 26, 2010–March 26, 2015, interest payments annually at March 26 in arrears. The loan is not secured. ISIN code FI4000012067.3) Loan-period June 20, 2011–June 20, 2016, interest payments annually at June 20 in arrears. The loan is not secured. ISIN code FI4000026653.4) In relation to the partial demerger implemented on June 30, 2013, YIT convened the holders of fixed-rate bonds falling due in 2015, issued at March 26, 2010, and falling due in 2016, issued at June 20, 2011, to noteholders’ meetings. The Board of Directors proposed for decision that the holders of bonds will be credited for the impacts of the demerger so that the total actual annual interest rate for their remaining maturity from the implementation date of the partial demerger will be increased by 0.500 percentage points (bond due 2015) and 0.550 percentage points (bond due 2016). The noteholders’ meetings unanimously accepted the proposals of YIT’s Board of Directors.
FINANCE LEASE LIABILITIESEUR mill. 2014 2013
Finance lease liabilities fall due in as follows:
Minimum lease payments
No later than 1 year 0.1 0.2
1-5 years 0.1 0.3
Later than 5 years
Total minimum lease payments 0.2 0.6
Present value of minimum lease payments
No later than 1 year 0.2 0.3
1-5 years 0.1 0.3
Later than 5 years
Total present value of minimum lease payments 0.3 0.6
Future finance charges 0.1 0.1
Finance expenses charged to income statement 0.0 0.1
YIT Group’s main finance lease agreements are the agreements of cars, machinery and equipment both in production and offices.
FINANCIAL STATEMENT
116
YIT ANNUAL REPORT 2014
YEAR 2014 BUSINESS OPERATIONS CORPORATE GOVERNANCE GRI INDEX
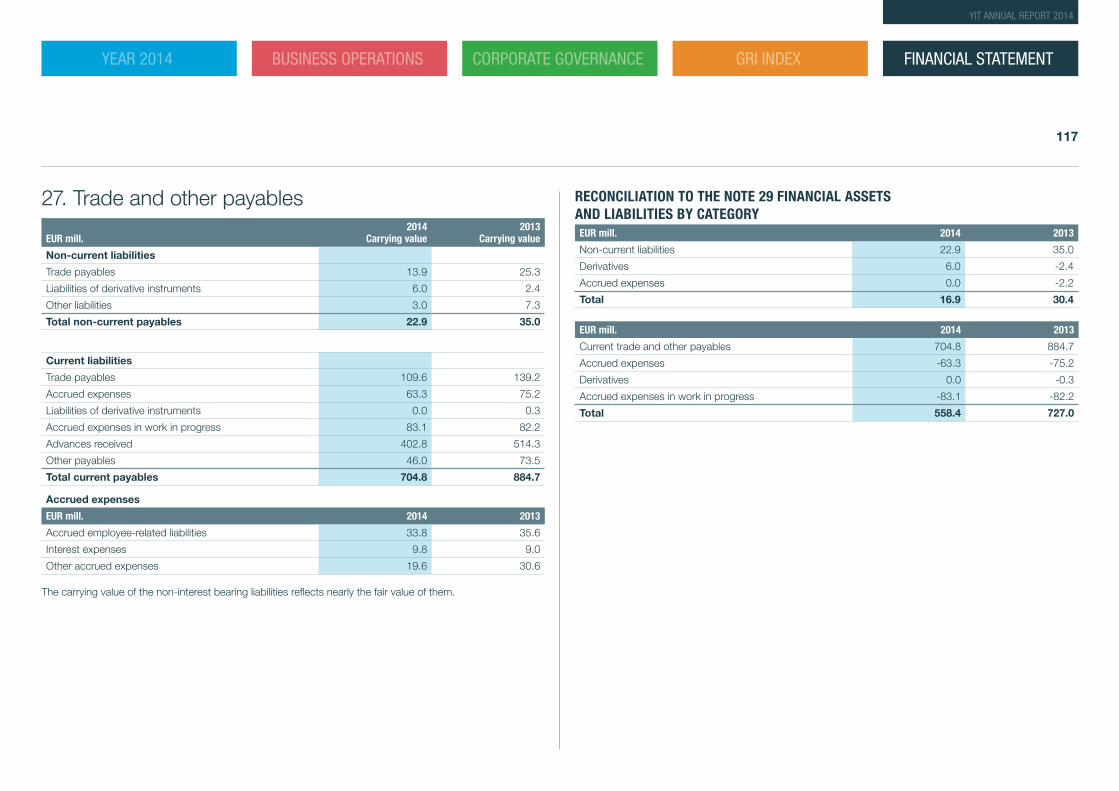
27. Trade and other payables
EUR mill.2014
Carrying value2013
Carrying value
Non-current liabilities
Trade payables 13.9 25.3
Liabilities of derivative instruments 6.0 2.4
Other liabilities 3.0 7.3
Total non-current payables 22.9 35.0
Current liabilities
Trade payables 109.6 139.2
Accrued expenses 63.3 75.2
Liabilities of derivative instruments 0.0 0.3
Accrued expenses in work in progress 83.1 82.2
Advances received 402.8 514.3
Other payables 46.0 73.5
Total current payables 704.8 884.7
Accrued expenses
EUR mill. 2014 2013
Accrued employee-related liabilities 33.8 35.6
Interest expenses 9.8 9.0
Other accrued expenses 19.6 30.6
The carrying value of the non-interest bearing liabilities reflects nearly the fair value of them.
RECONCILIATION TO THE NOTE 29 FINANCIAL ASSETS AND LIABILITIES BY CATEGORYEUR mill. 2014 2013
Non-current liabilities 22.9 35.0
Derivatives 6.0 -2.4
Accrued expenses 0.0 -2.2
Total 16.9 30.4
EUR mill. 2014 2013
Current trade and other payables 704.8 884.7
Accrued expenses -63.3 -75.2
Derivatives 0.0 -0.3
Accrued expenses in work in progress -83.1 -82.2
Total 558.4 727.0
FINANCIAL STATEMENT
117
YIT ANNUAL REPORT 2014
YEAR 2014 BUSINESS OPERATIONS CORPORATE GOVERNANCE GRI INDEX
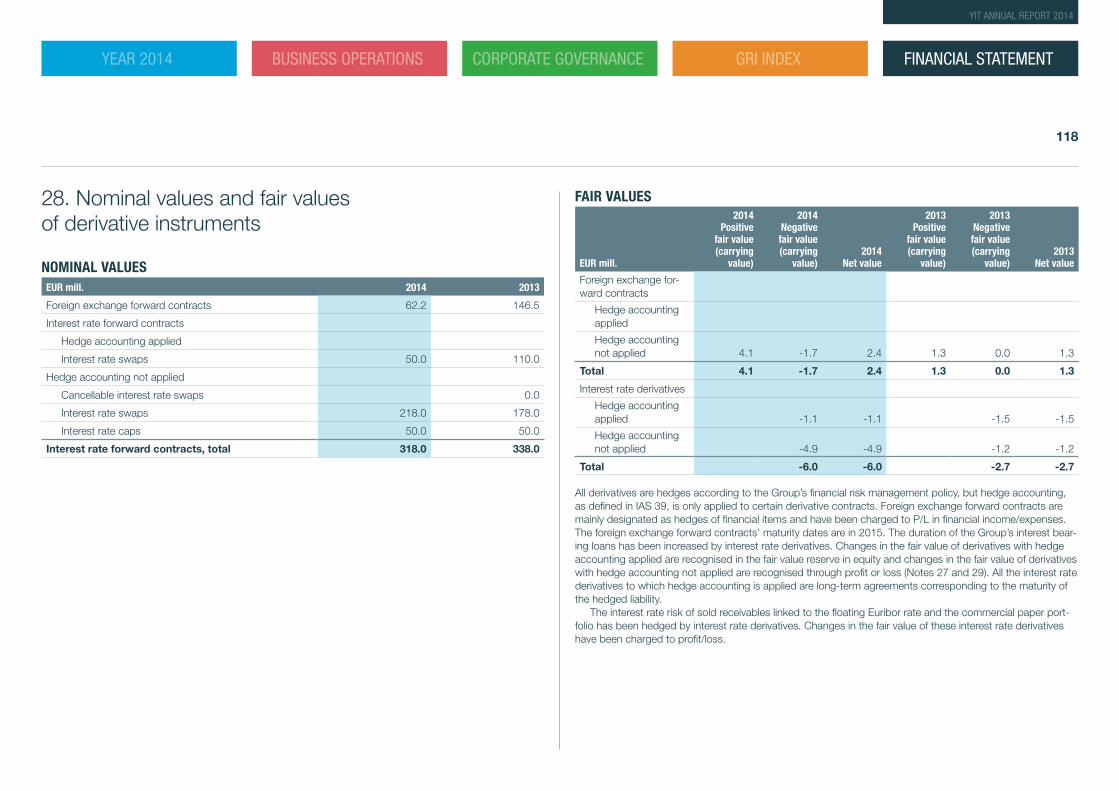
28. Nominal values and fair values of derivative instruments
NOMINAL VALUESEUR mill. 2014 2013
Foreign exchange forward contracts 62.2 146.5
Interest rate forward contracts
Hedge accounting applied
Interest rate swaps 50.0 110.0
Hedge accounting not applied
Cancellable interest rate swaps 0.0
Interest rate swaps 218.0 178.0
Interest rate caps 50.0 50.0
Interest rate forward contracts, total 318.0 338.0
FAIR VALUES
EUR mill.
2014 Positive
fair value (carrying
value)
2014 Negative fair value (carrying
value) 2014
Net value
2013 Positive
fair value (carrying
value)
2013 Negative fair value (carrying
value) 2013
Net value
Foreign exchange for-ward contracts
Hedge accounting applied
Hedge accounting not applied 4.1 -1.7 2.4 1.3 0.0 1.3
Total 4.1 -1.7 2.4 1.3 0.0 1.3
Interest rate derivatives
Hedge accounting applied -1.1 -1.1 -1.5 -1.5
Hedge accounting not applied -4.9 -4.9 -1.2 -1.2
Total -6.0 -6.0 -2.7 -2.7
All derivatives are hedges according to the Group’s financial risk management policy, but hedge accounting, as defined in IAS 39, is only applied to certain derivative contracts. Foreign exchange forward contracts are mainly designated as hedges of financial items and have been charged to P/L in financial income/expenses. The foreign exchange forward contracts’ maturity dates are in 2015. The duration of the Group’s interest bear-ing loans has been increased by interest rate derivatives. Changes in the fair value of derivatives with hedge accounting applied are recognised in the fair value reserve in equity and changes in the fair value of derivatives with hedge accounting not applied are recognised through profit or loss (Notes 27 and 29). All the interest rate derivatives to which hedge accounting is applied are long-term agreements corresponding to the maturity of the hedged liability.
The interest rate risk of sold receivables linked to the floating Euribor rate and the commercial paper port-folio has been hedged by interest rate derivatives. Changes in the fair value of these interest rate derivatives have been charged to profit/loss.
FINANCIAL STATEMENT
118
YIT ANNUAL REPORT 2014
YEAR 2014 BUSINESS OPERATIONS CORPORATE GOVERNANCE GRI INDEX
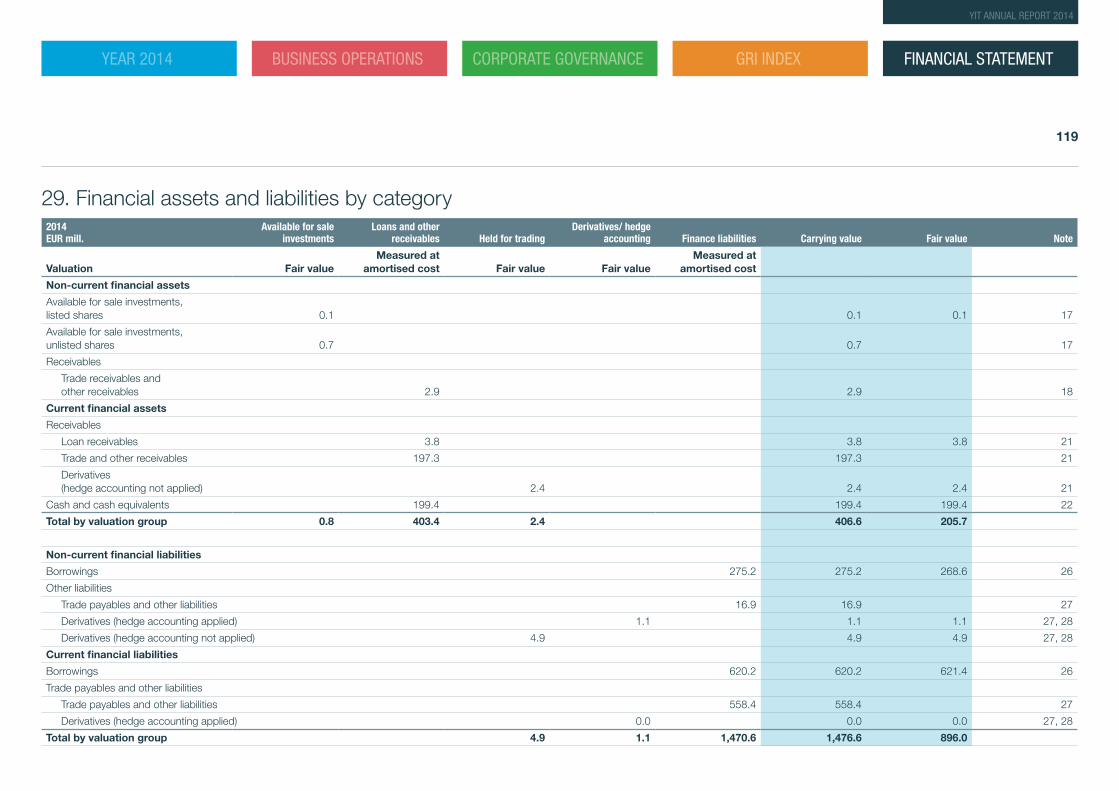
29. Financial assets and liabilities by category2014 EUR mill.
Available for sale investments
Loans and other receivables Held for trading
Derivatives/ hedge accounting Finance liabilities Carrying value Fair value Note
Valuation Fair valueMeasured at
amortised cost Fair value Fair valueMeasured at
amortised cost
Non-current financial assets
Available for sale investments, listed shares 0.1 0.1 0.1 17
Available for sale investments, unlisted shares 0.7 0.7 17
Receivables
Trade receivables and other receivables 2.9 2.9 18
Current financial assets
Receivables
Loan receivables 3.8 3.8 3.8 21
Trade and other receivables 197.3 197.3 21
Derivatives (hedge accounting not applied) 2.4 2.4 2.4 21
Cash and cash equivalents 199.4 199.4 199.4 22
Total by valuation group 0.8 403.4 2.4 406.6 205.7
Non-current financial liabilities
Borrowings 275.2 275.2 268.6 26
Other liabilities
Trade payables and other liabilities 16.9 16.9 27
Derivatives (hedge accounting applied) 1.1 1.1 1.1 27, 28
Derivatives (hedge accounting not applied) 4.9 4.9 4.9 27, 28
Current financial liabilities
Borrowings 620.2 620.2 621.4 26
Trade payables and other liabilities
Trade payables and other liabilities 558.4 558.4 27
Derivatives (hedge accounting applied) 0.0 0.0 0.0 27, 28
Total by valuation group 4.9 1.1 1,470.6 1,476.6 896.0
FINANCIAL STATEMENT
119
YIT ANNUAL REPORT 2014
YEAR 2014 BUSINESS OPERATIONS CORPORATE GOVERNANCE GRI INDEX
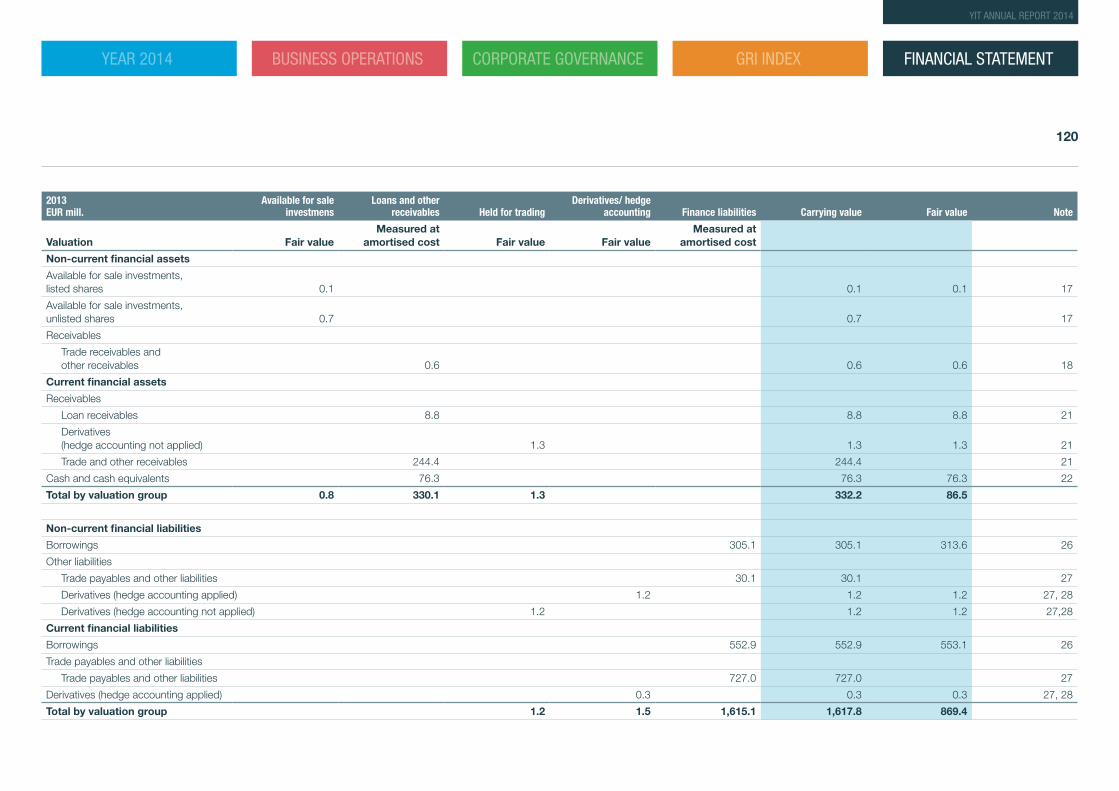
2013 EUR mill.
Available for sale investmens
Loans and other receivables Held for trading
Derivatives/ hedge accounting Finance liabilities Carrying value Fair value Note
Valuation Fair valueMeasured at
amortised cost Fair value Fair valueMeasured at
amortised cost
Non-current financial assets
Available for sale investments, listed shares 0.1 0.1 0.1 17
Available for sale investments, unlisted shares 0.7 0.7 17
Receivables
Trade receivables and other receivables 0.6 0.6 0.6 18
Current financial assets
Receivables
Loan receivables 8.8 8.8 8.8 21
Derivatives (hedge accounting not applied) 1.3 1.3 1.3 21
Trade and other receivables 244.4 244.4 21
Cash and cash equivalents 76.3 76.3 76.3 22
Total by valuation group 0.8 330.1 1.3 332.2 86.5
Non-current financial liabilities
Borrowings 305.1 305.1 313.6 26
Other liabilities
Trade payables and other liabilities 30.1 30.1 27
Derivatives (hedge accounting applied) 1.2 1.2 1.2 27, 28
Derivatives (hedge accounting not applied) 1.2 1.2 1.2 27,28
Current financial liabilities
Borrowings 552.9 552.9 553.1 26
Trade payables and other liabilities
Trade payables and other liabilities 727.0 727.0 27
Derivatives (hedge accounting applied) 0.3 0.3 0.3 27, 28
Total by valuation group 1.2 1.5 1,615.1 1,617.8 869.4
FINANCIAL STATEMENT
120
YIT ANNUAL REPORT 2014
YEAR 2014 BUSINESS OPERATIONS CORPORATE GOVERNANCE GRI INDEX
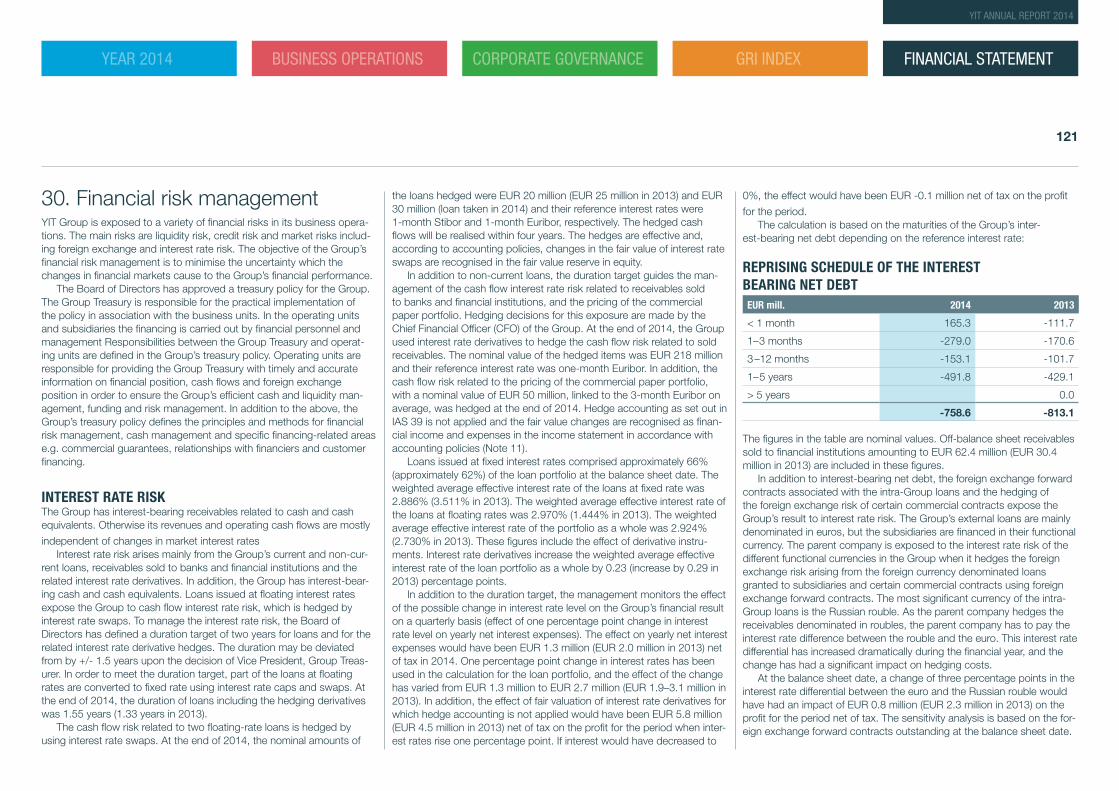
30. Financial risk managementYIT Group is exposed to a variety of financial risks in its business opera-tions. The main risks are liquidity risk, credit risk and market risks includ-ing foreign exchange and interest rate risk. The objective of the Group’s financial risk management is to minimise the uncertainty which the changes in financial markets cause to the Group’s financial performance.
The Board of Directors has approved a treasury policy for the Group. The Group Treasury is responsible for the practical implementation of the policy in association with the business units. In the operating units and subsidiaries the financing is carried out by financial personnel and management Responsibilities between the Group Treasury and operat-ing units are defined in the Group’s treasury policy. Operating units are responsible for providing the Group Treasury with timely and accurate information on financial position, cash flows and foreign exchange position in order to ensure the Group’s efficient cash and liquidity man-agement, funding and risk management. In addition to the above, the Group’s treasury policy defines the principles and methods for financial risk management, cash management and specific financing-related areas e.g. commercial guarantees, relationships with financiers and customer financing.
INTEREST RATE RISKThe Group has interest-bearing receivables related to cash and cash equivalents. Otherwise its revenues and operating cash flows are mostly
independent of changes in market interest ratesInterest rate risk arises mainly from the Group’s current and non-cur-
rent loans, receivables sold to banks and financial institutions and the related interest rate derivatives. In addition, the Group has interest-bear-ing cash and cash equivalents. Loans issued at floating interest rates expose the Group to cash flow interest rate risk, which is hedged by interest rate swaps. To manage the interest rate risk, the Board of Directors has defined a duration target of two years for loans and for the related interest rate derivative hedges. The duration may be deviated from by +/- 1.5 years upon the decision of Vice President, Group Treas-urer. In order to meet the duration target, part of the loans at floating rates are converted to fixed rate using interest rate caps and swaps. At the end of 2014, the duration of loans including the hedging derivatives was 1.55 years (1.33 years in 2013).
The cash flow risk related to two floating-rate loans is hedged by using interest rate swaps. At the end of 2014, the nominal amounts of
the loans hedged were EUR 20 million (EUR 25 million in 2013) and EUR 30 million (loan taken in 2014) and their reference interest rates were 1-month Stibor and 1-month Euribor, respectively. The hedged cash flows will be realised within four years. The hedges are effective and, according to accounting policies, changes in the fair value of interest rate swaps are recognised in the fair value reserve in equity.
In addition to non-current loans, the duration target guides the man-agement of the cash flow interest rate risk related to receivables sold to banks and financial institutions, and the pricing of the commercial paper portfolio. Hedging decisions for this exposure are made by the Chief Financial Officer (CFO) of the Group. At the end of 2014, the Group used interest rate derivatives to hedge the cash flow risk related to sold receivables. The nominal value of the hedged items was EUR 218 million and their reference interest rate was one-month Euribor. In addition, the cash flow risk related to the pricing of the commercial paper portfolio, with a nominal value of EUR 50 million, linked to the 3-month Euribor on average, was hedged at the end of 2014. Hedge accounting as set out in IAS 39 is not applied and the fair value changes are recognised as finan-cial income and expenses in the income statement in accordance with accounting policies (Note 11).
Loans issued at fixed interest rates comprised approximately 66% (approximately 62%) of the loan portfolio at the balance sheet date. The weighted average effective interest rate of the loans at fixed rate was 2.886% (3.511% in 2013). The weighted average effective interest rate of the loans at floating rates was 2.970% (1.444% in 2013). The weighted average effective interest rate of the portfolio as a whole was 2.924% (2.730% in 2013). These figures include the effect of derivative instru-ments. Interest rate derivatives increase the weighted average effective interest rate of the loan portfolio as a whole by 0.23 (increase by 0.29 in 2013) percentage points.
In addition to the duration target, the management monitors the effect of the possible change in interest rate level on the Group’s financial result on a quarterly basis (effect of one percentage point change in interest rate level on yearly net interest expenses). The effect on yearly net interest expenses would have been EUR 1.3 million (EUR 2.0 million in 2013) net of tax in 2014. One percentage point change in interest rates has been used in the calculation for the loan portfolio, and the effect of the change has varied from EUR 1.3 million to EUR 2.7 million (EUR 1.9–3.1 million in 2013). In addition, the effect of fair valuation of interest rate derivatives for which hedge accounting is not applied would have been EUR 5.8 million (EUR 4.5 million in 2013) net of tax on the profit for the period when inter-est rates rise one percentage point. If interest would have decreased to
0%, the effect would have been EUR -0.1 million net of tax on the profit
for the period.The calculation is based on the maturities of the Group’s inter-
est-bearing net debt depending on the reference interest rate:
REPRISING SCHEDULE OF THE INTEREST BEARING NET DEBTEUR mill. 2014 2013
< 1 month 165.3 -111.7
1–3 months -279.0 -170.6
3–12 months -153.1 -101.7
1–5 years -491.8 -429.1
> 5 years 0.0
-758.6 -813.1
The figures in the table are nominal values. Off-balance sheet receivables sold to financial institutions amounting to EUR 62.4 million (EUR 30.4 million in 2013) are included in these figures.
In addition to interest-bearing net debt, the foreign exchange forward contracts associated with the intra-Group loans and the hedging of the foreign exchange risk of certain commercial contracts expose the Group’s result to interest rate risk. The Group’s external loans are mainly denominated in euros, but the subsidiaries are financed in their functional currency. The parent company is exposed to the interest rate risk of the different functional currencies in the Group when it hedges the foreign exchange risk arising from the foreign currency denominated loans granted to subsidiaries and certain commercial contracts using foreign exchange forward contracts. The most significant currency of the intra-Group loans is the Russian rouble. As the parent company hedges the receivables denominated in roubles, the parent company has to pay the interest rate difference between the rouble and the euro. This interest rate differential has increased dramatically during the financial year, and the change has had a significant impact on hedging costs.
At the balance sheet date, a change of three percentage points in the interest rate differential between the euro and the Russian rouble would have had an impact of EUR 0.8 million (EUR 2.3 million in 2013) on the profit for the period net of tax. The sensitivity analysis is based on the for-eign exchange forward contracts outstanding at the balance sheet date.
FINANCIAL STATEMENT
121
YIT ANNUAL REPORT 2014
YEAR 2014 BUSINESS OPERATIONS CORPORATE GOVERNANCE GRI INDEX
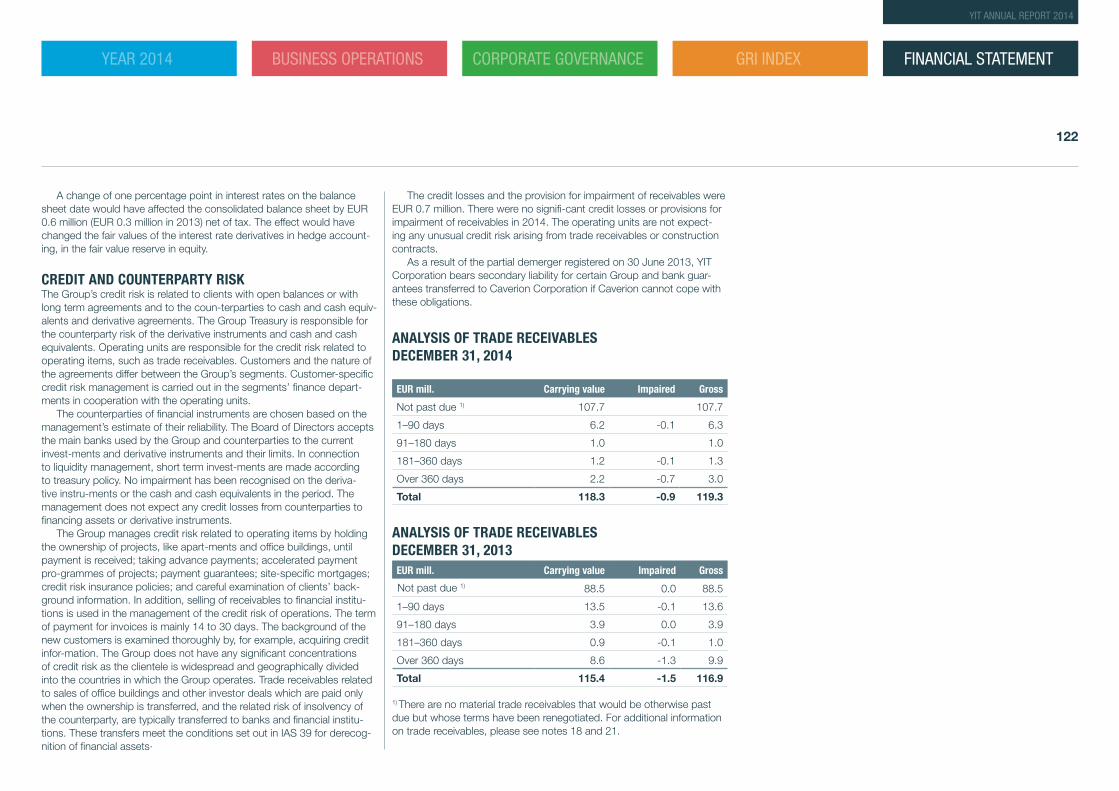
A change of one percentage point in interest rates on the balance sheet date would have affected the consolidated balance sheet by EUR 0.6 million (EUR 0.3 million in 2013) net of tax. The effect would have changed the fair values of the interest rate derivatives in hedge account-ing, in the fair value reserve in equity.
CREDIT AND COUNTERPARTY RISKThe Group’s credit risk is related to clients with open balances or with long term agreements and to the coun-terparties to cash and cash equiv-alents and derivative agreements. The Group Treasury is responsible for the counterparty risk of the derivative instruments and cash and cash equivalents. Operating units are responsible for the credit risk related to operating items, such as trade receivables. Customers and the nature of the agreements differ between the Group’s segments. Customer-specific credit risk management is carried out in the segments’ finance depart-ments in cooperation with the operating units.
The counterparties of financial instruments are chosen based on the management’s estimate of their reliability. The Board of Directors accepts the main banks used by the Group and counterparties to the current invest-ments and derivative instruments and their limits. In connection to liquidity management, short term invest-ments are made according to treasury policy. No impairment has been recognised on the deriva-tive instru-ments or the cash and cash equivalents in the period. The management does not expect any credit losses from counterparties to financing assets or derivative instruments.
The Group manages credit risk related to operating items by holding the ownership of projects, like apart-ments and office buildings, until payment is received; taking advance payments; accelerated payment pro-grammes of projects; payment guarantees; site-specific mortgages; credit risk insurance policies; and careful examination of clients’ back-ground information. In addition, selling of receivables to financial institu-tions is used in the management of the credit risk of operations. The term of payment for invoices is mainly 14 to 30 days. The background of the new customers is examined thoroughly by, for example, acquiring credit infor-mation. The Group does not have any significant concentrations of credit risk as the clientele is widespread and geographically divided into the countries in which the Group operates. Trade receivables related to sales of office buildings and other investor deals which are paid only when the ownership is transferred, and the related risk of insolvency of the counterparty, are typically transferred to banks and financial institu-tions. These transfers meet the conditions set out in IAS 39 for derecog-nition of financial assets.
The credit losses and the provision for impairment of receivables were EUR 0.7 million. There were no signifi-cant credit losses or provisions for impairment of receivables in 2014. The operating units are not expect-ing any unusual credit risk arising from trade receivables or construction contracts.
As a result of the partial demerger registered on 30 June 2013, YIT Corporation bears secondary liability for certain Group and bank guar-antees transferred to Caverion Corporation if Caverion cannot cope with these obligations.
ANALYSIS OF TRADE RECEIVABLES DECEMBER 31, 2014
EUR mill. Carrying value Impaired Gross
Not past due 1) 107.7 107.7
1–90 days 6.2 -0.1 6.3
91–180 days 1.0 1.0
181–360 days 1.2 -0.1 1.3
Over 360 days 2.2 -0.7 3.0
Total 118.3 -0.9 119.3
ANALYSIS OF TRADE RECEIVABLES DECEMBER 31, 2013EUR mill. Carrying value Impaired Gross
Not past due 1) 88.5 0.0 88.5
1–90 days 13.5 -0.1 13.6
91–180 days 3.9 0.0 3.9
181–360 days 0.9 -0.1 1.0
Over 360 days 8.6 -1.3 9.9
Total 115.4 -1.5 116.9
1) There are no material trade receivables that would be otherwise past due but whose terms have been renegotiated. For additional information on trade receivables, please see notes 18 and 21.
FINANCIAL STATEMENT
122
YIT ANNUAL REPORT 2014
YEAR 2014 BUSINESS OPERATIONS CORPORATE GOVERNANCE GRI INDEX
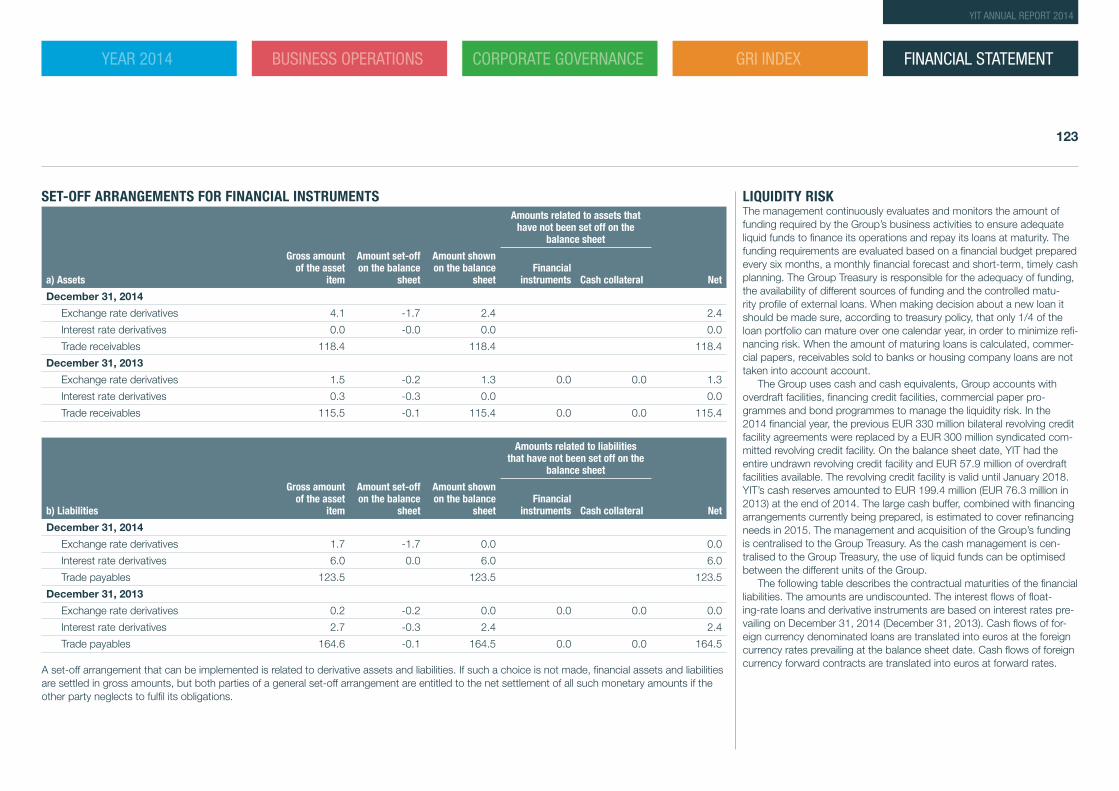
SET-OFF ARRANGEMENTS FOR FINANCIAL INSTRUMENTS
Amounts related to assets that have not been set off on the
balance sheet
a) Assets
Gross amount of the asset
item
Amount set-off on the balance
sheet
Amount shown on the balance
sheetFinancial
instruments Cash collateral Net
December 31, 2014
Exchange rate derivatives 4.1 -1.7 2.4 2.4
Interest rate derivatives 0.0 -0.0 0.0 0.0
Trade receivables 118.4 118.4 118.4
December 31, 2013
Exchange rate derivatives 1.5 -0.2 1.3 0.0 0.0 1.3
Interest rate derivatives 0.3 -0.3 0.0 0.0
Trade receivables 115.5 -0.1 115.4 0.0 0.0 115.4
Amounts related to liabilities that have not been set off on the
balance sheet
b) Liabilities
Gross amount of the asset
item
Amount set-off on the balance
sheet
Amount shown on the balance
sheetFinancial
instruments Cash collateral Net
December 31, 2014
Exchange rate derivatives 1.7 -1.7 0.0 0.0
Interest rate derivatives 6.0 0.0 6.0 6.0
Trade payables 123.5 123.5 123.5
December 31, 2013
Exchange rate derivatives 0.2 -0.2 0.0 0.0 0.0 0.0
Interest rate derivatives 2.7 -0.3 2.4 2.4
Trade payables 164.6 -0.1 164.5 0.0 0.0 164.5
A set-off arrangement that can be implemented is related to derivative assets and liabilities. If such a choice is not made, financial assets and liabilities are settled in gross amounts, but both parties of a general set-off arrangement are entitled to the net settlement of all such monetary amounts if the other party neglects to fulfil its obligations.
LIQUIDITY RISKThe management continuously evaluates and monitors the amount of funding required by the Group’s business activities to ensure adequate liquid funds to finance its operations and repay its loans at maturity. The funding requirements are evaluated based on a financial budget prepared every six months, a monthly financial forecast and short-term, timely cash planning. The Group Treasury is responsible for the adequacy of funding, the availability of different sources of funding and the controlled matu-rity profile of external loans. When making decision about a new loan it should be made sure, according to treasury policy, that only 1/4 of the loan portfolio can mature over one calendar year, in order to minimize refi-nancing risk. When the amount of maturing loans is calculated, commer-cial papers, receivables sold to banks or housing company loans are not taken into account account.
The Group uses cash and cash equivalents, Group accounts with overdraft facilities, financing credit facilities, commercial paper pro-grammes and bond programmes to manage the liquidity risk. In the 2014 financial year, the previous EUR 330 million bilateral revolving credit facility agreements were replaced by a EUR 300 million syndicated com-mitted revolving credit facility. On the balance sheet date, YIT had the entire undrawn revolving credit facility and EUR 57.9 million of overdraft facilities available. The revolving credit facility is valid until January 2018. YIT’s cash reserves amounted to EUR 199.4 million (EUR 76.3 million in 2013) at the end of 2014. The large cash buffer, combined with financing arrangements currently being prepared, is estimated to cover refinancing needs in 2015. The management and acquisition of the Group’s funding is centralised to the Group Treasury. As the cash management is cen-tralised to the Group Treasury, the use of liquid funds can be optimised between the different units of the Group.
The following table describes the contractual maturities of the financial liabilities. The amounts are undiscounted. The interest flows of float-ing-rate loans and derivative instruments are based on interest rates pre-vailing on December 31, 2014 (December 31, 2013). Cash flows of for-eign currency denominated loans are translated into euros at the foreign currency rates prevailing at the balance sheet date. Cash flows of foreign currency forward contracts are translated into euros at forward rates.
FINANCIAL STATEMENT
123
YIT ANNUAL REPORT 2014
YEAR 2014 BUSINESS OPERATIONS CORPORATE GOVERNANCE GRI INDEX
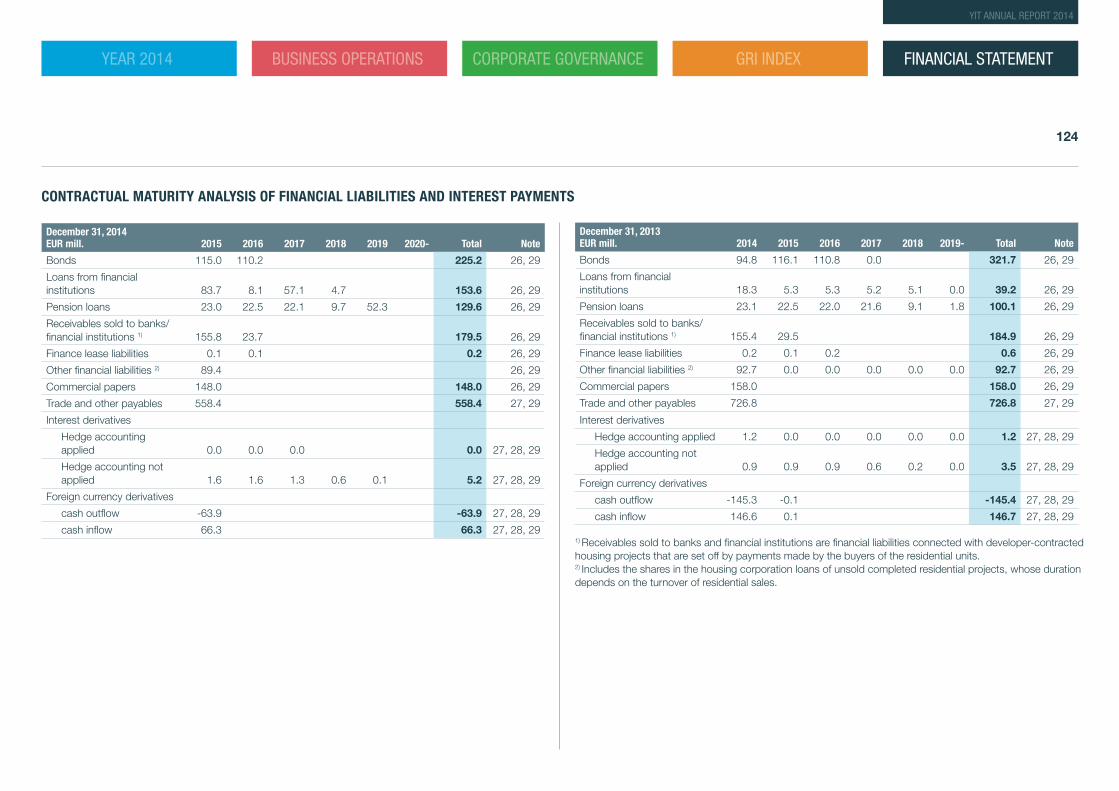
CONTRACTUAL MATURITY ANALYSIS OF FINANCIAL LIABILITIES AND INTEREST PAYMENTS December 31, 2014 EUR mill. 2015 2016 2017 2018 2019 2020- Total Note
Bonds 115.0 110.2 225.2 26, 29
Loans from financial institutions 83.7 8.1 57.1 4.7 153.6 26, 29
Pension loans 23.0 22.5 22.1 9.7 52.3 129.6 26, 29
Receivables sold to banks/ financial institutions 1) 155.8 23.7 179.5 26, 29
Finance lease liabilities 0.1 0.1 0.2 26, 29
Other financial liabilities 2) 89.4 26, 29
Commercial papers 148.0 148.0 26, 29
Trade and other payables 558.4 558.4 27, 29
Interest derivatives
Hedge accounting applied 0.0 0.0 0.0 0.0 27, 28, 29
Hedge accounting not applied 1.6 1.6 1.3 0.6 0.1 5.2 27, 28, 29
Foreign currency derivatives
cash outflow -63.9 -63.9 27, 28, 29
cash inflow 66.3 66.3 27, 28, 29
December 31, 2013 EUR mill. 2014 2015 2016 2017 2018 2019- Total Note
Bonds 94.8 116.1 110.8 0.0 321.7 26, 29
Loans from financial institutions 18.3 5.3 5.3 5.2 5.1 0.0 39.2 26, 29
Pension loans 23.1 22.5 22.0 21.6 9.1 1.8 100.1 26, 29
Receivables sold to banks/ financial institutions 1) 155.4 29.5 184.9 26, 29
Finance lease liabilities 0.2 0.1 0.2 0.6 26, 29
Other financial liabilities 2) 92.7 0.0 0.0 0.0 0.0 0.0 92.7 26, 29
Commercial papers 158.0 158.0 26, 29
Trade and other payables 726.8 726.8 27, 29
Interest derivatives
Hedge accounting applied 1.2 0.0 0.0 0.0 0.0 0.0 1.2 27, 28, 29
Hedge accounting not applied 0.9 0.9 0.9 0.6 0.2 0.0 3.5 27, 28, 29
Foreign currency derivatives
cash outflow -145.3 -0.1 -145.4 27, 28, 29
cash inflow 146.6 0.1 146.7 27, 28, 29
1) Receivables sold to banks and financial institutions are financial liabilities connected with developer-contracted housing projects that are set off by payments made by the buyers of the residential units.2) Includes the shares in the housing corporation loans of unsold completed residential projects, whose duration depends on the turnover of residential sales.
FINANCIAL STATEMENT
124
YIT ANNUAL REPORT 2014
YEAR 2014 BUSINESS OPERATIONS CORPORATE GOVERNANCE GRI INDEX
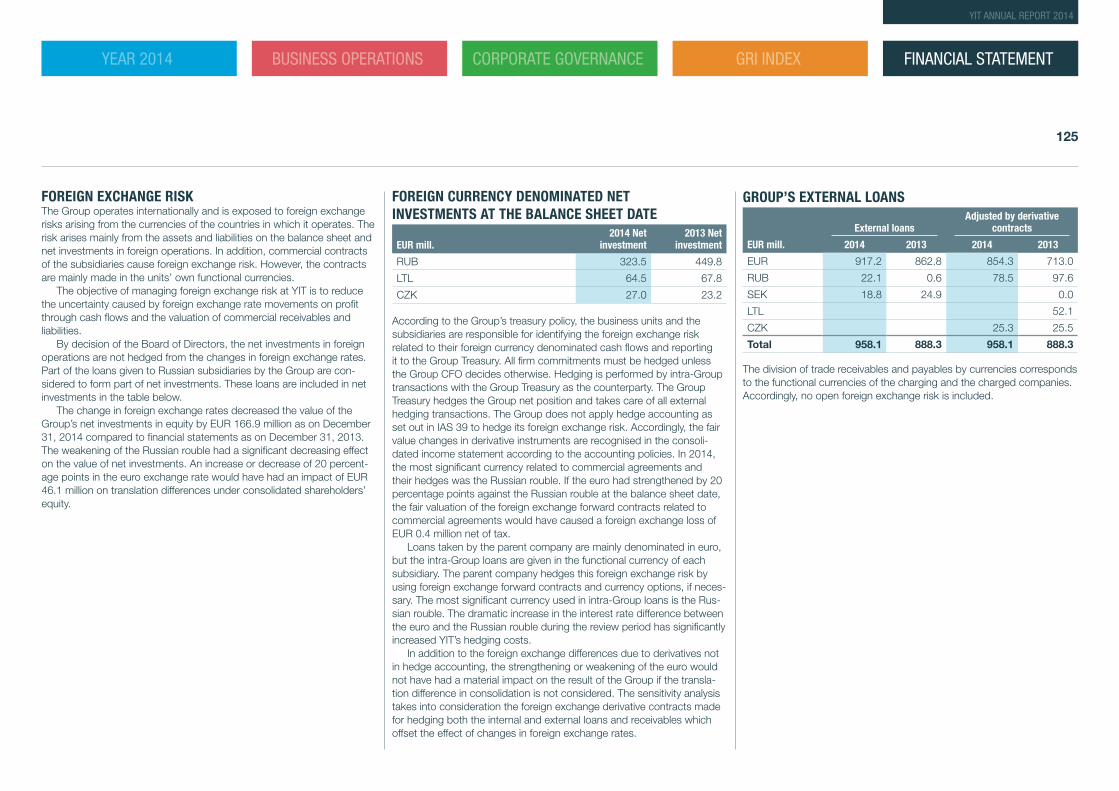
FOREIGN EXCHANGE RISKThe Group operates internationally and is exposed to foreign exchange risks arising from the currencies of the countries in which it operates. The risk arises mainly from the assets and liabilities on the balance sheet and net investments in foreign operations. In addition, commercial contracts of the subsidiaries cause foreign exchange risk. However, the contracts are mainly made in the units’ own functional currencies.
The objective of managing foreign exchange risk at YIT is to reduce the uncertainty caused by foreign exchange rate movements on profit through cash flows and the valuation of commercial receivables and liabilities.
By decision of the Board of Directors, the net investments in foreign operations are not hedged from the changes in foreign exchange rates. Part of the loans given to Russian subsidiaries by the Group are con-sidered to form part of net investments. These loans are included in net investments in the table below.
The change in foreign exchange rates decreased the value of the Group’s net investments in equity by EUR 166.9 million as on December 31, 2014 compared to financial statements as on December 31, 2013. The weakening of the Russian rouble had a significant decreasing effect on the value of net investments. An increase or decrease of 20 percent-age points in the euro exchange rate would have had an impact of EUR 46.1 million on translation differences under consolidated shareholders’ equity.
FOREIGN CURRENCY DENOMINATED NET INVESTMENTS AT THE BALANCE SHEET DATE
EUR mill.2014 Net
investment2013 Net
investment
RUB 323.5 449.8
LTL 64.5 67.8
CZK 27.0 23.2
According to the Group’s treasury policy, the business units and the subsidiaries are responsible for identifying the foreign exchange risk related to their foreign currency denominated cash flows and reporting it to the Group Treasury. All firm commitments must be hedged unless the Group CFO decides otherwise. Hedging is performed by intra-Group transactions with the Group Treasury as the counterparty. The Group Treasury hedges the Group net position and takes care of all external hedging transactions. The Group does not apply hedge accounting as set out in IAS 39 to hedge its foreign exchange risk. Accordingly, the fair value changes in derivative instruments are recognised in the consoli-dated income statement according to the accounting policies. In 2014, the most significant currency related to commercial agreements and their hedges was the Russian rouble. If the euro had strengthened by 20 percentage points against the Russian rouble at the balance sheet date, the fair valuation of the foreign exchange forward contracts related to commercial agreements would have caused a foreign exchange loss of EUR 0.4 million net of tax.
Loans taken by the parent company are mainly denominated in euro, but the intra-Group loans are given in the functional currency of each subsidiary. The parent company hedges this foreign exchange risk by using foreign exchange forward contracts and currency options, if neces-sary. The most significant currency used in intra-Group loans is the Rus-sian rouble. The dramatic increase in the interest rate difference between the euro and the Russian rouble during the review period has significantly increased YIT’s hedging costs.
In addition to the foreign exchange differences due to derivatives not in hedge accounting, the strengthening or weakening of the euro would not have had a material impact on the result of the Group if the transla-tion difference in consolidation is not considered. The sensitivity analysis takes into consideration the foreign exchange derivative contracts made for hedging both the internal and external loans and receivables which offset the effect of changes in foreign exchange rates.
GROUP’S EXTERNAL LOANS
External loansAdjusted by derivative
contracts
EUR mill. 2014 2013 2014 2013
EUR 917.2 862.8 854.3 713.0
RUB 22.1 0.6 78.5 97.6
SEK 18.8 24.9 0.0
LTL 52.1
CZK 25.3 25.5
Total 958.1 888.3 958.1 888.3 The division of trade receivables and payables by currencies corresponds to the functional currencies of the charging and the charged companies. Accordingly, no open foreign exchange risk is included.
FINANCIAL STATEMENT
125
YIT ANNUAL REPORT 2014
YEAR 2014 BUSINESS OPERATIONS CORPORATE GOVERNANCE GRI INDEX
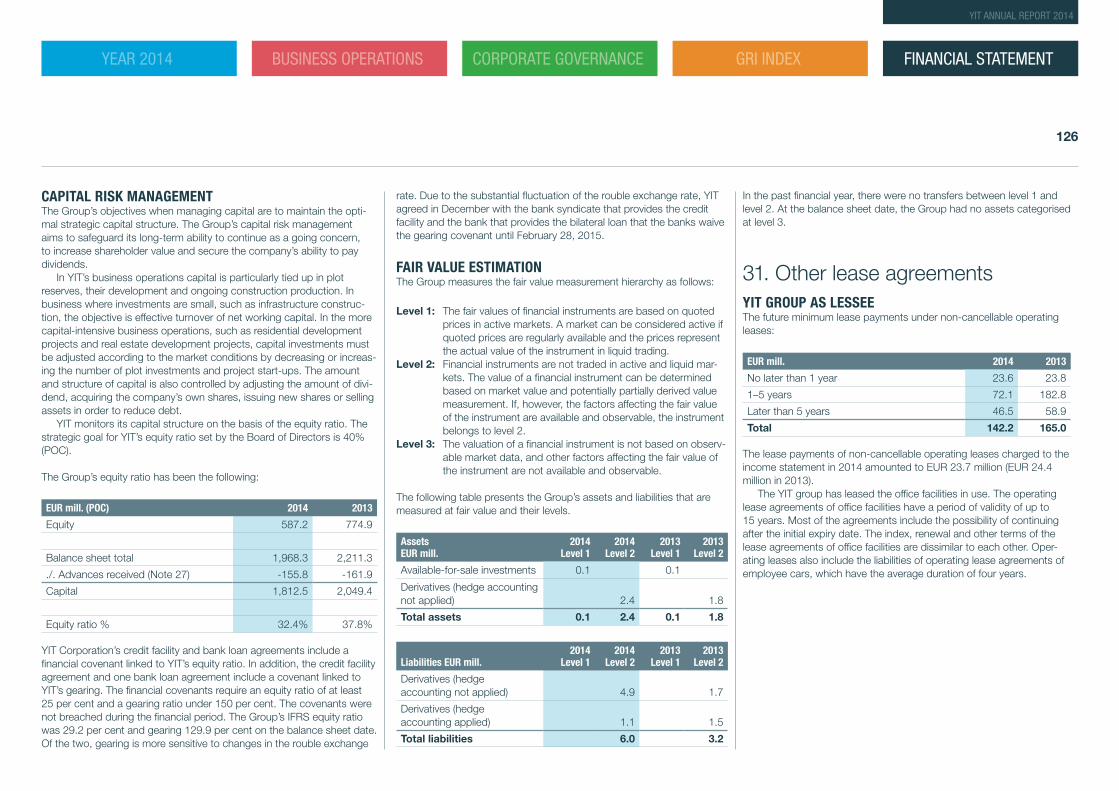
CAPITAL RISK MANAGEMENTThe Group’s objectives when managing capital are to maintain the opti-mal strategic capital structure. The Group’s capital risk management aims to safeguard its long-term ability to continue as a going concern, to increase shareholder value and secure the company’s ability to pay dividends.
In YIT’s business operations capital is particularly tied up in plot reserves, their development and ongoing construction production. In business where investments are small, such as infrastructure construc-tion, the objective is effective turnover of net working capital. In the more capital-intensive business operations, such as residential development projects and real estate development projects, capital investments must be adjusted according to the market conditions by decreasing or increas-ing the number of plot investments and project start-ups. The amount and structure of capital is also controlled by adjusting the amount of divi-dend, acquiring the company’s own shares, issuing new shares or selling assets in order to reduce debt.
YIT monitors its capital structure on the basis of the equity ratio. The strategic goal for YIT’s equity ratio set by the Board of Directors is 40% (POC).
The Group’s equity ratio has been the following:
EUR mill. (POC) 2014 2013
Equity 587.2 774.9
Balance sheet total 1,968.3 2,211.3
./. Advances received (Note 27) -155.8 -161.9
Capital 1,812.5 2,049.4
Equity ratio % 32.4% 37.8%
YIT Corporation’s credit facility and bank loan agreements include a financial covenant linked to YIT’s equity ratio. In addition, the credit facility agreement and one bank loan agreement include a covenant linked to YIT’s gearing. The financial covenants require an equity ratio of at least 25 per cent and a gearing ratio under 150 per cent. The covenants were not breached during the financial period. The Group’s IFRS equity ratio was 29.2 per cent and gearing 129.9 per cent on the balance sheet date. Of the two, gearing is more sensitive to changes in the rouble exchange
rate. Due to the substantial fluctuation of the rouble exchange rate, YIT agreed in December with the bank syndicate that provides the credit facility and the bank that provides the bilateral loan that the banks waive the gearing covenant until February 28, 2015.
FAIR VALUE ESTIMATIONThe Group measures the fair value measurement hierarchy as follows:
Level 1: The fair values of financial instruments are based on quoted prices in active markets. A market can be considered active if quoted prices are regularly available and the prices represent the actual value of the instrument in liquid trading.
Level 2: Financial instruments are not traded in active and liquid mar-kets. The value of a financial instrument can be determined based on market value and potentially partially derived value measurement. If, however, the factors affecting the fair value of the instrument are available and observable, the instrument belongs to level 2.
Level 3: The valuation of a financial instrument is not based on observ-able market data, and other factors affecting the fair value of the instrument are not available and observable.
The following table presents the Group’s assets and liabilities that are measured at fair value and their levels.
Assets EUR mill.
2014 Level 1
2014 Level 2
2013 Level 1
2013 Level 2
Available-for-sale investments 0.1 0.1
Derivatives (hedge accounting not applied) 2.4 1.8
Total assets 0.1 2.4 0.1 1.8
Liabilities EUR mill.2014
Level 12014
Level 22013
Level 12013
Level 2
Derivatives (hedge accounting not applied) 4.9 1.7
Derivatives (hedge accounting applied) 1.1 1.5
Total liabilities 6.0 3.2
In the past financial year, there were no transfers between level 1 and level 2. At the balance sheet date, the Group had no assets categorised at level 3.
31. Other lease agreementsYIT GROUP AS LESSEEThe future minimum lease payments under non-cancellable operating leases:
EUR mill. 2014 2013
No later than 1 year 23.6 23.8
1–5 years 72.1 182.8
Later than 5 years 46.5 58.9
Total 142.2 165.0
The lease payments of non-cancellable operating leases charged to the income statement in 2014 amounted to EUR 23.7 million (EUR 24.4 million in 2013).
The YIT group has leased the office facilities in use. The operating lease agreements of office facilities have a period of validity of up to 15 years. Most of the agreements include the possibility of continuing after the initial expiry date. The index, renewal and other terms of the lease agreements of office facilities are dissimilar to each other. Oper-ating leases also include the liabilities of operating lease agreements of employee cars, which have the average duration of four years.
FINANCIAL STATEMENT
126
YIT ANNUAL REPORT 2014
YEAR 2014 BUSINESS OPERATIONS CORPORATE GOVERNANCE GRI INDEX
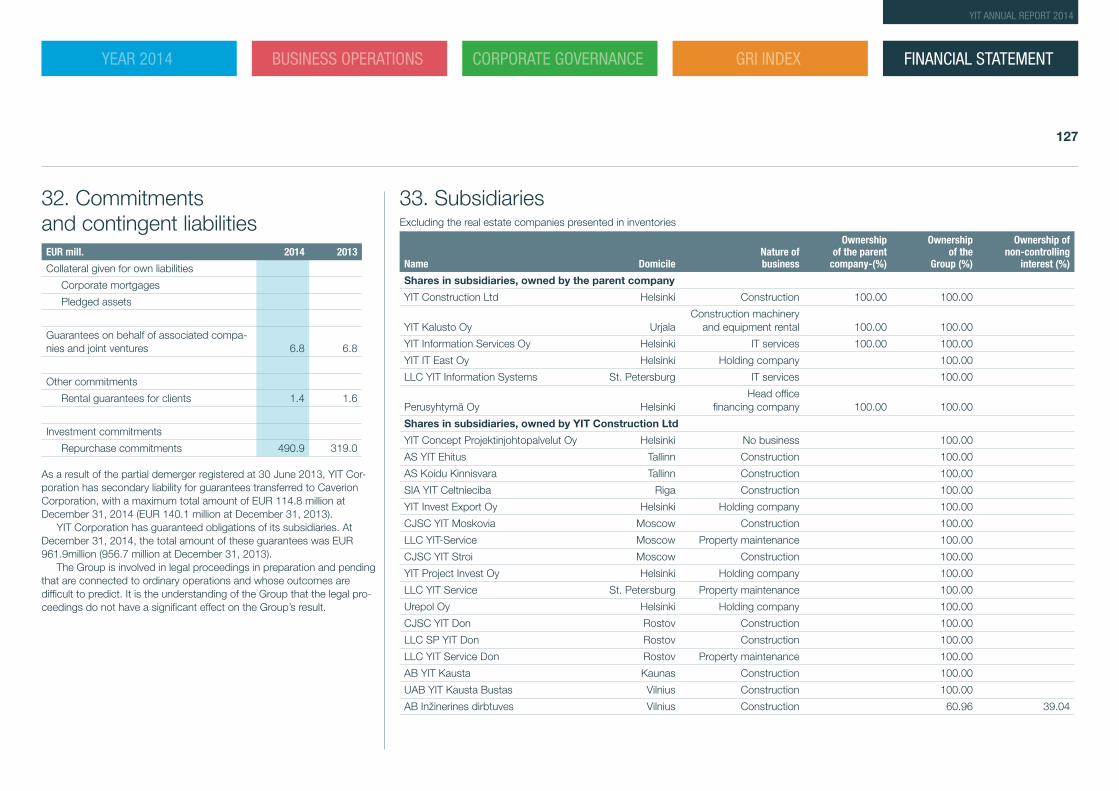
32. Commitments and contingent liabilitiesEUR mill. 2014 2013
Collateral given for own liabilities
Corporate mortgages
Pledged assets
Guarantees on behalf of associated compa-nies and joint ventures 6.8 6.8
Other commitments
Rental guarantees for clients 1.4 1.6
Investment commitments
Repurchase commitments 490.9 319.0
As a result of the partial demerger registered at 30 June 2013, YIT Cor-poration has secondary liability for guarantees transferred to Caverion Corporation, with a maximum total amount of EUR 114.8 million at December 31, 2014 (EUR 140.1 million at December 31, 2013).
YIT Corporation has guaranteed obligations of its subsidiaries. At December 31, 2014, the total amount of these guarantees was EUR 961.9million (956.7 million at December 31, 2013).
The Group is involved in legal proceedings in preparation and pending that are connected to ordinary operations and whose outcomes are difficult to predict. It is the understanding of the Group that the legal pro-ceedings do not have a significant effect on the Group’s result.
33. SubsidiariesExcluding the real estate companies presented in inventories
Name DomicileNature of business
Ownership of the parent
company-(%)
Ownership of the
Group (%)
Ownership of non-controlling
interest (%)
Shares in subsidiaries, owned by the parent company
YIT Construction Ltd Helsinki Construction 100.00 100.00
YIT Kalusto Oy UrjalaConstruction machinery
and equipment rental 100.00 100.00
YIT Information Services Oy Helsinki IT services 100.00 100.00
YIT IT East Oy Helsinki Holding company 100.00
LLC YIT Information Systems St. Petersburg IT services 100.00
Perusyhtymä Oy HelsinkiHead office
financing company 100.00 100.00
Shares in subsidiaries, owned by YIT Construction Ltd
YIT Concept Projektinjohtopalvelut Oy Helsinki No business 100.00
AS YIT Ehitus Tallinn Construction 100.00
AS Koidu Kinnisvara Tallinn Construction 100.00
SIA YIT Celtnieciba Riga Construction 100.00
YIT Invest Export Oy Helsinki Holding company 100.00
CJSC YIT Moskovia Moscow Construction 100.00
LLC YIT-Service Moscow Property maintenance 100.00
CJSC YIT Stroi Moscow Construction 100.00
YIT Project Invest Oy Helsinki Holding company 100.00
LLC YIT Service St. Petersburg Property maintenance 100.00
Urepol Oy Helsinki Holding company 100.00
CJSC YIT Don Rostov Construction 100.00
LLC SP YIT Don Rostov Construction 100.00
LLC YIT Service Don Rostov Property maintenance 100.00
AB YIT Kausta Kaunas Construction 100.00
UAB YIT Kausta Bustas Vilnius Construction 100.00
AB Inžinerines dirbtuves Vilnius Construction 60.96 39.04
FINANCIAL STATEMENT
127
YIT ANNUAL REPORT 2014
YEAR 2014 BUSINESS OPERATIONS CORPORATE GOVERNANCE GRI INDEX

Name DomicileNature of business
Ownership of the parent
company-(%)
Ownership of the
Group (%)
Ownership of non-controlling
interest (%)
YIT Salym Development Oy Helsinki Holding company 100.00
CJSC YIT Saint-Petersburg St. Petersburg Construction 100.00
LLC Gorelovo Infra St. Petersburg Construction 100.00
Tortum Oy Ab Helsinki Holding company 100.00
CJSC YIT Uralstroi Yekaterinburg Construction 99.94 0.06
CJSC YIT Comfort Yekaterinburg Construction 99.94 0.06
LLC Ural YIT Service Yekaterinburg Property maintenance 99.94 0.06
LLC YIT Tyumen Tyumen Construction 99.94 0.06
Finn-Stroi Oy Helsinki Holding company 100.00
CJSC YIT CityStroi Moscow Construction 74.99 25.01
LLC Hetber Moscow Construction 74.99 25.01
LLC Emerkom-Spetstroi Moscow Construction 74.99 25.01
LLC YIT CityService Moscow Property maintenance 74.99 25.01
CJSC TPK Strojmaterialy Moscow Construction 100.00
YIT Jupiter Oy Helsinki Holding company 100.00
YIT Mars Oy Helsinki Holding company 100.00
YIT Saturnus Oy Helsinki Holding company 100.00
YIT Sirius Oy Helsinki Holding company 100.00
CJSC YIT VDSK Moscow Construction 90.00 10.00
YIT Uranus Oy Helsinki Holding company 100.00
CJSC YIT Properties Moscow No business 100.00
YIT Neptunus Oy Helsinki Holding company 100.00
LLC YIT Kazan Kazan Construction 100.00
LLC YIT Service Kazan Kazan Property maintenance 100.00
YIT Stavo s.r.o ¹) Prague Construction 85.00 15.00
YIT Reding a.s. Bratislava Construction 100.00
Gala Residence s.r.o. Bratislava Construction 100.00
¹) YIT Group’s share in YIT Stavo s.r.o is 100% in IFRS accounting, because the minority share of 15% YIT is assessed to be a share based pay-ment to the management.
FINANCIAL STATEMENT
128
YIT ANNUAL REPORT 2014
YEAR 2014 BUSINESS OPERATIONS CORPORATE GOVERNANCE GRI INDEX
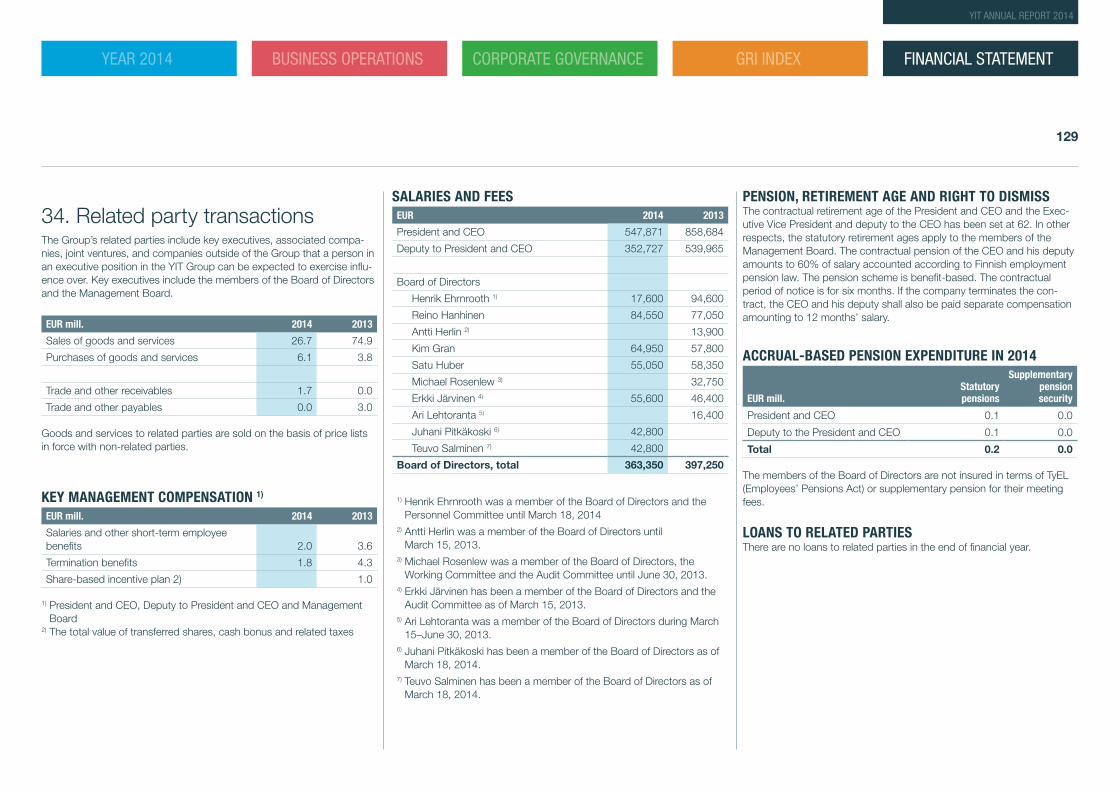
34. Related party transactionsThe Group’s related parties include key executives, associated compa-nies, joint ventures, and companies outside of the Group that a person in an executive position in the YIT Group can be expected to exercise influ-ence over. Key executives include the members of the Board of Directors and the Management Board.
EUR mill. 2014 2013
Sales of goods and services 26.7 74.9
Purchases of goods and services 6.1 3.8
Trade and other receivables 1.7 0.0
Trade and other payables 0.0 3.0
Goods and services to related parties are sold on the basis of price lists in force with non-related parties.
KEY MANAGEMENT COMPENSATION 1)
EUR mill. 2014 2013
Salaries and other short-term employee benefits 2.0 3.6
Termination benefits 1.8 4.3
Share-based incentive plan 2) 1.0
1) President and CEO, Deputy to President and CEO and Management Board
2) The total value of transferred shares, cash bonus and related taxes
SALARIES AND FEESEUR 2014 2013
President and CEO 547,871 858,684
Deputy to President and CEO 352,727 539,965
Board of Directors
Henrik Ehrnrooth 1) 17,600 94,600
Reino Hanhinen 84,550 77,050
Antti Herlin 2) 13,900
Kim Gran 64,950 57,800
Satu Huber 55,050 58,350
Michael Rosenlew 3) 32,750
Erkki Järvinen 4) 55,600 46,400
Ari Lehtoranta 5) 16,400
Juhani Pitkäkoski 6) 42,800
Teuvo Salminen 7) 42,800
Board of Directors, total 363,350 397,250
1) Henrik Ehrnrooth was a member of the Board of Directors and the Personnel Committee until March 18, 2014
2) Antti Herlin was a member of the Board of Directors until March 15, 2013.
3) Michael Rosenlew was a member of the Board of Directors, the Working Committee and the Audit Committee until June 30, 2013.
4) Erkki Järvinen has been a member of the Board of Directors and the Audit Committee as of March 15, 2013.
5) Ari Lehtoranta was a member of the Board of Directors during March 15–June 30, 2013.
6) Juhani Pitkäkoski has been a member of the Board of Directors as of March 18, 2014.
7) Teuvo Salminen has been a member of the Board of Directors as of March 18, 2014.
PENSION, RETIREMENT AGE AND RIGHT TO DISMISSThe contractual retirement age of the President and CEO and the Exec-utive Vice President and deputy to the CEO has been set at 62. In other respects, the statutory retirement ages apply to the members of the Management Board. The contractual pension of the CEO and his deputy amounts to 60% of salary accounted according to Finnish employment pension law. The pension scheme is benefit-based. The contractual period of notice is for six months. If the company terminates the con-tract, the CEO and his deputy shall also be paid separate compensation amounting to 12 months’ salary.
ACCRUAL-BASED PENSION EXPENDITURE IN 2014
EUR mill.Statutory pensions
Supplementary pension security
President and CEO 0.1 0.0
Deputy to the President and CEO 0.1 0.0
Total 0.2 0.0
The members of the Board of Directors are not insured in terms of TyEL (Employees’ Pensions Act) or supplementary pension for their meeting fees.
LOANS TO RELATED PARTIESThere are no loans to related parties in the end of financial year.
FINANCIAL STATEMENT
129
YIT ANNUAL REPORT 2014
YEAR 2014 BUSINESS OPERATIONS CORPORATE GOVERNANCE GRI INDEX
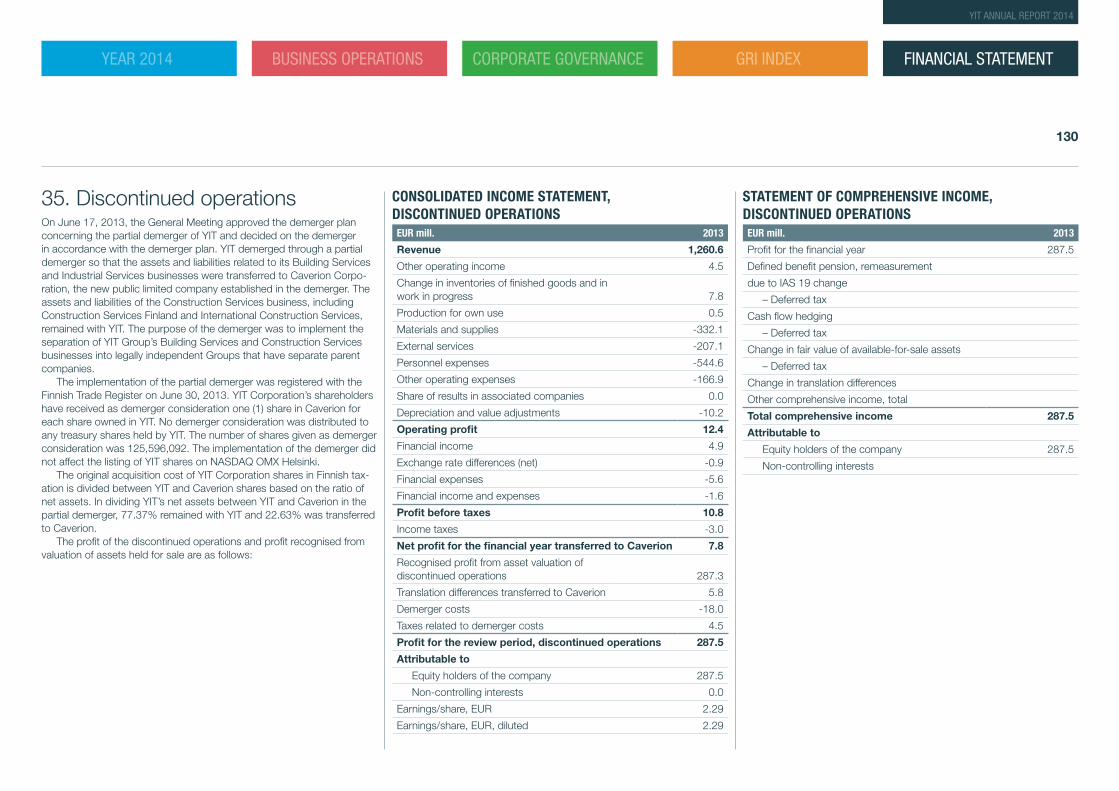
35. Discontinued operationsOn June 17, 2013, the General Meeting approved the demerger plan concerning the partial demerger of YIT and decided on the demerger in accordance with the demerger plan. YIT demerged through a partial demerger so that the assets and liabilities related to its Building Services and Industrial Services businesses were transferred to Caverion Corpo-ration, the new public limited company established in the demerger. The assets and liabilities of the Construction Services business, including Construction Services Finland and International Construction Services, remained with YIT. The purpose of the demerger was to implement the separation of YIT Group’s Building Services and Construction Services businesses into legally independent Groups that have separate parent companies.
The implementation of the partial demerger was registered with the Finnish Trade Register on June 30, 2013. YIT Corporation’s shareholders have received as demerger consideration one (1) share in Caverion for each share owned in YIT. No demerger consideration was distributed to any treasury shares held by YIT. The number of shares given as demerger consideration was 125,596,092. The implementation of the demerger did not affect the listing of YIT shares on NASDAQ OMX Helsinki.
The original acquisition cost of YIT Corporation shares in Finnish tax-ation is divided between YIT and Caverion shares based on the ratio of net assets. In dividing YIT’s net assets between YIT and Caverion in the partial demerger, 77.37% remained with YIT and 22.63% was transferred to Caverion.
The profit of the discontinued operations and profit recognised from valuation of assets held for sale are as follows:
CONSOLIDATED INCOME STATEMENT, DISCONTINUED OPERATIONS EUR mill. 2013
Revenue 1,260.6
Other operating income 4.5
Change in inventories of finished goods and in work in progress 7.8
Production for own use 0.5
Materials and supplies -332.1
External services -207.1
Personnel expenses -544.6
Other operating expenses -166.9
Share of results in associated companies 0.0
Depreciation and value adjustments -10.2
Operating profit 12.4
Financial income 4.9
Exchange rate differences (net) -0.9
Financial expenses -5.6
Financial income and expenses -1.6
Profit before taxes 10.8
Income taxes -3.0
Net profit for the financial year transferred to Caverion 7.8
Recognised profit from asset valuation of discontinued operations 287.3
Translation differences transferred to Caverion 5.8
Demerger costs -18.0
Taxes related to demerger costs 4.5
Profit for the review period, discontinued operations 287.5
Attributable to
Equity holders of the company 287.5
Non-controlling interests 0.0
Earnings/share, EUR 2.29
Earnings/share, EUR, diluted 2.29
STATEMENT OF COMPREHENSIVE INCOME, DISCONTINUED OPERATIONSEUR mill. 2013
Profit for the financial year 287.5
Defined benefit pension, remeasurement
due to IAS 19 change
– Deferred tax
Cash flow hedging
– Deferred tax
Change in fair value of available-for-sale assets
– Deferred tax
Change in translation differences
Other comprehensive income, total
Total comprehensive income 287.5
Attributable to
Equity holders of the company 287.5
Non-controlling interests
FINANCIAL STATEMENT
130
YIT ANNUAL REPORT 2014
YEAR 2014 BUSINESS OPERATIONS CORPORATE GOVERNANCE GRI INDEX
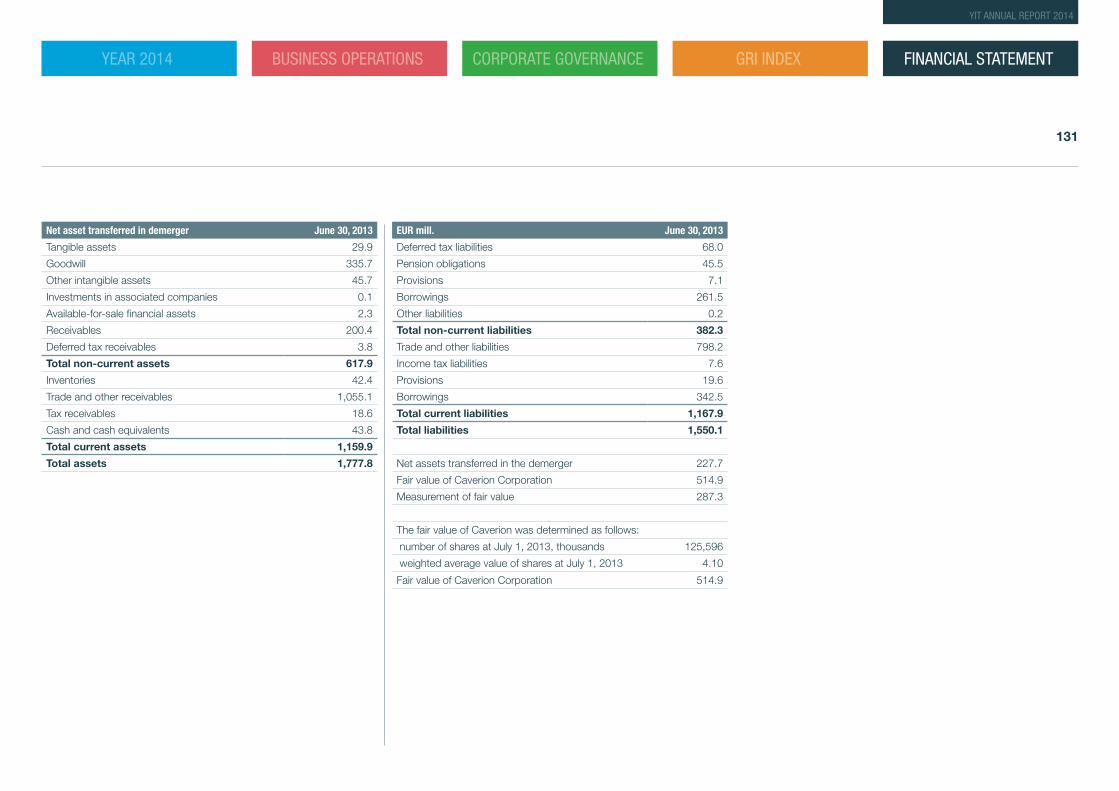
Net asset transferred in demerger June 30, 2013
Tangible assets 29.9
Goodwill 335.7
Other intangible assets 45.7
Investments in associated companies 0.1
Available-for-sale financial assets 2.3
Receivables 200.4
Deferred tax receivables 3.8
Total non-current assets 617.9
Inventories 42.4
Trade and other receivables 1,055.1
Tax receivables 18.6
Cash and cash equivalents 43.8
Total current assets 1,159.9
Total assets 1,777.8
EUR mill. June 30, 2013
Deferred tax liabilities 68.0
Pension obligations 45.5
Provisions 7.1
Borrowings 261.5
Other liabilities 0.2
Total non-current liabilities 382.3
Trade and other liabilities 798.2
Income tax liabilities 7.6
Provisions 19.6
Borrowings 342.5
Total current liabilities 1,167.9
Total liabilities 1,550.1
Net assets transferred in the demerger 227.7
Fair value of Caverion Corporation 514.9
Measurement of fair value 287.3
The fair value of Caverion was determined as follows:
number of shares at July 1, 2013, thousands 125,596
weighted average value of shares at July 1, 2013 4.10
Fair value of Caverion Corporation 514.9
FINANCIAL STATEMENT
131
YIT ANNUAL REPORT 2014
YEAR 2014 BUSINESS OPERATIONS CORPORATE GOVERNANCE GRI INDEX
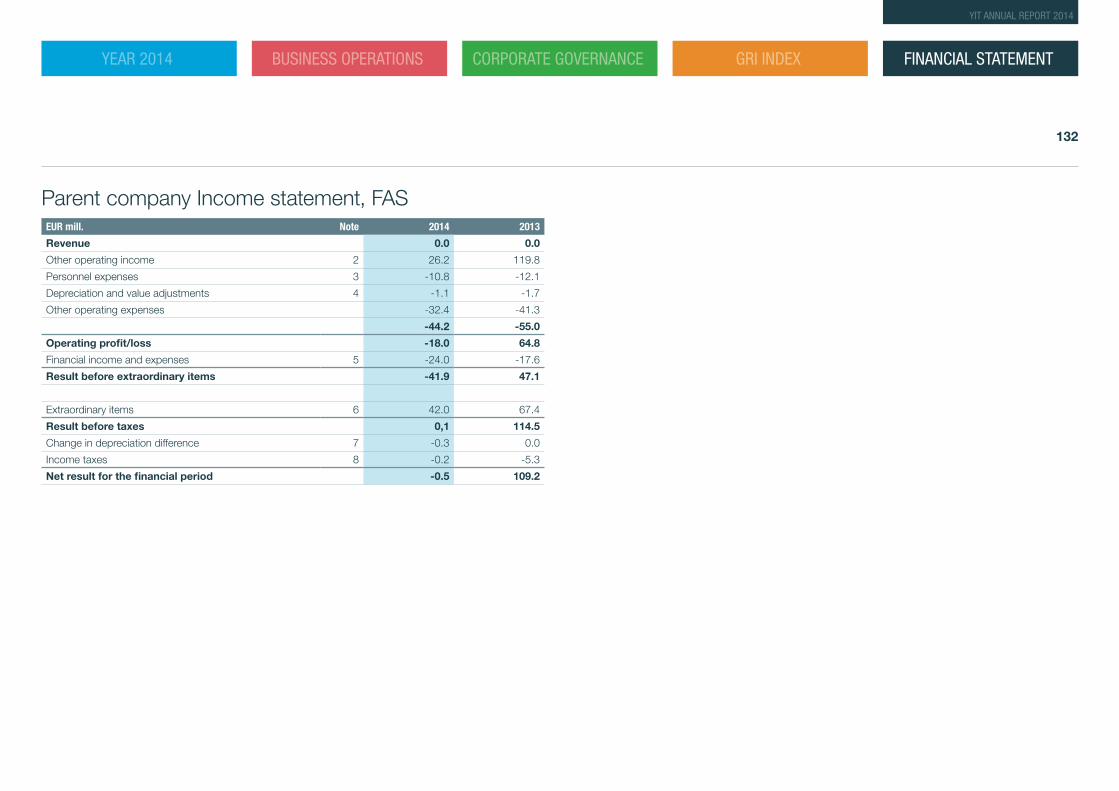
Parent company Income statement, FAS EUR mill. Note 2014 2013
Revenue 0.0 0.0
Other operating income 2 26.2 119.8
Personnel expenses 3 -10.8 -12.1
Depreciation and value adjustments 4 -1.1 -1.7
Other operating expenses -32.4 -41.3
-44.2 -55.0
Operating profit/loss -18.0 64.8
Financial income and expenses 5 -24.0 -17.6
Result before extraordinary items -41.9 47.1
Extraordinary items 6 42.0 67.4
Result before taxes 0,1 114.5
Change in depreciation difference 7 -0.3 0.0
Income taxes 8 -0.2 -5.3
Net result for the financial period -0.5 109.2
FINANCIAL STATEMENT
132
YIT ANNUAL REPORT 2014
YEAR 2014 BUSINESS OPERATIONS CORPORATE GOVERNANCE GRI INDEX
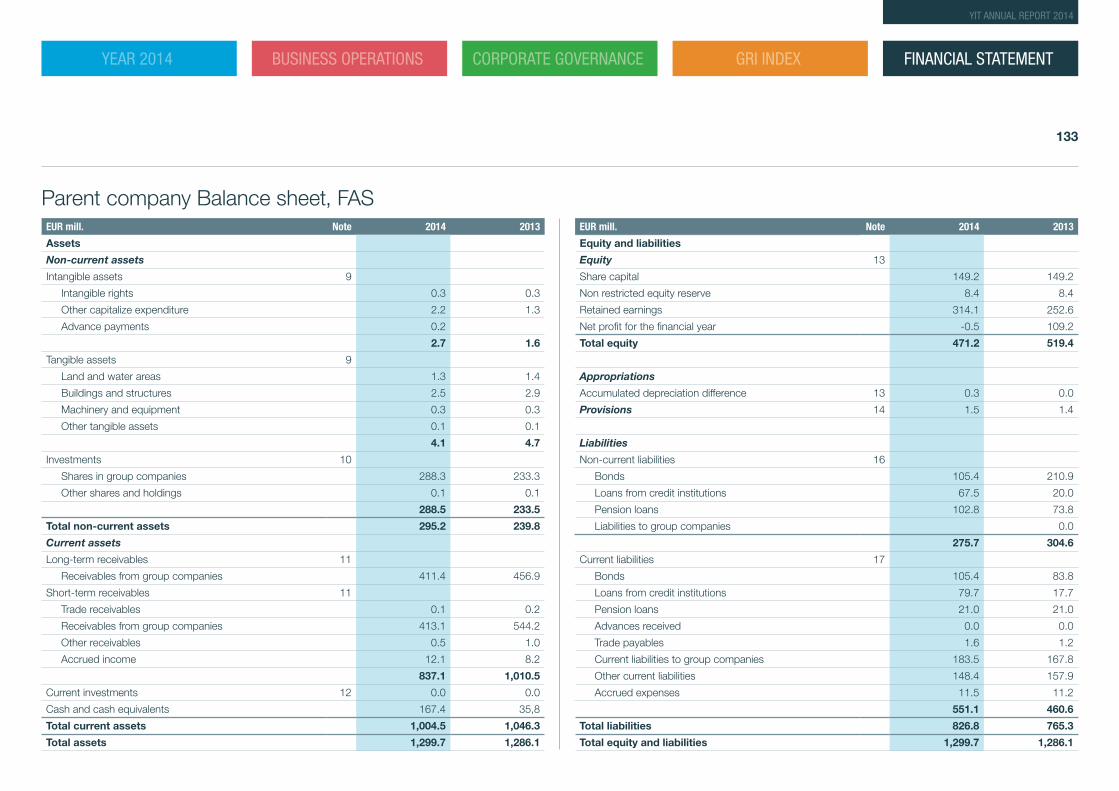
Parent company Balance sheet, FASEUR mill. Note 2014 2013
Assets
Non-current assets
Intangible assets 9
Intangible rights 0.3 0.3
Other capitalize expenditure 2.2 1.3
Advance payments 0.2
2.7 1.6
Tangible assets 9
Land and water areas 1.3 1.4
Buildings and structures 2.5 2.9
Machinery and equipment 0.3 0.3
Other tangible assets 0.1 0.1
4.1 4.7
Investments 10
Shares in group companies 288.3 233.3
Other shares and holdings 0.1 0.1
288.5 233.5
Total non-current assets 295.2 239.8
Current assets
Long-term receivables 11
Receivables from group companies 411.4 456.9
Short-term receivables 11
Trade receivables 0.1 0.2
Receivables from group companies 413.1 544.2
Other receivables 0.5 1.0
Accrued income 12.1 8.2
837.1 1,010.5
Current investments 12 0.0 0.0
Cash and cash equivalents 167.4 35,8
Total current assets 1,004.5 1,046.3
Total assets 1,299.7 1,286.1
EUR mill. Note 2014 2013
Equity and liabilities
Equity 13
Share capital 149.2 149.2
Non restricted equity reserve 8.4 8.4
Retained earnings 314.1 252.6
Net profit for the financial year -0.5 109.2
Total equity 471.2 519.4
Appropriations
Accumulated depreciation difference 13 0.3 0.0
Provisions 14 1.5 1.4
Liabilities
Non-current liabilities 16
Bonds 105.4 210.9
Loans from credit institutions 67.5 20.0
Pension loans 102.8 73.8
Liabilities to group companies 0.0
275.7 304.6
Current liabilities 17
Bonds 105.4 83.8
Loans from credit institutions 79.7 17.7
Pension loans 21.0 21.0
Advances received 0.0 0.0
Trade payables 1.6 1.2
Current liabilities to group companies 183.5 167.8
Other current liabilities 148.4 157.9
Accrued expenses 11.5 11.2
551.1 460.6
Total liabilities 826.8 765.3
Total equity and liabilities 1,299.7 1,286.1
FINANCIAL STATEMENT
133
YIT ANNUAL REPORT 2014
YEAR 2014 BUSINESS OPERATIONS CORPORATE GOVERNANCE GRI INDEX
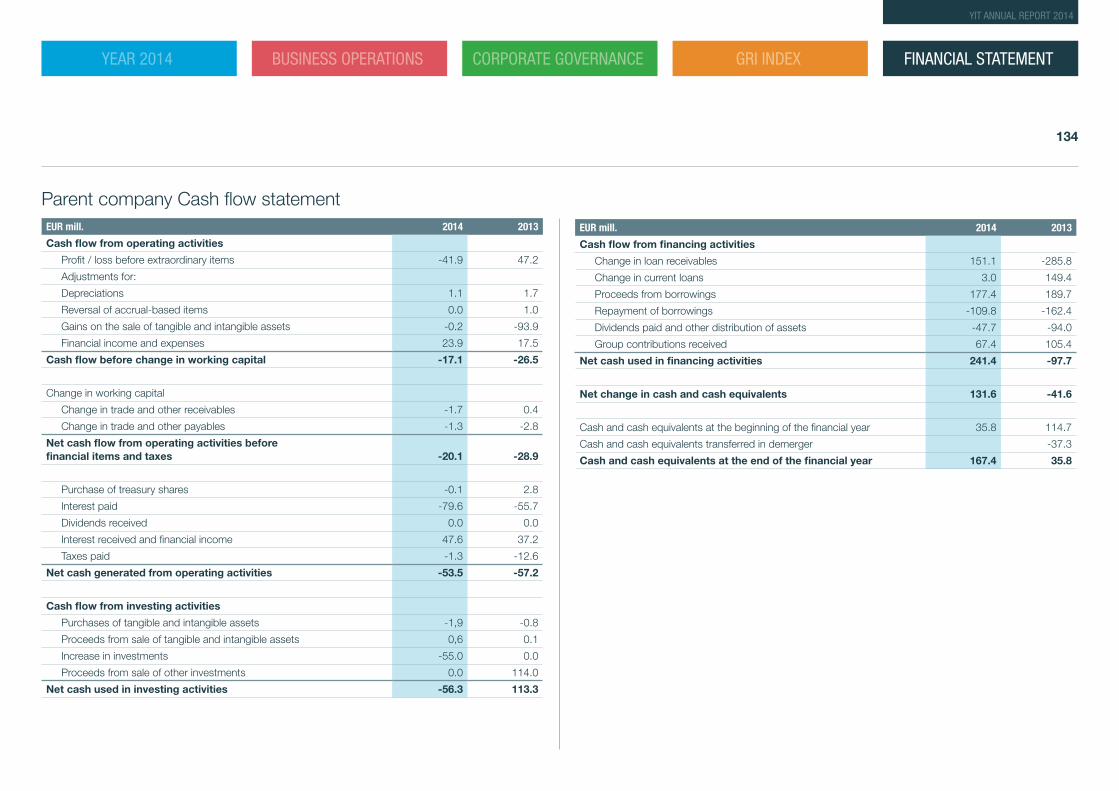
Parent company Cash flow statementEUR mill. 2014 2013
Cash flow from operating activities
Profit / loss before extraordinary items -41.9 47.2
Adjustments for:
Depreciations 1.1 1.7
Reversal of accrual-based items 0.0 1.0
Gains on the sale of tangible and intangible assets -0.2 -93.9
Financial income and expenses 23.9 17.5
Cash flow before change in working capital -17.1 -26.5
Change in working capital
Change in trade and other receivables -1.7 0.4
Change in trade and other payables -1.3 -2.8
Net cash flow from operating activities before financial items and taxes -20.1 -28.9
Purchase of treasury shares -0.1 2.8
Interest paid -79.6 -55.7
Dividends received 0.0 0.0
Interest received and financial income 47.6 37.2
Taxes paid -1.3 -12.6
Net cash generated from operating activities -53.5 -57.2
Cash flow from investing activities
Purchases of tangible and intangible assets -1,9 -0.8
Proceeds from sale of tangible and intangible assets 0,6 0.1
Increase in investments -55.0 0.0
Proceeds from sale of other investments 0.0 114.0
Net cash used in investing activities -56.3 113.3
EUR mill. 2014 2013
Cash flow from financing activities
Change in loan receivables 151.1 -285.8
Change in current loans 3.0 149.4
Proceeds from borrowings 177.4 189.7
Repayment of borrowings -109.8 -162.4
Dividends paid and other distribution of assets -47.7 -94.0
Group contributions received 67.4 105.4
Net cash used in financing activities 241.4 -97.7
Net change in cash and cash equivalents 131.6 -41.6
Cash and cash equivalents at the beginning of the financial year 35.8 114.7
Cash and cash equivalents transferred in demerger -37.3
Cash and cash equivalents at the end of the financial year 167.4 35.8
FINANCIAL STATEMENT
134
YIT ANNUAL REPORT 2014
YEAR 2014 BUSINESS OPERATIONS CORPORATE GOVERNANCE GRI INDEX
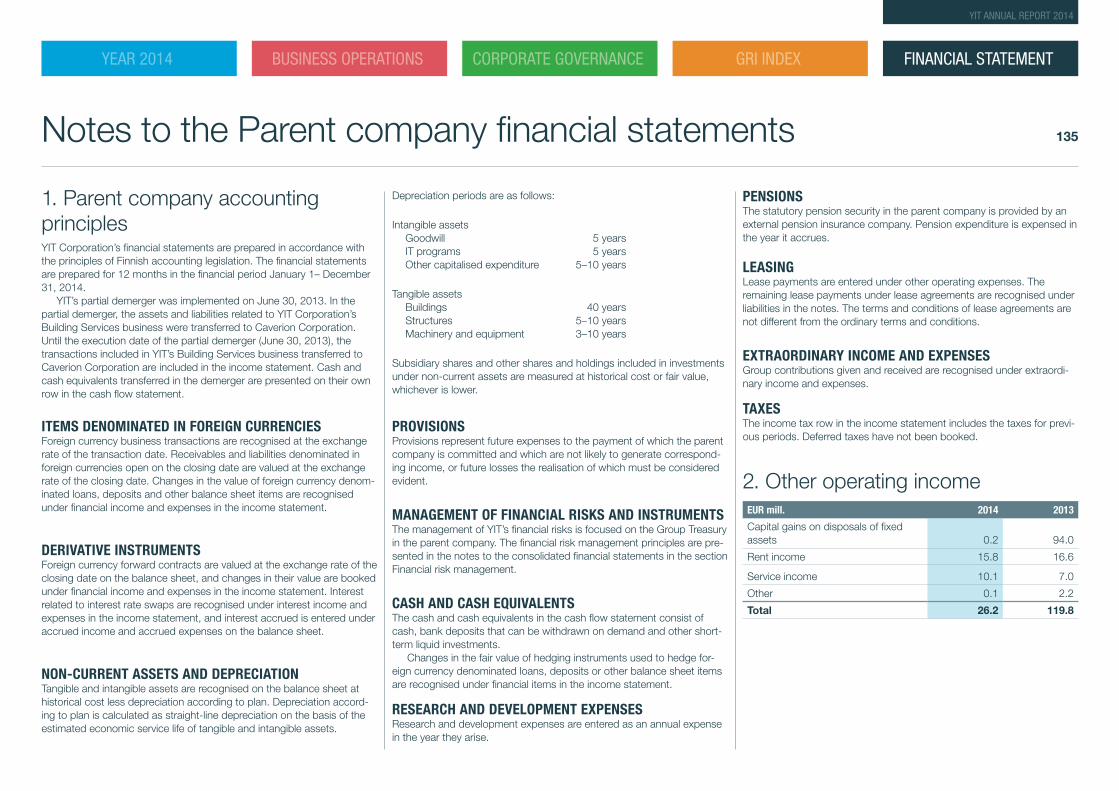
1. Parent company accounting principlesYIT Corporation’s financial statements are prepared in accordance with the principles of Finnish accounting legislation. The financial statements are prepared for 12 months in the financial period January 1– December 31, 2014.
YIT’s partial demerger was implemented on June 30, 2013. In the partial demerger, the assets and liabilities related to YIT Corporation’s Building Services business were transferred to Caverion Corporation. Until the execution date of the partial demerger (June 30, 2013), the transactions included in YIT’s Building Services business transferred to Caverion Corporation are included in the income statement. Cash and cash equivalents transferred in the demerger are presented on their own row in the cash flow statement.
ITEMS DENOMINATED IN FOREIGN CURRENCIESForeign currency business transactions are recognised at the exchange rate of the transaction date. Receivables and liabilities denominated in foreign currencies open on the closing date are valued at the exchange rate of the closing date. Changes in the value of foreign currency denom-inated loans, deposits and other balance sheet items are recognised under financial income and expenses in the income statement.
DERIVATIVE INSTRUMENTSForeign currency forward contracts are valued at the exchange rate of the closing date on the balance sheet, and changes in their value are booked under financial income and expenses in the income statement. Interest related to interest rate swaps are recognised under interest income and expenses in the income statement, and interest accrued is entered under accrued income and accrued expenses on the balance sheet.
NON-CURRENT ASSETS AND DEPRECIATIONTangible and intangible assets are recognised on the balance sheet at historical cost less depreciation according to plan. Depreciation accord-ing to plan is calculated as straight-line depreciation on the basis of the estimated economic service life of tangible and intangible assets.
Depreciation periods are as follows:
Intangible assets Goodwill 5 years IT programs 5 years Other capitalised expenditure 5–10 years
Tangible assets Buildings 40 years Structures 5–10 years Machinery and equipment 3–10 years
Subsidiary shares and other shares and holdings included in investments under non-current assets are measured at historical cost or fair value, whichever is lower.
PROVISIONSProvisions represent future expenses to the payment of which the parent company is committed and which are not likely to generate correspond-ing income, or future losses the realisation of which must be considered evident.
MANAGEMENT OF FINANCIAL RISKS AND INSTRUMENTSThe management of YIT’s financial risks is focused on the Group Treasury in the parent company. The financial risk management principles are pre-sented in the notes to the consolidated financial statements in the section Financial risk management.
CASH AND CASH EQUIVALENTSThe cash and cash equivalents in the cash flow statement consist of cash, bank deposits that can be withdrawn on demand and other short-term liquid investments.
Changes in the fair value of hedging instruments used to hedge for-eign currency denominated loans, deposits or other balance sheet items are recognised under financial items in the income statement.
RESEARCH AND DEVELOPMENT EXPENSESResearch and development expenses are entered as an annual expense in the year they arise.
PENSIONSThe statutory pension security in the parent company is provided by an external pension insurance company. Pension expenditure is expensed in the year it accrues.
LEASINGLease payments are entered under other operating expenses. The remaining lease payments under lease agreements are recognised under liabilities in the notes. The terms and conditions of lease agreements are not different from the ordinary terms and conditions.
EXTRAORDINARY INCOME AND EXPENSESGroup contributions given and received are recognised under extraordi-nary income and expenses.
TAXESThe income tax row in the income statement includes the taxes for previ-ous periods. Deferred taxes have not been booked.
2. Other operating incomeEUR mill. 2014 2013
Capital gains on disposals of fixed assets 0.2 94.0
Rent income 15.8 16.6
Service income 10.1 7.0
Other 0.1 2.2
Total 26.2 119.8
Notes to the Parent company financial statements
FINANCIAL STATEMENT
135
YIT ANNUAL REPORT 2014
YEAR 2014 BUSINESS OPERATIONS CORPORATE GOVERNANCE GRI INDEX
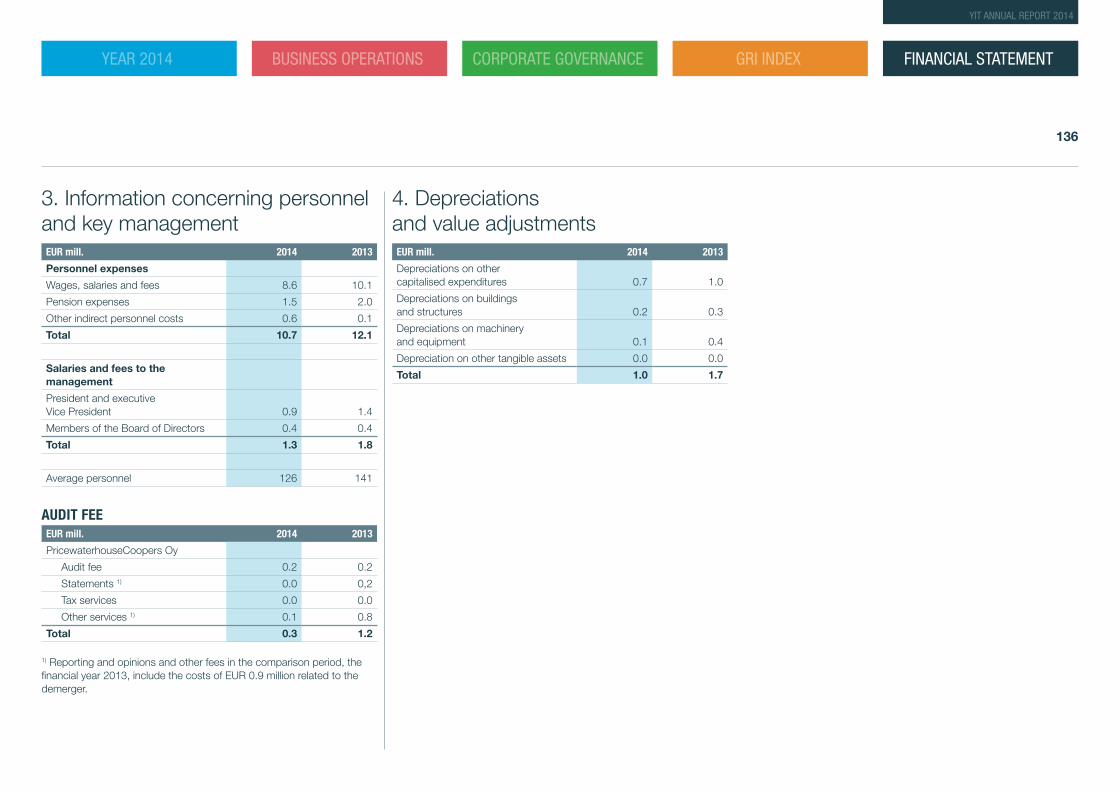
3. Information concerning personnel and key managementEUR mill. 2014 2013
Personnel expenses
Wages, salaries and fees 8.6 10.1
Pension expenses 1.5 2.0
Other indirect personnel costs 0.6 0.1
Total 10.7 12.1
Salaries and fees to the management
President and executive Vice President 0.9 1.4
Members of the Board of Directors 0.4 0.4
Total 1.3 1.8
Average personnel 126 141
AUDIT FEEEUR mill. 2014 2013
PricewaterhouseCoopers Oy
Audit fee 0.2 0.2
Statements 1) 0.0 0,2
Tax services 0.0 0.0
Other services 1) 0.1 0.8
Total 0.3 1.2
1) Reporting and opinions and other fees in the comparison period, the financial year 2013, include the costs of EUR 0.9 million related to the demerger.
4. Depreciations and value adjustmentsEUR mill. 2014 2013
Depreciations on other capitalised expenditures 0.7 1.0
Depreciations on buildings and structures 0.2 0.3
Depreciations on machinery and equipment 0.1 0.4
Depreciation on other tangible assets 0.0 0.0
Total 1.0 1.7
FINANCIAL STATEMENT
136
YIT ANNUAL REPORT 2014
YEAR 2014 BUSINESS OPERATIONS CORPORATE GOVERNANCE GRI INDEX
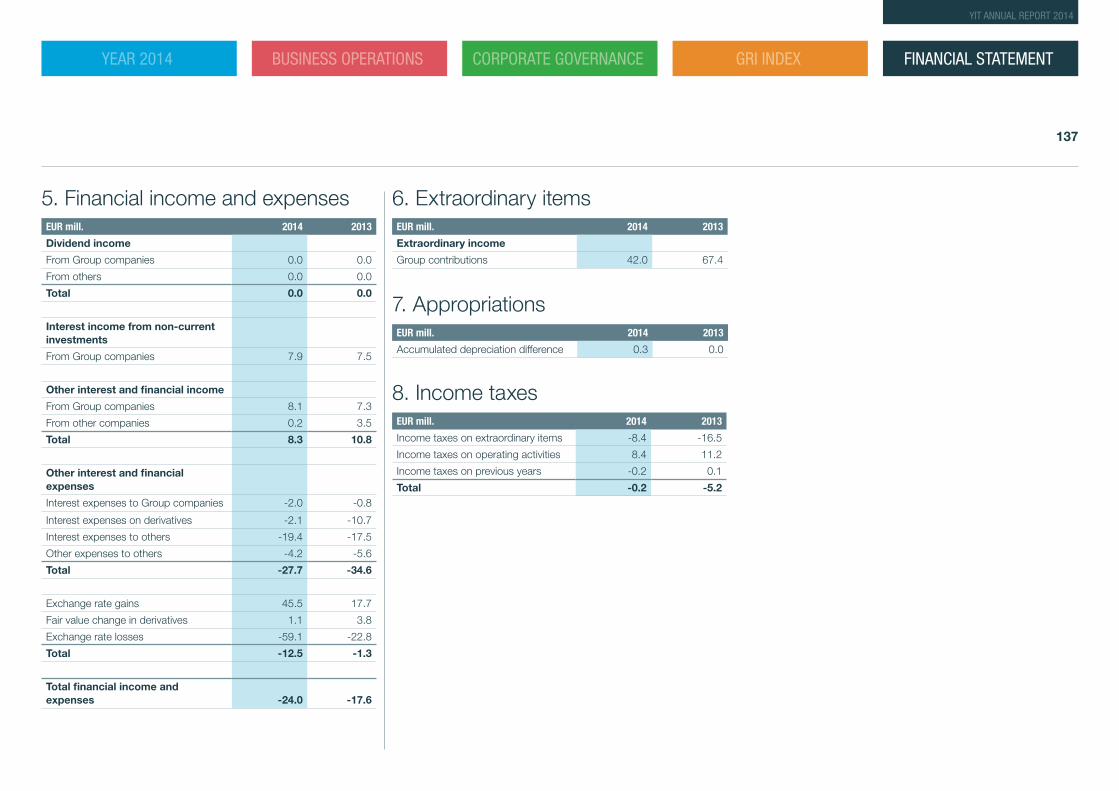
5. Financial income and expensesEUR mill. 2014 2013
Dividend income
From Group companies 0.0 0.0
From others 0.0 0.0
Total 0.0 0.0
Interest income from non-current investments
From Group companies 7.9 7.5
Other interest and financial income
From Group companies 8.1 7.3
From other companies 0.2 3.5
Total 8.3 10.8
Other interest and financial expenses
Interest expenses to Group companies -2.0 -0.8
Interest expenses on derivatives -2.1 -10.7
Interest expenses to others -19.4 -17.5
Other expenses to others -4.2 -5.6
Total -27.7 -34.6
Exchange rate gains 45.5 17.7
Fair value change in derivatives 1.1 3.8
Exchange rate losses -59.1 -22.8
Total -12.5 -1.3
Total financial income and expenses -24.0 -17.6
6. Extraordinary itemsEUR mill. 2014 2013
Extraordinary income
Group contributions 42.0 67.4
7. AppropriationsEUR mill. 2014 2013
Accumulated depreciation difference 0.3 0.0
8. Income taxesEUR mill. 2014 2013
Income taxes on extraordinary items -8.4 -16.5
Income taxes on operating activities 8.4 11.2
Income taxes on previous years -0.2 0.1
Total -0.2 -5.2
FINANCIAL STATEMENT
137
YIT ANNUAL REPORT 2014
YEAR 2014 BUSINESS OPERATIONS CORPORATE GOVERNANCE GRI INDEX
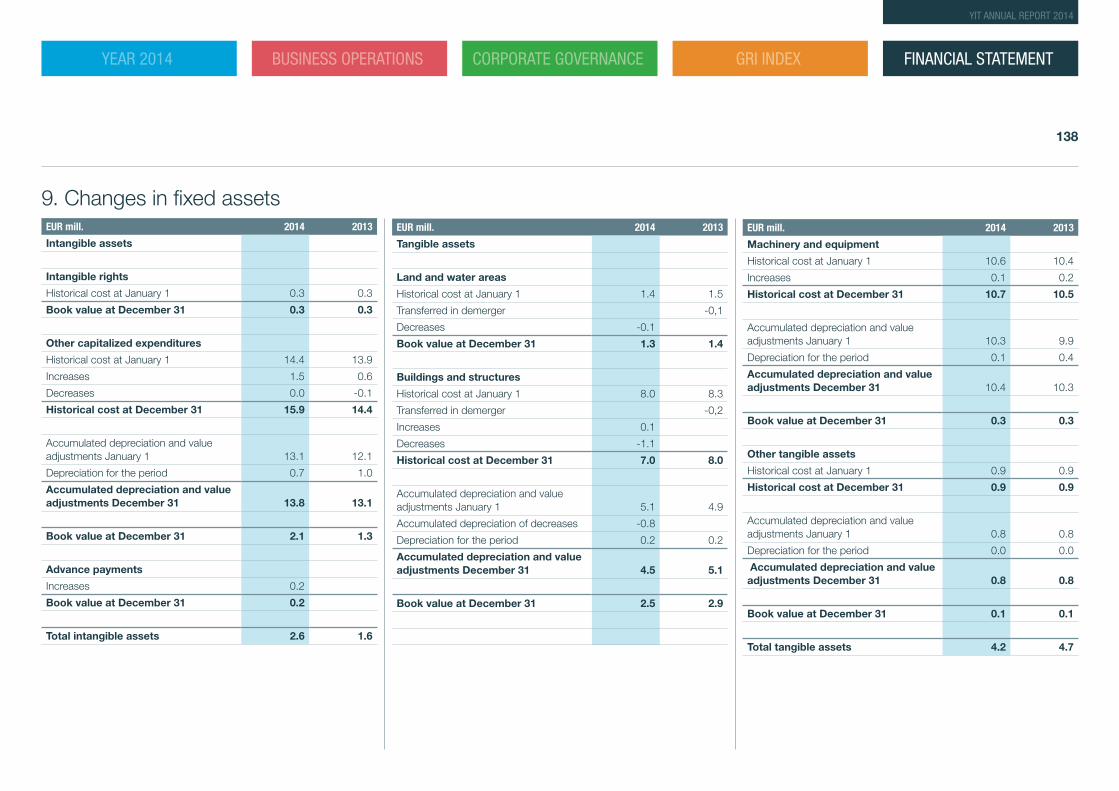
9. Changes in fixed assetsEUR mill. 2014 2013
Intangible assets
Intangible rights
Historical cost at January 1 0.3 0.3
Book value at December 31 0.3 0.3
Other capitalized expenditures
Historical cost at January 1 14.4 13.9
Increases 1.5 0.6
Decreases 0.0 -0.1
Historical cost at December 31 15.9 14.4
Accumulated depreciation and value adjustments January 1 13.1 12.1
Depreciation for the period 0.7 1.0
Accumulated depreciation and value adjustments December 31 13.8 13.1
Book value at December 31 2.1 1.3
Advance payments
Increases 0.2
Book value at December 31 0.2
Total intangible assets 2.6 1.6
EUR mill. 2014 2013
Tangible assets
Land and water areas
Historical cost at January 1 1.4 1.5
Transferred in demerger -0,1
Decreases -0.1
Book value at December 31 1.3 1.4
Buildings and structures
Historical cost at January 1 8.0 8.3
Transferred in demerger -0,2
Increases 0.1
Decreases -1.1
Historical cost at December 31 7.0 8.0
Accumulated depreciation and value adjustments January 1 5.1 4.9
Accumulated depreciation of decreases -0.8
Depreciation for the period 0.2 0.2
Accumulated depreciation and value adjustments December 31 4.5 5.1
Book value at December 31 2.5 2.9
EUR mill. 2014 2013
Machinery and equipment
Historical cost at January 1 10.6 10.4
Increases 0.1 0.2
Historical cost at December 31 10.7 10.5
Accumulated depreciation and value adjustments January 1 10.3 9.9
Depreciation for the period 0.1 0.4
Accumulated depreciation and value adjustments December 31 10.4 10.3
Book value at December 31 0.3 0.3
Other tangible assets
Historical cost at January 1 0.9 0.9
Historical cost at December 31 0.9 0.9
Accumulated depreciation and value adjustments January 1 0.8 0.8
Depreciation for the period 0.0 0.0
Accumulated depreciation and value adjustments December 31 0.8 0.8
Book value at December 31 0.1 0.1
Total tangible assets 4.2 4.7
FINANCIAL STATEMENT
138
YIT ANNUAL REPORT 2014
YEAR 2014 BUSINESS OPERATIONS CORPORATE GOVERNANCE GRI INDEX
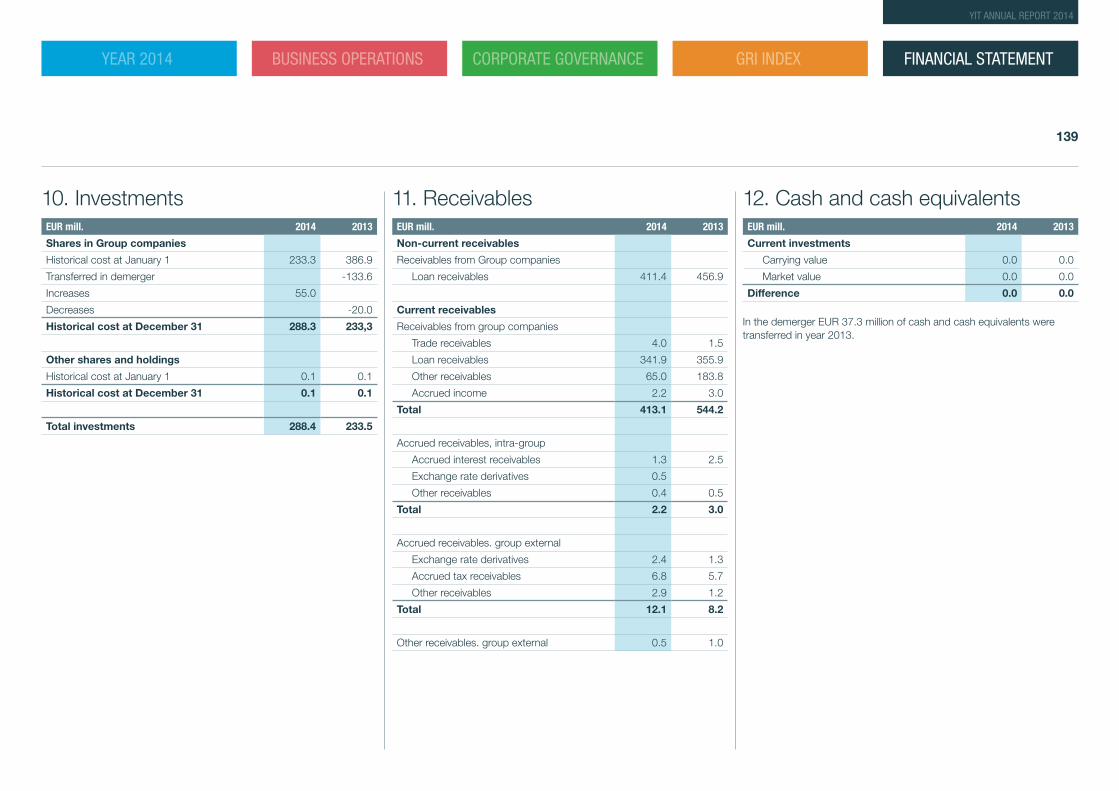
10. InvestmentsEUR mill. 2014 2013
Shares in Group companies
Historical cost at January 1 233.3 386.9
Transferred in demerger -133.6
Increases 55.0
Decreases -20.0
Historical cost at December 31 288.3 233,3
Other shares and holdings
Historical cost at January 1 0.1 0.1
Historical cost at December 31 0.1 0.1
Total investments 288.4 233.5
11. ReceivablesEUR mill. 2014 2013
Non-current receivables
Receivables from Group companies
Loan receivables 411.4 456.9
Current receivables
Receivables from group companies
Trade receivables 4.0 1.5
Loan receivables 341.9 355.9
Other receivables 65.0 183.8
Accrued income 2.2 3.0
Total 413.1 544.2
Accrued receivables, intra-group
Accrued interest receivables 1.3 2.5
Exchange rate derivatives 0.5
Other receivables 0.4 0.5
Total 2.2 3.0
Accrued receivables. group external
Exchange rate derivatives 2.4 1.3
Accrued tax receivables 6.8 5.7
Other receivables 2.9 1.2
Total 12.1 8.2
Other receivables. group external 0.5 1.0
12. Cash and cash equivalentsEUR mill. 2014 2013
Current investments
Carrying value 0.0 0.0
Market value 0.0 0.0
Difference 0.0 0.0
In the demerger EUR 37.3 million of cash and cash equivalents were transferred in year 2013.
FINANCIAL STATEMENT
139
YIT ANNUAL REPORT 2014
YEAR 2014 BUSINESS OPERATIONS CORPORATE GOVERNANCE GRI INDEX
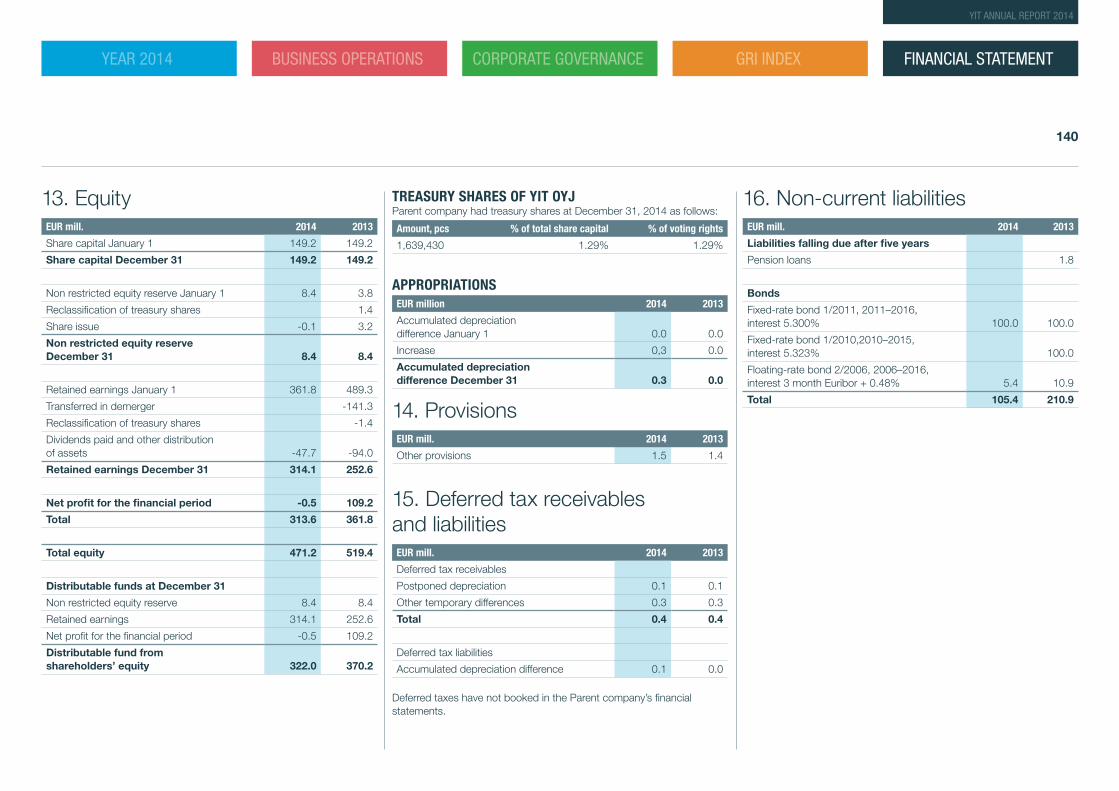
13. EquityEUR mill. 2014 2013
Share capital January 1 149.2 149.2
Share capital December 31 149.2 149.2
Non restricted equity reserve January 1 8.4 3.8
Reclassification of treasury shares 1.4
Share issue -0.1 3.2
Non restricted equity reserve December 31 8.4 8.4
Retained earnings January 1 361.8 489.3
Transferred in demerger -141.3
Reclassification of treasury shares -1.4
Dividends paid and other distribution of assets -47.7 -94.0
Retained earnings December 31 314.1 252.6
Net profit for the financial period -0.5 109.2
Total 313.6 361.8
Total equity 471.2 519.4
Distributable funds at December 31
Non restricted equity reserve 8.4 8.4
Retained earnings 314.1 252.6
Net profit for the financial period -0.5 109.2
Distributable fund from shareholders’ equity 322.0 370.2
TREASURY SHARES OF YIT OYJParent company had treasury shares at December 31, 2014 as follows:
Amount, pcs % of total share capital % of voting rights
1,639,430 1.29% 1.29%
APPROPRIATIONSEUR million 2014 2013
Accumulated depreciation difference January 1 0.0 0.0
Increase 0,3 0.0
Accumulated depreciation difference December 31 0.3 0.0
14. ProvisionsEUR mill. 2014 2013
Other provisions 1.5 1.4
15. Deferred tax receivables and liabilities EUR mill. 2014 2013
Deferred tax receivables
Postponed depreciation 0.1 0.1
Other temporary differences 0.3 0.3
Total 0.4 0.4
Deferred tax liabilities
Accumulated depreciation difference 0.1 0.0
Deferred taxes have not booked in the Parent company’s financial statements.
16. Non-current liabilitiesEUR mill. 2014 2013
Liabilities falling due after five years
Pension loans 1.8
Bonds
Fixed-rate bond 1/2011, 2011–2016, interest 5.300% 100.0 100.0
Fixed-rate bond 1/2010,2010–2015, interest 5.323% 100.0
Floating-rate bond 2/2006, 2006–2016, interest 3 month Euribor + 0.48% 5.4 10.9
Total 105.4 210.9
FINANCIAL STATEMENT
140
YIT ANNUAL REPORT 2014
YEAR 2014 BUSINESS OPERATIONS CORPORATE GOVERNANCE GRI INDEX
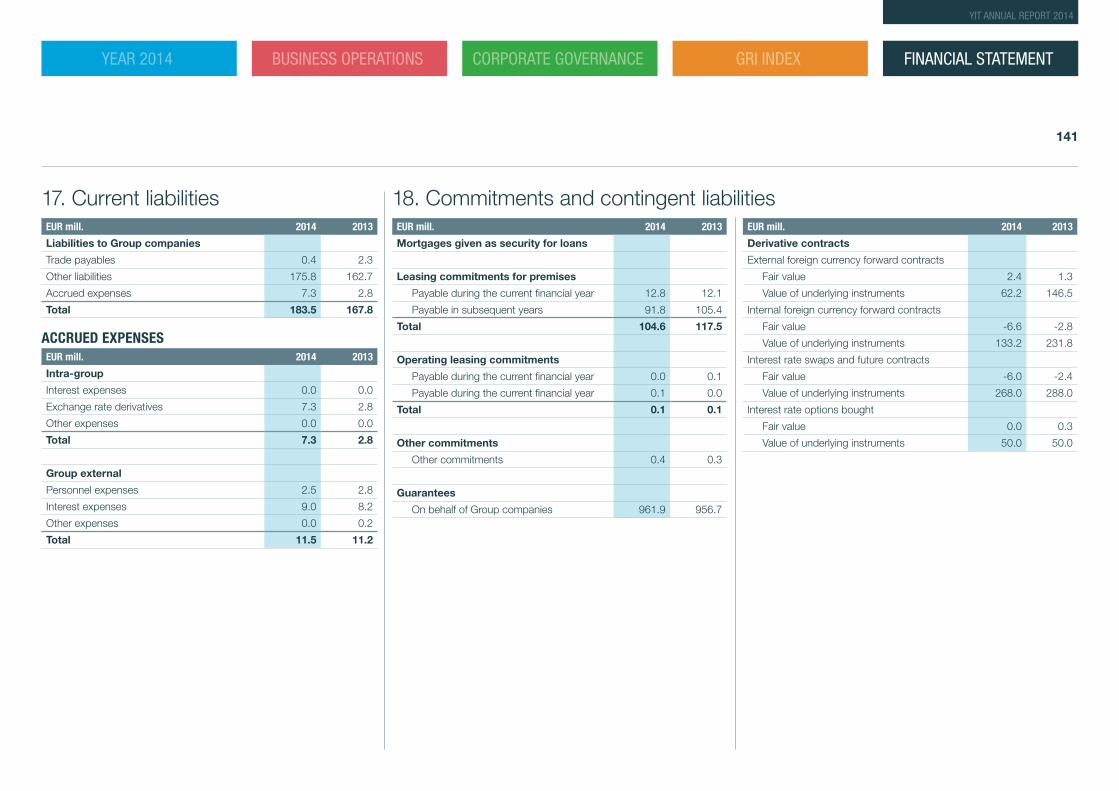
17. Current liabilitiesEUR mill. 2014 2013
Liabilities to Group companies
Trade payables 0.4 2.3
Other liabilities 175.8 162.7
Accrued expenses 7.3 2.8
Total 183.5 167.8
ACCRUED EXPENSESEUR mill. 2014 2013
Intra-group
Interest expenses 0.0 0.0
Exchange rate derivatives 7.3 2.8
Other expenses 0.0 0.0
Total 7.3 2.8
Group external
Personnel expenses 2.5 2.8
Interest expenses 9.0 8.2
Other expenses 0.0 0.2
Total 11.5 11.2
EUR mill. 2014 2013
Mortgages given as security for loans
Leasing commitments for premises
Payable during the current financial year 12.8 12.1
Payable in subsequent years 91.8 105.4
Total 104.6 117.5
Operating leasing commitments
Payable during the current financial year 0.0 0.1
Payable during the current financial year 0.1 0.0
Total 0.1 0.1
Other commitments
Other commitments 0.4 0.3
Guarantees
On behalf of Group companies 961.9 956.7
EUR mill. 2014 2013
Derivative contracts
External foreign currency forward contracts
Fair value 2.4 1.3
Value of underlying instruments 62.2 146.5
Internal foreign currency forward contracts
Fair value -6.6 -2.8
Value of underlying instruments 133.2 231.8
Interest rate swaps and future contracts
Fair value -6.0 -2.4
Value of underlying instruments 268.0 288.0
Interest rate options bought
Fair value 0.0 0.3
Value of underlying instruments 50.0 50.0
18. Commitments and contingent liabilities
FINANCIAL STATEMENT
141
YIT ANNUAL REPORT 2014
YEAR 2014 BUSINESS OPERATIONS CORPORATE GOVERNANCE GRI INDEX
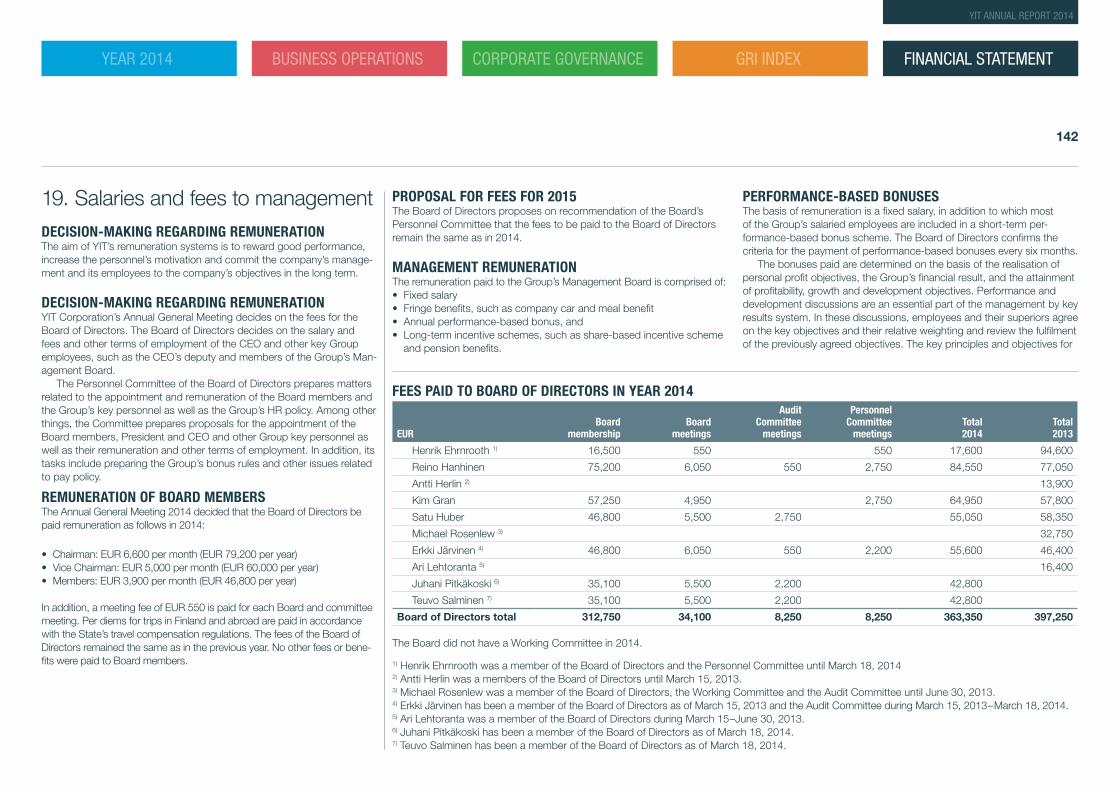
19. Salaries and fees to managementDECISION-MAKING REGARDING REMUNERATIONThe aim of YIT’s remuneration systems is to reward good performance, increase the personnel’s motivation and commit the company’s manage-ment and its employees to the company’s objectives in the long term.
DECISION-MAKING REGARDING REMUNERATIONYIT Corporation’s Annual General Meeting decides on the fees for the Board of Directors. The Board of Directors decides on the salary and fees and other terms of employment of the CEO and other key Group employees, such as the CEO’s deputy and members of the Group’s Man-agement Board.
The Personnel Committee of the Board of Directors prepares matters related to the appointment and remuneration of the Board members and the Group’s key personnel as well as the Group’s HR policy. Among other things, the Committee prepares proposals for the appointment of the Board members, President and CEO and other Group key personnel as well as their remuneration and other terms of employment. In addition, its tasks include preparing the Group’s bonus rules and other issues related to pay policy.
REMUNERATION OF BOARD MEMBERS The Annual General Meeting 2014 decided that the Board of Directors be paid remuneration as follows in 2014:
• Chairman: EUR 6,600 per month (EUR 79,200 per year)• Vice Chairman: EUR 5,000 per month (EUR 60,000 per year)• Members: EUR 3,900 per month (EUR 46,800 per year)
In addition, a meeting fee of EUR 550 is paid for each Board and committee meeting. Per diems for trips in Finland and abroad are paid in accordance with the State’s travel compensation regulations. The fees of the Board of Directors remained the same as in the previous year. No other fees or bene-fits were paid to Board members.
FEES PAID TO BOARD OF DIRECTORS IN YEAR 2014
EURBoard
membershipBoard
meetings
Audit Committee
meetings
Personnel Committee
meetingsTotal 2014
Total 2013
Henrik Ehrnrooth 1) 16,500 550 550 17,600 94,600
Reino Hanhinen 75,200 6,050 550 2,750 84,550 77,050
Antti Herlin 2) 13,900
Kim Gran 57,250 4,950 2,750 64,950 57,800
Satu Huber 46,800 5,500 2,750 55,050 58,350
Michael Rosenlew 3) 32,750
Erkki Järvinen 4) 46,800 6,050 550 2,200 55,600 46,400
Ari Lehtoranta 5) 16,400
Juhani Pitkäkoski 6) 35,100 5,500 2,200 42,800
Teuvo Salminen 7) 35,100 5,500 2,200 42,800
Board of Directors total 312,750 34,100 8,250 8,250 363,350 397,250
The Board did not have a Working Committee in 2014.
1) Henrik Ehrnrooth was a member of the Board of Directors and the Personnel Committee until March 18, 20142) Antti Herlin was a members of the Board of Directors until March 15, 2013.3) Michael Rosenlew was a member of the Board of Directors, the Working Committee and the Audit Committee until June 30, 2013.4) Erkki Järvinen has been a member of the Board of Directors as of March 15, 2013 and the Audit Committee during March 15, 2013–March 18, 2014.5) Ari Lehtoranta was a member of the Board of Directors during March 15–June 30, 2013.6) Juhani Pitkäkoski has been a member of the Board of Directors as of March 18, 2014.7) Teuvo Salminen has been a member of the Board of Directors as of March 18, 2014.
PROPOSAL FOR FEES FOR 2015 The Board of Directors proposes on recommendation of the Board’s Personnel Committee that the fees to be paid to the Board of Directors remain the same as in 2014.
MANAGEMENT REMUNERATIONThe remuneration paid to the Group’s Management Board is comprised of: • Fixed salary• Fringe benefits, such as company car and meal benefit• Annual performance-based bonus, and • Long-term incentive schemes, such as share-based incentive scheme
and pension benefits.
PERFORMANCE-BASED BONUSESThe basis of remuneration is a fixed salary, in addition to which most of the Group’s salaried employees are included in a short-term per-formance-based bonus scheme. The Board of Directors confirms the criteria for the payment of performance-based bonuses every six months.
The bonuses paid are determined on the basis of the realisation of personal profit objectives, the Group’s financial result, and the attainment of profitability, growth and development objectives. Performance and development discussions are an essential part of the management by key results system. In these discussions, employees and their superiors agree on the key objectives and their relative weighting and review the fulfilment of the previously agreed objectives. The key principles and objectives for
FINANCIAL STATEMENT
142
YIT ANNUAL REPORT 2014
YEAR 2014 BUSINESS OPERATIONS CORPORATE GOVERNANCE GRI INDEX
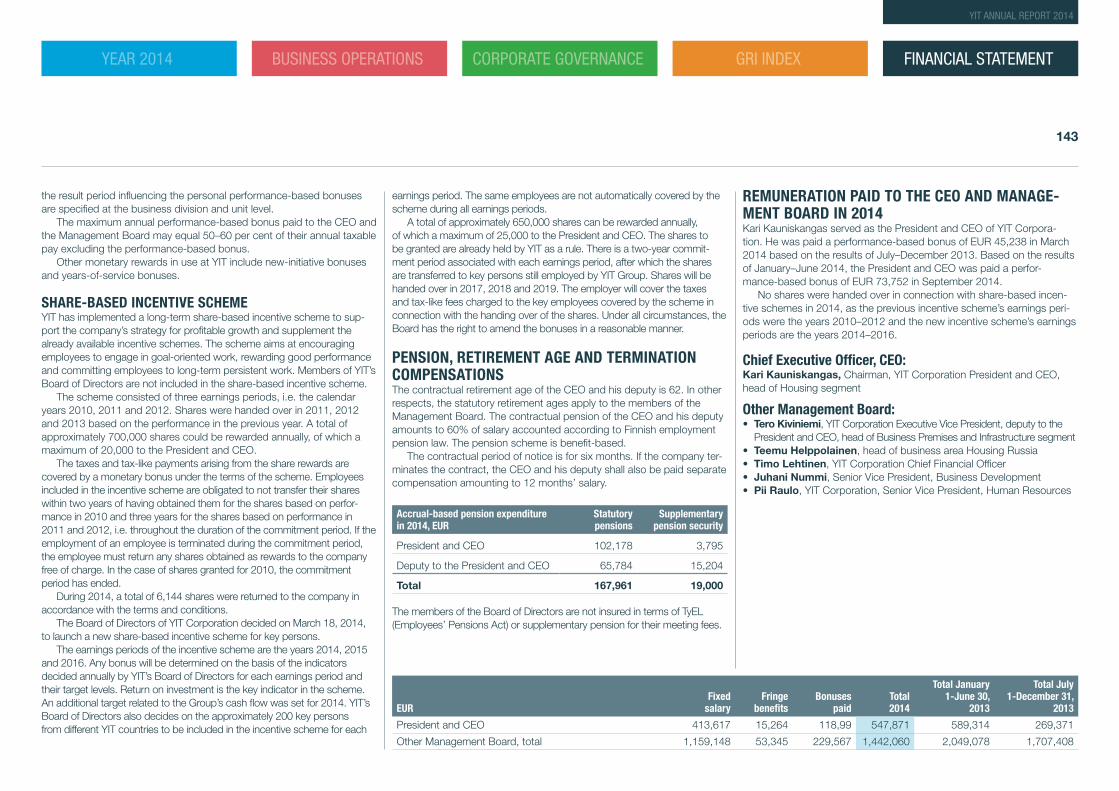
the result period influencing the personal performance-based bonuses are specified at the business division and unit level.
The maximum annual performance-based bonus paid to the CEO and the Management Board may equal 50–60 per cent of their annual taxable pay excluding the performance-based bonus.
Other monetary rewards in use at YIT include new-initiative bonuses and years-of-service bonuses.
SHARE-BASED INCENTIVE SCHEMEYIT has implemented a long-term share-based incentive scheme to sup-port the company’s strategy for profitable growth and supplement the already available incentive schemes. The scheme aims at encouraging employees to engage in goal-oriented work, rewarding good performance and committing employees to long-term persistent work. Members of YIT’s Board of Directors are not included in the share-based incentive scheme.
The scheme consisted of three earnings periods, i.e. the calendar years 2010, 2011 and 2012. Shares were handed over in 2011, 2012 and 2013 based on the performance in the previous year. A total of approximately 700,000 shares could be rewarded annually, of which a maximum of 20,000 to the President and CEO.
The taxes and tax-like payments arising from the share rewards are covered by a monetary bonus under the terms of the scheme. Employees included in the incentive scheme are obligated to not transfer their shares within two years of having obtained them for the shares based on perfor-mance in 2010 and three years for the shares based on performance in 2011 and 2012, i.e. throughout the duration of the commitment period. If the employment of an employee is terminated during the commitment period, the employee must return any shares obtained as rewards to the company free of charge. In the case of shares granted for 2010, the commitment period has ended.
During 2014, a total of 6,144 shares were returned to the company in accordance with the terms and conditions.
The Board of Directors of YIT Corporation decided on March 18, 2014, to launch a new share-based incentive scheme for key persons.
The earnings periods of the incentive scheme are the years 2014, 2015 and 2016. Any bonus will be determined on the basis of the indicators decided annually by YIT’s Board of Directors for each earnings period and their target levels. Return on investment is the key indicator in the scheme. An additional target related to the Group’s cash flow was set for 2014. YIT’s Board of Directors also decides on the approximately 200 key persons from different YIT countries to be included in the incentive scheme for each
earnings period. The same employees are not automatically covered by the scheme during all earnings periods.
A total of approximately 650,000 shares can be rewarded annually, of which a maximum of 25,000 to the President and CEO. The shares to be granted are already held by YIT as a rule. There is a two-year commit-ment period associated with each earnings period, after which the shares are transferred to key persons still employed by YIT Group. Shares will be handed over in 2017, 2018 and 2019. The employer will cover the taxes and tax-like fees charged to the key employees covered by the scheme in connection with the handing over of the shares. Under all circumstances, the Board has the right to amend the bonuses in a reasonable manner.
PENSION, RETIREMENT AGE AND TERMINATION COMPENSATIONSThe contractual retirement age of the CEO and his deputy is 62. In other respects, the statutory retirement ages apply to the members of the Management Board. The contractual pension of the CEO and his deputy amounts to 60% of salary accounted according to Finnish employment pension law. The pension scheme is benefit-based.
The contractual period of notice is for six months. If the company ter-minates the contract, the CEO and his deputy shall also be paid separate compensation amounting to 12 months’ salary.
Accrual-based pension expenditure in 2014, EUR
Statutory pensions
Supplementary pension security
President and CEO 102,178 3,795
Deputy to the President and CEO 65,784 15,204
Total 167,961 19,000
The members of the Board of Directors are not insured in terms of TyEL (Employees’ Pensions Act) or supplementary pension for their meeting fees.
REMUNERATION PAID TO THE CEO AND MANAGE-MENT BOARD IN 2014Kari Kauniskangas served as the President and CEO of YIT Corpora-tion. He was paid a performance-based bonus of EUR 45,238 in March 2014 based on the results of July–December 2013. Based on the results of January–June 2014, the President and CEO was paid a perfor-mance-based bonus of EUR 73,752 in September 2014.
No shares were handed over in connection with share-based incen-tive schemes in 2014, as the previous incentive scheme’s earnings peri-ods were the years 2010–2012 and the new incentive scheme’s earnings periods are the years 2014–2016.
Chief Executive Officer, CEO: Kari Kauniskangas, Chairman, YIT Corporation President and CEO, head of Housing segment
Other Management Board:• Tero Kiviniemi, YIT Corporation Executive Vice President, deputy to the
President and CEO, head of Business Premises and Infrastructure segment• Teemu Helppolainen, head of business area Housing Russia • Timo Lehtinen, YIT Corporation Chief Financial Officer• Juhani Nummi, Senior Vice President, Business Development• Pii Raulo, YIT Corporation, Senior Vice President, Human Resources
EURFixed
salaryFringe
benefitsBonuses
paidTotal 2014
Total January 1-June 30,
2013
Total July 1-December 31,
2013
President and CEO 413,617 15,264 118,99 547,871 589,314 269,371
Other Management Board, total 1,159,148 53,345 229,567 1,442,060 2,049,078 1,707,408
FINANCIAL STATEMENT
143
YIT ANNUAL REPORT 2014
YEAR 2014 BUSINESS OPERATIONS CORPORATE GOVERNANCE GRI INDEX
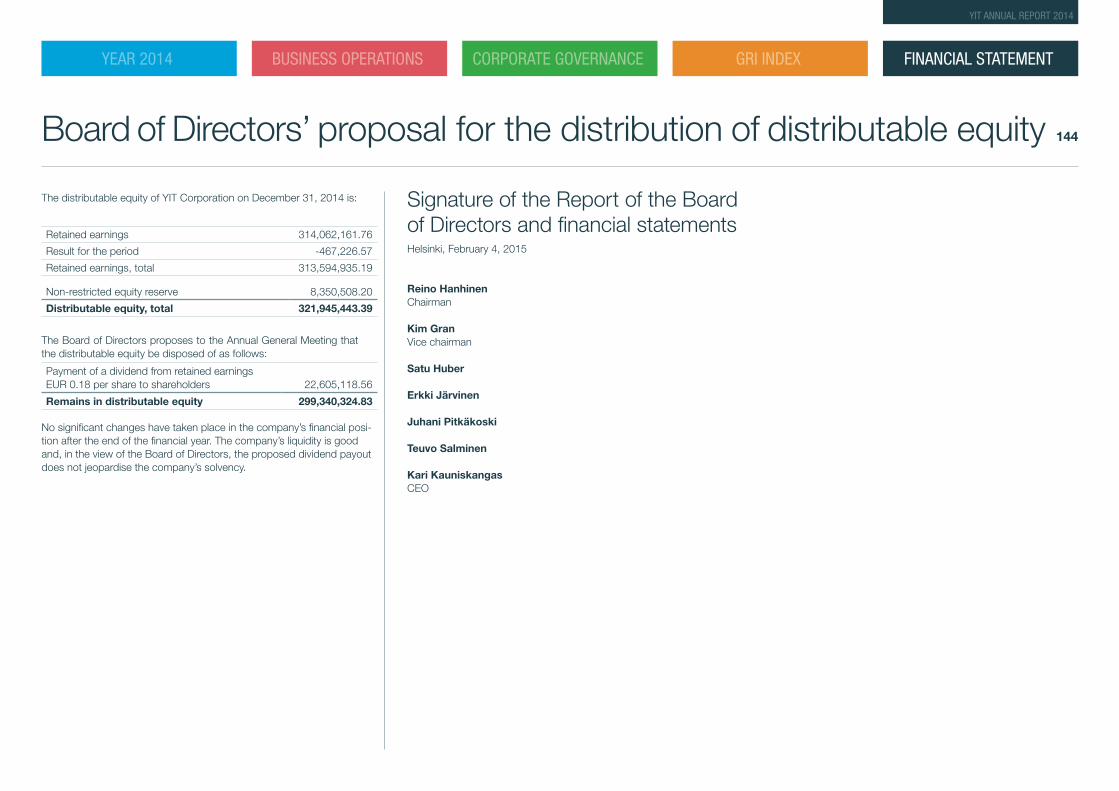
The distributable equity of YIT Corporation on December 31, 2014 is:
Retained earnings 314,062,161.76
Result for the period -467,226.57
Retained earnings, total 313,594,935.19
Non-restricted equity reserve 8,350,508.20
Distributable equity, total 321,945,443.39
The Board of Directors proposes to the Annual General Meeting that the distributable equity be disposed of as follows:
Payment of a dividend from retained earningsEUR 0.18 per share to shareholders 22,605,118.56
Remains in distributable equity 299,340,324.83
No significant changes have taken place in the company’s financial posi-tion after the end of the financial year. The company’s liquidity is good and, in the view of the Board of Directors, the proposed dividend payout does not jeopardise the company’s solvency.
Board of Directors’ proposal for the distribution of distributable equity
Signature of the Report of the Board of Directors and financial statementsHelsinki, February 4, 2015
Reino HanhinenChairman
Kim GranVice chairman
Satu Huber
Erkki Järvinen
Juhani Pitkäkoski
Teuvo Salminen
Kari KauniskangasCEO
FINANCIAL STATEMENT
144
YIT ANNUAL REPORT 2014
YEAR 2014 BUSINESS OPERATIONS CORPORATE GOVERNANCE GRI INDEX
AUDITOR’S REPORT (TRANSLATION FROM THE FINNISH ORIGINAL) TO THE ANNUAL GENERAL MEETING OF YIT CORPORATIONWe have audited the accounting records, the financial statements, the report of the Board of Directors and the administration of YIT Corporation for the year ended 31 December, 2014. The financial statements com-prise the consolidated statement of financial position, income statement, statement of comprehensive income, statement of changes in equity and statement of cash flows, and notes to the consolidated financial state-ments, as well as the parent company’s balance sheet, income state-ment, cash flow statement and notes to the financial statements.
RESPONSIBILITY OF THE BOARD OF DIRECTORS AND THE MANAGING DIRECTORThe Board of Directors and the Managing Director are responsible for the preparation of consolidated financial statements that give a true and fair view in accordance with International Financial Reporting Standards (IFRS) as adopted by the EU, as well as for the preparation of finan-cial statements and the report of the Board of Directors that give a true and fair view in accordance with the laws and regulations governing the preparation of the financial statements and the report of the Board of Directors in Finland. The Board of Directors is responsible for the appropriate arrangement of the control of the company’s accounts and finances, and the Managing Director shall see to it that the accounts of the company are in compliance with the law and that its financial affairs have been arranged in a reliable manner.
AUDITOR’S RESPONSIBILITYOur responsibility is to express an opinion on the financial statements, on the consolidated financial statements and on the report of the Board of Directors based on our audit. The Auditing Act requires that we comply
Auditor’s Report
with the requirements of professional ethics. We conducted our audit in accordance with good auditing practice in Finland. Good auditing practice requires that we plan and perform the audit to obtain reasonable assurance about whether the financial statements and the report of the Board of Directors are free from material misstatement, and whether the members of the Board of Directors of the parent company or the Manag-ing Director are guilty of an act or negligence which may result in liability in damages towards the company or whether they have violated the Lim-ited Liability Companies Act or the articles of association of the company.
An audit involves performing procedures to obtain audit evidence about the amounts and disclosures in the financial statements and the report of the Board of Directors. The procedures selected depend on the auditor’s judgment, including the assessment of the risks of mate-rial misstatement, whether due to fraud or error. In making those risk assessments, the auditor considers internal control relevant to the entity’s preparation of financial statements and report of the Board of Directors that give a true and fair view in order to design audit procedures that are appropriate in the circumstances, but not for the purpose of expressing an opinion on the effectiveness of the company’s internal control. An audit also includes evaluating the appropriateness of accounting policies used and the reasonableness of accounting estimates made by man-agement, as well as evaluating the overall presentation of the financial statements and the report of the Board of Directors.
We believe that the audit evidence we have obtained is sufficient and appropriate to provide a basis for our audit opinion.
OPINION ON THE CONSOLIDATED FINANCIAL STATEMENTSIn our opinion, the consolidated financial statements give a true and fair view of the financial position, financial performance, and cash flows of the group in accordance with International Financial Reporting Standards (IFRS) as adopted by the EU.
OPINION ON THE COMPANY’S FINANCIAL STATEMENTS AND THE REPORT OF THE BOARD OF DIRECTORSIn our opinion, the financial statements and the report of the Board of Directors give a true and fair view of both the consolidated and the parent company’s financial performance and financial position in accordance with the laws and regulations governing the preparation of the finan-cial statements and the report of the Board of Directors in Finland. The information in the report of the Board of Directors is consistent with the information in the financial statements.
Helsinki, 4 February 2015
PricewaterhouseCoopers OyAuthorised Public Accountants
Heikki LassilaAuthorised Public Accountant
FINANCIAL STATEMENT
145
YIT ANNUAL REPORT 2014
YEAR 2014 BUSINESS OPERATIONS CORPORATE GOVERNANCE GRI INDEX
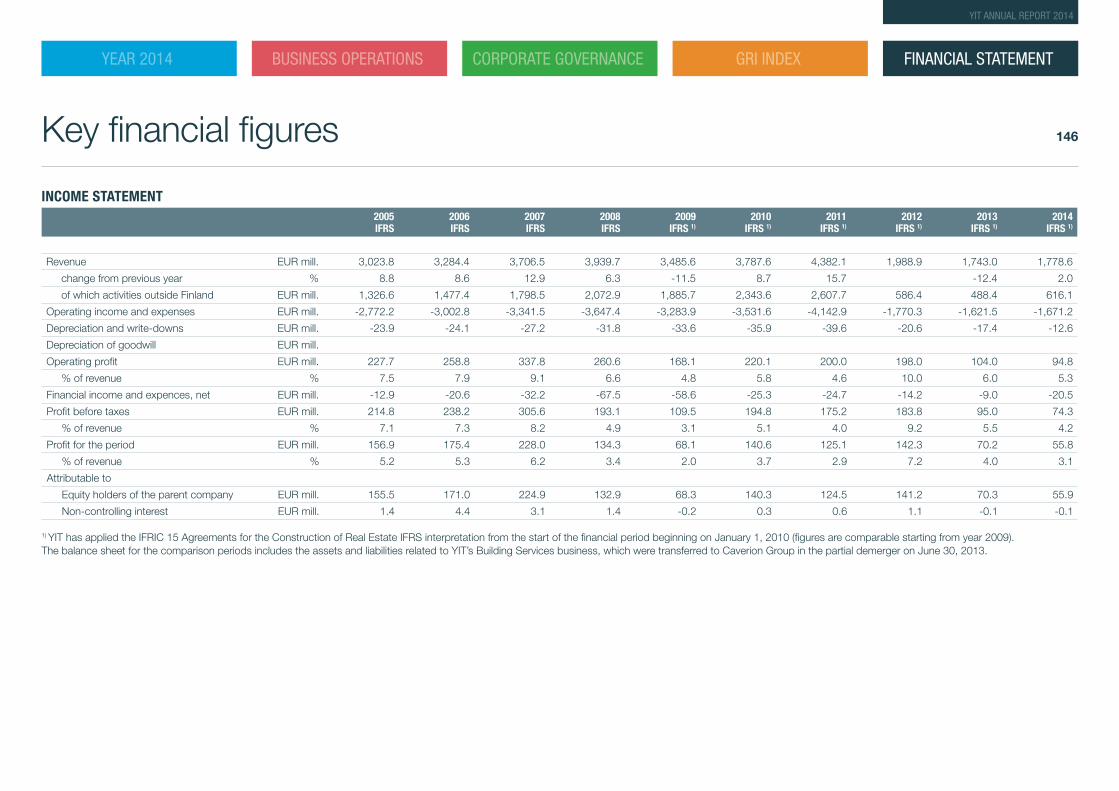
2005 IFRS
2006 IFRS
2007 IFRS
2008 IFRS
2009 IFRS 1)
2010 IFRS 1)
2011 IFRS 1)
2012 IFRS 1)
2013 IFRS 1)
2014 IFRS 1)
Revenue EUR mill. 3,023.8 3,284.4 3,706.5 3,939.7 3,485.6 3,787.6 4,382.1 1,988.9 1,743.0 1,778.6
change from previous year % 8.8 8.6 12.9 6.3 -11.5 8.7 15.7 -12.4 2.0
of which activities outside Finland EUR mill. 1,326.6 1,477.4 1,798.5 2,072.9 1,885.7 2,343.6 2,607.7 586.4 488.4 616.1
Operating income and expenses EUR mill. -2,772.2 -3,002.8 -3,341.5 -3,647.4 -3,283.9 -3,531.6 -4,142.9 -1,770.3 -1,621.5 -1,671.2
Depreciation and write-downs EUR mill. -23.9 -24.1 -27.2 -31.8 -33.6 -35.9 -39.6 -20.6 -17.4 -12.6
Depreciation of goodwill EUR mill.
Operating profit EUR mill. 227.7 258.8 337.8 260.6 168.1 220.1 200.0 198.0 104.0 94.8
% of revenue % 7.5 7.9 9.1 6.6 4.8 5.8 4.6 10.0 6.0 5.3
Financial income and expences, net EUR mill. -12.9 -20.6 -32.2 -67.5 -58.6 -25.3 -24.7 -14.2 -9.0 -20.5
Profit before taxes EUR mill. 214.8 238.2 305.6 193.1 109.5 194.8 175.2 183.8 95.0 74.3
% of revenue % 7.1 7.3 8.2 4.9 3.1 5.1 4.0 9.2 5.5 4.2
Profit for the period EUR mill. 156.9 175.4 228.0 134.3 68.1 140.6 125.1 142.3 70.2 55.8
% of revenue % 5.2 5.3 6.2 3.4 2.0 3.7 2.9 7.2 4.0 3.1
Attributable to
Equity holders of the parent company EUR mill. 155.5 171.0 224.9 132.9 68.3 140.3 124.5 141.2 70.3 55.9
Non-controlling interest EUR mill. 1.4 4.4 3.1 1.4 -0.2 0.3 0.6 1.1 -0.1 -0.1
1) YIT has applied the IFRIC 15 Agreements for the Construction of Real Estate IFRS interpretation from the start of the financial period beginning on January 1, 2010 (figures are comparable starting from year 2009).The balance sheet for the comparison periods includes the assets and liabilities related to YIT’s Building Services business, which were transferred to Caverion Group in the partial demerger on June 30, 2013.
Key financial figures
INCOME STATEMENT
FINANCIAL STATEMENT
146
YIT ANNUAL REPORT 2014
YEAR 2014 BUSINESS OPERATIONS CORPORATE GOVERNANCE GRI INDEX
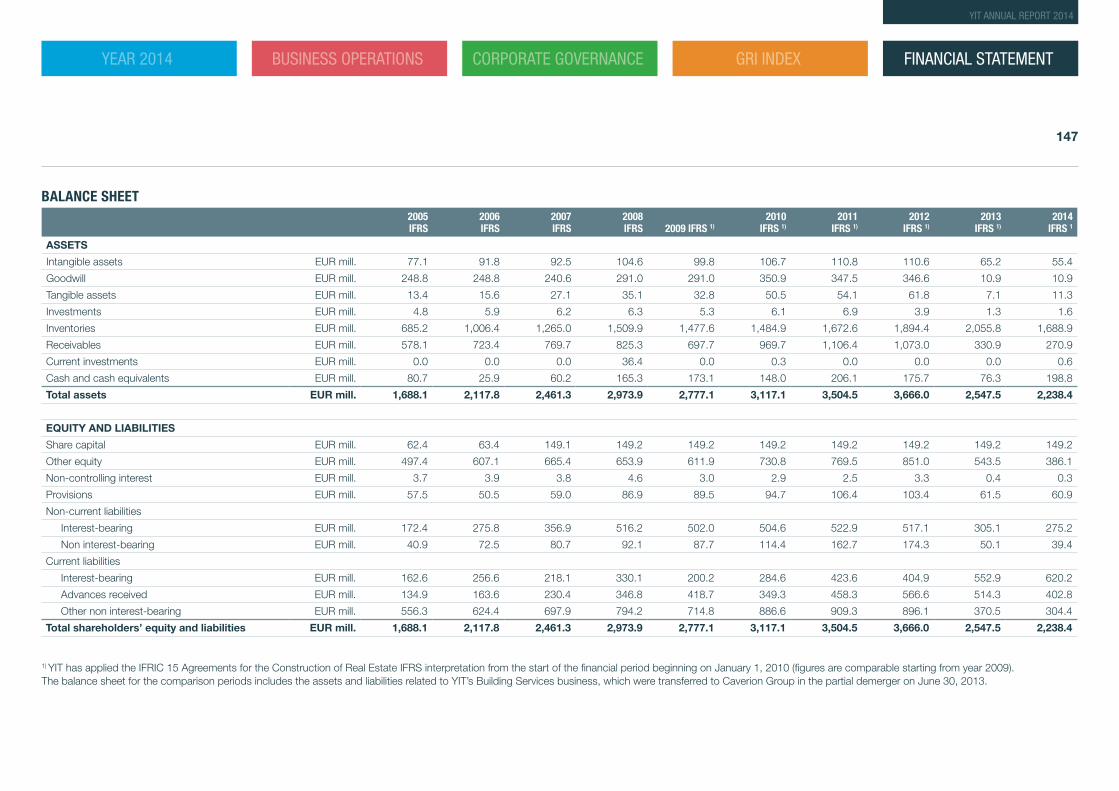
BALANCE SHEET2005IFRS
2006 IFRS
2007 IFRS
2008IFRS 2009 IFRS 1)
2010 IFRS 1)
2011 IFRS 1)
2012 IFRS 1)
2013 IFRS 1)
2014 IFRS 1
ASSETS
Intangible assets EUR mill. 77.1 91.8 92.5 104.6 99.8 106.7 110.8 110.6 65.2 55.4
Goodwill EUR mill. 248.8 248.8 240.6 291.0 291.0 350.9 347.5 346.6 10.9 10.9
Tangible assets EUR mill. 13.4 15.6 27.1 35.1 32.8 50.5 54.1 61.8 7.1 11.3
Investments EUR mill. 4.8 5.9 6.2 6.3 5.3 6.1 6.9 3.9 1.3 1.6
Inventories EUR mill. 685.2 1,006.4 1,265.0 1,509.9 1,477.6 1,484.9 1,672.6 1,894.4 2,055.8 1,688.9
Receivables EUR mill. 578.1 723.4 769.7 825.3 697.7 969.7 1,106.4 1,073.0 330.9 270.9
Current investments EUR mill. 0.0 0.0 0.0 36.4 0.0 0.3 0.0 0.0 0.0 0.6
Cash and cash equivalents EUR mill. 80.7 25.9 60.2 165.3 173.1 148.0 206.1 175.7 76.3 198.8
Total assets EUR mill. 1,688.1 2,117.8 2,461.3 2,973.9 2,777.1 3,117.1 3,504.5 3,666.0 2,547.5 2,238.4
EQUITY AND LIABILITIES
Share capital EUR mill. 62.4 63.4 149.1 149.2 149.2 149.2 149.2 149.2 149.2 149.2
Other equity EUR mill. 497.4 607.1 665.4 653.9 611.9 730.8 769.5 851.0 543.5 386.1
Non-controlling interest EUR mill. 3.7 3.9 3.8 4.6 3.0 2.9 2.5 3.3 0.4 0.3
Provisions EUR mill. 57.5 50.5 59.0 86.9 89.5 94.7 106.4 103.4 61.5 60.9
Non-current liabilities
Interest-bearing EUR mill. 172.4 275.8 356.9 516.2 502.0 504.6 522.9 517.1 305.1 275.2
Non interest-bearing EUR mill. 40.9 72.5 80.7 92.1 87.7 114.4 162.7 174.3 50.1 39.4
Current liabilities
Interest-bearing EUR mill. 162.6 256.6 218.1 330.1 200.2 284.6 423.6 404.9 552.9 620.2
Advances received EUR mill. 134.9 163.6 230.4 346.8 418.7 349.3 458.3 566.6 514.3 402.8
Other non interest-bearing EUR mill. 556.3 624.4 697.9 794.2 714.8 886.6 909.3 896.1 370.5 304.4
Total shareholders’ equity and liabilities EUR mill. 1,688.1 2,117.8 2,461.3 2,973.9 2,777.1 3,117.1 3,504.5 3,666.0 2,547.5 2,238.4
1) YIT has applied the IFRIC 15 Agreements for the Construction of Real Estate IFRS interpretation from the start of the financial period beginning on January 1, 2010 (figures are comparable starting from year 2009).The balance sheet for the comparison periods includes the assets and liabilities related to YIT’s Building Services business, which were transferred to Caverion Group in the partial demerger on June 30, 2013.
FINANCIAL STATEMENT
147
YIT ANNUAL REPORT 2014
YEAR 2014 BUSINESS OPERATIONS CORPORATE GOVERNANCE GRI INDEX

OTHER KEY FIGURES2005IFRS
2006IFRS
2007IFRS
2008IFRS
2009 IFRS 1)
2010 IFRS 1)
2011 IFRS 1)
2012 IFRS 1)
2013 IFRS 1)
2014 IFRS 1)
Operating cash flow after investments EUR mill. -19.4 229.8 -61.7 -17.3 49.9 -87.9 151.9
Cash flow from operating activities EUR mill. 167.3 -148.3 84.1 47.8 260.9 6.8 17.4 72.1 -92.5 159.5
Return on equity % 31.1 28.3 30.5 16.5 8.9 17.1 13.9 15.0 8.2 9.1
Return on investment % 26.4 24.8 26.2 17.5 11.0 14.4 12.0 10.9 6.1 6.4
Equity ratio % 36.3 34.5 36.7 30.7 32.4 31.9 30.2 32.5 34.3 29.2
Net interest-bearing debt EUR mill. 254.4 506.5 514.8 644.5 529.1 640.9 740.4 746.2 781.7 696.0
Gearing ratio % 45.1 75.1 62.9 79.8 69.2 72.6 80.4 73.9 112.0 129.9
Gross capital expenditures on non-current assets EUR mill. 30.1 50.4 51.6 85.2 27.9 129.7 48.7 44.6 20.2 13.9
% of revenue % 1.0 1.5 1.4 2.2 0.8 3.4 1.1 0.9 1.2 0.8
Research and development expenditure EUR mill. 19.0 21.0 22.0 19.0 15.2 17.5 20.1 7.5 15.0 14.5
% of revenue % 0.6 0.6 0.6 0.5 0.4 0.5 0.5 0.4 0.9 0.8
Order backlog as at Dec 31 EUR mill. 1,878.8 2,802.3 3,509.3 3,233.7 2,983.3 3,535.7 4,148.6 3,108.6 3,184.6 2,507.1
of wich orders from abroad EUR mill. 752.4 1,490.0 1,999.2 2,072.9 1,885.7 1,857.7 2,066.9 1,484.0 1,617.8 1,061.4
Number of employees at Dec 31 21,289 22,311 24,073 25,784 23,480 25,832 25,996 6,691 6,172 5,881
Average number of employees 21,194 21,846 23,394 25,057 24,497 24,317 26,254 6,730 6,575 6,116
1) YIT has applied the IFRIC 15 Agreements for the Construction of Real Estate IFRS interpretation from the start of the financial period beginning on January 1, 2010 (figures are comparable starting from year 2009).The balance sheet for the comparison periods includes the assets and liabilities related to YIT’s Building Services business, which were transferred to Caverion Group in the partial demerger on June 30, 2013.
FINANCIAL STATEMENT
148
YIT ANNUAL REPORT 2014
YEAR 2014 BUSINESS OPERATIONS CORPORATE GOVERNANCE GRI INDEX

SHARE-RELATED KEY FIGURES2005 IFRS
2006 IFRS
2007 IFRS
2008 IFRS
2009 IFRS 1)
2010 IFRS 1)
2011 IFRS 1)
2012 IFRS 1)
2013 IFRS 1)
2014 IFRS 1)
Earnings/ share EUR 1.26 1.36 1.77 1.05 0.55 1.12 0.99 1.13 0.56 0.44
Earnings/ share, diluted EUR 1.23 1.35 1.77 1.05 0.55 1.12 0.99 1.13 0.56 0.44
Eguity/ share EUR 4.49 5.29 6.40 6.38 6.09 7.04 7.33 8.02 5.56 4.26
Dividend/share EUR 0.55 0.65 0.80 0.50 0.40 0.65 0.70 0.75 0.38 0.18 2)
Dividend/earnings % 43.7 47.8 45.2 47.6 73.2 57.9 70.5 66.6 67.9 40.9 2)
Effective dividend yield % 3.0 3.1 5.3 10.9 2.8 3.5 5.7 5.1 3.7 4.2
Price/earnings multiple (P/E) % 14.3 15.4 8.5 4.4 26.3 16.7 12.5 13.1 18.1 9.7
Share price trend
Average price EUR 13.99 19.24 22.15 10.89 8.52 16.35 15.28 14.9 13.01 7.35
Low EUR 8.95 15.20 14.79 3.70 4.31 12.98 10.04 11.87 8.67 4.17
High EUR 18.25 23.88 27.90 19.99 14.49 19.00 21.92 17.25 17.88 10.70
Price at December 31 EUR 18.07 20.95 14.99 4.58 14.45 18.65 12.38 14.78 10.16 4.27
Market capitalisation at December 31 EUR mill. 2,254.4 2,656.0 1,907.0 576.2 1,807.4 2,332.7 1,550.9 1,853.2 1,276.0 536.2
Share turnover trend
Share turnover 1,000 120,368 184,577 245,672 295,156 190,057 127,537 151,023 96,887 111,193 144,276
Share turnover of shares outstanding % 97.4 147.2 193.6 232.2 151.8 102.0 120.6 77.3 88.6 114.9
Weighted average share-issue adjusted number of shares outstanding 1,000 123,544 125,357 126,872 127,104 125,167 125,078 125,210 125,352 125,529 125,587
Weighted average share-issue adjusted number of shares outstanding, diluted 1,000 126,522 126,773 127,028 127,104 125,167 125,078 125,210 125,352 125,529 125,587
Share -issue adjusted number of sharesoutstanding at December 31 1,000 124,794 126,777 127,218 125,798 125,078 125,078 125,271 125,384 125,590 125,584
1) YIT has applied the IFRIC 15 Agreements for the Construction of Real Estate IFRS interpretation from the start of the financial period beginning on January 1, 2010 (figures are comparable starting from year 2009).The balance sheet for the comparison periods includes the assets and liabilities related to YIT’s Building Services business, which were transferred to Caverion Group in the partial demerger on June 30, 2013.2) The Board of Directors proposal
FINANCIAL STATEMENT
149
YIT ANNUAL REPORT 2014
YEAR 2014 BUSINESS OPERATIONS CORPORATE GOVERNANCE GRI INDEX
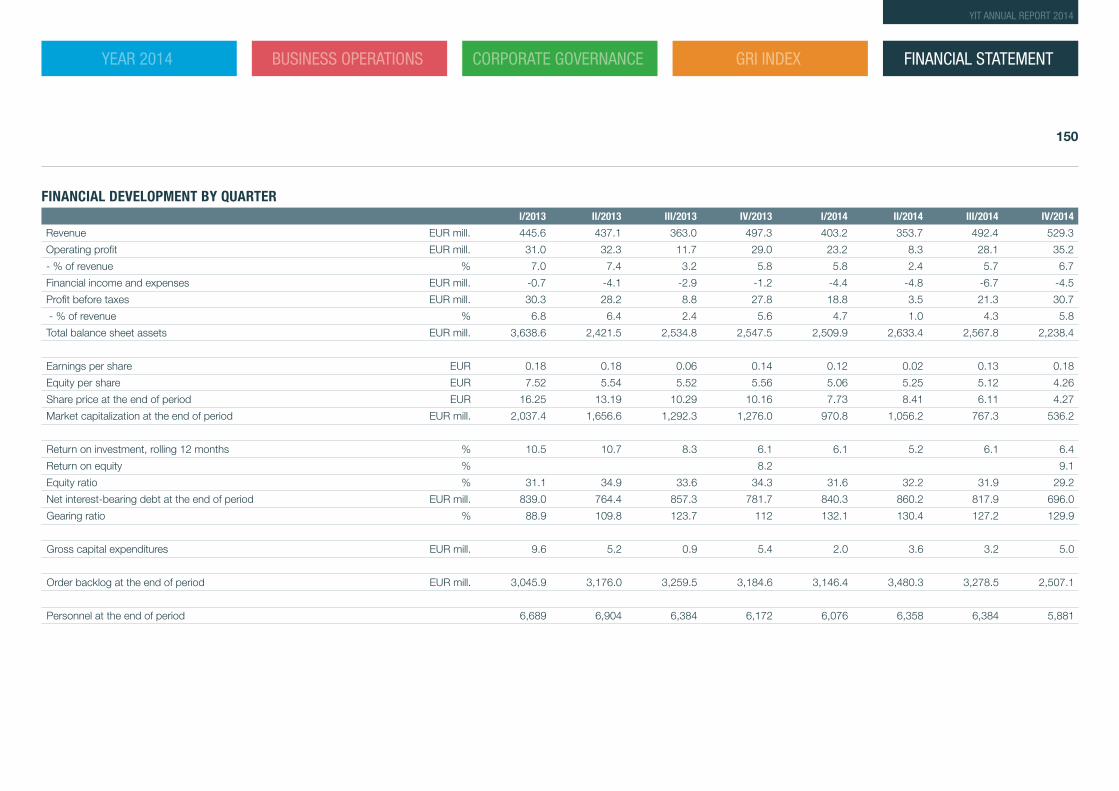
FINANCIAL DEVELOPMENT BY QUARTERI/2013 II/2013 III/2013 IV/2013 I/2014 II/2014 III/2014 IV/2014
Revenue EUR mill. 445.6 437.1 363.0 497.3 403.2 353.7 492.4 529.3
Operating profit EUR mill. 31.0 32.3 11.7 29.0 23.2 8.3 28.1 35.2
- % of revenue % 7.0 7.4 3.2 5.8 5.8 2.4 5.7 6.7
Financial income and expenses EUR mill. -0.7 -4.1 -2.9 -1.2 -4.4 -4.8 -6.7 -4.5
Profit before taxes EUR mill. 30.3 28.2 8.8 27.8 18.8 3.5 21.3 30.7
- % of revenue % 6.8 6.4 2.4 5.6 4.7 1.0 4.3 5.8
Total balance sheet assets EUR mill. 3,638.6 2,421.5 2,534.8 2,547.5 2,509.9 2,633.4 2,567.8 2,238.4
Earnings per share EUR 0.18 0.18 0.06 0.14 0.12 0.02 0.13 0.18
Equity per share EUR 7.52 5.54 5.52 5.56 5.06 5.25 5.12 4.26
Share price at the end of period EUR 16.25 13.19 10.29 10.16 7.73 8.41 6.11 4.27
Market capitalization at the end of period EUR mill. 2,037.4 1,656.6 1,292.3 1,276.0 970.8 1,056.2 767.3 536.2
Return on investment, rolling 12 months % 10.5 10.7 8.3 6.1 6.1 5.2 6.1 6.4
Return on equity % 8.2 9.1
Equity ratio % 31.1 34.9 33.6 34.3 31.6 32.2 31.9 29.2
Net interest-bearing debt at the end of period EUR mill. 839.0 764.4 857.3 781.7 840.3 860.2 817.9 696.0
Gearing ratio % 88.9 109.8 123.7 112 132.1 130.4 127.2 129.9
Gross capital expenditures EUR mill. 9.6 5.2 0.9 5.4 2.0 3.6 3.2 5.0
Order backlog at the end of period EUR mill. 3,045.9 3,176.0 3,259.5 3,184.6 3,146.4 3,480.3 3,278.5 2,507.1
Personnel at the end of period 6,689 6,904 6,384 6,172 6,076 6,358 6,384 5,881
FINANCIAL STATEMENT
150
YIT ANNUAL REPORT 2014
YEAR 2014 BUSINESS OPERATIONS CORPORATE GOVERNANCE GRI INDEX
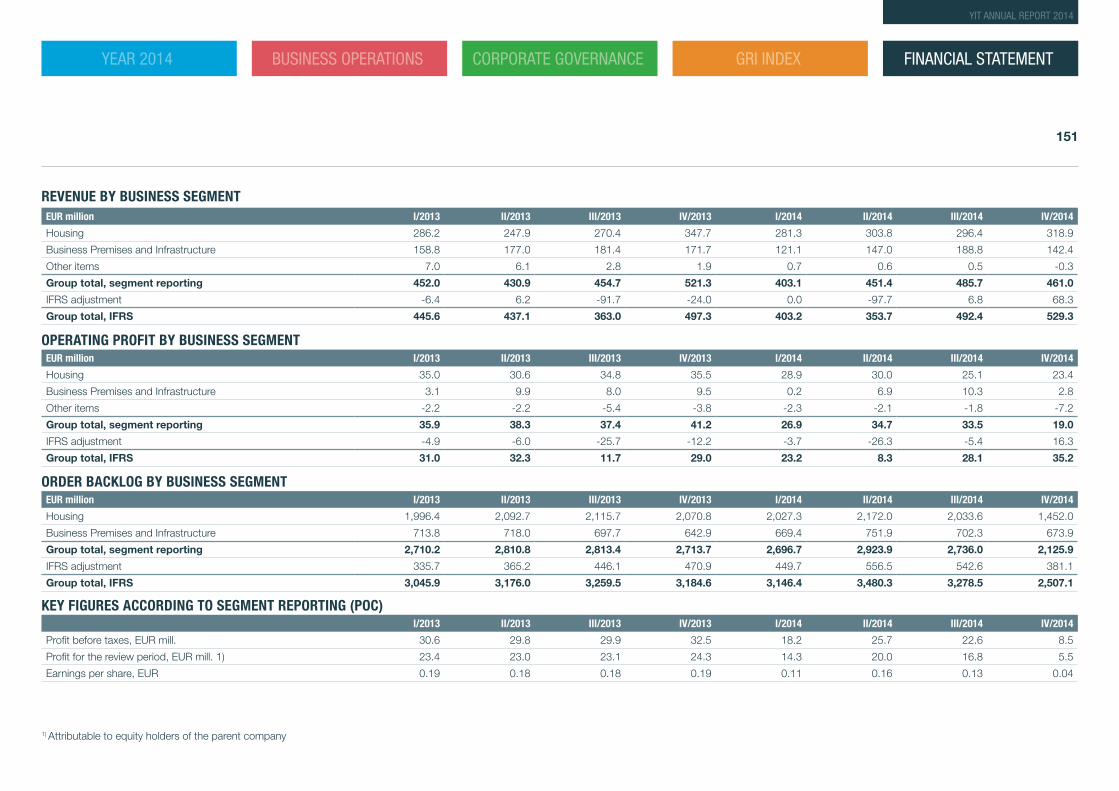
REVENUE BY BUSINESS SEGMENTEUR million I/2013 II/2013 III/2013 IV/2013 I/2014 II/2014 III/2014 IV/2014
Housing 286.2 247.9 270.4 347.7 281.3 303.8 296.4 318.9
Business Premises and Infrastructure 158.8 177.0 181.4 171.7 121.1 147.0 188.8 142.4
Other items 7.0 6.1 2.8 1.9 0.7 0.6 0.5 -0.3
Group total, segment reporting 452.0 430.9 454.7 521.3 403.1 451.4 485.7 461.0
IFRS adjustment -6.4 6.2 -91.7 -24.0 0.0 -97.7 6.8 68.3
Group total, IFRS 445.6 437.1 363.0 497.3 403.2 353.7 492.4 529.3
OPERATING PROFIT BY BUSINESS SEGMENTEUR million I/2013 II/2013 III/2013 IV/2013 I/2014 II/2014 III/2014 IV/2014
Housing 35.0 30.6 34.8 35.5 28.9 30.0 25.1 23.4
Business Premises and Infrastructure 3.1 9.9 8.0 9.5 0.2 6.9 10.3 2.8
Other items -2.2 -2.2 -5.4 -3.8 -2.3 -2.1 -1.8 -7.2
Group total, segment reporting 35.9 38.3 37.4 41.2 26.9 34.7 33.5 19.0
IFRS adjustment -4.9 -6.0 -25.7 -12.2 -3.7 -26.3 -5.4 16.3
Group total, IFRS 31.0 32.3 11.7 29.0 23.2 8.3 28.1 35.2
ORDER BACKLOG BY BUSINESS SEGMENTEUR million I/2013 II/2013 III/2013 IV/2013 I/2014 II/2014 III/2014 IV/2014
Housing 1,996.4 2,092.7 2,115.7 2,070.8 2,027.3 2,172.0 2,033.6 1,452.0
Business Premises and Infrastructure 713.8 718.0 697.7 642.9 669.4 751.9 702.3 673.9
Group total, segment reporting 2,710.2 2,810.8 2,813.4 2,713.7 2,696.7 2,923.9 2,736.0 2,125.9
IFRS adjustment 335.7 365.2 446.1 470.9 449.7 556.5 542.6 381.1
Group total, IFRS 3,045.9 3,176.0 3,259.5 3,184.6 3,146.4 3,480.3 3,278.5 2,507.1
KEY FIGURES ACCORDING TO SEGMENT REPORTING (POC)I/2013 II/2013 III/2013 IV/2013 I/2014 II/2014 III/2014 IV/2014
Profit before taxes, EUR mill. 30.6 29.8 29.9 32.5 18.2 25.7 22.6 8.5
Profit for the review period, EUR mill. 1) 23.4 23.0 23.1 24.3 14.3 20.0 16.8 5.5
Earnings per share, EUR 0.19 0.18 0.18 0.19 0.11 0.16 0.13 0.04
1) Attributable to equity holders of the parent company
FINANCIAL STATEMENT
151
YIT ANNUAL REPORT 2014
YEAR 2014 BUSINESS OPERATIONS CORPORATE GOVERNANCE GRI INDEX
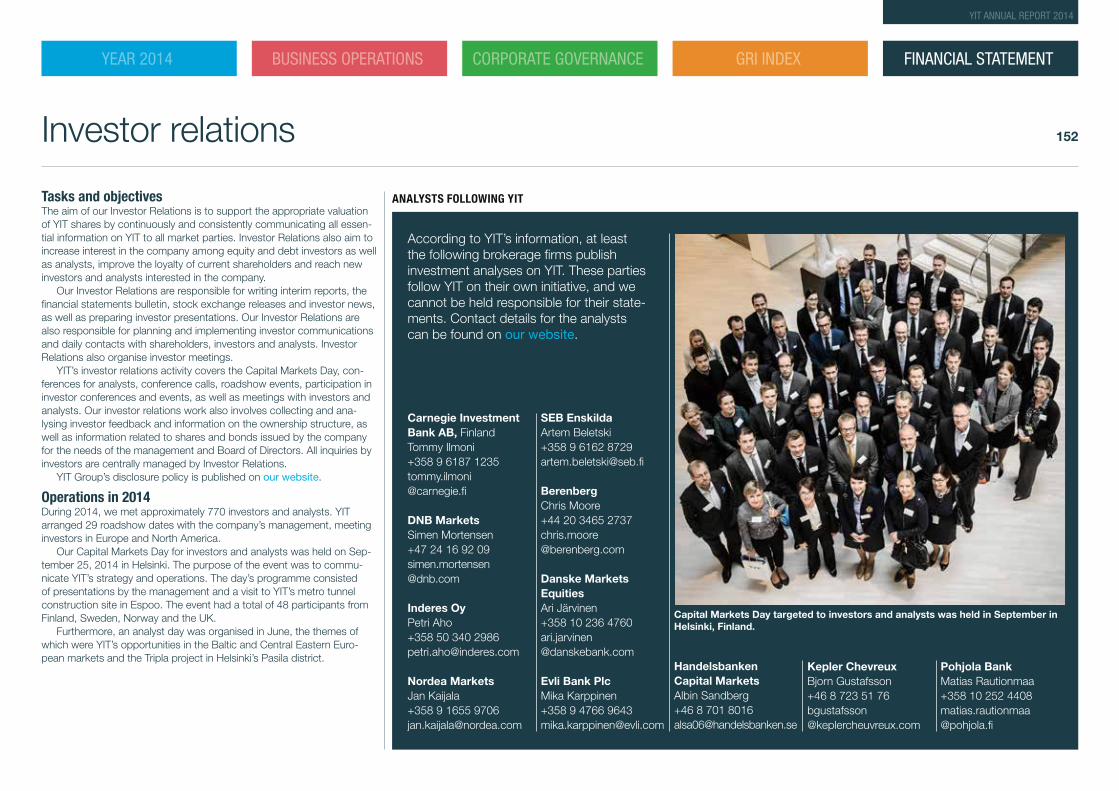
According to YIT’s information, at least the following brokerage firms publish investment analyses on YIT. These parties follow YIT on their own initiative, and we cannot be held responsible for their state-ments. Contact details for the analysts can be found on our website.
Tasks and objectivesThe aim of our Investor Relations is to support the appropriate valuation of YIT shares by continuously and consistently communicating all essen-tial information on YIT to all market parties. Investor Relations also aim to increase interest in the company among equity and debt investors as well as analysts, improve the loyalty of current shareholders and reach new investors and analysts interested in the company.
Our Investor Relations are responsible for writing interim reports, the financial statements bulletin, stock exchange releases and investor news, as well as preparing investor presentations. Our Investor Relations are also responsible for planning and implementing investor communications and daily contacts with shareholders, investors and analysts. Investor Relations also organise investor meetings.
YIT’s investor relations activity covers the Capital Markets Day, con-ferences for analysts, conference calls, roadshow events, participation in investor conferences and events, as well as meetings with investors and analysts. Our investor relations work also involves collecting and ana-lysing investor feedback and information on the ownership structure, as well as information related to shares and bonds issued by the company for the needs of the management and Board of Directors. All inquiries by investors are centrally managed by Investor Relations.
YIT Group’s disclosure policy is published on our website.
Operations in 2014During 2014, we met approximately 770 investors and analysts. YIT arranged 29 roadshow dates with the company’s management, meeting investors in Europe and North America.
Our Capital Markets Day for investors and analysts was held on Sep-tember 25, 2014 in Helsinki. The purpose of the event was to commu-nicate YIT’s strategy and operations. The day’s programme consisted of presentations by the management and a visit to YIT’s metro tunnel construction site in Espoo. The event had a total of 48 participants from Finland, Sweden, Norway and the UK.
Furthermore, an analyst day was organised in June, the themes of which were YIT’s opportunities in the Baltic and Central Eastern Euro-pean markets and the Tripla project in Helsinki’s Pasila district.
Investor relations
ANALYSTS FOLLOWING YIT
Capital Markets Day targeted to investors and analysts was held in September in Helsinki, Finland.
Carnegie Investment Bank AB, FinlandTommy Ilmoni+358 9 6187 1235 tommy.ilmoni @carnegie.fi DNB MarketsSimen Mortensen+47 24 16 92 09simen.mortensen @dnb.com
Inderes OyPetri Aho+358 50 340 [email protected] Nordea MarketsJan Kaijala+358 9 1655 [email protected]
SEB EnskildaArtem Beletski+358 9 6162 [email protected]
BerenbergChris Moore+44 20 3465 2737chris.moore @berenberg.com
Danske Markets EquitiesAri Järvinen+358 10 236 4760ari.jarvinen @danskebank.com
Evli Bank Plc Mika Karppinen +358 9 4766 9643 [email protected]
Handelsbanken Capital Markets Albin Sandberg+46 8 701 [email protected]
Kepler ChevreuxBjorn Gustafsson+46 8 723 51 76bgustafsson @keplercheuvreux.com
Pohjola BankMatias Rautionmaa+358 10 252 4408 matias.rautionmaa @pohjola.fi
FINANCIAL STATEMENT
152
YIT ANNUAL REPORT 2014
YEAR 2014 BUSINESS OPERATIONS CORPORATE GOVERNANCE GRI INDEX
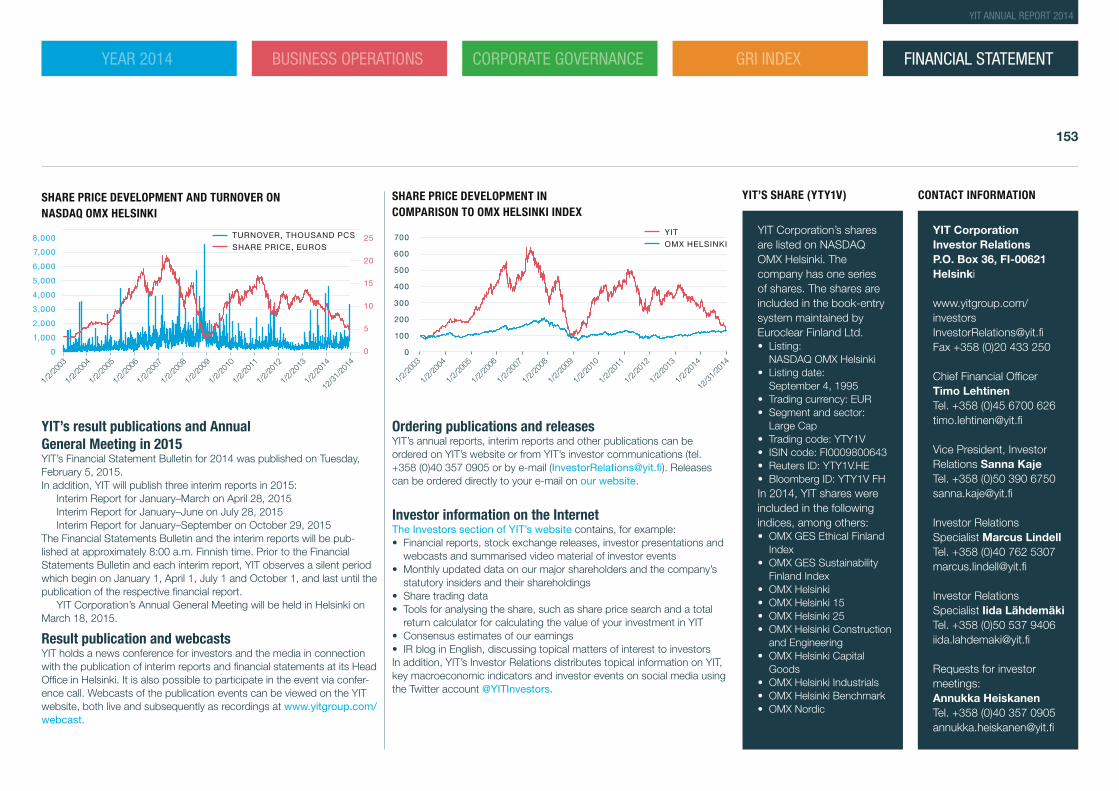
YIT’s result publications and Annual General Meeting in 2015YIT’s Financial Statement Bulletin for 2014 was published on Tuesday, February 5, 2015. In addition, YIT will publish three interim reports in 2015:
Interim Report for January–March on April 28, 2015Interim Report for January–June on July 28, 2015Interim Report for January–September on October 29, 2015
The Financial Statements Bulletin and the interim reports will be pub-lished at approximately 8:00 a.m. Finnish time. Prior to the Financial Statements Bulletin and each interim report, YIT observes a silent period which begin on January 1, April 1, July 1 and October 1, and last until the publication of the respective financial report.
YIT Corporation’s Annual General Meeting will be held in Helsinki on March 18, 2015.
Result publication and webcastsYIT holds a news conference for investors and the media in connection with the publication of interim reports and financial statements at its Head Office in Helsinki. It is also possible to participate in the event via confer-ence call. Webcasts of the publication events can be viewed on the YIT website, both live and subsequently as recordings at www.yitgroup.com/webcast.
Ordering publications and releasesYIT’s annual reports, interim reports and other publications can be ordered on YIT’s website or from YIT’s investor communications (tel. +358 (0)40 357 0905 or by e-mail ([email protected]). Releases can be ordered directly to your e-mail on our website.
Investor information on the InternetThe Investors section of YIT’s website contains, for example:• Financial reports, stock exchange releases, investor presentations and
webcasts and summarised video material of investor events• Monthly updated data on our major shareholders and the company’s
statutory insiders and their shareholdings• Share trading data• Tools for analysing the share, such as share price search and a total
return calculator for calculating the value of your investment in YIT• Consensus estimates of our earnings• IR blog in English, discussing topical matters of interest to investorsIn addition, YIT’s Investor Relations distributes topical information on YIT, key macroeconomic indicators and investor events on social media using the Twitter account @YITInvestors.
SHARE PRICE DEVELOPMENT AND TURNOVER ON NASDAQ OMX HELSINKI
SHARE PRICE DEVELOPMENT IN COMPARISON TO OMX HELSINKI INDEX
YIT Corporation’s shares are listed on NASDAQ OMX Helsinki. The company has one series of shares. The shares are included in the book-entry system maintained by Euroclear Finland Ltd.• Listing:
NASDAQ OMX Helsinki• Listing date:
September 4, 1995• Trading currency: EUR• Segment and sector:
Large Cap• Trading code: YTY1V• ISIN code: FI0009800643• Reuters ID: YTY1V.HE• Bloomberg ID: YTY1V FHIn 2014, YIT shares were included in the following indices, among others:• OMX GES Ethical Finland
Index• OMX GES Sustainability
Finland Index • OMX Helsinki• OMX Helsinki 15• OMX Helsinki 25• OMX Helsinki Construction
and Engineering• OMX Helsinki Capital
Goods• OMX Helsinki Industrials• OMX Helsinki Benchmark• OMX Nordic
YIT CorporationInvestor RelationsP.O. Box 36, FI-00621 Helsinki
www.yitgroup.com/[email protected] +358 (0)20 433 250
Chief Financial OfficerTimo LehtinenTel. +358 (0)45 6700 [email protected]
Vice President, Investor Relations Sanna Kaje Tel. +358 (0)50 390 [email protected]
Investor Relations Specialist Marcus Lindell Tel. +358 (0)40 762 5307 [email protected]
Investor Relations Specialist Iida Lähdemäki Tel. +358 (0)50 537 9406 [email protected]
Requests for investor meetings:Annukka HeiskanenTel. +358 (0)40 357 [email protected]
YIT’S SHARE (YTY1V) CONTACT INFORMATION
1/2/
2003
8,000
6,000
5,000
4,000
3,000
2,000
1,000
0
7,00020
15
10
5
0
25 TURNOVER, THOUSAND PCS
SHARE PRICE, EUROS
1/2/
2004
1/2/
2005
1/2/
2006
1/2/
2007
1/2/
2008
1/2/
2009
1/2/
2010
1/2/
2011
1/2/
2012
1/2/
2013
1/2/
2014
12/3
1/20
14
YIT
OMX HELSINKI700
600
500
400
300
200
100
0
1/2/
2003
1/2/
2004
1/2/
2005
1/2/
2006
1/2/
2007
1/2/
2008
1/2/
2009
1/2/
2010
1/2/
2011
1/2/
2012
1/2/
2013
1/2/
2014
12/3
1/20
14
FINANCIAL STATEMENT
153
YIT ANNUAL REPORT 2014
YEAR 2014 BUSINESS OPERATIONS CORPORATE GOVERNANCE GRI INDEX
Annual General Meeting 2015YIT Corporation’s Annual General Meeting will be held in Helsinki on Wednesday, March 18, 2015, starting at 10:00 a.m. (Finnish time) at Finlandia Hall (address: Mannerheimintie 13, FI-00100 Helsinki, Finland). Check-in for those who have registered for the meeting, distribution of ballots and serving of coffee will start at 9:00 a.m.
Participation rightsIn order to have the right to participate in the Annual General Meeting, a shareholder must be registered in the company’s shareholder regis-ter, which is maintained by Euroclear Finland Ltd, no later than on the record date of the Annual General Meeting on March 6, 2015. Share-holders whose shares are registered in their personal Finnish book-entry accounts are registered in the company’s shareholder register.
A shareholder whose shares are nominee-registered and who wishes to participate in the Annual General Meeting and exercise his right to vote must be entered in the company’s shareholder register by March 13, 2015, by 10:00 a.m. in order to participate in the meeting.
Notice of meetingThe notice of meeting is published no later than three weeks before the meeting on the company’s website. The notice contains the agenda, the names of the persons nominated for seats on the Board of Directors and the nominated auditor. The resolution proposals and documents pre-sented to the Annual General Meeting and presentation of the nominees for the Board of Directors will also be published on our website.
RegistrationRegistration for the Annual General Meeting will begin on February 5, 2015, and end on March 12, 2015 at 4:00 p.m. Registration is possible• online through YIT Corporation’s website: www.yitgroup.com/
agm2015• by telephone on the number +358 20 770 6890 Monday to Friday
from 9 a.m. to 4 p.m.
The shareholder’s name, personal ID number or business ID, address and telephone number and name of any assistant, proxy or legal rep-resentative must be declared in connection with the registration. The registration must reach the company prior to the end of the registration period.
It is requested that the company be notified of any proxies in con-nection with registration and that any proxies be sent in originals to the
Information for shareholders
address YIT Corporation, Viivi Kuokkanen, PO Pox 36, FI-00621 Helsinki prior to the end of the registration period.
Payment of dividendThe Board of Directors proposes to the Annual General Meeting that a dividend of EUR 0,18 per share be paid from 2014. The dividend is paid to a shareholder who, by the dividend record date (March 20, 2015), has been entered as a shareholder in the company’s shareholder register maintained by Euroclear Ltd.
The Board of Directors proposes that the dividend be paid on May 19, 2015.
Shareholder rightsShareholders have the right to have items included on the agenda of the Annual General Meeting, provided they demand, in writing, the Board of Directors to do so early enough so that the item can be included in the notice of the meeting. In order to have their items included on the agenda of the Annual General Meeting 2015, shareholders had to present their requests to YIT’s corporate services by January 8, 2015.
Shareholders have the right to raise questions at the General Meeting as set out in the Limited Liability Companies Act.
The minutes of the Annual General Meeting are made available for inspection by shareholders within two weeks of the meeting at YIT’s head office (Panuntie 11, Helsinki, Finland) and on our website. A shareholder or shareholders who own at least 10 per cent of all the company’s shares may demand that an extraordinary general meeting be convened.
Address changes of shareholdersShareholders are requested to give notification of any changes of address to the bank branch office in which their book-entry account is handled.
If the account is handled by Euroclear Finland Ltd, notifications of a change of address should be sent toEuroclear Finland LtdP.O. Box 1110FI-00101 Helsinki, FinlandStreet address: Urho Kekkosen katu 5CTelephone (switchboard): +358 20 770 6000Fax: +358 20 770 6658E-mail: [email protected]
• Registration opens: February 5, 2015• Record date of Annual General Meeting: March 6, 2015• Registration closes: March 12, 2015• Annual General Meeting: March 18, 2015• Dividend record date: March 20, 2015• Proposed dividend payment: May 19, 2015
More information on the Annual General Meeting is available on our website.
IMPORTANT DATES RELATED TO THE ANNUAL GENERAL MEETING
FINANCIAL STATEMENT
154
YIT ANNUAL REPORT 2014
YEAR 2014 BUSINESS OPERATIONS CORPORATE GOVERNANCE GRI INDEX
YIT CorporationP.O. Box 36 (Panuntie 11)FI-00621 Helsinki, Finland
tel. +358 20 433 [email protected]
www.yitgroup.com