annual report 2015/16 - barry callebaut is a b2b … report 2015/16 “we are the heart and engine...
TRANSCRIPT

Annual Report 2015/16
“We are the heart and engine of the chocolate and cocoa industry”

Barry Callebaut | Annual Report /
Key figures 2015/16
Sales Volume +2.2%
1.8 million tonnes
EBIT +0.1% in local currencies
401.7 CHF million
Net Profit (5.1%) in local currencies
219.0 CHF million
Free cash flow
404.0 CHF million
Dividend Payout ratio 39%
15.50 CHF per share
Sales Volume
In tonnes
Sales Revenue
In CHF million
EBIT
In CHF million
Net profit for the year
In CHF million
Sales Volume by Region
In tonnes EMEA 814,236 Americas 507,008 Asia Pacific 76,443 Global Cocoa 436,537
Sales Volume by Product Group
In tonnes Food Manufacturers 1,192,907 Products Cocoa Products 436,537 Gourmet & Specialties 204,780 Products
0
400,000
800,000
1,200,000
1,600,000
2,000,000
2011/12 2012/13 2013/14 2014/15 2015/160
1,500
3,000
4,500
6,000
7,500
2011/12 2012/13 2013/14 2014/15 2015/16
0
100
200
300
400
500
2011/12 2012/13 2013/14 2014/15 2015/160
60
120
180
240
300
2011/12 2012/13 2013/14 2014/15 2015/16
44%
28%
4%
24%
24%
65%
11%

Barry Callebaut | Annual Report /
Fiscal year 2015/16 in brief • Sales volume up +2.2%, reflecting above-market performance of the chocolate
business (+7.6%) and intentional phase-out of less profitable contracts in cocoa products (–12%)
• Operating profit (EBIT) temporarily affected by challenging cocoa products market as anticipated: +0.1% in local currencies (–3.2% in CHF); net profit down –5.1% in local currencies (–8.7% in CHF)
• Strong free cash flow generation of CHF 404.0 million • Mid-term guidance1 confirmed • Dr. W. Andreas Jacobs to step down as Chairman of the Board of Directors;
Patrick De Maeseneire proposed for election as new Chairman. All other Board members are standing for reelection for another term of office of one year
• Proposed payout to shareholders of CHF 15.5o per share; payout ratio of 39%
EMEA Americas Asia Pacific Global Cocoa
Volume growth vs. prior year .
+6.6% +8.8% +10.8% (12.0%)
EBIT growth vs. prior year in local currencies
+4.4% +12.0% +17.9% (60.3%)
1 On average for the 3-year period 2015/16 to 2017/18: 4–6% volume growth and EBIT above volume growth in local currencies, barring any major unforeseen events.
Barry Callebaut | Annual Report /
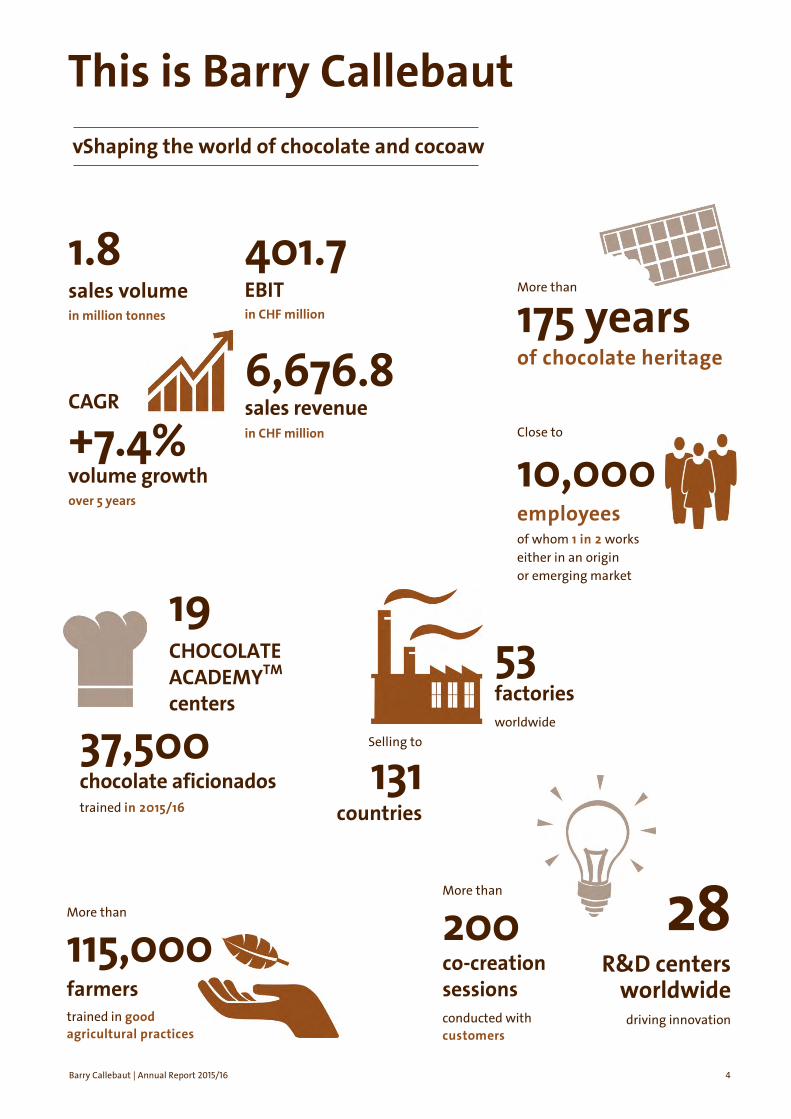
1.8 sales volume in million tonnes
CAGR
+7.4% volume growth over 5 years
401.7 EBIT in CHF million
6,676.8 sales revenue in CHF million
More than
175 years of chocolate heritage
Close to
10,000
employees of whom 1 in 2 works either in an origin or emerging market
19 CHOCOLATE ACADEMYTM centers
37,500 chocolate aficionados trained in 2015/16
53 factories worldwide
Selling to
131
countries
More than 200 co-creation sessions conducted with customers
This is Barry Callebaut “Shaping the world of chocolate and cocoa”
More than
115,000 farmers trained in good agricultural practices
28 R&D centers
worldwide driving innovation
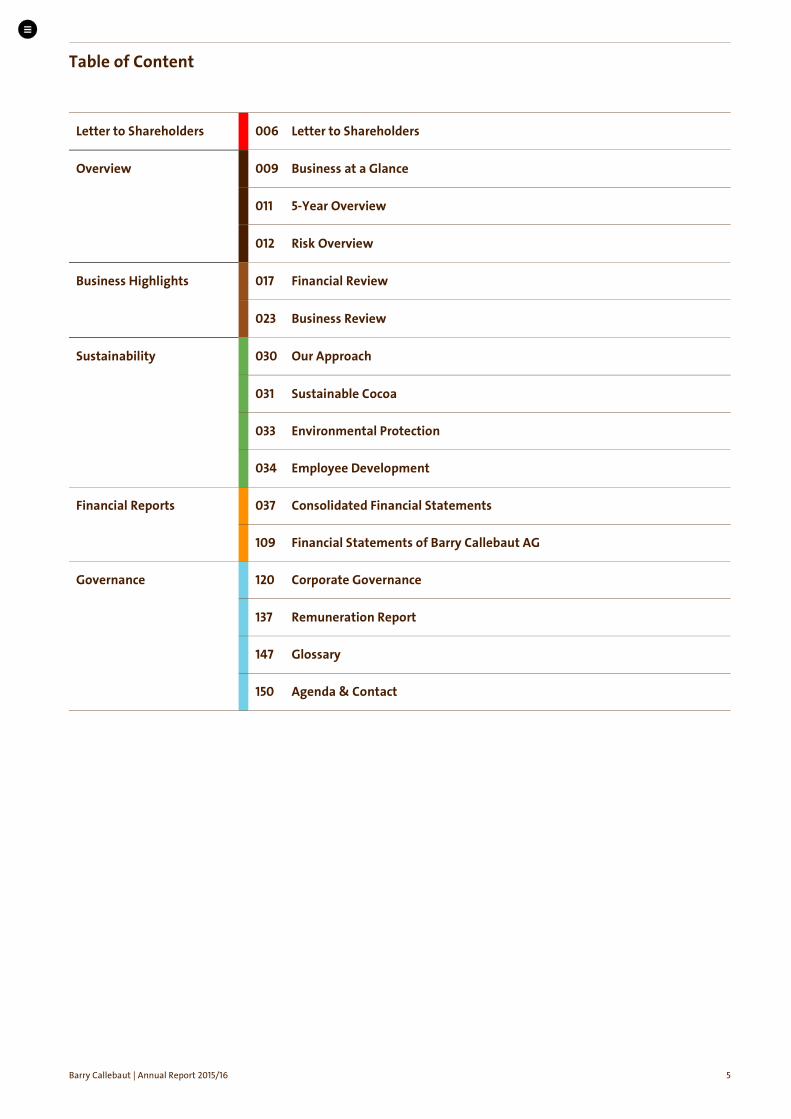
Table of Content
Barry Callebaut | Annual Report /
Letter to Shareholders Letter to Shareholders
Overview Business at a Glance
-Year Overview
Risk Overview
Business Highlights Financial Review
Business Review
Sustainability Our Approach
Sustainable Cocoa
Environmental Protection
Employee Development
Financial Reports Consolidated Financial Statements
Financial Statements of Barry Callebaut AG
Governance Corporate Governance
Remuneration Report
Glossary
Agenda & Contact
Letter to Shareholders Overview Business Highlights Sustainability Financial Reports Governance
Letter to Shareholders
Barry Callebaut | Annual Report /
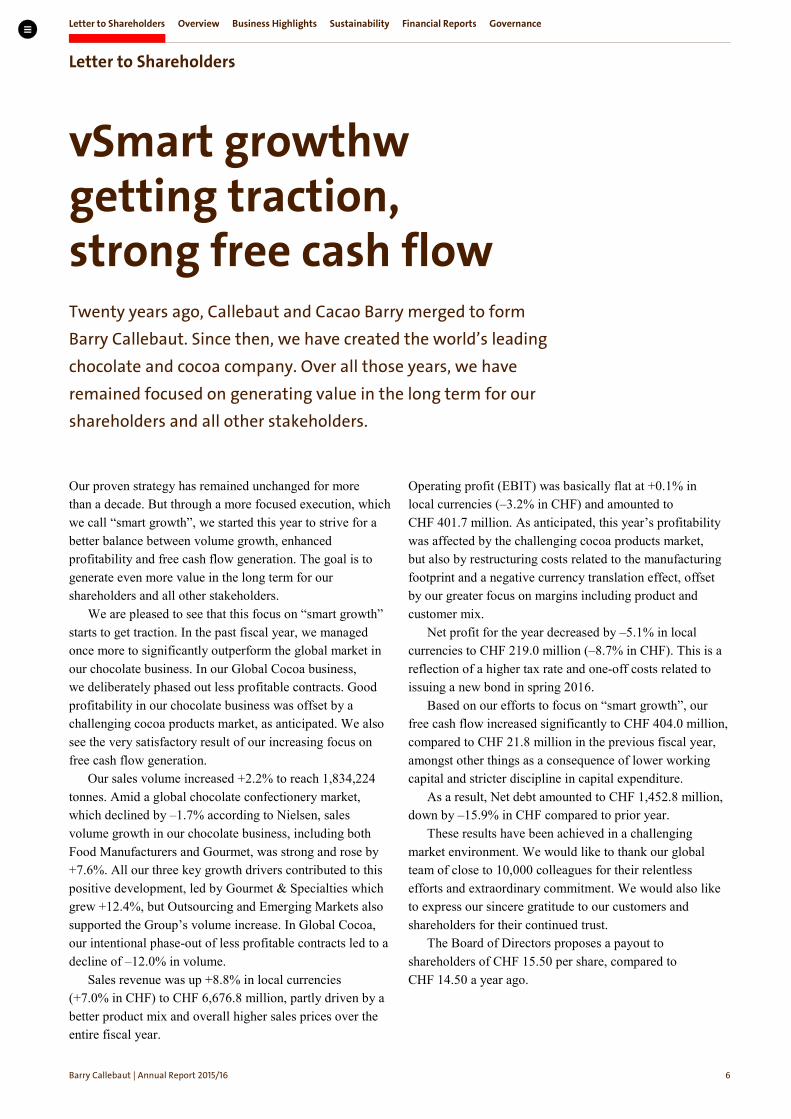
“Smart growth” getting traction, strong free cash flow Twenty years ago, Callebaut and Cacao Barry merged to form Barry Callebaut. Since then, we have created the world’s leading chocolate and cocoa company. Over all those years, we have remained focused on generating value in the long term for our shareholders and all other stakeholders.
Our proven strategy has remained unchanged for more than a decade. But through a more focused execution, which we call “smart growth”, we started this year to strive for a better balance between volume growth, enhanced profitability and free cash flow generation. The goal is to generate even more value in the long term for our shareholders and all other stakeholders.
We are pleased to see that this focus on “smart growth” starts to get traction. In the past fiscal year, we managed once more to significantly outperform the global market in our chocolate business. In our Global Cocoa business, we deliberately phased out less profitable contracts. Good profitability in our chocolate business was offset by a challenging cocoa products market, as anticipated. We also see the very satisfactory result of our increasing focus on free cash flow generation.
Our sales volume increased +2.2% to reach 1,834,224 tonnes. Amid a global chocolate confectionery market, which declined by –1.7% according to Nielsen, sales volume growth in our chocolate business, including both Food Manufacturers and Gourmet, was strong and rose by +7.6%. All our three key growth drivers contributed to this positive development, led by Gourmet & Specialties which grew +12.4%, but Outsourcing and Emerging Markets also supported the Group’s volume increase. In Global Cocoa, our intentional phase-out of less profitable contracts led to a decline of –12.0% in volume.
Sales revenue was up +8.8% in local currencies (+7.0% in CHF) to CHF 6,676.8 million, partly driven by a better product mix and overall higher sales prices over the entire fiscal year.
Operating profit (EBIT) was basically flat at +0.1% in local currencies (–3.2% in CHF) and amounted to CHF 401.7 million. As anticipated, this year’s profitability was affected by the challenging cocoa products market, but also by restructuring costs related to the manufacturing footprint and a negative currency translation effect, offset by our greater focus on margins including product and customer mix.
Net profit for the year decreased by –5.1% in local currencies to CHF 219.0 million (–8.7% in CHF). This is a reflection of a higher tax rate and one-off costs related to issuing a new bond in spring 2016.
Based on our efforts to focus on “smart growth”, our free cash flow increased significantly to CHF 404.0 million, compared to CHF 21.8 million in the previous fiscal year, amongst other things as a consequence of lower working capital and stricter discipline in capital expenditure.
As a result, Net debt amounted to CHF 1,452.8 million, down by –15.9% in CHF compared to prior year.
These results have been achieved in a challenging market environment. We would like to thank our global team of close to 10,000 colleagues for their relentless efforts and extraordinary commitment. We would also like to express our sincere gratitude to our customers and shareholders for their continued trust.
The Board of Directors proposes a payout to shareholders of CHF 15.50 per share, compared to CHF 14.50 a year ago.

Letter to Shareholders Overview Business Highlights Sustainability Financial Reports Governance
Letter to Shareholders
Barry Callebaut | Annual Report /
“The key message for 2016/17 is very simple: Growth! It is about competitive growth, ‘smart growth’ as we continue to deploy our strategy, and sustainable growth as sustain-ability is going to play a much bigger role in our agenda.”
Antoine de Saint-Affrique, CEO
“Twenty years ago, Callebaut and Cacao Barry merged. Since then, we have created the world’s leading chocolate and cocoa company – with a lot of passion, hard work and dedication from all our colleagues to whom I am very grateful.”
Andreas Jacobs, Chairman of the Board

Letter to Shareholders Overview Business Highlights Sustainability Financial Reports Governance
Letter to Shareholders
Barry Callebaut | Annual Report /
Consistent strategy implementation Our continued above-market growth is the result of the consistent implementation of our proven long-term strategy based on the four pillars Expansion, Innovation, Cost Leadership and Sustainability. In the past fiscal year, we again achieved significant progress:
Expansion Expansion of existing US West Coast chocolate factory. Acquisition of the FrieslandCampina Kievit vending activities in Germany, making us a leading supplier of vending powder mixes. Various new long-term agreements, for instance with Colian in Poland and Romega in Romania. New chocolate factory in Gresik (Indonesia) went on stream.
Innovation More than 200 co-creation sessions conducted with customers to support them in their product innovation. Roll-out of our new Barry Callebaut Studio concept at the most important trade shows in Europe and the US. Two relocated CHOCOLATE ACADEMY™ centers opened in Mumbai and Moscow. First Beverage Academy opened in Kageröd, Sweden. Licensing agreement with food supplement producer Naturex on the commercialization of the EFSA health claim on cocoa extracts.
Cost Leadership Streamlining of our cocoa manufacturing footprint in Asia as part of the Cocoa Leadership project. Successful expansion of the Shared Service Center in Poland.
Sustainability Inclusion in the SXI 25 Sustainability index of the most sustainable listed companies in Switzerland. Launch of HORIZONS sustainable cocoa and chocolate products. Acquisition of Licensed Buying Company Nyonkopa in Ghana. Introduction of Katchilè, an innovative tool for geo-traceability and farm impact measurement. Additional partnerships with customers like Tony’s Chocolonely and Kim’s Chocolates for sustainable cocoa farming.
Continuing to drive “smart growth” The key message for fiscal year 2016/17 is very simple: Growth! It is about competitive growth as well as “smart growth” as we continue to deploy our strategy, but also about sustainable growth as sustainability is going to play a much bigger role in our agenda.
We have good visibility on volume growth and expect to see a positive contribution to profitability from our Cocoa Leadership project, supported by some recent recovery in the cocoa products market.
On this basis, we confirm our three-year guidance, which is on average 4–6% volume growth and EBIT growth on average above volume growth in local currencies, barring any major unforeseen events.
Andreas Jacobs Antoine de Saint-Affrique Chairman of the Board Chief Executive Officer
Many thanks, Andreas Jacobs! Barry Callebaut’s remarkable success is clearly attributable to the stewardship and farsightedness of Andreas Jacobs. Andreas Jacobs joined the Board of Directors in 2003 and was elected its chairman in December 2005. After eleven years at the helm of our company, he will be stepping down from his post at the Annual General Meeting 2016.
Barry Callebaut owes its departing chairman a lot. The company’s undisputed global leadership in cocoa and chocolate production is largely due to the bold strategic decisions that Andreas Jacobs made in recent years. He had the strength and determination to turn his visions into reality. Andreas Jacobs had little appetite for short-termism nor was he obsessed with the next set of quarterly results, neither as Chairman nor as a representative of Jacobs Holding AG, our majority shareholder. Passionate and knowledgeable about every aspect of the company, caring for the people as much as he was for building the business for the long term, Andreas Jacobs has been a formidable ambassador of Barry Callebaut with all its stakeholders. As custodian of family values which are at the heart of our company, he carefully introduced his brother Nicolas Jacobs to the duties of a Director enabling the family’s intergenerational succession plan. The Jacobs family will therefore continue to be duly represented on our Board.
We would like to express our sincere gratitude to Andreas Jacobs for his strong leadership that has helped make Barry Callebaut what it is today.
Board of Directors, Executive Committee and employees of Barry Callebaut

Letter to Shareholders Overview Business Highlights Sustainability Financial Reports Governance
Business at a Glance
Barry Callebaut | Annual Report /
Our Vision We are the heart and engine of the chocolate and cocoa industry.
Our Values Everything we do is rooted in our five core values: customer focus, passion, entrepreneurship, team spirit and integrity.
Business model We are the world’s leading manufacturer of chocolate and cocoa products, mastering every step in the value chain from the sourcing of raw materials to the production of the finest chocolates. We are able to provide our customers with added-value products and services adapted to specific market needs, ahead of trends and at a competitive price. We serve the entire food industry – from global and local food manufacturers to artisanal and professional users of chocolate, such as chocolatiers, pastry chefs, bakers, hotels, restaurants or caterers.
We are a business-to-business company. In order to accommodate price fluctuations in raw materials, most of
our business is based on a cost-plus pricing system that passes on raw material costs directly to our customers.
Our input factors are talented people, deep chocolate and cocoa know-how, as well as various raw materials. Our output factors are high-quality chocolate and cocoa products as well as value-added services.
Competitive advantages We are fully vertically integrated and have a unique global footprint with 53 factories. With more than 175 years of chocolate heritage, our Group has an unparalleled blend of expertise in cocoa and chocolate, from the sourcing of the beans to the knowledge of future consumer trends. Through leadership in innovation and renovation of products, we help our customers grow. Combined with our cost leadership, this makes us the preferred outsourcing partner to the food industry. We have a number of long-term partnership agreements with leading global and local food companies. We are present on the ground in all key origin countries and have a long stand commitment to sustainability.

Letter to Shareholders Overview Business Highlights Sustainability Financial Reports Governance
Business at a Glance
Barry Callebaut | Annual Report /
The Barry Callebaut Group aims to outperform the global chocolate and cocoa market. This ambitious long-term strategy is based on four pillars: Strategy
Expansion We aim to expand our business based on three key growth drivers:
Emerging Markets: Next to further strengthening our position in the main markets of Western Europe and North America, we aim to tap into the growth potential of Emerging Markets.
Outsourcing & Partnerships: Implementing existing outsourcing volumes and strategic partnerships, as well as securing further outsourcing deals with global and local food manufacturers is an essential part of our business strategy.
Gourmet & Specialties: We intend to further accelerate the growth of our Gourmet & Specialties business globally.
Innovation We lead the development of the chocolate and cocoa market through innovation in our global gourmet brands and in co-creation with our industrial partners. Our market insights from around the world are brought together with our deep research & development expertise in areas like structuring, sensory, sugar reduction, and cocoa science. On this basis, a rich pipeline with value-added products and services will keep driving margin-accretive growth.
Cost Leadership Cost leadership is a core element of our competitiveness and one of the reasons – next to deep expertise and recognized quality – why many customers have chosen to outsource their production to us.
We continuously strive to improve our performance through technology upgrade, scale leverage, optimization of product flows, best-in-class sourcing capabilities and tight cost management along the complete value chain.
Sustainability We have a long-standing commitment to sustainability, as we believe that the future of our industry depends on its ability to make cocoa farming more viable and attractive to farmers, today and tomorrow. Farmer productivity and community development are the key pillars of our sustainable cocoa strategy. To scale up sustainability, we will have to move from sustainable cocoa to sustainable chocolate in the coming years, integrating sustainability commitments for every ingredient used in our chocolate.
Letter to Shareholders Overview Business Highlights Sustainability Financial Reports Governance
5-Year Overview
Barry Callebaut | Annual Report /
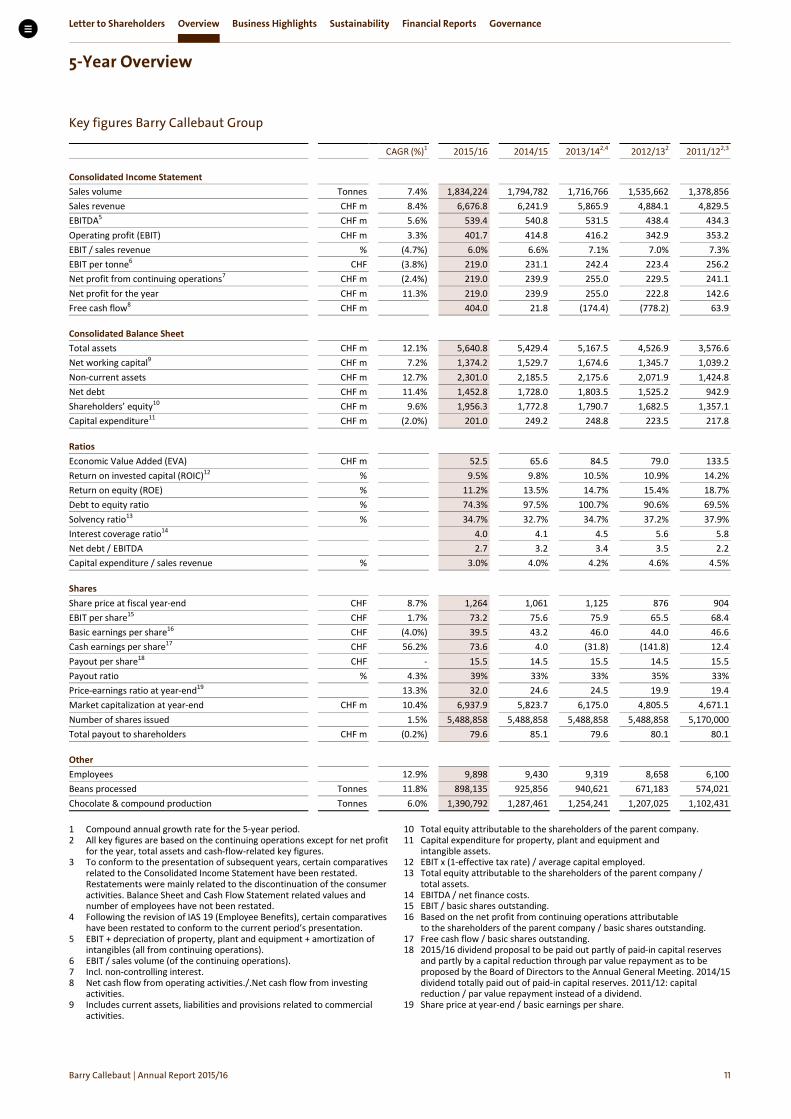
Key figures Barry Callebaut Group
CAGR (%)1 2015/16 2014/15 2013/142,4 2012/132 2011/122,3 Consolidated Income Statement
Sales volume Tonnes 7.4% 1,834,224 1,794,782 1,716,766 1,535,662 1,378,856 Sales revenue CHF m 8.4% 6,676.8 6,241.9 5,865.9 4,884.1 4,829.5 EBITDA5 CHF m 5.6% 539.4 540.8 531.5 438.4 434.3 Operating profit (EBIT) CHF m 3.3% 401.7 414.8 416.2 342.9 353.2 EBIT / sales revenue % (4.7%) 6.0% 6.6% 7.1% 7.0% 7.3% EBIT per tonne6 CHF (3.8%) 219.0 231.1 242.4 223.4 256.2 Net profit from continuing operations7 CHF m (2.4%) 219.0 239.9 255.0 229.5 241.1 Net profit for the year CHF m 11.3% 219.0 239.9 255.0 222.8 142.6 Free cash flow8 CHF m 404.0 21.8 (174.4) (778.2) 63.9 Consolidated Balance Sheet
Total assets CHF m 12.1% 5,640.8 5,429.4 5,167.5 4,526.9 3,576.6 Net working capital9 CHF m 7.2% 1,374.2 1,529.7 1,674.6 1,345.7 1,039.2 Non-current assets CHF m 12.7% 2,301.0 2,185.5 2,175.6 2,071.9 1,424.8 Net debt CHF m 11.4% 1,452.8 1,728.0 1,803.5 1,525.2 942.9 Shareholders’ equity10 CHF m 9.6% 1,956.3 1,772.8 1,790.7 1,682.5 1,357.1 Capital expenditure11 CHF m (2.0%) 201.0 249.2 248.8 223.5 217.8 Ratios
Economic Value Added (EVA) CHF m 52.5 65.6 84.5 79.0 133.5 Return on invested capital (ROIC)12 % 9.5% 9.8% 10.5% 10.9% 14.2% Return on equity (ROE) % 11.2% 13.5% 14.7% 15.4% 18.7% Debt to equity ratio % 74.3% 97.5% 100.7% 90.6% 69.5% Solvency ratio13 % 34.7% 32.7% 34.7% 37.2% 37.9% Interest coverage ratio14 4.0 4.1 4.5 5.6 5.8 Net debt / EBITDA 2.7 3.2 3.4 3.5 2.2 Capital expenditure / sales revenue % 3.0% 4.0% 4.2% 4.6% 4.5% Shares
Share price at fiscal year-end CHF 8.7% 1,264 1,061 1,125 876 904 EBIT per share15 CHF 1.7% 73.2 75.6 75.9 65.5 68.4 Basic earnings per share16 CHF (4.0%) 39.5 43.2 46.0 44.0 46.6 Cash earnings per share17 CHF 56.2% 73.6 4.0 (31.8) (141.8) 12.4 Payout per share18 CHF - 15.5 14.5 15.5 14.5 15.5 Payout ratio % 4.3% 39% 33% 33% 35% 33% Price-earnings ratio at year-end19 13.3% 32.0 24.6 24.5 19.9 19.4 Market capitalization at year-end CHF m 10.4% 6,937.9 5,823.7 6,175.0 4,805.5 4,671.1 Number of shares issued 1.5% 5,488,858 5,488,858 5,488,858 5,488,858 5,170,000 Total payout to shareholders CHF m (0.2%) 79.6 85.1 79.6 80.1 80.1 Other
Employees 12.9% 9,898 9,430 9,319 8,658 6,100 Beans processed Tonnes 11.8% 898,135 925,856 940,621 671,183 574,021 Chocolate & compound production Tonnes 6.0% 1,390,792 1,287,461 1,254,241 1,207,025 1,102,431
1 Compound annual growth rate for the 5-year period. 2 All key figures are based on the continuing operations except for net profit
for the year, total assets and cash-flow-related key figures. 3 To conform to the presentation of subsequent years, certain comparatives
related to the Consolidated Income Statement have been restated. Restatements were mainly related to the discontinuation of the consumer activities. Balance Sheet and Cash Flow Statement related values and number of employees have not been restated.
4 Following the revision of IAS 19 (Employee Benefits), certain comparatives have been restated to conform to the current period’s presentation.
5 EBIT + depreciation of property, plant and equipment + amortization of intangibles (all from continuing operations).
6 EBIT / sales volume (of the continuing operations). 7 Incl. non-controlling interest. 8 Net cash flow from operating activities./.Net cash flow from investing
activities. 9 Includes current assets, liabilities and provisions related to commercial
activities.
10 Total equity attributable to the shareholders of the parent company. 11 Capital expenditure for property, plant and equipment and
intangible assets. 12 EBIT x (1-effective tax rate) / average capital employed. 13 Total equity attributable to the shareholders of the parent company /
total assets. 14 EBITDA / net finance costs. 15 EBIT / basic shares outstanding. 16 Based on the net profit from continuing operations attributable
to the shareholders of the parent company / basic shares outstanding. 17 Free cash flow / basic shares outstanding. 18 2015/16 dividend proposal to be paid out partly of paid-in capital reserves
and partly by a capital reduction through par value repayment as to be proposed by the Board of Directors to the Annual General Meeting. 2014/15 dividend totally paid out of paid-in capital reserves. 2011/12: capital reduction / par value repayment instead of a dividend.
19 Share price at year-end / basic earnings per share.

Letter to Shareholders Overview Business Highlights Sustainability Financial Reports Governance
Risk Overview
Barry Callebaut | Annual Report /
Enterprise Risk Management The Group operates in the food industry and is exposed to a variety of risks and uncertainties. These are monitored through management processes and overseen by the Group’s enterprise risk management framework.
Overall responsibility for the Group’s Enterprise Risk Management lies with the Board of Directors (BoD). The BoD has delegated responsibility to the Audit, Finance, Risk, Quality and Compliance Committee (AFRQCC) for evaluating the Group’s risk and control environment.
The Group Risk Management and the Internal Audit teams support these bodies in identifying, prioritizing and reporting key risks affecting the Group’s strategic objec-tives and the evaluation of the effectiveness of risk mitigation activities. These include regular assessment of internal control procedures. Regional and functional management ensures that risks are managed appropriately, that existing measures and controls are operating effectively and mitigation actions are implemented.
Ongoing monitoring of the Group’s key risks and its referring risk management activities are embedded in regular management information channels and dedicated committees.
The AFRQCC meets as often as necessary to deal with any significant issues reported by Management, Internal Audit, Group Risk Management and/or External Regulators.
Group Risk Management, together with Internal Audit, facilitates the annual enterprise risk assessment process and presents the key risks to the Executive Committee (ExCo) and the AFRQCC. To ensure the Group achieves its strate-gic objectives, these bodies consider the appropriateness of the strategy and actions taken to mitigate these risks.
While it is acknowledged that the Group faces many risks, the BoD has identified the key inherent risks that could potentially impact the achievement of the Group’s objectives. These are outlined in the table below.
Key Risks Risk Description Measures
Strategic
Sustainable supply of suitable quality cocoa
Lack of a sufficient supply of suitable quality cocoa beans so that the Group may not be able to produce high-quality cocoa and chocolate products to deliver to its customers. Risk factors such as declining productivity attributable to aging trees, ageing farmers with little interest from the next generation to become farmers and the conversion of cocoa bean fields to other, more attractive crops could lead to a shortfall in high-quality cocoa beans in the mid- to long-term.
Under the umbrella of its overall sustainability strategy, the Group aims to improve the productivity and livelihood of farmers. Long-term measures also include the continuous evaluation and diversification of supply sources in origin countries, developing improved agricultural practices for cocoa plantations and maintaining industry dialogue with key stakeholders in origin countries.
Product development and innovation
Changing market trends and consumer habits could impact the future growth of the Group’s business.
Trend analysis by the Group’s marketing and customer insight teams, together with cross-func-tional commercial teams working closely with customers, aim to identify trends early in the marketplace, both positive and negative. The Group constantly invests in R&D as part of a well-structured process, enabling the Group to develop products which proactively address new trends and changing demand patterns.
Business transformation, acquisition and divestiture
Insufficient due diligence, inaccurate business plan assumptions, failure to successfully execute business plans due to ineffective post-merger integration processes or changes in market conditions can all have negative consequences. These can include an underperforming base business, reduced synergies, or higher than expected costs. In turn, these can negatively affect return on investment and potentially the share price.
The Group has a dedicated team with significant experience and capability in this area. This team maintains constant close collaboration with functional & regional experts, external advisors, and the Group’s Executive Committee. A clearly defined process is employed with regard to the evaluation, execution and integration of major acquisitions as well as the execution of major divestitures or business transformations.

Letter to Shareholders Overview Business Highlights Sustainability Financial Reports Governance
Risk Overview
Barry Callebaut | Annual Report /
External economic environment
Uncertain economic and political conditions may result in reduced demand for chocolate and cocoa products and may affect expansion plans and profitability in our regions.
The Group has a presence in both developed and emerging markets with a well-diversified business and operations portfolio in different market segments such as confectionery, ice cream, biscuits, powder beverages, etc. The global operations and innovations network is able to rapidly respond to customer requests and provide flexible, optimized recipes to adapt to changed market conditions.
Long-term outsourcing agreements and strategic partnerships
The Group has entered into a number of important, long-term outsourcing agreements and strategic partnerships with customers. Failure to renew, or early termination of existing long-term outsourcing agreements or strategic partnerships, or failure to enter into new agreements or failure to negotiate terms that are attractive to us, could have a material impact on the results of operations.
The Group has a largely diversified global customer base representing a healthy mix of small, medium and large customers. For global strategic customers, the Group has established long-term supply agreements governing the mutual co-operation, addressing standards for quality, quantity commitments, pricing, service levels, innovation and ethics. For these customers, the Group has appointed dedicated teams that maintain and develop a close relationship in order to respond to these customers’ needs in a fast and professional manner and to provide high-quality services. These teams have expertise in customer relationships, service, innovation, as well as commercial and pricing matters.
Talent management
Failure to attract, retain and develop creative, committed and skilled employees could impact the Group’s ability to achieve its strategic objectives.
Every effort is made to ensure optimal processes and policies are in place to attract, select, develop, reward and retain talent with the right capabilities and skill levels needed to achieve the Group’s strategic objectives. These include succession planning, talent reviews, remuneration bench-marking, long- and short-term incentive plans, training and leadership development programs as well as the tools to support and measure the success of all these processes.
Operational
Quality & food safety This risk is inherent to the Group’s operations within the food industry: products not meeting quality and food safety standards expose the Group to litigation, product liability and recall claims. This may also lead to loss of revenue and loss of market share and negatively impact the Group’s reputation. The risk that raw materials are accidentally or maliciously contaminated throughout the supply chain or that other prod-uct defects occur due to human error, equipment failure or other factors cannot be completely ruled out.
The Group’s quality management system is built on robust policies, guidelines, standards, and procedures. The Group’s quality assurance function performs regular site and supplier audits to ensure compliance with the Group’s quality management system and takes corrective action when gaps are identified. In addition, a quality engagement program is in effect across the full Group to ensure all employees of the Group maintain a zero-defect mindset.
Operations and supply chain The Group’s supply chain network for raw materials can be disrupted due to adverse weather conditions, climate changes, diseases (human or crop), natural disasters, political instability and other factors which could impact the ability to produce and deliver products to customers.
The Group’s Global Sourcing department is continuously monitoring weather, harvest, politi-cal risk and other indicators to timely anticipate potential supply shortages or interruptions. Short-term mitigation measures include adequate levels of safety stocks and a diversified regional supply network.

Letter to Shareholders Overview Business Highlights Sustainability Financial Reports Governance
Risk Overview
Barry Callebaut | Annual Report /
Information technology The Group’s business processes and its inter-action with customers and suppliers is highly dependent on reliable and secure Information Systems. Physical damage or cybercrime activities including unauthorized access to confidential data could have an adverse impact on the business and its operations, including e.g. the breakdown of global data centers or the breakdown of global-wide area networks.
The Group’s Information Management and Technology Department has implemented various preventive structures for the Group’s business-critical applications and locations. In the event of a major incident, disaster recovery solutions, plans and procedures are in place. A mid-term plan to enhance Information Security is regularly defined and improvements are being implemented continuously.
Financial
Raw material price volatility Market prices for raw materials and the structure of the terminal markets can have an influence on the Group’s operational results. To manage exposures to raw materials as well as foreign currency and interest rate fluctuations, the Group extensively uses derivative financial instruments and forward physical commitments. If related hedging strategies are not fully effective, this may affect the operational result. Furthermore, the Group’s profitability can be affected by its exposure to the volatility of the Combined Cocoa Ratio, which expresses the combined sales prices for cocoa butter and cocoa powder in relation to the cocoa bean price and our cost structure.
The Group’s commodity risk management and treasury policies require that all risk exposures are hedged back-to-back in accordance with the related limit framework from the moment such exposures are entered into. For its contract business, namely the Food Manufacturers Product Group, which accounts for the majority of the business, the Group attempts to mitigate the impact of volatility in raw material costs through a “cost-plus” pricing model, whereas exposures arising at contract signing are immediately hedged. In the Gourmet & Specialties Product Group, the Group applies a price list model whereby forecasted sales are hedged and price lists are adapted on a regular basis. In the Cocoa Product Group, market prices are applied with the result that profitability is affected by the develop-ment and volatility of the Combined Cocoa Ratio. The Group attempts to mitigate these effects by means of a central global management system which monitors the positions and exposures related to cocoa products globally, taking into account both internal and external demand. The Group’s financial risk management frame-work related to commodities, foreign currencies and interest rates is further described in note 26 to the Consolidated Financial Statements.
Treasury
The Group’s operations are exposed to liquidity risks, foreign currency and interest rate risks. Volatility in raw material prices affects the Group’s working capital requirements and might result in liquidity risks. Failure to deliver on key parameters including cash flow could result in a downgrade of the Group’s credit rating and restrict its access to financial markets.
The Group has established a robust financial risk management framework and governance structure. The Group’s liquidity is ensured by means of regular Group-wide monitoring and planning of liquidity coordinated by the Group’s centralized treasury department. Financing needs are covered through a combination of adequate credit lines with financial institutions on the one hand and short- and long-term debt capital market products on the other hand. Refer to note 26 to the Consolidated Financial Statements.
Letter to Shareholders Overview Business Highlights Sustainability Financial Reports Governance
Risk Overview
Barry Callebaut | Annual Report /
Compliance
Legal and regulatory The Group is subject to both international and national laws, regulations and standards in such diverse areas as product safety, product labeling, environment, health and safety, intellectual property rights, antitrust, anti-bribery, employment and taxes in all the countries it operates in as well as stock exchange listing and disclosure regulations in an ever-changing regulatory environment. Failure to comply with applicable laws and regulations could expose the Group to investigations, litigation, administrative and/or criminal proceedings potentially leading to significant costs, fines and/or criminal sanctions against the Group and/or its employees with possible reputational damage.
Dedicated regional and local functional managers, supported by specialized corporate functions and external advisors, ensure compliance with applicable laws and regulations. The Group has robust policies and procedures in place in the relevant areas. The Group’s Legal Department oversees the Groupʼs compliance program, which ensures awareness of the compliance risks and the Groupʼs compliance standards. The Code of Conduct and other Group policies set out the legal and ethical standards of behavior expected from all employees working for the Group.

Letter to Shareholders Overview Business Highlights Sustainability Financial Reports Governance
Business Highlights
Barry Callebaut | Annual Report /
Financial Review
Business Review Region EMEA Region Americas Region Asia Pacific Global Cocoa
Letter to Shareholders Overview Business Highlights Sustainability Financial Reports Governance
Financial Review
Barry Callebaut | Annual Report /
“Smart growth” getting traction, strong free cash flow generation Business Performance Review fiscal year / Summary In 2015/16, market conditions remained challenging with volumes of the global chocolate confectionery market in decline (according to Nielsen –1.7%), and a historically weak cocoa products market, as well as continued volatility of key raw materials.
Barry Callebaut’s Group volume increased by 2.2% to 1,834,224 tonnes.
Volume growth was driven by a strong Chocolate business, which went up by 7.6%, significantly out-performing the global chocolate market. The growth was broad-based, stemming from all regions and the key growth drivers Outsourcing, Gourmet & Specialties and Emerging Markets.
On the other hand, the Group intentionally phased out less profitable cocoa contracts, in line with its focus on “smart growth”. Sales to third parties of the Global Cocoa segment thus shrank by 12.0%.
Operating profit (EBIT) was flat versus prior year at +0.1% in local currencies (–3.2% in CHF) and amounted to CHF 401.7 million. This is the result of the strong growth and profitability in the chocolate business on the one hand and the negative impact from the very low combined cocoa ratio mainly affecting the Group’s cocoa business on the other hand. Net profit for the year decreased by 5.1% in local currencies and reached CHF 219.0 million.
The Group's greater focus on free cash flow (FCF) is one of the key elements in "smart growth". The FCF significantly improved to CHF 404.0 million, as a result of lower working capital and stricter discipline in capital expenditure.
Corporate strategy and mid-term guidance Barry Callebaut’s long-term strategy based on four pillars (Expansion, Innovation, Cost Leadership and Sustainability) remains unchanged. We continue to focus on a smart balance between consistent above-market volume growth and enhanced profitability. The mid-term guidance (until 2017/18) is as follows: • Average volume growth 4–6% • Average EBIT growth above volume growth*
* In local currencies and barring any major unforeseen events
General market Global economic growth (GDP) in 2015 was 3.1% based on data from the International Monetary Fund (IMF), reflecting a flat development in advanced economies relative to the previous year and a slight improvement in emerging markets and developing economies. Medium-term prospects have become less optimistic for advanced economies, in particular after the Brexit referendum, but a bit more positive for emerging markets and developing economies.
These considerations are taken into account in Barry Callebaut’s planning process, together with the focus on “smart growth” as the Group continues to follow its path of sustainable growth, consistently outperforming the market.
Continued volatility in raw material prices The 2015/16 cocoa crop was lower compared to prior year due to weak crops, in particular from Côte d’Ivoire and Brazil. London market trading was volatile, rallying approximately 28% from a low in the beginning of February 2016 to a level above GBP 2,500 in June, a price level last seen in the 1970’s. A large part of this increase, however, was currency-driven. The Brexit referendum led to a depreciation of 12% in the British pound against the US dollar. Weak overall demand did not entirely offset the decline in supply, resulting in a considerable deficit for the entire season.
The combined cocoa ratio which was at a historical low over the course of the fiscal year, due to significant over-supply coupled with weak demand and high cocoa bean prices, has recently recovered, albeit with regional differences.
At the beginning of the fiscal year, milk prices moved up due to fears of droughts and slightly increased demand on the world market. Towards the end of the fiscal year, prices started dropping to record low levels as production was outpacing demand by far. Price levels have recently bounced back as low milk prices to farmers are leading to high slaughter rates and a rapid reduction of production volumes.
After five years of a downward trend, world sugar prices reversed direction and reached their highest levels since 2012, driven by a world deficit and an all-time record net long position of hedge funds.
Prices in Europe have also recovered vigorously, supported by historically low EU stocks as well as supportive world sugar prices.

Letter to Shareholders Overview Business Highlights Sustainability Financial Reports Governance
Financial Review
Barry Callebaut | Annual Report /
Raw material prices September 2007–September 2016
Further volatility in currencies In fiscal year 2015/16, markets saw continued foreign currency exchange volatility, although on a smaller scale compared to prior year. The Group is naturally hedged to the extent that it produces and sells products locally and hedges any remaining currency exposure that arises from commercial transactions. Translation impacts arising from the translation of results into the Group’s reporting currency Swiss francs are however not hedged.
For the fiscal year under review, the average rate for the euro, which accounts for around half of the Group’s sales revenue, depreciated by 1.5% against the Swiss franc. The second most important currency for the Group, the US dollar, gained 3.1% against the Swiss franc. Some other currencies lost ground against the Swiss franc during the same period: the British pound declined on average by –4.2%, the Brazilian real depreciated 20.2%, the Mexican peso dropped 13.8%, the Polish zloty lost 5.0%, while other currencies like the Japanese yen appreciated by 7.9%.
The currency translation effects mentioned above represented a negative year-on-year impact of 1.8% on sales revenue and 3.3% (CHF 13.6 million) at EBIT level.
Sales revenue in functional currency
EUR 49.7% USD 35.6% BRL 6.0% CHF 2.6% RUB 1.7% JPY 1.1% Other 3.2%
Slow growth in the chocolate market The chocolate confectionery market for the period between September 2015 and August 2016 continued to show sluggish demand, although a slight improvement in recent quarters was observed. Several countries across different regions recorded negative growth compared to prior year. Main reasons for the decline in demand were still high cocoa bean prices translating to high prices for consumer products and a challenging economic environment in several countries, in particular in emerging markets.
According to Nielsen, the market for the period under review declined by 1.7%, with a slight recovery in the last quarter of the fiscal year under review.
Consolidated Income Statement
Volume growth driven by strong growth of the Chocolate business Sales volume for the fiscal year 2015/16 increased by 2.2% to 1,834,224 tonnes.
The Group’s Chocolate business grew by a strong 7.6% outperforming the overall weak global chocolate markets significantly. All regions and all the key growth drivers Outsourcing, Gourmet & Specialties and Emerging Markets contributed to this growth.
On the other hand, the Group deliberately phased out less profitable contracts in its Cocoa business, which in turn declined by –12.0%. This happened in alignment with the Group’s strategic focus on “smart growth” and generation of free cash flow.
Sales revenue significantly above prior year Sales revenue rose by 8.8% in local currencies (by 7.0% in CHF) to CHF 6,676.8 million, partly driven by a better product mix, as well as higher prices of ingredients which the Group largely passes on to its customers based on its cost plus business model.
0%
50%
100%
150%
200%
250%
300%
07 08 09 10 11 12 13 14 15 16
Cocoa beansMilk powderSugar worldSugar EU
Letter to Shareholders Overview Business Highlights Sustainability Financial Reports Governance
Financial Review
Barry Callebaut | Annual Report /
Improved Gross Profit Gross profit grew at a higher rate than volume growth, i.e. 4.4% in local currencies to CHF 863.2 million (+1.9% in CHF). This is the result of the strong margin development in the chocolate business due to the company’s greater focus on margins including product and customer mix, bolstered by the strong growth of the Gourmet & Specialties business. These positive effects outweighed the negative impact of the historically low combined cocoa ratio.
Continued discipline on fixed costs, with selective investments Marketing and sales expenses increased by 6.8% to CHF 129.5 million, which is mainly the result of the Group’s efforts undertaken to capture margin accretive growth in the Gourmet and Food manufacturers product groups, namely with specialties and decorations, as well as investments in select emerging markets.
General and administration expenses increased by 5.1% to CHF 332.8 million. This is partly the result of higher amortization expenses related to investments in processes and tools in recent years as well as continuous efforts related to quality and sustainability initiatives and the expansion in emerging markets.
Other income amounted to CHF 15.5 million compared to CHF 38.9 million in the prior year. This position contains non-sales-related income such as income from the Group’s Training Center, the sale of waste products, claims towards insurances and suppliers. The decrease versus prior year is mainly due to the recognition of part of the settlement of the dispute with Petra Foods related to the acquired Cocoa Ingredients business affecting prior-year comparables.
Other expense amounted to CHF 14.7 million com-pared to CHF 32.9 million in prior year. This position com-prises restructuring and severance costs, litigation, claims, impairment charges and some other non-recurring items. The decrease is due to reduced expenses for impairments, relocation and severance costs in light of the Group’s decision to centralize shared services in Europe and reor-ganize its Asian Cocoa business, which had affected the comparable number of prior year.
Operating income flat in local currencies Operating profit (EBIT) as anticipated was negatively affected by the challenging cocoa products market. It was flat 0.1% in local currencies (–3.2% in CHF) and amounted to CHF 401.7 million.
This is the result of the aforementioned strong growth, mix and profitability developments in the chocolate business on the one hand and the negative impact from the
historically low combined cocoa ratio mainly affecting the Group’s cocoa business on the other hand. EBIT per tonne declined by 2.0% in local currencies and amounted to CHF 219.
Net Profit affected by higher finance expense Finance income slightly increased and amounted to CHF 4.3 million (prior year CHF 3.7 million). Finance costs amounted to CHF 139.7 million, which corresponds to an increase of CHF 5.2 million mainly resulting from the ineffective part of the interest rate hedge related to the issue of the EUR 450 million Senior Notes in May 2016.
Income tax expenses increased to CHF 47.5 million, compared to CHF 44.3 million in prior year, despite a lower profit before tax. The Group’s effective tax rate increased to 17.8% (prior year: 15.6%), as the mix of taxable income was less favorable than in the prior year.
Net profit for the year decreased by –5.1% in local currencies (–8.7% in CHF) to CHF 219.0 million. This is the consequence of the lower EBIT and somewhat higher finance costs and tax expenses.
Consolidated Balance Sheet Total assets grew by 3.9% to CHF 5,640.8 million at the end of August 2016, compared to CHF 5,429.4 million the year before. The increase is mainly due to the combination of an increase of the cash position and of property, plant and equipment, partly compensated by lower receivables and derivative financial assets.
Net working capital decreased by CHF 155.5 million to CHF 1,374.2 million as of August 31, 2016, compared to CHF 1,529.7 million the year before. All main elements of working capital, i.e. inventory and derivatives, trade receivables and other current assets as well as trade payables and other current liabilities, contributed to the decrease. This is partly due to the increased focus on managing working capital, but partly also to the reduced availability of beans due to low crops in certain sourcing countries.
As a result, net debt decreased at August 31, 2016 from CHF 1,728.0 million to CHF 1,452.8 million. The weighted average maturity of the long-term debt (i.e. without any portion falling due in less than 12 months) increased from 4.8 to 6.9 years as a result of the issue of the EUR 450 million Senior Notes maturing in May 2024.
Equity – including equity attributable to the share-holders of the parent company and non-controlling interests – amounted to CHF 1,971.2 million, up CHF 184.1 million compared to the CHF 1,787.1 million at the end of August 2015. Equity attributable to the shareholders of
Letter to Shareholders Overview Business Highlights Sustainability Financial Reports Governance
Financial Review
Barry Callebaut | Annual Report /
the parent company amounted to CHF 1,956.3 million compared to last year’s CHF 1,772.8 million. The increase results from the net profit and a positive change in cumu-lative currency translation adjustments and cash flow hedging reserves. These effects were partly offset by the payout of a dividend to shareholders, the effects from the remeasurement of the defined benefit plans and movements related to the share plan and treasury shares.
Due to the aforementioned lower net debt and the higher equity, the debt-to-equity ratio improved from 97.5% to 74.3%. The solvency ratio increased from 32.7% to 34.7%. The return on invested capital (ROIC) slightly decreased to 9.5% from 9.8% in the prior year.
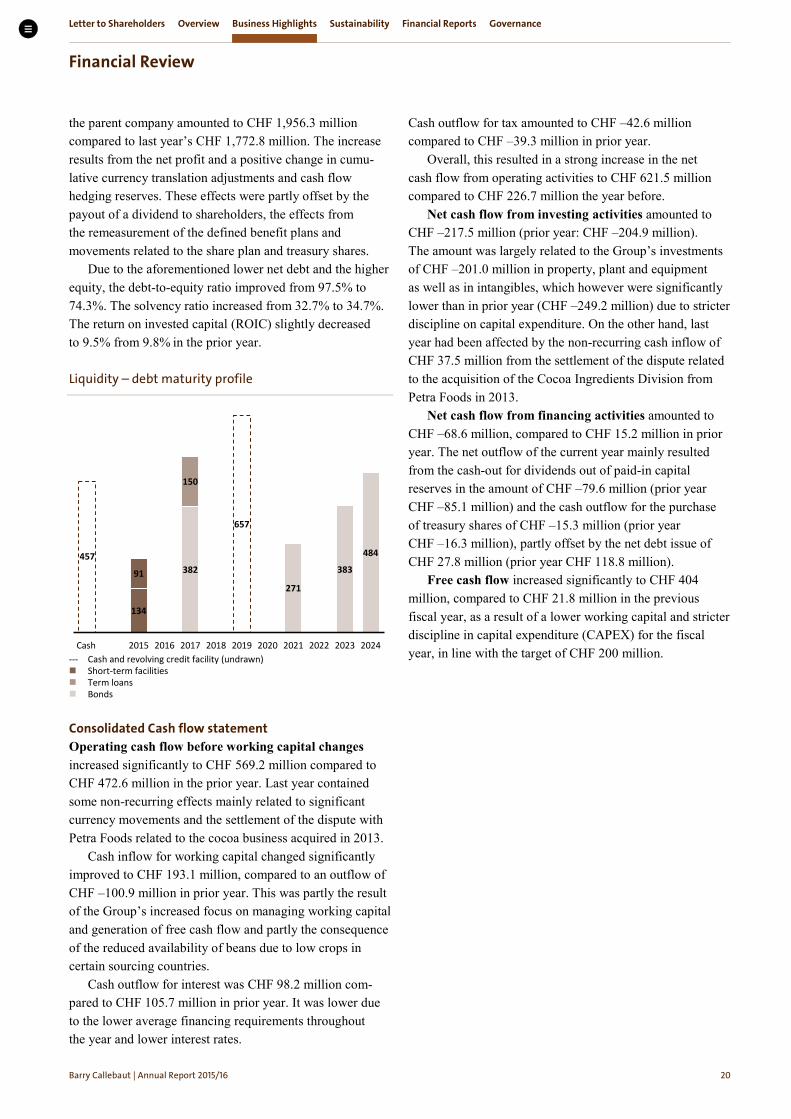
Liquidity – debt maturity profile
--- Cash and revolving credit facility (undrawn) Short-term facilities Term loans Bonds
Consolidated Cash flow statement Operating cash flow before working capital changes increased significantly to CHF 569.2 million compared to CHF 472.6 million in the prior year. Last year contained some non-recurring effects mainly related to significant currency movements and the settlement of the dispute with Petra Foods related to the cocoa business acquired in 2013.
Cash inflow for working capital changed significantly improved to CHF 193.1 million, compared to an outflow of CHF –100.9 million in prior year. This was partly the result of the Group’s increased focus on managing working capital and generation of free cash flow and partly the consequence of the reduced availability of beans due to low crops in certain sourcing countries.
Cash outflow for interest was CHF 98.2 million com-pared to CHF 105.7 million in prior year. It was lower due to the lower average financing requirements throughout the year and lower interest rates.
Cash outflow for tax amounted to CHF –42.6 million compared to CHF –39.3 million in prior year.
Overall, this resulted in a strong increase in the net cash flow from operating activities to CHF 621.5 million compared to CHF 226.7 million the year before.
Net cash flow from investing activities amounted to CHF –217.5 million (prior year: CHF –204.9 million). The amount was largely related to the Group’s investments of CHF –201.0 million in property, plant and equipment as well as in intangibles, which however were significantly lower than in prior year (CHF –249.2 million) due to stricter discipline on capital expenditure. On the other hand, last year had been affected by the non-recurring cash inflow of CHF 37.5 million from the settlement of the dispute related to the acquisition of the Cocoa Ingredients Division from Petra Foods in 2013.
Net cash flow from financing activities amounted to CHF –68.6 million, compared to CHF 15.2 million in prior year. The net outflow of the current year mainly resulted from the cash-out for dividends out of paid-in capital reserves in the amount of CHF –79.6 million (prior year CHF –85.1 million) and the cash outflow for the purchase of treasury shares of CHF –15.3 million (prior year CHF –16.3 million), partly offset by the net debt issue of CHF 27.8 million (prior year CHF 118.8 million).
Free cash flow increased significantly to CHF 404 million, compared to CHF 21.8 million in the previous fiscal year, as a result of a lower working capital and stricter discipline in capital expenditure (CAPEX) for the fiscal year, in line with the target of CHF 200 million.
457382
271
484
383
134
150
657
91
Cash 2015 2016 2017 2018 2019 2020 2021 2022 2023 2024

Letter to Shareholders Overview Business Highlights Sustainability Financial Reports Governance
Financial Review
Barry Callebaut | Annual Report /
+4.5% +4.6% +4.2% +4.0%+3.0%
Investments – CAPEX Capital expenditure reflected in the cash flow statement amounted to CHF –201.0 million (fiscal year 2014/15: CHF –249.2 million). The Group aims to continue its path of being more restrictive regarding the hurdles for approving CAPEX in the future. Capital expenditure
CAPEX as % of sales revenue Average = 4.1%
in CHF million Outlook The Group will continue to focus on the further imple-mentation of its “smart growth” strategy. There is good visibility on volume growth and expects to see a positive contribution in profitability from the Cocoa Leadership project, supported by some recent recovery in the cocoa products market. On this basis, the Group confirms its three-year guidance: On average 4–6% volume growth and EBIT growth on average above volume growth in local currencies, barring any major unforeseen events. Investors information Stock markets during the period from September 2015 until August 2016 were influenced by investor concerns over a perceived impending end to the US Federal Reserve policy of quantitative easing, along with the continued low oil prices, which decelerated investment in emerging markets, causing resonating negative global financial effects. Other issues include China devaluing its currency, as well as the Brexit referendum in which UK voters chose to leave the European Union.
Barry Callebaut share performance Barry Callebaut shares traded at CHF 1,264 at the end of August 2016, +19.1% above the previous year’s closing price, thus outperforming the European and Swiss indices during the same period. Euro Stoxx gained +5.0%, Swiss SPI declined –4.3% and SMIM +6.6%.
On June 24, 2016, Swiss stocks fell sharply and the franc increased in strength as a result of the Brexit referendum. Stocks in the US and most of Europe fell sharply immediately after the referendum, but they rebounded almost as quickly.
Our stock also followed the general trend, but started to outperform the relevant indices as of April, thanks to a good set of half-year results and progress made on cash flow generation and concluded the fiscal year with a positive performance. Barry Callebaut’s market capitalization amounted to CHF 6,937.9 million as of August 31, 2016.
The chart below illustrates the long-term performance of Barry Callebaut shares compared to the relevant indices (2006–2016):
Share price development Barry Callebaut vs. indices
Over a ten-year period (2006–2016), the long-term perfor-mance of Barry Callebaut shares (+128.2%) clearly exceeds the returns for the Swiss indices (SPI +35.7% and SMIM +40.4%) and the Euro Stoxx Food & Beverages (+118.9%).
0%
25%
50%
75%
100%
125%
150%
175%
200%
225%
250%
2006 2007 2008 2009 2010 2011 2012 2013 2014 2015 2016
Barry CallebautSwiss Market Index Mix-Cap (SMIM)Swiss Perfomance Index (SPI)Euro Stoxx Food & Beverage Index
218 224249 249
201
2011/12 2012/13 2013/14 2014/15 2015/16
Additional growthITUpgrade/efficiency gains existing sitesMaintenance CAPEX

Letter to Shareholders Overview Business Highlights Sustainability Financial Reports Governance
Financial Review
Barry Callebaut | Annual Report /
Dividend The Board of Directors will propose a payout to share-holders of CHF 15.50 per share at the Annual General Meeting of Shareholders on December 7, 2016. This represents an increased ratio of 39% of the net profit. The proposal foresees that the payout will be effected through a dividend payment partly from reserves from capital contributions (CHF 4.19 per share) and partly in the form of a capital repayment by way of par value reduction (CHF 11.31 per share). The distribution of these funds to shareholders will not be subject to withholding tax and – for individuals who are taxed in Switzerland and hold the shares privately – income tax. The dividend will be paid to shareholders on March 2, 2017, subject to approval by the Annual General Meeting of Shareholders. Key share data The share capital of Barry Callebaut AG as of August 31, 2016 amounted to CHF 102,092,759 consisting of 5,488,858 fully paid-in shares with a nominal value of CHF 18.60 each. There is one single class of shares in which every share has the same voting power and grants the same entitlement to dividends.
The free float, excluding the majority shareholders (Jacobs Holding and Renata Jacobs) at the end of August 2016 was 41% with the majority of the institutional shareholders based in Switzerland, followed by the US, UK, Norway and other countries.
Ownership structure August 2016
Country split of institutional shareholders
Analyst recommendations Currently, 12 financial analysts regularly cover Barry Callebaut. At the end of fiscal year 2015/16, 67% recommended to hold our shares, 25% had a sell recommendation and 8% a buy recommendation. At the end of August 2016, the average target price according to consensus estimates was CHF 1,099. Credit rating Barry Callebaut has active relationships with Standard & Poor’s and Moody’s, current ratings are:
Standard & Poor’s: BB+/Stable & Moody’s: Ba1/Stable.
50.1%
8.5%3.6%
37.8%Jacobs Holding AGRenata JacobsMassachusetts Mutual Life Insurance CompanyOther
82%
10%
3%2% 3%Switzerland
United StatesUnited KingdomNorwayOther

Letter to Shareholders Overview Business Highlights Sustainability Financial Reports Governance
Business Review | Region EMEA
Barry Callebaut | Annual Report /
Strong growth across the Region Region EMEA delivered a solid performance with well above market volume growth in both the Food Manufacturers and the Gourmet businesses in Western as well as Eastern Europe.
The European chocolate confectionery market still declined by 1.2%1, showing some signs of recovery in the last quarter confirming that consumption is generally picking up again.
Our sales volume in Region EMEA (Europe, Middle East, Africa) increased by +6.6% to 814,236 tonnes.
In Western Europe, sales volume growth was strong in the Food Manufacturers business, especially in Germany, the British Isles and the Netherlands, as well as in Gourmet. Beverages increased by more than a third, positively impacted by the successfully completed integration of FrieslandCampina Kievit. Furthermore, we opened our first Van Houten™ Beverage Academy center in Kageröd, Sweden, a center of expertise offering customers specialized services for chocolate, cocoa and all powder-based beverage products.
In EEMEA (Eastern Europe, Middle East, Africa), sales volume with Food Manufacturers grew significantly, driven by Turkey and Russia and many new customer wins, in contrast to a difficult economic environment. Strong growth also was seen in Gourmet, with increased sales under the Gourmet brand Callebaut®.
Sales revenue was up +9.7% in local currencies (+6.8% in CHF) to CHF 2,739.0 million due to higher raw material prices and the sale of higher value-added products. The Gourmet & Specialties business again achieved solid volume growth, driven by new product launches, new pack-aging, entering new categories such as chocolate drinks, thus outperforming the Food Service market.
Operating profit (EBIT) for the Region increased by +4.4% in local currencies (–0.1% in CHF) to CHF 289.5 million, fuelled by a strong product mix and more sales of margin-accretive specialties and decorations products.
Source: Nielsen, September – August .

Letter to Shareholders Overview Business Highlights Sustainability Financial Reports Governance
Business Review | Region EMEA
Barry Callebaut | Annual Report /
As an extension of the existing strategic partnership with Mondelēz International, we announced our intention to acquire and integrate their chocolate production facility in Halle, Belgium, in our network in September 2016. This transaction also includes a long-term agreement to supply
Mondelēz International with an additional 30,000 tonnes of liquid chocolate per annum. The expected closing of the transaction is by the end of December 2016, after completing works council consultations.
Sales Volume per Region Sales Volume EBIT
factories
EMEA Americas Asia Pacific Global Cocoa
In tonnes in CHF m
Sales Volume
EBIT
Key figures for Region EMEA
Change % 2015/16 2014/15
in local
currencies in CHF
Sales volume Tonnes 6.6% 814,236 763,646 Sales revenue CHF m 9.7% 6.8% 2,739.0 2,563.7 EBITDA CHF m 5.4% 1.1% 334.2 330.5 Operating profit (EBIT) CHF m 4.4% (0.1%) 289.5 289.7
44%
0
50
100
150
200
250
300
350
0
150,000
300,000
450,000
600,000
750,000
2011/12 2012/13 2013/14 2014/15 2015/16
Letter to Shareholders Overview Business Highlights Sustainability Financial Reports Governance
Business Review | Region Americas
Barry Callebaut | Annual Report /
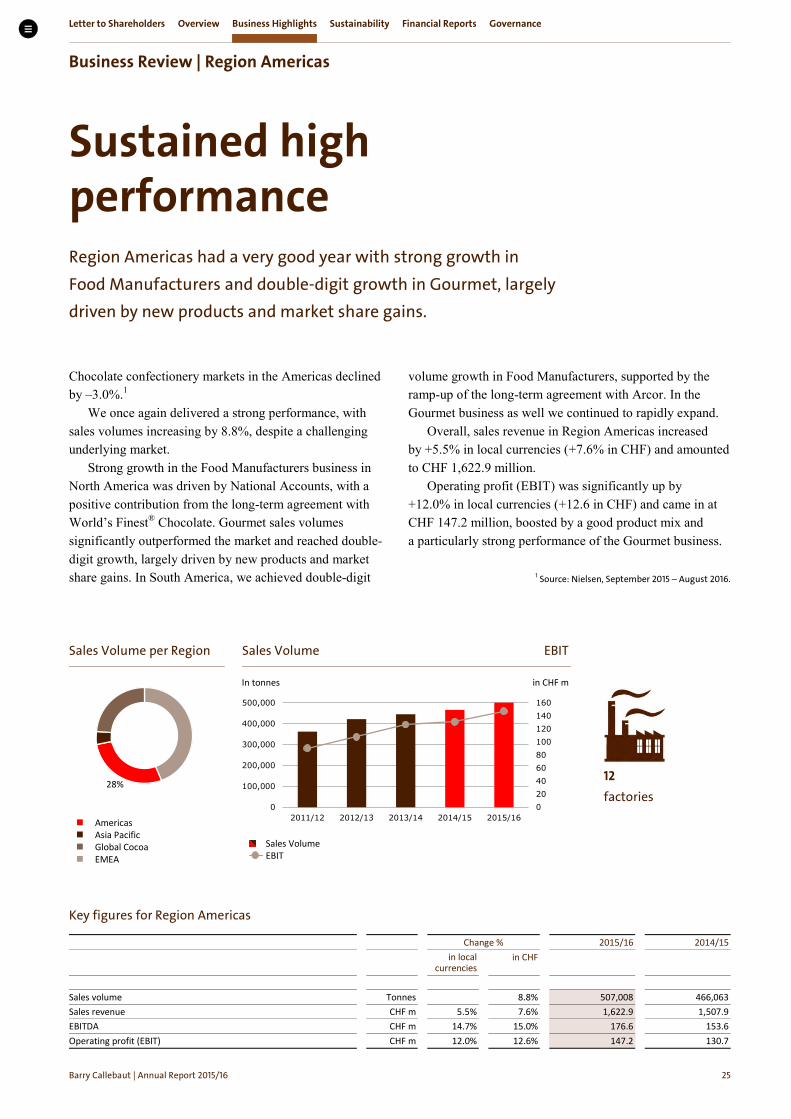
Sustained high performance Region Americas had a very good year with strong growth in Food Manufacturers and double-digit growth in Gourmet, largely driven by new products and market share gains.
Chocolate confectionery markets in the Americas declined by –3.0%.1
We once again delivered a strong performance, with sales volumes increasing by 8.8%, despite a challenging underlying market.
Strong growth in the Food Manufacturers business in North America was driven by National Accounts, with a positive contribution from the long-term agreement with World’s Finest® Chocolate. Gourmet sales volumes significantly outperformed the market and reached double-digit growth, largely driven by new products and market share gains. In South America, we achieved double-digit
volume growth in Food Manufacturers, supported by the ramp-up of the long-term agreement with Arcor. In the Gourmet business as well we continued to rapidly expand.
Overall, sales revenue in Region Americas increased by +5.5% in local currencies (+7.6% in CHF) and amounted to CHF 1,622.9 million.
Operating profit (EBIT) was significantly up by +12.0% in local currencies (+12.6 in CHF) and came in at CHF 147.2 million, boosted by a good product mix and a particularly strong performance of the Gourmet business.
Sales Volume per Region Sales Volume EBIT
factories
Americas Asia Pacific Global Cocoa EMEA
In tonnes in CHF m
Sales Volume
EBIT
Key figures for Region Americas
Change % 2015/16 2014/15
in local
currencies in CHF
Sales volume Tonnes 8.8% 507,008 466,063 Sales revenue CHF m 5.5% 7.6% 1,622.9 1,507.9 EBITDA CHF m 14.7% 15.0% 176.6 153.6 Operating profit (EBIT) CHF m 12.0% 12.6% 147.2 130.7
28%
Source: Nielsen, September – August .
020406080100120140160
0
100,000
200,000
300,000
400,000
500,000
2011/12 2012/13 2013/14 2014/15 2015/16
Letter to Shareholders Overview Business Highlights Sustainability Financial Reports Governance
Business Review | Region Asia Pacific
Barry Callebaut | Annual Report /
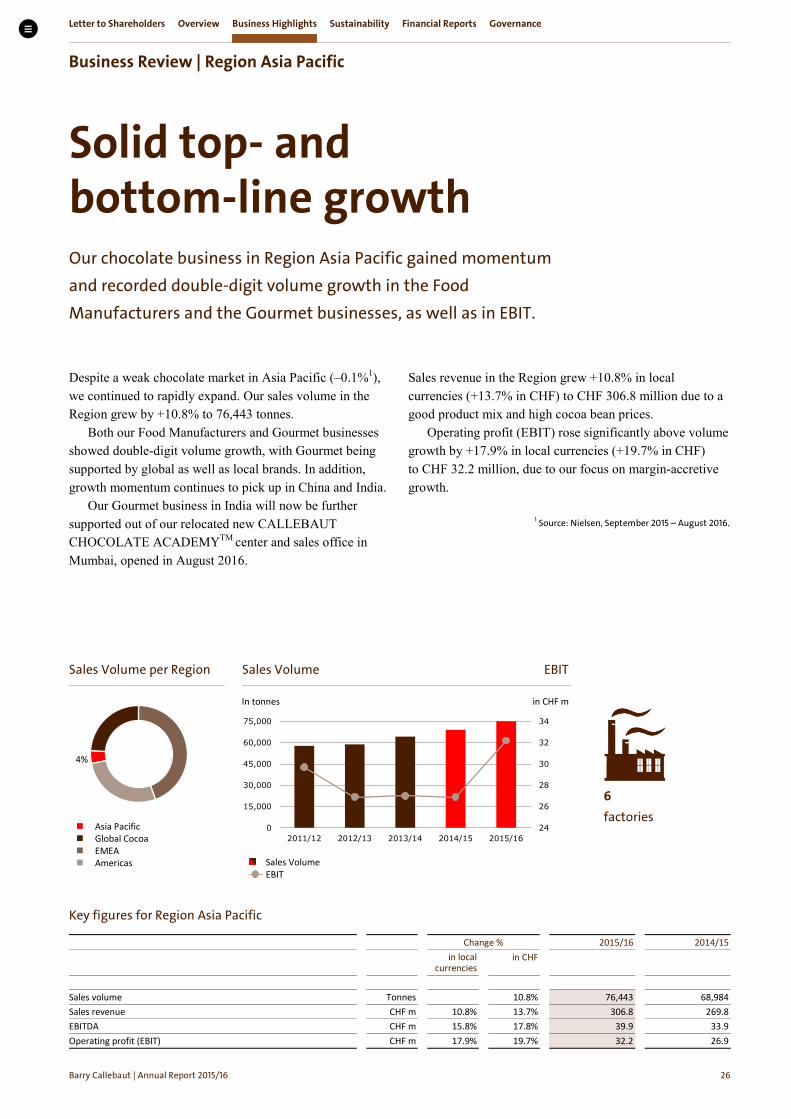
Solid top- and bottom-line growth Our chocolate business in Region Asia Pacific gained momentum and recorded double-digit volume growth in the Food Manufacturers and the Gourmet businesses, as well as in EBIT.
Despite a weak chocolate market in Asia Pacific (–0.1%1), we continued to rapidly expand. Our sales volume in the Region grew by +10.8% to 76,443 tonnes.
Both our Food Manufacturers and Gourmet businesses showed double-digit volume growth, with Gourmet being supported by global as well as local brands. In addition, growth momentum continues to pick up in China and India.
Our Gourmet business in India will now be further supported out of our relocated new CALLEBAUT CHOCOLATE ACADEMYTM center and sales office in Mumbai, opened in August 2016.
Sales revenue in the Region grew +10.8% in local currencies (+13.7% in CHF) to CHF 306.8 million due to a good product mix and high cocoa bean prices.
Operating profit (EBIT) rose significantly above volume growth by +17.9% in local currencies (+19.7% in CHF) to CHF 32.2 million, due to our focus on margin-accretive growth.
Sales Volume per Region Sales Volume EBIT
factories
Asia Pacific Global Cocoa EMEA Americas
In tonnes in CHF m
Sales Volume EBIT
Key figures for Region Asia Pacific
Change % 2015/16 2014/15
in local
currencies in CHF
Sales volume Tonnes 10.8% 76,443 68,984 Sales revenue CHF m 10.8% 13.7% 306.8 269.8 EBITDA CHF m 15.8% 17.8% 39.9 33.9 Operating profit (EBIT) CHF m 17.9% 19.7% 32.2 26.9
Source: Nielsen, September – August .
4%
24
26
28
30
32
34
0
15,000
30,000
45,000
60,000
75,000
2011/12 2012/13 2013/14 2014/15 2015/16

Letter to Shareholders Overview Business Highlights Sustainability Financial Reports Governance
Business Review | Global Cocoa
Barry Callebaut | Annual Report /
Intentional phase-out of less profitable contracts In response to a historically weak cocoa products market and to fully leverage our global scale in cocoa, we continued to adapt our business model through the Cocoa Leadership project.
In light of a still challenging cocoa products market and while focusing on higher internal demand to support the strong growth of our chocolate business, we continued to intentionally phase out less profitable cocoa contracts. This led to a decline in our third-party sales volume of –12.0% to 436,537 tonnes.
Sales revenue grew by +10.1% in local currencies (+5.7% in CHF) to CHF 2,008.1 million.
As anticipated in November 2015, the challenging market environment for cocoa products and the historically low combined cocoa ratio had a significant negative impact on profitability. Operating profit (EBIT) declined by 60.3% in local currencies (–62.5% in CHF) to CHF 17.7 million.
In response to the historically weak cocoa products market and to fully leverage our global scale in cocoa, we continued to adapt our business model through the multi-year Cocoa Leadership project, which will allow us to bring our cocoa business to the next level.
The implementation of the Cocoa Leadership project made good progress around the following three focal points:
Optimizing our operations: We optimized our cocoa manufacturing footprint by closing a cocoa factory in Thailand in early 2016 and reducing production capacity in Malaysia in November 2015, introduced a more competitive direct sourcing model and worked on more efficient product flows and optimal stock levels.
Leveraging our global scale: We centralized the combined ratio management, with a new organization and governance in place, and upgraded our market intelligence in order to anticipate the trends.
Driving Commercial Excellence: We sharpened our focus on customers and product applications, introduced a new pricing model and reduced the number of stock keeping units (SKUs) by 25%.

Letter to Shareholders Overview Business Highlights Sustainability Financial Reports Governance
Business Review | Global Cocoa
Barry Callebaut | Annual Report /
Raw material price developments The 2015/16 cocoa crop dropped compared to the prior year due to weak crops, in particular in Côte d’Ivoire and Brazil. London market trading was volatile, rallying approximately 27% from the low at the beginning of February 2016 to a level above GBP 2,500 in June, a price level last seen in the 1970’s. A large part of this increase, however, was currency-driven as the Brexit referendum led to a depreciation of 12% in the British pound against the US-dollar. Overall demand remained relatively weak, but this did not entirely offset the decline in supply. Therefore, the overall season ended with a considerable deficit.
The combined cocoa ratio, which was at a historical low over the course of the fiscal year, due to significant oversupply coupled with weak demand and high cocoa bean
prices, has recently recovered, albeit with regional differences.
After five years of a downward trend, the world sugar market reversed strongly to reach its highest level since 2012 on the basis of a world deficit and an all-time record net long position of the Funds. Prices in Europe have also recovered, vigorously supported by historically low EU stocks as well as supportive world sugar prices.
At the beginning of the fiscal year, milk powder prices moved up due to fears of drought and a bit more demand on the world market. Towards the second half of the fiscal year, prices started dropping to record low levels as production was outpacing demand by far. They have recently bounced back as low milk prices to farmers are leading to high slaughter rates and a rapid reduction of production volumes.
Key figures for Global Cocoa
Change % 2015/16 2014/15
in local
currencies in CHF
Sales volume Tonnes (12.0%) 436,537 496,089 Sales revenue CHF m 10.1% 5.7% 2,008.1 1,900.5 EBITDA CHF m (27.0%) (28.9%) 71.3 100.3 Operating profit (EBIT) CHF m (60.3%) (62.5%) 17.7 47.2
Sales Volume per Region Sales Volume EBIT
factories
Global Cocoa EMEA Americas Asia Pacific
In tonnes in CHF m
Sales Volume
EBIT
24%
0
20
40
60
80
100
0
100,000
200,000
300,000
400,000
500,000
2011/12 2012/13 2013/14 2014/15 2015/16
Letter to Shareholders Overview Business Highlights Sustainability Financial Reports Governance
Sustainability
Barry Callebaut | Annual Report /
Our Approach
Sustainable Cocoa
Environmental Protection
Employee Development

Letter to Shareholders Overview Business Highlights Sustainability Financial Reports Governance
Our Approach
Barry Callebaut | Annual Report /
Preparing to scale up sustainability Environmental and social challenges in our supply chain make sustainable business a conditio sine qua non for future growth.
A variety of sustainability challenges, such as global warming, decreasing cocoa yields, aging and impoverished farmers, require the chocolate industry to make sustain-ability a core value of its business model in order to safeguard chocolate production in the coming decades. In 2015, governments concluded two landmark agreements, the United Nations Sustainable Development Goals and the Paris Agreement on climate change. We will use both agreements as a guide in our efforts to further integrate sustainability into our business.
Sustainability is embedded in our company’s growth strategy, alongside Expansion, Innovation, and Cost Leadership, as well as in the “smart growth” execution of this strategy. In 2015/16, we made good progress on all three pillars of our sustainability strategy: sustainable cocoa, the environment and our employees. This has given Barry Callebaut a solid footing from which it can take the lead and scale up sustainable chocolate production from niche to norm. This is our vision for the coming years.
Barry Callebaut believes that cocoa production is sustainable when farmers earn an equitable income; engage in responsible labor practices; safeguard the environment; and can provide for the basic health and education needs and well-being of their families. Traceability of the cocoa bean will be a core prerequisite for bringing this vision to life. The Katchilè geo-traceability project is an important milestone in this respect. This App will digitally record information on farmers, their farms and their communities at every level of the supply chain. We will be rolling this App out across 65,000 farmers in Côte d’Ivoire, allowing Barry Callebaut to approach sustainability in an unprece-dented way, providing the right advice to farmers, driving adoption of best practices, and improving yields and livelihoods. The piloting of the Child Labor Monitoring and Remediation System (CLMRS) will start to provide us with a much more targeted on-the-ground monitoring and remediation system for child labor incidents.
Cocoa Horizons is the key offering of sustainably sourced cocoa and chocolate products, together with external certification sources such as UTZ Certified, Rainforest Alliance, Fairtrade and Organic. In 2015/16, 23% of cocoa beans were sourced through sustainability programs.
The Cocoa Horizons Foundation, celebrating its 1-year anniversary in 2016, which is pooling resources and funds from the purchase of HORIZONS products and contri-butions from donors and customers, aims to scale impact and drive positive change in cocoa communities. This year we will continue to invest in farmer financing programs and in social infrastructure for cocoa-growing communities.
We are proud that Barry Callebaut’s long-term commitment to sustainability is also acknowledged by external organizations. Since September 19, 2016, we have been part of the SXI Switzerland Sustainability 25® index basket. This index brings together the 25 most sustainable listed Swiss companies.
Letter to Shareholders Overview Business Highlights Sustainability Financial Reports Governance
Sustainable Cocoa
Barry Callebaut | Annual Report /
Continuing to drive cocoa sustainability Farmer productivity and community development are the key pillars of our sustainable cocoa strategy. To scale up sustainability, we will have to move from sustainable cocoa to sustainable chocolate in the coming years, integrating sustainability commitments for every ingredient used in our chocolate.
Traceability Understanding from which area and farmer we are sourcing, “traceability” is a key parameter in assessing the quality of yields and production methods. In addition, it also allows us to tackle sustainability challenges such as deforestation and child labor in the cocoa supply chain in a much more targeted manner. This year, we started to roll out a farm data management system, project Katchilè, across 65,000 farmers in Côte d’Ivoire. This cloud-based data management system allows us to be in contact with farmers in near real-time, offering an unprecedented level of transparency in the sourcing of our cocoa beans. In the coming years we will be extending this tool across Ghana, Tanzania and Indonesia. Increasing cocoa farmer productivity In 2015/16, we sourced from over 45,000 farmers through Biolands, our direct sourcing and farm services organiza-tion. Biolands allows us to engage with farmers and support them by providing training, fertilizers, services, and assis-tance in the production of certified cocoa.
We work with farmer cooperatives to implement cocoa sustainability programs. This year, we trained over 115,000 farmers. This included over 10,000 women farmers.
Together with the Jacobs Foundation, we will invest CHF 2.2 million through 2019 in cocoa farmer training programs in Côte d’Ivoire. The programs will focus on training farmers in 80 cocoa-growing communities in agricultural practices that will increase the cocoa yield, and thus the income, of the cocoa farmer. A special focus will be put on providing training to currently underrepresented
groups in cocoa farming, in particular young farmers and female farmers.
In Madagascar, we teamed up with Prova to diversify and stabilize the incomes of vanilla farmers by introducing cocoa production. Through the introduction of good agricultural practices, the aim is to increase the levels of vanilla yields as well as to support Madagascan farmers in the Bemanevika district to add cocoa to their farms.
Community building Thriving communities are as important for tackling environmental and social challenges in the cocoa supply chain as farmer productivity. The existence of child labor, low yields and the absence of adequate financial and social infrastructure are directly related to poverty and lack of education. Without the adequate infrastructure, the existing problems will be perpetuated. We focus on the building of financial and social infrastructure.
A solid financial infrastructure, creating access to loans for farmers, is an important pillar in community building. Barry Callebaut, together with IFC, a member of the World Bank Group, and Netherland’s Sustainable Trade Initiative IDH entered into a USD 9 million risk-sharing agreement to help more than 100,000 smallholder farmers in Côte d’Ivoire access credit needed to grow their production and earnings. Together, we will support farmers to purchase fertilizers, access farm services and individual coaching. As farmers increase production, they establish a financial track record and thus become bankable, making it possible for local financial institutions to provide loans directly to them – a giant leap forward in cocoa farm financing.

Letter to Shareholders Overview Business Highlights Sustainability Financial Reports Governance
Sustainable Cocoa
Barry Callebaut | Annual Report /
Tackling child labor We invest in both the prevention of child labor as well as the monitoring and remediation of any child labor incident in our supply chain.
Together with the International Cocoa Initiative (ICI), we started in 2016 with the piloting of a Child Labor Monitoring and Remediation System (CLMRS) across over 5,000 farmers in Côte d’Ivoire. Facilitators on the ground
work with communities to track and remediate child labor, as well as pinpoint the factors that contribute to it.
Child labor prevention is included in the curriculum of the 115,000 farmers we trained on cocoa sustainability. We continue to invest in school infrastructure. We built one new school and extended the classrooms of three existing schools in Ghana and Côte d’Ivoire. This allowed an additional 765 children to continue their education.

Letter to Shareholders Overview Business Highlights Sustainability Financial Reports Governance
Environmental Protection
Barry Callebaut | Annual Report /
Towards a positive impact on the environment Barry Callebaut continues to make progress in reducing its environmental footprint. The next step is to have a positive impact on the environment.
Barry Callebaut initiated in 2016 a project to measure the carbon footprint of chocolate, as well as our own environmental footprint. The results of this exercise will help us to recalibrate the targets that we set in the past. Merely reducing our carbon and environmental footprint is not good enough anymore. In the coming years, we need to explore how we can actually have a positive impact on the environment. Embedding energy efficiency in the business In 2015/16, our energy use was 297.92 kWh per tonne of production (MT).
This marks a good first step towards our 5-year, 20% energy reduction target (by 2020), as we decreased our energy use by 5.2% from the previous fiscal year.
We increased the global share of renewable energy in our operations by 6% to 23% of our total energy use. 41% of the electricity we use came from renewable sources. This is a 15% increase compared to the previous fiscal year. In fiscal year 2015/16, we appointed an energy champion at more than 75% of our production facilities who will lead on-site energy savings measures. We intend to introduce an energy champion system at all our sites.
Managing our carbon footprint In 2015/16, we emitted 295,089 tonnes CO2 across our global operations. This is a decrease of more than 10% compared to last year.
The mapping of the carbon footprint of our chocolate will allow us to put in place more targeted measures to reduce our carbon footprint over the years, and eventually become carbon positive through the in- and offsetting of our carbon footprint.
We are very proud to have been awarded the 2016 Carbon Disclosure Project (CDP) Climate Leadership Award as one of the best improvers for Germany, Austria and Switzerland.
Managing our water and waste footprint We managed, while growing in activity, to reduce our relative water usage to 0.5 m3 per tonne of production. This is a reduction of 5.6% compared to the previous fiscal year. We reduced our total water footprint by 0.07 million m3 water, to 2.25 million m3 water. Despite rising production volumes, we managed to keep our waste per unit of output unchanged.

Letter to Shareholders Overview Business Highlights Sustainability Financial Reports Governance
Employee Development
Barry Callebaut | Annual Report /
Investing in talent Helping our employees to reach their full potential
We now employ close to 10,000 employees from 70 nation-alities. Attracting the best talents from across the world is the basis for our company to prosper and grow.
We aim to offer a safe, engaging and collaborative workplace for our people, as well as the development and career growth opportunities they need to reach their full potential.
Supporting in-house talent development Our talent management process helps employees to focus on – and prepare for – the next step in their career. By focusing on internal candidates first, we aim to create the space for our employees to grow.
In 2015/16, we filled 40% of our vacant managerial positions with internal candidates.
Across the organization, we offer a wealth of training programs. These include technical and on-the-job skills development, as well as quality, health and safety courses. In fiscal year 2015/16, 338 managers and other professional associates took part in one of our Marbach talent and management development programs conducted in Germany, Singapore, and the United States.
Developing tomorrowʼs leaders The two-year Graduate Trainee Program Yourfuture@BC recruits and develops young top college graduates from around the world, with a focus on emerging markets. In 2015/16, there were 24 graduate trainees, bringing the total to 103 graduates from 32 nationalities since the program began. Promoting fair labor Barry Callebaut is committed to providing equal employ-ment and promotion opportunities to all employees. This is enshrined in our workplace policy.
Throughout our organization, we support freedom of association in line with local laws and regulations. More than 52% of all permanent contract employees are covered by a union or collective bargaining agreement. All Barry Callebaut employees are aged 16 or more and earn the minimum wage or more where one is defined.
Focus on Social and Ethical Responsibility We are fully committed to contribute to a working environment where business is conducted with integrity and in a manner which embraces sustainability, reduces environmental impact and where employees feel fully engaged and supported.
Barry Callebaut is a member of SEDEX (Supplier Ethical Data Exchange), the largest collaborative platform for sharing ethical supply chain data. Its main product is an online database allowing supply chain companies to share information on labor standards, health and safety, the environment, and business ethics. This is based on the SMETA audit methodology.
All our factories are SEDEX certified and more than 20 have been audited this year.
Health and safety We are continuously working towards preventing injuries to any employee, contractor or visitor.
Every Barry Callebaut plant has appointed a health and safety officer to coordinate the implementation of safety plans.
In fiscal year 2015/16, our rates of injury, occupational disability, lost days and absenteeism were low. The injury frequency rate was 10.6 accidents per million hours worked. The severity rate was 0.17 lost days per thousand hours worked. Through the safety programs at each plant, we aim to continue reducing accidents and injuries across our business.
We encourage our employees to live a healthy active lifestyle. In origin countries, we provide HIV/AIDS education to employees and their families.

Letter to Shareholders Overview Business Highlights Sustainability Financial Reports Governance
Employee Development
Barry Callebaut | Annual Report /
Employee benefits in origin countries Barry Callebaut supports employees with services, support programs and benefits. In cocoa-growing countries where medical care and education are not universally available, our programs support a broad range of services, including medical care, housing, and education.
We also encourage employees to engage in their local communities and recognize their outstanding achievements through the Chairman’s Award.
Average seniority by geographic region in year
2015/16 Africa 7.0 Americas 8.2 Asia 4.8 EMEA 10.7
Employees per geographic region
EMEA 4,135 Americas 2,661 Asia 1,773 Africa 1,329 Number of employees 9,898
Employees per function
Management 906 Office 3,120 Production 5,872 Number of employees 9,898
Gender of employees by function
Female Male
Age of employees by function
< 30 30–50 > 50
42%
27%
18%
13% 9%
32%
59%
0
1000
2000
3000
4000
5000
6000
0
1000
2000
3000
4000
5000
6000

Letter to Shareholders Overview Business Highlights Sustainability Financial Reports Governance
Financial Reports
Barry Callebaut | Annual Report /
Consolidated Financial Statements
Financial Statements of Barry Callebaut AG

Letter to Shareholders Overview Business Highlights Sustainability Financial Reports Governance
Consolidated Financial Statements
Barry Callebaut | Annual Report /
Consolidated Income Statement
for the fiscal year 2015/16 2014/15 in thousands of CHF Notes Revenue from sales and services 6,676,766 6,241,865 Cost of goods sold (5,813,556) (5,395,039) Gross profit 863,210 846,826 Marketing and sales expenses (129,525) (121,299) General and administration expenses (332,758) (316,699) Other income 6 15,466 38,909 Other expenses 7 (14,699) (32,916) Operating profit (EBIT) 401,694 414,821 Finance income 8 4,314 3,741 Finance costs 9 (139,708) (134,477) Share of result of equity-accounted investees, net of tax 17 191 55 Profit before income taxes 266,491 284,140 Income tax expenses 10 (47,530) (44,269) Net profit for the year 218,961 239,871
of which attributable to: shareholders of the parent company 217,050 237,214 non-controlling interest 25 1,911 2,657
Earnings per share Basic earnings per share (CHF/share) 11 39.57 43.25 Diluted earnings per share (CHF/share) 11 39.43 43.07

Letter to Shareholders Overview Business Highlights Sustainability Financial Reports Governance
Consolidated Financial Statements
Barry Callebaut | Annual Report /
Consolidated Statement of Comprehensive Income
for the fiscal year 2015/16 2014/15 in thousands of CHF Notes Net profit for the year 218,961 239,871 Cash flow hedges 26 19,824 (2,507) Tax effect on cash flow hedges 26 3,957 (379) Currency translation differences 51,074 (154,192) Items that may be reclassified subsequently to the income statement 74,855 (157,078) Remeasurement of defined benefit plans 24 (32,638) (7,857) Tax effect on remeasurement of defined benefit plans 7,108 475 Items that will never be reclassified to the income statement (25,530) (7,382) Other comprehensive (loss)/income for the year, net of tax 49,325 (164,460) Total comprehensive income for the year 268,286 75,411
of which attributable to: shareholders of the parent company 266,086 72,857 non-controlling interest 2,200 2,554

Letter to Shareholders Overview Business Highlights Sustainability Financial Reports Governance
Consolidated Financial Statements
Barry Callebaut | Annual Report /
Consolidated Balance Sheet
Assets as of August 31, 2016 2015 in thousands of CHF Notes Current assets Cash and cash equivalents 456,800 125,151 Short-term deposits 50 2,177 Trade receivables and other current assets 12 928,776 971,923 Inventories 13 1,623,807 1,629,814 Income tax receivables 12,099 16,273 Derivative financial assets 14 318,303 498,514 Total current assets 3,339,835 3,243,852 Non-current assets Property, plant and equipment 15 1,262,227 1,184,543 Equity-accounted investees 17 627 950 Intangible assets 18 927,289 896,068 Deferred tax assets 19 105,916 98,782 Other non-current assets 4,909 5,193 Total non-current assets 2,300,968 2,185,536 Total assets 5,640,803 5,429,388
Liabilities and equity as of August 31, 2016 2015 in thousands of CHF Notes Current liabilities Bank overdrafts 20 25,314 33,266 Short-term debt 20 731,340 645,907 Trade payables and other current liabilities 21 1,145,481 1,060,965 Income tax liabilities 44,519 43,759 Derivative financial liabilities 14 310,368 453,694 Provisions 22 18,874 9,333 Total current liabilities 2,275,896 2,246,924 Non-current liabilities Long-term debt 23 1,153,027 1,176,159 Employee benefit obligations 24 176,531 149,289 Provisions 22 5,475 4,474 Deferred tax liabilities 19 53,711 59,629 Other non-current liabilities 4,952 5,799 Total non-current liabilities 1,393,696 1,395,350 Total liabilities 3,669,592 3,642,274 Equity Share capital 25 102,093 102,093 Retained earnings and other reserves 1,854,194 1,670,750 Total equity attributable to the shareholders of the parent company 1,956,287 1,772,843 Non-controlling interest 25 14,924 14,271 Total equity 1,971,211 1,787,114 Total liabilities and equity 5,640,803 5,429,388

Letter to Shareholders Overview Business Highlights Sustainability Financial Reports Governance
Consolidated Financial Statements
Barry Callebaut | Annual Report /
Consolidated Cash Flow Statement
Cash flows from operating activities for the fiscal year 2015/16 2014/15 In thousands of CHF Notes Profit before income taxes 266,491 284,140 Adjustments for:
Depreciation of property, plant and equipment 15 97,666 90,796 Amortization of intangible assets 18 40,071 35,192 Impairment of property, plant & equipment 15 – 11,849 Impairment of intangible assets 18 678 492 Gain on acquisition-related settlement 1 – (37,490) Loss/(gain) on sale of property, plant and equipment, net 6/7 1,012 (4,777) Foreign exchange (gain)/loss 13,444 (84,064) Fair value (gain)/loss on derivative financial instruments (7,330) 12,435 (Gain)/loss on cash flow hedge reserve reclassified to the income statement 26 9,326 786 Write-down of inventories 13 10,522 22,380 Increase (decrease) of bad debt allowance (1,374) 9,182 Increase (decrease) of provisions 22 19,223 4,479 Increase (decrease) of employee benefit obligations (3,469) 684 Equity-settled share-based payments 4 12,226 12,887 Share of loss/(profit) of equity-accounted investees, net of tax 17 (191) (55) (Interest income) 8 (3,519) (2,366) Interest expenses 9 114,408 116,055
Operating cash flow before working capital changes 569,186 472,605 (Increase)/decrease in trade receivables and other current assets 9,244 (170,644) (Increase)/decrease in inventories 120,310 (71,957) Increase/(decrease) in trade payables and other current liabilities 74,558 146,525 Use of provisions 22 (11,061) (4,855) Cash generated from operating activities 762,237 371,674 (Interest paid) (98,159) (105,675) (Income taxes paid) (42,595) (39,317) Net cash from operating activities 621,483 226,682

Letter to Shareholders Overview Business Highlights Sustainability Financial Reports Governance
Consolidated Financial Statements
Barry Callebaut | Annual Report /
Consolidated Cash Flow Statement
Cash flows from investing activities for the fiscal year 2015/16 2014/15 in thousands of CHF Notes Purchase of property, plant and equipment 15 (159,622) (205,318) Proceeds from sale of property, plant and equipment 15 4,293 18,393 Purchase of intangible assets 18 (41,395) (43,867) Proceeds from sale of intangible assets 18 – 2,154 Acquisition of subsidiaries/businesses net of cash acquired 1 (26,928) (16,968) Proceeds from acquisition-related settlement 1 – 37,490 Purchase of short-term deposits – (864) Proceeds from sale of short-term deposits 2,107 – Sale/(Purchase) of other non-current assets 512 1,736 Interest received 8 3,519 2,366 Net cash flow from investing activities (217,514) (204,878)
Cash flows from financing activities for the fiscal year 2015/16 2014/15 in thousands of CHF Notes Proceeds from the issue of short-term debt 23,438 395,884 Repayment of short-term debt (481,374) (142,312) Proceeds from the issue of long-term debt 485,756 160,232 Repayment of long-term debt – (294,978) Dividend payment 25 (79,588) (85,077) Purchase of treasury shares (15,280) (16,306) Dividends paid to non-controlling interests 25 (1,547) (2,223) Net cash flow from financing activities (68,595) 15,220 Effect of exchange rate changes on cash and cash equivalents 4,227 (13,076) Net increase (decrease) in cash and cash equivalents 339,601 23,948 Cash and cash equivalents at beginning of year 91,885 67,937 Cash and cash equivalents at end of year 431,486 91,885 Net increase (decrease) in cash and cash equivalents 339,601 23,948 Cash and cash equivalents 456,800 125,151 Bank overdrafts 20 (25,314) (33,266) Cash and cash equivalents as defined for the cash flow statement 431,486 91,885

Letter to Shareholders Overview Business Highlights Sustainability Financial Reports Governance
Consolidated Financial Statements
Barry Callebaut | Annual Report /
Consolidated Statement of Changes in Equity
Attributable to the shareholders of the parent company
Share capital
Treasury shares
Retained earnings
Hedging reserves
Cumulative translation
adjustment
Total Non- controlling
interest
Total equity
in thousands of CHF as of September 1, 2014 102,093 (11,438) 2,142,952 (6,981) (438,144) 1,788,482 5,085 1,793,567
Currency translation adjustments – – – – (154,089) (154,089) (103) (154,192) Effect of cash flow hedges (note 26) – – – (2,507) – (2,507) – (2,507) Tax effect on cash flow hedges (note 26)
–
–
–
(379)
–
(379)
–
(379)
Items that may be reclassified subsequently to the income statement
–
–
–
(2,886)
(154,089)
(156,975)
(103)
(157,078)
Remeasurement of defined benefit plans (note 24)
–
–
(7,857)
–
–
(7,857)
–
(7,857)
Tax effect on remeasurement of defined benefit plans (note 19)
–
–
475
–
–
475
–
475
Items that will never be reclassified to the income statement
–
–
(7,382)
–
–
(7,382)
–
(7,382)
Other comprehensive income, net of tax – – (7,382) (2,886) (154,089) (164,357) (103) (164,460) Net profit for the year – – 237,214 – – 237,214 2,657 239,871 Total comprehensive income for the year – – 229,832 (2,886) (154,089) 72,857 2,554 75,411 Dividend to shareholders (note 25) – – (85,077) – – (85,077) (2,223) (87,300) Capital increase (note 25) – – – – – – 8,855 8,855 Purchase of treasury shares – (16,306) – – – (16,306) – (16,306) Equity-settled share-based payments (note 4)
–
16,163
(3,276)
–
–
12,887
–
12,887
as of August 31, 2015 102,093 (11,581) 2,284,431 (9,867) (592,233) 1,772,843 14,271 1,787,114
Currency translation adjustments – – – – 50,785 50,785 289 51,074 Effect of cash flow hedges (note 26) – – – 19,824 – 19,824 – 19,824 Tax effect on cash flow hedges (note 26)
–
–
–
3,957
–
3,957
–
3,957
Items that may be reclassified subsequently to the income statement
–
–
–
23,781
50,785
74,566
289
74,855
Remeasurement of defined benefit plans (note 24)
–
–
(32,638)
–
–
(32,638)
–
(32,638)
Tax effect on remeasurement of defined benefit plans (note 19)
–
–
7,108
–
–
7,108
–
7,108
Items that will never be reclassified to the income statement
–
–
(25,530) –
–
(25,530)
–
(25,530)
Other comprehensive income, net of tax – – (25,530) 23,781 50,785 49,036 289 49,325 Net profit for the year – – 217,050 – – 217,050 1,911 218,961 Total comprehensive income for the year – – 191,520 23,781 50,785 266,086 2,200 268,286 Dividend to shareholders (note 25) – – (79,588) – – (79,588) (1,547) (81,135) Purchase of treasury shares – (15,280) – – – (15,280) – (15,280) Equity-settled share-based payments (note 4)
–
13,911
(1,685)
–
–
12,226
–
12,226
as of August 31, 2016 102,093 (12,950) 2,394,678 13,914 (541,448) 1,956,287 14,924 1,971,211

Letter to Shareholders Overview Business Highlights Sustainability Financial Reports Governance
Consolidated Financial Statements
Barry Callebaut | Annual Report /
Summary of Accounting Policies
Organization and business activity Barry Callebaut AG (“The Company”) was incorporated on December 13, 1994, under Swiss law, having its head office in Zurich, Switzerland, at Pfingstweidstrasse 60. Barry Callebaut AG is registered in Switzerland and has been listed on the SIX Swiss Exchange (BARN, ISIN Number: CH0009002962) since 1998. As of August 31, 2016, Barry Callebaut’s market capitalization based on issued shares was CHF 6,937.9 million (August 31, 2015: CHF 5,823.7 million). The Group’s ultimate parent is Jacobs Holding AG with a share of 50.11% of the shares issued (August 31, 2015: 50.11%).
Barry Callebaut AG and its subsidiaries (“The Group”) is one of the world’s leading cocoa and chocolate companies, serving the entire food industry, from food manufac-turers to artisans and professional users of chocolate such as chocolatiers, pastry chefs or bakers, and products for vending machines. The Group offers a broad and expanding range of chocolate and other cocoa-based products with numerous recipes. It also provides a comprehensive range of services in the fields of product development, processing, training and marketing. The Group is fully vertically integrated along the entire value chain: from sourcing of raw materials to the production of the finest chocolate products.
The principal brands under which the Group operates are Barry Callebaut, Callebaut, Cacao Barry, Carma, Van Leer and Van Houten for chocolate products; Barry Callebaut, Bensdorp, Delfi, Van Houten and Chadler for cocoa powder and Bensdorp, Van Houten, Caprimo, Le Royal and Ögonblink for vending mixes.
The principal countries, in which the Group operates, include Belgium, Brazil, Cameroon, Canada, China, Côte d’Ivoire, France, Germany, Ghana, Indonesia, Italy, Japan, Malaysia, Mexico, the Netherlands, Poland, Russia, Singapore, Spain, Sweden, Switzerland, Turkey, the United Kingdom and the USA.
Basis of presentation The Consolidated Financial Statements of the Group have been prepared in accordance with International Financial Reporting Standards (IFRS) and comply with Swiss law.
For consolidation purposes, Barry Callebaut AG and its subsidiaries prepare financial statements using the historical cost basis as disclosed in the accounting policies below, except for the measurement of derivative financial instruments and trade receiv-ables that are managed and will be sold under the asset-backed securitization program that are both measured at fair value and for defined benefit obligation that is accounted for according to the projected unit credit method.
Due to rounding, the figures presented in the tables may not add up precisely to the totals provided.
Changes in accounting policies There were no amendments on IFRS with material impact on the Group’s Financial Statements in the current fiscal year. Use of judgment and estimates The preparation of financial statements requires management to make judgments, estimates and assumptions that affect the application of accounting policies and the reported amounts of assets, liabilities, income and expenses. Actual results may differ from these estimates.

Letter to Shareholders Overview Business Highlights Sustainability Financial Reports Governance
Consolidated Financial Statements
Barry Callebaut | Annual Report /
Estimates and underlying assumptions are reviewed on an ongoing basis. Revisions to accounting estimates are recognized prospectively.
Information about judgments made in applying accounting policies that have most significant effects on the amounts recognized in the Consolidated Financial Statements and assumptions and estimation uncertainties that have a significant risk of resulting in a material adjustment in the year ending August 31, 2016, are included in the following notes:
Note 1 Acquisitions: fair value measurement and contingent assets Note 18 Intangible assets – Allocation of goodwill to CGU’s/Impairment test: key assumptions underlying
recoverable amounts Note 19 Deferred tax assets and liabilities – Recognition of deferred tax assets: availability of future taxable
profits against which tax loss carry-forwards can be utilized Note 24 Employee benefit obligations – Measurement of defined benefit obligations: key actuarial assumptions Note 28 Contingent liabilities – uncertainties
Scope of consolidation/subsidiaries The Consolidated Financial Statements of the Group include all the assets, liabilities, income and expenses of Barry Callebaut AG and the companies which it controls. The Group controls an entity when the Group is exposed to, or has rights to, variable returns from its involvement with the entity and has the ability to affect those returns through its power over the entity. Non-controlling interests are shown as a component of equity in the balance sheet, and the share of the net profit attributable to non-controlling interest is shown as a component of the net profit for the year in the Consolidated Income Statement. Newly acquired companies are consolidated from the date control is transferred (the effective date of acquisition), using the acquisition method. Subsidiaries disposed of are included up to the effective date of disposal.
All intragroup balances and unrealized gains and losses or income and expenses arising from intragroup transactions are eliminated in preparing the Consolidated Financial Statements. Unrealized gains arising from transactions with associates and jointly controlled entities are eliminated to the extent of the Group’s interest in the entity. Unrealized losses are eliminated in the same way as unrealized gains, but only to the extent that there is no evidence of impairment.
Transactions with non-controlling interests The Group applies the policy of treating transactions with non-controlling interests equal to transactions with equity owners of the Group. For purchases from non-controlling interests, the difference between consideration paid and the relevant share acquired of the carrying value of net assets of the subsidiary is recorded in equity. Gains or losses on disposal to non-controlling interests are also recorded in equity.
Interests in equity-accounted investees Associates are those companies in which the Group has significant influence, but not control. This is normally presumed when the Group holds between 20% and 50% of the voting power of another entity. Joint ventures are those entities over whose activities the Group has joint control, established by contractual agreement and requiring unanimous consent for strategic financial and operating decisions. Associates and joint ventures are accounted for using the equity method (equity-accounted investees) and are recognized initially at cost. The Group’s investment includes goodwill identified on acquisition, net of any impairment losses. The Consolidated Financial Statements include the Group’s share of the income and expenses and equity movements of equity-accounted investees
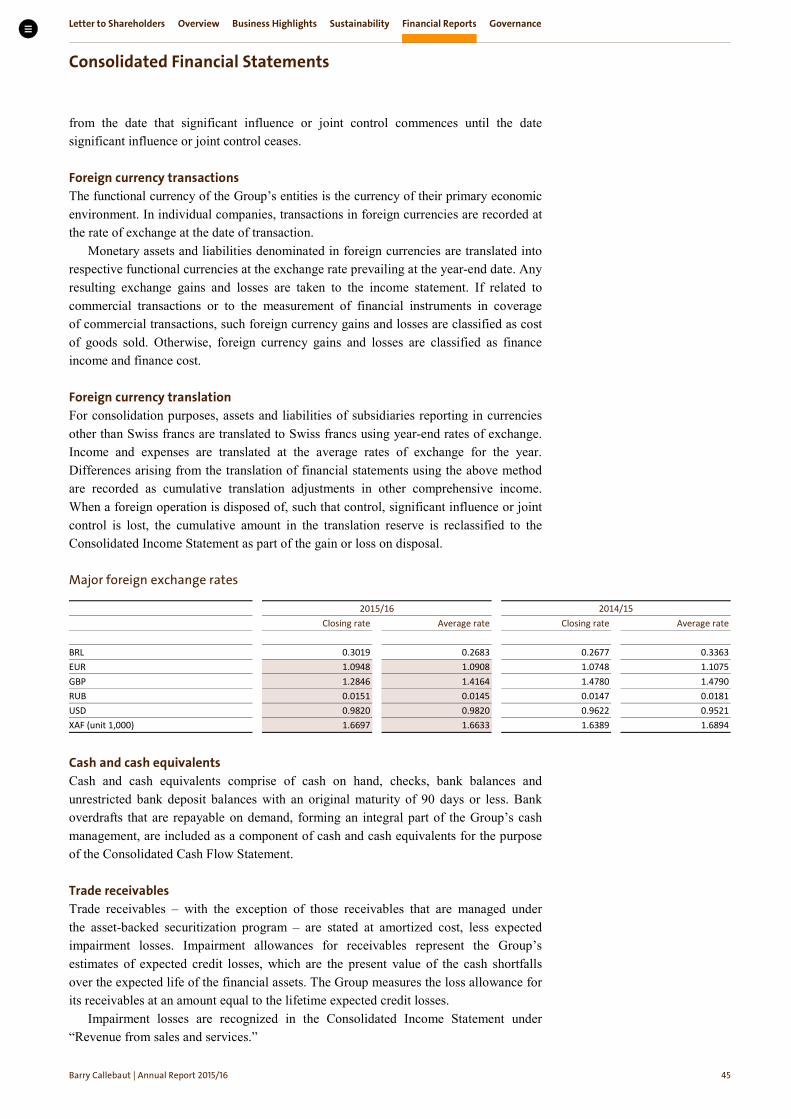
Letter to Shareholders Overview Business Highlights Sustainability Financial Reports Governance
Consolidated Financial Statements
Barry Callebaut | Annual Report /
from the date that significant influence or joint control commences until the date significant influence or joint control ceases.
Foreign currency transactions The functional currency of the Group’s entities is the currency of their primary economic environment. In individual companies, transactions in foreign currencies are recorded at the rate of exchange at the date of transaction.
Monetary assets and liabilities denominated in foreign currencies are translated into respective functional currencies at the exchange rate prevailing at the year-end date. Any resulting exchange gains and losses are taken to the income statement. If related to commercial transactions or to the measurement of financial instruments in coverage of commercial transactions, such foreign currency gains and losses are classified as cost of goods sold. Otherwise, foreign currency gains and losses are classified as finance income and finance cost.
Foreign currency translation For consolidation purposes, assets and liabilities of subsidiaries reporting in currencies other than Swiss francs are translated to Swiss francs using year-end rates of exchange. Income and expenses are translated at the average rates of exchange for the year. Differences arising from the translation of financial statements using the above method are recorded as cumulative translation adjustments in other comprehensive income. When a foreign operation is disposed of, such that control, significant influence or joint control is lost, the cumulative amount in the translation reserve is reclassified to the Consolidated Income Statement as part of the gain or loss on disposal.
Major foreign exchange rates
2015/16 2014/15 Closing rate Average rate Closing rate Average rate BRL 0.3019 0.2683 0.2677 0.3363 EUR 1.0948 1.0908 1.0748 1.1075 GBP 1.2846 1.4164 1.4780 1.4790 RUB 0.0151 0.0145 0.0147 0.0181 USD 0.9820 0.9820 0.9622 0.9521 XAF (unit 1,000) 1.6697 1.6633 1.6389 1.6894
Cash and cash equivalents Cash and cash equivalents comprise of cash on hand, checks, bank balances and unrestricted bank deposit balances with an original maturity of 90 days or less. Bank overdrafts that are repayable on demand, forming an integral part of the Group’s cash management, are included as a component of cash and cash equivalents for the purpose of the Consolidated Cash Flow Statement.
Trade receivables Trade receivables – with the exception of those receivables that are managed under the asset-backed securitization program – are stated at amortized cost, less expected impairment losses. Impairment allowances for receivables represent the Group’s estimates of expected credit losses, which are the present value of the cash shortfalls over the expected life of the financial assets. The Group measures the loss allowance for its receivables at an amount equal to the lifetime expected credit losses.
Impairment losses are recognized in the Consolidated Income Statement under “Revenue from sales and services.”
Letter to Shareholders Overview Business Highlights Sustainability Financial Reports Governance
Consolidated Financial Statements
Barry Callebaut | Annual Report /
The Group maintains an asset-backed securitization program for trade receivables, transferring the contractual rights to the cash flows of third-party trade receivables at their nominal value minus a discount. These receivables are derecognized from the balance sheet. The net amount reported under “Other current assets” or “Other current liabilities” is the amount of the discount minus the receivables already collected at the balance sheet date, but not yet remitted to the asset-purchasing company (see note 12). Before being sold, the receivables that are managed under the asset-backed securitization program are classified as financial assets measured at fair value through profit or loss.
Derivative financial instruments and hedging activities Derivative financial instruments are accounted for at fair value with fair value changes recognized in the Consolidated Income Statement.
As the Group also acts as cocoa bean trader, certain cocoa bean purchase and sales contracts are net cash settled and therefore, contracts allocated to the same portfolio are treated as derivative contracts.
Additionally, the Group applies the fair value option for its executory forward purchase and sale contracts (available under IFRS 9 as an alternative to the off-balance sheet treatment). These exemptions are applied for those cocoa contracts where the measurement eliminates or significantly reduces an accounting mismatch that would otherwise occur on own use contracts.
Hedge accounting The operating companies require cocoa beans and semi-finished cocoa products for manufacturing and selling of their products. Thus, the Group is exposed to the cocoa price risk on the purchase side due to increasing cocoa prices, on the sales side and inventory held to decreasing cocoa prices. The Group therefore applies fair value hedge accounting to hedge its cocoa price risk embedded in its chocolate stocks and sales contracts as well as in the cocoa stocks, purchase and sales contracts and uses cocoa bean futures to manage cocoa price risks (Contract Business – see risk management note 26).
The Group is also exposed to increasing sugar prices with regards to its forecasted sugar purchases. The Group therefore applies cash flow hedge accounting when it hedges its sugar price risk embedded in its forecasted sugar purchases with sugar futures.
The Group also enters into long fuel oil swaps to hedge its exposure to fuel oil price movements in its forecasted freight expenditures and it applies cash flow hedge account-ing for this hedging relationship.
The Group and its subsidiaries enter into sales and purchase contracts and have highly probable transactions denominated in various currencies and consequently are exposed to foreign currency risks, which are hedged by the Group’s centralized treasury department or – in case of legal restrictions – with local banks.
The Group’s interest rate risk is managed with interest rate derivatives. Hedge accounting is applied to derivatives that are effective in offsetting the changes in fair value or cash flows of the hedged items. The hedge relationship is documented and the effectiveness of such hedges is tested at regular intervals, at least on a semi-annual basis.
Fair value hedging – for commodity price risks and foreign currency exchange risks related to the Contract Business To reflect the Group’s activities of hedging its cocoa price risk exposure embedded in the cocoa and chocolate stocks and unrecognized firm commitments, the Group applies fair value hedge accounting. In this fair value hedge accounting relationship, the

Letter to Shareholders Overview Business Highlights Sustainability Financial Reports Governance
Consolidated Financial Statements
Barry Callebaut | Annual Report /
chocolate stocks and unrecognized firm sales commitments and the cocoa stocks, unrecognized firm purchase and sales commitments, respectively are designated as hedged items whereby cocoa bean futures are designated as hedging instruments. When cocoa and chocolate inventory is designated as a hedged item, the subsequent cumulative change in the fair value of the inventory attributable to the hedged cocoa price risk is adjusting the carrying amount of the hedged item (change of inventory cost value) with a corresponding gain or loss in the Consolidated Income Statement.
When unrecognized firm cocoa and chocolate commitments (purchase and sales contracts) are designated as hedged items, the subsequent cumulative change in the fair value of these contracts attributable to the hedged cocoa price risk is recognized as an asset or a liability (reported as “Derivative financial assets” and Derivative financial liabilities”) with a corresponding gain or loss in the Consolidated Income Statement. The hedging instrument is recorded at fair value under “Derivative financial assets” or “Derivative financial liabilities” and the changes in the fair value of the hedging instrument are also recognized in the Consolidated Income Statement.
For foreign currency exchange risks related to firm purchase and sales commitments in certain entities, fair value hedge accounting is applied. The hedge relationship is between the unrecognized firm commitments (hedged items) and the foreign currency forward contracts and monetary items (hedging instruments). The changes in fair value of the hedging instruments (attributable to foreign currency exchange rate movements) are recognized in the Consolidated Income Statement. The cumulative change in the fair value of the hedged items attributable to the foreign currency risk is recognized as “Trade receivables and other current assets” or “Trade payables and other current liabilities” with a corresponding gain or loss in the Consolidated Income Statement.
Cash flow hedging – for commodity price risks (cocoa price risk, sugar and fuel oil) and foreign currency exchange risks arising from forecasted purchase and sales transactions and firm commitments The Group enters into sugar futures to hedge the sugar price risk exposure embedded in certain forecasted sugar purchases, and into foreign exchange forward and futures contracts to hedge the currency risk arising from these forecasted sugar purchases.
The Group applies cash flow hedge accounting for these hedging relationships whereby the sugar futures and the foreign exchange forwards and futures are designated as hedging instruments to hedge the variability in cash flows attributable to the risk of sugar price movements and to the foreign currency risk respectively in the hedged forecasted sugar purchases.
The Group is also exposed to increasing fuel oil prices in its forecasted freight expenditures. Accordingly, it enters into long fuel oil swaps to hedge this fuel oil price risk exposure embedded in its forecasted freight expenditures, and into foreign exchange forward and futures contracts to hedge the currency risk arising from these forecasted transactions.
The Group applies cash flow hedge accounting for these hedging relationships whereby the long fuel oil swaps and the foreign exchange forwards and futures are designated as hedging instruments to hedge the variability in cash flows attributable to the risk of fuel oil price movements and to the foreign currency risk respectively in its hedged forecasted freight expenditures.
To a small extent, the Group also enters into exchange traded cocoa bean futures to hedge the cocoa price risk arising from forecasted sales of cocoa ingredients, and into foreign exchange forward and futures contracts to hedge the currency risk arising from forecasted cocoa sales transactions denominated in foreign currencies.

Letter to Shareholders Overview Business Highlights Sustainability Financial Reports Governance
Consolidated Financial Statements
Barry Callebaut | Annual Report /
The related entities apply cash flow hedge accounting whereby the cocoa bean futures and the foreign exchange forwards and futures are designated as hedging instruments to the underlying forecasted sales to hedge the variability in cash flow that is attributable to the risk of cocoa price movements and to the foreign exchange risk respectively. Cash flow hedging – for interest rate risks Barry Callebaut applies cash flow hedge accounting for interest rate derivatives, converting a portion of floating rate borrowings to fixed rate borrowings. Accounting for cash flow hedges For each cash flow hedge relationship, the effective part of any gain or loss on the derivative financial instrument is recognized directly in other comprehensive income. Gains or losses that are recognized in other comprehensive income are transferred to the Consolidated Income Statement in the same period in which the hedged exposure affects the Consolidated Income Statement. The ineffective part of any gain or loss is recog-nized immediately in the Consolidated Income Statement at the time hedge effectiveness is tested.
Hedge accounting is discontinued when the hedging instrument expires or is sold, terminated or exercised, or no longer qualifies for hedge accounting. At that point in time, any cumulative gain or loss on the hedging instrument recognized in other compre-hensive income is kept in other comprehensive income until the forecasted transaction occurs. If a hedged transaction is no longer expected to occur, the net cumulative gain or loss recognized in other comprehensive income is immediately transferred to the Consolidated Income Statement.
No hedge accounting designation The Group’s purchasing and sourcing centers and the Group’s centralized treasury department have derivative financial instruments that are measured at fair value without applying hedge accounting.
Price List Business commodity risk hedging is based on forecasted sales volume and excluded from hedge accounting, as no derivatives can be clearly designated to the forecasted price list sales. Therefore, these derivatives are carried at fair value with fair value changes recognized in the Consolidated Income Statement.
Other financial assets Other financial assets are the items that are reported on lines “Loans and other receivables” and “Other current financial assets” in note 12 – Trade receivables and other current assets. Other financial assets are classified as measured at amortized cost less expected impairment losses. The Group’s other financial assets have contractual cash flows that are solely principal, and the Group’s interest and business model is to hold these assets to collect contractual cash flows.
All purchases and sales of financial assets are recognized on the trade date. Financial assets are recognized when the Group becomes a party to the contractual provisions and are initially measured at fair value, which represents the consideration given for them, plus transaction costs.
Impairment allowances for other financial assets represent the Group’s estimates of expected credit losses, which are the present value of the cash shortfalls over the expected life of the financial assets. The Group measures the loss allowance for its other financial assets at an amount equal to the lifetime expected credit losses.

Letter to Shareholders Overview Business Highlights Sustainability Financial Reports Governance
Consolidated Financial Statements
Barry Callebaut | Annual Report /
Financial assets are derecognized when the Group loses control of the contractual rights to the cash flows of the assets. Such control is lost when the rights and benefits specified in the contract are realized, expired, or are surrendered.
Inventories Inventories are measured at the lower of cost and net realizable value. The cost of inventories comprises the costs of materials, direct production costs including labor costs and an appropriate proportion of production overheads and factory depreciation. Those inventories that are allocated as hedged items in a fair value hedge relationship are adjusted for the change in the fair value attributable to the hedged cocoa price risk. For movements in inventories, the average cost method is applied. Net realizable value is defined as the estimated selling price less costs of completion, direct selling and distribution expenses.
Intangible assets Goodwill Goodwill on acquisitions is the excess of acquisition date fair value of total consideration transferred plus the recognized amount of any non-controlling interest in the acquiree and the acquisition date fair value of assets acquired, liabilities and contingent liabilities assumed. Following the initial recognition, goodwill is measured at cost less any accumulated impairment losses. Goodwill is reviewed for impairment annually at the same time or more frequently if events or changes in circumstances indicate that the carrying value may be impaired.
Negative goodwill is recognized directly in the income statement. At the acquisition date, any goodwill acquired is allocated to each of the cash-generating units (CGU). The Group defines its CGU for goodwill impairment testing based on the way that it monitors and derives economic benefits from the acquired goodwill. The impairment tests are performed by comparing the carrying value of the assets of these CGU with their recoverable amount, based on their value in use, which corresponds to their future projected cash flows discounted at an appropriate pre-tax rate of return. The cash flows correspond to estimates made by Group Management in financial plans and business strategies covering a period of three years after making adjustments to consider the assets in their current condition. They are then projected to perpetuity using a multiple which corresponds to a steady growth rate. The group assesses the uncertainty of these estimates by making sensitivity analyses. Where the recoverable amount of the CGU is less than the carrying amount, an impairment loss is recognized.
Research and development costs Research costs are expensed as incurred.
Development costs for projects related to software, recipes and product innovation are capitalized as an intangible asset if it can be demonstrated that the project is expected to generate future economic benefits, it is probable that those future economic benefits will flow to the entity and the costs of the asset can be measured reliably. Development costs previously recognized as an expense are not recognized as an asset in a subsequent period. Development costs that have been capitalized are amortized on a straight-line basis over the period of their expected useful life. The amortization periods adopted do not exceed eight years.
Brand names, licenses and other intangible assets Other acquired intangible assets include brand names, licenses, customer relationships, patents and trademarks. Patents and licenses are amortized over their period of validity.
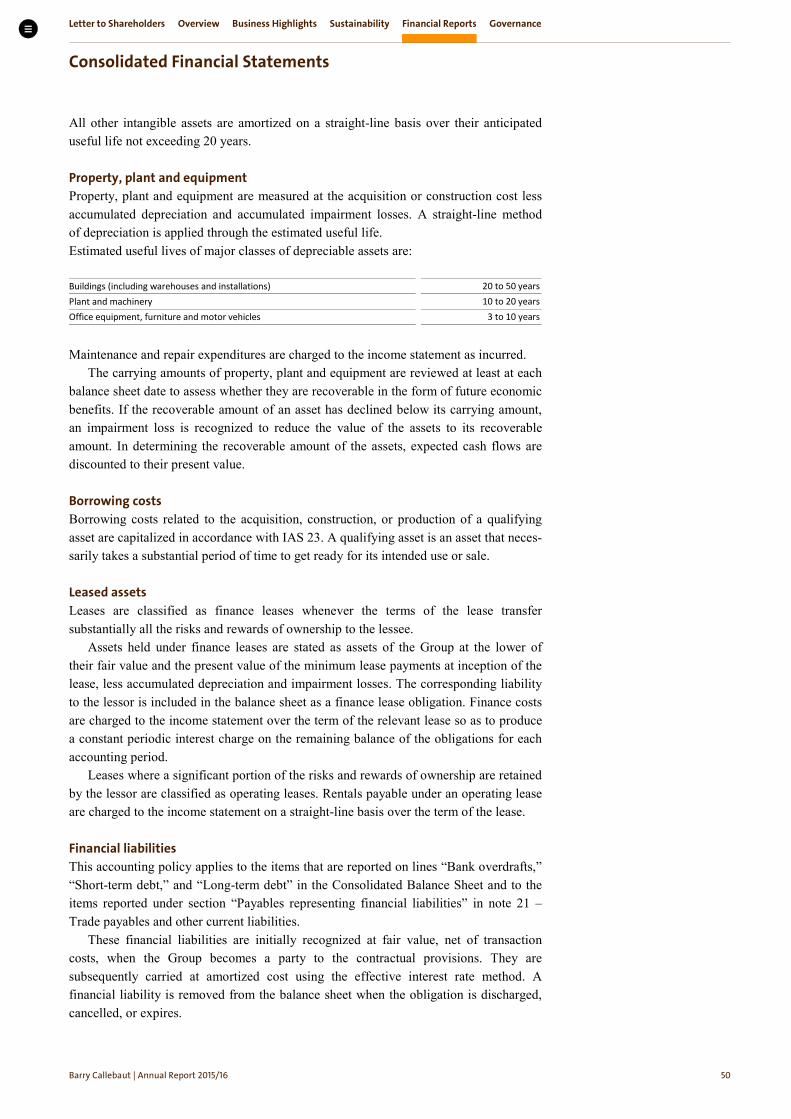
Letter to Shareholders Overview Business Highlights Sustainability Financial Reports Governance
Consolidated Financial Statements
Barry Callebaut | Annual Report /
All other intangible assets are amortized on a straight-line basis over their anticipated useful life not exceeding 20 years.
Property, plant and equipment Property, plant and equipment are measured at the acquisition or construction cost less accumulated depreciation and accumulated impairment losses. A straight-line method of depreciation is applied through the estimated useful life. Estimated useful lives of major classes of depreciable assets are:
Buildings (including warehouses and installations) 20 to 50 years Plant and machinery 10 to 20 years Office equipment, furniture and motor vehicles 3 to 10 years
Maintenance and repair expenditures are charged to the income statement as incurred.
The carrying amounts of property, plant and equipment are reviewed at least at each balance sheet date to assess whether they are recoverable in the form of future economic benefits. If the recoverable amount of an asset has declined below its carrying amount, an impairment loss is recognized to reduce the value of the assets to its recoverable amount. In determining the recoverable amount of the assets, expected cash flows are discounted to their present value.
Borrowing costs Borrowing costs related to the acquisition, construction, or production of a qualifying asset are capitalized in accordance with IAS 23. A qualifying asset is an asset that neces-sarily takes a substantial period of time to get ready for its intended use or sale.
Leased assets Leases are classified as finance leases whenever the terms of the lease transfer substantially all the risks and rewards of ownership to the lessee.
Assets held under finance leases are stated as assets of the Group at the lower of their fair value and the present value of the minimum lease payments at inception of the lease, less accumulated depreciation and impairment losses. The corresponding liability to the lessor is included in the balance sheet as a finance lease obligation. Finance costs are charged to the income statement over the term of the relevant lease so as to produce a constant periodic interest charge on the remaining balance of the obligations for each accounting period.
Leases where a significant portion of the risks and rewards of ownership are retained by the lessor are classified as operating leases. Rentals payable under an operating lease are charged to the income statement on a straight-line basis over the term of the lease.
Financial liabilities This accounting policy applies to the items that are reported on lines “Bank overdrafts,” “Short-term debt,” and “Long-term debt” in the Consolidated Balance Sheet and to the items reported under section “Payables representing financial liabilities” in note 21 – Trade payables and other current liabilities.
These financial liabilities are initially recognized at fair value, net of transaction costs, when the Group becomes a party to the contractual provisions. They are subsequently carried at amortized cost using the effective interest rate method. A financial liability is removed from the balance sheet when the obligation is discharged, cancelled, or expires.

Letter to Shareholders Overview Business Highlights Sustainability Financial Reports Governance
Consolidated Financial Statements
Barry Callebaut | Annual Report /
Provisions Provisions are recognized when the Group has a present legal or constructive obligation as a result of past events and it is probable that an outflow of resources will be required to settle the obligation, and a reliable estimate thereof can be made. Provisions are recorded for identifiable claims and restructuring costs. Restructuring provisions mainly comprise employee termination payments. Specific provisions for restructuring costs are recorded at such time as the management approves the decision to restructure and a formal plan for restructuring is communicated.
Employee benefit obligations/post-employment benefits Defined benefit plans – General The Group operates, apart from legally required social security schemes, a number of independent defined retirement benefit plans and other post-retirement or long-term employee benefit plans, which conform to local legal and tax requirements. The majority of the Group’s reported employee benefit obligations relates to plans located in the US, Belgium, United Kingdom, and Switzerland.
Defined benefit plans cover employees and certain family members in the event of retirement, disability, death in service or termination of employment. Other non-retirement-related defined benefit plans in a small number of Group entities include post-retirement benefit plans as well as long-service award plans for active employees. In most cases, these plans are externally funded in vehicles that are legally separate from the employer and operated by external service providers. However, for certain Group entities representing a small minority of the reported employee benefit obligations, no independent plan assets exist for defined benefit plans. For these plans, the related unfunded liability is included in the balance sheet.
The Group’s net obligation in respect of defined benefit plans is calculated sepa-rately for each plan by estimating the amount of future benefit that employees have earned in the current and prior periods, discounting that amount and deducting the fair value of any plan assets.
The calculation of defined benefit obligations is performed annually by a qualified actuary using the projected unit credit method. When the calculation results in a potential asset for the Group, the recognized asset is limited to the present value of economic benefits available in the form of any future refunds from the plan or reductions in future contributions to the plan. To calculate the present value of economic benefits, consideration is given to any applicable minimum funding requirements.
Remeasurement of the net defined benefit liability, which comprise actuarial gains and losses, the return on plan assets and the effect of the asset ceiling, are recognized immediately in other comprehensive income. The Group determines the net interest expense (income) on the net defined benefit liability (asset) for the period by applying the discount rate used to measure the defined benefit liability (asset), taking into account any changes in the net defined benefit liability (asset) during the period as a result of contributions and benefit payments. Net interest expense and other expenses related to defined benefit plans are recognized in profit or loss.
When the benefits of a plan are changed or when a plan is curtailed, the resulting change in benefit that relates to past service or the gain or loss on curtailment is recognized immediately in profit or loss. The Group recognizes gains and losses on the settlement of a defined benefit plan when the settlement occurs.

Letter to Shareholders Overview Business Highlights Sustainability Financial Reports Governance
Consolidated Financial Statements
Barry Callebaut | Annual Report /
The Group’s employee benefit schemes are exposed to changes in legislation and to investment return and matching risks, longevity risks and solvency risks. These risks may all require additional contributions and are therefore reviewed on a regular basis by the companies’ management or by the relevant Board of Trustees as follows: • Changes in legislation: monitoring of country-specific legislation changes • Investment return risk: analysis and optimization of the allocation and performance
of assets as well as monitoring of compliance with investment guidelines • Investment matching risk: analysis and optimization of asset-liability matching and
periodic fair valuation of assets and liabilities • Longevity risk: analysis of mortality assumptions and monitoring of demographic
development • Solvency risk: monitoring of solvency of external solution providers
Defined benefit plans – Switzerland The retirement benefit plans for all Swiss Group entities are defined benefit plans where contributions are expressed as a percentage of the insured actual salary. Members benefit from a guaranteed minimum interest on accrued savings and conversion rates at retirement in accordance with the Swiss Federal Law on compulsory occupational pension plans (BVG). This law defines the minimum pensionable salary and the minimum retirement credits. In addition to retirement benefits, the Swiss retirement benefit plans also provide for temporary partial or total disability benefits as well as for pre-retirement death benefits including widows’ and orphans’ benefits.
The benefit plans are outsourced to external insurance companies, which are responsible for the operation of the plan including the allocation of plan assets. The governance and the supervision as well as the responsibility to make changes in the plan lie with a Board of Trustees. It consists equally of employer and employee nominated representatives.
The applicable regulation requires the retirement benefit plans of all Swiss Group entities to be funded on the basis of employer and employee contributions, including risk premiums and savings contributions. In case of underfunding, recovery measures must be taken, such as additional financing from the employer or from the employer and employees, or reduction of benefits or a combination of both.
Defined benefit plans – Other countries In the US, the Group maintains a retirement benefit plan only for pensioners and deferred pensioners related to a discontinued operation. In addition, the Group offers a defined post-retirement medical benefit plan for active employees. This plan is governed by a Board of Trustees.
In Belgium, the Group operates defined benefit plans for events of retirement, actual and potential early retirement, temporary and permanent disability and death in service as well as a long-service award plan. The retirement benefit plans are funded by a combination of employer and employee contributions as regulated by the Belgian Pension Act.
In the United Kingdom, the Group operates a defined benefit retirement scheme in which members receive benefits based on the final salary with the contributions paid by the employer and the employees. This plan is, however, closed to new entrants and frozen for the existing beneficiaries as of January 31, 2014. As of February 1, 2014, all eligible employees are covered by a defined contribution plan which is run by a Board of Trustees in accordance with the UK Pension legislation.
Some benefits are also provided by defined contribution plans; contributions to such plans are charged to the Consolidated Income Statement as incurred.

Letter to Shareholders Overview Business Highlights Sustainability Financial Reports Governance
Consolidated Financial Statements
Barry Callebaut | Annual Report /
Post-retirement benefits other than pensions Certain subsidiaries provide health care and insurance benefits for a portion of their retired employees and their eligible dependents. The cost of these benefits is actuarially determined and included in the related function expenses over the employees’ working lives. The related liability is also included in the position “Employee benefit obligations.”
Termination benefits Termination benefits are expensed at the earlier of when the Group can no longer with-draw the offer of those benefits and when the Group recognizes costs for a restructuring.
If benefits are not expected to be settled wholly within 12 months of the end of the reporting period, then they are discounted.
Employee stock ownership program (Long-Term Incentive Plan [LTIP]) For the Long-Term Incentive Plan (LTIP), Barry Callebaut AG shares are purchased on the market and passed on to satisfy the awards. In accordance with IFRS 2, the compensation costs in relation with share awards granted under this deferred share plan are recognized in the income statement over the vesting period at their fair value as of the grant date.
Other long-term employee benefits Other long-term employee benefits represent amounts due to employees under deferred compensation arrangements mandated by certain jurisdictions in which the Group conducts its operations. Related costs of such benefits are recognized on an actuarial basis in the income statement. The related liability is included in other long-term liabilities.
Taxes Current income taxes are recognized based on taxable income, whereas other taxes such as non-recoverable taxes withheld on management fees and royalties received or paid are reported under “Other expenses.” Non-recoverable withholding taxes are only accrued if distribution by subsidiary companies is foreseen.
Income taxes are calculated in accordance with the tax regulations in effect in each country.
The Group determines the expected income tax rate by weighing the applicable tax rates in the jurisdictions concerned based on the mix of the profit before taxes per jurisdiction.
The applicable expected tax rate per company is the domestic corporate income tax rate applicable to the profit before taxes of the company for the respective fiscal year.
Deferred income taxes are recognized using the balance sheet liability method. Deferred income tax applies to all temporary differences arising between the tax values of assets and liabilities and their values in the Consolidated Financial Statements.
Revenue recognition Revenues from sales and services consist of the net sales turnover of semi-processed and processed goods and services related to food processing.
Revenues from the sale of goods are recognized when the significant risks and rewards of ownership of the goods have been transferred to the buyer, which is mainly upon shipment. Appropriate provisions are made for all additional costs to be incurred in connection with the sales including the cost of returns. Additionally, gains and losses related to derivative financial instruments used for hedging purposes are recognized in revenues in accordance with the policies set out in this section.
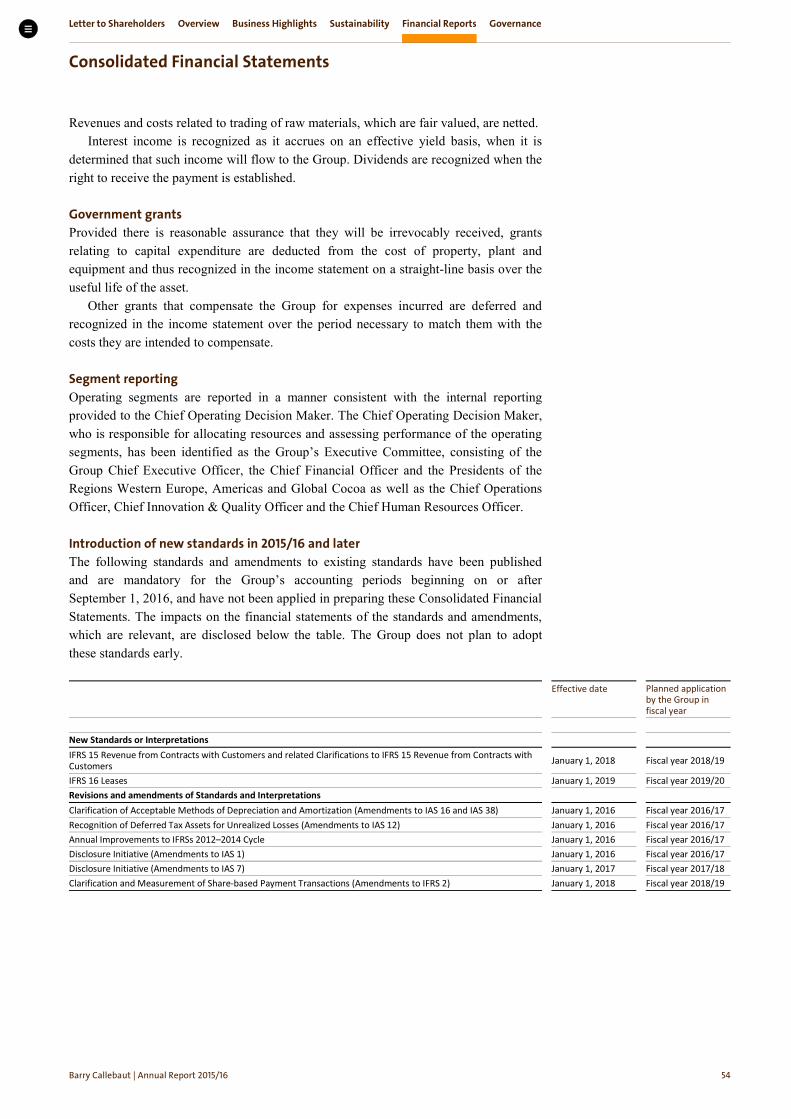
Letter to Shareholders Overview Business Highlights Sustainability Financial Reports Governance
Consolidated Financial Statements
Barry Callebaut | Annual Report /
Revenues and costs related to trading of raw materials, which are fair valued, are netted. Interest income is recognized as it accrues on an effective yield basis, when it is
determined that such income will flow to the Group. Dividends are recognized when the right to receive the payment is established.
Government grants Provided there is reasonable assurance that they will be irrevocably received, grants relating to capital expenditure are deducted from the cost of property, plant and equipment and thus recognized in the income statement on a straight-line basis over the useful life of the asset.
Other grants that compensate the Group for expenses incurred are deferred and recognized in the income statement over the period necessary to match them with the costs they are intended to compensate.
Segment reporting Operating segments are reported in a manner consistent with the internal reporting provided to the Chief Operating Decision Maker. The Chief Operating Decision Maker, who is responsible for allocating resources and assessing performance of the operating segments, has been identified as the Group’s Executive Committee, consisting of the Group Chief Executive Officer, the Chief Financial Officer and the Presidents of the Regions Western Europe, Americas and Global Cocoa as well as the Chief Operations Officer, Chief Innovation & Quality Officer and the Chief Human Resources Officer.
Introduction of new standards in / and later The following standards and amendments to existing standards have been published and are mandatory for the Group’s accounting periods beginning on or after September 1, 2016, and have not been applied in preparing these Consolidated Financial Statements. The impacts on the financial statements of the standards and amendments, which are relevant, are disclosed below the table. The Group does not plan to adopt these standards early.
Effective date
Planned application by the Group in fiscal year
New Standards or Interpretations IFRS 15 Revenue from Contracts with Customers and related Clarifications to IFRS 15 Revenue from Contracts with Customers January 1, 2018 Fiscal year 2018/19
IFRS 16 Leases January 1, 2019 Fiscal year 2019/20 Revisions and amendments of Standards and Interpretations Clarification of Acceptable Methods of Depreciation and Amortization (Amendments to IAS 16 and IAS 38) January 1, 2016 Fiscal year 2016/17 Recognition of Deferred Tax Assets for Unrealized Losses (Amendments to IAS 12) January 1, 2016 Fiscal year 2016/17 Annual Improvements to IFRSs 2012–2014 Cycle January 1, 2016 Fiscal year 2016/17 Disclosure Initiative (Amendments to IAS 1) January 1, 2016 Fiscal year 2016/17 Disclosure Initiative (Amendments to IAS 7) January 1, 2017 Fiscal year 2017/18 Clarification and Measurement of Share-based Payment Transactions (Amendments to IFRS 2) January 1, 2018 Fiscal year 2018/19
Letter to Shareholders Overview Business Highlights Sustainability Financial Reports Governance
Consolidated Financial Statements
Barry Callebaut | Annual Report /
IFRS Revenue Recognition The standard contains a single model that applies to contracts with customers and two approaches to recognizing revenue: revenue may be recognized over time, in a manner that best reflects the company’s performance, or at a point in time, when control of the good or service is transferred to the customer. For complex transactions with multiple components and/or variable amounts of consideration, or when the work is carried out under contract for an extended period of time, applying the standard may lead to revenue being accelerated or deferred in comparison with current requirements.
The model features a contract-based five-step analysis of transactions to determine whether, how much and when revenue is recognized. Potential impacts on the Group’s Consolidated Financial Statements have not yet been fully assessed.
IFRS Leasing The new standard was issued on January 13, 2016, and will replace IAS 17 Leases. The biggest change introduced by the new Standard is that leases will be brought onto com-panies’ balance sheets, increasing the visibility of their assets and liabilities. IFRS 16 removes the classification of leases as either operating leases or finance leases, treating all leases as finance leases. Short-term leases (less than 12 months) and leases of low-value assets (such as personal computers) are exempt from the requirements. IFRS 16 will become effective for financial year 2019/20. Potential impacts on the Group’s Consolidated Financial Statements have not yet been fully assessed.
Letter to Shareholders Overview Business Highlights Sustainability Financial Reports Governance
Consolidated Financial Statements
Barry Callebaut | Annual Report /
Notes to the Consolidated Financial Statements
Acquisitions
Acquisitions in 2015/16 FrieslandCampina Kievit On March 1, 2016, Barry Callebaut Group has closed the agreement to acquire the commercial beverages vending activities from FrieslandCampina Kievit. The transaction also includes a long-term contract manufacturing agreement under which Fries-landCampina Kievit will continue to produce vending products for Barry Callebaut, such as the Satro Quality Drinks range, at its state-of-the-art production site in Lippstadt, Germany. The acquired activities represent approx. 20,000 tonnes of addi-tional sales volume and CHF 55 million (EUR 50 million/USD 55 million) of additional sales revenue for Barry Callebaut.
The consideration transferred was CHF 26.2 million fully paid in cash. The agree-ments with the seller do not contain arrangements for contingent considerations.
The Group expensed acquisition-related costs, such as fees for due diligence work and lawyers of CHF 0.5 million over the course of the project immediately in the Consolidated Income Statement (included in “General and administration expenses”), of which all was recognized in the current fiscal period.
The goodwill of CHF 15.9 million arising from the acquisition of FrieslandCampina Kievit is attributable to the integration of the business into the Group’s existing business as well as for strengthening BC’s range of specialty products, further developing beverage and vending business by getting access to the latest process technology, increasing BC’s innovation power and expanding the product offering. The goodwill has been allocated to Region EMEA and is expected to be deductible for income tax purposes.
The revenue included in the Consolidated Income Statement for FrieslandCampina Kievit since March 1, 2016 was CHF 22.5 million. FrieslandCampina Kievit has also contributed CHF 2.4 million to net profit over the same period. Had FrieslandCampina Kievit been consolidated from September 1, 2015, it would have contributed revenue of CHF 50.3 million and net profit for the fiscal year of CHF 6.7 million to the Consolidated Income Statement.
Nyonkopa Cocoa Buying Company Limited On November 5, 2015, Barry Callebaut Group closed an agreement to acquire Nyonkopa Cocoa Buying Company Limited in Ghana. Nyonkopa is among the top ten private Licensed Buying Companies in Ghana authorized by the Ghana Cocoa Board (COCOBOD) to buy cocoa from farmers and to sell it to the Cocoa Marketing Company of the COCOBOD. The COCOBOD oversees the cocoa sector in Ghana, including quality control, sales and marketing.
Nyonkopa will be integrated into the Biolands Group, Barry Callebaut’s direct sourcing organization, so far present in Côte d’Ivoire and Tanzania.
The consideration transferred was CHF 0.7 million. Thereof CHF 0.2 million were paid in November 2015. The remaining CHF 0.5 million were paid in May 2016 after agreed Key Performance Indicators have been achieved.
The acquisition-related costs, in the amount of CHF 0.1 million were expensed (included in General and administration expenses).
The total identifiable assets were CHF –0.4 million, split into CHF 0.9 million assets and CHF 1.3 million liabilities. The remaining goodwill of CHF 1.1 million for

Letter to Shareholders Overview Business Highlights Sustainability Financial Reports Governance
Consolidated Financial Statements
Barry Callebaut | Annual Report /
Nyonkopa is attributable to the value created by the integration of the business into the Group’s existing business, such as improved access to Ghanaian farmers at farm level and the possibility to source directly from them and to provide the farmers with farm services. This is in line with Barry Callebaut’s strategy to make cocoa farming more sustainable and attractive to farmers and the approach to focus on farmer productivity and community development. The goodwill has been allocated to Region Global Cocoa and is expected to be deductible for income tax purposes.
The revenue included in the Consolidated Income Statement since November 5, 2015, contributed by Nyonkopa was CHF 33.5 million. Nyonkopa has also contributed CHF 0.8 million to net profit over the same period. Had Nyonkopa been consolidated from September 1, 2015, it would have contributed revenue of CHF 33.9 million and net profit for the fiscal year of CHF 0.9 million to the Consolidated Income Statement.
in thousands of CHF 2015/16 Recognized amounts of identifiable assets acquired and liabilities assumed Current assets 10,550 Non-current assets 904 Current liabilities (1,529) Non-current liabilities – Total identifiable net assets 9,925 Goodwill 17,003 Total consideration at fair value 26,928
thereof: Cash paid 26,928 Consideration deferred –
Acquisition in 2014/15 Settlement with Petra Foods regarding purchase price dispute Barry Callebaut and Petra Foods Ltd. reached an amicable commercial settlement and resolved their dispute regarding the determination of the final consideration for the Cocoa Ingredients Division, which Barry Callebaut had acquired from Petra Foods in 2013. As a result of this settlement, Petra Foods paid the lump sum of USD 38.8 million (i.e. CHF 37.5 million) in cash to Barry Callebaut at the end of August 2015, which was reflected in the cash flow from investing activities. With regards to the income statement, CHF 23.9 million was reported on line “Cost of goods sold” and CHF 13.6 million was reported under “Other income.” As part of this commercial settlement, the parties also agreed to extend the term of the cocoa supply agreement until end of June 2020. American Almond Products Co., Inc. On August 3, 2015, Barry Callebaut Group has closed an agreement to acquire the business consisting of a customer portfolio, brands and manufacturing equipment from nut products manufacturer American Almond Products Co., Inc. American Almond is known as a leader in the US in artisanal nut-based ingredients with a production facility located in Brooklyn, New York. The transaction with American Almond underlines Barry Callebaut’s strategic intention to further grow in adjacent ingredients products.
The consideration transferred was CHF 17.0 million fully paid in cash in three tranches: CHF 4.9 million nonrefundable down payment at the signing of the agreement; CHF 2.0 million to be deposited on a separate interest-bearing escrow account at the close of the agreement which shall be held until the 18-month anniversary of the Closing Date (i.e. January 3, 2017) and CHF 10.1 million closing date payment (i.e. August 3, 2015).

Letter to Shareholders Overview Business Highlights Sustainability Financial Reports Governance
Consolidated Financial Statements
Barry Callebaut | Annual Report /
During the reporting period, acquisition-related costs, such as fees for due diligence work and lawyers, in the amount of CHF 0.3 million were expensed (included in “General and administration expenses”).
in thousands of CHF 2014/15 Recognized amounts of identifiable assets acquired Tangible assets 241 Intangible assets 4,677 Total identifiable net assets 4,918 Goodwill 12,050 Total consideration at fair value 16,968
The goodwill of CHF 12.1 million arising from the acquisition is attributable to the integration of the business into the Group’s existing business and the related synergies as well as getting greater importance for our suppliers (market penetration throughout the production chain). The goodwill has been allocated to Region Americas.
The goodwill recognized is expected to be deductible for income tax purposes. The revenue included in the Consolidated Income Statement since August 3, 2015,
contributed by American Almond, was CHF 1.7 million. American Almond has also contributed CHF 0.3 million to net profit over the same period.
Had American Almond been consolidated from September 1, 2014, it would have contributed revenue of CHF 16.9 million and net profit for the fiscal year of CHF 2.0 million to the Consolidated Income Statement.
Discontinued operations and disposal The Group did not have any discontinued operations and disposals in 2015/16 and 2014/15.
Segment information External segment reporting is based on the internal organizational and management structure, as well as on the internal information reviewed regularly by the Chief Oper- ating Decision Maker. Barry Callebaut’s Chief Operating Decision Maker has been identified as the Executive Committee.
The Executive Committee considers the business from a geographic view. Hence, Presidents were appointed for each region. Since the Group’s cocoa activities operate independently of the Regions, the Global Cocoa business is reviewed by the Chief Operating Decision Maker as an own segment in addition to the geographical Regions EMEA (Europe, Middle East and Africa), Americas and Asia Pacific. Furthermore, the Executive Committee also views the Corporate function independently. The function “Corporate” consists mainly of headquarters services (incl. the Group’s centralized treasury department) to other segments. Thus, the Group reports Corporate separately.
The segment Global Cocoa is responsible for the procurement of ingredients for chocolate production (mainly cocoa; sugar, dairy and nuts are also common ingredients) and the Group’s cocoa-processing business. Most of the revenues of Global Cocoa are generated with the other segments of the Group.

Letter to Shareholders Overview Business Highlights Sustainability Financial Reports Governance
Consolidated Financial Statements
Barry Callebaut | Annual Report /
The regional chocolate business consists of chocolate production related to the Product Groups “Food Manufacturers’ Products” focusing on industrial customers and “Gourmet & Specialties Products” focusing on products for artisans and professional users of chocolate such as chocolatiers, pastry chefs or bakers as well as products for vending machines. Financial information by reportable segments
2015/16 in thousands of CHF
EMEA
Americas
Asia Pacific
Global Cocoa
Total Segments
Corporate Eliminations
Group
Revenues from external customers 2,738,963 1,622,894 306,790 2,008,119 6,676,766 – – 6,676,766 Revenues from transactions with other operating segments of the Group
5,014
662
–
1,904,239
1,909,915
–
(1,909,915)
–
Revenue from sales and services 2,743,977 1,623,556 306,790 3,912,358 8,586,681 – (1,909,915) 6,676,766 Operating profit (EBIT) 289,556 147,199 32,244 17,645 486,643 (84,950) – 401,694 Depreciation and amortization (44,649) (29,428) (7,624) (53,677) (135,379) (2,359) – (137,737) Impairment losses (674) – (4) (0) (678) – – (678) Total assets 1,427,009 819,134 186,322 2,694,172 5,126,637 2,141,037 (1,626,870) 5,640,803 Additions to property, plant, equipment and intangible assets
(82,420)
(42,864)
(15,364)
(54,319)
(194,968)
(23,956)
–
(218,924)
2014/15 in thousands of CHF
EMEA
Americas
Asia Pacific
Global Cocoa
Total Segments
Corporate Eliminations
Group
Revenues from external customers 2,563,682 1,507,875 269,824 1,900,484 6,241,865 – – 6,241,865 Revenues from transactions with other operating segments of the Group
4,611
623
–
1,669,368
1,674,602
–
(1,674,602)
–
Revenue from sales and services 2,568,293 1,508,498 269,824 3,569,852 7,916,467 – (1,674,602) 6,241,865 Operating profit (EBIT) 289,714 130,634 26,937 47,198 494,483 (79,662) – 414,821 Depreciation and amortization (40,828) (22,978) (6,917) (53,071) (123,794) (2,194) – (125,988) Impairment losses (569) – – (11,772) (12,341) – – (12,341) Total assets 1,340,869 1,080,208 162,576 2,818,132 5,401,785 1,371,352 (1,343,749) 5,429,388 Additions to property, plant, equipment and intangible assets
(85,877)
(68,558)
(15,406)
(67,586)
(237,427)
(28,726)
–
(266,153)
Global Cocoa comprises Group-wide sourcing and Global Cocoa processing functions also for the benefit of all the regions. Therefore, the major part of its operation profits is consequently allocated to the regions.
Segment revenue, segment results (operating profit EBIT) and segment assets are measured based on IFRS principles.
Finance income and costs, the Group’s share of result of equity-accounted investees and income taxes are not allocated to the respective segment for internal management purposes.
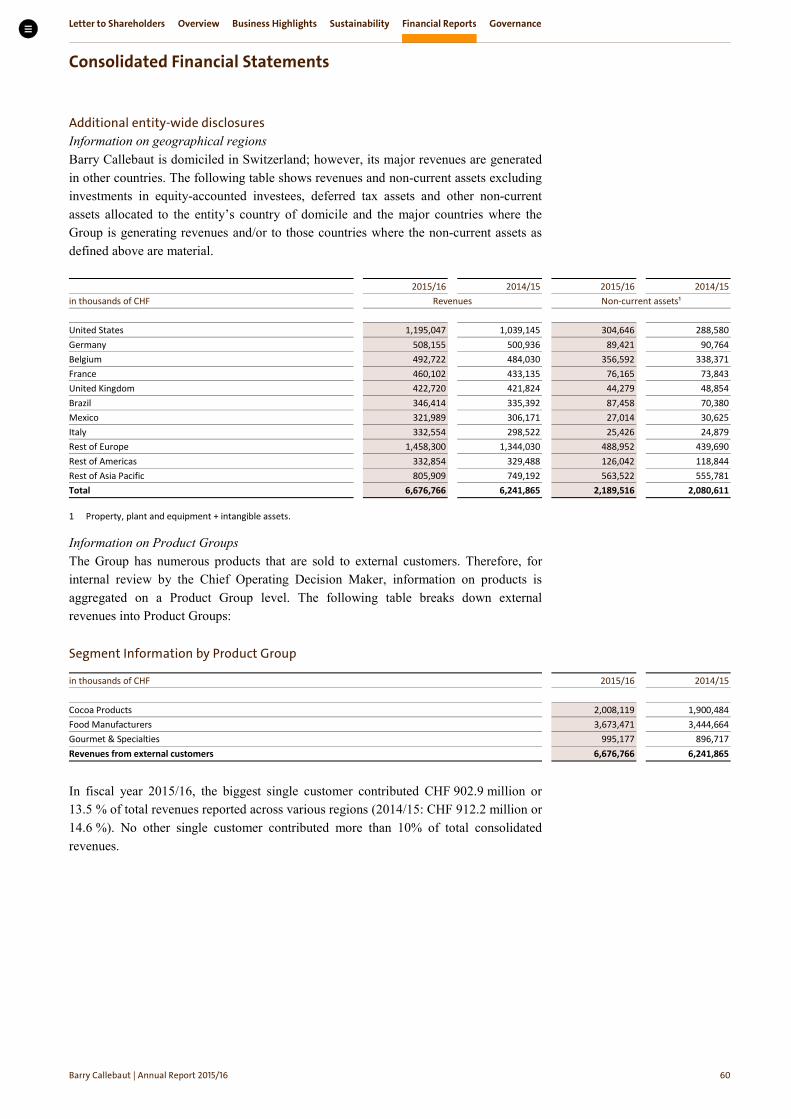
Letter to Shareholders Overview Business Highlights Sustainability Financial Reports Governance
Consolidated Financial Statements
Barry Callebaut | Annual Report /
Additional entity-wide disclosures Information on geographical regions Barry Callebaut is domiciled in Switzerland; however, its major revenues are generated in other countries. The following table shows revenues and non-current assets excluding investments in equity-accounted investees, deferred tax assets and other non-current assets allocated to the entity’s country of domicile and the major countries where the Group is generating revenues and/or to those countries where the non-current assets as defined above are material.
2015/16 2014/15 2015/16 2014/15 in thousands of CHF Revenues Non-current assets¹ United States 1,195,047 1,039,145 304,646 288,580 Germany 508,155 500,936 89,421 90,764 Belgium 492,722 484,030 356,592 338,371 France 460,102 433,135 76,165 73,843 United Kingdom 422,720 421,824 44,279 48,854 Brazil 346,414 335,392 87,458 70,380 Mexico 321,989 306,171 27,014 30,625 Italy 332,554 298,522 25,426 24,879 Rest of Europe 1,458,300 1,344,030 488,952 439,690 Rest of Americas 332,854 329,488 126,042 118,844 Rest of Asia Pacific 805,909 749,192 563,522 555,781 Total 6,676,766 6,241,865 2,189,516 2,080,611
1 Property, plant and equipment + intangible assets.
Information on Product Groups The Group has numerous products that are sold to external customers. Therefore, for internal review by the Chief Operating Decision Maker, information on products is aggregated on a Product Group level. The following table breaks down external revenues into Product Groups:
Segment Information by Product Group
in thousands of CHF 2015/16 2014/15 Cocoa Products 2,008,119 1,900,484 Food Manufacturers 3,673,471 3,444,664 Gourmet & Specialties 995,177 896,717 Revenues from external customers 6,676,766 6,241,865
In fiscal year 2015/16, the biggest single customer contributed CHF 902.9 million or 13.5 % of total revenues reported across various regions (2014/15: CHF 912.2 million or 14.6 %). No other single customer contributed more than 10% of total consolidated revenues.

Letter to Shareholders Overview Business Highlights Sustainability Financial Reports Governance
Consolidated Financial Statements
Barry Callebaut | Annual Report /
Personnel expenses
in thousands of CHF 2015/16 2014/15 Wages and salaries (408,845) (370,350) Compulsory social security contributions (74,144) (83,420) Equity-settled share-based payments (12,226) (12,887) Expenses related to defined benefit plans (11,812) (9,049) Contributions to defined contribution plans (2,656) (2,739) Increase in liability for long service leave (33) (32) Total personnel expenses (509,716) (478,477)
Research and development expenses
in thousands of CHF 2015/16 2014/15 Total research and development expenses (20,436) (20,334)
Research and development expenses not qualifying for capitalization are directly charged to the Consolidated Income Statement and are reported under “Marketing and sales expenses” and “General and administration expenses.” The part qualifying for capitalization is reported as addition under internally generated assets in note 18 – Intangible assets.
Other income
in thousands of CHF 2015/16 2014/15 Gain on disposal of property, plant and equipment 159 5,176 Group training centers, museums, outlets and rental income 2,531 2,893 Sale of shells of cocoa beans, waste and sundry sales 8,794 6,650 Litigations, claims and insurance 645 3,993 Release of unused provisions and accruals 1,454 2,959 Other 1,883 17,238 Total other income 15,466 38,909
Other income also includes a subsidy from Takasaki City of CHF 0.4 million while in prior year CHF 13.6 million were related to the commercial settlement with Petra Foods Ltd.
Other expenses
in thousands of CHF 2015/16 2014/15 Restructuring costs (5,029) (11,356) Loss on sale of waste (5) – Litigations and claims (2,633) (2,999) Costs related to chocolate museums (400) (359) Loss on sale of property, plant and equipment (1,171) (399) Impairment on property, plant and equipment (note 15) – (11,849) Impairment on other intangibles (note 18) (678) (492) Other (4,783) (5,462) Total other expenses (14,699) (32,916)
Restructuring costs include severance costs in connection with the setup of the Shared Service Center (SSC) in Lodz, Poland, and restructuring (reduction of capacity) in Asia.
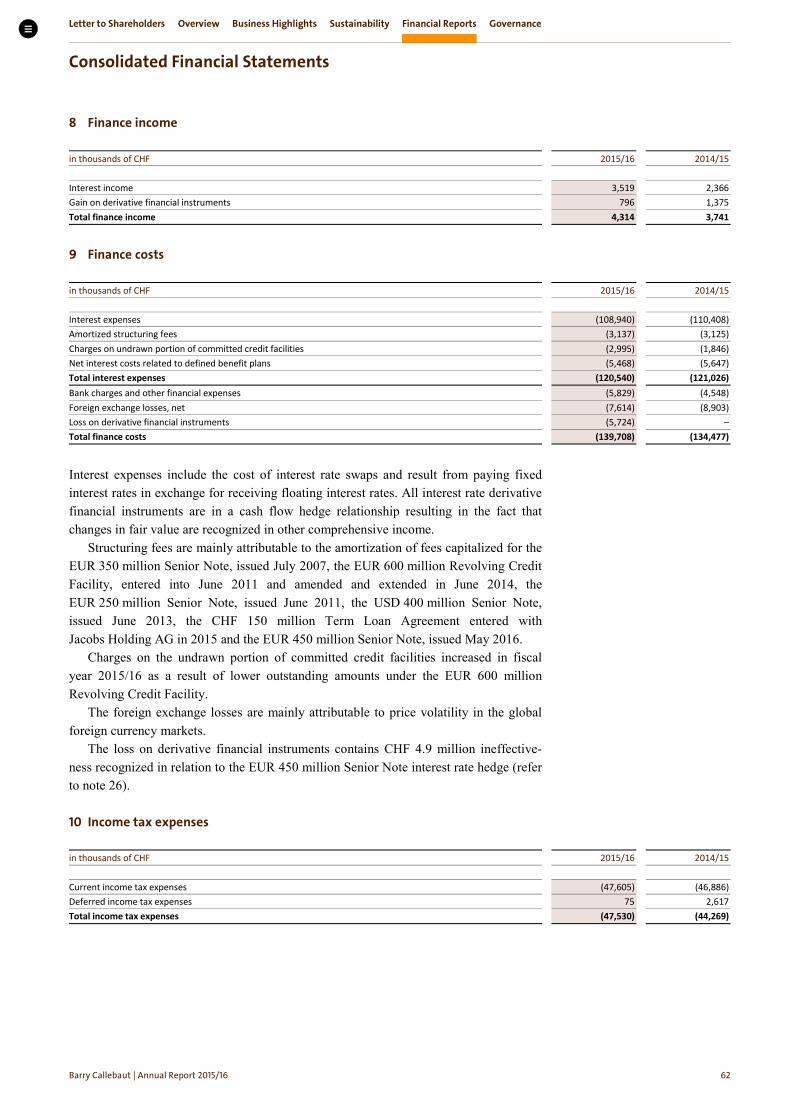
Letter to Shareholders Overview Business Highlights Sustainability Financial Reports Governance
Consolidated Financial Statements
Barry Callebaut | Annual Report /
Finance income
in thousands of CHF 2015/16 2014/15 Interest income 3,519 2,366 Gain on derivative financial instruments 796 1,375 Total finance income 4,314 3,741
Finance costs
in thousands of CHF 2015/16 2014/15 Interest expenses (108,940) (110,408) Amortized structuring fees (3,137) (3,125) Charges on undrawn portion of committed credit facilities (2,995) (1,846) Net interest costs related to defined benefit plans (5,468) (5,647) Total interest expenses (120,540) (121,026) Bank charges and other financial expenses (5,829) (4,548) Foreign exchange losses, net (7,614) (8,903) Loss on derivative financial instruments (5,724) – Total finance costs (139,708) (134,477)
Interest expenses include the cost of interest rate swaps and result from paying fixed interest rates in exchange for receiving floating interest rates. All interest rate derivative financial instruments are in a cash flow hedge relationship resulting in the fact that changes in fair value are recognized in other comprehensive income.
Structuring fees are mainly attributable to the amortization of fees capitalized for the EUR 350 million Senior Note, issued July 2007, the EUR 600 million Revolving Credit Facility, entered into June 2011 and amended and extended in June 2014, the EUR 250 million Senior Note, issued June 2011, the USD 400 million Senior Note, issued June 2013, the CHF 150 million Term Loan Agreement entered with Jacobs Holding AG in 2015 and the EUR 450 million Senior Note, issued May 2016.
Charges on the undrawn portion of committed credit facilities increased in fiscal year 2015/16 as a result of lower outstanding amounts under the EUR 600 million Revolving Credit Facility.
The foreign exchange losses are mainly attributable to price volatility in the global foreign currency markets.
The loss on derivative financial instruments contains CHF 4.9 million ineffective-ness recognized in relation to the EUR 450 million Senior Note interest rate hedge (refer to note 26).
Income tax expenses
in thousands of CHF 2015/16 2014/15 Current income tax expenses (47,605) (46,886) Deferred income tax expenses 75 2,617 Total income tax expenses (47,530) (44,269)
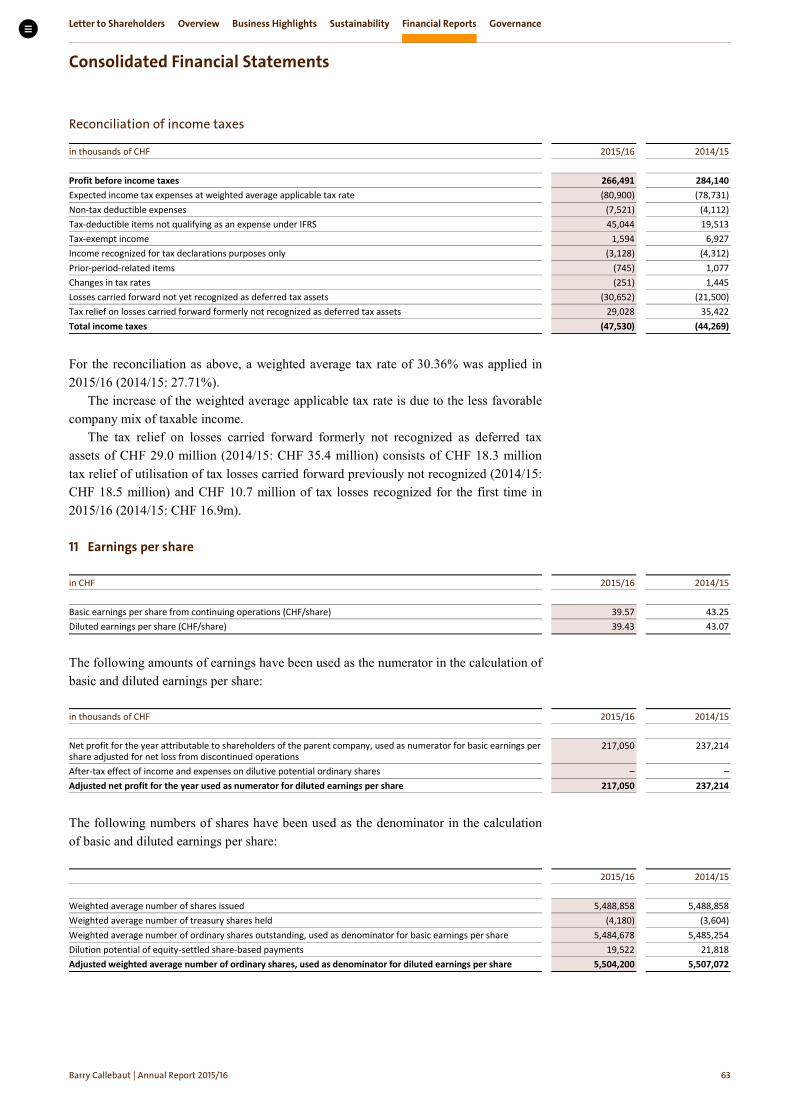
Letter to Shareholders Overview Business Highlights Sustainability Financial Reports Governance
Consolidated Financial Statements
Barry Callebaut | Annual Report /
Reconciliation of income taxes
in thousands of CHF 2015/16 2014/15 Profit before income taxes 266,491 284,140 Expected income tax expenses at weighted average applicable tax rate (80,900) (78,731) Non-tax deductible expenses (7,521) (4,112) Tax-deductible items not qualifying as an expense under IFRS 45,044 19,513 Tax-exempt income 1,594 6,927 Income recognized for tax declarations purposes only (3,128) (4,312) Prior-period-related items (745) 1,077 Changes in tax rates (251) 1,445 Losses carried forward not yet recognized as deferred tax assets (30,652) (21,500) Tax relief on losses carried forward formerly not recognized as deferred tax assets 29,028 35,422 Total income taxes (47,530) (44,269)
For the reconciliation as above, a weighted average tax rate of 30.36% was applied in 2015/16 (2014/15: 27.71%).
The increase of the weighted average applicable tax rate is due to the less favorable company mix of taxable income.
The tax relief on losses carried forward formerly not recognized as deferred tax assets of CHF 29.0 million (2014/15: CHF 35.4 million) consists of CHF 18.3 million tax relief of utilisation of tax losses carried forward previously not recognized (2014/15: CHF 18.5 million) and CHF 10.7 million of tax losses recognized for the first time in 2015/16 (2014/15: CHF 16.9m).
Earnings per share
in CHF 2015/16 2014/15 Basic earnings per share from continuing operations (CHF/share) 39.57 43.25 Diluted earnings per share (CHF/share) 39.43 43.07
The following amounts of earnings have been used as the numerator in the calculation of basic and diluted earnings per share:
in thousands of CHF 2015/16 2014/15 Net profit for the year attributable to shareholders of the parent company, used as numerator for basic earnings per share adjusted for net loss from discontinued operations
217,050
237,214
After-tax effect of income and expenses on dilutive potential ordinary shares – – Adjusted net profit for the year used as numerator for diluted earnings per share 217,050 237,214
The following numbers of shares have been used as the denominator in the calculation of basic and diluted earnings per share:
2015/16 2014/15 Weighted average number of shares issued 5,488,858 5,488,858 Weighted average number of treasury shares held (4,180) (3,604) Weighted average number of ordinary shares outstanding, used as denominator for basic earnings per share 5,484,678 5,485,254 Dilution potential of equity-settled share-based payments 19,522 21,818 Adjusted weighted average number of ordinary shares, used as denominator for diluted earnings per share 5,504,200 5,507,072

Letter to Shareholders Overview Business Highlights Sustainability Financial Reports Governance
Consolidated Financial Statements
Barry Callebaut | Annual Report /
Trade receivables and other current assets
as of August 31, 2016 2015 in thousands of CHF Trade receivables 436,604 418,815 Accrued income 37,324 21,276 Loans and other receivables 155,299 111,577 Other current financial assets 18,161 12,470 Receivables representing financial assets 647,387 564,138 Fair values of hedged firm commitments 14,857 99,111 Prepayments 63,425 122,989 Other current non-financial assets 1,276 922 Other taxes and receivables from government 201,831 184,763 Other receivables 281,388 407,785 Total trade receivables and other current assets 928,776 971,923
The Group runs an asset-backed securitization program, whereby trade receivables are sold at their nominal value minus a discount in exchange for cash. The amount of the receivables sold net of discounts as of August 31, 2016 is CHF 357.6 million (2015: CHF 360.3 million). This amount is derecognized from the balance sheet. The amount is the combination of the gross value of the receivables sold CHF 388.0 million (CHF 384.0 million as of August 31, 2015) and the discount CHF 30.4 million (CHF 23.7 million as of August 31, 2015).
Net amounts payable to the program amounted to CHF 73.6 million as of August 31, 2016 (2015: CHF 60.4 million), consisting of the balance of receivables collected before the next rollover date of CHF 104.0 million (2015: CHF 84.1 million), less the discount on receivables sold of CHF 30.4 million (2015: CHF 23.7 million). These amounts are included in note 21 – Other payables on a netted basis.
The discount is retained by the program to establish a dilution reserve, a yield reserve, and an insurance first loss reserve.
Trade receivables with the fair value of CHF 77.5 million (and CHF 77.5 million nominal amount) as of August 31, 2016 (2015: fair value CHF 73.9 million, nominal amount CHF 74.0 million), are held for realization through sale under the asset-backed securitization program and are therefore classified as measured at fair value through profit or loss.
Interest expense paid under the asset-backed securitization program amounted to CHF 3.3 million in fiscal year 2015/16 (2014/15: CHF 3.0 million) and is reported under interest expenses.
For detailed information about the expected credit losses calculated on the Group’s receivables, refer to note 26 – Credit risk and concentration of credit risk.
Inventories
as of August 31, 2016 2015 in thousands of CHF Cocoa beans stocks 468,034 512,405 Semi-finished and finished products 996,307 956,764 Other raw materials and packaging materials 159,466 160,645 Total inventories 1,623,807 1,629,814
As of August 31, 2016, the value of cocoa and chocolate inventories designated in hedging relationship amounted to CHF 895.6 million (2015: CHF 909.1 million). The value of the inventories designated in hedging relationship included CHF 35.1 million

Letter to Shareholders Overview Business Highlights Sustainability Financial Reports Governance
Consolidated Financial Statements
Barry Callebaut | Annual Report /
fair value hedge adjustment (2015: CHF 27.9 million). For further detail about the hedged inventories, refer to note 26 – Effect of hedge accounting on the financial position and performance.
As of August 31, 2016, inventories amounting to CHF 4.3 million (2015: CHF 0.7 million) are pledged as security for financial liabilities.
In fiscal year 2015/16, inventory write-downs of CHF 10.5 million related to price list business and stocks that are not designated in a hedge relationship were recognized as expenses (2014/15: CHF 22.4 million).
Derivative financial instruments and hedging activities
as of August 31, 2016 2015 in thousands of CHF
Derivative financial
assets Derivative financial
liabilities Derivative financial
assets Derivative financial
liabilities Cash flow hedges Interest rate risk
Swaps 13 8,670 4,768 9,492 Cocoa price risk
Forward and futures contracts 1,932 2,748 628 2,539 Sugar price risk
Futures contracts 31,358 – – 7,647 Fuel oil price risk
Swaps – 3,993 – 3,405 Foreign exchange risk
Forward and futures contracts 3,619 842 857 274 Fair value hedges Cocoa price risk
Forward and futures contracts – 89,859 209,188 216,927 Foreign exchange risk
Forward and futures contracts 3,599 3,693 36,963 52,119 Other – no hedge accounting Raw materials
Futures contracts and other derivatives 65,850 129,325 26,509 156,250 Forward contract at fair value using fair value option 83,748 7,539 161,634 4,114 Fair value adjustment on risk component for cocoa and chocolate sales and purchase contracts
52,755
–
– –
Foreign exchange risk Forward and futures contracts 75,430 63,699 57,966 926
Total derivative financial assets 318,303 – 498,514 – Total derivative financial liabilities – 310,368 – 453,694
Derivative financial instruments consist of items used in a cash flow hedging model, items used in a fair value hedging model and derivative instruments measured at fair value, for which no hedge accounting is applied.
The position “Other – no hedge accounting” contains the fair values of derivative financial instruments of the Group’s purchasing and sourcing centers and the Group’s centralized treasury department, which are not designated into hedge accounting relationship. The forward and future contracts for foreign exchange risks are in an economic hedge relationship.
For further details about fair value measurement and the hedge accounting relationships as of August 31, 2016 and their impacts, refer to note 26.

Letter to Shareholders Overview Business Highlights Sustainability Financial Reports Governance
Consolidated Financial Statements
Barry Callebaut | Annual Report /
Property, plant and equipment
2015/16
Land and buildings
Plant and machinery
Office equipment, furniture and
motor vehicles
Under construction
Total
in thousands of CHF At cost
as of September 1, 2015 462,895 1,519,005 105,123 119,067 2,206,090 Additions 9,766 66,444 7,367 76,046 159,622 Disposals (260) (16,131) (1,352) (227) (17,971) Currency translation adjustments 7,125 19,726 786 3,249 30,886 Reclassifications from under construction 14,589 23,697 13,351 (51,637) – as of August 31, 2016 494,115 1,612,740 125,274 146,498 2,378,627 Accumulated depreciation and impairment losses
as of September 1, 2015 179,553 765,938 76,028 28 1,021,547 Depreciation charge 16,328 72,217 9,122 – 97,666 Impairment losses – – – – – Disposals (33) (11,343) (1,291) – (12,666) Currency translation adjustments 2,046 7,177 631 – 9,854 Reclassified to assets held for sale 224 (222) (2) – – as of August 31, 2016 198,117 833,768 84,488 28 1,116,400 Net as of August 31, 2016 295,997 778,972 40,786 146,470 1,262,227
2014/15
Land and buildings
Plant and machinery
Office equipment, furniture and
motor vehicles
Under construction
Total
in thousands of CHF At cost as of September 1, 2014 445,794 1,507,412 106,402 129,389 2,188,997 Business combination – 241 – – 241 Additions 41,150 91,664 9,010 63,494 205,318 Disposals (3,821) (11,936) (3,139) (2,194) (21,090) Currency translation adjustments (34,181) (113,449) (9,707) (10,039) (167,376) Reclassifications from under construction 13,953 45,073 2,557 (61,583) – as of August 31, 2015 462,895 1,519,005 105,123 119,067 2,206,090 Accumulated depreciation and impairment losses
as of September 1, 2014 180,276 751,920 78,244 28 1,010,468 Depreciation charge 15,096 68,289 7,411 – 90,796 Impairment losses – 11,849 – – 11,849 Disposals (2,626) (2,339) (2,509) – (7,474) Currency translation adjustments (13,193) (63,781) (7,117) – (84,092) as of August 31, 2015 179,553 765,938 76,028 28 1,021,547 Net as of August 31, 2015 283,342 753,067 29,095 119,039 1,184,543

Letter to Shareholders Overview Business Highlights Sustainability Financial Reports Governance
Consolidated Financial Statements
Barry Callebaut | Annual Report /
The Group periodically reviews the remaining useful lives of assets recognized in property, plant and equipment.
No impairment losses in property, plant and equipment were recognized in fiscal year 2015/16 (2014/15 CHF 11.8 million).
Repair and maintenance expenses for the fiscal year 2015/16 amounted to CHF 57.7 million (2014/15: CHF 54.8 million).
As of August 31, 2016, plant and equipment held under finance leases amounted to CHF 2.8 million (2015: CHF 3.4 million). The related liabilities are reported under note 16 – Obligations under finance leases, note 20 – Bank overdrafts and short-term debt and note 23 – Long-term debt.
As of August 31, 2016, financial liabilities of CHF 0.4 million were secured by means of mortgages on properties (2015: CHF 0.9 million).
Obligations under finance leases
as of August 31, 2016 2015 2016 2015 in thousands of CHF Minimum lease payments Present value of minimum lease payments Amounts payable under finance leases
within one year 189 116 180 99 in the second to fifth year inclusive 309 211 296 199 more than five years – – – –
Total amount payable under finance leases 498 327 476 298 less: future finance charges (22) (29) – – Present value of lease obligations 476 298 476 298 Amount due for settlement next 12 months (note 20) 180 99 Amount due for settlement after 12 months 296 199
The Group entered into finance leasing arrangements for various assets. The weighted average term of finance leases entered into is 8.8 years (2014/15: 15 years). The average effective interest rate was 8.7% (2014/15: 7.1%). Interest rates are fixed at the contract date. All leases are on a fixed repayment basis, and no arrangement has been entered into for contingent rental payment.
as of August 31, 2016 2015 in thousands of CHF
Net carrying amount of property, plant and
equipment under finance lease Land and buildings 2,546 3,418 Furniture, equipment and motor vehicles 273 – Total assets under financial lease 2,819 3,418

Letter to Shareholders Overview Business Highlights Sustainability Financial Reports Governance
Consolidated Financial Statements
Barry Callebaut | Annual Report /
Equity-accounted investees The carrying amount of equity-accounted investees changed as follows:
in thousands of CHF 2015/16 2014/15 as of September 1, 950 1,094 Share of (loss)/profit 191 55 Dividends received (514) (134) Exchange rate differences – (65) as of August 31, 627 950
The Group’s investments in equity-accounted investees are attributable to the following companies:
as of August 31, 2016 2015 Ownership in % Shanghai Le Jia Food Service Co. Ltd., China 50 50 Nordic Industrial Sales AB, Finland 49 49
Summarized financial information in respect of the Group’s equity-accounted investees is set out below.
as of August 31, 2016 2015 in thousands of CHF Total current assets 2,533 4,596 Total non-current assets – – Total current liabilities 1,187 2,409 Total non-current liabilities – – Net assets as of August 31, 1,346 2,187 Group’s share of net assets of equity-accounted investees 627 950
in thousands of CHF 2015/16 2014/15 Total revenue 6,094 10,669 Total profit for the year 263 299 Other comprehensive income – – Total comprehensive income 263 299 Group’s share of (losses)/profits of equity-accounted investees 191 55
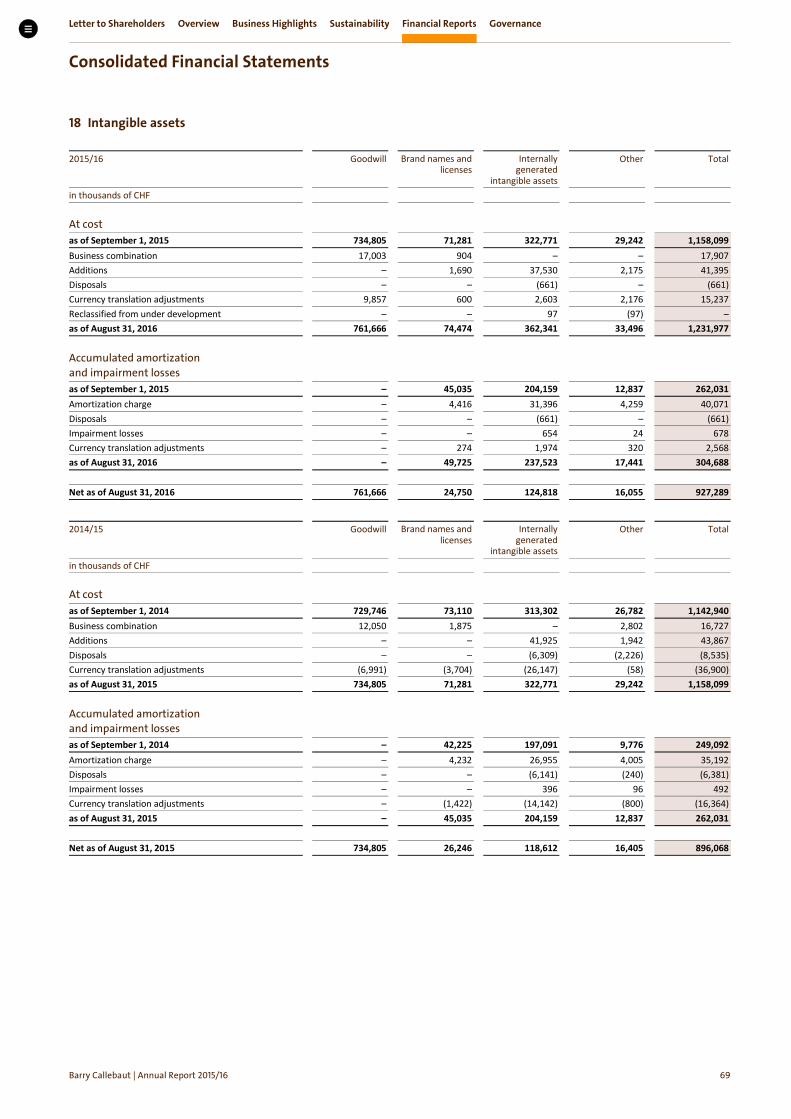
Letter to Shareholders Overview Business Highlights Sustainability Financial Reports Governance
Consolidated Financial Statements
Barry Callebaut | Annual Report /
Intangible assets
2015/16
Goodwill
Brand names and licenses
Internally generated
intangible assets
Other
Total
in thousands of CHF At cost
as of September 1, 2015 734,805 71,281 322,771 29,242 1,158,099 Business combination 17,003 904 – – 17,907 Additions – 1,690 37,530 2,175 41,395 Disposals – – (661) – (661) Currency translation adjustments 9,857 600 2,603 2,176 15,237 Reclassified from under development – – 97 (97) – as of August 31, 2016 761,666 74,474 362,341 33,496 1,231,977 Accumulated amortization and impairment losses
as of September 1, 2015 – 45,035 204,159 12,837 262,031 Amortization charge – 4,416 31,396 4,259 40,071 Disposals – – (661) – (661) Impairment losses – – 654 24 678 Currency translation adjustments – 274 1,974 320 2,568 as of August 31, 2016 – 49,725 237,523 17,441 304,688 Net as of August 31, 2016 761,666 24,750 124,818 16,055 927,289
2014/15
Goodwill
Brand names and licenses
Internally generated
intangible assets
Other
Total
in thousands of CHF At cost
as of September 1, 2014 729,746 73,110 313,302 26,782 1,142,940 Business combination 12,050 1,875 – 2,802 16,727 Additions – – 41,925 1,942 43,867 Disposals – – (6,309) (2,226) (8,535) Currency translation adjustments (6,991) (3,704) (26,147) (58) (36,900) as of August 31, 2015 734,805 71,281 322,771 29,242 1,158,099 Accumulated amortization and impairment losses
as of September 1, 2014 – 42,225 197,091 9,776 249,092 Amortization charge – 4,232 26,955 4,005 35,192 Disposals – – (6,141) (240) (6,381) Impairment losses – – 396 96 492 Currency translation adjustments – (1,422) (14,142) (800) (16,364) as of August 31, 2015 – 45,035 204,159 12,837 262,031 Net as of August 31, 2015 734,805 26,246 118,612 16,405 896,068
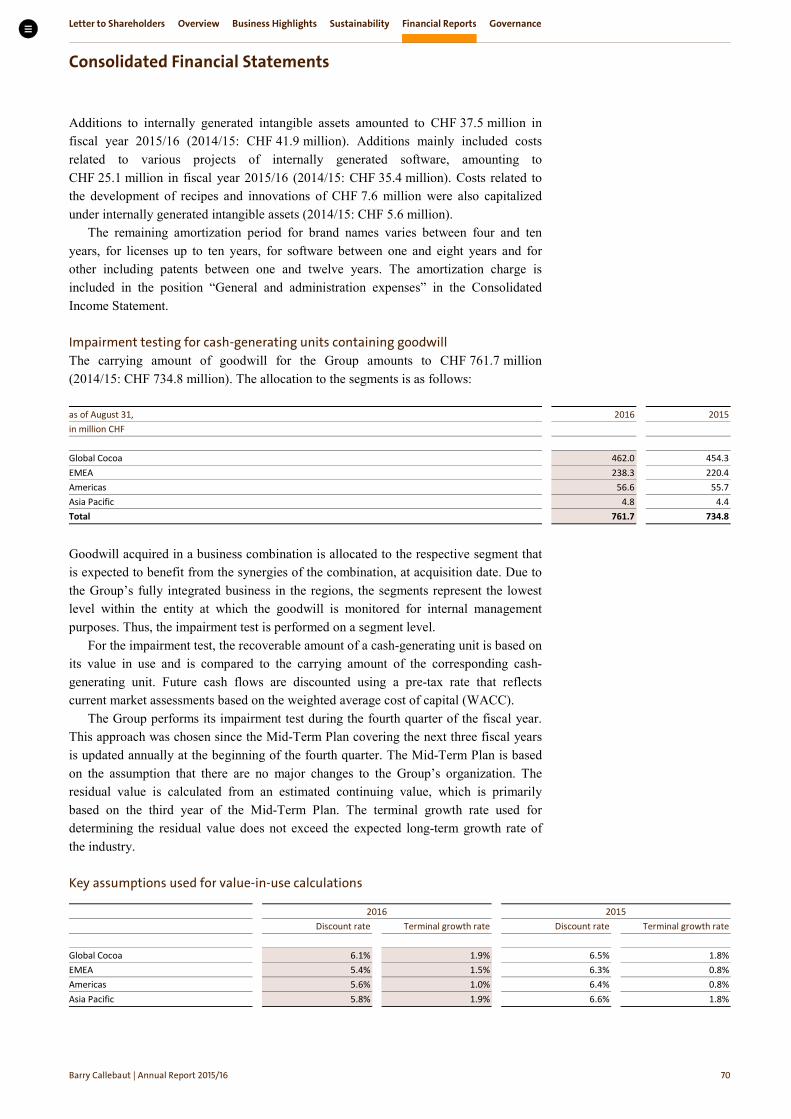
Letter to Shareholders Overview Business Highlights Sustainability Financial Reports Governance
Consolidated Financial Statements
Barry Callebaut | Annual Report /
Additions to internally generated intangible assets amounted to CHF 37.5 million in fiscal year 2015/16 (2014/15: CHF 41.9 million). Additions mainly included costs related to various projects of internally generated software, amounting to CHF 25.1 million in fiscal year 2015/16 (2014/15: CHF 35.4 million). Costs related to the development of recipes and innovations of CHF 7.6 million were also capitalized under internally generated intangible assets (2014/15: CHF 5.6 million).
The remaining amortization period for brand names varies between four and ten years, for licenses up to ten years, for software between one and eight years and for other including patents between one and twelve years. The amortization charge is included in the position “General and administration expenses” in the Consolidated Income Statement.
Impairment testing for cash-generating units containing goodwill The carrying amount of goodwill for the Group amounts to CHF 761.7 million (2014/15: CHF 734.8 million). The allocation to the segments is as follows:
as of August 31, 2016 2015 in million CHF Global Cocoa 462.0 454.3 EMEA 238.3 220.4 Americas 56.6 55.7 Asia Pacific 4.8 4.4 Total 761.7 734.8
Goodwill acquired in a business combination is allocated to the respective segment that is expected to benefit from the synergies of the combination, at acquisition date. Due to the Group’s fully integrated business in the regions, the segments represent the lowest level within the entity at which the goodwill is monitored for internal management purposes. Thus, the impairment test is performed on a segment level.
For the impairment test, the recoverable amount of a cash-generating unit is based on its value in use and is compared to the carrying amount of the corresponding cash-generating unit. Future cash flows are discounted using a pre-tax rate that reflects current market assessments based on the weighted average cost of capital (WACC).
The Group performs its impairment test during the fourth quarter of the fiscal year. This approach was chosen since the Mid-Term Plan covering the next three fiscal years is updated annually at the beginning of the fourth quarter. The Mid-Term Plan is based on the assumption that there are no major changes to the Group’s organization. The residual value is calculated from an estimated continuing value, which is primarily based on the third year of the Mid-Term Plan. The terminal growth rate used for determining the residual value does not exceed the expected long-term growth rate of the industry.
Key assumptions used for value-in-use calculations
2016 2015 Discount rate Terminal growth rate Discount rate Terminal growth rate Global Cocoa 6.1% 1.9% 6.5% 1.8% EMEA 5.4% 1.5% 6.3% 0.8% Americas 5.6% 1.0% 6.4% 0.8% Asia Pacific 5.8% 1.9% 6.6% 1.8%

Letter to Shareholders Overview Business Highlights Sustainability Financial Reports Governance
Consolidated Financial Statements
Barry Callebaut | Annual Report /
The annual impairment tests did not result in a need to recognize impairment losses in fiscal year 2015/16.
The key sensitivities in the impairment test are the WACC as well as the terminal growth rate.
The Group has carried out a sensitivity analysis, containing various scenarios. Taking reasonable possible changes in key assumptions into account, no impairment losses have been revealed.
Deferred tax assets and liabilities
Movement in deferred tax assets and liabilities
Inventories
Property, plant,
equipment/ intangible
assets
Other assets
Provisions
Other liabilities
Tax loss carry-
forwards
Total
in thousands of CHF as of September 1, 2014 (8,539) (40,150) (6,060) 702 23,857 65,500 35,310 Charged to the income statement 6,413 5,394 4,742 (1,198) (22,310) 9,576 2,617 Charged to equity – – (1,355) – 1,451 – 96 Currency translation effects 1,215 (296) 1,983 (139) (114) (1,519) 1,130 as of August 31, 2015 (911) (35,052) (690) (635) 2,884 73,557 39,153 Charged to the income statement 4,623 (10,172) (23,792) (5) 25,251 4,171 76 Charged to equity – – – – 11,065 – 11,065 Currency translation effects (4) (31) 311 (5) (77) 1,720 1,914 as of August 31, 2016 3,708 (45,255) (24,171) (645) 39,123 79,448 52,208
For fiscal year 2015/16, deferred tax income recognized in equity amounted to CHF 11.1 million (2014/15: CHF 0.1 million) and relates to the deferred tax impact on remeasurement of defined benefit plans of CHF 7.1 million (2014/15: CHF 0.5 million), cash flow hedging reserves CHF 4.0 million (2014/15: CHF –0.4 million). Recognized deferred tax assets and liabilities The recognized deferred tax assets and liabilities, without taking into consideration the offsetting of balances within the same tax jurisdiction, are attributable to the following:
as of August 31, 2016 2015 in thousands of CHF Assets Liabilities Net Assets Liabilities Net Inventories 8,695 (4,987) 3,708 6,297 (7,208) (911) Property, plant & equipment/intangible assets
29,683
(74,938)
(45,255)
43,921
(78,973)
(35,052)
Other assets 22,250 (46,421) (24,171) 35,876 (36,566) (690) Provisions 43 (688) (645) 16 (651) (635) Other liabilities 57,318 (18,195) 39,123 28,197 (25,313) 2,884 Tax losses carried forward 79,448 – 79,448 73,557 – 73,557 Tax assets/(liabilities) 197,437 (145,229) 52,208 187,864 (148,711) 39,153 Tax offsetting (91,520) 91,520 – (89,082) 89,082 – Reflected in the balance sheet 105,916 (53,711) 52,208 98,782 (59,629) 39,153

Letter to Shareholders Overview Business Highlights Sustainability Financial Reports Governance
Consolidated Financial Statements
Barry Callebaut | Annual Report /
Tax losses carried forward excluded from recognition of related deferred tax assets Tax losses carried forward not recognized as deferred tax assets have the following expiry dates.
as of August 31, 2016 2015 in thousands of CHF Expiry: Within 1 year 470 1,821 After 1 up to 2 years 2,352 19,010 After 2 up to 3 years 11,643 2,265 After 3 up to 10 years 86,849 77,847 After 10 years – 7,277 Unlimited 284,004 263,489 Total unrecognized tax losses carried forward 385,318 371,709
Tax losses carried forward utilized during the year 2015/16 were CHF 105.0 million (2014/15: CHF 117.3 million). The related tax relief amounted to CHF 36.1 million, of which CHF 17.8 million were already recognized as a deferred tax asset in the year before (2014/15: CHF 38.9 million of which CHF 20.3 million were already recognized as a deferred tax asset in the year before) and CHF 18.3 million that were previously not recognized (2015: CHF 18.5 million).
As of August 31, 2016, the Group had unutilized tax losses carried forward of approximately CHF 733.7 million (2015: approximately CHF 587.9 million) available for offset against future taxable income.
Of the total tax losses carried forward, an amount of CHF 348.4 million has been recognized for deferred taxation purposes resulting in a deferred tax asset of CHF 79.4 million (2014/15: CHF 216.2 million recognized resulting in a deferred tax asset of CHF 73.6 million). The net increase of CHF 5.8 million in the deferred tax asset on recognized tax losses carried forward consists of CHF 10.7 million tax relief on the first time recognition of prior year tax losses carried forward, CHF 12.9 million recognition of current year tax losses carried forwards and CHF 17.8 million utilization of tax losses already recognized as a deferred tax asset in prior year.
Bank overdrafts and short-term debt
as of August 31, 2016 2015 2016 2015 in thousands of CHF Carrying amounts Fair values Bank overdrafts 25,314 33,266 25,314 33,266 Commercial paper 133,928 195,672 133,928 195,672 Short-term portion of Senior Notes (note 23) 382,286 – 402,581 – Short-term debts 64,255 161,704 64,255 161,704 Short-term portion of long-term debts (note 23) 150,691 288,430 150,691 288,430 Interest-bearing loans from employees 0 2 0 2 Finance lease obligations (note 16) 180 99 180 99 Short-term debt 731,340 645,907 751,634 645,907 Bank overdrafts and short-term debt 756,654 679,173 776,949 679,173

Letter to Shareholders Overview Business Highlights Sustainability Financial Reports Governance
Consolidated Financial Statements
Barry Callebaut | Annual Report /
Short-term financial liabilities are mainly denominated in EUR, CHF, XAF and CLP as shown in the table below:
as of August 31, 2016 2015 Split per currency Amount Interest range Amount Interest range in thousands of CHF from to from to EUR 519,613 0.07% 6.00% 340,491 0.14% 3.60% CHF 151,393 0.52% 1.50% 101,887 0.52% 1.50% USD – 0.00% 0.00% 128,240 0.34% 4.25% IDR 10,561 6.50% 7.20% – 0.00% 0.00% XAF 31,465 4.50% 7.00% 53,163 2.85% 6.00% TRL 3,546 13.75% 13.75% 7,384 11.67% 14.00% CLP 27,593 4.88% 5.41% 15,394 4.48% 4.74% BRL 9,153 11.25% 15.94% 28,115 12.00% 15.00% Other 3,330 0.24% 10.00% 4,499 0.45% 11.79% Total 756,654 679,173
Trade payables and other current liabilities
as of August 31, 2016 2015 in thousands of CHF Trade payables 551,919 651,299 Amounts due to related parties 419 680 Accrued expenses 99,521 83,596 Other payables 335,053 154,531 Payables representing financial liabilities 986,912 890,106 Accrued wages and social security 90,290 79,796 Fair value of hedged firm commitments 22,283 59,490 Other taxes and payables to governmental authorities 45,996 31,535 Deferred income – 38 Other liabilities 158,569 170,859 Total trade payables and other current liabilities 1,145,481 1,060,965
The Group also has payables related to the asset-backed securitization program, see note 12 – Trade receivables and other current assets. Other payables also consist of outstanding ledger balances with commodity brokers.
Provisions
2015/16 Restructuring Litigation & claims Other Total in thousands of CHF as of September 1, 2015 3,194 5,054 5,559 13,807 Change in Group structure – acquisitions – – 770 770 Additions 5,101 3,049 12,528 20,678 Use of provisions (7,262) (2,248) (1,552) (11,061) Release of unused provisions (72) (105) (1,277) (1,454) Currency translation adjustments 52 306 1,251 1,609 as of August 31, 2016 1,012 6,056 17,280 24,348 of which: Current 839 3,453 14,582 18,874 Non-current 173 2,603 2,698 5,475

Letter to Shareholders Overview Business Highlights Sustainability Financial Reports Governance
Consolidated Financial Statements
Barry Callebaut | Annual Report /
2014/15 Restructuring Litigation & claims Other Total in thousands of CHF as of September 1, 2014 1,216 8,767 6,353 16,336 Additions 2,949 1,099 3,390 7,438 Use of provisions (779) (329) (3,747) (4,855) Release of unused provisions – (2,628) (331) (2,959) Currency translation adjustments (192) (1,855) (106) (2,153) as of August 31, 2015 3,194 5,054 5,560 13,808 of which: Current 3,194 2,765 3,374 9,333 Non-current – 2,289 2,185 4,474
Restructuring Additions to restructuring provisions in 2015/16 are mainly related to severance costs in connection with the setup of the Shared Service Center (SSC) in Lodz, Poland, and to restructuring (reduction of capacity) in Asia.
Litigation & claims The amount includes provisions for certain litigations and claims that have been set up to cover legal and administrative proceedings that arise in the ordinary course of business. The position includes claims from customers for product liability and recalls generally covered by a global insurance policy to the extent they are not covered. In management’s opinion, after taking appropriate legal advice, the outcome of these legal claims will not give rise to any significant loss beyond the amounts provided as of August 31, 2016.
Other provisions Other provisions relate mainly to amounts that have been provided to cover the negative outcome of onerous contracts and a smaller portion is related to the movement in exchange rates.
Long-term debt
as of August 31, 2016 2015 2016 2015 in thousands of CHF Carrying amounts Fair values Senior notes 1,520,331 1,013,734 1,696,635 1,138,177 Less current portion of Senior Notes (note 20) (382,286) – (402,581) – Loans 165,016 450,685 165,016 450,685 Less current portion (note 20) (150,691) (288,430) (150,691) (288,430) Other 658 171 658 171 Total long-term debt 1,153,027 1,176,159 1,309,037 1,300,603
On July 13, 2007, the Group issued a 6% Senior Note with maturity in 2017 for an amount of EUR 350 million. The Senior Note has been issued at a price of 99.005% and includes a coupon step-up clause of 0.25% (limited to 1.00% per annum) per downgraded notch per rating agency.
On June 15, 2011, the Group issued a 5.375% Senior Note with maturity in 2021 for an amount of EUR 250 million. The Senior Note has been issued at a price of 99.26% and includes a coupon step-up clause of 0.25% (limited to 1.00% per annum) per downgraded notch per rating agency. The coupon currently amounts to 5.625%.

Letter to Shareholders Overview Business Highlights Sustainability Financial Reports Governance
Consolidated Financial Statements
Barry Callebaut | Annual Report /
On June 15, 2011, the Group entered into a EUR 600 million Revolving Credit Facility (as amended and extended as per June 17, 2014) with maturity in 2019.
On June 20, 2013, the Group issued a 5.5% Senior Note with maturity in 2023 for an amount of USD 400 million. The Senior Note has been issued at a price of 98.122% and includes a coupon step-up clause of 0.25% (limited to 1.00% per annum) per downgraded notch per rating agency.
On February 25, 2015, the Group entered into a CHF 150 million fixed-rate Term Loan with Jacobs Holding AG with maturity in 2017.
On May 24, 2016, the Group issued a 2.375% Senior Note with maturity in 2024 for an amount of EUR 450 million. The Senior Note has been issued at a price of 99.104 %.
The EUR 350 million Senior Note, the EUR 250 million Senior Note, the EUR 600 million Revolving Credit Facility, the USD 400 million Senior Note, the CHF 150 million fixed-rate Term Loan and the EUR 450 million Senior Note all rank pari passu. The Senior Notes as well as the EUR 600 million Revolving Credit Facility and the CHF 150 million fixed-rate Term Loan are guaranteed by Barry Callebaut AG and certain of its subsidiaries.
In addition, there are financial covenants related to the Revolving Credit Facility and the CHF 150 million fixed-rate Term Loan which comprise of key figures related to profitability per tonne, interest cover ratio and tangible net worth value.
As a result, the maturity profile of the long-term debt can be summarized as follows:
as of August 31, 2016 2015 in thousands of CHF 2016/17 – 527,668 2017/18 7,502 3,161 2018/19 3,785 3,095 2019/20 3,755 3,059 2020/21 (and thereafter for 2015) 270,913 639,176 2021/22 (and thereafter for 2016) 867,073 – Total long-term debt 1,153,027 1,176,159
The weighted average maturity of the long-term debt (i.e. without any portion falling due in less than 12 months) increased from 4.8 to 6.9 years.
Long-term financial liabilities are to a major extent denominated in EUR and USD and at fixed interest rates.
as of August 31, 2016 2015 Split per currency Amount Interest range Amount Interest range in thousands of CHF from to from to EUR 758,233 0.96% 7.11% 643,223 2.00% 7.11% USD 380,274 5.50% 5.50% 371,253 5.50% 5.50% CHF – 0.00% 0.00% 149,778 0.82% 0.82% JPY 14,310 1.67% 1.67% 11,895 1.67% 1.67% Other 210 6.50% 6.50% 10 6.50% 6.50% Total long-term debt 1,153,027 1,176,159

Letter to Shareholders Overview Business Highlights Sustainability Financial Reports Governance
Consolidated Financial Statements
Barry Callebaut | Annual Report /
Employee benefit obligations The amounts recognized in the Consolidated Balance Sheet are determined as follows:
as of August 31, 2016 2015 2016 2015 in thousands of CHF
Defined benefit pension plans
Other long-term
employment benefit plans Present value of funded obligations 352,391 314,106 – – Fair value of plan assets (202,233) (190,045) – – Excess of liabilities (assets) of funded obligations 150,157 124,061 – – Present value of unfunded obligations 14,058 13,301 12,316 11,927 Net employee benefit obligations recognized in the balance sheet (recognized as a liability)
164,215
137,362
12,316
11,927
The changes in the present value of the employee benefit obligations are as follows:
2015/16 2014/15 2015/16 2014/15 in thousands of CHF Defined benefit pension plans
Other long-term
employment benefit plans Present value of defined benefit obligation as of September 1,
327,407
313,139
11,927
16,871
Currency translations 43 402 – – Current service cost 15,724 14,809 572 595 Past service cost (69) (2,139) – (3) Remeasurement through P&L – – (752) (429) Interest expense 8,207 9,179 501 516 Losses (gains) on curtailment 30 42 311 (251) Total recognized in income statement 23,936 22,293 632 428 Actuarial losses (gains) 37,500 9,296 – – thereof
Arising from changes in demographic assumptions
(7,132)
3,176
–
–
Arising from changes in financial assumptions
46,759
9,049
–
–
Arising from experience adjustments (2,127) (2,929) – – Total recognized in other comprehensive income 37,500 9,296 – – Reclassifications – 2,185 – (2,185) Exchange differences on foreign plans (8,845) (5,440) 470 (2,648) Benefits received 4,255 4,410 2 – Benefits paid (17,804) (18,476) (716) (539) Total other (22,395) (17,321) (244) (5,372) Present value of defined benefit obligation as of August 31,
366,448
327,407
12,316
11,927
thereof funded obligations 352,391 314,106 – – unfunded obligations 14,058 13,301 12,316 11,927
For all of its defined benefit plans, the Group expects to pay CHF 14.6 million in em-ployer contributions in fiscal year 2016/17 (2015/16: CHF 13.8 million).

Letter to Shareholders Overview Business Highlights Sustainability Financial Reports Governance
Consolidated Financial Statements
Barry Callebaut | Annual Report /
The movement in the fair value of plan assets is as follows:
2015/16 2014/15 in thousands of CHF Defined benefit pension plans Opening fair value of plan assets as of September 1,
190,045 183,017
Currency translations 22 325 Interest income 3,240 4,047 Contributions by employees 4,005 3,575 Total recognized in income statement 7,267 7,947 Return on plan assets excl. interest income 4,862 1,439 Total recognized in other comprehensive income 4,862 1,439 Contributions by employer 18,457 12,352 Exchange differences on foreign plans (6,445) (1,842) Benefits received 4,255 4,410 Benefits paid (16,207) (17,277) Total other 59 (2,357) Fair value of plan assets as of August 31, 202,233 190,045
The plan assets consist of the following categories of securities:
as of August 31, 2016 2015 in thousands of CHF Defined benefit pension plans Equities 74,119 77,644 Bonds 51,391 44,742 Insurance portfolio 63,553 58,441 Cash and other assets 13,171 9,218 Total fair value of plan assets 202,233 190,045
The plan assets do not include any ordinary shares issued by the Company nor any property occupied by the Group or one of its affiliates.
The amounts recognized in the Consolidated Income Statement are as follows:
2015/16 2014/15 2015/16 2014/15 in thousands of CHF
Defined benefit pension plans
Other long-term
employment benefit plans Current service costs 15,724 14,809 572 595 Net interest expense 4,967 5,132 501 516 Net currency translations 21 77 – – Past service cost (69) (2,139) – (3) Losses (gains) on curtailments and settlements 30 42 311 (251) Remeasurement – – (752) (429) Contributions by employees (4,005) (3,575) – – Total defined benefit expenses 16,669 14,346 632 428 Actual return on plan assets 8,102 5,486 – –
in thousands of CHF 2015/16 2014/15 Total defined contribution expenses (2,656) (2,739)
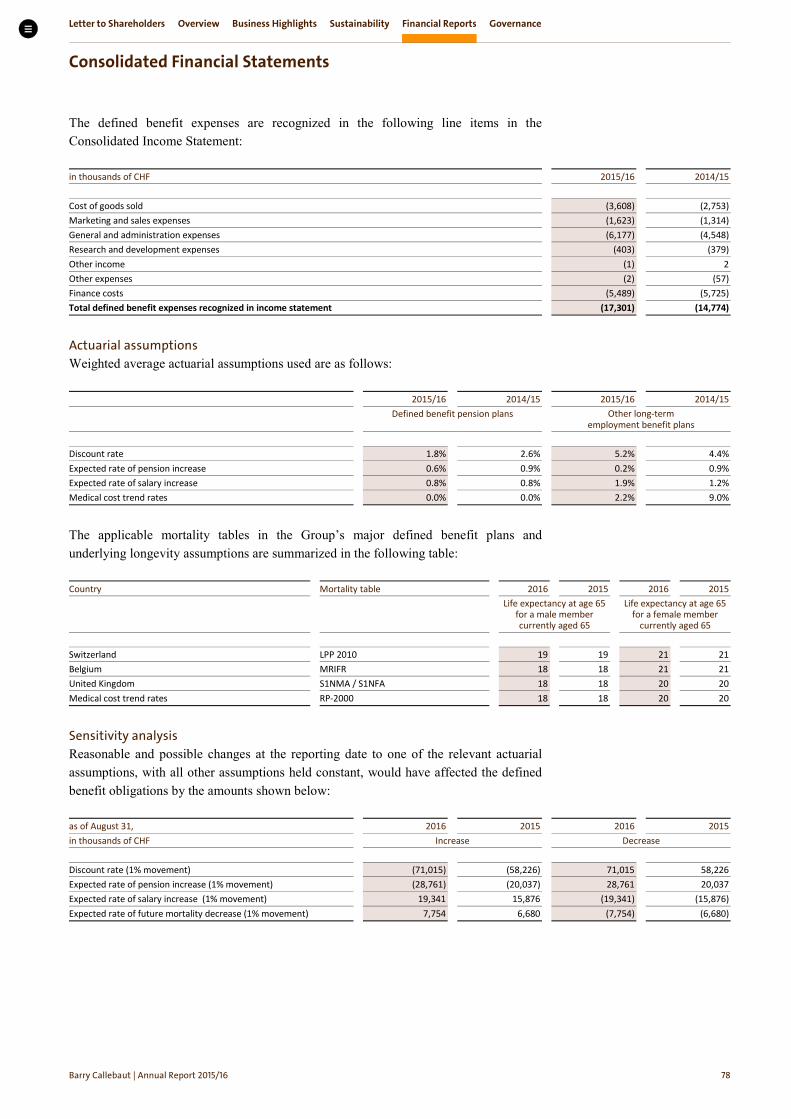
Letter to Shareholders Overview Business Highlights Sustainability Financial Reports Governance
Consolidated Financial Statements
Barry Callebaut | Annual Report /
The defined benefit expenses are recognized in the following line items in the Consolidated Income Statement:
in thousands of CHF 2015/16 2014/15 Cost of goods sold (3,608) (2,753) Marketing and sales expenses (1,623) (1,314) General and administration expenses (6,177) (4,548) Research and development expenses (403) (379) Other income (1) 2 Other expenses (2) (57) Finance costs (5,489) (5,725) Total defined benefit expenses recognized in income statement (17,301) (14,774)
Actuarial assumptions Weighted average actuarial assumptions used are as follows:
2015/16 2014/15 2015/16 2014/15
Defined benefit pension plans
Other long-term
employment benefit plans Discount rate 1.8% 2.6% 5.2% 4.4% Expected rate of pension increase 0.6% 0.9% 0.2% 0.9% Expected rate of salary increase 0.8% 0.8% 1.9% 1.2% Medical cost trend rates 0.0% 0.0% 2.2% 9.0%
The applicable mortality tables in the Group’s major defined benefit plans and underlying longevity assumptions are summarized in the following table:
Country Mortality table 2016 2015 2016 2015
Life expectancy at age 65 for a male member currently aged 65
Life expectancy at age 65 for a female member
currently aged 65 Switzerland LPP 2010 19 19 21 21 Belgium MRIFR 18 18 21 21 United Kingdom S1NMA / S1NFA 18 18 20 20 Medical cost trend rates RP-2000 18 18 20 20
Sensitivity analysis Reasonable and possible changes at the reporting date to one of the relevant actuarial assumptions, with all other assumptions held constant, would have affected the defined benefit obligations by the amounts shown below:
as of August 31, 2016 2015 2016 2015 in thousands of CHF Increase Decrease Discount rate (1% movement) (71,015) (58,226) 71,015 58,226 Expected rate of pension increase (1% movement) (28,761) (20,037) 28,761 20,037 Expected rate of salary increase (1% movement) 19,341 15,876 (19,341) (15,876) Expected rate of future mortality decrease (1% movement) 7,754 6,680 (7,754) (6,680)

Letter to Shareholders Overview Business Highlights Sustainability Financial Reports Governance
Consolidated Financial Statements
Barry Callebaut | Annual Report /
Equity compensation benefits Share awards are granted to participants according to individual contracts and the current employee stock ownership program. Deferred Share Plan 2011–2014 The former Deferred Share Plan 2011–2014 has reached its end. No grants were made under this plan after financial year 2013/14. The last tranches of the share awards granted under this plan vested in fiscal year 2015/16. Long-Term Incentive Plan The purpose of the Long-Term Incentive Plan (LTIP) is to provide the participants with an ownership interest in Barry Callebaut and to reward for the long-term performance of the company. The LTIP thus aligns their interests to those of the shareholders. The new LTIP was implemented for financial year 2014/15, and its terms and conditions remained valid for the grants awarded in fiscal year 2015/16.
The grant of share units under the LTIP is based on a target Long-Term Incentive (LTI) amount determined individually for each plan participant. The target LTI amount is divided by the average share price of the last three months of the preceding fiscal year in order to calculate the number of share units awarded. The share units vest in three tranches over three fiscal years, i.e. 30% after one year, 30% after two years, and 40% after three years from the grant date. The first two tranches are restricted share units (RSU) that vest subject to the LTIP participant continuing to be employed by Barry Callebaut. The final tranche consists of performance share units (PSU) that vest subject to meeting a performance criterion over the three-year vesting period. The performance criterion is the relative performance (3-year Compound Annual Growth Rate) of the Barry Callebaut share versus the share performance of a peer group of companies including chocolate companies, ingredient companies and FMCG companies: AAK, Aryzta, Hershey, Kellogg’s, Kerry, Lindt, Mondelēz, Nestlé, Olam, Petra and Unilever. The overperformance of the Barry Callebaut share price versus the benchmark share price of the peer group is incentivized by applying a multiplier of 25 on the overperformance in %, whereas in the case of underperformance, a multiplier of 12.5 applies. However, a cap and a floor apply at 5% over- or underperformance, so that the vesting for the last tranche can vary between 37.5% and 225% of the share awards granted. Consequently, the overall vesting ranges from 75% and 150% of the initially determined number of share units granted. Share units granted to Members of the Executive Committee may only vest to the extent that the actual market value of the vested shares (at vesting) in any given year does not exceed 160% of the target LTI amount defined at the most recent grant date for the respective plan participant (“Value Cap”). Furthermore, the Board of Directors reserves the right to suspend or adjust the vesting of the share units in case of a negative result from continuous operations of the Barry Callebaut Group. Once the shares are vested and transferred, they are free of any sales restrictions.
The share awards granted entitle the participants to full shareholders rights upon vesting. The vesting periods range between one and three years. In case of resignation or dismissal, the initially granted, but not yet vested share awards are forfeited. The Group currently uses treasury shares for this program.
Letter to Shareholders Overview Business Highlights Sustainability Financial Reports Governance
Consolidated Financial Statements
Barry Callebaut | Annual Report /
The fair value of the share awards granted in the first and second (not performance related) tranche is estimated by taking the market price at grant date less the present value of the expected dividends that will not be received on these rights during the vesting period. 6,279 share awards were granted in fiscal year 2015/16 with an average fair value of CHF 1,062 (in fiscal year 2014/15, 5,348 share awards were granted with an average fair value of CHF 992).
The fair value of the share awards granted in relation to the third, performance-related tranche is assessed as per grant date based on a valuation performed by experts applying the “Monte Carlo simulation” method. The most relevant parameters related to Barry Callebaut and the relevant peer group are the risk-free interest rate, annualized volatility, the share price and the dividend yields. The risk-free rates reflect three-year government bonds of the country of origin of the respective company and range from –0.6% to 1.7%. The volatilities and correlations are based on daily returns of a companyʼs share at its respective exchange of origin over a three-year period preceding the start of the vesting cycle (the annualized volatility for Barry Callebaut and its peer group ranges from 15.5% to 32.7%). The dividend yields are based on dividends paid over a three-year period preceding the start of the vesting cycle and range from 0.6% to 3.1%. The share prices are denominated in their respective currency and retrieved for the specified point in time. The base share price taken into account for Barry Callebaut is the share price at grant date and amounted to CHF 1,062.
In fiscal year 2015/16, 3,027 share awards were granted to members of the Executive Committee with an average fair value of CHF 880 (in fiscal year 2014/15, 2,600 share awards with an average fair value of CHF 782). To the other plan participants, 1,154 share awards were granted with an average fair value of CHF 1,222 per share (in fiscal year 2014/15, 972 share awards with an average fair value of CHF 942).
Board of Directors The Board of Directors (BoD) receives share awards outside these plans each year for the respective service period determined by the NCC as a fixed number of share awards for the BoD members. The total number of share awards at the beginning of the service period 2015/16 amounted to 2,190 with an average fair value of CHF 1,070 per share (2014/15: 2,190 share awards with an average fair value of CHF 1,029 per share).
Recognition in financial statements The fair value of the share awards at grant date is recognized over the vesting period as a personnel expense under either of these share plans. For 2015/16, the amount thus recognized (before taxes) was CHF 12.2 million with a corresponding increase in equity (2014/15: CHF 12.9 million). Of the amount recognized in 2015/16, CHF 1.0 million related to the Deferred Share Plan 2011–2014 (2014/15 CHF 4.8 million), CHF 8.9 million to the Long-Term Incentive Plan (2014/15 CHF 5.8 million) and CHF 2.3 million to the BoD plan (2014/15 CHF 2.3 million).
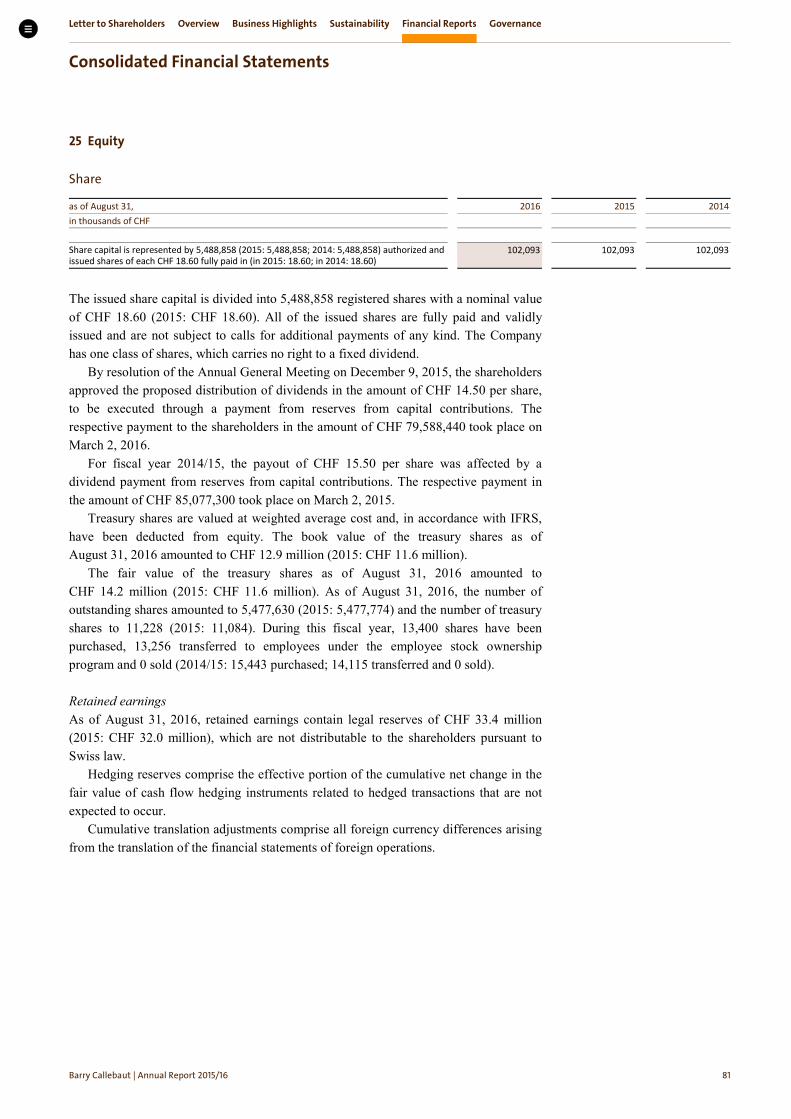
Letter to Shareholders Overview Business Highlights Sustainability Financial Reports Governance
Consolidated Financial Statements
Barry Callebaut | Annual Report /
Equity
Share
as of August 31, 2016 2015 2014 in thousands of CHF Share capital is represented by 5,488,858 (2015: 5,488,858; 2014: 5,488,858) authorized and issued shares of each CHF 18.60 fully paid in (in 2015: 18.60; in 2014: 18.60)
102,093
102,093
102,093
The issued share capital is divided into 5,488,858 registered shares with a nominal value of CHF 18.60 (2015: CHF 18.60). All of the issued shares are fully paid and validly issued and are not subject to calls for additional payments of any kind. The Company has one class of shares, which carries no right to a fixed dividend.
By resolution of the Annual General Meeting on December 9, 2015, the shareholders approved the proposed distribution of dividends in the amount of CHF 14.50 per share, to be executed through a payment from reserves from capital contributions. The respective payment to the shareholders in the amount of CHF 79,588,440 took place on March 2, 2016.
For fiscal year 2014/15, the payout of CHF 15.50 per share was affected by a dividend payment from reserves from capital contributions. The respective payment in the amount of CHF 85,077,300 took place on March 2, 2015.
Treasury shares are valued at weighted average cost and, in accordance with IFRS, have been deducted from equity. The book value of the treasury shares as of August 31, 2016 amounted to CHF 12.9 million (2015: CHF 11.6 million).
The fair value of the treasury shares as of August 31, 2016 amounted to CHF 14.2 million (2015: CHF 11.6 million). As of August 31, 2016, the number of outstanding shares amounted to 5,477,630 (2015: 5,477,774) and the number of treasury shares to 11,228 (2015: 11,084). During this fiscal year, 13,400 shares have been purchased, 13,256 transferred to employees under the employee stock ownership program and 0 sold (2014/15: 15,443 purchased; 14,115 transferred and 0 sold).
Retained earnings As of August 31, 2016, retained earnings contain legal reserves of CHF 33.4 million (2015: CHF 32.0 million), which are not distributable to the shareholders pursuant to Swiss law.
Hedging reserves comprise the effective portion of the cumulative net change in the fair value of cash flow hedging instruments related to hedged transactions that are not expected to occur.
Cumulative translation adjustments comprise all foreign currency differences arising from the translation of the financial statements of foreign operations.
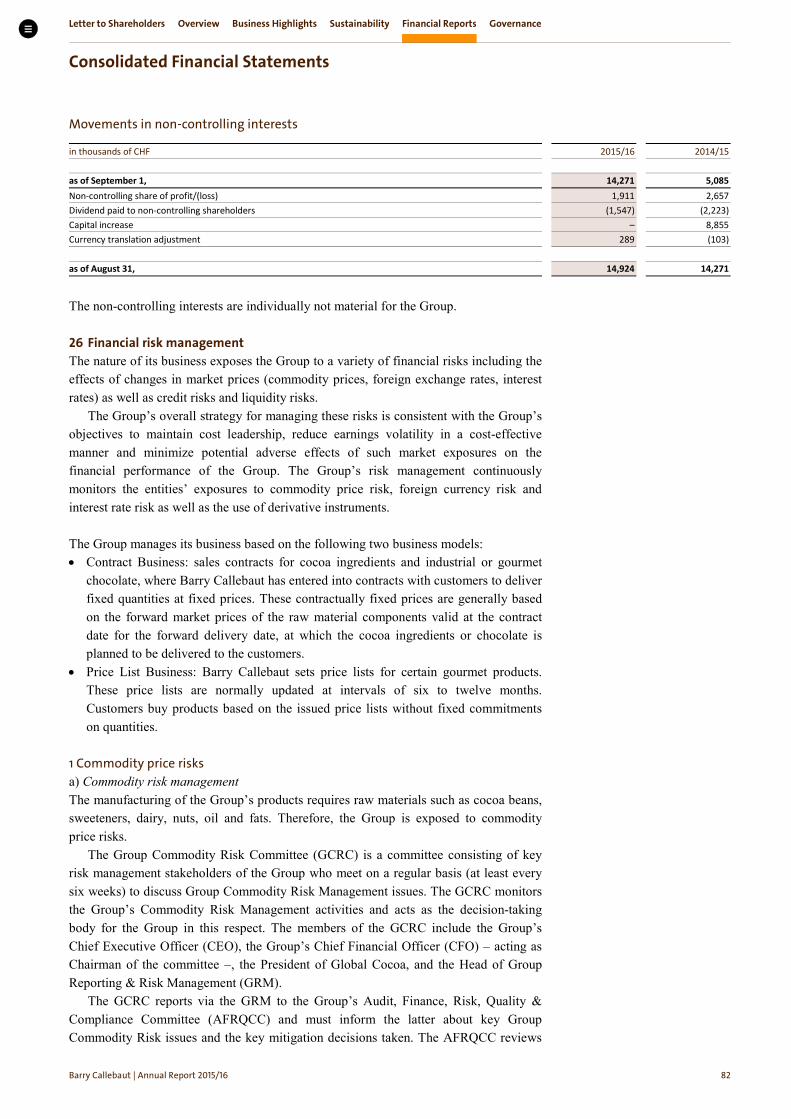
Letter to Shareholders Overview Business Highlights Sustainability Financial Reports Governance
Consolidated Financial Statements
Barry Callebaut | Annual Report /
Movements in non-controlling interests
in thousands of CHF 2015/16 2014/15 as of September 1, 14,271 5,085 Non-controlling share of profit/(loss) 1,911 2,657 Dividend paid to non-controlling shareholders (1,547) (2,223) Capital increase – 8,855 Currency translation adjustment 289 (103) as of August 31, 14,924 14,271
The non-controlling interests are individually not material for the Group.
Financial risk management The nature of its business exposes the Group to a variety of financial risks including the effects of changes in market prices (commodity prices, foreign exchange rates, interest rates) as well as credit risks and liquidity risks.
The Group’s overall strategy for managing these risks is consistent with the Group’s objectives to maintain cost leadership, reduce earnings volatility in a cost-effective manner and minimize potential adverse effects of such market exposures on the financial performance of the Group. The Group’s risk management continuously monitors the entities’ exposures to commodity price risk, foreign currency risk and interest rate risk as well as the use of derivative instruments.
The Group manages its business based on the following two business models: • Contract Business: sales contracts for cocoa ingredients and industrial or gourmet
chocolate, where Barry Callebaut has entered into contracts with customers to deliver fixed quantities at fixed prices. These contractually fixed prices are generally based on the forward market prices of the raw material components valid at the contract date for the forward delivery date, at which the cocoa ingredients or chocolate is planned to be delivered to the customers.
• Price List Business: Barry Callebaut sets price lists for certain gourmet products. These price lists are normally updated at intervals of six to twelve months. Customers buy products based on the issued price lists without fixed commitments on quantities.
1 Commodity price risks a) Commodity risk management The manufacturing of the Group’s products requires raw materials such as cocoa beans, sweeteners, dairy, nuts, oil and fats. Therefore, the Group is exposed to commodity price risks.
The Group Commodity Risk Committee (GCRC) is a committee consisting of key risk management stakeholders of the Group who meet on a regular basis (at least every six weeks) to discuss Group Commodity Risk Management issues. The GCRC monitors the Group’s Commodity Risk Management activities and acts as the decision-taking body for the Group in this respect. The members of the GCRC include the Group’s Chief Executive Officer (CEO), the Group’s Chief Financial Officer (CFO) – acting as Chairman of the committee –, the President of Global Cocoa, and the Head of Group Reporting & Risk Management (GRM).
The GCRC reports via the GRM to the Group’s Audit, Finance, Risk, Quality & Compliance Committee (AFRQCC) and must inform the latter about key Group Commodity Risk issues and the key mitigation decisions taken. The AFRQCC reviews

Letter to Shareholders Overview Business Highlights Sustainability Financial Reports Governance
Consolidated Financial Statements
Barry Callebaut | Annual Report /
and approves GCRC requests and ensures that the commodity risk management strategy is consistent with the Group’s objectives. It also sets the Group’s Value at Risk (VaR) limit for the major raw material components. The AFRQCC makes recommendations to the Board of Directors if deemed necessary and advises the Board of Directors on important risk matters and/or asks for approval.
In order to quantify and manage the Group’s consolidated exposure to commodity price risks, the concept of historical VaR is applied. The VaR concept serves as the analytical instrument for assessing the Group’s commodity price risk incurred under normal market conditions. The VaR indicates the loss, which, within a time horizon of ten days for raw materials, will not be exceeded at a confidence level of 95%, using seven years of historical market prices for each major raw material component. The VaR is complemented through the calculation of the expected shortfall and worst cases as well as the use of stress test scenarios.
However, liquidity, credit and fuel price risks are not included in the calculation, and the VaR is based on a static portfolio during the time horizon of the analysis. The GCRC breaks down the Group VaR limit into VaR limits for Global Cocoa and for Global Sourcing (the latter covering the sourcing activities of non-cocoa related raw materials – such as sugar, dairy, oils and fats). The heads of Global Cocoa and Global Sourcing allocate limits in metric tonnes to the related risk reporting units. The Board of Directors is the highest approval authority for all Group Commodity Risk Management (GCRM) matters and approves the GCRM Policy as well as the Group VaR limit.
The VaR framework of the Group is based on the standard historical VaR methodology; taking 2,000 days (equivalent to seven years) of the most recent prices, based on which the day-to-day relative price changes are calculated. This simulation of past market conditions is not predicting the future movement in commodity prices. Therefore, it does not represent actual losses. It only represents an indication of the future commodity price risks based on historical volatility. VaR is applied to materials with prices considered to exceed certain volatility levels (cocoa beans and cocoa products, dairy products, sugar and sweeteners, nuts, oils and fats). As of August 31, 2016, the Group had a total VaR for raw materials of CHF 20.7 million (2015: CHF 12.7 million) well within the Group limit. The average VaR over the fiscal year 2015/16 was CHF 13.6 million (2014/15: CHF 14.9 million).
b) Cocoa price risk and the Group’s hedging strategy The Group’s purchasing and sourcing centers make sourcing and risk management decisions for cocoa beans, semi-finished cocoa products and ingredients including hedging commodity price risk exposures. Within the overall limits as defined by the AFRQCC, the Group’s purchasing and sourcing centers can also act as a broker-trader with the objective to generate profits from fluctuations in raw material prices or broker-trader margins.
The fair value of the Group’s open sales and purchase commitments and inventory changes are continuously in line with price movements in the respective commodity markets. It is the Group’s policy to hedge its cocoa price risk resulting from its inventory, cocoa derivatives and purchase and sales contracts. The cocoa price risk component in cocoa stock purchase and sales contracts as well as chocolate stocks and sales contracts is hedged with exchange traded or over-the-counter cocoa bean derivatives applying fair value hedge accounting. The Group also applies cash flow hedge accounting whereby the cocoa price risk and foreign exchange risk from forecasted cocoa sales are hedged with cocoa bean futures and foreign exchange forward contracts.

Letter to Shareholders Overview Business Highlights Sustainability Financial Reports Governance
Consolidated Financial Statements
Barry Callebaut | Annual Report /
In order to calculate the cocoa bean price risk exposure, embedded in the various cocoa ingredients and chocolate stocks, purchase and sales contracts, the cocoa processing entities translate the various cocoa ingredient volumes in these positions into cocoa bean equivalent, using technical yields (to calculate, how much cocoa beans are needed to produce those cocoa ingredient volumes). These technical ratios vary according to cocoa ingredient types and cocoa processing units. The chocolate entities calculate the bean equivalent in their positions using the prevailing market/commercial ratios. The entities use this approach and these ratios to enter into the appropriate volume of hedging instruments in order to hedge the cocoa bean price risk component in their positions.
The Group also uses the same hedging ratios in hedge accounting as described above.
The cocoa bean price risk component is contractually specified in the purchase and sales contracts of cocoa ingredients and chocolate products. Therefore, the cocoa bean price risk component is considered separately identifiable and reliably measurable in the Group’s hedged items (cocoa ingredients purchase contracts, cocoa stocks, chocolate stocks, cocoa ingredients sales contracts and chocolate sales contracts) as well as in its hedging instruments (cocoa bean futures and other contracts accounted for as derivatives).
c) Sugar price risk hedges The Group applies cash flow hedge accounting for the hedging relationships when it hedges its commodity price risk as well as its foreign exchange risks attributable to its forecasted sugar purchases with sugar futures and with foreign exchange forward contracts respectively. When the Group enters into agreements with sugar suppliers where the price of the forecasted sugar purchases will be indexed to the raw sugar world market price, it hedges these forecasted sugar purchases with sugar futures, using a hedging ratio of 1:1.
The raw sugar world market price risk component is a contractually specified element in the hedged items. Therefore, the raw sugar world market price risk component is considered separately identifiable and reliably measurable in the Group’s hedged items (forecasted sugar purchases) as well as in its hedging instruments (sugar futures).
d) Fuel price risk hedges The Group entered into cash flow hedge relationships to hedge its fuel oil price exposures as well as its foreign exchange risks attributable to its forecasted freight expenditures with fuel oil swaps and with foreign exchange forward contracts respectively, applying a hedging ratio of 50% for the hedging of both risk components.
The Rotterdam IFO 380 Monthly Bunker Price is a separately identifiable and reliably measurable risk component in the forecasted freight expenditures, which is hedged by fuel oil swaps that are indexed to Fuel Oil 3,5 Percent Barges FOB Rotterdam Platt’s European prices. The commodities behind both the hedged price component and the prices used in the hedging SWAP’s are derivatives of crude oil, and there is a very strong correlation between the movements in the two prices.
The related accounting treatments are explained in the section “Summary of Accounting Policies” under the caption “Derivative financial instruments and hedging activities.”

Letter to Shareholders Overview Business Highlights Sustainability Financial Reports Governance
Consolidated Financial Statements
Barry Callebaut | Annual Report /
2 Foreign currency risks The Group operates across the world and consequently is exposed to multiple foreign currency risks, albeit primarily in EUR, USD and GBP. The Group actively monitors its transactional currency exposures and consequently enters into currency hedges with the aim of preserving the value of assets, commitments and anticipated transactions. The related accounting treatment is explained in the section “Summary of Accounting Policies” under the caption “Derivative financial instruments and hedging activities.”
All risks related to foreign currency exposures of assets and liabilities, certain unrecognized firm commitments and highly probable forecasted purchases and sales are centralized – to the extent possible – within the Group’s centralized treasury department, where the hedging strategies are defined.
Accordingly, the consolidated currency exposures are hedged in compliance with the Group’s Treasury Policy, mainly by means of forward currency contracts entered into with financial institutions of a high credit rating. The Group’s Treasury Policy imposes a dual risk control framework of both open position limits and near-time fair valuation of the net currency exposures. Both levels of control are substantially interlinked, avoiding excessive net currency exposures and substantial volatility in the Consolidated Income Statement.
The Group’s Treasury department is supervised by the Group Finance Committee, which meets on a monthly basis. The Group Finance Committee monitors the Group’s foreign currency risk position and acts as a decision-taking body for the Group in this respect. The Group Finance Committee consists of the Group’s CFO, the Head of Group Controlling, the Group’s Head of Treasury, the Head of Group Reporting & Risk Management, and other Group Finance stakeholders.
The Group’s Treasury Policy, giving guidance on treasury risk management including foreign currency and interest rate risks, is approved and annually reviewed by the AFRQCC. The Group’s Risk Management department reviews the consistency of the Group’s treasury management strategy with the Group’s Treasury Policy and reports the status to the Group’s CFO periodically. The AFRQCC is informed by the CFO about the status and important matters in their quarterly meetings and approves requests of the Group’s Finance Committee on important treasury risk matters including foreign currency risks for recommendation to the Board of Directors. The Board of Directors is the highest approval authority for all Group Treasury Risk Management matters.
The table below provides an overview of the net exposure of EUR, GBP and USD against the main functional currencies in the Group. According to the Group’s Treasury Policy, foreign exchange exposures are hedged as from identification on an intra-day basis in line with the approved exposure limits. In case of deviation from the agreed foreign exchange exposure limits, approval has to be sought from the Group’s Finance Committee. Companies with the same functional currency are shown in one group. EUR exposures of the reporting units in Côte d'Ivoire and Cameroon with functional currency CFA franc are not included, as the CFA franc has an exchange rate pegged to the EUR, currently at a rate of CFA franc 656 per euro (EUR long exposures of totally 270 million as per August 31, 2016 and 473 million as per August 31, 2015).
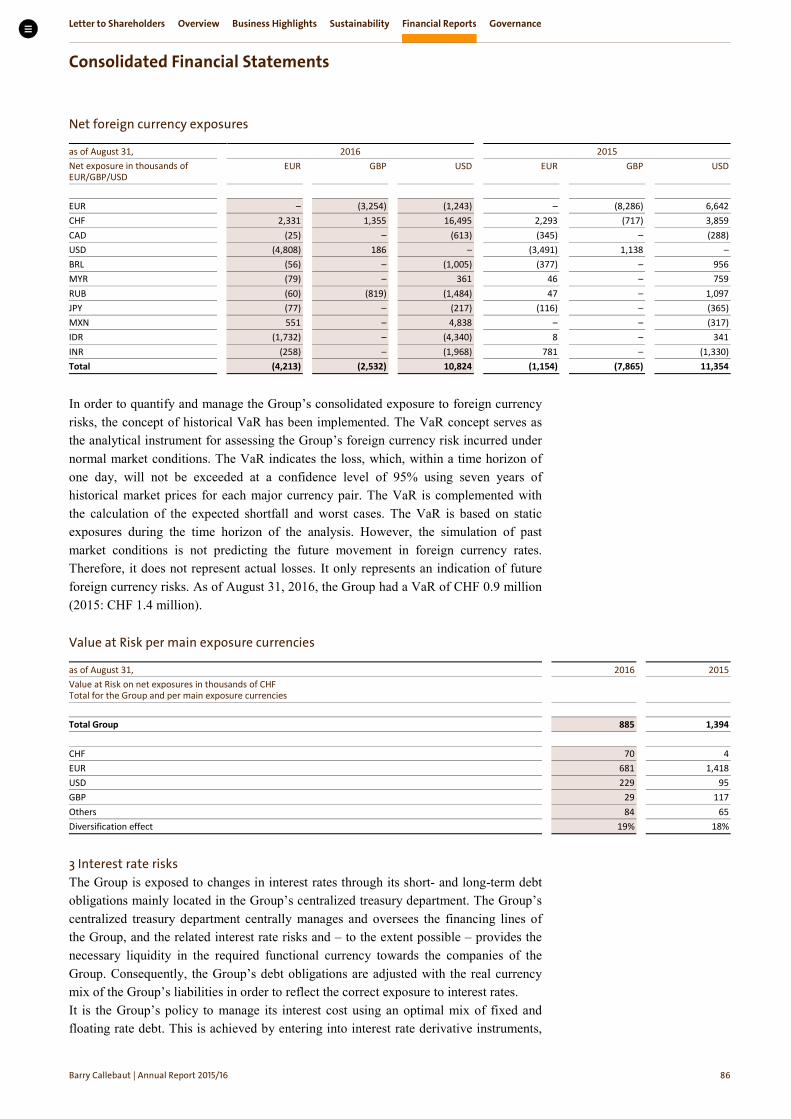
Letter to Shareholders Overview Business Highlights Sustainability Financial Reports Governance
Consolidated Financial Statements
Barry Callebaut | Annual Report /
Net foreign currency exposures
as of August 31, 2016 2015 Net exposure in thousands of EUR/GBP/USD
EUR GBP USD EUR GBP USD
EUR – (3,254) (1,243) – (8,286) 6,642 CHF 2,331 1,355 16,495 2,293 (717) 3,859 CAD (25) – (613) (345) – (288) USD (4,808) 186 – (3,491) 1,138 – BRL (56) – (1,005) (377) – 956 MYR (79) – 361 46 – 759 RUB (60) (819) (1,484) 47 – 1,097 JPY (77) – (217) (116) – (365) MXN 551 – 4,838 – – (317) IDR (1,732) – (4,340) 8 – 341 INR (258) – (1,968) 781 – (1,330) Total (4,213) (2,532) 10,824 (1,154) (7,865) 11,354
In order to quantify and manage the Group’s consolidated exposure to foreign currency risks, the concept of historical VaR has been implemented. The VaR concept serves as the analytical instrument for assessing the Group’s foreign currency risk incurred under normal market conditions. The VaR indicates the loss, which, within a time horizon of one day, will not be exceeded at a confidence level of 95% using seven years of historical market prices for each major currency pair. The VaR is complemented with the calculation of the expected shortfall and worst cases. The VaR is based on static exposures during the time horizon of the analysis. However, the simulation of past market conditions is not predicting the future movement in foreign currency rates. Therefore, it does not represent actual losses. It only represents an indication of future foreign currency risks. As of August 31, 2016, the Group had a VaR of CHF 0.9 million (2015: CHF 1.4 million).
Value at Risk per main exposure currencies
as of August 31, 2016 2015 Value at Risk on net exposures in thousands of CHF Total for the Group and per main exposure currencies
Total Group 885 1,394 CHF 70 4 EUR 681 1,418 USD 229 95 GBP 29 117 Others 84 65 Diversification effect 19% 18%
3 Interest rate risks The Group is exposed to changes in interest rates through its short- and long-term debt obligations mainly located in the Group’s centralized treasury department. The Group’s centralized treasury department centrally manages and oversees the financing lines of the Group, and the related interest rate risks and – to the extent possible – provides the necessary liquidity in the required functional currency towards the companies of the Group. Consequently, the Group’s debt obligations are adjusted with the real currency mix of the Group’s liabilities in order to reflect the correct exposure to interest rates. It is the Group’s policy to manage its interest cost using an optimal mix of fixed and floating rate debt. This is achieved by entering into interest rate derivative instruments,

Letter to Shareholders Overview Business Highlights Sustainability Financial Reports Governance
Consolidated Financial Statements
Barry Callebaut | Annual Report /
in which it exchanges fixed and floating interest rates. To avoid volatility in the Consolidated Income Statement, cash flow hedge accounting is applied to those derivative instruments.
As described in the caption “Foreign currency risks,” the Group’s Finance Committee, which meets on a monthly basis, monitors the Group’s interest risk positions and acts as a decision-taking body for the Group in this respect.
The Group’s Treasury Policy also covers the management of interest rate risks. As for foreign currency risks, the Group’s Risk Management department supervises the compliance of the treasury interest rate risk management strategy with the Group’s Treasury Policy and reports the status periodically to the Group’s CFO, who informs the AFRQCC in their quarterly meetings. The AFRQCC approves requests from the Group Finance Committee on important treasury matters, including interest rate risks, and provides recommendations thereon to the Board of Directors, which is the highest approval authority for all Group treasury matters.
The following schedule provides an overview of all interest-bearing items per year-end closing.
as of August 31, 2016 2015 in thousands of CHF Fixed interest-bearing items Carrying amount of financial liabilities 1,685,508 1,184,941 Reclassification due to interest rate derivative 164,225 161,217 Net fixed interest position 1,849,732 1,346,158 Floating interest-bearing items Carrying amount of financial assets (456,850) (127,328) Carrying amount of financial liabilities 224,173 670,391 Reclassification due to interest rate derivative (164,225) (161,217) Net floating interest position (396,902) 381,846
Sensitivity analysis on interest rate risks The following table shows the impact of a parallel shift of interest rates by 100 basis points (bps) up and 10 bps down on the Group’s equity and income statement, net of tax. The calculation is performed on both, the portion of the outstanding debt (excluding the asset-backed securitization program; see note 12) at floating interest rates and the outstanding derivatives exchanging floating into fixed interest rates at the respective year-end. This sensitivity analysis only indicates the potential impact for the respective fiscal year at the prevailing conditions in the financial markets. Consequently, it does not represent actual or future gains or losses, which are strictly managed and controlled, as clearly indicated in the Group’s Treasury Policy.
as of August 31, 2016 2015 Impact on Income statement Equity Income statement Equity in thousands of CHF
100 bps increase
10 bps decrease
100 bps increase
10 bps decrease
100 bps increase
10 bps decrease
100 bps increase
10 bps decrease
Floating rate bearing items 2,977 (298) – – (2,723) 145 – – Interest rate swaps – – 3,728 (377) – – 40,601 (4,328) Total interest rate sensitivity 2,977 (298) 3,728 (377) (2,723) 145 40,601 (4,328)

Letter to Shareholders Overview Business Highlights Sustainability Financial Reports Governance
Consolidated Financial Statements
Barry Callebaut | Annual Report /
4 Effect of hedge accounting on the financial position and performance a) Impact of hedging instruments designated in hedging relationships The impact of hedging instruments designated in hedging relationships as of August 31, 2016 on the Group’s Consolidated Balance Sheet is as follows:
in CHF million
Nominal amount of the hedging
instrument
Carrying amount of the hedging instrument
Line item in the Consolidated
Balance Sheet where the
hedging instrument is
reported
Fair value changes of the
hedging instrument used
as a basis to calculate hedge ineffectiveness
as of August 31, 2016 Assets Liabilities Cash flow hedges Interest rate risk
Swaps
191.6
0.0
8.7
Derivative financial assets
Derivative financial liabilities
1.0
Cocoa price risk Futures contracts
(68.4)
1.9
2.8
Derivative financial assets
Derivative financial liabilities
5.8
Sugar price risk Futures contracts 91.9
31.4
–
Derivative
financial liabilities 31.4
Fuel oil price risk Swaps 10.6
–
4.0
Derivative
financial liabilities 4.2
Foreign exchange risk Forward and futures contracts
1.8
3.6
0.8
Derivative financial assets
Derivative financial liabilities
2.8
Fair value hedges Cocoa price risk
Futures contracts
139.0
–
89.9
Derivative financial assets
Derivative financial liabilities
(12.2)
Foreign exchange risk Forward and futures contracts
(280.1)
3.6
3.7
Derivative financial assets
Derivative financial liabilities
21.7
Monetary items
164.2
467.0
302.8
Cash and cash equivalents
Trade receivables and other current
assets Short-term debt Trade payables
and other current liabilities
2.4

Letter to Shareholders Overview Business Highlights Sustainability Financial Reports Governance
Consolidated Financial Statements
Barry Callebaut | Annual Report /
in CHF million
Nominal amount of the hedging
instrument
Carrying amount of the hedging instrument
Line item in the Consolidated
Balance Sheet where the
hedging instrument is
reported
Fair value changes of the
hedging instrument used
as a basis to calculate hedge ineffectiveness
as of August 31, 2015 Assets Liabilities Cash flow hedges Interest rate risk Swaps
564.3
4.8
9.5
Derivative financial assets
Derivative financial liabilities
6.8
Cocoa price risk Futures contracts
(27.0)
0.6
2.5
Derivative financial assets
Derivative financial liabilities
(1.8)
Sugar price risk Futures contracts 64.3
–
7.6
Derivative
financial liabilities (7.6)
Fuel oil price risk Swaps 16.7
–
3.4
Derivative
financial liabilities (3.4)
Foreign exchange risk Forward and futures contracts
76.4
0.9
0.3
Derivative financial assets
Derivative financial liabilities
0.6
Fair value hedges Cocoa price risk Futures contracts
124.2
62.8
74.8
Derivative financial assets
Derivative financial liabilities
(23.8)
Foreign exchange risk Forward and futures contracts
(283.1)
37.0
52.1
Derivative financial assets
Derivative financial liabilities
(21.6)
Monetary items
(3.1)
359.0
362.1
Cash and cash equivalents
Trade receivables and other current
assets Short-term debt Trade payables
and other current liabilities
(23.9)

Letter to Shareholders Overview Business Highlights Sustainability Financial Reports Governance
Consolidated Financial Statements
Barry Callebaut | Annual Report /
b) Impact of hedged items designated in hedging relationships The impact of hedged items designated in hedging relationships as of August 31, 2016, on the Group’s Consolidated Balance Sheet is as follows:
in CHF million Carrying amount of the hedged item
Accumulated amount of fair value hedge
adjustments included in the carrying amount of the
hedged item
From the accumulated amount of fair value hedge adjustments: part related
to hedged items that ceased to be adjusted for
hedging gains or losses
Line item in the Conso-
lidated Balance
Sheet where the
hedged item is
reported
Fair value changes of
the hedged item used
as a basis to calculate
hedge ineffec-tiveness
Cash flow hedge
reserve
as of August 31, 2016 Assets Liabilities Assets Liabilities Assets Liabilities Cash flow hedges Interest rate risk
Forecasted interest payments n/a
n/a n/a
n/a n/a
n/a n/a (1.0) (13.2)
Cocoa price risk Forecasted cocoa sales n/a n/a n/a n/a n/a n/a n/a (5.7) (0.9)
Sugar price risk Forecasted sugar purchases n/a
n/a n/a
n/a n/a
n/a n/a (31.6) 28.4
Fuel oil price risk Forecasted fuel oil expenditures n/a
n/a n/a
n/a n/a
n/a n/a (4.0) (3.7)
Foreign exchange risk Forecasted purchase and sales transactions denominated in foreign currency
n/a
n/a
n/a
n/a
n/a
n/a
n/a
(2.8) 3.3
Fair value hedges Cocoa price risk
Cocoa and chocolate stocks 895.6 35.1 – Inventories 18.8 n/a
Risk component of cocoa and chocolate purchase and sales contracts
52.8 – 52.8 – – – Derivative financial
assets Derivative
financial liabilities
(5.8) n/a
Foreign exchange risk Firm purchase and sales commitments denominated in foreign currency
14.9 22.3 14.9 22.3 – – Trade receivables
and other current
assets Trade
payables and other
current liabilities
(24.6) n/a
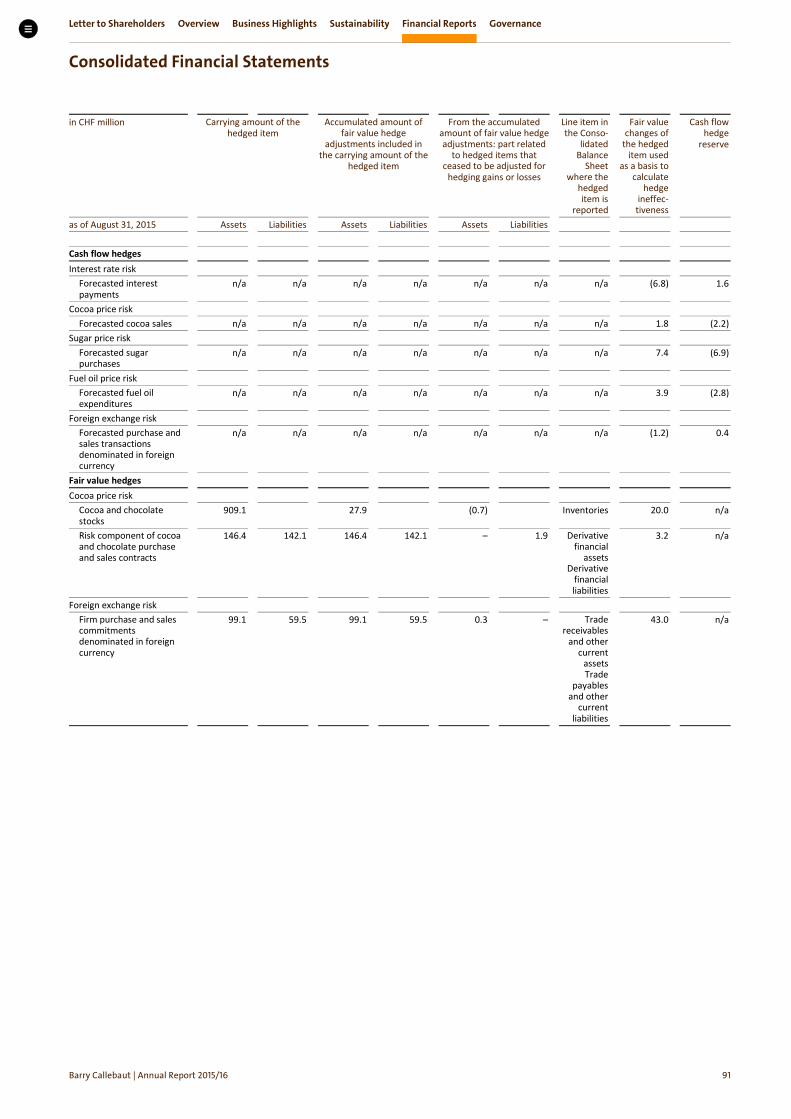
Letter to Shareholders Overview Business Highlights Sustainability Financial Reports Governance
Consolidated Financial Statements
Barry Callebaut | Annual Report /
in CHF million Carrying amount of the hedged item
Accumulated amount of fair value hedge
adjustments included in the carrying amount of the
hedged item
From the accumulated amount of fair value hedge adjustments: part related
to hedged items that ceased to be adjusted for
hedging gains or losses
Line item in the Conso-
lidated Balance
Sheet where the
hedged item is
reported
Fair value changes of
the hedged item used
as a basis to calculate
hedge ineffec-tiveness
Cash flow hedge
reserve
as of August 31, 2015 Assets Liabilities Assets Liabilities Assets Liabilities Cash flow hedges Interest rate risk
Forecasted interest payments n/a
n/a n/a
n/a n/a
n/a n/a (6.8) 1.6
Cocoa price risk Forecasted cocoa sales n/a n/a n/a n/a n/a n/a n/a 1.8 (2.2)
Sugar price risk Forecasted sugar purchases n/a
n/a n/a
n/a n/a
n/a n/a 7.4 (6.9)
Fuel oil price risk Forecasted fuel oil expenditures n/a
n/a n/a
n/a n/a
n/a n/a 3.9 (2.8)
Foreign exchange risk Forecasted purchase and sales transactions denominated in foreign currency
n/a
n/a
n/a
n/a
n/a
n/a
n/a
(1.2) 0.4
Fair value hedges Cocoa price risk
Cocoa and chocolate stocks 909.1 27.9 (0.7) Inventories 20.0 n/a
Risk component of cocoa and chocolate purchase and sales contracts
146.4 142.1 146.4 142.1 – 1.9 Derivative financial
assets Derivative
financial liabilities
3.2 n/a
Foreign exchange risk Firm purchase and sales commitments denominated in foreign currency
99.1 59.5 99.1 59.5 0.3 – Trade receivables
and other current
assets Trade
payables and other
current liabilities
43.0 n/a
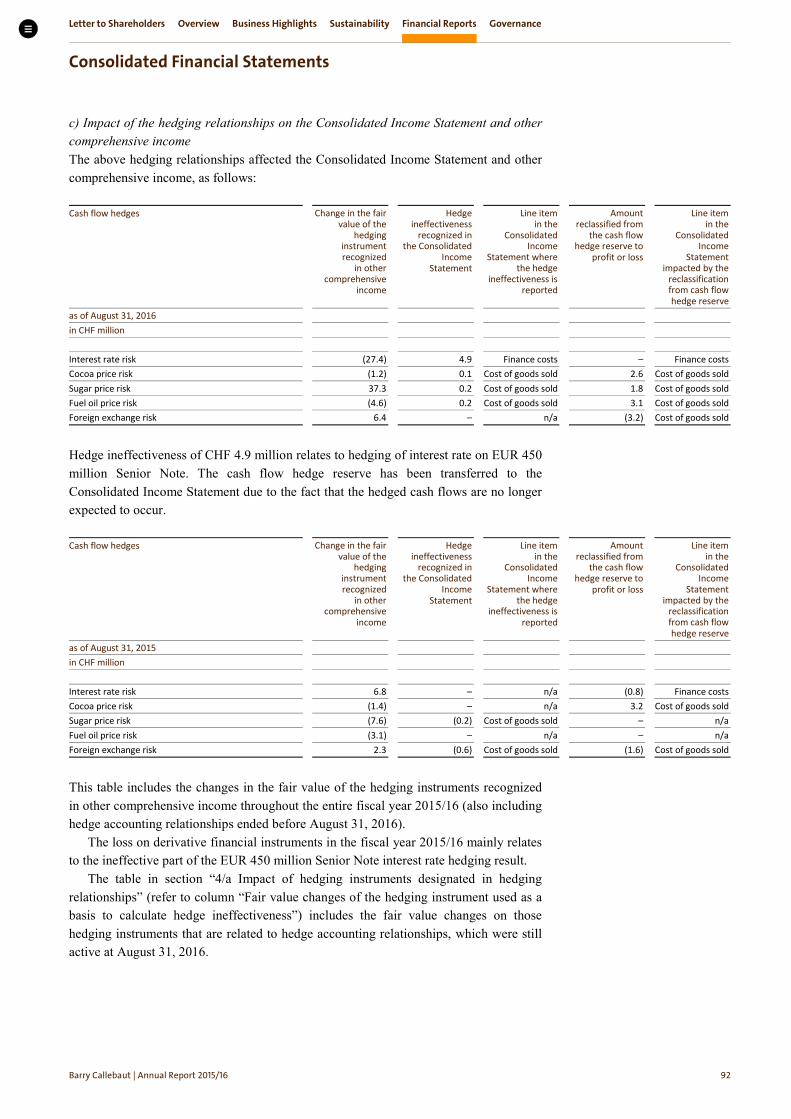
Letter to Shareholders Overview Business Highlights Sustainability Financial Reports Governance
Consolidated Financial Statements
Barry Callebaut | Annual Report /
c) Impact of the hedging relationships on the Consolidated Income Statement and other comprehensive income The above hedging relationships affected the Consolidated Income Statement and other comprehensive income, as follows:
Cash flow hedges
Change in the fair value of the
hedging instrument recognized
in other comprehensive
income
Hedge ineffectiveness
recognized in the Consolidated
Income Statement
Line item in the
Consolidated Income
Statement where the hedge
ineffectiveness is reported
Amount reclassified from
the cash flow hedge reserve to
profit or loss
Line item in the
Consolidated Income
Statement impacted by the
reclassification from cash flow hedge reserve
as of August 31, 2016 in CHF million Interest rate risk (27.4) 4.9 Finance costs – Finance costs Cocoa price risk (1.2) 0.1 Cost of goods sold 2.6 Cost of goods sold Sugar price risk 37.3 0.2 Cost of goods sold 1.8 Cost of goods sold Fuel oil price risk (4.6) 0.2 Cost of goods sold 3.1 Cost of goods sold Foreign exchange risk 6.4 – n/a (3.2) Cost of goods sold
Hedge ineffectiveness of CHF 4.9 million relates to hedging of interest rate on EUR 450 million Senior Note. The cash flow hedge reserve has been transferred to the Consolidated Income Statement due to the fact that the hedged cash flows are no longer expected to occur.
Cash flow hedges
Change in the fair value of the
hedging instrument recognized
in other comprehensive
income
Hedge ineffectiveness
recognized in the Consolidated
Income Statement
Line item in the
Consolidated Income
Statement where the hedge
ineffectiveness is reported
Amount reclassified from
the cash flow hedge reserve to
profit or loss
Line item in the
Consolidated Income
Statement impacted by the
reclassification from cash flow hedge reserve
as of August 31, 2015 in CHF million Interest rate risk 6.8 – n/a (0.8) Finance costs Cocoa price risk (1.4) – n/a 3.2 Cost of goods sold Sugar price risk (7.6) (0.2) Cost of goods sold – n/a Fuel oil price risk (3.1) – n/a – n/a Foreign exchange risk 2.3 (0.6) Cost of goods sold (1.6) Cost of goods sold
This table includes the changes in the fair value of the hedging instruments recognized in other comprehensive income throughout the entire fiscal year 2015/16 (also including hedge accounting relationships ended before August 31, 2016).
The loss on derivative financial instruments in the fiscal year 2015/16 mainly relates to the ineffective part of the EUR 450 million Senior Note interest rate hedging result.
The table in section “4/a Impact of hedging instruments designated in hedging relationships” (refer to column “Fair value changes of the hedging instrument used as a basis to calculate hedge ineffectiveness”) includes the fair value changes on those hedging instruments that are related to hedge accounting relationships, which were still active at August 31, 2016.

Letter to Shareholders Overview Business Highlights Sustainability Financial Reports Governance
Consolidated Financial Statements
Barry Callebaut | Annual Report /
Fair value hedges
in CHF million Hedge ineffectiveness
recognized in the Consolidated
Income Statement
Line item in the
Consolidated Income Statement
where the hedge ineffectiveness is
reported as of August 31, 2016 Cocoa price risk 0.8 Cost of goods sold Foreign exchange risk (0.5) Cost of goods sold
in CHF million Hedge ineffectiveness
recognized in the Consolidated
Income Statement
Line item in the
Consolidated Income Statement
where the hedge ineffectiveness is
reported as of August 31, 2015 Cocoa price risk (0.6) Cost of goods sold Foreign exchange risk (2.5) Cost of goods sold
Certain ineffectiveness can arise during the hedging process. The main sources of hedge ineffectiveness are considered to be timing differences between entering into the hedged items and into the hedging instruments and differences between the maturity profile of the hedged items and the hedging instruments.
For sources of hedge ineffectiveness, refer to section “1/a Commodity risk manage-ment” in this note.

Letter to Shareholders Overview Business Highlights Sustainability Financial Reports Governance
Consolidated Financial Statements
Barry Callebaut | Annual Report /
The following table provides further information about the effect of cash flow hedges on equity:
in thousands of CHF
Cocoa price risk Sugar price risk Fuel oil price risk Foreign exchange risk
Interest rate risk Total hedging reserve
as of September 1, 2014 (4,168) – – (303) (2,510) (6,981) Movements in the period:
Gains/(losses) taken into equity (1,355) (7,647) (3,149) 2,280 6,782 (3,089) Transfer to the Consolidated Income Statement for the period
3,165 – – (1,626) (753) 786
Thereof: Due to hedged cash flows that are no longer expected to occur/ineffectiveness
– – – – – –
Due to hedged item affected the Consolidated Income Statement
3,165 – – (1,626) (753) 786
Income taxes 485 779 347 59 (2,049) (379) Currency translation adjustment (325) – 3 (36) 154 (204)
as of August 31, 2015 (2,198) (6,868) (2,799) 374 1,624 (9,867) as of September 1, 2015 (2,198) (6,868) (2,799) 374 1,624 (9,867) Movements in the period:
Gains/(losses) taken into equity (1,205) 37,337 (4,636) 6,436 (27,392) 10,540 Transfer to the Consolidated Income Statement for the period
2,619 1,778 3,221 (3,221) 4,929 9,326
Thereof: Due to hedged cash flows that are no longer expected to occur/ineffectiveness
87 184 195 – 4,929 5,395
Due to hedged item affected the Consolidated Income Statement
2,532 1,594 3,026 (3,221) – 3,931
Income taxes (72) (3,805) 472 (273) 7,635 3,957 Currency translation adjustment (38) – 5 15 (24) (42)
as of August 31, 2016 (895) 28,442 (3,737) 3,331 (13,228) 13,914
5 Timing, nominal amount and pricing of hedging instruments As mentioned earlier in this note, the Group’s risk management continuously monitors the entities’ exposures to commodity price risk, foreign currency risk and interest rate risk as well as the use of derivative instruments.
The following table provides information about the maturity of the nominal amount and interest rates attached to the swaps held by the Group as of August 31, 2016 to hedge its interest rate risk:
as of August 31, 2016 Period of maturity First year Second to fifth year After five years Total
Nominal amount (CHF million) – 191.6 – 191.6 Average interest rate – 1.85% –
as of August 31, 2015 Period of maturity First year Second to fifth year After five years Total
Nominal amount (CHF million) – 188.1 376.2 564.3 Average interest rate – 1.58% 1.17%

Letter to Shareholders Overview Business Highlights Sustainability Financial Reports Governance
Consolidated Financial Statements
Barry Callebaut | Annual Report /
As of August 31, 2016, the Group held the following cocoa bean futures and other contracts accounted as derivatives to hedge the cocoa price risk exposure on its hedged items:
Period of maturity as of August 31, 2016 September – December
current year January – May
next year After May next year
Total
Nominal amount (in tonnes, net long/(short)) (29,277) 60,742 3,825 35,290 Average price (in CHF per tonne) 2,516 2,549 2,863
Period of maturity as of August 31, 2015 September – December
current year January – May
next year After May next year
Total
Nominal amount (in tonnes, net long/(short)) (51,622) 53,587 25,999 27,964 Average price (in CHF per tonne) 2,983 2,988 2,985
As of August 31, 2016, the Group held the following sugar futures to hedge the sugar price risk exposure on its forecasted sugar purchases:
Period of maturity as of August 31, 2016 September – October
current year November current year –
May next year After May next year
Total
Nominal amount (in tonnes, long) 91,034 120,700 70,765 282,499 Average price (in CHF per tonne) 319 335 340
Period of maturity as of August 31, 2015 September – October
current year November current year –
May next year After May next year
Total
Nominal amount (in tonnes, long) 85,496 97,232 41,728 224,456 Average price (in CHF per tonne) 272 291 305
As of August 31, 2016, the Group held the following fuel oil swaps to hedge the fuel oil price risk exposure on its forecasted freight expenditures:
Period of maturity as of August 31, 2016 September current year –
June next year July – December next year After next year Total
Nominal amount (in tonnes, long) 13,661 8,530 6,121 28,312 Average price (in CHF per tonne) 377 388 388
Period of maturity as of August 31, 2015 September current year –
June next year July – December next year After next year Total
Nominal amount (in tonnes, long) 16,468 9,145 20,715 46,328 Average price (in CHF per tonne) 349 354 373

Letter to Shareholders Overview Business Highlights Sustainability Financial Reports Governance
Consolidated Financial Statements
Barry Callebaut | Annual Report /
Information about the foreign exchange forwards and futures in case of the major foreign currency hedging pairs held by the Group as of August 31, 2016, to hedge its foreign exchange risk:
as of August 31, 2016 Period of maturity Current year Next year After next year Total
GBP exposure hedging in entities whose functional currency is EUR
Nominal amount (CHF million, long/(short)) (54.7) (72.4) (2.7) (129.8) Average foreign exchange rate (EUR/GBP) 0.853 0.879 0.869
USD exposure hedging in entities whose functional currency is EUR Nominal amount (CHF million, long/(short)) (189.9) (61.8) (2.1) (253.7) Average foreign exchange rate (EUR/USD) 1.082 1.113 1.007
GBP exposure hedging in entities whose functional currency is USD Nominal amount (CHF million, long/(short)) 74.5 29.7 0.7 104.8 Average foreign exchange rate (USD/GBP) 0.728 0.699 0.758
USD exposure hedging in entities whose functional currency is BRL Nominal amount (CHF million, long/(short)) 0.4 – – 0.4 Average foreign exchange rate (BRL/USD) 0.333 – –
as of August 31, 2015 Period of maturity Current year Next year After next year Total
GBP exposure hedging in entities whose functional currency is EUR
Nominal amount (CHF million, long/(short)) 87.7 (260.2) (3.5) (176.0) Average foreign exchange rate (EUR/GBP) 0.727 0.724 0.729
USD exposure hedging in entities whose functional currency is EUR Nominal amount (CHF million, long/(short)) (108.6) 17.9 15.8 (74.9) Average foreign exchange rate (EUR/USD) 1.140 1.125 1.134
GBP exposure hedging in entities whose functional currency is USD Nominal amount (CHF million, long/(short)) 34.8 (60.1) 3.4 (21.9) Average foreign exchange rate (USD/GBP) 0.643 0.642 0.645
USD exposure hedging in entities whose functional currency is BRL Nominal amount (CHF million, long/(short)) (2.3) – – (2.3) Average foreign exchange rate (BRL/USD) 0.293 – –
Letter to Shareholders Overview Business Highlights Sustainability Financial Reports Governance
Consolidated Financial Statements
Barry Callebaut | Annual Report /
6 Credit risk and concentration of credit risk Credit risk arising from customers, i.e. the risk of counter parties defaulting, is governed by the Groupʼs credit management policy. This policy defines the Group's credit management process such as the roles and responsibilities of the regional credit control organization, the initial customer account approval, setting and changing credit limits and payment terms, regular monitoring controls, collection effort process, credit insurance procedures and credit allowances. System embedded controls ensure that new customer orders and deliveries are not processed if a specific customer credit limit is exceeded due to outstanding or overdue open amounts.
Further, the Group has a credit insurance program whereby all customers with outstanding amounts larger than EUR 70,000 are insured as far as possible.
The Group’s credit risk also arises from derivative financial instruments, i.e. foreign exchange derivatives, interest rate derivatives, and commodity derivatives. The Group has foreign exchange and interest rate derivatives with 10–15 banks acting on an international scale and having sound credit ratings. In case of commodity derivatives, the Group enters into future deals in the New York and the London terminal markets, mainly with 5–6 counterparties, and the open positions per counterparty offset each other to a large extent leading to limited minimal open balances (as also represented by the value of derivative financial assets largely offsetting the value of derivative financial liabilities on the balance sheet). Counterparty exposures towards such financial institutions, referring limit utilization and total amount of all uninsured customers is monitored on a regular basis by the Group's centralized treasury department and reported to the Group's Finance Committee and the Audit, Finance, Risk, Quality and Compliance Committee.
As of August 31, 2016, the largest customer represents 8% (2015: 9%) whereas the ten biggest customers represent 29% (2015: 27%) of trade receivables. Due to the diverse geographic and large customer base, the Group has no material credit risk concentration. The extent of the Group’s credit risk exposure is represented on the one hand by the aggregate balance of amounts receivable, reduced by the effects of netting arrangements with counterparties. The maximum nominal credit risk exposure in the event all other parties fail to perform their obligation was CHF 1,208.3 million as of August 31, 2016 (2015: CHF 1,111.7 million).
All financial assets measured at amortized cost are first assessed for individual impairment. Subsequently, expected credit loss is calculated by applying the annualized Credit Default Swap rates (CDS) of the country of domicile (where available the individual CDS of the counterparty is applied) and by 25 bps (pro-rated in line with average payment terms). The expenses recognized according to the approach described above amounted to CHF 1.4 million in 2015/16 (2014/15: CHF 9.0 million).

Letter to Shareholders Overview Business Highlights Sustainability Financial Reports Governance
Consolidated Financial Statements
Barry Callebaut | Annual Report /
The following table summarizes the expected credit losses on the Group’s trade receivables at balance sheet date:
Ageing of trade receivables
as of August 31, 2016 2015 in thousands of CHF Total trade receivables measured at amortized cost 373,099 366,116
Of which: Insured receivables 198,374 274,452 Uninsured receivables with an individual balance over CHF 1 million 124,685 13,169 Uninsured receivables with an individual balance below CHF 1 million 50,040 78,495
Less lifetime expected credit losses for trade receivables (14,033) (21,194) Total trade receivables measured at amortized cost 359,066 344,922
Of which:
Not overdue 315,584 288,077 Lifetime expected credit losses for trade receivables not overdue (1,359) (845) Expected credit loss rate 0.43% 0.29% Past due less than 90 days 33,748 48,675 Lifetime expected credit losses for trade receivables past due less than 90 days (534) (219) Expected credit loss rate 1.58% 0.45% Past due more than 90 days 23,767 29,364 Lifetime expected credit losses for trade receivables past due more than 90 days (12,140) (20,130) Expected credit loss rate 51.08% 68.55%
Total trade receivables measured at amortized cost 359,066 344,922
The Group has insured certain credit risks through a credit insurance policy. A number of customers with significant outstanding amounts are covered by this policy. The movements in expected credit losses for trade receivables were as follows:
Movements in impairment provision for trade receivables
in thousands of CHF 2015/16 2014/15 as of September 1, 21,194 16,553 Changes to expected credit losses on financial assets already recognized at the beginning of the fiscal year 5,903 4,376 Changes to expected credit losses on new financial assets originated during the fiscal year 1,842 7,394 Write-offs (9,119) (2,588) Unused amounts reversed (6,219) (2,751) Currency translation adjustment 432 (1,790) as of August 31, 14,033 21,194
7 Liquidity risk Liquidity risk arises through a surplus of financial obligations over available financial assets due at any point in time. The Group’s liquidity is ensured by means of regular Group-wide monitoring and planning of liquidity coordinated by Group’s centralized treasury department. Financing needs are covered through a combination of adequate credit lines with financial institutions as well as through short-term and long-term debt capital market products (see note 23).

Letter to Shareholders Overview Business Highlights Sustainability Financial Reports Governance
Consolidated Financial Statements
Barry Callebaut | Annual Report /
Contractual maturities The table below provides an overview of contractual maturities for financial liabilities and derivatives.
as of August 31, 2016 In the first year In the second to the fifth year After five years Contractual amount
in thousands of CHF Non-derivative financial liabilities
Bank overdrafts (25,314) – – (25,314) Short-term debt (755,236) – – (755,236) Trade payables (552,339) – – (552,339) Long-term debt (48,926) (484,145) (963,446) (1,496,517) Other liabilities (434,574) – – (434,574)
Derivatives Interest rate derivatives (3,696) (4,933) – (8,630) Currency derivatives
Inflow 3,671,035 15,662 – 3,686,697 Outflow (3,554,087) (15,800) – (3,569,887)
Commodity derivatives (gross settled) Inflow 786,657 13,899 – 800,557 Outflow (1,384,651) – – (1,384,651)
Commodity derivatives (net settled) Inflow 99,140 – – 99,140 Outflow (133,999) (2,066) – (136,065)
Total net (2,335,989) (477,383) (963,446) (3,776,819)
as of August 31, 2015 In the first year In the second to the fifth year After five years Contractual amount
in thousands of CHF Non-derivative financial liabilities
Bank overdrafts (33,266) – – (33,266) Short-term debt (645,907) – – (645,907) Trade payables (651,979) – – (651,979) Long-term debt (60,295) (708,467) (731,972) (1,500,734) Other liabilities (238,127) – – (238,127)
Derivatives Interest rate derivatives (3,140) (15,387) 14,615 (3,912) Currency derivatives
Inflow 5,024,769 115,704 – 5,140,473 Outflow (4,836,584) (58,008) – (4,894,592)
Commodity derivatives (gross settled) Inflow 1,210,472 144,766 – 1,355,238 Outflow (1,524,788) (14,063) – (1,538,851)
Commodity derivatives (net settled) Inflow 89,003 2,357 – 91,360 Outflow (245,982) (149) – (246,131)
Total net (1,915,824) (533,247) (717,357) (3,166,428)

Letter to Shareholders Overview Business Highlights Sustainability Financial Reports Governance
Consolidated Financial Statements
Barry Callebaut | Annual Report /
8 Fair value of financial instruments a) Methods and assumptions The carrying value of the following financial instruments approximates fair value because of the short period to maturity: • Cash and cash equivalents • Bank overdrafts • Short-term deposits • Short-term debt • Other receivables and payables representing financial instruments Long-term debt In calculating the fair value of long-term debts, future principal and interest payments are discounted at market interest rates.
Derivative financial assets and liabilities The fair value measurement of some derivatives requires assumptions and management’s assessment of certain market parameters. Whenever possible, fair valuation is based on market prices. If required, a valuation model (including discounted cash flows, dealer or supplier quotes for similar instruments or recent arm’s-length transactions) is used, which takes into account the specific characteristics of the underlying assets or commodities such as the cost of carry, differentials for the properties and technical ratios reflecting production yield.
Carrying amount and fair value of each class of financial assets and liabilities are presented in the table below:
as of August 31, 2016
Financial assets (mandatorily)
measured at fair value through
profit or loss
Financial assets measured at
amortized cost
Financial liabilities (mandatorily)
measured at fair value through
profit or loss
Financial liabilities measured at
amortized cost
Total carrying amount
Fair value
in thousands of CHF Cash and cash equivalents – 456,800 – – 456,800 456,800 Short-term deposits – 50 – – 50 50 Trade receivables 77,538 359,066 – – 436,604 436,604 Derivative financial assets 318,303 – – – 318,303 318,303 Other assets1 – 212,972 – – 212,972 212,972 Total assets 395,841 1,028,889 – – 1,424,730 1,424,730 Bank overdrafts – – – 25,314 25,314 25,314 Short-term debt – – – 731,340 731,340 751,634 Trade payables – – – 552,339 552,339 552,339 Derivative financial liabilities – – 310,368 – 310,368 310,368 Long-term debt – – – 1,153,027 1,153,027 1,309,037 Other liabilities – – – 434,574 434,574 434,574 Total liabilities – – 310,368 2,896,593 3,206,961 3,383,265
1 Other assets contain accrued income, loans and other receivables and other current financial assets.

Letter to Shareholders Overview Business Highlights Sustainability Financial Reports Governance
Consolidated Financial Statements
Barry Callebaut | Annual Report /
as of August 31, 2015
Financial assets (mandatorily)
measured at fair value through
profit or loss
Financial assets measured at
amortized cost
Financial liabilities (mandatorily)
measured at fair value through
profit or loss
Financial liabilities measured at
amortized cost
Total carrying amount
Fair value
in thousands of CHF Cash and cash equivalents – 125,151 – – 125,151 125,151 Short-term deposits – 2,177 – – 2,177 2,177 Trade receivables 73,893 344,922 – – 418,815 418,815 Derivative financial assets 498,514 – – – 498,514 498,514 Other assets1 – 148,136 – – 148,136 148,136 Total assets 572,407 620,386 – – 1,192,793 1,192,793 Bank overdrafts – – – 33,266 33,266 33,266 Short-term debt – – – 645,907 645,907 645,907 Trade payables – – – 651,979 651,979 651,979 Derivative financial liabilities – – 453,694 – 453,694 453,694 Long-term debt – – – 1,176,159 1,176,159 1,300,602 Other liabilities – – – 238,127 238,127 238,127 Total liabilities – – 453,694 2,745,438 3,199,132 3,323,575
1 Other assets contain accrued income, loans and other receivables and other current financial assets.
b) Fair value hierarchy of financial instruments The fair value measurements of financial assets and liabilities are classified using a fair value hierarchy that reflects the significance of the inputs used in making the measurements. The fair value hierarchy has the following levels: • Level 1: The fair value is based on unadjusted, quoted prices in active markets which
give the best possible objective indication for the fair value of a financial asset or liability. A market is regarded as active if quoted prices are readily and regularly available from an exchange, dealer, broker or pricing service, and those prices represent actual and regularly occurring market transactions on an arm’s-length basis.
• Level 2: The estimation of the fair value is based on the results of a valuation model. The valuation model for commodity derivatives includes quoted prices in active markets, recent arm’s-length transactions or dealer and supplier quotes adjusted for the specific characteristics of the underlying commodities such as the cost of carry, differentials for the properties and conversion yields. Corroborated market data is used for the valuation of foreign exchange and interest rate derivatives. If all significant inputs required to fair value an instrument are observable, the instrument is included in level 2.
• Level 3: The valuation models used are based on parameters and assumptions not observable on the market.

Letter to Shareholders Overview Business Highlights Sustainability Financial Reports Governance
Consolidated Financial Statements
Barry Callebaut | Annual Report /
The following table summarizes the levels applied with regard to financial assets and financial liabilities measured at fair value:
as of August 31, 2016 Level 1 Level 2 Level 3 Total in thousands of CHF Trade receivables – – 77,538 77,538 Derivative financial assets 67,580 250,723 – 318,303 Short-term debt 751,634 – – 751,634 Derivative financial liabilities 24,557 285,811 – 310,368 Long-term debt 1,294,054 14,983 – 1,309,037
as of August 31, 2015 Level 1 Level 2 Level 3 Total in thousands of CHF Trade receivables – – 73,893 73,893 Derivative financial assets 47,603 450,911 – 498,514 Short-term debt 651,979 – – 651,979 Derivative financial liabilities 57,662 396,032 – 453,694 Long-term debt 1,138,177 162,425 – 1,300,602
From the value of derivative financial assets and derivative financial liabilities as of August 31, 2016, CHF 83.7 million and CHF 7.5 million, respectively, relates to the fair value of executory contracts measured at fair value using the fair value option (2014/15: CHF 161.6 million and 4.1 million). The fair value of each executory contract measured at fair value using the fair value option was calculated using the methods described in Level 2.
The value of the trade receivables measured at fair value was calculated using a discounted cash flow method based on the nominal value and the discount rates (mainly representing the risk free rate and credit risk of the counterparty) between the Group and the purchasing party.
There have been no transfers between the fair value hierarchy levels during the fiscal years 2015/16 and 2014/15.
9 Capital management The Group continues to apply its policy to maintain a sound capital base to support the continued development of the business. The Board of Directors seeks to maintain a prudent balance between debt and equity. In compliance with bank covenants, there is also a minimum Tangible Net Worth value (Equity – Intangible assets) set at CHF 500 million.
The target payout ratio to shareholders is set at 35% of the net profit in the form of a share capital reduction and repayment and/or dividend. Dividends will be paid from reserves from capital contributions as long as such remain available. The target ratio and the form of the payout recommended by the Board are reviewed on an annual basis and are subject to the decision of the Annual General Meeting of Shareholders.
The Group’s subsidiaries have complied with applicable local statutory capital requirements.

Letter to Shareholders Overview Business Highlights Sustainability Financial Reports Governance
Consolidated Financial Statements
Barry Callebaut | Annual Report /
10 Offsetting financial assets and financial liabilities The following financial assets and liabilities are subject to offsetting, enforceable master netting arrangement and similar agreements:
Related amounts not set off in the balance sheet as of August 31, 2016
Gross amounts of recognized
financial assets/ liabilities
Gross amounts of recognized
financial liabilities/
assets set off in the balance sheet
Net amounts of financial assets/
liabilities presented in the
balance sheet
Financial instruments
Cash collateral received or
deposited
Net amount
in thousands of CHF Derivative financial assets 421,627 (103,323) 318,303 (65,609) (264) 252,430 Derivative financial liabilities 413,691 (103,323) 310,368 (65,609) (40,027) 204,732
Related amounts not set off in the balance sheet as of August 31, 2015
Gross amounts of recognized
financial assets/ liabilities
Gross amounts of recognized
financial liabilities/
assets set off in the balance sheet
Net amounts of financial assets/
liabilities presented in the
balance sheet
Financial instruments
Cash collateral received or
deposited
Net amount
in thousands of CHF Derivative financial assets 715,454 (216,940) 498,514 (46,162) (5,132) 447,220 Derivative financial liabilities 670,634 (216,940) 453,694 (46,162) (68,989) 338,543
For the financial assets and liabilities subject to enforceable master netting arrangements or similar arrangements above, each agreement between the Group and the counterparty allows for net settlement of the relevant financial assets and liabilities when both elect to settle on a net basis. In the absence of such an election, financial assets and liabilities will be settled on a gross basis, however, each party to the master netting agreement or similar agreement will have the option to settle all such amounts on a net basis in the event of default, insolvency or bankruptcy or following other predefined events at the side of the counterparty. The cash collateral received and deposited are reported on lines “Trade payables and other current liabilities” and “Trade receivables and other current assets” in the Consolidated Balance Sheet.

Letter to Shareholders Overview Business Highlights Sustainability Financial Reports Governance
Consolidated Financial Statements
Barry Callebaut | Annual Report /
Related parties The following shareholders hold a participation of more than 3% of the issued share capital of the Group’s ultimate parent Barry Callebaut AG:
as of August 31, 2016 2015 Jacobs Holding AG, Zurich, Switzerland 50.11% 50.11% Renata Jacobs 8.48% 8.48% Massachusetts Mutual Life Insurance Company1 3.64% 3.09%
1 Including all subsidiaries controlled by the parent company
Significant transactions and balances between the Group and related parties are as follows:
in thousands of CHF Nature of cost/revenue 2015/16 2014/15 Other operating expenses charged by related parties (1,621) (5,227)
Jacobs Holding AG Management services (1,521) (2,015) Adecco Group1 Human resources services – (3,112) Other (101) (100)
Other payables to related parties 419 680
Jacobs Holding AG 419 135 Adecco Group1 – 520 Other – 25
Debt instruments due to related parties 149,926 249,694 Jacobs Holding AG 149,926 249,694
1 In 2014, Jacobs Holding AG sold their shares in Adecco Group. Therefore, Adecco Group is no longer considered
a related party of Barry Callebaut Group.
Compensation of key management personnel The key management personnel is defined as the Board of Directors and the Executive Committee. Key management compensation consists of the following:
in million CHF 2015/16 2014/15 Short-term employee benefits 13.3 9.8 Post-employment benefits 2.0 2.3 Share-based payments 9.3 10.3 Total 24.6 22.4
Further details related to the requirements of the Swiss Transparency law (Art. 663bbis
and 663c Swiss Code of Obligations) are disclosed in note 6 in the Financial Statements of Barry Callebaut AG and in the Remuneration Report.

Letter to Shareholders Overview Business Highlights Sustainability Financial Reports Governance
Consolidated Financial Statements
Barry Callebaut | Annual Report /
Commitments and contingencies
Capital commitments
as of August 31, 2016 2015 in thousands of CHF Property, plant & equipment 3,993 5,400 Intangible assets 1,923 1,625 Total capital commitments 5,916 7,025
Operating lease commitments Operating lease commitments represent rentals payable by the Group for certain vehicles, equipment, buildings and offices. Equipment and vehicle leases were nego-tiated for an average term of 2.4 years (2014/15: 2.2 years).
The future aggregate minimum lease payments under non-cancelable operating leases are due as follows:
as of August 31, 2016 2015 in thousands of CHF In the first year 14,783 16,228 In the second to the fifth year 38,676 42,667 After five years 27,578 20,800 Total future operating lease commitments 81,037 79,695 in thousands of CHF 2015/16 2014/15 Lease expenditure charged to the statement of income 15,687 16,767
Contingencies Group companies are involved in various legal actions and claims as they arise in the ordinary course of the business. This includes claims from customers for product liability and recalls, which are generally covered by a global insurance policy. Provisions have been made, where quantifiable, for probable outflows not covered by insurance. In the opinion of management, after taking appropriate legal advice, the future settlements of such actions and claims will not have a material effect on the Group’s financial position.

Letter to Shareholders Overview Business Highlights Sustainability Financial Reports Governance
Consolidated Financial Statements
Barry Callebaut | Annual Report /
Group entities The principal subsidiaries of Barry Callebaut as of August 31, 2016, are the following:1
Country Subsidiary Municipality of registration %-owned Currency Capital Switzerland Barry Callebaut Sourcing AG Zurich 100 CHF 2,000,000 Barry Callebaut Schweiz AG Dübendorf 100 CHF 4,600,000 Barry Callebaut Cocoa AG Zurich 100 CHF 100,000 Barry Callebaut Management Services AG Zurich 100 CHF 100,000 African Organic Produce AG Zurich 100 CHF – Belgium Barry Callebaut Services N.V. Lebbeke-Wieze 100 EUR 929,286,000 Barry Callebaut Belgium N.V. Lebbeke-Wieze 100 EUR 61,537,705 Pierre Iserentant SA Thimister-Clermont 100 EUR 260,908 International Business Company Belgium BVBA Kortrijk (Heule) 100 EUR 65,000 Brazil Barry Callebaut Brasil SA São Paulo 100 BRL 451,600,810 Cameroon Société Industrielle Camerounaise des Cacaos SA Douala 78.35 XAF 1,147,500,000 SEC Cacaos SA Douala 100 XAF 10,000,000 Canada Barry Callebaut Canada Inc. St.-Hyacinthe 100 CAD 2,000,000 Chile Barry Callebaut Chile SpA Santiago 100 CLP 8,001,000,000 China Barry Callebaut (Suzhou) Chocolate Co., Ltd. Suzhou 100 CNY 219,137,532 Côte d’Ivoire Société Africaine de Cacao SA Abidjan 100 XAF 25,695,651,316 Barry Callebaut Négoce SA Abidjan 100 XAF 3,700,000,000 Biopartenaire SA Yamoussoukro 100 XAF 200,000,000 Czech Republic Barry Callebaut Czech Republic s.r.o. Prague-Vinohrady 100 CZK 200,000 Denmark Barry Callebaut Denmark ApS Hostebro 100 DKK 500,000 Ecuador Barry Callebaut Ecuador SA Guayaquil 100 USD 50,000 France Barry Callebaut Manufacturing France SAS Hardricourt 100 EUR 6,637,540 Barry Callebaut France SAS Hardricourt 100 EUR 67,900,000 Barry Callebaut Nord Cacao SAS Gravelines 100 EUR 3,037,000 Germany Barry Callebaut Deutschland GmbH Norderstedt 100 EUR 77,600 C.J. van Houten & Zoon Holding GmbH Norderstedt 100 EUR 72,092,155 Schloss Marbach GmbH Öhningen 100 EUR 1,600,000 Barry Callebaut Manufacturing Norderstedt GmbH & Co. KG Norderstedt 100 EUR 50,100 Barry Callebaut Cocoa Germany GmbH Hamburg 100 EUR 25,000 Ghana Barry Callebaut Ghana Ltd. Tema 100 USD 9,204,219 Nyonkopa Cocoa Buying Company Ltd. Kumasi 100 GHS 4,250,000 Great Britain Barry Callebaut Manufacturing (UK) Ltd. Banbury, Oxfordshire 100 GBP 15,467,852 Barry Callebaut (UK) Ltd. Banbury, Oxfordshire 100 GBP 3,200,000 Barry Callebaut Beverage UK Ltd. Chester 100 GBP 40,000 India Barry Callebaut India Private Ltd. Maharashtra 100 INR 335,900,006 Indonesia P.T. Barry Callebaut Comextra Indonesia Makassar 60 IDR 30,750,000 P.T. Papandayan Cocoa Industries Bandung 100 USD 40,000,000 P.T. Barry Callebaut Indonesia Bandung 100 IDR 23,073,000 Italy Barry Callebaut Italia S.p.A. Assago 100 EUR 104,000 Barry Callebaut Manufacturing Italy Srl. Milano 100 EUR 2,646,841 Dolphin Srl. Milano 100 EUR 110,000 Japan Barry Callebaut Japan Ltd. Amagasaki 100 JPY 835,000,000

Letter to Shareholders Overview Business Highlights Sustainability Financial Reports Governance
Consolidated Financial Statements
Barry Callebaut | Annual Report /
Country Subsidiary Municipality of registration %-owned Currency Capital Malaysia Barry Callebaut Malaysia Sdn Bhd Petaling Jaya 100 MYR 35,000,000 Barry Callebaut Services Asia Pacific Sdn Bhd Petaling Jaya 100 MYR 500,000 Barry Callebaut Manufacturing Malaysia Sdn Bhd Johor Bahru 100 MYR 16,000,000 Mexico Barry Callebaut Mexico, S. de R.L. de CV Escobedo N.L. 100 MXN 128,246,530 Barry Callebaut Cocoa Mexico SA de CV Monterrey 100 USD 107,795 Philippines Cocoa Ingredients (Philippines) Inc. Makati City 100 PHP 8,114,000 Poland Barry Callebaut Manufacturing Polska Sp. z o.o. Lodz 100 PLN 10,000,000 Barry Callebaut Polska Sp. z o.o. Lodz 100 PLN 50,000 Barry Callebaut SSC Europe Sp. Z.o.o. Lodz 100 PLN 2,000,000 Russia Barry Callebaut NL Russia LLC Moscow-Chekhov 100 RUB 922,510,182 Gor Trade LLC Moscow-Chekhov 100 RUB 58,000,000 Serbia Barry Callebaut South East Europe d.o.o. Belgrade 100 RSD 1,185,539 Sierra Leone Bio United Ltd. Freetown 100 SLL 114,000,000 Singapore Barry Callebaut Chocolate Asia Pacific Pte. Ltd. Singapore 100 SGD 100,000,000 Barry Callebaut Cocoa Asia Pacific Pte Ltd Singapore 100 USD 324,242,738 Barry Callebaut Europe Holding Pte Ltd Singapore 100 USD 95,400,000 Spain Barry Callebaut Ibérica SL Barcelona 100 EUR 25,000 Barry Callebaut Manufacturing Ibérica, S.A.U. Gurb 100 EUR 987,600 La Morella Nuts S.A. Castellvell del Camp 100 EUR 344,554 Sweden Barry Callebaut Sweden AB Kågeröd 100 SEK 100,000 ASM Foods AB Mjölby 100 SEK 2,000,000 Tanzania Biolands International Ltd. Moshi 100 TZS 40,000,000 Thailand Siam Cocoa Products Co., Ltd. Bangkok 100 THB 125,000,000 The Netherlands Barry Callebaut Nederland B.V. Zundert 100 EUR 21,435,000 Barry Callebaut Decorations BV Zundert 100 EUR 18,242 Hoogenboom Benelux BV Zundert 100 EUR 18,152 Dings Décor B.V. Nuth 70 EUR 22,689 Barry Callebaut Cocoa Netherlands BV Zaandam 100 EUR 18,000 Turkey Barry Callebaut Eurasia Gida Sanayi Ve Ticaret Ltd. Sti. Istanbul 100 TRL 103,000,000 USA Barry Callebaut Cocoa USA Inc. Chicago, IL 100 USD 7,663 Barry Callebaut North America Holding Inc. Wilmington, DL 100 USD 100,001,000 Barry Callebaut USA LLC St. Albans, VT 100 USD 100,190,211
1 Barry Callebaut has some dormant companies which are not enclosed as principal subsidiaries, e.g.Barry Callebaut Manufacturing Germany GmbH, Barry Callebaut Holding (UK) Ltd, Selbourne, Barry Callebaut Nigeria, Adis Holding Inc., Barry Callebaut USA Holding, Inc., Omnigest SAS.
Subsequent events Approval of the Financial Statements The Consolidated Financial Statements were authorized for issue by the Board of Directors on October 31, 2016, and are subject to approval by the Annual General Meeting of Shareholders on December 7, 2016.
On September 15, 2016, the Group announced its intention to acquire and integrate the chocolate production facility of Mondelēz International in Halle, Belgium. Mondelēz International would enter into an agreement with Barry Callebaut for the long-term supply of 30,000 tonnes of liquid chocolate per annum. Under a toll-manufacturing agreement, the Group would make certain consumer products for Mondelēz International that are currently produced at the chocolate plant in Halle. As a result of this transaction, Barry Callebaut would be better equipped to capture business opportunities in the fast growing segment of specialty chocolate and fillings “Made in Belgium.” The closing of the transaction is still subject to a number of conditions and is expected to occur by the end of December 2016, after completing works council consultation. The establishment and allocation of the purchase price to net identifiable assets and goodwill can only be assessed at that point of time.
There are no other subsequent events that would require any modification of the value of the assets and liabilities or additional disclosures.

Report of the Statutory Auditor to the General Meeting of Shareholders of Barry Callebaut AG, Zurich Report of the Statutory Auditor on the Consolidated Financial Statements As statutory auditor, we have audited the accompanying consolidated financial statements of Barry Callebaut AG, which comprise the income statement, statement of comprehensive income, balance sheet, cash flow statement, statement of changes in equity and notes on pages 37 to 107 for the year ended 31 August 2016. Board of Directors’ Responsibility The board of directors is responsible for the preparation of the consolidated financial statements in accordance with International Financial Reporting Standards (IFRS) and the requirements of Swiss law. This responsibility includes designing, implementing and maintaining an internal control system relevant to the preparation of consolidated financial statements that are free from material misstatement, whether due to fraud or error. The board of directors is further responsible for selecting and applying appropriate accounting policies and making accounting estimates that are reasonable in the circumstances. Auditor’s Responsibility Our responsibility is to express an opinion on these consolidated financial statements based on our audit. We conducted our audit in accordance with Swiss law and Swiss Auditing Standards as well as International Standards on Auditing. Those standards require that we plan and perform the audit to obtain reasonable assurance whether the consolidated financial statements are free from material misstatement. An audit involves performing procedures to obtain audit evidence about the amounts and disclosures in the consolidated financial statements. The procedures selected depend on the auditor’s judgment, including the assessment of the risks of material misstatement of the consolidated financial statements, whether due to fraud or error. In making those risk assessments, the auditor considers the internal control system relevant to the entity’s preparation of the consolidated financial statements in order to design audit procedures that are appropriate in the circumstances, but not for the purpose of expressing an opinion on the effectiveness of the entity’s internal control system. An audit also includes evaluating the appropriateness of the accounting policies used and the reasonableness of accounting estimates made, as well as evaluating the overall presentation of the consolidated financial statements. We believe that the audit evidence we have obtained is sufficient and appropriate to provide a basis for our audit opinion. Opinion In our opinion, the consolidated financial statements for the year ended 31 August 2016 give a true and fair view of the financial position, the results of operations and the cash flows in accordance with International Financial Reporting Standards (IFRS) and comply with Swiss law. Report on Other Legal Requirements We confirm that we meet the legal requirements on licensing according to the Auditor Oversight Act (AOA) and independence (article 728 CO and article 11 AOA) and that there are no circumstances incompatible with our independence. In accordance with article 728a paragraph 1 item 3 CO and Swiss Auditing Standard 890, we confirm that an internal control system exists, which has been designed for the preparation of consolidated financial statements according to the instructions of the board of directors. We recommend that the consolidated financial statements submitted to you be approved. KPMG AG
François Rouiller Patricia Bielmann Licensed Audit Expert Licensed Audit Expert Auditor in Charge Zurich, 31 October 2016
KPMG AG is a subsidiary of KPMG Holding AG, which is a member of the KPMG network of independent firms affiliated with KPMG International Cooperative (“ KPMG International” ), a Swiss legal entity. All rights reserved.
KPMG AG Audit Badenerstrasse 172 P.O. Box 1872 Telephone +41 58 249 31 31 CH-8004 Zurich CH-8026 Zurich Fax +41 58 249 44 06 Internet www.kpmg.ch
Member of EXPERTsuisse
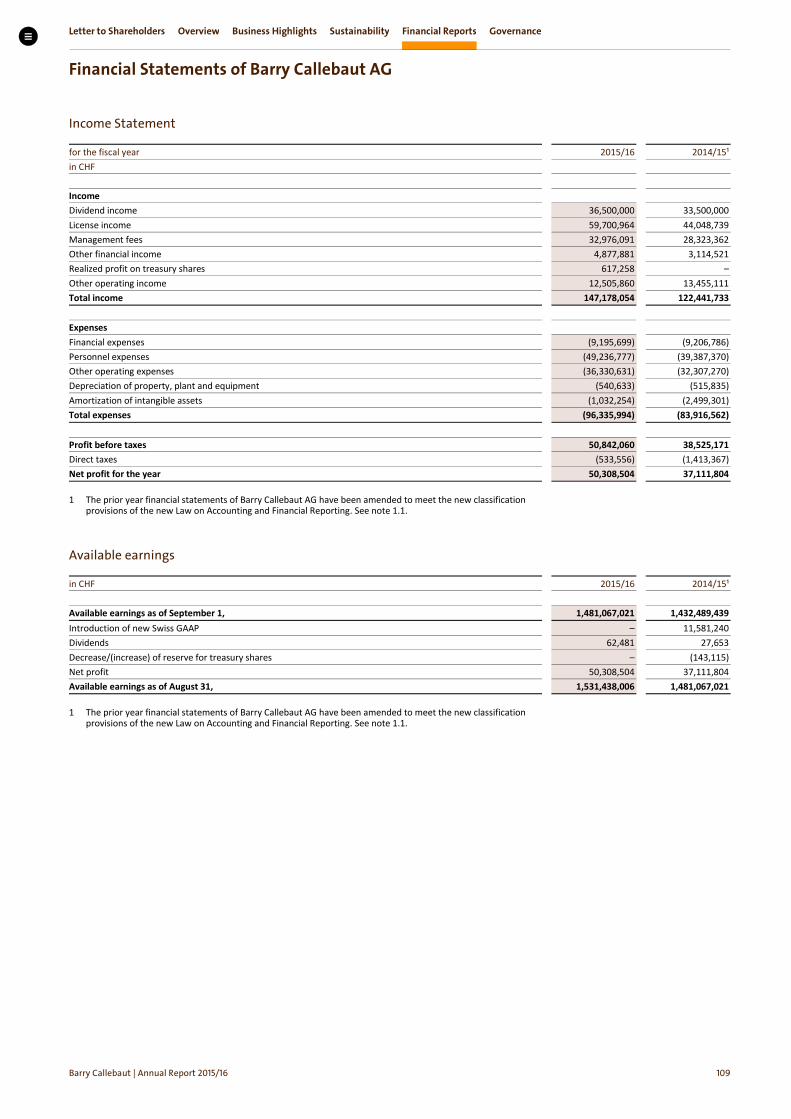
Letter to Shareholders Overview Business Highlights Sustainability Financial Reports Governance
Financial Statements of Barry Callebaut AG
Barry Callebaut | Annual Report /
Income Statement
for the fiscal year 2015/16 2014/15¹ in CHF Income Dividend income 36,500,000 33,500,000 License income 59,700,964 44,048,739 Management fees 32,976,091 28,323,362 Other financial income 4,877,881 3,114,521 Realized profit on treasury shares 617,258 – Other operating income 12,505,860 13,455,111 Total income 147,178,054 122,441,733 Expenses Financial expenses (9,195,699) (9,206,786) Personnel expenses (49,236,777) (39,387,370) Other operating expenses (36,330,631) (32,307,270) Depreciation of property, plant and equipment (540,633) (515,835) Amortization of intangible assets (1,032,254) (2,499,301) Total expenses (96,335,994) (83,916,562) Profit before taxes 50,842,060 38,525,171 Direct taxes (533,556) (1,413,367) Net profit for the year 50,308,504 37,111,804
1 The prior year financial statements of Barry Callebaut AG have been amended to meet the new classification provisions of the new Law on Accounting and Financial Reporting. See note 1.1.
Available earnings
in CHF 2015/16 2014/15¹ Available earnings as of September 1, 1,481,067,021 1,432,489,439 Introduction of new Swiss GAAP – 11,581,240 Dividends 62,481 27,653 Decrease/(increase) of reserve for treasury shares – (143,115) Net profit 50,308,504 37,111,804 Available earnings as of August 31, 1,531,438,006 1,481,067,021
1 The prior year financial statements of Barry Callebaut AG have been amended to meet the new classification provisions of the new Law on Accounting and Financial Reporting. See note 1.1.

Letter to Shareholders Overview Business Highlights Sustainability Financial Reports Governance
Financial Statements of Barry Callebaut AG
Barry Callebaut | Annual Report /
Balance Sheet
Assets as of August 31, 2016 2015¹ in CHF Current assets Cash and cash equivalents 141,587 110,174 Other short-term receivables from Group companies 50,094,609 22,475,758 Short-term interest-bearing loans to Group companies 72,433 73,060 Prepaid expenses and accrued income 2,522,020 1,656,806 Total current assets 52,830,649 24,315,798 Non-current assets Investments in Group companies 2,250,912,768 2,250,912,768 Property, plant and equipment 892,344 1,393,372 Intangible assets Trademarks 749,204 168,447 Patents/Product development costs 1,245,701 1,478,337 Other 424,389 329,679 Total non-current assets 2,254,224,406 2,254,282,603 Total assets 2,307,055,055 2,278,598,401
1 The prior year financial statements of Barry Callebaut AG have been amended to meet the new classification provisions of the new Law on Accounting and Financial Reporting. See note 1.1.
Liabilities and shareholders' equity as of August 31, 2016 2015¹ in CHF Short-term liabilities Bank overdrafts 1,238,320 7,980 Trade accounts payable
to third parties 3,422,537 2,323,034 to Group companies 10,830,602 43,541,624 to shareholders 418,969 135,000
Short-term interest-bearing loans from Group companies 584,293,554 351,055,795 Short-term provisions 25,195,815 21,324,154 Accrued expenses and deferred income 12,436,822 9,789,087 Total short-term liabilities 637,836,619 428,176,674 Long-term liabilities Long-term interest-bearing loans from Group companies – 150,000,000 Total long-term liabilities – 150,000,000 Total liabilities 637,836,619 578,176,674 Shareholders’ equity Share capital ² 102,092,759 102,092,759 Legal capital reserves Reserves from capital contributions 23,037,419 102,625,860 Legal retained earnings
General legal retained earnings 25,600,070 25,600,070 Voluntary retained earnings
Available earnings Profit brought forward 1,481,129,502 1,444,572,474 Profit for the year 50,308,504 37,111,804
Treasury shares (12,949,818) (11,581,240) Total shareholders’ equity 1,669,218,436 1,700,421,727 Total liabilities and shareholders’ equity 2,307,055,055 2,278,598,401
1 The prior year financial statements of Barry Callebaut AG have been amended to meet the new classification provisions of the new Law on Accounting and Financial Reporting. See note 1.1.
2 The share capital as of August 31, 2016, consists of 5,488,858 fully paid-in shares at a nominal value of CHF 18.60 as in the prior year.
Letter to Shareholders Overview Business Highlights Sustainability Financial Reports Governance
Financial Statements of Barry Callebaut AG
Barry Callebaut | Annual Report /
Notes to the Financial Statements
Principles 1.1 Initial application of the new Law on Accounting and Financial Reporting The annual financial statements for 2015/16 were prepared for the first time pursuant to the provisions of the Federal Law on Accounting and Financial Reporting (32nd section of the Swiss Code of Obligations; German: Obligationenrecht). In order to ensure comparability, the prior year’s amounts were restated to conform to the new classi-fication standards. The main changes are as follows: • Sequence of the income statement positions has changed. • Sequence of the balance sheet positions has changed. • “Accounts receivable from Group companies” are now reported under “Other short-
term receivables from Group companies.” • “Short-term loans granted to Group companies” are now reported under “Short-term
interest-bearing loans to Group companies.” • “Other current assets” are now reported under “Prepaid expenses and accrued
income.” • “Trade accounts payable” are now divided into “Trade accounts payable to third
parties,” “to Group companies” and “to shareholders.” • “Short-term provisions” were previously not reported separately, but included in
“Accrued liabilities.” • “Accrued expenses and deferred income” were previously not reported separately,
but included in “Accrued liabilities.” • “Accrued taxes” are now reported in “Short-term provisions.” • “Long-term loans from Group companies” are now reported under “Long-term
interest-bearing loans from Group companies.” • “Other legal reserves” were previously included in the caption “Legal reserves” and
are now reported under “General legal retained earnings” in the caption “Legal retained earnings.”
• “Available earnings” are now split into “Profit brought forward” and “Profit for the year.”
• “Treasury shares” were previously recognized as an asset and a corresponding equity reserve. Now they are recognized at acquisition cost and deducted from shareholders’ equity at the time of acquisition. The losses previously recognized through the income statement are not recycled.
1.2 General aspects These financial statements were prepared according to the provisions of the new Law on Accounting and Financial Reporting (32nd title of the Swiss code of Obligations). Where not prescribed by law, the significant accounting and valuation principles applied are described below.
Due to rounding, the figures presented in the tables may not add up precisely to the totals provided.
1.3 Investments Investments are stated at historical costs less any allowance for impairment.

Letter to Shareholders Overview Business Highlights Sustainability Financial Reports Governance
Financial Statements of Barry Callebaut AG
Barry Callebaut | Annual Report /
1.4 Treasury shares Treasury shares are recognized at acquisition cost and deducted from shareholders’ equity at the time of acquisition. In case of resale, the gain or loss is recognized through the income statement as financial income or financial expenses. 1.5 Share-based payments Should treasury shares be used for share-based payment programs for Board members and employees, the difference between the acquisition costs and any consideration paid by the employees at grant date is recognized as personnel expenses. 1.6 Short-term interest-bearing liabilities Short-term interest-bearing liabilities are recognized in the balance sheet at nominal value. 1.7 Long-term interest-bearing liabilities Long-term interest-bearing liabilities are recognized in the balance sheet at nominal value. 1.8 Revenue recognition for Management Fees and Licence fees Management fees and licence income are recorded as revenue as at the moment of invoicing. Once the service has been rendered, it is invoiced at the latest at the end of each quarter. 1.9 Foregoing a cash flow statement and additional disclosures in the notes As Barry Callebaut AG has prepared its consolidated financial statements in accordance with International Financial Reporting Standard (IFRS), it has decided to forego pre-senting additional information on interest-bearing-liabilities and audit fees in the notes as well as a cash flow statement in accordance with the law.

Letter to Shareholders Overview Business Highlights Sustainability Financial Reports Governance
Financial Statements of Barry Callebaut AG
Barry Callebaut | Annual Report /
Information on balance sheet and income statement items
2.1 Prepaid expenses and accrued income Short-term prepaid expenses and accrued income contain receivables for withholding tax, VAT and pension fund. 2.2 Investments
as of August, 31 2016 2015 Name and domicile Municipality of registration Share capital Purpose Percentage of ownership1 ADIS Holding Inc., Panama
Panama City CHF 41,624,342 Dormant
100%
100%
Barry Callebaut Belgium N.V., Belgium
Lebbeke-Wieze EUR 61,537,705 Production, sales
99.99%
99.99%
Barry Callebaut Cocoa AG, Switzerland
Zurich CHF 100,000 Sales
100%
100%
Barry Callebaut Decorations B.V., The Netherlands
Zundert EUR 18,242 Production, sales
100%
100%
Barry Callebaut Management Services AG, Switzerland
Zurich CHF 100,000 Management services
100%
100%
Barry Callebaut Nederland B.V., The Netherlands
Zundert EUR 21,435,000 Holding
100%
100%
Barry Callebaut Nigeria Ltd., Nigeria
Lagos NGN 10,000,000 Sales
1%
1%
Barry Callebaut Schweiz AG, Switzerland
Dübendorf CHF 4,600,000 Production, sales
100%
100%
Barry Callebaut Services N.V., Belgium
Lebbeke-Wieze EUR 929,286,000 Centralized treasury, management services
99.99%
99.99%
Barry Callebaut Sourcing AG, Switzerland
Zurich CHF 2,000,000 Sourcing
100%
100%
C.J. van Houten & Zoon Holding GmbH, Germany
Norderstedt EUR 72,092,155 Holding
100%
100%
Schloss Marbach GmbH, Germany
Öhningen EUR 1,600,000 Conference and training center
100%
100%
1 Capital rights (percentage of ownership) correspond with voting rights.
2.3 Short-term interest-bearing loans from Group companies
as of August 31, Maturity Interest 2016 2015 in CHF Short-term loan from Group companies 30.06.2015 0.725% – 100,000,000 Short-term loan from Group companies 21.09.2015 1.570% – 251,055,000 Short-term loan from Group companies 20.09.2016 1.220% 332,900,000 – Short-term loan from Group companies 20.09.2016 1.220% 101,000,000 – Short-term loan from Group companies 13.07.2017 1.025% 150,000,000 – – – Bank overdraft from Group companies n/a 1.220% 393,554 795 Total 584,293,554 351,055,795
2.4 Long-term interest-bearing loans from Group companies
as of August 31, Maturity Interest 2016 2015 in CHF Loan from Group companies 13.07.2017 1.025% – 150,000,000 Total – 150,000,000
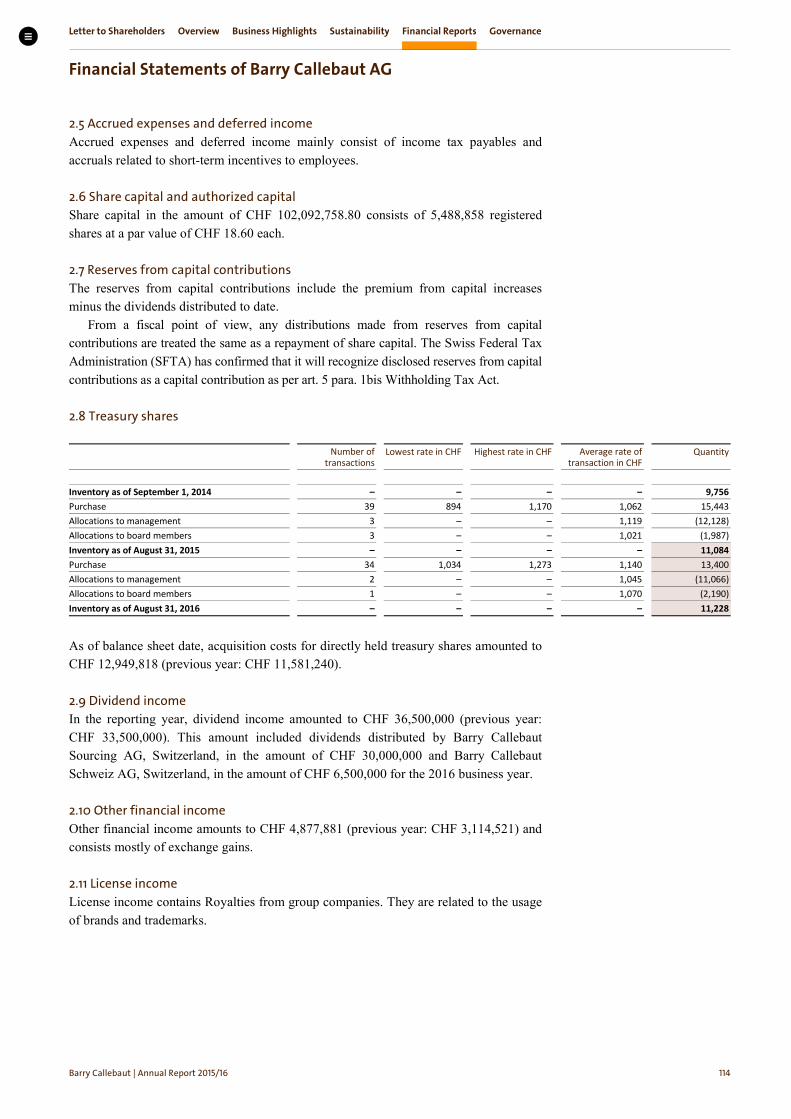
Letter to Shareholders Overview Business Highlights Sustainability Financial Reports Governance
Financial Statements of Barry Callebaut AG
Barry Callebaut | Annual Report /
2.5 Accrued expenses and deferred income Accrued expenses and deferred income mainly consist of income tax payables and accruals related to short-term incentives to employees. 2.6 Share capital and authorized capital Share capital in the amount of CHF 102,092,758.80 consists of 5,488,858 registered shares at a par value of CHF 18.60 each. 2.7 Reserves from capital contributions The reserves from capital contributions include the premium from capital increases minus the dividends distributed to date.
From a fiscal point of view, any distributions made from reserves from capital contributions are treated the same as a repayment of share capital. The Swiss Federal Tax Administration (SFTA) has confirmed that it will recognize disclosed reserves from capital contributions as a capital contribution as per art. 5 para. 1bis Withholding Tax Act.
2.8 Treasury shares
Number of transactions
Lowest rate in CHF Highest rate in CHF Average rate of transaction in CHF
Quantity
Inventory as of September 1, 2014 – – – – 9,756 Purchase 39 894 1,170 1,062 15,443 Allocations to management 3 – – 1,119 (12,128) Allocations to board members 3 – – 1,021 (1,987) Inventory as of August 31, 2015 – – – – 11,084 Purchase 34 1,034 1,273 1,140 13,400 Allocations to management 2 – – 1,045 (11,066) Allocations to board members 1 – – 1,070 (2,190) Inventory as of August 31, 2016 – – – – 11,228
As of balance sheet date, acquisition costs for directly held treasury shares amounted to CHF 12,949,818 (previous year: CHF 11,581,240). 2.9 Dividend income In the reporting year, dividend income amounted to CHF 36,500,000 (previous year: CHF 33,500,000). This amount included dividends distributed by Barry Callebaut Sourcing AG, Switzerland, in the amount of CHF 30,000,000 and Barry Callebaut Schweiz AG, Switzerland, in the amount of CHF 6,500,000 for the 2016 business year. 2.10 Other financial income Other financial income amounts to CHF 4,877,881 (previous year: CHF 3,114,521) and consists mostly of exchange gains. 2.11 License income License income contains Royalties from group companies. They are related to the usage of brands and trademarks.
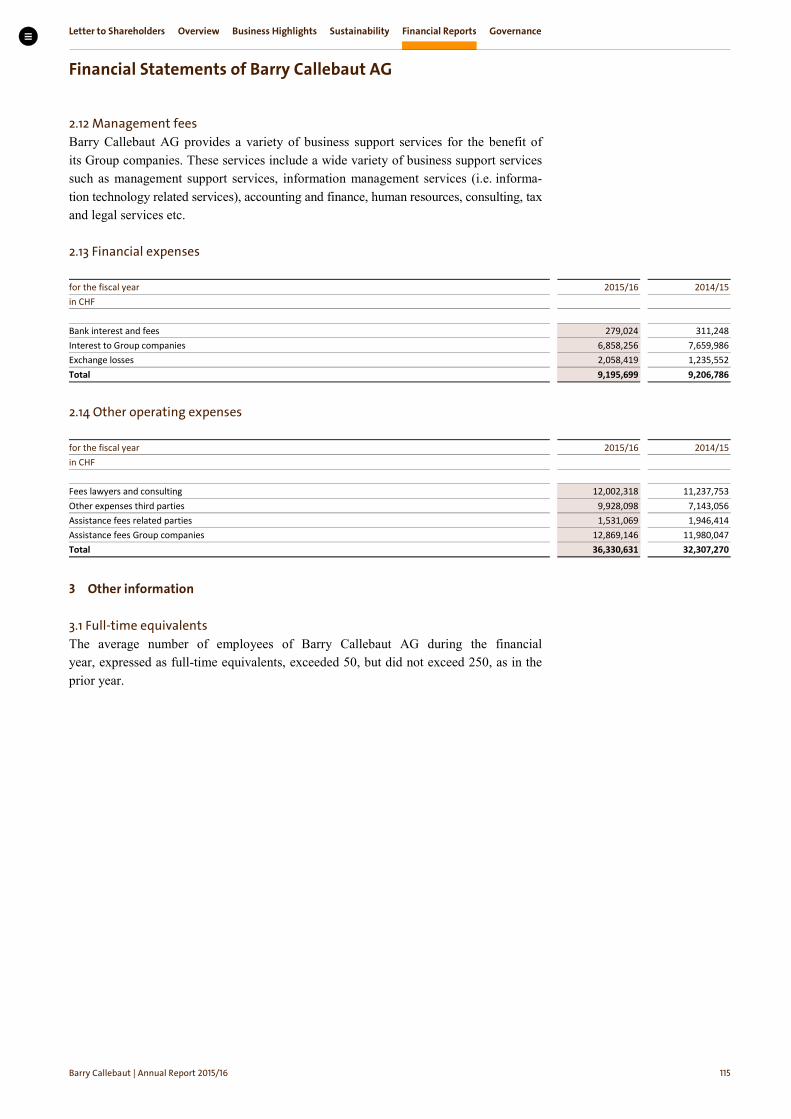
Letter to Shareholders Overview Business Highlights Sustainability Financial Reports Governance
Financial Statements of Barry Callebaut AG
Barry Callebaut | Annual Report /
2.12 Management fees Barry Callebaut AG provides a variety of business support services for the benefit of its Group companies. These services include a wide variety of business support services such as management support services, information management services (i.e. informa-tion technology related services), accounting and finance, human resources, consulting, tax and legal services etc. 2.13 Financial expenses
for the fiscal year 2015/16 2014/15 in CHF Bank interest and fees 279,024 311,248 Interest to Group companies 6,858,256 7,659,986 Exchange losses 2,058,419 1,235,552 Total 9,195,699 9,206,786
2.14 Other operating expenses
for the fiscal year 2015/16 2014/15 in CHF Fees lawyers and consulting 12,002,318 11,237,753 Other expenses third parties 9,928,098 7,143,056 Assistance fees related parties 1,531,069 1,946,414 Assistance fees Group companies 12,869,146 11,980,047 Total 36,330,631 32,307,270
Other information
3.1 Full-time equivalents The average number of employees of Barry Callebaut AG during the financial year, expressed as full-time equivalents, exceeded 50, but did not exceed 250, as in the prior year.
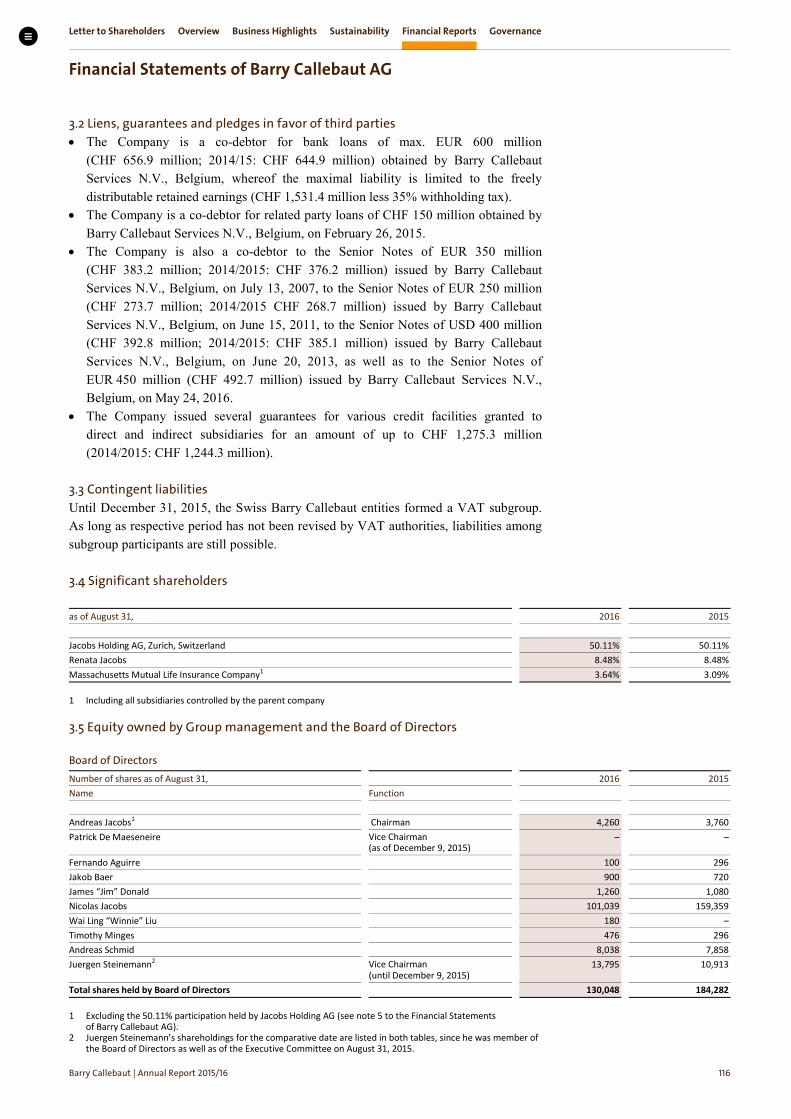
Letter to Shareholders Overview Business Highlights Sustainability Financial Reports Governance
Financial Statements of Barry Callebaut AG
Barry Callebaut | Annual Report /
3.2 Liens, guarantees and pledges in favor of third parties • The Company is a co-debtor for bank loans of max. EUR 600 million
(CHF 656.9 million; 2014/15: CHF 644.9 million) obtained by Barry Callebaut Services N.V., Belgium, whereof the maximal liability is limited to the freely distributable retained earnings (CHF 1,531.4 million less 35% withholding tax).
• The Company is a co-debtor for related party loans of CHF 150 million obtained by Barry Callebaut Services N.V., Belgium, on February 26, 2015.
• The Company is also a co-debtor to the Senior Notes of EUR 350 million (CHF 383.2 million; 2014/2015: CHF 376.2 million) issued by Barry Callebaut Services N.V., Belgium, on July 13, 2007, to the Senior Notes of EUR 250 million (CHF 273.7 million; 2014/2015 CHF 268.7 million) issued by Barry Callebaut Services N.V., Belgium, on June 15, 2011, to the Senior Notes of USD 400 million (CHF 392.8 million; 2014/2015: CHF 385.1 million) issued by Barry Callebaut Services N.V., Belgium, on June 20, 2013, as well as to the Senior Notes of EUR 450 million (CHF 492.7 million) issued by Barry Callebaut Services N.V., Belgium, on May 24, 2016.
• The Company issued several guarantees for various credit facilities granted to direct and indirect subsidiaries for an amount of up to CHF 1,275.3 million (2014/2015: CHF 1,244.3 million).
3.3 Contingent liabilities Until December 31, 2015, the Swiss Barry Callebaut entities formed a VAT subgroup. As long as respective period has not been revised by VAT authorities, liabilities among subgroup participants are still possible. 3.4 Significant shareholders
as of August 31, 2016 2015 Jacobs Holding AG, Zurich, Switzerland 50.11% 50.11% Renata Jacobs 8.48% 8.48% Massachusetts Mutual Life Insurance Company1 3.64% 3.09%
1 Including all subsidiaries controlled by the parent company
3.5 Equity owned by Group management and the Board of Directors Board of Directors
Number of shares as of August 31, 2016 2015 Name Function Andreas Jacobs1 Chairman 4,260 3,760 Patrick De Maeseneire Vice Chairman
(as of December 9, 2015) – –
Fernando Aguirre 100 296 Jakob Baer 900 720 James “Jim” Donald 1,260 1,080 Nicolas Jacobs 101,039 159,359 Wai Ling “Winnie” Liu 180 – Timothy Minges 476 296 Andreas Schmid 8,038 7,858 Juergen Steinemann2
Vice Chairman (until December 9, 2015)
13,795
10,913
Total shares held by Board of Directors 130,048 184,282
1 Excluding the 50.11% participation held by Jacobs Holding AG (see note 5 to the Financial Statements of Barry Callebaut AG).
2 Juergen Steinemann’s shareholdings for the comparative date are listed in both tables, since he was member of the Board of Directors as well as of the Executive Committee on August 31, 2015.
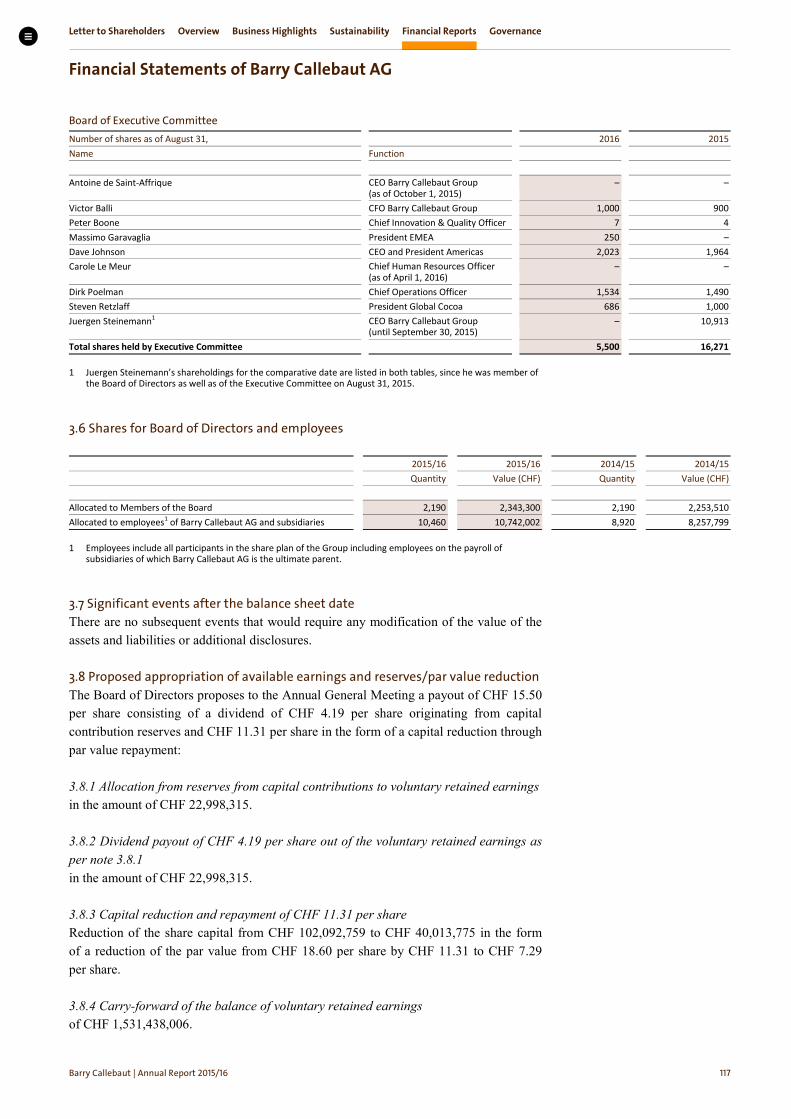
Letter to Shareholders Overview Business Highlights Sustainability Financial Reports Governance
Financial Statements of Barry Callebaut AG
Barry Callebaut | Annual Report /
Board of Executive Committee
Number of shares as of August 31, 2016 2015 Name Function Antoine de Saint-Affrique CEO Barry Callebaut Group
(as of October 1, 2015) – –
Victor Balli CFO Barry Callebaut Group 1,000 900 Peter Boone Chief Innovation & Quality Officer 7 4 Massimo Garavaglia President EMEA 250 – Dave Johnson CEO and President Americas 2,023 1,964 Carole Le Meur Chief Human Resources Officer
(as of April 1, 2016) – –
Dirk Poelman Chief Operations Officer 1,534 1,490 Steven Retzlaff President Global Cocoa 686 1,000 Juergen Steinemann1 CEO Barry Callebaut Group
(until September 30, 2015) – 10,913
Total shares held by Executive Committee 5,500 16,271
1 Juergen Steinemann’s shareholdings for the comparative date are listed in both tables, since he was member of the Board of Directors as well as of the Executive Committee on August 31, 2015.
3.6 Shares for Board of Directors and employees
2015/16 2015/16 2014/15 2014/15 Quantity Value (CHF) Quantity Value (CHF) Allocated to Members of the Board 2,190 2,343,300 2,190 2,253,510 Allocated to employees1 of Barry Callebaut AG and subsidiaries 10,460 10,742,002 8,920 8,257,799
1 Employees include all participants in the share plan of the Group including employees on the payroll of subsidiaries of which Barry Callebaut AG is the ultimate parent.
3.7 Significant events after the balance sheet date There are no subsequent events that would require any modification of the value of the assets and liabilities or additional disclosures. 3.8 Proposed appropriation of available earnings and reserves/par value reduction The Board of Directors proposes to the Annual General Meeting a payout of CHF 15.50 per share consisting of a dividend of CHF 4.19 per share originating from capital contribution reserves and CHF 11.31 per share in the form of a capital reduction through par value repayment: 3.8.1 Allocation from reserves from capital contributions to voluntary retained earnings in the amount of CHF 22,998,315. 3.8.2 Dividend payout of CHF 4.19 per share out of the voluntary retained earnings as per note 3.8.1 in the amount of CHF 22,998,315. 3.8.3 Capital reduction and repayment of CHF 11.31 per share Reduction of the share capital from CHF 102,092,759 to CHF 40,013,775 in the form of a reduction of the par value from CHF 18.60 per share by CHF 11.31 to CHF 7.29 per share. 3.8.4 Carry-forward of the balance of voluntary retained earnings of CHF 1,531,438,006.

Report of the Statutory Auditor to the General Meeting of Shareholders of Barry Callebaut AG, Zurich Report of the Statutory Auditor on the Financial Statements As statutory auditor, we have audited the accompanying financial statements of Barry Callebaut AG, which comprise the income statement, balance sheet and notes on pages 109 to 117 for the year ended 31 August 2016. Board of Directors’ Responsibility The board of directors is responsible for the preparation of the financial statements in accordance with the requirements of Swiss law and the company’s articles of incorporation. This responsibility includes designing, implementing and maintaining an internal control system relevant to the preparation of financial statements that are free from material misstatement, whether due to fraud or error. The board of directors is further responsible for selecting and applying appropriate accounting policies and making accounting estimates that are reasonable in the circumstances. Auditor’s Responsibility Our responsibility is to express an opinion on these financial statements based on our audit. We conducted our audit in accordance with Swiss law and Swiss Auditing Standards. Those standards require that we plan and perform the audit to obtain reasonable assurance whether the financial statements are free from material misstatement. An audit involves performing procedures to obtain audit evidence about the amounts and disclosures in the financial statements. The procedures selected depend on the auditor’s judgment, including the assessment of the risks of material misstatement of the financial statements, whether due to fraud or error. In making those risk assessments, the auditor considers the internal control system relevant to the entity’s preparation of the financial statements in order to design audit procedures that are appropriate in the circumstances, but not for the purpose of expressing an opinion on the effectiveness of the entity’s internal control system. An audit also includes evaluating the appropriateness of the accounting policies used and the reasonableness of accounting estimates made, as well as evaluating the overall presentation of the financial statements. We believe that the audit evidence we have obtained is sufficient and appropriate to provide a basis for our audit opinion. Opinion In our opinion, the financial statements for the year ended 31 August 2016 comply with Swiss law and the company’s articles of incorporation. Report on Other Legal Requirements We confirm that we meet the legal requirements on licensing according to the Auditor Oversight Act (AOA) and independence (article 728 CO and article 11 AOA) and that there are no circumstances incompatible with our independence. In accordance with article 728a paragraph 1 item 3 CO and Swiss Auditing Standard 890, we confirm that an internal control system exists, which has been designed for the preparation of financial statements according to the instructions of the board of directors. We further confirm that the proposed appropriation of available earnings complies with Swiss law and the company’s articles of incorporation. We recommend that the financial statements submitted to you be approved. KPMG AG
François Rouiller Patricia Bielmann Licensed Audit Expert Licensed Audit Expert Auditor in Charge Zurich, 31 October 2016
KPMG AG is a subsidiary of KPMG Holding AG, which is a member of the KPMG network of independent firms affiliated with KPMG International Cooperative (“ KPMG International” ), a Swiss legal entity. All rights reserved.
Member of EXPERTsuisse
KPMG AG Audit Badenerstrasse 172 P.O. Box 1872 Telephone +41 58 249 31 31 CH-8004 Zurich CH-8026 Zurich Fax +41 58 249 44 06 Internet www.kpmg.ch
Letter to Shareholders Overview Business Highlights Sustainability Financial Reports Governance
Governance
Barry Callebaut | Annual Report /
Corporate Governance
Remuneration Report
Glossary
Agenda & Contact
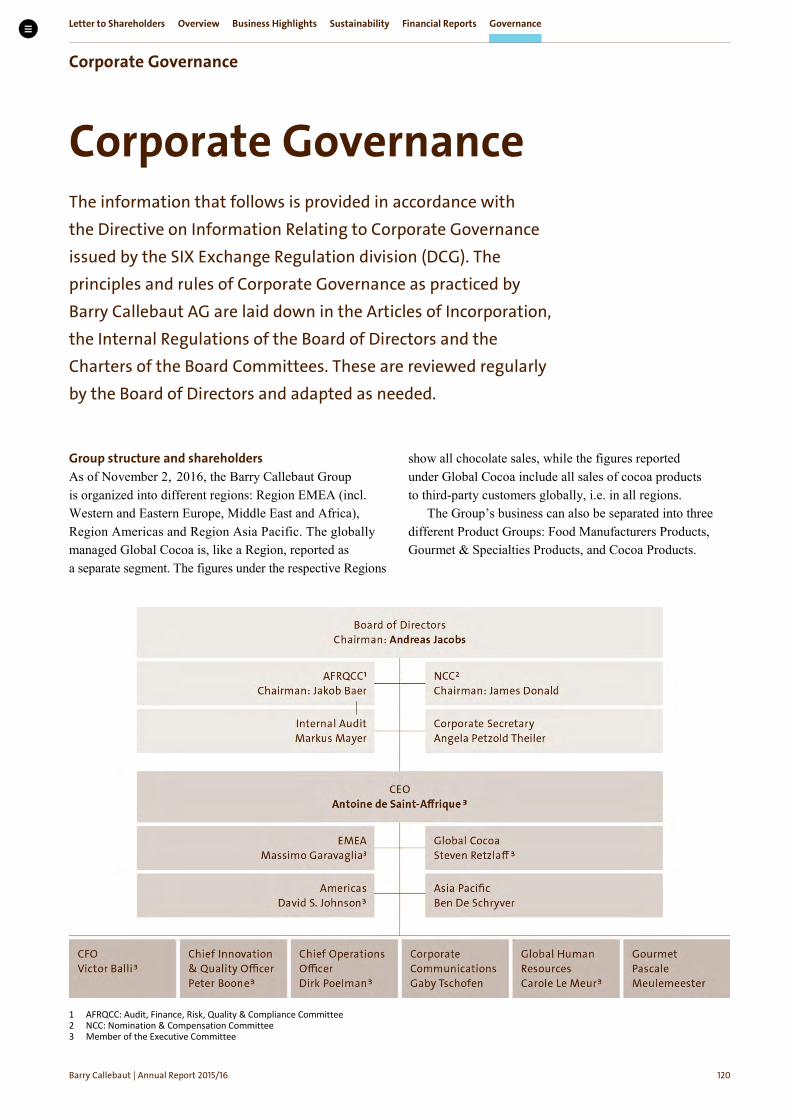
Letter to Shareholders Overview Business Highlights Sustainability Financial Reports Governance
Corporate Governance
Barry Callebaut | Annual Report /
Corporate Governance The information that follows is provided in accordance with the Directive on Information Relating to Corporate Governance issued by the SIX Exchange Regulation division (DCG). The principles and rules of Corporate Governance as practiced by Barry Callebaut AG are laid down in the Articles of Incorporation, the Internal Regulations of the Board of Directors and the Charters of the Board Committees. These are reviewed regularly by the Board of Directors and adapted as needed.
Group structure and shareholders As of November 2, 2016, the Barry Callebaut Group is organized into different regions: Region EMEA (incl. Western and Eastern Europe, Middle East and Africa), Region Americas and Region Asia Pacific. The globally managed Global Cocoa is, like a Region, reported as a separate segment. The figures under the respective Regions
show all chocolate sales, while the figures reported under Global Cocoa include all sales of cocoa products to third-party customers globally, i.e. in all regions.
The Group’s business can also be separated into three different Product Groups: Food Manufacturers Products, Gourmet & Specialties Products, and Cocoa Products.
1 AFRQCC: Audit, Finance, Risk, Quality & Compliance Committee 2 NCC: Nomination & Compensation Committee 3 Member of the Executive Committee

Letter to Shareholders Overview Business Highlights Sustainability Financial Reports Governance
Corporate Governance
Barry Callebaut | Annual Report /
The structure of the financial reporting is explained in note 3 to the Consolidated Financial Statements. Barry Callebaut AG (the “Company”) was incorporated on December 13, 1994, under Swiss law, having its head office in Zurich, Switzerland, at Pfingstweidstrasse 60. The Company is registered in Switzerland and has been listed on the SIX Swiss Exchange (BARN, ISIN Number: CH0009002962) since 1998. The Company has not requested admission to trading of its shares on any other stock exchange. As of August 31, 2016, the total number of issued shares in the Company was 5,488,858, and thus Barry Callebaut’s market capitalization based on issued shares was CHF 6,937.9 million (August 31, 2015: CHF 5,823.7 million).
The principal subsidiaries of the Company are listed in note 29 to the Consolidated Financial Statements. The significant shareholders of the Company are listed in note 3.4 to Financial Statements of the Company, with Jacobs Holding AG as a majority shareholder with a participation of 50.11% of the issued share capital (August 31, 2015: 50.11%). There are no cross-shareholdings equal to or greater than 5% of the issued share capital.
Capital structure The information required by the DCG regarding the capital structure is provided in note 25 (share capital, movements in the share capital) to the Consolidated Financial Statements. The Company has no convertible bonds outstanding. The Extraordinary General Meeting of Shareholders held on April 22, 2013, created authorized share capital of a maximum nominal amount of CHF 9.3 million for the purpose of financing the acquisition of the Cocoa Ingredients Division from Petra Foods Ltd. The Board of Directors of Barry Callebaut AG subsequently decided to increase the share capital by issuing 318,858 newly created shares
(approx. 6% of the existing shares) in June 2013 for the aforementioned purpose. The Annual General Meeting of Shareholders, held on December 10, 2014, deleted the authorized capital that was not used in the abovementioned transaction in the Articles of Incorporation of the Company. Except for the abovementioned capital increase, there were no changes in the capital structure during the fiscal year 2015/16, nor during the prior three fiscal years.
Board of Directors The Board of Directors is ultimately responsible for the policies and management of the Company. The Board of Directors establishes the strategic, accounting, organiza-tional and financing policies to be followed, and appoints the Executive Committee, to which the Board of Directors has delegated the operational management of the Company. Besides its non-transferable and inalienable duties pursuant to Swiss corporate law, the Board of Directors has retained certain competencies as set forth in the Company’s Internal Regulations and in a detailed tabular Annex thereto, both of which are publicly accessible on the website of Barry Callebaut (https://www.barry-callebaut.com/about-us/investors/corporate-governance/functioning-board). As set forth in the company’s Articles of Incorporation, no Member of the Board of Directors may hold more than 15 additional mandates, of which no more than five may be in stock-exchange-listed companies.
As of August 31, 2016, the Board of Directors consisted of ten non-executive members. Each Director is elected by the Shareholders of Barry Callebaut AG at the Annual General Meeting of Shareholders for a term of office of one year and may be re-elected for successive terms.
The composition of the Board of Directors of Barry Callebaut AG as of August 31, 2016, is as follows:
Name Nationality Member since Function AFRQCC NCC Andreas Jacobs German 2003 Chairman Patrick De Maeseneire Belgian 2015 Vice Chairman Fernando Aguirre US/Mexican 2013 Director Member Jakob Baer Swiss 2010 Director Chairman Member James L. Donald US 2008 Director Chairman Nicolas Jacobs Swiss 2012 Director Member Wai Ling Liu Hong Kong-Chinese 2014 Director Member Timothy E. Minges US 2013 Director Member Andreas Schmid Swiss 1997 Director Member Juergen Steinemann German 2014 Director
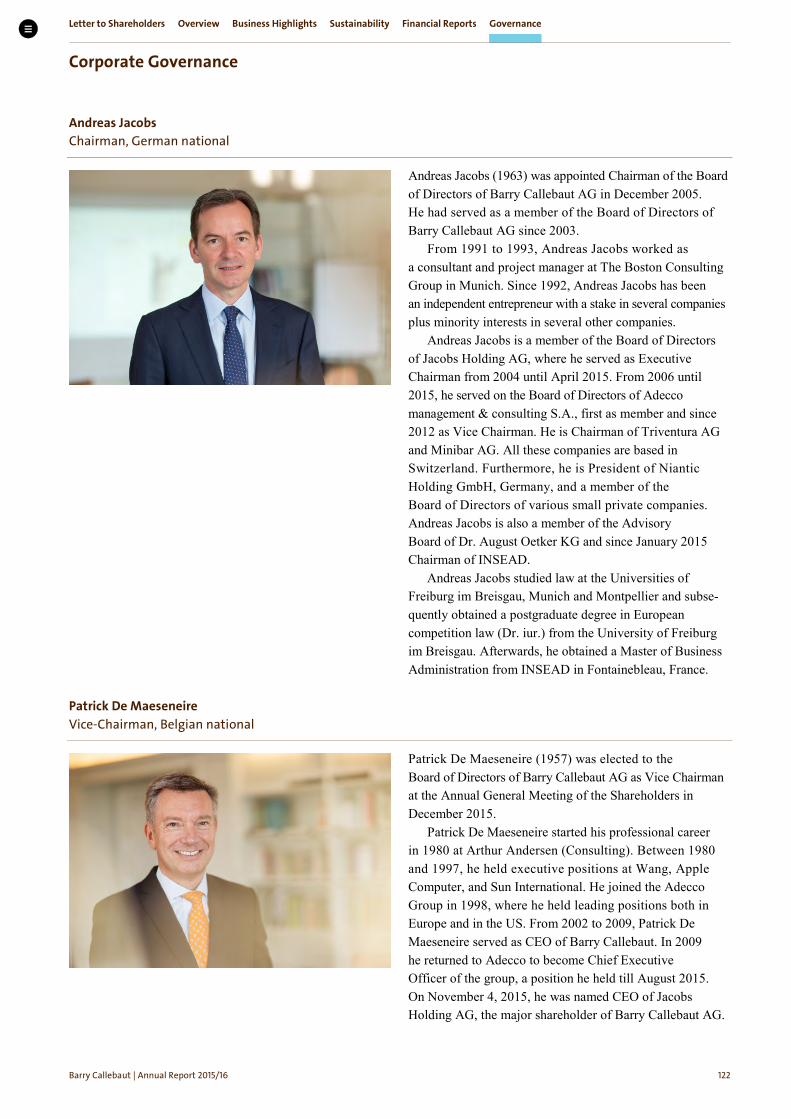
Letter to Shareholders Overview Business Highlights Sustainability Financial Reports Governance
Corporate Governance
Barry Callebaut | Annual Report /
Andreas Jacobs Chairman, German national
Andreas Jacobs (1963) was appointed Chairman of the Board of Directors of Barry Callebaut AG in December 2005. He had served as a member of the Board of Directors of Barry Callebaut AG since 2003.
From 1991 to 1993, Andreas Jacobs worked as a consultant and project manager at The Boston Consulting Group in Munich. Since 1992, Andreas Jacobs has been an independent entrepreneur with a stake in several companies plus minority interests in several other companies.
Andreas Jacobs is a member of the Board of Directors of Jacobs Holding AG, where he served as Executive Chairman from 2004 until April 2015. From 2006 until 2015, he served on the Board of Directors of Adecco management & consulting S.A., first as member and since 2012 as Vice Chairman. He is Chairman of Triventura AG and Minibar AG. All these companies are based in Switzerland. Furthermore, he is President of Niantic Holding GmbH, Germany, and a member of the Board of Directors of various small private companies. Andreas Jacobs is also a member of the Advisory Board of Dr. August Oetker KG and since January 2015 Chairman of INSEAD.
Andreas Jacobs studied law at the Universities of Freiburg im Breisgau, Munich and Montpellier and subse-quently obtained a postgraduate degree in European competition law (Dr. iur.) from the University of Freiburg im Breisgau. Afterwards, he obtained a Master of Business Administration from INSEAD in Fontainebleau, France.
Patrick De Maeseneire Vice-Chairman, Belgian national
Patrick De Maeseneire (1957) was elected to the Board of Directors of Barry Callebaut AG as Vice Chairman at the Annual General Meeting of the Shareholders in December 2015.
Patrick De Maeseneire started his professional career in 1980 at Arthur Andersen (Consulting). Between 1980 and 1997, he held executive positions at Wang, Apple Computer, and Sun International. He joined the Adecco Group in 1998, where he held leading positions both in Europe and in the US. From 2002 to 2009, Patrick De Maeseneire served as CEO of Barry Callebaut. In 2009 he returned to Adecco to become Chief Executive Officer of the group, a position he held till August 2015. On November 4, 2015, he was named CEO of Jacobs Holding AG, the major shareholder of Barry Callebaut AG.
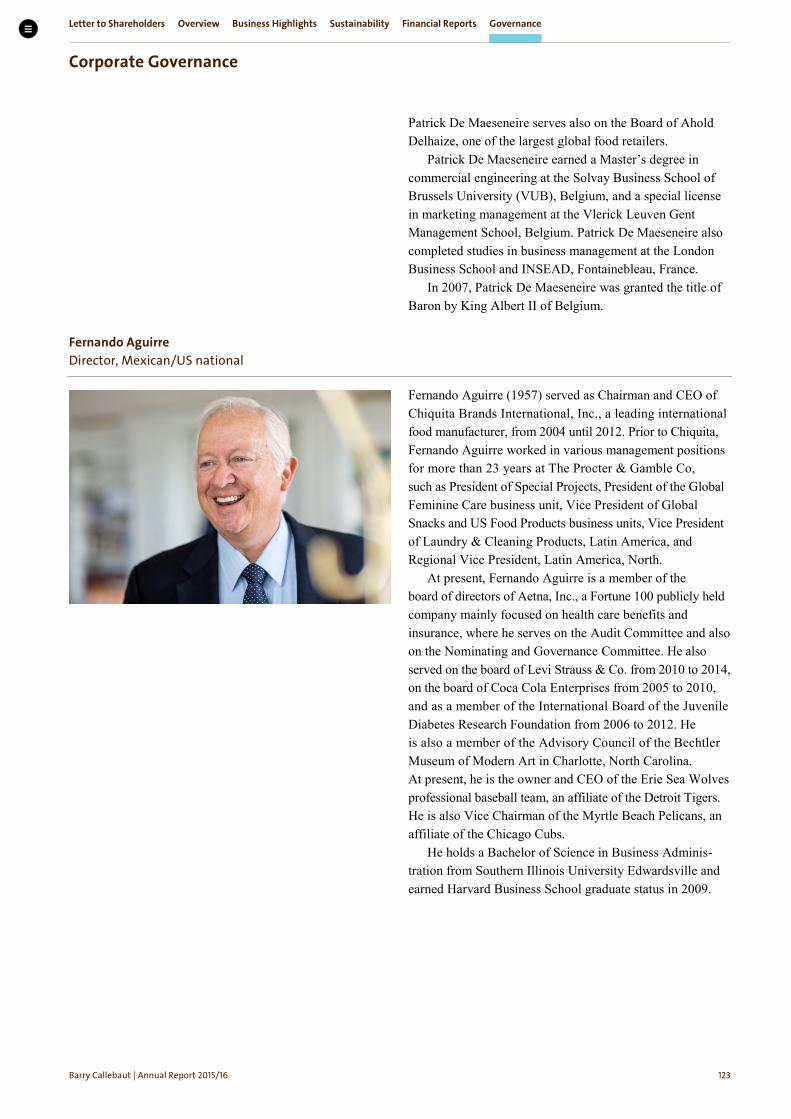
Letter to Shareholders Overview Business Highlights Sustainability Financial Reports Governance
Corporate Governance
Barry Callebaut | Annual Report /
Patrick De Maeseneire serves also on the Board of Ahold Delhaize, one of the largest global food retailers.
Patrick De Maeseneire earned a Master’s degree in commercial engineering at the Solvay Business School of Brussels University (VUB), Belgium, and a special license in marketing management at the Vlerick Leuven Gent Management School, Belgium. Patrick De Maeseneire also completed studies in business management at the London Business School and INSEAD, Fontainebleau, France.
In 2007, Patrick De Maeseneire was granted the title of Baron by King Albert II of Belgium.
Fernando Aguirre Director, Mexican/US national
Fernando Aguirre (1957) served as Chairman and CEO of Chiquita Brands International, Inc., a leading international food manufacturer, from 2004 until 2012. Prior to Chiquita, Fernando Aguirre worked in various management positions for more than 23 years at The Procter & Gamble Co, such as President of Special Projects, President of the Global Feminine Care business unit, Vice President of Global Snacks and US Food Products business units, Vice President of Laundry & Cleaning Products, Latin America, and Regional Vice President, Latin America, North.
At present, Fernando Aguirre is a member of the board of directors of Aetna, Inc., a Fortune 100 publicly held company mainly focused on health care benefits and insurance, where he serves on the Audit Committee and also on the Nominating and Governance Committee. He also served on the board of Levi Strauss & Co. from 2010 to 2014, on the board of Coca Cola Enterprises from 2005 to 2010, and as a member of the International Board of the Juvenile Diabetes Research Foundation from 2006 to 2012. He is also a member of the Advisory Council of the Bechtler Museum of Modern Art in Charlotte, North Carolina. At present, he is the owner and CEO of the Erie Sea Wolves professional baseball team, an affiliate of the Detroit Tigers. He is also Vice Chairman of the Myrtle Beach Pelicans, an affiliate of the Chicago Cubs.
He holds a Bachelor of Science in Business Adminis-tration from Southern Illinois University Edwardsville and earned Harvard Business School graduate status in 2009.

Letter to Shareholders Overview Business Highlights Sustainability Financial Reports Governance
Corporate Governance
Barry Callebaut | Annual Report /
Jakob Baer Director, Swiss national
Jakob Baer (1944) started his career in 1971 at the Federal Finance Administration. From 1975 until 1991, he was with Fides Group, where he held various positions, including Consultant, Head of Legal Department, Branch Office Manager Zurich, and Member of the Division Management Advisory Services. During 1991/1992, Jakob Baer led the planning and execution of the management buyout of the Advisory Services unit of Fides Group, which became part of KPMG Switzerland. He was a member of the Executive Committee of KPMG Switzerland from 1992 until 1994. From 1994 to 2004, he held the position of Chief Executive Officer of KPMG Switzerland and was a member of KPMG’s European and International Leadership Boards.
Jakob Baer was Counsel at Niederer Kraft & Frey AG, attorneys at law, Zurich, Switzerland, from 2004 to 2009. He also served as a member of the Board of Directors of Adecco from 2004 until April 2012, of Swiss Re and of Allreal Holding AG, each from 2005 until April 2014, and of Rieter Holding AG from 2006 until April 2016.
Jakob Baer is Chairman of Stäubli Holding AG and a member of the Board of Directors of IFBC AG, both in Switzerland.
He was admitted to the bar (1971) and subsequently obtained a Doctorate degree in law (Dr. iur.) from the University of Bern, Switzerland.
James “Jim” Donald Director, US national
Jim Donald (1954) served from October 1996 to October 2002 as Chairman, President & Chief Executive Officer of Pathmark Stores, Inc., a USD 4.6 billion regional super-market chain located in New York, New Jersey and Pennsylvania. Prior to that time, he held a variety of senior management positions with Albertson’s, Inc., Safeway, Inc., and Wal-Mart Stores, Inc. From October 2002 to March 2005, Jim Donald served as President of Starbucks, North America. Under his leadership, Starbucks experienced strong growth and performance. Jim Donald was also President & Chief Executive Officer of Starbucks Corporation from April 2005 to January 2008. Furthermore, Jim Donald served as President and Chief Executive Officer of Haggan, Inc., a 33-store Pacific Northwest grocery company based in Bellingham, from September 2009 until March 2011. Then, from February 2012 until August 2015, he served as Chief Executive Officer of Extended Stay, a large US-based hotel chain.

Letter to Shareholders Overview Business Highlights Sustainability Financial Reports Governance
Corporate Governance
Barry Callebaut | Annual Report /
From 2008 until June 2013, he also served as a member of the Board of Directors of Rite Aid Corporation, one of the leading drug-store chains in the US with more than 4,900 stores in 31 states.
Jim Donald graduated with a Bachelor’s degree in Business Administration from Century University, Albuquerque, New Mexico.
Nicolas Jacobs Director, Swiss national
Nicolas Jacobs (1982) serves as a Board member of Barry Callebaut since 2012 and was previously responsible as Managing Director for the cocoa and the chocolate operations of South America.
Nicolas Jacobs is further a Managing Partner of a venture capital and private equity company focused on investments in the FMCG sector. Nicolas acts as the Executive Co-Chairman of Jacobs Holding AG, a professional invest-ment company and majority shareholder of Barry Callebaut.
Nicolas Jacobs started his career at Goldman Sachs in 2006 and served for Burger King Corporation as a Senior Director for Global M&A and Development, with respon-sibilities for strategic projects and the expansion of Burger King globally.
Nicolas Jacobs holds a Master’s degree in law from the University of Zurich, a Master of Finance of London Business School and a Master of Business Administration from INSEAD in Fontainebleau.
Wai Ling “Winnie” Liu Director, Hong Kong-Chinese national
Winnie Liu (1968) started her career as Executive Trainee with the Swire Group, a UK Conglomerate in Hong Kong. From 1992 until 1999, she worked for Nestlé in Hong Kong, lastly as National Sales Head. She then served for Mars (Effems Food) China from 1999 until 2004, where she held several positions in Sales, Marketing and Key Account Management. From 2005 until 2007, Winnie Liu served as Regional Managing Director Southeast Asia (Singapore, Malaysia, Thailand, Philippines, and Indonesia) of adidas, where she was responsible for Total Business including Retail, Wholesale, Production and Supply Chain. In 2008, she joined Tesco China, which operates over 130 hyper-markets and 14 express shops and employs more than 26,000 staff. She first started as Chief Marketing Officer, then was appointed President for a region, and last served as Chief Operating Officer. After Tesco, Winnie became the Chief Executive Officer of ENZO jewelry chain stores (Luxury Retail) in Greater China, from 2013 until 2015.

Letter to Shareholders Overview Business Highlights Sustainability Financial Reports Governance
Corporate Governance
Barry Callebaut | Annual Report /
Winnie Liu graduated with a Bachelor’s degree in Social Sciences, a Major’s degree in Management Studies and a Minor in Economics & Psychology from the University of Hong Kong in 1990.
Timothy Minges Director, U.S. national
Timothy Minges (1958) spent 32 years at PepsiCo before retiring earlier this year. Prior to retirement, Tim was Executive Vice President Chief Customer Officer, PepsiCo North America Beverages and a member of PepsiCo’s Executive Committee. Until 2013 he was responsible for the entire PepsiCo operations throughout greater China. He joined PepsiCo in 1983 in the finance department of Frito-Lay North America and was promoted to a series of roles in finance, sales and general management. Tim moved to Asia in 1994 as General Manager of Frito-Lay Thailand and later assumed a series of roles, including President Asia Pacific, from 1999 to 2003. Prior to PepsiCo Tim practiced as a CPA at Alexander Grant (now Grant Thorton).
Tim sat on a variety of Boards at PepsiCo including the North American Coffee Partnership (a PepsiCo joint venture with Starbucks), Calbee Foods Japan, Pepsi-Cola Philippines and Serm Suk Thailand. At present, Tim is a non-executive board member of Tingyi-Asahi Beverages, Pepsico’s China bottler.
Tim holds a Bachelor of Science in Accounting from Miami University, Oxford, Ohio, and has completed the Pepsi Executive Development Program at Yale School of Management.
Andreas Schmid Director, Swiss national
Andreas Schmid (1957) was appointed CEO of Jacobs Holding AG in 1997. In 1999, he became Chairman of the Board of Directors and CEO of Barry Callebaut AG. In June 2002, he handed over the CEO function, but continued to assume the responsibility of Chairman until December 2005. After that he assumed the role of the Vice Chairman and has been serving as ordinary member of the Board of Directors since December 2014.
He started his career in 1984 at Union Bank of Switzerland. Following a position as assistant to a Swiss industrialist, he was CEO and Managing Director of Kopp Plastics (PTY) Ltd. in South Africa from 1989 to 1992. He then worked for the Jacobs Group in various staff and line functions until 1993. From 1993 to 1997, Andreas Schmid was President of the Mövenpick Consumer Goods Division and a member of the worldwide Group

Letter to Shareholders Overview Business Highlights Sustainability Financial Reports Governance
Corporate Governance
Barry Callebaut | Annual Report /
Executive Board of Management. Between 2007 and 2011, Andreas Schmid was Chairman of the Supervisory Board of Symrise AG, and between 2002 and 2006 he chaired the Board of Directors of Kuoni Travel Holding AG. He was a member of the Board of Adecco SA from 1999 to 2004 and a member of the Advisory Board of the Credit Suisse Group from 2001 to 2007, before the Advisory Board was dis-solved. Andreas Schmid has been a member of the Board of Directors of Steiner AG since 2008, and in 2010, he was appointed a member of the Board of Directors of Wirz Partner Holding AG and the Advisory Board of Allianz Global Corporate Specialty AG. He further was a member of the Board of Directors of Badrutt’s Palace Hotel AG from 2006 until 2015.
Andreas Schmid is currently Chairman of the Board of Directors of Oettinger Davidoff Group, of Flughafen Zurich AG, Helvetica Capital, and of gategroup Holding AG. Furthermore, Andreas Schmid is Chairman of the Board of Trustees of the Swiss foundation avenir suisse, a think tank for social and economic issues.
Andreas Schmid holds a Master’s degree in law and studied economics at the University of Zurich.
Juergen Steinemann Director, German national
Juergen Steinemann (1958) was elected to the Board of Directors of Barry Callebaut AG at the Annual General Meeting of the Shareholders in December 2014. He had served as Chief Executive Officer since August 2009 and stepped down at the end of September 2015.
Before joining Barry Callebaut, Juergen Steinemann served as a member of the Executive Board of Nutreco and as Chief Operating Officer since October 2001. Nutreco is a leading global animal nutrition and aquaculture company, headquartered in the Netherlands.
From 1999 to 2001, Juergen Steinemann served as Chief Executive Officer of Unilever’s former subsidiary Loders Croklaan, which produces and markets specialty oils and fats for the food industry.
Between 1990 and 1998, Juergen Steinemann was with the former Eridania Béghin-Say Group, where he held various senior positions in business-to-business marketing and sales, ultimately in the “Corporate Plan et Stratégie” unit at the head office in Paris. Next to the above, Juergen Steinemann is an entrepreneur who holds several invest-ments in the food and agri industry. Furthermore, he serves as Chairman of the Supervisory Board of METRO AG, a major international retailing company with brands such as Metro Cash & Carry, Media Markt and Saturn.

Letter to Shareholders Overview Business Highlights Sustainability Financial Reports Governance
Corporate Governance
Barry Callebaut | Annual Report /
Functioning of the Board The Board of Directors constitutes itself at its first meeting subsequent to the Company’s Annual General Meeting of Shareholders, with the exception of the Chairman and the Members of the Compensation Committee, who are elected by the Annual General Meeting of Shareholders pursuant to the Articles of Incorporation and Swiss corporate law. The Board of Directors elects the Vice Chairman. It meets as often as business requires, but at least four times per fiscal year. The meetings usually take place in Zurich. If possible, the Board of Directors meets once per year at one of the Barry Callebaut production sites and combines this meeting with a visit to the local operation. During fiscal year 2015/16, the Board of Directors met six times. Three meetings lasted eight hours, one five hours and two meetings lasted one hour. The two latter meetings took place in the form of conference calls. In the fiscal year 2015/16, the Board of Directors held one of the regular meetings in the context of a three-day visit to Chicago, US.
The Chairman invites the members of the Board to the meetings in writing, indicating the agenda and the motions for resolution thereto. The invitations are sent out at least ten business days prior to the meeting. Each member of the Board can request that the Chairman call for a meeting without undue delay. In addition to the materials for Board meetings, the members of the Board receive monthly financial reports.
At the request of one member of the Board, members of the Executive Committee are invited to attend meetings. The Board of Directors can determine by majority vote that other third parties, for example external consultants, may attend part or all of the meetings. In the fiscal year under review, the CEO, the CFO and, depending on the agenda items, other members of the Executive Committee or Management were present at all Board meetings and all Committee meetings. At the end of each physical Board meeting, there is a closed Board session without the participation of the Management.
Resolutions are adopted by a simple majority of the members of the Board being present or represented. Resolutions can also be adopted by unanimous circular decision. Members of the Board may only be represented by a fellow member of the Board. In the event of a tie vote, the proposal is deemed not to be resolved. Resolutions made at the Board meetings are documented through written minutes of the meeting.
Members of the Board may request any information necessary to fulfill their duties. Outside of meetings, any members of the Board may request information from members of the Executive Committee concerning the Group’s business development. Such requests for
information must be addressed to the Chairman of the Board.
The Board of Directors has formed the following Committees: Audit, Finance, Risk, Quality & Compliance Committee Jakob Baer (Chairman), Nicolas Jacobs, Timothy E. Minges and Andreas G. Schmid. The role of the Audit, Finance, Risk, Quality & Compliance Committee (AFRQCC) is to assist the Board of Directors in carrying out its responsibilities. The Board of Directors has not delegated any decision power to the AFRQCC. The primary task of the AFRQCC is to assist the Board of Directors in carrying out its responsibilities and make recommendations regarding the Company’s accounting policies, financial reporting, internal control system, legal and regulatory compliance and quality management. In addition, the AFRQCC reviews the basic risk manage-ment principles and guidelines, the hedging and financing strategies as well as the bases upon which the Board of Directors determines risk tolerance levels and limits for exposures of raw material positions. For details on the financial risk management, see note 26 to the Consolidated Financial Statements.
The AFRQCC further assists the Board of Directors in fulfilling its oversight responsibility of the external auditors. The AFRQCC recommends the external auditors for election, reviews the quality of their work, their qualification and independence, the audit fees, the external audit coverage, the reporting to the Board of Directors and/or the AFRQCC, and assesses the additional non-audit services as well as the annual financial statements and the notes thereto. The external auditors attended two meetings of the AFRQCC in fiscal year 2015/16; furthermore, the Chairman of the AFRQCC has met the lead external auditor three times outside AFRQCC meetings.
The Company has its own Internal Audit Department, which reports to the Chairman of the AFRQCC. The AFRQCC reviews the quality of the Internal Audit Department. The scope of internal auditing encompasses the examination and evaluation of the adequacy and effectiveness of the organization’s internal control system and the quality of performance in carrying out assigned responsibilities. Significant findings of the Internal Audit Department as well as the respective measures of the Management are presented and reviewed in the meetings of the AFRQCC and, in material cases, in the meetings of the Board of Directors. The AFRQCC reviews the annual plan of the Internal Audit Department based on a risk assessment. In the last fiscal year, the Internal Audit
Letter to Shareholders Overview Business Highlights Sustainability Financial Reports Governance
Corporate Governance
Barry Callebaut | Annual Report /
Department was supported on one project by third-party experts.
Pursuant to the Group’s “Fraud Response and Whistleblowing Policy,” the Fraud Committee, chaired by the Group’s General Counsel, evaluates and, as the case may be, investigates alleged violations of the Code of Conduct under the supervision of the Chairman of the AFRQCC. The Fraud Committee reports all pending cases to the AFRQCC on a regular basis.
The AFRQCC meets as often as business requires, but at least three times per fiscal year. The meetings usually take place in Zurich. In the last fiscal year, the Committee met six times. The meetings lasted two to three hours. One of the meetings took place in the context of the Board of Directors’ three-day visit to Chicago, US.
Nomination & Compensation Committee James L. Donald (Chairman), Patrick de Maeseneire, Fernando Aguirre and Wai Ling Liu The Company’s Nomination & Compensation Committee (NCC) is elected by the Annual General Meeting of Shareholders and advises the Board of Directors in deter-mining and verifying the compensation strategy and regulations of the Group as well as in preparing the motions for the attention of the General Meeting of Shareholders regarding the compensation of the Board of Directors and the Executive Committee. It further assists the Board of Directors in defining and monitoring the performance criteria and it makes recommendations to the Board of Directors with respect to the selection, nomination,
compensation, evaluation, and, when necessary, the replacement of key executives. The Board of Directors has not delegated any decision power to the NCC. The NCC establishes jointly with the CEO a general succession planning and development policy. The NCC reviews and recommends the remuneration to be paid to Members of the Board of Directors and the Members of the Executive Committee. It also ensures a transparent Board and Executive Committee nomination process and evaluates potential conflicts of interest involving executive management and Members of the Board. The NCC monitors the developments of the regulatory framework for compensation of the top management and the Board of Directors on an on-going basis and develops suggestions for the respective adaptations of the Group’s compensation system.
The NCC meets as often as business requires, but at least three times per fiscal year. The meetings usually take place in Zurich. Last year, the NCC met five times, once in the form of a conference call. The meetings lasted two hours. One of the meetings took place in the context of the Board of Directors’ three-day visit to Chicago, US. Executive Committee The Executive Committee consists of eight functions and is headed by the Chief Executive Officer. For external activities of each member of the Executive Committee, see the respective curriculum vitae. No member of the Executive Committee may hold more than five additional mandates, of which no more than two may be in stock-exchange-listed companies.
Name Function Nationality Member since Antoine de Saint-Affrique Chief Executive Officer French As from October 1, 2015 Juergen Steinemann Chief Executive Officer German 2009 (until September 30, 2015) Victor Balli Chief Financial Officer Swiss 2007 Peter Boone Chief Innovation & Quality Officer Dutch 2012 Massimo Garavaglia President EMEA Italian 2004 David S. Johnson President Americas US 2009 Carole Le Meur Head Global HR French 2016 Dirk Poelman Chief Operations Officer (COO) Belgian 2009 Steven Retzlaff President Global Cocoa US/Swiss 2008

Letter to Shareholders Overview Business Highlights Sustainability Financial Reports Governance
Corporate Governance
Barry Callebaut | Annual Report /
Antoine de Saint-Affrique Chief Executive Officer, French national
Antoine de Saint-Affrique (1964) is Chief Executive Officer of Barry Callebaut AG and has been appointed to that role as of October 1, 2015.
From September 2011 until September 2015, Antoine de Saint-Affrique served as President Unilever Foods and Member of Unilever’s Group Executive Committee, where he was accountable for businesses with a combined turnover of EUR 12.4 billion.
Prior to this, Antoine de Saint-Affrique was Executive Vice President of Unilever’s Skin category – an area of the business which includes leading brands such as Dove, Lux, Lifebuoy and Pond’s. From early 2005 to mid 2009, Antoine was Executive Vice President for Unilever’s Central and Eastern Europe region – an area covering 21 countries. He was based in Moscow. Before joining Unilever in 2000, Antoine was Marketing Vice President and a Partner at Amora Maille, a foods company which was acquired under a leveraged buyout from the Danone Group. He served as a reserve naval officer between 1987 and 1988.
Antoine has a degree in business administration from ESSEC (1987) in Paris, and a qualification in executive education from Harvard Business School. Since 2004, he has led the marketing course at Mines ParisTech (Corps des Mines).
A French national, Antoine has lived in Africa, the US, Hungary, the Netherlands, Russia, and the UK. He is a Non-Executive Director and a member of the audit committee at the ophthalmic company Essilor International, the world leader in corrective lenses. He has also been Conseiller du Commerce Extérieur since 2004.

Letter to Shareholders Overview Business Highlights Sustainability Financial Reports Governance
Corporate Governance
Barry Callebaut | Annual Report /
Victor Balli Chief Financial Officer, Swiss national
Victor Balli (1957) was appointed Chief Financial Officer and member of the Executive Committee in February 2007.
Before joining Barry Callebaut, Victor Balli was with Minibar since 1996. He began his career at Minibar as Chief Financial Officer and additionally held the position of Chief Executive Officer EMEA as of 2005. During this time, he also served as Executive Director and Board member of several group companies of Niantic, a family investment holding. From 1991 to 1995, he worked as a Principal with Adinvest AG, a corporate finance advisory company with offices in Zurich, San Francisco, New York, and London. From 1989 to 1991, Victor Balli served as Director of Corporate Finance with Marc Rich & Co. Holding in Zug. He started his professional career in 1985, working as a Financial Analyst & Business Development Manager with EniChem International SA in Zurich and Milan.
Victor Balli holds a Master’s degree in Economics from the University of St. Gallen and a Master’s degree as a Chemical Engineer from the Swiss Federal Institute of Technology in Zurich.
He is a Non-Executive Director and a member of the audit committee of Givaudan SA, the global leader in fragrance and flavors.
Peter Boone Chief Innovation & Quality Officer, Dutch national
Peter Boone (1970) was appointed to the position of Chief Innovation Officer and member of the Executive Committee at Barry Callebaut as of December 3, 2012. He assumed in addition responsibility for Quality Assurance as of June 24, 2013 and for Sustainability as of November 2015.
From November 2010 to December 2012, Peter Boone worked with Unilever as Chief Marketing Officer responsible for Australia and New Zealand. He was a member of the regional executive board. In his function as Chief Marketing Officer (CMO), he was responsible for the marketing of all brands in all categories in Australia and New Zealand.
Peter Boone started his career at the Information Services division of ITT Corp., where he worked in various marketing roles. In 1996, he joined Unilever as a Strategy Analyst at the Head Office in Rotterdam, Netherlands. Peter Boone also held other positions at Unilever such as Global Vice President Spreads & Cooking Products Category, Global Vice President Brand Development at the Unilever Headquarters in Rotterdam, the Netherlands, and Vice President Marketing & Sales Latin America Foods Solutions based in São Paulo, Brazil.

Letter to Shareholders Overview Business Highlights Sustainability Financial Reports Governance
Corporate Governance
Barry Callebaut | Annual Report /
Peter Boone holds a Doctorate in Business Administration (PhD) from the Erasmus University in Rotterdam, Netherlands.
Massimo Garavaglia President EMEA, Italian national
Massimo Garavaglia (1962) was appointed President EMEA (Europe, Middle East, Africa) as of October 1, 2015.
He is a member of the Executive Committee of Barry Callebaut AG. From 1990 to 1992, Massimo Garavaglia was sales manager for an Italian food products importer. He joined Callebaut Italy S.p.A. in 1992 as the country manager for Italy. After the merger between Callebaut and Cacao Barry in 1996, he was Barry Callebaut’s country manager in Italy until 2003. From 2003 until September 2004, he headed the region consisting of the Mediterranean Countries/Middle East/Eastern Europe. From September 2004 until 2006, he was President Food Manufacturers. Subsequently he served as President Americas until 2009. From 2009 to September 2015, he served as President Western Europe.
Massimo Garavaglia holds a Master’s degree in Economics and Business Administration from Bocconi University, Milan.
David Johnson CEO and President Americas, US national
David Johnson (1956) was appointed Chief Executive Officer and President Americas in May 2009 and is a member of the Executive Committee of Barry Callebaut AG.
Before joining Barry Callebaut, David Johnson served as Chief Executive Officer and member of the board for Michael Foods, Inc., a food processor and distributor headquartered in Minnetonka, MN, US.
From 1986 to 2006, David Johnson was with Kraft Foods Global, Inc. At Kraft Foods, he held several senior positions in different divisions, including marketing, strategy, operations, procurement and general management. His last position was President Kraft North America and Corporate Officer Kraft Foods Global, Inc. He started his career in 1980 at RJR Nabisco.
David Johnson is a member of the Board of Directors of Arthur J. Gallagher & Co., an international insurance brokerage and risk management company with headquarters in Itasca, IL, US.
David Johnson holds both a Bachelor’s and a Master’s degree in business from the University of Wisconsin.

Letter to Shareholders Overview Business Highlights Sustainability Financial Reports Governance
Corporate Governance
Barry Callebaut | Annual Report /
Carole Le Meur Chief Human Resource Officer since April 2016, French national
Carole Le Meur was appointed Chief Human Resources Officer and member of the Executive Committee of Barry Callebaut AG effective April 1, 2016.
From 2008 until joining Barry Callebaut, Carole Le Meur worked with Baxter Healthcare, Inc. From 2008 to 2013, she was Vice President Human Resources EMEA based in Zurich, Switzerland.
In 2014 she served as Vice President Human Resources Asia Pacific and Vice President Human Resources Intercontinental for Baxalta Incorporated prior to the spin-off from Baxter, with HR responsibility for the fast growth markets such as Latin America, Brazil, Russia, Turkey and Asia Pacific.
From 2002 to 2008, Carole Le Meur held several Global VP HR positions at Aventis, a leading European healthcare company, including Vice President Staffing Aventis Pasteur, Vice President Human Resources Global Industrial Operations and R&D France.
Carole Le Meur started her career in FMCG as Brand Marketing Manager with ICI Paints/Dulux in France, after which she served in various Sales and Marketing positions in Europe for Procter & Gamble Pharmaceuticals from 1990 to 1996. From 1996 to 2002 Carole Le Meur worked as an Executive Search consultant in the Healthcare and Consumer practices of two executive search firms in Europe.
Carole Le Meur holds a Master in Management from EM LYON Business School with a Major in International Affairs, as well as an Executive Master in Consulting and Coaching for Change from INSEAD and has completed executive programs at HEC and the Kellogg business school.

Letter to Shareholders Overview Business Highlights Sustainability Financial Reports Governance
Corporate Governance
Barry Callebaut | Annual Report /
Dirk Poelman Chief Operations Officer, Belgian national
Dirk Poelman (1961) was appointed Chief Operations Officer (COO) in September 2006 and member of the Executive Committee in November 2009, as well as Chief Innovation Officer (CIO) ad interim from June to December 2012. Since 1984, he has been working with Callebaut – which merged with Cacao Barry in 1996 – in various positions and countries: first as Engineering Manager, then as Production Manager, Operations Director and Chief Manufacturing Officer.
In 1997, Dirk Poelman became Executive Vice President Operations, responsible for the operations of the Group, and a member of the Senior Management Team. In 2004, he was appointed Vice President Operations and Research & Development.
Dirk Poelman holds an industrial engineering degree in electro-mechanics from the Catholic Industrial High School in Aalst, Belgium.
Steven Retzlaff President Global Cocoa, US and Swiss national
Steven Retzlaff (1963) was appointed President Global Cocoa (until August 2013 Global Sourcing & Cocoa) and member of the Executive Committee of Barry Callebaut AG in January 2008.
He joined Barry Callebaut in 1996 and has held various senior finance and general management positions. He is Vice Chairman of the World Cocoa Foundation and Vice Chairman of the European Cocoa Association.
From 1987 through 1993, he worked for KPMG in San Francisco and Zurich, and from 1993 to 1996 at JMP Newcor in Zug, Switzerland.
Steven Retzlaff holds a Bachelor of Arts in Eco-nomics from Whitman College. He also studied at the Institute of European Studies in Madrid and at INSEAD in Fontainebleau, France.

Letter to Shareholders Overview Business Highlights Sustainability Financial Reports Governance
Corporate Governance
Barry Callebaut | Annual Report /
Shareholders’ participation Each share of Barry Callebaut AG carries one vote at the General Meeting of Shareholders. Voting rights may be exercised only after a shareholder has been registered in the Company’s share register as a shareholder with voting rights.
Until December 2014, no shareholder holding more than 5% of the share capital could be registered as a shareholder with voting rights with respect to the shares such shareholder holds in excess thereof. This restriction has been deleted in the context of the revision of the Articles of Incorporation adopted by the General Meeting of Share-holders held on December 10, 2014.
Shareholders may register their shares in the name of a nominee approved by the Company and may exercise their voting rights by giving instructions to the nominee to vote on their behalf. However, a nominee holding more than 3% of the share capital will be registered as nominee for share-holders with voting rights only if it discloses the identity of each beneficial owner of shares claiming 0.5% or more of the share capital. No nominee holding more than 8% of the share capital may be registered as a shareholder with respect to the excess shares. The Board of Directors may, however, on a case-by-case basis, permit some or all of the excess shares to be registered with voting rights. In fiscal year 2015/16, no such exception was requested.
A resolution passed at the General Meeting of Share-holders with a majority of at least two thirds of the shares represented at such meeting is required to change the restrictions on the transferability of registered shares. Shareholders may be represented at the General Meeting of Shareholders by their respective legal representative, another shareholder or the independent proxy pursuant to the “Ordinance against Excessive Compensation at Listed Companies” (OaEC). The Articles of Incorporation follow the majority rules and the provisions on convocation prescribed by the Swiss law concerning general meetings of shareholders. Shareholders with registered voting rights who together represent at least 0.25% of the share capital or of the votes may call for the inclusion of an item on the agenda. Such request for inclusion must be made in writing at least 60 days prior to the date of the General Meeting of Shareholders setting forth the items to be included on the agenda and the motions put forward by the shareholders.
Notice of the General Meeting of Shareholders is given by way of one-time publication in the Company’s official publication organ (Swiss Official Gazette of Commerce, “Schweizerisches Handelsamtsblatt”). Shareholders registered in the share register with voting rights at the date specified in the invitation may additionally receive an
invitation to the General Meeting of Shareholders in writing. Furthermore, the Company offers its shareholders the opportunity to register with the online platform “Sherpany” and thus the possibility to submit their voting instructions to the independent proxy in an efficient manner. The published disclosures on significant share-holders of the Company are accessible via the disclosure platform of SIX Exchange Regulation: https://www.six-exchange-regulation.com/en/home/publications/significant-shareholders.html.
Change of control and defense measures According to the Swiss Stock Exchange and Securities Trading Act, an investor who acquires 331⁄3% of all voting rights in the Company has to submit a take-over offer for all shares outstanding. The Company has not elected to change or opt out of this rule.
There are no change of control clauses in the employ-ment contracts with the members of the Board of Directors nor of the Executive Committee.
External auditors At the Annual General Meeting of Shareholders of the Company held on December 8, 2015, the shareholders voted to appoint KPMG AG, Zurich, as statutory auditors. The statutory auditors are appointed annually by the General Meeting of Shareholders for a term of office of one year. The current lead auditor in charge has exercised this function since fiscal year 2014/15. Pursuant to the Swiss Code of Obligations, the lead auditor in charge may exercise her/his role during a maximum of seven years. The current lead auditor in charge may therefore exercise his function until and including fiscal year 2021/22.
For fiscal year 2015/16, the remuneration for the audit of the accounting records and the financial statements of the Company, and the audit of the Group’s consolidated financial statements, amounted to CHF 2.9 million. The remuneration was evaluated by the AFRQCC in view of the scope and the complexity of the Group. The performance of the auditors is monitored by the AFRQCC, to whom they present a detailed report on the result of the audit of the Group. Prior to the presentation to the AFRQCC, the lead auditor in charge reviews the audit findings with the Chairman of the AFRQCC without the presence of any members of the Management.
KPMG received a total amount of CHF 0.5 million for additional services, i.e. for transaction and other advisory (incl. due diligence). Adequate measures for the avoidance of potential conflicts of interests between the different services provided by KPMG were observed.

Letter to Shareholders Overview Business Highlights Sustainability Financial Reports Governance
Corporate Governance
Barry Callebaut | Annual Report /
Information policy The Company is committed to continuous and open communication with its shareholders, potential investors and other stakeholders based on the principles of trans-parency and equal treatment, i.e. simultaneous provision of price-sensitive information and no selective disclosure.
The Group provides detailed information on its business activities and financial performance in its annual and half-year reports and press releases, at conferences for media and financial analysts as well as at the Annual General Meeting of Shareholders. Further, representatives of the Group regularly meet (current and potential) investors in personal
meetings as well as present the Company and the Group at industry events and investor conferences.
Presentations are also made available on the Group’s website, which is updated continuously. The financial calendar for the fiscal year 2016/17 and contacts are published on page 150.
The published media releases of Barry Callebaut are accessible via https://www.barry-callebaut.com/about-us/media/news.
To subscribe to the Group’s electronic news alerts, please go to: https://www.barry-callebaut.com/about-us/media/subscribe-our-news-releases.

Letter to Shareholders Overview Business Highlights Sustainability Financial Reports Governance
Remuneration Report
Barry Callebaut | Annual Report /
Remuneration Report This Remuneration Report describes the fundamental principles of the remuneration system for the governing bodies at Barry Callebaut as well as the governance framework related to remuneration decisions. The report provides details on the remuneration of the members of the Board of Directors and the Executive Committee related to fiscal year 2015/16. Shareholdings of the members of the Board of Directors and the Executive Committee are also disclosed (reproduction of note 3.5 to the Financial Statements of Barry Callebaut AG).
The Remuneration Report is written in accordance with the “Ordinance against Excessive Compensation in listed Companies (OaEC)”, the Art. 663c paragraph 3 of the Swiss Code of Obligations and the Corporate Governance Directive issued by SIX Exchange Regulation.
Fundamental principles and governance related to remuneration The fundamental principles of the compensation are laid out in the Total Reward Policy that has been adopted by the Board of Directors in fiscal year 2014/15. Barry Callebaut believes that commitment and performance of its officers, managers and employees should be rewarded, reflecting the relevant market conditions, the performance of Barry Callebaut as a Company, and the individual employee’s contribution. Reward programs strengthen the attraction and retention of talented individuals and also support the employees’ on-going career development at Barry Callebaut. Market information is taken into account for the determination of individual salaries. However, as a general rule, the target compensation at Barry Callebaut, including that of the top management, is not directly linked to any external benchmark and is therefore determined on a discretionary basis. Barry Callebaut has a performance-oriented culture and uses an annual Performance Management and Development Process (PMDP) to monitor and assess the contributions of all employees to the achievement of business results as well as their personal and professional development.
Pursuant to the OaEC as implemented in the Company’s Articles of Incorporation (Article 30), the General Meeting of Shareholders approves the total remuneration of the members of the Board of Directors and the Executive Committee. The General Meeting of Shareholders approves the motions of the Board of Directors on an annual basis and with binding effect with regard to:
a) the aggregate maximum amount of the compensation of the Board of Directors for the forthcoming term of office;
b) the aggregate maximum amount of the fixed compensa-tion of the Executive Committee for the forthcoming financial year;
c) the aggregate maximum amount of the short-term and the long-term variable compensation of the Executive Committee for the past financial year.
The General Meeting of Shareholders votes separately on the aggregate compensation of the Board of Directors and the Executive Committee.
The Board of Directors reports to the General Meeting of Shareholders on the remuneration system and the actual remuneration of the past fiscal year in the Remuneration Report. The Remuneration Report is subject to a consultative vote of the General Meeting of Shareholders.
Further, the Articles of Incorporation include the principles of compensation applicable to the Board of Directors and to the Executive Committee. Those provisions can be found under https://www.barry-callebaut.com/sites/ default/files/publications/bc_statuten_e_2015.pdf and include: • Principles of compensation of the Board of Directors
(Articles 32 and 33); • Principles of compensation of the Executive Committee
(Articles 32 and 34); • Additional amount for new members of the Executive
Committee (Article 31); • Credits and loans (Article 35).
The Nomination & Compensation Committee (NCC) of Barry Callebaut assists the Board of Directors in fulfilling its responsibility by regularly evaluating the remuneration strategy and proposing individual compensation packages for the Board of Directors, the members of the Executive Committee, and other key members of the Management (for further details please refer to the “Functioning of the Board” section in the Corporate Governance Report). The Board of Directors has not delegated any decision power to the NCC, therefore remuneration decisions are taken by the full Board of Directors upon recommendations of the NCC.

Letter to Shareholders Overview Business Highlights Sustainability Financial Reports Governance
Remuneration Report
Barry Callebaut | Annual Report /
The General Meeting of Shareholders has elected the following members to the NCC:
Remuneration of the Board of Directors The remuneration structure of the Board of Directors is annually reviewed and determined at the discretion of the Board of Directors. It consists of fixed fees and grants of Barry Callebaut AG share awards. The fixed fees amount to CHF 400,000 for the Chairman of the Board of Directors, CHF 200,000 for the Vice Chairman, CHF 140,000 for members chairing a Board Committee and CHF 125,000 for the other members. The share award amounts to 500 shares for the Chairman, 250 for the Vice Chairman and 180 shares for the other members of the Board of Directors. Shares granted to the members of the Board are transferred with no restrictions at the end of the annual service period on the Board. In order to reinforce the independence of the Board in exercising its supervisory duties towards executive management, its remuneration is not linked to any performance criteria. Board members do not receive any lump-sum payments for expenses. The remuneration of the members of the Board is subject to the mandatory social security contributions. Pursuant to the Articles of
Incorporation, the members of the Board are in principle eligible for pension fund contributions by the Company. However, in fiscal year 2015/16 no such contributions were made with respect to non-executive members of the Board.
The increase in remuneration of the Board of Directors compared to the previous year is mainly due to the fact that there is one additional member in the Board. The remu-neration structure remained unchanged compared to the previous year.
At the General Meeting of Shareholders in December 2015, the shareholders approved a maximum aggregate amount of CHF 2,200,000 and 2,190 shares for the Board of Directors for the compensation period from the General Meeting of Shareholders in December 2015 until the General Meeting of Shareholders in December 2016. The compen-sation effectively paid for the portion of this term of office included in this compensation report (January 1, 2016 until August 31, 2016) is within the limit approved by the shareholders. A conclusive assessment for the entire period will be included in the remuneration report 2016/17.
Name Nationality Member of the NCC since James Donald (Chairman) US 2008 Patrick De Maeseneire Belgian 2015 Fernando Aguirre Mexican/US 2013 Wai Ling “Winnie“ Liu Hong Kong-Chinese 2014

Letter to Shareholders Overview Business Highlights Sustainability Financial Reports Governance
Remuneration Report
Barry Callebaut | Annual Report /
Remuneration of the Board of Directors for fiscal year / (audited figures)
in CHF
BoD Member Compensation fix
Other compensation1
Total cash related remuneration
Number of shares2 Value of shares3
Total remuneration
2015/16 Andreas Jacobs Chairman/Delegate
400,000
–
400,000
500
528,167
928,167
Patrick De Maeseneire4
Vice Chairman Member of the NCC5
133,333
12,863
146,196
167
178,333
324,529
Fernando Aguirre Member of the NCC
125,000
–
125,000
180
190,140
315,140
Jakob Baer Chairman of the AFRQCC6
140,000
34,259
174,259
180
190,140
364,399
Jim Donald Chairman of the NCC
140,000
–
140,000
180
190,140
330,140
Nicolas Jacobs Member of the AFRQCC
125,000
39,824
164,824
180
190,140
354,964
Wai Ling Liu Member of the NCC
125,000
47,224
172,224
180
190,140
362,364
Timothy E. Minges Member of the AFRQCC
125,000
–
125,000
180
190,140
315,140
Andreas Schmid Member of the AFRQCC
125,000
39,652
164,652
180
190,140
354,792
Juergen Steinemann 66,667 – 66,667 203 214,150 280,817 Total remuneration Board of Directors
1,505,000
173,822
1,678,822
2,130
2,251,630
3,930,452
1 Including social security contributions. 2 Number of shares granted in relation to the fiscal year under review;
vesting subject to meeting service conditions. Grants to BoD are based on the calendar year.
3 Value defined as closing share price at the beginning of the service period.
4 At the General Meeting of Shareholders held on December 8, 2015, Patrick De Maeseneire was elected as a member of the BoD and succeeded Juergen Steinemann in the role of the Vice Chairman.
5 Nomination & Compensation Committee. 6 Audit, Finance, Risk, Quality & Compliance Committee.
Remuneration of the Board of Directors for fiscal year / (audited figures)
in CHF
BoD Member Compensation fix
Other compensation1
Total cash related remuneration
Number of shares2 Value of shares3
Total remuneration
2014/15 Andreas Jacobs Chairman/Delegate
400,000
–
400,000
500
518,833
918,833
Juergen Steinemann4 Vice Chairman
– – – 167 172,944 172,944
Fernando Aguirre Member of the NCC5
125,000
–
125,000
180
186,780
311,780
Jakob Baer Chairman of the AFRQCC6
140,000
33,355
173,355
180
186,780
360,135
Jim Donald Chairman of the NCC
140,000
–
140,000
180
186,780
326,780
Nicolas Jacobs Member of the NCC
125,000
38,606
163,606
180
186,780
350,386
Wai Ling Liu7 Member of the NCC
83,333
9,865
93,198
180
186,780
279,978
Timothy E. Minges Member of the AFRQCC
125,000
–
125,000
180
186,780
311,780
Ajai Puri8 41,667 – 41,667 60 62,260 103,927 Andreas Schmid Member of the AFRQCC
152,500
41,899
194,399
180
186,780
381,179
Total remuneration Board of Directors
1,332,500
123,725
1,456,225
1,987
2,061,498
3,517,722
1 Including social security contributions. 2 Number of shares granted in relation to the fiscal year under review;
vesting subject to meeting service conditions. Grants to BoD are based on the calendar year.
3 Value defined as closing share price at the beginning of the service period. 4 At the General Meeting of Shareholders held on December 10, 2014,
Juergen Steinemann was elected as a member of the BoD and succeeded Andreas Schmid in the role of the Vice Chairman.
5 Nomination & Compensation Committee.
6 Audit, Finance, Risk, Quality & Compliance Committee. 7 At the General Meeting of Shareholders held on December 10, 2014,
Wai Ling Liu was elected as a member of the BoD and the NCC. 8 At the General Meeting of Shareholders held on December 10, 2014,
Ajai Puri did not stand for re-election to the BoD and the NCC, but continued to be a consultant for strategic and corporate governance issues to the BoD for the calendar year 2015. For these services, he received a compensation of CHF 125,000 in cash and 180 shares which are not included in the above table.
Letter to Shareholders Overview Business Highlights Sustainability Financial Reports Governance
Remuneration Report
Barry Callebaut | Annual Report /
Remuneration of the Executive Committee The individual remuneration of the members of the Executive Committee is reviewed annually and determined at the discretion of the Board of Directors, upon proposal of the NCC, based on the principles set out in the Executive Total Reward Policy, the market data from various sources, the scope and level of responsibility of the position, and the profile of the incumbent in terms of qualification, experience and skills set.
The remuneration structure for the Executive Committee of Barry Callebaut consists of three main compensation elements: a fixed annual base salary, an annual short-term cash bonus pursuant to the Company’s Short-Term Incentive Plan, and a long-term incentive comprised of share grants pursuant to the Company’s Long-Term Incentive Plan, as well as other benefits.
Base salary The fixed annual gross base salary is defined at the discretion of the Board of Directors on the basis of various criteria, such as market value of the role, scope of the position, and profile of the incumbent. Short-Term Incentive Plan (STIP) The STIP is designed to reward the business performance of the company and the individual contributions of the incumbent, over a time horizon of one year. This variable compensation allows employees to participate in the company’s success while being rewarded for their individual performance.
The STI target is expressed as percentage of the fixed annual base salary and varies between 75% and 125% for the members of the Executive Committee for the fiscal year 2015/16. The STI is paid out as a cash payment and depends
on the level of achievement of annual performance targets. The maximum payout is capped at 150% of the target amount. The performance criteria for the members of the Executive Committee are defined by the Board of Directors upon evaluation and recommendation of the NCC. For the fiscal year 2015/16, the bonus of the Executive Committee depends on the achievement of financial business targets (75 to 80% weight) and the achievement of individual strategic targets (20 to 25% weight). The financial business targets and their respective weight are summarized in the table below. Those financial objectives reflect the business strategy of profitable growth by rewarding top line (revenue) and bottom line contributions (EBIT, EPS), as well as the efficient use of the company’s assets (net working capital) and the residual income realized at company level (EVA).
Base salary
Annual gross base salary
• Determined at the discretion of the Board of Directors based on various criteria such as market value of the role, scope of the position and profile of the incumbent
• Target weight in % of total compensation: CEO 20% – 40%, Executive Committee 25% – 35% Variable annual bonus
Barry Callebaut Short-Term Incentive Plan (STIP)
• Based on the achievement of financial (75% – 80%) and personal strategic targets (20% – 25%) • Maximum payout: 150% of target • Knock-out threshold: 75%, i.e. below a target achievement of 75% there is no bonus payout • Payout in cash annually after release of full-year results, conditional upon the Company
reporting a net profit • Target weight in % of total compensation: CEO 20% – 40%, Executive Committee 25% – 35%
Share awards
Barry Callebaut Long-Term Incentive Plan (LTIP)
• As from 2014: LTIP; until 2014: “Deferred Share Plan 2011 – 2014” (last share awards vesting in 2016)
• Individual grant values approved by the Board of Directors; number of shares determined by dividing the grant value by the average share price over three months prior to the granting decision
• Vesting of award over a three-year vesting cycle: 30% in the first and second year each, 40% in the third year subject to a performance criteria
• Performance criteria: vesting of the final tranche depends on the relative performance of the Barry Callebaut share price compared to a basket of benchmark companies
• Target weight in % of total compensation: CEO 30% – 60%, Executive Committee 30% – 50% Other benefits
Risk benefits and perquisites
• Social security contributions by employer • Post-employment and retirement benefits • Insurances • Executive perquisites such as company car, relocation costs etc.

Letter to Shareholders Overview Business Highlights Sustainability Financial Reports Governance
Remuneration Report
Barry Callebaut | Annual Report /
*President Global Cocoa **Presidents EMEA/Americas
Long-Term Incentive Plan (LTIP) The purpose of the LTIP is to provide the participants with an ownership interest in Barry Callebaut and to reward for the long-term performance of the company. The LTIP thus aligns their interests to those of the shareholders. The new LTIP was implemented for financial year 2014/15, and its terms and conditions remained valid for the grants awarded in fiscal year 2015/16.
The grant of share units under the LTIP is based on a target LTI amount determined individually for each plan participant. The target LTI amount is divided by the average share price of the last three months of the preceding fiscal year in order to calculate the number of share units awarded. The share units vest in three tranches over three fiscal years, i.e. 30% after one year, 30% after two years, and 40% after three years from the grant date. The first two tranches are restricted share units (RSU) that vest subject to the LTIP participant continuing to be employed by Barry Callebaut. The final tranche consists of performance share units (PSU) that vest subject to meeting a perfor-mance criterion over the three-year vesting period. The performance criterion is the relative performance (3-year Compound Annual Growth Rate) of the Barry Callebaut share versus the share performance of a peer group of companies including chocolate companies, ingredient com-panies and FMCG companies: AAK, Aryzta, Hershey, Kellogg’s, Kerry, Lindt, Mondelēz, Nestlé, Olam, Petra and
Unilever. The overperformance of the Barry Callebaut share price versus the benchmark share price of the peer group is incentivized by applying a multiplier of 25 on the overperformance in %, whereas in the case of underper-formance, a multiplier of 12.5 applies. However, a cap and a floor apply at 5% over- or underperformance, so that the vesting for the last tranche can vary between 37.5% and 225% of the share awards granted. Consequently, the overall vesting ranges from 75% and 150% of the initially determined number of share units granted. Share units granted to members of the Executive Committee may only vest to the extent that the actual market value of the vested shares (at vesting) in any given year does not exceed 160% of the target LTI amount defined at the most recent grant date for the respective plan participant (value cap). Further-more, the Board of Directors reserves the right to suspend or adjust the vesting of the share units in case of a negative result from continuous operations of the Barry Callebaut Group. Once the shares are vested and transferred, they are free of any sales restrictions.
The following table provides an overview of the different performance scenarios and the respective impact on the total vesting opportunity for participants, expressed in % of the originally granted number of share units (subject to the respective plan participant’s continued service over the entire vesting cycle, the Value Cap not being reached and Barry Callebaut reporting a positive profit after tax):
Financial business target CEO/CFO Regional Presidents COO/CIO/CHRO Group EBIT 25% 15% 35% Group EBIT/MT 15% – 10% Group sales volume 20% – 20% EVA 30% 15% 15% Earnings per share 10% – – Regional EBIT
– 30%*
15%** –
Regional EBIT/MT – 15%** – Regional sales volume – 20% – Working capital – 20% 20% Total 100% 100% 100%
Performance achievement scenario Share awards 1st Tranche
Share awards 2nd Tranche
Share awards 3rd Tranche
Total share awards vested over a vesting cycle
100% achievement of performance criteria 30% 30% 40% 100% Top achievement of performance criteria (cap) 30% 30% 90% 150% Lowest achievement of performance criteria (floor) 30% 30% 15% 75%

Letter to Shareholders Overview Business Highlights Sustainability Financial Reports Governance
Remuneration Report
Barry Callebaut | Annual Report /
Deferred Share Plan 2011–2014(discontinued): The grant of share awards to management for the fiscal years 2011/12 until 2013/14 was regulated by a Deferred Share Plan 2011–2014. For that period (the “Grant Cycle”), an annual share value was determined by the Board of Directors for each individual plan participant. The number of share units to be granted to each participant with respect to each fiscal year was calculated by dividing the annual share grant value by the average closing price of the Company’s shares during the last three months of the previous fiscal year. The granted share awards vested according to the following schedule: 30% after one year, 30% after two years and 40% after three years. Actual shares were transferred upon vesting of the share awards. The vesting was subject to service criteria, but not to any performance criteria. No grants were made under the Deferred Share Plan 2011 – 2014 after financial year 2013/14.
Other benefits Other benefits include risks benefits that provide for a reasonable level of income in case of retirement, death or disability. Those consist of social security contributions, post-employment benefits, pension contributions and insur-ances. The members of the Executive Committee with a Swiss employment contract participate in the occupational
pension plan offered to all employees in Switzerland. members of the Executive Committee under foreign employment contract are insured commensurately with market conditions and with their position. Each plan varies in line with the local competitive and legal environ-ment and is, as a minimum, in accordance with the legal requirements of the respective country.
Further, members of the Executive Committee are also provided with certain executive perquisites such as relocation allowances, housing or other cost of living allowances, car allowances, and gross-ups for tax equali-zation of certain benefits. The benefits for each member of the Executive Committee are subject to their specific situation, the typical market practice and other factors after consideration of the total value of their individual remuneration package.
The monetary value of these benefits is disclosed in the remuneration tables at their fair value.
Employment contracts The members of the Executive Committee are employed under employment contracts of unlimited duration and subject to a notice period of maximum one year. They are not contractually entitled to severance payments or to change of control provisions.
Remuneration of the Executive Committee for fiscal year / (audited figures)
in CHF
Compen- sation fix
Compen- sation
variable2
Post-employ-
ment benefits3
Other compen-
sation
Total cash related
remunera- tion
Number of shares4
Value of shares5
Total remunera-
tion 2015/16
Remuneration Executive Committee1 5,326,055 5,764,245 1,790,860 904,564 13,785,724 7,569 7,486,645 21,272,369 Highest individual remuneration within Executive Committee: Antoine de Saint-Affrique CEO Barry Callebaut Group
1,546,360
1,390,000
166,862
14,523
3,117,745
1,587
1,565,798
4,683,543
1 Disclosure relates to the Executive Committee as in place on August 31, 2016, i.e.: Antoine de Saint-Affrique, Victor Balli, Peter Boone, Massimo Garavaglia, David Johnson, Carole Le Meur, Dirk Poelman, Steven Retzlaff. Also included is the remuneration of Juergen Steinemann (former CEO) for the transition period ending March 2016.
2 Based on best estimate of expected payout for fiscal year 2015/16 (accrual principle).
3 Including social security and pension contributions.
4 Number of shares granted in relation to the fiscal year 2015/16; vesting subject to meeting service and/or performance conditions.
5 Value of shares is defined as fair value at grant date. For restricted share units, this is the share price at grant date. For performance share units the fair value is established based on a valuation performed by experts applying the “Monte Carlo simulation method”.In both cases the net present value of expected dividends that will not be received by the plan participant during the vesting period is excluded from the fair value.

Letter to Shareholders Overview Business Highlights Sustainability Financial Reports Governance
Remuneration Report
Barry Callebaut | Annual Report /
Remuneration of the Executive Committee for fiscal year / (audited figures)
in CHF
Compen- sation fix
Compen- sation
variable
Post-employ-
ment benefits2
Other compen-
sation
Total cash related
remunera- tion
Number of shares3
Value of shares4
Total remunera-
tion 2014/15
Remuneration Executive Committee1 3,893,051 3,797,248 2,280,143 808,738 10,779,180 6,504 6,011,878 16,791,058 Highest individual remuneration within Executive Committee: Juergen Steinemann CEO Barry Callebaut Group
1,130,000
1,060,201
1,101,771
512,566
3,804,538
2,956
2,687,300
6,491,837
1 Disclosure relates to the Executive Committee as in place on August 31, 2015, i.e.: Juergen Steinemann, Victor Balli, Peter Boone, Massimo Garavaglia, David Johnson, Dirk Poelman and Steven Retzlaff.
2 Including social security and pension contributions. 3 Number of shares granted in relation to the fiscal year 2015/16; vesting
subject to meeting service and/or performance conditions.
4 Value of shares is defined as fair value at grant date. For restricted share units, this is the share price at grant date. For performance share units the fair value is established based on a valuation performed by experts applying the "Monte Carlo simulation method". In both cases the net present value of expected dividends that will not be received by the plan participant during the vesting period is excluded from the fair value.
Comments on the remuneration tables The increase in remuneration compared to the previous fiscal year is mainly due to the following factors: • Transition period from October 2015 through March
2016 with both Antoine de Saint-Affrique as CEO and Juergen Steinemann
• One additional member of the Executive Committee;
The aggregate amount of remuneration for the Executive Committee is subject to the approval of the General Meeting
of Shareholders. The maximum aggregate amount of fixed remuneration was approved by the General Meeting of Shareholders in December 2015 prospectively for fiscal year 2016/17. Accordingly, the fixed remuneration for financial year 2015/16 was not yet subject to the approval of the General Meeting of Shareholders. The aggregate compensation amount for the short-term and long-term incentives for fiscal year 2015/16 will be submitted to shareholders’ vote at the upcoming General Meeting of Shareholders in December 2016.
Shareholdings of the Board of Directors and the Executive Committee
Shareholdings of the Board of Directors
Number of shares as of August 31, 2016 2015 Name Function Andreas Jacobs1 Chairman 4,260 3,760 Patrick De Maeseneire Vice Chairman
(as of December 9, 2015) – –
Fernando Aguirre 100 296 Jakob Baer 900 720 James “Jim” Donald 1,260 1,080 Nicolas Jacobs 101,039 159,359 Wai Ling “Winnie” Liu 180 – Timothy Minges 476 296 Andreas Schmid 8,038 7,858 Juergen Steinemann2
Vice Chairman (until December 9, 2015)
13,795
10,913
Total shares held by Board of Directors 130,048 184,282
1 Excluding the 50.11% participation held by Jacobs Holding AG
(see note 3.4 to the Financial Statements of Barry Callebaut AG). 2 Juergen Steinemann’s shareholdings are listed in both tables for prior year,
since he was member of the Board of Directors as well as of the Executive Committee on August 31, 2015.

Letter to Shareholders Overview Business Highlights Sustainability Financial Reports Governance
Remuneration Report
Barry Callebaut | Annual Report /
Shareholdings of the Executive Committee
Number of shares as of August 31, 2016 2015 Name Function Antoine de Saint-Affrique CEO Barry Callebaut Group
(as of October 1, 2015) – –
Victor Balli CFO Barry Callebaut Group 1,000 900 Peter Boone Chief Innovation & Quality Officer 7 4 Massimo Garavaglia President EMEA 250 – Dave Johnson CEO and President Americas 2,023 1,964 Carole Le Meur Chief Human Resources Officer
(as of April 1, 2016) – –
Dirk Poelman Chief Operations Officer 1,534 1,490 Steven Retzlaff President Global Cocoa 686 1,000 Juergen Steinemann1 CEO Barry Callebaut Group
(until September 30, 2015) – 10,913
Total shares held by Executive Committee 5,500 16,271
1 Juergen Steinemann’s shareholdings are listed in both tables for prior year,
since he was member of the Board of Directors as well as of the Executive Committee on August 31, 2015.
Consideration paid for services of the majority shareholder In line with the practice of the past years, Barry Callebaut AG and Jacobs Holding AG, Zurich, have entered into an auxiliary services agreement, under which Jacobs Holding AG offers certain management and consultancy services to Barry Callebaut AG. In fiscal year 2015/16, the total compensation paid by Barry Callebaut AG under this agreement amounted to CHF 1.5 million (excl. VAT). The contract is renewable annually.
Loans and credits (audited) During fiscal year 2015/16, no loans or credits were granted to members of the Board of Directors and to members of the Executive Committee, nor to related parties.
As of 31 August 2016, there were no outstanding loans or credits to members of the Board of Directors and to members of the Executive Committee, nor to related parties.
Outlook: changes in the remuneration structure for the Executive Committee for fiscal year / During fiscal year 2015/16, the Board of Directors reviewed the current remuneration policy and programs with the objective of ensuring that they are still aligned to the company’s business strategy, to the evolving context in which the company operates and to the long-term interests of our shareholders. This review led to a number of changes to be implemented for fiscal year 2016/17.
Short-Term Incentive Plan (STIP) The STIP has been harmonized throughout the organization. For each participant, the STIP will be based on a collective performance factor (“CPF”) and an individual performance factor (“IPF”) weighted 60% and 40%, respectively.
For the members of the Executive Committee, the CPF (60% of STI) will be based on the performance of Barry Callebaut as a Group, measured as follows: • Group sales volume: 25% • Group EBIT: 25% • Free cash flow: 40% • Strategic initiatives: 10%
For each financial objective, an expected level of perfor-mance (“target”) will be defined, leading to a payout factor of 100%. A threshold level of performance, below which there is no payout, and a maximum level of performance, above which the payout is capped at 200%, will be determined as well.
The IPF (40% of STI) is based on the performance of the unit under responsibility, e.g. the respective Region or Function. The objectives are of primarily financial nature and support the strategy of profitable growth. Objectives may also include strategic initiatives that are key for the success of the Region/Function.
The maximum level of payout of the STI will be 200% of target.

Letter to Shareholders Overview Business Highlights Sustainability Financial Reports Governance
Remuneration Report
Barry Callebaut | Annual Report /
Long-Term Incentive Plan (LTIP) The LTIP will continue to be a combination of RSU and PSU, with a stronger weight on the performance-based portion in line with the company’s pay-for-performance philosophy. The share units will vest in three tranches over three fiscal years, i.e. 25% after one year, 25% after two years and 50% after three years from the grant date. The first two tranches are RSU that vest subject to the LTIP participant continuing to be employed by Barry Callebaut. The final tranche consists of PSU that vest subject to meeting two performance criteria over the three-year vesting period.
The performance criteria will continue to include the relative performance of the Barry Callebaut share price compared to a peer group of companies with a 50% weight and will also include the return on invested capital (ROIC) with a 50% weight. The vesting level will be capped at 200% of the target.
The share price performance will continue to be measured against the same peer group as in the current plan, however the measurement will be a percentile rank instead of an absolute differential compared to the average of the peer group. The target (100% payout) will be to achieve median performance, e.g. to outperform half of the peer companies.
The ROIC performance has been introduced in order to reward a sustainable management of the company’s assets. The ROIC target will be set by the Board of Directors on the basis of the long-term strategic plan of the company.
The combination of the two performance indicators ensures a strong alignment with the business strategy of Barry Callebaut and with the long-term interests of the Shareholders.

Report of the Statutory Auditor to the General Meeting of Barry Callebaut AG, Zurich We have audited the accompanying remuneration report dated 31 October 2016 of Barry Callebaut AG for the year ended 31 August 2016. The audit was limited to the information according to articles 14–16 of the Ordinance against Excessive compensation in Stock Exchange Listed Companies (Ordinance) contained in the tables referred to as audited on pages 138 to 145 of the remuneration report. Responsibility of the Board of Directors The Board of Directors is responsible for the preparation and overall fair presentation of the remuneration report in accordance with Swiss law and the Ordinance against Excessive compensation in Stock Exchange Listed Companies (Ordinance). The Board of Directors is also responsible for designing the remuneration system and defining individual remuneration packages. Auditor's Responsibility Our responsibility is to express an opinion on the accompanying remuneration report. We conducted our audit in accordance with Swiss Auditing Standards. Those standards require that we comply with ethical requirements and plan and perform the audit to obtain reasonable assurance about whether the remuneration report complies with Swiss law and articles 14–16 of the Ordinance. An audit involves performing procedures to obtain audit evidence on the disclosures made in the remuneration report with regard to compensation, loans and credits in accordance with articles 14–16 of the Ordinance. The procedures selected depend on the auditor’s judgment, including the assessment of the risks of material misstatements in the remuneration report, whether due to fraud or error. This audit also includes evaluating the reasonableness of the methods applied to value components of remuneration, as well as assessing the overall presentation of the remuneration report. We believe that the audit evidence we have obtained is sufficient and appropriate to provide a basis for our opinion. Opinion In our opinion, the remuneration report for the year ended 31 August 2016 of Barry Callebaut AG complies with Swiss law and articles 14–16 of the Ordinance. KPMG AG
François Rouiller Patricia Bielmann Licensed Audit Expert Licensed Audit Expert Auditor in Charge Zurich, 31 October 2016
KPMG AG/SA, a Sw iss corporation, is a subsidiary of KPMG Holding AG/SA, which is a member of the KPMG network of independent firms affiliated w ith KPMG International Cooperative (“ KPMG International” ), a Sw iss legal entity.
KPMG AG Audit Badenerstrasse 172 P.O. Box 1872 Telephone +41 58 249 31 31 CH-8004 Zurich CH-8026 Zurich Fax +41 58 249 44 06 Internet www.kpmg.ch
Member of the Swiss Institute of Certif ied Accountants and Tax Consultants

Glossary
Barry Callebaut | Annual Report /
ACTICOA™ A process developed by Barry Callebaut which conserves to a very high degree the polyphenols
naturally present in the cocoa bean, that may otherwise be destroyed during the chocolate production process.
Butter Refers to cocoa butter, the fat of the cocoa bean.
British Retail Consortium (BRC) BRC is one of the five food safety standards recognized by the Global Food Safety Initiative, a platform that groups global retailers and a large number of food manufacturers.
Cocoa butter ratio Price of 1 tonne of cocoa butter relative to the price of 1 tonne of cocoa beans.
Cocoa Horizons In 2012, Barry Callebaut launched its CHF 40 million cocoa sustainability initiative to boost farm productivity, increase quality and improve family livelyhoods in key cocoa producing countries over the next ten years. Cocoa powder ratio Price of 1 tonne of cocoa powder relative to the price of 1 tonne of cocoa beans. Combined cocoa ratio Combined sales prices for cocoa butter and cocoa powder relative to the cocoa bean price. Compound Consists of a blend of sugar, vegetable oil, cocoa liquor, powder and other products. Vegetable oil is substituted for cocoa butter to reduce product cost and to develop special melting profiles. Conche A large tank with a powerful stirring device inside that kneads the chocolate mixture slowly over a long time. Contact with air, heat and friction results in several different physical and chemical processes, necessary for the final taste and mouthfeel of the chocolate.
Controlled Fermentation Barry Callebaut developed a way to “control” and optimize cocoa fermentation. With the so-called Controlled Fermen-tation method, defined microorganisms provide a consistent, predictable and 100% “superior grade” cocoa bean quality. This in turn leads to improved flavor characteristics, zero default cocoa beans, enhanced levels of functional compo-nents (e.g. flavanols), and improved processability. Criollo Criollo is known as the prince among cocoa trees. This variety is fragile and produces small harvests. It grows primarily in South and Central America, and accounts for only 10% of the world crop. The cocoa has a pale color and a unique aroma. It is used in the production of high-quality chocolate and for blending.
Dark chocolate Dark chocolate is chocolate that contains more than 43% cocoa solids coming from cocoa liquor and
butter. This is the chocolate most often used for premium chocolate confections. Besides cocoa ingredients, it contains sugar, vanilla, and often lecithin. Drying After fermentation, the beans still contain 60% moisture, which must be reduced to 8% or less in order to ensure optimum conservation during storage and transportation. Drying can either be done by spreading the beans out in the sun or by placing them on a heated surface or by hot air. Thorough drying avoids the formation of molds. Dutching A treatment used during the making of cocoa powder in which cocoa solids are treated with an alkaline solution to neutralize acidity. This process darkens the cocoa and develops a milder chocolate flavor.
EBIT Operating profit (Earnings Before Interest and Taxes).
EBITDA Operating profit before depreciation and amortization (Earnings Before Interest, Taxes, Depreciation and Amortization).
A.
B.
C. D.
E.
Glossary
Barry Callebaut | Annual Report /
EVA Economic Value Added, or EVA, is an estimate of a firm’s economic profit – being the value created in excess of the required return of the company’s investors (being share-holders and debt holders). In other words: EVA is the profit earned by the firm less the cost of financing the firm’s capital.
Fermentation Fermentation is a delicate stage in cocoa bean processing. Beans and pulp are heaped in piles,
covered with banana leaves or put in boxes and left to ferment for several days. During fermentation, the beans lose their natural bitterness and astringency. Flavanol A specific type of polyphenol, known for its antioxidant activity. Forastero Forastero are the most commonly grown and used cocoa beans. Compared to Criollo, Forastero is a stronger tree that is easier to cultivate and produces higher yields. They make up about 90% of the world’s production and are grown mainly in West Africa. The cocoa has a pungent aroma.
Global Reporting Initiative (GRI) The Global Reporting Initiative (GRI) is a non-profit organization that promotes economic, environmental
and social sustainability. GRI’s Sustainability Reporting Framework enables all companies and organizations to measure and report their sustainability performance. By reporting transparently and with accountability, organiza-tions can increase the trust that stakeholders have in them, and in the global economy. www.globalreporting.org
Industry Protocol Also known as Harkin-Engel Protocol. The Protocol was signed in 2001 by cocoa and chocolate manu-
facturers, industry and trade associations, government organizations and NGOs in response to reports of children working under abusive labor conditions on cocoa farms in West Africa. The signatories condemned abusive labor practices, in particular the worst forms of child labor as defined by the International Labor Organization (ILO), and committed to work together to address the issue. Barry Callebaut is a signer of the Protocol.
Liquor Also known as cocoa liquor or cocoa mass. The thick liquid paste that is produced in the grinding process.
Milk chocolate Chocolate with at least 25% cocoa solids coming from cocoa liquor and butter to which powdered
milk, sugar, vanilla, and lecithin has been added. Good milk chocolate contains 30% chocolate liquor. Premium milk chocolate contains even more. Molding The process of creating figures and shapes out of chocolate. Chocolate is melted to 45°C, then cooled below its crystallization point, then heated again to 30°C. Following this tempering process, the chocolate is poured onto the inner surface of the molds, also heated to 30°C. After cooling, the final product is unmolded to reveal a glossy chocolate figure.
Nib The cocoa bean without shell.
Polyphenols Cocoa beans contain polyphenols of unusually high quality and effectiveness. Some display antioxidant
properties. By inhibiting oxidation, they protect body cells from damage caused by the oxidative effects of free radicals, which contribute to the aging process and to certain heart and brain diseases. Powder Refers to cocoa powder and is the product that remains when a large part of the cacao butter is removed from the cocoa liquor.
Roasting Roasting is a heating process aimed at developing the chocolate aroma. Roasting certain foods not only
makes them more digestible, but also more aromatic. Cocoa beans are roasted to a greater or lesser extent depending on what they are being used for. Cocoa powder needs more intense roasting, whereas chocolate requires finer roasting.
Semi-finished products Examples include cocoa liquor, cocoa butter and cocoa powder. Also called cocoa products.
F.
G.
I.
L.
M.
N. P.
R.
S.

Glossary
Barry Callebaut | Annual Report /
Trinitario Trinitario beans are a cross of Criollo and Forastero cocoa. It has characteristics of both: The trees
are easy to cultivate, and the cocoa beans have a strong, but relatively refined aroma.
Viscosity The measure of the flow characteristics of a melted chocolate.
Vegetable fats Sometimes used as a less expensive alternative to cocoa butter in chocolate products.
White chocolate White chocolate is made from cocoa butter
(at least 20%), powdered milk, sugar, and vanilla. It contains no cocoa liquor, which explains the ivory color of white chocolate.
T.
V. W.

Contact & Financial calendar
Contact
Barry Callebaut head office Barry Callebaut AG West-Park, Pfingstweidstrasse 60 8005 Zurich, Switzerland Phone +41 43 204 04 04 Fax +41 43 204 04 00 www.barry-callebaut.com
Investor Relations Evelyn Nassar Head of Investor Relations Phone +41 43 204 04 23 Fax +41 43 204 04 19 [email protected]
Media Christiaan Prins Head of External Affairs Phone +41 43 204 03 76 Fax +41 43 204 04 00 [email protected]
Address changes ShareCommServices AG Europastrasse 29 8152 Glattbrugg, Switzerland Phone +41 44 809 58 52 Fax +41 44 809 58 59
Financial calendar
December 7, 2016 Annual General Meeting of Shareholders 2015/16, Zurich January 25, 2017 3-month key sales figures 2016/17 April 12, 2017 Half-year results 2016/17, Zurich July 13, 2017 9-month key sales figures 2016/17 November 8, 2017 Full-year results 2016/17, Zurich December 13, 2017 Annual General Meeting of Shareholders 2016/17, Zurich Forward-looking statement Certain statements in this Letter to Investors regarding the business of the Barry Callebaut Group are of a forward-looking nature and are therefore based on management’s current assumptions about future developments. Such forward-looking statements are intended to be identified by words such as “believe”, “estimate”, “intend”, “may”, “will”, “expect”, “project” and similar expressions as they relate to the company. Forward-looking statements involve certain risks and uncertainties because they relate to future events. Actual results may vary materially from those targeted, expected or projected due to several factors. The factors that may affect the Barry Callebaut Group’s future financial results are discussed in the Annual Report 2015/16. Such factors are, among others, general economic conditions, foreign exchange fluctuations, competitive product and pricing pressures, as well as changes in tax regimes and regulatory developments. The reader is cautioned to not unduly rely on these forward-looking statements. The Barry Callebaut Group does not undertake to publish any update or revision of any forward-looking statements.
Impressum Publisher Barry Callebaut AG West-Park Pfingstweidstrasse Zurich Switzerland
Concept Source Associates, Zurich, Switzerland
Photography Fabian Haefeli Zurich, Switzerland Jos Schmid Zurich, Switzerland
Prepress Linkgroup AG, Zurich, Switzerland