annual report 2016 engineering the medicines of tomorrow€¦ · annual report 2016 morphosys ag...
TRANSCRIPT

Annu
al R
epor
t 20
16
Mor
phoS
ys A
G
Annual Report 2016
Engineering the Medicines of Tomorrow
Find out more about four selected programs from our proprietary portfolio and our partnered pipeline. Learn about the compounds’ mode of action, about the diseases they target,
and see what experts have to say in our online magazine.
ht tp://reports.morphosys.com/20 16/

In addition, 8 proprietary programs and 54 partnered discovery programs are in discovery stage, 1 proprietary and 22 partnered discovery programs are in preclinic.
M O S T A DVA N C E D D E V E LO P M E N T S TAG E
P R O G R A M / PA R T N E R I N D I C AT I O N
Guselkumab (CNTO1959) / Janssen / J&J Psoriasis
Gantenerumab / Roche Alzheimer’s disease
Anetumab ravtansine (BAY94-9343) / Bayer Solid tumors
BHQ880 / Novartis Multiple myeloma
BI-836845 / BI Solid tumors
Bimagrumab (BYM338) / Novartis Musculoskeletal diseases
BPS804 / Mereo / Novartis Brittle bone syndrome
CNTO3157 / Janssen / J&J Inflammation
CNTO6785 / Janssen / J&J Inflammation
Elgemtumab (LJM716) / Novartis Cancer
MOR103 (GSK3196165) / GlaxoSmithKline Inflammation
MOR202 / not partnered Multiple myeloma
MOR208 / not partnered DLBCL, CLL/SLL
Tarextumab (OMP-59R5) / OncoMed Cancer
Tesidolumab (LFG316) / Novartis Eye disease
Utomilumab (PF-05082566) / Novartis Solid tumors
l e g e n d : mor progr am out- l icensed mor progr am partnered d iscovery progr am
M O S T A DVA N C E D D E V E LO P M E N T S TAG E
P R O G R A M / PA R T N E R I N D I C AT I O N
VAY736 / Novartis Inflammation
BAY1093884 / Bayer Hemophilia
MOR106 / Galapagos Atopic dermatitis
MOR209/ES414 / Aptevo Prostate cancer
NOV-7 / Novartis Eye disease
NOV-8 / Novartis Inflammation
NOV-9 / Novartis Diabetic eye disease
NOV-10 / Novartis Cancer
NOV-11 / Novartis Blood disorders
NOV-12 / Novartis Prevention of thrombosis
NOV-13 / Novartis Cancer
NOV-14 / Novartis Asthma
Vantictumab (OMP-18R5) / OncoMed Solid tumors
DIS
CO
VE
RY
PR
EC
LIN
IC
PH
AS
E 1
PH
AS
E 2
PH
AS
E 3
MA
RK
ET
DIS
CO
VE
RY
PR
EC
LIN
IC
PH
AS
E 1
PH
AS
E 2
PH
AS
E 3
MA
RK
ET
Product PipelineMorphoSys’s Product Pipeline (December 31, 2016)
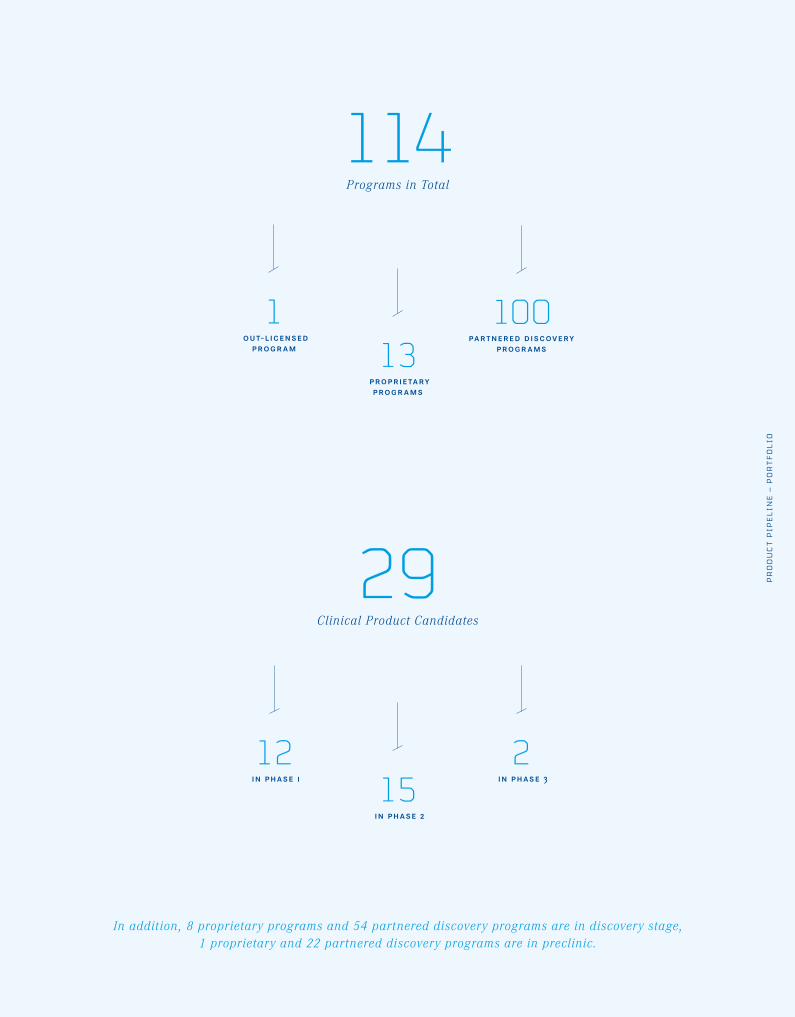
114Programs in Total
1 out- licensed
program
100partnered discovery
programs13 proprietary
programs
In addition, 8 proprietary programs and 54 partnered discovery programs are in discovery stage, 1 proprietary and 22 partnered discovery programs are in preclinic.
29Clinical Product Candidates
12 in phase 1
2 in phase 315
in phase 2
PRO
DU
CT P
IPEL
INE
– PO
RTF
OLI
O

PRO
DU
CT P
IPEL
INE
– PO
RTF
OLI
O
guselkumab
mor106
mor208
anetumab ravtansine
Find out more about four selected programs from our proprietary portfolio and our partnered pipeline. Learn about the compounds’ mode of action, about the diseases they target,
and see what experts have to say in our online magazine.
ht tp://reports.morphosys.com/20 16/

CON
TEN
TS
Engineering the Medicines of TomorrowOur mission is to make exceptional, innovative biopharmaceuticals to improve the lives of patients suffering from serious diseases. Our focus is on cancer. Innovative technologies and smart development strategies are central to our approach. Success is created by our people, who focus on excellence in all they do, collaborate closely across dis-ciplines and are driven by a desire to make the medicines of tomorrow a reality. Success benefits all of our stakeholders.

MorphoSys at a glance Figures, data, facts (December 31, 2016)
programs in
phase 1
programs in
discovery
programs in
preclinic
programs in
phase 3
programs in
phase 2
14 MOR Programs
13.5Years
market approval
Average period from project startthrough to market approval
project start
2
23
62
1215

CON
TEN
TS
40partnerships
with leading pharmaceutical and biotechnologycompanies as well as research organizations
17.5
78.7
95.7
2006
2015
2016
447 percent increase
in R&D expenses from 2006 to 2016 in total
Increase in R&D expenses from 2006 to 2016 in total (in million €)
31 nations
345 employees
≈
More than
12,000 patients
have been and are going to be treated in the near future with MorphoSys
antibodies in clinical trials


CON
TEN
TS
Phase 1
1
2
3
MOR106Focusing atopic dermatitis: The first Ylanthia antibody is in clinical development against this inflammatory skin disease.

In collaboration with our partner Galapagos, we develop the antibody against inflam-matory skin diseases. Find out more details in our online magazine.
http://reports.morphosys.com/2016/magazine/mor106

CON
TEN
TS


CON
TEN
TS
Phase 2
1
2
3
MOR208A potential new therapy for blood cancer:The therapeutic antibody is developed for the treatment of malignant B-cell diseases.

http://reports.morphosys.com/2016/magazine/mor208
MOR208 is being investigated in different clinical trials. Find out more about the characteristics of this antibody and about the indications to be treated in our online magazine.

CON
TEN
TS


CON
TEN
TS
Phase 2
1
2
3
ANETUMAB RAVTANSINEMesothelioma, a rare form of cancer, is often triggered by asbestos. Our partner Bayer is developing the antibody drug conjugate (ADC) in this and other indi cations.

http://reports.morphosys.com/2016/magazine/anetumab-ravtansine
The antibody drug conjugate (ADC) is based on MorphoSys’s HuCAL technology. Learn more about the compound and its clinical development in our online magazine.

CON
TEN
TS


CON
TEN
TS
Phase 3
1
2
3
GUSELKUMABFighting psoriasis: The fully human HuCAL antibody is developed by Janssen to treat various types of inflammatory skin diseases.

http://reports.morphosys.com/2016/magazine/guselkumab
Application for regulatory approval in Europe and the US has been submitted. Find more details about the compound in our online magazine.

CON
TEN
TS

Contents
12 A N N U A L R E P O R T 2016 Contents

CON
TEN
TS
the companyManagement Board of MorphoSys 14Letter to the Shareholders 14
group management reportOperations and Business Environment 19Analysis of Net Assets, Financial Position and Results of Operations 37Outlook and Forecast 46Shares and the Capital Market 51Sustainable Business Development 55Risk and Opportunity Report 62Statement on Corporate Governance and Corporate Governance Report 71
f inanc ial statementsConsolidated Statement of Income (IFRS) 96Consolidated Statement of Comprehensive Income (IFRS) 97Consolidated Balance Sheet (IFRS) 98Consolidated Statement of Changes in Stockholders’ Equity (IFRS) 100Consolidated Statement of Cash Flows (IFRS) 102Notes 104Responsibility Statement 144
addit ional informat ionAuditor’s Report 145Report of the Supervisory Board 146Supervisory Board of MorphoSys AG 150Senior Management Group of MorphoSys AG 152Glossary 154List of Figures and Tables 157Imprint 158
Contents A N N U A L R E P O R T 2016 13
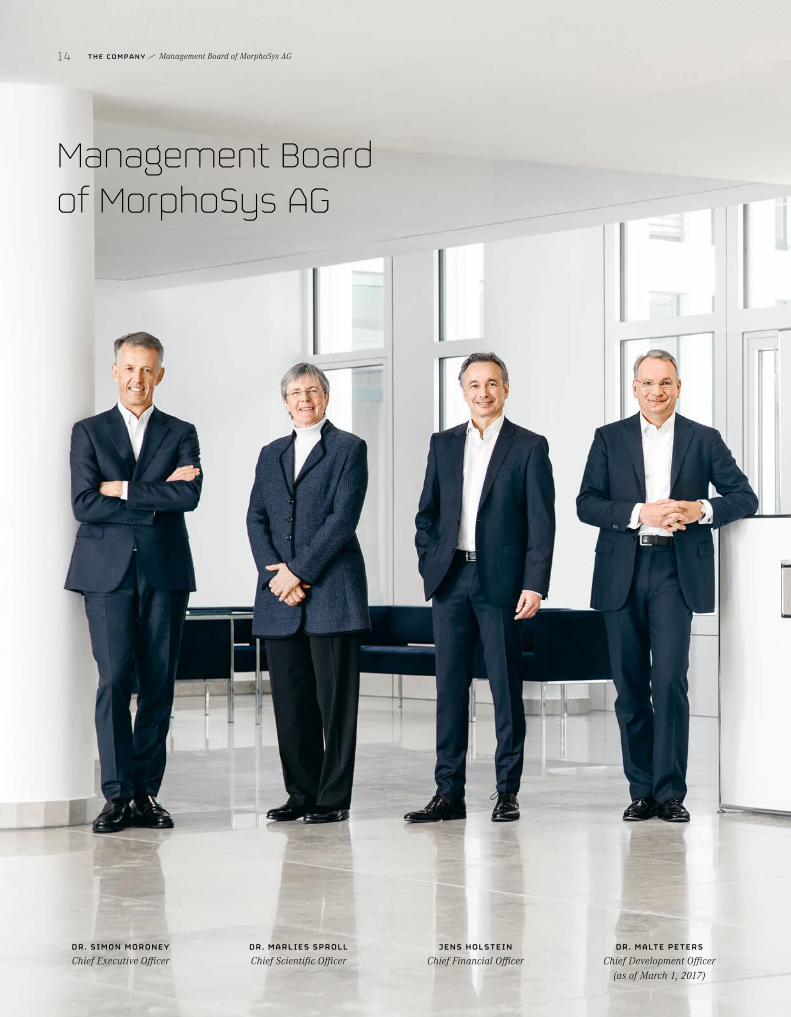
Management Board of MorphoSys AG
DR. SIMON MORONEYChief Executive Officer
DR. MARLIES SPROLLChief Scientific Officer
JENS HOL STEINChief Financial Officer
DR. MALTE PETERS Chief Development Officer
(as of March 1, 2017)
14 T H E C O M P A N Y Management Board of MorphoSys AG

Management Board of MorphoSys AG T H E C O M P A N Y 15
L E T T ER T O T HE SHAREHOL DERS
In 2016, we advanced our product pipeline, re- ported promising clinical data and strengthened our financial position. We are well prepared for a successful 2017.
DR. SIMON MORONEYChief Executive Officer
DR. MARLIES SPROLLChief Scientific Officer
JENS HOL STEINChief Financial Officer
DR. MALTE PETERS Chief Development Officer
(as of March 1, 2017)
Management Board of MorphoSys AG
14 T H E C O M P A N Y Management Board of MorphoSys AG
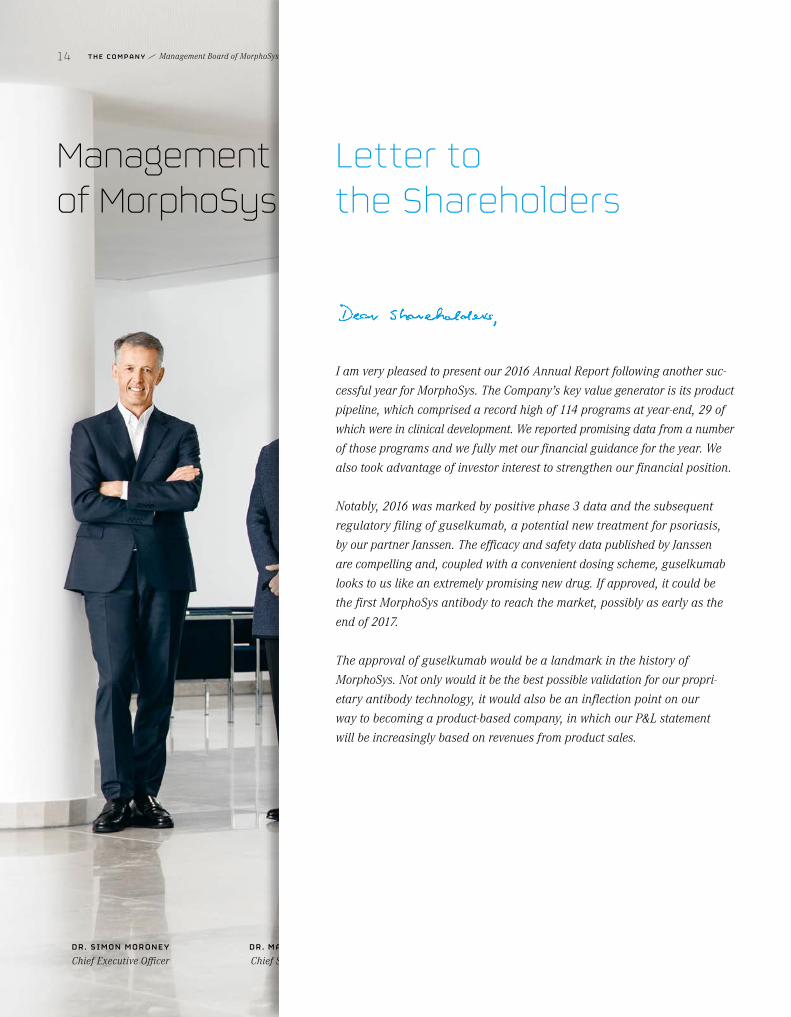
Letter to the Shareholders
I am very pleased to present our 2016 Annual Report following another suc-cessful year for MorphoSys. The Company’s key value generator is its product pipeline, which comprised a record high of 114 programs at year-end, 29 of which were in clinical development. We reported promising data from a number of those programs and we fully met our financial guidance for the year. We also took advantage of investor interest to strengthen our financial position.
Notably, 2016 was marked by positive phase 3 data and the subsequent regulatory filing of guselkumab, a potential new treatment for psoriasis, by our partner Janssen. The efficacy and safety data published by Janssen are compelling and, coupled with a convenient dosing scheme, guselkumab looks to us like an extremely promising new drug. If approved, it could be the first MorphoSys antibody to reach the market, possibly as early as the end of 2017.
The approval of guselkumab would be a landmark in the history of MorphoSys. Not only would it be the best possible validation for our propri-etary antibody technology, it would also be an inflection point on our way to becoming a product-based company, in which our P&L statement will be increasingly based on revenues from product sales.
Management Board of MorphoSys AG T H E C O M P A N Y 15
We continue to focus on executing our strategy of advancing our own port folio of promising programs in therapeutic areas with high unmet medical need. The emphasis is on oncology and inflammation, and our aim is to commer-cialize our own products in selected markets in the future. With the continued support of existing and new shareholders, we were pleased to announce at the end of the year a successful capital increase, raising EUR 115 million, and thereby significantly boosting our ability to execute this strategy.
Our Proprietary Development segment comprises our main value drivers. During 2016, we further increased our efforts to broaden and advance our portfolio, and we were pleased with the progress achieved during the year:
We began three phase 2 trials of our lead product MOR208, an Fc-enhanced antibody targeting CD19, in patients with B cell malignancies. We expect to transition one of these trials into a pivotal phase 3 study later this year, which would make MOR208 the first of our proprietary agents to enter the final stage of development.
MOR202, our anti-CD38 antibody for multiple myeloma, showed the potential we expect for an antibody in this exciting new target class. We reported very encouraging first efficacy in the highest dosing cohorts in combination with

DR. SIMON MORONEYChief Executive Officer
DR. MARLIES SPROLLChief Scientific Officer
JENS HOL STEINChief Financial Officer
DR. MALTE PETERS Chief Development Officer
(as of March 1, 2017)
Management Board of MorphoSys AG
14 T H E C O M P A N Y Management Board of MorphoSys AG
immunomodulatory drugs and confirmed MOR202’s best-in-class safety profile. We eagerly await more complete data from this program around mid-year 2017.
In collaboration with Galapagos, we brought MOR106 into the clinic. MOR106 is directed against IL-17C, a target which has been largely overlooked, but which plays an important role in inflammatory skin disorders, and is quite distinct from other members of the IL-17 cytokine family. By pursuing atopic dermatitis we are addressing an area of major unmet need, which is currently untapped by biologic therapies.
MOR103/GSK3196165, which is out-licensed to GSK, continues to progress through the clinic in two indications. Results from a phase 2b trial in rheuma-toid arthritis are anticipated during the second half of 2017.
At the close of 2016, five programs from our Proprietary Development segment were in the clinic. We have now expanded on this by bringing MOR107, the first product from our innovative lanthipeptide platform, into the clinic in February 2017.
Management Board of MorphoSys AG T H E C O M P A N Y 15
Led by guselkumab, our Partnered Discovery segment is nearing the point at which it becomes a royalty-based revenue generator for MorphoSys. Standing at 100 programs at the end of 2016, 24 of which were in clinical develop-ment, we are increasingly encouraged by the long-term value potential of this diverse portfolio.
Another significant event in this segment was Bayer’s start of a phase 2 study with the HuCAL-based antibody drug conjugate anetumab ravtansine in mesothelioma, a rare cancer with high unmet medical need. Bayer has indicated that this trial, which is expected to read out in 2017, could support a registration of the compound. We are extremely proud of all of our long- standing collaborations, and we are looking forward to further progress from the many programs with MorphoSys antibodies in this segment.
In 2017, the year of our 25th anniversary, we are in a very exciting stage of our corporate development. Over the past years MorphoSys successfully progressed from a leading provider of antibody technology to a discovery and development company with an extremely promising clinical portfolio. Now we are advancing towards the next stage, namely becoming a commercial, product-based biopharmaceutical company. The increasing visibility on the potential of our partnered discovery pipeline as a growing revenue source,

DR. SIMON MORONEYChief Executive Officer
DR. MARLIES SPROLLChief Scientific Officer
JENS HOL STEINChief Financial Officer
DR. MALTE PETERS Chief Development Officer
(as of March 1, 2017)
Management Board of MorphoSys AG
14 T H E C O M P A N Y Management Board of MorphoSys AG
dr. simon moroneyCHIEF EXECU T IVE OF F ICER
upcoming inflection points for our lead proprietary oncology programs entering decisive stages of clinical development, plus the financial strength to invest at the level required to maximize returns, mean that we are well positioned to build substantial value for all our stakeholders, including partners, investors and patients.
Of course, none of this would be possible without the dedication of our employees and therefore, on behalf of the MorphoSys management board and all our stakeholders, I would like to thank them for their continuing efforts and hard work. We are also very appreciative of our shareholders and thank you for your continued support. I look forward to a very successful 2017 for MorphoSys.

Management Board of MorphoSys AG T H E C O M P A N Y 15

Group Management Report
16 G R O U P M A N A G E M E N T R E P O R T Contents

1
2
3
4
5
6
7
1 Operations and Business Environment 192 Analysis of Net Assets, Financial Position and
Results of Operations 373 Outlook and Forecast 464 Shares and the Capital Market 515 Sustainable Business Development 556 Risk and Opportunity Report 627 Statement on Corporate Governance and
Corporate Governance Report 71
Contents G R O U P M A N A G E M E N T R E P O R T 17

In 2016, MorphoSys continued to build a broad, advanced and valuable pipeline of biopharmaceutical compounds as part of its strategic focus on the development of proprietary programs which are the Company’s main value drivers. We initiated three phase 2 trials with MOR208 in hemato-oncological indications, one of which is expected to transition into a pivotal phase 3 study in 2017. Our fifth proprietary program, MOR106, started clinical development in 2016 and was followed by MOR107 in February 2017 as the sixth proprietary program to enter clinical development. Programs in our Partnered Discovery segment also developed exceptionally well last year. Following positive phase 3 results, our partner Janssen submitted applications seeking regulatory approval for guselkumab for the treatment of psoriasis. If approved, this compound could become MorphoSys’s first marketed antibody and the basis for rising, royalty-based product sales, the proceeds of which could be reinvested in the future development of our proprietary port folio. We intend to con-tinue pursuing the path to becoming a fully integrated, commer-cial biopharmaceutical company specialized in oncology.
18 G R O U P M A N A G E M E N T R E P O R T

2
3
4
5
6
7
1Operations and Business Environment
Strategy and Group Management
STRATEGY AND OBJECTIVES MorphoSys’s goal is to make exceptional, innovative biopharma-ceuticals to improve the lives of patients suffering from serious diseases. With our sucessful transition from a technology provider to a drug development organization, we are well underway to reach our goal. This transition is supported by MorphoSys’s powerful technology platform for generating therapeutic antibodies. Mean-while, the Company has more than 100 drug candidates in devel-opment. Last year an application was submitted to the regulatory authorities for the first time seeking approval for an antibody based on MorphoSys’s proprietary technology. Most of the develop-ment programs are conducted in partnership with pharmaceutical and biotechnology companies. MorphoSys uses the revenues gen-erated from these partnerships to expand its proprietary develop-ment portfolio. This segment, which currently comprises 14 pro-grams, is gaining in importance and builds on top of an even broader pipeline of programs pursued with partners. Our high number of active development programs allow us to compensate for potential setbacks that may arise during the complex drug development process and help us to maximize the value of our technology.
The Proprietary Development segment focuses on developing therapeutic agents based on the Company’s proprietary technol-ogy platforms and candidates in-licensed from other companies. During clinical development, the Company determines whether and at which point it may pursue a partnership for later develop-ment and commercialization. The drug candidate can then be either completely out-licensed or developed further in cooperation with a
pharmaceutical or biotechnology company (co-development). In selected cases, individual projects may be developed on a propri-etary basis until they are ready for commercialization.
In the Partnered Discovery segment, MorphoSys generates anti-body* candidates for partners in the pharmaceutical and biotech-nology industries. MorphoSys receives contractual payments in-cluding license fees for technologies and funded research, as well as success-based milestone payments and royalties* on prod-uct sales. The funds generated from these partnerships support the Company’s long-term business model and help fund its propri-etary development activities.
Both segments are based on the Company’s innovative technolo-gies. Growth is driven mainly by HuCAL*, the industry’s most suc-cessful antibody library in terms of the number of clinical develop-ment candidates produced, and the follow-on platform Ylanthia*, which is today’s largest known library based on antibody Fab fragments. The acquisition of the biopharmaceutical company Lanthio Pharma B.V. in May 2015 secured for MorphoSys access to an innovative platform of therapeutic peptides. Additionally, the Company uses its financial resources to expand and deepen its technological base, for example through in-licensing. The in-li-censed programs MOR208 and MOR209/ES414 and the acquisition of Lanthio Pharma are good examples of how we are successfully implementing this strategy.*SEE GL OSSARY – page 154
1
Operations and Business Environment G R O U P M A N A G E M E N T R E P O R T 19

The Company’s goal is to maximize the portfolio’s full value by investing in proprietary drug candidates while maintaining finan-cial discipline and strict cost control to ensure increasing enter-prise value.
GROUP MANAGEMENT AND PERFORMANCE INDICATORSMorphoSys pays equal attention to financial and non-financial in-dicators when steering the Group. These indicators help to monitor the success of strategic decisions and give the Company the oppor-tunity to take quick corrective action when necessary. The Com-pany’s management also monitors and evaluates selected early indicators so that it can thoroughly assess a project’s progress and act promptly when problems occur.
FINANCIAL PERFORMANCE INDICATORS
Our financial performance indicators are described in detail in the section “Analysis of Net Assets, Financial Position and Results of Operations.” Earnings before interest and taxes (EBIT), revenues,
operating expenses, segment results and liquidity are the key financial indicators we use to measure our operating performance. Segment performance is reviewed monthly, and the budget for the current financial year is revised and updated on a quarterly basis. Every year, the Company prepares a mid-term plan for the three subsequent years. A thorough cost analysis is prepared regularly and used to monitor the Company’s adherence to financial targets and make comparisons to previous periods.
MorphoSys’s business performance is influenced by factors such as milestone and license payments, research and development ex-penses, other operating cash flows*, existing liquidity resources, expected cash inflows and working capital. These indicators are also routinely analyzed and evaluated with special attention being paid to the income statement, existing and future liquidity and available investment opportunities. The net present value of in-vestments is calculated using discounted cash flow models*.
01 TAB L EDevelopment of Financial Performance Indicators1
in million € 2016 2015 2014 2013 2012
MORPHOSYS GROUP
Revenues from continuing operations2 49.7 106.2 64.0 78.0 51.9
Operating expenses from continuing operations 109.8 93.7 70.1 67.9 49.8
EBIT (Earnings before interest and taxes) from continuing operations3 (59.9) 17.2 (5.9) 9.9 2.4
Liquidity 359.5 298.4 352.8 390.7 135.7
PROPRIETARY DEVELOPMENT
Segment revenues 0.6 59.9 15.0 26.9 7.0
Segment EBIT (77.6) 10.7 (18.4) (0.5) (11.0)
PARTNERED DISCOVERY
Segment revenues 49.1 46.3 49.0 51.0 44.7
Segment EBIT 31.0 20.4 25.9 25.4 23.0
1 Differences may occur due to rounding.2 Revenues from discontinued operations 2013 – 2012: 2013: € 0.6 million; 2012: € 17.7 million. 3 Contains unallocated expenses (see also Item 3.3 of the Notes): 2016: € 13.4 million; 2015: € 13.9 million; 2014: € 13.4 million; 2013: € 15.0 million; 2012: € 9.6 million.
20 G R O U P M A N A G E M E N T R E P O R T Operations and Business Environment

2
3
4
5
6
7
NON-FINANCIAL PERFORMANCE INDICATORS
For reporting purposes, MorphoSys uses the Sustainable Develop-ment Key Performance Indicators (SD KPIs*) recommended by the SD KPI standard. These indicators include success in proprietary research and development (SD KPI 1) and achievements in part-nered programs as benchmarks for the commercialization rate (SD KPI 2). In the past five years, there have been no product recalls, fines or settlements as the result of product safety or product lia-bility disputes (SD KPI 3).
To secure its lead in the market for therapeutics, MorphoSys relies on the steady progress of its product pipeline, not only in terms of the number of therapeutic antibody candidates (114 at the end of the reporting year) but also based on the progress of its develop-ment pipeline and prospective market potential. Because success-
ful products are based on superior technologies, another key per-formance indicator is the progress of the Company’s technology development. In addition to the quality of our research and devel-opment, our professional management of partnerships is also a core element of our success and refers to new contracts as well as the continued strategic development of existing alliances. Details on these performance indicators can be found in the section “Re-search and Development and Business Performance” (page 27).
The non-financial performance indicators described in the section “Sustainable Business Development” (page 55) are also used to manage the MorphoSys Group successfully.*SEE GL OSSARY – page 154
02 TAB L ESustainable Development Key Performance Indicators (SD KPIs) at MorphoSys (December 31)
2016 2015 2014 2013 2012
PROPRIETARY DEVELOPMENT (NUMBER OF INDIVIDUAL ANTIBODIES)
Programs in Discovery 8 8 5 3 2
Programs in Preclinic 1 2 2 0 0
Programs in Phase 1 2 1 1 1 1
Programs in Phase 21 3 3 2 2 2
TOTAL1 14 14 10 6 5
PARTNERED DISCOVERY (NUMBER OF INDIVIDUAL ANTIBODIES)
Programs in Discovery 54 43 40 37 34
Programs in Preclinic 22 25 25 22 20
Programs in Phase 1 10 9 8 6 8
Programs in Phase 2 12 9 8 8 6
Programs in Phase 3 2 3 3 2 1
TOTAL 100 89 84 75 69
R&D EXPENSES (IN MILLION € )
R&D Expenses on Behalf of Partners 17.2 22.1 19.6 17.5 16.0
Proprietary Development Expenses 77.1 54.1 33.5 27.5 18.1
Expenses for Technology Development 1.4 2.5 2.9 4.2 3.6
TOTAL 95.7 78.7 56.0 49.2 37.7
1 Thereof one out-licensed program: MOR103/GSK3196165, out-licensed to GSK.
Operations and Business Environment G R O U P M A N A G E M E N T R E P O R T 21

LEADING INDICATORS
MorphoSys monitors a variety of leading indicators to monitor the macroeconomic environment, the industry and the Company itself on a monthly basis. At the Company level, economic data is gathered on the progress of the segments’ individual programs. MorphoSys uses general market data and external financial reports to acquire information on early macroeconomic indicators, such as industry transactions, changes in the legal environment and the availabil-ity of research funds, and reviews this data carefully.
For active collaborations, there are joint steering committees that meet regularly to update and monitor the programs’ progress. These ongoing reviews give the Company a chance to intervene early when there are any negative developments and provide it with information on expected milestones and related payments well in advance. Partners in non-active collaborations regularly provide a written report to MorphoSys so that we can follow the progress of ongoing therapeutic programs.
The business development area uses market analyses to get an indication of the market’s demand for new technologies. By con-tinuously monitoring the market, MorphoSys can quickly respond to trends and requirements and initiate its own activities or part-nerships.
Before a therapeutic product is developed, a target product profile* (TPP) is created and continually updated during the development process. This approach gives an early indication of the properties the product should possess to be successful in the market and answers important questions, such as the level of efficacy to be achieved and whether development should be focused on improv-ing the safety profile or changing the drug candidate’s dosage form. The TPP also includes a detailed description of how the prod-uct could be positioned in the market and the relevant patient groups. By continuously monitoring the criteria and their fulfill-ment, the Company can always take the key factors into account during product development and respond promptly to any changes.
Organizational Structure
ORGANIZATION OF THE MORPHOSYS GROUPThe MorphoSys Group, consisting of MorphoSys AG and its sub-sidiaries, develops and commercializes high-quality antibodies for therapeutic applications. The activities of the Group’s two busi-ness segments are based on leading-edge proprietary technolo-gies. The Proprietary Development segment combines all of the Company’s proprietary research and development of therapeutic compounds. MorphoSys initially develops its proprietary and in- licensed compounds independently with the option to bring them into partnerships or out-license them. As of January 1, 2016, the development of proprietary technologies is now also conducted in this segment. The second business segment, Partnered Discovery, uses MorphoSys’s cutting-edge technologies to make human anti-body-based therapeutics on behalf of partners in the pharmaceu-tical industry. All business activities within the scope of these collaborations are reflected in this segment.
In the 2016 financial year, the Group was located at MorphoSys AG’s registered office, first in the Martinsried district, since autumn in the Steinkirchen district of the municipality of Planegg near Mu-nich, where also MorphoSys’s subsidiary Sloning BioTechnology GmbH is located, and in Groningen, the Netherlands, which is the location of its subsidiary Lanthio Pharma B.V. and its subsidiary LanthioPep B.V. In autumn 2016, MorphoSys AG moved to the Group’s new headquarters, which is also located in the municipal-ity of Planegg near Munich. The central corporate functions such as accounting, controlling, human resources, legal, patent, corpo-rate communications and investor relations, as well as the two seg-ments Proprietary Development and Partnered Discovery, are lo-cated at these new headquarters. The subsidiary Lanthio Pharma B.V. and its subsidiary LanthioPep B.V. in Groningen, the Nether-lands, are largely autonomous and independently managed. These subsidiaries have their own research and development laborato-ries, general management and administration, as well as human resources, accounting and business development departments.
Additional information on the Group’s structure can be found in the Notes (Item 2.2.1).
LEGAL STRUCTURE OF THE MORPHOSYS GROUP: GROUP MANAGEMENT AND SUPERVISIONMorphoSys AG, a German stock corporation listed in the Prime Standard segment of the Frankfurt Stock Exchange, is the parent company of the MorphoSys Group. In accordance with the Ger-man Stock Corporation Act, the Company has a dual management structure with the Management Board as the governing body,
22 G R O U P M A N A G E M E N T R E P O R T Operations and Business Environment

2
3
4
5
6
7
whose four members are appointed and supervised by the Super-visory Board. The Supervisory Board is elected by the Annual General Meeting and currently consists of six members. Detailed information concerning the Group’s management and control and its corporate governance principles can be found in the Corporate Governance Report. The Senior Management Group, consisting of 22 managers from various departments, supports the Manage-ment Board of MorphoSys AG.
Business Activities
DRUG DEVELOPMENTMorphoSys develops drugs using its own research and develop-ment (R&D) and in cooperation with pharmaceutical and biotech-nology partners. Our core business activity is developing new treatments for patients suffering from serious diseases. The Com-pany possesses one of the broadest pipelines in the biotechnology industry with 114 individual therapeutic antibody programs at the end of 2016, 29 of which are in clinical development. Figure 1 shows the revenues of the MorphoSys Group, divided into the busi-ness segments Proprietary Development and Partnered Discovery.
TECHNOLOGIESMorphoSys has developed a number of technologies providing di-rect access to fully human* antibodies for treating diseases. One of the most widely known MorphoSys technologies is HuCAL, which is a collection of billions of fully human antibodies and a system for their optimization. Another is Ylanthia, which rep-resents the next generation of antibody technology and is cur-rently the largest known antibody library in Fab format*. Ylanthia is based on an innovative concept for generating highly specific and fully human antibodies. MorphoSys expects Ylanthia to set a new standard for the pharmaceutical industry’s development of therapeutic antibodies in this decade and beyond. Slonomics* gives MorphoSys a patented, fully automated technology for gene synthesis and modification for generating highly diverse gene libraries in a controlled process. The lanthipeptide* technology developed by Lanthio Pharma B.V., a fully owned MorphoSys sub-sidiary, is a valuable addition to our existing library of antibodies and opens up new possibilities for discovering potential drugs based on stabilized peptides.›› SEE F IGURE 01 – Revenues of the MorphoSys Group by Segment (page 24)›› SEE F IGURE 02 – MorphoSys’s Product Pipeline (page 26)
PROPRIETARY DEVELOPMENTAn important goal of MorphoSys is to increase enterprise value through the proprietary development of therapeutic programs. To achieve this goal, the Company is focusing on cancer indications and selected programs in inflammatory diseases.
ONCOLOGY
The ability of monoclonal antibodies* to bind with specific anti-gens* on tumors, and unleash a therapeutic effect in patients, has led to their dominant role in targeted cancer therapies. According to a study by the QuintilesIMS Institute, expenditure in oncology is expected to be approximately US$ 75 billion worldwide in 2016 and increase to US$ 120–135 billion in the year 2021. MorphoSys is currently investing in the clinical development of three cancer programs: MOR208, MOR202 and MOR209/ES414.
MOR208 is directed against the target* molecule CD19*, which is implicated in many B cell malignancies. The market research firm Decision Resources expects the therapeutic market for the B cell malignancy non-Hodgkin’s lymphoma (NHL*) to reach approxi-mately US$ 19 billion in 2025. Current biological therapies for the treatment of B cell malignancies, including the blockbuster rituximab (trade name Rituxan®), obinutuzumab (trade name Gazyva®) and ofatumumab (trade name Arzerra®) are directed against the CD20* target molecule. Because the target molecule CD19 is expressed on a larger number of B cell subtypes, CD19 antibodies may offer a more promising therapeutic approach. The activity of MOR208 is enhanced by a modification in the Fc part* of the antibody, which is intended to lead to higher antibody-de-pendent cell-mediated cytotoxicity (ADCC*) and an improvement in antibody-dependent cellular phagocytosis (ADCP*), and thereby more effective tumor cell killing. The most advanced therapeutic approach against CD19 is currently the bispecific* antibody blina-tumomab (trade name Blincyto®) approved for acute lymphoblastic leukemia (ALL*). Other clinical programs directed against the same target molecule use alternative approaches to increase the antibody’s efficacy, for example by coupling with toxic substances or changing the antibody’s glycosylation pattern. Another thera-peutic approach against CD19 is the CAR-T* technology. This ther-apy extracts a certain type of immune cells (T cells*) from the pa-tients’ blood that are then altered outside of the body so that they can be better directed to the patients’ tumor cells and kill them. When these T cells are later re-administered into the patients’ blood via infusion, they subsequently bind and destroy targeted cancer cells. Alternative approaches using small molecules* are also being developed in the field of B cell malignancies.*SEE GL OSSARY – page 154
Operations and Business Environment G R O U P M A N A G E M E N T R E P O R T 23

0.6
49.144.7
51.0
26.9
15.0
49.046.3
64.0 49.751.91 78.01 106.2
partnered discovery proprietary development
20162012 2013 2014 2015
T O TAL
7.0
59.9
1 Group revenues from continuing operations; Sale of AbD Serotec to Bio-Rad was announced in 2012, and therefore respective revenues were reclassifi ed as dis-continued operations in accordance with IFRS 5.
F I G URE
01Revenues of the MorphoSys Group by Segment (in million €)
MOR202 is directed against the CD38* target molecule and is currently being developed for the treatment of multiple myeloma* (MM). After MorphoSys regained its rights to MOR202 from Cel-gene in March 2015, the Company continued developing MOR202 independently. Although MM is a relatively small area of oncology in terms of frequency of occurrence, the MM market has shown strong growth in recent years. Significant achievements in clinical practice and the introduction of effective new treatments have helped the market expand. However, there is still untapped market potential in terms of therapies that have better survival rates and lower side effects compared to currently available compounds. Despite significantly higher survival rates, the disease is seldom curable and a majority of patients experience a relapse. This has increased the attractiveness of alternative treatments, such as those targeting CD38. The approval of the CD38 antibody daratumumab (trade name Darzalex®) by the FDA* (Food and Drug Administra-tion) in November 2015 validated this treatment approach.
MorphoSys and its partner Aptevo Therapeutics (formerly Emer-gent BioSolutions) have been developing MOR209/ES414 since 2015 in a phase 1 clinical study in patients suffering from meta-static castration-resistant prostate cancer (mCRPC*). MOR209/ES414 is a bispecific anti-PSMA/anti-CD3* antibody based on Aptevo’s (formerly Emergent) ADAPTIR™ platform (modular pro-tein technology). The immunotherapeutic protein* is intended to activate the body’s T cell immune response against prostate can-cer cells bearing prostate specific membrane antigen (PSMA), an antigen commonly over-expressed in this tumor. The anti-CD3 binding domains of the compound selectively bind to the T cell receptor on cytotoxic T cells, which become activated when the anti-PSMA binding domains crosslink them to the cancer cells. Prostate cancer is the most commonly occurring cancer in men with approximately 900,000 new cases annually worldwide. As preclinical* in vitro and in vivo studies have shown, MOR209/ES414 redirects T cell cytotoxicity toward prostate cancer cells ex-pressing PSMA.
24 G R O U P M A N A G E M E N T R E P O R T Operations and Business Environment
2
3
4
5
6
7
INFLAMMATORY AND AUTOIMMUNE DISEASES*
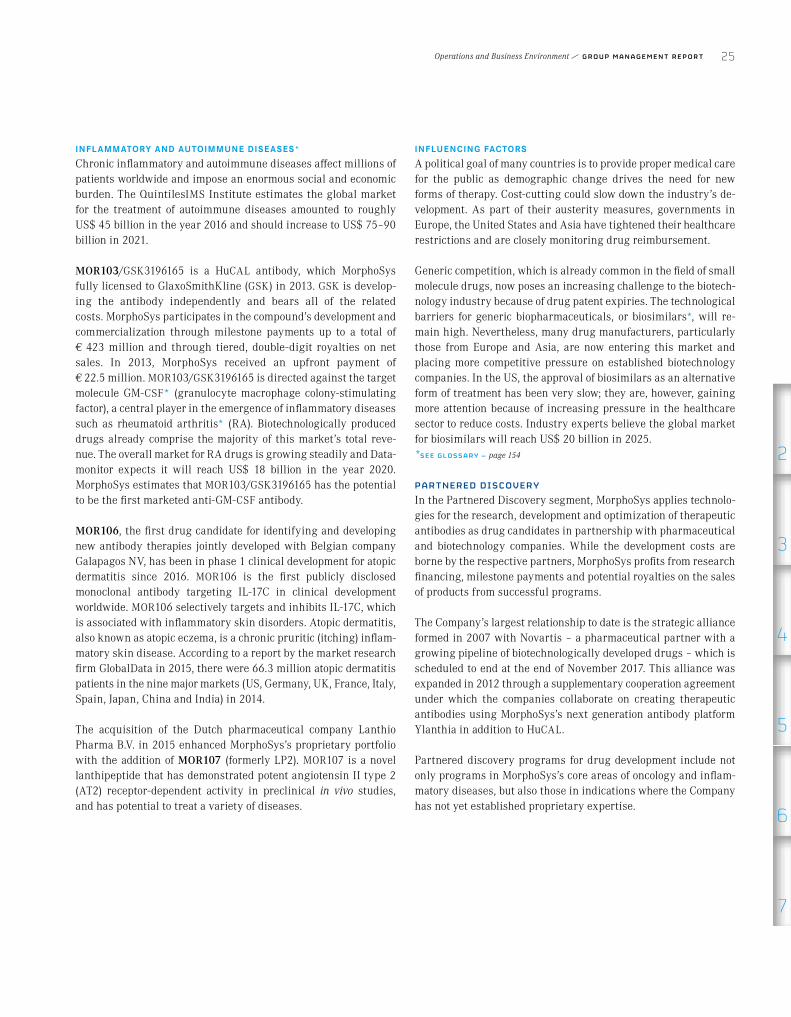
Chronic inflammatory and autoimmune diseases affect millions of patients worldwide and impose an enormous social and economic burden. The QuintilesIMS Institute estimates the global market for the treatment of autoimmune diseases amounted to roughly US$ 45 billion in the year 2016 and should increase to US$ 75–90 billion in 2021.
MOR103/GSK3196165 is a HuCAL antibody, which MorphoSys fully licensed to GlaxoSmithKline (GSK) in 2013. GSK is develop-ing the antibody independently and bears all of the related costs. MorphoSys participates in the compound’s development and commercialization through milestone payments up to a total of € 423 million and through tiered, double-digit royalties on net sales. In 2013, MorphoSys received an upfront payment of € 22.5 million. MOR103/GSK3196165 is directed against the target molecule GM-CSF* (granulocyte macrophage colony-stimulating factor), a central player in the emergence of inflammatory diseases such as rheumatoid arthritis* (RA). Biotechnologically produced drugs already comprise the majority of this market’s total reve-nue. The overall market for RA drugs is growing steadily and Data-monitor expects it will reach US$ 18 billion in the year 2020. MorphoSys estimates that MOR103/GSK3196165 has the potential to be the first marketed anti-GM-CSF antibody.
MOR106, the first drug candidate for identifying and developing new antibody therapies jointly developed with Belgian company Galapagos NV, has been in phase 1 clinical development for atopic dermatitis since 2016. MOR106 is the first publicly disclosed monoclonal antibody targeting IL-17C in clinical development worldwide. MOR106 selectively targets and inhibits IL-17C, which is associated with inflammatory skin disorders. Atopic dermatitis, also known as atopic eczema, is a chronic pruritic (itching) inflam-matory skin disease. According to a report by the market research firm GlobalData in 2015, there were 66.3 million atopic dermatitis patients in the nine major markets (US, Germany, UK, France, Italy, Spain, Japan, China and India) in 2014.
The acquisition of the Dutch pharmaceutical company Lanthio Pharma B.V. in 2015 enhanced MorphoSys’s proprietary portfolio with the addition of MOR107 (formerly LP2). MOR107 is a novel lanthipeptide that has demonstrated potent angiotensin II type 2 (AT2) receptor-dependent activity in preclinical in vivo studies, and has potential to treat a variety of diseases.
INFLUENCING FACTORS
A political goal of many countries is to provide proper medical care for the public as demographic change drives the need for new forms of therapy. Cost-cutting could slow down the industry’s de-velopment. As part of their austerity measures, governments in Europe, the United States and Asia have tightened their healthcare restrictions and are closely monitoring drug reimbursement.
Generic competition, which is already common in the field of small molecule drugs, now poses an increasing challenge to the biotech-nology industry because of drug patent expiries. The technological barriers for generic biopharmaceuticals, or biosimilars*, will re-main high. Nevertheless, many drug manufacturers, particularly those from Europe and Asia, are now entering this market and placing more competitive pressure on established biotechnology companies. In the US, the approval of biosimilars as an alternative form of treatment has been very slow; they are, however, gaining more attention because of increasing pressure in the healthcare sector to reduce costs. Industry experts believe the global market for biosimilars will reach US$ 20 billion in 2025.*SEE GL OSSARY – page 154
PARTNERED DISCOVERYIn the Partnered Discovery segment, MorphoSys applies technolo-gies for the research, development and optimization of therapeutic antibodies as drug candidates in partnership with pharmaceutical and biotechnology companies. While the development costs are borne by the respective partners, MorphoSys profits from research financing, milestone payments and potential royalties on the sales of products from successful programs.
The Company’s largest relationship to date is the strategic alliance formed in 2007 with Novartis – a pharmaceutical partner with a growing pipeline of biotechnologically developed drugs – which is scheduled to end at the end of November 2017. This alliance was expanded in 2012 through a supplementary cooperation agreement under which the companies collaborate on creating therapeutic antibodies using MorphoSys’s next generation antibody platform Ylanthia in addition to HuCAL.
Partnered discovery programs for drug development include not only programs in MorphoSys’s core areas of oncology and inflam-matory diseases, but also those in indications where the Company has not yet established proprietary expertise.
Operations and Business Environment G R O U P M A N A G E M E N T R E P O R T 25

mor program out- l icensed mor program partnered discovery program 1 market
*SEE GL OSSARY – page 154
F I G URE
02MorphoSys’s Product Pipeline (December 31, 2016)
P R O G R A M / PA R T N E R I N D I C AT I O N PHASE 1 2 3 M 1
Guselkumab (CNTO1959) / Janssen / J&J Plaque psoriasis (VOYAGE 1) Plaque psoriasis (VOYAGE 2) Plaque psoriasis (NAVIGATE) Pustular/Erythrodermic psoriasis* Plaque psoriasis Plaque psoriasis (POLARIS) Palmoplantar pustulosis* Psoriatic arthritis* (PsA)
Gantenerumab / Roche Mild Alzheimer’s disease (Marguerite RoAD) Prodromal Alzheimer’s disease Genetically predisposed for Alzheimer’s disease (DIAN) Safety, tolerability, pharmacokinetics (sc)
Anetumab ravtansine (BAY94-9343) / Bayer Mesothelioma* (MPM) Mesothelin-expressing lung adenocarcinoma Solid tumors Advanced malignancies (Japan) Ovarian cancer Solid tumors with hepatic/renal impairment ECG & drug interaction
BHQ880 / Novartis Multiple myeloma* (renal insuffi ciency) Smoldering multiple myeloma*
BI-836845 / BI Breast cancer Castration-resistant prostate cancer (CRPC) Solid tumors (Japan) EGFR* mutant non-small cell lung cancer (NSCLC)
Bimagrumab (BYM338) / Novartis Muscular atrophy hip fracture surgery Sarcopenia (dose-ranging) Sarcopenia (withdrawal extension study) Type 2 diabetes
BPS804 / Mereo / Novartis Osteoporosis Hypophosphatasia (HPP) Brittle bone disease
CNTO3157 / Janssen / J&J Asthma Safety and pharmacokinetic
CNTO6785 / Janssen / J&J Chronic obstructive pulmonary disease (COPD*) Rheumatoid arthritis*
Elgemtumab (LJM716) / Novartis ESCC HER2+ cancer (combo with BYL719 & trastuzumab) HER2+ cancer (combo with trastuzumab)
MOR103 (GSK3196165) / GlaxoSmithKline Rheumatoid arthritis* Rheumatoid arthritis* (mechanistic study) Hand osteoarthritis
MOR202 / not partnered Multiple myeloma *
P R O G R A M / PA R T N E R I N D I C AT I O N PHASE 1 2 3 M 1
MOR208 / not partnered CLL* or SLL* (COSMOS*) DLBCL* (B-MIND*) DLBCL* (L-MIND*) CLL* (IIT*-study)
Tarextumab (OMP-59R5) / OncoMed Small cell lung cancer (PINNACLE) Solid tumors
Tesidolumab (LFG316) / Novartis Age-related geographic atrophy Geographic atrophy Panuveitis Paroxysmal nocturnal hemoglobinuria Transplant associated microangiopathy Renal disease patients awaiting kidney transplant
Utomilumab (PF-05082566) / Novartis Solid tumors (JAVELIN medley)
(combo with avelumab) Solid tumors, NHL* (combo with rituximab) Solid tumors (combo with pembrolizumab) Solid tumors (combo with mogamulizumab) Solid tumors (combo with PF04518600)
VAY736 / Novartis Pemphigus vulgaris Primary Sjögren‘s syndrome Rheumatoid arthritis*
BAY1093884 / Bayer Hemophilia
MOR106 (Galapagos) Atopic dermatitis
MOR209/ES414 / Aptevo P rostate cancer (mCRPC*)
NOV-7 / Novartis Eye disease
NOV-8 / Novartis Infl ammation
NOV-9 / Novartis Diabetic eye disease
NOV-10 / Novartis Cancer
NOV-11 / Novartis Blood disorders
NOV-12 / Novartis Prevention of thrombosis
NOV-13 / Novartis Cancer
NOV-14 / Novartis Asthma
Vantictumab (OMP-18R5) / OncoMed Breast cancer Pancreatic cancer Non-small-cell lung carcinoma (NSCL)
26 G R O U P M A N A G E M E N T R E P O R T Operations and Business Environment

2
3
4
5
6
7
Examples of partnered discovery programs include:
Guselkumab, a HuCAL antibody targeting IL-23, is being devel-oped by MorphoSys’s partner Janssen in plaque psoriasis and psoriatic arthritis (PsA). In November 2016, Janssen submitted an application seeking approval of guselkumab for the treatment of moderate to severe plaque psoriasis in the US and Europe. If ap-proved, guselkumab would be the first marketed HuCAL antibody. Psoriasis is a chronic, autoimmune inflammatory disorder charac-terized by abnormal itching and physically painful skin areas. It is estimated that as many as 125 million people worldwide have psoriasis with approximately 25 % suffering from cases that are considered moderate to severe. Independent market experts fore-cast the market for psoriasis to grow from € 7.5 billion in 2014 to € 12 billion in the year 2024.
Anetumab ravtansine (BAY 94-9343), a HuCAL antibody-drug conjugate (ADC) against the target mesothelin, is a potential treat-ment for mesothelioma and other solid tumors which is being de-veloped by Bayer. Bayer believes if the potentially pivotal phase 2 study in mesothelioma, which started in early 2016, shows posi-tive results, the next step could be an application for regulatory approval. Mesothelioma is a tumor that develops in the lungs pri-marily as a result of exposure to asbestos. Bayer highlighted this program (as a Lighthouse Project) in September 2016 as a promis-ing compound with extraordinary potential. Bayer believes the peak sales potential for this compound is in excess of € 2 billion per year.
Utomilumab (PF-05082566) is a HuCAL antibody developed by Pfizer in the field of immuno-oncology. The compound is directed against the target 4-1BB (CD137) on T cells and is currently being tested in several phase 1/2 clinical trials in both solid and hemato-logical tumors. According to Pfizer, preclinical findings show the combination of utomilumab with checkpoint inhibitors could strengthen the immune response against cancer.
Gantenerumab is a HuCAL antibody developed by MorphoSys’s partner Roche targeting amyloid beta. It adds a potential treatment for Alzheimer’s disease to MorphoSys’s pipeline. This compound is being investigated in several clinical studies to see if there is a positive effect from intervening at an early stage in the disease’s progression. In two of these studies, Roche is evaluating the com-pound in around 1,000 patients with mild Alzheimer’s disease and 800 patients with prodromal Alzheimer’s disease. Roche has con-verted these trials into open-label studies to test higher doses after the temporary discontinuation of earlier studies at the end of 2014. There are currently no drugs that fundamentally improve the course of Alzheimer’s disease.
INNOVATION CAPITAL*Several years ago, MorphoSys started its Innovation Capital initia-tive to combine the traditional investment approach of an industry partner with the cooperative elements of compound development as flexibly as possible. This allowed the Company to make selec-tive investments in promising young companies whose products and technologies may potentially benefit MorphoSys. One example for this initiative is the investment in Lanthio Pharma in 2012 and the acquisition of the all remaining shares in the company in 2015.*SEE GL OSSARY – page 154
Research and Development and Business Performance
2016 BUSINESS PERFORMANCEMorphoSys’s business is strongly focused on advancing its thera-peutic programs in research and development to increase the Com-pany’s value. With the clinical development of proprietary pro-grams as the focal point of the Company, we strive to gain access to novel disease-specific target molecules, advanced product can-didates and innovative technology platforms to expand our pro-prietary development pipeline. MorphoSys also participates in the development success of its partners’ therapeutic programs. The first of these antibodies based on MorphoSys’s technology is ap-proaching the market.
The key measures of value and success of MorphoSys’s research and development include: • collaborations and partnerships with other companies to broaden
the Company’s technology base and pipeline of compounds and commercialize its therapeutic programs
• the initiation of projects and the progression of individual devel-opment programs
• clinical and preclinical research results • regulatory guidance of health authorities to pursue commercial-
ization of individual therapeutic programs • robust patent protection to secure MorphoSys’s market position
COLLABORATIONS AND PARTNERSHIPSPROPRIETARY DEVELOPMENT
In May 2016, MorphoSys and the University of Texas MD Anderson Cancer Center announced a long-term strategic alliance. With MorphoSys applying its Ylanthia technology platform, the part-ners plan to work together to identify, validate and develop novel anti-cancer antibodies up to the clinical proof of concept. The alliance aims to investigate numerous targets in a variety of on-cology indications. MorphoSys and MD Anderson will conduct early clinical studies of therapeutic antibody candidates after which MorphoSys has the option to continue developing selected antibodies in later stages of clinical development for its own pro-prietary pipeline.
Operations and Business Environment G R O U P M A N A G E M E N T R E P O R T 27

29 29
19
25
12 10
2016
PHASE
1 2 3
2012
116
1
2013
24
16
3
2014
2427
8
2015
F I G URE
03Active Clinical Studies* with MorphoSys Anti-bodies (December 31)
*SEE GL OSSARY – page 154
PARTNERED DISCOVERY
In November 2016, MorphoSys and LEO Pharma announced a stra-tegic alliance for the discovery and development of therapeutic antibodies for the treatment of skin diseases. The objective of the alliance is to identify novel, antibody-based therapeutics for un-met medical needs that will be valuable additions to both com-panies’ development pipelines. MorphoSys will apply its Ylanthia technology platform to generate fully human antibody candidates against the targets selected by LEO Pharma and will conduct all development activities up to the start of clinical testing. LEO Pharma will be responsible for clinical development and commer-cialization of resulting drugs in all indications outside of cancer. In skin cancer indications, MorphoSys will have options to co- develop and, in Europe, co-promote the respective antibody drugs. In addition, MorphoSys will have certain options to develop and commercialize therapeutic programs arising from the collabora-tion in other cancer indications. MorphoSys will receive R&D fund-ing as well as success-based development, regulatory and com-mercial milestone payments, plus royalties on net sales of drugs commercialized by LEO Pharma. Assuming all development, regu-latory and sales objectives are achieved, milestone payments could add up to € 111.5 million per antibody program.
PROJECT INITIATIONS AND PROGRESS, TRIAL EXTENSIONS During the 2016 financial year, the number of therapeutic pro-grams in the MorphoSys pipeline grew to a total of 114 (December 31, 2015: 103 programs) Proprietary Development and Partnered Discovery projects. At the end of 2016, MorphoSys had 14 projects (December 31, 2015: 14) in its Proprietary Development portfolio,
five of which were in clinical development and nine in preclinical development or the discovery phase. The number of programs be-ing pursued by our partners in the Partnered Discovery segment grew to a total of 100 (December 31, 2015: 89), 24 of which were in clinical development, 22 in preclinical development and 54 in the discovery phase. MorphoSys’s partnered and proprietary clinical pipeline currently comprises 29 unique antibody molecules that are being evaluated in more than 60 clinical trials.›› SEE F IGURE 03 – Active Clinical Studies with MorphoSys Antibodies (page 28)
PROPRIETARY DEVELOPMENT
Based on clinical results obtained with MOR208, MorphoSys initi-ated a phase 2 trial program in 2016 for its further development in combination with other cancer drugs for B-cell-based malignancies. • A trial initiated in April 2016 is evaluating MOR208 in combina-
tion with lenalidomide in patients suffering from relapsed or re-fractory diffuse large B cell lymphoma (DLBCL) (L-MIND study). The trial is designed as an open-label, single-arm study with the primary endpoint being the overall response rate (ORR) and mul-tiple secondary endpoints, including progression-free survival (PFS), overall survival (OS) and time to progression (TTP). In Au-gust 2016, MorphoSys announced the successful completion of the safety run-in phase of the L-MIND trial. No unexpected safety signals were detected and the trial was continued as planned.
28 G R O U P M A N A G E M E N T R E P O R T Operations and Business Environment

2
3
4
5
6
7
• In September 2016, MorphoSys disclosed that the first patient had been dosed in the safety evaluation part of a phase 2/3 clin-ical combination trial of MOR208. The B-MIND (Bendamustine- MOR208 IN DLBCL) trial will evaluate the safety and efficacy of MOR208 combined with the chemotherapeutic agent bendamus-tine in comparison to rituximab plus bendamustine. This trial will enroll 330 adult patients worldwide with relapsed or refrac-tory DLBCL who are not eligible for autologous stem cell trans-plantation. The trial’s phase 2 safety run-in is currently evaluat-ing the safety and tolerability of MOR208 with bendamustine in comparison to rituximab plus bendamustine. After the safety run-in, the trial will transition into a pivotal phase 3 trial, planned to start in 2017.
• In addition to the two combination studies with MOR208 in DLBCL, MorphoSys announced in December 2016 the start of a phase 2 combination study with MOR208 in a further indication. The trial which has been named COSMOS (CLL patients assessed for ORR & Safety in MOR208 Study), is designed to evaluate the safety and efficacy of MOR208 in combination with idelalisib in patients with relapsed or refractory chronic lymphocytic leuke-mia (CLL) or small lymphocytic lymphoma (SLL). The patients enrolled must have been refractory or shown relapse or intoler-ance to a prior therapy with a BTK inhibitor such as ibrutinib. This patient cohort shows a particularly high medical need.
The HuCAL antibody MOR202 targeting CD38 is currently being evaluated in a phase 1/2a dose-escalation study alone and in com-bination with the immunomodulatory cancer drugs (IMiDs) lena-lidomide and pomalidomide, in each case with dexamethasone, in patients with relapsed/refractory multiple myeloma (MM). In this trial, a growing number of patients in the reporting year were treated with the highest dose cohort of 16 mg/kg MOR202 in com-bination with lenalidomide and pomalidomide.
MOR209/ES414, which we are co-developing with our partner Aptevo Therapeutics (a spin-off of Emergent BioSolutions), is in a phase 1 trial in patients suffering from metastatic castration-resis-tant prostate cancer. The first patient was recruited for the trial according to the amended trial protocol in the fourth quarter of 2016.
The HuCAL antibody MOR103/GSK3196165, which was out-licensed to GlaxoSmithKline (GSK), is currently being developed in a phase 2b study in patients with rheumatoid arthritis. In April 2016, GSK announced the initiation of a phase 2a clinical trial to investigate the safety and efficacy of MOR103/GSK3196165 in patients with inflammatory hand osteoarthritis. GSK also initiated a mechanis-tic phase 2a trial of MOR103/GSK3196165 in rheumatoid arthritis to further investigate the GM-CSF signaling pathway.
In 2016, MOR106 became the fifth drug candidate from MorphoSys’s proprietary pipeline in clinical development. In April, MorphoSys and its development partner Galapagos NV announced the initia-tion of a phase 1 clinical trial to evaluate MOR106 in healthy vol-unteers. The trial was expanded at the end of September to include patients suffering from atopic dermatitis after MOR106 showed favorable safety results in healthy volunteers during the first phase of the study. MOR106 is the first antibody generated using MorphoSys’s proprietary Ylanthia technology to enter clinical de-velopment. This phase 1 trial investigates the safety, tolerability and pharmacokinetic profile of MOR106 in single ascending doses in healthy volunteers as well as multiple ascending doses in pa-tients with atopic dermatitis. MOR106 is the first publicly disclosed antibody targeting IL-17C in clinical development worldwide. Gala-pagos and MorphoSys jointly discovered MOR106 and are co-de-veloping this compound in clinical studies.
PARTNERED DISCOVERY
In January 2016, MorphoSys’s partner Bayer initiated a phase 2 clinical study in mesothelioma with the HuCAL-based antibody drug conjugate anetumab ravtansine (BAY 94-9343) which targets mesothelin. MorphoSys recognized the related milestone payment in the first quarter of 2016. Bayer’s objective is to apply for market approval based on the results of this study, if successful.
On April 21, 2016, MorphoSys announced that its partner Novartis confirmed that a phase 2b/3 study investigating the HuCAL anti-body bimagrumab (BYM338) in the rare disease sporadic inclu-sion body myositis (sIBM) did not meet its primary endpoint. All three of the phase 3 studies in this indication were discontinued. The HuCAL antibody’s active phase 2 clinical trials in sarcopenia, a form of age-related muscle loss, and muscular atrophy after hip operations continued as planned. In December 2016, Novartis an-nounced on the website clinicaltrials.gov, that a phase 2 trial with bimagrumab in another indication will be started. This trial is de-signed to assess the safety, pharmacokinetics and efficacy of the HuCAL antibody versus a placebo in around 60 obese patients with type 2 diabetes.
In July and October of 2016, MorphoSys announced the receipt of milestone payments from Novartis. These payments were trig-gered by the initiation of phase 1 clinical trials with novel HuCAL antibodies for the prevention of thrombosis and in the field of can-cer. The number of HuCAL antibodies investigated by Novartis in clinical trials rose to a total of 14 after the initiation of a clinical study of a further HuCAL antibody in the field of asthma in 2016.
Operations and Business Environment G R O U P M A N A G E M E N T R E P O R T 29

In October, MorphoSys announced that its licensee Janssen Re-search & Development, LLC (Janssen) reported positive results from a phase 3 clinical study of guselkumab in 837 patients with moderate to severe plaque psoriasis (“VOYAGE 1” study). Janssen reported that both of the trial’s co-primary endpoints were met, including improving the symptoms of psoriasis, while delivering clear or almost clear skin (measured by the parameters IGA 0 or 1 and PASI 90) at week 16 in patients receiving guselkumab, com-pared to those receiving a placebo. Janssen also reported that all major secondary endpoints achieved statistical significance in comparisons of guselkumab versus adalimumab (Humira®). In November 2016, Janssen submitted a regulatory filing to the U.S. Food and Drug Administration (FDA) and to the European Medi-cines Agency (EMA) for the treatment of adults living with moder-ate to severe plaque psoriasis.
In November 2016, MorphoSys announced that its licensee Janssen Research & Development, LLC (Janssen) had presented positive results from a phase 2a clinical study evaluating guselkumab in patients with active psoriatic arthritis (PsA). The data published by Janssen showed that a substantially higher percentage of pa-tients receiving guselkumab achieved at least a 20 percent im-provement in signs and symptoms of the disease (ACR 20) at week 24, the study’s primary endpoint, compared with patients receiv-ing placebo. Janssen announced that it will now evaluate the com-pound further in a phase 3 program in PsA.
CLINICAL STUDY DATA FROM CURRENT PROJECTSPROPRIETARY DEVELOPMENT
In 2016, MorphoSys announced data from clinical studies of its proprietary drug programs MOR202 and MOR208 at several in-dustry conferences.
Current data from a phase 2a clinical study with anti-CD38 anti-body MOR208 in patients with subtypes of relapsed or refractory non-Hodgkin’s lymphoma (NHL) was presented at the American Society of Clinical Oncology (ASCO) 2016 Annual Meeting (June), the Congress of the European Hematology Association (EHA) in June, the Annual Conference of the German, Austrian and Swiss Associations of Hematology and Medical Oncology (DGHO) in Oc-tober and the Annual Meeting of the American Society of Hema-tology (ASH) in December. This data primarily concerned the pa-tient subgroup analysis and the duration of response to continued therapy. In June 2016, MorphoSys also announced the publication of a clinical case report from this study in the Journal of Medical Case Reports.
This open-label, multi-center phase 2a study is evaluating the efficacy and safety of weekly doses of 12 mg/kg MOR208 in 92 pre-treated patients with various subtypes of relapsed/refractory NHL. Included in this study were patients with diffuse large B cell lymphoma (DLBCL*) and patients with indolent NHL (iNHL) in-cluding follicular lymphoma (FL*). All patients had received at least one prior rituximab-containing therapy. The most recent data presented at the ASH Annual Meeting in December 2016 showed continued long-lasting responses in patients after more than 26 months, confirming results from previous trials. Three patients with DLBCL and six with iNHL showed ongoing response to ther-apy; seven of whom achieved a complete response (CR) and two with a partial response (PR). The overall response rate (ORR) was 36 % in the DLBCL subgroup and 33 % in iNHL patients (both based on evaluable patients). The progression-free survival rate (PFSR) after 12 months was 39 % for both subgroups. In addition to the patients with an objective response (PR or CR), the majority of pa-tients with stable disease (SD) had a reduction in target lesion size (5/6 DLBCL and 14/17 iNHL). The duration of progression-free sur-vival (PFS) was similar in patients with rituximab non-refractory and rituximab refractory tumors who were treated with MOR208. This shows that MOR208 demonstrated clinical activity indepen-dent of any response to previous anti-CD20-based therapies.*SEE GL OSSARY – page 154
Updated results for safety and clinical activity from another ongo-ing phase 2 study with MOR208 were announced at the ASH An-nual Meeting in December 2016. In this investigator-initiated trial (IIT) conducted by scientists at the Ohio State University, MOR208 is being evaluated in various CLL patient populations, among oth-ers, in combination with the immunomodulator lenalidomide. The trial also includes a fourth cohort of CLL patients with identified resistance mutations to ibrutinib in which MOR208 was added to the ibrutinib therapy. According to the abstract submitted at the ASH conference, of the group of CLL patients with ibrutinib-resis-tant cells in the study, four out of seven patients had already been receiving MOR208 in addition to ibrutinib for at least three cycles of 28 days each, and no patient had developed progressive disease at the time the abstract data was submitted. Preliminary data show activity in patients in all cohorts, including ibrutinib-resis-tant CLL patients.
30 G R O U P M A N A G E M E N T R E P O R T Operations and Business Environment
2
3
4
5
6
7
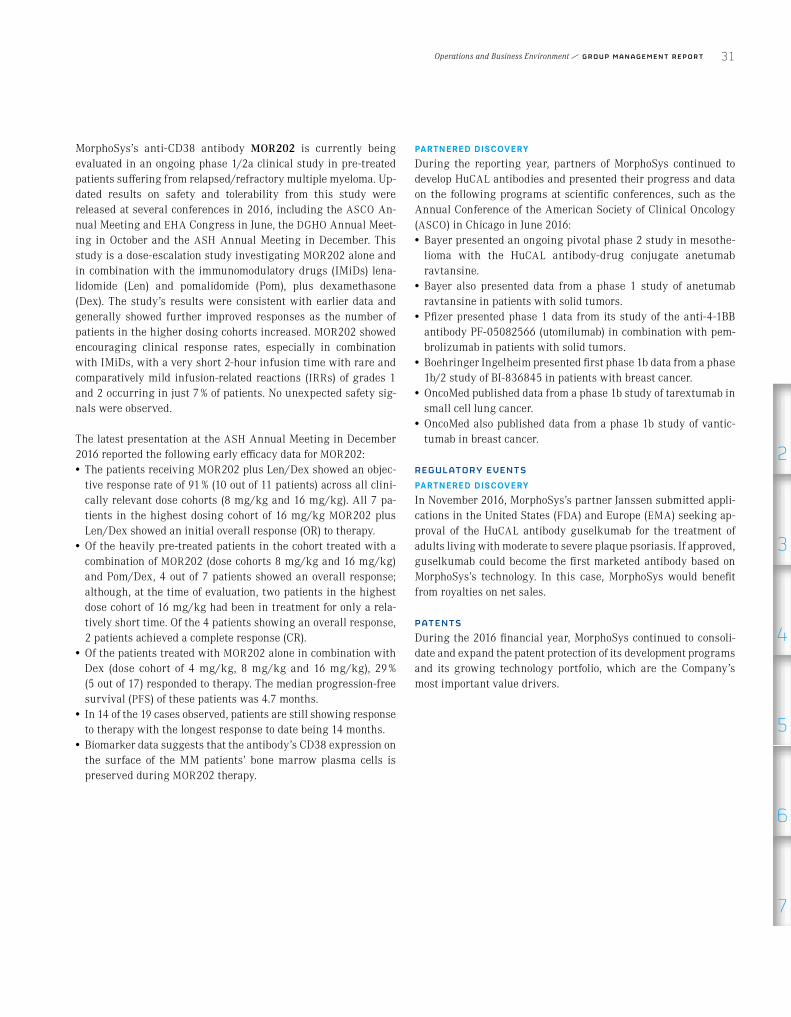
MorphoSys’s anti-CD38 antibody MOR202 is currently being evaluated in an ongoing phase 1/2a clinical study in pre-treated patients suffering from relapsed/refractory multiple myeloma. Up-dated results on safety and tolerability from this study were released at several conferences in 2016, including the ASCO An-nual Meeting and EHA Congress in June, the DGHO Annual Meet-ing in October and the ASH Annual Meeting in December. This study is a dose-escalation study investigating MOR202 alone and in combination with the immunomodulatory drugs (IMiDs) lena-lidomide (Len) and pomalidomide (Pom), plus dexamethasone (Dex). The study’s results were consistent with earlier data and generally showed further improved responses as the number of patients in the higher dosing cohorts increased. MOR202 showed encouraging clinical response rates, especially in combination with IMiDs, with a very short 2-hour infusion time with rare and comparatively mild infusion-related reactions (IRRs) of grades 1 and 2 occurring in just 7 % of patients. No unexpected safety sig-nals were observed.
The latest presentation at the ASH Annual Meeting in December 2016 reported the following early efficacy data for MOR202: • The patients receiving MOR202 plus Len/Dex showed an objec-
tive response rate of 91 % (10 out of 11 patients) across all clini-cally relevant dose cohorts (8 mg/kg and 16 mg/kg). All 7 pa-tients in the highest dosing cohort of 16 mg/kg MOR202 plus Len/Dex showed an initial overall response (OR) to therapy.
• Of the heavily pre-treated patients in the cohort treated with a combination of MOR202 (dose cohorts 8 mg/kg and 16 mg/kg) and Pom/Dex, 4 out of 7 patients showed an overall response; although, at the time of evaluation, two patients in the highest dose cohort of 16 mg/kg had been in treatment for only a rela-tively short time. Of the 4 patients showing an overall response, 2 patients achieved a complete response (CR).
• Of the patients treated with MOR202 alone in combination with Dex (dose cohort of 4 mg/kg, 8 mg/kg and 16 mg/kg), 29 % (5 out of 17) responded to therapy. The median progression-free survival (PFS) of these patients was 4.7 months.
• In 14 of the 19 cases observed, patients are still showing response to therapy with the longest response to date being 14 months.
• Biomarker data suggests that the antibody’s CD38 expression on the surface of the MM patients’ bone marrow plasma cells is preserved during MOR202 therapy.
PARTNERED DISCOVERY
During the reporting year, partners of MorphoSys continued to develop HuCAL antibodies and presented their progress and data on the following programs at scientific conferences, such as the Annual Conference of the American Society of Clinical Oncology (ASCO) in Chicago in June 2016: • Bayer presented an ongoing pivotal phase 2 study in mesothe-
lioma with the HuCAL antibody-drug conjugate anetumab ravtansine.
• Bayer also presented data from a phase 1 study of anetumab ravtansine in patients with solid tumors.
• Pfizer presented phase 1 data from its study of the anti-4-1BB antibody PF-05082566 (utomilumab) in combination with pem-brolizumab in patients with solid tumors.
• Boehringer Ingelheim presented first phase 1b data from a phase 1b/2 study of BI-836845 in patients with breast cancer.
• OncoMed published data from a phase 1b study of tarextumab in small cell lung cancer.
• OncoMed also published data from a phase 1b study of vantic-tumab in breast cancer.
REGULATORY EVENTS PARTNERED DISCOVERY
In November 2016, MorphoSys’s partner Janssen submitted appli-cations in the United States (FDA) and Europe (EMA) seeking ap-proval of the HuCAL antibody guselkumab for the treatment of adults living with moderate to severe plaque psoriasis. If approved, guselkumab could become the first marketed antibody based on MorphoSys’s technology. In this case, MorphoSys would benefit from royalties on net sales.
PATENTSDuring the 2016 financial year, MorphoSys continued to consoli-date and expand the patent protection of its development programs and its growing technology portfolio, which are the Company’s most important value drivers.
Operations and Business Environment G R O U P M A N A G E M E N T R E P O R T 31

345
2012 2013
4211
299329
365
2014 2015 2016
T O TAL
132 135
176
156
57
289
56
54
2015
60
305
20152016 2016
1 2012 includes employees of research and diagnostic segment AbD Serotec, which was sold as of January 10, 2013 (closing date).
F I G URE
04Total Headcount of the MorphoSys Group (December 31)
proprietarydevelopment
partnereddiscovery
unallocated employees in r&d
employees in general and administrative
empl
oye
es b
y se
gm
ent
empl
oye
es b
y fu
nc
tio
n
32 G R O U P M A N A G E M E N T R E P O R T Operations and Business Environment

2
3
4
5
6
7
On April 4, 2016, MorphoSys announced that it filed a lawsuit in the United States (U.S.) District Court of Delaware against Janssen Biotech and Genmab A/S for patent infringement of U.S. Patent Number 8,263,746. This patent, which is owned by MorphoSys, describes and claims antibodies with particular features that bind to CD38. By its complaint, MorphoSys seeks redress for the infringing manufacture, use and sale of Janssen’s and Genmab’s daratumumab, an antibody targeting CD38.
At the end of the financial year, the Company maintained over 50 different proprietary patent families worldwide in addition to the numerous patent families it pursues with its partners.
Group Development
In September 2016, MorphoSys announced the establishment of a Scientific Advisory Board (SAB), which was set up to advise the Company on strategic issues and future perspectives within its research and development activities. The inaugural members are Dr. Günther R. Adolf (previously at Boehringer Ingelheim, Vienna, Austria), Prof. Dr. Bruce D. Cheson (Georgetown University Hospi-tal, Washington D.C., USA), Dr. Sergio Quezada (University College London Cancer Institute, London, UK) and Dr. Raymond W. Sweet (previously at Janssen, J&J, Pennsylvania, USA).
In September 2016, MorphoSys’s Dutch subsidiary Lanthio Pharma B.V., specializing in the development of lanthipeptides*, announced the appointment of Axel Mescheder, MD as Chief Medical Officer. Dr. Mescheder has more than 20 years of management experience in R&D for the pharmaceutical and biotechnology industry. At Lanthio Pharma, Dr. Mescheder will be primarily focused on devel-oping Lanthio Pharma’s lanthipeptide portfolio, and preparing and executing the clinical development of MOR107.*SEE GL OSSARY – page 154
In November 2016, MorphoSys completed a private placement via an accelerated book building process raising gross proceeds of ap-proximately € 115.4 million. MorphoSys issued 2,622,088 new shares from authorized capital to institutional investors in Europe and North America at a price of € 44.00 per share. The offering represented approximately 9.9 % of the registered pre-transaction common stock and brought the total number of shares to 29,159,770. The new shares were admitted to trading on the Frankfurt Stock Exchange following their issue. The Company intends to use the proceeds in particular to fund the further clinical development of its proprietary programs. Furthermore, the proceeds of the trans-action will be used to advance pre-clinical assets as well as to fund potential in-licensing of oncology product candidates or additional technologies.
Group Headcount Development
Motivated, exceptionally skilled employees who are both creative and dedicated are the foundation of MorphoSys’s success. On December 31, 2016, the MorphoSys Group had 345 employees (December 31, 2015: 365), 137 of whom hold PhD degrees (December 31, 2015: 145). The MorphoSys Group employed an average of 354 employees in 2016 (2015: 356).›› SEE F IGURE 04 – Headcount of the MorphoSys Group (page 32)
A competitive remuneration system and favorable working envi-ronment are crucial factors when competing for the best employees. To be a competitive employer, MorphoSys compares the Company’s compensation with that paid by other companies in the biotech industry and similar sectors and makes adjustments when neces-sary. The remuneration system at MorphoSys includes fixed com-pensation and a variable annual bonus that is linked to the achievement of corporate goals. Individual goals promote both the employees’ personal development and the achievement of key corporate goals.
In addition, a “spot bonus” (given “on the spot”) is promptly awarded to employees for exceptional accomplishments. We made signifi-cant use of this instrument during the reporting year.
A detailed overview of headcount development and MorphoSys’s activities to promote successful long-term human resource devel-opment can be found in the section “Sustainable Business Develop-ment.”
Development of the Business Environment
Forecasts by the International Monetary Fund (IMF) predict a slowdown in global economic growth to 3.1 % in 2016 (2015: 3.2 %). This slightly lower forecast reflects the rather subdued outlook for the advanced economies after the Brexit vote in the UK in June 2016 and weaker than expected growth in the United States.
Although the market’s response to the Brexit vote has been some-what moderate, increasing economic, political and institutional uncertainty, coupled with a decline in trade and finance between the UK and the rest of the European Union, is expected to have a negative impact on the overall economy, especially in the UK. As a result, the 2016 growth forecast for the advanced economies was reduced to 1.6 % (2015: 2.1 %). After five years of declining growth rates, the emerging and developing economies are expected to re-port slightly higher growth of 4.1 % (2015: 4.1 %). The outlook for these countries varies but is generally less optimistic than in
Operations and Business Environment G R O U P M A N A G E M E N T R E P O R T 33
the past. Based on its outlook published in January 2017, the IMF expects the economic recovery in the eurozone to continue and projects growth of 1.7 % for 2016 (2015: 2.0 %). The 2016 forecast for Germany is also 1.7 % (2015: 1.5 %), with growth being driven by strong domestic demand. The US economy has lost momentum in recent quarters and expectations are for growth of 1.6 % for the whole of 2016 (2015: 2.6 %). The impact on the US and global econ-omy after the election of Donald Trump is not yet clear. The global economy’s growth engine, China, is expected to grow 6.7 % (2015: 6.9 %) thereby remaining within its official target range of 6.5 to 7 %, thanks to policy measures and strong credit growth. Russia continues to be stuck in a recession, although the economic trend improved slightly with a projected decline of just 0.6 % in 2016 compared to a reported –3.7 % in 2015. The Brazilian economy con-tinued to contract (2016 forecast: –3.5 % vs. 2015: –3.8 %).
MorphoSys takes into account all potential macroeconomic risks and opportunities when conducting business activities. Political uncertainty in the global markets did not cause the Company to refrain from or change any of its key activities in the past financial year. MorphoSys’s operations were also not affected by any fluctu-ations within individual countries and, therefore, in this respect were not directly impacted by global economic developments.
CURRENCY DEVELOPMENTSThe euro and the US dollar continued to edge toward parity in 2016. Following the rate increase by the US Federal Reserve in December 2016, further rate increases are expected in 2017. There is little evidence that the European Central Bank is planning to change the course of its monetary policy characterized by negative interest rates and large bond buying programs. These policies have placed pressure on the euro in 2016 causing it to reach a 13-year low in mid-December as it fell below the US$ 1.05 threshold. At the end of 2015, the euro was still at US$ 1.09. After the election of Donald Trump, Citigroup revised its forecast and now expects the euro to fall to $ 0.98 in the next six to 12 months.
Because most of the Company’s business is transacted in euros and US dollars, changes in these currencies could have an effect on MorphoSys’s future costs and revenues. Continued weakness in the euro versus the US dollar has a direct influence on the Compa-ny’s operating results because a growing share of its costs stem from clinical studies conducted in the United States. MorphoSys deals with this risk with appropriate hedge accounting measures.
REGULATORY ENVIRONMENTThe healthcare industry’s regulatory environment is dominated by continually rising product quality, safety and efficacy require-ments, which places ever-higher demands on the companies in-volved. Novel drugs are required to demonstrate a significant ben-efit over existing therapies in order to be approved, gain the market’s acceptance and be financially reimbursed. In the United States, which represents the world’s largest healthcare market, it is not yet clear what type of health policy will be pursued by the new Trump administration. Discussions have ranged from a with-drawal to an adaptation of the Affordable Care Act, but further de-tails have not yet been disclosed.
The US Food and Drug Administration (FDA) approved a total of 22 medications in 2016, including six for the treatment of cancer, or half of the previous year’s number (2015: 45). In the period from 2006 to 2014, the FDA approved an average of 28 new compounds every year. Nevertheless, a strong importance is still placed on the industry’s continued commitment to innovation and developing technologically better products and optimizing already approved treatments.
DEVELOPMENT OF THE PHARMACEUTICAL AND BIOTECHNOLOGY SECTORSIn comparison to an exceptionally strong year for the global phar-maceutical industry in 2015, the outlook for the industry in 2016 turned somewhat discouraging. Analysts expect the largest ten pharmaceutical companies to generate growth of just 2 % p.a. on average in 2016 and 2017. Experts cite two main causes for the growth slowdown: one is the decline in new innovative drugs in 2016 and the corresponding decline in the number of approvals; the other is fear of a growing price pressure in the United States.
Political uncertainty for both the overall economy and the pharma-ceutical industry has increased with the November 2016 election of Donald Trump as the new US president. Initially, the pharma industry was concerned it would be forced to face stricter price controls under a Clinton administration. These concerns have died down with Trump’s election win. In addition, a public petition in California demanding price caps for drugs in state-funded health-care programs, which received strong public attention, was lost in November 2016. In early January 2017, Trump stirred up the in-dustry again with his criticism of drug pricing and the location policies of US pharmaceutical companies. This resulted in a pain-ful loss for the pharmaceutical indices on the stock markets. Given the sharp rise in prices for certain products, such as Mylan’s EpiPen, which led to hearings in the US Congress and caused na-tionwide criticism in 2016, the public demands for price controls continue to exist.
34 G R O U P M A N A G E M E N T R E P O R T Operations and Business Environment

2
3
4
5
6
7
A report from the International Trade Administration of the US Department of Commerce expects worldwide pharmaceutical sales to grow annually by 4.9 %, or from roughly US$ 1 trillion to US$ 1.3 trillion between 2015 and 2020. The demand for pharma-ceutical products is being driven by a variety of demographic and economic trends, including a rapidly aging world population and the associated increased incidence of chronic diseases, increasing urbanization and greater disposable income, higher public health spending and a growing demand for more effective treatments.
The market for cancer drugs – the most important market for MorphoSys’s development pipeline – is one of the most attractive and fastest-growing segments of the pharmaceutical market. The US market research institute QuintilesIMS Institute estimates that, in 2015, the worldwide oncology market amounted to US$ 107 billion. A continuous increase in innovative therapies is the mar-ket’s key driver. The report from IMS expects the global market for oncology products to grow between 7.5 % and 10.5 % and reach US$ 150 billion in 2020. The majority of this growth is a result of the broader diversity of new products, especially immunothera-pies, which is offsetting the decline in some of the existing thera-pies with poorer clinical results. IMS also expects insurers to ne-gotiate harder with manufacturers and introduce new payment models to achieve better prices for drugs. The World Health Orga-nization (WHO) anticipates a 70 % increase in the number of can-cer-related diseases worldwide over the next 20 years.
According to the global auditing company PricewaterhouseCoopers (PWC), the number of mergers and acquisitions in the pharmaceuti-cal and healthcare sector in 2016 declined significantly compared to the prior year. A total of 387 M&A transactions with a reported total value of US$ 197.0 billion were completed in 2016 compared to 435 transactions with a reported value of US$ 286.6 billion in the same period of 2015.
Further information on the development of the stock market en-vironment can be found in the section “Shares and the Capital Market.”
DEVELOPMENT OF THE ANTIBODY SECTORThe year 2016 was a very dynamic and successful year for the clinical development of therapeutic antibodies. The FDA granted regulatory approval to seven antibodies – after a record of nine antibodies in the prior year. In a follow-up article to the scientific magazine mAbs Journal’s article “Antibodies to watch in 2016,” the Antibody Society disclosed that by the middle of 2016 a total of 53 antibodies were in phase 3 clinical trials (year-end 2015: 53), of which 15 are intended for treating cancer (year-end 2015: 17).
In November 2016, an application for regulatory approval was sub-mitted to the FDA for guselkumab, a compound derived with the help of MorphoSys’s technology. The application was submitted after a phase 3 clinical trial conducted by MorphoSys’s develop-ment partner Janssen delivered positive results for this compound in psoriasis.
Antibody compounds in the field of cancer immunotherapy contin-ued to dominate the headlines in 2016. Clinical data shown in 2015 further corroborated the efficacy of the anti-PD1 and anti-PD-L1 antibodies, which act by blocking immune checkpoints. These compounds, which trigger the body’s own immune system using antibodies to identify and kill tumor cells, were again a dominant theme at the spring 2016 ASCO Meeting, the world’s premier can-cer conference.
In 2016, the following antibodies received their first regulatory approval: • Zinplava® (bezlotoxumab) against Clostridium difficile infec-
tions • Lartruvo® (olaratumab) against soft tissue sarcoma • Zinbryta® (daclizumab) for multiple sclerosis • Tecentriq® (atezolizumab) used to treat the most common form of
bladder cancer • Cinqair® (reslizumab) against severe asthma • Taltz® (ixekizumab) for moderate to severe manifestations of
psoriasis • Anthim® (obiltoxaximab) for the treatment of inhalation anthrax
After the FDA granted first-time approval to a biosimilar (Zarxio®, filgrastim-sndz) in 2015, approval of the first biosimilar anti- body followed in April 2016, namely Inflectra® (infliximab-dyyb). Inflectra® is the biosimilar of Remicade® (infliximab).
Operations and Business Environment G R O U P M A N A G E M E N T R E P O R T 35

north america europe and asia
1.9
42.7
3.0
48.0
5.4
43.6
5.64.0
43.642.3
segment proprietary development
segment partnered discovery success-based payments
segment partnered discovery funded research and licensing fees
T O TAL
2012
7.0
2013
26.9
2014
15.0
2015
0.6
59.9
2016
64.0 49.751.9 78.0 106.2
F I G URE
05Revenues of the MorphoSys Group by Region (in %)
F I G URE
06Revenues Proprietary Development and Partnered Discovery (in million €)
%
2012
95
5
2013
89
11
2014
71
29
90
10
20162015
41
59
36 G R O U P M A N A G E M E N T R E P O R T Analysis of Net Assets, Financial Position and Results of Operations

3
4
5
6
7
2Analysis of Net Assets, Financial Position and Results of Operations
The MorphoSys Group’s scope of consolidation was unchanged as of December 31, 2016 in comparison to December 31, 2015. The consolidated financial statements as of December 31, 2016 include MorphoSys AG, Sloning BioTechnology GmbH, Lanthio Pharma B.V. and its subsidiary LanthioPep B.V. Further information on the Group’s organizational structure can be found on page 22.
Revenues
Group revenues in the financial year 2016 declined 53 % year-on-year to € 49.7 million as planned (2015: € 106.2 million). The previous year’s revenue figure included a one-off effect of approxi-mately € 59 million resulting from the termination of the MOR202 co-development and co-promotion agreement with Celgene.
Success-based payments amounted to 11 % or € 5.6 million (2015: 4 % or € 4.0 million) of total revenue. On a regional basis, MorphoSys generated 10 %, or € 5.1 million, of its commercial revenues with biotechnology and pharmaceutical companies and non-profit orga-nizations headquartered in North America and 90 %, or € 44.6 mil-lion, with customers headquartered primarily in Europe and Asia. In the same period of the previous year the distribution was 59 % and 41 %, respectively (see Figure 5: Revenues by Region). Roughly 95 % of Group revenues are attributable to activities with our partners Novartis, Pfizer and Janssen (2015: 97 % with Celgene, Novartis and Pfizer).›› SEE F IGURE 05 – Revenues of the MorphoSys Group by Region (page 36)
PROPRIETARY DEVELOPMENT SEGMENT The Proprietary Development segment achieved revenues of € 0.6 million in 2016 (2015: € 59.9 million). The 2015 revenue fig-ure contained a one-off effect in the amount of roughly € 59 mil-lion resulting from the termination of the MOR202 co-development and co-promotion agreement with Celgene.
PARTNERED DISCOVERY SEGMENTThe revenues generated by the Partnered Discovery segment of € 49.1 million included € 43.6 million in funded research and li-cense fees (2015: € 42.3 million) and € 5.6 million in success-based payments (2015: € 4.0 million).›› SEE F IGURE 06 – Revenues Proprietary Development and Partnered Discovery (page 36)
Operating Expenses
In 2016, operating expenses increased 17 % to € 109.8 million (2015: € 93.7 million). Expenses consisted of research and develop-ment expenses of € 95.7 million (2015: € 78.7 million) and general and administrative expenses of € 14.1 million (2014: € 15.1 mil-lion). Research and development expenses increased to continue the development of the increased number of projects.
Operating expenses in the Proprietary Development segment in-creased from € 54.1 million to € 78.5 million. In the Partnered Dis-covery segment these expenses declined to € 18.1 million (2015: € 25.9 million).
2
Analysis of Net Assets, Financial Position and Results of Operations G R O U P M A N A G E M E N T R E P O R T 37

2012
37.71
2013
49.21
2014
56.0
2015
78.7 95.7
7.2
17.8
1.6
11.1 13.0
21.2
2.2
12.8 15.021.0
2.3
17.8 29.225.6
3.0
21.0
2016
T O TAL
F I G URE
07Selected R & D Expenses (in million €)
external laboratory funding personnel consumables other (includes expenses for intan-gible assets, technical infrastructure and external services)
39.4
26.5
2.3
27.51 Due to the sale of sub stantially all of the AbD Serotec operating segment with closing date of January 10, 2013, the fi gures for the years 2012 to 2013 refer only to continuing operations.
22.116.018.1
3.6
17.527.5
4.2
19.6
33.5
2.9
54.1
2.5
20162012 2013 2014 2015
T O TAL
37.71 49.21 56.0 78.7F I G URE
08Distribution of R & D Expenses (in million €)
proprietarydevelopment expenses
r&d expenses onbehalf of partners
technologydevelopment expenses
17.2
77.1
1.4
95.7
1 Due to the sale of sub stantially all of the AbD Serotec operating segment with closing date of January 10, 2013, the fi gures for the years 2012 to 2013 refer only to continuing operations.
38 G R O U P M A N A G E M E N T R E P O R T Analysis of Net Assets, Financial Position and Results of Operations
3
4
5
6
7
Personnel expenses from share-based payments are included in general and administrative expenses and research and develop-ment expenses. These expenses amounted to € 2.4 million in 2016 (2015: € 3.6 million).
RESEARCH AND DEVELOPMENT EXPENSESResearch and development expenses increased by € 17.0 million in 2016 to a total of € 95.7 million (2015: € 78.7 million) and consisted of expenses for external laboratory services (2016: € 39.4 million; 2015: € 29.2 million), personnel expenses (2016: € 26.5 million; 2015: € 25.6 million), expenses for intangible assets (2016: € 13.7 million; 2015: € 7.2 million), technical infrastructure ex-penses (2016: € 5.9 million; 2015: € 5.2 million), expenses for external services (2016: € 5.0 million; 2015: € 5.2 million), other expenses (2016: € 2.9 million; 2015: € 3.4 million) and expenses for consumables (2016: € 2.3 million; 2015: € 3.0 million). Expenses for intangible assets primarily consisted of an impairment of € 10.1 million on the in-process R&D program MOR209/ES414. In 2015, a € 3.7 million impairment was recognized on goodwill re-sulting from the acquisition of Sloning BioTechnology GmbH.›› SEE F IGURE 07 – Selected R&D Expenses (page 38)
In 2016, the Company incurred proprietary development expenses of € 77.1 million (2015: € 54.1 million) and € 1.4 million (2015: € 2.5 million) for the technology development (see Figure 8: Distri-bution of R&D Expenses).›› SEE F IGURE 08 – Distribution of R&D Expenses (page 38)
GENERAL AND ADMINISTRATIVE EXPENSESGeneral and administrative expenses were below the previous year’s level and amounted to € 14.1 million (2015: € 15.1 million). These expenses mainly consisted of personnel expenses (2016: € 9.5 million; 2015: € 10.4 million), expenses for external services (2016: € 2.5 million; 2015: € 2.6 million), technical infrastructure expenses (2016: € 0.9 million; 2015: € 1.0 million) and other ex-penses (2016: € 1.2 million; 2015: € 1.1 million).
Other Income and Expenses
Other income totaled € 0.7 million (2015: € 5.5 million). In the year 2015, this item primarily contained earnings effects from the fair-value measurement of the shares already held in Lanthio Pharma B.V. in the amount of € 4.5 million. In 2016 and 2015, other income also included income from grants received and currency gains. Other expenses totaled € 0.6 million (2015: € 0.8 million) and mainly consisted of currency losses.
Earnings Before Interest and Taxes (EBIT)
Earnings before interest and taxes (EBIT) amounted to € –59.9 mil-lion as expected due to investments in proprietary development. In the previous year EBIT amounted to € 17.2 million due to a positive one-off effect. The Proprietary Development segment reported EBIT of € –77.6 million (2015: € 10.7 million), while the Part- nered Discovery segment achieved EBIT of € 31.0 million (2015: € 20.4 million).
Finance Income and Expenses
Finance income amounted to € 1.4 million (2015: € 3.8 million) and included mainly interest income as well as realized gains from the sale of available-for-sale securities and bonds. Finance expenses amounted to € 1.3 million (2015: € 0.4 million) and resulted mainly from realized losses from the sale of available-for-sale securities and bonds.
Taxes
The Group reported a tax expense of € 0.5 million in 2016 (2015: tax expense of € 5.7 million) derived from a deferred tax expense of € 0.6 million and a current tax income of € 0.1 million.
Consolidated Net Profit/Loss for the Period
In 2016, the net result for the period amounted to € –60.4 million (2015: € 14.9 million). The basic net result per share for 2016 is € –2.28 (2015: € 0.57).
Analysis of Net Assets, Financial Position and Results of Operations G R O U P M A N A G E M E N T R E P O R T 39
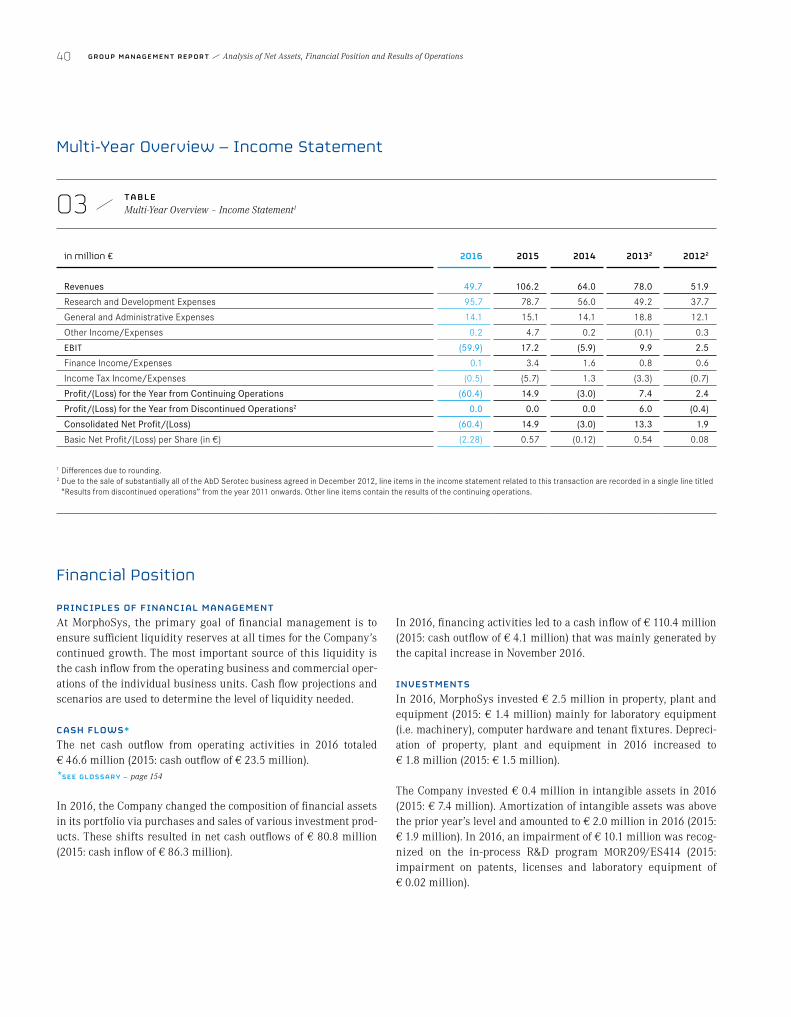
Multi-Year Overview – Income Statement
03 TAB L EMulti-Year Overview – Income Statement1
in million € 2016 2015 2014 20132 20122
Revenues 49.7 106.2 64.0 78.0 51.9
Research and Development Expenses 95.7 78.7 56.0 49.2 37.7
General and Administrative Expenses 14.1 15.1 14.1 18.8 12.1
Other Income/Expenses 0.2 4.7 0.2 (0.1) 0.3
EBIT (59.9) 17.2 (5.9) 9.9 2.5
Finance Income/Expenses 0.1 3.4 1.6 0.8 0.6
Income Tax Income/Expenses (0.5) (5.7) 1.3 (3.3) (0.7)
Profit/(Loss) for the Year from Continuing Operations (60.4) 14.9 (3.0) 7.4 2.4
Profit/(Loss) for the Year from Discontinued Operations2 0.0 0.0 0.0 6.0 (0.4)
Consolidated Net Profit/(Loss) (60.4) 14.9 (3.0) 13.3 1.9
Basic Net Profit/(Loss) per Share (in €) (2.28) 0.57 (0.12) 0.54 0.08
1 Differences due to rounding.2 Due to the sale of substantially all of the AbD Serotec business agreed in December 2012, line items in the income statement related to this transaction are recorded in a single line titled
“Results from discontinued operations” from the year 2011 onwards. Other line items contain the results of the continuing operations.
Financial Position
PRINCIPLES OF FINANCIAL MANAGEMENTAt MorphoSys, the primary goal of financial management is to ensure sufficient liquidity reserves at all times for the Company’s continued growth. The most important source of this liquidity is the cash inflow from the operating business and commercial oper-ations of the individual business units. Cash flow projections and scenarios are used to determine the level of liquidity needed.
CASH FLOWS*The net cash outflow from operating activities in 2016 totaled € 46.6 million (2015: cash outflow of € 23.5 million).*SEE GL OSSARY – page 154
In 2016, the Company changed the composition of financial assets in its portfolio via purchases and sales of various investment prod-ucts. These shifts resulted in net cash outflows of € 80.8 million (2015: cash inflow of € 86.3 million).
In 2016, financing activities led to a cash inflow of € 110.4 million (2015: cash outflow of € 4.1 million) that was mainly generated by the capital increase in November 2016.
INVESTMENTSIn 2016, MorphoSys invested € 2.5 million in property, plant and equipment (2015: € 1.4 million) mainly for laboratory equipment (i.e. machinery), computer hardware and tenant fixtures. Depreci-ation of property, plant and equipment in 2016 increased to € 1.8 million (2015: € 1.5 million).
The Company invested € 0.4 million in intangible assets in 2016 (2015: € 7.4 million). Amortization of intangible assets was above the prior year’s level and amounted to € 2.0 million in 2016 (2015: € 1.9 million). In 2016, an impairment of € 10.1 million was recog-nized on the in-process R&D program MOR209/ES414 (2015: impairment on patents, licenses and laboratory equipment of € 0.02 million).
40 G R O U P M A N A G E M E N T R E P O R T Analysis of Net Assets, Financial Position and Results of Operations

3
4
5
6
7
LIQUIDITYOn December 31, 2016, the Company held cash and cash equiva-lents, marketable securities and other financial assets of € 359.5 mil-lion versus € 298.4 million on December 31, 2015.
This amount consisted of cash and cash equivalents of € 73.9 mil-lion (December 31, 2015: € 90.9 million), marketable securities and bonds of € 69.9 million (December 31, 2015: € 97.4 million) and other financial assets in the amount of € 136.1 million (December 31, 2015: € 94.6 million) that are categorized as “loans and receiv-ables” under “other receivables” contained in “current assets.”
Other investments under the category of “loans and receivables” of € 79.5 million were reported under non-current assets as of De-cember 31, 2016 (December 31, 2015: € 15.5 million).
The increase in liquidity resulted primarily from the capital in-crease executed in November (€ 115.4 million). This was partially offset by the use of cash and cash equivalents for operations in the year 2016 and share repurchases for the Group’s long-term incen-tive programs.
04 TAB L EMult-Year Overview – Financial Situation1
in million € 2016 2015 2014 2013 2012
Net Cash Provided by/Used in Operating Activities2 (46.6) (23.5) (14.2) 89.1 1.8
Net Cash Provided by/Used in Investing Activities2 (80.8) 86.3 (21.5) (193.9) (12.1)
Net Cash Provided by/Used in Financing Activities2 110.4 (4.1) (3.9) 130.6 1.6
Cash and Cash Equivalents (as of 31 December)3 73.9 90.9 32.2 71.9 40.7
Available-for-sale Financial Assets 63.4 64.3 106.0 188.4 79.7
Bonds, Available-for-sale 6.5 33.1 7.5 11.1 0.0
Financial Assets Categorized as Loans and Receivables, Current Portion 136.1 94.6 157.0 119.3 10.0
Financial Assets Categorized as Loans and Receivables, Net of Current Portion 79.5 15.5 50.0 0.0 0.0
1 Differences due to rounding.2 In 2015, interest paid and interest received were reclassified from operating activities into investing activities and financing activities in the statement of cash flows. In order to provide
comparative information for the previous year, the figures for 2014 have been adjusted accordingly.3 In 2012, € 5.3 million in cash and cash equivalents was recorded under assets of disposal group classified as held for sale.
Net Assets
ASSETSAs of December 31, 2016, total assets amounted to € 463.6 million and were € 63.5 million higher than their level on December 31, 2015 (€ 400.1 million). Current assets increased by € 7.9 million. The rise in financial assets under the category “loans and receiv-ables” as well as “advance payments and other assets” was largely offset by the decline in available-for-sale bonds and cash and cash equivalents.
As of December 31, 2016, an amount of € 63.4 million (December 31, 2015: € 64.3 million) was invested in various money market funds and reported under “available-for-sale financial assets.” The item “bonds, available-for-sale” contained bonds totaling € 6.5 mil-lion (December 31, 2015: € 33.1 million). The category “loans and receivables” included financial instruments totaling € 136.1 mil-lion (December 31, 2015: € 94.6 million). These instruments were mainly term deposits with either fixed or variable interest rates.
Analysis of Net Assets, Financial Position and Results of Operations G R O U P M A N A G E M E N T R E P O R T 41

Non-current assets increased by € 55.6 million year-on-year to € 155.5 million as of December 31, 2016, primarily as a result of the investment in non-current financial assets in the category “loans and receivables” using financial liquidity from the capital increase executed in November. The effect of this investment was largely offset by the € 10.1 million decline in in-process R&D programs due to the impairment taken on the MOR209/ES414 program.
LIABILITIESCurrent liabilities increased from € 27.5 million on December 31, 2015 to € 38.3 million on December 31, 2016. This effect mainly resulted from the rise in accounts payable and accrued expenses.
Non-current liabilities (December 31, 2016: € 9.8 million; Decem-ber 31, 2015: € 9.9 million) remained virtually unchanged com-pared to December 31, 2015.
STOCKHOLDERS’ EQUITYAs of December 31, 2016, Group equity totaled € 415.5 million compared to € 362.7 million on December 31, 2015.
The number of shares issued totaled 29,159,770 as of December 31, 2016, of which 28,763,760 shares were outstanding (December 31, 2015: 26,537,682 shares issued and 26,103,012 shares outstanding).
On November 15, 2016, a total of 2,622,088 shares were issued in the context of a cash capital increase from Authorized Capital 2014-I and fully exhausted the Authorized Capital 2014-I. As a re-sult, the number of authorized ordinary shares fell by 2,622,088 shares, from 13,206,421 as of December 31, 2015 to 10,584,333 shares.
In comparison to December 31, 2015, the number of ordinary shares of conditional capital declined from 7,086,000 to 6,752,698. At the Annual General Meeting on June 2, 2016, Conditional Capi-tal 2003-II in the amount of € 36,000 and Conditional Capital 2011-I in the amount of € 6,600,000 were canceled. Created in their place was new Conditional Capital 2016-I in the amount of € 5,307,536 and Conditional Capital 2016-III in the amount of € 995,162.
On December 31, 2016, the Company held 396,010 shares of trea-sury stock valued at € 14,648,212, representing a decline com-pared to December 31, 2015 (434,670 shares, € 15,827,946) of € 1,179,743. The reason for this decline was the transfer of 90,955 shares of treasury stock valued at € 3,361,697 to the Management Board and Senior Management Group from the 2012 long-term in-centive (LTI) program. The vesting period for this LTI program expired on April 1, 2016 and October 1, 2016, respectively, and beneficiaries were given the option to receive a total of 90,955 shares within six months. Offsetting this amount was MorphoSys’s repurchase of 52,295 of its own shares at a weighted-average price per share of € 41.69 for a total value of € 2,179,963. The fee for this transaction was € 1,999.
Financing
As of December 31, 2016, the Company’s equity ratio amounted to 90 % compared to 91 % on December 31, 2015. The Group has cur-rently no financial debt vis-à-vis financial institutions.
Off-Balance-Sheet Financing
MorphoSys does not use any off-balance-sheet financing instru-ments such as the sale of receivables, asset-backed securities, sale-and-leaseback transactions or contingent liabilities in combi-nation with non-consolidated special-purpose entities.
Credit Rating
There is no agency currently assessing the creditworthiness of MorphoSys.
42 G R O U P M A N A G E M E N T R E P O R T Analysis of Net Assets, Financial Position and Results of Operations

3
4
5
6
7
Multi-Year Overview – Balance Sheet Structure
05 TAB L E Multi-Year Overview – Balance Sheet Structure1
in million € 12/31/2016 12/31/2015 12/31/2014 12/31/2013 12/31/2012
Assets
Current Assets 308.1 300.1 322.4 406.6 142.9
Non-current Assets 155.5 100.0 104.1 41.1 40.6
Assets of Disposal Group Classified as Held for Sale 0.0 0.0 0.0 0.0 40.9
Total 463.6 400.1 426.5 447.7 224.3
Equity and Liabilities
Current Liabilities 38.3 27.5 32.7 35.4 11.9
Non-current Liabilities 9.8 9.9 45.0 60.1 6.6
Liabilities of Disposal Group Classified as Held for Sale 0.0 0.0 0.0 0.0 3.7
Stockholders' Equity 415.5 362.7 348.8 352.1 202.0
Total 463.6 400.1 426.5 447.7 224.3
1 Differences due to rounding.
Comparison of Actual Business Results Versus Forecasts
MorphoSys demonstrated solid financial performance during the 2016 reporting year. A detailed comparison of the Company’s fore-casts versus the actual results can be found in Table 6 (page 44).
Analysis of Net Assets, Financial Position and Results of Operations G R O U P M A N A G E M E N T R E P O R T 43

06 TAB L EComparison of Actual Business Results Versus Forecasts
2016 Targets 2016 Results
Financial targets Group revenue between € 47 million and € 52 million Group revenue of € 49.7 millionExpenses for proprietary product and technology develop-ment of € 76 million to € 83 million
Expenses for proprietary product and technology develop-ment of € 78.5 million
EBIT of € –58 million to € –68 million EBIT of € –59.9 millionProprietary Development MOR208
• Initiation of the L-MIND trial (in combination with lenalidomide in DLBCL)
• Initiation of the B-MIND trial (in combination with bendamustine in DLBCL)
• Initiation of the COSMOS trial (in combination with idelalisib in CLL)
MOR208• Initiation of the L-MIND trial in April• Initiation of the B-MIND trial in September• Initiation of the COSMOS trial in December
MOR202• Continuation of the phase 1/2a study in additional cohorts
with the recommended dose of 16 mg/kg alone and in combination with pomalidomide and lenalidomide
MOR202• Presentation of clinical data from the ongoing phase
1/2a study at the ASCO Annual Meeting in June, the Ger-man, Austrian and Swiss Associations of Hematology and Medical Oncology in October and the annual ASH meeting in December
MOR209/ES414• Continuation of the adapted phase 1 trial in mCRPC under
the cooperation with Aptevo Therapeutics, a spin-off of Emergent BioSolutions
MOR209/ES414• Recruitment in the fourth quarter of 2016 of the first
patient for the trial under the adapted trial protocol
MOR106• Initiation of a phase 1 trial as part of the co-development
program with Galapagos
MOR106• Initiation of a phase 1 trial in healthy volunteers in April;
evaluation in patients suffering from atopic dermatitis started in September
MOR107• Initiation of a phase 1 trial
MOR107• Preparations for initiating phase 1 trial completed in 2016;
start of phase 1 study with healthy volunteers in February 2017
In-licensing of one or more targets and compounds to strengthen the proprietary development portfolio
• No target or compound in-licensed
Ongoing development of the lanthipeptide technology • Ongoing development of the lanthipeptide technology in the reporting year
Initiation and continuation of new development programs in the area of antibody discovery and preclinical development
• Initiation of a strategic partnership with MD Anderson Cancer Center to discover and develop new antibodies against cancer
Partnered Discovery
Progress of partnered discovery programs
• Net addition of 11 partnered discovery programs• Positive results from a phase 3 study with the HuCAL anti-
body guselkumab in plaque psoriasis; Janssen submitted application for regulatory approval in the United States and Europe
• Initiation of a pivotal phase 2 trial by partner Bayer with the HuCAL antibody anetumab ravtansine (BAY 94-9343) as a potential treatment for mesothelioma
• Initiation of a phase 1 trial by Novartis with a HuCAL anti-body to prevent thrombosis
• Initiation of a phase 1 trial by Novartis with a HuCAL anti-body against cancer
• Initiation of a strategic partnership with LEO Pharma to discover and develop novel antibodies for the treatment of skin diseases; MorphoSys has co-development and co-commercialization options in the area of cancer
44 G R O U P M A N A G E M E N T R E P O R T Analysis of Net Assets, Financial Position and Results of Operations

3
4
5
6
7
The Management Board’s General Assessment of Business Performance
The 2016 financial year marked a successful year for the Group overall. We successfully expanded our pipeline and increased the number of development programs to 114 by the end of 2016 (2015: 103). We significantly strengthened our liquidity through a capital increase that yielded € 115.4 million in gross proceeds. As a result, the Company can continue to develop its programs from a position of strength. Furthermore, the first antibody based on MorphoSys’s technologies has been filed for regulatory approval in the United States and Europe.
The Group’s revenue in the 2016 financial year decreased to € 49.7 million and EBIT declined to € –59.9 million. The main cause of the decline in revenue and negative EBIT was the termination of the Celgene cooperation and the related one-off effect in the amount of roughly € 59 million in 2015. Net cash outflows from operating activities totaled € 46.6 million. These outflows were the result of the increased investment in our proprietary R&D, as ex-pected. Our equity ratio of 90 % and liquidity of € 359.5 million underscore the Company’s very sound financial position.
The Proprietary Development business segment saw a clear matu-ration of its pipeline consisting of 14 active compounds (year-end 2015: 14). Three phase 2 combination studies were started with MOR208 in blood cancer indications. The ongoing dose-escalation study with MOR202 in multiple myeloma tests the drug at higher doses. Updated results were presented at major medical confer-ences. In our cooperation with Galapagos, MOR106 began clinical development in atopic dermatitis. The phase 1 study of MOR209/ES414 was resumed by our development partner Aptevo, with a new dosage regimen. Partner GSK launched two phase 2a studies with MOR103/GSK3196165 in hand osteoarthritis and rheumatoid arthritis. Preparations continued for the first clinical trial with MOR107, the active substance acquired as part of the acquisition of Lanthio Pharma. In addition, our cooperation with MD Anderson Cancer Center increased our access to innovative targets in cancer medicine.
The Partnered Discovery segment also progressed very well. Its pipeline significantly expanded and matured. The HuCAL anti-body guselkumab, developed by Janssen, met the study endpoint in a phase 3 study in plaque psoriasis, after which Janssen applied for regulatory approval in the United States and Europe in Novem-ber. Guselkumab could become the first antibody on the market based on MoprhoSys’s technologies – a momentous event in the history of the Company. The antibody bimagrumab missed its pri-mary endpoint in a phase 3 study in sIBM but ongoing phase 2 trials in two other indications continue and a phase 2 development in a new indication was started. Partner Bayer launched a pivotal phase 2 study with anetumab ravtansine in mesothelioma. With a total of 100, we ended the year with a record number of programs (year-end 2015: 89).
Accounting Judgments
In preparing the 2016 consolidated financial statements, no ac-counting policies or accounting options were used that differ from those in prior years and that, if used or exercised differently, would have had a material effect on the Company’s net assets, financial position, results of operations or balance sheet structure. Informa-tion on the effects of the Management Board’s use of estimates, assumptions and judgments can be found in the Notes to the Con-solidated Financial Statements.
Analysis of Net Assets, Financial Position and Results of Operations G R O U P M A N A G E M E N T R E P O R T 45

3Outlook and Forecast
MorphoSys is focusing a growing amount of its efforts on the de-velopment of its proprietary drug candidates. By continually ex-panding its development pipeline and focusing on areas of therapy with a high unmet medical need such as oncology and inflamma-tory diseases, MorphoSys intends to raise its potential for future growth and value appreciation and, at the same time, limit the overall risk inherent in developing novel drugs. These activities are enhanced through a large number of partnered programs, which we believe will yield higher revenues from royalties, which we can increasingly use to finance our proprietary programs.
General Statement on Expected Development
MorphoSys’s strategic focus is on the development of a broad and sustainable pipeline of innovative drug candidates, both on a pro-prietary basis and with partners. The foundation for achieving this is the Company’s continued investment in the development of in-novative and proven technologies. In the therapeutic area, the commercialization of these technologies provides contractually secured cash flows from long-term partnerships with major phar-maceutical companies. MorphoSys also plans to profit from the successful development of drug candidates through milestone payments and royalties from product sales as soon as the drugs are commercialized.
Revenues from R&D funding, license and milestone payments and a strong liquidity position enable MorphoSys to further expand its commercial operations by investing in the development of propri-etary drugs and technologies. The Management Board expects the following developments in 2017: • Higher investments in proprietary product candidates by con-
tinuing ongoing clinical studies and initiating new clinical studies.
• Continued expansion of proprietary development activities through potential in-licensing, company acquisitions, co-devel-opment and new proprietary development activities.
• New strategic agreements based on proprietary technologies focused on gaining access to innovative target molecules and compounds.
• Investments in technology development to maintain the Com-pany’s leading position in therapeutic antibodies and related technologies, such as lanthipeptides.
Strategic Outlook
MorphoSys’s business model is based on its proprietary technolo-gies, including the HuCAL and Ylanthia antibody libraries, the Slonomics platform and the lanthipeptide library. We want to con-tinue to use these technologies to develop innovative drug candi-dates so that patients have access to better treatment alternatives. MorphoSys’s management intends to continue expanding the Company’s proprietary portfolio of drug candidates and increase its investment in its proprietary development portfolio, particularly in the areas of oncology and inflammatory diseases. MorphoSys will also continue to concentrate on using and expanding its tech-nologies in fast-growing, innovation-driven areas of the life sci-ences sector.
46 G R O U P M A N A G E M E N T R E P O R T Outlook and Forecast

4
5
6
7
In the Proprietary Development segment, MorphoSys develops proprietary therapeutic antibodies and peptides, primarily in the areas of oncology and inflammatory diseases. Decisions to enter into alliances to develop MorphoSys’s proprietary candidates will be made on an individual basis. In some cases projects can remain in proprietary development for a longer period – even until their commercialization.
The Partnered Discovery segment generates contractually secured cash flows based on long-term cooperation agreements. The major-ity of development candidates derives from the partnership with Novartis. As previously mentioned, MorphoSys expects the part-nership with Novartis to terminate at the end of November 2017 in accordance with the contract and does not believe that Novartis will exercise its option to extend the contract. The companies are currently discussing how to ensure that the ongoing projects are completed as smoothly as possible. The development of candidates from this partnership continues even after the contract expires and can lead to further milestone payments and royalties. The Company’s broad partnered pipeline promises an impressive num-ber of market-ready, therapeutic antibodies in the coming years and financial participation in the form of royalty payments from product sales. During the 2017 financial year, we expect a decision by the regulatory authorities in the United States and Europe on an application for approval of one of our partner’s product candi-dates. A positive decision could result in the first marketed anti-body based on MorphoSys technology as early as 2017. We also expect results from a pivotal phase 2 study for a second product candidate.
For the foreseeable future, MorphoSys plans to invest a substantial portion of its financial resources in proprietary R&D. The Manage-ment Board believes that this is the best way to expand the Company’s portfolio of proprietary development candidates and strengthen its technology platform, and thereby maximize the Company’s value.
Expected Economic Development
The International Monetary Fund (IMF) expects the global econ-omy to grow 3.4 % in 2017, or slightly higher than in 2016 (esti-mated at 3.1 %). Brexit and lower-than-expected growth in the United States continue to put pressure on global interest rates be-cause these events are predicted to lead to a long-lasting continua-tion in expansive monetary policy.
Advanced economies are anticipated to grow 1.8 % in 2017 com-pared to a forecast of 1.6 % for 2016. The IMF expects moderate growth of 1.5 % for the eurozone, pointing out that the unemploy-ment rate in some of the key European countries will be even higher in ten years than prior to the crisis. There is still risk of weaker economic development in light of Brexit, the refugee crisis and potential protectionist measures of the new US government. The IMF expects economic growth in Germany to reach 1.4 % in 2017 (2016E 1.7 %). Record employment figures, increasing nomi-nal and real wages and low energy costs are fueling private con-sumption. However, challenges such as an aging population and a return to normal interest rate levels remain. The IMF is projecting a rise in US economic growth in 2017 to 2.2 % compared to ex-pected growth of 1.6 % in 2016.
According to the IMF, growth in the emerging and developing countries in 2017 is expected to reach 4.6 % (2016E: 4.2 %). Growth in China should equal 6.2 % in 2017 (2016E: 6.6 %) while Russia is expected to resume growth with a positive 1.1 %, after an expected drop of 0.8 % in 2016. The trend in Brazil is also expected to turn around with growth in 2017 expected at 0.5 % following a pro-jected decline of 3.3 % in 2016.
Expected Development of the Life Sciences Sector
After four years (2012–2015) of outstanding performance for bio-technology shares, during which the NASDAQ Biotechnology In-dex* more than tripled, the leading biotechnology index world-wide lost round 22 % of its value in 2016 for its worst annual performance since 2002. Based on a poll by the industry news service BioCentury, investors expect the sector to improve in 2017 and report positive performance for the year overall. Industry ex-perts expect M&A activity in 2017 to be high and believe the sector’s relative valuation is attractive. However, uncertainty is expected to remain high due to the new and difficult-to-read Trump administration, whereby most experts expect the political environment under a Republican-led US Congress to be industry- friendly overall.*SEE GL OSSARY – page 154
Fundamentally, the sector is still on a strong footing. Scientific advances and a growing understanding of biological relationships, such as those in combination therapies in immuno-oncology, cou-pled with a continued high medical need – particularly in cancer and chronic inflammatory diseases – and an aging population in the industrialized countries, lead industry experts to expect more innovation and new drug approvals. After the number of FDA
3
Outlook and Forecast G R O U P M A N A G E M E N T R E P O R T 47

approvals for new molecular entities declined from 45 in 2015 to 22 in the year 2016, BioCentury listed a potential 33 approvals for 2017 at the beginning of the year, including the approval of estab-lished drugs in new indications.
Future Research and Development and Expected Business Performance
PROPRIETARY DEVELOPMENTThe Company’s R&D budget for proprietary drug development will rise again in the 2017 financial year compared to the prior year. The majority of investment will fund the clinical development of the proprietary drug candidates MOR208, MOR202, MOR209/ES414, MOR106 and MOR107. Most of the investment within this group will be dedicated to the clinical development of MOR208. Further investment will be made in the area of target molecule validation and antibody and technology development. We will con-tinue to seek cooperation with academic institutes to gain access to new target molecules and technologies.
The plans for the Company’s proprietary portfolio in 2017 include: • Presentation of the first interim results of the phase 2 trial with
MOR208 in combination with lenalidomide in DLBCL (L-MIND study*).
• Completion of the phase 2 safety part of the B-MIND* study and initiation of the pivotal phase 3 part of the study in which MOR208 will be tested in combination with bendamustine in comparison to rituximab and bendamustine in DLBCL.
• Initiation of another study arm of the phase 2 COSMOS* trial with MOR208 in CLL* in addition to the ongoing study arm of the combination of MOR208 and idelalisib in order to test MOR208 with a further combination partner.
• Completion of the phase 1/2a dose-escalation trial in multiple myeloma, including the results of MOR202 in the highest dose of 16 mg/kg alone and in combination with pomalidomide and lenalidomide.
• Continuation of the phase 1 trial of MOR209/ES414 with adapted dose regimen in mCRPC* as part of the Aptevo cooperation.
• Completion of the phase 1 trial of MOR106 co-developed with Galapagos in atopic dermatitis.
• Initiation of a phase 1 study of MOR107 in healthy volunteers (started in February 2017).
• Initiation and continuation of new development programs in the field of antibody identification and preclinical development.
*SEE GL OSSARY – page 154
Based on information from the clinicaltrials.gov database, the Company also expects the possible publication of data from a phase 2b study of MOR103/GSK3196165 in rheumatoid arthritis and from a phase 2a study in hand osteoarthritis conducted by its partner GSK.
PARTNERED DISCOVERYMorphoSys will concentrate foremost on increasing the value of its current proprietary development pipeline using secured cash flows from its Novartis contract, which is scheduled to end at the end of November 2017, and the Company’s strong liquidity, which was reinforced by the capital increase executed in November 2016. MorphoSys plans additional collaborations with pharmaceutical and biotechnology companies based on the Ylanthia technology, similar to its partnership with LEO Pharma established in the reporting year.
The first partner-developed therapeutic antibody based on MorphoSys technology could receive market approval in 2017. MorphoSys also believes regulatory authorities may make a deci-sion in the second half of 2017 on Janssen’s application for the ap-proval of guselkumab to treat adults with moderate to severe pso-riasis. According to clinicaltrials.gov, anetumab ravtansine, an antibody-drug conjugate developed by Bayer, may report results in 2017 from a pivotal phase 2 trial in mesothelioma. MorphoSys as-sumes, that this could lead to an application for regulatory ap-proval. Based on other information from clinicaltrials.gov, results may be disclosed from up to 31 different clinical studies in various phases conducted by partners with antibodies based on MorphoSys technology in 2017.
Expected Personnel Development
The number of employees in the Proprietary Development segment is expected to remain fairly unchanged during the 2017 financial year. The number of employees in the Partnered Discovery seg-ment is expected to decline slightly.
48 G R O U P M A N A G E M E N T R E P O R T Outlook and Forecast

4
5
6
7
Expected Development of the Financial Position and Liquidity
MorphoSys has a solid financial base and predictable revenues. Revenues will be derived mainly from its collaboration with Novartis. MorphoSys expects the partnership with Novartis to terminate at the end of November 2017 in accordance with the contract and does not believe that Novartis will exercise its option to extend the contract. Slightly lower revenues are therefore ex-pected for the full year. In addition, MorphoSys receives suc-cess-based milestone payments for the successful development of product candidates. Based on these factors, the Management Board expects Group revenue in the 2017 financial year to reach a range of € 46 million to € 51 million, of which a majority will be gener-ated by the Partnered Discovery segment. This forecast does not take into account any additional revenue from future collabora-tions and/or licensing partnerships.
The Company was able to substantially strengthen its liquidity by successfully executing a capital increase in the gross amount of € 115.4 million in November 2016, allowing Morphosys to continue developing its proprietary pipeline from a position of strength.
Based on management’s current projections, R&D expenses for proprietary programs and technology development in 2017 are expected to be in the range of € 85 million to € 95 million. In addi-tion to continuing the ongoing studies for MOR208, MOR202, MOR209/ES414 and MOR106, MorphoSys initiated a clinical study of MOR107 in February 2017. R&D expenses in the Partnered Dis-covery segment are expected to be at roughly the same level as the previous years.
The Company’s EBIT in 2017 is expected to be in the range of € –75 million to € –85 million. This guidance does not take into account any potential in-licensing or co-development of further development candidates. The Partnered Discovery segment is ex-pected to generate a clearly positive operating result in 2017, which is anticipated to be slightly lower than in 2016 due to the contractual expiration of the cooperation with Novartis at the end of November 2016. MorphoSys expects the Proprietary Develop-ment segment to report a significant operating loss brought on by higher R&D expenses for proprietary programs, as planned.
In the years ahead, there will be an increasing effect on the net assets and financial position from one-time events, such as in- licensing and out-licensing proprietary product candidates, major milestone payments as well as royalties related to HuCAL or Ylanthia antibodies that reach the market. Just as failures in drug development can have a negative impact on the MorphoSys Group, these types of events can lead to a significant change in our finan-cial targets. Near-term revenue growth depends on the Company’s ability to enter new partnerships and/or out-license proprietary programs.
At the end of the 2016 financial year, MorphoSys had liquid funds of € 359.5 million (December 31, 2015: € 298.4 million). This rise is a result of the capital increase executed in November. The pro-ceeds of this capital increase were partially offset by proprietary research and development expenses and the buyback of shares for the Group’s long-term incentive programs. The projected loss in 2017 will cause a decline in liquidity. MorphoSys considers its solid cash position as an advantage that can be used to accelerate its future growth through strategic activities such as the in-licens-ing of compounds and investments in promising companies. Avail-able liquidity can also be used to fund high research and develop-ment for the Company’s proprietary portfolio of therapeutic antibodies.
DIVIDENDUnder German accounting principles, MorphoSys AG is reporting an accumulated loss in its separate financial statements, which does not permit the Company to pay a dividend for the 2016 financial year. In view of the anticipated losses in the year 2017, the Company expects to continue to report an accumulated loss. MorphoSys will invest further in the development of proprietary drugs and intends to do further in-licensing and acquisitions so that it can create additional shareholder value and open up new growth opportunities. Based on these plans, the Company does not expect to pay a dividend in the foreseeable future.
This outlook is based on the Management Board’s assumptions and takes into account all of the factors known at the time of pre-paring this annual report that could influence the Company in 2017 and beyond. Future results may differ from the expectations described in the section “Outlook and Forecast.” The key risks are described in the risk report.
Outlook and Forecast G R O U P M A N A G E M E N T R E P O R T 49

F I G URE
09Performance of the MorphoSys Share in 2016 (January 1, 2016 = 100 %)
F I G URE
10Performance of the MorphoSys Share 2012 – 2016 (January 1, 2012 = 100 %)
550
500
450
400
350
300
250
200
150
100
50
0
2012 2013 2014 2015 2016
morphosys ag nasdaq biotechnology index tecdax
110
100
90
80
70
60
50
JAN FEB MAR APR MAY JUN JUL AUG SEP OCT NOV DEC
morphosys ag nasdaq biotechnology index tecdax
50 G R O U P M A N A G E M E N T R E P O R T Shares and the Capital Market

5
6
7
4Shares and the Capital Market
The MorphoSys AG share price started the reporting year at € 57.65. Shortly after the year began, the pharmaceutical and biotechnology shares experienced massive downturns with the NASDAQ Biotechnology Index falling as much as 28 %. MorphoSys shares suffered disproportionately from this negative development and fell to their first low for the year in February with a drop of almost 40 %. The shares tried to recover as the year progressed but remained volatile due to the industry’s negative news flow. Novartis’s announcement of disappointing results from a partner phase 2b/3 RESILIENT study with bimagrumab also hurt the MorphoSys share price. The shares began to regain strength with the announcement of positive phase 3 trial results with gusel-kumab and the corresponding regulatory approval submission by partner Janssen in the fourth quarter. A successful capital in-crease placed with selected institutional investors in November confirmed the renewed confidence in MorphoSys. The shares closed the financial year at € 48.75 per share and a market capi-talization* of € 1.42 billion.*SEE GL OSSARY – page 154
Although MorphoSys shares declined 15 % for the year, their per-formance was still within the benchmark range. While the TecDAX fell only 1 % for the year, the NASDAQ Biotechnology Index experi-enced a sharp decline of 22 %. Sentiment remained poor following some setbacks in major indications, such as Alzheimer’s disease, and in new technologies, such as CAR-T, and due to the ongoing debate on healthcare prices in the US.›› SEE F IGURE 09 – Performance of the MorphoSys Share in 2016 (page 50)›› SEE F IGURE 10 – Performance of the MorphoSys Share 2012–2016 (page 50)
Stock Market Development
Stock markets also began the year 2016 with heavy losses, but the year as a whole saw fewer disruptions than in 2015. The surprising Brexit decision and the outcome of the US presidential election caused uncertainty, but have not led to any lasting market volatil-ity. After getting off to a weak start, Germany’s leading DAX index gained 7 % for the year accompanied by high volatility. Low inter-est rates continued to provide support in a market with little posi-tive momentum. The US Dow Jones Index, in contrast, after per-forming poorly in 2015, regained its former strength and climbed even higher following the presidential election.
Investments in the biotechnology sector are generally of a long-term nature. The lack of a solid framework and the loss of faith in the sector in 2016 caused investors to turn increasingly to short-term investments such as futures and index certificates. MorphoSys continued to expand its investor relations activities during the year, focusing its efforts once again on Europe and the United States. The greatest understanding and interest in investing in biotechnology companies continues to be in the United States.
4
Shares and the Capital Market G R O U P M A N A G E M E N T R E P O R T 51
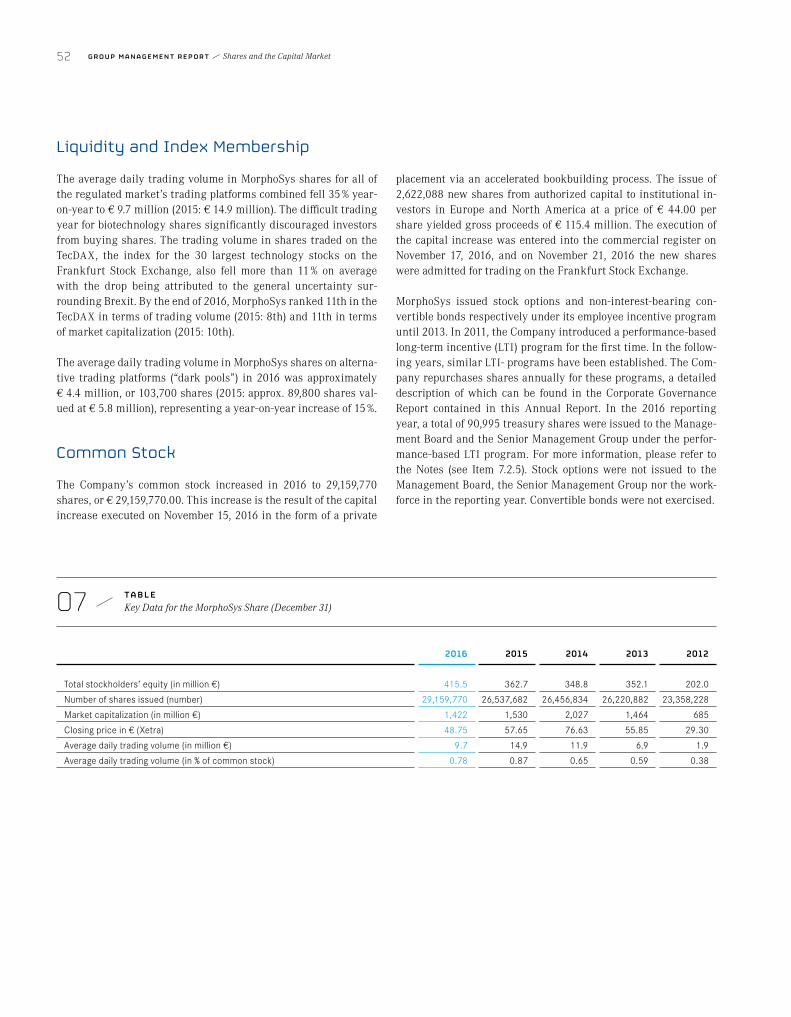
Liquidity and Index Membership
The average daily trading volume in MorphoSys shares for all of the regulated market’s trading platforms combined fell 35 % year-on-year to € 9.7 million (2015: € 14.9 million). The difficult trading year for biotechnology shares significantly discouraged investors from buying shares. The trading volume in shares traded on the TecDAX, the index for the 30 largest technology stocks on the Frankfurt Stock Exchange, also fell more than 11 % on average with the drop being attributed to the general uncertainty sur-rounding Brexit. By the end of 2016, MorphoSys ranked 11th in the TecDAX in terms of trading volume (2015: 8th) and 11th in terms of market capitalization (2015: 10th).
The average daily trading volume in MorphoSys shares on alterna-tive trading platforms (“dark pools”) in 2016 was approximately € 4.4 million, or 103,700 shares (2015: approx. 89,800 shares val-ued at € 5.8 million), representing a year-on-year increase of 15 %.
Common Stock
The Company’s common stock increased in 2016 to 29,159,770 shares, or € 29,159,770.00. This increase is the result of the capital increase executed on November 15, 2016 in the form of a private
placement via an accelerated bookbuilding process. The issue of 2,622,088 new shares from authorized capital to institutional in-vestors in Europe and North America at a price of € 44.00 per share yielded gross proceeds of € 115.4 million. The execution of the capital increase was entered into the commercial register on November 17, 2016, and on November 21, 2016 the new shares were admitted for trading on the Frankfurt Stock Exchange.
MorphoSys issued stock options and non-interest-bearing con-vertible bonds respectively under its employee incentive program until 2013. In 2011, the Company introduced a performance-based long-term incentive (LTI) program for the first time. In the follow-ing years, similar LTI- programs have been established. The Com-pany repurchases shares annually for these programs, a detailed description of which can be found in the Corporate Governance Report contained in this Annual Report. In the 2016 reporting year, a total of 90,995 treasury shares were issued to the Manage-ment Board and the Senior Management Group under the perfor-mance-based LTI program. For more information, please refer to the Notes (see Item 7.2.5). Stock options were not issued to the Management Board, the Senior Management Group nor the work-force in the reporting year. Convertible bonds were not exercised.
07 TAB L EKey Data for the MorphoSys Share (December 31)
2016 2015 2014 2013 2012
Total stockholders’ equity (in million €) 415.5 362.7 348.8 352.1 202.0
Number of shares issued (number) 29,159,770 26,537,682 26,456,834 26,220,882 23,358,228
Market capitalization (in million €) 1,422 1,530 2,027 1,464 685
Closing price in € (Xetra) 48.75 57.65 76.63 55.85 29.30
Average daily trading volume (in million €) 9.7 14.9 11.9 6.9 1.9
Average daily trading volume (in % of common stock) 0.78 0.87 0.65 0.59 0.38
52 G R O U P M A N A G E M E N T R E P O R T Shares and the Capital Market

5
6
7
International Investor Base
Various voting right notifications were issued during the report-ing year in accordance with Section 26 (1) of the German Securi-ties Trading Act (WpHG). These notifications were published on the MorphoSys website and can be found under Media and Inves-tors – Stock Information – Shareholder Structure.
According to the definition given by the Deutsche Börse, 98.6 % of MorphoSys AG’s shares were in free float at the end of the report-ing year.
08 TAB L EMorphoSys AG Shareholder Structure (December 31, 2016)
in % Shareholdings in MorphoSys AG exceeding 3 %1
Baillie Gifford & Co 5.41
Mark N. Lampert/BVF 4.17
Schroder International Selection Fund 3.03
1 According to voting right notifications pursuant to Section 26 (1) WpHG
An overview of the current shareholder structure can also be found on the Company’s website (Media and Investors – Stock In-formation – Shareholder Structure).
Annual General Meeting
The Management and Supervisory Boards of MorphoSys AG wel-comed shareholders to the Company’s 18th Annual General Meeting in Munich on June 2, 2016. The shareholders and proxies attending represented more than 54.1 % of the common stock of MorphoSys AG (2015: 50.8 % of the common stock).
Eight of the nine agenda items submitted for resolution were ad-opted by a clear majority. The resolution for the creation of Autho-rized Capital 2016-II and the authorization to grant subscription rights to the MorphoSys AG Management Board, governing bodies of affiliated companies in Germany and abroad and selected exec-utives of MorphoSys AG and affiliated companies in Germany and abroad (Performance Share Plan 2016) (Amendment to the Articles of Association) was supported by 72.25 % of the common stock present but did not receive the 75 % majority of votes necessary.
Investor Relations Activities
During the 2016 financial year, MorphoSys continued to strengthen its communication with the capital markets. The Company took part in over 20 international investor conferences and held an Investor’s Event in Chicago, IL, USA in June on the occasion of the ASCO Annual Meeting, the world’s largest conference for cancer. Several road shows were held at various locations in both Europe and the USA. The strongest interest continued to be in the United States where a large number of specialized healthcare investors are located. Currently, approximately 30 % of MorphoSys AG shares are held by institutional investors based in the USA.
The Management Board held conference calls with the publication of the annual, half-yearly and quarterly results to report past and expected business developments and answer questions from ana-lysts and investors.
The key topics when speaking with investors were the progress of the Company’s pipeline and the development of the proprietary portfolio, which had a total of 14 active programs at the end of the reporting year. Investors were particularly interested in the clini-cal results of our partnered programs, especially the data and plans for the pivotal studies.
Shares and the Capital Market G R O U P M A N A G E M E N T R E P O R T 53

There were a total of 14 analysts covering MorphoSys shares at the end of 2016. Four of these analysts had initiated coverage of the shares in 2016.
09 TAB L EAnalyst Recommendations (December 31, 2016)
Buy/Overweight Hold Sell n/a
10 3 0 1
Buy/Overweight; Hold; Sell; n/a = not available (no rating)
Detailed information on MorphoSys shares, financial ratios, the Company’s strategic direction and the Group’s recent developments can be found on the Company’s website (Media and Investors).
54 G R O U P M A N A G E M E N T R E P O R T Shares and the Capital Market

6
7
5Sustainable Business Development
MorphoSys is aware of its responsibility to present and future gen-erations and sees sustainable behavior as a prerequisite for long-term business success. As a biotechnology company conducting both research and drug development, observing the highest eco-logical, social and ethical standards is a top priority and a key component of MorphoSys’s corporate culture. The following sec-tion describes the Company’s sustainability strategy and the ac-tivities carried out during the reporting year that are used as non-financial performance indicators. The financial performance indicators are presented in the section “Analysis of Net Assets, Financial Position and Results of Operations.” Information on MorphoSys’s management structure and corporate governance practices can be found in the Corporate Governance Report.
Sustainable Corporate Management
Sustainability is a hallmark of MorphoSys’s corporate manage-ment and plays a major role in the pursuit of corporate goals and contributing value to society. This applies to the short- and long-term objectives of all levels of management and is reflected in the Company’s core task of developing even more effective and safer drugs. To ensure lasting business success, the Company incorpo-rates environmental and social responsibility into its daily busi-ness and bases its business model on sustainable growth that pro-tects the interests of its shareholders, creates long-term value and weighs the Company’s actions in terms of their impact on the en-vironment, society, patients and employees. This business model is reflected internally in a progressive human resources policy that takes employees’ needs seriously.
The Company’s long-term and sustainable business success rests on innovative research and development to meet the major chal-lenge of providing comprehensive healthcare in the future. Be-cause of a growing and aging population, biotechnology-derived drugs represent a growing portion of the overall healthcare sys-tem. In the opinion of management, all aspects of the current busi-ness model of MorphoSys support the sustainable investment in-terests of its shareholders.
A comprehensive risk management system ensures that factors that could threaten sustainable corporate performance are identi-fied early and corrected if necessary. MorphoSys only assumes risk when there is an opportunity to increase the Company’s en-terprise value. At the same time, a great effort is made to system-atically identify new opportunities and leverage its business suc-cess (more information on risks and opportunities can be found on page 62).
Group-wide compliance with the sustainability strategy is moni-tored by the entire Management Board, chaired by the Chief Finan-cial Officer. The Code of Conduct’s credo, which is available in Ger-man and English and applies to employees Group-wide, regulates the strategy’s implementation in daily operations. Employee train-ing on general and specific sections of the Code of Conduct is con-ducted regularly to ensure that the guidelines are understood and implemented. The Compliance Committee consists of five mem-bers and is available to employees at any time. The Compliance Officer, who is also a member of the committee, coordinates the elements of MorphoSys’s Compliance Management System. More information on this subject can be found on page 89 of the Cor-porate Governance Report. Employees can ask for advice on all matters concerning legal compliance and corporate responsibility and report any suspected violations. If preferred, this may be done
5
Sustainable Business Development G R O U P M A N A G E M E N T R E P O R T 55
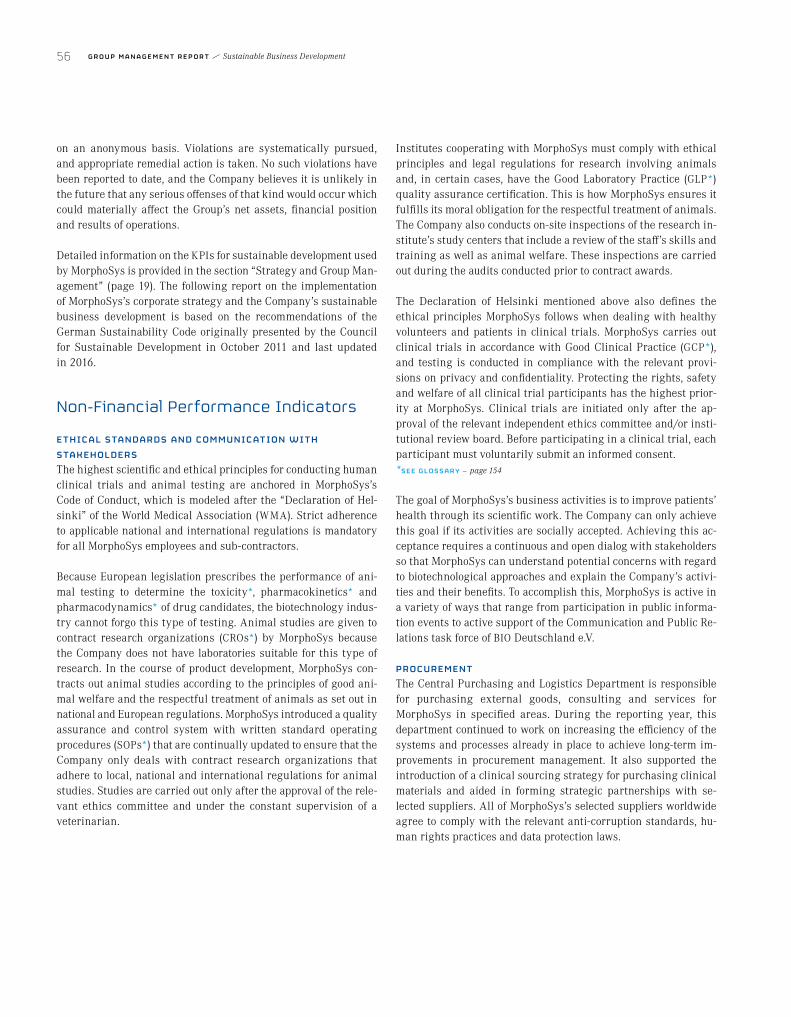
on an anonymous basis. Violations are systematically pursued, and appropriate remedial action is taken. No such violations have been reported to date, and the Company believes it is unlikely in the future that any serious offenses of that kind would occur which could materially affect the Group’s net assets, financial position and results of operations.
Detailed information on the KPIs for sustainable development used by MorphoSys is provided in the section “Strategy and Group Man-agement” (page 19). The following report on the implementation of MorphoSys’s corporate strategy and the Company’s sustainable business development is based on the recommendations of the German Sustainability Code originally presented by the Council for Sustainable Development in October 2011 and last updated in 2016.
Non-Financial Performance Indicators
ETHICAL STANDARDS AND COMMUNICATION WITH STAKEHOLDERSThe highest scientific and ethical principles for conducting human clinical trials and animal testing are anchored in MorphoSys’s Code of Conduct, which is modeled after the “Declaration of Hel-sinki” of the World Medical Association (WMA). Strict adherence to applicable national and international regulations is mandatory for all MorphoSys employees and sub-contractors.
Because European legislation prescribes the performance of ani-mal testing to determine the toxicity*, pharmacokinetics* and pharmacodynamics* of drug candidates, the biotechnology indus-try cannot forgo this type of testing. Animal studies are given to contract research organizations (CROs*) by MorphoSys because the Company does not have laboratories suitable for this type of research. In the course of product development, MorphoSys con-tracts out animal studies according to the principles of good ani-mal welfare and the respectful treatment of animals as set out in national and European regulations. MorphoSys introduced a quality assurance and control system with written standard operating procedures (SOPs*) that are continually updated to ensure that the Company only deals with contract research organizations that adhere to local, national and international regulations for animal studies. Studies are carried out only after the approval of the rele-vant ethics committee and under the constant supervision of a veterinarian.
Institutes cooperating with MorphoSys must comply with ethical principles and legal regulations for research involving animals and, in certain cases, have the Good Laboratory Practice (GLP*) quality assurance certification. This is how MorphoSys ensures it fulfills its moral obligation for the respectful treatment of animals. The Company also conducts on-site inspections of the research in-stitute’s study centers that include a review of the staff’s skills and training as well as animal welfare. These inspections are carried out during the audits conducted prior to contract awards.
The Declaration of Helsinki mentioned above also defines the ethical principles MorphoSys follows when dealing with healthy volunteers and patients in clinical trials. MorphoSys carries out clinical trials in accordance with Good Clinical Practice (GCP*), and testing is conducted in compliance with the relevant provi-sions on privacy and confidentiality. Protecting the rights, safety and welfare of all clinical trial participants has the highest prior-ity at MorphoSys. Clinical trials are initiated only after the ap-proval of the relevant independent ethics committee and/or insti-tutional review board. Before participating in a clinical trial, each participant must voluntarily submit an informed consent.*SEE GL OSSARY – page 154
The goal of MorphoSys’s business activities is to improve patients’ health through its scientific work. The Company can only achieve this goal if its activities are socially accepted. Achieving this ac-ceptance requires a continuous and open dialog with stakeholders so that MorphoSys can understand potential concerns with regard to biotechnological approaches and explain the Company’s activi-ties and their benefits. To accomplish this, MorphoSys is active in a variety of ways that range from participation in public informa-tion events to active support of the Communication and Public Re-lations task force of BIO Deutschland e.V.
PROCUREMENTThe Central Purchasing and Logistics Department is responsible for purchasing external goods, consulting and services for MorphoSys in specified areas. During the reporting year, this department continued to work on increasing the efficiency of the systems and processes already in place to achieve long-term im-provements in procurement management. It also supported the introduction of a clinical sourcing strategy for purchasing clinical materials and aided in forming strategic partnerships with se-lected suppliers. All of MorphoSys’s selected suppliers worldwide agree to comply with the relevant anti-corruption standards, hu-man rights practices and data protection laws.
56 G R O U P M A N A G E M E N T R E P O R T Sustainable Business Development

ONLY CER T IF IED COMP ANIES ARE AU T HORIZED BY
MORPHOSY S T O DISP OSE OF CHEMICAL WAS T E
!
ONLY SPECIALLY TRAINED EMPLOYEES ARE ALLOWED
TO WORK WITH TOXIC SUBSTANCES
IN T RODUC T ION OF HAZARDOUS MAT ERIAL S F OR R& D P URP OSE S :
P AT HOGENIC ORGANISMS ARE PROCESSED IN
L AB ORAT ORIES WI T H P AR T ICUL AR SAF E T Y S TANDARDS
L OWES T P OSSIBL E AMOUN T S OF HAZARDOUS
SUBS TANCES USED
A dedicated biosafety team as defi ned by the “Gentechnik Sicherheitsverordnung” (German Genetic Engineering Safety Directive) and other safety professionals perform an internal audit to assess the risk involved
Specifi c safety and evacuation training for the employees working with the substances
Assurance that all safety measures are imple-mented before actual work commences
F I G URE
11Occupational Safety at MorphoSys
6
7
ENVIRONMENTAL PROTECTION AND OCCUPATIONAL SAFETYBecause the biotechnology industry is subject to stringent regula-tory requirements, environmental protection and occupational safety are important tasks of Group management. The Technical Operations Department with its subdivisions monitors Group-wide compliance with all relevant requirements. In addition to strict compliance with all legal requirements, MorphoSys makes a tre-mendous effort to maintain sustainable environmental manage-ment and the effective protection of its employees.
MorphoSys was certified for the seventh consecutive year as a “bi-cycle-friendly company” for its participation in the “Bike to Work” initiative sponsored by the German Bicycle Club (ADFC) and a Ger-man health insurance company. MorphoSys also offers employees an extensive range of preventative healthcare options, such as au-togenic training, ball sports, weight training and marathons.
With one reportable occupational accident in the reporting year, the number of accidents was at the same very low level as in the previous year, placing the ratio of reportable accidents at MorphoSys significantly below the average ratio in Germany (22.8 reportable occupational accidents per 1,000 full-time employees in the latest survey conducted in 2015).
MorphoSys tries to minimize the amount of harmful substances used in its laboratories. Only those who are specially trained are allowed to work with toxins. Work involving contagious pathogens can only be carried out in secure laboratories. MorphoSys only uses certified companies to dispose of chemical waste and also refrains from labeling antibodies with radioactive substances.›› SEE F IGURE 11 – Occupational Safety at MorphoSys (page 57)
Sustainable Business Development G R O U P M A N A G E M E N T R E P O R T 57
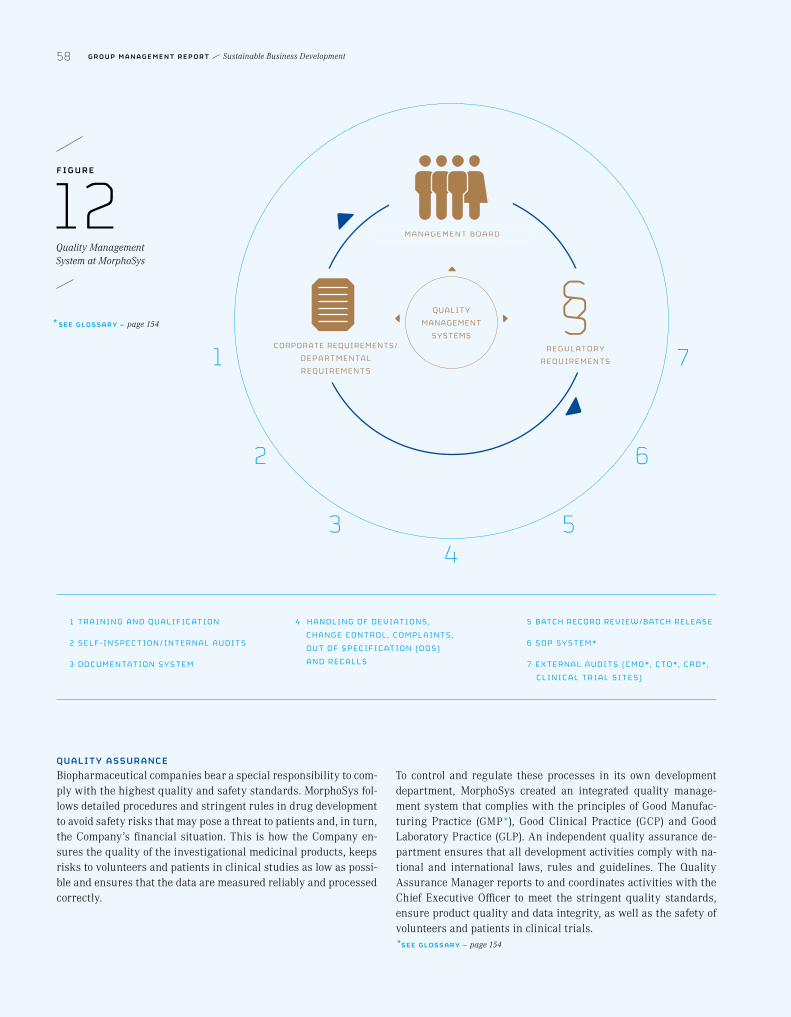
1 T RAINING AND QUAL IF IC AT ION
2 SEL F-INSPEC T ION / IN T ERNAL AUDI T S
3 DOCUMEN TAT ION SY S T EM
4 HANDL ING OF DEVIAT IONS , CHANGE CON T ROL , COMPL AIN T S , OU T OF SPEC IF IC AT ION ( O OS ) AND REC AL L S
5 BATCH RECORD REVIEW/BATCH RELEASE
6 SOP SY S T EM*
7 EX T ERNAL AUDI T S ( CMO *, C T O *, CRO *, CL INIC AL T RIAL SI T ES )
CORPORATE REQUIREMENTS/DEP AR T MEN TAL REQUIREMEN T S
REGUL AT OR Y REQUIREMEN T S
MANAGEMEN T B OARD
QUALITY MANAGEMENT
SYSTEMS
1
2
34
5
6
7*SEE GL OSSARY – page 154
F I G URE
12Quality Management System at MorphoSys
QUALITY ASSURANCEBiopharmaceutical companies bear a special responsibility to com-ply with the highest quality and safety standards. MorphoSys fol-lows detailed procedures and stringent rules in drug development to avoid safety risks that may pose a threat to patients and, in turn, the Company’s financial situation. This is how the Company en-sures the quality of the investigational medicinal products, keeps risks to volunteers and patients in clinical studies as low as possi-ble and ensures that the data are measured reliably and processed correctly.
To control and regulate these processes in its own development department, MorphoSys created an integrated quality manage-ment system that complies with the principles of Good Manufac-turing Practice (GMP*), Good Clinical Practice (GCP) and Good Laboratory Practice (GLP). An independent quality assurance de-partment ensures that all development activities comply with na-tional and international laws, rules and guidelines. The Quality Assurance Manager reports to and coordinates activities with the Chief Executive Officer to meet the stringent quality standards, ensure product quality and data integrity, as well as the safety of volunteers and patients in clinical trials.*SEE GL OSSARY – page 154
58 G R O U P M A N A G E M E N T R E P O R T Sustainable Business Development
6
7
The Quality Assurance Department prepares an annual review plan using a risk-based approach that is used when auditing the contract research institutes, suppliers and contract manufacturers selected for clinical studies as well as MorphoSys’s own depart-ments.
MorphoSys holds a manufacturing license for the approval of tested compounds for its proprietary development activities, and was also issued a certificate from the German authorities of Upper Bavaria confirming the Company’s compliance with Good Manu-facturing Practice (GMP) standards and guidelines.›› SEE F IGURE 12 – Quality Management System at MorphoSys (page 58)
INTELLECTUAL PROPERTYProprietary technology and the drug candidates derived therefrom are MorphoSys’s most valuable assets. Therefore, it is critical to the Company’s success that these assets are protected by appropri-ate measures such as patents and patent filings. Only through these means MorphoSys can ensure that these assets are exclu-sively utilized. It is also the reason our Intellectual Property (IP) Department seeks out the best strategy to protect all of the Compa-ny’s products and technologies. The rights of third parties are also actively monitored and respected.
MorphoSys’s core technologies, which include the Ylanthia anti-body library and the Slonomics technology, the basis for the Com-pany’s success. Each of these technologies is protected by a num-ber of patent families that protect various aspects of these assets. Meanwhile, most of these patents have been granted in all of the key regions, including the markets of Europe, the United States and Asia.
The same is true for our development programs. In addition to the patents that protect the drug candidates themselves, other patent applications were also filed that cover other aspects of the pro-grams. The relevant patents and associated protection certificates for development candidates MOR103/GSK3196165 (out-licensed to GSK) and MOR202 are expected to expire in 2031. The MOR208 program is also protected by various patents scheduled to expire in 2029 (US patent) and 2027 (European patent), aside from any possible regulatory or patent office extensions.
The programs developed in cooperation with or for partners are also fully secured by patent protection. MorphoSys’s patent de-partment works closely with the relevant partners. The patents covering these drug development programs have durations that significantly exceed those of the underlying technology patents.
MorphoSys also monitors the activities of its competitors and initi-ates any necessary actions. In April 2016, MorphoSys filed a patent infringement lawsuit against Janssen Biotech and Genmab. This lawsuit is still in progress.
MorphoSys’s patent attorneys currently maintain over 50 different patent families worldwide in addition to the numerous patent families the Company pursues with its partners. The patent port-folio is routinely analyzed and adapted to the Company’s corporate strategy.
HUMAN RESOURCESMorphoSys follows a progressive human resources policy for the long-term retention of professionally and personally suitable em-ployees from a variety of fields. In an industry such as the biotech-nology industry, where success largely depends on the creativity and commitment of staff, factors like employee retention and em-ployee satisfaction are crucial for success. At the end of the report-ing year, MorphoSys had employees representing 31 different na-tionalities (2015: 29) employed at the Company for an average of 6.9 years (2015: 6.0 years).›› SEE F IGURE 13 – Employees by Gender (page 60)›› SEE F IGURE 14 – Seniority (page 60)
Sustainable Business Development G R O U P M A N A G E M E N T R E P O R T 59

F I G URE
13Employees by Gender (December 31)
2015 2016
43 44
2427
37 %
36 %63 %
64 %
trai
nee
s (n
um
ber)
tota
l em
plo
yees
exec
uti
ves
(nu
mbe
r)
2015 2016
3 463
F I G URE
F I G URE
14
15
Seniority (average duration in years)
Workforce Turnover Rate (in %)
6.0 YEARS
YEARS6.9
2015
2016
4.1 %
%7.5
2015
2016
2015 2015
20162016
60 G R O U P M A N A G E M E N T R E P O R T Sustainable Business Development
6
7
Employees have access to a broad range of in-house and external training programs, advanced education, specialized continuing education and development programs and industry conferences. MorphoSys promotes not only ongoing professional education but also the personal development of its employees and in some cases even offers support through customized coaching.
MorphoSys requires all executives with management responsibil-ity to take part in management seminars created exclusively for the Company. The training is based on several thematically related components that aim to provide not only theoretical knowledge but also prepare participants for the special demands placed on the Company’s executives.
MorphoSys also actively promoted the professional career paths of specialists and experts during the reporting year. The intended goal of this type of career promotion, which is also available to employees without personnel responsibilities, is to continue to maintain flat hierarchies and place traditional management and professional career paths on equal footing, also in terms of titles and compensation structures.
MorphoSys offers in-house vocational training to open up promis-ing career prospects, particularly for young people. In awarding apprenticeships, the Company has been very successful in consid-ering students who are equally suitable but do not have a diploma. On December 31, 2016, MorphoSys had one trainee in the IT de-partment and six biology laboratory trainees (December 31, 2015: three IT trainees; six biology laboratory trainees).
As articulated in the Company’s credo, transparent communica-tion between employees is a central aspect of MorphoSys’s corpo-rate culture. One example is the employees’ use of the Company’s intranet to obtain target-group-specific information. MorphoSys also has a bi-weekly general meeting in which the Management Board presents the Company’s latest developments to employees, answers questions and provides an opportunity for employees to present selected projects. Employees’ questions and feedback can be taken directly in the meeting or submitted in advance in writ-ing – anonymously if desired.
MorphoSys maintains a Facebook career page to promote employer branding. The target group is potential applicants who want to learn more about the Company. The page presents employee pro-files and reports on a variety of activities extending beyond the typical workday to give an authentic and modern impression of the Company.
New employees are helped to become familiar with the Group through extensive onboarding activities. Employees can learn about the Company’s processes in two-day orientation seminars with presentations from all operating departments and by partici-pating in laboratory tours.
Free athletic and relaxation options, back strengthening activities, soccer, volleyball and basketball, as well as autogenic training and massage for a fee, all work to promote health and socializing among employees of all departments.
Providing feasible concepts for reconciling a professional career with personal life is a strategic success factor for progressive com-panies. For many years, MorphoSys has been offering employees a diverse range of options, such as flexible working hours and spe-cial part-time employment arrangements. Modern IT equipment also allows employees to work during business trips or from their home office without interruption. MorphoSys makes it easier for employees with families to re-enter the workforce and combine work and family life. The Company cooperates with an external provider offering employees additional services related to care and nursing.
MorphoSys makes every effort to protect employees from work-place hazards and maintain their health through preventative measures. The extremely low number of occupational accidents illustrates the success of the Company’s strict monitoring of all occupational protection and safety measures. During the report-ing year, there was one reportable occupational accident. MorphoSys tries to maintain the low number of accidents and the highest level of employee safety and well-being through the help of policies and training from the Department of Health and Occupational Safety and by offering routine medical examinations.›› SEE F IGURE 15 – Workforce Turnover Rate (page 60)
Sustainable Business Development G R O U P M A N A G E M E N T R E P O R T 61

6Risk and Opportunity Report
MorphoSys operates in an industry characterized by constant change and innovation. The challenges and opportunities in the healthcare sector are influenced by a wide variety of factors. Global demographic changes, medical advances and the desire to in-crease quality of life provide excellent growth opportunities for the pharmaceutical and biotechnology industries; however, com-panies must also grapple with growing regulatory requirements in the field of drug development as well as cost pressure on the healthcare systems.
MorphoSys makes a great effort to identify new opportunities and to leverage its business success to generate a lasting increase in enterprise value. Entrepreneurial success, however, is not achiev-able without conscious risk-taking. Through its worldwide opera-tions, MorphoSys is confronted with a number of risks that could affect its business. MorphoSys’s risk management system identi-fies these risks, evaluates them and takes suitable action to avert risk and reach its corporate objectives. A periodic strategy review ensures that there is a balance of risk and opportunity. MorphoSys only assumes risk when there is an opportunity to increase the Company’s enterprise value.
Risk Management System
The risk management system is an essential element of MorphoSys’s corporate governance and ensures the Company adheres to good corporate governance principles and complies with regulatory re-quirements.
MorphoSys has a comprehensive system in place to identify, as-sess, communicate and deal with risks throughout the Company. The risk management system identifies risk at a very early stage, making it possible to take action to limit operating losses and avoid risks that could jeopardize the Company. All actions to min-imize risk are assigned to risk officers, most of whom belong to MorphoSys’s Senior Management Group.
All material risks in the various business segments and the Com-pany as a whole are assessed using a systematic risk process that is carried out twice a year. Risks are assessed by comparing their quantifiable financial impact on the MorphoSys Group with their probability of occurrence with and without initiating a risk mitiga-tion process. This method is applied over a 12-month assessment period as well as a period of three years to include risks related to the Company’s proprietary development that have longer dura-tions. Additionally, there is a strategic risk assessment that spans more than three years. An overview of MorphoSys’s current risk assessment activities can be found in Tables 10 and 11 (page 70).
Risk managers enter their risks into a Group-wide IT platform that makes monitoring, analyzing and documenting risks much easier. The risk management system distinguishes risk owners from risk managers. Risk owners are typically the relevant department heads (usually members of the Senior Management Group). Risk managers can be department employees when the risks that fall under their area of responsibility are included in the risk manage-ment system. Risk owners and risk managers are required to up-date their risks and assessments at half-yearly intervals. The pro-cess for this is coordinated and led by the Corporate Finance & Corporate Development Department, which is also responsible for monitoring the evaluation process and summarizing the key infor-mation. The information is regularly presented to the Management
62 G R O U P M A N A G E M E N T R E P O R T Risk and Opportunity Report

F I G URE
16Risk and Opportunity Management System at MorphoSys
BUSINESS DEVEL OPMEN T
CORP ORAT E GOVERNANCE
SUPERVISOR Y B OARD
MANAGEMEN T B OARD
RISKMANAGEMEN T
COMPL IANCEMANAGEMEN T
OPP OR T UNI T YMANAGEMEN T
IN T ERNALCON T ROLSY S T EM
IN T ERNAL AUDI T
INNOVAT ION C API TAL
T ECHNOL OGY SCOU T ING
IMPL EMEN TMEASURES
ASSESSRISK
MONI T ORSY S T EM
DISCUSSION F ORUM
DEF INEOBJEC T IVES
7
6
Risk and Opportunity Report G R O U P M A N A G E M E N T R E P O R T 63

Board who, in turn, presents the results to the Supervisory Board twice a year. The entire evaluation process is based on standard-ized forms for the evaluations. Risk management and monitoring activities are carried out by the relevant managers. The changes in the risk profile resulting from these activities are recorded at regular intervals. An audit by external consultants ensures the ongoing development of the risk management system and that any potential changes in the Company’s risk areas are promptly incor-porated. The risk and opportunity management system combines a bottom-up approach for recognizing both short- and medium- term risks with a top-down approach in the area of strategic risks and opportunities. The top-down approach systematically identi-fies global strategic risks and opportunities and completes the overview of the overall risks and opportunities. Examples include environmental and industry risks, personnel risks and other risks that may result from the public perception of the Company. As part of the top-down approach, workshops are held twice per year with selected members of the Senior Management Group. Within these workshops the strategic risks and opportunities in different areas of the Company are assessed and discussed including those ex-ceeding a period of three years. The evaluation process is solely qualitative. These risks are listed in Table 11.
Principles of Risk and Opportunity Management
MorphoSys continually encounters both risks and opportunities. These could have a potential material impact on the net assets and financial position as well as a direct effect on intangible assets, such as the Company’s image in the sector or the Company’s trademark.
MorphoSys defines risk as an internal or external event that has an immediate impact on the Company and includes an assessment of the potential financial impact on the Company’s targets. There is a direct relationship between opportunity and risk. Seizing op-portunities has a positive influence on Company targets, whereas risk emergence has a negative influence.
Responsibilities Under the Risk and Opportunity Management System
The Management Board of MorphoSys AG is responsible for the risk and opportunity management system and ensures that all risks and opportunities are evaluated, monitored and presented in their entirety. The Corporate Finance & Corporate Development Department coordinates the implementation of actions and reports regularly to the Management Board. The Supervisory Board has appointed the Audit Committee to monitor the effectiveness of the Group’s risk management system. The Audit Committee periodi-cally reports its findings to the entire Supervisory Board, which is also directly informed by the Management Board twice a year.›› SEE F IGURE 16 – Risk and Opportunity Management System at MorphoSys (page 63)
Accounting-Related Internal Control System
MorphoSys employs extensive internal controls, Group-wide re-porting guidelines as well as other measures, such as employee training and ongoing professional education with the goal of main-taining accurate bookkeeping and accounting and ensuring reli-able financial reporting in the consolidated financial statements and group management report. This essential component of Group accounting consists of preventative, monitoring and detection measures intended to ensure security and control in accounting and operating functions. Detailed information about the internal control system for financial reporting can be found in the Corpo-rate Governance Report.
64 G R O U P M A N A G E M E N T R E P O R T Risk and Opportunity Report

7
Risks
RISK CATEGORIESMorphoSys divides its key risks into the following six categories. • Financial risk (includes risk resulting from insolvencies and
payment defaults; license fees; research funding and milestones that are lower than planned or anticipated; and risks associated with any form of financing and financial instruments, such as cash investments, bank failures, currencies, (negative) interest rates, taxes, debt collection and lack of funding)
• Operational risk (risk, for example, in the areas of procurement/production, customers and personnel, as well as risk related to preclinical or clinical trial results and other risk specific to the biotechnology industry)
• Strategic risk (for example mergers and acquisitions (M&A), shareholdings, R&D, corporate image, superior development proj-ects and technologies of competitors and portfolio development)
• External risk (risk beyond the Company’s control, such as eco-nomic, political and legal risk; as well as risk specific to compa-nies in the biotechnology and pharmaceutical industries, such as the risk to intellectual property protection or in the regulatory environment when seeking the approval of new drugs)
• Organizational risk (includes risk concerning IT, facilities man-agement, succession planning, business interruption and pro-cess delays as a result of the high complexity and number of projects)
• Compliance risk (for example, non-compliance with US FDA and European EMA* regulations, quality management policies, ac-counting standards, corporate governance or violations of the German Stock Corporation Act)
*SEE GL OSSARY – page 154
FINANCIAL RISK
MorphoSys’s financial risk management seeks to limit financial risk and reconciles this risk with the requirements of its business.
Financial risk can arise in relation to licensing agreements, for example when projects (products or technologies) do not material-ize, are delayed or out-licensed to a different degree than origi-nally planned. Risk also arises when revenues do not reach their projected level or when costs are higher than planned due to higher resource requirements. Detailed project preparations, such as those made through in-depth exchanges with internal and ex-ternal partners and consultants, ensure the optimal starting point early in the process and are important for minimizing risk. Finan-cial risk related to the Company’s proprietary programs was re-duced in 2013 by successfully partnering MOR103/GSK3196165. The financial risk relating to the fully proprietary programs
MOR202 and MOR208 remains entirely with MorphoSys. MorphoSys retains some risk with respect to the clinical develop-ment of programs introduced into partnerships; for example, MOR106 and MOR209/ES414. The early termination of develop-ment partnerships may force MorphoSys to bear future develop-ment costs alone and have a major impact on the Company’s in-come statement and financial planning.
Continuing economic difficulties in Europe indicate that potential bank insolvencies still pose a financial risk. For this reason, MorphoSys continues to invest only in funds and bank instru-ments deemed safe – to the extent this is possible and can be esti-mated – and that have maintained their high rating and/or are secured by a strong partner. MorphoSys has simulated various scenarios and set up appropriate contingency plans. A further risk is the receipt of adequate interest on financial investments, partic-ularly in light of today’s negative key interest rates.
In future, MorphoSys will continue to spend substantial resources on the development of product candidates, including the identifica-tion of target molecules and drug candidates, the conducting of preclinical studies and clinical trials, the manufacturing of mate-rial and the support of collaborations and joint development of pro-grams as well as the acquisition of new technologies and the in- licensing of new development candidates. The current financial resources and expected future cash in-flows should be sufficient to meet the Company’s current and near-term capital requirements. However, it is not guaranteed that funding will be sufficient in the long term at all times.
OPER ATIONAL RISK
Operational risk includes risks related to the exploration and de-velopment of proprietary drug candidates.
The termination of a clinical trial prior to out-licensing to part-ners – which does not necessarily imply the failure of an entire program – can occur when the trial data does not produce the ex-pected results, shows unexpected adverse side effects or is com-piled incorrectly. Clinical trial design and drafts of development plans are always completed with the utmost care. This gives the trials the best opportunity to show clinically relevant data in clin-ical testing and persuade regulatory agencies and potential part-ners. External experts also contribute to the Company’s existing internal know-how. Special steering committees and panels are formed to monitor the progress of clinical programs.
Risk and Opportunity Report G R O U P M A N A G E M E N T R E P O R T 65

Antibody production is a significant cost factor in the development of drugs. The Company’s obligation to comply with international drug regulatory agencies’ requirements at every step of produc-tion in order to ensure the highest quality compounds and patient safety plays a critical role in its costs. The production process for biopharmaceuticals is usually performed in cell culture systems with several thousand liters of culture volume and requires a number of steps to be carried out under strict supervision and con-trolled conditions until the individual investigational medicinal products are ready for use in patients. Therefore, depending on the phase of the project, lead times of up to one to two years must be scheduled for the supply of antibody material. This planning, cou-pled with early strategic financial investments, represent major factors in drug development because of the high complexity and risk involved in both the production process and clinical trial plan-ning, which can have a considerable effect on the speed and cost of development.
Any changes with respect to clinical trials such as the trial’s de-sign or the speed at which patients can be recruited can have a negative impact on the trial’s economic feasibility and potential. Such a case occurred at the end of 2016 when MorphoSys recog-nized a partial impairment on the carrying amount of MOR209/ES414 due to a significant delay in recruiting patients.
Operational risk can arise from the non-renewal of the cooperation agreement with Novartis. The current agreement ends end of No-vember 2017. Novartis has the option to extend this agreement for an additional two years. Should Novartis decide not to exercise this option, MorphoSys would stand to lose annual revenues of ap-proximately € 40 million as of the 2018 financial year. At this time, MorphoSys believes that the contract with Novartis will not be extended.
STR ATEGIC RISK
Access to sufficient financing options also poses a strategic risk for the Company. Following MorphoSys’s decision to develop its pro-prietary portfolio in-house, the financing of research and develop-ment is now a key focus. Risks in this respect can arise from a lack of access to capital. MorphoSys mitigates these risks by forming multidisciplinary teams responsible for overseeing the budget when adding to the proprietary portfolio. The Company also em-ploys various departments and external consultants to ensure the smooth execution of capital market transactions.
A further strategic risk is the danger that a development program introduced into a partnership may fail. Partnerships can be termi-nated prematurely, forcing MorphoSys to search for new develop-ment partners or bear the substantial cost of further development alone. This may result in a delay or even the termination of the development of individual candidates and could lead to additional costs and a potential long-term loss of revenue for MorphoSys due to delayed market entry. The termination of our partnership with Celgene for MOR202 is an example of the type of risk described.
Another strategic risk is that missed M&A opportunities or failed M&A transactions could block access to strategically important assets. To minimize this risk, MorphoSys has a number of quali-fied teams who screen the market to ensure that MorphoSys does not miss any acquisition opportunities.
EXTERNAL RISK
MorphoSys faces external risk with respect to intellectual prop-erty, among others. The patent protection of MorphoSys’s propri-etary technologies and compounds is especially important. To minimize risks in this area, MorphoSys keeps a vigilant eye on published patents and patent applications and analyzes the corre-sponding results. The Company also develops strategies to circum-vent external patents that may one day be relevant before they are issued or takes other appropriate action. Through the years, MorphoSys has seen increasing success with this strategy and has created ample leeway for its proprietary technology platforms and products for many years to come. Risks can also arise from enforc-ing the Company’s patents against third parties. External risks can also emerge from changes in the regulatory environment. These risks are minimized by providing ongoing training to the relevant personnel and by audits and discussions with external experts. It is also conceivable that competitors challenge patents of MorphoSys Group companies or that MorphoSys concludes that MorphoSys’s patents or patent families are infringed by competi-tors, which may prompt MorphoSys to take legal action against competitors. This type of legal action, particularly when it occurs in the USA, involves high costs and poses a significant financial risk.
As an internationally operating biotechnology company with nu-merous partnerships and an in-house research and development department for developing drug candidates, the MorphoSys Group is subject to a number of regulatory and legal risks. These risks include those related to patent, competition, tax and antitrust law, potential liability claims from existing partnerships and envi-ronmental protection. The Regulatory Affairs department is also
66 G R O U P M A N A G E M E N T R E P O R T Risk and Opportunity Report

7
affected by this risk in terms of the feedback it receives from reg-ulators on study design. Future legal proceedings are conceivable and cannot be anticipated. Therefore, we cannot rule out that we may incur expenses for legal or regulatory judgments or settle-ments that are not or cannot be partially or fully covered by in-surance and may have a significant impact on our business and results.
ORGANIZATIONAL RISK
The Proprietary Development and Technical Operations areas, among others, are subject to organizational risk. Proprietary De-velopment may face quality problems or delays within the organi-zation if the number of programs or their complexity increases. To reduce complexity and thereby reduce risk, the Company intro-duced uniform procedures and monitors their compliance by means of routine audits.
Risk in the Technical Operations area concerns procedures that may cause lasting damage, business interruptions or accidents in-volving harmful or polluting substances. Measures taken to avoid these types of disruptions include the routine inspection and maintenance of equipment and facilities and providing training and tutorials for the employees concerned. These risks are reduced even further using electronic monitoring systems. Financial risk in this area is generally covered by insurance. Additional informa-tion on MorphoSys’s operating environment can be found in the section “Sustainable Business Development.”
COMPLIANCE RISK
Compliance risk can arise when quality standards are not met or business processes are not conducted properly from a legal stand-point. To counter this risk, MorphoSys is committed to having its business operations meet the highest quality standards as set out in the Sustainability Report. The system is also routinely checked by external specialists and subjected to repeat testing by an inter-nal, independent in-house quality assurance department.
Specific risk can arise, for example, when the internal quality management system does not meet the legal requirements or when there is no internal system for detecting quality problems. If the internal controls are not able to detect violations of Good Man-ufacturing Practice (GMP), Good Clinical Practice (GCP) or Good Laboratory Practice (GLP) then this also would represent a compli-ance risk.
Inadequate or late financial communication can lead to fines or even lawsuits. Annual General Meetings conducted incorrectly may lead to legal disputes with shareholders resulting in signifi-cant costs from attempts to prevent either a challenge to or repeat of the Annual General Meeting. Pending decisions for corporate actions, such as capital increases, could also be compromised. To minimize these risks, the preparation and execution of the Annual General Meeting and all related documents and processes are carefully reviewed and monitored by the relevant internal depart-ments as well as external lawyers and, regarding the annual re-port, by the auditors.
THE MANAGEMENT BOARD’S EVALUATION OF THE OVERALL RISK SITUATION AT THE MORPHOSYS GROUPMorphoSys Group’s Management Board considers the overall risk to be appropriate and trusts in the effectiveness of the risk man-agement system in relation to changes in the environment and the needs of the ongoing business. It is the Management Board’s view that the MorphoSys Group’s continued existence is not jeopar-dized. This assessment applies to the MorphoSys Group as a whole as well as to each Group company. This conclusion is based on several factors that are summarized as follows: • The MorphoSys Group has an exceptionally high equity ratio. • The Management Board firmly believes that the MorphoSys
Group is well positioned to cope with any adverse events that may occur.
• The Group participates in a comprehensive portfolio of preclini-cal and clinical programs in partnerships with a number of large pharmaceutical companies and has a strong base of technologies for expanding the Company’s proprietary portfolio.
Despite these factors, it is impossible to rule out, control or influ-ence risk in its entirety.
Risk and Opportunity Report G R O U P M A N A G E M E N T R E P O R T 67

Opportunities
Leading antibody technologies, excellent know-how and a broad portfolio of validated clinical programs have made MorphoSys one of the world’s leading biotechnology companies in the field of ther-apeutic antibodies. This therapeutic class is now one of the most successful in the industry, and there is an impressive number of pharmaceutical and biotechnology companies in the field of anti-bodies that could potentially become customers or partners for MorphoSys’s products and technologies. Due to this fact and thanks to the Company’s extensive technological and product de-velopment expertise, MorphoSys has identified a number of future growth opportunities.
MorphoSys’s technologies for developing and optimizing thera-peutic antibody candidates have distinct advantages that can lead to higher success rates and shorter development times in the drug development process. The transfer and application of MorphoSys’s core capabilities – even those outside of the field of antibodies – opens up new opportunities for the Group because many classes of compounds have similar molecular structures. The Innovation Capital initiative seizes previously unavailable opportunities by making MorphoSys a strategic investor in young, innovative com-panies and allowing it to use synergies effectively.
OPPORTUNITY MANAGEMENT SYSTEM The opportunity management system is an important component of MorphoSys’s corporate management and is used to identify op-portunities early and generate added value for the Company.
Opportunity management is based on four pillars: • a routine discussion forum involving the Management Board
and selected members of the Senior Management Group, • the Company’s business development activities, • a technology scouting team, and • the Innovation Capital initiative.
Committees discuss specific opportunities and decide what action should be taken to exploit these opportunities. The meetings and their outcomes are recorded in detail, and any subsequent action is reviewed and monitored. The Group’s Business Development Team takes part in numerous conferences and in the process iden-tifies different opportunities that can enhance the Company’s growth. These opportunities are presented and evaluated within the committee using an evaluation process. The Technology Scout-ing Team searches specifically for innovative technologies that can generate synergies with MorphoSys’s technological infra-structure and identify new therapeutic molecules. These outcomes are also discussed and evaluated in interdepartmental commit-tees. The Innovative Capital initiative already described also al-lows MorphoSys to participate in these early innovations and make it possible for the Company to use them in the future. A proven process for evaluating opportunities gives MorphoSys a qualitative and replicable evaluation.
GENERAL STATEMENT ON OPPORTUNITIES Increased life expectancy in industrialized countries and rising incomes and living standards in emerging countries are expected to drive the demand for more innovative treatment options and advanced technologies. Scientific and medical progress has led to a better understanding of the biological process of disease and paves the way for new therapeutic approaches. Innovative thera-pies, such as fully human antibodies, have reached market matu-rity in recent years and have led to the development of commer-cially successful medical products. Therapeutic compounds based on proteins – also referred to as “biologics” – are less subject to generic competition than chemically produced molecules because the production of biological compounds is far more complex. The sharp rise in both the demand for antibodies and the interest in this class of drug candidates can be seen by the acquisitions and significant licensing agreements made over the past two to three years.
MARKET OPPORTUNITIES MorphoSys believes its antibody platforms HuCAL, Ylanthia, Slonomics and the in-licensed lanthipeptide technology can all be used to develop products addressing high unmet medical needs.
68 G R O U P M A N A G E M E N T R E P O R T Risk and Opportunity Report

7
THERAPEUTIC ANTIBODIES – PROPRIETARY DEVELOPMENTIt is reasonable to assume that the pharmaceutical industry will increase the level of in-licensing new drugs to refill its pipelines and replace key products and blockbusters that have lost patent protection. MorphoSys’s most advanced compounds MOR103/GSK3196165, MOR202 and MOR208 place the Company in an excellent position to capitalize on the needs of pharmaceutical companies.
Secured cash flows from the Partnered Discovery segment have allowed MorphoSys to strengthen its proprietary portfolio continu-ously. By investigating new disease areas, MorphoSys will con-tinue to expand its proprietary portfolio by adding clinical trials using the Company’s key drug candidates. MorphoSys intends to enhance its portfolio with additional programs and in doing so could take advantage of existing and future opportunities for co-development or partnerships. The Company is also looking for more opportunities to in-license interesting drug candidates.
Drug candidates MOR208 and MOR202 may give MorphoSys its first opportunity to market a drug on its own.
THERAPEUTIC ANTIBODIES – PARTNERED DISCOVERYBy developing drugs with a number of partners, MorphoSys has been able to spread the risk inextricably linked with drug develop-ment over a broader spectrum. With 100 individual therapeutic antibodies currently in partnered development programs, it is be-coming more likely that MorphoSys will have an opportunity to participate financially in marketed drugs. Our partner Janssen, for example, submitted an application to the US Food and Drug Ad-ministration (FDA) in November of 2016 to receive regulatory ap-proval for guselkumab.
TECHNOLOGY DEVELOPMENTMorphoSys continues to invest in its existing and new technolo-gies to defend its technological leadership. MorphoSys established a new technology platform with Ylanthia that, in contrast to its previous version HuCAL, is eligible for broader licensing to differ-ent partners. Commercialization of the Ylanthia antibody library began in 2012.
These types of technological advances can help the Company ex-pand its list of partners and increase not only the speed but also the success rate of its partnered and proprietary drug development programs. New technology modules that enable the production of antibodies against novel classes of target molecules can also pro-vide access to new disease areas in which antibody-based treat-ments are underrepresented.
Technology development is carried out by a team of scientists whose focus is the further development of MorphoSys technolo-gies. MorphoSys not only develops technology internally but also uses external resources to enhance its own activities. A good ex-ample of this is the Company’s acquisition of Lanthio Pharma, a Dutch company developing lanthipeptides.
ACQUISITION OPPORTUNITIESIn the past, MorphoSys has proven its ability to acquire com-pounds and technologies that accelerate its growth. Potential ac-quisition candidates are also systematically presented, discussed and evaluated during the routine meetings described above be-tween the Management Board and selected members of the Senior Management Group. After these meetings, promising candidates are reviewed in terms of their strategic synergies and evaluated by internal specialist committees. Protocols are completed on all can-didates and evaluations are systematically archived for follow-up and monitoring. A proprietary database helps administer this in-formation and keep it available.
MorphoSys plans to move forward with its acquisition strategy in the year ahead in order to enhance its existing portfolio and tech-nology platform and secure access to patents and licenses for novel proprietary technologies and products.
FINANCIAL OPPORTUNITIESExchange rate and interest rate developments can positively or negatively affect the Group’s financial results. Interest rate and fi-nancial market developments are continuously monitored to promptly identify and take advantage of opportunities.
Risk and Opportunity Report G R O U P M A N A G E M E N T R E P O R T 69

10 TAB L ESummary of Key Short- and Medium-Term Risks at MorphoSys
1-Year Assessment 3-Year Assessment
FINANCIAL RISK
Risk of missing revenue targets/incorrect budgeting ••• High ••• High
Risk of lower interest rates and bank insolvencies •• Moderate •• Moderate
OPER ATIONAL RISK
Risk related to development of proprietary antibodies ••• High ••• High
Risk related to non-extension of cooperation agreement with Novartis (financial loss) •• Moderate • Low
STR ATEGIC RISK
Risk of failure to receive financing • Low •• Moderate
Risk of missed acquisition opportunities • Low •• Moderate
EXTERNAL RISK
Patent-related risk (related to lawsuits, patent situation of technology platform, new national/international regulations) •• Moderate •• Moderate
Risk related to regulatory provisions • Low • Low
ORGANIZATIONAL RISK
Risk due to growing number and complexity of programs •• Moderate •• Moderate
Risk in the technical operations area • Low • Low
COMPLIANCE RISK
Quality risk related to legal requirements •• Moderate •• Moderate
Legal risk • Low • Low
LEGEND
• LOW RISK: low probability of occurrence, low impact
•• MODER ATE RISK: moderate probability of occurrence, moderate impact
••• HIGH RISK: moderate probability of occurrence, moderate to strong impact
•••• CATASTROPHIC RISK: high probability of occurrence, severe impact
11 TAB L ESummary of Key Long-Term Risks at MorphoSys
Segment Risk Order of Importance1
Proprietary Development Lack of competitiveness of the MorphoSys pipeline 1
Partnered Discovery Delay or termination of partnered programs 2
Proprietary Development Lack of funding for the MorphoSys pipeline 3
Proprietary Development Insufficient expansion of the MorphoSys pipeline 4
Proprietary Development Inability to build a sales structure 5
1 Declining importance of risk from 1 to 5, whereby 1 represents the most important risk.
70 G R O U P M A N A G E M E N T R E P O R T Risk and Opportunity Report

7Statement on Corporate Governance and Corporate Governance Report
The Statement on Corporate Governance and the Corporate Gover-nance Report are available on the Company’s website under Media and Investors – Corporate Governance.
Statement on Corporate Governance under Sec. 289a (HGB) for the 2016 Financial Year
In the Statement on Corporate Governance under Sec. 289a HGB, the Management Board and the Supervisory Board report on cor-porate governance. In addition to the annual Declaration of Confor-mity in accordance with Sec. 161 of the Stock Corporation Act (AktG), the Statement on Corporate Governance also includes rele-vant information on corporate governance practices and other as-pects of corporate governance, including a description of the work-ing practices of the Management Board and Supervisory Board.
DECLARATION OF CONFORMITY WITH THE GERMAN CORPO-RATE GOVERNANCE CODE (THE “CODE”) OF THE MANAGEMENT BOARD AND SUPERVISORY BOARD OF MORPHOSYS AGThe Management Board and Supervisory Board of MorphoSys AG declare the following under Sec. 161 of the German Stock Corpora-tion Act: 1. Since the last Declaration of Conformity on December 3, 2015,
MorphoSys AG has complied with the recommendations of the “Government Commission on the German Corporate Gover-nance Code” in the version from May 5, 2015 with the following exception:
There is no cap on the overall or individual variable remunera-tion components of Management Board members’ remuneration (see Item 4.2.3 Para. 2 sentence 6 of the Code). Based on the Supervisory Board’s existing limitations for the Management Board’s variable remuneration components and their annual al-location, the Supervisory Board does not believe that an addi-tional cap is required.
2. MorphoSys will continue to comply with the recommendations of the “Government Commission on the German Corporate Gov-ernance Code” in the version dated May 5, 2015 with the excep-tions described under Item 1.
Planegg, December 2, 2016
MorphoSys AG
On behalf of the On behalf of theManagement Board: Supervisory Board:
Dr. Simon Moroney Dr. Gerald MöllerChief Executive Officer Chairman of the Supervisory Board
7
Statement on Corporate Governance and Corporate Governance Report G R O U P M A N A G E M E N T R E P O R T 71
RELEVANT INFORMATION ON CORPORATE GOVERNANCE PRACTICESMorphoSys ensures compliance with laws and rules of conduct through the Group-wide application of the following documents: the Code of Conduct, the Compliance Management Handbook and supplementary internal guidelines.
MorphoSys’s Code of Conduct sets out the fundamental principles and key policies and practices for business behavior. The Code is a valuable tool for employees and executives, particularly in busi-ness, legal and ethical situations of conflict. It reinforces the prin-ciples of transparent and sound management and fosters trust in the Company from the financial markets, business partners, em-ployees and the public. Compliance with the Code of Conduct is carefully monitored. The Group-wide application of the Code is overseen by the Compliance Committee, and the Code itself is rou-tinely reviewed and updated when necessary. The Code of Conduct can be downloaded from the Company’s website under Media and Investors – Corporate Governance.
The Compliance Handbook describes MorphoSys’s Compliance Management System (CMS) and is intended to ensure compliance with all legal regulations as well as set out high ethical standards that apply to both the management and all employees. The Man-agement Board has overall responsibility for the compliance man-agement system and is required to report regularly to the Audit Committee and the Supervisory Board. In carrying out its compli-ance responsibility, the Management Board has assigned the rele-vant tasks to various offices at MorphoSys.
The Compliance Officer arranges the exchange of information be-tween the internal compliance-relevant posts. The Compliance Officer monitors the Company’s existing CMS and implements the CMS through appropriate measures and decisions taken on an individual basis. The Compliance Officer is the employee contact person for all compliance-related issues and implements the com-pliance requirements defined by the Compliance Committee.
The Compliance Officer is supported by a Compliance Committee that meets at regular intervals. The Compliance Committee sup-ports the Compliance Officer in the implementation and monitor-ing of the CMS. The Compliance Committee is particularly respon-sible for the identification and discussion of all compliance-relevant issues and thus makes it possible for the Compliance Officer as well as the other members of the Compliance Committee to period-ically verify MorphoSys’s compliance status and, if necessary, up-date the CMS.
More information on MorphoSys’s Compliance Management Sys-tem can be found in the Corporate Governance Report.
COMPOSITION OF THE MANAGEMENT BOARD AND SUPERVISORY BOARDMANAGEMENT BOARD
The Management Board of the Company consists of a Chief Execu-tive Officer and three other members. A schedule of responsibili-ties defines the different areas of responsibility as follows: • Dr. Simon Moroney, Chief Executive Officer, responsible for Strat-
egy and Planning; Compliance & Quality Assurance; Internal Audit; Human Resources; Business Development & Portfolio Management; Legal; the coordination of individual areas of the Management Board; representation of the Management Board to the Supervisory Board.
• Jens Holstein, Chief Financial Officer, responsible for Accounting and Taxes; Controlling; Corporate Finance & Corporate Develop-ment; Risk Management; IT; Technical Operations; Procure-ment & Logistics; Corporate Communications & Investor Rela-tions; Environmental Social Governance (ESG).
• Dr. Marlies Sproll, Chief Scientific Officer responsible for Devel-opment Partnerships & Technology Development; Target Mole-cule & Antibody Research; Protein Chemistry; Alliance Manage-ment; Intellectual Property.
• Dr. Arndt Schottelius, Chief Development Officer (up to February 28, 2017), responsible for Preclinical Development; Clinical Re-search; Clinical Operations; Drug Safety & Pharmacovigilance; Regulatory Affairs; Project Management.
• Dr. Malte Peters, Chief Development Officer (since March, 1, 2017), responsible for Preclinical Research; Clinical Develop-ment; Clinical Operations; Drug Safety & Pharmacovigilance; Regulatory Affairs; Project Management.
SUPERVISORY BOARD
As of December 31, 2016, the MorphoSys AG Supervisory Board consisted of six members who oversee and advise the Manage-ment Board. The current Supervisory Board consists of profession-ally qualified members who represent MorphoSys AG sharehold-ers. Dr. Gerald Möller, acting Chairman of the Supervisory Board, coordinates the Board’s activities, chairs the Supervisory Board meetings and represents the interests of the Supervisory Board externally. All Supervisory Board members are independent, as defined in the German Corporate Governance Code, and have many years of experience in the biotechnology and pharmaceuti-cal industries. The members were duly elected by the shareholders during the 2015 Annual General Meeting. The Chairperson of the Supervisory Board is not a former member of MorphoSys AG’s Management Board. The members of the Supervisory Board and its committees are listed in the table below.
72 G R O U P M A N A G E M E N T R E P O R T Statement on Corporate Governance and Corporate Governance Report

12 TAB L EComposition of the Supervisory Board
PositionInitial
Appointment End of TermAudit
Committee
Remuneration and Nomination
Committee
Science and Technology Committee
Dr. Gerald Möller Chairman 1999 2018
Dr. Frank Morich Deputy Chairman 2015 2017
Karin Eastham Member 2012 2018
Klaus Kühn Member 2015 2017
Dr. Marc Cluzel Member 2012 2018
Wendy Johnson Member 2015 2017
Independent financial expert Chairperson Member
WORKING PRACTICES OF THE MANAGEMENT BOARD AND SUPERVISORY BOARDTo ensure good corporate governance, a guiding principle of the cooperation between the Management Board and Supervisory Board at MorphoSys AG is the open, comprehensive and regular communication of information. The dual board system prescribed by the German Stock Corporation Act clearly differentiates be-tween a company’s management and supervision. The responsibil-ity of both boards is clearly stipulated by the legislator and the boards’ bylaws and Articles of Association. The boards work closely together to make decisions and take actions for the Com-pany’s benefit. Their stated objective is to sustainably increase the Company’s value.
Management Board members have their own area of responsibility defined in the schedule of responsibilities and regularly report to their Management Board colleagues. Cooperation among Manage-ment Board members is governed by the bylaws. The Supervisory Board ratifies both the schedule of responsibilities and the bylaws. Management Board meetings are typically held weekly and chaired by the Chief Executive Officer. During these meetings, res-olutions are passed concerning dealings and transactions that, under the bylaws, require the approval of the entire Management Board. At least half of the Management Board’s members must be present to pass a resolution. Management Board resolutions are passed by a simple majority and, in the event of a tied vote, the
Chief Executive Officer’s vote decides. For material events, each Management Board or Supervisory Board member can call an ex-traordinary meeting of the entire Management Board. Manage-ment Board resolutions can also be passed outside of meetings by an agreement made orally, by telephone or in writing (also by email). A written protocol is completed for each meeting of the full Management Board and is submitted for approval to the full Man-agement Board and for signature to the Chief Executive Officer at the following meeting.
Management Board strategy workshops are also held, in which the Group-wide strategic objectives are developed and prioritized.
The Management Board promptly and comprehensively informs the Supervisory Board in writing and at Supervisory Board meet-ings about planning, business development, the Group’s position, risk management and other compliance issues. Extraordinary meetings of the Supervisory Board are also called for material events. The Management Board involves the Supervisory Board in the strategy, planning and all fundamental Company issues. In addition to routine Supervisory Board meetings, a strategy meet-ing takes place between the Management Board and Supervisory Board once annually to discuss MorphoSys’s strategic direction. The Management Board’s bylaws specify that material business
Statement on Corporate Governance and Corporate Governance Report G R O U P M A N A G E M E N T R E P O R T 73

transactions require the approval of the Supervisory Board. De-tailed information on the cooperation of the Management Board and Supervisory Board and important items of discussion during the 2016 financial year can be found in the Report of the Supervi-sory Board.
The Supervisory Board holds a minimum of two meetings per cal-endar half-year and at least six meetings per full calendar year. The Supervisory Board has supplemented the Articles of Associa-tion with rules of procedure that apply to its duties. In accordance with these rules, the Chairperson of the Supervisory Board coordi-nates the activities of the Supervisory Board, chairs the Supervi-sory Board meetings and represents the interests of the Supervi-sory Board externally. The Supervisory Board typically passes its resolutions in meetings but resolutions may also be passed outside of meetings in writing (also by email), by telephone or video con-ference.
The Supervisory Board has a quorum when at least two-thirds of its members (including either the Chairperson or Deputy Chair-
person of the Supervisory Board) take part in the vote. Resolutions of the Supervisory Board are generally passed with a simple ma-jority unless the law prescribes otherwise. In the event of a tied vote, the Chairperson of the Supervisory Board’s vote decides.
Protocols are completed for Supervisory Board meetings and reso-lutions passed outside of meetings. A copy of the Supervisory Board’s protocol is made available to all Supervisory Board mem-bers. The Supervisory Board conducts an efficiency evaluation reg-ularly in accordance with the recommendation in Item 5.6 of the Code.
COMPOSITION AND WORKING PRACTICES OF THE MANAGE-MENT BOARD AND SUPERVISORY BOARD COMMITTEESThe Management Board has not formed any committees.
The Supervisory Board has three committees: the Audit Commit-tee, the Remuneration and Nomination Committee and the Science and Technology Committee. The members of the three committees formed by the Supervisory Board are professionally qualified.
13 TAB L EParticipation of Supervisory Board Members
S UP ERV I S O R Y B O ARD MEE T IN G S
by phone by phone by phone by phone
Name
01/15/
201602/24/
201603/16/
201606/01/
201607/21/
201610/12/
201610/13/
201611/08/
201611/15/
201612/08/
2016
Dr. Gerald Möller
Dr. Marc Cluzel
Karin Eastham – – –
Wendy Johnson
Klaus Kühn
Dr. Frank Morich
74 G R O U P M A N A G E M E N T R E P O R T Statement on Corporate Governance and Corporate Governance Report

MEE T IN G S O F T HE AUD I T C O MMI T T EE
by phone by phone by phone
Name
02/24/
201603/16/
201604/29/
201607/21/
201611/03/
201612/07/
2016
Karin Eastham – –
Wendy Johnson –
Klaus Kühn
MEE T IN G S O F T HE REM UNER AT I O N AND N O MINAT I O N C O MMI T T EE
by phone
by phone
by phone
by phone
by phone
by phone
by phone
by phone
by phone
by phone
Name
01/15/ 2016
02/23/ 2016
03/16/ 2016
04/01/ 2016
04/13/ 2016
05/20/ 2016
06/01/ 2016
06/29/ 2016
07/19/ 2016
08/22/ 2016
08/31/ 2016
09/08/ 2016
10/12/ 2016
12/08/ 2016
Dr. Gerald Möller
Dr. Marc Cluzel
Karin Eastham – –
MEE T IN G S O F T HE S C IEN C E AND T E C HN O L O G Y C O MMI T T EE
by phone by phone by phone
Name
02/24/ 2016
06/01/ 2016
06/30/ 2016
07/21/ 2016
10/05/ 2016
10/12/ 2016
11/07/ 2016
12/08/ 2016
Dr. Marc Cluzel
Wendy Johnson –
Frank Morich
at tended in perso n part i c i pated by ph o ne
Statement on Corporate Governance and Corporate Governance Report G R O U P M A N A G E M E N T R E P O R T 75

AUDIT COMMITTEE
The main task of the Audit Committee is to support the Supervi-sory Board in fulfilling its supervisory duties with respect to the accuracy of the annual and consolidated financial statements, the activities of the auditor and internal control functions, such as risk management, compliance and internal auditing. The Audit Com-mittee submits a recommendation to the Supervisory Board for the election at the Annual General Meeting of an independent auditor. The members of the Audit Committee are Klaus Kühn (Chairperson), Karin Eastham and Wendy Johnson. Klaus Kühn and Karin Eastham fulfill the prerequisite of being independent financial experts.
REMUNER ATION AND NOMINATION COMMITTEE
The Remuneration and Nomination Committee is responsible for preparing and reviewing the Management Board’s compensation system annually before its final approval. When necessary, the Committee searches for suitable candidates to appoint to the Man-agement Board and Supervisory Board and submits appointment proposals to the Supervisory Board. The Committee also prepares the contracts made with Management Board members. The mem-bers of the Remuneration and Nomination Committee are Ms. Karin Eastham (Chairperson), Dr. Gerald Möller and Dr. Marc Cluzel.
SCIENCE AND TECHNOLOGY COMMITTEE
The Science and Technology Committee advises the Supervisory Board on matters concerning proprietary drug and technology de-velopment and prepares the relevant Supervisory Board resolu-tions. The members of the Science and Technology Committee are Dr. Marc Cluzel (Chairperson), Dr. Frank Morich and Ms. Wendy Johnson.
The Supervisory Board members’ biographies can be found on the MorphoSys website under Company – Management – Supervisory Board.
Corporate Governance Report
At MorphoSys, responsible, sustainable and value-oriented corpo-rate governance is a high priority. Good corporate governance is an essential aspect of MorphoSys’s corporate management and forms the framework for the Group’s management and supervi-sion, which includes the Group’s organization, commercial princi-ples and tools for its guidance and control.
The German Corporate Governance Code (“the Code”) provides a standard for the transparent monitoring and management of com-panies that strongly emphasizes shareholder interests. Many of the corporate governance principles contained in the Code have been practiced at MorphoSys for many years. Corporate gover-nance issues at MorphoSys AG are detailed in the Statement on Corporate Governance under Sec. 289a HGB. The statement also contains the annual Declaration of Conformity, relevant informa-tion on corporate governance practices and a description of the Management Board and Supervisory Board’s working practices. Additional information can be found in this Corporate Governance Report.
COMMUNICATION WITH THE CAPITAL MARKETS At MorphoSys, a key principle of corporate communication is to simultaneously and fully inform institutional investors, private shareholders, financial analysts, employees and all other stake-holders of the Company’s situation through regular, transparent and timely communication. Shareholders have immediate access to the information provided to financial analysts and similar recip-ients and can obtain this information in both German and English. The Company is firmly committed to following a fair information policy.
Regular meetings with analysts and investors in the context of road shows and individual meetings play a central role in investor relations at MorphoSys. Conference calls accompany publications of quarterly results and give analysts and investors an immediate opportunity to ask questions about the Company’s development. Company presentations for on-site events, visual and audio record-ings of other important events as well as conference call tran-scripts are also available on the Company’s website to all inter-ested parties.
The Company’s website www.morphosys.com serves as a central platform for current information on the Company and its develop-ment. Financial reports, analyst meetings and conference presen-tations, as well as press releases and ad hoc statements, are also available. The important regularly scheduled publications and events (annual reports, interim reports, annual general meetings and press and analyst conferences) are published in the Company’s financial calendar well in advance.
76 G R O U P M A N A G E M E N T R E P O R T Statement on Corporate Governance and Corporate Governance Report

ESTABLISHMENT OF SPECIFIC TARGETS FOR THE COMPOSITION OF THE SUPERVISORY BOARDMorphoSys AG’s Supervisory Board has a total of six members. The Supervisory Board believes a ratio of at least two non-German members, or at least two members having extensive international experience, provides a fair share of diversity given the Company’s international orientation. The Supervisory Board currently meets this ratio.
The Supervisory Board also strives to have at least four indepen-dent members. The Supervisory Board currently meets this ratio. Material and lasting conflicts of interest should be avoided, partic-ularly those arising from activities for major competitors. No such conflict of interest currently exists.
It is also intended to maintain the current number of women on the Supervisory Board. The Supervisory Board has two female mem-bers and the Company intends to maintain this ratio in the future.
The age limit of 75 years contained in the Supervisory Board’s bylaws is currently respected, but the Supervisory Board may make an exception to this provision in specific cases.
At the Annual General Meeting, the Supervisory Board intends to propose an initial two-year period of office for Supervisory Board members. The Supervisory Board intends to allow reappointment only once for an additional term of three years but reserves the right to make exceptions in specific cases and permit members to be reappointed for a third or potentially fourth term of three years each.
The Supervisory Board intends to respect the targets described in future election proposals.
WOMEN’S QUOTA FOR THE SUPERVISORY BOARD, MANAGE-MENT BOARD AND THE TWO MANAGEMENT LEVELS BELOW THE MANAGEMENT BOARDIn July 2015, the Supervisory Board established a women’s quota for the Supervisory Board and Management Board, which contin-ues to apply:
“MorphoSys AG’s Supervisory Board has a total of six members. Two of those members are women, which places the current ratio of female members on the Company’s Supervisory Board above 30 %, at 33.33 %. The Supervisory Board intends to maintain this ratio in the future.”
The Company continues to meet this target ratio.
In July 2015, the Supervisory Board established a women’s quota for the Management Board, which continues to apply:
“The Management Board of MorphoSys AG has a total of four mem-bers, one of whom is a woman, placing the current ratio of female members on the Company’s Management Board below 30 % at 25 %. The Supervisory Board intends to maintain this ratio in the future.”
The Company continues to meet this target ratio.
In July 2015, the Management Board established a women’s quota for first management level below the Management Board, which continues to apply:
“At the time of the decision, the first management level below the Management Board (the Senior Management Group) consisted of 20 members, seven of whom were women, placing the level of female representation at this management level above 30 %, at 35 %. The Management Board intends to continue to maintain a minimum ratio of 30 %.”
The Company continues to meet this target ratio.
In July 2015, the Management Board established a women’s quota for the second management level below the Management Board, which continues to apply:
“At the time of the decision, the second management level below the Management Board (executives outside of the Senior Manage-ment Group) consisted of 48 members, 19 of whom were women, placing the level of female representation at this management level above 30 %, at 39.59 %. The Management Board intends to con-tinue to maintain a minimum ratio of 30 %.”
The Company continues to meet this target ratio.
REMUNERATION REPORTThe Remuneration Report presents the principles, structure and amount of Management Board and Supervisory Board remunera-tion. The report complies with the legal provisions and gives con-sideration to the Code’s recommendations.
Statement on Corporate Governance and Corporate Governance Report G R O U P M A N A G E M E N T R E P O R T 77
MANAGEMENT BOARD REMUNER ATION
The Management Board’s remuneration system is intended to pro-vide an incentive for performance-oriented and sustainable corpo-rate management. Therefore, the aggregate remuneration of the Management Board members consists of different components: fixed components, an annual cash bonus based on the achievement of corporate targets (short-term incentive – STI), a variable com-pensation component with a long-term incentive (long-term incen-tive – LTI) and other remuneration components. Variable remuner-ation components with long-term incentive consist of performance share plans from the current and prior years as well as a convert-ible bond program from the year 2013. Management Board mem-bers also receive fringe benefits in the form of non-cash benefits, mainly the use of a company car and the payment of insurance premiums. All remuneration packages are reviewed annually for their scope and appropriateness by the Remuneration and Nomina-tion Committee and compared to the results of an annual Manage-ment Board remuneration analysis. The amount of compensation paid to Management Board members highly depends on their indi-vidual areas of responsibility, their personal achievement of goals, the Company’s economic situation and success and the Company’s business prospects versus its competition. All decisions concern-ing adjustments to remuneration packages are made by the entire Supervisory Board. The Management Board’s remuneration and index-linked pension scheme were last adjusted in July 2016.
OVERVIEW
In the 2016 financial year, total benefits of € 4,383,658 (2015: € 4,521,009) were granted to the Management Board in accordance with the provisions of the German Corporate Governance Code.
Of the total remuneration for the year 2016, € 2,596,366 was cash compensation and € 1,787,292, or 41 %, resulted from personnel expenses for share-based compensation (performance share plan and convertible bond plan) (remuneration with long-term incen-tive – LTI).
The total amount of benefits paid to the Management Board in the 2016 financial year amounted to € 5,070,618 (2015: € 9,508,884). In addition to cash compensation payments of € 2,672,333 (2015: € 2,869,901), this amount includes mainly the relevant value of the transfer of treasury stock from a performance-based share plan (share-based compensation) amounting to € 2,398,285 (2015: € 4,622,005) under German tax law. Since there were no convert-ible bonds exercised in 2016, the total amount for 2016 does not include proceeds from the exercise of convertible bonds (2015: € 2,016,978).
As of April 1, 2016, a total of 57,967 of the Management Board’s shares of treasury stock from the 2012 performance-based share plan were vested because the vesting period for this LTI program had expired. The beneficiaries had the option to receive the shares within a six-month period ending on October 4, 2016. All transac-tions in MorphoSys shares executed by members of the Manage-ment Board were reported as required by law and published in the Corporate Governance Report as well as on the Company’s website.
In accordance with the requirements of Sec. 4.2.5 Para. 3 of the Code, the following table provides detailed mandatory information on the remuneration of the individual Management Board members.
Please note that the following tables are provided in the context of the German Corporate Governance Report and differ from the in-formation on Management Board remuneration presented in the Notes of this Annual Report (Item 7.3). These differences are due to the varying presentation requirements under the Corporate Gov-ernance Code and IFRS* (International Financial Reporting Stan-dards), the EU-wide accounting standard since 2005.*SEE GL OSSARY – page 154
FIXED REMUNER ATION AND FRINGE BENEFITS
The non-performance-related remuneration of the Management Board consists of fixed remuneration and additional benefits, which primarily include the use of company cars, as well as subsi-dies for health, welfare and disability insurance. The Chief Finan-cial Officer, Mr. Jens Holstein, receives an additional expense allowance for maintaining two households.
78 G R O U P M A N A G E M E N T R E P O R T Statement on Corporate Governance and Corporate Governance Report

PENSION EXPENSES
The Company also provides payments to Management Board mem-bers equal to a maximum of 10 % of the member’s fixed annual salary plus any payable taxes. This compensation is intended for the members’ individual retirement plans. Additionally, all Man-agement Board members participate in a pension plan in the form of a provident fund, which was introduced in cooperation with Allianz Pensions-Management e.V. The pension obligations of the provident fund will be met by Allianz Pensions-Management e.V. These pension obligations are not pension benefit plans.
PERFORMANCE- BASED COMPENSATION (SHORT-TERM INCENTIVE – STI )
Members of the Management Board each receive perfor-mance-based compensation in the form of an annual bonus pay-ment of up to 70 % of the gross base salary when 100 % of the mem-ber’s targets have been achieved. These bonus payments are dependent on the achievement of corporate targets specified by the Supervisory Board at the start of each financial year. They are based on the Company’s performance measured by revenue, oper-ating result, the progress of the partnered pipeline and the Com-pany’s proprietary pipeline. At the start of the year, the Supervi-sory Board assesses the degree to which corporate goals were achieved in the prior year and uses this information to determine the bonus. The bonus may not exceed 125 % of the target amount (corresponding to 87.5 % of the gross base salary). Performance- based compensation can be omitted if goals are not achieved. The bonus for the 2016 financial year will be paid in February 2017.
LONG -TERM INCENTIVE COMPENSATION (LONG -TERM INCENTIVE – LT I )
In 2011, MorphoSys introduced a new, long-term incentive com-pensation plan (Performance Share Plan) for the Management Board and members of the Senior Management Group. The LTI pro-gram is based on the allocation of shares linked to the achieve-ment of predefined performance targets over a four-year period.
Each year, the Supervisory Board determines the number of shares to be allocated to the Management Board. On April 1, 2016, the Management Board was granted 35,681 shares. Each Management Board member received an entitlement benefit for a specific num-ber of shares. For more information, please refer to Item 7.2.5 in the Notes to the Consolidated Financial Statements and the expla-nation on share buybacks in the Corporate Governance Report.
The Supervisory Board sets the long-term performance targets along with the allocation of shares for a given year. The target for the 2016 LTI program was the performance of the MorphoSys share compared to a benchmark index consisting equally of the NASDAQ Biotechnology Index and the German TecDAX Index. LTI program participants are awarded shares annually based on the daily relative performance of the MorphoSys share versus the benchmark index. There is a hurdle of 50 % and a cap of 200 % for the price performance in any given year. For example, if the rela-tive performance of the MorphoSys shares versus the benchmark index is less than 50 %, participants will not receive any entitle-ment benefits for the relevant year. Participants also do not receive entitlement benefits for additional shares when the share price performance exceeds 200 %.
The ultimate number of performance shares allocated to the LTI program participants is determined at the completion of the pro-gram, namely after four years. This calculation incorporates the number of shares initially allocated after adjusting for the share price development of the MorphoSys share versus the benchmark index and a “company factor” that is determined at the Supervi-sory Board’s discretion. This company factor is a number between zero and two that is set by the Supervisory Board based on the Company’s situation. The company factor’s predefined default value is one.
Statement on Corporate Governance and Corporate Governance Report G R O U P M A N A G E M E N T R E P O R T 79

MISCELL ANEOUS
Management Board members were not granted any loans or simi-lar benefits in the reporting year nor have they received any bene-fits from third parties that were promised or granted based on their position as a member of the Management Board.
TERMINATION OF MANAGEMENT BOARD EMPLOYMENT CONTR ACTS/
CHANGE OF CONTROL
If a Management Board member’s employment contract termi-nates due to member’s death, the member’s spouse or life partner is entitled to the fixed monthly salary for the month of death and the 12 months thereafter. In the event of a change of control, Man-
agement Board members are entitled to exercise their extraordi-nary right to terminate their employment contracts and receive any outstanding fixed salary for the remainder of the agreed con-tract period. Moreover, in such a case, all convertible bonds and performance shares granted will become vested immediately and can be exercised after the expiration of the statutory vesting pe-riod. A change of control has occurred when (i) MorphoSys trans-fers assets or a substantial portion of its assets to unaffiliated third parties, (ii) MorphoSys merges with an unaffiliated company or (iii) a shareholder or third party holds 30 % or more of MorphoSys’s voting rights.
14 TAB L ECompensation of the Management Board in 2016 and 2015 (Disclosure in Accordance with the German Corporate Governance Code)
B ENEF I T S G R AN T ED T O T HE MANA G EMEN T B O ARD
Dr. Simon Moroney Chief Executive Officer
Jens Holstein Chief Financial Officer
Dr. Arndt Schottelius Chief Development Officer
Dr. Marlies Sproll Chief Scientific Officer Total
in € 2015 2016
2016 (Mini-mum)
2016 (Maxi-mum) 2015 2016
2016 (Mini-mum)
2016 (Maxi-mum) 2015 2016
2016 (Mini-mum)
2016 (Maxi-mum) 2015 2016
2016 (Mini-mum)
2016 (Maxi-mum) 2015 2016
2016 (Mini-mum)
2016 (Maxi-mum)
Fixed Compensation 445,736 463,457 463,457 463,457 302,384 314,405 314,405 314,405 302,384 309,759 309,759 309,759 302,384 314,405 314,405 314,405 1,352,888 1,402,026 1,402,026 1,402,026
Fringe Benefits 36,887 34,270 34,270 34,270 39,735 46,300 46,300 46,300 29,889 28,388 28,388 28,388 22,954 24,141 24,141 24,141 129,465 133,099 133,099 133,099
Total Fixed Compensation 482,623 497,727 497,727 497,727 342,119 360,705 360,705 360,705 332,273 338,147 338,147 338,147 325,338 338,546 338,546 338,546 1,482,353 1,535,125 1,535,125 1,535,125
One-Year Variable Compensation1 238,692 210,873 0 405,525 161,926 143,054 0 275,105 156,635 140,940 0 271,039 156,635 143,054 0 275,105 713,888 637,921 0 1,226,774
Multi-Year Variable Compensation:
2013 Convertible Bonds Program2 (Vesting Period 4 Years) 164,969 33,964 33,964 33,964 168,984 34,791 34,791 34,791 112,990 23,263 23,263 23,263 112,990 23,263 23,263 23,263 559,933 115,281 115,281 115,281
2015 Long-Term Incentive Program3 (Vesting Period 4 Years) 441,159 0 0 0 302,149 0 0 0 302,149 0 0 0 302,149 0 0 0 1,347,606 0 0 0
2016 Long-Term Incentive Program3 (Vesting Period 4 Years) 0 563,820 0 2,255,280 0 369,397 0 1,477,588 0 369,397 0 1,477,588 0 369,397 0 1,477,588 0 1,672,011 0 6,688,044
Total Variable Compensation 844,820 808,657 33,964 2,694,769 633,059 547,242 34,791 1,787,484 571,774 533,600 23,263 1,771,890 571,774 535,714 23,263 1,775,956 2,621,427 2,425,213 115,281 8,030,099
Service Cost 138,280 142,096 142,096 142,096 90,800 92,875 92,875 92,875 94,064 95,473 95,473 95,473 94,085 92,876 92,876 92,876 417,229 423,320 423,320 423,320
Total Compensation 1,465,723 1,448,480 673,787 3,334,592 1,065,978 1,000,822 488,371 2,241,064 998,111 967,220 456,883 2,205,510 991,197 967,136 454,685 2,207,378 4,521,009 4,383,658 2,073,726 9,988,544
1 The one-year compensation granted for the 2016 financial year represents the bonus accrual for 2016 that will be paid in February 2017. The bonus granted for the 2015 financial year was paid in February 2016.
2 Stock-based compensation plans not issued on an annual basis. The fair value was determined pursuant to the regulations of IFRS 2 “Share-based Payment.” For plans that are not issued annually, the pro rata share of personnel expenses resulting from share-based payments is presented for each financial year.
3 Stock-based compensation plans issued annually. The fair value was determined pursuant to the regulations of IFRS 2 “Share-based Payment.” For plans issued annually, the personnel expenses resulting from share-based payments are presented for the entire term at the time of issue.
80 G R O U P M A N A G E M E N T R E P O R T Statement on Corporate Governance and Corporate Governance Report

14 TAB L ECompensation of the Management Board in 2016 and 2015 (Disclosure in Accordance with the German Corporate Governance Code)
B ENEF I T S G R AN T ED T O T HE MANA G EMEN T B O ARD
Dr. Simon Moroney Chief Executive Officer
Jens Holstein Chief Financial Officer
Dr. Arndt Schottelius Chief Development Officer
Dr. Marlies Sproll Chief Scientific Officer Total
in € 2015 2016
2016 (Mini-mum)
2016 (Maxi-mum) 2015 2016
2016 (Mini-mum)
2016 (Maxi-mum) 2015 2016
2016 (Mini-mum)
2016 (Maxi-mum) 2015 2016
2016 (Mini-mum)
2016 (Maxi-mum) 2015 2016
2016 (Mini-mum)
2016 (Maxi-mum)
Fixed Compensation 445,736 463,457 463,457 463,457 302,384 314,405 314,405 314,405 302,384 309,759 309,759 309,759 302,384 314,405 314,405 314,405 1,352,888 1,402,026 1,402,026 1,402,026
Fringe Benefits 36,887 34,270 34,270 34,270 39,735 46,300 46,300 46,300 29,889 28,388 28,388 28,388 22,954 24,141 24,141 24,141 129,465 133,099 133,099 133,099
Total Fixed Compensation 482,623 497,727 497,727 497,727 342,119 360,705 360,705 360,705 332,273 338,147 338,147 338,147 325,338 338,546 338,546 338,546 1,482,353 1,535,125 1,535,125 1,535,125
One-Year Variable Compensation1 238,692 210,873 0 405,525 161,926 143,054 0 275,105 156,635 140,940 0 271,039 156,635 143,054 0 275,105 713,888 637,921 0 1,226,774
Multi-Year Variable Compensation:
2013 Convertible Bonds Program2 (Vesting Period 4 Years) 164,969 33,964 33,964 33,964 168,984 34,791 34,791 34,791 112,990 23,263 23,263 23,263 112,990 23,263 23,263 23,263 559,933 115,281 115,281 115,281
2015 Long-Term Incentive Program3 (Vesting Period 4 Years) 441,159 0 0 0 302,149 0 0 0 302,149 0 0 0 302,149 0 0 0 1,347,606 0 0 0
2016 Long-Term Incentive Program3 (Vesting Period 4 Years) 0 563,820 0 2,255,280 0 369,397 0 1,477,588 0 369,397 0 1,477,588 0 369,397 0 1,477,588 0 1,672,011 0 6,688,044
Total Variable Compensation 844,820 808,657 33,964 2,694,769 633,059 547,242 34,791 1,787,484 571,774 533,600 23,263 1,771,890 571,774 535,714 23,263 1,775,956 2,621,427 2,425,213 115,281 8,030,099
Service Cost 138,280 142,096 142,096 142,096 90,800 92,875 92,875 92,875 94,064 95,473 95,473 95,473 94,085 92,876 92,876 92,876 417,229 423,320 423,320 423,320
Total Compensation 1,465,723 1,448,480 673,787 3,334,592 1,065,978 1,000,822 488,371 2,241,064 998,111 967,220 456,883 2,205,510 991,197 967,136 454,685 2,207,378 4,521,009 4,383,658 2,073,726 9,988,544
1 The one-year compensation granted for the 2016 financial year represents the bonus accrual for 2016 that will be paid in February 2017. The bonus granted for the 2015 financial year was paid in February 2016.
2 Stock-based compensation plans not issued on an annual basis. The fair value was determined pursuant to the regulations of IFRS 2 “Share-based Payment.” For plans that are not issued annually, the pro rata share of personnel expenses resulting from share-based payments is presented for each financial year.
3 Stock-based compensation plans issued annually. The fair value was determined pursuant to the regulations of IFRS 2 “Share-based Payment.” For plans issued annually, the personnel expenses resulting from share-based payments are presented for the entire term at the time of issue.
Statement on Corporate Governance and Corporate Governance Report G R O U P M A N A G E M E N T R E P O R T 81

SUPERVISORY BOARD REMUNER ATION
The remuneration of Supervisory Board members is governed by the Company’s Articles of Association and a corresponding An-nual General Meeting resolution on Supervisory Board remunera-tion. In the 2016 financial year, Supervisory Board members re-ceived fixed compensation, attendance fees and expense allowances for their participation in Supervisory Board and committee meet-ings. Each Supervisory Board member has received annual fixed compensation (€ 85,400 for Chairpersons, € 51,240 for Deputy Chairpersons and € 34,160 for all other members) for their mem-bership of the Supervisory Board. The Chairperson receives € 4,000 for each Supervisory Board meeting chaired and the other members receive € 2,000 for each Supervisory Board meeting at-tended. For committee work, the committee Chairperson receives € 12,000 and other committee members each receive € 6,000. Committee members also receive € 1,200 for their participation in a committee meeting. Participation in a Supervisory Board or com-mittee meeting by telephone or video conference results in a 50 % reduction in compensation for meeting participation. In certain cases, a fixed expense allowance is granted for travel time for meetings personally attended. Therefore, Supervisory Board
members residing outside of Europe who personally take part in a Supervisory Board or committee meeting are entitled to a fixed expense allowance of € 2,000 (plus any sales tax due) for addi-tional travel time in addition to attendance fees and reimbursed expenses.
Supervisory Board members are also reimbursed for travel ex-penses and value-added taxes (VAT) on their compensation.
In the 2016 financial year, Supervisory Board members received a total of € 529,680 (2015: € 529,270) excluding the reimbursement of travel expenses. This amount consists of fixed compensation and attendance fees for participating in Supervisory Board and committee meetings.
No loans were granted to Supervisory Board members by the Company.
The table below details the Supervisory Board’s remuneration.
P AY MEN T S D UR IN G T HE F INAN C I AL Y E AR
Dr. Simon Moroney Chief Executive Officer
Jens Holstein Chief Financial Officer
Dr. Arndt Schottelius Chief Development Officer
Dr. Marlies Sproll Chief Scientific Officer Total
in €
2015 2016 2015 2016 2015 2016 2015 2016 2015 2016
Fixed Compensation 445,736 463,457 302,384 314,405 302,384 309,759 302,384 314,405 1,352,888 1,402,026
Fringe Benefits 36,887 34,270 39,735 46,300 29,889 28,388 22,954 24,141 129,465 133,099
Total Fixed Compensation 482,623 497,727 342,119 360,705 332,273 338,147 325,338 338,546 1,482,353 1,535,125
One-Year Variable Compensation1 324,696 238,692 220,271 161,926 215,208 156,635 210,144 156,635 970,319 713,888
Multi-Year Variable Compensation:
2010 Convertible Bonds Program2 (Vesting Period 4 Years) 737,148 0 0 0 0 0 1,279,830 0 2,016,978 0
2011 Long-Term Incentive Program2 (Vesting Period 4 Years) 1,513,045 0 1,036,320 0 1,036,320 0 1,036,320 0 4,622,005 0
2012 Long-Term Incentive Program2 (Vesting Period 4 Years) 0 794,430 0 574,467 0 489,233 0 540,155 0 2,398,285
Other3 0 0 0 0 0 0 0 0 0 0
Total Variable Compensation 2,574,889 1,033,122 1,256,591 736,393 1,251,528 645,868 2,526,294 696,790 7,609,302 3,112,173
Service Cost 138,280 142,096 90,800 92,875 94,064 95,473 94,085 92,876 417,229 423,320
Total Compensation 3,195,792 1,672,945 1,689,510 1,189,973 1,677,865 1,079,488 2,945,717 1,128,212 9,508,884 5,070,618
1 The one-year variable compensation presented here represents the bonus paid in the respective financial year for the previous financial year.2 The date and value of the payments is the date and value applicable under German tax law. Therefore, this table shows the non-cash benefits arising in the respective financial year
from the difference between the exercise or conversion price and the stock market price at the time of exercising the convertible bonds or at the time of transfer of own shares from a performance share plan.
3 No compensation recovery claims against the Management Board existed in 2016 or 2015.
82 G R O U P M A N A G E M E N T R E P O R T Statement on Corporate Governance and Corporate Governance Report

15 TAB L ECompensation of the Supervisory Board in 2016 and 2015
Fixed Compensation Attendance Fees1 Total Compensation
in €
2016 2015 2016 2015 2016 2015
Dr. Gerald Möller 91,400 93,521 43,400 36,200 134,800 129,721
Dr. Frank Morich2 57,240 37,324 26,800 14,200 84,040 51,524
Dr. Marc Cluzel 52,160 50,089 34,600 28,000 86,760 78,089
Karin Eastham 52,160 50,089 24,400 36,800 76,560 86,889
Wendy Johnson2 46,160 30,099 33,800 26,400 79,960 56,499
Klaus Kühn2 46,160 30,099 21,400 14,200 67,560 44,299
Dr. Walter Blättler3 – 16,188 – 13,000 – 29,188
Dr. Daniel Camus3 – 16,188 – 8,400 – 24,588
Dr. Geoffrey Vernon3 – 20,073 – 8,400 – 28,473
Total 345,280 343,670 184,400 185,600 529,680 529,270
1 The attendance fee contains expense allowances for the attendance on Supervisory Board and committee meetings.2 Dr. Frank Morich, Wendy Johnson and Klaus Kühn joined the Supervisory Board of MorphoSys AG on May 8, 2015.3 Dr. Walter Blättler, Dr. Daniel Camus and Dr. Geoffrey Vernon left the Supervisory Board of MorphoSys AG on May 8, 2015.
P AY MEN T S D UR IN G T HE F INAN C I AL Y E AR
Dr. Simon Moroney Chief Executive Officer
Jens Holstein Chief Financial Officer
Dr. Arndt Schottelius Chief Development Officer
Dr. Marlies Sproll Chief Scientific Officer Total
in €
2015 2016 2015 2016 2015 2016 2015 2016 2015 2016
Fixed Compensation 445,736 463,457 302,384 314,405 302,384 309,759 302,384 314,405 1,352,888 1,402,026
Fringe Benefits 36,887 34,270 39,735 46,300 29,889 28,388 22,954 24,141 129,465 133,099
Total Fixed Compensation 482,623 497,727 342,119 360,705 332,273 338,147 325,338 338,546 1,482,353 1,535,125
One-Year Variable Compensation1 324,696 238,692 220,271 161,926 215,208 156,635 210,144 156,635 970,319 713,888
Multi-Year Variable Compensation:
2010 Convertible Bonds Program2 (Vesting Period 4 Years) 737,148 0 0 0 0 0 1,279,830 0 2,016,978 0
2011 Long-Term Incentive Program2 (Vesting Period 4 Years) 1,513,045 0 1,036,320 0 1,036,320 0 1,036,320 0 4,622,005 0
2012 Long-Term Incentive Program2 (Vesting Period 4 Years) 0 794,430 0 574,467 0 489,233 0 540,155 0 2,398,285
Other3 0 0 0 0 0 0 0 0 0 0
Total Variable Compensation 2,574,889 1,033,122 1,256,591 736,393 1,251,528 645,868 2,526,294 696,790 7,609,302 3,112,173
Service Cost 138,280 142,096 90,800 92,875 94,064 95,473 94,085 92,876 417,229 423,320
Total Compensation 3,195,792 1,672,945 1,689,510 1,189,973 1,677,865 1,079,488 2,945,717 1,128,212 9,508,884 5,070,618
1 The one-year variable compensation presented here represents the bonus paid in the respective financial year for the previous financial year.2 The date and value of the payments is the date and value applicable under German tax law. Therefore, this table shows the non-cash benefits arising in the respective financial year
from the difference between the exercise or conversion price and the stock market price at the time of exercising the convertible bonds or at the time of transfer of own shares from a performance share plan.
3 No compensation recovery claims against the Management Board existed in 2016 or 2015.
Statement on Corporate Governance and Corporate Governance Report G R O U P M A N A G E M E N T R E P O R T 83
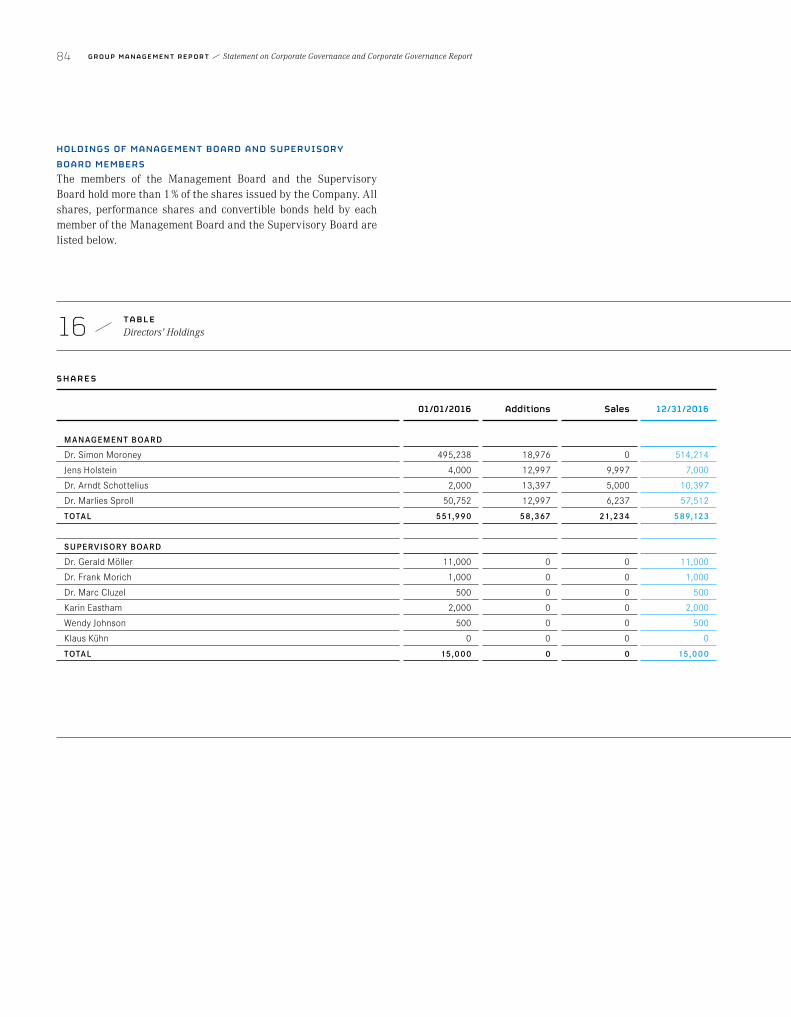
HOLDINGS OF MANAGEMENT BOARD AND SUPERVISORY BOARD MEMBERSThe members of the Management Board and the Supervisory Board hold more than 1 % of the shares issued by the Company. All shares, performance shares and convertible bonds held by each member of the Management Board and the Supervisory Board are listed below.
16 TAB L EDirectors’ Holdings
S HARE S
01/01/2016 Additions Sales 12/31/2016
MANAGEMENT BOARD
Dr. Simon Moroney 495,238 18,976 0 514,214
Jens Holstein 4,000 12,997 9,997 7,000
Dr. Arndt Schottelius 2,000 13,397 5,000 10,397
Dr. Marlies Sproll 50,752 12,997 6,237 57,512
TOTAL 551,990 58,367 21,234 589,123
SUPERVISORY BOARD
Dr. Gerald Möller 11,000 0 0 11,000
Dr. Frank Morich 1,000 0 0 1,000
Dr. Marc Cluzel 500 0 0 500
Karin Eastham 2,000 0 0 2,000
Wendy Johnson 500 0 0 500
Klaus Kühn 0 0 0 0
TOTAL 15,000 0 0 15,000
84 G R O U P M A N A G E M E N T R E P O R T Statement on Corporate Governance and Corporate Governance Report
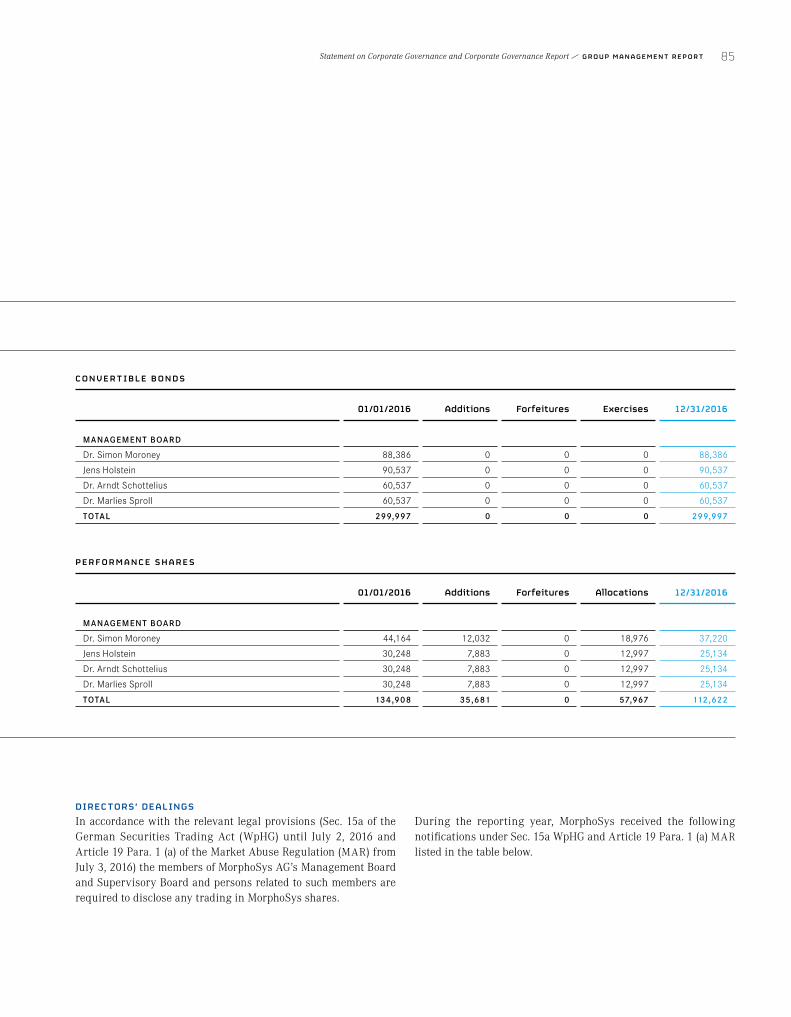
C O NVER T IB L E B O ND S
01/01/2016 Additions Forfeitures Exercises 12/31/2016
MANAGEMENT BOARD
Dr. Simon Moroney 88,386 0 0 0 88,386
Jens Holstein 90,537 0 0 0 90,537
Dr. Arndt Schottelius 60,537 0 0 0 60,537
Dr. Marlies Sproll 60,537 0 0 0 60,537
TOTAL 299,997 0 0 0 299,997
P ERF O RMAN C E S HARE S
01/01/2016 Additions Forfeitures Allocations 12/31/2016
MANAGEMENT BOARD
Dr. Simon Moroney 44,164 12,032 0 18,976 37,220
Jens Holstein 30,248 7,883 0 12,997 25,134
Dr. Arndt Schottelius 30,248 7,883 0 12,997 25,134
Dr. Marlies Sproll 30,248 7,883 0 12,997 25,134
TOTAL 134,908 35,681 0 57,967 112,622
DIRECTORS’ DEALINGSIn accordance with the relevant legal provisions (Sec. 15a of the German Securities Trading Act (WpHG) until July 2, 2016 and Article 19 Para. 1 (a) of the Market Abuse Regulation (MAR) from July 3, 2016) the members of MorphoSys AG’s Management Board and Supervisory Board and persons related to such members are required to disclose any trading in MorphoSys shares.
During the reporting year, MorphoSys received the following notifications under Sec. 15a WpHG and Article 19 Para. 1 (a) MAR listed in the table below.
Statement on Corporate Governance and Corporate Governance Report G R O U P M A N A G E M E N T R E P O R T 85

17 TAB L EDirectors’ Dealings
Party Sub-ject to the Notification Requirement Function
Date of Transaction
in 2016 Type of Transaction
Number of Stocks/
DerivativesAverage
Share PriceTransaction
Volume
Dr. Arndt Schottelius CDO 11/18/2016
Sale of MorphoSys AG shares; the shares sold derive from the Long-Term Incentive (LTI) Program 2012 of MorphoSys and have been granted after a four-year waiting period on 10/01/2016 1,500 € 45.935 € 68,902.175
Dr. Arndt Schottelius CDO 11/17/2016
Sale of MorphoSys AG shares; the shares sold derive from the Long-Term Incentive (LTI) Program 2012 of MorphoSys and have been granted after a four-year waiting period on 10/01/2016 3,500 € 44.617 € 156,160.300
Jens Holstein CFO 06/07/2016
Sale of MorphoSys AG shares; the shares sold derive from the Long-Term Incentive (LTI) Program 2012 of MorphoSys and have been granted after a four-year waiting period on 04/01/2016 9,997 € 47.017 € 470,028.949
Dr. Marlies Sproll CSO 05/13/2016
Sale of MorphoSys AG shares; the shares sold derive from the Long-Term Incentive (LTI) Program 2012 of MorphoSys and have been granted after a four-year waiting period on 04/01/2016 3,100 € 45.1284 € 139,898.040
Dr. Marlies Sproll CSO 05/12/2016
Sale of MorphoSys AG shares; the shares sold derive from the Long-Term Incentive (LTI) Program 2012 of MorphoSys and have been granted after a four-year waiting period on 04/01/2016 3,137 € 43.8891 € 137,680.107
Dr. Arndt Schottelius CDO 01/12/2016 Purchase of MorphoSys AG shares 400 € 48.55 € 19,420.00
AVOIDING CONFLICTS OF INTERESTManagement Board and Supervisory Board members are required to refrain from any actions that could lead to a conflict of interest with their duties at MorphoSys AG. Such transactions or the sec-ondary employment of Management Board members must be dis-closed immediately to the Supervisory Board and are subject to the Board’s approval. The Supervisory Board, in turn, must inform the Annual General Meeting of any conflicts of interest and their han-dling. In the 2016 financial year, a potential conflict of interest arose regarding a possible transaction. As a precautionary mea-sure, the affected Supervisory Board member did not take part in the corresponding meeting of the Supervisory Board. The transac-tion in question was not consummated.
STOCK REPURCHASESBy resolution of the Annual General Meeting on May 23, 2014, MorphoSys is authorized in accordance with Sec. 71 Para. 1 no. 8 AktG to repurchase its own shares in an amount of up to 10 % of the existing common stock. This authorization can be exercised in whole or in part, once or several times by the Company or a third party on the Company’s behalf for the purposes specified in the authorizing resolution. It is at the Management Board’s discretion to decide whether to carry out a repurchase on a stock exchange, via a public offer or through a public invitation to submit a bid.
86 G R O U P M A N A G E M E N T R E P O R T Statement on Corporate Governance and Corporate Governance Report
In March 2016, MorphoSys repurchased a total of 52,295 of its own shares based on the authorization from the year 2014. The Com-pany plans to use these shares for a long-term incentive program for the Management Board and Senior Management Group. The authorization also permits the shares to be used for other lawful purposes.
INFORMATION TECHNOLOGYThe main topics for the Information Technology department in the 2016 financial year included IT security and compliance and the design and construction of a new, future-oriented IT infrastruc-ture for the move to the Company’s new premises.
In designing the new IT infrastructure, emphasis was placed on achieving less complexity, more flexibility and a high level of secu-rity. Our new data centers are protected by state-of-the-art build-ing technology and fire extinguishing systems.
The planning and construction of the new building’s network and media technology infrastructure is based on the latest standards combining both safety and user-friendliness.
An internal CERT (Computer Emergency Response Team) has been established and is trained regularly in areas such as IT forensics and hacking methods to deal appropriately with any threats. Secu-rity-related system messages or user notifications are analyzed in detail. In a few cases, additional external IT security experts were used for a detailed analysis, whereby no serious security incidents occurred.
As part of the Company’s IT Security Awareness Campaign (ISAC) established in the prior year, additional campaigns were con-ducted in the reporting year to raise employees’ awareness with respect to their shared responsibility and essential contribution to the Company’s IT security.
INFORMATION ON THE INTERNAL CONTROL AND RISK MANAGEMENT SYSTEM WITH REGARD TO THE ACCOUNTING PROCESS UNDER SEC. 289 PARA. 5 AND SEC. 315 PARA. 2 NO. 5 HGBIn the 2016 financial year, MorphoSys completed a routine update of the documentation for its existing internal control and risk man-agement system. This update serves to maintain adequate internal control over financial reporting and to ensure the availability of all controls so that financial figures can be reported as precisely and accurately as possible. The COSO (Committee of Sponsoring Orga-nizations of the Treadway Commission) defines the corresponding COSO framework (“Internal Control – Integrated Framework”). This is the framework used by MorphoSys and is the most com-monly used for the internal control of financial reporting.
System constraints make it impossible to give absolute assurance that internal controls will always prevent or completely detect all misrepresentations made in the context of financial reporting. In-ternal controls can only provide reasonable assurance that finan-cial reporting is reliable and verify that the financial statements were prepared in accordance with the IFRS standards adopted by the European Union for external purposes.
The consolidated financial statements are subjected to numerous preparation, review and control processes so that the statements can be reported promptly to the market and shareholders. To ac-complish this, the Company’s executives have a coordinated plan for which all internal and external resources are made available. MorphoSys also uses a strict four-eyes principle to ensure the ac-curacy of the key financial ratios reported and the underlying exe-cution of all accounting processes. Numerous rules and guidelines are also followed to ensure the strict separation of the planning, posting and execution of financial transactions. This functional separation of processes is ensured by all of the Company’s operat-ing IT systems through the appropriate assignment of rights. Ex-ternal service providers routinely review the implementation of and compliance with these guidelines as well as the efficiency of the accounting processes. The reporting year’s most recent review showed insignificant cause for action. The appropriate corrective actions are being planned, and their implementation will be re-viewed again in the following year.
Statement on Corporate Governance and Corporate Governance Report G R O U P M A N A G E M E N T R E P O R T 87

COMPL IANCE OF F ICER
reports to
CHIEF EXECU T IVE OF F ICER
CHAIRMAN OF T HE AUDI T COMMI T T EE
reports, if required, to
manages the interfaces between the different compliance streams
F I G URE
17Compliance Management System(CMS)
T RAININGS
COMPL IANCE RISK MANAGEMEN T
SUPERVISION+
IMPROVEMEN T S
WHIS T L EBL OWERSY S T EM
COMPL IANCECOMMI T T EE
COMPL IANCEDOCUMEN T S
CMS
Credo Code of Conduct
88 G R O U P M A N A G E M E N T R E P O R T Statement on Corporate Governance and Corporate Governance Report
Predicting future events is not the job of MorphoSys’s internal con-trol and risk management system. The Company’s risk manage-ment system does, however, guarantee that business risks are de-tected and assessed early. The risks identified are eliminated or at least brought to an acceptable level using appropriate corrective measures. Special attention is given to risks that could jeopardize the Company.
The Management Board ensures that risks are always dealt with responsibly and keeps the Supervisory Board informed of any risks and their development. Detailed information on the risks and opportunities encountered by MorphoSys can be found in the “Risk and Opportunity Report.”
ACCOUNTING AND EXTERNAL AUDITMorphoSys AG prepares its financial statements in accordance with the provisions of the German Commercial Code (HGB) and the Stock Corporation Act (AktG). The consolidated financial state-ments are prepared in accordance with the International Financial Reporting Standards (IFRS), as applicable in the European Union.
For the election of the Company auditor, the Audit Committee of the Supervisory Board submits a nomination proposal to the Supervisory Board. At the 2016 Annual General Meeting, Price-waterhouseCoopers GmbH Wirtschaftsprüfungsgesellschaft was appointed auditor for the 2016 financial year. As proof of its inde-pendence, the auditor submitted a Declaration of Independence to the Supervisory Board. The lead auditor of these consolidated finan-cial statements was Mr. Dietmar Eglauer, who has audited the con-solidated financial statements since 2014. PricewaterhouseCoopers GmbH has been the auditor for MorphoSys AG since the 2011 financial year. Information on other consulting, audit and valua-tion services provided by PricewaterhouseCoopers GmbH to MorphoSys AG during the 2016 financial year can be found in the Notes under Item 6.1.
COMPLIANCE MANAGEMENT SYSTEMThe basic mechanisms of the compliance management system at MorphoSys are presented in the section “Relevant Information on Corporate Governance Practices”. In addition to this information, the responsibilities within the compliance organization are shown in Figure 17.›› SEE F IGURE 17 – Compliance Management System (CMS) (page 88)
INTERNAL AUDIT DEPARTMENT
As an element of corporate governance, the Internal Audit Depart-ment plays a key role in the Company’s compliance management system. The department’s main duty is to provide the MorphoSys Group with a systematic and uniform approach for evaluating and improving the effectiveness of risk management and supporting the management and monitoring activities when meeting set tar-gets. The accounting and consulting firm KPMG was reappointed by the Internal Audit Department in 2016 to perform the audit as a co-sourcing partner.
Internal auditing is based on a risk-oriented internal audit plan that is largely based on the results of the most recent risk surveys. The Management Board and Supervisory Board Committee’s audit requirements and recommendations are included in the audit plan.
The Internal Audit Department reports regularly to the Manage-ment Board. The head of Internal Audit and the Chief Executive Officer both report to the Supervisory Board’s Audit Committee twice annually or on an ad hoc basis when necessary.
Four audits were conducted successfully in the course of 2016. Some areas requiring action were identified and corrections were initiated or performed. Appropriate corrective action was initiated during the reporting year for any complaints. The Internal Audit Department is planning four audits in 2017.
Disclosures Under Sec. 289 Para 4, Sec. 315 Para. 4 HGB and Explanatory Report of the Management Board Under Sec. 176 Para. 1 Sentence 1 AktG
COMPOSITION OF COMMON STOCKAs of December 31, 2016, the Company’s statutory common stock amounted to € 29,159,770.00 and was divided into 29,159,770 no-par-value bearer shares. Excluding the 396,010 treasury shares held by the Company, the statutory common stock concerns bearer shares with voting rights granting each share one vote at the An-nual General Meeting.
Statement on Corporate Governance and Corporate Governance Report G R O U P M A N A G E M E N T R E P O R T 89

RESTRICTIONS AFFECTING VOTING RIGHTS OR THE TRANSFER OF SHARESThe Management Board is not aware of any restrictions that may affect voting rights, the transfer of shares or those that may emerge from agreements between shareholders.
Voting right restrictions may also arise from the provisions of the German Stock Corporation Act (AktG), such as those under Sec. 136 AktG, or the provisions for treasury stock under Sec. 71b AktG.
SHAREHOLDINGS IN COMMON STOCK EXCEEDING 10 % OF VOTING RIGHTSWe have not been notified of or are aware of any direct or indirect interests in the Company’s common stock that exceed 10 % of the voting rights.
SHARES WITH SPECIAL RIGHTS CONFERRING POWERS OF CONTROLShares with special rights conferring powers of control do not exist.
CONTROL OVER VOTING RIGHTS WITH REGARD TO EMPLOYEE OWNERSHIP OF CAPITALEmployees who hold shares in the Company exercise their voting rights directly in accordance with the statutory provisions and the Articles of Association as do other shareholders.
APPOINTMENT AND DISMISSAL OF MANAGEMENT BOARD MEMBERS AND AMENDMENTS TO THE ARTICLES OF ASSOCIATIONThe number of Management Board members, their appointment and dismissal and the nomination of the Chief Executive Officer are determined by the Supervisory Board in accordance with Sec. 6 of the Articles of Association and Sec. 84 AktG. The Compa-ny’s Management Board currently consists of the Chief Executive Officer and three other members. Management Board members may be appointed for a maximum term of five years. Reappoint-ments or extensions in the term of office are allowed for a maxi-mum term of five years in each case. The Supervisory Board may revoke the appointment of a Management Board member or the nomination of a Chief Executive Officer for good cause within the meaning of Sec. 84 Para. 3 AktG. If a required member of the Man-agement Board is absent, one will be appointed by the court in cases of urgency under Sec. 85 AktG.
As a rule, the Articles of Association can only be amended by a resolution of the Annual General Meeting in accordance with Sec. 179 Para. 1 sentence 1 AktG. Under Sec. 179 Para. 2 sentence 2 AktG in conjunction with Sec. 20 of the Articles of Association, the MorphoSys AG Annual General Meeting resolves amendments to the Articles of Association generally through a simple majority of the votes cast and a simple majority of the common stock repre-sented. If the law stipulates a higher mandatory majority of votes or capital, this shall be applied. Amendments to the Articles of Asso-ciation that only affect their wording can be resolved by the Super-visory Board in accordance with Sec. 179 Para. 1 sentence 2 AktG in conjunction with Sec. 12 Para. 3 of the Articles of Association.
POWER OF THE MANAGEMENT BOARD TO ISSUE SHARESThe Management Board’s power to issue shares is granted under Sec. 5 Para. 5 through Para. 6e of the Company’s Articles of Association as of November 16, 2016 and the following statutory provisions:
1. Authorized Capital a. According to Sec. 5 Para. 5 of the Articles of Association, with
the Supervisory Board’s consent, the Management Board is authorized to increase the Company’s common stock on one or more occasions by up to € 10,584,333.00 for cash contribu-tions and/or contributions in kind by issuing up to 10,584,333 new, no-par-value bearer shares until and including the date of April 30, 2020 (Authorized Capital 2015-I).
b. Shareholders are principally entitled to subscription rights in the case of a capital increase. One or more credit institutions may also subscribe to the shares with the obligation to offer the shares to shareholders for subscription. With the Supervi-sory Board’s consent, the Management Board is, however. authorized to exclude shareholder subscription rights:
aa) in the case of a capital increase for cash contribution, to the extent necessary to avoid fractional shares; or
bb) in the case of a capital increase for contribution in kind; or
cc) in the case of a capital increase for cash contribution when the new shares are placed on a domestic and/or foreign stock exchange in the context of a public offering.
90 G R O U P M A N A G E M E N T R E P O R T Statement on Corporate Governance and Corporate Governance Report
The total shares to be issued via a capital increase against contribution in cash and/or in kind, excluding pre-emptive rights and based on the authorizations mentioned above, shall not exceed 20 % of the common stock. The calculation used is based on either the effective date of the authorizations or the exercise of the authorizations, whichever amount is lower. The 20 % limit mentioned above shall take into account (i) treasury shares sold excluding pre-emptive rights after the effective date of these authorizations (unless they service the entitlements of members of the Management Board and/or employees under employee participation programs), (ii) shares that are issued from other authorized capital existing on the effective date of these authorizations and excluding pre-emptive rights during the effective period of these autho-rizations, and (iii) shares to be issued during the effective period of these authorizations to service convertible bonds and/or bonds with warrants whose basis for authorization ex-ists on the effective date of these authorizations provided that the convertible bonds and/or bonds with warrants have been issued with the exclusion of the pre-emptive rights of share-holders (unless they service the entitlements of members of the Management Board and/or employees under employee participation programs).
With the Supervisory Board’s consent, the Management Board is authorized to determine the further details of the capital increase and its implementation.
The previous Authorized Capital 2014-I under Sec. 5 Para. 6 of the Articles of Association was fully used and, therefore, canceled in the context of the capital increase carried out in November 2016.
2. Conditional Capital a. According to Sec. 5 Para. 6b of the Articles of Association, the
Company’s common stock is conditionally increased by up to € 5,307,536.00, divided into a maximum of 5,307,536 no-par-value bearer shares (Conditional Capital 2016-I). The condi-tional capital increase serves solely as a means to grant new shares to the holders of conversion or warrant rights, which will be issued by the company or companies in which the Company has a direct or indirect majority interest according to the authorizing resolution of the Annual General Meeting on June 2, 2016 under Agenda Item 7 letter a). The shares will be issued at the respective conversion or exercise price to be
determined in accordance with the resolution above. The condi-tional capital increase will only be carried out to the extent that the holders of conversion or warrant rights exercise these rights or fulfill conversion obligations under such bonds. The shares will be entitled to dividends as of the beginning of the previous financial year, provided they were issued before the start of the Company’s Annual General Meeting, or as of the beginning of the financial year in which they were issued. b. The previous Conditional Capital 2003-II under Sec. 5 Para. 6c
of the Articles of Association was canceled by a resolution of the Annual General Meeting on June 2, 2016.
c. According to Sec. 5 Para. 6e of the Articles of Association, the Company’s common stock is conditionally increased by up to € 450,000.00 through the issue of up to 450,000 new no- par-value bearer shares of the Company (Conditional Capital 2008-III). The conditional capital increase will only be exe-cuted to the extent that holders of the convertible bonds exer-cise their conversion rights for conversion into ordinary shares of the Company. The new shares participate in the Company’s profits from the beginning of the financial year, for which there has been no resolution on the appropriation of accumulated income at the time of issuance. With the Super-visory Board’s consent, the Management Board is authorized to determine the further details of the capital increase and its implementation.
d. According to Sec. 5 Para. 6f of the Articles of Association, the Company’s common stock is conditionally increased by up to € 995,162.00 through the issue of up to 995,162 new no- par-value bearer shares of the Company (Conditional Capital 2016-III). The conditional capital serves to meet the obliga-tions of subscription rights that have been issued and exer-cised based on the authorization resolved by the Annual Gen-eral Meeting of June 2, 2016 under Agenda Item 9 letter a). The conditional capital increase will only be executed to the extent that holders of subscription rights exercise their right to subscribe to shares of the Company. The shares will be is-sued at the exercise price set in each case as the issue amount in accordance with Agenda Item 9 letter a) subparagraph (8) of the Annual General Meeting’s resolution dated June 2, 2016; Sec. 9 Para.1 AktG remains unaffected. The new shares are entitled to dividends for the first time for the financial
Statement on Corporate Governance and Corporate Governance Report G R O U P M A N A G E M E N T R E P O R T 91

year for which there has been no resolution by the Annual General Meeting on the appropriation of accumulated income. The Manage-ment Board, and the Company’s Supervisory Board where mem-bers of the Management Board are concerned, is authorized to de-termine the additional details of the conditional capital increase and its execution.
POWER OF MANAGEMENT BOARD TO REPURCHASE SHARESThe Management Board’s power to repurchase the Company’s own shares is granted in Sec. 71 AktG and by the authorization of the Annual General Meeting of May 23, 2014:
Until and including the date of April 30, 2019, the Company is au-thorized to repurchase its own shares in an amount of up to 10 % of the common stock existing at the time of the resolution (or possi-bly a lower amount of common stock at the time of exercising this authorization) for any purpose permitted under the statutory lim-its. The repurchase takes place at the Management Board’s discre-tion on either the stock exchange, through a public offer or public invitation to submit a bid. The authorization may not be used for the purpose of trading in the Company’s own shares. The intended use of treasury stock acquired under this authorization may be found under Agenda Item 9 of the Annual General Meeting of May 23, 2014. These shares may be used as follows:
a. The shares may be redeemed without the redemption or its exe-cution requiring a further resolution of the Annual General Meeting.
b. The shares may be sold other than on the stock exchange or shareholder offer if the shares are sold for cash at a price that is not significantly below the market price of the Company’s shares of the same class at the time of the sale.
c. The shares may be sold for contribution in kind, particularly in conjunction with company mergers, acquisitions of companies, parts of companies or interests in companies.
d. The shares may be used to fulfill subscription or conversion rights resulting from the exercise of options and/or conversion rights or conversion obligations for Company shares.
e. The shares may be offered or transferred to employees of the Company and those of affiliated companies, members of the Company’s management and those of affiliated companies and/or used to meet commitments or obligations to purchase Com-pany shares that were or will be granted to employees of the Company or those of affiliated companies, members of the Com-pany’s management or managers of affiliated companies. The shares may also be used to fulfill obligations or rights to pur-chase Company shares that will be agreed with the Company’s employees, members of the senior management and affiliates in the context of employee participation programs.
If shares are used for the purposes mentioned above, shareholder subscription rights are excluded, with the exception of share redemptions.
MATERIAL AGREEMENTS MADE BY THE COMPANY THAT FALL UNDER THE CONDITION OF A CHANGE OF CONTROL AFTER A TAKEOVER BIDIn 2012, MorphoSys and Novartis Pharma AG extended their original cooperation agreement. Under this agreement, in specific cases of a change of control, Novartis Pharma AG is entitled but not obliged to take various measures that include the partial or complete termination of the collaboration agreement.
Under Sec. 29 and 30 of the German Securities Acquisition and Takeover Act (WpÜG), a change of control applies when 30 % or more of the Company’s voting rights are acquired.
92 G R O U P M A N A G E M E N T R E P O R T Statement on Corporate Governance and Corporate Governance Report

COMPENSATION AGREEMENTS CONCLUDED BY THE COMPANY WITH MANAGEMENT BOARD MEMBERS AND EMPLOYEES IN THE EVENT OF A TAKEOVER BIDFollowing a change of control, Management Board members may terminate their employment contract and demand the fixed salary still outstanding until the end of the contract period. Moreover, in such a case, all stock options, convertible bonds and performance shares granted will become vested immediately and can be exercised after the expiration of the statutory vesting or blackout periods.
Following a change of control, Senior Management Group mem-bers may also terminate their employment contract and demand a severance payment equal to one annual gross fixed salary. More-over, in such a case, all stock options, convertible bonds and per-formance shares granted will become vested immediately and can be exercised after the expiration of the statutory vesting or black-out periods.
The following cases constitute a change of control: (i) MorphoSys transfers all or a material portion of the Company’s assets to an unaffiliated entity, (ii) MorphoSys merges with an unaffiliated entity or (iii) a shareholder or third party directly or indirectly holds 30 % or more of MorphoSys’s voting rights.
Statement on Corporate Governance and Corporate Governance Report G R O U P M A N A G E M E N T R E P O R T 93

Financial Statements
94 F I N A N C I A L S TAT E M E N T S Contents

Consolidated Statement of Income (IFRS) 96Consolidated Statement of Comprehensive Income (IFRS) 97Consolidated Balance Sheet (IFRS) 98Consolidated Statement of Changes in Stockholders’ Equity (IFRS) 100Consolidated Statement of Cash Flows (IFRS) 102
notesGeneral Information 104Summary of Significant Accounting Policies 104Segment Reporting 117Notes to the Income Statement 119Notes to the Assets of the Balance Sheet 122Notes to Equity and Liabilities of the Balance Sheet 128Remuneration System for the Management Board and Employees of the Group 130Additional Notes 140
Contents F I N A N C I A L S TAT E M E N T S 95

Consolidated Statement of Income (IFRS)
in € Note 2016 2015
Revenues 2.7.1, 4.1 49,743,515 106,222,897
Operating Expenses
Research and Development 2.7.2, 4.2.1 95,723,069 78,655,788
General and Administrative 2.7.2, 4.2.2 14,116,085 15,072,046
Total Operating Expenses 109,839,154 93,727,834
Other Income 2.7.3, 4.3 708,571 5,498,041
Other Expenses 2.7.4, 4.3 553,925 758,772
Earnings before Interest and Taxes (EBIT) (59,940,993) 17,234,332
Finance Income 2.7.5, 4.3 1,385,164 3,827,177
Finance Expenses 2.7.6, 4.3 1,308,322 435,941
Income Tax Expenses 2.7.7, 4.4 (518,625) (5,724,800)
Consolidated Net Profit/(Loss) (60,382,776) 14,900,768
Basic Net Profit/(Loss) per Share 2.7.8, 4.5 (2.28) 0.57
Diluted Net Profit/(Loss) per Share 2.7.8, 4.5 (2.27) 0.57
Shares Used in Computing Basic Net Result per Share 2.7.8, 4.5 26,443,415 26,019,855
Shares Used in Computing Diluted Net Result per Share 2.7.8, 4.5 26,543,179 26,244,292
96 F I N A N C I A L S TAT E M E N T S Consolidated Statement of Income (IFRS)

Consolidated Statement of Comprehensive Income (IFRS)1
in € 2016 2015
Consolidated Net Profit/(Loss) (60,382,776) 14,900,768
Change in Unrealized Gains and Losses on Available-for-sale Financial Assets and Bonds 115,396 (268,749)
(Thereof Reclassifications of Unrealized Gains and Losses to Profit and Loss) 251,455 14,500
Change of Tax Effects presented in Other Comprehensive Income on Available-for-sale Financial Assets and Bonds (136,550) 71,233
Change in Unrealized Gains and Losses on Available-for-sale Financial Assets and Bonds, Net of Tax Effects (21,154) (197,516)
Change in Unrealized Gains on Cash-Flow Hedges 490,164 0
Change of Tax Effects presented in Other Comprehensive Income on Cash-Flow Hedges (130,751) 0
Change in Unrealized Gains on Cash-Flow Hedges, Net of Tax Effects 359,413 0
Foreign Currency Losses from Consolidation 0 (293,846)
Comprehensive Income 338,259 (491,362)
Total Comprehensive Income (60,044,517) 14,409,406
1 In financial years 2016 and 2015, the statement of comprehensive income only comprised components, which will be reclassified in terms of IAS 1.82A(b) to profit and loss in subsequent periods when specific conditions are met.
Consolidated Statement of Comprehensive Income (IFRS) F I N A N C I A L S TAT E M E N T S 97
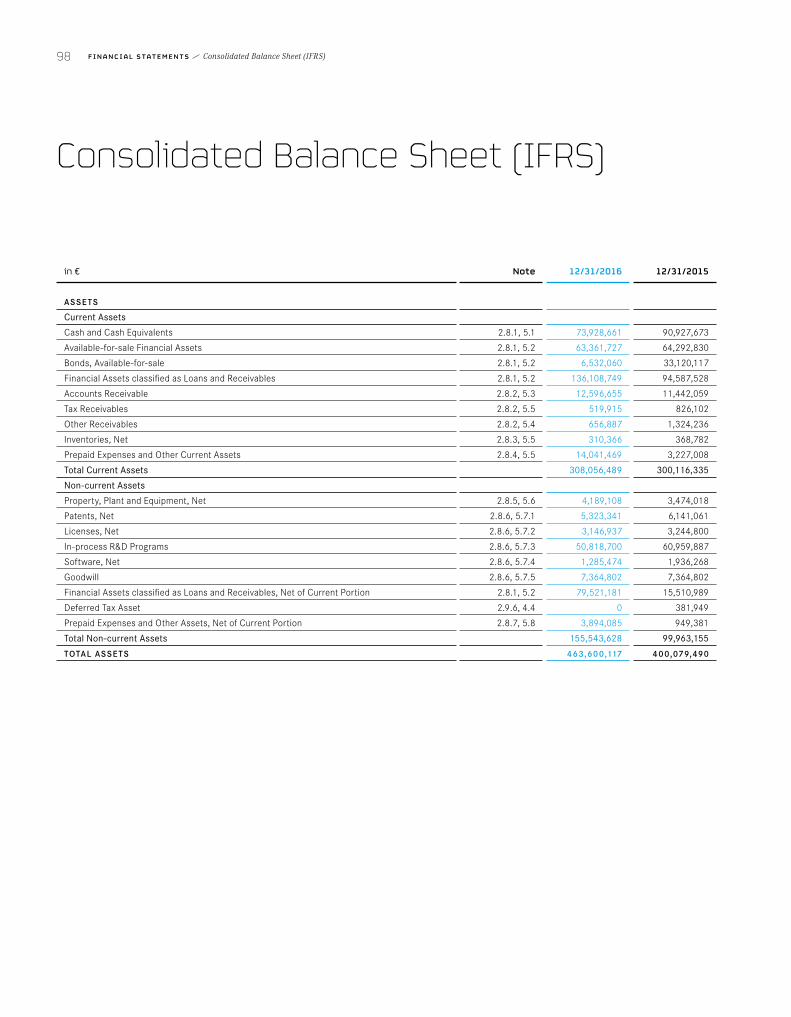
Consolidated Balance Sheet (IFRS)
in € Note 12/31/2016 12/31/2015
ASSETS
Current Assets
Cash and Cash Equivalents 2.8.1, 5.1 73,928,661 90,927,673
Available-for-sale Financial Assets 2.8.1, 5.2 63,361,727 64,292,830
Bonds, Available-for-sale 2.8.1, 5.2 6,532,060 33,120,117
Financial Assets classified as Loans and Receivables 2.8.1, 5.2 136,108,749 94,587,528
Accounts Receivable 2.8.2, 5.3 12,596,655 11,442,059
Tax Receivables 2.8.2, 5.5 519,915 826,102
Other Receivables 2.8.2, 5.4 656,887 1,324,236
Inventories, Net 2.8.3, 5.5 310,366 368,782
Prepaid Expenses and Other Current Assets 2.8.4, 5.5 14,041,469 3,227,008
Total Current Assets 308,056,489 300,116,335
Non-current Assets
Property, Plant and Equipment, Net 2.8.5, 5.6 4,189,108 3,474,018
Patents, Net 2.8.6, 5.7.1 5,323,341 6,141,061
Licenses, Net 2.8.6, 5.7.2 3,146,937 3,244,800
In-process R&D Programs 2.8.6, 5.7.3 50,818,700 60,959,887
Software, Net 2.8.6, 5.7.4 1,285,474 1,936,268
Goodwill 2.8.6, 5.7.5 7,364,802 7,364,802
Financial Assets classified as Loans and Receivables, Net of Current Portion 2.8.1, 5.2 79,521,181 15,510,989
Deferred Tax Asset 2.9.6, 4.4 0 381,949
Prepaid Expenses and Other Assets, Net of Current Portion 2.8.7, 5.8 3,894,085 949,381
Total Non-current Assets 155,543,628 99,963,155
TOTAL ASSETS 463,600,117 400,079,490
98 F I N A N C I A L S TAT E M E N T S Consolidated Balance Sheet (IFRS)

in € Note 12/31/2016 12/31/2015
LIABILITIES AND STOCKHOLDERS’ EQUIT Y
Current Liabilities
Accounts Payable and Accrued Expenses 2.9.1, 6.1 32,222,616 22,341,663
Tax Provisions 2.9.2, 6.2 1,652,006 1,698,276
Provisions 2.9.1, 6.2 3,195,252 1,436,384
Current Portion of Deferred Revenue 2.9.3, 6.3 1,232,072 1,994,120
Total Current Liabilities 38,301,946 27,470,443
Non-current Liabilities
Provisions, Net of Current Portion 2.9.1, 6.2 23,166 43,344
Deferred Revenue, Net of Current Portion 2.9.4, 6.3 1,672,872 2,512,666
Convertible Bonds due to Related Parties 2.9.5 218,293 225,000
Deferred Tax Liability 2.9.6, 4.4 7,421,835 7,092,030
Other Liabilities, Net of Current Portion 2.9.7, 6.4 501,840 0
Total Non-current Liabilities 9,838,006 9,873,040
Total Liabilities 48,139,952 37,343,483
Stockholders’ Equity
Common Stock 2.9.8, 6.5.1 29,159,770 26,537,682
Ordinary Shares Issued (29,159,770 and 26,537,682 for 2016 and 2015, respectively)
Ordinary Shares Outstanding (28,763,760 and 26,103,012 for 2016 and 2015, respectively)
Treasury Stock (396,010 and 434,670 shares for 2016 and 2015, respectively), at Cost 2.9.8, 6.5.4 (14,648,212) (15,827,946)
Additional Paid-in Capital 2.9.8, 6.5.5 428,361,175 319,394,322
Revaluation Reserve 2.9.8, 6.5.6 136,101 (202,158)
Accumulated Income/(Deficit) 2.9.8, 6.5.7 (27,548,669) 32,834,107
Total Stockholders’ Equity 415,460,165 362,736,007
TOTAL LIABILITIES AND STOCKHOLDERS’ EQUIT Y 463,600,117 400,079,490
Consolidated Balance Sheet (IFRS) F I N A N C I A L S TAT E M E N T S 99

Consolidated Statement of Changes in Stockholders’ Equity (IFRS)
Common Stock Treasury Stock Additional
Paid-in Capital €
Revaluation Reserve
€
Translation Reserve
€
Accumulated Income/(Deficit)
€
Total Stock-holders’ Equity
€
Shares € Shares €
BALANCE AS OF JANUARY 1, 2015 26,456,834 26,456,834 450,890 (14,251,962) 318,375,720 (4,642) 293,846 17,933,339 348,803,135
Compensation Related to the Grant of Convertible Bonds and Performance Shares 0 0 0 0 3,558,960 0 0 0 3,558,960
Exercise of Convertible Bonds Issued to Related Parties 80,848 80,848 0 0 1,276,589 0 0 0 1,357,437
Repurchase of Treasury Stock in Consideration of Bank Fees 0 0 88,670 (5,392,931) 0 0 0 0 (5,392,931)
Transfer of Treasury Stock for Long-Term Incentive Program 0 0 (104,890) 3,816,947 (3,816,947) 0 0 0 0
Reserves:
Change in Unrealized Gains and Losses on Available-for-sale Financial Assets and Bonds, Net of Tax Effects 0 0 0 0 0 (197,516) 0 0 (197,516)
Foreign Currency Losses from Consolidation 0 0 0 0 0 0 (293,846) 0 (293,846)
Consolidated Net Profit 0 0 0 0 0 0 0 14,900,768 14,900,768
Total Comprehensive Income 0 0 0 0 0 (197,516) (293,846) 14,900,768 14,409,406
BALANCE AS OF DECEMBER 31, 2015 26,537,682 26,537,682 434,670 (15,827,946) 319,394,322 (202,158) 0 32,834,107 362,736,007
BALANCE AS OF JANUARY 1, 2016 26,537,682 26,537,682 434,670 (15,827,946) 319,394,322 (202,158) 0 32,834,107 362,736,007
Capital Increase, Net of Issuance Cost of € 2,778,652 2,622,088 2,622,088 0 0 109,971,132 0 0 0 112,593,220
Compensation Related to the Grant of Convertible Bonds and Performance Shares 0 0 0 0 2,357,418 0 0 0 2,357,418
Repurchase of Treasury Stock in Consideration of Bank Fees 0 0 52,295 (2,181,963) 0 0 0 0 (2,181,963)
Transfer of Treasury Stock for Long-Term Incentive Program 0 0 (90,955) 3,361,697 (3,361,697) 0 0 0 0
Reserves:
Change in Unrealized Gains and Losses on Available-for-sale Financial Assets and Bonds, Net of Tax Effects 0 0 0 0 0 (21,154) 0 0 (21,154)
Change in Unrealized Gains on Cash-Flow Hedges, Net of Tax Effects 0 0 0 0 0 359,413 0 0 359,413
Consolidated Net Loss 0 0 0 0 0 0 0 (60,382,776) (60,382,776)
Total Comprehensive Income 0 0 0 0 0 338,259 0 (60,382,776) (60,044,517)
BALANCE AS OF DECEMBER 31, 2016 29,159,770 29,159,770 396,010 (14,648,212) 428,361,175 136,101 0 (27,548,669) 415,460,165
100 F I N A N C I A L S TAT E M E N T S Consolidated Statement of Changes in Stockholders’ Equity (IFRS)
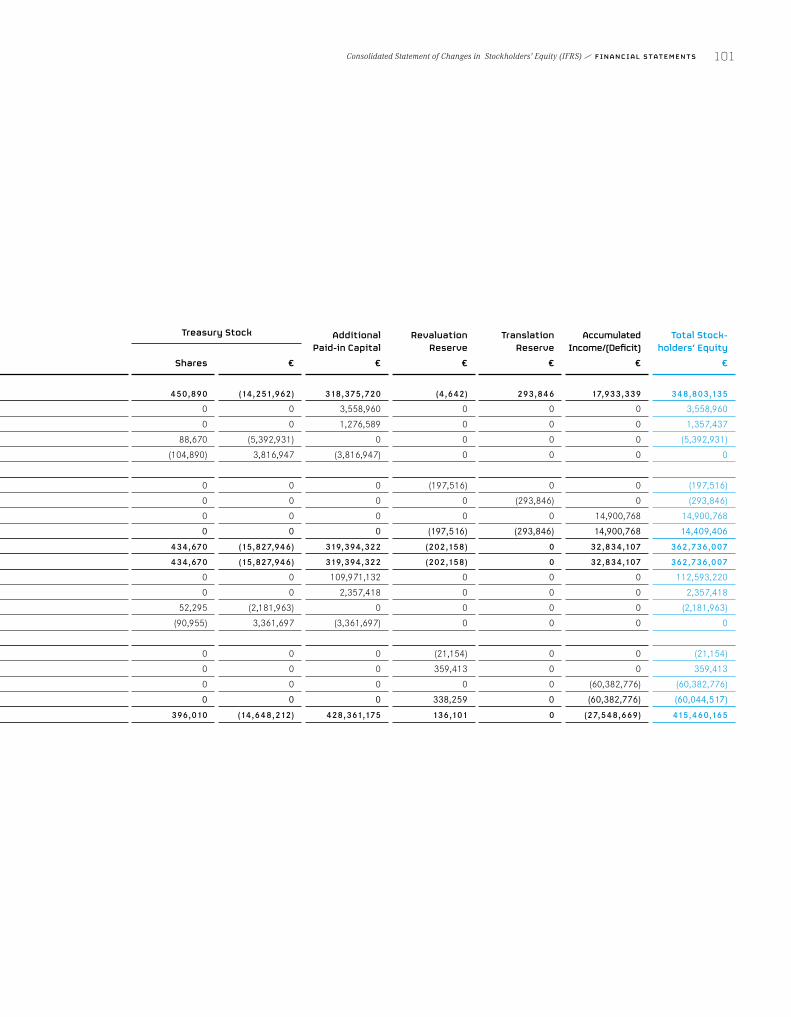
Consolidated Statement of Changes in Stockholders’ Equity (IFRS)
Common Stock Treasury Stock Additional
Paid-in Capital €
Revaluation Reserve
€
Translation Reserve
€
Accumulated Income/(Deficit)
€
Total Stock-holders’ Equity
€
Shares € Shares €
BALANCE AS OF JANUARY 1, 2015 26,456,834 26,456,834 450,890 (14,251,962) 318,375,720 (4,642) 293,846 17,933,339 348,803,135
Compensation Related to the Grant of Convertible Bonds and Performance Shares 0 0 0 0 3,558,960 0 0 0 3,558,960
Exercise of Convertible Bonds Issued to Related Parties 80,848 80,848 0 0 1,276,589 0 0 0 1,357,437
Repurchase of Treasury Stock in Consideration of Bank Fees 0 0 88,670 (5,392,931) 0 0 0 0 (5,392,931)
Transfer of Treasury Stock for Long-Term Incentive Program 0 0 (104,890) 3,816,947 (3,816,947) 0 0 0 0
Reserves:
Change in Unrealized Gains and Losses on Available-for-sale Financial Assets and Bonds, Net of Tax Effects 0 0 0 0 0 (197,516) 0 0 (197,516)
Foreign Currency Losses from Consolidation 0 0 0 0 0 0 (293,846) 0 (293,846)
Consolidated Net Profit 0 0 0 0 0 0 0 14,900,768 14,900,768
Total Comprehensive Income 0 0 0 0 0 (197,516) (293,846) 14,900,768 14,409,406
BALANCE AS OF DECEMBER 31, 2015 26,537,682 26,537,682 434,670 (15,827,946) 319,394,322 (202,158) 0 32,834,107 362,736,007
BALANCE AS OF JANUARY 1, 2016 26,537,682 26,537,682 434,670 (15,827,946) 319,394,322 (202,158) 0 32,834,107 362,736,007
Capital Increase, Net of Issuance Cost of € 2,778,652 2,622,088 2,622,088 0 0 109,971,132 0 0 0 112,593,220
Compensation Related to the Grant of Convertible Bonds and Performance Shares 0 0 0 0 2,357,418 0 0 0 2,357,418
Repurchase of Treasury Stock in Consideration of Bank Fees 0 0 52,295 (2,181,963) 0 0 0 0 (2,181,963)
Transfer of Treasury Stock for Long-Term Incentive Program 0 0 (90,955) 3,361,697 (3,361,697) 0 0 0 0
Reserves:
Change in Unrealized Gains and Losses on Available-for-sale Financial Assets and Bonds, Net of Tax Effects 0 0 0 0 0 (21,154) 0 0 (21,154)
Change in Unrealized Gains on Cash-Flow Hedges, Net of Tax Effects 0 0 0 0 0 359,413 0 0 359,413
Consolidated Net Loss 0 0 0 0 0 0 0 (60,382,776) (60,382,776)
Total Comprehensive Income 0 0 0 0 0 338,259 0 (60,382,776) (60,044,517)
BALANCE AS OF DECEMBER 31, 2016 29,159,770 29,159,770 396,010 (14,648,212) 428,361,175 136,101 0 (27,548,669) 415,460,165
Consolidated Statement of Changes in Stockholders’ Equity (IFRS) F I N A N C I A L S TAT E M E N T S 101
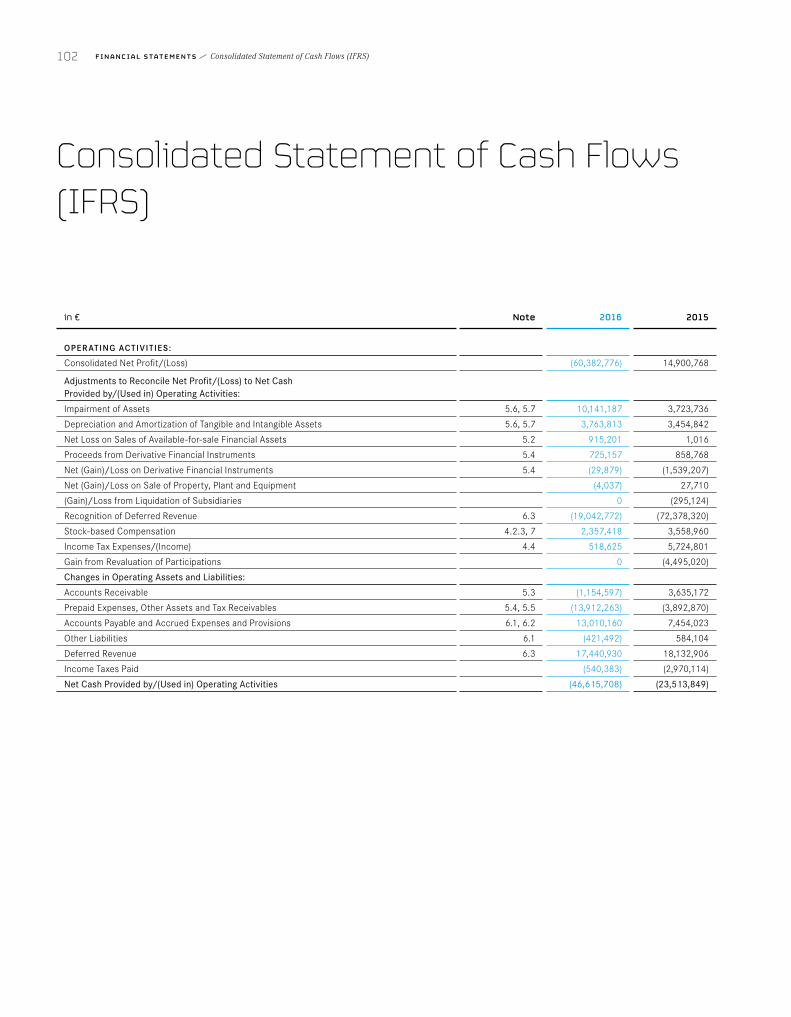
Consolidated Statement of Cash Flows (IFRS)
in € Note 2016 2015
OPER ATING ACTIVITIES:
Consolidated Net Profit/(Loss) (60,382,776) 14,900,768
Adjustments to Reconcile Net Profit/(Loss) to Net Cash Provided by/(Used in) Operating Activities:
Impairment of Assets 5.6, 5.7 10,141,187 3,723,736
Depreciation and Amortization of Tangible and Intangible Assets 5.6, 5.7 3,763,813 3,454,842
Net Loss on Sales of Available-for-sale Financial Assets 5.2 915,201 1,016
Proceeds from Derivative Financial Instruments 5.4 725,157 858,768
Net (Gain)/Loss on Derivative Financial Instruments 5.4 (29,879) (1,539,207)
Net (Gain)/Loss on Sale of Property, Plant and Equipment (4,037) 27,710
(Gain)/Loss from Liquidation of Subsidiaries 0 (295,124)
Recognition of Deferred Revenue 6.3 (19,042,772) (72,378,320)
Stock-based Compensation 4.2.3, 7 2,357,418 3,558,960
Income Tax Expenses/(Income) 4.4 518,625 5,724,801
Gain from Revaluation of Participations 0 (4,495,020)
Changes in Operating Assets and Liabilities:
Accounts Receivable 5.3 (1,154,597) 3,635,172
Prepaid Expenses, Other Assets and Tax Receivables 5.4, 5.5 (13,912,263) (3,892,870)
Accounts Payable and Accrued Expenses and Provisions 6.1, 6.2 13,010,160 7,454,023
Other Liabilities 6.1 (421,492) 584,104
Deferred Revenue 6.3 17,440,930 18,132,906
Income Taxes Paid (540,383) (2,970,114)
Net Cash Provided by/(Used in) Operating Activities (46,615,708) (23,513,849)
102 F I N A N C I A L S TAT E M E N T S Consolidated Statement of Cash Flows (IFRS)

in € Note 2016 2015
INVESTING ACTIVITIES:
Purchase of Available-for-sale Financial Assets 5.2 (166,923,795) (25,600,000)
Proceeds from Sales of Available-for-sale Financial Assets 5.2 167,873,152 67,505,472
Purchase of Bonds, Available-for-sale 5.2 0 (27,681,550)
Proceeds from Sales of Bonds, Available-for-sale 5.2 25,770,000 1,621,000
Purchase of Financial Assets Classified as Loans and Receivables 5.2 (256,499,997) (31,592,379)
Proceeds from Sales of Financial Assets Classified as Loans and Receivables 5.2 149,894,769 127,482,204
Acquisitions, Net of Cash Acquired 0 (18,169,658)
Purchase of Property, Plant and Equipment 5.6 (2,502,286) (1,386,639)
Proceeds from Disposals of Property, Plant and Equipment 5,000 3,050
Purchase of Intangible Assets 5.7 (411,204) (7,378,758)
Interest Received 2,008,325 1,466,156
Net Cash Provided by/(Used in) Investing Activities (80,786,036) 86,268,898
FINANCING ACTIVITIES:
Repurchase of Treasury Stock in Consideration of Bank Fees 6.5.4 (2,181,963) (5,392,931)
Proceeds of Share Issuance 6.5 115,371,872 0
Cost of Share Issuance (2,778,652) 0
Proceeds and (Outflows) in Connection with Convertible Bonds Granted to Related Parties (6,707) 1,330,758
Interest Paid (1,819) (3,433)
Net Cash Provided by/(Used in) Financing Activities 110,402,731 (4,065,606)
Effect of Exchange Rate Differences on Cash 0 69
Increase/(Decrease) in Cash and Cash Equivalents (16,999,013) 58,689,512
Cash and Cash Equivalents at the Beginning of the Period 90,927,673 32,238,161
Cash and Cash Equivalents at the End of the Period 73,928,661 90,927,673
Consolidated Statement of Cash Flows (IFRS) F I N A N C I A L S TAT E M E N T S 103
1 General InformationBUSINESS ACTIVITIES AND THE COMPANY MorphoSys AG (“the Company” or “MorphoSys”) is a leader in the develop-ment of highly efficient technologies for generating therapeutic anti bodies. The Company’s proprietary portfolio of compounds and the pipeline of compounds co-developed with partners from the pharmaceutical and bio-technology industry is one of the broadest in the industry. The Group was founded as a German limited liability company in July 1992. In June 1998, MorphoSys became a German stock corporation. In March 1999, the Com-pany completed its initial public offering on Germany’s “Neuer Markt”: the previous segment of the Deutsche Börse designated for high-growth com-panies. On January 15, 2003, MorphoSys AG was admitted to the Prime Standard segment of the Frankfurt Stock Exchange.
2 Summary of Significant Accounting Policies
2.1 BASIS OF AND CHANGES IN ACCOUNTING STANDARDS 2.1.1 BASIS OF APPLICATION These consolidated financial statements were prepared in accordance with the International Financial Reporting Standards (IFRS) as published by the International Accounting Standards Board (IASB), London. The state-ments take into account the recommendations of the International Finan-cial Reporting Standards Interpretations Committee (IFRS IC), as applica-ble in the European Union (EU) and also give consideration to the supplementary German commercial law provisions, applicable in accor-dance with Sec. 315a Para. 1 of the German Commercial Code (HGB).
These consolidated financial statements for the financial year ended De-cember 31, 2016 comprise MorphoSys AG and its subsidiaries (collectively referred to as the “MorphoSys Group” or the “Group”).
In preparing the consolidated financial statements in accordance with IFRS, the Management Board is required to make certain estimates and assumptions, which have an effect on the amounts recognized in the con-solidated financial statements and the accompanying notes. The actual results may differ from these estimates. The estimates and the underlying assumptions are subject to continuous review. Any changes in estimates are recognized in the period in which the changes are made and in all relevant future periods.
The consolidated financial statements were prepared in euro – the MorphoSys Group’s functional currency. Statements are prepared on the basis of historical cost, except for derivative financial instruments and available-for-sale financial assets, which are recognized at their respec-tive fair value. All figures in this report are rounded to the nearest euro, thousand euros or million euros.
Unless stated otherwise, the accounting policies set out below have been applied consistently to all periods presented in these consolidated finan-cial statements.
2.1.2 CHANGES IN ACCOUNTING POLICIES AND DISCLOSURES The accounting principles applied generally correspond to the policies used in the prior year.
The following new and revised standards and interpretations were applied for the first time in the financial year.
Notes
104 F I N A N C I A L S TAT E M E N T S Notes
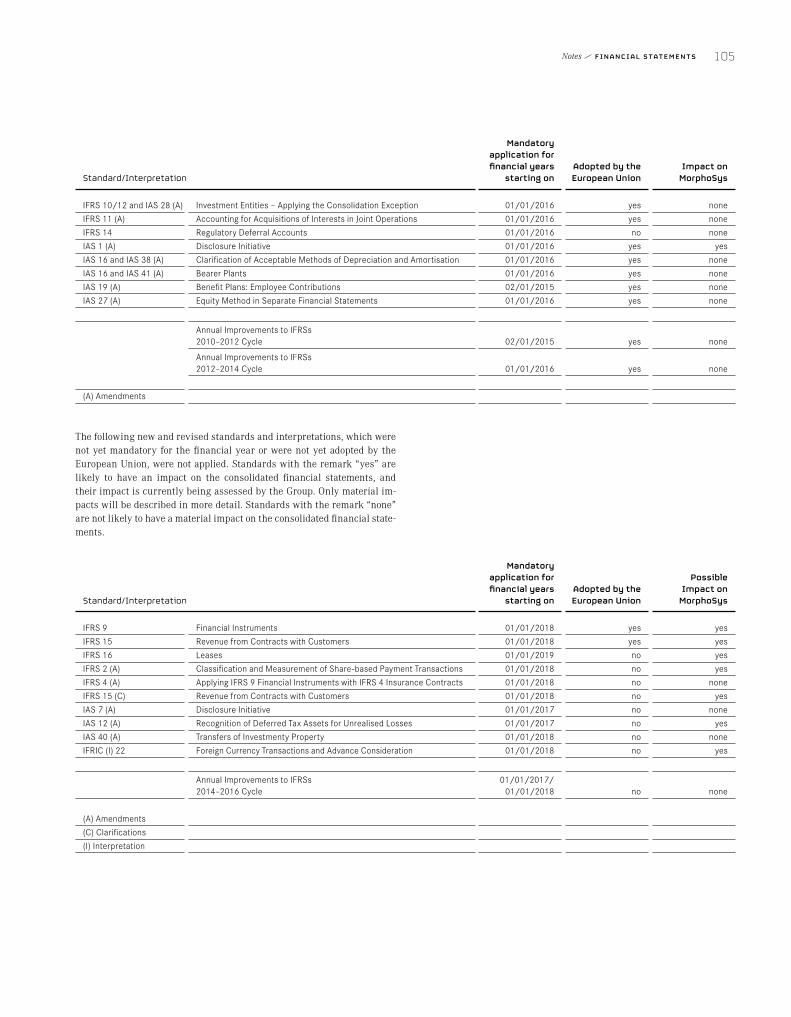
Standard/Interpretation
Mandatory application for financial years
starting on Adopted by the European Union
Impact on MorphoSys
IFRS 10/12 and IAS 28 (A) Investment Entities – Applying the Consolidation Exception 01/01/2016 yes noneIFRS 11 (A) Accounting for Acquisitions of Interests in Joint Operations 01/01/2016 yes noneIFRS 14 Regulatory Deferral Accounts 01/01/2016 no noneIAS 1 (A) Disclosure Initiative 01/01/2016 yes yesIAS 16 and IAS 38 (A) Clarification of Acceptable Methods of Depreciation and Amortisation 01/01/2016 yes noneIAS 16 and IAS 41 (A) Bearer Plants 01/01/2016 yes noneIAS 19 (A) Benefit Plans: Employee Contributions 02/01/2015 yes noneIAS 27 (A) Equity Method in Separate Financial Statements 01/01/2016 yes none
Annual Improvements to IFRSs 2010–2012 Cycle 02/01/2015 yes none
Annual Improvements to IFRSs 2012–2014 Cycle 01/01/2016 yes none
(A) Amendments
The following new and revised standards and interpretations, which were not yet mandatory for the financial year or were not yet adopted by the European Union, were not applied. Standards with the remark “yes” are likely to have an impact on the consolidated financial statements, and their impact is currently being assessed by the Group. Only material im-pacts will be described in more detail. Standards with the remark “none” are not likely to have a material impact on the consolidated financial state-ments.
Standard/Interpretation
Mandatory application for financial years
starting on Adopted by the European Union
Possible Impact on
MorphoSys
IFRS 9 Financial Instruments 01/01/2018 yes yesIFRS 15 Revenue from Contracts with Customers 01/01/2018 yes yesIFRS 16 Leases 01/01/2019 no yesIFRS 2 (A) Classification and Measurement of Share-based Payment Transactions 01/01/2018 no yesIFRS 4 (A) Applying IFRS 9 Financial Instruments with IFRS 4 Insurance Contracts 01/01/2018 no noneIFRS 15 (C) Revenue from Contracts with Customers 01/01/2018 no yesIAS 7 (A) Disclosure Initiative 01/01/2017 no noneIAS 12 (A) Recognition of Deferred Tax Assets for Unrealised Losses 01/01/2017 no yesIAS 40 (A) Transfers of Investmenty Property 01/01/2018 no noneIFRIC (I) 22 Foreign Currency Transactions and Advance Consideration 01/01/2018 no yes
Annual Improvements to IFRSs 2014–2016 Cycle
01/01/2017/ 01/01/2018 no none
(A) Amendments (C) Clarifications (I) Interpretation
Notes F I N A N C I A L S TAT E M E N T S 105

The new standard governing financial instruments, IFRS 9, may lead to changes in the classification and measurement of financial assets and finan cial liabilities, as well as to additional disclosures in the Notes. The provisions on impairments of financial assets and the accounting of hedging relationships may also result in changes from the currently applied provisions under IAS 39. The Group is currently assessing the possible impact of the application of IFRS 9 on the consolidated financial statements.
The new IFRS 15 standard on revenue recognition was reviewed for its potential impact on the revenue recognition of existing contracts and future contracts with partners and/or licensees. The review for the existing contrac tual arrangements revealed that no material quantitative effects on the consolidated financial statements compared to the regulations cur-rently applied are to be expected. Qualitative adjustments of the required disclosures in the Notes under IFRS 15 are expected, however, not before the standard’s first-time application as of January 1, 2018.
The Group also reviewed the new IFRS 16 standard governing leases for its potential impact on existing lease contracts. Currently, all leases are accounted for as operating leases pursuant to IAS 17. As of January 1, 2019, right-of-use assets under existing lease contracts will be capitalized and lease liabilities will be recognized. Rental costs currently recognized in the statement of income will be replaced by depreciation on the respective assets and interest expenses. From today’s perspective, the implementa-tion of IFRS 16 will have material quantitative effects on the consolidated balance sheet due to the rented premises at Semmelweisstraße 7, Planegg. The exact amount of assets and lease liabilities and the transitional pro-visions to be applied when switching from IAS 17 to IFRS 16 have not yet been determined.
2.2 CONSOLIDATION PRINCIPLES Intercompany balances and transactions and any unrealized gains arising from intercompany transactions are eliminated when preparing consoli-dated financial statements pursuant to IFRS 10.B86. Unrealized losses are eliminated in the same manner as unrealized gains but are considered an indication of the transferred asset’s possible impairment. Accounting policies have been applied consistently for all subsidiaries.
For all contracts and business transactions between group entities, the arm’s length principle was applied.
2.2.1 CONSOLIDATED COMPANIES AND SCOPE OF CONSOLIDATIONMorphoSys AG as ultimate parent company of the Group is located in Planegg near Munich. MorphoSys AG has two wholly owned subsidiaries (collectively referred to as the “MorphoSys Group” or the “Group”): Sloning BioTechnology GmbH (Planegg) and Lanthio Pharma B.V. (Groningen, The Netherlands). Additionally, MorphoSys AG’s investment in Lanthio Pharma B.V. indirectly gives it 100 % ownership in LanthioPep B.V. (Groningen, The Netherlands).
The consolidated financial statements for the year ended December 31, 2016 were prepared and approved by the Management Board in its meeting on March 6, 2017 by means of a resolution. The Management Board members are Dr. Simon Moroney (Chief Executive Officer), Jens Holstein (Chief Financial Officer), Dr. Marlies Sproll (Chief Scientific Officer), and Dr. Malte Peters (Chief Development Officer). Dr. Arndt Schottelius has been Chief Development Officer until February 28, 2017. Dr. Malte Peters assumed the position on March 1, 2017.
The Supervisory Board is authorized to amend the financial statements after their approval by the Management Board. MorphoSys Group’s regis-tered head office is located in Planegg (district of Munich) and the regis-tered business address is Semmelweisstraße 7, 82152 Planegg, Germany. The company is registered in the Commercial Register, Section B, of the District Court of Munich under the number HRB 121023.
2.2.2 CONSOLIDATION METHODSThe following Group subsidiaries are included in the scope of consolida-tion as shown in the following table.
Company
Established in/Purchase of
Shares
Included in Basis of Consolidation
since
Sloning BioTechnology GmbH October 2010 10/07/2010Lanthio Pharma B.V. May 2015 05/07/2015LanthioPep B.V. May 2015 05/07/2015
These subsidiaries are fully consolidated because they are either directly or indirectly wholly owned. MorphoSys controls these subsidiaries be-cause it possesses full power over the investees. Additionally, MorphoSys is subject to risk exposure or has rights to variable returns from its involve ment with the investees. MorphoSys also has unlimited capacity to exert power over the investees to influence their returns.
The Group does not have any entities consolidated as joint ventures by using the equity method as defined by IFRS 11 “Joint Arrangements” nor does it exercise a controlling influence as defined by IAS 28 “Investments in Associates and Joint Ventures”. Interests in such entities would be measured at fair value or historic cost in accordance with IAS 39.
Assets and liabilities of fully consolidated domestic and international enti-ties are recognized using Group-wide uniform accounting and valuation methods. The consolidation methods applied have not changed from the previous year.
Receivables, liabilities, expenses and income among consolidated entities are eliminated in the consolidated financial statements.
2.2.3 BASIS OF FOREIGN CURRENCY TR ANSLATIONIAS 21 “The Effects of Changes in Foreign Exchange Rates” governs the accounting for transactions and balances denominated in foreign curren-cies. Transactions denominated in foreign currencies are translated at the exchange rates prevailing on the date of the transaction. Any resulting translation differences are recognized in profit and loss. On the reporting date, assets and liabilities are translated at the closing rate, and income and expenses are translated at the average exchange rate for the financial year. Any foreign exchange rate differences derived from these trans-lations are recognized in the consolidated statement of income.
106 F I N A N C I A L S TAT E M E N T S Notes

2.3 FINANCIAL INSTRUMENTS AND FINANCIAL RISK MANAGEMENT 2.3.1 CREDIT RISK AND LIQUIDIT Y RISKFinancial instruments that could subject the Group to a concentration of credit and liquidity risk include primarily cash and cash equivalents, market able securities (consisting of available-for-sale financial assets and bonds), financial assets of the loans and receivables category, derivative financial instruments and receivables. The Group’s cash and cash equiva-lents are principally denominated in euros. Marketable securities and finan cial assets of the loans and receivables category represent invest-ments in high-quality securities. Cash, cash equivalents, marketable securi ties and financial assets of the loans and receivables category are held at several renowned financial institutions in Germany. The Group continuously monitors its positions with financial institutions that are counterparts to its financial instruments and these institutions’ credit ratings and does not expect any risk of non-performance.
One of the Group’s policies requires all customers who wish to transact business on credit terms to undergo a credit assessment based on external ratings. Nevertheless, the Group’s revenues and accounts receivable are still subject to credit risk from customer concentration. The Group’s most significant single customer accounted for € 8.4 million of accounts receiv-ables as of December 31, 2016 (December 31, 2015: € 8.3 million). This customer accounted for 66 % of the Group’s accounts receivable at the end of 2016. Three individual customers of the Group accounted for 85 %, 5 % and 5 %, respectively, of the total revenues in 2016. On December 31, 2015, one customer had accounted for 73 % of the Group’s accounts receivable and three customers had individually accounted for 56 %, 39 %, and 2 % of the Group’s revenues in 2015. Based on the Management Board’s assess-ment, no allowances were required in the financial years 2016 and 2015. The carrying amounts of financial assets represent the maximum credit risk.
The table below shows the credit risk of accounts receivables by region as of the reporting date.
in € 12/31/2016 12/31/2015
Europe and Asia 9,852,273 10,809,051USA and Canada 2,744,382 633,008Other 0 0TOTAL 12,596,655 11,442,059
The following table shows the term structure of trade receivables as of the reporting date.
in €; A/R are due since12/31/2016 0 – 30 days
12/31/2016 30 – 60 days
12/31/2016 60+ days
12/31/2016 Total
Accounts Receivable 12,596,655 0 0 12,596,655Write-off 0 0 0 0Accounts Receivable, Net of Allowance for Impairment 12,596,655 0 0 12,596,655
in €; A/R are due since12/31/2015 0 – 30 days
12/31/2015 30 – 60 days
12/31/2015 60+ days
12/31/2015 Total
Accounts Receivable 11,442,059 0 0 11,442,059Write-off 0 0 0 0Accounts Receivable, Net of Allowance for Impairment 11,442,059 0 0 11,442,059
Notes F I N A N C I A L S TAT E M E N T S 107

As of December 31, 2016 and December 31, 2015, the Group was not exposed to a credit risk from derivative financial instruments. The maximum credit risk of financial guarantees (rent deposits) on the reporting date amounted to € 1.3 million (December 31, 2015: € 0.6 million).
The contractually agreed maturities and the corresponding cash outflows of accounts payable are within one year. Convertible bonds issued to related parties mature on March 31, 2020 (maximum cash outflow: € 0.2 million).
2.3.2 MARKET RISKMarket risk is the risk that changes in market prices, such as foreign exchange rates, interest rates and equity prices will affect the Group’s results of operations or the value of the financial instruments held. The Group is exposed to currency and interest rate risks.
CURRENCY RISK
The consolidated financial statements are prepared in euros. Whereas MorphoSys’s expenses are predominantly incurred in euros, a portion of the revenue is dependent on the prevailing exchange rate of the US dollar. Throughout the year, the Group monitors the need to hedge foreign exchange rates to minimize currency risk and addresses this risk by using derivative financial instruments.
The table below shows the Group’s exposure to foreign currency risk based on the items’ carrying amounts.
as of December 31, 2016; in € EUR USD Other Total
Cash and Cash Equivalents 73,456,907 471,754 0 73,928,661Available-for-sale Financial Assets 63,361,727 0 0 63,361,727Bonds, Available-for-sale 6,532,060 0 0 6,532,060Financial Assets classified as Loans and Receivables 136,108,749 0 0 136,108,749Financial Assets classified as Loans and Receivables, Net of Current Portion 79,521,181 0 0 79,521,181Accounts Receivable 12,215,814 380,841 0 12,596,655Accounts Payable and Accrued Expenses (31,794,114) (428,502) 0 (32,222,616)TOTAL 339,402,324 424,093 0 339,826,417
as of December 31, 2015; in € EUR USD Other Total
Cash and Cash Equivalents 90,206,933 720,740 0 90,927,673Available-for-sale Financial Assets 64,292,830 0 0 64,292,830Bonds, Available-for-sale 33,120,117 0 0 33,120,117Financial Assets classified as Loans and Receivables 94,587,528 0 0 94,587,528Financial Assets classified as Loans and Receivables, Net of Current Portion 15,510,989 0 0 15,510,989Accounts Receivable 11,365,659 76,400 0 11,442,059Accounts Payable and Accrued Expenses (22,308,082) (28,548) (5,033) (22,341,663)TOTAL 286,775,974 768,592 (5,033) 287,539,533
Various foreign exchange rates and their impact on assets and liabilities were simulated in an in-depth sensitivity analysis to determine the effects on income. A 10 % increase in the euro versus the US dollar as of Decem-ber 31, 2016 would have reduced the Group’s income by less than € 0.1 mil-lion. A 10 % decline in the euro versus the US dollar would have increased the Group’s income by less than € 0.1 million.
A 10 % increase in the euro versus the US dollar as of December 31, 2015 would have reduced the Group’s income by € 0.1 million. A 10 % decline in the euro versus the US dollar would have increased the Group’s income by € 0.1 million.
108 F I N A N C I A L S TAT E M E N T S Notes

If the foreign exchange rates for the US dollar versus the euro had re-mained at the prior year’s average rate, the Group’s revenues would have been less than € 0.1 million lower. In 2015, Group revenues would have been € 0.1 million lower.
INTEREST R ATE RISK
The Group’s risk exposure to changes in interest rates mainly relates to available-for-sale securities. Changes in the general level of interest rates may lead to an increase or decrease in the fair value of these securities. The Group’s investment focus places the safety of an investment ahead of its return. Interest rate risk is limited because all securities can be liqui-dated within a maximum of two years.
The Group is not subject to significant interest rate risks from the liabili-ties currently reported in the balance sheet.
2.3.3 FAIR VALUE HIER ARCHY AND MEASUREMENT PROCEDURESThe IFRS 13 “Fair Value Measurement” guidelines must always be applied when measurement at fair value is required or permitted or disclosures regarding measurement at fair value are required based on another IAS/IFRS guideline. The fair value is the price that would be achieved for the sale of an asset in an arm’s length transaction between independent market participants or the price to be paid for the transfer of a liability (disposal or exit price). Accordingly, the fair value of a liability reflects the default risk (i.e., own credit risk). Measurement at fair value requires that the sale of the asset or the transfer of the liability takes place on the principal market or, if no such principal market is available, on the most advantageous market. The principal market is the market a company has access to that has the highest volume and level of activity.
Fair value is measured by using the same assumptions and taking into account the same characteristics of the asset or liability as would an inde-pendent market participant. Fair value is a market-based, not an entity- specific measurement. The fair value of non-financial assets is based on the best use of the asset by a market participant. For financial instruments, the use of bid prices for assets and ask prices for liabilities is permitted but not required if those prices best reflect the fair value in the respective circumstances. For simplification, mean rates are also permitted. Thus, IFRS 13 not only applies to financial assets but all assets and liabilities.
MorphoSys uses the following hierarchy for determining and disclosing the fair value of financial instruments:Level 1: Quoted (unadjusted) prices in active markets for identical
assets or liabilities to which the Company has access.Level 2: Inputs other than quoted prices included within Level 1 that are
observable for the assets or liabilities, either directly (i.e., as prices) or indirectly (i.e., derived from prices).
Level 3: Inputs for the asset or liability that are not based on observable market data (that is, unobservable inputs).
The carrying amounts of financial assets and liabilities, such as cash and cash equivalents, marketable securities, financial assets of the loans and receivables category and accounts receivable and accounts payable approxi mate their fair value because of their short-term maturities.
HIER ARCHY LE VEL 1
The fair value of financial instruments traded in active markets is based on the quoted market prices on the reporting date. A market is considered active if quoted prices are available from an exchange, dealer, broker, indus try group, pricing service or regulatory body that is easily and regu-larly accessible and prices reflect current and regularly occurring market transactions at arm’s length conditions. For assets held by the Group, the appropriate quoted market price is the buyer’s bid price. These instru-ments fall under Level 1 of the hierarchy (see also Item 5.2* of these Notes).*CROSS-REFERENCE to page 123
HIER ARCHY LE VEL 2 AND 3
The fair value of financial instruments not traded in active markets can be determined using valuation methods. In this case, fair value is estimated using the results of a valuation method that makes maximum use of market data and relies as little as possible on entity-specific inputs. If all inputs required for measuring fair value are observable, the instrument is allo-cated to Level 2. If important inputs are not based on observable market data, the instrument is allocated to Level 3.
Hierarchy level 2 contains the forward exchange contracts used for cur-rency hedging. Future cash flows for these forward exchange contracts are determined based on forward exchange rate curves. The fair value of these instruments corresponds to their discounted cash flows.
There were no financial assets or liabilities allocated to hierarchy level 3.
There were no transfers from one fair value hierarchy level to another in 2016 or 2015.
Notes F I N A N C I A L S TAT E M E N T S 109

The table below shows the fair values of financial assets and liabilities and the carrying amounts presented in the consolidated balance sheet.
December 31, 2016 (in 000’ €) NoteHierarchy
LevelLoans and
ReceivablesAvailable-
for-sale
Other Financial
Liabilities
Total Carrying Amount Fair value
Cash and Cash Equivalents 5.1 1 73,929 0 0 73,929 73,929
Financial Assets classified as Loans and Receivables 5.2 1 136,109 0 0 136,109 136,109Accounts Receivable 5.3 1 12,597 0 0 12,597 1
Forward Exchange Contracts Used for Hedging 5.4 2 520 0 0 520 520Other Receivables 5.4 1 137 0 0 137 137
Financial Assets classified as Loans and Receivables, Net of Current Portion 5.2 1 79,521 0 0 79,521 79,521Available-for-sale Financial Assets 5.2 1 0 63,362 0 63,362 63,362Bonds, Available-for-sale 5.2 1 0 6,532 0 6,532 6,532TOTAL 302,813 69,894 0 372,707 360,110Convertible Bonds – Liability Component 7.1 1 0 0 (218) (218) (218)Accounts Payable and Accrued Expenses 6.1 1 0 0 (32,223) (32,223) 1
Forward Exchange Contracts Used for Hedging 5.4 2 0 0 0 0 0TOTAL 0 0 (32,441) (32,441) (218)
1 Declaration waived in line with IFRS 7.29 (a).
December 31, 2015 (in 000’ €) NoteHierarchy
LevelLoans and
ReceivablesAvailable-
for-sale
Other Financial
Liabilities
Total Carrying Amount Fair value
Cash and Cash Equivalents 5.1 1 90,928 0 0 90,928 90,928
Financial Assets classified as Loans and Receivables 5.2 1 94,588 0 0 94,588 94,588Accounts Receivable 5.3 1 11,442 0 0 11,442 1
Forward Exchange Contracts Used for Hedging 5.3 2 750 0 0 750 7502
Other Receivables 5.4 1 574 0 0 574 574
Financial Assets classified as Loans and Receivables, Net of Current Portion 5.2 1 15,511 0 0 15,511 15,511Available-for-sale Financial Assets 5.2 1 0 64,293 0 64,293 64,293Bonds, Available-for-sale 5.2 1 0 33,120 0 33,120 33,120TOTAL 213,793 97,413 0 311,206 299,764Convertible Bonds – Liability Component 7.1 1 0 0 (225) (225) (225)Accounts Payable and Accrued Expenses 6.1 1 0 0 (22,342) (22,342) 1
Forward Exchange Contracts Used for Hedging 5.4 2 0 0 (25) (25) (25)TOTAL 0 0 (22,592) (22,592) (250)
1 Declaration waived in line with IFRS 7.29 (a). 2 As of December 31, 2015, nil had been disclosed; the carrying amount equaled the fair value.
110 F I N A N C I A L S TAT E M E N T S Notes

2.4 IMPAIRMENTS2.4.1 NON-DERIVATIVE FINANCIAL INSTRUMENTSA financial instrument not carried at fair value through profit or loss is assessed at each reporting date to determine if there is objective evidence for impairment. A financial instrument is impaired if objective evidence indicates that an event has occurred after the initial recognition of the asset that could result in a loss and whether that event could have a negative effect on the asset’s estimated future cash flows, which can be assessed reliably.
Objective evidence that financial instruments (including equity securities) are impaired can include the default or delinquency of a debtor, indica-tions that a debtor or issuer will enter insolvency, adverse changes in the payment status of borrowers or issuers in the Group as well as economic conditions that correlate with defaults or the disappearance of an active market for a marketable security. A significant or prolonged decline in an equity security’s fair value below its acquisition cost is objective evidence of impairment.
2.4.2 RECEIVABLESThe Group considers evidence of the impairment of receivables on an indi-vidual level. All individually significant receivables are tested specifically for impairment.
For a financial instrument measured at amortized cost less impairment, impairment is calculated as the difference between its carrying amount and the present value of the estimated future cash flows. Cash flows are discounted at the asset’s initial effective interest rate. Losses are recog-nized in profit or loss and reflected in an allowance account against receiv-ables. Interest on the impaired asset continues to be recognized. When a subsequent event (e.g., repayment by a debtor) causes the amount of im-pairment to decrease, the impairment is reversed through profit and loss.
2.4.3 AVAILABLE -FOR- SALE FINANCIAL ASSETS In case of objective indications, impairment of available-for-sale financial assets is recognized by reclassifying the accumulated losses from the reva luation reserve in equity to profit and loss. The amount of the accumu-lated loss to be reclassified from equity to profit and loss is the difference between the acquisition cost less amortization and any principal repay-ment and the current fair value less any impairment previously recog-nized in profit or loss. If in a subsequent period the fair value of an im-paired available-for-sale financial asset increases and this increase can be objectively linked to an event occurring after the impairment was recog-nized in profit or loss, then the impairment loss is reversed, and the amount of the reversal is recognized in profit or loss. Any subsequent incre ase in the fair value of an available-for-sale financial instrument is recognized in equity within other comprehensive income.
2.4.4 NON-FINANCIAL ASSETSThe carrying amounts of the Group’s non-financial assets, inventories and deferred tax assets are reviewed at each reporting date for any indication of impairment. The asset’s recoverable amount is estimated if such indica-tion exists. For goodwill and intangible assets that have indefinite useful lives or are not yet available for use, the recoverable amount is estimated at the same time each year, or if required. Impairment is recognized if the carrying amount of an asset or the cash-generating unit (CGU) exceeds its estimated recoverable amount.
The recoverable amount of an asset or CGU is the greater of its value-in-use or its fair value less costs of disposal. In assessing value-in-use, the estimated future pre-tax cash flows are discounted to their present value using a pre-tax discount rate that reflects current market assessments of the time value of money and the risks specific to the asset or CGU. For the purposes of impairment testing, assets that cannot be tested individually are grouped into the smallest group of assets that generates cash flows from ongoing use that are largely independent of the cash flows of other assets or CGUs. A ceiling test for the operating segment must be carried out for goodwill impairment testing. CGUs that have been allocated good-will are aggregated so that the level at which impairment testing is per-formed reflects the lowest level at which goodwill is monitored for internal reporting purposes. Goodwill acquired in a business combination may be allocated to groups of CGUs that are expected to benefit from the combina-tion’s synergies.
The Group’s corporate assets do not generate separate cash flows and are utilized by more than one CGU. Corporate assets are allocated to CGUs on a reasonable and consistent basis and are tested for impairment as part of the impairment testing of the CGU that was allocated the corporate asset.
Impairment losses are recognized in profit and loss. Goodwill impairment cannot be reversed. For all other assets, impairment recognized in prior periods is assessed on each reporting date for any indications that the losses decreased or no longer exist. Impairment is reversed when there has been a change in the estimates used to determine the recoverable amount. Impairment losses can only be reversed to the extent that the asset’s carrying amount does not exceed the carrying amount net of depreciation or amortization that would have been determined if an impair ment had not been recognized.
2.5 ADDITIONAL INFORMATION 2.5.1 KEY ESTIMATES AND ASSUMPTIONS Estimates and judgments are continually evaluated and based on histori-cal experience and other factors that include expectations of future events that are believed to be realistic under the prevailing circumstances.
The Group makes estimates and assumptions concerning the future. The resulting accounting-related estimates will, by definition, seldom corre-spond to the actual results. The estimates and assumptions that carry a significant risk of causing material adjustments to the carrying amounts of assets and liabilities in the next financial year are addressed below.
GOODWILL
The Group performs a yearly test to determine whether goodwill is subject to impairment in accordance with the accounting policies discussed in Item 2.4.4*. The recoverable amounts from cash-generating units have been determined using value-in-use calculations and are subjected to a sensitivity analysis. These calculations require the use of estimates (see also Item 5.7.5* in the Notes).*CROSS-REFERENCE to page 111 and page 127
INCOME TA XES
The Group is subject to income taxes in a number of tax jurisdictions. Due to the increasing complexity of tax laws and the corresponding uncer-tainty regarding the legal interpretation by the fiscal authority, tax calcu-lations are generally subject to an elevated amount of uncertainty. To the extent necessary, possible tax risks were taken into account in the form of provisions.
Notes F I N A N C I A L S TAT E M E N T S 111

Deferred tax assets on tax loss carryforwards are recognized based on the expected business performance of the relevant Group entity. For details on tax loss carryforwards and any recognized deferred tax assets, please refer to Item 4.4* in the Notes.*CROSS-REFERENCE to page 120
2.5.2 CAPITAL MANAGEMENTThe Management Board’s policy for capital management is to preserve a strong and sustainable capital base in order to maintain the confidence of investors, business partners, and the capital market and to support future business development. The Group’s capital base was further enhanced by a capital increase amounting to € 115.4 million carried out in November 2016 (private placement with institutional investors). As of December 31, 2016, the equity ratio was 89.6 % (December 31, 2015: 90.7 %; see also the following overview). The Group does not currently have any financial debt.
Under the respective incentive plans resolved by the Annual General Meeting, the Management Board and employees may participate in the Group’s performance through long-term performance-related remunera-tion consisting of convertible bonds. MorphoSys also established long-term incentive programs (LTI plan) in 2012, 2013, 2014, 2015 and 2016. These programs are based on the performance-related issue of shares, or “performance shares”, which are granted when certain predefined success criteria have been achieved and the vesting period has expired (for more information, please refer to Item 7.2* in the Notes). There were no changes in the Group’s approach to capital management during the year.*CROSS-REFERENCE to page 131
in 000’ € 12/31/2016 12/31/2015
Stockholders’ Equity 415,460 362,736In % of Total Capital 89.6 % 90.7 %Debt 48,140 37,343In % of Total Capital 10.4 % 9.3 %TOTAL CAPITAL 463,600 400,079
2.6 USE OF INTEREST RATES FOR VALUATION The Group uses interest rates to measure fair value. When calculating stock-based compensation, MorphoSys uses interest rates on German govern ment bonds with maturities of five or seven years on the date they were granted to determine the fair value of convertible bonds.
2.7 ACCOUNTING POLICIES APPLIED TO LINE ITEMS OF THE INCOME STATEMENT
2.7.1 REVENUES AND REVENUE RECOGNITIONThe Group’s revenue includes license fees, milestone payments, service fees and revenues from the sale of goods. Under IAS 18.9, revenues are measured at the fair value of the consideration received or receivable. In accordance with IAS 18.20b, revenues are recognized only to the extent that it is sufficiently probable that the Company will receive the economic benefits associated with the transaction.
LICENSE FEES AND MILESTONE PAYMENTS
Revenues related to non-refundable fees for providing access to tech-nologies, fees for the use of technologies and license fees are recognized on a straight-line basis over the period of the agreement unless a more appropriate method of revenue recognition is available. The period of the agreement usually corresponds to the contractually agreed term of the research project or, in the case of contracts without an agreed project term, the expected term of the collaboration. If all IAS 18.14 criteria are met, revenue is recognized immediately and in full. Revenues from mile-stone payments are recognized upon achievement of certain contractual criteria.
SERVICE FEES
Service fees from research and development collaborations are recognized in the period the services are provided.
Discounts that are likely to be granted and whose amount can be reliably determined are recognized as a reduction in revenue at the time of revenue recognition. The timing of the transfer of risks and rewards varies depend-ing on the terms of the sales contract. In accordance with IAS 18.21 and 18.25, revenue from multiple-component contracts is recognized by allocat ing the total consideration to the separately identifiable components based on their respective fair values and by applying IAS 18.20. The applicable revenue recognition criteria are assessed separately for each component.
Deferred revenue consist of customer payments that were not yet recog-nized as revenue because the related services specified in the contract were not yet rendered.
2.7.2 OPER ATING EXPENSES PERSONNEL EXPENSES RESULT ING FROM STOCK OPTIONS
The Group applies the provisions under IFRS 2 “Share-based Payment”, which require the Group to spread compensation expenses from the esti-mated fair values of share-based payments on the reporting date over the period in which the beneficiaries provide the services which triggered the granting of the share-based payments.
IFRS 2 “Share-based Payment” requires the consideration of the effects of share-based payments if the Group acquires goods or services in exchange for shares or stock options (“settlement in equity instruments”) or other assets that represent the value of a specific number of shares or stock options (“cash settlement”). The key impact of IFRS 2 on the Group is the expense resulting from the use of an option pricing model in relation to share-based incentives for employees and the Management Board. Additional information can be found under Items 7.1*, 7.2* and 7.3* in the Notes.*CROSS-REFERENCE to page 130–136
RESEARCH AND DE VELOPMENT
Research costs are expensed in the period they occur. Development costs are generally expensed as incurred in accordance with IAS 38.5 and IAS 38.11 to 38.23. Development costs are recognized as an intangible asset when the criteria of IAS 38.21 (probability of expected future economic benefits, reliability of cost measurement) are met and if the Group can provide proof under IAS 38.57.
112 F I N A N C I A L S TAT E M E N T S Notes

GENER AL AND ADMINISTR ATIVE
This line item contains personnel expenses, consumables, operating costs, amortization of intangible assets, expenses for external services, infra-structure costs and depreciation.
OPER ATING LEASE PAYMENTS
Payments made under operating leases are recognized in the income statement on a straight-line basis over the term of the lease. According to SIC-15, all incentive agreements in the context of operating leases are recogn ized as an integral part of the net consideration agreed for the use of the leased asset. The total amount of income from incentives is recog-nized as a reduction in lease expenses on a straight-line basis over the term of the lease.
All of the Group’s lease agreements are classified exclusively as operating leases. The Group did not engage in any finance lease arrangements in which the Group, as lessee, capitalized the assets at the start of the lease at the lower of fair value or the net present value of the minimum-lease payments and then depreciated the assets on a straight-line basis over their economic life.
2.7.3 OTHER INCOMEGOVERNMENT GR ANTS
Grants received from government agencies to fund specific research and development projects are recognized in the income statement in the sepa-rate line item “other income” to the extent that the related expenses have already occurred. Under the terms of the grants, government agencies generally have the right to audit the use of the funds granted to the Group.
Basically, government grants are cost subsidies, and their recognition through profit and loss is limited to the corresponding costs.
When the repayment of cost subsidies depends on the success of the devel-opment project, these cost subsidies are recognized as other liabilities until success has been achieved. If the condition for repayment is not met, then the grant is recognized under “other income”.
No payments were granted in the 2016 financial year that are required to be classified as investment subsidies.
2.7.4 OTHER EXPENSESThe line item “other expenses” consists mainly of currency losses from the operating business.
2.7.5 FINANCE INCOMEInterest income is recognized in the income statement as it occurs and takes into account the asset’s effective interest rate.
2.7.6 FINANCE EXPENSESFinance expenses are expensed in the income statement in the period they occur.
2.7.7 INCOME TA X EXPENSES/INCOMEIncome taxes consist of current and deferred taxes and are recognized in the income statement unless they relate to items recognized directly in equity.
Current taxes are the taxes expected to be payable on the year’s taxable income based on prevailing tax rates on the reporting date and any adjust-ments to taxes payable in previous years.
The calculation of deferred taxes is based on the balance sheet liability method that refers to the temporary differences between the carrying amounts of assets and liabilities and the amounts used for taxation pur-poses. The method of calculating deferred taxes depends on how the as-set’s carrying amount is expected to be realized and how the liabilities will be repaid. The calculation is based on the prevailing tax rates or those adopted on the reporting date.
Deferred tax assets and liabilities are offset when there is a legally enforce able right to offset current tax liabilities and assets and when they relate to income taxes imposed on the same taxable entity by the same tax authority or on different tax entities that intend to settle the balance of current tax assets and liabilities on a net basis or when the tax assets and liabilities are to be realized simultaneously.
Deferred tax assets are recognized only to the extent that it is likely that there will be future taxable income to offset. Deferred tax assets are reduced by the amount that the related tax benefit is no longer expected to be realized.
2.7.8 EARNINGS PER SHAREThe Group reports basic and diluted earnings per share. Basic earnings per share is computed by dividing the net profit or loss attributable to parent company shareholders by the weighted-average number of ordinary shares outstanding during the reporting period. Diluted earnings per share is calculated in the same manner with the exception that the net profit or loss attributable to parent company shareholders and the weighted average number of ordinary shares outstanding are adjusted for any dilu-tive effects resulting from convertible bonds granted to the Management Board and employees.
2.8 ACCOUNTING POLICIES APPLIED TO THE ASSETS OF THE BALANCE SHEET
2.8.1 LIQUIDIT YCASH AND CASH EQUIVALENTS
The Group regards all cash at banks and on hand and all short-term deposits with a maturity of three months or less as cash and cash equivalents. The Group invests most of its cash and cash equivalents at several major financial institutions: Commerzbank, UniCredit, Bayern LB, LBBW, BNP Paribas, Deutsche Bank, Sparkasse and Rabobank.
Cash and cash equivalents are recognized at nominal value. Marketable securities are recognized and measured at fair value. Any fluctuations in the fair value of marketable securities are directly recognized in equity. Permanent impairment is recognized in profit and loss.
NON - DERIVAT IVE F INANCIAL INSTRUMENTS
Depending on how they are classified, existing financial instruments are either measured at amortized cost (category “loans and receivables”) or fair value (category “available-for-sale financial assets”). The amortized cost of current receivables and current liabilities generally corresponds to either the nominal amount or repayment amount.
Notes F I N A N C I A L S TAT E M E N T S 113

All non-derivative financial instruments are initially recognized at fair value, which is defined as the fair value of the consideration provided net of transaction costs.
The Group applies IAS 39 for financial instruments in the form of debt and equity instruments. At the time of purchase, the Management Board deter mines the financial instrument’s classification and reviews this clas-sification at each reporting date. The classification depends on the purpose of acquiring the financial instrument. As of December 31, 2016 and De-cember 31, 2015, some financial instruments held by the Group were clas-sified as “available-for-sale”. These financial instruments are recognized or derecognized as of the date on which the Group commits to the financial instrument’s purchase or sale. Following their initial recognition, avail-able-for-sale financial assets are measured at fair value, and any resulting gain or loss is reported directly in the revaluation reserve within equity until the financial instruments are sold, redeemed, otherwise disposed of or considered impaired, at which time the accumulated loss is reported in profit and loss.
Guarantees granted for rent deposits and obligations from convertible bonds issued to employees are recorded under other assets as restricted cash since they are not available for use in the Group’s operations.
DERIVAT IVE F INANCIAL INSTRUMENTS
The Group uses derivative financial instruments to hedge its foreign exchange rate risk and cash flows. In accordance with IAS 39.9, stand-alone derivative financial instruments are predominantly held for trading and are initially recognized at fair value. After their initial recognition, derivative financial instruments are measured at fair value, which is de-fined as their quoted market price on the reporting date. Any resulting gain or loss from derivatives is recognized in profit and loss, unless the derivatives are effective and designated as hedging instruments under a hedging relationship (hedge accounting). According to the Group’s foreign currency hedging policy, the Group only hedges highly probable future cash flows and clearly identifiable receivables that can be collected within a 12-month period.
The use of derivative financial instruments is subject to a Group policy that is a written guideline approved by the Management Board for dealing with derivative financial instruments. Any changes in the fair value of derivative financial instruments are documented.
HEDGE ACCOUNTING
The Group has designated hedging instruments to hedge cash flows (cash flow hedges).
At the beginning of the hedge accounting, the hedging relationship between the underlying and the hedge transaction are documented, includ ing the risk management objectives and corporate strategy underly-ing the hedging relationship. Additionally, when concluding the hedge and also during the term of the hedge, the Group regularly provides docu-mentation if the hedging instrument designated for the hedging relation-ship is highly effective in terms of the hedged risk to compensate for any changes of the underlying transaction’s cash flows.
For information on the fair value of derivatives used for hedging, please refer to Item 5.4* in the Notes.*CROSS-REFERENCE to page 124
CASHFLOW HEDGES
The effective portion of the change in fair value of derivatives that are suitable for cash flow hedges and designated as such is recognized within other comprehensive income. The gain/loss attributable to the ineffective portion is immediately recognized in profit and loss with “other operating income/expenses”.
Amounts recognized within other comprehensive income are reclassified to the consolidated statement of income in the period in which the under-lying transaction is recognized in profit and loss. The gain/loss is re-corded in the same line item of the consolidated statement of income as the underlying transaction.
The hedging relationship is no longer accounted for if the Group dissolves the hedging relationship, the hedging instrument expires, is sold, termi-nated or exercised or no longer is suitable for hedging purposes. The full gain/loss recognized in other comprehensive income and accrued within equity remains in equity when the hedge accounting ends and is only recognized in profit and loss once the expected transaction is also recog-nized in profit and loss. If the transaction is no longer expected to materi-alize, the full gain/loss recognized in equity is immediately reclassified into the consolidated statement of income.
2.8.2 ACCOUNTS RECEIVABLE , INCOME TA X RECEIVABLES AND OTHER RECEIVABLES
Accounts receivable are measured at amortized cost less any impairment; for example, allowances for doubtful accounts (see Items 2.4.2* and 5.3* in the Notes).*CROSS-REFERENCE to page 111 and page 124
Income tax receivables mainly include receivables due from tax authori-ties in the context of capital gain taxes withheld.
Other non-derivative financial instruments are measured at amortized cost using the effective interest method less any impairment.
2.8.3 INVENTORIESInventories are measured at the lower value of production or acquisition cost and net realizable value under the FIFO method. Acquisition costs comprise all costs of purchase and those incurred in bringing the invento-ries into operating condition while taking into account purchase price reductions, such as bonuses and discounts. Net realizable value is the estimated selling price less the estimated expenses necessary for comple-tion and sale. Inventories are divided into the categories of raw materials and supplies.
2.8.4 PREPAID EXPENSES AND OTHER CURRENT ASSETSPrepaid expenses include expenses resulting from an outflow of liquid assets prior to the reporting date that are only recognized as expenses in the subsequent financial year. Such expenses usually involve maintenance contracts, sublicenses and prepayments for external laboratory services not yet performed. Other current assets primarily consist of receivables from tax authorities resulting from value-added taxes and restricted cash, such as rent deposits. This item is recognized at nominal value.
114 F I N A N C I A L S TAT E M E N T S Notes

2.8.5 PROPERT Y, PLANT AND EQUIPMENTProperty, plant and equipment is recorded at historical cost less accumu-lated depreciation (see also Item 5.6* in the Notes) and any impairment (see Item 2.4.4* in the Notes). Historical cost includes expenditures di-rectly related to the purchase at the time of the acquisition. Replacements purchases, building alterations and improvements are capitalized while repair and maintenance expenses are charged as expenses as they are incurred. Property, plant and equipment is depreciated on a straight-line basis over its useful life (see table below). Leasehold improvements are depreciated on a straight-line basis over the asset’s estimated useful life.*CROSS-REFERENCE to page 125 and page 111
Asset Class Useful LifeDepreciation
Rates
Computer Hardware 3 years 33 %
Low-value Laboratory and Office Equipment below € 410 Immediately 100 %
Permanent Improvements to Property/Buildings 10 years 10 %Office Equipment 8 years 13 %Laboratory Equipment 4 years 25 %
Asset’s residual values and useful lives are reviewed at the end of each reporting period and adjusted if appropriate.
Borrowing costs that can be directly attributed to the acquisition, con-struction or production of a qualifying asset are not included in the acqui-sition or production costs because the Group finances the entire operating business with equity.
2.8.6 INTANGIBLE ASSETSPurchased intangible assets are capitalized at acquisition cost and exclu-sively amortized on a straight-line basis over their useful lives. Internally generated intangible assets are recognized to the degree the recognition criteria set out in IAS 38 are met.
Development costs are capitalized as intangible assets when the capital-ization criteria described in IAS 38 have been met, namely, clear specifi-cation of the product or procedure, technical feasibility, intention of com-pletion, use, commercialization, coverage of development costs through future free cash flows, reliable determination of these free cash flows and availability of sufficient resources for completion of development and sale. Amortization is recorded in research and development expenses.
Expenses to be classified as research expenses are allocated to research and development expenses as defined by IAS 38.
Subsequent expenditures for capitalized intangible assets are capitalized only when they substantially increase the future economic benefits of the specific asset to which they relate. All other expenditures are expensed as incurred.
PATENTS
Patents obtained by the Group are recorded at acquisition cost less accu-mulated amortization (see below) and any impairment (see Item 2.4.4* in the Notes). Patent costs are amortized on a straight-line basis over the lower of the estimated useful life of the patent (ten years) or the remaining patent term. Amortization starts when the patent is issued. Technology identified in the purchase price allocation for the acquisition of Sloning BioTechnology GmbH is recorded at the fair value at the time of acquisi-tion, less accumulated amortization (useful life of ten years).*CROSS-REFERENCE to page 111
LICENSE RIGHTS
The Group has acquired license rights from third parties by making upfront license payments, paying annual fees to maintain the license and paying fees for sublicenses. The Group amortizes upfront license payments on a straight-line basis over the estimated useful life of the acquired license (eight to ten years). The amortization period and method are reviewed at the end of each financial year under IAS 38.104. Annual fees to maintain a license are amortized over the term of each annual agreement. Sublicense fees are amortized on a straight-line basis over the term of the contract or the estimated useful life of the collaboration for contracts without a set duration.
IN - PROCESS R&D PROGR AMS
This line item contains capitalized upfront payments from the in-licensing of two compounds for the Proprietary Development segment as well as a milestone payment for one of these compounds which was paid at a later time. Additionally, the line item also includes two compounds resulting from an acquisition. The assets are recorded at acquisition cost and are not yet available for use and therefore not subject to scheduled amortization. The assets were tested for impairment on the reporting date as required by IAS 36.
SOF T WARE
Software is recorded at acquisition cost less accumulated amortization (see below) and any impairment (see Item 2.4.4* in the Notes). Amorti-zation is recognized in profit and loss on a straight-line basis over the estim ated useful life of three to five years. Software is amortized from the date the software is operational.*CROSS-REFERENCE to page 111
GOODWILL
Goodwill is recognized for expected synergies from business combina-tions and the skills of the acquired workforce. Goodwill is tested annually for impairment as required by IAS 36 (see also Item 5.7.5* in the Notes).*CROSS-REFERENCE to page 127
Intangible Asset Class Useful LifeAmortisation
Rates
Patents 10 years 10 %License Rights 8 (10) years 13 % – 10 %In-process R&D Programs Not yet amortized –Software 3 (5) years 33 % – 20 %Goodwill Impairment Only –
Notes F I N A N C I A L S TAT E M E N T S 115

2.8.7 PREPAID EXPENSES AND OTHER ASSETS, NET OF CURRENT PORTIONThe non-current portion of expenses that occurred prior to the reporting date but to be recognized in subsequent financial years is also recorded under prepaid expenses. This line item contains maintenance contracts and sublicenses.
This line item also includes other non-current assets, which are recog-nized at fair value. Other non-current assets consist mainly of restricted cash, such as rent deposits.
2.9 ACCOUNTING POLICIES APPLIED TO EQUITY AND LIABILITY ITEMS OF THE BALANCE SHEET
2.9.1 ACCOUNTS PAYABLE, OTHER LIABILITIES AND OTHER PROVISIONSTrade payables and other liabilities are recognized at amortized cost. Liabili ties with a term of more than one year are discounted to their net present value. Liabilities with uncertain timing or amount are recorded as provisions.
IAS 37 requires the recognition of provisions for obligations to third par-ties arising from past events. Furthermore, provisions are only recognized for legal or factual obligations to third parties if the event’s occurrence is more likely than not. Provisions are recognized at the amount required to settle the respective obligation and discounted to the reporting date if the interest effect is material. The amount required to meet the obligation also includes expected price and cost increases. The interest portion of the added provisions is recorded in the finance result. The measurement of provisions is based on past experience and considers the circumstances in existence on the reporting date.
2.9.2 TAX PROVISIONSTax liabilities are recognized and measured at their nominal value. Tax liabilities contain obligations from current taxes, excluding deferred taxes. Provisions for trade taxes, corporate taxes and similar taxes on inco me are determined based on the taxable income of the consolidated entities less any prepayments made.
2.9.3 CURRENT PORTION OF DEFERRED REVENUEUpfront payments from customers for services to be rendered by the Group are recognized as deferred revenue in accordance with IAS 18.13 and measured at the lower of fair value or nominal value. The corresponding rendering of services and revenue recognition occurs within a twelve-month period after the reporting date.
2.9.4 DEFERRED REVENUEThis line item includes the non-current portion of deferred upfront pay-ments from customers in accordance with IAS 18.13, which are measured at the lower of fair value or nominal value. Due to its low materiality in the financial year, this line item was not discounted to its present value despite its long-term maturity.
2.9.5 CONVERTIBLE BONDS DUE TO RELATED PARTIESThe Group issued convertible bonds to the Group’s Management Board and employees. In accordance with IAS 32.28, the equity component of a convertible bond must be recorded separately under additional paid-in capital. The equity component is determined by deducting the separately determined amount of the liability component from the fair value of the convertible bond. The effect of the equity component is recognized in profit and loss in personnel expenses from share-based payments, whereas the effect on profit and loss from the liability component is recog-nized as interest expense. The Group applies the provisions of IFRS 2 “Share-based Payments” for all convertible bonds granted to the Manage-ment Board and the Group’s employees.
2.9.6 DEFERRED TA XESThe recognition and measurement of deferred taxes are based on the pro-visions of IAS 12. Deferred tax assets and liabilities are calculated using the liability method, which is common practice internationally. Under this method, taxes expected to be paid or recovered in subsequent financial years are based on the applicable tax rate at the time of recognition.
Deferred tax assets and liabilities are recorded separately in the balance sheet. Deferred tax liabilities take into account the future tax effects of temporary differences between the value of assets and liabilities in the balance sheet and tax loss carryforwards.
Deferred tax assets are offset against deferred tax liabilities if the taxes are levied by the same taxation authority and have matching terms. Pur-suant to IAS 12, deferred tax assets and liabilities may not be discounted.
2.9.7 OTHER LIABILITIESOther liabilities for rent-free periods and their corresponding release over the minimum rent period are calculated based on the effective interest method. Other liabilities are discounted due to their long-term maturities.
2.9.8 STOCKHOLDERS’ EQUIT YCOMMON STOCK
Ordinary shares are classified as stockholders’ equity. Incremental costs directly attributable to the issue of ordinary shares and stock options are recognized as a deduction from stockholders’ equity.
TREASURY STOCK
Repurchases of the Company’s own shares at prices quoted on an ex-change or at market value are recorded in this line item as a deduction from common stock.
When common stock that was recorded as stockholders’ equity is repur-chased, the amount of consideration paid, including directly attributable costs, is recognized as a deduction from stockholders’ equity net of taxes and is classified as treasury shares. When treasury shares are subse-quently sold or reissued, the proceeds are recognized as an increase in stockholders’ equity, and any difference between the proceeds from the transaction and the initial acquisition costs is recognized in additional paid-in capital.
116 F I N A N C I A L S TAT E M E N T S Notes
The allocation of treasury shares to beneficiaries (in this case: perfor-mance shares) under long-term incentive programs is reflected in this line item based on the set number of shares to be allocated after the expiration of the four-year vesting period (quantity structure) multiplied by the weighted-average purchase price of the treasury shares (value structure). The adjustment is carried out directly in equity by reducing the treasury stock line item, which is a deduction from common stock, while simulta-neously reducing the amount of additional paid-in capital. Further infor-mation can be found in Item 7.2.1.* in the Notes.*CROSS-REFERENCE to page 132
ADDIT IONAL PAID - IN CAPITAL
Additional paid-in capital mainly consists of personnel expenses resulting from the grant of convertible bonds and performance shares and the pro-ceeds from newly created shares in excess of their nominal value.
RE VALUATION RESERVE
The revaluation reserve mainly consists of unrealized gains and losses on available-for-sale securities and bonds that are measured directly in equity until they are sold as well as cash flow hedges.
ACCUMUL ATED INCOME/LOSS
The “accumulated income/loss” line item consists of the Group’s accumu-lated consolidated net profits/losses. A separate measurement of this item is not made.
3 Segment ReportingMorphoSys Group applies IFRS 8 “Segment Reporting”. An operating seg-ment is defined as a unit of an entity that engages in business activities from which it can earn revenues and incur expenses and whose operating results are regularly reviewed by the entity’s chief operating decision maker, the Management Board, and for which discrete financial informa-tion is available.
Segment information is provided for the Group’s operating segments based on the Group’s management and internal reporting structures. The segment results and segment assets include items that can be either directly attributed to the individual segment or allocated to the segments on a reasonable basis.
The Management Board evaluates a segment’s economic success using selected key figures so that all income and expenses are included. Operat-ing earnings before interest and taxes, or EBIT, is the key benchmark for measuring and evaluating the operating results. Other key internal reporting figures include revenues, operating expenses, segment results and the liquidity position.
The Group consists of the following operating segments.
3.1 PROPRIETARY DEVELOPMENTThe segment comprises all activities related to the proprietary develop-ment of therapeutic antibodies and peptides. These activities currently comprise a total of 14 antibodies and peptides, including the proprietary clinical programs MOR208, MOR202, MOR209/ES414, which is jointly deve lop ed with the US company Aptevo Therapeutics (a spin-off from Emergent BioSolutions), and MOR106, which is developed in cooperation with Galapagos. The program MOR103, also included in this segment, was out-licensed to GSK. All activities are now conducted by GlaxoSmithKline (GSK). The program has been part of this segment since the beginning of its development and will therefore continue to be reported there. MorphoSys is also pursuing other programs that are either at an early stage of proprietary development or fall under co-development agree-ments. One of these programs is the preclinical program MOR107 (for-merly LP2) resulting from the acquisition of Lanthio Pharma B.V. A further eight programs are in the discovery phase. Since January 1, 2016, the development of proprietary technologies has been allocated to the Pro-prietary Development segment. Until December 31, 2015, these activities and their related costs were contained in the Partnered Discovery segment.
3.2 PARTNERED DISCOVERYMorphoSys possesses one of the leading technologies for generating thera-peutics based on human antibodies. The Group markets this technology commercially through its partnerships with numerous pharmaceutical and biotechnology companies. The Partnered Discovery segment encom-passes all operating activities relating to these commercial agreements.
Notes F I N A N C I A L S TAT E M E N T S 117

3.3 CROSS-SEGMENT DISCLOSURE The information on segment assets is based on the assets’ respective locations.
Proprietary Development Partnered Discovery Unallocated GroupFor the Twelve-month Period Ended December 31 (in 000’ €) 2016 2015 2016 2015 2016 2015 2016 2015
External Revenues 621 59,939 49,123 46,284 0 0 49,744 106,223Other Operating Expenses 78,515 54,057 18,113 25,918 13,212 13,753 109,840 93,728Other Income 327 4,849 0 5 382 644 709 5,498Other Expenses 0 8 0 2 554 749 554 759SEGMENT EBIT (77,567) 10,723 31,010 20,369 (13,384) (13,858) (59,941) 17,234Finance Income 0 0 0 0 1,385 3,827 1,385 3,827Finance Expenses 0 0 0 0 1,308 436 1,308 436PROFIT BEFORE TA XES (77,567) 10,723 31,010 20,369 (13,307) (10,467) (59,864) 20,625Income Tax Expenses 0 0 0 0 (519) (5,725) (519) (5,725)NET PROFIT/(LOSS) (77,567) 10,723 31,010 20,369 (13,826) (16,191) (60,383) 14,901Current Assets 13,157 6,789 18,415 17,840 276,484 275,487 308,056 300,116Non-current Assets 59,292 69,353 10,165 11,269 86,087 19,341 155,544 99,963TOTAL SEGMENT ASSETS 72,449 76,142 28,580 29,109 362,571 294,828 463,600 400,079Current Liabilities 20,948 16,975 2,512 3,382 14,842 7,113 38,302 27,470Non-current Liabilities 6,930 7,037 2,165 2,568 743 268 9,838 9,873Stockholders’ Equity 0 0 0 0 415,460 362,736 415,460 362,736
TOTAL SEGMENT LIABILITIES AND EQUIT Y 27,878 24,012 4,677 5,950 431,045 370,117 463,600 400,079Capital Expenditure 1,358 7,487 1,181 995 374 284 2,913 8,766Depreciation and Amortization 1,272 858 2,117 2,243 375 354 3,764 3,455
The segment result is defined as a segment’s revenue less the segment’s operating expenses. In the 2016 financial year, impairments totaling € 10.1 million were recognized in the Proprietary Development segment (2015: impairments of € 3.7 million in the Partnered Discovery segment).
The Group’s key customers are allocated to the Partnered Discovery and Proprietary Development segments. As of December 31, 2016, the single most important customer represented accounts receivables of a carrying amount of € 8.4 million (December 31, 2015: € 8.3 million). Three of the Group’s customers that were all allocated to the Partnered Discovery seg-ment accounted for € 42.1 million, € 2.5 million and € 2.5 million, respec-tively, of the total revenues in 2016. In the 2015 financial year, three of the Group’s customers accounted for € 59.3 million, € 41.5 million and € 1.9 million, respectively. The largest customer was allocated to the Proprie tary Development segment and the other two customers to the Partnered Discovery segment.
The following overview shows the Group’s regional distribution of revenue.
in 000’ € 2016 2015
Germany 1,621 2,183Europe and Asia 43,046 41,800USA and Canada 5,077 62,240TOTAL 49,744 106,223
The decline in revenues is mainly due to a one-off effect in 2015 of approx-imately € 59 million resulting from the termination of the MOR202 co-de-velopment and co-promotion agreement with Celgene and the resulting release of deferred revenues.
A total of € 123.7 million (December 31, 2015: € 67.5 million) and € 32.6 million (December 31, 2015: € 32.1 million) of the Group’s non-cur-rent assets, excluding deferred tax assets, are located in Germany and the Netherlands, respectively. The Group’s total investments of € 2.8 million (December 31, 2015: € 8.7 million) were made in Germany, except for € 0.1 million (December 31, 2015: € 0.1 million), which were made in the Netherlands. In accordance with internal definitions, investments only include additions to property, plant and equipment as well as intangible assets which are not related to business combinations. MorphoSys defines investments as additions to non-current assets that are not related to acqui sitions.
118 F I N A N C I A L S TAT E M E N T S Notes

4 Notes to the Income Statement4.1 REVENUESIn 2016, revenues consisted of license fees and milestone payments totaling € 28.4 million (2015: € 85.4 million). All revenues were generated by the Partnered Discovery segment (2015: € 59.2 million in the Proprietary Devel-opment segment and € 26.2 million in the Partnered Discovery segment).
Of the service fees totaling € 21.4 million (2015: € 20.8 million), € 0.6 mil-lion (2015: € 0.7 million) were attributable to the Proprietary Development segment and € 20.8 million (2015: € 20.1 million) to the Partnered Discovery segment.
4.2 OPERATING EXPENSES4.2.1 RESEARCH AND DEVELOPMENT EXPENSESResearch and development expenses increased compared to the prior year due to substantial investments in proprietary product development as well as the partial impairment of MOR209/ES414 (see also Item 5.7.3* of these notes) and consist of the items below.*CROSS-REFERENCE to page 127
in 000’ € 2016 2015
Personnel Expenses 26,493 25,557 Consumable Supplies 2,321 2,971 Other Operating Expenses 2,922 3,352
Amortization and Other Costs of Intangible Assets 13,689 7,177 External Services 44,409 34,411
Depreciation and Other Costs for Infrastructure 5,889 5,188 TOTAL 95,723 78,656
in million € 2016 2015 2014 2013 2012
R&D Expenses on behalf of Partners 17,2 22,1 19,5 17,5 16,0 Proprietary Development Expenses 77,1 54,1 33,6 27,5 18,1 Technology Development Expenses 1,4 2,5 2,9 4,2 3,6 R&D TOTAL 95,7 78,7 56,0 49,2 37,7
4.2.2 GENER AL AND ADMINISTR ATIVE EXPENSESGeneral and administrative expenses include the items below.
in 000’ € 2016 2015
Personnel Expenses 9,521 10,354 Consumable Supplies 97 77 Other Operating Expenses 978 913 Amortization of Intangible Assets 111 109 External Services 2,484 2,643
Depreciation and Other Costs for Infrastructure 925 976 TOTAL 14,116 15,072
4.2.3 PERSONNEL EXPENSESPersonnel expenses include the items below.
in 000’ € 2016 2015
Wages and Salaries 27,146 26,559 Social Security Contributions 4,570 4,271
Stock-based Compensation Expense 2,357 3,559 Temporary Staff (External) 1,061 610 Other 880 912 TOTAL 36,014 35,911
In 2016 and 2015, other personnel expenses consisted mainly of recruit-ment costs.
Notes F I N A N C I A L S TAT E M E N T S 119

The average number of employees in the 2016 financial year was 354 (2015: 356). Of the 345 employees on December 31, 2016 (December 31, 2015: 365), 289 were active in research and development (December 31, 2015: 305) and 56 were engaged in general and administrative functions (December 31, 2015: 60 employees). As of December 31, 2016, there were 135 employees in the Proprietary Development segment and 156 employ-ees in the Partnered Discovery segment; 54 employees were not allocated to a segment (December 31, 2015: 132 in the Proprietary Development segment, 176 employees in the Partnered Discovery segment and 57 em-ployees were unallocated). Costs for defined-contribution plans amounted to € 0.5 million in 2016 (2015: € 0.5 million).
4.3 OTHER INCOME AND EXPENSES, FINANCE INCOME AND FINANCE EXPENSES
The line items “other income and expenses” and “finance income and finance expenses” include the following items.
in 000’ € 2016 2015
Gain from Revaluation of Participations 0 4,495Grant Income 327 359Gain on Exchange 192 306
Appreciation of Accounts Receivable Previously Deemed Impaired 15 0Miscellaneous Income 175 338Other Income 709 5,498Loss on Exchange (400) (460)Impairment of Other Receivables (7) (214)Miscellaneous Expenses (147) (85)Other Expenses (554) (759)
Gain on Available-for-sale Financial Assets and Bonds 294 94Interest Income 1,017 1,907Gain on Derivatives 74 1,826Finance Income 1,385 3,827Interest Expenses (20) (20)Loss on Derivatives (44) (287)Bank Fees (35) (34)
Loss on Available-for-sale Financial Assets and Bonds (1,209) (95)Finance Expenses (1,308) (436)TOTAL 232 8,130
4.4 INCOME TAX EXPENSES/INCOMEMorphoSys AG and its German subsidiary Sloning BioTechnology GmbH are subject to corporate taxes, the solidarity surcharge and trade taxes. The Company’s corporate tax rate of 15.0 % and the solidarity surcharge of 5.5 % remained unchanged. The effective trade tax rate of increased by 0.35 % from 10.50 % to 10.85 %.
The Dutch entities Lanthio Pharma B.V. and LanthioPep B.V. are subject to an income tax rate of 25 % on annual income exceeding € 200,000; annual income below € 200,000 is subject to a tax rate of 20 %. Subject to certain conditions, a tax rate of 5 % may be applicable under what is known as the “Innovation Box”.
Income taxes for the past financial year consist of the items listed below.
in 000’ € 2016 2015
Current Tax Income/(Expense) (Thereof Regarding Prior Years: k€ (60); 2015: k€ 3) 45 (4,182)Deferred Tax Expenses (564) (1,543)Total Income Tax Expense (519) (5,725)
Total Amount of Current Taxes Resulting from Entries Directly Recognized in Equity 0 (1)
Total Amount of Current Taxes Resulting from Entries Directly Recognized in Other Comprehensive Income (82) 38
Total Amount of Deferred Taxes Resulting from Entries Directly Recognized in Other Comprehensive Income (112) 35
Total Amount of Tax-Effects Resulting from Entries Directly Recognized in Equity or Other Comprehensive Income (194) 72
The following table reconciles the expected income tax expense with the actual income tax expense as presented in the consolidated financial state-ments. The combined income tax rate of 26.675 % in the 2016 financial year (2015: 26.33 %) was applied to profit before taxes to calculate the statutory income tax expense. This rate consisted of a corporate income tax of 15.0 %, a solidarity surcharge of 5.5 % on the corporate tax and an average trade tax of 10.85 % applicable to the Group.
in 000’ € 2016 2015
Profit Before Income Taxes (59,864) 20,626Expected Tax Rate 26.675 % 26.330 %Expected Income Tax 15,969 (5,431)Tax Effects Resulting from: Stock-based Compensation 5 (221)Non-Tax-Deductible Items (135) (1,039)
Differences in Profit and Loss Neutral Adjustments 812 1,689
Non-Recognition of Deferred Tax Assets on Temporary Differences (3,766) 0
Non-Recognition of Deferred Tax Assets on Current Year Tax Losses (13,354) (684)
Tax Rate Differences to Local Tax Rates (46) (28)Effect of Tax Rate Changes 0 (4)Prior Year Taxes 0 (3)Other Effects (4) (4)Actual Income Tax (519) (5,725)
120 F I N A N C I A L S TAT E M E N T S Notes
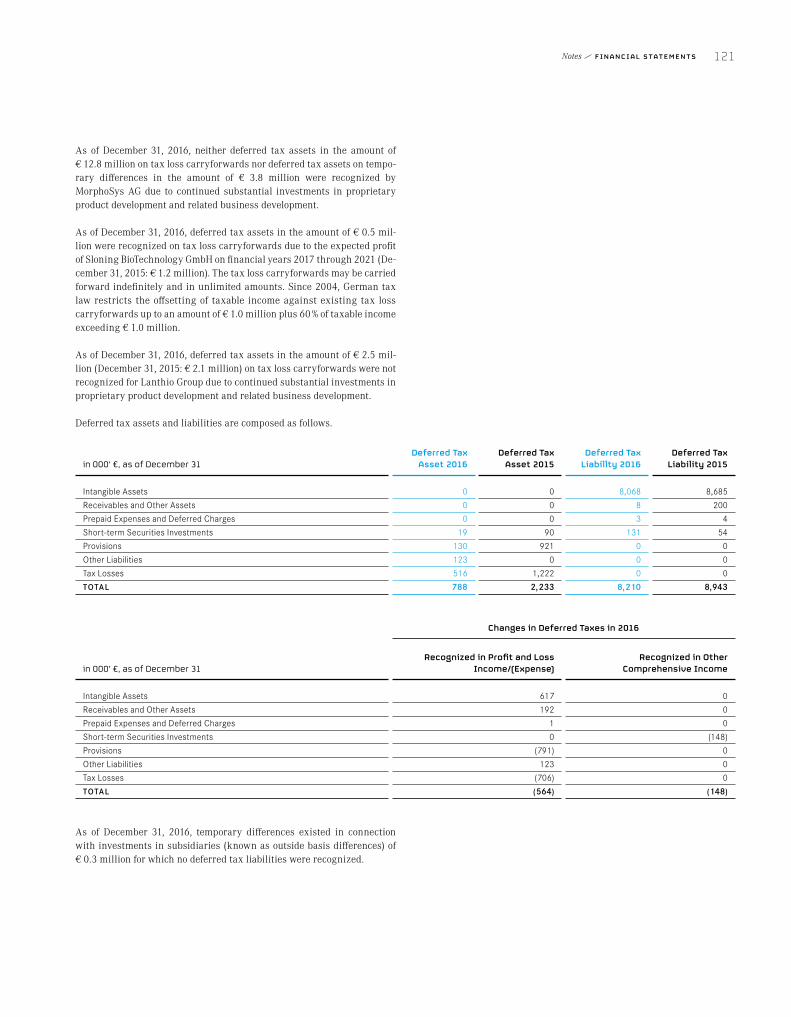
As of December 31, 2016, neither deferred tax assets in the amount of € 12.8 million on tax loss carryforwards nor deferred tax assets on tempo-rary differences in the amount of € 3.8 million were recognized by MorphoSys AG due to continued substantial investments in proprietary product development and related business development.
As of December 31, 2016, deferred tax assets in the amount of € 0.5 mil-lion were recognized on tax loss carryforwards due to the expected profit of Sloning BioTechnology GmbH on financial years 2017 through 2021 (De-cember 31, 2015: € 1.2 million). The tax loss carryforwards may be carried forward indefinitely and in unlimited amounts. Since 2004, German tax law restricts the offsetting of taxable income against existing tax loss carry forwards up to an amount of € 1.0 million plus 60 % of taxable income exceeding € 1.0 million.
As of December 31, 2016, deferred tax assets in the amount of € 2.5 mil-lion (December 31, 2015: € 2.1 million) on tax loss carryforwards were not recognized for Lanthio Group due to continued substantial investments in proprietary product development and related business development.
Deferred tax assets and liabilities are composed as follows.
in 000’ €, as of December 31Deferred Tax
Asset 2016Deferred Tax
Asset 2015Deferred Tax
Liabillty 2016Deferred Tax
Liability 2015
Intangible Assets 0 0 8,068 8,685Receivables and Other Assets 0 0 8 200Prepaid Expenses and Deferred Charges 0 0 3 4Short-term Securities Investments 19 90 131 54Provisions 130 921 0 0Other Liabilities 123 0 0 0Tax Losses 516 1,222 0 0TOTAL 788 2,233 8,210 8,943
Changes in Deferred Taxes in 2016
in 000’ €, as of December 31Recognized in Profit and Loss
Income/(Expense)Recognized in Other
Comprehensive Income
Intangible Assets 617 0Receivables and Other Assets 192 0Prepaid Expenses and Deferred Charges 1 0Short-term Securities Investments 0 (148)Provisions (791) 0Other Liabilities 123 0Tax Losses (706) 0TOTAL (564) (148)
As of December 31, 2016, temporary differences existed in connection with investments in subsidiaries (known as outside basis differences) of € 0.3 million for which no deferred tax liabilities were recognized.
Notes F I N A N C I A L S TAT E M E N T S 121
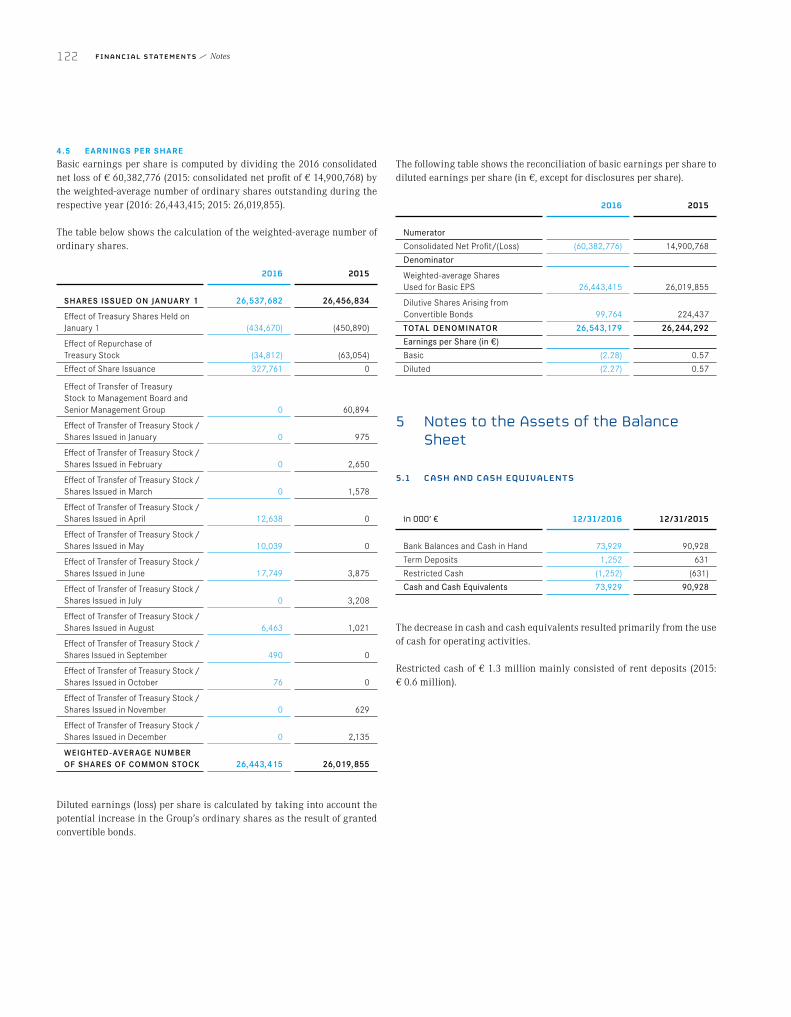
4.5 EARNINGS PER SHAREBasic earnings per share is computed by dividing the 2016 consolidated net loss of € 60,382,776 (2015: consolidated net profit of € 14,900,768) by the weighted-average number of ordinary shares outstanding during the respective year (2016: 26,443,415; 2015: 26,019,855).
The table below shows the calculation of the weighted-average number of ordinary shares.
2016 2015
SHARES ISSUED ON JANUARY 1 26,537,682 26,456,834
Effect of Treasury Shares Held on January 1 (434,670) (450,890)
Effect of Repurchase of Treasury Stock (34,812) (63,054)Effect of Share Issuance 327,761 0
Effect of Transfer of Treasury Stock to Management Board and Senior Management Group 0 60,894
Effect of Transfer of Treasury Stock / Shares Issued in January 0 975
Effect of Transfer of Treasury Stock / Shares Issued in February 0 2,650
Effect of Transfer of Treasury Stock / Shares Issued in March 0 1,578
Effect of Transfer of Treasury Stock / Shares Issued in April 12,638 0
Effect of Transfer of Treasury Stock / Shares Issued in May 10,039 0
Effect of Transfer of Treasury Stock / Shares Issued in June 17,749 3,875
Effect of Transfer of Treasury Stock / Shares Issued in July 0 3,208
Effect of Transfer of Treasury Stock / Shares Issued in August 6,463 1,021
Effect of Transfer of Treasury Stock / Shares Issued in September 490 0
Effect of Transfer of Treasury Stock / Shares Issued in October 76 0
Effect of Transfer of Treasury Stock / Shares Issued in November 0 629
Effect of Transfer of Treasury Stock / Shares Issued in December 0 2,135
WEIGHTED -AVERAGE NUMBER OF SHARES OF COMMON STOCK 26,443,415 26,019,855
Diluted earnings (loss) per share is calculated by taking into account the potential increase in the Group’s ordinary shares as the result of granted convertible bonds.
The following table shows the reconciliation of basic earnings per share to diluted earnings per share (in €, except for disclosures per share).
2016 2015
Numerator Consolidated Net Profit/(Loss) (60,382,776) 14,900,768Denominator
Weighted-average Shares Used for Basic EPS 26,443,415 26,019,855
Dilutive Shares Arising from Convertible Bonds 99,764 224,437TOTAL DENOMINATOR 26,543,179 26,244,292Earnings per Share (in €) Basic (2.28) 0.57Diluted (2.27) 0.57
5 Notes to the Assets of the Balance Sheet
5.1 CASH AND CASH EQUIVALENTS
in 000’ € 12/31/2016 12/31/2015
Bank Balances and Cash in Hand 73,929 90,928Term Deposits 1,252 631Restricted Cash (1,252) (631)Cash and Cash Equivalents 73,929 90,928
The decrease in cash and cash equivalents resulted primarily from the use of cash for operating activities.
Restricted cash of € 1.3 million mainly consisted of rent deposits (2015: € 0.6 million).
122 F I N A N C I A L S TAT E M E N T S Notes

5.2 FINANCIAL ASSETS AND BONDS, AVAILABLE-FOR-SALE AND FINANCIAL ASSETS CLASSIFIED AS LOANS AND RECEIVABLES
As of December 31, 2016 and December 31, 2015, available-for-sale financial assets consisted of the items below.
Gross Unrealized
in 000’ € Maturity Cost Gains Losses
Market Value
DECEMBER 31, 2016
Money Market Funds daily 63,433 2 73 63,362TOTAL 63,362DECEMBER 31, 2015
Money Market Funds daily 64,089 204 0 64,293TOTAL 64,293
In 2016, the Group recorded a net gain of € 0.3 million from the disposal of financial assets contained in the income statement. This gain was previ-ously recognized in stockholders’ equity (2015: net gain of less than € 0.1 million).
As of December 31, 2016 and December 31, 2015, bonds available-for-sale consisted of the items below.
Gross Unrealized
in 000’ € Maturity Cost Gains Losses
Market Value
DECEMBER 31, 2016
Bonds daily 6,620 2 90 6,532TOTAL 6,532DECEMBER 31, 2015
Bonds daily 33,599 1 480 33,120TOTAL 33,120
In 2016, the Group recorded a net loss of € 1.2 million from the disposal of financial assets contained in the income statement that were previously recognized in stockholders’ equity (2015: net loss of less than € 0.1 mil-lion). The bonds were purchased at a price above their nominal value. The loss that resulted from the product-specific price development is more than offset by the bond’s interest income and results in a positive overall result.
As of December 31, 2016, the Company held current financial assets of € 136.1 million (December 31, 2015: € 94.6 million) and non-current finan-cial assets of € 79.5 million (December 31, 2015: € 15.5 million), which were allocated to the “loans and receivables” category in accordance with IAS 39 “Financial Instruments”. These financial assets consisted mainly of term deposits with fixed or variable interest rates. The increase is a result of the investment in non-current financial assets using financial liquidity from the capital increase executed in November. The carrying amounts included interest receivables of € 0.1 million (December 31, 2015: € 1.2 million).
Interest income from financial assets under “loans and receivables” amounted to € 0.9 million (2015: € 1.9 million) and was recorded in the finance result. The risk associated with these financial instruments pri-marily resulted from bank credit risks. There was no indication of impair-ment in the financial year 2016.
Further information on accounting for financial assets is provided in Item 2.8.1* in the Notes.*CROSS-REFERENCE to page 113
Notes F I N A N C I A L S TAT E M E N T S 123
5.3 ACCOUNTS RECEIVABLEAll accounts receivable are non-interest bearing and generally have pay-ment terms of between 30 and 45 days. As of December 31, 2016 and December 31, 2015, accounts receivable included unbilled receivables amounting to € 3.3 million and € 3.9 million, respectively.
Based on the Management Board’s estimate, no net loss for allowances for doubtful receivables was recognized in profit and loss in 2016 and 2015.
5.4 OTHER RECEIVABLESUnder the Group’s hedging policy, highly probable cash flows and definite foreign currency receivables collectable within a twelve-month period are tested to determine if they should be hedged. MorphoSys began using foreign currency options and forwards to hedge its foreign exchange risk against US dollar receivables in 2003. These derivatives are recorded at their fair values under “other receivables”.
As of December 31, 2016, there were ten unsettled forward rate agree-ments with terms ranging from one to twelve months (December 31, 2015: 15 unsettled forward rate agreements). The resulting gross unrealized gain from these forward rate agreements of less than € 0.1 million as of December 31, 2016 was recorded in the finance result (December 31, 2015: gross unrealized gain of € 0.7 million and gross unrealized loss of less than € 0.1 million).
In January 2016, the Group entered into a forward rate agreement expiring in April 2017 to hedge future cash flows. As a cash flow hedge, this deriv-ative is accounted for under hedge accounting. As of December 31, 2016, a gross unrealized gain of € 0.5 million was recognized for this hedging instrument in the revaluation reserve within other comprehensive income.
As of December 31, 2016, immaterial impairments were recognized for other receivables (December 31, 2015: € 0.2 million).
5.5 INCOME TAX RECEIVABLES, INVENTORIES, PREPAID EXPENSES AND OTHER CURRENT ASSETS
As of December 31, 2016 tax receivables amounted to € 3.3 million (De-cember 31, 2015: € 2.7 million) and consisted of receivables due from tax authorities for the remaining surplus from prepayments for value-added taxes in the amount of € 2.8 million (December 31, 2015: € 1.5 million) and receivables from capital gain taxes withheld and income taxes for prior years in the amount of € 0.5 million (December 31, 2015: € 0.8 million).
Inventories amounting to € 0.3 million as of December 31, 2016 were stored at the Planegg location and consisted of raw materials and supplies. As in the previous year, no inventories were carried at fair value less selling costs as of the reporting date.
As of December 31, 2015, inventories amounting to € 0.4 million were stored at the Martinsried location and consisted of raw materials and supplies.
As of December 31, 2016, prepaid expenses and other current assets mainly consisted of combination compounds of € 7.3 million (Decem-ber 31, 2015: € 0.3 million), prepaid fees for external laboratory services of € 2.4 million (December 31, 2015: € 0.6 million), prepaid fees for sub-licenses of € 0.3 million (December 31, 2015: € 0.3 million), restricted cash for rent deposits of € 0.4 million (December 31, 2015: € 0), and other pre-payments amounting to € 0.8 million (December 31, 2015: € 0.5 million).
124 F I N A N C I A L S TAT E M E N T S Notes
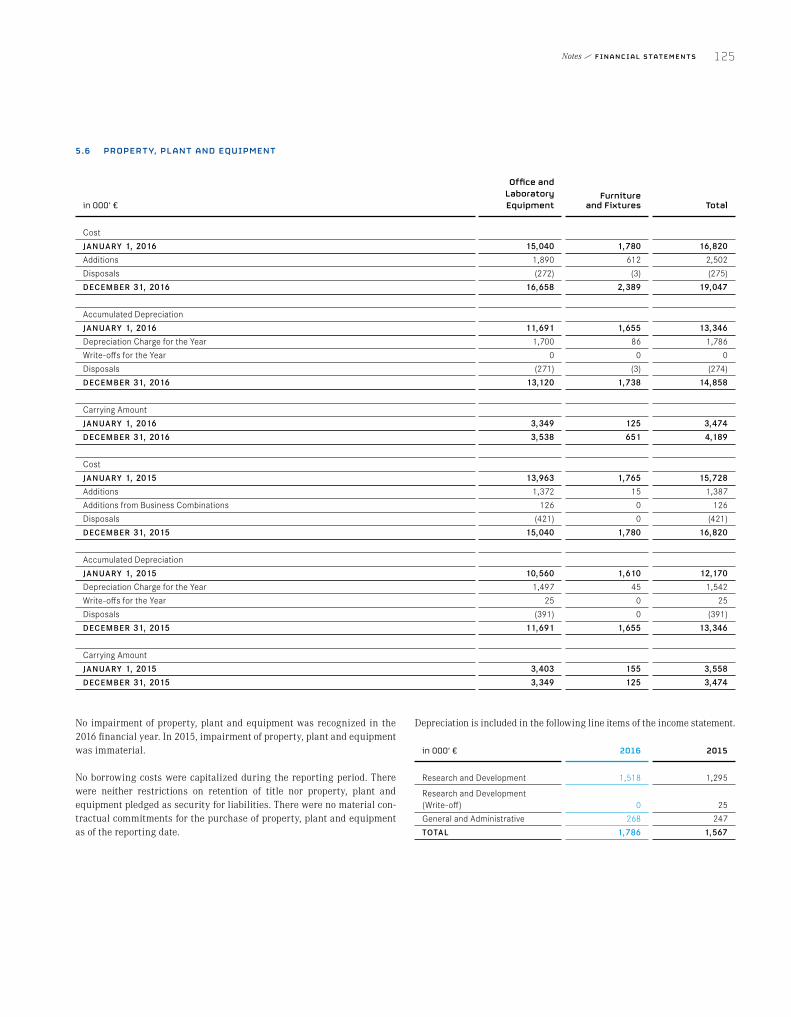
5.6 PROPERTY, PLANT AND EQUIPMENT
in 000’ €
Office and Laboratory Equipment
Furniture and Fixtures Total
Cost JANUARY 1, 2016 15,040 1,780 16,820Additions 1,890 612 2,502Disposals (272) (3) (275)DECEMBER 31, 2016 16,658 2,389 19,047 Accumulated Depreciation JANUARY 1, 2016 11,691 1,655 13,346Depreciation Charge for the Year 1,700 86 1,786Write-offs for the Year 0 0 0Disposals (271) (3) (274)DECEMBER 31, 2016 13,120 1,738 14,858 Carrying Amount JANUARY 1, 2016 3,349 125 3,474DECEMBER 31, 2016 3,538 651 4,189 Cost JANUARY 1, 2015 13,963 1,765 15,728Additions 1,372 15 1,387Additions from Business Combinations 126 0 126Disposals (421) 0 (421)DECEMBER 31, 2015 15,040 1,780 16,820 Accumulated Depreciation JANUARY 1, 2015 10,560 1,610 12,170Depreciation Charge for the Year 1,497 45 1,542Write-offs for the Year 25 0 25Disposals (391) 0 (391)DECEMBER 31, 2015 11,691 1,655 13,346 Carrying Amount JANUARY 1, 2015 3,403 155 3,558DECEMBER 31, 2015 3,349 125 3,474
No impairment of property, plant and equipment was recognized in the 2016 financial year. In 2015, impairment of property, plant and equipment was immaterial.
No borrowing costs were capitalized during the reporting period. There were neither restrictions on retention of title nor property, plant and equipment pledged as security for liabilities. There were no material con-tractual commitments for the purchase of property, plant and equipment as of the reporting date.
Depreciation is included in the following line items of the income statement.
in 000’ € 2016 2015
Research and Development 1,518 1,295
Research and Development (Write-off) 0 25General and Administrative 268 247TOTAL 1,786 1,567
Notes F I N A N C I A L S TAT E M E N T S 125
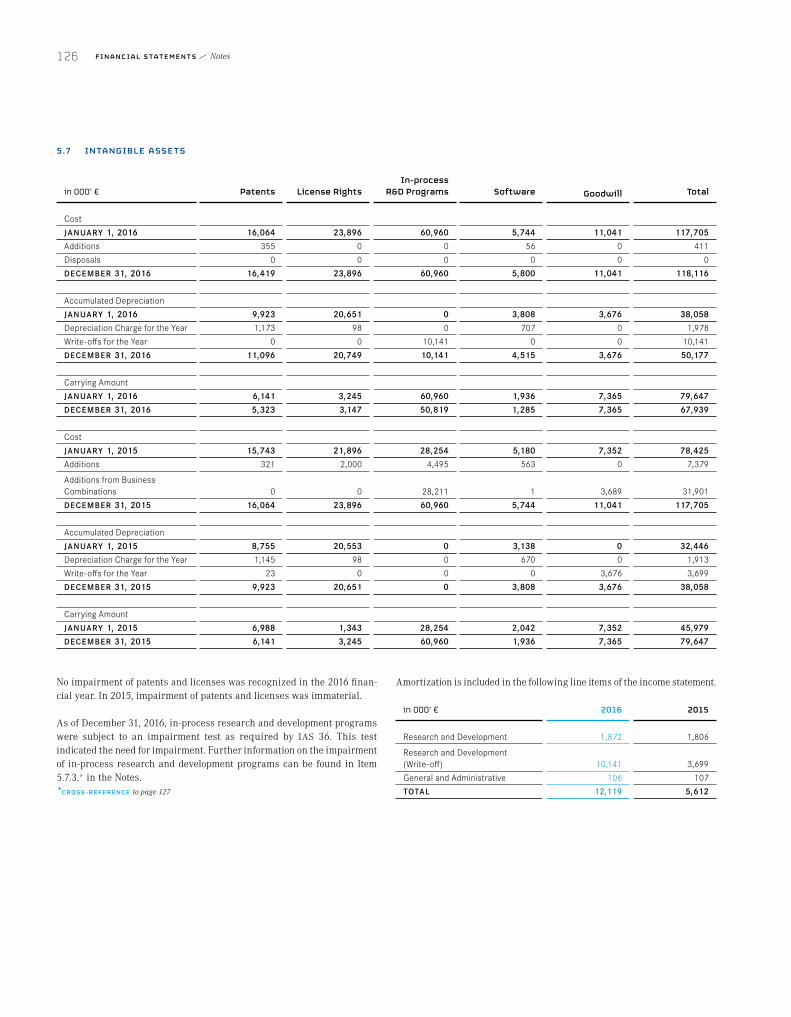
5.7 INTANGIBLE ASSETS
in 000’ € Patents License RightsIn-process
R&D Programs Software Goodwill Total
Cost JANUARY 1, 2016 16,064 23,896 60,960 5,744 11,041 117,705Additions 355 0 0 56 0 411Disposals 0 0 0 0 0 0DECEMBER 31, 2016 16,419 23,896 60,960 5,800 11,041 118,116 Accumulated Depreciation JANUARY 1, 2016 9,923 20,651 0 3,808 3,676 38,058Depreciation Charge for the Year 1,173 98 0 707 0 1,978Write-offs for the Year 0 0 10,141 0 0 10,141DECEMBER 31, 2016 11,096 20,749 10,141 4,515 3,676 50,177 Carrying Amount JANUARY 1, 2016 6,141 3,245 60,960 1,936 7,365 79,647DECEMBER 31, 2016 5,323 3,147 50,819 1,285 7,365 67,939 Cost JANUARY 1, 2015 15,743 21,896 28,254 5,180 7,352 78,425Additions 321 2,000 4,495 563 0 7,379
Additions from Business Combinations 0 0 28,211 1 3,689 31,901DECEMBER 31, 2015 16,064 23,896 60,960 5,744 11,041 117,705 Accumulated Depreciation JANUARY 1, 2015 8,755 20,553 0 3,138 0 32,446Depreciation Charge for the Year 1,145 98 0 670 0 1,913Write-offs for the Year 23 0 0 0 3,676 3,699DECEMBER 31, 2015 9,923 20,651 0 3,808 3,676 38,058 Carrying Amount JANUARY 1, 2015 6,988 1,343 28,254 2,042 7,352 45,979DECEMBER 31, 2015 6,141 3,245 60,960 1,936 7,365 79,647
No impairment of patents and licenses was recognized in the 2016 finan-cial year. In 2015, impairment of patents and licenses was immaterial.
As of December 31, 2016, in-process research and development programs were subject to an impairment test as required by IAS 36. This test indicated the need for impairment. Further information on the impairment of in-process research and development programs can be found in Item 5.7.3.* in the Notes.*CROSS-REFERENCE to page 127
Amortization is included in the following line items of the income statement.
in 000’ € 2016 2015
Research and Development 1,872 1,806
Research and Development (Write-off) 10,141 3,699 General and Administrative 106 107 TOTAL 12,119 5,612
126 F I N A N C I A L S TAT E M E N T S Notes

5.7.1 PATENTSIn the 2016 financial year, the carrying amount of patents declined by € 0.8 million from € 6.1 million to € 5.3 million. This was the result of additions amounting to € 0.4 million for patent applications, particularly for proprietary programs and technologies, which were offset by straight-line amortization of € 1.2 million.
5.7.2 LICENSESIn the 2016 financial year, the carrying amount of licenses declined by € 0.1 million from € 3.2 million to € 3.1 million.
5.7.3 IN -PROCESS R&D PROGR AMSIn the 2016 financial year, the carrying amount of in-process R&D pro-grams declined by € 10.1 million to € 50.8 million. The reason for the par-tial impairment of MOR209/ES414 was the expectation of a lower inflow of benefits and of a delay in the occurrence of future cash flows.
5.7.4 SOFTWAREIn the 2016 financial year, additions to this line item totaled € 0.1 million. The carrying amount decreased by € 0.7 million from € 1.9 million in 2015 to € 1.3 million in 2016. Additions were offset by amortization of € 0.7 mil-lion.
5.7.5 GOODWILLAs of September 30, 2016, goodwill of € 3.7 million from the 2010 acquisi-tion of Sloning BioTechnology GmbH was subject to an impairment test as required by IAS 36. The recoverable amount of the cash-generating unit Slonomics technology, which is part of the Partnered Discovery segment, was determined on the basis of value-in-use calculations. The calculation showed that the recoverable amount was higher than the carrying amount of the cash-generating unit. The cash flow forecasts took into account the payments expected under existing contracts as well as the future free cash flows from the contribution of the Slonomics technology to partnered programs and was offset by expected personnel and administrative ex-pen ses. Cash flow forecasts are based on a period of ten years because the Management Board believes that commercialization through licensing agreements, upfront payments, milestone payments, funded development services and royalties is only feasible by means of medium- to long-term contracts. For this reason, a planning horizon of ten years is considered appropriate for the value-in-use calculation. The cash flow forecasts are largely based on the assumption that the Slonomics technology is very beneficial for existing customers. The values of the underlying assump-tions were determined using both internal (past experience) and external sources of information (market information). Based on the updated ten-year cash flow forecast, the value-in-use was determined as follows: A beta factor of 1.2 (2015: 1.2), WACC before taxes of 12.2 % (2015: 12.7 %) and a perpetual growth rate of 1 % (2015: 1 %). In connection with calculating the value-in-use, a detailed sensitivity analysis was performed with regard to the growth rate and the discount rate. The sensitivity analysis assessed changes in one assumption at a time while all other assumptions remained unchanged compared to the original calculation. The analysis did not reveal
any additional need for impairment. The values ascribed to the assump-tions correspond to the Management Board’s forecasts for future develop-ment and are based on internal planning scenarios as well as external sources of information.
As of September 30, 2016, goodwill of € 3.7 million from the Lanthio Group acquisition was tested for impairment. The recoverable amount of the cash-generating unit Lanthio Group, which is part of the Proprietary Develop ment segment, was determined on the basis of value-in-use calcu-lations. The value-in-use was higher than the carrying amount of the cash-generating unit. The cash flow forecasts included planned cash inflows from the potential sale of compounds based on lanthipeptides expected to achieve market approval. These cash inflows were offset by expected oper-ating expenses for compound development and clinical trials as well as sales and administrative expenses. The duration and likelihood of indi-vidual stages of the study were taken into consideration. Cash flow fore-casts are based on a period of 30 years because the Management Board believes that after the successful approval of compounds, the drugs that follow can generate free cash flows within that period of time. The values of the underlying assumptions were determined using both internal (past experience) and external sources of information (market information). On the basis of the updated cash flow forecast, the value-in-use was deter-mined as follows: A beta factor of 1.2 (2015: 1.2) and WACC before taxes of 11.9 % (2015: 13.6 %). A detailed sensitivity analysis was performed with regard to the discount rate. This analysis did not reveal any need for impair ment. The values ascribed to the assumptions correspond to the Management Board’s forecasts for future development and are based on internal planning scenarios as well as external sources of information.
5.8 PREPAID EXPENSES AND OTHER ASSETS, NET OF CURRENT PORTION
This line item included the non-current portion of prepaid expenses and other assets. The increase in prepaid expenses mainly resulted from pre-paid rent for the premises at Semmelweisstraße 7, Planegg. The Group classified certain line items under other assets as “restricted cash” that are not available for use in the Group’s operations (see Items 2.8.1* and 5.1* in the Notes). As of December 31, 2016 and December 31, 2015, the Group held long-term restricted cash in the amount of € 0.9 million and € 0.6 million, respectively, for issued rent guarantees and of € 0.2 million each for convertible bonds granted to employees.*CROSS-REFERENCE to page 113 and page 122
Notes F I N A N C I A L S TAT E M E N T S 127
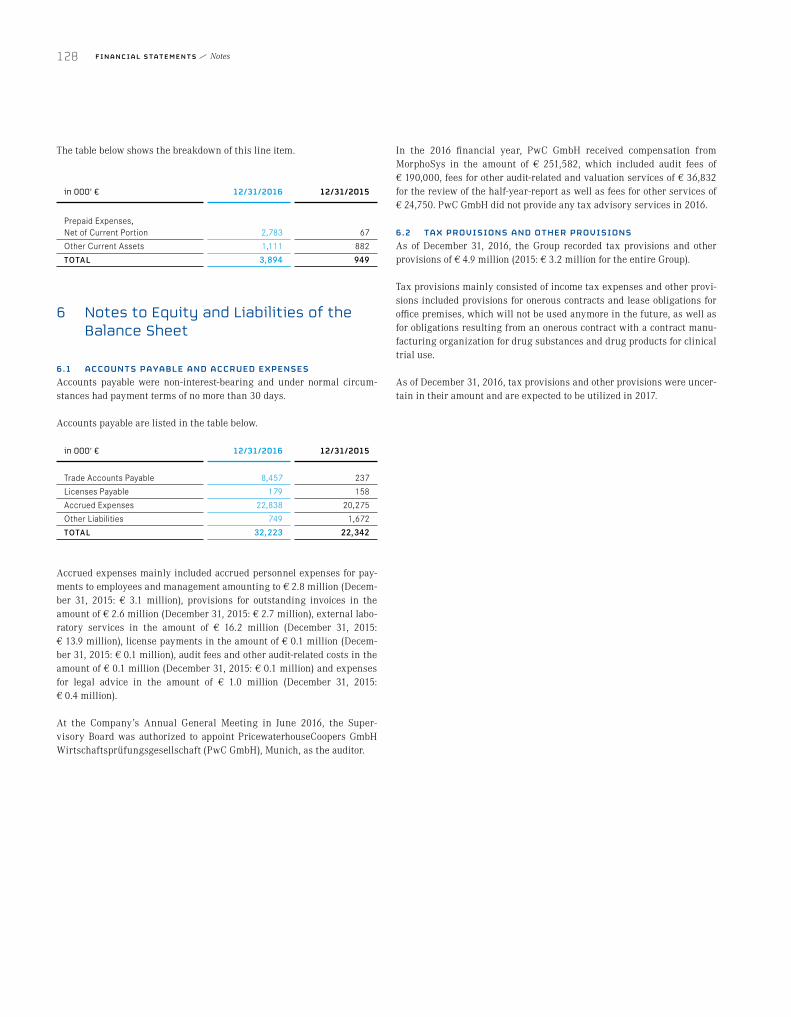
The table below shows the breakdown of this line item.
in 000’ € 12/31/2016 12/31/2015
Prepaid Expenses, Net of Current Portion 2,783 67Other Current Assets 1,111 882TOTAL 3,894 949
6 Notes to Equity and Liabilities of the Balance Sheet
6.1 ACCOUNTS PAYABLE AND ACCRUED EXPENSESAccounts payable were non-interest-bearing and under normal circum-stances had payment terms of no more than 30 days.
Accounts payable are listed in the table below.
in 000’ € 12/31/2016 12/31/2015
Trade Accounts Payable 8,457 237 Licenses Payable 179 158 Accrued Expenses 22,838 20,275 Other Liabilities 749 1,672 TOTAL 32,223 22,342
Accrued expenses mainly included accrued personnel expenses for pay-ments to employees and management amounting to € 2.8 million (Decem-ber 31, 2015: € 3.1 million), provisions for outstanding invoices in the amount of € 2.6 million (December 31, 2015: € 2.7 million), external labo-ratory services in the amount of € 16.2 million (December 31, 2015: € 13.9 million), license payments in the amount of € 0.1 million (Decem-ber 31, 2015: € 0.1 million), audit fees and other audit-related costs in the amount of € 0.1 million (December 31, 2015: € 0.1 million) and expenses for legal advice in the amount of € 1.0 million (December 31, 2015: € 0.4 million).
At the Company’s Annual General Meeting in June 2016, the Super-visory Board was authorized to appoint PricewaterhouseCoopers GmbH Wirtschaftsprüfungsgesellschaft (PwC GmbH), Munich, as the auditor.
In the 2016 financial year, PwC GmbH received compensation from MorphoSys in the amount of € 251,582, which included audit fees of € 190,000, fees for other audit-related and valuation services of € 36,832 for the review of the half-year-report as well as fees for other services of € 24,750. PwC GmbH did not provide any tax advisory services in 2016.
6.2 TAX PROVISIONS AND OTHER PROVISIONSAs of December 31, 2016, the Group recorded tax provisions and other provisions of € 4.9 million (2015: € 3.2 million for the entire Group).
Tax provisions mainly consisted of income tax expenses and other provi-sions included provisions for onerous contracts and lease obligations for office premises, which will not be used anymore in the future, as well as for obligations resulting from an onerous contract with a contract manu-facturing organization for drug substances and drug products for clinical trial use.
As of December 31, 2016, tax provisions and other provisions were uncer-tain in their amount and are expected to be utilized in 2017.
128 F I N A N C I A L S TAT E M E N T S Notes

The table below shows the development of tax provisions and other pro-visions in the 2016 financial year.
in 000’ € 01/01/2016 Additions Utilized Released 12/31/2016
Tax Provisions 1,698 114 0 160 1,652 Provisions 1,480 2,967 740 489 3,218 TOTAL 3,178 3,081 740 649 4,870
6.3 DEFERRED REVENUESDeferred revenues are payments received from customers for which the services have not been rendered. The table below shows the development of this line item.
in 000’ € 2016 2015
OPENING BAL ANCE 4,507 58,752
Prepayments Received in the Fiscal Year 17,441 18,133
Revenue Recognised through Release of Prepayments in line with Services Performed in the Fiscal Year (19,043) (72,378)CLOSING BAL ANCE 2,905 4,507thereof short-term 1,232 1,994thereof long-term 1,673 2,513
6.4 OTHER LIABILITIESOther liabilities exclusively consisted of the deferred amount of the rent-free period for the building located at Semmelweisstraße 7, Planegg, as agreed in the lease contract. This item is released over the contractually agreed minimum rent period.
The current portion amounting to € 0.1 million of this liability was includ ed in the item accounts payable and accrued expenses.
6.5 STOCKHOLDERS’ EQUITY6.5.1 COMMON STOCKAs of December 31, 2016, the Company’s common stock, including trea-sury stock, had increased by € 2,622,088 to € 29,159,770 from its level of € 26,537,682 as of December 31, 2015. Each no-par value share is entitled to one vote. The increase in common stock resulted entirely from the new shares created in the context of the capital increase in November 2016.
As of December 31, 2016, the Company held 396,010 shares of treasury stock amounting to € 14,648,212 which represents a decrease of € 1,179,734 compared to December 31, 2015 (434,670 shares, € 15,827,946). This decrease was the result of the transfer of 90,955 treasury stock to the Management Board and Senior Management under the 2012 long-term incen tive plan (LTI plan) totaling € 3,361,697. The vesting period for this LTI program expired on April 1, 2016 and October 1, 2016 and provided beneficiaries a six-month option to receive a total of 90,955 shares. The decline in treasury stock was partly offset by MorphoSys’s repurchase of 52,295 of its own shares on the stock exchange. The repurchase totaling € 2,179,963 was carried out at a weighted-average share price of € 41.69.
Brokerage fees for the repurchase totaled € 1,999. Shares of treasury stock can be used for the purposes named in the authorizations of the Annual General Meetings on May 19, 2011 and May 23, 2014, and particularly for any exist ing or future employee participation schemes and/or to finance acquisi tions. The shares may also be redeemed.
6.5.2 AUTHORIZED CAPITALOn November 15, 2016, a total of 2,622,088 shares were issued from Autho-rized Capital 2014-I in the context of a cash capital increase, which fully exhausted the previous Authorized Capital 2014-I. The cash capital in-crease was recorded in the commercial register on November 17, 2016. Compared to December 31, 2015, the number of authorized ordinary shares declined by 2,622,088 from 13,206,421 to 10,584,333.
6.5.3 CONDITIONAL CAPITALCompared to December 31, 2015, the number of ordinary shares of con-ditional capital decreased from 7,086,000 to 6,752,698. The Annual General Meeting on June 2, 2016 cancelled the Conditional Capital 2003-II amounting to € 36,000 and the Conditional Capital 2011-I amounting to € 6,600,000. At the same time, the Annual General Meeting created the Conditional Capital 2016-I amounting to € 5,307,536 and Conditional Capital 2016-III amounting to € 995,162.
6.5.4 TREASURY STOCKIn the years 2016 and 2015, the Group repurchased own shares. The com-position and development of this line item is listed in the following table.
Number of
Shares Value
As of 12/31/2010 79,896 9,774Purchase in 2011 84,019 1,747,067As of 12/31/2011 163,915 1,756,841Purchase in 2012 91,500 1,837,552As of 12/31/2012 255,415 3,594,393Purchase in 2013 84,475 2,823,625As of 12/31/2013 339,890 6,418,018Purchase in 2014 111,000 7,833,944As of 12/31/2014 450,890 14,251,962Purchase in 2015 88,670 5,392,931Transfer in 2015 (104,890) (3,816,947)As of 12/31/2015 434,670 15,827,946Purchase in 2016 52,295 2,181,963Transfer in 2016 (90,955) (3,361,697)As of 12/31/2016 396,010 14,648,212
Notes F I N A N C I A L S TAT E M E N T S 129

In 2016, the weighted average price of the repurchased shares was € 41.69 per share (2015: € 60.79 per share). Treasury shares are recognized at acqui sition cost.
6.5.5 ADDITIONAL PAID - IN CAPITALAs of December 31, 2016, additional paid-in capital amounted to € 428,361,175 (December 31, 2015: € 319,394,322). The total increase of € 108,966,853 resulted mainly from the capital increase in November 2016 (€ 109,971,132, net of costs for raising equity totaling € 2,778,652). In addition, additional paid-in capital increased by € 2,357,418 from person-nel expenses resulting from share-based payments. The reclassification of treasury shares of € 3,361,697 in the context of the allocation of shares under the 2012 performance-based share plan had a compensating effect.
In 2015, additional paid-in capital increased by € 1,018,602 and resulted from the exercise of convertible bonds granted (€ 1,276,590) and per-sonnel expenses resulting from share-based payments (€ 3,558,959). The reclassification of treasury shares of € 3,816,947 in the context of the allocation of shares under the 2011 performance-based share plan had a compensating effect.
6.5.6 REVALUATION RESERVEAs of December 31, 2016, the revaluation reserve amounted to € 136,101 (December 31, 2015: € –202,158). The increase amounting to a total of € 338,259 arose from a change in the unrealized gains and losses on available-for-sale securities and bonds of € –21,154 and the change in unrealized gains of € 359,413 from cash flow hedges.
6.5.7 ACCUMULATED INCOME/DEFICITThe consolidated net loss of € –60,382,776 was offset in accumulated deficit. The accumulated income from € 32,834,107 in 2015 inverted to an accumulated deficit of € –27,548,669 in 2016.
7 Remuneration System for the Management Board and Employees of the Group
7.1 CONVERTIBLE BONDS – 2013 PROGRAMOn April 1, 2013, MorphoSys AG granted the Management Board and members of the Senior Management Group convertible bonds with a total nominal value of € 225,000 and divided into 449,999 bearer bonds with equal rights from “Conditional Capital 2008-III”. The beneficiaries have the right to convert the bonds into Company shares. Each convertible bond can be exchanged for one of the Company’s bearer shares equal to the proportional amount of common stock, which currently stands at € 1. Exer-cise of the convertible bonds is subject to several conditions, such as the achievement of performance targets, the expiration of vesting periods, the exercisability of the conversion rights, the existence of an employment or service contract that is not under notice and the commencement of the exercise period.
The conversion price amounted to € 31.88 and was derived from the Com-pany’s share price in the XETRA closing auction of the Frankfurt Stock Exchange on the trading day preceding the issue of the convertible bonds. The exercise of the conversion rights is admissible if, on at least one trad-ing day during the lifetime of the convertible bonds, the share price of the Company has risen to more than 120 % of the price in the XETRA closing auction of the Frankfurt Stock Exchange on the trading day preceding the issue of the convertible bonds.
The exercise of the conversion rights is only admissible after the expira-tion of a four-year vesting period from the grant date. In the event of a change of control, the vesting period is shortened to two years from the grant date. For every year without a notice of termination of the employ-ment relationship with the Company or an affiliated company, 25 % of the conversion rights become vested. In the event of a change of control, all unvested conversion rights become vested.
If an employment or service contract of a beneficiary is terminated without notice, no further conversion rights can be vested under the above men-tioned vesting scheme. Thus, upon rendition of the notice, all conversion rights still unvested by this time will expire without substitution. In the event of a contractual notice of termination of such employment or service contract with the beneficiary or a mutually agreed dissolution contract, the previous sentence applies and becomes effective as of the date of termi nation of the employment or service contract.
130 F I N A N C I A L S TAT E M E N T S Notes

The following table shows the development of the convertible bond plans for Group employees in the 2016 and 2015 financial years.
Convertible
Bonds
Weighted- average Price (€)
OUTSTANDING ON JANUARY 1, 2015 530,847 29.58Granted 0 0.00Exercised (80,848) 16.79Forfeited 0 0.00Expired 0 0.00
OUTSTANDING ON DECEMBER 31, 2015 449,999 31.88
OUTSTANDING ON JANUARY 1, 2016 449,999 31.88Granted 0 0.00Exercised 0 0.00Forfeited (13,414) 31.88Expired 0 0.00
OUTSTANDING ON DECEMBER 31, 2016 436,585 31.88
From the grant date until December 31, 2016, one beneficiary left MorphoSys and, therefore, 13,414 convertible bonds were forfeited. As of December 31, 2016, the number of vested convertible bonds totaled 327,439 shares (December 31, 2015: 225,000 shares).
The following overview includes the weighted-average exercise price as well as information on the contract duration of significant groups of convert ible bonds as of December 31, 2016.
Range of Exercise PricesNumber
Outstanding
Remaining Contractual Life
(in Years)
Weighted- average Exercise
Price (€)Number
Exercisable
Weighted- average Exercise
Price (€)
€ 25.00 – € 40.00 436,585 3.25 31.88 327,439 31.88 436,585 3.25 31.88 327,439 31.88
The Group recognizes personnel expenses resulting from convertible bonds on a straight-line basis in accordance with IFRS 2 and IAS 32.28. The equity component of the convertible bonds is presented separately under additional paid-in capital. The corresponding amount is recognized as personnel expenses from convertible bonds. In 2016 and 2015, compen-sation expenses related to convertible bonds amounted to € 40,375 and € 839,906, respectively.
Notes F I N A N C I A L S TAT E M E N T S 131

7.2 LONG-TERM INCENTIVE PROGRAMSOn March 31, 2016, the conditions of the long-term incentive plans (LTI plan) 2012, 2013, 2014 and 2015 for the Management Board and Senior Management Group were amended to include a six-month exercise period following the four-year vesting period, during which the Company can transfer the performance shares to the beneficiaries. Previously, under these plans, the performance shares were automatically allocated following the four-year vesting period. Beneficiaries can now choose the exercise date within the six-month exercise period. The plan modification had no impact on the fair value of the performance shares or on the period over which the personnel expenses are to be recognized.
7.2.1 2012 LONG -TERM INCENTIVE PROGR AMOn April 1, 2012, MorphoSys established a long-term incentive plan (LTI plan) for the Management Board and the Senior Management Group. The vesting period of this plan expired on April 1, 2016. According to IFRS 2, this program is considered a share-based payment program with settle-ment in equity instruments and is accounted for accordingly. The LTI plan is a performance-related share plan and is paid out in ordinary shares (performance shares) of MorphoSys AG if predefined key performance criteria are achieved. These criteria are approved annually by the Super-visory Board. The fulfillment of these criteria was set at 200 % for two years, 54 % for one year and 0 % for one year. The Supervisory Board set the “company factor” at 0.88, meaning the number of performance shares to be allocated is scaled by a factor of 0.88. This factor resulted in an adjust-ment of previously recognized personnel expenses of € –0.2 million in the 2016 financial year. Previously, personnel expenses resulting from the 2012 LTI program were recognized based on the assumption of a company factor of 1.0. Based on these terms and the company factor, a total of 88,663 performance shares of MorphoSys AG were transferred to the ben-eficiaries on October 4, 2016 after the expiration of the four-year vesting period. The Management Board received 57,967 performance shares (for further information, please see the tables titled “Shares” and “Perfor-mance Shares” in Item 7.3* “Related Parties”), the Senior Management Group received 27,813 performance shares and former members of the Senior Management Group, who have left the Company in the meantime, received 2,883 performance shares.*CROSS-REFERENCE to page 136
On October 1, 2012, MorphoSys established another long-term incentive plan (LTI plan) for Senior Management Group members. The vesting period of this plan expired on October 1, 2016. The terms of this plan were identical to the April 1, 2012 plan. The fulfillment of the performance criteria was set at 200 % for one year, 54.8 % for one year and 0 % for two years. The Supervisory Board set the “company factor” at 1.57, meaning the number of performance shares to be allocated is scaled by a factor of 1.57. This factor resulted in an adjustment of previously recognized per-sonnel expenses of € 0.03 million in the 2016 financial year. Previously, personnel expenses resulting from the 2012 LTI program were recognized based on the assumption of a company factor of 1.0. Based on these terms and the company factor, a total of 2,292 performance shares of MorphoSys AG were transferred to the beneficiaries in October 2016 after the expiration of the four-year vesting period. The Senior Management Group received all of the 2,292 performance shares.
In 2016, personnel expenses from performance shares under the Group’s 2012 LTI plan amounted to € –158,752 (2015: € 108,619).
7.2.2 2013 LONG -TERM INCENTIVE PROGR AMOn April 1, 2013, MorphoSys established a long-term incentive plan (LTI plan) for the Management Board and the Senior Management Group. Accor ding to IFRS 2, this program is considered a share-based payment program with settlement in equity instruments and is accounted for ac-cordingly. The LTI plan is a performance-related share plan and will be paid out in ordinary shares (performance shares) of MorphoSys AG if prede-fined key performance criteria are achieved. These criteria are evaluated annually by the Supervisory Board. The grant date was April 1, 2013 and the vesting/performance period is four years. If the predefined key perfor-mance criteria for the respective period are fully met, 25 % of the perfor-mance shares become vested in each year of the four-year vesting period. The number of performance shares vested each year will be reduced or increased to the extent that the performance criteria of the respective year have been achieved between only 50 % and 99.9 % (<100 %) or the achieve-ment of the performance criteria has exceeded 100 % (maximum 200 %). If in one year the performance criteria are achieved by less than 50 %, no performance shares will become vested in that year. In any case, the max-imum pay-out at the end of the four-year period is limited by a factor deter-mined by the Group, which generally amounts to 1. However, in justified cases, the Supervisory Board may set this factor freely between 0 and 2, for example, if the level of payment is considered unreasonable in view of the Company’s general development. The right to receive a certain alloca-tion of performance shares under the LTI plan occurs only at the end of the four-year vesting period.
If the number of repurchased shares is not sufficient for servicing the LTI plan, MorphoSys reserves the right to pay a certain amount of the LTI plan in cash in the amount of the performance shares at the end of the vesting period, provided the cash amount does not exceed 200 % of the fair value of the performance shares on the grant date.
If a member of the Management Board prematurely ceases to hold an office at the MorphoSys Group before expiration of the four-year performance period, the member (or the member’s heirs) is entitled to performance shares determined on a precise daily pro rata basis. If a Management Board member prematurely ceases to hold an office at the MorphoSys Group for good reason as defined by Sec. 626 Para. 2 of the German Civil Code (BGB) before expiration of the four-year performance period, the beneficiary will not be entitled to an allocation of performance shares. If a change of control occurs during the four-year vesting period, all perfor-mance shares will be considered fully vested. In each case above, the right to receive a certain allocation of performance shares under the LTI plan only occurs at the end of the four-year vesting period.
In April and May of 2013, MorphoSys repurchased 84,475 of its own shares on the stock exchange at an average price of € 33.43 per share. The repur-chased shares can be used for all purposes named in the authorizations of the Annual General Meetings on May 19, 2011 and on May 23, 2014 and particularly for any existing or future employee participation schemes and/or to finance acquisitions. The shares may also be redeemed.
132 F I N A N C I A L S TAT E M E N T S Notes

Of these shares, 61,601 were allocated to beneficiaries retroactively effective April 1, 2013. This included 36,729 performance shares for the Management Board (for further information, please see the table titled “Performance Shares” in Item 7.3* “Related Parties”) and 24,872 perfor-mance shares for the Senior Management Group. The number of perfor-mance shares allocated is based on the full achievement of performance criteria and a company factor of 1. On the grant date (April 1, 2013), the fair value of the performance shares was € 29.08 per share. No dividends were included in the determination of the fair value of the performance shares since the Group does not intend to distribute any dividends in the foresee-able future. From the grant date until December 31, 2016, two beneficia-ries left MorphoSys and, therefore, 881 performance shares were forfeited. For the calculation of the personnel expenses resulting from share-based payments under the 2013 LTI plan, it was initially assumed that one bene-ficiary will leave the Company during the four-year period. In 2016, this assumption was updated.*CROSS-REFERENCE to page 136
On October 1, 2013, MorphoSys established another long-term incentive plan (LTI plan) for Senior Management Group members. The terms of the plan were identical to the April 1, 2013 plan. A total of 548 performance shares was allocated, and the fair value on the grant date was € 52.24 per share.
In 2016, personnel expenses from performance shares under the Group’s 2013 LTI plan amounted to € –23,571 (2015: € 299,024).
7.2.3 2014 LONG -TERM INCENTIVE PROGR AMOn April 1, 2014, MorphoSys established a long-term incentive plan (LTI plan) for the Management Board and the Senior Management Group. Accor ding to IFRS 2, this program is considered a share-based payment program with settlement in equity instruments and is accounted for accor dingly. The LTI plan is a performance-related share plan and will be paid out in ordinary shares (performance shares) of MorphoSys AG if predefined key performance criteria are achieved. These criteria are evalu-ated annually by the Supervisory Board. The grant date was April 1, 2014 and the vesting/performance period is four years. If the predefined key performance criteria for the respective period are fully met, 25 % of the performance shares become vested in each year of the four-year vesting period. The number of performance shares vested each year will be re-duced or increased to the extent that the performance criteria of the re-spective year have been achieved between only 50 % and 99.9 % (<100 %) or the achievement of the performance criteria has exceeded 100 % (maxi-mum 200 %). If in one year the performance criteria are met by less than 50 %, no performance shares will become vested in that year. In any case, the maximum pay-out at the end of the four-year period is limited by a factor determined by the Group, which generally amounts to 1. However, in justified cases, the Supervisory Board may set this factor freely be-tween 0 and 2, for example, if the level of payment is regarded as unrea-sonable in view of the general development of the Company. The right to receive a certain allocation of performance shares under the LTI plan, however, occurs only at the end of the four-year vesting period.
If the number of repurchased shares is not sufficient for servicing the LTI plan, MorphoSys reserves the right to pay a certain amount of the LTI plan in cash in the amount of the performance shares at the end of the vesting period, provided the cash amount does not exceed 200 % of the fair value of the performance shares on the grant date.
If a member of the Management Board ceases to hold an office at the MorphoSys Group because of termination (or if the Management Board member terminates the employment contract), resignation, death, injury, disability, by reaching retirement age (receipt of a normal retirement pension, early-retirement pension or disability pension, as long as the requirements for the disability pension entitlement are met) or under other circumstances subject to the Supervisory Board’s discretion, the Management Board member (or the member’s heirs) is entitled to perfor-mance shares determined on a precise daily pro rata basis.
If a member of the Management Board ceases to hold an office at the MorphoSys Group for good reason as defined by Sec. 626 Para. 2 of the German Civil Code (BGB) and/or as defined by Sec. 84 Para. 3 of the German Stock Corporation Act (AktG), the beneficiary will not be entitled to performance shares.
If a change of control occurs during the four-year vesting period, all per-formance shares will become fully vested. In this case, the right to receive a certain allocation of performance shares under the LTI plan occurs only at the end of the four-year vesting period.
In March 2014, MorphoSys repurchased 111,000 of its own shares on the stock exchange at an average price of € 70.53 per share. The repurchased shares may be used for all purposes named in the authorizations of the Annual General Meetings on May 19, 2011 and May 23, 2014 and particu-larly for any existing or future employee participation schemes and/or to finance acquisitions. The shares may also be redeemed.
A total of 32,513 of these shares were allocated to beneficiaries on April 1, 2014 with 18,264 performance shares allocated to the Management Board (further details may be found in the table titled “Performance Shares” in Item 7.3* “Related parties”) and 14,249 performance shares to the Senior Management Group. The number of performance shares allocated is based on the full achievement of performance criteria and a company factor of 1. The fair value of the performance shares on the grant date (April 1, 2014) was € 62.17 per share. No dividends were included in the determination of the fair value of the repurchased shares performance shares because the Group does not intend to distribute any dividends in the foreseeable future. From the grant date until December 31, 2016, two beneficiaries left MorphoSys and, therefore, 889 performance shares were forfeited. For the calculation of the personnel expenses from share-based payments under the 2014 LTI plan, it was initially assumed that one beneficiary will leave the Company during the four-year period. In 2016, this assumption was updated.*CROSS-REFERENCE to page 136
In 2016, personnel expenses resulting from performance shares under the Group’s 2014 LTI plan amounted to € 178,518 (2015: € 647,941).
Notes F I N A N C I A L S TAT E M E N T S 133

7.2.4 2015 LONG -TERM INCENTIVE PROGR AMOn April 1, 2015, MorphoSys established a long-term incentive plan (LTI plan) for the Management Board and the Senior Management Group. Accor ding to IFRS 2, this program is considered a share-based payment program with settlement in equity instruments and is accounted for accor dingly. The LTI plan is a performance-related share plan and will be paid out in ordinary shares (performance shares) of MorphoSys AG if prede fined key performance criteria are achieved. These criteria are eval-uated annually by the Supervisory Board. The grant date was April 1, 2015 and the vesting/performance period is four years. If the predefined key performance criteria for the respective period are fully met, 25 % of the performance shares become vested in each year of the four-year vesting period. The number of performance shares vested each year will be reduced or increased to the extent that the performance criteria of the respective year have been achieved between only 50 % and 99.9 % (<100 %) or the achievement of the performance criteria has exceeded 100 % (maxi-mum 200 %). If in one year the performance criteria are met by less than 50 %, no performance shares will become vested in that year. In any case, the maximum pay-out at the end of the four-year period is limited by a factor determined by the Group, which generally amounts to 1. However, in justified cases, the Supervisory Board may set this factor freely be-tween 0 and 2, for example, if the level of payment is regarded as unrea-sonable in view of the general development of the Company. The right to receive a certain allocation of performance shares under the LTI plan only occurs at the end of the four-year vesting period.
If the number of repurchased shares is not sufficient for servicing the LTI plan, MorphoSys reserves the right to pay a certain amount of the LTI plan in cash in the amount of the performance shares at the end of the vesting period, provided the cash amount does not exceed 200 % of the fair value of the performance shares on the grant date.
If a member of the Management Board ceases to hold an office at the MorphoSys Group because of termination (or if the Management Board member terminates the employment contract), resignation, death, injury, disability, by reaching retirement age (receipt of a normal retirement pension, early-retirement pension or disability pension, as long as the requirements for the disability pension entitlement are met) or under other circumstances subject to the Supervisory Board’s discretion, the Management Board member (or the member’s heirs) is entitled to perfor-mance shares determined on a precise daily pro rata basis.
If a member of the Management Board ceases to hold an office at the MorphoSys Group for good reason as defined by Sec. 626 Para. 2 of the German Civil Code (BGB) and/or as defined by Sec. 84 Para. 3 of the German Stock Corporation Act (AktG), the beneficiary will not be entitled to performance shares.
If a change of control occurs during the four-year vesting period, all per-formance shares will become fully vested. In this case, the right to receive a certain allocation of performance shares under the LTI plan occurs only at the end of the four-year vesting period.
In April 2015, MorphoSys repurchased 88,670 of its own shares on the stock exchange at an average price of € 60.79 per share. The repurchased shares may be used for all purposes named in the authorization of the Annual General Meeting on May 23, 2014 and particularly for any existing or future employee participation schemes and/or to finance acquisitions. The shares may also be redeemed.
A total of 40,425 of these shares were allocated to beneficiaries on April 1, 2015 with 21,948 performance shares allocated to the Management Board (further details may be found in the table titled “Performance Shares” in Item 7.3* “Related parties”) and 18,477 performance shares to the Senior Management Group. The number of shares allocated is based on the full achievement of the performance criteria and a company factor of 1. The fair value of the performance shares as of the grant date (April 1, 2015) was € 61.40 per share. No dividends were included in the determination of the fair value of the performance shares because the Group does not intend to distribute any dividends in the foreseeable future. From the grant date until December 31, 2016, one beneficiary left MorphoSys, and, therefore, 696 performance shares have been forfeited. For the calculation of the personnel expenses from share-based payments under the 2015 LTI plan, it was assumed that one beneficiary will leave the Company during the four-year period.*CROSS-REFERENCE to page 136
In 2016, personnel expenses from performance shares under the Group’s 2015 LTI plan amounted to € 837,153 (2015: € 1,104,730).
134 F I N A N C I A L S TAT E M E N T S Notes

7.2.5 2016 LONG -TERM INCENTIVE PROGR AMOn April 1, 2016, MorphoSys established a long-term incentive plan (LTI plan) for the Management Board and the Senior Management Group. According to IFRS 2, this program is considered a share-based payment program with settlement in equity instruments and is accounted for accor dingly. The LTI plan is a performance-related share plan and will be paid out in ordinary shares (performance shares) of MorphoSys AG if pre-defined key performance criteria are achieved. These criteria are evalu-ated annually by the Supervisory Board. The grant date was April 1, 2016 and the vesting/performance period is four years. If the predefined key performance criteria for the respective period are fully met, 25 % of the performance shares become vested in each year of the four-year vesting period. The number of performance shares vested each year will be re-duced or increased to the extent that the performance criteria of the re-spective year have been achieved between only 50 % and 99.9 % (<100 %) or the achievement of the performance criteria has exceeded 100 % (maxi-mum 200 %). If in one year the performance criteria are met by less than 50 %, no performance shares will become vested in that year. In any case, the maximum pay-out at the end of the four-year period is limited by a factor determined by the Group, which generally amounts to 1. However, in justified cases, the Supervisory Board may set this factor freely be-tween 0 and 2, for example, if the level of payment is regarded as unrea-sonable in view of the general development of the Company. The right to receive a certain allocation of performance shares under the LTI plan only occurs at the end of the four-year vesting period.
There is a six-month exercise period following the four-year vesting pe-riod, during which the Company can transfer the performance shares to the beneficiaries. Beneficiaries are free to choose the exercise date within this exercise period.
If the number of repurchased shares is not sufficient for servicing the LTI plan, MorphoSys reserves the right to pay a certain amount of the LTI plan in cash in the amount of the performance shares at the end of the vesting period, provided the cash amount does not exceed 200 % of the fair value of the performance shares on the grant date.
If a member of the Management Board ceases to hold an office at the MorphoSys Group because of termination (or if the Management Board member terminates the employment contract), resignation, death, injury, disability, by reaching retirement age (receipt of a normal retirement pension, early-retirement pension or disability pension, as long as the requirements for the disability pension entitlement are met) or under other circumstances subject to the Supervisory Board’s discretion, the Management Board member (or the member’s heirs) is entitled to perfor-mance shares determined on a precise daily pro rata basis.
If a member of the Management Board ceases to hold an office at the MorphoSys Group for good reason as defined by Sec. 626 Para. 2 of the German Civil Code (BGB) and/or as defined by Sec. 84 Para. 3 of the German Stock Corporation Act (AktG), the beneficiary will not be entitled to performance shares.
If a change of control occurs during the four-year vesting period, all per-formance shares will become fully vested. In this case, the right to receive a certain allocation of shares under the LTI plan occurs only at the end of the four-year vesting period.
In March 2016, MorphoSys repurchased 52,295 of its own shares on the stock exchange at an average price of € 41.69 per share. The repurchased shares may be used for all purposes named in the authorization of the Annual General Meeting on May 23, 2014 and particularly for any exist-ing or future employee participation schemes and/or to finance acquisi-tions. The shares may also be redeemed.
On April 1, 2016, a total of 68,143 of treasury shares were allocated to beneficiaries with 35,681 performance shares allocated to the Manage-ment Board (further details may be found in the table titled “Performance Shares” in Item 7.3* “Related parties”) and 32,462 performance shares to the Senior Management Group. The number of performance shares allo-cated is based on the full achievement of the performance criteria and a company factor of 1. The fair value of the performance shares as of the grant date (April 1, 2016) was € 46.86 per share. No dividends were in-cluded in the determination of the fair value of the performance shares because the Group does not intend to distribute any dividends in the fore-seeable future. From the grant date until December 31, 2016, one benefi-ciary left MorphoSys, and, therefore, 1,464 performance shares have been forfeited. The forfeiture of performance shares due to terminations by beneficiaries during the four-year period has been accounted for in the calculation of the personnel expenses from share-based payments under the 2016 LTI plan.*CROSS-REFERENCE to page 136
In 2016, personnel expenses from performance shares under the Group’s 2016 LTI plan amounted to € 1,483,694.
Notes F I N A N C I A L S TAT E M E N T S 135
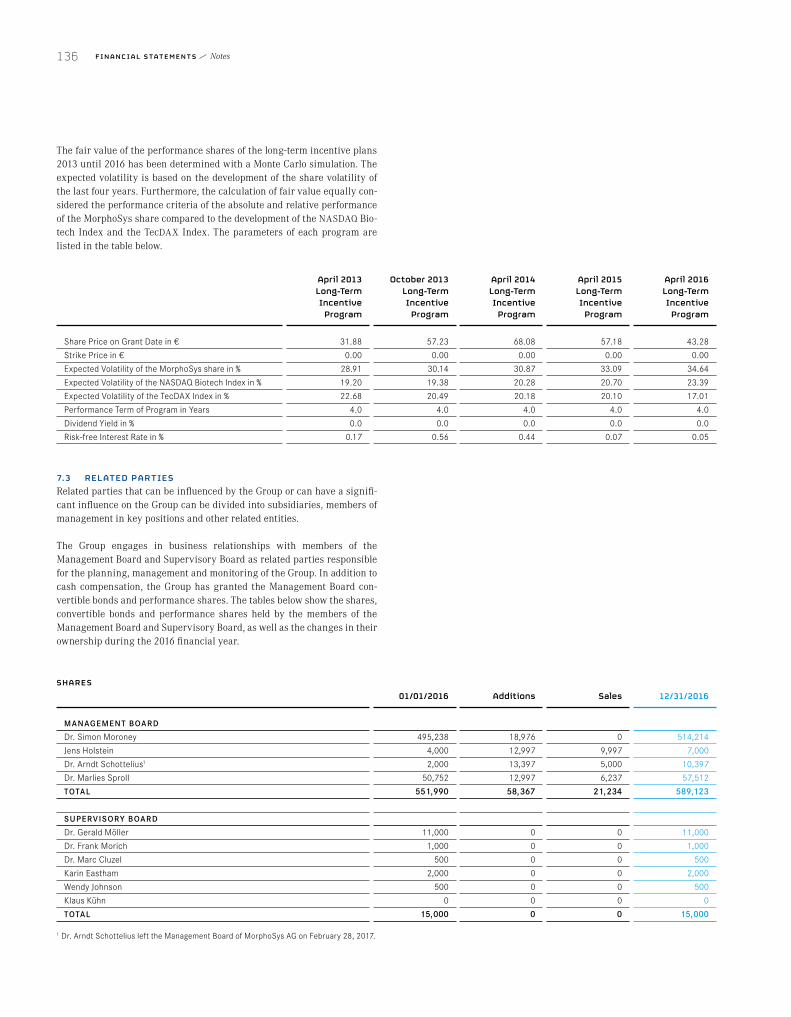
The fair value of the performance shares of the long-term incentive plans 2013 until 2016 has been determined with a Monte Carlo simulation. The expected volatility is based on the development of the share volatility of the last four years. Furthermore, the calculation of fair value equally con-sidered the performance criteria of the absolute and relative performance of the MorphoSys share compared to the development of the NASDAQ Bio-tech Index and the TecDAX Index. The parameters of each program are listed in the table below.
April 2013 Long-Term Incentive
Program
October 2013 Long-Term Incentive
Program
April 2014 Long-Term Incentive
Program
April 2015 Long-Term Incentive
Program
April 2016 Long-Term Incentive
Program
Share Price on Grant Date in € 31.88 57.23 68.08 57.18 43.28Strike Price in € 0.00 0.00 0.00 0.00 0.00Expected Volatility of the MorphoSys share in % 28.91 30.14 30.87 33.09 34.64Expected Volatility of the NASDAQ Biotech Index in % 19.20 19.38 20.28 20.70 23.39Expected Volatility of the TecDAX Index in % 22.68 20.49 20.18 20.10 17.01Performance Term of Program in Years 4.0 4.0 4.0 4.0 4.0Dividend Yield in % 0.0 0.0 0.0 0.0 0.0Risk-free Interest Rate in % 0.17 0.56 0.44 0.07 0.05
7.3 RELATED PARTIES Related parties that can be influenced by the Group or can have a signifi-cant influence on the Group can be divided into subsidiaries, members of management in key positions and other related entities.
The Group engages in business relationships with members of the Manage ment Board and Supervisory Board as related parties responsible for the planning, management and monitoring of the Group. In addition to cash compensation, the Group has granted the Management Board con-vertible bonds and performance shares. The tables below show the shares, convertible bonds and performance shares held by the members of the Management Board and Supervisory Board, as well as the changes in their ownership during the 2016 financial year.
SHARES 01/01/2016 Additions Sales 12/31/2016
MANAGEMENT BOARD
Dr. Simon Moroney 495,238 18,976 0 514,214Jens Holstein 4,000 12,997 9,997 7,000Dr. Arndt Schottelius1 2,000 13,397 5,000 10,397Dr. Marlies Sproll 50,752 12,997 6,237 57,512TOTAL 551,990 58,367 21,234 589,123 SUPERVISORY BOARD
Dr. Gerald Möller 11,000 0 0 11,000Dr. Frank Morich 1,000 0 0 1,000Dr. Marc Cluzel 500 0 0 500Karin Eastham 2,000 0 0 2,000Wendy Johnson 500 0 0 500Klaus Kühn 0 0 0 0TOTAL 15,000 0 0 15,000
1 Dr. Arndt Schottelius left the Management Board of MorphoSys AG on February 28, 2017.
136 F I N A N C I A L S TAT E M E N T S Notes

CONVERTIBLE BONDS 01/01/2016 Additions Forfeitures Exercises 12/31/2016
MANAGEMENT BOARD
Dr. Simon Moroney 88,386 0 0 0 88,386Jens Holstein 90,537 0 0 0 90,537Dr. Arndt Schottelius1 60,537 0 0 0 60,537Dr. Marlies Sproll 60,537 0 0 0 60,537TOTAL 299,997 0 0 0 299,997
PERFORMANCE SHARES 01/01/2016 Additions Forfeitures Allocations 12/31/2016
MANAGEMENT BOARD
Dr. Simon Moroney 44,164 12,032 0 18,976 37,220Jens Holstein 30,248 7,883 0 12,997 25,134Dr. Arndt Schottelius1 30,248 7,883 0 12,997 25,134Dr. Marlies Sproll 30,248 7,883 0 12,997 25,134TOTAL 134,908 35,681 0 57,967 112,622
1 Dr. Arndt Schottelius left the Management Board of MorphoSys AG on February 28, 2017.
The Supervisory Board of MorphoSys AG does not hold any convertible bonds or performance shares.
The total remuneration of the Management Board consists of several com-ponents, including fixed compensation, an annual cash bonus that is de-pendent upon the achievement of corporate and personal targets (short-term incentives – STI), variable compensation components with long-term incentives (LTI) and other remuneration components. Following the expi-ration of the relevant contract term, the service contracts of the Manage-ment Board members stipulate a non-competition clause for a period of six months. During this period, the Management Board member is entitled to compensation payments amounting to 100 % of the pro rata fixed compensation.
In 2016, the total remuneration of the Supervisory Board, excluding reim-bursement for travel costs, amounted to € 529,680 (2015: € 529,270).
While in the management report the remuneration of the Management Board and the Supervisory Board as members in key management posi-tions is presented in accordance with the provisions of the Corporate Gov-ernance Code, the following tables show the expense-based view in accor-dance with IAS 24.
Notes F I N A N C I A L S TAT E M E N T S 137

MANAGEMENT BOARD REMUNERATION FOR THE YEARS 2016 AND 2015 (IAS 24) :
Dr. Simon Moroney Chief Executive Officer
Jens Holstein Chief Financial Officer
Dr. Arndt Schottelius Chief Development Officer
Dr. Marlies Sproll Chief Scientific Officer Total
2015 2016 2015 2016 2015 2016 2015 2016 2015 2016
Fixed Compensation 445,736 463,457 302,384 314,405 302,384 309,759 302,384 314,405 1,352,888 1,402,026 Fringe Benefits 36,887 34,270 39,735 46,300 29,889 28,388 22,954 24,141 129,465 133,099 One -Year Variable Compensation 238,692 210,873 161,926 143,054 156,635 140,940 156,635 143,054 713,888 637,921 Total Short-Term Employee Benefits (IAS 24.17 (a)) 721,315 708,600 504,045 503,759 488,908 479,087 481,973 481,600 2,196,241 2,173,046 Service Cost 138,280 142,096 90,800 92,875 94,064 95,473 94,085 92,876 417,229 423,320 Total Benefit Expenses – Post-Employment Benefits (IAS 24.17 (b)) 138,280 142,096 90,800 92,875 94,064 95,473 94,085 92,876 417,229 423,320Multi-Year Variable Compensation1: 2013 Convertible Bonds Program (Vesting Period 4 Years) 164,969 33,964 168,984 34,791 112,990 23,263 112,990 23,263 559,933 115,2812011 Long-Term Incentive Program (Vesting Period 4 Years) 129,900 0 88,974 0 88,974 0 88,974 0 396,822 0 2012 Long-Term Incentive Program (Vesting Period 4 Years) 22,755 (42,350) 15,585 (29,007) 15,585 (29,007) 15,585 (29,007) 69,510 (129,371)2013 Long-Term Incentive Program (Vesting Period 4 Years) 57,029 (10,303) 39,061 (7,075) 39,061 (7,075) 39,061 (7,075) 174,212 (31,528)2014 Long-Term Incentive Program (Vesting Period 4 Years) 119,143 32,972 81,605 22,572 81,605 22,572 81,605 22,572 363,958 100,6882015 Long-Term Incentive Program (Vesting Period 4 Years) 196,345 148,799 134,483 101,906 134,483 101,906 134,483 101,906 599,794 454,517 2016 Long-Term Incentive Program (Vesting Period 4 Years) 0 269,420 0 176,511 0 176,511 0 176,511 0 798,953Total Stock-Based Compensation (IAS 24.17 (e)) 690,141 432,502 528,692 299,698 472,698 288,170 472,698 288,170 2,164,229 1,308,540 Total Compensation 1,549,736 1,283,198 1,123,537 896,332 1,055,670 862,730 1,048,756 862,646 4,777,699 3,904,906
1 The fair value was determined pursuant to the regulations of IFRS 2 “Share-based Payments”. This table shows the pro-rata share of personnel expenses resulting from stock-based compensation for the respective financial year. Further details can be found in Sections 7.1* and 7.2*.
*CROSS-REFERENCE to page 130–131
SUPERVISORY BOARD REMUNERATION FOR THE YEARS 2016 AND 2015:
Fixed Compensation Attendance Fees1 Total Compensation
in €
2016 2015 2016 2015 2016 2015
Dr. Gerald Möller 91,400 93,521 43,400 36,200 134,800 129,721 Dr. Frank Morich2 57,240 37,324 26,800 14,200 84,040 51,524 Dr. Marc Cluzel 52,160 50,089 34,600 28,000 86,760 78,089 Karin Eastham 52,160 50,089 24,400 36,800 76,560 86,889 Wendy Johnson2 46,160 30,099 33,800 26,400 79,960 56,499 Klaus Kühn2 46,160 30,099 21,400 14,200 67,560 44,299 Dr. Walter Blättler3 – 16,188 – 13,000 – 29,188 Dr. Daniel Camus3 – 16,188 – 8,400 – 24,588 Dr. Geoffrey Vernon3 – 20,073 – 8,400 – 28,473 TOTAL 345,280 343,670 184,400 185,600 529,680 529,270
1 The attendance fee contains expense allowances for the attendance at Supervisory Board and Committee meetings. 2 Dr. Frank Morich, Wendy Johnson and Klaus Kühn joined the Supervisory Board of MorphoSys AG on May 8, 2015. 3 Dr. Walter Blättler, Dr. Daniel Camus and Dr. Geoffrey Vernon left the Supervisory Board of MorphoSys AG on May 8, 2015.
In the years 2016 and 2015, there were no other long-term benefits in accord ance with IAS 24.17 (c) or benefits upon termination of employment in accordance with IAS 24.17 (d) accruing to the Management Board or Supervisory Board.
There are presently no other agreements with current or former members of the Supervisory Board.
138 F I N A N C I A L S TAT E M E N T S Notes
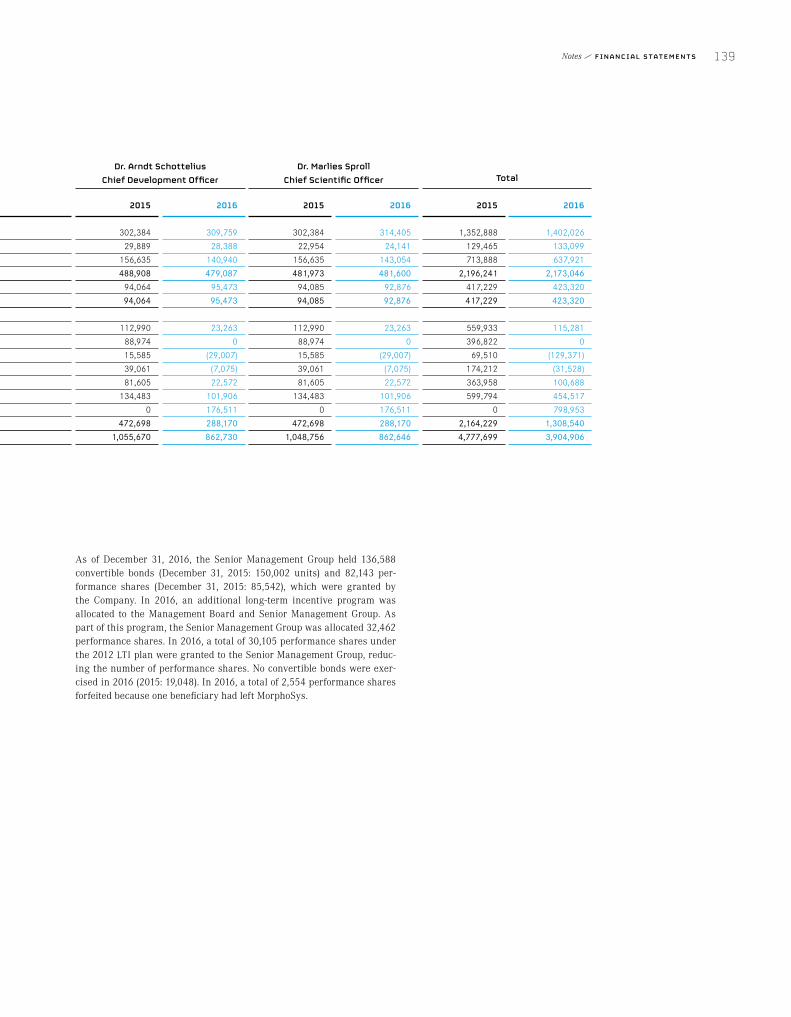
MANAGEMENT BOARD REMUNERATION FOR THE YEARS 2016 AND 2015 (IAS 24) :
Dr. Simon Moroney Chief Executive Officer
Jens Holstein Chief Financial Officer
Dr. Arndt Schottelius Chief Development Officer
Dr. Marlies Sproll Chief Scientific Officer Total
2015 2016 2015 2016 2015 2016 2015 2016 2015 2016
Fixed Compensation 445,736 463,457 302,384 314,405 302,384 309,759 302,384 314,405 1,352,888 1,402,026 Fringe Benefits 36,887 34,270 39,735 46,300 29,889 28,388 22,954 24,141 129,465 133,099 One -Year Variable Compensation 238,692 210,873 161,926 143,054 156,635 140,940 156,635 143,054 713,888 637,921 Total Short-Term Employee Benefits (IAS 24.17 (a)) 721,315 708,600 504,045 503,759 488,908 479,087 481,973 481,600 2,196,241 2,173,046 Service Cost 138,280 142,096 90,800 92,875 94,064 95,473 94,085 92,876 417,229 423,320 Total Benefit Expenses – Post-Employment Benefits (IAS 24.17 (b)) 138,280 142,096 90,800 92,875 94,064 95,473 94,085 92,876 417,229 423,320Multi-Year Variable Compensation1: 2013 Convertible Bonds Program (Vesting Period 4 Years) 164,969 33,964 168,984 34,791 112,990 23,263 112,990 23,263 559,933 115,2812011 Long-Term Incentive Program (Vesting Period 4 Years) 129,900 0 88,974 0 88,974 0 88,974 0 396,822 0 2012 Long-Term Incentive Program (Vesting Period 4 Years) 22,755 (42,350) 15,585 (29,007) 15,585 (29,007) 15,585 (29,007) 69,510 (129,371)2013 Long-Term Incentive Program (Vesting Period 4 Years) 57,029 (10,303) 39,061 (7,075) 39,061 (7,075) 39,061 (7,075) 174,212 (31,528)2014 Long-Term Incentive Program (Vesting Period 4 Years) 119,143 32,972 81,605 22,572 81,605 22,572 81,605 22,572 363,958 100,6882015 Long-Term Incentive Program (Vesting Period 4 Years) 196,345 148,799 134,483 101,906 134,483 101,906 134,483 101,906 599,794 454,517 2016 Long-Term Incentive Program (Vesting Period 4 Years) 0 269,420 0 176,511 0 176,511 0 176,511 0 798,953Total Stock-Based Compensation (IAS 24.17 (e)) 690,141 432,502 528,692 299,698 472,698 288,170 472,698 288,170 2,164,229 1,308,540 Total Compensation 1,549,736 1,283,198 1,123,537 896,332 1,055,670 862,730 1,048,756 862,646 4,777,699 3,904,906
1 The fair value was determined pursuant to the regulations of IFRS 2 “Share-based Payments”. This table shows the pro-rata share of personnel expenses resulting from stock-based compensation for the respective financial year. Further details can be found in Sections 7.1* and 7.2*.
*CROSS-REFERENCE to page 130–131
SUPERVISORY BOARD REMUNERATION FOR THE YEARS 2016 AND 2015:
Fixed Compensation Attendance Fees1 Total Compensation
in €
2016 2015 2016 2015 2016 2015
Dr. Gerald Möller 91,400 93,521 43,400 36,200 134,800 129,721 Dr. Frank Morich2 57,240 37,324 26,800 14,200 84,040 51,524 Dr. Marc Cluzel 52,160 50,089 34,600 28,000 86,760 78,089 Karin Eastham 52,160 50,089 24,400 36,800 76,560 86,889 Wendy Johnson2 46,160 30,099 33,800 26,400 79,960 56,499 Klaus Kühn2 46,160 30,099 21,400 14,200 67,560 44,299 Dr. Walter Blättler3 – 16,188 – 13,000 – 29,188 Dr. Daniel Camus3 – 16,188 – 8,400 – 24,588 Dr. Geoffrey Vernon3 – 20,073 – 8,400 – 28,473 TOTAL 345,280 343,670 184,400 185,600 529,680 529,270
1 The attendance fee contains expense allowances for the attendance at Supervisory Board and Committee meetings. 2 Dr. Frank Morich, Wendy Johnson and Klaus Kühn joined the Supervisory Board of MorphoSys AG on May 8, 2015. 3 Dr. Walter Blättler, Dr. Daniel Camus and Dr. Geoffrey Vernon left the Supervisory Board of MorphoSys AG on May 8, 2015.
In the years 2016 and 2015, there were no other long-term benefits in accord ance with IAS 24.17 (c) or benefits upon termination of employment in accordance with IAS 24.17 (d) accruing to the Management Board or Supervisory Board.
As of December 31, 2016, the Senior Management Group held 136,588 conver tible bonds (December 31, 2015: 150,002 units) and 82,143 per-formance shares (December 31, 2015: 85,542), which were granted by the Company. In 2016, an additional long-term incentive program was allocated to the Management Board and Senior Management Group. As part of this program, the Senior Management Group was allocated 32,462 performance shares. In 2016, a total of 30,105 performance shares under the 2012 LTI plan were granted to the Senior Management Group, reduc-ing the number of performance shares. No convertible bonds were exer-cised in 2016 (2015: 19,048). In 2016, a total of 2,554 performance shares forfeited because one beneficiary had left MorphoSys.
Notes F I N A N C I A L S TAT E M E N T S 139

8 Additional Notes 8.1 OBLIGATIONS ARISING FROM OPERATING LEASES, RENTAL
AND OTHER CONTRACTSThe Group leases facilities and equipment under long-term operating leases. In financial years 2016 and 2015, leasing expenses amounted to € 3.1 million and € 3.0 million. The 2015 amount includes the recognition of a provision for onerous contracts from rent obligations for office prem-ises. Leasing expenses for 2016 and 2015 include expenses for company cars and machinery totaling € 0.2 million and € 0.2 million, respectively. The majority of these contracts can be renewed on a yearly or quarterly basis. Some of these agreements may be terminated prematurely.
In 2016 a rental agreement was signed for the premises at Semmelweis-straße 7, Planegg. The contract includes a minimum rental period of ten years.
The future minimum payments under non-terminable operating leases, insurance contracts and other services are shown in the following table.
in 000’ €Rent and
Leasing 2017Rent and
Leasing 2016 Other 2017 Other 2016 Total 2017 Total 2016
Up to One Year 3,224 2,349 796 840 4,020 3,189Between One and Five Years 11,245 13,438 1 5 11,246 13,443More than Five Years 13,950 13,875 0 0 13,950 13,875TOTAL 28,419 29,662 797 845 29,216 30,507
Additionally, the future payments as shown in the table below may become due for outsourced studies. These amounts could be shifted or be sub-stantially lower due to changes in the study timeline or premature study termination.
in million € Total 2016
Up to One Year 50.8Between One and Five Years 112.2More than Five Years 0.0TOTAL 163.0
8.2 CONTINGENT ASSETS/CONTINGENT LIABILITIESContingent liabilities are potential obligations from past events that exist only when the occurrence of one or more uncertain future events – beyond the Company’s control – is confirmed. Current obligations can represent a contingent liability if it is not probable enough that an outflow of resources justifies the recognition of a provision. Moreover, it is not possible to make a sufficiently reliable estimate of the amount of the obligations.
The Management Board is unaware of any proceedings that may result in a significant obligation for the Group and may lead to a material adverse effect on the Group’s net assets, financial position or results of operations.
If certain milestones are achieved in the Proprietary Development seg-ment, for example, filing an application for an investigational new drug (IND) for specific target molecules, this may trigger milestone payments to licensors. However, no further details can be published since the timing and the achievement of such milestones are uncertain.
If a partner achieves certain milestones in the Partnered Discovery seg-ment, for example, filing an application for an investigational new drug (IND) for specific target molecules or the transfer of technology, this may trigger milestone payments to MorphoSys. However, no further details can be published since the timing, and the achievement of such milestones are uncertain.
140 F I N A N C I A L S TAT E M E N T S Notes

Obligations may arise from enforcing the Company’s patents against third parties. It is also conceivable that competitors may challenge the patents of the MorphoSys Group companies. MorphoSys may also come to the con-clusion that MorphoSys’s patents or patent families have been infringed upon by competitors, which may prompt MorphoSys to take legal action against competitors. At present, there are no specific indications that liabili ties have occurred as described above.
8.3 CORPORATE GOVERNANCEThe Group has submitted the Declaration of Conformity with the recom-mendations of the Government Commission on the German Corporate Governance Code for the 2016 financial year under Sec. 161 of the German Stock Corporation Act (AktG). This declaration was published on the Group’s website (www.morphosys.com) on December 2, 2016 and made permanently available to the public.
8.4 RESEARCH AND DEVELOPMENT AGREEMENTSThe Group has entered numerous research and development agreements as part of its proprietary research and development activities and its part-nered research strategy.
8.4.1 PROPRIETARY DEVELOPMENT SEGMENTIn the Proprietary Development segment, partnerships are entered into as part of the Group’s strategy to develop its own drugs in its core areas of oncology and inflammatory diseases. Our partners include (in alphabeti-cal order): Aptevo Therapeutics, G7 Therapeutics, Galapagos, GlaxoSmith-Kline, Immatics Biotechnologies, Merck Serono, MD Anderson Cancer Center, Temple University and Xencor.
In August 2014, MorphoSys and Aptevo Therapeutics, a spin-off from Emergent BioSolutions, announced a co-development and co-promotion agreement for MOR209/ES414. This compound is a bi-specific anti-PSMA/anti-CD3 antibody targeting prostate cancer that was developed by Aptevo based on its proprietary ADAPTIR™ platform (modular protein technol-ogy). In early March 2015, MorphoSys and its development partner Aptevo Therapeutics announced the commencement of a phase 1 clinical study with MOR209/ES414 in up to 130 patients suffering from metastatic cas-tration-resistant prostate cancer (mCRPC). The study’s launch triggered a milestone payment to Aptevo of € 4.7 million. The existing cooperation agreement was updated in the past financial year. After a joint examina-tion of the clinical results, the companies decided to adjust the dosing regimen and administration of MOR209/ES414. Clinical development will continue in 2016 with an adapted clinical development plan. A change in the contractual agreement brought down MorphoSys’s share in the costs for the years 2016 through 2018 and lowers MorphoSys’s potential mile-stone payments to Aptevo to a maximum of US$ 74 million. There were no changes made to the remaining financial agreements or the division of commercial rights. A partial impairment of € 10.1 million was recognized on the in-process MOR209/ES414 R&D program in 2016 as a result of the program’s lower expected value-in-use.
In August 2015, MorphoSys and Swiss-based G7 Therapeutics AG announced a new collaboration to develop novel antibody therapeutics targeting G protein-coupled receptors (GPCRs) and other potentially disease-related transmembrane proteins, such as ion channels. Under this agreement, G7 Therapeutics will give MorphoSys a choice of various receptors that can be linked to the emergence of a variety of diseases. MorphoSys will use its proprietary Ylanthia antibody library to identify and develop antibody compounds directed against these receptors. MorphoSys has the right to sublicense to partners access to these target molecules in conjunction with therapeutic antibody programs.
In November 2008, MorphoSys and Galapagos announced a long-term drug discovery and co-development cooperation aimed at exploring novel mechanisms for the treatment of inflammatory diseases and developing antibody therapies against these diseases. The agreement covers all activ-ities ranging from the probing of target molecules to the completion of clinical trials for novel therapeutic antibodies. After demonstrating clini-cal efficacy in humans, the programs may be out-licensed to partners for further development, approval, and commercialization. Both companies contributed their core technologies and expertise to the alliance. Along with the use of its adenovirus-based platform for the exploration of new target molecules for the development of antibodies, Galapagos provided access to target molecules already identified that are associated with bone and joint diseases. MorphoSys provided access to its antibody technolo-gies used for generating fully human antibodies directed against these target molecules. Under the terms of the agreement, Galapagos and MorphoSys will share the research and development costs. In July 2014, the collaboration advanced into the preclinical development of MOR106, an antibody from MorphoSys’ next-generation library Ylanthia directed against a novel Galapagos target molecule. The antibody will be co-devel-oped in the area of inflammatory diseases.
In June 2013, MorphoSys announced it had entered into a global agree-ment with GlaxoSmithKline (GSK) for the development and commercial-ization of MOR103. MOR103/GSK3196165 is MorphoSys’s proprietary HuCAL antibody against the GM-CSF target molecule. Under the agree-ment, GSK assumes responsibility for the compound’s entire development and commercialization. MorphoSys received an immediate upfront pay-ment of € 22.5 million as part of this agreement. Depending on the achievement of certain developmental stages and regulatory, commercial and revenue-related milestones, MorphoSys is eligible to receive addi-tional payments from GSK in the amount of up to € 423 million, as well as tiered double-digit royalties on net sales. The compound is currently being developed in a phase 2b study in patients with rheumatoid arthritis. In April 2016, GSK announced the initiation of a phase 2a clinical trial to investi gate the safety and efficacy of MOR103/GSK3196165 in patients with inflammatory hand osteoarthritis. GSK also initiated a mechanistic phase 2a trial of MOR103/GSK3196165 in rheumatoid arthritis to further investigate the GM-SCF signaling pathway.
Notes F I N A N C I A L S TAT E M E N T S 141

In August 2015, MorphoSys announced a strategic alliance in the field of immuno-oncology with the German company Immatics Biotechnologies GmbH. The alliance was formed to develop novel antibody-based therapies against a variety of cancer antigens that are recognized by T cells. The alliance agreement gives MorphoSys access to several of Immatics’s proprietary tumor-associated peptides (TUMAPs). In return, Immatics receives the right to develop MorphoSys’s Ylanthia antibodies against several TUMAPs. The companies will pay each other milestone payments and royalties on commercialized products based on the companies’ devel-opment progress.
In June 2014, MorphoSys and Merck KGaA announced an agreement to identify and develop therapeutic antibodies against target molecules of the class of immune checkpoints. Under this agreement, both MorphoSys and Merck Serono, the biopharmaceutical division of Merck, will co- develop therapies intended to trigger the immune system to attack tumors. MorphoSys will use its proprietary Ylanthia antibody library and other technology platforms to generate antibodies directed against the selected target molecules. Merck Serono is contributing its expertise in the field of immuno-oncology and clinical development and will assume full project responsibility starting with phase 1 of clinical development.
In May 2016, MorphoSys and the University of Texas MD Anderson Cancer Center announced a long-term strategic alliance. With MorphoSys apply-ing its Ylanthia technology platform, the partners will work together to identify, validate and develop novel anti-cancer antibodies through to clinical proof of concept by researching targets in a variety of oncology indications. MorphoSys and MD Anderson will conduct early clinical studies of therapeutic antibody candidates after which MorphoSys has the option to continue developing selected antibodies in later stages of clinical development for its own proprietary pipeline.
In April 2014, MorphoSys agreed to a strategic partnership with the Moulder Center for Drug Discovery Research, a division of the School of Pharmacy at Temple University, USA, to discover new therapeutic anti-bodies. Under this cooperation, the Moulder Center receives access to MorphoSys’s Ylanthia technology for validating new disease-related target molecules and generating therapeutic antibodies directed against these molecules. MorphoSys receives an exclusive option to further develop each antibody resulting from the cooperation. The department for new bio-therapeutic compound discovery at the Moulder Center deals with the compound’s design and optimization of lead candidates in various disease areas, including cancer, Alzheimer’s disease, cardiovascular, metabolic and viral diseases.
In June 2010, MorphoSys AG and the US-based biopharmaceutical com-pany Xencor signed an exclusive global licensing and cooperation agree-ment under which MorphoSys receives exclusive global licensing rights to the XmAb5574/MOR208 antibody for the treatment of cancer and other indications. The companies jointly conducted a phase 1/2a trial in the US in patients with chronic lymphocytic leukemia. MorphoSys is solely responsible for further clinical development after the successful comple-tion of the phase 1 clinical trial. Xencor received an upfront payment of US$ 13 million (approx. € 10.5 million) from MorphoSys, which was capi-talized under in-process R&D programs. Xencor is entitled to development, regulatory, and commercially-related milestone payments as well as tiered royalties on product sales.
In May 2015, MorphoSys acquired the Dutch company Lanthio Pharma B.V., which specializes in research and development of lanthipeptides. MorphoSys had initially acquired almost a 20 % interest in the biopharma-ceutical company in 2012 as part of its Innovation Capital initiative before acquiring the remaining shares in the past financial year. Lanthipeptides are a novel class of therapeutics demonstrating high target molecule selec-tivity and improved compound properties. This transaction adds MOR107 (formerly LP2) to MorphoSys’s proprietary portfolio. MOR107 is a novel lanthipeptide in development for fibrotic diseases.
8.4.2 PARTNERED DISCOVERY SEGMENTCommercial partnerships in the Partnered Discovery segment provide MorphoSys with various types of payments that are spread over the dura-tion of the agreements or recognized in full as revenue when reaching a predefined target or milestone. These payments include upfront payments upon signature, annual license fees in exchange for access to MorphoSys’s technologies and payments for funded research to be performed by MorphoSys on behalf of the partner. In addition, MorphoSys is entitled to development-related milestone payments and royalties on product sales for specific antibody programs.
Prior to the 2015 financial year, active collaborations with a number of partners had already ended because the agreements had expired. However, drug development programs initiated in the active phase are designed so that they can be continued by the partner and, therefore, still result in performance-based payments for the achievement of the defined mile-stones. For more detailed information on individual drug candidates within the various alliances – limited to information available to the pub-lic – please refer to the section “Research and Development” contained in this annual report and the overview of the Group’s drug pipeline. Detailed information on the Group’s individual research alliances is available on the Group’s website.
142 F I N A N C I A L S TAT E M E N T S Notes

Partnerships in the Partnered Discovery segment that ended before the beginning of 2015 but where drug development programs were still being pursued, include (in alphabetical order): Astellas, Bayer Healthcare Pharmaceuticals, Boehringer Ingelheim, ContraFect, Daiichi-Sankyo, F. Hoffmann-La Roche, GPC Biotech, Immunogen, Janssen Biotech, Merck & Co., OncoMed Pharmaceuticals, Pfizer, Fibron Ltd. (transfer of the contract from Prochon Biotech Ltd.) and Schering-Plough (a subsidiary of Merck & Co.).
Partnerships that were still active in 2015 include (in alphabetical order): GeneFrontier Corporation/Kaneka, Heptares, LEO Pharma and Novartis.
In November 2016, MorphoSys and LEO Pharma announced a strategic alliance for the discovery and development of therapeutic antibodies for the treatment of skin diseases. The objective of the alliance is to identify novel, antibody-based therapeutics for unmet medical needs that will be valuable additions to both companies’ development pipelines. MorphoSys will apply its Ylanthia technology platform to generate fully human anti-body candidates against the targets selected by LEO Pharma. MorphoSys will conduct all development activities up to the start of clinical testing. LEO Pharma will be responsible for clinical development and commercial-ization of resulting drugs in all indications outside of cancer. In skin can-cer indications, MorphoSys will have options to co-develop and, in Europe, co-promote the respective antibody drugs. In addition, MorphoSys will have certain options to develop and commercialize therapeutic programs in other cancer indications arising from the collaboration. MorphoSys will receive R&D funding as well as success-based development, regulatory and commercial milestone payments, plus royalties on net sales of drugs commercialized by LEO Pharma.
The Group’s most comprehensive alliance is with Novartis AG. Both com-panies started working together in 2004, which has led to the creation of several ongoing therapeutic antibody programs against a number of dis-eases. In December 2007, MorphoSys and Novartis significantly expanded their previous relationship and forged one of the most comprehensive stra-tegic alliances in the discovery and development of biopharmaceuticals. The contractually guaranteed annual payments for technology access, interna lization charges, and R&D services amount to more than € 400 mil-lion over the contract term of ten years. The total amount of guaranteed payments and probability-weighted performance-based milestones, con-tingent upon the successful clinical development and regulatory approval of several products, could exceed € 650 million by the expiration of the contract underlying the collaboration. In addition to these payments, MorphoSys is also entitled to royalties on any future product sales. MorphoSys expects the partnership with Novartis to terminate at the end of November 2017 in accordance with the contract and does not believe that Novartis will exercise its option to extend the contract.
In November 2012, MorphoSys and Novartis entered into a cooperation agreement for the use of the new Ylanthia technology platform. This was an extension of the existing strategic cooperation.
8.5 SUBSEQUENT EVENTSIn early January 2017, MorphoSys announced that the Company’s Super-visory Board has appointed Dr. Malte Peters as new Chief Development Officer. Dr. Peters will assume the position on March 1, 2017 and will suc-ceed Dr. Arndt Schottelius, who is leaving the Company to pursue other opportunities. Dr. Schottelius has been Chief Development Officer until February 28, 2017. Dr. Peters joins MorphoSys from Sandoz, a subsidiary of Novartis, where he served as Global Head, Clinical Development Bio-pharmaceuticals. With effect from March 1, 2017, Dr. Peters is entitled for the period of one year to request the transfer of treasury shares held by the Company to himself up to a total amount of € 500,000.
In February 2017, MorphoSys announced that it has added a second patent with US Patent Number 9,200,061 to its lawsuit against Janssen Biotech, and Genmab, A/S. This patent claims methods of treating hematologic cancer associated with the undesired presence of CD38-positive cells by administering antibodies that bind to a specific region of the target mole-cule, CD38. In a hearing that took place on February 6, 2017 the District Court granted MorphoSys’s request to add the 9,200,061 patent to the case.
Also in February 2017, MorphoSys announced that its fully owned subsid-iary Lanthio Pharma B.V., Groningen, Netherlands, has initiated a phase 1 clinical study with MOR107. MOR107, a selective agonist of the angioten-sin II receptor type 2, is a lanthipeptide based on Lanthio Pharma’s pro-prietary technology platform and the first lanthipeptide in MorphoSys’s clinical pipeline. The goal of the trial is to evaluate safety, tolerability, pharmacokinetics and pharmacodynamics in healthy male volunteers.
In March 2017, MorphoSys announced that its partner Roche plans to initiate a new pivotal phase 3 program with gantenerumab in patients with prodromal to mild Alzheimer’s disease. Gantenerumab is a monoclonal antibody directed against beta amyloid based on MorphoSys’s HuCAL anti-body library. MorphoSys was informed that Roche intends to commence preparations for two studies and that Roche expects to start the trials later in 2017.
Also in March 2017, MorphoSys announced that its licensee Janssen has reported positive results from two phase 3 clinical studies examining guselkumab, a fully human antibody directed against IL-23 identified from MorphoSys’s HuCAL antibody library, in patients with moderate to severe plaque psoriasis. Janssen has announced to present the data from its VOYAGE 2 and NAVIGATE studies at the American Academy of Dermatology (AAD) 2017 annual meeting in Orlando, Florida/USA, from March 3–7, 2017.
Apart from that, no events occurred after the reporting date of Decem-ber 31, 2016 that require reporting.
Notes F I N A N C I A L S TAT E M E N T S 143

8.6 RESPONSIBILITY STATEMENTTo the best of our knowledge, and in accordance with the applicable reporting principles, the consolidated financial statements give a true and fair view of the Group’s net assets, financial position and results of operations, and the group management report provides a fair review of the development and performance of the business and the position of the Group together with a description of the principal opportunities and risks associated with the Group’s expected development.
Planegg, March 6, 2017
Dr. Simon Moroney Jens HolsteinChief Executive Officer Chief Financial Officer
Dr. Malte Peters Dr. Marlies SprollChief Development Officer Chief Scientific Officer
144 F I N A N C I A L S TAT E M E N T S Notes

Auditor’s Report
We have audited the consolidated financial statements prepared by MorphoSys AG, Planegg, comprising the consolidated income statement, consolidated statement of comprehensive income, con-solidated balance sheet, consolidated statement of changes in stock-holders’ equity, consolidated statement of cash flows and notes, together with the group management report for the business year from January 1, 2016, to December 31, 2016. The preparation of the consolidated financial statements and the group management re-port in accordance with IFRS, as adopted by the EU, the additional requirements of German commercial law pursuant to Article 315a Section 1 German Commercial Code and supplementary provisions of the articles of incorporation are the responsibility of the Parent Company’s Board of Managing Directors. Our responsibility is to express an opinion on the consolidated financial statements and on the group management report based on our audit.
We conducted our audit of the consolidated financial statements in accordance with Article 317 German Commercial Code and Ger-man generally accepted standards for the audit of financial state-ments promulgated by the Institute of Public Auditors in Germany. Those standards require that we plan and perform the audit such that misstatements materially affecting the presentation of the net assets, financial position and results of operations in the consoli-dated financial statements in accordance with the applicable finan-cial reporting framework and in the group management report are detected with reasonable assurance. Knowledge of the business activities and the economic and legal environment of the Group and expectations as to possible misstatements are taken into ac-count in the determination of audit procedures. The effectiveness of the accounting-related internal control system and the evidence supporting the disclosures in the consolidated financial state-ments and the group management report are examined primarily on a test basis within the framework of the audit. The audit in-cludes assessing the annual financial statements of those entities included in consolidation, the determination of the entities to be included in consolidation, the accounting and consolidation prin-ciples used and significant estimates made by the Company’s
Board of Managing Directors, as well as evaluating the overall pre-sentation of the consolidated financial statements and the group management report. We believe that our audit provides a reason-able basis for our opinion.
Our audit has not led to any reservations.
In our opinion, based on the findings of our audit the consolidated financial statements comply with IFRS as adopted by the EU, the additional requirements of German commercial law pursuant to Article 315a Section 1 German Commercial Code and supplemen-tary provisions of the articles of incorporation and give a true and fair view of the net assets, financial position and results of operations of the Group in accordance with these requirements. The group management report is consistent with the consolidated financial statements, complies with legal requirements, as a whole provides a suitable view of the Group’s position and suitably pre-sents the opportunities and risks of future development.
Munich, March 6, 2017
PricewaterhouseCoopers GmbHWirtschaftsprüfungsgesellschaft
Dietmar Eglauer ppa. Bodo Kleinschrod Wirtschaftsprüfer Wirtschaftsprüfer(German Public Auditor) (German Public Auditor)
Auditor’s Report A D D I T I O N A L I N F O R M AT I O N 145

Report of the Supervisory Board
COOPERATION OF THE MANAGEMENT BOARD AND SUPERVISORY BOARDDuring the 2016 financial year, the Supervisory Board compre-hensively performed the duties assigned to it by law, the Articles of Association, Rules of Procedure and – with one exception – the recommendations of the German Corporate Governance Code (hereinafter referred to as the “Code”). We regularly advised and continually oversaw the Management Board in its management of the Company and dealt extensively with the operational and stra-tegic development of the Group. The Management Board fulfilled its duty to inform and furnish us with periodic written and verbal reports containing timely and detailed information on all business transactions and events of significant relevance to the Company. The Management Board prepared these reports in collaboration with the respective departments. In our committee meetings and plenary sessions, we had the opportunity to fully discuss the Management Board’s reports and the proposed resolutions. The Management Board answered our questions on strategic topics affecting the Company with a great level of detail and submitted the relevant documents in a timely manner. Any deviations from the business plan were thoroughly explained to us, and we were directly involved at an early stage in all decisions relevant to the Company.
A corresponding resolution was passed when the Supervisory Board’s approval for individual actions was required by law, the Articles of Association or the Rules of Procedure. The Supervisory Board members routinely prepared resolutions for Management Board actions requiring Supervisory Board approval based on the documentation provided in advance by the Management Board. When necessary, the Supervisory Board received the support of the relevant committees and, together with the Management Board, discussed any projects pending decision. All matters requiring approval were submitted for review to the Supervisory Board on a timely basis.
Outside of the meetings of the Supervisory Board plenum and the committees, the chairperson of the Supervisory Board regularly exchanged information and ideas with the Management Board and especially the Chief Executive Officer, Dr. Simon Moroney. The Supervisory Board chairperson was always kept promptly informed of the current business situation and any significant business transactions. The other Supervisory Board members also had reg-ular contact with the individual Management Board members.
KEY ITEMS OF DISCUSSION AT THE SUPERVISORY BOARD MEETINGS IN THE 2016 FINANCIAL YEARA total of nine Supervisory Board meetings were held in the 2016 financial year, whereby four meetings were conducted by tele-phone. With the exception of two meetings, all Supervisory Board members were present at all meetings. In urgent cases occurring outside of meetings, the Supervisory Board passed resolutions by written procedure.
In addition to the above, a one-day strategy meeting took place between the Management Board and the Supervisory Board in July 2016 that primarily addressed • the Company’s strategic focus; and • the further development of the Company’s product portfolio and
its impact on the net assets, financial position and results of operations.
During the 2016 financial year, the Supervisory Board paid partic-ular attention to the following topics and passed resolutions on these topics after a thorough review and discussion: • the evaluation of the Company’s achievement of the 2015 finan-
cial year corporate targets, an interim review and minor adjust-ment to the corporate targets defined by the Supervisory Board at the end of 2015 for the 2016 financial year and defining the corporate targets for the 2017 financial year;
• the filing of a patent infringement lawsuit by MorphoSys against Janssen Biotech and Genmab A/S, seeking compensation for the infringing manufacture, use and sale of Janssen’s and Genmab daratumumab’s antibody directed against CD38;
• the agenda and proposed resolutions for the 2016 Annual General Meeting;
• the conclusion of a strategic partnership with MD Anderson Cancer Center for the research and the development of thera-peutic antibodies against cancer;
• the conclusion of the strategic alliance with LEO Pharma for the development of therapeutic antibodies for the treatment of skin diseases;
• the execution of a capital increase from authorized capital in which a total of 2,622,088 new shares were issued to institu-tional investors in Europe and North America in the context of a private placement;
• the budget for the 2017 financial year.
146 A D D I T I O N A L I N F O R M AT I O N Report of the Supervisory Board

We also passed a resolution in the Supervisory Board plenum on the remuneration of Management Board members for the period July 1, 2016 to June 30, 2017 taking external benchmarking into consideration. We evaluated the achievement of the 2015 corporate targets that were agreed with the Management Board and dealt with the corporate targets for 2016. We commissioned an indepen-dent remuneration consultant to confirm the appropriateness of the Management Board’s compensation and its comparison to the remuneration of various levels of employees. We discussed and adopted the key performance indicators for the long-term incen-tive plans for both the Management Board and the Senior Manage-ment Group. We also drafted and adopted new management board agreements for Dr. Simon Moroney, Jens Holstein and Dr. Marlies Sproll. The new management board agreements will take effect on July 1, 2017, directly following the expiration of the current man-agement board agreements and will run for a term of three years. We have also appointed Dr. Malte Peters as a new member of the Management Board and Chief Development Officer effective March 1, 2017 and have drawn up and approved a corresponding manage-ment board agreement. His first term of office will end on June 30, 2019. The former Chief Development Officer, Dr. Arndt Schottelius, has resigned as management board member with effect February 28, 2017.
Furthermore, we approved the financial statements for the 2015 financial year and the Management Board’s proposal for the appro-priation of profits. We also dealt with the Corporate Governance Report as well as the Statement on Corporate Governance.
The focus of our regular discussions in the Supervisory Board’s plenary meetings were MorphoSys’s revenue and earnings devel-opment, the financial reports, the progress of the two business segments Partnered Discovery and Proprietary Development, the results and progress of the clinical programs for the development of proprietary drugs, the future development strategy and the de-velopment of new technologies. In addition, we discussed the re-sults of the efficiency review of the Supervisory Board’s work in 2016 that was conducted by an external consultant and evaluated possibilities for improvement. And finally, we kept ourselves regu-larly informed with respect to the Company’s cash investment pol-icy, risk management, internal audit results, internal control sys-tem and compliance management system.
CONFLICTS OF INTEREST IN THE SUPERVISORY BOARDIn the 2016 financial year, a potential conflict of interest within the Supervisory Board arose regarding a possible transaction that was not pursued any further. As a precautionary measure, the affected Supervisory Board member did not take part in the discussion of this issue.
ACTIVITIES AND MEETINGS OF SUPERVISORY BOARD COMMITTEESTo ensure that its duties are performed efficiently, the Supervisory Board has established three committees – the Audit Committee, the Remuneration and Nomination Committee and the Science and Technology Committee – to prepare the issues that fall within the Supervisory Board’s respective areas of responsibility for the Supervisory Board plenum. In each Supervisory Board meeting, the chairs of the committees report to the Supervisory Board on the committees’ work. The minutes of the committee meetings are made available to all Supervisory Board members. The composi-tion of these committees can be found in the “Statement on Corpo-rate Governance,” which is available on the Company’s website under the heading “Media & Investors > Corporate Governance > Statement on Corporate Governance,” and in the Annual Report on pages 71 to 76.
The Audit Committee met on six occasions in the 2016 financial year (three of those meetings were held by telephone). With the exception of three meetings, all committee members were present at all meetings. The committee dealt mainly with accounting issues, quarterly reports, financial statements and consolidated financial statements. The committee discussed these topics with the Man-agement Board and recommended the approval of the statements to the Supervisory Board. The auditor took part in three Audit Committee meetings and informed its members of the audit re-sults. The Audit Committee also made a recommendation to the Supervisory Board with respect to the Supervisory Board’s pro-posal at the Annual General Meeting for the election of the inde-pendent auditor. The committee also dealt with the risk manage-ment system, the outcome of the internal audit conducted in the 2016 financial year and specific reporting issues under interna-tional accounting rules (IFRS) that are or will become relevant for the Company. The committee regularly offered advice pertaining to the Company’s cash investment policy and reviewed the Man-agement Board’s investment recommendations.
To increase efficiency, there is a common Remuneration and Nomination Committee, in which the committees fulfill their re-spective roles. The committee met on fourteen occasions in the 2016 financial year (ten of those meetings held by telephone). With the exception of two meetings, all committee members were pres-ent at all meetings. In its function as a remuneration committee, the Remuneration and Nomination Committee mainly dealt with the Management Board’s remuneration system and level of com-pensation. In this context, the committee also commissioned an independent remuneration expert with the task of preparing a Management Board remuneration report to verify the appropri-ateness of the Management Board’s remuneration. Based on this report, the committee prepared a recommendation as to the fu-ture structure of the Management Board’s compensation and
Report of the Supervisory Board A D D I T I O N A L I N F O R M AT I O N 147

submitted this to the Supervisory Board for approval. In doing so, the committee also dealt with the ratio of compensation between the Management Board and the Senior Management Group and the staff overall and had this ratio reviewed by the commissioned re-muneration expert. This expert confirmed the appropriateness of the “vertical” compensation ratios. In addition, the committee gave careful consideration to the corporate targets as a basis for the Management Board’s short-term variable remuneration and offered appropriate recommendations to the Supervisory Board for resolution. The committee discussed the key performance indica-tors for the Management Board’s and Senior Management Group’s long-term incentive plans. In its role as a nomination committee, this committee addressed the re-appointment of Management Board members Dr. Simon Moroney, Jens Holstein and Dr. Marlies Sproll, and the appointment of Dr. Malte Peters as a new member of the Management Board. The committee also drafted the related management board agreements to be proposed by the Supervisory Board for resolution. In relation to the appointment of Dr. Malte Peters as a member of the Management Board, the Nomination Committee commissioned a recruitment agency to offer profes-sional support in the search for a suitable Management Board can-didate and, in consultation with the Supervisory Board, developed a list of candidate requirements and conducted the respective in-terviews with suitable candidates. In addition, the Nomination Committee dealt with the preparations for the election of a new Supervisory Board member in the framework of the Annual Gen-eral Meeting 2017, which became necessary as a result of the early resignation of Ms. Karin Eastham for personal reasons taking effect at the end of the 2017 Annual General Meeting. In this con-text, the Nomination Committee commissioned a recruitment agency to offer professional support in the search for suitable new Supervisory Board candidates and, in consultation with the Super-visory Board, developed a list of requirements that a candidate should possess in order to be nominated to the Supervisory Board. The Nomination Committee also conducted interviews with Super-visory Board candidates and submitted its recommendation for the new Supervisory Board nomination to be proposed at the Annual General Meeting, with which the Supervisory Board agreed. Super-visory Board members Dr. Frank Morich, Mr. Klaus Kühn and Ms. Wendy Johnson, whose terms of office are set to expire at the end of the 2017 Annual General Meeting, will stand for reappoint-ment for another term.
The Science and Technology Committee met on eight occasions during the 2016 financial year (three of those meetings were held by telephone). With the exception of one meeting, all committee members were present at all meetings. This committee dealt
mainly with the progress and expansion of the Company’s port-folio, the development of new technologies and the Company’s drug development plans including the required budget resources. The discussions focused on the initiation of new development pro-grams, the results of ongoing clinical studies for the development of proprietary drug candidates, development plans for current and planned clinical studies as well as the development strategy. The committee addressed the production of clinical trial materials for the Company’s proprietary drug candidates, the competitive and patent situations of the Company’s proprietary product candidates and discussed the Management Board’s recommendations on strengthening the portfolio. The Science and Technology Commit-tee also dealt with the patent infringement lawsuit against Janssen Biotech and Genmab A/S.
CORPORATE GOVERNANCEThe Supervisory Board devoted its attention to the further develop-ment of MorphoSys’s corporate governance taking into consider-ation the Code’s amendments made by the Government Commission German Corporate Governance Code in May 2015. The detailed Corporate Government Report, including the Corporate Gover-nance Statement according to Sec. 289a HGB (German Commercial Code), can be found on the Company’s website under the heading “Media & Investors > Corporate Governance > Corporate Gover-nance Report” and in the Annual Report on pages 71 – 93.
We also discussed with the Management Board the Company’s compliance with the Code’s recommendations and in one justified case approved an exception to the Code’s recommendations. Based on this consultation, the Management Board and the Supervisory Board submitted the annual Declaration of Conformity on Decem-ber 2, 2016. The current version of the annual Declaration of Con-formity can be found in this Annual Report and is permanently available to MorphoSys’s shareholders on the Company’s website under the heading “Media & Investors > Corporate Governance > Declaration of Conformity.”
CHANGES IN THE COMPOSITION OF THE MANAGEMENT BOARD AND SUPERVISORY BOARDThere were no changes in the composition of the Management Board in the reporting period. With effect from March 1, 2017, Dr. Malte Peters was newly appointed as a member of the Man-agement Board and Chief Development Officer. The former Chief Development Officer, Dr. Arndt Schottelius, has resigned as man-agement board member with effect February 28, 2017.
148 A D D I T I O N A L I N F O R M AT I O N Report of the Supervisory Board

There were no changes in the composition of the Supervisory Board in the reporting period. Ms. Karin Eastham has, however, resigned for personal reasons from her office as member of the Supervisory Board as of the 2017 Annual General Meeting.
AUDIT OF THE FINANCIAL STATEMENTSFor the 2016 financial year, the Company commissioned Price-waterhouseCoopers GmbH Wirtschaftsprüfungsgesellschaft, Munich (“PwC”) as its auditor. The audit contract was awarded by the Supervisory Board in accordance with the resolution of the Annual General Meeting on June 2, 2016. In accordance with Item 7.2.1 of the Code, the Supervisory Board obtained a declaration of indepen-dence from the auditor in advance.
The financial statements and the consolidated financial statements of MorphoSys AG, as well as the Management Report and Group Management Report for the 2016 financial year, were properly audited by PwC and issued with an unqualified Auditor’s Report. The key topics of the audit for the consolidated and separate finan-cial statements for the 2016 financial year were the capital in-crease executed in November 2016, the presentation and valuation of cash investments, the valuation of the carrying amounts of goodwill and intangible assets with indefinite useful lives, the pre-sentation and valuation of the stock option programs, the calcula-tion of current and deferred taxes, the revenue recognition and the completeness and accuracy of the Notes.
In addition, the auditor confirmed that the Management Board has established an appropriate reporting and monitoring system that is suitable in its design and administration for the early detection of developments that could threaten the Company’s existence.
The audit reports and documents relating to the financial state-ments and consolidated financial statements were provided on a timely basis to all Supervisory Board members for review. The audit report, the consolidated financial statements, the Group Management Report of the MorphoSys Group and the audit report, the annual financial statements and the Management Report of MorphoSys AG were discussed in detail at the Audit Committee meeting on March 6, 2017 and the meeting of the Supervisory Board on March 7, 2017. The auditor attended all meetings con-cerning the financial statements and reported on the key results of his audit. The auditor also explained the scope and focus of the audit and was available to the Audit Committee and the Super-visory Board to answer questions and provide further information.
The Audit Committee discussed the audit results in detail and rec-ommended to the Supervisory Board that it approve the financial statements prepared by the Management Board. The Supervisory Board also took note of the audit results and, in turn, reviewed the financial statements and management reports in accordance with the statutory provisions. Following its own examination, the Super-visory Board also determined that it sees no cause for objection. The financial statements and consolidated financial statements prepared by the Management Board and reviewed by the auditor, as well as the Management Report and Group Management Report, were subsequently approved by the Supervisory Board. Thus, the financial statements were adopted.
RECOGNITION FOR DEDICATED SERVICEOn behalf of the entire Supervisory Board, I would like to thank the members of the Management Board and the employees of MorphoSys for their achievements, their dedicated service and the inspirational work environment witnessed during this past finan-cial year. Through their efforts, MorphoSys’s portfolio has contin-ued to mature and expand, and important milestones have been achieved.
The Supervisory Board would also like to take this opportunity to thank the outgoing Management Board member, Dr. Arndt Schottelius, for his outstanding contribution and commitment. The Supervisory Board also thanks Supervisory Board member Ms. Karin Eastham for her commitment and constructive coopera-tion. Ms. Eastham will terminate her office at the end of the 2017 Annual General Meeting.
Planegg, March 7, 2017Dr. Gerald MöllerChairman of the Supervisory Board
Report of the Supervisory Board A D D I T I O N A L I N F O R M AT I O N 149

member of the supervisory board of:4sigma, Inc.*, Bermuda (Chairman of the Board of Directors)
Adrenomed AG, Germany (Member of the Supervisory Board)
Ayoxxa Biosystems GmbH*, Germany (Chairman of the Advisory Board)
Invendo Medical GmbH*, Germany (Chairman of the Advisory Board)
member of the supervisory board of:Moleac Pte. Ltd.*, Singapore (Member of the Board of Directors)
DR. GERALD MÖLLER Chairman, Heidelberg, Germany
* Membership in comparable domestic and foreign supervisory boards of commercial enterprises.
no other supervisory board memberships
DR. FRANK MORICH Deputy Chairman, Berlin, Germany
DR. MARC CLUZELBoard Member, Montpellier, France
Supervisory Board of MorphoSys AG
150 A D D I T I O N A L I N F O R M AT I O N Supervisory Board of MorphoSys AG

member of the supervisory board of:Geron Corp.*, USA (Member of the Board of Directors)
Illumina, Inc.*, USA (Member of the Board of Directors)
Veracyte, Inc.*, USA (Member of the Board of Directors)
member of the supervisory board of:AmpliPhi Biosciences Corp.*, USA (Member of the Board of Directors)
member of the supervisory board of:Flossbach von Storch AG, Germany (Chairman of the Supervisory Board)
Hella KGaA Hueck & Co.*, Germany (Member of the Supervisory Board,
Member of the Shareholders’ Committe)
KARIN EASTHAMBoard Member, Rancho Santa Fe, CA, USA
WENDY JOHNSONBoard Member, San Diego, CA, USA
KLAUS KÜHNBoard Member, Grevenbroich, Germany
Supervisory Board of MorphoSys AG A D D I T I O N A L I N F O R M AT I O N 151

Senior Management Group of MorphoSys AG
SASCHA ALILOVIC Head of Corporate Finance &
Corporate Development
MARTIN CLARK Head of Central Purchasing & Logistics
KLAUS DE WALL Head of Accounting & Tax
SILVIA DERMIETZEL Head of Human Resources
DR. MARKUS ENZELBERGER Head of Discovery Alliances &
Technologies
DR. GUDRUN GATZ-MACK Head of Clinical Operations
DR. STEFFEN HEEGER Head of Clinical Development
DR. GABRIELE ELBL Head of Regulatory Affairs
DR. BERND HUTTER Head of Intellectual Property
DR. BARBARA KREBS-POHL Head of Business Development &
Portfolio Management
ANKE LINNARTZ Head of Corporate Communications &
Investor Relations
DR. MARKUS LANG Head of Project Management
152 A D D I T I O N A L I N F O R M AT I O N Senior Management Group of MorphoSys AG

CHARLOTTE LOHMANN General Counsel
DR. STEFAN STEIDL Head of Preclinical Development
DR. RALF OSTENDORPHead of Protein Sciences & CMC
LARA SMITH WEBER Head of Controlling
STEFFEN POHLENZ Head of IT
DR. ARMIN WEIDMANN Head of Compliance &
Quality Assurance
DR. DOMINIKA WEINELT Head of Drug Safety &
Pharmacovigilance
DR. HARALD WATZKA Head of Alliance Management
DR. GÜNTER WELLNHOFER Head of Technical Operations
Senior Management Group of MorphoSys AG A D D I T I O N A L I N F O R M AT I O N 153
AADC – Antibody drug conjugate; a tumor growth-inhibit-ing substance (cytostatic) that is coupled to an antibody to attack tumors in an even more targeted manner
ADCC – Antibody-dependent cell-mediated cytotoxicity; a mechanism of cell-mediated immunity whereby an effector cell of the immune system actively destroys a target cell that has been bound by specific antibodies
ADCP – Antibody-dependent cellular phagocytosis
ALL – Acute lymphoblastic leukemia; a form of cancer of the white blood cells characterized by excess lymphoblasts
Antibody – Proteins of the immune system that recognize antigens, thereby triggering an immune response
Antibody library – A collection of genes that encode corresponding human antibodies
Antigen – Foreign substance stimulating antibody pro-duction; binding partner of antibody
Autoimmune disease – Disease caused by an im-mune response by the body against one of its own tissues, cells or molecules
BB-ALL – Acute lymphoblastic B cell leukemia, blood cancer affecting white blood cells, subform of ›› ALL
B cells – white blood cells, part of the immune system, capable of generation antibodies
B-MIND – Study to evaluate Bendamustine-MOR208 IN DLBCL
Biosimilars – Term used to describe officially approved new versions of innovator biopharmaceutical products, following patent expiration
Bispecific – Antibody consisting of parts from two different antibodies
CCAR-T technology – New therapeutic approach in which immune cells are reprogrammed
Cash flow – Key performance indicator in the cash flow statement used to assess the financial and earning capacity
CD3 – Surface antigen on T cells
CD19 – Therapeutic target for the treatment of B cell lymphomas and leukemias
CD20 – Therapeutic target for the treatment of B cell lymphomas and leukemias
CD38 – Therapeutic target for the treatment of multiple myeloma and certain leukemias
Clinical trial – Clinical trials allow safety and efficacy data to be collected for new drugs or devices; depending on the type of product and the stage of its development, investigators enroll healthy volunteers and/or patients into small pilot studies initially, followed by larger-scale studies in patients
CLL – Chronic lymphocytic leukemia; most common type of cancer of the blood and bone marrow, affecting the B cells
CMO – Contract manufacturing organization
COPD – Chronic obstructive pulmonary disease
COSMOS – CLL patients assessed for ORR / Safety in MOR208 Study
CR – Complete response
CRO – Contract research organization
CTO – Contract testing organization
DDiabetic nephropathy – Kidney disease due to dia-betes mellitus
Discounted cash flow model – Method of valuing assets, especially for due diligence
DLBCL – Diffuse large B cell lymphoma, a subform of ›› NHL
DoR – duration of response
EEGFR – Epidermal growth factor receptor; cell-surface receptor for members of the epidermal growth factor family (EGF-family) of extracellular protein ligands; the epidermal growth factor receptor is a receptor tyrosine kinase
EMA – European Medicines Agency
FFab format – The antigen binding fragment of the antibody
Fc part – Constant part of an antibody known as the Fc (fragment, crystallizable) region
FDA – Food and Drug Administration; US federal agency for the supervision of food and drugs
FL – Follicular lymphoma, a subform of ›› NHL
Glossary
154 A D D I T I O N A L I N F O R M AT I O N Glossary
GGCP – Good clinical practice; an inter national ethical and scientific quality standard for designing, conduct-ing, recording and reporting trials that involve the par-ticipation of human subjects
GLP – Good laboratory practice; a formal framework for the implementation of safety tests on chemical products
GM-CSF – Granulocyte-macrophage colony-stimulating factor; underlying target molecule of MOR103 program
GMP – Good manufacturing practice; term for the control and management of manufacturing and quality control testing of pharmaceutical products and medical devices
HHuCAL – Human Combinatorial Antibody Library; pro-prietary antibody library enabling rapid generation of specific human antibodies for all applications
Human – Of human origin
IIFRS – International Financial Reporting Standards; accounting standards issued by the IASB and adopted by the EU
IIT – Investigator initiated trial
Immuno-oncology – New class of compounds that stimulate the immune system to attack tumors
Inclusion body myositis – Inflammatory muscle disease (›› sIBM)
Innovation Capital – Investments in start-ups with technologies and product candidates being close to MorphoSys’s areas of interest
LLanthipeptides – Novel class of therapeutics with high target selectivity and improved drug-like properties
L-MIND – Study to evaluate Lanalidomide-MOR208 IN DLBCL
MMarket capitalization – Value of a com pany’s out-standing shares, as measured by shares times current price
MCL – Mantle cell lymphoma, a subform of ›› NHL
mCRPC – Metastatic castration-resistant prostate cancer
Mesothelioma – Diffusely growing tissue tumor affect-ing for example the pleura
Monoclonal antibody – Homogeneous antibody origin ating from a single clone, produced by a hybrid-oma cell
Multiple myeloma – Type of cancer that develops in a subset of white blood cells called plasma cells formed in the bone marrow; abbreviation: MM
NNasdaq Biotech Index – Stock market index made up of biotechnological or pharmaceutical companies list ed at the US stock exchange NASDAQ
NHL – Non-Hodgkin’s lymphoma; diverse group of blood cancers that include any kind of lymphoma except Hodgkin’s lymphoma
NK cells – Natural killer cells of the body’s immune sys-tem; cells capable of recognizing and killing abnormal cells, e.g. tumor cells
OORR – Overall response rate
OS – Overall survival
PPalmoplantar pustulosis – Psoriasis on hands and feet
Pediatric study – A study conducted in the area of children and adolescent medicine
PFS – Progression-free survival
Pharmacodynamics – Study of the effects of drugs on the body
Pharmacokinetics – Determination of the fate of sub-stances administered externally to a living organism
PR – Partial response
Preclinic – Preclinical stage of drug development; tests in animal models as well as in laboratory essays
Protein – Polymer consisting of amino acids, e. g. anti-bodies and enzymes
Psoriasis – A chronic, non-contagious autoimmune disease which affects the skin and joints
Psoriatic arthritis (PsA) – Chronic joint inflamma-tion that occures in connection with psoriasis
GL OSSAR Y R- Y
Glossary A D D I T I O N A L I N F O R M AT I O N 155

RRheumatoid arthritis – Inflammatory disease of the joints; abbreviation: RA
Royalties – Percentage share of ownership of the rev-enue generated by drug products
SScaffolds – Proteins with antibody - like capabilities
sIBM – Sporadic ›› inclusion body myositis, inflammatory muscle disease
SLL – Small lymphocytic lymphoma
Slonomics – DNA engineering and protein library gene ration platform acquired by MorphoSys in 2010
Small molecules – Low molecular compounds
SOP system – SOP = standard operating procedure
TTarget – Target molecule for therapeutic intervention, e.g. on the surface of diseased cells
Target molecule selectivity – Criteria to describe to what degree an antibody binds to other structures be-sides its target molecule
Target product profile (TPP) – Summary of specifi-cations on a planned therapeutic product
T cells – An abbreviation for T-lymphocytes; a sub type of white blood cells that together with B-lympho cytes are responsible for the body’s immune defense
TecDAX – Index of the 30 largest technology companies listed on the Frankfurt Stock Exchange
TTP – Time to progression
Toxicity – Poisonousness
YYlanthia – The novel next-generation antibody plat-form of MorphoSys
Glossary
156 A D D I T I O N A L I N F O R M AT I O N Glossary

List of Figures and Tables
Figures
Tables
01 Revenues of the MorphoSys Group by Segment 2402 MorphoSys’s Product Pipeline 2603 Active Clinical Studies with MorphoSys Antibodies 2804 Total Headcount of the MorphoSys Group 3205 Revenues of the MorphoSys Group by Region 3606 Revenues Proprietary Development and Partnered
Discovery 3607 Selected R&D Expenses 3808 Distribution of R&D Expenses 38
09 Performance of the MorphoSys Share in 2016 5010 Performance of the MorphoSys Share 2012–2016 5011 Occupational Safety at MorphoSys 5712 Quality Management System at MorphoSys 5813 Employees by Gender 6014 Seniority 6015 Workforce Turnover Rate 6016 Risk and Opportunity Management System at MorphoSys 6317 Compliance Management System (CMS) 88
01 Development of Financial Performance Indicators 2002 Sustainable Development Key Performance Indicators
(SD KPIs) at MorphoSys 2103 Multi-Year Overview – Income Statement 4004 Multi-Year Overview – Financial Situation 4105 Multi-Year Overview – Balance Sheet Structure 4306 Comparison of Actual Business Results Versus Forecasts 4407 Key Data for the MorphoSys Share 5208 MorphoSys AG Shareholder Structure 5309 Analyst Recommendations 54
10 Summary of Key Short- and Medium-Term Risks at MorphoSys 70
11 Summary of Key Long-Term Risks at MorphoSys 7012 Composition of the Supervisory Board 7313 Participation of Supervisory Board Members 7414 Compensation of the Management Board in 2016 and 2015 8015 Compensation of the Supervisory Board in 2016 and 2015 8316 Directors’ Holdings 8417 Directors’ Dealings 86
List of Figures and Tables A D D I T I O N A L I N F O R M AT I O N 157

Imprint
MorphoSys AGSemmelweisstrasse 782152 PlaneggGermany Phone: +49-89-89927-0Fax: +49-89-89927-222Email: [email protected]
Corporate Communications and Investor RelationsPhone: +49-89-89927-404Fax: +49-89-89927-5404Email: [email protected]
Concept and Design3st kommunikation GmbH, Mainz
Photography/Picture CreditsAndreas Pohlmann, MunichMatthias Haslauer, HamburgGetty Images
TranslationKlusmann Communications, Niedernhausen
Editorial OfficeApostroph, Hamburg
Typesetting and LithographyKnecht GmbH, Ockenheim
PrinterWoeste Druck + Verlag GmbH & Co. KG, Essen-Kettwig
Copy DeadlineMarch 7, 2017 (except financial statements)
This financial report is also published in German and is available for download from our website (PDF, HTML).
HuCAL®, HuCAL GOLD®, HuCAL PLATINUM®, CysDisplay®, RapMAT®, arYla®, Ylanthia®, 100 billion high potentials®, Slonomics®, Lanthio Pharma® and LanthioPep® are registered trademarks of the MorphoSys Group.
158 A D D I T I O N A L I N F O R M AT I O N Imprint

Key Figures (IFRS)MorphoSys Group (in million €, if not stated otherwise)
12/31/16 12/31/15 12/31/14 12/31/13 12/31/12 12/31/11 12/31/10 12/31/09 12/31/08 12/31/07
RESULTS1 Revenues 49.7 106.2 64.0 78.0 51.9 82.1 87.0 81.0 71.6 62.0
Cost of Goods Sold 0.0 0.0 0.0 0.0 0.0 0.0 7.3 6.7 7.1 7.9
R&D Expenses 95.7 78.7 56.0 49.2 37.7 55.9 46.9 39.0 27.6 22.2
SG&A Expenses 14.1 15.1 14.1 18.8 12.1 14.9 23.2 23.9 20.5 24.8
Personnel Expenses (Excluding Stock-Based Compensation) 33.7 32.4 26.7 27.4 24.1 27.7 29.6 26.1 21.5 18.8
Capital Expenditure 2.9 8.8 20.5 5.6 1.8 2.9 13.8 3.8 3.8 12.0
Depreciation of Tangible Assets 1.8 1.5 1.4 1.5 1.7 1.7 2.1 1.6 1.5 1.5
Amortization of Intangible Assets 2.0 1.9 2.7 3.3 3.5 3.8 4.0 3.8 4.8 3.7
EBIT (59.9) 17.2 (5.9) 9.9 2.5 9.8 13.1 12.8 16.5 8.3
Net Profit/(Loss) (60.4) 14.9 (3.0) 13.3 1.9 8.2 9.2 9.0 13.2 11.5
Net Profit/(Loss) from Discontinued Operations – – – 6.0 (0.4) 0.0 – – – –
BALANCE SHEET Total Assets 463.6 400.1 426.5 447.7 224.3 228.4 209.8 206.1 203.3 184.7
Cash, Marketable Securities and Other Financial Assets 359.5 298.4 352.8 390.7 135.7 134.4 108.4 135.1 137.9 106.9
Intangible Assets 67.9 79.6 46.0 35.1 35.0 66.0 69.2 17.4 19.7 22.3
Total Liabilities 48.1 37.3 77.7 95.5 22.3 31.3 23.9 32.2 41.3 39.2
Stockholders’ Equity 415.5 362.7 348.8 352.1 202.0 197.1 185.9 173.9 162.0 145.5
Equity Ratio (in %) 90 % 91 % 82 % 79 % 90 % 86 % 89 % 84 % 80 % 79 %
MORPHOSYS SHARE Number of Shares Issued 29,159,770 26,537,682 26,456,834 26,220,882 23,358,228 23,112,167 22,890,252 22,660,557 22,478,787 22,160,259
Group Earnings/(Loss) per Share, Diluted (in €) (2.27) 0.57 (0.12) 0.54 0.08 0.36 0.40 0.40 0.59 0.53
Dividend (in €) – – – – – – – – – –
Share Price (in €) 48.75 57.65 76.63 55.85 29.30 17.53 18.53 17.04 18.75 16.10
PERSONNEL DATA Total Group Employees (Number2) 345 365 329 299 421 446 464 404 334 295
1 Due to the agreement between Bio-Rad and MorphoSys, signed in December 2012, to acquire substantially all of the AbD Serotec segment, for the years 2013, 2012 and 2011, revenues, income and expenses in connection with the transaction are shown in the line item “Net Profit/(Loss) from Discontinued Operations.” All other line items consist of amounts from continuing operations.
2 2007 to 2012 including employees from the discontinued operations of AbD Serotec.

Annu
al R
epor
t 20
16
Mor
phoS
ys A
G
March 9publ icat ion of 20 16 ye ar - end results
May 3publication of first quarter interim statement 2017
November 7publication of third quarter interim statement 2017
May 1720 17 annual gener almeet ing in munich
August 3publ icat ion of 20 17 half -ye ar report
MorphoSys AGSemmelweisstrasse 782152 PlaneggGermanyPhone: +49-89-89927-0Fax: +49-89-89927-222www.morphosys.com
Financial Calendar 2017