annual report 2016 - griffith.edu.au · governance 8 other governance ... griffith university -...
TRANSCRIPT

Annual Report 2016

Contents
Chancellor and Vice Chancellor’s Report 1
Letter of Compliance 6
Organisational Structure 7
Governance 8
Other Governance Reports 12
Research 18
Learning and Teaching and theStudent Experience 34
Financial Summary 52
Financial Statements 55
Appendix: Indicators and Targets 109
Glossary 123
Campus Locations 154
The following sections will be reported separately online (not within this report):
• Consultancies
• Overseas Travel
Please access at griffith.edu.au/annual-report or on the Queensland Government Open Data website at qld.gov.au/data
Vision
Our vision is to be one of the most influential universities in Australia and the Asia–Pacific region.
Mission
The mission of Griffith University is to engage in outstanding scholarship that makes a major contribution to society and to produce groundbreaking research. Students will be provided with an excellent education and the capacity to use knowledge gained to exercise influence and make meaningful lifelong contributions to their communities.
Statement of Values and Commitments
In pursuit of our vision and mission, the University is committed to:
• Rigorous standards of scholarship
• Positively influencing our communities through our teaching, research and scholarly activities
• Recognising our location in the Asia–Pacific and deepening our engagement with the region
• Bringing disciplines together to address the key issues of our time
• Promoting the respect of individual rights and ethical standards
• Participatory decision making and problem solving
• Contributing to a robust, equitable and environmentally sustainable society
• Recognising and valuing diversity
• Recognising the unique place of First Peoples in Australian history and culture, and enabling their continued contribution to the nation.
Griffith University is committed to providing accessible services to people from all culturally and linguistically diverse backgrounds. If you require assistance to understand the annual report, you can contact the Office of Marketing and Communications on +61 7 3735 6741 to arrange an interpreter to effectively communicate the report to you.

Griffith University - Annual Report 2016 1
Strategic Overview
External Environment
The Australian Government announced its 2016–2017 budget on 3 May 2016, with a number of key measures affecting the higher education sector including:
• a 12-month delay to the introduction of higher education changes (to 1 January 2018)
• the removal of the efficiency dividend (restoring $1.2 billion)
• the ruling out of full deregulation of student fees
• the introduction of $12 million to support implementation of National Strategy for International Education
• a cut to the Higher Education Participation and Partnerships Programme ($152 million)
• the abolition of the Office of Learning & Teaching, but retainment of the learning and teaching awards ($18 million).
In May, the Minister for Education and Training, Senator the Hon Simon Birmingham, released the options paper ‘Driving Innovation, Fairness and Excellence in Australian Higher Education’, outlining potential higher education policy reforms. The paper canvassed options on a wide range of issues including the operation of the demand driven system and future funding arrangements. The Minister subsequently appointed an expert panel to review submissions to the discussion paper. The panel’s report and the Government’s response are expected in the first half of 2017.
During 2016, there was robust debate about university admissions practices, in particular the use of the Australian Tertiary Admission Rank (ATAR). In February, Minister Birmingham asked the Higher Education Standards Panel to provide advice on options to improve the transparency of domestic higher education student admissions policies.
In April, the panel released a consultation paper ‘Higher Education Standards Panel—Consultation on the Transparency of Higher Education Admissions Processes’. The panel called for public submissions to the paper on how to improve the information available and the understanding of prospective students and their families about admission requirements.
Chancellor and Vice Chancellor’s Report
Professor Ian O’Connor Vice Chancellor and President
Mr Henry Smerdon AM DUniv Chancellor
2 Griffith University - Annual Report 2016
On 16 November, the Minister released the panel’s admissions transparency report in his keynote speech to the Australian Financial Review Higher Education Summit in Melbourne. The Minister indicated in his speech that the Government supports the intent of the recommendations and will respond in due course.
The higher education sector supports the recommendations that will create a more transparent and coherent higher education admissions system that places prospective students squarely at the centre. The recommendations strike the right balance by strengthening information standardisation and consistency, while respecting the autonomy of universities to determine the mechanisms and criteria for student admissions.
The Griffith 2020 Agenda
Griffith University’s Strategic Plan covers the period 2013–2017. The current phase of the plan is known as Griffith 2020, which is a multi-faceted project backed by a fund of $60 million, encompassing teaching and learning, research, student scholarships and staff renewal.
In preparing for the implementation of several key elements of Griffith 2020 in 2017, the University has undertaken major structural and curricular changes in teaching and learning founded upon the four pillars of: flexibility; market-informed academic planning; engaged and relevant; and quality.
The University will provide students with greater flexibility by moving from two 13-week semesters to three 12-week trimesters in 2017. Sixteen major programs have been selected to run over the three trimesters, and nine of these have entry points in all three trimesters. It is estimated that more than half of Griffith’s students will be enrolled in one of these programs by 2019–2020.
In addition to the flexibility afforded by the introduction of trimesters, a significant number of programs have been redesigned to include a common first year, with students being able to delay their choice of specialisation of either major or program until second year. Programs include the Bachelor of Education, which is the first education degree in Australia in which both primary and secondary education students undertake a common foundation year.
As part of the Griffith 2020 agenda, the University has undertaken a process of market-informed academic planning with a comprehensive review of all undergraduate degrees. As a result, Griffith will commence offering the Bachelor of Engineering (Honours) in Civil Engineering at the Nathan campus, in addition to its offering at the Gold Coast. Plans are also in train to expand health offerings in Brisbane in 2018. As well as expanding its suite of double degrees across its campuses, Griffith will also increase its online offerings in 2017.
Griffith has also introduced a number of initiatives that are directed towards enhancing graduate employability, and ensuring students have the opportunity to be engaged with industry, through programs that are relevant to industry needs.
• All undergraduate students will have the opportunity to undertake a capstone project or experience by 2018. This is underway, with significantly increased opportunities for students to undertake a work-integrated learning (WIL) project, an industry placement, service learning, or a research project.
• Commencing in 2017, all students, including higher degree by research (HDR) students, will have access to an e-Portfolio to record their achievements both in the classroom and through other extracurricular activities.
• Griffith is the first Australian university to join UniTemps, the University of Warwick’s program that facilitates placement of students in part-time and casual paid employment, both on-campus and externally.
• In 2016, a trial of an e-mentoring platform was undertaken, which will, in 2017, significantly expand the number of mentoring opportunities for students.
• The University has refurbished teaching spaces to promote project-based learning, particularly in business and engineering.
• Griffith is responding to student demand for access to programs in entrepreneurship and innovation through the three-day start-up program and a number of other cross-disciplinary innovation experiences. Expanding these opportunities will be a priority for 2017.
• Griffith continues to support a comprehensive global mobility program.
Chancellor and Vice Chancellor’s Report
Griffith University - Annual Report 2016 3
The fourth pillar of the Griffith 2020 strategy is to enhance the quality of our academic programs, through curriculum reform, technology-supported pedagogy and a focus on academic staff professional development.
Strategies to ensure continuous improvement in the quality of our teaching programs include:
• maintaining the well-established five-year review cycle for all schools, but with a greater focus on quality assurance and future strategic planning for 2017
• introducing a ‘Student Evaluation of Program’ survey designed to measure students’ perception of program-wide integration, development of graduate attributes and employability
• expanding technology-enhanced learning through self-help video recording studios, virtual and augmented reality capability, peer-to-peer learning platforms and support for ‘flipped’ classrooms
• better coordination of academic staff professional development activities between Human Resource Management and Learning Futures, Griffith’s academic development unit, with increased support for staff to upskill in innovative pedagogy and assessment, technology enhanced learning, using analytics and scholarship, as well as leadership and management
• piloting a Higher Education Academy (HEA) fellowship scheme in 2017 as a means of broadening recognition of staff achievements in learning and teaching. This will complement the activities of the well-established communities of practice, scholarly networks and internal award and grant schemes.
In the research domain, a key driver of strategy has been a program of investment that builds on our earlier Areas of Strategic Investment (ASI) program, targeted at development and expansion of world-leading research. We have now developed areas which are acknowledged as internationally excellent (top 200) and a small number that are considered world leading (top 20) benchmarked against relevant top-200 institutions. A program of 2020 Research investment builds ‘step change’ in performance of those existing ASIs.
In terms of research training, Griffith views the presence of a large and vibrant graduate research student community as an essential part of its research fabric. The University has substantially increased its HDR load over recent years as part of a targeted and sustained increase in internally funded PhD scholarships and also by increasing its share of Commonwealth-funded PhD students as a result of improved research performance. HDR load in 2016 is now at suitably high levels to support annual HDR completions of 300+ (completions for 2016 are estimated to be 340). Achieving this (from ‘pre-plan’ completions of typically less than 200) is the result of improved process around student administrative management, better engagement of academic groups and schools in progression management, skills training for both students and supervisors, and close alignment between scholarships and resource support, and areas of research strength for the University. The University will continue to engage with local and international partners in collaborative support of strategic HDR programs, and international recruitment of high quality students will remain a key component of meeting HDR commencement and load targets.
Griffith also made a decision to activate the recommendations of the Australian Council of Learned Academies (ACOLA) review into research training, in advance of the Commonwealth’s decision to accept all of the review recommendations. Our next steps involve the following initiatives:
• introducing the HDR Reconnect program to track the employment and career outcomes of all of our 2,400 PhD graduates
• collecting baseline data on current levels of industry engagement of HDR candidates at Griffith
• continued promotion of the Advance Queensland PhD Industry Experience Program to the Griffith HDR cohort and support of the Queensland Government’s Department of Science, Information Technology and Innovation in the continued development of this program
• developing an industry and other end-user mentoring program applicable to all HDR candidates to supplement existing regional schemes and the proposed national scheme
• promoting funding opportunities available for establishing industry–university collaborative projects in order to create HDR placement opportunities.
Chancellor and Vice Chancellor’s Report
4 Griffith University - Annual Report 2016
Chancellor and Vice Chancellor’s Report
2016 Overview
2016 was another very successful year for Griffith staff, students and alumni.
The Australian Awards for University Teaching Citations for Outstanding Contributions to Student Learning were announced by Senator the Hon Simon Birmingham, Minister for Education and Training, in September. National Citations are awarded to those who have made a significant contribution to the quality of student learning in a specific area of responsibility over a sustained period, whether they are academic staff, general staff, sessional staff or institutional associates. Citations were awarded to all six nominees from Griffith—the only university in Australia to be awarded the maximum number of citations. Currently, Griffith leads the country in the number of citations won since 2010 with 44. The next highest institution is the Queensland University of Technology (QUT) with 38.
In the other major national award scheme—the 2016 Australian Awards for University Teaching—two Griffith staff received Awards for Teaching Excellence. Two Griffith staff members were also successful in the 2016 Women in Technology Awards, while Griffith won an institutional award by being named 2016 Employer of Choice.
In 2016, the University was once again awarded the Employer of Choice for Gender Equality citation. This marks 16 consecutive years of recognition by the Workplace Gender Equality Agency, and its predecessor the Equal Opportunity for Women in the Workplace Agency. Griffith was one of just 15 universities and 106 organisations Australia-wide to have been recognised by the Agency for showing leadership in gender equality policies and practice. During 2016, Griffith strengthened its commitment to gender equality through participation in the Athena SWAN charter program, which will see the University develop an action plan to improve gender representation and diversity in our science, technology, engineering, mathematics and medicine (STEMM) disciplines.
During 2016, Griffith researchers figured prominently in articles appearing in the prestigious journal Nature— a number of which, such as research into the genomic history of First Australians, made world headlines. In addition, Griffith’s Chair in Rock Art Research, Professor Paul Taçon, was awarded one of 16 national 2016 Australia Research Council (ARC) Australian Laureate Fellowships. These highly prestigious awards support outstanding Australian and international researchers and research leaders to build Australia’s research capacity.
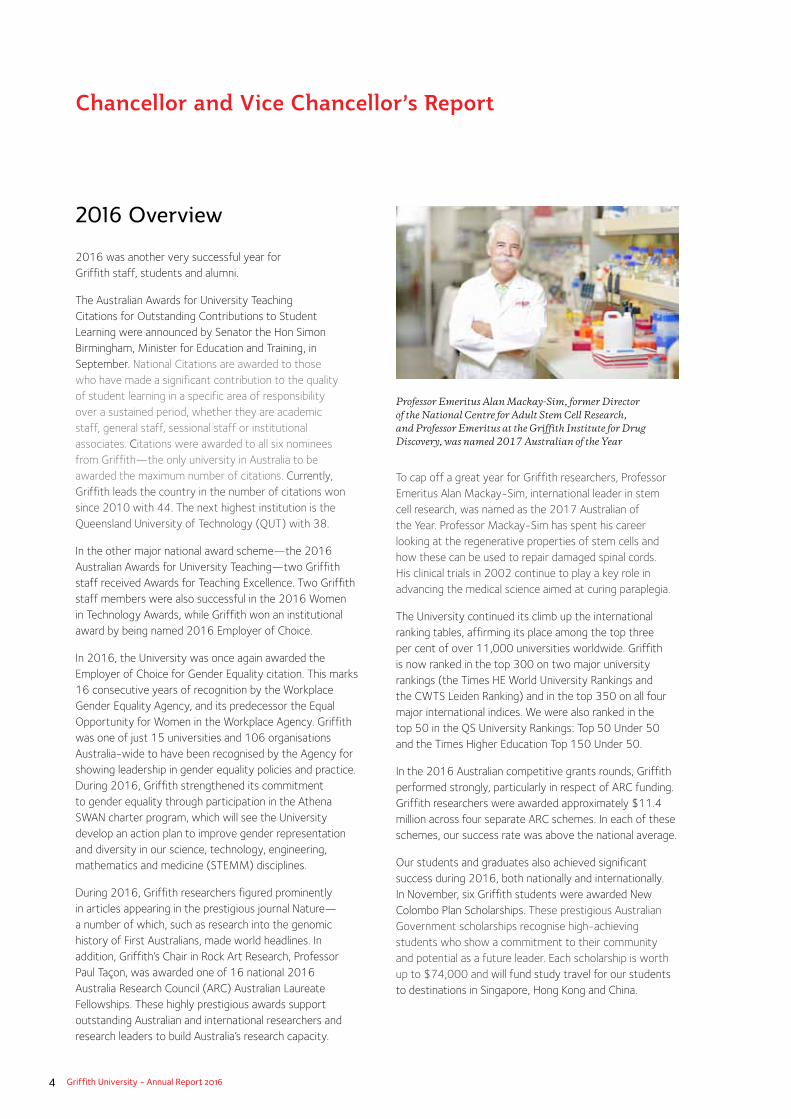
To cap off a great year for Griffith researchers, Professor Emeritus Alan Mackay-Sim, international leader in stem cell research, was named as the 2017 Australian of the Year. Professor Mackay-Sim has spent his career looking at the regenerative properties of stem cells and how these can be used to repair damaged spinal cords. His clinical trials in 2002 continue to play a key role in advancing the medical science aimed at curing paraplegia.
The University continued its climb up the international ranking tables, affirming its place among the top three per cent of over 11,000 universities worldwide. Griffith is now ranked in the top 300 on two major university rankings (the Times HE World University Rankings and the CWTS Leiden Ranking) and in the top 350 on all four major international indices. We were also ranked in the top 50 in the QS University Rankings: Top 50 Under 50 and the Times Higher Education Top 150 Under 50.
In the 2016 Australian competitive grants rounds, Griffith performed strongly, particularly in respect of ARC funding. Griffith researchers were awarded approximately $11.4 million across four separate ARC schemes. In each of these schemes, our success rate was above the national average.
Our students and graduates also achieved significant success during 2016, both nationally and internationally. In November, six Griffith students were awarded New Colombo Plan Scholarships. These prestigious Australian Government scholarships recognise high-achieving students who show a commitment to their community and potential as a future leader. Each scholarship is worth up to $74,000 and will fund study travel for our students to destinations in Singapore, Hong Kong and China.
Professor Emeritus Alan Mackay-Sim, former Director of the National Centre for Adult Stem Cell Research, and Professor Emeritus at the Griffith Institute for Drug Discovery, was named 2017 Australian of the Year
Griffith University - Annual Report 2016 5
Griffith alumnus, Chris Eigeland, was selected as Australia’s Youth Representative to the United Nations; Queensland Conservatorium alumnus Tim Munro won his third Grammy award (the only Australian to receive a Grammy in 2016); while fellow Conservatorium graduate Dami Im finished runner-up at the 2016 Eurovision Song Contest in Sweden.
Much of the success of 2016 was captured in the roll-out of Griffith’s new ‘Remarkable’ positioning campaign in September. The goal of this innovative campaign is to define the core essence of the University and to communicate this through a cohesive, consistent and compelling narrative across all our media channels.
Chancellor and Vice Chancellor’s Report
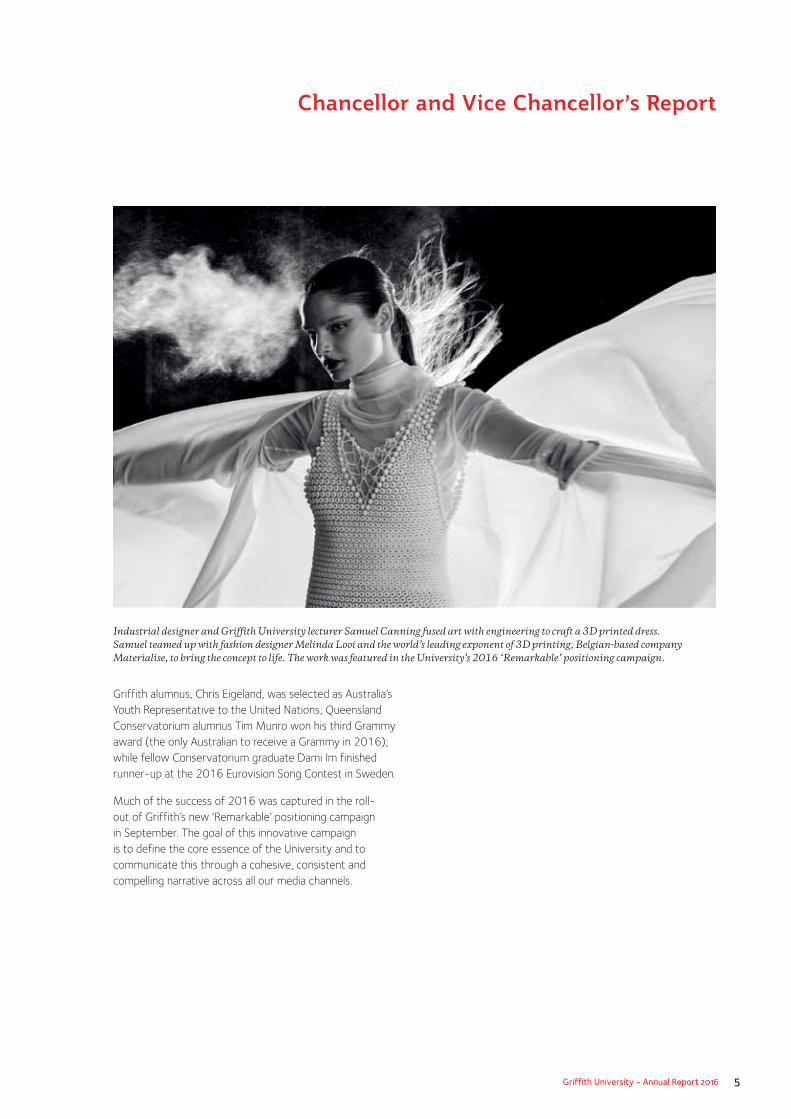
Industrial designer and Griffith University lecturer Samuel Canning fused art with engineering to craft a 3D printed dress. Samuel teamed up with fashion designer Melinda Looi and the world’s leading exponent of 3D printing, Belgian-based company Materialise, to bring the concept to life. The work was featured in the University’s 2016 ‘Remarkable’ positioning campaign.
6 Griffith University - Annual Report 2016
Report to the Minister for Education and Minister for Tourism, Major Events and the Commonwealth Games
Presented to Parliament by Command
28 February 2017
The Honourable Kate Jones MP Minister for Education and Minister for Tourism, Major Events and the Commonwealth Games PO Box 15033
CITY EAST QLD 4002
Dear Minister
I am pleased to present, on behalf of the Council of Griffith University, this Annual Report 2016.
I certify that this Annual Report complies with:
• the prescribed requirements of the Financial Accountability Act 2009 and the
Financial and Performance Management Standard 2009, and
• the detailed requirements set out in the Annual Report Requirements for Queensland Government Agencies.
A checklist outlining the annual reporting requirements can be accessed at
griffith.edu.au/annual-report
Yours sincerely
Mr Henry Smerdon AM DUniv
Chancellor
Griffith University
Letter of Compliance
Griffith University - Annual Report 2016 7
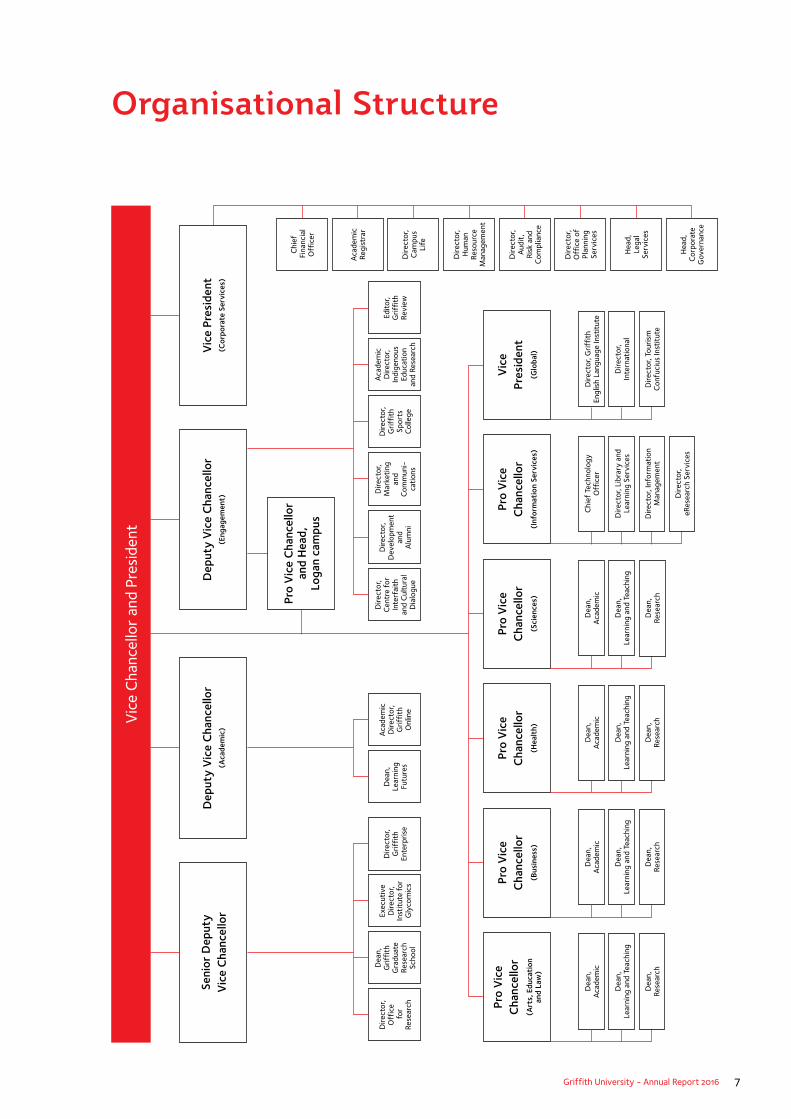
Organisational StructureV
ice
Cha
ncel
lor
and
Pres
iden
t
Dep
uty
Vic
e C
hanc
ello
r (A
cade
mic
)
Vic
e Pr
esid
ent
(C
orpo
rate
Ser
vice
s)
Chi
ef
Fin
anci
al
Off
icer
Dire
ctor
, C
ampu
s
Life
Dire
ctor
, A
udit
, Ri
sk a
nd
Com
plia
nce
Hea
d,
Lega
l Se
rvic
es
Aca
dem
ic
Regi
stra
r
Dire
ctor
, H
uman
Re
sour
ce
Man
agem
ent
Dire
ctor
, O
ffic
e of
Pl
anni
ng
Serv
ices
Hea
d,
Cor
pora
te
Gov
erna
nce
Seni
or D
eput
y
Vic
e C
hanc
ello
rD
eput
y V
ice
Cha
ncel
lor
(Eng
agem
ent)
Pro
Vic
e
Cha
ncel
lor
(Bus
ines
s)
Pro
Vic
e
Cha
ncel
lor
(Sci
ence
s)
Vic
e
Pres
iden
t(G
loba
l)
Pro
Vic
e
Cha
ncel
lor
(Art
s, E
duca
tion
an
d La
w)
Pro
Vic
e
Cha
ncel
lor
(Hea
lth)
Pro
Vic
e
Cha
ncel
lor
(Inf
orm
atio
n Se
rvic
es)
Dire
ctor
, C
entr
e fo
r In
terf
aith
an
d C
ultu
ral
Dia
logu
e
Dire
ctor
, D
evel
opm
ent
and
A
lum
ni
Aca
dem
ic
Dire
ctor
, In
dige
nous
Ed
ucat
ion
an
d Re
sear
ch
Edito
r,
Gri
ffit
h
Revi
ew
Dire
ctor
, M
arke
ting
an
d C
omm
uni-
catio
ns
Dire
ctor
, G
riff
ith
Sp
orts
C
olle
ge
Aca
dem
ic
Dire
ctor
, G
riff
ith
O
nlin
e
Dea
n,
Lear
ning
Fu
ture
s
Dire
ctor
, O
ffic
e f
or
Rese
arch
Dea
n,
Gri
ffit
h G
radu
ate
Rese
arch
Sc
hool
Exec
utiv
e D
irect
or,
Inst
itut
e fo
r G
lyco
mic
s
Dire
ctor
, G
riff
ith
Ente
rpri
se
Dea
n,
Aca
dem
ic
Dea
n,
Lear
ning
and
Tea
chin
g
Dea
n,
Rese
arch
Dea
n,
Aca
dem
ic
Dea
n,
Lear
ning
and
Tea
chin
g
Dea
n,
Rese
arch
Dea
n,
Aca
dem
ic
Dea
n,
Lear
ning
and
Tea
chin
g
Dea
n,
Rese
arch
Dea
n,
Aca
dem
ic
Dea
n,
Lear
ning
and
Tea
chin
g
Dea
n,
Rese
arch
Chi
ef T
echn
olog
y O
ffic
er
Dire
ctor
, Lib
rary
and
Le
arni
ng S
ervi
ces
Dire
ctor
, Inf
orm
atio
n M
anag
emen
t
Dire
ctor
, Gri
ffit
h
Engl
ish
Lang
uage
Inst
itut
e
Dire
ctor
, In
tern
atio
nal
Dire
ctor
, Tou
rism
C
onfu
cius
Inst
itut
e
Pro
Vic
e C
hanc
ello
r
and
Hea
d,
Loga
n ca
mpu
s
Dire
ctor
, eR
esea
rch
Serv
ices

8 Griffith University - Annual Report 2016
Management and Structure
Establishment
Griffith University was established on 21 September 1971, under the Griffith University Act 1971.
University Council
Role
Under the Griffith University Act 1998, the Council is Griffith University’s governing body and has overall responsibility for the University’s sound and effective governance.
The Council approves the University’s strategic direction; monitors the University’s progress, using agreed performance indicators; and approves the University’s budget, policies and delegations of authority. The Council reviews its own performance annually. University committees are subject to biennial review.
Membership
Membership, at 31 December 2016, is listed below:
Chancellor
Mr Henry Smerdon AM (commenced as Chancellor on 1 June 2015) Ex officio
Deputy Chancellor
Ms Rachel Hunter (commenced as Deputy Chancellor on 6 October 2015)
Vice Chancellor
Professor Ian O’Connor Ex officio
Seven members appointed by the Governor in Council
Ms Rachel Hunter, Deputy Chancellor, was appointed as a Governor in Council member from 23 July 2015 up to 30 October 2017.
The following six members were appointed as Governor in Council members from 31 October 2013 up to 30 October 2017:
Mr Ian Alderdice Mr Clinton Dines Mr Mark Gray Mr Garry Redlich Ms Ann Robilotta-Glenister OAM Ms Rhonda White AO
Two members of the University’s academic staff, elected by academic staff (Term of office from 28 October 2013 up to 27 October 2017)
Associate Professor Liz Jones Dr Arthur Poropat (retired from the University on 23 December 2016) Professor Alf Lizzio was appointed by Council (December 2016) under Section 20A(2) of the Griffith University Act 1998 for a term of office as an elected academic staff member commencing from 24 December 2016 up to 27 October 2017 being the balance of Dr Poropat’s term of office.
One member of the University’s general staff, elected by general staff
Dr Naveen Sharma Dr Sharma was appointed by Council under Section 20A(2) of the Griffith University Act 1998 for a term of office as the general staff member commencing from 16 June 2014 up to 27 October 2017.
One postgraduate student of the University, elected by postgraduate students (Term of office from 28 October 2015 up to 27 October 2017)
Mr Ritesh Chowdhary
Governance
Griffith University - Annual Report 2016 9
One undergraduate student of the University, elected by undergraduate students (Term of office from 28 October 2015 up to 27 October 2017)
Mr David Cody
Four additional members appointed under Section 16, Griffith University Act 1998 (Term of office from 1 January 2016 up to 31 December 2017)
Dr Robert Anderson OAM Ms Sandra Anderson Mr Craig Bassingthwaighte The Honourable Rob Borbidge AO
Colin McAndrew, Vice President (Corporate Services), is Council Secretary, although he is not a member of the Council.
Council Meetings
In 2016, the Council of Griffith University held six meetings:
• 24-25 February (strategic meeting) (off campus) 18 out of 18 members attended
• 4 April (ordinary meeting) (Gold Coast campus) 14 out of 18 members attended
• 6 June (ordinary meeting) (Nathan campus) 15 out of 18 members attended
• 1 August (ordinary meeting) (Logan campus) 16 out of 18 members attended
• 10 October (ordinary meeting) (Nathan campus) 15 out of 18 members attended
• 5 December (ordinary meeting) (Gold Coast campus) 12 out of 18 members attended
Council Subcommittees
The key committees that report directly to the Council are:
• the Academic Committee, the senior body within the University responsible for teaching and learning, and research policies (chairperson as at 31 December 2016: Professor Debra Henly)
• the Finance, Resources and Risk Committee, responsible for advising Council on critical resource issues, including income projections, operating budget allocations, capital expenditure, financing strategies and risk management (chairperson as at 31 December 2016: Mr Mark Gray)
• the Audit Committee, responsible for assisting the University Council and the Vice Chancellor discharge financial and performance management responsibilities imposed under the Financial Accountability Act 2009, Financial and Performance Management Standard 2009 and other relevant legislation (chairperson as at 31 December 2016: Mr Ian Rodin)
External committee members do not receive remuneration.
Advisory Council
In addition to these committees, there is one advisory council; namely, the Gold Coast Advisory Council (chairperson as at 31 December 2016: Dr John Kearney). The Gold Coast Advisory Council advises the University Council on strategic directions for teaching, research and community service at the Gold Coast campus.
Governance

10 Griffith University - Annual Report 2016
Enabling Legislation
Griffith University is constituted under the Griffith University Act 1998 as a body corporate and has a common seal.
Functions and Powers
The Griffith University Act 1998 provides for a broad range of functions and powers, including the specific provisions below.
University Functions
The University’s functions are:
• to provide education at university standard
• to provide facilities for study and research generally, and, in particular, for people in the cities of Brisbane, Gold Coast and Logan
• to encourage study and research
• to encourage the advancement and development of knowledge, and its application to government, industry, commerce and the community
• to provide courses of study or instruction (at the level of achievement the Council considers appropriate) to meet the needs of the community generally, and, in particular, the people in the cities of Brisbane, Gold Coast and Logan
• to confer higher education awards
• to disseminate knowledge and promote scholarship
• to provide facilities and resources for the wellbeing of the University’s staff, students and other persons undertaking courses at the University
• to exploit commercially, for the University’s benefit, a facility or resource of the University, including, for example, study, research or knowledge, or practical application of study, research or knowledge, belonging to the University, whether alone or with someone else
• to perform other functions given to the University under this or another Act.
University General Powers
The University has all the powers of an individual, and may, for example:
• enter into contracts
• acquire, hold, dispose of, and deal with property
• appoint agents and attorneys
• engage consultants
• fix charges, and other terms, for services and other facilities it supplies
• do anything else necessary or convenient to be done for, or in connection with, its functions.
The University has the powers given to it under the Griffith University Act 1998 or any another Act, and may exercise its powers inside or outside Queensland and outside Australia.
Council Powers
The Council may do anything necessary or convenient to be done for, or in connection with, its functions. The Council has the powers given to it under the Griffith University Act 1998 or any another Act and, in particular:
• to appoint the University’s staff
• to manage and control the University’s affairs and property
• to manage and control the University’s finances
Note. Further details of Griffith University governance are outlined on pages 12 to 17.
Governance
Griffith University - Annual Report 2016 11
Governance
University Management
Through its organisational and management structure, Griffith fosters coherence and cooperation across the University in its teaching, research and service, and promotes the efficient and effective deployment of resources (including administrative resources) across its five campuses.
Academic units, including schools and departments are organised into four groups: Arts, Education and Law; Business; Health; and Sciences. These groups facilitate teaching, research and service activities across campuses.
Administrative support services—such as academic and student administration, finance, human resource management, information technology and facilities—are organised as centralised offices that operate across all campuses.
This structure supports consistent service levels, efficient resource use, and access to professional support and specialist expertise for all areas.
Griffith’s approach is to embed quality in all of its processes to achieve excellent outcomes. The culture is one of innovation and responsiveness, of review and improvement.
Responsibility for quality is explicitly assigned to line managers, particularly the Deputy Vice Chancellors, the Pro Vice Chancellors, Deans, Heads of Schools and Departments, and Office Directors—in consultation with key committees.
Compliance with the Voluntary Code of Best Practice for the Governance of Australian Universities
The Voluntary Code of Best Practice for the Governance of Australian Universities (the Code) was approved by the Ministerial Council for Tertiary Education and Employment in 2011. The Code details the best practice requirements for University governance. Compliance with the Code is subject to annual review by the University Council. The University is compliant with all aspects of the Code.
Registration and AccreditationThe Tertiary Education Quality and Standards Agency (TEQSA) is Australia’s independent national regulator of the higher education sector. The Higher Education Standards Framework (Threshold Standards) 2015 (HES) will commence on 1 January 2017 and is established under s58 of the Tertiary Education Quality and Standards Agency Act 2011 (TEQSA Act 2011).
The standards detailed in the HES Framework represent the minimum acceptable requirements for the provision of higher education in Australia by providers registered under the TEQSA Act 2011. All registered providers must meet all of the standards all of the time.
From 1 January 2017, TEQSA will undertake assessment of applications (and any regulatory actions arising) against the new HES Framework. The HES Framework is comprised of seven domains: Student participation and attainment; Learning environment; Teaching; Research and Research Training; Institutional Quality Assurance; Governance and Accountability; and Representation, Information and Information Management.
A detailed analysis of the University’s compliance with the HES Framework was undertaken in late 2016. A small number of minor gaps in Griffith University policies and procedures were identified. Relevant senior officers have been advised about the identified gaps and action is in the process of being undertaken to address the gaps through the University’s committee approval process. A status report on the University’s compliance will be made to Council at its February and August 2017 meetings.
Standard 6.1.3(d) of the HES Framework is a new corporate governance requirement that will require Council to undertake ‘Periodic (at least every seven years) independent reviews of the effectiveness of the governing body and academic governance processes and ensuring that the findings of such reviews are considered by a competent body or officer(s) and that agreed actions are implemented.’
The independent review reports on corporate and academic governance processes will form the major part of the core evidence for TEQSA renewal of registration purposes. The University’s registration renewal date is 11 June 2022. The renewal of registration application to TEQSA will be supported by the independent review reports and associated action plans. TEQSA will treat the independent review reports and associated action plans as ‘core of core’ in terms of the re-registration process.
12 Griffith University - Annual Report 2016
Other Governance Reports
Audit Committee
The Audit Committee’s primary role is to assist and support the University Council (Council) and the Vice Chancellor to discharge the financial and performance management responsibilities imposed under the Financial Accountability Act 2009, Financial and Performance Management Standard 2009 and other relevant legislation. The Audit Committee membership comprises:
• the chairperson, appointed by the Council Mr Ian Rodin
• one Council member appointed by the Council from amongst the members of Council who is neither a staff nor student member of the University Ms Sandra Anderson
• one member appointed by the Council from either of the following categories: (i) a member of the Council who is neither a staff or student member of the University (ii) a member external to the University with expertise in auditing and/or accounting Ms Ann Robilotta-Glenister OAM
• two members appointed by Council with expertise in auditing and/or accounting Mr Simon Hancox Mr Gareth Long.
None of the Audit Committee members may be staff or students of the University. The members are not remunerated.
At its December 2016 meeting, Council resolved to re-appoint each of the members for a further term upon the conclusion of their preceding terms of office on 31 December 2016.
Throughout 2016 the Audit Committee observed the terms of its Constitution and had due regard to Treasury’s Audit Committee Guidelines.
In 2016, the Audit Committee held four meetings:
• 23 February: Nathan campus, five out of five members attended Major focus: review of draft 2015 financial statements.
• 11 May: Nathan campus, four out of five members attended Major focus: Vice Chancellor’s annual presentation on strategic issues; annual updates on risk management framework and compliance framework.
• 17 August: Queensland Conservatorium, South Bank campus, five out five members attended Major focus: review of external audit strategy; annual update on cyber security; annual review of Audit Committee Constitution; annual review of Internal Audit Charter; annual self-review of performance.
• 9 November: Nathan campus, three out of five members attended Major focus: review of draft 2017 Internal Audit Annual Plan; presentation from the Queensland Audit Office about the draft key audit matters report.
At its February meeting, the Audit Committee reviewed the University’s 2015 Annual Financial Statements and recommended the Statements to the Chancellor and the Vice Chancellor for signing. The 2015 Annual Financial Statements were subsequently certified by the Queensland Audit Office (QAO) and were tabled in parliament on 31 March 2016.
QAO, as the external auditor, has appointed Crowe Horwath as their contract auditor.
Crowe Horwath attended all Audit Committee meetings during 2016 and were present when client strategies and management letters were considered. Audit Committee reviewed external audit’s management letters and the University’s responses to ensure any issues related to internal control systems were responded to by management in an appropriate and timely manner. At its August 2016 meeting, the Audit Committee reviewed and confirmed the Client Strategy prepared by the external auditors. The Strategy contained the external audit approach, engagement strategy, data analytics strategy, advice about changes to audit reporting from 2017, and the audit plan for controlled entities.
During 2015 the QAO performed an Area of Control Focus audit on risk management.
Griffith University - Annual Report 2016 13
Other Governance Reports
The QAO’s report entitled ‘Area of controls focus – Risk management in Universities, Griffith University, December 2015’ was considered at the February 2016 meeting. The Audit Committee noted that the QAO had rated the University’s risk management practices as either ‘established’ or ‘integrated’ and that the assessment of the University’s performance against the QAO’s maturity model was above the education sector average. The Committee noted the Auditor-General of Queensland’s 2015 Report on Education Sector Entities following its tabling in Parliament in May 2016. The actions that the University would implement in response to the risk management findings detailed in the Auditor-General of Queensland’s report were discussed and endorsed at the November meeting. The Committee noted that a risk management maturity review had been scheduled in the 2017 Internal Audit annual plan.
The Audit Committee monitored internal audit activities throughout 2016. The Internal Audit Charter was reviewed by Audit Committee at its September meeting and the Vice Chancellor subsequently endorsed the Charter on the recommendation of the Committee.
The 2017 Internal Audit annual plan was reviewed by the Audit Committee at its November 2016 meeting and was subsequently approved by the Vice Chancellor on the Committee’s recommendation. On completion of planned 2016 internal audits, the Audit Committee assessed the audit report findings and the responses from management. The Audit Committee also monitored implementation of audit recommendations.
At its August 2016 meeting, the Audit Committee completed the annual review of its Constitution and the revised Constitution was subsequently approved by the Council (October 2016).
Management’s approach to maintaining a sound and effective control environment was monitored and evaluated by the Audit Committee throughout the year via external and internal audit activities and reporting functions, and reports from University management at Committee meetings.
All Audit Committee meeting minutes were provided to subsequent meetings of the Council. The Committee’s 2016 Annual Report to Council was considered by the December 2016 meeting of the Council. The Report detailed the Committee’s performance in relation to its functions, discussed the discharge of its responsibilities under its Constitution and reported on the findings of its annual self-evaluation process.
Internal Audit
The role of the University’s internal audit function is to provide an independent, objective assurance and consulting service designed to add value and improve the operations of the University and its controlled entities (collectively, the University) as required by the Financial Accountability Act 2009. Internal Audit helps the University to accomplish its objectives by bringing a systematic, disciplined approach to evaluate and improve the effectiveness of risk management, control and governance processes.
The function operates under a Charter, which is reviewed by Audit Committee annually and approved by the Vice Chancellor, and has regard to the Institute of Internal Auditors International Professional Practices Framework and the Queensland Treasury Audit Committee Guidelines.
The internal audit function performs its activities in accordance with its responsibilities under the Charter and follows the internal audit plan, which is reviewed annually, endorsed by the Audit Committee and approved by the Vice Chancellor. The annual audit plan is developed based on review of the University’s key strategic and operational risks, discussion with University senior executive, governance committees, external and co-sourced auditors, higher education risk factors, specific management concerns, and other sources such as the Tertiary Education Quality and Standards Agency (TEQSA) Regulatory Risk Framework; and Crime and Corruption Commission (CCC) and QAO reports and plans.
University management maintain risk registers at corporate, and group and divisional levels. Fraud and Academic Fraud risk registers are also maintained. Significant risks identified during audits and reviews are notified to University management and the Audit Committee in a timely manner to enable management to take appropriate remedial action. Mitigating actions being undertaken to address risks and internal audit recommendations are followed up on a quarterly basis by Internal Audit to ensure timely implementation.
The function is independent of management and the external auditors, and reports administratively to the Vice President (Corporate Services) and functionally to the Vice Chancellor and Audit Committee.
14 Griffith University - Annual Report 2016
Systems have been established to ensure an effective and efficient internal audit function, including policies, procedures, templates, a quality assurance and improvement program, internal and external quality assessment and reporting to senior management and Audit Committee. The key performance indicators reported by internal audit are progress against the internal audit plan and implementation of recommendations.
Internal audit achievements during the year included completion of the annual internal audit plan, which included audit reports with recommendations for internal control and/or business process improvements, completion of grant acquittal reviews and completion and or update of risk assurance maps for key financial processes.
Mr Dhanesh Raniga, Director, Audit, Risk and Compliance and Mr Dimitri Constantinous, Manager, Internal Audit hold appropriate qualifications as required by the Financial Accountability Regulations 2009, including Certified Practicing Accountant and professional memberships of the Institute of Internal Auditors.
External Scrutiny
There were no significant findings or issues identified by any external reviewer about the University during 2016.
In November 2016, the Office of the Information Commissioner tabled the Follow-up of Report No. 2 of 2014-15 Review of universities’ implementation of recommendations, which examined the compliance with Right to Information (RTI) and Information Privacy (IP) by Griffith University, Queensland University of Technology, University of Queensland and University of Southern Queensland. The report found that Griffith University had fully implemented nine and partially implemented two of the 11 recommendations, and as a result, was able to meet RTI and IP obligations more efficiently and effectively.
Risk Management
Risk management guides University operational and strategic operations. The University has a risk management framework that facilitates sound risk management processes, risk identification and mitigation methodology, training and reporting and establishes responsibilities for implementation of response strategies. A key activity for the Council and for University management is to identify the University’s major strategic risks and define mitigation strategies to address these risks. Council endorsed the University’s 2016 corporate risk register and associated mitigation strategies at its April 2016 meeting.
Work continues in developing comprehensive and effective business continuity plans to grow capability to deal with unanticipated impact on identified critical processes across the University. This work will continue into 2017 with ongoing review and analysis of critical processes to identify procedural vulnerabilities and develop understanding and capability to respond to disruptive events. Business process improvement occurring as a by-product of business continuity planning also ensures these processes are as resilient as possible.
Workforce Planning and Performance
The University employs 4,562 full time equivalent staff. The retention rate for staff is 92.90% and the permanent separation rate is 6.69%.
The University is committed to ensuring its workforce is representative of the communities it serves.
Workforce plans are part of the planning framework for academic groups and administrative divisions and are strategically aligned with corporate planning processes which focus on core areas—teaching and learning, research and research training, and engagement.
For 16 consecutive years, the University’s employment practices have been recognised as leading, being awarded the Employer of Choice for Gender Equality citation by the Workplace Gender Equality Agency (and its predecessor the Equal Opportunity for Women in the Workplace Agency) along with an Employer of Choice award by Women in Technology in 2016.
Other Governance Reports
Griffith University - Annual Report 2016 15
The University’s employment policies actively promote flexible work practices recognising the need for staff to balance their work, family and other commitments. Innovative use of information technology also enables staff to work flexibly. Additional provisions are available for primary and secondary carers for paid leave for family, carer and parental responsibilities. Parenting rooms are available across all University campuses. In 2016, the University launched its Domestic and Family Violence Support policy.
The University is committed to supporting a positive health and safety culture and in 2016 launched a Staff Well-being program. The program is available to all University staff and initiatives are grouped into four areas: Healthy Places, Healthy Lifestyle, Healthy Community and Healthy Minds.
The University has enterprise agreements for academic and general staff. Fair Work Australia approved the Griffith University Academic Staff Enterprise Agreement 2012–2016 on 21 January 2014 and the Griffith University General Staff Enterprise Agreement 2012–2016 on 13 February 2014. Negotiations commenced in October for replacement Enterprise Agreements for both academic and general staff.
Code of Conduct
The University’s Code of Conduct (the Code) is derived from the Public Sector Ethics Act 1994. A revised code was approved by University Council in April 2016 and is shaped around the four key ethical principles contained in the Act to guide ethical decision making and behaviour. The ethical principles are:
• integrity and impartiality
• promoting the public good
• commitment to the system of government
• accountability and transparency.
The revised code was written as a capstone policy and includes new sections on academic freedom, public comment and alcohol and drugs. The Code is published on the University’s website where it is accessible to staff and students. The Code is provided to all new staff commencing at the University as part of their online induction and the University website provides a frequently asked questions page listing additional information. The Vice Chancellor writes to all staff annually to remind them about the Code and other University policies relating to integrity. This includes the Griffith University Code for the Responsible Conduct of Research; the Conflict of Interest policy; the Personal Relationships in the Workplace policy; the Gifts and Benefits policy; the Fraud Control policy; and the Public Interest Disclosure policy. These policies are subject to regular review and are accessible to staff and students via the University’s website.
Gold Coast Innovation Centre Ltd
Gold Coast Innovation Centre Ltd is a registered public company, limited by guarantee and unlisted on the Stock Exchange. It was incorporated on 27 September 2007 using powers granted under Section 65 of the Griffith University Act 1998.
Gold Coast Innovation Centre Ltd was established to encourage the growth of and to mentor emerging technology enterprises in Queensland. It provided support and incubation services and facilities to emerging technology enterprises in Queensland to assist them in the development and commercialisation of their technology.
In 2013, the stakeholders in the company (Queensland State Government, Gold Coast City Council and Griffith University) decided to stop ongoing funding to support its operations beyond 30 June 2013. The company therefore limited its activities to operating as a holding company, retaining equity interests and options over unissued shares obtained in lieu of cash for consulting services rendered whilst those companies were incubates.
Other Governance Reports
16 Griffith University - Annual Report 2016
Information Systems and Recordkeeping
The records management function is managed under the wider umbrella of the Information Management portfolio in Information Services. During 2016, the focus has continued to work toward operationalisation of the Information Management Framework. This included commissioning an independent Information Management Maturity Assessment to provide a baseline assessment of the University’s information management capabilities. This in turn informed the refinement of the Information Management Plan supporting the Griffith Digital Strategy 2020 and the associated actions identified for implementation in 2017. Working toward better information governance, the University published Phase I of an Information Asset Register (IAR) and approved the Data Classification Guidelines, which were accompanied by relevant tools to advise staff on the appropriate content repositories for University information. The IAR will continue to be populated with key University information assets into 2017.
Work continued on the Digital Personnel Files Project, with staff files now automatically created in the records management system in real time. Enhancements also mean that recruitment records are digitally and automatically transferred to the personnel file, replacing the need to print and scan. Digitisation of hardcopy staff files was completed, with all files now available for digital access from any campus to appropriate personnel.
A pilot of a digital signature application was completed and recommended for wider implementation in 2017.
External Engagement
In 2016, Griffith was the winner, for the second year in a row, of the Records and Information Management Professionals Association of Australasia (RIMPA) Chris Simpson Award (Teamwork and Partnership category). This award from the Queensland Local Government & Corporations Chapter of RIMPA recognises individuals or groups who have worked cooperatively toward a common goal, using an effective method of transferring ‘know how’ to create sustainable working relationships that enable the elevation of recordkeeping within an organisation.
Griffith worked with Queensland State Archives and the Australasian Universities Recordkeeping and Archivists (AURA) Forum to establish a collaboration platform for AURA members, to replace an existing listserv discussion group. This website allows for a historical record of previous discussion to be kept as a knowledge base for members going forward.
Griffith also had two staff members involved in the Queensland State Archives’ Proof of Concept for a Digital Archive Project, one in a technical capacity and the other on the Project Board.
Government Objectives for the Community
Griffith University’s objectives and activities align with the Queensland Government’s objectives for the community through:
• high-quality, student-focused learning and teaching that prepares work-ready graduates of influence in strong demand by employers across a broad range of professions and industries
• groundbreaking research that delivers social dividends and generates the knowledge needed to solve problems
• community service through social inclusion and engagement programs, and innovative partnerships
• pursuit of its sustainability agenda.
More information about the Queensland Government’s objectives for the community is available at premiers.qld.gov.au/publications/categories/plans/governments-objectives-for-the-community.aspx
Other Governance Reports
Griffith University - Annual Report 2016 17
Sustainability Commitment
Griffith’s sustainability commitment is embedded in all areas of the University with sustainability as one of five high level goals in the Griffith Strategic Plan 2013–2017.
The Sustainability Plan 2017–2020 was approved in November 2016. The Plan builds on the experience of the previous Sustainability Plan 2013–2015, and further refines the University’s sustainability goals and strategies.
Sustainability Highlights for 2016
• In October, the University reaffirmed a commitment to the world’s largest corporate sustainability initiative, the United Nations Global Compact.
• The University was a finalist in the 2016 Green Gown Australasia Awards in the Continuous Improvement: Institutional Change category.
• In July the University took delivery of 22 new hybrid cars, replacing 30% of the pool vehicle fleet. All fleet cars will be replaced with enviro-friendly alternatives over the next two years, reducing the University’s emissions by an estimated 30 tonnes of C02 per annum.
• Development of a Sustainable Transport Strategy to increase the proportion of travel by sustainable modes was started.
• A Green Labs Pilot Program was launched in March/April on the Nathan and Gold Coast campuses. The pilot highlighted energy savings and other benefits, with progressive roll out across the University to 2020.
• A new Sustainability Awareness module was launched in early 2016 for staff induction.
• An Environmental Performance website was introduced to provide information on energy and water use, including live consumption data along with data on waste, recycling and composting and tips on how to reduce waste, energy and water consumption.
• The Sustainability Teaching Network audited Griffith’s Teaching programs and an up-to-date list of programs with sustainability themes has been placed on the Sustainability website. The Sustainability Hub for learning and teaching is being upgraded with resources for students and staff.
• Griffith’s MBA, which is built on core values such as sustainable business practices, responsible leadership and an Asia-Pacific perspective, was placed in Australia’s top five MBAs in the CEO Magazine Global MBA 2016 Rankings. The Carbon Neutrality Project was implemented in 2014 and has established the Griffith MBA program as the only one in Australia, and one of only three in the world, to have a carbon neutral certification.
• Griffith University Sustainability Awards for staff were held in September 2016 with winners and highly commended in three categories: Team, Group and Individual.
Sustainability Partnerships
The University is a member of the following:
• Gold Coast 2018 Commonwealth Games Sustainability Advisory Panel
• Business South Bank Sustainability Committee
• United Nations Global Compact Network Australia’s Environmental Leadership Group
• Australasian Campuses Towards Sustainability Inc (ACTS)—this is a member-based organisation representing higher and further education institutions within Australia and New Zealand. Griffith hosts the ACTS Secretariat.
Other Governance Reports
18 Griffith University - Annual Report 2016
Research
The Research Plan 2013–2017, adopted by the University Council in August 2013, provides operational support for the implementation of the Griffith University Strategic Plan 2013–2017 through its goals, targets and strategies.
The overarching research and research training goal is to continuously improve our research performance and, through our research, deliver social dividends. The University has four key research objectives for the period 2013–2017 to:
• c onsolidate world-class research strength through our selected areas of strategic investment
• demonstrate research of international standing in all our discipline areas as recognised by Excellence in Research for Australia (ERA) and other international ranking metrics
• maintain a culture of research quality and performance that is well supported by infrastructure (physical and electronic), and resources (financial and human)
• maintain our core commitments as a university to innovation, bringing disciplines together, and undertaking socially relevant research which provides demonstrable community benefit.
Research Excellence
Key Research Objective
Demonstrate research of international standing in all our discipline areas as recognised by ERA and other international ranking metrics.
Griffith’s 2016 University Ranking Performance
In 2016, Griffith maintained its place in the top three per cent of universities worldwide with another successful year for international rankings. For the first time, Griffith is now ranked in the top 300 on two major university rankings (the Times HE and CWTS Leiden) and in the top 350 on all four major international indices (the Academic Ranking of World Universities, the Times Higher Education World University rankings, the CWTS Leiden ranking and the QS World Ranking).
The University maintained its position in the 101–150 band on the ARWU Social Sciences field ranking, placing it at equal eighth in Australia alongside the Australian National University. Social Sciences at Griffith also secured a top 150 position on the QS and the National Taiwan University ranking schemes. Griffith was ranked 34th in the QS Top 50 under 50 (up from 38th last year) thus reinforcing Griffith’s place among other youthful and dynamic higher education institutions around the world.
Vice Chancellor’s Research Excellence Awards
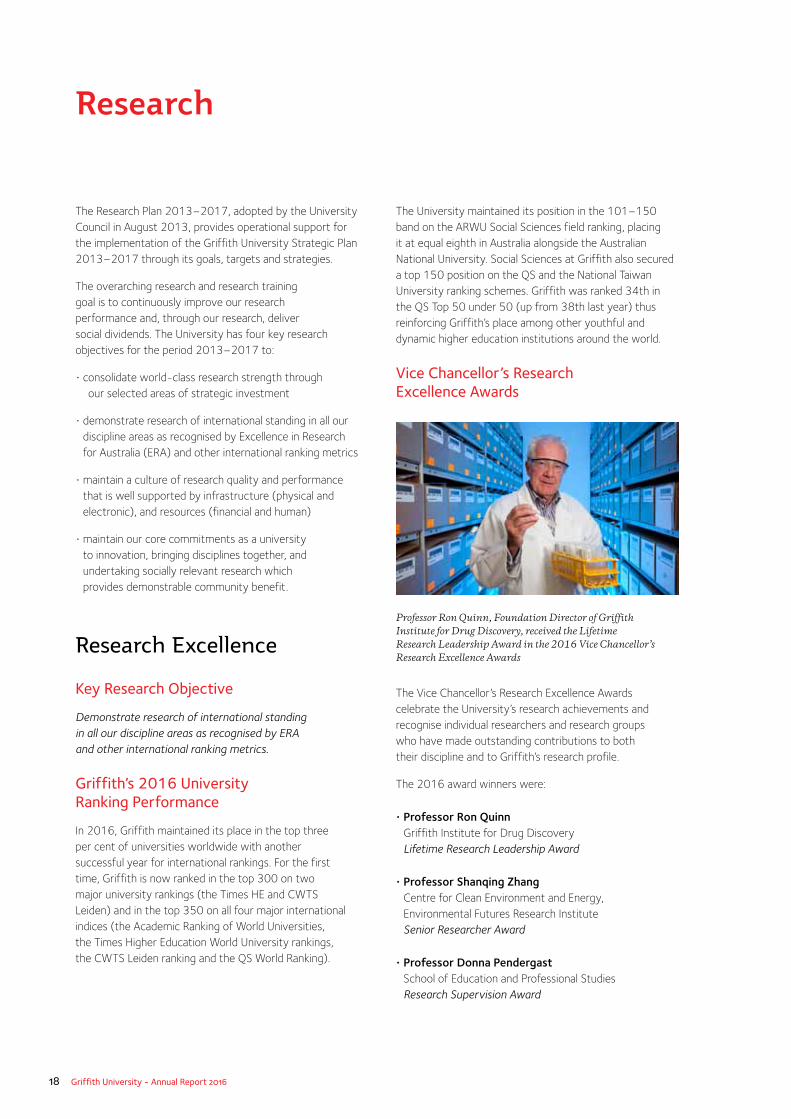
Professor Ron Quinn, Foundation Director of Griffith Institute for Drug Discovery, received the Lifetime Research Leadership Award in the 2016 Vice Chancellor’s Research Excellence Awards
The Vice Chancellor’s Research Excellence Awards celebrate the University’s research achievements and recognise individual researchers and research groups who have made outstanding contributions to both their discipline and to Griffith’s research profile.
The 2016 award winners were:
• Professor Ron Quinn Griffith Institute for Drug Discovery Lifetime Research Leadership Award
• Professor Shanqing Zhang Centre for Clean Environment and Energy, Environmental Futures Research Institute Senior Researcher Award
• Professor Donna Pendergast School of Education and Professional Studies Research Supervision Award
Griffith University - Annual Report 2016 19
• Dr Lauren Ball Menzies Health Institute Queensland Early Career Researcher Award
• Professor Paul Scuffham, Associate Professor Tracy Comans, Dr Louisa Gordon, Associate Professor Shu-Kay Ng, Associate Professor Erika Turkstra, Ms Anne Bucetti, Ms Gemma Hynard, Ms Rani Scott, Dr Shoku Maru, Ms Erin Pitt, Dr Joshua Bynes, Dr Martin Downes, Dr Sanjeewa Kularatna, Dr Kim-Huong Nguyen, Dr Jean Spinks, Haitham Tuffaha, Ms Emilie Bettington, Ms Maria Donahue, Mr Thomas Elliott, Mr Robbie James, Dr Cindy Mervin, Mr Gabor Mihala, Ms Nicole Moretto, Ms Jodie Osborne, Ms Dinusha Vithanchchi Centre for Applied Health Economics, Menzies Health Institute Queensland Research Group or Team Award
2016 Higher Education Research Data Collection of Research Income for 2015
The Higher Education Research Data Collection (HERDC) comprises research income data submitted by universities each year to the Commonwealth Department of Education and Training. Data collected from HERDC is used, along with data from the Higher Education Student Collection, for determining Commonwealth research block funding allocations to universities.
Research Income
Griffith’s HERDC research income for 2015 was $72.8 million, an increase of 7.43% over the 2014 figure. Griffith recorded increases across all categories of income, with the largest increase of $3.99 million for Other Public Sector Research Funding, and $125,000 for Australian Competitive Grants, $731,000 in Industry and Other Funding, and in Cooperative Research Centre Funding of $185,000.
Research Publications
The Australian Government released the National Innovation and Science Agenda in 2015, introducing new funding arrangements for research block grants commencing in 2017. The new arrangement removes the collection of research publication counts from the HERDC submission as a measure for allocating research block grant funding.
Griffith continues to collect research publications data for annual performance reports and for the next ERA submission. The publications collection for 2015 is showing an increase of 1.12% in total weighted publication points, from 2,305 in 2014 to 2,331 in 2015, mainly due to an increase in refereed journal articles. The total number of unweighted research outputs, 3,663 in 2015, is slightly more than the 2014 figure of 3,621, again with the largest increase in the number of refereed journal articles.
Australian Research Council and National Health and Medical Research Council Funding Success
Griffith achieved excellent funding outcomes in the major Australian Research Council (ARC) and National Health and Medical Research Council (NHMRC) schemes in 2016, receiving more than $19 million for new research projects. Griffith University was awarded 16 ARC Discovery Projects (19.8% application success rate), four Future Fellowships (44.4% success rate), five Discovery Early Career Researcher Awards (19.2% success rate) and two Linkage Infrastructure, Equipment and Facilities (LIEF) grants (40% success rate). Griffith’s success rates across all of these schemes were above the national average. Earlier in 2016, Griffith was awarded $2.5 million for an ARC Laureate Fellowship, and six ARC Linkage Project grants worth more than $1.3 million. The University continued its success in securing Australian competitive grants through the NHMRC Project Grants (funding commencing in 2017), receiving more than $1.37 million in research funding, as well as $2.4 million for hosting the Centre for Research Excellence in Prostate Cancer Survivorship.
Research
20 Griffith University - Annual Report 2016
Selection of Major Grants in 2016
Some examples of Griffith University’s major research projects awarded during 2016 are as follows:
Chronic Fatigue Syndrome Research
Professors Sonya Marshall-Gradisnik, Don Staines and Dr Samantha Johnston from the National Centre For Neuroimmunology and Emerging Diseases (NCNED) at Menzies Health Institute Queensland, Griffith University, were awarded $4 million in funding from the Stafford Fox Medical Research Foundation as part of a bid to accelerate the diagnosis of Chronic Fatigue Syndrome (CFS) and the discovery of appropriate treatments. CFS, also known as Myalgic Encephalomyelitis (ME), is a highly debilitating disorder characterised by profound fatigue, muscle and joint pain, cerebral symptoms of impaired memory and concentration, impaired cardiovascular function, gut disorder and sensory dysfunction such as noise intolerance and balance disturbance. Many cases can continue for months or years, and it is believed around 200,000 Australians are affected. The prevalence rate of CFS/ME worldwide is estimated around 1.2%.
The funding from the Stafford Fox Medical Research Foundation will allow Griffith to develop the first- of-its-kind diagnostic blood test which uses novel technologies to identify genetic markers for CFS, and will also enable researchers at NCNED to investigate possible pharmacological treatments. The funding award is the second round of funding from the Stafford Fox Medical Research Foundation which previously provided $2.5 million to NCNED to investigate CFS and develop the diagnostic test.
Griffith’s ARC Australian Laureate Fellowship
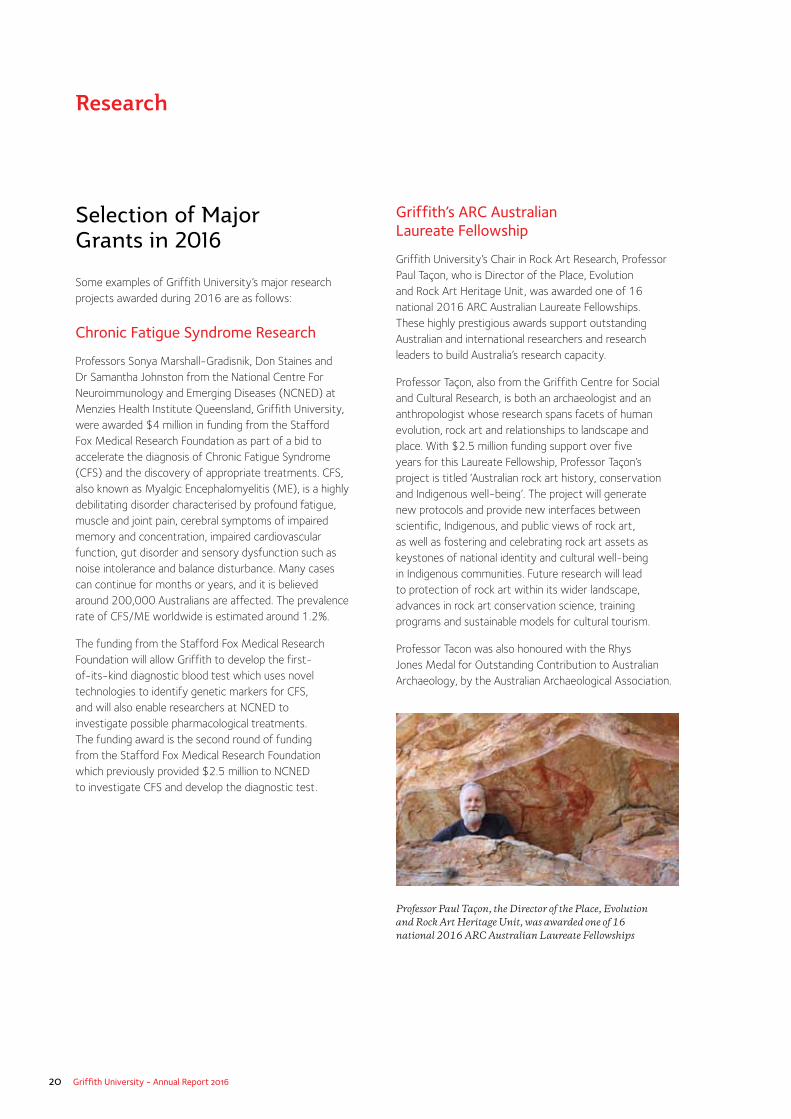
Griffith University’s Chair in Rock Art Research, Professor Paul Taçon, who is Director of the Place, Evolution and Rock Art Heritage Unit, was awarded one of 16 national 2016 ARC Australian Laureate Fellowships. These highly prestigious awards support outstanding Australian and international researchers and research leaders to build Australia’s research capacity.
Professor Taçon, also from the Griffith Centre for Social and Cultural Research, is both an archaeologist and an anthropologist whose research spans facets of human evolution, rock art and relationships to landscape and place. With $2.5 million funding support over five years for this Laureate Fellowship, Professor Taçon’s project is titled ‘Australian rock art history, conservation and Indigenous well-being’. The project will generate new protocols and provide new interfaces between scientific, Indigenous, and public views of rock art, as well as fostering and celebrating rock art assets as keystones of national identity and cultural well-being in Indigenous communities. Future research will lead to protection of rock art within its wider landscape, advances in rock art conservation science, training programs and sustainable models for cultural tourism.
Professor Tacon was also honoured with the Rhys Jones Medal for Outstanding Contribution to Australian Archaeology, by the Australian Archaeological Association.
Professor Paul Taçon, the Director of the Place, Evolution and Rock Art Heritage Unit, was awarded one of 16 national 2016 ARC Australian Laureate Fellowships
Research
Griffith University - Annual Report 2016 21
Research
2017 Australian of the Year
In 2016, Griffith University’s Professor Alan Mackay- Sim was named the 2017 Queensland Australian of the Year for his research into stem cells and their use in repairing damaged spinal cords. He was named Australian of the Year during a live announcement at Parliament House in Canberra in 2017 on Australia Day eve. The Professor Emeritus at the Griffith Institute for Drug Discovery has given hope to thousands of Australians with spinal cord injuries through his world-leading research.
Professor Mackay-Sim is recognised as a global authority on the human sense of smell and the biology of nasal cells. He led the world’s first clinical trial using these cells in the treatment of spinal cord injury.
Professor Mackay-Sim has championed the use of stem cells to understand the biological bases of multiple brain disorders and diseases such as schizophrenia, Parkinson’s disease and Hereditary Spastic Paraplegia. The award reflects the quality of research undertaken in Australia and helps raise awareness of stem cell research, disability in the community and the importance of scientific research to advance clinical therapies.
Tropical Medicine Researchers Awarded Funding
Griffith University received a total of $1.25 million in federal government funding to support research in developing new therapeutic agents for tuberculosis, and a vaccine for Group A Streptococcus. The Minister for Trade and Investment Steven Ciobo announced the grants as part of almost $7 million funded to 11 organisations under the Tropical Medicine Commercialisation program to fight tropical diseases.
The $1 million grant to the Griffith Institute for Drug Discovery is to find a cure for tuberculosis, which kills more than 1 million people globally each year. The Institute for Glycomics was the recipient of $250,000 towards a Streptococcus vaccine, which has the potential to significantly reduce the rates of rheumatic heart disease in young Indigenous Australians—those most at-risk of streptococcal disease.
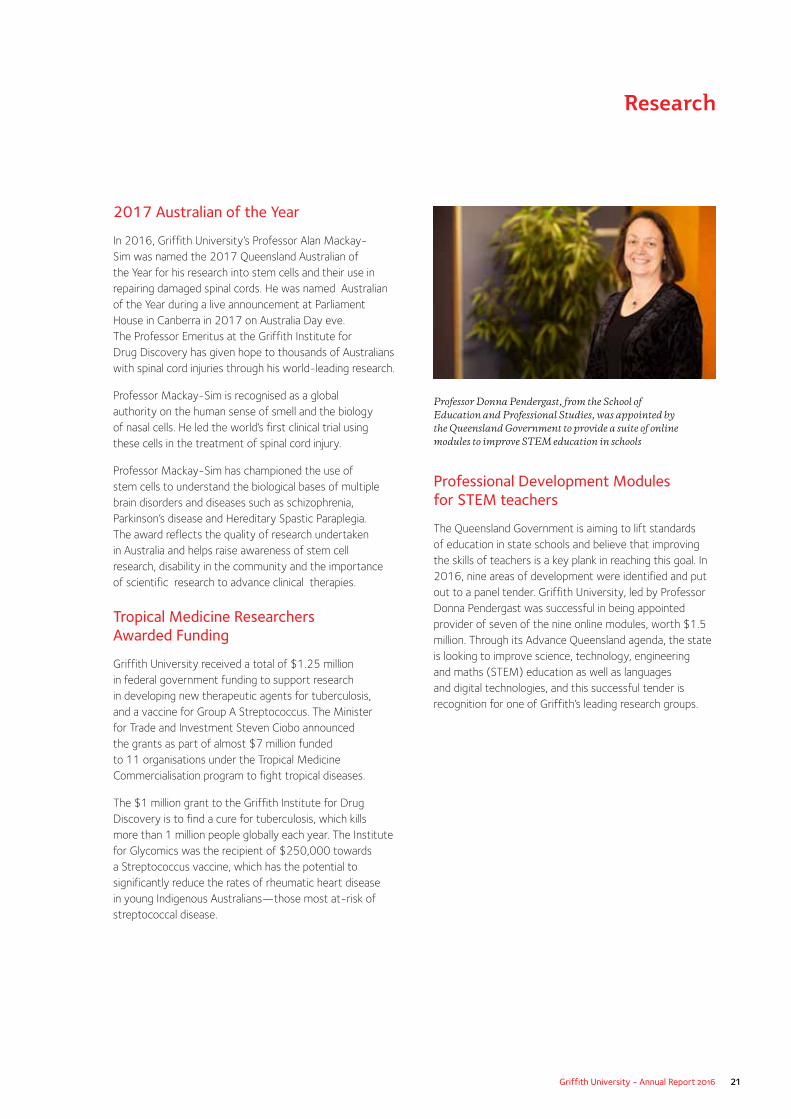
Professional Development Modules for STEM teachers
The Queensland Government is aiming to lift standards of education in state schools and believe that improving the skills of teachers is a key plank in reaching this goal. In 2016, nine areas of development were identified and put out to a panel tender. Griffith University, led by Professor Donna Pendergast was successful in being appointed provider of seven of the nine online modules, worth $1.5 million. Through its Advance Queensland agenda, the state is looking to improve science, technology, engineering and maths (STEM) education as well as languages and digital technologies, and this successful tender is recognition for one of Griffith’s leading research groups.
Professor Donna Pendergast, from the School of Education and Professional Studies, was appointed by the Queensland Government to provide a suite of online modules to improve STEM education in schools
22 Griffith University - Annual Report 2016
Research Education Highlights
2016 Scholarship Rounds Highlights
A total of 970 scholarship applications for higher degrees by research (HDR) were received in 2016 (for the mid-year and end-of-year scholarship rounds combined) with 297 applications considered to meet the highest level for admission (Honours 1 or equivalent).
As at December 2016, HDR load was 1,639 full-time equivalents (FTE) against 1,597 for 2015, with 340 confirmed HDR completions. The total 2016 HDR completions exceeded the 2015 HDR completions by about 100, with the increase assisted by the implementation of an online thesis submission and examination module at the end of 2015.
2016 Higher Education Conference Poster Exhibition
Two post-confirmation PhD candidates—Bo-Pang and Riyad Rahimullah—showcased their research at the Higher Education Conference Poster Exhibition on 9–11 March 2016 and Bo-Pang won the poster exhibition prize. The conference is Universities Australia’s flagship HDR event, which attracts over 800 delegates from both within and outside the university sector, and is attended by Vice Chancellors, Chancellors, eminent scientists and researchers, international education specialists, policy makers, business representatives, and the media.
The poster exhibition highlights and celebrates innovative research that is addressing a community issue. Bo-Pang’s research is a theoretically grounded social marketing study focused on promoting active school travel and Riyad Rahimullah’s project title was ‘The debate on violent extremism: Voices of young Australian Muslims’.
FameLab Australia Final
Griffith Glycomics Institute PhD candidate Barbara Hadley was one of 12 finalists to compete in the FameLab Australia Final in Perth in May 2016. As a FameLab national finalist, Barbara explained her scientific concept, Sialic acid and its role in disease, to a general audience in just three minutes, with no PowerPoint presentation. Since its inception at The Times Cheltenham Science Festival in 2005, FameLab has grown into the world leading science communication competition, run in over 25 countries.
International Student Research Forum
From 12 to 16 June 2016, 10 Griffith University PhD candidates attended the International Student Research Forum (ISRF) 2016, which was hosted by The University of Chinese Academy of Sciences (UCAS), in Beijing.
The ISRF is a cooperative arrangement involving Griffith University, University of Nebraska Medical Center, UCAS, University of Tokyo Institute of Medical Science, University of Southern Denmark, and new member, University of Aberdeen.
Formed in 2005, this annual forum provides a friendly environment for early-career researchers to present their research and gain international exposure to higher degree researchers. It also serves as a unique networking opportunity for developing research collaborations and professional friendships as part of an international approach to foster the career development of future science leaders. The forum is restricted to HDR candidates in the life and medical sciences, with Griffith University delegates being equally represented from health and sciences.
Advance Queensland PhD Scholarships
Two Griffith PhD candidates—Megan Arnold and Nadia Campagnolo—were awarded Advance Queensland Awards for projects commencing in 2016. Megan Arnold’s research focused on new prophylactic drugs for malaria and Nadia Campagnolo’s research focused on the association between diet and inflammation in Chronic Fatigue Syndrome.
Research
Griffith University - Annual Report 2016 23
Research
The Advance Queensland Research Fellowships and PhD Scholarships program supports researchers undertaking original work that will have a positive impact on Queensland. The $10 million initiative foresees these projects will help drive innovation and collaboration in new and existing industries.
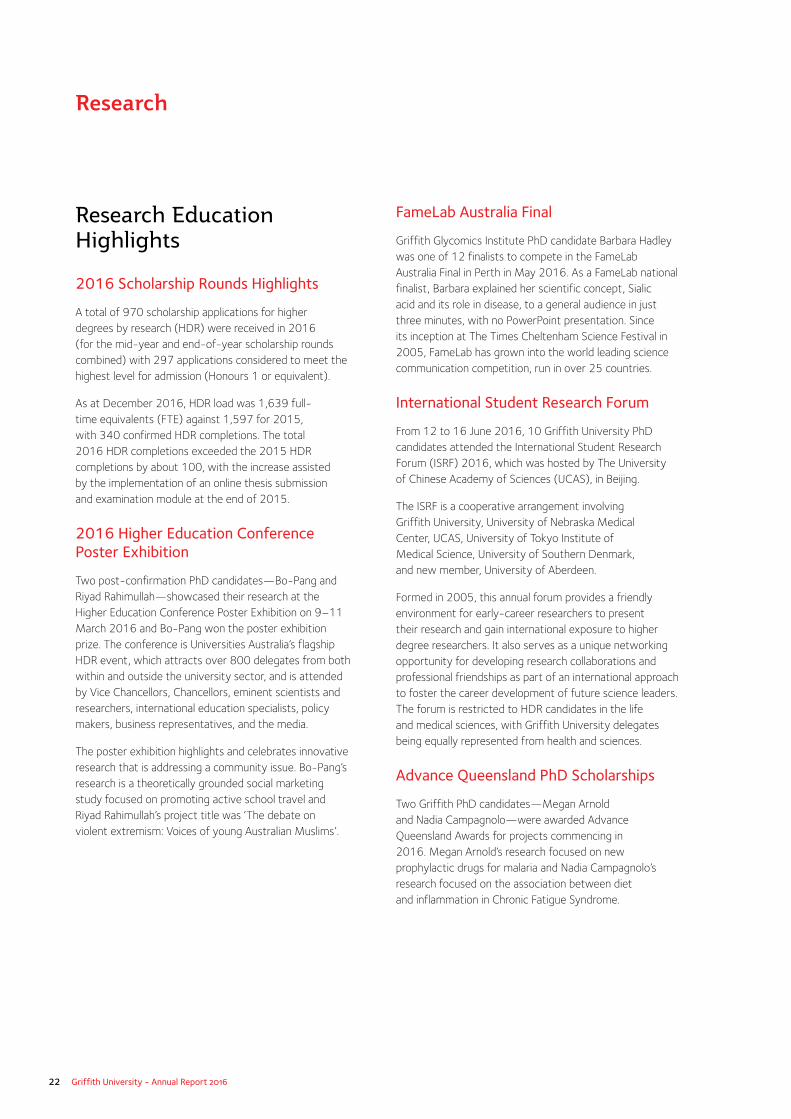
Three Minute Thesis Competition
The Griffith Three Minute Thesis Competition (3MT®) Final was held at the Gold Coast in late August with finalists competing in four prize categories. Susan Chapman from the School of Education and Professional Studies was the overall winner for her presentation on the immersion of arts in education which is facilitating enhanced student learning. Susan represented Griffith at the 3MT Asia–Pacific final.
Katherine Lee from the School of Medicine was the runner-up and the people’s choice winner for her research into the possible genetic markers of bowel cancer, helping medical professionals develop a deeper understanding of the disease. First time entrant, honours student Kaamna Deo from the School of Applied Psychology, won the undergraduate and postgraduate coursework research category award for her research into behavioural cues and strategies to train yourself into beneficial behaviours.
Griffith Three Minute Thesis Competition 2016 finalists
International Thesis Award
Griffith HDR graduate Dr Pamela Humphreys was awarded the 2016 International Education Association Australia (IEAA) Outstanding Postgraduate Thesis award for her PhD research, English Language Proficiency in Higher Education: Student Conceptualisations & Outcomes. The award was presented in October at the Australian International Education Conference (AIEC) in Melbourne. Dr Humphreys is the Deputy Director of the Griffith English Language Institute.
China Scholarship Council Fair
Professor Sue-Berners Price, Sherman Xia, Professor David Shum and Professor Geoff Tansley had a successful trip to Beijing to attend the China Scholarship Council (CSC) Fair 2016 to promote Griffith to potential high-achieving HDR candidates.
CSC and Griffith collaborate by providing scholarship opportunities and placements to selected Chinese graduate students who wish to complete a PhD degree at Griffith as part of the China Scholarship Council – Griffith University Joint Funding Program.
Professor Berners-Price also visited the University of the Chinese Academy of Sciences (UCAS), meeting the HDR candidates coming to Griffith under the GU-UCAS Doctoral program in 2017.
Griffith HDR Conference 2016
The inaugural Griffith HDR Conference was held on 30 November at the Gold Coast campus with the theme of ‘Visibility: How to stand out from the crowd’. This conference focused on employability and career preparation in diverse HDR careers and pathways, through a range of presentations, workshops and discussions. The conference examined the broader skills HDRs are developing and looked to ways to apply this in the context of future career opportunities and in identifying potential avenues to increase research visibility.

24 Griffith University - Annual Report 2016
Indigenous Research
Indigenous Research Unit
The Indigenous Research Unit (IRU) continued to build its membership, grant funding success, publication output, and major research collaborations in 2016. IRU membership and collaborative research grants traverse across the health, science, business, education, medicine, nursing, law, and engineering disciplines.
Some of the current Australian Competitive Grants projects that are supported by input from the IRU are:
• ‘Looking for the ‘X’ factor: contextualised learning and young Indigenous Australian children’
• ‘Deaths in young people involved in the youth justice system: towards evidence-based prevention’
• ‘Characterising the deleterious mutational load in Aboriginal Australians’
• ‘Australian Nurse Family Partnership Program - Workforce Development Research Project’.
The IRU continued the ‘Indigenous Knowledges and Research’ seminar series to researchers and doctoral candidates across the University. Seminar presentations included:
• ‘Understanding organisation, place and belonging in Indigenous Research’
• ‘Transgenerational trauma, White Privilege, and Aboriginal-White relations in Australia’
• ‘Research and Repatriation? Provenancing ancestral remains and understanding the population history of Cape York’
• ‘Indigenous focused research and an examination of emerging methodologies’
• ‘Conducting qualitative research with Indigenous People on socially sensitive issues: Talkin’ ‘bout my moola’
• ‘Why Living Law matters: Indigenous Law, Traditional Knowledge and Intercultural Justice’
• ‘Towards establishing a participatory process for managing water and energy efficiency in remote Aboriginal and Torres Strait Island communities’
• ‘Decolonising Indigenous Representation: Ontological transformations through a Digital Lens’.
Research
Research team leader Dr James St John with researcher Marie-Laure Vial at the Griffith University Clem Jones Centre for Neurobiology and Stem Cell Research
Research Infrastructure and Resources
Key research objective
Maintain a culture of research quality and performance that is well supported by infrastructure (physical and electronic) and resources (financial and human).
Clem Jones Centre for Neurobiology and Stem Cell Research
The Honourable Annastacia Palaszczuk MP, Premier of Queensland and Minister for the Arts, officially opened the Clem Jones Centre for Neurobiology and Stem Cell Research at the Griffith Institute for Drug Discovery on Thursday 19 May 2016. The focus of the research of the Clem Jones Centre for Neurobiology and Stem Cell Research is to develop therapies for acquired brain injuries and spinal cord injuries.
In particular, the research team led by Dr James St John is planning to conduct a Phase I/IIa clinical trial to treat the paralysed spinal cord commencing in late 2018. The therapy uses olfactory cells taken from the nose and transplanted into the spinal cord to form a bridge for the regenerating nerve cells. In 2002, Professor Emeritus Alan Mackay-Sim led the world’s first Phase I clinical trial of this therapy that takes cells from the nose and transplants them into the spinal cord. His work showed that the treatment was safe for use in humans. Because of this groundbreaking work, researchers from around the world have continued to improve the therapy. Dr St John’s team is combining improved cell purification techniques with natural product drug discovery and three-dimensional bioprinting to produce olfactory cell nerve bridges that will give greater functional recovery to patients with spinal cord paralysis. The generous support of the Clem Jones Foundation will enable the research team to start crucial preparations for the clinical trial.
Griffith University - Annual Report 2016 25
Research
Research Centre of Human Evolution
Griffith’s Research Centre of Human Evolution (RCHE)—the first academic centre specifically focused on the subject of human evolution in our region—was officially launched by the Honourable Leeanne Enoch MP, Minister for Housing and Public Works and Minister for Science and Innovation on 8 July 2016.
Griffith’s Dr Adam Brumm and Professor Rainer Grun were part of an international team of researchers who announced the discovery of ancestors to the Liang Bua hobbit, in Indonesia. Stone tool artefacts found on the island of Sulawesi, and dating back to at least 118,000 years ago, suggest a mystery population of archaic humans colonised the island long before the appearance of our species, Homo sapiens. As reported in the June edition of Nature, fossil remains of hominins that are similar in size to the Liang Bua hobbit but at least ten times older have been excavated at Mata Menge. This pioneering research is the most significant breakthrough yet to help with our understanding of the origin of hobbits.
Professor Grun also co-authored the feature journal article ‘Inter-group violence among early Holocene hunter-gatherers of West Turkana, Kenya’ in the January edition of Nature. Skeletal remains of a group of hunter-gatherers massacred around 10,000 years ago have raised questions about humankind’s propensity for warfare. The fossilised bones of the Stone Age victims were unearthed at Nataruk—30 kilometres west of Kenya’s fossil-rich Lane Turkana—and are believed to be the earliest scientifically dated historical evidence of human conflict.
Researchers from Griffith’s RCHE along with nine Aboriginal Australian Elders, collaborated with an international team on a large-scale project to sequence the complete genomes of 83 Aboriginal Australians and 25 Highland Papuans. The research, published in the September edition of Nature, found that Indigenous Australians and Papuans are descendants of a single wave of migrants who left Africa around 70,000 years ago. RCHE’s Professor David Lambert, who is one of the authors of the Nature paper, collected saliva samples for DNA sequencing in collaboration with Aboriginal Australian communities and individuals throughout the Australian mainland.
ARC Centre of Excellence for Quantum Computation and Communication Technology
ARC Centres of Excellence are prestigious foci of expertise through which high-quality researchers maintain and develop Australia’s international standing in research areas of national priority.
Griffith researchers are part of a successful Centre led by the University of New South Wales, the ARC Centre of Excellence for Quantum Computation and Communication Technology. This is the third time that this Centre has been funded under the Centres of Excellence scheme. Professor Howard Wiseman, Professor Geoff Pryde and Dr Mirko Lobino from the Centre for Quantum Dynamics are Chief Investigators in the Centre of Excellence, which was awarded $33.7 million over seven years. This Centre aims to implement quantum processors able to run error corrected algorithms and transfer information across networks with absolute security. Australian researchers have established global leadership in quantum information, an innovative technology which could transform all industries dependent on computational power.
Griffith’s NHMRC Centre of Research Excellence in Prostate Cancer Survivorship
Professor Suzanne Chambers and Professor Paul Scuffham, from Menzies Health Institute Queensland, are Chief Investigators in the Centre for Research Excellence in Prostate Cancer Survivorship, which was awarded $2.4 million to be administered and hosted by Griffith University, from 2016 to 2020. Centre partners are Cancer Council Queensland, Edith Cowan University, and the Prostate Cancer Foundation of Australia.
The Centre for Research Excellence will translate research into action across four main themes for the benefit of approximately 200,000 Australian men diagnosed with prostate cancer, examining psychosocial and psychosexual health, exercise medicine, the economic cost of prostate cancer and geographic inequalities in prostate cancer outcomes.
26 Griffith University - Annual Report 2016
Griffith Centre for Social and Cultural Research
Award-winning journalist Peter Greste launched the Griffith Centre for Social and Cultural Research at South Bank on October 17 2016. The multidisciplinary centre (formerly known as the Centre for Cultural Research) deepens our understanding of the challenges confronting contemporary society, and explores important research themes such as global mobility, crisis, conflict and security and First Nations’ communities and culture among others.
Reflecting its interdisciplinary nature, the Centre’s four research themes are:
1. History, Media and Change—considering the notion of ‘change’ through the lenses of history and media
2. Crises: Communities, Safety and Security—considering crises, safety and disasters in contemporary social and political contexts
3. Language, Culture and Belonging—linguists, sociologists, communication researchers, Islamic studies scholars and cultural experts investigate language diversity and different ways of belonging.
4. Heritage and Wellbeing—developing new research projects on the role and significance of heritage in the contemporary world as well as new ways to protect and present it for future generations.
Cities Research Institute
The Director of the new Cities Research Institute, launched in 2016, Professor Paul Burton, will lead the development of new collaborative and transdisciplinary research programs that address the challenges facing cities in Australia and the wider Asia–Pacific region. Incorporating the Griffith Centre for Coastal Management and a new strand of urban water research previously associated with the Smart Water Research Centre, the new Institute now constitutes the largest centre of research in Australia focusing on cities and processes of urban change and development.
The Urban Research Program, which preceded the Cities Research Institute, looked at a range of issues during the 12 years it operated, including the impact of climate change on food security in cities and more recently how to capture increases in land value from public investment in infrastructure, such as light rail. Australian cities need more sophisticated research that brings together experts from different fields, like engineering, to face the complex challenges of today. The Cities Research Institute focuses on three main themes:
1. Intelligent infrastructure—How do we make sure our infrastructure networks (roads, rail, power, water and so on) are fit for purpose and able to meet the demands of the future? How do we harness new technologies to help manage and modify demand?
2. Quality places—How do we build new suburbs that allow us to live our own version of the good life? Can we make them easy to walk and cycle around? How do we make the most of our parks and green spaces and how do we deliver housing affordability to all age groups?
3. Transforming communities—As our population grows it will probably become more diverse in terms of age, social and ethnic background and wealth, so how do we manage this growing diversity so that we are able to live well together?
Research
Griffith University - Annual Report 2016 27
Research
Research Innovation
Key research objective
Maintain our core commitments as a university to innovation, bringing disciplines together and undertaking socially relevant research which provides demonstrable community benefit.
With more than 1,700 experts conducting research across all major academic disciplines and research institutes and centres, Griffith’s expertise, research capabilities, innovations and knowledge (‘intellectual assets’) are used by government, industry, and the community. Griffith University’s researchers provide multidisciplinary and proactive solutions for industry, government and the community. Some project examples are included here:
Non-toxic Solution to Fruit Flies
Griffith University and agricultural product company AgNova Technologies have collaborated to produce Fruition, the nation’s first non-toxic fruit fly trap. The launch of Fruition was held on 10 October 2016, and is the first commercialised response to help growers minimise crop losses following restrictions on the use of insecticide sprays. Through a unique combination of colour, shape and smell, the Fruition traps attract and catch female fruit flies before they lay eggs in fruit. This invention has the potential to significantly improve outcomes for Australia’s $4.8 billion horticulture industry.
Professor Dick Drew, of Griffith’s International Centre for the Management of Pest Fruit Flies (ICMPFF), has dedicated his career to fruit fly research and developed the trap over 30 years of investigation.
The partnership between Griffith and AgNova won second prize in the Technology One Industry Engagement Award of the Australian Financial Review Higher Education Awards. The award aims to recognise higher education institutions working with industry in a way that goes beyond standard commercial relationships and is genuinely reciprocal, mutually beneficial, and highly valued by both partners.
Utilitas Partnership
A collaboration between Utilitas and Griffith University could turn food waste and garden clippings into clean energy, reducing the 20 million tonnes of organic waste that end up in landfill in Australia each year. Utilitas is a Queensland-based biogas energy developer and has partnered with the university to develop advanced biogas technologies and processes aimed at recovering energy, nutrients and water from organic waste. While the project is initially focused on cane trash and other crop waste, once the economics of the initiative are proven on a large scale, the technology will be applied to other organic waste like lawn clippings and garden cuttings.
RealWell Resources for Children’s Well-being
A unique suite of online resources, called RealWell, aims to promote community-wide understanding and advancement of children’s well-being. It has been developed by Professor Ross Homel and Dr Kate Freiberg from the Griffith Criminology Institute. A core component of RealWell is an interactive video game called Rumble’s Quest.
As children play Rumble’s Quest they guide an avatar through the game’s interactive landscape, accompanied by an animal companion. As they progress, the creature asks questions designed to obtain a detailed measure of the child’s social-emotional wellbeing. Well-being is subjective and complex but it’s also a significant indicator of positive, healthy development. If a child’s well-being is diminished, analysts can see things like depression, anxiety, loss of self-control and other behavioural issues. It is critical to identify and respond to child wellbeing issues early before they turn into mental health problems, disengagement, or delinquency. Rumble’s Quest gives children the opportunity to report their own feelings and sense of wellbeing as they journey through the game, rather than speaking to an adult, they can use their own voices and experiences.
28 Griffith University - Annual Report 2016
Developing Elite Sport in Papua New Guinea
Griffith University has been assisting Papua New Guinea (PNG) to develop its elite sporting program. Griffith’s consultation has been led by Professor Kristine Toohey from the Department of Tourism, Sport and Hotel Management in the Griffith Business School, with Griffith Sports College Director and former Olympic rower Duncan Free. The pair is assisting in the development of a strategic plan for the PNG Olympic Committee high performance area. They joined a team including University of Technology Sydney and Stirling University (Scotland). Part of the challenge for PNG is transitioning from a system based almost entirely on the energy of volunteers, to trained local professionals. The system will also need to be self-sustaining so that it is not reliant on external advisors. However, the new program will also need to keep all the volunteers engaged while continuing to build capacity.
SuperCool Partnership
Cold food distribution adds costs to food and tax bills, with small to medium enterprises (SMEs) forming a substantial part of the food supply chain. However, SMEs have limited resources and find it difficult to commit the substantial dollars required to invest in research and development. SuperCool Asia Pacific needed to reduce wastage in their food delivery section and through a government grant scheme called Australian Government’s Entrepreneurs’ Programme, they partnered with Griffith and were granted funds to develop a device which can determine the thermal properties of food in refrigerated transport and cold storage.
Dr Hanan H Hamid, Research Fellow at the School of Engineering, successfully completed SuperCool’s thermal sensor project, and developed a probe that can mimic the temperature of food products. The probe was handed over to SuperCool in September 2016 and has wider international potential to assist in cold food distribution and thus improve nutritional outcomes overseas.
Parents Under Pressure Expansion
In 2016, Griffith’s Parents Under Pressure (PuP) program expanded its national and international training and service delivery in the UK, Ireland and into central Australia. PuP has saved millions of dollars in costs that would otherwise be incurred, and delivered immense social benefit to families in need. Developed by Professor Sharon Dawe from the School of Applied Psychology and researchers from The University of Queensland, PuP focuses on families at extreme risk due to problems with addictions and/or mental illness, with children in their care. An intervention can also cost the state millions of dollars over a child’s lifetime and lead to significant upheaval for all. The program is largely delivered in people’s homes and for many families this may be their final chance to stay together.
Autism Education Research
The number of school students with autism in mainstream schools has risen dramatically over the past decade. In 2016, the Autism Centre of Excellence (ACE), led by Professor Jacqui Roberts, was been contracted by the Queensland Department of Education and Training to review advice given to classroom teachers in better understanding and guiding decisions around behaviour management in autistic children.
Staff from ACE will develop an online tool for conducting Functional Behaviour Assessment. The tool will assist schools to proactively support students with autism who display complex and challenging behaviours. The web-based tool will include a decision-making assistance model that provides guided assessment and matched interventions appropriate to the student, to develop an individual behaviour support plan for the student. This will help teachers make better decisions and better behaviorial management plans with parents and school administrators.
Research
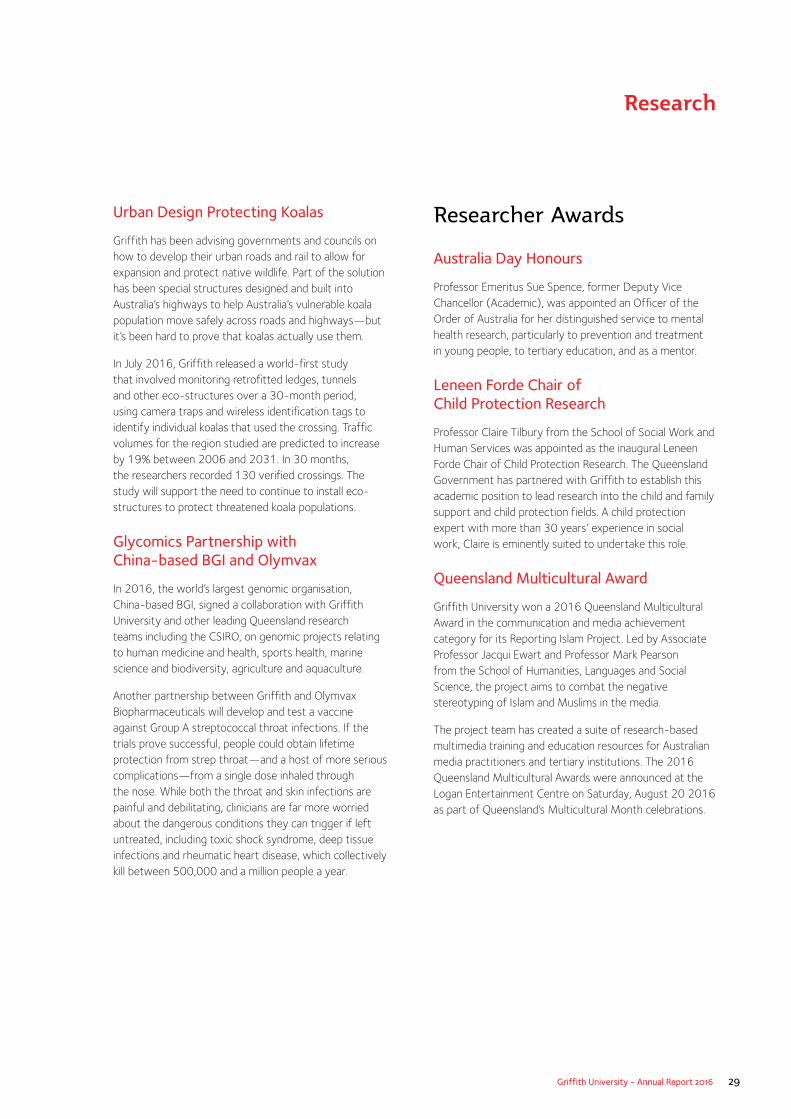
Griffith University - Annual Report 2016 29
Research
Urban Design Protecting Koalas
Griffith has been advising governments and councils on how to develop their urban roads and rail to allow for expansion and protect native wildlife. Part of the solution has been special structures designed and built into Australia’s highways to help Australia’s vulnerable koala population move safely across roads and highways—but it’s been hard to prove that koalas actually use them.
In July 2016, Griffith released a world-first study that involved monitoring retrofitted ledges, tunnels and other eco-structures over a 30-month period, using camera traps and wireless identification tags to identify individual koalas that used the crossing. Traffic volumes for the region studied are predicted to increase by 19% between 2006 and 2031. In 30 months, the researchers recorded 130 verified crossings. The study will support the need to continue to install eco-structures to protect threatened koala populations.
Glycomics Partnership with China-based BGI and Olymvax
In 2016, the world’s largest genomic organisation, China-based BGI, signed a collaboration with Griffith University and other leading Queensland research teams including the CSIRO, on genomic projects relating to human medicine and health, sports health, marine science and biodiversity, agriculture and aquaculture.
Another partnership between Griffith and Olymvax Biopharmaceuticals will develop and test a vaccine against Group A streptococcal throat infections. If the trials prove successful, people could obtain lifetime protection from strep throat—and a host of more serious complications—from a single dose inhaled through the nose. While both the throat and skin infections are painful and debilitating, clinicians are far more worried about the dangerous conditions they can trigger if left untreated, including toxic shock syndrome, deep tissue infections and rheumatic heart disease, which collectively kill between 500,000 and a million people a year.
Researcher Awards
Australia Day Honours
Professor Emeritus Sue Spence, former Deputy Vice Chancellor (Academic), was appointed an Officer of the Order of Australia for her distinguished service to mental health research, particularly to prevention and treatment in young people, to tertiary education, and as a mentor.
Leneen Forde Chair of Child Protection Research
Professor Claire Tilbury from the School of Social Work and Human Services was appointed as the inaugural Leneen Forde Chair of Child Protection Research. The Queensland Government has partnered with Griffith to establish this academic position to lead research into the child and family support and child protection fields. A child protection expert with more than 30 years’ experience in social work, Claire is eminently suited to undertake this role.
Queensland Multicultural Award
Griffith University won a 2016 Queensland Multicultural Award in the communication and media achievement category for its Reporting Islam Project. Led by Associate Professor Jacqui Ewart and Professor Mark Pearson from the School of Humanities, Languages and Social Science, the project aims to combat the negative stereotyping of Islam and Muslims in the media.
The project team has created a suite of research-based multimedia training and education resources for Australian media practitioners and tertiary institutions. The 2016 Queensland Multicultural Awards were announced at the Logan Entertainment Centre on Saturday, August 20 2016 as part of Queensland’s Multicultural Month celebrations.
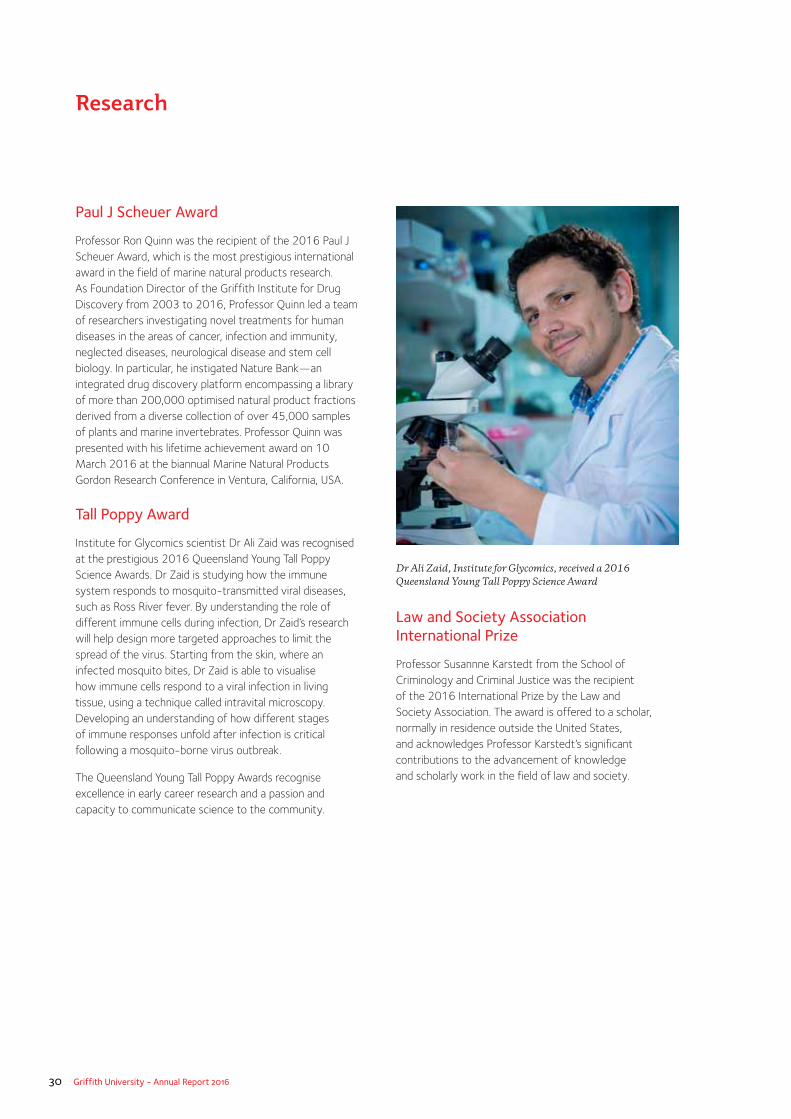
30 Griffith University - Annual Report 2016
Paul J Scheuer Award
Professor Ron Quinn was the recipient of the 2016 Paul J Scheuer Award, which is the most prestigious international award in the field of marine natural products research. As Foundation Director of the Griffith Institute for Drug Discovery from 2003 to 2016, Professor Quinn led a team of researchers investigating novel treatments for human diseases in the areas of cancer, infection and immunity, neglected diseases, neurological disease and stem cell biology. In particular, he instigated Nature Bank—an integrated drug discovery platform encompassing a library of more than 200,000 optimised natural product fractions derived from a diverse collection of over 45,000 samples of plants and marine invertebrates. Professor Quinn was presented with his lifetime achievement award on 10 March 2016 at the biannual Marine Natural Products Gordon Research Conference in Ventura, California, USA.
Tall Poppy Award
Institute for Glycomics scientist Dr Ali Zaid was recognised at the prestigious 2016 Queensland Young Tall Poppy Science Awards. Dr Zaid is studying how the immune system responds to mosquito-transmitted viral diseases, such as Ross River fever. By understanding the role of different immune cells during infection, Dr Zaid’s research will help design more targeted approaches to limit the spread of the virus. Starting from the skin, where an infected mosquito bites, Dr Zaid is able to visualise how immune cells respond to a viral infection in living tissue, using a technique called intravital microscopy. Developing an understanding of how different stages of immune responses unfold after infection is critical following a mosquito-borne virus outbreak.
The Queensland Young Tall Poppy Awards recognise excellence in early career research and a passion and capacity to communicate science to the community.
Dr Ali Zaid, Institute for Glycomics, received a 2016 Queensland Young Tall Poppy Science Award Law and Society Association International Prize
Professor Susannne Karstedt from the School of Criminology and Criminal Justice was the recipient of the 2016 International Prize by the Law and Society Association. The award is offered to a scholar, normally in residence outside the United States, and acknowledges Professor Karstedt’s significant contributions to the advancement of knowledge and scholarly work in the field of law and society.
Research
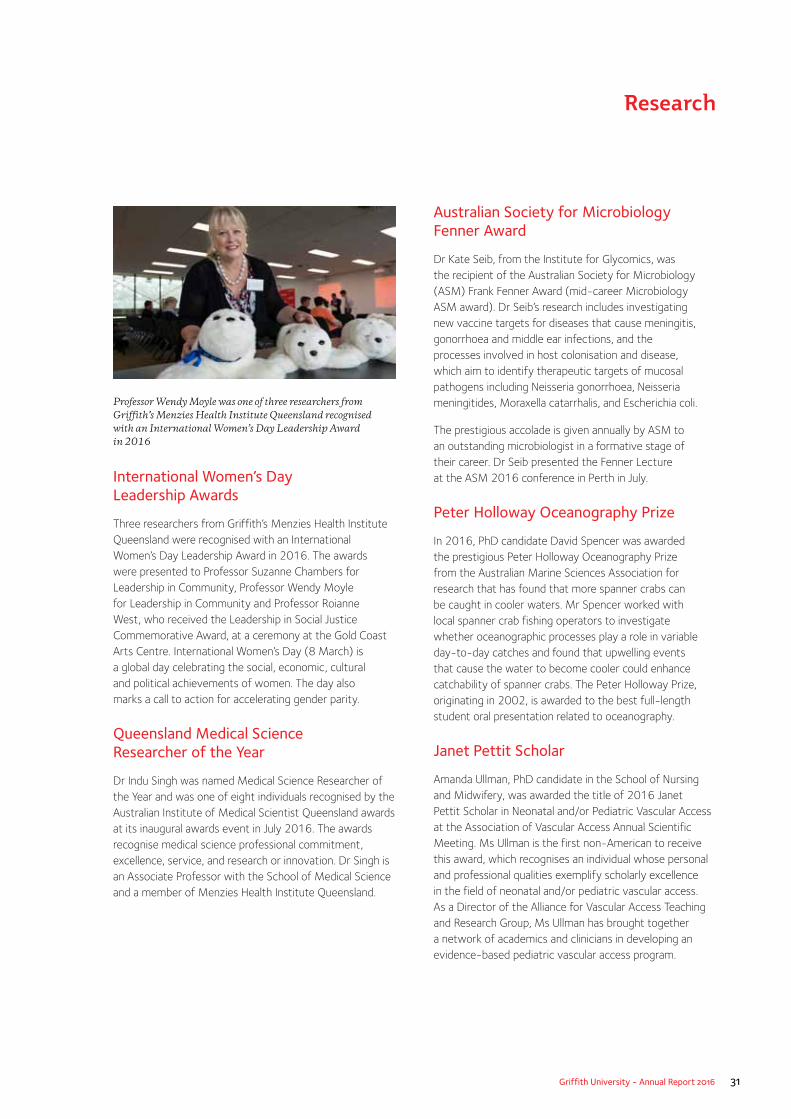
Griffith University - Annual Report 2016 31
Research
International Women’s Day Leadership Awards
Three researchers from Griffith’s Menzies Health Institute Queensland were recognised with an International Women’s Day Leadership Award in 2016. The awards were presented to Professor Suzanne Chambers for Leadership in Community, Professor Wendy Moyle for Leadership in Community and Professor Roianne West, who received the Leadership in Social Justice Commemorative Award, at a ceremony at the Gold Coast Arts Centre. International Women’s Day (8 March) is a global day celebrating the social, economic, cultural and political achievements of women. The day also marks a call to action for accelerating gender parity.
Queensland Medical Science Researcher of the Year
Dr Indu Singh was named Medical Science Researcher of the Year and was one of eight individuals recognised by the Australian Institute of Medical Scientist Queensland awards at its inaugural awards event in July 2016. The awards recognise medical science professional commitment, excellence, service, and research or innovation. Dr Singh is an Associate Professor with the School of Medical Science and a member of Menzies Health Institute Queensland.
Australian Society for Microbiology Fenner Award
Dr Kate Seib, from the Institute for Glycomics, was the recipient of the Australian Society for Microbiology (ASM) Frank Fenner Award (mid-career Microbiology ASM award). Dr Seib’s research includes investigating new vaccine targets for diseases that cause meningitis, gonorrhoea and middle ear infections, and the processes involved in host colonisation and disease, which aim to identify therapeutic targets of mucosal pathogens including Neisseria gonorrhoea, Neisseria meningitides, Moraxella catarrhalis, and Escherichia coli.
The prestigious accolade is given annually by ASM to an outstanding microbiologist in a formative stage of their career. Dr Seib presented the Fenner Lecture at the ASM 2016 conference in Perth in July.
Peter Holloway Oceanography Prize
In 2016, PhD candidate David Spencer was awarded the prestigious Peter Holloway Oceanography Prize from the Australian Marine Sciences Association for research that has found that more spanner crabs can be caught in cooler waters. Mr Spencer worked with local spanner crab fishing operators to investigate whether oceanographic processes play a role in variable day-to-day catches and found that upwelling events that cause the water to become cooler could enhance catchability of spanner crabs. The Peter Holloway Prize, originating in 2002, is awarded to the best full-length student oral presentation related to oceanography.
Janet Pettit Scholar
Amanda Ullman, PhD candidate in the School of Nursing and Midwifery, was awarded the title of 2016 Janet Pettit Scholar in Neonatal and/or Pediatric Vascular Access at the Association of Vascular Access Annual Scientific Meeting. Ms Ullman is the first non-American to receive this award, which recognises an individual whose personal and professional qualities exemplify scholarly excellence in the field of neonatal and/or pediatric vascular access. As a Director of the Alliance for Vascular Access Teaching and Research Group, Ms Ullman has brought together a network of academics and clinicians in developing an evidence-based pediatric vascular access program.
Professor Wendy Moyle was one of three researchers from Griffith’s Menzies Health Institute Queensland recognised with an International Women’s Day Leadership Award in 2016
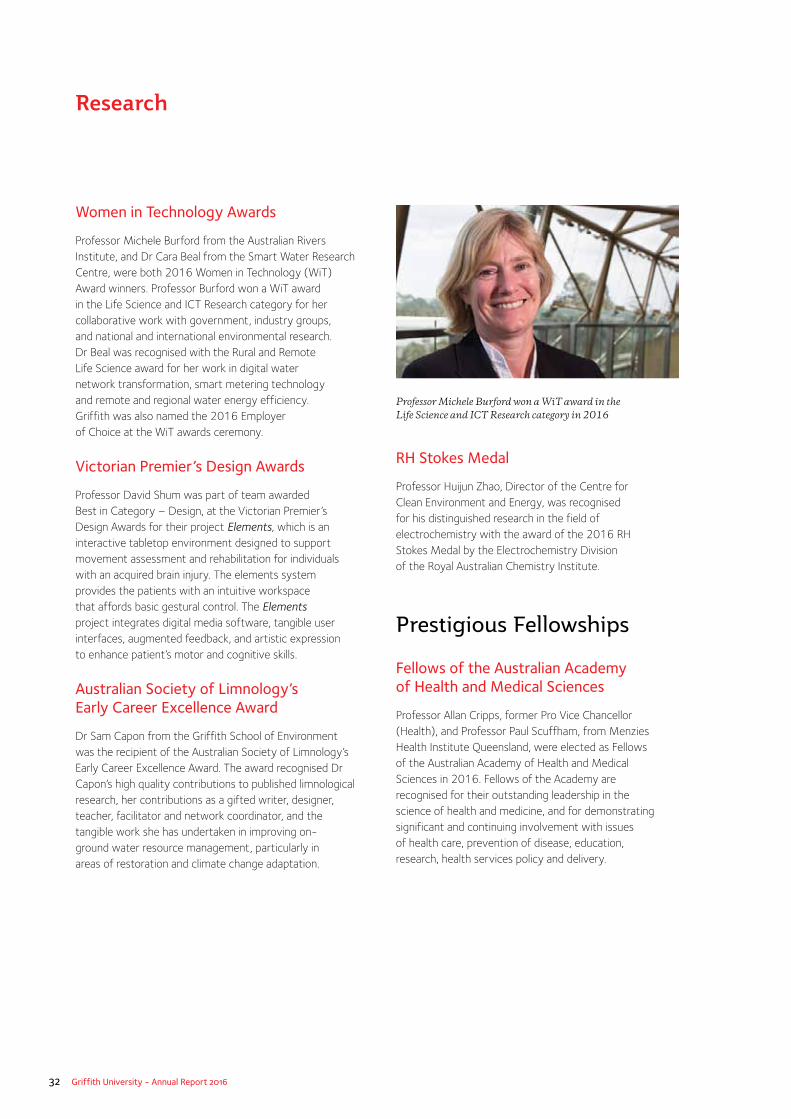
32 Griffith University - Annual Report 2016
Women in Technology Awards
Professor Michele Burford from the Australian Rivers Institute, and Dr Cara Beal from the Smart Water Research Centre, were both 2016 Women in Technology (WiT) Award winners. Professor Burford won a WiT award in the Life Science and ICT Research category for her collaborative work with government, industry groups, and national and international environmental research. Dr Beal was recognised with the Rural and Remote Life Science award for her work in digital water network transformation, smart metering technology and remote and regional water energy efficiency. Griffith was also named the 2016 Employer of Choice at the WiT awards ceremony.
Victorian Premier’s Design Awards
Professor David Shum was part of team awarded Best in Category – Design, at the Victorian Premier’s Design Awards for their project Elements, which is an interactive tabletop environment designed to support movement assessment and rehabilitation for individuals with an acquired brain injury. The elements system provides the patients with an intuitive workspace that affords basic gestural control. The Elements project integrates digital media software, tangible user interfaces, augmented feedback, and artistic expression to enhance patient’s motor and cognitive skills.
Australian Society of Limnology’s Early Career Excellence Award
Dr Sam Capon from the Griffith School of Environment was the recipient of the Australian Society of Limnology’s Early Career Excellence Award. The award recognised Dr Capon’s high quality contributions to published limnological research, her contributions as a gifted writer, designer, teacher, facilitator and network coordinator, and the tangible work she has undertaken in improving on-ground water resource management, particularly in areas of restoration and climate change adaptation.
RH Stokes Medal
Professor Huijun Zhao, Director of the Centre for Clean Environment and Energy, was recognised for his distinguished research in the field of electrochemistry with the award of the 2016 RH Stokes Medal by the Electrochemistry Division of the Royal Australian Chemistry Institute.
Prestigious Fellowships
Fellows of the Australian Academy of Health and Medical Sciences
Professor Allan Cripps, former Pro Vice Chancellor (Health), and Professor Paul Scuffham, from Menzies Health Institute Queensland, were elected as Fellows of the Australian Academy of Health and Medical Sciences in 2016. Fellows of the Academy are recognised for their outstanding leadership in the science of health and medicine, and for demonstrating significant and continuing involvement with issues of health care, prevention of disease, education, research, health services policy and delivery.
Research
Professor Michele Burford won a WiT award in the Life Science and ICT Research category in 2016
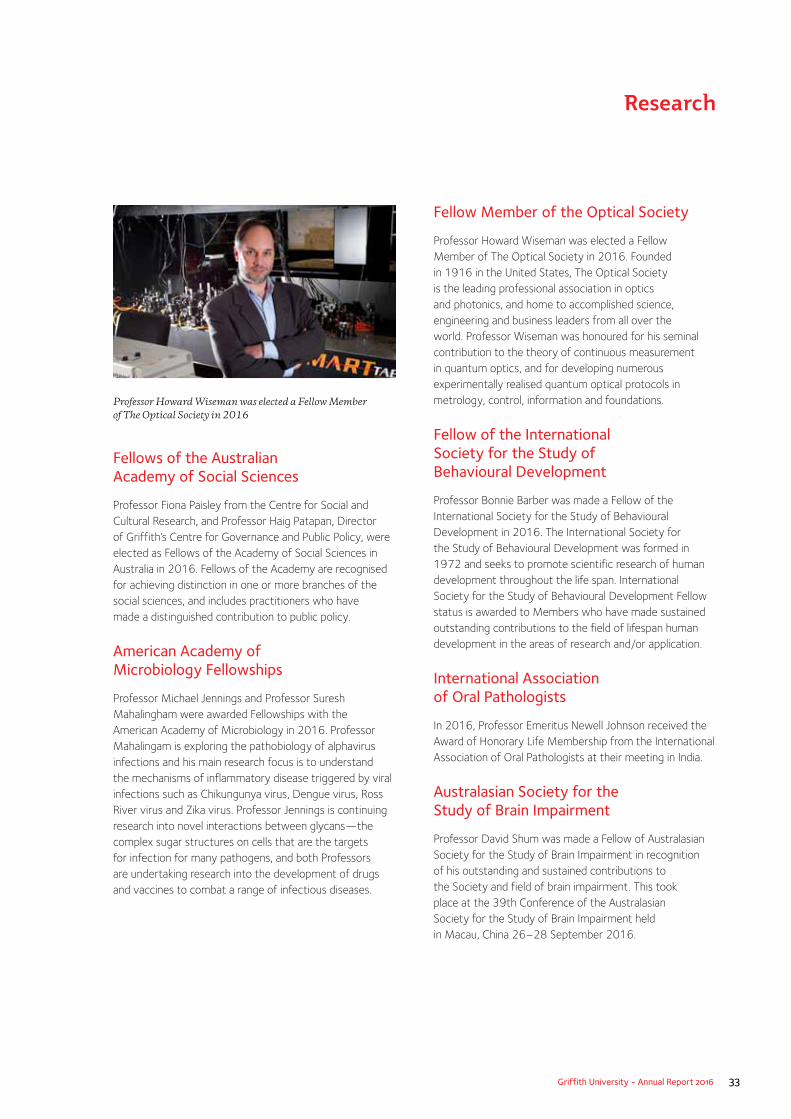
Griffith University - Annual Report 2016 33
Research
Fellows of the Australian Academy of Social Sciences
Professor Fiona Paisley from the Centre for Social and Cultural Research, and Professor Haig Patapan, Director of Griffith’s Centre for Governance and Public Policy, were elected as Fellows of the Academy of Social Sciences in Australia in 2016. Fellows of the Academy are recognised for achieving distinction in one or more branches of the social sciences, and includes practitioners who have made a distinguished contribution to public policy.
American Academy of Microbiology Fellowships
Professor Michael Jennings and Professor Suresh Mahalingham were awarded Fellowships with the American Academy of Microbiology in 2016. Professor Mahalingam is exploring the pathobiology of alphavirus infections and his main research focus is to understand the mechanisms of inflammatory disease triggered by viral infections such as Chikungunya virus, Dengue virus, Ross River virus and Zika virus. Professor Jennings is continuing research into novel interactions between glycans—the complex sugar structures on cells that are the targets for infection for many pathogens, and both Professors are undertaking research into the development of drugs and vaccines to combat a range of infectious diseases.
Fellow Member of the Optical Society
Professor Howard Wiseman was elected a Fellow Member of The Optical Society in 2016. Founded in 1916 in the United States, The Optical Society is the leading professional association in optics and photonics, and home to accomplished science, engineering and business leaders from all over the world. Professor Wiseman was honoured for his seminal contribution to the theory of continuous measurement in quantum optics, and for developing numerous experimentally realised quantum optical protocols in metrology, control, information and foundations.
Fellow of the International Society for the Study of Behavioural Development
Professor Bonnie Barber was made a Fellow of the International Society for the Study of Behavioural Development in 2016. The International Society for the Study of Behavioural Development was formed in 1972 and seeks to promote scientific research of human development throughout the life span. International Society for the Study of Behavioural Development Fellow status is awarded to Members who have made sustained outstanding contributions to the field of lifespan human development in the areas of research and/or application.
International Association of Oral Pathologists
In 2016, Professor Emeritus Newell Johnson received the Award of Honorary Life Membership from the International Association of Oral Pathologists at their meeting in India.
Australasian Society for the Study of Brain Impairment
Professor David Shum was made a Fellow of Australasian Society for the Study of Brain Impairment in recognition of his outstanding and sustained contributions to the Society and field of brain impairment. This took place at the 39th Conference of the Australasian Society for the Study of Brain Impairment held in Macau, China 26–28 September 2016.
Professor Howard Wiseman was elected a Fellow Member of The Optical Society in 2016
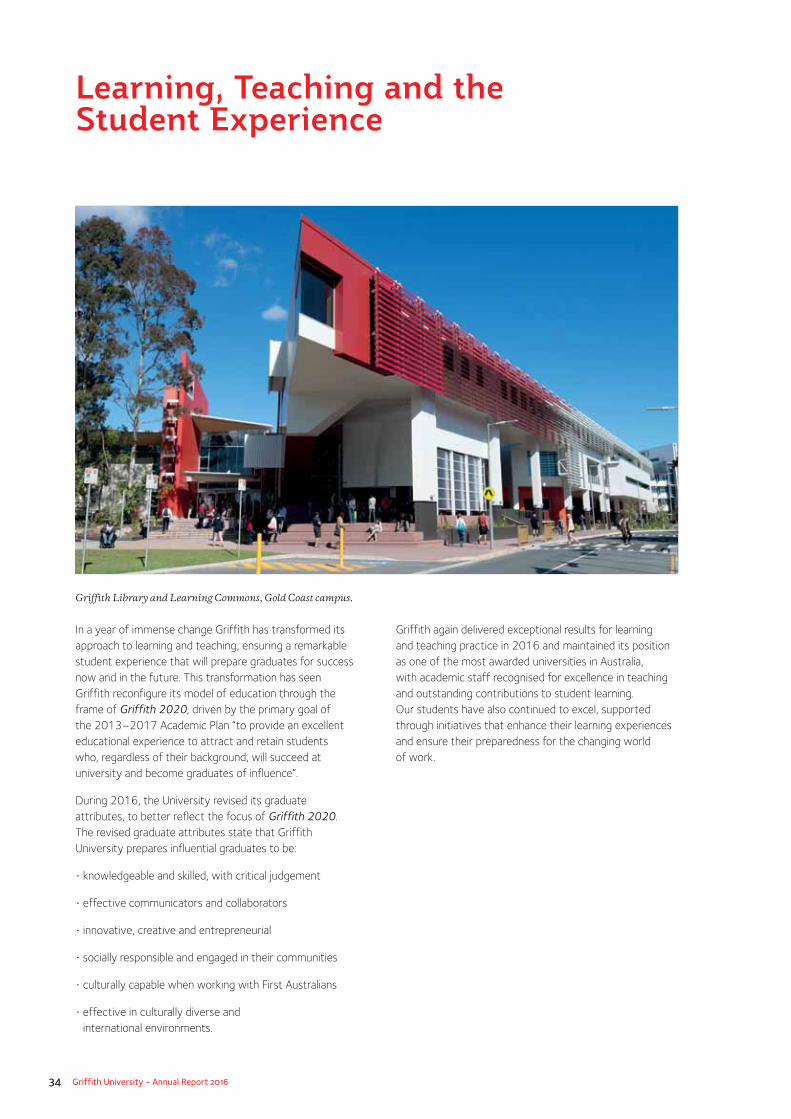
34 Griffith University - Annual Report 2016
In a year of immense change Griffith has transformed its approach to learning and teaching, ensuring a remarkable student experience that will prepare graduates for success now and in the future. This transformation has seen Griffith reconfigure its model of education through the frame of Griffith 2020, driven by the primary goal of the 2013–2017 Academic Plan “to provide an excellent educational experience to attract and retain students who, regardless of their background, will succeed at university and become graduates of influence”.
During 2016, the University revised its graduate attributes, to better reflect the focus of Griffith 2020. The revised graduate attributes state that Griffith University prepares influential graduates to be:
• knowledgeable and skilled, with critical judgement
• effective communicators and collaborators
• innovative, creative and entrepreneurial
• socially responsible and engaged in their communities
• culturally capable when working with First Australians
• effective in culturally diverse and international environments.
Learning, Teaching and the Student Experience
Griffith again delivered exceptional results for learning and teaching practice in 2016 and maintained its position as one of the most awarded universities in Australia, with academic staff recognised for excellence in teaching and outstanding contributions to student learning. Our students have also continued to excel, supported through initiatives that enhance their learning experiences and ensure their preparedness for the changing world of work.
Griffith Library and Learning Commons, Gold Coast campus.
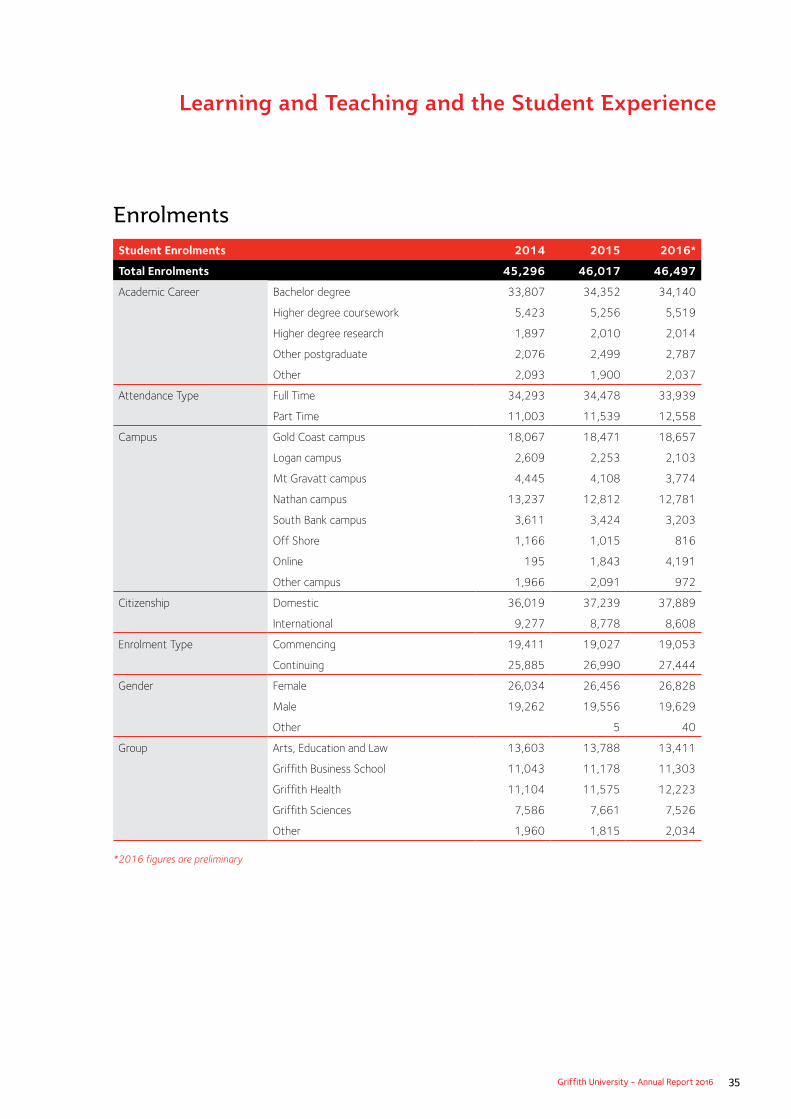
Griffith University - Annual Report 2016 35
Learning and Teaching and the Student Experience
Enrolments Student Enrolments 2014 2015 2016*
Total Enrolments 45,296 46,017 46,497
Academic Career Bachelor degree 33,807 34,352 34,140
Higher degree coursework 5,423 5,256 5,519
Higher degree research 1,897 2,010 2,014
Other postgraduate 2,076 2,499 2,787
Other 2,093 1,900 2,037
Attendance Type Full Time 34,293 34,478 33,939
Part Time 11,003 11,539 12,558
Campus Gold Coast campus 18,067 18,471 18,657
Logan campus 2,609 2,253 2,103
Mt Gravatt campus 4,445 4,108 3,774
Nathan campus 13,237 12,812 12,781
South Bank campus 3,611 3,424 3,203
Off Shore 1,166 1,015 816
Online 195 1,843 4,191
Other campus 1,966 2,091 972
Citizenship Domestic 36,019 37,239 37,889
International 9,277 8,778 8,608
Enrolment Type Commencing 19,411 19,027 19,053
Continuing 25,885 26,990 27,444
Gender Female 26,034 26,456 26,828
Male 19,262 19,556 19,629
Other 5 40
Group Arts, Education and Law 13,603 13,788 13,411
Griffith Business School 11,043 11,178 11,303
Griffith Health 11,104 11,575 12,223
Griffith Sciences 7,586 7,661 7,526
Other 1,960 1,815 2,034
*2016 figures are preliminary
36 Griffith University - Annual Report 2016
Student numbers rose slightly to 46,497 in 2016, with health disciplines the primary driver of the increase. A softening in commencing student demand was offset by an increase in the number of domestic continuing enrolments.
Higher degree research student numbers remained steady during 2016, while those undertaking coursework postgraduate programs increased. In particular, the Griffith Business School continued to experience strong demand for its accelerated online MBA, reflecting increasing student interest in online and accelerated offerings not previously available.
International student commencements in 2016 decreased by 2% compared with 2015, primarily reflecting a decline in undergraduate commencements, while there was small growth in postgraduate coursework and study abroad (non-award) commencements. International higher degree research commencements were steady. Commencing student load increased in Semester 1, 2016; however, overall student numbers for 2016 were adversely affected by the introduction of the simplified student visa framework (SSVF) immigration policy.
In 2016, Griffith welcomed 917 study abroad and exchange students, while over 1,260 Griffith students participated in an overseas experience.
Implementation of Griffith 2020The major focus of the academic community in 2016 was the implementation of the Griffith 2020 framework. Griffith 2020 has guided program redesign to align with the needs of students and industry, with a focus on employability, innovation, entrepreneurship, cross-disciplinary collaboration, digital technologies, global mobility and the capabilities required for success in the new world in which we are operating. Four themes underpin Griffith 2020:
1. flexibility
2. market-informed academic planning
3. engaged and relevant
4. quality.
Significant outcomes from each of these themes are outlined over the following pages.
1. FlexibilityAll Griffith University programs will move to 12-week trimesters from 2017, though not all programs will offer courses in all three trimesters. The trimester-based academic calendar will provide students with additional options to enter Griffith programs throughout the year, and opportunities to accelerate their studies or spread their study load across the three trimesters. Many Griffith programs have also been redesigned to include a common first year, allowing students to delay their choice of specialisation until second year.
In total, 43 Griffith programs have been designed or redesigned to align with the core principles of Griffith 2020. Of these:
• 16 major programs will run over all three trimesters, nine of which will have entry points in every trimester, from 2017
• four new single degree programs and 14 new or redesigned double degrees will commence in 2017, to meet market demand
• 22 programs have been redesigned to accommodate a common first year.
Griffith Online
Griffith continued to implement its online strategy this year to increase the number of flexible options for students to study Griffith programs in the cloud. Currently, a suite of 75 degrees can be studied fully online, with 37 of these programs also available on-campus. A number of these online programs are offered in collaboration with partners including Pearson and Open Universities Australia (OUA).
Each new online program and course is developed in accordance with Griffith’s Practice Standards in Online Learning, and the internationally benchmarked Quality Matters online course design framework.
Griffith Online has promoted an innovative approach to learning and teaching with the introduction of new technologies and resources to support students and staff. In 2016, we trialled the use of virtual reality in an undergraduate program and implemented Yammer to foster peer-to-peer and peer-to-convener engagement. Yammer has transformed the online learning experience and, when coupled with our synchronous communication in online courses, it makes for an exceptionally rich learning experience.
Learning and Teaching and the Student Experience

Griffith University - Annual Report 2016 37
Griffith Pearson Alliance
The University’s partnership with the Pearson Australia Group aims to assist Griffith in achieving the scale of online education growth required to meet the University’s strategic goals.
Five new online programs were launched in 2016 in partnership with Pearson, each with six commencement points throughout a calendar year. They are:
• Master of Marketing/Graduate Certificate in Marketing
• Master of Finance and Investments
• Master of Global Law/Graduate Certificate in Global Law Practice.
In addition, enrolment numbers in the existing program suite have continued to steadily grow. In particular, the Griffith MBA is performing well, attracting high enrolments and maintaining its place as one of Australia’s leading MBA programs. With core values of responsibility, sustainability, and ensuring our students have a global orientation, the MBA continues to be a leader at Griffith in the use of technologies to interact with, teach and learn from students.
Open Universities Australia
Griffith University enrolled more students than any other provider through Open Universities Australia (OUA) in 2016. However, in line with the overall decline in OUA, Griffith OUA enrolments fell in 2016 (24,210 unit enrolments in 2016 compared with 30,319 unit enrolments in 2015), primarily as a result of 12-16% downturn in enrolments in business, education, arts and humanities, and criminology and criminal justice. Enrolments heavily favoured undergraduate programs (22,820 unit enrolments) compared to postgraduate programs of study (1,390 unit enrolments). OUA continues to provide the advantage of reaching students outside Queensland, with 31% of students enrolled in OUA-Griffith units coming from New South Wales and 22% of students from Victoria, compared to 26% from Queensland. Undergraduate enrolments for Commonwealth supported places (CSP) at Griffith showed improved performance again in 2016, reaching 1538 CSP students in 2016.
During 2016, OUA committed to move to an ‘open portfolio’ approach, in which all partner universities are free to offer any program. Previously, each program could only be offered by a single university. Griffith continues to revitalise its OUA portfolio of programs. In 2016, OUA offerings of the Bachelor of Business and the Bachelor of Arts were renewed to align with changes to on-campus degrees. A new OUA pathway was introduced for criminology in August 2016, to promote Griffith criminology and criminal justice units, and transition students into CSP places. 530 students graduated from Griffith OUA Programs in the last 12 months.
Through the Open2Study platform (a free open education platform offered by OUA), Griffith offers two massive open online courses (MOOCs) entitled Introduction to Business in Asia and Understanding the Origins of Crime. A further 8,810 students undertook these courses during 2016, bringing the total to 13,191 students for Introduction to Business in Asia and 24,475 students for Understanding the Origins of Crime since the first offering of these courses in April 2013.
AMP Partnership
In 2016, Griffith Business School continued its successful partnership with AMP Services Ltd to deliver a suite of postgraduate programs in financial planning. These programs combine theoretical coursework with real-life experience—co-delivered by AMP—and are designed to prepare participants for practice as financial planners.
Learning and Teaching and the Student Experience
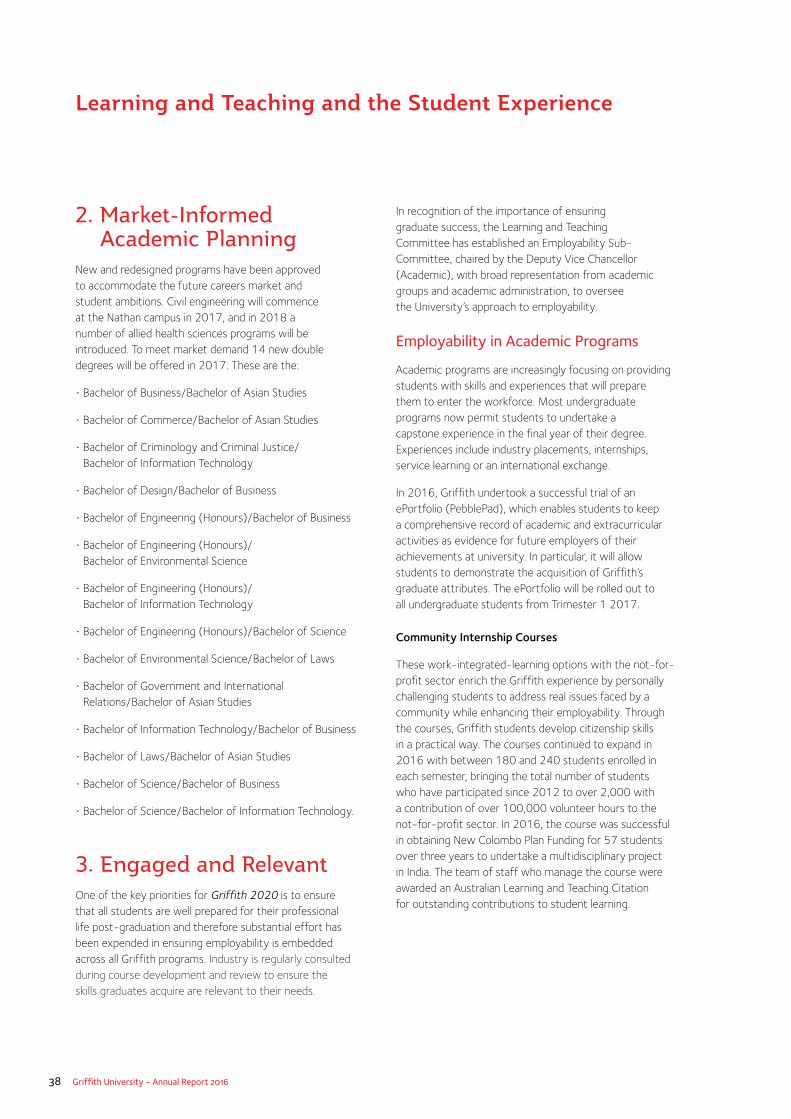
38 Griffith University - Annual Report 2016
2. Market-Informed Academic Planning
New and redesigned programs have been approved to accommodate the future careers market and student ambitions. Civil engineering will commence at the Nathan campus in 2017, and in 2018 a number of allied health sciences programs will be introduced. To meet market demand 14 new double degrees will be offered in 2017. These are the:
• Bachelor of Business/Bachelor of Asian Studies
• Bachelor of Commerce/Bachelor of Asian Studies
• Bachelor of Criminology and Criminal Justice/Bachelor of Information Technology
• Bachelor of Design/Bachelor of Business
• Bachelor of Engineering (Honours)/Bachelor of Business
• Bachelor of Engineering (Honours)/Bachelor of Environmental Science
• Bachelor of Engineering (Honours)/Bachelor of Information Technology
• Bachelor of Engineering (Honours)/Bachelor of Science
• Bachelor of Environmental Science/Bachelor of Laws
• Bachelor of Government and International Relations/Bachelor of Asian Studies
• Bachelor of Information Technology/Bachelor of Business
• Bachelor of Laws/Bachelor of Asian Studies
• Bachelor of Science/Bachelor of Business
• Bachelor of Science/Bachelor of Information Technology.
3. Engaged and RelevantOne of the key priorities for Griffith 2020 is to ensure that all students are well prepared for their professional life post-graduation and therefore substantial effort has been expended in ensuring employability is embedded across all Griffith programs. Industry is regularly consulted during course development and review to ensure the skills graduates acquire are relevant to their needs.
In recognition of the importance of ensuring graduate success, the Learning and Teaching Committee has established an Employability Sub-Committee, chaired by the Deputy Vice Chancellor (Academic), with broad representation from academic groups and academic administration, to oversee the University’s approach to employability.
Employability in Academic Programs
Academic programs are increasingly focusing on providing students with skills and experiences that will prepare them to enter the workforce. Most undergraduate programs now permit students to undertake a capstone experience in the final year of their degree. Experiences include industry placements, internships, service learning or an international exchange.
In 2016, Griffith undertook a successful trial of an ePortfolio (PebblePad), which enables students to keep a comprehensive record of academic and extracurricular activities as evidence for future employers of their achievements at university. In particular, it will allow students to demonstrate the acquisition of Griffith’s graduate attributes. The ePortfolio will be rolled out to all undergraduate students from Trimester 1 2017.
Community Internship Courses
These work-integrated-learning options with the not-for-profit sector enrich the Griffith experience by personally challenging students to address real issues faced by a community while enhancing their employability. Through the courses, Griffith students develop citizenship skills in a practical way. The courses continued to expand in 2016 with between 180 and 240 students enrolled in each semester, bringing the total number of students who have participated since 2012 to over 2,000 with a contribution of over 100,000 volunteer hours to the not-for-profit sector. In 2016, the course was successful in obtaining New Colombo Plan Funding for 57 students over three years to undertake a multidisciplinary project in India. The team of staff who manage the course were awarded an Australian Learning and Teaching Citation for outstanding contributions to student learning.
Learning and Teaching and the Student Experience
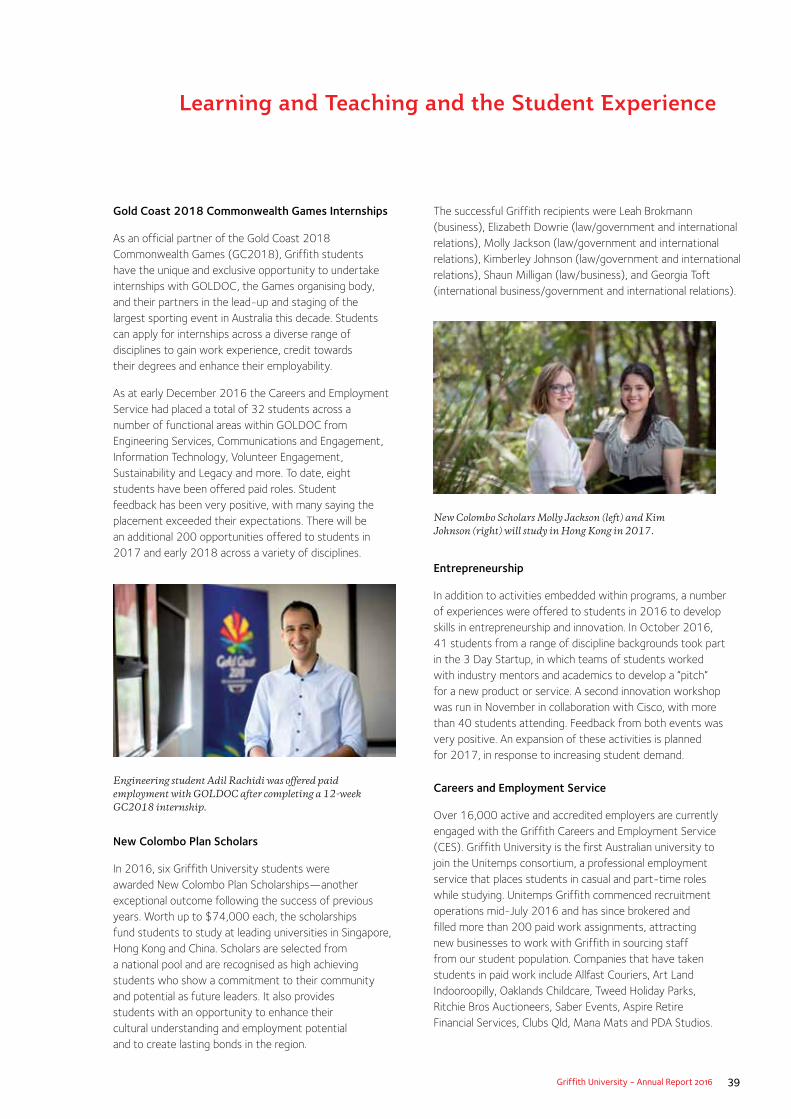
Griffith University - Annual Report 2016 39
Gold Coast 2018 Commonwealth Games Internships
As an official partner of the Gold Coast 2018 Commonwealth Games (GC2018), Griffith students have the unique and exclusive opportunity to undertake internships with GOLDOC, the Games organising body, and their partners in the lead-up and staging of the largest sporting event in Australia this decade. Students can apply for internships across a diverse range of disciplines to gain work experience, credit towards their degrees and enhance their employability.
As at early December 2016 the Careers and Employment Service had placed a total of 32 students across a number of functional areas within GOLDOC from Engineering Services, Communications and Engagement, Information Technology, Volunteer Engagement, Sustainability and Legacy and more. To date, eight students have been offered paid roles. Student feedback has been very positive, with many saying the placement exceeded their expectations. There will be an additional 200 opportunities offered to students in 2017 and early 2018 across a variety of disciplines.
New Colombo Plan Scholars
In 2016, six Griffith University students were awarded New Colombo Plan Scholarships—another exceptional outcome following the success of previous years. Worth up to $74,000 each, the scholarships fund students to study at leading universities in Singapore, Hong Kong and China. Scholars are selected from a national pool and are recognised as high achieving students who show a commitment to their community and potential as future leaders. It also provides students with an opportunity to enhance their cultural understanding and employment potential and to create lasting bonds in the region.
Learning and Teaching and the Student Experience
Engineering student Adil Rachidi was offered paid employment with GOLDOC after completing a 12-week GC2018 internship.
New Colombo Scholars Molly Jackson (left) and Kim Johnson (right) will study in Hong Kong in 2017.
The successful Griffith recipients were Leah Brokmann (business), Elizabeth Dowrie (law/government and international relations), Molly Jackson (law/government and international relations), Kimberley Johnson (law/government and international relations), Shaun Milligan (law/business), and Georgia Toft (international business/government and international relations).
Entrepreneurship
In addition to activities embedded within programs, a number of experiences were offered to students in 2016 to develop skills in entrepreneurship and innovation. In October 2016, 41 students from a range of discipline backgrounds took part in the 3 Day Startup, in which teams of students worked with industry mentors and academics to develop a “pitch” for a new product or service. A second innovation workshop was run in November in collaboration with Cisco, with more than 40 students attending. Feedback from both events was very positive. An expansion of these activities is planned for 2017, in response to increasing student demand.
Careers and Employment Service
Over 16,000 active and accredited employers are currently engaged with the Griffith Careers and Employment Service (CES). Griffith University is the first Australian university to join the Unitemps consortium, a professional employment service that places students in casual and part-time roles while studying. Unitemps Griffith commenced recruitment operations mid-July 2016 and has since brokered and filled more than 200 paid work assignments, attracting new businesses to work with Griffith in sourcing staff from our student population. Companies that have taken students in paid work include Allfast Couriers, Art Land Indooroopilly, Oaklands Childcare, Tweed Holiday Parks, Ritchie Bros Auctioneers, Saber Events, Aspire Retire Financial Services, Clubs Qld, Mana Mats and PDA Studios.
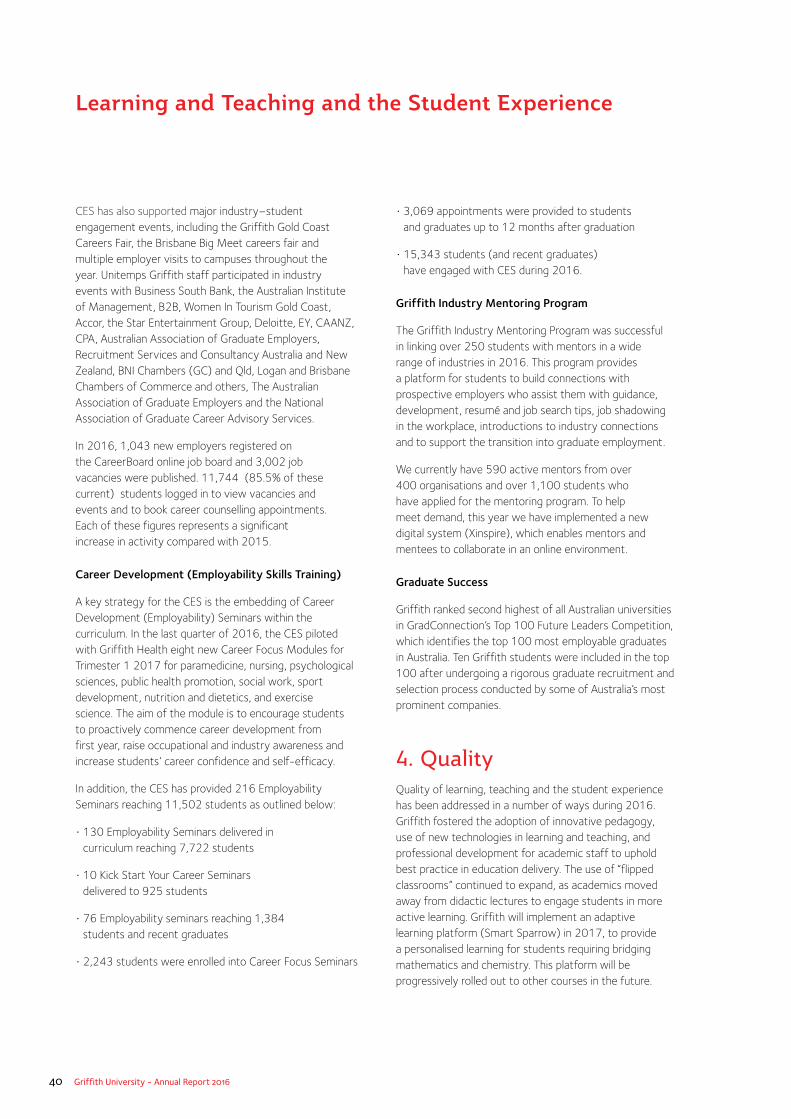
40 Griffith University - Annual Report 2016
CES has also supported major industry–student engagement events, including the Griffith Gold Coast Careers Fair, the Brisbane Big Meet careers fair and multiple employer visits to campuses throughout the year. Unitemps Griffith staff participated in industry events with Business South Bank, the Australian Institute of Management, B2B, Women In Tourism Gold Coast, Accor, the Star Entertainment Group, Deloitte, EY, CAANZ, CPA, Australian Association of Graduate Employers, Recruitment Services and Consultancy Australia and New Zealand, BNI Chambers (GC) and Qld, Logan and Brisbane Chambers of Commerce and others, The Australian Association of Graduate Employers and the National Association of Graduate Career Advisory Services.
In 2016, 1,043 new employers registered on the CareerBoard online job board and 3,002 job vacancies were published. 11,744 (85.5% of these current) students logged in to view vacancies and events and to book career counselling appointments. Each of these figures represents a significant increase in activity compared with 2015.
Career Development (Employability Skills Training)
A key strategy for the CES is the embedding of Career Development (Employability) Seminars within the curriculum. In the last quarter of 2016, the CES piloted with Griffith Health eight new Career Focus Modules for Trimester 1 2017 for paramedicine, nursing, psychological sciences, public health promotion, social work, sport development, nutrition and dietetics, and exercise science. The aim of the module is to encourage students to proactively commence career development from first year, raise occupational and industry awareness and increase students’ career confidence and self-efficacy.
In addition, the CES has provided 216 Employability Seminars reaching 11,502 students as outlined below:
• 130 Employability Seminars delivered in curriculum reaching 7,722 students
• 10 Kick Start Your Career Seminars delivered to 925 students
• 76 Employability seminars reaching 1,384 students and recent graduates
• 2,243 students were enrolled into Career Focus Seminars
• 3,069 appointments were provided to students and graduates up to 12 months after graduation
• 15,343 students (and recent graduates) have engaged with CES during 2016.
Griffith Industry Mentoring Program
The Griffith Industry Mentoring Program was successful in linking over 250 students with mentors in a wide range of industries in 2016. This program provides a platform for students to build connections with prospective employers who assist them with guidance, development, resumé and job search tips, job shadowing in the workplace, introductions to industry connections and to support the transition into graduate employment.
We currently have 590 active mentors from over 400 organisations and over 1,100 students who have applied for the mentoring program. To help meet demand, this year we have implemented a new digital system (Xinspire), which enables mentors and mentees to collaborate in an online environment.
Graduate Success
Griffith ranked second highest of all Australian universities in GradConnection’s Top 100 Future Leaders Competition, which identifies the top 100 most employable graduates in Australia. Ten Griffith students were included in the top 100 after undergoing a rigorous graduate recruitment and selection process conducted by some of Australia’s most prominent companies.
4. QualityQuality of learning, teaching and the student experience has been addressed in a number of ways during 2016. Griffith fostered the adoption of innovative pedagogy, use of new technologies in learning and teaching, and professional development for academic staff to uphold best practice in education delivery. The use of “flipped classrooms” continued to expand, as academics moved away from didactic lectures to engage students in more active learning. Griffith will implement an adaptive learning platform (Smart Sparrow) in 2017, to provide a personalised learning for students requiring bridging mathematics and chemistry. This platform will be progressively rolled out to other courses in the future.
Learning and Teaching and the Student Experience
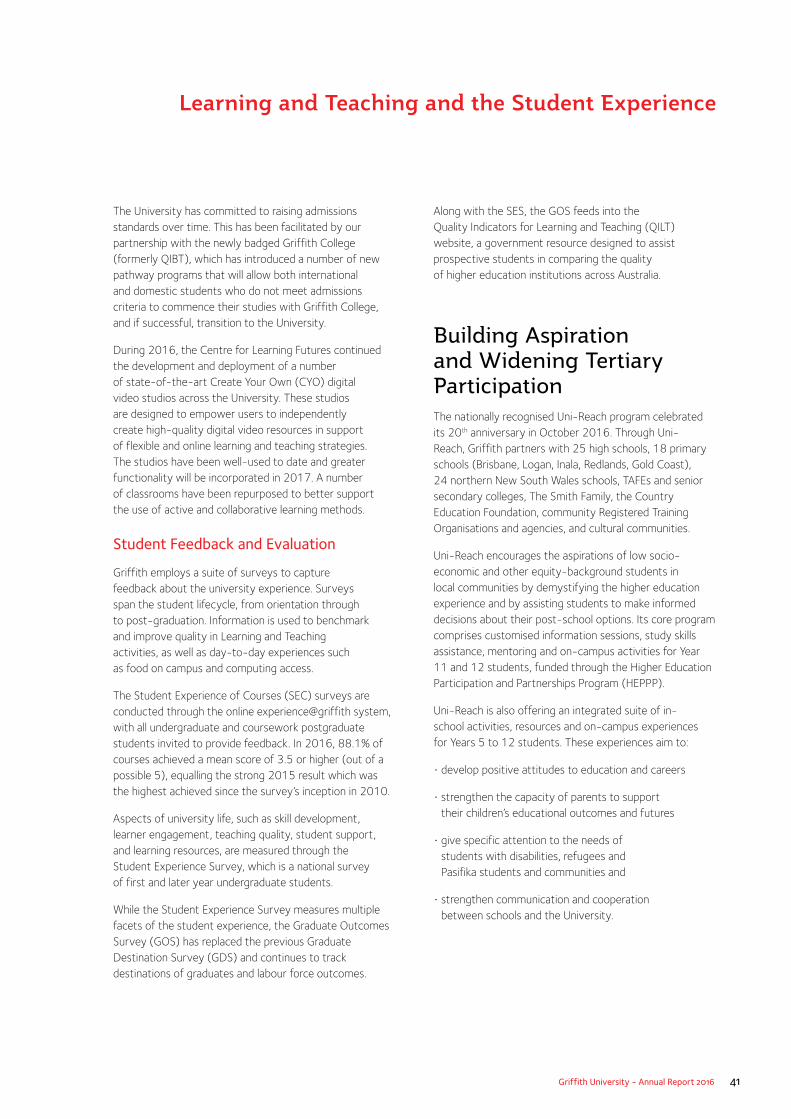
Griffith University - Annual Report 2016 41
The University has committed to raising admissions standards over time. This has been facilitated by our partnership with the newly badged Griffith College (formerly QIBT), which has introduced a number of new pathway programs that will allow both international and domestic students who do not meet admissions criteria to commence their studies with Griffith College, and if successful, transition to the University.
During 2016, the Centre for Learning Futures continued the development and deployment of a number of state-of-the-art Create Your Own (CYO) digital video studios across the University. These studios are designed to empower users to independently create high-quality digital video resources in support of flexible and online learning and teaching strategies. The studios have been well-used to date and greater functionality will be incorporated in 2017. A number of classrooms have been repurposed to better support the use of active and collaborative learning methods.
Student Feedback and Evaluation
Griffith employs a suite of surveys to capture feedback about the university experience. Surveys span the student lifecycle, from orientation through to post-graduation. Information is used to benchmark and improve quality in Learning and Teaching activities, as well as day-to-day experiences such as food on campus and computing access.
The Student Experience of Courses (SEC) surveys are conducted through the online experience@griffith system, with all undergraduate and coursework postgraduate students invited to provide feedback. In 2016, 88.1% of courses achieved a mean score of 3.5 or higher (out of a possible 5), equalling the strong 2015 result which was the highest achieved since the survey’s inception in 2010.
Aspects of university life, such as skill development, learner engagement, teaching quality, student support, and learning resources, are measured through the Student Experience Survey, which is a national survey of first and later year undergraduate students.
While the Student Experience Survey measures multiple facets of the student experience, the Graduate Outcomes Survey (GOS) has replaced the previous Graduate Destination Survey (GDS) and continues to track destinations of graduates and labour force outcomes.
Along with the SES, the GOS feeds into the Quality Indicators for Learning and Teaching (QILT) website, a government resource designed to assist prospective students in comparing the quality of higher education institutions across Australia.
Building Aspiration and Widening Tertiary ParticipationThe nationally recognised Uni-Reach program celebrated its 20th anniversary in October 2016. Through Uni-Reach, Griffith partners with 25 high schools, 18 primary schools (Brisbane, Logan, Inala, Redlands, Gold Coast), 24 northern New South Wales schools, TAFEs and senior secondary colleges, The Smith Family, the Country Education Foundation, community Registered Training Organisations and agencies, and cultural communities.
Uni-Reach encourages the aspirations of low socio-economic and other equity-background students in local communities by demystifying the higher education experience and by assisting students to make informed decisions about their post-school options. Its core program comprises customised information sessions, study skills assistance, mentoring and on-campus activities for Year 11 and 12 students, funded through the Higher Education Participation and Partnerships Program (HEPPP).
Uni-Reach is also offering an integrated suite of in-school activities, resources and on-campus experiences for Years 5 to 12 students. These experiences aim to:
• develop positive attitudes to education and careers
• strengthen the capacity of parents to support their children’s educational outcomes and futures
• give specific attention to the needs of students with disabilities, refugees and Pasifika students and communities and
• strengthen communication and cooperation between schools and the University.
Learning and Teaching and the Student Experience
42 Griffith University - Annual Report 2016
This extended Uni-Reach program is complemented by an adult learner engagement strategy. In 2016, the Griffith Adult Learners Week event received an award from Adult Learning Australia for the way the program partners with TAFEs and Community Colleges, and celebrates the diverse journeys of adults in higher education. In recent years, a number of programs within the Uni-Reach framework have received awards and recognition at the state, national and international level. Programs targeting the Pasifika community were awarded a 2016 Silver Excellence award from NASPA (Student Affairs Administrators in Higher Education—the peak body for student affairs in the United States) following on from an Office of Learning and Teaching award in 2014. The career outreach “Launch into Life” initiatives received a Highly Commended citation in the 2016 Griffith Awards for Excellence in Teaching (GAET) round.
Student Mentoring
Research1 shows that mentoring is one of the most effective tools to support transition and retention of students from equity backgrounds. It has also been shown to improve the retention, success and graduate outcomes of mentors from similar backgrounds. In 2016, 123 mentors were trained with many serving in roles in both the widening participation and transition space.
Students of Low SES
In 2016, in addition to an ongoing commitment to student welfare and wellbeing, the University continued to implement strategies—funded through HEPPP—which aim to increase the participation, retention and success rates of domestic undergraduate students from equity backgrounds. The funding Griffith received as part of the program has been used in a variety of ways, including to:
• support the Uni-Key (now in its 21st year) and Uni-Skills peer mentoring programs, and Peer Assisted Study Sessions (PASS) in a broad range of threshold courses
• continue the Widening Tertiary Participation Program for Pasifika Communities
• provide direct financial support to students, including more scholarships, bursaries and laptops offered in each semester, and funding for extra-curricular opportunities and professional development activities such as conference attendance
• provide careers and employment projects to help students find suitable on-campus work and develop career-focused skills, for example, the Student Partners Program, Peer Mentoring programs, and support for students from refugee backgrounds near to graduation with specialised employability workshops
• support learning projects that enhance current and prospective student experience, for example, supporting students from refugee backgrounds with support such as intensive academic skills workshops (Heads Up program).
Aboriginal and Torres Strait Islander Students
The University has a long-standing commitment to increasing the number of Aboriginal and Torres Strait Islander students successfully graduating from its programs. The GUMURRII Student Support Unit, in its 29th year of operation, provides extensive academic support for Aboriginal and Torres Strait Islander students throughout the course of their studies.
GUMURRII provides a space for Aboriginal and Torres Strait Islander students on all five campuses, enabling students to experience social and cultural activities and access computer labs, study rooms and personal learning support.
In total, 968 Aboriginal and Torres Strait Islander students were enrolled in 2016, with 118 Aboriginal and Torres Strait Islander students graduating across a diverse range of disciplines, including 96 undergraduate, 21 postgraduate and one research postgraduate.
Throughout 2016, GUMURRII participated in a number of community events, including: NAIDOC Week, Walk and Talk, Harmony Week and the 2016 Show Me Your World Tour – Indigenous Hero’s Day, which is in its sixth year and brings students from Doomadgee, Mornington Island, Normanton, Burketown and Karumba to showcase possibilities of scholarship, schools, university and professions. GUMURRII continues to work closely with a number of community partners including KPMG, Queensland Reds, Career Trackers-Indigenous Internship Program, AIME, Indigenous Accountants Australia, Murri Sisters, 2 Spirits, 98.9 FM and NRMA Insurance Broncos Indigenous Programs.
Learning and Teaching and the Student Experience
1 Bennett, A., Naylor, R., Mellor, K., Brett, M., Gore, J., Harvey, A., Munn, B., James, R., Smith, M., and Whitty, G. (2015). The Critical Interventions Framework Part 2: Equity Initiatives in Australian Higher Education: A Review of Evidence of Impact.
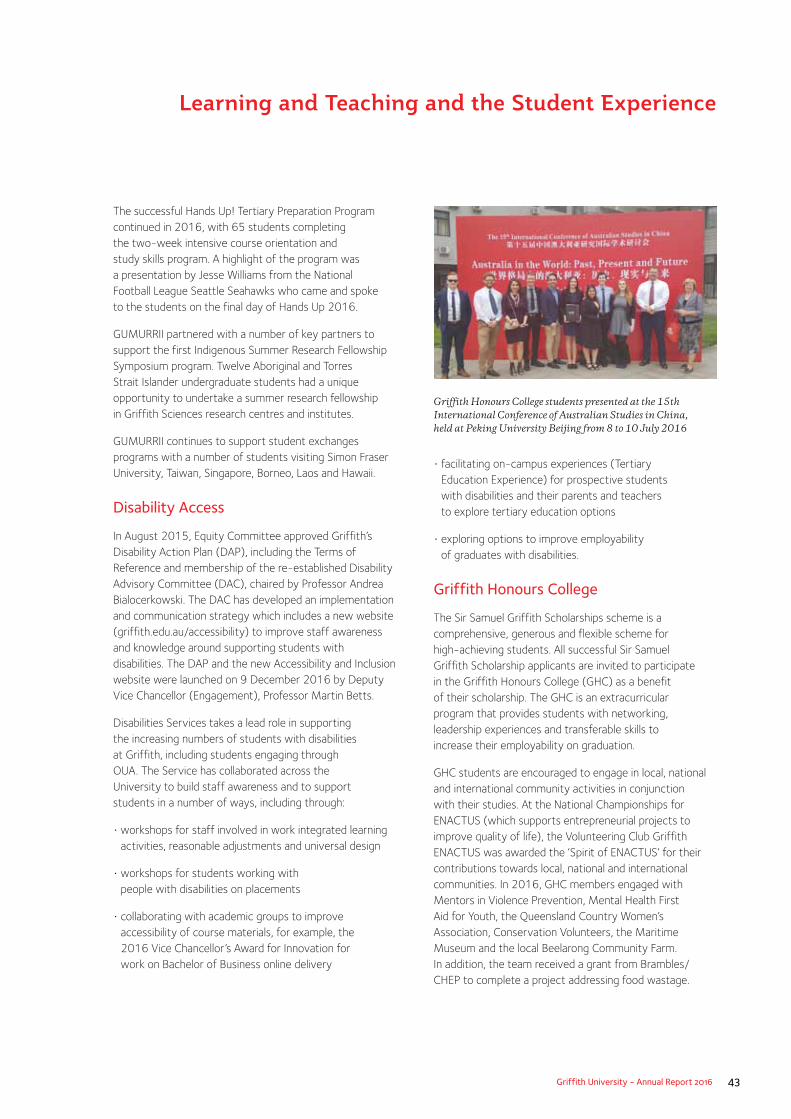
Griffith University - Annual Report 2016 43
The successful Hands Up! Tertiary Preparation Program continued in 2016, with 65 students completing the two-week intensive course orientation and study skills program. A highlight of the program was a presentation by Jesse Williams from the National Football League Seattle Seahawks who came and spoke to the students on the final day of Hands Up 2016.
GUMURRII partnered with a number of key partners to support the first Indigenous Summer Research Fellowship Symposium program. Twelve Aboriginal and Torres Strait Islander undergraduate students had a unique opportunity to undertake a summer research fellowship in Griffith Sciences research centres and institutes.
GUMURRII continues to support student exchanges programs with a number of students visiting Simon Fraser University, Taiwan, Singapore, Borneo, Laos and Hawaii.
Disability Access
In August 2015, Equity Committee approved Griffith’s Disability Action Plan (DAP), including the Terms of Reference and membership of the re-established Disability Advisory Committee (DAC), chaired by Professor Andrea Bialocerkowski. The DAC has developed an implementation and communication strategy which includes a new website (griffith.edu.au/accessibility) to improve staff awareness and knowledge around supporting students with disabilities. The DAP and the new Accessibility and Inclusion website were launched on 9 December 2016 by Deputy Vice Chancellor (Engagement), Professor Martin Betts.
Disabilities Services takes a lead role in supporting the increasing numbers of students with disabilities at Griffith, including students engaging through OUA. The Service has collaborated across the University to build staff awareness and to support students in a number of ways, including through:
• workshops for staff involved in work integrated learning activities, reasonable adjustments and universal design
• workshops for students working with people with disabilities on placements
• collaborating with academic groups to improve accessibility of course materials, for example, the 2016 Vice Chancellor’s Award for Innovation for work on Bachelor of Business online delivery
• facilitating on-campus experiences (Tertiary Education Experience) for prospective students with disabilities and their parents and teachers to explore tertiary education options
• exploring options to improve employability of graduates with disabilities.
Griffith Honours College
The Sir Samuel Griffith Scholarships scheme is a comprehensive, generous and flexible scheme for high-achieving students. All successful Sir Samuel Griffith Scholarship applicants are invited to participate in the Griffith Honours College (GHC) as a benefit of their scholarship. The GHC is an extracurricular program that provides students with networking, leadership experiences and transferable skills to increase their employability on graduation.
GHC students are encouraged to engage in local, national and international community activities in conjunction with their studies. At the National Championships for ENACTUS (which supports entrepreneurial projects to improve quality of life), the Volunteering Club Griffith ENACTUS was awarded the ‘Spirit of ENACTUS’ for their contributions towards local, national and international communities. In 2016, GHC members engaged with Mentors in Violence Prevention, Mental Health First Aid for Youth, the Queensland Country Women’s Association, Conservation Volunteers, the Maritime Museum and the local Beelarong Community Farm. In addition, the team received a grant from Brambles/CHEP to complete a project addressing food wastage.
Learning and Teaching and the Student Experience
Griffith Honours College students presented at the 15th International Conference of Australian Studies in China, held at Peking University Beijing from 8 to 10 July 2016
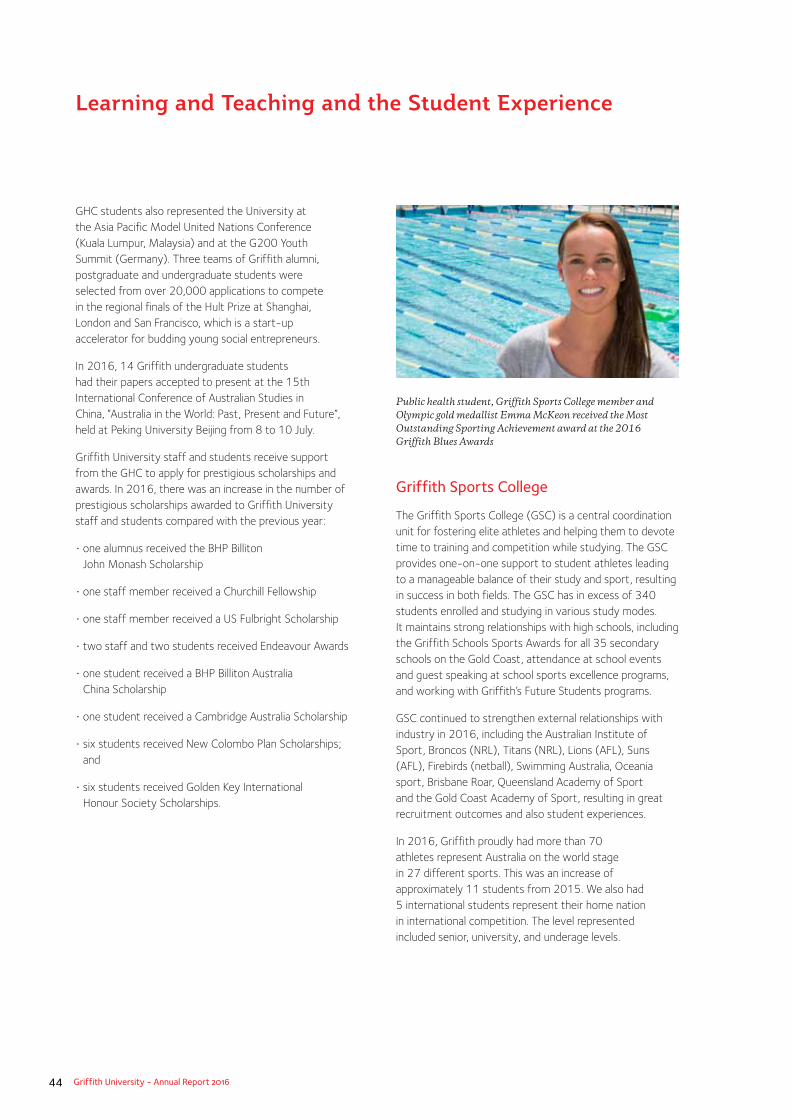
44 Griffith University - Annual Report 2016
GHC students also represented the University at the Asia Pacific Model United Nations Conference (Kuala Lumpur, Malaysia) and at the G200 Youth Summit (Germany). Three teams of Griffith alumni, postgraduate and undergraduate students were selected from over 20,000 applications to compete in the regional finals of the Hult Prize at Shanghai, London and San Francisco, which is a start-up accelerator for budding young social entrepreneurs.
In 2016, 14 Griffith undergraduate students had their papers accepted to present at the 15th International Conference of Australian Studies in China, “Australia in the World: Past, Present and Future”, held at Peking University Beijing from 8 to 10 July.
Griffith University staff and students receive support from the GHC to apply for prestigious scholarships and awards. In 2016, there was an increase in the number of prestigious scholarships awarded to Griffith University staff and students compared with the previous year:
• one alumnus received the BHP Billiton John Monash Scholarship
• one staff member received a Churchill Fellowship
• one staff member received a US Fulbright Scholarship
• two staff and two students received Endeavour Awards
• one student received a BHP Billiton Australia China Scholarship
• one student received a Cambridge Australia Scholarship
• six students received New Colombo Plan Scholarships; and
• six students received Golden Key International Honour Society Scholarships.
Griffith Sports College
The Griffith Sports College (GSC) is a central coordination unit for fostering elite athletes and helping them to devote time to training and competition while studying. The GSC provides one-on-one support to student athletes leading to a manageable balance of their study and sport, resulting in success in both fields. The GSC has in excess of 340 students enrolled and studying in various study modes. It maintains strong relationships with high schools, including the Griffith Schools Sports Awards for all 35 secondary schools on the Gold Coast, attendance at school events and guest speaking at school sports excellence programs, and working with Griffith’s Future Students programs.
GSC continued to strengthen external relationships with industry in 2016, including the Australian Institute of Sport, Broncos (NRL), Titans (NRL), Lions (AFL), Suns (AFL), Firebirds (netball), Swimming Australia, Oceania sport, Brisbane Roar, Queensland Academy of Sport and the Gold Coast Academy of Sport, resulting in great recruitment outcomes and also student experiences.
In 2016, Griffith proudly had more than 70 athletes represent Australia on the world stage in 27 different sports. This was an increase of approximately 11 students from 2015. We also had 5 international students represent their home nation in international competition. The level represented included senior, university, and underage levels.
Learning and Teaching and the Student Experience
Public health student, Griffith Sports College member and Olympic gold medallist Emma McKeon received the Most Outstanding Sporting Achievement award at the 2016 Griffith Blues Awards
Griffith University - Annual Report 2016 45
We had many Griffith University athletes and alumni represent Australia at the Rio 2016 Olympics and Paralympics. Griffith was the number one university in the country for athletes at the Olympics, with 17 current students and seven alumni representing Australia. Griffith athletes won three gold, four silver and four bronze medals at Rio, and we were the top performing Australian university at the Olympics, and were ranked ninth in the world for gold medal athletes. Griffith was also proud to have three current students and four alumni compete at the Rio 2016 Paralympics, where our athletes won one gold medal and two bronze medals.
The Griffith Blues Awards were held in October 2016 to celebrate and honour all of the University’s outstanding athletes and acknowledge their performances throughout the year. Athletes who represented at the senior level were awarded the Full Blue while those representing in various age categories or World University Championships were awarded the Half Blue.
The Most Outstanding Sporting Achievement was awarded to Emma McKeon (swimming) – Bachelor of Public Health in Health Promotion and Public Health Nutrition student.
The Griffith Academic Athlete of the Year was awarded to Clare Polkinghorne (women’s football) – Master of Criminology and Criminal Justice student.
The GSC continued to improve its support for athletes through increased visibility of, and access to, College staff, better response rates and better liaison with course convenors, student success advisors and other internal stakeholders.
Retention
In addition to the strategies outlined in earlier sections, the University has committed significant resources to address issues around student retention and academic success. Approaches taken are shifting from reliance largely on face-to-face support for students, to the use of analytics and online resources.
Although the University made the decision to discontinue the Student Success Advisor Strategy at the end of 2016, the predictive analytics approach developed as part of this strategy will continue.
Learning Futures have scoped the need for self-help digital tools that would facilitate academic advising at scale, both for prevention and intervention at key touch points in the student lifecycle (for example, failure/underperformance on early assessment and academic probation). The development and deployment of automated course-based predictive analytics and linkage to student help systems has been identified as a priority. The re-purposing of the current program-based predictive analytics processes is also in progress.
Throughout 2016, Learning Futures staff implemented the installation, design, customisation and evaluation of staff-facing analytics dashboards in Learning@Griffith. These Course Analytics reports are designed to provide Convenors with actionable intelligence across a range of indicators of student engagement and performance and will inform evidence-based design, delivery and review of courses and programs. Course Analytics for Learning will be deployed to a cross-university early adopter group in Trimester 1 2017 and fully deployed in Trimester 2.
The Griffith Graduate Scheme aims to improve the retention of two key student groups who are at potential risk of early attrition: lower performing students who are at risk of failure and students who may transfer to other institutions. A key feature of this program is the employment of Griffith postgraduate students as coaches and the engagement of Griffith Alumni. The Griffith Graduate Scheme includes Student Success Coaching, the Academic Excellence Society (ACES), and Snap Chat Your Future Campaign.
The Student Success Coaching Program is a case-management model targeting degrees with large student enrolments and high numbers of students identified by predictive analytics as being at risk of early attrition or failure. The focus is on supporting students to improve their academic success and complete their degree at Griffith. The program has been implemented in targeted degree programs since Semester 1 2014, with a total of 819 commencing students participating in the program. Coaches support allocated at-risk students across the semester through weekly contact to clarify student aspirations, support student achievement, strengthen student’s relationships with key academic staff, refer to university services as appropriate, and strengthen institutional loyalty and commitment. The program has seen significant improvements in retention of coached students.
Learning and Teaching and the Student Experience
46 Griffith University - Annual Report 2016
Academic Excellence Society
The ACES strategy—introduced in 2014—aims to improve retention through creating cohort- specific student communities that recognise academic performance and validate student identity. Target groups include high achieving students and flight risk students who are lost through inter- institutional transfer. The strategy is particularly focused on strengthening the sense of connection and sense of identity of potential flight-risk students. High-performing first year students are invited to join ACES based on their academic performance in each of their first and second semesters of study, with membership retained through to degree completion. In 2016 the ACES strategy was operational in a range of schools, including humanities (371 students), criminology (196 students), business (887 students), sciences (50 students) and medical science (105 students). Students who are members of ACES in their school are retained at higher levels (a 2014–2015 first year retention rate of 89-92% and 2015–2016 first year retention rate of 81–87%) than the baseline retention rate of 72–74% for Griffith first year students.
Snap Chat Your Future Campaign
The Snap Chat Your Future Campaign was first trialled in 2015 with first year flight risk students, to support students’ career development and focus, clarify student aspirations, and strengthen institutional commitment. The purpose of this campaign is to increase both student motivation and engagement with their degrees, and improve their confidence in, and commitment to their degree through a range of strategies including alumni events for first year students and pop-up events in large first year classes. In 2016, the campaign was embedded in the schools of humanities, languages and social science, criminology and criminal justice, business, natural sciences and medical science.
Student SupportIn 2016, there were 1,019 Griffith scholarship recipients. This marked a slight increase of 51 scholarships compared with 2015. Overall for 2016 we received an increase of 107% in the number of applications.
In 2016, 45 peer-mentoring or peer-learning programs operated across Griffith with approximately 1,000 students providing mentoring for both undergraduate and postgraduate students. Mentoring at Griffith provides a centralised-support, information, best practice and referral service for mentoring programs operating in schools and central elements. In addition, the service also offers free student mentor training using a standardised curriculum that can be tailored to meet individual program needs. In 2016, 550 peer mentors accessed this training to support transition and engagement programs in their academic areas (an 18.5% increase from 2015).
English Language skills
The Griffith English Language Enhancement Strategy (GELES) is designed to enhance the academic success of both international and domestic students with English as an Additional Language (EAL) background. Its systematic service delivery across the student lifecycle is unique in Australia and a series of state, national and international awards have benchmarked GELES as best practice in its field. A review of GELES was completed in early 2016 and it was proposed to extend GELES to reach postgraduate students (both coursework and HDR) under the Postgraduate English Language Enhancement (PELE) program as an ongoing additional strand of GELES, as well as embed employability support in GELES. The PELE adjunct tutorial pilot program was undertaken in 2014 and 2015 and as a result the PELE initiative was endorsed by the executive group for implementation in Trimester 2 2017.
Student LeadershipIn 2016, a series of professional development workshops were created under the LEAD banner (Leadership, Enrichment and Development workshops). These programs are available to all students on a University-wide basis with both online and on-campus workshops and events on offer. During 2016, 368 students attended at least one event or workshop. This series will be expanded in 2017.
In 2016, 12 students were selected to represent Griffith with two attending the National Student Leadership Forum hosted by the Commonwealth Parliament and ten students attending the Students 4 Students Leadership Conference hosted by the University of Wollongong.
Learning and Teaching and the Student Experience
Griffith University - Annual Report 2016 47
Griffith International Student Leadership
In 2016, Griffith International›s Student Linx program continued to provide welcome, transition and engagement activities to support international students, and to provide the Griffith Mates peer mentors with opportunities to develop their employability skills. Throughout each semester, the Griffith Mates are mentored by staff within Griffith International’s Student Experience Unit to deliver a diverse calendar of events and activities. In 2016, Griffith International had 159 Griffith Mates volunteers, from 41 countries, speaking 39 languages, studying 37 programs across the five campuses. Throughout the year they delivered 92 student-led events and activities with 3,751 registered student engagements.
Student Professional Development and Community Engagement Fund
The Student Professional Development and Community Engagement (PDCE) Fund is a HEPPP-funded project coordinated by Mentoring at Griffith. The PDCE fund is vital in enabling students from equity backgrounds to participate in leadership and personal development activities resulting in an increased engagement with the University and improved retention rates and academic results. In 2016, the fund has supported 40 students in identified equity groups to participate in professional, community or leadership development activities through financial sponsorship.
Celebrated TeachersThe University has continued its strong record of success at the national level in the Awards for Australian University Teaching (AAUT), coordinated by the Australian Government’s Department of Education and Training. Over the past seven years (2010–2016), Griffith has won 15 Awards (10 for Teaching Excellence and five for Programs that Enhance Learning), 44 Citations for Outstanding Contributions to Student Learning, and eight National Teaching Fellowships. Griffith was the only university to be awarded the maximum available six citations in 2016. These results place Griffith first in Australia for citations and fellowships and third for awards in 2015 and 2016. Three Griffith academics have been named the Prime Minister’s Australian University Teacher of the Year, and this remains the highest number for any university in Australia. Two of these were awarded in consecutive years (2014 and 2015), an outcome matched by only one other Australian university.
National Awards
The AAUT recognise quality teaching practice and outstanding contributions to student learning. In 2016, two Teaching Excellence Awards were awarded to Griffith staff.
Professor Gemma Carey from the Queensland Conservatorium Griffith University received an AAUT Teaching Excellence Award (Humanities and the Arts category). Professor Gemma Carey is recognised as an international pioneer for her evidence-based approach to enhancing studio teaching. Her scholarship, professional development strategies, exemplary program and course design and innovative assessment methodologies have influenced practice both nationally and internationally, and have significantly contributed to transforming the teaching and assessment of music performance and pedagogy. Central to her teaching and educational leadership is a long-standing commitment to ensuring student-centred learning, developing the pedagogical agility of staff, and designing and delivering relevant and contemporary curricula which prepare graduates for performance mastery and sustainable employment. She has led a number of collaborative curriculum renewal and staff development initiatives which have transformed undergraduate and postgraduate program quality and teaching practices, resulting in sustained improvements in both student learning and experience, and collaborative school culture. Her disciplinary standing and the substantive nature of her contributions to reforming practice within music education have been recognised through a range of institutional, national and international leadership roles. Professor Carey also received a national citation in 2016.
Professor Mark Brimble from the Department of Accounting, Finance and Economics, received an AAUT Teaching Excellence Award (Law, Economics, Business and Related Studies category). Professor Mark Brimble has strategically influenced the development of the financial advising profession, the emerging discipline of financial planning, and financial planning education in Australia through his sustained leadership of strategic collaborations between higher education and industry, and the development of national industry standards for the benefit of students and the Australian public. He holds key national leadership roles in the finance profession and the finance discipline, and is making significant contributions in establishing a national and international academic financial planning community.
Learning and Teaching and the Student Experience
48 Griffith University - Annual Report 2016
He is recognised for his evidence-informed approach to educational innovation, particularly in work-integrated learning and graduate skills, and he has led the design, development, and scholarly evaluation of innovative undergraduate and postgraduate programs in commerce and financial planning. There is clear evidence that his programs and courses develop well-rounded graduates who are able to demonstrate both disciplinary and technical knowledge, and professional capabilities. He is an active academic leader and mentor, and has been instrumental in helping colleagues systematically evaluate their teaching practices and adopt innovative practices and digital technologies in support of student learning. His educational and leadership contributions have been recognised nationally both within higher education, and by peak industry and professional bodies. Professor Brimble also received a national citation in 2016.
National Citations
The Citations for Outstanding Contributions to Student Learning are national awards to those who have made a significant contribution to the quality of student learning in a specific area of responsibility over a sustained period. All six Griffith applicants were awarded 2016 citations.
• Professor Mark Brimble Department of Accounting, Finance and Economics For strategic leadership of the financial advice profession and the emerging discipline of finance and financial planning in Australia
• Professor Gemma Carey Queensland Conservatorium Griffith University For transforming the teaching and assessment of music pedagogy both nationally and internationally
• Professor Richard John Griffith Sciences For leadership in STEM education and the sustained faculty-wide enhancement of university science students’ experience of learning and teaching quality
• Associate Professor Suzanne Owen Griffith Health For leading Go Health Go Griffith: an innovative educational partnership facilitating the aspirations and capabilities of high school students from diverse backgrounds for careers in health
• Professor Anne Tiernan School of Government and International Relations For developing the capability of emerging public sector leaders and the quality of government through industry-engaged and research-led learning in the Graduate Certificate in Policy Analysis
• The Griffith Community Internship program Learning Futures For the Griffith Community Internship: An innovative whole-of-university approach for developing our students’ employability and civic engagement
Griffith Academy of Learning and Teaching Scholars
The Griffith Academy of Learning and Teaching Scholars (GALTS) comprises Griffith academic staff who have been recognised through the National Office for Learning and Teaching, now the Department of Education and Training, award schemes. Members contribute to scholarship and capacity-building in learning and teaching, and advise executive and senior staff on strategic issues and directions in learning and teaching. GALTS members continue to be actively engaged with mentoring and critical review of staff applications for the Griffith internal schemes, and the Griffith external applications for the Department of Education and Training Citations and Awards.
The GALTS Chair, Professor Keithia Wilson leads the University’s highly successful processes for developing applications for citation and awards, with GALTS members contributing to the mentoring of applicants and the preparation, writing and editing of citation and award applications.
Currently, a number of GALTS members are engaged in scholarly, sector-wide projects focused on quality in higher education learning and teaching. These include two OLT Fellowships and an OLT Grant.
Grants
Strategic Priority Commissioned Projects support the investigation of key issues that have been identified as important in the Australian higher education system. Griffith was successful as a Partner Institution for two 2016 Office for Learning and Teaching Strategic Commissioned Projects awarded to Ms Karen van Haeringen (Academic Services) and Dr Kaye Broadbent and Professor Glenda Strachan (Department of Employment Relations and Human Resources).
Learning and Teaching and the Student Experience
Griffith University - Annual Report 2016 49
Griffith Awards
Vice Chancellor’s Award
The Vice Chancellor’s Award for the Griffith University Teacher of the Year for 2016 was presented to Dr Kevin Larkin (School of Education and Professional Studies). Dr Larkin is a dedicated educator of 30 years, a scholar, and a leader of learning and teaching in his discipline, having published research in teaching mathematics education, as well as contributing to Australian Government commissioned learning and teaching projects. Kevin has held a number of leadership roles as the First Year Coordinator and Acting Program Director for the Bachelor of Education (Primary) degree, the flagship program of the School of Education and Professional Studies. A major strength of Kevin’s teaching is his dedication and commitment to motivating and inspiring the next generation of teachers to overcome their anxiety with mathematics and to develop their teaching skills as quality mathematics educators.
Griffith Awards for Excellence in Teaching
The Griffith Awards for Excellence in Teaching for 2016 (GAETs), presented at the Celebrating Teaching Gala Nights, recognised the following inspirational staff who are committed to enhancing the quality of the student experience:
• Dr Kevin Larkin School of Education and Professional Studies Group Excellence in Teaching Award, Arts, Education and Law
• Dr Mirela Malin Department of Accounting, Finance and Economics Group Excellence in Teaching Award, Griffith Business School
• Dr Sean Horan School of Allied Health Sciences Group Excellence in Teaching Award, Griffith Health
• Dr Christopher Love School of Natural Sciences Group Excellence in Teaching Award, Griffith Sciences
• Ms Amy Goldschmied Department of Marketing Griffith Excellence in Teaching Priority Area Award, Sessional Academic
• Mrs Alison White School of Natural Sciences Griffith Excellence in Teaching Priority Area Award, Employability in the Curriculum
• Ms Natalie Oostergo Learning Futures Griffith Excellence in Teaching Priority Area Award, Student Advising
Each semester our excellent teachers are identified following close monitoring of the online surveys for student experience of teaching and courses. Exemplary teachers who achieved outstanding student evaluations of teaching for their courses with a mean of greater than 4.8 (out of 5) for all items, and a minimum response rate of 40% for courses with a minimum class size of 25 for undergraduate courses and 15 for postgraduate courses are recognised in the semester lists of excellent teachers displayed on the Griffith University Learning and Teaching website.
Internationalisation Awards
The fifth Griffith Internationalisation Awards recognised 15 academic staff for outstanding achievements in promoting the University internationally. The 2016 award recipients were Dr Yun Jiang Feng for most outstanding contribution to overall internationalisation at Griffith and Associate Professor Leigh Shutter for most outstanding contribution to the development of short term global mobility programs.
Celebrating Teaching Week
Celebrating Teaching Week is a key learning and teaching event for recognising and rewarding excellence in education and disseminating award winning approaches and innovative ideas. The 2016 program included five University-wide professional learning opportunities focused on the theme “Future Ready”. Events were streamed live and recorded to facilitate maximum access by staff. The 2016 program featured active and digital learning and included student presentations as well as presentations from colleagues from other institutions and from industry.
The Vice Chancellor’s 2016 Celebrating Teaching Gala Night presentation ceremonies and receptions were attended by award winners, colleagues, families, industry and partner schools.
Learning and Teaching and the Student Experience
50 Griffith University - Annual Report 2016
Staff Development
Nearly 200 senior University managers participated in the Senior Leadership Conference in February 2016. The conference provided an opportunity to bring senior University leaders up-to-date with the strategic directions and priorities of the University, with reflection and discussion on how this translates to their part of the University and their role as a senior leader. Main themes discussed included the alignment of University strategies with the future world of work, employability of our students and external engagement with industry.
Two Academic Leaders Fora were held in Semester 2 2016. The fora provided further opportunities to engage academic leaders in discussion around key strategies and direction for the University and in 2016, focused on the new world of work, student and graduate success, consultation on changes to academic plans and processes, and achieving Griffith 2020.
Over 120 research ethics, researcher development, and research supervision training sessions were provided to research staff, HDR supervisors and students and early career researchers through the Office for Research, Griffith Graduate Research School and Griffith Social and Behavioural Sciences Research College. Sessions included a focus on the conduct of responsible research, integrity and ethics in research and supervision, effective supervision for domestic and international students, career development, research management, methodology, writing and profiling, amongst others.
Training and development for general staff was expanded to include a series of eLearning modules, enhancing the ability of staff across all Griffith campuses to participate in skills and knowledge development. The annual Short Courses Program continued to provide face-to-face training opportunities, and managers and supervisors accessed a range of internal and external management and leadership development opportunities.
Learning and Teaching and the Student Experience
Griffith staff are positively engaging with the fully online offering of the Graduate Certificate in Higher Education. This program provides academic staff with the opportunity to expand their abilities to teach in a range of learning modes that best facilitate student learning experiences and outcomes. Participants of the program deepen their current understanding of scholarly approaches to teaching, learning, curriculum design and assessment. In 2016, the program had 170 enrolments across four courses and 20 academic and professional staff are expected to graduate in 2017.
A range of academic staff development programs were offered to key groups: staff new to teaching, Course Convenors and Program Directors. These programs were strategically aligned to support the focus of the Griffith 2020 strategy. Staff evaluations of their learning in these programs are consistently positive.
Significant collaborative work has been undertaken during 2016 to develop digital platforms to support flexible staff professional learning at scale. These platforms will be launched in 2017 and will provide systematic opportunities for staff to develop their job-relevant capabilities in their own time and at their own pace.
Gender Equality
The University was recognised as a leader in gender equality again in 2016, receiving both the Employer of Choice for Gender Equality citation by the Workplace Gender Equality Agency and the Employer of Choice award by Women in Technology.
The University seeks to provide a respectful and supportive work and study environment and in 2016, launched both the Domestic and Family Violence Support Policy and its participation in the Universities Australia “Respect. Now. Always.” campaign. These activities highlight Griffith’s commitment to ending sexual harassment and violence on Australian university campuses and within the broader community.
The University values the contributions of all staff and recognises the need for staff to balance their work, family and external commitments. Staff with family and carer responsibilities are supported through a range of provisions such as parenting facilities, flexible work arrangements and leave options.
The inaugural cohort of the Leneen Forde Future Leaders program achieved remarkable results, with 10 of the 15 participants being rewarded through academic promotion or promotion to a more senior role. The second cohort of 14 participants commenced the two-year program in November 2016.

Griffith University - Annual Report 2016 51
The University officially launched its participation in the Athena SWAN Charter at a symposium in November 2016. The Athena SWAN self-assessment team, being led by Deputy Vice Chancellor (Academic) Professor Debra Henly, aims to achieve a Bronze Award in 2018, following detailed analysis of the Griffith Sciences and Health workforces and the development of an action plan to enhance gender equality in Science, Technology, Engineering, Mathematics and Medicine (STEMM) at Griffith.
These programs, together with the Women in Leadership program and Women’s only Academic Promotions sessions are having a positive influence on the University’s goal to increase gender representation in senior roles.
Staff Diversity
Goals set in the University’s Strategic Plan in relation to the representation of women are on target. Thirty-nine per cent of academics at senior level (associate professor and professor) are women, and women represent 46% of all academic staff. Thirty-five of the 64 staff promoted across the University in 2016 were female (55%).
Forty-four per cent of staff in senior administrative and professional roles (HEW 10 and above) are women. The number of Aboriginal and Torres Strait Islander staff members across the University increased by 2 (to 56). Staff from more than 100 countries are employed across academic and professional roles. Overall, Griffith represents one of the most diverse and gender-balanced academic environments in the country.
Learning and Teaching Outlook
For Griffith, 2016 was a year of significant change, in preparation for the introduction of trimesters, new degrees and the focus on flexibility and employability that underpins Griffith 2020. While debates regarding reform to higher education legislation remain unresolved, the release of the Australian Government’s Innovation Statement, and a number of other key reports about future workforce planning and entrepreneurship, have focussed the learning and teaching agenda on graduate employability, industry engagement and entrepreneurship.
Learning and Teaching and the Student Experience
The local climate in South East Queensland remains highly competitive and dynamic, particularly with the graduation from high school of the part-cohort in 2019 (resulting from the earlier introduction of the preparatory year). In addition, in 2016 the Queensland State Government has commenced work on significant revisions to secondary school assessment and flagged a move to replace OPs with an ATAR score. More broadly, universities across Australia are experiencing increased competition from private providers, particularly in online education.
In coming years, the tertiary sector can expect further disruption from technology, that has the potential to radically change how learning and teaching is delivered, and how we best support students’ progress through university. In 2017, Griffith will launch a number of key technology platforms, including ePortfolios and an adaptive learning platform (Smart Sparrow) that will allow students to follow a personalized path through courses of study. We expect to launch at least two MOOCs in partnership with Open Universities UK online platform, FutureLearn.
Griffith will undertake a number of projects that aim to ensure all students receive timely and personalised support and advice, through an enhanced myGriffith website, and through the use of advanced analytics which will enable academic and professional staff to identify students at risk and how best to help them.
Equity and social inclusion are fundamental tenets of Griffith’s mission. The University takes seriously its obligation to increase participation by students from low socio-economic and disadvantaged backgrounds. For example, we have an extremely strong and proud record in attracting First Nations’ students and in supporting these students to complete their studies. Griffith will continue its exemplary Higher Education Participation Program agenda, to promote social inclusion and increase participation of First Nations’ students, students of low socio-economic status, and students with a disability. The University will also continue to attract and support students who are high academic achievers, through its Honours College, and elite athletes through its Sports College.
2017 presents a number of important opportunities for Griffith to capitalise on the reputational gains that will flow from the implementation of Griffith 2020, which will demonstrate that the University, its learning and teaching programs and the student experience are truly remarkable.
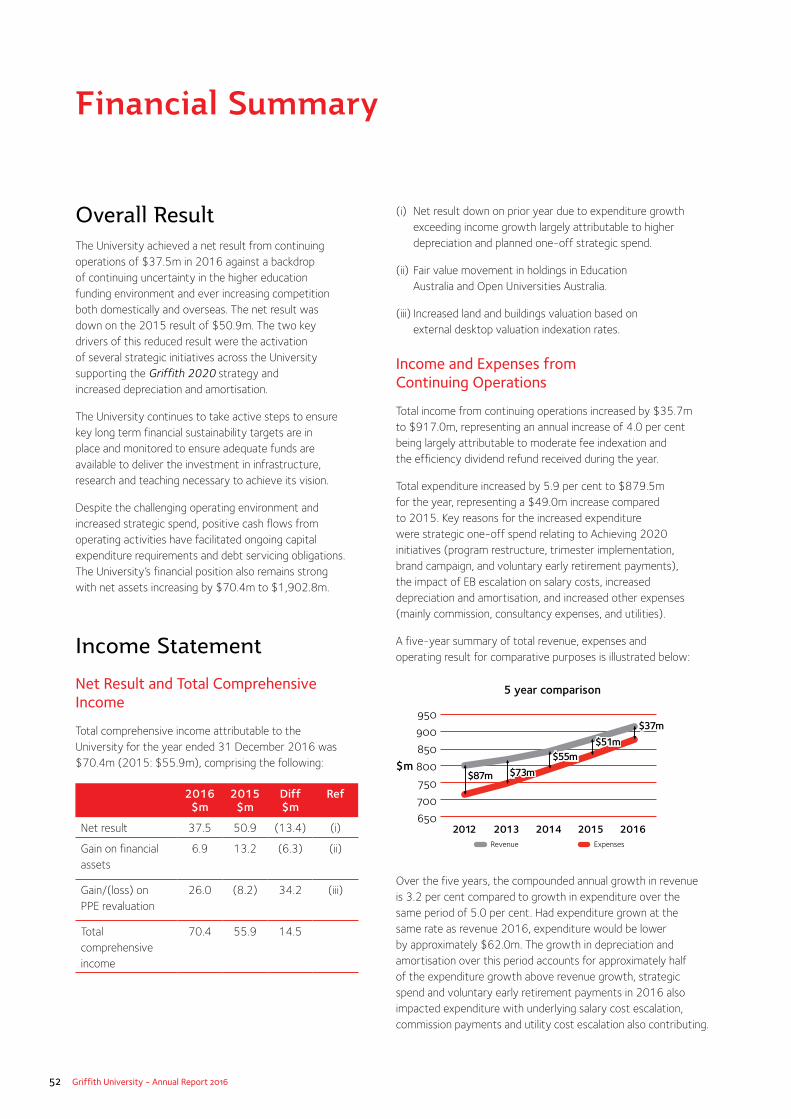
52 Griffith University - Annual Report 2016
Financial Summary
Overall ResultThe University achieved a net result from continuing operations of $37.5m in 2016 against a backdrop of continuing uncertainty in the higher education funding environment and ever increasing competition both domestically and overseas. The net result was down on the 2015 result of $50.9m. The two key drivers of this reduced result were the activation of several strategic initiatives across the University supporting the Griffith 2020 strategy and increased depreciation and amortisation.
The University continues to take active steps to ensure key long term financial sustainability targets are in place and monitored to ensure adequate funds are available to deliver the investment in infrastructure, research and teaching necessary to achieve its vision.
Despite the challenging operating environment and increased strategic spend, positive cash flows from operating activities have facilitated ongoing capital expenditure requirements and debt servicing obligations. The University’s financial position also remains strong with net assets increasing by $70.4m to $1,902.8m.
Income StatementNet Result and Total Comprehensive Income
Total comprehensive income attributable to the University for the year ended 31 December 2016 was $70.4m (2015: $55.9m), comprising the following:
2016 $m
2015 $m
Diff $m
Ref
Net result 37.5 50.9 (13.4) (i)
Gain on financial assets
6.9 13.2 (6.3) (ii)
Gain/(loss) on PPE revaluation
26.0 (8.2) 34.2 (iii)
Total comprehensive income
70.4 55.9 14.5
(i) Net result down on prior year due to expenditure growth exceeding income growth largely attributable to higher depreciation and planned one-off strategic spend.
(ii) Fair value movement in holdings in Education Australia and Open Universities Australia.
(iii) Increased land and buildings valuation based on external desktop valuation indexation rates.
Income and Expenses from Continuing Operations
Total income from continuing operations increased by $35.7m to $917.0m, representing an annual increase of 4.0 per cent being largely attributable to moderate fee indexation and the efficiency dividend refund received during the year.
Total expenditure increased by 5.9 per cent to $879.5m for the year, representing a $49.0m increase compared to 2015. Key reasons for the increased expenditure were strategic one-off spend relating to Achieving 2020 initiatives (program restructure, trimester implementation, brand campaign, and voluntary early retirement payments), the impact of EB escalation on salary costs, increased depreciation and amortisation, and increased other expenses (mainly commission, consultancy expenses, and utilities).
A five-year summary of total revenue, expenses and operating result for comparative purposes is illustrated below:
5 year comparison
Revenue Expenses
$m
950
900
850
800
750
700
6502012 2013 2014 2015 2016
Over the five years, the compounded annual growth in revenue is 3.2 per cent compared to growth in expenditure over the same period of 5.0 per cent. Had expenditure grown at the same rate as revenue 2016, expenditure would be lower by approximately $62.0m. The growth in depreciation and amortisation over this period accounts for approximately half of the expenditure growth above revenue growth, strategic spend and voluntary early retirement payments in 2016 also impacted expenditure with underlying salary cost escalation, commission payments and utility cost escalation also contributing.
$87m $73m
$55m$51m
$37m
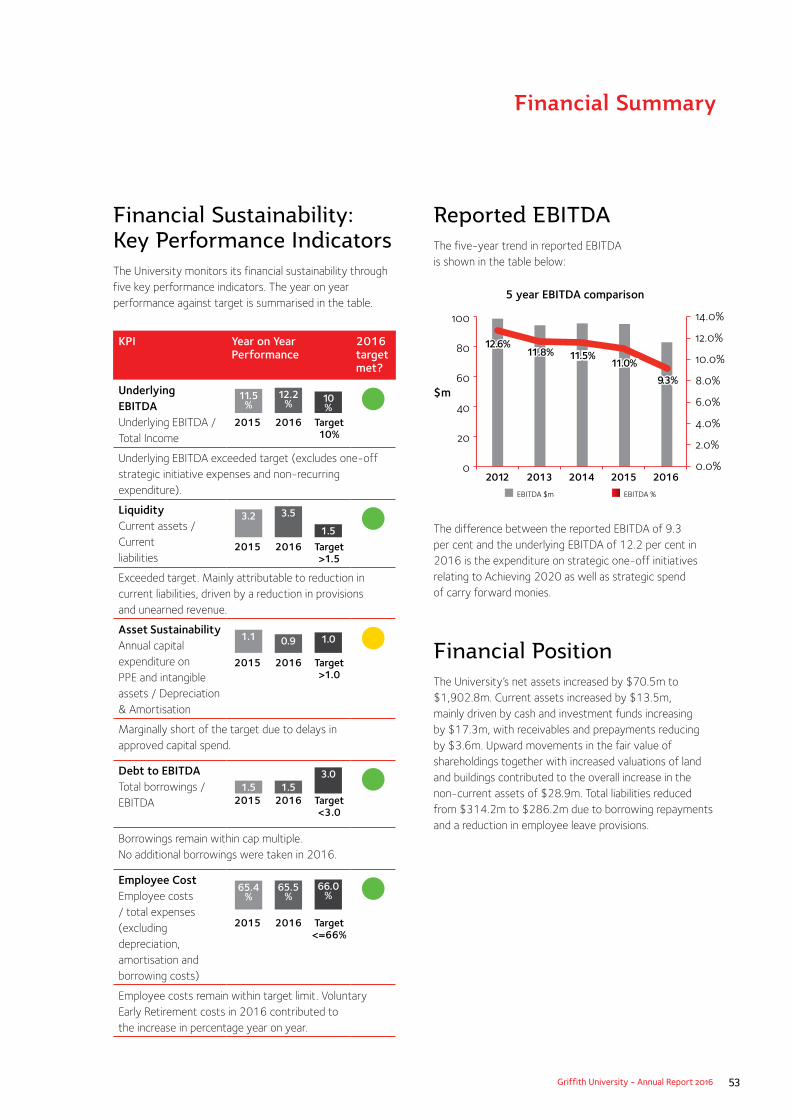
Griffith University - Annual Report 2016 53
Financial Summary
Financial Sustainability: Key Performance IndicatorsThe University monitors its financial sustainability through five key performance indicators. The year on year performance against target is summarised in the table. KPI Year on Year
Performance2016 target met?
Underlying EBITDA Underlying EBITDA / Total Income
Underlying EBITDA exceeded target (excludes one-off strategic initiative expenses and non-recurring expenditure).
Liquidity Current assets / Current liabilities
Exceeded target. Mainly attributable to reduction in current liabilities, driven by a reduction in provisions and unearned revenue.
Asset Sustainability Annual capital expenditure on PPE and intangible assets / Depreciation & Amortisation
Marginally short of the target due to delays in approved capital spend.
Debt to EBITDA Total borrowings / EBITDA
Borrowings remain within cap multiple. No additional borrowings were taken in 2016.
Employee Cost Employee costs / total expenses (excluding depreciation, amortisation and borrowing costs)
Employee costs remain within target limit. Voluntary Early Retirement costs in 2016 contributed to the increase in percentage year on year.
Reported EBITDAThe five-year trend in reported EBITDA is shown in the table below:
5 year EBITDA comparison
EBITDA $m EBITDA %
$m
100
80
60
40
20
02012 2013 2014 2015 2016
14.0%
12.0%
10.0%
8.0%
6.0%
4.0%
2.0%
0.0%
12.6%11.5%
11.0%
9.3%
11.8%
The difference between the reported EBITDA of 9.3 per cent and the underlying EBITDA of 12.2 per cent in 2016 is the expenditure on strategic one-off initiatives relating to Achieving 2020 as well as strategic spend of carry forward monies.
Financial PositionThe University’s net assets increased by $70.5m to $1,902.8m. Current assets increased by $13.5m, mainly driven by cash and investment funds increasing by $17.3m, with receivables and prepayments reducing by $3.6m. Upward movements in the fair value of shareholdings together with increased valuations of land and buildings contributed to the overall increase in the non-current assets of $28.9m. Total liabilities reduced from $314.2m to $286.2m due to borrowing repayments and a reduction in employee leave provisions.
2015 2016 Target >1.0
2015 2016 Target <3.0
2015 2016 Target <=66%
2015 2016 Target >1.5
2015 2016 Target 10%
11.5 %
10 %
12.2 %
3.21.5
3.5
1.1 1.00.9
1.53.0
1.5
65.4 %
66.0 %
65.5 %
54 Griffith University - Annual Report 2016
Financial Summary
Future DirectionThe University will continue to remain agile and responsive to the challenges and opportunities in both the higher education and wider macroeconomic environments. The uncertainty in the Commonwealth Government funding arena has been well publicised and coupled with increasing competition for enrolments in both domestic and international markets creates challenging operating conditions for the University.
The challenges of growing the main revenue streams, combined with limiting increasing demands on resources will require careful consideration and planning to ensure the ongoing financial position supports and complements the University’s wider strategic objectives and long term financial sustainability. It is anticipated that the impact of strategic initiative spending on the University’s net result will continue in 2017 and 2018.
Griffith University - Annual Report 2016 55
ContentsStatement of Comprehensive Income
Statement of Financial Position
Statement of Changes in Equity
Statement of Cash Flows
Notes to the Financial Statements
1. Summary of significant accounting policies
Income
2. Australian Government financial assistance including Australian Government loan programs (HELP)
3. State and Local Government financial assistance 4. Fees and charges 5. Investment revenue and other investment income 6. Consultancy and contracts 7. Other revenue
Expenses
8. Employee related expenses 9. Other expenses
Assets
10. Cash and cash equivalents 11. Receivables 12. Other financial assets 13. Property, plant and equipment 14. Intangible assets and premium on leased property 15. Other non-financial assets
Liabilities
16. Trade and other payables 17. Borrowings 18. Provisions 19. Other liabilities
Equity
20. Reserves and retained earnings
Disclosure Notes
21. Financial risk management 22. Key management personnel disclosures 23. Remuneration of auditors 24. Contingencies 25. Commitments 26. Events occurring after the reporting period 27. Reconciliation of net result after income tax
to net cash provided by operating activities28. Service concession arrangements 29. Fair value measurements 30. Acquittal of Australian Government financial assistance
Griffith University Certificate
Independent Auditor’s Report
Financial Statements
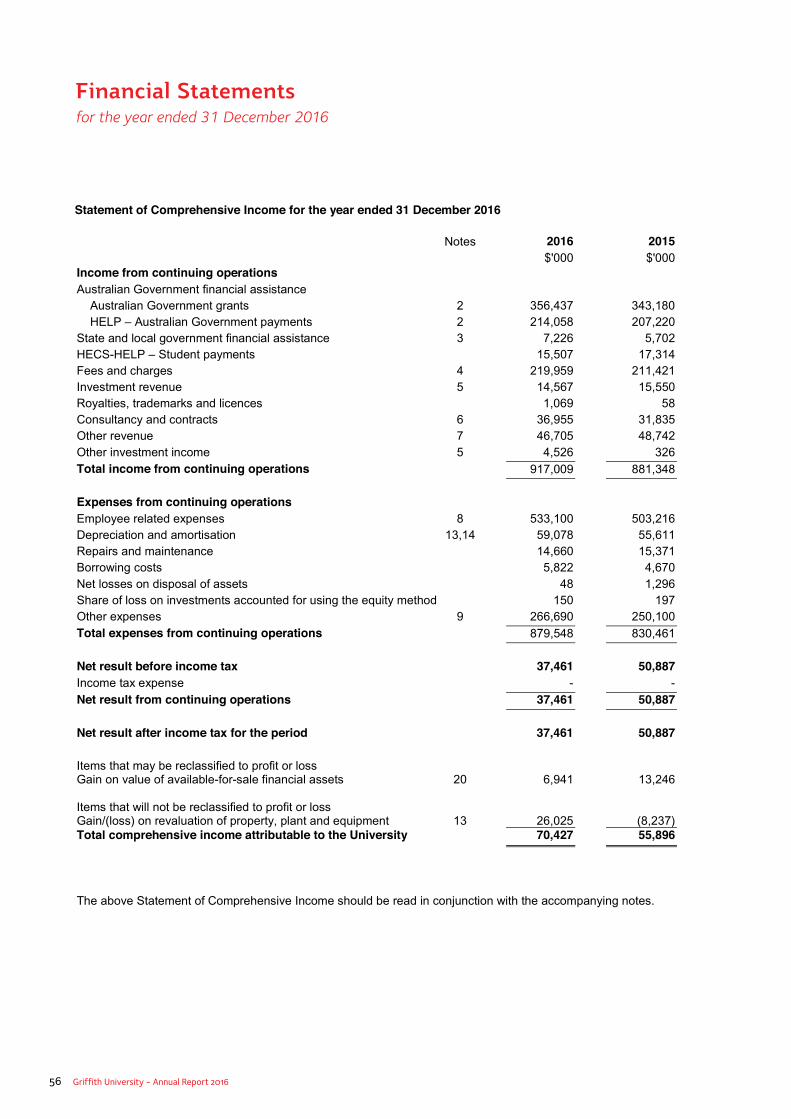
56 Griffith University - Annual Report 2016
Statement of Comprehensive Income for the year ended 31 December 2016
Notes 2016 2015$'000 $'000
Income from continuing operationsAustralian Government financial assistance
Australian Government grants 2 356,437 343,180 HELP – Australian Government payments 2 214,058 207,220
State and local government financial assistance 3 7,226 5,702HECS-HELP – Student payments 15,507 17,314Fees and charges 4 219,959 211,421Investment revenue 5 14,567 15,550Royalties, trademarks and licences 1,069 58Consultancy and contracts 6 36,955 31,835Other revenue 7 46,705 48,742Other investment income 5 4,526 326Total income from continuing operations 917,009 881,348
Expenses from continuing operationsEmployee related expenses 8 533,100 503,216Depreciation and amortisation 13,14 59,078 55,611Repairs and maintenance 14,660 15,371Borrowing costs 5,822 4,670Net losses on disposal of assets 48 1,296Share of loss on investments accounted for using the equity method 150 197Other expenses 9 266,690 250,100Total expenses from continuing operations 879,548 830,461
Net result before income tax 37,461 50,887Income tax expense - -Net result from continuing operations 37,461 50,887
Net result after income tax for the period 37,461 50,887
Items that may be reclassified to profit or lossGain on value of available-for-sale financial assets 20 6,941 13,246
Items that will not be reclassified to profit or lossGain/(loss) on revaluation of property, plant and equipment 13 26,025 (8,237)Total comprehensive income attributable to the University 70,427 55,896
The above Statement of Comprehensive Income should be read in conjunction with the accompanying notes.
Financial Statements for the year ended 31 December 2016
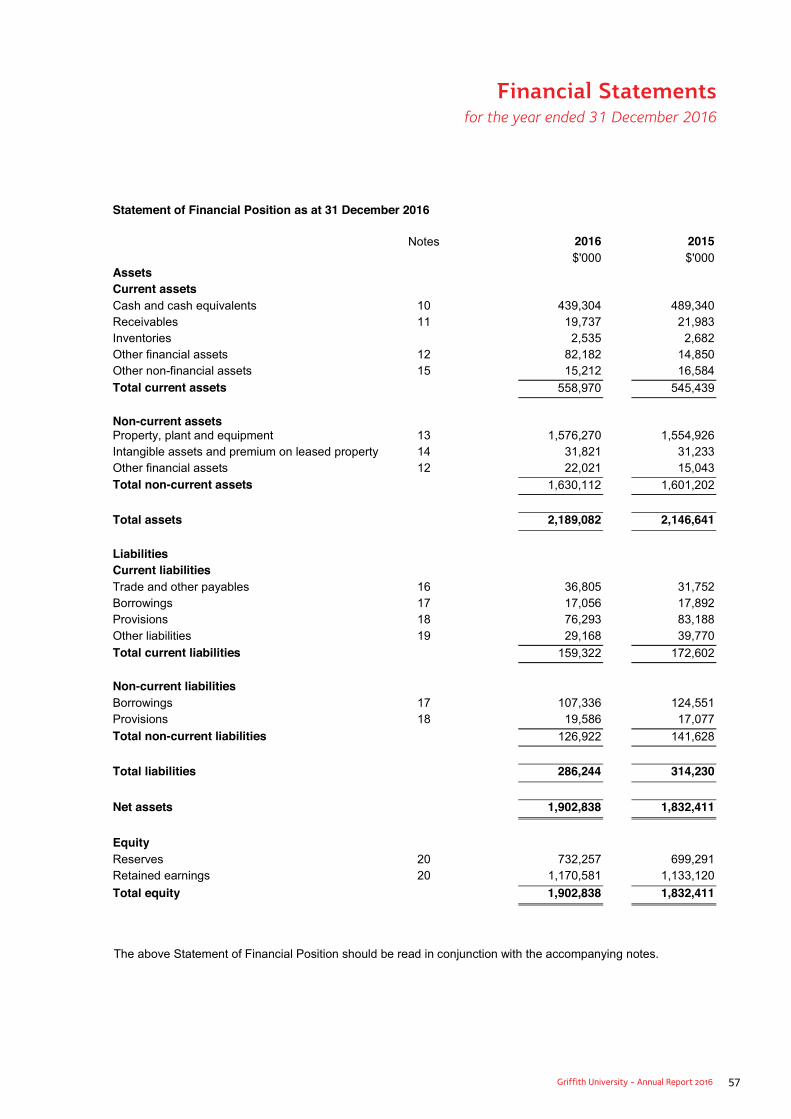
Griffith University - Annual Report 2016 57
Financial Statements for the year ended 31 December 2016
Statement of Financial Position as at 31 December 2016
Notes 2016 2015$'000 $'000
AssetsCurrent assetsCash and cash equivalents 10 439,304 489,340Receivables 11 19,737 21,983Inventories 2,535 2,682Other financial assets 12 82,182 14,850Other non-financial assets 15 15,212 16,584
Total current assets 558,970 545,439
Non-current assetsProperty, plant and equipment 13 1,576,270 1,554,926Intangible assets and premium on leased property 14 31,821 31,233Other financial assets 12 22,021 15,043Total non-current assets 1,630,112 1,601,202
Total assets 2,189,082 2,146,641
LiabilitiesCurrent liabilitiesTrade and other payables 16 36,805 31,752Borrowings 17 17,056 17,892Provisions 18 76,293 83,188Other liabilities 19 29,168 39,770
Total current liabilities 159,322 172,602
Non-current liabilitiesBorrowings 17 107,336 124,551Provisions 18 19,586 17,077
Total non-current liabilities 126,922 141,628
Total liabilities 286,244 314,230
Net assets 1,902,838 1,832,411
EquityReserves 20 732,257 699,291Retained earnings 20 1,170,581 1,133,120
Total equity 1,902,838 1,832,411
The above Statement of Financial Position should be read in conjunction with the accompanying notes.

58 Griffith University - Annual Report 2016
Financial Statements for the year ended 31 December 2016
Statement of Changes in Equity for the year ended 31 December 2016
NotesReserves Retained
EarningsTotal
$’000 $’000 $’000
Balance at 1 January 2015 694,282 1,082,233 1,776,515Net result - 50,887 50,887Loss on revaluation of property, plant and equipment (8,237) - (8,237)Gain on revaluation of available-for-sale financial assets 13,246 - 13,246Balance at 31 December 2015 20 699,291 1,133,120 1,832,411
Balance at 1 January 2016 699,291 1,133,120 1,832,411Net result - 37,461 37,461Gain on revaluation of property, plant and equipment 26,025 - 26,025Gain on revaluation of available-for-sale financial assets 6,941 - 6,941
Balance at 31 December 2016 20 732,257 1,170,581 1,902,838
The above Statement of Changes in Equity should be read in conjunction with the accompanying notes.
Statement of Changes in Equity for the year ended 31 December 2016
Notes Reserves Retained Earnings
Total
$’000 $’000 $’000
Balance at 1 January 2015 694,282 1,082,233 1,776,515Net result - 50,887 50,887Loss on revaluation of property, plant and equipment (8,237) - (8,237)Gain on revaluation of available-for-sale financial assets 13,246 - 13,246Balance at 31 December 2015 20 699,291 1,133,120 1,832,411
Balance at 1 January 2016 699,291 1,133,120 1,832,411Net result - 37,461 37,461Gain on revaluation of property, plant and equipment 26,025 - 26,025Gain on revaluation of available-for-sale financial assets 6,941 - 6,941
Balance at 31 December 2016 20 732,257 1,170,581 1,902,838
The above Statement of Changes in Equity should be read in conjunction with the accompanying notes.
Statement of Changes in Equity for the year ended 31 December 2016
NotesReserves Retained
EarningsTotal
$’000 $’000 $’000
Balance at 1 January 2015 694,282 1,082,233 1,776,515Net result - 50,887 50,887Loss on revaluation of property, plant and equipment (8,237) - (8,237)Gain on revaluation of available-for-sale financial assets 13,246 - 13,246Balance at 31 December 2015 20 699,291 1,133,120 1,832,411
Balance at 1 January 2016 699,291 1,133,120 1,832,411Net result - 37,461 37,461Gain on revaluation of property, plant and equipment 26,025 - 26,025Gain on revaluation of available-for-sale financial assets 6,941 - 6,941
Balance at 31 December 2016 20 732,257 1,170,581 1,902,838
The above Statement of Changes in Equity should be read in conjunction with the accompanying notes.
Statement of Changes in Equity for the year ended 31 December 2016
NotesReserves Retained
EarningsTotal
$’000 $’000 $’000
Balance at 1 January 2015 694,282 1,082,233 1,776,515Net result - 50,887 50,887Loss on revaluation of property, plant and equipment (8,237) - (8,237)Gain on revaluation of available-for-sale financial assets 13,246 - 13,246Balance at 31 December 2015 20 699,291 1,133,120 1,832,411
Balance at 1 January 2016 699,291 1,133,120 1,832,411Net result - 37,461 37,461Gain on revaluation of property, plant and equipment 26,025 - 26,025Gain on revaluation of available-for-sale financial assets 6,941 - 6,941
Balance at 31 December 2016 20 732,257 1,170,581 1,902,838
The above Statement of Changes in Equity should be read in conjunction with the accompanying notes.
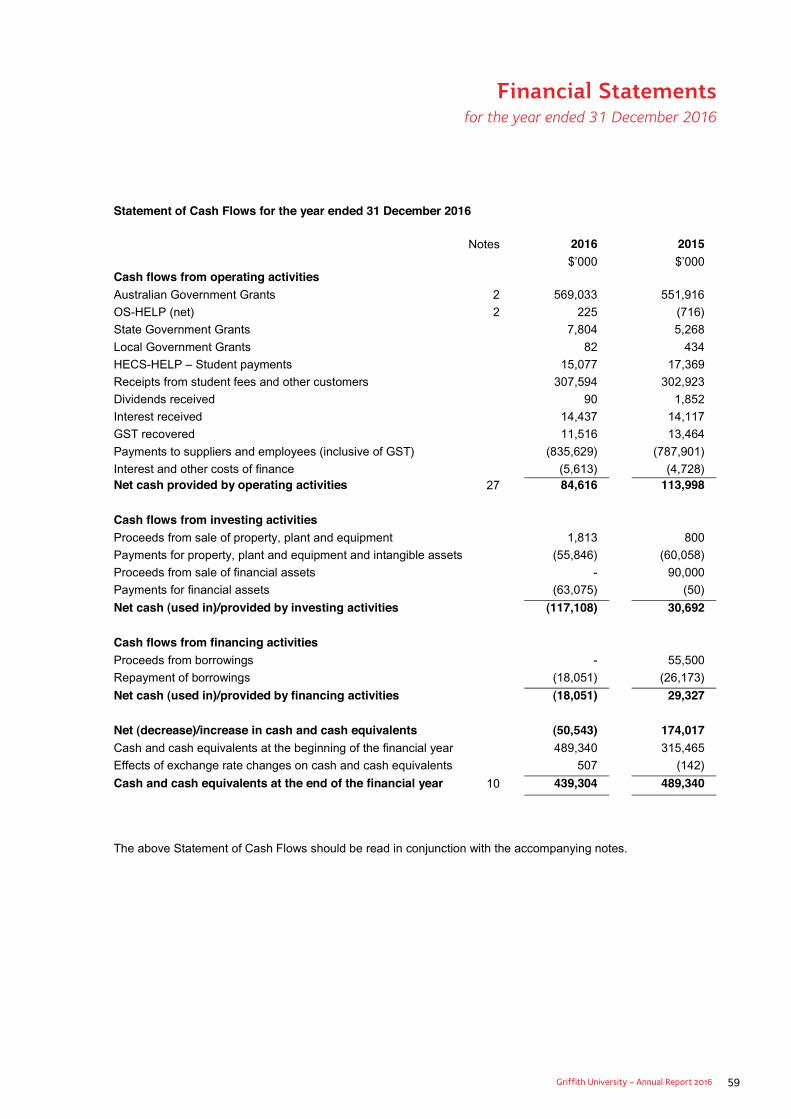
Griffith University - Annual Report 2016 59
Financial Statements for the year ended 31 December 2016
Statement of Cash Flows for the year ended 31 December 2016
Notes 2016 2015$’000 $’000
Cash flows from operating activitiesAustralian Government Grants 2 569,033 551,916
OS-HELP (net) 2 225 (716)
State Government Grants 7,804 5,268
Local Government Grants 82 434
HECS-HELP – Student payments 15,077 17,369
Receipts from student fees and other customers 307,594 302,923
Dividends received 90 1,852
Interest received 14,437 14,117
GST recovered 11,516 13,464
Payments to suppliers and employees (inclusive of GST) (835,629) (787,901)
Interest and other costs of finance (5,613) (4,728)Net cash provided by operating activities 27 84,616 113,998
Cash flows from investing activitiesProceeds from sale of property, plant and equipment 1,813 800
Payments for property, plant and equipment and intangible assets (55,846) (60,058)
Proceeds from sale of financial assets - 90,000
Payments for financial assets (63,075) (50)
Net cash (used in)/provided by investing activities (117,108) 30,692
Cash flows from financing activitiesProceeds from borrowings - 55,500
Repayment of borrowings (18,051) (26,173)
Net cash (used in)/provided by financing activities (18,051) 29,327
Net (decrease)/increase in cash and cash equivalents (50,543) 174,017Cash and cash equivalents at the beginning of the financial year 489,340 315,465
Effects of exchange rate changes on cash and cash equivalents 507 (142)
Cash and cash equivalents at the end of the financial year 10 439,304 489,340
The above Statement of Cash Flows should be read in conjunction with the accompanying notes.
60 Griffith University - Annual Report 2016
Financial Statements for the year ended 31 December 2016
Notes to the financial statements for the year ended 31 December 2016
1. Summary of significant accounting policies
Griffith University is constituted under the Griffith University Act 1998 (Qld) and is a statutory body within the meaning given in the Financial Accountability Act 2009 (Qld). The principal address of Griffith University is Parklands Drive, Southport, Queensland 4222.
The financial statements are parent entity financial statements consisting of Griffith University only. Consolidated financial statements have not been prepared as the sole subsidiary is not considered material. The parent and ultimate parent entity is Griffith University. The presentation currency is Australian Dollars.
The principal accounting policies adopted in the preparation of the financial statements are set out below. These policies have been consistently applied for all years reported unless otherwise stated.
(a) Basis of preparation
The annual financial statements represent the audited general purpose financial statements of Griffith University.They have been prepared on an accrual basis and comply with Australian Accounting Standards.
Griffith University applies Tier 1 reporting requirements.
Additionally the statements have been prepared in accordance with the following statutory requirements:• Higher Education Support Act 2003 (Cth) (Financial Statement Guidelines)• Financial and Performance Management Standard 2009 (Qld)
Griffith University is a not-for-profit entity and these statements have been prepared on that basis. Some of the Australian Accounting Standards requirements for not-for-profit entities are inconsistent with the IFRS requirements.
(i) Date of authorisation for issueThe financial statements were authorised for issue by Griffith University at the date of signing the Griffith University Certificate.
(ii) Historical cost conventionThese financial statements have been prepared under the historical cost convention, as modified by the revaluation of available-for-sale financial assets, financial assets and liabilities at fair value through profit and loss, certain classes of property, plant and equipment and assets held for sale.
(iii) Critical accounting estimatesThe preparation of financial statements in conformity with Australian Accounting Standards requires the use of certain critical accounting estimates. It also requires management to exercise its judgement in the process of applying the University’s accounting policies. The estimates and underlying assumptions are reviewed on an ongoing basis.
University management has made no judgement in the process of applying accounting policies that would have a significant impact on the amounts disclosed in the financial report, other than the normal operational judgement affecting depreciation, impairment, revaluation of assets and calculation of employee benefits.
(b) Comparative amounts
Where necessary, comparative information has been reclassified to enhance comparability in respect of changes in presentation adopted in the current year.
(c) Revenue recognition
Revenue is recognised when it is probable that the economic benefits associated with the transaction will flow to the University and can be reliably measured. Interest revenue is recognised when the University becomes entitled to the income. Revenue from rendering services or provision of goods is recognised when the University has a right to be compensated, and the amount of revenue and the stage of completion of the service can be reliably measured. In some cases this may not be probable until consideration is received or an uncertainty is removed.
Griffith University - Annual Report 2016 61
Financial Statements for the year ended 31 December 2016
Notes to the financial statements for the year ended 31 December 2016
1. Summary of significant accounting policies (continued)
(c) Revenue recognition (continued)
(i) Government grantsGrants from the government are recognised at their fair value where the University obtains control of the right to receive the grant, it is probable that economic benefits will flow to the University and it can be reliably measured.
Where grants are received that are reciprocal in nature, revenue is progressively recognised as it is earned, according to the terms of the funding agreements.
(ii) HELP paymentsRevenue from HELP is categorised into those received from the Australian Government and those received directly from students. Revenue is recognised and measured in accordance with the above disclosure.
(iii) Student fees and chargesFees and charges are recognised as income when earned. Fees and charges received by the University prior to balance date which relate to future periods are treated as unearned revenue in liabilities.
(iv) Consultancy and contracts/Fee for serviceContract revenue is recognised in accordance with the percentage of completion method. The stage of completion is measured by reference to labour hours incurred to date as a percentage of estimated total labour hours for each contract.
(d) Cash and cash equivalents
Cash and cash equivalents comprises cash on hand, cash at bank, cash deposits held at call with financial institutions and other short term, highly liquid investments with original maturities of three months or less that are readily convertible to known amounts of cash and subject to an insignificant risk of changes in value.
(e) Receivables
Trade receivables are recognised at fair value and subsequently measured at amortised cost using the effective interest method, less provision for impairment. Trade receivables are due for settlement no more than 30 days from the date of recognition.
Collectability of trade receivables is reviewed on an ongoing basis. Debts which are known to be uncollectible are written off. A provision for impairment of receivables is established when there is objective evidence that the University will not be able to collect all amounts due according to the original terms of receivables. Significant financial difficulties of the debtor, probability that the debtor will enter bankruptcy or financial reorganisation, and default or delinquency in payments (more than 90 days overdue) are considered indicators that the trade receivable is impaired. The amount of the provision is recognised in the Statement of Comprehensive Income.
(f) Investments and other financial assets
(i) ClassificationThe University classifies its investments into the following categories:
• Financial assets at fair value through profit or loss;• Loans and receivables;• Held-to-maturity investments; or• Available-for-sale financial assets.
Held-to-maturity investments principally comprise term deposits with a maturity date of greater than 90 days at acquisition. Available-for-sale financial assets are included in non-current assets unless management intends to dispose of the investment within 12 months of balance date. Financial assets at fair value through profit or loss are classified as current assets. Investments are recognised at fair value plus transaction costs. Financial assets are derecognised when the rights to receive cash flows from the financial assets have expired or have been transferred and the University has transferred substantially all the risks and rewards of ownership.
62 Griffith University - Annual Report 2016
Financial Statements for the year ended 31 December 2016
Notes to the financial statements for the year ended 31 December 2016
1. Summary of significant accounting policies (continued)
(f) Investments and other financial assets (continued)
(ii) Subsequent measurementAvailable-for-sale assets and financial assets at fair value through profit or loss are subsequently carried at fair value. Held-to-maturity investments are carried at amortised cost using the effective interest rate method.Changes in the fair value of available-for-sale financial assets are recognised in equity. Gains or losses arising from changes in the fair value of the ‘financial assets at fair value through profit or loss’ category are included in the Statement of Comprehensive Income within other income or other expenses in the period in which they arise.
(iii) Fair valueThe fair values of investments and other financial assets are based on quoted prices in an active market, discounted where appropriate based on liquidity. If an active market can not be readily identified and reliably measured the assets are carried at historical cost.
(iv) ImpairmentThe University assesses at each balance date whether there is objective evidence that a financial asset or group of financial assets is impaired. In the case of equity securities classified as available-for-sale, a significant or prolonged decline in the fair value of a security below its cost is considered in determining whether the security is impaired. If any such evidence exists for available-for-sale financial assets, the cumulative loss – measured as the difference between the acquisition cost and the current fair value, less any impairment loss on that financialasset previously recognised in profit and loss – is removed from equity and recognised in the Statement of Comprehensive Income. Impairment losses recognised in the Statement of Comprehensive Income on equity instruments are not reversed through the Statement of Comprehensive Income.
(g) Fair value measurement
The fair value of assets and liabilities must be measured for recognition and disclosure purposes.
The University classifies fair value measurements using a fair value hierarchy that reflects the significance of the inputs used in making the measurements. The level in the fair value hierarchy is determined on the basis of the lowest level input that is significant to the fair value measurement in its entirety.
The fair value of assets or liabilities traded in active markets (such as available-for-sale securities) is based on quoted market prices for identical assets or liabilities at the balance sheet date (level 1). The quoted market price used for assets held by the University is the most representative of fair value in the circumstances within the bid-ask spread.
The fair value of assets or liabilities that are not traded in an active market is determined using valuation techniques. The University uses a variety of methods and makes assumptions that are based on market conditions existing at each balance date. Quoted market prices or dealer quotes for similar instruments (level 2) are used for long-term debt instruments held. Other techniques that are not based on observable market data (level 3) such as estimated discounted cash flows, are used to determine fair value for the remaining assets and liabilities.
Fair value measurement of non-financial assets is based on the highest and best use of the asset. The University considers market participants use of, or purchase of, the asset to use it in a manner that would be highest and best use.
The carrying value less impairment provision of trade receivables and payables are assumed to approximate their fair values due to their short-term nature. The fair value of financial liabilities for disclosure purposes is estimated by discounting the future contractual cash flows at the current market rate that is available to the University for similar financial instruments.
Griffith University - Annual Report 2016 63
Financial Statements for the year ended 31 December 2016
Notes to the financial statements for the year ended 31 December 2016 1. Summary of significant accounting policies (continued) (h) Property, plant and equipment (i) Acquisition All assets acquired during the accounting period have been initially recognised at cost. Cost is the value of assets given as consideration including costs incurred in preparing the assets ready for use.
Expenditure on existing infrastructure and buildings has been added to the value of the existing assets where the
expenditure is deemed to increase the useful life of the asset as opposed to expenditure which maintains the useful life of the asset.
Items or components which form an integral part of an asset are recognised as a single asset (functional asset).
The recognition threshold is applied to the aggregate cost of each functional asset.
The asset recognition threshold is $5,000 for all property, plant and equipment, except infrastructure and buildings, which are capitalised when the cost exceeds $10,000 and land where the cost is $1 or greater. (ii) Revaluation Land, buildings, infrastructure, artworks and heritage library collections are valued at fair value in accordance with the Queensland Treasurer’s Guidelines “Non-current Asset Policies for the Queensland Public Sector”. Artworks and heritage library collections are comprehensively revalued at five year intervals. Independent comprehensive revaluations are performed on land, buildings and infrastructure every three years, or whenever a material variation in these assets is expected to have occurred. In the intervening years a University specialist performs revaluations of artworks, while desktop valuations are performed on heritage library collections, land, buildings and infrastructure by independent valuers. Increases in the carrying amounts arising on revaluation of land and buildings and infrastructure are recognised, net of tax, in other comprehensive income and accumulated in equity under the heading of revaluation surplus. To the extent that the increase reverses a decrease previously recognised in profit or loss, the increase is first recognised in profit or loss. Decreases that reverse previous increases of the same asset class are also recognised in other comprehensive income to the extent of the remaining reserve attributable to the asset class. All other decreases are charged to the income statement. Land, buildings and infrastructure are shown at fair value, based on periodic, but at least triennial, valuations by external independent valuers, less subsequent depreciation for buildings and infrastructure. On revaluation, accumulated depreciation is restated proportionately with the change in the gross carrying amount of the asset, so that the carrying amount of the asset after the revaluation equals its revalued amount. All other property, plant and equipment, except as stated above, is stated at historical cost less depreciation. (a) Buildings and infrastructure In 2016, building and infrastructure assets underwent a desktop revaluation by Matthew Ward B.App.Sc. AAPI and Nicholas Fein BE of AssetVal Pty Ltd, licensed property valuers. The gross value was established utilising the current replacement value of a new asset with similar service potential and includes allowances for preliminaries and professional fees and any restrictions placed on certain assets. The gross current values have been indexed with reference to costing guides issued by the Australian Institute of Quantity Surveyors, Rawlinson’s (Australian Construction Handbook) and the valuers own internal market research and costings. In accordance with the requirements of the “Non-current Asset Policies for the Queensland Public Sector”, the accumulated depreciation has been restated to reflect the consumed or expired service potential, thus reporting the University’s building and infrastructure assets at fair value in accordance with the requirements of AASB 116 Property, Plant and Equipment. The resultant change in the property, plant and equipment revaluation surplus is reported as part of note 20 Reserves and retained earnings. (b) Library collection Books contained in the Heritage Library Collection underwent a desktop revaluation in 2016 by Jorn Harbeck of Harbeck Rare Books Pty Ltd, a registered valuer under the Cultural Gifts Program of the Australian Government.

64 Griffith University - Annual Report 2016
Financial Statements for the year ended 31 December 2016
Notes to the financial statements for the year ended 31 December 2016
1. Summary of significant accounting policies (continued)
(h) Property, plant and equipment (continued)
(ii) Revaluation (continued)
(c) LandIn 2016, land underwent a desktop revaluation by Matthew Ward B.App.Sc. AAPI and Nicholas Fein BE of AssetVal Pty Ltd, licensed property valuers. The valuation was carried out on a market value basis and represents the estimated amount each property might reasonably be expected to realise in an exchange between willing and knowledgeable parties in an arm’s length transaction. The resultant change in the property, plant and equipment revaluation surplus is reported as part of note 20 Reserves and retained earnings.
(d) Art collection (Queensland College of Art)All artworks contained in the collection underwent a desktop review during 2016 by an internal specialist, based on indexation rates from Ross Searle of Ross Searle and Associates, and where applicable, the replacement value of the collection was adjusted, with corresponding entry made to the property, plant and equipmentrevaluation surplus.
(iii) Repairs and maintenanceAny repairs and maintenance expenditure above a threshold of $10,000 subsequent to the original acquisition or completion of a building or infrastructure that either extends the life or increases the service potential is deemed to be capital in nature. All other repairs and maintenance expenditure is charged to the Statement of Comprehensive Income during the financial period in which they are incurred.
(iv) Impairment of assetsAssets are tested at least annually for impairment, or when significant events or circumstances indicate that the carrying amount may not be recoverable. An impairment loss is recognised in the Statement of Comprehensive Income for the amount by which the asset’s carrying amount exceeds its recoverable amount, unless the asset ismeasured at a revalued amount. Impairment losses on assets previously revalued are off-set against the property, plant and equipment revaluation surplus to the extent available.
(v) DepreciationLand, art and library collections are not depreciated. All other asset categories are depreciated over their estimated useful economic lives to the University using the straight-line method. The residual value and useful life of each asset category is reviewed annually, and adjusted if appropriate.
For each class of depreciable asset the following useful lives are used for depreciation calculation purposes:
Buildings – variable, based on periodic assessments of condition – 10 to 80 yearsInfrastructure – variable, based on periodic assessments of condition – 25 to 80 years Plant and equipment – up to 10 yearsVehicles – 2.5 to 7 years
(vi) Derecognition of property, plant and equipmentAn item of property, plant and equipment is derecognised when disposed of or when no future economic benefits are expected to arise from the continued use of the asset.
Gains and losses on disposal are determined by comparing proceeds with the carrying amount. These gains or losses are recognised in the Statement of Comprehensive Income. When revalued assets are disposed, amounts included in the property, plant and equipment revaluation surplus relating to that asset are transferred to retained earnings.

Griffith University - Annual Report 2016 65
Financial Statements for the year ended 31 December 2016
Notes to the financial statements for the year ended 31 December 2016
1. Summary of significant accounting policies (continued)
(i) Intangible assets
(i) Research Research costs incurred in obtaining new scientific or technical knowledge and understanding, are recognised in the Statement of Comprehensive Income as an expense when they are incurred.
(ii) DevelopmentExpenditure on development activities, including software, being the application of research findings or other knowledge to a plan or design for the production of new or substantially improved products or services before the start of commercial production or use, is capitalised if the product or service is technically and commercially feasible, adequate resources are available to complete development and the costs on completion of the asset exceed the capitalisation threshold of $100,000. The expenditure capitalised comprises all directly attributable costs, including costs of materials, services, direct labour and an appropriate portion of overheads.
Other development expenditure is recognised in the Statement of Comprehensive Income as an expense as incurred.
Capitalised development expenditure is stated at cost less accumulated amortisation and impairment losses recognised. Amortisation is calculated using the straight-line method to allocate the cost over the period of the expected benefit, which varies from 1 to 5 years.
(iii) LicencesLicences have a finite useful life and are carried at cost less accumulated amortisation and impairment losses. Amortisation is calculated using the straight-line method to allocate the cost of licences over their estimated useful lives which varies from 5 to 10 years.
(j) Trade and other payables
These amounts represent liabilities for goods and services provided to the University prior to the end of the financial year and which are unpaid. The amounts owed by the University are unsecured and are normally paid within 30 days of recognition.
(k) Borrowings
Borrowings are initially recognised at fair value, net of transaction costs incurred and are subsequently measured at amortised cost, using the effective interest rate method.
Effective interest is charged to the Statement of Comprehensive Income over the period of the borrowings and recognises any difference between the fair value of borrowings at inception and the redemption amount. As it is the intention of the University to hold its borrowings for their full term, the accumulated effective interest charged to the Statement of Comprehensive Income will, over time, exactly offset the accumulated fair value gain on borrowings.
Borrowings are classified as current liabilities unless the University has an unconditional right to defer settlement of the liability for at least 12 months after the end of the reporting period.
(l) Borrowing costs
Borrowing costs, which include interest calculated using the effective interest method and administration fees, are expensed in the period in which they arise. Costs that are not settled in the period in which they arise are added to the carrying amount of the borrowing.
(m) Employee benefits
(i) Short-term obligationsLiabilities for short-term employee benefits including wages and salaries due but unpaid at reporting date are recognised in the Statement of Financial Position at the current pay rates.
Prior history indicates that on average, sick leave taken each reporting period is less than the entitlement accrued. This is expected to continue in future periods. Accordingly, it is unlikely that existing accumulated entitlements will be used by employees and no liability for unused sick leave entitlements is recognised. As sick leave is non-vesting, an expense is recognised for this leave as it is taken.
66 Griffith University - Annual Report 2016
Financial Statements for the year ended 31 December 2016
Notes to the financial statements for the year ended 31 December 2016
1. Summary of significant accounting policies (continued)
(m) Employee benefits (continued)
(ii) Other long-term obligationsThe liability for other long-term employee benefits are those that are not expected to be settled wholly before twelve months after the end of the annual reporting period. Other long-term employee benefits include such things as annual leave and long service leave liabilities.
It is measured at the present value of expected future payments to be made in respect of services provided by employees up to the reporting date. Consideration is given to expected future salary levels, experience of employee departures and periods of service. Expected future payments are discounted using market yields at the reporting date on national government bonds with terms to maturity and currency that match, as closely as possible, the estimated future cash outflows.
Regardless of the expected timing of settlements, provisions made in respect of employee benefits are classified as a current liability, unless there is an unconditional right to defer the settlement of the liability for at least twelve months after the reporting date, in which case it will be reported as a non-current liability.
(iii) Retirement benefit obligationsContributions made by the University to employee superannuation funds are charged as expenses when incurred and the University’s legal or constructive obligation is limited to these contributions.
(iv) Key executive management personnel and remunerationKey executive management personnel and remuneration disclosures are made in accordance with section 3 of the Financial Reporting Requirements for Queensland Government Agencies issued by Queensland Treasury. Refer to note 22 for the disclosure on key executive management personnel and remuneration.
(n) Rounding of amounts
Amounts in the financial report are rounded to the nearest thousand dollars.
(o) Taxation
The activities of the University are exempt from Commonwealth taxation except for Fringe Benefits Tax (FBT)and Goods and Services Tax (GST). State taxes are payable where applicable, e.g. Payroll Tax.
Revenues, expenses and assets are recognised net of the amount of associated GST, unless the GST incurred is not recoverable from the taxation authority. In this case GST is recognised as part of the cost of acquisition of the asset or as part of the expense. Receivables and payables are recorded at the GST inclusive amount. The net amount of GST recoverable from, or payable to, the Australian Taxation Office is included with other receivables or payables in the Statement of Financial Position.
Cash flows are included in the Statement of Cash Flows on a gross basis and the GST component of cash flows arising from financing or investing activities, which are recoverable from, or payable to, the taxation authority are classified as operating cash flows.
Commitments and contingencies are disclosed net of the amount of GST recoverable from, or payable to, the taxation authority.
The University incurs Payroll Tax at the rate determined by the State Government for payments made to and benefits received by the employees.
In relation to any foreign operations, the University is subject to tax under the Tax Acts applicable in the relevant countries. Tax in respect of these operations is brought to account in the year it is incurred.
Notes to the financial statements for the year ended 31 December 2016 1. Summary of significant accounting policies (continued) (m) Employee benefits (continued)
(ii) Other long-term obligations The liability for other long-term employee benefits are those that are not expected to be settled wholly before twelve months after the end of the annual reporting period. Other long-term employee benefits include such things as annual leave and long service leave liabilities. Other long-term obligations are measured at the present value of expected future payments to be made in respect of services provided by employees up to the reporting date. Consideration is given to expected future salary levels, experience of employee departures and periods of service. Expected future payments are discounted using market yields at the reporting date on national government bonds with terms to maturity and currency that match, as closely as possible, the estimated future cash outflows. Regardless of the expected timing of settlements, provisions made in respect of employee benefits are classified as a current liability, unless there is an unconditional right to defer the settlement of the liability for at least twelve months after the reporting date, in which case it will be reported as a non-current liability. (iii) Retirement benefit obligations Contributions made by the University to employee superannuation funds are charged as expenses when incurred and the University’s legal or constructive obligation is limited to these contributions.
(iv) Key executive management personnel and remuneration Key executive management personnel and remuneration disclosures are made in accordance with section 3 of the Financial Reporting Requirements for Queensland Government Agencies issued by Queensland Treasury. Refer to note 22 for the disclosure on key executive management personnel and remuneration. (n) Rounding of amounts Amounts in the financial report are rounded to the nearest thousand dollars. (o) Taxation The activities of the University are exempt from Commonwealth taxation except for Fringe Benefits Tax (FBT) and Goods and Services Tax (GST). State taxes are payable where applicable, e.g. Payroll Tax. Revenues, expenses and assets are recognised net of the amount of associated GST, unless the GST incurred is not recoverable from the taxation authority. In this case GST is recognised as part of the cost of acquisition of the asset or as part of the expense. Receivables and payables are recorded at the GST inclusive amount. The net amount of GST recoverable from, or payable to, the Australian Taxation Office is included with other receivables or payables in the Statement of Financial Position.
Cash flows are included in the Statement of Cash Flows on a gross basis and the GST component of cash flows arising from financing or investing activities, which are recoverable from, or payable to, the taxation authority are classified as operating cash flows. Commitments and contingencies are disclosed net of the amount of GST recoverable from, or payable to, the taxation authority. The University incurs Payroll Tax at the rate determined by the State Government for payments made to and benefits received by the employees. In relation to any foreign operations, the University is subject to tax under the Tax Acts applicable in the relevant countries. Tax in respect of these operations is brought to account in the year it is incurred.
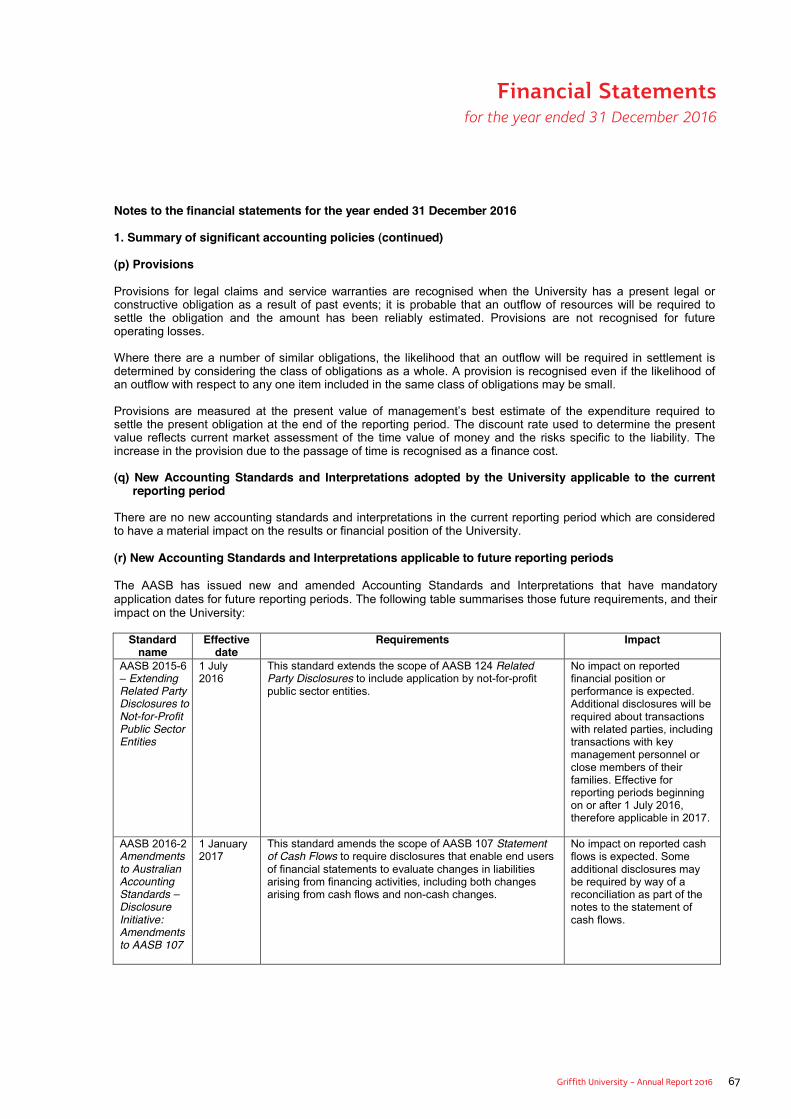
Griffith University - Annual Report 2016 67
Financial Statements for the year ended 31 December 2016
Notes to the financial statements for the year ended 31 December 2016
1. Summary of significant accounting policies (continued)
(p) Provisions
Provisions for legal claims and service warranties are recognised when the University has a present legal or constructive obligation as a result of past events; it is probable that an outflow of resources will be required to settle the obligation and the amount has been reliably estimated. Provisions are not recognised for futureoperating losses.
Where there are a number of similar obligations, the likelihood that an outflow will be required in settlement is determined by considering the class of obligations as a whole. A provision is recognised even if the likelihood of an outflow with respect to any one item included in the same class of obligations may be small.
Provisions are measured at the present value of management’s best estimate of the expenditure required to settle the present obligation at the end of the reporting period. The discount rate used to determine the present value reflects current market assessment of the time value of money and the risks specific to the liability. The increase in the provision due to the passage of time is recognised as a finance cost.
(q) New Accounting Standards and Interpretations adopted by the University applicable to the current reporting period
There are no new accounting standards and interpretations in the current reporting period which are considered to have a material impact on the results or financial position of the University.
(r) New Accounting Standards and Interpretations applicable to future reporting periods
The AASB has issued new and amended Accounting Standards and Interpretations that have mandatory application dates for future reporting periods. The following table summarises those future requirements, and their impact on the University:
Standard name
Effective date
Requirements Impact
AASB 2015-6– Extending Related Party Disclosures to Not-for-Profit Public Sector Entities
1 July 2016
This standard extends the scope of AASB 124 Related Party Disclosures to include application by not-for-profit public sector entities.
No impact on reported financial position or performance is expected.Additional disclosures will be required about transactions with related parties, including transactions with key management personnel or close members of their families. Effective for reporting periods beginning on or after 1 July 2016, therefore applicable in 2017.
AASB 2016-2Amendments to Australian Accounting Standards –Disclosure Initiative: Amendments to AASB 107
1 January 2017
This standard amends the scope of AASB 107 Statement of Cash Flows to require disclosures that enable end users of financial statements to evaluate changes in liabilities arising from financing activities, including both changes arising from cash flows and non-cash changes.
No impact on reported cash flows is expected. Some additional disclosures may be required by way of areconciliation as part of the notes to the statement of cash flows.
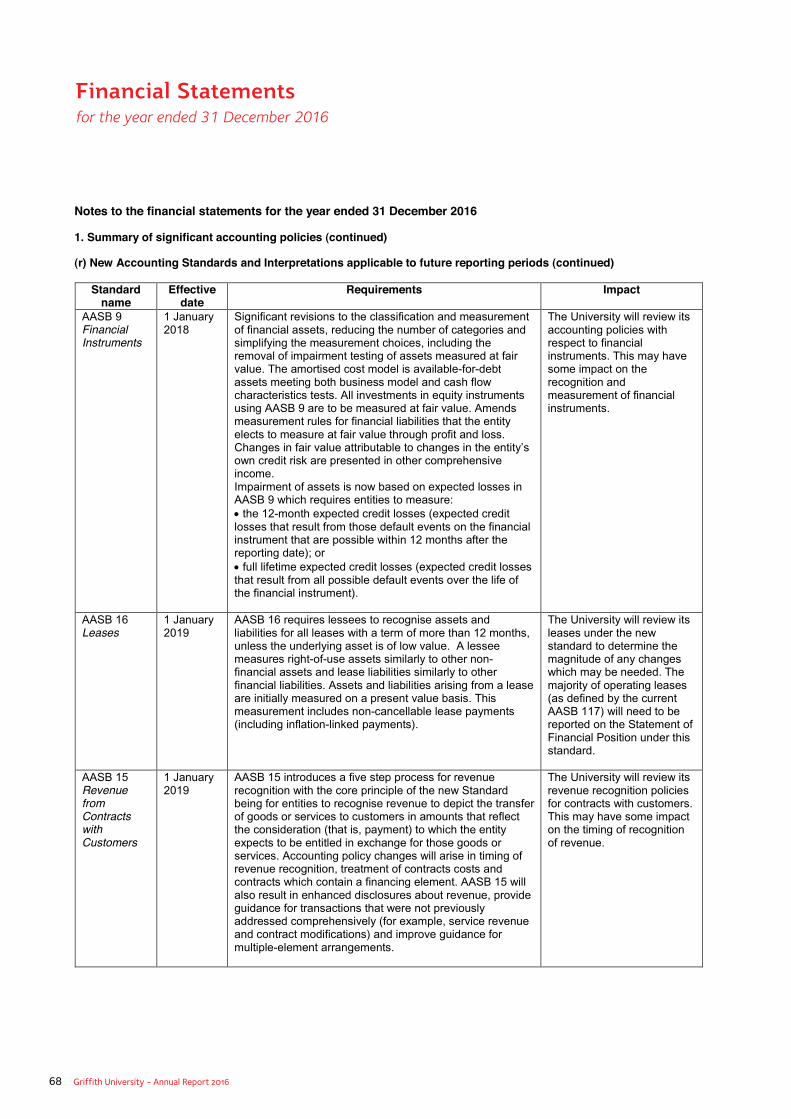
68 Griffith University - Annual Report 2016
Financial Statements for the year ended 31 December 2016
Notes to the financial statements for the year ended 31 December 2016
1. Summary of significant accounting policies (continued)
(r) New Accounting Standards and Interpretations applicable to future reporting periods (continued)
Standard name
Effective date
Requirements Impact
AASB 9 Financial Instruments
1 January 2018
Significant revisions to the classification and measurement of financial assets, reducing the number of categories and simplifying the measurement choices, including the removal of impairment testing of assets measured at fair value. The amortised cost model is available-for-debt assets meeting both business model and cash flow characteristics tests. All investments in equity instruments using AASB 9 are to be measured at fair value. Amends measurement rules for financial liabilities that the entity elects to measure at fair value through profit and loss. Changes in fair value attributable to changes in the entity’s own credit risk are presented in other comprehensive income.Impairment of assets is now based on expected losses in AASB 9 which requires entities to measure: • the 12-month expected credit losses (expected credit losses that result from those default events on the financial instrument that are possible within 12 months after the reporting date); or• full lifetime expected credit losses (expected credit losses that result from all possible default events over the life of the financial instrument).
The University will review its accounting policies with respect to financial instruments. This may have some impact on the recognition and measurement of financial instruments.
AASB 16Leases
1 January 2019
AASB 16 requires lessees to recognise assets and liabilities for all leases with a term of more than 12 months, unless the underlying asset is of low value. A lessee measures right-of-use assets similarly to other non-financial assets and lease liabilities similarly to other financial liabilities. Assets and liabilities arising from a lease are initially measured on a present value basis. This measurement includes non-cancellable lease payments (including inflation-linked payments).
The University will review its leases under the new standard to determine the magnitude of any changes which may be needed. The majority of operating leases (as defined by the current AASB 117) will need to be reported on the Statement of Financial Position under this standard.
AASB 15 Revenue from Contracts with Customers
1 January 2019
AASB 15 introduces a five step process for revenue recognition with the core principle of the new Standard being for entities to recognise revenue to depict the transfer of goods or services to customers in amounts that reflect the consideration (that is, payment) to which the entity expects to be entitled in exchange for those goods or services. Accounting policy changes will arise in timing of revenue recognition, treatment of contracts costs and contracts which contain a financing element. AASB 15 will also result in enhanced disclosures about revenue, provide guidance for transactions that were not previously addressed comprehensively (for example, service revenue and contract modifications) and improve guidance for multiple-element arrangements.
The University will review its revenue recognition policies for contracts with customers.This may have some impact on the timing of recognition of revenue.
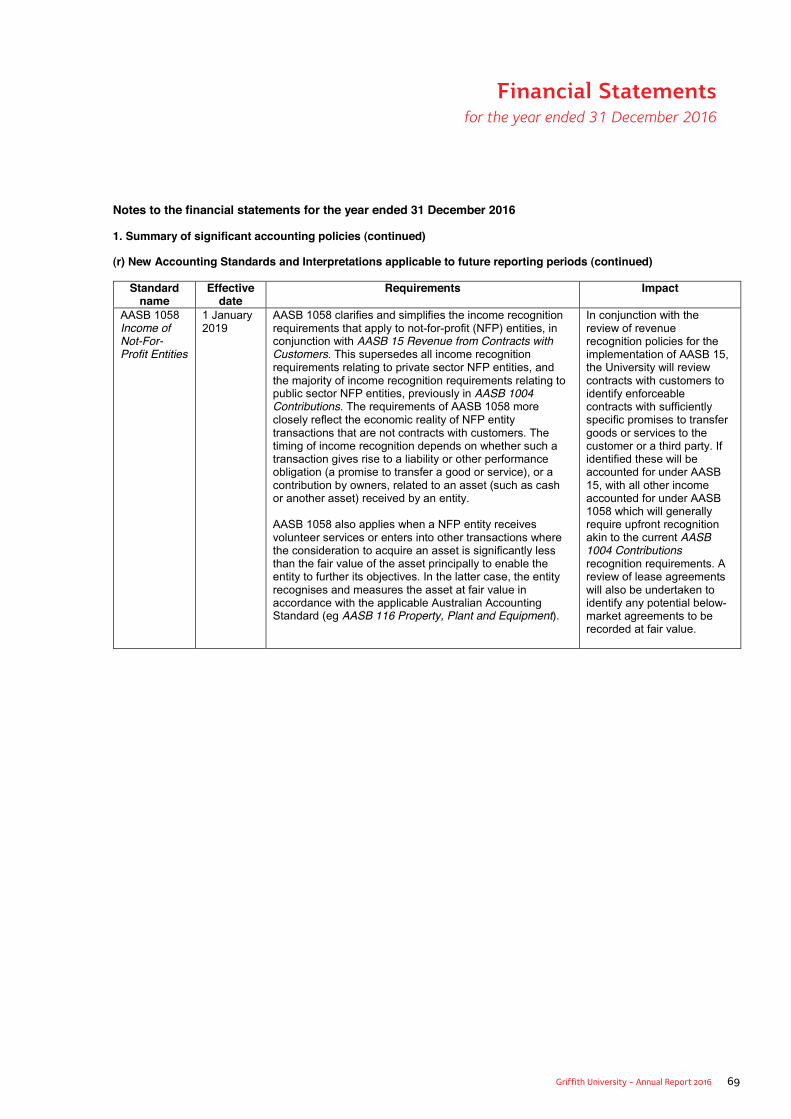
Griffith University - Annual Report 2016 69
Financial Statements for the year ended 31 December 2016
Notes to the financial statements for the year ended 31 December 2016
1. Summary of significant accounting policies (continued)
(r) New Accounting Standards and Interpretations applicable to future reporting periods (continued)
Standard name
Effective date
Requirements Impact
AASB 1058 Income of Not-For-Profit Entities
1 January 2019
AASB 1058 clarifies and simplifies the income recognition requirements that apply to not-for-profit (NFP) entities, in conjunction with AASB 15 Revenue from Contracts with Customers. This supersedes all income recognition requirements relating to private sector NFP entities, and the majority of income recognition requirements relating to public sector NFP entities, previously in AASB 1004 Contributions. The requirements of AASB 1058 more closely reflect the economic reality of NFP entity transactions that are not contracts with customers. The timing of income recognition depends on whether such a transaction gives rise to a liability or other performance obligation (a promise to transfer a good or service), or a contribution by owners, related to an asset (such as cash or another asset) received by an entity.
AASB 1058 also applies when a NFP entity receives volunteer services or enters into other transactions where the consideration to acquire an asset is significantly less than the fair value of the asset principally to enable the entity to further its objectives. In the latter case, the entity recognises and measures the asset at fair value in accordance with the applicable Australian Accounting Standard (eg AASB 116 Property, Plant and Equipment).
In conjunction with the review of revenue recognition policies for the implementation of AASB 15, the University will review contracts with customers to identify enforceable contracts with sufficiently specific promises to transfer goods or services to the customer or a third party. If identified these will be accounted for under AASB 15, with all other income accounted for under AASB 1058 which will generally require upfront recognition akin to the current AASB1004 Contributionsrecognition requirements. A review of lease agreements will also be undertaken to identify any potential below-market agreements to be recorded at fair value.

70 Griffith University - Annual Report 2016
Notes to the financial statements for the year ended 31 December 2016
2. Australian Government financial assistance including Australian Government loan programs (HELP)
Notes
2016
2015 $’000 $’000 (a) Commonwealth Grant Scheme and Other Grants Commonwealth Grant Scheme#1 269,238 255,554 Disability Support Program 251 223 Indigenous Support Program 2,106 1,950 Higher Education Participation Program#2 6,047 5,985 Promotion of Excellence in Learning and Teaching 323 1,201 Australian Maths and Science Partnership Program 1,020 918
Total Commonwealth Grant Scheme and Other Grants 30.1 278,985 265,831
(b) Higher Education Loan Programs HECS-HELP 178,110 175,011 FEE-HELP#3 31,370 27,805 SA-HELP 4,578 4,404
Total Higher Education Loan Programs 30.2 214,058 207,220
(c) Scholarships Australian Postgraduate Awards 6,577 6,577 International Postgraduate Research Scholarships 510 521 Commonwealth Education Cost Scholarships#4 203 90 Commonwealth Accommodation Scholarships#4 172 85 Indigenous Access Scholarships 162 80
Total Scholarships 30.3 7,624 7,353
(d) Education Research Joint Research Engagement Program 8,289 8,535 Research Training Scheme 15,235 15,028 Research Infrastructure Block Grants 4,195 4,270 Sustainable Research Excellence in Universities 3,253 2,802
Total Education Research Grants 30.4 30,972 30,635
Financial Statements for the year ended 31 December 2016
Notes to the financial statements for the year ended 31 December 2016
2. Australian Government financial assistance including Australian Government loan programs (HELP)
Notes
2016
2015 $’000 $’000 (a) Commonwealth Grant Scheme and Other Grants Commonwealth Grant Scheme#1 269,238 255,554 Disability Support Program 251 223 Indigenous Support Program 2,106 1,950 Higher Education Participation Program#2 6,047 5,985 Promotion of Excellence in Learning and Teaching 323 1,201 Australian Maths and Science Partnership Program 1,020 918
Total Commonwealth Grant Scheme and Other Grants 30.1 278,985 265,831
(b) Higher Education Loan Programs HECS-HELP 178,110 175,011 FEE-HELP#3 31,370 27,805 SA-HELP 4,578 4,404
Total Higher Education Loan Programs 30.2 214,058 207,220
(c) Scholarships Australian Postgraduate Awards 6,577 6,577 International Postgraduate Research Scholarships 510 521 Commonwealth Education Cost Scholarships#4 203 90 Commonwealth Accommodation Scholarships#4 172 85 Indigenous Access Scholarships 162 80
Total Scholarships 30.3 7,624 7,353
(d) Education Research Joint Research Engagement Program 8,289 8,535 Research Training Scheme 15,235 15,028 Research Infrastructure Block Grants 4,195 4,270 Sustainable Research Excellence in Universities 3,253 2,802
Total Education Research Grants 30.4 30,972 30,635
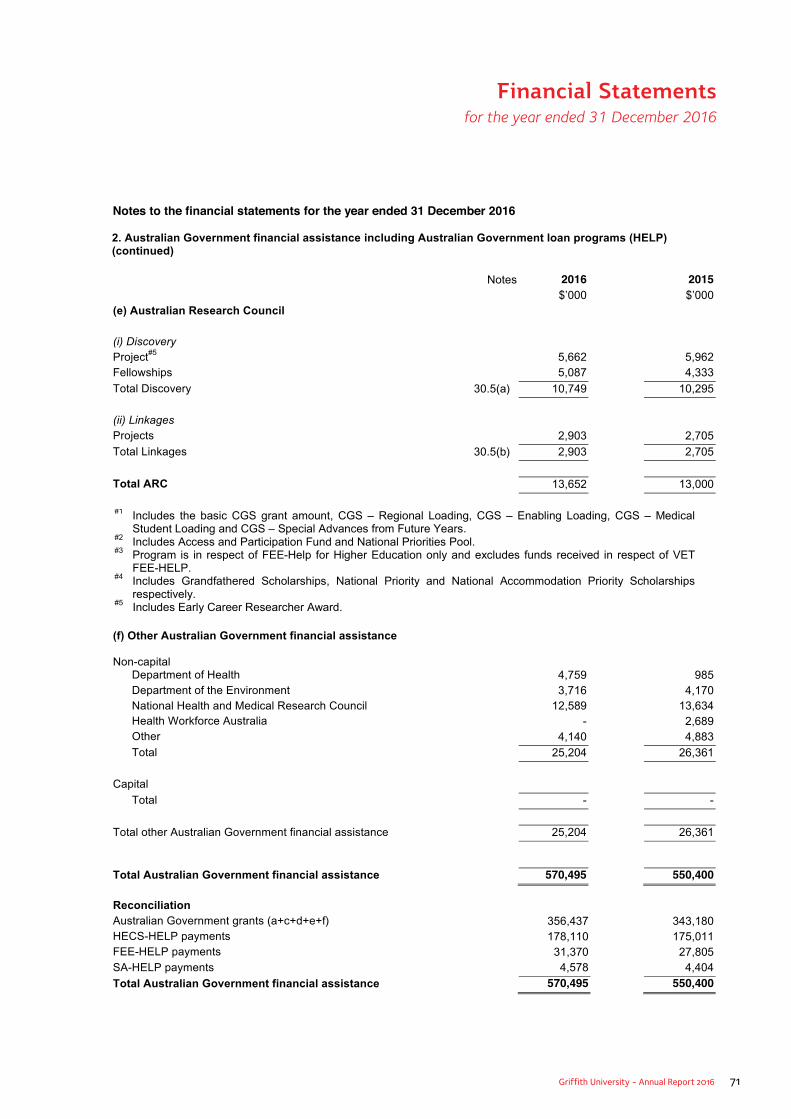
Griffith University - Annual Report 2016 71
Financial Statements for the year ended 31 December 2016
Notes to the financial statements for the year ended 31 December 2016
2. Australian Government financial assistance including Australian Government loan programs (HELP) (continued)
Notes 2016 2015
$’000 $’000
(e) Australian Research Council (i) Discovery Project#5 5,662 5,962 Fellowships 5,087 4,333
Total Discovery 30.5(a) 10,749 10,295
(ii) Linkages Projects 2,903 2,705
Total Linkages 30.5(b) 2,903 2,705
Total ARC 13,652 13,000
#1 Includes the basic CGS grant amount, CGS – Regional Loading, CGS – Enabling Loading, CGS – Medical
Student Loading and CGS – Special Advances from Future Years. #2 Includes Access and Participation Fund and National Priorities Pool. #3 Program is in respect of FEE-Help for Higher Education only and excludes funds received in respect of VET
FEE-HELP. #4 Includes Grandfathered Scholarships, National Priority and National Accommodation Priority Scholarships
respectively. #5 Includes Early Career Researcher Award. (f) Other Australian Government financial assistance Non-capital
Department of Health 4,759 985 Department of the Environment 3,716 4,170 National Health and Medical Research Council 12,589 13,634 Health Workforce Australia - 2,689 Other 4,140 4,883
Total 25,204 26,361
Capital
Total - -
Total other Australian Government financial assistance 25,204 26,361
Total Australian Government financial assistance 570,495 550,400
Reconciliation Australian Government grants (a+c+d+e+f) 356,437 343,180 HECS-HELP payments 178,110 175,011 FEE-HELP payments 31,370 27,805
SA-HELP payments 4,578 4,404
Total Australian Government financial assistance 570,495 550,400
Notes to the financial statements for the year ended 31 December 2016
2. Australian Government financial assistance including Australian Government loan programs (HELP) (continued)
Notes 2016 2015$’000 $’000
(e) Australian Research Council
(i) DiscoveryProject#5 5,662 5,962Fellowships 5,087 4,333
Total Discovery 30.5(a) 10,749 10,295
(ii) LinkagesProjects 2,903 2,705
Total Linkages 30.5(b) 2,903 2,705
Total ARC 13,652 13,000
#1 Includes the basic CGS grant amount, CGS – Regional Loading, CGS – Enabling Loading, CGS – Medical Student Loading and CGS – Special Advances from Future Years.
#2 Includes Access and Participation Fund and National Priorities Pool.#3 Program is in respect of FEE-Help for Higher Education only and excludes funds received in respect of VET
FEE-HELP.#4 Includes Grandfathered Scholarships, National Priority and National Accommodation Priority Scholarships
respectively.#5 Includes Early Career Researcher Award.
(f) Other Australian Government financial assistance
Non-capitalDepartment of Health 4,759 985Department of the Environment 3,716 4,170National Health and Medical Research Council 12,589 13,634Health Workforce Australia - 2,689Other 4,140 4,883Total 25,204 26,361
Capital
Total - -
Total other Australian Government financial assistance 25,204 26,361
Total Australian Government financial assistance 570,495 550,400
ReconciliationAustralian Government grants (a+c+d+e+f) 356,437 343,180HECS-HELP payments 178,110 175,011FEE-HELP payments 31,370 27,805SA-HELP payments 4,578 4,404Total Australian Government financial assistance 570,495 550,400
Notes to the financial statements for the year ended 31 December 2016
2. Australian Government financial assistance including Australian Government loan programs (HELP) (continued)
Notes 2016 2015
$’000 $’000
(e) Australian Research Council (i) Discovery Project#5 5,662 5,962 Fellowships 5,087 4,333
Total Discovery 30.5(a) 10,749 10,295
(ii) Linkages Projects 2,903 2,705
Total Linkages 30.5(b) 2,903 2,705
Total ARC 13,652 13,000
#1 Includes the basic CGS grant amount, CGS – Regional Loading, CGS – Enabling Loading, CGS – Medical
Student Loading and CGS – Special Advances from Future Years. #2 Includes Access and Participation Fund and National Priorities Pool. #3 Program is in respect of FEE-Help for Higher Education only and excludes funds received in respect of VET
FEE-HELP. #4 Includes Grandfathered Scholarships, National Priority and National Accommodation Priority Scholarships
respectively. #5 Includes Early Career Researcher Award. (f) Other Australian Government financial assistance Non-capital
Department of Health 4,759 985 Department of the Environment 3,716 4,170 National Health and Medical Research Council 12,589 13,634 Health Workforce Australia - 2,689 Other 4,140 4,883
Total 25,204 26,361
Capital
Total - -
Total other Australian Government financial assistance 25,204 26,361
Total Australian Government financial assistance 570,495 550,400
Reconciliation Australian Government grants (a+c+d+e+f) 356,437 343,180 HECS-HELP payments 178,110 175,011 FEE-HELP payments 31,370 27,805
SA-HELP payments 4,578 4,404
Total Australian Government financial assistance 570,495 550,400
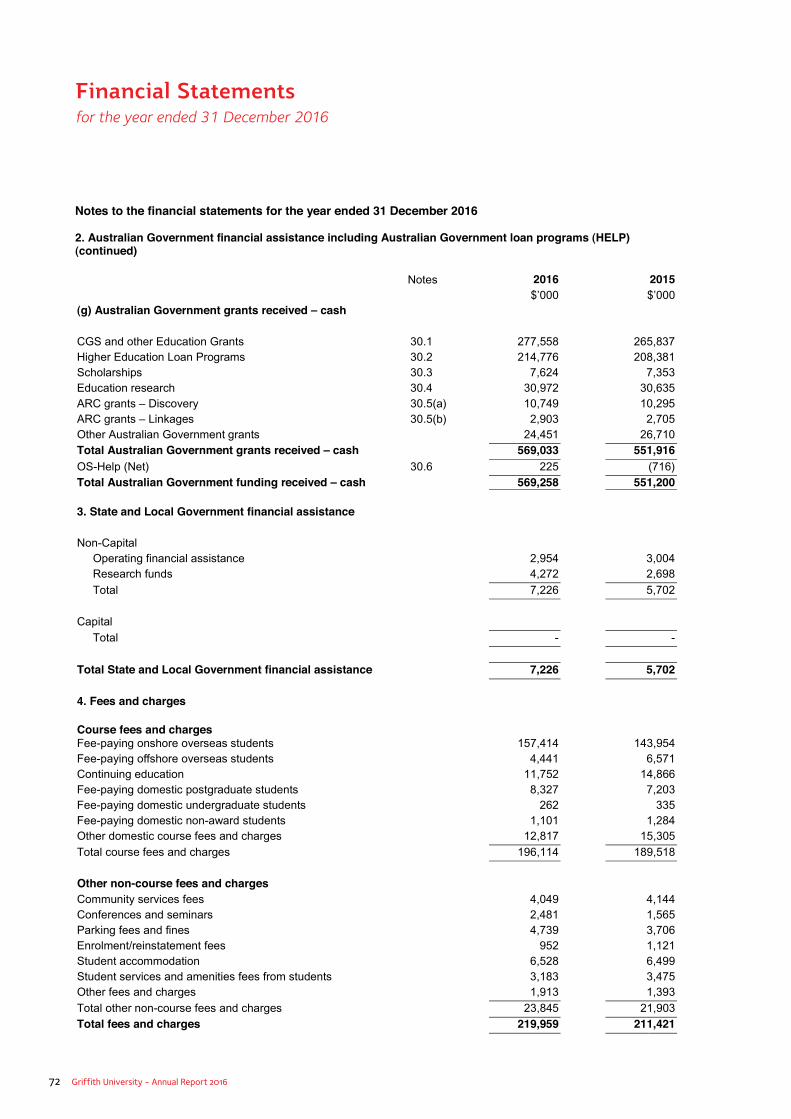
72 Griffith University - Annual Report 2016
Financial Statements for the year ended 31 December 2016
Notes to the financial statements for the year ended 31 December 2016
2. Australian Government financial assistance including Australian Government loan programs (HELP) (continued)
Notes 2016 2015
$’000 $’000(g) Australian Government grants received – cash
CGS and other Education Grants 30.1 277,558 265,837 Higher Education Loan Programs 30.2 214,776 208,381 Scholarships 30.3 7,624 7,353 Education research 30.4 30,972 30,635 ARC grants – Discovery 30.5(a) 10,749 10,295 ARC grants – Linkages 30.5(b) 2,903 2,705 Other Australian Government grants 24,451 26,710 Total Australian Government grants received – cash 569,033 551,916 OS-Help (Net) 30.6 225 (716) Total Australian Government funding received – cash 569,258 551,200
3. State and Local Government financial assistance
Non-CapitalOperating financial assistance 2,954 3,004 Research funds 4,272 2,698
Total 7,226 5,702
Capital
Total - -
Total State and Local Government financial assistance 7,226 5,702
4. Fees and charges
Course fees and chargesFee-paying onshore overseas students 157,414 143,954Fee-paying offshore overseas students 4,441 6,571Continuing education 11,752 14,866Fee-paying domestic postgraduate students 8,327 7,203Fee-paying domestic undergraduate students 262 335Fee-paying domestic non-award students 1,101 1,284Other domestic course fees and charges 12,817 15,305
Total course fees and charges 196,114 189,518
Other non-course fees and chargesCommunity services fees 4,049 4,144Conferences and seminars 2,481 1,565Parking fees and fines 4,739 3,706Enrolment/reinstatement fees 952 1,121Student accommodation 6,528 6,499Student services and amenities fees from students 3,183 3,475Other fees and charges 1,913 1,393
Total other non-course fees and charges 23,845 21,903Total fees and charges 219,959 211,421
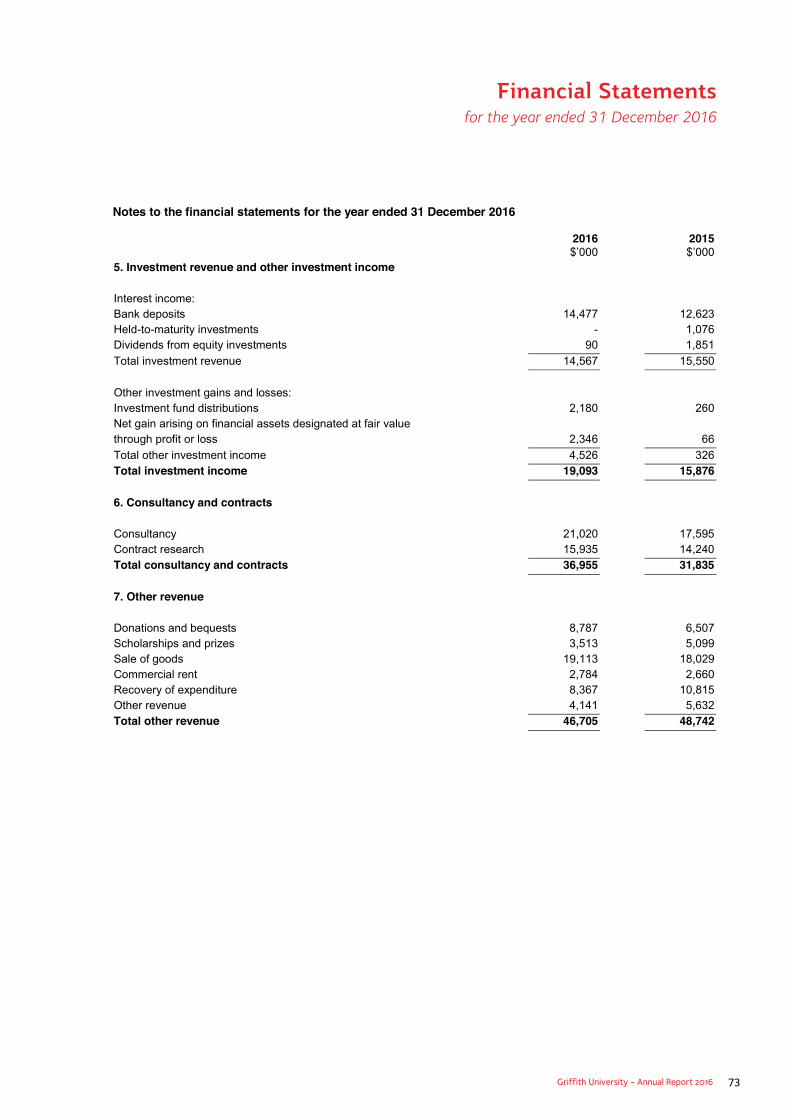
Griffith University - Annual Report 2016 73
Financial Statements for the year ended 31 December 2016
Notes to the financial statements for the year ended 31 December 2016
2016 2015$’000 $’000
5. Investment revenue and other investment income
Interest income:Bank deposits 14,477 12,623Held-to-maturity investments - 1,076Dividends from equity investments 90 1,851
Total investment revenue 14,567 15,550
Other investment gains and losses:Investment fund distributions 2,180 260Net gain arising on financial assets designated at fair valuethrough profit or loss 2,346 66
Total other investment income 4,526 326Total investment income 19,093 15,876
6. Consultancy and contracts
Consultancy 21,020 17,595 Contract research 15,935 14,240 Total consultancy and contracts 36,955 31,835
7. Other revenue
Donations and bequests 8,787 6,507Scholarships and prizes 3,513 5,099Sale of goods 19,113 18,029Commercial rent 2,784 2,660Recovery of expenditure 8,367 10,815Other revenue 4,141 5,632Total other revenue 46,705 48,742

74 Griffith University - Annual Report 2016
Financial Statements for the year ended 31 December 2016
Notes to the financial statements for the year ended 31 December 2016
2016 2015$’000 $’000
8. Employee related expenses
AcademicSalaries 206,420 192,663 Contributions to funded superannuation and pension schemes 32,675 31,109 Payroll tax 12,216 12,292 Worker’s compensation 699 635Long service leave 3,441 4,513 Annual leave 15,490 15,774
Total academic 270,941 256,986
Non-academicSalaries 199,657 186,332 Contributions to funded superannuation and pension schemes 31,607 30,160Payroll tax 11,887 9,675 Worker’s compensation 691 625Long service leave 3,329 4,324 Annual leave 14,988 15,114
Total non-academic 262,159 246,230 Total employee related expenses 533,100 503,216
9. Other expenses
Scholarships and prizes 43,821 43,538External grants and third party payments 14,533 15,839 Advertising, marketing and promotional expenses 13,694 10,884Audit fees, bank charges, legal costs and insurance 4,050 3,852Clinical and practical teaching fee 17,696 13,781Commission and partnership organisation expenses 20,829 18,639Computer expenses 9,914 7,805Consultancy 18,873 15,245Hospitality 2,572 2,677Inventory used 6,473 7,228Laboratory consumables 9,457 8,922Non-capitalised equipment 12,447 15,196Operating lease fees and other rental 3,550 3,212Printing and stationery 5,580 6,053Safety security and cleaning 11,737 9,637Staff recruitment and benefits 3,272 3,941Subscriptions and reference materials 13,560 11,227Travel and conferences 18,423 17,283Utilities 13,270 12,445Other expenses 22,939 22,696Total other expenses 266,690 250,100
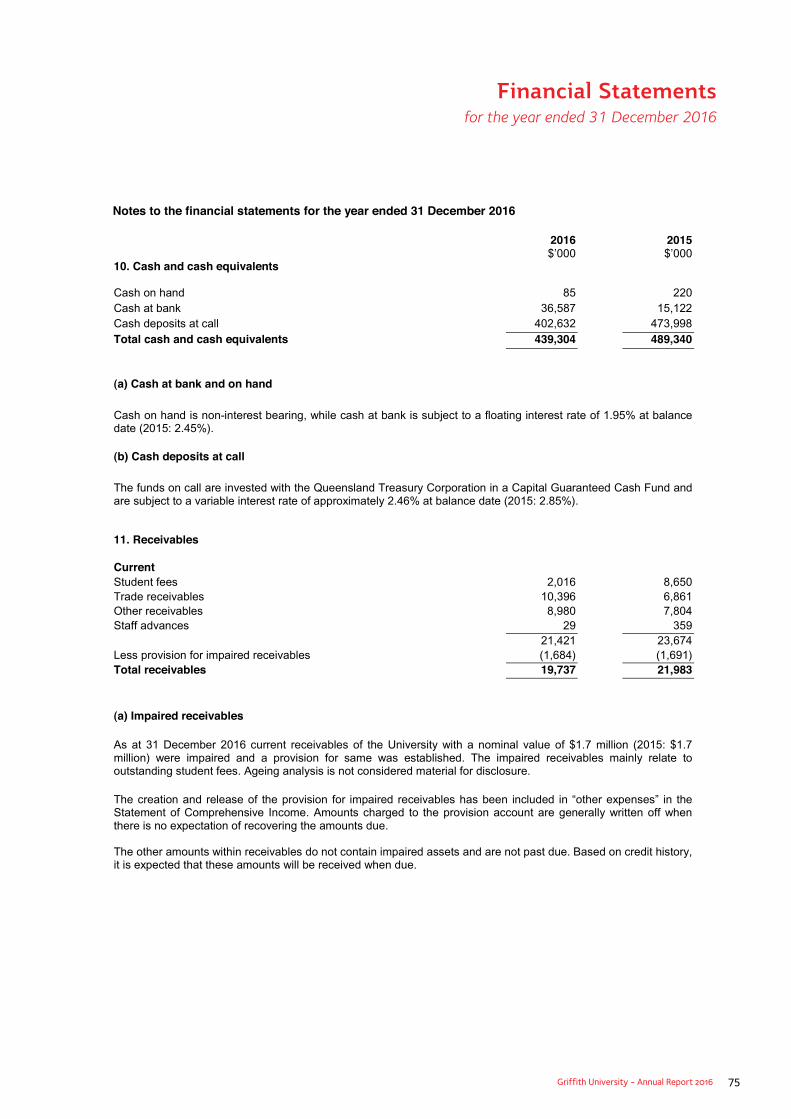
Griffith University - Annual Report 2016 75
Financial Statements for the year ended 31 December 2016
Notes to the financial statements for the year ended 31 December 2016
2016 2015$’000 $’000
10. Cash and cash equivalents
Cash on hand 85 220Cash at bank 36,587 15,122 Cash deposits at call 402,632 473,998 Total cash and cash equivalents 439,304 489,340
(a) Cash at bank and on hand
Cash on hand is non-interest bearing, while cash at bank is subject to a floating interest rate of 1.95% at balance date (2015: 2.45%).
(b) Cash deposits at call
The funds on call are invested with the Queensland Treasury Corporation in a Capital Guaranteed Cash Fund and are subject to a variable interest rate of approximately 2.46% at balance date (2015: 2.85%).
11. Receivables
CurrentStudent fees 2,016 8,650Trade receivables 10,396 6,861Other receivables 8,980 7,804Staff advances 29 359
21,421 23,674Less provision for impaired receivables (1,684) (1,691)Total receivables 19,737 21,983
(a) Impaired receivables
As at 31 December 2016 current receivables of the University with a nominal value of $1.7 million (2015: $1.7million) were impaired and a provision for same was established. The impaired receivables mainly relate to outstanding student fees. Ageing analysis is not considered material for disclosure.
The creation and release of the provision for impaired receivables has been included in “other expenses” in the Statement of Comprehensive Income. Amounts charged to the provision account are generally written off when there is no expectation of recovering the amounts due.
The other amounts within receivables do not contain impaired assets and are not past due. Based on credit history, it is expected that these amounts will be received when due.
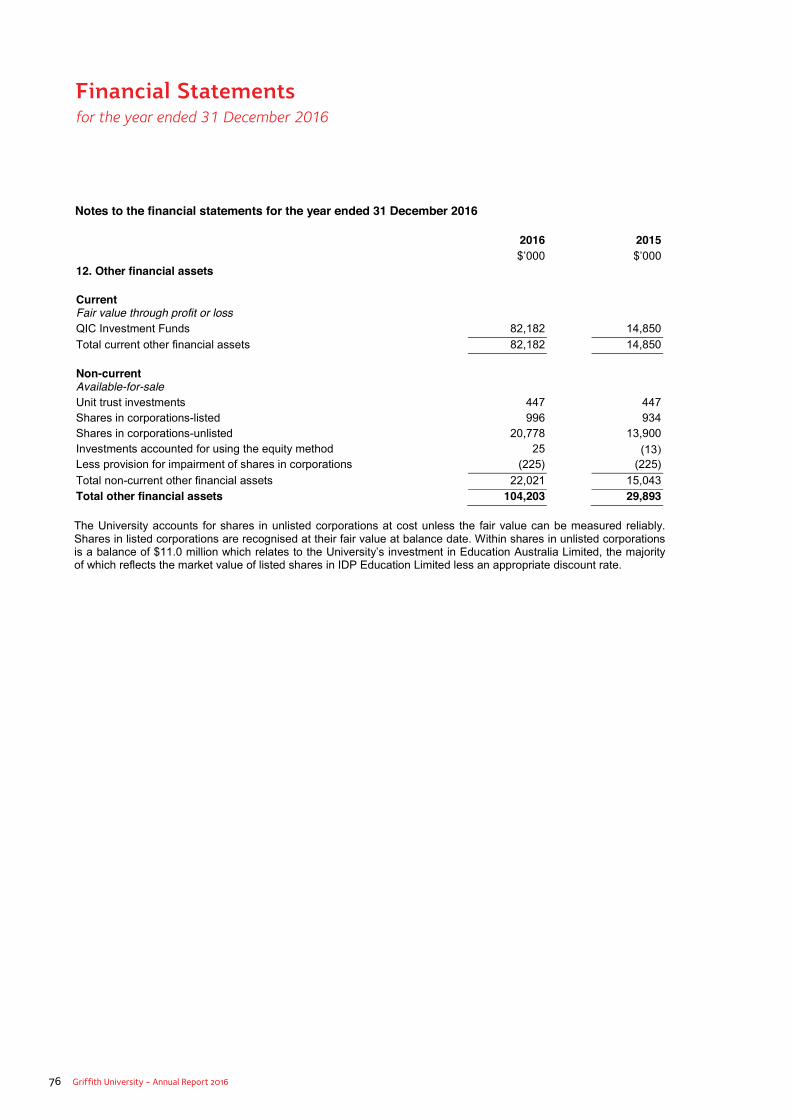
76 Griffith University - Annual Report 2016
Financial Statements for the year ended 31 December 2016
Notes to the financial statements for the year ended 31 December 2016
2016 2015$’000 $’000
12. Other financial assets
CurrentFair value through profit or lossQIC Investment Funds 82,182 14,850
Total current other financial assets 82,182 14,850
Non-currentAvailable-for-saleUnit trust investments 447 447Shares in corporations-listed 996 934Shares in corporations-unlisted 20,778 13,900 Investments accounted for using the equity method 25 (13)Less provision for impairment of shares in corporations (225) (225)
Total non-current other financial assets 22,021 15,043 Total other financial assets 104,203 29,893
The University accounts for shares in unlisted corporations at cost unless the fair value can be measured reliably.Shares in listed corporations are recognised at their fair value at balance date. Within shares in unlisted corporations is a balance of $11.0 million which relates to the University’s investment in Education Australia Limited, the majority of which reflects the market value of listed shares in IDP Education Limited less an appropriate discount rate.
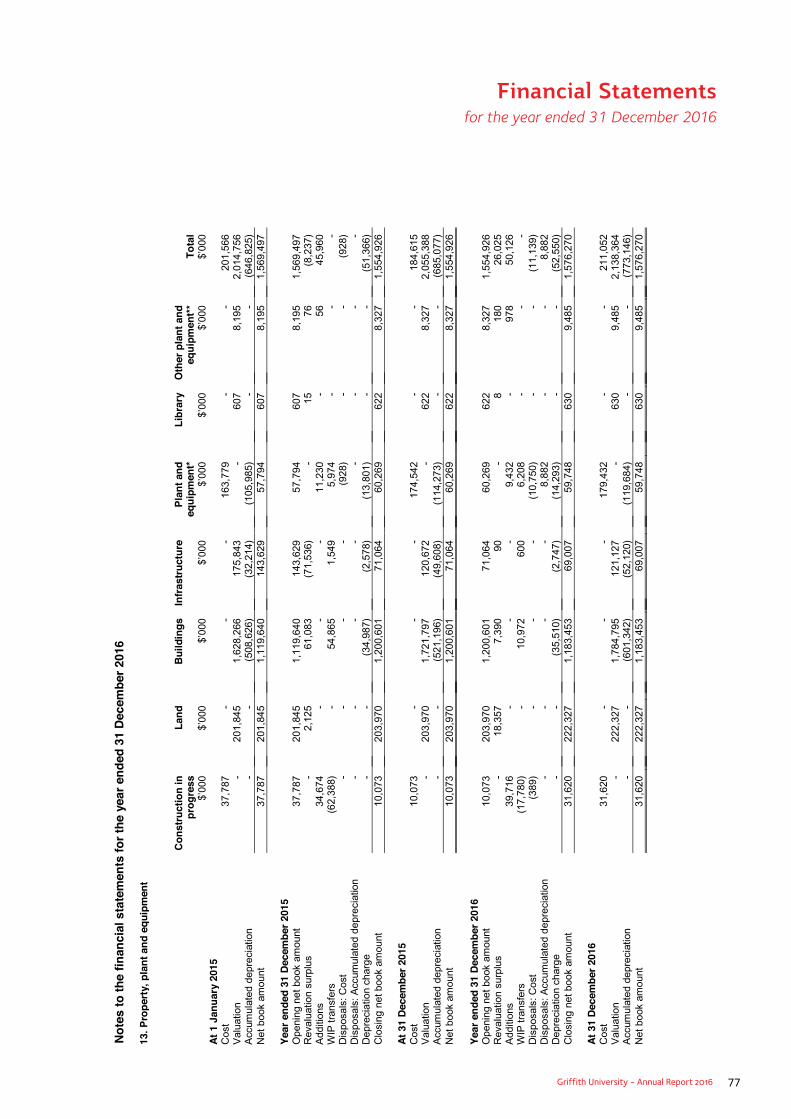
Griffith University - Annual Report 2016 77
Financial Statements for the year ended 31 December 2016
Note
s to
the
finan
cial
sta
tem
ents
for t
he y
ear e
nded
31
Dece
mbe
r 201
6
13. P
rope
rty,
pla
nt a
nd e
quip
men
t
Cons
truct
ion
in
prog
ress
$’00
0
Land
$’00
0
Build
ings
$’00
0
Infra
stru
ctur
e
$’00
0
Plan
t and
eq
uipm
ent*
$’00
0
Libr
ary
$’00
0
Oth
er p
lant
and
eq
uipm
ent**
$’00
0To
tal
$’00
0At
1 J
anua
ry 2
015
Cos
t37
,787
--
-16
3,77
9-
-20
1,56
6V
alua
tion
-20
1,84
51,
628,
266
175,
843
-60
78,
195
2,01
4,75
6A
ccum
ulat
ed d
epre
ciat
ion
--
(508
,626
)(3
2,21
4)(1
05,9
85)
--
(646
,825
)N
et b
ook
amou
nt37
,787
201,
845
1,11
9,64
014
3,62
957
,794
607
8,19
51,
569,
497
Year
end
ed 3
1 De
cem
ber 2
015
Ope
ning
net
boo
k am
ount
37,7
8720
1,84
51,
119,
640
143,
629
57,7
9460
78,
195
1,56
9,49
7R
eval
uatio
n su
rplu
s-
2,12
561
,083
(71,
536)
-15
76(8
,237
)A
dditi
ons
34,6
74-
--
11,2
30-
5645
,960
WIP
tra
nsfe
rs(6
2,38
8)-
54,8
651,
549
5,97
4-
--
Dis
posa
ls: C
ost
--
--
(928
)-
-(9
28)
Dis
posa
ls: A
ccum
ulat
ed d
epre
ciat
ion
--
--
--
--
Dep
reci
atio
n ch
arge
--
(34,
987)
(2,5
78)
(13,
801)
--
(51,
366)
Clo
sing
net
boo
k am
ount
10,0
7320
3,97
01,
200,
601
71,0
6460
,269
622
8,32
71,
554,
926
At 3
1 De
cem
ber 2
015
Cos
t10
,073
--
-17
4,54
2-
-18
4,61
5V
alua
tion
-20
3,97
01,
721,
797
120,
672
-62
28,
327
2,05
5,38
8A
ccum
ulat
ed d
epre
ciat
ion
--
(521
,196
)(4
9,60
8)(1
14,2
73)
--
(685
,077
)N
et b
ook
amou
nt10
,073
203,
970
1,20
0,60
171
,064
60,2
6962
28,
327
1,55
4,92
6
Year
end
ed 3
1 De
cem
ber 2
016
Ope
ning
net
boo
k am
ount
10,0
7320
3,97
01,
200,
601
71,0
6460
,269
622
8,32
71,
554,
926
Rev
alua
tion
surp
lus
-18
,357
7,39
090
-8
180
26,0
25A
dditi
ons
39,7
16-
--
9,43
2-
978
50,1
26W
IP t
rans
fers
(17,
780)
-10
,972
600
6,20
8-
--
Dis
posa
ls:C
ost
(389
)-
--
(10,
750)
--
(11,
139)
Dis
posa
ls: A
ccum
ulat
ed d
epre
ciat
ion
--
--
8,88
2-
-8,
882
Dep
reci
atio
n ch
arge
--
(35,
510)
(2,7
47)
(14,
293)
--
(52,
550)
Clo
sing
net
boo
k am
ount
31,6
2022
2,32
71,
183,
453
69,0
0759
,748
630
9,48
51,
576,
270
At 3
1 De
cem
ber 2
016
Cos
t31
,620
--
-17
9,43
2-
-21
1,05
2V
alua
tion
-22
2,32
71,
784,
795
121,
127
-63
09,
485
2,13
8,36
4A
ccum
ulat
ed d
epre
ciat
ion
--
(601
,342
)(5
2,12
0)(1
19,6
84)
--
(773
,146
)N
et b
ook
amou
nt31
,620
222,
327
1,18
3,45
369
,007
59,7
4863
09,
485
1,57
6,27
0
Not
es to
the
finan
cial
sta
tem
ents
for t
he y
ear e
nded
31
Dece
mbe
r 201
6
13. P
rope
rty,
pla
nt a
nd e
quip
men
t
Cons
truct
ion
in
prog
ress
$’00
0
Land
$’00
0
Build
ings
$’00
0
Infra
stru
ctur
e
$’00
0
Plan
t and
eq
uipm
ent*
$’00
0
Libr
ary
$’00
0
Oth
er p
lant
and
eq
uipm
ent**
$’00
0To
tal
$’00
0At
1 J
anua
ry 2
015
Cos
t37
,787
--
-16
3,77
9-
-20
1,56
6V
alua
tion
-20
1,84
51,
628,
266
175,
843
-60
78,
195
2,01
4,75
6A
ccum
ulat
ed d
epre
ciat
ion
--
(508
,626
)(3
2,21
4)(1
05,9
85)
--
(646
,825
)N
et b
ook
amou
nt37
,787
201,
845
1,11
9,64
014
3,62
957
,794
607
8,19
51,
569,
497
Year
end
ed 3
1 De
cem
ber 2
015
Ope
ning
net
boo
k am
ount
37,7
8720
1,84
51,
119,
640
143,
629
57,7
9460
78,
195
1,56
9,49
7R
eval
uatio
n su
rplu
s-
2,12
561
,083
(71,
536)
-15
76(8
,237
)A
dditi
ons
34,6
74-
--
11,2
30-
5645
,960
WIP
tra
nsfe
rs(6
2,38
8)-
54,8
651,
549
5,97
4-
--
Dis
posa
ls: C
ost
--
--
(928
)-
-(9
28)
Dis
posa
ls: A
ccum
ulat
ed d
epre
ciat
ion
--
--
--
--
Dep
reci
atio
n ch
arge
--
(34,
987)
(2,5
78)
(13,
801)
--
(51,
366)
Clo
sing
net
boo
k am
ount
10,0
7320
3,97
01,
200,
601
71,0
6460
,269
622
8,32
71,
554,
926
At 3
1 De
cem
ber 2
015
Cos
t10
,073
--
-17
4,54
2-
-18
4,61
5V
alua
tion
-20
3,97
01,
721,
797
120,
672
-62
28,
327
2,05
5,38
8A
ccum
ulat
ed d
epre
ciat
ion
--
(521
,196
)(4
9,60
8)(1
14,2
73)
--
(685
,077
)N
et b
ook
amou
nt10
,073
203,
970
1,20
0,60
171
,064
60,2
6962
28,
327
1,55
4,92
6
Year
end
ed 3
1 De
cem
ber 2
016
Ope
ning
net
boo
k am
ount
10,0
7320
3,97
01,
200,
601
71,0
6460
,269
622
8,32
71,
554,
926
Rev
alua
tion
surp
lus
-18
,357
7,39
090
-8
180
26,0
25A
dditi
ons
39,7
16-
--
9,43
2-
978
50,1
26W
IP t
rans
fers
(17,
780)
-10
,972
600
6,20
8-
--
Dis
posa
ls:C
ost
(389
)-
--
(10,
750)
--
(11,
139)
Dis
posa
ls: A
ccum
ulat
ed d
epre
ciat
ion
--
--
8,88
2-
-8,
882
Dep
reci
atio
n ch
arge
--
(35,
510)
(2,7
47)
(14,
293)
--
(52,
550)
Clo
sing
net
boo
k am
ount
31,6
2022
2,32
71,
183,
453
69,0
0759
,748
630
9,48
51,
576,
270
At 3
1 De
cem
ber 2
016
Cos
t31
,620
--
-17
9,43
2-
-21
1,05
2V
alua
tion
-22
2,32
71,
784,
795
121,
127
-63
09,
485
2,13
8,36
4A
ccum
ulat
ed d
epre
ciat
ion
--
(601
,342
)(5
2,12
0)(1
19,6
84)
--
(773
,146
)N
et b
ook
amou
nt31
,620
222,
327
1,18
3,45
369
,007
59,7
4863
09,
485
1,57
6,27
0
Note
s to
the
finan
cial
sta
tem
ents
for t
he y
ear e
nded
31
Dece
mbe
r 201
6
13. P
rope
rty,
pla
nt a
nd e
quip
men
t
Cons
truct
ion
in
prog
ress
$’00
0
Land
$’00
0
Build
ings
$’00
0
Infra
stru
ctur
e
$’00
0
Plan
t and
eq
uipm
ent*
$’00
0
Libr
ary
$’00
0
Oth
er p
lant
and
eq
uipm
ent**
$’00
0To
tal
$’00
0At
1 J
anua
ry 2
015
Cos
t37
,787
--
-16
3,77
9-
-20
1,56
6V
alua
tion
-20
1,84
51,
628,
266
175,
843
-60
78,
195
2,01
4,75
6A
ccum
ulat
ed d
epre
ciat
ion
--
(508
,626
)(3
2,21
4)(1
05,9
85)
--
(646
,825
)N
et b
ook
amou
nt37
,787
201,
845
1,11
9,64
014
3,62
957
,794
607
8,19
51,
569,
497
Year
end
ed 3
1 De
cem
ber 2
015
Ope
ning
net
boo
k am
ount
37,7
8720
1,84
51,
119,
640
143,
629
57,7
9460
78,
195
1,56
9,49
7R
eval
uatio
n su
rplu
s-
2,12
561
,083
(71,
536)
-15
76(8
,237
)A
dditi
ons
34,6
74-
--
11,2
30-
5645
,960
WIP
tra
nsfe
rs(6
2,38
8)-
54,8
651,
549
5,97
4-
--
Dis
posa
ls: C
ost
--
--
(928
)-
-(9
28)
Dis
posa
ls: A
ccum
ulat
ed d
epre
ciat
ion
--
--
--
--
Dep
reci
atio
n ch
arge
--
(34,
987)
(2,5
78)
(13,
801)
--
(51,
366)
Clo
sing
net
boo
k am
ount
10,0
7320
3,97
01,
200,
601
71,0
6460
,269
622
8,32
71,
554,
926
At 3
1 De
cem
ber 2
015
Cos
t10
,073
--
-17
4,54
2-
-18
4,61
5V
alua
tion
-20
3,97
01,
721,
797
120,
672
-62
28,
327
2,05
5,38
8A
ccum
ulat
ed d
epre
ciat
ion
--
(521
,196
)(4
9,60
8)(1
14,2
73)
--
(685
,077
)N
et b
ook
amou
nt10
,073
203,
970
1,20
0,60
171
,064
60,2
6962
28,
327
1,55
4,92
6
Year
end
ed 3
1 De
cem
ber 2
016
Ope
ning
net
boo
k am
ount
10,0
7320
3,97
01,
200,
601
71,0
6460
,269
622
8,32
71,
554,
926
Rev
alua
tion
surp
lus
-18
,357
7,39
090
-8
180
26,0
25A
dditi
ons
39,7
16-
--
9,43
2-
978
50,1
26W
IP t
rans
fers
(17,
780)
-10
,972
600
6,20
8-
--
Dis
posa
ls:C
ost
(389
)-
--
(10,
750)
--
(11,
139)
Dis
posa
ls: A
ccum
ulat
ed d
epre
ciat
ion
--
--
8,88
2-
-8,
882
Dep
reci
atio
n ch
arge
--
(35,
510)
(2,7
47)
(14,
293)
--
(52,
550)
Clo
sing
net
boo
k am
ount
31,6
2022
2,32
71,
183,
453
69,0
0759
,748
630
9,48
51,
576,
270
At 3
1 De
cem
ber 2
016
Cos
t31
,620
--
-17
9,43
2-
-21
1,05
2V
alua
tion
-22
2,32
71,
784,
795
121,
127
-63
09,
485
2,13
8,36
4A
ccum
ulat
ed d
epre
ciat
ion
--
(601
,342
)(5
2,12
0)(1
19,6
84)
--
(773
,146
)N
et b
ook
amou
nt31
,620
222,
327
1,18
3,45
369
,007
59,7
4863
09,
485
1,57
6,27
0
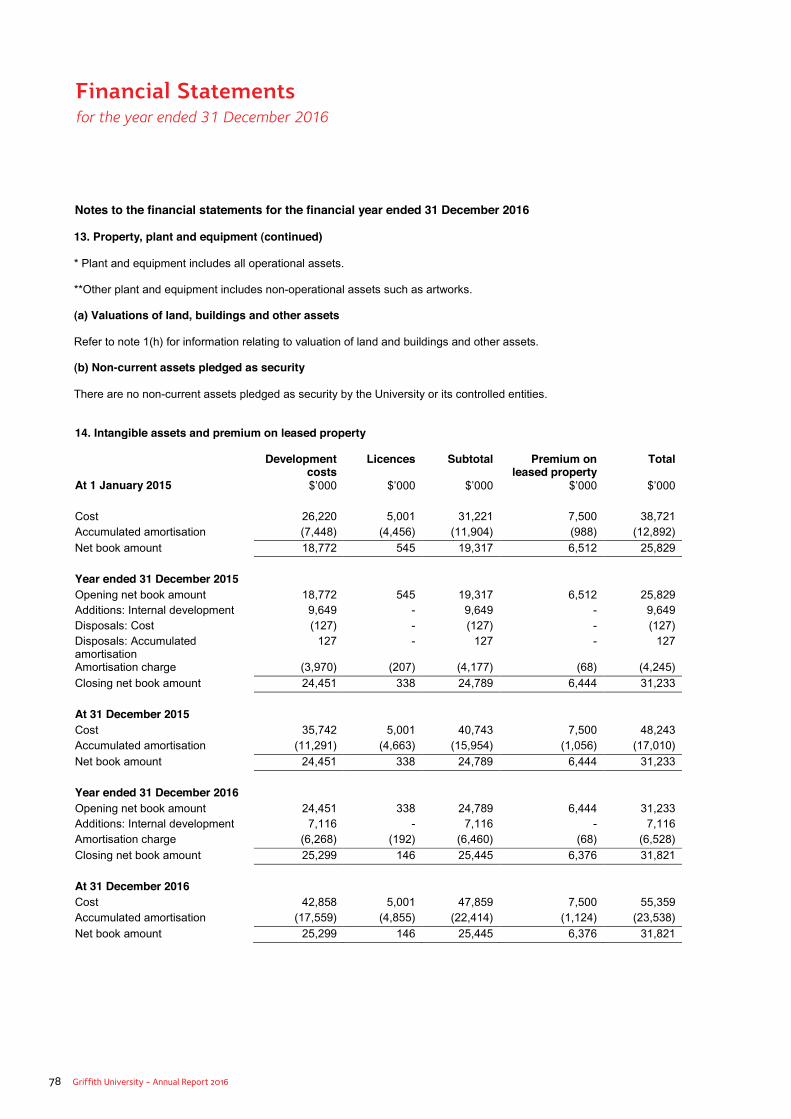
78 Griffith University - Annual Report 2016
Financial Statements for the year ended 31 December 2016
Notes to the financial statements for the financial year ended 31 December 2016
13. Property, plant and equipment (continued)
* Plant and equipment includes all operational assets.
**Other plant and equipment includes non-operational assets such as artworks.
(a) Valuations of land, buildings and other assets
Refer to note 1(h) for information relating to valuation of land and buildings and other assets.
(b) Non-current assets pledged as security
There are no non-current assets pledged as security by the University or its controlled entities.
14. Intangible assets and premium on leased property
Development costs
Licences Subtotal Premium on leased property
Total
At 1 January 2015 $’000 $’000 $’000 $’000 $’000
Cost 26,220 5,001 31,221 7,500 38,721Accumulated amortisation (7,448) (4,456) (11,904) (988) (12,892)
Net book amount 18,772 545 19,317 6,512 25,829
Year ended 31 December 2015Opening net book amount 18,772 545 19,317 6,512 25,829Additions: Internal development 9,649 - 9,649 - 9,649Disposals: Cost (127) - (127) - (127)Disposals: Accumulated amortisation
127 - 127 - 127
Amortisation charge (3,970) (207) (4,177) (68) (4,245)
Closing net book amount 24,451 338 24,789 6,444 31,233
At 31 December 2015Cost 35,742 5,001 40,743 7,500 48,243Accumulated amortisation (11,291) (4,663) (15,954) (1,056) (17,010)
Net book amount 24,451 338 24,789 6,444 31,233
Year ended 31 December 2016Opening net book amount 24,451 338 24,789 6,444 31,233Additions: Internal development 7,116 - 7,116 - 7,116Amortisation charge (6,268) (192) (6,460) (68) (6,528)
Closing net book amount 25,299 146 25,445 6,376 31,821
At 31 December 2016Cost 42,858 5,001 47,859 7,500 55,359Accumulated amortisation (17,559) (4,855) (22,414) (1,124) (23,538)
Net book amount 25,299 146 25,445 6,376 31,821
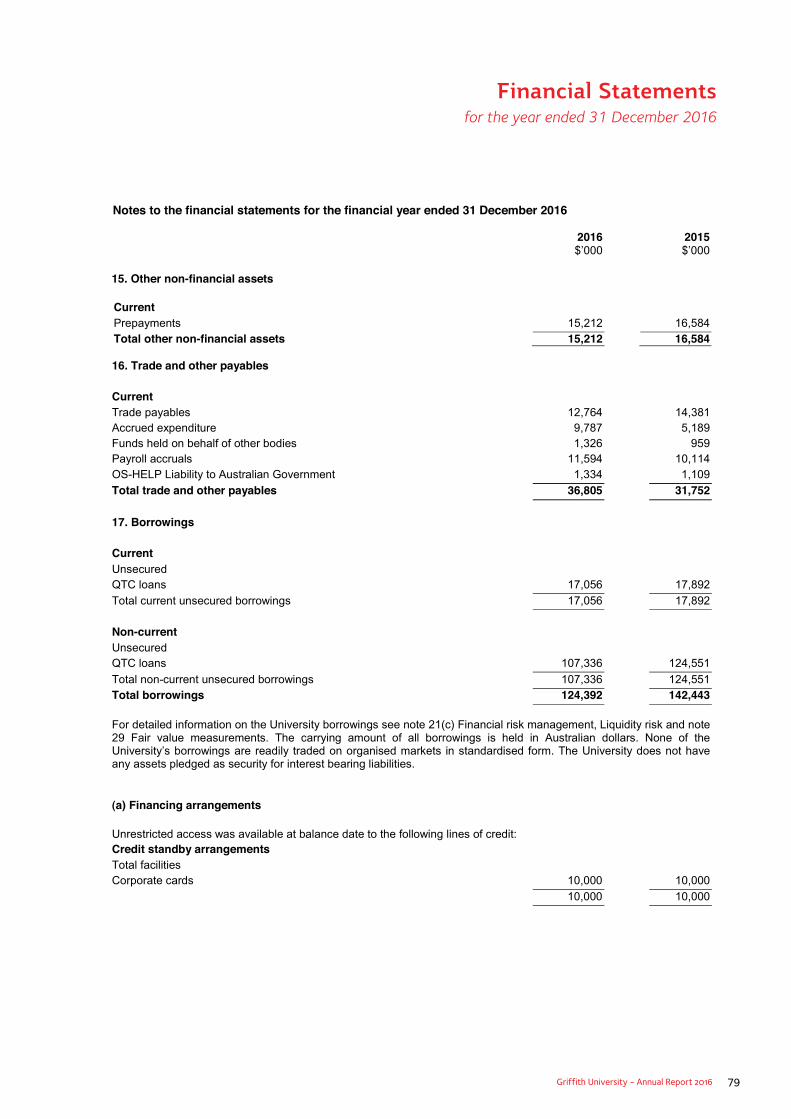
Griffith University - Annual Report 2016 79
Financial Statements for the year ended 31 December 2016
Notes to the financial statements for the financial year ended 31 December 2016
2016 2015$’000 $’000
15. Other non-financial assets
CurrentPrepayments 15,212 16,584Total other non-financial assets 15,212 16,584
16. Trade and other payables
CurrentTrade payables 12,764 14,381 Accrued expenditure 9,787 5,189 Funds held on behalf of other bodies 1,326 959Payroll accruals 11,594 10,114 OS-HELP Liability to Australian Government 1,334 1,109
Total trade and other payables 36,805 31,752
17. Borrowings
CurrentUnsecuredQTC loans 17,056 17,892
Total current unsecured borrowings 17,056 17,892
Non-currentUnsecuredQTC loans 107,336 124,551
Total non-current unsecured borrowings 107,336 124,551 Total borrowings 124,392 142,443
For detailed information on the University borrowings see note 21(c) Financial risk management, Liquidity risk and note 29 Fair value measurements. The carrying amount of all borrowings is held in Australian dollars. None of the University’s borrowings are readily traded on organised markets in standardised form. The University does not have any assets pledged as security for interest bearing liabilities.
(a) Financing arrangements
Unrestricted access was available at balance date to the following lines of credit:Credit standby arrangementsTotal facilitiesCorporate cards 10,000 10,000
10,000 10,000

80 Griffith University - Annual Report 2016
Financial Statements for the year ended 31 December 2016
Notes to the financial statements for the financial year ended 31 December 2016
2016 201517. Borrowings (continued) $’000 $’000
(a) Financing arrangements (continued)
Used at balance dateCorporate cards 735 731
735 731
Unused at balance dateCorporate cards 9,265 9,269
9,265 9,269
(b) Risk exposures
The exposure of the University’s borrowings to interest rate changes and the contractual repricing dates at the balance dates are as follows:
6 months or less - 9,402 6 – 12 months - 8,490 1 – 5 years - 54,610 Over 5 years - 69,941
Total borrowings - 142,443
Current borrowings - 17,892 Non-current borrowings - 124,551
Total borrowings - 142,443
During 2016, all of the University’s borrowings were converted to fixed interest rates. Therefore at balance date thereis considered to be no risk exposure relating to interest rate changes.
18. Provisions
Current provisions expected to be settled within 12 monthsEmployee benefitsLong service leave 8,147 6,922Annual leave 30,416 29,515Voluntary early retirement and severance pay 768 52
Subtotal 39,331 36,489
Current provisions expected to be settled after more than 12 monthsEmployee benefitsLong service leave 31,589 40,051 Annual leave 5,373 6,648
Subtotal 36,962 46,699
Total current provisions 76,293 83,188
Non-current provisionsEmployee benefitsLong service leave 19,586 17,077
Total non-current provisions 19,586 17,077
Total provisions 95,879 100,265
The long service leave and annual leave provision reflects the amount of long service leave and annual leave accrued as at 31 December 2016. It is measured as the present value of expected future payments to be made in respect of services provided by employees up to the reporting date. Consideration is given to expected future salary increases, experience of employee departures and periods of service. Expected future payments are discounted using Reserve Bank of Australia’s indicative mid rates of selected Commonwealth Government securities.
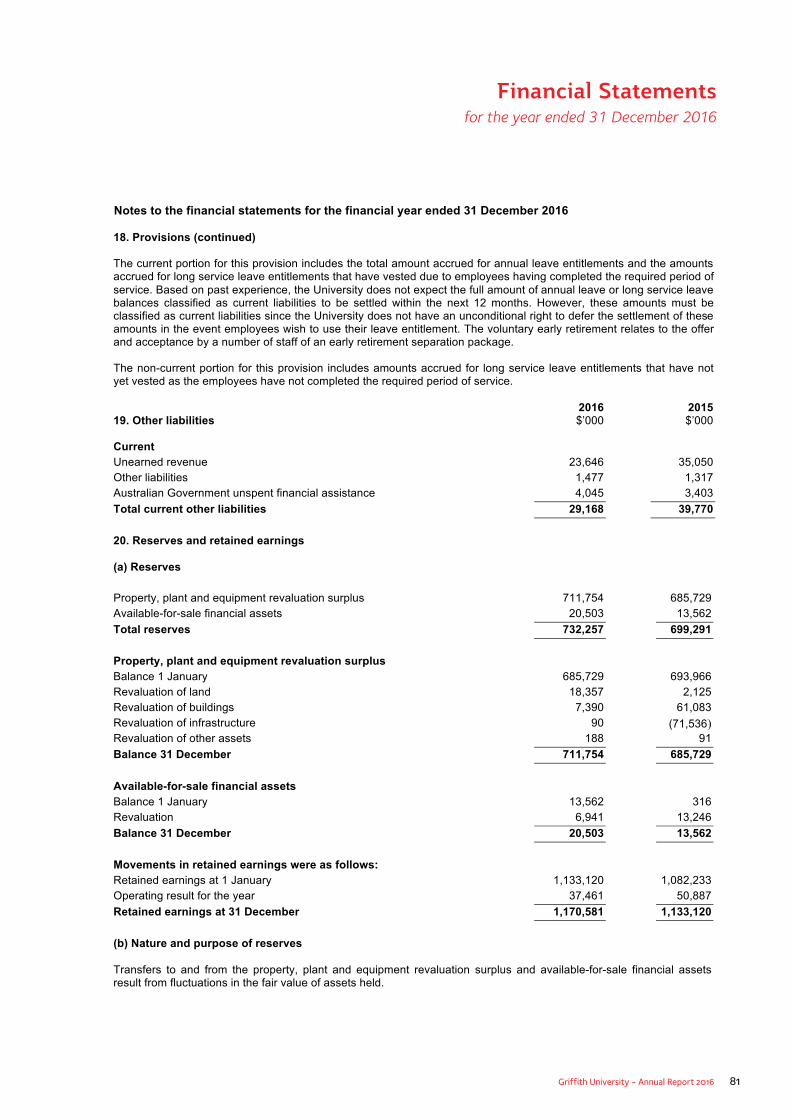
Griffith University - Annual Report 2016 81
Financial Statements for the year ended 31 December 2016
Notes to the financial statements for the financial year ended 31 December 2016 18. Provisions (continued) The current portion for this provision includes the total amount accrued for annual leave entitlements and the amounts accrued for long service leave entitlements that have vested due to employees having completed the required period of service. Based on past experience, the University does not expect the full amount of annual leave or long service leave balances classified as current liabilities to be settled within the next 12 months. However, these amounts must be classified as current liabilities since the University does not have an unconditional right to defer the settlement of these amounts in the event employees wish to use their leave entitlement. The voluntary early retirement relates to the offer and acceptance by a number of staff of an early retirement separation package. The non-current portion for this provision includes amounts accrued for long service leave entitlements that have not yet vested as the employees have not completed the required period of service.
2016
2015 19. Other liabilities
$’000 $’000
Current Unearned revenue 23,646 35,050 Other liabilities 1,477 1,317 Australian Government unspent financial assistance 4,045 3,403
Total current other liabilities 29,168 39,770 20. Reserves and retained earnings
(a) Reserves Property, plant and equipment revaluation surplus 711,754 685,729 Available-for-sale financial assets 20,503 13,562
Total reserves 732,257 699,291
Property, plant and equipment revaluation surplus Balance 1 January 685,729 693,966 Revaluation of land 18,357 2,125 Revaluation of buildings 7,390 61,083 Revaluation of infrastructure 90 (71,536) Revaluation of other assets 188 91
Balance 31 December 711,754 685,729
Available-for-sale financial assets Balance 1 January 13,562 316 Revaluation 6,941 13,246
Balance 31 December 20,503 13,562 Movements in retained earnings were as follows: Retained earnings at 1 January 1,133,120 1,082,233 Operating result for the year 37,461 50,887
Retained earnings at 31 December 1,170,581 1,133,120 (b) Nature and purpose of reserves Transfers to and from the property, plant and equipment revaluation surplus and available-for-sale financial assets result from fluctuations in the fair value of assets held.
82 Griffith University - Annual Report 2016
Financial Statements for the year ended 31 December 2016
Notes to the financial statements for the financial year ended 31 December 2016
21. Financial risk management The University’s activities expose it to a variety of financial risks including market risk (including price risk, foreign exchange risk and cash flow and fair value interest rate risk), credit risk and liquidity risk. These risks are managed by the University as described below. The University’s financial instruments consist mainly of cash funds, equity instruments, accounts receivable and payable, and borrowings. Risk management is carried out by the Office of Finance under policies approved by the University Council.
(a) Market risk
(i) Foreign exchange risk The University’s exposure to foreign exchange risk lies in its purchase of goods and services from sources overseas in foreign currency and the exchange rate impact on affordability of study in Australia for overseas students. The University has approval to hedge foreign currency transactions and may utilise this ability on significant foreign currency contracts. The University also holds bank accounts in Hong Kong dollars, Japanese Yen and United States dollars. Management do not consider the financial impact of foreign exchange risk to be material for further disclosure and analysis. (ii) Price risk The University’s exposure to price risk lies in managed funds administered by QIC, the shareholdings in Education Australia Limited and Navitas Limited. The remainder of the University share holdings and investments are not subject to price risk as they are not publicly traded.
The University mitigates this risk by constant review of investment holdings to determine appropriate action.
The management and operation of the University's investment portfolio is governed by the Griffith University Act 1998 (Qld) and the Statutory Bodies Financial Arrangements Act 1982 (Qld).
The University's investment strategy seeks to achieve compliance with statutory and legislative requirements, to preserve and improve the value of the University's investment assets over time, and to earn a return commensurate with the term of the University's investments and the credit worthiness of the underlying counterparties.
Outlined in the following table is the University’s sensitivity analysis to price risk. The University has chosen a fluctuation of 10% (2015: 10%) to outline this sensitivity. The decision not to change the sensitivity relates to the University’s management study of current market data.
(iii) Cash flow and interest rate risk The University’s exposure to interest rate risk arises predominantly from assets and liabilities bearing variable interest rates. Where possible to mitigate this risk, the University holds fixed rate assets and liabilities to maturity.
Outlined in the table below is the University’s sensitivity analysis to interest rate risk. Interest rate risk lies in balances in bank accounts earning interest and QTC managed funds. At balance date, the University’s borrowings from QTC were under fixed interest rates, therefore are not considered to be exposed to interest rate risk. The University has chosen a fluctuation of 1% (2015: 1%) to outline this sensitivity. The decision not to change the sensitivity relates to the University’s management study of current market data.

Griffith University - Annual Report 2016 83
Financial Statements for the year ended 31 December 2016
Notes to the financial statements for the year ended 31 December 2016 21. Financial risk management (continued) (a) Market risk (continued)
(iii) Cash flow and fair value interest rate risk (continued)
Interest rate risk Price risk -1% +1% -10% +10%
Carrying Amount
Result
Equity
Result
Equity
Result
Equity
Result
Equity
31 December 2016
$’000 $’000 $’000 $’000 $’000 $’000 $’000 $’000 $’000
Financial assets
Cash and cash equivalents#1
439,304 (4,335) (4,335) 4,335 4,335 - - - -
Other financial assets#2
104,203 - - - - (9,421) (9,421) 9,421 9,421
Trade and other receivables
19,737 - - - - - - - -
Financial liabilities Trade and other payables
36,805 - - - - - - - -
Borrowings 124,392 - - - - - - - - Other liabilities 1,477 - - - - - - - -
Total (decrease)/ increase
(4,335) (4,335) 4,335 4,335 (9,421) (9,421) 9,421 9,421
Interest rate risk Price risk
-1% 1% -10% +10%
Carrying Amount
Result
Equity
Result
Equity
Result
Equity
Result
Equity
31 December 2015
$’000 $’000 $’000 $’000 $’000 $’000 $’000 $’000 $’000
Financial assets Cash and cash equivalents#1
489,340 (4,869) (4,869) 4,869 4,869 - - - -
Other financial assets#2
31,434 - - - - (2,498) (2,498) 2,498 2,498
Trade and other receivables
21,983 - - - - - - - -
Financial liabilities Trade and other payables
31,762 - - - - - - - -
Borrowings 142,443 1,424 1,424 (1,424) (1,424) - - - - Other liabilities 1,317 - - - - - - - -
Total (decrease)/ increase
(3,445) (3,445) 3,445 3,445 (2,498) (2,498) 2,498 2,498
#1 Within cash and cash equivalents, $5.8 million (2015: $2.4 million) has no interest rate risk exposure. #2 Within other financial assets, $9.7 million (2015: $4.7 million) has no price risk exposure.
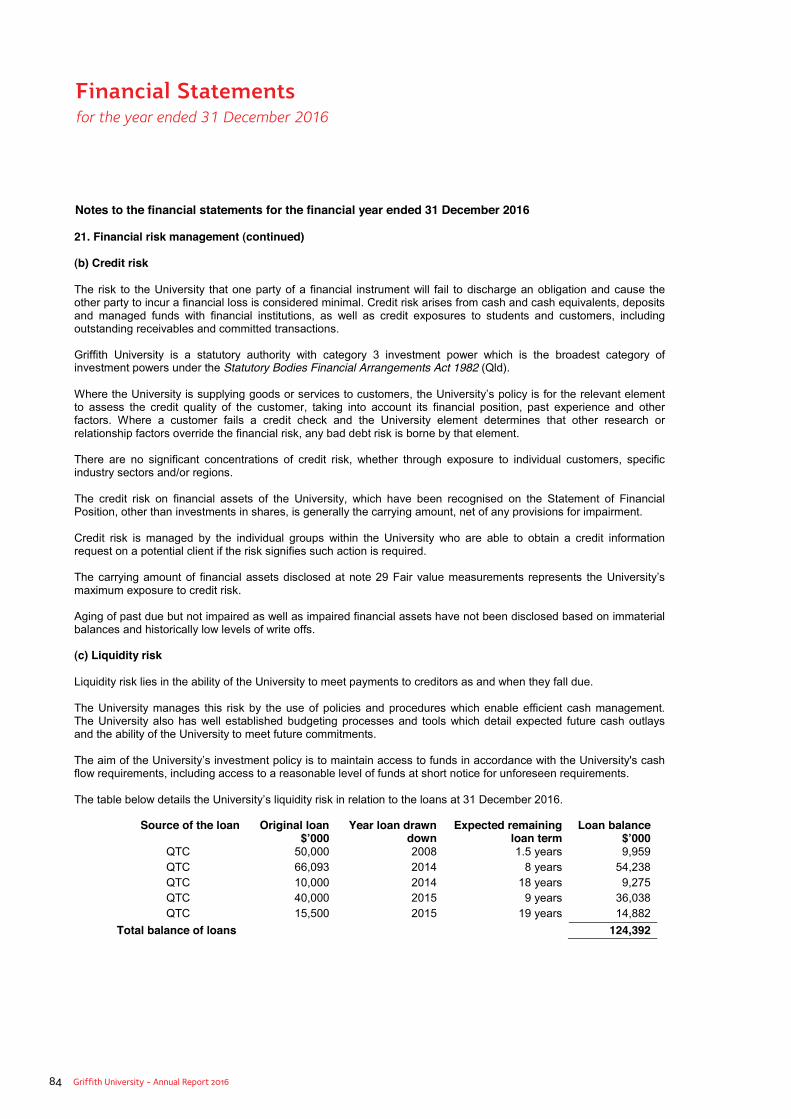
84 Griffith University - Annual Report 2016
Financial Statements for the year ended 31 December 2016
Notes to the financial statements for the financial year ended 31 December 2016
21. Financial risk management (continued)
(b) Credit risk
The risk to the University that one party of a financial instrument will fail to discharge an obligation and cause the other party to incur a financial loss is considered minimal. Credit risk arises from cash and cash equivalents, deposits and managed funds with financial institutions, as well as credit exposures to students and customers, including outstanding receivables and committed transactions.
Griffith University is a statutory authority with category 3 investment power which is the broadest category of investment powers under the Statutory Bodies Financial Arrangements Act 1982 (Qld).
Where the University is supplying goods or services to customers, the University’s policy is for the relevant element to assess the credit quality of the customer, taking into account its financial position, past experience and other factors. Where a customer fails a credit check and the University element determines that other research or relationship factors override the financial risk, any bad debt risk is borne by that element.
There are no significant concentrations of credit risk, whether through exposure to individual customers, specific industry sectors and/or regions.
The credit risk on financial assets of the University, which have been recognised on the Statement of Financial Position, other than investments in shares, is generally the carrying amount, net of any provisions for impairment.
Credit risk is managed by the individual groups within the University who are able to obtain a credit information request on a potential client if the risk signifies such action is required.
The carrying amount of financial assets disclosed at note 29 Fair value measurements represents the University’s maximum exposure to credit risk.
Aging of past due but not impaired as well as impaired financial assets have not been disclosed based on immaterial balances and historically low levels of write offs.
(c) Liquidity risk
Liquidity risk lies in the ability of the University to meet payments to creditors as and when they fall due.
The University manages this risk by the use of policies and procedures which enable efficient cash management.The University also has well established budgeting processes and tools which detail expected future cash outlays and the ability of the University to meet future commitments.
The aim of the University’s investment policy is to maintain access to funds in accordance with the University's cash flow requirements, including access to a reasonable level of funds at short notice for unforeseen requirements.
The table below details the University’s liquidity risk in relation to the loans at 31 December 2016.
Source of the loan Original loan $’000
Year loan drawn down
Expected remaining loan term
Loan balance$’000
QTC 50,000 2008 1.5 years 9,959QTC 66,093 2014 8 years 54,238QTC 10,000 2014 18 years 9,275QTC 40,000 2015 9 years 36,038QTC 15,500 2015 19 years 14,882
Total balance of loans 124,392
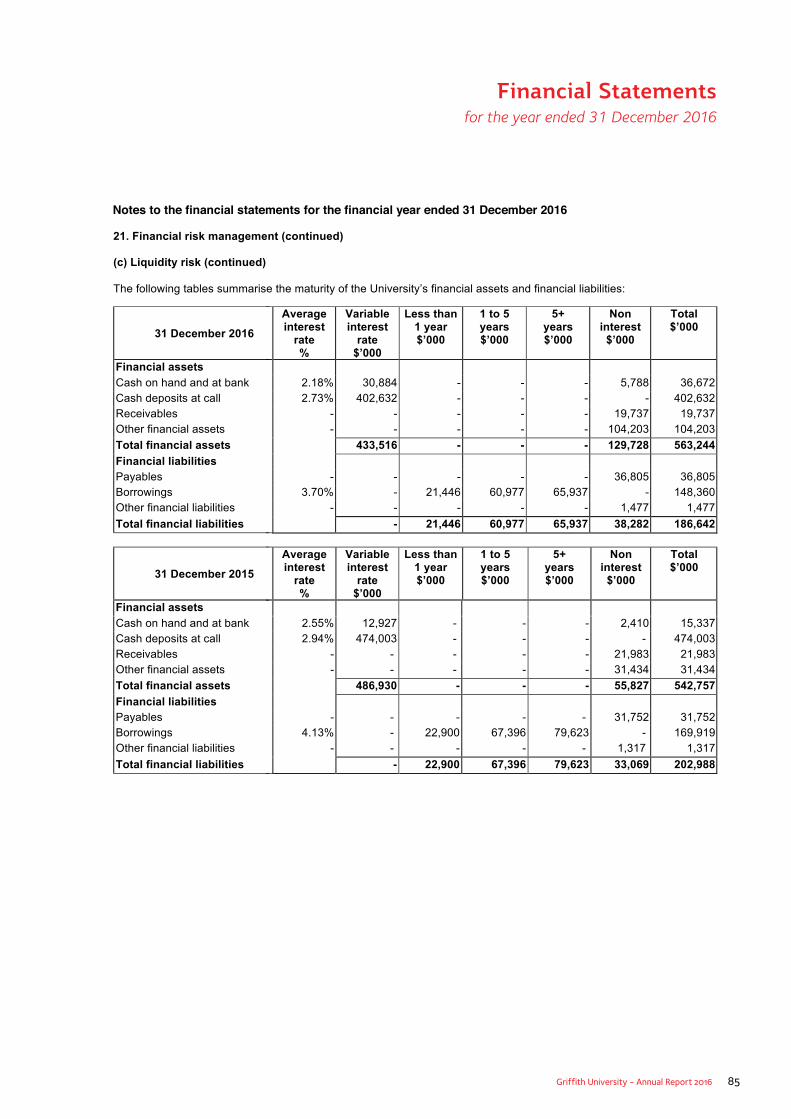
Griffith University - Annual Report 2016 85
Financial Statements for the year ended 31 December 2016
Notes to the financial statements for the financial year ended 31 December 2016
21. Financial risk management (continued)
(c) Liquidity risk (continued)
The following tables summarise the maturity of the University’s financial assets and financial liabilities:
31 December 2016 Average interest
rate%
Variable interest
rate$’000
Less than 1 year $’000
1 to 5years$’000
5+ years$’000
Non interest
$’000
Total$’000
Financial assetsCash on hand and at bank 2.18% 30,884 - - - 5,788 36,672Cash deposits at call 2.73% 402,632 - - - - 402,632Receivables - - - - - 19,737 19,737Other financial assets - - - - - 104,203 104,203Total financial assets 433,516 - - - 129,728 563,244Financial liabilitiesPayables - - - - - 36,805 36,805Borrowings 3.70% - 21,446 60,977 65,937 - 148,360Other financial liabilities - - - - - 1,477 1,477
Total financial liabilities - 21,446 60,977 65,937 38,282 186,642
31 December 2015 Average interest
rate%
Variable interest
rate$’000
Less than 1 year $’000
1 to 5years$’000
5+ years$’000
Non interest
$’000
Total$’000
Financial assetsCash on hand and at bank 2.55% 12,927 - - - 2,410 15,337Cash deposits at call 2.94% 474,003 - - - - 474,003Receivables - - - - - 21,983 21,983Other financial assets - - - - - 31,434 31,434Total financial assets 486,930 - - - 55,827 542,757Financial liabilitiesPayables - - - - - 31,752 31,752Borrowings 4.13% - 22,900 67,396 79,623 - 169,919Other financial liabilities - - - - - 1,317 1,317
Total financial liabilities - 22,900 67,396 79,623 33,069 202,988
Notes to the financial statements for the year ended 31 December 2016 21. Financial risk management (continued) (c) Liquidity risk (continued)
The following tables summarise the maturity of the University’s financial assets and financial liabilities:
31 December 2016
Average interest
rate %
Variable interest
rate $’000
Less than 1 year $’000
1 to 5 years $’000
5+ years $’000
Non interest
$’000
Total $’000
Financial assets
Cash on hand and at bank 2.18% 30,884 - - - 5,788 36,672 Cash deposits at call 2.73% 402,632 - - - - 402,632 Receivables - - - - - 19,737 19,737 Other financial assets - - - - - 104,203 104,203
Total financial assets 433,516 - - - 129,728 563,244 Financial liabilities Payables - - - - - 36,805 36,805 Borrowings 3.70% - 21,446 60,977 65,937 - 148,360 Other financial liabilities - - - - - 1,477 1,477
Total financial liabilities - 21,446 60,977 65,937 38,282 186,642
31 December 2015
Average interest
rate %
Variable interest
rate $’000
Less than 1 year $’000
1 to 5 years $’000
5+ years $’000
Non interest
$’000
Total $’000
Financial assets
Cash on hand and at bank 2.55% 12,927 - - - 2,410 15,337 Cash deposits at call 2.94% 474,003 - - - - 474,003 Receivables - - - - - 21,983 21,983 Other financial assets - - - - - 31,434 31,434
Total financial assets 486,930 - - - 55,827 542,757 Financial liabilities Payables - - - - - 31,752 31,752 Borrowings 4.13% - 22,900 67,396 79,623 - 169,919 Other financial liabilities - - - - - 1,317 1,317
Total financial liabilities - 22,900 67,396 79,623 33,069 202,988
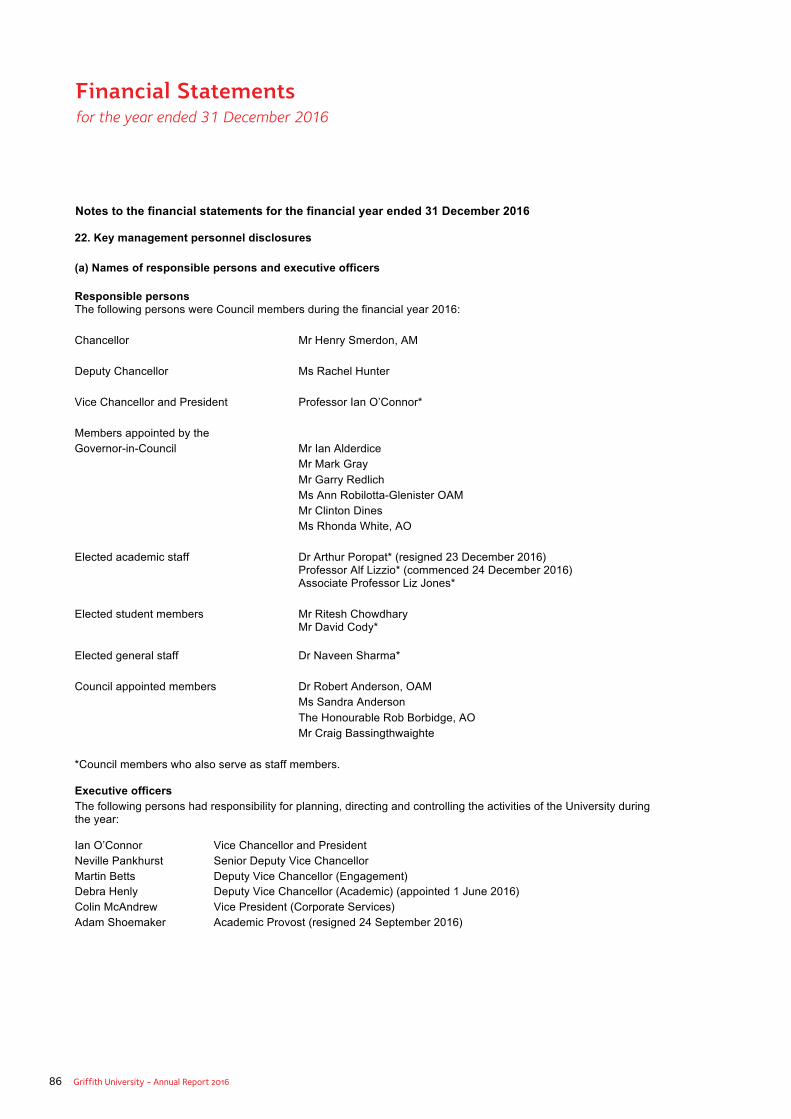
86 Griffith University - Annual Report 2016
Financial Statements for the year ended 31 December 2016
Notes to the financial statements for the financial year ended 31 December 2016
22. Key management personnel disclosures (a) Names of responsible persons and executive officers Responsible persons The following persons were Council members during the financial year 2016: Chancellor Mr Henry Smerdon, AM Deputy Chancellor Ms Rachel Hunter Vice Chancellor and President Professor Ian O’Connor* Members appointed by the Governor-in-Council Mr Ian Alderdice Mr Mark Gray
Mr Garry Redlich Ms Ann Robilotta-Glenister OAM Mr Clinton Dines Ms Rhonda White, AO Elected academic staff Dr Arthur Poropat* (resigned 23 December 2016)
Professor Alf Lizzio* (commenced 24 December 2016) Associate Professor Liz Jones* Elected student members Mr Ritesh Chowdhary
Mr David Cody* Elected general staff Dr Naveen Sharma* Council appointed members Dr Robert Anderson, OAM Ms Sandra Anderson
The Honourable Rob Borbidge, AO Mr Craig Bassingthwaighte
*Council members who also serve as staff members. Executive officers The following persons had responsibility for planning, directing and controlling the activities of the University during the year: Ian O’Connor Vice Chancellor and President Neville Pankhurst Senior Deputy Vice Chancellor Martin Betts Deputy Vice Chancellor (Engagement) Debra Henly Deputy Vice Chancellor (Academic) (appointed 1 June 2016) Colin McAndrew Vice President (Corporate Services) Adam Shoemaker Academic Provost (resigned 24 September 2016)
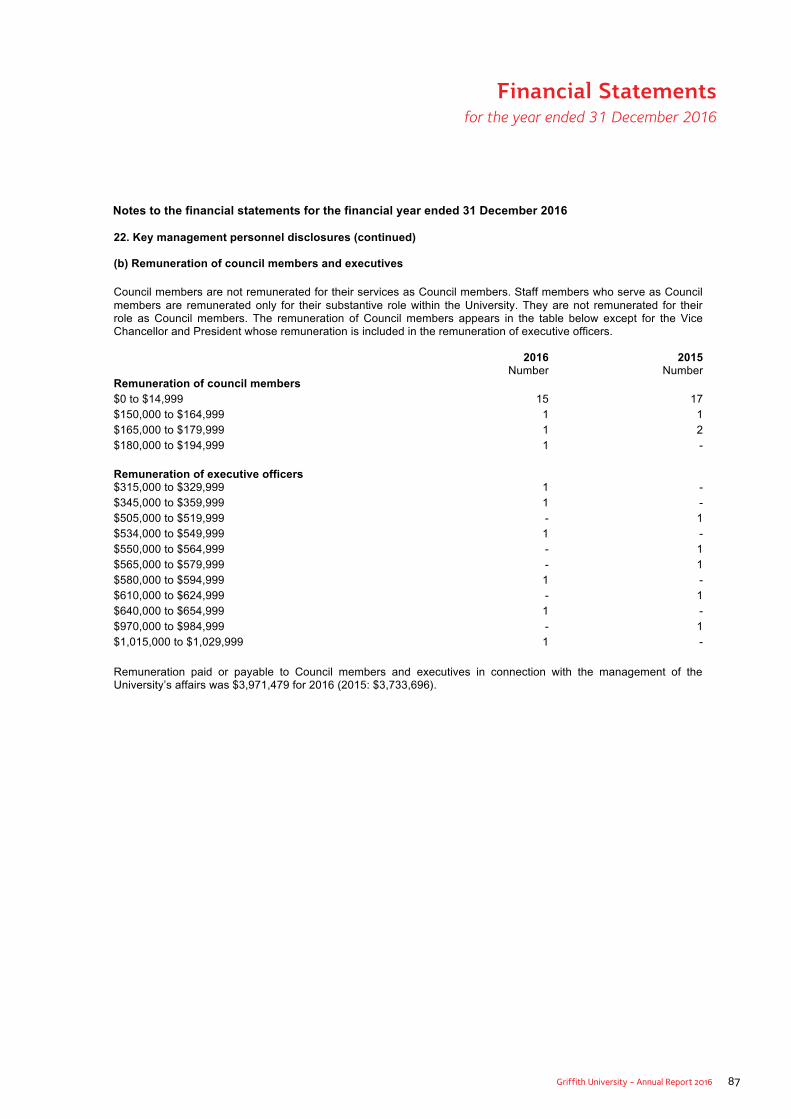
Griffith University - Annual Report 2016 87
Financial Statements for the year ended 31 December 2016
Notes to the financial statements for the financial year ended 31 December 2016 22. Key management personnel disclosures (continued) (b) Remuneration of council members and executives Council members are not remunerated for their services as Council members. Staff members who serve as Council members are remunerated only for their substantive role within the University. They are not remunerated for their role as Council members. The remuneration of Council members appears in the table below except for the Vice Chancellor and President whose remuneration is included in the remuneration of executive officers. 2016 2015 Number Number Remuneration of council members $0 to $14,999 15 17 $150,000 to $164,999 1 1 $165,000 to $179,999 1 2 $180,000 to $194,999 1 - Remuneration of executive officers
$315,000 to $329,999 1 - $345,000 to $359,999 1 - $505,000 to $519,999 - 1 $534,000 to $549,999 1 - $550,000 to $564,999 - 1 $565,000 to $579,999 - 1 $580,000 to $594,999 1 - $610,000 to $624,999 - 1 $640,000 to $654,999 1 - $970,000 to $984,999 - 1 $1,015,000 to $1,029,999 1 - Remuneration paid or payable to Council members and executives in connection with the management of the University’s affairs was $3,971,479 for 2016 (2015: $3,733,696).
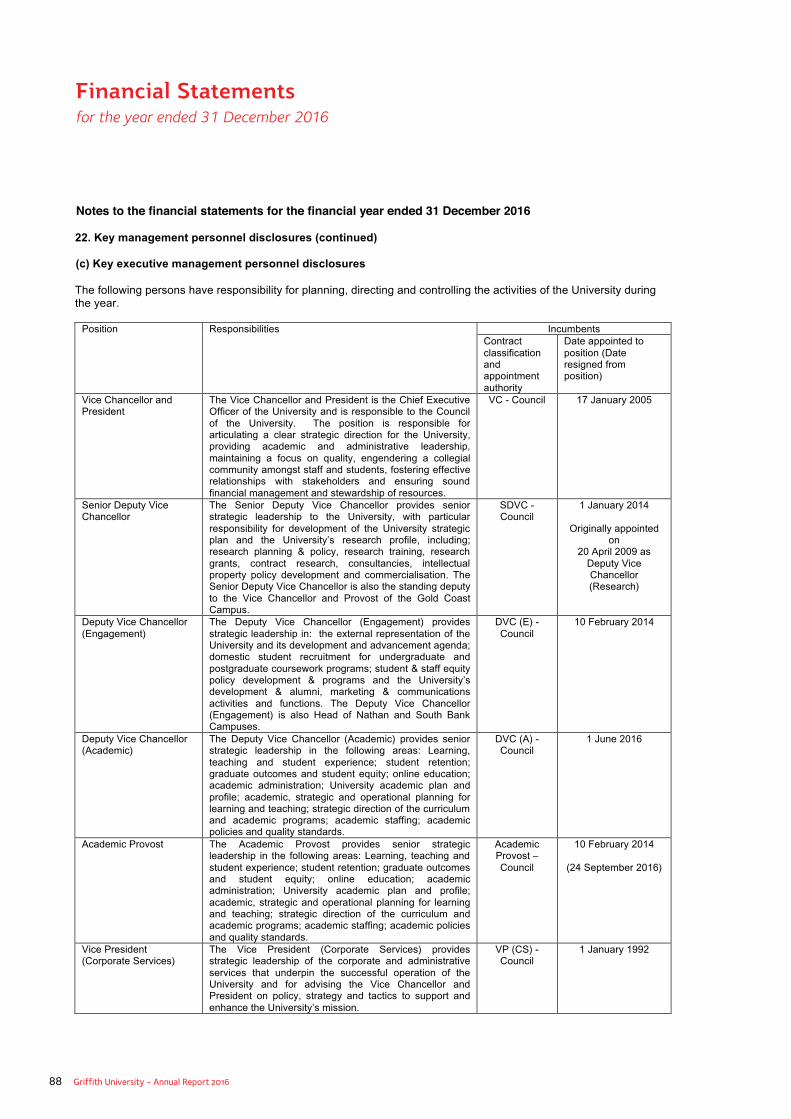
88 Griffith University - Annual Report 2016
Financial Statements for the year ended 31 December 2016
Notes to the financial statements for the year ended 31 December 2016
22. Key management personnel disclosures (continued)
(c) Key executive management personnel disclosures The following persons have responsibility for planning, directing and controlling the activities of the University during the year.
Position Responsibilities Incumbents Contract
classification and appointment authority
Date appointed to position (Date resigned from position)
Vice Chancellor and President
The Vice Chancellor and President is the Chief Executive Officer of the University and is responsible to the Council of the University. The position is responsible for articulating a clear strategic direction for the University, providing academic and administrative leadership, maintaining a focus on quality, engendering a collegial community amongst staff and students, fostering effective relationships with stakeholders and ensuring sound financial management and stewardship of resources.
VC - Council 17 January 2005
Senior Deputy Vice Chancellor
The Senior Deputy Vice Chancellor provides senior strategic leadership to the University, with particular responsibility for development of the University strategic plan and the University’s research profile, including; research planning & policy, research training, research grants, contract research, consultancies, intellectual property policy development and commercialisation. The Senior Deputy Vice Chancellor is also the standing deputy to the Vice Chancellor and Provost of the Gold Coast Campus.
SDVC - Council
1 January 2014
Originally appointed on
20 April 2009 as Deputy Vice Chancellor (Research)
Deputy Vice Chancellor (Engagement)
The Deputy Vice Chancellor (Engagement) provides strategic leadership in: the external representation of the University and its development and advancement agenda; domestic student recruitment for undergraduate and postgraduate coursework programs; student & staff equity policy development & programs and the University’s development & alumni, marketing & communications activities and functions. The Deputy Vice Chancellor (Engagement) is also Head of Nathan and South Bank Campuses.
DVC (E) - Council
10 February 2014
Deputy Vice Chancellor (Academic)
The Deputy Vice Chancellor (Academic) provides senior strategic leadership in the following areas: Learning, teaching and student experience; student retention; graduate outcomes and student equity; online education; academic administration; University academic plan and profile; academic, strategic and operational planning for learning and teaching; strategic direction of the curriculum and academic programs; academic staffing; academic policies and quality standards.
DVC (A) - Council
1 June 2016
Academic Provost The Academic Provost provides senior strategic leadership in the following areas: Learning, teaching and student experience; student retention; graduate outcomes and student equity; online education; academic administration; University academic plan and profile; academic, strategic and operational planning for learning and teaching; strategic direction of the curriculum and academic programs; academic staffing; academic policies and quality standards.
Academic Provost – Council
10 February 2014
(24 September 2016)
Vice President (Corporate Services)
The Vice President (Corporate Services) provides strategic leadership of the corporate and administrative services that underpin the successful operation of the University and for advising the Vice Chancellor and President on policy, strategy and tactics to support and enhance the University’s mission.
VP (CS) - Council
1 January 1992
Notes to the financial statements for the financial year ended 31 December 2016
22. Key management personnel disclosures (continued)
(c) Key executive management personnel disclosures
The following persons have responsibility for planning, directing and controlling the activities of the University during the year.
Position Responsibilities IncumbentsContract classification andappointment authority
Date appointed to position (Date resigned from position)
Vice Chancellor andPresident
The Vice Chancellor and President is the Chief Executive Officer of the University and is responsible to the Council of the University. The position is responsible for articulating a clear strategic direction for the University, providing academic and administrative leadership,maintaining a focus on quality, engendering a collegial community amongst staff and students, fostering effective relationships with stakeholders and ensuring sound financial management and stewardship of resources.
VC - Council 17 January 2005
Senior Deputy ViceChancellor
The Senior Deputy Vice Chancellor provides senior strategic leadership to the University, with particular responsibility for development of the University strategic plan and the University’s research profile, including; research planning & policy, research training, research grants, contract research, consultancies, intellectual property policy development and commercialisation. The Senior Deputy Vice Chancellor is also the standing deputy to the Vice Chancellor and Provost of the Gold Coast Campus.
SDVC -Council
1 January 2014
Originally appointed on
20 April 2009 as Deputy Vice Chancellor (Research)
Deputy Vice Chancellor (Engagement)
The Deputy Vice Chancellor (Engagement) provides strategic leadership in: the external representation of the University and its development and advancement agenda; domestic student recruitment for undergraduate and postgraduate coursework programs; student & staff equity policy development & programs and the University’s development & alumni, marketing & communications activities and functions. The Deputy Vice Chancellor (Engagement) is also Head of Nathan and South Bank Campuses,
DVC (E) -Council
10 February 2014
Deputy Vice Chancellor (Academic)
The Deputy Vice Chancellor (Academic) provides senior strategic leadership in the following areas: Learning, teaching and student experience; student retention; graduate outcomes and student equity; online education; academic administration; University academic plan and profile; academic, strategic and operational planning for learning and teaching; strategic direction of the curriculum and academic programs; academic staffing; academic policies and quality standards.
DVC (A) -Council
1 June 2016
Academic Provost The Academic Provost provides senior strategic leadership in the following areas: Learning, teaching and student experience; student retention; graduate outcomes and student equity; online education; academic administration; University academic plan and profile; academic, strategic and operational planning for learning and teaching; strategic direction of the curriculum and academic programs; academic staffing; academic policies and quality standards.
Academic Provost –Council
10 February 2014
(24 September 2016)
Vice President (Corporate Services)
The Vice President (Corporate Services) provides strategic leadership of the corporate and administrative services that underpin the successful operation of the University and for advising the Vice Chancellor and President on policy, strategy and tactics to support and enhance the University’s mission.
VP (CS) -Council
1 January 1992
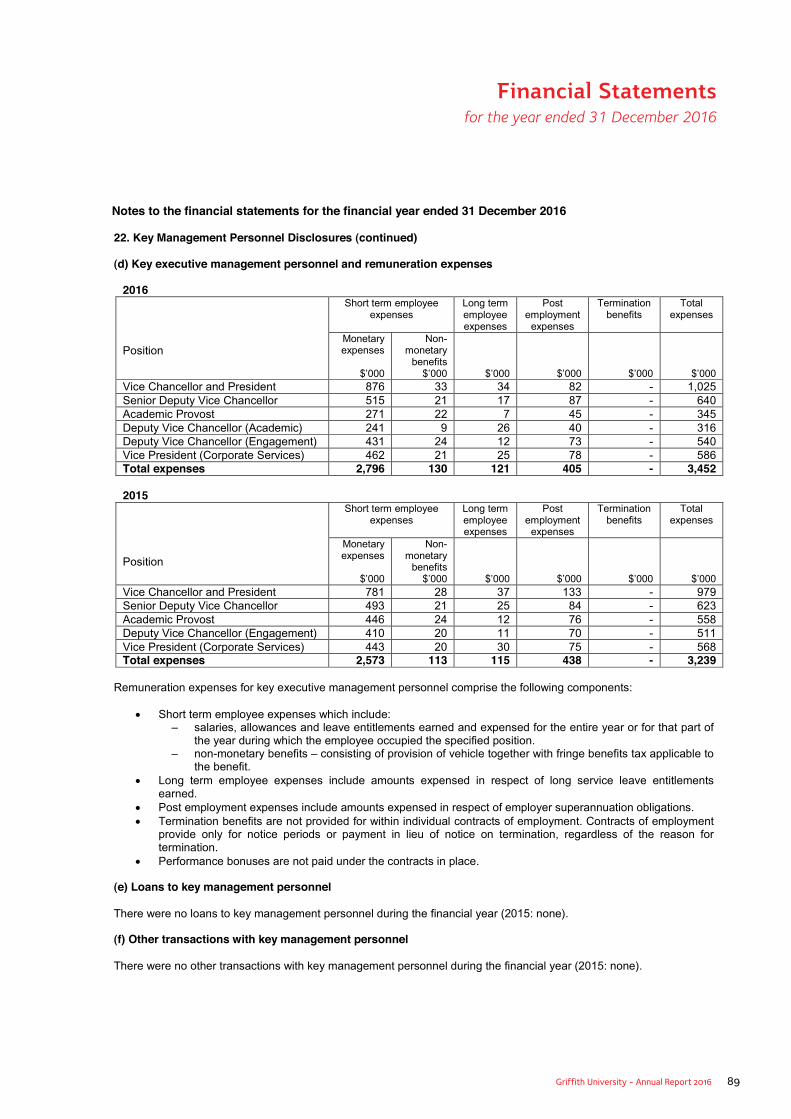
Griffith University - Annual Report 2016 89
Financial Statements for the year ended 31 December 2016
Notes to the financial statements for the financial year ended 31 December 2016
22. Key Management Personnel Disclosures (continued)
(d) Key executive management personnel and remuneration expenses
2016
Position
Short term employee expenses
Long term employee expenses
Post employment
expenses
Termination benefits
Total expenses
Monetary expenses
$’000
Non-monetary
benefits $’000 $’000 $’000 $’000 $’000
Vice Chancellor and President 876 33 34 82 - 1,025Senior Deputy Vice Chancellor 515 21 17 87 - 640Academic Provost 271 22 7 45 - 345Deputy Vice Chancellor (Academic) 241 9 26 40 - 316Deputy Vice Chancellor (Engagement) 431 24 12 73 - 540Vice President (Corporate Services) 462 21 25 78 - 586Total expenses 2,796 130 121 405 - 3,452
2015
Position
Short term employee expenses
Long term employee expenses
Post employment
expenses
Termination benefits
Total expenses
Monetary expenses
$’000
Non-monetary
benefits $’000 $’000 $’000 $’000 $’000
Vice Chancellor and President 781 28 37 133 - 979Senior Deputy Vice Chancellor 493 21 25 84 - 623Academic Provost 446 24 12 76 - 558Deputy Vice Chancellor (Engagement) 410 20 11 70 - 511Vice President (Corporate Services) 443 20 30 75 - 568Total expenses 2,573 113 115 438 - 3,239
Remuneration expenses for key executive management personnel comprise the following components:
• Short term employee expenses which include: – salaries, allowances and leave entitlements earned and expensed for the entire year or for that part of
the year during which the employee occupied the specified position.– non-monetary benefits – consisting of provision of vehicle together with fringe benefits tax applicable to
the benefit.• Long term employee expenses include amounts expensed in respect of long service leave entitlements
earned.• Post employment expenses include amounts expensed in respect of employer superannuation obligations.• Termination benefits are not provided for within individual contracts of employment. Contracts of employment
provide only for notice periods or payment in lieu of notice on termination, regardless of the reason for termination.
• Performance bonuses are not paid under the contracts in place.
(e) Loans to key management personnel
There were no loans to key management personnel during the financial year (2015: none).
(f) Other transactions with key management personnel
There were no other transactions with key management personnel during the financial year (2015: none).

90 Griffith University - Annual Report 2016
Financial Statements for the year ended 31 December 2016
Notes to the financial statements for the financial year ended 31 December 2016
2016 2015$’000 $’000
23. Remuneration of auditors
Audit of the Financial StatementsFees paid to Queensland Audit Office 220 225Total 220 225
24. Contingencies
Contingent assetsThe University has a number of outstanding insurance claims, which are currently being assessed by the University’s insurers. The University believes that it would be misleading to estimate the final amounts recoverable, if any, in respect of the outstanding claims as at 31 December 2016.
Contingent liabilitiesManagement is not aware of any contingent liabilities existing at balance date.
25. Commitments
(a) Capital commitments
Capital expenditure contracted for at the reporting date but not recognised as liabilities is as follows:
2016 2015$’000 $’000
Property, plant and equipmentWithin one year 55,377 18,282 Between one and five years 682 352Later than five years - -Total Property, plant and equipment commitments 56,059 18,634
(b) Other expenditure commitments
Commitments for expenditure in existence at the reporting date but not recognised as liabilities, payable:
Within one year 37,458 38,952Later than one year but not later than five years 420 1,279Later than five years - -Total other expenditure commitments 37,878 40,231
26. Events occurring after the reporting period
A review of events after the reporting date has not identified any issues which would materially affect the information disclosed in the Statement of Comprehensive Income and Statement of Financial Position.
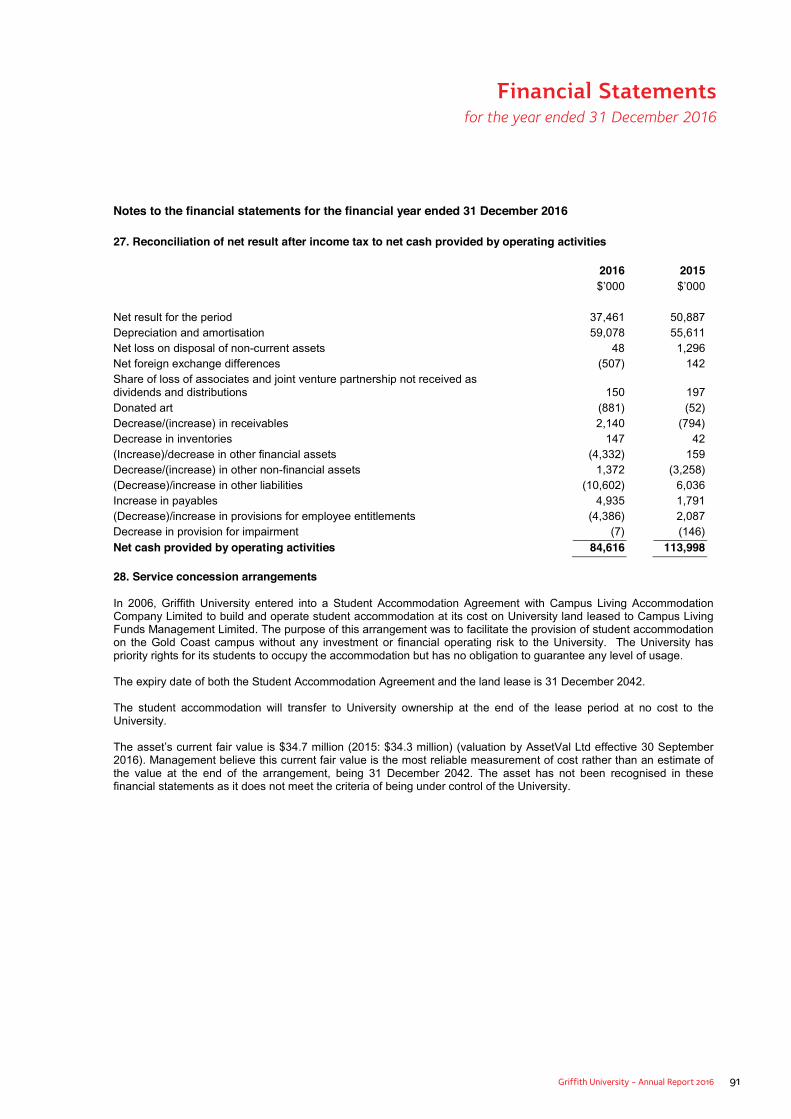
Griffith University - Annual Report 2016 91
Financial Statements for the year ended 31 December 2016
Notes to the financial statements for the financial year ended 31 December 2016
27. Reconciliation of net result after income tax to net cash provided by operating activities
2016 2015$’000 $’000
Net result for the period 37,461 50,887 Depreciation and amortisation 59,078 55,611 Net loss on disposal of non-current assets 48 1,296Net foreign exchange differences (507) 142Share of loss of associates and joint venture partnership not received as dividends and distributions 150 197Donated art (881) (52)Decrease/(increase) in receivables 2,140 (794) Decrease in inventories 147 42(Increase)/decrease in other financial assets (4,332) 159Decrease/(increase) in other non-financial assets 1,372 (3,258) (Decrease)/increase in other liabilities (10,602) 6,036 Increase in payables 4,935 1,791 (Decrease)/increase in provisions for employee entitlements (4,386) 2,087 Decrease in provision for impairment (7) (146) Net cash provided by operating activities 84,616 113,998
28. Service concession arrangements
In 2006, Griffith University entered into a Student Accommodation Agreement with Campus Living Accommodation Company Limited to build and operate student accommodation at its cost on University land leased to Campus Living Funds Management Limited. The purpose of this arrangement was to facilitate the provision of student accommodation on the Gold Coast campus without any investment or financial operating risk to the University. The University has priority rights for its students to occupy the accommodation but has no obligation to guarantee any level of usage.
The expiry date of both the Student Accommodation Agreement and the land lease is 31 December 2042.
The student accommodation will transfer to University ownership at the end of the lease period at no cost to the University.
The asset’s current fair value is $34.7 million (2015: $34.3 million) (valuation by AssetVal Ltd effective 30 September2016). Management believe this current fair value is the most reliable measurement of cost rather than an estimate of the value at the end of the arrangement, being 31 December 2042. The asset has not been recognised in these financial statements as it does not meet the criteria of being under control of the University.
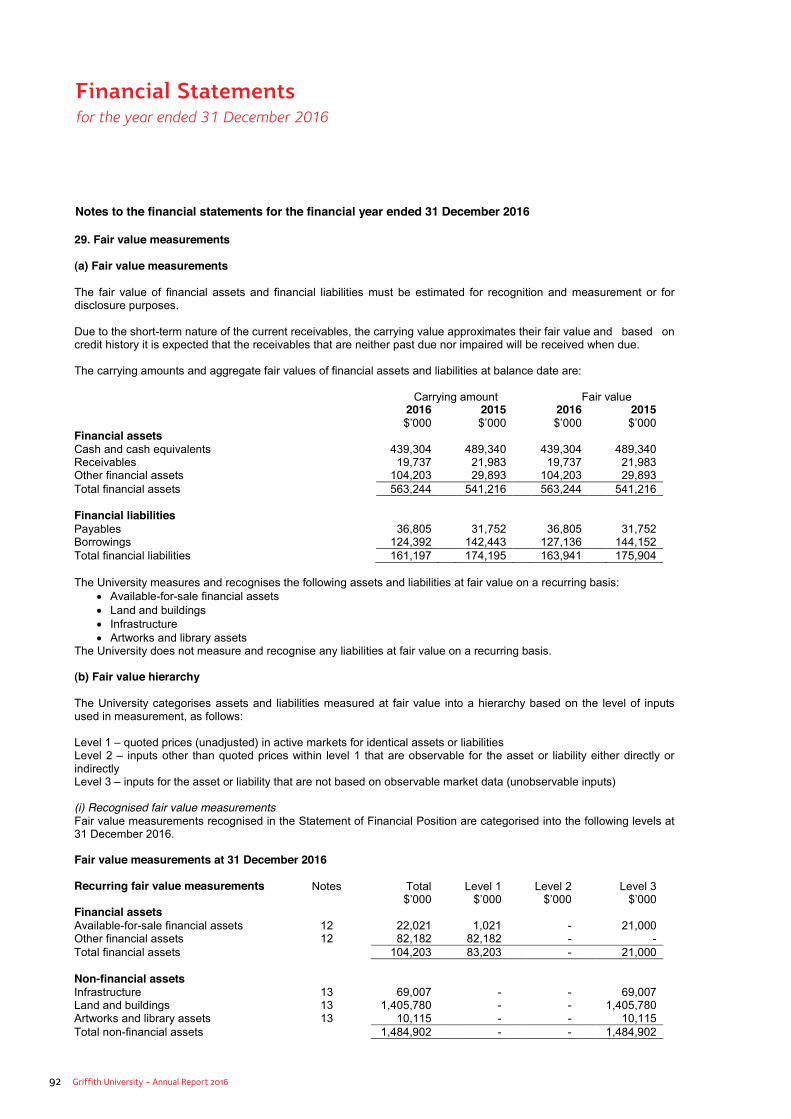
92 Griffith University - Annual Report 2016
Financial Statements for the year ended 31 December 2016
Notes to the financial statements for the financial year ended 31 December 2016
29. Fair value measurements
(a) Fair value measurements
The fair value of financial assets and financial liabilities must be estimated for recognition and measurement or for disclosure purposes.
Due to the short-term nature of the current receivables, the carrying value approximates their fair value and based on credit history it is expected that the receivables that are neither past due nor impaired will be received when due.
The carrying amounts and aggregate fair values of financial assets and liabilities at balance date are:
Carrying amount Fair value2016$’000
2015$’000
2016$’000
2015$’000
Financial assetsCash and cash equivalents 439,304 489,340 439,304 489,340Receivables 19,737 21,983 19,737 21,983Other financial assets 104,203 29,893 104,203 29,893Total financial assets 563,244 541,216 563,244 541,216
Financial liabilitiesPayables 36,805 31,752 36,805 31,752Borrowings 124,392 142,443 127,136 144,152Total financial liabilities 161,197 174,195 163,941 175,904
The University measures and recognises the following assets and liabilities at fair value on a recurring basis:• Available-for-sale financial assets• Land and buildings• Infrastructure• Artworks and library assets
The University does not measure and recognise any liabilities at fair value on a recurring basis.
(b) Fair value hierarchy
The University categorises assets and liabilities measured at fair value into a hierarchy based on the level of inputs used in measurement, as follows:
Level 1 – quoted prices (unadjusted) in active markets for identical assets or liabilitiesLevel 2 – inputs other than quoted prices within level 1 that are observable for the asset or liability either directly or indirectlyLevel 3 – inputs for the asset or liability that are not based on observable market data (unobservable inputs)
(i) Recognised fair value measurementsFair value measurements recognised in the Statement of Financial Position are categorised into the following levels at 31 December 2016.
Fair value measurements at 31 December 2016
Recurring fair value measurements
Financial assets
Notes Total$’000
Level 1$’000
Level 2$’000
Level 3$’000
Available-for-sale financial assets 12 22,021 1,021 - 21,000Other financial assets 12 82,182 82,182 - -Total financial assets 104,203 83,203 - 21,000
Non-financial assetsInfrastructure 13 69,007 - - 69,007Land and buildings 13 1,405,780 - - 1,405,780Artworks and library assets 13 10,115 - - 10,115Total non-financial assets 1,484,902 - - 1,484,902
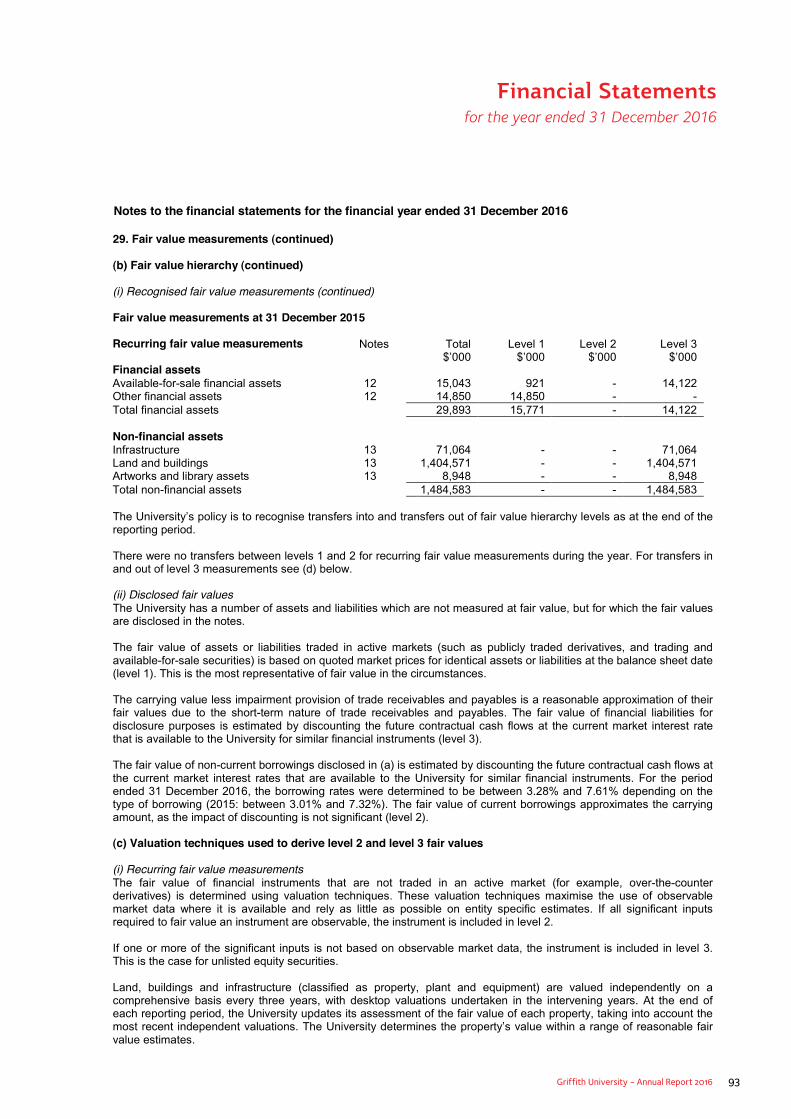
Griffith University - Annual Report 2016 93
Financial Statements for the year ended 31 December 2016
Notes to the financial statements for the financial year ended 31 December 2016
29. Fair value measurements (continued)
(b) Fair value hierarchy (continued)
(i) Recognised fair value measurements (continued)
Fair value measurements at 31 December 2015
Recurring fair value measurements
Financial assets
Notes Total$’000
Level 1$’000
Level 2$’000
Level 3$’000
Available-for-sale financial assets 12 15,043 921 - 14,122Other financial assets 12 14,850 14,850 - -Total financial assets 29,893 15,771 - 14,122
Non-financial assetsInfrastructure 13 71,064 - - 71,064Land and buildings 13 1,404,571 - - 1,404,571Artworks and library assets 13 8,948 - - 8,948Total non-financial assets 1,484,583 - - 1,484,583
The University’s policy is to recognise transfers into and transfers out of fair value hierarchy levels as at the end of the reporting period.
There were no transfers between levels 1 and 2 for recurring fair value measurements during the year. For transfers in and out of level 3 measurements see (d) below.
(ii) Disclosed fair valuesThe University has a number of assets and liabilities which are not measured at fair value, but for which the fair values are disclosed in the notes.
The fair value of assets or liabilities traded in active markets (such as publicly traded derivatives, and trading and available-for-sale securities) is based on quoted market prices for identical assets or liabilities at the balance sheet date (level 1). This is the most representative of fair value in the circumstances.
The carrying value less impairment provision of trade receivables and payables is a reasonable approximation of their fair values due to the short-term nature of trade receivables and payables. The fair value of financial liabilities for disclosure purposes is estimated by discounting the future contractual cash flows at the current market interest rate that is available to the University for similar financial instruments (level 3).
The fair value of non-current borrowings disclosed in (a) is estimated by discounting the future contractual cash flows at the current market interest rates that are available to the University for similar financial instruments. For the period ended 31 December 2016, the borrowing rates were determined to be between 3.28% and 7.61% depending on the type of borrowing (2015: between 3.01% and 7.32%). The fair value of current borrowings approximates the carrying amount, as the impact of discounting is not significant (level 2).
(c) Valuation techniques used to derive level 2 and level 3 fair values
(i) Recurring fair value measurementsThe fair value of financial instruments that are not traded in an active market (for example, over-the-counter derivatives) is determined using valuation techniques. These valuation techniques maximise the use of observable market data where it is available and rely as little as possible on entity specific estimates. If all significant inputs required to fair value an instrument are observable, the instrument is included in level 2.
If one or more of the significant inputs is not based on observable market data, the instrument is included in level 3. This is the case for unlisted equity securities.
Land, buildings and infrastructure (classified as property, plant and equipment) are valued independently on a comprehensive basis every three years, with desktop valuations undertaken in the intervening years. At the end of each reporting period, the University updates its assessment of the fair value of each property, taking into account the most recent independent valuations. The University determines the property’s value within a range of reasonable fair value estimates.
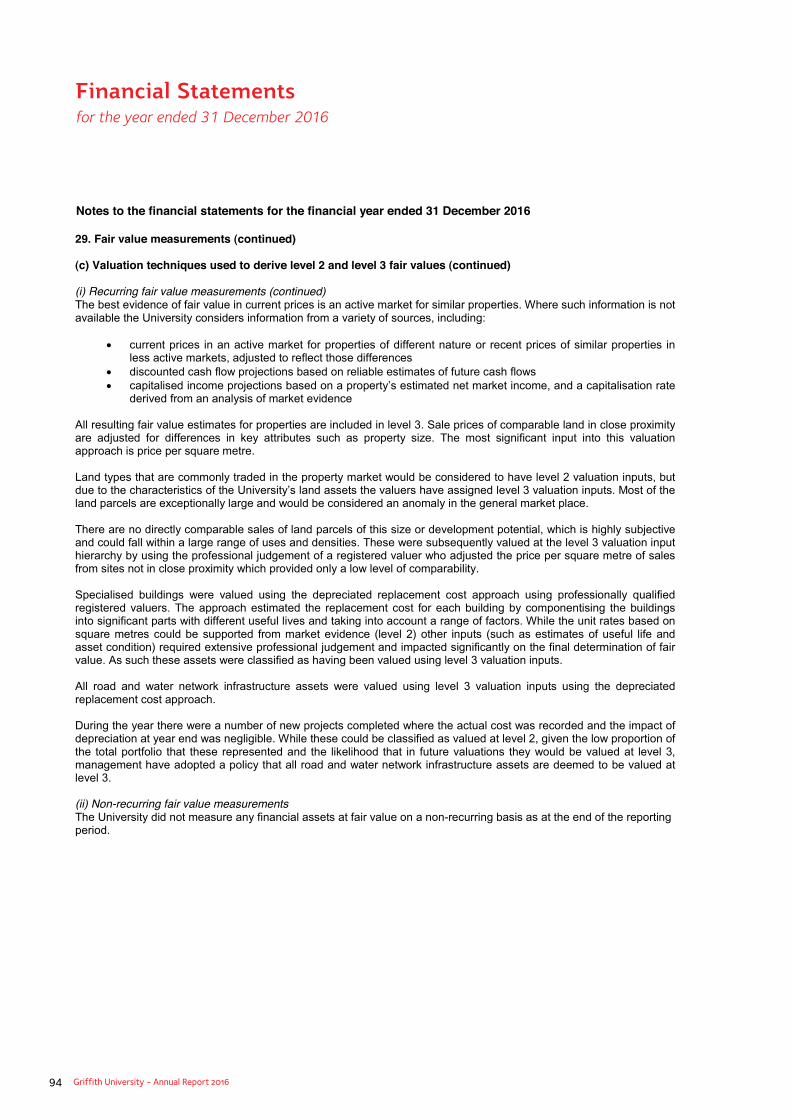
94 Griffith University - Annual Report 2016
Financial Statements for the year ended 31 December 2016
Notes to the financial statements for the financial year ended 31 December 2016
29. Fair value measurements (continued)
(c) Valuation techniques used to derive level 2 and level 3 fair values (continued)
(i) Recurring fair value measurements (continued)The best evidence of fair value in current prices is an active market for similar properties. Where such information is not available the University considers information from a variety of sources, including:
• current prices in an active market for properties of different nature or recent prices of similar properties in less active markets, adjusted to reflect those differences
• discounted cash flow projections based on reliable estimates of future cash flows• capitalised income projections based on a property’s estimated net market income, and a capitalisation rate
derived from an analysis of market evidence
All resulting fair value estimates for properties are included in level 3. Sale prices of comparable land in close proximity are adjusted for differences in key attributes such as property size. The most significant input into this valuation approach is price per square metre.
Land types that are commonly traded in the property market would be considered to have level 2 valuation inputs, but due to the characteristics of the University’s land assets the valuers have assigned level 3 valuation inputs. Most of the land parcels are exceptionally large and would be considered an anomaly in the general market place.
There are no directly comparable sales of land parcels of this size or development potential, which is highly subjective and could fall within a large range of uses and densities. These were subsequently valued at the level 3 valuation input hierarchy by using the professional judgement of a registered valuer who adjusted the price per square metre of sales from sites not in close proximity which provided only a low level of comparability.
Specialised buildings were valued using the depreciated replacement cost approach using professionally qualified registered valuers. The approach estimated the replacement cost for each building by componentising the buildings into significant parts with different useful lives and taking into account a range of factors. While the unit rates based on square metres could be supported from market evidence (level 2) other inputs (such as estimates of useful life and asset condition) required extensive professional judgement and impacted significantly on the final determination of fair value. As such these assets were classified as having been valued using level 3 valuation inputs.
All road and water network infrastructure assets were valued using level 3 valuation inputs using the depreciated replacement cost approach.
During the year there were a number of new projects completed where the actual cost was recorded and the impact of depreciation at year end was negligible. While these could be classified as valued at level 2, given the low proportion of the total portfolio that these represented and the likelihood that in future valuations they would be valued at level 3,management have adopted a policy that all road and water network infrastructure assets are deemed to be valued at level 3.
(ii) Non-recurring fair value measurementsThe University did not measure any financial assets at fair value on a non-recurring basis as at the end of the reporting period.
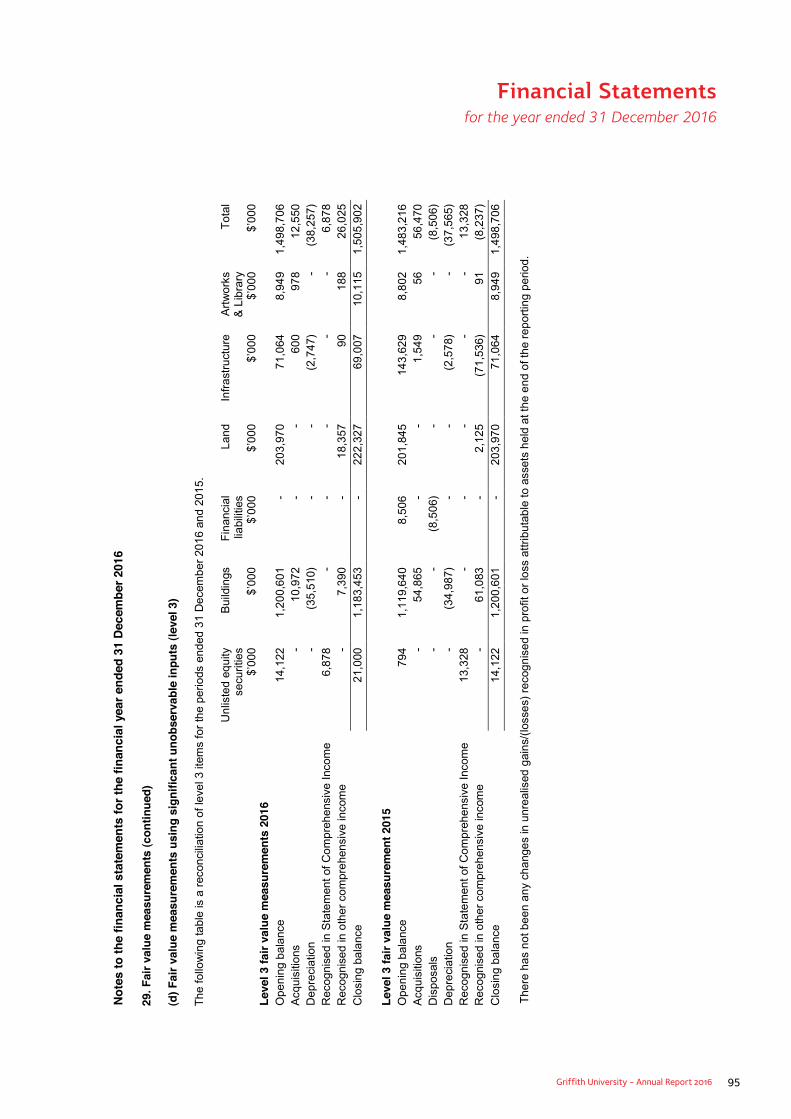
Griffith University - Annual Report 2016 95
Financial Statements for the year ended 31 December 2016
Note
s to
the
finan
cial
sta
tem
ents
for t
he fi
nanc
ial y
ear e
nded
31
Dece
mbe
r 201
6
29. F
air v
alue
mea
sure
men
ts (c
ontin
ued)
(d) F
air v
alue
mea
sure
men
tsus
ing
sign
ifica
nt u
nobs
erva
ble
inpu
ts (l
evel
3)
The
follo
win
g ta
ble
is a
rec
onci
liatio
n of
leve
l 3 it
ems
for
the
perio
ds e
nded
31
Dec
embe
r 20
16an
d 20
15.
Unl
iste
d eq
uity
secu
ritie
s$’
000
Bui
ldin
gs
$’00
0
Fin
anci
allia
bilit
ies
$’00
0
Land
$’00
0
Infr
astr
uctu
re
$’00
0
Art
wor
ks
& L
ibra
ry$’
000
Tot
al
$’00
0Le
vel 3
fair
valu
e m
easu
rem
ents
201
6O
peni
ng b
alan
ce14
,122
1,20
0,60
1-
203,
970
71,0
648,
949
1,49
8,70
6A
cqui
sitio
ns-
10,9
72-
-60
097
812
,550
Dep
reci
atio
n -
(35,
510)
--
(2,7
47)
-(3
8,25
7)R
ecog
nise
d in
Sta
tem
ent o
f Com
preh
ensi
ve In
com
e6,
878
--
--
-6,
878
Rec
ogni
sed
in o
ther
com
preh
ensi
ve in
com
e-
7,39
0-
18,3
5790
188
26,0
25C
losi
ng b
alan
ce21
,000
1,18
3,45
3-
222,
327
69,0
0710
,115
1,50
5,90
2
Leve
l 3 fa
ir va
lue
mea
sure
men
t 201
5O
peni
ng b
alan
ce79
41,
119,
640
8,50
620
1,84
5 14
3,62
9 8,
802
1,48
3,21
6 A
cqui
sitio
ns-
54,8
65-
-1,
549
5656
,470
D
ispo
sals
--
(8,5
06)
--
-(8
,506
)D
epre
ciat
ion
-(3
4,98
7)-
-(2
,578
)-
(37,
565)
Rec
ogni
sed
in S
tate
men
t of C
ompr
ehen
sive
Inco
me
13,3
28-
--
--
13,3
28R
ecog
nise
d in
oth
er c
ompr
ehen
sive
inco
me
-61
,083
-
2,12
5 (7
1,53
6)91
(8,2
37)
Clo
sing
bal
ance
14,1
22
1,20
0,60
1 -
203,
970
71,0
64
8,94
9 1,
498,
706
The
re h
as n
ot b
een
any
chan
ges
in u
nrea
lised
gai
ns/(
loss
es)
reco
gnis
ed in
pro
fit o
r lo
ss a
ttrib
utab
le to
ass
ets
held
at t
he e
nd o
f the
rep
ortin
g pe
riod.

96 Griffith University - Annual Report 2016
Financial Statements for the year ended 31 December 2016
Notes to the financial statements for the financial year ended 31 December 2016
29. Fair value measurements (continued)
(d) Fair value measurements using significant unobservable inputs (level 3) (continued)
(i) Valuation inputs and relationships to fair valueThe following table summarises the quantitative information about the significant unobservable inputs used in level 3 fair value measurements. See (c) for the valuation techniques adopted.
Description Fair value at 31 December
2016$’000
Unobservable inputs* Range of inputs (probability
weighted average)
Relationship of unobservable inputs to fair value
Lower Upper Lower $’000 Upper $’000Buildings 1,183,453 Replacement cost
rateAsset condition
(2.50)% 2.50% (29,586) 29,586
Land 222,327 Price per square metre
(2.50)% 2.50% (5,558) 5,558
Infrastructure 69,007 Unit cost rateAsset condition
(2.50)% 2.50% (1,725) 1,725
* There were no significant inter-relationships between unobservable inputs that materially affect fair value.
(ii) Valuation processesThe University engages external, independent and qualified valuers to determine the fair value of the University’s land,buildings and infrastructure on a regular basis. An annual assessment is undertaken to determine whether the carrying amount of the assets is materially different from the fair value. If any variation is considered material a revaluation is undertaken either by comprehensive revaluation or by applying an interim revaluation using appropriate indices.
The main level 3 inputs used are derived and evaluated as follows:
Cost for land restricted in use (non-saleable) – estimated cost to replace the existing land if the University had to acquire it on the open market in competition with other market participants. Due to the restricted nature and unique characteristics of this land there was insufficient market evidence of directly comparable sales. Reference was made to sales of land with a limited level of comparability at distant locations and adjusted by the valuer using professional judgement to take account of the differing characteristics. These were evaluated for reasonableness against the price per square metre for other restricted in use land held by the University.
Replacement cost rate – given the specialised nature of the assets and limited market based evidence of value, depreciated replacement cost approach has been adopted to estimate the fair value of buildings. The replacement cost involves estimating a price per square metre replacement cost. This replacement cost rate is determined having regard to recent construction data, consideration of building size, material, type, and structure to derive the unit rate, and Rawlinson's cost data and cost indices for different regions in Queensland. The Rawlinson's cost data selected is then subject to review by engineers and valuers taking into account site specifics.
Unit cost rate – Unit rates are developed by summing each component which goes into producing a unit (be it metres, square metres, tonnes, etc.) of an infrastructure asset. The major components of any asset are the raw materials, plant, labour and intangible overheads. The raw cost of material, as well as plant and labour hire rates, are established either through communicating directly with suppliers and obtaining quoted prices, by using cost guides such as the Rawlinsons’ Construction Handbook and through reviewing prices supplied by the University. Intangibles are estimated using industry standards as a starting point which are then tailored to suit the University. These unit costs are then applied to known measurements of the asset, or asset subcomponent, to produce a replacement cost, which is then depreciated to estimate the fair value.
Griffith University - Annual Report 2016 97
Financial Statements for the year ended 31 December 2016
Notes to the financial statements for the financial year ended 31 December 2016
29. Fair value measurements (continued)
(d) Fair value measurements using significant unobservable inputs (level 3) (continued)
(ii) Valuation processes (continued)Asset condition – asset condition assessments are used in estimating the remaining useful lives of buildings and infrastructure. Where the condition was able to be determined from the valuer’s inspection, or where detailed condition reports have been prepared, the remaining life is dependent on the recorded condition, using a sliding scale. Where detailed condition is not available but the age of the asset is known, the remaining life is estimated using the current age of the assets, adjusted for obsolescence after visual inspection. Where neither the condition nor the age are known, assumptions are made as to the age and condition of the assets in collaboration with the University, in order to obtain a depreciated replacement cost which reasonably reflects the value of the asset.
The nature of road and water network infrastructure is that there is a very large number of assets which comprise the network and as a result it is not considered reasonable and cost effective to inspect every asset for the purposes of completing a valuation. As a consequence reliance is placed on the accuracy of data held in the asset management system and its associated internal controls. This includes regular planned inspections and updates to the system following maintenance activities and renewal treatments. Likewise, especially for water network infrastructure, a large portion of the portfolio is located underground and may only be inspected on an irregular basis.
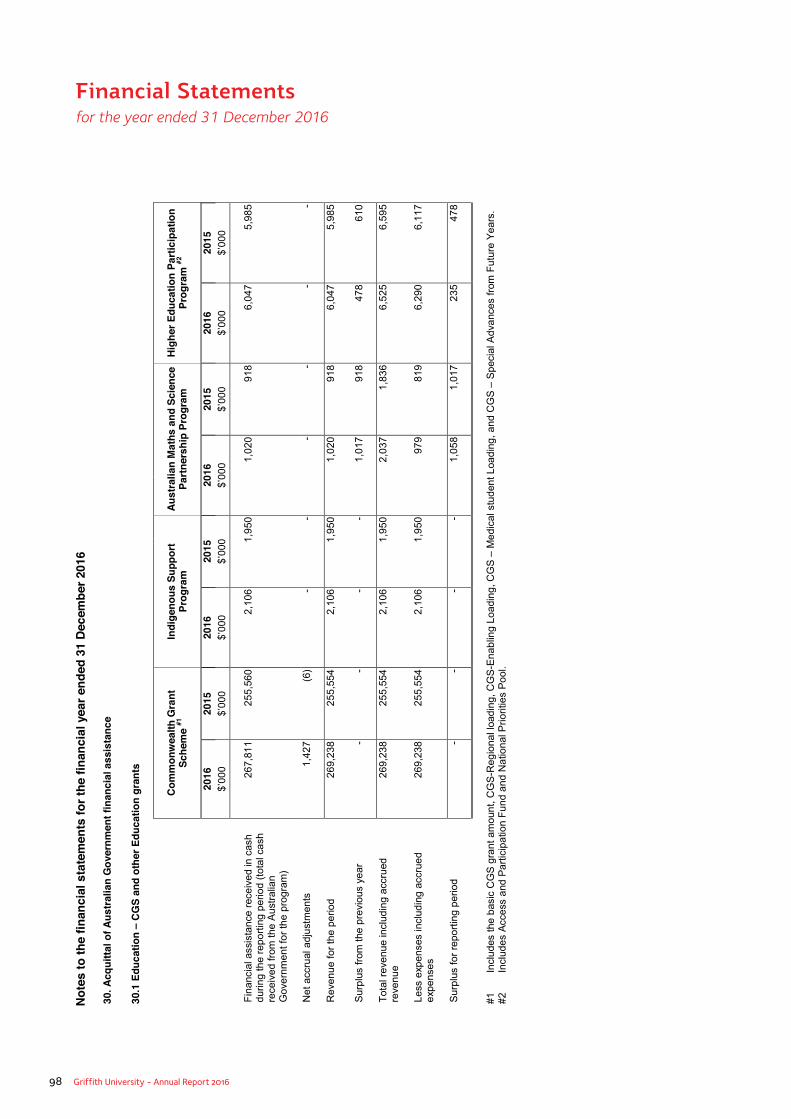
98 Griffith University - Annual Report 2016
Financial Statements for the year ended 31 December 2016
Note
s to
the
finan
cial
sta
tem
ents
for t
he fi
nanc
ial y
ear e
nded
31
Dec
embe
r 201
6
30. A
cqui
ttal o
f Aus
tralia
n G
over
nmen
t fin
anci
al a
ssis
tanc
e
30.1
Edu
catio
n–
CG
S an
d ot
her E
duca
tion
gran
ts
Com
mon
wea
lth G
rant
Sc
hem
e #1
Indi
geno
us S
uppo
rt Pr
ogra
mAu
stra
lian
Mat
hs a
nd S
cien
ce
Partn
ersh
ip P
rogr
amHi
gher
Edu
catio
nPa
rtici
patio
n Pr
ogra
m#2
2016
2015
2016
2015
2016
2015
2016
2015
$’00
0$’
000
$’00
0$’
000
$’00
0$’
000
$’00
0$’
000
Fin
anci
al a
ssis
tanc
e re
ceiv
ed in
cas
h du
ring
the
repo
rtin
g pe
riod
(tot
al c
ash
rece
ived
from
the
Aus
tral
ian
Gov
ernm
ent f
or th
e pr
ogra
m)
267,
811
255,
560
2,10
61,
950
1,02
091
86,
047
5,98
5
Net
acc
rual
adj
ustm
ents
1,42
7(6
)-
--
--
-
Rev
enue
for
the
perio
d26
9,23
825
5,55
4 2,
106
1,95
0 1,
020
918
6,04
75,
985
Sur
plus
from
the
prev
ious
yea
r-
--
-1,
017
918
478
610
Tot
al r
even
ue in
clud
ing
accr
ued
reve
nue
269,
238
255,
554
2,10
61,
950
2,03
71,
836
6,52
56,
595
Less
exp
ense
s in
clud
ing
accr
ued
expe
nses
269,
238
255,
554
2,10
61,
950
979
819
6,29
06,
117
Sur
plus
for
repo
rtin
g pe
riod
--
--
1,05
81,
017
235
478
#1In
clud
es th
e ba
sic
CG
S g
rant
am
ount
, CG
S-R
egio
nal l
oadi
ng, C
GS
-Ena
blin
g Lo
adin
g, C
GS
–M
edic
al s
tude
ntLo
adin
g,an
d C
GS
–S
peci
al A
dvan
ces
from
Fut
ure
Yea
rs.
#2
In
clud
es A
cces
s an
d P
artic
ipat
ion
Fun
d an
d N
atio
nal P
riorit
ies
Poo
l.
Not
es to
the
finan
cial
sta
tem
ents
for t
he fi
nanc
ial y
ear e
nded
31
Dece
mbe
r 201
6
30. A
cqui
ttal o
f Aus
tralia
n G
over
nmen
t fin
anci
al a
ssis
tanc
e
30.1
Edu
catio
n–
CG
S an
d ot
her E
duca
tion
gran
ts
Com
mon
wea
lth G
rant
Sc
hem
e #1
Indi
geno
us S
uppo
rt Pr
ogra
mAu
stra
lian
Mat
hs a
nd S
cien
ce
Partn
ersh
ip P
rogr
amHi
gher
Edu
catio
nPa
rtici
patio
n Pr
ogra
m#2
2016
2015
2016
2015
2016
2015
2016
2015
$’00
0$’
000
$’00
0$’
000
$’00
0$’
000
$’00
0$’
000
Fin
anci
al a
ssis
tanc
e re
ceiv
ed in
cas
h du
ring
the
repo
rtin
g pe
riod
(tot
al c
ash
rece
ived
from
the
Aus
tral
ian
Gov
ernm
ent f
or th
e pr
ogra
m)
267,
811
255,
560
2,10
61,
950
1,02
091
86,
047
5,98
5
Net
acc
rual
adj
ustm
ents
1,42
7(6
)-
--
--
-
Rev
enue
for
the
perio
d26
9,23
825
5,55
4 2,
106
1,95
0 1,
020
918
6,04
75,
985
Sur
plus
from
the
prev
ious
yea
r-
--
-1,
017
918
478
610
Tot
al r
even
ue in
clud
ing
accr
ued
reve
nue
269,
238
255,
554
2,10
61,
950
2,03
71,
836
6,52
56,
595
Less
exp
ense
s in
clud
ing
accr
ued
expe
nses
269,
238
255,
554
2,10
61,
950
979
819
6,29
06,
117
Sur
plus
for
repo
rtin
g pe
riod
--
--
1,05
81,
017
235
478
#1In
clud
es th
e ba
sic
CG
S g
rant
am
ount
, CG
S-R
egio
nal l
oadi
ng, C
GS
-Ena
blin
g Lo
adin
g, C
GS
–M
edic
al s
tude
ntLo
adin
g,an
d C
GS
–S
peci
al A
dvan
ces
from
Fut
ure
Yea
rs.
#2
In
clud
es A
cces
s an
d P
artic
ipat
ion
Fun
d an
d N
atio
nal P
riorit
ies
Poo
l.

Griffith University - Annual Report 2016 99
Financial Statements for the year ended 31 December 2016
Note
s to
the
finan
cial
sta
tem
ents
for t
he fi
nanc
ial y
ear e
nded
31
Dece
mbe
r 201
6
30. A
cqui
ttal o
f Aus
tralia
n G
over
nmen
t fin
anci
al a
ssis
tanc
e (c
ontin
ued)
30.1
Edu
catio
n–
CGS
and
othe
r Edu
catio
n gr
ants
(con
tinue
d) Dis
abili
ty S
uppo
rtPr
ogra
mPr
omot
ion
of E
xcel
lenc
e in
Lear
ning
and
Tea
chin
gTo
tal
2016
2015
2016
2015
2016
2015
$’00
0$’
000
$’00
0$’
000
$’00
0$’
000
Fin
anci
al a
ssis
tanc
e re
ceiv
ed in
cas
h du
ring
the
repo
rtin
g pe
riod
(tot
al c
ash
rece
ived
from
the
Aus
tral
ian
Gov
ernm
ent f
or th
e pr
ogra
ms)
251
223
323
1,20
1 27
7,55
826
5,83
7
Net
acc
rual
adj
ustm
ents
--
--
1,42
7(6
)
Rev
enue
for
the
perio
d
25
122
332
31,
201
278,
985
265,
831
(Def
icit)
/sur
plus
from
the
prev
ious
yea
r(1
49)
-1,
122
577
2,46
82,
105
Tot
al r
even
ue in
clud
ing
accr
ued
reve
nue
102
223
1,44
51,
778
281,
453
267,
936
Less
exp
ense
s in
clud
ing
accr
ued
expe
nses
281
372
913
656
279,
807
265,
468
(Def
icit)
/sur
plus
for
repo
rtin
g pe
riod
(179
)(1
49)
532
1,12
2 1,
646
2,46
8
Note
s to
the
finan
cial
sta
tem
ents
for t
he fi
nanc
ial y
ear e
nded
31
Dece
mbe
r 201
6
30. A
cqui
ttal o
f Aus
tralia
n G
over
nmen
t fin
anci
al a
ssis
tanc
e (c
ontin
ued)
30.1
Edu
catio
n–
CGS
and
othe
r Edu
catio
n gr
ants
(con
tinue
d) Disa
bilit
y Su
ppor
tPr
ogra
mPr
omot
ion
of E
xcel
lenc
e in
Lear
ning
and
Tea
chin
gTo
tal
2016
2015
2016
2015
2016
2015
$’00
0$’
000
$’00
0$’
000
$’00
0$’
000
Fin
anci
al a
ssis
tanc
e re
ceiv
ed in
cas
h du
ring
the
repo
rtin
g pe
riod
(tot
al c
ash
rece
ived
from
the
Aus
tral
ian
Gov
ernm
ent f
or th
e pr
ogra
ms)
251
223
323
1,20
1 27
7,55
826
5,83
7
Net
acc
rual
adj
ustm
ents
--
--
1,42
7(6
)
Rev
enue
for
the
perio
d
25
122
332
31,
201
278,
985
265,
831
(Def
icit)
/sur
plus
from
the
prev
ious
yea
r(1
49)
-1,
122
577
2,46
82,
105
Tot
al r
even
ue in
clud
ing
accr
ued
reve
nue
102
223
1,44
51,
778
281,
453
267,
936
Less
exp
ense
s in
clud
ing
accr
ued
expe
nses
281
372
913
656
279,
807
265,
468
(Def
icit)
/sur
plus
for
repo
rtin
g pe
riod
(179
)(1
49)
532
1,12
2 1,
646
2,46
8
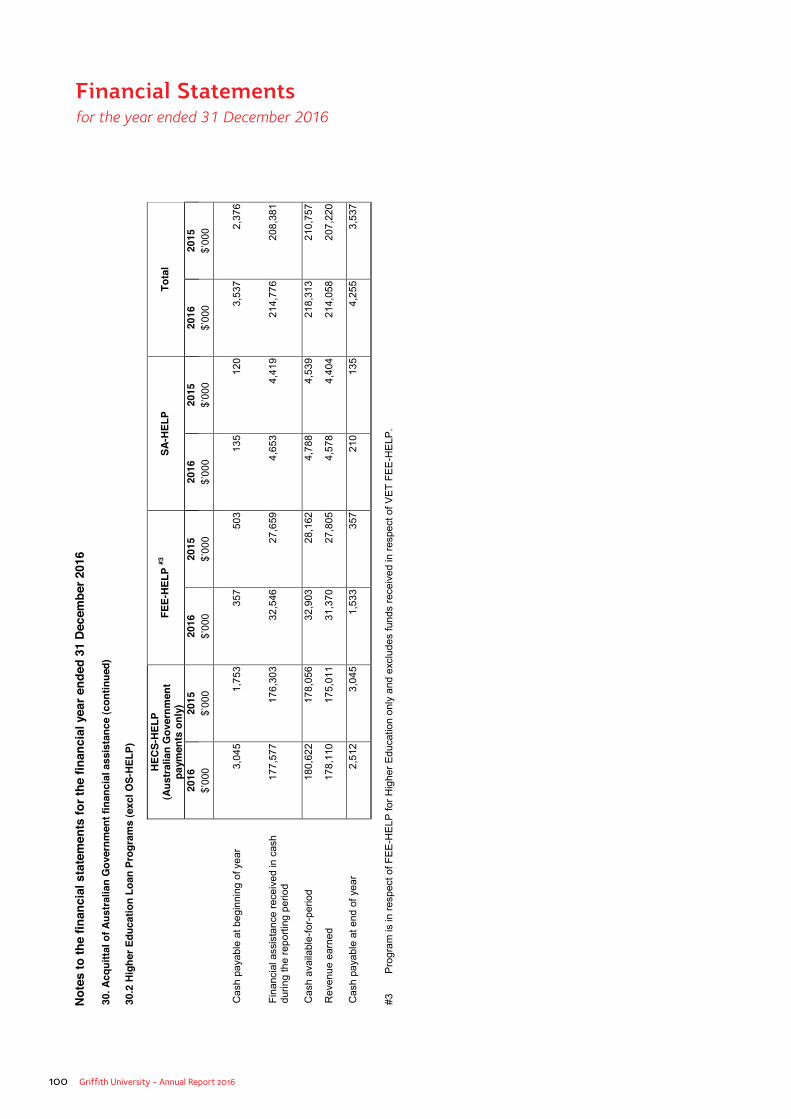
100 Griffith University - Annual Report 2016
Financial Statements for the year ended 31 December 2016
Note
s to
the
finan
cial
sta
tem
ents
for t
he fi
nanc
ial y
ear e
nded
31
Dece
mbe
r 201
6
30. A
cqui
ttal o
f Aus
tralia
n G
over
nmen
t fin
anci
al a
ssis
tanc
e (c
ontin
ued)
30.2
Hig
her E
duca
tion
Loan
Pro
gram
s (e
xcl O
S-H
ELP)
HECS
-HEL
P(A
ustr
alia
n G
over
nmen
t pa
ymen
ts o
nly)
FEE-
HELP
#3SA
-HEL
PTo
tal
2016
2015
2016
2015
2016
2015
2016
2015
$’00
0$’
000
$’00
0$’
000
$’00
0$’
000
$’00
0$’
000
Cas
h pa
yabl
e at
beg
inni
ng o
f yea
r3,
045
1,75
335
750
313
512
03,
537
2,37
6
Fin
anci
al a
ssis
tanc
e re
ceiv
ed in
cas
h du
ring
the
repo
rtin
g pe
riod
177,
577
176,
303
32,5
4627
,659
4,65
34,
419
214,
776
208,
381
Cas
h av
aila
ble-
for-
perio
d
18
0,62
217
8,05
632
,903
28,1
624,
788
4,53
921
8,31
321
0,75
7
Rev
enue
ear
ned
178,
110
175,
011
31,3
7027
,805
4,57
84,
404
214,
058
207,
220
Cas
h pa
yabl
e at
end
of y
ear
2,51
23,
045
1,53
335
721
013
54,
255
3,53
7
#3
P
rogr
am is
in r
espe
ct o
f FE
E-H
ELP
for
Hig
her
Edu
catio
n on
ly a
nd e
xclu
des
fund
s re
ceiv
ed in
res
pect
of V
ET
FE
E-H
ELP
.
Not
es to
the
finan
cial
sta
tem
ents
for t
he fi
nanc
ial y
ear e
nded
31
Dece
mbe
r 201
6
30. A
cqui
ttal o
f Aus
tralia
n G
over
nmen
t fin
anci
al a
ssis
tanc
e (c
ontin
ued)
30.2
Hig
her E
duca
tion
Loan
Pro
gram
s (e
xcl O
S-HE
LP)
HEC
S-HE
LP(A
ustra
lian
Gov
ernm
ent
paym
ents
onl
y)FE
E-HE
LP#3
SA-H
ELP
Tota
l
2016
2015
2016
2015
2016
2015
2016
2015
$’00
0$’
000
$’00
0$’
000
$’00
0$’
000
$’00
0$’
000
Cas
h pa
yabl
e at
beg
inni
ng o
f yea
r3,
045
1,75
335
750
313
512
03,
537
2,37
6
Fin
anci
al a
ssis
tanc
e re
ceiv
ed in
cas
h du
ring
the
repo
rtin
g pe
riod
177,
577
176,
303
32,5
4627
,659
4,65
34,
419
214,
776
208,
381
Cas
h av
aila
ble-
for-
perio
d
18
0,62
217
8,05
632
,903
28,1
624,
788
4,53
921
8,31
321
0,75
7
Rev
enue
ear
ned
178,
110
175,
011
31,3
7027
,805
4,57
84,
404
214,
058
207,
220
Cas
h pa
yabl
e at
end
of y
ear
2,51
23,
045
1,53
335
721
013
54,
255
3,53
7
#3
P
rogr
am is
in r
espe
ct o
f FE
E-H
ELP
for
Hig
her
Edu
catio
n on
ly a
nd e
xclu
des
fund
s re
ceiv
ed in
res
pect
of V
ET
FE
E-H
ELP
.
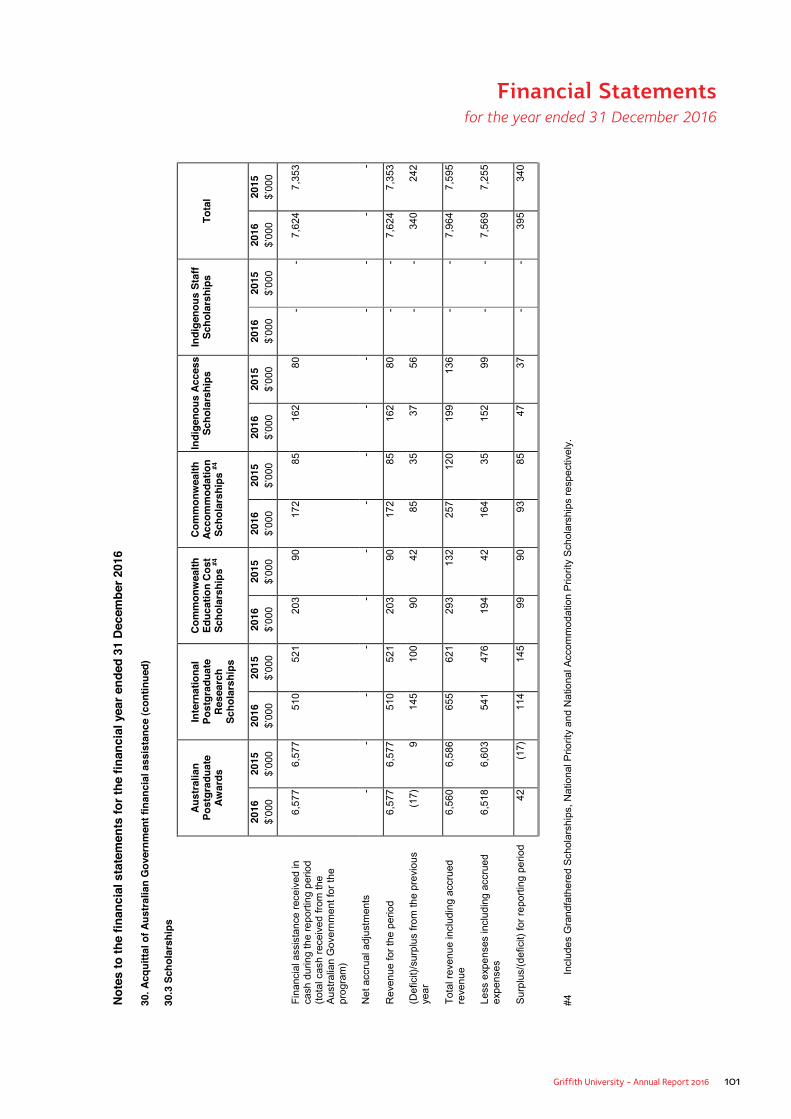
Griffith University - Annual Report 2016 101
Financial Statements for the year ended 31 December 2016
Note
s to
the
finan
cial
sta
tem
ents
for t
he fi
nanc
ial y
ear e
nded
31
Dec
embe
r 201
6
30.A
cqui
ttal o
f Aus
tralia
n G
over
nmen
t fin
anci
al a
ssis
tanc
e (c
ontin
ued)
30.3
Sch
olar
ship
s
Aust
ralia
n Po
stgr
adua
te
Awar
ds
Inte
rnat
iona
l Po
stgr
adua
te
Res
earc
h Sc
hola
rshi
ps
Com
mon
wea
lth
Educ
atio
n Co
st
Scho
lars
hips
#4
Com
mon
wea
lth
Acco
mm
odat
ion
Scho
lars
hips
#4
Indi
geno
us A
cces
s Sc
hola
rshi
psIn
dige
nous
Sta
ff Sc
hola
rshi
psTo
tal
2016
2015
2016
2015
2016
2015
2016
2015
2016
2015
2016
2015
2016
2015
$’00
0$’
000
$’00
0$’
000
$’00
0$’
000
$’00
0$’
000
$’00
0$’
000
$’00
0$’
000
$’00
0$’
000
Fin
anci
al a
ssis
tanc
e re
ceiv
ed in
ca
sh d
urin
g th
e re
port
ing
perio
d (t
otal
cas
h re
ceiv
ed fr
om th
e A
ustr
alia
n G
over
nmen
t for
the
prog
ram
)
6,57
76,
577
510
521
203
9017
285
162
80-
-7,
624
7,35
3
Net
acc
rual
adj
ustm
ents
--
--
--
--
--
--
--
Rev
enue
for
the
perio
d6,
577
6,57
7 51
052
120
390
172
8516
280
--
7,62
47,
353
(Def
icit)
/sur
plus
from
the
prev
ious
ye
ar(1
7)9
145
100
9042
8535
3756
--
340
242
Tot
al r
even
ue in
clud
ing
accr
ued
reve
nue
6,56
06,
586
655
621
293
132
257
120
199
136
--
7,96
47,
595
Less
exp
ense
s in
clud
ing
accr
ued
expe
nses
6,51
86,
603
541
476
194
4216
435
152
99-
-7,
569
7,25
5
Sur
plus
/(de
ficit)
for
repo
rtin
g pe
riod
42(1
7)
114
145
9990
9385
4737
--
395
340
#4
In
clud
es G
rand
fath
ered
Sch
olar
ship
s, N
atio
nal P
riorit
y an
d N
atio
nal A
ccom
mod
atio
n P
riorit
y S
chol
arsh
ips
resp
ectiv
ely.
Note
s to
the
finan
cial
sta
tem
ents
for t
he fi
nanc
ial y
ear e
nded
31
Dece
mbe
r 201
6
30.A
cqui
ttal o
f Aus
tralia
n G
over
nmen
t fin
anci
al a
ssis
tanc
e (c
ontin
ued)
30.3
Sch
olar
ship
s
Aust
ralia
n Po
stgr
adua
te
Awar
ds
Inte
rnat
iona
l Po
stgr
adua
te
Rese
arch
Sc
hola
rshi
ps
Com
mon
wea
lth
Educ
atio
n Co
st
Scho
lars
hips
#4
Com
mon
wea
lth
Acco
mm
odat
ion
Scho
lars
hips
#4
Indi
geno
us A
cces
s Sc
hola
rshi
psIn
dige
nous
Sta
ff Sc
hola
rshi
psTo
tal
2016
2015
2016
2015
2016
2015
2016
2015
2016
2015
2016
2015
2016
2015
$’00
0$’
000
$’00
0$’
000
$’00
0$’
000
$’00
0$’
000
$’00
0$’
000
$’00
0$’
000
$’00
0$’
000
Fin
anci
al a
ssis
tanc
e re
ceiv
ed in
ca
sh d
urin
g th
e re
port
ing
perio
d (t
otal
cas
h re
ceiv
ed fr
om th
e A
ustr
alia
n G
over
nmen
t for
the
prog
ram
)
6,57
76,
577
510
521
203
9017
285
162
80-
-7,
624
7,35
3
Net
acc
rual
adj
ustm
ents
--
--
--
--
--
--
--
Rev
enue
for
the
perio
d6,
577
6,57
7 51
052
120
390
172
8516
280
--
7,62
47,
353
(Def
icit)
/sur
plus
from
the
prev
ious
ye
ar(1
7)9
145
100
9042
8535
3756
--
340
242
Tot
al r
even
ue in
clud
ing
accr
ued
reve
nue
6,56
06,
586
655
621
293
132
257
120
199
136
--
7,96
47,
595
Less
exp
ense
s in
clud
ing
accr
ued
expe
nses
6,51
86,
603
541
476
194
4216
435
152
99-
-7,
569
7,25
5
Sur
plus
/(de
ficit)
for
repo
rtin
g pe
riod
42(1
7)
114
145
9990
9385
4737
--
395
340
#4
In
clud
es G
rand
fath
ered
Sch
olar
ship
s, N
atio
nal P
riorit
y an
d N
atio
nal A
ccom
mod
atio
n P
riorit
y S
chol
arsh
ips
resp
ectiv
ely.
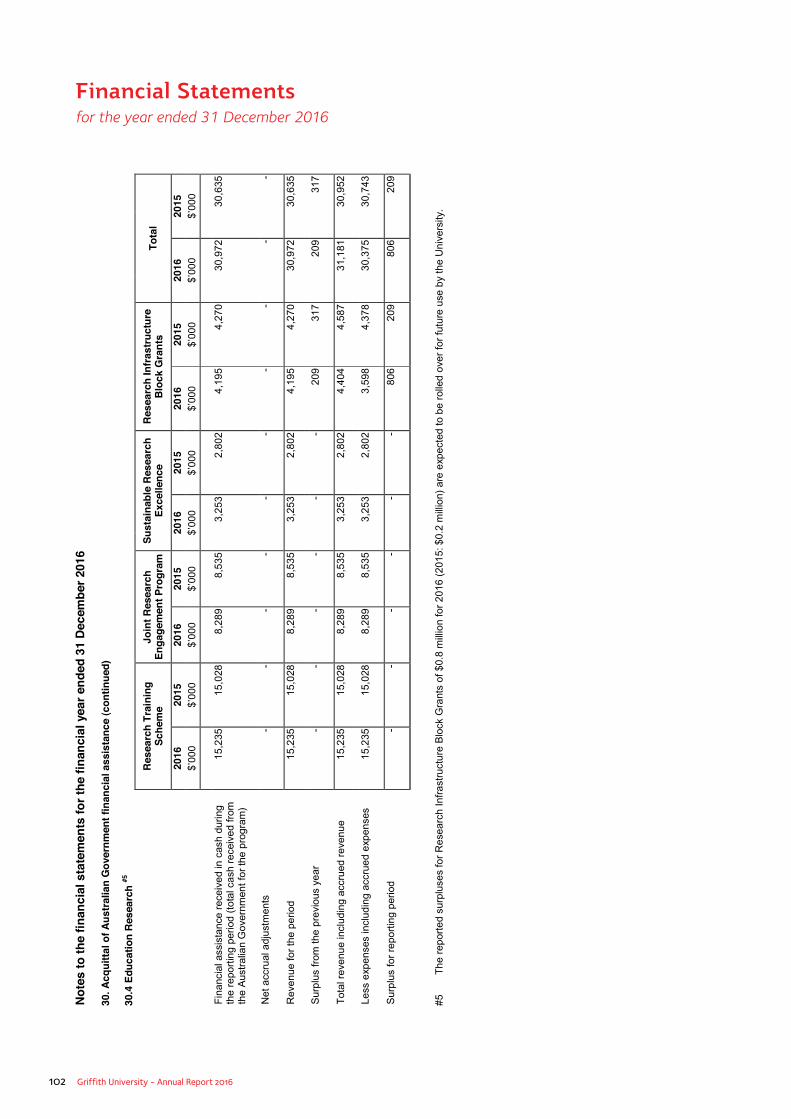
102 Griffith University - Annual Report 2016
Financial Statements for the year ended 31 December 2016
Note
s to
the
finan
cial
sta
tem
ents
for t
he fi
nanc
ial y
ear e
nded
31
Dec
embe
r 201
6
30. A
cqui
ttal o
f Aus
tralia
n G
over
nmen
t fin
anci
al a
ssis
tanc
e (c
ontin
ued)
30.4
Edu
catio
nRe
sear
ch #5
Res
earc
h Tr
aini
ng
Sche
me
Join
t Res
earc
h En
gage
men
t Pro
gram
Sust
aina
ble
Rese
arch
Ex
celle
nce
Rese
arch
Infr
astr
uctu
re
Bloc
k G
rant
sTo
tal
2016
2015
2016
2015
2016
2015
2016
2015
2016
2015
$’00
0$’
000
$’00
0$’
000
$’00
0$’
000
$’00
0$’
000
$’00
0$’
000
Fin
anci
al a
ssis
tanc
e re
ceiv
ed in
cas
h du
ring
the
repo
rtin
g pe
riod
(tot
al c
ash
rece
ived
from
th
e A
ustr
alia
n G
over
nmen
t for
the
prog
ram
)
15,2
3515
,028
8,
289
8,53
5 3,
253
2,80
2 4,
195
4,27
0 30
,972
30,6
35
Net
acc
rual
adj
ustm
ents
--
--
--
--
--
Rev
enue
for
the
perio
d15
,235
15,0
28
8,28
98,
535
3,25
32,
802
4,19
54,
270
30,9
7230
,635
Sur
plus
from
the
prev
ious
yea
r-
--
--
-20
931
720
931
7
Tot
al r
even
ue in
clud
ing
accr
ued
reve
nue
15,2
3515
,028
8,
289
8,53
5 3,
253
2,80
2 4,
404
4,58
7 31
,181
30,9
52
Less
exp
ense
s in
clud
ing
accr
ued
expe
nses
15,2
3515
,028
8,
289
8,53
5 3,
253
2,80
2 3,
598
4,37
8 30
,375
30,7
43
Sur
plus
for
repo
rtin
g pe
riod
--
--
--
806
209
806
209
#5
T
he r
epor
ted
surp
luse
s fo
r R
esea
rch
Infr
astr
uctu
re B
lock
Gra
nts
of $
0.8
mill
ion
for
2016
(20
15: $
0.2
mill
ion)
are
exp
ecte
d to
be
rolle
d ov
er fo
r fu
ture
use
by
the
Uni
vers
ity.
Note
s to
the
finan
cial
sta
tem
ents
for t
he fi
nanc
ial y
ear e
nded
31
Dece
mbe
r 201
6
30. A
cqui
ttal o
f Aus
tralia
n G
over
nmen
t fin
anci
al a
ssis
tanc
e (c
ontin
ued)
30.4
Edu
catio
nRe
sear
ch #5
Rese
arch
Tra
inin
g Sc
hem
eJo
int R
esea
rch
Enga
gem
ent P
rogr
amSu
stai
nabl
e Re
sear
ch
Exce
llenc
eRe
sear
ch In
frast
ruct
ure
Bloc
k G
rant
sTo
tal
2016
2015
2016
2015
2016
2015
2016
2015
2016
2015
$’00
0$’
000
$’00
0$’
000
$’00
0$’
000
$’00
0$’
000
$’00
0$’
000
Fin
anci
al a
ssis
tanc
e re
ceiv
ed in
cas
h du
ring
the
repo
rtin
g pe
riod
(tot
al c
ash
rece
ived
from
th
e A
ustr
alia
n G
over
nmen
t for
the
prog
ram
)
15,2
3515
,028
8,
289
8,53
5 3,
253
2,80
2 4,
195
4,27
0 30
,972
30,6
35
Net
acc
rual
adj
ustm
ents
--
--
--
--
--
Rev
enue
for
the
perio
d15
,235
15,0
28
8,28
98,
535
3,25
32,
802
4,19
54,
270
30,9
7230
,635
Sur
plus
from
the
prev
ious
yea
r-
--
--
-20
931
720
931
7
Tot
al r
even
ue in
clud
ing
accr
ued
reve
nue
15,2
3515
,028
8,
289
8,53
5 3,
253
2,80
2 4,
404
4,58
7 31
,181
30,9
52
Less
exp
ense
s in
clud
ing
accr
ued
expe
nses
15,2
3515
,028
8,
289
8,53
5 3,
253
2,80
2 3,
598
4,37
8 30
,375
30,7
43
Sur
plus
for
repo
rtin
g pe
riod
--
--
--
806
209
806
209
#5
T
he r
epor
ted
surp
luse
s fo
r R
esea
rch
Infr
astr
uctu
re B
lock
Gra
nts
of $
0.8
mill
ion
for
2016
(20
15: $
0.2
mill
ion)
are
exp
ecte
d to
be
rolle
d ov
er fo
r fu
ture
use
by
the
Uni
vers
ity.
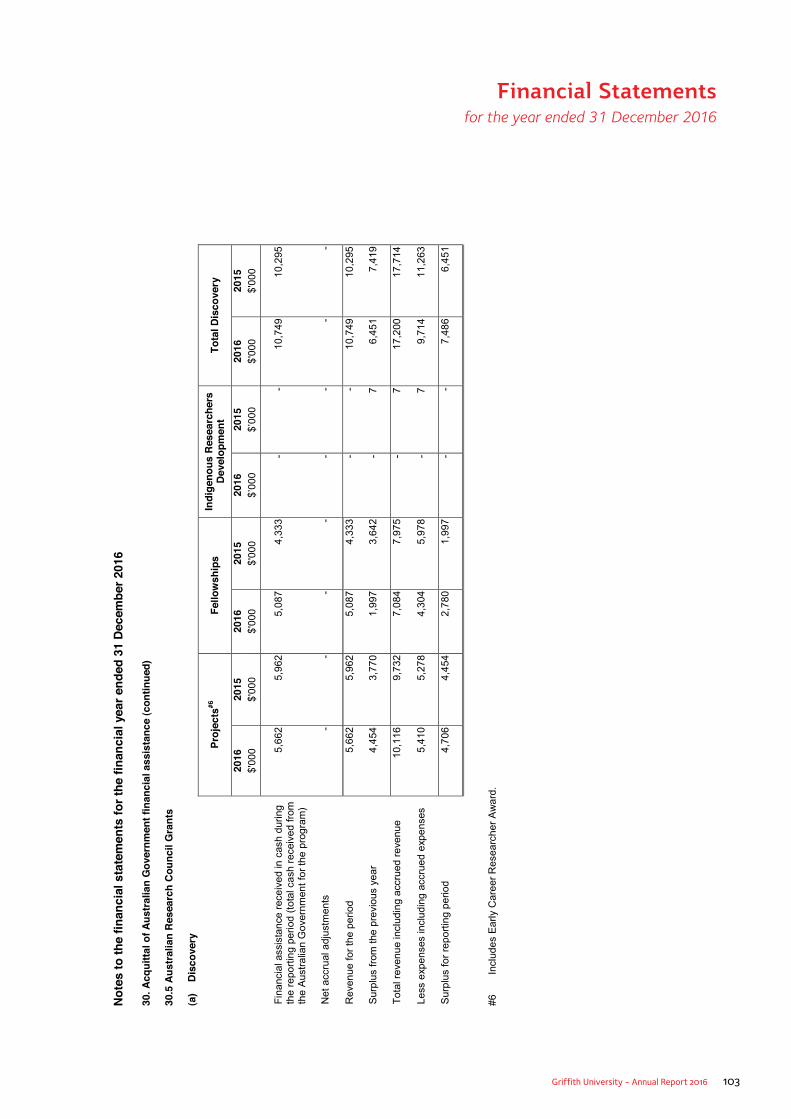
Griffith University - Annual Report 2016 103
Financial Statements for the year ended 31 December 2016
Note
s to
the
finan
cial
sta
tem
ents
for t
he fi
nanc
ial y
ear e
nded
31
Dece
mbe
r 201
6
30. A
cqui
ttal o
f Aus
tralia
n G
over
nmen
t fin
anci
al a
ssis
tanc
e (c
ontin
ued)
30.5
Aust
ralia
n Re
sear
ch C
ounc
il G
rant
s
(a)
Dis
cove
ry
Proj
ects
#6Fe
llow
ship
sIn
dige
nous
Res
earc
hers
De
velo
pmen
tTo
tal D
isco
very
2016
2015
2016
2015
2016
2015
2016
2015
$'00
0$'
000
$'00
0$'
000
$’00
0$’
000
$'00
0$'
000
Fin
anci
al a
ssis
tanc
e re
ceiv
ed in
cas
h du
ring
the
repo
rtin
g pe
riod
(tot
al c
ash
rece
ived
from
th
e A
ustr
alia
n G
over
nmen
t for
the
prog
ram
)
5,66
25,
962
5,08
74,
333
--
10,7
4910
,295
Net
acc
rual
adj
ustm
ents
--
--
--
--
Rev
enue
for
the
perio
d5,
662
5,96
2 5,
087
4,33
3 -
-10
,749
10,2
95
Sur
plus
from
the
prev
ious
yea
r4,
454
3,77
0 1,
997
3,64
2 -
76,
451
7,41
9
Tot
al r
even
ue in
clud
ing
accr
ued
reve
nue
10,1
169,
732
7,08
47,
975
-7
17,2
0017
,714
Less
exp
ense
s in
clud
ing
accr
ued
expe
nses
5,41
05,
278
4,30
45,
978
-7
9,71
411
,263
Sur
plus
for
repo
rtin
g pe
riod
4,70
64,
454
2,78
01,
997
--
7,48
66,
451
#6
In
clud
es E
arly
Car
eer
Res
earc
her
Aw
ard.
Note
s to
the
finan
cial
sta
tem
ents
for t
he fi
nanc
ial y
ear e
nded
31
Dece
mbe
r 201
6
30. A
cqui
ttal o
f Aus
tral
ian
Gov
ernm
ent f
inan
cial
ass
ista
nce
(con
tinue
d)
30.5
Aust
ralia
n Re
sear
ch C
ounc
il G
rant
s
(a)
Dis
cove
ry
Proj
ects
#6Fe
llow
ship
sIn
dige
nous
Res
earc
hers
De
velo
pmen
tTo
tal D
isco
very
2016
2015
2016
2015
2016
2015
2016
2015
$'00
0$'
000
$'00
0$'
000
$’00
0$’
000
$'00
0$'
000
Fin
anci
al a
ssis
tanc
e re
ceiv
ed in
cas
h du
ring
the
repo
rtin
g pe
riod
(tot
al c
ash
rece
ived
from
th
e A
ustr
alia
n G
over
nmen
t for
the
prog
ram
)
5,66
25,
962
5,08
74,
333
--
10,7
4910
,295
Net
acc
rual
adj
ustm
ents
--
--
--
--
Rev
enue
for
the
perio
d5,
662
5,96
2 5,
087
4,33
3 -
-10
,749
10,2
95
Sur
plus
from
the
prev
ious
yea
r4,
454
3,77
0 1,
997
3,64
2 -
76,
451
7,41
9
Tot
al r
even
ue in
clud
ing
accr
ued
reve
nue
10,1
169,
732
7,08
47,
975
-7
17,2
0017
,714
Less
exp
ense
s in
clud
ing
accr
ued
expe
nses
5,41
05,
278
4,30
45,
978
-7
9,71
411
,263
Sur
plus
for
repo
rtin
g pe
riod
4,70
64,
454
2,78
01,
997
--
7,48
66,
451
#6
In
clud
es E
arly
Car
eer
Res
earc
her
Aw
ard.
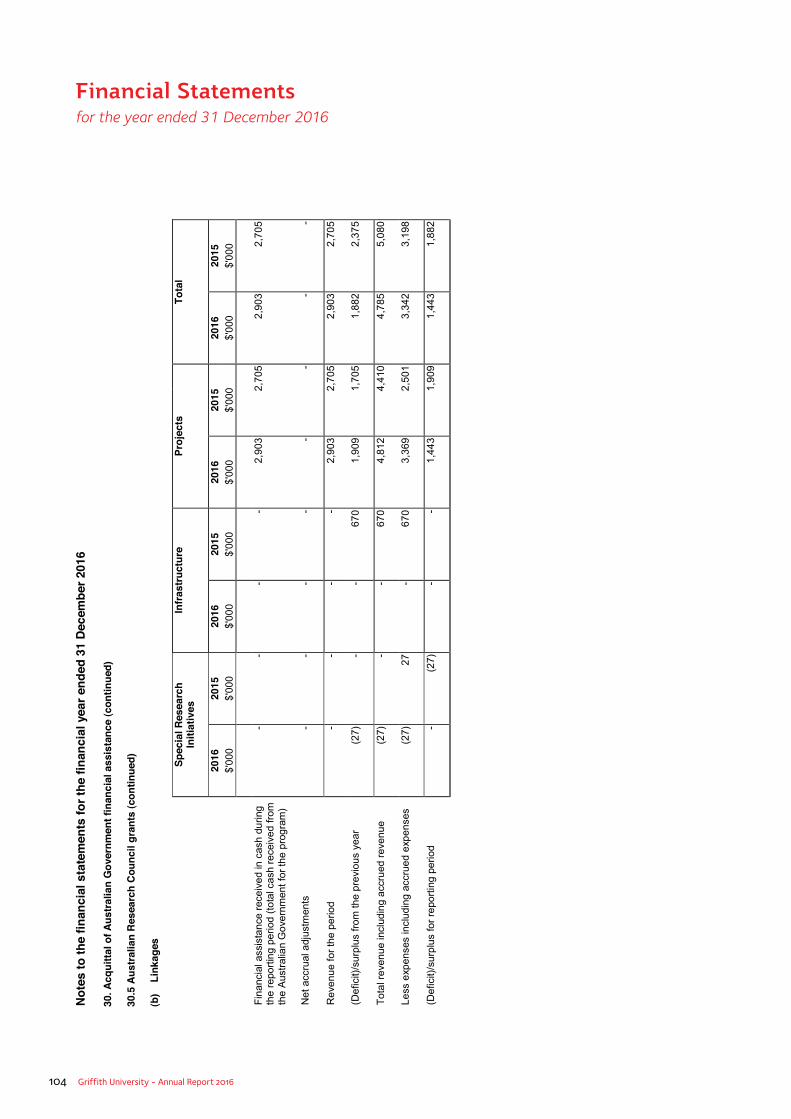
104 Griffith University - Annual Report 2016
Financial Statements for the year ended 31 December 2016
Note
s to
the
finan
cial
sta
tem
ents
for t
he fi
nanc
ial y
ear e
nded
31
Dece
mbe
r 201
6
30. A
cqui
ttal o
f Aus
tralia
n G
over
nmen
t fin
anci
al a
ssis
tanc
e (c
ontin
ued)
30.5
Aust
ralia
n Re
sear
ch C
ounc
il gr
ants
(con
tinue
d)
(b)
Lin
kage
s
Spec
ial R
esea
rch
Initi
ativ
esIn
frast
ruct
ure
Proj
ects
Tota
l
2016
2015
2016
2015
2016
2015
2016
2015
$'00
0$'
000
$'00
0$'
000
$'00
0$'
000
$'00
0$'
000
Fin
anci
al a
ssis
tanc
e re
ceiv
ed in
cas
h du
ring
the
repo
rtin
g pe
riod
(tot
al c
ash
rece
ived
from
th
e A
ustr
alia
n G
over
nmen
t for
the
prog
ram
)
--
--
2,90
32,
705
2,90
32,
705
Net
acc
rual
adj
ustm
ents
--
--
--
--
Rev
enue
for
the
perio
d-
--
-2,
903
2,70
5 2,
903
2,70
5
(Def
icit)
/sur
plus
from
the
prev
ious
yea
r(2
7)-
-67
01,
909
1,70
5 1,
882
2,37
5
Tot
al r
even
ue in
clud
ing
accr
ued
reve
nue
(27)
--
670
4,81
24,
410
4,78
55,
080
Less
exp
ense
s in
clud
ing
accr
ued
expe
nses
(27)
27-
670
3,36
92,
501
3,34
23,
198
(Def
icit)
/sur
plus
for
repo
rtin
g pe
riod
-(2
7)-
-1,
443
1,90
9 1,
443
1,88
2
Not
es to
the
finan
cial
sta
tem
ents
for t
he fi
nanc
ial y
ear e
nded
31
Dece
mbe
r 201
6
30. A
cqui
ttal o
f Aus
tralia
n G
over
nmen
t fin
anci
al a
ssis
tanc
e (c
ontin
ued)
30.5
Aust
ralia
n Re
sear
ch C
ounc
il gr
ants
(con
tinue
d)
(b)
Lin
kage
s
Spec
ial R
esea
rch
Initi
ativ
esIn
frast
ruct
ure
Proj
ects
Tota
l
2016
2015
2016
2015
2016
2015
2016
2015
$'00
0$'
000
$'00
0$'
000
$'00
0$'
000
$'00
0$'
000
Fin
anci
al a
ssis
tanc
e re
ceiv
ed in
cas
h du
ring
the
repo
rtin
g pe
riod
(tot
al c
ash
rece
ived
from
th
e A
ustr
alia
n G
over
nmen
t for
the
prog
ram
)
--
--
2,90
32,
705
2,90
32,
705
Net
acc
rual
adj
ustm
ents
--
--
--
--
Rev
enue
for
the
perio
d-
--
-2,
903
2,70
5 2,
903
2,70
5
(Def
icit)
/sur
plus
from
the
prev
ious
yea
r(2
7)-
-67
01,
909
1,70
5 1,
882
2,37
5
Tot
al r
even
ue in
clud
ing
accr
ued
reve
nue
(27)
--
670
4,81
24,
410
4,78
55,
080
Less
exp
ense
s in
clud
ing
accr
ued
expe
nses
(27)
27-
670
3,36
92,
501
3,34
23,
198
(Def
icit)
/sur
plus
for
repo
rtin
g pe
riod
-(2
7)-
-1,
443
1,90
9 1,
443
1,88
2
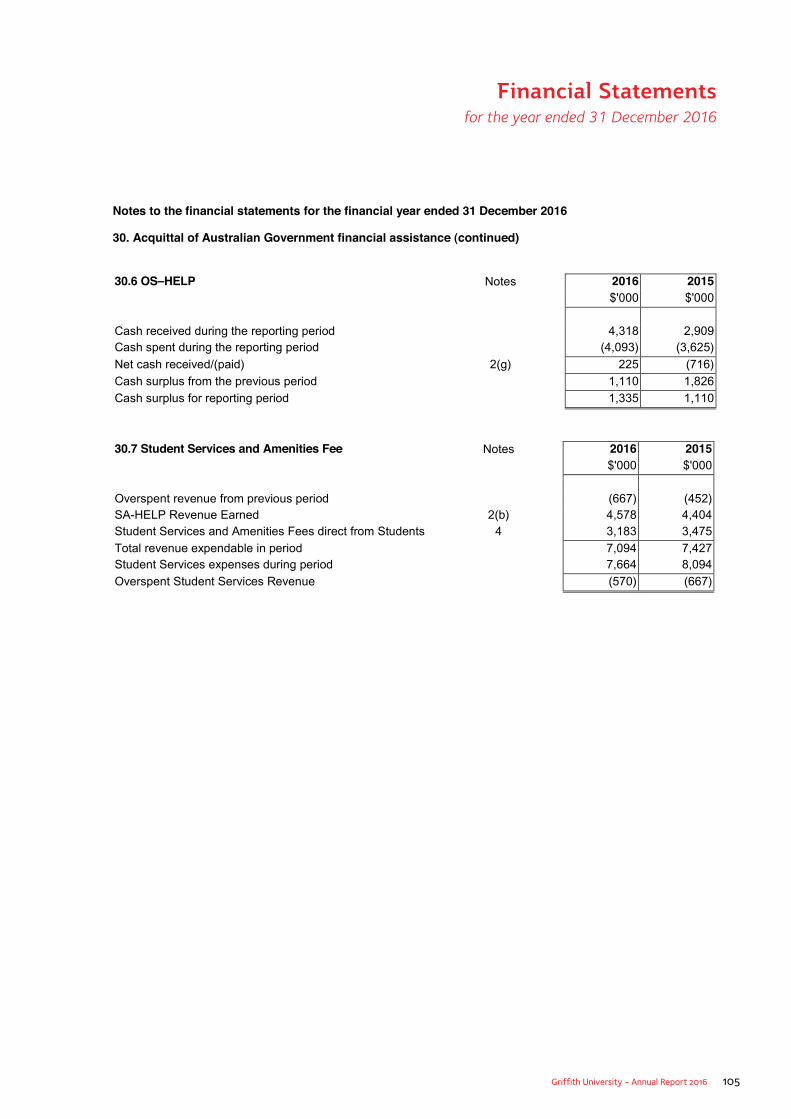
Griffith University - Annual Report 2016 105
Financial Statements for the year ended 31 December 2016
Notes to the financial statements for the financial year ended 31 December 2016
30. Acquittal of Australian Government financial assistance (continued)
30.6 OS–HELP Notes 2016 2015$'000 $'000
Cash received during the reporting period 4,318 2,909 Cash spent during the reporting period (4,093) (3,625)
Net cash received/(paid) 2(g) 225 (716)
Cash surplus from the previous period 1,110 1,826
Cash surplus for reporting period 1,335 1,110
30.7 Student Services and Amenities Fee Notes 2016 2015$'000 $'000
Overspent revenue from previous period (667) (452)SA-HELP Revenue Earned 2(b) 4,578 4,404Student Services and Amenities Fees direct from Students 4 3,183 3,475
Total revenue expendable in period 7,094 7,427Student Services expenses during period 7,664 8,094
Overspent Student Services Revenue (570) (667)

106 Griffith University - Annual Report 2016
Financial Statements for the year ended 31 December 2016
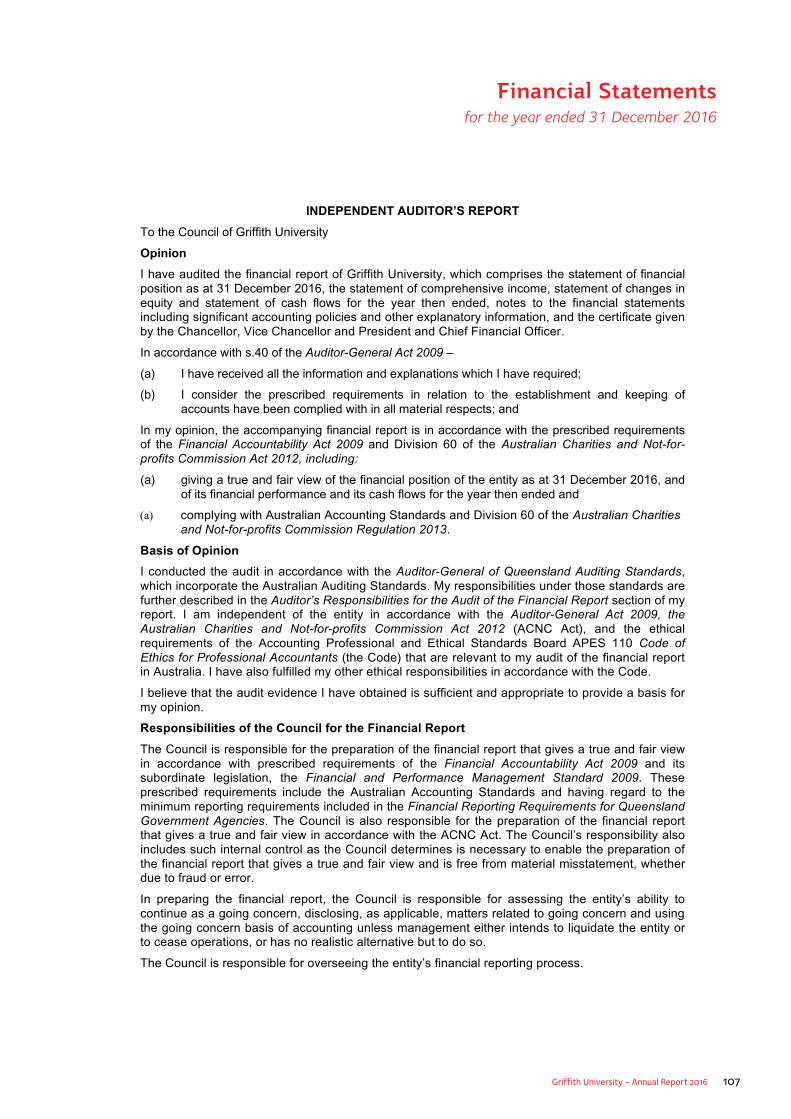
Griffith University - Annual Report 2016 107
INDEPENDENT AUDITOR’S REPORT To the Council of Griffith University
Opinion I have audited the financial report of Griffith University, which comprises the statement of financial position as at 31 December 2016, the statement of comprehensive income, statement of changes in equity and statement of cash flows for the year then ended, notes to the financial statements including significant accounting policies and other explanatory information, and the certificate given by the Chancellor, Vice Chancellor and President and Chief Financial Officer.
In accordance with s.40 of the Auditor-General Act 2009 –
(a) I have received all the information and explanations which I have required;
(b) I consider the prescribed requirements in relation to the establishment and keeping of accounts have been complied with in all material respects; and
In my opinion, the accompanying financial report is in accordance with the prescribed requirements of the Financial Accountability Act 2009 and Division 60 of the Australian Charities and Not-for-profits Commission Act 2012, including:
(a) giving a true and fair view of the financial position of the entity as at 31 December 2016, and of its financial performance and its cash flows for the year then ended and
(a) complying with Australian Accounting Standards and Division 60 of the Australian Charities and Not-for-profits Commission Regulation 2013.
Basis of Opinion I conducted the audit in accordance with the Auditor-General of Queensland Auditing Standards, which incorporate the Australian Auditing Standards. My responsibilities under those standards are further described in the Auditor’s Responsibilities for the Audit of the Financial Report section of my report. I am independent of the entity in accordance with the Auditor-General Act 2009, the Australian Charities and Not-for-profits Commission Act 2012 (ACNC Act), and the ethical requirements of the Accounting Professional and Ethical Standards Board APES 110 Code of Ethics for Professional Accountants (the Code) that are relevant to my audit of the financial report in Australia. I have also fulfilled my other ethical responsibilities in accordance with the Code.
I believe that the audit evidence I have obtained is sufficient and appropriate to provide a basis for my opinion.
Responsibilities of the Council for the Financial Report The Council is responsible for the preparation of the financial report that gives a true and fair view in accordance with prescribed requirements of the Financial Accountability Act 2009 and its subordinate legislation, the Financial and Performance Management Standard 2009. These prescribed requirements include the Australian Accounting Standards and having regard to the minimum reporting requirements included in the Financial Reporting Requirements for Queensland Government Agencies. The Council is also responsible for the preparation of the financial report that gives a true and fair view in accordance with the ACNC Act. The Council’s responsibility also includes such internal control as the Council determines is necessary to enable the preparation of the financial report that gives a true and fair view and is free from material misstatement, whether due to fraud or error.
In preparing the financial report, the Council is responsible for assessing the entity’s ability to continue as a going concern, disclosing, as applicable, matters related to going concern and using the going concern basis of accounting unless management either intends to liquidate the entity or to cease operations, or has no realistic alternative but to do so.
The Council is responsible for overseeing the entity’s financial reporting process.
Financial Statements for the year ended 31 December 2016
108 Griffith University - Annual Report 2016
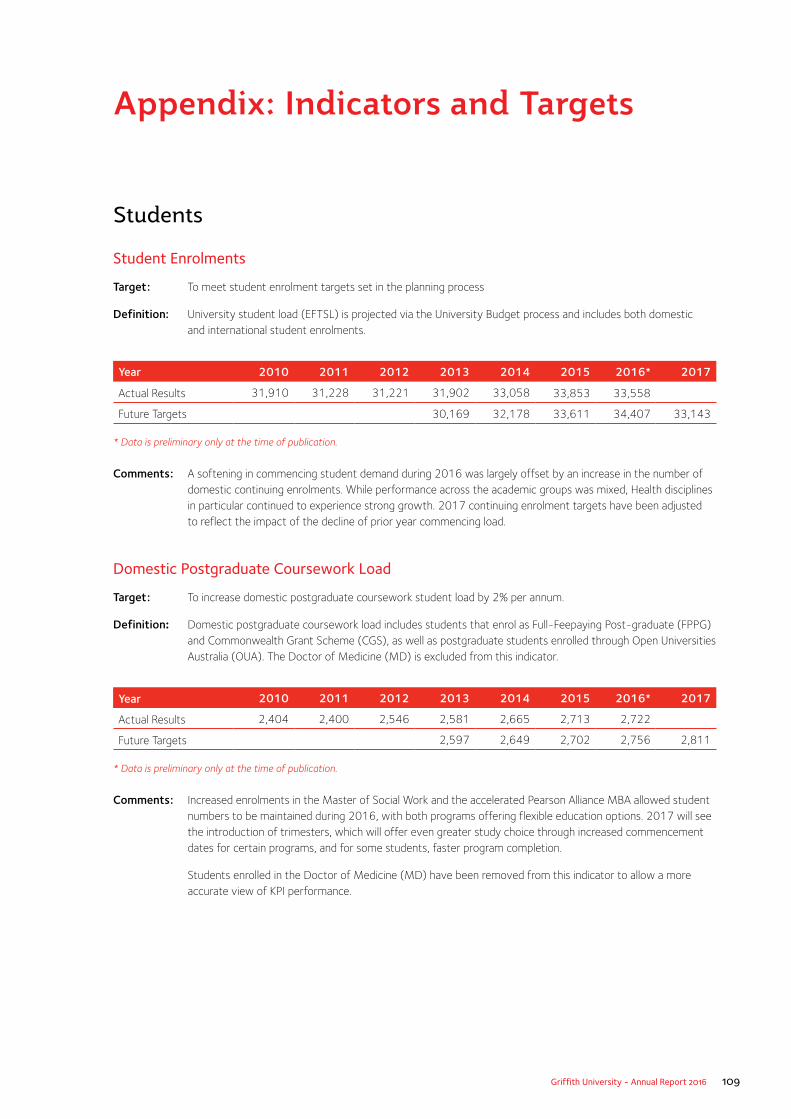
Griffith University - Annual Report 2016 109
Appendix: Indicators and Targets
Students
Student Enrolments
Target: To meet student enrolment targets set in the planning process
Definition: University student load (EFTSL) is projected via the University Budget process and includes both domestic and international student enrolments.
Year 2010 2011 2012 2013 2014 2015 2016* 2017
Actual Results 31,910 31,228 31,221 31,902 33,058 33,853 33,558
Future Targets 30,169 32,178 33,611 34,407 33,143
* Data is preliminary only at the time of publication.
Comments: A softening in commencing student demand during 2016 was largely offset by an increase in the number of
domestic continuing enrolments. While performance across the academic groups was mixed, Health disciplines in particular continued to experience strong growth. 2017 continuing enrolment targets have been adjusted to reflect the impact of the decline of prior year commencing load.
Domestic Postgraduate Coursework Load
Target: To increase domestic postgraduate coursework student load by 2% per annum.
Definition: Domestic postgraduate coursework load includes students that enrol as Full-Feepaying Post-graduate (FPPG) and Commonwealth Grant Scheme (CGS), as well as postgraduate students enrolled through Open Universities Australia (OUA). The Doctor of Medicine (MD) is excluded from this indicator.
Year 2010 2011 2012 2013 2014 2015 2016* 2017
Actual Results 2,404 2,400 2,546 2,581 2,665 2,713 2,722
Future Targets 2,597 2,649 2,702 2,756 2,811
* Data is preliminary only at the time of publication.
Comments: Increased enrolments in the Master of Social Work and the accelerated Pearson Alliance MBA allowed student
numbers to be maintained during 2016, with both programs offering flexible education options. 2017 will see the introduction of trimesters, which will offer even greater study choice through increased commencement dates for certain programs, and for some students, faster program completion.
Students enrolled in the Doctor of Medicine (MD) have been removed from this indicator to allow a more accurate view of KPI performance.
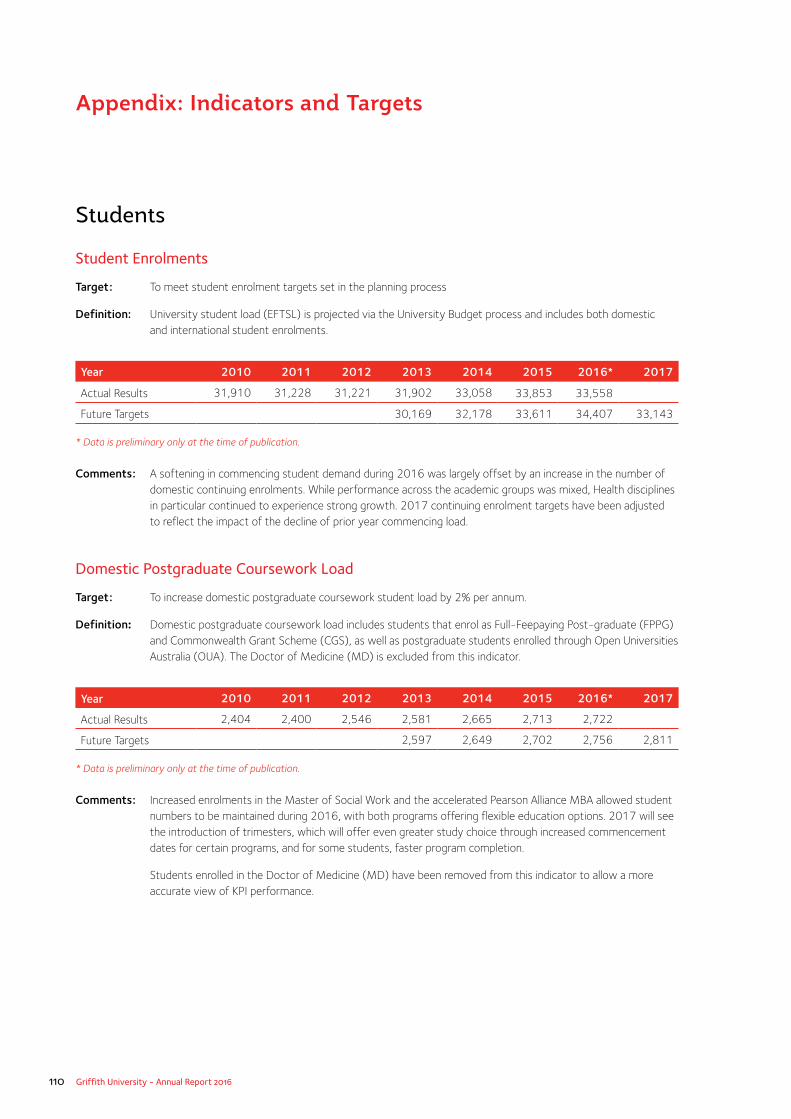
110 Griffith University - Annual Report 2016
Students
Student Enrolments
Target: To meet student enrolment targets set in the planning process
Definition: University student load (EFTSL) is projected via the University Budget process and includes both domestic and international student enrolments.
Year 2010 2011 2012 2013 2014 2015 2016* 2017
Actual Results 31,910 31,228 31,221 31,902 33,058 33,853 33,558
Future Targets 30,169 32,178 33,611 34,407 33,143
* Data is preliminary only at the time of publication.
Comments: A softening in commencing student demand during 2016 was largely offset by an increase in the number of
domestic continuing enrolments. While performance across the academic groups was mixed, Health disciplines in particular continued to experience strong growth. 2017 continuing enrolment targets have been adjusted to reflect the impact of the decline of prior year commencing load.
Domestic Postgraduate Coursework Load
Target: To increase domestic postgraduate coursework student load by 2% per annum.
Definition: Domestic postgraduate coursework load includes students that enrol as Full-Feepaying Post-graduate (FPPG) and Commonwealth Grant Scheme (CGS), as well as postgraduate students enrolled through Open Universities Australia (OUA). The Doctor of Medicine (MD) is excluded from this indicator.
Year 2010 2011 2012 2013 2014 2015 2016* 2017
Actual Results 2,404 2,400 2,546 2,581 2,665 2,713 2,722
Future Targets 2,597 2,649 2,702 2,756 2,811
* Data is preliminary only at the time of publication.
Comments: Increased enrolments in the Master of Social Work and the accelerated Pearson Alliance MBA allowed student
numbers to be maintained during 2016, with both programs offering flexible education options. 2017 will see the introduction of trimesters, which will offer even greater study choice through increased commencement dates for certain programs, and for some students, faster program completion.
Students enrolled in the Doctor of Medicine (MD) have been removed from this indicator to allow a more accurate view of KPI performance.
Appendix: Indicators and Targets
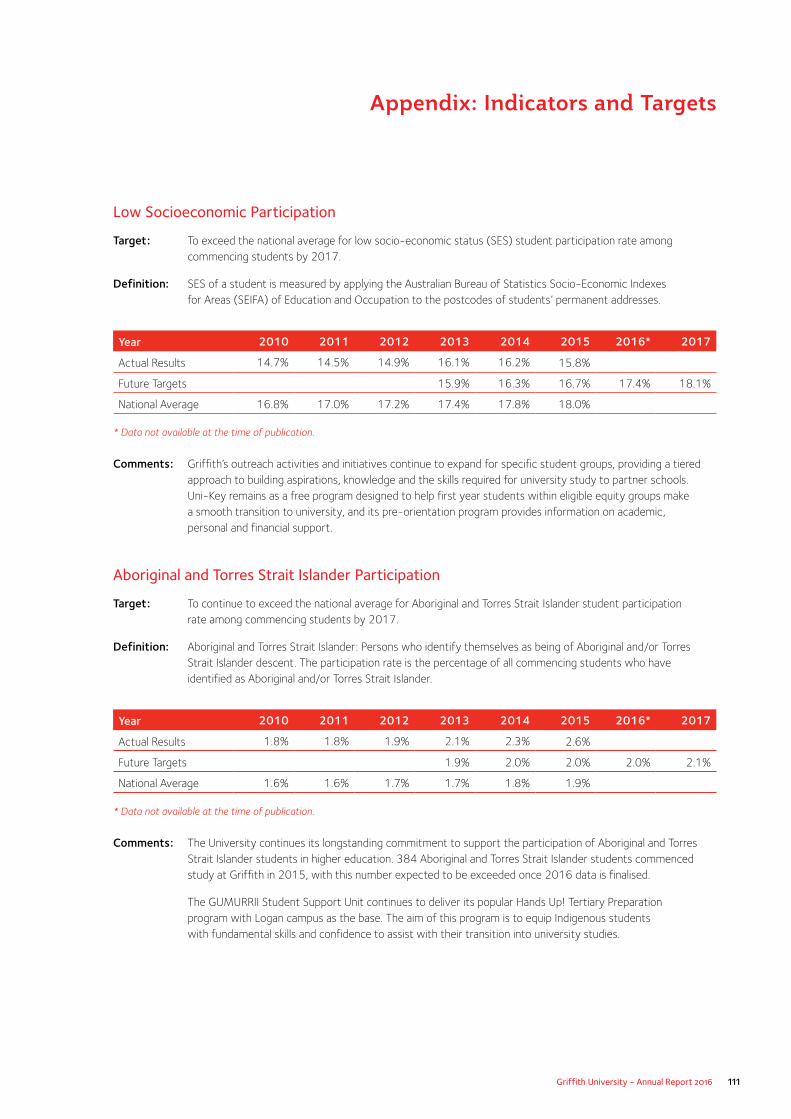
Griffith University - Annual Report 2016 111
Appendix: Indicators and Targets
Low Socioeconomic Participation
Target: To exceed the national average for low socio-economic status (SES) student participation rate among commencing students by 2017.
Definition: SES of a student is measured by applying the Australian Bureau of Statistics Socio-Economic Indexes for Areas (SEIFA) of Education and Occupation to the postcodes of students’ permanent addresses.
Year 2010 2011 2012 2013 2014 2015 2016* 2017
Actual Results 14.7% 14.5% 14.9% 16.1% 16.2% 15.8%
Future Targets 15.9% 16.3% 16.7% 17.4% 18.1%
National Average 16.8% 17.0% 17.2% 17.4% 17.8% 18.0%
* Data not available at the time of publication.
Comments: Griffith’s outreach activities and initiatives continue to expand for specific student groups, providing a tiered
approach to building aspirations, knowledge and the skills required for university study to partner schools. Uni-Key remains as a free program designed to help first year students within eligible equity groups make a smooth transition to university, and its pre-orientation program provides information on academic, personal and financial support.
Aboriginal and Torres Strait Islander Participation
Target: To continue to exceed the national average for Aboriginal and Torres Strait Islander student participation rate among commencing students by 2017.
Definition: Aboriginal and Torres Strait Islander: Persons who identify themselves as being of Aboriginal and/or Torres Strait Islander descent. The participation rate is the percentage of all commencing students who have identified as Aboriginal and/or Torres Strait Islander.
Year 2010 2011 2012 2013 2014 2015 2016* 2017
Actual Results 1.8% 1.8% 1.9% 2.1% 2.3% 2.6%
Future Targets 1.9% 2.0% 2.0% 2.0% 2.1%
National Average 1.6% 1.6% 1.7% 1.7% 1.8% 1.9%
* Data not available at the time of publication.
Comments: The University continues its longstanding commitment to support the participation of Aboriginal and Torres
Strait Islander students in higher education. 384 Aboriginal and Torres Strait Islander students commenced study at Griffith in 2015, with this number expected to be exceeded once 2016 data is finalised.
The GUMURRII Student Support Unit continues to deliver its popular Hands Up! Tertiary Preparation program with Logan campus as the base. The aim of this program is to equip Indigenous students with fundamental skills and confidence to assist with their transition into university studies.
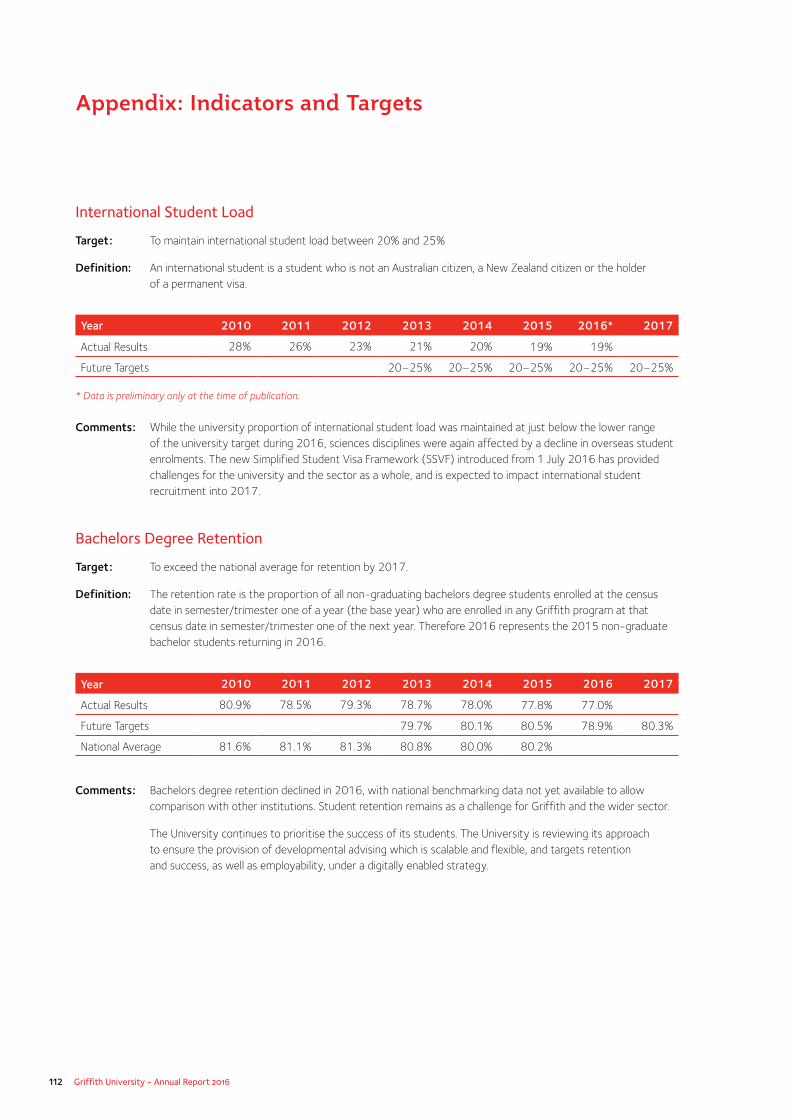
112 Griffith University - Annual Report 2016
Appendix: Indicators and Targets
International Student Load
Target: To maintain international student load between 20% and 25%
Definition: An international student is a student who is not an Australian citizen, a New Zealand citizen or the holder of a permanent visa.
Year 2010 2011 2012 2013 2014 2015 2016* 2017
Actual Results 28% 26% 23% 21% 20% 19% 19%
Future Targets 20–25% 20–25% 20–25% 20–25% 20–25%
* Data is preliminary only at the time of publication.
Comments: While the university proportion of international student load was maintained at just below the lower range
of the university target during 2016, sciences disciplines were again affected by a decline in overseas student enrolments. The new Simplified Student Visa Framework (SSVF) introduced from 1 July 2016 has provided challenges for the university and the sector as a whole, and is expected to impact international student recruitment into 2017.
Bachelors Degree Retention
Target: To exceed the national average for retention by 2017.
Definition: The retention rate is the proportion of all non-graduating bachelors degree students enrolled at the census date in semester/trimester one of a year (the base year) who are enrolled in any Griffith program at that census date in semester/trimester one of the next year. Therefore 2016 represents the 2015 non-graduate bachelor students returning in 2016.
Year 2010 2011 2012 2013 2014 2015 2016 2017
Actual Results 80.9% 78.5% 79.3% 78.7% 78.0% 77.8% 77.0%
Future Targets 79.7% 80.1% 80.5% 78.9% 80.3%
National Average 81.6% 81.1% 81.3% 80.8% 80.0% 80.2%
Comments: Bachelors degree retention declined in 2016, with national benchmarking data not yet available to allow
comparison with other institutions. Student retention remains as a challenge for Griffith and the wider sector.
The University continues to prioritise the success of its students. The University is reviewing its approach to ensure the provision of developmental advising which is scalable and flexible, and targets retention and success, as well as employability, under a digitally enabled strategy.
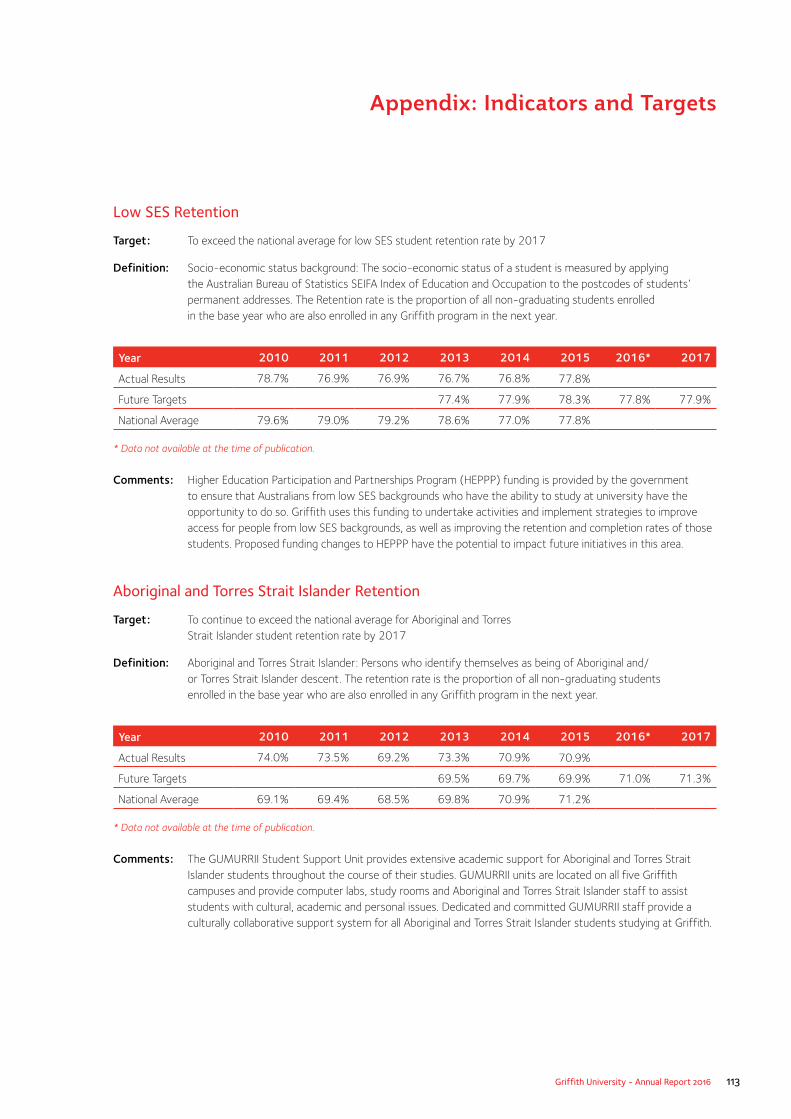
Griffith University - Annual Report 2016 113
Appendix: Indicators and Targets
Low SES Retention
Target: To exceed the national average for low SES student retention rate by 2017
Definition: Socio-economic status background: The socio-economic status of a student is measured by applying the Australian Bureau of Statistics SEIFA Index of Education and Occupation to the postcodes of students’ permanent addresses. The Retention rate is the proportion of all non-graduating students enrolled in the base year who are also enrolled in any Griffith program in the next year.
Year 2010 2011 2012 2013 2014 2015 2016* 2017
Actual Results 78.7% 76.9% 76.9% 76.7% 76.8% 77.8%
Future Targets 77.4% 77.9% 78.3% 77.8% 77.9%
National Average 79.6% 79.0% 79.2% 78.6% 77.0% 77.8%
* Data not available at the time of publication.
Comments: Higher Education Participation and Partnerships Program (HEPPP) funding is provided by the government
to ensure that Australians from low SES backgrounds who have the ability to study at university have the opportunity to do so. Griffith uses this funding to undertake activities and implement strategies to improve access for people from low SES backgrounds, as well as improving the retention and completion rates of those students. Proposed funding changes to HEPPP have the potential to impact future initiatives in this area.
Aboriginal and Torres Strait Islander Retention
Target: To continue to exceed the national average for Aboriginal and Torres Strait Islander student retention rate by 2017
Definition: Aboriginal and Torres Strait Islander: Persons who identify themselves as being of Aboriginal and/or Torres Strait Islander descent. The retention rate is the proportion of all non-graduating students enrolled in the base year who are also enrolled in any Griffith program in the next year.
Year 2010 2011 2012 2013 2014 2015 2016* 2017
Actual Results 74.0% 73.5% 69.2% 73.3% 70.9% 70.9%
Future Targets 69.5% 69.7% 69.9% 71.0% 71.3%
National Average 69.1% 69.4% 68.5% 69.8% 70.9% 71.2%
* Data not available at the time of publication.
Comments: The GUMURRII Student Support Unit provides extensive academic support for Aboriginal and Torres Strait Islander students throughout the course of their studies. GUMURRII units are located on all five Griffith campuses and provide computer labs, study rooms and Aboriginal and Torres Strait Islander staff to assist students with cultural, academic and personal issues. Dedicated and committed GUMURRII staff provide a culturally collaborative support system for all Aboriginal and Torres Strait Islander students studying at Griffith.

114 Griffith University - Annual Report 2016
Course Experience Questionnaire: Overall Satisfaction
Target: To achieve national ranking in the top third for graduates’ perceptions of Overall Satisfaction with their degree program (CEQ) by 2017.
Definition: The Overall Satisfaction Index (OSI) is based on a single question “Overall, I was satisfied with the quality of this program” and is determined by the percentage agreement of all graduating bachelors degree respondents. Percentage agreement is calculated as the ratio of the number of responses with an answer of 4 (agree) or 5 (strongly agree) on a scale of 1 to 5 about being satisfied with their experience, as a proportion of the total number of responses. Where respondents provide information for two majors, both responses are included.
The results in any given year pertain to student cohorts from the previous year. 2015 results are based on students who graduated in 2014.
Year 2010 2011 2012 2013 2014 2015 2016 2017
Actual Results 80.0% 82.5% 82.7% 84.3% 84.6% 85.9%
Future Targets 84.1% 84.5% 84.7% 85.1% 85.5%
National Average 81.1% 82.2% 83.3% 83.0% 82.7% 83.4%
Comments: Continual improvement in this indicator has been achieved since 2010, with 85.9% of survey respondents
expressing satisfaction with the quality of their program. In recent years Griffith has consistently performed above the national average in this indicator and ranks in the top third of Australian universities.
2014 graduates were the last students surveyed under the Course Experience Questionnaire (CEQ), which has now been replaced by the Student Experience Survey. The Student Experience Survey is a national survey of first and later year undergraduate students that measures all aspects of university life, such as skill development, learner engagement, teaching quality, student support, and learning resources.
Appendix: Indicators and Targets

Griffith University - Annual Report 2016 115
Appendix: Indicators and Targets
Course Experience Questionnaire: Good Teaching Scale
Target: To achieve national ranking in the top third for graduates’ perceptions of Good Teaching (CEQ) by 2017.
Definition: Good Teaching Scale (GTS) is based on six specific questions: 1. The staff put a lot of time into commenting on my work 2. The teaching staff normally gave me helpful feedback on how I was going 3. The teaching staff of this course motivated me to do my best work 4. My lecturers were extremely good at explaining things 5. The teaching staff worked hard to make their subjects interesting 6. The staff made a real effort to understand difficulties I might be having with my work.
It is determined by the percentage agreement of all graduating bachelors degree respondents. It is calculated as the ratio of the number of students who responded with an average rating of 3.5 or above (on a scale of 1 to 5 for the six questions), as a proportion of the total number of students who responded to those items. The results in any given year pertain to student cohorts from the previous year. 2015 results are based on students who graduated in 2014.
Year 2010 2011 2012 2013 2014 2015 2016 2017
Actual Results 63.0% 67.0% 68.9% 72.8% 72.8% 74.3%
Future Targets 72.7% 73.2% 73.4% 74.6% 74.8%
National Average 65.9% 68.3% 70.1% 70.5% 71.0% 71.9%
Comments: In 2016, two Griffith staff members were successful in winning highly competitive Awards for Australian
University Teaching (AAUT) National Teaching Excellence Awards. The university continues to be recognised in the areas of learning and teaching with Griffith academics being named Australian University Teacher of the Year for two of the past three years.
2014 graduates were the last students surveyed under the Course Experience Questionnaire (CEQ), which has now been replaced by the Student Experience Survey.
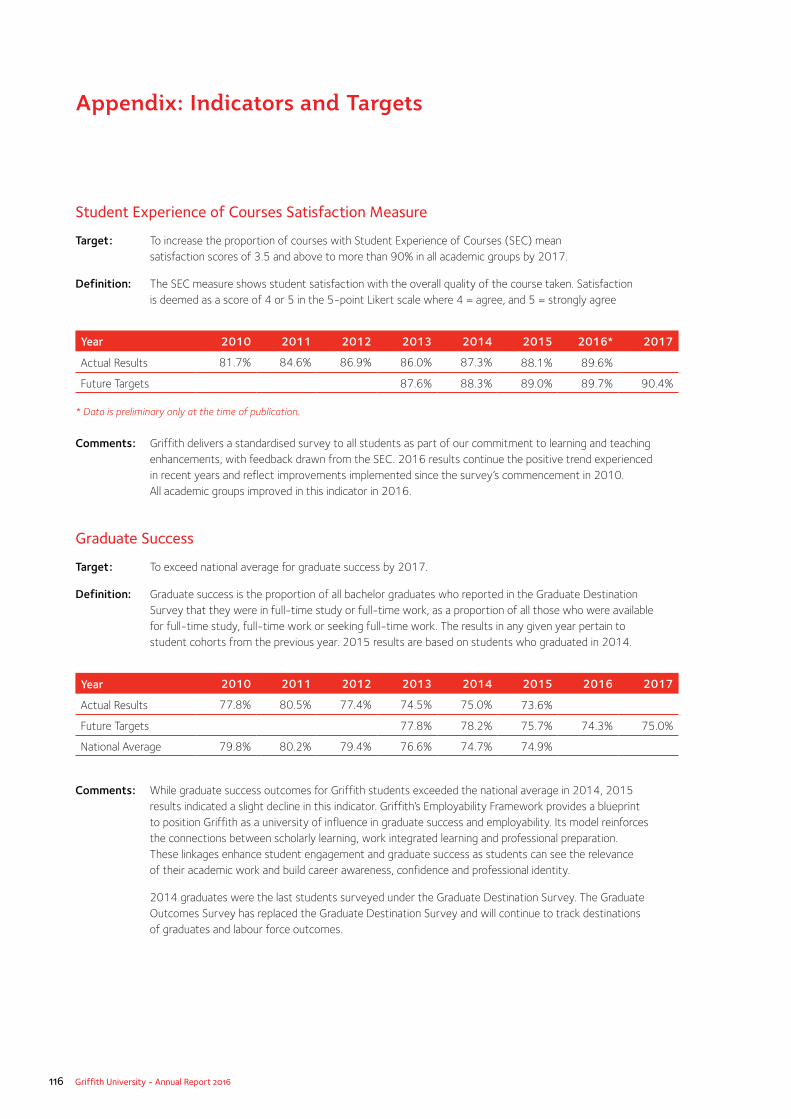
116 Griffith University - Annual Report 2016
Student Experience of Courses Satisfaction Measure
Target: To increase the proportion of courses with Student Experience of Courses (SEC) mean satisfaction scores of 3.5 and above to more than 90% in all academic groups by 2017.
Definition: The SEC measure shows student satisfaction with the overall quality of the course taken. Satisfaction is deemed as a score of 4 or 5 in the 5-point Likert scale where 4 = agree, and 5 = strongly agree
Year 2010 2011 2012 2013 2014 2015 2016* 2017
Actual Results 81.7% 84.6% 86.9% 86.0% 87.3% 88.1% 89.6%
Future Targets 87.6% 88.3% 89.0% 89.7% 90.4%
* Data is preliminary only at the time of publication.
Comments: Griffith delivers a standardised survey to all students as part of our commitment to learning and teaching
enhancements, with feedback drawn from the SEC. 2016 results continue the positive trend experienced in recent years and reflect improvements implemented since the survey’s commencement in 2010. All academic groups improved in this indicator in 2016.
Graduate Success
Target: To exceed national average for graduate success by 2017.
Definition: Graduate success is the proportion of all bachelor graduates who reported in the Graduate Destination Survey that they were in full-time study or full-time work, as a proportion of all those who were available for full-time study, full-time work or seeking full-time work. The results in any given year pertain to student cohorts from the previous year. 2015 results are based on students who graduated in 2014.
Year 2010 2011 2012 2013 2014 2015 2016 2017
Actual Results 77.8% 80.5% 77.4% 74.5% 75.0% 73.6%
Future Targets 77.8% 78.2% 75.7% 74.3% 75.0%
National Average 79.8% 80.2% 79.4% 76.6% 74.7% 74.9%
Comments: While graduate success outcomes for Griffith students exceeded the national average in 2014, 2015
results indicated a slight decline in this indicator. Griffith’s Employability Framework provides a blueprint to position Griffith as a university of influence in graduate success and employability. Its model reinforces the connections between scholarly learning, work integrated learning and professional preparation. These linkages enhance student engagement and graduate success as students can see the relevance of their academic work and build career awareness, confidence and professional identity.
2014 graduates were the last students surveyed under the Graduate Destination Survey. The Graduate Outcomes Survey has replaced the Graduate Destination Survey and will continue to track destinations of graduates and labour force outcomes.
Appendix: Indicators and Targets
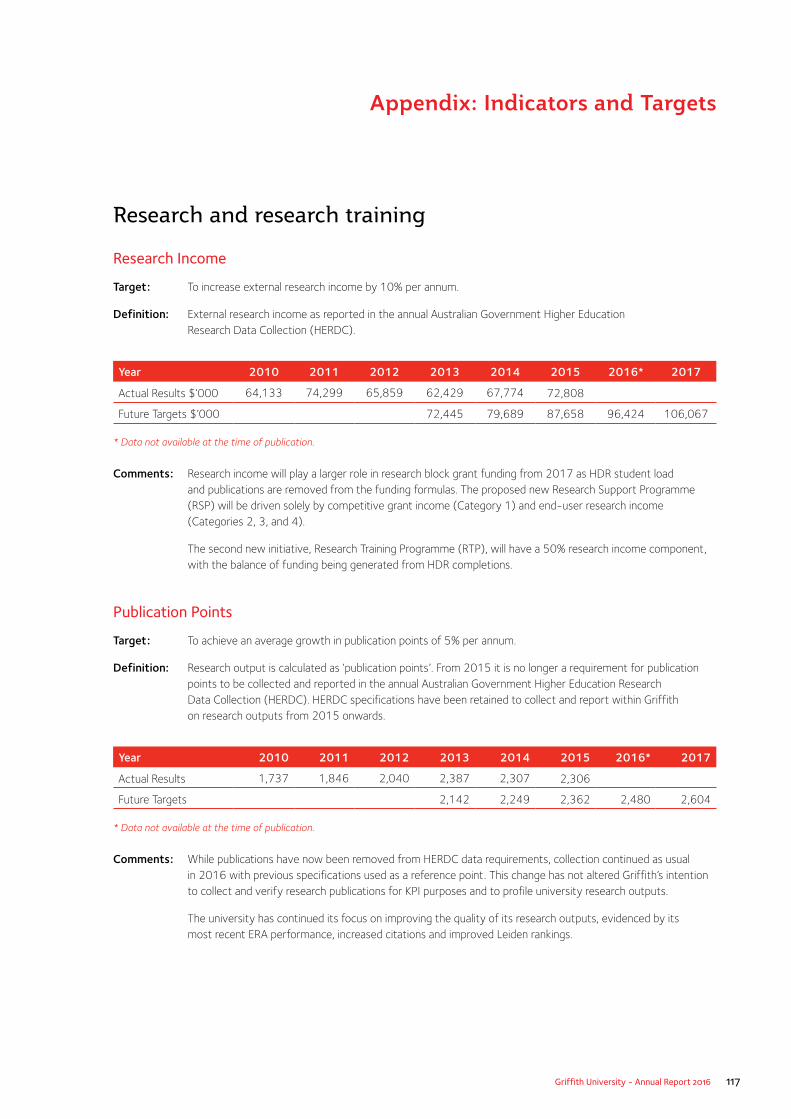
Griffith University - Annual Report 2016 117
Appendix: Indicators and Targets
Research and research training
Research Income
Target: To increase external research income by 10% per annum.
Definition: External research income as reported in the annual Australian Government Higher Education Research Data Collection (HERDC).
Year 2010 2011 2012 2013 2014 2015 2016* 2017
Actual Results $’000 64,133 74,299 65,859 62,429 67,774 72,808
Future Targets $’000 72,445 79,689 87,658 96,424 106,067
* Data not available at the time of publication.
Comments: Research income will play a larger role in research block grant funding from 2017 as HDR student load
and publications are removed from the funding formulas. The proposed new Research Support Programme (RSP) will be driven solely by competitive grant income (Category 1) and end-user research income (Categories 2, 3, and 4).
The second new initiative, Research Training Programme (RTP), will have a 50% research income component, with the balance of funding being generated from HDR completions.
Publication Points
Target: To achieve an average growth in publication points of 5% per annum.
Definition: Research output is calculated as ‘publication points’. From 2015 it is no longer a requirement for publication points to be collected and reported in the annual Australian Government Higher Education Research Data Collection (HERDC). HERDC specifications have been retained to collect and report within Griffith on research outputs from 2015 onwards.
Year 2010 2011 2012 2013 2014 2015 2016* 2017
Actual Results 1,737 1,846 2,040 2,387 2,307 2,306
Future Targets 2,142 2,249 2,362 2,480 2,604
* Data not available at the time of publication.
Comments: While publications have now been removed from HERDC data requirements, collection continued as usual
in 2016 with previous specifications used as a reference point. This change has not altered Griffith’s intention to collect and verify research publications for KPI purposes and to profile university research outputs.
The university has continued its focus on improving the quality of its research outputs, evidenced by its most recent ERA performance, increased citations and improved Leiden rankings.

118 Griffith University - Annual Report 2016
Citations
Target: To achieve an average growth in citations of 5% per annum for those disciplines where citation data are relevant.
Definition: Total number of citations recorded in a given year attributable to research published in any prior year under the Griffith by-line. Source: Thomson Reuters – Web of Science.
Year 2010 2011 2012 2013 2014 2015 2016* 2017
Actual Results 18,311 21,872 25,301 31,914 39,486 48,255
Future Targets 25,199 26,459 27,782 29,171 30,629
* Data not available at the time of publication.
Comments: Over 48,000 citations were amassed in 2015, a considerable increase over the 2014 figure of 39,486.
This reflects not only the growing volume and quality of Griffith University research but the reach and citation impact reflecting increased recognition by academic colleagues from around the world, and is consistent with the university’s strongly improved ERA result in 2015.
Higher Degree by Research Commencements
Target: To increase HDR commencements by 5% per annum.
Definition: The number of students commencing a HDR program within the calendar year.
Year 2010+ 2011+ 2012+ 2013 2014 2015 2016* 2017
Actual Results 385 390 465 487 440 512 508
Future Targets 434 456 478 502 528
+ 3 year average of 2010/11/12 used as a starting base for target projection
* Data is preliminary only at the time of publication.
Comments: 2016 commencing enrolments tracked closely to previous year results. Health disciplines again experienced significant increases, with 27% more commencements than recorded during 2015. A softening in international student enrolments was mostly offset by growth in domestic HDR students.
Appendix: Indicators and Targets
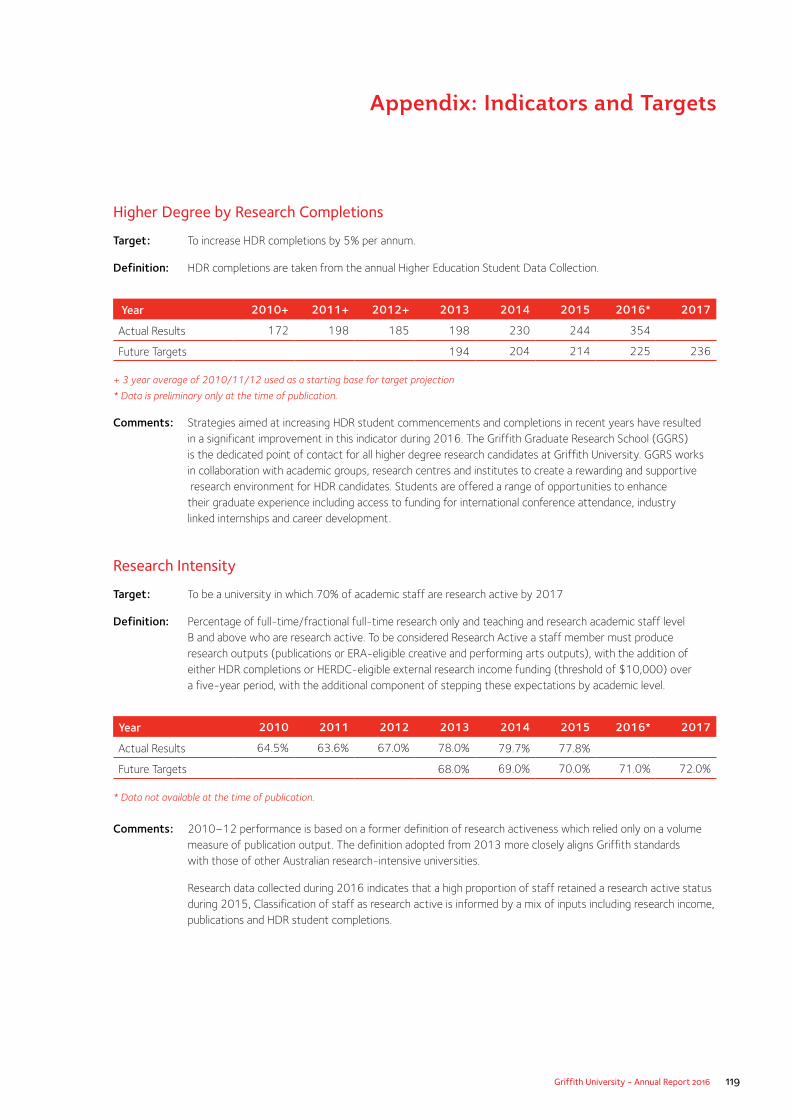
Griffith University - Annual Report 2016 119
Appendix: Indicators and Targets
Higher Degree by Research Completions
Target: To increase HDR completions by 5% per annum.
Definition: HDR completions are taken from the annual Higher Education Student Data Collection.
Year 2010+ 2011+ 2012+ 2013 2014 2015 2016* 2017
Actual Results 172 198 185 198 230 244 354
Future Targets 194 204 214 225 236
+ 3 year average of 2010/11/12 used as a starting base for target projection
* Data is preliminary only at the time of publication.
Comments: Strategies aimed at increasing HDR student commencements and completions in recent years have resulted in a significant improvement in this indicator during 2016. The Griffith Graduate Research School (GGRS) is the dedicated point of contact for all higher degree research candidates at Griffith University. GGRS works in collaboration with academic groups, research centres and institutes to create a rewarding and supportive research environment for HDR candidates. Students are offered a range of opportunities to enhance their graduate experience including access to funding for international conference attendance, industry linked internships and career development.
Research Intensity
Target: To be a university in which 70% of academic staff are research active by 2017
Definition: Percentage of full-time/fractional full-time research only and teaching and research academic staff level B and above who are research active. To be considered Research Active a staff member must produce research outputs (publications or ERA-eligible creative and performing arts outputs), with the addition of either HDR completions or HERDC-eligible external research income funding (threshold of $10,000) over a five-year period, with the additional component of stepping these expectations by academic level.
Year 2010 2011 2012 2013 2014 2015 2016* 2017
Actual Results 64.5% 63.6% 67.0% 78.0% 79.7% 77.8%
Future Targets 68.0% 69.0% 70.0% 71.0% 72.0%
* Data not available at the time of publication.
Comments: 2010–12 performance is based on a former definition of research activeness which relied only on a volume
measure of publication output. The definition adopted from 2013 more closely aligns Griffith standards with those of other Australian research-intensive universities.
Research data collected during 2016 indicates that a high proportion of staff retained a research active status during 2015, Classification of staff as research active is informed by a mix of inputs including research income, publications and HDR student completions.
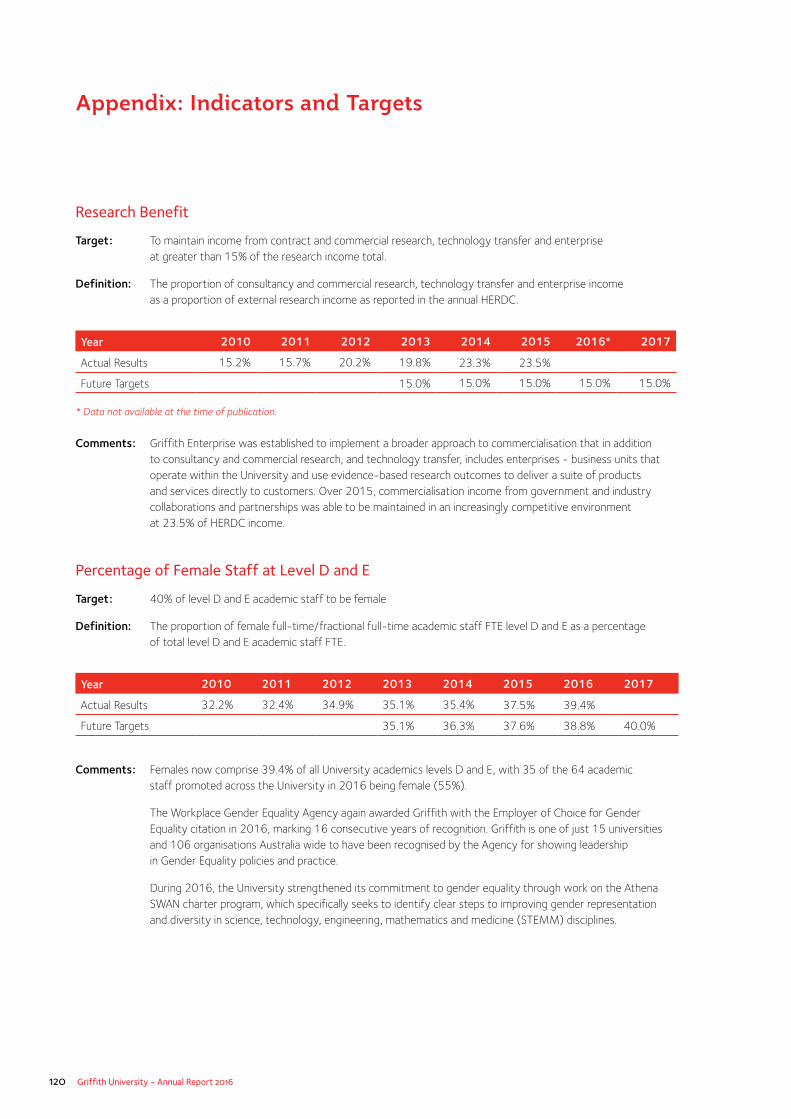
120 Griffith University - Annual Report 2016
Research Benefit
Target: To maintain income from contract and commercial research, technology transfer and enterprise at greater than 15% of the research income total.
Definition: The proportion of consultancy and commercial research, technology transfer and enterprise income as a proportion of external research income as reported in the annual HERDC.
Year 2010 2011 2012 2013 2014 2015 2016* 2017
Actual Results 15.2% 15.7% 20.2% 19.8% 23.3% 23.5%
Future Targets 15.0% 15.0% 15.0% 15.0% 15.0%
* Data not available at the time of publication.
Comments: Griffith Enterprise was established to implement a broader approach to commercialisation that in addition
to consultancy and commercial research, and technology transfer, includes enterprises - business units that operate within the University and use evidence-based research outcomes to deliver a suite of products and services directly to customers. Over 2015, commercialisation income from government and industry collaborations and partnerships was able to be maintained in an increasingly competitive environment at 23.5% of HERDC income.
Percentage of Female Staff at Level D and E
Target: 40% of level D and E academic staff to be female
Definition: The proportion of female full-time/fractional full-time academic staff FTE level D and E as a percentage of total level D and E academic staff FTE.
Year 2010 2011 2012 2013 2014 2015 2016 2017
Actual Results 32.2% 32.4% 34.9% 35.1% 35.4% 37.5% 39.4%
Future Targets 35.1% 36.3% 37.6% 38.8% 40.0%
Comments: Females now comprise 39.4% of all University academics levels D and E, with 35 of the 64 academic
staff promoted across the University in 2016 being female (55%).
The Workplace Gender Equality Agency again awarded Griffith with the Employer of Choice for Gender Equality citation in 2016, marking 16 consecutive years of recognition. Griffith is one of just 15 universities and 106 organisations Australia wide to have been recognised by the Agency for showing leadership in Gender Equality policies and practice.
During 2016, the University strengthened its commitment to gender equality through work on the Athena SWAN charter program, which specifically seeks to identify clear steps to improving gender representation and diversity in science, technology, engineering, mathematics and medicine (STEMM) disciplines.
Appendix: Indicators and Targets
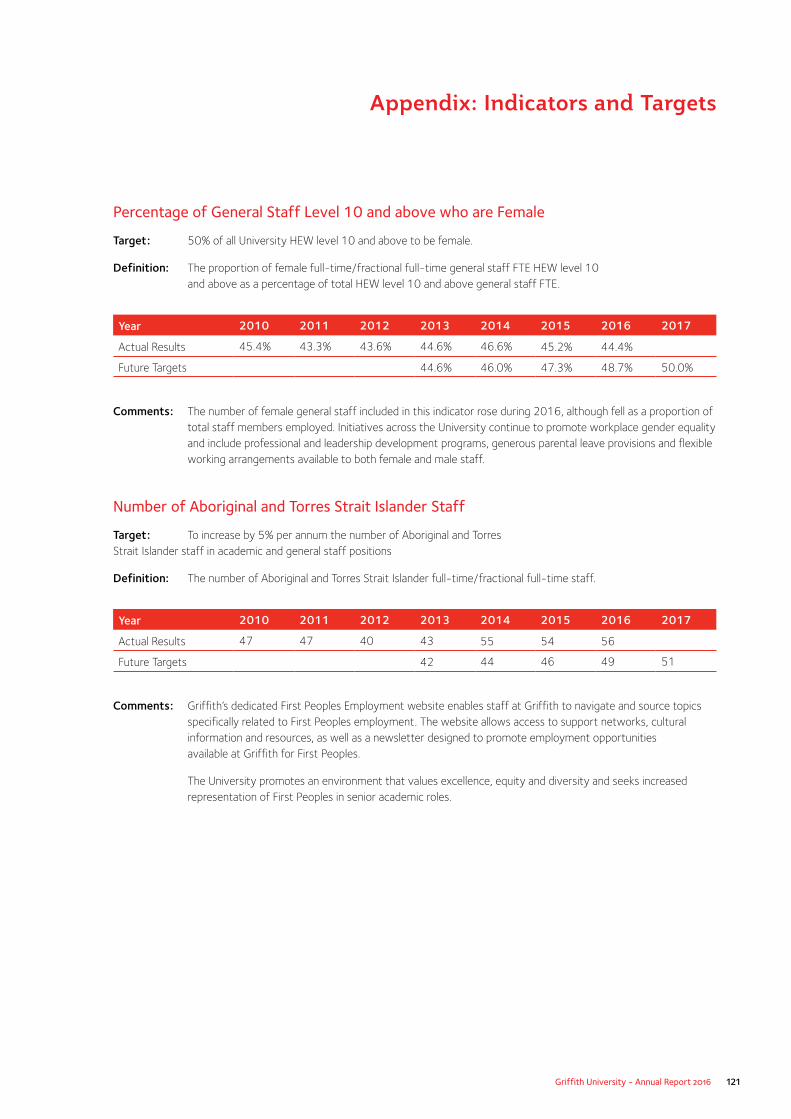
Griffith University - Annual Report 2016 121
Appendix: Indicators and Targets
Percentage of General Staff Level 10 and above who are Female
Target: 50% of all University HEW level 10 and above to be female.
Definition: The proportion of female full-time/fractional full-time general staff FTE HEW level 10 and above as a percentage of total HEW level 10 and above general staff FTE.
Year 2010 2011 2012 2013 2014 2015 2016 2017
Actual Results 45.4% 43.3% 43.6% 44.6% 46.6% 45.2% 44.4%
Future Targets 44.6% 46.0% 47.3% 48.7% 50.0%
Comments: The number of female general staff included in this indicator rose during 2016, although fell as a proportion of
total staff members employed. Initiatives across the University continue to promote workplace gender equality and include professional and leadership development programs, generous parental leave provisions and flexible working arrangements available to both female and male staff.
Number of Aboriginal and Torres Strait Islander Staff
Target: To increase by 5% per annum the number of Aboriginal and Torres Strait Islander staff in academic and general staff positions
Definition: The number of Aboriginal and Torres Strait Islander full-time/fractional full-time staff.
Year 2010 2011 2012 2013 2014 2015 2016 2017
Actual Results 47 47 40 43 55 54 56
Future Targets 42 44 46 49 51
Comments: Griffith’s dedicated First Peoples Employment website enables staff at Griffith to navigate and source topics
specifically related to First Peoples employment. The website allows access to support networks, cultural information and resources, as well as a newsletter designed to promote employment opportunities available at Griffith for First Peoples.
The University promotes an environment that values excellence, equity and diversity and seeks increased representation of First Peoples in senior academic roles.
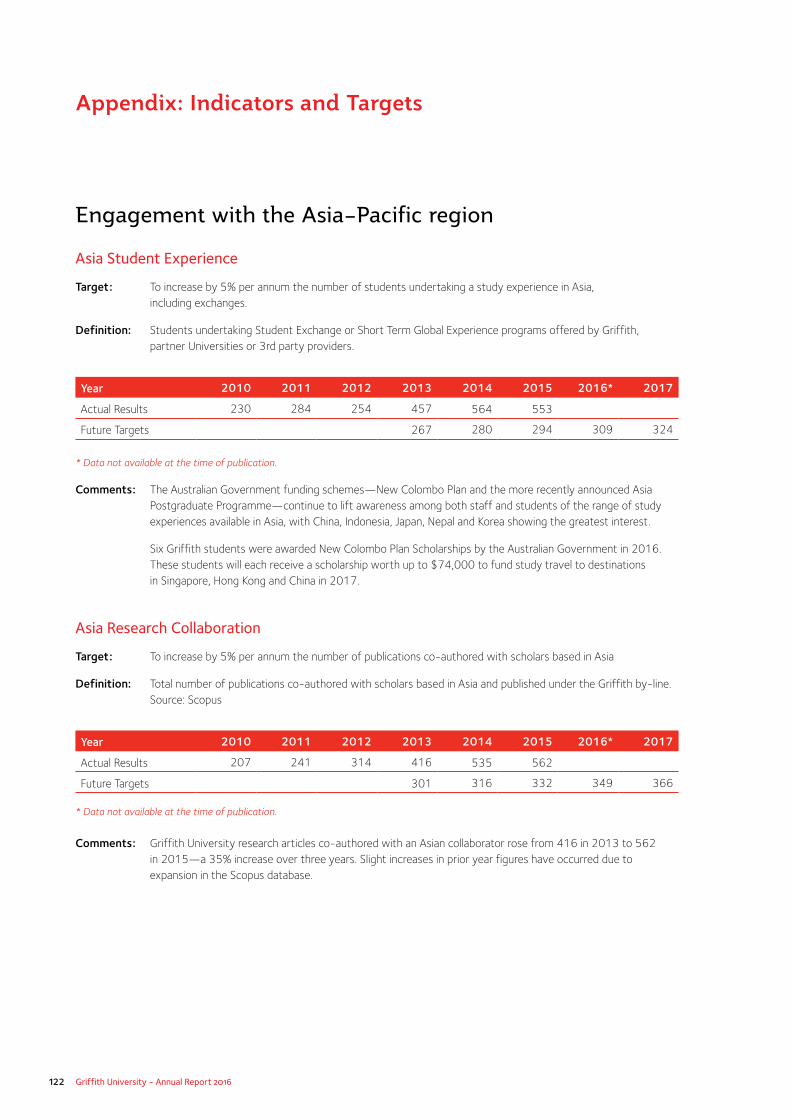
122 Griffith University - Annual Report 2016
Engagement with the Asia–Pacific region
Asia Student Experience
Target: To increase by 5% per annum the number of students undertaking a study experience in Asia, including exchanges.
Definition: Students undertaking Student Exchange or Short Term Global Experience programs offered by Griffith, partner Universities or 3rd party providers.
Year 2010 2011 2012 2013 2014 2015 2016* 2017
Actual Results 230 284 254 457 564 553
Future Targets 267 280 294 309 324 * Data not available at the time of publication.
Comments: The Australian Government funding schemes—New Colombo Plan and the more recently announced Asia Postgraduate Programme—continue to lift awareness among both staff and students of the range of study experiences available in Asia, with China, Indonesia, Japan, Nepal and Korea showing the greatest interest.
Six Griffith students were awarded New Colombo Plan Scholarships by the Australian Government in 2016. These students will each receive a scholarship worth up to $74,000 to fund study travel to destinations in Singapore, Hong Kong and China in 2017.
Asia Research Collaboration
Target: To increase by 5% per annum the number of publications co-authored with scholars based in Asia
Definition: Total number of publications co-authored with scholars based in Asia and published under the Griffith by-line. Source: Scopus
Year 2010 2011 2012 2013 2014 2015 2016* 2017
Actual Results 207 241 314 416 535 562
Future Targets 301 316 332 349 366
* Data not available at the time of publication.
Comments: Griffith University research articles co-authored with an Asian collaborator rose from 416 in 2013 to 562
in 2015—a 35% increase over three years. Slight increases in prior year figures have occurred due to expansion in the Scopus database.
Appendix: Indicators and Targets
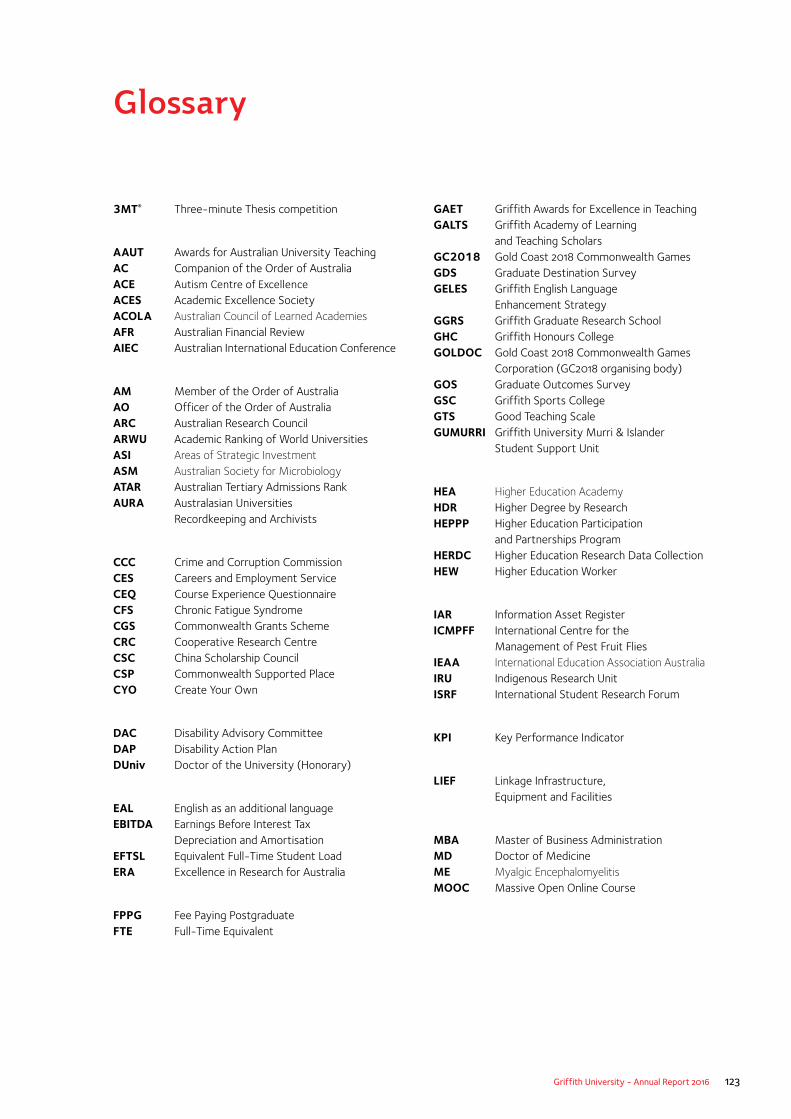
Griffith University - Annual Report 2016 123
3MT® Three-minute Thesis competition
AAUT Awards for Australian University Teaching AC Companion of the Order of Australia ACE Autism Centre of Excellence ACES Academic Excellence Society ACOLA Australian Council of Learned Academies AFR Australian Financial Review AIEC Australian International Education Conference
AM Member of the Order of Australia AO Officer of the Order of Australia ARC Australian Research Council ARWU Academic Ranking of World Universities ASI Areas of Strategic Investment ASM Australian Society for Microbiology ATAR Australian Tertiary Admissions Rank AURA Australasian Universities
Recordkeeping and Archivists
CCC Crime and Corruption Commission CES Careers and Employment Service CEQ Course Experience Questionnaire CFS Chronic Fatigue Syndrome CGS Commonwealth Grants Scheme CRC Cooperative Research Centre CSC China Scholarship Council CSP Commonwealth Supported Place CYO Create Your Own
DAC Disability Advisory Committee DAP Disability Action Plan DUniv Doctor of the University (Honorary)
EAL English as an additional language EBITDA Earnings Before Interest Tax
Depreciation and Amortisation EFTSL Equivalent Full-Time Student Load ERA Excellence in Research for Australia
FPPG Fee Paying Postgraduate FTE Full-Time Equivalent
GAET Griffith Awards for Excellence in Teaching GALTS Griffith Academy of Learning
and Teaching ScholarsGC2018 Gold Coast 2018 Commonwealth Games GDS Graduate Destination Survey GELES Griffith English Language
Enhancement StrategyGGRS Griffith Graduate Research School GHC Griffith Honours College GOLDOC Gold Coast 2018 Commonwealth Games
Corporation (GC2018 organising body)GOS Graduate Outcomes Survey GSC Griffith Sports College GTS Good Teaching Scale GUMURRI Griffith University Murri & Islander
Student Support Unit
HEA Higher Education Academy HDR Higher Degree by Research HEPPP Higher Education Participation
and Partnerships ProgramHERDC Higher Education Research Data Collection HEW Higher Education Worker
IAR Information Asset Register ICMPFF International Centre for the
Management of Pest Fruit Flies IEAA International Education Association Australia IRU Indigenous Research Unit ISRF International Student Research Forum
KPI Key Performance Indicator
LIEF Linkage Infrastructure,
Equipment and Facilities
MBA Master of Business Administration MD Doctor of Medicine ME Myalgic Encephalomyelitis MOOC Massive Open Online Course
Glossary

124 Griffith University - Annual Report 2016
Glossary
NAIDOC National Aborigines and Islanders Day Observance Committee
NCNED National Centre For Neuroimmunology and Emerging Diseases
NHMRC National Health and Medical Research Council
OAM Medal of the Order of Australia OLT Office for Learning and Teaching OP Overall Position—a number (1 to 25) that
indicates a Year 12 student’s statewide rank-orderposition, based on overall achievement in Board subjects
OSI Overall Satisfaction Index OUA Open Universities Australia
PELE Postgraduate English Language Enhancement PDCE Professional Development and
Community Engagement PhD Doctor of Philosophy PNG Papua New Guinea PuP Parents Under Pressure
QAO Queensland Audit Office QIBT Queensland Institute of
Business and TechnologyQILT Quality Indicators for Learning and Teaching QS World University Rankings Since 2004,
Quacquarelli Symonds Limited has produced world university rankings for students and academics
RCHE Research Centre of Human Evolution RIMPA Records and Information Management
Professionals Association of AustralasiaRSP Research Support Programme RTP Research Training Programme
SEC Student Experience of Courses SEIFA Socio-Economic Indexes for Areas SES Socio-economic Status SMEs small to medium enterprises SSVF Simplified Student Visa Framework STEMM Science, technology, engineering,
mathematics and medicine disciplines
TEQSA Tertiary Education Quality
and Standards Agency
UCAS University of Chinese Academy of Sciences URAP University Ranking by Academic Performance
WIL Work-integrated learning WiT Women in Technology

Griffith University - Annual Report 2016 125
Gold CoastParklands Drive Southport Qld 4222 Telephone: +61 7 5552 8800
LoganUniversity Drive Meadowbrook Qld 4131 Telephone: +61 7 3735 7111
Mt GravattMessines Ridge Road Mt Gravatt Qld 4122 Telephone: +61 7 3735 7111
Nathan170 Kessels Road Nathan Qld 4111 Telephone: +61 7 3735 7111
South Bank Queensland College of Art Griffith Film School Griffith Graduate Centre 226 Grey Street South Bank Qld 4101 Telephone: +61 7 3735 3112 Queensland Conservatorium 140 Grey Street South Bank Qld 4101 Telephone: +61 7 3735 7111
Campus Locations
Annual Report 2016 produced by: Office of Marketing and Communications Gold Coast campus, Griffith University Parklands Drive Southport Qld 4222 Australia Telephone: +61 7 5552 7846
Availability of Report The Annual Report 2016 is available at griffith.edu.au/annual-report
Like us on facebook.com/griffithuniversity
Follow us on linkedin.com/company/griffith-university
Follow us on twitter.com/griffith-uni
Watch us on youtube.com/user/griffithuniversity
Follow us on instagram.com/griffithuniversity
Find us on iTunesU Griffith University
Join us on flickr.com/groups/griffithuniversity
© 2017 Griffith UniversityISSN: 0311 1075 CRICOS No. 00233E
griffith.edu.au
Griffith U
niversity Annual Report 2
01
6 ISSN
: 0311 10
75 CRICO
S No. 0
0233E