annual report 2016 - handelsbankenfile/shyp_annual_report_2016.pdf · the level of investment in...
TRANSCRIPT

Annual Report
2016
– a Handelsbanken company

IV STADSHYPOTEK | ANNUAL REPORT 2016
Highlights of the year
Income totalled SEK 12,415 million (11,779).
Operating profit increased by SEK 650 million to SEK 11,366 million (10,716).
Net loan losses totalled SEK -2 million (2).
Profit after tax amounted to SEK 8,857 million (8,322).
Loans to the public grew by 6 per cent, or SEK 68 billion, to SEK 1,151 billion (1,083).
Expenses before loan losses decreased by SEK 18 million and amounted to SEK -1,047 million (-1,065).
PUBLICATION DATE FOR INTERIM REPORTJanuary–June 18 July 2017

11
THE CHIEF EXECUTIVE’S COMMENTS 2
ADMINISTRATION REPORT
Five-year overview 4
Organisation, sustainability and employees 5
Corporate governance report 7
Lending 10
Funding 12
Performance and financial position 14
FINANCIAL REPORTS
Income statement and Statement of comprehensive income 16
Balance sheet 17
Statement of changes in equity 18
Cash flow statement 19
Notes 20
SIGNATURES OF THE BOARD AND THE CHIEF EXECUTIVE 54
AUDITOR’S REPORT 55
STADSHYPOTEK’S BOND TABLES 58
CALCULATION OF KEY FIGURES 59
DEFINITIONS 60
FACTS ABOUT THE COMPANY 61
Contents
The pages in the Annual Report which are part of the administration report are marked separately.
Stadshypotek AB (publ) Corporate identity number: 556459-6715 Registered office: Stockholm www.stadshypotek.se
This Annual Report is also available in Swedish.

2 STADSHYPOTEK | ANNUAL REPORT 2016
THE CHIEF EXECUTIVE'S COMMENTS
THE PAST YEARIn 2016, the Swedish property market has remained in focus, mainly owing to rising prop-erty prices and the housing shortage. The basic explanation for high housing prices in Sweden is that demand is outstripping supply. Although the level of investment in construction projects has been high in recent years, there is still a con-siderable housing shortage, particularly in major cities. The sharp rise in Sweden’s population in recent years has added to the problem, and will continue to do so. The buoyant demand for properties, coupled with continuing price increases, meant another year of strong growth for the Swedish mortgage market in 2016.
Over time, this substantial growth in mort-gages has also led to a rapid increase in house-hold debt ratios in recent years. Meanwhile, the payment capacity of Swedish households has remained strong, as the result of high increases in real wage levels, low inflation, low interest rates and earlier tax cuts. In addition, household savings ratios are generally high, both from a historical perspective and by international stan-dards. According to Handelsbanken’s current forecast, interest rates are expected to remain at historically low levels until the spring of 2018.
The amortisation requirement introduced in Sweden as of 1 June 2016 appears to have only had a marginal effect on the housing market in macroeconomic terms. It is, however, difficult to judge whether this will subdue the demand for properties – and accordingly price trends – to a greater extent in the longer term. A healthy rate of repayment is good, both for society in general and for individual households. It creates a buffer that helps households cope with a possible decline in property prices.
BOOSTING CONSUMER PROTECTION IN THE MORTGAGE MARKETOn 1 January 2017, the EU’s Mortgage Credit Directive was implemented in Swedish legisla-tion. This has generated a considerable amount of work in 2016 in order to make the necessary adjustments to comply with the requirements. The purpose of the Directive is to create a more open and efficient credit market for mortgage loans within the EU, thus further reinforcing protection for consumers and safeguarding financial stability in the market. In Sweden, there have also been calls to promote a healthy cul-ture of amortisation, regardless of loan-to-value (LTV) ratio, and to adopt a more open approach with regards to information about interest rates. Moreover, all bank employees who work with mortgage loans are to be required to sit an exam organised by SwedSec in order to obtain a licence.
The changes that will be most noticeable to customers are those concerning new mort-gages. In future, customers will receive specific information about an offering and its terms and conditions in the form of a fact sheet and a doc-ument that summarises the Bank’s offering with details of matters such as the interest rate fixing periods chosen, the interest rate offered and the loan amount. Customers will also receive a pro-posal for an individual amortisation plan, regard-less of the property’s loan-to-value ratio, which demonstrates how amortisation affects debt levels and the cost of interest from a long-term perspective.
MARKET FUNDINGThe market has been characterised by falling interest rates and the continuing buying of bonds by both the European Central Bank (ECB) and the Swedish Riksbank. However, since the US elections, interest rates have risen and we have also witnessed an interest rate hike
by the Federal Reserve. In 2016, Stadshypotek continued to enjoy good access to market fund-ing. The Swedish market for covered bonds remained our most important source of funding, with Stadshypotek making issues of around SEK 112 billion. We have also been active in the international capital market, completing three euro transactions. These included our first issue using the Finnish cover pool as collateral. There was considerable interest in this and we issued EUR 500 million for 10 years at a rate of 0.13 per cent. This means that Stadshypotek now has three active pools for covered bonds: in Sweden, Norway and Finland. The last two of these are used to finance Stadshypotek’s oper-ations in the countries concerned. During the year, we also received a preliminary AAA rating for a Danish pool for covered bonds.
CUSTOMER SATISFACTIONIn the 2016 survey carried out by Swedish Quality Index (SKI), Handelsbanken once again had the most satisfied mortgage loan customers of all the major banks. For property finance in the corporate market, Handels-banken received a very high rating. For both the private and corporate markets, we received high ratings regarding the Bank’s image. This suggests, among other things, that there is a clear perception that we care about our cus-tomers and that it is easy to have a mortgage with us. A personal meeting with our expert advisers offers considerable added value and this obviously applies equally to private cus-tomers and corporate customers alike. I am very pleased to see that we once again received a high rating this year. Throughout 2016, we continued to develop our offering to mortgage loan customers, resulting in customer benefits in the form of personal meetings at branches and the range of digital services offered.
The Chief Executive’s commentsThe growth rate for mortgage loans in Sweden remained high throughout 2016, albeit slightly lower than the previous year. Stadshypotek grew in line with the market, at a rate of around 7.5 per cent, and was thus able to defend its market position in Sweden. The rate of growth in the corporate market in Sweden dropped to around 4 per cent in 2016, compared to around 7 per cent in 2015. Stadshypotek’s volumes for the corporate market in Sweden rose marginally in 2016. In other countries where Stadshypotek has branches – Denmark, Norway and Finland – growth in lending varied.

STADSHYPOTEK | ANNUAL REPORT 2016 3
THE CHIEF EXECUTIVE'S COMMENTS
FINANCIAL PERFORMANCE IN 2016 During the year, our operating profit increased by 6.1 per cent, or SEK 650 million, to SEK 11,366 million. This increase was primarily attributable to net interest income in Sweden and mainly the result of higher lending volumes to the private market. The profit at our Danish branch increased by 27 per cent to SEK 320 million, as the result of higher lending volumes to the private market. At our branches in Norway and Finland, profits declined as the result of shrinking margins. Our expenses decreased by SEK 18 million to SEK 1,047 million, mainly due to a lower level of compensation paid to Handels-banken for the services performed by its branch operations on behalf of Stadshypotek.
CREDIT RISKS REMAIN LOW Stadshypotek’s net loan losses for the year totalled SEK 2 million, compared to the previous year, when recoveries exceeded new loan losses and the net amount recovered totalled SEK 2 million.
Stadshypotek’s lending operations are inte-grated with Handelsbanken’s operations and its lending is carried out via the Bank’s branch network. Handelsbanken’s decentralised ways of working, combined with reliable knowledge of local market conditions and proximity to the customer, regardless of where Stads hypotek/Handelsbanken is operating, are factors which continue to contribute positively to the low level of credit risk. Of all credit exposures at Stads-hypotek at the year-end, 99 per cent were to customers with an estimated repayment cap acity categorised as normal or better than normal. The proportion of impaired loans was very low, at 0.01 per cent. In summary, Stads-hypotek’s credit portfolio remains strong.
Ulrica Stolt Kirkegaard Stockholm, February 2017

ADMINISTRATION REPORT
4 STADSHYPOTEK | ANNUAL REPORT 2016
Key figures 2016 2015 2014 2013 2012
Profit before loan losses, SEK m 11,368 10,714 8,719 8,118 7,907
Loan losses/recoveries, SEK m -2 2 22 -22 -21
Operating profit, SEK m 11,366 10,716 8,741 8,096 7,886
Total assets, SEK m 1,187,525 1,116,431 1,058,857 984,659 925,961
Equity, SEK m 33,018 32,616 32,368 26,723 25,940
Return on equity, % 24.4 24.2 20.9 20.3 19.6
C/I ratio before loan losses, % 8.4 9.0 14.9 14.5 3.5
C/I ratio after loan losses, % 8.4 9.0 14.6 14.7 3.8
Net interest margin, % 1.07 1.08 1.00 0.99 0.89
Loan loss ratio, % 0.00 -0.00 -0.00 0.00 0.00
Reserve ratio for impaired loans, % 31.2 29.6 24.4 17.0 35.4
Proportion of impaired loans, % 0.01 0.01 0.01 0.02 0.01
Total capital ratio, %1 67.4 67.8 67.1 62.3 56.9
Tier 1 ratio, % 1 39.2 43.1 42.4 41.2 40.6
Common equity tier 1 ratio, % 39.2 40.2 39.0
Return on total assets, % 0.77 0.76 0.66 0.66 0.64
Average number of employees 78 77 72 69 45
1 Capital ratio and tier 1 ratio according to Basel II up to and including 2013.
Five-year overview
Income statementsSEK m 2016 2015 2014 2013 2012
Interest income 20,295 21,884 26,946 29,023 32,163
Interest expense -7,933 -10,128 -16,706 -19,592 -24,111
Net interest income 12,362 11,756 10,240 9,431 8,052
Net fee and commission income -29 -6 -7 -5 -7
Net gains/losses on financial transactions 82 29 7 70 150
Total income 12,415 11,779 10,240 9,496 8,195
Expenses -1,047 -1,065 -1,521 -1,378 -288
Profit before loan losses 11,368 10,714 8,719 8,118 7,907
Loan losses -2 2 22 -22 -21
Operating profit 11,366 10,716 8,741 8,096 7,886
Taxes -2,509 -2,394 -1,968 -1,805 -2,085
Profit for the year 8,857 8,322 6,773 6,291 5,801
Balance sheetsSEK m, 31 December 2016 2015 2014 2013 2012
Assets
Loans to credit institutions 12,027 10,516 10,148 7,966 5,758
Loans to the public 1,150,611 1,082,659 1,018,533 955,251 891,200
Value change of interest-hedged item in portfolio hedge 35 28 70 96 5,271
Derivative instruments 22,746 20,514 24,960 15,235 20,708
Other assets 2,106 2,714 5,146 6,111 3,024
Total assets 1,187,525 1,116,431 1,058,857 984,659 925,961
Liabilities and equity
Due to credit institutions 497,110 472,238 405,074 337,097 286,294
Issued securities 612,787 568,416 579,485 572,746 565,865
Derivative instruments 4,429 4,145 4,063 8,186 11,988
Other liabilities 18,481 18,316 17,167 18,707 19,174
Subordinated liabilities 21,700 20,700 20,700 21,200 16,700
Equity 33,018 32,616 32,368 26,723 25,940
Total liabilities and equity 1,187,525 1,116,431 1,058,857 984,659 925,961
For definitions and calculation of key figures, see pages 59 and 60.

ADMINISTRATION REPORT
STADSHYPOTEK | ANNUAL REPORT 2016 5
Organisation, sustainability and employeesStadshypotek AB (publ), corporate identity number 556459-6715, is a public credit market company authorised to conduct operations under the Swedish Banking and Financing Business Act. Its core business comprises the financing of residential property and also office and commercial buildings. Since 1997, the company has been a wholly owned subsidiary of Svenska Handelsbanken AB (publ), corporate identity number 502007-7862.
ORGANISATIONStadshypotek AB is responsible for Handels-banken’s mortgage business in Sweden, Denmark, Finland and Norway. In Sweden, the business comprises the financing of residential property and also office and commercial build-ings. The business operations of Stadshypotek’s branches in Denmark, Finland and Norway focus primarily on the financing of residential property.
INTEGRATION WITH HANDELSBANKENThe business operations of Stadshypotek are highly decentralised. The basic principle is that the organisation and working practices are cen-tred around Handelsbanken’s branch offices, which are responsible for all the business of individual customers. One consequence of this approach is that Stadshypotek’s lending opera-tions in Sweden are run via Handelsbanken’s Swedish branch operations, while the lending operations at Stadshypotek’s branches in Denmark, Finland and Norway are run via Handelsbanken’s branch operations in each of the respective countries. Stadshypotek’s treasury function is integrated with Handels-banken’s Treasury Department. A collaboration agreement regulates the overall relationship between the parties and individual outsourcing agreements specify the services which Handels banken is to perform on behalf of Stadshypotek. Handelsbanken’s decentralised method of working has been successfully applied since Handelsbanken’s acquisition of the company in 1997.
SUSTAINABILITYSustainability is completely integrated into Stads-hypotek’s corporate culture and working methods, and the principles are established in the Sustain-ability policy and Policy for ethical standards which are decided by Stadshypotek’s Board.
International initiatives and guidelines with the common aim of encouraging and facilitating cor-porate sustainability must guide Stadshypotek’s work in this field.
Such initiatives and guidelines include the UN Global Compact, the OECD Guidelines for
Multinational Enterprises, the UN Environment Programme Finance Initiative (UNEP FI), the UN Principles for Responsible Investment (PRI), the UN Guiding Principles on Business and Human Rights and the International Labour Organiza-tion’s core conventions.
EnvironmentAccording to Stadshypotek, integrating environ-mental aspects into operations is a basic premise of long-term value creation. Thus environmental efforts are a natural part of operations, with the company taking responsibility for contributing to long-term sustainable development and seeking to minimise its environmental impact.
Stadshypotek must strive to minimise its indi-rect impact on the environment, for example through its lending and investment. This can be achieved with long-term sustainable business decisions in which environmental factors are taken into consideration.
PERSONNELIn 2016, the average number of employees at Stadshypotek was 78 (77). Of these, 46 per cent (47) were women and 54 per cent (53) were men. Stadshypotek’s branches in Finland and Norway have no employees. They buy all services from Handelsbanken’s branch in each of the respective countries. At Stadshypotek’s branch in Denmark, three people work part-time and, in addition, administrative services are purchased from Handelsbanken’s branch in Denmark. The heads of Handelsbanken’s regional banks in Denmark, Finland and Norway also represent Stadshypotek’s branches in each of the respective countries.
Staff developmentThe decentralised way of working adopted by the parent company Handelsbanken also applies to the employees at Stadshypotek. The Handelsbanken Group’s strength is derived from the combined expertise of its employees. The most important source of increased profes-sionalism is learning in your daily work, where all employees are responsible for constant
development – their own and that of the opera-tions. All employees participate in their own unit’s business planning every year. After that, individual competency mapping, planning dialogues and performance reviews are carried out, linking business goals with the goals of individual employees. Each employee then puts together an action plan setting out the goals to be attained and the conditions necessary for this. Based on the action plan and follow-ups, all employees then have a salary dialogue review with their line manager at the end of the year.
Stadshypotek is part of the Handelsbanken Group’s internal labour market. The strong cor-porate culture and the Handelsbanken Group’s values are crucial to the success of operations, so internal recruitment is important. Internal mobility spreads the working methods, exchange of experience and corporate culture throughout the Handelsbanken Group. Employ-ees with many years’ experience and extensive knowledge acquired from different parts of the Handelsbanken Group make a vital contribution to the Group having satisfied customers. Stads-hypotek’s need for employees in various posi-tions is primarily met through internal recruit-ment within the Handelsbanken Group. Managers must be exemplary ambassadors for the Bank’s corporate culture, which explains why most managers are recruited internally.
Gender equality and diversityWork to promote gender equality, diversity and an inclusive corporate culture is a fundamental part of the Handelsbanken Group’s core values. At Stadshypotek, women and men must have the same opportunities to develop. Regardless of background, the staff have their own charac-teristics and strengths and their own way of expressing themselves as individuals. No type of discrimination is allowed at Stadshypotek. Stadshypotek works continuously for gender equality and diversity, which is vital for being able to attract and retain competent employees. A prioritised element of the work related to equality is increasing awareness of how social and cultural norms affect us in our daily lives.

ADMINISTRATION REPORT
6 STADSHYPOTEK | ANNUAL REPORT 2016
Work environment and healthThe overall, long-term goal of work environment efforts is for the employees to enjoy good health, to develop on a personal level and to function in an optimal way. Many different factors influence this goal. A work environment survey is carried out at least once a year by managers, together with work environment representatives and employees, covering the physical and the psychosocial working environment as well as gender equality, diversity and an inclusive corporate culture. The results form the basis of a work environment plan which is integrated with the unit’s business plan and in this way becomes a natural part of how the operation develops. Stadshypotek also follows up the sickness absence rate figures, as well as reported incidents.
OKTOGONEN – THE HANDELSBANKEN GROUP’S PROFIT-SHARING SCHEMEStadshypotek’s employees are covered by the Handelsbanken Group’s profit-sharing scheme. Allocations to the profit-sharing scheme are subject to the Handelsbanken Group achieving its goal of better profitability than the average of peer banks in its home markets. All employees receive an equal part of the allocated amount, regardless of their position or duties. Payments can start to be made in the year the holder reaches the age of 60.

ADMINISTRATION REPORT
STADSHYPOTEK | ANNUAL REPORT 2016 7
Corporate governance report
The shareholders ultimately make the decisions about Stadshypotek’s governance. At the annual general meeting, the shareholders appoint the Board and the auditors. The Board is responsible to the owners for the company’s organisation and management of the company’s affairs, and it appoints a Chief Executive to run the company’s operating activities. The auditors examine the financial reporting, among other matters, and submit an auditor's report.
BOARD AND CHIEF EXECUTIVEThe Board is to continuously assess the com-pany’s financial situation and ensure that Stads-hypotek is organised such that the accounting records, management of funds and other aspects of the company’s financial circum-stances are satisfactorily controlled. The Board establishes policies and instructions on how this should be done and establishes rules of procedure for the Board and also instructions for the Chief Executive.
The fundamental rules regarding the allocation of responsibilities among the Board, the Chair-man and the Chief Executive are manifested in the Board’s rules of procedure, as well as in its instructions to the Chief Executive.
Chairman of the BoardThe Board’s rules of procedure state that the Chairman shall ensure that the Board carries out its work efficiently and that it fulfils its duties. This involves organising and managing the Board’s work and creating the best possible conditions for this work. The Chairman must also ensure that the Board members continually update and expand their knowledge of Stads-hypotek, and that new members receive an appropriate introduction and training. The Chairman must be available to the Chief Execu-tive as an advisor and discussion partner, but must also prepare the Board’s evaluation of the Chief Executive's work. In addition, the Chair-man is responsible for ensuring that the Board’s work is evaluated annually. The Chairman is also responsible for contacts with the owner on ownership matters and for conveying points of view from the owner to the Board.
Board membersThe members of the Board have broad and extensive experience of banking and finance, and several members have worked on Stads-hypotek’s Board for a long time and are very familiar with the company’s operations.
During the year, the Board convened 17 times, of which nine times by correspondence.
At the annual general meeting on 14 March 2016, Stefan Nilsson was elected as a new Board member, while Yonnie Bergqvist, Michael Green, Olof Lindstrand, Ulrica Stolt Kirkegaard
and Michael Bertorp were re-elected as mem-bers until the annual general meeting has been held in 2017. After Yonnie Bergqvist asked to be relieved of his duties as Board member and Chairman on 7 November, the Board elected Stefan Nilsson as new Chairman at the Board meeting held on 11 November 2016. Monica Morén was appointed employee representative by the Financial Sector Union of Sweden.
For information on certain terms of employ-ment for executive officers and on loans to Board members and executive officers, see note 6 on page 33.
COMPANY MANAGEMENT• Ulrica Stolt Kirkegaard, Chief Executive,
employed since 2014• Heléne Boström, Finance, employed
since 2006• Christer Ericsson, Systems Development,
employed since 2006• Heléne Grönberg, Business Development
and Market, Sweden, employed since 2012• Mattias Lidgren, Funding, employed
at Handelsbanken• Yvonne Orre, Credits, employed since 2007 • Ulrika Söderberg, Legal Affairs, employed
since 2015• Lolou Sörenson, HR, employed at
Handelsbanken• Pär Tysk, Branches, Covered Bonds and
Global Product Owner, employed since 2014• Johan Nordström, Property Valuations,
employed 2016.
AUDITORSAt the annual general meeting in 2016, KPMG AB were appointed auditors of Stadshypotek AB until the annual general meeting in 2017. The chief auditor is Anders Bäckström, autho-rised public accountant, Stockholm.
FRAMEWORK FOR CONTROLInternal control for operations Responsibility for internal control has been dele-gated from the Chief Executive to department managers and branch managers who are respon-sible for internal control within their respective units. This responsibility means that the appropri-ate instructions and procedures for the operation
must be in place, and compliance with these procedures must be monitored regularly. The responsibility for internal control is thus an integral part of managerial responsibility at Stadshypotek.
Internal AuditInternal audit operations at Stadshypotek are managed by Group Audit at Handelsbanken in accordance with the collaboration agreement and outsourcing agreements between Stads-hypotek and Handelsbanken. Internal Audit’s assignments are based on an internal auditing policy established by the Board. Each year, the Board determines a plan for the work of the Internal Audit function. Internal Audit must inde-pendently examine Stadshypotek’s operations and reporting and also evaluate and examine the business operation’s processes for risk management, internal governance and control to establish how satisfactory they are. The con-clusions of internal audits, the actions to be taken and their status are reported to the Board.
Compliance The Compliance function must ensure that laws, regulations and internal rules, as well as accepted business practices and standards, are complied with in the operations conducted by Stadshypotek. The function must also assist in drawing up internal rules and provide informa-tion about new and amended rules for opera-tions. The Head of Compliance submits regular reports regarding material observations to the Chief Executive. In addition, the Chief Executive receives a quarterly compliance report and twice a year, a compliance report is submitted to the Board.
Risk ControlRisk Control is responsible for identifying, mea-suring, analysing and reporting all material risks in the business. Risk Control is also responsible for ensuring that the application of measuring methods used for calculating risk utilisation, in accordance with the applicable internal and external regulations, are fit for purpose and accurate. Moreover, Risk Control is responsible for ensuring that the models applied are regu-larly evaluated and that the results of the evaluation are documented.

ADMINISTRATION REPORT
8 STADSHYPOTEK | ANNUAL REPORT 2016
The Head of Risk Control informs the Chief Executive and the Head of Group Risk Control at Handelsbanken of any material observations that could be deemed to involve risk or of any comments from public authorities.
The Head of Risk Control submits a monthly risk report to the Chief Executive and the Head of Group Risk Control at Handelsbanken. These reports are presented to the Board on a quar-terly basis by the Head of Risk Control.
REMUNERATION PRINCIPLESThe principles for Stadshypotek’s system of remuneration are established in a remuneration policy decided by the Board.
Stadshypotek has a long-term view of its staff’s employment. Remuneration varies over an employee’s period of employment with Stads hypotek and good efforts must always be rewarded. The total level of remuneration should help improve Stadshypotek’s competitive posi-tion and profitability so that the company is able to attract, retain and develop skilled employees
and establish a healthy management succes-sion structure.
Stadshypotek has a low risk tolerance in general. This approach is reflected in the com-pany’s view of remuneration. Stadshypotek considers that fixed remuneration contributes to healthy operations and all employees of Stads hypotek therefore only receive a fixed remuneration. There are no exceptions to this principle of a fixed salary.
Remuneration for work performed is set indi-vidually for each employee. Remuneration is paid in the form of a fixed salary, customary salary benefits and a pension provision. Salaries are established locally and are based on factors known in advance: the nature and level of diffi-culty of the work, competencies, performance and results achieved, leadership (for managers who are responsible for the career development of employees), and supply and demand on the market, as well as performance as an ambassa-dor for Stadshypotek’s business culture.
Stadshypotek’s view is that fixed remuneration does not lead to behaviour that gives rise to an increased risk level.
INTERNAL CONTROL REGARDING FINANCIAL REPORTINGThe control environment described above in this corporate governance report is fundamental to Stadshypotek’s internal control of financial reporting.
Risk assessment is another part of the inter-nal control process and comprises identification and management of the risks that may affect financial reporting, as well as the control activi-ties aimed at preventing, detecting and correct-ing deviations.
Risk assessmentThe annual self-evaluations carried out at all departments are an essential part of Stads-hypotek’s risk assessment. Risks related to financial reporting are part of this overall analysis.
NameStefan Nilsson, Chairman
Ulrica Stolt Kirkegaard, Board member
Michael Bertorp, Board member
Education B.A. Business Administration Uppsala UniversityAMP – Harvard
M.A. EconomicsB.A. Business Administration
Law graduate
Year of birth 1957 1968 1949
Other assignments Chairman • Handelsbanken Liv AB• Handelsbanken Fastigheter AB• Handelsbanken Regional Bank The NetherlandsVice Chairman • Handelsbanken Regional Bank Denmark• Handelsbanken Regional Bank Finland• Handelsbanken Regional Bank Norway
Chairman• Setra Group AB Board member • Xact Kapitalförvaltning AB • Idevall & Partners Fonder AB• Maderna Corporate Services AB
Background • Handelsbanken Senior Management 1997– 2006, 2013 –
• 2013 – 2016 Regional Bank Eastern Sweden
• 2008 – 2013 Handelsbanken USA
• 2006 – 2007 Handelsbanken International
• 2002 – 2006 Handelsbanken Pension & Life
• 1997– 2002 Regional Bank Northern Sweden
• 1992 –1997 Regional Bank Central Sweden
• 1988 –1992 Handelsbanken Capital Markets
• Chief Executive Stadshypotek since 2014• 2014 –
Handelsbanken Senior Management• 2014 –
Stadshypotek• 2006 – 2014
Handelsbanken Regional Bank Stockholm• 1998 – 2006
Handelsbanken Markets• 1994 – 1998
Handelsbanken Regional Bank Central Sweden
• 2006 – Legal consultancy business
• 1986 – 2006 SCA
• 1985 – 1986 Sunds Defibrator AB
• 1984 – 1985 SCA
• 1982 – 1984 Ministry of Justice
• 1972 – 1982 Swedish courts
Employed at Handelsbanken since 1980 Employed at Handelsbanken since 1994
Board meeting attendance
11/17 17/17 17/17

ADMINISTRATION REPORT
STADSHYPOTEK | ANNUAL REPORT 2016 9
In a self-evaluation, the employee defines the events that constitute potential risks to the operation and then estimates the probability and consequences of each risk. An action plan is then developed based on the self-evaluation.
Control activitiesVarious control activities are incorporated in the financial reporting process. Reported amounts and analyses of income statements and balance sheets are reconciled and checked regularly within the finance and accounting department.
Heads of finance and accounting at branches are responsible for ensuring that the control activ-ities in the financial reporting for their respective units are fit for purpose; in other words, that they are designed to prevent, detect and correct errors and deviations, and are in compliance with internal guidelines and instructions. At each quarterly closing of accounts, the branches certify that the prescribed periodic checks and reconciliation of accounts have been carried out.
MonitoringInternal Audit, Compliance, Risk Control and the finance and accounting department monitor compliance with internal policies, instructions and other policy documents. The policy estab-lished by the Board for internal audit states that it must examine internal governance and control.
SHAREHOLDERS AND SHAREHOLDERS’ MEETINGRights of shareholders Stadshypotek AB is a wholly owned subsidiary of Svenska Handelsbanken AB (publ). Stads-hypotek’s Articles of Association contain no limitations with regard to the number of votes each shareholder may represent at a share-holders’ meeting.
Every year, a shareholders’ meeting is held which is an annual general meeting where Stads hypotek’s shareholders decide on matters that include the following:• which individuals should be appointed as
members of the Board of the company
• who should be appointed as the company’s auditors
• determining fees to Board members and auditors
• adopting the income statement and balance sheet
• appropriation of profits• whether the Board and Chief Executive are
to be discharged from liability for the past financial year.
The shareholders at a shareholders’ meeting also make decisions regarding possible amend-ments to the company’s Articles of Association.
NameOlof Lindstrand, Board member
Michael Green,Board member
Monica Morén, Employee representative
Education Law graduate Economics programme upper secondary schoolBusiness AdministrationEconomicsLegal studiesContract law and Company law
Upper secondary school
Year of birth 1949 1966 1958
Other assignments Chairman• Xact Kapitalförvaltning ABBoard member• AB Handel och Industri• Ecster AB
Chairman• Handelsbanken InternationalBoard member• Handelsbanken Liv AB• Handelsbanken Fonder AB• Ecster AB• AB Handel och Industri• EFN AB• Swedish-American Chamber of Commerce,
New York (SACC N.Y.)• Financial Competence Centre in Gothenburg• Handelsbanken Regional Bank
Northern Great Britain • Handelsbanken Regional Bank
Southern Great Britain• Handelsbanken Regional Bank
Central Great Britain • Handelsbanken Regional Bank
South West Great Britain• Handelsbanken Regional Bank
North East Great Britain
Board member• Handelsbanken Regional Bank
Central SwedenDeputy Board member• Handelsbanken's Pension Fund• Handelsbanken’s Pension Foundation• Handelsbanken’s Staff Foundation
Background • 2006 – 2011 EVP Handelsbanken
• 2011 – 2015 Handelsbanken Senior Management
• 2005 – 2011 Handelsbanken Central Credit Department
• 2002 – 2005 Handelsbanken Capital Markets
• 2000 – 2002 Handelsbanken Markets
• 1996 – 2000 Handelsbanken Central Development Department
• 1992 – 1996 Handelsbanken Central Credit Department
• 1985 – 1992 Handelsbanken Regional Bank Stockholm City
• 1977 – 1985 Swartlings law firm
• 1974 – 1977 Swedish courts
• EVP Handelsbanken since 2008• 2008 –
Handelsbanken Senior Management• 2015 –2016
Handelsbanken Sweden• 2011 – 2015
Handelsbanken Capital Markets• 2008 – 2011
Handelsbanken Regional Bank Western Sweden
• 2006 – 2007 Handelsbanken USA
• 1994 – 2005 Handelsbanken Regional Bank Western Sweden
• 1986 – 1994 Götabanken
• 1977 – Handelsbanken Regional Bank Central Sweden
Employed at Handelsbanken since 1985 Employed at Handelsbanken since 1994 Employed at Handelsbanken since 1977
Board meeting attendance
17/17 11/17 11/17

ADMINISTRATION REPORT
10 STADSHYPOTEK | ANNUAL REPORT 2016
LendingSTADSHYPOTEK’S ROLE IN HANDELSBANKENIn the Swedish operations of the Handels-banken Group, mortgage finance is conducted principally via Stadshypotek. At Stadshypotek’s branches in Denmark, Finland and Norway, business operations focus primarily on financing residential property. Lending takes place through Handelsbanken’s branch network in the country concerned. As a result of the decen-tralised method of working within the Handels-banken Group, the branches have been dele-gated responsibility for marketing, contact with customers, pricing and processing all mortgage loans. Handelsbanken thus acts as an agent for Stadshypotek, with responsibility for ensuring that credit assessment and collateral valuations are carried out in accordance with the guide-lines approved by Stadshypotek’s Board.
MORTGAGE MARKET IN SWEDENIn 2016, the Swedish mortgage market was characterised by a continued demand for mort-gage loans. Table 1 on page 11 shows mort-gage lending to households with single-family housing or housing co-operative apartments as collateral at year-end and the year-on-year change, as reported by Statistics Sweden.
According to Mäklarstatistik (estate agent statistics), single-family house prices rose by 9 per cent (12) for Sweden as a whole in 2016. Prices of housing co-operative apartments rose by an average of 7 per cent (16) for Sweden as a whole. Continued migration to metropolitan areas, with their limited supply of housing, led to rising prices in these areas. However, the rate of increase in prices has been lower than in previous years in all metropolitan areas. Table 2 on page 11 shows price increases in the Greater Stockholm, Greater Gothenburg and Greater Malmö areas.
CORPORATE MARKET IN SWEDEN The market for lending secured by mortgages to non-financial companies grew by 3.7 per cent during the year, compared with 7.4 per cent in 2015. The lower rate of market growth in percentage terms was entirely attributable to commercial properties. Table 3 on page 11 shows lending secured by mortgages to Swedish non-financial companies as reported by Statistics Sweden, both at year-end and the year-on-year change.
Transaction volumes for commercial proper-ties remained high in 2016. Rents for offices and
commercial premises remained stable during the year. In more attractive market locations, vacancy rates were low. As rental properties, modern office premises generally hold greater appeal than less modern premises, and this is also reflected in the level of rents and vacancies. The required rate of return on residential proper-ties remained low during the year.
MORTGAGE MARKETS IN DENMARK, FINLAND AND NORWAYIn all countries where Stadshypotek has branches, mortgage markets continued to grow in 2016, and housing prices rose. The increase in mortgage lending to households was largest in Norway, where the annual percentage increase was 6.8 per cent. The increase in housing prices was also highest in Norway, with an annual increase of 12.8 per cent. Tables 4 and 5 on page 11 show mortgage lending to households and the trend in housing prices in each country.
BOOSTING CONSUMER PROTECTION IN THE MORTGAGE MARKETOn 1 January 2017, the EU’s Mortgage Credit Directive came into effect. The purpose of the Directive is to create a more open and efficient credit market for mortgage loans within the EU, thus contributing to better protection for con-sumers and safeguarding financial stability in the market. In Sweden, requirements are also being introduced to:• promote a healthy amortisation culture,
which means that all customers will have an individual mortgage amortisation plan, regardless of the loan-to-value ratio.
• increase transparency regarding interest rates when making offers to customers.
For customers, one result of the Directive is new documentation when applying for a mortgage loan. The aim of this is to clarify the loan offer and make it easier for customers to compare different banks’ offers. The individual amortisa-tion plan is intended to show how debt and the cost of interest decrease over time if the cus-tomer chooses a higher level of amortisation than that required by the Swedish Financial Supervisory Authority.
AMORTISATION REQUIREMENTOn 1 June 2016, the Swedish Financial Super-visory Authority’s regulations on amortisation of mortgage loans came into effect. The aim of the
amortisation requirement is to establish a more robust amortisation culture in society and promote balance in the personal finances of individual households.
The amortisation requirement means that, for new mortgage loans with a loan-to-value ratio of 50–70 per cent of the market value, at least 1 per cent of the total amount borrowed must be amortised each year. Mortgage loans with a loan-to-value ratio of more than 70 per cent of the market value must be amortised annually by at least 2 per cent of the total amount of the loan.
Households will amortise based on the new amortisation requirement. Households with a loan-to-value ratio of 50–70 per cent of their home’s market value will experience the biggest change in their amortisation plan.
STADSHYPOTEK’S LENDINGIn 2016, Stadshypotek’s lending volume in Sweden rose by SEK 46.6 billion (57.6). Loans to the private market increased by SEK 46.3 bil-lion (46.9), while loans to the corporate market grew by SEK 0.3 billion (10.7). At year-end, Stadshypotek’s loans to the public in Sweden were SEK 983.3 billion (936.7). Some 68 per cent – SEK 670.7 billion – of Stadshypotek’s loans to the public are to the private market.
The Handelsbanken Group’s market share for loans to Swedish households secured by mortgages on single-family housing or housing co-operative apartments was 22.9 per cent (23.0) at the end of December. According to Statistics Sweden’s statistics, the market com-prises total lending to Swedish households with single-family homes or co-operative apartments as collateral. The market share therefore also includes Handelsbanken’s lending to Swedish households with collateral in single-family hous-ing or co-operative apartments.
At year-end, loans to the public by Stads-hypotek’s branch in Norway totalled NOK 75.4 billion (69.7), with the private market accounting for NOK 58.2 billion (54.0) and the corporate market for NOK 17.2 billion (15.8). Loans to the public by Stadshypotek’s branch in Denmark totalled DKK 28.7 billion (24.0) at year-end, all of which were loans to the private market. At year-end, loans to the public by Stadshypotek’s branch in Finland totalled EUR 5.3 billion (5.3), with the private market accounting for EUR 2.3 billion (2.3) and the corporate market account-ing for EUR 3.0 billion (3.0).

ADMINISTRATION REPORT
STADSHYPOTEK | ANNUAL REPORT 2016 11
Table 4. Mortgage markets in Denmark, Finland and Norway
Mortgage lending to households 1
2016 2015 Change Change, %
Denmark 2, DKK bn 1,506 1,470 36 2.4
Finland 3, EUR bn 94 92 2 2.2
Norway 4, NOK bn 2,524 2,364 160 6.8
Table 3. Corporate market in Sweden
Lending to non-financial companies, SEK bn 31 December
Type of collateral 2016 2015 Change, SEK bn Change, %
Property 952 918 34 3.7
of which multi-family dwellings 674 633 41 6.5
of which housing co- operative associations 416 388 28 7.2
Table 5. Mortgage markets in Denmark, Finland and Norway
Price change 5, % 2016 2015
Denmark 4
– Single-family housing 3.6 5.2
– Owner-occupied apartments 6.9 11.5
Finland 2 3.1 -0.3
Norway 6 12.8 5.0
1 Sources: Denmark – Association of Danish Mortgage Banks, Finland – Bank of Finland, Norway – Statistics Norway2 At 30 September3 At 30 November4 At 31 October5 Sources: Denmark – Statistics Denmark, Finland – Statistics Finland, Norway – Eiendomsverdi6 At 31 December
Table 1. Mortgage market in Sweden
Mortgage lending to households, SEK bn 31 December
Type of collateral 2016 2015 Change, SEK bn Change, %
Single-family housing as collateral 2,001 1,890 111 5.9
Housing co-operative apartment as collateral 901 806 95 11.8
Total 2,902 2,696 206 7.6
Table 2. Mortgage market in Sweden
Price change, % 2016 2015
Single-family housing
Greater Stockholm 6 17
Greater Gothenburg 11 14
Greater Malmö 8 12
Housing co-operative apartments
Greater Stockholm 6 18
Greater Gothenburg 12 18
Greater Malmö 14 12

ADMINISTRATION REPORT
12 STADSHYPOTEK | ANNUAL REPORT 2016
FundingStadshypotek’s treasury function is integrated with Handelsbanken’s Treasury Department. This organisational structure offers the best conditions for using the funding source and instrument offering the lowest funding cost each time funding is carried out. An integrated treasury department has also made it possible to make efficient use of the Handelsbanken Group’s liquidity.
FUNDING INSTRUMENTSStadshypotek raises funds mainly on the Swedish money market and capital market and through the parent company. Foreign markets are also used for the purposes of diversification. The primary source of funding is bonds in Sweden.
Covered bonds are issued in the company’s own name and primarily within the framework of a benchmark loan system aimed at the Swedish institutional market. This means that only a small number of separate bonds are issued, with respective final maturity dates set at intervals of about nine months. Concentrating large volumes into a small number of loans in this manner achieves good market liquidity. At year-end, Stadshypotek had eight outstanding benchmark loans which mature between 2017 and 2022. Stadshypotek’s bonds are arranged by five market makers. The same programme is also used for issues in Norwegian kronor.
International issues of covered bonds are done mainly within a Euro Medium Term Covered Note (EMTCN) programme. The total facility amount of this programme is EUR 20 bil-lion. Issues under this programme are arranged according to agreements signed with 21 banks.
In addition, Stadshypotek has a US Medium Term Covered Bond programme for issues in the US. The total facility amount of this pro-gramme is USD 15 billion. Stadshypotek has reached sales agreements with 13 banks as part of the programme.
Stadshypotek also has a programme for issues in Australia (AMTCN) aimed at Australian and Asian investors.
In addition to the above, Stadshypotek has commercial paper programmes in Sweden and Europe. The ceiling for the Swedish commercial paper programme is SEK 90 billion. The ceiling for the European programme is EUR 4 billion.
Covered bondsCovered bonds are issued on an ongoing basis, by permission of the Swedish Financial Super-visory Authority, under the Covered Bonds (Issuance) Act (2003:1223). Covered bonds are bonds with priority rights to Stadshypotek’s assets (the cover pool assets). These assets
consist of credits and their associated collateral pursuant to the Swedish legislation for such bonds.
Stadshypotek has previously established covered bond pools in Sweden and Norway. In 2016, a cover pool was established in Finland, and the first issue was collateralised by assets in the Finnish pool. All pools have been given the highest possible rating by Moody’s: Aaa. A pre-liminary rating was also issued in respect of the Danish operations. The cover pools consist of collateral as per the legislation mentioned above and include a safety buffer (over collateral, or OC) that exceeds the statutory requirements by a good margin.
The unutilised facilities under the cover pools, including the Danish branch, corresponded to 66 per cent of the nominal debts at 31 Decem-ber 2016. Information about the assets in the cover pools is provided in the tables on page 13.
INTEREST RATE TRENDS The annual average for both long and short Swedish bond yields continued to fall in 2016 compared with 2015. Short bond yields had already turned negative in 2015, and in 2016, longer bond yields, up to five years, also dropped below zero. Early in the year, the Riksbank cut the repo rate again, this time to -0.5 per cent, and continued to buy government bonds.
After the United Kingdom voted to leave the European Union in the referendum held in June, bond yields and stock prices suffered more declines. However, investors decided that, as happened before, increased risks would also mean increased stimulus from central banks, mainly the Bank of England in this case. Thus stock markets recovered quickly. Surprisingly robust economic statistics in the wake of the referendum led to bond yields also rising in the autumn.
Since the US presidential election, markets have concentrated on the prospects of a more expansionary fiscal policy. Fiscal stimulus in the US is expected to create a stronger platform for interest rate hikes by the Federal Reserve and a greater need for funding for the US government. In combination, these factors pushed US bond yields up at the end of the year.
While the Federal Reserve raised its rate for the second time in this cycle, the ECB signalled that purchases of bonds would continue throughout 2017, and the Riksbank has sig-nalled that purchases of government bonds will continue in the first half of 2017. However, further stimulus from central banks in Europe limited the impact of the rise in US rates on European bond yields.
As with interest rates in general, yields on mort-gage bonds declined in 2016. However, this trend was interrupted after the US election in November, when yields on Swedish mortgage bonds rose in line with yields in the US and else-where. Despite this late rally, mortgage bond yields declined substantially in 2016.
FUNDING The integration of Stadshypotek’s Treasury func-tion with Handelsbanken’s Treasury department ensures efficient management of the Handels-banken Group’s liquidity and market funding. Among other things, Handelsbanken’s liquidity surplus is used to finance funding at Stads-hypotek. Liquidity is transferred on a daily basis in the form of overnight loans and lending trans-actions from Handelsbanken to Stadshypotek that involve maturities of up to around one year. In addition, long-term funding in Handels-banken’s name on the international capital market can be passed on to Stadshypotek.
With the aim of reducing liquidity risk, short-term funding is augmented by long-term fund-ing, which is adjusted using swap agreements so that the interest fixing period matches the maturity of lending. Thus, Stadshypotek has good diversification of its funding with respect to both geographical markets and maturity.
Lending with long-term rate fixing has mainly been financed in Stadshypotek’s own name in Sweden through the issue of covered bonds. Stadshypotek also has international long-term funding in its own name through international funding programmes.
Stadshypotek uses swap agreements to reduce interest rate and currency risks in con-nection with funding. The use of derivatives increases flexibility in connection with the funding. Thus, funding can be carried out when market conditions are favourable, without exposing the company to interest rate and currency risks.
At the end of the year, interest rate swap agreements in which fixed interest is received totalled SEK 232.2 billion (208.9), while interest rate swap agreements paying fixed interest amounted to SEK 25.0 billion (11.5). The issued volume of bonds from Stadshypotek’s bench-mark series during the year was SEK 112.7 bil-lion (112.8). During the year, a nominal volume totalling SEK 82.7 billion (115.3) matured or was repurchased. The carrying amount of the out-standing benchmark loans was SEK 408.1 billion (385.6) at year-end.
Sales of bonds from the EMTCN programme totalled the equivalent of approximately EUR 2.75 billion (1.25). The outstanding volume at year-end was the equivalent of around EUR 11.0 billion (9.1).

ADMINISTRATION REPORT
STADSHYPOTEK | ANNUAL REPORT 2016 13
At 31 December 2016, the cover pool assets, categorised by type of collateral, were as follows:
Type of collateral Sweden Norway Denmark Finland Total
Public 10,526 16,256 26,782
Single-family housing 400,843 41,284 23,500 9,672 475,299
Second homes 20,102 1,710 2,686 935 25,433
Rental properties 214,706 16,090 9,639 240,435
Housing co-operative apartments, units 191,416 4,474 11 195,901
Owner-occupied apartments 10,423 4,140 14,563
Housing company shares – apartments 595 6,663 7,258
Housing company shares – houses 4,224 4,224
Commercial/Offices 35,273 99 35,372
Agricultural 28,989 535 14 27 29,565
Residential farms 16 486 502
Other 1,007 46 1,053
Total 902,862 75,226 30,826 47,473 1,056,387
Stadshypotek’s funding31 DecemberSEK bn
2016 2015
Carryingamount
Share, %
Carryingamount
Share, % Change
Funding from the parent company 518.8 45.9 493.0 46.4 25.8
of which subordinated liabilities 21.7 - 20.7 - 1.0
Commercial paper - - - -
Covered bonds, SEK 443.0 39.1 421.1 39.7 21.9
of which repos 0.0 - 0.3 - -0.3
Covered bonds, other currencies 169.8 15.0 146.4 13.8 23.4
Commercial paper – ECP - - 0.9 0.1 -0.9
Total 1,131.6 100.0 1,061.4 100.0 70.2
In Norway, a total of NOK 10.2 billion (1.5) was issued. The outstanding volume at year-end was NOK 27.0 billion (17.0).
No issues were made under the US or Australian programmes during the year. The outstanding volumes at year-end were USD 3.75 billion (3.75) and AUD 750 million (750) respectively.
At year-end, there was no outstanding volume in the European commercial paper programme (preceding year SEK 0.9 billion).
Stadshypotek’s total funding at year-end was SEK 1,131.6 billion (1,061.4), of which SEK 518.8 billion (493.0) came from Handels-banken. The breakdown of funding by instru-ment is shown in the table below.
RATINGSIn 2016, Fitch upgraded Stadshypotek’s long-term rating, from AA- to AA. Other ratings remained unchanged during the year.
StadshypotekCovered
bonds Long-term Short-term
Moody’s Aaa - P-1
Standard & Poor’s AA- A-1+
Fitch AA F1+
Average loan-to-value ratio of the cover pools31 December% 2016 2015
Swedish pool 49.97 53.57
Norwegian pool 53.63 56.68
Finnish pool 48.72 -
Lending volumes available in cover pools31 DecemberSEK m
Assets pooled Assets utilised
2016 2015 2016 2015
Swedish pool 902,862 859,400 626,458 600,024
Norwegian pool 75,226 62,264 31,270 17,701
Finnish pool 47,473 - 5,192 -

ADMINISTRATION REPORT
14 STADSHYPOTEK | ANNUAL REPORT 2016
Performance and financial positionFINANCIAL PERFORMANCEStadshypotek’s operating profit for the year was SEK 11,366 million (10,716), an increase of SEK 650 million, or 6.1 per cent, compared to the previous year.
OPERATING INCOMEIncome totalled SEK 12,415 million (11,779), up 5.4 per cent on the figure for 2015. Of this income, SEK 598 million (875) was attributable to the branch in Norway, SEK 385 million (426) to the branch in Finland and SEK 345 million (276) to the branch in Denmark.
Net interest income grew by SEK 606 million, or 5.2 per cent, to SEK 12,362 million (11,756). Of the net interest income, SEK 577 million (875) was attributable to the branch in Norway, SEK 377 million (417) to the branch in Finland and SEK 345 million (276) to the branch in Denmark. Excluding the branches, net interest income thus increased by SEK 875 million. This increase was primarily due to higher lend-ing volumes to the private market in Sweden. The decrease in net interest income at the Norwegian branch was attributable to weaker margins for both the private market and corpo-rate market, although this was offset slightly by an increase in lending volumes. The decrease in net interest income at the Finnish branch was a result of weaker margins, while net interest income at the Danish branch increased due to an increase in lending volumes to the private market. Net gains/losses on financial transac-tions increased, to SEK 82 million (29).
EXPENSES AND LOAN LOSSESExpenses decreased by SEK 18 million, or 1.7 per cent, to SEK -1,047 million (-1,065), of which SEK -58 million (-59) was attributable to the branch in Norway, SEK -36 million (-34) to the branch in Finland and SEK -23 million (-24) to the branch in Denmark. Staff costs rose by SEK -5 million, or 5.6 per cent, compared to 2015 due to an increase in the number of employees and annual salary increases. Other administrative expenses decreased by SEK 16 million, or 1.7 per cent, mainly due to a lower level of sales compensation paid to the parent company for the services performed by the branch operations on behalf of Stadshypotek related to the sale and administration of mort-gage loans. Development costs for IT systems were also lower compared to the previous year.
Net loan losses totalled SEK -2 million (2).
TAXES AND NET PROFIT FOR THE YEARAfter taxes of SEK -2,509 million (-2,394), profit for the year after tax was SEK 8,857 million (8,322).
PROFITABILITYThe profit corresponded to a return on equity of 24.4 per cent (24.2).
For a five-year overview of income state-ments and balance sheets, and for key financial figures and ratios, see page 4.
OTHER COMPREHENSIVE INCOMEOther comprehensive income consists primarily of the effective portion of the change in the fair value of interest rate swaps and cross-currency interest rate swaps used as hedging instru-ments in cash flow hedging. Cash flow hedges are applied to manage exposures to variations in cash flows relating to changes in the variable interest rates on lending and funding. Cash flow hedging is also used to hedge currency risk in future cash flows relating to funding in foreign currencies. Lending and funding are measured at amortised cost, whereas the derivatives that hedge these items are recognised at market value. Over time, the market values of the derivatives reach zero as each individual hedge reaches maturity, but this entails volatility in other comprehensive income during the term of the hedge. In 2016, changes in the value of hedge derivatives in cash flow hedges equalled SEK -984 million (-542) after tax. These value changes derive primarily from changes in the discount rates for the relevant currencies as well as the time factor that reduces the market value of a derivative to zero as its maturity date approaches.
TOTAL ASSETS AND EQUITYAt 31 December 2016, Stadshypotek’s total assets stood at SEK 1,187,525 million (1,116,431), and equity was SEK 33,018 million (32,616).
GROUP CONTRIBUTIONSA Group contribution of SEK 10,100 million (9,235) has been provided to the parent company, Handelsbanken.
FINANCIAL RISKSFor information about financial risks, see note 2.
RECOMMENDED APPROPRIATION OF PROFITS In accordance with the balance sheet for Stads-hypotek AB, the following profits after deduction for a net paid Group contribution of SEK 7,878 million are at the disposal of the annual general meeting:
Retained earnings SEK 9,329 million
Fair value fund SEK 2,664 million
Profit for the year SEK 8,857 million
Total SEK 20,850 million
The Board proposes that the profits be carried forward to the next year.
When assessing the amount of the Group contribution from the company, account has been taken of the nature of operations, their scope, the consolidation requirement and risk-taking.
The Board’s assessment is that the above appropriation of profits is prudent and well-adapted to the operations as a going concern. Unrealised changes in the value of assets and liabilities at fair value have had a net impact on equity of SEK 3,156 million.
The total capitalisation of Stadshypotek at year-end exceeded the statutory minimum requirement pursuant to Regulation (EU) No 575/2013 and Directive 2013/36/EU and other relevant requirements established by the authorities for the company.
Half-yearly performance 2016 2015 2014
SEK m Jul-Dec Jan-Jun Jul-Dec Jan-Jun Jul-Dec
Interest income 10,153 10,142 10,415 11,469 13,060
Interest expense -3,825 -4,108 -4,527 -5,601 -7,647
Net interest income 6,328 6,034 5,888 5,868 5,413
Net fee and commission income -15 -14 -4 -2 -4
Net gains/losses on financial transactions 39 43 -30 59 -75
Total income 6,352 6,063 5,854 5,925 5,334
Staff costs -46 -48 -47 -42 -44
Other administrative expenses -480 -467 -468 -495 -713
Depreciation and amortisation -3 -3 -6 -7 -7
Total expenses -529 -518 -521 -544 -764
Profit before loan losses 5,823 5,545 5,333 5,381 4,570
Net loan losses -7 5 -1 3 26
Operating profit 5,816 5,550 5,332 5,384 4,596


Financial reports
16 staDsHYpoteK | annUal report 2016
Income statement
SEK m 2016 2015
Interest income 20,295 21,884
Interest expense -7,933 -10,128
Net interest income Note 3 12,362 11,756
Fee and commission income 13 14
Fee and commission expense -42 -20
Net fee and commission income Note 4 -29 -6
Net gains/losses on financial transactions Note 5 82 29
Other income 0 0
Total income 12,415 11,779
Staff costs Note 6 -94 -89
Other administrative expenses Note 7 -947 -963
Depreciation and amortisation of intangible assets and property and equipment Note 14, 15 -6 -13
Total expenses before loan losses -1,047 -1,065
Profit before loan losses 11,368 10,714
Net loan losses Note 8 -2 2
Operating profit 11,366 10,716
Taxes Note 9 -2,509 -2,394
Profit for the year 8,857 8,322
Net earnings per share, before and after dilution, SEK 54,674 51,370
Statement of comprehensive income
SEK m 2016 2015
Profit for the year 8,857 8,322
Other comprehensive income
Items that may subsequently be reclassified to the income statement
Cash flow hedges Note 23 -1,262 -695
Translation differences for the year 407 -329
Taxes on items that may subsequently be reclassified to the income statement
– cash flow hedges Note 23 278 153
Total comprehensive income for the year 8,280 7,451

Financial reports
staDsHYpoteK | annUal report 2016 17
Balance sheet
SEK m, 31 December 2016 2015
ASSETS
Loans to credit institutions Note 10 12,027 10,516
Loans to the public Note 11 1,150,611 1,082,659
Value change of interest-hedged item in portfolio hedge 35 28
Shares and participating interests in Group companies Note 12 0 0
Derivative instruments Note 13 22,746 20,514
Intangible assets Note 14 12 14
Property and equipment Note 15 0 0
Current tax assets - 71
Other assets Note 16 701 1,221
Prepaid expenses and accrued income Note 17 1,393 1,408
Total assets 1,187,525 1,116,431
of which Group claims Note 25 34,849 31,093
LIABILITIES AND EQUITY
Due to credit institutions Note 18 497,110 472,238
Issued securities Note 19 612,787 568,416
Derivative instruments Note 13 4,429 4,145
Current tax liabilities 188 -
Deferred tax liabilities Note 9 735 1,012
Other liabilities Note 20 10,143 9,273
Accrued expenses and deferred income Note 21 7,415 8,031
Subordinated liabilities Note 22 21,700 20,700
Total liabilities 1,154,507 1,083,815
Equity Note 23
Share capital 4,050 4,050
Other funds 10,782 11,347
Retained earnings 9,329 8,897
Profit for the year 8,857 8,322
Total equity 33,018 32,616
Total liabilities and equity 1,187,525 1,116,431
of which Group liabilities Note 25 533,896 506,740

Financial reports
18 staDsHYpoteK | annUal report 2016
Restricted equity Non-restricted equity
SEK m Share
capital 1 Statutory
reserve
Fund for software
developedin-house
Hedgereserve
Translationreserve
Retained earnings Total
Equity at 31 December 2014 4,050 8,106 4,133 -21 16,100 32,368
Profit for the year 8,322 8,322
Other comprehensive income -542 -329 -871
Total comprehensive income for the year -542 -329 8,322 7,451
Group contributions provided -9,235 -9,235
Tax effect on Group contributions 2,032 2,032
Equity at 31 December 2015 4,050 8,106 3,591 -350 17,219 32,616
Profit for the year 8,857 8,857
Other comprehensive income -984 407 -577
Total comprehensive income for the year -984 407 8,857 8,280
Fund for software developed in-house 12 -12 -
Group contributions provided -10,100 -10,100
Tax effect on Group contributions 2,222 2,222
Equity at 31 December 2016 4,050 8,106 12 2,607 57 18,186 33,018
1 Average number of shares, before and after dilution, 162,000.
Statement of changes in equity

Financial reports
staDsHYpoteK | annUal report 2016 19
SEK m 2016 2015
OPERATING ACTIVITIES
Operating profit 11,366 10,716
of which paid-in interest 20,310 22,287
of which paid-out interest -8,267 -10,292
Adjustment for non-cash items in profit/loss:
Loan losses 22 27
Unrealised changes in value 158 466
Depreciation, amortisation and impairment 6 13
Paid income tax -169 -314
Change in the assets and liabilities of operating activities:
Loans to the public -67,974 -64,156
Due to credit institutions 24,872 67,183
Issued securities 44,371 -11,069
Derivative instruments, net -3,110 3,730
Other 0 1,112
Cash flow from operating activities 9,542 7,708
INVESTING ACTIVITIES
Investment in tangible non-current assets 0 0
Disposal of tangible non-current assets - -
Investment in intangible non-current assets -3 -
Cash flow from investing activities -3 0
FINANCING ACTIVITIES
Subordinated loans 1,000 -
Group contribution paid out -9,235 -7,180
Cash flow from financing activities -8,235 -7,180
CASH FLOW FOR THE YEAR 1,304 528
Liquid funds at beginning of year 5,516 5,129
Cash flow from operating activities 9,542 7,708
Cash flow from investing activities -3 0
Cash flow from financing activities -8,235 -7,180
Exchange rate difference on liquid funds 207 -141
Liquid funds at end of year 7,027 5,516
Liquid funds consist of funds available with banks and equivalent institutions, excluding funds on a blocked account.
Liquid funds with banks and equivalent institutions 7,027 5,516
Funds on a blocked account with banks relating to issuance of covered bonds 5,000 5,000
Loans to credit institutions 12,027 10,516
Cash flow statement

notes
20 staDsHYpoteK | annUal report 2016
NotesNOTE 1 Accounting policies
Stadshypotek’s Annual Report is prepared in accordance with the Swedish Annual Accounts Act for Credit Institutions and Securities Compa-nies (1995:1559), the regulations and general guidelines issued by the Swedish Financial Supervisory Authority, FFFS 2008:25, Annual reports in credit institutions and securities com-panies, the Swedish Financial Reporting Board’s recommendation RFR 2 Accounting for legal enti-ties, and statements from the Swedish Financial Reporting Board. In accordance with the Finan-cial Supervisory Authority’s general guidelines, Stadshypotek applies statutory IFRS. This means that the international accounting standards and interpretations of these standards as adopted by the EU have been applied to the extent that is possible within the framework of national laws and directives and the link between accounting and taxation.
The parent company, Svenska Handelsbanken AB, prepares consolidated accounts which include Stadshypotek.
Stadshypotek’s subsidiary holdings comprise the dormant company Svenska Intecknings Garanti AB Sigab. In accordance with Chapter 7, Section 7(4) of the Swedish Annual Accounts Act for Credit Institu-tions and Securities Companies, Stadshypotek has not prepared consolidated accounts as its subsidi-ary is of marginal significance.
The presentation currency is Swedish kronor.
ISSUE AND ADOPTION OF ANNUAL REPORTThe Annual Report was approved for issue by the Board and Chief Executive on 7 February 2017 and will be submitted for adoption by the AGM on 28 March 2017.
CHANGED ACCOUNTING POLICIES, ETC.ESMA has published guidelines on disclosures regarding alternative performance measures which should be followed in financial reports pub-lished after 3 July 2016. The guidelines entail an increase in the disclosure of financial ratios that are not defined in IFRS. In accordance with the requirements in the guidelines, the company informs about definitions and reconciliation of alternative performance measures in the Annual Report on pages 59 – 60. In other respects, the accounting policies, classifications and calcula-tion methods applied during the financial year agree in all essential respects with the policies applied in the 2015 Annual Report.
FUTURE REGULATORY CHANGESIFRS 9 Financial Instruments, which is to replace IAS 39 Financial Instruments: Recognition and Measurement, has been adopted for application by the EU. The standard must be applied as of the 2018 financial year. The standard comprises
three areas: classification and measurement, impairment of financial instruments and general hedge accounting. According to the new classifi-cation and measurement rules, financial assets must be classified at fair value through profit or loss, at amortised cost or at fair value through other comprehensive income. The starting point for classification of debt instruments is the com-pany’s business model for managing the financial assets and whether the instrument’s contractual cash flows only contain payments of interest and principal amounts. Equity instruments are to be classified at fair value through profit or loss unless the company at the time of initial recognition opted to present these instruments at fair value through other comprehensive income. This option means that only dividends from these holdings are recognised in the income statement. Other gains and losses due to changes in fair value are not permitted to be reclassified from other comprehensive income to the income statement. The rules for classification of financial liabilities are largely unchanged compared to IAS 39. The main change is that fair value changes due to own credit risk for financial liabili-ties where it has been decided to measure at fair value through profit or loss are presented in other comprehensive income instead of in the income statement. Stadshypotek’s current assessment is that the classification and measurement rules are not expected to have any significant impact on the financial reports. No reclassifications between fair value and amortised cost are expected for the first application period.
As a result of the new regulations on impair-ment, a model is being introduced which is based on expected loan losses and not on incurred loan losses as in the existing model in IAS 39. IFRS 9 states that all assets measured at amortised cost and fair value through other comprehensive income, as well as guarantees and credit commit-ments, must be subject to the impairment testing requirement. The assets whose impairment needs to be tested are split into three stages depending on the degree of credit impairment. Stage 1 comprises assets for which the credit risk has not increased significantly since initial recog-nition. Stage 2 comprises assets for which the credit risk has significantly increased since initial recognition. Stage 3 comprises assets which have been individually valued as impaired loans. In stage 1, provisions are to be recognised corre-sponding to the loss expected to occur within 12 months. In stages 2 and 3, provisions are to be recognised corresponding to the loss expected to occur during the entire remaining maturity of the asset. Forward-looking factors must be taken into account in conjunction with the calculation of these provisions. The provisions must also be
based on a probability-weighted outcome, unlike the current IAS 39 where the provision is based on the most expected outcome. Depending on the factors which are established as defining a significant increase in the credit risk, and how the forward-looking factors are weighted in the calcu-lation of the provisions, these may fluctuate more over time than is the case today.
The new general rules for hedge accounting allow the company’s own risk management to be better reflected in the financial reports and also introduce less detailed rules for how the effective-ness of the hedges is to be assessed.
Stadshypotek is currently analysing the finan-cial effects of IFRS 9 in more detail.
IFRS 15 Revenue from Contracts with Cus-tomers has also been adopted for application in the EU. The standard must be applied as of the 2018 financial year, but can be applied before this. Stadshypotek does not intend to apply the standard ahead of the stipulated date. IFRS 15 introduces a five-step model to establish how and when revenue must be recognised. However, the standard does not apply to financial instruments, insurance contracts or leases. IFRS 15 also con-tains increased disclosure requirement relating to revenue. The current assessment is that the new standard will not have any material impact on Stadshypotek’s financial reports, capital ade-quacy and large exposures.
IFRS 16 Leases has also been published by the IASB. Assuming that IFRS 16 is adopted by the EU, and the date of implementation proposed by the IASB is not changed, this standard will be applied as of the 2019 financial year. The main change due to the new standard is that all lease contracts (with the exception of short-term and minor lease contracts) must be recognised as an asset (right-of-use asset) and as a liability in the lessee’s balance sheet. The lease payment must be reported as depreciation and interest expense. There are also increased disclosure requirements. For lessors, the requirements are largely unchanged. The company is analysing the finan-cial effects of the new standard.
None of the other changes in the accounting regulations issued for application are expected to have a material impact on Stadshypotek’s finan-cial reports, capital adequacy, large exposures or other circumstances according to the applicable operating rules.
SHARES AND PARTICIPATING INTERESTS IN SUBSIDIARIES Shares and participating interests in subsidiaries are measured at cost.

notes
staDsHYpoteK | annUal report 2016 21
RECOGNITION OF LIABILITIES AND ASSETS IN FOREIGN CURRENCY The company’s presentation currency is Swedish kronor. The functional currency for the company’s operations outside Sweden usually differs from the company's presentation currency. The cur-rency used in the economic environment where the operations are primarily conducted is regarded as the functional currency.
Transactions in foreign currency are translated to the functional currency on the transaction date. Monetary items and assets and liabilities at fair value are valued at the functional currency’s spot price at the end of the balance sheet date. Exchange rate differences are recognised in the income statement.
Translation of foreign operations to the Group’s presentation currency When translating the foreign units’ balance sheets and income statements from the functional cur-rency to the company’s presentation currency, the current method has been used. This means that assets and liabilities are translated at the closing day rate. Equity is translated at the rate applicable at the time of investment or earning. The income statement has been translated at the average annual rate. Translation differences are recognised as a component of Other comprehen-sive income and are included in the translation reserve in equity.
RECOGNITION OF ASSETS AND LIABILITIES IN THE BALANCE SHEET An asset is defined as a resource over which there is control as a result of past events and that is expected to provide future economic benefit. Assets are recognised on the balance sheet when it is probable that the future economic benefits related to the asset will accrue to the company and when the value or acquisition cost of the asset can be reliably measured.
Liabilities are the company’s existing obligations which as a result of past events are expected to lead to an outflow of resources from the company. A liability is recognised on the balance sheet when, in order to fulfil an existing obligation, it is probable that the company must surrender a resource with a value that can be reliably measured.
Purchases and sales of money market and capital market instruments on the spot market are recognised on the trade date. The same applies to derivatives. Other financial assets and liabilities are normally recognised on the settlement date.
Financial assets are removed from the balance sheet when the contractual rights to the cash flows originating from the asset expire or when all risks and rewards related to the asset are trans-ferred to another party. A financial liability is removed from the balance sheet when the obliga-tion ceases or is cancelled.
Financial assets and liabilities are set off on the balance sheet if Stadshypotek has a contractual right to set off the recognised amounts and intends to settle the payments simultaneously with a net amount.
Stadshypotek has no framework agreements regarding offsetting, which means that the disclosure requirements in IFRS 7 Financial instruments: Disclosures do not apply.
CLASSIFICATION AND RECOGNITION OF FINANCIAL ASSETS AND LIABILITIESFor the purposes of measurement, in compliance with IAS 39, all financial assets are placed in the following valuation categories:1. loans and receivables2. assets held to maturity3. assets at fair value through profit or loss – held for trading – assets which upon initial recognition were
designated at fair value through profit or loss4. available-for-sale assets.
Financial liabilities are classified as follows:1. liabilities at fair value through profit or loss – liabilities held for trading – liabilities which upon initial recognition were
designated at fair value through profit or loss2. other financial liabilities.
The classification in the balance sheet is indepen-dent of the measurement category. Thus, differ-ent measurement principles may be applied for assets and liabilities carried on the same line on the balance sheet. A classification into measure-ment categories of the financial assets and liabili-ties which are recognised on the balance sheet is shown in note 28.
Stadshypotek’s financial assets and liabilities are categorised in loans and receivables and other financial liabilities respectively. Derivatives that are not formal hedging instruments come under the held-for-trading category. Upon initial recognition, all financial assets and liabilities are designated at fair value. For assets and liabilities at fair value through profit or loss, the transaction costs are recognised in the income statement under Net gains/losses on financial transactions. For other financial instruments, the transaction costs are included in the acquisition value.
Loans and receivablesUnlisted interest-bearing assets are classified as Loans and receivables. Assets in the category Loans and receivables are measured at amor-tised cost, i.e. the discounted present value of all future cash flows relating to the instrument where the discount rate is the asset’s effective interest rate at the time of acquisition.
Loans and receivables are subject to impair-ment testing when indications of an impairment loss are present. The impairment loss is rec-ognised in the income statement. Thus, loans and receivables are recognised at their net amount, after deduction for probable and actual loan losses. Early redemption fees for loans and receivables which are repaid before maturity are recognised immediately in the income statement under Net gains/losses on financial transactions.
DerivativesDerivative instruments consist of financial deriva-tive contracts. All derivative contracts are carried at fair value. If the fair value is positive, it is reported on the balance sheet as an asset. If the fair value is negative, it is reported as a liability. Changes in fair value are recognised directly in the income statement under Net gains/losses on financial transactions. For derivatives recognised as hedging instruments in cash flow hedging, the effective portion of the change in fair value is reported as a component in other total compre-hensive income and in the hedging reserve in equity.
Financial guarantees Premiums for purchased financial guarantees are accrued and recognised as decreased interest income in net interest income if the debt instru-ment to which the guarantee refers is recognised there. Other premiums for purchased guarantees are recognised in Net fee and commission income.
Other financial liabilitiesFinancial liabilities are measured at amortised cost, which is the discounted present value of all future cash flows relating to the instrument where the discount rate is the asset’s effective interest rate at the time of issue.
For repurchased bonds, the realised price dif-ferences are recognised in the income statement in their entirety at the time of repurchase and are reported under Net gains/losses on financial transactions.
PRINCIPLES FOR MEASUREMENT OF FINANCIAL ASSETS AND LIABILITIESFair value is defined as the price that would be received to sell an asset or paid to transfer a liabil-ity in an orderly transaction between independent market participants.
For financial instruments traded on an active market, the fair value is the same as the quoted market price. An active market is one where quoted prices are readily and regularly available from a regulated market, execution venue, reliable news service or equivalent, and where the price information received can be verified by means of regularly occurring transactions. The current mar-ket price is generally the same as the current bid price for financial assets or the current asking price for financial liabilities.
For financial instruments where there is no reli-able information about market prices, fair value is established using valuation models. The valuation models used are based on input data which essentially can be verified using market observa-tions such as market rates. If necessary, an adjustment is made for other variables which a market participant would be expected to take into consideration when setting a price.
Stadshypotek’s derivative contracts, including interest rate swaps and various types of linear currency derivatives, are valued using valuation models based on listed market rates and other

notes
22 staDsHYpoteK | annUal report 2016
market prices. The valuation of non-linear deriva-tive contracts that are not actively traded is also based on a reasonable assumption of market- based input data such as volatility.
HEDGE ACCOUNTING Cash flow hedges are applied to manage expo-sures to variations in cash flows relating to changes in the floating interest rates on lending and funding. The expected maturity for this type of lending and funding is normally much longer than the fixing period, which is very short. Cash flow hedging is also used to hedge currency risk in future cash flows deriving from funding. Interest rate swaps and cross-currency interest swaps which are hedging instruments in cash flow hedges are measured at fair value. If the swap’s value change is effective – that is, it corresponds to future cash flows related to the hedged item – it is recognised as a component of Other com-prehensive income and in the hedge reserve in Equity. Ineffective components of the swap’s value change are recognised in the income statement under Net gains/losses on financial transactions.
Fair value hedges are used to protect the com-pany against undesirable impact on profit/loss due to exposure to changes in market prices. Fair value hedges are applied for individual assets, and for portfolios of financial instruments. Hedged risks in hedging packages at fair value comprise interest rate risk on lending at fixed interest rates, and on lending with a rate cap. The hedging instruments in these hedging packages consist of interest rate swaps and interest rate options (caps). In the case of fair value hedges, the hedge instrument and hedged risk are both recognised at fair value. Changes in value are recognised directly in the income statement under Net gains/losses on financial transactions. When portfolio hedging is applied, the value of the hedged item is reported as a separate line item on the balance sheet in conjunction with Loans to the public. When fair value hedges are prematurely termi-nated, the accrued value change on the hedged item is amortised in Net gains/losses on financial transactions. Accumulated value changes on portfolio hedges at fair value which have been ter-minated prematurely are reported on the balance sheet under Other assets. At 1 January 2016, only fair value hedges remained for portfolios of financial instruments.
LOAN LOSSES Loans and receivables at amortised costIn accordance with outsourcing agreements, units with customer and credit responsibility in the Bank regularly perform individual assessments of the need for recognising impairment losses for loans and receivables measured at amortised cost. Impairment testing is performed where there are objective circumstances indicating that the recoverable amount of the loan is less than its carrying amount. Objective evidence could, according to the circumstances, be late or non-payment, bankruptcy, changed credit rating, or a decline in the market value of the collateral.
When performing impairment testing, the recov-erable amount of the loan is calculated by dis-counting the estimated future cash flows related to the loan and collateral (including any guaran-tees) by the effective interest rate of the loan. Collateral in the form of property mortgages is measured at fair value. An impairment loss is recognised if the estimated recoverable value is less than the carrying amount and is rec-ognised as a loan loss in the income statement. A reported loan loss reduces the carrying amount of the loan on the balance sheet, either directly (actual loss) or by a provision account for loan losses (probable loss).
In addition to this individual assessment of loans, a collective assessment is made of individ-ually measured loans with the purpose of identify-ing the need to recognise an impairment loss that cannot yet be allocated to individual loans. The analysis is based on a distribution of individually valued loans in terms of the risk class. An impair-ment loss is recognised if this is justifiable taking into account changes in the risk classification and expected loss. Impairment losses which have been recognised for a group of loans are trans-ferred to impairment losses for individual loans as soon as there is available information about the impairment in value at an individual level.
Loan losses for the period comprise actual losses and probable losses on credits granted, minus recoveries and reversals of previous impairment losses recognised for probable loan losses. Actual loan losses may refer to entire loans or parts of loans and are recognised when there is no realistic possibility of recovery. This is the case, for example, when a trustee in bank-ruptcy has estimated bankruptcy dividends, when a scheme of arrangement has been accepted, or a concession has been extended in some other way. An amount forgiven in connec-tion with reconstruction of a loan or group of loans is always classified as an actual loss. If the customer is following a payment plan for a loan which was previously classified as an actual loan loss, the amount of the loss is subject to new testing. Recoveries comprise reversed amounts on loan losses previously reported as actual losses. Information about probable and actual losses is presented in note 8.
In certain cases, interest effects can arise because the recoverable amount increases when the time to payment becomes shorter. Reversals of previously provisioned amounts are recognised as interest income in accordance with the effec-tive interest method.
Disclosures concerning impaired loansInformation concerning impaired loans is pro-vided gross, before a provision for probable loan losses, and net, after a provision for probable loan losses. Loans are defined as impaired if it is not probable that all contracted cash flows will be ful-filled. The full amount of all loans which have been classified as impaired are carried as impaired loans even if parts of the loan are covered by col-lateral. Loans which have been written off as
actual loan losses are not included in impaired loans.
INTANGIBLE ASSETS An intangible asset is an identifiable non-mone-tary asset without physical form. An intangible asset is only recognised on the balance sheet if the probable future economic benefits attribut-able to the asset will flow to the company and the acquisition cost can be reliably measured. This means that internally generated values in the form of goodwill, trademarks, customer databases and similar are not recognised as assets on the balance sheet.
Investments in software developed in-house are carried as an expense on a current basis to the extent that the expenditure refers to maintenance of existing business operations or previously capitalised software. In the case of the development of new software in-house, or the development of new business operations for existing software, the expenditure incurred is capitalised from the time when it is probable that economic benefit will arise and can be reliably measured.
Stadshypotek’s intangible assets consist of intangible assets for which it is possible to estab-lish an estimated useful life, thus enabling them to be amortised. The amortisation is on a straight-line basis over the useful life of the asset. The amortisation period is tested on an individual basis at the time of new acquisition and also continually if there are indications that the useful life may have changed.
Intangible assets with a finite useful life are tested for impairment when there is an indication that the asset may be impaired. Impairment test-ing is performed by calculating the recoverable amount of the assets, i.e. the higher of the value in use and the fair value, less costs to sell. As long as the recoverable amount exceeds the carrying amount, no impairment loss needs to be rec-ognised. Impairment losses are recognised directly in the income statement.
EQUIPMENT Stadshypotek’s tangible non-current assets consist of equipment that is recorded at cost of acquisition less accumulated depreciation and impairment losses. Depreciation is based on the estimated useful lives of the assets. A linear depreciation plan is usually applied. The estimated useful lives are reviewed annually. Personal computers and other IT equipment are usually depreciated over three years. Other equipment is normally depreciated over five years.
Impairment testing of property and equipment is carried out when there is an indication that the value of the asset may have decreased. Impairment loss is recognised in cases where the recoverable amount is less than the carrying amount. Any impairment losses are recognised immediately in the income statement.
NOTE 1 Cont.

notes
staDsHYpoteK | annUal report 2016 23
EQUITY Equity consists of the line items Share capital, Reserves and Retained earnings.
Retained earnings Retained earnings comprise the profits generated from the current and previous financial years.
Translation reserveThe translation reserve comprises unrealised foreign exchange effects arising due to translation of the balance sheets and income statements of foreign units to the company’s presentation currency.
Hedge reserveUnrealised changes in value on derivative instru-ments which comprise hedge instruments in cash flow hedges are reported in the hedge reserve.
GROUP CONTRIBUTIONGroup contributions are recognised in accor-dance with the economic substance of the contri-bution. Group contributions provided by Stads-hypotek to the parent company are treated as dividends and recognised as a reduction of retained earnings.
INCOME Income is recognised in the income statement when it is probable that future economic benefits will be gained and these benefits can be reliably measured. The following general principles apply to recognition of income for various types of fees:
Fees that constitute part of the effective inter-est of a financial instrument that is measured at amortised cost are accrued in accordance with the effective interest method.
Fees attributable to a specific service or action are recognised as income at the time the service is performed. This income includes fees for pay-ment reminders and demands.
Net interest incomeInterest income and interest expense are rec-ognised as Net interest income in the income statement. Net interest income also includes interest deriving from derivative instruments that hedge items whose interest flows are recognised in Net interest income. In addition to interest income and interest expense, net interest income includes the fee to the Resolution Fund (Stability Fund until the end of 2015).
Net fee and commission incomeIncome and expense for various kinds of services are recognised in the income statement under Fee and commission income and Fee and com-mission expense respectively. Among other things, this means that payment reminder and demand fees are recognised as commission income and also that fees to market makers are recognised as commission expense. Fees comparable to interest that constitute integrated components of financial instruments and are
therefore included when calculating the effective interest are recognised as net interest income and not commission.
Net gains/losses on financial transactionsNet gains/losses on financial transactions include all items with an impact on profit or loss which arise when measuring financial assets and liabili-ties at fair value in the income statement and when financial assets and liabilities are realised. Specifically, the items reported here are: • capital gains or losses from the disposal and
settlement of financial assets and liabilities• unrealised changes in fair value of the hedged
risk in assets which are hedged items in hedges at fair value, and amortisation of unre-alised value changes for hedges which have been prematurely terminated
• unrealised value changes on derivatives which comprise hedging instruments in fair value hedges
• ineffective component of the value change on derivatives which comprise hedging instru-ments in cash flow hedges
• realised and unrealised changes in value on financial assets and liabilities classified as held for trading.
REMUNERATION TO EMPLOYEES Staff costsStaff costs consist of salaries, pension costs and other forms of direct staff costs including social security costs, special payroll tax on pension costs and other forms of payroll overheads.
Accounting for pensions Defined benefit plansStadshypotek has pension obligations which are guaranteed through insurance with Pensions-kassan SHB, försäkringsförening (pension fund). These obligations are reported according to the IAS 19 rules for defined benefit plans, whereby the company under common control shares the risks related to the pension obligations, since the pension fund’s assets are not allocated among the employers who have insurance with the pension fund. According to these rules, Stads-hypotek reports the insurance charges which are debited for the period as an expense.
Defined contribution pension plans1)
Defined contribution pension plans refer to those plans where the company’s obligations are limited to the contributions the company has undertaken to pay. In such cases, the size of the employee’s pension is determined by the contributions the company pays towards the plan or to an insur-ance company and the return on the capital invested that these contributions generate. Con-sequently, the employee bears the actuarial risk (that the benefit is lower than expected) and the investment risk (that the assets invested prove to be insufficient to generate the expected benefits). The company’s obligations regarding contribu-tions to defined contribution plans are reported as
an expense in the profit for the year to the degree such benefits are accumulated as a result of the employees working for the company over a period of time.
TAXES The tax expense for the period consists of current tax and deferred tax. Current tax refers to taxes relating to the period’s, or previous periods’, tax-able result. Deferred tax is tax referring to tempo-rary differences between the carrying amount of an asset or liability and its taxable value. Deferred taxes are valued at the tax rate which is deemed to be applicable when the item is realised. Tax is recognised in the income statement, in Other comprehensive income or directly in Equity depending on where the underlying transaction is reported.
MATERIAL ASSESSMENTS AND ASSUMPTIONS CONCERNING THE FUTURE In certain cases, the application of the company’s accounting policies means that assessments must be made that have a material impact on amounts reported. The amounts reported are also affected in a number of cases by assump-tions about the future. Such assumptions always imply a risk for adjustment of the reported value of assets and liabilities. The assessments and assumptions applied always reflect the manage-ment’s best and fairest assessments and are con-tinually subject to examination and validation.
Those assessments and assumptions that have had a material impact on the financial reports concern the need for recognising impair-ment losses for loans. The value of the company’s loans is measured regularly and individually for each receivable. If necessary, the loan is written down to the assessed recoverable amount. The estimated recoverable amount is based on an assessment of the counterparty’s financial repay-ment capacity and assumptions regarding the realisable value of the collateral. The final out-come may deviate from the original provisions for loan losses. The assessments and assumptions used are subject to regular examinations by the internal credit organisation. See also note 2 for a more detailed description of internal risk control and how Stadshypotek manages credit risk.
SEGMENT REPORTING The segment reporting presents income and expenses broken down by business segment. A business segment is a part of the company that runs operations which generate external or inter-nal income and expenses and of which the profit/loss is regularly assessed and followed up by the company management as part of corporate gov-ernance. As part of segment reporting, income and expenses are also stated according to the geographical areas where Stadshypotek has operations.
1) This text refers to the BTPK plan, which is a defined contribution plan.

notes
24 staDsHYpoteK | annUal report 2016
NOTE 2 Risks and risk control
RISKS AND UNCERTAINTY FACTORS Regulatory developments are continuing at a fast pace. Stadshypotek’s historically low tolerance of risk, sound capitalisation and, as part of the Handelsbanken Group, strong liquidity mean that the company is well equipped to operate in line with the new, stricter regulations and to cope with substantially more difficult market conditions than those experienced in recent years.
RISK CONTROLStadshypotek’s operations are conducted with a controlled low level of risk. Stadshypotek’s risks are credit risk, market risk, liquidity risk, operational risk and business risk. Credit risk is the risk of Stadshypotek facing economic loss because Stads-hypotek’s counterparties cannot fulfil their contrac-tual obligations. Market risks stem from price changes in the financial markets. The market risks affecting Stadshypotek are interest rate risk and exchange rate risk. Liquidity risk comprises the risk that Stads hypotek will not be able to meet its pay-ment obligations when they fall due without being affected by unacceptable costs or losses. Opera-tional risks are defined as the risk of loss due to inadequate or failed internal processes, human error, malfunctioning systems, or external events. The definition includes legal risk. Credit risk is the most significant risk for Stadshypotek.
The Stadshypotek Board establishes policies describing how various risks should be managed and reported. In addition, Stadshypotek’s Chief Executive sets guidelines and instructions for managing and controlling all types of risk. These documents have been based on the policies that the Board of Handelsbanken has adopted for managing and reporting risks within the Handels-banken Group as a whole. Stadshypotek’s risk management aims to ensure compliance with the strict approach to risk established by the Board.
Stadshypotek’s lending operations are inte-grated with those of Handelsbanken, which means that Stadshypotek’s lending is carried out via the Bank’s branch network. Moreover Stadshypotek’s funding needs are managed by Handelsbanken’s Treasury department. Individual outsourcing agree-ments specify the services which Handelsbanken is to perform on behalf of Stadshypotek. Thus, the business operations at Stadshypotek are con-ducted according to the same fundamental princi-ples which apply at Handelsbanken. The Bank’s corporate culture is characterised by a clear division of responsibility where each part of the business operations bears full responsibility for its business and for risk management. The person who is most familiar with the customer and the market condi-tions is the person best equipped to assess the risk and also take action at an early stage in the event of problems. Each branch and each profit centre bears the responsibility for dealing with any problems that arise. Consequently, this encourages high risk awareness and a cautious approach in the business operations.
In addition to the accountability of decision -makers, control procedures are in place to ensure
that excessive risks are not taken in individual trans-actions or local operations. In lending, this means that large loans are subject to limits and are assessed at various decision levels, depending on the size of the credit limit. Procedures also exist to limit market risk and liquidity risk at Stads hypotek. Here, the company’s Board establishes limits.
Stadshypotek also has risk control indepen-dent of business operations which is responsible for the regular follow-up and monitoring of all risks applying to operations, primarily credit risk, mar-ket risk, liquidity risk, counterparty risk and opera-tional risk. The risk control function carries out daily measurements and checks to ensure that risk exposure for market, liquidity and counter-party risks is within the set limits. Limit utilisation is reported internally within the company and to the parent company’s Group Risk Control. In addi-tion, limit utilisation is reported regularly to the Chief Executive and Board of Stads hypotek.
Stadshypotek is also covered by Group Risk Control at Handelsbanken, which is designed to identify the Handelsbanken Group’s risks, gauge them, and ensure that management of these risks complies with the Group's low risk tolerance. Group Risk Control is responsible for the independent reporting of risks for the banking group of which Stadshypotek is a part. Group Risk Control also develops and provides models for measuring risk that are applied in Stadshypotek’s operations and perform certain calculations that provide a basis for some of Stadshypotek’s external reporting.
Stadshypotek also has a procedure for continual capital planning to ensure that it has a sufficient amount of capital to secure the company’s survival if a serious loss were to occur, despite the mea-sures taken to manage the risks. The method for calculating economic capital ensures that all risks are considered in a consistent manner when the need for capital is assessed.
CREDIT RISKSCredit risk is defined as the risk of Stadshypotek facing economic loss because its counterparties cannot fulfil their contractual obligations.
Rules for lending at Stadshypotek Lending is to be made in accordance with the terms stated in the Credit Instructions for Stads hypotek, established annually by the Board of Stadshypotek. The Credit Instructions include the maximum per-mitted loan-to-value ratio for various property types and a requirement that loans above a certain amount be subject to an advance examination conducted by Stadshypotek’s credit department before the loan can be disbursed. Stadshypotek’s business consists of property financing – primarily residential properties. The normal limit for satisfac-tory mortgage collateral is a maximum of 75 per cent of the market value of the property. This applies to lending in Sweden and also to Stads-hypotek’s branches in Norway and Finland. In Sweden, since 1 June 2016, the loan-to-value ratio for residential properties such as single-family homes, second homes and housing co-operative apartments is 85 per cent of the market value of the property. At the Danish branch, the corresponding limit is that mortgage loans must not exceed 80 per cent of the property’s market value, which is the
customary LTV for mortgage loans in Denmark. However, Handelsbanken Denmark issues an internal credit guarantee for amounts exceeding 75 per cent of the market value.
For office and commercial properties, which are only mortgaged in the Swedish market, a maximum of 60 per cent of the market value applies. Industrial and warehouse properties are not financed by Stadshypotek.
Principles for managing credit riskAll lending takes place through Handelsbanken’s branch office network, on behalf of Stadshypotek, through an outsourcing agreement. Lending opera-tions are based on the same fundamental principles that apply at the Bank, but also take into account other special instructions and regulations regarding the granting of credit, as specified by Stads-hypotek. In the Bank’s decentralised organisation, the branch responsible for the customer has total credit responsibility. The branches are responsible for credit decisions, but large credits are subject to limits and are assessed by a special credit organi-sation. Decisions on limits are made at the branch, regional or central level, depending on the size of the credit limit. The Bank is selective in choosing customers, and borrowers must be of high quality. The quality requirement is never neglected in favour of higher credit volumes or to achieve higher returns. Some 99 per cent (99) of the overall volume for Stads hypotek’s credit exposures was to customers with a repayment capacity assessed as normal or better than normal, i.e. with a rating grade between one and five on the Bank’s ten-point rating scale for risk.
Handelsbanken aims to be a relationship bank and the branches maintain ongoing contact with the customer, which gives them an in-depth understand-ing of each individual customer and a continually updated picture of the private customer or company. This contact also enables the branch to quickly iden-tify any problems and take action. In many cases, this means that the Bank can take action more rap-idly – before problems have escalated – than would have been possible with a more centralised manage-ment of problem loans. In other words, the branch handles any problems that arise when a customer’s repayment capacity is impaired. If necessary, the branch receives support from the regional head office and Stads hypotek’s credit department. Handelsbanken’s working methods mean that all employees whose work involves transactions linked to credit risk adopt a tried and tested approach to such risks and this constitutes an important part of the Handelsbanken Group’s culture.
According to the Handelsbanken Group’s and Stadshypotek’s Credit Policy, weak repayment capacity can never be accepted on the grounds that good collateral has been offered to the Bank. Collateral may, however, substantially reduce Stads hypotek’s loss if the borrower cannot fulfil his/her commitments towards Stadshypotek. Credits in Stadshypotek must therefore always be satisfac-torily secured by mortgages in property or a co- operative apartment. Unsecured credit may be granted when the government, county councils or municipalities are the borrower or the guarantor, or when lending to joint ownership associations. In addition to the advance examination conducted

notes
staDsHYpoteK | annUal report 2016 25
in accordance with the Credit Instructions for Stads-hypotek, Stadshypotek’s credit department carries out an additional examination after loans have been disbursed. This examination covers loans selected according to pre-determined criteria, such as the credit decision having been made in line with the proper formal procedures and the LTV complying with the regulations. In addition, Stadshypotek’s
credit department conducts regular checks of Stadshypotek’s loan portfolio to ensure that property values and LTVs are at a satisfactory level and comply well with the Credit Instructions for Stadshypotek. Stadshypotek’s valuation unit carries out regular checks to ensures that the property valuations are corrected performed and that they adequately reflect the market value of the property.
Loan-to-valueLoan-to-value (LTV) is lending as a proportion of the market value of the collateral. The latest valuation is mainly used as the market value when compiling the LTVs. Handelsbanken continuously checks the market values for properties: residential properties at least every three years and commercial proper-ties every year.
Loan-to-value analysis, Stadshypotek Sweden
31 December 2016 2015
Loan-to-value ratioPrivate market
Corporate market Total
Private market
Corporate market Total
0–60% 92.0 97.8 93.8 89.5 97.5 92.1
61–75% 5.7 2.1 4.6 7.8 2.4 6.0
>75% 2.3 0.1 1.6 2.7 0.1 1.9
Loans to the public, by borrower category and by type of collateral
Loans to the public, by borrower category 2016 2015
31 December SEK m
Loans before provisions
Provisions for probable
loan lossesLoans after provisions
Loans before provisions
Provisions for probable
loan lossesLoans after provisions
Households 830,089 -18 830,071 765,109 -18 765,091
Public sector, municipal companies 24,701 - 24,701 30,111 - 30,111
Housing co-operative associations 162,125 -12 162,113 152,046 -7 152,039
Other legal entities 133,732 -2 133,730 135,430 -7 135,423
Total loans to the public, before collective provision 1,150,647 -32 1,150,615 1,082,696 -32 1,082,664
Collective provision -4 -4 -5 -5
Total loans to the public 1,150,647 -36 1,150,611 1,082,696 -37 1,082,659
of which in operations outside Sweden
Households 120,154 -1 120,153 103,253 - 103,253
Public sector, municipal companies 10,383 - 10,383 11,193 - 11,193
Housing co-operative associations 30,067 - 30,067 24,945 - 24,945
Other legal entities 6,735 - 6,735 6,550 - 6,550
Total loans to the public in operations outside Sweden before collective provision 167,339 -1 167,338 145,941 - 145,941
Collective provision -1 -1 - -
Total loans to the public in operations outside Sweden 167,339 -2 167,337 145,941 - 145,941
Loans to the public, by type of collateral 2016 2015
31 December SEK m
Loans before provisions
Provisions for probable
loan lossesLoans after provisions
Loans before provisions
Provisions for probable
loan lossesLoans after provisions
Single-family housing 564,661 -16 564,645 527,725 -17 527,708
Housing co-operative apartments 209,448 -2 209,446 184,313 -1 184,312
Owner-occupied apartments 16,848 - 16,848 15,767 - 15,767
Private market 790,957 -18 790,939 727,805 -18 727,787
Multi-family dwellings 293,904 -14 293,890 283,784 -14 283,770
Offices and commercial buildings 65,786 - 65,786 71,107 - 71,107
Corporate market 359,690 -14 359,676 354,891 -14 354,877
Total loans to the public, before collective provision 1,150,647 -32 1,150,615 1,082,696 -32 1,082,664
Collective provision -4 -4 -5 -5
Total loans to the public 1,150,647 -36 1,150,611 1,082,696 -37 1,082,659
of which in operations outside Sweden
Single-family housing 98,165 -1 98,164 83,256 - 83,256
Housing co-operative apartments 5,251 - 5,251 4,333 - 4,333
Owner-occupied apartments 16,848 - 16,848 15,767 - 15,767
Private market 120,264 -1 120,263 103,356 - 103,356
Multi-family dwellings 46,820 - 46,820 42,286 - 42,286
Offices and commercial buildings 255 - 255 299 - 299
Corporate market 47,075 - 47,075 42,585 - 42,585
Total loans to the public in operations outside Sweden before collective provision 167,339 -1 167,338 145,941 - 145,941
Collective provision -1 -1 - -
Total loans to the public in operations outside Sweden 167,339 -2 167,337 145,941 - 145,941

notes
26 staDsHYpoteK | annUal report 2016
Geographical breakdown of lending in Sweden
31 December Stockholm Västra Götaland Skåne Other counties
Proportion of lending, % 2016 2015 2016 2015 2016 2015 2016 2015
Single-family housing 31.1 30.9 14.0 14.1 13.3 13.4 41.6 41.6
Housing co-operative apartments 66.5 67.8 10.1 9.9 7.8 8.0 15.6 14.4
Private market 41.9 41.5 12.8 12.9 11.7 11.8 33.6 33.8
Multi-family dwellings 34.6 34.2 15.6 16.3 11.2 11.2 38.6 38.3
Offices and commercial buildings 26.4 32.1 18.4 16.4 11.6 10.2 43.6 41.3
Corporate market 32.9 33.7 16.2 16.3 11.3 11.0 39.6 39.0
Total 39.0 38.9 13.9 14.0 11.5 11.5 35.6 35.6
The maturity structure for loans that have become due for repayment on the balance sheet date, but which are not classified as impaired loans, is given below. Here, becoming due for payment is defined as loans that have not been paid five days after the due date.
Maturity structure for loans which are not impaired loans
31 DecemberSEK mNumber of days overdue
2016 2015
Households Corporate Households Corporate
≤ 30 1,006 143 1,281 194
31– 60 127 16 113 3
61– 90 81 13 80 12
91– 360 157 5 147 4
> 360 70 2 89 6
Total 1,441 179 1,710 219
Risk classificationThe Handelsbanken Group’s risk rating system comprises a number of different systems, methods, processes and procedures to support the Handelsbanken Group’s classification and quantification of credit risk.
The Handelsbanken Group’s internal risk clas-sification system, which is also used for credits in Stadshypotek, is applied to measure the credit risk of all operations in a reliable and consistent manner. The risk rating is based on the Bank’s internal rating, which is determined by an assess-ment of each counterparty’s repayment capacity. The rating is determined by the risk of financial strain and by the assessed resistance to this strain. The method and classification are based on the rating model that the Handelsbanken Group has applied for several decades.
The internal rating is the most important com-ponent of the Handelsbanken Group’s model for calculating capital requirements according to the IRB Approach. The rating is dynamic; it is reas-sessed if there are signs that the counterparty’s repayment capacity has changed. The rating is also reviewed periodically as stipulated in the regulations. The rating is made by the person responsible for granting the credit and it is sub-sequently checked by independent bodies.
Risk classification methodsTo quantify the Handelsbanken Group’s credit risks, which thus also includes Stadshypotek’s credit risks, Handelsbanken calculates the proba-bility of its customers defaulting (probability of default, or PD), the Handelsbanken Group’s
expected exposure at default (EAD), and the pro-portion of the loan that the Handelsbanken Group is expected to lose in the case of default (loss given default, or LGD). Default is defined as when the counterparty is either 90 days late in making payment, or when an assessment has been made that the counterparty will not be able to pay as contractually agreed, for example, if declared bankrupt.
The PD value is expressed as a percentage where, for example, a PD value of 0.5 per cent means that one borrower in 200 with the same PD value is expected to default within one year. A credit in default does not necessarily mean that Stadshypotek will incur a loss since there is collat-eral for the exposure. Nor does a default mean that it is out of the question that the counterparty will pay at some time in the future, since the payment problems may be temporary. At Stads-hypotek, unsecured loans may only be granted when the government, county councils or munici-palities are the borrower or the guarantor, or when lending to joint ownership associations.
For corporate exposures, the internal rating set for each counterparty is directly converted into a rating grade on a scale between 1 and 10 (where risk class 10 refers to counterparties that have defaulted). Corporate exposures are divided into four counterparty types based on the business evaluation template used for the counterparty. The PD is calculated individually for each risk class and counterparty type.
For retail exposures, the risk class is also based on the internal rating assigned to all credit customers. The rating is not translated directly
into a risk class as for corporate exposures; instead, the different exposures are sorted into a number of smaller groups on the basis of certain factors. Such factors include the type of credit, the counterparty’s debt-servicing record and whether there are one or more borrowers. An average default rate is calculated for each of the smaller groups, and on the basis of this, the groups are sorted into one of the ten risk classes. Different models are used for exposures to private individuals and to small companies respectively (that are also classed as retail exposures), but the principle is the same.
For retail exposures and exposures to medium- sized companies, property companies and housing co-operative associations, the LGD is determined using the Handelsbanken Group’s own loss his-tory. For exposures to large corporates that are subject to a capital requirement using the IRB Approach with own estimates of LGD and credit conversion factor (CCF), the LGD is determined on the basis of internal losses and external obser-vations. For retail exposures secured by property in Sweden and for property exposures to medi-um-sized companies, property companies and housing co-operative associations, different LGD values are applied depending on the loan-to-value ratio of the collateral.
For each exposure class, the PD is calculated for each of the risk classes that refer to non- defaulted counterparties or agreements. PD is based on calculations of the historical percentage of defaults for different types of exposure. The average default rate is then adjusted by a margin of conservatism and a business cycle adjustment
NOTE 2 Cont.
Lending in Sweden, which accounts for 86 per cent (87) of Stadshypotek’s total lending, extends to all parts of Sweden, with a concentration in urban areas. Categories of borrowers vary from individual households to large property compa-
nies. At the year-end, lending was divided as fol-lows: single-family housing, housing co-operative apartments and owner-occupied apartments 68.7 per cent (67.2); multi-family dwellings 25.5 per cent (26.2) and offices and commercial
property 5.7 per cent (6.6). Lending to the largest customer category corresponded to 0.38 per cent (0.45) of the entire portfolio. There were 24 (21) customers or customer categories with loans of SEK 1 billion or more.

notes
staDsHYpoteK | annUal report 2016 27
factor. The margin is intended to ensure that the long-term probability of default is not under-estimated.
In the near future, Handelsbanken expects to receive approval from the Swedish Financial Supervisory Authority to use new models for cal-culation of the PD values for companies. These models estimate the long-term PD, including a margin of conservatism and a business cycle adjustment, at the portfolio level. This portfolio PD is then allocated among the various risk classes. Normally the portfolio PD will not vary year to year, though the risk-class PD will, as the distribution of counterparties among the risk classes varies over time. When the new models are implemented, it is assessed that the risk weights for companies will increase, but that the future variation in risk weights – and thus the capital requirement – will significantly decrease.
When establishing LGD, the risk measure must reflect the loss rates during economically unfavourable circumstances, known as downturn LGD. For collateral in property, the downturn LGD is based on observed loss rates from the property crisis in the early 1990s.
In addition to the capital adequacy calculation, measures of risk (PD, EAD, LGD) are used to cal-culate the cost of capital in each individual trans-action and to calculate economic capital (EC). This means that margins in the form of business cycle adjustments and safety adjustments in the risk measurements are also included in the calcu-lations of cost of capital in individual transactions and in calculations of economic capital, which means that the loss levels implied by the risk
Privatbostäder
0
10
20
30
40
50
60
7080
90
Proportion of exposure, %
Corporate Retail
>1.00%
0.61%
–1.00
%
0.31%
–0.60
%
0.06%
–0.30
%
<0.05%
PD intervals and proportion of exposureby exposure type, corporate and retail,excluding defaulted credits
Non-performing loans by borrower category and by type of collateral
Non-performing loans by borrower category
31 December
SEK m
2016 2015
Non-per-forming
loans which are
not impaired
loans
Non-per-forming
loans which are
included in impaired
loans
Non-per-forming
loans which are
not impaired
loans
Non-per-forming
loans which are
included in impaired
loans
Households 308 35 316 50
Public sector, municipal companies - - - -
Housing co-operative associations - - - -
Other legal entities 20 6 22 16
Total 328 41 338 66
of which in operations outside Sweden
Households 68 4 70 2
Public sector, municipal companies - - - -
Housing co-operative associations - - - -
Other legal entities 3 0 8 1
Total non-performing loans in operations outside Sweden 71 4 78 3
Non-performing loans by type of collateral
31 December
SEK m
2016 2015
Non-per-forming
loans which are
not impaired
loans
Non-per-forming
loans which are
included in impaired
loans
Non-per-forming
loans which are
not impaired
loans
Non-per-forming
loans which are
included in impaired
loans
Single-family housing 237 33 254 46
Housing co-operative apartments 39 7 31 9
Owner-occupied apartments 22 0 21 2
Private market 298 40 306 57
Multi-family dwellings 1 1 14 9
Offices and commercial buildings 29 - 18 0
Corporate market 30 1 32 9
Total 328 41 338 66
of which in operations outside Sweden
Single-family housing 49 4 56 1
Housing co-operative apartments - - 1 -
Owner-occupied apartments 22 0 21 2
Private market 71 4 78 3
Multi-family dwellings - - - -
Offices and commercial buildings - - - -
Corporate market - - - -
Total non-performing loans in operations outside Sweden 71 4 78 3
measurements are conservative. The method used means that the Handelsbanken Group’s historical losses have a direct impact on risk calculations and capital requirements.
The above diagram shows a breakdown of Stadshypotek’s exposures (EAD), excluding credits in default, between the different PD inter-vals for each exposure class. The PD values used are those applied when calculating the capital requirement.
Loan lossesNet loan losses totalled SEK -2 million. In 2015, recoveries exceeded new loan losses and totalled
SEK 2 million net. The loan loss ratio was 0.00 per cent (-0.00) of total lending. The largest loan loss attributable to a single customer or customer category was SEK 4.9 million (1.9). The ten largest loan losses totalled SEK 13 million (9).
Loan losses are reported in note 8 on page 34.
Impaired loansAt 31 December 2016, Stadshypotek’s impaired loans, before deduction of the provision for prob-able loan losses, amounted to SEK 103 million (109). These impaired loans included non-per-forming loans of SEK 41 million (66) and SEK 62 million (43) in loans on which the borrowers pay interest and amortisation, but which are neverthe-less considered impaired due to uncertainty regarding the borrowers’ repayment capacity and the value of the collateral. There were also non-performing loans of SEK 328 million (338) that are not classed as being impaired loans. After deductions for specific provisions totalling SEK -32 million (-32) and collective provisions for individually assessed loans of SEK -4 million (-5) for probable loan losses, impaired loans totalled SEK 67 million (72).
Impaired loans are also reported in note 11 on page 35. For a definition of impaired loans and other terms, see page 60.
Repossessed propertyAs of 31 December 2016, there was no repos-sessed property.

notes
28 staDsHYpoteK | annUal report 2016
NOTE 2 Cont.
Counterparty riskCounterparty risks arise when Stadshypotek has entered into derivative agreements, such as for-ward rate contracts, swaps or options, with a counterparty and there is a risk that this counter-party will not be able to meet its obligations. Counterparty risk is regarded as a credit risk, with the market value of the contract determining the size of the exposure. Since November 2013, all Stads hypotek’s derivative agreements are entered into with Handelsbanken as the counterparty, which means that the parent company assumes this type of credit risk. Some of the credit limits available in the parent company are thus intended to cover any counterparty risks derived from Stads-hypotek’s transactions in derivatives. If Stads-hypotek were again to enter into derivative agree-ments with an external counterparty, these would be restricted by means of credit limits established as part of the standard credit process at Handels-banken and assigned to Stadshypotek.
MARKET RISKMarket risks originate from changes in price and volatility on the financial markets and are divided into interest rate risks, equity price risks, exchange rate risks and commodity price risks. The market risks affecting Stadshypotek are interest rate risk and exchange rate risk. Stads-
hypotek’s Board decides on limits for interest rate risk and exchange rate risk.
Interest rate riskInterest rate risks arise when the rate adjustment periods for financial assets and liabilities or deriv-atives do not coincide. At Stadshypotek, interest rate risk is measured and limits set as the abso-lute total of the least favourable changes in fair value per currency in the case of substantial instantaneous upward or downward parallel shifts of one percentage point for all interest rates. This risk measure includes both items at market value and not at market value and it is therefore not appropriate to assess the effects on the balance sheet and income statement. Nor does it take into account Stadshypotek’s opportunities to adapt to changed interest rate levels.
Since the benchmark loans are concentrated on a small number of final maturity dates, it is not possible to match maturities in a traditional man-ner. Instead, the general method for achieving risk-neutral matching is based on the use of two different bonds to finance one lending transaction. Since one of the bonds has a shorter maturity than the lending and the other a longer maturity, the resultant interest rate risks for the two borrow-ing items balance one another, so the borrowing is risk-neutral with respect to the lending.
Stadshypotek uses interest rate swaps to hedge against risks on its own balance sheet. Long-term funding may be shortened using interest rate swaps, so that the interest rate fixing period matches the short-term lending at fixed and variable rates. Stadshypotek’s capped rate loan offers borrowers insurance against future interest rate increases. This is a five-year loan where the interest rate on the loan goes down when short-term interest rates fall. If the short-term rate of interest increases, the borrower never has to pay more than a pre-determined maximum rate of interest. This commitment is hedged with interest rate caps on terms corresponding to this lending.
The equity capital is placed in lending with an rate adjustment period averaging 1.5 (1.5) years. The daily interest rate risk on equity capital must not deviate from a risk limit specified by the Board. At 31 December 2016, Stadshypotek’s interest rate risk in the case of a parallel increase in the yield curve of one percentage point was SEK -446 million (-348).
Exchange rate riskStadshypotek has a commercial paper programme in Europe. In 2016, an issue was made in GBP as part of this programme. The exchange rate risk in connection with all short-term funding in foreign currencies is eliminated by matching currency
Impaired loans by borrower category and by type of collateral
Impaired loans by borrower category
31 December
SEK m
2016 2015
Impaired loans
Provision for
probable loan
losses
Net impaired
loansImpaired
loans
Provision for
probable loan
losses
Net impaired
loans
Households 69 -18 51 72 -18 54
Public sector, municipal companies - - - - - -
Housing co-operative associations 27 -12 15 21 -7 14
Other legal entities 7 -2 5 16 -7 9
Total 103 -32 71 109 -32 77
of which in operations outside Sweden
Households 8 -1 7 2 0 2
Public sector, municipal companies - - - - - -
Housing co-operative associations - - - - - -
Other legal entities 0 0 0 1 0 1
Total impaired loans in operations outside Sweden 8 -1 7 3 0 3
Impaired loans by type of collateral
31 December
SEK m
2016 2015
Impaired loans
Provision for
probable loan
losses
Net impaired
loansImpaired
loans
Provision for
probable loan
losses
Net impaired
loans
Single-family housing 65 -16 49 68 -17 51
Housing co-operative apartments 8 -2 6 10 -1 9
Owner-occupied apartments 0 0 0 1 0 1
Private market 73 -18 55 79 -18 61
Multi-family dwellings 30 -14 16 30 -14 16
Offices and commercial buildings 0 0 0 0 0 0
Corporate market 30 -14 16 30 -14 16
Total 103 -32 71 109 -32 77
of which in operations outside Sweden
Single-family housing 8 -1 7 2 0 2
Housing co-operative apartments - - - - - -
Owner-occupied apartments 0 0 0 1 0 1
Private market 8 -1 7 3 0 3
Multi-family dwellings - - - - - -
Offices and commercial buildings - - - - - -
Corporate market - - - - - -
Total impaired loans in operations outside Sweden 8 -1 7 3 0 3
The reserved amount for probable losses in the tables showing impaired loans consists of a specific provision for individually assessed receivables.

notes
staDsHYpoteK | annUal report 2016 29
The table below shows the interest rate fixing periods for assets and liabilities.
Interest rate fixing periods for Stadshypotek’s assets and liabilities31 December 2016
SEK m Up to 3 mths 3–6 mths 6–12 mths 1–5 yrs Over 5 yrs Total
ASSETS
Loans to credit institutions 12,027 - - - - 12,027
Loans to the public 692,316 47,444 60,171 335,111 15,569 1,150,611
Total 704,343 47,444 60,171 335,111 15,569 1,162,638
LIABILITIES
Due to credit institutions 357,470 44,509 27,014 64,139 3,978 497,110
Issued securities 84,620 66,942 2,022 402,261 56,942 612,787
Subordinated liabilities 16,300 5,400 - - - 21,700
Total 458,390 116,851 29,036 466,400 60,920 1,131,597
Off-balance-sheet items -175,925 18,903 768 139,393 33,903 17,042
Difference between assets and liabilities including off-balance-sheet items 70,028 -50,504 31,903 8,104 -11,448 48,083
Interest rate fixing periods for Stadshypotek’s assets and liabilities31 December 2015
SEK m Up to 3 mths 3–6 mths 6–12 mths 1–5 yrs Over 5 yrs Total
ASSETS
Loans to credit institutions 10,516 - - - - 10,516
Loans to the public 653,691 56,592 62,340 294,226 15,810 1,082,659
Total 664,207 56,592 62,340 294,226 15,810 1,093,175
LIABILITIES
Due to credit institutions 342,747 66,838 16,573 42,725 3,355 472,238
Issued securities 63,444 13,770 61,305 397,203 32,694 568,416
Subordinated liabilities 20,700 - - - - 20,700
Total 426,891 80,608 77,878 439,927 36,050 1,061,354
Off-balance-sheet items -190,421 13,762 11,950 146,267 25,486 7,043
Difference between assets and liabilities including off-balance-sheet items 46,895 -10,255 -3,588 566 5,246 38,863
swaps. Stadshypotek has also issued bonds in EUR, GBP and CHF under the EMTCN pro-gramme, in USD under the US Medium Term Covered Bond Programme, and in AUD under the AMTCN programme, all of which were converted into Swedish kronor using cross-currency interest rate swaps. The aim is that the business should not at any point be exposed to exchange rate risk as the result of funding in markets outside Sweden. All other refinancing in the foreign markets is raised through Handelsbanken and is subsequently transferred to Stadshypotek in Swedish kronor.
LIQUIDITY RISKLiquidity risk is the risk that Stadshypotek will not be able to meet its payment obligations when they fall due without being affected by unaccept-able costs or losses. Stadshypotek’s Board decides on the limits for liquidity risk. The liquidity risk is measured and limited by carrying out a gap analysis of cash flows for various maturities and all currencies, and a gap analysis of groups of currencies. The liquidity deficit consists of the amount by which estimated outgoing payments exceed estimated incoming payments, and is restricted by limits. To an increasing extent, loans with a short interest fixing period and variable rate loans have long-term funding in order to minimise the liquidity risk. However, some of this lending is
still funded by issues in short-term debt instru-ments. The maturity structure of the funding is well-diversified and adapted so that Handels-banken’s liquidity at Group level is in balance.
Stadshypotek has a contingency plan for managing a liquidity shortage, and this plan also describes the company’s liquidity-creating mea-sures. Stadshypotek is included in an agreement regarding liquidity support within the Handels-banken Group. According to the agreement, Handelsbanken holds a liquidity reserve for the Handelsbanken Group in its entirety, and is thereby responsible for Stadshypotek fulfilling the requirements for a liquidity reserve in accordance with the Swedish Financial Supervisory Authority’s regulation FFFS 2010:7. It is also stipulated that, in accordance with Article 8 of CRR and Chapter 6, Section 1 of FFFS 2014:12, the parties must provide each other with the required liquidity support.
Stadshypotek’s liquidity situation is regularly stress-tested. The stress tests focus on the short-term effects in the case of certain assumptions which are relevant to the operations, for example disruptions in the market for covered bonds. Group Risk Control conducts stress tests focus-ing on long-term disruptions for the entire Group, taking Stadshypotek’s liquidity requirements into consideration.
The maturity analysis overleaf shows cash flows for the contracted payment commitments that are due for payment at the latest within the stated time intervals, including interest flows. Also shown are assets, liabilities and interest flows that mature in the time intervals corresponding to the contractual maturity dates. Interest flows for lend-ing are matched in time with the liabilities that funded the lending. The total outstanding amount of these commitments does not necessarily rep-resent future funding requirements. For derivative instruments, cash flows are reported net for inter-est rate swaps and gross for instruments where gross cash flows are paid or received, such as cross-currency interest rate swaps. Loans to the public are reported as maturing in the time interval over five years remaining to maturity. Repayments according to plan during the current interest rate fixing period and fixed interest flows are reported on their respective maturity dates.
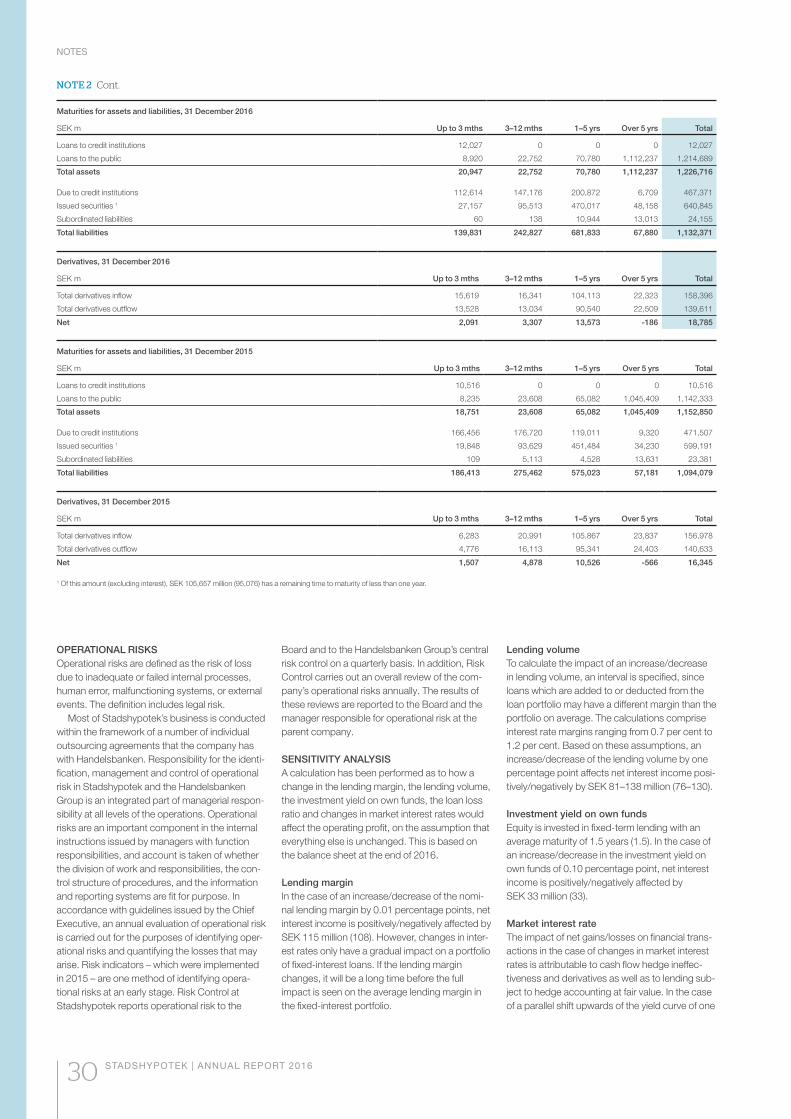
notes
30 staDsHYpoteK | annUal report 2016
OPERATIONAL RISKSOperational risks are defined as the risk of loss due to inadequate or failed internal processes, human error, malfunctioning systems, or external events. The definition includes legal risk.
Most of Stadshypotek’s business is conducted within the framework of a number of individual outsourcing agreements that the company has with Handelsbanken. Responsibility for the identi-fication, management and control of operational risk in Stadshypotek and the Handelsbanken Group is an integrated part of managerial respon-sibility at all levels of the operations. Operational risks are an important component in the internal instructions issued by managers with function responsibilities, and account is taken of whether the division of work and responsibilities, the con-trol structure of procedures, and the information and reporting systems are fit for purpose. In accordance with guidelines issued by the Chief Executive, an annual evaluation of operational risk is carried out for the purposes of identifying oper-ational risks and quantifying the losses that may arise. Risk indicators – which were implemented in 2015 – are one method of identifying opera-tional risks at an early stage. Risk Control at Stadshypotek reports operational risk to the
Board and to the Handelsbanken Group’s central risk control on a quarterly basis. In addition, Risk Control carries out an overall review of the com-pany’s operational risks annually. The results of these reviews are reported to the Board and the manager responsible for operational risk at the parent company.
SENSITIVITY ANALYSISA calculation has been performed as to how a change in the lending margin, the lending volume, the investment yield on own funds, the loan loss ratio and changes in market interest rates would affect the operating profit, on the assumption that everything else is unchanged. This is based on the balance sheet at the end of 2016.
Lending marginIn the case of an increase/decrease of the nomi-nal lending margin by 0.01 percentage points, net interest income is positively/negatively affected by SEK 115 million (108). However, changes in inter-est rates only have a gradual impact on a portfolio of fixed-interest loans. If the lending margin changes, it will be a long time before the full impact is seen on the average lending margin in the fixed-interest portfolio.
Lending volumeTo calculate the impact of an increase/decrease in lending volume, an interval is specified, since loans which are added to or deducted from the loan portfolio may have a different margin than the portfolio on average. The calculations comprise interest rate margins ranging from 0.7 per cent to 1.2 per cent. Based on these assumptions, an increase/decrease of the lending volume by one percentage point affects net interest income posi-tively/negatively by SEK 81–138 million (76–130).
Investment yield on own fundsEquity is invested in fixed-term lending with an average maturity of 1.5 years (1.5). In the case of an increase/decrease in the investment yield on own funds of 0.10 percentage point, net interest income is positively/negatively affected by SEK 33 million (33).
Market interest rateThe impact of net gains/losses on financial trans-actions in the case of changes in market interest rates is attributable to cash flow hedge ineffec-tiveness and derivatives as well as to lending sub-ject to hedge accounting at fair value. In the case of a parallel shift upwards of the yield curve of one
NOTE 2 Cont.
Maturities for assets and liabilities, 31 December 2016
SEK m Up to 3 mths 3–12 mths 1–5 yrs Over 5 yrs Total
Loans to credit institutions 12,027 0 0 0 12,027
Loans to the public 8,920 22,752 70,780 1,112,237 1,214,689
Total assets 20,947 22,752 70,780 1,112,237 1,226,716
Due to credit institutions 112,614 147,176 200,872 6,709 467,371
Issued securities 1 27,157 95,513 470,017 48,158 640,845
Subordinated liabilities 60 138 10,944 13,013 24,155
Total liabilities 139,831 242,827 681,833 67,880 1,132,371
Derivatives, 31 December 2016
SEK m Up to 3 mths 3–12 mths 1–5 yrs Over 5 yrs Total
Total derivatives inflow 15,619 16,341 104,113 22,323 158,396
Total derivatives outflow 13,528 13,034 90,540 22,509 139,611
Net 2,091 3,307 13,573 -186 18,785
Maturities for assets and liabilities, 31 December 2015
SEK m Up to 3 mths 3–12 mths 1–5 yrs Over 5 yrs Total
Loans to credit institutions 10,516 0 0 0 10,516
Loans to the public 8,235 23,608 65,082 1,045,409 1,142,333
Total assets 18,751 23,608 65,082 1,045,409 1,152,850
Due to credit institutions 166,456 176,720 119,011 9,320 471,507
Issued securities 1 19,848 93,629 451,484 34,230 599,191
Subordinated liabilities 109 5,113 4,528 13,631 23,381
Total liabilities 186,413 275,462 575,023 57,181 1,094,079
Derivatives, 31 December 2015
SEK m Up to 3 mths 3–12 mths 1–5 yrs Over 5 yrs Total
Total derivatives inflow 6,283 20,991 105,867 23,837 156,978
Total derivatives outflow 4,776 16,113 95,341 24,403 140,633
Net 1,507 4,878 10,526 -566 16,345
1 Of this amount (excluding interest), SEK 105,657 million (95,076) has a remaining time to maturity of less than one year.

notes
staDsHYpoteK | annUal report 2016 31
percentage point, net gains/losses on financial transactions will change by SEK -0.5 million (2).
Further, an estimate has been made of the effect that changes in market rates would have on net interest income. The effect that changes in interest rates have on net interest income is expressed as the change in net interest income over a 12-month period in the case of a general increase in market rates of one percentage point. This effect reflects the differences in interest-fixing periods and the breakdown of volumes into assets, liabilities and derivatives, based on the assumption that the size of the balance sheet remains constant. The effect on net interest income at the year-end was SEK 165 million (134).
Loan loss ratioIn the case of an increase/decrease of the loan loss ratio by 0.01 percentage point, loan losses are negatively/positively affected by SEK 108 mil-lion (102).
ECONOMIC CAPITALStadshypotek applies a model for economic capi-tal (EC), which is a vital component in planning to ensure that Stadshypotek has sufficient capital at all times in relation to all risks in the company.
Economic capital is calculated with a time hori-zon of one year and a confidence level that reflects an acceptable level of risk and desired rating. The Board has determined that the calcu-lation of economic capital must be made with a 99.97 per cent confidence level, which captures an event which is extremely unfavourable for Stadshypotek. EC is the difference between the outcome in an average year with positive results and the outcome at a 99.97 per cent confidence level. Diversification effects between the different risk classes are taken into account when calculat-ing EC. Since the risks are partly independent of each other, the capital requirement for all risks is lower than the sum of the economic capital for each individual risk.
The capital and other financial resources which form a buffer that can absorb negative outcomes are called available financial resources (AFR). AFR comprises Stadshypotek’s equity, adjusted for intangible assets, but including tier 1 loans with a supplement for perpetual subordinated loans, and also the profit/loss before tax for the next twelve months.
Credit risk is calculated using simulated out-comes of default for all Stadshypotek’s counter- parties and exposures. Market risks comprise interest rate risk in the business operations. The non-financial risks comprise business risk and operational risk. Business risk is related to unex-pected variations in earnings which may arise. For example, this may arise if demand or competition changes unexpectedly, thus resulting in lower volumes and squeezed margins.
The Board stipulates that the AFR/EC ratio should exceed 120 per cent. All calculations show that Stadshypotek is well capitalised in relation to its total risks.
CAPITAL PLANNINGStadshypotek’s capital policy – most recently adopted by the Board in 2016 – states the guide-lines for the capital planning.
The capital requirement is a function of Stads-hypotek’s risks, expected development, the regu-lations and target ratios, Stadshypotek’s model for economic capital and also of stress tests. The capital planning is divided into short-term and mid- to long-term forecasting. The part of capital planning that comprises short-term forecasts up to two years ahead principally focuses on assess-ing existing performance and the development of the capital requirement. This forecasting is neces-sary to enable continual adaptation of the size and composition of own funds. Capital planning is performed through an ongoing analysis of changes in volume, risk and performance, and by monitoring events that may affect capital require-ments and capital levels. Short-term forecasting includes all sub-components that make up Stadshypotek’s own funds and, in addition to the regulatory minimum requirements and buffers, the capital requirement includes Pillar 2 of the regulations. The analysis is based on a cautious basic scenario for how the existing earnings capacity can cope with various changes in volume.
The part of capital planning that comprises mid- to long-term forecasts aims to ensure com-pliance with statutory capital requirements and that Stadshypotek’s AFR at all times covers by a good margin all risks calculated according to the economic capital model.
The objective is to forecast the expected per-formance and judge whether Stadshypotek’s resistance is satisfactory in various scenarios. The planning period is at least five years. Various sce-narios and stress tests are performed as part of the forecast work. A basic scenario forms the foundation of the capital forecast. This scenario is obtained from expected performance in the next five years regarding profit, volume growth and financial assumptions such as loan losses and performance on the fixed income market. The basic scenario is then compared to the outcomes in a number of business cycle and crisis scenar-ios. The stress scenarios have been established following analysis of the historical links between the impacts of various macroeconomic variables on the financial markets and have been selected by using the scenarios expected to have the greatest adverse impact on Stadshypotek. The result of the internal capital assessment is reported annually to the Board.
STADSHYPOTEK’S TARGET RATIOS FOR REGULATORY CAPITALThe targets for Stadshypotek’s capitalisation are set annually by the Board. A cornerstone of the internal capital requirement assessment regarding regulatory capital is the combination of stress and scenario analyses concerning Stadshypotek’s situation, examined from both the long-term and short-term perspective. The scenarios used are based primarily on Stadshypotek’s internal risk tolerance and on requirements expressly stipu-lated in regulations or issued by public authorities.
In addition to the internal assessment of the capital requirement, the Swedish Financial Super-visory Authority has communicated that the tar-get figures of Swedish banks must not be lower than the total capital requirement calculated by the Supervisory Authority, regardless of the banks’ internal calculations. Stadshypotek has taken this into consideration when setting the target ratios for its regulatory capital. The Board has decided that common equity tier 1 capital, tier 1 capital and the total capital ratio under normal circumstances should be at least one percentage point higher than the overall capital requirement announced by the Swedish Financial Supervisory Authority.

notes
32 staDsHYpoteK | annUal report 2016
NOTE 3 Net interest income
SEK m 2016 2015
Interest income
Loans to the public 20,116 21,691
Loans to credit institutions 179 193
Total 20,295 21,884
Interest expense
Due to credit institutions -2,241 -2,184
Issued securities
Commercial paper and other short-term borrowings -3 -36
Bonds and other long-term borrowings -8,476 -10,398
Subordinated liabilities -448 -479
Other
Derivative instruments1 3,503 3,177
Fee to Resolution Fund (Stability Fund in 2015) -267 -207
Other interest expense -1 -1
Total -7,933 -10,128
Net interest income 12,362 11,756
1 Net interest income from derivative instruments which are recognised at fair value and derive from Stadshypotek’s funding and can have both a positive and a negative impact on interest expense.
During the year, the average interest rate on loans to the public was 1.8 per cent (2.1). During the year, the average funding rate (due to credit institu-tions, issued securities and subordinated loans) was 1.0 per cent (1.3). SEK 2 million (2) of the interest income related to impaired loans. The interest income is entirely attributable to assets measured at amortised cost. Total interest expense on liabilities measured at amortised cost for 2016 was SEK 11,168 million (13,098).
NOTE 4 Net fee and commission income
SEK m 2016 2015
Fee and commission income
Lending commissions 10 11
Other commissions 3 3
Total 13 14
Fee and commission expense
Commission on payments 0 0
Commission on securities -42 -20
Other commissions 0 0
Total -42 -20
Net fee and commission income -29 -6
NOTE 5 Net gains/losses on financial transactions
SEK m 2016 2015
Hedge accounting -8 -111
of which net gains/losses, fair value hedges -11 -112
of which ineffective portion of cash flow hedges 3 1
Loans, measured at cost 272 304
Financial liabilities, measured at cost -224 -361
Derivatives not recognised as hedges -4 181
Other 46 16
Total 82 29
The profit/loss item Net gains/losses, fair value hedges includes the net result of unrealised and realised changes in the fair value of financial assets and liabilities which are subject to hedge accounting. Interest income and interest expense for hedging instruments are recognised under net interest income. Changes in the value of hedging instruments in cash flow hedges which exceed the changes in the value of hedged future cash flows are recognised under the item Ineffective portion of cash flow hedges. Deriva-tives not recognised as hedges are included in the held-for-trading category. The line item Loans, measured at cost refers to early redemption charges for loans and receivables which have been repaid ahead of time. The line item Financial liabilities, measured at cost refers to realised price differences when repurchasing bonds.

notes
staDsHYpoteK | annUal report 2016 33
The average number of employees in the company during the year was 78 (77). Of these employees, 46 per cent (47) were women and 54 per cent (53) were men. Stadshypotek has pension obligations according to the BTP2 agreement which are guaranteed through insurance with Pensionskassan SHB, försäkringsförening (pension fund).
These obligations are reported according to the revised IAS 19 rules for defined benefit plans, whereby the company under common control shares the risks related to the pension obligations, since the pension fund’s assets are not allocated among the employers who have insurance with the pen-sion fund. According to these rules, Stadshypotek reports the insurance charges which are debited for the period as an expense.
The pension fund does not debit the charges calculated on the basis of the revised IAS 19 definition of defined benefit net expense for pensions. The charges are debited in accordance with the rules in the statutes for the pen-sion fund with the purpose of debiting charges corresponding to an expense for pension benefits accrued during the period. The rules do not take into account actuarial gains and losses which have occurred. Nor do they take into account fluctuations in real return. Fees to the pension fund for 2017 are expected to amount to SEK 14.5 million.
The pension fund’s obligations totalled SEK 6,099 million (5,586) at 31 December 2016, based on prudent assumptions, where the discount rate has been set in accordance with the principles in FFFS 2008:23 (Regu-lations governing insurance companies’ choice of interest rate of calculation of technical provisions). The fair value of the pension fund’s assets was SEK 11,561 million (10,241) at 31 December 2016. The pension fund’s assets are broken down as follows:
Pension fund’s plan assets 31 December 2016 2015
Listed shares and participations 11,114 9,743
Unlisted shares and participations 62 82
Listed interest-bearing securities 298 303
Unlisted interest-bearing securities - -
Other plan assets 87 113
Total 11,561 10,241
Further information about the defined benefit pension plan can be found in note G8 of the 2016 Annual Report for the Handelsbanken Group.
REMUNERATION TO EMPLOYEESStadshypotek has a long-term view of its staff’s employment. Remuneration varies over an employee’s period of employment with Stadshypotek and good efforts must always be rewarded. The total level of remuneration should help improve Stadshypotek’s competitive position and profitability so that the company is able to attract, retain and develop skilled employees and establish a healthy management succession structure. Stadshypotek gener-ally has a low risk tolerance, which is reflected in its attitude towards remu-neration. Stadshypotek considers that fixed remuneration contributes to healthy operations and all employees of Stadshypotek therefore only receive a fixed remuneration. There is no variable remuneration at Stadshypotek. Remuneration for work performed is set individually for each employee. Remuneration is paid in the form of a fixed salary, customary salary benefits and a pension provision. Salaries are set locally and are based on salary- setting factors which are determined in advance.
NOTE 6 Staff costs
SEK m 2016 2015
Salaries and other remuneration -55 -53
Social security costs -18 -17
of which special payroll tax -3 -2
Pension premiums paid -14 -11
Provision to profit-sharing foundation -2 -4
Other staff costs -5 -4
Total -94 -89
Total remuneration is defined as that which Stadshypotek pays directly or indirectly to an employee as part of their employment, such as cash salary, other cash remuneration, customary salary benefits, company car and pen-sion provisions. At Stadshypotek, the rules for pensions to employees are agreed through collective agreements and in local agreements, while for the Chief Executive, they follow Stadshypotek’s guidelines. The Board decides on the level of remuneration paid to individuals in Stadshypotek’s executive management who are employees of Stadshypotek and on the remuneration paid to employees who have overall responsibility for Stadshypotek’s control functions in the areas of compliance and risk control.
Remuneration policyThe principles for Stadshypotek’s system of remuneration are established in a remuneration policy decided by the Board. The Board of Stadshypotek has a designated member who prepares decisions concerning the levels of remuneration which are to be set by Stadshypotek’s Board. Stadshypotek’s remuneration policy is reviewed annually or whenever necessary. Stads-hypotek’s remuneration policy is based on a risk analysis produced by the Risk Control function at Stadshypotek, which is independent of the business operations. The Chief Executive and all other managers concerned at Stads-hypotek are responsible for identifying, managing and limiting the risks in the system of remuneration. The Chief Executive is responsible for proposing the structure of the remuneration system in line with Stadshypotek’s view of risks and long-term approach. Risk Control and Compliance must identify, monitor, analyse and report on material risks associated with the remunera-tion policy.
TERMS AND REMUNERATION OF SENIOR MANAGEMENTFor the Chief Executive, remuneration is paid in the form of a fixed salary, customary salary benefits and pension provisions. Decisions regarding the remuneration paid to the Chief Executive are taken by an extraordinary shareholders’ meeting at Stads hypotek.
There are no agreements involving termination benefits. The Chief Execu-tive, Ulrica Stolt Kirkegaard, has a retirement age of 65. The pension is a defined benefit pension scheme that provides 60 per cent of salary and accrues at a rate of 1/180th per month during the period 1 May 2014–30 April 2029 when the pension is fully paid up and available for disbursement upon reaching the retirement age. If the employment is terminated before reaching the retirement age, a paid-up policy is disbursed covering the retirement pension amount already accrued.
Salary and remuneration to the Chief Executive totalled SEK 2.6 million (2.7), including benefits of SEK 241 thousand (314). Board member Michael Bertorp has received a fee of SEK 260 thousand (250). No fees have been paid to any other members of the Board. The year’s pension cost for the Chief Executive totalled SEK 1.2 million (1.3). For other members of the company’s executive management, remuneration is paid in the form of a fixed salary, customary salary benefits and a pension provision in accor-dance with the terms of the applicable collective agreement, the occupa-tional pension plan for the Swedish banks (BTP2). The year’s pension cost for other members of the company's executive management, a total of 7 people (6), was SEK 2.5 million (2.5).

notes
34 staDsHYpoteK | annUal report 2016
Remuneration to other members of the company’s executive management and to risk-takersFixed salary and other benefits to other members of the company’s executive management were SEK 8.0 million (7.2).
Fixed salaries and other benefits to individuals who are not members of the company’s executive management, but who are deemed to be
capable of influencing the company’s level of risk (as described in the definition in the Swedish Financial Supervisory Authority’s regulations gov-erning remuneration systems in credit institutions, securities companies and fund management companies) totalled SEK 12.4 million (10.1), divided among 20 (16) individuals.
At the end of 2016, the following loans to executive officers of the company were outstanding at Stadshypotek: SEK m 2016 2015
Chief Executive and other members of the company’s executive management 33 27
To other Board members (excluding Chief Executive) 13 16
To Board members and Executive Directors of Svenska Handelsbanken AB 66 56
The loans concerned have been granted to 24 (23) individuals and all have been secured by pledged collateral. Stadshypotek’s interest income for loans to the above-mentioned categories totals SEK 1.3 million (1.4). Members of the company’s executive management who are employed by Stadshypotek are subject to the same credit terms as other employees. The discount on the interest rate for credits is determined on the basis of the government borrowing rate set annually by the Swedish Tax Authority plus one percentage point. The discount on the interest rate is taxed in connection with monthly salary pay-ments and constitutes a basis for employer’s contributions for Stadshypotek. Interest payable on credits exceeding SEK 1.5 million is determined by applying normal commercial terms. All credits are subject to the customary credit assessment.
2016 2015
Gender distribution, number Men Women Men Women
Board 4 2 4 2
Company’s executive management1 3 5 2 5
1 Employees of Stadshypotek. The company’s executive management also includes two individuals employed by Handelsbanken.
NOTE 7 Other administrative expenses
SEK m 2016 2015
Cost of premises -7 -7
IT costs -114 -116
Communications -1 -1
Travel and marketing -3 -3
Purchased services -802 -816
Supplies 0 0
Other expenses -20 -20
Total -947 -963
Audit costs 2016 2015
External auditing:
KPMG AB, audit assignments -0.4 -0.4
KPMG AB, audit activities in addition to audit assignments 1 -0.3 -0.9
Internal audit -1.9 -1.9
Operating lease contracts 2016 2015
Lease payments for the period 2 -9 -8
1 For review of issue prospectuses.2 Lease payments mainly refer to rents.
NOTE 8 Loan losses
SEK m 2016 2015
Specific provision for individually assessed loans
The year’s provision -15 -11
Reversal of previous provisions 5 4
Total -10 -7
Collective provision
Collective provision for individually assessed loans 1 -1
Write-offs
Actual loan losses for the year -24 -36
Utilised share of previous provisions 10 18
Reversal of actual loan losses in previous years 21 28
Total 7 10
Net loan losses -2 2
Both actual and probable loan losses reduce the corresponding receivable amount on the assets side of the balance sheet.
All written-down and recovered losses refer to loans to the public.Loans which after individual assessment are deemed to have been
recognised at the correct value must also be assessed to establish whether a collective provision for probable loan losses might nevertheless be necessary. In connection with this, SEK 4 million (5) was reserved at 31 December 2016.
NOTE 6 Cont.

notes
staDsHYpoteK | annUal report 2016 35
NOTE 9 Taxes
SEK m 2016 2015
Current tax
Tax cost for the year -2,508 -2,393
Adjustment of tax relating to previous years 0 -2
Deferred tax
Changes in temporary differences -1 1
Total -2,509 -2,394
Nominal tax rate in Sweden 22.0 22.0
Deviations
Non-taxable income/non-deductible expenses -0.0 -0.0
Different tax rates in other countries 0.1 0.3
Tax relating to previous years 0.0 0.0
Effective tax rate 22.1 22.3
Deferred tax assets
Derivative instruments - -
Deferred tax liabilities
Derivative instruments 735 1,012
NOTE 10 Loans to credit institutions
SEK m 2016 2015
Loans in Swedish kronor
Banks 7,811 7,427
Loans in foreign currency
Banks 4,216 3,089
Total 12,027 10,516
Average balance, loans to credit institutions 8,847 8,392
NOTE 11 Loans to the public
SEK m 2016 2015
Loans in Swedish kronor
Loans at cost 983,308 936,755
Specific provision for individually assessed loans -31 -32
Collective provision for individually assessed loans -3 -5
Total 983,274 936,718
Loans in foreign currency
Loans at cost 167,339 145,941
Specific provision for individually assessed loans -1 -
Collective provision for individually assessed loans -1 -
Total 167,337 145,941
Carrying amount 1,150,611 1,082,659
Average balance, loans to the public 1,116,551 1,050,279
Non-performing loans, etc. 2016 2015
Impaired loans 103 109
Specific provision for individually assessed loans -32 -32
Collective provision for individually assessed loans -4 -5
Net impaired loans 67 72
Reserve ratio for impaired loans, % 31.2 29.6
Proportion of impaired loans, % 0.01 0.01
Non-performing loans for which interest is recognised as income 328 338
Carrying amount of loan receivables restructured during the year
– before restructuring 2 3
– after restructuring 2 0
Impaired loans reclassified as normal loans during the year 0 0
Change in provision for probable loan losses 2016 2015
Provision for individually
valued receivables
Collective provision for individually
assessed loans
Total provision for probable loan losses
Provision for individually
valued receivables
Collective provision for individually
assessed loans
Total provision for probable loan losses
Provision at beginning of year -32 -5 -37 -43 -4 -47
The year’s provision -15 - -15 -11 - -11
Reversal from previous provisions 5 1 6 4 -1 3
Utilised for actual losses 10 - 10 18 - 18
Provision at end of year -32 -4 -36 -32 -5 -37
Change in deferred tax 2016
Opening balance
Recognised in income statement
Recognised in other
comprehensive income
Closing balance
Hedging instruments -1,012 -1 278 -735
Change in deferred tax 2015
Opening balance
Recognised in income statement
Recognised in other
comprehensive income
Closing balance
Hedging instruments -1,166 1 153 -1,012

notes
36 staDsHYpoteK | annUal report 2016
NOTE 13 Derivative instruments
Nominal amount/maturity
SEK mup to 1
yearover 1 year
up to 5 yearsover 5 years Total 2016 Total 2015
Positive market
values 2016
Positive market
values 2015
Negative market
values 2016
Negative market
values 2015
DERIVATIVES FOR CASH-FLOW HEDGE ACCOUNTING
Interest rate-related contracts
Interest rate swaps 38,898 187,865 30,403 257,166 220,380 8,679 10,559 1,386 1,253
Currency-related contracts
Cross-currency interest rate swaps 26,022 90,749 21,376 138,147 132,766 14,038 9,915 3,041 2,822
DERIVATIVES FOR FAIR VALUE HEDGES
Interest rate-related contracts
Options 530 5,115 - 5,645 6,785 28 38 - -
OTHER DERIVATIVES
Interest rate-related contracts
Options - 222 - 222 543 0 1 0 0
Interest rate swaps - 9 - 9 9 - - 1 1
Other interest-related derivatives 8,433 - - 8,433 54,588 1 1 1 1
Currency-related contracts
Currency swaps - - - - 967 - - - 68
Total 73,883 283,960 51,779 409,622 416,038 22,746 20,514 4,429 4,145
Currency breakdown of market values
SEK -103,275 -78,866 17,658 38,791
USD 41,342 30,170 7,537 -1,418
EUR 84,653 62,845 -11,977 -23,294
GBP 0 4,362 -3,837 -5,248
CHF - 1,965 - -
DKK 0 1 - -
AUD 26 37 -4,952 -4,686
NOTE 14 Intangible assets
Software developed in-houseSEK m 2016 2015
Cost of acquisition at beginning of year 65 65
Cost of acquisition of additional intangible assets 4 -
Disposals and retirements -38 -
Cost of acquisition at end of year 31 65
Opening accumulated amortisation -51 -38
Disposals and retirements 38 -
Amortisation for the year -6 -13
Closing accumulated depreciation -19 -51
Closing residual value 12 14
NOTE 15 Property and equipment
SEK m 2016 2015
Cost of acquisition at beginning of year 3 3
Cost of acquisition of new assets 0 0
Cost of acquisition of assets sold during the year - -
Cost of acquisition at end of year 3 3
Accumulated depreciation according to plan, opening bal-ance -3 -3
Amortisation for the year 0 0
Accumulated depreciation of assets sold during the year - -
Closing accumulated depreciation -3 -3
Residual value according to plan 0 0
NOTE 12 Shares and participating interests in Group companies
SEK m 2016 2015
Shares in Group companies 0 0
Name DomicileCorporate
identity no.Number of
sharesNominal
value, SEK ’000Proportion of
share capital, %
Carrying amount,
SEK ’000
Svenska Intecknings Garanti AB Sigab Stockholm 556432-7285 1,000 100 100 100
The holdings consist of unlisted shares.

notes
staDsHYpoteK | annUal report 2016 37
NOTE 19 Issued securities
SEK m 2016 2015
Certificates ¹ - 933
Bonds ² 612,787 567,483
Total 612,787 568,416
¹ Certificates
Certificates in Swedish kronor - -
Certificates in foreign currency - 933
Total carrying amount - 933
of which at amortised cost - 933
² Bonds
Bonds in Swedish kronor 425,388 400,100
Foreign currency bonds 169,982 146,021
Total nominal value 595,370 546,121
Bonds in Swedish kronor 442,982 421,046
Foreign currency bonds 169,805 146,437
Total carrying amount 612,787 567,483
of which at amortised cost 612,787 567,483
Average balance issued securities in SEK 441,350 428,726
Average balance issued securities in foreign currency 162,071 145,288
SEK m 2016 2015
Issued securities at beginning of period 568,416 579,485
Issued 155,758 171,274
Repurchased -41,932 -56,841
Matured -68,170 -112,183
Price differences, exchange rate effects, etc. -1,285 -13,319
Issued securities at end of period 612,787 568,416
For a list of bonds, see page 58.
NOTE 20 Other liabilities
SEK m 2016 2015
Group contributions provided 10,100 9,235
Other liabilities 43 38
Total 10,143 9,273
NOTE 18 Due to credit institutions
SEK m 2016 2015
Due in Swedish kronor
Banks 366,421 345,782
Due in foreign currency
Banks 130,689 126,456
Total 497,110 472,238
Average balance due to credit institutions 470,031 437,692
NOTE 17 Prepaid expenses and accrued income
SEK m 2016 2015
Accrued interest 1,347 1,362
Other accrued income 42 44
Prepaid expenses 4 2
Total 1,393 1,408
NOTE 16 Other assets
SEK m 2016 2015
Settlement claims in respect of own securities - 0
Other 701 1,221
Total 701 1,221
The line item Other includes accumulated value changes on fair value portfolio hedges that have been terminated prematurely.
NOTE 21 Accrued expenses and deferred income
SEK m 2016 2015
Accrued interest 7,268 7,692
Other accrued expenses 29 223
Deferred income 118 116
Total 7,415 8,031
NOTE 22 Subordinated liabilities
Stadshypotek has four dated subordinated loans of SEK 3,000 million, SEK 4,900 million, SEK 4,500 million and SEK 4,000 million respectively and two perpetual loans of SEK 4,800 million and SEK 500 million respectively. The loans have a three-month variable coupon linked to Stibor. The dated loans fall due for payment on 3 January 2025, 30 June 2026, 3 January 2029 and 29 January 2026 respectively. For the perpetual loans, subject to the approval of the Swedish Financial Supervisory Authority, Stadshypotek has the right of repayment on each future interest due date.
NOTE 23 Equity
At the balance sheet date, the share capital comprised 162,000 class A shares with a nominal value of SEK 25,000 each. There have been no changes during the year.
Restricted and unrestricted equity are stated under Statement of changes in equity. The translation reserve consists entirely of translation differences arising from conversion of the income statements and balance sheets of foreign branches.
Change in hedge reserve
SEK m 2016 2015
Hedge reserve at beginning of year 3,591 4,133
Unrealised value changes during the year 3,792 -1,832
Reclassified to the income statement -4,776 1,290
Hedge reserve at end of year 2,607 3,591

notes
38 staDsHYpoteK | annUal report 2016
SEK m 2016 2015
Assets pledged for own debt 1 667,920 622,726
Other pledged assets - -
Pledged collateral 667,920 622,726
Guarantee commitments - -
Undertakings 1,592 2,178
Contingent liabilities 1,592 2,178
NOTE 25 Disclosure of related-party transactions
SEK m 2016 2015
BALANCE SHEET
Group claims
Loans to credit institutions 12,027 10,516
Derivative instruments 22,746 20,512
Other assets 32 21
Prepaid expenses and accrued income 44 44
Total 34,849 31,093
Group liabilities
Due to credit institutions 497,110 472,220
Derivative instruments 4,429 4,145
Other liabilities 10,122 9,256
Accrued expenses and deferred income 535 419
Subordinated liabilities 21,700 20,700
Total 533,896 506,740
INCOME STATEMENT
Interest income 180 195
Interest expense 1 809 509
Fee and commission expense -7 0
Other administrative expenses -908 -925
Total 74 -211
1 Interest expense includes interest from derivative instruments which may have both a positive and a negative impact on interest expenses.
Pension premiums paid to Pensionskassan SHB, försäkringsförening are reported in note 6. Note 6 also contains information about loans granted to executive officers and other disclosures relating to the terms and conditions of executive officers and the remuneration paid to them.
The business operations of Stadshypotek are highly decentralised. The basic principle is that the organisation and working practices are cen-tred around Handelsbanken’s branch offices, which are responsible for all the business of individual customers. One consequence of this approach is that Stadshypotek’s lending opera-tions are run via Handelsbanken’s Swedish branch operations and the lending operations in Stadshypotek’s branches in Norway, Denmark and Finland are run via Handelsbanken’s branch operations in each of the respective countries. Lending is to be carried out to the extent and on the terms stated in Stadshypotek’s Credit Policy
and Credit Instructions, established annually by the Board of Stadshypotek. The Credit Instruc-tions include the maximum permitted loan-to-value ratio for various property types, as well as the decision levels applying to Stadshypotek’s lending via the Bank’s branches. The Credit Instructions also state that for loan amounts in excess of a certain limit, an advance examination of the case and an approval of the property is to be provided by Stadshypotek’s credit committee before the loan is disbursed. Stadshypotek’s funding needs are managed by Handelsbanken’s Treasury department. The services which Handelsbanken performs on behalf of Stads-hypotek are regulated in outsourcing agreements between the parties.
Most of the inter-company transactions are thus with the parent company, Handelsbanken. The services that Stadshypotek purchases from the parent company, which are included in other
administrative expenses, consist primarily of sales compensation, IT services and the treasury function. Stadshypotek’s branches outside Sweden make payments to Handelsbanken’s branches in the respective countries for services rendered by them on behalf of Stadshypotek. In addition, inter-company transactions consist of funding from the parent company, derivative transactions and lending to the parent company.
The line item Other assets referred to above includes a claim of SEK 4 million (3) on fellow subsidiaries. Accrued expenses and deferred income include SEK 0 million (0) relating to deal-ings with fellow subsidiaries. Fee and commis-sion expense include SEK 0 million (0) attribut-able to fellow subsidiaries. Other administrative expenses include SEK 10 million (9) attributable to fellow subsidiaries. Other inter-company transactions refer to transactions with the parent company.
1 The collateral comprises loans against mortgages in single-family housing, second homes, multi-family dwellings and housing co-operative apartments with a loan-to-value ratio of up to 75 per cent of the market value as well as office and commercial buildings with a loan-to-value ratio of up to 60 per cent of the market value plus additional collateral in the form of cash funds in a blocked account. A separate specification is kept of the assets and the covered bonds, and also derivatives relating to these. In the event of the company’s insolvency, pursuant to the Swedish Right of Priority Act, the holders of Stadshypotek’s covered bonds have prior rights to the assets registered as collateral. If, at the time of a bankruptcy decision, the assets in the total collateral fulfil the terms of the Act, these must instead be kept separate from the bank-ruptcy estate’s other assets and liabilities. In this event, the holders of the bonds must receive contractual payments under the terms of the bond for the period until maturity.
NOTE 24 Pledged assets and contingent liabilities
Contracted future operating lease charges broken down by the years they fall due for payment 2016 2015
2016 - 7.7
2017 8.8 7.0
2018 7.9 6.4
2019 7.1 5.9
2020 4.3 4.0
2021 2.0 2.0
2022 2.0 -
Total 32.1 33.0

notes
staDsHYpoteK | annUal report 2016 39
NOTE 26 Segment information
Income statement 2016 2015
SEK m Private Corporate Total Private Corporate Total
Net interest income 9,229 3,133 12,362 8,566 3,190 11,756
Net fee and commission income -22 -7 -29 -4 -2 -6
Net gains/losses on financial transactions 62 20 82 21 8 29
Total operating income 9,269 3,146 12,415 8,583 3,196 11,779
Expenses -784 -263 -1,047 -777 -288 -1,065
Profit before loan losses 8,485 2,883 11,368 7,806 2,908 10,714
Net loan losses -1 -1 -2 4 -2 2
Operating profit 8,484 2,882 11,366 7,810 2,906 10,716
Balance sheet 31 December 2016 2015
SEK m Private Corporate Total Private Corporate Total
Assets
Loans to credit institutions 8,334 3,693 12,027 7,139 3,377 10,516
Loans to the public 790,939 359,672 1,150,611 727,787 354,872 1,082,659
Other assets 16,982 7,905 24,887 15,510 7,746 23,256
Total assets 816,255 371,270 1,187,525 750,436 365,995 1,116,431
Liabilities and equity
Due to credit institutions 343,854 153,256 497,110 320,060 152,178 472,238
Issued securities 417,973 194,814 612,787 378,915 189,501 568,416
Other liabilities 16,445 6,465 22,910 14,982 7,479 22,461
Subordinated liabilities 14,801 6,899 21,700 13,799 6,901 20,700
Total liabilities 793,073 361,434 1,154,507 727,756 356,059 1,083,815
Equity 33,018 32,616
Total liabilities and equity 1,187,525 1,116,431
Private market is defined as lending secured by mortgages in single-family or two-family houses, second homes, housing co-operative apartments or residential farms. Corporate market is defined as lending secured by mortgages in multi-family dwellings, family farms, commercial and office buildings or state and municipal loans.
Geographical breakdown of business segments 2016 2015
SEK m Sweden Norway Denmark Finland Total Sweden Norway Denmark Finland Total
Income 11,087 598 345 385 12,415 10,202 875 276 426 11,779
Operating profit 10,157 540 320 349 11,366 9,256 816 252 392 10,716
Tax -2,234 -135 -70 -70 -2,509 -2,036 -220 -59 -79 -2,394
Public subsidies - - - - - - - - - -
Intangible assets 12 - - - 12 14 - - - 14
Property and equipment 0 - - - 0 0 - - - 0
Total assets 1,015,817 80,881 39,676 51,151 1,187,525 967,279 67,777 31,642 49,733 1,116,431
Other information
Average number of employees 77 - 1 - 78 76 - 1 - 77
The geographical distribution of income and expenses is based on the country where the business transactions are carried out. For further information about the branches, see page 5.

notes
40 staDsHYpoteK | annUal report 2016
NOTE 27 Assets and liabilities in foreign currencies
The total value in Swedish kronor of the company’s assets and liabilities in foreign currencies is specified in the following table.
31 December 2016SEK m AUD CHF DKK EUR GBP NOK USD Total
Assets
Loans to credit institutions - - 2,623 335 - 1,259 - 4,217
Loans to the public - - 37,051 50,724 - 79,564 - 167,339
Accrued income and prepaid expenses - - 1 65 - 88 - 154
Other assets - - - 42 - - - 42
Liabilities
Due to credit institutions - - 38,465 43,194 - 49,030 - 130,689
Issued securities 4,956 - - 98,347 3,853 28,521 34,128 169,805
Other liabilities - - 90 3 - 139 - 232
Accrued expenses and deferred income 38 - 0 517 3 281 114 953
Derivative positions 4,979 - 0 96,631 3,836 - 33,805 139,251
Retained earnings and branch profits for the year - - 1,120 3,132 - 2,963 - 7,215
Net foreign currency position -15 0 0 2,604 -20 -23 -437 2,109
31 December 2015SEK m AUD CHF DKK EUR GBP NOK USD Total
Assets
Loans to credit institutions - - 2,073 260 - 756 - 3,089
Loans to the public - - 29,566 49,389 - 66,986 - 145,941
Accrued income and prepaid expenses - - 2 67 - 85 - 154
Other assets - - - 23 - - - 23
Liabilities
Due to credit institutions - - 30,735 46,957 - 48,764 - 126,456
Issued securities 4,682 1,935 - 83,143 9,572 16,392 31,645 147,369
Other liabilities - - 78 0 - 202 - 280
Accrued expenses and deferred income 37 3 1 728 9 166 106 1,050
Derivative positions 4,724 1,964 1 86,140 9,610 - 31,588 134,027
Retained earnings and branch profits for the year - - 827 2,728 - 2,318 - 5,873
Net foreign currency position 5 26 1 2,323 29 -15 -163 2,206
The net foreign currency positions reported in the table are due to differences in valuation principles between lending and funding at amortised cost and derivatives at fair value. Stadshypotek’s risk management strategy means that inflows and outflows in foreign currency are completely matched.
NOTE 28 Classification of financial assets and liabilities
31 December 2016SEK m
Loans and receivables
Derivatives that do not constitute
formal hedges
Derivatives designated as hedging
instrumentsFinancial liabilities at amortised cost
Non-financial assets/liabilities Total Fair value
Assets
Loans to credit institutions 12,027 12,027 12,027
Loans to the public 1,150,611 1,150,611 1,161,681
Value change of interest-hedged item in portfolio hedge 35 35
Derivative instruments - 22,746 22,746 22,746
Intangible assets 12 12 12
Property and equipment 0 0 0
Current tax assets 0 0 0
Other assets 701 701 701
Prepaid expenses and accrued income 1,393 1,393 1,393
Total assets 1,164,767 - 22,746 12 1,187,525 1,198,560
Liabilities
Due to credit institutions 497,110 497,110 501,783
Issued securities 612,787 612,787 623,522
Derivative instruments 1 4,428 4,429 4,429
Deferred tax liabilities 735 735 735
Other liabilities 9,408 923 10,331 10,331
Accrued expenses and deferred income 7,415 7,415 7,415
Subordinated liabilities 21,700 21,700 23,350
Total liabilities 1 4,428 1,148,420 1,658 1,154,507 1,171,565

notes
staDsHYpoteK | annUal report 2016 41
31 December 2015SEK m
Loans and receivables
Derivatives that do not constitute
formal hedges
Derivatives designated as hedging
instrumentsFinancial liabilities at amortised cost
Non-financial assets/liabilities Total Fair value
Assets
Loans to credit institutions 10,516 10,516 10,516
Loans to the public 1,082,659 1,082,659 1,093,346
Value change of interest-hedged item in portfolio hedge 28 28
Derivative instruments 2 20,512 20,514 20,514
Intangible assets 14 14 14
Property and equipment 0 0 0
Current tax assets 71 71 71
Other assets 1,221 1,221 1,221
Prepaid expenses and accrued income 1,408 1,408 1,408
Total assets 1,095,832 2 20,512 85 1,116,431 1,127,090
Liabilities
Due to credit institutions 472,238 472,238 474,250
Issued securities 568,416 568,416 578,295
Derivative instruments 70 4,075 4,145 4,145
Deferred tax liabilities 1,012 1,012 1,012
Other liabilities 9,273 9,273 9,273
Accrued expenses and deferred income 8,031 8,031 8,031
Subordinated liabilities 20,700 20,700 22,079
Total liabilities 70 4,075 1,078,658 1,012 1,083,815 1,097,085
NOTE 29 Fair value measurement of financial instruments
31 December 2016SEK m Level 1 Level 2 Level 3 Total
Assets
Derivative instruments - 22,746 - 22,746
Total financial assets at fair value - 22,746 - 22,746
Liabilities
Derivative instruments - 4,429 - 4,429
Total financial liabilities at fair value - 4,429 - 4,429
31 December 2015SEK m Level 1 Level 2 Level 3 Total
Assets
Derivative instruments - 20,514 - 20,514
Total financial assets at fair value - 20,514 - 20,514
Liabilities
Derivative instruments - 4,145 - 4,145
Total financial liabilities at fair value - 4,145 - 4,145
VALUATION PROCESSStadshypotek’s independent risk control is responsible for the existence of fit-for-purpose instructions and processes for the fair value mea-surement of financial instruments. In general, the valuations are based on externally generated data as far as is possible, considering the circum-stances in each case. In the case of model valu-ation, valuation models that are established in the market are always used. The models and input data which form the basis of the valuations are regularly validated by the independent risk control function to ensure that they are consistent with market practice and established financial theory.
New and changed valuation models are always validated before they come into use.
Stadshypotek is included in the Handelsbanken Group’s guidelines and instructions for valuation of financial instruments. Valuation matters which are of principle importance are discussed by the Handelsbanken Group’s valuation committee which includes representatives of both central and local risk control as well as financial functions. The valuation committee ensures that general instruc-tions for valuation of financial instruments are con-sistently followed throughout the Handelsbanken Group and serve as support for decision-making in valuation and accounting matters.
PRINCIPLES FOR FAIR VALUE MEASUREMENT OF FINANCIAL INSTRUMENTS Fair value is defined as the price that would be received to sell an asset or paid to transfer a liability in an orderly transaction between independent market participants. For financial instruments traded on an active market, the fair value is the same as the quoted market price. An active market is one where quoted prices are readily and regularly available from a regulated market, execution venue, reliable news service or equivalent, and where the price information received can be veri-fied by means of regularly occurring transactions.

notes
42 staDsHYpoteK | annUal report 2016
The current market price is generally the same as the current bid price for financial assets or the current asking price for financial liabilities.
For financial instruments where there is no reli-able information about market prices, fair value is established using valuation models. The valuation models used are based on input data which essentially can be verified using market observa-tions such as market rates. If necessary, an adjustment is made for other variables which a market participant would be expected to take into consideration when setting a price.
Stadshypotek’s derivative contracts, including interest rate swaps and various types of linear currency derivatives, are valued using valuation models based on listed market rates and other market prices. The valuation of non-linear derivative contracts that are not actively traded is also based on a reasonable assumption of market-based input data such as volatility.
VALUATION HIERARCHYIn the tables, financial instruments measured at fair value have been categorised in terms of how the valuations have been carried out and the extent of market data used in the valuation. The categorisation is shown as levels 1–3 in the table.
The categorisation is based on the valuation method used on the balance sheet date.
Financial instruments which are valued at the current market price are categorised as level 1. Financial instruments which are valued using valuation models which are substantially based on market data are categorised as level 2. Level 2 includes interest and currency-related derivatives. Financial instruments valued using models which to a material extent are based on input data that is not possible to verify using external market information are categorised as level 3.
PRINCIPLES FOR INFORMATION ABOUT THE FAIR VALUES OF FINANCIAL INSTRUMENTS MEASURED AT COST OR AMORTISED COSTInformation about the fair values of financial instru-ments which are measured at cost or amortised cost is shown in the table below. These instru-ments essentially comprise lending and funding. For means of payment and short-term receivables and liabilities, the carrying amount is considered to be an acceptable estimate of the fair value. Receivables and liabilities with the maturity date or the date for next interest rate fixing falling within 30 days are defined as short-term.
The valuation of fixed-rate lending is based on the current market rate with an adjustment for an assumed credit and liquidity risk premium on market terms. The premium is assumed to be the same as the average margin for new lending at the time of the measurement. Issued securities have been valued at the current market price where this has been available. Funding where market price information has not been found has been valued using a valuation model based on market data in the form of prices or interest rates for similar instruments. In the table below, the valuation used for the information about the fair value of financial instruments measured at cost or amortised cost is categorised in the valuation hierarchy described above. Level 1 contains inter-est-bearing liabilities for which there is a current market price. Lending has been categorised as level 3 due to the assumptions about credit and liquidity premium which have been used. Other instruments are categorised as level 2.
Financial instruments measured at cost or amortised cost 31 December 2016SEK m Level 1 Level 2 Level 3 Total
Assets
Loans to the public - - 1,161,681 1,161,681
Total - - 1,161,681 1,161,681
Liabilities
Due to credit institutions - 501,783 - 501,783
Issued securities 552,897 70,625 - 623,522
Subordinated liabilities - 23,350 - 23,350
Total 552,897 595,758 - 1,148,655
Financial instruments measured at cost or amortised cost 31 December 2015SEK m Level 1 Level 2 Level 3 Total
Assets
Loans to the public - - 1,093,346 1,093,346
Total - - 1,093,346 1,093,346
Liabilities
Due to credit institutions - 474,250 - 474,250
Issued securities 514,080 64,215 - 578,295
Subordinated liabilities - 22,079 - 22,079
Total 514,080 560,544 - 1,074,624
NOTE 29 Cont.

notes
staDsHYpoteK | annUal report 2016 43
NOTE 30 Capital adequacy
CAPITAL POLICYStadshypotek aims to maintain a satisfactory capital level which reflects the risk inherent in the company’s operations and which exceeds the minimum statutory requirements. A healthy capital level is needed to manage situations of financial strain and also for other events such as acquisitions and major growth in volumes.
LEGAL CAPITAL REQUIREMENTAccording to the new capital adequacy regula-tions, Regulation (EU) No 575/2013 (CRR), which came into force in the EU on 1 January 2014 and directive 2013/36/EU which was implemented in Sweden on 2 August 2014, Stadshypotek must have common equity tier 1 capital, tier 1 capital and total own funds which at least correspond to the individual requirements relative to the total risk exposure amount for credit risks, market risks and operational risks. In addition to maintaining capital according to the minimum requirement, Stadshypotek must hold common equity tier 1 capital to fulfil the requirement for a capital con-servation buffer and a countercyclical capital buf-fer. The company must also perform an internal capital assessment. Stadshypotek’s capital policy – most recently adopted by the Board in 2016 – states the guidelines for the internal capital ade-quacy assessment. Since 1 February 2016, the resolution authority, which is the National Debt Office in Sweden, must also establish a minimum requirement for own funds and eligible liabilities (MREL) for the Handelsbanken Group and possi-bly also for Stadshypotek. In 2016, Stadshypotek met all the statutory minimum and buffer levels.
DESCRIPTION OF OWN FUNDSOwn funds consist of tier 1 capital and tier 2 capi-tal. The tier 1 capital is divided into common equity tier 1 capital and other tier 1 capital. Com-mon equity tier 1 capital mainly comprises equity and has been affected by the Board’s proposal for appropriation of profits. Deductions for intan-gible assets are made from the common equity tier 1 capital. A neutrality adjustment is made for
the effect of cash flow hedges on equity. Institu-tions with permission to use internal ratings- based models (IRB institutions) must make a deduction for the difference between expected loan losses under the IRB method and the provi-sions recognised in the accounts for probable loan losses where the expected loan losses exceed the provisions made. The deduction is made from the common equity tier 1 capital.
At 29 December, with the consent of the Swedish Financial Supervisory Authority, a tier 1 capital loan was repaid to the parent company, which means that the common equity tier 1 capital and the tier 1 capital are now the same amount.
The tier 2 capital consists of subordinated loans with a maturity of at least five years.
Stadshypotek is included in Handelsbanken’s consolidated situation. In general, Stadshypotek and its parent company are able to re-allocate capital between the companies, to the extent that is permitted by legislation, for example capital adequacy requirements and restrictions in corpo-rate law. Stadshypotek sees no other material or legal obstacles to a rapid transfer of funds from own funds, or repayment of liabilities between the Stadshypotek and its parent company.
DESCRIPTION OF THE CAPITAL REQUIREMENTCredit risks – Since Stadshypotek’s lending takes place via Handelsbanken’s branch network, Handelsbanken’s IRB Approach is also applied for Stadshypotek’s risk classification and for cal-culating the credit risk for Stadshypotek’s credits. The Swedish Financial Supervisory Authority has approved the Handelsbanken Group’s IRB Approach. There are two different IRB Approaches: a foundation approach and an advanced approach. In the foundation approach, the Bank uses its own method to determine the probability of the customer defaulting within one year (PD), while the other parameters are set by the Financial Supervisory Authority. In the advanced approach, the Bank uses its own
methods to calculate the loss in the case of default (LGD) and the exposure at default (EAD). The advanced IRB Approach has been applied for retail exposures (households and small com-panies) since 2007. Since 31 December 2010, the advanced IRB Approach has been applied for medium-sized companies, housing cooperative associations and property companies, and in 2013, Stadshypotek received the Financial Supervisory Authority’s approval to extend its use of the advanced IRB Approach to large compa-nies as well.
Operational risk – Like its parent company, Stadshypotek uses the standardised approach which means that the capital requirement is cal-culated by multiplying a factor specified in the regulations by the average operating income during the last three years.
Market risk – Stadshypotek has no market risks that are reported according to the capital adequacy rules for market risk. For a description of risk management, see note 2, Risks and risk control, on page 24.

notes
44 staDsHYpoteK | annUal report 2016
Transitional own funds Amounts subject to pre-regulation (EU) No 575/2013 treatment or
prescribed residual amount of Regulation
(EU) No 575/2013
Amounts subject to pre-regulation (EU) No 575/2013 treatment or
prescribed residual amount of Regulation
(EU) No 575/2013SEK m 2016 2015
Common equity tier 1 (CET1) capital: instruments and reserves
Capital instruments and the related share premium accounts 4,050 4,050
Of which: Shares 4,050 4,050
Retained earnings 17,447 17,003
Accumulated other comprehensive income (and any other reserves, to include unrealised gains and losses according to the applicable accounting standards) 2,664 3,241
Funds for general banking risk
Amount of qualifying items referred to in Article 484(3) and the related share premium accounts subject to phase-out from CET1
Public sector capital injections grandfathered until 1 January 2018
Minority interests (amount allowed in consolidated CET1)
Independently reviewed interim profits net of any foreseeable charge or dividend 8,857 8,322
Common equity tier 1 capital before regulatory adjustments 33,018 - 32,616 -
Common equity tier 1 capital: regulatory adjustments
Additional value adjustments (negative amount) -0 -0
Intangible assets (net of related tax liability) (negative amount) -12 -14
[non-relevant in EU regulation]
Deferred tax assets that rely on future profitability excluding those arising from temporary differences (net of related tax liability where the conditions in Article 38(3) are met) (negative amount)
Fair value reserves related to gains or losses on cash flow hedges -2,607 -3,591
Negative amounts resulting from the calculation of expected loss amounts -236 -214
Any increase in equity that results from securitised assets (negative amount)
Gains or losses on liabilities measured at fair value resulting from changes in the institution’s own credit standing
Defined-benefit pension fund assets (negative amount)
Direct and indirect holdings by an institution of own CET1 instruments (negative amount)
Holdings of the CET1 instruments of financial sector entities where those entities have reciprocal cross holdings with the institution designed to inflate artificially the own funds of the institution (negative amount)
Direct and indirect holdings of the CET1 instruments of financial sector entities where the institution does not have a significant investment in those entities (amount above 10% threshold and net of eligible short positions) (negative amount)
Direct, indirect and synthetic holdings of the CET1 instruments of financial sector entities where the institution has a significant investment in those entities (amount above 10% threshold and net of eligible short positions) (negative amount)
[non-relevant in EU regulation]
Exposure amount of the following items which qualify for a RW of 1,250%, where the institution opts for the deduction alternative
Deferred tax assets arising from temporary differences (amount above 10% threshold, net of related tax liability where the conditions in Article 38 (3) are met) (negative amount)
Amount exceeding the 15% threshold (negative amount)
[non-relevant in EU regulation]
Losses for the current financial year (negative amount)
Foreseeable tax charges relating to CET1 items (negative amount)
Regulatory adjustments applied to common equity tier 1 capital in respect of amounts subject to pre-CRR treatment
Regulatory adjustments relating to unrealised gains and losses pursuant to Articles 467 and 468
Amount to be deducted from or added to common equity tier 1 capital with regard to additional filters and deductions required pre-CRR
Qualifying AT 1 deductions that exceed the AT1 capital of the institution (negative amount)
Total regulatory adjustments to common equity tier 1 (CET1) -2,855 - -3,819 -
Common equity tier 1 capital 30,163 - 28,797 -
Additional tier 1 (AT1) capital: instruments
Capital instruments and the related share premium accounts
Amount of qualifying items referred to in Article 484(4) and the related share premium accounts subject to phase-out from AT1 2,100 2,100
Public sector capital injections grandfathered until 1 January 2018
Qualifying tier 1 capital included in consolidated AT1 capital (including minority interest not included in row 5) issued by subsidiaries and held by third parties
Additional tier 1 (AT1) capital before regulatory adjustments - - 2,100 2,100
Presentation in accordance with the requirements of Commission Implementing Regulation (EU) No 1423/2013.
NOTE 30 Cont.
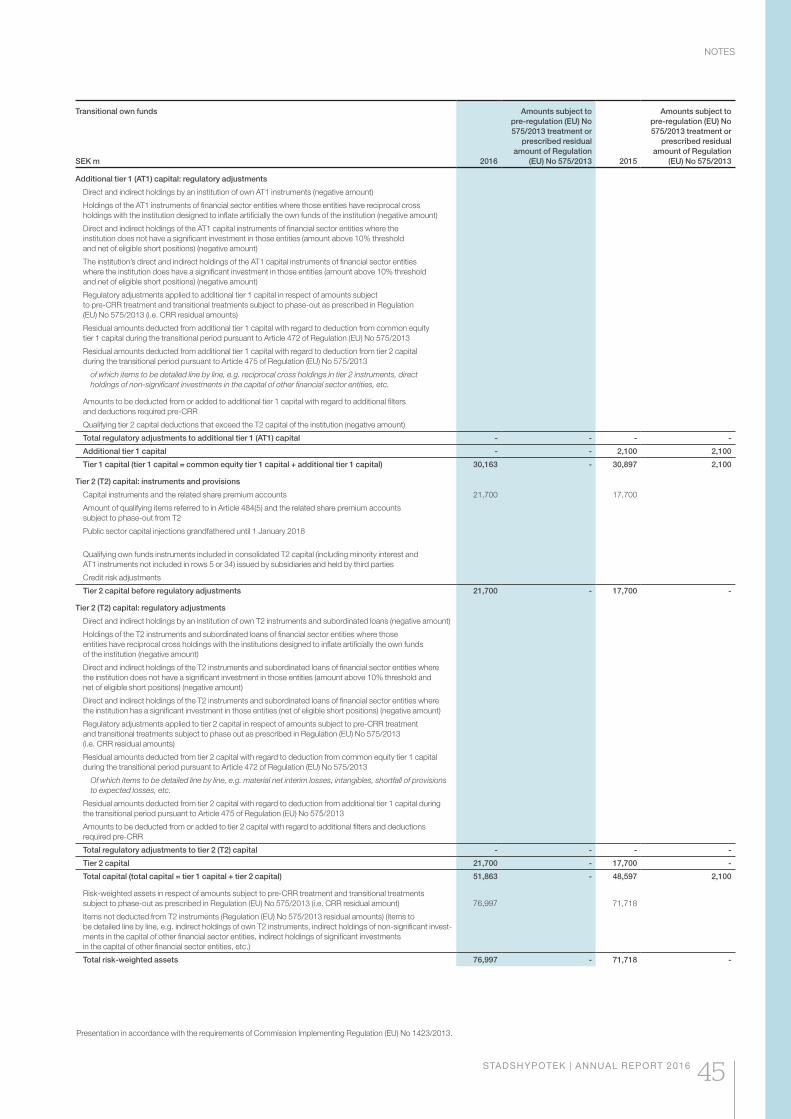
notes
staDsHYpoteK | annUal report 2016 45
Transitional own funds Amounts subject to pre-regulation (EU) No 575/2013 treatment or
prescribed residual amount of Regulation
(EU) No 575/2013
Amounts subject to pre-regulation (EU) No 575/2013 treatment or
prescribed residual amount of Regulation
(EU) No 575/2013SEK m 2016 2015
Additional tier 1 (AT1) capital: regulatory adjustments
Direct and indirect holdings by an institution of own AT1 instruments (negative amount)
Holdings of the AT1 instruments of financial sector entities where those entities have reciprocal cross holdings with the institution designed to inflate artificially the own funds of the institution (negative amount)
Direct and indirect holdings of the AT1 capital instruments of financial sector entities where the institution does not have a significant investment in those entities (amount above 10% threshold and net of eligible short positions) (negative amount)
The institution’s direct and indirect holdings of the AT1 capital instruments of financial sector entities where the institution does have a significant investment in those entities (amount above 10% threshold and net of eligible short positions) (negative amount)
Regulatory adjustments applied to additional tier 1 capital in respect of amounts subject to pre-CRR treatment and transitional treatments subject to phase-out as prescribed in Regulation (EU) No 575/2013 (i.e. CRR residual amounts)
Residual amounts deducted from additional tier 1 capital with regard to deduction from common equity tier 1 capital during the transitional period pursuant to Article 472 of Regulation (EU) No 575/2013
Residual amounts deducted from additional tier 1 capital with regard to deduction from tier 2 capital during the transitional period pursuant to Article 475 of Regulation (EU) No 575/2013
of which items to be detailed line by line, e.g. reciprocal cross holdings in tier 2 instruments, direct holdings of non-significant investments in the capital of other financial sector entities, etc.
Amounts to be deducted from or added to additional tier 1 capital with regard to additional filters and deductions required pre-CRR
Qualifying tier 2 capital deductions that exceed the T2 capital of the institution (negative amount)
Total regulatory adjustments to additional tier 1 (AT1) capital - - - -
Additional tier 1 capital - - 2,100 2,100
Tier 1 capital (tier 1 capital = common equity tier 1 capital + additional tier 1 capital) 30,163 - 30,897 2,100
Tier 2 (T2) capital: instruments and provisions
Capital instruments and the related share premium accounts 21,700 17,700
Amount of qualifying items referred to in Article 484(5) and the related share premium accounts subject to phase-out from T2
Public sector capital injections grandfathered until 1 January 2018
Qualifying own funds instruments included in consolidated T2 capital (including minority interest and AT1 instruments not included in rows 5 or 34) issued by subsidiaries and held by third parties
Credit risk adjustments
Tier 2 capital before regulatory adjustments 21,700 - 17,700 -
Tier 2 (T2) capital: regulatory adjustments
Direct and indirect holdings by an institution of own T2 instruments and subordinated loans (negative amount)
Holdings of the T2 instruments and subordinated loans of financial sector entities where those entities have reciprocal cross holdings with the institutions designed to inflate artificially the own funds of the institution (negative amount)
Direct and indirect holdings of the T2 instruments and subordinated loans of financial sector entities where the institution does not have a significant investment in those entities (amount above 10% threshold and net of eligible short positions) (negative amount)
Direct and indirect holdings of the T2 instruments and subordinated loans of financial sector entities where the institution has a significant investment in those entities (net of eligible short positions) (negative amount)
Regulatory adjustments applied to tier 2 capital in respect of amounts subject to pre-CRR treatment and transitional treatments subject to phase out as prescribed in Regulation (EU) No 575/2013 (i.e. CRR residual amounts)
Residual amounts deducted from tier 2 capital with regard to deduction from common equity tier 1 capital during the transitional period pursuant to Article 472 of Regulation (EU) No 575/2013
Of which items to be detailed line by line, e.g. material net interim losses, intangibles, shortfall of provisions to expected losses, etc.
Residual amounts deducted from tier 2 capital with regard to deduction from additional tier 1 capital during the transitional period pursuant to Article 475 of Regulation (EU) No 575/2013
Amounts to be deducted from or added to tier 2 capital with regard to additional filters and deductions required pre-CRR
Total regulatory adjustments to tier 2 (T2) capital - - - -
Tier 2 capital 21,700 - 17,700 -
Total capital (total capital = tier 1 capital + tier 2 capital) 51,863 - 48,597 2,100
Risk-weighted assets in respect of amounts subject to pre-CRR treatment and transitional treatments subject to phase-out as prescribed in Regulation (EU) No 575/2013 (i.e. CRR residual amount) 76,997 71,718
Items not deducted from T2 instruments (Regulation (EU) No 575/2013 residual amounts) (items to be detailed line by line, e.g. indirect holdings of own T2 instruments, indirect holdings of non-significant invest-ments in the capital of other financial sector entities, indirect holdings of significant investments in the capital of other financial sector entities, etc.)
Total risk-weighted assets 76,997 - 71,718 -
Presentation in accordance with the requirements of Commission Implementing Regulation (EU) No 1423/2013.
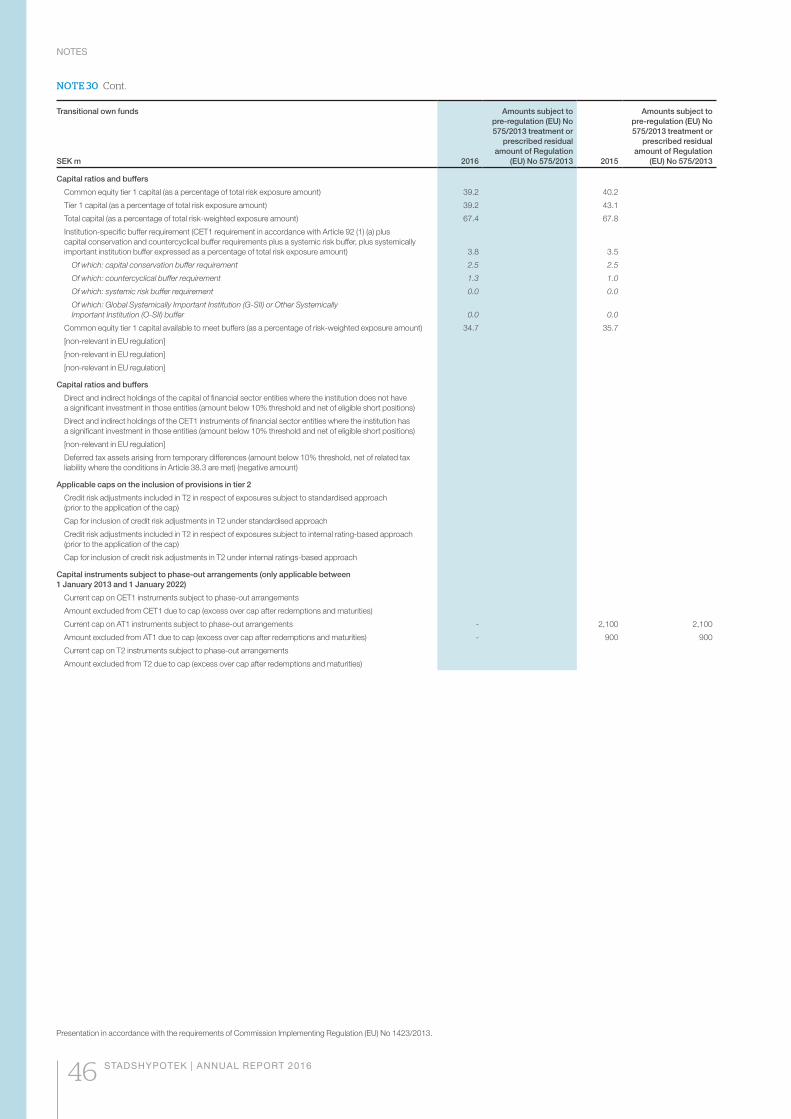
notes
46 staDsHYpoteK | annUal report 2016
Transitional own funds Amounts subject to pre-regulation (EU) No 575/2013 treatment or
prescribed residual amount of Regulation
(EU) No 575/2013
Amounts subject to pre-regulation (EU) No 575/2013 treatment or
prescribed residual amount of Regulation
(EU) No 575/2013SEK m 2016 2015
Capital ratios and buffers
Common equity tier 1 capital (as a percentage of total risk exposure amount) 39.2 40.2
Tier 1 capital (as a percentage of total risk exposure amount) 39.2 43.1
Total capital (as a percentage of total risk-weighted exposure amount) 67.4 67.8
Institution-specific buffer requirement (CET1 requirement in accordance with Article 92 (1) (a) plus capital conservation and countercyclical buffer requirements plus a systemic risk buffer, plus systemically important institution buffer expressed as a percentage of total risk exposure amount) 3.8 3.5
Of which: capital conservation buffer requirement 2.5 2.5
Of which: countercyclical buffer requirement 1.3 1.0
Of which: systemic risk buffer requirement 0.0 0.0
Of which: Global Systemically Important Institution (G-SII) or Other Systemically Important Institution (O-SII) buffer 0.0 0.0
Common equity tier 1 capital available to meet buffers (as a percentage of risk-weighted exposure amount) 34.7 35.7
[non-relevant in EU regulation]
[non-relevant in EU regulation]
[non-relevant in EU regulation]
Capital ratios and buffers
Direct and indirect holdings of the capital of financial sector entities where the institution does not have a significant investment in those entities (amount below 10% threshold and net of eligible short positions)
Direct and indirect holdings of the CET1 instruments of financial sector entities where the institution has a significant investment in those entities (amount below 10% threshold and net of eligible short positions)
[non-relevant in EU regulation]
Deferred tax assets arising from temporary differences (amount below 10% threshold, net of related tax liability where the conditions in Article 38.3 are met) (negative amount)
Applicable caps on the inclusion of provisions in tier 2
Credit risk adjustments included in T2 in respect of exposures subject to standardised approach (prior to the application of the cap)
Cap for inclusion of credit risk adjustments in T2 under standardised approach
Credit risk adjustments included in T2 in respect of exposures subject to internal rating-based approach (prior to the application of the cap)
Cap for inclusion of credit risk adjustments in T2 under internal ratings-based approach
Capital instruments subject to phase-out arrangements (only applicable between 1 January 2013 and 1 January 2022)
Current cap on CET1 instruments subject to phase-out arrangements
Amount excluded from CET1 due to cap (excess over cap after redemptions and maturities)
Current cap on AT1 instruments subject to phase-out arrangements - 2,100 2,100
Amount excluded from AT1 due to cap (excess over cap after redemptions and maturities) - 900 900
Current cap on T2 instruments subject to phase-out arrangements
Amount excluded from T2 due to cap (excess over cap after redemptions and maturities)
Presentation in accordance with the requirements of Commission Implementing Regulation (EU) No 1423/2013.
NOTE 30 Cont.

notes
staDsHYpoteK | annUal report 2016 47
Capital instruments, main features 1 Common equity tier 1 capital Tier 2 capital
Issuer Stadshypotek AB Stadshypotek AB
Unique identifier (e.g. CUSIP, ISIN or Bloomberg identifier for private placement)
Governing law(s) of the instrument Swedish law Swedish law
Regulatory treatment
Transitional CRR rules Common equity tier 1 capital Tier 2 capital
Post-transitional CRR rules Common equity tier 1 capital Tier 2 capital
Eligible at solo/(sub-)consolidated/solo & (sub)consolidated Individual and group Individual and group
Instrument type (types to be specified by each jurisdiction) Share Subordinated loans
Amount recognised in regulatory capital (currency in million, at most recent reporting date)
SEK 4,050m SEK 4,800m
Nominal amount of instrument SEK 4,050m SEK 4,800m
Issue price SEK 4,050m SEK 4,800m
Redemption price N/A SEK 4,800m
Accounting classification Equity Liability – amortised cost
Original date of issuance 26 Mar 2007
Perpetual or dated Perpetual Perpetual
Original maturity date N/A N/A
Issuer call subject to prior supervisory approval N/A Yes
Optional call date, contingent call dates and redemption amount N/A 28 Mar 2012
Subsequent call dates, if applicable N/A At each future interest due date, this being the end of each quarter
Coupons/dividends
Fixed or floating dividend/coupons N/A Floating
Coupon rate and any related index N/A 3-month Stibor
Existence of dividend stopper N/A No
Fully discretionary, partially discretionary or mandatory (in terms of timing)
N/A Partially discretionary
Fully discretionary, partially discretionary or mandatory (in terms of amount)
N/A Mandatory
Existence of step-up or other incentive to redeem No No
Non-cumulative or cumulative Non-cumulative Cumulative
Convertible or non-convertible Non-convertible Non-convertible
If convertible, conversion trigger(s) N/A N/A
If convertible, fully or partially N/A N/A
If convertible, conversion rate N/A N/A
If convertible, mandatory or optional conversion N/A N/A
If convertible, specify instrument type convertible into N/A N/A
If convertible, specify issuer of instrument it converts into N/A N/A
Write-down features No Yes
If write-down, write-down trigger(s) N/A Utilised to cover losses to avoid Stadshypotek being obliged to go into liquidation.
If write-down, full or partial N/A Fully or partially
If write-down, permanent or temporary N/A Temporary
If temporary write-down, description of write-up mechanism N/A Is only permitted from unappropriated earnings according to the balance sheet adopted.
Position in subordination hierarchy in liquidation (specify instrument type immediately senior to instrument)
Lowest Subordinate to all senior funding
Non-compliant transitioned features No No
If yes, specify non-compliant features N/A N/A
1 N/A if the question is not applicable.
Presentation in accordance with the requirements of Commission Implementing Regulation (EU) No 1423/2013.

notes
48 staDsHYpoteK | annUal report 2016
Capital instruments, main features 1 Tier 2 capital Tier 2 capital
Issuer Stadshypotek AB Stadshypotek AB
Unique identifier (e.g. CUSIP, ISIN or Bloomberg identifier for private placement)
Governing law(s) of the instrument Swedish law Swedish law
Regulatory treatment
Transitional CRR rules Tier 2 capital Tier 2 capital
Post-transitional CRR rules Tier 2 capital Tier 2 capital
Eligible at solo/(sub-)consolidated/solo & (sub)consolidated Individual and group Individual and group
Instrument type (types to be specified by each jurisdiction) Subordinated loans Subordinated loans
Amount recognised in regulatory capital (currency in million, at most recent reporting date)
SEK 500m SEK 4,900m
Nominal amount of instrument SEK 500m SEK 4,900m
Issue price SEK 500m SEK 4,900m
Redemption price SEK 500m SEK 4,900m
Accounting classification Liability – amortised cost Liability – amortised cost
Original date of issuance 29 Dec 2008 15 Jun 2011
Perpetual or dated Perpetual Dated
Original maturity date N/A 30 Jun 2026
Issuer call subject to prior supervisory approval Yes Yes
Optional call date, contingent call dates and redemption amount 29 Dec 2013 30 Jun 2021Stadshypotek is entitled to renegotiate the terms
and conditions or, if 5 years have passed since the disbursement, redeem the loan if, due to changes
to the applicable regulations at the time of issue, fully or partially, the loan is not allowed to be
included in the regulatory own funds.
Subsequent call dates, if applicable At each future interest due date, this being the end of each quarter
At each future interest due date, this being the end of each quarter
Coupons/dividends
Fixed or floating dividend/coupons Floating Floating
Coupon rate and any related index 3-month Stibor 3-month Stibor plus 239bp
Existence of dividend stopper No No
Fully discretionary, partially discretionary or mandatory (in terms of timing)
Partially discretionary Fully discretionary
Fully discretionary, partially discretionary or mandatory (in terms of amount)
Mandatory Mandatory
Existence of step-up or other incentive to redeem No No
Non-cumulative or cumulative Cumulative Non-cumulative
Convertible or non-convertible Non-convertible Non-convertible
If convertible, conversion trigger(s) N/A N/A
If convertible, fully or partially N/A N/A
If convertible, conversion rate N/A N/A
If convertible, mandatory or optional conversion N/A N/A
If convertible, specify instrument type convertible into N/A N/A
If convertible, specify issuer of instrument it converts into N/A N/A
Write-down features Yes No
If write-down, write-down trigger(s) Utilised to cover losses to avoid Stadshypotek being obliged to go into liquidation
N/A
If write-down, full or partial Fully or partially N/A
If write-down, permanent or temporary Temporary N/A
If temporary write-down, description of write-up mechanism Is only permitted from unappropriated earnings according to the balance sheet adopted
N/A
Position in subordination hierarchy in liquidation (specify instrument type immediately senior to instrument)
Subordinate to all senior funding Subordinate to all senior funding
Non-compliant transitioned features No No
If yes, specify non-compliant features N/A N/A
1 N/A if the question is not applicable.
Presentation in accordance with the requirements of Commission Implementing Regulation (EU) No 1423/2013.
NOTE 30 Cont.

notes
staDsHYpoteK | annUal report 2016 49
Capital instruments, main features 1 Tier 2 capital Tier 2 capital Tier 2 capital
Issuer Stadshypotek AB Stadshypotek AB Stadshypotek AB
Unique identifier (e.g. CUSIP, ISIN or Bloomberg identifier for private placement)
Governing law(s) of the instrument Swedish law Swedish law Swedish law
Regulatory treatment
Transitional CRR rules Tier 2 capital Tier 2 capital Tier 2 capital
Post-transitional CRR rules Tier 2 capital Tier 2 capital Tier 2 capital
Eligible at solo/(sub-)consolidated/solo & (sub)consolidated Individual and group Individual and group Individual and group
Instrument type (types to be specified by each jurisdiction) Subordinated loans Subordinated loans Subordinated loans
Amount recognised in regulatory capital (currency in million, at most recent reporting date)
SEK 4,500m SEK 3,000m SEK 4,000m
Nominal amount of instrument SEK 4,500m SEK 3,000m SEK 4,000m
Issue price SEK 4,500m SEK 3,000m SEK 4,000m
Redemption price SEK 4,500m SEK 3,000m SEK 4,000m
Accounting classification Liability – amortised cost Liability – amortised cost Liability – amortised cost
Original date of issuance 27 Dec 2013 22 Dec 2014 29 Dec 2016
Perpetual or dated Dated Dated Dated
Original maturity date 3 Jan 2029 3 Jan 2025 29 Jun 2026
Issuer call subject to prior supervisory approval Yes Yes Yes
Optional call date, contingent call dates and redemption amount 3 Jan 2024Stadshypotek is entitled to renegoti-
ate the terms and conditions or, if 5 years have passed since the dis-
bursement, redeem the loan if, due to changes to the applicable regulations
at the time of issue, fully or partially, the loan is not allowed to be included
in the regulatory own funds.
3 Jan 2020Stadshypotek is entitled to renegoti-
ate the terms and conditions or, if 5 years have passed since the dis-
bursement, redeem the loan if, due to changes to the applicable regulations
at the time of issue, fully or partially, the loan is not allowed to be included
in the regulatory own funds.
29 Jun 2021Stadshypotek is entitled to renegoti-
ate the terms and conditions or, if 5 years have passed since the dis-
bursement, redeem the loan if, due to changes to the applicable regulations
at the time of issue, fully or partially, the loan is not allowed to be included
in the regulatory own funds.
Subsequent call dates, if applicable At each future interest due date, this being the third of the month after the
end of each quarter
At each future interest due date, this being the third of the month after the
end of each quarter
At each future interest due date, this being the 29th at the end of each
quarter
Coupons/dividends
Fixed or floating dividend/coupons Floating Floating Floating
Coupon rate and any related index 3-month Stibor plus 200bp 3-month Stibor plus 140bp 3-month Stibor plus 200bp
Existence of dividend stopper No No No
Fully discretionary, partially discretionary or mandatory (in terms of timing)
Fully discretionary Fully discretionary Fully discretionary
Fully discretionary, partially discretionary or mandatory (in terms of amount)
Mandatory Mandatory Mandatory
Existence of step-up or other incentive to redeem No No No
Non-cumulative or cumulative Non-cumulative Non-cumulative Non-cumulative
Convertible or non-convertible Non-convertible Non-convertible Non-convertible
If convertible, conversion trigger(s) N/A N/A N/A
If convertible, fully or partially N/A N/A N/A
If convertible, conversion rate N/A N/A N/A
If convertible, mandatory or optional conversion N/A N/A N/A
If convertible, specify instrument type convertible into N/A N/A N/A
If convertible, specify issuer of instrument it converts into N/A N/A N/A
Write-down features No No No
If write-down, write-down trigger(s) N/A N/A N/A
If write-down, full or partial N/A N/A N/A
If write-down, permanent or temporary N/A N/A N/A
If temporary write-down, description of write-up mechanism N/A N/A N/A
Position in subordination hierarchy in liquidation (specify instrument type immediately senior to instrument)
Subordinate to all senior funding Subordinate to all senior funding Subordinate to all senior funding
Non-compliant transitioned features No No No
If yes, specify non-compliant features N/A N/A N/A
1 N/A if the question is not applicable.
Presentation in accordance with the requirements of Commission Implementing Regulation (EU) No 1423/2013.

notes
50 staDsHYpoteK | annUal report 2016
CAPITAL ADEQUACY ANALYSISThe disclosures reported in this section refer to the minimum capital requirements under Pillar 1. On 1 January 2014, the European Capital Requirements Regulation (CRR) came into force, and on 2 August 2014, the Capital Requirements Directive (CRD) IV was implemented in Sweden. Own funds and capital requirement are calculated in accordance with the new EU regulations. All references to CRD IV in this Annual Report refer to the new regulations in their entirety regardless of legislative form (regulation, directive, executive decree or national implementation).
Capital requirement31 DecemberSEK m 2016 2015
Credit risk according to standardised approach 18 33
Credit risk according to IRB Approach 4,782 4,500
Operational risk 1,360 1,205
Total capital requirement 6,160 5,738
Adjustment according to Basel I floor 39,017 36,555
Capital requirement, Basel I floor 45,177 42,293
Total own funds, Basel I floor 52,099 48,811
Capital adequacy analysis31 December 2016 2015
Common equity tier 1 ratio, CRD IV 39.2% 40.2%
Tier 1 ratio, CRD IV 39.2% 43.1%
Total capital ratio, CRD IV 67.4% 67.8%
Risk exposure amount CRD IV, SEK m 76,997 71,718
Own funds in relation to capital requirement according to Basel I floor 115% 115%
Institution-specific buffer requirement 3.8% 3.5%
of which capital conservation buffer requirement 2.5% 2.5%
of which countercyclical capital buffer requirement 1.3% 1.0%
Common equity tier 1 capital available for use as a buffer 34.7% 35.7%
Leverage ratio31 DecemberSEK m 2016 2015
Balance sheet according to the reporting regulations 1,187,525 1,116,431
Adjustment for differences between the carrying amount and leverage exposure – derivatives 7,823 7,719
Assets recognised off the balance sheet, gross (before adjustment of the credit conversion factor) 422 805
Deduction from assets off the balance sheet after applying the credit conversion factor -211 -403
Assets recognised off the balance sheet, net 211 402
Further adjustments according to CRR, Article 429.4 -2,855 -3,819
Assets on which the leverage ratio is calculated 1,192,704 1,120,733
Capital on which the leverage ratio can be calculated
Tier 1 capital 30,163 30,897
Leverage ratio
Leverage ratio calculated using tier 1 capital 2.53% 2.75%
As of 2015, a disclosure requirement applies under CRD IV regarding a non-risk-based leverage ratio. No binding requirement has yet been decided but on 23 November 2016, the EU Commission published its proposal that 3 per cent be applied.
NOTE 30 Cont.

notes
staDsHYpoteK | annUal report 2016 51
Credit risks IRB Exposure amount Average risk weight, % Capital requirement
SEK m 2016 2015 2016 2015 2016 2015
Corporate 311,382 303,628 6.6 6.8 1,640 1,646
of which other lending, foundation approach 5 463 49.1 8.0 0 3
of which other lending, advanced approach 311,377 303,165 6.6 6.8 1,640 1,643
– Large corporates 164 191 31.8 43.5 4 7
– Medium-sized companies 10,723 8,687 19.8 20.1 170 139
– Property companies 145,265 148,258 10.0 10.2 1,159 1,206
– Housing co-operative associations 155,225 146,029 2.5 2.5 307 291
Retail 805,338 741,976 4.9 4.8 3,142 2,854
of which private individuals 798,588 735,284 4.8 4.7 3,053 2,770
of which small companies 6,750 6,692 16.5 15.7 89 84
Total 1,116,720 1,045,604 5.4 5.4 4,782 4,500
Capital requirement credit risks, standardised approach 1 2016 2015
SEK m Exposure valueAverage risk
weight, %Capital
requirement Exposure valueAverage risk
weight, %Capital
requirement
Sovereign and central banks 3,397 0.0 0 4,427 0.0 0
Municipalities 27,277 0.0 0 29,632 0.0 0
Institutions 46,895 0.0 0 43,686 0.0 0
Corporate 8 100.0 1 11 100.0 1
Retail - - - - - -
Past due items - - - - - -
Other items 211 100.0 17 402 100.0 32
Total 77,788 0.3 18 78,158 0.5 331 Details of capital requirement for exposure classes where there are exposures.
Exposure amount/exposure value by country broken down into volumes calculated according to the IRB Approach and standardised approach
2016 2015
SEK m IRB Approach Standardised approach IRB Approach Standardised approach
Sweden 968,915 58,203 918,459 58,842
Denmark 35,498 1,525 28,224 1,347
Finland 33,252 17,759 32,061 17,852
Norway 79,055 301 66,860 117
Total 1,116,720 77,788 1,045,604 78,158
Information regarding maturity for capital adequacy
IRB-approved exposures broken down by maturity according to capital adequacy regulations (M), 2016 SEK m Exposure amount Within 1 yr 1 yr–2.5 yrs 2.5 years 2.5 yrs–5 yrs =5 yrs
Corporate exposures 311,382 65,912 21,473 30 18,132 205,835
Total 311,382 65,912 21,473 30 18,132 205,835
IRB-approved exposures broken down by maturity according to capital adequacy regulations (M), 2015 SEK m Exposure amount Within 1 yr 1 yr–2.5 yrs 2.5 years 2.5 yrs–5 yrs =5 yrs
Corporate exposures 303,628 63,033 19,615 464 20,743 199,773
Total 303,628 63,033 19,615 464 20,743 199,773

notes
52 staDsHYpoteK | annUal report 2016
Exposures approved for the IRB Approach
Exposures by sector and counterparty type, broken down into exposure classes SEK m
2016 2015
of which SME of which SME
Retail exposures
Private individuals 801,681 738,321
Small companies 6,787 6,727
Corporate exposures
Housing co-operative associations 157,118 157,099 148,484 148,484
Property management 160,425 110,384 163,876 109,475
Manufacturing 63 60 82 79
Retail 368 367 341 301
Hotel and restaurant 482 472 533 527
Passenger and goods transport by sea 4 4 4 4
Other transport and communication 352 98 355 112
Construction 458 418 473 437
Electricity, gas and water 2,210 1,464 2,538 1,634
Agriculture, hunting and forestry 5,737 5,692 4,286 4,286
Other services 1,115 1,040 1,203 1,181
Holding, investment, insurance companies, mutual funds, etc. 1,771 1,021 2,147 1,152
Other corporate lending 416 416 284 284
Institutional exposures - -
Securitisation positions - -
Total 1,138,987 1,069,654
Geographical breakdown
IRB-approved exposures by country, broken down into corporate and retail exposures, 2016 Retail exposures
SEK m Corporate exposures Private individuals Small companies
Sweden 291,935 683,695 6,082
Denmark 338 36,372 309
Finland 19,563 21,011 330
Norway 18,683 60,603 66
Total 330,519 801,681 6,787
Exposures calculated using the standardised approach, by country, broken down into exposure classes 2016, details of capital require-ment for exposure classes where there are exposures
SEK mSovereign and central banks Municipalities Institutions Corporate Retail Other items
Sweden - 2,612 42,689 1 - 0
Denmark - - 1 3 - -
Finland 3,033 7,060 0 0 - 211
Norway - - - 4 - -
Total 3,033 9,672 42,690 8 - 211
IRB-approved exposures by country, broken down into corporate and retail exposures, 2015 Retail exposures
SEK m Corporate exposures Private individuals Small companies
Sweden 291,608 636,681 5,988
Denmark 236 29,004 317
Finland 17,179 21,306 359
Norway 15,583 51,330 63
Total 324,606 738,321 6,727
Exposures calculated using the standardised approach, by country, broken down into exposure classes 2015, details of capital require-ment for exposure classes where there are exposures
SEK mSovereign and central banks Municipalities Institutions Corporate Retail Other items
Sweden - 3,378 39,443 0 - 201
Denmark - - 4 10 - -
Finland 4,051 6,956 4 - - 401
Norway - - - 1 - -
Total 4,051 10,334 39,451 11 - 602
NOTE 30 Cont.

notes
staDsHYpoteK | annUal report 2016 53
Impaired and/or non-performing loans
Impaired and/or non-performing loans, by country, 2016 Impaired loansNon-performing loans which are
not impaired loansSEK m Gross Provisions Net 1Of which past
due 60 days
Sweden 96 31 65 37 257
Denmark 3 1 2 - 8
Finland 4 0 4 4 39
Norway - - - - 24
Total 103 32 71 41 328
Impaired and/or non-performing loans, by country, 2015 Impaired loansNon-performing loans which are
not impaired loansSEK m Gross Provisions Net 1Of which past
due 60 days
Sweden 106 32 74 63 260
Denmark - - - - -
Finland 3 - 3 3 57
Norway 0 - - - 21
Total 109 32 77 66 338
Impaired and/or non-performing loans, broken down by sector and counterparty, 2016 Impaired loans
Non-performing loans which are
not impaired loansSEK m Gross Provisions Net 1Of which past
due 60 days
Private individuals 69 18 51 35 308
Housing co-operative associations 27 12 15 - -
Property management 7 2 5 6 20
Manufacturing - - - - -
Total 103 32 71 41 328
Impaired and/or non-performing loans, broken down by sector and counterparty, 2015 Impaired loans
Non-performing loans which are
not impaired loansSEK m Gross Provisions Net 1Of which past
due 60 days
Private individuals 71 18 53 49 317
Housing co-operative associations 21 7 14 - -
Property management 17 7 10 17 21
Manufacturing - - - - -
Total 109 32 77 66 3381 Carrying amount after specific provisions for individually assessed loans.
Stadshypotek is part of the banking group led by Handelsbanken and the requirement for information according to Pillar 3 in CRR/CRD IV is fulfilled byHandelsbanken’s information according to Pillar 3, which is available on the website www.handelsbanken.com.
NOTE 31 Material events after balance sheet date
There have been no material events after the balance sheet date.
NOTE 32 Recommended appropriation of profits
The Board proposes that the profits be carried forward to the next year. The Board’s recommended appropriation of profits is shown on page 14.

signatUres oF tHe BoarD anD tHe cHieF execUtive
54 staDsHYpoteK | annUal report 2016
Signatures of the Board and the Chief Executive
We hereby declare that the Annual Report was prepared in accordance with generally accepted accounting practices for credit market companies in Sweden, that these accounts give a fair presentation of the company's financial position and performance, and that the statutory administration report provides
a fair view of the company’s operations, financial position and performance and describes material risks and uncertainties to which the company is exposed.
Michael Bertorp Michael Green
Olof Lindstrand Monica MorénEmployee representative
Stefan NilssonChairman
Ulrica Stolt KirkegaardChief Executive
Stockholm, 7 February 2017

aUDitor’s report
staDsHYpoteK | annUal report 2016 55
Auditor’s report
REPORT ON THE ANNUAL ACCOUNTS OpinionsWe have audited the annual accounts of Stads-hypotek AB (publ) for the year 2016. The annual accounts of the company are included on pages 4–54 in this document.
In our opinion, the annual accounts have been prepared in accordance with the Annual Accounts Act for Credit Institutions and Securities Compa-nies, and present fairly, in all material respects, the financial position of Stadshypotek AB (publ) as at 31 December 2016 and its financial perfor-mance and cash flow for the year then ended in accordance with the Annual Accounts Act for Credit Institutions and Securities Companies.
A corporate governance statement has been prepared. The statutory administration report
and the corporate governance statement are consistent with the other parts of the annual accounts, and the corporate governance statement is in accordance with the Annual Accounts Act for Credit Institutions and Securities Companies.
We therefore recommend that the general meeting of shareholders adopts the income statement and balance sheet.
Basis for opinionsWe conducted our audit in accordance with International Standards on Auditing (ISA) and generally accepted auditing standards in Sweden. Our responsibilities under those standards are further described in the Auditor’s Responsibilities section. We are independent
of Stadshypotek AB (publ) in accordance with professional ethics for accountants in Sweden and have otherwise fulfilled our ethical responsi-bilities in accordance with these requirements.
We believe that the audit evidence we have obtained is sufficient and appropriate to provide a basis for our opinions.
Key audit matters Key audit matters of the audit are those matters that, in our professional judgment, were of most significance in our audit of the annual accounts of the current period. These matters were addressed in the context of our audit of, and in forming our opinion thereon, the annual accounts as a whole, but we do not provide a separate opinion on these matters.
To the general meeting of the shareholders of Stadshypotek AB (publ), corp. id 556459-6715.
Credit risk and loan impairment provisionsDetailed information and description of the key audit matter are provided in the annual accounts. Information on lending to the public is disclosed in note 11 and in note 2 from page 24 where also Stadsypotek’s credit risk management is disclosed. Reported losses are specified in note 8. Relevant accounting principles are described in note 1 on pages 20–23.
Description of key audit matterStadshypotek’s lending to the public amounted to SEK 1,150,611 million as at 31 December 2016, representing 97 per cent of total assets. Allowance for loan losses amounted to SEK -2 million.
Allowance for loan losses corresponding to management‘s best estimate of potential losses incurred in the loan portfolios at the balance sheet date. The allowance is calculated either on an indi-vidual basis for overdue loans or on a collective basis for groups of similar loans.
Most of Stadshypotek’s business consists of credit. Credit risk exposure represents the company’s dominant risk. There is an inherent uncertainty in the recognition of provisions for loan losses because they are based on estimates by the management of a large number of internal and external observations such as estimates of future cash flows. There is uncertainty associated with the assess-ment of those cash flows. Against this background, this area has been considered to be the most important key audit matter in the audit of Stadshypotek.
Response in the auditWe have tested the design and effectiveness of the company’s key controls in the credit process, including credit approval, credit review, rating classification, identification and determination of credits that should be reserved for. Tested controls consist of manual controls as well as automatic controls in application systems. We also tested IT general controls, including access management of these systems.
We have challenged the assessment of the recoverable value of future cash flows for specific provisions made for individually assessed loans made by branch managers, regional banks manage-ment, central credit department and company management.
For loans that are valued by collective provision models, we have challenged the assumptions in the models. We also checked on a sam-ple basis input data in the models and the accuracy of the calculations.
We have assessed the facts presented in the disclosures in the financial statements and the adequacy of the information as descrip-tion of management’s assumptions.
We also reviewed audit work performed by Handelsbanken’s internal audit.
Other information than the annual accounts The printed Annual Report also contains other information than the formal annual accounts and is found on pages 1–3 and 58–61. The Board of Directors and the Managing Director are responsible for this other information.
Our opinion on the annual accounts does not cover this other information and we do not express any form of assurance conclusion regarding this other information.
In connection with our audit of the annual accounts, our responsibility is to read the information identified above and consider whether the information is materially inconsistent with the annual accounts. In this procedure we also take into account our knowledge otherwise obtained in the audit and assess whether the information otherwise appears to be materially misstated.
If we, based on the work performed concerning this information, conclude that there is a material misstatement of this other information, we are required to report that fact. We have nothing to report in this regard.

aUDitor’s report
56 staDsHYpoteK | annUal report 2016
Responsibilities of the Board of Directors and the Managing DirectorThe Board of Directors and the Managing Director are responsible for the preparation of the annual accounts and that they give a fair presentation in accordance with the Annual Accounts Act for Credit Institutions and Securities Companies. The Board of Directors and the Managing Director are also responsible for such internal control as they determine is necessary to enable the preparation of annual accounts that are free from material misstatement, whether due to fraud or error.
In preparing the annual accounts the Board of Directors and the Managing Director are responsible for the assessment of the company’s ability to continue as a going concern. They disclose, as applicable, matters related to going concern and using the going concern basis of accounting. The going concern basis of accounting is however not applied if the Board of Directors and the Managing Director intend to liquidate the company, to cease operations, or have no realistic alternative but to do so.
Auditor’s responsibilityOur objectives are to obtain reasonable assur-ance about whether the annual accounts as a whole are free from material misstatement, whether due to fraud or error, and to issue an auditor’s report that includes our opinions. Reasonable assurance is a high level of assur-ance, but is not a guarantee that an audit con-ducted in accordance with ISAs and generally accepted auditing standards in Sweden will always detect a material misstatement when it exists. Misstatements can arise from fraud or error and are considered material if, individually or in the aggregate, they could reasonably be expected to influence the economic decisions of users taken on the basis of these annual accounts.
As part of an audit in accordance with ISAs, we exercise professional judgment and maintain professional skepticism throughout the audit. We also:• Identify and assess the risks of material
misstatement of the annual accounts, whether due to fraud or error, design and perform audit procedures responsive to those risks, and obtain audit evidence that is sufficient and appropriate to provide a basis for our opinions. The risk of not detecting a material misstatement resulting from fraud is higher than for one resulting from error, as fraud may involve collusion, forgery, inten-tional omissions, misrepresentations, or the override of internal control.
• Obtain an understanding of the company’s internal control relevant to our audit in order to design audit procedures that are appropriate in the circumstances, but not for the purpose of expressing an opinion on the effectiveness of the company’s internal control.
• Evaluate the appropriateness of accounting policies used and the reasonableness of accounting estimates and related disclosures made by the Board of Directors and the Managing Director.
• Conclude on the appropriateness of the Board of Directors’ and the Managing Director’s use of the going concern basis of accounting in preparing the annual accounts. We also draw a conclusion, based on the audit evidence obtained, as to whether any material uncertainty exists related to events or conditions that may cast significant doubt on the company’s ability to continue as a going concern. If we conclude that a material uncertainty exists, we are required to draw attention in our auditor’s report to the related disclosures in the annual accounts or, if such disclosures are inadequate, to modify our opinion about the annual accounts. Our
conclusions are based on the audit evidence obtained up to the date of our auditor’s report. However, future events or conditions may cause the company to cease to continue as a going concern.
• Evaluate the overall presentation, structure and content of the annual accounts, including the disclosures, and whether the annual accounts represent the underlying trans-actions and events in a manner that achieves fair presentation.
We must inform the Board of Directors of, among other matters, the planned scope and timing of the audit. We must also inform of significant audit findings during our audit, including any significant deficiencies in internal control that we identified.
We must also provide the Board of Directors with a statement that we have complied with relevant ethical requirements regarding indepen-dence, and to communicate with them all relationships and other matters that may reasonably be thought to bear on our inde-pendence, and where applicable, related safeguards.
From the matters communicated with the Board of Directors, we determine those matters that were of most significance in the audit of the annual accounts and consolidated accounts, including the most important assessed risks for material misstatement, and are therefore the key audit matters. We describe these matters in the auditor’s report unless law or regulation precludes disclosure about the matter or when, in extremely rare circum-stances, we determine that a matter should not be communicated in the auditor’s report because the adverse consequences of doing so would reasonably be expected to outweigh the public interest benefits of such communication.

aUDitor’s report
staDsHYpoteK | annUal report 2016 57
Stockholm, 22 February 2017
KPMG AB
Anders BäckströmAuthorised Public Accountant
REPORT ON OTHER LEGAL AND REGULATORY REQUIREMENTSOpinionsIn addition to our audit of the annual accounts, we have also audited the administration of the Board of Directors and the Managing Director of Stadshypotek AB (publ) for the year 2016 and the proposed appropriations of the company’s profit or loss.
We recommend to the general meeting of shareholders that the profit be appropriated in accordance with the proposal in the statutory administration report and that the members of the Board of Directors and the Managing Director be discharged from liability for the financial year.
Basis for opinionsWe conducted the audit in accordance with generally accepted auditing standards in Sweden. Our responsibilities under those stan-dards are further described in the Auditor’s Responsibilities section. We are independent of Stadshypotek AB (publ) in accordance with professional ethics for accountants in Sweden and have otherwise fulfilled our ethical responsi-bilities in accordance with these requirements.
We believe that the audit evidence we have obtained is sufficient and appropriate to provide a basis for our opinions.
Responsibilities of the Board of Directors and the Managing Director The Board of Directors is responsible for the proposal for appropriations of the company’s profit or loss. At the proposal of a dividend, this includes an assessment of whether the dividend is justifiable considering the requirements which the company’s type of operations, size and risks place on the size of the company’s equity, consolidation requirements, liquidity and position in general.
The Board of Directors is responsible for the company’s organization and the administration of the company’s affairs. This includes among other things continuous assessment of the company’s financial situation and ensuring that the company’s organization is designed so that the accounting, management of assets and the company’s financial affairs otherwise are controlled in a reassuring manner. The Manag-ing Director shall manage the ongoing adminis-tration according to the Board of Directors’ guidelines and instructions and among other matters take measures that are necessary to fulfil the company’s accounting in accordance with law and handle the management of assets in a reassuring manner.
Auditor’s responsibilityOur objective concerning the audit of the administration, and thereby our opinion about discharge from liability, is to obtain audit evidence to assess with a reasonable degree of assurance whether any member of the Board of Directors or the Managing Director in any material respect:• has undertaken any action or been guilty of
any omission which can give rise to liability to the company, or
• in any other way has acted in contravention of the Companies Act, the Banking and Financing Business Act, the Annual Accounts Act for Credit Institutions and Securities Companies or the Articles of Association.
Our objective concerning the audit of the proposed appropriations of the company’s profit or loss, and thereby our opinion about this, is to assess with reasonable degree of assurance whether the proposal is in accor-dance with the Companies Act.
Reasonable assurance is a high level of assurance, but is not a guarantee that an
audit conducted in accordance with generally accepted auditing standards in Sweden will always detect actions or omissions that can give rise to liability to the company, or that the proposed appropriations of the company’s profit or loss are not in accordance with the Companies Act.
As part of an audit in accordance with gener-ally accepted auditing standards in Sweden, we exercise professional judgment and maintain professional skepticism throughout the audit. The examination of the administration and the proposed appropriations of the company’s profit or loss is based primarily on the audit of the accounts. Additional audit procedures per-formed are based on our professional judgment with starting point in risk and materiality. This means that we focus the examination on such actions, areas and relationships that are mate-rial for the operations and where deviations and violations would have particular importance for the company’s situation. We examine and test decisions undertaken, support for decisions, actions taken and other circumstances that are relevant to our opinion concerning discharge from liability. As a basis for our opinion on the Board of Directors’ proposed appropriations of the company’s profit or loss we examined the Board of Directors’ reasoned statement and a selection of supporting evidence in order to be able to assess whether the proposal is in accor-dance with the Companies Act.

staDsHYpoteK’s BonD taBles
58 staDsHYpoteK | annUal report 2016
Stadshypotek’s bond tables
Covered bonds, SEKLoan no. Interest rate, % Loan date
Interest due dates Maturity date
Outstanding amount, SEK ’000
1579 6.00% 040621 06-21 170621 65,695,000
1580 3.00% 120321 03-21 180321 72,350,000
1581 3.00% 121219 12-19 181219 79,500,000
1582 2.50% 130918 09-19 190918 65,350,000
1583 4.25% 090617 06-17 200617 49,732,000
1584 1.50% 150317 03-17 210317 32,600,000
1585 1.50% 151215 12-15 211215 13,500,000
1586 4.50% 090921 09-21 220921 12,311,000
EMTN CB 3.25% 111103 11-03 261103 2,000,000
2004 3M Stibor+0.11% 140128 02-03, 05-03, 08-03, 11-03 170203 5,000,000
2005 3M Stibor+0.07% 140526 02-03, 05-03, 08-03, 11-03 170503 5,000,000
2006 1.81% 141125 11-25 251125 400,000
2007 3M Stibor+0.05% 141218 03-01, 06-01, 09-01, 12-01 171201 5,000,000
2008 3M Nibor+1.11% 150603 03-01, 06-01, 09-01, 12-01 180601 5,500,000
2009 3M Stibor+1.26% 160126 04-04, 07-04, 10-03 180103 5,000,000
2010 3M Stibor+1.15% 160420 05-03, 08-03, 11-03 171103 1,450,000
2011 3M Stibor+1.32% 160420 07-04, 10-03 190403 5,000,000
Total 425,388,000
Covered bonds, foreign currencyCurrency Amount Interest rate, % Loan date
Interest due dates Maturity date
Outstanding amount, SEK ’000
AUD 450,000,000 3M BBSW +1.05% 121010 01-11, 04-11, 07-11, 10-10 171010 2,951,438
AUD 300,000,000 4.25% 121010 04-11, 10-10 171010 1,967,625
EUR 1,500,000,000 1.88% 120321 03-21 170321 14,374,500
EUR 1,000,000,000 1.00% 130319 06-20 180619 9,583,000
EUR 1,000,000,000 1.63% 131030 10-31 201030 9,583,000
EUR 1,250,000,000 1.00% 140401 04-01 190401 11,978,750
EUR 300,000,000 3M Euribor+0.12% 140523 02-23, 05-23, 08-23, 11-23 190523 2,874,900
EUR 1,250,000,000 0.63% 141110 11-10 211110 11,978,750
EUR 1,250,000,000 0.38% 151124 02-24 210224 11,978,750
EUR 1,250,000,000 0.38% 160222 02-22 230222 11,978,750
EUR 1,000,000,000 0.05% 160620 06-20 220620 9,583,000
EUR 500,000,000 0.13% 161005 10-05 261005 4,791,500
GBP 345,000,000 3M Libor+0.28% 150817 02-17, 05-17, 08-17, 11-17 180817 3,854,633
NOK 4,000,000,000 3M Nibor+0.69% 120313 03-14, 06-13, 09-13, 12-13 170313 4,218,000
NOK 4,500,000,000 3M Nibor+0.72% 120516 02-16, 05-18, 08-16, 11-16 190516 4,745,250
NOK 4,500,000,000 3M Nibor+0.42% 130312 03-14, 06-13, 09-12, 12-12 180312 4,745,250
NOK 4,500,000,000 3M Nibor+0.28% 140605 03-07, 06-06, 09-05, 12-05 200605 4,745,250
NOK 4,500,000,000 3M Nibor+0.65% 160115 04-15, 07-15, 10-17 210115 4,745,250
NOK 5,000,000,000 3M Nibor+0.75% 160408 07-08, 10-10 220408 5,272,500
USD 1,250,000,000 1.25% 130523 05-23, 11-23 180523 11,343,875
USD 1,500,000,000 1.88% 121002 04-04, 10-03 191002 13,612,650
USD 1,000,000,000 1.75% 150409 04-11, 10-11 200409 9,075,100
Total 169,981,721
Total bonds, SEK ’000Change
during 2016Outstanding
amount, SEK ’000
Covered bonds, SEK 25,288,000 425,388,000
Covered bonds, foreign currency 23,961,111 169,981,721
Total 49,249,111 595,369,721

calcUlation oF KeY FigUres
staDsHYpoteK | annUal report 2016 59
Return on equitySEK m 2016 2015 2014 2013 2012
Equity at 31 December 33,018 32,616 32,368 26,723 25,940
Adjustment tax hedge reserve -2,607 -3,591 -4,133 190 0
Paid Group contribution reversed 7,878 7,203 5,600 5,203 5,218
Total adjusted equity at 31 December 38,289 36,228 33,835 32,116 31,158
Adjusted equity average 1 36,368 34,444 32,355 31,024 29,539
Profit for the period 8,857 8,322 6,773 6,291 5,801
Return on equity 24.4% 24.2% 20.9% 20.3% 19.6%
1 An average of the closing balance for the past five quarters.
Calculation of key figuresFor definitions, see page 60.

DeFinitions
60 staDsHYpoteK | annUal report 2016
Definitions
ALTERNATIVE PERFORMANCE MEASURES
Alternative performance measures (APMs) are financial measures of historical and future performance, financial position or cash flow that are defined neither in IFRS nor the capital requirement regulations. Stadshypotek uses APMs to describe the performance of the oper-ations and to increase comparability between periods. These need not be comparable with similar key figures (performance measures) presented by other companies.
C/I ratioTotal expenses in relation to total income. The C/I ratio is calculated before and after loan losses, including changes in value of repossessed property.
Impaired loanLoans are classified as impaired loans if con-tracted cash flows are not likely to be fulfilled. The full amount of all claims which give rise to a specific provision are included in impaired loans even if parts are covered by collateral.
Impaired loans reserve ratio excluding collective provisionsTotal provisions excluding collective provisions in relation to gross impaired loans.
Loan loss ratioLoan losses in relation to loans to the public at the beginning of the year.
Net interest marginNet interest income in relation to average total assets.
Non-performing loanA loan where interest, repayments or over - drafts have been due for payment for more than 60 days.
Proportion of impaired loansNet impaired loans in relation to total loans to the public and credit institutions (excluding banks).
Restructured loanA loan where some kind of concession has been made due to the borrower’s inadequate payment capacity.
Return on equityProfit for the year in relation to average equity adjusted for rights issues, dividends and changes in the value of derivatives in cash flow hedges.
Return on total assetsNet profit in relation to average total assets.
KEY FIGURES DEFINED IN THE CAPITAL REQUIREMENT REGULATIONS
Additional tier 1 capitalAdditional tier 1 capital consists of perpetual subordinated loans which fulfil the requirements stated in Regulation (EU) No 575/2013 and can therefore be included as tier 1 capital.
Common equity tier 1 capitalCommon equity tier 1 capital is one of the components of own funds and mainly com-prises equity. Deductions are made for, inter alia, dividends generated, goodwill and other intangible assets, and also the difference between an expected loss and provisions made for probable loan losses.
Common equity tier 1 ratioCommon equity tier 1 capital in relation to risk-weighted assets.
Common equity tier 1 ratio available for use as a bufferThe common equity tier 1 ratio after a deduction for the part of common equity tier 1 capital required to comply with all formal capital requirements.
Leverage ratioTier 1 capital in relation to total assets, including certain off-balance-sheet items recalculated with conversion factors defined in the stan-dardised approach and regulatory adjustments from own funds.
Own funds/Total capitalOwn funds are the sum of tier 1 and tier 2 capital.
Risk-weighted assetsTotal risk exposure amount. The statutory capital requirement is based on this.
Tier 1 capitalCommon equity tier 1 capital including additional tier 1 capital.
Tier 1 ratioTier 1 capital in relation to risk-weighted assets.
Tier 2 capitalTier 2 capital is one of the components of own funds and consists of subordinated loans which fulfil the requirements stated in Regulation (EU) No 575/2013 to be included as tier 2 capital.
Total capital ratioTotal own funds for capital adequacy purposes in relation to risk-weighted assets.

STADSHYPOTEK | ANNUAL REPORT 2016 61
Facts about the companyRegistered name: Stadshypotek AB (publ)Corporate identity number: 556459-6715Date of registration: 23 December 1992Registered office: Stockholm
Share capital: SEK 4,050,000,000 registered on 22 December 1997. The lowest and highest permissible share capital according to the Articles of Association is SEK 2,000,000,000 and SEK 8,000,000,000 respectively.
Number of shares: 162,000 shares with a quotient value of SEK 25,000 per share.
Number of votes per share: Each share carries one vote.
Convertible debt, etc.: The company has not issued any debt instruments which can be converted into or exchanged for shares or which entail the right to subscribe to new shares.
Ownership: A subsidiary of Svenska Handels banken AB (publ), corporate identity number 502007-7862. The Bank publishes consolidated annual accounts in which Stadshypotek AB is included.
ADDRESSESStadshypotek ABOffice address: Torsgatan 12Postal address: SE-103 70 Stockholm, SwedenTel: +46 (0)8 701 54 00. Fax: +46 (0)8 701 55 40Website: www.stadshypotek.se
Handelsbanken KreditOffice address: Havneholmen 29Postal address: DK-1561 Copenhagen V, DenmarkTel: +45 (0)46 79 12 00
Stadshypotek AB (publ), branch operations in FinlandOffice address: Aleksanderkatu 11Postal address: FI-00100 Helsinki, FinlandTel: +358 (0)10 444 11
Handelsbanken EindomskredittOffice address: Tjuvholmen Allé 11Postal address: Postboks 1342 Vika NO-0113 Oslo, NorwayTel: +47 (0)22 39 70 00

www.stadshypotek.se | +46 (0)8 701 54 00 | SE-103 70 Stockholm, Sweden