annual report 2016 - kohinoor millskohinoormills.com/.../kmlannualreport20161.pdf · annual report...
TRANSCRIPT
Annual Report 2016

01Annual Report 2016
CONTENTSKohinoor Mills Limited
Company Profile 02
Company Information 03
Mission & Vision Statement, Business Activities 04
Board of Directors 06
Strategic Business Objectives 08
Code of Conduct 10
Notice of 29th Annual General Meeting 12
Directors’ Report 15
Pattern of Shareholding 24
Six Years’ Performance 27
Statement of Compliance with the Code of Corporate Governance 31
Review Report to the Members on the Statement of Compliance with the Code of Corporate Governance 33
Auditors’ Report to the Members 35
Financial Statements 36-91
Kohinoor Mills Limited and its subsidiary
Directors’ Report 94
Auditors’ Report to the Members 95
Consolidated Financial Statements 96-153
Proxy Form
Director Report (Urdu)
Proxy Form (Urdu)

02 Kohinoor Mills Limited
Kohinoor Mills Limited’s vision is to achieve and then remain as the most progressive and profitable textile organization in Pakistan. Incorporated in 1987 as a small weaving mill, today Kohinoor Mills broadly undertakes three major businesses, weaving, dyeing and power generation. It has, and continues to develop, a portfolio of businesses that are major players within their respective industries. Bringing together outstanding knowledge of customer needs with leading edge technology platforms
your Company undertakes to provide superior products to its customers.
With an annual turnover of over Rs. 8.5 billion, today Kohinoor Mills Limited employs about 1,700 employees. It aims to create superior value for Kohinoor’s customers and stakeholders without compromising its commitment to safety, environment and health for the communities in which it operates. Its products range is from greige fabric to processed fabric.
COMPANY PROFILE

03Annual Report 2016
Board of DirectorsMr. Rashid Ahmed ChairmanMr. Aamir Fayyaz Sheikh Chief ExecutiveMr. Asad Fayyaz Sheikh DirectorMr. Ali Fayyaz Sheikh DirectorMr. Riaz Ahmed DirectorMr. Aamir Amin Director (NIT Nominee)Mr. Shahbaz Munir Director
Audit CommitteeMr. Riaz Ahmed ChairmanMr. Rashid Ahmed MemberMr. Shahbaz Munir MemberMr. Ali Fayyaz Sheikh Member
Human Resource & Remuneration CommitteeMr. Rashid Ahmed ChairmanMr. Asad Fayyaz Sheikh MemberMr. Shahbaz Munir Member
Chief Financial Officer Mr. Kamran Shahid
Head of Internal AuditMr. Jamal Asif
Legal Advisors• Raja Mohammad Akram & Co., Advocate & Legal Consultants, Lahore.• Malik Muhammad Ashraf Kumma Advocate
Company SecretaryMr. Muhammad Rizwan Khan
AuditorsM/s. Riaz Ahmad & Co.,Chartered Accountants
BankersAllied Bank LimitedAl Baraka Bank (Pakistan) LimitedAskari Bank LimitedBank Alfalah LimitedFaysal Bank LimitedHabib Bank LimitedHabib Metropolitan Bank LimitedNational Bank of PakistanNIB Bank Limited Silk Bank Limited Standard Chartered Bank (Pakistan) LtdThe Bank of PunjabUnited Bank Limited
Registered Office & Mills 8th K.M. Manga Raiwind Road,District Kasur, PakistanUAN: (92-42 ) 111-941-941Cell Lines: (92-333) 4998801-6Land Lines: (92-42) 36369340Fax (92-42) 36369340 Ext: 444Email: [email protected] : www.kohinoormills.com
Shares RegistrarHameed Majeed Associates (Pvt.) Ltd, HM House, 7 Bank Square, Lahore.Land Lines: (92-42) 37235081 & 82 Fax: (92-42) 37358817
Other Corporate InformationKohinoor Mills Limited is registered in Pakistan under Companies Ordinance, 1984. The registration number of the Company is 0017194
Kohinoor Mills Limited is listed on Pakistan Stock Exchange Limited as a Public Limited Company and its shares are traded under textile composite sector. Shares trading symbol is KML
The National Tax Number of the Company is 0658184-6
Financial statements are available on website of the Company i.e., www.kohinoormills.com
COMPANY INFORMATION
04 Kohinoor Mills Limited
To become and then remain as the most progressive and profitable company exhibiting a meaningful role on sustainable basis in the economy of Pakistan in terms of industry standards and stakeholders interest
The Company shall achieve its mission through a continuous process of sourcing, developing, implementing and managing the best leading edge technology, industry best practices, human resource and innovative products and services and selling these to its customers, suppliers and stakeholders
The Company is principally engaged in the business of textile manufacturing covering weaving, bleaching, dyeing, buying, selling and otherwise dealing in yarn, cloth and other goods and fabrics made from raw cotton and synthetic fiber and to generate, and supply electricity
Business Activities
Our Mission
Our Vision

05Annual Report 2016
Rejoicing Twenty Nine years in business
Excellence, Quality, Service, Innovation , Technology......

06 Kohinoor Mills Limited
BOARD OF DIRECTORS
Rashid AhmedChairman
Asad Fayyaz SheikhDirector
Aamir Fayyaz SheikhChief Executive

07Annual Report 2016
Ali Fayyaz SheikhDirector Aamir Amin
Director
Riaz AhmedDirector Shahbaz Munir
Director

08 Kohinoor Mills Limited
Left to RightMr. Kamran Shahid (Chief Financial Officer), Mr. Mazhar Noor (Deputy General Manager-Power), Mr. M. Aamir Alam Qureshi (General Manager Marketing-Dyeing), Mr. Asad-ullah (General Manager Production-Dyeing), Mr. Arif Shafique (General Manager Production-Weaving), Mr. Adnan Shahid (General Manager Marketing-Weaving)
• Continue to build the Company as the most preferred and leading Regional Supplier of fabrics; • To achieve Market dominance through greater market outreach in to new and existing markets;• Ensure reliability and sustainability of operations and business process;• To gain customer satisfaction through high quality and timely service;• Innovation focus to develop further specialized product competencies;• To maintain highest workplace safety standards;• Consistent improvement in quality through implementation of systems;• To explore options on alternate sources of fuel supply for future needs;• Focus on developing and retaining good Human Resource;• To carry on benchmark performance as per acclaimed environmental practices;• To develop and promote the reputation and image of the Company for its stakeholders in specific
and non-stakeholders in general;• To adopt a distinct Corporate and Social Responsibility policy in order to contribute and securing
the community within which it operates;• Avoidance of conflict of interest and justice to all irrespective of gender, ethnicity, beliefs, cultures
and religions; • Full compliance with all the applicable laws and regulations;• Commitment towards team work to achieve common goals whilst fairly recognizing and
rewarding individuals contribution on merit;• To conduct uncompromising ethics and honesty at all times.
STRATEGIC BUSINESS OBjECTIVES

09Annual Report 2016together we grow

10 Kohinoor Mills Limited
Introduction to the Code
This code has been formulated to ensure that directors and employees of the Company operate within acceptable standards of conduct and sound business principles which strive for development and growth. The Company takes pride in adherence to its principles and continues to serve its customers, stakeholders and society.
Contents
This code identifies the acceptable standards under following headings:
• Core values• Business culture• Responsibilities
Core values
The credibility, goodwill and repute earned over the years can be maintained through continued conviction in our corporate values of honesty, justice, integrity, and respect. The Company strongly believes in democratic leadership style with fair, transparent, ethical and high professional standards of conduct in all areas of business activities.
Business culture
Operations The Company shall formulate and monitor its objectives, strategies and overall business plan of the organization.
The Company shall be continuously involved in the research and development of new products while improving quality of existing products using highest level of quality control measures at every stage of its operations. Creativity and innovation must prevail at all levels of hierarchy to achieve organizational excellence.
Abidance of Law It is Company’s prime object to comply with all applicable laws and regulations and to co-operate with all governmental and regulatory bodies.
Corporate Reporting and Internal Controls The Company maintains effective, transparent and secure financial reporting
and internal control systems so as to ensure reliable performance measurement and compliance with local regulations and international accounting standards as applicable.
The Company strictly adheres to the principles of good corporate governance and is committed to high standards of corporate governance.
The Company regularly updates and upgrades manufacturing and reporting systems so as to keep abreast with technological advancements and achieve economies of production.
Integrity and Confidentiality The Company believes in uprightness and expects it to be a fundamental
responsibility of employees to act in Company’s best interest while holding confidential information and neither to solicit internal information from others nor to disclose Company’s figures, data or any material information to any unauthorized person/body.
Inside information about the Company, its customers, vendors, employees shall not be used for their own gain or for that of others directly or indirectly.
CODE OF CONDUCT
11Annual Report 2016
Insider Trading No employees or his/her spouse will transact in the shares of the Company during the closed period prior to the announcement of financial results. Employees categorized as executives according to the requirement of code of corporate governance should also inform the company secretary immediately about transactions performed by them and their spouse other than during the closed period.
Whistle Blowing Policy The company is committed to high standards of ethical, moral and legal business conduct and open communication. In line with these commitments the company placed whistle blowing policy on its intranet namely KNET to provide an avenue for its employees to raise their concerns and get assurance that they will be protected from reprisals or victimization for whistle blowing matters such as unlawful activity, activities not in line with the company’s policy including code of conduct.
Responsibilities
Shareholders The Company believes in maximizing shareholders value by providing consistent growth and fair return on their investment.
Customers The Company considers it imperative to maintain cordial relationship with the customers as integral to its growth and development of business and is committed to provide high quality products and services that conform to highest international standards.
Employees The Company is an equal opportunity employer at all levels with respect to issues such as color; race, gender, age; ethnicity and religious beliefs and its promotional policies are free of any discrimination. We do not tolerate an form of harassment or victimization.
The Company ensures that employees work towards achievement of corporate objectives, individually and collectively as a team and conduct themselves at work and in society as respectable employees and good citizens.
The Company believes in continuous development and training of its employees.
The Company has set high standards of performance and recognizes employee’s contribution towards its growth and reward them based on their performance. The Company believes development, growth and recognition result in motivated employees.
All employees of the Company are part of Kohinoor family and the families of all members are also part and parcel of Kohinoor family. The Company believes that the sense of belonging to Kohinoor fulfils an essential need of its employees and the organization and as such will always be nurtured.
Environmentand Social Responsibility Protecting the environment in which we live is an important element. The
Company uses all means to ensure a clean, safe, and healthy and pollution free environment not only for its workers and employees but also for the well being of all people who live in and around any of the production and manufacturing facilities. The Company will always employ such technology as may be beneficial in maintaining a healthy and hygienic working environment. It also believes in community development without political affiliations with any person or group of persons and contributes part of its resources for a better environment with an unprejudiced approach.
12 Kohinoor Mills Limited
A. Ordinary Business:
1. To confirm the minutes of Extra Ordinary General Meeting held on March 31, 2016.2. To receive, consider and adopt the Audited Accounts for the year ended june 30, 2016,
together with Directors’ and Auditors’ Reports thereon.3. To appoint auditors for the year ending june 30, 2017 and fix their remuneration.
B. Special Business:
4. To consider and if thought fit, to pass the following resolution as special resolution with or without modification(s), addition(s) or deletion(s) to alter the Articles of Association of the company:
“RESOLVED that in accordance with the provisions of Section 28 and other applicable provisions of the Companies Ordinance, 1984 and subject to requisite permission and clearance, the following new Article 73A be and is hereby inserted after the existing Article 73 in the Articles of Association of the company:
73A. Electronic Voting:
I. This article shall only be applicable for the purposes of electronic voting;
II. The company shall comply with the mandatory requirements of law regarding the use of electronic voting by its members at general meetings. Members may be allowed to appoint members as well as non-members as proxies for the purposes of electronic voting pursuant to this article.”
“RESOLVED FURTHER that the Company Secretary be and is hereby authorized to take or cause to be taken any and all actions necessary and make necessary filings and complete legal formalities as may be required to implement this resolution.”
5. To consider dissemination of Annual Audited Accounts through CD/DVD/USB instead of transmitting the same in the form of hard copies. However, for convenience of shareholder Standard Request Form will be uploaded on company website namely www.kohinoormills.com for those who opt to receive Annual Audited Accounts at their registered addresses or through email:
Notice of the MeetingNotice is hereby given that the Annual General Meeting of the Company will be held at 8 Kilometer, Manga Raiwind Road, District Kasur on Thursday, October 20, 2016 at 2:30 p.m., to transact the following business:
29thGeneral Meeting
Annual
13Annual Report 2016
“RESOLVED that dissemination of information regarding Annual Audited Accounts to the shareholders in soft form i.e CD/DVD/USB as notified by Securities & Exchange Commission of Pakistan vide its SRO 470(I)/2016 dated May 31, 2016 be and is hereby approved.”
6. To transact any other business of the Company with permission of the Chair.
Statement of material facts under Section 160 (1) (b) of the Companies Ordinance, 1984 is annexed with this Notice
By Order of the Board
Kasur: (MUHAMMAD RIZWAN KHAN) Wednesday, September 28, 2016 Company Secretary
NOTES 1. Closure of Shares Transfer Books
The shares transfer books of the Company will remain closed from October 12, 2016 to October 20, 2016 (both days inclusive). Transfers received in order at the office of our Shares Registrar, Hameed Majeed Associates (Pvt.) Ltd, HM House, 7 Bank Square, Lahore, by the close of business hours (5:00 p.m.) on Tuesday, October 11, 2016, will be treated as in time.
2. Participation in the Annual General Meeting
A member eligible to attend and vote at this meeting may appoint another member as his/her proxy to attend, speak and vote instead of him/her. Proxies in order to be effective must be received at the Company’s Registered Office duly stamped and signed not later than 48 hours before the time for holding the meeting. A member may not appoint more than one proxy. A copy of member attested Computerized National Identity Card (CNIC) must be attached with the proxy form. In case of corporate entity, the Board of Directors’ Resolution/Power of Attorney with specimen signature of the nominee shall be furnished along with proxy form to the Company. Shareholders through CDC are requested to bring original CNIC, Account Number and Participant Number at the time of attending the meeting.
3. Submission of copy of CNIC and Change of Address
Members, who have not yet submitted photocopies of their CNIC are requested to send the same at earliest to Shares Registrar of the Company.
Shareholders are also requested to promptly notify change in their addresses, if any, to Shares Registrar of the Company.

14 Kohinoor Mills Limited
This statement sets out the material facts pertaining to the special business to be transacted at the Annual General Meeting of the Company to be held on Thursday, October 20, 2016.
Item 1 of agenda:
Insertion of Article 73A in the Articles of Association
Securities and Exchange Commission of Pakistan (SECP) has issued Companies (E-Voting) Regulation 2016 on january 22, 2016 vide S.R.O 43(1)/2016. The directors have recommended alteration in the Articles of Association by inserting a new Article 73A therein which will give the members option to be part of the decision making in the general meeting of the company through electronic means.
The directors, sponsors, majority shareholders and their relatives are not interested, directly or indirectly, in the above business except to the extent of shares that are held by them in the company.
Original and amended copies of the Articles of Association have been kept at the registered office of the company which can be inspected on any working day during usual business hours till the date of Annual General Meeting.
Item 2 of agenda:
Dissemination of information regarding Annual Audited Accounts to the shareholders through CD/DVD/USB
In order to implement SECP directions vide its SRO 470(i)/2016 dated May 31, 2016, with respect to transmission / circulation of information such as Annual Audited Accounts through CD/DVD/USB instead of hard copies, resolution is part of the notice for consensus of shareholders to adopt the newly introduced mode of transmission.
The directors, sponsors, majority shareholders and their relatives are not interested, directly or indirectly, in the above business except to the extent of shares that are held by them in the company.
Statement under Section 160 (1) (b) of the Companies Ordinance, 1984

15Annual Report 2016
Textile Industry Outlook
The continuing slide in the overall exports, both in value and quantity terms, is an alarming sign for the country’s economy. Although, reduction in import bills due to reduced oil prices have partially offset huge negative impact on the aggregate balance of trade, but the Government has failed to take on serious steps to curb its repercussions on macro- economic situation. The total textile exports for FY 2015-16 stands at US$ 12.7 Billion, the lowest level since FY 2009-10.
Earnest steps are needed from the Government to reverse this negative trend. Reducing the ERF rate, zero rating of sales tax and assured supply of RLNG are some of the encouraging recent steps. Nonetheless, much more needs to be done by the Government to enhance exports of textiles and clothing sector.
Operating & Financial Results
During the financial year ended june 30, 2016, your company earned a gross profit of Rs. 1,393 million on sales of Rs. 8,551 million compared to gross profit of Rs. 1,299 million on sales of Rs. 7,906 million for the previous financial year 2014-15. During FY 2015-16, your company recorded a net profit of Rs. 119 million (EPS: Rs. 2.33 per share), compared to net profit of Rs. 123 million (EPS: Rs. 2.42 per share) in the previous financial year.
Net profit for the FY 2015-16 includes net notional interest expense of Rs. 242 million as per IAS: 39, due to restructuring of financial liabilities of the company in an earlier period and conversion of some of the facilities to SBP ERF scheme to benefit from lower mark-up rates, compared to expense of Rs. 135 million recognized in FY 2014-15. Had there been no such notional adjustment, net profit for FY 2015-16 would have been Rs. 360 million (EPS: Rs. 7.08 per share) and net profit of Rs. 258 million for FY 2014-15 (EPS: Rs. 5.07 per share).
Better capacity utilization, continued savings in fuel and power costs resulted in some improvement in the overall operating performance of the company.
Dividend
Owing to significant principal and deferred markup payments to banks, your directors have regrettably decided to omit dividend this year.
DIRECTORS’ REPORTThe Directors of the Company are pleased to present the audited financial statements for the year ended june 30, 2016. These financial statements are presented in accordance with the requirements of the Companies Ordinance, 1984.

16 Kohinoor Mills Limited
Performance Overview
A brief overview of performance of your company for the year ended june 30, 2016 is discussed below. Please also refer page no. 27 of this Annual Report for six years’ performance overview of your Company.
Weaving Division
Owing to increased overseas competition and rising raw material prices, the performance in this division was not as per expectation during the year. Management is making efforts to enhance export performance and profitability in this division for the ensuing period.
Dyeing Division
This division recorded significant improvement in its operating performance, achieving record capacity utilization through increased sales to international brands, during the year. The management has set a higher volume and profitability targets for the following period, hence “raising the bar”. Being the flagship division of the Company, its better performance is expected to result in better overall results for the Company.
17Annual Report 2016
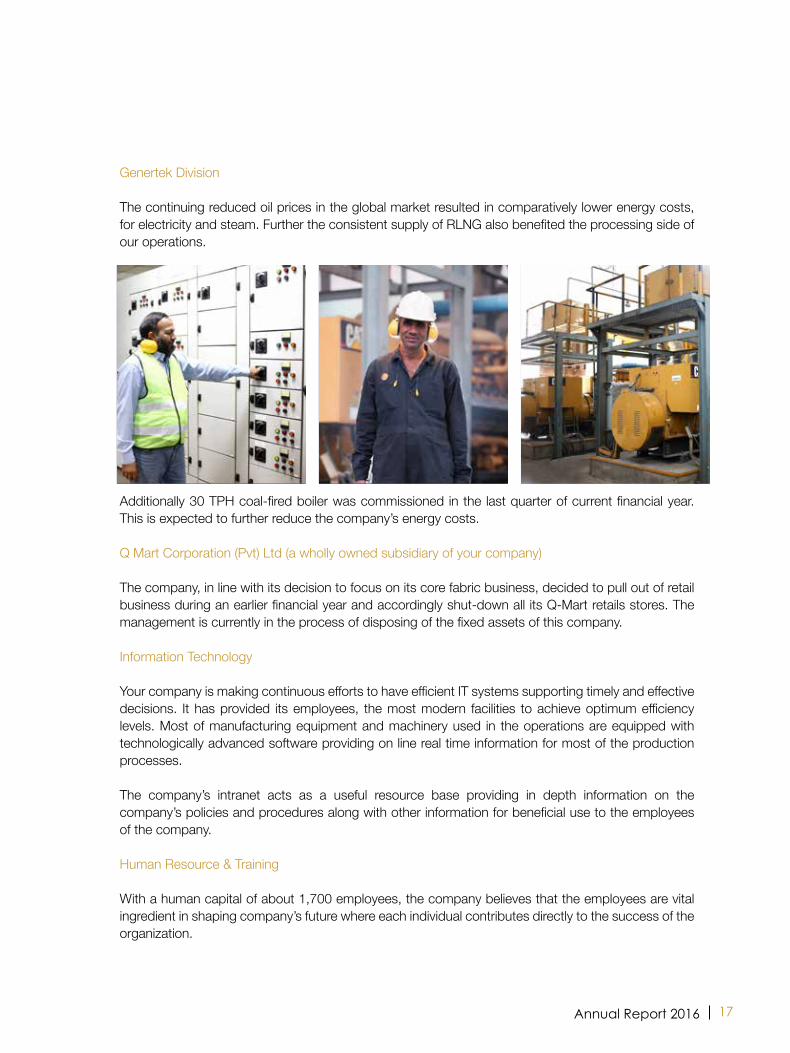
Genertek Division
The continuing reduced oil prices in the global market resulted in comparatively lower energy costs, for electricity and steam. Further the consistent supply of RLNG also benefited the processing side of our operations.
Additionally 30 TPH coal-fired boiler was commissioned in the last quarter of current financial year. This is expected to further reduce the company’s energy costs.
Q Mart Corporation (Pvt) Ltd (a wholly owned subsidiary of your company)
The company, in line with its decision to focus on its core fabric business, decided to pull out of retail business during an earlier financial year and accordingly shut-down all its Q-Mart retails stores. The management is currently in the process of disposing of the fixed assets of this company.
Information Technology
Your company is making continuous efforts to have efficient IT systems supporting timely and effective decisions. It has provided its employees, the most modern facilities to achieve optimum efficiency levels. Most of manufacturing equipment and machinery used in the operations are equipped with technologically advanced software providing on line real time information for most of the production processes.
The company’s intranet acts as a useful resource base providing in depth information on the company’s policies and procedures along with other information for beneficial use to the employees of the company.
Human Resource & Training
With a human capital of about 1,700 employees, the company believes that the employees are vital ingredient in shaping company’s future where each individual contributes directly to the success of the organization.
18 Kohinoor Mills Limited
Your company’s HR team is a group of highly skilled and experienced professionals. They work very closely with business teams to design efficient people solutions that will effectively meet the business goals.
Your company places a premium on respect for individuals, equal opportunities, advancement based on merit, effective communication, and the development of high performance culture. The company takes pride in continuous improvement at all levels and strives to ensure that opportunity for growth and varied career experiences are provided to all employees.
Your company is an equal opportunity employer and this is practiced in all aspects of the company’s business activities including recruitment and employment.
Combined with state of the art technology and HR Information Systems, the result is a high performance environment within which individuals can achieve their professional and personal dreams.
Training & Development
Your company believes in human resource development through training and development and places due emphasis on training in all spheres of its production process. The company made efforts during the year with more focused and cost effective training programs for the major technical categories such as weavers, technologists and quality control inspectors.
Candidates are engaged through a Trainee Scheme and trained in-house over a period of 6 months through a career path. This has helped company in preparing a highly skilled workforce and also provides replacements to cover turnover.
In-house training sessions are regularly conducted in general management, fire fighting, first aid, health and safety, computer and technical disciplines.
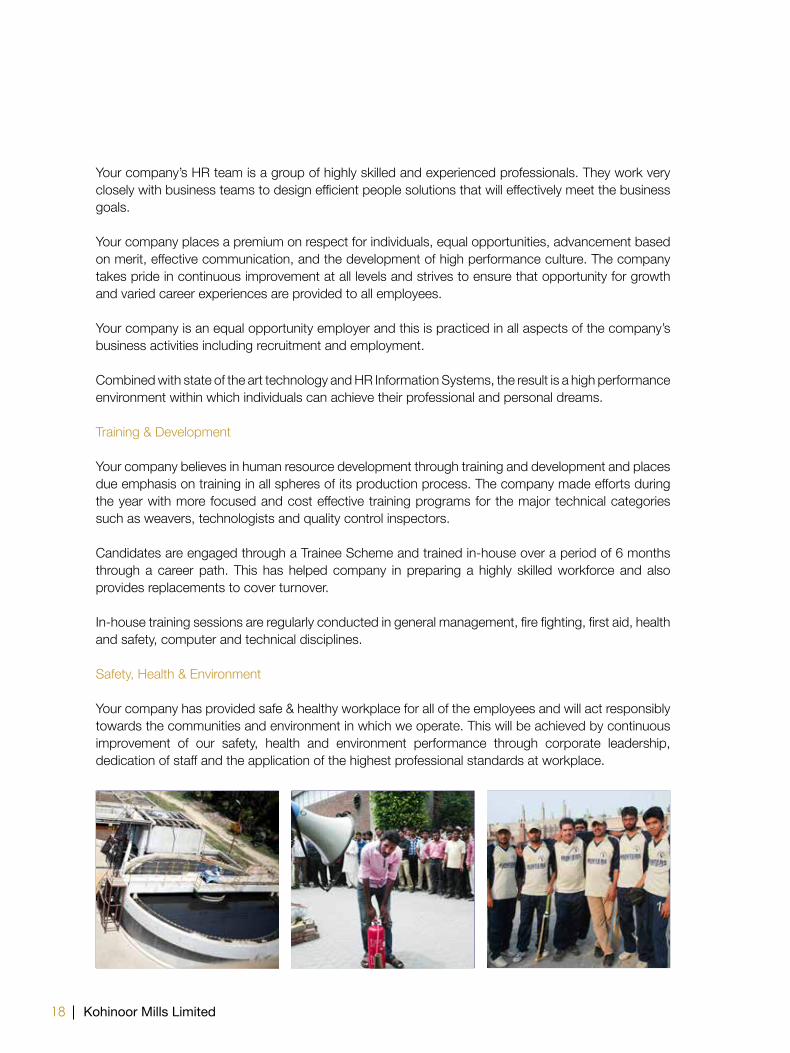
Safety, Health & Environment
Your company has provided safe & healthy workplace for all of the employees and will act responsibly towards the communities and environment in which we operate. This will be achieved by continuous improvement of our safety, health and environment performance through corporate leadership, dedication of staff and the application of the highest professional standards at workplace.
19Annual Report 2016
Corporate Social Responsibility
Your company has very distinct Corporate and Social Responsibility (CSR) policy in fulfilling its responsibilities of securing the community within which it operates.
Your company through its directors is actively involved in various social responsibility initiatives in the field of primary education and health care. Your company has donated Rs. 5 million to Friends of Punjab Institute of Cardiology (PIC) for building a new emergency block and state-of-the-art Cath Lab at PIC, Lahore. In addition the company is taking an active part through APTMA initiatives for Clean Water for remote areas.
Compliance with the Code of Corporate Governance
The Board reviews the company’s strategic direction on regular basis. The business plans and budgetary targets, set by the Board are also reviewed regularly. The Sub-Committees are empowered for effective compliance of Code of Corporate Governance. The Board is committed to maintain a high standard of good Corporate Governance.
Corporate & Financial Reporting Frame Work
The Board of Directors of the company is fully cognizant of its responsibility as laid down in the Code of Corporate Governance issued by the Securities & Exchange Commission of Pakistan. The following statements are a manifestation of its commitment towards compliance with best practices of Code of Corporate Governance.
a. The financial statements together with the notes thereon have been drawn up in conformity with the Companies Ordinance, 1984. These Statements, prepared by the management of the company, present fairly its state of affairs, the results of its operations, cash flows and changes in equity.
b. The company has maintained proper books of account as required by the Companies Ordinance, 1984.
c. Appropriate accounting policies have been consistently applied in preparation of financial statements. Accounting estimates are based on reasonable and prudent judgment.
d. International Financial Reporting Standards, as applicable in Pakistan, have been followed in preparation of financial statements and any departures therefrom has been adequately disclosed and explained.
e. The system of internal control is sound in design and has been effectively implemented and monitored.
f. There are no significant doubts upon the company’s ability to continue as a going concern.
20 Kohinoor Mills Limited
g. There has been no material departure from the best practices of Corporate Governance as detailed in rule book of Pakistan Stock Exchange Limited.
h. There are no significant plans for any corporate restructuring, business expansion or discontinuation of any part of company’s operations.
i. Information regarding statutory payments on account of outstanding taxes, duties, levies and other charges (if any) has been given in related note(s) to the audited accounts.
j. The company strictly complies with the standard of safety rules & regulations. It also follows environmental friendly policies.
k. The valuation of investment made by the staff retirement benefit fund (Provident Fund), based on their respective un-audited accounts is as follows:
june 30, 2016 Rs. 112.01 million Un-audited june 30, 2015 Rs. 120.35 million Audited
Board of Directors
The Board of Directors is responsible for the overall governance and administration of the company. All directors are aware of their duties and powers conferred by the Companies Ordinance, 1984, Code of Corporate Governance and Company’s Memorandum and Articles of Association. They exercise their fiduciary responsibilities through board meetings which are held every quarter for reviewing and approving the adoption of company’s financial statements in addition to review and adoption of company’s significant plans and decisions, projections, forecasts, and budgets having regard to the recommendations of the Sub-committees. The responsibilities include establishing the company’s strategic objectives, providing leadership, supervising the management of the business and reporting to shareholders on their stewardship.
During the year under review five (5) meetings of the Board of Directors were held. The attendance by each Director is as follows:
Sr. Name of the Directors No. of meetings attended
1 Mr. Rashid Ahmed 52 Mr. Aamir Fayyaz Sheikh 53 Mr. Asad Fayyaz Sheikh 54 Mr. Ali Fayyaz Sheikh 35 Mr. Riaz Ahmed 46 Mr. Aamir Amin 47 Mr. Shahbaz Munir 5
Leave of absence was granted to the director unable to attend the meeting.
21Annual Report 2016
Other than those set out below, there has been no trading in shares during the year under review by the Directors, Executives, their spouses and minor children:
Sr. Name Designation Purchased Sold No. of Shares
1 Mrs. Muneeza Asad Fayyaz Director’s spouse 75,000 - 2 Mr. Rashid Ahmed Director - 138,651 3 Mr. Kamran Shahid CFO - 255,000
Annual Board Performance Evaluation
The Board considers its performance assessment as a key contributor to good governance as it provides feedback from the Directors on their perceptions of how the Board is currently performing its role and responsibilities. Envisaging the same, the Board devised in-house questionnaires based on emerging and leading practices to assist performance of the board as a whole, of its committees and of its members. The Company Secretary presents the summarized report for discussion and review of the Board annually.
Directors’ Training Programme
All directors other than exempted have already completed Directors’ Training Programme.
Audit Committee
The Audit Committee operates according to the terms of reference determined by the Board of Directors of the company. It focuses on monitoring compliance with the best practices of the Code of Corporate Governance and relevant statutory requirements, changes in accounting policies and practices, compliance with applicable accounting standards and listing regulations.
It recommends to the Board of Directors the terms of appointment of external auditors and reviews their recommendations relating to audit. Other responsibilities include monitoring the internal audit function, safeguarding company’s assets through appropriate internal control systems including financial and operational controls, accounting system and reporting structure, preliminary review of business plans and quarterly, half-yearly and annual results prior to approval and publication by the Board.
During the year under review five (5) meetings of the Audit Committee were held. The attendance by each member was as follows:
Sr. Name of the Members No. of meetings attended 1 Mr. Riaz Ahmed 52 Mr. Rashid Ahmed 53 Mr. Ali Fayyaz Sheikh 44 Mr. Shahbaz Munir 5
Leave of absence was granted to the member unable to attend the meeting.

22 Kohinoor Mills Limited
Human Resource and Remuneration Committee
The Human Resource and Remuneration Committee (HR & R) operates according to terms of reference approved by the Board of Directors and is responsible for recommending human resource management policies to the board, selection, evaluation, compensation (including retirement benefits) and succession planning of the Chief Executive Officer (CEO), Chief Financial Officer (CFO), Company Secretary and Head of Internal Audit; and consideration and approval on recommendations of CEO on such matters for key management positions who report directly to CEO.
During the year under review five (5) meetings of the HR & R Committee were held, the attendance by its members was as follows:
Sr. Name of the Members No. of meetings attended 1 Mr. Rashid Ahmed 52 Mr. Asad Fayyaz Sheikh 53 Mr. Shahbaz Munir 5
Code of Conduct
In order to promote integrity for the Board, senior management and other employees of the Company, the Board has prepared and disseminated Code of Conduct on Company’s website for information of his/her understanding of the professional standards and corporate values for everybody associated or dealing with the Company.
Pattern of Shareholding
The Statement of Pattern of Shareholding along with categories of shareholders of the company as at june 30, 2016, as required under section 236 of the Companies Ordinance, 1984 and Code of Corporate Governance is annexed with this report.
Future Prospects
Declining exports and uncertain political and security situation are big challenges for the Government. Despite several positive steps, including interest rate reduction, the payment of sales tax refunds, zero-rating of textile sector, the overall impact of these on economy at large remain to be seen. In short, the current macro-economic scenario is not very amicable. Further, slump in overseas high-street demand also remains a cause of concern.
To counter this challenging economic situation, cost effectiveness, niche marketing, product and customer development are the essential tools to remain competitive domestically and internationally. The efforts on marketing side especially focused on international brands and technical textiles, will ensure increased revenue and better margin. On the cost side, better supply-chain management for raw materials and innovation in production processes shall remain pivotal parts of the strategy. The current order book of the company is healthy and it has confirmed orders up to December 2016 at
23Annual Report 2016
full capacity. Therefore, the management is confident that the company shall be able to improve its operational performance, going forward.
Auditors
The external auditors of the company, M/s Riaz Ahmad & Company, Chartered Accountants shall retire on the conclusion of forthcoming Annual General Meeting. Being eligible for re-appointment under the Companies Ordinance, 1984, they have offered their services as auditors of the company for the year ending june 30, 2017. The Board of Directors endorsed its recommendations of Audit Committee for their re-appointment.
The auditors have conveyed that they have been assigned satisfactory rating under the Quality Control Review Program of the Institute of Chartered Accountants of Pakistan and the firm is fully compliant with the code of ethics issued by International Federation of Accountants (IFAC). Further they are also not rendering any related services to the company. The auditors have also confirmed that neither the firm nor any of their partners, their spouses or minor children at any time during the year held or traded in the shares of the company.
Acknowledgment
The board places on record its profound gratitude for its valued shareholders, banks, financial institutions and customers, whose cooperation, continued support and patronage have enabled the company to strive for constant improvement. During the period under review, relations between the management and employees remained cordial and we wish to place on record our appreciation for the dedication, perseverance and diligence of the staff and workers of the company.
For and on behalf of the Board
Kasur: AAMIR FAYYAZ SHEIKHSeptember 01, 2016 Chief Executive
24 Kohinoor Mills Limited
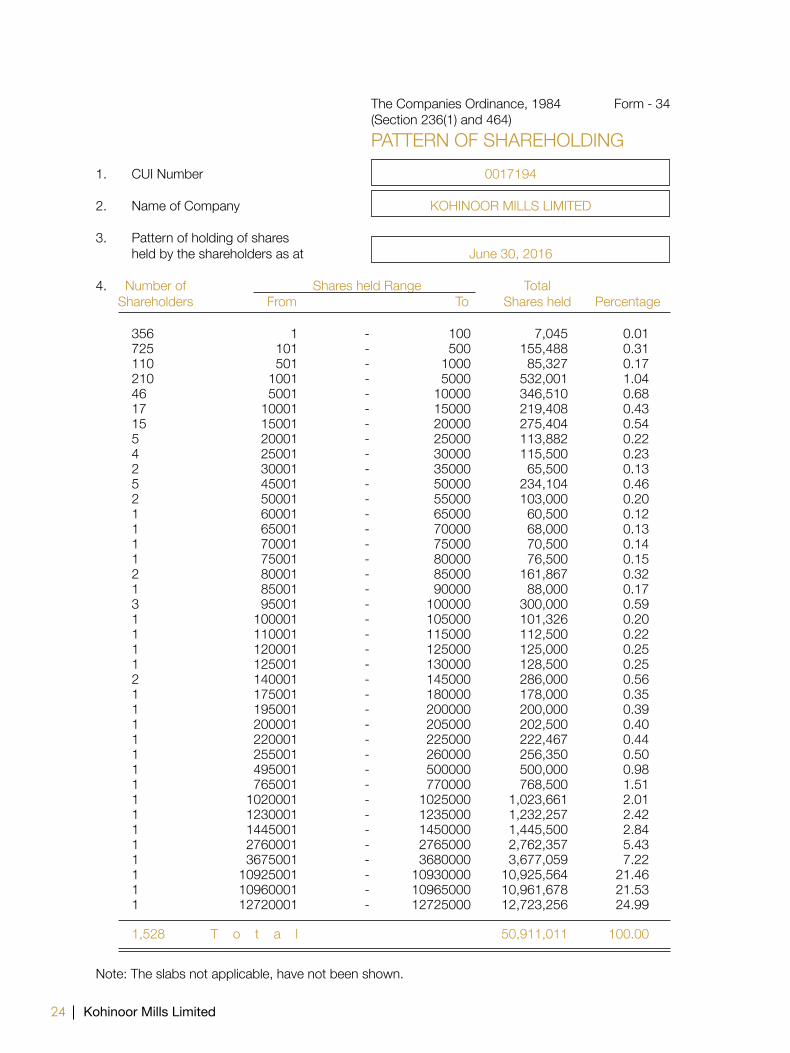
The Companies Ordinance, 1984 Form - 34 (Section 236(1) and 464) PATTERN OF SHAREHOLDING 1. CUI Number 0017194 2. Name of Company KOHINOOR MILLS LIMITED 3. Pattern of holding of shares held by the shareholders as at june 30, 2016
4. Number of Shares held Range Total Shareholders From To Shares held Percentage 356 1 - 100 7,045 0.01 725 101 - 500 155,488 0.31 110 501 - 1000 85,327 0.17 210 1001 - 5000 532,001 1.04 46 5001 - 10000 346,510 0.68 17 10001 - 15000 219,408 0.43 15 15001 - 20000 275,404 0.54 5 20001 - 25000 113,882 0.22 4 25001 - 30000 115,500 0.23 2 30001 - 35000 65,500 0.13 5 45001 - 50000 234,104 0.46 2 50001 - 55000 103,000 0.20 1 60001 - 65000 60,500 0.12 1 65001 - 70000 68,000 0.13 1 70001 - 75000 70,500 0.14 1 75001 - 80000 76,500 0.15 2 80001 - 85000 161,867 0.32 1 85001 - 90000 88,000 0.17 3 95001 - 100000 300,000 0.59 1 100001 - 105000 101,326 0.20 1 110001 - 115000 112,500 0.22 1 120001 - 125000 125,000 0.25 1 125001 - 130000 128,500 0.25 2 140001 - 145000 286,000 0.56 1 175001 - 180000 178,000 0.35 1 195001 - 200000 200,000 0.39 1 200001 - 205000 202,500 0.40 1 220001 - 225000 222,467 0.44 1 255001 - 260000 256,350 0.50 1 495001 - 500000 500,000 0.98 1 765001 - 770000 768,500 1.51 1 1020001 - 1025000 1,023,661 2.01 1 1230001 - 1235000 1,232,257 2.42 1 1445001 - 1450000 1,445,500 2.84 1 2760001 - 2765000 2,762,357 5.43 1 3675001 - 3680000 3,677,059 7.22 1 10925001 - 10930000 10,925,564 21.46 1 10960001 - 10965000 10,961,678 21.53 1 12720001 - 12725000 12,723,256 24.99 1,528 T o t a l 50,911,011 100.00
Note: The slabs not applicable, have not been shown.
25Annual Report 2016
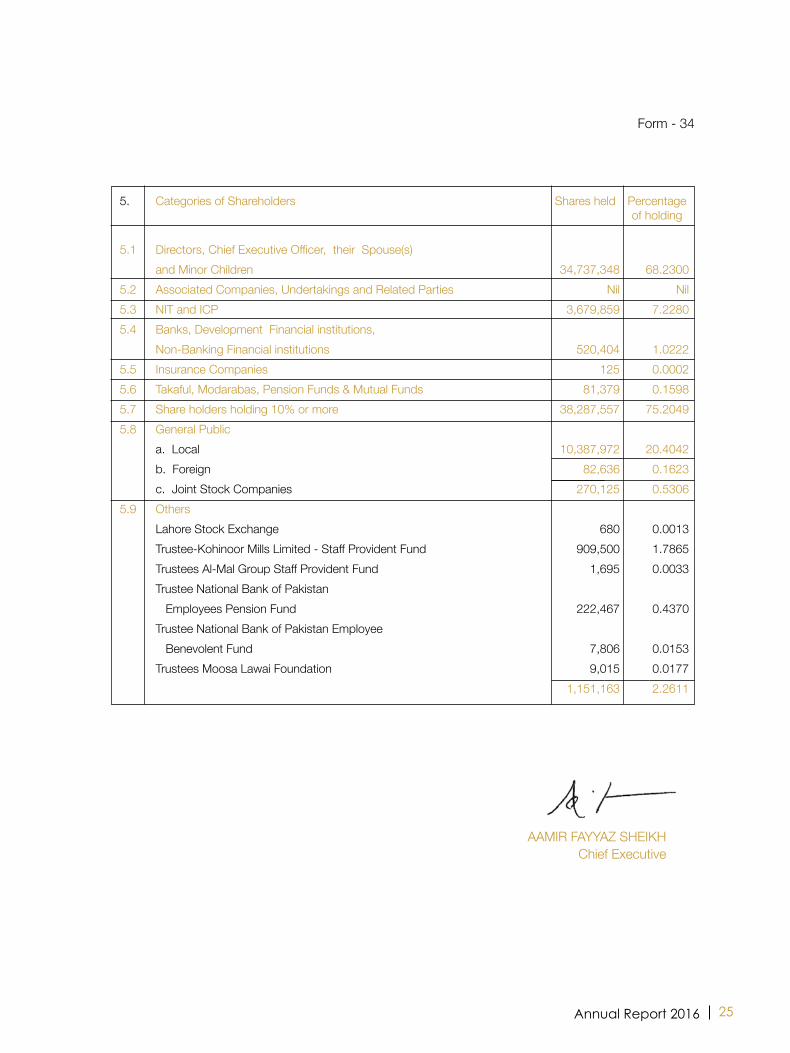
5. Categories of Shareholders Shares held Percentage of holding 5.1 Directors, Chief Executive Officer, their Spouse(s) and Minor Children 34,737,348 68.23005.2 Associated Companies, Undertakings and Related Parties Nil Nil5.3 NIT and ICP 3,679,859 7.22805.4 Banks, Development Financial institutions, Non-Banking Financial institutions 520,404 1.02225.5 Insurance Companies 125 0.00025.6 Takaful, Modarabas, Pension Funds & Mutual Funds 81,379 0.15985.7 Share holders holding 10% or more 38,287,557 75.20495.8 General Public a. Local 10,387,972 20.4042 b. Foreign 82,636 0.1623 c. Joint Stock Companies 270,125 0.53065.9 Others Lahore Stock Exchange 680 0.0013 Trustee-Kohinoor Mills Limited - Staff Provident Fund 909,500 1.7865 Trustees Al-Mal Group Staff Provident Fund 1,695 0.0033 Trustee National Bank of Pakistan Employees Pension Fund 222,467 0.4370 Trustee National Bank of Pakistan Employee Benevolent Fund 7,806 0.0153 Trustees Moosa Lawai Foundation 9,015 0.0177 1,151,163 2.2611
AAMIR FAYYAZ SHEIKH Chief Executive
Form - 34

26 Kohinoor Mills Limited
Information under Clause 5.19.11 (x) of Pakistan Stock Exchange Limted Rule Book as at june 30, 2016 Number of Shares held
I. Associated Companies, Undertakings and Related Parties Nil - II. Mutual Funds Nil - III. Directors, CEO and their Spouse(s) and minor children Mr. Rashid Ahmed (Chairman) 3,850 Mr. Aamir Fayyaz Sheikh (Chief Executive) 12,723,256 Mr. Asad Fayyaz Sheikh (Director) 10,961,678 Mr. Ali Fayyaz Sheikh (Director) 10,925,564 Mr. Riaz Ahmed (Director) 20,000 Mr. Shahbaz Munir (Director) 3,000 Mr. Aamir Amin (Director NIT Nominee) - Mrs. Muneeza Asad Fayyaz (Director’s Spouse) 100,000
34,737,348 IV. Executives 256,350 V. Public Sector Companies and Corporations 17,532 VI. Banks, Development Finance Institutions, Non-banking Finance Companies, Insurance Companies, Takaful, Modarabas and Pension Funds 5,414,118 VII. Shareholders holding five percent or more voting Rights Mr. Aamir Fayyaz Sheikh 12,723,256 Mr. Asad Fayyaz Sheikh 10,961,678 Mr. Ali Fayyaz Sheikh 10,925,564 National Bank of Pakistan-Trustee Department NI(U)T Fund 3,677,059
38,287,557
Information under clause 5.19.11 (xii) of Pakistan Stock Exchange Limited Rule Book relating to all trades in the share of the Company as at june 30, 2016 carried out by its Directors, Executives, and their spouses and minor children are disclosed on page no 21.

27Annual Report 2016
2015-16 2014-15 2013-14 2012-13 2011-12 2010-11
OPERATING Gross Margin % 16.29 16.43 13.45 16.31 14.67 (1.81)Pre Tax Margin % 2.37 3.03 0.70 12.86 11.00 (23.32)Net Margin % 1.39 1.56 1.37 11.93 10.05 (26.79) PERFORMANCE Return on Long Term Assets % 3.16 3.11 3.01 29.17 17.58 (41.38)Total Assets Turnover x 1.35 1.26 1.30 1.44 1.08 0.90 Fixed Assets Turnover x 2.37 2.14 2.26 2.52 1.83 1.70 Inventory Turnover Days 59.13 58.34 52.80 45.36 53.41 63.84 Return on Equity % 0.14 0.14 0.14 1.93 nm nm Return on Capital Employed % 36.36 25.86 13.65 48.03 36.36 nm Retention % 100 100 100 100 100 - LEVERAGE Debt:Equity 68:32 67:33 71:29 82:18 nm nm LIQUIDITY Current 0.75 1.05 1.19 1.33 1.06 0.38 Quick 0.39 0.56 0.70 0.82 0.67 0.26 VALUATION Earning per share (pre tax) Rs. 3.98 4.70 1.06 21.36 13.53 (23.87)Earning per share (after tax) Rs. 2.33 2.42 2.09 19.81 12.36 (27.42)Breakup value Rs. 17.04 17.30 15.23 10.24 (11.21) (24.69)Price earning ratio Rs. 8.65 7.16 5.96 0.82 0.19 (0.04)Market price to breakup value Rs. 1.19 1.00 0.82 1.58 (0.21) (0.04)Market value per share Rs. 20.20 17.30 12.49 16.20 2.36 1.06 Market capitalization Rs. In million 1,028 881 636 825 120 54 HISTORICAL TRENDS Turnover Rs. In million 8,551 7,906 7,772 8,452 6,262 5,210 Gross profit Rs. In million 1,393 1,299 1,045 1,378 919 (95)Profit/(Loss) before tax Rs. In million 203 239 54 1,087 689 (1,215)Profit/(Loss) after tax Rs. In million 119 123 107 1,009 629 (1,396) FINANCIAL POSITION Shareholder’s funds Rs. In million 867 881 775 521 (571) (1,257)Property Plant and Equipment Rs. In million 3,614 3,694 3,441 3,355 3,413 3,063 Current assets Rs. In million 2,592 2,326 2,445 2,403 2,243 2,414 Current liabilities Rs. In million 3,474 2,207 2,047 1,804 2,116 6,345 Long term assets Rs. In million 3,761 3,951 3,542 3,457 3,580 3,373 Long term liabilities Rs. In million 930 2,086 2,396 2,794 3,423 31
SIX YEARS’ PERFORMANCE

28 Kohinoor Mills Limited
PERFORMANCE OVERVIEW
4.90%5.55%

29Annual Report 2016

30 Kohinoor Mills Limited
STATEMENT OF VALUE ADDITION
2016 2015 %age Amount (000) %age Amount (000)Value Added Local Sales 16.23% 1,387,911 16.47% 1,302,063 Export Sales 83.77% 7,163,181 83.53% 6,603,957
Total Sales 100% 8,551,092 100% 7,906,021 Value Allocated Materials 56.24% 4,808,762 54.66% 4,321,066 Other Manufacturing Cost 20.55% 1,756,879 21.80% 1,723,828 Staff cost 4.51% 385,512 4.41% 348,792 Depreciation & Amortization 2.42% 206,913 2.70% 213,518 Operating Expenses 8.65% 739,470 8.50% 671,902 Financial Expenses 5.27% 450,764 4.90% 387,592 Pre-tax Profit 2.37% 202,792 3.03% 239,323
100% 8,551,092 100% 7,906,021
56.24%
2.37%
8.65%
2.42%
4.51%20.55%20.55%
5.27%4.90%

31Annual Report 2016
Statement of Compliance with the Code of Corporate Governance for the Year Ended june 30, 2016
This statement is being presented to comply with the Code of Corporate Governance (CCG) contained in the Regulation No. 5.19 of listing regulations of Pakistan Stock Exchange Limited for the purpose of establishing a framework of good governance, whereby a listed company is managed in compliance with the best practices of corporate governance.
The Company has applied the principles contained in the CCG in the following manner:
1. The Company encourages representation of independent, non-executive directors and directors representing minority interests on its Board of Directors. At present the Board includes:
Category Names
Independent Director Mr. Riaz Ahmed Executive Directors Mr. Aamir Fayyaz Sheikh Mr. Asad Fayyaz Sheikh Non-Executive Directors Mr. Ali Fayyaz Sheikh Mr. Rashid Ahmed Mr. Shahbaz Munir Mr. Aamir Amin
The above named independent director meets the criteria of independence under clause 5.19.1.(b) of the CCG.
2. The directors have confirmed that none of them is serving as a Director on more than seven listed companies, including this company.
3. All the resident directors of the company are registered as taxpayers and none of them has defaulted in payment of any loan to a banking company, a DFI or an NBFI or, being a member of a stock exchange, has been declared as a defaulter by that stock exchange.
4. No casual vacancy was occurred on the board during the year. The same Board was re-elected on March 31, 2016.
5. The company prepared a ‘Code of Conduct’ and has ensured that appropriate steps have been taken to disseminate it throughout the company along with its supporting policies and procedures.
6. The Board has developed a vision/mission statement, overall corporate strategy
and significant policies of the company. A complete record of particulars of significant policies along with the dates on which they were approved or amended has been maintained.
7. All the powers of the Board have been duly exercised and decisions on material transactions, including appointment and determination of remuneration and terms and conditions of employment of the CEO, other executive and non-executive directors, have been taken by the Board/shareholders.
8. The meetings of the Board were presided over by the Chairman and the Board met at least once in every quarter. Written notices of the Board meetings, along with agenda and working papers, were circulated at least seven days before the meetings. The minutes of meetings were appropriately recorded and circulated.
9. All directors other than exempted have already completed directors’ training programme.
32 Kohinoor Mills Limited
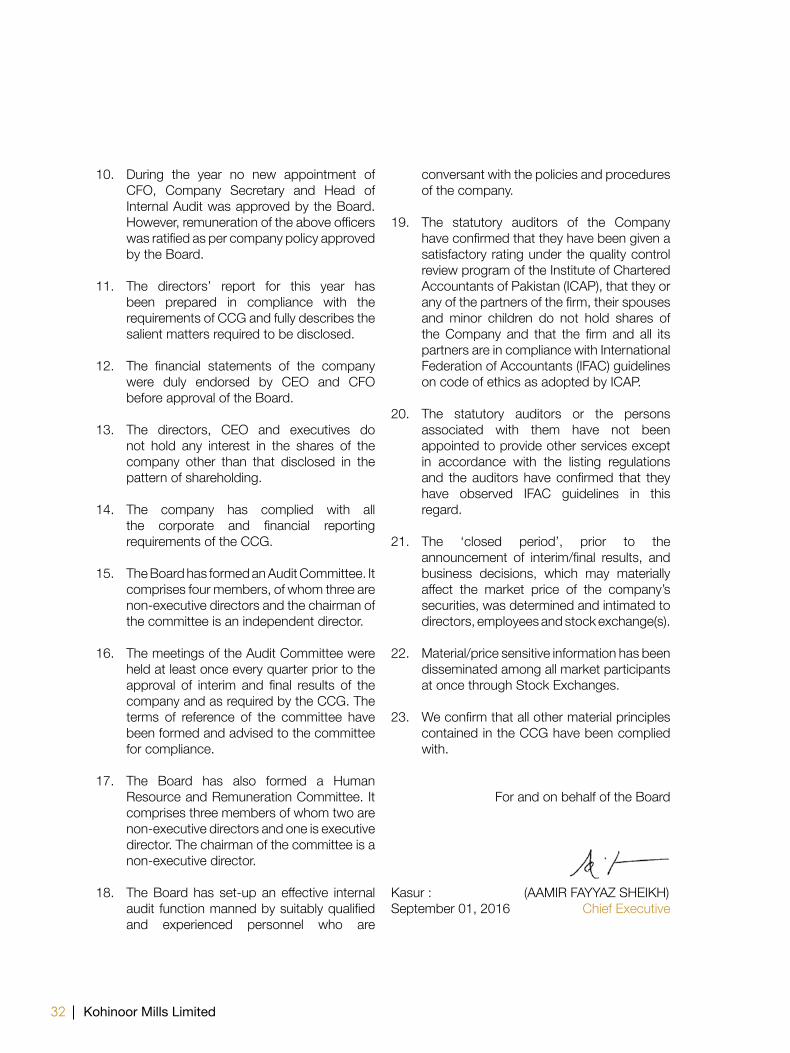
10. During the year no new appointment of CFO, Company Secretary and Head of Internal Audit was approved by the Board. However, remuneration of the above officers was ratified as per company policy approved by the Board.
11. The directors’ report for this year has been prepared in compliance with the requirements of CCG and fully describes the salient matters required to be disclosed.
12. The financial statements of the company were duly endorsed by CEO and CFO before approval of the Board.
13. The directors, CEO and executives do not hold any interest in the shares of the company other than that disclosed in the pattern of shareholding.
14. The company has complied with all the corporate and financial reporting requirements of the CCG.
15. The Board has formed an Audit Committee. It comprises four members, of whom three are non-executive directors and the chairman of the committee is an independent director.
16. The meetings of the Audit Committee were held at least once every quarter prior to the approval of interim and final results of the company and as required by the CCG. The terms of reference of the committee have been formed and advised to the committee for compliance.
17. The Board has also formed a Human Resource and Remuneration Committee. It comprises three members of whom two are non-executive directors and one is executive director. The chairman of the committee is a non-executive director.
18. The Board has set-up an effective internal
audit function manned by suitably qualified and experienced personnel who are
conversant with the policies and procedures of the company.
19. The statutory auditors of the Company have confirmed that they have been given a satisfactory rating under the quality control review program of the Institute of Chartered Accountants of Pakistan (ICAP), that they or any of the partners of the firm, their spouses and minor children do not hold shares of the Company and that the firm and all its partners are in compliance with International Federation of Accountants (IFAC) guidelines on code of ethics as adopted by ICAP.
20. The statutory auditors or the persons associated with them have not been appointed to provide other services except in accordance with the listing regulations and the auditors have confirmed that they have observed IFAC guidelines in this regard.
21. The ‘closed period’, prior to the announcement of interim/final results, and business decisions, which may materially affect the market price of the company’s securities, was determined and intimated to directors, employees and stock exchange(s).
22. Material/price sensitive information has been disseminated among all market participants at once through Stock Exchanges.
23. We confirm that all other material principles contained in the CCG have been complied with.
For and on behalf of the Board
Kasur : (AAMIR FAYYAZ SHEIKH) September 01, 2016 Chief Executive
33Annual Report 2016
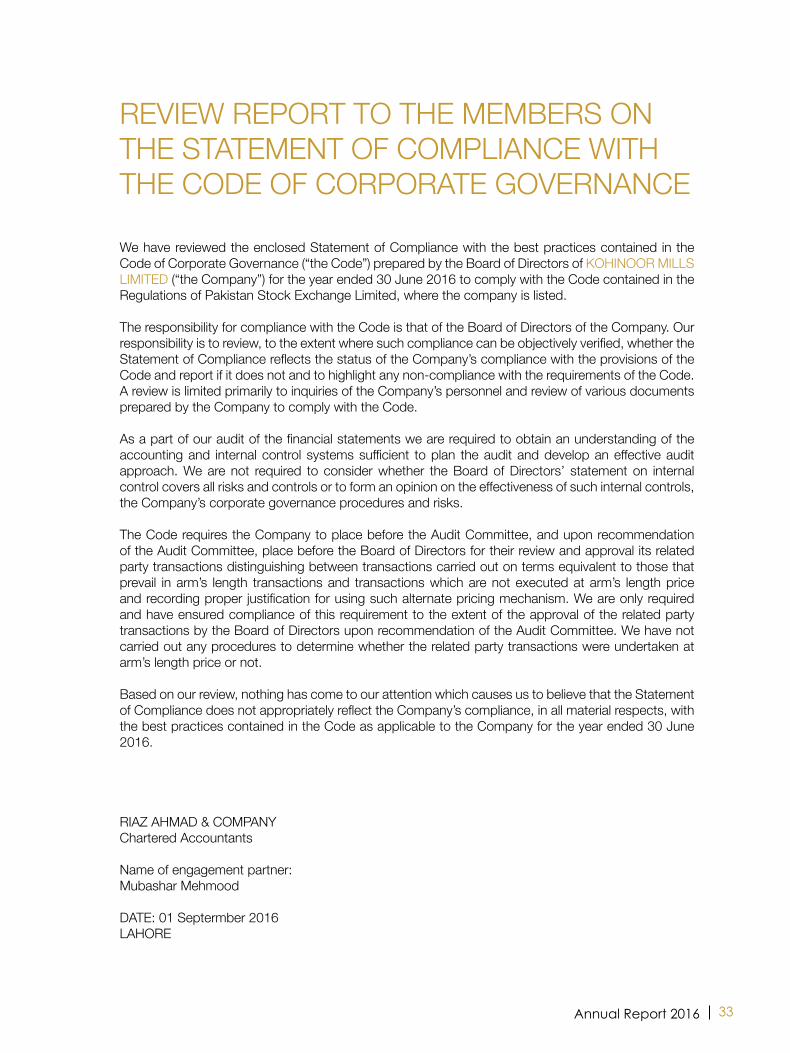
REVIEW REPORT TO THE MEMBERS ON THE STATEMENT OF COMPLIANCE WITH THE CODE OF CORPORATE GOVERNANCE
We have reviewed the enclosed Statement of Compliance with the best practices contained in the Code of Corporate Governance (“the Code”) prepared by the Board of Directors of KOHINOOR MILLS LIMITED (“the Company”) for the year ended 30 june 2016 to comply with the Code contained in the Regulations of Pakistan Stock Exchange Limited, where the company is listed.
The responsibility for compliance with the Code is that of the Board of Directors of the Company. Our responsibility is to review, to the extent where such compliance can be objectively verified, whether the Statement of Compliance reflects the status of the Company’s compliance with the provisions of the Code and report if it does not and to highlight any non-compliance with the requirements of the Code. A review is limited primarily to inquiries of the Company’s personnel and review of various documents prepared by the Company to comply with the Code.
As a part of our audit of the financial statements we are required to obtain an understanding of the accounting and internal control systems sufficient to plan the audit and develop an effective audit approach. We are not required to consider whether the Board of Directors’ statement on internal control covers all risks and controls or to form an opinion on the effectiveness of such internal controls, the Company’s corporate governance procedures and risks.
The Code requires the Company to place before the Audit Committee, and upon recommendation of the Audit Committee, place before the Board of Directors for their review and approval its related party transactions distinguishing between transactions carried out on terms equivalent to those that prevail in arm’s length transactions and transactions which are not executed at arm’s length price and recording proper justification for using such alternate pricing mechanism. We are only required and have ensured compliance of this requirement to the extent of the approval of the related party transactions by the Board of Directors upon recommendation of the Audit Committee. We have not carried out any procedures to determine whether the related party transactions were undertaken at arm’s length price or not.
Based on our review, nothing has come to our attention which causes us to believe that the Statement of Compliance does not appropriately reflect the Company’s compliance, in all material respects, with the best practices contained in the Code as applicable to the Company for the year ended 30 june 2016.
RIAZ AHMAD & COMPANYChartered Accountants
Name of engagement partner:Mubashar Mehmood
DATE: 01 Septermber 2016LAHORE
34 Kohinoor Mills Limited
Financial StatementsFor the year ended 30 june 2016

35Annual Report 2016
We have audited the annexed balance sheet of KOHINOOR MILLS LIMITED as at 30 June 2016 and the related profit and loss account, statement of comprehensive income, cash flow statement and statement of changes in equity together with the notes forming part thereof, for the year then ended and we state that we have obtained all the information and explanations which, to the best of our knowledge and belief, were necessary for the purposes of our audit.
It is the responsibility of the company’s management to establish and maintain a system of internal control, and prepare and present the above said statements in conformity with the approved accounting standards and the requirements of the Companies Ordinance, 1984. Our responsibility is to express an opinion on these statements based on our audit.
We conducted our audit in accordance with the auditing standards as applicable in Pakistan. These standards require that we plan and perform the audit to obtain reasonable assurance about whether the above said statements are free of any material misstatement. An audit includes examining, on a test basis, evidence supporting the amounts and disclosures in the above said statements. An audit also includes assessing the accounting policies and significant estimates made by management, as well as, evaluating the overall presentation of the above said statements. We believe that our audit provides a reasonable basis for our opinion and, after due verification, we report that:
(a) in our opinion, proper books of account have been kept by the company as required by the Companies Ordinance, 1984;
(b) in our opinion:
i) the balance sheet and profit and loss account together with the notes thereon have been drawn up in conformity with the Companies Ordinance, 1984, and are in agreement with the books of account and are further in accordance with accounting policies consistently applied;
ii) the expenditure incurred during the year was for the purpose of the company’s business;
and iii) the business conducted, investments made and the expenditure incurred during the year
were in accordance with the objects of the company;
(c) in our opinion and to the best of our information and according to the explanations given to us, the balance sheet, profit and loss account, statement of comprehensive income, cash flow statement and statement of changes in equity together with the notes forming part thereof conform with approved accounting standards as applicable in Pakistan, and, give the information required by the Companies Ordinance, 1984, in the manner so required and respectively give a true and fair view of the state of the company’s affairs as at 30 June 2016 and of the profit, its comprehensive income, its cash flows and changes in equity for the year then ended; and
(d) in our opinion, no Zakat was deductible at source under the Zakat and Ushr Ordinance, 1980
(XVIII of 1980).
RIAZ AHMAD & COMPANYChartered Accountants Name of engagement partner:Mubashar Mehmood
DATE: 01 September 2016
LAHORE
AUDITORS’ REPORT TO THE MEMBERS

36 Kohinoor Mills Limited
Note 2016 2015 Rupees Rupees
EQUITY AND LIABILITIES Share capital and reserves Authorized share capital 3 1,100,000,000 1,100,000,000 Issued, subscribed and paid-up share capital 4 509,110,110 509,110,110 Reserves 5 358,240,114 371,887,258 Total equity 867,350,224 880,997,368 Surplus on revaluation of operating fixed assets - net of deferred income tax 6 1,081,449,031 1,102,492,273
LIABILITIES Non-current liabilities Long term financing - secured 7 735,286,694 1,532,875,759 Sponsor’s loan 8 - 196,855,369 Deferred liabilities 9 194,599,666 356,647,458
929,886,360 2,086,378,586 Current liabilities Trade and other payables 10 853,749,084 848,944,580 Accrued mark-up 11 194,483,901 250,378,063 Sponsor’s loan 8 272,000,000 - Short term borrowings - secured 12 1,917,369,966 756,228,140 Current portion of long term financing 7 163,323,416 279,032,044 Provision for taxation 73,303,245 72,208,980
3,474,229,612 2,206,791,807
Total liabilities 4,404,115,972 4,293,170,393 Contingencies and commitments 13 TOTAL EQUITY AND LIABILITIES 6,352,915,227 6,276,660,034
The annexed notes form an integral part of these financial statements.
BALANCE SHEET AS AT 30 JUNE 2016
AAMIR FAYYAZ SHEIKH Chief Executive
37Annual Report 2016
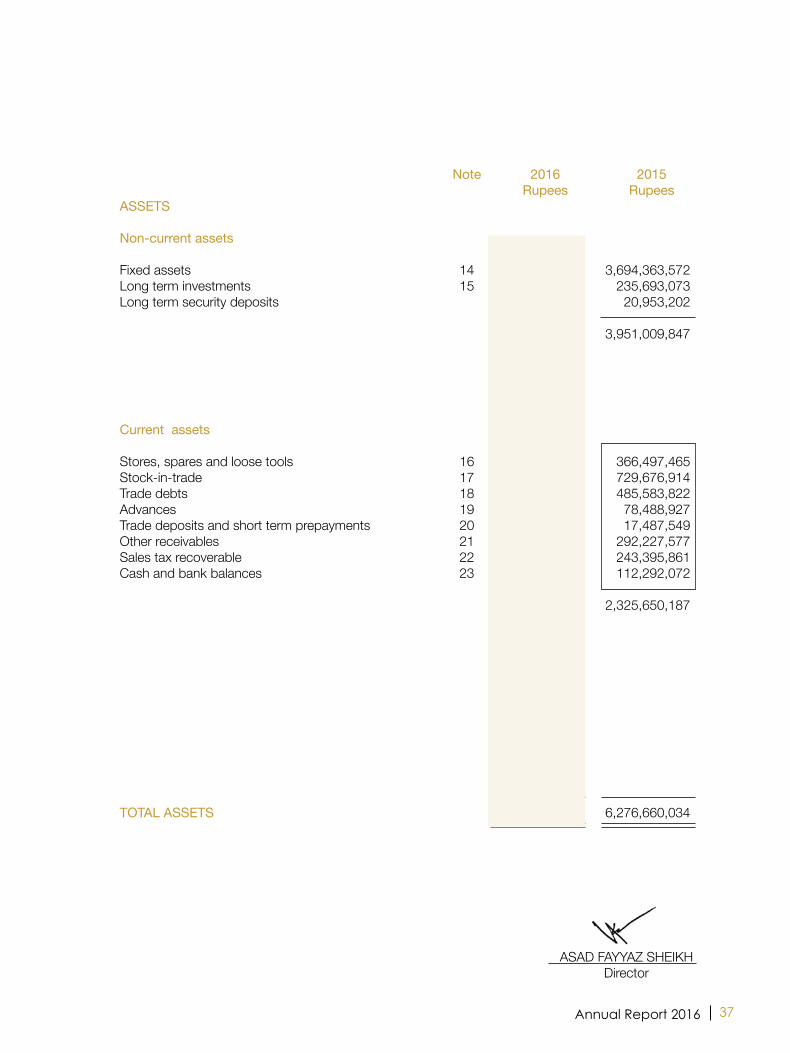
Note 2016 2015 Rupees Rupees
ASSETS Non-current assets Fixed assets 14 3,613,786,853 3,694,363,572 Long term investments 15 126,357,045 235,693,073 Long term security deposits 21,200,012 20,953,202
3,761,343,910 3,951,009,847 Current assets Stores, spares and loose tools 16 416,776,129 366,497,465 Stock-in-trade 17 806,079,356 729,676,914 Trade debts 18 465,442,351 485,583,822 Advances 19 74,812,228 78,488,927 Trade deposits and short term prepayments 20 14,389,121 17,487,549 Other receivables 21 311,146,735 292,227,577 Sales tax recoverable 22 449,022,395 243,395,861 Cash and bank balances 23 53,903,002 112,292,072
2,591,571,317 2,325,650,187
TOTAL ASSETS 6,352,915,227 6,276,660,034
ASAD FAYYAZ SHEIKH Director
38 Kohinoor Mills Limited
Note 2016 2015 Rupees Rupees
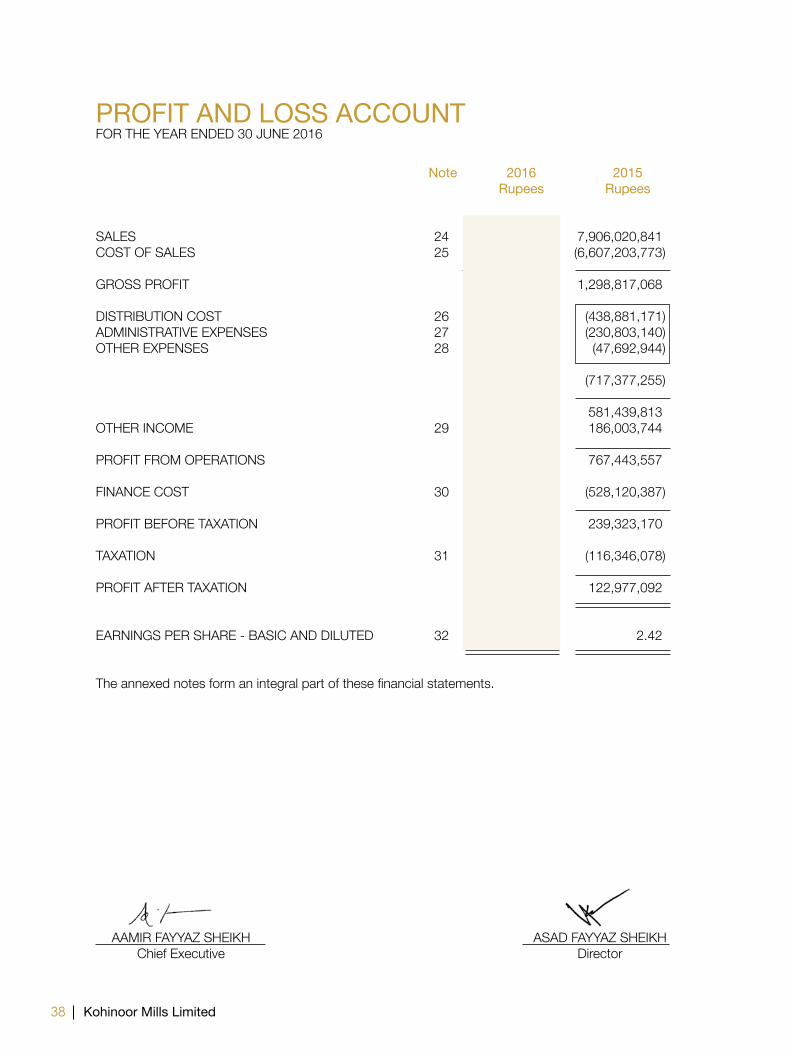
SALES 24 8,551,091,835 7,906,020,841 COST OF SALES 25 (7,158,065,284) (6,607,203,773) GROSS PROFIT 1,393,026,551 1,298,817,068 DISTRIBUTION COST 26 (497,552,931) (438,881,171)ADMINISTRATIVE EXPENSES 27 (232,700,374) (230,803,140)OTHER EXPENSES 28 (53,970,345) (47,692,944) (784,223,650) (717,377,255) 608,802,901 581,439,813 OTHER INCOME 29 44,753,708 186,003,744 PROFIT FROM OPERATIONS 653,556,609 767,443,557 FINANCE COST 30 (450,764,146) (528,120,387) PROFIT BEFORE TAXATION 202,792,463 239,323,170 TAXATION 31 (83,960,087) (116,346,078)
PROFIT AFTER TAXATION 118,832,376 122,977,092
EARNINGS PER SHARE - BASIC AND DILUTED 32 2.33 2.42 The annexed notes form an integral part of these financial statements.
PROFIT AND LOSS ACCOUNTFOR THE YEAR ENDED 30 JUNE 2016
AAMIR FAYYAZ SHEIKH ASAD FAYYAZ SHEIKH Chief Executive Director

39Annual Report 2016
2016 2015 Rupees Rupees
PROFIT AFTER TAXATION 118,832,376 122,977,092 OTHER COMPREHENSIVE INCOME Items that will not be reclassified to profit or loss - - Items that may be reclassified subsequently to profit or loss: Deficit arising on re-measurement of available for sale investment to fair value (104,808,983) (19,870,001) Deferred income tax relating to re-measurement of available for sale investment to fair value 25,540,380 6,090,116 Other comprehensive loss for the year - net of tax (79,268,603) (13,779,885) TOTAL COMPREHENSIVE INCOME FOR THE YEAR 39,563,773 109,197,207 The annexed notes form an integral part of these financial statements.
STATEMENT OF COMPREHENSIVE INCOME FOR THE YEAR ENDED 30 JUNE 2016
AAMIR FAYYAZ SHEIKH ASAD FAYYAZ SHEIKH Chief Executive Director
40 Kohinoor Mills Limited
Note 2016 2015 Rupees Rupees
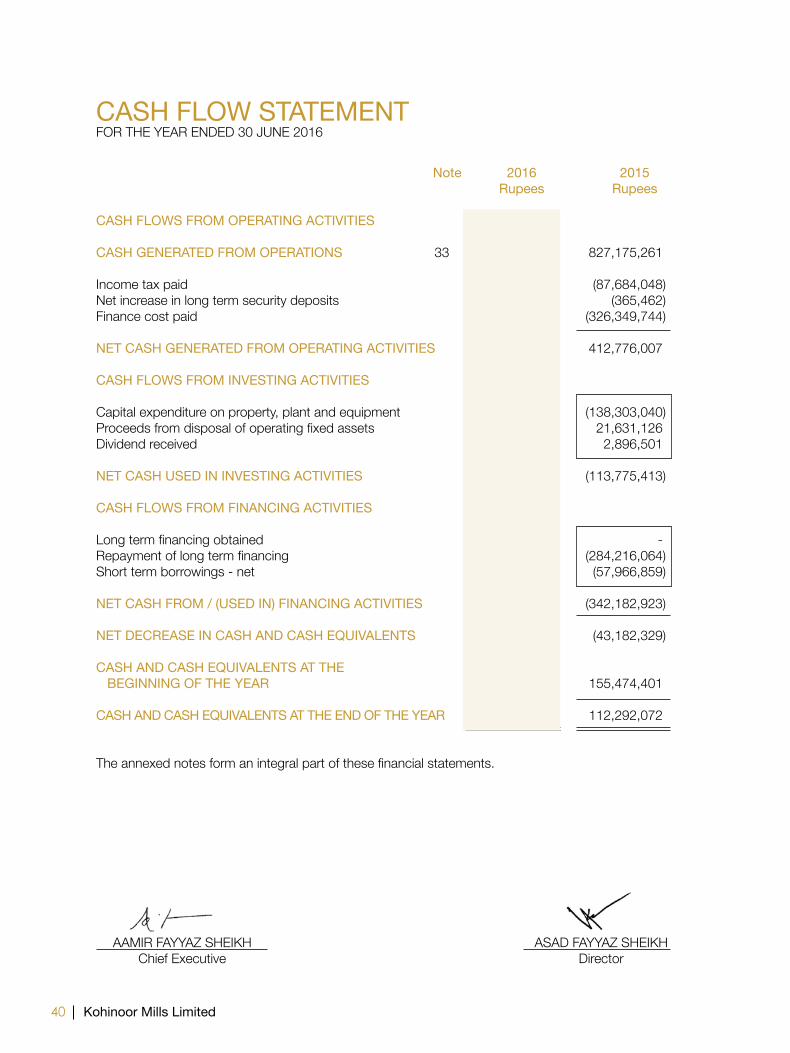
CASH FLOWS FROM OPERATING ACTIVITIES CASH GENERATED FROM OPERATIONS 33 584,419,530 827,175,261 Income tax paid (90,420,324) (87,684,048)Net increase in long term security deposits (246,810) (365,462)Finance cost paid (410,903,778) (326,349,744) NET CASH GENERATED FROM OPERATING ACTIVITIES 82,848,618 412,776,007 CASH FLOWS FROM INVESTING ACTIVITIES Capital expenditure on property, plant and equipment (184,510,636) (138,303,040)Proceeds from disposal of operating fixed assets 33,732,732 21,631,126 Dividend received 3,218,336 2,896,501 NET CASH USED IN INVESTING ACTIVITIES (147,559,568) (113,775,413) CASH FLOWS FROM FINANCING ACTIVITIES Long term financing obtained 36,300,000 - Repayment of long term financing (1,191,119,946) (284,216,064)Short term borrowings - net 1,161,141,826 (57,966,859)
NET CASH FROM / (USED IN) FINANCING ACTIVITIES 6,321,880 (342,182,923) NET DECREASE IN CASH AND CASH EQUIVALENTS (58,389,070) (43,182,329) CASH AND CASH EQUIVALENTS AT THE BEGINNING OF THE YEAR 112,292,072 155,474,401 CASH AND CASH EQUIVALENTS AT THE END OF THE YEAR 53,903,002 112,292,072 The annexed notes form an integral part of these financial statements.
CASH FLOW STATEMENTFOR THE YEAR ENDED 30 JUNE 2016
AAMIR FAYYAZ SHEIKH ASAD FAYYAZ SHEIKH Chief Executive Director
41Annual Report 2016
STAT
EMEN
T O
F C
HAN
GES
IN E
QU
ITY
FOR
THE
YEAR
END
ED 3
0 JU
NE 2
016
R
ESER
VES
C
APIT
AL R
ESER
VES
REVE
NU
E RE
SERV
ES
Shar
e pr
emiu
m
Fair
valu
e
Gen
eral
Ac
cum
ulat
ed
Sub-
Tota
l Eq
uity
por
tion
Tota
l
re
serv
es
rese
rves
Sub
-Tot
al
rese
rve
loss
of s
pons
or’s
loan
re
serv
es
----
----
----
----
----
----
----
----
----
----
----
----
-- R
UP
EE
S -
----
----
----
----
----
----
----
----
----
----
----
---
Bala
nce
as a
t 30
June
201
4
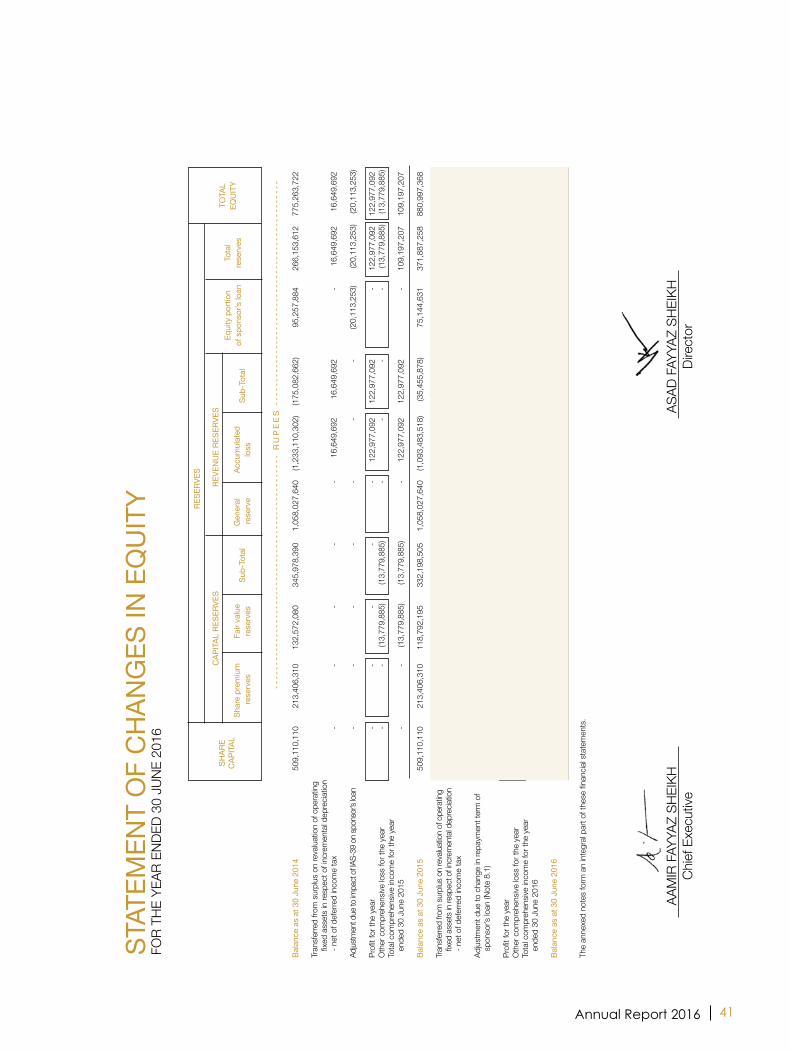
509
,110
,110
2
13,4
06,3
10
132
,572
,080
3
45,9
78,3
90
1,0
58,0
27,6
40
(1,2
33,1
10,3
02)
(175
,082
,662
) 9
5,25
7,88
4
266
,153
,612
7
75,2
63,7
22
Tran
sfer
red
from
sur
plus
on
reva
luat
ion
of o
pera
ting
fix
ed a
sset
s in
resp
ect o
f inc
rem
enta
l dep
recia
tion
- n
et o
f def
erre
d in
com
e ta
x -
-
-
-
-
1
6,64
9,69
2
16,
649,
692
-
1
6,64
9,69
2
16,
649,
692
Adjus
tmen
t due
to im
pact
of IA
S-39
on
spon
sor’s
loan
-
-
-
-
-
-
-
(2
0,11
3,25
3)
(20,
113,
253)
(2
0,11
3,25
3)
Pr
ofit f
or th
e ye
ar
-
-
-
-
-
122
,977
,092
1
22,9
77,0
92
-
122
,977
,092
1
22,9
77,0
92
Oth
er c
ompr
ehen
sive
loss
for t
he y
ear
-
-
(13,
779,
885)
(1
3,77
9,88
5)
-
-
-
-
(13,
779,
885)
(1
3,77
9,88
5)To
tal c
ompr
ehen
sive
inco
me
for t
he y
ear
en
ded
30 J
une
2015
-
-
(1
3,77
9,88
5)
(13,
779,
885)
-
1
22,9
77,0
92
122
,977
,092
-
1
09,1
97,2
07
109
,197
,207
Ba
lanc
e as
at 3
0 Ju
ne 2
015
509
,110
,110
2
13,4
06,3
10
118
,792
,195
3
32,1
98,5
05
1,0
58,0
27,6
40
(1,0
93,4
83,5
18)
(35,
455,
878)
7
5,14
4,63
1
371
,887
,258
8
80,9
97,3
68
Tran
sferre
d fro
m s
urpl
us o
n re
valua
tion
of o
pera
ting
fix
ed a
sset
s in
resp
ect o
f incr
emen
tal d
epre
ciatio
n
- net
of d
efer
red
inco
me
tax
-
-
-
-
-
21,
933,
714
2
1,93
3,71
4
-
21,
933,
714
2
1,93
3,71
4
Ad
just
men
t due
to c
hang
e in
repa
ymen
t ter
m o
f
spon
sor’s
loan
(Not
e 8.
1)
-
-
-
-
-
-
-
(75,
144,
631)
(7
5,14
4,63
1)
(75,
144,
631)
Profi
t for
the
year
-
-
-
-
-
1
18,8
32,3
76
118
,832
,376
-
1
18,8
32,3
76
118
,832
,376
O
ther
com
preh
ensiv
e lo
ss fo
r the
yea
r -
-
(7
9,26
8,60
3)
(79,
268,
603)
-
-
-
-
(7
9,26
8,60
3)
(79,
268,
603)
Tota
l com
preh
ensiv
e in
com
e fo
r the
yea
r
ende
d 30
Jun
e 20
16
-
-
(79,
268,
603)
(7
9,26
8,60
3)
-
118
,832
,376
1
18,8
32,3
76
-
39,
563,
773
3
9,56
3,77
3
Ba
lanc
e as
at 3
0 Ju
ne 2
016
509
,110
,110
2
13,4
06,3
10
39,
523,
592
2
52,9
29,9
02
1,0
58,0
27,6
40
(952
,717
,428
) 1
05,3
10,2
12
-
358
,240
,114
8
67,3
50,2
24
The
anne
xed
note
s fo
rm a
n in
tegr
al pa
rt of
thes
e fin
ancia
l sta
tem
ents
.
SHAR
E C
APIT
ALTO
TAL
EQU
ITY
AA
MIR
FAY
YAZ
SHEI
KH
ASAD
FAY
YAZ
SHEI
KH
Chief
Exe
cutiv
e
Dire
ctor

42 Kohinoor Mills Limited
NOTES TO THE FINANCIAL STATEMENTSFOR THE YEAR ENDED 30 JUNE 2016
1. THE COMPANY AND ITS OPERATIONS
Kohinoor Mills Limited (“the Company”) is a public limited company incorporated on 21 December 1987 in Pakistan under the Companies Ordinance, 1984 and its shares are quoted on Pakistan Stock Exchange Limited. The registered office of the Company is situated at 8-K.M., Manga Raiwind Road, District Kasur. The Company is principally engaged in the business of textile manufacturing covering weaving, bleaching, dyeing, buying, selling and otherwise dealing in yarn, cloth and other goods and fabrics made from raw cotton and synthetic fiber and to generate, and supply electricity.
2. SUMMARY OF SIGNIFICANT ACCOUNTING POLICIES
The significant accounting policies applied in the preparation of these financial statements are set out below. These policies have been consistently applied to all years presented, unless otherwise stated:
2.1 Basis of preparation a) Statement of compliance These financial statements have been prepared in accordance with approved accounting
standards as applicable in Pakistan. Approved accounting standards comprise of such International Financial Reporting Standards (IFRS) issued by the International Accounting Standards Board as are notified under the Companies Ordinance, 1984, provisions of and directives issued under the Companies Ordinance, 1984. In case requirements differ, the provisions or directives of the Companies Ordinance, 1984 shall prevail.
b) Accounting convention These financial statements have been prepared under the historical cost convention,
except for freehold land and buildings which are carried at revalued amounts and certain financial instruments which are carried at their fair value.
c) Critical accounting estimates and judgments The preparation of financial statements in conformity with the approved accounting
standards requires the use of certain critical accounting estimates. It also requires the management to exercise its judgment in the process of applying the Company’s accounting policies. Estimates and judgments are continually evaluated and are based on historical experience and other factors, including expectations of future events that are believed to be reasonable under the circumstances. The areas where various assumptions and estimates are significant to the Company’s financial statements or where judgments were exercised in application of accounting policies are as follows:
Financial instruments The fair value of financial instruments that are not traded in an active market is
determined by using valuation techniques based on assumptions that are dependent on conditions existing at the balance sheet date.
43Annual Report 2016
Useful lives, patterns of economic benefits and impairments Estimates with respect to residual values and useful lives and pattern of flow of economic
benefits are based on the analysis of the management of the Company. Further, the Company reviews the value of assets for possible impairments on an annual basis. Any change in the estimates in the future might affect the carrying amount of respective item of property, plant and equipment, with a corresponding effect on the depreciation charge and impairment.
Taxation In making the estimates for income tax currently payable by the Company, the management
takes into account the current income tax law and the decisions of appellate authorities on certain issues in the past.
Provision for doubtful debts The Company reviews its receivable against any provision required for any doubtful balances on
an ongoing basis. The provision is made while taking into consideration expected recoveries, if any.
Inventories Net realizable value of inventories is determined with reference to currently prevailing selling
prices less estimated expenditure to make sales. Provision for obsolescence of stores, spares and loose tools Provision for obsolescence of items of stores, spares and loose tools is made on the basis of
management’s estimate of net realizable value and ageing analysis prepared on an item-by-item basis.
d) Standards that are effective in current year and are relevant to the Company The following standards are mandatory for the Company’s accounting periods beginning on or
after 01 July 2015: IFRS 10 ‘Consolidated Financial Statements’ (effective for annual periods beginning on or after
01 January 2015). Concurrent with the issuance of IFRS 10, the IASB has also issued IFRS 11 ‘Joint Arrangements’, IFRS 12 ‘Disclosure of Interests in Other Entities’, IAS 27 ‘Separate Financial Statements’ and IAS 28 ‘Investments in Associates and Joint Ventures’. The objective of IFRS 10 is to have a single basis for consolidation for all entities, regardless of the nature of the investee, and that basis is control. The definition of control includes three elements: power over an investee, exposure or rights to variable returns of the investee and the ability to use power over the investee to affect the investor’s returns. IFRS 10 replaces those parts of IAS 27 that address when and how an investor should prepare consolidated financial statements and replaces Standing Interpretations Committee (SIC) 12 ‘Consolidation – Special Purpose Entities’ in its entirety. This standard does not have significant impact on these financial statements, except for certain additional disclosures.

44 Kohinoor Mills Limited
IFRS 12 ‘Disclosures of Interests in Other Entities’ (effective for annual periods beginning on or after 01 January 2015). This standard includes the disclosure requirements for all forms of interests in other entities, including joint arrangements, associates, special purpose vehicles and other off-balance sheet vehicles. This standard does not have significant impact on these financial statements, except for certain additional disclosures.
IFRS 13 ‘Fair value Measurement’ (effective for annual periods beginning on or after 01 January
2015). This standard aims to improve consistency and reduce complexity by providing a precise definition of fair value and a single source of fair value measurement and disclosure requirements for use across IFRSs. The requirements, which are largely aligned between IFRSs and US GAAP, do not extend the use of fair value accounting but provide guidance on how it should be applied where its use is already required or permitted by other standards within IFRSs or US GAAP. This standard does not have significant impact on these financial statements, except for certain additional disclosures.
e) Amendments to published standards that are effective in current year but not relevant to the
Company There are amendments to published standards that are mandatory for accounting periods
beginning on or after 01 July 2015 but are considered not to be relevant or do not have any significant impact on the Company’s financial statements and are therefore not detailed in these financial statements.
f) Standards and amendments to published approved accounting standards that are not yet
effective but relevant to the Company The following standards and amendments to existing standards have been published and are
mandatory for the Company’s accounting periods beginning on or after 01 July 2016 or later periods: IFRS 9 ‘Financial Instruments’ (effective for annual periods beginning on or after 01 January 2018).
A finalized version of IFRS 9 which contains accounting requirements for financial instruments, replacing IAS 39 ‘Financial Instruments: Recognition and Measurement’. Financial assets are classified by reference to the business model within which they are held and their contractual cash flow characteristics. The 2014 version of IFRS 9 introduces a ‘fair value through other comprehensive income’ category for certain debt instruments. Financial liabilities are classified in a similar manner as under IAS 39, however there are differences in the requirements applying to the measurement of an entity’s own credit risk. The 2014 version of IFRS 9 introduces an ‘expected credit loss’ model for the measurement of the impairment of financial assets, so it is no longer necessary for a credit event to have occurred before a credit loss is recognized. It introduces a new hedge accounting model that is designed to be more closely aligned with how entities undertake risk management activities when hedging financial and non-financial risk exposures. The requirements for the derecognition of financial assets and liabilities are carried forward from IAS 39. The management of the Company is in the process of evaluating the impacts of the aforesaid standard on the Company’s financial statements.
IFRS 15 ‘Revenue from Contracts with Customers’ (effective for annual periods beginning on or
after 01 January 2018). IFRS 15 provides a single, principles based five-step model to be applied to all contracts with customers. The five steps in the model are: identify the contract with the customer; identify the performance obligations in the contract; determine the transaction price; allocate the transaction price to the performance obligations in the contracts; and recognize

45Annual Report 2016
revenue when (or as) the entity satisfies a performance obligation. Guidance is provided on topics such as the point in which revenue is recognized, accounting for variable consideration, costs of fulfilling and obtaining a contract and various related matters. New disclosures about revenue are also introduced. The aforesaid standard is not expected to have a material impact on the Company’s financial statements.
IFRS 15 (Amendments), ‘Revenue from Contracts with Customers’ (effective for annual periods
beginning on or after 01 January 2018). Amendments clarify three aspects of the standard (identifying performance obligations, principal versus agent considerations, and licensing) and to provide some transition relief for modified contracts and completed contracts. The aforesaid amendments are not expected to have a material impact on the Company’s financial statements.
IAS 7 (Amendments), ‘Statement of Cash Flows’ (effective for annual periods beginning on
or after 01 January 2017). Amendments have been made to clarify that entities shall provide disclosures that enable users of financial statements to evaluate changes in liabilities arising from financing activities. The aforesaid amendments will result in certain additional disclosures in the Company’s financial statements.
IAS 16 (Amendments) ‘Property, Plant and Equipment’ (effective for annual periods beginning
on or after 01 January 2016). The amendments clarify that a depreciation method which is based on revenue, generated by an activity by using of an asset is not appropriate for property, plant and equipment; and add guidance that expected future reductions in the selling price of an item that was produced using an asset could indicate the expectation of technological or commercial obsolescence of the asset, which, in turn, might reflect a reduction of the future economic benefits embodied in the asset. However, the amendments are not expected to have a material impact on the Company’s financial statements.
IAS 27 (Amendments) ‘Separate Financial Statements’ (effective for annual periods beginning on or after 01 January 2016). The amendments have been made to permit investments in subsidiaries, joint ventures and associates to be optionally accounted for using the equity method in separate financial statements. The management of the Company is in the process of evaluating the impacts of the aforesaid amendments on the Company’s financial statements.
Amendments to IFRS 10 and IAS 28 (deferred indefinitely) to clarify the treatment of the sale
or contribution of assets from an investor to its associates or joint venture, as follows: require full recognition in the investor’s financial statements of gains and losses arising on the sale or contribution of assets that constitute a business (as defined in IFRS 3 ‘Business Combinations’); require the partial recognition of gains and losses where the assets do not constitute a business, i.e. a gain or loss is recognized only to the extent of the unrelated investors’ interests in that associate or joint venture. These requirements apply regardless of the legal form of the transaction, e.g. whether the sale or contribution of assets occur by an investor transferring shares in a subsidiary that holds the assets (resulting in loss of control of the subsidiary), or by the direct sale of the assets themselves. The management of the Company is in the process of evaluating the impacts of the aforesaid amendments on the Company’s financial statements.
On 25 September 2014, IASB issued Annual Improvements to IFRSs: 2012 – 2014 Cycle,
incorporating amendments to four IFRSs more specifically in IAS 34 ‘Interim Financial Reporting’, which is considered relevant to the Company’s financial statements. These amendments are effective for annual periods beginning on or after 01 January 2016. This amendment is unlikely to have a significant impact on the Company’s financial statements and has therefore not been analyzed in detail.

46 Kohinoor Mills Limited
g) Standard and amendments to published standards that are not yet and not considered relevant to the Company
There are other standard and amendments to published standards that are mandatory for
accounting periods beginning on or after 01 July 2016 but are considered not to be relevant or do not have any significant impact on the Company’s financial statements and are therefore not detailed in these financial statements
2.2 Employee benefit The Company operates a funded contributory provident fund scheme for its permanent
employees. The Company and employees make equal monthly contributions of 8.33 percent of the basic salary, towards the fund. The Company’s contribution is charged to the profit and loss account.
2.3 Provisions Provisions are recognized in the balance sheet when the Company has a legal or constructive
obligation as a result of past events and it is probable that outflow of economic benefits will be required to settle the obligation and a reliable estimate can be made of the amount of obligation. However, provisions are reviewed at each balance sheet date and adjusted to reflect current best estimate.
2.4 Taxation Current Provision for current tax is based on the taxable income for the year determined in accordance
with the prevailing law for taxation of income. The charge for current tax is calculated using prevailing tax rates or tax rates expected to apply to the profit for the year if enacted. The charge for current tax also includes adjustments, where considered necessary, to provision for tax made in previous years arising from assessments framed during the year for such years.
Deferred Deferred tax is accounted for using the balance sheet liability method in respect of all temporary
differences arising from differences between the carrying amount of assets and liabilities in the financial statements and the corresponding tax bases used in the computation of the taxable profit. Deferred tax liabilities are generally recognized for all taxable temporary differences and deferred tax assets to the extent that it is probable that taxable profits will be available against which the deductible temporary differences, unused tax losses and tax credits can be utilized.
Deferred tax is calculated at the rates that are expected to apply to the period when the
differences reverse based on tax rates that have been enacted or substantively enacted by the balance sheet date. Deferred tax is charged or credited in the profit and loss account, except to the extent that it relates to items recognized in other comprehensive income or directly in equity. In this case the tax is also recognized in statement of comprehensive income or directly in equity, respectively.

47Annual Report 2016
2.5 Foreign currencies The financial statements are presented in Pak Rupees, which is the Company’s functional
currency. All monetary assets and liabilities in foreign currencies are translated into Pak Rupees at exchange rates prevailing at the balance sheet date. Transactions in foreign currencies are translated into Pak Rupees at the spot rate. All non-monetary items are translated into Pak Rupees at exchange rates prevailing on the date of transaction or on the date when fair values are determined. Exchange gains and losses, where applicable, are recognized in the profit and loss account.
2.6 Fixed assets 2.6.1 Property, plant and equipment and depreciation Owned a) Cost
Property, plant and equipment except freehold land and buildings are stated at cost less accumulated depreciation and any identified impairment loss. Freehold land is stated at revalued amount less any identified impairment loss, buildings are stated at revalued amount less accumulated depreciation and any identified impairment loss, while capital work-in-progress is stated at cost less any identified impairment loss.
Subsequent costs are included in the asset’s carrying amount or recognized as a
separate asset, as appropriate, only when it is probable that future economic benefits associated with the item will flow to the Company and the cost of the item can be measured reliably. All other repair and maintenance costs are charged to income during the period in which they are incurred.
Increases in the carrying amount arising on revaluation of operating fixed assets are
credited to surplus on revaluation of operating fixed assets. Decreases that offset previous increases of the same assets are charged against this surplus, all other decreases are charged to income. Each year the difference between depreciation based on revalued carrying amount of the asset (the depreciation charged to the income) and depreciation based on the assets’ original cost is transferred from surplus on revaluation of operating fixed assets to retained earnings. All transfers to / from surplus on revaluation of operating fixed assets are net of applicable deferred income tax.
b) Depreciation Depreciation on all operating fixed assets is charged to income on a reducing balance
method so as to write off cost / depreciable amount of an asset over its estimated useful life at the rates as disclosed in note 14.1. Depreciation on additions is charged from the month in which the asset is put to use and on disposal up to the month of disposal. The residual values and useful lives are reviewed by the management, at each financial year end and adjusted if impact on depreciation is significant.
48 Kohinoor Mills Limited
c) Derecognition An item of property, plant and equipment is derecognized on disposal or when no
future economic benefits are expected from its use or disposal. Any gain or loss arising on derecognition of the asset (calculated as the difference between the net disposal proceeds and carrying amount of the asset) is included in the profit and loss account in the year the asset is derecognized.
Leased a) Finance leases Leases where the Company has substantially all the risk and rewards of ownership
are classified as finance lease. Assets subject to finance lease are capitalized at the commencement of the lease term at the lower of present value of minimum lease payments under the lease agreements and the fair value of the leased assets, each determined at the inception of the lease.
The related rental obligation net of finance cost, is included in liabilities against assets
subject to finance lease. The liabilities are classified as current and long term depending upon the timing of payments.
Each lease payment is allocated between the liability and finance cost so as to achieve
a constant rate on the balance outstanding. The finance cost is charged to income over the lease term.
Depreciation of assets subject to finance lease is recognized in the same manner as for
owned assets. Depreciation of the leased assets is charged to income. b) Operating leases Leases where significant portion of the risk and rewards of ownership are retained by
the lessor are classified as operating leases. Payments made under operating leases are charged to the income on a straight-line basis over the period of lease.
2.6.2 Intangible assets Intangible assets, which are non-monetary assets without physical substance, are recognized
at cost, which comprise purchase price, non-refundable purchase taxes and other directly attributable expenditures relating to their implementation and customization. After initial recognition an intangible asset is carried at cost less accumulated amortization and impairment losses, if any. Intangible assets are amortized from the month, when these assets are available for use, using the straight line method, whereby the cost of the intangible asset is amortized over its estimated useful life over which economic benefits are expected to flow to the Company. The useful life and amortization method is reviewed and adjusted, if appropriate, at each balance sheet date.

49Annual Report 2016
2.7 Investments Classification of an investment is made on the basis of intended purpose for holding such
investment. Management determines the appropriate classification of its investments at the time of purchase and re-evaluates such designation on regular basis.
Investments are initially measured at fair value plus transaction costs directly attributable to
acquisition, except for “Investment at fair value through profit or loss” which is initially measured at fair value.
The Company assesses at the end of each reporting period whether there is any objective
evidence that investments are impaired. If any such evidence exists, the Company applies the provisions of IAS 39 ‘Financial Instruments: Recognition and Measurement’ to all investments, except investment in subsidiary company, which is tested for impairment in accordance with the provisions of IAS 36 ‘Impairment of Assets’.
a) Investments at fair value through profit or loss Investments classified as held-for-trading and those designated as such are included in this
category. Investments are classified as held-for-trading if they are acquired for the purpose of selling in the short term. Gains or losses on investments held-for-trading are recognized in profit and loss account.
b) Held-to-maturity Investments with fixed or determinable payments and fixed maturity are classified as held-to-
maturity when the Company has the positive intention and ability to hold to maturity. Investments intended to be held for an undefined period are not included in this classification. Other long term investments that are intended to be held to maturity are subsequently measured at amortized cost. This cost is computed as the amount initially recognized minus principal repayments, plus or minus the cumulative amortization using the effective interest method of any difference between the initially recognized amount and the maturity amount. For investments carried at amortized cost, gains and losses are recognized in profit and loss account when the investments are derecognized or impaired, as well as through the amortization process.
c) Available-for-sale Investments intended to be held for an indefinite period of time, which may be sold in response to
need for liquidity, or changes to interest rates or equity prices are classified as available-for-sale. After initial recognition, investments which are classified as available-for-sale are measured at fair value. Gains or losses on available-for-sale investments are recognized directly in statement of comprehensive income until the investment is sold, de-recognized or is determined to be impaired, at which time the cumulative gain or loss previously reported in statement of comprehensive income is included in profit and loss account. These are sub-categorized as under:
Quoted For investments that are actively traded in organized capital markets, fair value is determined by
reference to stock exchange quoted market bids at the close of business on the balance sheet date.

50 Kohinoor Mills Limited
Unquoted Fair value of unquoted investments is determined on the basis of appropriate valuation
techniques as allowed by IAS 39 ‘Financial Instruments: Recognition and Measurement’. d) Equity investments in associated companies The investments in associates in which the Company does not have significant influence are
classified as “Available-for-Sale”. e) Investment in subsidiary company Investment in subsidiary company is accounted for at cost less impairment loss, if any, in
accordance with IAS 27 ‘Separate Financial Statements’. 2.8 Inventories Inventories, except for stock in transit, waste stock and rejected goods are stated at lower of
cost and net realizable value. Cost is determined as follows: Stores, spares and loose tools Useable stores and spares are valued principally at moving average cost, while items considered
obsolete are carried at nil value. In transit stores and spares are valued at cost comprising invoice value plus other charges paid thereon.
Stock in trade Cost of raw material is based on weighted average cost.
Cost of work in process and finished goods comprises prime cost and appropriate production overheads determined on weighted average cost. Cost of goods purchased for resale are valued at their respective purchase price by using first-in-first-out method.
Materials in transit are valued at cost comprising invoice value plus other charges paid thereon.
Waste stock and rejected goods are valued at net realizable value. Net realizable value signifies the estimated selling price in the ordinary course of business less
the estimated costs of completion and the estimated costs necessary to make a sale. 2.9 Non-current assets held for sale Non-current assets classified as assets held for sale are stated at the lower of carrying amount
and fair value less costs to sell if their carrying amount is recoverable principally through a sale transaction rather than through continuing use.
2.10 Borrowing costs Borrowing costs are recognized as expense in the period in which these are incurred except
to the extent of borrowing costs that are directly attributable to the acquisition, construction or production of a qualifying asset. Such borrowing cost, if any, are capitalized as part of the cost of that asset.

51Annual Report 2016
2.11 Revenue recognition Revenue from different sources is recognized as under. (a) Revenue from sale of goods is recognized on dispatch of goods to customer. (b) Dividend on equity investments is recognized as income when right to receive payment
is established. (c) Profit on bank deposits is recognized on a time proportion basis taking into account,
the principal outstanding and rates of profits applicable thereon. 2.12 Impairment a) Financial assets A financial asset is considered to be impaired if objective evidence indicate that one or more
events had a negative effect on the estimated future cash flow of that asset. An impairment loss in respect of a financial asset measured at amortized cost is calculated as
a difference between its carrying amount and the present value of estimated future cash flows discounted at the original effective interest rate. An impairment loss in respect of available for sale financial asset is calculated with reference to its current fair value.
Individually significant financial assets are tested for impairment on an individual basis. The
remaining financial assets are assessed collectively in groups that share similar credit risk characteristics.
b) Non-financial assets The carrying amounts of the Company’s non-financial assets are reviewed at each balance
sheet date to determine whether there is any indication of impairment. If such indication exists, the recoverable amount of such asset is estimated. An impairment loss is recognized wherever the carrying amount of the asset exceeds its recoverable amount. Impairment losses are recognized in profit and loss account. A previously recognized impairment loss is reversed only if there has been a change in the estimates used to determine the asset’s recoverable amount since the last impairment loss was recognized. If that is the case, the carrying amount of the asset is increased to its recoverable amount. That increased amount cannot exceed the carrying amount that would have been determined, net of depreciation, had no impairment loss been recognized for the asset in prior years. Such reversal is recognized in profit and loss account.
2.13 Share capital Ordinary shares are classified as equity and recognized at their face value. Incremental costs
directly attributable to the issue of new shares are shown in equity as a deduction, net of tax, if any.
52 Kohinoor Mills Limited
2.14 Financial instruments Financial instruments are recognized at fair value when the Company becomes party to the
contractual provisions of the instrument by following trade date accounting. Any gain or loss on the subsequent measurement is charged to the profit and loss account except for available for sale investments. The Company derecognizes a financial asset or a portion of financial asset when, and only when, the enterprise loses the control over contractual right that comprises the financial asset or a portion of financial asset. While a financial liability or a part of financial liability is derecognized from the balance sheet when, and only when, it is extinguished, i.e., when the obligation specified in contract is discharged, cancelled or expired.
The particular measurement methods adopted are disclosed in the individual policy statements
associated with each item. Financial assets are investments, trade debts, deposits, advances, other receivables and cash
and bank balances. Financial liabilities are classified according to the substance of the contractual agreements
entered into. Significant financial liabilities are long term financing, short term borrowings, sponsor’s loan, accrued markup and trade and other payables.
2.14.1 Trade debts and other receivables Trade debts and other receivable are initially measured at fair value and subsequently
at amortized cost using effective interest rate method less provision for impairment. A provision is established when there is objective evidence that the Company will not be able to collect all amounts due according to the original terms of receivables. Trade debts and other receivables considered irrecoverable are written off.
2.14.2 Trade and other payables Liabilities for trade and other amounts payable are initially recognized at fair value
which is normally the transaction cost. 2.14.3 Markup bearing borrowings Borrowings are recognized initially at fair value and are subsequently stated at
amortized cost, any difference between the proceeds and the redemption value is recognized in the profit and loss account over the period of the borrowing using the effective interest rate method.
2.14.4 Cash and cash equivalents Cash and cash equivalents comprise cash in hand, cash at banks on current accounts,
saving and deposit accounts and other short term highly liquid instruments that are readily convertible into known amounts of cash and which are subject to insignificant risk of changes in values.
53Annual Report 2016
2.15 Derivative financial instruments Derivative financial instruments are initially recognized at fair value on the date a derivative contract
is entered into and are remeasured to fair value at subsequent reporting dates. The method of recognizing the resulting gain or loss depends on whether the derivative is designated as a hedging instrument, and if so, the nature of the item being hedged. The Company designates certain derivatives as cash flow hedges.
The Company documents at the inception of the transaction the relationship between the
hedging instruments and hedged items, as well as its risk management objective and strategy for undertaking various hedge transactions. The Company also documents its assessment, both at hedge inception and on an ongoing basis, of whether the derivatives that are used in hedging transactions are highly effective in offsetting changes in cash flow of hedged items.
The effective portion of changes in the fair value of derivatives that are designated and qualify
as cash flow hedges are recognized in statement of comprehensive income. The gain or loss relating to the ineffective portion is recognized immediately in the profit and loss account.
Amounts accumulated in equity are recognized in profit and loss account in the periods when
the hedged item will affect profit or loss. 2.16 Segment reporting Segment reporting is based on the operating (business) segments of the Company. An operating
segment is a component of the Company that engages in business activities from which it may earn revenues and incur expenses, including revenues and expenses that relate to the transactions with any of the Company’s other components. An operating segment’s operating results are reviewed regularly by the chief executive to make decisions about resources to be allocated to the segment and assess its performance, and for which discrete financial information is available.
Segment results that are reported to the chief executive include items directly attributable to a
segment as well as those that can be allocated on a reasonable basis. Those income, expenses, assets, liabilities and other balances which cannot be allocated to a particular segment on a reasonable basis are reported as unallocated.
The Company has three reportable business segments. Weaving (Producing different quality
of greige fabric using yarn), Dyeing (Converting greige into dyed fabric) and Power Generation (Generating and distributing power).
Transactions among the business segments are recorded at arm’s length prices using admissible
valuation methods. Inter segment sales and purchases are eliminated from the total. 2.17 Off setting of financial assets and liabilities Financial assets and liabilities are set off and the net amount is reported in the financial statements
when there is legally enforceable right to set off and the Company intends either to settle on a net basis, or to realize the asset and settle the liability simultaneously.
2.18 Dividend and other appropriations Dividend to the shareholders is recognized in the period in which it is declared and other
appropriations are recognized in the period in which these are approved by the Board of Directors.

54 Kohinoor Mills Limited
3. AUTHORIZED SHARE CAPITAL 2016 2015 2016 2015 (NUMBER OF SHARES) Rupees Rupees
80,000,000 80,000,000 Ordinary shares of Rupees 10 each 800,000,000 800,000,000 30,000,000 30,000,000 Preference shares of Rupees 10 each 300,000,000 300,000,000
110,000,000 110,000,000 1,100,000,000 1,100,000,000
4. ISSUED, SUBSCRIBED AND PAID-UP SHARE CAPITAL 2016 2015 (NUMBER OF SHARES)
28,546,003 28,546,003 Ordinary shares of Rupees 285,460,030 285,460,030 10 each fully paid in cash
18,780,031 18,780,031 Ordinary shares of Rupees 10 each 187,800,310 187,800,310 issued as fully paid bonus shares
3,584,977 3,584,977 Ordinary shares of Rupees 10 each 35,849,770 35,849,770 issued due to merger with Kohinoor Genertek Limited as per scheme of arrangement 50,911,011 50,911,011 509,110,110 509,110,110
2016 2015 Rupees Rupees5. RESERVES
Composition of reserves is as follows:
Capital reserves Share premium reserve (Note 5.1) 213,406,310 213,406,310 Fair value reserve - net of deferred income tax (Note 5.2) 39,523,592 118,792,195
252,929,902 332,198,505 Revenue reserves General reserve 1,058,027,640 1,058,027,640 Accumulated loss (952,717,428) (1,093,483,518)
105,310,212 (35,455,878) Equity portion of sponsor’s loan (Note 8) - 75,144,631 358,240,114 371,887,258
5.1 This reserve can be utilized by the Company only for the purposes specified in section 83(2) of the Companies Ordinance, 1984.
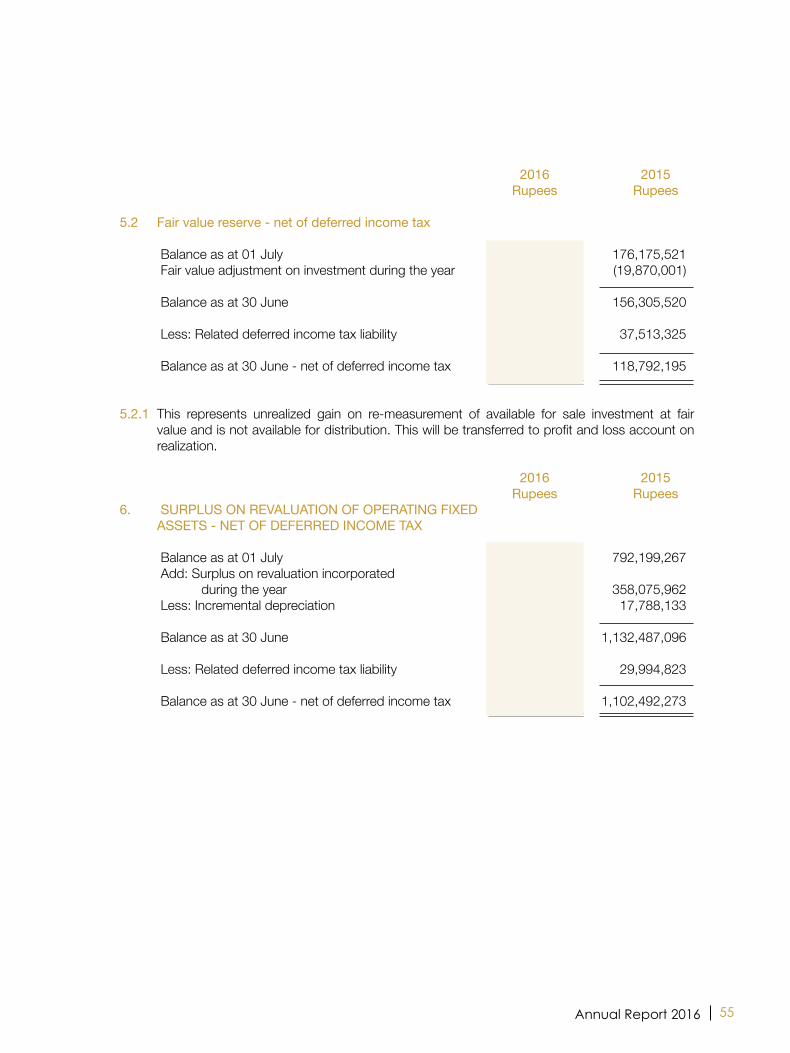
55Annual Report 2016
2016 2015 Rupees Rupees
5.2 Fair value reserve - net of deferred income tax
Balance as at 01 July 156,305,520 176,175,521 Fair value adjustment on investment during the year (104,808,983) (19,870,001)
Balance as at 30 June 51,496,537 156,305,520 Less: Related deferred income tax liability 11,972,945 37,513,325 Balance as at 30 June - net of deferred income tax 39,523,592 118,792,195
5.2.1 This represents unrealized gain on re-measurement of available for sale investment at fair value and is not available for distribution. This will be transferred to profit and loss account on realization.
2016 2015 Rupees Rupees6. SURPLUS ON REVALUATION OF OPERATING FIXED ASSETS - NET OF DEFERRED INCOME TAX Balance as at 01 July 1,132,487,096 792,199,267 Add: Surplus on revaluation incorporated during the year - 358,075,962 Less: Incremental depreciation 23,433,455 17,788,133
Balance as at 30 June 1,109,053,641 1,132,487,096 Less: Related deferred income tax liability 27,604,610 29,994,823 Balance as at 30 June - net of deferred income tax 1,081,449,031 1,102,492,273

56 Kohinoor Mills Limited
Natio
nal B
ank
of
Pakis
tan
Unite
d Ba
nk L
imite
d
The
Bank
of P
unjab
Fays
al Ba
nk L
imite
d
464
,245
,511
11,
586,
079 -
161
,894
,049
512
,468
,070
171
,233
,629
348
,856
,629
177
,161
,865
This
loan
is re
paya
ble
in 36
st
eppe
d up
qu
arte
rly
insta
lmen
ts c
omm
ence
d fro
m 3
1 M
arch
201
5 an
d en
ding
on
31
Dece
mbe
r 202
3. T
his lo
an c
arrie
s m
ark-
up a
t the
ra
te o
f 7.7
0% p
er a
nnum
bas
ed o
n th
e av
erag
e co
st o
f fu
nds o
f the
ban
k w
hich
will
be re
view
ed a
nnua
lly. M
ark-
up
will
be a
ccru
ed o
ver n
ine y
ears
dur
ing w
hich
the
princ
ipal
will
be re
paid
. The
acc
rued
mar
k-up
will
be re
paid
in tw
elve
equa
l qu
arte
rly i
nsta
lmen
ts c
omm
encin
g on
31
Mar
ch
2024
and
end
ing o
n 31
Dec
embe
r 202
6.
This
loan
is re
paya
ble
in 28
equ
al qu
arte
rly in
stalm
ents
of
Rupe
es 1
3.54
0 m
illion
each
com
men
ced
from
09
Febr
uary
20
12 a
nd e
nding
on
09 N
ovem
ber
2018
. M
ark-
up i
s pa
yabl
e qu
arte
rly a
t the
rate
of 5
.00%
per
ann
um.
As p
er t
he r
evise
d te
rms
of r
estru
ctur
ing, t
his lo
an w
as
repa
yabl
e in
31 s
tepp
ed u
p qu
arte
rly in
stalm
ents
from
30
June
201
1 to
31
Dece
mbe
r 201
8. H
owev
er, th
is loa
n ha
s be
en fu
lly re
paid
dur
ing th
e ye
ar. T
his lo
an c
arrie
d m
ark-
up a
t the
rate
of 9
.55%
per
ann
um b
ased
on
the
cost
of
fund
s of
the
bank
app
rove
d by
SBP
upt
o 31
Mar
ch 2
013
and
ther
eafte
r 5.0
0% p
er a
nnum
. Mar
k-up
acc
rued
upt
o 31
Mar
ch 2
013
will
be re
paid
by t
he e
nd o
f 30
June
201
7,
ther
efor
e, p
rese
nted
in a
ccru
ed m
ark-
up (N
ote
11).
This
loan i
s rep
ayab
le in
31 st
eppe
d up
qua
rterly
inst
almen
ts
com
men
ced
from
31
Mar
ch 2
013
and
endi
ng o
n 30
Se
ptem
ber 2
020.
Mar
k-up
is p
ayab
le qu
arte
rly a
t the
rate
of
5.0
0% p
er a
nnum
. Mar
k-up
upt
o 30
Sep
tem
ber 2
011
is re
calcu
lated
at t
he ra
te o
f 8.5
% p
er a
nnum
and
will
be
repa
id o
n 30
Sep
tem
ber 2
020.
Firs
t par
i pas
su c
harg
e of
Rup
ees
1,43
8.55
0 m
illion
by
way
of h
ypot
heca
tion
and
mor
tgag
e ch
arge
ove
r pr
esen
t and
futu
re fi
xed
asse
ts o
f the
Com
pany
, par
i pa
ssu
char
ge o
f Ru
pees
667
milli
on a
nd r
ankin
g ch
arge
of R
upee
s 10
0 m
illion
ove
r cu
rrent
ass
ets
of
the
Com
pany
as
mar
gin
and
pers
onal
guar
ante
es o
f Sp
onso
r dire
ctor
s.
Firs
t par
i pas
su c
harg
e of
Rup
ees 6
06.0
00 m
illion
(with
25
% m
argi
n) o
ver a
ll pre
sent
and
futu
re c
urre
nt a
sset
s an
d Ru
pees
200
.000
milli
on o
ver fi
xed
asse
ts o
f the
Co
mpa
ny a
nd p
erso
nal g
uara
ntee
s of
two
dire
ctor
s.
Join
t par
i pas
su c
harg
e of
Rup
ees 7
52.3
00 m
illion
ove
r fix
ed a
sset
s, p
ari p
assu
cha
rge
of R
upee
s 53
4.00
0 m
illion
an
d ra
nkin
g ch
arge
of
Ru
pees
26
8.00
0 m
illion
on
all p
rese
nt a
nd fu
ture
cur
rent
ass
ets
of th
e Co
mpa
ny.
Firs
t par
i pas
su c
harg
e of
Rup
ees
266.
800
milli
on o
ver
curre
nt a
sset
s, r
ankin
g ch
arge
of
Rupe
es 2
40.0
00
milli
on o
ver
curre
nt a
sset
s an
d ex
clusiv
e ch
arge
of
Rupe
es 9
4.00
0 m
illion
on
pow
er g
ener
ator
s of
the
Co
mpa
ny.
----
----
Rup
ees
----
----
7.1
Lend
er20
1620
15Se
curit
yTe
rms
2016
20
15
Ru
pees
Ru
pees
7.
LON
G T
ERM
FIN
ANC
ING
- SE
CU
RED
Fi
nanc
ing
from
ban
king
com
pani
es (N
ote
7.1
and
7.2)
898
,610
,110
1
,811
,907
,803
Less
: Cur
rent
por
tion
show
n un
der c
urre
nt lia
biliti
es
1
63,3
23,4
16
279
,032
,044
735
,286
,694
1
,532
,875
,759
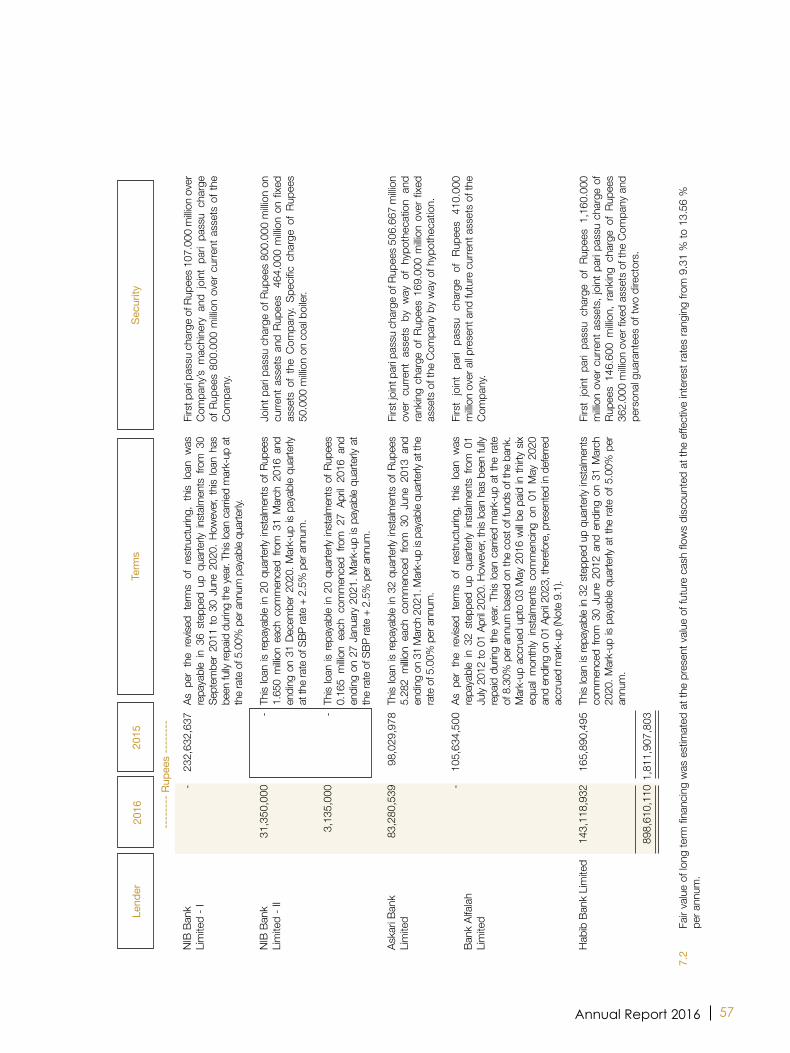
57Annual Report 2016
NIB
Bank
Li
mite
d - I
NIB
Bank
Li
mite
d - I
I
Aska
ri Ba
nk
Lim
ited
Bank
Alfa
lah
Lim
ited
Habi
b Ba
nk L
imite
d
-
31,
350,
000
3,1
35,0
00
83,
280,
539 -
143
,118
,932
898
,610
,110
232
,632
,637
- -
98,
029,
978
105
,634
,500
165
,890
,495
1,8
11,9
07,8
03 As
per
the
rev
ised
term
s of
res
truct
uring
, th
is loa
n w
as
repa
yabl
e in
36 s
tepp
ed u
p qu
arte
rly in
stalm
ents
fro
m 3
0 Se
ptem
ber 2
011
to 3
0 Ju
ne 2
020.
How
ever,
this
loan
has
been
fully
repa
id d
uring
the
year.
This
loan
car
ried
mar
k-up
at
the
rate
of 5
.00%
per
ann
um p
ayab
le qu
arte
rly.
This
loan
is re
paya
ble
in 20
qua
rterly
inst
almen
ts o
f Rup
ees
1.65
0 m
illion
each
com
men
ced
from
31
Mar
ch 2
016
and
endi
ng o
n 31
Dec
embe
r 202
0. M
ark-
up is
pay
able
quar
terly
at
the
rate
of S
BP ra
te +
2.5
% p
er a
nnum
.
This
loan
is re
paya
ble
in 20
qua
rterly
inst
almen
ts o
f Rup
ees
0.16
5 m
illion
each
com
men
ced
from
27
April
2016
and
en
ding
on
27 J
anua
ry 2
021.
Mar
k-up
is p
ayab
le qu
arte
rly a
t th
e ra
te o
f SBP
rate
+ 2
.5%
per
ann
um.
This
loan
is re
paya
ble
in 32
qua
rterly
inst
almen
ts o
f Rup
ees
5.28
2 m
illion
each
com
men
ced
from
30
June
201
3 an
d en
ding
on
31 M
arch
202
1. M
ark-
up is
pay
able
quar
terly
at t
he
rate
of 5
.00%
per
ann
um.
As p
er t
he r
evise
d te
rms
of r
estru
ctur
ing,
this
loan
was
re
paya
ble
in 32
ste
pped
up
quar
terly
inst
almen
ts f
rom
01
July
2012
to 0
1 Ap
ril 20
20. H
owev
er, th
is loa
n ha
s be
en fu
lly
repa
id d
uring
the
year.
This
loan
car
ried
mar
k-up
at t
he ra
te
of 8
.30%
per
ann
um b
ased
on
the
cost
of f
unds
of t
he b
ank.
M
ark-
up a
ccru
ed u
pto
03 M
ay 2
016
will
be p
aid in
thirt
y six
eq
ual m
onth
ly ins
talm
ents
com
men
cing
on 0
1 M
ay 2
020
and
endi
ng o
n 01
Apr
il 202
3, th
eref
ore,
pre
sent
ed in
def
erre
d ac
crue
d m
ark-
up (N
ote
9.1)
.
This
loan
is re
paya
ble
in 32
ste
pped
up
quar
terly
inst
almen
ts
com
men
ced
from
30
June
201
2 an
d en
ding
on
31 M
arch
20
20. M
ark-
up is
pay
able
quar
terly
at t
he ra
te o
f 5.0
0% p
er
annu
m.
Firs
t par
i pas
su c
harg
e of
Rup
ees
107.
000
milli
on o
ver
Com
pany
’s m
achi
nery
and
joi
nt p
ari
pass
u ch
arge
of
Rup
ees
800.
000
milli
on o
ver c
urre
nt a
sset
s of
the
Com
pany
.
Join
t par
i pas
su c
harg
e of
Rup
ees
800.
000
milli
on o
n cu
rrent
ass
ets
and
Rupe
es
464.
000
milli
on o
n fix
ed
asse
ts o
f th
e Co
mpa
ny.
Spec
ific c
harg
e of
Rup
ees
50.0
00 m
illion
on
coal
boile
r.
Firs
t joi
nt p
ari p
assu
cha
rge
of R
upee
s 50
6.66
7 m
illion
ov
er c
urre
nt a
sset
s by
way
of
hypo
thec
atio
n an
d ra
nkin
g ch
arge
of R
upee
s 16
9.00
0 m
illion
ove
r fixe
d as
sets
of t
he C
ompa
ny b
y w
ay o
f hyp
othe
catio
n.
Firs
t jo
int
pari
pass
u ch
arge
of
Rupe
es 4
10.0
00
milli
on o
ver a
ll pre
sent
and
futu
re c
urre
nt a
sset
s of
the
Com
pany
. Fi
rst
join
t pa
ri pa
ssu
char
ge o
f Ru
pees
1,1
60.0
00
milli
on o
ver c
urre
nt a
sset
s, jo
int p
ari p
assu
cha
rge
of
Rupe
es 1
46.6
00 m
illion
, ra
nkin
g ch
arge
of
Rupe
es
362.
000
milli
on o
ver fi
xed
asse
ts o
f the
Com
pany
and
pe
rson
al gu
aran
tees
of t
wo
dire
ctor
s.
7.2
Fair
valu
e of
long
term
fina
ncin
g w
as e
stim
ated
at t
he p
rese
nt v
alue
of fu
ture
cas
h flo
ws
disc
ount
ed a
t the
effe
ctive
inte
rest
rate
s ra
ngin
g fro
m 9
.31
% to
13.
56 %
pe
r ann
um.
----
----
Rup
ees
----
----
Lend
er20
1620
15Se
curit
yTe
rms

58 Kohinoor Mills Limited
2016 2015 Rupees Rupees8. SPONSOR’S LOAN Interest free loan (Note 8.1) 272,000,000 272,000,000 Equity portion of sponsor loan: Gain on recognition of sponsor’s loan at fair value (113,316,111) (113,316,111) Adjustment due to impact of IAS-39 38,171,480 38,171,480 Adjustment due to change in repayment terms (Note 8.1) 75,144,631 - - (75,144,631) Less: Transferred to current liabilities 272,000,000 - - 196,855,369 8.1 This represents unsecured interest free loan obtained from a director of the Company.
Previously, this was repayable on 30 June 2018. Fair value of sponsor’s loan was estimated at the present value of future cash flow discounted at the effective interest rate of 11.38% per annum. During the year ended 30 June 2015, initial gain and impact of IAS-39 ‘Financial Instruments: Recognition and Measurement’ on sponsor’s loan was corrected retrospectively and recognized directly in equity, previously these were recognized in profit and loss account. During the current year, terms of repayment of loan have been changed w.e.f. 01 July 2015. Now, this loan is repayable on demand. Consequently, the equity portion of loan amounting to Rupees 75.145 million (unwinded portion of difference between present value of loan at initial recognition and cash received) as on 30 June 2015 has been transferred to the carrying value of loan, which has now been presented in current liabilities.
2016 2015 Rupees Rupees9. DEFERRED LIABILITIES Deferred accrued mark-up (Note 9.1) 155,022,111 300,789,834 Deferred income tax liability (Note 9.2) 39,577,555 55,857,624 194,599,666 356,647,458 9.1 Deferred accrued mark-up National Bank of Pakistan 49,530,302 24,933,065 The Bank of Punjab - 139,309,000 Bank Alfalah Limited 38,873,381 69,929,341 Faysal Bank Limited 66,618,428 66,618,428 155,022,111 300,789,834 9.1.1 This represents accrued mark-up on long term financing deferred in accordance with
the terms of long term financing disclosed in note 7.1 to these financial statements.

59Annual Report 2016
9.2 Deferred income tax liability The net liability for deferred taxation originated due to temporary differences relating to:
2016 2015 Rupees Rupees Taxable temporary differences on: Accelerated tax depreciation and amortization - 90,114,650 Surplus on revaluation of operating fixed assets 27,604,610 29,994,823 Surplus on revaluation of investment - available for sale 11,972,945 37,513,325 39,577,555 157,622,798 Deductible temporary difference on: Accumulated tax losses - (101,765,174) Net deferred income tax liability recognized 39,577,555 55,857,624 10. TRADE AND OTHER PAYABLES Creditors 570,788,935 541,331,380 Advances from customers 33,638,439 31,376,386 Sales commission payable 87,378,208 97,314,086 Income tax deducted at source 11,436,822 7,801,040 Security deposits - interest free 602,278 602,278 Payable to employees’ provident fund trust 1,563,635 1,266,662 Accrued and other liabilities (Note 10.1) 92,690,269 125,999,218 Workers’ profit participation fund (Note 10.2) 50,918,962 38,521,994 Unclaimed dividend 4,731,536 4,731,536 853,749,084 848,944,580 10.1 This includes an amount of Rupees 56.300 million (2015: Rupees 70.000 million) payable on
demand to spouse of a director of the Company. 2016 2015 Rupees Rupees10.2 Workers’ profit participation fund Balance as at 01 July 38,521,994 16,834,274 Add: Allocation for the year (Note 28) 23,773,023 19,920,121 Interest accrued for the year (Note 30) 2,845,679 1,767,599 Less: Paid during the year 14,221,734 - Balance as at 30 June 50,918,962 38,521,994 10.2.1 The Company retains workers’ profit participation fund for its business operations till the
date of allocation to workers. Interest is paid at prescribed rate under the Companies Profit (Workers’ Participation) Act, 1968 on funds utilized by the Company till the date of allocation to workers.

60 Kohinoor Mills Limited
2016 2015 Rupees Rupees11. ACCRUED MARK-UP Long term financing 167,897,839 212,434,850 Short term borrowings 26,586,062 37,943,213 194,483,901 250,378,063 12. SHORT TERM BORROWINGS - SECURED From banking companies SBP refinance (Note 12.1 and 12.2) 1,394,770,000 369,009,000 Other short term finances (Note 12.1 and 12.3) 522,599,966 387,219,140 1,917,369,966 756,228,140 12.1 These facilities are secured against hypothecation charge on current assets, lien on export
contracts / letters of credit, first and second pari passu charge on fixed and current assets, personal guarantees of directors and ranking charge on current assets of the Company.
12.2 These carry mark-up range from 3.5% to 4.5% per annum (2015: 6% to 7.5% per annum) on
outstanding balance. 12.3 These carry mark-up ranging from 6.24% to 9.26% per annum (2015: 5% to 13.73% per
annum) on outstanding balance. 13. CONTINGENCIES AND COMMITMENTS 13.1 Contingencies 13.1.1 The Deputy Collector (Refund – Gold) by order dated 19 June 2007 rejected the input
tax claim of the Company, for the month of June 2005, amounting to Rupees 10.345 million incurred in zero rated local supplies of textile and articles thereof on the grounds that the input tax claim is in contravention of SRO 992(I)/2005 which states that no registered person engaged in the export of specified goods (including textile and articles thereof) shall, either through zero-rating or otherwise, be entitled to deduct or reclaim input tax paid in respect of stocks of such goods acquired up to 05 June 2005, if not used for the purpose of exports made up to the 31 December 2005. Consequently, the Company filed an appeal before the Appellate Tribunal Inland Revenue (ATIR). ATIR has decided this appeal in favour of the Company subject to necessary verification. Pending the outcome of necessary verification, no provision for inadmissible input tax has been recognized in these financial statements, since the Company is confident of the favourable outcome of verification.
13.1.2 The Additional Collector, Sales Tax Department has raised sales tax demand amounting
to Rupees 8.956 million along with additional tax and penalty, as a result of sales tax audit for the year 1999-2000 conducted by the Sales Tax Department. The Company is contesting the demand and management is confident that decision will be in favour of the Company, hence, no provision their against has been made in these financial statements.
13.1.3 As a result of sales tax audit for the year 2009-2010 conducted by Regional Tax Office,
Lahore, Assistant Commissioner Inland Revenue, Sales Tax Department has raised sales tax demand amounting to Rupees 9.975 million along with additional tax and penalty. Currently, the case is pending for hearing at Appellate Tribunal Inland Revenue, Lahore and the management is confident that decision will be in favour of the Company, hence, no provision their against has been made in these financial statements.

61Annual Report 2016
13.1.4 Pursuant to the sale of assets agreement with M/s Interloop Limited, the Company is contingently liable for Rupees 31.958 million against payment of certain outstanding dues to Employees’ Old-Age Benefits Institution (EOBI) and bifurcation of gas connections in favour of M/s Interloop Limited. To secure the performance of aforesaid conditions, the Company has pledged equity investment (note 15.3) and bank balance (note 23.4) with Allied Bank Limited. However, no provision has been recognized in these financial statements as the management is confident to fulfil the conditions in accordance with the sale of assets agreement.
13.1.5 Bank guarantees of Rupees 81.66 million (2015: Rupees 81.66 million) are given by the banks
of the Company in favour of Sui Northern Gas Pipelines Limited against gas connections. 13.1.6 Bank guarantee of Rupees 6.5 million (2015: Rupees 6.5 million) is given by the bank of
the Company in favour of Director, Excise and Taxation to cover the disputed amount of infrastructure cess.
13.1.7 Bank guarantees of Rupees 8.164 million (2015: Rupees 8.164 million) are given by the
bank of the Company in favour of Lahore Electric Supply Company Limited against electricity connections.
13.1.8 Lahore Electric Supply Company Limited (LESCO) served a notice to the Company in
connection with violation of Power Purchase Agreement. According to the aforesaid notice, the Company was using gas along with Refined Furnace Oil (RFO) in the ratio of 50:50 as co-fuel in order to generate electric power for sale to LESCO whereas tariff was charged to LESCO on the basis of RFO. The matter is being resolved under the provisions of above said Power Purchase Agreement and referred to Mr. Justice (Retd.) Syed Jamshed Ali Shah for arbitration. The proceedings of arbitration are in process. An amount of Rupees 86.833 million receivable by the Company from LESCO is still unpaid. Full provision against this receivable has been made in books of account. However, the Company is confident that the said amount will be recovered.
13.1.9 Provision for gas infrastructure development cess and late payment charges thereon
amounting to Rupees 24.812 million for the period from September 2014 to March 2015 has not been recognized in the books of account as the Company has obtained stay order from Honorable Lahore High Court, Lahore and is confident of favorable outcome of the matter.
13.2 Commitments 13.2.1 Aggregate commitments for capital expenditure and revenue expenditures are
amounting to Rupees 19.554 million and Rupees 26.033 million (2015: Rupees Nil and Rupees 26.230 million) respectively.
13.2.2 Post dated cheques issued to suppliers are amounting to Rupees 168.214 million
(2015: Rupees 127.752 million). 2016 2015 Rupees Rupees14. FIXED ASSETS Property, plant and equipment Operating fixed assets (Note 14.1) 3,585,296,846 3,663,368,205 Capital work-in-progress (Note 14.2) 28,490,007 30,995,367 3,613,786,853 3,694,363,572 Intangible asset - computer software (Note 14.1 and 14.1.5) - - 3,613,786,853 3,694,363,572

62 Kohinoor Mills Limited
14.1
R
econ
cilia
tions
of c
arry
ing
amou
nts
of o
pera
ting
fixed
ass
ets
and
inta
ngib
le a
sset
at t
he b
egin
ning
and
end
of t
he y
ear a
re a
s fo
llow
s:
O
pera
ting
fixed
ass
ets
Des
crip
tion
Fre
ehol
d R
esid
entia
l Fa
ctor
y Pl
ant a
nd
Stan
d-by
El
ectri
c Fu
rnitu
re,
M
otor
Inta
ngib
le
la
nd
build
ing
bu
ildin
g m
achi
nery
eq
uipm
ent
Inst
alla
tions
fix
ture
s an
d
Com
pute
rs
vehi
cles
To
tal
asse
t
eq
uipm
ent
-
----
----
----
----
----
----
----
----
----
----
----
----
---
(RU
PE
ES
) --
----
----
----
----
----
----
----
----
----
----
----
----
--
As a
t 30
June
201
4
Co
st /
reva
lued
amou
nt
484
,092
,625
2
11,8
31,9
78
691
,846
,399
4
,112
,152
,817
1
,615
,659
1
37,3
99,1
59
92,
596,
625
4
6,89
6,90
3
141
,544
,267
5
,919
,976
,432
9
,296
,899
Ac
cum
ulate
d de
prec
iatio
n / a
mor
tizat
ion
-
(62,
429,
399)
(2
39,5
26,9
65)
(2,0
07,0
65,8
78)
(197
,273
) (7
0,53
9,58
1)
(57,
747,
240)
(3
6,54
5,36
8)
(40,
023,
941)
(2
,514
,075
,645
) (9
,296
,899
)
Net b
ook
value
4
84,0
92,6
25
149
,402
,579
4
52,3
19,4
34
2,1
05,0
86,9
39
1,4
18,3
86
66,
859,
578
3
4,84
9,38
5
10,
351,
535
1
01,5
20,3
26
3,4
05,9
00,7
87
-
Ye
ar e
nded
30
June
201
5
O
penin
g ne
t boo
k va
lue
484
,092
,625
1
49,4
02,5
79
452
,319
,434
2
,105
,086
,939
1
,418
,386
6
6,85
9,57
8
34,
849,
385
1
0,35
1,53
5
101
,520
,326
3
,405
,900
,787
-
Ad
ditio
ns
-
-
19,
415,
778
8
4,83
1,54
2
-
8,7
17,9
37
4,8
70,3
24
2,5
24,1
24
21,
701,
307
1
42,0
61,0
12
-
Disp
osals
:
Cos
t -
-
-
(1
9,85
6,44
4)
-
-
(932
,400
) -
(1
1,43
1,11
7)
(32,
219,
961)
-
Acc
umula
ted
depr
eciat
ion
-
-
-
6,9
16,0
82
-
-
575
,608
-
6
,331
,481
1
3,82
3,17
1
-
-
-
-
(1
2,94
0,36
2)
-
-
(356
,792
) -
(5
,099
,636
) (1
8,39
6,79
0)
-
Depr
eciat
ion
char
ge
-
(7,4
70,1
29)
(23,
102,
253)
(1
62,9
97,0
78)
(127
,946
) (6
,980
,154
) (3
,819
,210
) (3
,539
,441
) (1
6,23
6,55
5)
(224
,272
,766
) -
Su
rplus
on
reva
luatio
n 2
27,3
81,3
74
19,
054,
548
1
11,6
40,0
40
-
-
-
-
-
-
358
,075
,962
-
Clos
ing n
et b
ook
value
7
11,4
73,9
99
160
,986
,998
5
60,2
72,9
99
2,0
13,9
81,0
41
1,2
90,4
40
68,
597,
361
3
5,54
3,70
7
9,3
36,2
18
101
,885
,442
3
,663
,368
,205
-
As a
t 30
June
201
5
Co
st /
reva
lued
amou
nt
711
,473
,999
2
30,8
86,5
26
822
,902
,217
4
,177
,127
,915
1
,615
,659
1
46,1
17,0
96
96,
534,
549
4
9,42
1,02
7
151
,814
,457
6
,387
,893
,445
9
,296
,899
Ac
cum
ulate
d de
prec
iatio
n / a
mor
tizat
ion
-
(69,
899,
528)
(2
62,6
29,2
18)
(2,1
63,1
46,8
74)
(325
,219
) (7
7,51
9,73
5)
(60,
990,
842)
(4
0,08
4,80
9)
(49,
929,
015)
(2
,724
,525
,240
) (9
,296
,899
)
Net b
ook
value
7
11,4
73,9
99
160
,986
,998
5
60,2
72,9
99
2,0
13,9
81,0
41
1,2
90,4
40
68,
597,
361
3
5,54
3,70
7
9,3
36,2
18
101
,885
,442
3
,663
,368
,205
-
Year
end
ed 3
0 Ju
ne 2
016
Ope
ning
net b
ook
value
7
11,4
73,9
99
160
,986
,998
5
60,2
72,9
99
2,0
13,9
81,0
41
1,2
90,4
40
68,
597,
361
3
5,54
3,70
7
9,3
36,2
18
101
,885
,442
3
,663
,368
,205
-
Ad
ditio
ns
-
-
31,
740,
020
1
26,0
99,6
56
-
2,7
57,5
38
1,4
54,1
39
4,4
74,8
77
20,
489,
766
1
87,0
15,9
96
-
Disp
osals
:
Cos
t -
-
-
(3
3,07
2,96
9)
-
-
(45,
000)
(4
2,50
0)
(39,
996,
051)
(7
3,15
6,52
0)
-
A
ccum
ulate
d de
prec
iatio
n -
-
-
1
1,08
3,92
8
-
-
8,1
85
23,
211
1
5,11
0,71
9
26,
226,
043
-
-
-
-
(2
1,98
9,04
1)
-
-
(36,
815)
(1
9,28
9)
(24,
885,
332)
(4
6,93
0,47
7)
-
Depr
eciat
ion
-
(8,0
49,3
50)
(28,
094,
547)
(1
52,5
55,7
30)
(115
,143
) (6
,981
,405
) (3
,653
,398
) (3
,346
,909
) (1
5,36
0,39
6)
(218
,156
,878
) -
Clos
ing n
et b
ook
value
7
11,4
73,9
99
152
,937
,648
5
63,9
18,4
72
1,9
65,5
35,9
26
1,1
75,2
97
64,
373,
494
3
3,30
7,63
3
10,
444,
897
8
2,12
9,48
0
3,5
85,2
96,8
46
-
As
at 3
0 Ju
ne 2
016
Cost
/ re
value
d am
ount
7
11,4
73,9
99
230
,886
,526
8
54,6
42,2
37
4,2
70,1
54,6
02
1,6
15,6
59
148
,874
,634
9
7,94
3,68
8
53,
853,
404
1
32,3
08,1
72
6,5
01,7
52,9
21
9,2
96,8
99
Accu
mula
ted
depr
eciat
ion
/ am
ortiz
atio
n -
(7
7,94
8,87
8)
(290
,723
,765
) (2
,304
,618
,676
) (4
40,3
62)
(84,
501,
140)
(6
4,63
6,05
5)
(43,
408,
507)
(5
0,17
8,69
2)
(2,9
16,4
56,0
75)
(9,2
96,8
99)
Net b
ook
value
7
11,4
73,9
99
152
,937
,648
5
63,9
18,4
72
1,9
65,5
35,9
26
1,1
75,2
97
64,
373,
494
3
3,30
7,63
3
10,
444,
897
8
2,12
9,48
0
3,5
85,2
96,8
46
-
Depr
eciat
ion
/ am
ortiz
atio
n ra
te %
per
ann
um
- 5
5 10
10
10
10
30
20
20
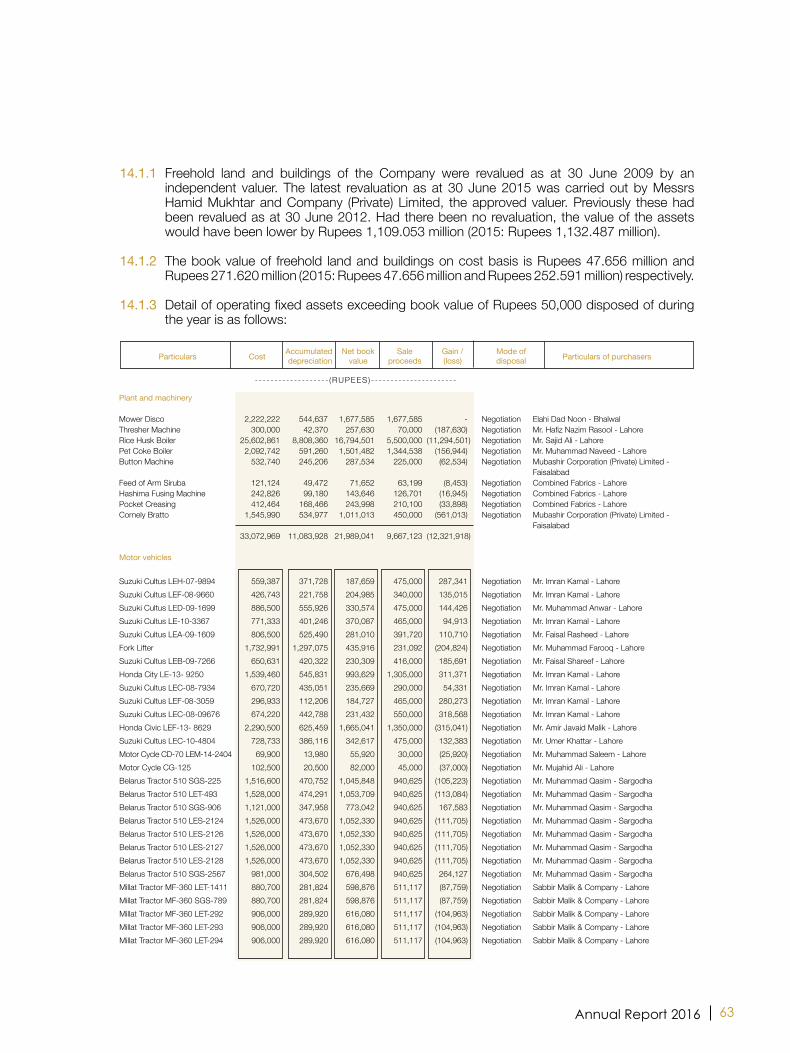
63Annual Report 2016
Particulars Cost Accumulated Net book Sale Gain / Mode of Particulars of purchasers depreciation value proceeds (loss) disposal
- - - - - - - - - - - - - - - - - - - (RUPEES) - - - - - - - - - - - - - - - - - - - - - -
Plant and machinery Mower Disco 2,222,222 544,637 1,677,585 1,677,585 - Negotiation Elahi Dad Noon - Bhalwal Thresher Machine 300,000 42,370 257,630 70,000 (187,630) Negotiation Mr. Hafiz Nazim Rasool - Lahore Rice Husk Boiler 25,602,861 8,808,360 16,794,501 5,500,000 (11,294,501) Negotiation Mr. Sajid Ali - Lahore Pet Coke Boiler 2,092,742 591,260 1,501,482 1,344,538 (156,944) Negotiation Mr. Muhammad Naveed - Lahore Button Machine 532,740 245,206 287,534 225,000 (62,534) Negotiation Mubashir Corporation (Private) Limited - Faisalabad Feed of Arm Siruba 121,124 49,472 71,652 63,199 (8,453) Negotiation Combined Fabrics - Lahore Hashima Fusing Machine 242,826 99,180 143,646 126,701 (16,945) Negotiation Combined Fabrics - Lahore Pocket Creasing 412,464 168,466 243,998 210,100 (33,898) Negotiation Combined Fabrics - Lahore Cornely Bratto 1,545,990 534,977 1,011,013 450,000 (561,013) Negotiation Mubashir Corporation (Private) Limited - Faisalabad 33,072,969 11,083,928 21,989,041 9,667,123 (12,321,918) Motor vehicles Suzuki Cultus LEH-07-9894 559,387 371,728 187,659 475,000 287,341 Negotiation Mr. Imran Kamal - Lahore Suzuki Cultus LEF-08-9660 426,743 221,758 204,985 340,000 135,015 Negotiation Mr. Imran Kamal - Lahore Suzuki Cultus LED-09-1699 886,500 555,926 330,574 475,000 144,426 Negotiation Mr. Muhammad Anwar - Lahore Suzuki Cultus LE-10-3367 771,333 401,246 370,087 465,000 94,913 Negotiation Mr. Imran Kamal - Lahore Suzuki Cultus LEA-09-1609 806,500 525,490 281,010 391,720 110,710 Negotiation Mr. Faisal Rasheed - Lahore Fork Lifter 1,732,991 1,297,075 435,916 231,092 (204,824) Negotiation Mr. Muhammad Farooq - Lahore Suzuki Cultus LEB-09-7266 650,631 420,322 230,309 416,000 185,691 Negotiation Mr. Faisal Shareef - Lahore Honda City LE-13- 9250 1,539,460 545,831 993,629 1,305,000 311,371 Negotiation Mr. Imran Kamal - Lahore Suzuki Cultus LEC-08-7934 670,720 435,051 235,669 290,000 54,331 Negotiation Mr. Imran Kamal - Lahore Suzuki Cultus LEF-08-3059 296,933 112,206 184,727 465,000 280,273 Negotiation Mr. Imran Kamal - Lahore Suzuki Cultus LEC-08-09676 674,220 442,788 231,432 550,000 318,568 Negotiation Mr. Imran Kamal - Lahore Honda Civic LEF-13- 8629 2,290,500 625,459 1,665,041 1,350,000 (315,041) Negotiation Mr. Amir Javaid Malik - Lahore Suzuki Cultus LEC-10-4804 728,733 386,116 342,617 475,000 132,383 Negotiation Mr. Umer Khattar - Lahore Motor Cycle CD-70 LEM-14-2404 69,900 13,980 55,920 30,000 (25,920) Negotiation Mr. Muhammad Saleem - Lahore Motor Cycle CG-125 102,500 20,500 82,000 45,000 (37,000) Negotiation Mr. Mujahid Ali - Lahore Belarus Tractor 510 SGS-225 1,516,600 470,752 1,045,848 940,625 (105,223) Negotiation Mr. Muhammad Qasim - Sargodha Belarus Tractor 510 LET-493 1,528,000 474,291 1,053,709 940,625 (113,084) Negotiation Mr. Muhammad Qasim - Sargodha Belarus Tractor 510 SGS-906 1,121,000 347,958 773,042 940,625 167,583 Negotiation Mr. Muhammad Qasim - Sargodha Belarus Tractor 510 LES-2124 1,526,000 473,670 1,052,330 940,625 (111,705) Negotiation Mr. Muhammad Qasim - Sargodha Belarus Tractor 510 LES-2126 1,526,000 473,670 1,052,330 940,625 (111,705) Negotiation Mr. Muhammad Qasim - Sargodha Belarus Tractor 510 LES-2127 1,526,000 473,670 1,052,330 940,625 (111,705) Negotiation Mr. Muhammad Qasim - Sargodha Belarus Tractor 510 LES-2128 1,526,000 473,670 1,052,330 940,625 (111,705) Negotiation Mr. Muhammad Qasim - Sargodha Belarus Tractor 510 SGS-2567 981,000 304,502 676,498 940,625 264,127 Negotiation Mr. Muhammad Qasim - Sargodha Millat Tractor MF-360 LET-1411 880,700 281,824 598,876 511,117 (87,759) Negotiation Sabbir Malik & Company - Lahore Millat Tractor MF-360 SGS-789 880,700 281,824 598,876 511,117 (87,759) Negotiation Sabbir Malik & Company - Lahore Millat Tractor MF-360 LET-292 906,000 289,920 616,080 511,117 (104,963) Negotiation Sabbir Malik & Company - Lahore Millat Tractor MF-360 LET-293 906,000 289,920 616,080 511,117 (104,963) Negotiation Sabbir Malik & Company - Lahore Millat Tractor MF-360 LET-294 906,000 289,920 616,080 511,117 (104,963) Negotiation Sabbir Malik & Company - Lahore
14.1.1 Freehold land and buildings of the Company were revalued as at 30 June 2009 by an independent valuer. The latest revaluation as at 30 June 2015 was carried out by Messrs Hamid Mukhtar and Company (Private) Limited, the approved valuer. Previously these had been revalued as at 30 June 2012. Had there been no revaluation, the value of the assets would have been lower by Rupees 1,109.053 million (2015: Rupees 1,132.487 million).
14.1.2 The book value of freehold land and buildings on cost basis is Rupees 47.656 million and
Rupees 271.620 million (2015: Rupees 47.656 million and Rupees 252.591 million) respectively. 14.1.3 Detail of operating fixed assets exceeding book value of Rupees 50,000 disposed of during
the year is as follows:

64 Kohinoor Mills Limited
Millat Tractor MF-360 LET-295 906,000 298,618 607,382 475,000 (132,382) Negotiation Chopra Trading Company - Lahore Millat Tractor MF-360 LET-296 906,000 289,920 616,080 511,117 (104,963) Negotiation Sabbir Malik & Company - Lahore Millat Tractor MF-360 LET-297 906,000 289,920 616,080 511,118 (104,962) Negotiation Sabbir Malik & Company - Lahore Millat Tractor MF-360 LET-298 906,000 289,920 616,080 511,118 (104,962) Negotiation Sabbir Malik & Company - Lahore Millat Tractor MF-360 LET-300 906,000 289,920 616,080 511,118 (104,962) Negotiation Sabbir Malik & Company - Lahore Millat Tractor MF-360 LET-301 906,000 289,920 616,080 511,118 (104,962) Negotiation Sabbir Malik & Company - Lahore Millat Tractor MF-360 LES-2503 931,000 289,644 641,356 511,118 (130,238) Negotiation Sabbir Malik & Company - Lahore Millat Tractor MF-360 LES-2504 931,000 289,645 641,355 511,118 (130,237) Negotiation Sabbir Malik & Company - Lahore Millat Tractor MF-360 LES-2505 931,000 289,645 641,355 511,118 (130,237) Negotiation Sabbir Malik & Company - Lahore Millat Tractor MF-360 LES-2506 931,000 289,645 641,355 511,118 (130,237) Negotiation Sabbir Malik & Company - Lahore Millat Tractor MF-360 LES-2253 931,000 289,645 641,355 511,118 (130,237) Negotiation Sabbir Malik & Company - Lahore Millat Tractor MF-360 LES-2257 931,000 289,645 641,355 511,118 (130,237) Negotiation Sabbir Malik & Company - Lahore Millat Tractor MF-360 LES-2263 931,000 289,645 641,355 511,118 (130,237) Negotiation Sabbir Malik & Company - Lahore
39,890,051 15,076,799 24,813,252 23,992,812 (820,440)
Aggregate of other items of operating fixed assets with individual book values not exceeding Rupees 50,000 193,500 65,316 128,184 72,797 (55,387)
73,156,520 26,226,043 46,930,477 33,732,732 (13,197,745)
2016 2015 Rupees Rupees14.1.4 The depreciation charge for the year has been allocated as follows: Cost of sales (Note 25) 206,798,532 214,389,853 Distribution cost (Note 26) 2,449,324 1,576,261 Administrative expenses (Note 27) 8,909,022 8,306,652
218,156,878 224,272,766 14.1.5 Intangible asset - computer software has been fully amortized but still in the use of the
Company.
Particulars Cost Accumulated Net book Sale Gain / Mode of Particulars of purchasers depreciation value proceeds (loss) disposal
- - - - - - - - - - - - - - - - - - - (RUPEES) - - - - - - - - - - - - - - - - - - - - - -

65Annual Report 2016
2016 2015 Rupees Rupees14.2 Capital work-in-progress Plant and machinery 20,345,577 - Civil works - 23,478,029 Advances for capital expenditures 8,144,430 7,517,338
28,490,007 30,995,367 15. LONG TERM INVESTMENTS Investment in subsidiary company - at cost Q Mart Corporation (Private) Limited - unquoted 30,000,000 (2015: 30,000,000) ordinary shares of Rupees 10 each 300,000,000 300,000,000 Less: Impairment loss (Note 15.1) 225,843,663 221,316,618 74,156,337 78,683,382 Available for sale Associated company (without significant influence) K-2 Hosiery (Private) Limited - unquoted 1,194,000 (2015: 1,194,000) ordinary shares of Rupees 10 each (Note 15.2) - - Other Security General Insurance Company Limited - unquoted (Note 15.3) 643,667 (2015: 643,667) fully paid ordinary shares of Rupees 10 each 704,171 704,171 Add: Fair value adjustment 51,496,537 156,305,520
52,200,708 157,009,691
126,357,045 235,693,073 15.1 Impairment loss Balance as at 01 July 221,316,618 218,986,005 Add: Impairment loss recognized during the year (Note 28) 4,527,045 2,330,613 Balance as at 30 June 225,843,663 221,316,618 15.2 Investment in K-2 Hosiery (Private) Limited has been impaired and written off against provision. 15.3 Ordinary shares of Security General Insurance Company Limited have been valued by an
independent valuer at Rupees 81.09 (2015: Rupees 243.93 valued by the management) per share using present value technique (2015: net assets based valuation method). 640,000 ordinary shares of Security General Insurance Company Limited have been pledged in favour of Allied Bank Limited to serve the performance of certain conditions of sale of assets agreement with M/s Interloop Limited.

66 Kohinoor Mills Limited
2016 2015 Rupees Rupees16. STORES, SPARES AND LOOSE TOOLS Stores and spares 431,259,251 379,540,096 Loose tools 3,007,915 3,586,377 434,267,166 383,126,473 Less: Provision for slow moving, obsolete and damaged store items (Note 16.1) 17,491,037 16,629,008
416,776,129 366,497,465 16.1 Provision for slow moving, obsolete and damaged store items Balance as on 01 July 16,629,008 16,629,008 Add: Provision for the year (Note 28) 2,955,416 - Less: Stores and spares written off against provision (2,093,387) - Balance as on 30 June 17,491,037 16,629,008 17. STOCK-IN-TRADE Raw material 197,119,225 139,659,658 Work-in-process 136,625,320 143,336,567 Finished goods (Note 17.1 and 17.2) 472,334,811 446,680,689 806,079,356 729,676,914 17.1 This includes finished goods of Rupees 58.969 million (2015: Rupees 78.533 million) valued at
net realizable value. 17.2 Finished goods include stock-in-transit amounting to Rupees 42.261 million (2015: Rupees
20.641 million). 2016 2015 Rupees Rupees18. TRADE DEBTS Considered good: Secured (against letters of credit) 317,938,696 365,851,374 Unsecured 147,503,655 119,732,448 465,442,351 485,583,822 Considered doubtful: Others - unsecured 88,480,269 88,480,269 Less: Provision for doubtful trade debts Balance as at 01 July 88,480,269 88,358,572 Add: Provision for the year (Note 28) - 121,697 Balance as at 30 June 88,480,269 88,480,269 - -
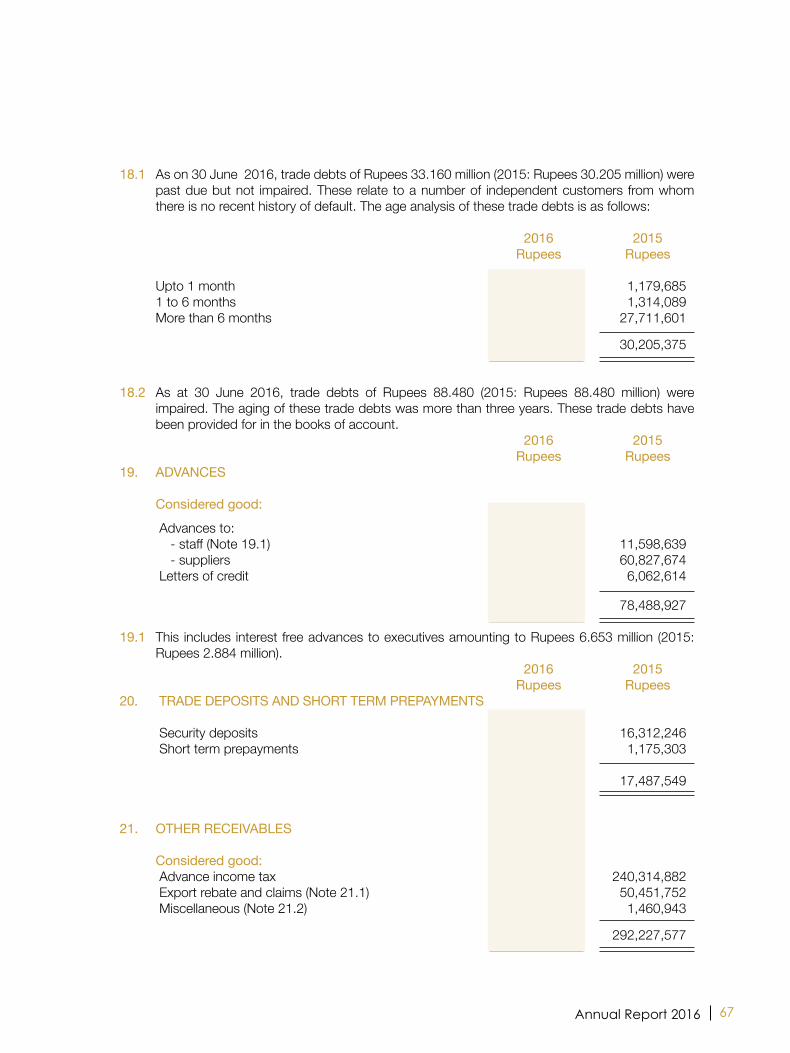
67Annual Report 2016
18.1 As on 30 June 2016, trade debts of Rupees 33.160 million (2015: Rupees 30.205 million) were past due but not impaired. These relate to a number of independent customers from whom there is no recent history of default. The age analysis of these trade debts is as follows:
2016 2015 Rupees Rupees
Upto 1 month 475,178 1,179,685 1 to 6 months 1,833,081 1,314,089 More than 6 months 30,851,467 27,711,601 33,159,726 30,205,375
18.2 As at 30 June 2016, trade debts of Rupees 88.480 (2015: Rupees 88.480 million) were
impaired. The aging of these trade debts was more than three years. These trade debts have been provided for in the books of account.
2016 2015 Rupees Rupees19. ADVANCES Considered good: Advances to: - staff (Note 19.1) 12,288,661 11,598,639 - suppliers 57,285,999 60,827,674 Letters of credit 5,237,568 6,062,614 74,812,228 78,488,927 19.1 This includes interest free advances to executives amounting to Rupees 6.653 million (2015:
Rupees 2.884 million). 2016 2015 Rupees Rupees20. TRADE DEPOSITS AND SHORT TERM PREPAYMENTS Security deposits 13,275,546 16,312,246 Short term prepayments 1,113,575 1,175,303 14,389,121 17,487,549 21. OTHER RECEIVABLES Considered good: Advance income tax 258,020,167 240,314,882 Export rebate and claims (Note 21.1) 50,474,213 50,451,752 Miscellaneous (Note 21.2) 2,652,355 1,460,943
311,146,735 292,227,577

68 Kohinoor Mills Limited
2016 2015 Rupees Rupees21.1 Export rebate and claims Considered good 50,474,213 50,451,752 Considered doubtful 35,493,049 39,481,490 Less: Provision for doubtful export rebate and claims (Note 21.1.1) 35,493,049 39,481,490
- - 50,474,213 50,451,752 21.1.1 Provision for doubtful export rebate and claims Balance as at 01 July 39,481,490 30,514,452 Add : Provision for the year (Note 28) - 8,967,038 Less: Export rebate receivable written off against provision 3,988,441 - Balance as at 30 June 35,493,049 39,481,490 21.2 Miscellaneous Considered good 2,652,355 1,460,943 Considered doubtful (Note 21.2.2) 1,608,032 - Less: Provision for doubtful miscellaneous receivables (Note 21.2.1) (1,608,032) - - - 2,652,355 1,460,943 21.2.1 Provision for doubtful miscellaneous receivables Balance as at 01 July - - Add: Provision for the year (Note 28) 1,608,032 - Balance as at 30 June 1,608,032 - 21.2.2 This represents amount of Rupees 1.608 million (2015: Rupees 0.383 million)
receivable from Q Mart Corporation (Private) Limited - subsidiary company against certain expenses paid on its behalf.

69Annual Report 2016
2016 2015 Rupees Rupees22. SALES TAX RECOVERABLE Sales tax recoverable 476,421,086 270,794,552 Less: Provision for doubtful sales tax recoverable (Note 22.1) 27,398,691 27,398,691 449,022,395 243,395,861 22.1 Provision for doubtful sales tax recoverable Balance as at 01 July 27,398,691 25,157,276 Add: Provision for the year (Note 28) - 2,241,415 Balance as at 30 June 27,398,691 27,398,691 23. CASH AND BANK BALANCES Cash in hand (Note 23.1) 3,225,554 2,985,777 Cash with banks: On current accounts (Note 23.2 and 23.4) 23,182,410 38,989,239 On deposit accounts (Note 23.3 and 23.5) 27,495,038 70,317,056 50,677,448 109,306,295
53,903,002 112,292,072 23.1 Cash in hand includes foreign currency of US$ 7,015 and Euro 160 (2015: US$ Nil and Euro Nil).
23.2 Cash with banks on current accounts includes foreign currency balance of US$ Nil (2015: US$
788.72). 23.3 Rate of profit on bank deposits ranges from 4.25% to 5.8% (2015: 4.5% to 7%) per annum.
23.4 Cash with banks on current accounts includes an amount of Rupees 8.491 million (2015: Rupees
8.491 million) with Allied Bank Limited, in a non-checking account, to secure performance of certain conditions of sale of assets agreement with M/s Interloop Limited.
23.5 This includes term deposit receipts of Rupees 18 million (2015: Rupees 55.560 million) which
are under lien with the bank. 2016 2015 Rupees Rupees24. SALES Export 7,134,170,081 6,576,994,814 Local (Note 24.1) 1,387,911,328 1,302,063,344 Export rebate 29,010,426 26,962,683 8,551,091,835 7,906,020,841

70 Kohinoor Mills Limited
2016 2015 Rupees Rupees24.1 Local sales Sales 1,182,614,822 1,056,648,140 Less: Sales tax 54,557,433 45,582,109 1,128,057,389 1,011,066,031 Processing income 259,853,939 290,997,313 1,387,911,328 1,302,063,344 25. COST OF SALES Raw material consumed (Note 25.1) 4,783,212,447 4,325,268,356 Chemicals consumed 744,850,309 698,391,221 Salaries, wages and other benefits 371,865,559 337,998,698 Employees’ provident fund contributions 13,433,272 12,216,998 Cloth conversion and processing charges 48,631,535 21,111,495 Fuel, oil and power 649,704,430 708,672,422 Stores, spares and loose tools consumed 138,229,533 100,401,544 Packing materials consumed 56,164,295 57,948,288 Repair and maintenance 58,185,463 43,919,391 Insurance 9,186,181 9,798,729 Other manufacturing expenses 73,852,172 104,054,440 Depreciation on operating fixed assets (Note 14.1.4) 206,798,532 214,389,853 7,154,113,728 6,634,171,435 Work-in-process inventory As on 01 July 143,336,567 128,250,466 As on 30 June (136,625,320) (143,336,567) 6,711,247 (15,086,101) Cost of goods manufactured 7,160,824,975 6,619,085,334 Cost of yarn and cloth purchased for resale 22,894,431 13,433,875 7,183,719,406 6,632,519,209 Finished goods inventory As on 01 July 446,680,689 421,365,253 As on 30 June (472,334,811) (446,680,689) (25,654,122) (25,315,436) 7,158,065,284 6,607,203,773 25.1 Raw material consumed Opening stock 139,659,658 148,615,983 Purchased during the year 4,840,672,014 4,316,312,031 4,980,331,672 4,464,928,014 Less: Closing stock (197,119,225) (139,659,658) 4,783,212,447 4,325,268,356

71Annual Report 2016
2016 2015 Rupees Rupees26. DISTRIBUTION COST Salaries and other benefits 65,763,690 54,052,094 Employees’ provident fund contributions 2,434,891 2,192,149 Travelling, conveyance and entertainment 29,080,241 25,654,723 Printing and stationery 222,101 222,849 Communications 36,371,171 34,341,582 Vehicles’ running 3,266,522 3,346,245 Insurance 3,080,251 1,939,004 Repair and maintenance 39,573 9,034 Commission to selling agents 190,241,713 138,665,162 Outward freight and handling 124,147,176 136,198,694 Clearing and forwarding 40,082,981 36,603,912 Sales promotion and advertising 286,160 3,504,355 Depreciation on operating fixed assets (Note 14.1.4) 2,449,324 1,576,261 Miscellaneous 87,137 575,107
497,552,931 438,881,171 27. ADMINISTRATIVE EXPENSES Salaries and other benefits 123,073,919 115,458,246 Employees’ provident fund contributions 2,970,144 3,078,108 Travelling, conveyance and entertainment 35,316,888 31,833,757 Printing and stationery 2,878,908 4,368,114 Communications 5,007,960 4,428,574 Vehicles’ running 9,170,596 8,671,354 Legal and professional 5,614,815 7,490,058 Insurance 5,736,831 5,321,803 Fee, subscription and taxes 3,126,428 2,157,842 Repair and maintenance 7,737,373 7,289,562 Electricity, gas and water 338,112 198,957 Auditors’ remuneration (Note 27.1) 1,480,000 1,396,000 Depreciation on operating fixed assets (Note 14.1.4) 8,909,022 8,306,652 Miscellaneous 21,339,378 30,804,113 232,700,374 230,803,140
27.1 Auditors’ remuneration Audit fee 1,190,000 1,125,000 Half yearly review and other certifications 210,000 200,000 Reimbursable expenses 80,000 71,000
1,480,000 1,396,000

72 Kohinoor Mills Limited
2016 2015 Rupees Rupees28. OTHER EXPENSES Workers’ profit participation fund (Note 10.2) 23,773,023 19,920,121 Donations (Note 28.1) 6,428,038 14,112,060 Loss on sale of operating fixed assets 13,197,745 - Impairment loss on investment in subsidiary company (Note 15.1) 4,527,045 2,330,613 Provision for doubtful trade debts (Note 18) - 121,697 Provision for slow moving, obsolete and damaged store items (Note 16.1) 2,955,416 - Provision for doubtful export rebate and claims (Note 21.1.1) - 8,967,038 Provision for doubtful sales tax recoverable (Note 22.1) - 2,241,415 Provision for doubtful miscellaneous receivables (Note 21.2.1) 1,608,032 - Miscellaneous 1,481,046 - 53,970,345 47,692,944
28.1 This includes an amount of Rupees 5.000 million given to Friends of Punjab Institute of Cardiology in which chief executive of the Company is trustee.
2016 2015 Rupees Rupees29. OTHER INCOME Income from financial assets Dividend on equity investment 3,218,336 2,896,501 Exchange gain - net 11,452,878 3,011,586 Return on bank deposits 2,807,772 5,732,715 Accrued mark-up written back - 2,172,628 Gain on recognition of long term financing at fair value - 138,355,873 Income from non-financial assets Scrap sales 27,044,517 30,600,105 Gain on sale of operating fixed assets - 3,234,336 Other 230,205 - 44,753,708 186,003,744

73Annual Report 2016
2016 2015 Rupees Rupees30. FINANCE COST Mark-up on long term financing 113,077,157 147,244,004 Mark-up on short term borrowings 33,514,787 65,927,704 Adjustment due to impact of IAS - 39 241,522,253 273,416,786 Bank commission and other financial charges 59,804,270 39,764,294 Interest on workers’ profit participation fund (Note 10.2) 2,845,679 1,767,599 450,764,146 528,120,387 31. TAXATION Current (Note 31.1) 73,303,245 72,208,980 Prior year adjustment 506,059 4,960,679 Deferred tax 10,150,783 39,176,419 83,960,087 116,346,078
31.1 The Company falls under the ambit of presumptive tax regime under section 169 of the Income Tax Ordinance, 2001. Provision for income tax is made accordingly. Further, provision against income from other sources is made under the relevant provisions of the Income Tax Ordinance, 2001.
31.2 Provision for deferred income tax is not required as the Company is chargeable to tax under section 169 of the Income Tax Ordinance, 2001 and no temporary differences are expected to arise in the foreseeable future except for deferred tax liability as explained in note 9.2.
31.3 Reconciliation of tax expense and product of accounting profit multiplied by the applicable tax rate is not required in view of presumptive taxation.
32. EARNINGS PER SHARE - BASIC AND DILUTED
There is no dilutive effect on the basic earnings per share, which is based on:
2016 2015 Profit attributable to ordinary shareholders (Rupees) 118,832,376 122,977,092 Weighted average number of ordinary shares (Numbers) 50,911,011 50,911,011 Earnings per share - Basic (Rupees) 2.33 2.42

74 Kohinoor Mills Limited
2016 2015 Rupees Rupees33. CASH GENERATED FROM OPERATIONS Profit before taxation 202,792,463 239,323,170 Adjustment for non-cash charges and other items: Depreciation on operating fixed assets 218,156,878 224,272,766 Dividend income (3,218,336) (2,896,501) Loss / (gain) on sale of operating fixed assets 13,197,745 (3,234,336) Impairment loss on investment in subsidiary company 4,527,045 2,330,613 Gain on recognition of long term financing at fair value - (138,355,873) Adjustment due to impact of IAS - 39 241,522,253 273,416,786 Provision for doubtful trade debts - 121,697 Provision for slow moving, obsolete and damaged store items 2,955,416 - Provision for doubtful export rebate and claims - 8,967,038 Provision for doubtful sales tax recoverable - 2,241,415 Provision for doubtful miscellaneous receivable 1,608,032 - Accrued mark-up written back - (2,172,628) Finance cost 209,241,893 254,703,601 Working capital changes (Note 33.1) (306,363,859) (31,542,487)
584,419,530 827,175,261
33.1 Working capital changes (Increase) / decrease in current assets Stores, spares and loose tools (53,234,080) (48,731,299) Stock-in-trade (76,402,442) (31,445,212) Trade debts 20,141,471 47,778,828 Advances 3,676,699 9,154,208 Trade deposits and short term prepayments 3,098,428 1,925,737 Other receivables (2,821,905) (13,905,030) Sales tax recoverable (205,626,534) (43,298,532)
(311,168,363) (78,521,300) Increase in trade and other payables 4,804,504 46,978,813 (306,363,859) (31,542,487)

75Annual Report 2016
34. REMUNERATION TO CHIEF EXECUTIVE, DIRECTOR AND EXECUTIVES
Aggregate amounts charged in these financial statements for remuneration, including all benefits to chief executive, director and other executives are as follows:
2016 2015 Chief Chief
Executive Director Executives Executive Director Executives
---------------------------------- (Rupees) ------------------------------------- Managerial remuneration 5,082,000 3,630,000 48,139,213 4,620,000 3,300,000 42,614,323 House rent 1,270,500 1,402,500 12,360,318 1,155,000 1,485,000 9,985,271 Utilities 508,200 362,979 4,810,058 462,000 330,000 4,248,776 Special allowance 1,016,400 231,000 8,796,155 924,000 - 7,845,484 Contribution to provident fund 423,331 302,385 4,016,998 384,846 274,896 3,531,580 Other allowances 854,700 973,521 10,517,885 777,000 885,000 10,177,457 9,155,131 6,902,385 88,640,627 8,322,846 6,274,896 78,402,891 Number of persons 1 1 45 1 1 34
34.1 Chief executive, directors and executives of the Company are provided with free use of the Company’s owned and maintained cars.
34.2 Meeting fee of Rupees 1,000,000 (2015: Rupees 1,000,000) was paid to the non-executive
directors for attending meetings. 34.3 No remuneration was paid to non-executive directors of the Company. 35. TRANSACTIONS WITH RELATED PARTIES Related parties comprise of subsidiary company, other related parties, key management
personnel and provident fund trust. The Company in the normal course of business carries out transactions with related parties. Detail of transactions with related parties other than those which have been specifically disclosed elsewhere in these financial statements.
2016 2015 Rupees Rupees Subsidiary company Expenses paid on behalf of Q Mart Corporation (Private) Limited 1,224,208 811,823

76 Kohinoor Mills Limited
36. PROVIDENT FUND RELATED DISCLOSURES The following information is based on un-audited financial statements of the provident fund for
the year ended 30 June 2016 and audited financial statements of the provident fund for the year ended 30 June 2015:
2016 2015 Rupees Rupees
Size of the fund - Total assets 118,390,478 126,301,897 Cost of investments 103,042,969 103,042,969 Percentage of investments made 94.61% 95.29% Fair value of investments 112,013,208 120,351,088
36.1 The break-up of fair value of investments is as follows: 2016 2015 2016 2015 Percentage Rupees Rupees Deposits 39.40 43.59 44,134,103 52,471,983 Mutual funds 38.55 35.88 43,180,542 43,180,542 Listed securities 22.05 20.53 24,698,563 24,698,563 100.00 100.00 112,013,208 120,351,088 36.2 Investments, out of provident fund, have been made in accordance with the provisions of
section 227 of the Companies Ordinance, 1984 and the rules formulated for this purpose.
2016 2015
37. NUMBER OF EMPLOYEES Number of employees as on June 30 Permanent 1635 1644 Contractual 55 14 Average number of employees during the year Permanent 1614 1619 Contractual 57 13

77Annual Report 2016
Wea
ving
Dye
ing
P
ower
E
limin
atio
n of
inte
r-
T
otal
- Com
pany
G
ener
atio
n
s
egm
ent t
rans
actio
ns
2016
20
15
2016
20
15
2016
20
15
2016
20
15
2016
20
15
----
----
----
----
----
----
----
----
----
----
----
----
----
----
--- (
R u
p e
e s
) --
----
----
----
----
----
----
----
----
----
----
----
----
----
----
Sales
-Ext
erna
l 2
,165
,586
,734
2
,051
,042
,015
6
,385
,505
,101
5
,854
,978
,826
-
-
-
-
8
,551
,091
,835
7
,906
,020
,841
-In
ters
egm
ent
1,4
22,9
06,2
72
1,7
17,7
14,7
55
58,
879,
608
5
8,47
1,72
0
692
,872
,062
8
31,7
75,1
59
(2,1
74,6
57,9
42)
(2,6
07,9
61,6
34)
-
-
3
,588
,493
,006
3
,768
,756
,770
6
,444
,384
,709
5
,913
,450
,546
6
92,8
72,0
62
831
,775
,159
(2
,174
,657
,942
) (2
,607
,961
,634
) 8
,551
,091
,835
7
,906
,020
,841
Co
st o
f sale
s (3
,285
,914
,052
) (3
,441
,427
,982
) (5
,329
,554
,741
) (4
,958
,914
,057
) (7
17,2
54,4
33)
(814
,823
,368
) 2
,174
,657
,942
2
,607
,961
,634
(7
,158
,065
,284
) (6
,607
,203
,773
)
Gro
ss p
rofit
3
02,5
78,9
54
327
,328
,788
1
,114
,829
,968
9
54,5
36,4
89
(24,
382,
371)
1
6,95
1,79
1
-
-
1,3
93,0
26,5
51
1,2
98,8
17,0
68
Dist
ribut
ion
cost
(1
08,7
38,3
93)
(88,
372,
177)
(3
88,8
14,5
38)
(350
,508
,994
) -
-
-
-
(4
97,5
52,9
31)
(438
,881
,171
)Ad
min
istra
tive
expe
nses
(8
9,81
7,42
1)
(96,
717,
901)
(1
31,0
07,9
01)
(120
,754
,405
) (1
1,87
5,05
2)
(13,
330,
834)
-
-
(2
32,7
00,3
74)
(230
,803
,140
)
(1
98,5
55,8
14)
(185
,090
,078
) (5
19,8
22,4
39)
(471
,263
,399
) (1
1,87
5,05
2)
(13,
330,
834)
-
-
(7
30,2
53,3
05)
(669
,684
,311
)
Profi
t bef
ore
taxa
tion
and
unall
ocat
ed in
com
e / e
xpen
ses
104
,023
,140
1
42,2
38,7
10
595
,007
,529
4
83,2
73,0
90
(36,
257,
423)
3
,620
,957
-
-
6
62,7
73,2
46
629
,132
,757
Un
alloc
ated
inco
me
and
expe
nses
:
Fina
nce
cost
(4
50,7
64,1
46)
(528
,120
,387
)O
ther
exp
ense
s
(5
3,97
0,34
5)
(47,
692,
944)
Oth
er in
com
e
4
4,75
3,70
8
186
,003
,744
Ta
xatio
n
(8
3,96
0,08
7)
(116
,346
,078
)
(5
43,9
40,8
70)
(506
,155
,665
)
Profi
t afte
r tax
atio
n
1
18,8
32,3
76
122
,977
,092
Wea
ving
Dye
ing
Pow
er
Tota
l - C
ompa
ny
G
ener
atio
n
20
16
2015
20
16
2015
20
16
2015
20
16
2015
--
----
----
----
----
----
----
----
----
----
--- (
R u
p e
e s
) --
----
----
----
----
----
----
----
----
----
----
----
--Se
gmen
t ass
ets
2,1
15,4
42,4
98
2,1
13,6
86,4
70
2,3
17,6
03,7
40
2,3
93,3
43,3
39
975
,175
,365
8
98,2
10,4
07
5,4
08,2
21,6
03
5,4
05,2
40,2
16
Long
term
inve
stm
ents
1
26,3
57,0
45
235
,693
,073
Un
alloc
ated
ass
ets
818
,336
,579
6
35,7
26,7
45 To
tal a
sset
s as
per
bala
nce
shee
t
6
,352
,915
,227
6
,276
,660
,034
Se
gmen
t lia
bilit
ies
383
,037
,689
3
26,6
77,8
67
293
,692
,062
3
16,8
50,0
33
107
,037
,478
1
33,9
38,9
68
783
,767
,229
7
77,4
66,8
68
Long
term
fina
ncin
g - s
ecur
ed
898
,610
,110
1
,811
,907
,803
Sp
onso
r’s lo
an
272
,000
,000
1
96,8
55,3
69
Accr
ued
mar
k-up
1
94,4
83,9
01
250
,378
,063
Sh
ort t
erm
bor
row
ings
- se
cure
d
1
,917
,369
,966
7
56,2
28,1
40
Defe
rred
liabi
lities
1
94,5
99,6
66
356
,647
,458
Pr
ovisi
on fo
r tax
atio
n
7
3,30
3,24
5
72,
208,
980
Unall
ocat
ed lia
biliti
es
69,
981,
855
7
1,47
7,71
2 To
tal li
abilit
ies a
s pe
r bala
nce
shee
t
4
,404
,115
,972
4
,293
,170
,393
38.2
Re
conc
iliatio
n of
repo
rtabl
e se
gmen
t ass
ets
and
liabi
litie
s
38.
SEG
MEN
T IN
FORM
ATIO
N38
.1
The
Com
pany
has
thre
e re
porta
ble
segm
ents
. The
follo
wing
sum
mar
y des
crib
es th
e op
erat
ion in
eac
h of
the
Com
pany
’s re
porta
ble
segm
ents
:
Wea
ving
Prod
uctio
n of
diffe
rent
qua
lities
of g
reig
e fa
bric
usin
g ya
rn
Dyein
g Pr
oces
sing
of g
reig
e fa
bric
for p
rodu
ctio
n of
dye
d fa
bric
Po
wer
Gen
erat
ion
Gen
erat
ion
and
dist
ribut
ion
of p
ower
usin
g ga
s, o
il and
ste
am

78 Kohinoor Mills Limited
38.3 Geographical information The Company’s revenue from external customers by geographical location is detailed below: 2016 2015 Rupees Rupees Australia 203,308,572 265,001,282 Asia 4,802,495,886 3,868,337,096 Europe 1,489,017,074 1,632,234,345 United States of America and Canada 194,810,736 357,512,292 Africa 473,548,239 480,872,482 Pakistan 1,387,911,328 1,302,063,344 8,551,091,835 7,906,020,841 38.4 All non-current assets of the Company as at reporting date are located and operating in
Pakistan.
38.5 Revenue from major customers The Company’s revenue is earned from a large mix of customers.
2016 201539. PLANT CAPACITY AND PRODUCTION Weaving Number of looms in operation 174 174 Rated capacity of operative looms converted to 60 picks (square meter) 48,892,878 48,892,878 Actual production converted to 60 picks (square meter) 48,530,269 47,921,848 Number of days worked during the year (3 shifts per day) 365 365 Dyeing Rated capacity in 3 shifts (linear meter) 36,000,000 30,000,000 Actual production for three shifts (linear meter) 30,419,874 27,712,263 No. of days worked during the year (3 shifts per day) 360 353 Power generation Number of generators installed 9 9 Installed capacity (Mega Watt Hours) 300,381 300,381 Actual generation (Mega Watt Hours) 33,270 32,718 39.1 Under utilization of available capacity for weaving and dyeing divisions is due to normal
maintenance. 39.2 Actual power generation in comparison to installed is low due to periodical scheduled and
unscheduled maintenance of generators and low demand.

79Annual Report 2016
40. FINANCIAL RISK MANAGEMENT 40.1 Financial risk factors The Company’s activities expose it to a variety of financial risks: market risk (including currency
risk, other price risk and interest rate risk), credit risk and liquidity risk. The Company’s overall risk management programme focuses on the unpredictability of financial markets and seeks to minimize potential adverse effects on the financial performance.
Risk management is carried out by the Company’s finance department under policies approved
by the Board of Directors (the Board). The Company’s finance department evaluates and hedges financial risk. The Board provides principles for overall risk management, as well as policies covering specific areas such as currency risk, other price risk, interest rate risk, credit risk and liquidity risk.
(a) Market risk (i) Currency risk Currency risk is the risk that the fair value or future cash flows of a financial instrument
will fluctuate because of changes in foreign exchange rates. Currency risk arises mainly from future commercial transactions or receivables and payables that exist due to transactions in foreign currencies.
The Company is exposed to currency risk arising from various currency exposures,
primarily with respect to the United States Dollar (USD) and Euro. Currently, the Company’s foreign exchange risk exposure is restricted to foreign currency bank balances and the amounts receivable from / payable to the foreign entities. The Company uses forward exchange contracts to hedge its foreign currency risk, when considered appropriate. The Company’s exposure to currency risk was as follows:
2016 2015 Cash in hand - USD 7,015 - Cash in hand - Euro 160 - Cash at banks - USD - 789 Trade debts - USD 4,895,432 9,704,733 Trade debts - Euro 158,226 205,485 Trade and other payable - USD (1,080,919) (200,543) Trade and other payable - Euro (1,501) - Net exposure - USD 3,821,528 9,504,979 Net exposure - Euro 156,885 205,485 The following significant exchange rates were applied during the year:
Rupees per US Dollar Average rate 104.29 101.31 Reporting date rate 104.50 101.50 Rupees per Euro Average rate 115.31 120.86 Reporting date rate 116.08 113.57

80 Kohinoor Mills Limited
Sensitivity analysis If the functional currency, at reporting date, had weakened / strengthened by 5% against
the USD and Euro with all other variables held constant, the impact on profit after taxation for the year would have been higher / lower by Rupees 19.003 million (2015: Rupees 46.328 million) mainly as a result of exchange gains / losses on translation of foreign exchange denominated financial instruments. Currency risk sensitivity to foreign exchange movements has been calculated on a symmetric basis. In management’s opinion, the sensitivity analysis is unrepresentative of inherent currency risk as the year end exposure does not reflect the exposure during the year.
(ii) Other price risk Other price risk represents the risk that the fair value or future cash flows of a financial
instrument will fluctuate because of changes in market prices (other than those arising from interest rate risk or currency risk), whether those changes are caused by factors specific to the individual financial instrument or its issuer, or factors affecting all similar financial instrument traded in the market. The Company is not exposed to other price risk.
(iii) Interest rate risk This represents the risk that the fair value or future cash flows of a financial instrument will
fluctuate because of changes in market interest rates. The Company has no significant long-term interest-bearing assets except for bank
balances on saving accounts. The Company’s interest rate risk arises from long term financing and short term borrowings. Borrowings obtained at variable rates expose the Company to cash flow interest rate risk. Borrowings obtained at fixed rate expose the Company to fair value interest rate risk.
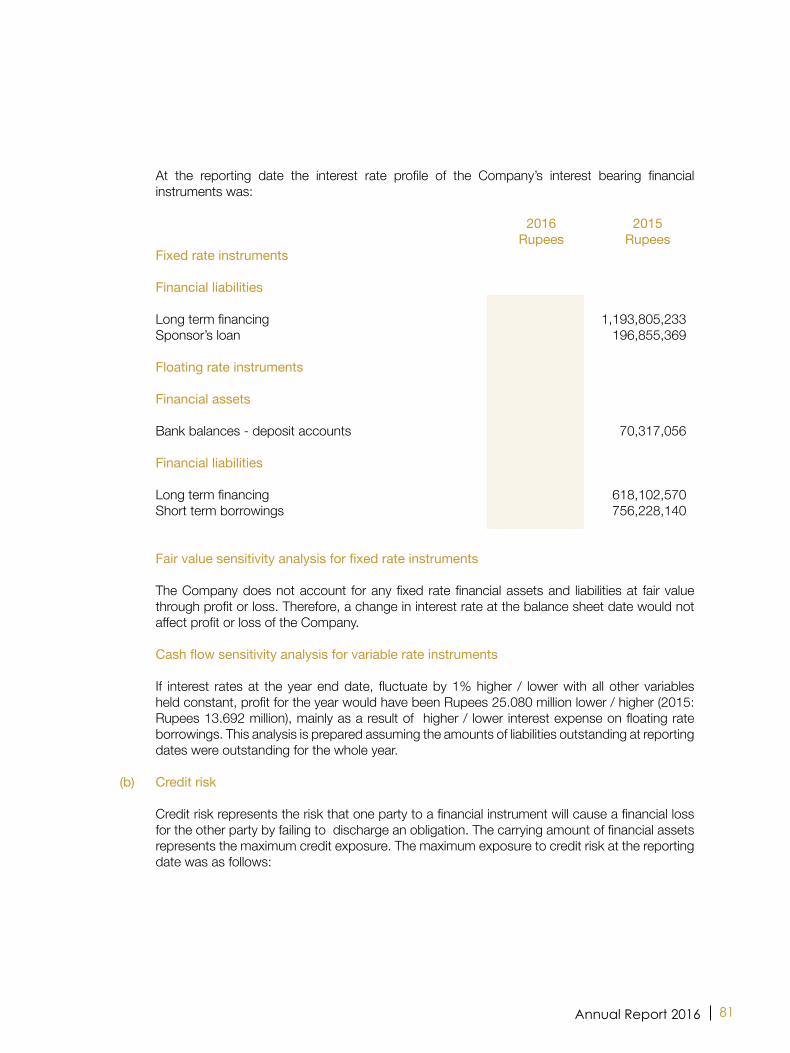
81Annual Report 2016
At the reporting date the interest rate profile of the Company’s interest bearing financial instruments was:
2016 2015 Rupees Rupees Fixed rate instruments Financial liabilities Long term financing 399,879,599 1,193,805,233 Sponsor’s loan - 196,855,369 Floating rate instruments Financial assets Bank balances - deposit accounts 27,495,038 70,317,056 Financial liabilities Long term financing 498,730,511 618,102,570 Short term borrowings 1,917,369,966 756,228,140 Fair value sensitivity analysis for fixed rate instruments The Company does not account for any fixed rate financial assets and liabilities at fair value
through profit or loss. Therefore, a change in interest rate at the balance sheet date would not affect profit or loss of the Company.
Cash flow sensitivity analysis for variable rate instruments If interest rates at the year end date, fluctuate by 1% higher / lower with all other variables
held constant, profit for the year would have been Rupees 25.080 million lower / higher (2015: Rupees 13.692 million), mainly as a result of higher / lower interest expense on floating rate borrowings. This analysis is prepared assuming the amounts of liabilities outstanding at reporting dates were outstanding for the whole year.
(b) Credit risk Credit risk represents the risk that one party to a financial instrument will cause a financial loss
for the other party by failing to discharge an obligation. The carrying amount of financial assets represents the maximum credit exposure. The maximum exposure to credit risk at the reporting date was as follows:
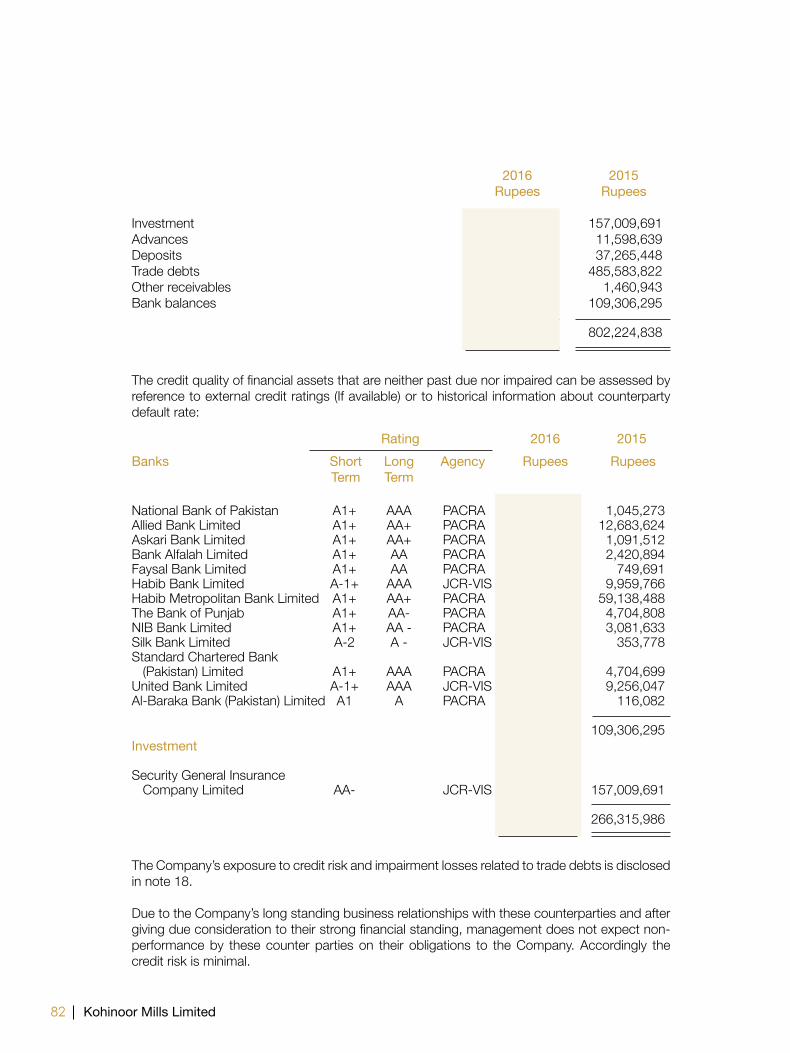
82 Kohinoor Mills Limited
2016 2015 Rupees Rupees Investment 52,200,708 157,009,691 Advances 12,288,661 11,598,639 Deposits 34,475,558 37,265,448 Trade debts 465,442,351 485,583,822 Other receivables 2,652,355 1,460,943 Bank balances 50,677,448 109,306,295 617,737,081 802,224,838 The credit quality of financial assets that are neither past due nor impaired can be assessed by
reference to external credit ratings (If available) or to historical information about counterparty default rate:
Rating 2016 2015 Banks Short Long Agency Rupees Rupees Term Term National Bank of Pakistan A1+ AAA PACRA 229,782 1,045,273 Allied Bank Limited A1+ AA+ PACRA 10,299,862 12,683,624 Askari Bank Limited A1+ AA+ PACRA 255,414 1,091,512 Bank Alfalah Limited A1+ AA PACRA 303,397 2,420,894 Faysal Bank Limited A1+ AA PACRA 402,242 749,691 Habib Bank Limited A-1+ AAA JCR-VIS 5,902,809 9,959,766 Habib Metropolitan Bank Limited A1+ AA+ PACRA 18,499,258 59,138,488 The Bank of Punjab A1+ AA- PACRA 754,664 4,704,808 NIB Bank Limited A1+ AA - PACRA 11,298,546 3,081,633 Silk Bank Limited A-2 A - JCR-VIS 31,112 353,778 Standard Chartered Bank (Pakistan) Limited A1+ AAA PACRA 2,041,776 4,704,699 United Bank Limited A-1+ AAA JCR-VIS 644,500 9,256,047 Al-Baraka Bank (Pakistan) Limited A1 A PACRA 14,086 116,082 50,677,448 109,306,295 Investment Security General Insurance Company Limited AA- JCR-VIS 52,200,708 157,009,691 102,878,156 266,315,986 The Company’s exposure to credit risk and impairment losses related to trade debts is disclosed
in note 18. Due to the Company’s long standing business relationships with these counterparties and after
giving due consideration to their strong financial standing, management does not expect non-performance by these counter parties on their obligations to the Company. Accordingly the credit risk is minimal.
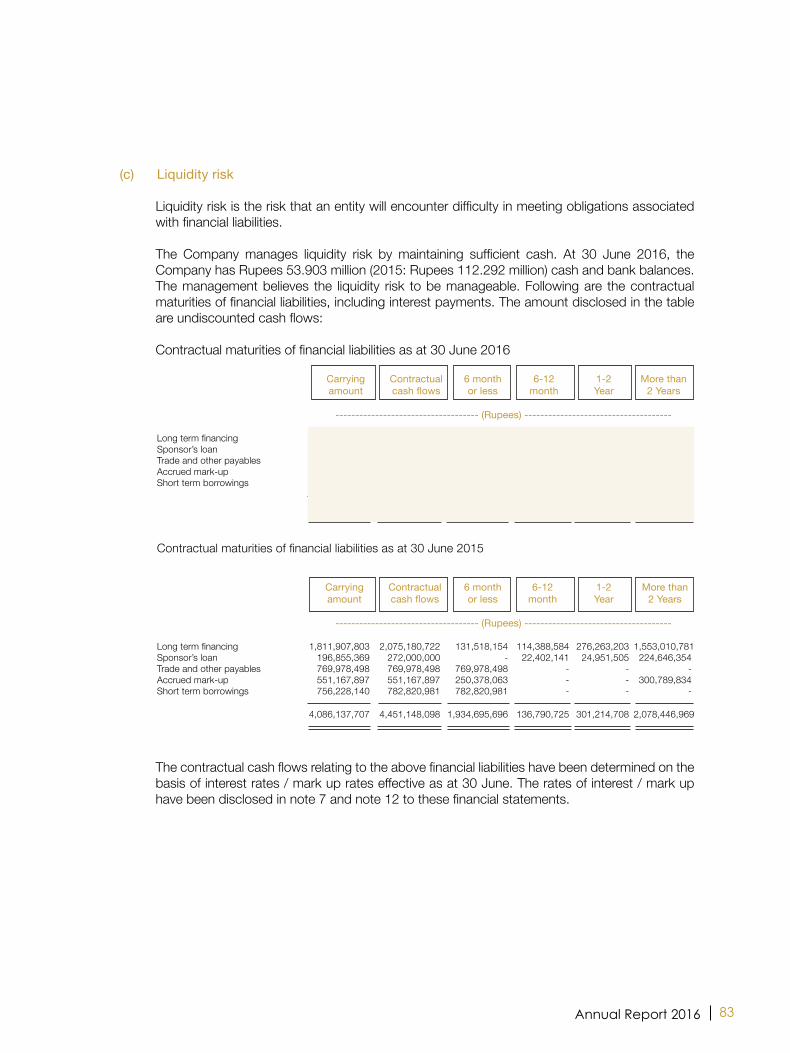
83Annual Report 2016
(c) Liquidity risk
Liquidity risk is the risk that an entity will encounter difficulty in meeting obligations associated with financial liabilities.
The Company manages liquidity risk by maintaining sufficient cash. At 30 June 2016, the
Company has Rupees 53.903 million (2015: Rupees 112.292 million) cash and bank balances. The management believes the liquidity risk to be manageable. Following are the contractual maturities of financial liabilities, including interest payments. The amount disclosed in the table are undiscounted cash flows:
Contractual maturities of financial liabilities as at 30 June 2016 Carrying Contractual 6 month 6-12 1-2 More than
amount cash flows or less month Year 2 Years
------------------------------------ (Rupees) ------------------------------------- Long term financing 898,610,110 1,089,741,205 77,496,745 32,559,948 69,655,501 910,029,011 Sponsor’s loan 272,000,000 272,000,000 272,000,000 - - - Trade and other payables 756,191,226 756,191,226 756,191,226 - - - Accrued mark-up 349,506,012 349,506,012 194,483,901 - - 155,022,111 Short term borrowings 1,917,369,966 1,961,624,931 1,961,624,931 - - - 4,193,677,314 4,429,063,374 3,261,796,803 32,559,948 69,655,501 1,065,051,122
Contractual maturities of financial liabilities as at 30 June 2015 Carrying Contractual 6 month 6-12 1-2 More than
amount cash flows or less month Year 2 Years
------------------------------------ (Rupees) ------------------------------------- Long term financing 1,811,907,803 2,075,180,722 131,518,154 114,388,584 276,263,203 1,553,010,781 Sponsor’s loan 196,855,369 272,000,000 - 22,402,141 24,951,505 224,646,354 Trade and other payables 769,978,498 769,978,498 769,978,498 - - - Accrued mark-up 551,167,897 551,167,897 250,378,063 - - 300,789,834 Short term borrowings 756,228,140 782,820,981 782,820,981 - - -
4,086,137,707 4,451,148,098 1,934,695,696 136,790,725 301,214,708 2,078,446,969
The contractual cash flows relating to the above financial liabilities have been determined on the basis of interest rates / mark up rates effective as at 30 June. The rates of interest / mark up have been disclosed in note 7 and note 12 to these financial statements.

84 Kohinoor Mills Limited
40.2 Financial instruments by categories
Assets as per balance sheet
2016 2015 Loans and Available Total Loans and Available Total receivables for sale receivables for sale - -- - - - - - - - (Rupees) - - - - - - -- - - - - - - -- - - (Rupees) - - - - - -- - -
Investments - 52,200,708 52,200,708 - 157,009,691 157,009,691 Advances 12,288,661 - 12,288,661 11,598,639 - 11,598,639 Deposits 34,475,558 - 34,475,558 37,265,448 - 37,265,448 Trade debts 465,442,351 - 465,442,351 485,583,822 - 485,583,822 Other receivables 2,652,355 - 2,652,355 1,460,943 - 1,460,943 Cash and bank balances 53,903,002 - 53,903,002 112,292,072 - 112,292,072 568,761,927 52,200,708 620,962,635 648,200,924 157,009,691 805,210,615
2016 2015 Rupees Rupees Financial liabilities at amortized cost Sponsor’s loan 272,000,000 196,855,369 Long term financing 898,610,110 1,811,907,803 Accrued mark-up 349,506,012 551,167,897 Short term borrowings 1,917,369,966 756,228,140 Trade and other payables 756,191,226 769,978,498 4,193,677,314 4,086,137,707 40.3 Capital risk management The Company’s objectives when managing capital are to safeguard the Company’s ability to
continue as a going concern in order to provide returns for shareholders and benefits for other stake holders and to maintain an optimal capital structure to reduce the cost of capital. In order to maintain or adjust the capital structure, the Company may adjust the amount of dividends paid to share holders, issue new shares or sell assets to reduce debt.

85Annual Report 2016
41. RECOGNIZED FAIR VALUE MEASUREMENTS - FINANCIAL INSTRUMENTS (i) Fair value hierarchy Judgements and estimates are made in determining the fair values of the financial instruments
that are recognised and measured at fair value in these financial statements. To provide an indication about the reliability of the inputs used in determining fair value, the Company has classified its financial instruments into the following three levels. An explanation of each level follows underneath the table.
Recurring fair value measurements Level 1 Level 2 Level 3 Total At 30 June 2016 .............................. (Rupees) ............................. Financial asset Available for sale financial asset - - 52,200,708 52,200,708 Total financial asset - - 52,200,708 52,200,708
Recurring fair value measurements Level 1 Level 2 Level 3 Total At 30 June 2015 .............................. (Rupees) .............................
Financial asset Available for sale financial asset - - 157,009,691 157,009,691 Total financial asset - - 157,009,691 157,009,691
The above table does not include fair value information for financial assets and financial liabilities not measured at fair value if the carrying amounts are a reasonable approximation of fair value. Due to short term nature, carrying amounts of certain financial assets and financial liabilities are considered to be the same as their fair value. For the majority of the non-current receivables, the fair values are also not significantly different to their carrying amounts.
There was no transfer in and out of level 3 measurements. The Company’s policy is to recognise transfers into and transfers out of fair value hierarchy
levels as at the end of the reporting period. Level 1: The fair value of financial instruments traded in active markets (such as publicly traded
derivatives, and trading and available-for-sale securities) is based on quoted market prices at the end of the reporting period. The quoted market price used for financial assets held by the Company is the current bid price. These instruments are included in level 1.

86 Kohinoor Mills Limited
Level 2: The fair value of financial instruments that are not traded in an active market (for example, over-the-counter derivatives) is determined using valuation techniques which maximise the use of observable market data and rely as little as possible on entity-specific estimates. If all significant inputs required to fair value an instrument are observable, the instrument is included in level 2.
Level 3: If one or more of the significant inputs is not based on observable market data, the
instrument is included in level 3. This is the case for unlisted equity securities. (ii) Valuation techniques used to determine fair values Specific valuation technique used to value financial instrument was discounted cash flow
analysis. (iii) Fair value measurements using significant unobservable inputs (level 3) The following table presents the changes in level 3 items for the year ended 30 June 2016 and
30 June 2015:
Unlisted equity security Rupees
Balance as on 01 July 2014 176,879,692 Less : Deficit recognized in other comprehensive income 19,870,001 Balance as on 30 June 2015 157,009,691 Less : Deficit recognized in other comprehensive income 104,808,983
Balance as on 30 June 2016 52,200,708
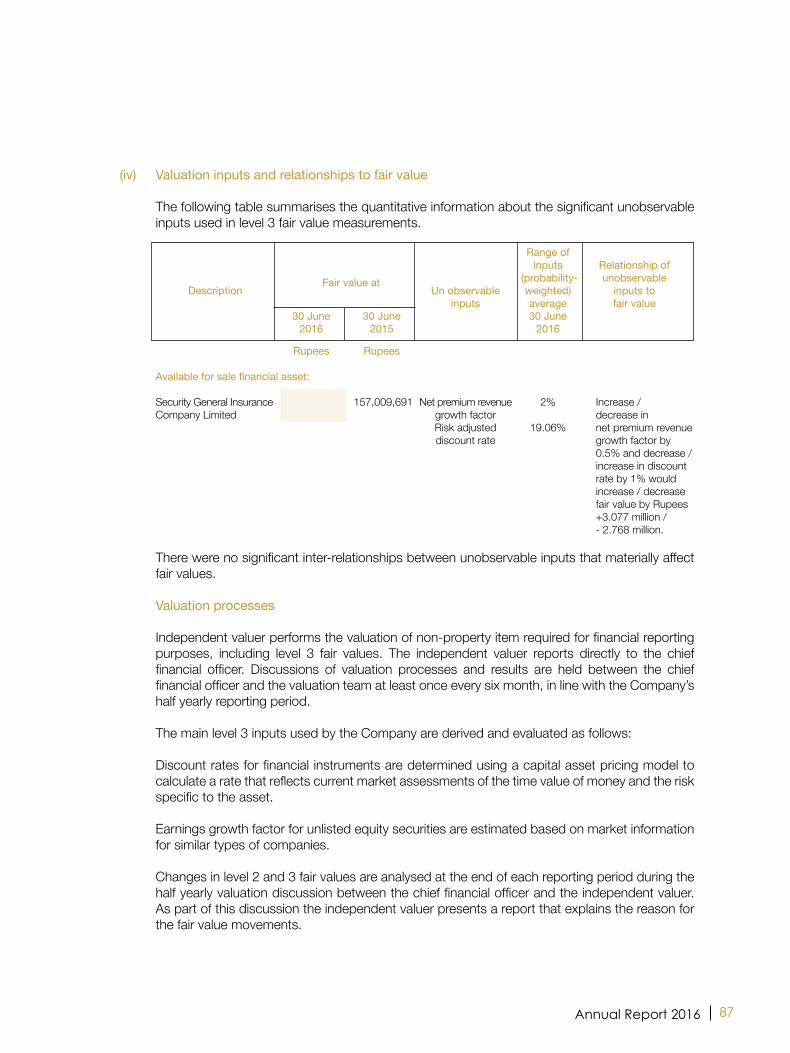
87Annual Report 2016
(iv) Valuation inputs and relationships to fair value The following table summarises the quantitative information about the significant unobservable
inputs used in level 3 fair value measurements.
Range of inputs Relationship of (probability- unobservable Description
Fair value at Un observable weighted) inputs to
inputs average fair value 30 June 30 June 30 June 2016 2015 2016
Rupees Rupees Available for sale financial asset: Security General Insurance 52,200,708 157,009,691 Net premium revenue 2% Increase / Company Limited growth factor decrease in
Risk adjusted 19.06% net premium revenue discount rate growth factor by 0.5% and decrease / increase in discount rate by 1% would increase / decrease fair value by Rupees +3.077 million / - 2.768 million.
There were no significant inter-relationships between unobservable inputs that materially affect fair values.
Valuation processes Independent valuer performs the valuation of non-property item required for financial reporting
purposes, including level 3 fair values. The independent valuer reports directly to the chief financial officer. Discussions of valuation processes and results are held between the chief financial officer and the valuation team at least once every six month, in line with the Company’s half yearly reporting period.
The main level 3 inputs used by the Company are derived and evaluated as follows: Discount rates for financial instruments are determined using a capital asset pricing model to
calculate a rate that reflects current market assessments of the time value of money and the risk specific to the asset.
Earnings growth factor for unlisted equity securities are estimated based on market information
for similar types of companies. Changes in level 2 and 3 fair values are analysed at the end of each reporting period during the
half yearly valuation discussion between the chief financial officer and the independent valuer. As part of this discussion the independent valuer presents a report that explains the reason for the fair value movements.
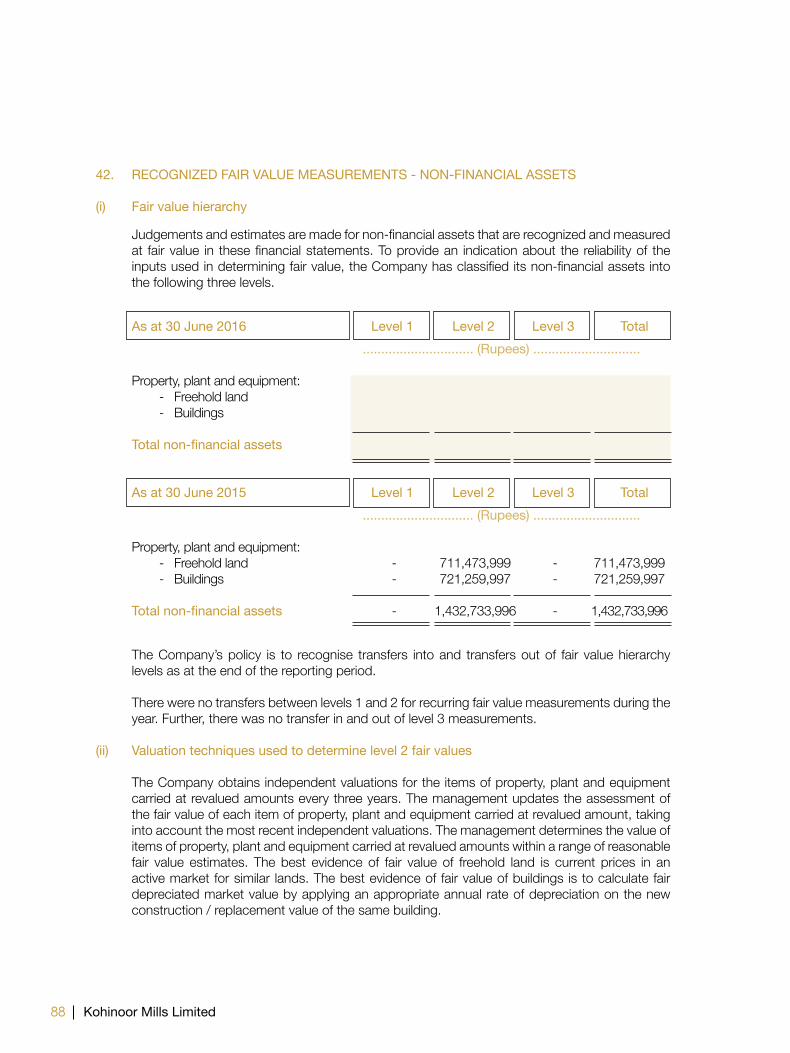
88 Kohinoor Mills Limited
42. RECOGNIZED FAIR VALUE MEASUREMENTS - NON-FINANCIAL ASSETS (i) Fair value hierarchy
Judgements and estimates are made for non-financial assets that are recognized and measured at fair value in these financial statements. To provide an indication about the reliability of the inputs used in determining fair value, the Company has classified its non-financial assets into the following three levels.
As at 30 June 2016 Level 1 Level 2 Level 3 Total .............................. (Rupees) ............................. Property, plant and equipment: - Freehold land - 711,473,999 - 711,473,999 - Buildings - 716,856,120 - 716,856,120 Total non-financial assets - 1,428,330,119 - 1,428,330,119
As at 30 June 2015 Level 1 Level 2 Level 3 Total .............................. (Rupees) .............................
Property, plant and equipment: - Freehold land - 711,473,999 - 711,473,999 - Buildings - 721,259,997 - 721,259,997 Total non-financial assets - 1,432,733,996 - 1,432,733,996
The Company’s policy is to recognise transfers into and transfers out of fair value hierarchy levels as at the end of the reporting period.
There were no transfers between levels 1 and 2 for recurring fair value measurements during the
year. Further, there was no transfer in and out of level 3 measurements. (ii) Valuation techniques used to determine level 2 fair values The Company obtains independent valuations for the items of property, plant and equipment
carried at revalued amounts every three years. The management updates the assessment of the fair value of each item of property, plant and equipment carried at revalued amount, taking into account the most recent independent valuations. The management determines the value of items of property, plant and equipment carried at revalued amounts within a range of reasonable fair value estimates. The best evidence of fair value of freehold land is current prices in an active market for similar lands. The best evidence of fair value of buildings is to calculate fair depreciated market value by applying an appropriate annual rate of depreciation on the new construction / replacement value of the same building.

89Annual Report 2016
Valuation processes The Company engages external, independent and qualified valuer to determine the fair value
of the Company’s items of property, plant and equipment carried at revalued amounts at the end of every three years. As at 30 June 2015, the fair values of the items of property, plant and equipment were determined by Messers Hamid Mukhtar and Company (Private) Limited, the approved valuer.
Changes in fair values are analysed between the chief financial officer and the valuer. As part of
this discussion the team presents a report that explains the reason for the fair value movements.
43. INFORMATION FOR ALL SHARES ISLAMIC INDEX SCREENING
43.1 2016 2015 Description Note Carried under Carried under Non-Shariah Shariah Non-Shariah Shariah arrangements arrangements arrangements arrangements
------------------------- Rupees -------------------------
Assets Loans and advances Loans to employees 19 - 12,288,661 - 11,598,639 Advances to supplier - 57,285,999 - 60,827,674 Letters of credit - 5,237,568 - 6,062,614 Other advance Receivable from subsidiary company 21.2 - 1,608,032 - 383,824 Deposits Long term deposits - 21,200,012 - 20,953,202 Security deposits 20 - 13,275,546 - 16,312,246 Bank balances 23 50,663,496 13,952 109,190,213 116,082 Liabilities Loan and advances Long term financing 7 898,610,110 - 1,811,907,803 - Short term borrowings 12 1,917,369,966 - 756,228,140 - Sponsor’s loan 8 - 272,000,000 - 196,855,369 Advances from customers 10 - 33,638,439 - 31,376,386 Deposits Security deposits - interest free 10 - 602,278 - 602,278 Income Profit on deposits with banks 29 2,807,772 - 5,732,715 - Other comprehensive income Unrealized loss on investment 5.2 104,808,983 - 19,870,001 -
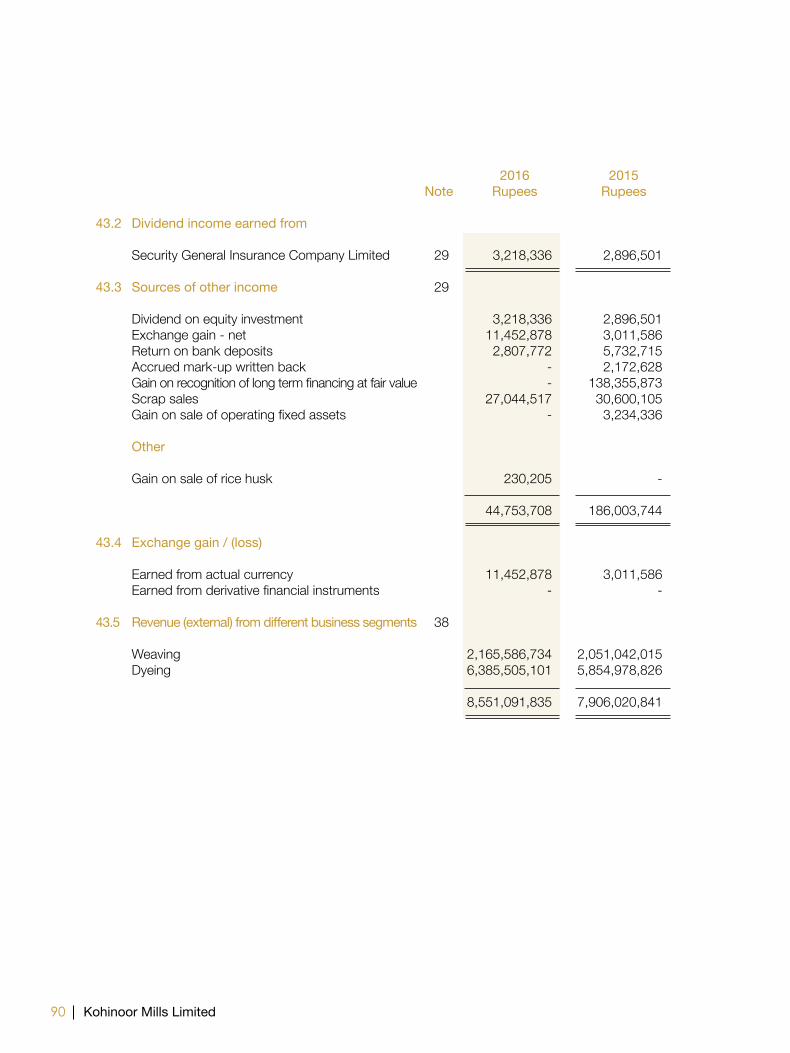
90 Kohinoor Mills Limited
2016 2015 Note Rupees Rupees 43.2 Dividend income earned from Security General Insurance Company Limited 29 3,218,336 2,896,501 43.3 Sources of other income 29 Dividend on equity investment 3,218,336 2,896,501 Exchange gain - net 11,452,878 3,011,586 Return on bank deposits 2,807,772 5,732,715 Accrued mark-up written back - 2,172,628 Gain on recognition of long term financing at fair value - 138,355,873 Scrap sales 27,044,517 30,600,105 Gain on sale of operating fixed assets - 3,234,336 Other Gain on sale of rice husk 230,205 - 44,753,708 186,003,744 43.4 Exchange gain / (loss) Earned from actual currency 11,452,878 3,011,586 Earned from derivative financial instruments - - 43.5 Revenue (external) from different business segments 38 Weaving 2,165,586,734 2,051,042,015 Dyeing 6,385,505,101 5,854,978,826 8,551,091,835 7,906,020,841

91Annual Report 2016
43.6 Relationship with banks
Relationship Non Islamic With Islamic Name window window operations operations
Allied Bank Limited a 0 Standard Chartered Bank (Pakistan) Limited a 0 NIB Bank Limited a 0 Habib Bank Limited a 0 Habib Metropolitan Bank Limited a 0 Askari Bank Limited a 0 Bank Alfalah Limited a 0 Faysal Bank Limited a 0 National Bank of Pakistan a 0 Silkbank Limited a 0 United Bank Limited a 0 Al-Baraka Bank (Pakistan) Limited 0 a The Bank of Punjab a 0
44. AUTHORIZATION OF FINANCIAL STATEMENTS These financial statements were authorized for issue by the Board of Directors of the Company
on September 01, 2016. 45. CORRESPONDING FIGURES Corresponding figures have been rearranged / regrouped, wherever necessary, for the purpose
of comparison. However, no significant rearrangements / regroupings have been made in these financial statements
46. GENERAL Figures have been rounded off to nearest of Rupee.
AAMIR FAYYAZ SHEIKH ASAD FAYYAZ SHEIKH Chief Executive Director

92 Kohinoor Mills Limited
93Annual Report 2016
ConsolidatedFinancial Statements
For the year ended 30 June 2016

94 Kohinoor Mills Limited and its Subsidiary
The Directors are pleased to present the consolidated audited results of Kohinoor Mills Limited and its subsidiary Q-Mart Corporation (Private) Limited (the Group) for the year ended 30 June 2016. The group results are being presented as required by section 237 of the Companies Ordinance, 1984.
During the financial year ended 30 June 2016, the Group earned a net profit after tax of Rupees 120 million, compared to net profit of Rupees 120 million during the preceding financial year.
Better capacity utilization, continued savings in fuel and power costs resulted in some improvement in the overall operating performance of the company.
The current order book of the parent company is healthy and it has confirmed orders up to December 2016 at full capacity. Thus the management is confident that the parent company shall be able to improve its operational performance, going forward. Further, the group, in line with divestment plan, is in the process of disposing of the remaining fixed assets of the subsidiary company.
The Directors’ Report giving a detailed analysis of the performance of the parent company for the year ended 30 June 2016, has also been presented separately.
On behalf of the Board
Aamir Fayyaz SheikhChief Executive
Kasur:01 September 2016
DirectorS’ report
95Annual Report 2016
We have audited the annexed consolidated financial statements comprising consolidated balance sheet of Kohinoor Mills Limited (the Holding Company) and its Subsidiary Company, Q Mart Corporation (Private) Limited as at 30 June 2016 and the related consolidated profit and loss account, consolidated statement of comprehensive income, consolidated cash flow statement and consolidated statement of changes in equity together with the notes forming part thereof, for the year then ended. We have also expressed separate opinions on the financial statements of Kohinoor Mills Limited and its Subsidiary Company, Q Mart Corporation (Private) Limited. These financial statements are the responsibility of the Holding Company’s management. Our responsibility is to express an opinion on these financial statements based on our audit. Our audit was conducted in accordance with the International Standards on Auditing and accordingly included such tests of accounting records and such other auditing procedures as we considered necessary in the circumstances.
In our opinion, these consolidated financial statements present fairly the financial position of Kohinoor Mills Limited and its Subsidiary Company, Q Mart Corporation (Private) Limited as at 30 June 2016 and the results of their operations for the year then ended.
We draw attention to Note 1.2.2 to these consolidated financial statements, which states that the Subsidiary Company, Q Mart Corporation (Private) Limited is no longer a going concern for the reasons stated in the aforesaid note. Our opinion is not qualified in respect of this matter.
RIAZ AHMAD & COMPANYChartered Accountants
Name of engagement partner:Mubashar Mehmood
Date: 01 September 2016
LAHORE
AUDitorS’ report to tHe MeMBerS
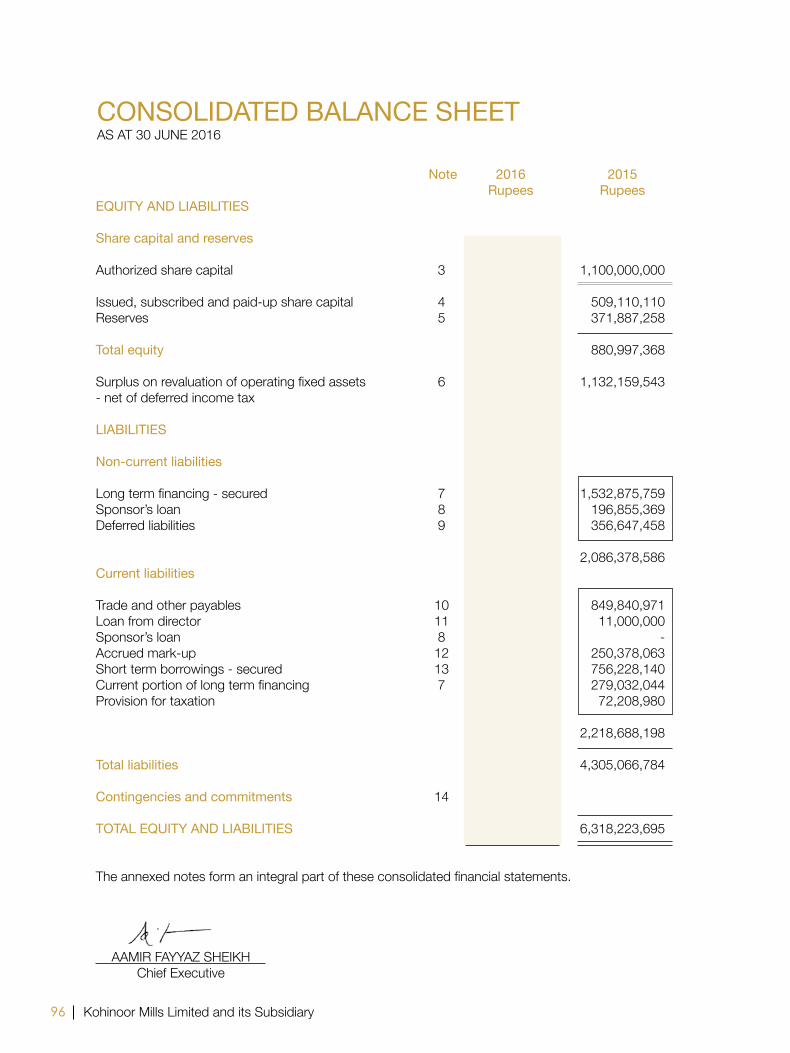
96 Kohinoor Mills Limited and its Subsidiary
Note 2016 2015 rupees rupees
eQUitY AND LiABiLitieS Share capital and reserves Authorized share capital 3 1,100,000,000 1,100,000,000 Issued, subscribed and paid-up share capital 4 509,110,110 509,110,110 Reserves 5 359,848,146 371,887,258 total equity 868,958,256 880,997,368 Surplus on revaluation of operating fixed assets 6 1,110,540,847 1,132,159,543 - net of deferred income tax LiABiLitieS Non-current liabilities Long term financing - secured 7 735,286,694 1,532,875,759 Sponsor’s loan 8 - 196,855,369 Deferred liabilities 9 194,599,666 356,647,458
929,886,360 2,086,378,586 current liabilities Trade and other payables 10 854,276,002 849,840,971 Loan from director 11 11,000,000 11,000,000 Sponsor’s loan 8 272,000,000 - Accrued mark-up 12 194,483,901 250,378,063 Short term borrowings - secured 13 1,917,369,966 756,228,140 Current portion of long term financing 7 163,323,416 279,032,044 Provision for taxation 73,303,245 72,208,980
3,485,756,530 2,218,688,198
total liabilities 4,415,642,890 4,305,066,784 contingencies and commitments 14 totAL eQUitY AND LiABiLitieS 6,395,141,993 6,318,223,695
The annexed notes form an integral part of these consolidated financial statements.
coNSoLiDAteD BALANce SHeet AS AT 30 JuNe 2016
AAMIR FAYYAZ SHEIKH Chief Executive

97Annual Report 2016
Note 2016 2015 rupees rupees
ASSetS Non-current assets Fixed assets 15 3,728,919,899 3,813,798,093 Long term investments 16 52,200,708 157,009,691 Long term security deposits 21,200,012 20,953,202
3,802,320,619 3,991,760,986
current assets Stores, spares and loose tools 17 416,776,129 366,497,465 Stock-in-trade 18 806,079,356 729,676,914 Trade debts 19 465,442,351 485,583,822 Advances 20 74,812,228 78,488,927 Trade deposits and short term prepayments 21 14,447,911 17,487,549 Other receivables 22 312,257,942 292,954,960 Sales tax recoverable 23 449,022,395 243,395,861 Cash and bank balances 24 53,983,062 112,377,211
2,592,821,374 2,326,462,709
totAL ASSetS 6,395,141,993 6,318,223,695
ASAD FAYYAZ SHEIKH Director

98 Kohinoor Mills Limited and its Subsidiary
Note 2016 2015 rupees rupees
SALeS 25 8,551,091,835 7,906,020,841 COST OF SALeS 26 (7,158,065,284) (6,607,203,773) GROSS PROFIT 1,393,026,551 1,298,817,068 DISTRIBUTION COST 27 (497,552,931) (438,881,171)ADMINISTRATIVE EXPENSES 28 (237,669,121) (236,119,162)OTHER EXPENSES 29 (47,840,347) (45,555,352) (783,062,399) (720,555,685) 609,964,152 578,261,383 OTHER INCOME 30 45,133,528 186,540,398 PROFIT FROM OPERATIONS 655,097,680 764,801,781 FINANCe COST 31 (450,764,146) (528,178,217) PROFIT BEFORE TAXATION 204,333,534 236,623,564 TAXATION 32 (84,691,715) (116,347,865)
PROFIT AFTER TAXATION 119,641,819 120,275,699
EARNINGS PER SHARE - BASIC AND DILUTED 33 2.35 2.36 The annexed notes form an integral part of these consolidated financial statements.
coNSoLiDAteD proFit AND LoSS AccoUNtFOR THE YEAR ENDED 30 JUNE 2016
AAMIR FAYYAZ SHEIKH ASAD FAYYAZ SHEIKH Chief Executive Director

99Annual Report 2016
2016 2015 rupees rupees
proFit AFter tAXAtioN 119,641,819 120,275,699 otHer coMpreHeNSiVe iNcoMe Items that will not be reclassified to profit or loss - - Items that may be reclassified subsequently to profit or loss: Deficit arising on re-measurement of available for sale investment to fair value (104,808,983) (19,870,001) Deferred income tax relating to re-measurement of available for sale investment to fair value 25,540,380 6,090,116 Other comprehensive loss for the year - net of tax (79,268,603) (13,779,885) totAL coMpreHeNSiVe iNcoMe For tHe YeAr 40,373,216 106,495,814 The annexed notes form an integral part of these consolidated financial statements.
coNSoLiDAteD StAteMeNt oF coMpreHeNSiVe iNcoMeFOR THE YEAR ENDED 30 JUNE 2016
AAMIR FAYYAZ SHEIKH ASAD FAYYAZ SHEIKH Chief Executive Director

100 Kohinoor Mills Limited and its Subsidiary
Note 2016 2015 rupees rupees
cASH FLoWS FroM operAtiNG ActiVitieS cASH GeNerAteD FroM operAtioNS 34 584,922,944 827,175,261 Income tax paid (90,928,817) (87,684,048)Net increase in long term security deposits (246,810) (365,462)Finance cost paid (410,903,778) (326,407,574) Net cASH GeNerAteD FroM operAtiNG ActiVitieS 82,843,539 412,718,177 cASH FLoWS FroM iNVeStiNG ActiVitieS Capital expenditure on property, plant and equipment (184,510,636) (138,303,040)Proceeds from disposal of operating fixed assets 33,732,732 21,631,126 Dividend received 3,218,336 2,896,501 Net cASH USeD iN iNVeStiNG ActiVitieS (147,559,568) (113,775,413) cASH FLoWS FroM FiNANciNG ActiVitieS Long term financing obtained 36,300,000 - Repayment of long term financing (1,191,119,946) (284,216,064)Short term borrowings - net 1,161,141,826 (57,966,859)
Net cASH FroM / (USeD iN) FiNANciNG ActiVitieS 6,321,880 (342,182,923) Net DecreASe iN cASH AND cASH eQUiVALeNtS (58,394,149) (43,240,159) cASH AND cASH eQUiVALeNtS At tHe BeGiNNiNG oF tHe YeAr 112,377,211 155,617,370 cASH AND cASH eQUiVALeNtS At tHe eND oF tHe YeAr 53,983,062 112,377,211 The annexed notes form an integral part of these consolidated financial statements.
coNSoLiDAteD cASH FLoW StAteMeNtFOR THE YEAR ENDED 30 JUNE 2016
AAMIR FAYYAZ SHEIKH ASAD FAYYAZ SHEIKH Chief Executive Director
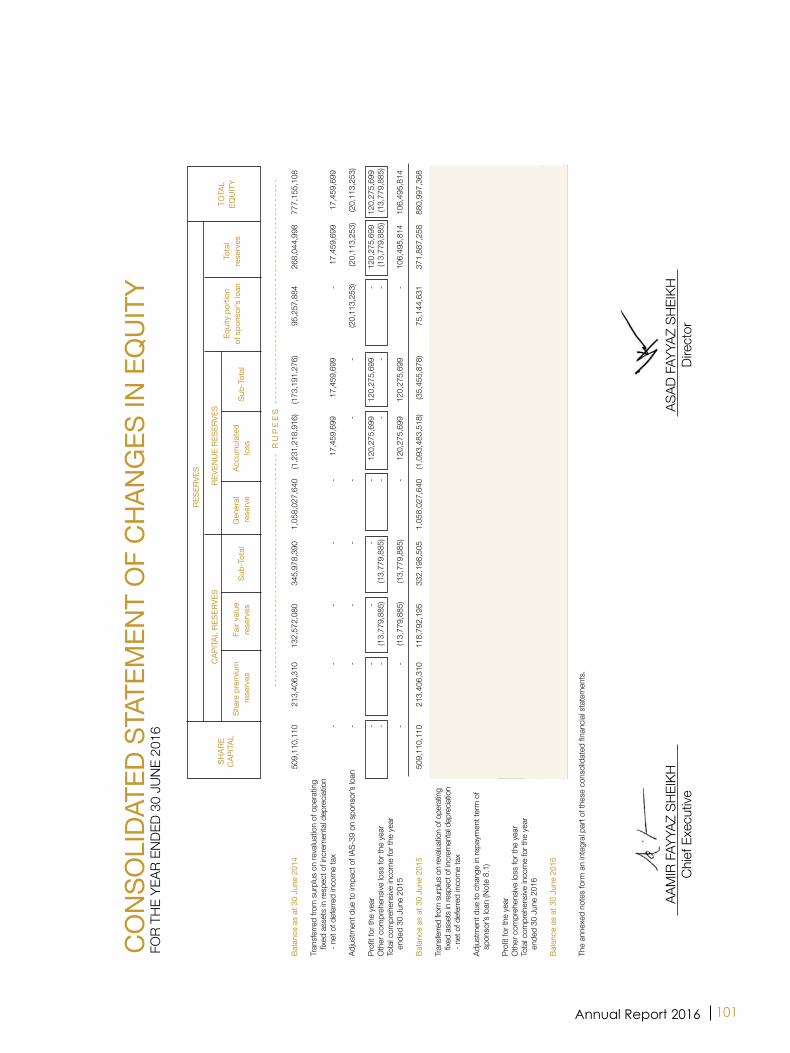
101Annual Report 2016
co
NSo
LiDA
teD
StAt
eMeN
t o
F c
HAN
GeS
iN e
QU
itY
FOR
THE
YEAR
END
ED 3
0 JU
NE 2
016
r
eSer
VeS
c
Apit
AL r
eSer
VeS
reVe
NU
e re
SerV
eS
Shar
e pr
emiu
m
Fair
valu
e
Gen
eral
Ac
cum
ulat
ed
Sub-
tota
l eq
uity
por
tion
tota
l
re
serv
es
rese
rves
Sub
-tot
al
rese
rve
loss
of s
pons
or’s
loan
re
serv
es
----
----
----
----
----
----
----
----
----
----
----
----
-- r
Up
ee
S -
----
----
----
----
----
----
----
----
----
----
----
---
Bala
nce
as a
t 30
June
201
4
509
,110
,110
2
13,4
06,3
10
132
,572
,080
3
45,9
78,3
90
1,0
58,0
27,6
40
(1,2
31,2
18,9
16)
(173
,191
,276
) 9
5,25
7,88
4
268
,044
,998
7
77,1
55,1
08
Tran
sfer
red
from
sur
plus
on
reva
luat
ion
of o
pera
ting
fix
ed a
sset
s in
resp
ect o
f inc
rem
enta
l dep
recia
tion
- n
et o
f def
erre
d in
com
e ta
x -
-
-
-
-
1
7,45
9,69
9
17,
459,
699
-
1
7,45
9,69
9
17,
459,
699
Adju
stm
ent d
ue to
impa
ct o
f IAS
-39
on s
pons
or’s
loan
-
-
-
-
-
-
-
(2
0,11
3,25
3)
(20,
113,
253)
(2
0,11
3,25
3)
Pr
ofit f
or th
e ye
ar
-
-
-
-
-
120
,275
,699
1
20,2
75,6
99
-
120
,275
,699
1
20,2
75,6
99
Oth
er c
ompr
ehen
sive
loss
for t
he y
ear
-
-
(13,
779,
885)
(1
3,77
9,88
5)
-
-
-
-
(13,
779,
885)
(1
3,77
9,88
5)To
tal c
ompr
ehen
sive
inco
me
for t
he y
ear
en
ded
30 J
une
2015
-
-
(1
3,77
9,88
5)
(13,
779,
885)
-
1
20,2
75,6
99
120
,275
,699
-
1
06,4
95,8
14
106
,495
,814
Ba
lanc
e as
at 3
0 Ju
ne 2
015
509
,110
,110
2
13,4
06,3
10
118
,792
,195
3
32,1
98,5
05
1,0
58,0
27,6
40
(1,0
93,4
83,5
18)
(35,
455,
878)
7
5,14
4,63
1
371
,887
,258
8
80,9
97,3
68
Tran
sferre
d fro
m s
urpl
us o
n re
valua
tion
of o
pera
ting
fix
ed a
sset
s in
resp
ect o
f incr
emen
tal d
epre
ciatio
n
- net
of d
efer
red
inco
me
tax
-
-
-
-
-
22,
732,
303
2
2,73
2,30
3
-
22,
732,
303
2
2,73
2,30
3
Ad
just
men
t due
to c
hang
e in
repa
ymen
t ter
m o
f
spon
sor’s
loan
(Not
e 8.
1)
-
-
-
-
-
-
-
(75,
144,
631)
(7
5,14
4,63
1)
(75,
144,
631)
Profi
t for
the
year
-
-
-
-
-
1
19,6
41,8
19
119
,641
,819
-
1
19,6
41,8
19
119
,641
,819
O
ther
com
preh
ensiv
e lo
ss fo
r the
yea
r -
-
(7
9,26
8,60
3)
(79,
268,
603)
-
-
-
-
(7
9,26
8,60
3)
(79,
268,
603)
Tota
l com
preh
ensiv
e in
com
e fo
r the
yea
r
ende
d 30
Jun
e 20
16
-
-
(79,
268,
603)
(7
9,26
8,60
3)
-
119
,641
,819
1
19,6
41,8
19
-
40,
373,
216
4
0,37
3,21
6
Ba
lanc
e as
at 3
0 Ju
ne 2
016
509
,110
,110
2
13,4
06,3
10
39,
523,
592
2
52,9
29,9
02
1,0
58,0
27,6
40
(951
,109
,396
) 1
06,9
18,2
44
-
359
,848
,146
8
68,9
58,2
56
The
anne
xed
note
s fo
rm a
n in
tegr
al pa
rt of
thes
e co
nsol
idat
ed fi
nanc
ial s
tate
men
ts.
SHAr
e c
Apit
ALto
tAL
eQU
itY
AA
MIR
FAY
YAZ
SHEI
KH
ASAD
FAY
YAZ
SHEI
KH
Chief
Exe
cutiv
e
Dire
ctor

102 Kohinoor Mills Limited and its Subsidiary
NoteS to tHe coNSoLiDAteD FiNANciAL StAteMeNtSFOR THE YEAR ENDED 30 JUNE 2016
1. LeGAL StAtUS AND NAtUre oF BUSiNeSS tHe GroUp The Group consists of:
Holding company
- Kohinoor Mills Limited
Subsidiary company (wholly owned) - Q Mart Corporation (Private) Limited 1.1 Kohinoor Mills Limited Kohinoor Mills Limited (“the Holding Company”) is a public limited company incorporated on 21
December 1987 in Pakistan under the Companies Ordinance, 1984 and its shares are quoted on Pakistan Stock Exchange Limited. The registered office of the Holding Company is situated at 8-K.M., Manga Raiwind Road, District Kasur. The Holding Company is principally engaged in the business of textile manufacturing covering weaving, bleaching, dyeing, buying, selling and otherwise dealing in yarn, cloth and other goods and fabrics made from raw cotton and synthetic fiber and to generate and supply electricity.
1.2 Q Mart corporation (private) Limited
1.2.1 Q Mart Corporation (Private) Limited (“the Subsidiary Company”), a wholly owned subsidiary of Kohinoor Mills Limited was incorporated in Pakistan on 18 July 2005 as a private limited company under the Companies Ordinance, 1984. The registered office of the Subsidiary Company is situated at 8-K.M., Manga Raiwind Road, District Kasur. The principal activity of the Subsidiary Company was to carry on business as a retailer in all types of general merchandise.
1.2.2 During the year ended 30 June 2013, the Holding Company, in line with its decision
to focus on its core fabric business, has decided to pull out of retail business and has accordingly shut-down all Q-Mart retail stores. The Subsidiary Company has disposed of all assets except for freehold land and building on freehold land. A large number of receivables and payables have been settled. As the Subsidiary Company has ceased trading and disposed of majority of its assets, hence, the Subsidiary Company is not considered a going concern. All assets and liabilities of the Subsidiary Company reported in its financial statements are based on estimated realizable / settlement values.
2. SUMMArY oF SiGNiFicANt AccoUNtiNG poLicieS The significant accounting policies applied in the preparation of these consolidated financial
statements are set out below. These policies have been consistently applied to all years presented, unless otherwise stated:
103Annual Report 2016
2.1 Basis of preparation a) Statement of compliance These consolidated financial statements have been prepared in accordance with approved
accounting standards as applicable in Pakistan. Approved accounting standards comprise of such International Financial Reporting Standards (IFRS) issued by the International Accounting Standards Board as are notified under the Companies Ordinance, 1984, provisions of and directives issued under the Companies Ordinance, 1984. In case requirements differ, the provisions or directives of the Companies Ordinance, 1984 shall prevail.
b) Accounting convention These consolidated financial statements have been prepared under the historical cost
convention, except for lands and buildings which are carried at revalued amounts and certain financial instruments which are carried at their fair value.
c) critical accounting estimates and judgments The preparation of these consolidated financial statements in conformity with the approved
accounting standards requires the use of certain critical accounting estimates. It also requires the management to exercise its judgment in the process of applying accounting policies. Estimates and judgments are continually evaluated and are based on historical experience and other factors, including expectations of future events that are believed to be reasonable under the circumstances. The areas where various assumptions and estimates are significant to these consolidated financial statements or where judgments were exercised in application of accounting policies are as follows:
Financial instruments The fair value of financial instruments that are not traded in an active market is determined by
using valuation techniques based on assumptions that are dependent on conditions existing at the balance sheet date.
Useful lives, patterns of economic benefits and impairments Estimates with respect to residual values and useful lives and pattern of flow of economic benefits
are based on the analysis of the management. Further, the values of assets are reviewed for possible impairments on an annual basis. Any change in the estimates in the future might affect the carrying amount of respective item of property, plant and equipment, with a corresponding effect on the depreciation charge and impairment.
taxation In making the estimates for income tax liability, the management takes into account the current
income tax law and the decisions of appellate authorities on certain issues in the past. provision for doubtful debts Receivables are reviewed against any provision required for any doubtful balances on an ongoing
basis. The provision is made while taking into consideration expected recoveries, if any.

104 Kohinoor Mills Limited and its Subsidiary
inventories Net realizable value of inventories is determined with reference to currently prevailing selling
prices less estimated expenditure to make sales. provision for obsolescence of stores, spares and loose tools Provision for obsolescence of items of stores, spares and loose tools is made on the basis of
management’s estimate of net realizable value and ageing analysis prepared on an item-by-item basis. d) Standards that are effective in current year and are relevant to the Group The following standards are mandatory for the Group’s accounting periods beginning on or after
01 July 2015: IFRS 10 ‘Consolidated Financial Statements’ (effective for annual periods beginning on or after
01 January 2015). Concurrent with the issuance of IFRS 10, the IASB has also issued IFRS 11 ‘Joint Arrangements’, IFRS 12 ‘Disclosure of Interests in Other Entities’, IAS 27 ‘Separate Financial Statements’ and IAS 28 ‘Investments in Associates and Joint Ventures’. The objective of IFRS 10 is to have a single basis for consolidation for all entities, regardless of the nature of the investee, and that basis is control. The definition of control includes three elements: power over an investee, exposure or rights to variable returns of the investee and the ability to use power over the investee to affect the investor’s returns. IFRS 10 replaces those parts of IAS 27 that address when and how an investor should prepare consolidated financial statements and replaces Standing Interpretations Committee (SIC) 12 ‘Consolidation – Special Purpose Entities’ in its entirety. This standard does not have significant impact on these consolidated financial statements, except for certain additional disclosures.
IFRS 12 ‘Disclosures of Interests in Other Entities’ (effective for annual periods beginning on
or after 01 January 2015). This standard includes the disclosure requirements for all forms of interests in other entities, including joint arrangements, associates, special purpose vehicles and other off-balance sheet vehicles. This standard does not have significant impact on these consolidated financial statements, except for certain additional disclosures.
IFRS 13 ‘Fair value Measurement’ (effective for annual periods beginning on or after 01 January
2015). This standard aims to improve consistency and reduce complexity by providing a precise definition of fair value and a single source of fair value measurement and disclosure requirements for use across IFRSs. The requirements, which are largely aligned between IFRSs and US GAAP, do not extend the use of fair value accounting but provide guidance on how it should be applied where its use is already required or permitted by other standards within IFRSs or US GAAP. This standard does not have significant impact on these consolidated financial statements, except for certain additional disclosures.
e) Amendments to published standards that are effective in current year but not relevant to the
Group There are amendments to published standards that are mandatory for accounting periods
beginning on or after 01 July 2015 but are considered not to be relevant or do not have any significant impact on the Group’s consolidated financial statements and are therefore not detailed in these financial statements.
105Annual Report 2016
f) Standards and amendments to published approved accounting standards that are not yet effective but relevant to the Group
Following standards and amendments to existing standards have been published and are
mandatory for the Group’s accounting periods beginning on or after 01 July 2016 or later periods:
IFRS 9 ‘Financial Instruments’ (effective for annual periods beginning on or after 01 January 2018).
A finalized version of IFRS 9 which contains accounting requirements for financial instruments, replacing IAS 39 ‘Financial Instruments: Recognition and Measurement’. Financial assets are classified by reference to the business model within which they are held and their contractual cash flow characteristics. The 2014 version of IFRS 9 introduces a ‘fair value through other comprehensive income’ category for certain debt instruments. Financial liabilities are classified in a similar manner as under IAS 39, however there are differences in the requirements applying to the measurement of an entity’s own credit risk. The 2014 version of IFRS 9 introduces an ‘expected credit loss’ model for the measurement of the impairment of financial assets, so it is no longer necessary for a credit event to have occurred before a credit loss is recognized. It introduces a new hedge accounting model that is designed to be more closely aligned with how entities undertake risk management activities when hedging financial and non-financial risk exposures. The requirements for the derecognition of financial assets and liabilities are carried forward from IAS 39. The management of the Group is in the process of evaluating the impacts of the aforesaid standard on the Group’s consolidated financial statements.
IFRS 15 ‘Revenue from Contracts with Customers’ (effective for annual periods beginning on or
after 01 January 2018). IFRS 15 provides a single, principles based five-step model to be applied to all contracts with customers. The five steps in the model are: identify the contract with the customer; identify the performance obligations in the contract; determine the transaction price; allocate the transaction price to the performance obligations in the contracts; and recognize revenue when (or as) the entity satisfies a performance obligation. Guidance is provided on topics such as the point in which revenue is recognized, accounting for variable consideration, costs of fulfilling and obtaining a contract and various related matters. New disclosures about revenue are also introduced. The aforesaid standard is not expected to have a material impact on the Group’s consolidated financial statements.
IFRS 15 (Amendments), ‘Revenue from Contracts with Customers’ (effective for annual periods
beginning on or after 01 January 2018). Amendments clarify three aspects of the standard (identifying performance obligations, principal versus agent considerations, and licensing) and to provide some transition relief for modified contracts and completed contracts. The aforesaid amendments are not expected to have a material impact on the Group’s consolidated financial statements.
IAS 7 (Amendments), ‘Statement of Cash Flows’ (effective for annual periods beginning on
or after 01 January 2017). Amendments have been made to clarify that entities shall provide disclosures that enable users of financial statements to evaluate changes in liabilities arising from financing activities. The aforesaid amendments will result in certain additional disclosures in the Group’s consolidated financial statements.
IAS 16 (Amendments) ‘Property, Plant and Equipment’ (effective for annual periods beginning
on or after 01 January 2016). The amendments clarify that a depreciation method which is based on revenue, generated by an activity by using of an asset is not appropriate for property,

106 Kohinoor Mills Limited and its Subsidiary
plant and equipment; and add guidance that expected future reductions in the selling price of an item that was produced using an asset could indicate the expectation of technological or commercial obsolescence of the asset, which, in turn, might reflect a reduction of the future economic benefits embodied in the asset. However, the amendments are not expected to have a material impact on the Group’s consolidated financial statements.
IAS 27 (Amendments) ‘Separate Financial Statements’ (effective for annual periods beginning
on or after 01 January 2016). The amendments have been made to permit investments in subsidiaries, joint ventures and associates to be optionally accounted for using the equity method in separate financial statements. The management of the Group is in the process of evaluating the impacts of the aforesaid amendments on the Group’s consolidated financial statements.
Amendments to IFRS 10 and IAS 28 (deferred indefinitely) to clarify the treatment of the sale
or contribution of assets from an investor to its associates or joint venture, as follows: require full recognition in the investor’s financial statements of gains and losses arising on the sale or contribution of assets that constitute a business (as defined in IFRS 3 ‘Business Combinations’); require the partial recognition of gains and losses where the assets do not constitute a business, i.e. a gain or loss is recognized only to the extent of the unrelated investors’ interests in that associate or joint venture. These requirements apply regardless of the legal form of the transaction, e.g. whether the sale or contribution of assets occur by an investor transferring shares in a subsidiary that holds the assets (resulting in loss of control of the subsidiary), or by the direct sale of the assets themselves. The management of the Group is in the process of evaluating the impacts of the aforesaid amendments on the Group’s consolidated financial statements.
On 25 September 2014, IASB issued Annual Improvements to IFRSs: 2012 – 2014 Cycle,
incorporating amendments to four IFRSs more specifically in IAS 34 ‘Interim Financial Reporting’, which is considered relevant to the Group’s consolidated financial statements. These amendments are effective for annual periods beginning on or after 01 January 2016. This amendment is unlikely to have a significant impact on the Group’s consolidated financial statements and has therefore not been analyzed in detail.
g) Standard and amendments to published standards that are not yet effective and not
considered relevant to the Group There are other standard and amendments to published standards that are mandatory for
accounting periods beginning on or after 01 July 2016 but are considered not to be relevant or do not have any significant impact on the Group’s consolidated financial statements and are therefore not detailed in these consolidated financial statements
2.2 consolidation Subsidiary
Subsidiaries are those entities in which the Holding Company directly or indirectly controls, beneficially owns or holds more than 50% of the voting securities or otherwise has power to elect and appoint more than 50% of its directors. The financial statements of the Subsidiary Company are included in the consolidated financial statements from the date control commences until the date that control ceases.
107Annual Report 2016
The assets and liabilities of Subsidiary Company have been consolidated on a line by line basis and the carrying value of investment held by the Holding Company is eliminated against Holding Company’s share in paid up capital of the Subsidiary Company.
Inter Group balances and transactions have been eliminated. Non-controlling interests are that part of net results of the operations and of net assets of the
Subsidiary Company attributable to interest which are not owned by the Holding Company. Non-controlling interests are presented as a separate item in the consolidated financial statements.
2.3 Employee benefit The Holding Company operates a funded contributory provident fund scheme for its permanent
employees. The Holding Company and employees make equal monthly contributions of 8.33 percent of the basic salary, towards the fund. The Holding Company’s contribution is charged to the profit and loss account.
2.4 provisions Provisions are recognized in the balance sheet when the Group has a legal or constructive
obligation as a result of past events and it is probable that outflow of economic benefits will be required to settle the obligation and a reliable estimate can be made of the amount of obligation. However, provisions are reviewed at each balance sheet date and adjusted to reflect current best estimate.
2.5 taxation current Provision for current tax is based on the taxable income for the year determined in accordance
with the prevailing law for taxation of income. The charge for current tax is calculated using prevailing tax rates or tax rates expected to apply to the profit for the year if enacted. The charge for current tax also includes adjustments, where considered necessary, to provision for tax made in previous years arising from assessments framed during the year for such years.
Deferred Deferred tax is accounted for using the balance sheet liability method in respect of all temporary
differences arising from differences between the carrying amount of assets and liabilities in the financial statements and the corresponding tax bases used in the computation of the taxable profit. Deferred tax liabilities are generally recognized for all taxable temporary differences and deferred tax assets to the extent that it is probable that taxable profits will be available against which the deductible temporary differences, unused tax losses and tax credits can be utilized.
Deferred tax is calculated at the rates that are expected to apply to the period when the
differences reverse based on tax rates that have been enacted or substantively enacted by the balance sheet date. Deferred tax is charged or credited in the profit and loss account, except to the extent that it relates to items recognized in other comprehensive income or directly in equity. In this case the tax is also recognized in statement comprehensive income or directly in equity, respectively.
108 Kohinoor Mills Limited and its Subsidiary
2.6 Foreign currencies
These consolidated financial statements are presented in Pak Rupees, which is the Group’s functional currency. All monetary assets and liabilities in foreign currencies are translated into Pak Rupees at exchange rates prevailing at the balance sheet date. Transactions in foreign currencies are translated into Pak Rupees at the spot rate. All non-monetary items are translated into Pak Rupees at exchange rates prevailing on the date of transaction or on the date when fair values are determined. Exchange gains and losses, where applicable, are recognized in the profit and loss account.
2.7 Fixed assets 2.7.1 property, plant and equipment and depreciation owned a) cost
Property, plant and equipment except freehold land and buildings are stated at cost less accumulated depreciation and any identified impairment loss. Freehold land is stated at revalued amount less any identified impairment loss, buildings are stated at revalued amount less accumulated depreciation and any identified impairment loss, while capital work-in-progress is stated at cost less any identified impairment loss.
Subsequent costs are included in the asset’s carrying amount or recognized as a
separate asset, as appropriate, only when it is probable that future economic benefits associated with the item will flow to the Group and the cost of the item can be measured reliably. All other repair and maintenance costs are charged to income during the period in which they are incurred.
Increases in the carrying amount arising on revaluation of operating fixed assets are
credited to surplus on revaluation of operating fixed assets. Decreases that offset previous increases of the same assets are charged against this surplus, all other decreases are charged to income. each year the difference between depreciation based on revalued carrying amount of the asset (the depreciation charged to the income) and depreciation based on the assets’ original cost is transferred from surplus on revaluation of operating fixed assets to accumulated loss. All transfers to / from surplus on revaluation of operating fixed assets are net of applicable deferred income tax.
b) Depreciation Depreciation on all operating fixed assets is charged to income on a reducing balance
method so as to write off cost / depreciable amount of an asset over its estimated useful life at the rates as disclosed in note 15.1. Depreciation on additions is charged from the month in which the asset is put to use and on disposal up to the month of disposal. The residual values and useful lives are reviewed by the management, at each financial year end and adjusted if impact on depreciation is significant.

109Annual Report 2016
c) Derecognition An item of property, plant and equipment is derecognized on disposal or when no
future economic benefits are expected from its use or disposal. Any gain or loss arising on derecognition of the asset (calculated as the difference between the net disposal proceeds and carrying amount of the asset) is included in the consolidated profit and loss account in the year the asset is derecognized.
Leased a) Finance leases Leases where the Group has substantially all the risk and rewards of ownership are
classified as finance lease. Assets subject to finance lease are capitalized at the commencement of the lease term at the lower of present value of minimum lease payments under the lease agreements and the fair value of the leased assets, each determined at the inception of the lease.
The related rental obligation net of finance cost, is included in liabilities against assets
subject to finance lease. The liabilities are classified as current and long term depending upon the timing of payments.
Each lease payment is allocated between the liability and finance cost so as to achieve
a constant rate on the balance outstanding. The finance cost is charged to income over the lease term.
Depreciation of assets subject to finance lease is recognized in the same manner as for
owned assets. Depreciation of the leased assets is charged to income. b) operating leases Leases where significant portion of the risk and rewards of ownership are retained by
the lessor are classified as operating leases. Payments made under operating leases are charged to the income on a straight-line basis over the period of lease.
2.7.2 intangible assets Intangible assets, which are non-monetary assets without physical substance, are
recognized at cost, which comprise purchase price, non-refundable purchase taxes and other directly attributable expenditures relating to their implementation and customization. After initial recognition an intangible asset is carried at cost less accumulated amortization and impairment losses, if any. Intangible assets are amortized from the month, when these assets are available for use, using the straight line method, whereby the cost of the intangible asset is amortized over its estimated useful life over which economic benefits are expected to flow to the Group. The useful life and amortization method are reviewed and adjusted, if appropriate, at each balance sheet date.
2.8 investments Classification of an investment is made on the basis of intended purpose for holding such
investment. Management determines the appropriate classification of its investments at the time of purchase and re-evaluates such designation on regular basis.
110 Kohinoor Mills Limited and its Subsidiary
Investments are initially measured at fair value plus transaction costs directly attributable to acquisition, except for “Investment at fair value through profit or loss” which is initially measured at fair value.
a) Investments at fair value through profit or loss Investments classified as held-for-trading and those designated as such are included in this
category. Investments are classified as held-for-trading if they are acquired for the purpose of selling in the short term. Gains or losses on investments held-for-trading are recognized in the consolidated profit and loss account.
b) Held-to-maturity Investments with fixed or determinable payments and fixed maturity are classified as held-to-
maturity when the Group has the positive intention and ability to hold to maturity. Investments intended to be held for an undefined period are not included in this classification. Other long term investments that are intended to be held to maturity are subsequently measured at amortized cost. This cost is computed as the amount initially recognized minus principal repayments, plus or minus the cumulative amortization using the effective interest method of any difference between the initially recognized amount and the maturity amount. For investments carried at amortized cost, gains and losses are recognized in profit and loss account when the investments are derecognized or impaired, as well as through the amortization process.
c) Available-for-sale Investments intended to be held for an indefinite period of time, which may be sold in response
to need for liquidity, or changes to interest rates or equity prices are classified as available-for-sale. After initial recognition, investments which are classified as available-for-sale are measured at fair value. Gains or losses on available-for-sale investments are recognized directly in consolidated statement of comprehensive income until the investment is sold, de-recognized or is determined to be impaired, at which time the cumulative gain or loss previously reported in the consolidated statement of comprehensive income is included in the consolidated profit and loss account. These are sub-categorized as under:
Quoted For investments that are actively traded in organized capital markets, fair value is determined by
reference to stock exchange quoted market bids at the close of business on the balance sheet date.
Unquoted Fair value of unquoted investments is determined on the basis of appropriate valuation
techniques as allowed by IAS 39 ‘Financial Instruments: Recognition and Measurement’. d) equity investments in associated companies The investments in associates in which the Group does not have significant influence are
classified as “Available-for-Sale”.

111Annual Report 2016
2.9 inventories Inventories, except for stock in transit, waste stock and rejected goods are stated at lower of
cost and net realizable value. Cost is determined as follows: Stores, spares and loose tools useable stores and spares are valued principally at moving average cost, while items considered
obsolete are carried at nil value. In transit stores and spares are valued at cost comprising invoice value plus other charges paid thereon.
Stock-in-trade Cost of raw material is based on weighted average cost. Cost of work in process and finished goods comprises prime cost and appropriate production
overheads determined on weighted average cost. Cost of goods purchased for resale are valued at their respective purchase price by using first-in-first-out method.
Materials in transit are valued at cost comprising invoice value plus other charges paid thereon.
Waste stock and rejected goods are valued at net realizable value. Net realizable value signifies the estimated selling price in the ordinary course of business less
the estimated costs of completion and the estimated costs necessary to make a sale. 2.10 Non-current assets held for sale Non-current assets classified as assets held for sale are stated at the lower of carrying amount
and fair value less costs to sell if their carrying amount is recoverable principally through a sale transaction rather than through continuing use.
2.11 Borrowing costs Borrowing costs are recognized as expense in the period in which these are incurred except
to the extent of borrowing costs that are directly attributable to the acquisition, construction or production of a qualifying asset. Such borrowing cost, if any, are capitalized as part of the cost of that asset.
2.12 revenue recognition Revenue from different sources is recognized as under. (a) Revenue is recognized when the Group has transferred significant risks and rewards
associated with ownership of the goods to the buyers. Export sales and local sales are recognized on shipment and dispatch of goods to the customers respectively.
(b) Dividend on equity investments is recognized as income when right to receive payment
is established. (c) Profit on bank deposits is recognized on a time proportion basis taking into account,
the principal outstanding and rates of profits applicable thereon.

112 Kohinoor Mills Limited and its Subsidiary
2.13 impairment a) Financial assets A financial asset is considered to be impaired if objective evidence indicate that one or
more events had a negative effect on the estimated future cash flow of that asset. An impairment loss in respect of a financial asset measured at amortized cost is
calculated as a difference between its carrying amount and the present value of estimated future cash flows discounted at the original effective interest rate. An impairment loss in respect of available for sale financial asset is calculated with reference to its current fair value.
Individually significant financial assets are tested for impairment on an individual basis.
The remaining financial assets are assessed collectively in groups that share similar credit risk characteristics.
b) Non-financial assets The carrying amounts of the Group’s non-financial assets are reviewed at each
balance sheet date to determine whether there is any indication of impairment. If such indication exists, the recoverable amount of such asset is estimated. An impairment loss is recognized wherever the carrying amount of the asset exceeds its recoverable amount. Impairment losses are recognized in consolidated profit and loss account. A previously recognized impairment loss is reversed only if there has been a change in the estimates used to determine the asset’s recoverable amount since the last impairment loss was recognized. If that is the case, the carrying amount of the asset is increased to its recoverable amount. That increased amount cannot exceed the carrying amount that would have been determined, net of depreciation, had non impairment loss been recognized for the assets in prior years. Such reversal is recognized in consolidated profit and loss account.
2.14 Share capital Ordinary shares are classified as equity and recognized at their face value. Incremental costs
directly attributable to the issue of new shares are shown in equity as a deduction, net of tax, if any.
2.15 Financial instruments Financial instruments are recognized at fair value when the Group becomes party to the
contractual provisions of the instrument by following trade date accounting. Any gain or loss on the subsequent measurement is charged to the consolidated profit and loss account except for available for sale investments. The Group derecognizes a financial asset or a portion of financial asset when, and only when, the enterprise loses the control over contractual right that comprises the financial asset or a portion of financial asset. While a financial liability or a part of financial liability is derecognized from the consolidated balance sheet when, and only when, it is extinguished, i.e., when the obligation specified in contract is discharged, cancelled or expired.
113Annual Report 2016
The particular measurement methods adopted are disclosed in the individual policy statements associated with each item.
Financial assets are investments, trade debts, deposits, advances, other receivables and cash and bank balances.
Financial liabilities are classified according to the substance of the contractual agreements
entered into. Significant financial liabilities are long term financing, short term borrowings, accrued markup, sponsors’ loan, loan from director and trade and other payables.
2.15.1 trade debts and other receivables Trade debts and other receivable are initially measured at fair value and subsequently
at amortized cost using effective interest rate method less provision for impairment. A provision is established when there is objective evidence that the Group will not be able to collect all amounts due according to the original terms of receivables. Trade debts and other receivables considered irrecoverable are written off.
2.15.2 trade and other payables Liabilities for trade and other amounts payable are initially recognized at fair value which
is normally the transaction cost. 2.15.3 Markup bearing borrowings Borrowings are recognized initially at fair value and are subsequently stated at amortized
cost, any difference between the proceeds and the redemption value is recognized in the consolidated profit and loss account over the period of the borrowing using the effective interest rate method.
2.15.4 cash and cash equivalents Cash and cash equivalents comprise cash in hand, cash at banks on current accounts,
saving and deposit accounts and other short term highly liquid instruments that are readily convertible into known amounts of cash and which are subject to insignificant risk of changes in values.
2.16 Derivative financial instruments Derivative financial instruments are initially recognized at fair value on the date a derivative
contract is entered into and are remeasured to fair value at subsequent reporting dates. The method of recognizing the resulting gain or loss depends on whether the derivative is designated as a hedging instrument, and if so, the nature of the item being hedged. The Group designates certain derivatives as cash flow hedges.
The Group documents at the inception of the transaction the relationship between the hedging
instruments and hedged items, as well as its risk management objective and strategy for undertaking various hedge transactions. The Group also documents its assessment, both at hedge inception and on an ongoing basis, of whether the derivatives that are used in hedging transactions are highly effective in offsetting changes in cash flow of hedged items.
114 Kohinoor Mills Limited and its Subsidiary
The effective portion of changes in the fair value of derivatives that are designated and qualify as cash flow hedges are recognized in the consolidated statement of comprehensive income. The gain or loss relating to the ineffective portion is recognized immediately in the consolidated profit and loss account.
Amounts accumulated in equity are recognized in the consolidated profit and loss account in
the periods when the hedged item will affect profit or loss. 2.17 Segment reporting Segment reporting is based on the operating (business) segments of the Group. An operating
segment is a component of the Group that engages in business activities from which it may earn revenues and incur expenses, including revenues and expenses that relate to the transactions with any of the Group’s other components. An operating segment’s operating results are reviewed regularly by the Group’s Chief Operating Decision Maker to make decisions about resources to be allocated to the segment and assess its performance, and for which discrete financial information is available.
Segment results that are reported to the Group’s Chief Operating Decision Maker include items
directly attributable to a segment as well as those that can be allocated on a reasonable basis. Those incomes, expenses, assets, liabilities and other balances which can not be allocated to a particular segment on a reasonable basis are reported as unallocated.
The Group has four reportable business segments. Weaving (Producing different quality of greige
fabric using yarn), Dyeing (Converting greige into dyed fabric), Power Generation (Generating and distributing power) and Retail (The segment was engaged in selling all type of general merchandise).
Transactions among the business segments are recorded at arm’s length prices using admissible
valuation methods. Inter segment sales and purchases are eliminated from the total. 2.18 Off setting of financial assets and liabilities Financial assets and liabilities are set off and the net amount is reported in the consolidated
financial statements when there is legally enforceable right to set off and the Group intends either to settle on a net basis, or to realize the asset and settle the liability simultaneously.
2.19 Dividend and other appropriations Dividend to the shareholders is recognized in the period in which it is declared and other
appropriations are recognized in the period in which these are approved by the Board of Directors.
2.20 Goodwill Goodwill represents the excess of the cost of an acquisition over the fair value of the Group’s
share of the identifiable net assets acquired. Goodwill is tested annually for impairment and carried at cost less accumulated impairment losses. Any impairment is recognized immediately through the consolidated profit and loss account and is not subsequently reversed.

115Annual Report 2016
3. AUtHoriZeD SHAre cApitAL 2016 2015 2016 2015 (NUMBer oF SHAreS) rupees rupees
80,000,000 80,000,000 Ordinary shares of Rupees 10 each 800,000,000 800,000,000 30,000,000 30,000,000 Preference shares of Rupees 10 each 300,000,000 300,000,000
110,000,000 110,000,000 1,100,000,000 1,100,000,000
4. iSSUeD, SUBScriBeD AND pAiD-Up SHAre cApitAL 2016 2015 (NUMBer oF SHAreS)
28,546,003 28,546,003 Ordinary shares of Rupees 285,460,030 285,460,030 10 each fully paid in cash
18,780,031 18,780,031 Ordinary shares of Rupees 10 each 187,800,310 187,800,310 issued as fully paid bonus shares
3,584,977 3,584,977 Ordinary shares of Rupees 10 each 35,849,770 35,849,770 issued due to merger with Kohinoor Genertek Limited as per scheme of arrangement 50,911,011 50,911,011 509,110,110 509,110,110
2016 2015 rupees rupees5. reSerVeS
Composition of reserves is as follows:
capital reserves Share premium reserve (Note 5.1) 213,406,310 213,406,310 Fair value reserve - net of deferred income tax (Note 5.2) 39,523,592 118,792,195
252,929,902 332,198,505 revenue reserves General reserve 1,058,027,640 1,058,027,640 Accumulated loss (951,109,396) (1,093,483,518)
106,918,244 (35,455,878) equity portion of sponsor’s loan (Note 8) - 75,144,631 359,848,146 371,887,258
5.1 This reserve can be utilized by the purposes specified in section 83(2) of the Companies Ordinance, 1984.

116 Kohinoor Mills Limited and its Subsidiary
2016 2015 rupees rupees
5.2 Fair value reserve - net of deferred income tax
Balance as at 01 July 156,305,520 176,175,521 Fair value adjustment on investment during the year (104,808,983) (19,870,001)
Balance as at 30 June 51,496,537 156,305,520 Less: Related deferred income tax liability 11,972,945 37,513,325 Balance as at 30 June - net of deferred income tax 39,523,592 118,792,195
5.2.1 This represents unrealized gain on re-measurement of available for sale investment at fair value and is not available for distribution. This will be transferred to profit and loss account on realization.
2016 2015 rupees rupees6. SUrpLUS oN reVALUAtioN oF operAtiNG FiXeD ASSetS - Net oF DeFerreD iNcoMe tAX Balance as at 01 July 1,169,670,496 826,901,350 Add: Surplus on revaluation incorporated during the year - 361,748,466 Less: Incremental depreciation 24,607,850 18,979,320 Balance as at 30 June 1,145,062,646 1,169,670,496 Less: Related deferred income tax liability 34,521,799 37,510,953 Balance as at 30 June - net of deferred income tax 1,110,540,847 1,132,159,543
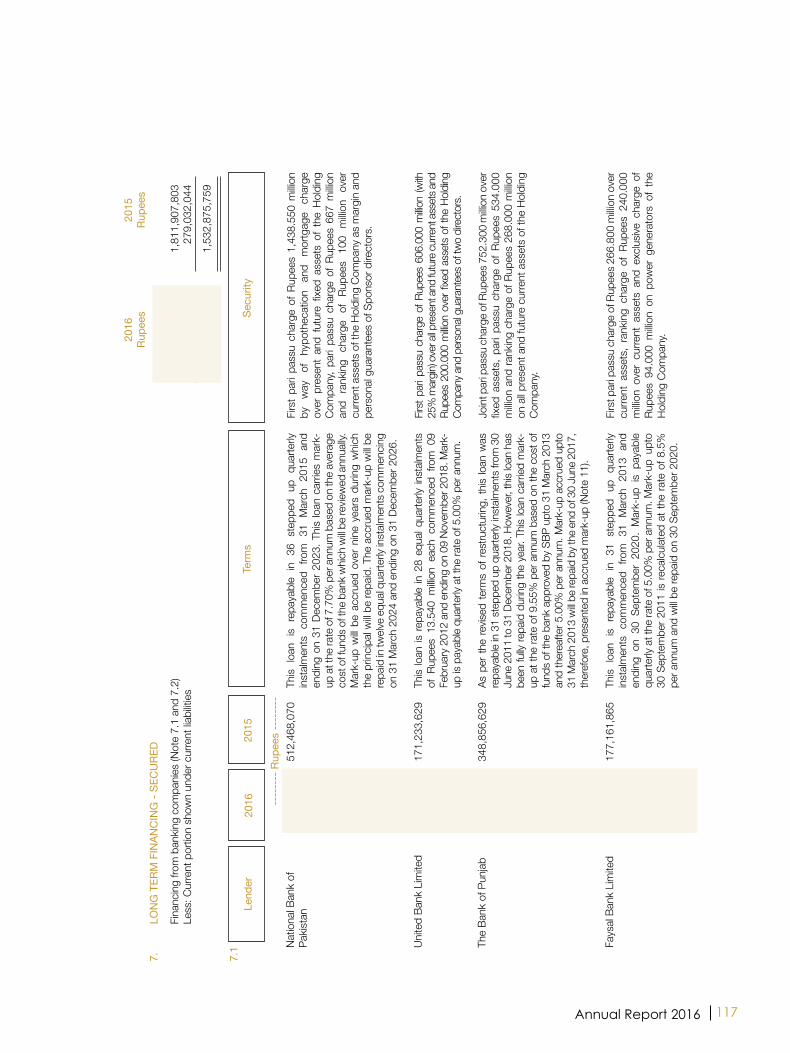
117Annual Report 2016
Natio
nal B
ank
of
Pakis
tan
unite
d Ba
nk L
imite
d
The
Bank
of P
unjab
Fays
al Ba
nk L
imite
d
464
,245
,511
11,
586,
079 -
161
,894
,049
512
,468
,070
171
,233
,629
348
,856
,629
177
,161
,865
This
loan
is
repa
yabl
e in
36
step
ped
up q
uarte
rly
inst
almen
ts c
omm
ence
d fro
m 3
1 M
arch
201
5 an
d en
ding
on
31 D
ecem
ber 2
023.
Thi
s lo
an c
arrie
s m
ark-
up a
t the
rate
of 7
.70%
per
ann
um b
ased
on
the
aver
age
cost
of f
unds
of t
he b
ank
whi
ch w
ill be
revie
wed
ann
ually
. M
ark-
up w
ill be
acc
rued
ove
r ni
ne y
ears
dur
ing
whi
ch
the
prin
cipal
will
be re
paid
. The
acc
rued
mar
k-up
will
be
repa
id in
twelv
e eq
ual q
uarte
rly in
stalm
ents
com
men
cing
on 3
1 M
arch
202
4 an
d en
ding
on
31 D
ecem
ber 2
026.
This
loan
is re
paya
ble
in 28
equ
al qu
arte
rly in
stalm
ents
of
Rup
ees
13.5
40 m
illion
each
com
men
ced
from
09
Febr
uary
201
2 an
d en
ding
on
09 N
ovem
ber 2
018.
Mar
k-up
is p
ayab
le qu
arte
rly a
t the
rate
of 5
.00%
per
ann
um.
As p
er th
e re
vised
term
s of
rest
ruct
uring
, this
loan
was
re
paya
ble
in 31
ste
pped
up
quar
terly
inst
almen
ts fr
om 3
0 Ju
ne 2
011
to 3
1 De
cem
ber 2
018.
How
ever
, this
loan
has
be
en fu
lly re
paid
dur
ing th
e ye
ar. T
his lo
an c
arrie
d m
ark-
up a
t the
rate
of 9
.55%
per
ann
um b
ased
on
the
cost
of
fund
s of
the
bank
app
rove
d by
SBP
upt
o 31
Mar
ch 2
013
and
ther
eafte
r 5.0
0% p
er a
nnum
. Mar
k-up
acc
rued
upt
o 31
Mar
ch 2
013
will
be re
paid
by t
he e
nd o
f 30
June
201
7,
ther
efor
e, p
rese
nted
in a
ccru
ed m
ark-
up (N
ote
11).
This
loan
is
repa
yabl
e in
31
step
ped
up q
uarte
rly
inst
almen
ts c
omm
ence
d fro
m 3
1 M
arch
201
3 an
d en
ding
on
30 S
epte
mbe
r 20
20.
Mar
k-up
is
paya
ble
quar
terly
at t
he ra
te o
f 5.0
0% p
er a
nnum
. Mar
k-up
upt
o 30
Sep
tem
ber 2
011
is re
calcu
lated
at t
he ra
te o
f 8.5
%
per a
nnum
and
will
be re
paid
on
30 S
epte
mbe
r 202
0.
Firs
t par
i pas
su c
harg
e of
Rup
ees
1,43
8.55
0 m
illion
by
w
ay
of
hypo
thec
atio
n an
d m
ortg
age
char
ge
over
pre
sent
and
fut
ure
fixed
ass
ets
of t
he H
oldi
ng
Com
pany
, pa
ri pa
ssu
char
ge o
f Rup
ees
667
milli
on
and
rank
ing
char
ge
of
Rupe
es
100
milli
on
over
cu
rrent
ass
ets
of th
e Ho
ldin
g Co
mpa
ny a
s m
argi
n an
d pe
rson
al gu
aran
tees
of S
pons
or d
irect
ors.
First
par
i pas
su c
harg
e of
Rup
ees
606.
000
millio
n (w
ith
25%
mar
gin) o
ver a
ll pre
sent
and
futu
re cu
rrent
asse
ts an
d Ru
pees
200
.000
millio
n ov
er fi
xed
asse
ts o
f the
Hold
ing
Com
pany
and
per
sona
l gua
rant
ees o
f two
dire
ctor
s.
Join
t par
i pas
su c
harg
e of
Rup
ees 7
52.3
00 m
illion
ove
r fix
ed a
sset
s, p
ari p
assu
cha
rge
of R
upee
s 53
4.00
0 m
illion
and
rank
ing
char
ge o
f Rup
ees
268.
000
milli
on
on a
ll pre
sent
and
futu
re c
urre
nt a
sset
s of
the
Hold
ing
Com
pany
.
Firs
t par
i pas
su c
harg
e of
Rup
ees
266.
800
milli
on o
ver
curre
nt a
sset
s, r
ankin
g ch
arge
of
Rupe
es 2
40.0
00
milli
on o
ver
curre
nt a
sset
s an
d ex
clusiv
e ch
arge
of
Rupe
es 9
4.00
0 m
illion
on
pow
er g
ener
ator
s of
the
Ho
ldin
g Co
mpa
ny.
----
----
rup
ees
----
----
7.1
Lend
er20
1620
15Se
curit
yte
rms
2016
20
15
ru
pees
ru
pees
7.
LoN
G t
erM
FiN
ANc
iNG
- Se
cU
reD
Fi
nanc
ing
from
ban
king
com
pani
es (N
ote
7.1
and
7.2)
898
,610
,110
1
,811
,907
,803
Less
: Cur
rent
por
tion
show
n un
der c
urre
nt lia
biliti
es
1
63,3
23,4
16
279
,032
,044
735
,286
,694
1
,532
,875
,759

118 Kohinoor Mills Limited and its Subsidiary
NIB
Bank
Li
mite
d - I
NIB
Bank
Li
mite
d - I
I
Aska
ri Ba
nk
Lim
ited
Bank
Alfa
lah
Lim
ited
Habi
b Ba
nk L
imite
d
-
31,
350,
000
3,1
35,0
00
83,
280,
539 -
143
,118
,932
898
,610
,110
232
,632
,637
- -
98,
029,
978
105
,634
,500
165
,890
,495
1,8
11,9
07,8
03 As
per
the
rev
ised
term
s of
res
truct
urin
g, t
his
loan
was
re
paya
ble
in 3
6 st
eppe
d up
qua
rterly
inst
almen
ts fr
om 3
0 Se
ptem
ber 2
011
to 3
0 Ju
ne 2
020.
How
ever
, thi
s lo
an h
as
been
fully
repa
id d
urin
g th
e ye
ar. T
his
loan
car
ried
mar
k-up
at
the
rate
of 5
.00%
per
ann
um p
ayab
le qu
arte
rly.
This
loan
is re
paya
ble
in 2
0 qu
arte
rly in
stalm
ents
of R
upee
s 1.
650
milli
on e
ach
com
men
ced
from
31
Mar
ch 2
016
and
endi
ng o
n 31
Dec
embe
r 202
0. M
ark-
up is
pay
able
quar
terly
at
the
rate
of S
BP ra
te +
2.5
% p
er a
nnum
.
This
loan
is re
paya
ble
in 2
0 qu
arte
rly in
stalm
ents
of R
upee
s 0.
165
milli
on e
ach
com
men
ced
from
27
April
2016
and
en
ding
on
27 J
anua
ry 2
021.
Mar
k-up
is p
ayab
le qu
arte
rly
at th
e ra
te o
f SBP
rate
+ 2
.5%
per
ann
um.
This
loan
is re
paya
ble
in 3
2 qu
arte
rly in
stalm
ents
of R
upee
s 5.
282
milli
on e
ach
com
men
ced
from
30
June
201
3 an
d en
ding
on
31 M
arch
202
1. M
ark-
up is
pay
able
quar
terly
at
the
rate
of 5
.00%
per
ann
um.
As p
er t
he r
evise
d te
rms
of r
estru
ctur
ing,
thi
s lo
an w
as
repa
yabl
e in
32
step
ped
up q
uarte
rly in
stalm
ents
from
01
July
2012
to 0
1 Ap
ril 20
20. H
owev
er, t
his
loan
has
bee
n fu
lly r
epaid
dur
ing
the
year
. Thi
s lo
an c
arrie
d m
ark-
up a
t th
e ra
te o
f 8.3
0% p
er a
nnum
bas
ed o
n th
e co
st o
f fun
ds
of th
e ba
nk. M
ark-
up a
ccru
ed u
pto
03 M
ay 2
016
will
be
paid
in t
hirty
six
equa
l mon
thly
inst
almen
ts c
omm
encin
g on
01
May
202
0 an
d en
ding
on
01 A
pril
2023
, the
refo
re,
pres
ente
d in
def
erre
d ac
crue
d m
ark-
up (N
ote
9.1)
.
This
loan
is re
paya
ble i
n 32
step
ped
up q
uarte
rly in
stalm
ents
co
mm
ence
d fro
m 3
0 Ju
ne 2
012
and
endi
ng o
n 31
Mar
ch
2020
. Mar
k-up
is p
ayab
le qu
arte
rly a
t th
e ra
te o
f 5.0
0%
per a
nnum
.
Firs
t par
i pas
su c
harg
e of
Rup
ees
107.
000
milli
on o
ver
Com
pany
’s m
achi
nery
and
joi
nt p
ari
pass
u ch
arge
of
Rup
ees
800.
000
milli
on o
ver c
urre
nt a
sset
s of
the
Hold
ing
Com
pany
.
Join
t par
i pas
su c
harg
e of
Rup
ees
800.
000
milli
on o
n cu
rrent
ass
ets
and
Rupe
es
464.
000
milli
on o
n fix
ed
asse
ts o
f th
e Ho
ldin
g Co
mpa
ny.
Spec
ific c
harg
e of
Ru
pees
50.
000
milli
on o
n co
al bo
iler.
First
joint
par
i pas
su c
harg
e of
Rup
ees
506.
667
millio
n ov
er cu
rrent
asse
ts b
y way
of h
ypot
heca
tion a
nd ra
nking
ch
arge
of R
upee
s 16
9.00
0 m
illion
over
fixe
d as
sets
of
the
Hold
ing C
ompa
ny b
y w
ay o
f hyp
othe
catio
n.
Firs
t jo
int
pari
pass
u ch
arge
of
Rupe
es 4
10.0
00
milli
on o
ver a
ll pre
sent
and
futu
re c
urre
nt a
sset
s of
the
Hold
ing
Com
pany
. Fi
rst
join
t pa
ri pa
ssu
char
ge o
f Ru
pees
1,1
60.0
00
milli
on o
ver c
urre
nt a
sset
s, jo
int p
ari p
assu
cha
rge
of
Rupe
es 1
46.6
00 m
illion
, ra
nkin
g ch
arge
of
Rupe
es
362.
000
milli
on o
ver
fixed
ass
ets
of t
he H
oldi
ng
Com
pany
and
per
sona
l gua
rant
ees
of tw
o di
rect
ors.
7.2
Fair
valu
e of
long
term
fina
ncin
g w
as e
stim
ated
at t
he p
rese
nt v
alue
of fu
ture
cas
h flo
ws
disc
ount
ed a
t the
effe
ctive
inte
rest
rate
s ra
ngin
g fro
m 9
.31
% to
13.
56 %
pe
r ann
um.
----
----
rup
ees
----
----
Lend
er20
1620
15Se
curit
yte
rms
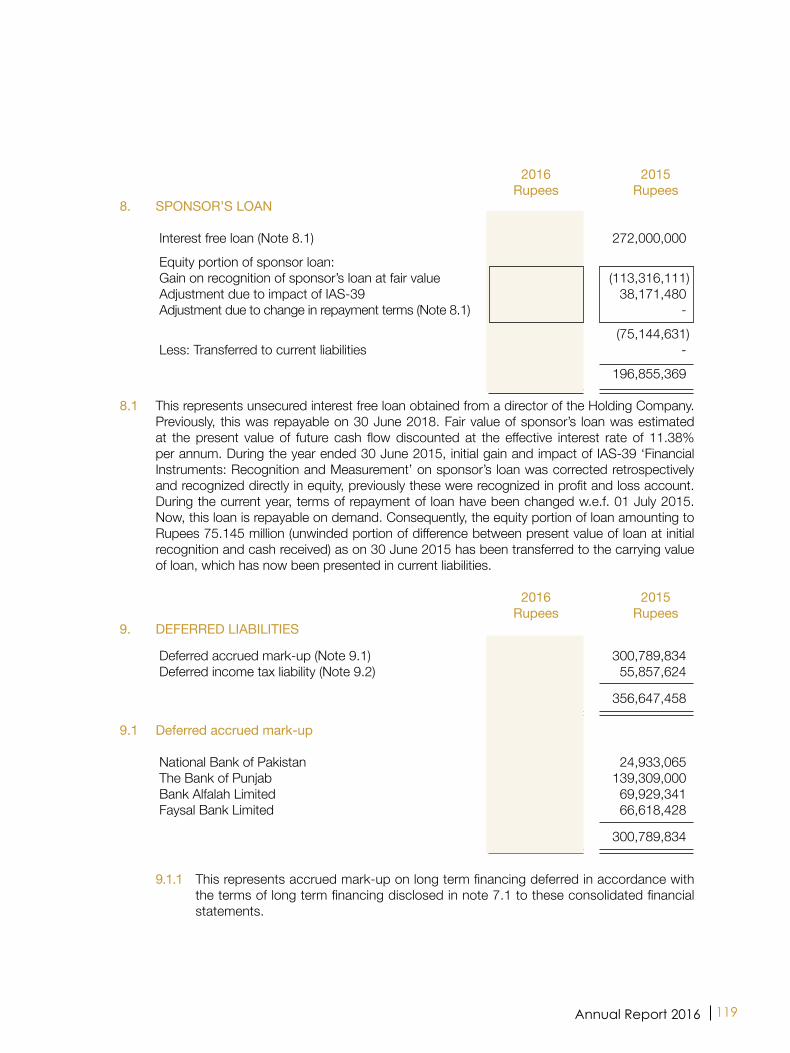
119Annual Report 2016
2016 2015 rupees rupees8. SpoNSor’S LoAN Interest free loan (Note 8.1) 272,000,000 272,000,000 equity portion of sponsor loan: Gain on recognition of sponsor’s loan at fair value (113,316,111) (113,316,111) Adjustment due to impact of IAS-39 38,171,480 38,171,480 Adjustment due to change in repayment terms (Note 8.1) 75,144,631 - - (75,144,631) Less: Transferred to current liabilities 272,000,000 - - 196,855,369 8.1 This represents unsecured interest free loan obtained from a director of the Holding Company.
Previously, this was repayable on 30 June 2018. Fair value of sponsor’s loan was estimated at the present value of future cash flow discounted at the effective interest rate of 11.38% per annum. During the year ended 30 June 2015, initial gain and impact of IAS-39 ‘Financial Instruments: Recognition and Measurement’ on sponsor’s loan was corrected retrospectively and recognized directly in equity, previously these were recognized in profit and loss account. During the current year, terms of repayment of loan have been changed w.e.f. 01 July 2015. Now, this loan is repayable on demand. Consequently, the equity portion of loan amounting to Rupees 75.145 million (unwinded portion of difference between present value of loan at initial recognition and cash received) as on 30 June 2015 has been transferred to the carrying value of loan, which has now been presented in current liabilities.
2016 2015 rupees rupees9. DeFerreD LiABiLitieS Deferred accrued mark-up (Note 9.1) 155,022,111 300,789,834 Deferred income tax liability (Note 9.2) 39,577,555 55,857,624 194,599,666 356,647,458 9.1 Deferred accrued mark-up National Bank of Pakistan 49,530,302 24,933,065 The Bank of Punjab - 139,309,000 Bank Alfalah Limited 38,873,381 69,929,341 Faysal Bank Limited 66,618,428 66,618,428 155,022,111 300,789,834 9.1.1 This represents accrued mark-up on long term financing deferred in accordance with
the terms of long term financing disclosed in note 7.1 to these consolidated financial statements.
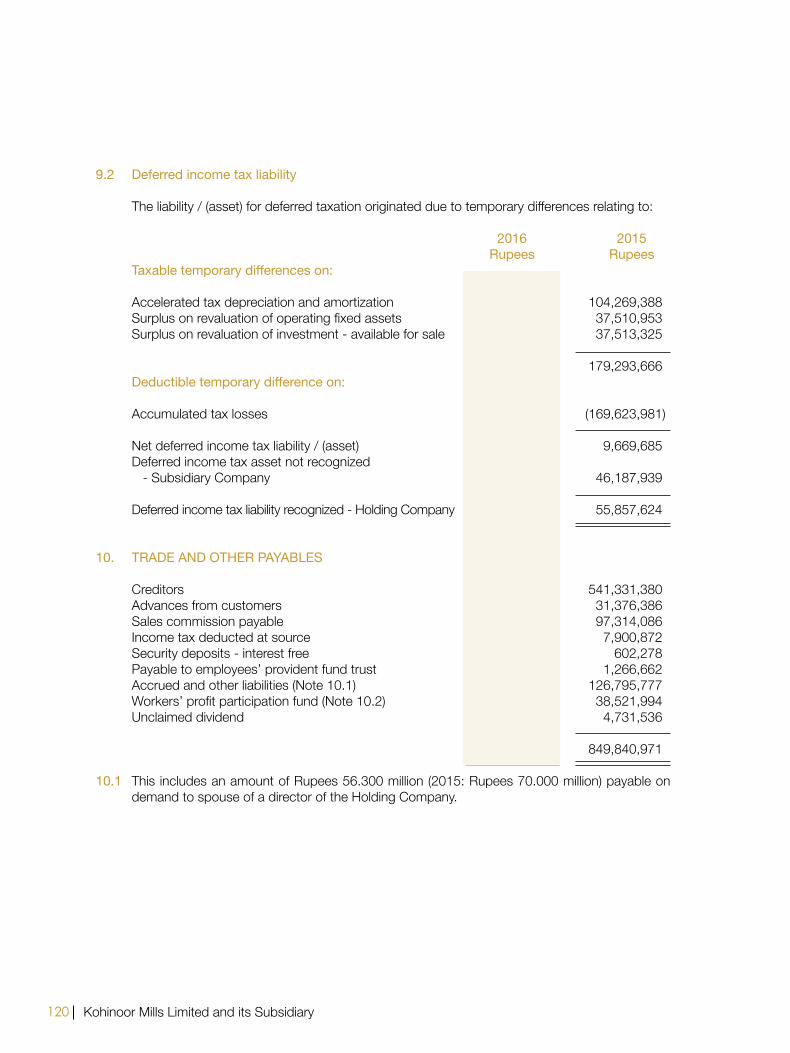
120 Kohinoor Mills Limited and its Subsidiary
9.2 Deferred income tax liability The liability / (asset) for deferred taxation originated due to temporary differences relating to:
2016 2015 rupees rupees Taxable temporary differences on: Accelerated tax depreciation and amortization 12,112,397 104,269,388 Surplus on revaluation of operating fixed assets 34,521,799 37,510,953 Surplus on revaluation of investment - available for sale 11,972,945 37,513,325 58,607,141 179,293,666 Deductible temporary difference on: Accumulated tax losses (59,578,962) (169,623,981) Net deferred income tax liability / (asset) (971,821) 9,669,685 Deferred income tax asset not recognized - Subsidiary Company 40,549,376 46,187,939 Deferred income tax liability recognized - Holding Company 39,577,555 55,857,624 10. trADe AND otHer pAYABLeS Creditors 570,788,935 541,331,380 Advances from customers 33,638,439 31,376,386 Sales commission payable 87,378,208 97,314,086 Income tax deducted at source 11,536,654 7,900,872 Security deposits - interest free 602,278 602,278 Payable to employees’ provident fund trust 1,563,635 1,266,662 Accrued and other liabilities (Note 10.1) 93,117,355 126,795,777 Workers’ profit participation fund (Note 10.2) 50,918,962 38,521,994 unclaimed dividend 4,731,536 4,731,536 854,276,002 849,840,971 10.1 This includes an amount of Rupees 56.300 million (2015: Rupees 70.000 million) payable on
demand to spouse of a director of the Holding Company.
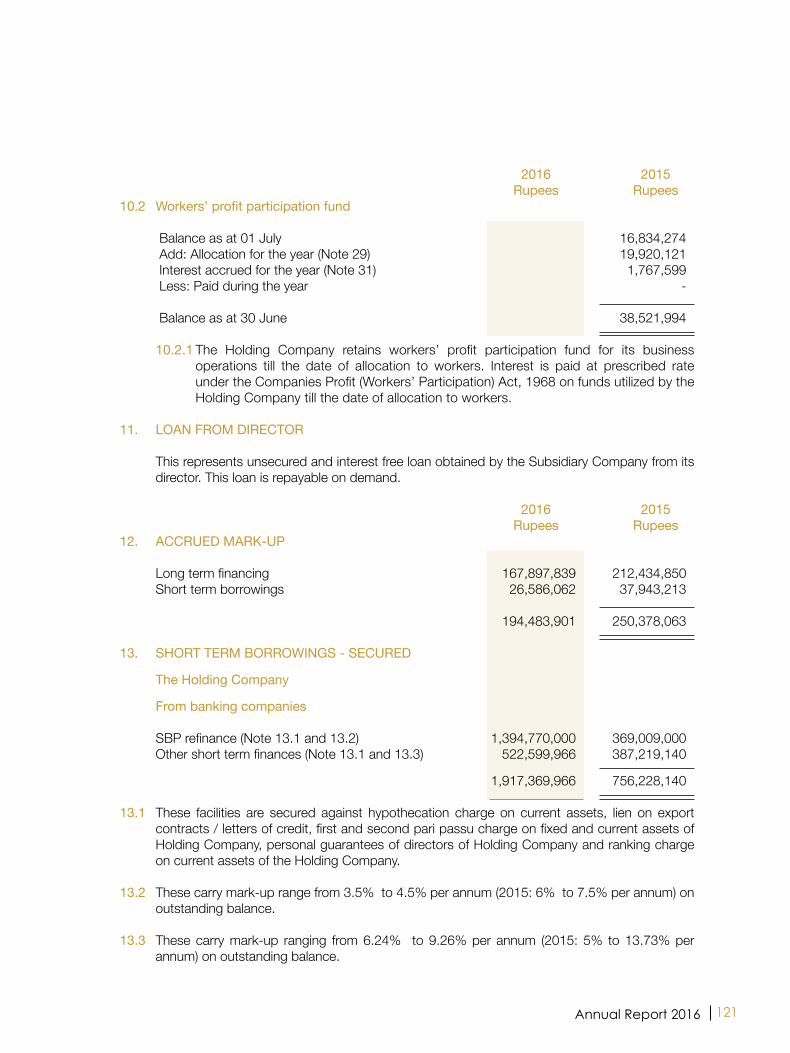
121Annual Report 2016
2016 2015 rupees rupees10.2 Workers’ profit participation fund Balance as at 01 July 38,521,994 16,834,274 Add: Allocation for the year (Note 29) 23,773,023 19,920,121 Interest accrued for the year (Note 31) 2,845,679 1,767,599 Less: Paid during the year 14,221,734 - Balance as at 30 June 50,918,962 38,521,994 10.2.1 The Holding Company retains workers’ profit participation fund for its business
operations till the date of allocation to workers. Interest is paid at prescribed rate under the Companies Profit (Workers’ Participation) Act, 1968 on funds utilized by the Holding Company till the date of allocation to workers.
11. LoAN FroM Director This represents unsecured and interest free loan obtained by the Subsidiary Company from its
director. This loan is repayable on demand.
2016 2015 rupees rupees12. AccrUeD MArK-Up Long term financing 167,897,839 212,434,850 Short term borrowings 26,586,062 37,943,213 194,483,901 250,378,063 13. SHort terM BorroWiNGS - SecUreD the Holding company From banking companies SBP refinance (Note 13.1 and 13.2) 1,394,770,000 369,009,000 Other short term finances (Note 13.1 and 13.3) 522,599,966 387,219,140 1,917,369,966 756,228,140 13.1 These facilities are secured against hypothecation charge on current assets, lien on export
contracts / letters of credit, first and second pari passu charge on fixed and current assets of Holding Company, personal guarantees of directors of Holding Company and ranking charge on current assets of the Holding Company.
13.2 These carry mark-up range from 3.5% to 4.5% per annum (2015: 6% to 7.5% per annum) on
outstanding balance. 13.3 These carry mark-up ranging from 6.24% to 9.26% per annum (2015: 5% to 13.73% per
annum) on outstanding balance.

122 Kohinoor Mills Limited and its Subsidiary
14. coNtiNGeNcieS AND coMMitMeNtS 14.1 contingencies
Holding company 14.1.1 The Deputy Collector (Refund – Gold) by order dated 19 June 2007 rejected the input
tax claim of the Holding Company, for the month of June 2005, amounting to Rupees 10.345 million incurred in zero rated local supplies of textile and articles thereof on the grounds that the input tax claim is in contravention of SRO 992(I)/2005 which states that no registered person engaged in the export of specified goods (including textile and articles thereof) shall, either through zero-rating or otherwise, be entitled to deduct or reclaim input tax paid in respect of stocks of such goods acquired up to 05 June 2005, if not used for the purpose of exports made up to the 31 December 2005. Consequently, the Holding Company filed an appeal before the Appellate Tribunal Inland Revenue (ATIR). ATIR has decided this appeal in favour of the Holding Company subject to necessary verification. Pending the outcome of necessary verification, no provision for inadmissible input tax has been recognized in these consolidated financial statements, since the Holding Company is confident of the favourable outcome of verification.
14.1.2 The Additional Collector, Sales Tax Department has raised sales tax demand amounting
to Rupees 8.956 million along with additional tax and penalty, as a result of sales tax audit for the year 1999-2000 conducted by the Sales Tax Department. The Holding Company is contesting the demand and management is confident that decision will be in favour of the Holding Company, hence, no provision their against has been made in these consolidated financial statements.
14.1.3 As a result of sales tax audit for the year 2009-2010 conducted by Regional Tax Office,
Lahore, Assistant Commissioner Inland Revenue, Sales Tax Department has raised sales tax demand amounting to Rupees 9.975 million along with additional tax and penalty. Currently, the case is pending for hearing at Appellate Tribunal Inland Revenue, Lahore and the management is confident that decision will be in favour of the Holding Company, hence, no provision there against has been made in these consolidated financial statements.
14.1.4 Pursuant to the sale of assets agreement with M/s Interloop Limited, the Holding
Company is contingently liable for Rupees 31.958 million against payment of certain outstanding dues to Employees’ Old-Age Benefits Institution (EOBI) and bifurcation of gas connections in favour of M/s Interloop Limited. To secure the performance of aforesaid conditions, the Holding Company has pledged equity investment (note 16.2) and bank balance (note 24.4) with Allied Bank Limited. However, no provision has been recognized in these consolidated financial statements as the management is confident to fulfil the conditions in accordance with the sale of assets agreement.
14.1.5 Bank guarantees of Rupees 81.66 million (2015: Rupees 81.66 million) are given by the
banks of the Holding Company in favour of Sui Northern Gas Pipelines Limited against gas connections.
14.1.6 Bank guarantee of Rupees 6.5 million (2015: Rupees 6.5 million) is given by the bank of
the Holding Company in favour of Director, Excise and Taxation to cover the disputed amount of infrastructure cess.
14.1.7 Bank guarantees of Rupees 8.164 million (2015: Rupees 8.164 million) are given by
the bank of the Holding Company in favour of Lahore electric Supply Company Limited against electricity connections.
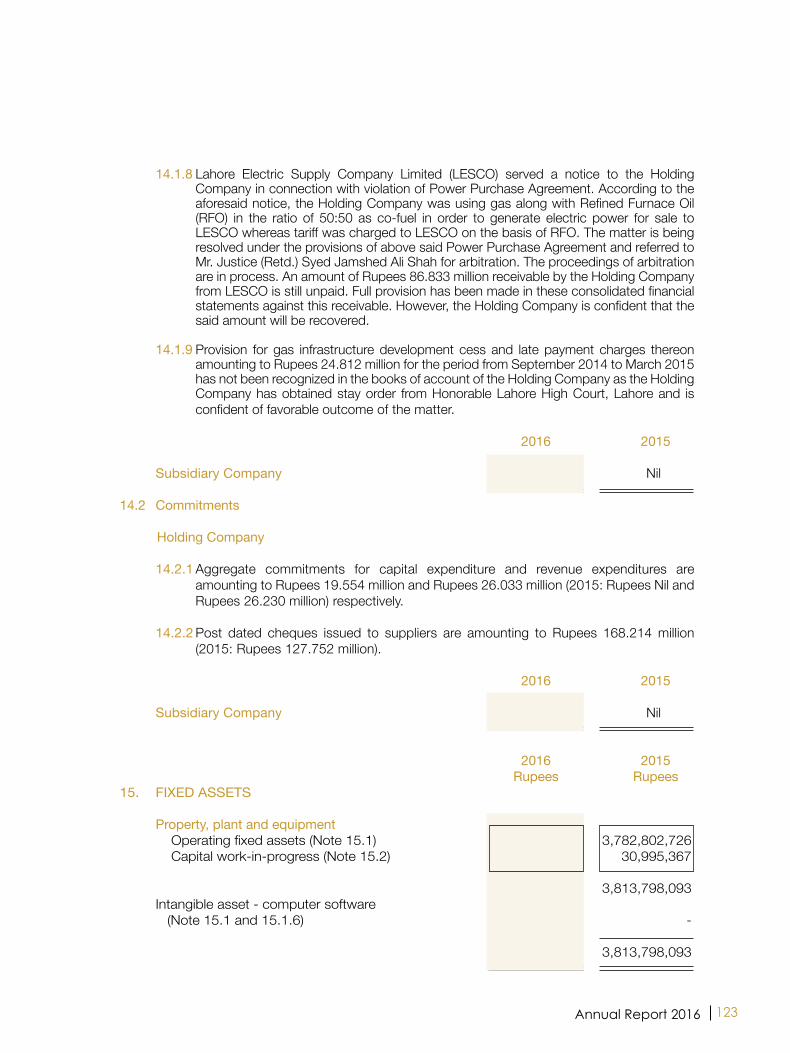
123Annual Report 2016
14.1.8 Lahore electric Supply Company Limited (LeSCO) served a notice to the Holding Company in connection with violation of Power Purchase Agreement. According to the aforesaid notice, the Holding Company was using gas along with Refined Furnace Oil (RFO) in the ratio of 50:50 as co-fuel in order to generate electric power for sale to LESCO whereas tariff was charged to LESCO on the basis of RFO. The matter is being resolved under the provisions of above said Power Purchase Agreement and referred to Mr. Justice (Retd.) Syed Jamshed Ali Shah for arbitration. The proceedings of arbitration are in process. An amount of Rupees 86.833 million receivable by the Holding Company from LESCO is still unpaid. Full provision has been made in these consolidated financial statements against this receivable. However, the Holding Company is confident that the said amount will be recovered.
14.1.9 Provision for gas infrastructure development cess and late payment charges thereon
amounting to Rupees 24.812 million for the period from September 2014 to March 2015 has not been recognized in the books of account of the Holding Company as the Holding Company has obtained stay order from Honorable Lahore High Court, Lahore and is confident of favorable outcome of the matter.
2016 2015
Subsidiary company Nil Nil
14.2 commitments
Holding company 14.2.1 Aggregate commitments for capital expenditure and revenue expenditures are
amounting to Rupees 19.554 million and Rupees 26.033 million (2015: Rupees Nil and Rupees 26.230 million) respectively.
14.2.2 Post dated cheques issued to suppliers are amounting to Rupees 168.214 million
(2015: Rupees 127.752 million). 2016 2015
Subsidiary company Nil Nil
2016 2015 rupees rupees15. FiXeD ASSetS
property, plant and equipment Operating fixed assets (Note 15.1) 3,700,429,892 3,782,802,726 Capital work-in-progress (Note 15.2) 28,490,007 30,995,367
3,728,919,899 3,813,798,093 Intangible asset - computer software (Note 15.1 and 15.1.6) - -
3,728,919,899 3,813,798,093

124 Kohinoor Mills Limited and its Subsidiary
15.1
R
econ
cilia
tions
of c
arry
ing
amou
nts
of o
pera
ting
fixed
ass
ets
and
inta
ngib
le a
sset
at t
he b
egin
ning
and
end
of t
he y
ear a
re a
s fo
llow
s:
O
pera
ting
fixed
ass
ets
Des
crip
tion
Fre
ehol
d r
esid
entia
l Fa
ctor
y pl
ant a
nd
Stan
d-by
el
ectri
c Fu
rnitu
re,
M
otor
inta
ngib
le
la
nd
build
ing
bu
ildin
g m
achi
nery
eq
uipm
ent
inst
alla
tions
fix
ture
s an
d
com
pute
rs
vehi
cles
to
tal
asse
t
eq
uipm
ent
---
----
----
----
----
----
----
----
----
----
----
----
----
----
----
----
- (R
UP
EE
S)
----
----
----
----
----
----
----
----
----
----
----
----
----
----
----
----
As
at 3
0 Ju
ne 2
014
Cos
t / re
valu
ed a
mou
nt
514
,680
,475
3
37,5
64,0
45
691
,846
,399
4,
112,
152,
817
1
,615
,659
1
37,3
99,1
59
92,
596,
625
4
6,89
6,90
3
141
,544
,267
6
,076
,296
,349
1
6,64
5,92
3 Ac
cum
ulat
ed d
epre
ciat
ion
/ am
ortiz
atio
n -
(9
8,50
4,44
7)
(239
,526
,965
) (2,
007,
065,
878)
(1
97,2
73)
(70,
539,
581)
(5
7,74
7,24
0)
(36,
545,
368)
(4
0,02
3,94
1)
(2,5
50,1
50,6
93)
(16,
645,
923)
Net
boo
k va
lue
514
,680
,475
2
39,0
59,5
98
452
,319
,434
2,
105,
086,
939
1
,418
,386
6
6,85
9,57
8
34,
849,
385
1
0,35
1,53
5
101
,520
,326
3
,526
,145
,656
-
Year
end
ed 3
0 Ju
ne 2
015
Ope
ning
net
boo
k va
lue
514
,680
,475
2
39,0
59,5
98
452
,319
,434
2,
105,
086,
939
1
,418
,386
6
6,85
9,57
8
34,
849,
385
1
0,35
1,53
5
101
,520
,326
3
,526
,145
,656
-
Ad
ditio
ns
-
-
19,
415,
778
8
4,83
1,54
2
-
8,7
17,9
37
4,8
70,3
24
2,5
24,1
24
21,
701,
307
1
42,0
61,0
12
-
Disp
osal
s:
C
ost
-
-
-
(19,
856,
444)
-
-
(9
32,4
00)
-
(11,
431,
117)
(3
2,21
9,96
1)
-
A
ccum
ulat
ed d
epre
ciat
ion
-
-
-
6,9
16,0
82
-
-
575
,608
-
6
,331
,481
1
3,82
3,17
1
-
-
-
-
(1
2,94
0,36
2)
-
-
(356
,792
) -
(5
,099
,636
) (1
8,39
6,79
0)
-
Dep
reci
atio
n ch
arge
-
(1
1,95
2,98
1)
(23,
102,
253)
(1
62,9
97,0
78)
(127
,946
) (6
,980
,154
) (3
,819
,210
) (3
,539
,441
) (1
6,23
6,55
5)
(228
,755
,618
) -
Su
rplu
s on
reva
luat
ion
230
,198
,524
1
9,90
9,90
2
111
,640
,040
-
-
-
-
-
-
3
61,7
48,4
66
-
Clo
sing
net b
ook
valu
e 7
44,8
78,9
99
247
,016
,519
5
60,2
72,9
99
2,01
3,98
1,04
1
1,2
90,4
40
68,
597,
361
3
5,54
3,70
7
9,3
36,2
18
101
,885
,442
3
,782
,802
,726
-
As a
t 30
June
201
5
C
ost /
reva
lued
am
ount
7
44,8
78,9
99
357
,473
,947
8
22,9
02,2
17
4,17
7,12
7,91
5
1,6
15,6
59
146
,117
,096
9
6,53
4,54
9
49,
421,
027
1
51,8
14,4
57
6,5
47,8
85,8
66
16,
645,
923
Accu
mul
ated
dep
reci
atio
n / a
mor
tizat
ion
-
(110
,457
,428
) (2
62,6
29,2
18) (
2,16
3,14
6,87
4)
(325
,219
) (7
7,51
9,73
5)
(60,
990,
842)
(4
0,08
4,80
9)
(49,
929,
015)
(2
,765
,083
,140
) (1
6,64
5,92
3)
Net
boo
k va
lue
744
,878
,999
2
47,0
16,5
19
560
,272
,999
2,
013,
981,
041
1
,290
,440
6
8,59
7,36
1
35,
543,
707
9
,336
,218
1
01,8
85,4
42
3,7
82,8
02,7
26
-
Ye
ar e
nded
30
June
201
6
O
peni
ng n
et b
ook
valu
e 7
44,8
78,9
99
247
,016
,519
5
60,2
72,9
99
2,01
3,98
1,04
1
1,2
90,4
40
68,
597,
361
3
5,54
3,70
7
9,3
36,2
18
101
,885
,442
3
,782
,802
,726
-
Ad
ditio
ns
-
-
31,
740,
020
1
26,0
99,6
56
-
2,7
57,5
38
1,4
54,1
39
4,4
74,8
77
20,
489,
766
1
87,0
15,9
96
-
Disp
osal
s:
C
ost
-
-
-
(33,
072,
969)
-
-
(4
5,00
0)
(42,
500)
(3
9,99
6,05
1)
(73,
156,
520)
-
Acc
umul
ated
dep
reci
atio
n -
-
-
1
1,08
3,92
8
-
-
8,1
85
23,
211
1
5,11
0,71
9
26,
226,
043
-
-
-
-
(2
1,98
9,04
1)
-
-
(36,
815)
(1
9,28
9)
(24,
885,
332)
(4
6,93
0,47
7)
-
Dep
reci
atio
n -
(1
2,35
0,82
5)
(28,
094,
547)
(1
52,5
55,7
30)
(115
,143
) (6
,981
,405
) (3
,653
,398
) (3
,346
,909
) (1
5,36
0,39
6)
(222
,458
,353
) -
Clo
sing
net b
ook
valu
e 7
44,8
78,9
99
234
,665
,694
5
63,9
18,4
72
1,96
5,53
5,92
6
1,1
75,2
97
64,
373,
494
3
3,30
7,63
3
10,
444,
897
8
2,12
9,48
0
3,7
00,4
29,8
92
-
As
at 3
0 Ju
ne 2
016
Cos
t / re
valu
ed a
mou
nt
744
,878
,999
3
57,4
73,9
47
854
,642
,237
4,
270,
154,
602
1
,615
,659
1
48,8
74,6
34
97,
943,
688
5
3,85
3,40
4
132
,308
,172
6
,661
,745
,342
1
6,64
5,92
3 Ac
cum
ulat
ed d
epre
ciat
ion
/ am
ortiz
atio
n -
(1
22,8
08,2
53)
(290
,723
,765
) (2,
304,
618,
676)
(4
40,3
62)
(84,
501,
140)
(6
4,63
6,05
5)
(43,
408,
507)
(5
0,17
8,69
2)
(2,9
61,3
15,4
50)
(16,
645,
923)
Net
boo
k va
lue
744
,878
,999
2
34,6
65,6
94
563
,918
,472
1,
965,
535,
926
1
,175
,297
6
4,37
3,49
4
33,
307,
633
1
0,44
4,89
7
82,
129,
480
3
,700
,429
,892
-
D
epre
ciat
ion
/ am
ortiz
atio
n ra
te %
per
ann
um
- 5
5 10
10
10
10
30
20
20

125Annual Report 2016
particulars cost Accumulated Net book Sale Gain / Mode of particulars of purchasers depreciation value proceeds (loss) disposal
- - - - - - - - - - - - - - - - - - - (RUPEES) - - - - - - - - - - - - - - - - - - - - - -
plant and machinery Mower Disco 2,222,222 544,637 1,677,585 1,677,585 - Negotiation elahi Dad Noon - Bhalwal Thresher Machine 300,000 42,370 257,630 70,000 (187,630) Negotiation Mr. Hafiz Nazim Rasool - Lahore Rice Husk Boiler 25,602,861 8,808,360 16,794,501 5,500,000 (11,294,501) Negotiation Mr. Sajid Ali - Lahore Pet Coke Boiler 2,092,742 591,260 1,501,482 1,344,538 (156,944) Negotiation Mr. Muhammad Naveed - Lahore Button Machine 532,740 245,206 287,534 225,000 (62,534) Negotiation Mubashir Corporation (Private) Limited - Faisalabad Feed of Arm Siruba 121,124 49,472 71,652 63,199 (8,453) Negotiation Combined Fabrics - Lahore Hashima Fusing Machine 242,826 99,180 143,646 126,701 (16,945) Negotiation Combined Fabrics - Lahore Pocket Creasing 412,464 168,466 243,998 210,100 (33,898) Negotiation Combined Fabrics - Lahore Cornely Bratto 1,545,990 534,977 1,011,013 450,000 (561,013) Negotiation Mubashir Corporation (Private) Limited - Faisalabad 33,072,969 11,083,928 21,989,041 9,667,123 (12,321,918) Motor vehicles Suzuki Cultus LeH-07-9894 559,387 371,728 187,659 475,000 287,341 Negotiation Mr. Imran Kamal - Lahore Suzuki Cultus LeF-08-9660 426,743 221,758 204,985 340,000 135,015 Negotiation Mr. Imran Kamal - Lahore Suzuki Cultus LeD-09-1699 886,500 555,926 330,574 475,000 144,426 Negotiation Mr. Muhammad Anwar - Lahore Suzuki Cultus Le-10-3367 771,333 401,246 370,087 465,000 94,913 Negotiation Mr. Imran Kamal - Lahore Suzuki Cultus LEA-09-1609 806,500 525,490 281,010 391,720 110,710 Negotiation Mr. Faisal Rasheed - Lahore Fork Lifter 1,732,991 1,297,075 435,916 231,092 (204,824) Negotiation Mr. Muhammad Farooq - Lahore Suzuki Cultus LeB-09-7266 650,631 420,322 230,309 416,000 185,691 Negotiation Mr. Faisal Shareef - Lahore Honda City Le-13- 9250 1,539,460 545,831 993,629 1,305,000 311,371 Negotiation Mr. Imran Kamal - Lahore Suzuki Cultus LeC-08-7934 670,720 435,051 235,669 290,000 54,331 Negotiation Mr. Imran Kamal - Lahore Suzuki Cultus LeF-08-3059 296,933 112,206 184,727 465,000 280,273 Negotiation Mr. Imran Kamal - Lahore Suzuki Cultus LeC-08-09676 674,220 442,788 231,432 550,000 318,568 Negotiation Mr. Imran Kamal - Lahore Honda Civic LeF-13- 8629 2,290,500 625,459 1,665,041 1,350,000 (315,041) Negotiation Mr. Amir Javaid Malik - Lahore Suzuki Cultus LeC-10-4804 728,733 386,116 342,617 475,000 132,383 Negotiation Mr. umer Khattar - Lahore Motor Cycle CD-70 LeM-14-2404 69,900 13,980 55,920 30,000 (25,920) Negotiation Mr. Muhammad Saleem - Lahore Motor Cycle CG-125 102,500 20,500 82,000 45,000 (37,000) Negotiation Mr. Mujahid Ali - Lahore Belarus Tractor 510 SGS-225 1,516,600 470,752 1,045,848 940,625 (105,223) Negotiation Mr. Muhammad Qasim - Sargodha Belarus Tractor 510 LeT-493 1,528,000 474,291 1,053,709 940,625 (113,084) Negotiation Mr. Muhammad Qasim - Sargodha Belarus Tractor 510 SGS-906 1,121,000 347,958 773,042 940,625 167,583 Negotiation Mr. Muhammad Qasim - Sargodha Belarus Tractor 510 LeS-2124 1,526,000 473,670 1,052,330 940,625 (111,705) Negotiation Mr. Muhammad Qasim - Sargodha Belarus Tractor 510 LeS-2126 1,526,000 473,670 1,052,330 940,625 (111,705) Negotiation Mr. Muhammad Qasim - Sargodha Belarus Tractor 510 LeS-2127 1,526,000 473,670 1,052,330 940,625 (111,705) Negotiation Mr. Muhammad Qasim - Sargodha
15.1.1 Freehold land and buildings of the Holding Company and its Subsidiary Company were revalued as at 30 June 2015 by an independent approved valuer (Messrs Hamid Mukhtar and Company (Private) Limited). Had there been no revaluation, the value of the assets would have been lower by Rupees 1,145.063 million (2015: Rupees 1,169.670 million).
15.1.2 The book value of freehold land and buildings on cost basis is Rupees 67.366 million and
Rupees 331.035 million (2015: Rupees 67.366 million and Rupees 315.133 million) respectively. 15.1.3 Freehold land includes two pieces of land having carrying value of Rupees 25.275 million
(2015: Rupees 25.275 million) and Rupees 5.390 million (2015: Rupees 5.390 million) which are in the name of Mr. Amir Fayyaz Sheikh (director) and Mrs. Amir Fayyaz Shiekh respectively. The management is in the process of selling these pieces of land. Previously, titles of these pieces of land were not transferred in the name of the Subsidiary Company to save Subsidiary Company’s expenses on transfer duties.
15.1.4 Detail of operating fixed assets exceeding book value of Rupees 50,000 disposed of during
the year is as follows:

126 Kohinoor Mills Limited and its Subsidiary
Belarus Tractor 510 LeS-2128 1,526,000 473,670 1,052,330 940,625 (111,705) Negotiation Mr. Muhammad Qasim - Sargodha Belarus Tractor 510 SGS-2567 981,000 304,502 676,498 940,625 264,127 Negotiation Mr. Muhammad Qasim - Sargodha Millat Tractor MF-360 LET-1411 880,700 281,824 598,876 511,117 (87,759) Negotiation Sabbir Malik & Company - Lahore Millat Tractor MF-360 SGS-789 880,700 281,824 598,876 511,117 (87,759) Negotiation Sabbir Malik & Company - Lahore Millat Tractor MF-360 LET-292 906,000 289,920 616,080 511,117 (104,963) Negotiation Sabbir Malik & Company - Lahore Millat Tractor MF-360 LET-293 906,000 289,920 616,080 511,117 (104,963) Negotiation Sabbir Malik & Company - Lahore Millat Tractor MF-360 LET-294 906,000 289,920 616,080 511,117 (104,963) Negotiation Sabbir Malik & Company - Lahore Millat Tractor MF-360 LeT-295 906,000 298,618 607,382 475,000 (132,382) Negotiation Chopra Trading Company - Lahore Millat Tractor MF-360 LET-296 906,000 289,920 616,080 511,117 (104,963) Negotiation Sabbir Malik & Company - Lahore Millat Tractor MF-360 LET-297 906,000 289,920 616,080 511,118 (104,962) Negotiation Sabbir Malik & Company - Lahore Millat Tractor MF-360 LET-298 906,000 289,920 616,080 511,118 (104,962) Negotiation Sabbir Malik & Company - Lahore Millat Tractor MF-360 LET-300 906,000 289,920 616,080 511,118 (104,962) Negotiation Sabbir Malik & Company - Lahore Millat Tractor MF-360 LET-301 906,000 289,920 616,080 511,118 (104,962) Negotiation Sabbir Malik & Company - Lahore Millat Tractor MF-360 LES-2503 931,000 289,644 641,356 511,118 (130,238) Negotiation Sabbir Malik & Company - Lahore Millat Tractor MF-360 LES-2504 931,000 289,645 641,355 511,118 (130,237) Negotiation Sabbir Malik & Company - Lahore Millat Tractor MF-360 LES-2505 931,000 289,645 641,355 511,118 (130,237) Negotiation Sabbir Malik & Company - Lahore Millat Tractor MF-360 LES-2506 931,000 289,645 641,355 511,118 (130,237) Negotiation Sabbir Malik & Company - Lahore Millat Tractor MF-360 LES-2253 931,000 289,645 641,355 511,118 (130,237) Negotiation Sabbir Malik & Company - Lahore Millat Tractor MF-360 LES-2257 931,000 289,645 641,355 511,118 (130,237) Negotiation Sabbir Malik & Company - Lahore Millat Tractor MF-360 LES-2263 931,000 289,645 641,355 511,118 (130,237) Negotiation Sabbir Malik & Company - Lahore
39,890,051 15,076,799 24,813,252 23,992,812 (820,440)
Aggregate of other items of operating fixed assets with individual book values not exceeding Rupees 50,000 193,500 65,316 128,184 72,797 (55,387)
73,156,520 26,226,043 46,930,477 33,732,732 (13,197,745)
2016 2015 rupees rupees15.1.5 The depreciation charge for the year has been allocated as follows: Cost of sales (Note 26) 206,798,532 214,389,853 Distribution cost (Note 27) 2,449,324 1,576,261 Administrative expenses (Note 28) 13,210,497 12,789,504 222,458,353 228,755,618 15.1.6 Intangible asset - computer software has been fully amortized but still in the use of the
Company.
particulars cost Accumulated Net book Sale Gain / Mode of particulars of purchasers depreciation value proceeds (loss) disposal
- - - - - - - - - - - - - - - - - - - (RUPEES) - - - - - - - - - - - - - - - - - - - - - -
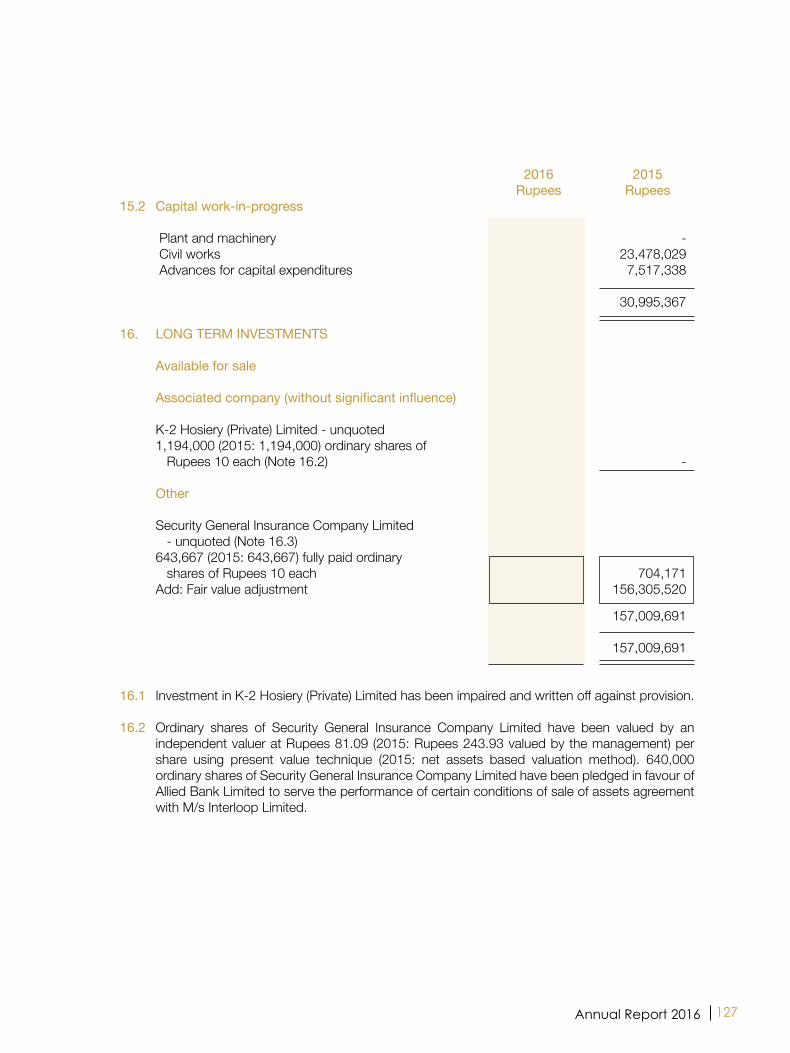
127Annual Report 2016
2016 2015 rupees rupees15.2 capital work-in-progress Plant and machinery 20,345,577 - Civil works - 23,478,029 Advances for capital expenditures 8,144,430 7,517,338
28,490,007 30,995,367 16. LoNG terM iNVeStMeNtS Available for sale Associated company (without significant influence) K-2 Hosiery (Private) Limited - unquoted 1,194,000 (2015: 1,194,000) ordinary shares of Rupees 10 each (Note 16.2) - - other Security General Insurance Company Limited - unquoted (Note 16.3) 643,667 (2015: 643,667) fully paid ordinary shares of Rupees 10 each 704,171 704,171 Add: Fair value adjustment 51,496,537 156,305,520
52,200,708 157,009,691
52,200,708 157,009,691 16.1 Investment in K-2 Hosiery (Private) Limited has been impaired and written off against provision. 16.2 Ordinary shares of Security General Insurance Company Limited have been valued by an
independent valuer at Rupees 81.09 (2015: Rupees 243.93 valued by the management) per share using present value technique (2015: net assets based valuation method). 640,000 ordinary shares of Security General Insurance Company Limited have been pledged in favour of Allied Bank Limited to serve the performance of certain conditions of sale of assets agreement with M/s Interloop Limited.

128 Kohinoor Mills Limited and its Subsidiary
2016 2015 rupees rupees17. StoreS, SpAreS AND LooSe tooLS Stores and spares 431,259,251 379,540,096 Loose tools 3,007,915 3,586,377 434,267,166 383,126,473 Less: Provision for slow moving, obsolete and damaged store items (Note 17.1) 17,491,037 16,629,008
416,776,129 366,497,465 17.1 Provision for slow moving, obsolete and damaged store items Balance as on 01 July 16,629,008 16,629,008 Add: Provision for the year (Note 29) 2,955,416 - Less: Stores and spares written off against provision (2,093,387) - Balance as on 30 June 17,491,037 16,629,008 18. StocK-iN-trADe Raw material 197,119,225 139,659,658 Work-in-process 136,625,320 143,336,567 Finished goods (Note 18.1 and 18.2) 472,334,811 446,680,689 806,079,356 729,676,914 18.1 This includes finished goods of Rupees 58.969 million (2015: Rupees 78.533 million) valued at
net realizable value. 18.2 Finished goods include stock-in-transit amounting to Rupees 42.261 million (2015: Rupees
20.641 million). 2016 2015 rupees rupees19. trADe DeBtS Considered good: Secured (against letters of credit) 317,938,696 365,851,374 unsecured 147,503,655 119,732,448 465,442,351 485,583,822 Considered doubtful: Others - unsecured 88,480,269 88,480,269 Less: Provision for doubtful trade debts Balance as at 01 July 88,480,269 88,358,572 Add: Provision for the year (Note 29) - 121,697 Balance as at 30 June 88,480,269 88,480,269 - -
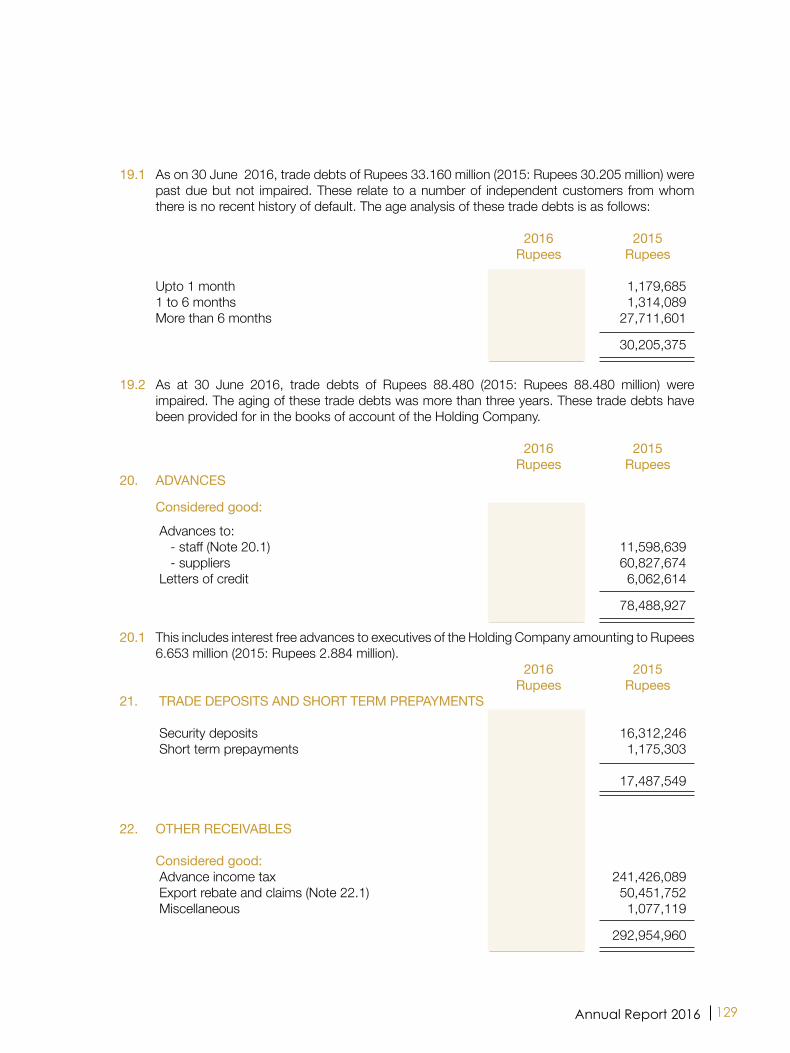
129Annual Report 2016
19.1 As on 30 June 2016, trade debts of Rupees 33.160 million (2015: Rupees 30.205 million) were past due but not impaired. These relate to a number of independent customers from whom there is no recent history of default. The age analysis of these trade debts is as follows:
2016 2015 rupees rupees
upto 1 month 475,178 1,179,685 1 to 6 months 1,833,081 1,314,089 More than 6 months 30,851,467 27,711,601 33,159,726 30,205,375
19.2 As at 30 June 2016, trade debts of Rupees 88.480 (2015: Rupees 88.480 million) were
impaired. The aging of these trade debts was more than three years. These trade debts have been provided for in the books of account of the Holding Company.
2016 2015 rupees rupees20. ADVANceS Considered good: Advances to: - staff (Note 20.1) 12,288,661 11,598,639 - suppliers 57,285,999 60,827,674 Letters of credit 5,237,568 6,062,614 74,812,228 78,488,927 20.1 This includes interest free advances to executives of the Holding Company amounting to Rupees
6.653 million (2015: Rupees 2.884 million). 2016 2015 rupees rupees21. trADe DepoSitS AND SHort terM prepAYMeNtS Security deposits 13,275,546 16,312,246 Short term prepayments 1,172,365 1,175,303 14,447,911 17,487,549 22. otHer receiVABLeS Considered good: Advance income tax 259,131,374 241,426,089 Export rebate and claims (Note 22.1) 50,474,213 50,451,752 Miscellaneous 2,652,355 1,077,119 312,257,942 292,954,960

130 Kohinoor Mills Limited and its Subsidiary
2016 2015 rupees rupees22.1 export rebate and claims considered good 50,474,213 50,451,752 Considered doubtful 35,493,049 39,481,490 Less: Provision for doubtful export rebate and claims (Note 21.1.1) 35,493,049 39,481,490
- - 50,474,213 50,451,752 22.1.1 provision for doubtful export rebate and claims Balance as at 01 July 39,481,490 30,514,452 Add : Provision for the year (Note 29) - 8,967,038 Less: Export rebate receivable written off against provision 3,988,441 - Balance as at 30 June 35,493,049 39,481,490 23. SALeS tAX recoVerABLe Sales tax recoverable 476,421,086 270,794,552 Less: Provision for doubtful sales tax recoverable (Note 23.1) 27,398,691 27,398,691 449,022,395 243,395,861
23.1 provision for doubtful sales tax recoverable Balance as at 01 July 27,398,691 25,157,276 Add: Provision for the year (Note 28) - 2,241,415 Balance as at 30 June 27,398,691 27,398,691 24. cASH AND BANK BALANceS Cash in hand (Note 24.1) 3,225,554 2,985,777
Cash with banks: On current accounts (Note 24.2 and 24.4) 23,262,470 39,074,378 On deposit accounts (Note 24.3 and 24.5) 27,495,038 70,317,056 50,757,508 109,391,434
53,983,062 112,377,211
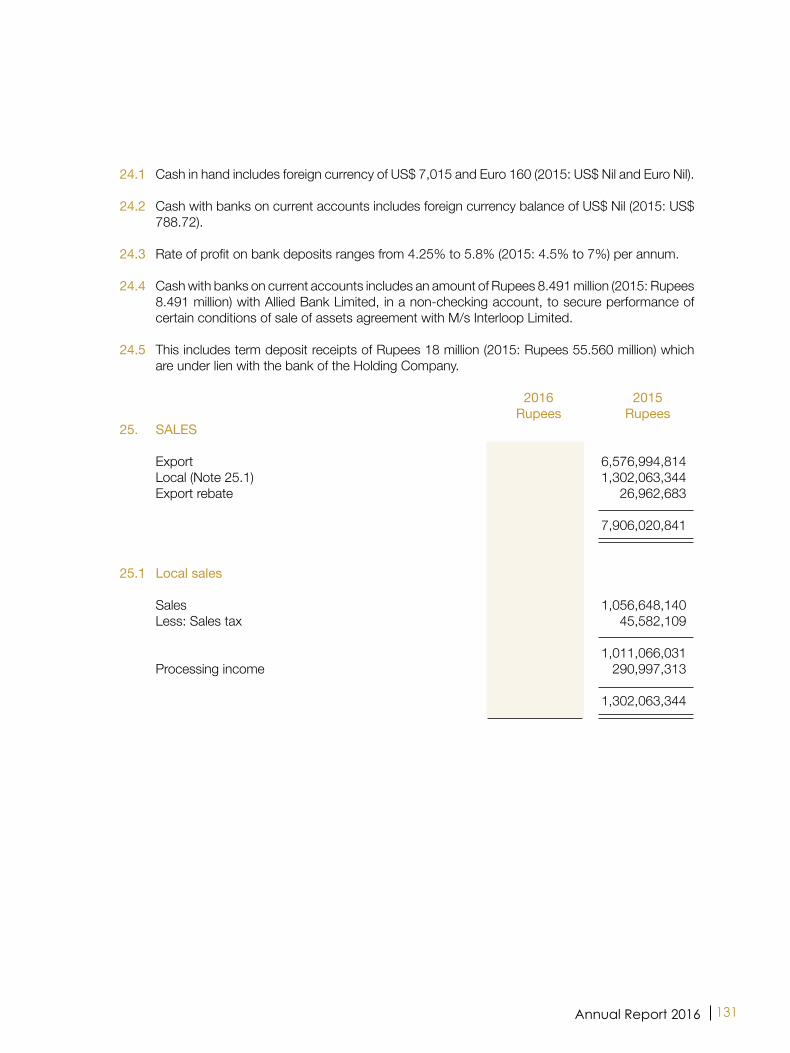
131Annual Report 2016
24.1 Cash in hand includes foreign currency of uS$ 7,015 and euro 160 (2015: uS$ Nil and euro Nil). 24.2 Cash with banks on current accounts includes foreign currency balance of uS$ Nil (2015: uS$
788.72). 24.3 Rate of profit on bank deposits ranges from 4.25% to 5.8% (2015: 4.5% to 7%) per annum. 24.4 Cash with banks on current accounts includes an amount of Rupees 8.491 million (2015: Rupees
8.491 million) with Allied Bank Limited, in a non-checking account, to secure performance of certain conditions of sale of assets agreement with M/s Interloop Limited.
24.5 This includes term deposit receipts of Rupees 18 million (2015: Rupees 55.560 million) which
are under lien with the bank of the Holding Company. 2016 2015 rupees rupees25. SALeS Export 7,134,170,081 6,576,994,814 Local (Note 25.1) 1,387,911,328 1,302,063,344 Export rebate 29,010,426 26,962,683 8,551,091,835 7,906,020,841
25.1 Local sales Sales 1,182,614,822 1,056,648,140 Less: Sales tax 54,557,433 45,582,109 1,128,057,389 1,011,066,031 Processing income 259,853,939 290,997,313 1,387,911,328 1,302,063,344

132 Kohinoor Mills Limited and its Subsidiary
2016 2015 rupees rupees26. coSt oF SALeS Raw material consumed (Note 26.1) 4,783,212,447 4,325,268,356 Chemicals consumed 744,850,309 698,391,221 Salaries, wages and other benefits 371,865,559 337,998,698 employees’ provident fund contributions 13,433,272 12,216,998 Cloth conversion and processing charges 48,631,535 21,111,495 Fuel, oil and power 649,704,430 708,672,422 Stores, spares and loose tools consumed 138,229,533 100,401,544 Packing materials consumed 56,164,295 57,948,288 Repair and maintenance 58,185,463 43,919,391 Insurance 9,186,181 9,798,729 Other manufacturing expenses 73,852,172 104,054,440 Depreciation on operating fixed assets (Note 15.1.5) 206,798,532 214,389,853 7,154,113,728 6,634,171,435 Work-in-process inventory As on 01 July 143,336,567 128,250,466 As on 30 June (136,625,320) (143,336,567) 6,711,247 (15,086,101) Cost of goods manufactured 7,160,824,975 6,619,085,334 Cost of yarn and cloth purchased for resale 22,894,431 13,433,875 7,183,719,406 6,632,519,209 Finished goods inventory As on 01 July 446,680,689 421,365,253 As on 30 June (472,334,811) (446,680,689) (25,654,122) (25,315,436) 7,158,065,284 6,607,203,773 26.1 raw material consumed Opening stock 139,659,658 148,615,983 Purchased during the year 4,840,672,014 4,316,312,031
4,980,331,672 4,464,928,014 Less: Closing stock (197,119,225) (139,659,658) 4,783,212,447 4,325,268,356

133Annual Report 2016
2016 2015 rupees rupees27. DiStriBUtioN coSt Salaries and other benefits 65,763,690 54,052,094 employees’ provident fund contributions 2,434,891 2,192,149 Travelling, conveyance and entertainment 29,080,241 25,654,723 Printing and stationery 222,101 222,849 Communications 36,371,171 34,341,582 Vehicles’ running 3,266,522 3,346,245 Insurance 3,080,251 1,939,004 Repair and maintenance 39,573 9,034 Commission to selling agents 190,241,713 138,665,162 Outward freight and handling 124,147,176 136,198,694 Clearing and forwarding 40,082,981 36,603,912 Sales promotion and advertising 286,160 3,504,355 Depreciation on operating fixed assets (Note 15.1.5) 2,449,324 1,576,261 Miscellaneous 87,137 575,107
497,552,931 438,881,171 28. ADMiNiStrAtiVe eXpeNSeS Salaries and other benefits 123,333,919 115,686,246 employees’ provident fund contributions 2,970,144 3,078,108 Travelling, conveyance and entertainment 35,316,888 31,833,757 Printing and stationery 2,878,908 4,368,114 Communications 5,007,960 4,430,594 Vehicles’ running 9,170,596 8,671,354 Legal and professional 5,677,405 7,714,208 Insurance 5,786,167 5,321,803 Fee, subscription and taxes 3,126,428 2,157,842 Repair and maintenance 7,737,373 7,406,562 electricity, gas and water 371,458 198,957 Auditors’ remuneration (Note 28.1) 1,742,000 1,658,000 Depreciation on operating fixed assets (Note 15.1.5) 13,210,497 12,789,504 Miscellaneous 21,339,378 30,804,113 237,669,121 236,119,162
28.1 Auditors’ remuneration Audit fee 1,440,000 1,375,000 Half yearly review and other certifications 210,000 200,000 Reimbursable expenses 92,000 83,000 1,742,000 1,658,000
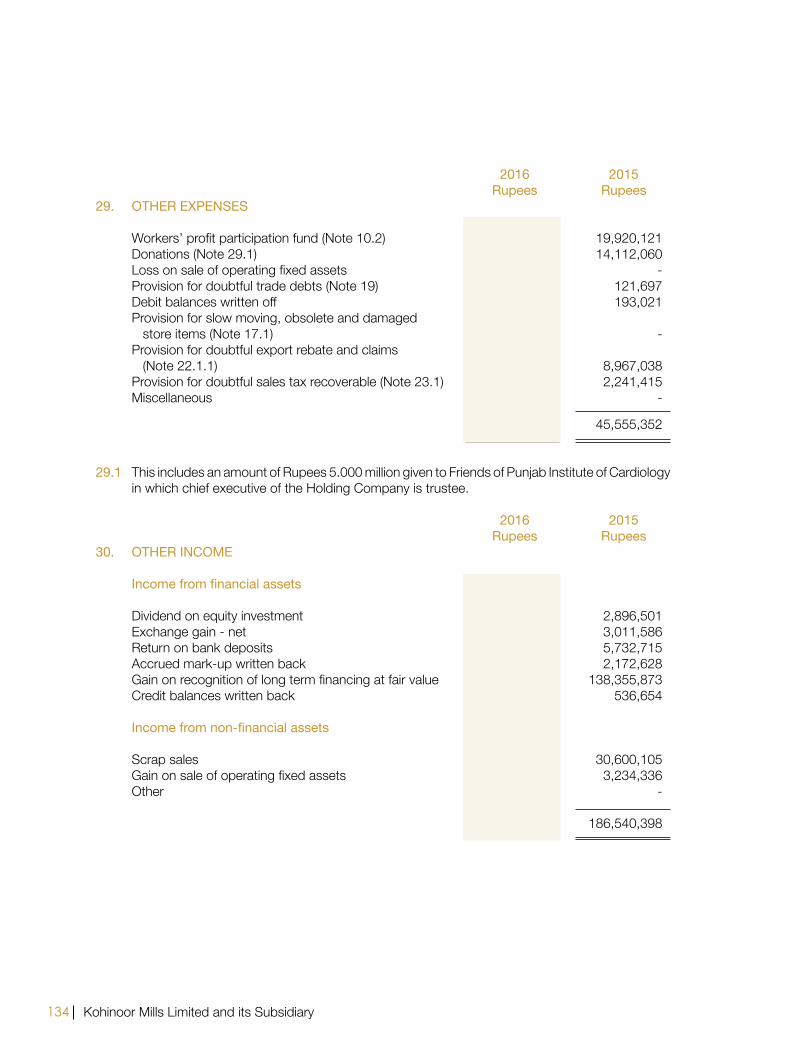
134 Kohinoor Mills Limited and its Subsidiary
2016 2015 rupees rupees29. otHer eXpeNSeS Workers’ profit participation fund (Note 10.2) 23,773,023 19,920,121 Donations (Note 29.1) 6,428,038 14,112,060 Loss on sale of operating fixed assets 13,197,745 - Provision for doubtful trade debts (Note 19) - 121,697 Debit balances written off 5,079 193,021 Provision for slow moving, obsolete and damaged store items (Note 17.1) 2,955,416 - Provision for doubtful export rebate and claims (Note 22.1.1) - 8,967,038 Provision for doubtful sales tax recoverable (Note 23.1) - 2,241,415 Miscellaneous 1,481,046 - 47,840,347 45,555,352
29.1 This includes an amount of Rupees 5.000 million given to Friends of Punjab Institute of Cardiology in which chief executive of the Holding Company is trustee.
2016 2015 rupees rupees30. otHer iNcoMe Income from financial assets Dividend on equity investment 3,218,336 2,896,501 Exchange gain - net 11,452,878 3,011,586 Return on bank deposits 2,807,772 5,732,715 Accrued mark-up written back - 2,172,628 Gain on recognition of long term financing at fair value - 138,355,873 Credit balances written back 379,820 536,654 Income from non-financial assets Scrap sales 27,044,517 30,600,105 Gain on sale of operating fixed assets - 3,234,336 Other 230,205 - 45,133,528 186,540,398
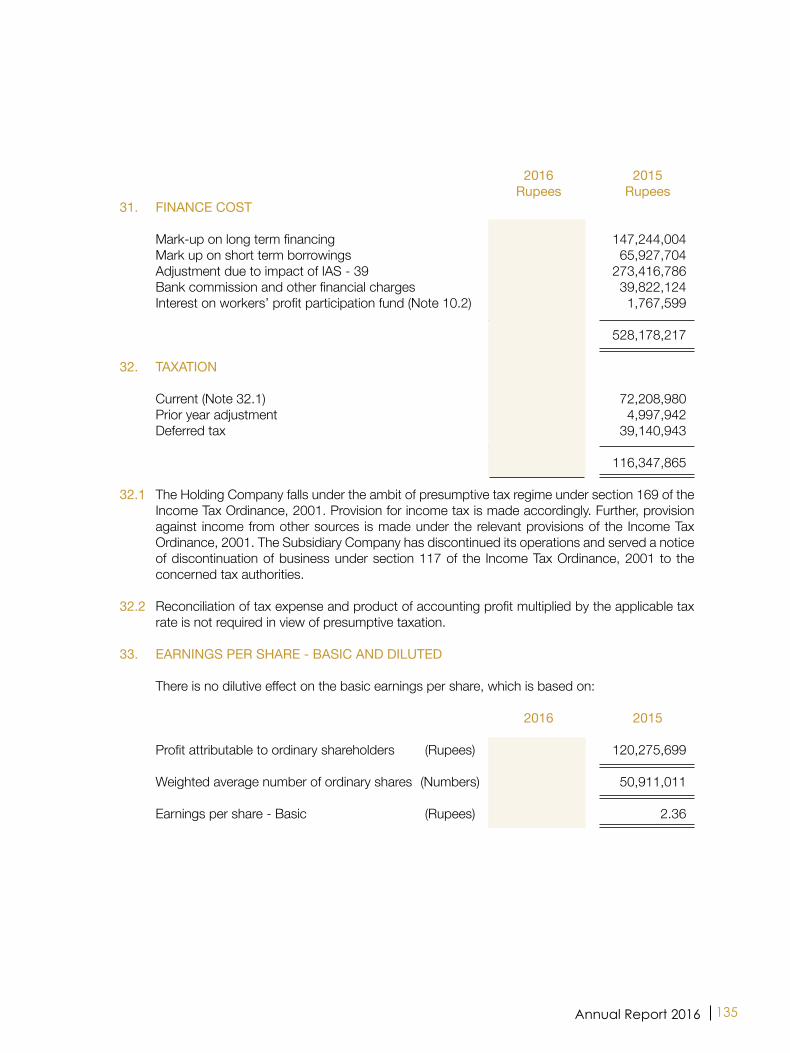
135Annual Report 2016
2016 2015 rupees rupees31. FiNANce coSt Mark-up on long term financing 113,077,157 147,244,004 Mark up on short term borrowings 33,514,787 65,927,704 Adjustment due to impact of IAS - 39 241,522,253 273,416,786 Bank commission and other financial charges 59,804,270 39,822,124 Interest on workers’ profit participation fund (Note 10.2) 2,845,679 1,767,599 450,764,146 528,178,217 32. tAXAtioN Current (Note 32.1) 73,303,245 72,208,980 Prior year adjustment 1,014,552 4,997,942 Deferred tax 10,373,918 39,140,943 84,691,715 116,347,865
32.1 The Holding Company falls under the ambit of presumptive tax regime under section 169 of the Income Tax Ordinance, 2001. Provision for income tax is made accordingly. Further, provision against income from other sources is made under the relevant provisions of the Income Tax Ordinance, 2001. The Subsidiary Company has discontinued its operations and served a notice of discontinuation of business under section 117 of the Income Tax Ordinance, 2001 to the concerned tax authorities.
32.2 Reconciliation of tax expense and product of accounting profit multiplied by the applicable tax
rate is not required in view of presumptive taxation. 33. eArNiNGS per SHAre - BASic AND DiLUteD
There is no dilutive effect on the basic earnings per share, which is based on:
2016 2015 Profit attributable to ordinary shareholders (Rupees) 119,641,819 120,275,699 Weighted average number of ordinary shares (Numbers) 50,911,011 50,911,011 Earnings per share - Basic (Rupees) 2.35 2.36

136 Kohinoor Mills Limited and its Subsidiary
2016 2015 rupees rupees34. cASH GeNerAteD FroM operAtioNS Profit before taxation 204,333,534 236,623,564 Adjustment for non-cash charges and other items: Depreciation on operating fixed assets 222,458,353 228,755,618 Dividend income (3,218,336) (2,896,501) Loss / (gain) on sale of operating fixed assets 13,197,745 (3,234,336) Gain on recognition of long term financing at fair value - (138,355,873) Adjustment due to impact of IAS - 39 241,522,253 273,416,786 Provision for doubtful trade debts - 121,697 Debit balances written off 5,079 193,021 Credit balances written back (379,820) (536,654) Provision for slow moving, obsolete and damaged store items 2,955,416 - Provision for doubtful export rebate and claims - 8,967,038 Provision for doubtful sales tax recoverable - 2,241,415 Accrued mark-up written back - (2,172,628) Finance cost 209,241,893 254,761,431 Working capital changes (Note 34.1) (305,193,173) (30,709,317)
584,922,944 827,175,261
34.1 Working capital changes (increase) / decrease in current assets Stores, spares and loose tools (53,234,080) (48,731,299) Stock-in-trade (76,402,442) (31,445,212) Trade debts 20,141,471 47,778,828 Advances 3,671,620 8,961,187 Trade deposits and short term prepayments 3,039,638 1,925,737 Other receivables (1,597,697) (13,328,185) Sales tax recoverable (205,626,534) (43,298,532)
(310,008,024) (78,137,476) Increase in trade and other payables 4,814,851 47,428,159 (305,193,173) (30,709,317)

137Annual Report 2016
35. reMUNerAtioN to cHieF eXecUtiVe, Director AND eXecUtiVeS
Aggregate amounts charged in these consolidated financial statements for remuneration, including all benefits to chief executive, director and other executives of the Holding Company are as follows:
2016 2015 chief chief
executive Director executives executive Director executives
---------------------------------- (rupees) ------------------------------------- Managerial remuneration 5,082,000 3,630,000 48,139,213 4,620,000 3,300,000 42,614,323 House rent 1,270,500 1,402,500 12,360,318 1,155,000 1,485,000 9,985,271 utilities 508,200 362,979 4,810,058 462,000 330,000 4,248,776 Special allowance 1,016,400 231,000 8,796,155 924,000 - 7,845,484 Contribution to provident fund 423,331 302,385 4,016,998 384,846 274,896 3,531,580 Other allowances 854,700 973,521 10,517,885 777,000 885,000 10,177,457 9,155,131 6,902,385 88,640,627 8,322,846 6,274,896 78,402,891 Number of persons 1 1 45 1 1 34
35.1 Chief executive, directors and executives of the Holding Company are provided with free use of Holding Company’s owned and maintained cars.
35.2 Meeting fee of Rupees 1,000,000 (2015: Rupees 1,000,000) was paid to the non-executive
directors of the Holding Company for attending meetings. 35.3 No remuneration was paid to non-executive directors of the Holding Company. 35.4 No remuneration was paid by Subsidiary Company to its chief executive or any director. 36. trANSActioNS WitH reLAteD pArtieS Related parties comprise of other related parties, key management personnel and provident
fund trust. The Group in the normal course of business carries out transactions with related parties. There are no other transaction with related parties, other than those which have been specifically disclosed elsewhere in these consolidated financial statements.

138 Kohinoor Mills Limited and its Subsidiary
37. proViDeNt FUND reLAteD DiScLoSUreS The following information is based on un-audited financial statements of the provident fund of
the Holding Company for the year ended 30 June 2016 and audited financial statements of the provident fund of the Holding Company for the year ended 30 June 2015:
2016 2015 rupees rupees
Size of the fund - Total assets 118,390,478 126,301,897 Cost of investments 103,042,969 103,042,969 Percentage of investments made 94.61% 95.29% Fair value of investments 112,013,208 120,351,088
37.1 The break-up of fair value of investments is as follows: 2016 2015 2016 2015 percentage rupees rupees Deposits 39.40 43.59 44,134,103 52,471,983 Mutual funds 38.55 35.88 43,180,542 43,180,542 Listed securities 22.05 20.53 24,698,563 24,698,563 100.00 100.00 112,013,208 120,351,088 37.2 Investments, out of provident fund of the Holding Company, have been made in accordance
with the provisions of section 227 of the Companies Ordinance, 1984 and the rules formulated for this purpose.
2016 2015
38. NUMBer oF eMpLoYeeS Number of employees as on June 30 Permanent 1637 1646 Contractual 55 14 Average number of employees during the year Permanent 1616 1621 Contractual 57 13

139Annual Report 2016
39.
SeG
MeN
t iN
ForM
Atio
N39
.1
The
Gro
up h
as fo
ur re
porta
ble
segm
ents
. The
follo
wing
sum
mar
y des
crib
es th
e op
erat
ion in
eac
h of
the
Gro
up’s
repo
rtabl
e se
gmen
ts:
W
eavin
g Pr
oduc
tion
of d
iffere
nt q
ualiti
es o
f gre
ige
fabr
ic us
ing
yarn
Dy
eing
Proc
essin
g of
gre
ige
fabr
ic fo
r pro
duct
ion
of d
yed
fabr
ic
Pow
er G
ener
atio
n G
ener
atio
n an
d di
strib
utio
n of
pow
er u
sing
gas,
oil a
nd s
team
Re
tail
This
segm
ent w
as e
ngag
ed in
the
busin
ess
of s
ellin
g all
type
s of
gen
eral
mer
chan
dise
W
eavi
ng
Dye
ing
pow
er
reta
il el
imin
atio
n of
inte
r- to
tal-
Gro
up
Gen
erat
ion
se
gmen
t tra
nsac
tions
20
16
2015
20
16
2015
20
16
2015
20
16
2015
20
16
2015
20
16
2015
--
----
-- --
----
----
----
----
----
----
----
----
----
----
----
----
----
----
----
----
----
----
----
- (R
u p
e e
s) --
----
----
----
----
----
----
----
----
----
----
----
----
----
----
----
----
----
----
----
----
----
----
Sales
-Ext
erna
l 2
,165
,586
,734
2
,051
,042
,015
6
,385
,505
,101
5
,854
,978
,826
-
-
-
-
-
-
8
,551
,091
,835
7
,906
,020
,841
-In
ters
egm
ent
1,4
22,9
06,2
72
1,7
17,7
14,7
55
58,
879,
608
5
8,47
1,72
0
692
,872
,062
8
31,7
75,1
59
-
-
(2,1
74,6
57,9
42)
(2,6
07,9
61,6
34)
-
-
3
,588
,493
,006
3
,768
,756
,770
6
,444
,384
,709
5
,913
,450
,546
6
92,8
72,0
62
831
,775
,159
-
-
(2
,174
,657
,942
) (2
,607
,961
,634
) 8
,551
,091
,835
7
,906
,020
,841
Co
st o
f sale
s (3
,285
,914
,052
) (3
,441
,427
,982
) (5
,329
,554
,741
) (4
,958
,914
,057
) (7
17,2
54,4
33)
(814
,823
,368
) -
-
2
,174
,657
,942
2
,607
,961
,634
(7
,158
,065
,284
) (6
,607
,203
,773
)
Gro
ss p
rofit
3
02,5
78,9
54
327
,328
,788
1
,114
,829
,968
9
54,5
36,4
89
(24,
382,
371)
1
6,95
1,79
1
-
-
-
-
1,3
93,0
26,5
51
1,2
98,8
17,0
68
Dist
ribut
ion
cost
(1
08,7
38,3
93)
(88,
372,
177)
(3
88,8
14,5
38)
(350
,508
,994
) -
-
-
-
-
-
(4
97,5
52,9
31)
(438
,881
,171
)Ad
min
istra
tive
expe
nses
(8
9,81
7,42
1)
(96,
717,
901)
(1
31,0
07,9
01)
(120
,754
,405
) (1
1,87
5,05
2)
(13,
330,
834)
(4
,968
,747
) (5
,316
,022
) -
-
(2
37,6
69,1
21)
(236
,119
,162
)
(1
98,5
55,8
14)
(185
,090
,078
) (5
19,8
22,4
39)
(471
,263
,399
) (1
1,87
5,05
2)
(13,
330,
834)
(4
,968
,747
) (5
,316
,022
) -
-
(7
35,2
22,0
52)
(675
,000
,333
)
Profi
t bef
ore
taxa
tion
and
unall
ocat
ed in
com
e / e
xpen
ses
104
,023
,140
1
42,2
38,7
10
595
,007
,529
4
83,2
73,0
90
(36,
257,
423)
3
,620
,957
(4
,968
,747
) (5
,316
,022
) -
-
6
57,8
04,4
99
623
,816
,735
Un
alloc
ated
inco
me
and
expe
nses
:
Fina
nce
cost
(4
50,7
64,1
46)
(528
,178
,217
)O
ther
exp
ense
s
(4
7,84
0,34
7)
(45,
555,
352)
Oth
er in
com
e
4
5,13
3,52
8
186
,540
,398
Ta
xatio
n
(8
4,69
1,71
5)
(116
,347
,865
)
(5
38,1
62,6
80)
(503
,541
,036
)
Profi
t afte
r tax
atio
n
1
19,6
41,8
19
120
,275
,699
39.2
rec
onci
liatio
n of
repo
rtabl
e se
gmen
t ass
ets
and
liabi
litie
s
Wea
ving
Dye
ing
Pow
er
Reta
il T
otal-
Gro
up
Gen
erat
ion
20
16
2015
20
16
2015
20
16
2015
20
16
2015
20
16
2015
--
----
----
----
----
----
----
----
----
----
----
----
----
----
----
----
----
----
--- (
R u
p e
e s)
----
----
----
----
----
----
----
----
----
----
----
----
----
----
----
----
----
----
-
Segm
ent a
sset
s 2
,115
,442
,498
2,1
13,6
86,4
70
2,31
7,60
3,74
0 2
,393
,343
,339
9
75,1
75,3
65
898
,210
,407
1
16,3
83,1
03
120
,630
,867
5
,524
,604
,706
5,5
25,8
71,0
83 Lo
ng te
rm in
vest
men
ts
52,
200,
708
1
57,0
09,6
91
unall
ocat
ed a
sset
s
8
18,3
36,5
79
635
,342
,921
Tota
l ass
ets
as p
er b
alanc
e sh
eet
6,3
95,1
41,9
93 6
,318
,223
,695
Se
gmen
t liab
ilities
3
83,0
37,6
89
326
,677
,867
2
93,6
92,0
62
316
,850
,033
1
07,0
37,4
78
133
,938
,968
5
26,9
18
896
,391
7
84,2
94,1
47
778
,363
,259
unall
ocat
ed lia
biliti
es:
Lo
ng te
rm fi
nanc
ing
- sec
ured
8
98,6
10,1
10 1
,811
,907
,803
Sp
onso
r’s lo
an
272
,000
,000
1
96,8
55,3
69
Loan
from
dire
ctor
1
1,00
0,00
0
11,
000,
000
Accr
ued
mar
k-up
1
94,4
83,9
01
250
,378
,063
Sh
ort t
erm
bor
row
ings
- se
cure
d
1
,917
,369
,966
7
56,2
28,1
40
Defe
rred
liabi
lities
1
94,5
99,6
66
356
,647
,458
Pr
ovisi
on fo
r tax
atio
n
7
3,30
3,24
5
72,
208,
980
unall
ocat
ed lia
biliti
es
69,
981,
855
7
1,47
7,71
2
Tota
l liab
ilities
as
per b
alanc
e sh
eet
4,4
15,6
42,8
90 4
,305
,066
,784
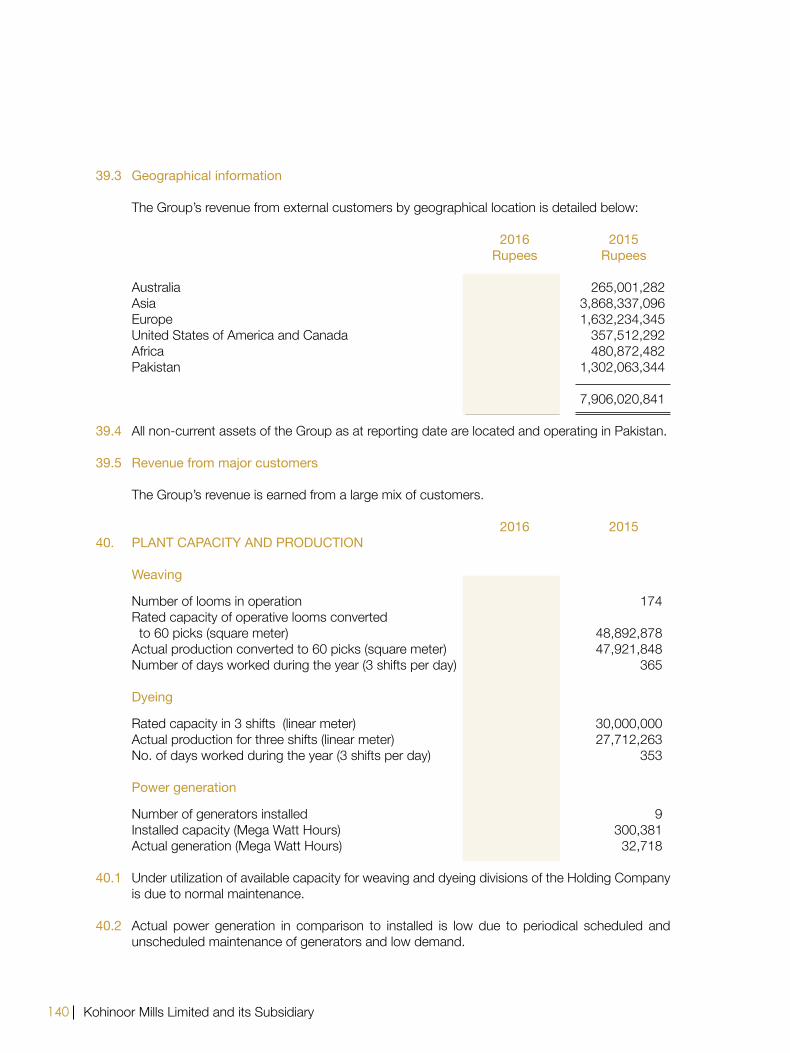
140 Kohinoor Mills Limited and its Subsidiary
39.3 Geographical information The Group’s revenue from external customers by geographical location is detailed below: 2016 2015 rupees rupees Australia 203,308,572 265,001,282 Asia 4,802,495,886 3,868,337,096 europe 1,489,017,074 1,632,234,345 united States of America and Canada 194,810,736 357,512,292 Africa 473,548,239 480,872,482 Pakistan 1,387,911,328 1,302,063,344 8,551,091,835 7,906,020,841 39.4 All non-current assets of the Group as at reporting date are located and operating in Pakistan.
39.5 revenue from major customers The Group’s revenue is earned from a large mix of customers.
2016 201540. pLANt cApAcitY AND proDUctioN Weaving Number of looms in operation 174 174 Rated capacity of operative looms converted to 60 picks (square meter) 48,892,878 48,892,878 Actual production converted to 60 picks (square meter) 48,530,269 47,921,848 Number of days worked during the year (3 shifts per day) 365 365 Dyeing Rated capacity in 3 shifts (linear meter) 36,000,000 30,000,000 Actual production for three shifts (linear meter) 30,419,874 27,712,263 No. of days worked during the year (3 shifts per day) 360 353 power generation Number of generators installed 9 9 Installed capacity (Mega Watt Hours) 300,381 300,381 Actual generation (Mega Watt Hours) 33,270 32,718 40.1 under utilization of available capacity for weaving and dyeing divisions of the Holding Company
is due to normal maintenance. 40.2 Actual power generation in comparison to installed is low due to periodical scheduled and
unscheduled maintenance of generators and low demand.

141Annual Report 2016
41. FiNANciAL riSK MANAGeMeNt 41.1 Financial risk factors The Group’s activities expose it to a variety of financial risks: market risk (including currency
risk, other price risk and interest rate risk), credit risk and liquidity risk. The Group’s overall risk management programme focuses on the unpredictability of financial markets and seeks to minimize potential adverse effects on the financial performance.
Risk management is carried out by the Board of Directors of the Holding Company and the
Subsidiary Company (the respective Board). The Board provides principles for overall risk management, as well as policies covering specific areas such as currency risk, other price risk, interest rate risk, credit risk and liquidity risk.
(a) Market risk (i) currency risk Currency risk is the risk that the fair value or future cash flows of a financial instrument
will fluctuate because of changes in foreign exchange rates. Currency risk arises mainly from future commercial transactions or receivables and payables that exist due to transactions in foreign currencies.
The Group is exposed to currency risk arising from various currency exposures,
primarily with respect to the united States Dollar (uSD) and euro. Currently, the Group’s foreign exchange risk exposure is restricted to foreign currency bank balances and the amounts receivable from / payable to the foreign entities. The Group uses forward exchange contracts to hedge its foreign currency risk, when considered appropriate. The Group’s exposure to currency risk was as follows:
2016 2015 Cash in hand - uSD 7,015 - Cash in hand - euro 160 - Cash at banks - uSD - 789 Trade debts - uSD 4,895,432 9,704,733 Trade debts - euro 158,226 205,485 Trade and other payable - uSD (1,080,919) (200,543) Trade and other payable - euro (1,501) - Net exposure - USD 3,821,528 9,504,979 Net exposure - Euro 156,885 205,485 The following significant exchange rates were applied during the year:
rupees per US Dollar Average rate 104.29 101.31 Reporting date rate 104.50 101.50 rupees per euro Average rate 115.31 120.86 Reporting date rate 116.08 113.57

142 Kohinoor Mills Limited and its Subsidiary
Sensitivity analysis If the functional currency, at reporting date, had weakened / strengthened by 5% against
the USD and Euro with all other variables held constant, the impact on profit after taxation for the year would have been higher / lower by Rupees 19.003 million (2015: Rupees 46.328 million) mainly as a result of exchange gains / losses on translation of foreign exchange denominated financial instruments. Currency risk sensitivity to foreign exchange movements has been calculated on a symmetric basis. In management’s opinion, the sensitivity analysis is unrepresentative of inherent currency risk as the year end exposure does not reflect the exposure during the year.
(ii) other price risk Other price risk represents the risk that the fair value or future cash flows of a financial
instrument will fluctuate because of changes in market prices (other than those arising from interest rate risk or currency risk), whether those changes are caused by factors specific to the individual financial instrument or its issuer, or factors affecting all similar financial instrument traded in the market. The Group is not exposed to commodity price risk.
(iii) interest rate risk This represents the risk that the fair value or future cash flows of a financial instrument will
fluctuate because of changes in market interest rates. The Group has no significant long-term interest-bearing assets except for bank balances
on saving accounts. The Group’s interest rate risk arises from long term financing and short term borrowings. Borrowings obtained at variable rates expose the Group to cash flow interest rate risk. Borrowings obtained at fixed rate expose the Group to fair value interest rate risk.

143Annual Report 2016
At the balance sheet date the interest rate profile of the Group’s interest bearing financial instruments was:
2016 2015 rupees rupees Fixed rate instruments Financial liabilities Long term financing 399,879,599 1,193,805,233 Sponsor’s loan - 196,855,369 Floating rate instruments Financial assets Bank balances - deposit accounts 27,495,038 70,317,056 Financial liabilities Long term financing 498,730,511 618,102,570 Short term borrowings 1,917,369,966 756,228,140 Fair value sensitivity analysis for fixed rate instruments The Group does not account for any fixed rate financial assets and liabilities at fair value through
profit or loss. Therefore, a change in interest rate at the balance sheet date would not affect profit or loss for the period.
Cash flow sensitivity analysis for variable rate instruments If interest rates at the year end date, fluctuate by 1% higher / lower with all other variables
held constant, profit for the year would have been Rupees 25.080 million lower / higher (2015: Rupees 13.692 million), mainly as a result of higher / lower interest expense on floating rate borrowings. This analysis is prepared assuming the amounts of liabilities outstanding at reporting dates were outstanding for the whole year.
(b) credit risk Credit risk represents the risk that one party to a financial instrument will cause a financial loss
for the other party by failing to discharge an obligation. The carrying amount of financial assets represents the maximum credit exposure. The maximum exposure to credit risk at the reporting date was as follows:

144 Kohinoor Mills Limited and its Subsidiary
2016 2015 rupees rupees Investment 52,200,708 157,009,691 Advances 12,288,661 11,598,639 Deposits 34,475,558 37,265,448 Trade debts 465,442,351 485,583,822 Other receivables 2,652,355 1,077,119 Bank balances 50,757,508 109,391,434 617,817,141 801,926,153 The credit quality of financial assets that are neither past due nor impaired can be assessed by
reference to external credit ratings (If available) or to historical information about counterparty default rate:
rating 2016 2015 Banks Short Long Agency rupees rupees term term National Bank of Pakistan A1+ AAA PACRA 229,782 1,045,273 Allied Bank Limited A1+ AA+ PACRA 10,300,604 12,684,893 Askari Bank Limited A1+ AA+ PACRA 255,414 1,091,512 Bank Alfalah Limited A1+ AA PACRA 304,240 2,423,309 Faysal Bank Limited A1+ AA PACRA 480,717 828,166 Habib Bank Limited A-1+ AAA JCR-VIS 5,902,809 9,959,766 Habib Metropolitan Bank Limited A1+ AA+ PACRA 18,499,258 59,138,488 The Bank of Punjab A1+ AA- PACRA 754,664 4,704,808 NIB Bank Limited A1+ AA - PACRA 11,298,546 3,081,633 Silk Bank Limited A-2 A - JCR-VIS 31,112 353,778 Standard Chartered Bank (Pakistan) Limited A1+ AAA PACRA 2,041,776 4,707,679 United Bank Limited A-1+ AAA JCR-VIS 644,500 9,256,047 Al-Baraka Bank (Pakistan) Limited A1 A PACRA 14,086 116,082 50,757,508 109,391,434 investment Security General Insurance Company Limited AA- JCR-VIS 52,200,708 157,009,691 102,958,216 266,401,125 The Group’s exposure to credit risk and impairment losses related to trade debts is disclosed in
Note 19. Due to the Group’s long standing business relationships with these counterparties and after
giving due consideration to their strong financial standing, management does not expect non-performance by these counter parties on their obligations to the Group. Accordingly the credit risk is minimal.
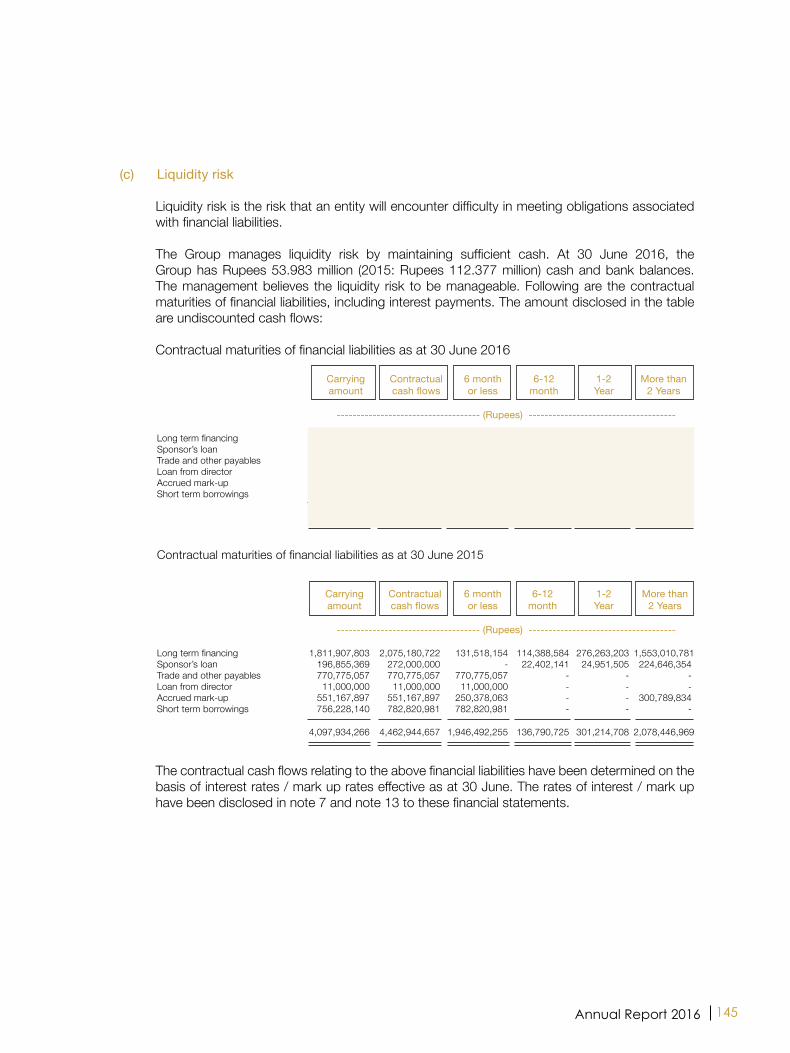
145Annual Report 2016
(c) Liquidity risk
Liquidity risk is the risk that an entity will encounter difficulty in meeting obligations associated with financial liabilities.
The Group manages liquidity risk by maintaining sufficient cash. At 30 June 2016, the Group has Rupees 53.983 million (2015: Rupees 112.377 million) cash and bank balances. The management believes the liquidity risk to be manageable. Following are the contractual maturities of financial liabilities, including interest payments. The amount disclosed in the table are undiscounted cash flows:
Contractual maturities of financial liabilities as at 30 June 2016 carrying contractual 6 month 6-12 1-2 More than
amount cash flows or less month Year 2 Years
------------------------------------ (rupees) ------------------------------------- Long term financing 898,610,110 1,089,741,205 77,496,745 32,559,948 69,655,501 910,029,011 Sponsor’s loan 272,000,000 272,000,000 272,000,000 - - - Trade and other payables 756,618,312 756,618,312 756,618,312 - - - Loan from director 11,000,000 11,000,000 11,000,000 - - - Accrued mark-up 349,506,012 349,506,012 194,483,901 - - 155,022,111 Short term borrowings 1,917,369,966 1,961,624,931 1,961,624,931 - - - 4,205,104,400 4,440,490,460 3,273,223,889 32,559,948 69,655,501 1,065,051,122
Contractual maturities of financial liabilities as at 30 June 2015 carrying contractual 6 month 6-12 1-2 More than
amount cash flows or less month Year 2 Years
------------------------------------ (rupees) ------------------------------------- Long term financing 1,811,907,803 2,075,180,722 131,518,154 114,388,584 276,263,203 1,553,010,781 Sponsor’s loan 196,855,369 272,000,000 - 22,402,141 24,951,505 224,646,354 Trade and other payables 770,775,057 770,775,057 770,775,057 - - - Loan from director 11,000,000 11,000,000 11,000,000 - - - Accrued mark-up 551,167,897 551,167,897 250,378,063 - - 300,789,834 Short term borrowings 756,228,140 782,820,981 782,820,981 - - -
4,097,934,266 4,462,944,657 1,946,492,255 136,790,725 301,214,708 2,078,446,969 The contractual cash flows relating to the above financial liabilities have been determined on the
basis of interest rates / mark up rates effective as at 30 June. The rates of interest / mark up have been disclosed in note 7 and note 13 to these financial statements.

146 Kohinoor Mills Limited and its Subsidiary
41.2 Financial instruments by categories
Assets as per balance sheet
2016 2015 Loans and Available total Loans and Available total receivables for sale receivables for sale - -- - - - - - - - (rupees) - - - - - - -- - - - - - - -- - - (rupees) - - - - - -- - -
Investments - 52,200,708 52,200,708 - 157,009,691 157,009,691 Advances 12,288,661 - 12,288,661 11,598,639 - 11,598,639 Deposits 34,475,558 - 34,475,558 37,265,448 - 37,265,448 Trade debts 465,442,351 - 465,442,351 485,583,822 - 485,583,822 Other receivables 2,652,355 - 2,652,355 1,077,119 - 1,077,119 Cash and bank balances 53,983,062 - 53,983,062 112,377,211 - 112,377,211
568,841,987 52,200,708 621,042,695 647,902,239 157,009,691 804,911,930
2016 2015 rupees rupees Financial liabilities at amortized cost Sponsor’s loan 272,000,000 196,855,369 Long term financing 898,610,110 1,811,907,803 Accrued mark-up 349,506,012 551,167,897 Loan from director 11,000,000 11,000,000 Short term borrowings 1,917,369,966 756,228,140 Trade and other payables 756,618,312 770,775,057 4,205,104,400 4,097,934,266 41.3 capital risk management The Group’s objectives when managing capital are to safeguard the Group’s ability to continue
as a going concern in order to provide returns for shareholders and benefits for other stake holders and to maintain an optimal capital structure to reduce the cost of capital. In order to maintain or adjust the capital structure, the Group may adjust the amount of dividends paid to share holders, issue new shares or sell assets to reduce debt.

147Annual Report 2016
42. recoGNiZeD FAir VALUe MeASUreMeNtS - FiNANciAL iNStrUMeNtS (i) Fair value hierarchy Judgements and estimates are made in determining the fair values of the financial instruments
that are recognised and measured at fair value in these consolidated financial statements. To provide an indication about the reliability of the inputs used in determining fair value, the Group has classified its financial instruments into the following three levels. An explanation of each level follows underneath the table.
recurring fair value measurements Level 1 Level 2 Level 3 total At 30 June 2016 .............................. (rupees) ............................. Financial asset Available for sale financial asset - - 52,200,708 52,200,708 Total financial asset - - 52,200,708 52,200,708
recurring fair value measurements Level 1 Level 2 Level 3 total At 30 June 2015 .............................. (rupees) .............................
Financial asset Available for sale financial asset - - 157,009,691 157,009,691 Total financial asset - - 157,009,691 157,009,691
The above table does not include fair value information for financial assets and financial liabilities not measured at fair value if the carrying amounts are a reasonable approximation of fair value. Due to short term nature, carrying amounts of certain financial assets and financial liabilities are considered to be the same as their fair value. For the majority of the non-current receivables, the fair values are also not significantly different to their carrying amounts.
There was no transfer in and out of level 3 measurements.
The Group’s policy is to recognise transfers into and transfers out of fair value hierarchy levels as at the end of the reporting period.
Level 1: The fair value of financial instruments traded in active markets (such as publicly traded derivatives, and trading and available-for-sale securities) is based on quoted market prices at the end of the reporting period. The quoted market price used for financial assets held by the Group is the current bid price. These instruments are included in level 1.

148 Kohinoor Mills Limited and its Subsidiary
Level 2: The fair value of financial instruments that are not traded in an active market (for example, over-the-counter derivatives) is determined using valuation techniques which maximise the use of observable market data and rely as little as possible on entity-specific estimates. If all significant inputs required to fair value an instrument are observable, the instrument is included in level 2.
Level 3: If one or more of the significant inputs is not based on observable market data, the instrument is included in level 3. This is the case for unlisted equity securities.
(ii) Valuation techniques used to determine fair values
Specific valuation technique used to value financial instrument was using discounted cash flow analysis.
(iii) Fair values measurements using significant unobservable inputs (level 3)
The following table presents the changes in level 3 items for the year ended 30 June 2016 and 30 June 2015:
Unlisted equity security rupees
Balance as on 01 July 2014 176,879,692 Less : Deficit recognized in other comprehensive income 19,870,001 Balance as on 30 June 2015 157,009,691 Less : Deficit recognized in other comprehensive income 104,808,983
Balance as on 30 June 2016 52,200,708

149Annual Report 2016
(iv) Valuation inputs and relationships to fair value The following table summarises the quantitative information about the significant unobservable
inputs used in level 3 fair value measurements.
range of inputs relationship of (probability- unobservable Description
Fair value at Un observable weighted) inputs to
inputs average fair value 30 June 30 June 30 June 2016 2015 2016
rupees rupees Available for sale financial asset: Security General Insurance 52,200,708 157,009,691 Net premium revenue 2% Increase / Company Limited growth factor decrease in
Risk adjusted 19.06% net premium revenue discount rate growth factor by 0.5% and decrease / increase in discount rate by 1% would increase / decrease fair value by Rupees +3.077 million / - 2.768 million.
There were no significant inter-relationships between unobservable inputs that materially affect fair values.
Valuation processes Independent valuer performs the valuation of non-property item required for financial reporting
purposes, including level 3 fair values. The independent valuer reports directly to the chief financial officer. Discussions of valuation processes and results are held between the chief financial officer and the valuation team at least once every six month, in line with the Group’s half yearly reporting period.
The main level 3 inputs used are derived and evaluated as follows: Discount rates for financial instruments are determined using a capital asset pricing model to
calculate a rate that reflects current market assessments of the time value of money and the risk specific to the asset.
earnings growth factor for unlisted equity securities are estimated based on market information
for similar types of companies. Changes in level 2 and 3 fair values are analysed at the end of each reporting period during the
half yearly valuation discussion between the chief financial officer and the independent valuer. As part of this discussion the independent valuer presents a report that explains the reason for the fair value movements.

150 Kohinoor Mills Limited and its Subsidiary
43. recoGNiZeD FAir VALUe MeASUreMeNtS - NoN-FiNANciAL ASSetS (i) Fair value hierarchy
Judgements and estimates are made for non-financial assets that are recognized and measured at fair value in these consolidated financial statements. To provide an indication about the reliability of the inputs used in determining fair value, the Group has classified its non-financial assets into the following three levels.
As at 30 June 2016 Level 1 Level 2 Level 3 total .............................. (rupees) ............................. Property, plant and equipment: - Freehold land - 744,878,999 - 744,878,999 - Buildings - 798,584,166 - 798,584,166 Total non-financial assets - 1,543,463,165 - 1,543,463,165
As at 30 June 2015 Level 1 Level 2 Level 3 total .............................. (rupees) .............................
Property, plant and equipment: - Freehold land - 744,878,999 - 744,878,999 - Buildings - 807,289,518 - 807,289,518 Total non-financial assets - 1,552,168,517 - 1,552,168,517
The Group’s policy is to recognise transfers into and transfers out of fair value hierarchy levels as at the end of the reporting period.
There were no transfers between levels 1 and 2 for recurring fair value measurements during the
year. Further, there was no transfer in and out of level 3 measurements. (ii) Valuation techniques used to determine level 2 fair values The Group obtains independent valuations for the items of property, plant and equipment
carried at revalued amounts every three years. The management updates the assessment of the fair value of each item of property, plant and equipment carried at revalued amount, taking into account the most recent independent valuations. The management determines the value of items of property, plant and equipment carried at revalued amounts within a range of reasonable fair value estimates. The best evidence of fair value of freehold land is current prices in an active market for similar lands. The best evidence of fair value of buildings is to calculate fair depreciated market value by applying an appropriate annual rate of depreciation on the new construction / replacement value of the same building.
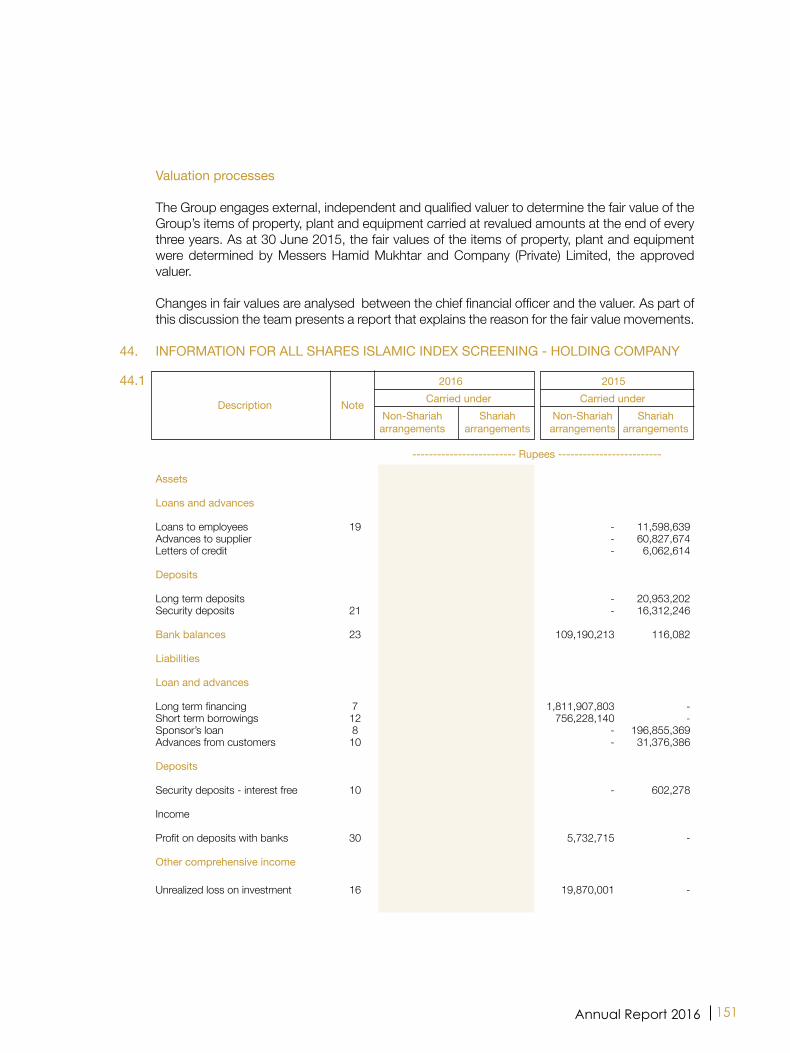
151Annual Report 2016
Valuation processes The Group engages external, independent and qualified valuer to determine the fair value of the
Group’s items of property, plant and equipment carried at revalued amounts at the end of every three years. As at 30 June 2015, the fair values of the items of property, plant and equipment were determined by Messers Hamid Mukhtar and Company (Private) Limited, the approved valuer.
Changes in fair values are analysed between the chief financial officer and the valuer. As part of
this discussion the team presents a report that explains the reason for the fair value movements.
44. iNForMAtioN For ALL SHAreS iSLAMic iNDeX ScreeNiNG - HoLDiNG coMpANY
44.1 2016 2015 Description Note carried under carried under Non-Shariah Shariah Non-Shariah Shariah arrangements arrangements arrangements arrangements
------------------------- rupees -------------------------
Assets Loans and advances Loans to employees 19 - 12,288,661 - 11,598,639 Advances to supplier - 57,285,999 - 60,827,674 Letters of credit - 5,237,568 - 6,062,614 Deposits Long term deposits - 21,200,012 - 20,953,202 Security deposits 21 - 13,275,546 - 16,312,246 Bank balances 23 50,663,496 13,952 109,190,213 116,082 Liabilities Loan and advances Long term financing 7 898,610,110 - 1,811,907,803 - Short term borrowings 12 1,917,369,966 - 756,228,140 - Sponsor’s loan 8 - 272,000,000 - 196,855,369 Advances from customers 10 - 33,638,439 - 31,376,386 Deposits Security deposits - interest free 10 - 602,278 - 602,278 Income Profit on deposits with banks 30 2,807,772 - 5,732,715 - other comprehensive income unrealized loss on investment 16 104,808,983 - 19,870,001 -
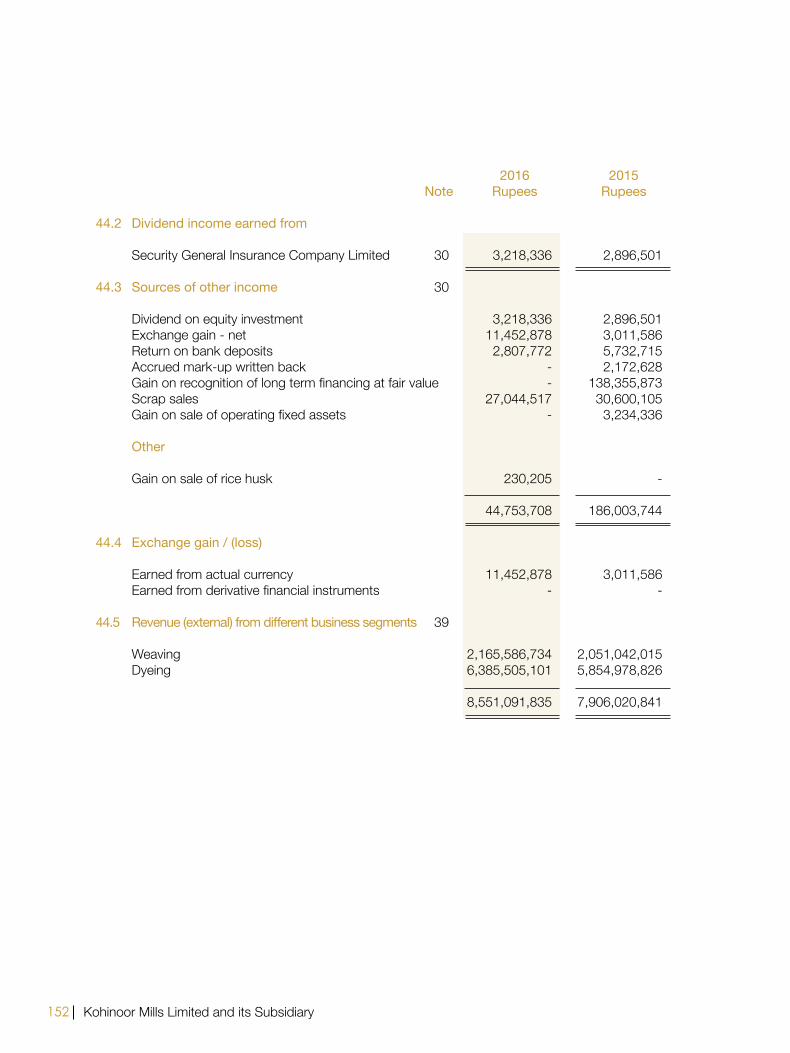
152 Kohinoor Mills Limited and its Subsidiary
2016 2015 Note rupees rupees 44.2 Dividend income earned from Security General Insurance Company Limited 30 3,218,336 2,896,501 44.3 Sources of other income 30 Dividend on equity investment 3,218,336 2,896,501 Exchange gain - net 11,452,878 3,011,586 Return on bank deposits 2,807,772 5,732,715 Accrued mark-up written back - 2,172,628 Gain on recognition of long term financing at fair value - 138,355,873 Scrap sales 27,044,517 30,600,105 Gain on sale of operating fixed assets - 3,234,336 other Gain on sale of rice husk 230,205 - 44,753,708 186,003,744 44.4 exchange gain / (loss) earned from actual currency 11,452,878 3,011,586 Earned from derivative financial instruments - - 44.5 Revenue (external) from different business segments 39 Weaving 2,165,586,734 2,051,042,015 Dyeing 6,385,505,101 5,854,978,826 8,551,091,835 7,906,020,841
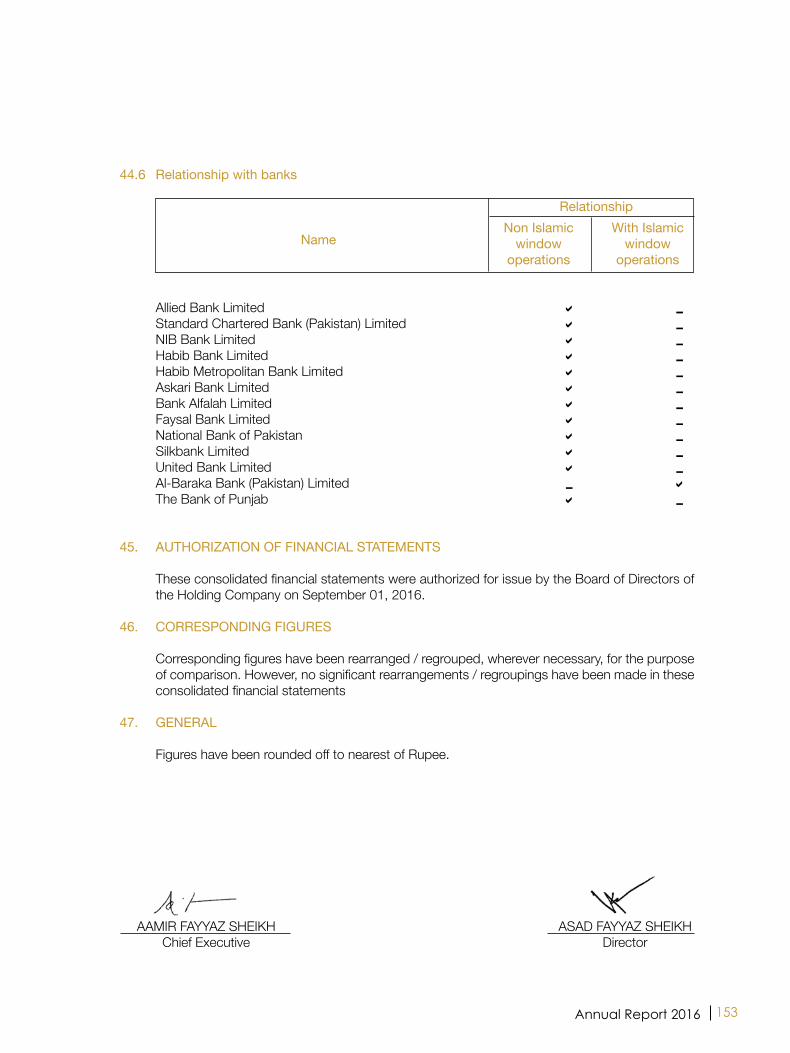
153Annual Report 2016
44.6 relationship with banks
relationship Non islamic With islamic Name window window operations operations
Allied Bank Limited a 0 Standard Chartered Bank (Pakistan) Limited a 0 NIB Bank Limited a 0 Habib Bank Limited a 0 Habib Metropolitan Bank Limited a 0 Askari Bank Limited a 0 Bank Alfalah Limited a 0 Faysal Bank Limited a 0 National Bank of Pakistan a 0 Silkbank Limited a 0 united Bank Limited a 0 Al-Baraka Bank (Pakistan) Limited 0 a The Bank of Punjab a 0
45. AUtHoriZAtioN oF FiNANciAL StAteMeNtS These consolidated financial statements were authorized for issue by the Board of Directors of
the Holding Company on September 01, 2016. 46. correSpoNDiNG FiGUreS Corresponding figures have been rearranged / regrouped, wherever necessary, for the purpose
of comparison. However, no significant rearrangements / regroupings have been made in these consolidated financial statements
47. GeNerAL Figures have been rounded off to nearest of Rupee.
AAMIR FAYYAZ SHEIKH ASAD FAYYAZ SHEIKH Chief Executive Director

154 Kohinoor Mills Limited and its Subsidiary
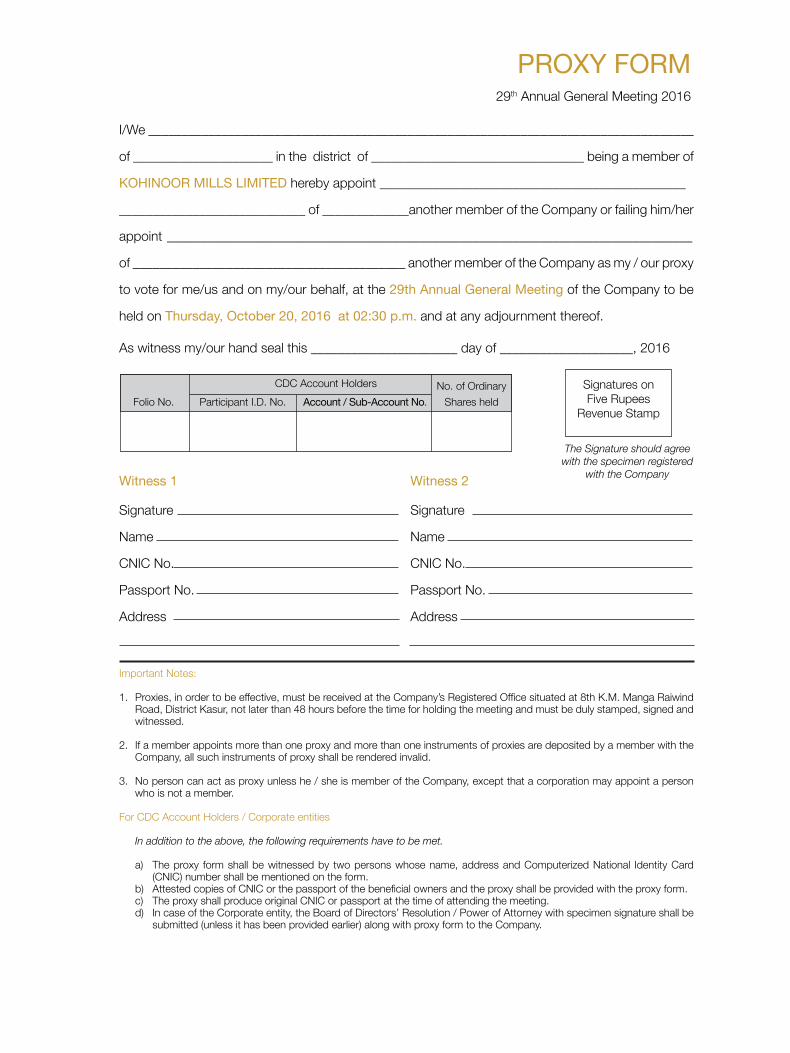
proXY ForM
I/We __________________________________________________________________________________
of _____________________ in the district of ________________________________ being a member of
KoHiNoor MiLLS LiMiteD hereby appoint ______________________________________________
____________________________ of _____________another member of the Company or failing him/her
appoint _______________________________________________________________________________
of _________________________________________ another member of the Company as my / our proxy
to vote for me/us and on my/our behalf, at the 29th Annual General Meeting of the Company to be
held on Thursday, October 20, 2016 at 02:30 p.m. and at any adjournment thereof.
As witness my/our hand seal this ______________________ day of ____________________, 2016
CDC Account Holders No. of Ordinary Folio No. Participant I.D. No. Account / Sub-Account No. Shares held
Witness 1 Witness 2
Signature Signature
Name Name
CNIC No. CNIC No.
Passport No. Passport No.
Address Address
Important Notes:
1. Proxies, in order to be effective, must be received at the Company’s Registered Office situated at 8th K.M. Manga Raiwind Road, District Kasur, not later than 48 hours before the time for holding the meeting and must be duly stamped, signed and witnessed.
2. If a member appoints more than one proxy and more than one instruments of proxies are deposited by a member with the Company, all such instruments of proxy shall be rendered invalid.
3. No person can act as proxy unless he / she is member of the Company, except that a corporation may appoint a person who is not a member.
For CDC Account Holders / Corporate entities
In addition to the above, the following requirements have to be met.
a) The proxy form shall be witnessed by two persons whose name, address and Computerized National Identity Card (CNIC) number shall be mentioned on the form.
b) Attested copies of CNIC or the passport of the beneficial owners and the proxy shall be provided with the proxy form. c) The proxy shall produce original CNIC or passport at the time of attending the meeting. d) In case of the Corporate entity, the Board of Directors’ Resolution / Power of Attorney with specimen signature shall be
submitted (unless it has been provided earlier) along with proxy form to the Company.
Signatures onFive Rupees
Revenue Stamp
The Signature should agree with the specimen registered
with the Company
29th Annual General Meeting 2016

AFFIX
CORRECT
POSTAGeThe Company Secretary
KoHiNoor MiLLS LiMiteD8-Km, Manga Raiwind Road, Distt. Kasur,Pakistan.


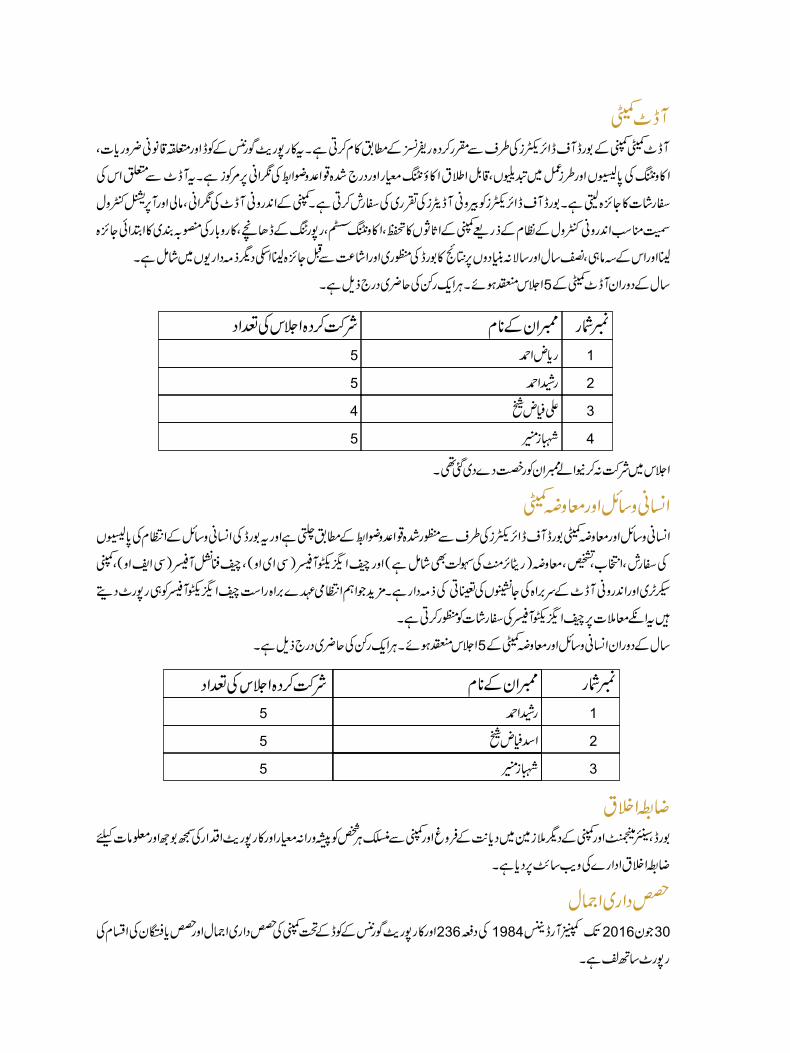


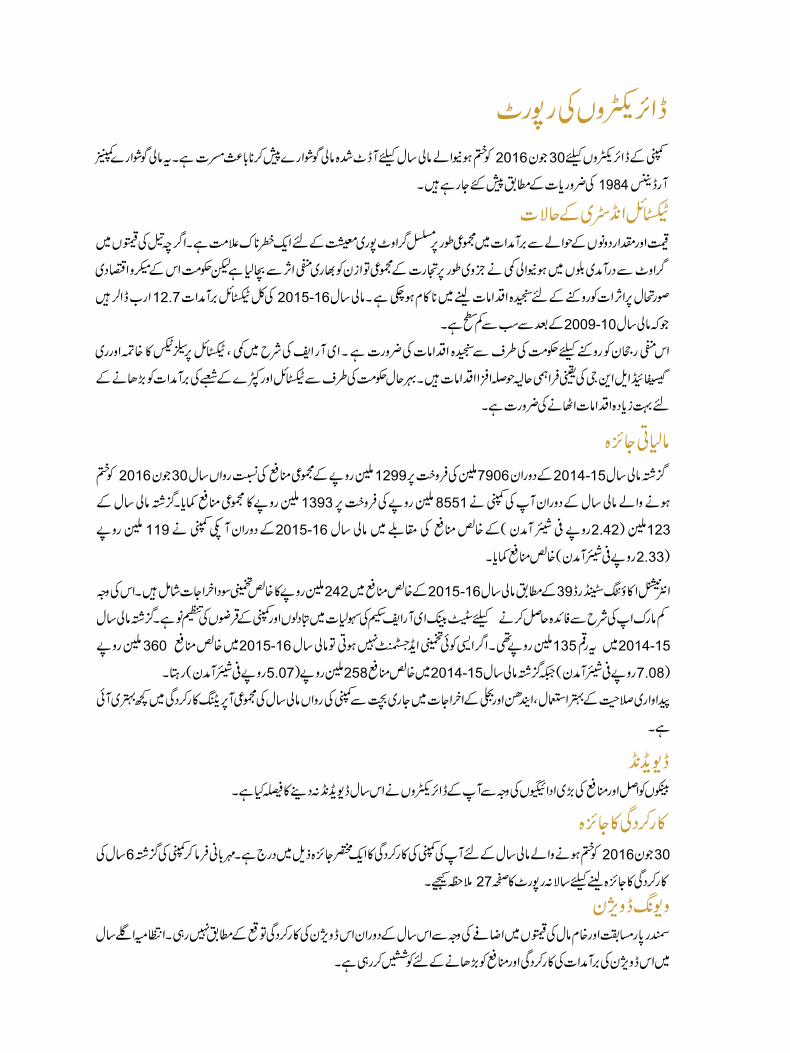

To explore visit website: https://www.secp.gov.pk/

8-Kilometer, Manga Raiwind Road,District Kasur, Pakistan