annual report 2016 - 任天堂ホームページ · pdf fileannual report 2016 for the fiscal...
TRANSCRIPT

Annual Report 2016
for the fiscal year ended March 31, 2016
Nintendo Co., Ltd.

Table of Contents Information on the Company ....................................................................................................................................... 1
I. Overview of the Company ............................................................................................................................... 1 1. Key financial data and trends .......................................................................................................................... 1 2. Description of business ................................................................................................................................... 3 3. Subsidiaries and associates ............................................................................................................................. 4
II. Business Overview .......................................................................................................................................... 6 1. Overview of operating results and cash flow .................................................................................................. 6 2. Risk factors ..................................................................................................................................................... 6 3. Research and development activities .............................................................................................................. 9 4. Analysis of financial position, operating results and cash flow .................................................................... 10
III. Equipment and Facilities ............................................................................................................................... 12 Overview of capital investments ........................................................................................................................ 12
IV. Profile of the Company .................................................................................................................................. 13 1. Members of the Board of Directors .............................................................................................................. 13 2. Corporate Governance .................................................................................................................................. 16
V. Financial Information .................................................................................................................................... 20 Consolidated financial statements, etc. ............................................................................................................... 20 Notes to Consolidated Financial Statements ...................................................................................................... 28

- 1 -
Information on the Company
I. Overview of the Company
1. Key financial data and trends
Consolidated financial data Fiscal year 72nd 73rd 74th 75th 76th
Fiscal year ended March 31 2012 2013 2014 2015 2016
Net sales (Millions of yen)
(Millions of dollars)¥647,652 ¥635,422 ¥571,726 ¥549,780 ¥504,459 U.S.$4,464
Operating income (loss) (Millions of yen)
(Millions of dollars)
(37,320) (36,410) (46,425) 24,770 32,881 290
Ordinary income (loss) (Millions of yen)
(Millions of dollars)
(60,863) 10,482 6,086 70,530 28,790 254
Profit (loss) attributable to owners of parent
(Millions of yen)
(Millions of dollars)
(43,204) 7,099 (23,222) 41,843 16,505 146
Comprehensive income (Millions of yen)
(Millions of dollars)
(51,045) 49,307 17,971 59,373 (3,689) (32)
Net assets (Millions of yen)
(Millions of dollars)1,191,025 1,227,520 1,118,438 1,167,556 1,160,901 10,273
Total assets (Millions of yen)
(Millions of dollars)1,368,401 1,447,878 1,306,410 1,352,944 1,296,902 11,477
Net assets per share (Yen)
(Dollars)9,313.15 9,598.22 9,447.00 9,862.52 9,662.73 85.51
Net income (loss) per share (Yen)
(Dollars)
(337.86) 55.52 (183.59) 353.49 137.40 1.21
Diluted net income per share (Yen)
(Dollars)
– – – – – –
Capital adequacy ratio (%)
87.03 84.77 85.60 86.29 89.50 –
Return on equity (ROE) (%)
– 0.59 – 3.66 1.42 –
Price earnings ratio (PER) (Times)
– 182.10 – 50.00 116.45 –
Net cash provided by (used in) operating activities
(Millions of yen)
(Millions of dollars)
(94,955) (40,390) (23,114) 60,293 55,190 488
Net cash provided by (used in) investing activities
(Millions of yen)
(Millions of dollars)
(164,392) 89,104 (20,084) (105,394) (71,740) (634)
Net cash provided by (used in) financing activities
(Millions of yen)
(Millions of dollars)
(39,823) (12,873) (127,163) (11,916) (2,996) (26)
Cash and cash equivalents at end of period (Millions of yen)
(Millions of dollars)
¥407,186 ¥469,395 ¥341,266 ¥281,539 ¥258,095 U.S.$2,284

- 2 -
Fiscal year 72nd 73rd 74th 75th 76th
Fiscal year ended March 31 2012 2013 2014 2015 2016
Number of employees [Separately, average number of temporary employees] (Persons)
4,928 [803]
5,080[753]
5,213[717]
5,120[667]
5,064 [633]
–[–]
(Notes) 1. Dollar amounts are the yen equivalent, calculated, for convenience only, at a rate of ¥113 to U.S.$1, the prevailing exchange rate on March 31, 2016.
2. Net sales do not include consumption taxes. 3. “Diluted net income per share” is not noted because the Company has not issued any dilutive shares. 4. “Return on equity” and “Price earnings ratio” for the 72nd and 74th fiscal years are not noted because the
Company recorded net losses attributable to owners of parent in those fiscal years. 5. The Company has adopted the “Revised Accounting Standard for Business Combinations” (ASBJ Statement No.
21 of September 13, 2013) and other standards, and “net income (loss)” are presented as “profit (loss) attributable to owners of parent” from the fiscal year ended March 31, 2016, accordingly.

- 3 -
2. Description of business
In the field of home entertainment, Nintendo Co., Ltd., its subsidiaries and associates (composed of 27 subsidiaries and five associates as of March 31, 2016), primarily engage in the development, manufacture and sale of entertainment products. Nintendo’s major products are categorized into computer-enhanced “dedicated video game platforms,” playing cards, Karuta and other products. “Dedicated video game platforms” are defined as hardware and software for the handheld systems and home consoles developed by Nintendo Co., Ltd. and its subsidiaries and associates, manufactured by Nintendo Co., Ltd. and distributed primarily by Nintendo Co., Ltd. in Japan and by its subsidiaries and associates in overseas markets.
The positions of Nintendo Co., Ltd. and its main subsidiaries and associates are described below. Segment information is omitted as Nintendo operates as a single business segment.
- Development Nintendo Co., Ltd., Nintendo Technology Development Inc., Nintendo Software Technology Corporation, Retro Studios, Inc., Nintendo European Research and Development SAS, ND CUBE Co., Ltd., 1-UP Studio Inc., MONOLITH SOFTWARE INC., Mario Club Co., Ltd. - Manufacture Nintendo Co., Ltd. - Sale Nintendo Co., Ltd., Nintendo of America Inc., Nintendo of Canada Ltd., Nintendo of Europe GmbH, Nintendo France S.A.R.L., Nintendo Benelux B.V., Nintendo Ibérica, S.A., Nintendo Australia Pty Limited, Nintendo RU LLC., Nintendo of Korea Co., Ltd., iQue (China) Ltd., Nintendo (Hong Kong) Limited - Other Nintendo Network Services Inc.

- 4 -
3. Subsidiaries and associates
(1) Consolidated subsidiaries
Name of company LocationCapital stock
or Investments in capital
Description of principal
business
Percentage of voting
rights held by the
Company
Relationship with Nintendo Co., Ltd. (the “Company”)
Concurrent positions held by directors
Loans Business transactions Leasing of fixed assets
Director of the
Company(number)
Employee of the
Company(number)
Nintendo of America Inc. *1, 2
U.S. Thousands of
US$ 110,000
Sale 100 1 – – Purchasing products manufactured by the
Company –
Nintendo of Canada Ltd.
Canada Thousands of
Can$ 4,000
Sale 100
(100) 1 – –
Purchasing products manufactured by the
Company from Nintendo of America Inc.
–
Nintendo of Europe GmbH *1, 2
GermanyThousands of
EUR 30,000
Sale 100 – 1 – Purchasing products manufactured by the
Company –
Nintendo France S.A.R.L. *1
France Thousands of
EUR 10,000
Sale 100 – 1 –
Purchasing products manufactured by the
Company from Nintendo of Europe GmbH
–
Nintendo Benelux B.V.
The Netherlands
Thousands of EUR 6,800
Sale 100 – 1 –
Purchasing products manufactured by the
Company from Nintendo of Europe GmbH
–
Nintendo Ibérica, S.A.
Spain Thousands of
EUR 3,000
Sale 100
(100) – 1 –
Purchasing products manufactured by the
Company from Nintendo of Europe GmbH
–
Nintendo RU LLC. Russia Millions of
RUB 104
Sale 100
(100) – – –
Purchasing products manufactured by the
Company from Nintendo of Europe GmbH
–
Nintendo Australia Pty Limited
AustraliaThousands of
A$ 8,500
Sale 100 – 1 – Purchasing products manufactured by the
Company –
Nintendo of Korea Co., Ltd. *1
Korea Millions of
KRW 25,000
Sale 100 1 3 – Purchasing products manufactured by the
Company –
iQue (China) Ltd. *1
China Thousands of
US$ 29,000
Sale 100
(100) – 1 –
Purchasing parts from the Company and
entrusted license of manufacturing and sale
–
Nintendo Technology Development Inc.
U.S. US$
1 Development 100 – 2 –
Entrusted development of hardware OS
–
Nintendo Software Technology Corporation
U.S. Thousands of
US$ 20
Development 100 – – – Entrusted development
of software –
Retro Studios, Inc. *1
U.S. Thousands of
US$ 10,001
Development 100 1 – – Entrusted development
of software –
Nintendo (Hong Kong) Limited
China Thousands of
HK$ 49,300
Sale 100 – 2 –
Purchase of products manufactured by the
Company and entrusted purchase of parts for
products manufactured by the Company
–
Nintendo European Research and Development SAS
France Thousands of
EUR 300
Development100
(100) – – –
Entrusted development of software
–
ND CUBE Co., Ltd. Chuo-ku, Tokyo
Millions of JPY 483
Development 97 1 1 – Entrusted development
of software –
1-UP Studio Inc. Chiyoda-ku, Tokyo
Millions of JPY 90
Development 100 – 3 – Entrusted development
of software –
MONOLITH SOFTWARE INC.
Meguro-ku, Tokyo
Millions of JPY 75
Development 97 1 1 – Entrusted development
of software –

- 5 -
Name of company LocationCapital stock
or Investments in capital
Description of principal
business
Percentage of voting
rights held by the
Company
Relationship with Nintendo Co., Ltd. (the “Company”)
Concurrent positions held by directors
Loans Business transactions Leasing of fixed assets
Director of the
Company(number)
Employee of the
Company(number)
Nintendo Network Services Inc.
Chiyoda-ku, Tokyo
Millions of JPY 100
Other 100 – 4 GrantedEntrusted management of network services of the
Company
Leasing of buildings owned by
the Company
Mario Club Co., Ltd.
Higashiyama-ku, Kyoto
Millions of JPY 450
Development 100 – 5 – Entrusted inspection of
software etc.
Leasing of buildings owned by
the Company
(Notes) 1. There are six other consolidated subsidiaries not listed above. 2. Figures in parentheses in Percentage of voting rights held by the Company represent the proportion of indirect
ownership. 3. Companies marked with *1 are specified subsidiaries. 4. Proportion of sales of consolidated subsidiaries marked with *2, excluding inter-company transactions of sales,
over total sales on a consolidated basis surpasses 10%. Major financial information is as follows.
Name of company Net sales
(Millions of yen) Ordinary income (Millions of yen)
Net income (Millions of yen)
Total net assets (Millions of yen)
Total assets (Millions of yen)
Nintendo of America Inc. 220,228 14,375 12,936 176,967 241,662
Nintendo of Europe GmbH 111,425 4,010 2,432 66,917 100,473
Name of company Net sales
(Millions of dollars) Ordinary income
(Millions of dollars) Net income
(Millions of dollars)Total net assets
(Millions of dollars) Total assets
(Millions of dollars)
Nintendo of America Inc. 1,948 127 114 1,566 2,138
Nintendo of Europe GmbH 986 35 21 592 889
(2) Associates accounted for using equity method
Name of company LocationCapital stock
or Investments in capital
Description of principal
business
Percentage of voting
rights held by the
Company
Relationship with the Company
Concurrent positions held by directors
Loans Business transactions Leasing of fixed assets
Director of the
Company(number)
Employee of the
Company(number)
The Pokémon Company
Minato-ku, Tokyo
Millions of JPY 365
Sale and license of Pokémon
related goods
32 – 1 –
Purchasing products manufactured by the
Company and entrusted manufacturing of
products
–
WARPSTAR, Inc. Chiyoda-ku, Tokyo
Millions of JPY 10
Animation production
and intellectual
property management
50 – 3 – Entrusted management of
merchandising rights
Leasing of buildings owned by
the Company
PUX Corporation Kadoma-shi, Osaka
Millions of JPY 45
Development of software engine and
license business
27 – 1 – Entrusted development
of software –
(Note) There is one associate accounted for using equity method other than the ones listed above.

- 6 -
II. Business Overview
1. Overview of operating results and cash flow
(1) Operating results During the fiscal year ended March 31, 2016, for Nintendo 3DS, Animal Crossing: Happy Home Designer and Pokémon Super Mystery Dungeon were released globally and both became hits, selling 3.04 million and 1.22 million units, respectively. There were also multiple hit titles from third-party publishers. However, due to the lack of major titles like Pokémon Omega Ruby/Pokémon Alpha Sapphire and Super Smash Bros. for Nintendo 3DS, which energized the entire 3DS business during the prior fiscal year, the worldwide sales of Nintendo 3DS hardware and software were 6.79 million and 48.52 million units, respectively.
With respect to Wii U, Splatoon sold 4.27 million units and Super Mario Maker sold 3.52 million units, both becoming blockbusters and contributing to energizing the Wii U platform. In addition, The Legend of Zelda: Twilight Princess HD, which was released globally in March, got off to a good start. The global sales of the Wii U hardware and software reached 3.26 million and 27.36 million units, respectively.
In addition to the above, amiibo sales continued to maintain momentum and showed strong performance globally. The figure-type and the card-type sold approximately 24.70 million units and approximately 28.90 million units, respectively. Furthermore, sales of additional download content for Nintendo 3DS and Wii U increased and total download sales reached ¥43.9 billion. Moreover, our first smart device app, Miitomo, was released globally in March and started off well.
As a result, net sales were ¥504.4 billion (U.S.$4,463 million; a decrease of 8.2% on a year on year basis), of which overseas sales were ¥368.9 billion (U.S.$ 3,264 million; a decrease of 11.0% on a year on year basis, and 73.1% of total sales). Operating income was ¥32.8 billion (U.S.$290 million; an increase of 32.7% on a year on year basis). Mainly due to the re-evaluation of assets in foreign currencies, exchange losses by yen appreciation totaled ¥18.3 billion (U.S.$161 million). As a result, ordinary income was ¥28.7 billion (U.S.$253 million; a decrease of 59.2% on a year on year basis) and profit attributable to owners of parent was ¥16.5 billion (U.S.$146 million; a decrease of 60.6% on a year on year basis).
Segment information is omitted as Nintendo operates as a single business segment.
(2) Cash flow
The ending balance of “Cash and cash equivalents” (collectively, “Cash”) as of March 31, 2016 was ¥258.0 billion (U.S.$2,283 million), with a decrease of ¥23.4 billion during the fiscal year. During the previous fiscal year, there was a decrease of ¥59.7 billion. Net increase (decrease) of Cash and contributing factors during the fiscal year ended March 31, 2016 are as follows:
Net cash provided by (used in) operating activities: There were decreasing factors towards ¥27.7 billion (U.S.$245 million) of Profit before income taxes such as payments of income taxes and various expenses. However, due to increasing factors such as decrease of inventory and collection of trade accounts receivable and notes receivable, net cash resulted in an increase of ¥55.1 billion (U.S.$487 million) compared to an increase of ¥60.2 billion last year.
Net cash provided by (used in) investing activities: Net cash from investing activities decreased by ¥71.7 billion (U.S.$634 million) compared to a decrease of ¥105.3 billion last year mainly due to payments into time deposits and purchase of short-term and long-term investment securities exceeding proceeds from withdrawal of time deposits, sales of short-term and long-term investment securities.
Net cash provided by (used in) financing activities: There were increasing factors due to the disposal of treasury shares. However, net cash from financing activities decreased by ¥2.9 billion (U.S.$25 million) compared to a decrease of ¥11.9 billion last year mainly due to payments of cash dividends.
2. Risk factors
Listed below are the various risks that could significantly affect Nintendo’s operating results, share price and financial condition. However, unpredictable risks may exist other than the risks set forth herein.
Note that matters pertaining to the future presented herein are determined by Nintendo as of the end of the fiscal year ended March 31, 2016.

- 7 -
(1) Risks around economic environment • Fluctuation in foreign exchange rates
Nintendo distributes its products globally with overseas sales accounting for about 70% of its total sales. The majority of monetary transactions are made in local currencies. In order to reduce the influence of fluctuations in foreign exchange rates, we have implemented measures such as increasing purchases in U.S. dollars; however, it is difficult to eliminate the risks completely. In addition, the Company holds a substantial amount of assets in foreign currencies. Thus, fluctuations in foreign exchange rates have a strong influence not only when accounts in foreign currencies are converted to Japanese yen but also when they are revaluated for financial reporting purposes.
(2) Risks around business activities
• Fluctuation of market environment and competition against other companies Nintendo’s business is engaged in one segment of the broad entertainment field. However, its business can be affected by trends in other segments of the entertainment field. If consumer preferences shift to other forms of entertainment, it is possible that the video game market may shrink. The emergence of new competitors resulting from technological innovation could have a detrimental impact as well. In the video game industry, it may become even more difficult to be profitable due to large investments required in research and development, and marketing. In addition, competition may intensify with large-scale companies doing business in the same industry or in other segments of the entertainment field. As a result, Nintendo may experience difficulty in maintaining or expanding its market share as well as sustaining profitability. Furthermore, as the market for smart device gaming services is in the development stage, it is possible that Nintendo may face rapid structural changes or the imposition of new laws and regulations and, if unable to adapt to such changes, be affected in terms of its business and performance.
• Development of new products
Although Nintendo continuously makes efforts to develop innovative and attractive products in the field of computer entertainment, the development process is complicated and includes many uncertainties. The various risks involved are as follows: a. Despite the substantial costs and time needed for development of software for dedicated video game
platforms and applications for smart device gaming services, there is no guarantee that all new products and services will be accepted by consumers due to ever shifting consumer preferences. Also, development of certain products may be suspended or aborted.
b. While development of hardware is time-consuming, with technology continuously advancing, it is possible that the Company may not be able to incorporate technologies required for entertainment. Furthermore, delays of hardware launches could adversely affect market share.
c. Due to the nature of Nintendo products and services, it may become difficult to develop, sell or launch the products and services as planned and the original plan could differ to a large extent.
• Product valuation and adequate inventory procurement
Products in the video game industry have relatively short life cycles, and are significantly impacted by consumers’ preferences as well as seasonality. Although production is projected based on the forecasted equilibrium point of supply and demand, it is difficult to forecast demand accurately, which may lead to excess inventory. Obsolete inventory could have an adverse effect on Nintendo’s operations and financial position.
• Overseas business expansion and international activities
In addition to Japan, Nintendo engages in business in the United States, Europe, Australia, Asia and other areas in the world. Expansion of business to these overseas markets involves risks such as a) unpredictable enforcement of or changes in laws or regulations, b) disadvantages from emergence of political or economic factors, c) disadvantages from inconsistency of multilateral taxation systems and diversity of tax law interpretation, d) difficulty of recruiting and securing human resources, e) social disruption resulting from terrorist attacks, war and other catastrophic events.
• Dependency on outside manufacturers
Nintendo commissions a number of outside manufacturers to produce key components or assemble finished products. In the event one or more of these businesses fail, Nintendo may have difficulty procuring key components or manufacturing its products. In addition, suppliers may be unable to provide necessary components on a timely basis. A shortage of key components could cause marginal decline due to higher costs, shortage of products and quality control issues. These issues may impair the relationship between Nintendo

- 8 -
and its customers. Furthermore, as many suppliers’ production facilities are located overseas, potential production interruptions caused by societal violence, natural disasters or any other accidents in the area could negatively affect Nintendo’s operating performance.
• Business operations affected by seasonal fluctuation
A major portion of demand for Nintendo’s products is focused around the holiday season. Should Nintendo fail to release attractive new products or supply hardware during that period, it would suffer unfavorable operating performance.
• Unauthorized access to systems
Nintendo operates various Internet services, including Internet-based competition games, download sales of digital software and service provision via Internet servers, in addition to providing information via the Internet. If a cyber-attack were launched against these systems resulting in the termination or destruction of the systems, or the leakage or unauthorized use of data, it could have an adverse effect on Nintendo’s future operating results, share price and financial condition.
(3) Risks around legal regulations and litigation
• Product liability Nintendo manufactures its products in accordance with applicable quality control standards in locations of sale. However, large-scale product recalls may occur, and any such recalls would likely be primarily caused by discovery of defective products. Also, the defect of a product may lead to product reimbursement compensation resulting in additional expenses, and Nintendo’s reputation as well as its operating performance and financial position may suffer.
• Limitations of enforcing intellectual property rights
Although Nintendo continues to accumulate various intellectual properties to produce different products, there are geographical regions in which it is difficult to effectively tackle unauthorized uploading via the Internet and copied products, which may have a negative impact on Nintendo’s operating performance and financial position in the future.
• Leakage or unauthorized access of personal or confidential information
Nintendo possesses personally identifiable information about its consumers, as well as confidential information concerning development and business operations. If such personally identifiable information or confidential information were ever leaked outside of Nintendo, due to breach or other unauthorized access or disclosure, it could have an adverse effect on Nintendo’s future operating performance, share price and financial condition.
• Changes in accounting standards and taxation systems
Unpredicted adoptions of or changes in accounting standards or taxation systems could have an effect on Nintendo’s performance and financial position. Conflict of views between Nintendo and the tax authorities may cause additional tax costs.
• Litigation
Nintendo’s operations in Japan and overseas may be subject to litigation, disputes and other legal procedures. These issues may affect Nintendo’s operating performance.
(4) Other risks
Other than the risks set forth above, factors such as uncollectibility of notes and accounts receivable - trade, collapse of financial institutions and environmental restrictions may adversely affect Nintendo’s operating performance and financial position.

- 9 -
3. Research and development activities
Nintendo primarily engages in the active development of hardware and software for handheld and home console video game systems, with support from various companies and organizations, in its effort to put smiles on the faces of everyone Nintendo touches around the world by offering new and compelling products that anyone can enjoy. Nintendo also undertakes the planning and development of smart device application software.
With respect to hardware, Nintendo continuously investigates and undertakes research on fundamental technologies spanning data storage technology such as semiconductor memories, display technology such as liquid crystal displays, and electronic components, while it also carries out research and development activities to examine the applicability of various technologies including interfaces such as touch panels and sensors, wireless communication, networks and security to the field of home entertainment. Nintendo is also devoted to the development of a gaming platform codenamed “NX” with a brand-new concept, which will be launched in March 2017 globally.
Moreover, Nintendo continues to enhance the durability, safety, quality and performance of its products to ensure that consumers can comfortably enjoy them over an extended period, as well as design and develop various accessories, and pursue cost-cutting and energy conservation initiatives.
With respect to software, Nintendo focuses on taking full advantage of hardware features in planning its products, designing games whose elements include graphics, music and game scripts, and developing programs.
Furthermore, in response to increasing system and software complexity, the research & development divisions of hardware, system software and networks have been integrated into one research & development division in order to diversify ideas for unique product planning. Also, in order to deal with digital business expansion, Nintendo has strongly driven the expansion of system infrastructure that supports various networking functions of software and multi-sectorial network services such as Nintendo eShop.
In addition, Nintendo has newly established the research and development structure for smart device software to promote the planning and development of smart device application software and the development of a back-end server system.
In terms of its component procurement and manufacturing processes, Nintendo, with the cooperation and support of its manufacturing partners, continuously examines, and accumulates relevant technical know-how on, how one can apply new test methods and technologies in the mass production of components, and complies with various sustainable procurement standards and relevant regulations.
Research and development expenses for the fiscal year were ¥69.0 billion (U.S.$610 million), with the outcomes of major research and development activities described below. Segment information is omitted since Nintendo operates as a single business segment.
In the Nintendo 3DS family, Nintendo launched special hardware editions of each model in order to ensure that the Nintendo 3DS family would appeal to a wider range of consumers. Nintendo released a total of fifteen compatible titles (figure for the Japanese market; the same shall apply hereinafter) which included Animal Crossing: Happy Home Designer, which enables players to freely design homes for characters of the popular series and also to invite their favorite characters by tapping amiibo cards, and Fire Emblem Fates: Birthright/Conquest, which introduces the new concept whereby consumers can choose a scenario of software upon purchase and enables a wide variety of players to enjoy it for longer than before with enriched additional contents.
With respect to Wii U, Nintendo worked on the development of system software and system features, and conducted system updates for the hardware as necessary, in order to further enhance the user experience of the system. Nintendo released a total of ten compatible titles, including Splatoon, a new-concept action shooter utilizing new IP suitable for children as well in which players compete with each other to get their ink on as many places as possible and claim their turf, and Super Mario Maker, which enables players to enjoy creating their own Mario levels by using the Wii U GamePad controller touch screen to add enemies, blocks, pipes and others and sharing them via the Internet.
In addition to this, for amiibo, Nintendo has further enriched the lineup, including the launch of new card-type and yarn-knitted amiibo.
In the area of the smart device business, Nintendo has successfully launched a delivery of Miitomo, Nintendo’s first smart device application which transforms communication among friends to entertainment, in March 2016.
Nintendo has also established My Nintendo, a new membership service which is positioned as a bridge connecting dedicated video game platforms and smart devices.
Moreover, Nintendo is working on the development of a new product that improves people’s QOL (Quality of Life) in enjoyable ways. Nintendo’s aim is to enable consumers to make daily efforts to improve their QOL in a fun manner by making sleep and fatigue status visible and offering various services based on this information.

- 10 -
Nintendo continues to engage in the development of new products for the future.
4. Analysis of financial position, operating results and cash flow
All financial information contained below is based on the consolidated financial statements disclosed in the Annual Securities Report (Japanese only). Any forward-looking statements contained in the following overview are made based on information available as of the end of the fiscal year ended March 31, 2016.
(1) Important accounting policies and assumptions
Consolidated financial statements of Nintendo are prepared in accordance with accounting standards generally accepted in Japan. In preparing such statements, assumptions that may affect the value of assets, liabilities, revenue and expenses are made based on the accounting policies selected and adopted by management. Management takes into account past results and the likelihood of future events to form assumptions in a reasonable fashion, but uncertainties inherent with such assumptions may cause the actual results to be materially different from these assumptions. Important accounting policies adopted in the consolidated financial statements of Nintendo are detailed in the section of “V. Financial Information, Consolidated financial statements, etc., Basis of Presenting Consolidated Financial Statements.”
(2) Factors which may have a significant impact on operating results
Nintendo operates as a business in the field of home entertainment, in which the availability of hit titles and their sales volumes may have a significant impact on its operating results. In addition, the field of entertainment is wide in scope, and any successful non-gaming propositions that provide consumers with more entertainment value and surprises may also have an impact.
More than 70% of Nintendo’s total sales are generated in the overseas markets, with most transactions carried out in local currencies. While Nintendo has attempted to increase dollar-based purchases in order to reduce the impact of exchange rate fluctuations, it is difficult to completely eliminate their risk. As a result, exchange rate fluctuations may have an impact on Nintendo’s financial performance.
While video game systems and their compatible software, which are Nintendo’s main products, represent a majority of total sales, hardware and software have very different profit margins, and fluctuations of their proportions of the total sales may have an impact on gross profit and the gross profit percentage to sales.
In addition, there may be other fluctuating factors as described in “II. Business Overview, 2. Risk factors.”
(3) Analysis of operating results for the fiscal year ended March 31, 2016
Sales and profits decreased when compared to the previous fiscal year.
(Net sales and operating income)
Net sales decreased from the previous fiscal year by ¥45.3 billion to ¥504.4 billion (U.S.$4,463 million; a decrease of 8.2% on a year-on-year basis) due to decreased sales of Nintendo 3DS hardware and software, despite the increase in Wii U software sales. However, due to the increase in the proportion of amiibo in sales and the increase in download sales, gross profit increased from the previous fiscal year by ¥6.3 billion to ¥220.9 billion (U.S.$1,954 million; an increase of 3.0% on a year-on-year basis). Due to such factors as the decrease in advertising expenses, total selling, general and administrative expenses decreased from the previous fiscal year by ¥1.7 billion, resulting in an operating income of ¥32.8 billion (U.S.$290 million; an increase of 32.7% on a year-on-year basis).
(Non-operating income and expenses, and ordinary income)
Net non-operating loss was ¥4.0 billion (U.S.$35 million), due mainly to foreign exchange losses by yen appreciation. As a result, ordinary income was ¥28.7 billion (U.S.$253 million; a decrease of 59.2% on a year-on-year basis).
(Profit attributable to owners of parent)
Profit attributable to owners of parent was ¥16.5 billion (U.S.$146 million; a decrease of 60.6% on a year-on-year basis), primarily due to the decrease in ordinary income.

- 11 -
(4) Financial position Total assets decreased overall by ¥56.0 billion compared with the previous fiscal year, to ¥1,296.9 billion (U.S.$11,476 million) mainly due to a decrease in securities and inventories. Total liabilities decreased by ¥49.3 billion compared to the previous fiscal year to ¥136.0 billion (U.S.$1,203 million) mainly due to a decrease in notes and accounts payable-trade. Net assets decreased by ¥6.6 billion compared to the previous fiscal year to ¥1,160.9 billion (U.S.$10,273 million) due to the decrease in foreign currency translation adjustment and retained earnings.
Cash flow information is described in “II. Business Overview, 1. Overview of operating results and cash flow, (2) Cash flow.”
(5) Liquidity of funds
The current ratio as of March 31, 2016, is 1,037%, and the ratio of total liabilities to cash and cash equivalents is 1.9 times.
Major components of the working capital requirements include purchase expenses of materials and parts for manufacturing, advertising expenses and research and development expenses, and dividend and income tax payments. Moreover, it is Nintendo’s basic policy to internally provide the capital necessary to fund future growth, including capital investments.
During the launch periods of new products and the year-end sales season, there may be temporary increases in notes and accounts receivable - trade, notes and accounts payable - trade and inventories, which may have a downward or upward impact on net cash provided by (used in) operating activities.
Moreover, Nintendo maintains retained earnings that are necessary in order to adapt to changes in the business environment and to pursue further business expansion in the future. Payments into or withdrawals from time deposits with maturities of more than three months, as well as the timing of acquisition or sale of short-term investment securities, may have an upward or downward impact on net cash provided by (used in) investing activities.
- 12 -
III. Equipment and Facilities
Overview of capital investments
Nintendo develops, manufactures and distributes electronic entertainment products, and in the fiscal year ended March 31, 2016, it invested ¥10.414 billion (U.S.$92 million) which was mainly used for research and development facilities, and included intangible assets such as internal use computer software.
Regarding the required funds, all of the capital investments were self-financed and we did not raise external financing. Segment information is omitted as Nintendo operates as a single business segment.

- 13 -
IV. Profile of the Company
1. Members of the Board of Directors
Position Job title Name Date of birth Past experience Term Number of shares held (hundreds)
Director and President (Representative Director)
Tatsumi Kimishima
April 21, 1950
January 2002 Appointed as Director of Nintendo of America Inc. (to present)
June 2002 Appointed as Director of the Company (to present)
May 2006 Appointed as Director and Chairman (CEO) of Nintendo of America Inc.
June 2013 Appointed as Managing Director General Manager, Corporate Analysis & Administration Division and General Manager, General Affairs Division
June 2014 In charge of Personnel Division September 2015 Appointed as Director and President
(to present) Appointed as Representative Director (to present)
*1 10
Director (Representative Director)
Technology Fellow
Genyo Takeda
March 7, 1949
July 1972 Joined the Company June 2000 Appointed as Director (to present) May 2002 Appointed as Senior Managing
Director Appointed as Representative Director (to present)
February 2013 General Manager, Integrated Research & Development Division
September 2015 Appointed as Technology Fellow (to present)
*1 2
Director (Representative Director)
Creative Fellow
Shigeru Miyamoto
November 16, 1952
April 1977 Joined the Company June 2000 Appointed as Director (to present)
General Manager, Entertainment Analysis & Development Division
May 2002 Appointed as Senior Managing Director Appointed as Representative Director (to present)
September 2015 Appointed as Creative Fellow (to present)
*1 1
Director
Managing Executive Officer General Manager, Entertainment Planning & Development Division
Shinya Takahashi
November 9, 1963
April 1989 Joined the Company July 2012 Deputy General Manager, Software
Planning & Development Division June 2013 Appointed as Director (to present)
General Manager, Software Planning & Development Division
April 2014 In charge of Development Administration & Support Division
September 2015 General Manager, Entertainment Planning & Development Division (to present) Supervisor of Business Development Division, Development Administration & Support Division (to present)
June 2016 Appointed as Managing Executive Officer (to present)
*1 1
Director
Managing Executive Officer General Manager, Corporate Planning Department
Shuntaro Furukawa
January 10, 1972
April 1994 Joined the Company May 2012 Outside Director of the Pokémon
Company (to present) July 2015 General Manager, Corporate
Planning Department (to present) June 2016 Appointed as Director (to present)
Appointed as Managing Executive Officer (to present) Supervisor of Corporate Analysis & Administration Division (to present)
*1 1

- 14 -
Position Job title Name Date of birth Past experience Term Number of shares held (hundreds)
Director as an Audit and Supervisory Committee Member
Naoki Noguchi
February 8, 1954
June 1980 Joined the Company May 2010 General Manager, Software Planning
& Development Administration Department
March 2014 Deputy General Manager, Human Resources Division
June 2016 Appointed as Director as an Audit and Supervisory Committee Member (to present)
*2 1
Director as an Audit and Supervisory Committee Member
Naoki Mizutani
December 22, 1950
April 1979 Registered as attorney-at-law May 1989 Registered as patent attorney June 1989 Opened Mizutani Law and Patent
Office June 2003 Appointed as Auditor of the
Company June 2014 Appointed as Director of the
Company June 2016 Appointed as Director as an Audit
and Supervisory Committee Member of the Company (to present)
*2 –
Director as an Audit and Supervisory Committee Member
Yoshimi Mitamura
November 27, 1948
April 1968 Appointed clerk of the Ministry of Finance
July 2000 Director, Miyazu Tax Office, Osaka Regional Taxation Bureau
July 2004 Director, Katsuragi Tax Office, Osaka Regional Taxation Bureau
July 2007 Head of Taxation Department No. 1, Osaka Regional Taxation Bureau
August 2008 Registered as a certified tax accountant
September 2008 Opened Yoshimi Mitamura Certified Tax Accountant Office
June 2012 Appointed as Auditor of the Company
June 2016 Appointed as Director as an Audit and Supervisory Committee Member of the Company (to present)
*2 –
Director as an Audit and Supervisory Committee Member
Katsuhiro Umeyama
July 29, 1965
March 1994 Registered as certified public accountant
July 1999 Opened Umeyama Certified Public Accountant Office
August 1999 Registered as a certified tax accountant
October 1999 Opened Umeyama Certified Tax Accountant Office (current Umeyama Certified Tax Accountant LLC)
November 2005 Appointed as Outside Auditor of KURAUDIA Co., Ltd.
July 2009 Appointed as Representative Partner of Umeyama Certified Tax Accountant LLC (to present)
April 2012 Appointed as Inspector (part-time) of Shiga University of Medical Science (to present)
June 2012 Appointed as Auditor of the Company
November 2015 Appointed as Outside Director (Audit and Supervisory Committee Member), KURAUDIA Co., Ltd. (to present)
June 2016 Appointed as Director as an Audit and Supervisory Committee Member of the Company (to present)
*2 –
Total 16
(Notes) 1. Following the resolution to approve the partial amendment to the Articles of Incorporation at the Annual General Meeting of Shareholders held on June 29, 2016, the Company transitioned to a Company with Audit and Supervisory Committee effective the same day.
2. Directors, Mr. Naoki Mizutani, Mr. Yoshimi Mitamura and Mr. Katsuhiro Umeyama, are Outside Directors. 3. *1 The term of office of Directors (excluding those who are Audit and Supervisory Committee Members)
commenced upon election at the Annual General Meeting of Shareholders for the fiscal year ended on March

- 15 -
31, 2016 and expires at the close of the Annual General Meeting of Shareholders for the fiscal year ending March 31, 2017.
4. *2 The term of office of Directors who are Audit and Supervisory Committee Members commenced upon election at the Annual General Meeting of Shareholders for the fiscal year ended on March 31, 2016 and expires at the close of the Annual General Meeting of Shareholders for the fiscal year ending March 31, 2018.
5. The Company has adopted the Executive Officer System since June 29, 2016 for the purpose of clarifying the responsibility for the execution of operations and establishing a more flexible management structure which can appropriately and swiftly respond to the rapidly changing business environment through the separation of the management decision-making and supervisory functions from the execution of operations, as well as by accelerating the delegation of authority to execute operations. Seven executive officers, excluding those who have the concurrent position as Director, are as follows.
Title Name
Senior Executive Officer General Manager, Finance Administration Division Supervisor of General Affairs Division In charge of Quality Assurance Department
Shigeyuki Takahashi
Senior Executive Officer General Manager, Marketing Division In charge of Advertising Department
Satoshi Yamato
Senior Executive Officer General Manager, Licensing Division Susumu Tanaka
Senior Executive Officer General Manager, Manufacturing Division
Hirokazu Shinshi
Executive OfficerGeneral Manager, Platform Technology Development Division
Ko Shiota
Executive OfficerPresident, Nintendo of Europe GmbH
Satoru Shibata
Executive OfficerPresident, Nintendo of America Inc. Reginald Fils-Aime

- 16 -
2. Corporate Governance <Principles concerning corporate governance> At Nintendo, we strive to maximize long-term corporate value while carefully considering the benefits for everyone we touch. We are working to achieve a highly transparent and sound system of corporate governance; we also educate our employees about our policies, including good corporate ethics. (1) Outline of corporate governance system The Company transitioned to a Company with Audit and Supervisory Committee following the resolution at the 76th Annual General Meeting of Shareholders held on June 29, 2016, for the purpose of strengthening the supervisory function of the Board of Directors, and thereby further promoting corporate governance. At the same time, the Company has introduced the Executive Officer System for the purpose of clarifying the responsibility for, and thereby accelerating, the execution of operations through the separation of the management decision-making and supervisory functions from the execution of operations, as well as by accelerating the delegation of authority to execute operations. The Board of Directors consists of five Directors (excluding Directors who are Audit and Supervisory Committee Members) and four Directors who are Audit and Supervisory Committee Members (including three Outside Directors). The term of office of Directors (excluding Directors who are Audit and Supervisory Committee Members) is one year and the term of office of Directors who are Audit and Supervisory Committee Members is two years. In addition to the meetings of the Board of Directors, which are generally held monthly, the Company also holds meetings of the Executive Management Committee consisting of the Directors (excluding Directors who are Audit and Supervisory Committee Members) twice a month in principle, in order to strongly drive management activities and thereby ensure prompt and efficient decision-making. Furthermore, the Company maintains the system where executive officers appointed by the Board of Directors every year perform their respective duties under the President's supervision and instructions. The Audit and Supervisory Committee consists of one full-time Internal Director and three Outside Directors, all of the Outside Directors are designated as independent officers. The Audit and Supervisory Committee Members attend meetings of the Board of Directors and other important meetings, inspect important documents, have regular meetings with the President and hold monthly meetings of the Audit and Supervisory Committee as a general rule to share audit opinions. Furthermore, the full-time Audit and Supervisory Committee Members conduct fieldwork auditing over each division of the Company, etc., based on the annual audit plan. With respect to internal auditing, the Internal Auditing Department, under the direct supervision of the President, conducts internal auditing from a fair and unbiased perspective independent from business divisions, and works on the promotion and improvement of internal control including subsidiaries and associates. Accounting Auditor maintains close coordination with the Audit and Supervisory Committee, as well as the Internal Auditing Department, regarding accounting auditing, including the report on the audit plan and audit results, as well as information and opinion exchanges as necessary even during the period, in order to ensure effective and efficient auditing. <Reasons for choosing the current corporate governance system> As stated above, the Company has become a Company with Audit and Supervisory Committee for the purpose of strengthening the supervisory function of the Board of Directors, and thereby further promoting corporate governance. The Company has also introduced the Executive Officer System for the purpose of clarifying the responsibility for, and thereby accelerating, the execution of operations through the separation of the management decision-making and supervisory functions from the execution of operations, as well as by accelerating the delegation of authority to execute operations. The Company's basic policy is that persons who have extensive knowledge of our distinctive business be elected as Directors of the Company since the Company undertakes a unique software-led hardware-software integrated business in the field of entertainment. Furthermore, multiple number of Outside Directors have been elected as Audit and Supervisory Committee Members in the Board of Directors of the Company in

- 17 -
order to integrate objective viewpoints different from Directors appointed from within the company, and ensure appropriate audit and supervision over the execution of operations from an independent standpoint. Reference: Corporate Governance System

- 18 -
(2) Company’s Systems and Policies <System to ensure proper business execution>
1) System to ensure that the Company’s Directors and employees execute their duties in compliance with the laws and regulations and the Articles of Incorporation
By establishing an Audit and Supervisory Committee which consists of a majority of Outside Directors, the Company aims to strengthen the supervisory functions of the Board of Directors and further promote corporate governance. Furthermore, the Company has established a compliance program (legal risk management policy) to define normative systems for compliance and has designed a compliance manual and otherwise implemented measures for promotion of compliance through establishment of a Compliance Committee in order to ensure that Directors’ and employees’ execution of duties complies with the laws and regulations and the Articles of Incorporation. In addition, The Company has established a whistleblowing policy (“Compliance Hotline”) for early discovery and correction of illegal conduct.
In addition to regular audits by the Audit and Supervisory Committee, the Internal Auditing Department, under the direct supervision of the President, regularly evaluates whether the operation of internal controls and financial reporting process of each division and department are appropriate and effective through internal audits, and proposes and suggests measures to make improvements, etc.
The Company has a system to deal with antisocial forces that threaten social order and security at the company level, having appointed a responsible division for dealing with antisocial forces based on its commitment to taking a tough stance against such forces. The Company has also built a system to collaborate with police, attorneys and other outside expert organizations during ordinary times to prepare for emergencies.
2) System for storage and management of information related to the execution of duties of the
Company’s Directors The Company records information related to Directors’ execution of duties as minutes of
meetings of the Board of Directors, Executive Management Committee and other important meetings, as well as documents such as action memos (including electronic records). Each such record is stored and managed for an appropriate retention period, respectively, based on internal regulations.
3) Regulations or any other systems of the Company for management of risk of loss
As a general rule, each division and department manages risks pertaining to work within its jurisdiction. Furthermore, the Internal Auditing Department monitors the risk management system of each division and department, and proposes and advises on policies for improvement, etc. Further, under the Compliance Committee, thorough compliance efforts are promoted at each division and department. In addition, the Company has established a Product Safety Committee and other structures to guarantee product safety, prevent the occurrence of product accidents and ensure prompt response in the event of an accident.
4) System to ensure that the execution of duties of the Company’s Directors is efficient
In addition to the meetings of the Board of Directors held monthly as a general rule, meetings of the Executive Management Committee, which consists of all Directors (excluding Directors who are Audit and Supervisory Committee Members), are held twice a month generally at the Company, to make prompt and efficient decisions.
Furthermore, the Company has introduced the Executive Officer System for the purpose of clarifying the responsibility for the execution of operations through the separation of the management decision-making and supervisory functions from the execution of operations, as well as by accelerating the delegation of authority to execute operations.
With regards to the execution of business based on decisions made by the Board of Directors or the Executive Management Committee, internal regulations set forth the allocation of duties and authorities to ensure organized and efficient operation of business.
5) System to ensure proper business execution within the Company group
The system seeks to ensure proper business execution within the Company group as a whole by ensuring proper business execution by each subsidiary.
The Company has established internal regulations applicable to its subsidiaries mainly to ensure efficient risk management and business operation by the subsidiaries. Pursuant to the regulations,

- 19 -
the responsible divisions and departments of the Company identify and manage such matters as the management status of the respective subsidiaries they are in charge of, obtaining information therefrom as necessary, and subsidiaries are required to obtain the Company’s prior approval for significant matters.
Furthermore, in addition to audits by the Company’s Accounting Auditors, the Audit and Supervisory Committee also conducts audits with respect to subsidiaries as necessary. The Internal Auditing Department likewise conducts audits with respect to subsidiaries as needed in addition to providing guidance and cooperation on internal controls. Major subsidiaries have established internal auditing divisions or departments, and each subsidiary is promoting the establishment of internal control systems suitable to the size of the subsidiary and the law in the region where the subsidiary is located, with the cooperation of relevant divisions and departments of the Company.
In addition to providing guidance and cooperation on compliance to each subsidiary as needed, the Company has established a whistleblowing system at major subsidiaries to render it possible to provide information directly to the Company in order to enhance and promote the compliance of the Company group as a whole. Under the umbrella of the Global Compliance Conference, which comprises top management and other members of the Company and its major subsidiaries, the person in charge of compliance at each company regularly holds meetings.
6) System to ensure that the Audit and Supervisory Committee effectively performs its duty ・ Matters related to employees to assist the duty of the Audit and Supervisory Committee
The Company has established a special organization to assist the duty of the Audit and Supervisory Committee, the Audit and Supervisory Committee Office, and the Office has dedicated staff members who work to assist the duty of the Committee under the direction of the Committee.
Employees in the Audit and Supervisory Committee Office are selected and transferred with the agreement of the Audit and Supervisory Committee to ensure independence of such employees and effectiveness of the direction of the Committee to such employees.
・ System for reporting to the Audit and Supervisory Committee The President of the Company regularly holds meetings with the Audit and Supervisory
Committee Members, and provides them with timely reports regarding the matters designated by law. The Company’s Internal Auditing Department provides the Audit and Supervisory Committee with internal audit reports in a timely manner and, furthermore, the Company’s Directors and other employees report to the Audit and Supervisory Committee as needed matters reported by a Director or another employee of a subsidiary or matters concerning execution of the Company’s or a subsidiary’s business.
An employee who reports to the Audit and Supervisory Committee will not be treated unfavorably.
・ Other systems to ensure that audits by the Audit and Supervisory Committee are effective The Audit and Supervisory Committee attends the meetings of the Board of Directors as well
as participate in important committees and meetings that are deemed necessary in order to ensure that the audits conducted are effective. In the event an Audit and Supervisory Committee member requests the payment of costs and expenses in connection with the performance of his/her duties, the request is processed pursuant to relevant laws in accordance with internal regulations.
7) System to ensure fairness and reliability of financial reporting
In order to ensure the fairness and reliability of financial reporting, the Company implements internal controls for financial reporting which it has developed in an appropriate manner in compliance with laws and regulations such as the Financial Instruments and Exchange Act. The Company also assesses implementation of these internal controls, checks their validity on an ongoing basis and takes necessary measures to improve them.

- 20 -
V. Financial Information
Consolidated financial statements, etc.
(1) Consolidated financial statements (i) Consolidated balance sheets
Previous fiscal year
(As of March 31, 2015)Current fiscal year
(As of March 31, 2016)
(Millions of yen) (Millions of yen)
(Millions of dollars)
Assets
Current assets
Cash and deposits 534,706 570,448 5,048
Notes and accounts receivable - trade 55,794 38,731 342
Securities 380,587 338,892 2,999
Inventories *1 76,897 *1 40,433 357
Deferred tax assets 15,597 6,597 58
Other 34,466 26,401 233
Allowance for doubtful accounts (451) (369) (3)
Total current assets 1,097,597 1,021,135 9,036
Non-current assets
Property, plant and equipment
Buildings and structures, net 42,447 39,977 353
Machinery, equipment and vehicles, net 1,330 1,120 9
Tools, furniture and fixtures, net 4,770 3,791 33
Land 42,925 42,553 376
Construction in progress 14 309 2
Total property, plant and equipment *2 91,488 *2 87,752 776
Intangible assets
Software 11,190 9,408 83
Other 1,240 568 5
Total intangible assets 12,430 9,977 88
Investments and other assets
Investment securities *3 96,294 *3 125,774 1,113
Deferred tax assets 30,558 32,195 284
Net defined benefit asset 9,174 7,092 62
Other 15,399 12,974 114
Allowance for doubtful accounts (0) (0) (0)
Total investments and other assets 151,426 178,037 1,575
Total non-current assets 255,346 275,766 2,440
Total assets 1,352,944 1,296,902 11,477

- 21 -
Previous fiscal year
(As of March 31, 2015)Current fiscal year
(As of March 31, 2016)
(Millions of yen) (Millions of yen)
(Millions of dollars)
Liabilities
Current liabilities
Notes and accounts payable - trade 58,464 31,857 281
Income taxes payable 16,529 1,878 16
Provision for bonuses 2,220 2,294 20
Other 67,018 62,407 552
Total current liabilities 144,232 98,437 871
Non-current liabilities
Net defined benefit liability 25,416 23,546 208
Other 15,739 14,017 124
Total non-current liabilities 41,155 37,563 332
Total liabilities 185,387 136,001 1,203
Net assets
Shareholders’ equity
Capital stock 10,065 10,065 89
Capital surplus 11,734 13,256 117
Retained earnings 1,409,764 1,401,359 12,401
Treasury shares (270,986) (250,563) (2,217)
Total shareholders’ equity 1,160,578 1,174,118 10,390
Accumulated other comprehensive income
Valuation difference on available-for-sale securities 16,671 11,909 105
Foreign currency translation adjustment (9,804) (25,250) (223)
Total accumulated other comprehensive income 6,866 (13,341) (118)
Non-controlling interests 110 124 1
Total net assets 1,167,556 1,160,901 10,273
Total liabilities and net assets 1,352,944 1,296,902 11,477

- 22 -
(ii) Consolidated statements of income and consolidated statements of comprehensive income Consolidated statements of income
Previous fiscal year (From April 1, 2014to March 31, 2015)
Current fiscal year (From April 1, 2015 to March 31, 2016)
(Millions of yen) (Millions of yen)
(Millions of dollars)
Net sales 549,780 504,459 4,464
Cost of sales *1, *3 335,196 *1, *3 283,494 2,508
Gross profit 214,584 220,965 1,955
Selling, general and administrative expenses *2, *3 189,814 *2, *3 188,083 1,664
Operating income 24,770 32,881 290
Non-operating income
Interest income 4,018 4,693 41
Foreign exchange gains 34,051 – –
Gain on redemption of securities 5,233 6,801 60
Share of profit of entities accounted for using equity method 952 1,887 16
Other 1,788 1,168 10
Total non-operating income 46,043 14,550 128
Non-operating expenses
Sales discounts 205 106 0
Foreign exchange losses – 18,356 162
Other 77 178 1
Total non-operating expenses 283 18,641 164
Ordinary income 70,530 28,790 254
Extraordinary income
Gain on sales of non-current assets *4 47 *4 9 0
Gain on sales of investment securities – 398 3
Gain on sales of shares of subsidiaries 3,689 – –
Total extraordinary income 3,737 407 3
Extraordinary losses
Loss on disposal of non-current assets *5 446 *5 351 3
Restructuring loss *6 1,729 *6 1,130 10
Total extraordinary losses 2,176 1,482 13
Profit before income taxes 72,091 27,715 245
Income taxes - current 25,922 2,482 21
Income taxes - deferred 4,306 8,714 77
Total income taxes 30,228 11,197 99
Profit 41,862 16,518 146
Profit attributable to non-controlling interests 18 13 0
Profit attributable to owners of parent 41,843 16,505 146

- 23 -
Consolidated statements of comprehensive income
Previous fiscal year (From April 1, 2014to March 31, 2015)
Current fiscal year (From April 1, 2015 to March 31, 2016)
(Millions of yen) (Millions of yen)
(Millions of dollars)
Profit 41,862 16,518 146
Other comprehensive income
Valuation difference on available-for-sale securities 2,962 (4,663) (41)
Foreign currency translation adjustment 14,468 (15,446) (136)
Share of other comprehensive income of entities accounted for using equity method 79 (97) (0)
Total other comprehensive income *1 17,511 *1 (20,208) (178)
Comprehensive income 59,373 (3,689) (32)
Comprehensive income attributable to
Comprehensive income attributable to owners of parent 59,356 (3,703) (32)
Comprehensive income attributable to non-controlling interests 17 13 0

- 24 -
(iii) Consolidated statements of changes in equity Previous fiscal year (from April 1, 2014 to March 31, 2015)
(Millions of yen)
Shareholders’ equity
Capital stock Capital surplus Retained earnings Treasury shares Total shareholders’
equity Balance at beginning of current period
10,065 11,734 1,378,085 (270,958) 1,128,927
Cumulative effects of changes in accounting policies
1,673 1,673
Restated balance 10,065 11,734 1,379,758 (270,958) 1,130,600
Changes of items during period
Dividends of surplus (11,837) (11,837)
Profit attributable to owners of parent
41,843 41,843
Purchase of treasury shares (27) (27)
Disposal of treasury shares
Net changes of items other than shareholders’ equity
Total changes of items during period
– – 30,006 (27) 29,978
Balance at end of current period 10,065 11,734 1,409,764 (270,986) 1,160,578
Accumulated other comprehensive income
Non-controlling interests
Total net assets
Valuation difference on
available-for-sale securities
Foreign currency translation adjustment
Total accumulated other
comprehensive income
Balance at beginning of current period
13,628 (24,274) (10,645) 157 1,118,438
Cumulative effects of changes in accounting policies
1,673
Restated balance 13,628 (24,274) (10,645) 157 1,120,112
Changes of items during period
Dividends of surplus (11,837)
Profit attributable to owners of parent
41,843
Purchase of treasury shares (27)
Disposal of treasury shares -
Net changes of items other than shareholders’ equity
3,042 14,469 17,512 (46) 17,466
Total changes of items during period
3,042 14,469 17,512 (46) 47,444
Balance at end of current period 16,671 (9,804) 6,866 110 1,167,556

- 25 -
Current fiscal year (from April 1, 2015 to March 31, 2016) (Millions of yen)
Shareholders’ equity
Capital stock Capital surplus Retained earnings Treasury shares Total shareholders’
equity Balance at beginning of current period
10,065 11,734 1,409,764 (270,986) 1,160,578
Changes of items during period
Dividends of surplus (24,910) (24,910)
Profit attributable to owners of parent
16,505 16,505
Purchase of treasury shares (42) (42)
Disposal of treasury shares 1,522 20,465 21,987
Net changes of items other than shareholders’ equity
Total changes of items during period
- 1,522 (8,405) 20,422 13,539
Balance at end of current period
10,065 13,256 1,401,359 (250,563) 1,174,118
Accumulated other comprehensive income
Non-controlling interests
Total net assets
Valuation difference on
available-for-sale securities
Foreign currency translation adjustment
Total accumulated other
comprehensive income
Balance at beginning of current period
16,671 (9,804) 6,866 110 1,167,556
Changes of items during period
Dividends of surplus (24,910)
Profit attributable to owners of parent
16,505
Purchase of treasury shares (42)
Disposal of treasury shares 21,987
Net changes of items other than shareholders’ equity
(4,761) (15,446) (20,208) 13 (20,194)
Total changes of items during period
(4,761) (15,446) (20,208) 13 (6,655)
Balance at end of current period
11,909 (25,250) (13,341) 124 1,160,901

- 26 -
Current fiscal year (from April 1, 2015 to March 31, 2016) (Millions of dollars)
Shareholders’ equity
Capital stock Capital surplus Retained earnings Treasury shares Total shareholders’
equity Balance at beginning of current period 89 103 12,475 (2,398) 10,270
Changes of items during period
Dividends of surplus (220) (220)
Profit attributable to owners of parent
146 146
Purchase of treasury shares (0) (0)
Disposal of treasury shares 13 181 194
Net changes of items other than shareholders’ equity
Total changes of items during period
- 13 (74) 180 119
Balance at end of current period 89 117 12,401 (2,217) 10,390
Accumulated other comprehensive income
Non-controlling interests
Total net assets
Valuation difference on
available-for-sale securities
Foreign currency translation adjustment
Total accumulated other
comprehensive income
Balance at beginning of current period 147 (86) 60 0 10,332
Changes of items during period
Dividends of surplus (220)
Profit attributable to owners of parent
146
Purchase of treasury shares (0)
Disposal of treasury shares 194
Net changes of items other than shareholders’ equity
(42) (136) (178) 0 (178)
Total changes of items during period
(42) (136) (178) 0 (58)
Balance at end of current period 105 (223) (118) 1 10,273

- 27 -
(iv) Consolidated statements of cash flows
Previous fiscal year (From April 1, 2014to March 31, 2015)
Current fiscal year (From April 1, 2015 to March 31, 2016)
(Millions of yen) (Millions of yen)
(Millions of dollars)
Cash flows from operating activities
Profit before income taxes 72,091 27,715 245
Depreciation 9,011 9,139 80
Increase (decrease) in allowance for doubtful accounts 310 (55) (0)
Increase (decrease) in net defined benefit liability 3,755 (707) (6)
Interest and dividend income (4,330) (5,134) (45)
Foreign exchange losses (gains) (33,261) 14,527 128
Share of (profit) loss of entities accounted for using equity method (952) (1,887) (16)
Decrease (increase) in notes and accounts receivable - trade (24,198) 15,444 136
Decrease (increase) in inventories 88,204 34,501 305
Increase (decrease) in notes and accounts payable - trade 3,558 (21,556) (190)
Increase (decrease) in accrued consumption taxes (82) (95) (0)
Other, net (36,506) (5,794) (51)
Subtotal 77,599 66,097 584
Interest and dividend income received 4,861 5,963 52
Interest expenses paid (3) (0) (0)
Income taxes paid (22,164) (16,869) (149)
Net cash provided by (used in) operating activities 60,293 55,190 488
Cash flows from investing activities
Payments into time deposits (756,613) (674,717) (5,970)
Proceeds from withdrawal of time deposits 651,117 659,857 5,839
Purchase of property, plant and equipment and intangible assets (4,582) (4,670) (41)
Proceeds from sales of property, plant and equipment and intangible assets 191 1,574 13
Purchase of short-term and long-term investment securities (736,367) (1,072,852) (9,494)
Proceeds from sales and redemption of short-term and long-term investment securities 740,525 1,019,443 9,021
Other, net 334 (374) (3)
Net cash provided by (used in) investing activities (105,394) (71,740) (634)
Cash flows from financing activities
Cash dividends paid (11,835) (24,929) (220)
Purchase of treasury shares (27) (42) (0)
Proceeds from sales of treasury shares - 21,987 194
Other, net (52) (12) (0)
Net cash provided by (used in) financing activities (11,916) (2,996) (26)
Effect of exchange rate change on cash and cash equivalents (2,710) (3,898) (34)
Net increase (decrease) in cash and cash equivalents (59,727) (23,443) (207)
Cash and cash equivalents at beginning of period 341,266 281,539 2,491
Cash and cash equivalents at end of period *1 281,539 *1 258,095 2,284

- 28 -
Notes to Consolidated Financial Statements
Basis of Presenting Consolidated Financial Statements
The accompanying consolidated financial statements of Nintendo Co., Ltd. (the “Company”) and its consolidated subsidiaries are compiled from the consolidated financial statements prepared by the Company as requested by the Financial Instruments and Exchange Act of Japan and are prepared on the basis of accounting principles and practices generally accepted in Japan, which are different in certain respects as to application and disclosure requirements of the International Financial Reporting Standards. The financial statements of the Company and its domestic subsidiaries are prepared on the basis of the accounting and relevant legal requirements in Japan. The financial statements of the overseas consolidated subsidiaries are prepared on the basis of the accounting and relevant legal requirements of their countries of domicile and no adjustment has been made to their financial statements in consolidation to the extent that significant differences do not occur, as allowed under the generally accepted accounting principles and practices in Japan.
As permitted by the Financial Instruments and Exchange Act of Japan, each amount of the accompanying consolidated financial statements is rounded down to the nearest one million yen. Consequently, the totals shown in the accompanying consolidated financial statements do not necessarily agree with the sums of the individual amounts.
The consolidated financial statements presented herein are stated in Japanese yen, the currency of the country in which the Company is incorporated and operates. The rate of ¥113 to U.S.$1, the approximate current rate of exchange on March 31, 2016, has been applied for the purpose of presentation of the accompanying consolidated financial statements in U.S. dollars. These amounts in U.S. dollars are included solely for convenience and are unaudited. These translations should not be construed as representations that the Japanese yen amounts actually represent, have been or could be converted into U.S. dollars at this or any other rate of exchange.
The accompanying consolidated financial statements are not intended to present the consolidated financial position, results of operations and cash flows in accordance with accounting principles and practices generally accepted in countries and jurisdictions other than Japan.

- 29 -
Significant matters forming the basis of preparing the consolidated financial statements
1. Scope of consolidation
(1) Number of consolidated subsidiaries: 26 companies The names of significant consolidated subsidiaries are omitted because they are provided in “I. Overview of the Company, 3. Subsidiaries and associates.”
(2) The unconsolidated subsidiary is as follows: Fukuei Co., Ltd. The above is unconsolidated because it is a small-scale company and none of its total assets, net sales, net income or loss, retained earnings or other items have a significant impact on the consolidated financial statements.
2. Application of the equity method
(1) Number of associates accounted for under the equity method: following 4 companies Name of significant associates accounted for under the equity method
The Pokémon Company, WARPSTAR, Inc., PUX Corporation, and First Avenue Entertainment, LLLP (2) The company among the unconsolidated subsidiaries not accounted for under the equity method is Fukuei Co.,
Ltd., and the company among the associates not accounted for under the equity method is Ape Inc. This is because the impact each of said companies has on net income or loss, retained earnings, etc., is negligible, and it is immaterial as a whole.
(3) With respect to associates accounted for under the equity method whose account closing dates differ from the
consolidated account closing date, the financial statements of each of the companies, either based on their fiscal year or based on provisional accounts closing, are incorporated.
3. Year-ends of consolidated subsidiaries
Of consolidated subsidiaries, Nintendo Phuten Co., Ltd., iQue (China) Ltd., Nintendo RU LLC. and three other subsidiaries close accounts on December 31 every year.
As the difference between closing dates is within three months, the above subsidiaries were accounted for based on the financial statements as of the account closing date of each subsidiary. Necessary adjustments were made to the consolidated financial statements to reflect any significant transactions that took place between their account closing dates and the consolidated account closing date.
4. Accounting policies
(1) Valuation basis and method for important assets (i) Securities
For held-to-maturity debt securities, the amortized cost method (straight-line method) is used. For other securities with market quotations, the market price method based on the market price, etc., on the account closing date is used (valuation difference is reported as a component of net assets and the cost of sales is calculated using the moving average method), and securities without market quotations are stated at cost using the moving-average method.
(ii) Derivatives The fair value method is applied.
(iii) Inventories They are mainly stated at cost using the moving-average method (the figures shown in the balance sheets have been calculated by writing them down based on decline in profitability).

- 30 -
(2) Depreciation and amortization methods of significant depreciable and amortizable assets (i) Property, plant and equipment (excluding leased assets):
The Company and its domestic consolidated subsidiaries apply the declining balance method, but certain tools, furniture and fixtures are subject to depreciation based on their useful lives in line with their commercial obsolescence. However, the straight-line method is applied for buildings, except for accompanying facilities, acquired on April 1, 1998 or thereafter. Overseas consolidated subsidiaries apply the straight-line method based on the estimated economic useful lives.
Useful lives of main assets are as follows: Buildings and structures 3-60 years
(ii) Intangible assets (excluding leased assets): Intangible assets are amortized using the straight-line method. Software for internal use is amortized over the estimated internal useful life (principally five years).
(iii) Leased assets Leased assets in finance lease transactions that do not transfer ownership
The straight-line method with no residual value is applied, regarding the lease term as useful life. (3) Accounting for significant reserves
(i) Allowance for doubtful accounts The Company and its domestic consolidated subsidiaries provide the allowance for doubtful accounts based on the historical analysis of loss experience for general receivables and on individual evaluations of uncollectible amounts for specific receivables including doubtful accounts. Overseas consolidated subsidiaries provide the allowance for doubtful accounts based on the individual evaluation of uncollectible amount for each of receivables.
(ii) Provision for bonuses The Company and certain consolidated subsidiaries provide the reserve for the estimated amount of bonuses to be paid to the employees.
(4) Accounting method for retirement benefit liability
(i) Periodic allocation method for estimated benefit obligation Upon calculating the retirement benefit obligations, the estimated benefit obligation is attributed to periods up until the end of the fiscal year ended March 31, 2016, on a benefit formula basis.
(ii) Amortization method for actuarial gains and losses and past service cost Actuarial gains and losses and past service cost are processed collectively in the year in which they are incurred.
(iii) Application of simple method at small enterprises, etc. Some consolidated subsidiaries apply a simple method in which an estimated amount required to be paid for voluntary retirement benefits at the end of the fiscal year is deemed as the retirement benefit obligations in the calculations of net defined benefit liability and retirement benefit expenses.
Assets in the Company’s defined benefit corporate pension plan are recorded as “Net defined benefit asset” under investments and other assets as the plan assets exceeded the retirement benefit obligations.
(5) Standards of translation into yen of significant assets or liabilities denominated in foreign currencies All the monetary receivables and payables of the Company and its domestic consolidated subsidiaries denominated in foreign currencies are translated into Japanese yen based on the spot rate of exchange in the foreign exchange market on the respective account closing dates. The foreign exchange gains and losses from translation are recognized in the accompanying consolidated statements of income. Assets or liabilities of overseas consolidated subsidiaries, etc. are translated into yen based on the spot rate of exchange in the foreign exchange market on the account closing date, while revenue and expenses are translated into yen based on the average rate of exchange for the fiscal year. The differences resulting from such translations are included in “Foreign currency translation adjustment” and “Non-controlling interests” under net assets.

- 31 -
(6) Amortization method of goodwill and period thereof Goodwill is mainly amortized on a straight-line basis over five years. Immaterial goodwill is amortized in full in the same fiscal year in which it is incurred.
(7) Scope of cash and cash equivalents in the consolidated statements of cash flow
“Cash and cash equivalents” include cash on hand, time deposit which can be withdrawn on demand and short-term investments, with little risk of fluctuation in value and maturity of three months or less of the acquisition date, which are promptly convertible to cash.
(8) Other important matters in preparing the consolidated financial statements
Accounting for consumption taxes Consumption taxes and local consumption taxes are accounted for by the tax exclusion method.
Changes in accounting policies
Application of accounting standards for business combinations, etc.
Effective beginning the fiscal year ended March 31, 2016, Nintendo has adopted the "Revised Accounting Standard for Business Combinations (ASBJ Statement No. 21 of September 13, 2013; hereafter the "Business Combinations Accounting Standard")," the "Revised Accounting Standard for Consolidated Financial Statements (ASBJ Statement No. 22 of September 13, 2013; hereafter the "Consolidation Accounting Standard")," the "Revised Accounting Standard for Business Divestitures (ASBJ Statement No. 7 of September 13, 2013; hereafter the "Business Divestitures Accounting Standard")" and other standards. Accordingly, the accounting method was changed to record the difference arising from changes in equity in subsidiaries which Nintendo continues to control as a capital surplus, and business acquisition costs as expenses for the fiscal year in which they occurred. Regarding business combinations implemented on or after April 1, 2015, the accounting method was changed to reflect adjustments to the allocation of acquisition cost under provisional accounting treatment on the consolidated financial statements of the fiscal year in which the relevant business combinations became or will become effective. In addition, the changes in the presentation of net income and the changes in the presentation from minority interests to non-controlling interests have been implemented. In connection with the changes in the presentation of the consolidated financial statements, reclassifications have been made on the consolidated financial statements of the fiscal year ended March 31, 2015.
The Business Combinations Accounting Standard and other standards were applied in accordance with the transitional treatments stated in Article 58-2 (4) of the Business Combinations Accounting Standard, Article 44-5 (4) of the Consolidation Accounting Standard and Article 57-4 (4) of the Business Divestitures Accounting Standard from the beginning of the fiscal year ended March 31, 2016.
Changes in description method have been implemented for cash flow statement of the fiscal year ended March 31, 2016, as cash flows related to acquisition or sale of subsidiaries without changes in consolidation scope were provided in the section of cash flows from financing activities while cash flows related to the cost incurred from acquisition or sale of subsidiaries entailing changes in consolidation scope were provided in the section of cash flows from operating activities.
There is no impact on consolidated financial statements or per share information in the fiscal year ended March 31, 2016.
Unapplied accounting standards and guidance “Revised Implementation Guidance on Recoverability of Deferred Tax Assets” (ASBJ Guidance No. 26 of March 28, 2016) (“ Revised Implementation Guidance”) 1. Overview The Revised Implementation Guidance basically follows the framework used in the JICPA Guidance No. 66 “Auditing Treatment for Judgment of Recoverability of Deferred Tax Assets” where entities are classified into five categories and the amount of deferred tax assets to be posted is assessed based on such categories whereas necessary revisions are made regarding the following treatments: (i) treatment of entities which do not satisfy any of criteria for category 1 to category 5; (ii) criteria for the classification of the category 2 and the category 3; (iii) treatment of deductible temporary differences unable to be scheduled for entities in the category 2; (iv) treatment of reasonable estimable periods for taxable income before adding or deducting deductible temporary

- 32 -
differences for entities in the category 3; and (v) treatment when entities which satisfy the criteria for category 4 also fall within category 2 or category 3. 2. Scheduled date of adoption The Revised Implementation Guidance is scheduled to be adopted from the beginning of the fiscal year ending March 31, 2017. 3. Impact of adopting the accounting standards and guidance The impact on its consolidated financial statements was under assessment as of the time the consolidated financial statements for the current fiscal year was prepared.

- 33 -
Changes in presentations
Notes to consolidated statements of income
“Share of profit of entities accounted for using equity method” which was included in “Other” under “Non-operating income” in the previous fiscal year, is separately listed from the fiscal year ended March 31, 2016, because of an increase in the amount’s materiality. The consolidated financial statements of the previous fiscal year have been reclassified to reflect this change in presentation.
As a result, ¥2,740 million presented in “Other” under “Non-operating income” in the consolidated statements of income of the previous fiscal year has been reclassified as ¥952 million of “Share of profit of entities accounted for using equity method” and ¥1,788 million of “Other.”
Notes to consolidated balance sheets
*1. Inventories as of March 31, 2015 and 2016 were as follows:
Previous fiscal year
(As of March 31, 2015)Current fiscal year
(As of March 31, 2016)
Finished goods ¥ 70,054 million ¥ 36,300 million U.S.$ 321million
Work in process 1,466 30 0
Raw materials and supplies ¥ 5,376 ¥ 4,102 U.S.$ 36
*2. Accumulated depreciation of property, plant and equipment as of March 31, 2015 and 2016 were as
follows:
Previous fiscal year
(As of March 31, 2015)Current fiscal year
(As of March 31, 2016)
Accumulated depreciation ¥ 68,416 million ¥ 67,211 million U.S.$ 594 million
*3. Investments in unconsolidated subsidiaries and associates as of March 31, 2015 and 2016 were as
follows:
Previous fiscal year
(As of March 31, 2015)Current fiscal year
(As of March 31, 2016)
Investment securities ¥ 11,653 million ¥ 11,595 million U.S.$ 102 million

- 34 -
Notes to consolidated statements of income
*1. The ending inventory balance is the amount after write-down of book value due to decline in profitability, and the loss on valuation of inventories included in cost of sales for the years ended March 31, 2015 and 2016 were as follows:
Previous fiscal year (From April 1, 2014 to March 31, 2015)
Current fiscal year (From April 1, 2015 to March 31, 2016)
Loss on valuation of inventories ¥ 9,471 million ¥ 4,981 million U.S.$ 44 million
*2. The major items of selling, general and administrative expenses for the years ended March 31, 2015 and 2016 were as follows:
Previous fiscal year (From April 1, 2014 to March 31, 2015)
Current fiscal year (From April 1, 2015 to March 31, 2016)
Research and development expenses ¥ 63,296 million ¥ 69,064 million U.S.$ 611 million
Advertising expenses 54,834 46,636 412
Salaries, allowances and bonuses 21,713 22,282 197
Depreciation 5,762 6,137 54
Retirement benefit expenses 6,408 3,476 30
Provision for bonuses 647 635 5
Provision of allowance for doubtful accounts ¥ 407 ¥ 48 U.S.$ 0
*3. Research and development expenses included in general and administrative expenses and
manufacturing costs for the years ended March 31, 2015 and 2016 were as follows.
Previous fiscal year (From April 1, 2014 to March 31, 2015)
Current fiscal year (From April 1, 2015 to March 31, 2016)
Research and development expenses ¥ 63,336 million ¥ 69,066million U.S.$ 611 million
*4. Gain on sales of non-current assets for the years ended March 31, 2015 and 2016 were as follows:
Previous fiscal year (From April 1, 2014 to March 31, 2015)
Current fiscal year (From April 1, 2015 to March 31, 2016)
Buildings and structures ¥26 millionMachinery, equipment and vehicles
¥ 9 million U.S.$ 0 million
Land 13
Machinery, equipment and vehicles
7
Total ¥47 ¥ 9 U.S.$ 0
*5. Loss on disposal of non-current assets for the years ended March 31, 2015 and 2016 were as follows:
Previous fiscal year (From April 1, 2014 to March 31, 2015)
Current fiscal year (From April 1, 2015 to March 31, 2016)
Loss on retirement Loss on retirement Buildings and structures ¥ 323 million Buildings and structures ¥ 175 million U.S.$ 1 million Land 116 Software 164 1 Software
3 Tools, furniture and fixtures
11 0
Tools, furniture and fixtures
1
Machinery, equipment and vehicles
1
Total ¥ 446 Total ¥ 351 U.S.$ 3

- 35 -
*6. Restructuring loss
Previous fiscal year (from April 1, 2014 to March 31, 2015) Restructuring loss for the year ended March 31, 2015 primarily consisted of impairment loss on non-current assets and extraordinary severance payment expenses associated with the restructuring of business in Europe.
Current fiscal year (from April 1, 2015 to March 31, 2016)
Restructuring loss for the year ended March 31, 2016 primarily consisted of extraordinary severance payment expenses associated with the restructuring of business in the United States.

- 36 -
Notes to consolidated statements of comprehensive income
*1. Reclassification adjustments and tax effects related to other comprehensive income
Previous fiscal year (From April 1, 2014 to March 31, 2015)
Current fiscal year (From April 1, 2015 to March 31, 2016)
Valuation difference on available-for-sale securities:
Amount arising during the fiscal year ¥ 8,690 million ¥ 383 million U.S.$ 3 million
Reclassification adjustments (5,344) (7,240) (64)
Amount before tax effects 3,346 (6,857) (60)
Tax effects (383) 2,193 19
Valuation difference on available-for-sale securities
2,962 (4,663) (41)
Foreign currency translation adjustment:
Amount arising during the fiscal year 14,468 (15,446) (136)
Foreign currency translation adjustment 14,468 (15,446) (136)
Share of other comprehensive income of entities accounted for using equity method:
Amount arising during the fiscal year 79 (97) (0)
Total other comprehensive income ¥ 17,511 ¥ (20,208) U.S.$ (178)
Notes to consolidated statements of changes in equity
Previous fiscal year (From April 1, 2014 to March 31, 2015) 1. Matters concerning outstanding shares
(Shares)
Type of share As of April 1,
2014 Increase Decrease
As of March 31, 2015
Common shares 141,669,000 – – 141,669,000
2. Matters concerning treasury shares
(Shares)
Type of share As of April 1,
2014 Increase Decrease
As of March 31, 2015
Common shares 23,294,719 2,286 – 23,297,005
(Summary of causes of changes) The increase is from acquisitions in line with buyback requests for shares less than one unit.
3. Matters concerning dividends
(1) Amount of dividends paid
Resolution Type of
share Amount of dividends
Dividends per share
Record date Effective date
Annual General Meeting of Shareholders held on June 27, 2014
Common shares
¥11,837 million ¥100 March 31, 2014 June 30, 2014
(2) Dividend payments for which the record date is in the fiscal year ended March 31, 2015 and the effective
date is in the following fiscal year
Resolution Type of share
Amount of dividends
Source of dividends
Dividends per share
Record date Effective date
Annual General Meeting of Shareholders held on June 26, 2015
Common shares
¥21,306 millionRetained earnings
¥180 March 31, 2015 June 29, 2015

- 37 -
Current fiscal year (From April 1, 2015 to March 31, 2016) 1. Matters concerning outstanding shares
(Shares)
Type of share As of April 1,
2015 Increase Decrease
As of March 31, 2016
Common shares 141,669,000 – – 141,669,000
2. Matters concerning treasury shares
(Shares)
Type of share As of April 1,
2015 Increase Decrease
As of March 31, 2016
Common shares 23,297,005 2,099 1,759,427 21,539,677
(Summary of causes of changes) The increase is from acquisitions in line with buyback requests for shares less than one unit. The decrease is from the transfer of the shares to DeNA Co., Ltd. based on the resolution at the meeting of the Board of Directors held on March 17, 2015 (1,759,400 shares) and also from sales in line with selling requests for shares less than one unit (27 shares).
3. Matters concerning dividends
(1) Amount of dividends paid
Resolution Type of
share Amount of dividends
Dividends per share
Record date Effective date
Annual General Meeting of Shareholders held on June 26, 2015
Common shares
¥21,306 million [U.S.$188 million]
¥180[U.S.$ 1.59]
March 31, 2015 June 29, 2015
Meeting of Board of Directors held on October 28, 2015
Common shares
¥3,603 million [U.S.$31 million]
¥30[U.S.$ 0.26]
September 30, 2015
December 1, 2015
(2) Dividend payments for which the record date is in the fiscal year ended March 31, 2016 and the effective
date is in the following fiscal year
Resolution Type of share
Amount of dividends
Source of dividends
Dividends per share
Record date Effective date
Annual General Meeting of Shareholders held on June 29, 2016
Common shares
¥14,415 million[U.S.$ 127 million]
Retained earnings
¥120[U.S.$1.06]
March 31, 2016 June 30, 2016
Notes to consolidated statements of cash flows
*1. The reconciliations of cash and cash equivalents at end of period with the amount presented in the consolidated balance sheets for the years ended March 31, 2015 and 2016 were as follows:
Previous fiscal year (From April 1, 2014 to March 31, 2015)
Current fiscal year (From April 1, 2015 to March 31, 2016)
Cash and deposits ¥ 534,706 million ¥ 570,448 million U.S.$ 5,048 million
Time deposits with maturity of more than three months
(335,217) (335,174) (2,966)
Short-term investments with maturity of three months or less
82,050 22,821 201
Cash and cash equivalents ¥ 281,539 ¥ 258,095 U.S.$ 2,284

- 38 -
Lease transactions
1. Finance lease transactions
Information of finance leases as of March 31, 2015 and 2016 were omitted as they are immaterial.
2. Operating lease transactions
Future lease payments under non-cancelable operating leases
Previous fiscal year
(As of March 31, 2015)Current fiscal year
(As of March 31, 2016)
Due within one year ¥ 1,337 million ¥ 1,337 million U.S.$ 11 million
Due after one year 2,498 6,631 58
Total ¥ 3,836 ¥ 7,968 U.S.$ 70
Financial instruments
1. Condition of financial instruments
(1) Policy for measures relating to financial instruments Nintendo (the Company and its consolidated subsidiaries) invests its funds in highly safe financial assets such as deposits. Nintendo utilizes derivatives to reduce risk as described below and for the purpose of improving the investment yield on short-term financial assets, and does not enter into transactions for speculative purposes.
(2) Details of financial instruments, related risks, and risk management system
Notes and accounts receivable - trade are exposed to credit risk from customers. In order to reduce this risk, Nintendo monitors the financial position and transaction history, assesses creditworthiness and sets a transaction limit for each customer. Since bonds included in securities and investment securities are mainly those that are held to maturity and issued by financial institutions that have high creditworthiness, the credit risk is minimal. Such bonds are also subject to foreign currency exchange risk and market risk. Nintendo closely monitors the market price of such bonds and the financial position of the issuer and reviews their status on a regular basis. Stocks included in investment securities are mainly those of companies with which the Company has business relationships. These stocks are exposed to market risk, but the balance held is immaterial. Notes and accounts payable - trade and income taxes payable are all due within one year. Derivative transactions include foreign exchange forward contracts, non-deliverable forward contracts and currency option contracts to reduce risk of exchange rate fluctuations arising from deposits and trade receivables denominated in foreign currencies. These transactions are conducted by the Finance Department of the Company and the departments in charge of financial matters of its consolidated subsidiaries after securing approval from the president or the director in charge within limits such as the balance of foreign currency deposits. The status of derivative transactions is reported to the director in charge and the Board of Directors on a regular basis. Since counterparties of such transactions are limited to financial institutions that have high creditworthiness, Nintendo judges that risk due to default is minimal.
(3) Supplementary explanation regarding fair values of financial instruments
The fair values of financial instruments include values based on market prices and reasonably measured values when market prices are unavailable. As variable factors are incorporated into the measurement of such values, the values may vary depending on the assumptions used. In addition, the contract amounts of the derivative transactions described in “Derivative transactions” do not represent the market risk of derivative transactions.
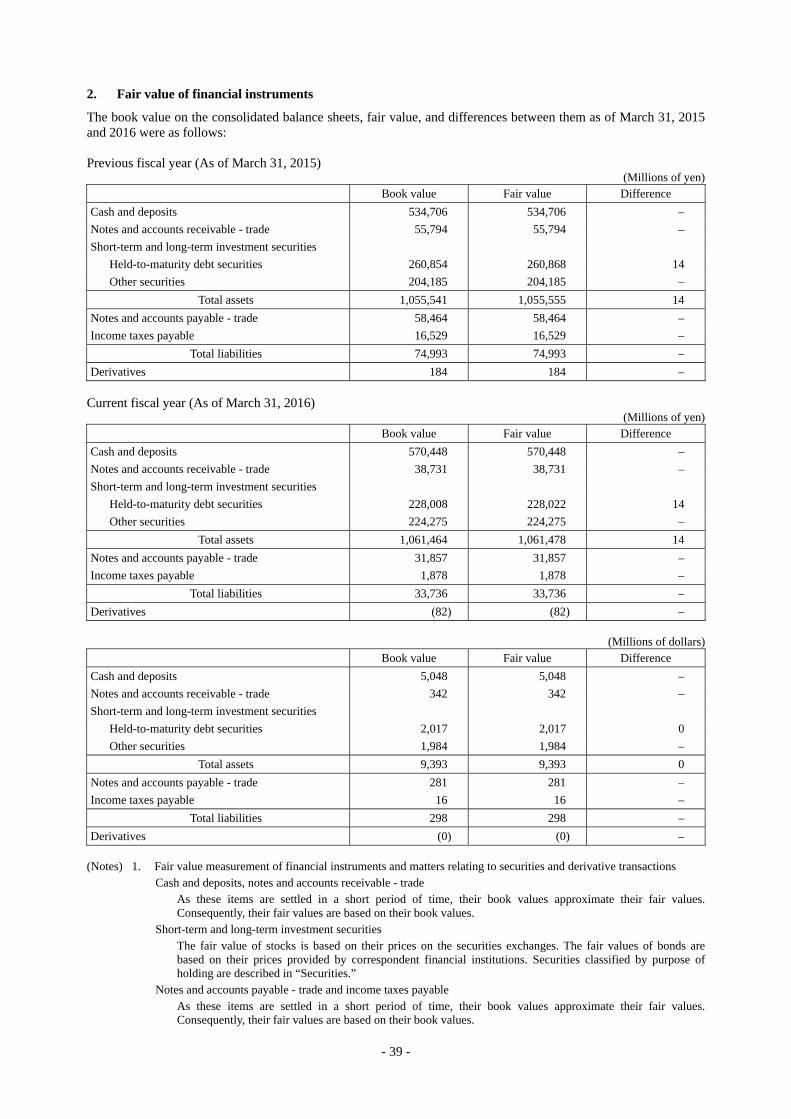
- 39 -
2. Fair value of financial instruments
The book value on the consolidated balance sheets, fair value, and differences between them as of March 31, 2015 and 2016 were as follows: Previous fiscal year (As of March 31, 2015)
(Millions of yen) Book value Fair value Difference
Cash and deposits 534,706 534,706 –
Notes and accounts receivable - trade 55,794 55,794 –
Short-term and long-term investment securities
Held-to-maturity debt securities 260,854 260,868 14
Other securities 204,185 204,185 –
Total assets 1,055,541 1,055,555 14
Notes and accounts payable - trade 58,464 58,464 –
Income taxes payable 16,529 16,529 –
Total liabilities 74,993 74,993 –
Derivatives 184 184 – Current fiscal year (As of March 31, 2016)
(Millions of yen) Book value Fair value Difference
Cash and deposits 570,448 570,448 –
Notes and accounts receivable - trade 38,731 38,731 –
Short-term and long-term investment securities
Held-to-maturity debt securities 228,008 228,022 14
Other securities 224,275 224,275 –
Total assets 1,061,464 1,061,478 14
Notes and accounts payable - trade 31,857 31,857 –
Income taxes payable 1,878 1,878 –
Total liabilities 33,736 33,736 –
Derivatives (82) (82) –
(Millions of dollars) Book value Fair value Difference
Cash and deposits 5,048 5,048 –
Notes and accounts receivable - trade 342 342 –
Short-term and long-term investment securities
Held-to-maturity debt securities 2,017 2,017 0
Other securities 1,984 1,984 –
Total assets 9,393 9,393 0
Notes and accounts payable - trade 281 281 –
Income taxes payable 16 16 –
Total liabilities 298 298 –
Derivatives (0) (0) – (Notes) 1. Fair value measurement of financial instruments and matters relating to securities and derivative transactions
Cash and deposits, notes and accounts receivable - trade As these items are settled in a short period of time, their book values approximate their fair values. Consequently, their fair values are based on their book values.
Short-term and long-term investment securities The fair value of stocks is based on their prices on the securities exchanges. The fair values of bonds are based on their prices provided by correspondent financial institutions. Securities classified by purpose of holding are described in “Securities.”
Notes and accounts payable - trade and income taxes payable As these items are settled in a short period of time, their book values approximate their fair values. Consequently, their fair values are based on their book values.

- 40 -
Derivative transactions
Assets and liabilities arising from derivative transactions are shown on a net basis. The items that are net liabilities are shown in the parentheses. Matters regarding fair value measurement method and derivative transactions by type of transaction target are provided in “Derivative transactions.”
2. Consolidated balance sheets amounts of financial instruments for which the fair value is deemed extremely
difficult to determine
Previous fiscal year
(As of March 31, 2015) Current fiscal year
(As of March 31, 2016)
Unlisted stocks ¥ 11,841 million ¥ 12,383 million U.S.$109 million
These unlisted stocks which do not have market prices and of which future cash flows cannot be estimated are not included in “Short-term and long-term investment securities,” since the estimation of the fair value is deemed to be extremely difficult. 3. Redemption schedule for monetary receivables and securities with maturity subsequent to the consolidated
account closing date Previous fiscal year (As of March 31, 2015)
(Millions of yen)
Due within one yearDue after one year through five years
Due after five years through ten years
Cash and deposits 534,706 – –
Notes and accounts receivable - trade 55,794 – –
Short-term and long-term investment securities
Held-to-maturity debt securities
Certificate of deposits 185,830 – –
Money held in trust 10,000 – –
Corporate and government bonds 65,025 – –
Other securities with maturity
Certificate of deposits – 2,241 –
Corporate and government bonds 119,097 49,460 –
Other – 11,260 728
Total 970,454 62,961 728
Current fiscal year (As of March 31, 2016) (Millions of yen)
Due within one yearDue after one year through five years
Due after five years through ten years
Cash and deposits 570,448 – –
Notes and accounts receivable - trade 38,731 – –
Short-term and long-term investment securities
Held-to-maturity debt securities
Certificate of deposits 196,241 – –
Money held in trust 12,000 – –
Corporate and government bonds 19,760 – –
Other securities with maturity
Certificate of deposits 1,239 862 –
Corporate and government bonds 118,181 35,939 –
Other 18 18,902 2,577
Total 956,622 55,703 2,577

- 41 -
(Millions of dollars)
Due within one yearDue after one year through five years
Due after five years through ten years
Cash and deposits 5,048 – –
Notes and accounts receivable - trade 342 – –
Short-term and long-term investment securities
Held-to-maturity debt securities
Certificate of deposits 1,736 – –
Money held in trust 106 – –
Corporate and government bonds 174 – –
Other securities with maturity
Certificate of deposits 10 7 –
Corporate and government bonds 1,045 318 –
Other 0 167 22
Total 8,465 492 22
Securities
1. Held-to-maturity debt securities
Previous fiscal year (As of March 31, 2015) (Millions of yen)
Book value Fair value Difference
Securities whose fair value exceeds their book value on the consolidated balance sheets
37,016 37,037 20
Securities whose fair value does not exceed their book value on the consolidated balance sheets
223,837 223,830 (6)
Total 260,854 260,868 14
Current fiscal year (As of March 31, 2016) (Millions of yen)
Book value Fair value Difference
Securities whose fair value exceeds their book value on the consolidated balance sheets
11,000 11,017 17
Securities whose fair value does not exceed their book value on the consolidated balance sheets
217,008 217,004 (3)
Total 228,008 228,022 14
(Millions of dollars) Book value Fair value Difference
Securities whose fair value exceeds their book value on the consolidated balance sheets
97 97 0
Securities whose fair value does not exceed their book value on the consolidated balance sheets
1,920 1,920 (0)
Total 2,017 2,017 0

- 42 -
2. Other securities
Previous fiscal year (As of March 31, 2015) (Millions of yen)
Book value Acquisition cost Difference
Securities whose book value on the consolidated balance sheets exceeds their acquisition cost
Equity securities 20,322 7,077 13,245
Debt securities 98,984 88,841 10,142
Other 684 684 0
Sub-total 119,992 96,603 23,388
Securities whose book value on the consolidated balance sheets does not exceed their acquisition cost
Debt securities 82,479 82,520 (41)
Other 1,714 1,714 (0)
Sub-total 84,193 84,235 (41)
Total 204,185 180,838 23,347
Current fiscal year (As of March 31, 2016)
(Millions of yen) Book value Acquisition cost Difference
Securities whose book value on the consolidated balance sheets exceeds their acquisition cost
Equity securities 45,248 27,854 17,394
Debt securities 50,162 48,604 1,557
Other 1,240 1,239 0
Sub-total 96,651 77,699 18,952
Securities whose book value on the consolidated balance sheets does not exceed their acquisition cost
Equity securities 1,067 1,146 (79)
Debt securities 125,603 127,981 (2,378)
Other 954 958 (4)
Sub-total 127,624 130,086 (2,462)
Total 224,275 207,785 16,489
(Millions of dollars)
Book value Acquisition cost Difference
Securities whose book value on the consolidated balance sheets exceeds their acquisition cost
Equity securities 400 246 153
Debt securities 443 430 13
Other 10 10 0
Sub-total 855 687 167
Securities whose book value on the consolidated balance sheets does not exceed their acquisition cost
Equity securities 9 10 (0)
Debt securities 1,111 1,132 (21)
Other 8 8 (0)
Sub-total 1,129 1,151 (21)
Total 1,984 1,838 145

- 43 -
3. Other securities sold during the fiscal years ended March 31, 2015 and 2016
Previous fiscal year (From April 1, 2014 to March 31, 2015) (Millions of yen)
Amount sold Total gain Total loss
Debt securities 192,626 124 16
Other 78,469 2 –
Total 271,096 127 16
Current fiscal year (From April 1, 2015 to March 31, 2016)
(Millions of yen) Amount sold Total gain Total loss
Debt securities 430,885 125 94
Other 155,922 398 –
Total 586,807 524 94
(Millions of dollars)
Amount sold Total gain Total loss
Debt securities 3,813 1 0
Other 1,379 3 –
Total 5,192 4 0

- 44 -
Derivative transactions
Derivative contracts not qualifying for hedge accounting
Currencies Previous fiscal year (As of March 31, 2015)
(Millions of yen)
Classification Type of transaction Contract amountPortion of
contract amount over one year
Fair value Unrealized gain (loss)
Transactions other than market transactions
Exchange forward contracts
Selling Canadian Dollar
3,585 – 16 15
Selling British Pound 899 – 3 3
Currency options Written call options
Euro [Premium]
14,060 [64]
– [–]
50
14
Australian Dollar [Premium]
2,811 [24]
– [–]
8
15
Purchased put options
Euro [Premium]
9,373 [176]
– [–]
207
31
Australian Dollar [Premium]
1,874 [15]
– [–] 16 0
Total – – – 81
Current fiscal year (As of March 31, 2016) (Millions of yen)
Classification Type of transaction Contract amountPortion of
contract amount over one year
Fair value Unrealized gain (loss)
Transactions other than market transactions
Exchange forward contracts
Selling Canadian Dollar
1,878 – (76) (81)
Selling British Pound 490 – 5 5
Currency options Written call options
U.S. Dollar [Premium]
8,685 [33]
– [–]
24 8
Euro [Premium]
11,602 [52]
– [–]
63
(10)
Australian Dollar [Premium]
3,369 [14]
– [–]
13
0
Purchased put options
U.S. Dollar [Premium]
5,790 [33]
– [–]
30 (2)
Euro [Premium]
7,735 [52]
– [–]
46
(5)
Australian Dollar [Premium]
1,800 [14]
– [–] 12 (1)
Total – – – (87)

- 45 -
(Millions of dollars)
Classification Type of transaction Contract amountPortion of
contract amount over one year
Fair value Unrealized gain (loss)
Transactions other than market transactions
Exchange forward contracts
Selling Canadian Dollar
16 – (0) (0)
Selling British Pound 4 – 0 0
Currency options Written call options
U.S. Dollar [Premium]
76 [0]
– [–]
0
0
Euro [Premium]
102 [0]
– [–]
0
(0)
Australian Dollar [Premium]
29 [0]
– [–]
0
0
Purchased put options
U.S. Dollar [Premium]
51 [0]
– [–]
0
(0)
Euro [Premium]
68 [0]
– [–]
0
(0)
Australian Dollar [Premium]
15 [0]
– [–] 0 (0)
Total – – – (0)
(Notes) 1. The fair value as of March 31, 2015 and 2016 is calculated based on price quoted by correspondent financial institutions.
2. Amounts presented in square parentheses [ ] above are option premiums. Retirement benefits
1. Summary of retirement benefit plans adopted
The Company has a defined benefit corporate pension plan and a lump-sum severance payments plan which are defined benefit plans. Certain consolidated subsidiaries have defined contribution plans as well as defined benefit plans. The Company and certain consolidated subsidiaries may also pay extra retirement allowance to employees. Certain consolidated subsidiaries adopt a simple method to calculate retirement benefit obligation. 2. Defined benefit plans
(1) Reconciliation between beginning balance and ending balance of retirement benefit obligations (excluding those under the plan in which a simple method is applied)
Previous fiscal year (From April 1, 2014 to March 31, 2015)
Current fiscal year (From April 1, 2015 to March 31, 2016)
(Millions of yen) (Millions of yen) (Millions of dollars)
Beginning balance of retirement benefit obligations 41,785 49,922 441
Cumulative effects of changes in accounting policies (2,594) - -
Restated balance 39,191 49,922 441
Current service costs 2,776 3,132 27
Interest cost 1,140 1,197 10
Actuarial gains and losses 4,791 21 0
Retirement benefits paid (2,122) (2,616) (23)
Foreign currency translation difference 4,145 (1,877) (16)
Ending balance of retirement benefit obligations 49,922 49,780 440

- 46 -
(2) Reconciliation between beginning balance and ending balance of plan assets (excluding those under the plan
in which a simple method is applied)
Previous fiscal year (From April 1, 2014 to March 31, 2015)
Current fiscal year (From April 1, 2015 to March 31, 2016)
(Millions of yen) (Millions of yen) (Millions of dollars)
Beginning balance of plan assets 28,174 33,933 300
Expected return on assets 1,018 1,063 9
Actuarial gains and losses 1,968 (2,012) (17)
Contribution by the business operator 3,224 3,798 33
Retirement benefits paid (2,020) (2,519) (22)
Foreign currency translation difference 1,567 (714) (6)
Ending balance of plan assets 33,933 33,548 296
(3) Reconciliation between beginning balance and ending balance of net defined benefit liability under the plan in
which a simple method is applied
Previous fiscal year (From April 1, 2014 to March 31, 2015)
Current fiscal year (From April 1, 2015 to March 31, 2016)
(Millions of yen) (Millions of yen) (Millions of dollars)
Beginning balance of net defined benefit liability 201 251 2
Retirement benefit expenses 75 65 0
Retirement benefit payment (4) (9) (0)
Contribution into plan (20) (19) (0)
Other - (67) (0)
Foreign currency translation difference 0 (0) (0)
Ending balance of net defined benefit liability 251 221 1
(4) Reconciliation between ending balance of retirement benefit obligations and plan assets, and net defined
benefit liability and net defined benefit asset recorded in consolidated balance sheets
Previous fiscal year
(As of March 31, 2015) Current fiscal year
(As of March 31, 2016)
(Millions of yen) (Millions of yen) (Millions of dollars)
Retirement benefit obligations for funded plans 35,349 35,839 317
Plan assets (34,084) (33,704) (298)
1,264 2,135 18
Retirement benefit obligations for unfunded plans 14,976 14,318 126
Net amounts of liabilities and assets recorded in consolidated balance sheets
16,241 16,453 145
Net defined benefit liability 25,416 23,546 208
Net defined benefit asset (9,174) (7,092) (62)
Net amounts of liabilities and assets recorded in consolidated balance sheets
16,241 16,453 145
(Note) Includes those under the plan in which a simple method is applied.

- 47 -
(5) Retirement benefit expenses and their breakdown
Previous fiscal year (From April 1, 2014 to March 31, 2015)
Current fiscal year (From April 1, 2015 to March 31, 2016)
(Millions of yen) (Millions of yen) (Millions of dollars)
Current service costs 2,851 3,198 28
Interest cost 1,140 1,197 10
Expected return on assets (1,018) (1,063) (9)
Amortization of actuarial gains and losses treated as expenses
2,822 2,033 17
Severance payment expenses 1,220 911 8
Other 263 131 1
Retirement benefit expenses for defined benefit plan
7,279 6,409 56
(Note) Retirement benefit expenses of consolidated subsidiaries applying a simple method are recorded in “Current service costs.”
(6) Plan assets a. Main components of plan assets
The ratios of components to plan assets by major category are as follows.
Previous fiscal year
(As of March 31, 2015) Current fiscal year
(As of March 31, 2016)
Stocks 40% 37%
Bonds 49 57
Other 11 6
Total 100 100
b. Method for establishing expected long-term return rate on plan assets
In order to determine expected long-term return rate on plan assets, the present as well as expected future allocation of plan assets, along with the present as well as expected long-term rate of return on various assets comprising plan assets, are considered.
(7) Matters concerning the basis for actuarial calculation The main calculation bases for actuarial gains or losses are as follows.
Previous fiscal year (From April 1, 2014 to March 31, 2015)
Current fiscal year (From April 1, 2015 to March 31, 2016)
Discount rate 1.1% to 3.6% 0.4% to 3.9%
Expected long-term return rate on plan assets 1.5% to 7.0% 1.1% to 7.0%
3. Defined contribution plans
The amount of contribution required for the defined contribution plans at certain consolidated subsidiaries was ¥979 million for the year ended March 31, 2015 and ¥1,118 million (U.S.$9 million) for the year ended March 31, 2016.

- 48 -
Income taxes
1. Significant components of deferred tax assets and liabilities
Previous fiscal year
(As of March 31, 2015)Current fiscal year
(As of March 31, 2016)
Deferred tax assets
Research and development expenses ¥ 33,806 million ¥ 30,714 million U.S.$ 271 million
Operating loss carryforwards for tax purposes 16,546 14,844 131
Net defined benefit liability 9,508 8,546 75
Accounts payable - other and accrued expenses 7,987 7,518 66
Revenue recognition for tax purposes 5,080 4,427 39
Unrealized intra-group profit and write-downs on inventory
11,005 3,923 34
Other 19,002 15,972 141
Deferred tax assets subtotal 102,936 85,947 760
Valuation allowance (35,171) (28,094) (248)
Total deferred tax assets 67,765 57,852 511
Deferred tax liabilities
Undistributed retained earnings of subsidiaries and associates
(6,827) (6,864) (60)
Valuation difference on available-for-sale securities
(7,077) (5,514) (48)
Other (8,502) (6,680) (59)
Total deferred tax liabilities (22,406) (19,059) (168)
Net deferred tax assets ¥ 45,359 ¥ 38,792 U.S.$ 343
2. Significant factors in the difference between the statutory tax rate and effective tax rate
Previous fiscal year
(As of March 31, 2015) Current fiscal year
(As of March 31, 2016)
Statutory tax rate 35.5% 33.0%
(Reconciliations)
Effect of unrecognized tax effect on unrealized gains - 11.2
Decrease in deferred tax assets due to change in statutory tax rate
6.0 8.1
Different tax rates applied to the consolidated subsidiaries (0.4) 1.8
Foreign tax credit on retained earnings of the overseas consolidated subsidiaries
(0.2) 0.4
Special deduction applied to the gross research and development expenses
(1.6) -
Valuation allowances 2.0 (20.0)
Other 0.7 5.9
Effective tax rate after tax effect accounting 41.9 40.4
3. Amendment to deferred tax assets and liabilities due to change in corporation tax rates
As “Act for Partial Amendment of the Income Tax Act, etc.” (Act No. 15 of 2016) and “Act for Partial Amendment of the Council Tax Act, etc.” (Act No. 13 of 2016) were enacted by the Diet on March 29, 2016, the effective statutory tax rate used to measure deferred tax assets and liabilities was changed from 32.2% to 30.8% for temporary differences expected to be eliminated in the fiscal year beginning on April 1, 2016 and on April 1, 2017 and to 30.5% for temporary differences expected to be eliminated in the fiscal year beginning on and after April 1, 2018. As a result, deferred tax assets after offsetting deferred tax liabilities decreased by 1,972 million yen (U.S.$17 million) and valuation difference on available-for-sale securities increased by 267 million yen (U.S.$2 million). Income taxes-deferred increased by 2,240 million yen (U.S.$19 million).

- 49 -
Asset retirement obligations
Information of asset retirement obligations was omitted as its amount is immaterial. Real estate for rent
Information of real estate for rent was omitted as its amount is immaterial.
Segment information, etc.
Segment information
The main business of Nintendo is developing, manufacturing, and distributing handheld and home console hardware systems and related software. Development and manufacturing of products for worldwide use are primarily done by the Company. The Company distributes products in Japan while distribution in overseas markets is done by local subsidiaries. Nintendo operates as a single operating segment with single distribution channel and market for Nintendo’s products and with each major geographic subsidiary solely responsible for distributing. Decision for allocation of the management resources and evaluation of business results are made on a company-wide basis, not based on a product category or region basis. Therefore, segment information is omitted. Related information
Previous fiscal year (From April 1, 2014 to March 31, 2015)
1. Information about products and services
(Millions of yen)
Handheld Hardware
Home ConsoleHardware
Handheld Software
Home ConsoleSoftware
Other Total
Sales to third parties
149,616 105,548 149,941 84,742 59,931 549,780
2. Information by geographic areas
(1) Net sales
(Millions of yen)
Japan The Americas
Europe Other Total of which U.S.
135,049 241,646 207,432 154,338 18,746 549,780
(Note) Net sales are categorized by country or region based on the location of the customer.
(2) Property, plant and equipment (Millions of yen)
Japan U.S. Other Total
65,168 25,298 1,021 91,488
(Note) Property, plant and equipment are categorized by country based on its location.
3. Information about major customers
(Millions of yen)
Net sales Name of related segment
GameStop, Inc. 56,205 –
(Note) There was no mention of related segment as Nintendo operates as a single operating segment.

- 50 -
Current fiscal year (From April 1, 2015 to March 31, 2016)
1. Information about products and services
(Millions of yen)
Handheld Hardware
Home ConsoleHardware
Handheld Software
Home ConsoleSoftware
Other Total
Sales to third parties
113,239 102,404 109,179 92,345 87,290 504,459
2. Information by geographic areas
(1) Net sales
(Millions of yen)
Japan The Americas
Europe Other Total of which U.S.
135,461 225,837 192,757 126,916 16,243 504,459
(Note) Net sales are categorized by country or region based on the location of the customer.
(2) Property, plant and equipment
(Millions of yen)
Japan U.S. Other Total
64,381 22,545 824 87,752
(Note) Property, plant and equipment are categorized by country based on its location.
3. Information about major customers
Of sales to third parties, no major customer accounts for 10% or more of net sales in the consolidated financial statements of income.
Information about impairment loss of non-current assets by reportable segment
The information was omitted as Nintendo operates as a single operating segment.
Information about amortized and unamortized balances of goodwill by reportable segment
The information was omitted as Nintendo operates as a single operating segment.
Information about gain on bargain purchase by reportable segment
The information was omitted as Nintendo operates as a single operating segment.
Related party transactions
Not applicable.

- 51 -
Per share information
Previous fiscal year (From April 1, 2014 to March 31, 2015)
Current fiscal year (From April 1, 2015 to March 31, 2016)
Net assets per share ¥ 9,862.52 ¥ 9,662.73 U.S.$ 85.51
Net income per share 353.49 137.40 1.21
(Notes) 1. Diluted net income per share is omitted as no residual securities were outstanding as of March 31, 2015 and 2016. 2. The basis of calculation of net income per share is as follows:
Previous fiscal year (From April 1, 2014 to March 31, 2015)
Current fiscal year (From April 1, 2015 to March 31, 2016)
Profit attributable to owners of parent ¥ 41,843 million ¥ 16,505 million U.S.$ 146 million
Amount not attributable to common shareholders – – –
Profit attributable to owners of parent related to common shares ¥ 41,843 million ¥ 16,505 million U.S.$ 146 million
Average number of shares (common shares)
118,373 thousand shares
120,125 thousand shares
–
Significant subsequent events
Not applicable. (v) Supporting schedules to the consolidated financial statements
Supplemental schedule of bonds
Not applicable.

- 52 -
Supplemental schedule of borrowings
Classification Beginning balance Ending balance Average
interest rate (%) Payment due
Short-term loans payable – – – –
Long-term loans payable due within one year – – – –
Lease obligations due within one year ¥12 million [U.S.$0million]
¥12 million[U.S.$0 million]
– –
Long-term loans payable due after one year – – – –
Lease obligations due after one year 12 [0]
– – –
Other interest-bearing liabilities – – – –
Total ¥25 [U.S.$0]
¥12 [U.S.$ 0]
– –
(Note) The average interest rates of lease obligations are omitted as the interest equivalents included in the total lease payments are allocated to each fiscal year by straight-line basis.
Supplemental schedule of asset retirement obligations
The information was omitted as the amounts of asset retirement obligations as of the beginning and end of the fiscal year ended March 31, 2016 were less than or equal to a hundredth of the total of liabilities and net assets as of the beginning and end of the fiscal year ended March 31, 2016.
(2) Others
Quarterly information of the fiscal year ended March 31, 2016 (Millions of yen)
(Cumulative period) Three months Six months Nine months Fiscal year
Net sales 90,223 204,182 425,664 504,459
Profit before income taxes 14,285 16,419 54,759 27,715
Profit attributable to owners of parent
8,284 11,466 40,558 16,505
Net income per share (Yen) 68.97 95.46 337.64 137.40
(Millions of dollars)
(Cumulative period) Three months Six months Nine months Fiscal year
Net sales 798 1,806 3,766 4,464
Profit before income taxes 126 145 484 245
Profit attributable to owners of parent
73 101 358 146
Net income per share (Dollars) 0.61 0.84 2.98 1.21
(Yen)
(Accounting period) First quarter Second quarter Third quarter Fourth quarter
Net income (loss) per share 68.97 26.49 242.17 (200.23)
(Dollars)
(Accounting period) First quarter Second quarter Third quarter Fourth quarter
Net income (loss) per share 0.61 0.23 2.14 (1.77)

- 53 -
Corporate Information Common Stock Nintendo Co., Ltd. common stock is listed on the Tokyo Stock Exchange, Section 1.
Annual General Meeting of Shareholders The Annual General Meeting of Shareholders for the fiscal year ended March 31, 2016 was held on June 29, 2016
at Nintendo Co., Ltd. in Kyoto, Japan. Independent Auditor PricewaterhouseCoopers Kyoto
Kyoto, Japan
Contact Information Investor Relations Investor Relations Group Corporate Communications Department Nintendo Co., Ltd. 11-1 Hokotate-cho, Kamitoba, Minami-ku, Kyoto 601-8501, Japan Tel: +81-75-662-9600 E-mail: [email protected]
Corporate Communications Corporate Communications Department Nintendo Co., Ltd. 11-1 Hokotate-cho, Kamitoba, Minami-ku, Kyoto 601-8501, Japan Tel: +81-75-662-9600
Corporate Communications Department Nintendo of America Inc. 2000 Bridge Parkway Ste 200, Redwood City, CA 94065 Tel: +1-650-226-4040
For more information, please visit Nintendo’s website. President’s Message
https://www.nintendo.co.jp/ir/en/management/message.html Dividend Policy
https://www.nintendo.co.jp/ir/en/stock/dividend/index.html#haitou_houshin Sales Data
https://www.nintendo.co.jp/ir/en/sales/index.html Company History
https://www.nintendo.co.jp/corporate/en/history/index.html