annual report 2016 - · pdf filespecialist wholesale businesses of aad, bearing wholesalers,...
TRANSCRIPT

Annual Report 2016
Bapcor Limited is Australia’s leading provider of automotive aftermarket parts, accessories, automotive equipment and services, and motor vehicle servicing; operating out of over 750 locations across Australia.
Bapcor has three key business segments – Trade, Retail and Specialist Wholesale. Its businesses include the iconic brands of Burson Auto Parts, Autobarn, AutoPro, Car Parts, Sprint Auto Parts, Opposite Lock, Midas, ABS and the specialist wholesale businesses of AAD, Bearing Wholesalers, Baxters and Roadsafe.
1 ANNUAL REPORT 2016
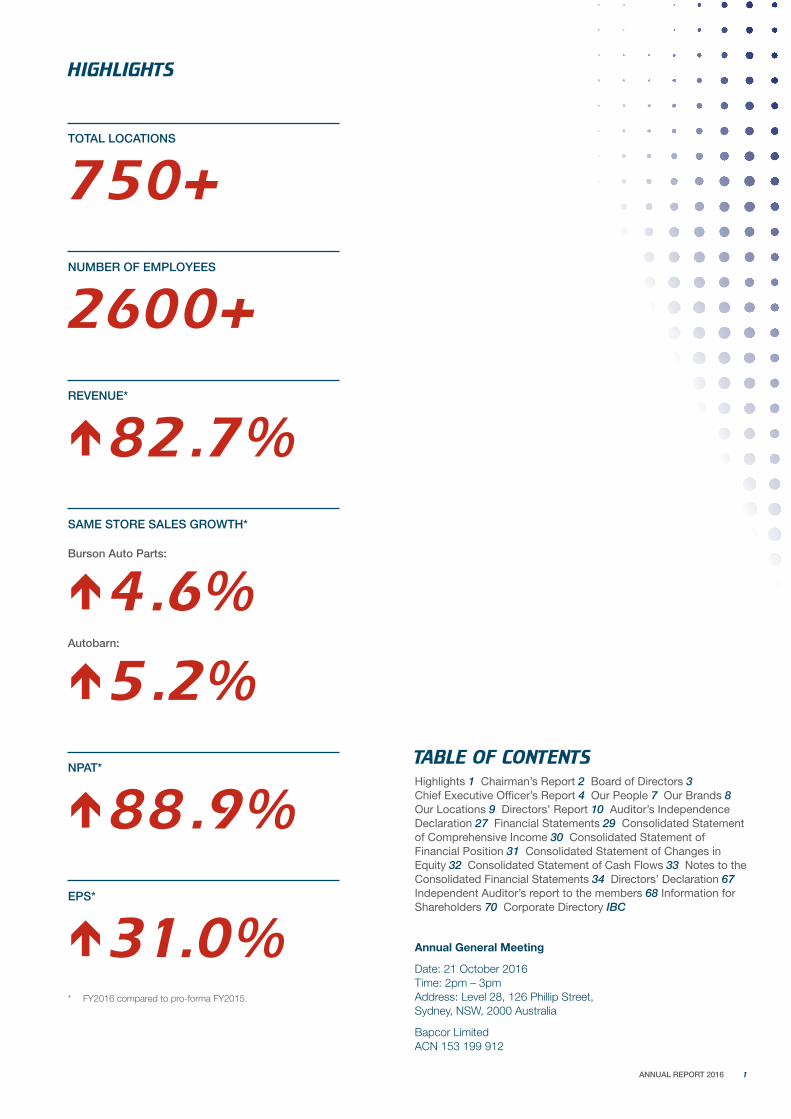
TOTAL LOCATIONS
750+NUMBER OF EMPLOYEES
2600+REVENUE*
é82.7%SAME STORE SALES GROWTH*
Burson Auto Parts:
é4.6%Autobarn:
é5.2%NPAT*
é88.9%EPS*
é31.0%* FY2016 compared to pro-forma FY2015.
HIGHLIGHTS
TABLE OF CONTENTSHighlights 1 Chairman’s Report 2 Board of Directors 3 Chief Executive Officer’s Report 4 Our People 7 Our Brands 8 Our Locations 9 Directors’ Report 10 Auditor’s Independence Declaration 27 Financial Statements 29 Consolidated Statement of Comprehensive Income 30 Consolidated Statement of Financial Position 31 Consolidated Statement of Changes in Equity 32 Consolidated Statement of Cash Flows 33 Notes to the Consolidated Financial Statements 34 Directors’ Declaration 67 Independent Auditor’s report to the members 68 Information for Shareholders 70 Corporate Directory IBC
Annual General Meeting
Date: 21 October 2016 Time: 2pm – 3pmAddress: Level 28, 126 Phillip Street,Sydney, NSW, 2000 Australia
Bapcor Limited ACN 153 199 912
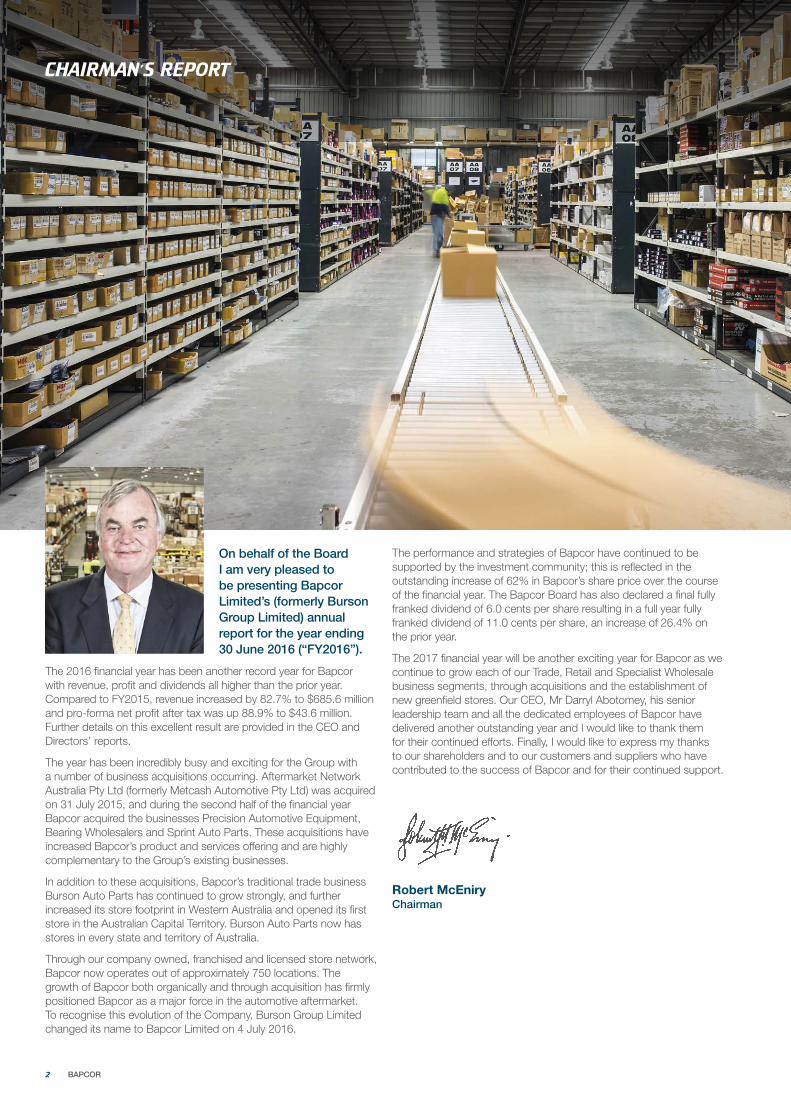
On behalf of the Board I am very pleased to be presenting Bapcor Limited’s (formerly Burson Group Limited) annual report for the year ending 30 June 2016 (“FY2016”).
The 2016 financial year has been another record year for Bapcor with revenue, profit and dividends all higher than the prior year. Compared to FY2015, revenue increased by 82.7% to $685.6 million and pro-forma net profit after tax was up 88.9% to $43.6 million. Further details on this excellent result are provided in the CEO and Directors’ reports.
The year has been incredibly busy and exciting for the Group with a number of business acquisitions occurring. Aftermarket Network Australia Pty Ltd (formerly Metcash Automotive Pty Ltd) was acquired on 31 July 2015, and during the second half of the financial year Bapcor acquired the businesses Precision Automotive Equipment, Bearing Wholesalers and Sprint Auto Parts. These acquisitions have increased Bapcor’s product and services offering and are highly complementary to the Group’s existing businesses.
In addition to these acquisitions, Bapcor’s traditional trade business Burson Auto Parts has continued to grow strongly, and further increased its store footprint in Western Australia and opened its first store in the Australian Capital Territory. Burson Auto Parts now has stores in every state and territory of Australia.
Through our company owned, franchised and licensed store network, Bapcor now operates out of approximately 750 locations. The growth of Bapcor both organically and through acquisition has firmly positioned Bapcor as a major force in the automotive aftermarket. To recognise this evolution of the Company, Burson Group Limited changed its name to Bapcor Limited on 4 July 2016.
The performance and strategies of Bapcor have continued to be supported by the investment community; this is reflected in the outstanding increase of 62% in Bapcor’s share price over the course of the financial year. The Bapcor Board has also declared a final fully franked dividend of 6.0 cents per share resulting in a full year fully franked dividend of 11.0 cents per share, an increase of 26.4% on the prior year.
The 2017 financial year will be another exciting year for Bapcor as we continue to grow each of our Trade, Retail and Specialist Wholesale business segments, through acquisitions and the establishment of new greenfield stores. Our CEO, Mr Darryl Abotomey, his senior leadership team and all the dedicated employees of Bapcor have delivered another outstanding year and I would like to thank them for their continued efforts. Finally, I would like to express my thanks to our shareholders and to our customers and suppliers who have contributed to the success of Bapcor and for their continued support.
Robert McEniryChairman
CHAIRMAN’S REPORT
2 BAPCOR
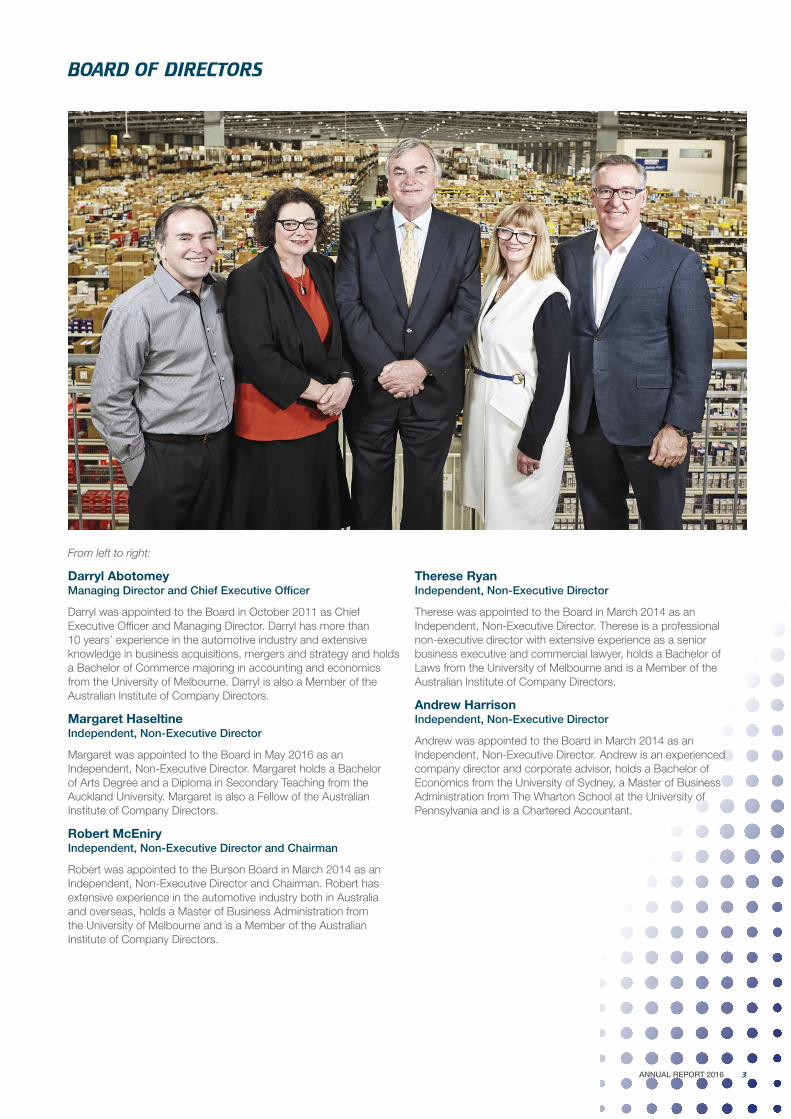
From left to right:
Darryl Abotomey Managing Director and Chief Executive Officer
Darryl was appointed to the Board in October 2011 as Chief Executive Officer and Managing Director. Darryl has more than 10 years’ experience in the automotive industry and extensive knowledge in business acquisitions, mergers and strategy and holds a Bachelor of Commerce majoring in accounting and economics from the University of Melbourne. Darryl is also a Member of the Australian Institute of Company Directors.
Margaret Haseltine Independent, Non-Executive Director
Margaret was appointed to the Board in May 2016 as an Independent, Non-Executive Director. Margaret holds a Bachelor of Arts Degree and a Diploma in Secondary Teaching from the Auckland University. Margaret is also a Fellow of the Australian Institute of Company Directors.
Robert McEniry Independent, Non-Executive Director and Chairman
Robert was appointed to the Burson Board in March 2014 as an Independent, Non-Executive Director and Chairman. Robert has extensive experience in the automotive industry both in Australia and overseas, holds a Master of Business Administration from the University of Melbourne and is a Member of the Australian Institute of Company Directors.
Therese Ryan Independent, Non-Executive Director
Therese was appointed to the Board in March 2014 as an Independent, Non-Executive Director. Therese is a professional non-executive director with extensive experience as a senior business executive and commercial lawyer, holds a Bachelor of Laws from the University of Melbourne and is a Member of the Australian Institute of Company Directors.
Andrew Harrison Independent, Non-Executive Director
Andrew was appointed to the Board in March 2014 as an Independent, Non-Executive Director. Andrew is an experienced company director and corporate advisor, holds a Bachelor of Economics from the University of Sydney, a Master of Business Administration from The Wharton School at the University of Pennsylvania and is a Chartered Accountant.
BOARD OF DIRECTORS
3 ANNUAL REPORT 2016
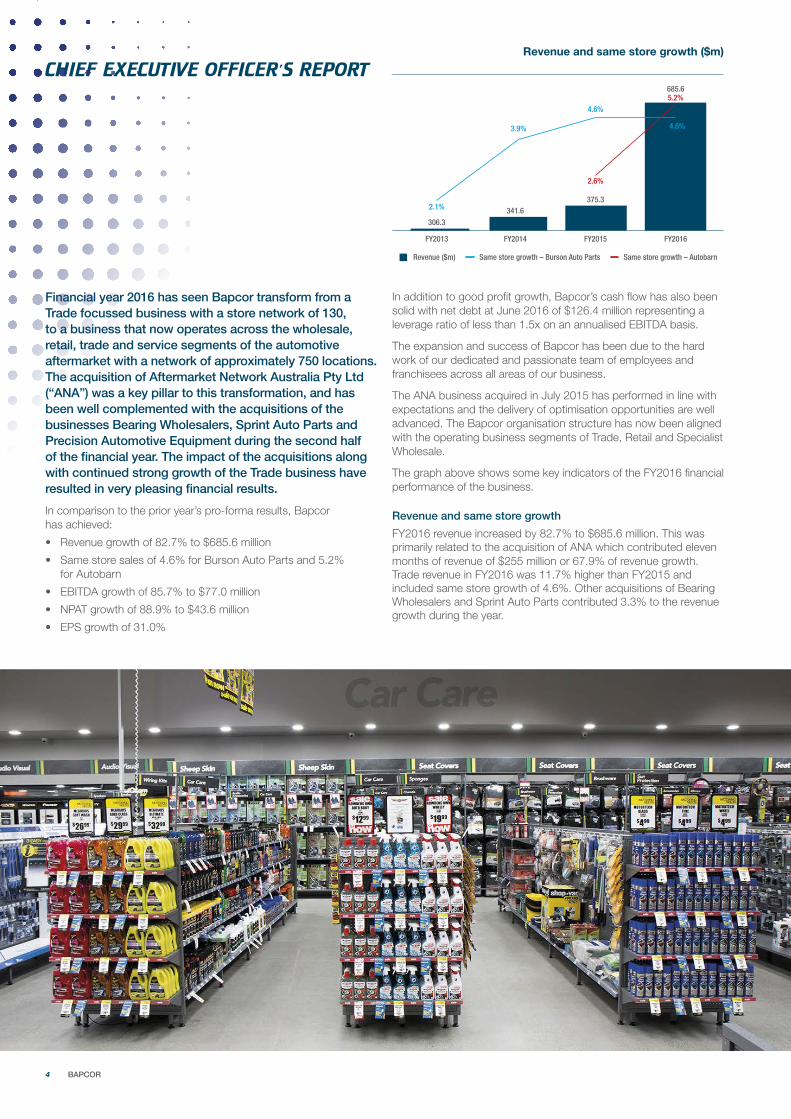
CHIEF EXECUTIVE OFFICER’S REPORTRevenue and same store growth ($m)
FY2013 FY2014 FY2015 FY2016
306.3
2.1% 341.6
3.9%
375.3
2.6%
4.6%
685.65.2%
4.6%
Same store growth – AutobarnSame store growth – Burson Auto PartsRevenue ($m)
Financial year 2016 has seen Bapcor transform from a Trade focussed business with a store network of 130, to a business that now operates across the wholesale, retail, trade and service segments of the automotive aftermarket with a network of approximately 750 locations. The acquisition of Aftermarket Network Australia Pty Ltd (“ANA”) was a key pillar to this transformation, and has been well complemented with the acquisitions of the businesses Bearing Wholesalers, Sprint Auto Parts and Precision Automotive Equipment during the second half of the financial year. The impact of the acquisitions along with continued strong growth of the Trade business have resulted in very pleasing financial results.
In comparison to the prior year’s pro-forma results, Bapcor has achieved:
• Revenue growth of 82.7% to $685.6 million
• Same store sales of 4.6% for Burson Auto Parts and 5.2% for Autobarn
• EBITDA growth of 85.7% to $77.0 million
• NPAT growth of 88.9% to $43.6 million
• EPS growth of 31.0%
In addition to good profit growth, Bapcor’s cash flow has also been solid with net debt at June 2016 of $126.4 million representing a leverage ratio of less than 1.5x on an annualised EBITDA basis.
The expansion and success of Bapcor has been due to the hard work of our dedicated and passionate team of employees and franchisees across all areas of our business.
The ANA business acquired in July 2015 has performed in line with expectations and the delivery of optimisation opportunities are well advanced. The Bapcor organisation structure has now been aligned with the operating business segments of Trade, Retail and Specialist Wholesale.
The graph above shows some key indicators of the FY2016 financial performance of the business.
Revenue and same store growth
FY2016 revenue increased by 82.7% to $685.6 million. This was primarily related to the acquisition of ANA which contributed eleven months of revenue of $255 million or 67.9% of revenue growth. Trade revenue in FY2016 was 11.7% higher than FY2015 and included same store growth of 4.6%. Other acquisitions of Bearing Wholesalers and Sprint Auto Parts contributed 3.3% to the revenue growth during the year.
4 BAPCOR
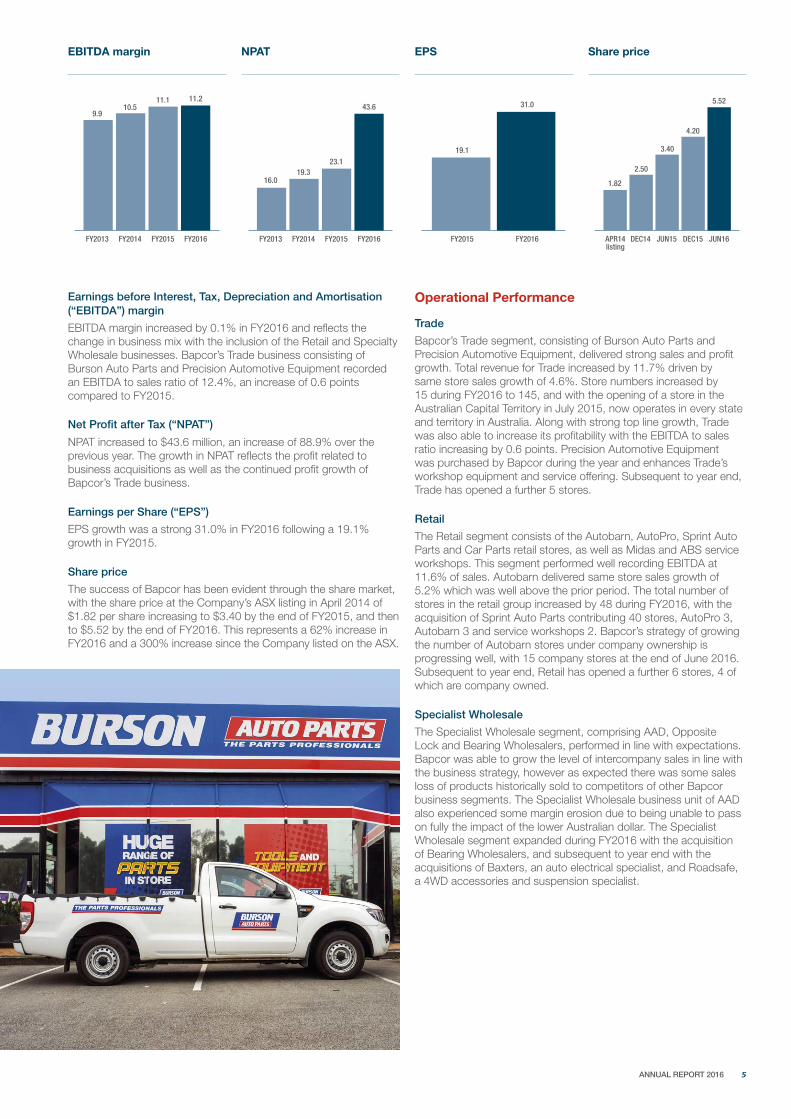
Earnings before Interest, Tax, Depreciation and Amortisation (“EBITDA”) margin
EBITDA margin increased by 0.1% in FY2016 and reflects the change in business mix with the inclusion of the Retail and Specialty Wholesale businesses. Bapcor’s Trade business consisting of Burson Auto Parts and Precision Automotive Equipment recorded an EBITDA to sales ratio of 12.4%, an increase of 0.6 points compared to FY2015.
Net Profit after Tax (“NPAT”)
NPAT increased to $43.6 million, an increase of 88.9% over the previous year. The growth in NPAT reflects the profit related to business acquisitions as well as the continued profit growth of Bapcor’s Trade business.
Earnings per Share (“EPS”)
EPS growth was a strong 31.0% in FY2016 following a 19.1% growth in FY2015.
Share price
The success of Bapcor has been evident through the share market, with the share price at the Company’s ASX listing in April 2014 of $1.82 per share increasing to $3.40 by the end of FY2015, and then to $5.52 by the end of FY2016. This represents a 62% increase in FY2016 and a 300% increase since the Company listed on the ASX.
Operational Performance
Trade
Bapcor’s Trade segment, consisting of Burson Auto Parts and Precision Automotive Equipment, delivered strong sales and profit growth. Total revenue for Trade increased by 11.7% driven by same store sales growth of 4.6%. Store numbers increased by 15 during FY2016 to 145, and with the opening of a store in the Australian Capital Territory in July 2015, now operates in every state and territory in Australia. Along with strong top line growth, Trade was also able to increase its profitability with the EBITDA to sales ratio increasing by 0.6 points. Precision Automotive Equipment was purchased by Bapcor during the year and enhances Trade’s workshop equipment and service offering. Subsequent to year end, Trade has opened a further 5 stores.
Retail
The Retail segment consists of the Autobarn, AutoPro, Sprint Auto Parts and Car Parts retail stores, as well as Midas and ABS service workshops. This segment performed well recording EBITDA at 11.6% of sales. Autobarn delivered same store sales growth of 5.2% which was well above the prior period. The total number of stores in the retail group increased by 48 during FY2016, with the acquisition of Sprint Auto Parts contributing 40 stores, AutoPro 3, Autobarn 3 and service workshops 2. Bapcor’s strategy of growing the number of Autobarn stores under company ownership is progressing well, with 15 company stores at the end of June 2016. Subsequent to year end, Retail has opened a further 6 stores, 4 of which are company owned.
Specialist Wholesale
The Specialist Wholesale segment, comprising AAD, Opposite Lock and Bearing Wholesalers, performed in line with expectations. Bapcor was able to grow the level of intercompany sales in line with the business strategy, however as expected there was some sales loss of products historically sold to competitors of other Bapcor business segments. The Specialist Wholesale business unit of AAD also experienced some margin erosion due to being unable to pass on fully the impact of the lower Australian dollar. The Specialist Wholesale segment expanded during FY2016 with the acquisition of Bearing Wholesalers, and subsequent to year end with the acquisitions of Baxters, an auto electrical specialist, and Roadsafe, a 4WD accessories and suspension specialist.
FY2013 FY2014 FY2015 FY2016
9.910.5
11.1 11.2
FY2013 FY2014 FY2015 FY2016
16.019.3
23.1
43.6
FY2015 FY2016
19.1
31.0
DEC14APR14listing
JUN15 DEC15 JUN16
2.50
3.40
4.20
5.52
1.82
EBITDA margin NPAT EPS Share price
5 ANNUAL REPORT 2016
StrategyBapcor’s strategy is to be Australasia’s leading provider of aftermarket parts, accessories and services. Across the different business segments, Bapcor’s strategy is as follows:
Trade
Trade’s strategy is to be a trade focussed “parts professionals” business supplying service workshops. The target is to grow Burson Auto Parts store numbers from 145 as the end of June 2016 to 200 stores by 2021, with 25% of sales being our home brand product. Currently, Trade is operating with 150 stores and 10% home brand product.
Retail
Retail’s strategy for Autobarn is to be the premium retailer of automotive accessories, with a target to grow to 200 stores by 2023, with a majority of growth being company owned stores, and 35% home brand product. Currently, Autobarn is at 117 stores and around 14% home brand.
The retail business includes the franchise stores of Autobarn, AutoPro, Car Parts and Sprint Auto Parts. The strategy is to support the independent parts stores via Bapcor’s extensive supply chain capabilities and brand support. Currently, there are 235 independent stores with the target to maintain that number of independent stores over 200.
The Service business consists of the brands Midas and ABS and aims to be experts at scheduled car servicing at affordable prices. There are currently 143 stores. Bapcor is currently conducting a strategic review of the Service business to determine the long-term strategy of the business.
Specialist Wholesale
The Specialist Wholesale business strategy aims to be the number one or number two industry category specialists in the parts programs in which it operates. The parts programs in which it currently operates include brake, suspension, 4WD, cooling, engine, gaskets, bearings and auto electrical. The strategy for Specialist Wholesale is to continue to strengthen its current category depth and expand into other specialist wholesale categories. The target is to grow revenue to over $200 million by 2021 of which it currently is around $160 million (annualised).
Investor Day 2016In April 2016 Bapcor held its inaugural Investor Day which was well attended by more than 70 shareholder and investor representatives. The attendees were introduced to Bapcor’s senior leadership team and participated in a tour of the Bapcor head office, the Preston and Nunawading distribution centres, and various Autobarn and Burson Auto Parts stores.
OutlookBapcor is forecasting another strong year of revenue and profit growth in FY2017 with the inclusion of a full twelve months trading of the ANA business, Bearing Wholesalers, Sprint Auto Parts, Precision Automotive Equipment, as well as the inclusion of Baxters and Roadsafe. The benefits of the optimisation projects of between $5 million and $7 million will also be achieved in FY2017. The core businesses in Trade and Retail are also expected to perform well, including adding additional stores to their networks. Trading to date in FY2017 has been in line with our expectations.
Bapcor has been able to deliver an outstanding result in the last financial year and have such a positive outlook due to the dedicated and passionate staff, franchisees and suppliers who are instrumental in the success of the business. All their efforts are appreciated and Bapcor is grateful for their continued support.
Darryl AbotomeyManaging Director and Chief Executive Officer
CHIEF EXECUTIVE OFFICER’S REPORT continued
6 BAPCOR

a
Greg Fox Chief Financial Officer and Company Secretary – Bapcor Limited
Greg has more than 25 years’ experience in the automotive, industrial and public accounting sectors. Greg joined Bapcor as Chief Financial Officer in 2012 with responsibility for finance, legal, company secretarial and plays a key role in strategic initiatives. Greg was previously Chief Financial Officer at Atlas Steels and at Plexicor, which was a major supplier to the automotive industry. Greg also held various senior financial positions with Amcor after commencing his career as a Chartered Accountant.
b
Paul Dumbrell Chief Operating Officer – Specialist Businesses
Paul has been in the automotive industry for over 15 years and commenced with Automotive Brands Group in 2007 within their marketing department. Prior to his current role, he was the Chief Executive Officer of Aftermarket Network Australia under both Metcash and Bapcor ownership. Paul is now responsible for the Specialist Wholesale segment including AAD, Opposite Lock, Bearing Wholesalers, Baxters and Roadsafe.
c
Craig Magill Executive General Manager – Trade
Craig has an extensive career in the automotive industry spanning more than 25 years. Before joining Bapcor, he was the General Manager of RAC’S (WA) automotive workshops, which was preceded by many years at Repco. Craig is responsible for all aspects of the Trade segment.
d
Peter Tilley Executive General Manager – Retail
Peter is responsible for the Retail segment of Bapcor including the development and implementation of retail programs across brand marketing, franchisee training, business field support, property management and new store development. Peter was previously the General Manager of Retail at Sigma Pharmaceuticals and General Manager of business operations at Hairhouse Warehouse.
e
Grant Jarrett Executive General Manager – Operations
Grant brings over 35 years’ experience in the automotive industry to Bapcor, holding various roles at RMP and within the Automotive Brands Group. Grant is responsible for the Group’s distribution centres and logistics as well as product development, replenishment and events in the Retail business unit.
f
Mathew Cooper Executive General Manager – Development
Mat has over 15 years’ experience in the automotive, industrial and public accounting sectors. Mat commenced as Executive General Manager – Development within Bapcor in February 2016 and previously was the General Manager – Commercial of the ANA business. Prior, he held other roles with Amcor, General Motors and Deloitte Touche Tohmatsu. Mat is responsible for the development, co-ordination and consolidation of all strategies and plans for the expansion of Bapcor.
b caOUR PEOPLE
d e f
7 ANNUAL REPORT 2016

OUR BRANDS
THE DRIVING FORCE IN AUTOMOTIVE SOLUTIONS
8 BAPCOR

At the end of June 2016 the network consisted of over 750 locations, across the brands operated by Bapcor, Australia wide.
The location and set up of the stores is designed to enable Bapcor to deliver the highest quality of service to our customers.
With the additional ANA, Precision Automotive Equipment, Bearing Wholesalers and Sprint Auto Parts acquisitions, Bapcor now has distribution centres in Victoria, New South Wales, Queensland, South Australia and Western Australia.
OUR LOCATIONS
9 ANNUAL REPORT 2016
750+LOCATIONS
AUSTRALIA WIDE
DIRECTORS’ REPORT
Your Directors present their report on the consolidated entity (referred to hereafter as “Bapcor” or the “Group”) consisting of Bapcor Limited (the “Company”) and the entities it controlled at the end of, or during, the financial year ending 30 June 2016 (“FY2016”). The Company changed its name on 4 July 2016 from Burson Group Limited to Bapcor Limited.
1. DirectorsThe following persons were Directors of the Company at any time during FY2016, or since the end of FY2016 up to the date of this report:
Current Directors
Robert McEniry Independent Non-Executive Chairman
Darryl Abotomey Chief Executive Officer and Managing Director
Andrew Harrison Independent, Non-Executive Director
Therese Ryan Independent, Non-Executive Director
Margaret Haseltine Independent, Non-Executive Director (appointed 30 May 2016)
2. Principal activitiesDuring the year the principal activities of Bapcor were the sale and distribution of motor vehicle aftermarket parts and accessories, automotive equipment and services, and motor vehicle servicing.
Bapcor is the largest automotive aftermarket parts, accessories and services supplier in Australia with a network covering approximately 750 sites.
3. Significant changes in the state of affairsOn 31 July 2015 Bapcor completed its acquisition of the entire issued capital of Aftermarket Network Australia Pty Ltd (formerly Metcash Automotive Holdings Pty Ltd) (“ANA”). ANA is a wholesaler, distributor and retailer of automotive aftermarket parts and operates a network of service workshops. ANA’s retail network has historically been predominantly a franchise operation and includes the brands Autobarn, Autopro, Opposite Lock and Car Parts, and the franchise service centres of Midas and ABS. The wholesale business known as AAD comprises the brands of ATAP, IBS, Partco and Garrmax.
To assist in funding the ANA acquisition, in June 2015 the Company conducted a pro-rata renounceable rights issue (Entitlements Offer) to raise approximately $218.0 million, of which $159.8 million was raised through the institutional component of the Entitlements Offer in late FY2015, and $57.7 million was raised through the retail component of the Entitlements Offer during FY2016 in July 2015. In addition, in July 2015, the Company issued shares to entities associated with certain vendors of ANA as part consideration for its acquisition of ANA, and increased its debt facilities to $200.0 million. For further details refer to section 5.5.1 of this report.
During the financial year, Bapcor also completed a number of other acquisitions including Bearing Wholesalers, Precision Equipment and Sprint Auto Parts which have increased the range of product and services Bapcor can now offer and strongly complements the existing businesses.
To recognise the evolution of the Company and to avoid confusion between different segments of the business, Burson Group Limited changed its name to Bapcor Limited on 4 July 2016. The change of company name only impacted the parent company with the customer facing trading names remaining unchanged.
Given the growth of the organisation, the operating segments have been redefined and as a result the previously reported ANA business segment has been replaced with the segments as outlined below. Refer to section 5 for details of the operational performance of each segment.
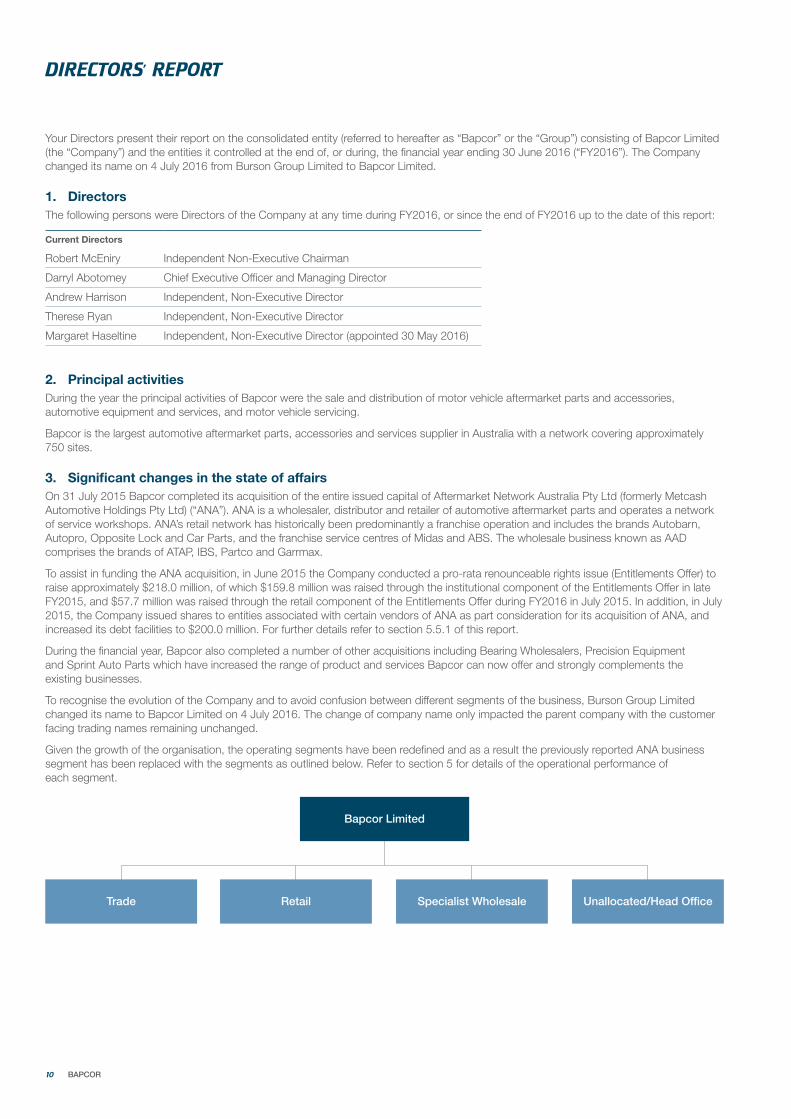
Bapcor Limited
Trade Retail Specialist Wholesale Unallocated/Head Office
10 BAPCOR
4. DividendsFully franked dividends were paid to shareholders of Bapcor during the year as follows:
30 September 2015 $11,497,000 (4.7 cents per share) 8 April 2016 $12,231,000 (5.0 cents per share)
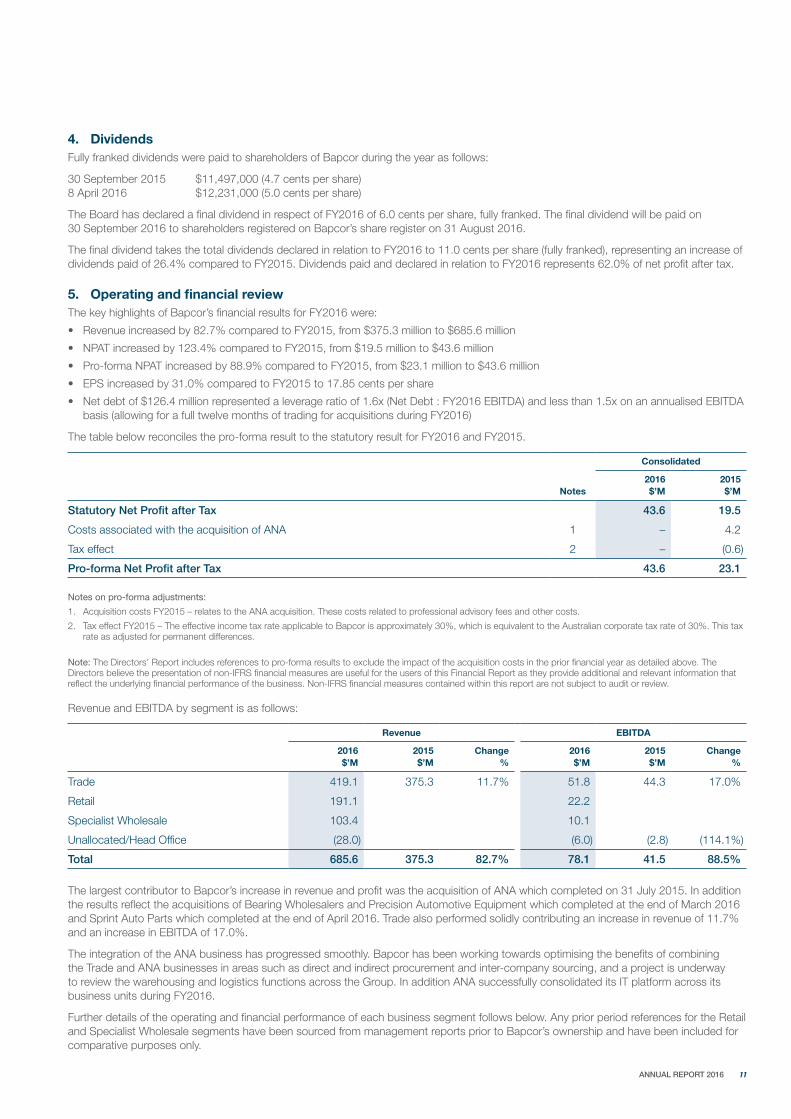
The Board has declared a final dividend in respect of FY2016 of 6.0 cents per share, fully franked. The final dividend will be paid on 30 September 2016 to shareholders registered on Bapcor’s share register on 31 August 2016.
The final dividend takes the total dividends declared in relation to FY2016 to 11.0 cents per share (fully franked), representing an increase of dividends paid of 26.4% compared to FY2015. Dividends paid and declared in relation to FY2016 represents 62.0% of net profit after tax.
5. Operating and financial reviewThe key highlights of Bapcor’s financial results for FY2016 were:
• Revenue increased by 82.7% compared to FY2015, from $375.3 million to $685.6 million
• NPAT increased by 123.4% compared to FY2015, from $19.5 million to $43.6 million
• Pro-forma NPAT increased by 88.9% compared to FY2015, from $23.1 million to $43.6 million
• EPS increased by 31.0% compared to FY2015 to 17.85 cents per share
• Net debt of $126.4 million represented a leverage ratio of 1.6x (Net Debt : FY2016 EBITDA) and less than 1.5x on an annualised EBITDA basis (allowing for a full twelve months of trading for acquisitions during FY2016)
The table below reconciles the pro-forma result to the statutory result for FY2016 and FY2015.
Consolidated
Notes2016 $’M
2015 $’M
Statutory Net Profit after Tax 43.6 19.5
Costs associated with the acquisition of ANA 1 – 4.2
Tax effect 2 – (0.6)
Pro-forma Net Profit after Tax 43.6 23.1
Notes on pro-forma adjustments:
1. Acquisition costs FY2015 – relates to the ANA acquisition. These costs related to professional advisory fees and other costs.
2. Tax effect FY2015 – The effective income tax rate applicable to Bapcor is approximately 30%, which is equivalent to the Australian corporate tax rate of 30%. This tax rate as adjusted for permanent differences.
Note: The Directors’ Report includes references to pro-forma results to exclude the impact of the acquisition costs in the prior financial year as detailed above. The Directors believe the presentation of non-IFRS financial measures are useful for the users of this Financial Report as they provide additional and relevant information that reflect the underlying financial performance of the business. Non-IFRS financial measures contained within this report are not subject to audit or review.
Revenue and EBITDA by segment is as follows:
Revenue EBITDA
2016 $’M
2015 $’M
Change%
2016 $’M
2015 $’M
Change%
Trade 419.1 375.3 11.7% 51.8 44.3 17.0%
Retail 191.1 22.2
Specialist Wholesale 103.4 10.1
Unallocated/Head Office (28.0) (6.0) (2.8) (114.1%)
Total 685.6 375.3 82.7% 78.1 41.5 88.5%
The largest contributor to Bapcor’s increase in revenue and profit was the acquisition of ANA which completed on 31 July 2015. In addition the results reflect the acquisitions of Bearing Wholesalers and Precision Automotive Equipment which completed at the end of March 2016 and Sprint Auto Parts which completed at the end of April 2016. Trade also performed solidly contributing an increase in revenue of 11.7% and an increase in EBITDA of 17.0%.
The integration of the ANA business has progressed smoothly. Bapcor has been working towards optimising the benefits of combining the Trade and ANA businesses in areas such as direct and indirect procurement and inter-company sourcing, and a project is underway to review the warehousing and logistics functions across the Group. In addition ANA successfully consolidated its IT platform across its business units during FY2016.
Further details of the operating and financial performance of each business segment follows below. Any prior period references for the Retail and Specialist Wholesale segments have been sourced from management reports prior to Bapcor’s ownership and have been included for comparative purposes only.
11 ANNUAL REPORT 2016
5.1. Operating and financial review – Trade
The Trade segment consists of the Burson Auto Parts and Precision Automotive Equipment business units. This segment is a distributor of:
• Automotive aftermarket parts and consumables to trade workshops for the service and repair of vehicles
• Automotive workshop equipment such as vehicle hoists and scanning equipment, including servicing of the equipment
• Automotive accessories and maintenance products to do-it-yourself vehicle owners
Trade increased its revenue by 11.7% in FY2016 with same store growth contributing 4.6% (compared to 4.6% in FY2015). During FY2016, Burson Auto Parts continued to expand its store network with the number of stores increasing from 130 at 30 June 2015 to 145 at 30 June 2016. Of the increase in 15 stores, 5 were individual store acquisitions and 10 were greenfield store developments including a conversion of a company owned AutoPro store. The average cost per new store including inventory was $580,000. The new stores are located as follows:
• Acquisitions – Gympie and Beaudesert in Queensland, Albion Park Rail and Cessnock in New South Wales, and Geelong North in Victoria;
• Greenfields – Atherton in Queensland, Belmore and Maitland in New South Wales, Fyshwick in Australian Capital Territory, Cranbourne, Sale and Epping in Victoria, and Bibra Lake, Myaree and Rockingham in Western Australia.
With the establishment of the store in the Australian Capital Territory, Burson Auto Parts now operates in all states and territories of Australia.
In addition to the new stores, in April 2016 Precision Automotive Equipment was acquired and became part of the Trade segment. Precision Automotive Equipment is one of Australia’s largest businesses that imports, distributes and services automotive workshop equipment, including hoists, tyre changes, wheel balancers and wheel aligners.
Gross margin percentage increased by 1.4 percentage points in FY2016 compared to FY2015 due to a continued focus on profitable sales throughout the business as well as a price increase in January 2016. A high proportion of greenfield start-up stores and the start-up of the Brisbane distribution centre resulted in an increase in CODB by 0.8%. EBITDA as a percentage of sales increased by 0.6%.
The 8,000 square meter distribution centre in Brisbane commissioned in June 2015 has performed well and now services over 40 stores located in Queensland and northern New South Wales.
At the end of June 2016 there were 6 stores open in Western Australia compared to 3 at the end of FY2015. Whilst the Western Australian market continues to be very price competitive, Bapcor remains committed to its longer term strategy to grow the store network in this region, opening its seventh store in July 2016.
5.2. Operating and financial review – Retail
The Retail segment consists of business units that are retail customer focused, and includes Autobarn, Autopro, Sprint Auto Parts and Car Parts retail store brands, and the Midas and ABS workshop service brands.
The Retail segment performed well during the year recording EBITDA of $22.2 million at 11.6% of sales. Autobarn recorded same store sales growth of 5.2% (compared to 2.6% in FY2015). The number of company owned and franchise stores in the retail segment increased by 48 stores during FY2016. This consisted of Autobarn +3, independent businesses of Autopro, Car Parts and Sprint Auto Parts +43 and the service workshops of Midas and ABS +2.
The Bapcor strategy is to grow the Autobarn store network to a target of 200 stores nationally, predominantly through adding company owned stores. As at June 2016 there were 15 company owned Autobarn stores compared to 10 at June 2015.
Bapcor is undertaking a strategic review of the Service business to ascertain the long-term strategy for the business.
5.3. Operating and financial review – Specialist Wholesale
The Specialist Wholesale segment consists of the operations that specialise in automotive aftermarket wholesale and includes the AAD business as well as Bearing Wholesalers and Opposite Lock.
AAD consists of the historical ATAP, IBS, Partco and Garmax brands. As expected, AAD sales in FY2016 were relatively flat compared to FY2015 as this business experienced some sales loss with the change in ownership to Bapcor. Progress has been made with AAD supplying additional volume and product groups to other group businesses and this will continue in FY2017 with vertical integration being a key business strategy.
AAD gross margin percentage was below FY2015 as the lower Australian dollar resulted in higher costs of goods which were unable to be fully passed through to the market. Strong cost control offset some of the gross margin erosion.
Bearing Wholesalers was acquired by Bapcor at the end of March 2016. Bearing Wholesalers is the largest bearings reseller in Australia, specialising in bearing kits, gearbox kits, differential kits and timing belt kits, and currently has 8 branches across Australia. Bearing Wholesalers performed strongly in the three months of operations as part of the Group.
Opposite Lock is an Australia wide 4WD specialty equipment and accessories business that has 66 predominantly franchise stores (including 12 store within a store) and a further 17 stockists. Opposite Lock also supplies wholesale equipment and accessories to dealerships and to overseas markets. This business was acquired by ANA in July 2016 and the business has since undertaken some operational changes, notably the warehousing functions have been integrated into existing ANA warehouses.
12 BAPCOR
DIRECTORS’ REPORT continued
5.4. Operating and financial review – Unallocated/Head Office
The Unallocated/Head Office segment consists of all elimination and head office costs or adjustments that are not in the control of the other segments. Unallocated costs increased during FY2016 from $2.8 million in FY2015 to $6.0 million in FY2016 due largely to $1.3 million of intercompany profit in stock eliminations and an increase in share-based payments expense of $0.8 million. Additional resources were also employed in head office due to the significant increase in size of the business.
5.5. Financial position
5.5.1. Capital raising and debtIn July 2015, Bapcor raised $57.7 million from the retail component of the Entitlements Offer to fund its acquisition of ANA (in addition to the $159.8 million raised through the institutional component of the Entitlements Offer in late FY2015), and issued shares to entities associated with certain vendors of ANA as those vendors elected to rollover a portion of their ANA shares into Bapcor shares as consideration.
As a result of the issues of shares described above, ordinary shares on issue increased from 219,663,293 as at 30 June 2015 to 244,622,784. The number of ordinary shares on issue in Bapcor further increased in March 2016 to 245,857,351 due to the issue of shares by Bapcor to the vendors of Bearing Wholesalers as part consideration for that acquisition.
Bapcor’s external debt facility was renegotiated effective 31 July 2015 for 3 years. The renegotiated debt facility is $200.0 million in aggregate and comprises a $171.0 million revolving facility for working capital and general corporate purposes (including funding of acquisitions), and a $29.0 million facility for working capital and general corporate purposes, the issuance of letters of credit/bank guarantees, and the provision of transactional and foreign exchange facilities. Subsequent to the FY2016 year end, the external debt facility was renegotiated to increase the facility by a further $50.0 million to $250.0 million, with the increase available for general corporate purposes, capital expenditure and acquisitions.
As at the end of June 2016, Bapcor’s leverage ratio was 1.6x (Net Debt : FY2016 EBITDA). After annualising ANA’s result from 11 to 12 months, as well as annualising the recent acquisitions of Bearing Wholesales and Precision Automotive Equipment, the leverage ratio at year end is less than 1.5x.
6. StrategyBapcor’s strategy is to be Australasia’s leading provider of aftermarket parts, accessories and services. With the acquisition of ANA, Bapcor’s strategy is as follows:
Trade
Trade consists of the Burson Auto Parts and Precision Automotive Equipment business units and are trade focussed “parts professionals” businesses supplying service workshops. The target is to grow Burson Auto Parts store numbers from 145 at the end of June 2016 to 200 stores by 2021 with 25% home brand product content.
Retail
Autobarn – The premium retailer of automotive accessories, Autobarn had 99 franchise stores and 15 company owned stores at the end of June 2016 with a target to grow to 200 stores by 2023, with a majority of growth being company owned stores and 35% home brand product content.
Independents – The independents group consists of the franchise stores of AutoPro, Car Parts and Sprint Auto Parts. The strategy is to supply the independent parts stores via Bapcor’s extensive supply chain capabilities and brand support. There were 235 independent stores at the end of June 2016. The target is to maintain the number of independent stores at over 200 and convert these stores to Burson Auto Parts or Autobarn stores when commercially sensible opportunities arise.
Service – The service business consists of the brands Midas and ABS and aims to be experts at scheduled car servicing at affordable prices. There were 142 stores at the end of June 2016. Bapcor is currently conducting a strategic review of the service business to determine the long-term strategy.
Specialist Wholesale
The Specialist Wholesale business strategy aims to be the number one or number two industry category specialists in the parts programs in which it operates. The parts programs in which the Specialist Wholesale segment has historically operated are brake, suspension, 4WD, cooling, engine and gaskets. The recent acquisition of Bearing Wholesalers expanded this specialist wholesale product range into bearings, and the acquisition of Baxters expanded specialist wholesale into auto electrical. The Roadsafe acquisition further strengthened the 4WD and suspension product categories. The strategy for Specialist Wholesale is to continue to strengthen its current category depth and expand into other specialist wholesale categories. The target is to grow revenue to over $200 million by 2021.
Other
A number of acquisition opportunities are presented to Bapcor from time to time to expand its business that would accelerate the segment strategies outlined above. These opportunities will be considered on their merits and pursued if the Board believes they will enhance shareholder value.
13 ANNUAL REPORT 2016
7. Industry trendsThe automotive aftermarket parts market in Australia continues to experience growth based on:
• population growth,
• increasing number of vehicles per person,
• change in the age mix of vehicles (i.e. more vehicles in the four years or older range), and
• an increase in the value of parts sold.
Demand for automotive parts, accessories and services are resilient as vehicle maintenance is critical to operating a vehicle. Vehicle servicing is driven by the number of kilometres travelled, with the number of kilometres travelled by passenger and light commercial vehicles not significantly impacted by economic conditions. Volatility in new vehicle sales does not directly impact demand as parts distributed by Bapcor are predominantly used to service vehicles that are aged four years or older.
Ford, Holden and Toyota have announced they will be ceasing manufacturing operations in Australia (Ford in October 2016 and Holden and Toyota during 2017). Bapcor does not expect demand for parts to be affected by the decline in the Australian vehicle manufacturing industry, as Bapcor distributes parts for a wide range of vehicle makes and models irrespective of where the vehicle is manufactured, and demand for Bapcor’s services is driven by the total number of registered vehicles on the road in Australia and not the location of vehicle manufacture.
8. Material business risksThere are a number of factors that could have an effect on the financial prospects of Bapcor. These include:
Competition risk – The Australian automotive aftermarket parts and accessories distribution industry is competitive and Bapcor may face increased competition from existing competitors (including through downward price pressure), new competitors that enter the industry, vehicle manufacturers, and new technologies or technical advances in vehicles or their parts. Increased competition could have an adverse effect on the financial performance, industry position and future prospects of Bapcor.
Increased bargaining power of customers – A significant majority of Bapcor’s sales are derived from repeat orders from customers. Bapcor may experience increased bargaining power from customers due to consolidation of existing workshops forming larger chains, greater participation of existing workshops in purchasing and buying groups, and closure of independent workshops resulting in greater market share of larger chains. An increase in bargaining power of customers may result in a decrease in prices or loss of customer accounts, which may in turn adversely effect Bapcor’s sales and profitability.
Supplier pressure or relationship damage – Bapcor’s business model depends on having access to a wide range of automotive parts; in particular parts with established brands that drive customer orders. An increase in pricing pressure from suppliers or a damaged relationship with a supplier may increase the prices at which Bapcor procures parts or limit Bapcor’s ability to procure parts from that supplier. If prices of parts increase, Bapcor will be required to pass on or absorb the price increases, which may result in a decreased demand for Bapcor’s products or a decrease in profitability. If Bapcor is no longer able to order parts from a key supplier, Bapcor may lose customer orders and accounts, resulting in lower sales. Any decline in demand, sales or profitability may have an adverse effect on Bapcor’s business and financial performance.
Exchange rate risk – A large proportion of Bapcor’s parts are sourced from overseas, either indirectly through local suppliers or directly by Bapcor. This exposes Bapcor to potential changes in the purchase price of products due to exchange rate movements. Historically Bapcor has been able to pass on the majority of the impact of foreign exchange movements through to the market. If the situation arises where Bapcor is not able to recoup foreign exchange driven cost increases, this may lead to a decrease in profitability.
Managing growth and integration risk – The integration of acquired businesses and the continued strategy of growing the store network will require Bapcor to integrate these businesses and where appropriate upscale its operational and financial systems, procedures and controls and expand and retain, manage and train its employees. There is a risk of a material adverse impact on Bapcor if it is not able to manage its expansion and growth efficiently and effectively, or if the performance of new stores or acquisitions does not meet expectations.
Expansion – A key part of Bapcor’s growth strategy is to increase the size of its store network, which it intends to achieve through store acquisitions and greenfield developments. If suitable acquisition targets are not able to be identified; acquisitions are not able to be made on acceptable terms; or suitable greenfield sites are not available, this may limit Bapcor’s ability to execute its growth strategy within its expected timeframe. Further, new stores may not prove to be as successful as Bapcor anticipates including due to issues arising from integrating new businesses. This could negatively impact Bapcor’s financial performance and its capacity to pursue further acquisitions.
14 BAPCOR
DIRECTORS’ REPORT continued
9. OutlookBapcor expects to continue to see strong profit growth in FY2017 due to a number of factors as follows:
• A full 12 months of results will be included for the ANA acquisition (11 months in FY2016) as well as other acquisitions made during FY2016
• The inclusion of the recent acquisitions of Baxters and Roadsafe
• Forecast optimisation savings of between $5.0 million and $7.0 million as a result of the ANA acquisition
• Continued store network growth and solid performance in the underlying businesses
Since June 2016 Burson Auto Parts has opened a further 5 stores, taking the total number of stores in the Burson Auto Parts store network to 150, and is targeting to reach at least 156 stores by the end of FY2017. Trading trends in July and month to date August have been strong.
In Retail Autobarn has opened a further 4 stores since June 2016 and is targeting to increase the number of company owned stores by 10 in FY2017. Other store growth targets in FY2017 include Autopro +5 stores, Midas +5 stores and Opposite Lock +10 stores (including store within a store).
10. Information on Directors
Robert McEniry, Independent, Non-Executive Director and Chairman
Robert was appointed to the Bapcor Board in March 2014 as an Independent, Non-Executive Director and Chairman. Robert holds a Master of Business Administration from the University of Melbourne and is a Member of the Australian Institute of Company Directors.
Experience and expertise Robert has extensive experience in the automotive industry both in Australia and overseas. Robert’s former roles include President and Chief Executive Officer (and Chairman) of Mitsubishi Motors Australia Ltd, Chief Executive Officer of Nucleus Network Ltd, Chief Executive Officer of South Pacific Tyres Ltd, and board member of the Executive Committee for the Federal Chamber of Automotive Industries
Other current directorships Robert is currently on the boards of Multiple Sclerosis Ltd, Australian Home Care Services Ltd (Chairman), Automotive Holdings Group Ltd and Stillwell Motor Group Ltd (Chairman).
Special responsibilities Chair of the BoardMember of the Nomination and Remuneration CommitteeMember of the Audit and Risk Management Committee
Relevant interest in Bapcor securities as at the date of this report
40,294 ordinary shares
Darryl Abotomey, Chief Executive Officer and Managing Director
Darryl was appointed to the Board in October 2011 as Chief Executive Officer and Managing Director. Darryl holds a Bachelor of Commerce majoring in accounting and economics from the University of Melbourne. Darryl is also a Member of the Australian Institute of Company Directors.
Experience and expertise Darryl has more than ten years’ experience in the automotive aftermarket industry. Darryl has extensive experience in business acquisitions, strategy, finance, information technology and general management in distribution and other industrial businesses. Darryl was a former Director and Chief Financial Officer of Exego Group (Repco). He has also previously held directorships with The Signcraft Group, PaperlinX Limited, CPI Group Limited and Pinegro Products Pty Ltd.
Other current directorships None.
Special responsibilities Chief Executive Officer and Managing Director
Relevant interest in Bapcor securities as at the date of this report
1,787,306 ordinary shares451,148 performance rights
15 ANNUAL REPORT 2016
Andrew Harrison, Independent, Non-Executive Director
Andrew was appointed to the Board in March 2014 as an Independent, Non-Executive Director. Andrew holds a Bachelor of Economics from the University of Sydney, a Master of Business Administration from The Wharton School at the University of Pennsylvania and is a Chartered Accountant.
Experience and expertise Andrew is an experienced company director and corporate advisor. Andrew has previously held executive and non-executive directorships with public, private and private equity owned companies; including as Chief Financial Officer of Seven Group Holdings, Group Finance Director of Landis and Gyr, and Chief Financial Officer and a director of Alesco Limited. Andrew was previously a Senior Manager at Gresham Partners Limited, an Associate at Chase Manhattan Bank (New York) and a Senior Manager at Ernst & Young (Sydney and London).
Other current directorships Andrew is currently on the boards of Estia Health Limited, WiseTech Global Limited, Xenith IP Limited, IVE Group Limited and Ingogo Limited.
Special responsibilities Chair of the Audit and Risk Management CommitteeMember of the Nomination and Remuneration Committee
Relevant interest in Bapcor securities as at the date of this report
44,000 ordinary shares
Therese Ryan, Independent, Non-Executive Director
Therese was appointed to the Board in March 2014 as an Independent, Non-Executive Director. Therese holds a Bachelor of Laws from the University of Melbourne and is a Member of the Australian Institute of Company Directors.
Experience and expertise Therese is a professional non-executive director and has extensive experience as a senior business executive and commercial lawyer working in widely diversified businesses in Australia and internationally. Previously, she was Vice President and General Counsel of General Motors International Operations based in Shanghai, Assistant Secretary of General Motors Corporation and prior to that General Counsel and Company Secretary of GM Holden.
Other current directorships Therese is currently a board member of the Victorian Managed Insurance Authority, VicForests, Metropolitan Fire Brigade, Gippsland Water and WA Super.
Special responsibilities Chair of the Nomination and Remuneration CommitteeMember of the Audit and Risk Management Committee
Relevant interest in Bapcor securities as at the date of this report
32,976 ordinary shares
Margaret Haseltine, Independent, Non-Executive Director
Margaret was appointed to the Board in May 2016 as an Independent, Non-Executive Director. Margaret holds a Bachelor of Arts Degree and a Diploma in Secondary Teaching from the Auckland University. Margaret is also a Fellow of the Australian Institute of Company Directors.
Experience and expertise Margaret has more than 30 years’ business experience in a broad range of senior positions, and 10 years’ experience in board directorship. A proven executive leader, Margaret has significant experience in the areas of supply chain and logistics, customer interface in the FMCG sector, change management, governance, and management within a large corporate environment.Previously, she held various senior positions with Mars Food Australia, including Chief Executive Officer, spanning a 20-year career.
Other current directorships Margaret is currently a board member of Southern Hospitality Ltd, Bagtrans Pty. Ltd. and Stuart Alexander and Co Pty Ltd.
Special responsibilities Member of the Nomination and Remuneration CommitteeMember of the Audit and Risk Management Committee
Relevant interest in Bapcor securities as at the date of this report
Nil ordinary shares
16 BAPCOR
DIRECTORS’ REPORT continued
11. Company Secretary and officersThe following persons were officers of the Company at any time during FY2016, or since the end of FY2016 to the date of this report:
Current Chief Financial Officer and Company Secretary:
Gregory Lennox Fox (2 March 2012 – present)Greg has more than 25 years’ experience in the automotive, industrial and public accounting sectors. Greg joined Bapcor as Chief Financial Officer in 2012 with responsibility for finance, legal, company secretarial and plays a key role in strategic initiatives. Greg was previously Chief Financial Officer at Atlas Steels and at Plexicor, which was a major supplier to the automotive industry. Greg also held various senior financial positions with Amcor Ltd after commencing his career as a Chartered Accountant.
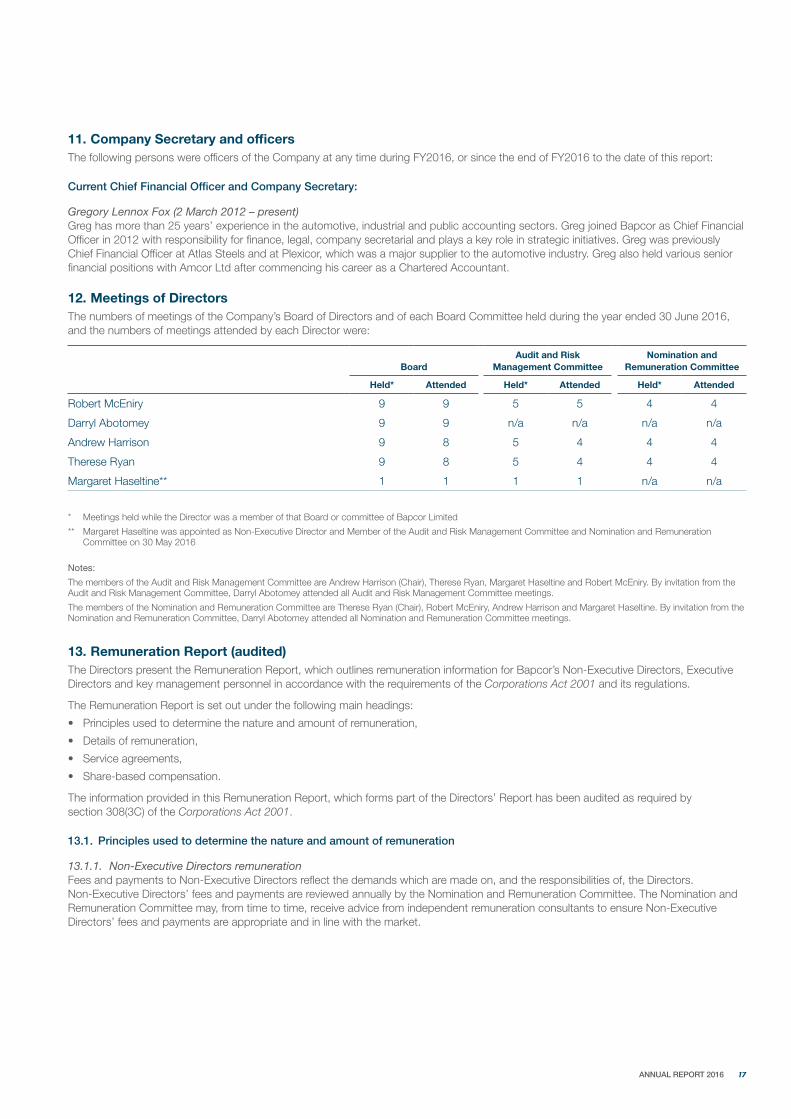
12. Meetings of DirectorsThe numbers of meetings of the Company’s Board of Directors and of each Board Committee held during the year ended 30 June 2016, and the numbers of meetings attended by each Director were:
BoardAudit and Risk
Management CommitteeNomination and
Remuneration Committee
Held* Attended Held* Attended Held* Attended
Robert McEniry 9 9 5 5 4 4
Darryl Abotomey 9 9 n/a n/a n/a n/a
Andrew Harrison 9 8 5 4 4 4
Therese Ryan 9 8 5 4 4 4
Margaret Haseltine** 1 1 1 1 n/a n/a
* Meetings held while the Director was a member of that Board or committee of Bapcor Limited
** Margaret Haseltine was appointed as Non-Executive Director and Member of the Audit and Risk Management Committee and Nomination and Remuneration Committee on 30 May 2016
Notes:
The members of the Audit and Risk Management Committee are Andrew Harrison (Chair), Therese Ryan, Margaret Haseltine and Robert McEniry. By invitation from the Audit and Risk Management Committee, Darryl Abotomey attended all Audit and Risk Management Committee meetings.
The members of the Nomination and Remuneration Committee are Therese Ryan (Chair), Robert McEniry, Andrew Harrison and Margaret Haseltine. By invitation from the Nomination and Remuneration Committee, Darryl Abotomey attended all Nomination and Remuneration Committee meetings.
13. Remuneration Report (audited)The Directors present the Remuneration Report, which outlines remuneration information for Bapcor’s Non-Executive Directors, Executive Directors and key management personnel in accordance with the requirements of the Corporations Act 2001 and its regulations.
The Remuneration Report is set out under the following main headings:
• Principles used to determine the nature and amount of remuneration,
• Details of remuneration,
• Service agreements,
• Share-based compensation.
The information provided in this Remuneration Report, which forms part of the Directors’ Report has been audited as required by section 308(3C) of the Corporations Act 2001.
13.1. Principles used to determine the nature and amount of remuneration
13.1.1. Non-Executive Directors remunerationFees and payments to Non-Executive Directors reflect the demands which are made on, and the responsibilities of, the Directors. Non-Executive Directors’ fees and payments are reviewed annually by the Nomination and Remuneration Committee. The Nomination and Remuneration Committee may, from time to time, receive advice from independent remuneration consultants to ensure Non-Executive Directors’ fees and payments are appropriate and in line with the market.
17 ANNUAL REPORT 2016
Under the Company’s Constitution, and as required by the listing rules of the ASX the total amount paid to all Non-Executive Directors for their services must not exceed in aggregate in any financial year the amount agreed by the shareholders at the annual general meeting. This amount has been fixed at $700,000 with effect from 21 March 2014.
Annual Non-Executive Directors’ fees currently agreed to be paid by the Company are:
• To the Chair, Robert McEniry, $170,000 plus superannuation at the superannuation guarantee rate. The fee includes membership of the Committees.
• The other Non-Executive Directors, $85,000 plus superannuation at the superannuation guarantee rate. In addition, the Chair of the Audit and Risk Management Committee, and the Chair of the Nomination and Remuneration Committee will each be paid an additional $9,100 plus superannuation at the superannuation guarantee rate. Committee members other than the Chair and the Chair of the Committees will be paid an annual fee of $3,700 plus superannuation at the superannuation guarantee rate.
Directors may also be reimbursed for expenses properly incurred by the Directors in connection with the affairs of Bapcor including travel and other expenses in attending to the Company’s affairs.
13.1.2. Executive remunerationBapcor aims to reward executives with a level and mix of remuneration based on their position and responsibility, which is both fixed and variable. The executive remuneration and reward framework has four components:
• base pay and non-monetary benefits;
• short-term performance incentives;
• share-based performance incentives; and
• other remuneration such as superannuation and long service leave.
From time to time the Nomination and Remuneration Committee may consider “one-off” payments to executives, as part of their remuneration, in relation to specific events.
The combination of these comprises the executive’s total remuneration. Fixed remuneration, consisting of base salary, superannuation and non-monetary benefits, are reviewed annually by the Nomination and Remuneration Committee, based on individual and business unit performance, the overall performance of Bapcor and comparable market remunerations.
13.1.3. Short-term incentive planThe Chief Executive Officer and other senior management of Bapcor are eligible to participate in Bapcor’s short-term incentive plan (STI Plan).
Participants in the STI Plan have a target cash payment which is set as a percentage of their total fixed annual remuneration. Actual short-term incentive payments in any given year may be below, at or above that target depending on the achievement of financial and non-financial criteria as set by the Board, in accordance with the terms of the STI Plan, which may be varied from time to time by the Board. No incentive payment is payable if the threshold performance target is not met.
At least 70% and up to 100% of the annual incentive payment will be assessed by financial measures and quantitative key performance indicators. The financial measures and indicators used under the STI Plan may reference Bapcor’s revenue, EBITDA and NPAT performance, or a combination of these measures, as agreed by the Board. Up to 30% of the annual incentive payment will be assessed having regard to non-financial measures, being key performance indicators determined annually by the Board.
These measures are tested annually after the end of the relevant financial year.
Where available, payments under the STI Plan will be made immediately after the release of full year financial results to the ASX except in relation to any portion of an award above the target up to the maximum award, which will be deferred for a period of 12 months. Awards will also be subject to claw back for any material financial misstatements in relation to Bapcor’s performance for the relevant period which are subsequently revealed.
13.1.4. Long term incentive planThe Long Term Incentive Plan (LTIP) is intended to assist in the motivation, retention and reward of certain senior executives. The LTIP is designed to align the interests of senior executives more closely with the interests of shareholders by providing an opportunity for senior executives to receive an equity interest in Bapcor through the granting of performance rights (Performance Rights). The vesting of the Performance Rights is subject to satisfaction of certain performance conditions.
18 BAPCOR
DIRECTORS’ REPORT continued
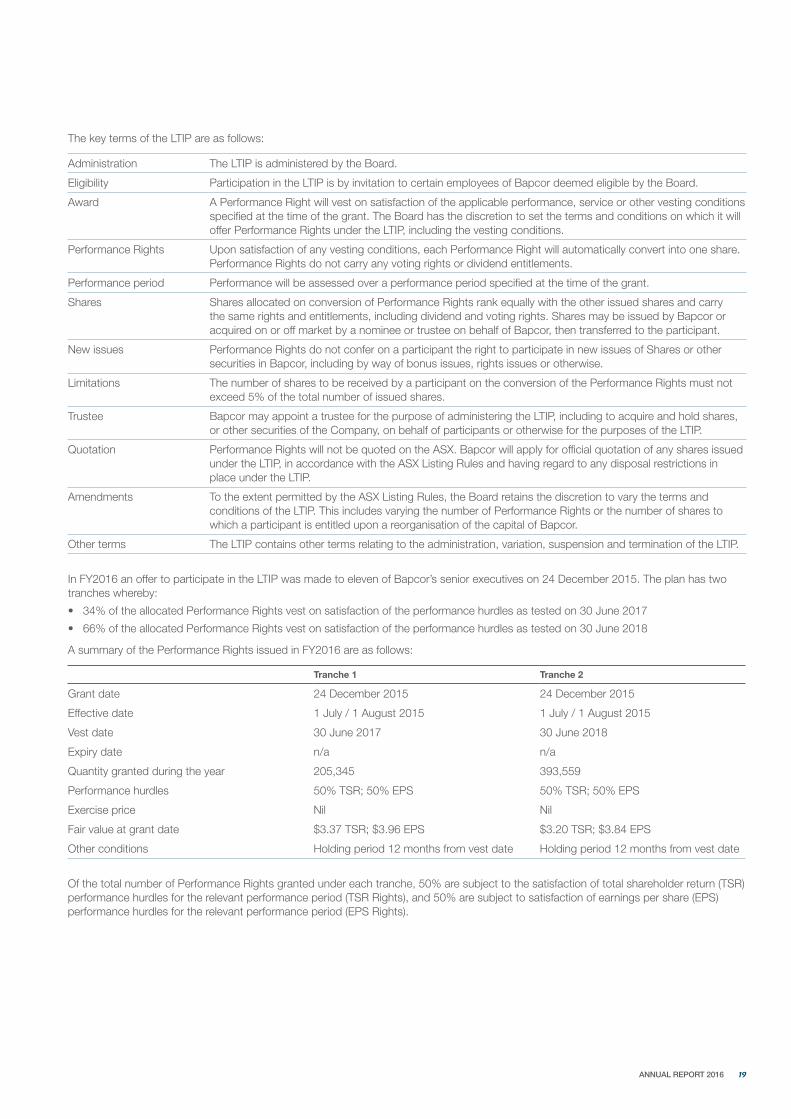
The key terms of the LTIP are as follows:
Administration The LTIP is administered by the Board.
Eligibility Participation in the LTIP is by invitation to certain employees of Bapcor deemed eligible by the Board.
Award A Performance Right will vest on satisfaction of the applicable performance, service or other vesting conditions specified at the time of the grant. The Board has the discretion to set the terms and conditions on which it will offer Performance Rights under the LTIP, including the vesting conditions.
Performance Rights Upon satisfaction of any vesting conditions, each Performance Right will automatically convert into one share. Performance Rights do not carry any voting rights or dividend entitlements.
Performance period Performance will be assessed over a performance period specified at the time of the grant.
Shares Shares allocated on conversion of Performance Rights rank equally with the other issued shares and carry the same rights and entitlements, including dividend and voting rights. Shares may be issued by Bapcor or acquired on or off market by a nominee or trustee on behalf of Bapcor, then transferred to the participant.
New issues Performance Rights do not confer on a participant the right to participate in new issues of Shares or other securities in Bapcor, including by way of bonus issues, rights issues or otherwise.
Limitations The number of shares to be received by a participant on the conversion of the Performance Rights must not exceed 5% of the total number of issued shares.
Trustee Bapcor may appoint a trustee for the purpose of administering the LTIP, including to acquire and hold shares, or other securities of the Company, on behalf of participants or otherwise for the purposes of the LTIP.
Quotation Performance Rights will not be quoted on the ASX. Bapcor will apply for official quotation of any shares issued under the LTIP, in accordance with the ASX Listing Rules and having regard to any disposal restrictions in place under the LTIP.
Amendments To the extent permitted by the ASX Listing Rules, the Board retains the discretion to vary the terms and conditions of the LTIP. This includes varying the number of Performance Rights or the number of shares to which a participant is entitled upon a reorganisation of the capital of Bapcor.
Other terms The LTIP contains other terms relating to the administration, variation, suspension and termination of the LTIP.
In FY2016 an offer to participate in the LTIP was made to eleven of Bapcor’s senior executives on 24 December 2015. The plan has two tranches whereby:
• 34% of the allocated Performance Rights vest on satisfaction of the performance hurdles as tested on 30 June 2017
• 66% of the allocated Performance Rights vest on satisfaction of the performance hurdles as tested on 30 June 2018
A summary of the Performance Rights issued in FY2016 are as follows:
Tranche 1 Tranche 2
Grant date 24 December 2015 24 December 2015
Effective date 1 July / 1 August 2015 1 July / 1 August 2015
Vest date 30 June 2017 30 June 2018
Expiry date n/a n/a
Quantity granted during the year 205,345 393,559
Performance hurdles 50% TSR; 50% EPS 50% TSR; 50% EPS
Exercise price Nil Nil
Fair value at grant date $3.37 TSR; $3.96 EPS $3.20 TSR; $3.84 EPS
Other conditions Holding period 12 months from vest date Holding period 12 months from vest date
Of the total number of Performance Rights granted under each tranche, 50% are subject to the satisfaction of total shareholder return (TSR) performance hurdles for the relevant performance period (TSR Rights), and 50% are subject to satisfaction of earnings per share (EPS) performance hurdles for the relevant performance period (EPS Rights).
19 ANNUAL REPORT 2016
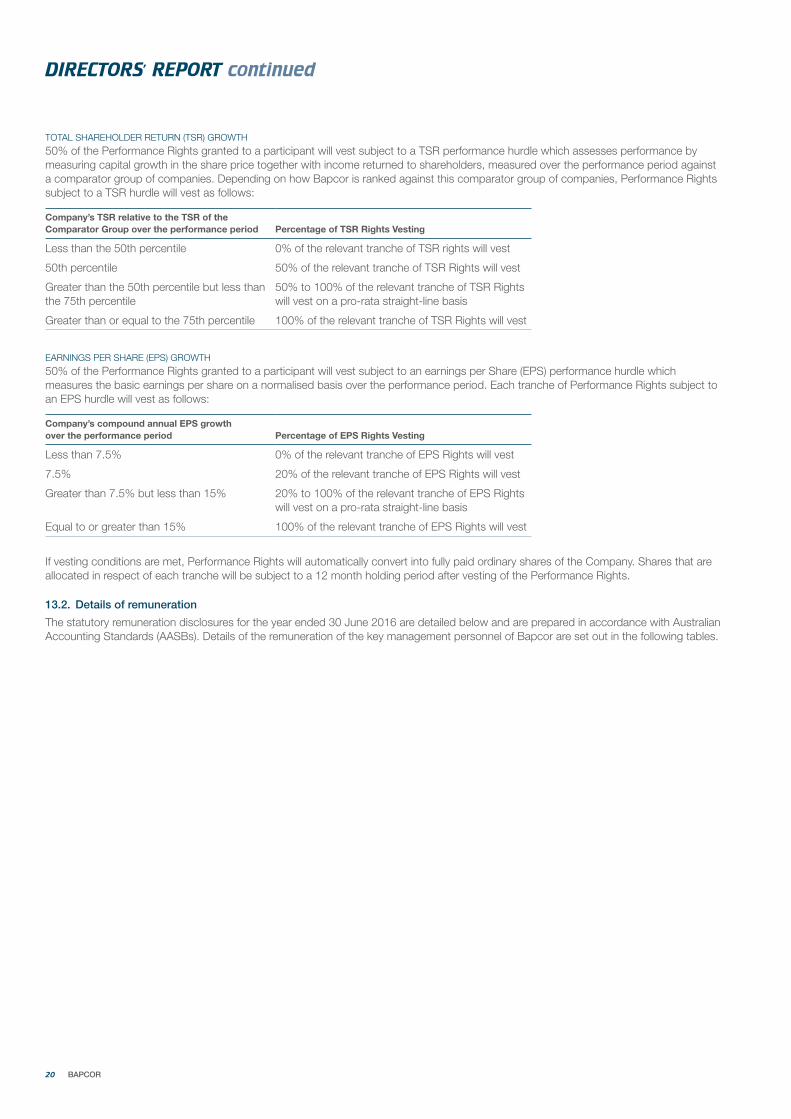
TOTAL SHAREHOLDER RETURN (TSR) GROWTH
50% of the Performance Rights granted to a participant will vest subject to a TSR performance hurdle which assesses performance by measuring capital growth in the share price together with income returned to shareholders, measured over the performance period against a comparator group of companies. Depending on how Bapcor is ranked against this comparator group of companies, Performance Rights subject to a TSR hurdle will vest as follows:
Company’s TSR relative to the TSR of the Comparator Group over the performance period Percentage of TSR Rights Vesting
Less than the 50th percentile 0% of the relevant tranche of TSR rights will vest
50th percentile 50% of the relevant tranche of TSR Rights will vest
Greater than the 50th percentile but less than the 75th percentile
50% to 100% of the relevant tranche of TSR Rights will vest on a pro-rata straight-line basis
Greater than or equal to the 75th percentile 100% of the relevant tranche of TSR Rights will vest
EARNINGS PER SHARE (EPS) GROWTH
50% of the Performance Rights granted to a participant will vest subject to an earnings per Share (EPS) performance hurdle which measures the basic earnings per share on a normalised basis over the performance period. Each tranche of Performance Rights subject to an EPS hurdle will vest as follows:
Company’s compound annual EPS growth over the performance period Percentage of EPS Rights Vesting
Less than 7.5% 0% of the relevant tranche of EPS Rights will vest
7.5% 20% of the relevant tranche of EPS Rights will vest
Greater than 7.5% but less than 15% 20% to 100% of the relevant tranche of EPS Rights will vest on a pro-rata straight-line basis
Equal to or greater than 15% 100% of the relevant tranche of EPS Rights will vest
If vesting conditions are met, Performance Rights will automatically convert into fully paid ordinary shares of the Company. Shares that are allocated in respect of each tranche will be subject to a 12 month holding period after vesting of the Performance Rights.
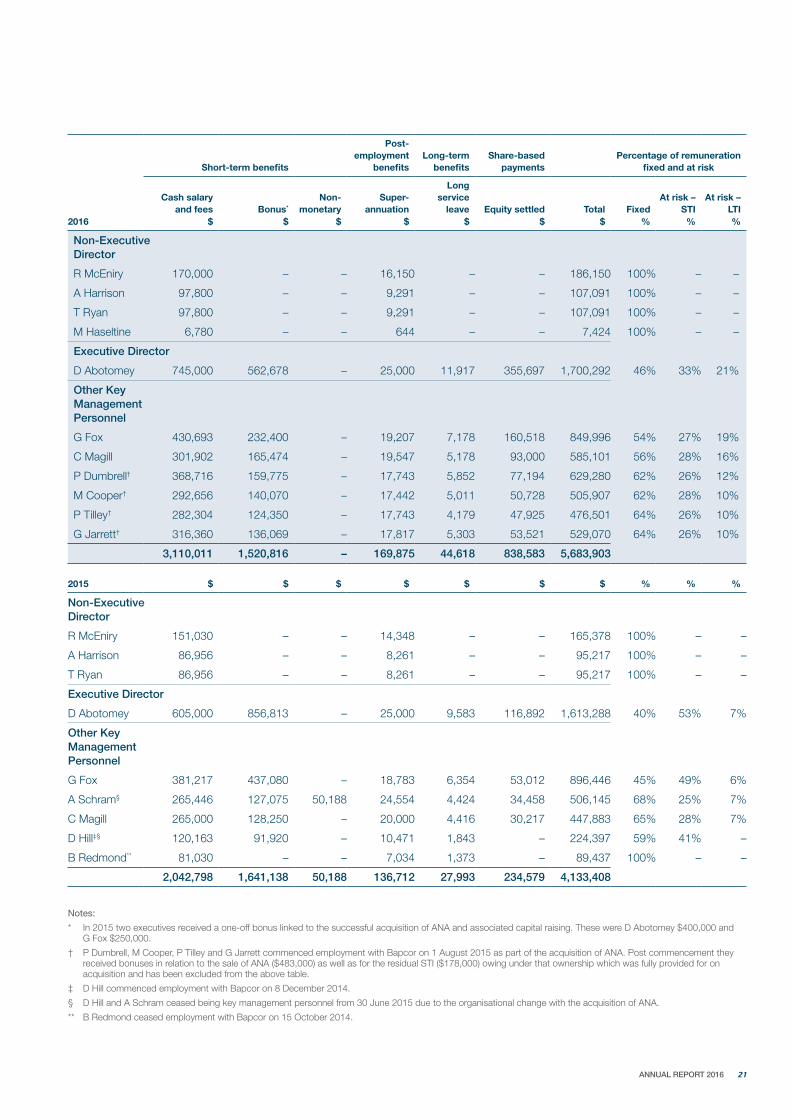
13.2. Details of remuneration
The statutory remuneration disclosures for the year ended 30 June 2016 are detailed below and are prepared in accordance with Australian Accounting Standards (AASBs). Details of the remuneration of the key management personnel of Bapcor are set out in the following tables.
20 BAPCOR
DIRECTORS’ REPORT continued
Short-term benefits
Post- employment
benefitsLong-term
benefitsShare-based
paymentsPercentage of remuneration
fixed and at risk
Cash salary and fees Bonus*
Non- monetary
Super- annuation
Long service
leave Equity settled Total FixedAt risk –
STIAt risk –
LTI2016 $ $ $ $ $ $ $ % % %
Non-Executive Director
R McEniry 170,000 – – 16,150 – – 186,150 100% – –
A Harrison 97,800 – – 9,291 – – 107,091 100% – –
T Ryan 97,800 – – 9,291 – – 107,091 100% – –
M Haseltine 6,780 – – 644 – – 7,424 100% – –
Executive Director
D Abotomey 745,000 562,678 – 25,000 11,917 355,697 1,700,292 46% 33% 21%
Other Key Management Personnel
G Fox 430,693 232,400 – 19,207 7,178 160,518 849,996 54% 27% 19%
C Magill 301,902 165,474 – 19,547 5,178 93,000 585,101 56% 28% 16%
P Dumbrell† 368,716 159,775 – 17,743 5,852 77,194 629,280 62% 26% 12%
M Cooper† 292,656 140,070 – 17,442 5,011 50,728 505,907 62% 28% 10%
P Tilley† 282,304 124,350 – 17,743 4,179 47,925 476,501 64% 26% 10%
G Jarrett† 316,360 136,069 – 17,817 5,303 53,521 529,070 64% 26% 10%
3,110,011 1,520,816 – 169,875 44,618 838,583 5,683,903
2015 $ $ $ $ $ $ $ % % %
Non-Executive Director
R McEniry 151,030 – – 14,348 – – 165,378 100% – –
A Harrison 86,956 – – 8,261 – – 95,217 100% – –
T Ryan 86,956 – – 8,261 – – 95,217 100% – –
Executive Director
D Abotomey 605,000 856,813 – 25,000 9,583 116,892 1,613,288 40% 53% 7%
Other Key Management Personnel
G Fox 381,217 437,080 – 18,783 6,354 53,012 896,446 45% 49% 6%
A Schram§ 265,446 127,075 50,188 24,554 4,424 34,458 506,145 68% 25% 7%
C Magill 265,000 128,250 – 20,000 4,416 30,217 447,883 65% 28% 7%
D Hill‡§ 120,163 91,920 – 10,471 1,843 – 224,397 59% 41% –
B Redmond** 81,030 – – 7,034 1,373 – 89,437 100% – –
2,042,798 1,641,138 50,188 136,712 27,993 234,579 4,133,408
Notes:
* In 2015 two executives received a one-off bonus linked to the successful acquisition of ANA and associated capital raising. These were D Abotomey $400,000 and G Fox $250,000.
† P Dumbrell, M Cooper, P Tilley and G Jarrett commenced employment with Bapcor on 1 August 2015 as part of the acquisition of ANA. Post commencement they received bonuses in relation to the sale of ANA ($483,000) as well as for the residual STI ($178,000) owing under that ownership which was fully provided for on acquisition and has been excluded from the above table.
‡ D Hill commenced employment with Bapcor on 8 December 2014.
§ D Hill and A Schram ceased being key management personnel from 30 June 2015 due to the organisational change with the acquisition of ANA.
** B Redmond ceased employment with Bapcor on 15 October 2014.
21 ANNUAL REPORT 2016
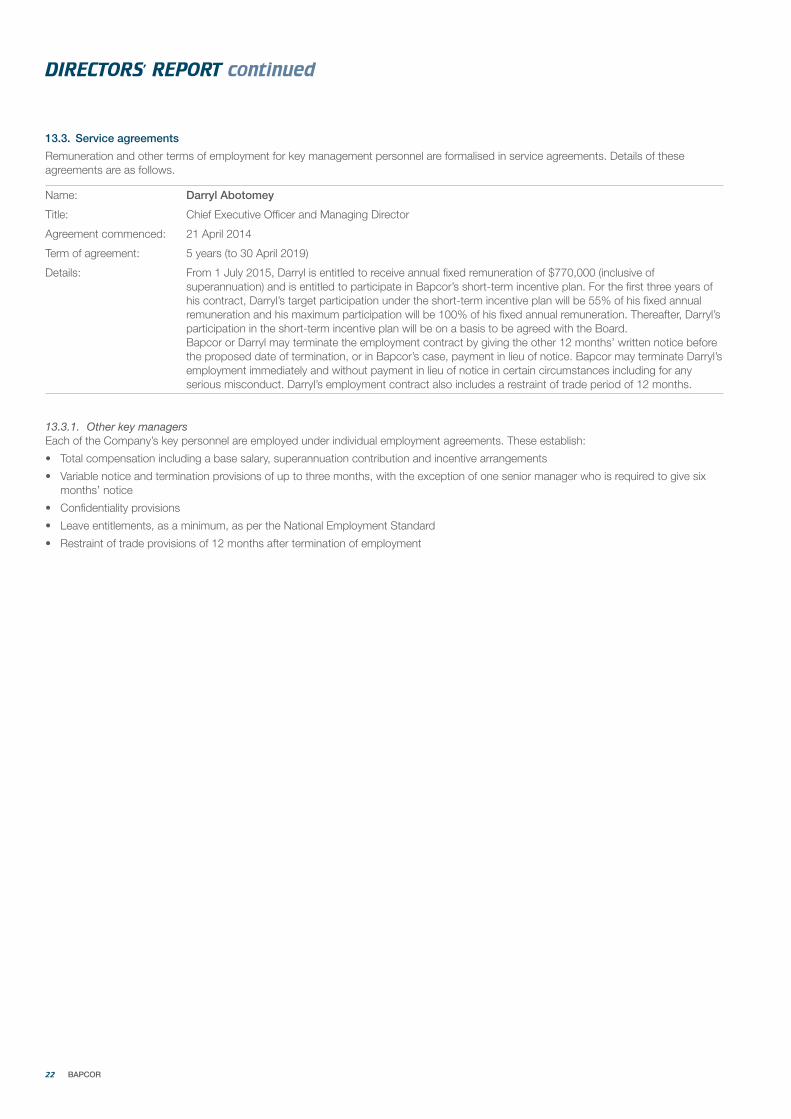
13.3. Service agreements
Remuneration and other terms of employment for key management personnel are formalised in service agreements. Details of these agreements are as follows.
Name: Darryl Abotomey
Title: Chief Executive Officer and Managing Director
Agreement commenced: 21 April 2014
Term of agreement: 5 years (to 30 April 2019)
Details: From 1 July 2015, Darryl is entitled to receive annual fixed remuneration of $770,000 (inclusive of superannuation) and is entitled to participate in Bapcor’s short-term incentive plan. For the first three years of his contract, Darryl’s target participation under the short-term incentive plan will be 55% of his fixed annual remuneration and his maximum participation will be 100% of his fixed annual remuneration. Thereafter, Darryl’s participation in the short-term incentive plan will be on a basis to be agreed with the Board.Bapcor or Darryl may terminate the employment contract by giving the other 12 months’ written notice before the proposed date of termination, or in Bapcor’s case, payment in lieu of notice. Bapcor may terminate Darryl’s employment immediately and without payment in lieu of notice in certain circumstances including for any serious misconduct. Darryl’s employment contract also includes a restraint of trade period of 12 months.
13.3.1. Other key managersEach of the Company’s key personnel are employed under individual employment agreements. These establish:
• Total compensation including a base salary, superannuation contribution and incentive arrangements
• Variable notice and termination provisions of up to three months, with the exception of one senior manager who is required to give six months’ notice
• Confidentiality provisions
• Leave entitlements, as a minimum, as per the National Employment Standard
• Restraint of trade provisions of 12 months after termination of employment
22 BAPCOR
DIRECTORS’ REPORT continued

13.4. Share-based compensation
13.4.1. Performance rights outstanding for key management personnelThe following table outlines the details of the LTI grants outstanding for each key management personnel participant and other movements in options and performance rights in the year.
No options will vest if the performance conditions are not satisfied, hence the minimum value of the option yet to vest is nil. Fair value is calculated in accordance with Bapcor’s accounting policy as discussed in note 1(r)(iii). There were no amounts paid and there were no amounts outstanding or due from key management personnel in relation to the grant of options during the year.
Grant dateQuantity granted Vest date
Exercise price
$
Value at grant date*
$Vested
%Quantity
vested
Forfeited/ lapsed
%
Value expensed this year†
$
D Abotomey 24/04/2014
24/12/2015
70,071220,08955,198
105,790
30/06/201630/06/201730/06/201730/06/2018
–
–
382,342
574,449
0%
0%
–
–
0%
0%
154,990
200,707
G Fox 24/04/2014
24/12/2015
31,77899,81424,81447,558
30/06/201630/06/201730/06/201730/06/2018
–
–
173,398
258,243
0%
0%
–
–
0%
0%
70,290
90,227
C Magill 24/04/2014
24/12/2015
18,11456,89414,55827,901
30/06/201630/06/201730/06/201730/06/2018
–
–
93,634
151,505
0%
0%
–
–
0%
0%
40,066
52,935
P Dumbrell 24/12/2015 21,23040,688
30/06/201730/06/2018
– 220,940 0% – 0% 77,194
M Cooper 24/12/2015 13,95126,738
30/06/201730/06/2018
– 145,189 0% – 0% 50,728
P Tilley 24/12/2015 13,18025,261
30/06/201730/06/2018
– 137,168 0% – 0% 47,925
G Jarrett 24/12/2015 14,71928,211
30/06/201730/06/2018
– 153,186 0% – 0% 53,521
Total 956,557 2,290,054 838,583
Notes:
* Value at grant date has been determined as the fair value of Performance Rights at grant
† Value expensed this year is the current years expense calculated by allocating the fair value (determined at grant), of the Performance Rights, over the relevant vesting period as required by the Accounting Standards.
13.5. Performance against key measures
The Company aims to align its executive remuneration to its strategic and business objectives and the creation of shareholder wealth. The table below shows measures of the Bapcor’s financial performance over the last two years as required by the Corporations Act 2001. However, these are not necessarily consistent with the measures used in determining variable amount of remuneration awarded to key management personnel. As a consequence, there may not always be a direct correlation between the key measures below and the variable remuneration awarded.
13.5.1. Key measures of the group2016 2015
Pro-forma net profit after tax for the year ($’000) 43,582 23,067
Dividend declared (cents per share) 11.0 8.7
Declared dividend payout ratio on pro-forma NPAT (%) 62.0 78.2
Increase in share price (%) 62.4 61.9
Pro-forma NPAT growth (%) 88.9 19.1
Pro-forma EPS – TERP adjusted (cents)‡ 17.85 13.62
Pro-forma EPS – TERP adjusted–growth (%) 31.0 19.1
Note:
‡ 2015 EPS has been retrospectively adjusted to take into consideration the impact of the rights issue performed in 2016 and the impact on the number of shares as per AASB 133 Earnings Per Share
23 ANNUAL REPORT 2016
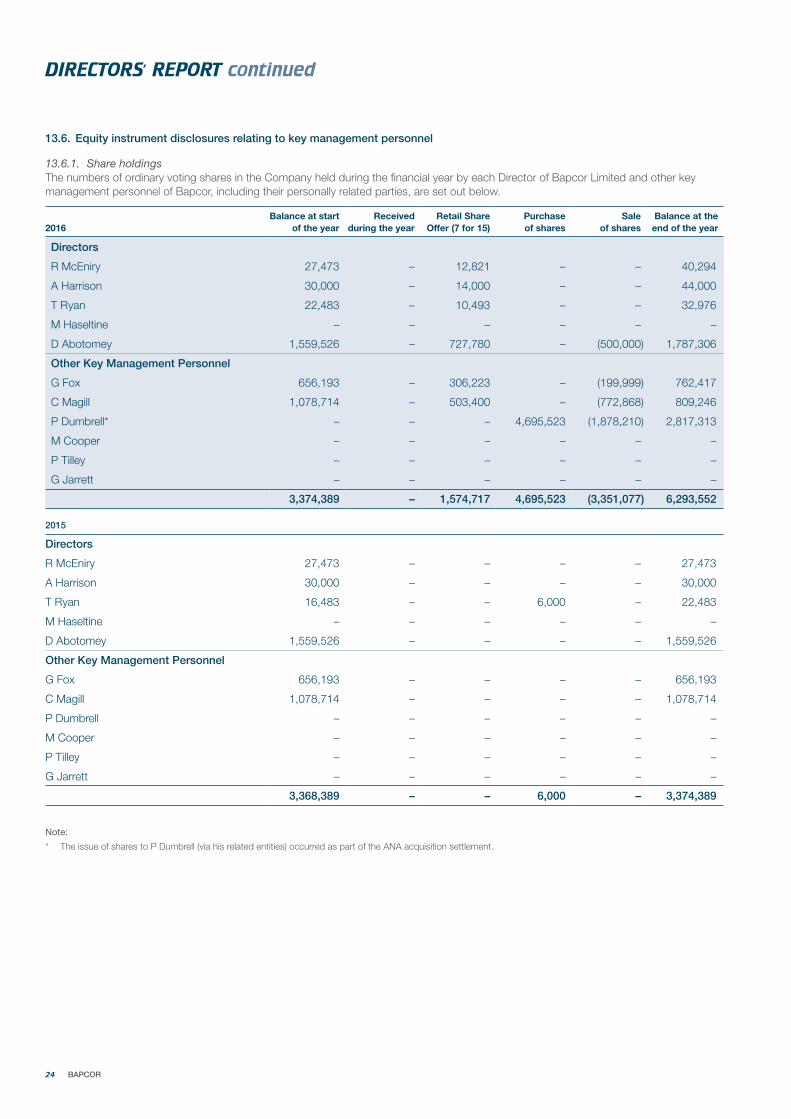
13.6. Equity instrument disclosures relating to key management personnel
13.6.1. Share holdingsThe numbers of ordinary voting shares in the Company held during the financial year by each Director of Bapcor Limited and other key management personnel of Bapcor, including their personally related parties, are set out below.
2016Balance at start
of the yearReceived
during the yearRetail Share
Offer (7 for 15)Purchase of shares
Sale of shares
Balance at the end of the year
Directors
R McEniry 27,473 – 12,821 – – 40,294
A Harrison 30,000 – 14,000 – – 44,000
T Ryan 22,483 – 10,493 – – 32,976
M Haseltine – – – – – –
D Abotomey 1,559,526 – 727,780 – (500,000) 1,787,306
Other Key Management Personnel
G Fox 656,193 – 306,223 – (199,999) 762,417
C Magill 1,078,714 – 503,400 – (772,868) 809,246
P Dumbrell* – – – 4,695,523 (1,878,210) 2,817,313
M Cooper – – – – – –
P Tilley – – – – – –
G Jarrett – – – – – –
3,374,389 – 1,574,717 4,695,523 (3,351,077) 6,293,552
2015
Directors
R McEniry 27,473 – – – – 27,473
A Harrison 30,000 – – – – 30,000
T Ryan 16,483 – – 6,000 – 22,483
M Haseltine – – – – – –
D Abotomey 1,559,526 – – – – 1,559,526
Other Key Management Personnel
G Fox 656,193 – – – – 656,193
C Magill 1,078,714 – – – – 1,078,714
P Dumbrell – – – – – –
M Cooper – – – – – –
P Tilley – – – – – –
G Jarrett – – – – – –
3,368,389 – – 6,000 – 3,374,389
Note:
* The issue of shares to P Dumbrell (via his related entities) occurred as part of the ANA acquisition settlement.
24 BAPCOR
DIRECTORS’ REPORT continued
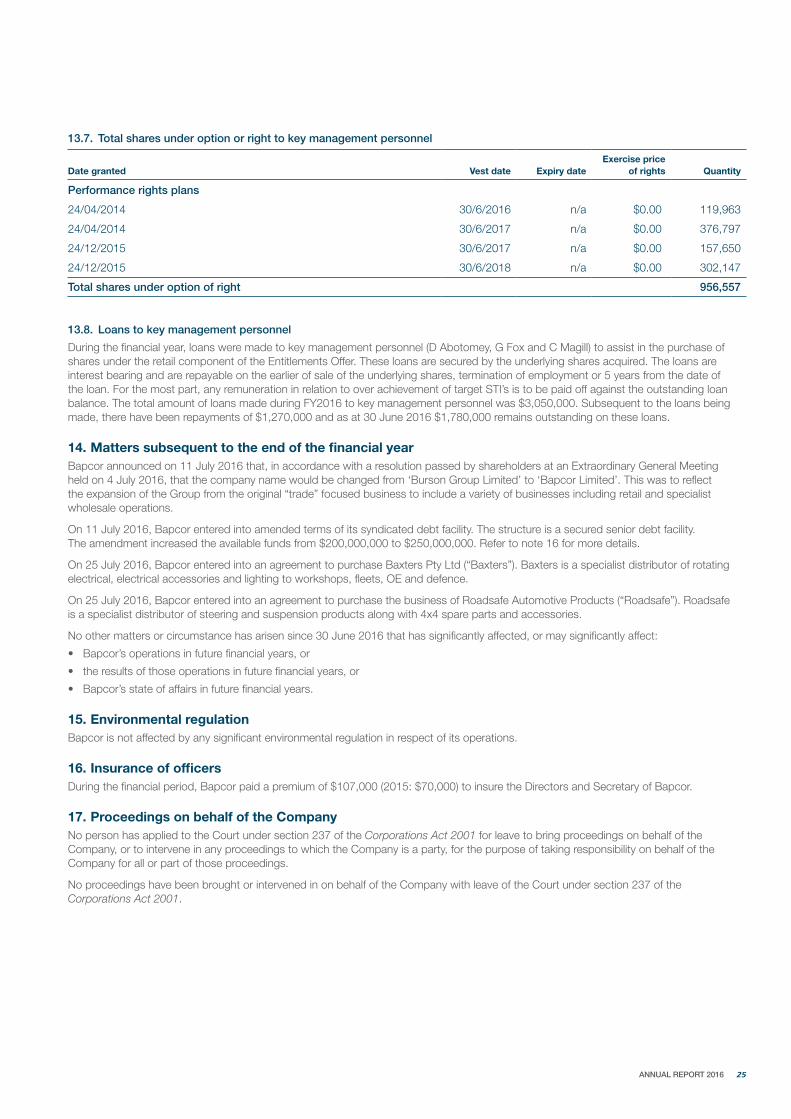
13.7. Total shares under option or right to key management personnel
Date granted Vest date Expiry dateExercise price
of rights Quantity
Performance rights plans
24/04/2014 30/6/2016 n/a $0.00 119,963
24/04/2014 30/6/2017 n/a $0.00 376,797
24/12/2015 30/6/2017 n/a $0.00 157,650
24/12/2015 30/6/2018 n/a $0.00 302,147
Total shares under option of right 956,557
13.8. Loans to key management personnel
During the financial year, loans were made to key management personnel (D Abotomey, G Fox and C Magill) to assist in the purchase of shares under the retail component of the Entitlements Offer. These loans are secured by the underlying shares acquired. The loans are interest bearing and are repayable on the earlier of sale of the underlying shares, termination of employment or 5 years from the date of the loan. For the most part, any remuneration in relation to over achievement of target STI’s is to be paid off against the outstanding loan balance. The total amount of loans made during FY2016 to key management personnel was $3,050,000. Subsequent to the loans being made, there have been repayments of $1,270,000 and as at 30 June 2016 $1,780,000 remains outstanding on these loans.
14. Matters subsequent to the end of the financial yearBapcor announced on 11 July 2016 that, in accordance with a resolution passed by shareholders at an Extraordinary General Meeting held on 4 July 2016, that the company name would be changed from ‘Burson Group Limited’ to ‘Bapcor Limited’. This was to reflect the expansion of the Group from the original “trade” focused business to include a variety of businesses including retail and specialist wholesale operations.
On 11 July 2016, Bapcor entered into amended terms of its syndicated debt facility. The structure is a secured senior debt facility. The amendment increased the available funds from $200,000,000 to $250,000,000. Refer to note 16 for more details.
On 25 July 2016, Bapcor entered into an agreement to purchase Baxters Pty Ltd (“Baxters”). Baxters is a specialist distributor of rotating electrical, electrical accessories and lighting to workshops, fleets, OE and defence.
On 25 July 2016, Bapcor entered into an agreement to purchase the business of Roadsafe Automotive Products (“Roadsafe”). Roadsafe is a specialist distributor of steering and suspension products along with 4x4 spare parts and accessories.
No other matters or circumstance has arisen since 30 June 2016 that has significantly affected, or may significantly affect:
• Bapcor’s operations in future financial years, or
• the results of those operations in future financial years, or
• Bapcor’s state of affairs in future financial years.
15. Environmental regulationBapcor is not affected by any significant environmental regulation in respect of its operations.
16. Insurance of officersDuring the financial period, Bapcor paid a premium of $107,000 (2015: $70,000) to insure the Directors and Secretary of Bapcor.
17. Proceedings on behalf of the CompanyNo person has applied to the Court under section 237 of the Corporations Act 2001 for leave to bring proceedings on behalf of the Company, or to intervene in any proceedings to which the Company is a party, for the purpose of taking responsibility on behalf of the Company for all or part of those proceedings.
No proceedings have been brought or intervened in on behalf of the Company with leave of the Court under section 237 of the Corporations Act 2001.
25 ANNUAL REPORT 2016

18. AuditorPricewaterhouseCoopers continues in office in accordance with section 327 of the Corporations Act 2001.
Extension of current audit engagement partner’s tenure
The Company’s current audit engagement partner Mr Daniel Rosenberg of PricewaterhouseCoopers was appointed during the 2012 financial year audit. Under the Corporations Act 2001 (Cth), audit engagement partners must be rotated at least every 5 years. Accordingly, Mr Rosenberg would ordinarily have been replaced with another audit engagement partner at the conclusion of the 2016 reporting season.
Given this, the Audit and Risk Committee, as well as the Board, considered the impact of the rotation of Mr Rosenberg in 2016, in particular, in relation to audit quality, the Board noted that, amongst other things: given the Company’s recent ASX listing and the recent significant acquisition of Aftermarket Network Australia Pty Ltd it is important that the detailed knowledge and understanding that Mr Rosenberg has built up in relation to the Company and its industry over the past five years is retained to ensure the quality of the audit of the Company.
Accordingly, the Board resolved in accordance with section 324DAA of the Corporations Act 2001 to extend Mr Rosenberg’s term for an additional financial year on the basis that such an extension would be in the best interests of the Company. This means that Mr Rosenberg will continue as the Company’s audit engagement partner for the 2017 financial year. Importantly, in considering the extension of Mr Rosenberg’s term as audit engagement partner, the Board was satisfied that such an extension would not give rise to a conflict of interest situation, as defined in the Corporations Act and, thereby, impair Mr Rosenberg’s independence. PricewaterhouseCoopers have agreed in writing to the extension of Mr Rosenberg’s term.
19. Remuneration of auditorsDetails of the amounts paid or payable to the auditor for audit and non-audit services provided during the financial year by the auditor are outlined in note 21 to the financial statements.
The Directors are satisfied that the provision of non-audit services during the financial year, by the auditor (or by another person or firm on the auditor’s behalf), is compatible with the general standard of independence for auditors imposed by the Corporations Act 2001.
The Directors are of the opinion that the services as disclosed in note 21 to the financial statements do not compromise the external auditor’s independence requirements of the Corporations Act 2001 for the following reasons:
• all non-audit services have been reviewed and approved to ensure that they do not impact the integrity and objectivity of the auditor, and
• none of the services undermine the general principles relating to auditor independence as set out in APES 110 Code of Ethics for Professional Accountants issued by the Accounting Professional and Ethical Standards Board, including reviewing or auditing the auditor’s own work, acting in a management or decision-making capacity for the company, acting as advocate for the company or jointly sharing economic risks and rewards.
20. Auditor’s independence declarationA copy of the auditor’s independence declaration as required under section 307C of the Corporations Act 2001 is set out on page 27.
21. Rounding of amountsThe Company is of a kind referred to in Class Order 98/100, issued by the Australian Securities & Investments Commission, relating to the “rounding off” of amounts. In accordance with that Class Order amounts in the Directors’ Report and Financial Report are rounded off to the nearest thousand dollars, unless otherwise indicated.
Signed in accordance with a resolution of the Directors made pursuant to s.298(2) of the Corporations Act 2001.
On behalf of the Directors,
Robert McEniry Chairman
Darryl Abotomey Chief Executive Officer
Melbourne 18 August 2016
26 BAPCOR
DIRECTORS’ REPORT continued

27 ANNUAL REPORT 2016
PricewaterhouseCoopers, ABN 52 780 433 757 Freshwater Place, 2 Southbank Boulevard, SOUTHBANK VIC 3006, GPO Box 1331, MELBOURNE VIC 3001 T: 61 3 8603 1000, F: 61 3 8603 1999, www.pwc.com.au
Liability limited by a scheme approved under Professional Standards Legislation.
Auditor’s Independence Declaration
As lead auditor for the audit of Bapcor Limited (formerly Burson Group Limited) for the year ended 30 June 2016, I declare that to the best of my knowledge and belief, there have been:
a) no contraventions of the auditor independence requirements of the Corporations Act 2001 inrelation to the audit; and
b) no contraventions of any applicable code of professional conduct in relation to the audit.
This declaration is in respect of Bapcor Limited and the entities it controlled during the period.
Daniel Rosenberg MelbournePartner 18 August 2016PricewaterhouseCoopers
AUDITOR’S INDEPENDENCE DECLARATION
Bapcor Limited (formerly Burson Group Limited) ABN 80 153 199 912
Lodged with the ASX under Listing Rule 4.3A
These financial statements are the consolidated financial statements of the consolidated entity consisting of Bapcor Limited and its subsidiaries. The financial statements are presented in the Australian currency.
Bapcor Limited is a company limited by shares, incorporated and domiciled in Australia. Its registered office and principal place of business is:
Bapcor Limited61–63 Gower StreetPreston VIC 3072
A description of the nature of the consolidated entity’s operations and its principal activities is included in the Directors’ Report commencing on page 10, which is not part of these financial statements.
The financial statements were authorised for issue by the Directors’ on 18 August 2016. The Directors have the power to amend and reissue the financial statements.
28 BAPCOR

29 ANNUAL REPORT 2016
FINANCIAL STATEMENTS for the year ended 30 June 2016
Consolidated statement of comprehensive income 30
Consolidated statement of financial position 31
Consolidated statement of changes in equity 32
Consolidated statement of cash flows 33
Notes to the consolidated financial statements 34
Directors’ declaration 67
Independent auditor’s report to the members 68
Shareholder information 70
Corporate information IBC

Consolidated
Notes2016
$’0002015 $’000
Revenue 4 685,629 375,317
Cost of goods sold (382,679) (219,886)
Employee benefits expense (132,714) (75,408)
Occupancy expenses (23,897) (12,371)
Freight (11,470) (3,872)
Other expenses 5 (56,691) (22,300)
Acquisition costs 5 (1,149) (4,211)
Depreciation and amortisation expense 5 (10,055) (5,162)
Finance costs 5 (4,858) (3,423)
Profit before income tax 62,116 28,684
Income tax expense 6 (18,534) (9,177)
Profit for the year attributable to the Owners of Bapcor Limited 43,582 19,507
Other comprehensive income
Item that may be reclassified to profit or loss
Changes in the fair value of cash flow hedges 18(a) (1,256) –
Other comprehensive income/(loss) for the year, net of tax (1,256) –
Total comprehensive income for the year attributable to the Owners of Bapcor Limited 42,326 19,507
Earnings per share for profit attributable to the ordinary equity holders of the Company:
Cents Cents
Basic earnings per share 29 17.85 11.52
Diluted earnings per share 29 17.78 11.48
The above consolidated statement of comprehensive income should be read in conjunction with the accompanying notes.
30 BAPCOR
CONSOLIDATED STATEMENT OF COMPREHENSIVE INCOME for the year ended 30 June 2016

Consolidated
Notes2016
$’0002015$’000
Assets
Current assets
Cash and cash equivalents 7 22,392 107,896
Trade and other receivables 8 87,304 33,415
Inventories 9 163,020 77,206
Total current assets 272,716 218,517
Non-current assets
Trade and other receivables 8 573 –
Property, plant and equipment 10 36,213 23,057
Deferred tax assets 11 20,614 11,847
Intangible assets 12 348,840 99,854
Other non-current assets 13 4,466 935
Total non-current assets 410,706 135,693
Total assets 683,422 354,210
Liabilities
Current liabilities
Trade and other payables 14 121,507 68,488
Current tax liabilities 6,236 5,098
Derivative payables 18(a)(i) 420 –
Provisions 15 26,607 11,414
Total current liabilities 154,770 85,000
Non-current liabilities
Borrowings 16 148,184 –
Derivative payables 18(a)(i) 1,374 –
Provisions 15 12,874 2,285
Total non-current liabilities 162,432 2,285
Total liabilities 317,202 87,285
Net assets 366,220 266,925
Equity
Contributed equity 17 416,427 337,390
Other reserves 18(a) 845 441
Retained earnings/(accumulated losses) 18(b) (51,052) (70,906)
Total equity 366,220 266,925
The above consolidated statement of financial position should be read in conjunction with the accompanying notes.
31 ANNUAL REPORT 2016
CONSOLIDATED STATEMENT OF FINANCIAL POSITION as at 30 June 2016

Attributable to owners of Bapcor Limited
Consolidated Notes
Contributed equity$’000
Reserves$’000
Retained earnings/
(accumulated losses)
$’000Total equity
$’000
Balance at 1 July 2014 180,775 56 (83,870) 96,961
Profit for the year – – 19,507 19,507
Other comprehensive income/(loss) – – – –
Total comprehensive income for the year – – 19,507 19,507
Transactions with owners in their capacity as owners:
Contributions of equity, net of transaction costs and tax 17(b) 156,615 – – 156,615
Dividends and distributions provided for or paid 19 – – (6,543) (6,543)
Share-based payments 18(a)(i) – 385 – 385
Balance at 30 June 2015 337,390 441 (70,906) 266,925
Balance at 1 July 2015 337,390 441 (70,906) 266,925
Profit for the year – – 43,582 43,582
Other comprehensive income/(loss) – (1,256) – (1,256)
Total comprehensive income for the year – (1,256) 43,582 42,326
Transactions with owners in their capacity as owners:
Contributions of equity, net of transaction costs and tax 17(b) 79,037 – – 79,037
Dividends and distributions provided for or paid 19 – – (23,728) (23,728)
Share-based payments 18(a)(i) – 1,660 – 1,660
Balance at 30 June 2016 416,427 845 (51,052) 366,220
The above consolidated statement of changes in equity should be read in conjunction with the accompanying notes.
32 BAPCOR
CONSOLIDATED STATEMENT OF CHANGES IN EQUITY for the year ended 30 June 2016
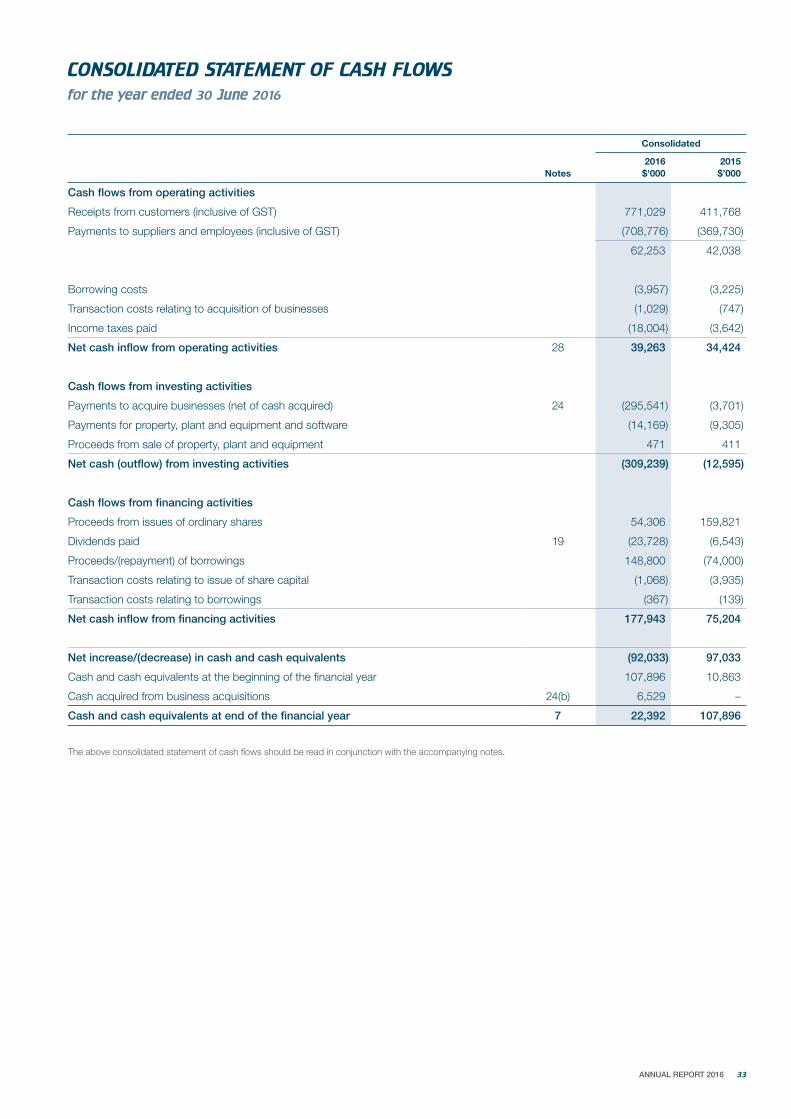
Consolidated
Notes2016
$’0002015$’000
Cash flows from operating activities
Receipts from customers (inclusive of GST) 771,029 411,768
Payments to suppliers and employees (inclusive of GST) (708,776) (369,730)
62,253 42,038
Borrowing costs (3,957) (3,225)
Transaction costs relating to acquisition of businesses (1,029) (747)
Income taxes paid (18,004) (3,642)
Net cash inflow from operating activities 28 39,263 34,424
Cash flows from investing activities
Payments to acquire businesses (net of cash acquired) 24 (295,541) (3,701)
Payments for property, plant and equipment and software (14,169) (9,305)
Proceeds from sale of property, plant and equipment 471 411
Net cash (outflow) from investing activities (309,239) (12,595)
Cash flows from financing activities
Proceeds from issues of ordinary shares 54,306 159,821
Dividends paid 19 (23,728) (6,543)
Proceeds/(repayment) of borrowings 148,800 (74,000)
Transaction costs relating to issue of share capital (1,068) (3,935)
Transaction costs relating to borrowings (367) (139)
Net cash inflow from financing activities 177,943 75,204
Net increase/(decrease) in cash and cash equivalents (92,033) 97,033
Cash and cash equivalents at the beginning of the financial year 107,896 10,863
Cash acquired from business acquisitions 24(b) 6,529 –
Cash and cash equivalents at end of the financial year 7 22,392 107,896
The above consolidated statement of cash flows should be read in conjunction with the accompanying notes.
33 ANNUAL REPORT 2016
CONSOLIDATED STATEMENT OF CASH FLOWS for the year ended 30 June 2016
1 Summary of significant accounting policiesThe principal accounting policies adopted in the preparation of these consolidated financial statements are set out below. These policies have been consistently applied to all the years presented, unless otherwise stated. The financial statements are for the consolidated entity consisting of Bapcor Limited and its subsidiaries (‘the Group’).
(a) Basis of preparation
These general purpose financial statements have been prepared in accordance with Australian Accounting Standards and Interpretations issued by the Australian Accounting Standards Board and the Corporations Act 2001. Bapcor Limited is a for-profit entity for the purpose of preparing the financial statements.
(i) Compliance with IFRS
The Financial Report also complies with International Financial Reporting Standards (IFRS) as issued by the International Accounting Standards Board.
(ii) Changes in accounting policy, disclosures, standards and interpretations
The accounting policies adopted are consistent with those of the previous financial years.
(iii) Early adoption of standards
Bapcor Limited has not elected to apply any pronouncements to the annual reporting period beginning 1 July 2015.
(iv) New and amended standards adopted
A number of new or amended standards became applicable for the current reporting period, however, the Group did not have to change its accounting policies or make retrospective adjustments as a result of adopting these standards.
(v) New and amended standards not yet adopted
Title of standard Nature of change Impact Application date
AASB 15 Revenue from Contracts with Customers
This new standard will replace AASB 118 which covers contracts for goods and services and AASB 111 which covers construction contracts. The new standard is based on the principle that revenue is recognised when control of a good or service transfers to a customer – so the transfer of control replaces the existing notion of the transfer of risks and rewards.The standard permits a modified retrospective approach for the adoption. Under this approach entities will recognise transitional adjustments in retained earnings on the date of initial application. They will only need to apply the new rules to contracts that are not completed as of the date of initial application.
Management is currently assessing the effects of the new standard on the Group’s financial statements.At this stage the Group is not able to estimate the effect of the new rules on the Group’s financial statements. The Group will make more detailed assessments of the effect over the next twelve months.
Mandatory for financial years beginning on or after 1 January 2018. Expected date of adoption by the Group: 1 January 2018.
AASB 9 Financial Instruments
AASB 9 addresses the classification, measurement and derecognition of financial assets and financial liabilities, introduces new rules for hedge accounting and a new impairment model for financial assets.
Management is currently assessing the effects of the new standard on the Group’s financial statements.At this stage the Group is not able to estimate the effect of the new rules on the Group’s financial statements. The Group will make more detailed assessments of the effect over the next twelve months.
Must be applied for financial years commencing on or after 1 January 2018.Based on the transitional provisions in the completed AASB 9, early adoption in phases was only permitted for annual reporting periods beginning before 1 February 2015. After that date, the new rules must be adopted in their entirety.The Group is currently assessing whether it should adopt AASB 9 before its mandatory date.
34 BAPCOR
NOTES TO THE CONSOLIDATED FINANCIAL STATEMENTS for the year ended 30 June 2016
Title of standard Nature of change Impact Application date
AASB 16 Leases AASB 16 was issued in February 2016. It will result in almost all leases being recognised on the balance sheet, as the distinction between operating and finance leases is removed. Under the new standard, an asset (the right to use the leased item) and a financial liability to pay rentals are recognised. The only exceptions are short-term and low-value leases. The accounting for lessors will not significantly change.
The standard will affect primarily the accounting for the Group’s operating leases. As at the reporting date, the Group has net operating lease commitments of $74.8M. However, the Group has not yet determined to what extent these commitments will result in the recognition of an asset and a liability for future payments and how this will affect the Group’s profit and classification of cash flows. Some of the commitments may be covered by the exception for short-term and low-value leases and some commitments may relate to arrangements that will not qualify as leases under AASB 16.
Mandatory for financial years commencing on or after 1 January 2019. At this stage, the Group does not intend to adopt the standard before its effective date.
(vi) Historical cost convention
These financial statements have been prepared under the historical cost convention, as modified by the revaluation of available-for-sale financial assets, financial assets and liabilities (including derivative instruments) at fair value through profit or loss, certain classes of property, plant and equipment and investment property.
(vii) Rounding of amounts
Bapcor Limited is of a kind referred to in Class Order 98/100, issued by the Australian Securities and Investments Commission, relating to the ‘rounding off of amounts in the Financial Report. Amounts in the Financial Report have been rounded off in accordance with that Class Order to the nearest thousand dollars, or in certain cases, the nearest dollar.
(viii) Critical accounting estimates
The preparation of financial statements requires the use of certain critical accounting estimates. It also requires management to exercise its judgement in the process of applying Bapcor Limited’s accounting policies. The areas involving a higher degree of judgement or complexity, or areas where assumptions and estimates are significant to the financial statements, are disclosed in note 3.
(b) Principles of consolidation
(i) Subsidiaries
The consolidated financial statements incorporate the assets and liabilities of all subsidiaries of Bapcor Limited (‘the Company’ or ‘parent entity’) as at 30 June 2016 and the results of all subsidiaries for the year then ended. Bapcor Limited and its subsidiaries together are referred to in this Financial Report as Bapcor or ‘the Group’ or ‘the consolidated entity’.
Subsidiaries are all entities (including special purpose entities) over which Bapcor has control. Bapcor controls an entity when the Group is exposed to, or has rights to, variable returns from its involvement with the entity and has the ability to affect those returns through its power to direct the activities of the entity.
Subsidiaries are fully consolidated from the date on which control is transferred to the Group. They are de-consolidated from the date that control ceases.
The acquisition method of accounting is used to account for business combinations by the Group (refer to note 1(h)).
Bapcor applies a policy of treating transactions with minority interests as transactions with parties external to the Group. Disposals to minority interests result in gains and losses for the Group that are recorded in the consolidated income statement. Purchases from minority interests result in goodwill, being the difference between any consideration paid and the relevant share acquired of the carrying value of identifiable net assets of the subsidiary.
Intercompany transactions, balances and unrealised gains on transactions between Group companies are eliminated. Unrealised losses are also eliminated unless the transaction provides evidence of an impairment of the asset transferred. Accounting policies of subsidiaries have been changed where necessary to ensure consistency with the policies adopted by the Group.
Non-controlling interests in the results and equity of subsidiaries are shown separately in the consolidated income statement, consolidated statement of comprehensive income, consolidated statement of changes in equity and consolidated statement of financial position respectively.
Investments in subsidiaries are accounted for at cost in the separate financial statements of Bapcor Limited.
35 ANNUAL REPORT 2016
(c) Segment reporting
Operating segments are reported in a manner consistent with the internal reporting provided to the senior management personnel. Bapcor has three operating business segments. Refer to note 32 for further information.
(d) Foreign currency translation
(i) Functional and presentation currency
Items included in the financial statements of each of Bapcor’s entities are measured using the currency of the primary economic environment in which the entity operates (‘the functional currency’). The consolidated financial statements are presented in Australian dollars, which is Bapcor Limited’s functional and presentation currency.
(ii) Transactions and balances
Foreign currency transactions are translated into the functional currency using the exchange rates prevailing at the dates of the transactions. Foreign exchange gains and losses resulting from the settlement of such transactions and from the translation at year end exchange rates of monetary assets and liabilities denominated in foreign currencies are recognised in profit or loss, except when they are deferred in equity as qualifying cash flow hedges and qualifying net investment hedges or are attributable to part of the net investment in a foreign operation.
Foreign exchange gains and losses that relate to borrowings are presented in the consolidated statement of comprehensive income, within finance costs. All other foreign exchange gains and losses are presented in the consolidated statement of comprehensive income on a net basis within other income or other expenses.
Non-monetary items that are measured at fair value in a foreign currency are translated using the exchange rates at the date when the fair value was determined. Translation differences on assets and liabilities carried at fair value are reported as part of the fair value gain or loss. For example, translation differences on non-monetary assets and liabilities such as equities held at fair value through profit or loss are recognised in profit or loss as part of the fair value gain or loss and translation differences on non-monetary assets such as equities classified as available-for-sale financial assets are recognised in other comprehensive income.
(e) Revenue recognition
Revenue is measured at the fair value of the consideration received or receivable. Amounts disclosed as revenue are net of returns, trade allowances, rebates and amounts collected on behalf of third parties.
Bapcor recognises revenue when the amount of revenue can be reliably measured, it is probable that future economic benefits will flow to the entity and specific criteria have been met for each of Bapcor’s activities as described below. Bapcor bases its estimates on historical results, taking into consideration the type of customer, the type of transaction and the specifics of each arrangement.
Revenue is recognised for the major business activities as follows:
(i) Sale of goods
A sale is recorded when goods have been delivered to the customer, the customer has accepted the goods and collectability of the related receivables is probable.
(ii) Interest income
Interest income is recognised on a proportional basis taking into account the interest rates applicable to the financial assets.
(iii) Rendering of services – franchise fees and advertising
Revenue from the provision of franchise and advertising services is recognised on an accruals basis.
Revenue from the provision of accounting and information technology support is recognised on a periodical as-delivered basis.
(f) Income tax
The income tax expense or revenue for the period is the tax payable on the current period’s taxable income based on the applicable income tax rate for each jurisdiction adjusted by changes in deferred tax assets and liabilities attributable to temporary differences and to unused tax losses.
The current income tax charge is calculated on the basis of the tax laws enacted or substantively enacted at the end of the reporting period in the countries where Bapcor’s subsidiaries and associates operate and generate taxable income. Management periodically evaluates positions taken in tax returns with respect to situations in which applicable tax regulation is subject to interpretation. It establishes provisions where appropriate on the basis of amounts expected to be paid to the tax authorities.
Deferred income tax is provided in full, using the liability method, on temporary differences arising between the tax bases of assets and liabilities and their carrying amounts in the consolidated financial statements. However, deferred tax liabilities are not recognised if they arise from the initial recognition of goodwill. Deferred income tax is also not accounted for if it arises from initial recognition of an asset or liability in a transaction other than a business combination that at the time of the transaction affects neither accounting nor taxable profit or loss. Deferred income tax is determined using tax rates (and laws) that have been enacted or substantially enacted by the end of the reporting period and are expected to apply when the related deferred income tax asset is realised or the deferred income tax liability is settled.
36 BAPCOR
NOTES TO THE CONSOLIDATED FINANCIAL STATEMENTS continued

Deferred tax assets are recognised for deductible temporary differences and unused tax losses only if it is probable that future taxable amounts will be available to utilise those temporary differences and losses.
Deferred tax liabilities and assets are not recognised for temporary differences between the carrying amount and tax bases of investments in foreign operations where the company is able to control the timing of the reversal of the temporary differences and it is probable that the differences will not reverse in the foreseeable future.
Deferred tax assets and liabilities are offset when there is a legally enforceable right to offset current tax assets and liabilities and when the deferred tax balances relate to the same taxation authority. Current tax assets and tax liabilities are offset where the entity has a legally enforceable right to offset and intends either to settle on a net basis, or to realise the asset and settle the liability simultaneously.
Current and deferred tax is recognised in profit or loss, except to the extent that it relates to items recognised in other comprehensive income or directly in equity. In this case, the tax is also recognised in other comprehensive income or directly in equity, respectively.
(i) Tax consolidation legislation
The Company and all its wholly-owned Australian entities are part of a tax-consolidated group under Australian taxation law. Bapcor Limited is the head entity in the tax-consolidated group. Tax expense/income, deferred tax liabilities and deferred tax assets arising from temporary differences are recognised by the members of the tax consolidated group using the ‘separate taxpayer within group’ approach. Current tax liabilities and assets and deferred tax assets arising from unused tax losses and tax credits of the members of the tax-consolidated group are recognised by the Company (as head entity in the tax-consolidated group).
Due to the existence of a tax funding arrangement between the entities in the tax-consolidated group, amounts are recognised as payable to or receivable by the Company and each member of the group in relation to the tax contribution amounts paid or payable between the parent entity and the other members of the tax-consolidated group in accordance with the arrangement. Where the tax contribution amount recognised by each member of the tax-consolidated group for a particular period is different to the aggregate of the current tax liability or asset and any deferred tax asset arising from unused tax losses and tax credits in respect of that period, the difference is recognised as a contribution from (or distribution to) equity participants.
(g) Leases
Leases of property, plant and equipment where Bapcor, as lessee, has substantially all the risks and rewards of ownership are classified as finance leases. Finance leases are capitalised at the lease’s inception at the fair value of the leased property or, if lower, the present value of the minimum lease payments. The corresponding rental obligations, net of finance charges, are included in other short-term and long-term payables. Each lease payment is allocated between the liability and finance cost. The finance cost is charged to profit or loss over the lease period so as to produce a constant periodic rate of interest on the remaining balance of the liability for each period. The property, plant and equipment acquired under finance leases is depreciated over the asset’s useful life or over the shorter of the asset’s useful life and the lease term if there is no reasonable certainty that Bapcor will obtain ownership at the end of the lease term.
Leases in which a significant portion of the risks and rewards of ownership are not transferred to Bapcor as lessee are classified as operating leases (note 23).
(h) Business combinations
The acquisition method of accounting is used to account for all business combinations, regardless of whether equity instruments or other assets are acquired. The consideration transferred for the acquisition of a subsidiary comprises the fair values of the assets transferred, the liabilities incurred and the equity interests issued by Bapcor. The consideration transferred also includes the fair value of any asset or liability resulting from a contingent consideration arrangement and the fair value of any pre-existing equity interest in the subsidiary.
Acquisition-related costs are expensed as incurred. Identifiable assets acquired and liabilities and contingent liabilities assumed in a business combination are, with limited exceptions, measured initially at their fair values at the acquisition-date. On an acquisition-by-acquisition basis, the Group recognises any non-controlling interest in the acquiree either at fair value or at the non-controlling interest’s proportionate share of the acquiree’s net identifiable assets.
The excess of the consideration transferred and the amount of any non-controlling interest in the acquiree over the fair value of the net identifiable assets acquired is recorded as goodwill. If those amounts are less than the fair value of the net identifiable assets of the subsidiary acquired and the measurement of all amounts has been reviewed, the difference is recognised directly in profit or loss as a bargain purchase.
Where settlement of any part of cash consideration is deferred, the amounts payable in the future are discounted to their present value as at the date of exchange. The discount rate used is the entity’s incremental borrowing rate, being the rate at which a similar borrowing could be obtained from an independent financier under comparable terms and conditions.
Contingent consideration is classified either as equity or a financial liability. Amounts classified as a financial liability are subsequently remeasured to fair value with changes in fair value recognised in profit or loss.
37 ANNUAL REPORT 2016
(i) Impairment of assets
Goodwill and intangible assets that have an indefinite useful life are not subject to amortisation and are tested annually for impairment, or more frequently if events or changes in circumstances indicate that they might be impaired. Other assets are tested for impairment whenever events or changes in circumstances indicate that the carrying amount may not be recoverable. An impairment loss is recognised for the amount by which the asset’s carrying amount exceeds its recoverable amount. The recoverable amount is the higher of an asset’s fair value less costs to sell and value-in-use. For the purposes of assessing impairment, assets are grouped at the lowest levels for which there are separately identifiable cash inflows which are largely independent of the cash inflows from other assets or groups of assets (cash-generating units). Non-financial assets other than goodwill that suffered an impairment are reviewed for possible reversal of the impairment at the end of each reporting period.
(j) Cash and cash equivalents
For the purpose of presentation in the consolidated statement of cash flows, cash and cash equivalents includes cash on hand, deposits held at call with financial institutions, other short-term, highly liquid investments with original maturities of three months or less that are readily convertible to known amounts of cash and which are subject to an insignificant risk of changes in value, and bank overdrafts. Bank overdrafts are shown within borrowings in current liabilities in the consolidated statement of financial position.
(k) Trade receivables
Trade receivables are recognised initially at fair value and subsequently measured at amortised cost using the effective interest method, less provision for impairment. Trade receivables are generally due for settlement within 30 to 60 days. They are presented as current assets unless collection is not expected for more than 12 months after the end of the reporting period.
Collectability of trade receivables is reviewed on an ongoing basis. Debts which are known to be uncollectible are written off by reducing the carrying amount directly. An allowance account (provision for impairment of trade receivables) is used when there is objective evidence that the Group will not be able to collect all amounts due according to the original terms of the receivables. Significant financial difficulties of the debtor, probability that the debtor will enter bankruptcy or financial reorganisation, and default or delinquency in payments (more than 30 days overdue) are considered indicators that the trade receivable is impaired. The amount of the impairment allowance is the difference between the asset’s carrying amount and the present value of estimated future cash flows, discounted at the original effective interest rate. Cash flows relating to short-term receivables are not discounted if the effect of discounting is immaterial.
The amount of the impairment loss is recognised in profit or loss within other expenses. When a trade receivable for which an impairment allowance had been recognised becomes uncollectible in a subsequent period, it is written off against the allowance account. Subsequent recoveries of amounts previously written off are credited against other expenses in profit or loss.
(l) Inventories
Inventory is valued at lower of cost and net realisable value on an average cost basis. Cost comprises direct material and an appropriate proportion of variable and fixed overhead expenditure along with any applicable rebates and discounts.
(m) Property, plant and equipment
Property, plant and equipment is stated at historical cost less depreciation. Historical cost includes expenditure that is directly attributable to the acquisition of the items. Cost may also include transfers from equity of any gains or losses on qualifying cash flow hedges of foreign currency purchases of property, plant and equipment.
Subsequent costs are included in the asset’s carrying amount or recognised as a separate asset, as appropriate, only when it is probable that future economic benefits associated with the item will flow to the Group and the cost of the item can be measured reliably. The carrying amount of any component accounted for as a separate asset is derecognised when replaced. All other repairs and maintenance are charged to profit or loss during the reporting period in which they are incurred.
Depreciation on other assets is calculated using the straight-line method to allocate their cost or revalued amounts, net of their residual values, over their estimated useful lives as follows:
• Plant and equipment 2–15 years
• Motor vehicles 3–7 years
• Leasehold improvements 5–7 years
The assets’ residual values and useful lives are reviewed, and adjusted if appropriate, at the end of each reporting period.
An asset’s carrying amount is written down immediately to its recoverable amount if the asset’s carrying amount is greater than its estimated recoverable amount (note 1(i)).
Gains and losses on disposals are determined by comparing proceeds with carrying amount. These are included in profit or loss. When revalued assets are sold, it is Group policy to transfer any amounts included in other reserves in respect of those assets to retained earnings.
38 BAPCOR
NOTES TO THE CONSOLIDATED FINANCIAL STATEMENTS continued
(n) Intangible assets
(i) Goodwill
Goodwill is measured as described in note 1(h). Goodwill on acquisitions of subsidiaries is included in intangible assets. Goodwill is not amortised but it is tested for impairment annually, or more frequently if events or changes in circumstances indicate that it might be impaired, and is carried at cost less accumulated impairment losses. Gains and losses on the disposal of an entity include the carrying amount of goodwill relating to the entity sold.
Goodwill is allocated to cash-generating units for the purpose of impairment testing. The allocation is made to those cash-generating units or groups of cash-generating units that are expected to benefit from the business combination in which the goodwill arose, identified according to operating segments.
(ii) Software
Costs incurred in acquiring, developing and implementing new software are recognised as intangible assets only when it is probable that future economic benefits associated with the item will flow to the Group and the cost of the item can be measured reliably. The expenditure capitalised comprises all directly attributable costs, including costs of materials, services, licenses and direct labour. Software has a finite useful life and is carried at cost less accumulated amortisation and impairment losses.
Amortisation is calculated using the straight-line method to allocate the cost of software over their estimated useful lives, which is two and a half to four years.
(iii) Brands and trademarks
Brands and trademarks are recognised as intangible assets where a registered trademark is acquired with attributable value. Trade names are valued using a relief from royalty method. Trade names are considered indefinite life intangibles and are not amortised unless there is an intention to discontinue use of the name in which case it is amortised over its estimated remaining useful life.
(iv) Customer contracts
Contractual customer relationships are recognised as intangible assets when the criteria specified in the relevant accounting standards have been met. These are assessed to have a finite life and are amortised over the assets useful life. Customer contracts are currently amortised between three and twenty years.
(o) Trade and other payables
These amounts represent liabilities for goods and services provided to Bapcor prior to the end of financial period which are unpaid. The amounts are unsecured and are usually paid within 30 to 90 days of recognition. Trade and other payables are presented as current liabilities unless payment is not due within 12 months from the end of the reporting period. They are recognised initially at their fair value and subsequently measured at amortised cost using the effective interest method.
(p) Borrowings
Borrowings are initially recognised at fair value, net of transaction costs incurred. Borrowings are subsequently measured at amortised cost. Any difference between the proceeds (net of transaction costs) and the redemption amount is recognised in profit or loss over the period of the borrowings using the effective interest method. Fees paid on the establishment of loan facilities are recognised as transaction costs of the loan to the extent that it is probable that some or all of the facility will be drawn down. In this case, the fee is deferred until the draw down occurs. To the extent there is no evidence that it is probable that some or all of the facility will be drawn down, the fee is capitalised as a prepayment for liquidity services and amortised over the period of the facility to which it relates.
Preference shares, which are mandatorily redeemable on a specific date or specific event, are classified as liabilities.
Borrowings are classified as current liabilities unless Bapcor has an unconditional right to defer settlement of the liability for at least 12 months after the reporting period.
Fees paid on the establishment of loan facilities, which are not an incremental cost relating to the actual draw-down of the facility, are recognised as transaction costs of the loan to the extent that it is probable that some or all of the facility will be drawn down. In this case, the fee is deferred until the draw down occurs. To the extent there is no evidence that it is probable that some or all of the facility will be drawn down, the fee is amortised on a straight-line basis over the term of the facility.
39 ANNUAL REPORT 2016
(q) Provisions
Provisions are recognised when Bapcor has a present legal or constructive obligation as a result of past events, it is probable that an outflow of resources will be required to settle the obligation and the amount has been reliably estimated. Provisions are not recognised for future operating losses.
Where there are a number of similar obligations, the likelihood that an outflow will be required in settlement is determined by considering the class of obligations as a whole. A provision is recognised even if the likelihood of an outflow with respect to any one item included in the same class of obligations may be small.
Provisions are measured at the present value of management’s best estimate of the expenditure required to settle the present obligation at the end of the reporting period. The discount rate used to determine the present value is a pre-tax rate that reflects current market assessments of the time value of money and the risks specific to the liability. The increase in the provision due to the passage of time is recognised as interest expense.
(r) Employee benefits
(i) Short-term obligations
Liabilities for wages and salaries, including non-monetary benefits that are expected to be settled within 12 months after the end of the period in which the employees render the related service are recognised in respect of employee’s services up to the end of the reporting period and are measured at the amounts expected to be paid when the liabilities are settled. The liabilities are recognised in the provision for employee benefits. All other short-term employee benefit obligations are presented as payables.
(ii) Other long-term employee benefit obligations
The liability for long service leave and annual leave which is not expected to be settled within 12 months after the end of the period in which the employees render the related service is recognised in the provision for employee benefits and measured as the present value of expected future payments to be made in respect of services provided by employees up to the end of the reporting period using the projected unit credit method. Consideration is given to expected future wage and salary levels, experience of employee departures and periods of service. Expected future payments are discounted using market yields at the end of the reporting period on corporate bonds with terms to maturity and currency that match, as closely as possible, the estimated future cash outflows.
The obligations are presented as current liabilities in the consolidated statement of financial position if the entity does not have an unconditional right to defer settlement for at least twelve months after the end of the reporting period, regardless of when the actual settlement is expected to occur.
(iii) Share-based payments
Share-based compensation benefits are provided to employees via the Long-Term Incentive Plan (LTIP). Information relating to these schemes are included in note 33. The fair value of performance rights granted under the LTIP is recognised as an employee benefit expense over the period during which the employees become unconditionally entitled to the rights and options with a corresponding increase in equity. The total amount to be expensed is determined by reference to the fair value of the rights and options granted, which includes any market performance conditions and the impact of any non-vesting conditions but excludes the impact of any service and non-market performance vesting conditions. Non-market vesting conditions are included in assumptions about the number of options that are expected to vest which are revised at the end of each reporting period. The impact of the revision to original estimates, if any, is recognised in the consolidated income statement, with a corresponding adjustment to equity.
The fair value is measured at grant date and the expense recognised over the life of the plan. The fair value is independently determined using a Black-Scholes or similar option pricing model that takes into account the exercise price, the term of the option, the impact of dilution, the share price at grant date and expected price volatility of the underlying share, the expected dividend yield and the risk-free interest rate for the term of the option.
(s) Derivative financial instruments
Derivatives are initially recognised at fair value on the date a derivative contract is entered into and are subsequently remeasured to their fair value at each reporting date. The accounting for subsequent changes in fair value depends on whether the derivative is designated as a hedging instrument, and if so, the nature of the item being hedged.
Derivatives are classified as current or non-current depending on the expected period of realisation.
(i) Cash flow hedges
Cash flow hedges are used to cover the consolidated entity’s exposure to variability in cash flows that is attributable to particular risk associated with a recognised asset or liability or a firm commitment which could affect income or expenses. The effective portion of the gain or loss on the hedging instrument is recognised directly in equity, whilst the ineffective portion is recognised in profit or loss. Amounts taken to equity are transferred out of equity and included in the measurement of the hedged transaction when the forecast transaction occurs. When a forecast transaction is no longer expected to occur, the cumulative gain or loss that was reported in equity is immediately reclassified to profit or loss.
40 BAPCOR
NOTES TO THE CONSOLIDATED FINANCIAL STATEMENTS continued
Cash flow hedges are tested for effectiveness on a regular basis both retrospectively and prospectively to ensure that each hedge is highly effective and continues to be designated as a cash flow hedge. If the forecast transaction is no longer expected to occur, amounts recognised in equity are transferred to profit or loss. When the hedged item is closed out, the cumulative gain or loss that was previously reported in equity is immediately reclassified to profit and loss.
If the hedging instrument is sold, terminated, expires, exercised without replacement or rollover, or if the hedge becomes ineffective and is no longer a designated hedge, amounts previously recognised in equity remain in equity until the forecast transaction occurs.
(t) Contributed equity
Ordinary shares are classified as equity.
(u) Earnings per share (EPS)
(i) Basic EPS
Basic EPS is calculated by dividing:
• the profit attributable to owners of the company, excluding any costs of servicing equity other than ordinary shares;
• by the weighted average number of ordinary shares outstanding during the financial year, adjusted for bonus elements in ordinary shares issued during the year and excluding treasury shares.
(ii) Diluted EPS
Diluted EPS adjusts the figures used in the determination of basic EPS to take into account:
• the after income tax effect of interest and other financing costs associated with dilutive potential ordinary shares; and
• the weighted average number of shares assumed to have been issued for no consideration in relation to dilutive potential ordinary shares.
(v) Dividends
Provision is made for the amount of any dividend declared, being appropriately authorised and no longer at the discretion of the entity, on or before the end of the reporting period but not distributed at the end of the reporting period.
(w) Goods and Services Tax (GST)
Revenues, expenses and assets are recognised net of the amount of associated GST, unless the GST incurred is not recoverable from the taxation authority. In this case it is recognised as part of the cost of acquisition of the asset or as part of the expense.
Receivables and payables are stated inclusive of the amount of GST receivable or payable. The net amount of GST recoverable from, or payable to, the taxation authority is included with other receivables or payables in the consolidated statement of financial position.
Cash flows are presented on a gross basis. The GST components of cash flows arising from investing or financing activities which are recoverable from, or payable to the taxation authority, are presented as operating cash flows.
(x) Parent entity financial information
The financial information for the parent entity, Bapcor Limited, disclosed in note 31 has been prepared on the same basis as the consolidated financial statements, except as set out below.
(i) Investments in subsidiaries, associates and joint venture entities
Investments in subsidiaries are accounted for at cost in the financial statements of Bapcor Limited. Dividends received from subsidiaries are recognised in the parent entity’s profit or loss.
(ii) Financial guarantees
Where the parent entity has provided financial guarantees in relation to loans and payables of subsidiaries for no compensation, the fair values of these guarantees are accounted for as contributions and recognised as part of the cost of the investment.
41 ANNUAL REPORT 2016

2 Financial risk managementBapcor’s principal financial liabilities, other than derivatives, comprise of loans and borrowings, trade and other payables, and financial guarantee contracts. The main purpose of these financial liabilities is to finance Bapcor’s operations and to provide guarantees to support its operations. Bapcor’s principal financial assets are trade and other receivables and cash and short-term deposits that derive directly from its operations.
Bapcor is exposed to market risk, credit risk and liquidity risk. Bapcor’s senior management oversees the management of these risks. It is Bapcor’s policy that no trading in derivatives for speculative purposes may be undertaken.
Bapcor holds the following financial instruments:
Notes2016
$’0002015$’000
Financial assets
Cash and cash equivalents 7 22,392 107,896
Trade and other receivables* 8 84,385 32,388
Financial liabilities
Trade and other payables 14 121,507 68,488
Derivative financial instruments 18(a) 1,794 –
Deferred consideration 24 12,748 –
Borrowings (principal) 16 148,800 –
* Trade and other receivables in the table excludes prepayments which are not classified as financial instruments.
The carrying value of the assets and liabilities disclosed in the table above closely approximates or equals their fair value.
Borrowings are issued at variable interest rates (for details of the maturity of borrowings, refer to note 16) and cash and cash equivalents (refer to note 7) attract interest at variable interest rates. A portion of trade and other receivables are loans to customers and attract interest (refer to note 8).
All other financial assets and liabilities are non-interest bearing.
(a) Market risk
(i) Foreign exchange risk
Foreign exchange risk is the risk that a movement in exchange rates will lead to an adverse effect on profitability and cash flows. The Group’s exposure to the risk of changes in foreign exchange rates relates primarily to the Group’s purchasing activities when denominated in a foreign currency. The objective of foreign exchange management is to minimise the risk of fluctuations in foreign currency in the short to medium term through the use of forward exchange contracts.
The Group manages its foreign currency risk by hedging transactions that are expected to occur within a maximum 12-month period for hedges of forecasted purchases.
When a derivative is entered into for the purpose of being a hedge, the Group negotiates the terms of those derivatives to closely match the terms of the hedged exposure. For hedges of forecast transactions, the derivatives cover the period of exposure from the point the cash flows of the transactions are forecasted up to the point of settlement of the resulting payable that is denominated in the foreign currency.
The following table demonstrates the sensitivity to a reasonable change in USD rates, with all other variables held constant. The impact on the Group’s profit before tax is due to changes in the fair value of monetary assets and liabilities. The pre-tax impact on the Group’s equity is due to changes in the fair value of forward exchange contracts designated as cash flow hedges. The Group’s exposure to foreign currency changes for all other currencies is not material.
2016 2015
Effect on profit before tax
$’000
Effect on equity
$’000
Effect on profit before tax
$’000
Effect on equity
$’000
Change in USD rate +5% (146) (977) – –
Change in USD rate –5% 161 1,080 – –
42 BAPCOR
NOTES TO THE CONSOLIDATED FINANCIAL STATEMENTS continued
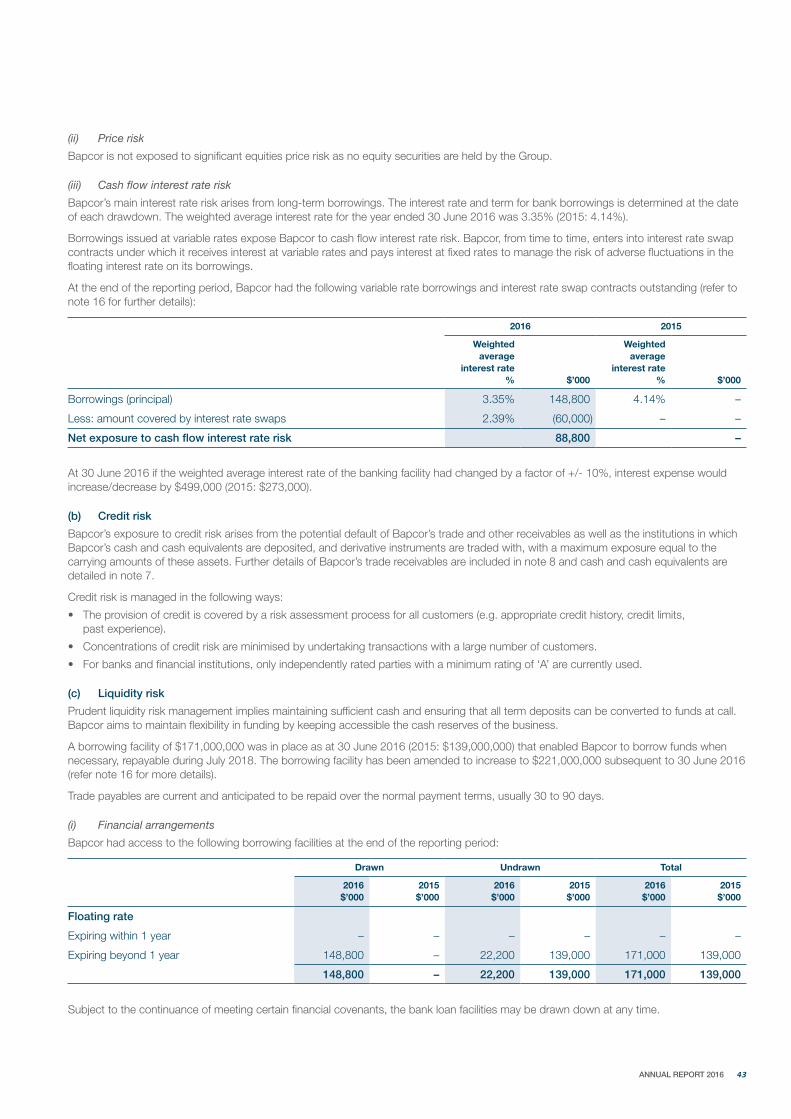
(ii) Price risk
Bapcor is not exposed to significant equities price risk as no equity securities are held by the Group.
(iii) Cash flow interest rate risk
Bapcor’s main interest rate risk arises from long-term borrowings. The interest rate and term for bank borrowings is determined at the date of each drawdown. The weighted average interest rate for the year ended 30 June 2016 was 3.35% (2015: 4.14%).
Borrowings issued at variable rates expose Bapcor to cash flow interest rate risk. Bapcor, from time to time, enters into interest rate swap contracts under which it receives interest at variable rates and pays interest at fixed rates to manage the risk of adverse fluctuations in the floating interest rate on its borrowings.
At the end of the reporting period, Bapcor had the following variable rate borrowings and interest rate swap contracts outstanding (refer to note 16 for further details):
2016 2015
Weighted average
interest rate% $’000
Weighted average
interest rate% $’000
Borrowings (principal) 3.35% 148,800 4.14% –
Less: amount covered by interest rate swaps 2.39% (60,000) – –
Net exposure to cash flow interest rate risk 88,800 –
At 30 June 2016 if the weighted average interest rate of the banking facility had changed by a factor of +/- 10%, interest expense would increase/decrease by $499,000 (2015: $273,000).
(b) Credit risk
Bapcor’s exposure to credit risk arises from the potential default of Bapcor’s trade and other receivables as well as the institutions in which Bapcor’s cash and cash equivalents are deposited, and derivative instruments are traded with, with a maximum exposure equal to the carrying amounts of these assets. Further details of Bapcor’s trade receivables are included in note 8 and cash and cash equivalents are detailed in note 7.
Credit risk is managed in the following ways:
• The provision of credit is covered by a risk assessment process for all customers (e.g. appropriate credit history, credit limits, past experience).
• Concentrations of credit risk are minimised by undertaking transactions with a large number of customers.
• For banks and financial institutions, only independently rated parties with a minimum rating of ‘A’ are currently used.
(c) Liquidity risk
Prudent liquidity risk management implies maintaining sufficient cash and ensuring that all term deposits can be converted to funds at call. Bapcor aims to maintain flexibility in funding by keeping accessible the cash reserves of the business.
A borrowing facility of $171,000,000 was in place as at 30 June 2016 (2015: $139,000,000) that enabled Bapcor to borrow funds when necessary, repayable during July 2018. The borrowing facility has been amended to increase to $221,000,000 subsequent to 30 June 2016 (refer note 16 for more details).
Trade payables are current and anticipated to be repaid over the normal payment terms, usually 30 to 90 days.
(i) Financial arrangements
Bapcor had access to the following borrowing facilities at the end of the reporting period:
Drawn Undrawn Total
2016$’000
2015$’000
2016$’000
2015$’000
2016$’000
2015$’000
Floating rate
Expiring within 1 year – – – – – –
Expiring beyond 1 year 148,800 – 22,200 139,000 171,000 139,000
148,800 – 22,200 139,000 171,000 139,000
Subject to the continuance of meeting certain financial covenants, the bank loan facilities may be drawn down at any time.
43 ANNUAL REPORT 2016
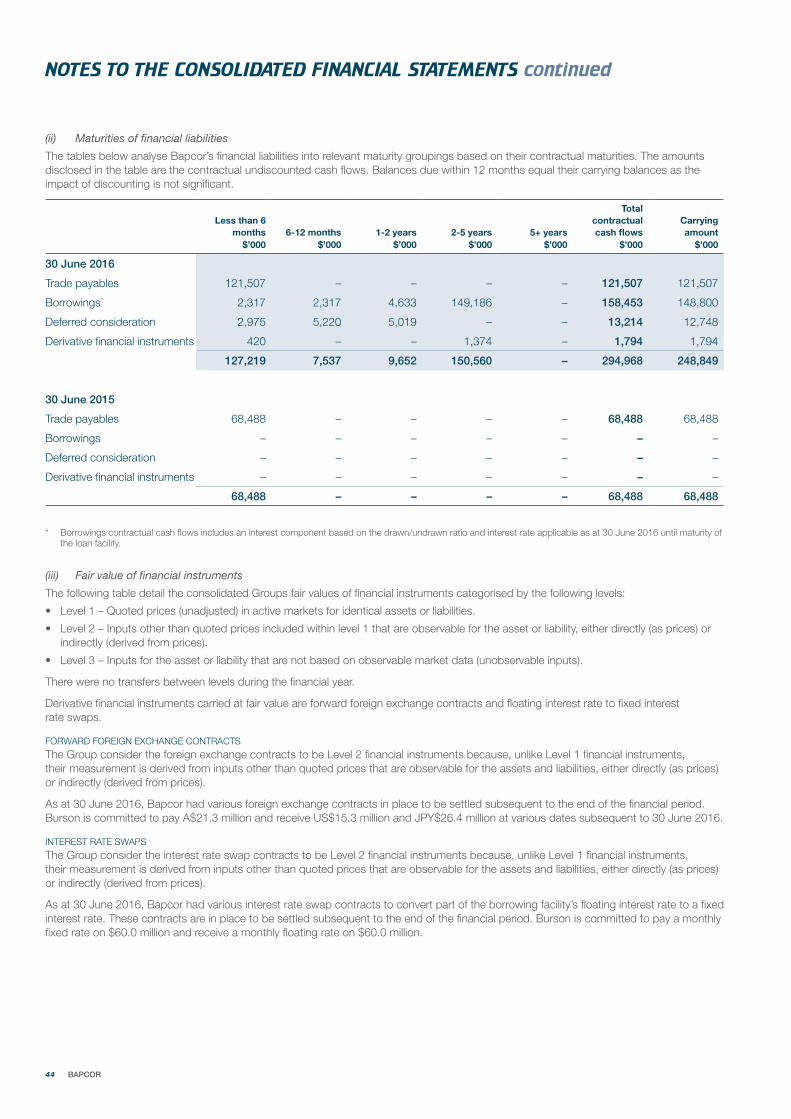
(ii) Maturities of financial liabilities
The tables below analyse Bapcor’s financial liabilities into relevant maturity groupings based on their contractual maturities. The amounts disclosed in the table are the contractual undiscounted cash flows. Balances due within 12 months equal their carrying balances as the impact of discounting is not significant.
Less than 6 months 6-12 months 1-2 years 2-5 years 5+ years
Total contractual cash flows
Carrying amount
$’000 $’000 $’000 $’000 $’000 $’000 $’000
30 June 2016
Trade payables 121,507 – – – – 121,507 121,507
Borrowings* 2,317 2,317 4,633 149,186 – 158,453 148,800
Deferred consideration 2,975 5,220 5,019 – – 13,214 12,748
Derivative financial instruments 420 – – 1,374 – 1,794 1,794
127,219 7,537 9,652 150,560 – 294,968 248,849
30 June 2015
Trade payables 68,488 – – – – 68,488 68,488
Borrowings – – – – – – –
Deferred consideration – – – – – – –
Derivative financial instruments – – – – – – –
68,488 – – – – 68,488 68,488
* Borrowings contractual cash flows includes an interest component based on the drawn/undrawn ratio and interest rate applicable as at 30 June 2016 until maturity of the loan facility.
(iii) Fair value of financial instruments
The following table detail the consolidated Groups fair values of financial instruments categorised by the following levels:
• Level 1 – Quoted prices (unadjusted) in active markets for identical assets or liabilities.
• Level 2 – Inputs other than quoted prices included within level 1 that are observable for the asset or liability, either directly (as prices) or indirectly (derived from prices).
• Level 3 – Inputs for the asset or liability that are not based on observable market data (unobservable inputs).
There were no transfers between levels during the financial year.
Derivative financial instruments carried at fair value are forward foreign exchange contracts and floating interest rate to fixed interest rate swaps.
FORWARD FOREIGN EXCHANGE CONTRACTS
The Group consider the foreign exchange contracts to be Level 2 financial instruments because, unlike Level 1 financial instruments, their measurement is derived from inputs other than quoted prices that are observable for the assets and liabilities, either directly (as prices) or indirectly (derived from prices).
As at 30 June 2016, Bapcor had various foreign exchange contracts in place to be settled subsequent to the end of the financial period. Burson is committed to pay A$21.3 million and receive US$15.3 million and JPY$26.4 million at various dates subsequent to 30 June 2016.
INTEREST RATE SWAPS
The Group consider the interest rate swap contracts to be Level 2 financial instruments because, unlike Level 1 financial instruments, their measurement is derived from inputs other than quoted prices that are observable for the assets and liabilities, either directly (as prices) or indirectly (derived from prices).
As at 30 June 2016, Bapcor had various interest rate swap contracts to convert part of the borrowing facility’s floating interest rate to a fixed interest rate. These contracts are in place to be settled subsequent to the end of the financial period. Burson is committed to pay a monthly fixed rate on $60.0 million and receive a monthly floating rate on $60.0 million.
44 BAPCOR
NOTES TO THE CONSOLIDATED FINANCIAL STATEMENTS continued

DEFERRED CONSIDERATION
The Group consider contingent consideration to be a Level 3 financial instrument because inputs in valuing this instrument are not based on observable market data. The fair value of this instrument is determined based on an estimated discounted cash flow analysis. Refer note 24(c) for more information.
The Group consider that the carrying amount of other financial assets and liabilities recorded in the financial statements to approximate their fair values.
(d) Capital risk management
Bapcor’s policy is to maintain a capital structure for the business which ensures sufficient liquidity and support for business operations, maintains shareholder and market confidence, provides strong stakeholder returns and positions the business for future growth. In assessing capital management Bapcor considers both equity and debt instruments.
The ongoing maintenance of this policy is characterised by:
• Ongoing cash flow forecast analysis and detailed budgeting processes which, combined with continual development of banking relationships, is directed at providing a sound financial positioning for Bapcor’s operations and financial management activities; and
• A capital structure that provides adequate funding for Bapcor’s potential acquisition and investment strategies, building future growth in shareholder value. The syndicated loan facility can be partly used to fund significant investments as part of Bapcor’s growth strategy.
Bapcor is not subject to externally imposed capital requirements, other than contractual banking covenants and obligations. The Company has complied with all bank lending requirements during the year and at the date of this report, which include the following covenants:
• Net leverage ratio not exceeding 2.50:1 (Net Debt : EBITDA); with scope to 3.00:1 post significant acquisition
• Fixed charge cover ratio not exceeding 1.75:1 (EBITDA plus Rent : Net Total Cash Interest plus Rent)
3 Critical accounting judgements, estimates and assumptionsEstimates and judgments are continually evaluated and are based on historical experience and other factors, including expectations of future events that may have a financial impact on the entity and that are believed to be reasonable under the circumstances.
(a) Judgements
In the process of applying the Group’s accounting policies, the following judgements were made, apart from those involving estimations, which have a significant effect on the amounts recognised in the financial statements:
(i) Purchase price allocation
Determining the acquisition date fair value of assets acquired and liabilities assumed on acquisition of controlled entities. This includes judgements around contingent consideration components. For more information refer to note 24.
(ii) Contractual customer relationships and trademarks
Identifying those acquired relationships with customers and trademarks that meet the definition of separately identifiable intangibles that have a finite life.
(b) Estimates and assumptions
The carrying amounts of certain assets and liabilities are often determined based on estimates and assumptions of future events. The key estimates and assumptions that have a significant risk of causing a material adjustment to the carrying amounts of certain assets and liabilities within the next annual reporting period are:
(i) Provision for onerous lease
The Group recognises provisions for rental agreements where the arrangements are estimated to be ‘onerous’ to the Group. In measuring these provisions, assumptions are made about utilisation of premises, future rental costs and in determining the appropriate discount rate to be used in the cash flow calculations. Refer to note 15.
(ii) Impairment of goodwill and other intangible assets
The Group determines whether goodwill and other intangible assets are impaired on an annual basis in accordance with the accounting policy stated in note 1(n). This requires an estimation of the recoverable amount of the cash-generating units to which the goodwill and other intangible assets are allocated. The assumptions used in this estimation of the recoverable amount and the carrying amount of goodwill and other intangible assets are discussed in note 12.
(iii) Contractual customer relationships
The useful life of contractual customer relationships of between 3 to 20 years includes estimates of future attrition rates based on historical rates experienced.
45 ANNUAL REPORT 2016

4 Revenue
Consolidated
Notes2016
$’0002015$’000
Sales revenue 685,629 375,317
685,629 375,317
5 Expenses
Profit before income tax includes the following specific expenses:
Depreciation and amortisation expense
Plant and equipment 10 4,593 2,422
Motor vehicles 10 2,604 2,126
Amortisation 12 2,476 466
Make good provision 382 148
10,055 5,162
Acquisition costs
Relating to ANA acquisition:
Professional consultants costs – 3,514
Transaction related one-off management bonus – 650
Other transaction costs – 47
Relating to other acquisitions:
Professional consultants costs 652 –
Other transaction costs 497 –
1,149 4,211
Other expenses
Motor vehicles 6,499 5,619
IT and communication 9,316 5,672
Advertising 17,324 1,962
Administration 23,552 9,047
56,691 22,300
Finance costs-interest and finance charges paid/payable 4,858 3,423
Net loss on disposal of property, plant and equipment 32 51
Rental expense relating to operating leases – minimum lease payments 26,122 11,326
Defined contribution superannuation expense 8,596 5,479
46 BAPCOR
NOTES TO THE CONSOLIDATED FINANCIAL STATEMENTS continued

6 Income tax
(a) Income tax expense
Consolidated
2016$’000
2015$’000
Current tax 19,319 8,617
Deferred tax (638) 560
Over provision in prior years (147) -
18,534 9,177
The entire income tax expense relates to profit from continuing operations.
Deferred income tax expense included in income tax expense comprises:
Decrease in deferred tax assets 839 573
Decrease in deferred tax liabilities (1,477) (13)
(638) 560
(b) Numerical reconciliation of income tax expense to prima facie tax payable
Profit from ordinary activities before income tax expense 62,116 28,684
Income tax calculated at 30% (2015: 30%) 18,635 8,605
Tax effect of amounts that are not deductible/(taxable) in calculating income tax:
Entertainment 11 5
Acquisition costs 7 552
Other 28 15
46 572
Income tax adjusted for permanent differences:
Over provision in prior year (147) –
Income tax expense attributable to profit from ordinary activities 18,534 9,177
(c) Amounts recognised directly in equity
Deferred tax credited directly to hedge reserve 538 –
Deferred tax credited directly to share capital 321 1,325
Deferred tax credited directly to share-based payment reserve 725 137
1,584 1,462
7 Cash and cash equivalents
Cash at bank and in hand 22,392 107,896
22,392 107,896
47 ANNUAL REPORT 2016
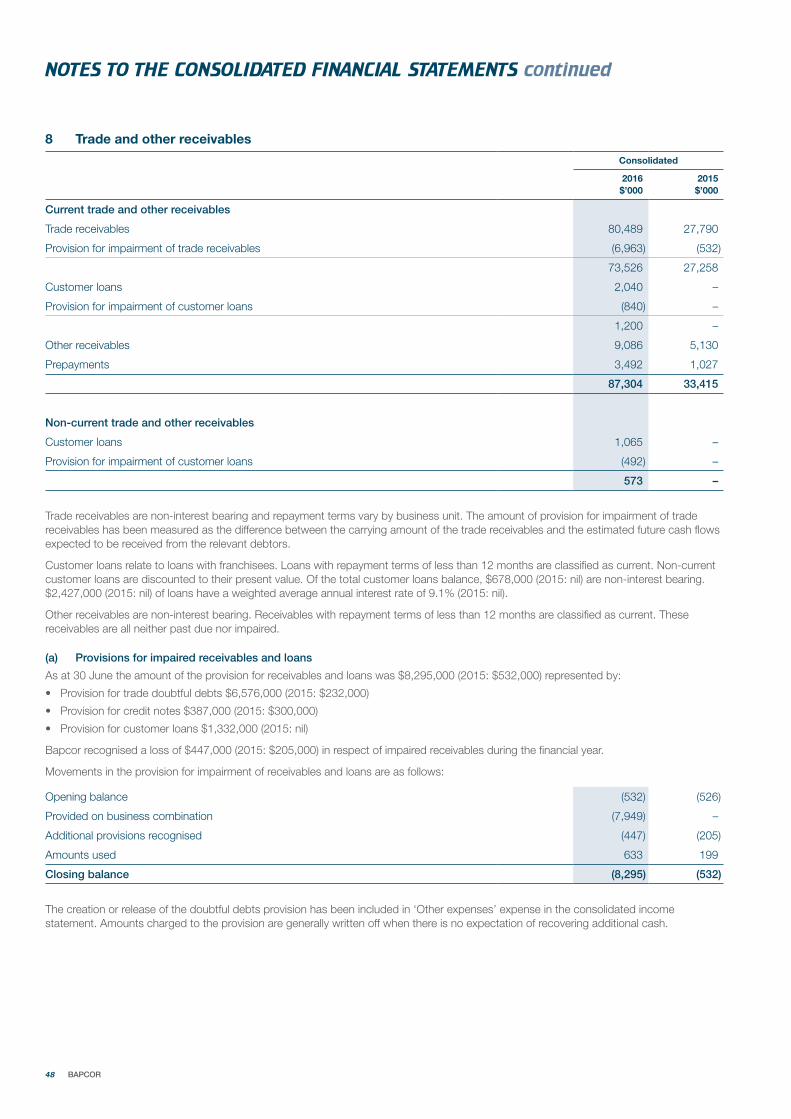
8 Trade and other receivables
Consolidated
2016$’000
2015$’000
Current trade and other receivables
Trade receivables 80,489 27,790
Provision for impairment of trade receivables (6,963) (532)
73,526 27,258
Customer loans 2,040 –
Provision for impairment of customer loans (840) –
1,200 –
Other receivables 9,086 5,130
Prepayments 3,492 1,027
87,304 33,415
Non-current trade and other receivables
Customer loans 1,065 –
Provision for impairment of customer loans (492) –
573 –
Trade receivables are non-interest bearing and repayment terms vary by business unit. The amount of provision for impairment of trade receivables has been measured as the difference between the carrying amount of the trade receivables and the estimated future cash flows expected to be received from the relevant debtors.
Customer loans relate to loans with franchisees. Loans with repayment terms of less than 12 months are classified as current. Non-current customer loans are discounted to their present value. Of the total customer loans balance, $678,000 (2015: nil) are non-interest bearing. $2,427,000 (2015: nil) of loans have a weighted average annual interest rate of 9.1% (2015: nil).
Other receivables are non-interest bearing. Receivables with repayment terms of less than 12 months are classified as current. These receivables are all neither past due nor impaired.
(a) Provisions for impaired receivables and loans
As at 30 June the amount of the provision for receivables and loans was $8,295,000 (2015: $532,000) represented by:
• Provision for trade doubtful debts $6,576,000 (2015: $232,000)
• Provision for credit notes $387,000 (2015: $300,000)
• Provision for customer loans $1,332,000 (2015: nil)
Bapcor recognised a loss of $447,000 (2015: $205,000) in respect of impaired receivables during the financial year.
Movements in the provision for impairment of receivables and loans are as follows:
Opening balance (532) (526)
Provided on business combination (7,949) –
Additional provisions recognised (447) (205)
Amounts used 633 199
Closing balance (8,295) (532)
The creation or release of the doubtful debts provision has been included in ‘Other expenses’ expense in the consolidated income statement. Amounts charged to the provision are generally written off when there is no expectation of recovering additional cash.
48 BAPCOR
NOTES TO THE CONSOLIDATED FINANCIAL STATEMENTS continued
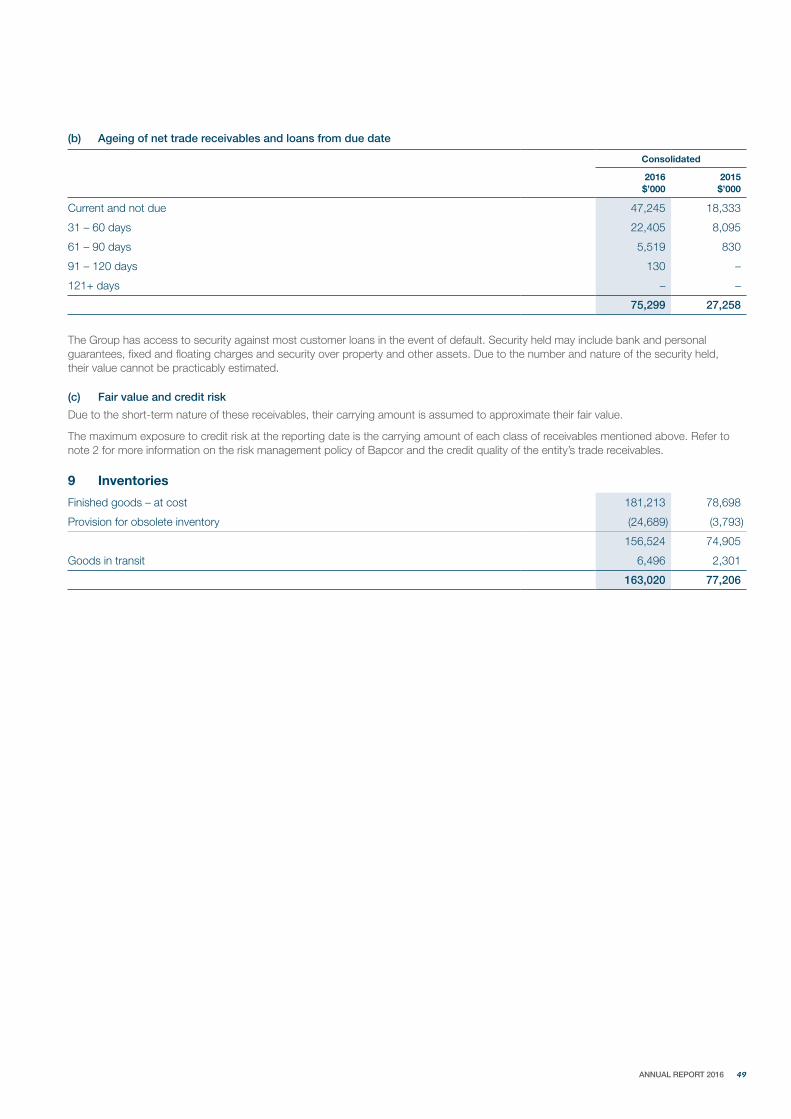
(b) Ageing of net trade receivables and loans from due date
Consolidated
2016$’000
2015$’000
Current and not due 47,245 18,333
31 – 60 days 22,405 8,095
61 – 90 days 5,519 830
91 – 120 days 130 –
121+ days – –
75,299 27,258
The Group has access to security against most customer loans in the event of default. Security held may include bank and personal guarantees, fixed and floating charges and security over property and other assets. Due to the number and nature of the security held, their value cannot be practicably estimated.
(c) Fair value and credit risk
Due to the short-term nature of these receivables, their carrying amount is assumed to approximate their fair value.
The maximum exposure to credit risk at the reporting date is the carrying amount of each class of receivables mentioned above. Refer to note 2 for more information on the risk management policy of Bapcor and the credit quality of the entity’s trade receivables.
9 Inventories
Finished goods – at cost 181,213 78,698
Provision for obsolete inventory (24,689) (3,793)
156,524 74,905
Goods in transit 6,496 2,301
163,020 77,206
49 ANNUAL REPORT 2016
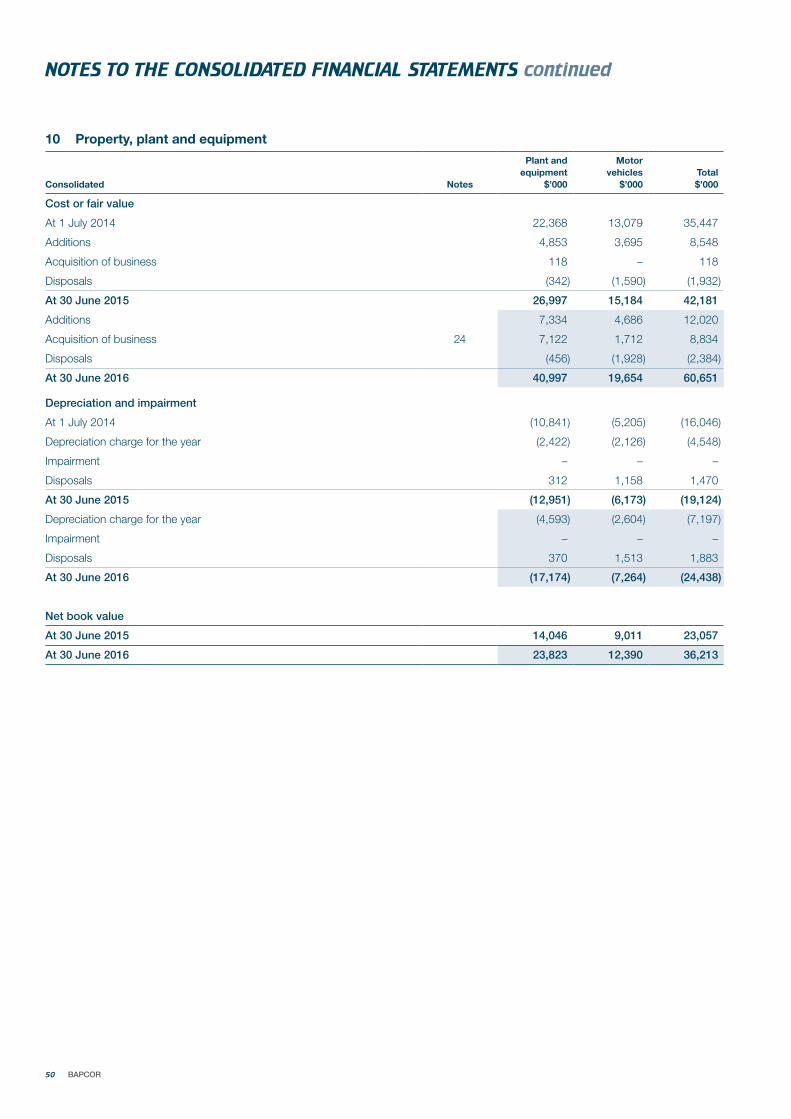
10 Property, plant and equipment
Consolidated Notes
Plant and equipment
$’000
Motor vehicles
$’000Total$’000
Cost or fair value
At 1 July 2014 22,368 13,079 35,447
Additions 4,853 3,695 8,548
Acquisition of business 118 – 118
Disposals (342) (1,590) (1,932)
At 30 June 2015 26,997 15,184 42,181
Additions 7,334 4,686 12,020
Acquisition of business 24 7,122 1,712 8,834
Disposals (456) (1,928) (2,384)
At 30 June 2016 40,997 19,654 60,651
Depreciation and impairment
At 1 July 2014 (10,841) (5,205) (16,046)
Depreciation charge for the year (2,422) (2,126) (4,548)
Impairment – – –
Disposals 312 1,158 1,470
At 30 June 2015 (12,951) (6,173) (19,124)
Depreciation charge for the year (4,593) (2,604) (7,197)
Impairment – – –
Disposals 370 1,513 1,883
At 30 June 2016 (17,174) (7,264) (24,438)
Net book value
At 30 June 2015 14,046 9,011 23,057
At 30 June 2016 23,823 12,390 36,213
50 BAPCOR
NOTES TO THE CONSOLIDATED FINANCIAL STATEMENTS continued
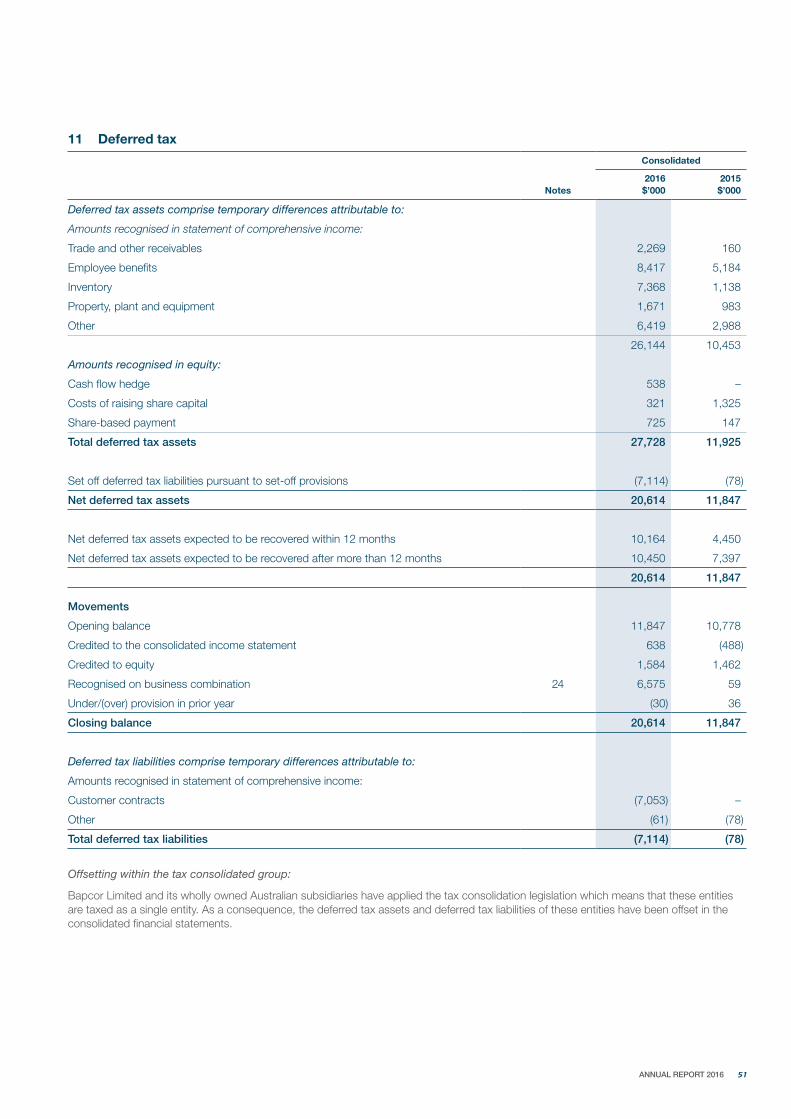
11 Deferred tax
Consolidated
Notes2016
$’0002015$’000
Deferred tax assets comprise temporary differences attributable to:
Amounts recognised in statement of comprehensive income:
Trade and other receivables 2,269 160
Employee benefits 8,417 5,184
Inventory 7,368 1,138
Property, plant and equipment 1,671 983
Other 6,419 2,988
26,144 10,453
Amounts recognised in equity:
Cash flow hedge 538 –
Costs of raising share capital 321 1,325
Share-based payment 725 147
Total deferred tax assets 27,728 11,925
Set off deferred tax liabilities pursuant to set-off provisions (7,114) (78)
Net deferred tax assets 20,614 11,847
Net deferred tax assets expected to be recovered within 12 months 10,164 4,450
Net deferred tax assets expected to be recovered after more than 12 months 10,450 7,397
20,614 11,847
Movements
Opening balance 11,847 10,778
Credited to the consolidated income statement 638 (488)
Credited to equity 1,584 1,462
Recognised on business combination 24 6,575 59
Under/(over) provision in prior year (30) 36
Closing balance 20,614 11,847
Deferred tax liabilities comprise temporary differences attributable to:
Amounts recognised in statement of comprehensive income:
Customer contracts (7,053) –
Other (61) (78)
Total deferred tax liabilities (7,114) (78)
Offsetting within the tax consolidated group:
Bapcor Limited and its wholly owned Australian subsidiaries have applied the tax consolidation legislation which means that these entities are taxed as a single entity. As a consequence, the deferred tax assets and deferred tax liabilities of these entities have been offset in the consolidated financial statements.
51 ANNUAL REPORT 2016
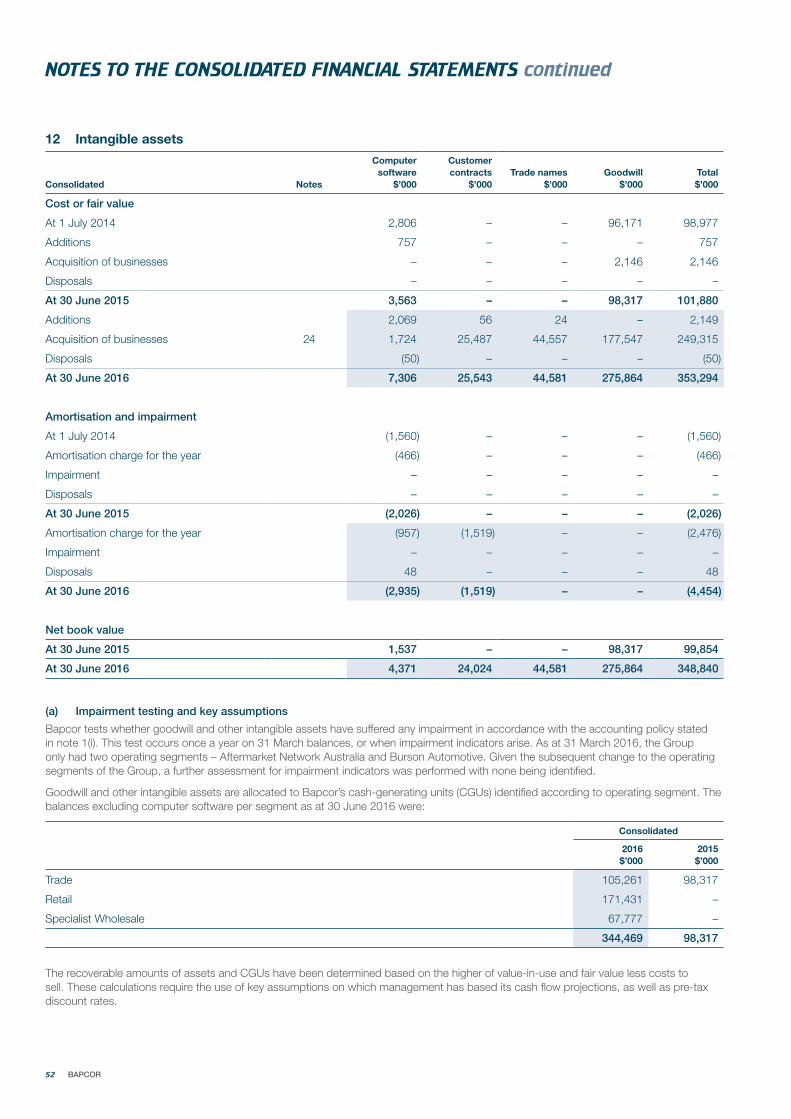
12 Intangible assets
Consolidated Notes
Computer software
$’000
Customer contracts
$’000Trade names
$’000Goodwill
$’000Total$’000
Cost or fair value
At 1 July 2014 2,806 – – 96,171 98,977
Additions 757 – – – 757
Acquisition of businesses – – – 2,146 2,146
Disposals – – – – –
At 30 June 2015 3,563 – – 98,317 101,880
Additions 2,069 56 24 – 2,149
Acquisition of businesses 24 1,724 25,487 44,557 177,547 249,315
Disposals (50) – – – (50)
At 30 June 2016 7,306 25,543 44,581 275,864 353,294
Amortisation and impairment
At 1 July 2014 (1,560) – – – (1,560)
Amortisation charge for the year (466) – – – (466)
Impairment – – – – –
Disposals – – – – –
At 30 June 2015 (2,026) – – – (2,026)
Amortisation charge for the year (957) (1,519) – – (2,476)
Impairment – – – – –
Disposals 48 – – – 48
At 30 June 2016 (2,935) (1,519) – – (4,454)
Net book value
At 30 June 2015 1,537 – – 98,317 99,854
At 30 June 2016 4,371 24,024 44,581 275,864 348,840
(a) Impairment testing and key assumptions
Bapcor tests whether goodwill and other intangible assets have suffered any impairment in accordance with the accounting policy stated in note 1(i). This test occurs once a year on 31 March balances, or when impairment indicators arise. As at 31 March 2016, the Group only had two operating segments – Aftermarket Network Australia and Burson Automotive. Given the subsequent change to the operating segments of the Group, a further assessment for impairment indicators was performed with none being identified.
Goodwill and other intangible assets are allocated to Bapcor’s cash-generating units (CGUs) identified according to operating segment. The balances excluding computer software per segment as at 30 June 2016 were:
Consolidated
2016$’000
2015$’000
Trade 105,261 98,317
Retail 171,431 –
Specialist Wholesale 67,777 –
344,469 98,317
The recoverable amounts of assets and CGUs have been determined based on the higher of value-in-use and fair value less costs to sell. These calculations require the use of key assumptions on which management has based its cash flow projections, as well as pre-tax discount rates.
52 BAPCOR
NOTES TO THE CONSOLIDATED FINANCIAL STATEMENTS continued
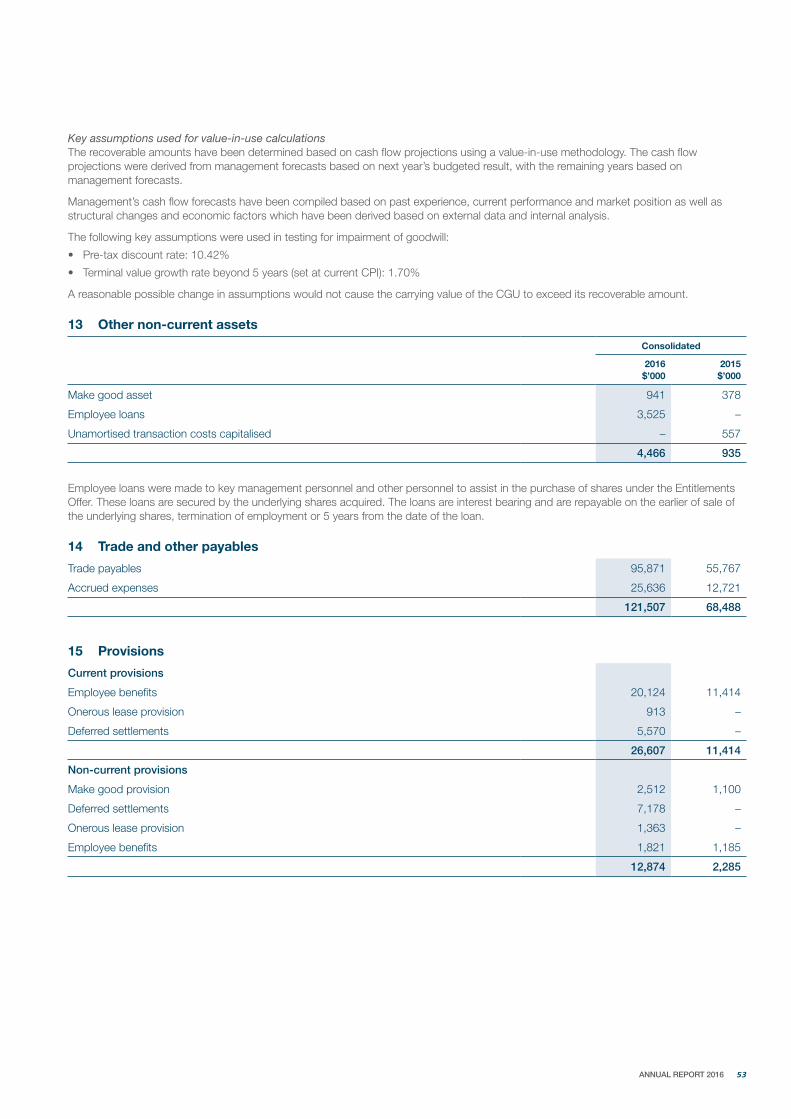
Key assumptions used for value-in-use calculationsThe recoverable amounts have been determined based on cash flow projections using a value-in-use methodology. The cash flow projections were derived from management forecasts based on next year’s budgeted result, with the remaining years based on management forecasts.
Management’s cash flow forecasts have been compiled based on past experience, current performance and market position as well as structural changes and economic factors which have been derived based on external data and internal analysis.
The following key assumptions were used in testing for impairment of goodwill:
• Pre-tax discount rate: 10.42%
• Terminal value growth rate beyond 5 years (set at current CPI): 1.70%
A reasonable possible change in assumptions would not cause the carrying value of the CGU to exceed its recoverable amount.
13 Other non-current assets
Consolidated
2016$’000
2015$’000
Make good asset 941 378
Employee loans 3,525 –
Unamortised transaction costs capitalised – 557
4,466 935
Employee loans were made to key management personnel and other personnel to assist in the purchase of shares under the Entitlements Offer. These loans are secured by the underlying shares acquired. The loans are interest bearing and are repayable on the earlier of sale of the underlying shares, termination of employment or 5 years from the date of the loan.
14 Trade and other payables
Trade payables 95,871 55,767
Accrued expenses 25,636 12,721
121,507 68,488
15 Provisions
Current provisions
Employee benefits 20,124 11,414
Onerous lease provision 913 –
Deferred settlements 5,570 –
26,607 11,414
Non-current provisions
Make good provision 2,512 1,100
Deferred settlements 7,178 –
Onerous lease provision 1,363 –
Employee benefits 1,821 1,185
12,874 2,285
53 ANNUAL REPORT 2016
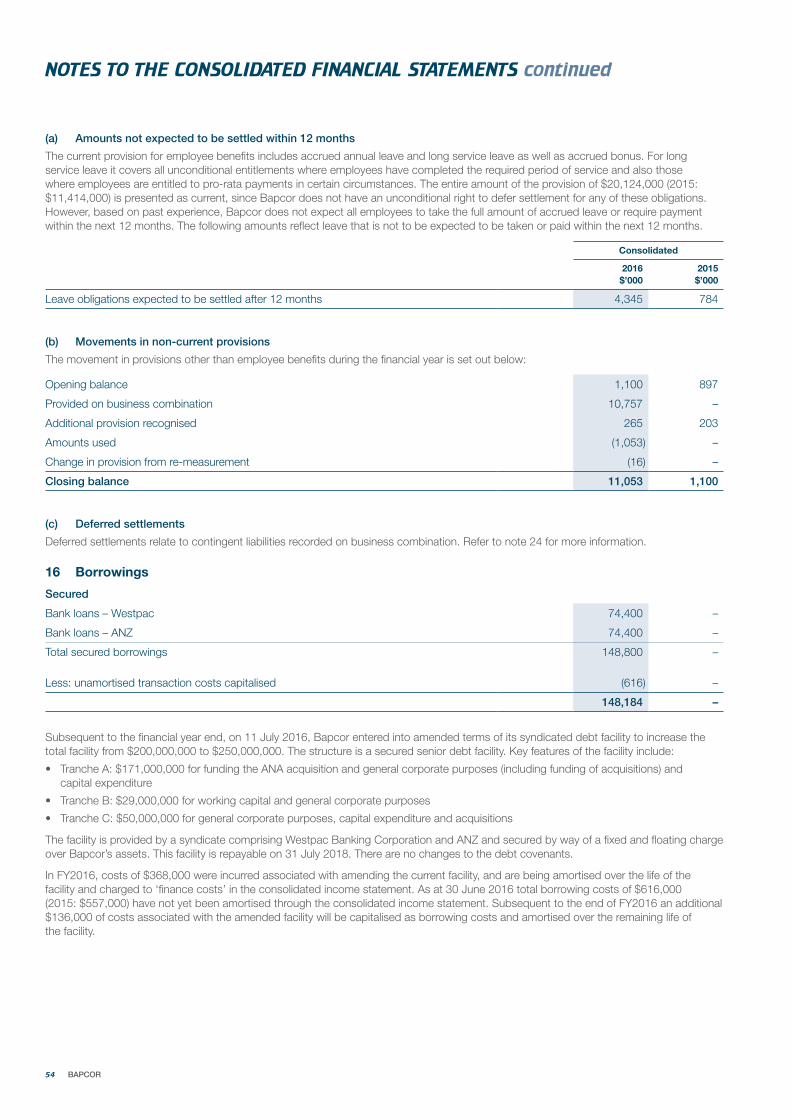
(a) Amounts not expected to be settled within 12 months
The current provision for employee benefits includes accrued annual leave and long service leave as well as accrued bonus. For long service leave it covers all unconditional entitlements where employees have completed the required period of service and also those where employees are entitled to pro-rata payments in certain circumstances. The entire amount of the provision of $20,124,000 (2015: $11,414,000) is presented as current, since Bapcor does not have an unconditional right to defer settlement for any of these obligations. However, based on past experience, Bapcor does not expect all employees to take the full amount of accrued leave or require payment within the next 12 months. The following amounts reflect leave that is not to be expected to be taken or paid within the next 12 months.
Consolidated
2016$’000
2015$’000
Leave obligations expected to be settled after 12 months 4,345 784
(b) Movements in non-current provisions
The movement in provisions other than employee benefits during the financial year is set out below:
Opening balance 1,100 897
Provided on business combination 10,757 –
Additional provision recognised 265 203
Amounts used (1,053) –
Change in provision from re-measurement (16) –
Closing balance 11,053 1,100
(c) Deferred settlements
Deferred settlements relate to contingent liabilities recorded on business combination. Refer to note 24 for more information.
16 Borrowings
Secured
Bank loans – Westpac 74,400 –
Bank loans – ANZ 74,400 –
Total secured borrowings 148,800 –
Less: unamortised transaction costs capitalised (616) –
148,184 –
Subsequent to the financial year end, on 11 July 2016, Bapcor entered into amended terms of its syndicated debt facility to increase the total facility from $200,000,000 to $250,000,000. The structure is a secured senior debt facility. Key features of the facility include:
• Tranche A: $171,000,000 for funding the ANA acquisition and general corporate purposes (including funding of acquisitions) and capital expenditure
• Tranche B: $29,000,000 for working capital and general corporate purposes
• Tranche C: $50,000,000 for general corporate purposes, capital expenditure and acquisitions
The facility is provided by a syndicate comprising Westpac Banking Corporation and ANZ and secured by way of a fixed and floating charge over Bapcor’s assets. This facility is repayable on 31 July 2018. There are no changes to the debt covenants.
In FY2016, costs of $368,000 were incurred associated with amending the current facility, and are being amortised over the life of the facility and charged to ‘finance costs’ in the consolidated income statement. As at 30 June 2016 total borrowing costs of $616,000 (2015: $557,000) have not yet been amortised through the consolidated income statement. Subsequent to the end of FY2016 an additional $136,000 of costs associated with the amended facility will be capitalised as borrowing costs and amortised over the remaining life of the facility.
54 BAPCOR
NOTES TO THE CONSOLIDATED FINANCIAL STATEMENTS continued
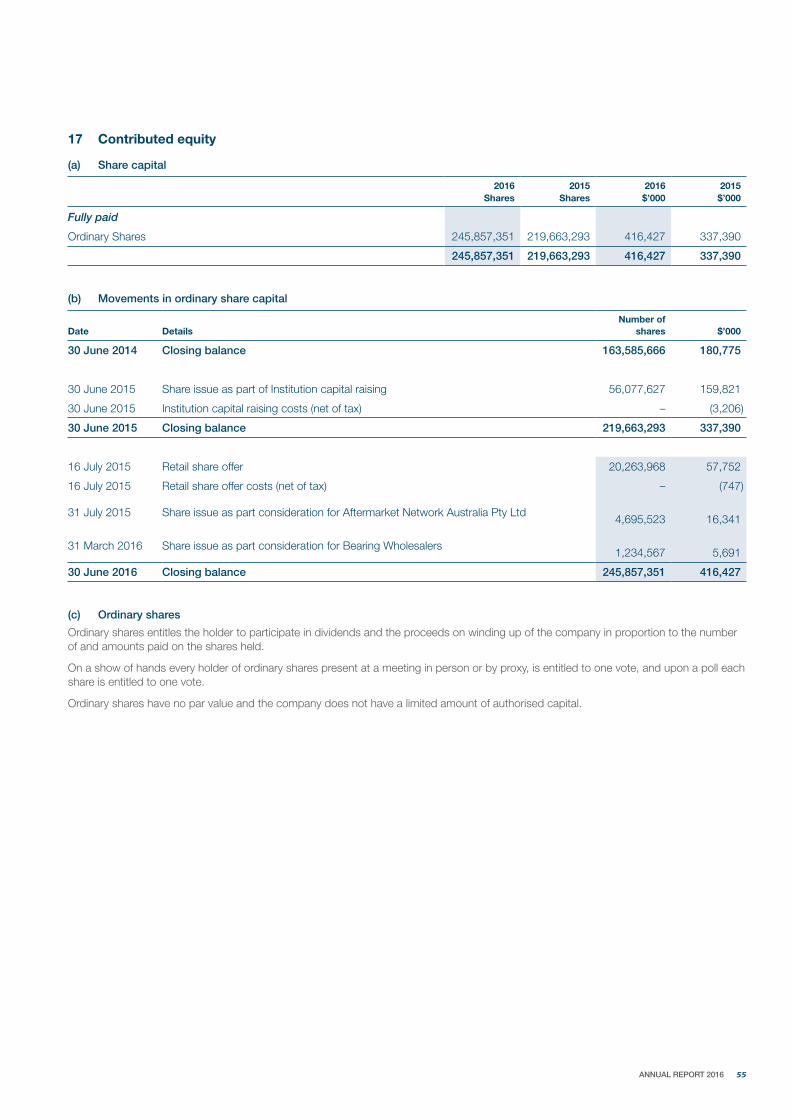
17 Contributed equity
(a) Share capital
2016 2015 2016 2015Shares Shares $’000 $’000
Fully paid
Ordinary Shares 245,857,351 219,663,293 416,427 337,390
245,857,351 219,663,293 416,427 337,390
(b) Movements in ordinary share capital
Date DetailsNumber of
shares $’000
30 June 2014 Closing balance 163,585,666 180,775
30 June 2015 Share issue as part of Institution capital raising 56,077,627 159,821
30 June 2015 Institution capital raising costs (net of tax) – (3,206)
30 June 2015 Closing balance 219,663,293 337,390
16 July 2015 Retail share offer 20,263,968 57,752
16 July 2015 Retail share offer costs (net of tax) – (747)
31 July 2015 Share issue as part consideration for Aftermarket Network Australia Pty Ltd4,695,523 16,341
31 March 2016 Share issue as part consideration for Bearing Wholesalers1,234,567 5,691
30 June 2016 Closing balance 245,857,351 416,427
(c) Ordinary shares
Ordinary shares entitles the holder to participate in dividends and the proceeds on winding up of the company in proportion to the number of and amounts paid on the shares held.
On a show of hands every holder of ordinary shares present at a meeting in person or by proxy, is entitled to one vote, and upon a poll each share is entitled to one vote.
Ordinary shares have no par value and the company does not have a limited amount of authorised capital.
55 ANNUAL REPORT 2016
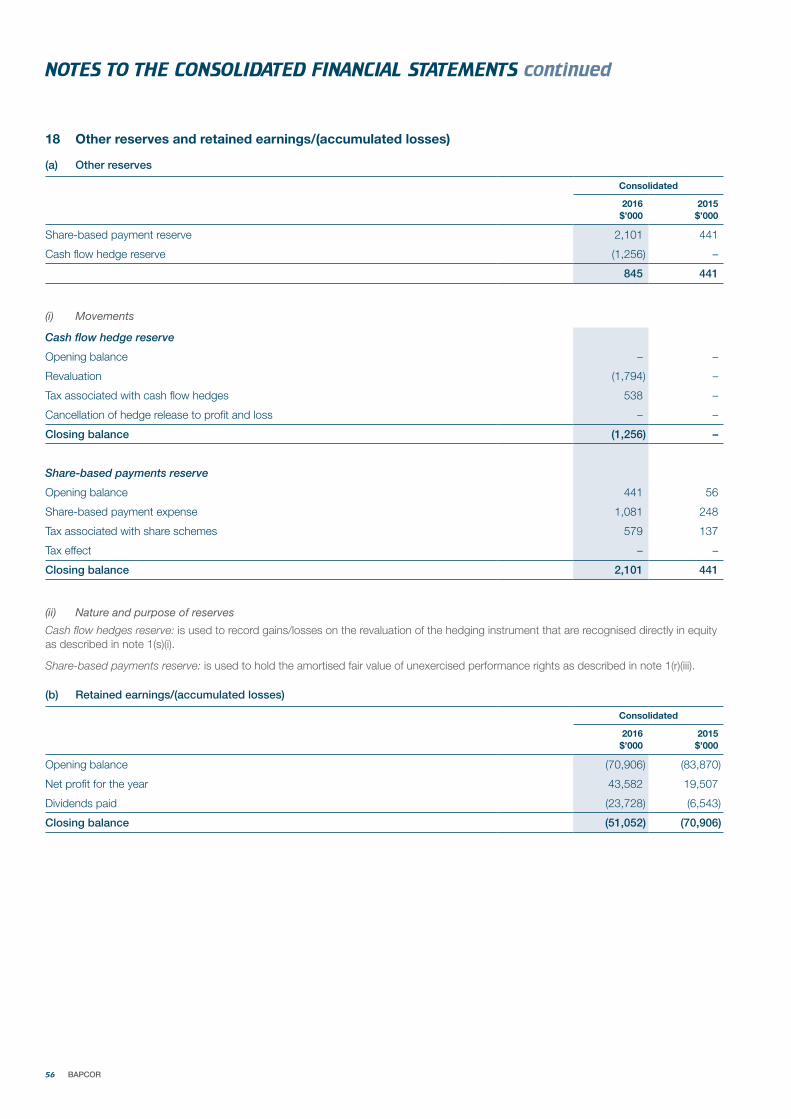
18 Other reserves and retained earnings/(accumulated losses)
(a) Other reserves
Consolidated
2016$’000
2015$’000
Share-based payment reserve 2,101 441
Cash flow hedge reserve (1,256) –
845 441
(i) Movements
Cash flow hedge reserve
Opening balance – –
Revaluation (1,794) –
Tax associated with cash flow hedges 538 –
Cancellation of hedge release to profit and loss – –
Closing balance (1,256) –
Share-based payments reserve
Opening balance 441 56
Share-based payment expense 1,081 248
Tax associated with share schemes 579 137
Tax effect – –
Closing balance 2,101 441
(ii) Nature and purpose of reserves
Cash flow hedges reserve: is used to record gains/losses on the revaluation of the hedging instrument that are recognised directly in equity as described in note 1(s)(i).
Share-based payments reserve: is used to hold the amortised fair value of unexercised performance rights as described in note 1(r)(iii).
(b) Retained earnings/(accumulated losses)
Consolidated
2016$’000
2015$’000
Opening balance (70,906) (83,870)
Net profit for the year 43,582 19,507
Dividends paid (23,728) (6,543)
Closing balance (51,052) (70,906)
56 BAPCOR
NOTES TO THE CONSOLIDATED FINANCIAL STATEMENTS continued
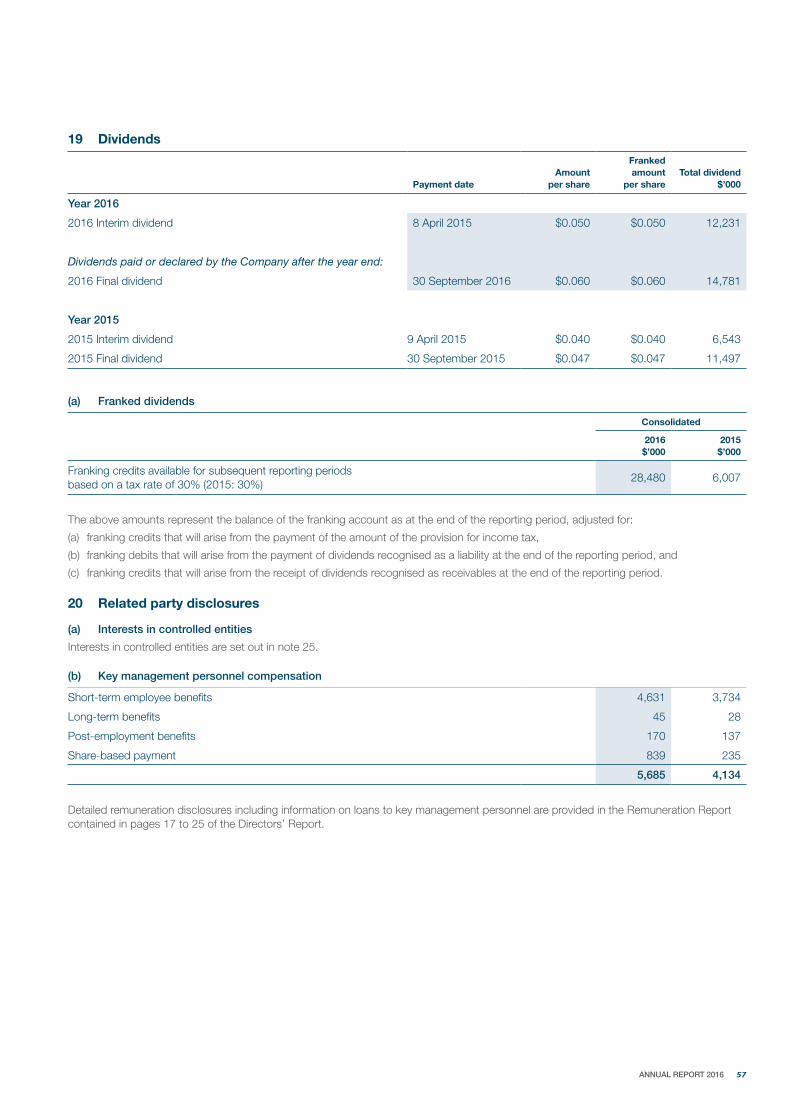
19 Dividends
Payment dateAmount
per share
Franked amount
per shareTotal dividend
$’000
Year 2016
2016 Interim dividend 8 April 2015 $0.050 $0.050 12,231
Dividends paid or declared by the Company after the year end:
2016 Final dividend 30 September 2016 $0.060 $0.060 14,781
Year 2015
2015 Interim dividend 9 April 2015 $0.040 $0.040 6,543
2015 Final dividend 30 September 2015 $0.047 $0.047 11,497
(a) Franked dividends
Consolidated
2016$’000
2015$’000
Franking credits available for subsequent reporting periodsbased on a tax rate of 30% (2015: 30%)
28,480 6,007
The above amounts represent the balance of the franking account as at the end of the reporting period, adjusted for:
(a) franking credits that will arise from the payment of the amount of the provision for income tax,
(b) franking debits that will arise from the payment of dividends recognised as a liability at the end of the reporting period, and
(c) franking credits that will arise from the receipt of dividends recognised as receivables at the end of the reporting period.
20 Related party disclosures
(a) Interests in controlled entities
Interests in controlled entities are set out in note 25.
(b) Key management personnel compensation
Short-term employee benefits 4,631 3,734
Long-term benefits 45 28
Post-employment benefits 170 137
Share-based payment 839 235
5,685 4,134
Detailed remuneration disclosures including information on loans to key management personnel are provided in the Remuneration Report contained in pages 17 to 25 of the Directors’ Report.
57 ANNUAL REPORT 2016
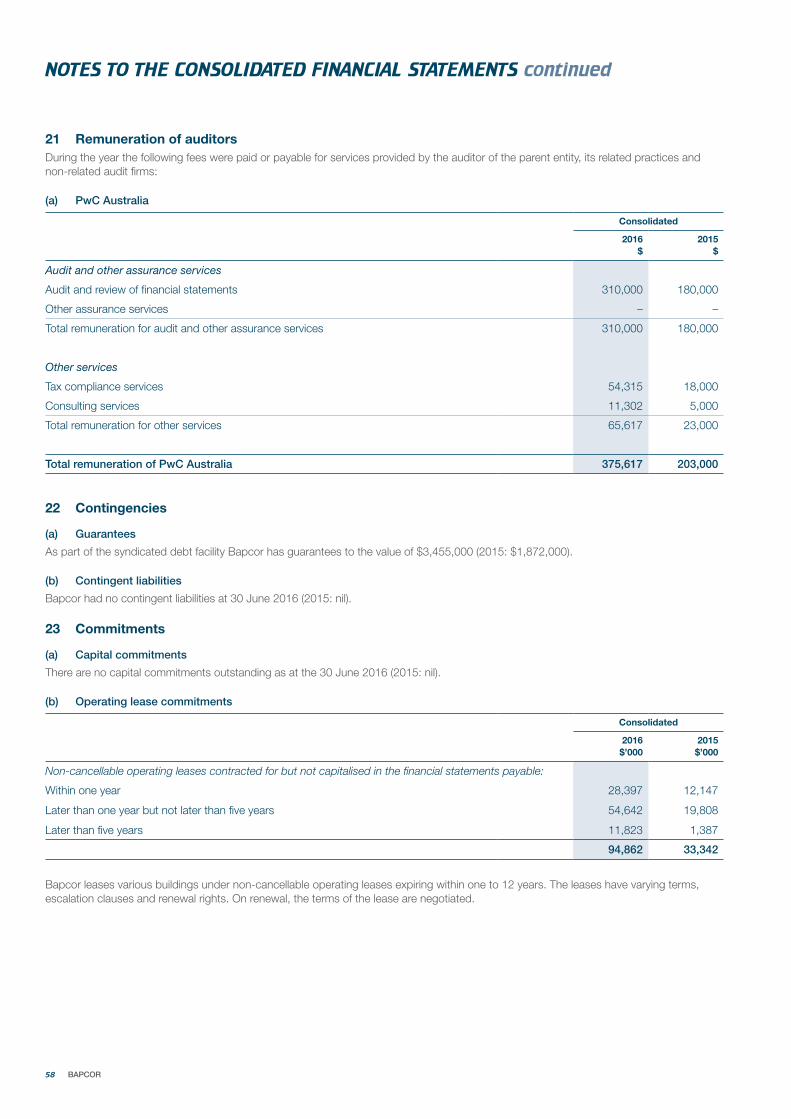
21 Remuneration of auditorsDuring the year the following fees were paid or payable for services provided by the auditor of the parent entity, its related practices and non-related audit firms:
(a) PwC Australia
Consolidated
2016$
2015$
Audit and other assurance services
Audit and review of financial statements 310,000 180,000
Other assurance services – –
Total remuneration for audit and other assurance services 310,000 180,000
Other services
Tax compliance services 54,315 18,000
Consulting services 11,302 5,000
Total remuneration for other services 65,617 23,000
Total remuneration of PwC Australia 375,617 203,000
22 Contingencies
(a) Guarantees
As part of the syndicated debt facility Bapcor has guarantees to the value of $3,455,000 (2015: $1,872,000).
(b) Contingent liabilities
Bapcor had no contingent liabilities at 30 June 2016 (2015: nil).
23 Commitments
(a) Capital commitments
There are no capital commitments outstanding as at the 30 June 2016 (2015: nil).
(b) Operating lease commitments
Consolidated
2016$’000
2015$’000
Non-cancellable operating leases contracted for but not capitalised in the financial statements payable:
Within one year 28,397 12,147
Later than one year but not later than five years 54,642 19,808
Later than five years 11,823 1,387
94,862 33,342
Bapcor leases various buildings under non-cancellable operating leases expiring within one to 12 years. The leases have varying terms, escalation clauses and renewal rights. On renewal, the terms of the lease are negotiated.
58 BAPCOR
NOTES TO THE CONSOLIDATED FINANCIAL STATEMENTS continued
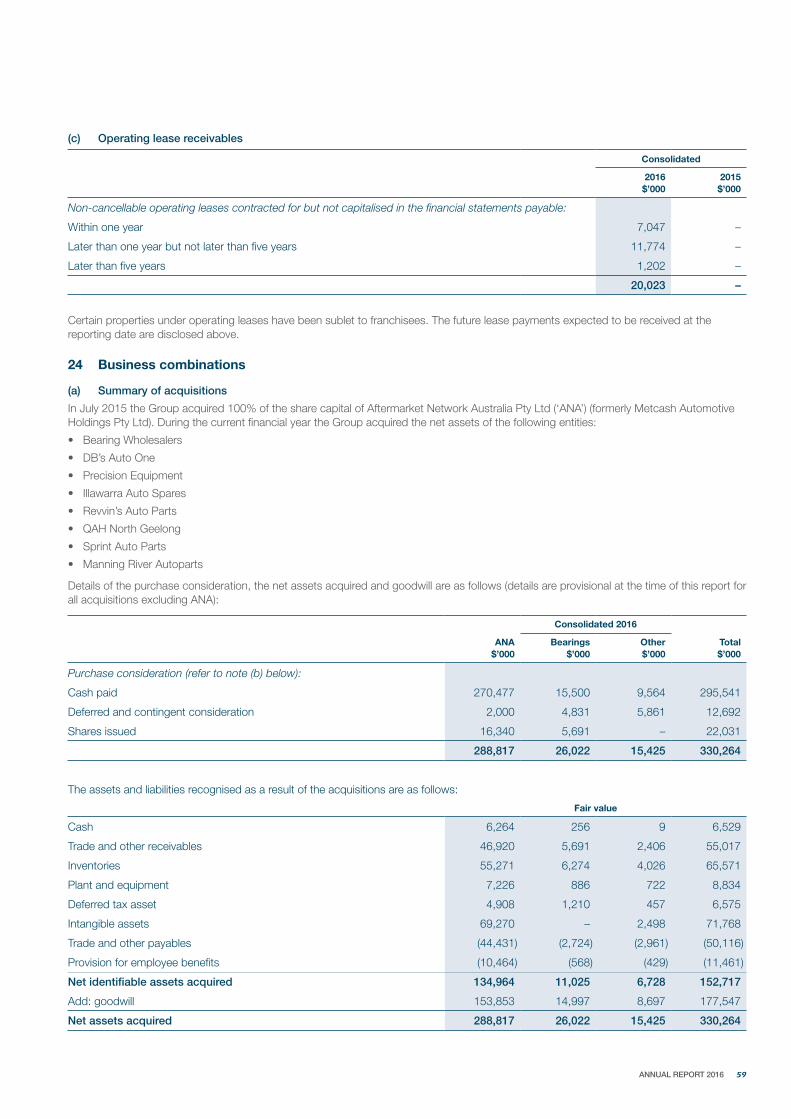
(c) Operating lease receivables
Consolidated
2016$’000
2015$’000
Non-cancellable operating leases contracted for but not capitalised in the financial statements payable:
Within one year 7,047 –
Later than one year but not later than five years 11,774 –
Later than five years 1,202 –
20,023 –
Certain properties under operating leases have been sublet to franchisees. The future lease payments expected to be received at the reporting date are disclosed above.
24 Business combinations
(a) Summary of acquisitions
In July 2015 the Group acquired 100% of the share capital of Aftermarket Network Australia Pty Ltd (‘ANA’) (formerly Metcash Automotive Holdings Pty Ltd). During the current financial year the Group acquired the net assets of the following entities:
• Bearing Wholesalers
• DB’s Auto One
• Precision Equipment
• Illawarra Auto Spares
• Revvin’s Auto Parts
• QAH North Geelong
• Sprint Auto Parts
• Manning River Autoparts
Details of the purchase consideration, the net assets acquired and goodwill are as follows (details are provisional at the time of this report for all acquisitions excluding ANA):
Consolidated 2016
ANA$’000
Bearings$’000
Other$’000
Total$’000
Purchase consideration (refer to note (b) below):
Cash paid 270,477 15,500 9,564 295,541
Deferred and contingent consideration 2,000 4,831 5,861 12,692
Shares issued 16,340 5,691 – 22,031
288,817 26,022 15,425 330,264
The assets and liabilities recognised as a result of the acquisitions are as follows:
Fair value
Cash 6,264 256 9 6,529
Trade and other receivables 46,920 5,691 2,406 55,017
Inventories 55,271 6,274 4,026 65,571
Plant and equipment 7,226 886 722 8,834
Deferred tax asset 4,908 1,210 457 6,575
Intangible assets 69,270 – 2,498 71,768
Trade and other payables (44,431) (2,724) (2,961) (50,116)
Provision for employee benefits (10,464) (568) (429) (11,461)
Net identifiable assets acquired 134,964 11,025 6,728 152,717
Add: goodwill 153,853 14,997 8,697 177,547
Net assets acquired 288,817 26,022 15,425 330,264
59 ANNUAL REPORT 2016
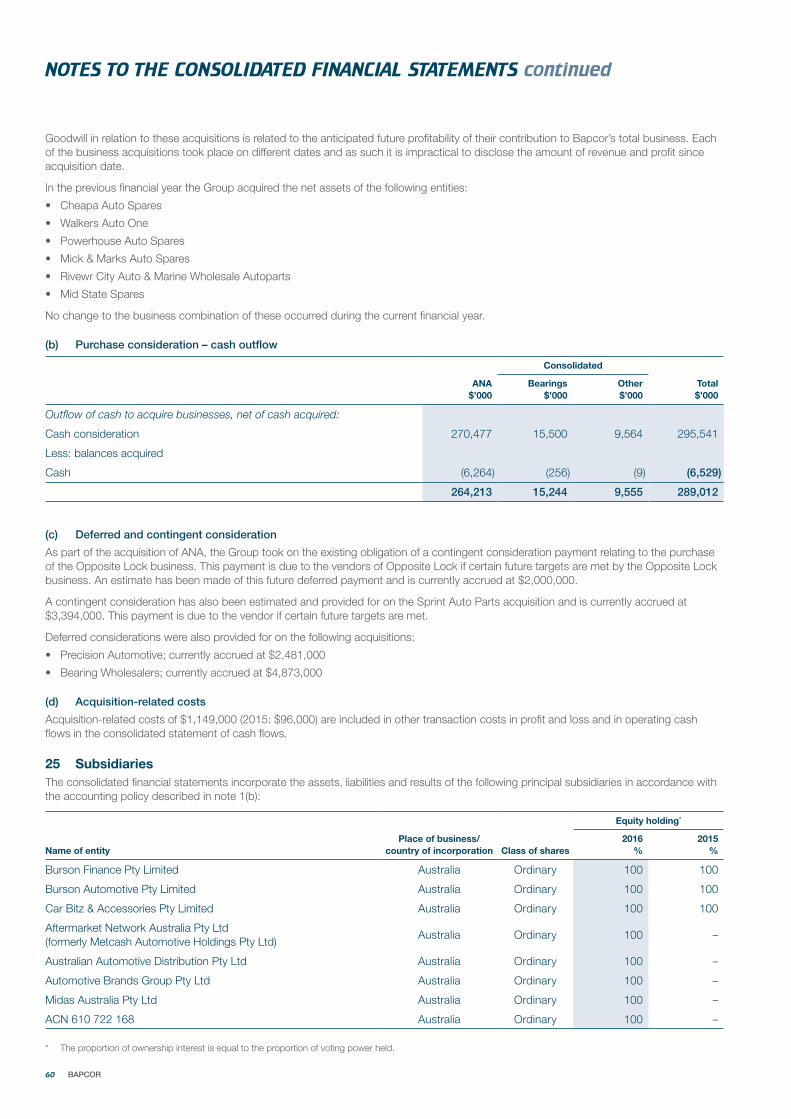
Goodwill in relation to these acquisitions is related to the anticipated future profitability of their contribution to Bapcor’s total business. Each of the business acquisitions took place on different dates and as such it is impractical to disclose the amount of revenue and profit since acquisition date.
In the previous financial year the Group acquired the net assets of the following entities:
• Cheapa Auto Spares
• Walkers Auto One
• Powerhouse Auto Spares
• Mick & Marks Auto Spares
• Rivewr City Auto & Marine Wholesale Autoparts
• Mid State Spares
No change to the business combination of these occurred during the current financial year.
(b) Purchase consideration – cash outflow
Consolidated
ANA$’000
Bearings$’000
Other$’000
Total$’000
Outflow of cash to acquire businesses, net of cash acquired:
Cash consideration 270,477 15,500 9,564 295,541
Less: balances acquired
Cash (6,264) (256) (9) (6,529)
264,213 15,244 9,555 289,012
(c) Deferred and contingent consideration
As part of the acquisition of ANA, the Group took on the existing obligation of a contingent consideration payment relating to the purchase of the Opposite Lock business. This payment is due to the vendors of Opposite Lock if certain future targets are met by the Opposite Lock business. An estimate has been made of this future deferred payment and is currently accrued at $2,000,000.
A contingent consideration has also been estimated and provided for on the Sprint Auto Parts acquisition and is currently accrued at $3,394,000. This payment is due to the vendor if certain future targets are met.
Deferred considerations were also provided for on the following acquisitions:
• Precision Automotive; currently accrued at $2,481,000
• Bearing Wholesalers; currently accrued at $4,873,000
(d) Acquisition-related costs
Acquisition-related costs of $1,149,000 (2015: $96,000) are included in other transaction costs in profit and loss and in operating cash flows in the consolidated statement of cash flows.
25 SubsidiariesThe consolidated financial statements incorporate the assets, liabilities and results of the following principal subsidiaries in accordance with the accounting policy described in note 1(b):
Equity holding*
Name of entityPlace of business/
country of incorporation Class of shares2016
%2015
%
Burson Finance Pty Limited Australia Ordinary 100 100
Burson Automotive Pty Limited Australia Ordinary 100 100
Car Bitz & Accessories Pty Limited Australia Ordinary 100 100
Aftermarket Network Australia Pty Ltd (formerly Metcash Automotive Holdings Pty Ltd)
Australia Ordinary 100 –
Australian Automotive Distribution Pty Ltd Australia Ordinary 100 –
Automotive Brands Group Pty Ltd Australia Ordinary 100 –
Midas Australia Pty Ltd Australia Ordinary 100 –
ACN 610 722 168 Australia Ordinary 100 –
* The proportion of ownership interest is equal to the proportion of voting power held.
60 BAPCOR
NOTES TO THE CONSOLIDATED FINANCIAL STATEMENTS continued
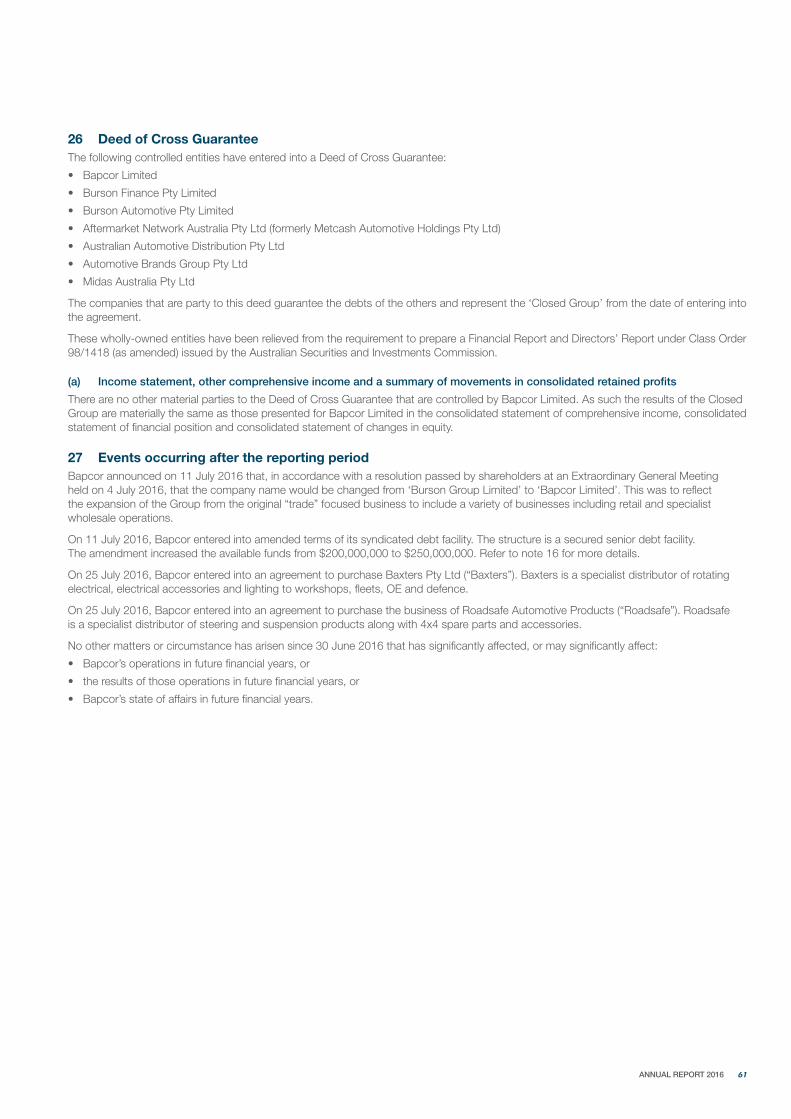
26 Deed of Cross GuaranteeThe following controlled entities have entered into a Deed of Cross Guarantee:
• Bapcor Limited
• Burson Finance Pty Limited
• Burson Automotive Pty Limited
• Aftermarket Network Australia Pty Ltd (formerly Metcash Automotive Holdings Pty Ltd)
• Australian Automotive Distribution Pty Ltd
• Automotive Brands Group Pty Ltd
• Midas Australia Pty Ltd
The companies that are party to this deed guarantee the debts of the others and represent the ‘Closed Group’ from the date of entering into the agreement.
These wholly-owned entities have been relieved from the requirement to prepare a Financial Report and Directors’ Report under Class Order 98/1418 (as amended) issued by the Australian Securities and Investments Commission.
(a) Income statement, other comprehensive income and a summary of movements in consolidated retained profits
There are no other material parties to the Deed of Cross Guarantee that are controlled by Bapcor Limited. As such the results of the Closed Group are materially the same as those presented for Bapcor Limited in the consolidated statement of comprehensive income, consolidated statement of financial position and consolidated statement of changes in equity.
27 Events occurring after the reporting periodBapcor announced on 11 July 2016 that, in accordance with a resolution passed by shareholders at an Extraordinary General Meeting held on 4 July 2016, that the company name would be changed from ‘Burson Group Limited’ to ‘Bapcor Limited’. This was to reflect the expansion of the Group from the original “trade” focused business to include a variety of businesses including retail and specialist wholesale operations.
On 11 July 2016, Bapcor entered into amended terms of its syndicated debt facility. The structure is a secured senior debt facility. The amendment increased the available funds from $200,000,000 to $250,000,000. Refer to note 16 for more details.
On 25 July 2016, Bapcor entered into an agreement to purchase Baxters Pty Ltd (“Baxters”). Baxters is a specialist distributor of rotating electrical, electrical accessories and lighting to workshops, fleets, OE and defence.
On 25 July 2016, Bapcor entered into an agreement to purchase the business of Roadsafe Automotive Products (“Roadsafe”). Roadsafe is a specialist distributor of steering and suspension products along with 4x4 spare parts and accessories.
No other matters or circumstance has arisen since 30 June 2016 that has significantly affected, or may significantly affect:
• Bapcor’s operations in future financial years, or
• the results of those operations in future financial years, or
• Bapcor’s state of affairs in future financial years.
61 ANNUAL REPORT 2016

28 Reconciliation of profit after income tax to net cash inflow from operating activities
Consolidated
2016$’000
2015$’000
Profit for the year 43,582 19,507
Depreciation and amortisation 9,673 5,014
Accelerated amortisation of capitalised borrowing costs 459 377
Amortisation of share-based payment 1,081 248
Net loss on sale of non-current assets (32) 51
Other non-cash movement – –
Change in operating assets and liabilities:
(Increase)/decrease in trade receivables 631 (982)
Increase in inventories (20,382) (6,505)
(Increase)/decrease in deferred tax assets (122) 501
Decrease in other operating assets 13,981 –
Increase/(decrease) in trade and other payables (11,230) 10,219
Increase in provision for income taxes payable 1,676 5,034
Increase in other operating liabilities 662 1,046
Decrease in deferred tax liabilities (987) –
Increase/(decrease) in other provisions 271 (86)
Net cash inflow from operating activities 39,263 34,424
29 Earnings per share (EPS)All shares are fully paid and have been included in both the Basic EPS and the Diluted EPS. FY2015 EPS has been retrospectively adjusted to take into consideration the impact of the rights issue performed in 2016 and the impact on the number of shares as per AASB 133 Earnings Per Share.
2016 cents
per share
2015 cents
per share
Basic EPS 17.85 11.52
Diluted EPS 17.78 11.48
(a) Weighted average number of shares used as the denominator
2016Number
2015Number
Weighted average number of shares used as the denominator in calculating basic EPS 244,185,356 169,316,153
Weighted average number of options 935,184 647,537
Weighted average number of shares used as the denominator in calculating diluted EPS 245,120,540 169,963,690
(b) Reconciliation of earnings used in calculating EPS
2016 $’000
2015 $’000
Earnings used in calculating basic EPS 43,582 19,507
Earnings used in calculating diluted EPS 43,582 19,507
62 BAPCOR
NOTES TO THE CONSOLIDATED FINANCIAL STATEMENTS continued
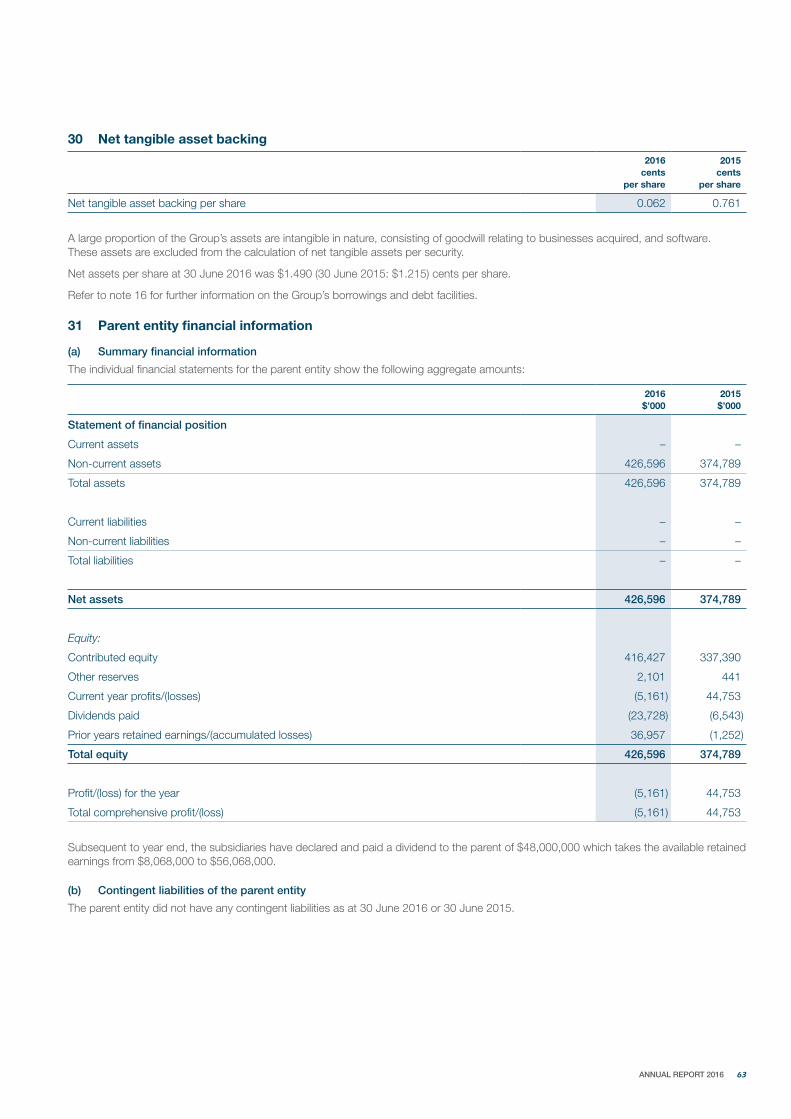
30 Net tangible asset backing
2016 cents
per share
2015 cents
per share
Net tangible asset backing per share 0.062 0.761
A large proportion of the Group’s assets are intangible in nature, consisting of goodwill relating to businesses acquired, and software. These assets are excluded from the calculation of net tangible assets per security.
Net assets per share at 30 June 2016 was $1.490 (30 June 2015: $1.215) cents per share.
Refer to note 16 for further information on the Group’s borrowings and debt facilities.
31 Parent entity financial information
(a) Summary financial information
The individual financial statements for the parent entity show the following aggregate amounts:
2016$’000
2015$’000
Statement of financial position
Current assets – –
Non-current assets 426,596 374,789
Total assets 426,596 374,789
Current liabilities – –
Non-current liabilities – –
Total liabilities – –
Net assets 426,596 374,789
Equity:
Contributed equity 416,427 337,390
Other reserves 2,101 441
Current year profits/(losses) (5,161) 44,753
Dividends paid (23,728) (6,543)
Prior years retained earnings/(accumulated losses) 36,957 (1,252)
Total equity 426,596 374,789
Profit/(loss) for the year (5,161) 44,753
Total comprehensive profit/(loss) (5,161) 44,753
Subsequent to year end, the subsidiaries have declared and paid a dividend to the parent of $48,000,000 which takes the available retained earnings from $8,068,000 to $56,068,000.
(b) Contingent liabilities of the parent entity
The parent entity did not have any contingent liabilities as at 30 June 2016 or 30 June 2015.
63 ANNUAL REPORT 2016
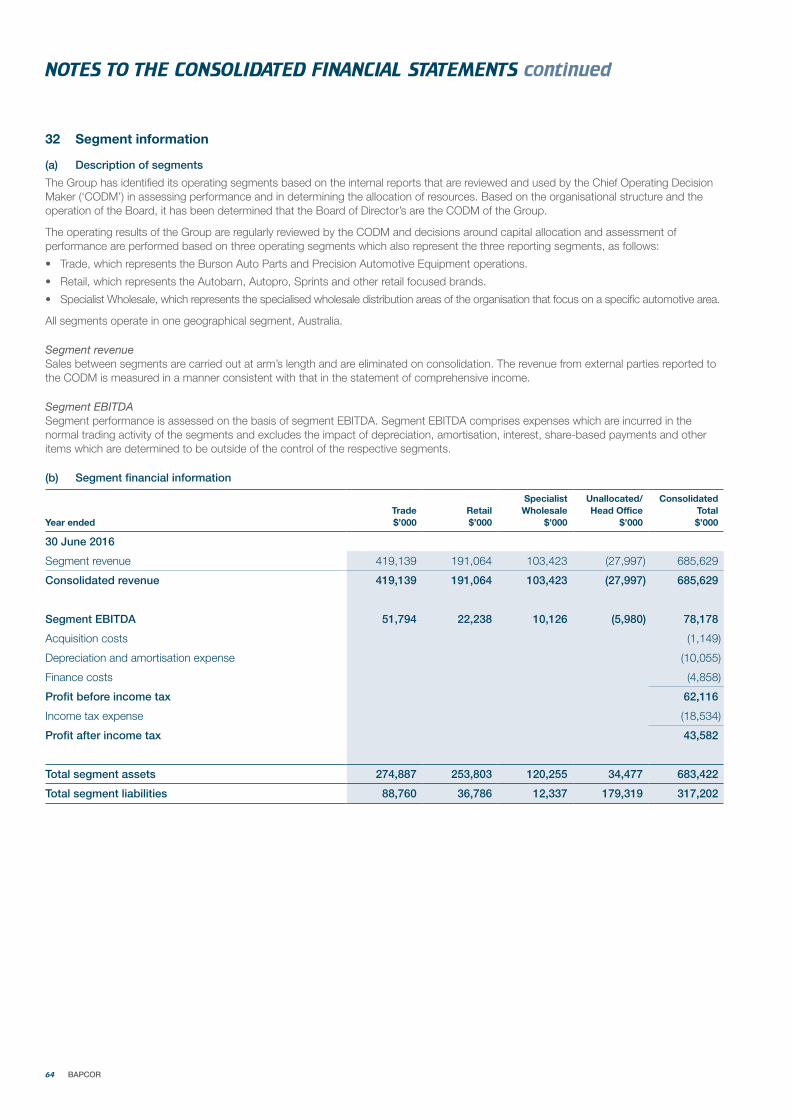
32 Segment information
(a) Description of segments
The Group has identified its operating segments based on the internal reports that are reviewed and used by the Chief Operating Decision Maker (‘CODM’) in assessing performance and in determining the allocation of resources. Based on the organisational structure and the operation of the Board, it has been determined that the Board of Director’s are the CODM of the Group.
The operating results of the Group are regularly reviewed by the CODM and decisions around capital allocation and assessment of performance are performed based on three operating segments which also represent the three reporting segments, as follows:
• Trade, which represents the Burson Auto Parts and Precision Automotive Equipment operations.
• Retail, which represents the Autobarn, Autopro, Sprints and other retail focused brands.
• Specialist Wholesale, which represents the specialised wholesale distribution areas of the organisation that focus on a specific automotive area.
All segments operate in one geographical segment, Australia.
Segment revenueSales between segments are carried out at arm’s length and are eliminated on consolidation. The revenue from external parties reported to the CODM is measured in a manner consistent with that in the statement of comprehensive income.
Segment EBITDASegment performance is assessed on the basis of segment EBITDA. Segment EBITDA comprises expenses which are incurred in the normal trading activity of the segments and excludes the impact of depreciation, amortisation, interest, share-based payments and other items which are determined to be outside of the control of the respective segments.
(b) Segment financial information
Year endedTrade$’000
Retail$’000
Specialist Wholesale
$’000
Unallocated/Head Office
$’000
Consolidated Total $’000
30 June 2016
Segment revenue 419,139 191,064 103,423 (27,997) 685,629
Consolidated revenue 419,139 191,064 103,423 (27,997) 685,629
Segment EBITDA 51,794 22,238 10,126 (5,980) 78,178
Acquisition costs (1,149)
Depreciation and amortisation expense (10,055)
Finance costs (4,858)
Profit before income tax 62,116
Income tax expense (18,534)
Profit after income tax 43,582
Total segment assets 274,887 253,803 120,255 34,477 683,422
Total segment liabilities 88,760 36,786 12,337 179,319 317,202
64 BAPCOR
NOTES TO THE CONSOLIDATED FINANCIAL STATEMENTS continued
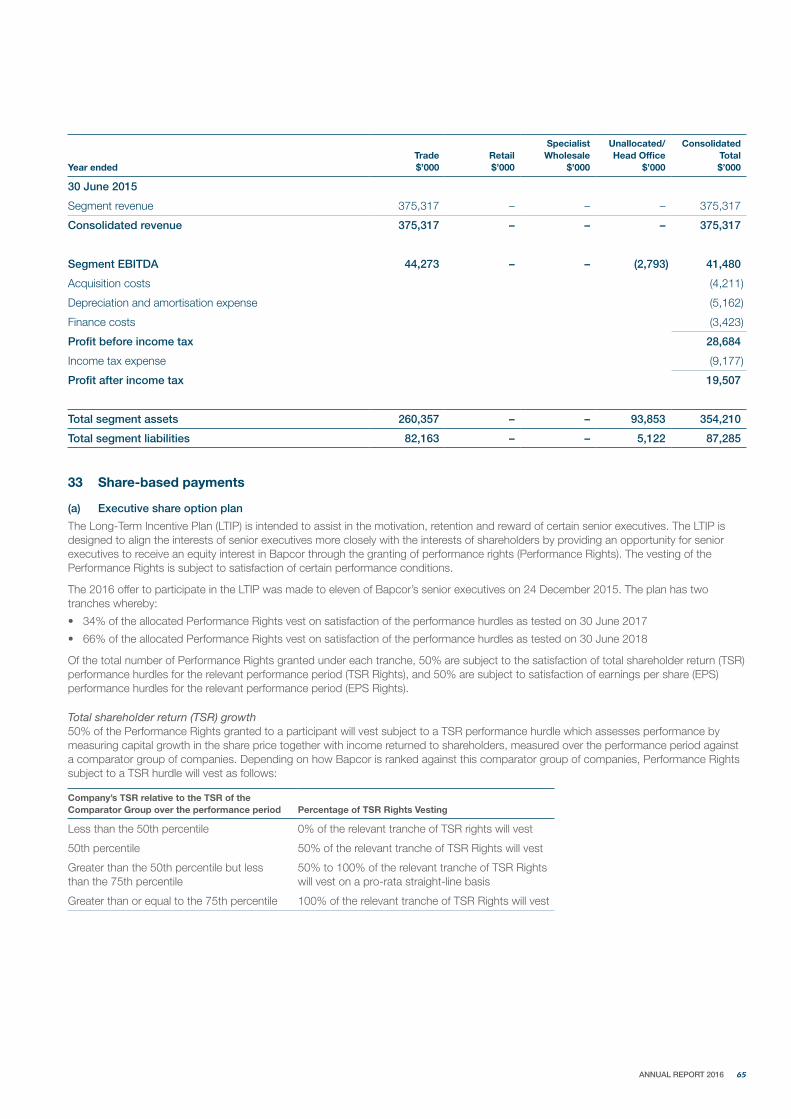
Year endedTrade$’000
Retail$’000
Specialist Wholesale
$’000
Unallocated/Head Office
$’000
Consolidated Total $’000
30 June 2015
Segment revenue 375,317 – – – 375,317
Consolidated revenue 375,317 – – – 375,317
Segment EBITDA 44,273 – – (2,793) 41,480
Acquisition costs (4,211)
Depreciation and amortisation expense (5,162)
Finance costs (3,423)
Profit before income tax 28,684
Income tax expense (9,177)
Profit after income tax 19,507
Total segment assets 260,357 – – 93,853 354,210
Total segment liabilities 82,163 – – 5,122 87,285
33 Share-based payments
(a) Executive share option plan
The Long-Term Incentive Plan (LTIP) is intended to assist in the motivation, retention and reward of certain senior executives. The LTIP is designed to align the interests of senior executives more closely with the interests of shareholders by providing an opportunity for senior executives to receive an equity interest in Bapcor through the granting of performance rights (Performance Rights). The vesting of the Performance Rights is subject to satisfaction of certain performance conditions.
The 2016 offer to participate in the LTIP was made to eleven of Bapcor’s senior executives on 24 December 2015. The plan has two tranches whereby:
• 34% of the allocated Performance Rights vest on satisfaction of the performance hurdles as tested on 30 June 2017
• 66% of the allocated Performance Rights vest on satisfaction of the performance hurdles as tested on 30 June 2018
Of the total number of Performance Rights granted under each tranche, 50% are subject to the satisfaction of total shareholder return (TSR) performance hurdles for the relevant performance period (TSR Rights), and 50% are subject to satisfaction of earnings per share (EPS) performance hurdles for the relevant performance period (EPS Rights).
Total shareholder return (TSR) growth50% of the Performance Rights granted to a participant will vest subject to a TSR performance hurdle which assesses performance by measuring capital growth in the share price together with income returned to shareholders, measured over the performance period against a comparator group of companies. Depending on how Bapcor is ranked against this comparator group of companies, Performance Rights subject to a TSR hurdle will vest as follows:
Company’s TSR relative to the TSR of the Comparator Group over the performance period Percentage of TSR Rights Vesting
Less than the 50th percentile 0% of the relevant tranche of TSR rights will vest
50th percentile 50% of the relevant tranche of TSR Rights will vest
Greater than the 50th percentile but less than the 75th percentile
50% to 100% of the relevant tranche of TSR Rights will vest on a pro-rata straight-line basis
Greater than or equal to the 75th percentile 100% of the relevant tranche of TSR Rights will vest
65 ANNUAL REPORT 2016
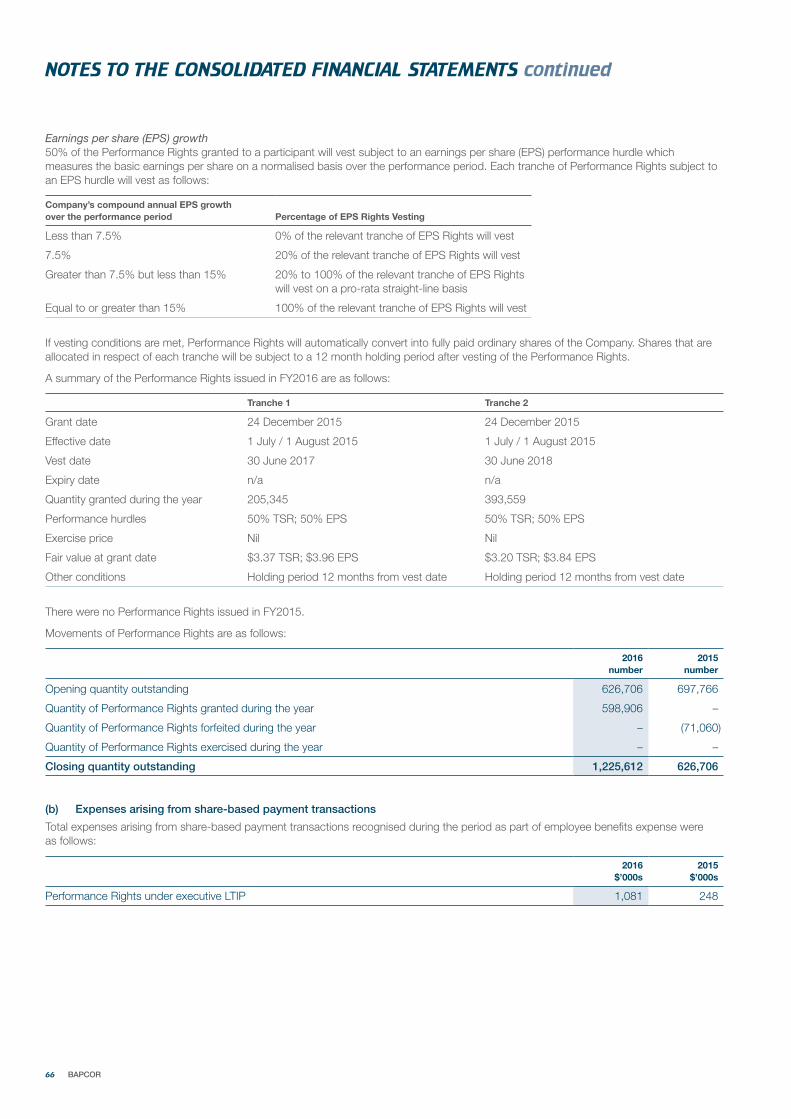
Earnings per share (EPS) growth50% of the Performance Rights granted to a participant will vest subject to an earnings per share (EPS) performance hurdle which measures the basic earnings per share on a normalised basis over the performance period. Each tranche of Performance Rights subject to an EPS hurdle will vest as follows:
Company’s compound annual EPS growth over the performance period Percentage of EPS Rights Vesting
Less than 7.5% 0% of the relevant tranche of EPS Rights will vest
7.5% 20% of the relevant tranche of EPS Rights will vest
Greater than 7.5% but less than 15% 20% to 100% of the relevant tranche of EPS Rights will vest on a pro-rata straight-line basis
Equal to or greater than 15% 100% of the relevant tranche of EPS Rights will vest
If vesting conditions are met, Performance Rights will automatically convert into fully paid ordinary shares of the Company. Shares that are allocated in respect of each tranche will be subject to a 12 month holding period after vesting of the Performance Rights.
A summary of the Performance Rights issued in FY2016 are as follows:
Tranche 1 Tranche 2
Grant date 24 December 2015 24 December 2015
Effective date 1 July / 1 August 2015 1 July / 1 August 2015
Vest date 30 June 2017 30 June 2018
Expiry date n/a n/a
Quantity granted during the year 205,345 393,559
Performance hurdles 50% TSR; 50% EPS 50% TSR; 50% EPS
Exercise price Nil Nil
Fair value at grant date $3.37 TSR; $3.96 EPS $3.20 TSR; $3.84 EPS
Other conditions Holding period 12 months from vest date Holding period 12 months from vest date
There were no Performance Rights issued in FY2015.
Movements of Performance Rights are as follows:
2016number
2015number
Opening quantity outstanding 626,706 697,766
Quantity of Performance Rights granted during the year 598,906 –
Quantity of Performance Rights forfeited during the year – (71,060)
Quantity of Performance Rights exercised during the year – –
Closing quantity outstanding 1,225,612 626,706
(b) Expenses arising from share-based payment transactions
Total expenses arising from share-based payment transactions recognised during the period as part of employee benefits expense were as follows:
2016$’000s
2015$’000s
Performance Rights under executive LTIP 1,081 248
66 BAPCOR
NOTES TO THE CONSOLIDATED FINANCIAL STATEMENTS continued

This declaration is made in accordance with a resolution of Directors.
In the Directors’ opinion:
(a) the financial statements, comprising; the consolidated statement of comprehensive income; consolidated statement of financial position; consolidated statement of changes in equity; consolidated statement of cash flows; and accompanying notes, are in accordance with the Corporations Act 2001, including:
(i) complying with Accounting Standards, the Corporations Regulations 2001 and other mandatory professional reporting requirements; and
(ii) giving a true and fair view of the consolidated entity’s financial position as at 30 June 2016 and of its performance for the financial year ended on that date; and
(b) there are reasonable grounds to believe that Bapcor Limited will be able to pay its debts as and when they become due and payable; and
(c) at the date of this declaration, there are reasonable grounds to believe that the members of the extended closed group identified in note 25 will be able to meet any obligations or liabilities to which they are, or may become, subject by virtue of the deed of cross guarantee described in note 26.
Note 1(a) confirms that the financial statements also comply with International Financial Reporting Standards as issued by the International Accounting Standards Board.
The Directors have been given the declarations by the Chief Executive Officer and Chief Financial Officer required by section 295A of the Corporations Act 2001 for the financial year ended 30 June 2016.
On behalf of the Board of Bapcor Limited,
Robert McEniry Chairman
Melbourne 18 August 2016
67 ANNUAL REPORT 2016
DIRECTORS’ DECLARATION
68 BAPCOR
INDEPENDENT AUDITOR’S REPORT TO THE MEMBERS
PricewaterhouseCoopers, ABN 52 780 433 757 Freshwater Place, 2 Southbank Boulevard, SOUTHBANK VIC 3006, GPO Box 1331, MELBOURNE VIC 3001 T: 61 3 8603 1000, F: 61 3 8603 1999, www.pwc.com.au
Liability limited by a scheme approved under Professional Standards Legislation.
Independent auditor’s report to the members of Bapcor Limited (formerly Burson Group Limited)
Report on the financial report We have audited the accompanying financial report of Bapcor Limited (the company), which comprises the consolidated statement of financial position as at 30 June 2016, the consolidated statement of comprehensive income, consolidated statement of changes in equity and consolidated statement of cash flows for the year ended on that date, a summary of significant accounting policies, other explanatory notes and the directors’ declaration for Bapcor Limited (the consolidated entity). The consolidated entity comprises the company and the entities it controlled at year’s end or from time to time during the financial year.
Directors' responsibility for the financial report The directors of the company are responsible for the preparation of the financial report that gives a true and fair view in accordance with Australian Accounting Standards and the Corporations Act 2001 and for such internal control as the directors determine is necessary to enable the preparation of the financial report that is free from material misstatement, whether due to fraud or error. In Note 1(a)(i), the directors also state, in accordance with Accounting Standard AASB 101 Presentation of Financial Statements, that the financial statements comply with International Financial Reporting Standards.
Auditor’s responsibility Our responsibility is to express an opinion on the financial report based on our audit. We conducted our audit in accordance with Australian Auditing Standards. Those standards require that we comply with relevant ethical requirements relating to audit engagements and plan and perform the audit to obtain reasonable assurance whether the financial report is free from material misstatement.
An audit involves performing procedures to obtain audit evidence about the amounts and disclosures in the financial report. The procedures selected depend on the auditor’s judgement, including the assessment of the risks of material misstatement of the financial report, whether due to fraud or error. In making those risk assessments, the auditor considers internal control relevant to the consolidated entity’s preparation and fair presentation of the financial report in order to design audit procedures that are appropriate in the circumstances, but not for the purpose of expressing an opinion on the effectiveness of the entity’s internal control. An audit also includes evaluating the appropriateness of accounting policies used and the reasonableness of accounting estimates made by the directors, as well as evaluating the overall presentation of the financial report.
We believe that the audit evidence we have obtained is sufficient and appropriate to provide a basis for our audit opinion.
Independence In conducting our audit, we have complied with the independence requirements of the Corporations Act 2001.
69 ANNUAL REPORT 2016
Independent auditor’s report to the members of Bapcor Limited (formerly Burson Group Limited) (continued)
Auditor’s opinion In our opinion:
(a) the financial report of Bapcor Limited is in accordance with the Corporations Act 2001, including:
(i) giving a true and fair view of the consolidated entity's financial position as at 30 June 2016 and of its performance for the year ended on that date; and
(ii) complying with Australian Accounting Standards and the Corporations Regulations 2001.
(b) the financial report and notes also comply with International Financial Reporting Standards as disclosed in Note 1(a)(i).
Report on the Remuneration Report We have audited the remuneration report included in pages 17 to 25 of the directors’ report for the year ended 30 June 2016. The directors of the company are responsible for the preparation and presentation of the remuneration report in accordance with section 300A of the Corporations Act 2001. Our responsibility is to express an opinion on the remuneration report, based on our audit conducted in accordance with Australian Auditing Standards.
Auditor’s opinion In our opinion, the remuneration report of Bapcor Limited for the year ended 30 June 2016 complies with section 300A of the Corporations Act 2001.
PricewaterhouseCoopers
Daniel Rosenberg Melbourne Partner 18 August 2016
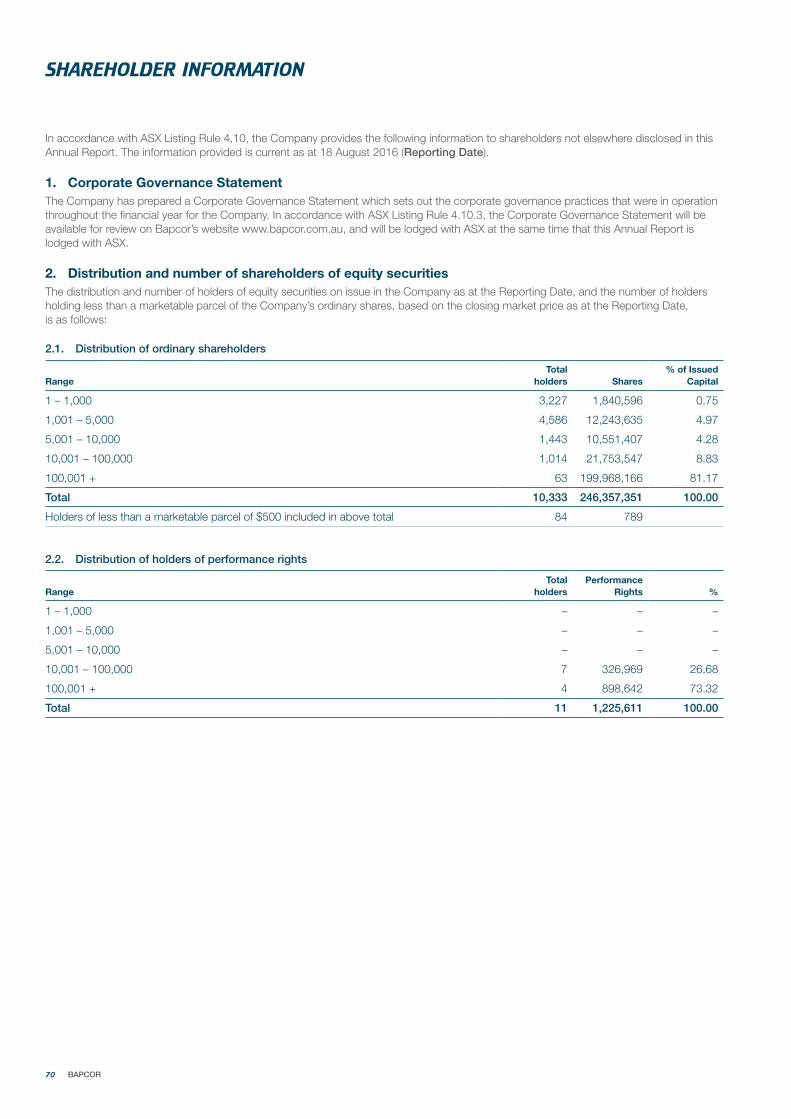
In accordance with ASX Listing Rule 4.10, the Company provides the following information to shareholders not elsewhere disclosed in this Annual Report. The information provided is current as at 18 August 2016 (Reporting Date).
1. Corporate Governance StatementThe Company has prepared a Corporate Governance Statement which sets out the corporate governance practices that were in operation throughout the financial year for the Company. In accordance with ASX Listing Rule 4.10.3, the Corporate Governance Statement will be available for review on Bapcor’s website www.bapcor.com.au, and will be lodged with ASX at the same time that this Annual Report is lodged with ASX.
2. Distribution and number of shareholders of equity securitiesThe distribution and number of holders of equity securities on issue in the Company as at the Reporting Date, and the number of holders holding less than a marketable parcel of the Company’s ordinary shares, based on the closing market price as at the Reporting Date, is as follows:
2.1. Distribution of ordinary shareholders
RangeTotal
holders Shares% of Issued
Capital
1 – 1,000 3,227 1,840,596 0.75
1,001 – 5,000 4,586 12,243,635 4.97
5,001 – 10,000 1,443 10,551,407 4.28
10,001 – 100,000 1,014 21,753,547 8.83
100,001 + 63 199,968,166 81.17
Total 10,333 246,357,351 100.00
Holders of less than a marketable parcel of $500 included in above total 84 789
2.2. Distribution of holders of performance rights
RangeTotal
holdersPerformance
Rights %
1 – 1,000 – – –
1,001 – 5,000 – – –
5,001 – 10,000 – – –
10,001 – 100,000 7 326,969 26.68
100,001 + 4 898,642 73.32
Total 11 1,225,611 100.00
70 BAPCOR
SHAREHOLDER INFORMATION
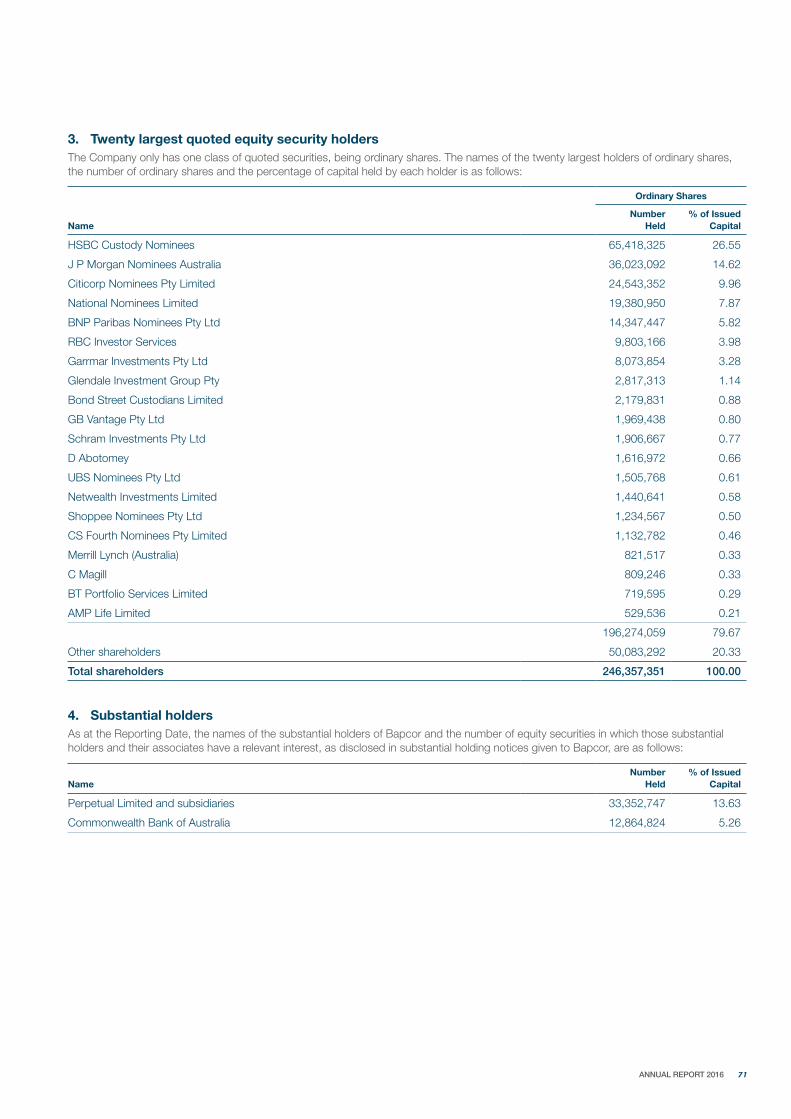
3. Twenty largest quoted equity security holdersThe Company only has one class of quoted securities, being ordinary shares. The names of the twenty largest holders of ordinary shares, the number of ordinary shares and the percentage of capital held by each holder is as follows:
Ordinary Shares
NameNumber
Held% of Issued
Capital
HSBC Custody Nominees 65,418,325 26.55
J P Morgan Nominees Australia 36,023,092 14.62
Citicorp Nominees Pty Limited 24,543,352 9.96
National Nominees Limited 19,380,950 7.87
BNP Paribas Nominees Pty Ltd 14,347,447 5.82
RBC Investor Services 9,803,166 3.98
Garrmar Investments Pty Ltd 8,073,854 3.28
Glendale Investment Group Pty 2,817,313 1.14
Bond Street Custodians Limited 2,179,831 0.88
GB Vantage Pty Ltd 1,969,438 0.80
Schram Investments Pty Ltd 1,906,667 0.77
D Abotomey 1,616,972 0.66
UBS Nominees Pty Ltd 1,505,768 0.61
Netwealth Investments Limited 1,440,641 0.58
Shoppee Nominees Pty Ltd 1,234,567 0.50
CS Fourth Nominees Pty Limited 1,132,782 0.46
Merrill Lynch (Australia) 821,517 0.33
C Magill 809,246 0.33
BT Portfolio Services Limited 719,595 0.29
AMP Life Limited 529,536 0.21
196,274,059 79.67
Other shareholders 50,083,292 20.33
Total shareholders 246,357,351 100.00
4. Substantial holdersAs at the Reporting Date, the names of the substantial holders of Bapcor and the number of equity securities in which those substantial holders and their associates have a relevant interest, as disclosed in substantial holding notices given to Bapcor, are as follows:
NameNumber
Held% of Issued
Capital
Perpetual Limited and subsidiaries 33,352,747 13.63
Commonwealth Bank of Australia 12,864,824 5.26
71 ANNUAL REPORT 2016

5. Voting rightsThe voting rights attaching to each class of equity securities are set out below:
5.1. Ordinary shares
At a general meeting of Bapcor, every holder of ordinary shares present in person or by proxy, attorney or representative has one vote on a show of hands and on a poll, one vote for each ordinary share held.
5.2. Performance rights
Performance rights do not carry any voting rights.
6. Unquoted equity securities1,225,611 unlisted performance rights have been granted to 11 persons. There are no persons who hold 20% or more of performance rights that were not issued or acquired under an employee incentive scheme.
7. Voluntary escrowThe number and class of restricted securities or securities subject to voluntary escrow that are on issue, and the date that the escrow period ends, are as follows:
Class of restricted securities Type of restriction Number of securities Escrow period
Ordinary shares Voluntary escrow 1,234,567 From 31 March 2016 until 1 April 2017
8. On-market buy-backThe Company is not currently conducting an on-market buy-back.
72 BAPCOR
SHAREHOLDER INFORMATION continued

DirectorsRobert McEniry (Independent, Non-Executive Director and Chairman)Darryl Abotomey (Chief Executive Officer and Managing Director)Andrew Harrison (Independent, Non-Executive Director)Therese Ryan (Independent, Non-Executive Director)Margaret Haseltine (Independent, Non-Executive Director)
Company SecretaryGregory Fox
Registered office61 Gower StreetPreston VIC 3072AUSTRALIA
Share registryComputershare Investor Services Pty Ltd452 Johnston StreetAbbotsford VIC 3067Ph: +61 3 9415 4000
Auditor PricewaterhouseCoopersFreshwater Place2 Southbank BoulevardSouthbank VIC 3006
Stock exchange listingBapcor Limited shares are listed on the Australian Securities Exchange(ASX: BAP)
Websitewww.bapcor.com.au
RM-16069 ANNUAL REPORT 2016
CORPORATE INFORMATION

www.bapcor.com.au