annual report 2017 - 2017.myobreports.com.au · myob annual report 2017 contents business review...
TRANSCRIPT

ANNUAL REPORT
2017
MYOB ANNUAL REPORT 2017
ContentsBusiness Review
Introduction 1
MYOB story 2
Chairman’s Letter 4
MYOB’s vision for the accounting industry 6
The Connected Practice 7
Financial and Operational Highlights 8
Business Segments 9
CEO Report 10
Creating Long Term Strategic Value 14
Product Innovation 16
The MYOB Way 18
Executive Management Team 20
Governance 22
Board of Directors 23
Operational and Financial Review 26
Directors’ Report 36
Remuneration Report 38
Financial Report 49
Consolidated Financial Statements 50
Notes to the Financial Statements 54
Directors’ Declaration 80
Other Information
Independent Auditor’s Report 81
Shareholder Information 86
Corporate Directory 88
Other InformationFinancial ReportDirectors’ Report Remuneration Report
This is an interactive PDF designed to enhance your experience. The best way to utilise this PDF is through Adobe Reader. Click on the links above in the contents or use the buttons at the top and bottom of the following pages to navigate.
This is an interactive PDF designed to enhance your experience. The best way to utilise this PDF is through Adobe Reader. Click on the links above in the contents or use the buttons at the top and bottom of the following pages to navigate.
Financial Report Other InformationFinancial ReportDirectors’ Report Remuneration ReportBusiness Review

1MYOB ANNUAL REPORT 2017
At MYOB, we take great pride in helping businesses succeed. That’s why every single thing we do, each and every day, aligns to this vision.
We believe when small and medium sized businesses thrive, so too does the local and national economy.
Other InformationFinancial ReportDirectors’ Report Remuneration Report Other InformationDirectors’ Report Remuneration Report Financial ReportBusiness Review

2 MYOB ANNUAL REPORT 2017
Helping businesses succeed
At MYOB we’re proud to continue our 26-year history of delivering intelligent and intuitive business solutions that
make life easier for our clients. Our solutions save time, simplify processes and take away stress, so that anyone
running a business can focus on what’s important to them. We understand success is personal, and we’ll continue to seek ways to make every part of business life easier.
Making the future
We’ve made great strides in delivering our vision of the Connected Practice, where seamless connectivity will allow
businesses and advisers to collaborate in real-time. The rewards of automation and accurate data feeds are
significant, and we’re excited to see more and more accountants, bookkeepers and small business advisers
join us on the Connected Practice journey.
Business Review Other InformationDirectors’ Report Remuneration Report Financial Report

3MYOB ANNUAL REPORT 2017
Our business community
We are passionate about our business community, and we continue to seek out opportunities for businesses, small
and large, to thrive. Whether through our commitment to paying our suppliers within 30 days, our investment in the start-up community or through policy advocacy,
we are committed to creating a positive community and an environment that enables more businesses to succeed.
Investing in innovation
Delivering great experiences for our clients is what we live for! Last year we invested $68 million in research and development to create market-leading products and services which remove
time-intensive tasks for Australian and New Zealand businesses. We believe the development of our MYOB
Platform will deliver greater efficiencies and savings for small and medium enterprises (“SMEs”) and advisers, and enable
seamless collaboration through an integrated online platform.
Other InformationBusiness Review Financial ReportDirectors’ Report Remuneration Report Other InformationDirectors’ Report Remuneration Report Financial Report
4 MYOB ANNUAL REPORT 2017
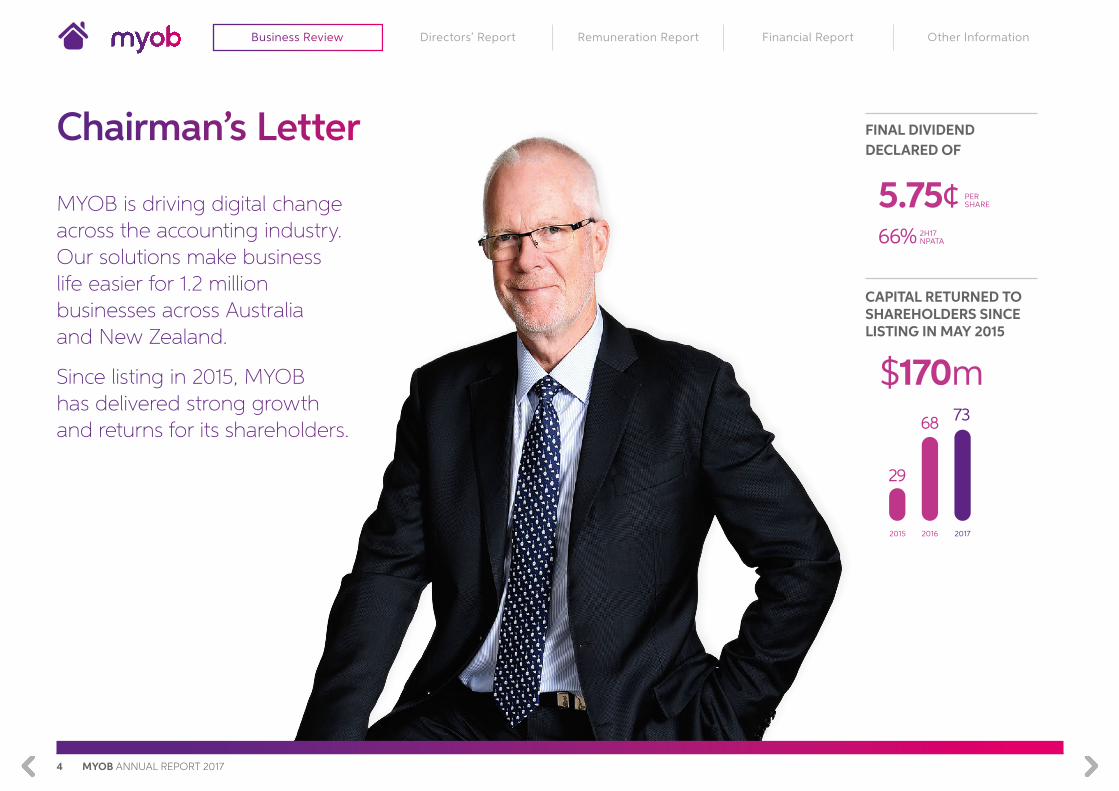
MYOB is driving digital change across the accounting industry. Our solutions make business life easier for 1.2 million businesses across Australia and New Zealand.
Since listing in 2015, MYOB has delivered strong growth and returns for its shareholders.
Chairman’s Letter
2H17 NPATA
PER SHARE
2015 2016 2017
FINAL DIVIDEND DECLARED OF
CAPITAL RETURNED TO SHAREHOLDERS SINCE LISTING IN MAY 2015
$170m
66%
5.75¢
29
68 73
Business Review Other InformationDirectors’ Report Remuneration Report Financial Report
5MYOB ANNUAL REPORT 2017
On behalf of the Board of Directors, I am pleased to present MYOB Group’s Annual Report for the year ending 31 December, 2017.
This past financial year has been a year of robust growth, both organically and via acquisitions. Our continued investment in the MYOB Platform allows accountants to connect and provide enhanced service to their customers. This has seen the business deliver strong results in our Clients & Partners segment, achieving record levels of online subscriber growth, reaching a total of 399,000 subscribers at the end of 2017. With the accelerating growth in online subscribers in 2017, MYOB is on a trajectory to reach 1 million online subscribers by 2020. Our Enterprise segment continues to grow with MYOB recognised as the number one ERP provider Australia and New Zealand by iStart 1.
In 2017, we announced two strategic acquisitions which support our expansion plans:
• The $48 million acquisition of a payment solutions provider, Paycorp (completed in April 2017), which positions MYOB as a market leader in providing a seamless and integrated payment solution into accounting software flows.
• The decision to acquire the assets of Reckon’s Accountant Group (announced in November 2017) strengthens and deepens our growing adviser base and creates an opportunity to accelerate online SME growth through
a larger referral network. We look forward to receiving confirmation of the transaction from the regulators and accelerating the delivery of our Connected Practice vision.
In 2017, we’ve also seen our capital structure and liquidity improve with our largest shareholder Bain Capital, gradually reducing their stake from 56% at the start of the year, to holding 23% of our register as at December 2017. It is also pleasing to see continued interest and investment from both local and international investors as liquidity in our shares continues to improve.
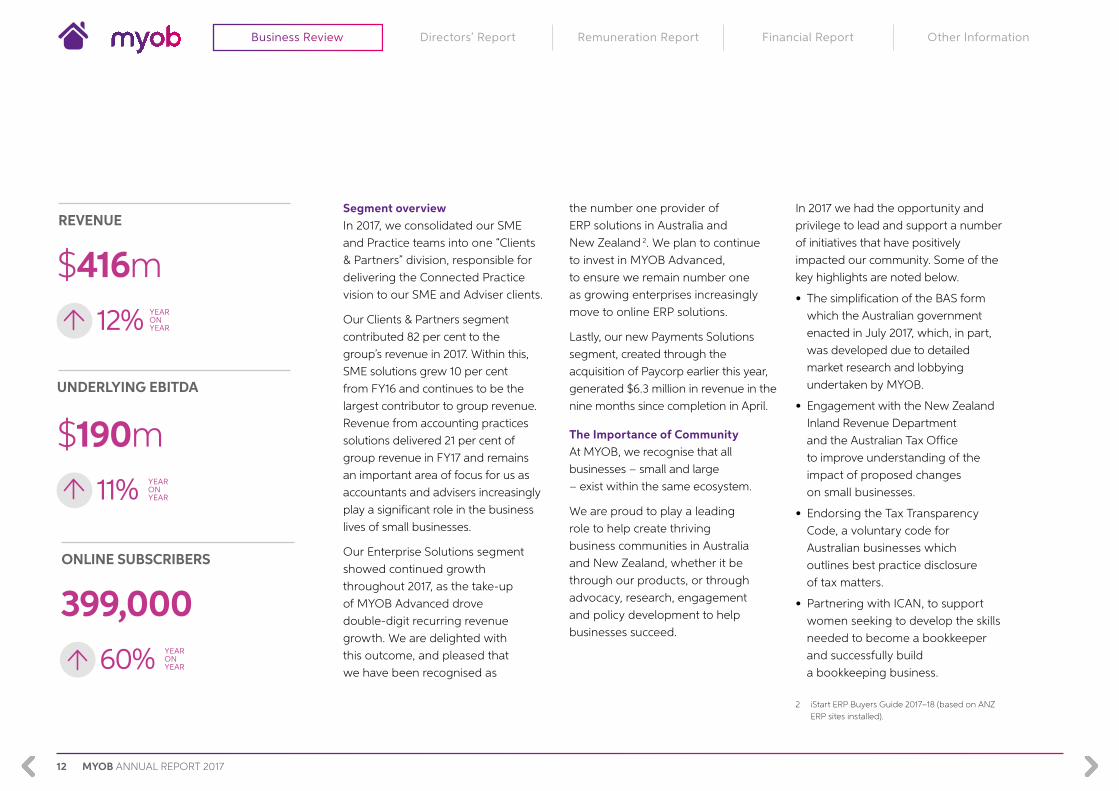
Financial highlightsIn 2017, MYOB delivered double-digit growth across all key financial measures, driven by record online subscriber growth. Revenue rose to $416 million, up 12 per cent year on year. Underlying earnings (EBITDA) of $190 million was up 11 per cent on the prior year period and NPATA, our preferred measure of after-tax profit, also increased 10 per cent to $102 million.
A record 60 per cent growth in online subscribers across our Clients & Partners segment is an outstanding result and shows that the investment we continue to make in our product development, sales and marketing teams is driving strong outcomes. The migration rate of active non-paying users to paying online subscriptions has almost doubled in three years as our customers join us in embracing the benefits and efficiencies of moving online.
Dividends and Capital Management Our balance sheet remains very strong and on the back of solid financial results, the Board is pleased to declare a final dividend of 5.75 cents per share, delivering a payout ratio of 66 per cent of 2H17 NPATA. This takes the full-year dividend to 11.5 cents.
In August 2017, we announced our intention to undertake an on-market share buyback of up to 5 per cent of the Company’s issued capital, as part of our commitment to optimise and manage capital efficiently. Funded from existing cash, the Company acquired more than $3 million of shares in 2017 (and a further $3 million purchased in January and February 2018) and continues to retain a strong balance sheet with the flexibility to pursue strategic acquisitions in line with our growth strategy.
The dividend and buyback combined represents a total of $73 million of capital returned to shareholders in 2017, and a total of $170 million of capital returned to shareholders since listing.
2018 and beyondThe accounting industry is changing and we remain at the forefront of this change, leading the journey for our clients and partners. Our continued focus in delivering intuitive, intelligent business solutions in line with our Connected Practice vision is delivering value for our clients and partners and driving long term value for shareholders.
We are excited about our growth segments, Payment and Enterprise and the potential of these large market opportunities.
On behalf of the Board, I would like to thank our shareholders and our clients, the 1.2 million business owners and accountants in Australia and New Zealand who use our software, for their support and continued feedback that enables us to create better digital solutions that help businesses succeed.
I would also like to acknowledge the long term support and continued investment from Bain Capital, our major shareholder. I thank Paul Edgerley, former Managing Director at Bain Capital, for his two years’ service on the Board and I am delighted to be working with Edward Han, Managing Director of Bain Capital in Australia, who joined in April 2017.
Finally, I would like to acknowledge the commitment and passion of our executive team, led by our exceptional CEO, Tim Reed.
There is much to look forward to in 2018 and I am confident we have a talented and highly capable team in place to generate superior results for our clients, partners and shareholders.
Justin MilneChairman
1 iStart ERP Buyers Guide 2017–18 (based on ANZ ERP sites installed).
Other InformationBusiness Review Financial ReportDirectors’ Report Remuneration Report Other InformationDirectors’ Report Remuneration Report Financial Report

6 MYOB ANNUAL REPORT 2017
MYOB’s vision for the accounting industry
A new, better way is emerging for SMEs and their Advisers (Accountants, Bookkeepers and Certified Consultants).
The accounting industry is changing. Global trends such as Big Data and Internet of Things (IoT), Artificial Intelligence and Machine Learning and the changing nature of work is transforming the way the accounting industry operates.
MYOB is at the forefront of this changing environment and has created an exciting and bold vision to deliver seamless connectivity between the SME, adviser and the broader accounting ecosystem. We have defined this as The Connected Practice.
Business Review Other InformationDirectors’ Report Remuneration Report Financial Report

7MYOB ANNUAL REPORT 2017
The Connected Practice
ADVISORYRUN THE PRACTICE
TRANSACTION PROCESSING
COMPLIANCE
The Connected Practice will deliver seamless connectivity across the ecosystem, to enable effective, insight-led decision making by businesses and their advisers, ultimately driving increased referrals of SME solutions for MYOB.
AdvisersAccountants and Bookkeepers become business coaches and compliance managers
Transaction Processing
Become primary owner of automated transaction processing, configure systems, process only anomalies
Compliance
Review prefilled data; ensure deadline met
Advisory
Review business performance and cashflow, recommend improvements, consult on key business decisions
SMEsThings just get done
Mobile Moments
Quick and easy accounting on a mobile device e.g. get a bill, approve it, file it, account for it, schedule payment, all in 5-10 seconds on a mobile device
Track business performance
Leverage AI set up by adviser, SME views through any device
Interactions with adviser via MYOB apps
Questions, source docs, signing and compliance lodgment, all via a shared online workspace
Other InformationBusiness Review Financial ReportDirectors’ Report Remuneration Report Other InformationDirectors’ Report Remuneration Report Financial Report

8 MYOB ANNUAL REPORT 2017
Financial and Operational Highlights
YEAR ON YEAR
YEAR ON YEAR
YEAR ON YEAR
YEAR ON YEAR
YEAR ON YEAR
YEAR ON YEAR
REVENUE
SME PAYING SUBSCRIBERS
UNDERLYING EBITDA
ONLINE SUBSCRIBERS
NPATA
% OF NEW SME DIY CLIENTS ONLINE
$416m
618k
$190m
399k
$102m
94%
12%
6%
11%
60% 2%
10%
Final dividend declared of 5.75¢ per share
NPATA EPS of 16.9¢
Underlying EBITDA margin of 45.6%
Recurring revenue represents 96% of total revenue
Statutory EBITIDA of $182m and NPAT of $61m
Business Review Other InformationDirectors’ Report Remuneration Report Financial Report

9MYOB ANNUAL REPORT 2017
Business Segments
FY17 REVENUE FY17 REVENUE FY17 REVENUE
$343.4m $64.6m $6.3m
9 mths revenue in 2017
OF GROUP REVENUE
82%OF GROUP REVENUE
16%OF GROUP REVENUE
2%FROM 2016
8%FROM 2016
25%
Clients & Partners
Clients & Partners provides accounting, payroll, tax and other business management solutions to SMEs and Advisers, with secure bank transaction data from banks and other financial institutions. These tools assist in the management of SME businesses and the efficient completion of compliance
(tax and accounting) through Advisers.
In 2017 MYOB consolidated its go-to-market teams (in the SME Solutions and Practice Solutions divisions) into a new single “Clients & Partners” segment. The internal change aligns strongly with our vision of the Connected Practice to bring SMEs and Advisers together in an efficient manner.
Enterprise Solutions
Enterprise Solutions provides intelligent and adaptable business management software, including Enterprise Resource Planning (ERP), Payroll and Human Capital Management (HCM) solutions to more than 8,000 medium and large businesses, across Tier 3 (50–300 employees
businesses) and Tier 2 (300–1,000 employees).
MYOB’s market-leading cloud ERP solution, MYOB Advanced, was launched in 2015 and has achieved rapid success in the market. In 2017 MYOB business was recognised by iStart as the #1 ERP vendor in Australia and New Zealand 1.
Payment Solutions
Payment Solutions provides simple and secure payment solutions for businesses of all sizes, including payment gateway services, fraud management, merchant service facilities and invoice payments. MYOB’s payment solutions provide competitive transaction rates and quick settlements, working in conjunction
with major banks.
In 2017 MYOB acquired Paycorp, a payment solutions provider, creating an opportunity for MYOB to bridge the gap between accounting and payments, through an integrated and seamless payment solution into accounting software flows.
1 iStart ERP Buyers Guide 2017–18 (based on ANZ ERP sites installed).
Other InformationBusiness Review Financial ReportDirectors’ Report Remuneration Report Other InformationDirectors’ Report Remuneration Report Financial Report
10 MYOB ANNUAL REPORT 2017
At MYOB, we help businesses succeed.
Our passionate team of more than 1,500 employees across Australia and New Zealand are here to make a difference in the lives of our clients and partners by bringing this vision to life.
We believe small and medium businesses are the heartbeat of a thriving economy and throughout our 26-year history, we’ve built a unique understanding of what motivates the 1.2 million clients that use our solutions.
We’ve formed a strong and enduring partnership with the accounting industry and continue to create intelligent, intuitive business solutions that accountants, bookkeepers and small business advisers can use to connect with their clients in smarter, more efficient ways.
CEO Report
Business Review Other InformationDirectors’ Report Remuneration Report Financial Report
11MYOB ANNUAL REPORT 2017
Dear Shareholder,
As I look back over the past 12 months, I’m proud of the progress we’ve made as a team. Our solutions have improved the business lives of our many clients across Australia and New Zealand, giving them back valuable time and resources while providing improved financial insight, and thereby allowing them to focus on what matters most to them – achieving success as they define it.
I’m delighted that we’ve seen record growth in the take up of our online products. We know the positive impact these solutions have on our clients’ business lives, and the positive impact they have on our financial performance.
The Connected Practice In 2017, we made great strides towards the delivery of our Connected Practice vision for the industry.
It’s irrefutable that global trends, such as Artificial Intelligence, Machine Learning and Big Data, will fundamentally change the way businesses will operate and interact. We believe that this provides an enormous opportunity to shape the way business is done, namely through offering
small businesses the chance to connect more efficiently across their ecosystems – to their accountants, bookkeepers, banks, suppliers and taxation authorities.
Our Connected Practice vision describes a future where seamless connectivity is experienced across the business ecosystem. We envisage business transactions being executed and recorded in real-time; allowing business performance information to be available and up-to-date at all times, as compliance activities are completed in the background. The impact: insight-led decision making by businesses and their advisers delivered at a dramatically lower cost.
Our investment in the development of the MYOB Platform, the online tools and services which bring to life the Connected Practice vision, is progressing well. In 2017, our clients endorsed our vision, and I’m pleased to share that we’ve seen an incredibly strong take-up of all the MYOB Platform tools we’ve released to market, with more than 150,000 clients now using the MYOB Portal; 95,000 online MYOB Practice Ledgers and more than 8,000 practices using the MYOB Platform tools.
Record online subscriber growth drives robust financial resultsThe highlights of our financial results for the twelve months ended 31 December 2017 are the double-digit increases in revenue, underlying EBITDA and NPATA. We continue to deliver industry leading margins with FY17 achieving a 45.6 per cent EBITDA margin.
I’m pleased to report that our focused investment on the development of the
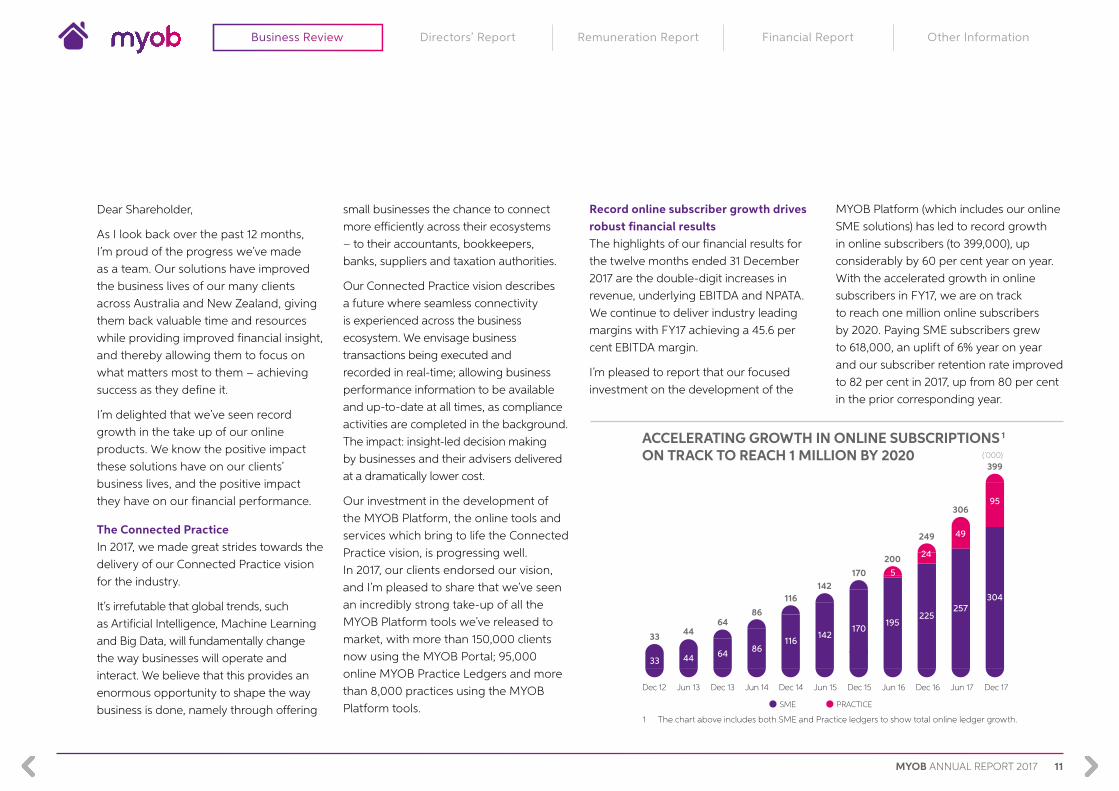
MYOB Platform (which includes our online SME solutions) has led to record growth in online subscribers (to 399,000), up considerably by 60 per cent year on year. With the accelerated growth in online subscribers in FY17, we are on track to reach one million online subscribers by 2020. Paying SME subscribers grew to 618,000, an uplift of 6% year on year and our subscriber retention rate improved to 82 per cent in 2017, up from 80 per cent in the prior corresponding year.
ACCELERATING GROWTH IN ONLINE SUBSCRIPTIONS 1 ON TRACK TO REACH 1 MILLION BY 2020
PRACTICE
Dec 12 Jun 13 Dec 13 Jun 14 Dec 14 Jun 15 Dec 15 Jun 16 Dec 16 Jun 17 Dec 17
33
33
44
44
64
64
86116
142170
195225
25786116
142170
200
249
306
304
399
5
24
49
95
SME
1 The chart above includes both SME and Practice ledgers to show total online ledger growth.
(’000)
Other InformationBusiness Review Financial ReportDirectors’ Report Remuneration Report Other InformationDirectors’ Report Remuneration Report Financial Report
12 MYOB ANNUAL REPORT 2017
Segment overviewIn 2017, we consolidated our SME and Practice teams into one “Clients & Partners” division, responsible for delivering the Connected Practice vision to our SME and Adviser clients.
Our Clients & Partners segment contributed 82 per cent to the group’s revenue in 2017. Within this, SME solutions grew 10 per cent from FY16 and continues to be the largest contributor to group revenue. Revenue from accounting practices solutions delivered 21 per cent of group revenue in FY17 and remains an important area of focus for us as accountants and advisers increasingly play a significant role in the business lives of small businesses.
Our Enterprise Solutions segment showed continued growth throughout 2017, as the take-up of MYOB Advanced drove double-digit recurring revenue growth. We are delighted with this outcome, and pleased that we have been recognised as
the number one provider of ERP solutions in Australia and New Zealand 2. We plan to continue to invest in MYOB Advanced, to ensure we remain number one as growing enterprises increasingly move to online ERP solutions.
Lastly, our new Payments Solutions segment, created through the acquisition of Paycorp earlier this year, generated $6.3 million in revenue in the nine months since completion in April.
The Importance of CommunityAt MYOB, we recognise that all businesses – small and large – exist within the same ecosystem.
We are proud to play a leading role to help create thriving business communities in Australia and New Zealand, whether it be through our products, or through advocacy, research, engagement and policy development to help businesses succeed.
In 2017 we had the opportunity and privilege to lead and support a number of initiatives that have positively impacted our community. Some of the key highlights are noted below.
• The simplification of the BAS form which the Australian government enacted in July 2017, which, in part, was developed due to detailed market research and lobbying undertaken by MYOB.
• Engagement with the New Zealand Inland Revenue Department and the Australian Tax Office to improve understanding of the impact of proposed changes on small businesses.
• Endorsing the Tax Transparency Code, a voluntary code for Australian businesses which outlines best practice disclosure of tax matters.
• Partnering with ICAN, to support women seeking to develop the skills needed to become a bookkeeper and successfully build a bookkeeping business.
YEAR ON YEAR
REVENUE
$416m12%
YEAR ON YEAR
ONLINE SUBSCRIBERS
399,00060%
YEAR ON YEAR
$190m11%
UNDERLYING EBITDA
2 iStart ERP Buyers Guide 2017–18 (based on ANZ ERP sites installed).
Business Review Other InformationDirectors’ Report Remuneration Report Financial Report

13MYOB ANNUAL REPORT 2017
• And a personal highlight – forming
part of the Business Council of
Australia’s working group to design the
Supplier Payments code, a voluntary
code which commits to paying small
businesses within 30 days, with MYOB
a founding signatory.
In addition, we threw our support
behind the businesses of tomorrow,
working with start-ups and innovation
incubators across Australia and New
Zealand. In 2017, we launched our first
“State of Start-Ups Aotearoa” report,
highlighting opportunities for Kiwi
businesses, and announced our
partnership with “She Starts” in
Australia, an organisation which offers
support and assistance for budding
female entrepreneurs.
Our people are everythingAt MYOB, we are a vibrant and
passionate team of more than 1,500
people, united by one purpose
– to help businesses succeed.
Our people are our greatest asset and I’m delighted by some of the progress we’ve made this year in strengthening our team.
We’ve been able to attract top tier expertise across the business, including Helen Lea, in a new role as Chief Employee Experience Officer; Hugh Fahy, General Manager, Engineering and Nick Burkett, promoted to the role of General Manager, Operations and Service. I welcome them to a committed and enthusiastic 10-member executive team that is a privilege to work alongside and lead.
2017 also saw the launch of #FutureMakers, the “MYOB Way” of delivering client success more rapidly, through great product experiences. #FutureMakers builds on the strong agile software development processes that we use at MYOB, and focuses on delivering better solutions to our clients sooner.
This year we also took the first substantive steps to driving better gender equality in our business. With a personal commitment through the Male Champions of Change initiative, as well as executive support, we undertook a number of initiatives in this area.
This included completing our first gender pay-gap analysis, following which we immediately moved to close any specific, individual gender-based anomalies; and committing to a goal of 40% female recruitment into our entry level software engineering roles – a target I’m delighted to say we exceeded in our 2018 graduate intake.
Looking ahead As I enter my tenth year as CEO I remain
passionate and committed to MYOB
achieving its own business success.
Our industry is an exciting one and we
have a clear and defined strategy for
long term growth as we move forward
into 2018 and beyond. We will continue
to focus on delivering value to our
clients and partners, being
a responsible and active member of our
community, and creating long term
value for our shareholders.
I wish to thank all our shareholders for their loyalty and continued support. It’s been an extraordinary year in setting MYOB up for long term success and I’m excited by the opportunities that lie ahead.
Tim Reed Chief Executive Officer
Other InformationBusiness Review Financial ReportDirectors’ Report Remuneration Report Other InformationDirectors’ Report Remuneration Report Financial Report
14 MYOB ANNUAL REPORT 2017
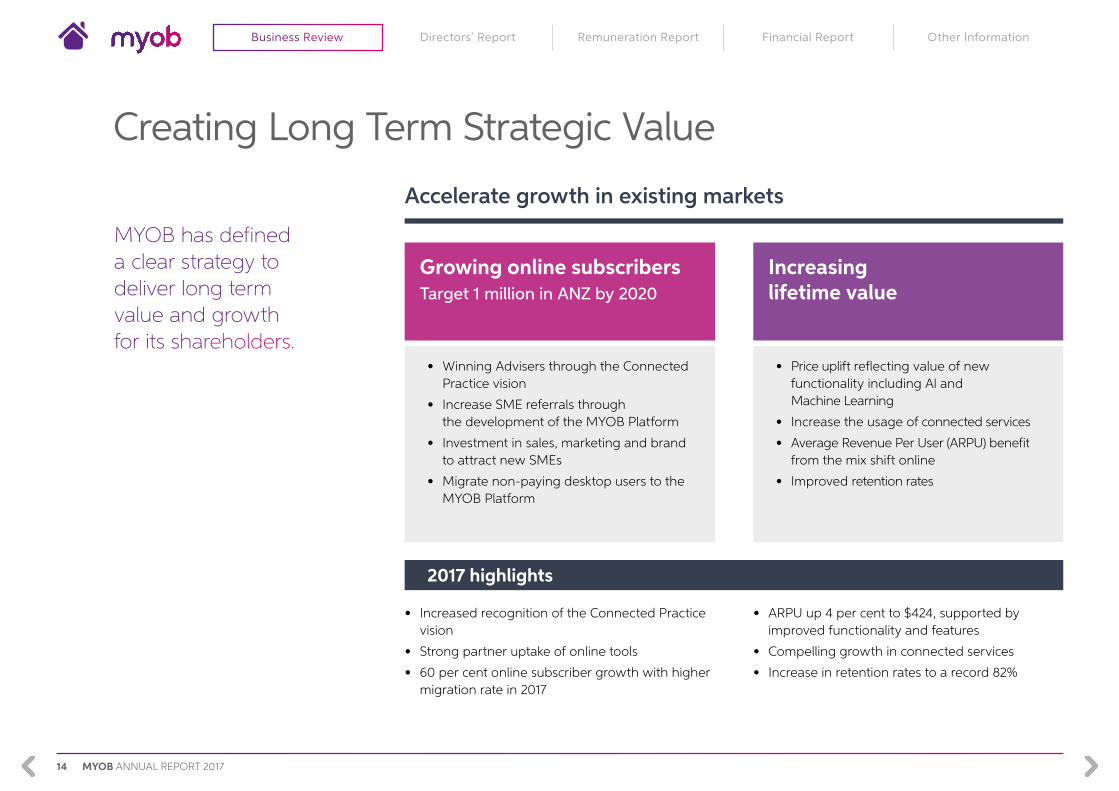
Growing online subscribers Target 1 million in ANZ by 2020
Increasing lifetime value
Creating Long Term Strategic Value
• Winning Advisers through the Connected Practice vision
• Increase SME referrals through the development of the MYOB Platform
• Investment in sales, marketing and brand to attract new SMEs
• Migrate non-paying desktop users to the MYOB Platform
• Increased recognition of the Connected Practice vision
• Strong partner uptake of online tools
• 60 per cent online subscriber growth with higher migration rate in 2017
• Price uplift reflecting value of new functionality including AI and Machine Learning
• Increase the usage of connected services
• Average Revenue Per User (ARPU) benefit from the mix shift online
• Improved retention rates
• ARPU up 4 per cent to $424, supported by improved functionality and features
• Compelling growth in connected services
• Increase in retention rates to a record 82%
Accelerate growth in existing markets
MYOB has defined a clear strategy to deliver long term value and growth for its shareholders.
2017 highlights
Business Review Other InformationDirectors’ Report Remuneration Report Financial Report

15MYOB ANNUAL REPORT 2017
Increasing the Total Addressable Market (TAM) through Payments
Increasing Share and TAM through Enterprise
Strategic Acquisition Opportunities
Penetrate new markets already opened Strengthen core and new TAM
• Increase the number of clients using MYOB PayDirect
• Increase per client usage of PayDirect through new payment types
• Expand the Paycorp client base
• 100%+ growth in PayDirect Online transactions
• Paycorp acquisition fully integrated
• Launch of MYOB PayBy
• Increase market share in Tier 3 with MYOB Advanced
• Migrate existing Tier 3 desktop clients online
• Increase TAM by providing solutions for larger (Tier 2) Enterprises
• More than 450 sites using MYOB Advanced
• MYOB Advanced now almost 60% of new ERP sales
• MYOB recognised as a market leader in ERP solutions in Australia and New Zealand 1
• Target acquisitions within MYOB’s core business
• Seek out new investment opportunities which leverage our core business and increase TAM
• Acquisition of Reckon’s Accountant Group assets progressing
• Continue to seek out value accretive acquisitions
2017 highlights
1 iStart ERP Buyers Guide 2017–18 (based on ANZ ERP sites installed).
Other InformationBusiness Review Financial ReportDirectors’ Report Remuneration Report Other InformationDirectors’ Report Remuneration Report Financial Report

16 MYOB ANNUAL REPORT 2017
Product InnovationIn 2017, we continued to invest in research and development to create intelligent, intuitive, market-leading products and solutions that create efficiencies and impact the business lives of our clients. Some of our key SME innovation highlights include:
In 2017, MYOB continued its investment in mobile innovation with the introduction of the MYOB Invoices mobile app for iOS and Android devices. This app enables SMEs to invoice and provide quotes on-the-go, saving data entry time by automatically updating to MYOB’s accounting software.
MYOB developed enhancements to its Smart Bill solution which automates bill processing through the application of next-generation Artificial Intelligence, while also piloting a direct supplier feed service. These enhancements ensure fast and easy bill processing and eliminate many data entry errors.
Approximately three out of four small business owners have online security concerns, and the consequences of data breaches can be very significant for businesses and individuals. In 2017 MYOB introduced Two-Factor Authentication (2FA), a simple and easily manageable way to increase the security of a user’s online identity, which in turn protects the security of their online MYOB data.
With the introduction of the Simplified BAS reporting initiative enacted by the Australian Tax Office in 2017, MYOB developed and introduced the ability for small businesses to lodge their BAS online directly from MYOB’s accounting software, AccountRight Live and take advantage of the government initiative.
Two factor authentication to increase security
Automated bill processing
MYOB Invoices mobile app
Simplified BAS (Business Activity Statements) for GST processing
Business Review Other InformationDirectors’ Report Remuneration Report Financial Report
17MYOB ANNUAL REPORT 2017
Building on the success of our Connected Practice vision to deliver seamless connectivity across the accounting ecosystem, we continued our focused investment towards building out the tools and products which form the MYOB Platform. Some of the development highlights are noted below.
Transaction ProcessingIn Transaction Processing, we continued to target inefficiencies in how our partners manage their Transaction Processing work and collaborate with their clients at scale. Key innovations include enhancing our MYOB Dashboard for Connected Ledger, Essentials and AccountRight Live clients through the introduction of a range of coding status and bank feed efficiency metrics. We also increased the functionality of the Portal to enhance Partner workflows and streamline collaboration.
ComplianceIn Compliance, we continued to improve the core Client Accounting workflow efficiency with multiple enhancements to Workpapers, Statutory Reporter, Assets and the online practice Ledger. Fundamental to our ongoing business as usual, we delivered high quality, timely Tax (AU & NZ) and FBT (AU) releases, while continuing to support our clients through the ongoing ATO technology transition from the Electronic Lodgement System (ELS) to the Practitioner Lodgement Service (PLS).
AdvisoryIn Advisory, we built an AccountRight connector to Microsoft’s PowerBI to allow advisers to effortlessly create dashboards and charts to provide in-depth analysis and insights for
their clients. We also partnered with a third party to develop MYOB Advisor, a proprietary tool utilising Natural Language Generation which helps advisers scale up their advisory business by generating advisory reports quickly and easily. MYOB Advisor will be launched early in 2018.
Enterprise SolutionsAcross our Enterprise Solutions segment, 2017 saw MYOB continue to grow with the introduction of a new unified payroll solution for the MYOB Advanced platform, called Advanced People. MYOB Advanced was further enhanced by the integration of new dashboard and reporting capabilities that leverages Microsoft Power BI. There were also a range of workflow enhancements developed during the year for Wholesale and Distribution businesses that reduce manual data entry to further streamline operations. In addition, sales and services teams received a boost with the delivery of new mobile working capabilities in MYOB Greentree, providing enhanced mobile interfaces with new functionality to teams in the field.
Payment SolutionsFollowing the acquisition of Paycorp in April 2017, we completed the integration of the Paycorp team into MYOB’s newly created Payment Solutions division and expanded its transactional relationship with major financial institutions and payment providers. The MYOB Payment Solutions team have launched additional functionality for clients, including improved security through 3DSecure for PayDirect Online customers and delivered numerous enhancements for enterprise clients, including a dynamic surcharging module and improved fraud management.
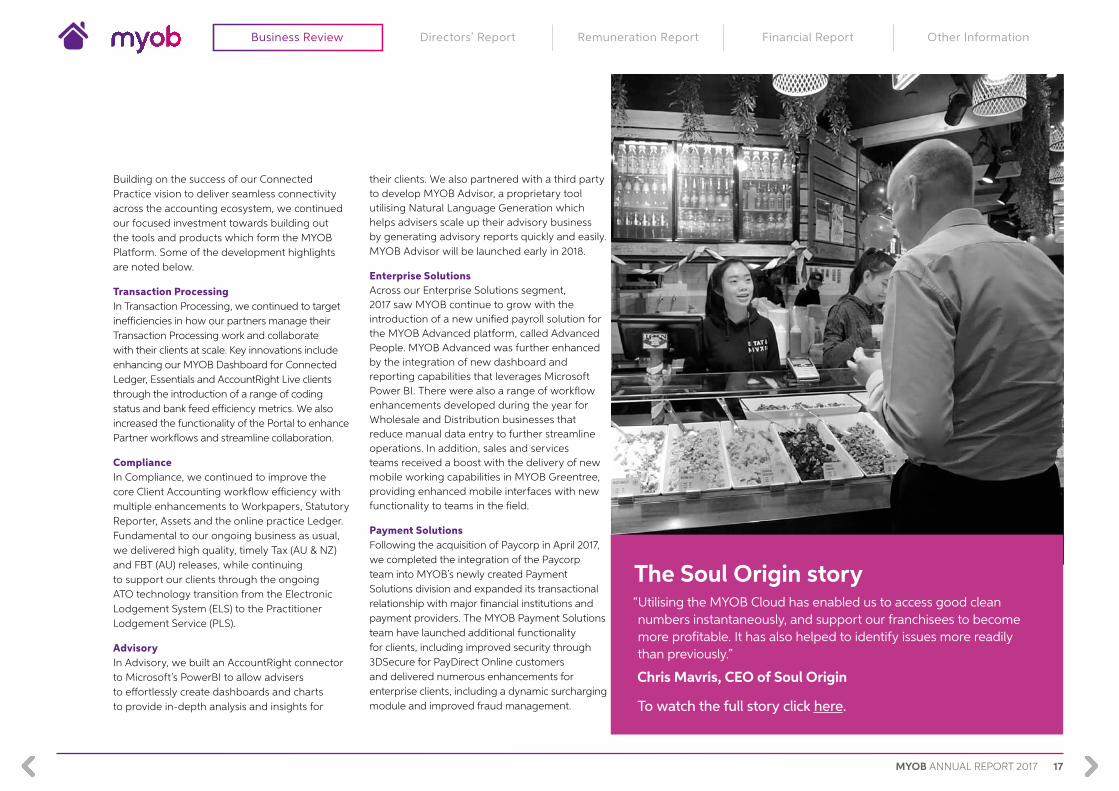
The Soul Origin story“Utilising the MYOB Cloud has enabled us to access good clean numbers instantaneously, and support our franchisees to become more profitable. It has also helped to identify issues more readily than previously.”
Chris Mavris, CEO of Soul Origin
To watch the full story click here.
Other InformationBusiness Review Financial ReportDirectors’ Report Remuneration Report Other InformationDirectors’ Report Remuneration Report Financial Report

18 MYOB ANNUAL REPORT 2017
The MYOB Way
SIMPLIFY
Make it easier
INNOVATE
Find new ways
At the heart of everything we do lies The MYOB Way, a powerful combination of our Vision, Values and Experience. It is who we are, how we act and everything that makes us uniquely MYOB.
Click here to view The MYOB Way video.
Business Review Other InformationDirectors’ Report Remuneration Report Financial Report

19MYOB ANNUAL REPORT 2017
COLLABORATE
We’re better together
CLIENTS
Drive our world
PASSION
Love your work
RESULTS
Achieve our goals
Other InformationBusiness Review Financial ReportDirectors’ Report Remuneration Report Other InformationDirectors’ Report Remuneration Report Financial Report

20 MYOB ANNUAL REPORT 2017
Left to right: Nick Burkett, David Weickhardt, Richard Moore, John Moss, Tim Reed, Helen Lea, Hugh Fahy. Front row: Carolyn Luey, Andrew Birch, Natalie Feehan.
Executive Management TeamTIM REEDExecutive Director, Chief Executive Officer
Tim Reed joined MYOB in June 2003 and was appointed CEO in 2008. Throughout his time, Tim has overseen the business’ growth and its transformation into an online business. He has also led the creation of the Enterprise Division in 2007 and several acquisitions including BankLink and Paycorp. Prior to joining MYOB, Tim worked in Silicon Valley with a number of global technology and internet businesses. Tim serves on the Board of the Business Council of Australia (BCA) and leads the BCA’s innovation taskforce. Tim holds an MBA from Harvard Business School, graduating as Baker Scholar, and a Bachelor of Commerce (Honours) from the University of Melbourne.
RICHARD MOOREChief Financial Officer
Richard Moore joined MYOB in April 2012 as CFO and General Manager, Shared Services. During his time at MYOB, Richard has overseen the company’s transition from private to public ownership, with the ASX’s largest technology IPO in 2015. Prior to joining MYOB, Richard held multiple senior finance roles across a diverse range of industries, including CFO of Jetstar Airways, CFO of BankWest Business and eight years in finance roles at GE Capital (Europe and Australia). Richard worked for PwC in Edinburgh, Scotland and holds a Master of Arts (Honours) in Economics from the University of Edinburgh. He is also a Member of the Institute of Chartered Accountants of Scotland.
Business Review Other InformationDirectors’ Report Remuneration Report Financial Report

21MYOB ANNUAL REPORT 2017
ANDREW BIRCHChief Operating Officer
Andrew Birch joined MYOB in 2009 as General Manager, Enterprise Division. In 2017 Andrew was appointed Chief Operating Officer responsible for the strategic direction and delivery across MYOB’s go-to-market business units and has lead and integrated a range of acquisitions across the business. Prior to joining MYOB, Andrew held a number of senior management positions within the technology, telecommunications and software sectors. His experience extends across leadership and growth sectors, including Honeywell Pacific and Vodafone Australia, as well as mid-size technology businesses within Australia and New Zealand. Andrew holds a Bachelor of Engineering from Swinburne Institute of Technology and a Master of Business Administration from RMIT University.
HELEN LEAChief Employee Experience Officer
Helen joined MYOB in June 2017 as Chief Employee Experience Officer. Prior to joining MYOB, Helen held senior roles in human resources, talent and performance, organisational culture and transformation advisory. Helen’s career spans a variety of organisations and sectors, including banking, telecommunications, industrial and consumer goods. Helen worked at British American Tobacco as the global Head of Organisational Culture and later as Head of Human Resources for Australasia, along with positions of Executive Director – Organisational Development and Enterprise Services at Telstra. Helen has a Masters Degree in Organisational Psychology from the University of the Witwatersrand, is a registered Organisational Psychologist and a Fellow of the Australian Human Resources Institute.
JOHN MOSSChief Strategy Officer
John Moss joined MYOB in January 2007 and has held positions as Corporate Development Manager, General Manager, Product and General Manager, Business Division before being appointed to his current role as Chief Strategy Officer in February 2012. Prior to joining MYOB, John previously held senior strategy and consulting roles with Sensis, Arthur Andersen and Booz Allen & Hamilton. John also spent 10 years in Europe working in the oil industry for Schlumberger and Shell in engineering and commercial roles. John holds a Master of Business Administration from the Melbourne Business School and a Master of Arts and Bachelor of Arts (Honours) in Engineering Science from the University of Oxford.
DAVID WEICKHARDTGeneral Manager, Product
David joined MYOB in November 2016 as General Manager, Product. Prior to joining MYOB, David was growing and improving businesses for six years for BHP Billiton, in Australia and the US. Formerly he was an associate principal at McKinsey, working in Australia, the UK and the Middle East. While at McKinsey, David helped a wide variety of technology and industrial companies develop breakthrough growth strategies, improve operational performance and deliver large capital investment projects. David holds a Masters of Business Administration from Stanford University (where he was a Siebel Scholar and an Arjay Miller Scholar), and holds degrees in Computer Science and Electrical/Electronics Engineering (1st class Honours) from the University of Melbourne.
CAROLYN LUEYGeneral Manager, Enterprise Solutions & New Zealand
Carolyn Luey joined MYOB in January 2017 as General Manager, Enterprise Solutions and New Zealand. She has over 15 years of experience in strategy, marketing, product management, business development and digital media across a range of industries. Prior to joining MYOB, Carolyn held executive roles at NZME including Chief Operating Officer responsible for operations across digital, radio and print and Group Strategy and Operations Director responsible for strategy, technology, product and development of new businesses during the transformation to NZME. She also spent 8 years at Telecom New Zealand in marketing, strategy and product roles. Carolyn holds a Bachelor of Commerce Honours, Marketing from the University of Auckland.
HUGH FAHYGeneral Manager, Engineering
Hugh Fahy joined MYOB in June 2017 in the role of General Manager, Engineering. Prior to joining MYOB, Hugh held a number of technology leadership roles in telecomms, gaming and eCommerce including most recently Group CTO of Net-A-Porter and Development and Product Director at Betfair. Hugh spent fifteen years with the Vodafone Group in the UK, Hungary and South Africa.
Hugh was also one of the founders of betNOW, an innovative social gaming start-up in the UK and was VP, Engineering of Motricity in North Carolina developing mobile content solutions. Hugh holds a BSc (Honours) in Computing and Informatics from Plymouth University.
NATALIE FEEHANGeneral Manager, Marketing
Natalie Feehan joined MYOB in May 2015 as General Manager, Marketing.
Natalie has more than 15 years of marketing experience, with seven years senior management experience. Prior to joining MYOB, Natalie held a number of senior marketing positions at REA Group, including most recently Group Manager, Marketing Strategy. Natalie also worked as Assistant Brand and CRM Manager for BMW.
Natalie holds a Bachelor of Business (Marketing, Human Resource Management) and a Master of Commerce from Swinburne University of Technology.
NICK BURKETTGeneral Manager, Operations and Service
Nick Burkett joined MYOB in 2012 as Strategy Manager. He then became Retention & Renewals Manager and Head of Client Sales & Service prior to being appointed General Manager of Operations and Service.
Prior to MYOB, Nick was at Bain & Company working in Australia, China, the UK and South Africa where he focused on the Telecommunications, Media and Technology sector. Nick holds degrees in Computer Science, Electrical Engineering and a Diploma of Modern Languages in Mandarin from the University of Melbourne. Nick was on the Dean’s honours list multiple times, won the prize for best final year Electrical Engineering project, and graduated with first class honours.
Other InformationBusiness Review Financial ReportDirectors’ Report Remuneration Report Other InformationDirectors’ Report Remuneration Report Financial Report
22 MYOB ANNUAL REPORT 2017
Governance
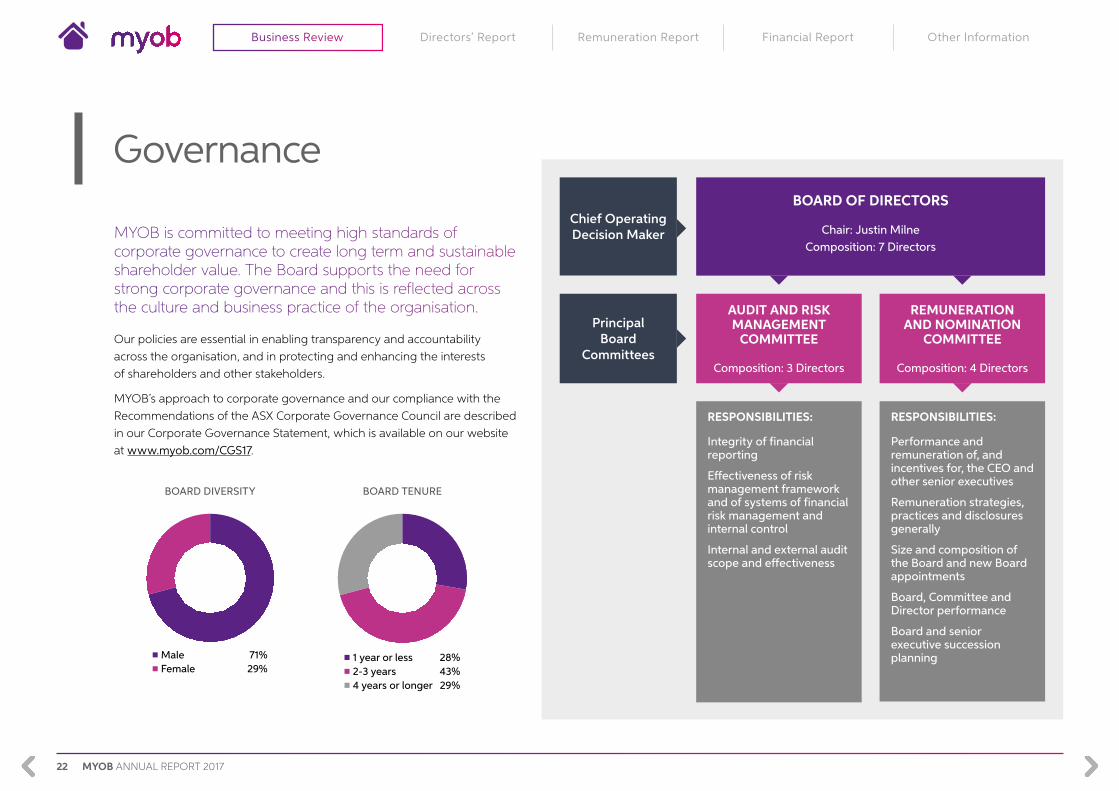
MYOB is committed to meeting high standards of corporate governance to create long term and sustainable shareholder value. The Board supports the need for strong corporate governance and this is reflected across the culture and business practice of the organisation.
Our policies are essential in enabling transparency and accountability across the organisation, and in protecting and enhancing the interests of shareholders and other stakeholders.
MYOB’s approach to corporate governance and our compliance with the Recommendations of the ASX Corporate Governance Council are described in our Corporate Governance Statement, which is available on our website at www.myob.com/CGS17.
BOARD DIVERSITY BOARD TENURE
Male 71%Female 29%
1 year or less 28%2-3 years 43%4 years or longer 29%
BOARD OF DIRECTORS
Chair: Justin MilneComposition: 7 Directors
RESPONSIBILITIES:
Integrity of financial reporting
Effectiveness of risk management framework and of systems of financial risk management and internal control
Internal and external audit scope and effectiveness
RESPONSIBILITIES:
Performance and remuneration of, and incentives for, the CEO and other senior executives
Remuneration strategies, practices and disclosures generally
Size and composition of the Board and new Board appointments
Board, Committee and Director performance
Board and senior executive succession planning
Chief Operating Decision Maker
Principal Board
Committees
REMUNERATION AND NOMINATION
COMMITTEE
Composition: 4 Directors
AUDIT AND RISK MANAGEMENT
COMMITTEE
Composition: 3 Directors
Business Review Other InformationDirectors’ Report Remuneration Report Financial Report
23MYOB ANNUAL REPORT 2017
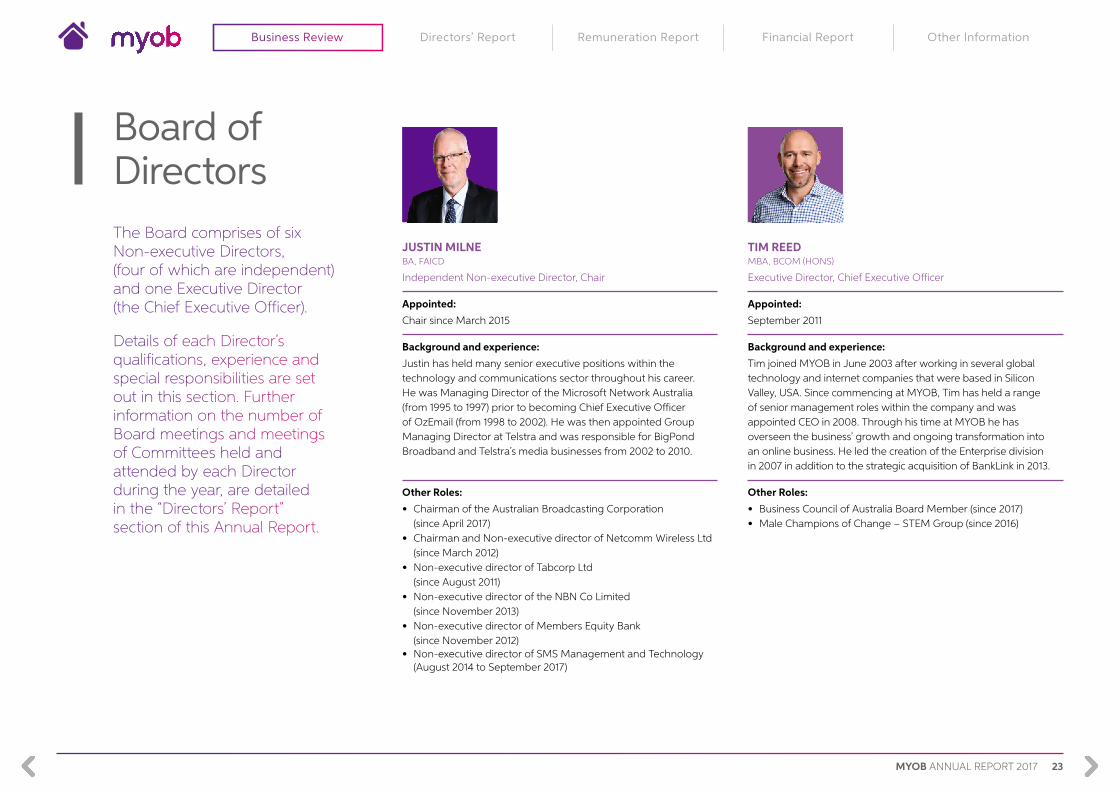
JUSTIN MILNE BA, FAICD
Independent Non-executive Director, Chair
Appointed:Chair since March 2015
Background and experience:Justin has held many senior executive positions within the technology and communications sector throughout his career. He was Managing Director of the Microsoft Network Australia (from 1995 to 1997) prior to becoming Chief Executive Officer of OzEmail (from 1998 to 2002). He was then appointed Group Managing Director at Telstra and was responsible for BigPond Broadband and Telstra’s media businesses from 2002 to 2010.
Other Roles:• Chairman of the Australian Broadcasting Corporation
(since April 2017)• Chairman and Non-executive director of Netcomm Wireless Ltd
(since March 2012)• Non-executive director of Tabcorp Ltd
(since August 2011)• Non-executive director of the NBN Co Limited
(since November 2013)• Non-executive director of Members Equity Bank
(since November 2012)• Non-executive director of SMS Management and Technology
(August 2014 to September 2017)
TIM REED MBA, BCOM (HONS)
Executive Director, Chief Executive Officer
Appointed:September 2011
Background and experience:Tim joined MYOB in June 2003 after working in several global technology and internet companies that were based in Silicon Valley, USA. Since commencing at MYOB, Tim has held a range of senior management roles within the company and was appointed CEO in 2008. Through his time at MYOB he has overseen the business’ growth and ongoing transformation into an online business. He led the creation of the Enterprise division in 2007 in addition to the strategic acquisition of BankLink in 2013.
Other Roles:• Business Council of Australia Board Member (since 2017) • Male Champions of Change – STEM Group (since 2016)
Board of DirectorsThe Board comprises of six Non-executive Directors, (four of which are independent) and one Executive Director (the Chief Executive Officer).
Details of each Director’s qualifications, experience and special responsibilities are set out in this section. Further information on the number of Board meetings and meetings of Committees held and attended by each Director during the year, are detailed in the “Directors’ Report” section of this Annual Report.
Other InformationBusiness Review Financial ReportDirectors’ Report Remuneration Report Other InformationDirectors’ Report Remuneration Report Financial Report

24 MYOB ANNUAL REPORT 2017
ANDREW STEVENS MCOM, BCOM, FCA
Independent Non-executive Director, Chair of the Audit and Risk Management Committee
Appointed:March 2015
Background and experience:Andrew has extensive experience in business and technology, most notably having held senior leadership roles at IBM and PwC. As the Managing Director, Australia and New Zealand at IBM (from 2011 to 2014), he led the transformation of the business to become a leader in cloud-based computing, helping blue chip clients to derive business benefits from new and emerging technologies. Prior to his senior roles at IBM, Andrew was Chief Operating Officer of PwC Management Consulting, Asia Pacific (from 2000 to 2002).
Other Roles:• Non-executive director of Stockland (since July 2017)• Non-executive director of Thorn Group Limited (since June 2015)• Non-executive director of the GWS Giants Football Club
(since 2012)• Non-executive director of the Australian Chamber Orchestra
(from 2011 to April 2017)• Chairman of Advanced Manufacturing Growth Centre Limited
(since 2015)• Director of Committee for Economic Development Australia
(CEDA) (since 2013)• Male Champion of Change (since 2011)
ANNE WARD BA, LLB, FAICD
Independent Non-executive Director, Chair of the Remuneration and Nomination Committee
Appointed:March 2015
Background and experience:Anne has wide-ranging experience as a commercial lawyer, advising major corporations on strategic transactions, mergers and acquisitions, capital markets, contract law and regulation and corporate governance. She was General Counsel (Australia and Asia) for National Australia Bank and was a corporate partner at two major Australian law firms, Minter Ellison and Herbert Geer. In 2013, Anne’s achievements were recognised when she was named one of Australia’s 100 Women of Influence by Westpac and the Australian Financial Review.
Other Roles:• Chairman and Independent director of Colonial First State
Investments Ltd, Avanteos Investments Limited and Colonial Mutual Superannuation Pty Ltd (since January 2013)
• Chairman and Non-executive director of Qantas Superannuation Limited (since April 2005)
• Chairman of Zoological Parks and Gardens Board of Victoria (since March 2013)
• Non-executive director of FlexiGroup Ltd (from January 2013 to August 2015)
• Member of RMIT University Council (since April 2015)
CRAIG BOYCE MBA, BSE, MSC
Non-executive Director
Appointed:September 2011
Background and experience:Craig is currently a Partner in the ALS Investment Fund which supports and finances biotech companies that develop disease modifying therapeutics for ALS (also called Motor Neuron or Lou Gehrig’s disease). Craig previously spent 18 years (1998 to 2016) at Bain Capital, where he served as Managing Director. In addition to MYOB, he was involved in a number of key investments by funds advised by Bain Capital, including: Retail Zoo, Uniview, RISE Education (NASDAQ: REDU), ChinaPnR, Gymboree China, Fleetcor (NYSE: FLT), Contec, Houghton Mifflin, and SuperPages Canada.
Other Roles:• Non-executive director of Retail Zoo Pty Ltd (from 2014 to 2016)
• Non-executive director of Chemigen (since 2008)
• Non-executive director of Fleetcor (from 2006 to 2010)
• Non-executive director of Contec (from 2008 to 2010)
Business Review Other InformationDirectors’ Report Remuneration Report Financial Report

25MYOB ANNUAL REPORT 2017
FIONA PAK-POY MBA, B.ENG (HONS)
Independent Non-executive Director
Appointed:January 2017
Background and experience:Fiona is a professional non-executive director with extensive experience in a variety of industries, principally in the technology sector, where she has been an executive, adviser and investor in businesses from high tech start-ups to ASX 50 and Fortune 500 companies. A qualified engineer, Fiona has had executive appointments with the Boston Consulting Group and international engineering firms, based in both Australia and the United States before being appointed as General Partner of Innovation Capital, a leading Australian venture capital fund manager (from 2002 to 2013).
Other Roles:• Non-executive director of Isentia Group (since May 2014)
• Non-executive director of the Securities Industry Research Centre of Asia Pacific (since November 2015)
• Member of the Biomedical Translation Fund Committee (since May 2016)
• Non-executive director of the Sydney School of Entrepreneurship (since December 2016)
• Non-executive director of Novotech Aus Holdco (since November 2017)
EDWARD HAN MBA, BA
Non-executive Director
Appointed:April 2017
Background and experience:Edward is a Managing Director of Bain Capital Private Equity LP and is based in Sydney. He joined Bain Capital in 1998 and has been involved in a number of key investments across a wide variety of sectors including technology, software, media, telecommunications, industrials and education. Prior to joining Bain Capital, Edward was a consultant at McKinsey & Company.
Other Roles:• Director of Only About Children Pty Ltd (since 2016)• Director of Camp Australia Pty Ltd (since 2017)• Chairman of Hugel, Inc. (since 2017)
PAUL EDGERLEY
Note: In April 2017, Paul Edgerley, (former Managing Director at Bain Capital from 1990 to 2016) stepped down from the MYOB Board of Directors. Paul held the position of Non-executive Director at MYOB since 2013.
Other InformationBusiness Review Financial ReportDirectors’ Report Remuneration Report Other InformationDirectors’ Report Remuneration Report Financial Report

26 MYOB ANNUAL REPORT 2017
I am pleased to present the Operating and Financial Review (OFR) for MYOB Group Limited for the year ended 31 December 2017. This OFR is designed to assist shareholders understand MYOB’s business performance and the factors underlying its results and financial position.
It complements the financial disclosures in the Annual Financial Report. The OFR covers the period from 1 January 2017 to 31 December 2017, including the comparative prior period.
Operational and Financial Review
Business Review Other InformationDirectors’ Report Remuneration Report Financial Report

27MYOB ANNUAL REPORT 2017
Operational and Financial Review
1. COMPELLING FINANCIAL RESULTS
MYOB has delivered a year of robust growth with revenue up 12 per cent, underlying EBITDA up 11 per cent, NPAT up 16 per cent and NPATA up 10 per cent from FY16. This performance is underpinned by revenue growth in all segments combined with prudent expense management, which has allowed increased investment in product and marketing year on year. MYOB’s strong cash generation has allowed a dividend of 5.75c per share to be declared for 2H17. Table 1 contains a high-level view of MYOB’s financial results. A detailed analysis of this performance is provided.
1.1 NPATA RESULTMYOB considers NPATA (net profit after tax and after adding back the tax effected amortisation expense related to acquired intangibles), rather than NPAT, to be a more meaningful measure of after tax profit due to the large amount of non-cash amortisation of acquired intangibles that is reflected in NPAT.
NPATA was $101.6 million against the result for FY16 of $92.4 million. The driver of improved NPATA against the result for FY16 was primarily increased EBITDA. NPATA grew at 10 per cent, broadly in line with the 11 per cent underlying and statutory EBITDA growth.
Table 1: Financial results
$M; 12 MONTHS ENDED 31 DECEMBER 2017 2016 V FY16
Revenue 416.5 370.4 12%Underlying EBITDA 189.9 171.4 11%Statutory EBITDA 182.2 164.3 11%NPAT 60.7 52.2 16%NPATA 101.6 92.4 10%
MYOB uses an underlying EBITDA measure to more meaningfully reflect the operational performance of the business. This measure excludes one-off and non-recurring expenses, which are predominantly transaction and integration costs from acquisitions. The reconciliation between statutory and underlying EBITDA is shown in Table 2 below.
1.2 RECONCILIATION FROM STATUTORY TO UNDERLYING EBITDA
Table 2: Reconciliation of statutory to underlying EBITDA
EBITDA
$M; 12 MONTHS ENDED 31 DECEMBER NOTE 2017 2016
Statutory Result 182.2 164.3 Acquisition transaction and integration costs 1 5.2 4.2 Offer related adjustments and other transaction costs 2 – 0.2 Business transformation one-off costs 3 1.2 0.9 Other non-recurring adjustments 4 – 1.7 (Gain)/loss on FX translation of intercompany loans 5 1.3 0.0Total one-off non-recurring adjustments 7.7 7.1 Underlying Result 189.9 171.4
Notes to Table 2:
1. An adjustment has been made to remove one-off transaction costs, redundancy and integration costs relating to the acquisitions of Ace Payroll, IMS, Greentree and Paycorp that were expensed in the FY16 and FY17 Statutory Results.
2. FY16 adjustment relates to the payment of final IPO-related fees. No expenses in FY17.
3. Adjustment to remove the impact of business transformation initiatives and costs including redundancy payments.
4. FY16 adjustment to reverse the impact of other one-off and non-recurring items that were expensed in the FY16 Statutory EBITDA relating to expenditure on the one-off MYOB brand transformation. No expenses in FY17.
5. Adjustment to remove the FX movement on intercompany loans between AU and NZ entities, which are not related to the underlying performance of the business.
REVENUE ($m) UNDERLYINGEBITDA ($m)
NPATA ($m)
FY16 FY16 FY16FY17 FY17 FY17
416
190 102370
171 92
12% 11% 10%
Other InformationBusiness Review Financial ReportDirectors’ Report Remuneration Report Other InformationDirectors’ Report Remuneration Report Financial Report
28 MYOB ANNUAL REPORT 2017
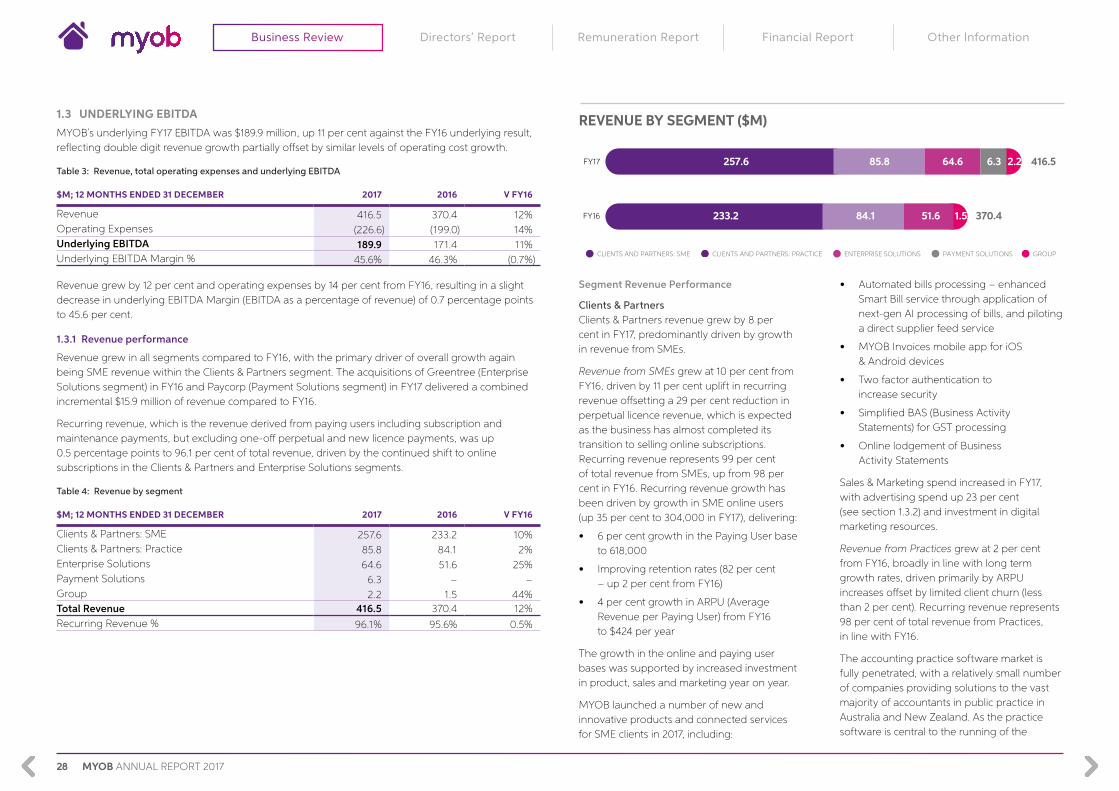
1.3 UNDERLYING EBITDAMYOB’s underlying FY17 EBITDA was $189.9 million, up 11 per cent against the FY16 underlying result, reflecting double digit revenue growth partially offset by similar levels of operating cost growth.
Table 3: Revenue, total operating expenses and underlying EBITDA
$M; 12 MONTHS ENDED 31 DECEMBER 2017 2016 V FY16
Revenue 416.5 370.4 12%Operating Expenses (226.6) (199.0) 14%Underlying EBITDA 189.9 171.4 11%Underlying EBITDA Margin % 45.6% 46.3% (0.7%)
Revenue grew by 12 per cent and operating expenses by 14 per cent from FY16, resulting in a slight decrease in underlying EBITDA Margin (EBITDA as a percentage of revenue) of 0.7 percentage points to 45.6 per cent.
1.3.1 Revenue performance
Revenue grew in all segments compared to FY16, with the primary driver of overall growth again being SME revenue within the Clients & Partners segment. The acquisitions of Greentree (Enterprise Solutions segment) in FY16 and Paycorp (Payment Solutions segment) in FY17 delivered a combined incremental $15.9 million of revenue compared to FY16.
Recurring revenue, which is the revenue derived from paying users including subscription and maintenance payments, but excluding one-off perpetual and new licence payments, was up 0.5 percentage points to 96.1 per cent of total revenue, driven by the continued shift to online subscriptions in the Clients & Partners and Enterprise Solutions segments.
Table 4: Revenue by segment
$M; 12 MONTHS ENDED 31 DECEMBER 2017 2016 V FY16
Clients & Partners: SME 257.6 233.2 10%Clients & Partners: Practice 85.8 84.1 2%Enterprise Solutions 64.6 51.6 25%Payment Solutions 6.3 – –Group 2.2 1.5 44%Total Revenue 416.5 370.4 12%Recurring Revenue % 96.1% 95.6% 0.5%
Segment Revenue Performance
Clients & PartnersClients & Partners revenue grew by 8 per cent in FY17, predominantly driven by growth in revenue from SMEs.
Revenue from SMEs grew at 10 per cent from FY16, driven by 11 per cent uplift in recurring revenue offsetting a 29 per cent reduction in perpetual licence revenue, which is expected as the business has almost completed its transition to selling online subscriptions. Recurring revenue represents 99 per cent of total revenue from SMEs, up from 98 per cent in FY16. Recurring revenue growth has been driven by growth in SME online users (up 35 per cent to 304,000 in FY17), delivering:
• 6 per cent growth in the Paying User base to 618,000
• Improving retention rates (82 per cent – up 2 per cent from FY16)
• 4 per cent growth in ARPU (Average Revenue per Paying User) from FY16 to $424 per year
The growth in the online and paying user bases was supported by increased investment in product, sales and marketing year on year.
MYOB launched a number of new and innovative products and connected services for SME clients in 2017, including:
• Automated bills processing – enhanced Smart Bill service through application of next-gen AI processing of bills, and piloting a direct supplier feed service
• MYOB Invoices mobile app for iOS & Android devices
• Two factor authentication to increase security
• Simplified BAS (Business Activity Statements) for GST processing
• Online lodgement of Business Activity Statements
Sales & Marketing spend increased in FY17, with advertising spend up 23 per cent (see section 1.3.2) and investment in digital marketing resources.
Revenue from Practices grew at 2 per cent from FY16, broadly in line with long term growth rates, driven primarily by ARPU increases offset by limited client churn (less than 2 per cent). Recurring revenue represents 98 per cent of total revenue from Practices, in line with FY16.
The accounting practice software market is fully penetrated, with a relatively small number of companies providing solutions to the vast majority of accountants in public practice in Australia and New Zealand. As the practice software is central to the running of the
REVENUE BY SEGMENT ($M)
233.2 84.1 51.6 1.5 370.4
CLIENTS AND PARTNERS: SME CLIENTS AND PARTNERS: PRACTICE ENTERPRISE SOLUTIONS GROUPPAYMENT SOLUTIONS
FY16
257.6 85.8 64.6 6.3 2.2 416.5FY17
Business Review Other InformationDirectors’ Report Remuneration Report Financial Report

29MYOB ANNUAL REPORT 2017
accounting practice, churn is low and hence overall growth rates are muted with new software sales making up less than 2 per cent of revenue.
In 2017, MYOB launched a number of new products for Practice clients, supporting our Connected Practice Strategy.
• In Transaction Processing, we continued to enhance our MYOB dashboard for Connected Ledger, Essentials and AccountRight Live clients by introducing indicators to show coding status and bank feed efficiency. We also increased the functionality of the portal to enhance Partner workflows and streamline collaboration.
• In Compliance, we continued to refine client accounting with online practice ledgers to provide efficient workflows for practices.
• In Advisory, we built connectors to Microsoft PowerBI to allow advisers to easily generate insights for their clients. We also partnered with a 3rd party to develop MYOB Adviser, a proprietary tool utilising Natural Language Processing which helps advisers start advisory conversations with their clients, which will be launched early in 2018.
Enterprise SolutionsEnterprise Solutions revenue grew 25 per cent from FY16, of which 18 per cent was driven by a full year of revenue from the acquisition of Greentree in August 2016. Aside from acquisitions, underlying revenue was up 7.5 per cent from FY16.
This growth rate was lower than that in FY16 due to the impact of the shift from selling up-front desktop software licences (MYOB Exo) to online subscriptions (MYOB Advanced). Recurring revenue grew 11 per cent in FY17 and now
represents 81 per cent of Enterprise Solutions total revenue, up from 80 per cent in FY16.
During 2017, MYOB launched the following new solutions for Enterprise Solutions clients:
• Advanced People – a cloud payroll solution for bigger businesses.
• Improved analytics for Advanced Business with new dashboard & reporting features and integration with Microsoft Power BI.
• Streamlined workflows for wholesale distribution businesses using Advanced Business.
• Mobile interfaces for remote staff using Greentree.
Payments SolutionsPayments Solutions revenue was $6.3 million for the nine months to 31 December 2017, from the April acquisition of Paycorp. Further revenue from MYOB’s PayDirect Online invoicing solution for SMEs is included in Clients & Partners SME revenue. Since the acquisition, MYOB has:
• Fully integrated the Paycorp team into MYOB’s dedicated Payment Solutions division.
• Enhanced the team with payments-specific expertise in product management, business development and technical delivery.
• Expanded its transactional relationship with major financial institutions and payment providers.
The MYOB Payment Solutions team have launched additional functionality for clients, including:
• Improved security through 3DSecure for PayDirect Online customers.
• Delivered numerous enhancements for enterprise clients, including a dynamic surcharging module and improved fraud management.
GroupGroup revenue relates to grant income received in New Zealand, totalling $2.2 million in FY17, up $0.7 million from FY16.
1.3.2 Operating expenses
Operating expenses grew by 14 per cent from FY16 to $227 million.
Cost of goods sold increased by 22 per cent from FY16, driven by increased hosting costs for MYOB’s online solutions, which are becoming a greater proportion of the overall subscriber base over time. It also reflects increased COGS from acquisitions, especially those relating to Paycorp, which operates a higher COGS/lower opex model than the other MYOB segments.
Aside from COGS, operating expenses grew by 12 per cent, in line with revenue growth.
Sales and marketing expenses increased by 10 per cent, due to increased investment in digital sales and marketing headcount as well as increased advertising spend (up 23 per cent) to support the launch of the new MYOB brand in the first half.
Services and support costs increased by 17 per cent, driven by increased investment in people and technology in the customer support contact centre, and services delivered to accountants and partners.
Research and development expenses increased by 12 per cent, and overall R&D spend was up 21 per cent on FY16. (see section 1.3.3).
General office and administration costs increased by 13 per cent in FY17 due to additional costs from acquisition and investment in people-related initiatives.
All five expense categories include increases due to having a full year of ongoing expenses from the Greentree acquisition which occurred in August 2016, and nine months of expenses from the Paycorp acquisition (April 2017).
Table 5 outlines operating expenses and their composition.
Table 5: Operating expenses
$M; 12 MONTHS ENDED 31 DECEMBER 2017 2016 V FY16
Cost of Goods Sold 35.9 29.4 22%Sales & Marketing 82.1 74.4 10%Services & Support 34.7 29.6 17%Research & Development 32.5 28.9 12%General Office / Admin 41.4 36.7 13%Total Operating Expenses 190.6 169.6 12%Total COGS + Opex 226.6 198.9 14%
Other InformationBusiness Review Financial ReportDirectors’ Report Remuneration Report Other InformationDirectors’ Report Remuneration Report Financial Report

30 MYOB ANNUAL REPORT 2017
1.3.3 Research and development expenditure
Research and development (R&D) costs are primarily staff-related. In FY17 they were 16.3 per cent of revenue, up from 15.1 per cent in FY16.
In FY17 incremental investment was focused on the MYOB Platform, including the new products and features referenced in section 1.3.1. The MYOB accounting policy is to expense R&D on existing products, and capitalise R&D costs related to new products that have not been released in the market and have not generated any revenue, in order to match the timing of the recognition of the expense and associated revenue. As such, much of these incremental costs were capitalised rather than expensed.
This resulted in a higher capex/opex ratio in FY17 (52 per cent) than FY16 (48 per cent). For FY18 we expect investment levels (excluding Reckon integration funded investment) to remain approximately 16 per cent of revenue and for capex to make up between 50 per cent and 55 per cent of the total.
Table 6: Research and development spend
$M; 12 MONTHS ENDED 31 DECEMBER 2017 2016 V FY16
Expensed research and development 32.5 28.9 12%Capitalised research and development 35.3 27.2 30%Total 67.8 56.0 21%R&D as a percentage of revenue 16.3% 15.1% 1.1%
1.3.4 Other expenses below EBITDA
Other expenses below statutory EBITDA primarily relate to depreciation and amortisation of capitalised R&D, amortisation of acquired intangibles, funding costs and tax. Table 7 outlines other expenses below EBITDA and their composition.
Table 7: Other expenses below EBITDA
$M; 12 MONTHS ENDED 31 DECEMBER 2017 2016 V FY16
Statutory EBITDA 182.2 164.3 11%Depreciation/software amortisation (22.3) (18.4) 21%
EBITA 159.9 146.0 10%Amortisation of acquired intangibles (58.4) (57.4) 2%
EBIT 101.4 88.5 15%Net interest expense (13.6) (14.8) (8%)Share of losses from equity accounted investments (2.4) (2.6) (10%)
PBT 85.5 71.1 20%Tax expense (24.8) (19.0) 31%
NPAT 60.7 52.2 16%D&A add back (tax effected) 40.9 40.2 2%
NPATA 101.6 92.4 10%
Depreciation/software amortisation increased by 21 per cent in FY17 due to increased levels of R&D capitalisation over the past two years, driven by the shift in spend to new online solutions in all segments.
Amortisation of acquired intangibles increased by 2 per cent due to amortisation of intangible assets from new acquisitions offsetting certain intangible asset categories being fully amortised.
Net interest expense decreased by 8 per cent due to the lower interest rate environment in FY17.
Share of losses from equity accounted investments reduced by 10 per cent in FY17 due to the improved year on year financial performance from both OnDeck Australia and Kounta.
The effective tax rate in FY17 was 29 per cent, (statutory 30 per cent) due to R&D tax rebates claimed in the Australian tax group. Tax expense increased by 31 per cent in FY17 due to the 19 per cent increase in PBT (profit before tax) and the phasing of the R&D tax rebates noted above.
D&A (depreciation & amortisation) add back (tax effected) is 70 per cent of the non-cash amortisation of acquired intangibles, which is added back to NPAT to determine NPATA, hence has moved in line with the amortisation of acquired intangibles (up 2 per cent on FY16).
OPERATING EXPENSES ($M)
FY15 23.5 174.935.7
FY16 29.4 74.4 198.936.729.6 28.9
FY17 35.9 82.1 226.641.434.7 32.5
62.7 26.526.5
RESEARCH &DEVELOPMENT
GENERAL OFFICE/ADMINISTRATION
SERVICE &SUPPORT
SALES &MARKETING
COST OF GOODS SOLD
Business Review Other InformationDirectors’ Report Remuneration Report Financial Report

31MYOB ANNUAL REPORT 2017
2. STRONG BALANCE SHEET AND HIGH CASH FLOW CONVERSION
MYOB has a stable base for future growth with a strong balance sheet and high cash flow conversion.
2.1 MYOB BALANCE SHEET
Table 8: MYOB’s summary Balance Sheet
$M; AS AT 31 DECEMBER 2017 2016
Assets Current assets
Cash and cash equivalents 54.8 61.4 Other current assets 45.6 34.8
Total current assets 100.4 96.3
Non-current assets Intangible assets & goodwill 1,256.6 1,245.4 Other non-current assets 42.9 45.2
Total non-current assets 1,299.5 1,290.5 Total assets 1,399.9 1,386.8
Liabilities Current liabilities
Unearned revenue 50.0 49.7Other current liabilities 50.7 41.7
Total current liabilities 100.7 91.5
Non-current liabilities –Interest-bearing loans and borrowings 432.5 434.8 –Other non-current liabilities 22.2 6.0
Total non-current liabilities 454.7 440.8 Total liabilities 555.4 532.3 Net assets 844.4 854.5
Equity Contributed equity 1,141.6 1,141.4 Retained earnings (304.8) (356.2)Reserves 7.7 69.3
Total equity 844.4 854.5
The cash balance decreased by $6.6 million during FY17 due to the acquisition of Paycorp in April 2017 together with the payment of two dividends during the year, offsetting strong cash generation from the operations of the business.
The net current asset position (current assets less current liabilities) is slightly negative in FY17 ($0.3 million) due to the decrease in cash noted above.
Intangible assets increased in FY17 due to increased goodwill associated with the acquisition of Paycorp mostly offset by their continued amortisation.
The debt position is in line with FY16, with the $2.3 million decrease entirely driven by AU/NZ FX movements.
Contributed equity was stable in FY17 and retained earnings improved, reflecting the $60 million net profit after tax for FY17.
2.2 MYOB CASH FLOW GENERATIONCash conversion in FY17 was 72 per cent, slightly below FY16 due to higher levels of capital expenditure (both R&D and other) in FY17. Table 9 shows MYOB’s cash flow conversion.
Table 9: MYOB’s free cash flow conversion
$M; 12 MONTHS ENDED 31 DECEMBER 2017 2016
Underlying EBITDA 189.9 171.4 Non-cash items in EBITDA 0.7 0.4 Change in net working capital (1.8) (3.1)Operating free cash flow before capital expenditure 188.8 168.6 Research and development capex (35.3) (26.9)PPE and other capital expenditure (15.8) (9.2)Net free cash flow before financing, tax and dividends 137.7 132.5 Cash conversion % 72% 77%
Operating free cash flow before capital expenditure increased by $20.2 million, or 12 per cent, from FY16, in line with higher underlying EBITDA and positive movement in net working capital.
Change in net working capital is $1.3 million positive from FY16, due to movements in prepayment and trade creditor balances.
The majority of capital expenditure spend is R&D, which made up $35.3 million of $51.1 million total capex in FY17 (69 per cent), up 31 per cent on FY16. Other capex increased from $9.2 million in FY16 to $15.8 million in FY17, due to IP purchases linked to the Greentree acquisition and increased Property, Plant and Equipment spend.
2.3 MYOB DEBT LEVELSTable 10 compares the indebtedness of MYOB as at 31 December 2017 and 31 December 2016.
Table 10: MYOB indebtedness as at 31 December 2017 compared to 31 December 2016
$M; AS AT 31 DECEMBER 2017 2016
Interest bearing loans and borrowings 432.5 434.8 Cash and cash equivalents (54.8) (61.4)Net indebtedness 377.7 373.3 Debt ratios:Net debt / underlying EBITDA 1.99x 2.18xInterest coverage (underlying EBITDA / net interest costs) 13.96x 11.59x
The financial covenants contained in the facility agreement outlined in the IPO prospectus were tested as at 31 December 2017 and show significant headroom.
Other InformationBusiness Review Financial ReportDirectors’ Report Remuneration Report Other InformationDirectors’ Report Remuneration Report Financial Report
32 MYOB ANNUAL REPORT 2017
3. MYOB STRATEGY
The key pillars of MYOB’s growth strategy are:
Accelerate growth in existing markets
1. Growing online subscribers
2. Increasing lifetime value of those subscribers
Penetrate new markets already opened
3. Increase TAM (Total Addressable Market) through Payments
4. Increase share and TAM in Enterprise
Strengthen core and new TAM 5. Strategic acquisition opportunities
3.1 GROWING ONLINE SUBSCRIBERS
3.1.1 Winning advisers through the Connected Practice Vision
MYOB has embarked upon a strategy to deliver seamless connectivity between the SME, advisers and the broader accounting ecosystem through the building of an intelligent, intuitive platform. This creates efficiencies in compliance and transaction processing, and enables growth in advisory services.
Historically these three core processes have been completed in sequence, with transactions processed by SME accounting systems, compliance work undertaken by the accountant using a bespoke accounting practice suite of tools, and advice being offered to their clients after the first two processes are complete.
The Connected Practice vision allows these three processes to run concurrently, and delivers a strong value proposition to accountants in practice, which is expected to drive adoption of online practice solutions and encourage referral of MYOB’s SME solutions by accountants.
The aim of the Connected Practice vision is both to automate the accountants’ processes and collaboration tools, and to increase their clients’ (SMEs) adoption of online accounting. For the accountant, this expands business opportunities and lowers cost of production, and should deliver higher levels of referrals of online SME solutions by accountants which will help MYOB gain higher online penetration and market share.
3.1.2 Increased referrals through the MYOB Platform
Adoption of online accounting software by small to medium businesses is estimated at less than 40 per cent, compared to desktop accounting software penetration of greater than 70 per cent, which has taken 30 years to achieve. Current online penetration levels provide a large opportunity for MYOB to grow its online user base through increasing numbers of paying users.
MYOB has grown its online SME user base by 79,000 to 304,000 in 2017, up 35 per cent from prior year. This has contributed to a total SME paying user base increase of 33,000 to 618,000 in 2017, up 6 per cent year on year, which is a key driver of the increase in SME revenue (See section 1.3.1).
In 4Q17, 94 per cent of new MYOB SME clients chose online subscriptions, up from 92 per cent in 4Q16, resulting in online users now making up 49 per cent of MYOB’s SME paying user base (up from 38 per cent in FY16).
MYOB has invested in the MYOB Platform to drive the uptake of online accounting solutions amongst SMEs and accountants, with total online subscriptions (SME and Practice) up 60 per cent year on year to 399,000 in December 2017.
Online subscriptions growth is expected to further accelerate in 2018 with momentum building for Practice Ledger and Connected Ledger.
MYOB continues to invest in product innovation to enable MYOB to offer a differentiated and competitive product offering. In FY17 MYOB invested 16.3 per cent of revenue on R&D.
A significant portion of the 2017 R&D spend has been focused on the development of the MYOB Platform including further enhancements to the online Practice Ledger and Connected Ledger (online version of BankLink), both of which launched during 2016.
New products and features launched in 2017 which have helped drive online adoption include additional features for online solutions for accountants and SME’s launched in prior years, including:
• Portal – An online collaboration platform that enables an accountant to securely share documents with their clients and take digital signature approvals, even when they are mobile. In December 2017, >150,000 clients were using portal, up >180 per cent on December 2016
• Dashboard – A powerful single view for an accountant to interact with their clients online. Dashboard allows an accountant to manage their clients’ data in real time from a single screen. In 2017 the Dashboard was upgraded to allow access to both Essentials and AccountRight client files
• Practice Ledger – The online replacement for ledgers within the desktop practice suite. 95,000 practice ledgers are being used in December 2017, up almost 400 per cent from the prior year
• Connected Ledger – The online solution for clients where the accountant does all the transaction processing, replacing BankLink. Connected Ledger enables collaboration between the accountant and SME and includes bank feeds to simplify the accountant’s workflows.
Business Review Other InformationDirectors’ Report Remuneration Report Financial Report
33MYOB ANNUAL REPORT 2017
As noted in section 1.3.3 investment in existing products (expensed) grew by 12 per cent in 2017, but investment in the platform (capitalised) increased by 30 per cent. Continued investment in the MYOB Platform will result in investment remaining at approximately 16 per cent of revenue in FY18 (excluding any investment funded by the Reckon integration fund).
3.1.3 Investment in Sales, Marketing and Brand to attract new SME’s
To attract new clients whilst retaining and upgrading our existing base, we have invested in a Brand Transformation and Repositioning strategy. This work commenced in 2016, and extended through 2017, where we invested in marketing activities across all touchpoints, to ensure high awareness of new MYOB online products (continuing to move perceptions away from a brand known for desktop accounting software to a tech company offering a range of online accounting solutions).
MYOB has also strengthened its Executive and Board ranks in 2017, adding:
• Helen Lea, who joined MYOB in June 2017 as Chief Employee Experience Officer. Helen has worked in human resources, talent and performance, organisational culture and transformation advisory roles in a variety of sectors, including most recently Executive Director – Organisational Development and Enterprise Services at Telstra.
• Hugh Fahy, who joined in June 2017 as General Manager, Engineering. Hugh has held a number of technology leadership roles in telecoms, gaming and eCommerce including most recently Group CTO of Net-A-Porter. Hugh replaced Adam Ferguson, who left MYOB after 13 years in total, and after 2 years as General Manager, Engineering & Experience.
• Ed Han, who joined MYOB in April 2017 as a non-executive director. Ed is a Managing Director of Bain Capital Private Equity LP, based in Sydney. Ed has worked for Bain Capital since 1998 and has been involved in key investments by funds in technology hardware, technology software, media, telecommunications and education sectors.
3.1.4 Migrating non-paying desktop clients to the MYOB Platform
MYOB has a history of providing clients with significant enhancements, such as the provision of bank feeds, the Smart Bills service, PaySuper and improved workflows.
The continued enhancements to online products has resulted in an increased rate of migration of MYOB’s active non-paying SME base, with penetration up >40 per cent over the past year to 10 per cent in 2017.
3.2 INCREASING LIFETIME VALUE
3.2.1 Price uplift from new functionality including AI and machine Learning
As noted in section 1.3.1, ARPU from SME products increased from $406 in FY16 to $424 in FY17 due to increased prices (approximately 5 per cent) slightly offset by a shift in sales to lower-ARPU products such as the Connected Ledger (compared to Essentials and AccountRight).
From 2013 to 2017 MYOB has increased ARPU from SME products by, on average, 5 per cent per annum (from $351 p.a. to $424 p.a.) driven by similarly sized annual price rises. These price rises reflect the increased functionality delivered into the products over time, and have come at the same time as a continued improvement in client retention (see section 3.2.3).
MYOB intends to drive growth in average revenue per paying user and increased retention by providing enhanced product functionality and additional value to clients enabling percentage price increases in line with historical experience (which have been in the mid-single digit percentages).
3.2.2 Increased usage of connected services
MYOB believes that there is a significant opportunity to drive incremental revenue through growing sales of connected services:
• invoicing, payments and debtor management: integrated invoicing, payments and debtor management solutions to help SMEs manage cash flows and reduce manual processing;
• data analysis: analysis of aggregated data and provision of advice to clients on ways to improve their business management or recommend add-on products of interest and value (e.g. SME insurance and lending);
• additional services: MYOB believes there are also other opportunities to develop and offer additional services to SMEs that address existing business issues (including reaching new customers or reducing the cost of major categories of expenditure)
Uptake of online connected services was higher in FY17 when compared to FY16:
• 35 per cent increase in monthly bank transactions fed into online solutions
• 60 per cent increase in Smart Bills processed per month
• >100 per cent increase in monthly PayDirect Online transactions
3.2.3 Improved retention
SME paying user retention rates have improved from 80 per cent in 2016 to 82 per cent in 2017. This is the largest increase that has been seen in the past four years and reflects the impact of the greater online mix (making up 49 per cent of SME paying users). SMEs who use one or more online features (Bank feeds, Smart Bills, online invoicing, etc.) show significantly higher retention levels than those who do not.
3.3 INCREASING TAM THROUGH PAYMENTS
3.3.1 Increase per client usage of MYOB PayDirect
MYOB’s PayDirect Online solution allows SMEs to raise an online invoice from their software or mobile device, and email it instantly to a customer. When their customer views the invoice, they can pay it online directly via a “pay now” button embedded in the online invoice. As it is fully integrated into the accounting software, once the payment is finalised the accounts are updated automatically, saving SME’s time on manual data entry.
PayDirect Online is available as a native feature in MYOB’s online accounting solutions so users are not required to sign up to a third-party service. On average, an SME using PayDirect Online gets paid within 10 days, a reduction of more than 70 per cent (or more than 30 days) from those using a paper or pdf invoice.
In the next 12 months, MYOB intends to launch PayDirect Online in New Zealand which will allow NZ customers to use the same payment services.
MYOB will also be implementing enhanced risk and fraud management systems and processes that will allow MYOB to better manage risk so that it can offer payment services to a broader section of its customer base.
Other InformationBusiness Review Financial ReportDirectors’ Report Remuneration Report Other InformationDirectors’ Report Remuneration Report Financial Report

34 MYOB ANNUAL REPORT 2017
3.3.2 Increased per client usage of PayDirect through new payment types
Currently PayDirect Online offers payment by Visa and MasterCard only. Over the next 12 months, MYOB intends to roll out other payment types, including Bpay, American Express, POLi and China Union Pay as well as an MYOB eWallet, which will increase customer choice and per client usage.
3.3.3 Expand Paycorp client base
In April 2017, MYOB acquired Paycorp, a payments service provider that provides the back-end payment processing services for MYOB’s PayDirect online service. The acquisition of Paycorp provided MYOB with Paycorp’s wholesale payment products and margins.
MYOB also inherited major client relationships with the acquisition of Paycorp, such as Vodafone, Telstra, Bank of New Zealand and GraysOnline. Over the next 12 months, MYOB intends to deliver new payment offerings for these clients, and plans to offer core payments services to new enterprise clients, including gateway services, merchant services, alternate payment types, fraud screening and payment terminals.
3.4 INCREASING SHARE AND TAM IN ENTERPRISE
3.4.1 Increased share in Tier 3 with MYOB Advanced
MYOB Enterprise Solutions offer business management solutions to larger enterprises, in both Tier 3 (business with 50–300 employees) and Tier 2 (300–1,000 employees).
Over the past three years, MYOB has expanded its Enterprise business by driving growth through its first-to-market cloud solution, complemented with inorganic growth.
MYOB’s market-leading cloud Enterprise Resource Planning (ERP) solution, MYOB Advanced, was launched in 2015 and has achieved rapid success in the market. MYOB Advanced has enabled MYOB to increase its absolute number of new client adds in the ANZ market, and in 2017, MYOB Advanced outsold the desktop MYOB EXO solution, a remarkable achievement just two years after launch.
In 2017, MYOB launched the HR Management (HRM) module of MYOB Advanced, and continues to develop its feature set, further increasing the opportunity to grow MYOB’s addressable market in the Enterprise segment.
3.4.2 Migrate existing Tier 3 desktop clients online
As MYOB Advanced becomes the main ERP solution for MYOB’s new enterprise clients, the opportunity also exists to start migrating existing desktop (Exo) clients to MYOB Advanced.
3.4.3 Increased TAM by providing solutions for larger (Tier 2) Enterprises
In 2014 and 2016, MYOB acquired two Tier 2 Enterprise business management solutions, both offering the opportunity for MYOB to expand into larger Enterprise clients:
• PayGlobal – acquired in August 2014, PayGlobal offers on-premise HRM solutions for larger (>500 FTE) businesses. The PayGlobal acquisition has delivered a highly profitable business and the opportunity to bring the MYOB Advanced HRM system to a larger market.
• Greentree – acquired in August 2016, Greentree offers on-premise ERP solutions for larger (>500 FTE) businesses. The Greentree acquisition has provided further Tier 2 ERP clients, together with new channels to market via larger Value Added Resellers (VARs), but with the focus on ERP, rather than HRM enterprise solutions.
The expanded MYOB Enterprise Solutions business has been recognised by iStart as the #1 ERP vendor in Australia and New Zealand, based on sites installed.
3.5 STRATEGIC ACQUISITION OPPORTUNITIES
3.5.1 Targeted acquisitions within our core business
In November 2017, MYOB announced that it had entered into a purchase agreement to acquire the assets of the Accountant Group in Australia and New Zealand from Reckon Limited. Highlights of the acquisition include:
• Reckon’s Accountant Group provides practice software solutions to more than 3,000 accounting practices in Australia and New Zealand through three product lines; Reckon APS, Reckon Elite and Reckon Docs.
• The acquisition would strengthen MYOB’s growing adviser base, creating an opportunity to accelerate online SME growth via a larger referral network.
• The acquisition would enable MYOB to accelerate the development of its online practice suite to bring all MYOB advisers online faster and provide an online migration path for Reckon’s Accountant Group clients.
• The transaction will be funded by a committed debt facility and is subject to regulatory approval from both the ACCC and NZCC, and other customary closing conditions.
3.5.2 New investment opportunities which leverage our core business and increase TAM
MYOB continues to review the market for potential acquisition targets in all segments.
Business Review Other InformationDirectors’ Report Remuneration Report Financial Report

35MYOB ANNUAL REPORT 2017
4. PROACTIVELY MANAGED RISKS
MYOB deals with a variety of business risks, which it actively assesses and manages as part of its risk management framework. MYOB’s core risks and the way they are managed are described below. This is not a comprehensive list of the risks involved or the mitigating actions that have been adopted.
4.1 STRATEGIC RISKMYOB has a clear strategy to ensure the continued growth of the organisation (refer to section 3 for further information). MYOB’s strategic direction, together with its ability to successfully execute on that strategy, is critical to its future success.
MYOB devotes a significant amount of time and resources to developing, monitoring and reviewing its strategic direction. This process involves a number of activities, including:
• dedicated strategy days at Board and Executive level;
• regular engagement with external subject matter experts and consultants; and
• ongoing monitoring and review of strategy by an in-house strategy team and others within the organisation.
MYOB is confident that its thorough approach to the development, review and execution of its strategy greatly reduces its risk in this area.
4.2 RISK TO SECURITY AND INTEGRITY OF SENSITIVE INFORMATION
MYOB’s products involve the storage and transmission of its clients’ proprietary information, including personal or identifying information regarding their employees, clients and suppliers, as well as their finance and payroll data.
MYOB systems are architected, built and managed to reduce the potential for security or data privacy breaches. MYOB’s hosting partners use highly secure, fully redundant data centres and penetration testing is undertaken regularly, as is disaster recovery planning and testing.
4.3 INTEGRATION OF ACQUIRED BUSINESSES AND EXECUTION OF NEW ACQUISITIONS
MYOB maintains a register of potential strategic acquisitions and investment opportunities. Acquisitions and investments have risk around financial value creation. MYOB has successfully acquired and integrated many businesses over the past few years and created value by following a disciplined process.
The process includes initial strategic and financial analysis, due diligence and contract execution which MYOB undertakes in conjunction with its accounting and legal advisers. Once a business is acquired, MYOB has a robust process covering people, systems, products and clients to ensure the acquired business delivers on or exceeds the expected financial and operational results.
MYOB has applied (and will continue to apply) its well established and proven processes in relation to its proposed acquisition of the Accountant Group assets in Australia and New Zealand from Reckon Limited.
4.4 RELIANCE ON CORE AND THIRD PARTY IT INFRASTRUCTURE
MYOB and its cloud users are dependent on the performance, reliability and availability of MYOB’s technology platforms, third party data centres and global communications systems including servers, the internet, hosting services and the cloud environment in which it provides its products.
MYOB uses Microsoft Azure and Amazon Web Services for the provision of data centres for its key online products, and MYOB core systems are hosted in an external data centre managed by Interactive Pty Ltd. These partners host this data in highly secure, fully redundant data centres, and MYOB’s communications infrastructure is similarly secure. MYOB’s relationships with these providers are designed to maximise reliability and connectivity, with ongoing systems testing and monitoring.
4.5 ABILITY TO ATTRACT AND RETAIN KEY PERSONNEL
MYOB’s ongoing success depends on its ability to attract and retain appropriately skilled personnel. MYOB continues to develop leadership, learning, development and engagement initiatives to drive and deliver a results-oriented and high-engagement culture. This high-performance culture engages, empowers and connects MYOB’s people to drive business success.
As a tech employer of choice, MYOB is also proud to offer employees the opportunity to work in state of the art work spaces which facilitate agile work practices, including the MYOB innovation hub in Richmond, Victoria, which MYOB will double in size in 2Q18.
4.6 SENSITIVITY TO CHANGES IN POLITICAL AND REGULATORY ENVIRONMENTS
MYOB’s business is influenced and affected by laws, accounting standards and government policy in Australia and New Zealand. MYOB works closely with the ATO and IRD, has a team who monitor relevant changes in laws, accounting standards and government policies, and also works with accountant partners to ensure products and services are compliant at all times.
5. FY18 OUTLOOK
The Connected Practice vision, together with the development of the MYOB Platform, is expected to accelerate online subscriber growth in 2018.
We expect organic revenue growth to remain in the 8%–10% range, with EBITDA margins of 43%–45%. Including the acquisition of Reckon Accountant Group assets (assuming a 2Q18 acquisition date) total revenue growth is expected to be 14%–16%, with EBITDA margins of 41%–43%.
We expect FY18 R&D investment to be approx. 16% of revenue.
We will continue to pursue growth and investment opportunities whilst maintaining capital efficiency. With the acquisition of Reckon’s Accountant Group assets, we expect transaction and integration costs (including accelerating Platform development) to be in the range of $15 million to $20 million in FY18.
Other InformationBusiness Review Financial ReportDirectors’ Report Remuneration Report Other InformationDirectors’ Report Remuneration Report Financial Report
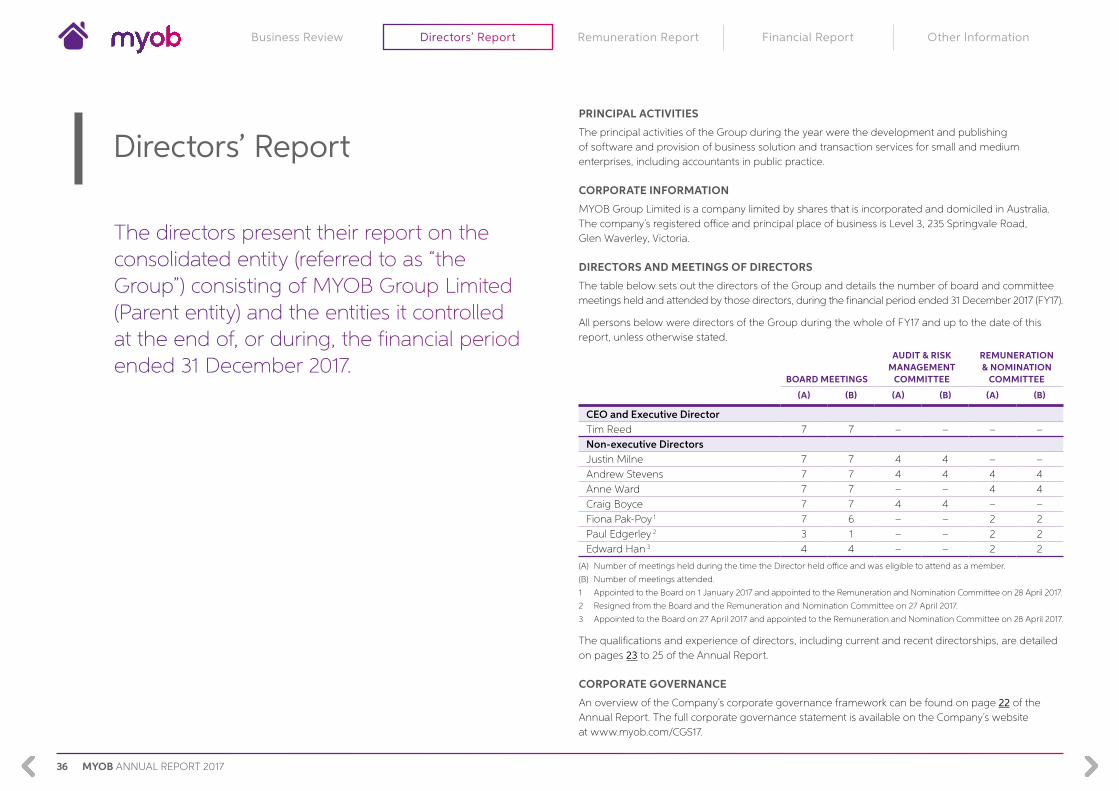
36 MYOB ANNUAL REPORT 2017
PRINCIPAL ACTIVITIES
The principal activities of the Group during the year were the development and publishing of software and provision of business solution and transaction services for small and medium enterprises, including accountants in public practice.
CORPORATE INFORMATION
MYOB Group Limited is a company limited by shares that is incorporated and domiciled in Australia. The company’s registered office and principal place of business is Level 3, 235 Springvale Road, Glen Waverley, Victoria.
DIRECTORS AND MEETINGS OF DIRECTORS
The table below sets out the directors of the Group and details the number of board and committee meetings held and attended by those directors, during the financial period ended 31 December 2017 (FY17).
All persons below were directors of the Group during the whole of FY17 and up to the date of this report, unless otherwise stated.
BOARD MEETINGS
AUDIT & RISKMANAGEMENT
COMMITTEE
REMUNERATION & NOMINATION
COMMITTEE
(A) (B) (A) (B) (A) (B)
CEO and Executive DirectorTim Reed 7 7 – – – –Non-executive DirectorsJustin Milne 7 7 4 4 – –Andrew Stevens 7 7 4 4 4 4Anne Ward 7 7 – – 4 4Craig Boyce 7 7 4 4 – –Fiona Pak-Poy 1 7 6 – – 2 2Paul Edgerley 2 3 1 – – 2 2Edward Han 3 4 4 – – 2 2
(A) Number of meetings held during the time the Director held office and was eligible to attend as a member.
(B) Number of meetings attended.
1 Appointed to the Board on 1 January 2017 and appointed to the Remuneration and Nomination Committee on 28 April 2017.
2 Resigned from the Board and the Remuneration and Nomination Committee on 27 April 2017.
3 Appointed to the Board on 27 April 2017 and appointed to the Remuneration and Nomination Committee on 28 April 2017.
The qualifications and experience of directors, including current and recent directorships, are detailed on pages 23 to 25 of the Annual Report.
CORPORATE GOVERNANCE
An overview of the Company’s corporate governance framework can be found on page 22 of the Annual Report. The full corporate governance statement is available on the Company’s website at www.myob.com/CGS17.
Directors’ Report
The directors present their report on the consolidated entity (referred to as “the Group”) consisting of MYOB Group Limited (Parent entity) and the entities it controlled at the end of, or during, the financial period ended 31 December 2017.
Other InformationRemuneration ReportDirectors’ ReportBusiness Review Financial Report

37MYOB ANNUAL REPORT 2017
COMPANY SECRETARY
The Company Secretary is Ian Boylan. Ian joined the Group in June 2006 as Corporate Counsel and has held the positions of General Counsel and Company Secretary since January 2011. Prior to joining the Group, Ian was a legal counsel at IAG. Ian is a solicitor and was admitted to practice whilst working for Eversheds LLP in England. He was admitted to practice in Australia whilst working for Minter Ellison in Melbourne. Ian has a Bachelor of Laws (Honours) from Nottingham Trent University, England.
OFFICERS
The names and roles of other Officers of the Company during FY17 are shown in section 1 “Key Management Personnel” of the Remuneration Report on page 40 of the Annual Report.
INSURANCE OF OFFICERS
During the financial period, MYOB Group Limited entered into Deeds of Indemnity and paid a premium to insure the directors, officers and managers of the Company and its controlled entities. The terms of the insurance contract require that the amount of the premium paid be kept confidential.
AUDITOR AND NON-ASSURANCE SERVICES
PricewaterhouseCoopers (PwC) continues in office in accordance with section 327 of the Corporations Act 2001.
It is the Group’s policy to engage PwC on assignments additional to their statutory audit duties where their expertise and experience with the Group are important. These assignments are principally due diligence reporting on acquisitions and tax advice.
Details of the amounts paid or payable for non-assurance services by PwC are disclosed in Note 22 “Auditor’s remuneration” to the Financial Statements.
The Board of Directors has considered the position and, in accordance with the advice received from the Audit and Risk Management Committee, is satisfied that the provision of the non-assurance services is compatible with the general standard of independence for auditors imposed by the Corporations Act 2001.
The directors are satisfied that the provision of non-assurance services by the auditor did not compromise the auditor independence requirements of the Corporations Act 2001 for the following reasons:
• all non-assurance services have been reviewed by the Audit and Risk Management Committee to ensure they do not impact the integrity and objectivity of the auditor; and
• none of the services undermine the general principles relating to auditor independence as set out in APES 110 Code of Ethics for Professional Accountants.
A copy of the Auditor’s Independence Declaration as required under section 307C of the Corporations Act 2001 is set out on page 48 of the Annual Report.
PROCEEDINGS ON BEHALF OF THE COMPANY
No proceedings have been brought or intervened in on behalf of the Company, nor have any applications for leave to do so been made in respect of the Company, under section 237 of the Corporations Act 2001.
ENVIRONMENTAL REGULATION
The operations of the Group are not subject to any particular or significant environmental regulations under a Commonwealth, State or Territory law.
OTHER INFORMATION
The following information, contained in other sections of this Annual Report, also forms part of this Directors’ Report:
• Operational and Financial Review on pages 26 to 35 of the Annual Report;
• Details of dividends paid and declared as outlined in Note 4 “Dividends” to the Financial Statements;
• Significant changes in the state of affairs as outlined in Note 12 “Business combinations” and Note 20 “Events occurring after reporting date” to the Financial Statements;
• Likely developments in the operations of the Group are outlined in the “FY18 Outlook” section of the Operational and Financial Review on page 35 of the Annual Report; and
• Remuneration Report on pages 40 to 48.
ROUNDING OF AMOUNTS
The Group is of a kind referred to in the Australian Securities and Investments Commission Class Order 2016/191 dated 24 March 2016. In accordance with that Class Order, amounts in the financial statements and Directors’ Report have been rounded to the nearest thousand dollars, unless otherwise stated.
This report is made in accordance with a resolution of directors.
Justin Milne Chair
Tim Reed Executive Director and Chief Executive Officer
Sydney 23 February 2018
Sydney 23 February 2018
Other InformationRemuneration ReportDirectors’ ReportBusiness Review Financial Report
38 MYOB ANNUAL REPORT 2017
Dear Shareholder,
On behalf of the Board, I am pleased to present MYOB’s Remuneration Report for 2017.
Based on the Group’s financial performance, the short
term incentive payments awarded to Key Management
Personnel (KMP) for FY17 were 71% of target, reflecting
achievement rates of 96–98% against the corresponding
financial and operational measures set for the year.
At MYOB, we pride ourselves on high performance
expectations and targets that are stretching for
participants to achieve. The “loan-funded” Long Term
Incentive Plan (LTIP) introduced in FY17 remains on foot,
and vesting will be tested against the relevant shareholder
metrics in FY18 and FY19.
Other InformationDirectors’ Report Remuneration ReportBusiness Review Financial Report

39MYOB ANNUAL REPORT 2017
The past two years at MYOB has seen a number of changes in the Executive
structure, with new executives bringing a diversity of experience and skills into
the mix. These changes have improved our capacity and capability to lead
MYOB through the next phase of performance and growth.
It has also been a period of change in the Company’s remuneration structure.
The move from private equity ownership in 2015, where a Management Equity
Plan or Performance Share Scheme (LTI) had been applied, was followed by
the implementation of a new approach to both short and long term incentives,
designed to support the transition to a listed company.
In recent months, the Remuneration and Nomination Committee has reviewed the
effectiveness of our incentive model. It is our view that the competitive and rapid
changes in our industry require a degree of agility and flexibility not provided in our
current arrangements. Feedback from investors and participants also pointed to the
complexity of the arrangements, and a consequential dilution of the incentive value
of the arrangements.
The Committee took advice on developing trends in the incentive landscape, and
listened to the perspectives of participants and of proxy advisers. Our primary
objective was to ensure that MYOB’s remuneration structure is best aligned to the
Company’s strategy and the creation of value for our shareholders. The result was
a new Unified Incentive Plan (UIP) to be launched in FY18, with no further grant
to be issued under the current LTIP.
The UIP unifies the short and long term incentive arrangements into one scheme.
Annual performance metrics will result in both a cash award and deferred equity
for participants. We took some time to select metrics that will focus on outcomes
and decisions in the shorter term that also operate in the best interests of the
longer term Company performance.
We are confident that this new approach strikes a constructive balance between
short and long term organisational performance, motivational value to participants
and alignment with shareholder interests.
Anne Ward Chair of the Remuneration and Nomination Committee
Other InformationDirectors’ Report Remuneration ReportBusiness Review Financial Report

40 MYOB ANNUAL REPORT 2017
The ultimate aim of the report is to provide shareholders with an understanding of the Group’s remuneration principles and policies and the corresponding relationship between the Group’s operating and financial performance to senior executive remuneration outcomes.
1. KEY MANAGEMENT PERSONNEL
The KMP of the MYOB Group includes the Chief Executive Officer (CEO) and his direct reports. It also includes all Directors of the Board. KMP during FY17 were:
NAME POSITION
Non-executive DirectorsJustin Milne Independent Non-executive Director, ChairAndrew Stevens Independent Non-executive DirectorAnne Ward Independent Non-executive DirectorCraig Boyce Non-executive DirectorFiona Pak-Poy Independent Non-executive Director (appointed 1 January 2017)Edward Han Non-executive Director (appointed 27 April 2017)Paul Edgerley Non-executive Director (resigned 27 April 2017)
Senior executivesTim Reed Executive Director, CEORichard Moore Chief Financial OfficerAndrew Birch Chief Operating OfficerJohn Moss Chief Strategy OfficerHelen Lea Chief Employee Experience Officer (from 15 June 2017)David Weickhardt General Manager, ProductHugh Fahy General Manager, Engineering (from 15 June 2017)Adam Ferguson General Manager, Engineering & Experience (to 1 October 2017)James Scollay General Manager, Clients & Partners (to 1 October 2017)
There have been no changes in KMP since the end of the financial period.
Remuneration Report
This report outlines the remuneration framework and the associated performance outcomes for the Key Management Personnel (KMP) for the financial period ended 31 December 2017 (FY17). The report has been prepared in accordance with the requirements of section 300A of the Corporations Act 2001.
CONTENTS
1 Key management personnel
2 Remuneration governance
3 Remuneration strategy and framework
4 Group performance and FY17 remuneration outcomes
5 Non-executive Director remuneration
6 Other information
Other InformationDirectors’ Report Remuneration ReportBusiness Review Financial Report
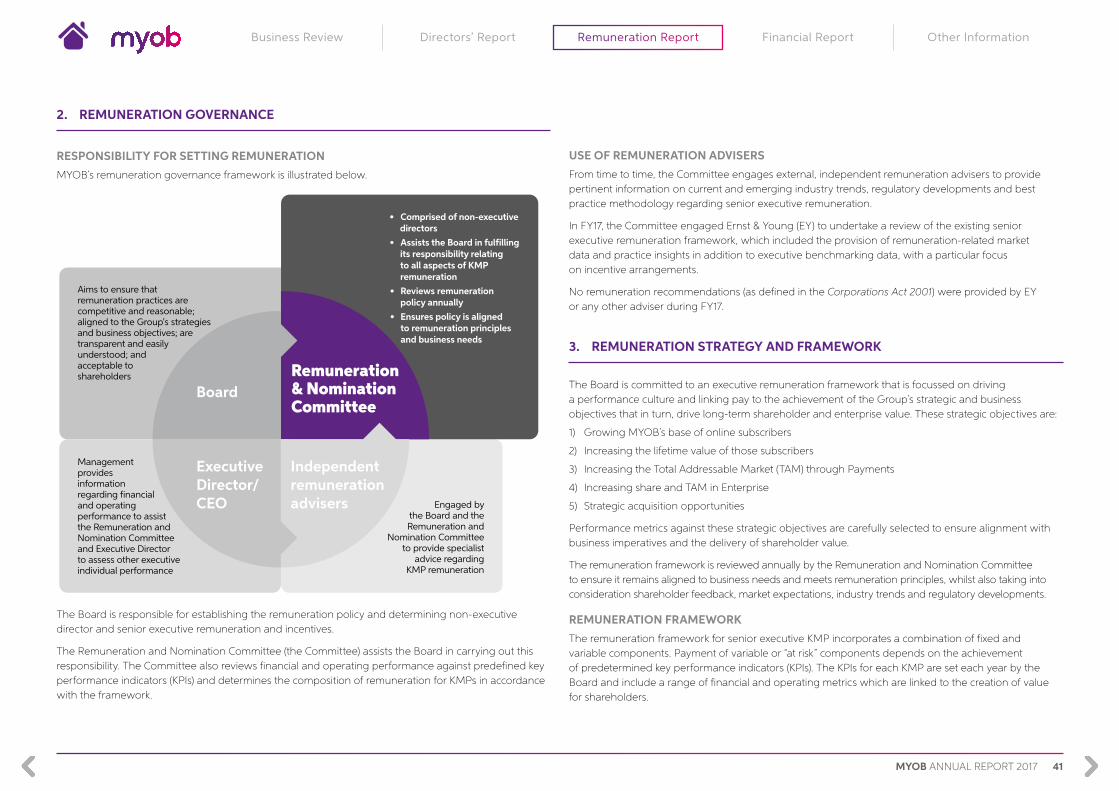
41MYOB ANNUAL REPORT 2017
2. REMUNERATION GOVERNANCE
RESPONSIBILITY FOR SETTING REMUNERATIONMYOB’s remuneration governance framework is illustrated below.
Aims to ensure that remuneration practices are competitive and reasonable; aligned to the Group's strategies and business objectives; are transparent and easily understood; and acceptable to shareholders
• Comprised of non-executive directors
• Assists the Board in ful�lling its responsibility relating to all aspects of KMP remuneration
• Reviews remuneration policy annually
• Ensures policy is aligned to remuneration principles and business needs
Engaged by the Board and the Remuneration and
Nomination Committee to provide specialist
advice regarding KMP remuneration
Management provides information regarding �nancial and operating performance to assist the Remuneration and Nomination Committee and Executive Directorto assess other executive individual performance
REMUNERATION GOVERNANCEREV
Remuneration & Nomination Committee
Independent remuneration advisers
ExecutiveDirector/CEO
Board
The Board is responsible for establishing the remuneration policy and determining non-executive director and senior executive remuneration and incentives.
The Remuneration and Nomination Committee (the Committee) assists the Board in carrying out this responsibility. The Committee also reviews financial and operating performance against predefined key performance indicators (KPIs) and determines the composition of remuneration for KMPs in accordance with the framework.
USE OF REMUNERATION ADVISERSFrom time to time, the Committee engages external, independent remuneration advisers to provide pertinent information on current and emerging industry trends, regulatory developments and best practice methodology regarding senior executive remuneration.
In FY17, the Committee engaged Ernst & Young (EY) to undertake a review of the existing senior executive remuneration framework, which included the provision of remuneration-related market data and practice insights in addition to executive benchmarking data, with a particular focus on incentive arrangements.
No remuneration recommendations (as defined in the Corporations Act 2001) were provided by EY or any other adviser during FY17.
3. REMUNERATION STRATEGY AND FRAMEWORK
The Board is committed to an executive remuneration framework that is focussed on driving a performance culture and linking pay to the achievement of the Group’s strategic and business objectives that in turn, drive long-term shareholder and enterprise value. These strategic objectives are:
1) Growing MYOB’s base of online subscribers
2) Increasing the lifetime value of those subscribers
3) Increasing the Total Addressable Market (TAM) through Payments
4) Increasing share and TAM in Enterprise
5) Strategic acquisition opportunities
Performance metrics against these strategic objectives are carefully selected to ensure alignment with business imperatives and the delivery of shareholder value.
The remuneration framework is reviewed annually by the Remuneration and Nomination Committee to ensure it remains aligned to business needs and meets remuneration principles, whilst also taking into consideration shareholder feedback, market expectations, industry trends and regulatory developments.
REMUNERATION FRAMEWORKThe remuneration framework for senior executive KMP incorporates a combination of fixed and variable components. Payment of variable or “at risk” components depends on the achievement of predetermined key performance indicators (KPIs). The KPIs for each KMP are set each year by the Board and include a range of financial and operating metrics which are linked to the creation of value for shareholders.
Other InformationDirectors’ Report Remuneration ReportBusiness Review Financial Report

42 MYOB ANNUAL REPORT 2017
An explanation of each element of the remuneration framework for FY17 is set out below.
OBJECTIVE ATTRACT AND RETAIN THE BEST TALENT
REWARD CURRENT YEAR PERFORMANCE
REWARD LONGER-TERM SUSTAINABLE PERFORMANCE
FIXED VARIABLE OR “AT RISK”
REMUNERATION COMPONENT (FY17)
FIXED REMUNERATION(FR)
SHORT TERM INCENTIVE (STI)
PERFORMANCE SHARE SCHEME (LTI)
LONG TERM INCENTIVE PLAN (LTIP)
PURPOSE Provide competitive market salary and reward individual contribution
Reward the achievement of annual performance targets consisting of KPI’s that address financial and operational measures of performance
Provide long term incentives and deliver long term shareholder returns (an extension of the private equity Management “A” share scheme)
Provide long term incentives and deliver long term shareholder returns
TERM 1 year 1 year 3 years 1
1 No additional performance shares have been issued since the Initial Public Offering (IPO) in May 2015. The scheme is closed to new participants. Final testing date will be 30 September 2018.
3 years 2
2 Applies to the 2017 grant year only. Refer to paragraph “Proposed changes for FY18”.
INSTRUMENT Cash• Base salary and other non-monetary
benefits including statutory superannuation obligations
Cash• Annual cash payment on meeting
pre-defined financial and operational hurdles
Performance shares • Performance shares which may
convert to ordinary shares when share price reaches or exceeds pre-determined level on the relevant testing date
Ordinary shares• Performance will be measured at end
of years 2 and 3 with share vesting at that point should hurdles be met
PERFORMANCE METRICS • Individual roles and responsibilities• Level of expertise and effectiveness• Market (benchmarking)
• Financial measures (weighting: 70%) – Group Underlying EBITDA
• Operational measures (weighting: 30%) – Group online market share 3
3 Market share is defined as the relative share of online subscribers disclosed by MYOB and its key competitors.
Share price • Total Shareholder Return (TSR) (weighting: 50%)
• Earnings Per Share (EPS) (weighting: 50%)
POTENTIAL VALUE Positioned at median market rate • CEO: 75% of FR on target. Maximum STI opportunity of 150% (2016: 150%) of FR
• KMP: 30–50% of FR on target. Maximum STI opportunity of between 60% and 100% (2016: 60% and 100%)
Dependent on meeting prescribed share price hurdles set for the testing dates of 30 September 2017 and 2018
• CEO: 56.25% of FR on target. Maximum LTIP opportunity of 75% of FR
• KMP: 22.5–37.5% of FR on target. Maximum LTIP opportunity of between 30% and 50% of FR
Other InformationDirectors’ Report Remuneration ReportBusiness Review Financial Report
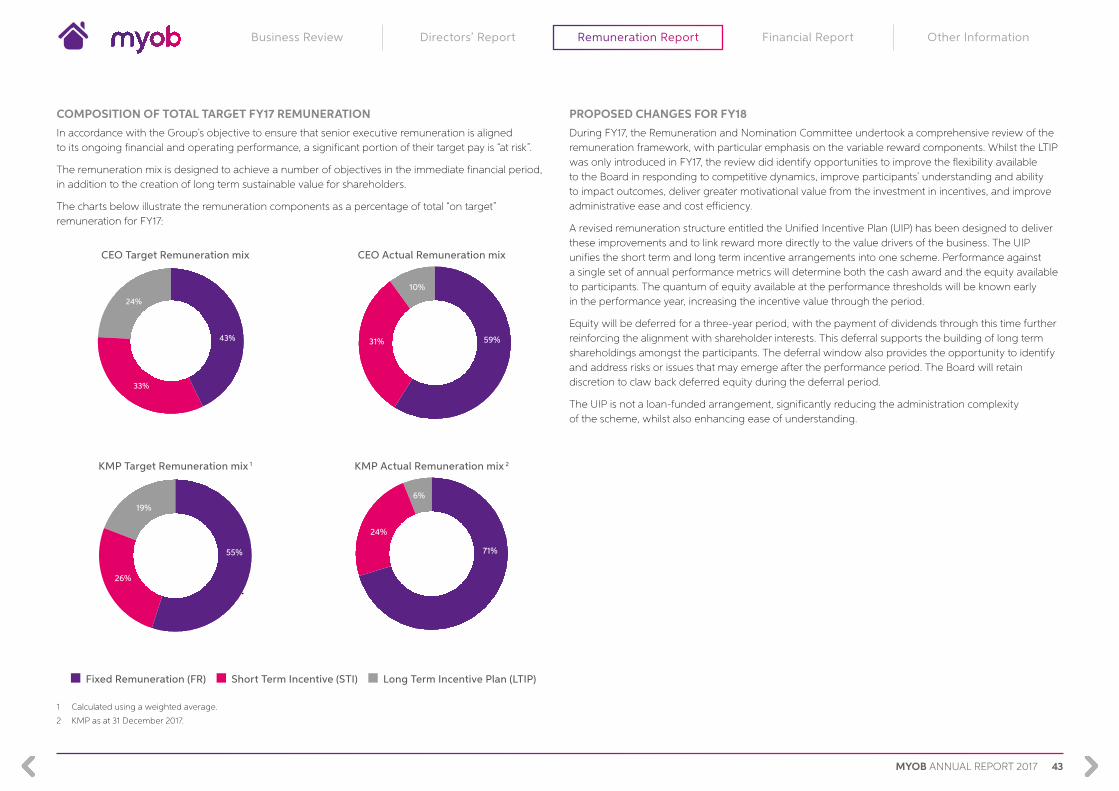
43MYOB ANNUAL REPORT 2017
COMPOSITION OF TOTAL TARGET FY17 REMUNERATIONIn accordance with the Group’s objective to ensure that senior executive remuneration is aligned to its ongoing financial and operating performance, a significant portion of their target pay is “at risk”.
The remuneration mix is designed to achieve a number of objectives in the immediate financial period, in addition to the creation of long term sustainable value for shareholders.
The charts below illustrate the remuneration components as a percentage of total “on target” remuneration for FY17:
CEO Target Remuneration mix CEO Actual Remuneration mix
Fixed Remuneration (FR) 43%Short Term Incentive (STI) 33%Long Term Incentive Plan (LTIP) 24%
43%
33%
24%
Fixed Remuneration (FR) 58%Short Term Incentive (STI) 32%Long Term Incentive Plan (LTIP) 10%
59%31%
10%
KMP Target Remuneration mix 1 KMP Actual Remuneration mix 2
Fixed Remuneration (FR) 55%Short Term Incentive (STI) 26%Long Term Incentive Plan (LTIP) 19%
55%
26%
19%
Fixed Remuneration (FR) 69%Short Term Incentive (STI) 25%Long Term Incentive Plan (LTIP) 6%
71%
24%
6%
Fixed Remuneration (FR) Short Term Incentive (STI) Long Term Incentive Plan (LTIP)
1 Calculated using a weighted average.
2 KMP as at 31 December 2017.
PROPOSED CHANGES FOR FY18During FY17, the Remuneration and Nomination Committee undertook a comprehensive review of the remuneration framework, with particular emphasis on the variable reward components. Whilst the LTIP was only introduced in FY17, the review did identify opportunities to improve the flexibility available to the Board in responding to competitive dynamics, improve participants’ understanding and ability to impact outcomes, deliver greater motivational value from the investment in incentives, and improve administrative ease and cost efficiency.
A revised remuneration structure entitled the Unified Incentive Plan (UIP) has been designed to deliver these improvements and to link reward more directly to the value drivers of the business. The UIP unifies the short term and long term incentive arrangements into one scheme. Performance against a single set of annual performance metrics will determine both the cash award and the equity available to participants. The quantum of equity available at the performance thresholds will be known early in the performance year, increasing the incentive value through the period.
Equity will be deferred for a three-year period, with the payment of dividends through this time further reinforcing the alignment with shareholder interests. This deferral supports the building of long term shareholdings amongst the participants. The deferral window also provides the opportunity to identify and address risks or issues that may emerge after the performance period. The Board will retain discretion to claw back deferred equity during the deferral period.
The UIP is not a loan-funded arrangement, significantly reducing the administration complexity of the scheme, whilst also enhancing ease of understanding.
Other InformationDirectors’ Report Remuneration ReportBusiness Review Financial Report

44 MYOB ANNUAL REPORT 2017
SERVICE AGREEMENTSThe remuneration and other terms of employment for the senior executive KMP are formalised in employment contracts, which are reviewed annually.
The CEO and senior executives are entitled to receive pay in lieu of notice, in addition to any leave entitlements upon cessation of employment.
All service agreements are for unlimited duration but may be terminated immediately in the event of serious misconduct, in which case the executive is not entitled to any payment in lieu of notice.
The following table outlines the key contractual arrangements for the CEO and senior executive KMP.
POSITIONCONTRACTUAL TERM
EMPLOYER NOTICE PERIOD
EMPLOYEE NOTICE PERIOD
POST-EMPLOYMENT RESTRAINTS
CEO and Senior executives Ongoing Six months Six months
24-month non-competition period
4. GROUP PERFORMANCE AND FY17 REMUNERATION OUTCOMES
OVERVIEW OF THE GROUP’S PERFORMANCE A key objective of the senior executive remuneration strategy is to drive long term growth in shareholder value, which is accomplished through the achievement of the Group’s operating and financial performance objectives.
The following table sets out information about the Group’s key financial performance and movements in shareholders’ wealth for the past three financial years.
FINANCIAL PERIOD ENDED 31 DECEMBER 2015 2016 2017
Revenue ($M) 327.8 370.4 416.5Underlying EBITDA ($M) 152.9 171.4 189.9NPATA ($M) 85.9 92.4 101.6Dividends paid ($M) – 62.2 69.3Capital expenditure ($M) 25.4 36.1 51.1NPATA earnings per share (cents) 14.7 15.7 16.9
Details of the Group’s operating and financial outcomes for FY17 are further discussed in the “Operational and Financial Review” section of the Annual Report.
Other InformationDirectors’ Report Remuneration ReportBusiness Review Financial Report

45MYOB ANNUAL REPORT 2017
SENIOR EXECUTIVE ACTUAL REMUNERATION OUTCOMES
SHORT TERM BENEFITSLONG TERM
BENEFITSPOST-EMPLOYMENT
BENEFITSSHARE-BASED
PAYMENTSTERMINATION
BENEFITS TOTAL
PERCENTAGE PERFORMANCE
RELATED
CASH SALARY
STI 1 OTHER 2 LEAVE 3 SUPERANNUATION 4 LTI 5 LTIP 6 TERMINATION PAYMENTS
$ $ $ $ $ $ $ $ $ %
CEO and Executive DirectorTim Reed 2017 890,916 486,059 – 37,689 27,083 – 154,216 – 1,595,963 40
2016 820,001 453,940 – (50,180) 30,000 77,177 – – 1,330,938 40Senior executivesRichard Moore 2017 502,916 187,081 – 27,229 27,083 – 60,477 – 804,786 31
2016 469,639 178,016 – 20,116 30,000 43,041 – – 740,812 30Andrew Birch 2017 504,262 194,141 – 35,086 32,354 – 54,429 – 820,272 30
2016 410,959 200,598 – 21,104 39,042 28,496 – – 700,199 33John Moss 2017 313,478 76,245 – (14,935) 32,183 – 24,675 – 431,646 23
2016 310,503 72,631 – 12,503 29,498 14,767 – – 439,902 20Helen Lea 2017 232,397 86,602 – 1,285 15,103 – – – 335,387 26
2016 – – – – – – – – – –David Weickhardt 2017 410,959 158,843 – 2,662 39,041 – 54,429 – 665,934 32
2016 54,795 – – – 5,206 – – – 60,001 –Hugh Fahy 2017 224,446 86,602 69,398 1,276 21,322 – – – 403,044 26
2016 – – – – – – – – – –Adam Ferguson 2017 59,910 – – – 24,344 – – 384,383 468,637 –
2016 392,695 153,094 – 24,640 37,306 29,015 – – 636,750 29James Scollay 2017 184,195 – – – 28,929 – – 132,921 346,045 –
2016 392,695 175,471 – 16,796 37,306 28,941 – – 651,209 31
Total2017 3,323,479 1,275,573 69,398 90,292 247,442 – 348,226 517,304 5,871,714 282016 2,851,287 1,233,750 – 44,979 208,358 221,437 – – 4,559,811 32
1 The STI payments awarded to KMP for FY17 were 71% of target, reflecting achievement rates of 96–98%, against the corresponding financial and operational measures set for the year.
2 Other short term benefits comprise relocation expenses paid by the Group on behalf of KMP. These benefits have been excluded from performance-related calculations.
3 Long term benefits relate to long service leave entitlements accrued for the year net of leave taken.
4 Superannuation payments are made in accordance with relevant statutory requirements.
5 Performance shares held under the LTI did not convert to ordinary shares during FY17 as the share price did not meet the prescribed hurdle set for the second testing date of 30 September 2017.
6 The LTIP scheme will vest as follows: two thirds over two years and one third over three years. Accordingly, LTIP shares did not vest in FY17 as a test date did not occur during the financial period.
Other InformationDirectors’ Report Remuneration ReportBusiness Review Financial Report
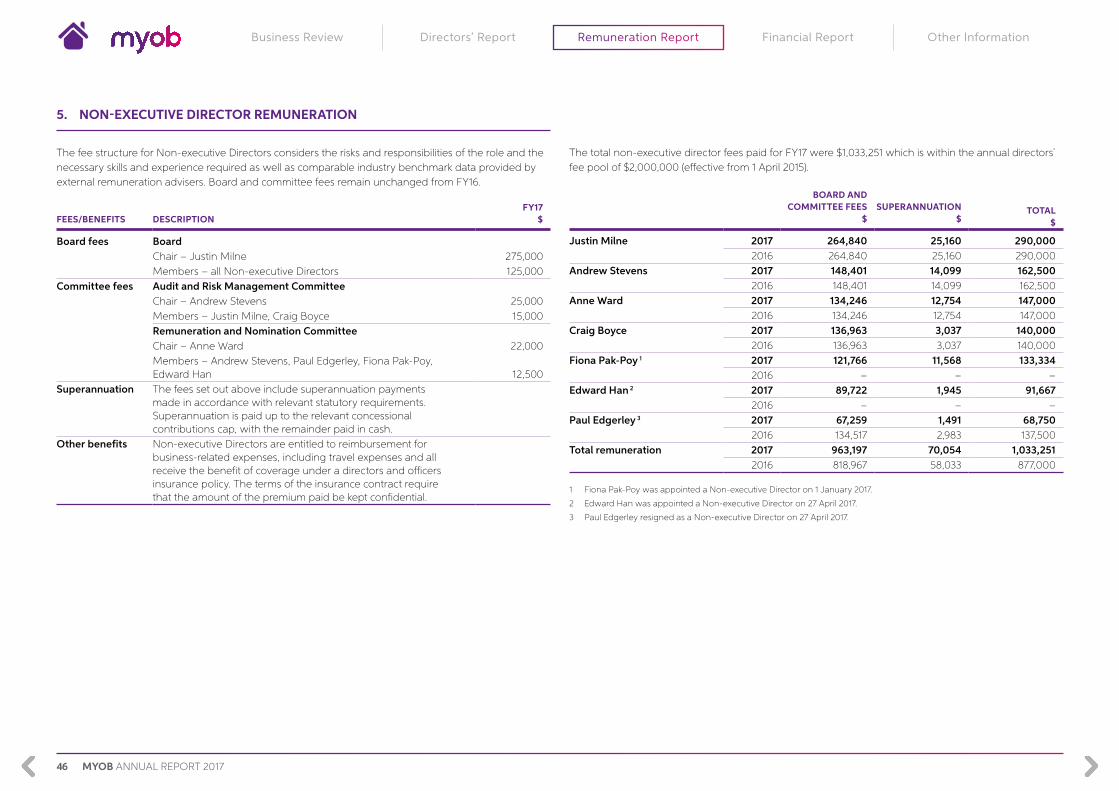
46 MYOB ANNUAL REPORT 2017
5. NON-EXECUTIVE DIRECTOR REMUNERATION
The fee structure for Non-executive Directors considers the risks and responsibilities of the role and the necessary skills and experience required as well as comparable industry benchmark data provided by external remuneration advisers. Board and committee fees remain unchanged from FY16.
FEES/BENEFITS DESCRIPTIONFY17
$
Board fees BoardChair – Justin Milne 275,000Members – all Non-executive Directors 125,000
Committee fees Audit and Risk Management CommitteeChair – Andrew Stevens 25,000Members – Justin Milne, Craig Boyce 15,000Remuneration and Nomination CommitteeChair – Anne Ward 22,000Members – Andrew Stevens, Paul Edgerley, Fiona Pak-Poy, Edward Han 12,500
Superannuation The fees set out above include superannuation payments made in accordance with relevant statutory requirements. Superannuation is paid up to the relevant concessional contributions cap, with the remainder paid in cash.
Other benefits Non-executive Directors are entitled to reimbursement for business-related expenses, including travel expenses and all receive the benefit of coverage under a directors and officers insurance policy. The terms of the insurance contract require that the amount of the premium paid be kept confidential.
The total non-executive director fees paid for FY17 were $1,033,251 which is within the annual directors’ fee pool of $2,000,000 (effective from 1 April 2015).
BOARD AND COMMITTEE FEES
$SUPERANNUATION
$TOTAL
$
Justin Milne 2017 264,840 25,160 290,0002016 264,840 25,160 290,000
Andrew Stevens 2017 148,401 14,099 162,5002016 148,401 14,099 162,500
Anne Ward 2017 134,246 12,754 147,0002016 134,246 12,754 147,000
Craig Boyce 2017 136,963 3,037 140,0002016 136,963 3,037 140,000
Fiona Pak-Poy 1 2017 121,766 11,568 133,3342016 – – –
Edward Han 2 2017 89,722 1,945 91,6672016 – – –
Paul Edgerley 3 2017 67,259 1,491 68,7502016 134,517 2,983 137,500
Total remuneration 2017 963,197 70,054 1,033,2512016 818,967 58,033 877,000
1 Fiona Pak-Poy was appointed a Non-executive Director on 1 January 2017.
2 Edward Han was appointed a Non-executive Director on 27 April 2017.
3 Paul Edgerley resigned as a Non-executive Director on 27 April 2017.
Other InformationDirectors’ Report Remuneration ReportBusiness Review Financial Report

47MYOB ANNUAL REPORT 2017
6. OTHER INFORMATION
KMP SHARE MOVEMENTSThe table below summarises the movements in the number of ordinary shares held by KMP during the financial period for which they were a KMP:
ORDINARY SHARES
FY17
BALANCE AT BEGINNING
OF FINANCIAL PERIOD
PURCHASE OF SHARES
SALE OF SHARES
OTHER CHANGES
DURING THE YEAR
BALANCE AT END OF FINANCIAL
PERIOD
NUMBER NUMBER NUMBER NUMBER NUMBER
Non-executive DirectorsJustin Milne 80,925 – – – 80,925Andrew Stevens 55,895 30,000 – – 85,895Anne Ward 27,397 28,750 – – 56,147Craig Boyce 100,000 – – – 100,000Paul Edgerley – – – – –Fiona Pak-Poy – 20,833 – – 20,833Edward Han – – – – –
Senior executivesTim Reed 10,695,514 – – – 10,695,514Richard Moore 1,599,405 – – – 1,599,405Andrew Birch 2,155,778 – – – 2,155,778John Moss 982,171 – – – 982,171Helen Lea – – – – –David Weickhardt – – – – –Hugh Fahy – – – – –Adam Ferguson 1 3,163,773 – – – 3,163,773James Scollay 1 1,434,606 – – – 1,434,606
1 The amounts disclosed in “Balance at end of financial period” for Adam Ferguson and James Scollay reflect the number of ordinary shares held at the date on which they ceased to be KMP on 1 October 2017.
EXECUTIVE KMP SHARE RIGHTS
Performance Share Scheme (LTI)
Performance shares were issued to certain senior executives prior to the IPO in 2015. Performance shares may convert into ordinary shares, if the share price of ordinary shares reaches or exceeds a predetermined hurdle at the 30 September testing date. Performance shares confer on the holder the right to receive notices and to attend Annual General Meetings (AGMs) in addition to receiving the published financial reports of the Group circulated to shareholders. The holder is not entitled to vote on any resolutions proposed at AGMs.
Performance shares held under the LTI did not convert to ordinary shares during FY17 as the share price did not meet the prescribed hurdle set for the second testing date of 30 September 2017. The final testing date for Performance Shares will be 30 September 2018.
The performance shares held by each executive KMP during FY17 is set out in the table below.
PERFORMANCE SHARES
BALANCE AT BEGINNING
OF FINANCIAL PERIOD
GRANTED DURING
YEAR
RIGHTS TO DEFERRED SHARES BALANCE AT END OF FINANCIAL
PERIOD (UNVESTED)VESTED FORFEITED
FY17 NUMBER NUMBER NUMBER % NUMBER % NUMBER
Senior executives 1
Tim Reed 1,614,210 – – – – – 1,614,210Richard Moore 496,680 – – – – – 496,680Andrew Birch 394,240 – – – – – 394,240John Moss 248,340 – – – – – 248,340Adam Ferguson 2 465,638 – – – (465,638) 100 –James Scollay 2 403,553 – – – (403,553) 100 –
1 No additional performance shares have been issued since the IPO in May 2015. The scheme is closed to new participants therefore there are no amounts held by Helen Lea, David Weickhardt and Hugh Fahy as their employment commenced after this date.
2 Performance shares are converted to one ordinary share upon cessation of employment. Adam Ferguson and James Scollay both ceased to be KMP on 1 October 2017.
Other InformationDirectors’ Report Remuneration ReportBusiness Review Financial Report

48 MYOB ANNUAL REPORT 2017
Long Term Incentive Plan (LTIP)
On 1 February 2017, 7,060,400 ordinary shares at $3.4587 per share were issued as new equity of MYOB Group Limited to participants of the LTIP, to be used to satisfy share based payment obligations upon vesting. Subject to achievement of TSR and EPS hurdles, two thirds of LTIP shares will vest after two years and one third after three years.
The LTIP is a loan-funded share plan, with the loans being repaid from the proceeds of selling shares after vesting. This means the key benefit to the KMP is the share price appreciation above the $3.4587 grant price, not the absolute value of the shares granted.
The rights to ordinary shares held by each executive KMP during FY17 is set out in the table below:
ORDINARY SHARES
FY17
BALANCE AT BEGINNING
OF FINANCIAL PERIOD
GRANTED DURING
YEAR
RIGHTS TO DEFERRED SHARES BALANCE AT END OF FINANCIAL
PERIOD(UNVESTED)VESTED FORFEITED
NUMBER NUMBER NUMBER % NUMBER % NUMBER
Senior executives 1
Tim Reed – 1,417,282 – – – – 1,417,282Richard Moore – 555,797 – – – – 555,797Andrew Birch – 500,217 – – – – 500,217John Moss – 226,765 – – – – 226,765David Weickhardt – 500,217 – – – – 500,217James Scollay 2 – 477,984 – – (477,984) 100 –
1 Helen Lea and Hugh Fahy were ineligible to participate in the FY17 grant year of the LTIP scheme due to their commencement date. Adam Ferguson chose not to participate in the LTIP scheme.
2 James Scollay ceased to be KMP on 1 October 2017.
OTHER TRANSACTIONS WITH KMPOther than the LTIP non-recourse loans noted above, there were no loans made during the year, or remaining unsettled at 31 December 2017, between the Group and its KMP and/or their related parties.
As lead auditor for the audit of MYOB Group Limited for the year ended 31 December 2017, I declare that to the best of my knowledge and belief, there have been:
(a) no contraventions of the auditor independence requirements of the Corporations Act 2001 in relation to the audit; and
(b) no contraventions of any applicable code of professional conduct in relation to the audit.
This declaration is in respect of MYOB Group Limited and the entities it controlled during the period.
Nadia CarlinPartnerPricewaterhouseCoopers
Melbourne23 February 2018
Auditor’s Independence Declaration
PricewaterhouseCoopers, ABN 52 780 433 757 2 Riverside Quay, SOUTHBANK VIC 3006, GPO Box 1331, MELBOURNE VIC 3001 T: 61 3 8603 1000, F: 61 3 8603 1999, www.pwc.com.au
Liability limited by a scheme approved under Professional Standards Legislation.
Other InformationDirectors’ Report Remuneration ReportBusiness Review Financial Report
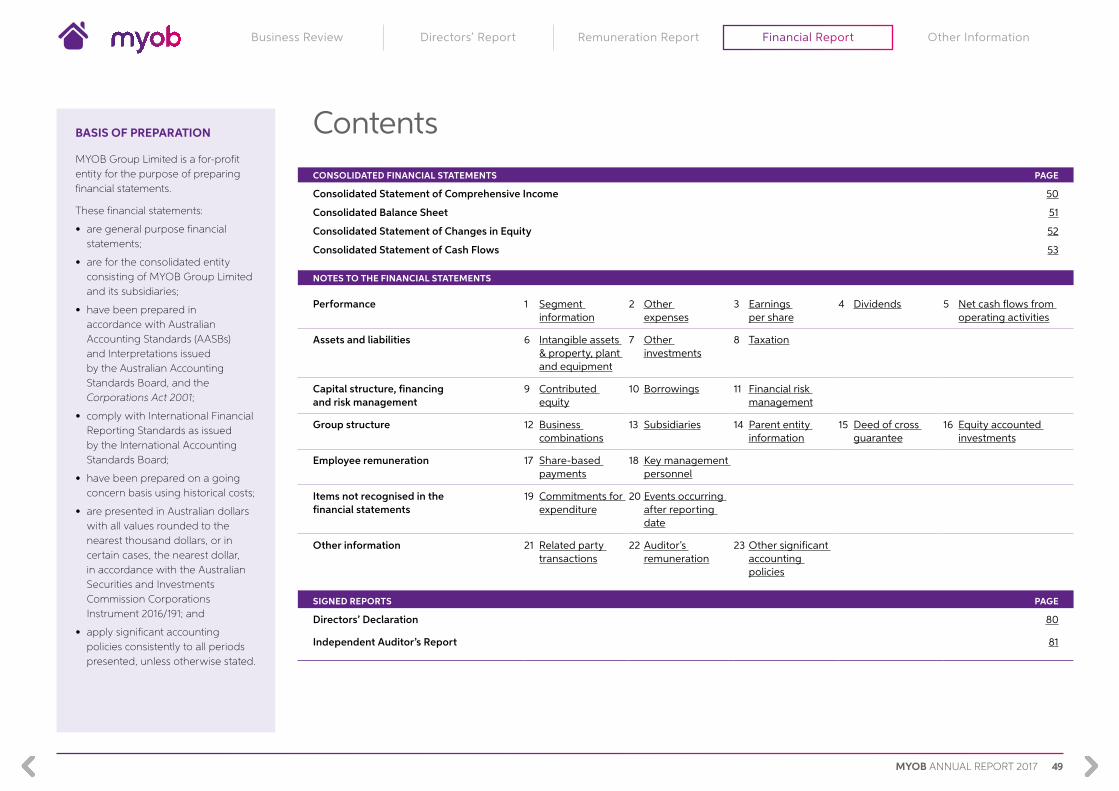
49MYOB ANNUAL REPORT 2017
BASIS OF PREPARATION
MYOB Group Limited is a for-profit entity for the purpose of preparing financial statements.
These financial statements:
• are general purpose financial statements;
• are for the consolidated entity consisting of MYOB Group Limited and its subsidiaries;
• have been prepared in accordance with Australian Accounting Standards (AASBs) and Interpretations issued by the Australian Accounting Standards Board, and the Corporations Act 2001;
• comply with International Financial Reporting Standards as issued by the International Accounting Standards Board;
• have been prepared on a going concern basis using historical costs;
• are presented in Australian dollars with all values rounded to the nearest thousand dollars, or in certain cases, the nearest dollar, in accordance with the Australian Securities and Investments Commission Corporations Instrument 2016/191; and
• apply significant accounting policies consistently to all periods presented, unless otherwise stated.
ContentsCONSOLIDATED FINANCIAL STATEMENTS PAGE
Consolidated Statement of Comprehensive Income 50
Consolidated Balance Sheet 51
Consolidated Statement of Changes in Equity 52
Consolidated Statement of Cash Flows 53
NOTES TO THE FINANCIAL STATEMENTS
Performance 1 Segment information
2 Other expenses
3 Earnings per share
4 Dividends 5 Net cash flows from operating activities
Assets and liabilities 6 Intangible assets & property, plant and equipment
7 Other investments
8 Taxation
Capital structure, financing and risk management
9 Contributed equity
10 Borrowings 11 Financial risk management
Group structure 12 Business combinations
13 Subsidiaries 14 Parent entity information
15 Deed of cross guarantee
16 Equity accounted investments
Employee remuneration 17 Share-based payments
18 Key management personnel
Items not recognised in the financial statements
19 Commitments for expenditure
20 Events occurring after reporting date
Other information 21 Related party transactions
22 Auditor’s remuneration
23 Other significant accounting policies
SIGNED REPORTS PAGE
Directors’ Declaration 80
Independent Auditor’s Report 81
Other InformationDirectors’ Report Remuneration Report Financial ReportBusiness Review

50 MYOB ANNUAL REPORT 2017
Consolidated Statement of Comprehensive Income
FOR THE PERIOD ENDED 31 DECEMBER 2017
NOTE2017
$’0002016
$’000
RevenueService revenue 395,466 349,536Revenue from sale of goods 18,819 19,358Other revenue 2,198 1,523Total revenue 1 416,483 370,417
ExpensesStaff related expenses (140,728) (124,517)General office and administration (32,886) (31,228)Direct materials (18,536) (15,123)Royalties (3,409) (3,195)Reseller commissions (13,986) (11,053)Marketing expenses (17,021) (13,875)Other expenses 2 (7,734) (7,075)Depreciation and amortisation (80,746) (75,816)Net finance costs (13,602) (14,789)Total expenses (328,648) (296,671)
Share of losses from equity accounted investments 16 (2,353) (2,614)
Profit before income tax 85,482 71,132
Income tax expense 8 (24,802) (18,970)
Profit after income tax attributable to owners of MYOB Group Limited 60,680 52,162
Other comprehensive incomeItems that may be classified to income or loss:Foreign currency translation (2,327) 1,655
Other comprehensive income/(loss) for the period, net of tax (2,327) 1,655
Total comprehensive income for the period attributable to owners of MYOB Group Limited 58,353 53,817
NOTE2017
CENTS2016
CENTS
Earnings per share attributable to ordinary equity holders of MYOB Group LimitedBasic earnings per share 3 10.12 8.87Diluted earnings per share 3 10.12 8.87
The above Consolidated Statement of Comprehensive Income should be read in conjunction with the accompanying notes.
Other InformationDirectors’ Report Remuneration Report Financial ReportBusiness Review
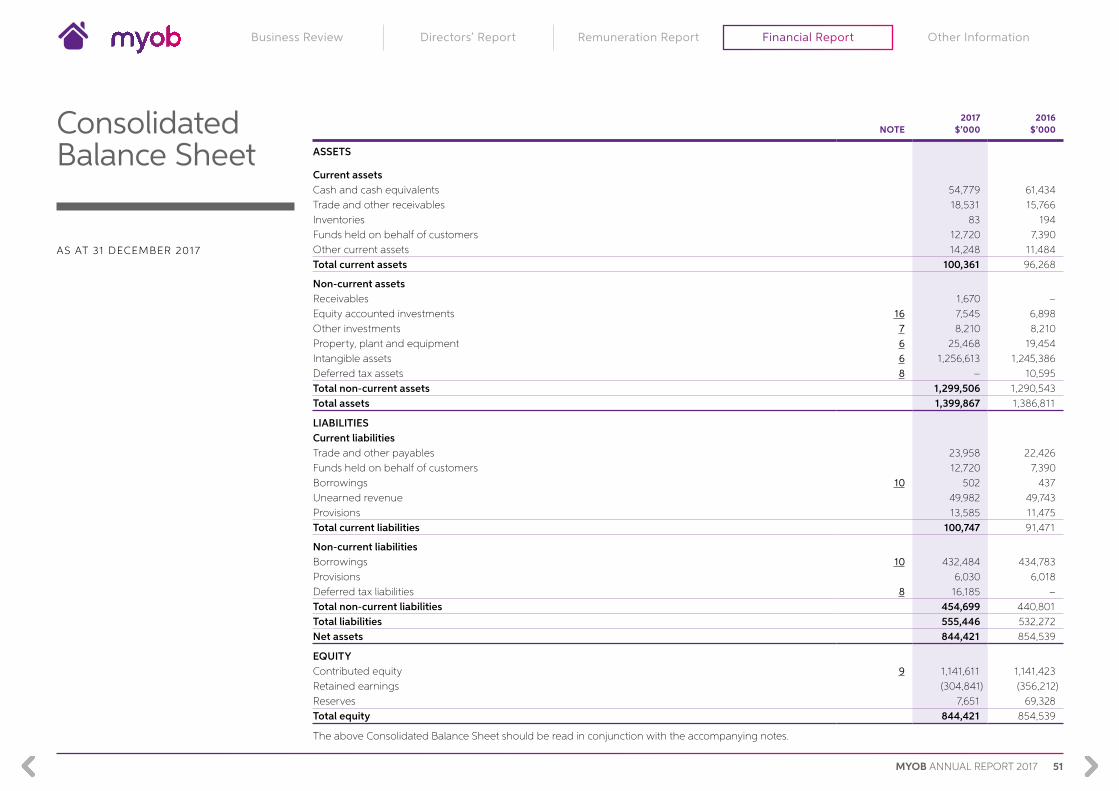
51MYOB ANNUAL REPORT 2017
Consolidated Balance Sheet
AS AT 31 DECEMBER 2017
NOTE2017
$’0002016
$’000
ASSETS
Current assetsCash and cash equivalents 54,779 61,434Trade and other receivables 18,531 15,766Inventories 83 194Funds held on behalf of customers 12,720 7,390Other current assets 14,248 11,484Total current assets 100,361 96,268
Non-current assetsReceivables 1,670 –Equity accounted investments 16 7,545 6,898Other investments 7 8,210 8,210Property, plant and equipment 6 25,468 19,454Intangible assets 6 1,256,613 1,245,386Deferred tax assets 8 – 10,595Total non-current assets 1,299,506 1,290,543Total assets 1,399,867 1,386,811
LIABILITIESCurrent liabilitiesTrade and other payables 23,958 22,426Funds held on behalf of customers 12,720 7,390Borrowings 10 502 437Unearned revenue 49,982 49,743Provisions 13,585 11,475Total current liabilities 100,747 91,471
Non-current liabilitiesBorrowings 10 432,484 434,783Provisions 6,030 6,018Deferred tax liabilities 8 16,185 –Total non-current liabilities 454,699 440,801Total liabilities 555,446 532,272Net assets 844,421 854,539
EQUITYContributed equity 9 1,141,611 1,141,423Retained earnings (304,841) (356,212)Reserves 7,651 69,328Total equity 844,421 854,539
The above Consolidated Balance Sheet should be read in conjunction with the accompanying notes.
Other InformationDirectors’ Report Remuneration Report Financial ReportBusiness Review

52 MYOB ANNUAL REPORT 2017
Consolidated Statement of Changes in Equity
FOR THE PERIOD ENDED 31 DECEMBER 2017
ISSUED CAPITAL
$’000
FOREIGN CURRENCY
TRANSLATION RESERVE
$’000
SHARE-BASED PAYMENTS
RESERVE$’000
UNDISTRIBUTED PROFIT
RESERVE$’000
RETAINED EARNINGS
$’000
TOTAL EQUITY
$’000
Balance at 1 January 2017 1,141,423 7,871 1,457 60,000 (356,212) 854,539Profit after income tax – – – – 60,680 60,680Other comprehensive loss, net of tax – (2,327) – – – (2,327)Total comprehensive income/(loss) for the period – (2,327) – – 60,680 58,353
Transactions with owners in their capacity as owners:Long Term Incentive Plan (LTIP) – – 650 – – 650Conversion of forfeited Treasury shares 3,456 – – – – 3,456Share buyback (3,268) – – – – (3,268)Profit reserve – – – (60,000) 60,000 –Dividends – – – – (69,303) (69,303)Other – – – – (6) (6)Balance at 31 December 2017 1,141,611 5,544 2,107 – (304,841) 844,421
Balance at 1 January 2016 1,138,097 6,216 4,584 130,000 (416,182) 862,715Profit after income tax – – – – 52,162 52,162Other comprehensive income, net of tax – 1,655 – – – 1,655Total comprehensive income for the period – 1,655 – – 52,162 53,817
Transactions with owners in their capacity as owners:Performance Share Scheme (LTI) – – 411 – – 411Transfer cost on conversion of Performance shares 3,538 – (3,538) – – –Profit reserve – – – (70,000) 70,000 –Dividends – – – – (62,189) (62,189)Initial Public Offering listing costs (212) – – – – (212)Other – – – – (3) (3)Balance at 31 December 2016 1,141,423 7,871 1,457 60,000 (356,212) 854,539
Foreign currency translation reserveThe foreign currency translation reserve is used to record exchange differences arising from the translation of the financial statements of foreign subsidiaries.
Share-based payments reserveThe share-based payments reserve is used to recognise the fair value of providing shares to participants of employee share schemes.
Undistributed profit reserveThis reserve held quarantined profits of relevant entities of the Group to support future Group dividend payments during a period that the Group as a whole was in a loss-making position. As at 31 December 2017 the reserve has been fully utilised and is no longer required.
The above Consolidated Statement of Changes in Equity should be read in conjunction with the accompanying notes.
Other InformationDirectors’ Report Remuneration Report Financial ReportBusiness Review

53MYOB ANNUAL REPORT 2017
Consolidated Statement of Cash Flows
FOR THE PERIOD ENDED 31 DECEMBER 2017
NOTE2017
$0002016
$000
Cash flows from operating activitiesReceipts from customers 414,224 406,711Payments to suppliers and employees (233,781) (246,153)Interest paid (13,582) (15,203)Income tax paid (3,807) (460)Interest received 865 938Net cash flows from operating activities 163,919 145,833
Cash flows from investing activitiesAcquired software costs (1,300) (1,200)Acquired intangible assets (1,603) –Investment in equity accounted investments (3,000) –Purchase of property, plant and equipment (12,944) (8,132)Capitalised new product development 6 (35,288) (26,879)Purchase of business acquisition, net of cash acquired 12 (47,545) (22,820)Net cash flows used in investing activities (101,680) (59,031)
Cash flows from financing activitiesProceeds from on-market sale of forfeited Treasury shares 9 3,456 –Debt transaction costs – (264)Repayment of finance lease liabilities (410) –Share buyback by parent entity 9 (3,268) –Dividends paid by parent entity 4 (69,303) (62,189)Net cash flows used in financing activities (69,525) (62,453)
Net increase/(decrease) in cash and cash equivalents (7,286) 24,349Cash and cash equivalents at beginning of period 61,434 36,384Effect of exchange rate changes on cash and cash equivalents 631 701Cash and cash equivalents at end of period 54,779 61,434
The above Consolidated Statement of Cash Flows should be read in conjunction with the accompanying notes.
Other InformationDirectors’ Report Remuneration Report Financial ReportBusiness Review

54 MYOB ANNUAL REPORT 2017
Notes to the Financial Statements
FOR THE PERIOD ENDED 31 DECEMBER 2017
PERFORMANCE
1 SEGMENT INFORMATION
Management has determined the Group’s operating segments based on the reports reviewed by the Board (the Chief Operating Decision Maker). During the financial reporting period ended 31 December 2017, management reviewed and updated its internal reporting structure and consequently reportable segments are now presented differently from previously published financial results. The Board analyses the Group’s activities by operating segments which are organised and managed separately according to the nature of the customers they service with each segment offering different products and serving different markets. The Board reviews each of the operating segments down to contribution level for the purpose of making decisions about resource allocation and performance assessment.
Segment performance is evaluated based on operating profit or loss (segment result), which in certain respects, is presented differently from operating profit or loss in the Consolidated Financial Statements. There are no significant transactions between segments.
The operating segments and their respective types of products and services are disclosed as follows:
REPORTABLE SEGMENT PRINCIPAL ACTIVITIES
Clients & Partners Provides business management software to small and medium enterprises (SMEs) and accounting professionals in practice
Enterprise Solutions Provides enterprise resource planning and human resource management software and services to medium and large enterprises
Operations & Service
Provides support, training and services to SMEs and accounting professionals in practice
Corporate (incl. R&D)
Provides internal support and shared services to MYOB’s client-facing teams, including product research and development functions, in addition to holding the equity accounted investments
Other InformationDirectors’ Report Remuneration Report Financial ReportBusiness Review
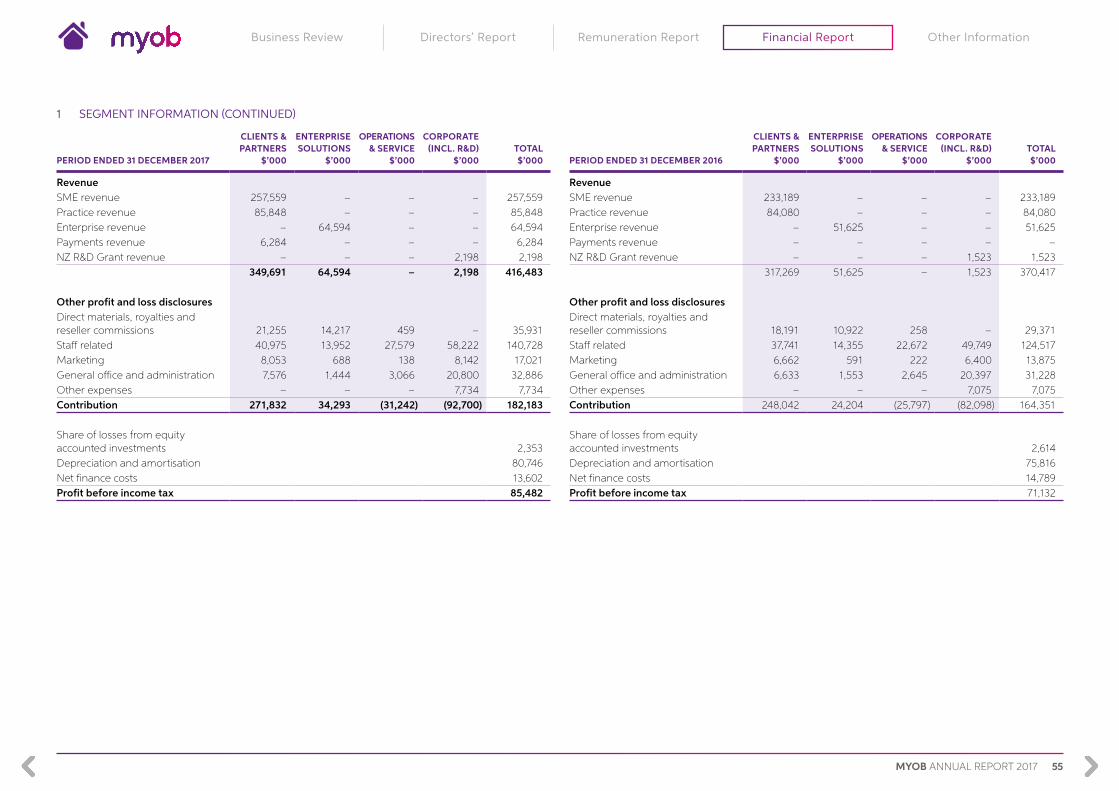
55MYOB ANNUAL REPORT 2017
PERIOD ENDED 31 DECEMBER 2017
CLIENTS & PARTNERS
$’000
ENTERPRISE SOLUTIONS
$’000
OPERATIONS & SERVICE
$’000
CORPORATE (INCL. R&D)
$’000TOTAL $’000
RevenueSME revenue 257,559 – – – 257,559Practice revenue 85,848 – – – 85,848Enterprise revenue – 64,594 – – 64,594Payments revenue 6,284 – – – 6,284NZ R&D Grant revenue – – – 2,198 2,198
349,691 64,594 – 2,198 416,483
Other profit and loss disclosuresDirect materials, royalties and reseller commissions 21,255 14,217 459 – 35,931Staff related 40,975 13,952 27,579 58,222 140,728Marketing 8,053 688 138 8,142 17,021General office and administration 7,576 1,444 3,066 20,800 32,886Other expenses – – – 7,734 7,734Contribution 271,832 34,293 (31,242) (92,700) 182,183
Share of losses from equity accounted investments 2,353Depreciation and amortisation 80,746Net finance costs 13,602Profit before income tax 85,482
1 SEGMENT INFORMATION (CONTINUED)
PERIOD ENDED 31 DECEMBER 2016
CLIENTS & PARTNERS
$’000
ENTERPRISE SOLUTIONS
$’000
OPERATIONS & SERVICE
$’000
CORPORATE (INCL. R&D)
$’000TOTAL $’000
RevenueSME revenue 233,189 – – – 233,189Practice revenue 84,080 – – – 84,080Enterprise revenue – 51,625 – – 51,625Payments revenue – – – – –NZ R&D Grant revenue – – – 1,523 1,523
317,269 51,625 – 1,523 370,417
Other profit and loss disclosuresDirect materials, royalties and reseller commissions 18,191 10,922 258 – 29,371Staff related 37,741 14,355 22,672 49,749 124,517Marketing 6,662 591 222 6,400 13,875General office and administration 6,633 1,553 2,645 20,397 31,228Other expenses – – – 7,075 7,075Contribution 248,042 24,204 (25,797) (82,098) 164,351
Share of losses from equity accounted investments 2,614Depreciation and amortisation 75,816Net finance costs 14,789Profit before income tax 71,132
Other InformationDirectors’ Report Remuneration Report Financial ReportBusiness Review
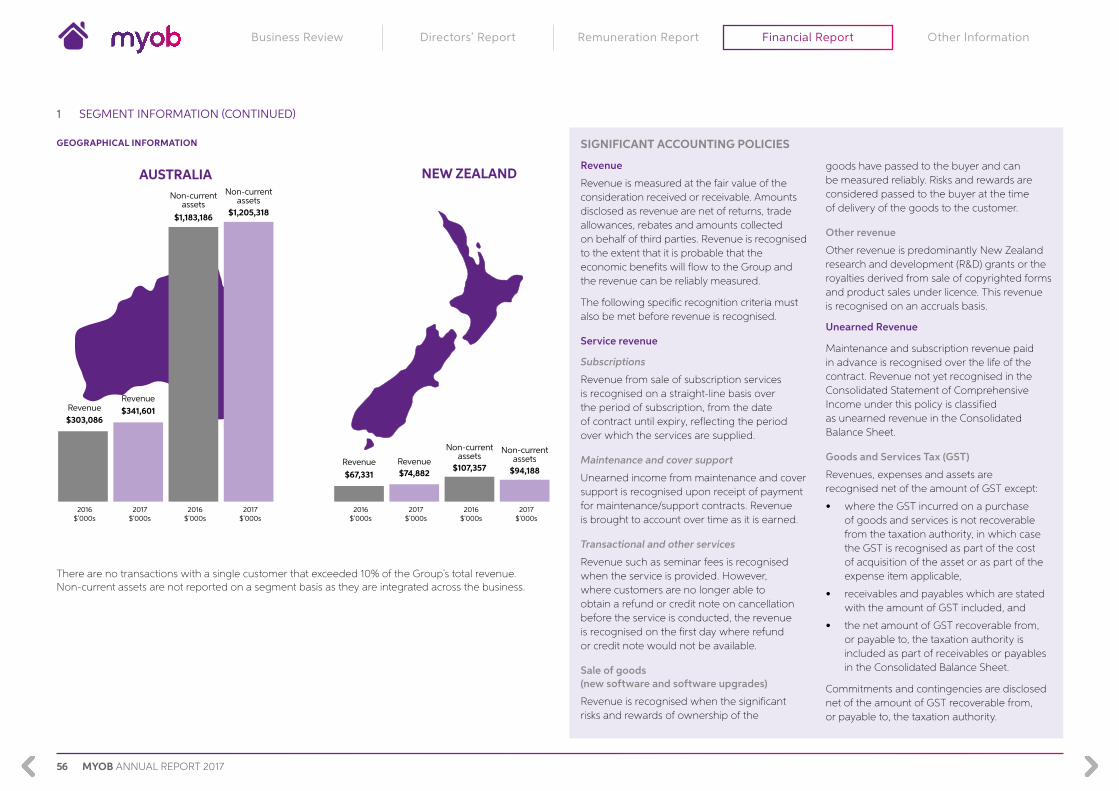
56 MYOB ANNUAL REPORT 2017
SIGNIFICANT ACCOUNTING POLICIES
Revenue
Revenue is measured at the fair value of the consideration received or receivable. Amounts disclosed as revenue are net of returns, trade allowances, rebates and amounts collected on behalf of third parties. Revenue is recognised to the extent that it is probable that the economic benefits will flow to the Group and the revenue can be reliably measured.
The following specific recognition criteria must also be met before revenue is recognised.
Service revenue
Subscriptions
Revenue from sale of subscription services is recognised on a straight-line basis over the period of subscription, from the date of contract until expiry, reflecting the period over which the services are supplied.
Maintenance and cover support
Unearned income from maintenance and cover support is recognised upon receipt of payment for maintenance/support contracts. Revenue is brought to account over time as it is earned.
Transactional and other services
Revenue such as seminar fees is recognised when the service is provided. However, where customers are no longer able to obtain a refund or credit note on cancellation before the service is conducted, the revenue is recognised on the first day where refund or credit note would not be available.
Sale of goods (new software and software upgrades)
Revenue is recognised when the significant risks and rewards of ownership of the
goods have passed to the buyer and can be measured reliably. Risks and rewards are considered passed to the buyer at the time of delivery of the goods to the customer.
Other revenue
Other revenue is predominantly New Zealand research and development (R&D) grants or the royalties derived from sale of copyrighted forms and product sales under licence. This revenue is recognised on an accruals basis.
Unearned Revenue
Maintenance and subscription revenue paid in advance is recognised over the life of the contract. Revenue not yet recognised in the Consolidated Statement of Comprehensive Income under this policy is classified as unearned revenue in the Consolidated Balance Sheet.
Goods and Services Tax (GST)
Revenues, expenses and assets are recognised net of the amount of GST except:
• where the GST incurred on a purchase of goods and services is not recoverable from the taxation authority, in which case the GST is recognised as part of the cost of acquisition of the asset or as part of the expense item applicable,
• receivables and payables which are stated with the amount of GST included, and
• the net amount of GST recoverable from, or payable to, the taxation authority is included as part of receivables or payables in the Consolidated Balance Sheet.
Commitments and contingencies are disclosed net of the amount of GST recoverable from, or payable to, the taxation authority.
GEOGRAPHICAL INFORMATION
SEGMENT INFORMATION
AUSTRALIA NEW ZEALAND
2016$’000s
2017$’000s
2016$’000s
2017$’000s
2016$’000s
2017$’000s
2016$’000s
2017$’000s
Revenue$303,086
Revenue$341,601
Non-currentassets
$1,183,186
Non-currentassets
$1,205,318
Revenue$67,331
Revenue$74,882
Non-currentassets
$107,357
Non-currentassets
$94,188
There are no transactions with a single customer that exceeded 10% of the Group’s total revenue. Non-current assets are not reported on a segment basis as they are integrated across the business.
1 SEGMENT INFORMATION (CONTINUED)
Other InformationDirectors’ Report Remuneration Report Financial ReportBusiness Review

57MYOB ANNUAL REPORT 2017
2 OTHER EXPENSES
2017$’000
2016$’000
One-off marketing expenses 1 – 1,711Integration costs 5,244 4,232Redundancy and restructuring 1,213 1,179Other 1,277 (47)Total other expenses 7,734 7,075
1 One-off marketing expenses relate to brand transformation initiatives.
3 EARNINGS PER SHARE
2017 2016
Profit after income tax attributable to owners of MYOB Group Limited ($’000) 60,680 52,162WANOS 1 used in the calculation of basic EPS (shares) 599,515,038 588,209,635WANOS 1 used in the calculation of diluted EPS (shares) 2 599,515,038 588,209,635Basic EPS (cents per share) 10.12 8.87Diluted EPS (cents per share) 10.12 8.87
1 Weighted average number of ordinary shares.
2 Performance shares and Treasury shares were assessed as not being dilutive at reporting date.
CALCULATION OF EARNINGS PER SHARE
Basic earnings per share
Basic earnings per share is calculated as net profit attributable to members of MYOB Group Limited, adjusted to exclude any costs of servicing equity (other than dividends), divided by the weighted average number of ordinary shares.
Diluted earnings per share
Diluted earnings per share is calculated as net profit attributable to members of MYOB Group Limited, adjusted for:
• costs of servicing equity (other than dividends);
• the after-tax effect of dividends and interest associated with dilutive potential ordinary shares that have been recognised as expenses; and
• other non-discretionary changes in revenues or expenses during the year that would result from the dilution of potential ordinary shares;
divided by the weighted average number of ordinary shares and dilutive potential ordinary shares.
Other InformationDirectors’ Report Remuneration Report Financial ReportBusiness Review
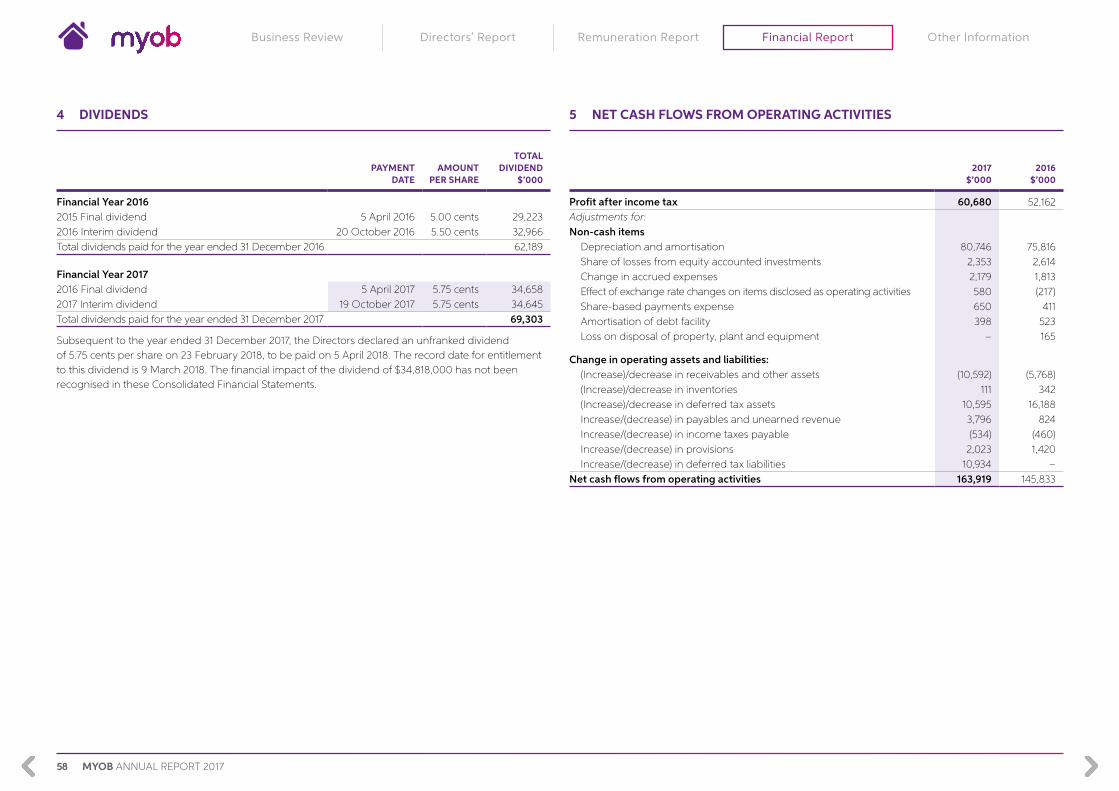
58 MYOB ANNUAL REPORT 2017
4 DIVIDENDS
PAYMENTDATE
AMOUNT PER SHARE
TOTAL DIVIDEND
$’000
Financial Year 20162015 Final dividend 5 April 2016 5.00 cents 29,2232016 Interim dividend 20 October 2016 5.50 cents 32,966Total dividends paid for the year ended 31 December 2016 62,189
Financial Year 20172016 Final dividend 5 April 2017 5.75 cents 34,6582017 Interim dividend 19 October 2017 5.75 cents 34,645Total dividends paid for the year ended 31 December 2017 69,303
Subsequent to the year ended 31 December 2017, the Directors declared an unfranked dividend of 5.75 cents per share on 23 February 2018, to be paid on 5 April 2018. The record date for entitlement to this dividend is 9 March 2018. The financial impact of the dividend of $34,818,000 has not been recognised in these Consolidated Financial Statements.
5 NET CASH FLOWS FROM OPERATING ACTIVITIES
2017
$’0002016
$’000
Profit after income tax 60,680 52,162Adjustments for:Non-cash items
Depreciation and amortisation 80,746 75,816Share of losses from equity accounted investments 2,353 2,614Change in accrued expenses 2,179 1,813Effect of exchange rate changes on items disclosed as operating activities 580 (217)Share-based payments expense 650 411Amortisation of debt facility 398 523Loss on disposal of property, plant and equipment – 165
Change in operating assets and liabilities:(Increase)/decrease in receivables and other assets (10,592) (5,768)(Increase)/decrease in inventories 111 342(Increase)/decrease in deferred tax assets 10,595 16,188Increase/(decrease) in payables and unearned revenue 3,796 824Increase/(decrease) in income taxes payable (534) (460)Increase/(decrease) in provisions 2,023 1,420Increase/(decrease) in deferred tax liabilities 10,934 –
Net cash flows from operating activities 163,919 145,833
Other InformationDirectors’ Report Remuneration Report Financial ReportBusiness Review
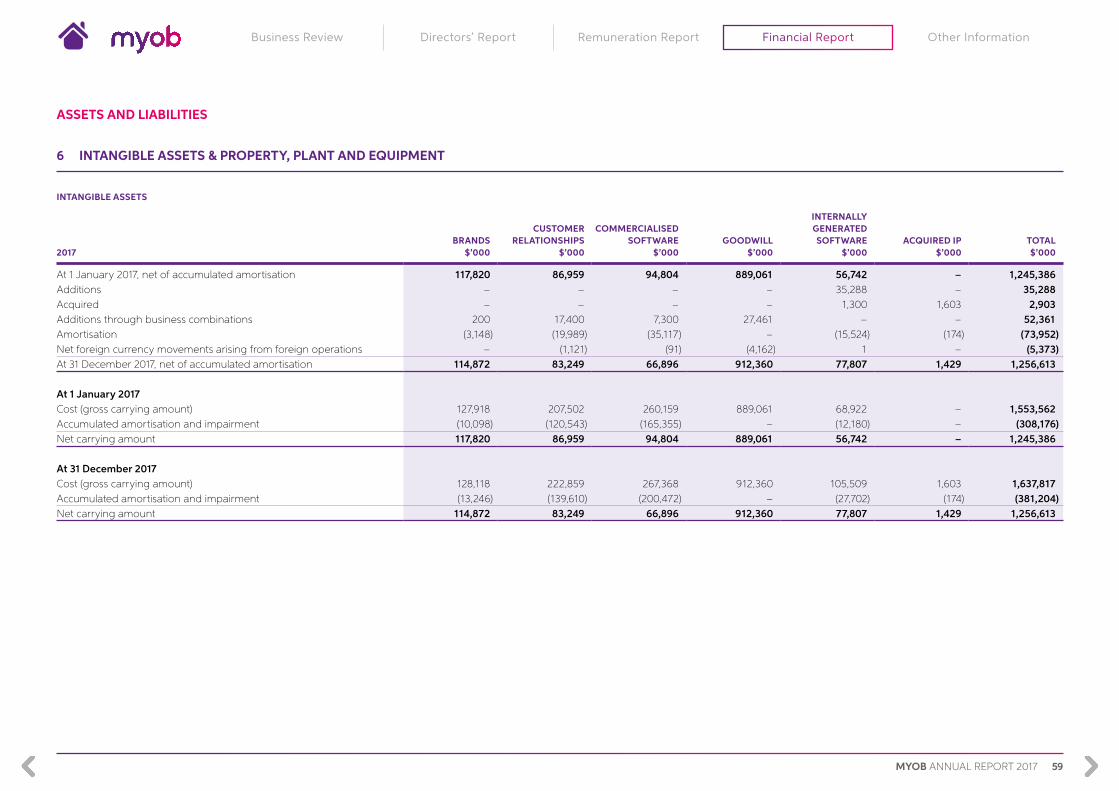
59MYOB ANNUAL REPORT 2017
ASSETS AND LIABILITIES
6 INTANGIBLE ASSETS & PROPERTY, PLANT AND EQUIPMENT
INTANGIBLE ASSETS
2017BRANDS
$’000
CUSTOMER RELATIONSHIPS
$’000
COMMERCIALISED SOFTWARE
$’000GOODWILL
$’000
INTERNALLY GENERATED SOFTWARE
$’000ACQUIRED IP
$’000TOTAL$’000
At 1 January 2017, net of accumulated amortisation 117,820 86,959 94,804 889,061 56,742 – 1,245,386Additions – – – – 35,288 – 35,288Acquired – – – – 1,300 1,603 2,903Additions through business combinations 200 17,400 7,300 27,461 – – 52,361Amortisation (3,148) (19,989) (35,117) – (15,524) (174) (73,952)Net foreign currency movements arising from foreign operations – (1,121) (91) (4,162) 1 – (5,373)At 31 December 2017, net of accumulated amortisation 114,872 83,249 66,896 912,360 77,807 1,429 1,256,613
At 1 January 2017Cost (gross carrying amount) 127,918 207,502 260,159 889,061 68,922 – 1,553,562Accumulated amortisation and impairment (10,098) (120,543) (165,355) – (12,180) – (308,176)Net carrying amount 117,820 86,959 94,804 889,061 56,742 – 1,245,386
At 31 December 2017Cost (gross carrying amount) 128,118 222,859 267,368 912,360 105,509 1,603 1,637,817Accumulated amortisation and impairment (13,246) (139,610) (200,472) – (27,702) (174) (381,204)Net carrying amount 114,872 83,249 66,896 912,360 77,807 1,429 1,256,613
Other InformationDirectors’ Report Remuneration Report Financial ReportBusiness Review

60 MYOB ANNUAL REPORT 2017
2016 1
BRANDS$’000
CUSTOMER RELATIONSHIPS
$’000
COMMERCIALISED SOFTWARE
$’000GOODWILL
$’000
INTERNALLY GENERATED SOFTWARE
$’000TOTAL$’000
At 1 January 2016, net of accumulated amortisation 120,343 94,920 122,977 874,568 41,327 1,254,135Additions – – – – 26,879 26,879Acquired – – – – 1,200 1,200Additions through business combinations 670 12,244 5,357 12,447 – 30,718Amortisation (3,193) (20,698) (33,531) – (12,651) (70,073)Net foreign currency movements arising from foreign operations – 493 1 2,046 (13) 2,527At 31 December 2016, net of accumulated amortisation 117,820 86,959 94,804 889,061 56,742 1,245,386
At 1 January 2016Cost (gross carrying amount) 127,248 194,362 254,802 874,568 67,184 1,518,164Accumulated amortisation and impairment (6,905) (99,442) (131,825) – (25,857) (264,029)Net carrying amount 120,343 94,920 122,977 874,568 41,327 1,254,135
At 31 December 2016Cost (gross carrying amount) 127,918 207,502 260,159 889,061 68,922 1,553,562Accumulated amortisation and impairment (10,098) (120,543) (165,355) – (12,180) (308,176)Net carrying amount 117,820 86,959 94,804 889,061 56,742 1,245,386
1 FY17 data has been restated for a retrospective change in accounting policy applied during the period (refer Note 23 “Other significant accounting policies”).
6 INTANGIBLE ASSETS & PROPERTY, PLANT AND EQUIPMENT (CONTINUED)
PROPERTY, PLANT AND EQUIPMENTProperty, plant and equipment of $25.5 million (2016: $19.5 million) includes plant and equipment and leasehold improvements. During the period, the Group purchased property, plant and equipment of $12.9 million, net of depreciation expense of $6.8 million and exchange rate differences.
Impairment tests for goodwill, intangible assets and property, plant and equipment
At each reporting date, the Group assess whether there is any indication that an asset may be impaired. Where an indicator of impairment exists, the Group makes a formal estimate of the recoverable amount. Where the carrying amount of an asset exceeds its recoverable amount, the asset is considered impaired and is written down to its recoverable amount.
Recoverable amount is the greater of fair value less costs to sell and value-in-use. For the purposes of assessing impairment, assets are grouped at the lowest levels for which there are separately identifiable cash inflows which are largely independent of the cash inflows from other assets or groups of assets (cash-generating units (CGU’s)). Non-financial assets, other than goodwill, that have recognised an impairment in the past are reviewed for possible reversal of the impairment at the end of each reporting period.
To further develop the connected practice strategy envisaged for the future of the accounting industry, management has updated its reporting structure by consolidating the go-to-market functions from the SME Solutions and Practice Solutions business divisions into a single Clients & Partners reportable segment. In addition, the operations and support functions from the SME Solutions and Practice Solutions business divisions have been consolidated into a new Operations & Service reportable segment. These changes in segment reporting (refer Note 1 “Segment reporting”), in addition to the acquisition of the Paycorp business, has warranted a reassessment of CGU’s which have now been identified as Client & Partners, Enterprise Solutions and Payment Solutions, to which goodwill was applied for the period ended 31 December 2017.
If management’s judgement in regard to the allocation of goodwill to CGU’s for the purpose of impairment testing had not changed during the financial reporting period, and goodwill and intangible assets with indefinite lives were tested for impairment as allocated to the separate CGU’s identified in the period ended 31 December 2016, no impairment for goodwill and intangibles with indefinite lives would have been identified.
Other InformationDirectors’ Report Remuneration Report Financial ReportBusiness Review

61MYOB ANNUAL REPORT 2017
A CGU level summary of the allocation is presented below:
2017
CLIENTS & PARTNERS
$’000
ENTERPRISE SOLUTIONS
$’000
PAYMENT SOLUTIONS
$’000TOTAL$’000
Brands 100,961 13,741 170 114,872Customer relationships 55,799 11,350 16,100 83,249Commercialised software 56,098 4,593 6,205 66,896Goodwill 771,425 113,474 27,461 912,360Internally generated software 65,577 13,659 – 79,236Total intangible assets 1,049,860 156,817 49,936 1,256,613
2016
SME SOLUTIONS
$’000
PRACTICE SOLUTIONS
$’000
ENTERPRISE SOLUTIONS
$’000TOTAL$’000
Brands 75,190 28,496 14,134 117,820
Customer relationships 28,896 43,653 14,410 86,959
Commercialised software 63,544 25,093 6,167 94,804
Goodwill 557,103 216,647 115,311 889,061
Internally generated software 16,974 25,970 13,798 56,742
Total intangible assets 741,707 339,859 163,820 1,245,386
The recoverable amount of a CGU is determined on its value-in-use, with exception to the Payment Solutions CGU for which the fair value of the Paycorp acquisition in the year has been used, deducting the estimated cost to sell. These calculations use cash flow projections based on financial forecasts approved by management covering a five-year period.
6 INTANGIBLE ASSETS & PROPERTY, PLANT AND EQUIPMENT (CONTINUED) Cash flows beyond the five-year period are extrapolated using the estimated growth rates stated below. The growth rate does not exceed the long term average growth rate for the business in which the CGU operates.
Key assumptions for value-in-use calculations
2017 2016
Nominal discount rate (pre-tax) 13.14% 13.36%Terminal growth rate 2.50% 2.50%
Nominal discount rate (pre-tax) is the Group’s Weighted Average Cost of Capital. Terminal growth rate is the expected industry growth rate.
Key assumptions for value-in-use calculations
Management used historical amounts (allocation methodology at the time was around 2015 revenue plan % splits per CGU) for existing intangible assets that were not easily identifiable.
The recoverable amount of the intangible assets in the Client & Partners and Enterprise Solutions segments exceeds the carrying value at 31 December 2017. An increase of 2.0% in the pre-tax discount rate of 13.14% or a 5% decrease in revenue cashflow forecasts does not result in an impairment of intangible assets at 31 December 2017. Changes of this magnitude would be considered reasonably possible.
Other InformationDirectors’ Report Remuneration Report Financial ReportBusiness Review

62 MYOB ANNUAL REPORT 2017
SIGNIFICANT ACCOUNTING POLICIES
Goodwill
Goodwill on acquisition is initially measured at the excess of the consideration transferred in a business combination over the acquirer’s interest in the net fair value of the identifiable assets, liabilities and contingent liabilities.
Following initial recognition, goodwill is measured at cost less any accumulated impairment losses. Goodwill is not amortised, instead it is reviewed for impairment annually or more frequently if events or changes in circumstances indicate that the carrying value may be impaired.
As at the acquisition date, any goodwill acquired is allocated to each of the cash-generating units.
Intangible assets
Following initial recognition, intangible assets are carried at cost less any accumulated amortisation and any accumulated impairment losses. Intangible assets are amortised over the useful life and assessed for impairment whenever there is an indication that the intangible asset may be impaired.
Where amortisation is charged on assets with finite lives, this expense is taken to the profit or loss.
Research and development costs
Research costs are expensed as incurred.
Following the initial recognition of the development expenditure, the cost model is applied, requiring the asset to be carried at cost less any accumulated amortisation and accumulated impairment losses.
Useful life of assets
A summary of the policies applied to the Group’s intangible assets subject to amortisation is as follows:
COMMERCIAL ISED SOFTWARE
INTERNALLY GENERATED SOFTWARE
CUSTOMER RELATIONSHIPS ACQUIRED IP BRANDS 1
Method used 2 5 to 8 years – straight line
5 years – straight line
9.25 to 17 years – diminishing value
5 years – straight line
3 to 5 years – straight line
Internally generated/Acquired Acquired Internally generated
Acquired Acquired Acquired
Impairment test/ Recoverable amount testing
Tested annually only if there is an indication of impairment Tested annually
1 The MYOB brand ($112.5 million) is considered to have an indefinite useful life, as the longevity of the brand is not considered to be dissimilar to the Group’s business. The Group continues to make the required investment to preserve key brand characteristics, including market position and reputation. However, the acquired brands of BankLink, PayGlobal, ACE, IMS, Greentree and Paycorp (original cost $15.6 million) are being amortised over their perceived useful life of three to five years.
2 The useful life of finite intangible assets is judgemental and reviewed annually by management.
Property, plant and equipment is stated at cost less accumulated depreciation using the depreciation table below:
CLASS OF ASSETS DEPRECIATION PERIOD
Plant and equipment 3 – 5 years
Leasehold improvements 3 – 8 years 1
1 or duration of lease, whichever is shorter.
Gains or losses on disposal
Gains or losses arising from the sale of an asset are measured as the difference between the net disposal proceeds and the carrying amount of the asset and are recognised in the Consolidated Statement of Comprehensive Income when the asset is sold.
6 INTANGIBLE ASSETS & PROPERTY, PLANT AND EQUIPMENT (CONTINUED)
Other InformationDirectors’ Report Remuneration Report Financial ReportBusiness Review

63MYOB ANNUAL REPORT 2017
CRITICAL ACCOUNTING ESTIMATES AND JUDGEMENTS
Carrying value of goodwill and indefinite lived intangible assets
The Group determines whether goodwill and intangible assets with indefinite useful lives are impaired at least on an annual basis. This requires an estimation of the recoverable amount of the cash-generating units to which the goodwill and intangible assets with indefinite useful lives are allocated.
Useful life of intangible assets
The useful life of intangible assets are assessed to be either finite or indefinite. For treatment of finite intangible assets, refer to the useful life of assets table in “Significant accounting policies”. Brand names that have indefinite lives are not amortised. Management use judgement in determining whether an individual brand will have a finite life or an indefinite life. In making this determination, management make use of information on the long term strategy for the brand, the level of growth or decline of the markets that the brand operates in, the history of the market and the brand’s position within that market. If a brand is assessed to have a finite life, management will use judgement in determining the useful life of the brand and will consider the period over which expected cash flows will continue to be derived in making that decision.
Capitalisation of internally generated software
An intangible asset arising from development expenditure on an internal project is recognised only when the Group can demonstrate the technical feasibility of completing the intangible asset so that it will be available for use or sale, its intention to complete and its ability to use or sell the asset, how the asset will generate future economic benefits, the availability of resources to complete the development and the ability to measure reliably the expenditure attributable to the intangible asset during its development.
The Group commences amortising internally generated software projects at the earlier of 1st January or 1st July subsequent to the date of any component of the project being sold into the market.
6 INTANGIBLE ASSETS & PROPERTY, PLANT AND EQUIPMENT (CONTINUED) 7 OTHER INVESTMENTS
2017$’000
2016$’000
ProjectX, International Limited 8,210 8,210
8,210 8,210
The Group holds 68.08% of the Class B-1 preference shares on issue and 8.22% of all shares on issue.
SIGNIFICANT ACCOUNTING POLICIESInvestments held by the Group are measured against the accounting standard criteria around control and then on materiality and influence to determine the appropriate accounting treatment at each reporting date. Where the Group has determined that it does not have either control, or significant influence, the investment will be disclosed as an available-for-sale investment at fair market value or cost.Conversely, where the Group has determined that it does have control or significant influence, the investment is treated as an equity accounted investment in accordance with AASB 128 Investments in Associates & Joint Ventures (refer to Note 16 “Equity accounted investments”).
8 TAXATION
Tax consolidated group
MYOB Group Limited and its wholly owned Australian resident subsidiaries are members of an Australian income tax consolidated group. MYOB Group Limited is the head company.
The entities in the tax consolidated group have entered into a tax sharing and funding agreement which limits the joint and several liability of each member entity and appropriate compensation is provided for current tax payable or receivable in the group.
INCOME TAX EXPENSE
2017$’000
2016$’000
Current tax 3,396 6,378
Deferred tax 21,649 13,234
Adjustment of tax for the prior period (243) (642)
24,802 18,970
Other InformationDirectors’ Report Remuneration Report Financial ReportBusiness Review

64 MYOB ANNUAL REPORT 2017
NUMERICAL RECONCILIATION OF INCOME TAX EXPENSE TO PRIMA FACIE TAX PAYABLE
2017$’000
2016$’000
Profit for the year before income tax expense 85,482 71,132
Prima facie tax 25,645 21,340
Tax effect of amounts which are not deductible/(taxable) in calculating taxable income
Entertainment 269 353
Research and development rebate 1 (1,391) (2,786)
Recouped depreciation on transfer of Greentree software – 1,141
Sundry items 654 (343)
(468) (1,635)
Difference in overseas tax rate (132) (93)
Adjustment for current tax of prior periods (243) (642)
Income tax expense 24,802 18,970
Deferred tax expense (21,649) (13,234)
Income tax paid during the year (3,807) (480)
Items recognised directly to equity 2,421 –
Other adjustments 645 162
Income tax payable 2 2,412 5,418
1 Companies within the Group may be entitled to claim special tax deductions for investments in qualifying assets or in relation to qualifying expenditure (e.g. the Research and Development Tax Incentive regime in Australia or other investment allowances). The Group accounts for such allowances as tax credits, which means that the allowance reduces income tax payable and current tax expense. A deferred tax asset is recognised for unclaimed tax credits that are carried forward.
2 Income tax payable relates to NZ tax group.
EFFECTIVE TAX RATE
2017 2016
Australian consolidated group 29% 25%
Consolidated group 29% 27%
The above effective tax rates (ETRs) have been calculated as income tax expense divided by accounting profit for the Australian consolidated group and the Consolidated group.
Australian consolidated group
The effective tax rate for year ended 31 December 2017 is lower than the Australian company tax rate predominantly due to the impact of the research and development rebate, prior period adjustments and non-deductible expenses. The effective tax rate excluding the impact of these items is 30%.
Consolidated group
The effective tax rate for year ended 31 December 2017 is lower than the Australian company tax rate predominantly due to impact of the research and development rebate, prior period adjustments and non-deductible expenses. The effective tax rate excluding the impact of these items is 29.8% (which is a combination of corporate tax rates of 28% in New Zealand and 30% in Australia).
DEFERRED TAX ASSETS AND LIABILITIES
2017$’000
2016$’000
Deferred tax balances comprise temporary differences attributable to items:
Tax losses (carried forward) 7,009 35,784
Commercialised software and capitalised product development 18,553 17,544
Business capital costs 5,751 8,431
Liabilities other than employee benefits 5,402 5,425
Employee benefits 4,448 3,834
Customer relationships (24,661) (25,662)
Brand and other intangible assets (34,462) (35,346)
Equity accounted investments 1,731 –
Other 44 585
Net deferred tax asset/(liability) (16,185) 10,595
FY16 data has been restated for a retrospective change in accounting policy applied during the period (refer Note 23 “Other significant accounting policies”).
8 TAXATION (CONTINUED)
Other InformationDirectors’ Report Remuneration Report Financial ReportBusiness Review

65MYOB ANNUAL REPORT 2017
SIGNIFICANT ACCOUNTING POLICIES
Current and deferred taxes
The income tax for the period is determined on existing tax laws or substantively enacted tax laws at the end of the reporting period. For deferred income tax, consideration is also given to whether these laws are expected to be enacted at the time the deferred asset or liability is realised.
Deferred tax assets and liabilities are recognised for all temporary differences, other than for:
• Initial recognition of goodwill;
• Initial recognition of an asset or liability in a transaction that is not a business combination and at that time the transaction affects neither accounting profit nor taxable profit or loss; and
• Temporary differences associated with investments in subsidiaries where the timing of the reversal can be controlled and it is probable that it will not reverse in the foreseeable future.
Deferred tax assets and liabilities are offset when there is a legally enforceable right to do so and when the deferred tax balances relate to the same taxation authority.
Deferred tax assets are recognised only if it is probable that future taxable amounts will be available to utilise those temporary differences and losses. Capital losses of $1.928 million have not been recognised as a deferred tax asset as management has not determined their recovery as probable (2016: $1.928 million).
CRITICAL ACCOUNTING ESTIMATES AND JUDGEMENTS
Recovery of deferred tax assets
Deferred tax assets are recognised for deductible temporary differences and unused tax losses as management considers probable that sufficient taxable temporary differences are expected to reverse in a future period or future taxable profits will be available to utilise those temporary differences with reference to tax requirements. Significant management judgement is required to determine the amount of deferred tax assets that can be recognised, based upon the likely timing and the level of future taxable profits.
ADOPTION OF VOLUNTARY TAX TRANSPARENCY CODEMYOB is signatory to the Board of Taxation’s Corporate Tax Transparency Code Register. This reflects MYOB’s commitment to the Voluntary Tax Transparency Code (TTC). As MYOB is classified as a medium business under the TTC, Part A tax disclosures as required have been included in this financial report.
8 TAXATION (CONTINUED) CAPITAL STRUCTURE, FINANCING AND RISK MANAGEMENT
9 CONTRIBUTED EQUITY
ORDINARY SHARESOrdinary shares are classified as equity and are fully paid, have no par value, carry one vote per share (either in person or by proxy) and have the right to dividends. Incremental costs, directly attributable to the issue of new shares or the exercise of options, are recognised as a deduction from equity, net of any related income tax benefit.
TREASURY SHARESTreasury shares are ordinary shares that are still retained by the Group until such time as they become available to participants of the Long Term Incentive Plan (LTIP). On 1 February 2017, 7,060,400 ordinary shares at $3.4587 per share were issued as new equity of MYOB Group Limited, to be used to satisfy share-based payment obligations upon vesting, and are held in trust as treasury shares.
Treasury shares are recognised at cost and deducted from equity, net of any income tax effects. No gain or loss is recognised in profit or loss on the purchase, sale, issue or cancellation of treasury shares. Any difference between the cost of acquisition and the consideration when reissued is recognised in the share-based payments reserve.
REPURCHASE OF SHARE CAPITALWhere the Group purchases its own equity instruments, as a result of a share buyback, those instruments are deducted from equity and the re-purchased shares are cancelled. The amount of consideration paid, including directly attributable costs, is recognised as a deduction from contributed equity, net of any related income tax effects. On 24 August 2017, the Group announced its intention to undertake an on-market share buyback of up to five per cent of its issued capital, equivalent to approximately 30,322,081 ordinary shares. The buyback commenced on 8 September 2017 and is expected to continue for a period of up to 12 months.
Other InformationDirectors’ Report Remuneration Report Financial ReportBusiness Review
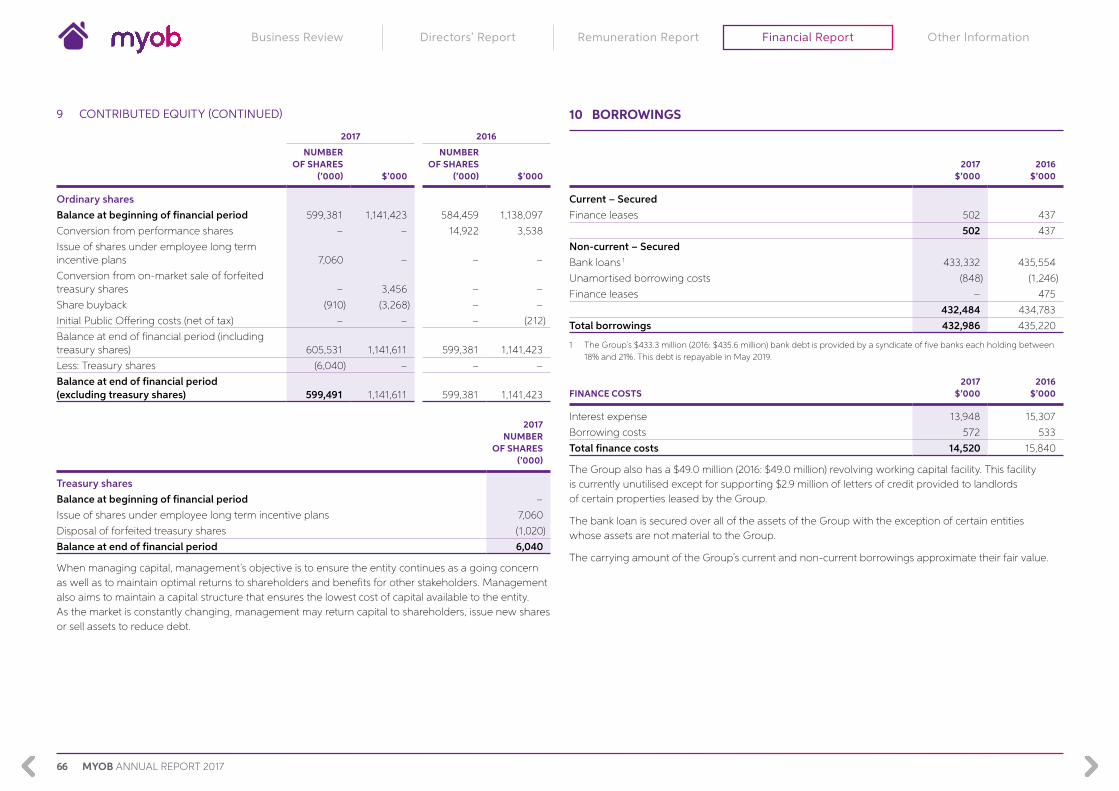
66 MYOB ANNUAL REPORT 2017
2017 2016
NUMBER OF SHARES
(’000) $’000
NUMBER OF SHARES
(’000) $’000
Ordinary sharesBalance at beginning of financial period 599,381 1,141,423 584,459 1,138,097
Conversion from performance shares – – 14,922 3,538
Issue of shares under employee long term incentive plans 7,060 – – –
Conversion from on-market sale of forfeited treasury shares – 3,456 – –
Share buyback (910) (3,268) – –
Initial Public Offering costs (net of tax) – – – (212)
Balance at end of financial period (including treasury shares) 605,531 1,141,611 599,381 1,141,423
Less: Treasury shares (6,040) – – –
Balance at end of financial period (excluding treasury shares) 599,491 1,141,611 599,381 1,141,423
2017NUMBER
OF SHARES (’000)
Treasury sharesBalance at beginning of financial period –
Issue of shares under employee long term incentive plans 7,060
Disposal of forfeited treasury shares (1,020)
Balance at end of financial period 6,040
When managing capital, management’s objective is to ensure the entity continues as a going concern as well as to maintain optimal returns to shareholders and benefits for other stakeholders. Management also aims to maintain a capital structure that ensures the lowest cost of capital available to the entity. As the market is constantly changing, management may return capital to shareholders, issue new shares or sell assets to reduce debt.
9 CONTRIBUTED EQUITY (CONTINUED) 10 BORROWINGS
2017$’000
2016$’000
Current – Secured Finance leases 502 437
502 437
Non-current – SecuredBank loans 1 433,332 435,554
Unamortised borrowing costs (848) (1,246)
Finance leases – 475
432,484 434,783
Total borrowings 432,986 435,220
1 The Group’s $433.3 million (2016: $435.6 million) bank debt is provided by a syndicate of five banks each holding between 18% and 21%. This debt is repayable in May 2019.
FINANCE COSTS2017
$’0002016
$’000
Interest expense 13,948 15,307
Borrowing costs 572 533
Total finance costs 14,520 15,840
The Group also has a $49.0 million (2016: $49.0 million) revolving working capital facility. This facility is currently unutilised except for supporting $2.9 million of letters of credit provided to landlords of certain properties leased by the Group.
The bank loan is secured over all of the assets of the Group with the exception of certain entities whose assets are not material to the Group.
The carrying amount of the Group’s current and non-current borrowings approximate their fair value.
Other InformationDirectors’ Report Remuneration Report Financial ReportBusiness Review

67MYOB ANNUAL REPORT 2017
SIGNIFICANT ACCOUNTING POLICIES
Interest-bearing loans and borrowings
All loans and borrowings are initially recognised at cost, being the fair value of the consideration received net of issue costs associated with the borrowing. After initial recognition, interest-bearing loans and borrowings are subsequently measured at amortised cost, using the effective interest method. Amortised cost is calculated by taking into account any issue costs and any discount or premium on settlement.
Borrowings are classified as non-current liabilities when the Group has an unconditional right to defer settlement for at least twelve months from reporting date.
Borrowing costs
Borrowing costs directly attributable to the acquisition, construction or production of a qualifying asset are capitalised as part of the cost of that asset. All other borrowing costs are expensed in the period they occur. Borrowing costs consist of interest and other costs that an entity incurs in connection with the borrowing of funds.
Borrowings are removed from the Consolidated Balance Sheet when the obligation specified in the contract is discharged, cancelled or expired. The difference between the carrying amount of a financial liability that has been extinguished or transferred to another party and the consideration paid, including any non-cash assets transferred or liabilities assumed, is recognised in profit or loss as other income or finance costs.
Derivative financial instruments and hedging
The Group does not use derivative financial instruments to hedge its risks associated with interest rate fluctuations. This decision is within the scope of the existing company risk profile.
10 BORROWINGS (CONTINUED) 11 FINANCIAL RISK MANAGEMENT
The Group’s activities expose it to a variety of financial risks: foreign exchange risk, interest rate risk, credit risk and liquidity risk. The Group’s overall risk management program focuses on the unpredictability of financial markets and seeks to minimise potential adverse effects on the financial performance of the Group. The Group uses different methods to measure different types of risk to which it is exposed. These methods include sensitivity analysis in the case of interest rates, aging analysis for credit risk and economic trend and major competitor performance analysis to determine market risk.
Risk that �uctuations in foreign exchange rates may impact the Group results
Risk that �uctuations in interest rates may impact the Group results
Risk that default by a customer or supplier could impact the Group's �nancial position and results
Risk that the Group might encounter di�culty in settling its debts or in meeting its obligations related to �nancial liabilities
Foreign exchange risk
Credit risk
Liquidity risk
Interest rate risk
FINANCIAL RISK MANAGEMENT
Other InformationDirectors’ Report Remuneration Report Financial ReportBusiness Review

68 MYOB ANNUAL REPORT 2017
FOREIGN EXCHANGE RISKThe Australian dollar (AUD) is the functional currency of the Group and as a result, currency exposures arise from transactions and balances in currencies other than the Australian dollar. The Group is exposed to the New Zealand dollar (NZD) through its inter-company loan transactions.
At reporting date, the Group’s exposure to foreign currencies were as follows:
NEW ZEALAND DOLLARS (NZD)
2017$’000
2016$’000
Financial assetsCash and cash equivalents 13,397 12,346
Trade and other receivables 6,662 7,545
Financial liabilitiesTrade and other payables (3,838) (2,902)
Borrowings (37,522) (39,866)
Net exposure (21,301) (22,877)
Material sensitivities to foreign exchange movements
The Group is primarily exposed to changes in NZD/AUD exchange rates. The sensitivity of the Group profit after tax to changes in the foreign exchange rates arises mainly from the New Zealand operating result as well as long term borrowings held in New Zealand dollars. Utilising a range of +5% to -5%, a sensitivity analysis showed that the impact to the Group profit after tax would be less than $0.3 million with no significant impact on equity. The Group’s exposure to other foreign exchange movements is not material.
INTEREST RATE RISKThe Group’s main interest rate risk arises from long term borrowings. Borrowings issued at variable rates expose the Group to cash flow interest rate risk. Borrowings issued at fixed rates expose the Group to fair value interest rate risk if the borrowings are carried at fair value. The Group’s borrowings at variable rate were denominated in Australian dollars and New Zealand dollars.
As at the end of the reporting period, the Group had the following variable rate borrowings:
2017 2016
BALANCE$’000
WEIGHTED AVERAGE INTEREST
RATE%
BALANCE$’000
WEIGHTED AVERAGE INTEREST
RATE%
Secured bank loans 433,332 3.17 435,554 3.21
Sensitivity to interest rate movements
The weighted average interest rate for the period ended 31 December 2017 was 3.17% (2016: 3.21%). If the weighted average interest rate had been 10% higher or 10% lower, interest expense would increase/decrease by $0.4 million.
LIQUIDITY RISKThe Group’s objective is to maintain a balance between continuity of funding and flexibility through the use of credit facilities and committed bank loans. The Group minimises liquidity risk by maintaining a sufficient level of cash and equivalents as well as ensuring the Group has access to the use of credit facilities as required.
Financing arrangements
The Group had access to the following borrowing facilities at the end of the reporting period:
DRAWN UNDRAWN TOTAL
2017$’000
2016$’000
2017$’000
2016$’000
2017$’000
2016$’000
Floating rateExpiring within one year – – 180,000 – 180,000 –
Expiring beyond one year 2,917 2,917 46,132 46,132 49,049 49,049
2,917 2,917 226,132 46,132 229,049 49,049
On 16 November 2017, the Group announced that it had entered into a purchase agreement to acquire the assets of the Accountant Group in Australia and New Zealand from Reckon Limited for a total consideration of $180.0 million. The transaction will be funded by a committed debt facility and is subject to regulatory approval and other customary closing conditions. In the interim, the Group has arranged bridging finance of $180.0 million which remains undrawn at reporting date.
In addition to the bridging loan, the Group also has a $49.0 million (2016: $49.0 million) revolving working capital facility that may be drawn upon at any time. This facility is currently unutilised except for supporting $2.9 million of letters of credit provided to landlords of certain properties leased by the Group.
Under the Group’s senior facility agreement there is a requirement to report half-yearly to the banking syndicate on a number of key ratios to ensure that the business is monitoring and managing cash, liquidity, borrowings and interest expense. The Group is in compliance with any covenants in relation to its financing arrangements.
11 FINANCIAL RISK MANAGEMENT (CONTINUED)
Other InformationDirectors’ Report Remuneration Report Financial ReportBusiness Review

69MYOB ANNUAL REPORT 2017
Maturity analysis of financial liabilities
The table below presents the Group’s financial liabilities into relevant maturity groupings based on their contractual maturities for all non-derivative financial liabilities. The amounts disclosed in the table are the contractual undiscounted cash flows. Balances due within 12 months equal their carrying balances as the impact of discounting is not significant.
MATURING IN:
6 MONTHS OR LESS
$’000
6 MONTHS TO 1 YEAR
$’000
1 TO 5 YEARS
$’000
CONTRACT UAL TOTAL$’000
CARRYING AMOUNT
$’000
2017Trade and other payables 23,958 – – 23,958 23,958
Funds held on behalf of customers 12,720 – – 12,720 12,720
Finance leases 286 246 – 532 502
Secured bank loan 6,950 6,878 452,922 466,750 433,332
Total financial liabilities 43,914 7,124 452,922 503,960 470,512
2016Trade and other payables 22,426 – – 22,426 22,426
Funds held on behalf of customers 7,390 – – 7,390 7,390
Finance leases 250 250 502 1,002 912
Secured bank loan 6,994 7,107 469,633 483,734 435,554
Total financial liabilities 37,060 7,357 470,135 514,552 466,282
CREDIT RISKCredit risk arises from cash and cash equivalents, deposits with banks and financial institutions, as well as credit exposures to customers, including outstanding receivables.
The maximum exposure to credit risk at the reporting date is the carrying amount of the financial assets. It is the Group’s policy that all customers who wish to trade on credit terms are subject to credit verification procedures. In addition, receivable balances are monitored on an ongoing basis with the result that the Group’s exposure to bad debts is limited.
There are no significant concentrations of credit risk within the Group. The Group minimises concentrations of credit risks in relation to trade accounts receivable by undertaking transactions with a large number of customers. The majority of customers are concentrated in Australia and New Zealand.
GROUP STRUCTURE
12 BUSINESS COMBINATIONS
PAYCORPOn 23 February 2017, MYOB Acquisition Pty Limited (a subsidiary of MYOB Group Limited) entered into an agreement to purchase 100% of the issued shares in Paycorp Payment Solutions Pty Ltd and specific assets owned by Paycorp International Private Limited for a total consideration of $49.01 million. The purchase was completed on 1 April 2017. Additional payments of $0.05 million (final completion payment) and $0.48 million (stamp duty) in relation to the acquisition were subsequently paid in August 2017 and November 2017 respectively.
The acquisition is a strategic investment for the Group as it enables the business to play a larger role in the provision of automated payment solutions and complements its existing portfolio of integrated accounting solution software.
The acquired business contributed revenue of $6.3 million to the Group for the period from 1 April 2017 to 31 December 2017. If the acquisition had occurred on 1 January 2017, the contributed revenue for the period ended 31 December 2017 would have been $8.8 million. Acquisition related costs of $0.5 million were included in other expenses in the Consolidated Statement of Comprehensive Income.
Details of the final purchase consideration, the net assets acquired and goodwill are as follows:
$’000
Cash 49,541
Total purchase consideration 49,541
The fair value assets and liabilities recognised as a result of the acquisition are as follows:
$’000
Cash and cash equivalents 1,996Property, plant and equipment 88Receivables and prepayments 1,937Payables (1,463)Provisions (98)Net identifiable assets acquired 2,460
Goodwill 27,461Intellectual property – Brand 200Intellectual property – Customer Relationships 17,400Intellectual property – Commercialised Software 7,300Deferred tax liability (5,280)Net assets acquired 49,541
11 FINANCIAL RISK MANAGEMENT (CONTINUED)
Other InformationDirectors’ Report Remuneration Report Financial ReportBusiness Review

70 MYOB ANNUAL REPORT 2017
SIGNIFICANT ACCOUNTING POLICIES
Business combinations
The Group follows accounting standards and guidelines to classify investments appropriately. If an investment meets the criteria around control then it accounts for the investment as a subsidiary. Business combinations (acquisitions of subsidiaries) are accounted for using the acquisition method. The consideration transferred in a business combination is measured at fair value, which is calculated as the sum of the acquisition date fair values of the assets transferred by the acquirer, the liabilities incurred by the acquirer to former owners of the acquiree and the equity issued by the acquirer. Acquisition-related costs are expensed as incurred, and included in other expenses.Identifiable assets acquired and liabilities and contingent liabilities assumed in a business combination are, with limited exceptions, measured initially at their fair values at the acquisition date. When the Group acquires a business, it assesses the financial assets and liabilities assumed for appropriate classification and designation in accordance with the contractual terms, economic conditions, the Group’s operating or accounting policies and other pertinent conditions as at the acquisition date.The excess of the consideration transferred over the fair value of the net identifiable assets acquired is recorded as goodwill. Any contingent consideration to be transferred by the acquirer will be recognised at fair value at the acquisition date. Subsequent changes to the fair value of the contingent consideration will be recognised in the profit or loss.
13 SUBSIDIARIES
The Consolidated Financial Statements include the financial statements of MYOB Group Limited and the subsidiaries listed in the following table.
ENTITYCOUNTRY OF INCORPORATION
EQUITY INTEREST HELD BY THE CONSOLIDATED ENTITY
2017 %
2016 %
Ace Payroll Intermediary Limited New Zealand 100 100
Ace Payroll Plus Limited New Zealand 100 100
ACN 086 760 303 Pty Ltd ^ Australia 100 100
ACN 136 926 960 Pty Limited ~ Australia – 100
Banklink Limited New Zealand 100 100
Banklink Pty Limited Australia 100 100
Blitz Payments Pty Ltd + Australia 100 –
Business Interface Services Pty Ltd + Australia 100 –
ENTITYCOUNTRY OF INCORPORATION
EQUITY INTEREST HELD BY THE CONSOLIDATED ENTITY
2017 %
2016 %
Cayman Holdings Limited ^ Caymans 100 100
Greentree FRL Limited New Zealand 100 100
Greentree Hei Matau Holdings Limited New Zealand 100 100
Greentree International AU Pty Limited Australia 100 100
Greentree International New Zealand Limited New Zealand 100 100
Greentree Modules Limited New Zealand 100 100
Greentree Services Pty Limited Australia 100 100
Greentree Software UK Limited ~ New Zealand – 100
Information Management Services Limited New Zealand 100 100
Media Transfer Services Limited New Zealand 100 100
MYOB Acquisition Pty Ltd * Australia 100 100
MYOB Asia Sdn Bhd ^ Malaysia 100 100
MYOB Australia Pty Ltd * Australia 100 100
MYOB Finance Australia Limited ^ Australia 100 100
MYOB Finance NZ Limited New Zealand 100 100
MYOB Finance Pty Ltd ^ Australia 100 100
MYOB Group Limited # Australia – –
MYOB Holdings Pty Ltd * Australia 100 100
MYOB New Zealand Group Limited New Zealand 100 100
MYOB NZ ESS Limited New Zealand 100 100
MYOB NZ Limited New Zealand 100 100
MYOB Technology Pty Ltd * Australia 100 100
Paycorp Australia Pty Ltd + Australia 100 –
Paycorp Holdings Pty Ltd + Australia 100 –
Paycorp NZ Limited + New Zealand 100 –
Paycorp Payment Solutions Pty Ltd + Australia 100 –
PayGlobal Limited New Zealand 100 100
PayGlobal Pty Ltd Australia 100 100
Solution 6 Pty Ltd ^ Australia 100 100
* An ASIC-approved Deed of Cross Guarantee has been entered into by MYOB Group Limited (the parent entity) and these entities. Refer to Note 15 “Deed of Cross Guarantee” for further details.
# Parent entity.
^ Entity in the process of liquidation.
+ Entity acquired during the financial period.
~ Entity disposed during the financial period.
12 BUSINESS COMBINATIONS (CONTINUED)
Other InformationDirectors’ Report Remuneration Report Financial ReportBusiness Review

71MYOB ANNUAL REPORT 2017
14 PARENT ENTITY INFORMATION
The parent entity within the Group is MYOB Group Limited. The financial information for the parent entity has been prepared on the same basis as the Consolidated Financial Statements.
SUMMARISED FINANCIAL INFORMATIONThe individual financial statements for the parent entity show the following aggregate amounts:
BALANCE SHEET2017
$’0002016
$’000
Current assets 1 1
Non-current assets 1,186,045 1,195,056
Total assets 1,186,046 1,195,057
Current liabilities 2 2
Total liabilities 2 2
Net assets 1,186,044 1,195,055
EquityIssued capital 1,141,611 1,141,423
Reserves 1,457 1,457
Retained earnings 42,976 52,175
Total equity 1,186,044 1,195,055
Profit for the year 60,104 317,706
Total comprehensive income 60,104 317,706
CONTINGENT LIABILITIES OF THE PARENT ENTITYThere are no contingent liabilities or contingent assets as at 31 December 2017. From time to time, the Company is a party to litigation, claims and other contingencies which arise in the ordinary course of business. The Company records a contingent liability when it is probable that a loss has been incurred and the amount of loss can be reasonably estimated in accordance with applicable accounting standards.
15 DEED OF CROSS GUARANTEE
The subsidiaries identified with the following symbol “*” in Note 13 “Subsidiaries” are parties to a deed of cross guarantee under which each company guarantees the debts of the others. By entering into the Deed, the wholly owned entities have been relieved from the requirement to prepare a financial report and directors’ report under ASIC Corporations (Wholly-owned Companies) Instrument 2016/785.
These subsidiaries and MYOB Group Limited together referred to as the “Closed Group”, originally entered into the Deed on 29 June 2015. The effect of the Deed is that each party to it has guaranteed to pay any deficiency in the event of the winding up of any of the entities in the Closed Group.
The Consolidated Statement of Comprehensive Income of the entities which are members of the Closed Group is as follows:
2017$’000
2016$’000
Consolidated Statement of Comprehensive IncomeProfit before income tax 78,566 63,890
Pre-acquisition earnings adjustments (152) (521)
Income tax expense (23,089) (15,813)
Profit after income tax 55,325 47,556
Accumulated losses at the beginning of the financial period (352,016) (407,383)
Profit for the period 55,325 47,556
Transfer between reserves 60,000 70,000
Dividends paid (69,303) (62,189)
Accumulated losses at the end of the financial period (305,994) (352,016)
Other InformationDirectors’ Report Remuneration Report Financial ReportBusiness Review

72 MYOB ANNUAL REPORT 2017
The Consolidated Balance Sheet of the entities which are members of the Closed Group is as follows:
2017$’000
2016$’000
Consolidated Balance SheetCurrent assetsCash and cash equivalents 33,003 45,947Trade and other receivables 38,828 41,372Inventories 86 192Funds held on behalf of customers 8,130 6,697Other current assets 12,310 8,736Total current assets 92,357 102,944
Non-current assetsEquity accounted investments 7,545 6,898Other investments 126,700 77,159Property, plant and equipment 21,776 17,511 Intangible assets 1,104,941 1,132,045Deferred tax assets – 12,397Total non-current assets 1,260,962 1,246,010Total assets 1,353,319 1,348,954
Current liabilitiesTrade and other payables 45,261 51,823Funds held on behalf of customers 8,130 6,697Borrowings 313 288Unearned revenue 37,545 33,508Provisions 11,834 9,852Total current liabilities 103,083 102,168
Non-current liabilitiesBorrowings 395,212 395,178Provisions 5,723 5,687Deferred tax liabilities 15,819 –Total non-current liabilities 416,754 400,865Total liabilities 519,837 503,033Net assets 833,482 845,921
EquityContributed equity 1,141,611 1,141,423Retained earnings (305,994) (352,016)Reserves (2,135) 56,514Total equity 833,482 845,921
At 31 December 2017, the Consolidated Balance Sheet reflected an excess of current liabilities over current assets of $10.7 million. The directors are not aware of any uncertainties relating to events or conditions that may cast significant doubt upon the Group’s ability to continue as a going concern.
15 DEED OF CROSS GUARANTEE (CONTINUED)
Other InformationDirectors’ Report Remuneration Report Financial ReportBusiness Review

73MYOB ANNUAL REPORT 2017
16 EQUITY ACCOUNTED INVESTMENTS
The Group’s ownership interest in equity accounted investments are listed below.
ASSOCIATE PRINCIPAL ACTIVITYCOUNTRY OF INCORPORATION
REPORTING DATE
2017 %
2016 %
Kounta Holdings Pty Limited
Cloud-based Point of Sale system Australia 30 June 39.5 39.5
OnDeck Capital Australia Pty Ltd
Provider of finance to small business Australia 31 December 30.0 30.0
The ownership interest at the Group’s and the associates’ reporting dates are the same. When the annual financial reporting date is different to the Group’s, financial information is obtained as at 31 December to report on an annual basis consistent with the Group’s reporting date.
2017$’000
2016$’000
At the beginning of the financial period 6,898 9,512
Increase in investment in associates 1 3,000 –
Share of losses from equity accounted investments (2,353) (2,614)
At the end of the financial period 7,545 6,898
1 No dividends were received from associates during the period.
The carrying value of the equity accounted investments held by the Group is reported in accordance with AASB 128 Investments in Associates & Joint Ventures. In the Directors’ opinion the realisable value of the investments is higher than the equity accounted value, and the original cost, based on financial performance being in line with expectations. The Group is satisfied that the strategic alignment and outlook for these investments remain unchanged at 31 December 2017.
SIGNIFICANT ACCOUNTING POLICIES
Equity accounted investments
The Group’s investments in its associates, being entities in which the Group has significant influence and are neither subsidiaries nor jointly controlled assets, are accounted for using the equity method. Under this method, the investment in associates is carried in the Consolidated Balance Sheet at cost plus the Group’s post-acquisition of the associates’ net profit/loss.
Where the Group has determined that it does not have either control or significant influence, the investment is disclosed as an available-for-sale investment at fair market value or cost (refer to Note 7 “Other investments”).
EMPLOYEE REMUNERATION
17 SHARE-BASED PAYMENTS
Benefits are provided to employees (including the CEO and Senior Executives) of the Group in the form of share-based payments, whereby employees render services in exchange for equity/rights over shares.
The Group has two forms of share-based payments:
PERFORMANCE SHARE SCHEME (LTI)During MYOB Group’s Initial Public Offering on 7 May 2015, all previously issued 48,111,176 Management “A” shares were converted to 3,547,710 ordinary shares and 21,286,246 performance shares. Performance shares do not carry any voting rights or entitle the holder to any dividends or any returns, on a reduction of capital or upon winding up of the Company.
The number of shares into which performance shares may convert varies upon the share price over a 20-business day consecutive volume weighted average price (VWAP) ending on the relevant testing dates being 30 September 2016, 30 September 2017 and 30 September 2018.
Performance shares held under the LTI did not convert to ordinary shares during FY17 as the share price did not meet the prescribed hurdle set for the second testing date of 30 September 2017.
The maximum number of shares into which the remaining performance shares may still convert is 4,296,962 (which could occur if the share price on the final testing date of 30 September 2018 was at least $5.30). Any share price on or above $4.08 on the final testing date of 30 September 2018 will result in a conversion of a portion of the remaining performance shares.
LONG TERM INCENTIVE PLAN (LTIP)On 1 February 2017, 7,060,400 ordinary shares at $3.4587 per share were issued as new equity of MYOB Group Limited to participants of the LTIP. These ordinary shares that are retained by the Group until such time as they become available to participants of the LTIP (following the achievement of prescribed performance metrics) are classified as treasury shares per AASB 132 Financial Instruments: Presentation. Under this accounting standard, treasury shares are deducted from contributed equity (refer Note 9 “Contributed equity”).
Other InformationDirectors’ Report Remuneration Report Financial ReportBusiness Review

74 MYOB ANNUAL REPORT 2017
Movements in employee equity plans during the financial period were:
NUMBER OF SHARES (’000)
LTI LTIP
Outstanding at the beginning of the financial period 5,841 –
Granted during the financial period – 7,060
Forfeited or cancelled during the financial period (1,544) (1,020)
Outstanding at the end of the financial period 4,297 6,040
The expenses arising from share-based payments are as follows:
2017$’000
2016$’000
Performance Share Scheme (LTI) – 412
Long Term Incentive Plan (LTIP) 650 –
650 412
SIGNIFICANT ACCOUNTING POLICIESThe LTI and the LTIP are accounted for as share-based payments under AASB 2 Share-based Payment as any distribution would be based upon the equity value of MYOB Group Limited. The share-based payment expense in relation to these schemes is recognised in MYOB Australia Pty Ltd, a subsidiary of MYOB Group Limited, on a pro-rata basis over the expected vesting period. The arrangement is treated as an equity settled expense. This treatment for the LTI was a continuation of the Management “A” share scheme. That share scheme vested over five years in line with the Management “A” share scheme and concluded in September 2016. The LTIP scheme will vest as follows: two thirds over two years and one third over three years.
The fair value of the shares for all employee based share schemes are calculated by an external valuer with reference to the expected future return from the plan. It includes estimates around the expected future exit date and the estimated enterprise value of the Group, from which the distribution would be calculated.
18 KEY MANAGEMENT PERSONNEL
2017$’000
2016$’000
Short term employee benefits 4,670 4,085
Post-employment benefits 247 208
Long term benefits 90 45
Share-based payments 348 222
Termination benefits 517 –
5,872 4,560
Remuneration disclosures are provided in the “Remuneration Report” on pages 40 to 48 of the Annual Report.
17 SHARE-BASED PAYMENTS (CONTINUED)
Other InformationDirectors’ Report Remuneration Report Financial ReportBusiness Review
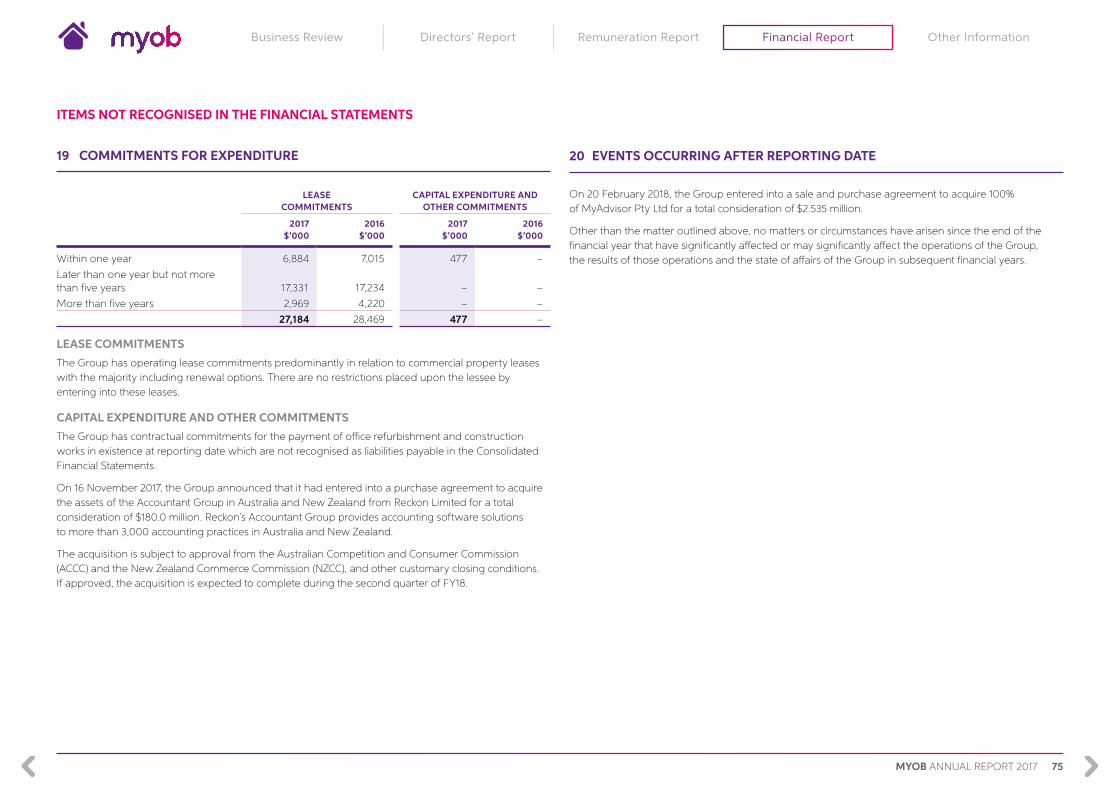
75MYOB ANNUAL REPORT 2017
ITEMS NOT RECOGNISED IN THE FINANCIAL STATEMENTS
19 COMMITMENTS FOR EXPENDITURE
LEASE COMMITMENTS
CAPITAL EXPENDITURE AND OTHER COMMITMENTS
2017$’000
2016$’000
2017$’000
2016$’000
Within one year 6,884 7,015 477 –
Later than one year but not more than five years 17,331 17,234 – –
More than five years 2,969 4,220 – –
27,184 28,469 477 –
LEASE COMMITMENTSThe Group has operating lease commitments predominantly in relation to commercial property leases with the majority including renewal options. There are no restrictions placed upon the lessee by entering into these leases.
CAPITAL EXPENDITURE AND OTHER COMMITMENTSThe Group has contractual commitments for the payment of office refurbishment and construction works in existence at reporting date which are not recognised as liabilities payable in the Consolidated Financial Statements.
On 16 November 2017, the Group announced that it had entered into a purchase agreement to acquire the assets of the Accountant Group in Australia and New Zealand from Reckon Limited for a total consideration of $180.0 million. Reckon’s Accountant Group provides accounting software solutions to more than 3,000 accounting practices in Australia and New Zealand.
The acquisition is subject to approval from the Australian Competition and Consumer Commission (ACCC) and the New Zealand Commerce Commission (NZCC), and other customary closing conditions. If approved, the acquisition is expected to complete during the second quarter of FY18.
20 EVENTS OCCURRING AFTER REPORTING DATE
On 20 February 2018, the Group entered into a sale and purchase agreement to acquire 100% of MyAdvisor Pty Ltd for a total consideration of $2.535 million.
Other than the matter outlined above, no matters or circumstances have arisen since the end of the financial year that have significantly affected or may significantly affect the operations of the Group, the results of those operations and the state of affairs of the Group in subsequent financial years.
Other InformationDirectors’ Report Remuneration Report Financial ReportBusiness Review
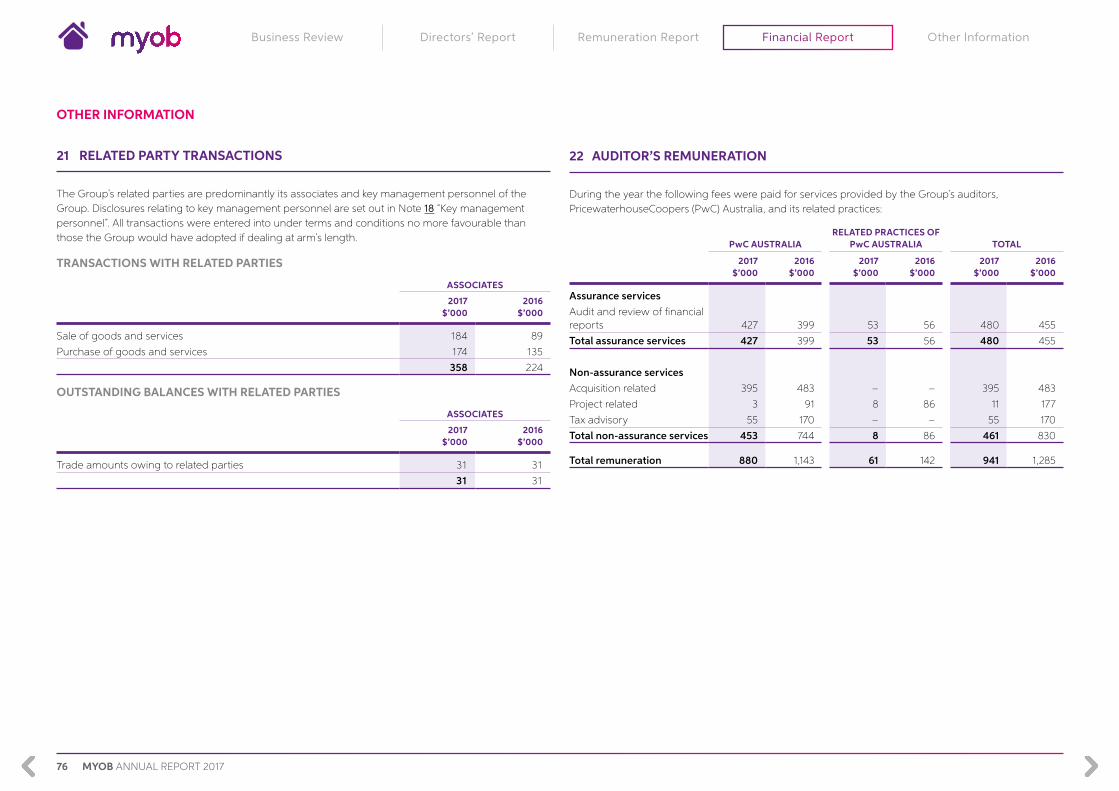
76 MYOB ANNUAL REPORT 2017
OTHER INFORMATION
21 RELATED PARTY TRANSACTIONS
The Group’s related parties are predominantly its associates and key management personnel of the Group. Disclosures relating to key management personnel are set out in Note 18 “Key management personnel”. All transactions were entered into under terms and conditions no more favourable than those the Group would have adopted if dealing at arm’s length.
TRANSACTIONS WITH RELATED PARTIES
ASSOCIATES
2017$’000
2016$’000
Sale of goods and services 184 89
Purchase of goods and services 174 135
358 224
OUTSTANDING BALANCES WITH RELATED PARTIES
ASSOCIATES
2017$’000
2016$’000
Trade amounts owing to related parties 31 31
31 31
22 AUDITOR’S REMUNERATION
During the year the following fees were paid for services provided by the Group’s auditors, PricewaterhouseCoopers (PwC) Australia, and its related practices:
PwC AUSTRALIARELATED PRACTICES OF
PwC AUSTRALIA TOTAL
2017$’000
2016 $’000
2017 $’000
2016 $’000
2017 $’000
2016 $’000
Assurance servicesAudit and review of financial reports 427 399 53 56 480 455
Total assurance services 427 399 53 56 480 455
Non-assurance servicesAcquisition related 395 483 – – 395 483
Project related 3 91 8 86 11 177
Tax advisory 55 170 – – 55 170
Total non-assurance services 453 744 8 86 461 830
Total remuneration 880 1,143 61 142 941 1,285
Other InformationDirectors’ Report Remuneration Report Financial ReportBusiness Review

77MYOB ANNUAL REPORT 2017
23 OTHER SIGNIFICANT ACCOUNTING POLICIES
PRINCIPLES OF CONSOLIDATIONThe Consolidated Financial Statements comprise the financial statements of MYOB Group Limited and its subsidiaries (the Group) as at 31 December each year. Subsidiaries are all entities (including structured entities) over which the Group has control. The Group controls an entity when the Group is exposed to, or has rights to, variable returns from its involvement with the entity and has the ability to affect those returns through its power to direct the activities of the entity.
In preparing the Consolidated Financial Statements, all intercompany balances and transactions, including unrealised profits arising from intra-group transactions, income/expenses and profits/losses from intra-group transactions have been eliminated in full. Unrealised losses are eliminated unless the transaction provides evidence of the impairment of the asset. Subsidiaries are consolidated from the date on which control is transferred to the Group and cease to be consolidated from the date on which control is transferred out of the Group.
Where there is loss of control of a subsidiary, the Consolidated Financial Statements include the results for the part of the reporting period during which the Group had control.
The Consolidated Financial Statements have been prepared on a going concern basis. At 31 December 2017, the Consolidated Balance Sheet reflected an excess of current liabilities over current assets of $0.4 million. The directors are not aware of any uncertainties relating to events or conditions that may cast significant doubt upon the Group’s ability to continue as a going concern.
CRITICAL ACCOUNTING ESTIMATES AND JUDGEMENTSThe preparation of financial statements requires the use of certain critical accounting estimates.
It also requires management to exercise its judgement in the process of applying the Group’s accounting policies. The areas involving a higher degree of judgement or complexity, or areas where assumptions and estimates are significant to the financial statements, are disclosed in the relevant note to the financial statements.
FIRST TIME ADOPTION OF EQUITY ACCOUNTINGDuring the financial reporting period, investments held by the Group were measured against the applicable accounting standard criteria around control, materiality and influence so as to determine the appropriate accounting treatment per its accounting policy. On completion of the assessment, it was determined that the Kounta Holdings Pty Limited and OnDeck Capital Australia Pty Ltd investments, classified as associates under AASB 128 Investments in Associates & Joint Ventures, have now become material in nature and should be equity accounted. The impact of this change on the Consolidated Financial Statements is summarised below:
FINANCIAL STATEMENT DISCLOSURE FINANCIAL STATEMENT PERIOD
ORIGINAL DISCLOSURE
($’000)
INCREASE/ (DECREASE)
($’000)
RESTATED AMOUNT
($’000)
Consolidated Statement of Comprehensive IncomeShare of losses from equity accounted investments Year ended 31 December 2016 – (2,614) (2,614)
Profit before income tax Year ended 31 December 2016 73,746 (2,614) 71,132
Income tax expense Year ended 31 December 2016 (19,754) 784 (18,970)
Profit after income tax attributable to owners of MYOB Group Limited Year ended 31 December 2016 53,992 (1,830) 52,162
Total comprehensive income for the period attributable to owners of MYOB Group Limited Year ended 31 December 2016 55,647 (1,830) 53,817
Consolidated Balance SheetDeferred tax assets As at 31 December 2016 44,716 1,025 45,741 1
Investments in equity accounted investments As at 31 December 2016 – 6,898 6,898
Other investments As at 31 December 2016 18,525 (10,315) 8,210
Retained earnings As at 31 December 2016 (353,820) (2,392) (356,212)
FINANCIAL STATEMENT DISCLOSURE FINANCIAL STATEMENT PERIOD
ORIGINAL DISCLOSURE
($’000)DECREASE
(CENTS)
RESTATED AMOUNT
(CENTS)
Earnings per shareBasic earnings per share Year ended 31 December 2016 9.18 (0.31) 8.87
Diluted earnings per share Year ended 31 December 2016 8.92 (0.05) 8.87
1 The restated deferred tax asset balance in the above table excludes the change in accounting policy impact shown below in section “Changes in accounting policies”.
Other InformationDirectors’ Report Remuneration Report Financial ReportBusiness Review

78 MYOB ANNUAL REPORT 2017
CHANGES IN ACCOUNTING POLICIESIn November 2016, the IFRS Interpretations Committee (IFRIC) responded to requests to clarify how an entity determines the expected manner of recovery of an intangible asset with an indefinite useful life for the purposes of measuring deferred tax in accordance with AASB 112 Income Taxes.
AASB 112 states that measurement of deferred tax liabilities and deferred tax assets reflects the tax consequences that follow from the manner in which the entity expects, at the end of the reporting period, to recover or settle the carrying amount of the assets and liabilities. The carrying value is recovered in the form of economic benefits that flow to the entity in future periods, thereby the assets are recovered either through sale or recovered through use.
In applying the new interpretation, the Group has now determined the carrying amount of the MYOB Brand intangible asset is expected to be recovered through use, rather than through a specific plan to sell the asset. This has resulted in the recognition of a deferred tax liability based on the difference between the carrying amount and the tax base at the Australian company tax rate of 30 per cent.
Consequently the Group has retrospectively changed its accounting policy with respect to the MYOB Brand intangible asset in determining its deferred tax position. The impact of this change on the Consolidated Financial Statements is summarised below:
FINANCIAL STATEMENT DISCLOSURE FINANCIAL STATEMENT PERIOD
ORIGINAL DISCLOSURE
($’000)
INCREASE/(DECREASE)
($’000)
RESTATED AMOUNT
($’000)
Consolidated Balance SheetIntangible assets (Goodwill) As at 31 December 2016 1,210,240 35,146 1,245,386
Deferred tax assets As at 31 December 2016 45,741 1 (35,146) 10,595
1 The amount shown as the disclosed deferred tax asset balance in the table above includes the adjustment from adoption of equity accounting shown above in section “First time adoption of equity accounting.”
New and amended Accounting Standards and Interpretations
Accounting standards issued but not yet effective
Certain new accounting standards and interpretations have been published that are not mandatory for the 31 December 2017 reporting period and have not yet been applied in these financial statements. The Group’s assessment of the impact of these new standards and interpretations is set out below.
SUMMARY
APPLICATION DATE OF
STANDARD
APPLICATION DATE FOR
GROUP
AASB 9 Financial InstrumentsAASB 9 introduces an expected credit loss model when assessing impairment of financial instruments. For the Group, this will result in a change in how the impairment of trade receivables is assessed.
These changes are not expected to result in a material impact on the financial statements.
1 January 2018 1 January 2018
AASB 15 Revenue from contracts with customersAASB 15’s new revenue model is based on the principle that revenue is recognised when control of a good or service transfers to a customer – so the notion of control replaces the existing notion of risks and rewards. It also clarifies how the consideration should be allocated between different deliverables in a contract.
The change from a risk and reward assessment to the notion of control is not expected to change the timing of revenue recognition for the services provided by the Group. However, as different products (services) have different revenue recognition points, the change in allocation of consideration between products in a multiple product contract may result in a change in timing of when the total contract consideration is recognised.
The Group will report for the first time under the new revenue accounting standard for the full year ending 31 December 2018 (interim financial report 30 June 2018). Based on the assessment to date, the Group expects to apply the full retrospective approach upon transition to AASB 15. As a result, the Group will apply all of the requirements of AASB 15 to each comparative period presented.
The Group is further progressing its analysis of the potential impact on each revenue stream, product type and location. Work to date has focused primarily on subscription services revenue as this accounts for the majority of the Group’s sales revenue. To date, no material measurement differences have been identified between AASB 118, the current revenue recognition standard, and AASB 15.
1 January 2018 1 January 2018
23 OTHER SIGNIFICANT ACCOUNTING POLICIES (CONTINUED)
Other InformationDirectors’ Report Remuneration Report Financial ReportBusiness Review

79MYOB ANNUAL REPORT 2017
SUMMARY
APPLICATION DATE OF
STANDARD
APPLICATION DATE FOR
GROUP
AASB 16 LeasesAASB 16 will affect the accounting by lessees and will result in the recognition of almost all leases on the balance sheet. The standard removes the current distinction between operating and financing leases and requires recognition of an asset (the right to use the leased item) and a financial liability to pay rentals for almost all lease contracts. The Group will be required to recognise an asset and a financial liability for the majority of its property leases. In addition, the operating lease rental associated with these leases will no longer be recognised in the income statement, instead being replaced by depreciation of the lease asset and interest expense on the lease liability.
This is not expected to materially change the profit after tax over the duration of most leases, but will change Group EBITDA, NPAT and NPATA (which is the measure utilised by the Chief Operating Decision Maker to measure profitability and reward financial performance).
The Group is intending to report under the new leasing standard for the full year ending 31 December 2019 (interim financial report 30 June 2019).
There are a number of transition options available upon adopting the new standard – the “retrospective approach” and the “modified retrospective approach”. The Group has not yet determined which transition approach to apply. To date, work has focused on the identification of the provisions of the standard which will most impact the Group and conducting a detailed review of its existing contracts and corresponding financial reporting impacts.
As at the reporting date, the Group has non-cancellable operating lease commitments of $27.2 million, see Note 19, “Commitments for expenditure”.
1 January 2019 1 January 2019
There are no other new accounting standards issued but not yet effective.
23 OTHER SIGNIFICANT ACCOUNTING POLICIES (CONTINUED)
Other InformationDirectors’ Report Remuneration Report Financial ReportBusiness Review

80 MYOB ANNUAL REPORT 2017
Directors’ Declaration
In the directors’ opinion:
a) the financial statements and notes as set out on pages 50 to 79, are in accordance with the Corporations Act 2001 including:
(i) complying with Accounting Standards, the Corporations Regulations 2001 and other mandatory professional reporting requirements; and
(ii) giving a true and fair view of the consolidated entity’s financial position as at 31 December 2017 and of its performance for the financial year ended on that date; and
b) there are reasonable grounds to believe that the consolidated entity will be able to pay its debts as and when they become due and payable; and
c) at the date of the declaration, there are reasonable grounds to believe that the members of the Closed Group identified in Note 13 will be able to meet any obligations or liabilities to which they are, or may become, subject by virtue of the Deed of Cross Guarantee described in Note 15.
The “Basis of preparation” on page 49 confirms that the financial statements also comply with International Financial Reporting Standards as issued by the International Accounting Standards Board.
The directors have been given the declarations by the Chief Executive Officer and Chief Financial Officer required by section 295A of the Corporations Act 2001.
This declaration is made in accordance with a resolution of the Board of Directors.
Justin Milne Chair
Tim Reed Executive Director and Chief Executive Officer
Sydney 23 February 2018
Sydney 23 February 2018
Other InformationDirectors’ Report Remuneration Report Financial ReportBusiness Review

81MYOB ANNUAL REPORT 2017
Independent Auditor’s Report
REPORT ON THE AUDIT OF THE FINANCIAL REPORT
Our opinion
In our opinion:
The accompanying financial report of MYOB Group Limited (the Company) and its controlled entities (together the Group) is in accordance with the Corporations Act 2001, including:
a) giving a true and fair view of the Group’s financial position as at 31 December 2017 and of its financial performance for the year then ended
b) complying with Australian Accounting Standards and the Corporations Regulations 2001.
What we have audited
The Group financial report comprises:
• the consolidated balance sheet as at 31 December 2017
• the consolidated statement of comprehensive income for the year then ended
• the consolidated statement of changes in equity for the year then ended
• the consolidated statement of cash flows for the year then ended
• the notes to the consolidated financial statements, which include a summary of significant accounting policies
• the directors’ declaration.
Basis for opinion
We conducted our audit in accordance with Australian Auditing Standards. Our responsibilities under those standards are further described in the Auditor’s responsibilities for the audit of the financial report section of our report.
We believe that the audit evidence we have obtained is sufficient and appropriate to provide a basis for our opinion.
Independence
We are independent of the Group in accordance with the auditor independence requirements of the Corporations Act 2001 and the ethical requirements of the Accounting Professional and Ethical Standards Board’s APES 110 Code of Ethics for Professional Accountants (the Code) that are relevant to our audit of the financial report in Australia. We have also fulfilled our other ethical responsibilities in accordance with the Code.
Our audit approach
An audit is designed to provide reasonable assurance about whether the financial report is free from material misstatement. Misstatements may arise due to fraud or error. They are considered material if individually or in aggregate, they could reasonably be expected to influence the economic decisions of users taken on the basis of the financial report.
We tailored the scope of our audit to ensure that we performed enough work to be able to give an opinion on the financial report as a whole, taking into account the geographic and management structure of the Group, its accounting processes and controls and the industry in which it operates.
PricewaterhouseCoopers, ABN 52 780 433 757 2 Riverside Quay, SOUTHBANK VIC 3006, GPO Box 1331, MELBOURNE VIC 3001 T: 61 3 8603 1000, F: 61 3 8603 1999, www.pwc.com.au
Liability limited by a scheme approved under Professional Standards Legislation.
TO THE MEMBERS OF MYOB GROUP LIMITED
Directors’ Report Remuneration Report Other InformationBusiness Review Other InformationFinancial Report

82 MYOB ANNUAL REPORT 2017
MATERIALITY AUDIT SCOPE KEY AUDIT MATTERS
• For the purpose of our audit, we used Group overall materiality of $4.5m which is based on approximately 2.5% of the Group’s earnings before interest, tax, depreciation and amortisation (EBITDA).
• We applied this threshold, together with qualitative considerations, to determine the scope of our audit and the nature, timing and extent of our audit procedures and to evaluate the effect of misstatements on the financial report as a whole.
• We chose EBITDA because, in our view, it is the metric against which the performance of the Group is most commonly measured. For instance it formed the basis of the Group’s IPO prospectus and market outlook forecasts and is a generally accepted benchmark in the industry.
• We selected 2.5% based on our professional judgement noting that it is within the range of commonly acceptable earnings related thresholds.
• Our audit focused on where the Group made subjective judgements; for example, significant accounting estimates involving assumptions and inherently uncertain future events.
• The Group operates across Australia and New Zealand. Acting under our instructions, component auditors performed an audit of the financial information of MYOB New Zealand as it is financially significant to the Group. The remaining audit procedures were performed by PwC Australia.
• Amongst other relevant topics, we communicated the following key audit matters to the Audit and Risk Management Committee:
– Carrying value of goodwill and indefinite lived intangible assets
– Capitalisation of internally generated software
– Useful life of intangible assets
– Recovery of tax losses carried forward
These are further described in the Key audit matters section of our report.
Audit scope
Materiality Key auditmatters
Directors’ Report Remuneration ReportBusiness Review Other InformationOther InformationFinancial Report

83MYOB ANNUAL REPORT 2017
Key audit matters
Key audit matters are those matters that, in our professional judgement, were of most significance in our audit of the financial report for the current period. The key audit matters were addressed in the context of our audit of the financial report as a whole, and in forming our opinion thereon, and we do not provide a separate opinion on these matters. Further, any commentary on the outcomes of a particular audit procedure is made in that context.
KEY AUDIT MATTER HOW OUR AUDIT ADDRESSED THE KEY AUDIT MATTER
Carrying value of goodwill and indefinite lived intangible assets(Refer to note 6 in the financial report)
The Group has $1,257m of intangible assets comprised of goodwill, brands, commercialised software, internally generated software, acquired IP and customer relationships. These assets are assessed for impairment for each cash generating unit (CGU) through the use of discounted cash flow models (the models).
During the year, the Group updated its reporting structure along with its development and sales operations in line with the evolution of the business to a connected practice. This, in addition with the acquisition of Paycorp, warranted a reassessment of CGUs, such that impairment is now assessed for 3 CGUs, being Clients & Partners, Enterprise Solutions and Payment Solutions.
The assessment of whether an impairment charge was necessary was a key audit matter as these balances are the largest asset on the balance sheet and because the assessment involved significant judgement by the Group, including the reassessment of CGUs, and forecasting the following key assumptions:
• Future cash flows for 2018–2022
• Nominal discount rate (pre tax)
• Terminal growth rate
We performed a number of procedures including the following:
• Evaluated whether the reassessment of CGUs was consistent with our knowledge of the Group’s operations and updated internal Group reporting.
• Evaluated the methodology applied by the Group in allocating corporate assets and costs across CGUs.
• Considered whether the methodology in the models was consistent with the basis required by Australian Accounting Standards.
• Compared the cash flow forecasts for 2018 in the models to those in the latest Board approved budgets.
• Evaluated the Group’s ability to forecast future results for impairment models by comparing budgets with reported actual results for the previous year.
• Assessed whether the growth rate assumptions in the models’ forecasts were consistent with our understanding of key metrics such as the historic customer retention rates, number of paying users and the average revenue per paying user.
• Evaluated the appropriateness of the nominal discount rate by assessing the reasonableness of the relevant inputs to the calculation.
• Evaluated the appropriateness of the terminal growth rate by comparison to the long term average growth rates of the countries the Group operates in, being Australia and New Zealand.
• Evaluated the adequacy of the disclosures made in note 6 of the financial report, including those regarding the key assumptions and sensitivities to changes in such assumptions, in light of the requirements of Australian Accounting Standards.
Capitalisation of internally generated software(Refer to note 6 in the financial report)
During the year, the Group capitalised internal software development project costs of $37m. These projects were predominantly in relation to the development of the MYOB Platform. The costs mainly comprised of payroll.
The Group’s accounting policy is described in note 6 in the financial report.
The capitalisation of internally generated software costs was a key audit matter due to the size of the internal costs capitalised and the judgement involved in assessing whether the criteria set out in the Australian Accounting Standards required for capitalisation of such costs had been met, particularly:
• The technical feasibility of the project
• The likelihood of the project delivering sufficient future economic benefits.
The Group’s judgements also included whether capitalised costs were of a developmental rather than research nature (which would result in the costs being expensed rather than capitalised) and whether costs, including payroll costs, were directly attributable to relevant projects.
We performed a number of procedures including the following:
• Discussed the organisational process for development of the MYOB platform and in turn the financial controls for the recording of capitalised internally generated software.
• On a sample basis, agreed payroll and other capitalised costs to supporting documentation and assessed the determination of these as capital or not.
• Assessed key metrics that support the future income stream of a selection of the projects including assessing the number of users who have migrated to newly released products to examine whether the initial assumptions applied in determining project feasibility continue to hold true.
Directors’ Report Remuneration Report Other InformationBusiness Review Other InformationFinancial Report
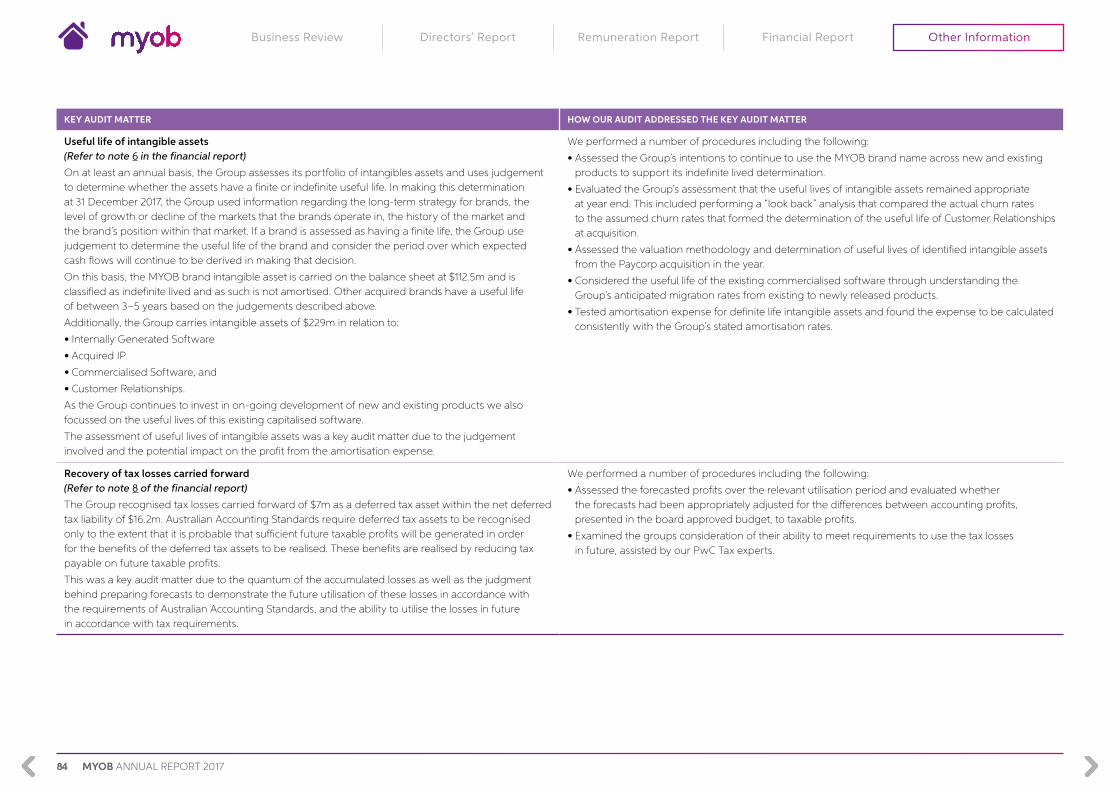
84 MYOB ANNUAL REPORT 2017
KEY AUDIT MATTER HOW OUR AUDIT ADDRESSED THE KEY AUDIT MATTER
Useful life of intangible assets(Refer to note 6 in the financial report)
On at least an annual basis, the Group assesses its portfolio of intangibles assets and uses judgement to determine whether the assets have a finite or indefinite useful life. In making this determination at 31 December 2017, the Group used information regarding the long-term strategy for brands, the level of growth or decline of the markets that the brands operate in, the history of the market and the brand’s position within that market. If a brand is assessed as having a finite life, the Group use judgement to determine the useful life of the brand and consider the period over which expected cash flows will continue to be derived in making that decision.
On this basis, the MYOB brand intangible asset is carried on the balance sheet at $112.5m and is classified as indefinite lived and as such is not amortised. Other acquired brands have a useful life of between 3–5 years based on the judgements described above.
Additionally, the Group carries intangible assets of $229m in relation to:
• Internally Generated Software
• Acquired IP
• Commercialised Software, and
• Customer Relationships.
As the Group continues to invest in on-going development of new and existing products we also focussed on the useful lives of this existing capitalised software.
The assessment of useful lives of intangible assets was a key audit matter due to the judgement involved and the potential impact on the profit from the amortisation expense.
We performed a number of procedures including the following:
• Assessed the Group’s intentions to continue to use the MYOB brand name across new and existing products to support its indefinite lived determination.
• Evaluated the Group’s assessment that the useful lives of intangible assets remained appropriate at year end. This included performing a “look back” analysis that compared the actual churn rates to the assumed churn rates that formed the determination of the useful life of Customer Relationships at acquisition.
• Assessed the valuation methodology and determination of useful lives of identified intangible assets from the Paycorp acquisition in the year.
• Considered the useful life of the existing commercialised software through understanding the Group’s anticipated migration rates from existing to newly released products.
• Tested amortisation expense for definite life intangible assets and found the expense to be calculated consistently with the Group’s stated amortisation rates.
Recovery of tax losses carried forward(Refer to note 8 of the financial report)
The Group recognised tax losses carried forward of $7m as a deferred tax asset within the net deferred tax liability of $16.2m. Australian Accounting Standards require deferred tax assets to be recognised only to the extent that it is probable that sufficient future taxable profits will be generated in order for the benefits of the deferred tax assets to be realised. These benefits are realised by reducing tax payable on future taxable profits.
This was a key audit matter due to the quantum of the accumulated losses as well as the judgment behind preparing forecasts to demonstrate the future utilisation of these losses in accordance with the requirements of Australian Accounting Standards, and the ability to utilise the losses in future in accordance with tax requirements.
We performed a number of procedures including the following:
• Assessed the forecasted profits over the relevant utilisation period and evaluated whether the forecasts had been appropriately adjusted for the differences between accounting profits, presented in the board approved budget, to taxable profits.
• Examined the groups consideration of their ability to meet requirements to use the tax losses in future, assisted by our PwC Tax experts.
Directors’ Report Remuneration ReportBusiness Review Other InformationOther InformationFinancial Report
85MYOB ANNUAL REPORT 2017
Other information
The directors are responsible for the other information. The other information comprises the information included in the Group’s annual report for the year ended 31 December 2017, including the Business Review, Operational and Financial Review, Directors’ Report, Shareholder Information and Corporate Directory, but does not include the financial report and our auditor’s report thereon.
Our opinion on the financial report does not cover the other information and accordingly we do not express any form of assurance conclusion thereon.
In connection with our audit of the financial report, our responsibility is to read the other information identified above and, in doing so, consider whether the other information is materially inconsistent with the financial report or our knowledge obtained in the audit, or otherwise appears to be materially misstated.
If, based on the work we have performed, we conclude that there is a material misstatement of this other information, we are required to report that fact. We have nothing to report in this regard.
Responsibilities of the directors for the financial report
The directors of the Company are responsible for the preparation of the financial report that gives a true and fair view in accordance with Australian Accounting Standards and Corporations Act 2001 and for such internal control as the directors determine is necessary to enable the preparation of the financial report that gives a true and fair view and is free from material misstatement, whether due to fraud or error.
In preparing the financial report, the directors are responsible for assessing the ability of the Group to continue as a going concern, disclosing, as applicable, matters related to going concern and using the going concern basis of accounting unless the directors either intend to liquidate the Group or to cease operations, or have no realistic alternative but to do so.
Auditor’s responsibilities for the audit of the financial report
Our objectives are to obtain reasonable assurance about whether the financial report as a whole is free from material misstatement, whether due to fraud or error, and to issue an auditor’s report that includes our opinion. Reasonable assurance is a high level of assurance, but is not a guarantee that an audit conducted in accordance with the Australian Auditing Standards will always detect a material misstatement when it exists. Misstatements can arise from fraud or error and are considered material if, individually or in the aggregate, they could reasonably be expected to influence the economic decisions of users taken on the basis of the financial report.
A further description of our responsibilities for the audit of the financial report is located at the Auditing and Assurance Standards Board website at: http://www.auasb.gov.au/auditors_responsibilities/ar1.pdf. This description forms part of our auditor’s report.
REPORT ON THE REMUNERATION REPORT
Our opinion on the remuneration report
We have audited the remuneration report included in pages 40 to 48 of the directors’ report for the year ended 31 December 2017.
In our opinion, the remuneration report of MYOB Group Limited for the year ended 31 December 2017 complies with section 300A of the Corporations Act 2001.
Responsibilities
The directors of the Company are responsible for the preparation and presentation of the remuneration report in accordance with section 300A of the Corporations Act 2001. Our responsibility is to express an opinion on the remuneration report, based on our audit conducted in accordance with Australian Auditing Standards.
PricewaterhouseCoopers
Nadia Carlin Partner
Melbourne 23 February 2018
Directors’ Report Remuneration Report Other InformationBusiness Review Other InformationFinancial Report

86 MYOB ANNUAL REPORT 2017
ORDINARY SHARES (ASX LISTED)
TOP 20 HOLDERSThe twenty largest holders of ordinary shares (as shown on the register on 31 January 2018) held 571,226,213 shares, equal to 94.33% of the total issued ordinary capital.
RANK NAMEORDINARY
SHARES% OF ISSUED
CAPITAL
1 HSBC CUSTODY NOMINEES (AUSTRALIA) LIMITED 146,242,567 24.15%
2 BAIN CAPITAL ABACUS HOLDINGS L.P. 139,929,138 23.11%
3 J P MORGAN NOMINEES AUSTRALIA LIMITED 130,907,094 21.62%
4 CITICORP NOMINEES PTY LIMITED 52,240,429 8.63%
5 NATIONAL NOMINEES LIMITED 28,076,322 4.64%
6 BNP PARIBAS NOMINEES PTY LTD <AGENCY LENDING DRP A/C> 19,673,464 3.25%
7 PACIFIC CUSTODIANS PTY LIMITED <MYO PLANS CTRL A/C> 15,650,537 2.58%
8 BNP PARIBAS NOMS PTY LTD <DRP> 8,889,344 1.47%
9 TIMOTHY REED 6,775,299 1.12%
10 UBS NOMINEES PTY LTD 5,470,941 0.90%
11 BNP PARIBAS NOMINEES PTY LTD <AGENCY LENDING COLLATERAL> 2,887,000 0.48%
12 UBS NOMINEES PTY LTD 2,650,560 0.44%
13 AVANTEOS INVESTMENTS LIMITED <ENCIRCLE IMA A/C> 2,446,076 0.40%
14 FERGATRON CONSULTING PTY LIMITED 1,766,864 0.29%
15 NETWEALTH INVESTMENTS LIMITED <WRAP SERVICES A/C> 1,525,047 0.25%
16 RICHARD GILLEN MOORE 1,465,037 0.24%
17 AMP LIFE LIMITED 1,345,406 0.22%
18 CITICORP NOMINEES PTY LIMITED <COLONIAL FIRST STATE INV A/C> 1,161,483 0.19%
19 ADAM FERGUSON 1,130,832 0.19%
20 AUST EXECUTOR TRUSTEES LTD <GFFD> 992,773 0.16%
Total 571,226,213 94.33%Balance of register 34,305,080 5.67%Grand total 605,531,293 100.00%
Shareholder Information
Directors’ Report Remuneration ReportBusiness Review Other InformationOther InformationFinancial Report

87MYOB ANNUAL REPORT 2017
UNLISTED PERFORMANCE SHARES
As at 31 January 2018, there were a total of 4,296,962 unlisted performance shares on issue.
DISTRIBUTION OF SHAREHOLDINGS (AS AT 31 JANUARY 2018)
RANGEPERFORMANCE
SHARES % OF TOTALNO. OF
HOLDERS
100,001 and Over 2,964,560 68.99% 6
10,001 to 100,000 1,326,193 30.86% 36
5,001 to 10,000 6,209 0.14% 1
1,001 to 5,000 – – –
1 to 1,000 – – –
Total 4,296,962 100.00% 43
VOTING RIGHTSPerformance shareholders have no voting rights (subject to any rights under the Corporations Act 2001 and ASX Listing Rules, to the extent such rights cannot be excluded).
DISTRIBUTION OF SHAREHOLDINGS (AS AT 31 JANUARY 2018)
RANGEORDINARY
SHARES % OF TOTALNO. OF
HOLDERS
100,001 and Over 583,640,836 96.38% 79
10,001 to 100,000 12,993,845 2.15% 430
5,001 to 10,000 3,465,099 0.57% 490
1,001 to 5,000 4,661,687 0.77% 2,205
1 to 1,000 769,826 0.13% 1,719
Total 605,531,293 100.00% 4,923Less than marketable parcels 3,923 – 86
SUBSTANTIAL HOLDINGS (AS AT 31 JANUARY 2018)
SUBSTANTIAL HOLDER
NUMBER OF ORDINARY SHARES IN WHICH THE HOLDER (OR THEIR ASSOCIATES)
HAVE A RELEVANT INTEREST
Bain Capital Abacus Holdings, L.P. 146,989,538
FIL Investment Management (Australia) Limited 42,128,846
FIL Investment Management (Hong Kong) Limited 4,004,091
FIL Limited 22,815
TA Universal Investment Holdings Ltd 33,854,348
Commonwealth Bank of Australia 30,279,145
VOTING RIGHTSAt a general meeting of the company, every shareholder present in person or by proxy, representative or attorney has one vote on a show of hands and, on a poll, one vote for each fully paid share held by the shareholder.
ON-MARKET BUYBACK An on-market buyback is currently in progress. For further information, please refer to the relevant ASX announcement dated 24 August 2017.
Directors’ Report Remuneration Report Other InformationBusiness Review Other InformationFinancial Report

88 MYOB ANNUAL REPORT 2017
COMPANY’S REGISTERED OFFICEMYOB Group Limited Level 3, 235 Springvale Road Glen Waverley, VIC, 3150, Australia Telephone: +61 3 9222 9777
SHARE REGISTRYLink Market Services Limited Level 12, 680 George Street Sydney, NSW, 2000, Australia Telephone: +61 1300 554 474 Email: [email protected]
AUDITORPricewaterhouseCoopers 2 Riverside Quay Southbank, VIC, 3006, Australia Telephone: +61 3 8603 1000 Website: www.pwc.com.au
Corporate Directory
Directors’ Report Remuneration ReportBusiness Review Other InformationOther InformationFinancial Report