annual report 2017 - hebronsavingsbank.com annu… · in 2017, with net income of $3.3 million,...
TRANSCRIPT

Established
1910
HSB Bancorp, Inc. & Subsidiary
2017 Annual Report

TOTAL ASSETS 625 600 $592.0
575 $561.9
550 $550.7 $557.2
525 $524.7
500 475 450 425 400 375 350 325
NET INCOME
4800
4500 4200
3900
3600
3300
3000
2700
2400
2100
1800
1500
1200
900
600 300
$4339
$3793
$3509 $3308
$3177
(MIL
LIO
NS )
(MIL
LIO
NS )
HSB BANCORP, INC. & SUBSIDIARY FIVE YEAR FINANCIAL HIGHLIGHTS
2013 2014 2015 2016 2017 2013 2014 2015 2016 2017
500
475
450
425
$443.6
$459.5
$435.8
$469.8
$505.7
500
475
450
425
$433.2
$444.6
$456.9
$465.9
$495.1
400
400
375
350
325
300
275
250
225
375
350
325
300
275
250
225
200
2013 2014 2015 2016 2017
200
2013 2014 2015 2016 2017
TOTAL DEPOSITS TOTAL LOANS
(MIL
LIO
NS )
(THO
USAN
DS )
HSB Bancorp Inc. and Subsidiary
TO OUR STOCKHOLDERS:
HSB Bancorp, Inc. and its wholly-owned subsidiary, Hebron Savings Bank, completed another extremely successful year in 2017, with net income of $3.3 million, despite a last-minute income tax adjustment of $1.1 million. Prior to December 22, 2017, we were on target to report consolidated net income of approximately $4.4 million for 2017. However, on that day, President Trump upset the banking world when he signed into law the Tax Cuts and Jobs Act, which reduced the corporate tax rate from 35% to 21%. While the effect of such a generous tax cut would be tremendously beneficial in future years, it did have a substantial impact on 2017’s earnings. The primary reason being that the law was enacted in 2017, a year prior to its effective date of 2018. The issue centers around deferred tax assets, a balance sheet account, which are simply future tax benefits arising from timing differences between financial statement expenses and tax return deductions. These deferred tax assets are valued at enacted future corporate tax rates. Consequently, in 2017, corporations were required to make a one-time adjustment to write-down the deferred tax asset value reported on their balance sheets to reflect the lower future tax rates…even though they would not receive the benefit of those lower rates until 2018. Compounding the issue, banks typically have higher deferred tax assets than other corporations due to expenses related to the allowance for loan losses and other real estate owned, which are unique to financial institutions.
For the past few years, we have been intentionally restricting our asset growth in an effort to improve our tier 1 capital ratio, the primary indicator of a safe and sound financial institution. This past year, our assets increased $30 million, or 5%, to $592 million. Due to a similar percentage increase in stockholders’ equity, resulting primarily from earnings, we were able to increase the bank’s tier 1 capital ratio slightly from 8.69% to 8.71%, its highest level since December 31, 2000. Although a bank with a ratio of 5% or greater is considered to be “well-capitalized”, it is our strategic goal to increase this percentage to 10% by 2021.
For the most part, we were able to control asset growth by using existing cash reserves and investments, rather than soliciting expensive new deposits, to fund our extraordinary loan growth of $36 million. 2017 marks our highest year of loan growth in the past ten years. Deposits also increased $29 million to $495 million at year-end. It’s important to recognize that the majority of this increase was in our lower-cost checking and savings accounts. These core deposits increased $17 million, while our higher-cost certificate of deposit accounts increased only $12 million. We continue to be a major competitor in Wicomico, Dorchester, and Somerset Counties. As of June 30, 2017, the bank held the highest amount of customer deposits of any bank, large or small, in Wicomico County and held the second highest amount in both Dorchester and Somerset Counties. Out of the 14 community banks on the Eastern Shore, we remain the second largest in asset size, loans, deposits, and number of full-service branches.
We also continue to make progress in reducing our troubled loans. Nonaccrual loans, those troubled loans in which interest income is no longer being accrued, decreased from 2.97% of total loans at December 31, 2016, to 2.66% at December 31, 2017. Net loan charge-offs increased slightly from $1.6 million to $1.7, but we were able to increase our allowance for loan losses by $438 thousand to $7.7 million. Substandard loans, as a percentage of total loans, remained constant at 4.32%.
We were able to increase stockholder dividends to $.65 per share, up $.06 over last year’s payment, for a total payout of $1.1 million. While several community banks in our area have been unable to pay any stockholder dividends in recent years, we have consistently paid out at least 25% of our earnings, year after year since 2002, to our stockholders. The book value of the company’s stock also appreciated to $29.84 per share, with earnings per share of $2.05. As a stockholder, you can rest assured that Hebron Savings Bank, through a dedicated team of directors and employees, will remain safe and strong. We thank you for your support this past year and look forward to serving you in 2018 and beyond.
Sincerely,
Donna K. Defino, CPA, MBA President & Chief Executive Officer
C O N T E N T S
Page(s)
INDEPENDENT AUDITORS’ REPORT 3 – 4
FINANCIAL STATEMENTS
Consolidated Balance Sheets 5 Consolidated Statements of Income 6 Consolidated Statements of Comprehensive Income 7 Consolidated Statements of Stockholders’ Equity 8 Consolidated Statements of Cash Flows 9 – 10 Notes to Consolidated Financial Statements 11 – 38

INDEPENDENT AUDITORS’ REPORT
Board of Directors HSB Bancorp, Inc. & Subsidiary Hebron, Maryland
We have audited the accompanying consolidated financial statements of HSB Bancorp, Inc. and subsidiary, which comprise the consolidated balance sheets as of December 31, 2017 and 2016, and the related consolidated statements of income, comprehensive income, stockholders’ equity, and cash flows for the years then ended, and the related notes to the financial statements.
Management’s Responsibility for the Financial Statements
Management is responsible for the preparation and fair presentation of these consolidated financial statements in accordance with accounting principles generally accepted in the United States of America; this includes the design, implementation, and maintenance of internal control relevant to the preparation and fair presentation of financial statements that are free from material misstatement, whether due to fraud or error.
Auditors’ Responsibility
Our responsibility is to express an opinion on these consolidated financial statements based on our audits. We conducted our audits in accordance with auditing standards generally accepted in the United States of America. Those standards require that we plan and perform the audits to obtain reasonable assurance about whether the consolidated financial statements are free of material misstatement.
An audit involves performing procedures to obtain audit evidence about the amounts and disclosures in the consolidated financial statements. The procedures selected depend on the auditor's judgment, including the assessment of the risks of material misstatement of the financial statements, whether due to fraud or error. In making those risk assessments, the auditor considers internal control relevant to the entity's preparation and fair presentation of the consolidated financial statements in order to design audit procedures that are appropriate in the circumstances, but not for the purpose of expressing an opinion on the effectiveness of the entity's internal control. Accordingly, we express no such opinion. An audit also includes evaluating the appropriateness of accounting policies used and the reasonableness of significant accounting estimates made by management, as well as evaluating the overall presentation of the consolidated financial statements.
We believe that the audit evidence we have obtained is sufficient and appropriate to provide a basis for our audit opinion.

Opinion
In our opinion, the consolidated financial statements referred to above present fairly, in all material respects, the financial position of HSB Bancorp, Inc. and subsidiary as of December 31, 2017 and 2016, and the results of their operations and their cash flows for the years then ended in accordance with accounting principles generally accepted in the United States of America.
Salisbury, Maryland January 29, 2018
HSB BANCORP, INC. & SUBSIDIARY
5
CONSOLIDATED BALANCE SHEETS December 31, 2017 and 2016
ASSETS
2017 2016
Cash and due from banks $ 9,320,615 $ 11,546,433 Federal funds sold - 473,622 Interest-bearing deposits in other banks 4,172,077 2,995,663 Securities held-to-maturity, at amortized cost -
fair value 2017 $16,206,461; 2016 $16,580,402 16,182,751 16,766,502 Securities available-for-sale, at fair value 23,189,657 27,515,581 Loans, less allowance for credit losses
2017 $7,700,000; 2016 $7,262,379 505,680,027 469,810,724 Accrued interest receivable on investment securities and loans 1,611,402 1,495,930 Bank premises and equipment, at cost,
less accumulated depreciation 11,106,925 11,353,414 Federal Home Loan Bank stock, at cost 2,365,700 2,507,000 Common stock in the HSB Statutory Trust I 93,000 93,000 Net deferred income tax benefits 2,681,114 3,529,229 Other real estate owned 2,381,393 1,857,800 Cash value of life insurance 11,992,631 10,697,828 Other assets 1,262,096 1,239,045
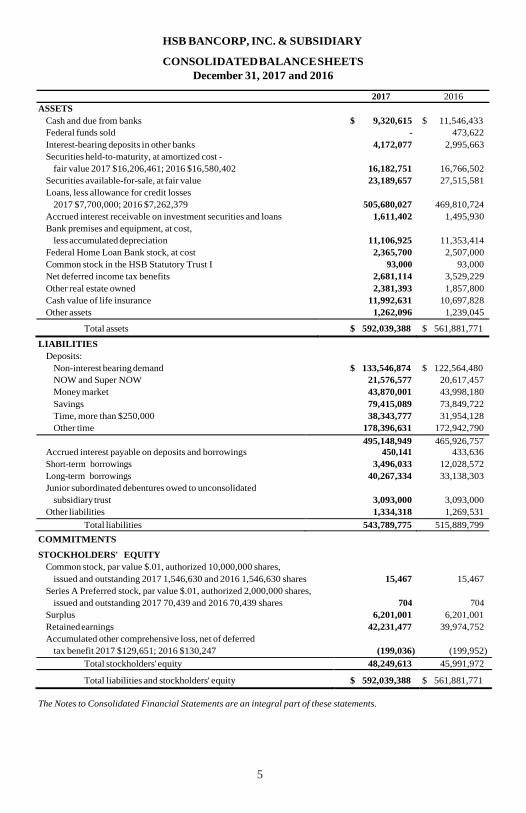
Total assets $ 592,039,388 $ 561,881,771
LIABILITIES Deposits:
Non-interest bearing demand $ 133,546,874 $ 122,564,480 NOW and Super NOW 21,576,577 20,617,457 Money market 43,870,001 43,998,180 Savings 79,415,089 73,849,722 Time, more than $250,000 38,343,777 31,954,128 Other time 178,396,631 172,942,790
495,148,949 465,926,757 Accrued interest payable on deposits and borrowings 450,141 433,636 Short-term borrowings 3,496,033 12,028,572 Long-term borrowings Junior subordinated debentures owed to unconsolidated
subsidiary trust
40,267,334
3,093,000
33,138,303
3,093,000 Other liabilities 1,334,318 1,269,531
Total liabilities 543,789,775 515,889,799 COMMITMENTS
STOCKHOLDERS' EQUITY Common stock, par value $.01, authorized 10,000,000 shares,
issued and outstanding 2017 1,546,630 and 2016 1,546,630 shares 15,467 15,467 Series A Preferred stock, par value $.01, authorized 2,000,000 shares,
issued and outstanding 2017 70,439 and 2016 70,439 shares 704 704 Surplus 6,201,001 6,201,001 Retained earnings 42,231,477 39,974,752 Accumulated other comprehensive loss, net of deferred
tax benefit 2017 $129,651; 2016 $130,247 (199,036) (199,952) Total stockholders' equity 48,249,613 45,991,972
Total liabilities and stockholders' equity $ 592,039,388 $ 561,881,771
The Notes to Consolidated Financial Statements are an integral part of these statements.

HSB BANCORP, INC. & SUBSIDIARY
6
CONSOLIDATED STATEMENTS OF INCOME Years Ended December 31, 2017 and 2016
INTEREST INCOME ON
2017 2016
Loans, including fees $ 23,361,751 $ 22,028,642 Investment securities:
Taxable 762,355 870,465 Exempt from Federal income tax 243,425 246,288
Federal funds sold 6,549 5,919 Deposits in other banks 64,978 123,613
24,439,058 23,274,927
INTEREST EXPENSE ON
Deposits 3,133,831 3,124,459 Borrowings 1,031,324 1,257,008 Junior subordinated debentures 95,377 79,372
4,260,532 4,460,839 NET INTEREST INCOME
20,178,526
18,814,088
Provision for credit losses 2,159,639 2,137,594 NET INTEREST INCOME AFTER PROVISION
FOR CREDIT LOSSES 18,018,887 16,676,494
OTHER INCOME
Service charges on deposit accounts 1,260,817 1,212,381 Earnings of investment in life insurance 294,803 292,385 Other 692,394 658,579
2,248,014 2,163,345
OTHER EXPENSES Salaries and benefits
7,888,677
7,733,202 Occupancy 2,057,681 1,998,490 Losses on other real estate owned 100,773 87,942 Other expenses 3,534,484 3,423,224
13,581,615 13,242,858 INCOME BEFORE TAXES ON INCOME
6,685,286
5,596,981
Federal and State income taxes 3,377,466 1,803,718 NET INCOME
$ 3,307,820
$ 3,793,263
The Notes to Consolidated Financial Statements are an integral part of these statements.

7
HSB BANCORP, INC. & SUBSIDIARY
CONSOLIDATED STATEMENTS OF COMPREHENSIVE INCOME Years Ended December 31, 2017 and 2016
2017 2016 NET INCOME
$ 3,307,820
$ 3,793,263
Other comprehensive gain (loss), net of tax:
Unrealized holding gain (loss) on securities available-for-sale
arising during the period 1,513 (210,966) Deferred income tax (liabilities) benefits (597) 83,216
Other comprehensive income (loss), net of tax 916 (127,750) Reclassification adjustment for gains included
in net income - 1,397 Deferred income tax liabilities - (551)
Other comprehensive income, net of tax - 846
Total other comprehensive income (loss) 916 (126,904) Comprehensive income $ 3,308,736 $ 3,666,359
The Notes to Consolidated Financial Statements are an integral part of these statements.
8
HSB BANCORP, INC. & SUBSIDIARY
CONSOLIDATED STATEMENTS OF STOCKHOLDERS' EQUITY Years Ended December 31, 2017 and 2016
Common Stock
Series A Preferred
Stock
Surplus
Retained Earnings
Accumulated Other
Comprehensive Income (Loss)
Total Stockholders'
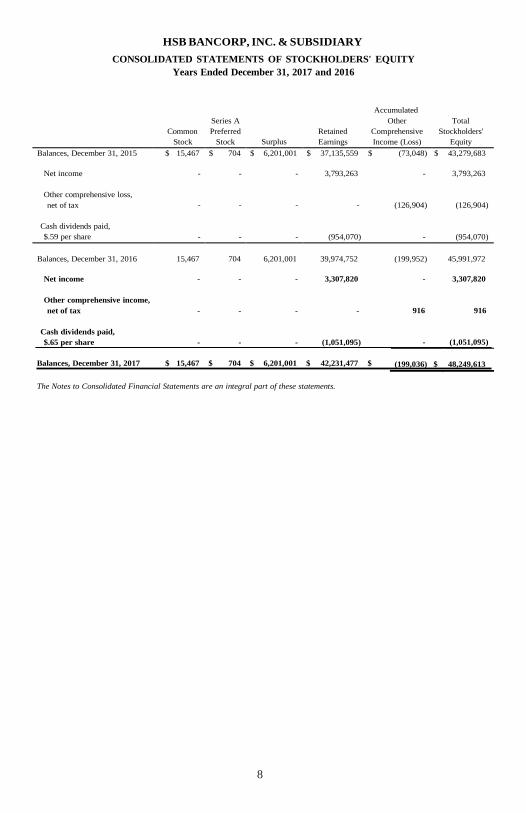
Equity Balances, December 31, 2015 $ 15,467 $ 704 $ 6,201,001 $ 37,135,559 $ (73,048) $ 43,279,683
Net income - - - 3,793,263 - 3,793,263
Other comprehensive loss, net of tax
-
-
-
-
(126,904)
(126,904)
Cash dividends paid, $.59 per share
-
-
-
(954,070)
-
(954,070)
Balances, December 31, 2016
15,467
704
6,201,001
39,974,752
(199,952)
45,991,972
Net income - - - 3,307,820
Other comprehensive income, net of tax - - - -
Cash dividends paid, $.65 per share - - - (1,051,095)
Balances, December 31, 2017
$ 15,467 $
704 $
6,201,001 $
42,231,477 $
The Notes to Consolidated Financial Statements are an integral part of these statements.
- 3,307,820
916
916
-
(1,051,095)
(199,036) $
48,249,613
9
HSB BANCORP, INC. & SUBSIDIARY
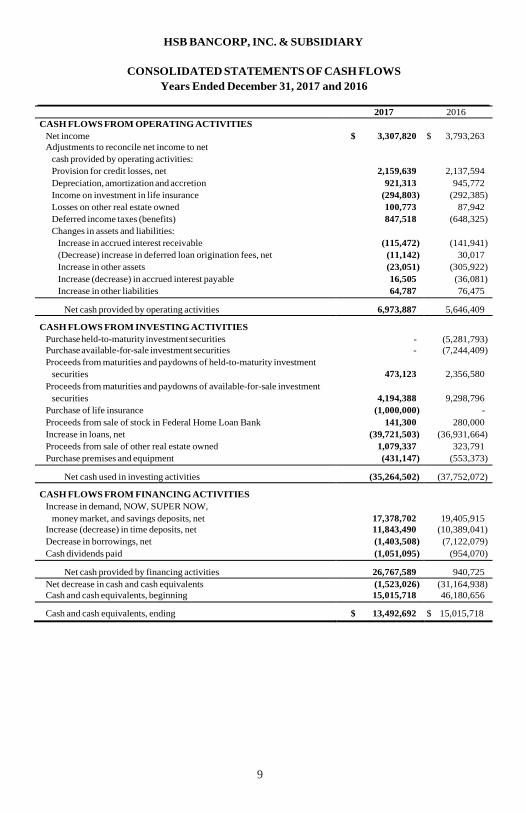
CONSOLIDATED STATEMENTS OF CASH FLOWS Years Ended December 31, 2017 and 2016
2017 2016 CASH FLOWS FROM OPERATING ACTIVITIES
Net income
$ 3,307,820 $ 3,793,263
Adjustments to reconcile net income to net cash provided by operating activities: Provision for credit losses, net
2,159,639
2,137,594 Depreciation, amortization and accretion 921,313 945,772 Income on investment in life insurance (294,803) (292,385) Losses on other real estate owned 100,773 87,942 Deferred income taxes (benefits) Changes in assets and liabilities:
Increase in accrued interest receivable
847,518
(115,472)
(648,325)
(141,941) (Decrease) increase in deferred loan origination fees, net (11,142) 30,017 Increase in other assets (23,051) (305,922) Increase (decrease) in accrued interest payable 16,505 (36,081) Increase in other liabilities 64,787 76,475
Net cash provided by operating activities 6,973,887 5,646,409
CASH FLOWS FROM INVESTING ACTIVITIES Purchase held-to-maturity investment securities
-
(5,281,793) Purchase available-for-sale investment securities Proceeds from maturities and paydowns of held-to-maturity investment
securities
-
473,123
(7,244,409)
2,356,580 Proceeds from maturities and paydowns of available-for-sale investment
securities
4,194,388
9,298,796 Purchase of life insurance (1,000,000) - Proceeds from sale of stock in Federal Home Loan Bank 141,300 280,000 Increase in loans, net (39,721,503) (36,931,664) Proceeds from sale of other real estate owned 1,079,337 323,791 Purchase premises and equipment (431,147) (553,373)
Net cash used in investing activities (35,264,502) (37,752,072)
CASH FLOWS FROM FINANCING ACTIVITIES Increase in demand, NOW, SUPER NOW,
money market, and savings deposits, net
17,378,702
19,405,915 Increase (decrease) in time deposits, net 11,843,490 (10,389,041) Decrease in borrowings, net (1,403,508) (7,122,079) Cash dividends paid (1,051,095) (954,070)
Net cash provided by financing activities 26,767,589 940,725 Net decrease in cash and cash equivalents (1,523,026) (31,164,938) Cash and cash equivalents, beginning 15,015,718 46,180,656
Cash and cash equivalents, ending $ 13,492,692 $ 15,015,718

10
HSB BANCORP, INC. & SUBSIDIARY
CONSOLIDATED STATEMENTS OF CASH FLOWS Years Ended December 31, 2017 and 2016
2017 2016 SUPPLEMENTARY CASH FLOW INFORMATION
Interest paid $ 4,244,027 $ 4,496,920 Income taxes paid 2,807,275 2,765,027 Unrealized appreciation (depreciation) on securities
available-for-sale 1,513 (209,569)
SUPPLEMENTARY NON-CASH INVESTING ACTIVITIES Loans converted to other real estate owned
$ 1,703,703 $
774,180
The Notes to Consolidated Financial Statements are an integral part of these statements.
11
NOTES TO CONSOLIDATED FINANCIAL STATEMENTS
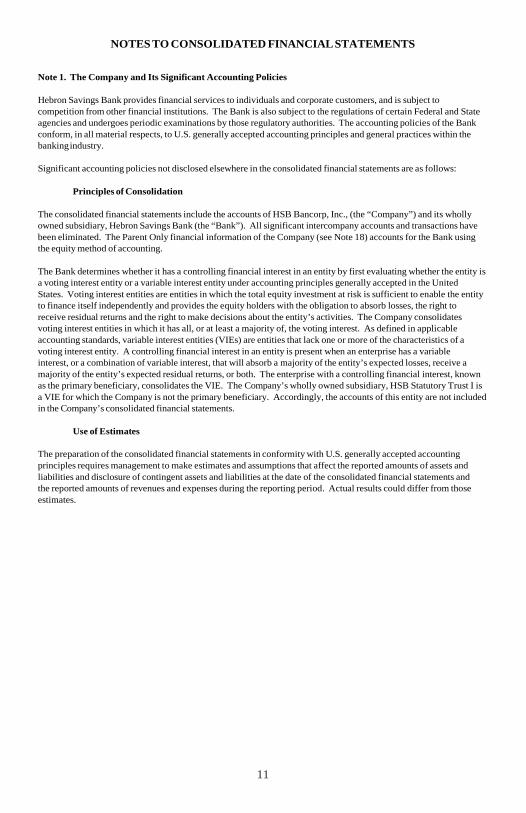
Note 1. The Company and Its Significant Accounting Policies
Hebron Savings Bank provides financial services to individuals and corporate customers, and is subject to competition from other financial institutions. The Bank is also subject to the regulations of certain Federal and State agencies and undergoes periodic examinations by those regulatory authorities. The accounting policies of the Bank conform, in all material respects, to U.S. generally accepted accounting principles and general practices within the banking industry.
Significant accounting policies not disclosed elsewhere in the consolidated financial statements are as follows:
Principles of Consolidation
The consolidated financial statements include the accounts of HSB Bancorp, Inc., (the “Company”) and its wholly owned subsidiary, Hebron Savings Bank (the “Bank”). All significant intercompany accounts and transactions have been eliminated. The Parent Only financial information of the Company (see Note 18) accounts for the Bank using the equity method of accounting.
The Bank determines whether it has a controlling financial interest in an entity by first evaluating whether the entity is a voting interest entity or a variable interest entity under accounting principles generally accepted in the United States. Voting interest entities are entities in which the total equity investment at risk is sufficient to enable the entity to finance itself independently and provides the equity holders with the obligation to absorb losses, the right to receive residual returns and the right to make decisions about the entity’s activities. The Company consolidates voting interest entities in which it has all, or at least a majority of, the voting interest. As defined in applicable accounting standards, variable interest entities (VIEs) are entities that lack one or more of the characteristics of a voting interest entity. A controlling financial interest in an entity is present when an enterprise has a variable interest, or a combination of variable interest, that will absorb a majority of the entity’s expected losses, receive a majority of the entity’s expected residual returns, or both. The enterprise with a controlling financial interest, known as the primary beneficiary, consolidates the VIE. The Company’s wholly owned subsidiary, HSB Statutory Trust I is a VIE for which the Company is not the primary beneficiary. Accordingly, the accounts of this entity are not included in the Company’s consolidated financial statements.
Use of Estimates
The preparation of the consolidated financial statements in conformity with U.S. generally accepted accounting principles requires management to make estimates and assumptions that affect the reported amounts of assets and liabilities and disclosure of contingent assets and liabilities at the date of the consolidated financial statements and the reported amounts of revenues and expenses during the reporting period. Actual results could differ from those estimates.

12
NOTES TO CONSOLIDATED FINANCIAL STATEMENTS
Note 1. The Company and Its Significant Accounting Policies (Continued)
Securities Held-to-Maturity
Bonds, notes, and debentures for which the Bank has the positive intent and ability to hold to maturity are reported at cost, adjusted for premiums and discounts that are recognized in interest income using methods approximating the interest method over the periods to maturity. Securities transferred into held-to-maturity from the available-for-sale portfolio are recorded at fair value at time of transfer with unrealized gains or losses reflected in equity and amortized over the remaining life of the security.
Securities Available-for-Sale
Securities designated as available-for-sale are stated at estimated fair value as determined by quoted market prices. They represent those securities, which management may decide to sell as part of the Bank’s asset/liability strategy, or that may be sold in response to changing interest rates or liquidity needs. Changes in unrealized appreciation (depreciation) on securities available-for-sale are reported in other comprehensive income. Realized gains (losses) on securities available-for-sale are included in other income (expense) and, when applicable, are reported as a reclassification adjustment, net of tax, in other comprehensive income. The gains and losses on securities sold are determined by the specific identification method. Premiums and discounts are recognized in interest income using the interest method over the period to maturity. Additionally, declines in the fair value of the individual investment securities below their cost that are other than temporary are reflected as realized losses in the consolidated statements of income.
Other Securities
Federal Home Loan Bank (“FHLB”) stock is an equity interest in the FHLB, which does not have a readily determinable fair value for purposes of ASC Topic 320 Investments-Debts and Equity Securities because its ownership is restricted and it lacks a market. FHLB stock can be sold back only at its par value of $100 per share and only to the FHLB or another member institution.
Allowance for Credit Losses
Loans are generally carried at the amount of unpaid principal, adjusted for unearned loan fees, which are amortized over the term of the loan using the effective interest rate method. Interest on loans is accrued based on the principal amounts outstanding. It is the Bank’s policy to discontinue the accrual of interest when a loan is specifically determined to be impaired or when principal or interest is delinquent for ninety days or more. When a loan is placed on nonaccrual status, all interest previously accrued but not collected is reversed against current period interest income. Interest income generally is not recognized on specific impaired loans unless the likelihood of further loss is remote. Cash collections on such loans are applied as reductions of the loan principal balance and no interest income is recognized on those loans until the principal balance has been collected. Interest income on other nonaccrual loans is recognized only to the extent of interest payments received. The carrying value of impaired loans is based on the present value of the loan’s expected future cash flows or, alternatively, the observable market price of the loan or the fair value of the collateral.
The allowance for loan losses is maintained at a level believed adequate by management to absorb probable losses inherent in the loan portfolio and is based on the size and current risk characteristics of the loan portfolio, an assessment of individual problem loans and actual loss experience, the value of the underlying collateral, and current economic events in specific industries and geographical areas, including unemployment levels, and other pertinent factors, including regulatory guidance and general economic conditions.

13
NOTES TO CONSOLIDATED FINANCIAL STATEMENTS
Note 1. The Company and Its Significant Accounting Policies (Continued)
Allowance for Credit Losses (Continued)
Determination of the allowance is inherently subjective, as it requires significant estimates, including the amounts and timing on historical loss experience, and consideration of current economic trends, all of which may be susceptible to significant change. Loan losses are charged off against the allowance, while recoveries of amounts previously charged off are credited to the allowance. A provision for credit losses is charged to operations based on management’s periodic evaluation of the factors previously mentioned, as well as other pertinent factors. Evaluations are conducted at least monthly and more often if deemed necessary.
The allowance for credit losses typically consists of an allocated component and an unallocated component. The allocated component of the allowance for credit losses reflects expected losses resulting from analyses developed through specific credit allocations for individual loans and historical loss experience for each loan category. The specific credit allocations are based on regular analyses of all loans over a fixed-dollar amount where the internal credit rating is at or below a predetermined classification. The historical loan loss element is determined statistically using an informal loss migration analysis that examines loss experience and the related internal grading of loans charged off over a current three year period. The loss migration analysis is performed quarterly and loss factors are updated regularly based on actual experience. The allocated component of the allowance for credit losses also includes consideration of concentrations and changes in portfolio mix and volume.
Any unallocated portion of the allowance reflects management’s estimate of probable inherent but undetected losses within the portfolio due to uncertainties in economic conditions, delays in obtaining information, including unfavorable information about a borrower’s financial condition, the difficulty in identifying triggering events that correlate perfectly to subsequent loss rates, and risk factors that have not yet manifested themselves in loss allocation factors. In addition, the unallocated allowance includes a component that explicitly accounts for the inherent imprecision in loan loss migration models. The historical losses used in the migration analysis may not be representative of actual unrealized losses inherent in the portfolio. It is management’s intent to continually refine the methodology for the allowance for credit losses in an attempt to directly allocate potential losses in the loan portfolio under ASC Topic 310 and minimize the unallocated portion of the allowance for credit losses.
Other Real Estate Owned (OREO)
OREO comprises properties acquired in partial or total satisfaction of problem loans. The properties are recorded at the lower of cost or fair value (appraised value) at the date acquired. Losses arising at the time of acquisition of such properties are charged against the allowance for credit losses. Subsequent write-downs and losses realized from the sale of OREO totaled $100,773 and $87,942 for 2017 and 2016, respectively, and are included in other expenses. Expenses of operation are also included in other expenses as detailed in Note 11. Property acquired through foreclosure proceedings totaled $2,381,393 and $1,857,800 at December 31, 2017 and 2016, respectively. The Bank financed sales of OREO totaling $754,041 and $15,887 at December 31, 2017 and 2016, respectively. At December 31, 2017 and 2016, loans secured by residential real estate properties in process of foreclosure totaled approximately $855,000 and $2,440,000, respectively.
Reserve for Unfunded Commitments
The reserve for unfunded commitments is established through a provision for unfunded commitments charged to other expenses. The reserve is calculated by utilizing the same methodology and factors as the allowance for credit losses. The reserve, based on evaluations of the collectability of loans and prior loan loss experience, is an amount that management believes will be adequate to absorb possible losses on unfunded commitments (off-balance sheet financial instruments) that may become uncollectible in the future.

14
NOTES TO CONSOLIDATED FINANCIAL STATEMENTS
Note 1. The Company and Its Significant Accounting Policies (Continued)
Long-Lived Assets
The carrying value of long-lived assets and certain identifiable intangibles, including goodwill, is reviewed by the Bank for impairment whenever events or changes in circumstances indicate that the carrying amount of an asset may not be recoverable, as prescribed in ASC Topic 360 Property, Plant and Equipment. As of December 31, 2017, certain loans existed in which management considered impaired (See Note 4).
Premises, Equipment, and Depreciation
Land is carried at cost. Other premises and equipment are carried at cost net of accumulated depreciation. Depreciation is computed using the straight-line and accelerated methods over the estimated useful lives of the assets. Maintenance and repairs are expensed as incurred while major additions and improvements are capitalized. Gains and losses on dispositions are included in current operations.
Income Taxes
The provision for federal and state income taxes is based upon the results of operations, adjusted for tax exempt income. Deferred income taxes are provided under ASC Topic 740 Income Taxes by applying the enacted statutory tax rates to temporary differences between financial and taxable bases.
Temporary differences, which give rise to deferred tax benefits, relate principally to the allowance for credit losses, deferred subcontractor costs, OREO property, accrued vacation and net unrealized depreciation on securities available-for-sale.
Temporary differences, which give rise to deferred tax liabilities, relate principally to accumulated depreciation, unearned income on loans and net unrealized appreciation on securities available-for-sale.
Credit Risk
The Bank has deposits in other financial institutions in excess of amounts insured by the Federal Deposit Insurance Corporation (FDIC).
Cash and Cash Equivalents
The Bank has included cash and due from banks, Federal funds sold, and interest-bearing deposits in other banks with maturities less than three months as cash and cash equivalents for the purposes of reporting cash flows.
The Bank is required to maintain a non-interest bearing cash reserve at one of its correspondent banks against its corporate credit card account. Such reserve averaged approximately $100,000 during the years ended December 31, 2017 and 2016.
Advertising Costs
The Bank expenses advertising costs for the period in which they are incurred. The Bank incurred advertising costs totaling $68,357 and $49,184, for the years 2017 and 2016, respectively.
Financial Statement Presentation
Certain amounts in the prior year’s financial statements have been reclassified to conform to the current year’s presentation.

15
NOTES TO CONSOLIDATED FINANCIAL STATEMENTS
Note 2. Debt and Equity Securities
Securities held-to-maturity are as follows:
Obligations of States and political
December 31, 2017 Gross Gross
Amortized Unrealized Unrealized Fair Cost Gains Losses Value
subdivisions $ 16,171,807 $ 184,487 $ 161,108 $ 16,195,186 Mortgage-backed securities and CMOs 10,944 331 - 11,275
$ 16,182,751 $ 184,818 $ 161,108 $ 16,206,461
Obligations of States and political
December 31, 2016 Gross Gross
Amortized Unrealized Unrealized Fair Cost Gains Losses Value
subdivisions $ 16,737,492 $ 224,395 $ 411,277 $ 16,550,610 Mortgage-backed securities and CMOs 29,010 782 - 29,792
$ 16,766,502 $ 225,177 $ 411,277 $ 16,580,402
Securities available-for-sale are as follows:
Obligations of U.S. Government
December 31, 2017 Gross Gross
Amortized Unrealized Unrealized Fair Cost Gains Losses Value
agencies $ 4,632,510 $ 2,921 $ 18,182 $ 4,617,249 Mortgage-backed securities and CMOs 15,885,834 14,305 314,379 15,585,760 Mutual funds 3,000,000 - 13,352 2,986,648
$ 23,518,344 $ 17,226 $ 345,913 $ 23,189,657
Obligations of U.S. Government
December 31, 2016 Gross Gross
Amortized Unrealized Unrealized Fair Cost Gains Losses Value
agencies $ 5,206,467 $ 17,438 $ 20,827 $ 5,203,078 Mortgage-backed securities and CMOs 19,639,314 27,056 340,515 19,325,855 Mutual funds 3,000,000 - 13,352 2,986,648
$ 27,845,781 $ 44,494 $ 374,694 $ 27,515,581

16
NOTES TO CONSOLIDATED FINANCIAL STATEMENTS
Note 2. Debt and Equity Securities (Continued)
The following is a summary of gross unrealized losses and fair values, aggregated by investment category and length of time that individual securities have been in continuous unrealized loss position, at December 31, 2017:
Obligations of States and political
Less than 12 months 12 months or more Total Fair Unrealized Fair Unrealized Fair Unrealized
Value Loss Value Loss Value Loss
subdivisions M ortgage-backed securities
$ 3,405,640 $ 19,578 $ 5,377,022 $ 141,530 $ 8,782,662 $ 161,108
and CMOs - - - - - - Total securities with unrealized losses $ 3,405,640 $ 19,578 $ 5,377,022 $ 141,530 $ 8,782,662 $ 161,108
Securities available-for-sale:
Obligations of U.S. Government
Less than 12 months 12 months or more Total Fair Unrealized Fair Unrealized Fair Unrealized
Value Loss Value Loss Value Loss
agencies M ortgage-backed securities
$ 1,499,145 $ 1,570 $ 1,986,080 $ 16,612 $ 3,485,225 $ 18,182
and CMOs 4,271,915 54,960 9,980,389 259,419 14,252,304 314,379 M utual Funds 2,986,648 13,352 - - 2,986,648 13,352 Total securities with unrealized losses $ 8,757,708 $ 69,882 $ 11,966,469 $ 276,031 $ 20,724,177 $ 345,913
For individual securities classified as either available-for-sale or held-to-maturity, the Bank must determine whether a decline in fair value below the amortized cost basis is other than temporary. If the decline in fair value is considered to be other than temporary, the cost basis of the individual security shall be written down to the fair value as a new cost basis and the amount of the write-down shall be included in earnings (that is, accounted for as a realized loss). At December 31, 2017, the Bank held 4 obligations of U.S. Government agencies, 35 Mortgage- backed securities and CMOs, and 14 obligations of states and political subdivisions having continuous unrealized loss positions for more than 12 months. Management has reviewed each investment and determined through various valuation methods that all unrealized loss positions as of December 31, 2017 are temporary unrealized losses relatin primarily to changes in market interest rates over the yields available at the time the underlying securities were purchased and that none of the losses are due to reasons of credit quality.
In addition to the above analysis, management also believes it has the ability and intent to hold the securities classified as held-to-maturity until they mature, at which time management believes the Bank will receive full value for the securities. Management also feels it has the ability and intent to hold the securities classified as available-for sale for a period of time sufficient for a recovery of cost and has no plans to sell securities that are currently in a loss position.
17
NOTES TO CONSOLIDATED FINANCIAL STATEMENTS
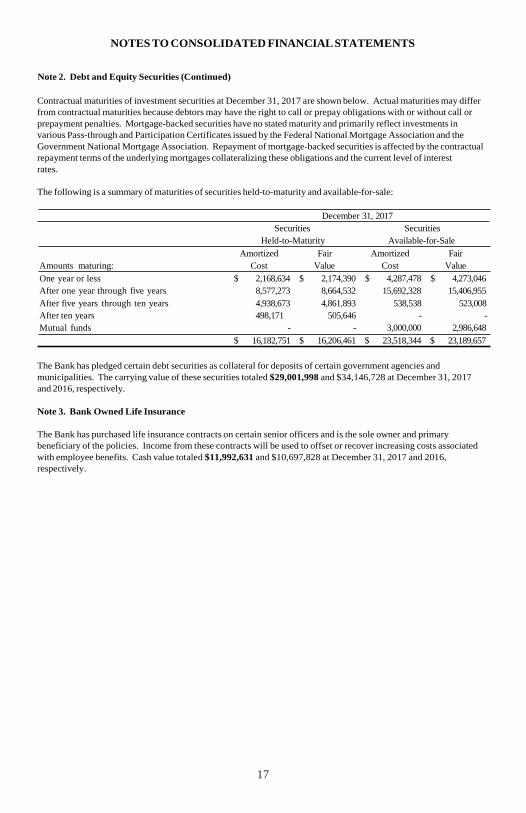
Note 2. Debt and Equity Securities (Continued)
Contractual maturities of investment securities at December 31, 2017 are shown below. Actual maturities may differ from contractual maturities because debtors may have the right to call or prepay obligations with or without call or prepayment penalties. Mortgage-backed securities have no stated maturity and primarily reflect investments in various Pass-through and Participation Certificates issued by the Federal National Mortgage Association and the Government National Mortgage Association. Repayment of mortgage-backed securities is affected by the contractual repayment terms of the underlying mortgages collateralizing these obligations and the current level of interest rates.
The following is a summary of maturities of securities held-to-maturity and available-for-sale:
Securities
December 31, 2017 Securities
Held-to-Maturity Available-for-Sale
Amortized Fair Amortized Fair Amounts maturing: Cost Value Cost Value
One year or less $ 2,168,634 $ 2,174,390 $ 4,287,478 $ 4,273,046 After one year through five years 8,577,273 8,664,532 15,692,328 15,406,955 After five years through ten years 4,938,673 4,861,893 538,538 523,008 After ten years 498,171 505,646 - - Mutual funds - - 3,000,000 2,986,648
$ 16,182,751 $ 16,206,461 $ 23,518,344 $ 23,189,657
The Bank has pledged certain debt securities as collateral for deposits of certain government agencies and municipalities. The carrying value of these securities totaled $29,001,998 and $34,146,728 at December 31, 2017 and 2016, respectively.
Note 3. Bank Owned Life Insurance
The Bank has purchased life insurance contracts on certain senior officers and is the sole owner and primary beneficiary of the policies. Income from these contracts will be used to offset or recover increasing costs associated with employee benefits. Cash value totaled $11,992,631 and $10,697,828 at December 31, 2017 and 2016, respectively.

18
NOTES TO CONSOLIDATED FINANCIAL STATEMENTS
Note 4. Loans and Allowances for Credit Losses
The Bank makes loans to customers primarily throughout the Lower Eastern Shore of the State of Maryland. The principal categories of the loan portfolio are as follows:
2017 2016 Real estate loans:
Construction
$ 83,583,527
$ 61,089,028 Residential Mortgages 214,149,279 213,036,107 Commercial Mortgages 149,136,208 139,870,724
446,869,014 413,995,859 Commercial & industrial loans 64,098,635 60,029,692 Consumer loans 2,441,242 3,087,556
513,408,891 477,113,107 Less: unearned income on loans 28,864 40,004
513,380,027 477,073,103 Less: allowance for credit losses 7,700,000 7,262,379
$ 505,680,027 $ 469,810,724
Management has an established methodology to determine the adequacy of the allowance for loan losses that assesses the risks and losses inherent in the loan portfolio. For purposes of determining the allowance for loan losses, the Bank has segmented certain loans in the portfolio by product type. Loans are segmented into the following pools: real estate loans, commercial and industrial loans, and consumer loans. Real estate loans are further divided into the following three classes: construction, land development, and other land loans (“construction”), residential mortgages, and commercial mortgages. Each of these segments are reviewed and analyzed quarterly using the average historical charge-offs over a current three year period for their respective segments as well as the following qualitative factors:
1. Changes in the levels and trends in delinquencies, nonaccruals, classified assets and troubled debt
restructurings. 2. Changes in the nature and volume of the portfolio. 3. Effects of any changes in lending policies, procedures, including underwriting standards and collections,
charge off and recovery practices. 4. Changes in the experience, depth and ability of management. 5. Changes in the national and local economic conditions and developments, including the condition of
various market segments. 6. Changes in the concentration of credits within each pool. 7. Changes in the quality of the Bank’s loan review system and the degree of oversight by the Board. 8. Changes in external factors such as competition and the legal environment.
The above factors result in a codified FASB ASC 450-10- 20 calculated reserve for environmental factors.
All credit exposures risk rated at “substandard” or “doubtful” with outstanding balances or “special mention” with outstanding balances greater than or equal to $250,000 are to be reviewed no less than quarterly for the purpose of determining if a specific allocation is needed for that credit. The establishment of a specific reserve does not necessarily mean that the credit with the specific reserve will definitely incur loss at the reserve level. It is only an estimation of potential loss based upon anticipated events. A specific reserve will not be established unless loss elements can be determined and quantified based on known facts. The total allowance reflects management’s estimate of loan losses inherent in the loan portfolio as of December 31, 2017.

19
NOTES TO CONSOLIDATED FINANCIAL STATEMENTS
Note 4. Loans and Allowances for Credit Losses (Continued)
The activity in the allowance for loan losses for 2017 and 2016 is as follows:
December 31, 2017
Beginning Balance $ 1,155,469 $ 3,852,519 $ 1,273,347 $ 743,557 $ 185,079 $ 52,408 $ 7,262,379 Charge-offs (299,900) (614,130) (635,805) (85,131) (169,608) - (1,804,574) Recoveries 3,758 12,877 57,151 6,021 2,749 - 82,556 Provision 652,490 461,782 805,583 113,583 92,479 33,722 2,159,639
Ending Balance 1,511,817 3,713,048 1,500,276 778,030 110,699 86,130 7,700,000
Ending Balance of: Individually evaluated for impairment:
Related loan balance 10,678,661 23,073,272 17,072,934 1,886,317 49,773 - 52,760,957 Balance in allowance 712,947 2,113,087 414,791 240,007 15,753 - 3,496,585
Collectively evaluated for impairment: Related loan balance 72,904,866 191,076,007 132,063,274 62,212,318 2,391,469 - 460,647,934 Balance in allowance 798,870 1,599,961 1,085,485 538,023 94,946 86,130 4,203,415
Total Related loan balance 83,583,527 214,149,279 149,136,208 64,098,635 2,441,242 - 513,408,891 Balance in allowance 1,511,817 3,713,048 1,500,276 778,030 110,699 86,130 7,700,000
December 31, 2016
Beginning Balance $ 809,521 $ 4,397,646 $ 808,199 $ 500,402 $ 88,314 $ 108,297 $ 6,712,379 Charge-offs (105,404) (773,316) (403,333) (203,613) (174,709) - (1,660,375) Recoveries 1,856 30,761 8,487 24,184 7,493 - 72,781 Provision 449,496 197,428 859,994 422,584 263,981 (55,889) 2,137,594
Ending Balance 1,155,469 3,852,519 1,273,347 743,557 185,079 52,408 7,262,379
Ending Balance of: Individually evaluated for impairment:
Related loan balance 7,351,706 25,401,478 14,750,038 1,256,727 123,510 - 48,883,459 Balance in allowance 364,251 1,949,147 427,834 196,388 70,963 - 3,008,583
Collectively evaluated for impairment: Related loan balance 53,737,322 187,634,629 125,120,686 58,772,965 2,964,046 - 428,229,648 Balance in allowance 791,218 1,903,372 845,513 547,169 114,116 52,408 4,253,796
Total Related loan balance 61,089,028 213,036,107 139,870,724 60,029,692 3,087,556 - 477,113,107 Balance in allowance 1,155,469 3,852,519 1,273,347 743,557 185,079 52,408 7,262,379
As of December 31, 2017 and 2016, the allowance for loan losses included an unallocated excess of $86,130 and $52,408, respectively. Management is comfortable with these amounts as they feel the amounts are adequate to absorb additional inherent potential losses in the loan portfolio as further described in Note 1.
Real Estate Loan s Commercial and
Industrial Consumer Unallocated Total
Construction Residential Mortgages
Commercial Mortgages
Real Estate Loans Commercial and
Industrial Consumer Unallocated Total
Construction Residential Mortgages
Commercial Mortgages
20
NOTES TO CONSOLIDATED FINANCIAL STATEMENTS
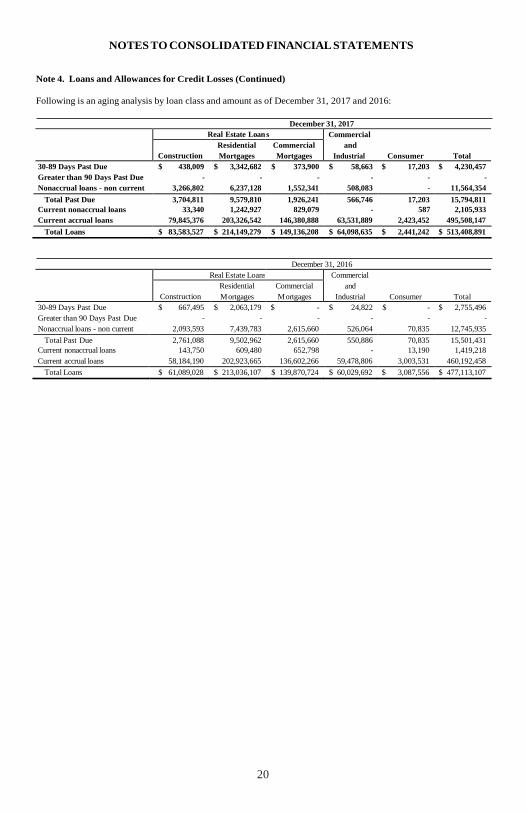
Note 4. Loans and Allowances for Credit Losses (Continued)
Following is an aging analysis by loan class and amount as of December 31, 2017 and 2016:
December 31, 2017
30-89 Days Past Due $ 438,009 $ 3,342,682 $ 373,900 $ 58,663 $ 17,203 $ 4,230,457 Greater than 90 Days Past Due - - - - - - Nonaccrual loans - non current 3,266,802 6,237,128 1,552,341 508,083 - 11,564,354
Total Past Due 3,704,811 9,579,810 1,926,241 566,746 17,203 15,794,811 Current nonaccrual loans 33,340 1,242,927 829,079 - 587 2,105,933 Current accrual loans 79,845,376 203,326,542 146,380,888 63,531,889 2,423,452 495,508,147
Total Loans $ 83,583,527 $ 214,149,279 $ 149,136,208 $ 64,098,635 $ 2,441,242 $ 513,408,891
December 31, 2016
30-89 Days Past Due $ 667,495 $ 2,063,179 $ - $ 24,822 $ - $ 2,755,496 Greater than 90 Days Past Due - - - - - - Nonaccrual loans - non current 2,093,593 7,439,783 2,615,660 526,064 70,835 12,745,935
Total Past Due 2,761,088 9,502,962 2,615,660 550,886 70,835 15,501,431 Current nonaccrual loans 143,750 609,480 652,798 - 13,190 1,419,218 Current accrual loans 58,184,190 202,923,665 136,602,266 59,478,806 3,003,531 460,192,458
Total Loans $ 61,089,028 $ 213,036,107 $ 139,870,724 $ 60,029,692 $ 3,087,556 $ 477,113,107
Real Estate Loan s Commercial and
Industrial Consumer Total
Construction Residential Mortgages
Commercial Mortgages
Real Estate Loans Commercial and
Industrial Consumer Total
Construction Residential M ortgages
Commercial M ortgages

21
NOTES TO CONSOLIDATED FINANCIAL STATEMENTS
Note 4. Loans and Allowances for Credit Losses (Continued)
The Bank's policies, consistent with regulatory guidelines, provide for the classification of loans that are considered to be of lesser quality as special mention, substandard, or doubtful assets. Special mention is a warning or watch classification, which portrays one or more deficiencies in the credit quality of the borrower or the pledged collateral. Substandard loans include loans with a high loan-to-value ratio or credits that are unable to adjust due to unfavorable industry or economic conditions. Loans classified as doubtful are critical credits with an element of probable loss and insufficient collateral. The risk ratings are adjusted, as necessary, if loans become delinquent, if significant adverse information is discovered regarding the underlying credit, and if the normal periodic reviews of the underlying credits indicate that a change in risk rating is appropriate. A summary of the risk rating of loans receivable as of December 31, 2017 and 2016 is as follows:
December 31, 2017
Pass $ 72,858,699 $ 187,300,326 $ 131,485,887 $ 61,409,136 $ 2,400,273 $ 455,454,321 Special Mention 5,566,029 15,841,433 13,453,850 861,017 38,239 35,760,568 Substandard 5,158,799 11,007,520 4,196,471 1,828,482 2,730 22,194,002 Doubtful - - - - - -
$ 83,583,527 $ 214,149,279 $ 149,136,208 $ 64,098,635 $ 2,441,242 $ 513,408,891
December 31, 2016
Pass $ 54,927,683 $ 184,721,145 $ 124,923,304 $ 57,957,974 $ 2,966,594 $ 425,496,700 Special M ention 3,401,061 17,673,022 8,359,739 1,522,440 36,937 30,993,199 Substandard 2,760,284 10,641,940 6,587,681 549,278 84,025 20,623,208 Doubtful - - - - - -
$ 61,089,028 $ 213,036,107 $ 139,870,724 $ 60,029,692 $ 3,087,556 $ 477,113,107
Real Estate Loan s Commercial and
Industrial Consumer Total
Construction Residential Mortgages
Commercial Mortgages
Real Estate Loans Commercial and
Industrial Consumer Total
Construction Residential M ortgages
Commercial M ortgages
22
NOTES TO CONSOLIDATED FINANCIAL STATEMENTS
Note 4. Loans and Allowances for Credit Losses (Continued)
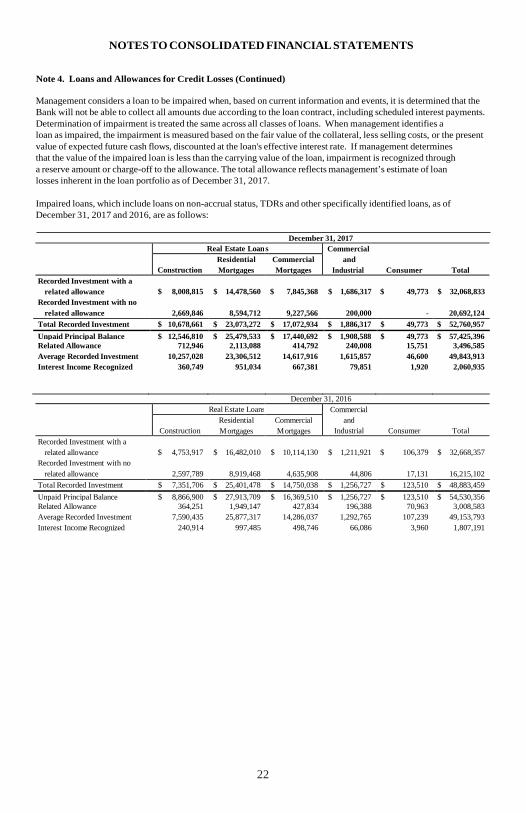
Management considers a loan to be impaired when, based on current information and events, it is determined that the Bank will not be able to collect all amounts due according to the loan contract, including scheduled interest payments. Determination of impairment is treated the same across all classes of loans. When management identifies a loan as impaired, the impairment is measured based on the fair value of the collateral, less selling costs, or the present value of expected future cash flows, discounted at the loan's effective interest rate. If management determines that the value of the impaired loan is less than the carrying value of the loan, impairment is recognized through a reserve amount or charge-off to the allowance. The total allowance reflects management’s estimate of loan losses inherent in the loan portfolio as of December 31, 2017.
Impaired loans, which include loans on non-accrual status, TDRs and other specifically identified loans, as of December 31, 2017 and 2016, are as follows:
December 31, 2017
Real Estate Loan s Commercial and
Industrial Consumer Total
Construction Residential Mortgages
Commercial Mortgages
Recorded Investment with a related allowance
Recorded Investment with no
$ 8,008,815
$ 14,478,560 $
7,845,368
$ 1,686,317 $
49,773
$ 32,068,833
related allowance 2,669,846 8,594,712 9,227,566 200,000 - 20,692,124 Total Recorded Investment $ 10,678,661 $ 23,073,272 $ 17,072,934 $ 1,886,317 $ 49,773 $ 52,760,957 Unpaid Principal Balance $ 12,546,810 $ 25,479,533 $ 17,440,692 $ 1,908,588 $ 49,773 $ 57,425,396 Related Allowance 712,946 2,113,088 414,792 240,008 15,751 3,496,585 Average Recorded Investment 10,257,028 23,306,512 14,617,916 1,615,857 46,600 49,843,913 Interest Income Recognized 360,749 951,034 667,381 79,851 1,920 2,060,935
December 31, 2016
Real Estate Loans Commercial and
Industrial Consumer Total
Construction Residential M ortgages
Commercial M ortgages
Recorded Investment with a related allowance
Recorded Investment with no
$ 4,753,917
$ 16,482,010
$ 10,114,130
$ 1,211,921 $
106,379
$ 32,668,357
related allowance 2,597,789 8,919,468 4,635,908 44,806 17,131 16,215,102 Total Recorded Investment $ 7,351,706 $ 25,401,478 $ 14,750,038 $ 1,256,727 $ 123,510 $ 48,883,459 Unpaid Principal Balance $ 8,866,900 $ 27,913,709 $ 16,369,510 $ 1,256,727 $ 123,510 $ 54,530,356 Related Allowance 364,251 1,949,147 427,834 196,388 70,963 3,008,583 Average Recorded Investment 7,590,435 25,877,317 14,286,037 1,292,765 107,239 49,153,793 Interest Income Recognized 240,914 997,485 498,746 66,086 3,960 1,807,191

23
NOTES TO CONSOLIDATED FINANCIAL STATEMENTS
Note 4. Loans and Allowances for Credit Losses (Continued)
The Bank generally places loans on nonaccrual status when the full and timely collection of interest or principal becomes uncertain, part of the principal balance has been charged off and no restructuring has occurred, or the loan reaches 90 days past due. When a loan is placed on nonaccrual status, the accrued unpaid interest receivable is reversed against interest income, and future payments are applied to principal. Loans are returned to accrual status when the borrower makes at least six regularly scheduled payments and the collectability is no longer doubtful. The Bank classifies loans on nonaccrual status as impaired. Information regarding these loans as of December 31, 2017 and 2016 is summarized as follows:
Real Estate Loan s Commercial and
Industrial Consumer Total
Construction Residential Mortgages
Commercial Mortgages
In situations where, for economic or legal reasons related to a borrower's financial difficulties, the Bank may grant a concession for other than an insignificant period of time to the borrower that would not otherwise be considered, the related loan is classified as a Troubled Debt Restructuring (TDR). Management strives to identify borrowers in financial difficulty early and work with them to modify to more affordable terms before their loan reaches nonaccrual status. These modified terms may include rate reductions, principal or interest forgiveness, or other actions intended to minimize the loss and to avoid foreclosure or repossession of the collateral. For TDRs with interest rates modified below market, the “specific” valuation allowance amounts were determined by comparing the discounted future expected present value of cash flows under the modified agreements against the carrying value of the original loan and a separate reserve in the allowance for loan losses has been established and identified as for TDRs. TDRs with principal reductions are individually evaluated for impairment and have been charged off to their net realizable value through the allowance for loan losses.
The following table includes the recorded investment and number of modifications for TDRs. The Bank reports the recorded investment in the loans prior to a modification and also the recorded investment in the loans after the loans were restructured.
December 31, 2017
Number of modifications 13 76 12 3 3 107 Recorded investment prior to modification $ 8,616,696 $ 16,850,311 $ 6,357,945 $ 105,256 $ 55,762 $ 31,985,970 Recorded investment after modification $ 5,329,535 $ 13,871,230 $ 5,754,965 $ 96,821 $ 47,043 $ 25,099,594
December 31, 2016
Number of modifications 13 89 13 1 1 117 Recorded investment prior to modification $ 8,316,696 $ 17,415,981 $ 7,334,475 $ 30,016 $ 41,930 $ 33,139,098 Recorded investment after modification $ 5,697,800 $ 14,796,322 $ 7,209,751 $ 24,820 $ 39,485 $ 27,768,178
Real Estate Loan s Commercial and
Industrial Consumer Total
Construction Residential Mortgages
Commercial Mortgages
Real Estate Loans Commercial and
Industrial Consumer Total
Construction Residential M ortgages
Commercial M ortgages
December 31, 2017 $ 3,300,142 $ 7,480,055 $ 2,381,420 $ 508,083 $ 587 $ 13,670,287 December 31, 2016 $ 2,237,343 $ 8,049,263 $ 3,268,458 $ 526,064 $ 84,025 $ 14,165,153

24
NOTES TO CONSOLIDATED FINANCIAL STATEMENTS
Note 4. Loans and Allowances for Credit Losses (Continued)
TDRs, included in impaired loans, which are not performing as agreed in the current reporting period, are as follows:
December 31, 2017
Number of modifications 3 39 4 - - 46 Recorded investment $ 2,461,923 $ 4,293,928 $ 1,205,550 $ - $ - $ 7,961,401
December 31, 2016
Real Estate Loans Commercial and
Industrial Consumer Total
Construction Residential M ortgages
Commercial M ortgages
Troubled debt restructurings (TDRs) with a commitment to lend additional funds were $0 at December 31, 2017 and 2016.
In the normal course of banking business, loans are made to senior officers and directors and their affiliated interests. In the opinion of management, these loans are consistent with sound banking practices, are within regulatory lending limitations, and do not involve more than the normal risk of collectability.
Loans to senior officers, directors, and their affiliates at December 31, 2017 and 2016 are summarized as follows:
2017 2016
Loans, beginning $ 12,088,000 $ 11,400,000 Additions 8,059,000 4,018,000 Repayments/eliminations (6,205,000) (3,330,000)
Loans, ending $ 13,942,000 $ 12,088,000
Outstanding loan commitments and unused lines and letters of credit were approximately as follows:
2017 2016 Loan commitments, including approved loans
and unused lines of credit
$ 90,817,000
$ 88,864,000 Letters of credit 5,540,000 4,680,000
Real Estate Loan s Commercial and
Industrial Consumer Total
Construction Residential Mortgages
Commercial Mortgages
Number of modifications 2 34 2 - - 38 Recorded investment $ 1,803,880 $ 3,194,929 $ 364,203 $ - $ - $ 5,363,012

25
NOTES TO CONSOLIDATED FINANCIAL STATEMENTS
Note 4. Loans and Allowances for Credit Losses (Continued)
Loan commitments and lines of credit are agreements to lend to customers as long as there is no violation of any conditions of the contracts. Loan commitments generally have interest rates fixed at current market amounts, fixed expiration dates, and may require payment of a fee. Lines of credit generally have variable interest rates. Many of the loan commitments and lines of credit are expected to expire without being drawn upon; accordingly, the total commitment amounts do not necessarily represent future cash requirements. The Bank evaluates each customer’s creditworthiness on a case-by-case basis. The amount of collateral or other security obtained, if deemed necessary by the Bank upon extension of credit, is based on management’s credit evaluation. Collateral held varies but may include deposits held in financial institutions, U.S. Treasury securities, other marketable securities, accounts receivable, inventory, property and equipment, personal residences, income-producing commercial properties, and land under development. Personal guarantees are also obtained to provide added security for certain commitments.
Letters of credit are commitments issued to guarantee the performance of a customer to a third party. Loan commitments and letters of credit are made on the same terms, including collateral, as outstanding loans. The Bank has accrued credit losses of $250,000 and $237,622, related to these financial instruments with off-balance sheet risk in other liabilities at December 31, 2017 and 2016, respectively.
Note 5. Premises, Equipment, and Depreciation Bank premises and equipment are as follows:
December 31, 2017
Cost Accumulated Depreciation
Net
Land $ 4,549,738 $ - $ 4,549,738 Buildings and land improvements 8,128,307 2,927,549 5,200,758 Furniture and equipment 7,894,358 6,537,929 1,356,429
$ 20,572,403 $ 9,465,478 $ 11,106,925
December 31, 2016
Cost
Accumulated Depreciation
Net
Land $ 4,549,738 $ - $ 4,549,738 Buildings and land improvements 8,056,471 2,731,984 5,324,487 Furniture and equipment 7,575,067 6,095,878 1,479,189
$ 20,181,276 $ 8,827,862 $ 11,353,414
Depreciation expense totaled $677,636 and $669,693 for the years ended December 31, 2017 and 2016, respectively.

26
NOTES TO CONSOLIDATED FINANCIAL STATEMENTS
Note 6. Income Taxes
Components of income tax expense for the years ended December 31, 2017 and 2016 are as follows:
Currently payable
2017 2016
Federal $ 1,993,092 $ 1,951,673 State 536,856 500,370
Total current 2,529,948 2,452,043 Deferred income taxes (benefits)
Federal
901,566 (512,726) State (54,048) (135,599)
Total deferred 847,518 (648,325)
$ 3,377,466 $ 1,803,718
A reconciliation of tax computed at the respective federal statutory tax rate of 34% to the actual tax expense for the years ended December 31, 2017 and 2016 is as follows:
2017 2016 Tax at federal statutory rate Tax effect of:
Tax exempt income
$ 2,272,998
(331,238)
$ 1,902,971
(351,708) One-time adjustment to deferred tax asset due to the Tax Cuts and Jobs Act 1,105,935 - Other 16,534 11,705
State income taxes, net of federal benefit 313,237 240,750
$ 3,377,466 $ 1,803,718
Income taxes included in other assets on the balance sheets are as follows:
2017 2016 Federal income tax refund claims $ 200,467 $ 243,559 S tate income tax refund claims 82,569 69,425 Deferred tax benefits:
Allowance for credit losses $ 2,118,847
$ 2,864,647
Deferred subcontractor costs 74,208 120,512 OREO property 361,962 422,996 Accrued vacation 103,017 121,472 Net unrealized depreciation on securities available-for-sale 129,651 130,247
2,787,685 3,659,874 Deferred tax liabilities:
Accumulated depreciation
101,043
123,918 Unearned income on loans 5,528 6,727
106,571 130,645 Net deferred income tax benefits $ 2,681,114 $ 3,529,229
On December 22, 2017 the Tax Cuts and Jobs Act was signed into law which, among other items, reduced the corporate tax rate from a graduated set of rates with a maximum of 35% to a flat 21% beginning with taxable years starting after December 31, 2017. As required under ASC Topic 740, the Bank re-measured its deferred income tax assets and liabilities for temporary differences from the current corporate tax rate to the new corporate tax rate of 21% as of December 31, 2017. The cumulative adjustment, which totaled $1,105,935, was recognized in income tax expense from continuing operations as a discrete item in the period that included the enactment date, December 31, 2017. Beginning in 2018 the Company’s federal statutory tax rate will be 21%.

27
NOTES TO CONSOLIDATED FINANCIAL STATEMENTS
Note 6. Income Taxes (Continued)
Management has determined that no valuation allowance is required as it believes it is more likely than not that all of the deferred tax assets will be fully realizable in the future. At December 31, 2017 and 2016, management believes there are no uncertain tax positions under ASC Topic 740 Income Taxes. The Bank’s federal and state income tax returns for 2014, 2015, and 2016 are subject to examination by the IRS and/or state tax authorities, generally for three years after they were filed. The 2017 income returns will be filed in 2018.
Note 7. Junior Subordinated Debentures owed to Unconsolidated Subsidiary Trust
The Company sponsored a trust, HSB Statutory Trust I, of which 100% of the common equity is owned by the Company. Trust I was formed for the purpose of issuing Company-obligated mandatorily redeemable capital securities (the capital securities) to third-party investors and investing the proceeds from the sale of such capital securities solely in junior subordinated debt securities of the Company (the debentures). The debentures held by the trust are the sole assets of that trust. Trust I is a variable interest entity (VIE), however, since the Company is not the primary beneficiary of this arrangement, the accounts of this entity are not included in the consolidated financial statements. Distributions on the capital securities issued by the trust are payable quarterly at a 5.95% rate per annum for 5 years until June 2010, then floating at the 3-month LIBOR plus 1.85% thereafter. The capital securities are subject to mandatory redemption, in whole or in part, upon repayment of the debentures. The Company has entered into agreements which, taken collectively, fully and unconditionally guarantee the capital securities subject to the terms of each of the guarantees. Both the capital securities of the statutory trust and the junior subordinated debentures are scheduled to mature on June 2035, unless called by the Company.
Despite the fact that HSB Statutory Trust I is not included in the Company’s consolidated financial statements, the trust preferred securities issued by these subsidiary trusts are included in the Tier 1 capital of the Company for regulatory capital purposes. Federal Reserve Board rules limit the aggregate amount of restricted core capital elements (which includes trust preferred securities, among other things) that may be included in the Tier 1 capital of most bank holding companies to 25% of all core capital elements, including restricted core capital elements, net of goodwill less any associated deferred tax liability. Amounts of restricted core capital elements in excess of these limits generally may be included in Tier 2 capital. The current quantitative limits do not preclude the Company from including the $3.0 million in trust preferred securities outstanding in Tier 1 capital.
Note 8. Deposits
Time deposits and their remaining maturities at December 31, 2017 are approximately as follows:
2018 $ 68,740,000 2019 64,536,000 2020 36,279,000 2021 32,977,000 2022 and thereafter 14,208,000
$ 216,740,000 Interest expense on deposits for the years ended December 31, 2017 and 2016 is as follows:
2017 2016 NOW, Super NOW and money market $ 111,891 $ 120,132 Savings 100,182 89,842 Time, $100,000 or more 1,480,322 1,456,303 Other time 1,441,436 1,458,182
$ 3,133,831 $ 3,124,459
28
NOTES TO CONSOLIDATED FINANCIAL STATEMENTS
Note 8. Deposits (Continued)
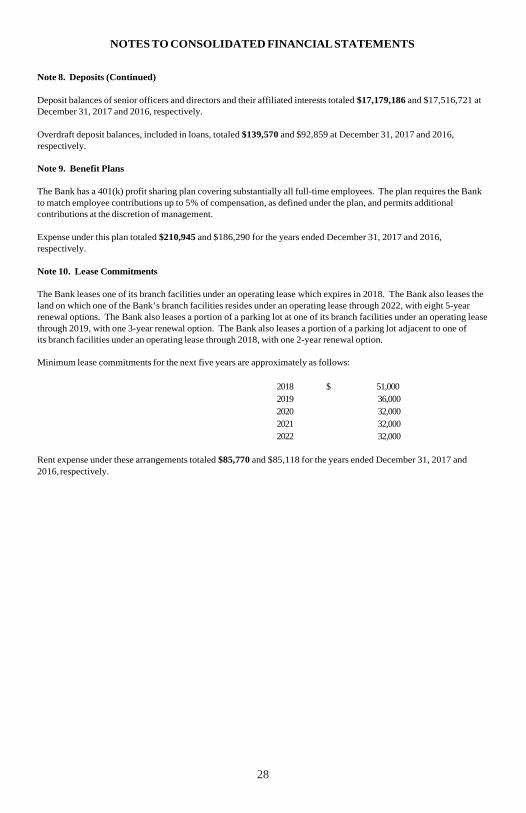
Deposit balances of senior officers and directors and their affiliated interests totaled $17,179,186 and $17,516,721 at December 31, 2017 and 2016, respectively.
Overdraft deposit balances, included in loans, totaled $139,570 and $92,859 at December 31, 2017 and 2016, respectively.
Note 9. Benefit Plans
The Bank has a 401(k) profit sharing plan covering substantially all full-time employees. The plan requires the Bank to match employee contributions up to 5% of compensation, as defined under the plan, and permits additional contributions at the discretion of management.
Expense under this plan totaled $210,945 and $186,290 for the years ended December 31, 2017 and 2016, respectively.
Note 10. Lease Commitments
The Bank leases one of its branch facilities under an operating lease which expires in 2018. The Bank also leases the land on which one of the Bank’s branch facilities resides under an operating lease through 2022, with eight 5-year renewal options. The Bank also leases a portion of a parking lot at one of its branch facilities under an operating lease through 2019, with one 3-year renewal option. The Bank also leases a portion of a parking lot adjacent to one of its branch facilities under an operating lease through 2018, with one 2-year renewal option.
Minimum lease commitments for the next five years are approximately as follows:
2018 $ 51,000 2019 36,000 2020 32,000 2021 32,000 2022 32,000
Rent expense under these arrangements totaled $85,770 and $85,118 for the years ended December 31, 2017 and 2016, respectively.

29
NOTES TO CONSOLIDATED FINANCIAL STATEMENTS
Note 11. Other Operating Expenses
Other operating expenses include the following:
2017 2016 Advertising and marketing $ 110,811 $ 96,510 ATM and debit card processing 403,914 386,117 Bank service charges 88,450 95,902 Courier and travel 164,838 162,236 Data processing outsourced 229,405 195,369 Directors' fees 246,037 263,692 Donations 77,554 81,838 Dues and subscriptions 76,845 76,123 FDIC and Maryland assessments 551,561 703,678 Insurance 112,326 112,933 Loan collection and OREO operating 409,676 166,391 Long and short 22,763 670 Postage 153,725 149,113 Professional services 308,147 373,947 Seminars 29,546 32,065 Stationery, printing, and supplies 272,707 295,153 Telephone 238,595 231,487 Provision for unfunded commitments 37,584 -
$ 3,534,484 $ 3,423,224
Note 12. Borrowings and Credit Facilities
The Bank has borrowings from the FHLB totaling $43,763,367 and $45,166,875 at December 31, 2017 and 2016, respectively, with fixed and variable interest rates ranging from .80% to 5.94%, maturing at various dates through December 2028. Based on lendable collateral value, the Bank has available for future borrowings approximately $46,000,000 and $47,000,000 at December 31, 2017 and 2016, respectively. The Bank has pledged approximately $118,000,000 and $114,000,000 at December 31, 2017 and 2016, respectively, of its wholly owned residential (1-4 units) first mortgage loan portfolio, as collateral for this credit facility. The Bank has purchased stock of the FHLB as a condition for obtaining a credit facility from the FHLB.
At December 31, 2017, the scheduled maturities of borrowings are approximately as follows:
2018
$ 3,496,000 2019 2,775,000 2020 473,000 2021 4,213,000 2022 14,250,000 2023 and thereafter 18,556,000
$ 43,763,000
Additionally, the Bank has unsecured credit availability of $10,000,000 with one correspondent bank and secured credit availability of $9,000,000 with two correspondent banks for short-term liquidity needs, if necessary. The secured credit facilities must be collateralized with securities at the time of usage. At December 31, 2017 and 2016, there were no borrowings outstanding under any of the credit facilities. At December 31, 2017, securities pledged under the secured credit facilities had an amortized cost and fair value of $1,299,820 and $1,291,011, respectively. At December 31, 2016, securities pledged under the secured credit facilities had an amortized cost and fair value of $1,369,791 and $1,362,807, respectively.
30
NOTES TO CONSOLIDATED FINANCIAL STATEMENTS
Note 13. Regulatory Capital Requirements
The Company and the Bank are subject to various regulatory capital requirements administered by federal and state banking agencies. Failure to meet minimum capital requirements can initiate certain mandatory, and possibly additional discretionary, actions by regulators that, if undertaken, could have a direct material effect on the individual and consolidated financial statements. The Company and the Bank must meet specific capital adequacy guidelines that involve quantitative measures of the assets, liabilities, and certain off-balance-sheet items as calculated under regulatory accounting practices. The capital amounts and classifications are also subject to qualitative judgments by the regulators about components, risk weightings, and other factors.
The Common Equity Tier 1, Tier 1 and Total capital ratios are calculated by dividing the respective capital amounts by risk-weighted assets. Risk-weighted assets are calculated based on regulatory requirements and include total assets, with certain exclusions, allocated by risk weight category, and certain off-balance-sheet items, among other things. The leverage ratio is calculated by dividing Tier 1 capital by adjusted quarterly average total assets, which exclude goodwill and other intangible assets, among other things.
When fully phased in on January 1, 2019, the Basel III Capital Rules will require the Company and Bank to maintain (i) a minimum ratio of Common Equity Tier 1 capital to risk-weighted assets of at least 4.5%, plus a 2.5% “capital conservation buffer” (which is added to the 4.5% Common Equity Tier 1 capital ratio as that buffer is phased in, effectively resulting in a minimum ratio of Common Equity Tier 1 capital to risk-weighted assets of at least 7.0% upon full implementation), (ii) a minimum ratio of Tier 1 capital to risk-weighted assets of at least 6.0%, plus the capital conservation buffer (which is added to the 6.0% Tier 1 capital ratio as that buffer is phased in, effectively resulting in a minimum Tier 1 capital ratio of 8.5% upon full implementation), (iii) a minimum ratio of Total capital (that is, Tier 1 plus Tier 2) to risk-weighted assets of at least 8.0%, plus the capital conservation buffer (which is added to the 8.0% Total capital ratio as that buffer is phased in, effectively resulting in a minimum Total capital ratio of 10.5% upon full implementation) and (iv) a minimum leverage ratio of 4.0%, calculated as the ratio of Tier 1 capital to average quarterly assets.
The implementation of the capital conservation buffer began on January 1, 2016 at the 0.625% level and will be phased in over a four-year period (increasing by that amount on each subsequent January 1, until it reaches 2.5% on January 1, 2019). The Basel III Capital Rules also provide for a “countercyclical capital buffer” that is applicable to only certain covered institutions and does not have any current applicability to the Company or Bank. The capital conservation buffer is designed to absorb losses during periods of economic stress and, as detailed above, effectively increases the minimum required risk-weighted capital ratios. Banking institutions with a ratio of Common Equity Tier 1 capital to risk-weighted assets below the effective minimum (4.5% plus the capital conservation buffer and, if applicable, the countercyclical capital buffer) will face constraints on dividends, equity repurchases and compensation based on the amount of the shortfall.
Management believes, as of December 31, 2017 and 2016, that the Company and Bank meet all capital adequacy requirements to which it is subject. The most recent notification from the FDIC categorized the Bank as “well capitalized” under the regulatory framework for prompt corrective action. To be categorized as “well capitalized” the Bank must maintain minimum Common Equity Tier 1, Tier 1 and Total capital to risk-weighted assets and Tier I leverage ratios. There have been no conditions or events since that notification that management believes have changed the Bank’s category.
As discussed in Note 7, the capital securities held by the HSB Statutory Trust I qualifies as Tier 1 capital for the Company under Federal Reserve Board guidelines.

31
NOTES TO CONSOLIDATED FINANCIAL STATEMENTS
Note 13. Regulatory Capital Requirements (Continued)
A comparison of capital as of December 31, 2017 and 2016 for the Company and Bank is presented below. The minimum required capital amounts presented include the minimum required capital levels as of December 31, 2017 and December 31, 2016, based on the phase-in provisions of the Basel III Capital Rules. Capital levels required to be considered well capitalized are based upon prompt corrective action regulations, as amended to reflect the changes under the Basel III Capital Rules.
For Minimum
To Be Well Capitalized
Under Prompt Corrective Action
As of December 31, 2017 Actual Adequacy Purposes Provisions
Total Capital (to Risk-Weighted Assets) Amount Ratio Amount Ratio Amount Ratio
Company $ 58,029,000 11.0% $ 48,664,000 9.3% $ - N/A Bank 57,963,000 11.0% 48,653,000 9.3% 52,598,000 10.0%
Tier I Capital (to Risk-Weighted Assets)
Company 51,435,000 9.8% 38,129,000 7.3% - N/A Bank 51,370,000 9.8% 38,159,000 7.3% 42,107,000 8.0%
Common Equity Tier I Capital (to Risk-Weighted Assets)
Company 48,435,000 9.2% 30,272,000 5.8% - N/A Bank 51,370,000 9.8% 30,264,000 5.8% 34,212,000 6.5%
Tier I Capital (to Average Assets)
Company 51,435,000 8.7% 23,594,000 4.0% - N/A Bank 51,370,000 8.7% 23,591,000 4.0% 29,489,000 5.0%
As of December 31, 2016
Total Capital (to Risk-Weighted Assets)
Amount Ratio Amount Ratio Amount Ratio
Company $ 55,327,000 11.3% $ 42,305,000 8.6% $ - N/A Bank 55,277,000 11.3% 42,304,000 8.6% 49,048,000 10.0%
Tier I Capital (to Risk-Weighted Assets)
Company 49,179,000 10.0% 32,484,000 6.6% - N/A Bank 49,130,000 10.0% 32,484,000 6.6% 39,226,000 8.0%
Common Equity Tier I Capital (to Risk-Weighted Assets)
Company 46,179,000 9.4% 25,151,000 5.1% - N/A Bank 49,130,000 10.0% 25,129,000 5.1% 31,871,000 6.5%
Tier I Capital (to Average Assets)
Company 49,179,000 8.7% 22,611,000 4.0% - N/A Bank 49,130,000 8.7% 22,614,000 4.0% 28,268,000 5.0%
According to FDIC capital guidelines, the Bank is considered to be “Well Capitalized.”

32
NOTES TO CONSOLIDATED FINANCIAL STATEMENTS
Note 13. Regulatory Capital Requirements (Continued)
Under Maryland banking law, the Board of Directors may declare cash dividends from undivided profits after providing for expenses, losses, interest and taxes accrued or due.
Note 14. Issuance of Preferred Stock
On October 15, 2008, the Company issued Series A Preferred Stock to all Common stockholders with less than 1,000 shares on a one-for-one basis. No dividends or distributions will be given to Common stockholders unless the Series A Preferred stockholders receive at least an equal amount. Dividends on the Series A Preferred Stock are not cumulative and no rights accrue. Series A Preferred Stock are not entitled to vote, they are not convertible into or exchangeable for any other class of stock and are entitled to receive any liquidation amount, prior to payment to Common stockholders. Except as noted above, all pertinent rights and privileges of the Series A Preferred Stock are the same as the Common Stock.
Note 15. Fair Values of Financial Instruments
Disclosure about Fair Value of Financial Instruments (“ASC Topic 825") requires the disclosure of the estimated fair values of financial instruments. Quoted market prices, where available, are shown as estimates of fair values. Because no quoted market prices are available for a significant part of the Company’s financial instruments, the fair values of such instruments have been derived based on the amount and timing of future cash flows and estimated discount rates.
Present value techniques used in estimating the fair value of many of the Company’s financial instruments are significantly affected by the assumptions used. Fair values derived from using present value techniques are not substantiated by comparisons to independent markets and, in many cases, could not be realized in immediate settlement of the instruments.
ASC Topic 825 excludes certain financial instruments and all nonfinancial instruments from its disclosure requirements. Accordingly, the aggregate fair value amounts presented do not represent the underlying value of the Company.

33
NOTES TO CONSOLIDATED FINANCIAL STATEMENTS
Note 15. Fair Values of Financial Instruments (Continued)
The following table shows the estimated fair values and the related carrying values of the Bank’s financial instruments at December 31, 2017 and 2016. Items that are not financial instruments are not included.
2017 2016 Estimated Estimated
Financial assets:
Carrying Fair Carrying Fair Amount Value Amount Value
Cash and due from banks $ 9,320,615 $ 9,320,615 $ 11,546,433 $ 11,546,433 Federal funds sold - - 473,622 473,622 Interest-bearing deposits in
other banks 4,172,077 4,172,077 2,995,663 2,995,663 Securities held-to-maturity 16,182,751 16,206,461 16,766,502 16,580,402 Securities available-for-sale 23,189,657 23,189,657 27,515,581 27,515,581 Loans, net of allowance for
credit losses 505,680,027 514,412,027 469,810,724 483,454,745 Accrued interest receivable 1,611,402 1,611,402 1,495,930 1,495,930 Federal Home Loan Bank stock 2,365,700 2,365,700 2,507,000 2,507,000 Common stock-Statutory Trust I 93,000 93,000 93,000 93,000 Cash value of life insurance 11,992,631 11,992,631 10,697,828 10,697,828
Financial liabilities:
Deposits $ 495,148,949 $ 492,860,949 $ 465,926,757 $ 465,069,757 Accrued interest payable 450,141 450,141 433,636 433,636 Short-term borrowings 3,496,033 3,496,033 12,028,572 12,028,572 Long-term borrowings 40,267,334 39,306,326 33,138,303 33,064,302 Junior subordinated debentures
owed to unconsolidated subsidiary trust 3,093,000 1,478,713 3,093,000 1,230,574
Unrecognized financial instruments: Commitments to extend credit 90,817,000 90,817,000 88,864,000 88,864,000 Standby letters of credit 5,540,000 5,540,000 4,680,000 4,680,000
For purposes of the above disclosures of estimated fair value, the following assumptions were used:
Cash and cash equivalents
The estimated fair value for cash and due from banks, interest-bearing deposits in other banks, and Federal funds sold is considered to approximate cost because of their short-term nature.
Investment Securities
Fair values for securities are based on quoted market prices, where available. If quoted market prices are not available, fair values are based on quoted market prices of comparable instruments. See Note 16 for further discussion.

34
NOTES TO CONSOLIDATED FINANCIAL STATEMENTS
Note 15. Fair Values of Financial Instruments (Continued)
Loans
The estimated fair value for certain homogeneous categories of loans, such as residential mortgages, is based on the quoted market price for securities backed by similar loans, adjusted for differences in loan characteristics. The estimated fair value of other loans is determined by discounting future cash flows using current rates at which similar loans would be made to borrowers with similar credit ratings and for the same remaining maturities.
Deposits
The estimated fair value of deposits with no stated maturity, such as non-interest-bearing demand deposits, savings, NOW and super NOW accounts and money market accounts, is equal to the amount payable on demand at the reporting date (that is, their carrying amounts). The fair value of certificates of deposit is based on the rates currently offered for deposits of similar maturities. The fair value estimates do not include the benefit that results from the low-cost funding provided by the deposit liabilities compared to the cost of borrowing funds in the market.
Borrowings
The estimated fair value approximates carrying value for short-term borrowings. The fair value of long-term fixed rate borrowings is estimated by discounting future cash flows using current interest rates currently offered for similar financial instruments.
Junior Subordinated Debentures
Fair value is usually estimated based on quoted market prices of similar instruments. If quoted market prices are not available the fair value is determined by using the discounted value of expected cash flows using market rates.
Other Assets and Liabilities
The estimated fair value for cash and due from banks, interest-bearing deposits in other banks, and Federal funds sold is considered to approximate cost because of their short-term nature.
Other assets and liabilities of the Bank that are not defined as financial instruments are not included in the above disclosures, such as property and equipment. Also, non-financial instruments typically not recognized in the financial statements nevertheless may have value but are not included in the above disclosures. These include, among other items, the estimated earnings power of core deposit accounts, the trained work force, customer goodwill, and similar items.
The following table presents the carrying amount, fair value, and placement in the fair value hierarchy of the Bank’s financial instruments not disclosed elsewhere as of December 31, 2017. This table excludes financial instruments for which the carrying amount approximates fair value.
Financial Assets:
Carrying Fair Amount Value Level 1 Level 2 Level 3
Loans, net $ 505,680,027 $ 514,412,027 $ - $ 514,412,027 $ -
Financial Liabilities:
Deposits 495,148,949 492,860,949 278,440,533 214,420,416 - Long-term borrowings 40,267,334 39,306,326 - 39,306,326 - Junior subordinated debentures
owed to unconsolidated subsidiary trust 3,093,000 1,478,713 - 1,478,713 -
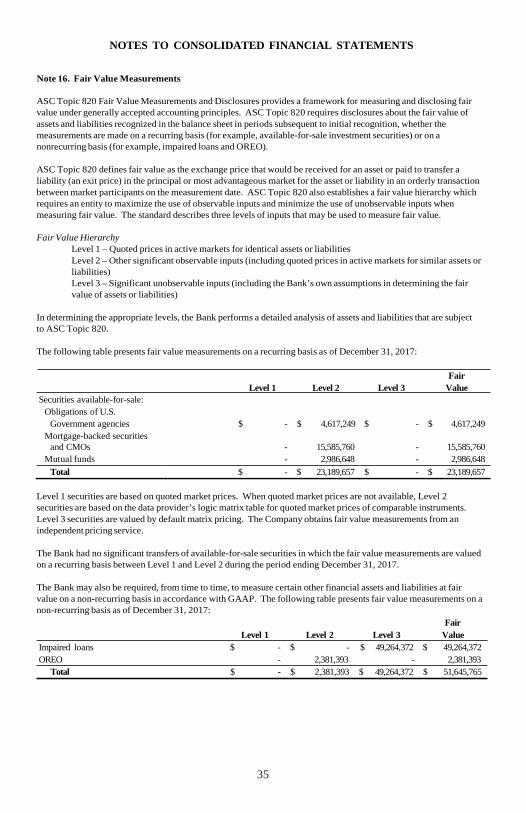
35
NOTES TO CONSOLIDATED FINANCIAL STATEMENTS
Note 16. Fair Value Measurements
ASC Topic 820 Fair Value Measurements and Disclosures provides a framework for measuring and disclosing fair value under generally accepted accounting principles. ASC Topic 820 requires disclosures about the fair value of assets and liabilities recognized in the balance sheet in periods subsequent to initial recognition, whether the measurements are made on a recurring basis (for example, available-for-sale investment securities) or on a nonrecurring basis (for example, impaired loans and OREO).
ASC Topic 820 defines fair value as the exchange price that would be received for an asset or paid to transfer a liability (an exit price) in the principal or most advantageous market for the asset or liability in an orderly transaction between market participants on the measurement date. ASC Topic 820 also establishes a fair value hierarchy which requires an entity to maximize the use of observable inputs and minimize the use of unobservable inputs when measuring fair value. The standard describes three levels of inputs that may be used to measure fair value.
Fair Value Hierarchy
Level 1 – Quoted prices in active markets for identical assets or liabilities Level 2 – Other significant observable inputs (including quoted prices in active markets for similar assets or liabilities) Level 3 – Significant unobservable inputs (including the Bank’s own assumptions in determining the fair value of assets or liabilities)
In determining the appropriate levels, the Bank performs a detailed analysis of assets and liabilities that are subject to ASC Topic 820.
The following table presents fair value measurements on a recurring basis as of December 31, 2017:
Securities available-for-sale: Obligations of U.S.
Fair Level 1 Level 2 Level 3 Value
Government agencies Mortgage-backed securities
$ - $ 4,617,249 $ - $ 4,617,249
and CMOs - 15,585,760 - 15,585,760 Mutual funds - 2,986,648 - 2,986,648
Total $ - $ 23,189,657 $ - $ 23,189,657
Level 1 securities are based on quoted market prices. When quoted market prices are not available, Level 2 securities are based on the data provider’s logic matrix table for quoted market prices of comparable instruments. Level 3 securities are valued by default matrix pricing. The Company obtains fair value measurements from an independent pricing service.
The Bank had no significant transfers of available-for-sale securities in which the fair value measurements are valued on a recurring basis between Level 1 and Level 2 during the period ending December 31, 2017.
The Bank may also be required, from time to time, to measure certain other financial assets and liabilities at fair value on a non-recurring basis in accordance with GAAP. The following table presents fair value measurements on a non-recurring basis as of December 31, 2017:
Fair Level 1 Level 2 Level 3 Value
Impaired loans $ - $ - $ 49,264,372 $ 49,264,372 OREO - 2,381,393 - 2,381,393
Total $ - $ 2,381,393 $ 49,264,372 $ 51,645,765

36
NOTES TO CONSOLIDATED FINANCIAL STATEMENTS
Note 16. Fair Value Measurements (Continued)
The Bank is predominantly a cash flow lender with real estate serving as collateral on a majority of loans. In accordance with ASC Topic 310 Receivables, loans which the Bank has deemed to be impaired financial assets are primarily valued on a nonrecurring basis at the fair values of the underlying real estate collateral. The Bank determines such fair values from independent appraisals. In addition, on non-collateral dependent TDRs the impairment is measured as the present value of expected future cash flows discounted at the loan’s original effective interest rate. All impaired loans are classified as Level 3 inputs.
Non-Financial Assets and Non-Financial Liabilities:
Application of ASC Topic 820 to non-financial assets and non-financial liabilities became effective January 1, 2009. The Corporation has no non-financial assets or non-financial liabilities measured at fair value on a recurring basis. Certain non-financial assets and non-financial liabilities typically measured at fair value on a non-recurring basis include foreclosed assets (upon initial recognition or subsequent impairment), non-financial assets and non-financial liabilities measured at fair value in the second step of a goodwill impairment test, and intangible assets and other non-financial long-lived assets measured at fair value for impairment assessment.
In accordance with ASC Topic 360 Property, Plant and Equipment, foreclosed real estate (OREO) was adjusted to their fair values, resulting in an impairment charge, which was included in earnings for the year. Foreclosed real estate, which are considered to be non-financial assets, have been valued using a market approach. The values were determined using current market prices of similar real estate assets, less costs to sell, which the Bank considers to be Level 2 inputs.

37
NOTES TO CONSOLIDATED FINANCIAL STATEMENTS
Note 17. Date of Management’s Review
In preparing the financial statements, the Bank has evaluated events and transactions for potential recognition or disclosure through January 29, 2018, the date that the financial statements were available to be issued.
Note 18. Parent Company Financial Information
Comparative Balance Sheets, Statements of Income, and Statements of Cash Flows for HSB Bancorp, Inc. (Parent Only) are presented below:
BALANCE SHEETS December 31, 2017 and 2016
2017 2016 ASSETS Cash and due from banks $ 31,380 $ 21,003 Investment in Bank 51,183,757 48,942,575 Investment in the HSB Statutory Trust I 93,000 93,000 Other assets 38,907 32,020
Total assets $ 51,347,044 $ 49,088,598
LIABILITIES
Borrowed funds from subsidiary $ 3,093,000 $ 3,093,000 Accrued interest payable on borrowed funds 4,431 3,626
Total liabilities 3,097,431 3,096,626
STOCKHOLDERS’ EQUITY
Common stock 15,467 15,467 Series A Preferred stock 704 704 Surplus 6,201,001 6,201,001 Retained earnings 42,231,477 39,974,752 Accumulated other comprehensive loss (199,036) (199,952)
Total stockholders’ equity 48,249,613 45,991,972 Total liabilities and stockholders’ equity $ 51,347,044 $ 49,088,598
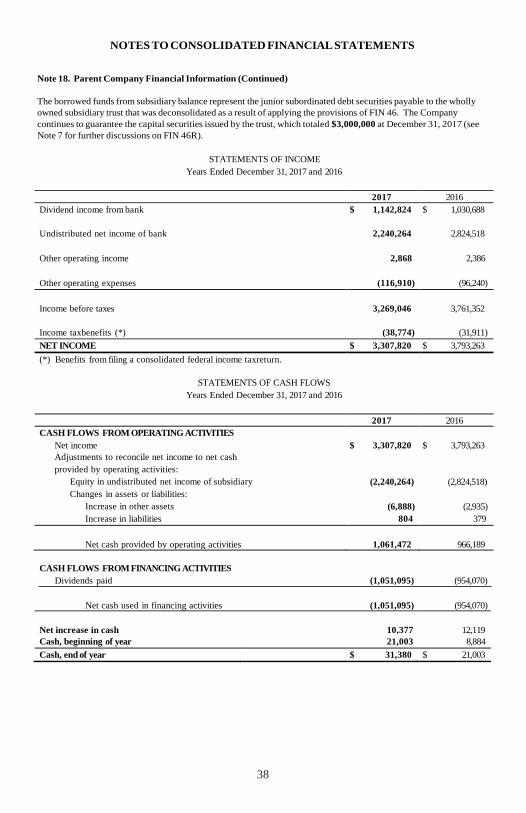
38
NOTES TO CONSOLIDATED FINANCIAL STATEMENTS
Note 18. Parent Company Financial Information (Continued)
The borrowed funds from subsidiary balance represent the junior subordinated debt securities payable to the wholly owned subsidiary trust that was deconsolidated as a result of applying the provisions of FIN 46. The Company continues to guarantee the capital securities issued by the trust, which totaled $3,000,000 at December 31, 2017 (see Note 7 for further discussions on FIN 46R).
STATEMENTS OF INCOME Years Ended December 31, 2017 and 2016
2017 2016 Dividend income from bank $ 1,142,824 $ 1,030,688
Undistributed net income of bank 2,240,264 2,824,518
Other operating income 2,868 2,386
Other operating expenses (116,910) (96,240)
Income before taxes
3,269,046
3,761,352
Income taxbenefits (*) (38,774) (31,911) NET INCOME $ 3,307,820 $ 3,793,263 (*) Benefits from filing a consolidated federal income taxreturn.
STATEMENTS OF CASH FLOWS Years Ended December 31, 2017 and 2016
2017 2016 CASH FLOWS FROM OPERATING ACTIVITIES
Net income $ 3,307,820
$ 3,793,263
Adjustments to reconcile net income to net cash provided by operating activities:
Equity in undistributed net income of subsidiary
(2,240,264)
(2,824,518) Changes in assets or liabilities:
Increase in other assets
(6,888)
(2,935) Increase in liabilities 804 379
Net cash provided by operating activities
1,061,472
966,189
CASH FLOWS FROM FINANCING ACTIVITIES Dividends paid (1,051,095) (954,070)
Net cash used in financing activities (1,051,095) (954,070)
Net increase in cash
10,377
12,119
Cash, beginning of year 21,003 8,884 Cash, end of year $ 31,380 $ 21,003

OFFICERS & DIRECTORS
OFFICERS -HSB BANCORP, INC
DONNA K. DEFINO, CPA, MBA, President KIMBERLY T. THOMAS, CPA, Vice-President & Secretary/Treasurer CATHY D. BRINSFIELD, Vice-President & Assistant Secretary W. TRENT PUSEY, Vice-President ELLEN P. VANDEGRIFT, Vice-President
SENIOR OFFICERS -HEBRON SAVINGS BANK DONNA K. DEFINO, CPA, MBA, President & Chief Executive Officer CATHY D. BRINSFIELD, Executive Vice-President & Chief Operating Officer W. TRENT PUSEY, Executive Vice-President & Chief Lending Officer KIMBERLY T. THOMAS, CPA, Executive Vice President & Chief Financial Officer RONALD T. EVANS, Senior Vice-President & Chief Credit Officer ELLEN P. VANDEGRIFT, Senior Vice-President & Chief Retail Lending Officer
DIRECTORS - HSB BANCORP, INC. & HEBRON SAVINGS BANK
CHARLES R. SMITH, III, Chairman of the Board MARK S. HOLLOWAY ROBERT E. HOLLOWAY CHARLES W. KELLY
VICTOR H. LAWS, III E. SCOTT TAWES THOMAS C. THOMPSON SUSAN WILGUS-MURPHY
HONORARY DIRECTOR -HSB BANCORP, INC. & HEBRON SAVINGS BANK
EDWARD Q. WILGUS EDWARD C. WRIGHT
Titis annual report ltas not been reviewed, or confirmed for accuracy or relevance, by tlte Federal Deposit lusurance Corporation.

More Than 100 Years of Personal Banking Services
Branch Locations HEBRON
101 N. Main Street • P.O. Box 59 • Hebron, MD 21830 410.749.1185 • Fax 410.543.0703
SALISBURY
415 E. Carroll Street • Salisbury, MD 21804 410.742.8526 • Fax 410.742.8630
Quantico Square • 1008 W. Main Street • Salisbury, MD 21801 410.543.9183 • Fax 410.543.9401
1310 Mt. Hermon Road • Salisbury, MD 21804 410.546.8118 • Fax 410.546.8050
543C Riverside Drive • Salisbury, MD 21801 410.341.6670 • Fax 410.341.6678
2730 North Salisbury Boulevard • Salisbury, MD 21801 410.548.2233 • Fax 410.548.9706
FRUITLAND
108 E. Cedar Lane • Fruitland, MD 21826 410.860.4884 • Fax 410.860.2662
SHARPTOWN
303 Main Street • P.O. Box 236 • Sharptown, MD 21861 410.883.3121 • Fax 410.883.2322
VIENNA
100 Market & Race Streets • P.O. Box 158 • Vienna, MD 21869 410.376.3186 • Fax 410.376.0343
CAMBRIDGE
6 Cedar Street • Cambridge, MD 21613 410.228.9202 • Fax 410.228.5787
2801 Ocean Gateway • Cambridge, MD 21613 410.228.2440 • Fax 410.228.2446
PRINCESS ANNE
30499 Mount Vernon Road • Princess Anne, MD 21853 410.651.1722 • Fax 410.749.5528
CRISFIELD
57 Richardson Avenue • Crisfield, MD 21817 410.968.0500 • Fax 410.968.0550
Visit us at our website: www.HebronSavingsBank.com