annual report 2017 - network tasman annual... · annual report 2017 network tasman limited &...
TRANSCRIPT

ANNUALREPORT2017

2
NETWORK TASMAN LIMITED & GROUPANNUAL REPORT 2017
Directors’ Report 4
Board of Directors 7
Chief Executive’s Report 8
Financial Performance 12
Operational Performance 13
Audited Financial Statements 19
Audit Report 50
Statutory Information 54
Corporate Governance 56
Directory 58
Contents

3
NETWORK TASMAN LIMITED & GROUP ANNUAL REPORT 2017
Performance OverviewA graphical summary of the year’s highlights
FinancialOPERATING REVENUE EBITDASURPLUS AFTER TAX
$46m $17.8m$8mDISCOUNTS (incl. GST)CAPEX SPEND DIVIDENDS
$11.9m$11.2m $2m
Safety ReliabilitySAIDI(MINUTES)
186SAIFI(OUTAGES)
1.58PUBLIC SAFETY OR PROPERTY DAMAGE
0 events
LOST TIMEINJURY
1LTI
NETWORK CONNECTIONS SMART METERS INSTALLED ENERGY VOLUMES DELIVERED
39,299 22,568 645GWh
Network

NETWORK TASMAN LIMITED & GROUPANNUAL REPORT 2017
4
Our VisionOur vision at Network Tasman is to be a successful network services company for the benefit of our consumers. Our vision is supported by our values of Safety and Wellbeing, Reliability, Efficiency and Consumer Value. We strive to achieve our vision by delivering security of supply and cost efficiency to our consumers while ensuring the appropriate levels of investment in our network.
SCI TargetsWe have exceeded our SCI financial targets for 2016/17 delivering an operating surplus of $8 million which is $0.5 million above last year. Prudent financial management has seen the cost of our lines business stay within targets, with operating costs per connection lying below the national average for electricity distribution businesses (EDBs).
From a safety perspective there was one sub-contractor lost time injury (LTI) the result of an excavator trenching leg injury.
Although we met the reliability limits set by the Commerce Commission, our more stringent internal targets were not achieved. The Commerce Commission’s compliance places more emphasis on planned outages, and is also adjusted for the Golden Bay line asset purchase while adjusting planned outages by 50% and unplanned outages are subject to a boundary or limit each day. This year the unplanned outages were higher
due to significant events beyond our control including earthquakes, storms, bird strikes, car versus poles and a shift away from light copper live line work. The December 2014 purchase of the Golden Bay 66kV line assets expanded our network, impacting the reliability outcome and will increase the targets for future years.
Asset Management Plan (AMP) and Line Network ConditionTo support our planning during the year the Board engaged an independent review of the network by Mitton ElectroNet. The review examined our current capability to ensure reliability, our future capabilities and sought to identify any weak points in our line network. We are pleased to report the outcomes of the review confirmed our belief that the line network assets were in good overall condition.
The review noted a limited number of old poles, copper wires, pole-mounted transformers due for replacement which were already included in the AMP prior to the review. A further engineering review has been commissioned on the life of concrete poles (90% of poles) and initial results indicate life could exceed 150 years vindicating the earlier decisions to use predominantly concrete poles.
Management and the Board devotes considerable time to developing our AMP. The company is facing a significant increase in capital spend in the next 10 years, as is the general case with infrastructure in New Zealand. Key drivers are the need to replace aging assets in near future,
The company’s performance this year was very satisfactory, having met all of the financial targets set out in the Statement of Corporate Intent (SCI).
Directors’ ReportOn behalf of the Directors of Network Tasman I have pleasure in presenting the annual report and audited financial statements for the financial year ended 31 March 2017.

5
NETWORK TASMAN LIMITED & GROUP ANNUAL REPORT 2017
Directors’ Report
meeting security of supply requirements and supporting strong regional growth. The Tasman regional population has grown nearly 50% between Network Tasman’s establishment in 1993 to 2017 and new connections are currently at a 10-year peak. To meet this regional growth additional network capacity at Motueka, Hira/Glenduan and Brightwater is provided for in the AMP.
Future PricingIn considering our future we can and will meet our key capabilities of maintaining security of supply, increasing capital expenditure on the network for replacement and growth, maintain effective pricing and meeting our consumer targets. We will also need to meet the impact of new technologies – both behind and before the meter. In this context it is increasingly important that our prices reflect cost.
A key question for all EDBs is how do we send signals to consumers who wish for security of supply, but may install their own energy? Network Tasman is currently undertaking an extensive pricing review to determine the appropriate pricing strategy going forward that will sustainably support the business and required investment while at the same time supporting consumers in their technology choices.
Network Tasman’s Financial CapabilitiesThe company is in a strong financial position with a current low debt ratio of 7% which provides us with significant financial leverage to meet the requirements of funding future capital expenditure and new technology requirements. We will maintain the continuance of the current dividend policy in consultation with our shareholder Network Tasman Trust. We have a strong risk management and insurance programme in place and are confident in our restoration capability to deal with a disaster occurrence impacting our network.
Future TechnologiesWe are now seeing new technologies becoming mainstream and approaching economic viability. The Tasman region has the highest penetration of solar in NZ and, more generally, our region appears to have
a relatively high number of early adopters of new technologies.
The company has spent a considerable amount of time looking at the impact and opportunities of these new technologies. As an example we have been trialling batteries, solar and electric vehicle charging at our 281 Queen St investment property and are looking at options to use battery storage to delay or avoid future capital investment on rural lines.
We firmly believe that new technologies will drive lines companies to work together to share knowledge and experience rather than working in isolation. Co-operation and knowledge sharing will drive efficiencies and ensure that our shareholders achieve the greatest returns from their investment.
Network Tasman FibreOur fibre network has continued to provide a solid return on investment but is now facing a changing environment with UFB deployment occurring across New Zealand. In order to mitigate the potential for loss of value in our fibre business, the Board undertook a strategic review of the business in late 2016.
As a result a new strategy has now been implemented including launching refreshed products and pricing to retain existing customers and support new growth.
The strategy also involves a renewed focus on strengthening relationships with Retail Service Providers (RSPs) and removing barriers to the use of our services by improving ordering systems and processes.
Growth of fibre connections continues in new subdivisions. We continue to examine opportunities for innovation and the supply of value-added services. Our CCTV services are an example of a successful service offering of this type.
PropertyWe are continuing to see solid returns from our portfolio of legacy properties which are tenanted with quality tenants at market returns. Development of the portfolio will continue as the need and opportunity arise and when commercial returns can be achieved.
We firmly believe that new technologies will drive lines companies to work together to share knowledge and experience rather than working in isolation.
6
NETWORK TASMAN LIMITED & GROUPANNUAL REPORT 2017
Directors’ Report
Since Network Tasman Limited was established in 1993 more than $200 million has been paid to consumers by way of discounts and dividends.
Advanced MetersOur deployment of advanced meters via SmartCo is progressing well. The deployment in our region is now at 72% of the rollout for contracted retailers, with completion expected by end of 2017. Contracts with all of the major retailers that are actively engaged in advanced meter deployment programmes provide certainty of income flow.
Advanced meters open a range of opportunities for improving network planning, service quality, customer experiences and network management. Collaborative activities with other EDBs via SmartCo are enabling us to investigate how the benefits can best be realised from these opportunities.
Future ChallengesNetwork Tasman, like all electricity distribution businesses, faces a range of challenges in the future. For example:
z There is uncertainty as to the likely political and regulatory response to issues raised around the number of regional lines companies in New Zealand and their operating and governance structures.
z The Inland Revenue is currently reviewing the tax treatment of network discounts which raise the possibility of taxation changes affecting consumer-owned EDBs and the level of discount that consumers receive.
z From a capital asset planning perspective there is the requirement to renew old assets and ensure provision for strong regional growth while considering and taking advantage of disruptive new technologies.
z The recent Kaikoura earthquake reminded us all of the risk from natural disasters such as earthquakes and severe storms and the need for robust disaster recovery plans.
Noting the political desire is for increased co-operation between EDB’s we are very supportive of such co-operation, such as shared services, as long as the initiatives are value enhancing for our consumers.
We are confident our highly skilled and experienced board and management team has the ability to develop the necessary strategies to manage these challenges.
DividendNetwork Tasman again paid a fully imputed dividend of $2 million to our shareholder, the Network Tasman Trust. Since Network Tasman Limited was established in 1993 more than $200 million has been paid to consumers by way of discounts and dividends.
AcknowledgmentsMr. Wayne Mackey, CEO retired in September 2016. Mr. Mackey worked for Network Tasman for 18 years and was instrumental in developing the fibre and metering investments for the company. He is leaving the company in a sound financial and operational position. We welcome Mr. Oliver Kearney as the new CEO.
Mr. Kevin Hartshorne has worked for the company and predecessor companies for 43 years. Over that time Mr. Hartshorne held a number of positions, latterly as our Customer Services Manager.
The Directors would like to acknowledge the retirement of these two long serving staff members and wish them well for the future.
We would also note the impending retirement of Ms. Annette Milligan, who has been a director of the company, for her past nine years of service. I would like to thank Ms. Milligan for her wise counsel over those years and wish her well for the future.
We also extend our thanks to the many contractors that work on our network including our key contractors Delta, Treescape and ElectroNet.
Finally I would like to offer my thanks to staff and to my fellow board members
John McCliskie Chairman

7
NETWORK TASMAN LIMITED & GROUP ANNUAL REPORT 2017
Michael J McCliskie (John) Dip. Horticulture, Chartered Fellow IOD
Chairman (since February 2008)
John has a background in international fruit marketing and is a director of a number of local and national companies involved in primary production. John is an experienced company director with past involvement in a range of SMEs, corporates, co-operatives and government entities. He is a Councillor of the Institute of Directors of NZ and director of Nelson Electricity and a number of private companies.
Annette Milligan BA
Director(since February 2008)
Annette has been involved in health, education and youth sectors through personal companies, ministerial appointments to national committees and boards, and appointments to several trusts in the Nelson community.
Tony Reilly B.Agr.Com
Director(since July 2008)
Tony has been involved in agricultural governance since 1995 at a local and national level, particularly in the dairy sector. Tony is also a director of Ravensdown, Landcorp Farming and a number of private companies.
Roger Sutton BE Mechanical, FIPENZ
Director(since August 2015)
Roger has an extensive background in the energy industry as both an executive but also as a director. He was Chief Executive of Orion NZ from 2003 until 2011. His directorships have been of private, listed and government organisations. He was Chief Executive of the Canterbury Earthquake Recovery Authority from 2011 until 2015. He is currently General Manager of the Christchurch District Energy Company.
Sarah-Jane Weir LLB, Master of Intellectual Property Law
Director (since September 2013)
Sarah-Jane practised as a commercial lawyer for more than 20 years and now combines this with her governance work. She has provided legal advice to clients active in many sectors, including the electricity industry, and to entities in both public and private ownership. Sarah-Jane is a director of Nelmac Limited and has involvement with a number of trusts and other community organisations.
James O Williamson (Jim) BE (Hons) Electrical, NZCE (Telecommunications), Dip Management, IOD
Director (since July 2007)
Jim is an experienced company director with a track record of governance and executive management over several different industries. His employment career has principally been in the operation and development of large-scale public infrastructural assets. He is the past Chief Executive of Port Nelson Ltd.
Board of Directors
NETWORK TASMAN LIMITED & GROUPANNUAL REPORT 2017
8
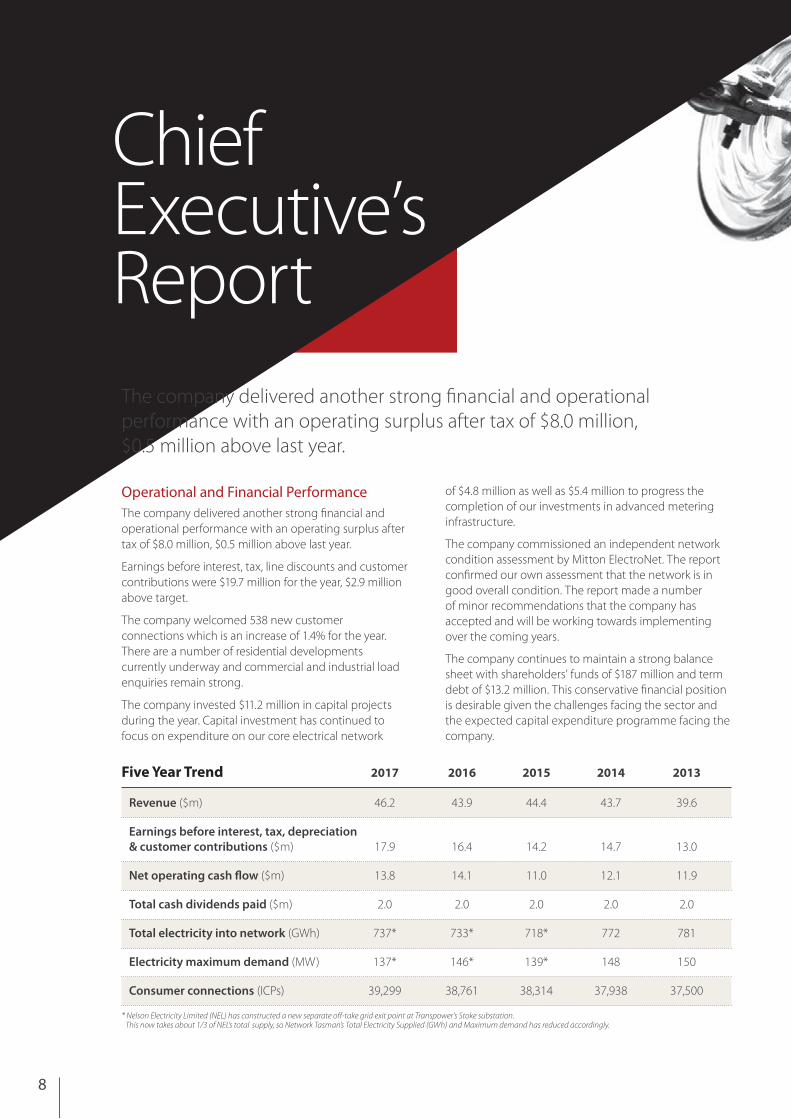
Operational and Financial Performance The company delivered another strong financial and operational performance with an operating surplus after tax of $8.0 million, $0.5 million above last year.
Earnings before interest, tax, line discounts and customer contributions were $19.7 million for the year, $2.9 million above target.
The company welcomed 538 new customer connections which is an increase of 1.4% for the year. There are a number of residential developments currently underway and commercial and industrial load enquiries remain strong.
The company invested $11.2 million in capital projects during the year. Capital investment has continued to focus on expenditure on our core electrical network
of $4.8 million as well as $5.4 million to progress the completion of our investments in advanced metering infrastructure.
The company commissioned an independent network condition assessment by Mitton ElectroNet. The report confirmed our own assessment that the network is in good overall condition. The report made a number of minor recommendations that the company has accepted and will be working towards implementing over the coming years.
The company continues to maintain a strong balance sheet with shareholders’ funds of $187 million and term debt of $13.2 million. This conservative financial position is desirable given the challenges facing the sector and the expected capital expenditure programme facing the company.
ChiefExecutive’s Report
The company delivered another strong financial and operational performance with an operating surplus after tax of $8.0 million, $0.5 million above last year.
Five Year Trend 2017 2016 2015 2014 2013
Revenue ($m) 46.2 43.9 44.4 43.7 39.6
Earnings before interest, tax, depreciation & customer contributions ($m) 17.9 16.4 14.2 14.7 13.0
Net operating cash flow ($m) 13.8 14.1 11.0 12.1 11.9
Total cash dividends paid ($m) 2.0 2.0 2.0 2.0 2.0
Total electricity into network (GWh) 737* 733* 718* 772 781
Electricity maximum demand (MW) 137* 146* 139* 148 150
Consumer connections (ICPs) 39,299 38,761 38,314 37,938 37,500
* Nelson Electricity Limited (NEL) has constructed a new separate off-take grid exit point at Transpower’s Stoke substation. This now takes about 1/3 of NEL’s total supply, so Network Tasman’s Total Electricity Supplied (GWh) and Maximum demand has reduced accordingly.

9
NETWORK TASMAN LIMITED & GROUP ANNUAL REPORT 2017
Chief Executive’s Report
Reliability Network SAIDI minutes (average duration of supply interruptions per connected consumer, excluding Transpower planned and unplanned faults) were 186 minutes against a target of 115 minutes (186 minutes in 2015/16).
Network reliability was affected by unplanned outages from the Kaikoura earthquake and an increase in planned outages from less live line work being undertaken for safety reasons.
Network Tasman continues to focus on planned maintenance on the network and vegetation control to ensure improvement of the long-term safety and reliability of the electricity network.
Health and SafetyWorkplace health and safety remains a key priority across all activities of the company. I believe there has been significant progress toward developing a safety focused culture with the company and our contractors.
The Health and Safety Committee, comprising the full board, is tasked with ensuring that health and safety is a key consideration in every operational decision made within the company for the protection of staff and the public.
There are several priorities for the company over the next year.
Firstly we must continue to develop a company culture and capability that puts safety first in all that we do. This will require closer liaison with our contractors and
All consumers want and need a reliable electricity supply.
Our Asset Management Plan takes that into account through planned maintenance activities and the way we manage our network assets as they approach the end of their life.
SAIDI (System Average Interruption Duration Index– see graph to the right) is one of the ways we measure our network reliability. During the last three years our network achieved a 99.97% reliability measure.
Reliability targets – measuring our performance
PUBLIC SAFETY OR PROPERTY DAMAGE
SAIDI(MINUTES)
LOST TIMEINJURY
0 events 1LTI186SAIFI(OUTAGES)
1.58
SAIDI Unplanned SAIDI Planned
156
252
147177
159129 128
180 186 186
2008/092007/08 2009/10 2010/11 2011/12 2012/13 2013/14 2014/15 2015/16 2016/17
* In 2014/15 Network Tasman ceased light copper live line work and purchased the Golden Bay 66KV line assets
*

NETWORK TASMAN LIMITED & GROUPANNUAL REPORT 2017
investment in the skills of our staff, management and directors.
Secondly, we must ensure that our expectations and standards are clearly communicated to our staff and contractors. We must work with them to ensure that those standards are being achieved.
Finally we must ensure that best practice health and safety systems are implemented across all our activities.
Health and safety is a process of continual refinement and we remain committed to delivering a safe workplace for all.
Line Pricing Retail competition in the region continues to intensify with seven new companies entering our market over the last year. There are currently 19 electricity retailers operating on our network offering an increasing number of innovative products and services to our consumers.
Network Tasman has continued to hold its own distribution charges well below Commerce Commission pricing limits and has held our annual price movements close to the annual rate of inflation for more than a decade. Network Tasman’s line charges for residential consumers are the lowest in the country and currently account for about 25% of the average residential customer’s power bills.
As a regulated lines company, the Commerce Commission sets a maximum amount of revenue that we can charge. Over the last 5 years our pricing has been well under this limit and Network Tasman has given up over $10 million in allowable price increases over that period.
Line charge discounts to consumers for the year increased by 1.23% to a record $11.9 million, inclusive of GST.
Consumer focus and engagement by Network Tasman included a consumer survey which found a positive 84.5% overall consumer satisfaction. Feedback is also sought through regular visits and workshops with key business consumers, with workshops planned for residential and other business customers for the coming year.
Electric vehiclesThe company has now commissioned three electric vehicle fast charging stations in Richmond, Nelson and Takaka. These units can fully charge an electric vehicle in around half an hour and greatly increase the ability of EVs to travel within the company’s distribution area.
It is pleasing to note that usage on these sites is steadily increasing. Electric vehicles present an opportunity for New Zealand and the electricity sector, and it is likely as it is with solar photo-voltaic (PV), the Nelson/Tasman region will be an early and active adopter of the technologies.
Chief Executive’s Report
10
0
5
10
15
20Cents per kWh
Your consumer-owned electricity distributor
Other providersNetwork Tasman
Source: Ministry of Business, Employment and Innovation – Quarterly Survey of Domestic Electricity Prices
Domestic Prices Distribution Component, after discount 2016/17
$ Millions
2012/13 2013/14 2014/15 2015/16 2016/170
1
2
3
4
Revenue forgone by NTL under the regulatory cap
11
NETWORK TASMAN LIMITED & GROUP ANNUAL REPORT 2017
Chief Executive’s Report
Investment PropertiesThe company’s main investments are the properties at 281 Queen Street and 24 Main Road Hope which have been owned by the company for a number of years.
After a period of significant re-investment, the company has secured a number of blue chip tenants on long term leases. Occupancy of the properties is 100% with a weighted average lease term to expiry of 8.2 years.
Responding to changeThe electricity distribution sector is facing a number of challenges going forward. Declining consumption, increased compliance and regulatory costs and increasing distributed generation options present both a threat and an opportunity for traditional utilities. The company’s key priority is to ensure that our core network business remains competitive and responsive to the opportunities that become available.
Customers will increasingly have options over the source and management of their energy needs. It seems likely that prices for distributed generation and residential scale battery storage systems will decline significantly. When these technologies become economic and are adopted by consumers, there will be an impact upon the variable component of the company’s revenue base under the current pricing structure.
As largely fixed cost businesses, network companies are required to recover the cost of their networks via fixed and variable charges. The low user fixed charging regime remains an impediment for network companies pricing our services to consumers in an economically rational manner.
ConclusionNetwork Tasman is proud to be a locally owned company that provides high quality, reliable infrastructure to our customers. We remain committed to delivering our customers line services at the lowest possible cost. We remain focused on our core electricity distribution network and a limited number of complementary businesses.
The electricity distribution sector is likely to face a number of challenges in the years ahead. The company remains committed to ensuring it is well positioned to respond to these challenges and our strong balance sheet, robust cash flows and a balanced portfolio of businesses position us to respond to the challenges ahead with confidence.
The company is fortunate to have a highly skilled management team to navigate what is likely to be a period of rapid change in the industries in which we operate.
I would like to thank my team for their efforts over the last year.
Oliver Kearney Chief Executive Officer
InvestmentsThe company’s investments in fibre, Nelson Electricity Limited and our legacy investment properties all contributed to the overall profitability of the company.
Fibre The company has developed a strategy to retain our market share in the face of increasingly ubiquitous fibre coverage and lower wholesale pricing. Capital expenditure on the fibre network is being targeted at growing customer connections around our existing fibre network and providing value added services. Niche services such as the CCTV network continue to grow in terms of utilisation and returns from our investment.
Nelson Electricity Limited (50%)The company has held a long term investment in Nelson Electricity Limited that provides electricity distribution services for Nelson city. Nelson Electricity completed the significant re-development of the Haven Road sub-station in 2014 and has continued to repay debt incurred in that development. Network Tasman received a fully imputed dividend of $0.9 million from Nelson Electricity during the year.
On Metering Limited (50%)On Metering (OML), our joint venture with Alpine Energy, continues to deploy advanced meters in the North Canterbury region as part of the SmartCo consortium. As at 31 March 2017, On Metering had deployed a total of 16,635 meters installed. Returns from this investment are supported by long-term fixed price contracts with major electricity retailers.

NETWORK TASMAN LIMITED & GROUPANNUAL REPORT 2017
12
Customer contributions of $1.7 million reflect the buoyant nature of the residential property market with a number of large sub-divisions being developed across the region.
Consumers continue to receive significant discounts off their power accounts. During the year Network Tasman paid two line discounts to consumers in August and December. This year line discounts credited to consumers’ power accounts reached a record $11.9 million including GST ($11.7 million in 2016).
The financial targets as set down in Network Tasman’s Statement of Corporate Intent are compared below with the actual results for the year ended 31 March 2017.
Cash flow from operations was $13.8 million for the year. This cash flow enables Network Tasman to fund both maintenance and growth capital expenditure on the electricity network and fund additional investments in the fibre optic communications network as required.
Network Tasman spent $11.2 million on capital expenditure during the year. Other capital investment in the electricity network has been concentrated on improving network safety and reliability.
In the non-regulated business units, additions to the company’s investment properties and investments in advanced meters by Network Tasman and On Metering are realising increasing returns which will continue in
the ensuing years. Capital expenditure on the fibre network has been focused on organic growth around the existing network including reticulating several rural sub-divisions in the Tasman area.
Cash operating costs per customer were below target at $277 p.a.
The company again paid a fully imputed dividend of $2 million to the Network Tasman Trust.
At the end of the financial year the group had total cash of $2.8 million and term loans of $13.2 million.
Financial PerformanceStrong contributions from the core electricity, fibre and investment property business units were partially off-set by start-up costs for the advanced metering activities.
Highlights ▶ Operating surplus of $8.0 million against 7.5
million last year.
▶ Record line charge discounts credited to consumers of $11.9 million including GST.
▶ Cash flow from operations of $13.8 million for the year allows Network Tasman to invest $11.2 million in capital expenditure while maintaining a conservatively funded balance sheet.
▶ A fully imputed dividend of $2 million paid to the Network Tasman Trust.
Financial performance targetsActual Result
2017SCI Target
2017Actual Result
2016
Total company:
Surplus before interest, tax, line discount and customer contributions $mil 19.7 16.8 19.1
Operating surplus after tax and customer contributions $mil 8.0 5.6 7.5
Operating surplus to shareholders' funds % 4.27% 3.10% 4.18%
Line business only:
Total network costs per consumer $ 436 455 439
Cash operating costs per consumer $ 277 291 277
Line Charge Discounts (Excluding GST) $mil 10.3 10.3 10.2

13
Operational Performance
NETWORK TASMAN LIMITED & GROUP ANNUAL REPORT 2017
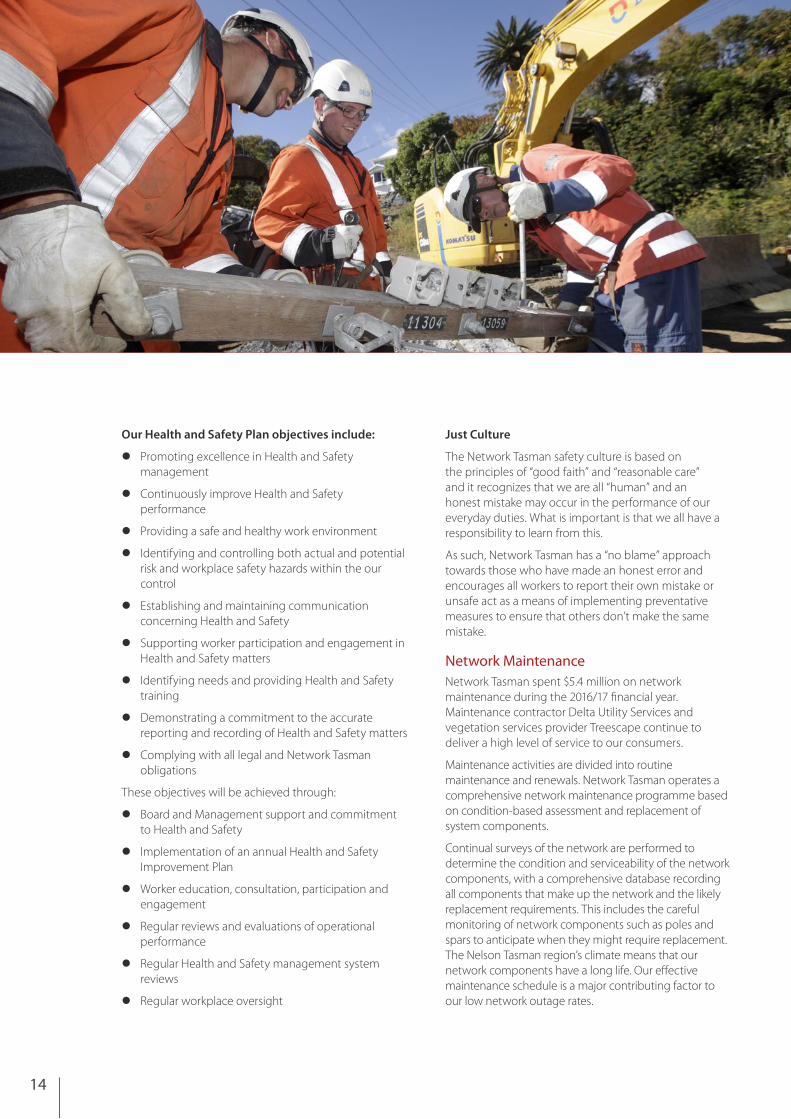
Health and SafetyNetwork Tasman is committed to ensuring the good health and safety of every employee, contractor and visitor to our workplace, to ensuring healthy and safe working conditions, and to the safe operation of all equipment in the workplace. Health and Safety continues to be a high priority for Network Tasman with the board and management reviewing all aspects of our operations.
For this reason, Network Tasman this year adopted a Drug and Alcohol Policy, which prohibits all employees and contractors, at all levels, from working or conducting company business under the influence of drugs or alcohol.
Management continues to work closely with contractors and staff to ensure that safety is a key consideration in all activities.
The safety performance targets as set down in Network Tasman’s Statement of Corporate Intent are compared in the table below with the actual results for the year.
We believe the following workplace key values, beliefs and guiding principles form the basis of good Health and Safety practice:
z Achieve our Goal: To maintain a “Zero harm” status at all times and continuously improve our Health and Safety systems
z Safety goes hand in hand, not in competition
z All injuries are preventable, none are acceptable
z Unsafe acts and conditions are never acceptable
z All our people are empowered to prevent and correct unsafe acts and conditions
z No one will be directed to do anything that they genuinely believe is unsafe
z Contractors are parts of our business when used and their Health and Safety is our concern
z Everyone is responsible for ensuring no other person comes to harm
z All workers will be fit for work and unaffected by drugs or alcohol
Highlights ▶ Deployment of Tasman region advanced
meters near completion for contracted retailers.
▶ Completed stage 2 of the undergrounding of the electricity network on High Street Motueka.
▶ Strategic review of Network Tasman Fibre business completed and revised product and pricing launched.
▶ Line Network independent review shows network in good overall condition.
Safety of electricity supplyActual Result
2017SCI Target
2017Actual Result
2016
Lost time injuries not to exceed - number 1 0 1
Public Safety and Damage Events
Public Injury Events number 0 0 0
Public Property Damage Events number 0 0 1
There was one lost time injury recorded during the year, the result of an excavator trenching leg injury. The incident was investigated by the sub-contractor concerned and by Network Tasman management. There was no public safety injury or property damage recorded during the year.
14
NETWORK TASMAN LIMITED & GROUPANNUAL REPORT 2017
Operational Performance
Our Health and Safety Plan objectives include:
z Promoting excellence in Health and Safety management
z Continuously improve Health and Safety performance
z Providing a safe and healthy work environment
z Identifying and controlling both actual and potential risk and workplace safety hazards within the our control
z Establishing and maintaining communication concerning Health and Safety
z Supporting worker participation and engagement in Health and Safety matters
z Identifying needs and providing Health and Safety training
z Demonstrating a commitment to the accurate reporting and recording of Health and Safety matters
z Complying with all legal and Network Tasman obligations
These objectives will be achieved through:
z Board and Management support and commitment to Health and Safety
z Implementation of an annual Health and Safety Improvement Plan
z Worker education, consultation, participation and engagement
z Regular reviews and evaluations of operational performance
z Regular Health and Safety management system reviews
z Regular workplace oversight
Just Culture
The Network Tasman safety culture is based on the principles of “good faith” and “reasonable care” and it recognizes that we are all “human” and an honest mistake may occur in the performance of our everyday duties. What is important is that we all have a responsibility to learn from this.
As such, Network Tasman has a “no blame” approach towards those who have made an honest error and encourages all workers to report their own mistake or unsafe act as a means of implementing preventative measures to ensure that others don’t make the same mistake.
Network Maintenance Network Tasman spent $5.4 million on network maintenance during the 2016/17 financial year. Maintenance contractor Delta Utility Services and vegetation services provider Treescape continue to deliver a high level of service to our consumers.
Maintenance activities are divided into routine maintenance and renewals. Network Tasman operates a comprehensive network maintenance programme based on condition-based assessment and replacement of system components.
Continual surveys of the network are performed to determine the condition and serviceability of the network components, with a comprehensive database recording all components that make up the network and the likely replacement requirements. This includes the careful monitoring of network components such as poles and spars to anticipate when they might require replacement. The Nelson Tasman region’s climate means that our network components have a long life. Our effective maintenance schedule is a major contributing factor to our low network outage rates.
15
NETWORK TASMAN LIMITED & GROUP ANNUAL REPORT 2017
Operational Performance
Reliability performance targets (excludes Transpower planned and unplanned outages)
Actual Result2017
SCI Target2017
Actual Result2016
Average duration of supply interruptions per connected consumer (SAIDI) not to exceed - minutes 186 115 186
Average number of supply interruptions per connected consumer (SAIFI) not to exceed - number 1.58 1.36 1.59
Average duration of supply interruptions (CAIDI) not to exceed - minutes 118 85 117
Faults per 100 km of line not to exceed - number 6.8 6.0 5.2
% faults not restored within three hours not to exceed - % 26% 20 19
Other providersNetwork Tasman
0
100
200
300
400
500
Your consumer-owned electricity distributor
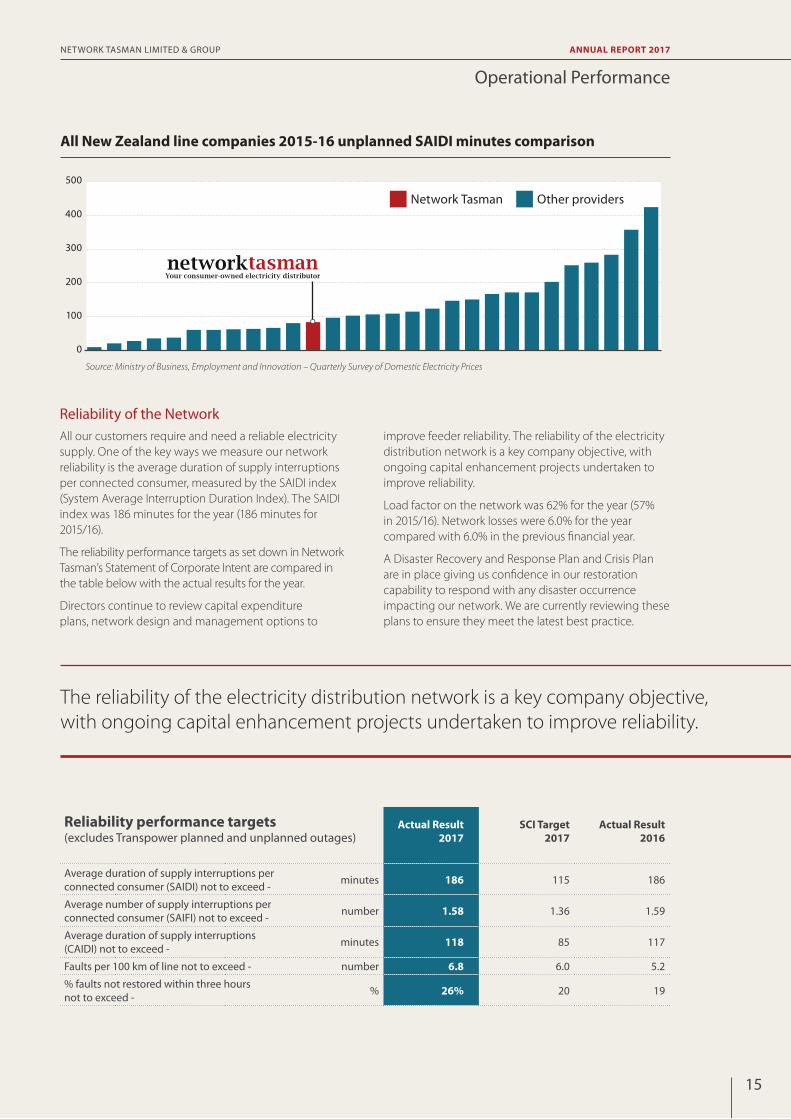
All New Zealand line companies 2015-16 unplanned SAIDI minutes comparison
All our customers require and need a reliable electricity supply. One of the key ways we measure our network reliability is the average duration of supply interruptions per connected consumer, measured by the SAIDI index (System Average Interruption Duration Index). The SAIDI index was 186 minutes for the year (186 minutes for 2015/16).
The reliability performance targets as set down in Network Tasman’s Statement of Corporate Intent are compared in the table below with the actual results for the year.
Directors continue to review capital expenditure plans, network design and management options to
improve feeder reliability. The reliability of the electricity distribution network is a key company objective, with ongoing capital enhancement projects undertaken to improve reliability.
Load factor on the network was 62% for the year (57% in 2015/16). Network losses were 6.0% for the year compared with 6.0% in the previous financial year.
A Disaster Recovery and Response Plan and Crisis Plan are in place giving us confidence in our restoration capability to respond with any disaster occurrence impacting our network. We are currently reviewing these plans to ensure they meet the latest best practice.
Reliability of the Network
The reliability of the electricity distribution network is a key company objective, with ongoing capital enhancement projects undertaken to improve reliability.
Source: Ministry of Business, Employment and Innovation – Quarterly Survey of Domestic Electricity Prices
NETWORK TASMAN LIMITED & GROUPANNUAL REPORT 2017
16
Operational Performance
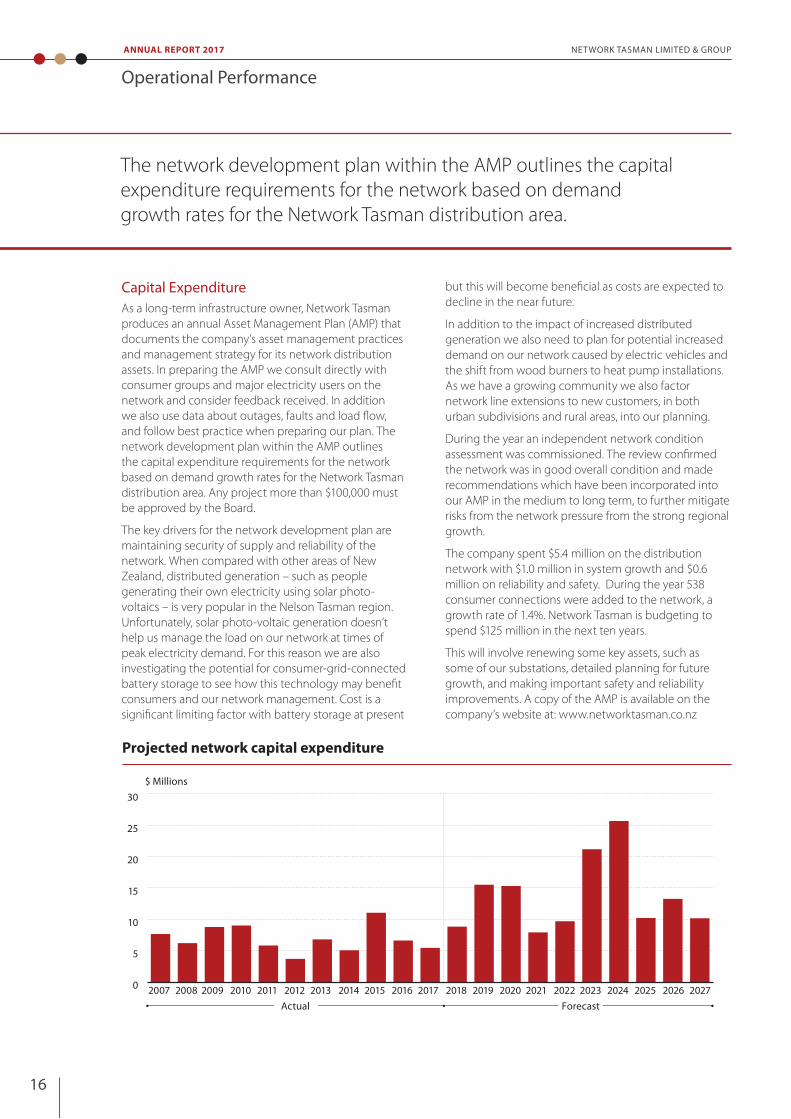
The network development plan within the AMP outlines the capital expenditure requirements for the network based on demand growth rates for the Network Tasman distribution area.
$ Millions
0
5
10
15
20
25
30
2007 2008 2009 2010 2011 2012 2013 2014 2015 2016 2017 2018 2019 2020 2021 2022 2023 2024 2025 2026 2027Actual Forecast
Projected network capital expenditure
Capital ExpenditureAs a long-term infrastructure owner, Network Tasman produces an annual Asset Management Plan (AMP) that documents the company’s asset management practices and management strategy for its network distribution assets. In preparing the AMP we consult directly with consumer groups and major electricity users on the network and consider feedback received. In addition we also use data about outages, faults and load flow, and follow best practice when preparing our plan. The network development plan within the AMP outlines the capital expenditure requirements for the network based on demand growth rates for the Network Tasman distribution area. Any project more than $100,000 must be approved by the Board.
The key drivers for the network development plan are maintaining security of supply and reliability of the network. When compared with other areas of New Zealand, distributed generation – such as people generating their own electricity using solar photo-voltaics – is very popular in the Nelson Tasman region. Unfortunately, solar photo-voltaic generation doesn’t help us manage the load on our network at times of peak electricity demand. For this reason we are also investigating the potential for consumer-grid-connected battery storage to see how this technology may benefit consumers and our network management. Cost is a significant limiting factor with battery storage at present
but this will become beneficial as costs are expected to decline in the near future.
In addition to the impact of increased distributed generation we also need to plan for potential increased demand on our network caused by electric vehicles and the shift from wood burners to heat pump installations. As we have a growing community we also factor network line extensions to new customers, in both urban subdivisions and rural areas, into our planning.
During the year an independent network condition assessment was commissioned. The review confirmed the network was in good overall condition and made recommendations which have been incorporated into our AMP in the medium to long term, to further mitigate risks from the network pressure from the strong regional growth.
The company spent $5.4 million on the distribution network with $1.0 million in system growth and $0.6 million on reliability and safety. During the year 538 consumer connections were added to the network, a growth rate of 1.4%. Network Tasman is budgeting to spend $125 million in the next ten years.
This will involve renewing some key assets, such as some of our substations, detailed planning for future growth, and making important safety and reliability improvements. A copy of the AMP is available on the company’s website at: www.networktasman.co.nz

NETWORK TASMAN LIMITED & GROUP ANNUAL REPORT 2017
RegulationAs a non-exempt electricity distribution company, Network Tasman continues to be subject to price and quality control by the Commerce Commission. The company’s audited annual compliance statement shows that it was fully compliant with both the price and quality controls for 2016/17. The company’s total line revenue (including distribution and transmission revenue) was significantly below the maximum permitted by regulation and has been for the past 5 years.
In a December 2016 decision, the Commerce Commission set out a number of refinements to the Input Methodologies (IMs), which underpin the price–quality controls. Changes to permitted cost allocation methodologies in the IMs are likely to have a slight adverse effect on Network Tasman’s allowable revenue from 2020/21. The Commission’s final decision on parameters used to calculate the Weighted Average Cost of Capital will further reduce allowable returns, by an estimated 5 basis points. A change to apply a revenue cap rather than a weighted average price cap is expected to reduce the complexity associated with adopting more efficient pricing.
Network Tasman is also subject to regulations set by the Electricity Authority. Upcoming projects by the Authority include a review of distribution pricing principles and research on the efficiency of distribution company arrangements. The Authority has also shown considerable interest in transitioning to distribution prices which better reflect services provided and the underlying costs of providing those services.
The deployment of smart meters provides new options for pricing structures which may provide improved economic signals to consumers as compared to existing pricing. Improving distribution pricing signals is likely to be increasingly important in the context of the uptake of evolving technologies such as solar panels, battery storage and electric vehicles.
Management is currently conducting a review of its pricing structures, including consultation with retailers and end customers. Network Tasman is working extensively with other EDBs and the ENA (Electricity Networks Association) as part of a coordinated national approach to examining future pricing options and pricing alignment.
The Authority’s review of the Transmission Pricing Methodology (TPM) which applies to Transpower’s pricing is ongoing. The Authority’s indicative analysis shows that the TPM changes proposed would have little impact on transmission charges to Network Tasman, however uncertainty over the exact impact remains until the proposed changes are confirmed and the details of how the new methodology will be implemented are clearer.
17
Operational Performance
Fibre NetworkThe company’s existing fibre networks continue to provide solid returns on capital employed despite the increasing competitive pressure from Chorus’ Ultra-Fast Broadband network.
The focus of the fibre business unit during the year has been on increasing utilisation of the company’s existing investments in fibre. The company was selected as the preferred supplier to a number of large rural and industrial sub-divisions and is providing layer 2 lit services as sections are developed.
Following a strategic review of the fibre network business, the potential market opportunities have been reviewed resulting in a reset of the pricing strategy to ensure our products are competitive.
The fibre business unit continues to provide an excellent return on funds employed and management continues to review market opportunities to grow the business where a commercial return can be achieved.
Nelson Picton
Te Tau Ihu
Motueka
Richmond
Network Tasman Fibre network
Blenheim
Top House

NETWORK TASMAN LIMITED & GROUPANNUAL REPORT 2017
Operational Performance
18
Advanced MetersDeployment of advanced meters is now due for completion in 2017 for contracted retailers on the Network Tasman network and is well underway on the On Metering (MainPower) network.
Associate company SmartCo is negotiating contracts with several additional retailers that will extend the penetration of Network Tasman and On Metering controlled advanced meters on those networks. SmartCo is also reviewing options for member networks to achieve the network benefits identified at the time the investments were made. Ultimately advanced meters will allow distribution companies to pro-actively manage the service provided by their networks and allow consumers to ultimately control their energy use and therefore their power costs.
Mass deployment for contracted retailers is scheduled to be completed by 2018 and once completed the advanced meters and RF mesh networks will provide retailers and network companies the ability to improve the overall service provided to consumers.
The company has utilised its investment in the radio
frequency mesh network to automate the management of our electricity network. This is the first stage of using our investment to achieve significant network benefits from our investment in the mesh network and advanced meters.
Nelson Electricity Limited Nelson Electricity has again delivered a credible return on funds employed despite increased funding costs for the recent capital investment programme together with declining electricity volumes.
Property PortfolioThe company’s investment property at 281 Queen Street, Richmond is now fully leased with Nelson Marlborough Public Health and DHB as anchor tenants.
The remaining industrial properties held by Network Tasman continue to be fully tenanted. While demand for well-located industrial properties in the Tasman region remains strong, Network Tasman will continue to cautiously develop its remaining land holdings when suitable long–term, quality tenants can be secured on favourable commercial terms.
500
525
550
575
600
625
650
675
700
2012 2013 2014 2015 2016 2017 2012 2013 2014 2015 2016 2017
500
525
550
575
600
625
650
675
700
30
32
34
36
38
40
30000
32000
34000
36000
38000
40000
500
525
550
575
600
625
650
675
700
2012 2013 2014 2015 2016 2017 2012 2013 2014 2015 2016 2017
500
525
550
575
600
625
650
675
700
30
32
34
36
38
40
30000
32000
34000
36000
38000
40000
Network supply and demand profile
80Apr May Jun Jul Aug Sep Oct Nov Dec Jan Feb Mar
85
90
95
100
105
110
115
120
125
2006–07 2016–17
Total Monthly Max System Demand
Energy delivered to NTL’s network (GWh) Consumer connections (000’s)

19
NETWORK TASMAN LIMITED & GROUP ANNUAL REPORT 2017
The directors consider that the financial statements of Network Tasman Limited and Group have been prepared using appropriate accounting policies, which have been consistently applied and supported by reasonable judgments and estimates and that all relevant financial reporting and accounting standards have been followed.
The directors also believe that proper accounting records have been kept which enable, with reasonable accuracy, the determination of the financial position of Network Tasman Limited and Group and facilitate compliance of the financial statements with the Financial Reporting Act 2013.
The directors are pleased to present the financial statements of Network Tasman Limited & Group for the year ended 31 March 2017.
For and on behalf of the board of directors.
MJ McCliskie AP Reilly Chairman Director 30 June 2017 30 June 2017
The directors of Network Tasman Limited are responsible for preparing the company and Group’s financial statements and ensuring that they give a true and fair view of the Group’s financial position as at 31 March 2017 and the results of their operations and cash flows for the year ended 31 March 2017.
Financial Statements
20
NETWORK TASMAN LIMITED & GROUPANNUAL REPORT 2017
Financial Statements
The accompanying notes and accounting policies form part of and are to be read in conjunction with this statement.
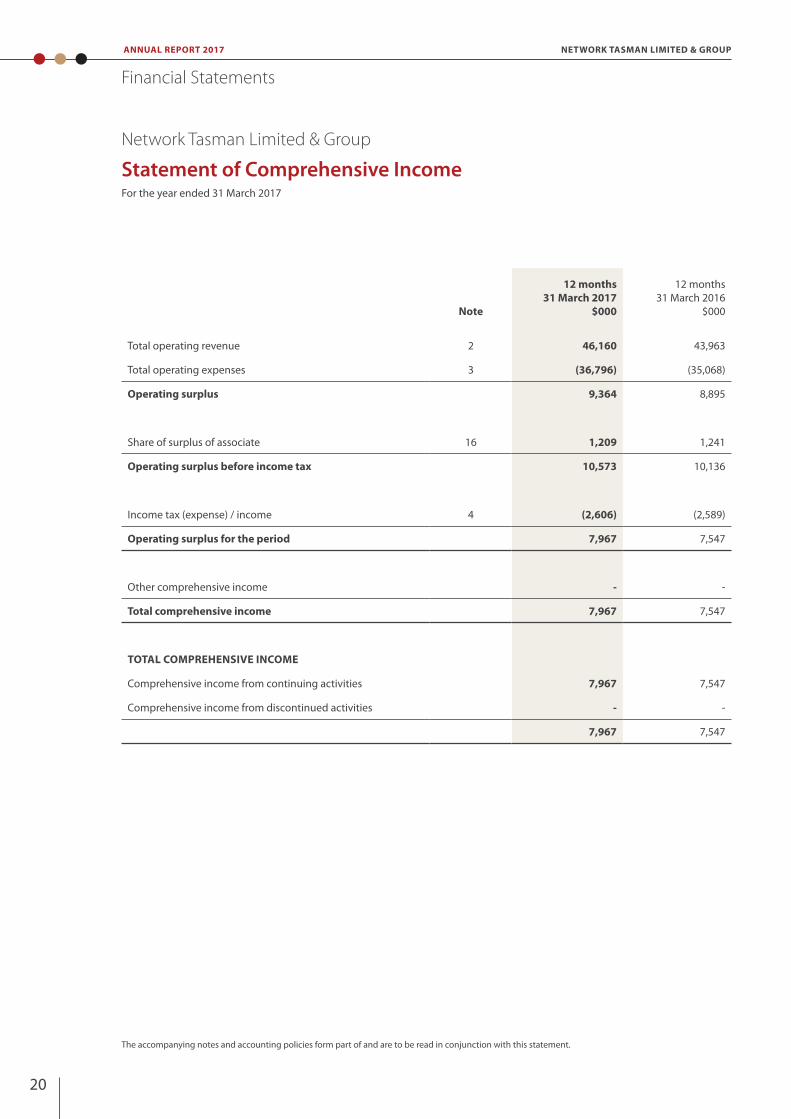
Network Tasman Limited & Group
Statement of Comprehensive IncomeFor the year ended 31 March 2017
Note
12 months 31 March 2017
$000
12 months 31 March 2016
$000
Total operating revenue 2 46,160 43,963
Total operating expenses 3 (36,796) (35,068)
Operating surplus 9,364 8,895
Share of surplus of associate 16 1,209 1,241
Operating surplus before income tax 10,573 10,136
Income tax (expense) / income 4 (2,606) (2,589)
Operating surplus for the period 7,967 7,547
Other comprehensive income - -
Total comprehensive income 7,967 7,547
TOTAL COMPREHENSIVE INCOME
Comprehensive income from continuing activities 7,967 7,547
Comprehensive income from discontinued activities - -
7,967 7,547

21
NETWORK TASMAN LIMITED & GROUP ANNUAL REPORT 2017
Financial Statements
The accompanying notes and accounting policies form part of and are to be read in conjunction with this statement.
Network Tasman Limited & Group
Statement of Changes in EquityFor the year ended 31 March 2017
Note
12 months 31 March 2017
$000
12 months 31 March 2016
$000
TOTAL EQUITY AT BEGINNING OF PERIOD 7 180,721 175,174
Total comprehensive income 7,967 7,547
OTHER MOVEMENTS
Distributions to owners during the period 6 (2,000) (2,000)
Total equity at end of period 7 186,688 180,721

22
NETWORK TASMAN LIMITED & GROUPANNUAL REPORT 2017
Financial Statements
The accompanying notes and accounting policies form part of and are to be read in conjunction with this statement.
Network Tasman Limited & Group
Balance SheetAs at 31 March 2017
Note
12 months 31 March 2017
$000
12 months 31 March 2016
$000
CURRENT ASSETS
Cash and cash equivalents 9 2,758 2,115
Other financial assets 10 259 259
Debtors and receivables 11 5,569 5,671
Advances to associates 12 5,625 4,475
Total current assets 14,211 12,520
NON-CURRENT ASSETS
Property, plant and equipment 13 183,715 179,726
Investment properties 14 25,279 24,270
Intangible assets 15 208 208
Investment in associate 16 11,504 11,195
Total non-current assets 220,706 215,399
Total assets 234,917 227,919
CURRENT LIABILITIES
Payables and accruals 17 4,942 4,936
Tax payable 18 635 707
Provisions 19 360 799
Loans and borrowings 20 174 217
Total current liabilities 6,111 6,659
NON-CURRENT LIABILITIES
Provisions 19 276 255
Loans and borrowings 20 13,241 12,194
Deferred taxation 21 28,601 28,090
Total non-current liabilities 42,118 40,539
EQUITY
Attributable to shareholders of the company 7 186,688 180,721
Total equity 186,688 180,721
Total liabilities and equity 234,917 227,919

23
NETWORK TASMAN LIMITED & GROUP ANNUAL REPORT 2017
Financial Statements
The accompanying notes and accounting policies form part of and are to be read in conjunction with this statement.
Network Tasman Limited & Group
Statement of Cash FlowsFor the year ended 31 March 2017
Note
12 months 31 March 2017
$000
12 months 31 March 2016
$000
CASH FLOWS FROM OPERATING ACTIVITIES
Cash was provided from:
Receipts from customers 43,516 51,213
Dividend income received 900 840
Interest income received 36 66
44,452 52,119
Cash was applied to:
Payments to suppliers and employees 28,000 35,401
Income tax paid 2,167 2,114
Interest expense paid 501 511
30,668 38,026
Net cash flows from operating activities 23 13,784 14,093
CASH FLOWS FROM INVESTING ACTIVITIES
Cash was provided from:
Proceeds from sale of property, plant and equipment 8 8
8 8
Cash was applied to:
Purchase of property, plant and equipment and investment properties 11,235 15,801
Investment in associates 1,150 2,200
12,385 18,001
Net cash flows from investing activities (12,377) (17,993)
CASH FLOWS FROM FINANCING ACTIVITIES
Cash was provided from:
Term Loans 1,500 4,000
1,500 4,000
Cash was applied to:
Dividends paid 2,000 2,000
Finance lease repayments 264 227
2,264 2,227
Net cash flows from financing activities (764) 1,773
NET INCREASE (DECREASE) IN CASH HELD 643 (2,127)
Cash balances at beginning of period 2,115 4,124
Exchange gain / (losses) on cash balance for the year - 118
Cash balances at end of period 2,758 2,115
COMPOSITION OF CASH BALANCES AT END OF YEAR
Cash on hand and at bank 84 90
Cash equivalents - term deposits 2,674 2,025
Total 9 2,758 2,115

24
NETWORK TASMAN LIMITED & GROUPANNUAL REPORT 2017
Financial Statements
Network Tasman Limited & Group
Notes to and forming part of the Financial StatementsFor the year ended 31 March 2017
1. Statement of Accounting Policies
Statement of ComplianceThe reporting entity is Network Tasman Limited and Group. Network Tasman Limited is a profit-oriented company registered under the Companies Act 1993 and its financial statements comply with section 44 of the Energy Companies Act 1992. The financial statements are for Network Tasman Limited and its interest in associate entities (Nelson Electricity Limited and On Metering Limited) and wholly-owned non-trading subsidiary company Tasman Energy Limited, are referred to as “The Group”.
These financial statements have been prepared in accordance with Generally Accepted Accounting Practice in New Zealand (NZ GAAP). They comply with the New Zealand Equivalents to In ternational Financial Reporting Standards (NZ IFRS) and other applicable financial reporting standards as appropriate for for-profit entities. Network Tasman Limited and Group is a tier 1 entity.
Basis of preparationThese financial statements are presented in New Zealand dollars, which is the groups functional and presentation currency, rounded to the nearest thousand dollars ($’000) unless otherwise stated. The financial statements have been prepared on the basis of historical cost with the exception of some distribution system assets and investment properties, which have been measured at fair value. Cost is based on the fair value of the consideration given in exchange for assets.
Transactions in foreign currencies are translated at the foreign exchange rate ruling on the day of the transaction. Foreign currency monetary items at balance date are translated at the exchange rate ruling at that date. Non-monetary assets and liabilities carried at fair value that are denominated in foreign currencies are translated at the rates ruling at the date when the fair value was determined. Exchange differences are recognised in the operating surplus in the period in which they arise.
The statement of comprehensive income and cash flow statement have been prepared so that all components are stated exclusive of GST. All components in the statement of financial position are stated net of GST except for receivables and payables which are stated inclusive of GST.
The financial statements comprise a Statement of Comprehensive Income, Balance Sheet, Cash Flow Statement, Statement of Changes in Equity and notes to these statements.
New standards issued but not yet effectiveA number of new standards and interpretations have been issued but are not yet effective for the current year-end. The reported results and financial position of the Group is not expected to change on adoption of these pronouncements as they do not result in any changes to the Group’s existing accounting policies. Adoption will however result in changes to information currently disclosed in the financial statements.
The following are new standards that may impact Network Tasman Limited. The Group does not intend to adopt any of the new pronouncements before their effective dates.
NZ IFRS 15 Revenue from Contracts with Customers - Effective 1 Jan 2018
NZ IFRS 16 Leases – Effective 1 January 2019
2. SUMMARY OF KEY ACCOUNTING POLICIESKey accounting policies have been adopted in preparation and presentation of the financial statements and can be found in the specific note to which the policy applies.
Estimates and underlying assumptions are regularly reviewed. Any change to estimates is recognised in the period if the change affects only that period, or into future periods if it also affects future periods.
These accounting policies have been applied consistently to all years presented unless otherwise stated.
Other than the above, there have been no changes in accounting policies and disclosures.

25
NETWORK TASMAN LIMITED & GROUP ANNUAL REPORT 2017
Financial Statements
Network Tasman Limited & Group
Notes to and forming part of the Financial StatementsFor the year ended 31 March 2017
Note
12 months 31 March 2017
$000
12 months 31 March 2016
$000
2 OPERATING REVENUE
CONTINUING ACTIVITIES
TRADING REVENUE
Line revenue (net of discounts) 35,763 34,786
Customer contributions 1,818 2,094
Exchange gains - 118
Other revenue 6,131 5,025
INVESTMENT REVENUE
Interest income 36 66
Rental income from investment properties 1,768 1,874
Increase in fair value of investment properties 644 -
Total operating revenue from continuing activities 46,160 43,963
ACCOUNTING POLICY
REVENUE
Line revenue
Retailer-owned electricity meters are read on the basis of constant cycles each year. Line revenues include an estimated amount for accrued sales as at 31 March 2017.
Lease income
The income from leases is recognised in the statement of comprehensive income as it accrues.
Customer contributions
Cash contributions from customers, including government agencies, relating to assets are credited directly to income when the asset is connected to the network. The Group acquires certain distribution assets for less than their replacement cost. Such assets are recognised at fair value and the difference between the cash cost and the fair value is recognised as revenue in the year of acquisition.
Investment income
Interest and rental income is recognised in the statement of comprehensive income as it accrues. Dividend income is recognised in the statement of comprehensive income on the date that the dividend is declared.
Change in fair value of investment properties
The increase or decrease arising from the investment property valuation is recognised in the statement of comprehensive income.
KEY JUDGEMENT
Network Tasman invoices its customers (predominantly electricity retailers) monthly for electricity delivery services on the basis of metered usage figures provided by those retailers. Network Tasman is entirely reliant upon the accuracy of the monthly metered data supplied by the retailers. Estimates are inherent in this data, however any inaccuracies in the estimates are corrected in subsequent months when read data becomes available. All meters are read at least once a year, with the majority read bi-monthly.

26
NETWORK TASMAN LIMITED & GROUPANNUAL REPORT 2017
Financial Statements
Network Tasman Limited & Group
Notes to and forming part of the Financial StatementsFor the year ended 31 March 2017
Note
12 months 31 March 2017
$000
12 months 31 March 2016
$000
3 OPERATING EXPENSES
Operating expenses include:
Gross transmission costs 15,180 14,212
DEPRECIATION OF PROPERTY, PLANT AND EQUIPMENT AND AMORTISATION OF INTANGIBLE ASSETS
Primary distribution assets 379 522
Secondary distribution assets 4,793 4,775
Substation assets 529 491
Load control plant 109 89
Streetlights 14 15
Consumer connections 1,645 817
Freehold buildings 53 50
Plant and equipment 100 65
Computer equipment 157 206
Motor vehicles 36 47
Assets leased from Transpower 230 251
Intangible assets 140 111
Total depreciation of property, plant and equipment and amortisation of intangible assets 8,185 7,439
AUDITORS' FEES
Audit fee - Network Tasman Ltd 56 56
Audit fee - non-trading subsidiaries 2 7
Other assurance services - Audit New Zealand 28 32
Other assurance services comprise an independent assurance report on the company's regulatory disclosure in accordance with the Electricity (Information Disclosure) Requirements 2008 and the default price - quality path compliance statement.
COSTS OF OFFERING CREDIT
Bad debts written off 6 5
Change in provision for doubtful debts (6) 1
GOVERNANCE EXPENSES
Directors' fees 234 226
OTHER EXPENSES
Donations 8 9
Employment costs 3,468 3,301
Loss on disposal of assets 272 190
Decrease in fair value of investment properties - 346
INTEREST EXPENSE
Interest expense on Transpower new investment agreements 67 140
Other Interest Paid 436 372

27
NETWORK TASMAN LIMITED & GROUP ANNUAL REPORT 2017
Financial Statements
Network Tasman Limited & Group
Notes to and forming part of the Financial StatementsFor the year ended 31 March 2017
Note
12 months 31 March 2017
$000
12 months 31 March 2016
$000
4 INCOME TAX
Operating surplus before income tax 10,573 10,136
Prima facie taxation at 28% 2,960 2,838
PLUS / (LESS) TAXATION EFFECT OF:
Non-taxable customer contributions (465) (531)
Depreciation 306 361
Equity accounted earnings from associate (339) (348)
Change in fair value of investment properties (180) 97
Movement in deferred tax 511 145
Other adjustments (180) 24
(347) (252)
Under/(Over) provision from prior years (7) 3
Income tax expense recognised in statement of financial performance 2,606 2,589
Comprising:
Current tax liability 2,095 2,444
Deferred tax on temporary differences 21 511 145
2,606 2,589
ACCOUNTING POLICY
TAXATION
Income tax expense comprises both current tax and deferred tax, and is calculated using tax rates that have been enacted or substantively enacted by balance date.
Current tax is the amount of income tax payable based on the taxable profit for the current year and any adjustments to income tax payable in respect of prior years.
Current and deferred tax are recognised as an expense or income in the profit and loss, except where they relate to items that are recognised outside profit and loss (whether in other comprehensive income or directly in equity) in which case the tax is also recognised outside profit and loss.
Deferred tax is the amount of income tax payable or recoverable in future periods in respect of temporary differences and unused tax losses. Temporary differences are differences between the carrying amount of assets and liabilities in the financial statements and the corresponding tax bases used in the calculation of taxable profit.
Deferred tax liabilities are generally recognised for all taxable temporary differences. Deferred tax assets are recognised to the extent that it is probable that taxable profits will be available against which the deductible temporary differences or tax losses can be utilised. Deferred tax is calculated at the tax rates that are expected to apply in the period when the liability is settled or the asset is recognised, using tax rates that have been enacted or substantially enacted by balance date.

28
NETWORK TASMAN LIMITED & GROUPANNUAL REPORT 2017
Financial Statements
Network Tasman Limited & Group
Notes to and forming part of the Financial StatementsFor the year ended 31 March 2017
Note
12 months 31 March 2017
$000
12 months 31 March 2016
$000
5 IMPUTATION CREDIT ACCOUNT
Imputation credits available for use in subsequent reporting periods 17,841 16,174
6 DIVIDENDS
Dividends during the period:
Dividends paid 2,000 2,000
Total dividends paid 2,000 2,000
7 EQUITY
Issued and paid up capital 57,185 57,185
Share premium reserve 1,938 1,938
Retained earnings 8 127,565 121,598
Total equity 186,688 180,721
ISSUED AND PAID UP CAPITAL
Balance at beginning of period 57,185 57,185
Balance at end of period 57,185 57,185
All shares are $1 shares and are fully paid. There is no uncalled capital. All shares carry equal voting rights. None of the shares carry fixed dividend rights.
SHARE PREMIUM RESERVE
Balance at beginning of period 1,938 1,938
Premium paid during year - -
Balance at end of period 1,938 1,938
8 RETAINED EARNINGS
Balance at beginning of period 121,598 116,051
Operating surplus for the period 7,967 7,547
Total available for appropriation 129,565 123,598
Dividends paid 6 (2,000) (2,000)
Balance at end of period 127,565 121,598

29
NETWORK TASMAN LIMITED & GROUP ANNUAL REPORT 2017
Financial Statements
Network Tasman Limited & Group
Notes to and forming part of the Financial StatementsFor the year ended 31 March 2017
9 CASH AND EQUIVALENTS
Cash on hand and at bank 84 90
Cash equivalents 2,674 2,025
Total cash and equivalents 2,758 2,115
The carrying value of short-term deposits with original maturity dates of three months or less approximates their fair value. The short term deposits are with the Bank of New Zealand and their Standard & Poors ratings is AA-. The interest rates on these investments range from 1% to 1% (31 March 2016: 1% to 1%).
ACCOUNTING POLICY
CASH AND CASH EQUIVALENTS
Cash and cash equivalents includes cash on hand, deposits held at call with banks and investments in money market instruments with maturities of three months or less at their inception.
10 OTHER FINANCIAL ASSETS
Loan to SmartCo Ltd 259 259
Total other financial assets 259 259
The carrying value of short-term deposits with original maturity dates of three months or more approximates their fair value.The interest rates on these investments range from 0% to 0% (31 March 2016: 0% to 0%).
SMARTCO LIMITED
Opening balance 259 159
Plus advances - 100
Less repayments - -
Closing balance at end of period 259 259
No interest is charged on the loan to SmartCo Limited.
Note
12 months 31 March 2017
$000
12 months 31 March 2016
$000

30
NETWORK TASMAN LIMITED & GROUPANNUAL REPORT 2017
Financial Statements
Network Tasman Limited & Group
Notes to and forming part of the Financial StatementsFor the year ended 31 March 2017
11 DEBTORS AND RECEIVABLES
Current
Trade receivables 4,851 4,886
Interest accrued - -
Sundry receivables 385 463
Prepayments 333 322
Total current receivables 5,569 5,671
TOTAL CURRENT RECEIVABLESThe carrying value of receivables approximates their fair value. As at 31 March 2017 and 31 March 2016 the receivables have been assessed for impairment and appropriate provisions applied, as detailed below.
Note
12 months 31 March 2017
$000
12 months 31 March 2016
$000
12 months 31 March 2017
$000
12 months 31 March 2016
$000
TRADE RECEIVABLES
31 March 2017 31 March 2016
$'000 $'000
Gross Impairment Net Gross Impairment Net
Not past due 4,522 - 4,522 4,529 - 4,529
Past due 1 - 30 days 196 - 196 230 - 230
Past due 31 - 60 days 25 - 25 10 - 10
Past due 61 - 90 days 4 - 4 25 - 25
Past due > 90 days 104 - 104 98 (6) 92
4,851 - 4,851 4,892 (6) 4,886
Movement in provision for impairment of receivables are as follows:
MOVEMENT IN PROVISION FOR IMPAIRMENT
Opening balance 6 5
Additional provisions made during the year - 6
Receivables written off during period (6) (5)
Closing balance (0) 6
31
NETWORK TASMAN LIMITED & GROUP ANNUAL REPORT 2017
Financial Statements
Network Tasman Limited & Group
Notes to and forming part of the Financial StatementsFor the year ended 31 March 2017
ACCOUNTING POLICY
RECEIVABLES
Receivables are initially measured at fair value and subsequently measured at amortised cost using effective interest method, less any provision for impairment.
IMPAIRMENT
Where an indicator of impairment exists either at an individual asset or at the cash generating unit level, the fair value of the asset will be determined by assessing the recoverable amount of the individual asset or the cash generating unit.
A cash generating unit is defined as the smallest identifiable group of assets that generates cash inflows that are largely independent of the cash inflows from other assets or groups of assets. An impairment loss for a non-revalued asset is recognised in the operating surplus for the year.
The carrying amounts of the Group’s assets, other than inventory, investment property and deferred tax assets are reviewed at each balance date to determine whether there is any indication of impairment. If any such indication exists for an asset, the asset’s recoverable amount is estimated in order to determine the extent of
the impairment loss (if any). Where the asset does not generate cash flows that are independent from other assets, the Group estimates the recoverable amount of the cash-generating unit to which the asset belongs.
The recoverable amounts are the higher of fair value (less costs to sell) and value in use. In assessing value in use, the estimated future pre-tax cash flows are discounted to their present value using a pre-tax discount rate that reflects current market assessments of the time value of money and the risks specific to the asset for which the estimates of future cash flows have not been adjusted.
Equity instruments are deemed to be impaired whenever there is a significant or prolonged decline in fair value below the original purchase price. Any subsequent recovery of an impairment loss in respect of an investment in an equity instrument classified as available-for-sale is not reversed through the operating surplus.
KEY JUDGEMENT
Judgement is exercised in choosing the levels of provision for doubtful receivables and assessing the factors impacting recoverability.
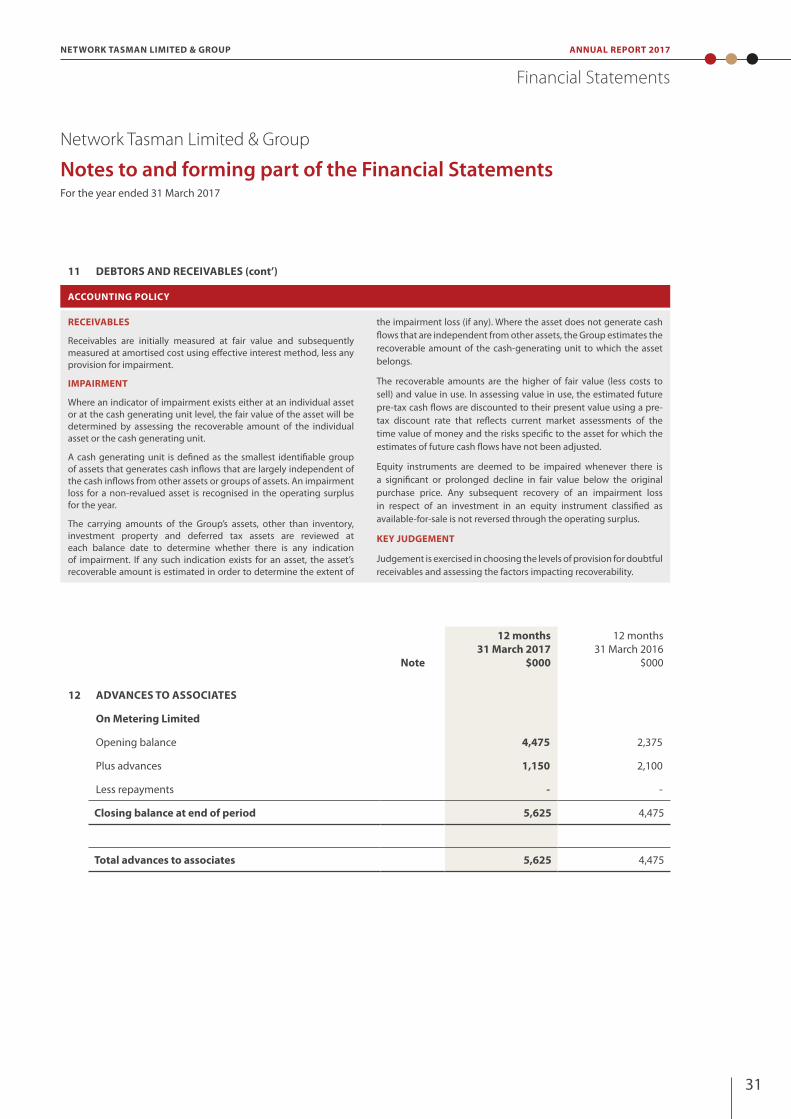
11 DEBTORS AND RECEIVABLES (cont’)
Note
12 months 31 March 2017
$000
12 months 31 March 2016
$000
12 ADVANCES TO ASSOCIATES
On Metering Limited
Opening balance 4,475 2,375
Plus advances 1,150 2,100
Less repayments - -
Closing balance at end of period 5,625 4,475
Total advances to associates 5,625 4,475
32
NETWORK TASMAN LIMITED & GROUPANNUAL REPORT 2017
Financial Statements
Network Tasman Limited & Group
Notes to and forming part of the Financial StatementsFor the year ended 31 March 2017
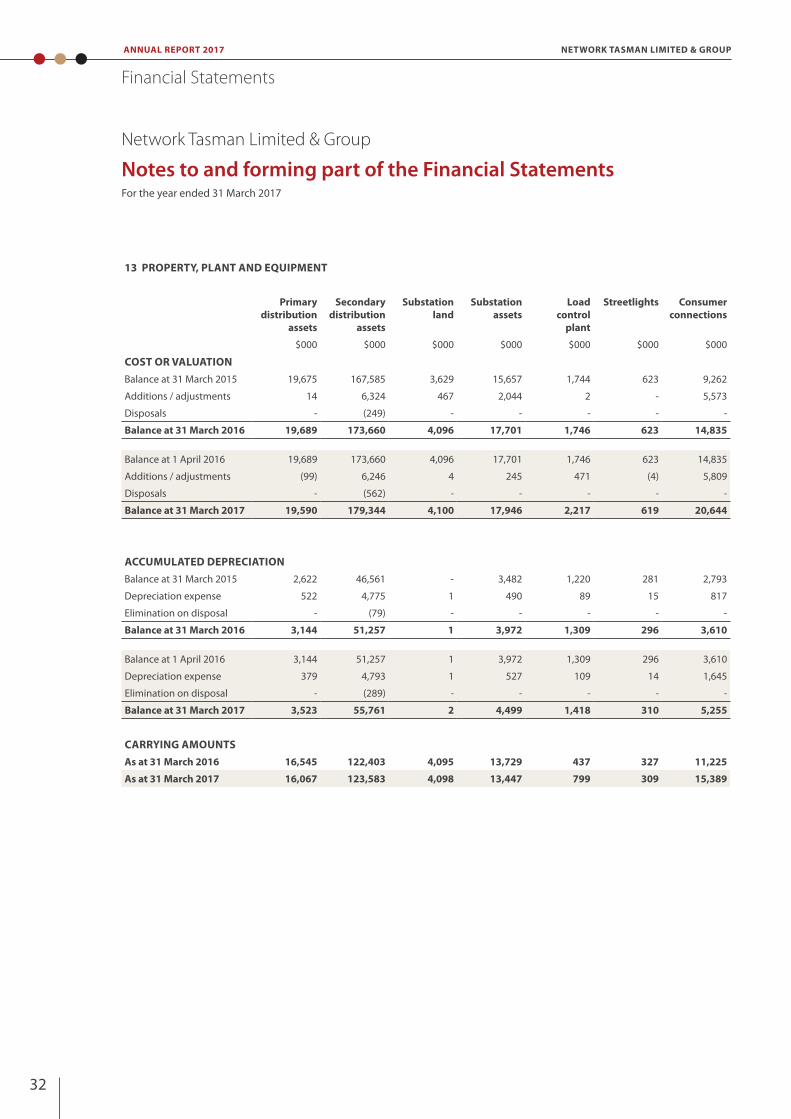
13 PROPERTY, PLANT AND EQUIPMENT
Primary distribution
assets
Secondary distribution
assets
Substation land
Substation assets
Load control
plant
Streetlights Consumer connections
$000 $000 $000 $000 $000 $000 $000
COST OR VALUATIONBalance at 31 March 2015 19,675 167,585 3,629 15,657 1,744 623 9,262
Additions / adjustments 14 6,324 467 2,044 2 - 5,573
Disposals - (249) - - - - -
Balance at 31 March 2016 19,689 173,660 4,096 17,701 1,746 623 14,835
Balance at 1 April 2016 19,689 173,660 4,096 17,701 1,746 623 14,835
Additions / adjustments (99) 6,246 4 245 471 (4) 5,809
Disposals - (562) - - - - -
Balance at 31 March 2017 19,590 179,344 4,100 17,946 2,217 619 20,644
ACCUMULATED DEPRECIATIONBalance at 31 March 2015 2,622 46,561 - 3,482 1,220 281 2,793
Depreciation expense 522 4,775 1 490 89 15 817
Elimination on disposal - (79) - - - - -
Balance at 31 March 2016 3,144 51,257 1 3,972 1,309 296 3,610
Balance at 1 April 2016 3,144 51,257 1 3,972 1,309 296 3,610
Depreciation expense 379 4,793 1 527 109 14 1,645
Elimination on disposal - (289) - - - - -
Balance at 31 March 2017 3,523 55,761 2 4,499 1,418 310 5,255
CARRYING AMOUNTSAs at 31 March 2016 16,545 122,403 4,095 13,729 437 327 11,225
As at 31 March 2017 16,067 123,583 4,098 13,447 799 309 15,389
33
NETWORK TASMAN LIMITED & GROUP ANNUAL REPORT 2017
Financial Statements
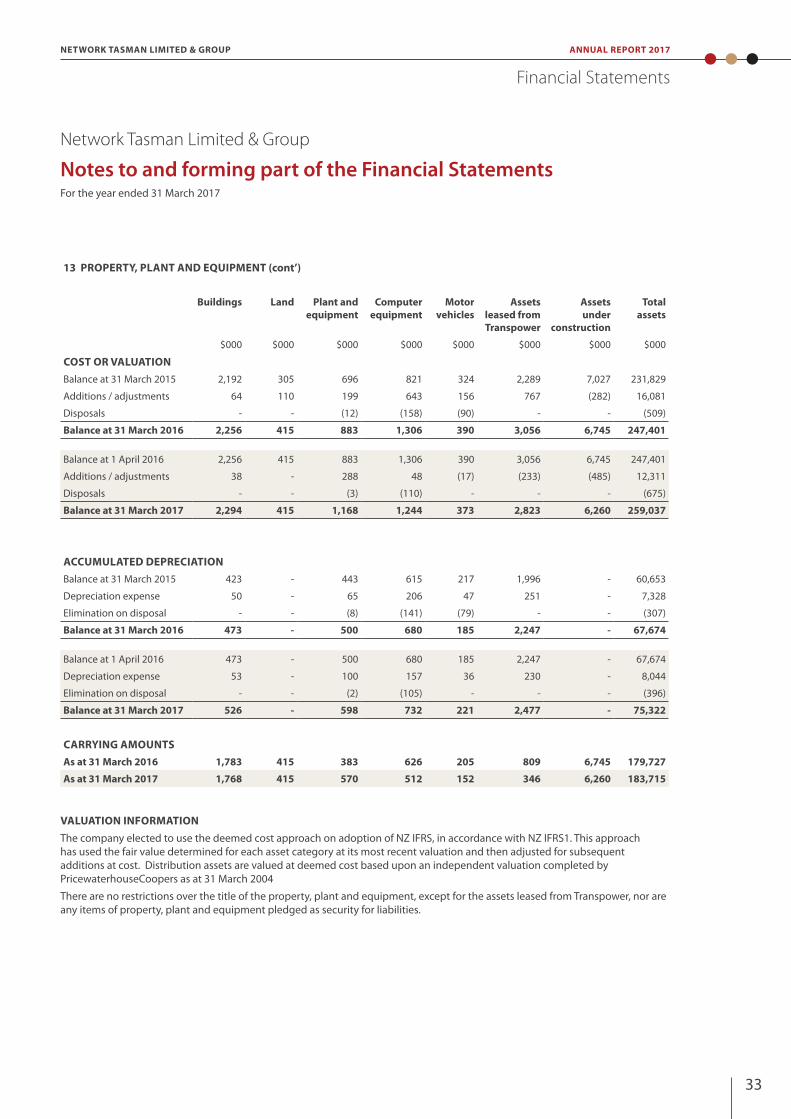
13 PROPERTY, PLANT AND EQUIPMENT (cont’)
Buildings Land Plant and equipment
Computer equipment
Motor vehicles
Assets leased from Transpower
Assets under
construction
Total assets
$000 $000 $000 $000 $000 $000 $000 $000
COST OR VALUATIONBalance at 31 March 2015 2,192 305 696 821 324 2,289 7,027 231,829
Additions / adjustments 64 110 199 643 156 767 (282) 16,081
Disposals - - (12) (158) (90) - - (509)
Balance at 31 March 2016 2,256 415 883 1,306 390 3,056 6,745 247,401
Balance at 1 April 2016 2,256 415 883 1,306 390 3,056 6,745 247,401
Additions / adjustments 38 - 288 48 (17) (233) (485) 12,311
Disposals - - (3) (110) - - - (675)
Balance at 31 March 2017 2,294 415 1,168 1,244 373 2,823 6,260 259,037
ACCUMULATED DEPRECIATIONBalance at 31 March 2015 423 - 443 615 217 1,996 - 60,653
Depreciation expense 50 - 65 206 47 251 - 7,328
Elimination on disposal - - (8) (141) (79) - - (307)
Balance at 31 March 2016 473 - 500 680 185 2,247 - 67,674
Balance at 1 April 2016 473 - 500 680 185 2,247 - 67,674
Depreciation expense 53 - 100 157 36 230 - 8,044
Elimination on disposal - - (2) (105) - - - (396)
Balance at 31 March 2017 526 - 598 732 221 2,477 - 75,322
CARRYING AMOUNTSAs at 31 March 2016 1,783 415 383 626 205 809 6,745 179,727
As at 31 March 2017 1,768 415 570 512 152 346 6,260 183,715
Network Tasman Limited & Group
Notes to and forming part of the Financial StatementsFor the year ended 31 March 2017
VALUATION INFORMATIONThe company elected to use the deemed cost approach on adoption of NZ IFRS, in accordance with NZ IFRS1. This approach has used the fair value determined for each asset category at its most recent valuation and then adjusted for subsequent additions at cost. Distribution assets are valued at deemed cost based upon an independent valuation completed by PricewaterhouseCoopers as at 31 March 2004
There are no restrictions over the title of the property, plant and equipment, except for the assets leased from Transpower, nor are any items of property, plant and equipment pledged as security for liabilities.
34
NETWORK TASMAN LIMITED & GROUPANNUAL REPORT 2017
Financial Statements
Network Tasman Limited & Group
Notes to and forming part of the Financial StatementsFor the year ended 31 March 2017
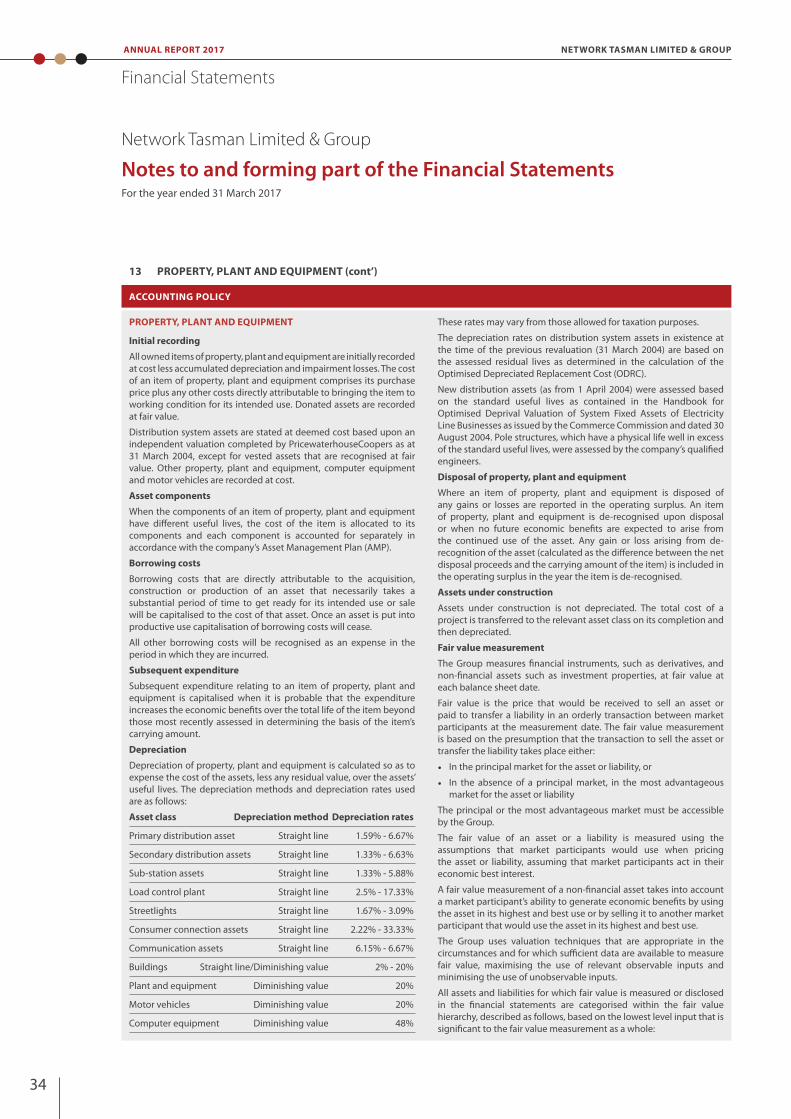
ACCOUNTING POLICY
PROPERTY, PLANT AND EQUIPMENT
Initial recording
All owned items of property, plant and equipment are initially recorded at cost less accumulated depreciation and impairment losses. The cost of an item of property, plant and equipment comprises its purchase price plus any other costs directly attributable to bringing the item to working condition for its intended use. Donated assets are recorded at fair value.
Distribution system assets are stated at deemed cost based upon an independent valuation completed by PricewaterhouseCoopers as at 31 March 2004, except for vested assets that are recognised at fair value. Other property, plant and equipment, computer equipment and motor vehicles are recorded at cost.
Asset components
When the components of an item of property, plant and equipment have different useful lives, the cost of the item is allocated to its components and each component is accounted for separately in accordance with the company’s Asset Management Plan (AMP).
Borrowing costs
Borrowing costs that are directly attributable to the acquisition, construction or production of an asset that necessarily takes a substantial period of time to get ready for its intended use or sale will be capitalised to the cost of that asset. Once an asset is put into productive use capitalisation of borrowing costs will cease.
All other borrowing costs will be recognised as an expense in the period in which they are incurred.
Subsequent expenditure
Subsequent expenditure relating to an item of property, plant and equipment is capitalised when it is probable that the expenditure increases the economic benefits over the total life of the item beyond those most recently assessed in determining the basis of the item’s carrying amount.
Depreciation
Depreciation of property, plant and equipment is calculated so as to expense the cost of the assets, less any residual value, over the assets’ useful lives. The depreciation methods and depreciation rates used are as follows:
Asset class Depreciation method Depreciation rates
Primary distribution asset Straight line 1.59% - 6.67%
Secondary distribution assets Straight line 1.33% - 6.63%
Sub-station assets Straight line 1.33% - 5.88%
Load control plant Straight line 2.5% - 17.33%
Streetlights Straight line 1.67% - 3.09%
Consumer connection assets Straight line 2.22% - 33.33%
Communication assets Straight line 6.15% - 6.67%
Buildings Straight line/Diminishing value 2% - 20%
Plant and equipment Diminishing value 20%
Motor vehicles Diminishing value 20%
Computer equipment Diminishing value 48%
These rates may vary from those allowed for taxation purposes.
The depreciation rates on distribution system assets in existence at the time of the previous revaluation (31 March 2004) are based on the assessed residual lives as determined in the calculation of the Optimised Depreciated Replacement Cost (ODRC).
New distribution assets (as from 1 April 2004) were assessed based on the standard useful lives as contained in the Handbook for Optimised Deprival Valuation of System Fixed Assets of Electricity Line Businesses as issued by the Commerce Commission and dated 30 August 2004. Pole structures, which have a physical life well in excess of the standard useful lives, were assessed by the company’s qualified engineers.
Disposal of property, plant and equipment
Where an item of property, plant and equipment is disposed of any gains or losses are reported in the operating surplus. An item of property, plant and equipment is de-recognised upon disposal or when no future economic benefits are expected to arise from the continued use of the asset. Any gain or loss arising from de-recognition of the asset (calculated as the difference between the net disposal proceeds and the carrying amount of the item) is included in the operating surplus in the year the item is de-recognised.
Assets under construction
Assets under construction is not depreciated. The total cost of a project is transferred to the relevant asset class on its completion and then depreciated.
Fair value measurement
The Group measures financial instruments, such as derivatives, and non-financial assets such as investment properties, at fair value at each balance sheet date.
Fair value is the price that would be received to sell an asset or paid to transfer a liability in an orderly transaction between market participants at the measurement date. The fair value measurement is based on the presumption that the transaction to sell the asset or transfer the liability takes place either:
• In the principal market for the asset or liability, or
• In the absence of a principal market, in the most advantageous market for the asset or liability
The principal or the most advantageous market must be accessible by the Group.
The fair value of an asset or a liability is measured using the assumptions that market participants would use when pricing the asset or liability, assuming that market participants act in their economic best interest.
A fair value measurement of a non-financial asset takes into account a market participant’s ability to generate economic benefits by using the asset in its highest and best use or by selling it to another market participant that would use the asset in its highest and best use.
The Group uses valuation techniques that are appropriate in the circumstances and for which sufficient data are available to measure fair value, maximising the use of relevant observable inputs and minimising the use of unobservable inputs.
All assets and liabilities for which fair value is measured or disclosed in the financial statements are categorised within the fair value hierarchy, described as follows, based on the lowest level input that is significant to the fair value measurement as a whole:
13 PROPERTY, PLANT AND EQUIPMENT (cont’)
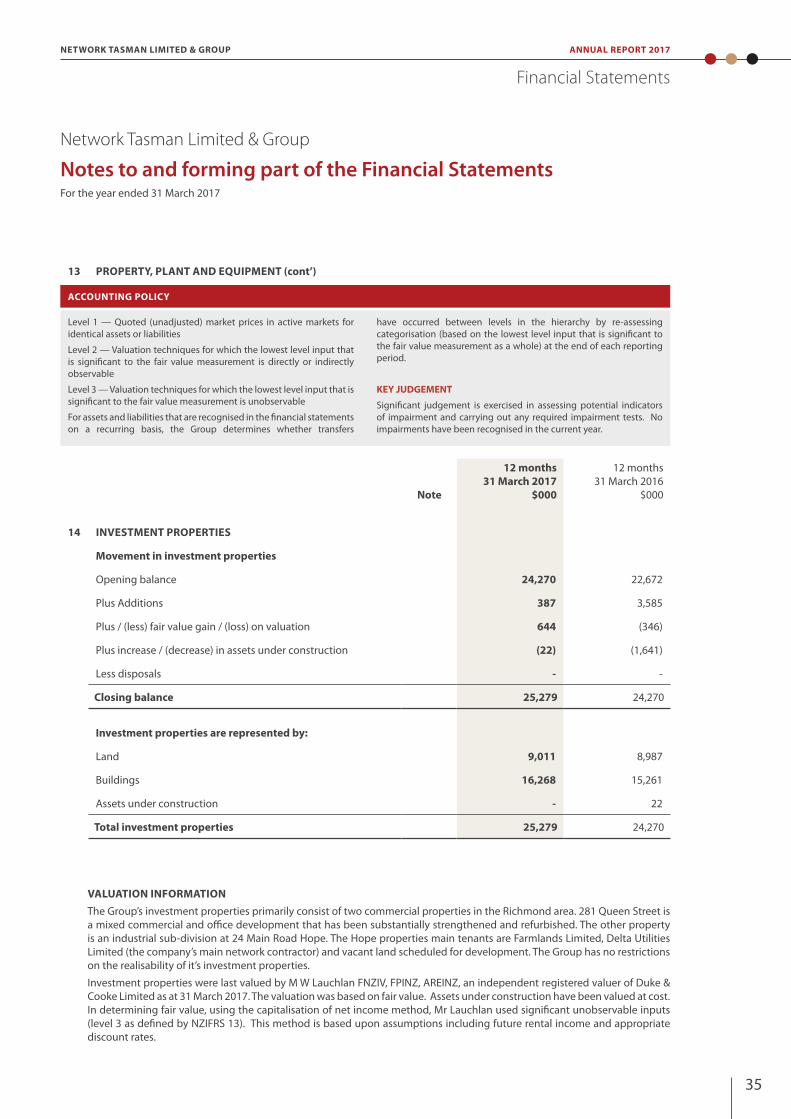
35
NETWORK TASMAN LIMITED & GROUP ANNUAL REPORT 2017
Financial Statements
Network Tasman Limited & Group
Notes to and forming part of the Financial StatementsFor the year ended 31 March 2017
ACCOUNTING POLICY
Level 1 — Quoted (unadjusted) market prices in active markets for identical assets or liabilities
Level 2 — Valuation techniques for which the lowest level input that is significant to the fair value measurement is directly or indirectly observable
Level 3 — Valuation techniques for which the lowest level input that is significant to the fair value measurement is unobservable
For assets and liabilities that are recognised in the financial statements on a recurring basis, the Group determines whether transfers
have occurred between levels in the hierarchy by re-assessing categorisation (based on the lowest level input that is significant to the fair value measurement as a whole) at the end of each reporting period.
KEY JUDGEMENT
Significant judgement is exercised in assessing potential indicators of impairment and carrying out any required impairment tests. No impairments have been recognised in the current year.
13 PROPERTY, PLANT AND EQUIPMENT (cont’)
Note
12 months 31 March 2017
$000
12 months 31 March 2016
$000
14 INVESTMENT PROPERTIES
Movement in investment properties
Opening balance 24,270 22,672
Plus Additions 387 3,585
Plus / (less) fair value gain / (loss) on valuation 644 (346)
Plus increase / (decrease) in assets under construction (22) (1,641)
Less disposals - -
Closing balance 25,279 24,270
Investment properties are represented by:
Land 9,011 8,987
Buildings 16,268 15,261
Assets under construction - 22
Total investment properties 25,279 24,270
VALUATION INFORMATIONThe Group’s investment properties primarily consist of two commercial properties in the Richmond area. 281 Queen Street is a mixed commercial and office development that has been substantially strengthened and refurbished. The other property is an industrial sub-division at 24 Main Road Hope. The Hope properties main tenants are Farmlands Limited, Delta Utilities Limited (the company’s main network contractor) and vacant land scheduled for development. The Group has no restrictions on the realisability of it’s investment properties.
Investment properties were last valued by M W Lauchlan FNZIV, FPINZ, AREINZ, an independent registered valuer of Duke & Cooke Limited as at 31 March 2017. The valuation was based on fair value. Assets under construction have been valued at cost. In determining fair value, using the capitalisation of net income method, Mr Lauchlan used significant unobservable inputs (level 3 as defined by NZIFRS 13). This method is based upon assumptions including future rental income and appropriate discount rates.

36
NETWORK TASMAN LIMITED & GROUPANNUAL REPORT 2017
Financial Statements
Network Tasman Limited & Group
Notes to and forming part of the Financial StatementsFor the year ended 31 March 2017
14 INVESTMENT PROPERTIES (cont’)
Reconciliation of Fair Value
Office / commercial
$000Industrial
$000 Other$000
31 March 2017$000
31 March 2016$000
Opening Balance 13,376 7,396 3,498 24,270 22,672
Additions 207 175 5 387 3,585
Plus increase / (decrease) in assets under construction (17) (5) - (22) (1,641)
Change in Fair Value 194 375 75 644 (346)
Closing Balance (excluding work in progress) 13,760 7,941 3,578 25,279 24,270
The following discount rates were used
Valuation Technique
Discount Rate Weighted Average Lease Term
281 Queen Street DCF Method 7% - 7.5% 5.4 years
24 Main Road Hope DCF Method 8.25% - 8.5% 3.4 years
Under the DCF method, fair value is estimated using assumptions regarding the benefits and liabilities of ownership over the asset’s life including an exit or terminal value. This method involves the projection of a series of cash flows on a real property interest. To this projected cash flow series, a market-derived discount rate is applied to establish the present value of the income stream associated with the asset. The exit yield is normally separately determined and differs from the discount rate.
The duration of the cash flows and the specific timing of inflows and outflows are determined by events such as rent reviews, lease renewal and related re-letting, redevelopment, or refurbishment. The appropriate duration is typically driven by market behaviour that is a characteristic of the class of real property. Periodic cash flow is typically estimated as gross income less vacancy, non-recoverable expenses, collection losses, lease incentives, maintenance cost, agent and commission costs and other operating and management expenses. The series of periodic net operating income, along with an estimate of the terminal value anticipated at the end of the projection period, is then discounted.
Significant increases (decreases) in estimated rental value and rent growth per annum in isolation would result in a significantly higher (lower) fair value of the properties. Significant increases (decreases) in long-term vacancy rate and discount rate (and exit yield) in isolation would result in a significantly lower (higher) fair value. Generally, a change in the assumption made for the estimated rental value is accompanied by:
a. A directionally similar change in the rent growth per annum and discount rate (and exit yield) b. An opposite change in the long term vacancy rate.
ACCOUNTING POLICY
INVESTMENT PROPERTIES
Investment properties are measured at cost including transaction costs. Subsequent to initial recognition investment properties are stated at fair value.
Gains or losses arising from changes in the fair values of investment properties are recognised in the operating surplus in the year in which they arise. Valuations are determined on an annual basis by independent registered valuers, Duke & Cooke Limited.
KEY JUDGEMENT
The valuation of investment properties is undertaken by an independent registered valuer. This valuation involves the use of judgement, estimations and assumptions.
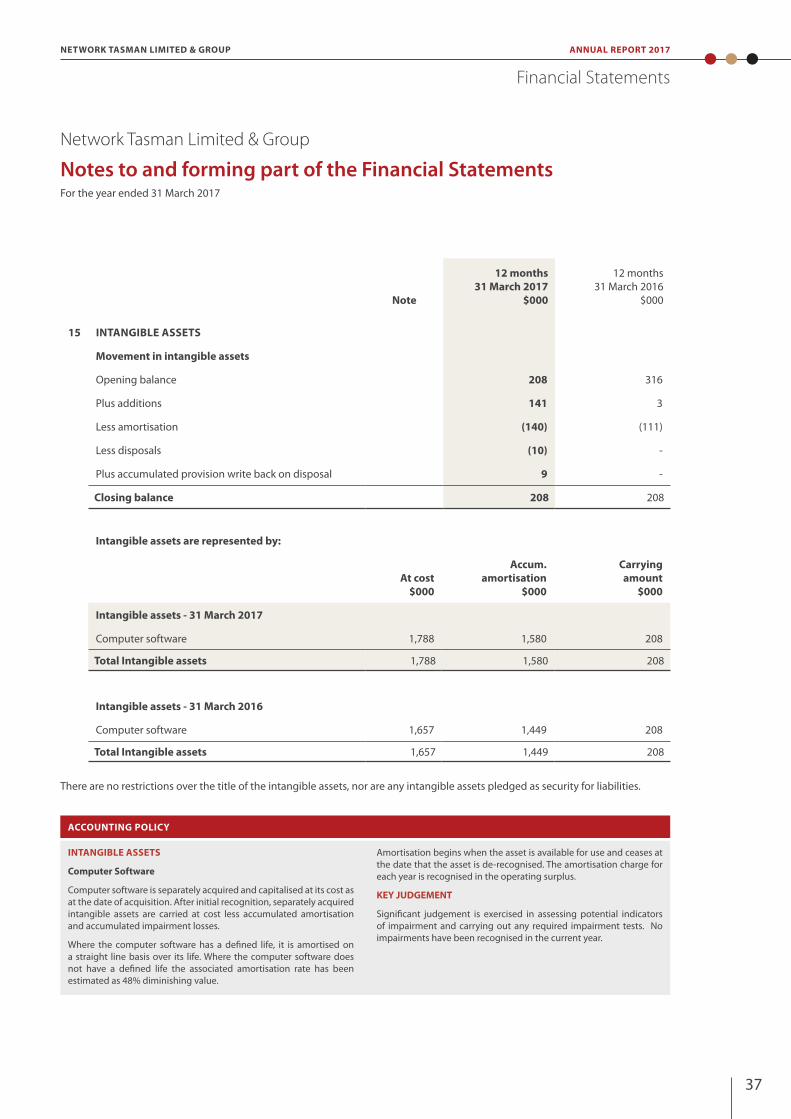
37
NETWORK TASMAN LIMITED & GROUP ANNUAL REPORT 2017
Financial Statements
Network Tasman Limited & Group
Notes to and forming part of the Financial StatementsFor the year ended 31 March 2017
ACCOUNTING POLICY
INTANGIBLE ASSETS
Computer Software
Computer software is separately acquired and capitalised at its cost as at the date of acquisition. After initial recognition, separately acquired intangible assets are carried at cost less accumulated amortisation and accumulated impairment losses.
Where the computer software has a defined life, it is amortised on a straight line basis over its life. Where the computer software does not have a defined life the associated amortisation rate has been estimated as 48% diminishing value.
Amortisation begins when the asset is available for use and ceases at the date that the asset is de-recognised. The amortisation charge for each year is recognised in the operating surplus.
KEY JUDGEMENT
Significant judgement is exercised in assessing potential indicators of impairment and carrying out any required impairment tests. No impairments have been recognised in the current year.
Note
12 months 31 March 2017
$000
12 months 31 March 2016
$000
15 INTANGIBLE ASSETS
Movement in intangible assets
Opening balance 208 316
Plus additions 141 3
Less amortisation (140) (111)
Less disposals (10) -
Plus accumulated provision write back on disposal 9 -
Closing balance 208 208
Intangible assets are represented by:
At cost $000
Accum. amortisation
$000
Carrying amount
$000
Intangible assets - 31 March 2017
Computer software 1,788 1,580 208
Total Intangible assets 1,788 1,580 208
Intangible assets - 31 March 2016
Computer software 1,657 1,449 208
Total Intangible assets 1,657 1,449 208
There are no restrictions over the title of the intangible assets, nor are any intangible assets pledged as security for liabilities.
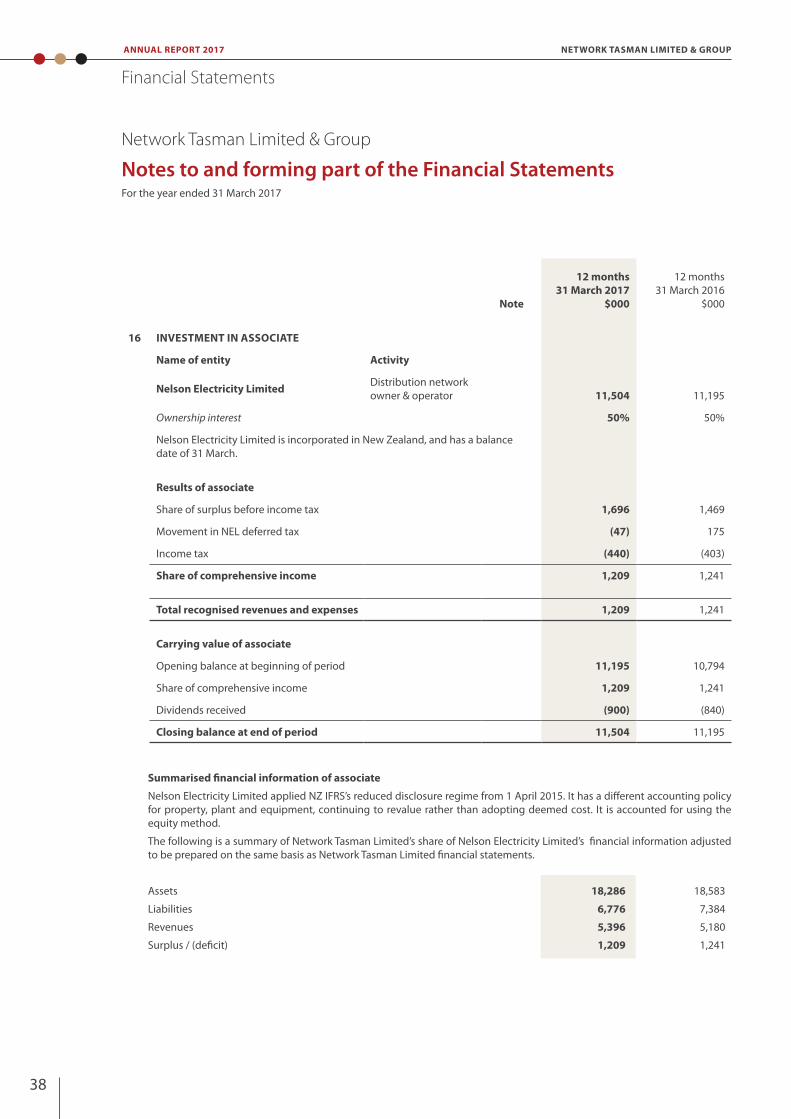
38
NETWORK TASMAN LIMITED & GROUPANNUAL REPORT 2017
Financial Statements
Network Tasman Limited & Group
Notes to and forming part of the Financial StatementsFor the year ended 31 March 2017
Note
12 months 31 March 2017
$000
12 months 31 March 2016
$000
16 INVESTMENT IN ASSOCIATE
Name of entity Activity
Nelson Electricity Limited Distribution network owner & operator 11,504 11,195
Ownership interest 50% 50%
Nelson Electricity Limited is incorporated in New Zealand, and has a balance date of 31 March.
Results of associate
Share of surplus before income tax 1,696 1,469
Movement in NEL deferred tax (47) 175
Income tax (440) (403)
Share of comprehensive income 1,209 1,241
Total recognised revenues and expenses 1,209 1,241
Carrying value of associate
Opening balance at beginning of period 11,195 10,794
Share of comprehensive income 1,209 1,241
Dividends received (900) (840)
Closing balance at end of period 11,504 11,195
Summarised financial information of associate
Nelson Electricity Limited applied NZ IFRS’s reduced disclosure regime from 1 April 2015. It has a different accounting policy for property, plant and equipment, continuing to revalue rather than adopting deemed cost. It is accounted for using the equity method.
The following is a summary of Network Tasman Limited’s share of Nelson Electricity Limited’s financial information adjusted to be prepared on the same basis as Network Tasman Limited financial statements.
Assets 18,286 18,583
Liabilities 6,776 7,384
Revenues 5,396 5,180
Surplus / (deficit) 1,209 1,241

39
NETWORK TASMAN LIMITED & GROUP ANNUAL REPORT 2017
Financial Statements
Network Tasman Limited & Group
Notes to and forming part of the Financial StatementsFor the year ended 31 March 2017
Note
12 months 31 March 2017
$000
12 months 31 March 2016
$000
16 INVESTMENT IN ASSOCIATE (cont')
Name of entity Activity
On Metering Limited Meter deployment company
Ownership interest 50% 50%
On Metering Limited is incorporated in New Zealand, and has a balance date of 31 March. On Metering Limited applied NZ IFRS's reduced disclosure regime. It is accounted for using the equity method.
Summarised financial information of associate
The following is a summary of Network Tasman Limited's share of On Metering Limited's financial information.
Assets 5,652 4,982
Liabilities 5,813 4,986
Unrecognised losses (161) (4)
Revenues 469 446
Surplus / (deficit) (157) 101
Total carrying value of associates
Nelson Electricity Limited 11,504 11,195
On Metering Limited - -
Total 11,504 11,195
17 PAYABLES AND ACCRUALS
Current
Trade payables and accruals 4,942 4,936
Total current payables and accruals 4,942 4,936
Trade payables are non-interest bearing and are normally settled on 30 day terms, therefore the carrying value of trade payables approximate their fair value.
ACCOUNTING POLICY
CREDITORS AND OTHER PAYABLES
Creditors and other payables are initially measured at fair value and subsequently measured at amortised cost using the effective interest method.
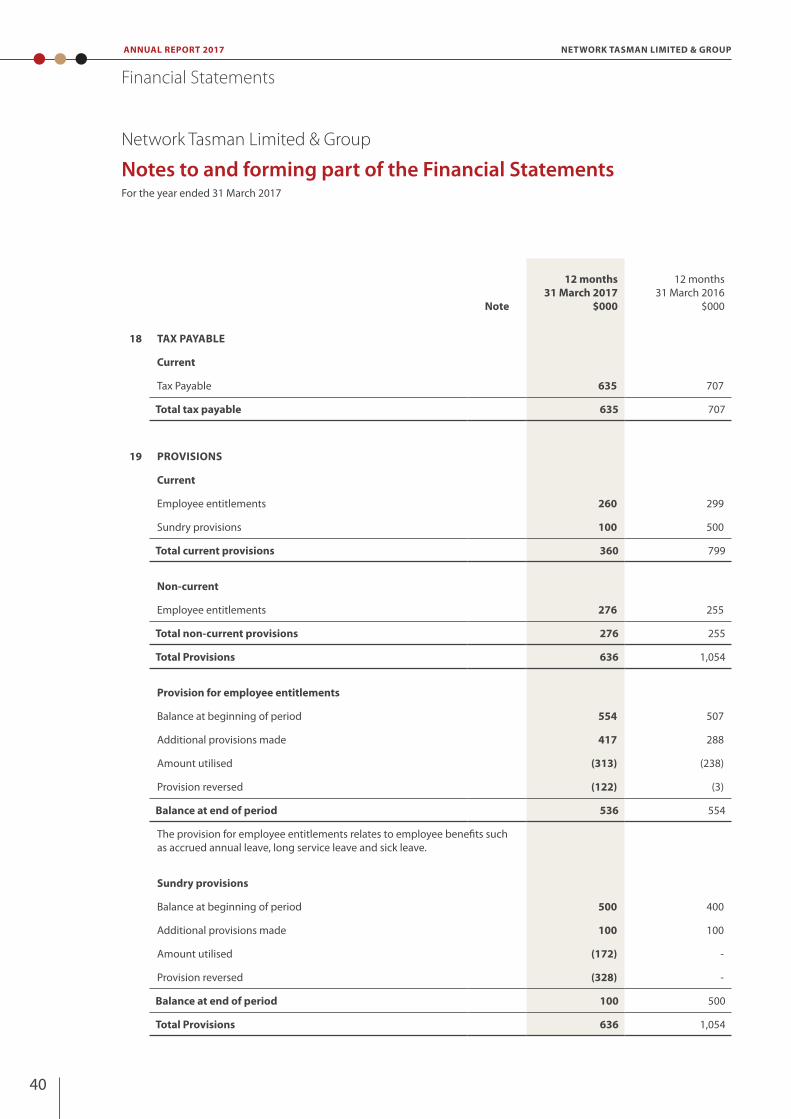
40
NETWORK TASMAN LIMITED & GROUPANNUAL REPORT 2017
Financial Statements
Network Tasman Limited & Group
Notes to and forming part of the Financial StatementsFor the year ended 31 March 2017
Note
12 months 31 March 2017
$000
12 months 31 March 2016
$000
18 TAX PAYABLE
Current
Tax Payable 635 707
Total tax payable 635 707
19 PROVISIONS
Current
Employee entitlements 260 299
Sundry provisions 100 500
Total current provisions 360 799
Non-current
Employee entitlements 276 255
Total non-current provisions 276 255
Total Provisions 636 1,054
Provision for employee entitlements
Balance at beginning of period 554 507
Additional provisions made 417 288
Amount utilised (313) (238)
Provision reversed (122) (3)
Balance at end of period 536 554
The provision for employee entitlements relates to employee benefits such as accrued annual leave, long service leave and sick leave.
Sundry provisions
Balance at beginning of period 500 400
Additional provisions made 100 100
Amount utilised (172) -
Provision reversed (328) -
Balance at end of period 100 500
Total Provisions 636 1,054

41
NETWORK TASMAN LIMITED & GROUP ANNUAL REPORT 2017
Financial Statements
Network Tasman Limited & Group
Notes to and forming part of the Financial StatementsFor the year ended 31 March 2017
20 LOANS AND BORROWINGS Note
12 months 31 March 2017
$000
12 months 31 March 2016
$000
Current
Secured bank loans - -
Finance lease liabilities 174 217
Total current loans and borrowings 174 217
Non-current
Secured bank loans 13,000 11,500
Finance lease liabilities 241 694
Total non- current loans and borrowings 13,241 12,194
Total loans and borrowings 13,415 12,411
All financial liabilities are classified as financial liabilities measured at amortised cost.All loans and borrowings are held on market terms; therefore their carrying amount approximates their fair value.
(a) TERMS AND DEBT REPAYMENT SCHEDULE
The terms and conditions of outstanding loans were as follows: Facility Expiry Interest
RateYear of
MaturityMarch
2017$000
March 2016$000
Bank of New Zealand Limited - Secured 29 September 2017 3.34% 2017 10,000 10,000
Bank of New Zealand Limited - Secured 20 August 2018 3.34% 2018 3,000 1,500
13,000 11,500
(b) SECURITY
Bank of New Zealand Limited
The bank loans are secured over a Negative Pledge Agreement where Network Tasman Limited undertakes not to dispose of, encumber or grant a security interest in any asset of the company without written permission from the Bank.
ACCOUNTING POLICY
EMPLOYEE ENTITLEMENTS
Employee entitlements include annual leave, a provision for sick leave entitlement and long service leave. Provisions made in respect of employee benefits expected to be settled within 12 months are measured at their nominal values using the remuneration rate expected to apply at the time of settlement. Provisions made in respect of employee benefits which are not expected to be settled within 12 months, such as long service leave, are measured at the full
value of the estimated future cash outflows to be made by the Group taking into account the years of service, years of entitlement and the likelihood staff will reach the point of entitlement.
KEY JUDGEMENT
Judgement is exercised in using consumer price index long run usage index and discount rates to determined the Group’s liability for non-vested long service and retiring leave entitlements.
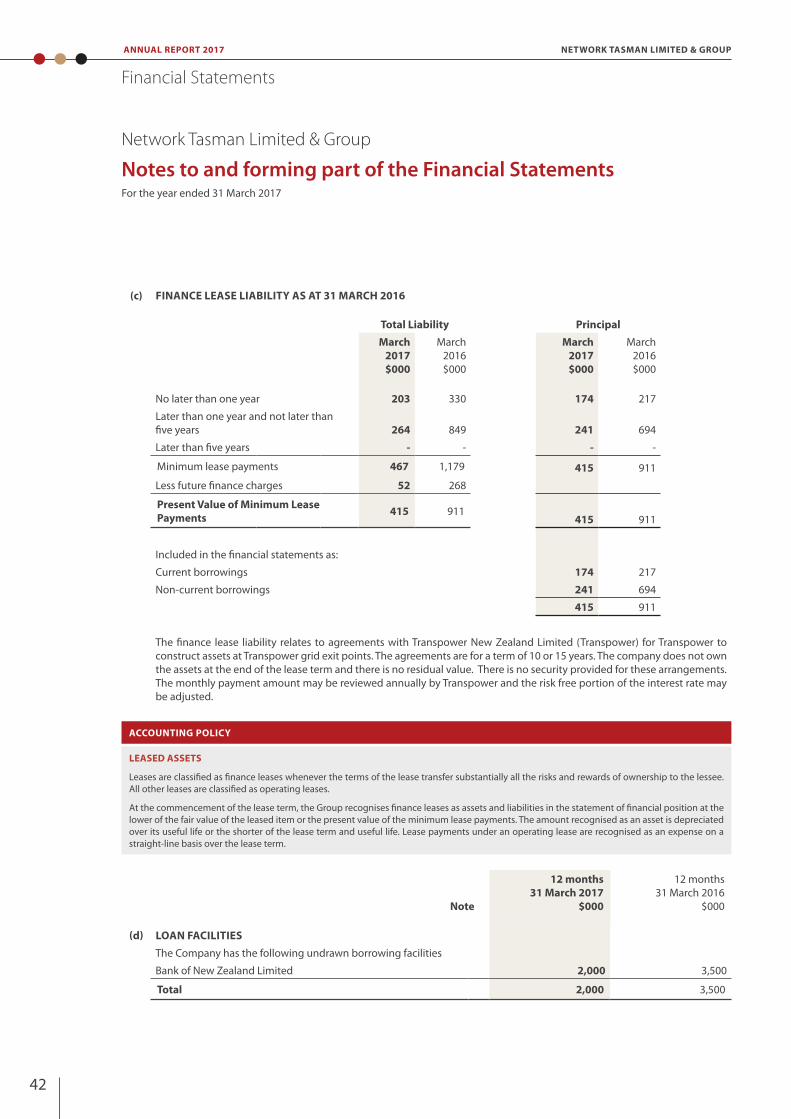
42
NETWORK TASMAN LIMITED & GROUPANNUAL REPORT 2017
Financial Statements
Network Tasman Limited & Group
Notes to and forming part of the Financial StatementsFor the year ended 31 March 2017
(c) FINANCE LEASE LIABILITY AS AT 31 MARCH 2016
Total Liability Principal
March 2017$000
March 2016$000
March 2017$000
March 2016$000
No later than one year 203 330 174 217
Later than one year and not later than five years 264 849 241 694
Later than five years - - - -
Minimum lease payments 467 1,179 415 911
Less future finance charges 52 268
Present Value of Minimum Lease Payments 415 911
415 911
Included in the financial statements as:
Current borrowings 174 217
Non-current borrowings 241 694
415 911
The finance lease liability relates to agreements with Transpower New Zealand Limited (Transpower) for Transpower to construct assets at Transpower grid exit points. The agreements are for a term of 10 or 15 years. The company does not own the assets at the end of the lease term and there is no residual value. There is no security provided for these arrangements. The monthly payment amount may be reviewed annually by Transpower and the risk free portion of the interest rate may be adjusted.
ACCOUNTING POLICY
LEASED ASSETS
Leases are classified as finance leases whenever the terms of the lease transfer substantially all the risks and rewards of ownership to the lessee. All other leases are classified as operating leases.
At the commencement of the lease term, the Group recognises finance leases as assets and liabilities in the statement of financial position at the lower of the fair value of the leased item or the present value of the minimum lease payments. The amount recognised as an asset is depreciated over its useful life or the shorter of the lease term and useful life. Lease payments under an operating lease are recognised as an expense on a straight-line basis over the lease term.
(d) LOAN FACILITIES
The Company has the following undrawn borrowing facilities
Bank of New Zealand Limited 2,000 3,500
Total 2,000 3,500
Note
12 months 31 March 2017
$000
12 months 31 March 2016
$000

43
NETWORK TASMAN LIMITED & GROUP ANNUAL REPORT 2017
Financial Statements
Network Tasman Limited & Group
Notes to and forming part of the Financial StatementsFor the year ended 31 March 2017
21 DEFERRED TAXATION
Balance at beginning of period 28,090 27,945
Deferred tax on temporary differences 511 145
Balance at end of period 28,601 28,090
Analysis of temporary deferred tax differences
For the year ended 31 March 2017Fixed assets
$000Provisions
$000Finance leases
$000Total$000
Opening balance 28,633 (288) (255) 28,090
Charge to income 255 117 139 511
Charge to equity - - - -
Closing balance 28,888 (171) (116) 28,601
Note
12 months 31 March 2017
$000
12 months 31 March 2016
$000
For the year ended 31 March 2016Fixed assets
$000Provisions
$000Finance leases
$000Total$000
Opening balance 28,294 (245) (104) 27,945
Charge to income 339 (43) (151) 145
Charge to equity - - - -
Closing balance 28,633 (288) (255) 28,090
Under current accounting standards, Network Tasman is required to recognise a deferred tax liability equal to the tax effect of the difference between the Company's accounting value of fixed assets and the equivalent tax carrying values for the same assets. Adjustments for provisions and finance leases result in the reducing the deferred tax liability.
Analysis of operating leases
No later than one year 1,594 233
Later than one year and not later than five years 4,690 291
Later than five years 1,469 -
7,753 524
The lease arrangements are renewed on a periodic basis as disclosed in the lessors' individual contracts; no agreement exceeds 8 years. In 2017 rental income received from leases with non-cancellable operating lease arrangements amounted to $1,768,000 (2016: $1,874,000)
22 OPERATING LEASE ARRANGEMENTS
Network Tasman has 19 non-cancellable operating leases as lessor of land and buildings that comprise the investment property portfolio.
Note
12 months 31 March 2017
$000
12 months 31 March 2016
$000
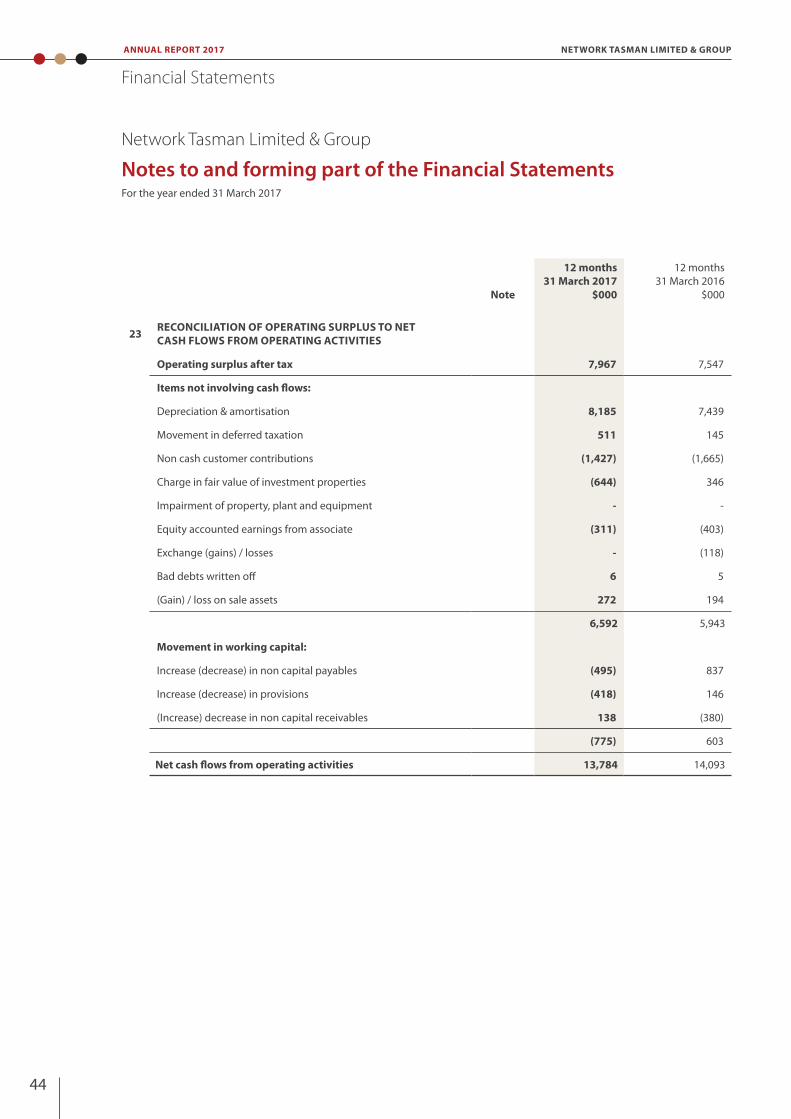
44
NETWORK TASMAN LIMITED & GROUPANNUAL REPORT 2017
Financial Statements
Network Tasman Limited & Group
Notes to and forming part of the Financial StatementsFor the year ended 31 March 2017
Note
12 months 31 March 2017
$000
12 months 31 March 2016
$000
23 RECONCILIATION OF OPERATING SURPLUS TO NET CASH FLOWS FROM OPERATING ACTIVITIES
Operating surplus after tax 7,967 7,547
Items not involving cash flows:
Depreciation & amortisation 8,185 7,439
Movement in deferred taxation 511 145
Non cash customer contributions (1,427) (1,665)
Charge in fair value of investment properties (644) 346
Impairment of property, plant and equipment - -
Equity accounted earnings from associate (311) (403)
Exchange (gains) / losses - (118)
Bad debts written off 6 5
(Gain) / loss on sale assets 272 194
6,592 5,943
Movement in working capital:
Increase (decrease) in non capital payables (495) 837
Increase (decrease) in provisions (418) 146
(Increase) decrease in non capital receivables 138 (380)
(775) 603
Net cash flows from operating activities 13,784 14,093
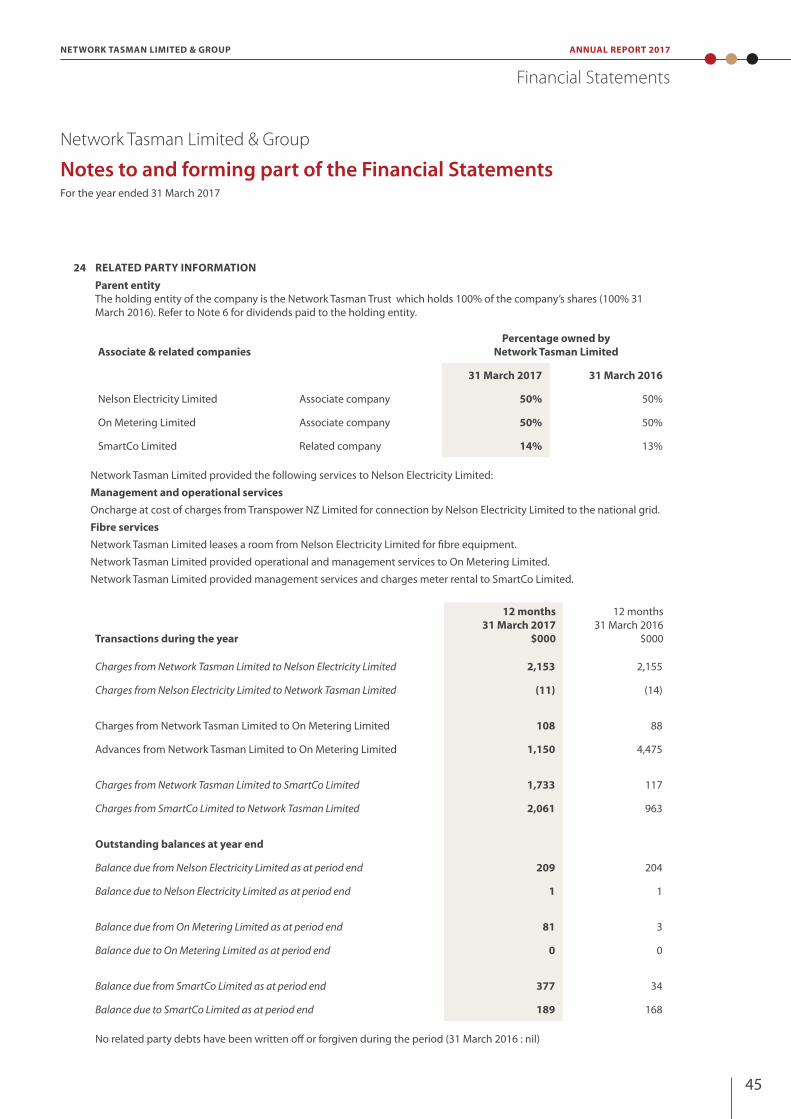
45
NETWORK TASMAN LIMITED & GROUP ANNUAL REPORT 2017
Financial Statements
24 RELATED PARTY INFORMATION
Parent entityThe holding entity of the company is the Network Tasman Trust which holds 100% of the company’s shares (100% 31 March 2016). Refer to Note 6 for dividends paid to the holding entity.
Associate & related companiesPercentage owned by
Network Tasman Limited
31 March 2017 31 March 2016
Nelson Electricity Limited Associate company 50% 50%
On Metering Limited Associate company 50% 50%
SmartCo Limited Related company 14% 13%
Network Tasman Limited provided the following services to Nelson Electricity Limited:
Management and operational services Oncharge at cost of charges from Transpower NZ Limited for connection by Nelson Electricity Limited to the national grid.
Fibre servicesNetwork Tasman Limited leases a room from Nelson Electricity Limited for fibre equipment.
Network Tasman Limited provided operational and management services to On Metering Limited.
Network Tasman Limited provided management services and charges meter rental to SmartCo Limited.
Network Tasman Limited & Group
Notes to and forming part of the Financial StatementsFor the year ended 31 March 2017
Transactions during the year
Charges from Network Tasman Limited to Nelson Electricity Limited 2,153 2,155
Charges from Nelson Electricity Limited to Network Tasman Limited (11) (14)
Charges from Network Tasman Limited to On Metering Limited 108 88
Advances from Network Tasman Limited to On Metering Limited 1,150 4,475
Charges from Network Tasman Limited to SmartCo Limited 1,733 117
Charges from SmartCo Limited to Network Tasman Limited 2,061 963
Outstanding balances at year end
Balance due from Nelson Electricity Limited as at period end 209 204
Balance due to Nelson Electricity Limited as at period end 1 1
Balance due from On Metering Limited as at period end 81 3
Balance due to On Metering Limited as at period end 0 0
Balance due from SmartCo Limited as at period end 377 34
Balance due to SmartCo Limited as at period end 189 168
No related party debts have been written off or forgiven during the period (31 March 2016 : nil)
Transactions during the year
12 months 31 March 2017
$000
12 months 31 March 2016
$000
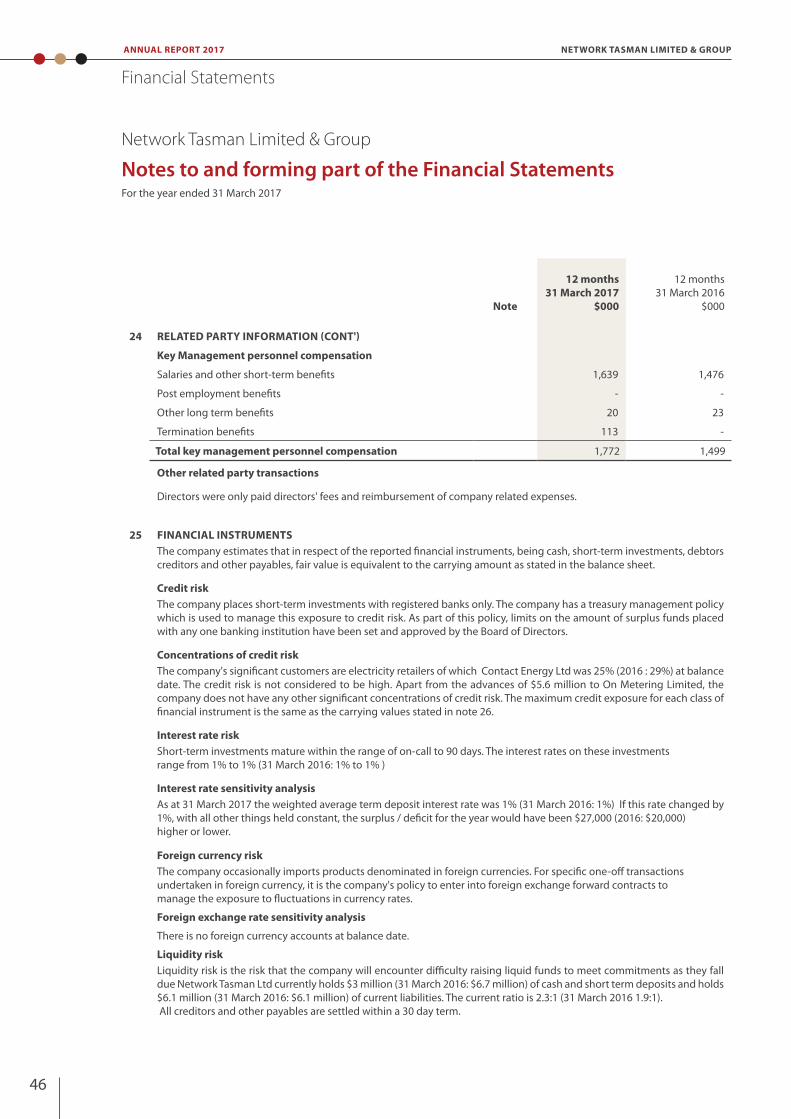
46
NETWORK TASMAN LIMITED & GROUPANNUAL REPORT 2017
Financial Statements
Network Tasman Limited & Group
Notes to and forming part of the Financial StatementsFor the year ended 31 March 2017
Note
12 months 31 March 2017
$000
12 months 31 March 2016
$000
24 RELATED PARTY INFORMATION (CONT')
Key Management personnel compensation
Salaries and other short-term benefits 1,639 1,476
Post employment benefits - -
Other long term benefits 20 23
Termination benefits 113 -
Total key management personnel compensation 1,772 1,499
Other related party transactions
Directors were only paid directors' fees and reimbursement of company related expenses.
25 FINANCIAL INSTRUMENTSThe company estimates that in respect of the reported financial instruments, being cash, short-term investments, debtors creditors and other payables, fair value is equivalent to the carrying amount as stated in the balance sheet.
Credit riskThe company places short-term investments with registered banks only. The company has a treasury management policy which is used to manage this exposure to credit risk. As part of this policy, limits on the amount of surplus funds placed with any one banking institution have been set and approved by the Board of Directors.
Concentrations of credit riskThe company's significant customers are electricity retailers of which Contact Energy Ltd was 25% (2016 : 29%) at balance date. The credit risk is not considered to be high. Apart from the advances of $5.6 million to On Metering Limited, the company does not have any other significant concentrations of credit risk. The maximum credit exposure for each class of financial instrument is the same as the carrying values stated in note 26.
Interest rate riskShort-term investments mature within the range of on-call to 90 days. The interest rates on these investmentsrange from 1% to 1% (31 March 2016: 1% to 1% )
Interest rate sensitivity analysisAs at 31 March 2017 the weighted average term deposit interest rate was 1% (31 March 2016: 1%) If this rate changed by 1%, with all other things held constant, the surplus / deficit for the year would have been $27,000 (2016: $20,000)higher or lower.
Foreign currency riskThe company occasionally imports products denominated in foreign currencies. For specific one-off transactionsundertaken in foreign currency, it is the company's policy to enter into foreign exchange forward contracts tomanage the exposure to fluctuations in currency rates.
Foreign exchange rate sensitivity analysis
There is no foreign currency accounts at balance date.
Liquidity riskLiquidity risk is the risk that the company will encounter difficulty raising liquid funds to meet commitments as they fall due Network Tasman Ltd currently holds $3 million (31 March 2016: $6.7 million) of cash and short term deposits and holds $6.1 million (31 March 2016: $6.1 million) of current liabilities. The current ratio is 2.3:1 (31 March 2016 1.9:1). All creditors and other payables are settled within a 30 day term.
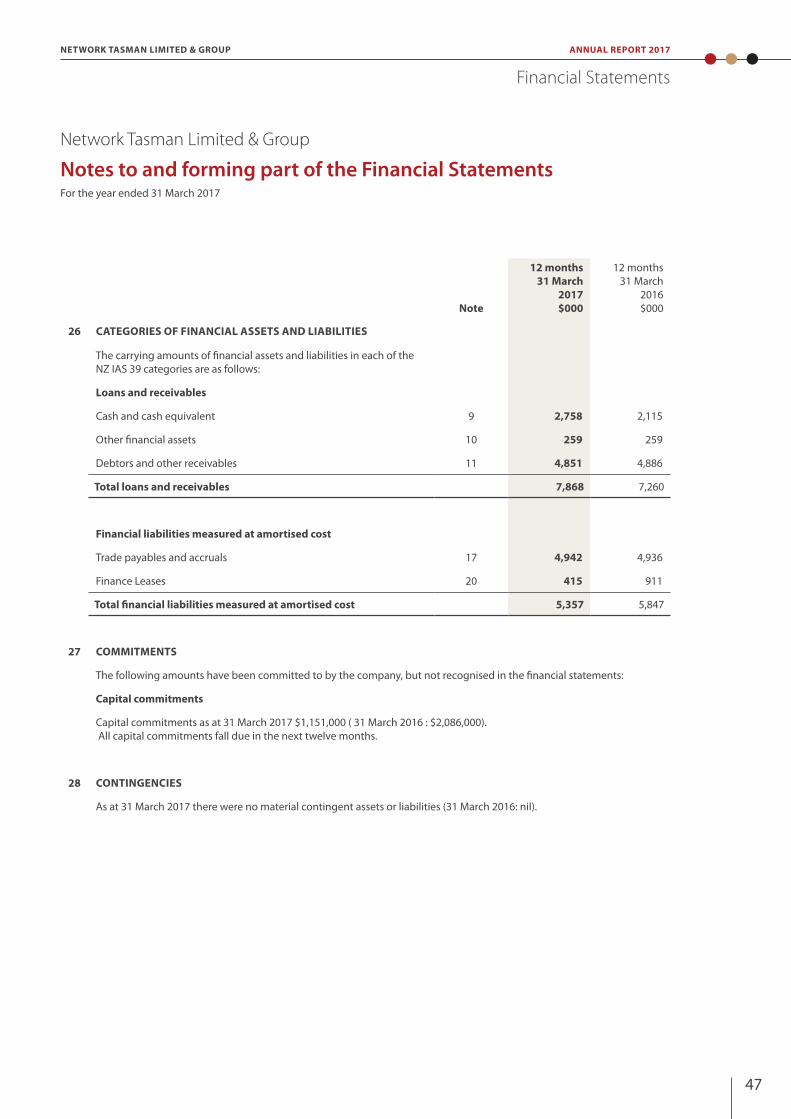
47
NETWORK TASMAN LIMITED & GROUP ANNUAL REPORT 2017
Financial Statements
Note
12 months 31 March
2017$000
12 months 31 March
2016$000
26 CATEGORIES OF FINANCIAL ASSETS AND LIABILITIES
The carrying amounts of financial assets and liabilities in each of the NZ IAS 39 categories are as follows:
Loans and receivables
Cash and cash equivalent 9 2,758 2,115
Other financial assets 10 259 259
Debtors and other receivables 11 4,851 4,886
Total loans and receivables 7,868 7,260
Financial liabilities measured at amortised cost
Trade payables and accruals 17 4,942 4,936
Finance Leases 20 415 911
Total financial liabilities measured at amortised cost 5,357 5,847
27 COMMITMENTS
The following amounts have been committed to by the company, but not recognised in the financial statements:
Capital commitments
Capital commitments as at 31 March 2017 $1,151,000 ( 31 March 2016 : $2,086,000). All capital commitments fall due in the next twelve months.
28 CONTINGENCIES
As at 31 March 2017 there were no material contingent assets or liabilities (31 March 2016: nil).
Network Tasman Limited & Group
Notes to and forming part of the Financial StatementsFor the year ended 31 March 2017

48
NETWORK TASMAN LIMITED & GROUPANNUAL REPORT 2017
Financial Statements
Network Tasman Limited & Group
Notes to and forming part of the Financial StatementsFor the year ended 31 March 2017
29 PERFORMANCE TARGETS
The following financial and reliability performance targets for the 12 months ending 31 March 2017 are specified in the company's Statement of Corporate Intent (SCI). Forecast results are compared to the performance targets below:
ActualResult
2017
SCITarget
2017
ActualResult
2016
Financial performance targets
Total company:
Surplus before interest, tax, line discount and customer contributions $mil 19.7 16.8 19.1
Operating surplus after tax and customer contributions $mil 8.0 5.6 7.5
Operating surplus to shareholders' funds % 4.27% 3.10% 4.18%
Line business only:
Total network costs per consumer $ 436 455 439
Cash operating costs per consumer $ 277 291 277
Line Charge Discounts (Excluding GST) $mil 10.3 10.3 10.2
Reliability performance targets (excludes Transpower planned and unplanned outages)
Average duration of supply interruptions per connected consumer (SAIDI) not to exceed -
minutes 186 115 186
Average number of supply interruptions per connected consumer (SAIFI) not to exceed -
number 1.58 1.36 1.59
Average duration of supply interruptions (CAIDI) not to exceed -
minutes 118 85 117
Faults per 100 km of line not to exceed - number 6.8 6.0 5.2
% faults not restored within three hours not to exceed -
% 26% 20 19
The SAIDI, SAIFI and CAIDI measures are industry standards, which enable assessment and comparison of network performance. Industry statistics include rural and urban networks. The Network Tasman network includes a significant rural component.
SAIDI =Total Annual Consumer Minutes of Non Supply
Total Number of Consumers
SAIFI = Total Annual Consumer Supply Interruptions
Total Number of Consumers
CAIDI = Total Annual Consumer Minutes of Non Supply
Total Annual Consumer Supply Interruptions

49
NETWORK TASMAN LIMITED & GROUP ANNUAL REPORT 2017
Financial Statements
Network Tasman Limited & Group
Notes to and forming part of the Financial StatementsFor the year ended 31 March 2017
29 PERFORMANCE TARGETS (cont')
The SAIDI and SAIFI statistics for unplanned outages were well over target for 2016/17 (115/75 and 1.29/1.07). The Kaikoura earthquake on 14 Nov 2016 generated 19 SAIDI points. Aside from this there was the mix of normally expected fault outages, but there were more of them expected. Most fault outages are external influence (car vs pole, tree felled over line etc) that we do not have direct control over.
The SAIDI and SAIFI statistics for planned outages were well over target for the year. (70/40 and 0.28/0.29). This was due to two main causes. There was a higher than normal number of shutdowns resulting from less live line work being undertaken for safety reasons. Renewal of older lines in some areas by conductor replacement is also now occurring. This type of work requires increased shutdowns to complete the work. This work will continue for the next ten years.
We have adjusted our Class B planned outages for SAIDI and SAIFI statement of corporate intent targets upward for 2017/18 to account for the above.
Safety of electricity supply
ActualResult
2017
SCITarget
2017
ActualResult
2016
Lost time injuries not to exceed - number 1 0 1
Public Safety and Damage Events
Public Injury Events number 0 0 0
Public Property Damage Events number 0 0 1
30 EVENTS OCCURRING AFTER BALANCE DATE
The directors of Network Tasman Limited are not aware of any significant event occurring subsequent to balance date which, if known at balance date, would have resulted in a different assessment within the financial statements.
31 CAPITAL MANAGEMENT
Network Tasman’s capital is its issued and paid up capital, share premium reserve and retained earnings. Equity is represented by net assets as disclosed in the balance sheet. The company manages its revenue, expenses, assets and liabilities and day to day financial transactions prudently. The purpose of managing Network Tasman’s equity is to ensure the company achieves its goals and objectives, whilst remaining a going concern.

50
NETWORK TASMAN LIMITED & GROUPANNUAL REPORT 2017
Audit Report
Independent Auditor’s Report
To the readers of Network Tasman Limited’s group financial statements and performance information
for the year ended 31 March 2017
The Auditor-General is the auditor of Network Tasman Limited Group (the Group). The Auditor-General has appointed me, Ian Lothian, using the staff and resources of Audit New Zealand, to carry out the audit of the financial statements of the Group on his behalf.
Opinion on the financial statements and the performance information
We have audited:
the financial statements of the Group on pages 20 to 49, that comprise the balance sheet as at 31 March 2017, the statement of comprehensive income, statement of changes in equity and statement of cash flows for the year ended on that date and the notes to the financial statements that include accounting policies and other explanatory information; and
the performance information of the Group on page 48 to 49.
In our opinion:
the financial statements of the Group:
present fairly, in all material respects:
its financial position as at 31 March 2017; and
its financial performance and cash flows for the year then ended; and
comply with generally accepted accounting practice in New Zealand in accordance with the New Zealand equivalents to International Financial Reporting Standards
the performance information of the Group presents fairly, in all material respects, the Group’s achievements measured against the performance targets adopted for the year ended 31 March 2017.
Our audit was completed on 30 June 2017. This is the date at which our opinion is expressed.
The basis for our opinion is explained below. In addition, we outline the responsibilities of the Board of Directors and our responsibilities relating to the financial statements and the performance information, and we explain our independence.
Basis for our opinion
We carried out our audit in accordance with the Auditor-General’s Auditing Standards, which incorporate the Professional and Ethical Standards and the International Standards on Auditing (New Zealand) issued by the New Zealand Auditing and Assurance Standards Board. Our responsibilities under those standards are further described in the Responsibilities of the auditor section of our report.
We have fulfilled our responsibilities in accordance with the Auditor-General’s Auditing Standards.
We believe that the audit evidence we have obtained is sufficient and appropriate to provide a basis for our opinion.
Responsibilities of the Board of Directors for the financial statements and the performance information
The Board of Directors is responsible on behalf of the Group for preparing financial statements that are fairly presented and that comply with generally accepted accounting practice in New Zealand.
The Board of Directors is also responsible on behalf of the Group for preparing performance information that is fairly presented.
The Board of Directors is responsible for such internal control as it determines is necessary to enable it to prepare financial statements and performance information that are free from material misstatement, whether due to fraud or error.
In preparing the financial statements and the performance information, the Board of Directors is responsible on behalf of the Group for assessing the company’s ability to continue as a going concern. The Board of Directors is also responsible for disclosing, as applicable, matters related to going concern and using the going concern basis of accounting, unless there is an intention to liquidate the Group or to cease operations, or there is no realistic alternative but to do so.
The Board of Directors’ responsibilities arise from the Energy Companies Act 1992.
Responsibilities of the auditor for the audit of the financial statements and the performance information
Our objectives are to obtain reasonable assurance about whether the financial statements and the performance information, as a whole, are free from material misstatement, whether due to fraud or error, and to issue an auditor’s report that includes our opinion.
Reasonable assurance is a high level of assurance, but it is not a guarantee that an audit carried out in accordance with the Auditor-General’s Auditing Standards will always detect a material misstatement when it exists. Misstatements are differences or omissions of amounts or disclosures, and can arise from fraud or error. Misstatements are considered material if, individually or in the aggregate, they could reasonably be expected to influence the decisions of readers taken on the basis of these financial statements and performance information.
We did not evaluate the security and controls over the electronic publication of the financial statements and the performance information.

51
NETWORK TASMAN LIMITED & GROUP ANNUAL REPORT 2017
Audit Report
Independent Auditor’s Report
To the readers of Network Tasman Limited’s group financial statements and performance information
for the year ended 31 March 2017
The Auditor-General is the auditor of Network Tasman Limited Group (the Group). The Auditor-General has appointed me, Ian Lothian, using the staff and resources of Audit New Zealand, to carry out the audit of the financial statements of the Group on his behalf.
Opinion on the financial statements and the performance information
We have audited:
the financial statements of the Group on pages 20 to 49, that comprise the balance sheet as at 31 March 2017, the statement of comprehensive income, statement of changes in equity and statement of cash flows for the year ended on that date and the notes to the financial statements that include accounting policies and other explanatory information; and
the performance information of the Group on page 48 to 49.
In our opinion:
the financial statements of the Group:
present fairly, in all material respects:
its financial position as at 31 March 2017; and
its financial performance and cash flows for the year then ended; and
comply with generally accepted accounting practice in New Zealand in accordance with the New Zealand equivalents to International Financial Reporting Standards
the performance information of the Group presents fairly, in all material respects, the Group’s achievements measured against the performance targets adopted for the year ended 31 March 2017.
Our audit was completed on 30 June 2017. This is the date at which our opinion is expressed.
The basis for our opinion is explained below. In addition, we outline the responsibilities of the Board of Directors and our responsibilities relating to the financial statements and the performance information, and we explain our independence.
Basis for our opinion
We carried out our audit in accordance with the Auditor-General’s Auditing Standards, which incorporate the Professional and Ethical Standards and the International Standards on Auditing (New Zealand) issued by the New Zealand Auditing and Assurance Standards Board. Our responsibilities under those standards are further described in the Responsibilities of the auditor section of our report.
We have fulfilled our responsibilities in accordance with the Auditor-General’s Auditing Standards.
We believe that the audit evidence we have obtained is sufficient and appropriate to provide a basis for our opinion.
Responsibilities of the Board of Directors for the financial statements and the performance information
The Board of Directors is responsible on behalf of the Group for preparing financial statements that are fairly presented and that comply with generally accepted accounting practice in New Zealand.
The Board of Directors is also responsible on behalf of the Group for preparing performance information that is fairly presented.
The Board of Directors is responsible for such internal control as it determines is necessary to enable it to prepare financial statements and performance information that are free from material misstatement, whether due to fraud or error.
In preparing the financial statements and the performance information, the Board of Directors is responsible on behalf of the Group for assessing the company’s ability to continue as a going concern. The Board of Directors is also responsible for disclosing, as applicable, matters related to going concern and using the going concern basis of accounting, unless there is an intention to liquidate the Group or to cease operations, or there is no realistic alternative but to do so.
The Board of Directors’ responsibilities arise from the Energy Companies Act 1992.
Responsibilities of the auditor for the audit of the financial statements and the performance information
Our objectives are to obtain reasonable assurance about whether the financial statements and the performance information, as a whole, are free from material misstatement, whether due to fraud or error, and to issue an auditor’s report that includes our opinion.
Reasonable assurance is a high level of assurance, but it is not a guarantee that an audit carried out in accordance with the Auditor-General’s Auditing Standards will always detect a material misstatement when it exists. Misstatements are differences or omissions of amounts or disclosures, and can arise from fraud or error. Misstatements are considered material if, individually or in the aggregate, they could reasonably be expected to influence the decisions of readers taken on the basis of these financial statements and performance information.
We did not evaluate the security and controls over the electronic publication of the financial statements and the performance information.

52
NETWORK TASMAN LIMITED & GROUPANNUAL REPORT 2017
Audit Report
As part of an audit in accordance with the Auditor-General’s Auditing Standards, we exercise professional judgement and maintain professional scepticism throughout the audit. Also:
We identify and assess the risks of material misstatement of the financial statements and the performance information, whether due to fraud or error, design and perform audit procedures responsive to those risks, and obtain audit evidence that is sufficient and appropriate to provide a basis for our opinion. The risk of not detecting a material misstatement resulting from fraud is higher than one resulting from error, as fraud may involve collusion, forgery, intentional omissions, misrepresentations, or the override of internal control.
We obtain an understanding of internal control relevant to the audit in order to design audit procedures that are appropriate in the circumstances, but not for the purpose of expressing an opinion on the effectiveness of the Group’s internal control.
We evaluate the appropriateness of the reported performance information within the Group’s framework for reporting its performance.
We evaluate the appropriateness of accounting policies used and the reasonableness of accounting estimates and related disclosures made by the Board of Directors.
We conclude on the appropriateness of the use of the going concern basis of accounting by the Board of Directors and, based on the audit evidence obtained, whether a material uncertainty exists related to events or conditions that may cast significant doubt on the Group’s ability to continue as a going concern. If we conclude that a material uncertainty exists, we are required to draw attention in our auditor’s report to the related disclosures in the financial statements and performance information or, if such disclosures are inadequate, to modify our opinion. Our conclusions are based on the audit evidence obtained up to the date of our auditor’s report. However, future events or conditions may cause the Group to cease to continue as a going concern.
We evaluate the overall presentation, structure and content of the financial statements and the performance information, including the disclosures, and whether the financial statements and the performance information represent the underlying transactions and events in a manner that achieves fair presentation.
We obtain sufficient appropriate audit evidence regarding the financial statements of the entities or business activities within the Group to express an opinion on the consolidated financial statements and performance information. We are responsible for the direction, supervision and performance of the Group audit. We remain solely responsible for our audit opinion.
We communicate with the Board of Directors regarding, among other matters, the planned scope and timing of the audit and significant audit findings, including any significant deficiencies in internal control that we identify during our audit.
Our responsibilities arise from the Public Audit Act 2001.
Independence
We are independent of the Group in accordance with the independence requirements of the Auditor-General’s Auditing Standards, which incorporate the independence requirements of
Professional and Ethical Standard 1 (Revised): Code of Ethics for Assurance Practitioners issued by the New Zealand Auditing and Assurance Standards Board.
In addition to the audit, we have carried out two assurance engagements for the group. These engagements were in respect of the group’s disclosure information prepared under the Commerce Commission’s requirement in the Electricity Distribution Information Disclosure Determination 2012 and the Annual Compliance Statement prepared under the Electricity Distribution Services Default Price-Quality Path Determination 2015. These assignments are compatible with the independence requirements.
Other than the audit, and these assignments, we have no relationship with or interests in the group.
Ian Lothian Audit New Zealand On behalf of the Auditor-General Christchurch, New Zealand
53
NETWORK TASMAN LIMITED & GROUP ANNUAL REPORT 2017
Audit Report
As part of an audit in accordance with the Auditor-General’s Auditing Standards, we exercise professional judgement and maintain professional scepticism throughout the audit. Also:
We identify and assess the risks of material misstatement of the financial statements and the performance information, whether due to fraud or error, design and perform audit procedures responsive to those risks, and obtain audit evidence that is sufficient and appropriate to provide a basis for our opinion. The risk of not detecting a material misstatement resulting from fraud is higher than one resulting from error, as fraud may involve collusion, forgery, intentional omissions, misrepresentations, or the override of internal control.
We obtain an understanding of internal control relevant to the audit in order to design audit procedures that are appropriate in the circumstances, but not for the purpose of expressing an opinion on the effectiveness of the Group’s internal control.
We evaluate the appropriateness of the reported performance information within the Group’s framework for reporting its performance.
We evaluate the appropriateness of accounting policies used and the reasonableness of accounting estimates and related disclosures made by the Board of Directors.
We conclude on the appropriateness of the use of the going concern basis of accounting by the Board of Directors and, based on the audit evidence obtained, whether a material uncertainty exists related to events or conditions that may cast significant doubt on the Group’s ability to continue as a going concern. If we conclude that a material uncertainty exists, we are required to draw attention in our auditor’s report to the related disclosures in the financial statements and performance information or, if such disclosures are inadequate, to modify our opinion. Our conclusions are based on the audit evidence obtained up to the date of our auditor’s report. However, future events or conditions may cause the Group to cease to continue as a going concern.
We evaluate the overall presentation, structure and content of the financial statements and the performance information, including the disclosures, and whether the financial statements and the performance information represent the underlying transactions and events in a manner that achieves fair presentation.
We obtain sufficient appropriate audit evidence regarding the financial statements of the entities or business activities within the Group to express an opinion on the consolidated financial statements and performance information. We are responsible for the direction, supervision and performance of the Group audit. We remain solely responsible for our audit opinion.
We communicate with the Board of Directors regarding, among other matters, the planned scope and timing of the audit and significant audit findings, including any significant deficiencies in internal control that we identify during our audit.
Our responsibilities arise from the Public Audit Act 2001.
Independence
We are independent of the Group in accordance with the independence requirements of the Auditor-General’s Auditing Standards, which incorporate the independence requirements of
Professional and Ethical Standard 1 (Revised): Code of Ethics for Assurance Practitioners issued by the New Zealand Auditing and Assurance Standards Board.
In addition to the audit, we have carried out two assurance engagements for the group. These engagements were in respect of the group’s disclosure information prepared under the Commerce Commission’s requirement in the Electricity Distribution Information Disclosure Determination 2012 and the Annual Compliance Statement prepared under the Electricity Distribution Services Default Price-Quality Path Determination 2015. These assignments are compatible with the independence requirements.
Other than the audit, and these assignments, we have no relationship with or interests in the group.
Ian Lothian Audit New Zealand On behalf of the Auditor-General Christchurch, New Zealand

54
NETWORK TASMAN LIMITED & GROUPANNUAL REPORT 2017
Statutory InformationThe Group’s principal activity is to own and operate the electricity distribution network in the wider Nelson and Tasman areas, excluding Nelson Electricity’s supply area in Nelson city.
Principal activities In addition to its principal activity, the Group has interests in complementary businesses including Network Tasman Fibre (a fibre optic communications network), commercial and industrial property, 50% shareholdings in Nelson Electricity Limited and On Metering Limited and advanced metering on the Network Tasman network.
Directors holding office during the year were: y MJ McCliskie (Chairman) y AM Milligan y AP Reilly y RA Sutton y SJ Weir y JO Williamson
Remuneration of directorsDirectors received the following fees:
Director 2017
MJ McCliskie (Chairman) 63,269
AP Reilly 36,443
JO Williamson 36,444
AM Milligan 36,452
SJ Weir 36,031
RA Sutton 36,031
Remuneration of employeesThe number of employees whose remuneration and benefits exceeded $100,000 in the financial year was:
Remuneration band 2017
$100,000 - $109,999 4
$120,000 - $129,999 2
$150,000 - $159,999 1
$170,000 - $179,999 1
$190,000 - $199,999 1
$210,000 - $219,999 2
$240,000 - $249,999 1
$250,000 – $259,000 1
Directors’ insuranceThe Group has Directors’ and Officers’ liability insurance cover to a value of $10 million which covers Directors of Network Tasman Limited and Directors representing Network Tasman Limited on associated company boards. The insurance does not cover liabilities arising from criminal actions.
Directors’ benefitsNo director of the Group has received or become entitled to receive benefits other than benefits included in the total remuneration listed above. However, directors may receive benefits as consumers of Network Tasman and beneficiaries of the Network Tasman Trust. Any benefits received will be on the same terms and conditions as all other consumers and beneficiaries.
There were no loans made by the Group to any director nor has the Group guaranteed any debts incurred by a director.
AuditorsAs required by statute the Auditor-General will appoint the auditors and directors will negotiate their fee and terms of audit. The fees paid to the auditors for audit work and other services are disclosed in the financial statements.

55
NETWORK TASMAN LIMITED & GROUP ANNUAL REPORT 2017
Statutory Information
Entries recorded in the interests registerThe following represents the particulars of the entries made in the Network Tasman’s interests register for the year ended 31 March 2017:
MJ McCliskie Speirs Foods Limited Director (ceased 30 June 2016) Heartland Group Limited Chairman (ceased 26 August 2016) Compass Fruit Limited Chairman (ceased 26 August 2016) Seventeen Limited Chairman (ceased 26 August 2016) Alandale Orchards Limited Chairman Nelson Electricity Limited Director Institute of Directors NZ Councillor Tribunal to consider protection for the Ngaruroro and Clive rivers Member
A Milligan Health Click Limited Director Independent Nursing Practice Limited Director London Plane Limited (Property) Director The Quit Group Trustee Nelson-Marlborough District Health Board Clinical Director, Woman, Child and Youth Services
AP Reilly AP & KM Reilly Limited Chairman Ravensdown Limited Director Dos Rios Dairy Limited Director Landcorp Farming Limited Director
RA Sutton Network Waitaki Limited Consultant (ceased 28 October 2016) Big Brothers Big Sisters Board Member Roger Sutton Consulting Principal Anglican Church Property Trust Trustee Independent Line Services Director The Lines Company Limited Consultant Christchurch Youth Hub Trustee Christchurch District Energy Company Limited General Manager
SJ Weir Nelson Bays Rugby Union Audit Committee Member (ceased August 2016) Nelmac Limited Director Marriott Orthodontics Limited Director Anderson Lloyd Lawyers Consultant to & former Partner Copyright Tribunal Trustee Rata Foundation Trustee Nelson Law Society Standards Committee Member Institute of Directors - Nelson/Marlborough Branch Chair Nelson City Council Arts Festival Transition Board Member Nelson Marlborough Tasman Community Services Forum Consultant Cawthron Institute Trust Board Trustee
J Williamson Nelson Tasman Region Hospice Trust Board Trustee
56
NETWORK TASMAN LIMITED & GROUPANNUAL REPORT 2017
Corporate GovernanceThe Board of Directors of Network Tasman Limited and Group (the “Board”) recognises the requirement to adopt best practice in relation to its corporate governance policies and procedures.
The Board is committed to a high standard of corporate governance and is guided by the “Code of Proper Practice for Directors” as recommended by the Institute of Directors in New Zealand.
Role of the Board of DirectorsThe Board is appointed by the shareholders to supervise the management of the company. The Board establishes the company’s objectives, strategies for achieving objectives, the overall policy framework within which Network Tasman’s business is conducted and monitors management’s performance. The Board has delegated the day-to-day management of the company to the chief executive.
The Board also ensures that appropriate procedures are in place to provide for effective internal control and that the business complies fully with legislative health and safety requirements.
Board operations and membershipNetwork Tasman’s constitution allows for a maximum of eight directors of the company.
The Board currently comprises six directors: a non-executive chairman and five non-executive directors. Board members have an appropriate range of proficiencies, experience and skills to ensure that all governance responsibilities are completed to ensure the best possible management of resources.
Network Tasman’s constitution sets out policies and procedures for the operation of the Board, including the appointment and removal of directors.
The full board met 13 times during the financial year ended 31 March 2017.
Board CommitteesHealth and Safety Committee
The Board has a Health and Safety Committee, comprising the full Board, to maintain an effective governance framework in accordance with relevant legislation and achieve the safety vision of “everyone safe, all of the time”. The committee supported by the Health and Safety Officer is tasked with ensuring that health and safety are key considerations in every operational decision made within the company.
Management and the Board are focused on ensuring a thorough health and safety management system (HSMS) oversight process is operating across all business units of the company. Activities include reviews with contractors and site visits. The committee met four times during the year.
Remuneration Sub-committee
The Board has a Remuneration Sub-committee comprising three non-executive directors. The Remuneration Sub-committee is responsible for assisting the Board in overseeing the appointment, performance and remuneration of the chief executive and members of the executive team (including succession planning) and reviewing the Remuneration Policy with the objective of being a good employer. The committee met two times during the year.
Audit and Risk Sub-committee
The Board has an Audit and Risk Sub-committee comprising two non-executive directors. The Audit and Risk Sub-committee is responsible for overseeing the financial, accounting and internal and external audit activities of the company, including reviewing the adequacy and effectiveness of internal controls and monitoring of corporate risk assessment, meeting with and reviewing the performance of the external auditors, reviewing the financial statements and making recommendations on financial and accounting policies. The committee met three times during the year. Specific areas overseen by the Audit Sub-committee include the following:
y Risk and Risk Management
The Board has overall responsibility for the company’s risk management and internal control systems. The Board has established policies and procedures that are designed to provide effective internal control. Annual budgets, asset management plans, business plans and longer-term strategic plans are prepared and agreed by the board, as well as a delegated authority policy. Financial statements and operational reports are prepared on a monthly basis and reviewed by the board throughout the year to monitor performance against budget targets and objectives.
In addition, the Board monitors the risk management framework and reviews ways to enhance existing risk
Corporate GovernanceThe Board of Directors of Network Tasman Limited and Group (the “Board”) recognises the requirement to adopt best practice in relation to its corporate governance policies and procedures.

57
NETWORK TASMAN LIMITED & GROUP ANNUAL REPORT 2017
Corporate Governance
management strategies, including the segregation of duties, the employment of suitably qualified and experienced staff and the implementation, where considered necessary and effective, and considers the recommendations made by the internal and external auditors.
y Internal Audit
The Board implemented an internal audit programme during 2016/17, utilising an experienced independent internal auditor. Three audits were completed during the year.
y Treasury Policy
Exposure to interest rate risk is managed in accordance with the company’s treasury policy that sets limits of management authority and levels of exposure to banking institutions.
Pricing Sub-committee
The Board established a Pricing Sub-committee comprising two non-executive directors during the year. The Pricing Sub-committee is responsible for assisting management and the Board to monitor and implement the current pricing strategy and in developing future pricing strategy based on key principles including “no surprises”/predictability, economic efficiency and equity. Activities include benchmarking with other electricity lines businesses, maintaining common standards, sending consumers signals on future price changes ahead of time and overseeing the five yearly price resets. The committee met twice during the year.
Telecommunications and AMI Sub-committee
The Board has a Telecommunications and AMI Sub-committee comprising two non-executive directors. The committee is responsible for overseeing the company’s fibre network and advanced metering activities including the development of new business opportunities. The committee did not meet during the year with all activities overseen by the full board.
Statement of Corporate IntentIn accordance with section 39 of the Energy Companies Act 1992, the Board submits to the shareholder trust a draft Statement of Corporate Intent (SCI) for the coming financial year. The SCI sets out the company’s overall objectives, intentions and financial and performance targets for shareholder review.
A copy of the Statement of Corporate Intent is available on the company’s website www.networktasman.co.nz
The Role of the Shareholder TrustThe Network Tasman Trust (“the Trust”) holds all the shares in Network Tasman Limited. The board aims to ensure that the trust is informed of all major developments impacting on the company’s affairs.
Board members meet frequently with trustees to communicate matters of importance. Information is also provided by way of the Interim Report, Annual Report, Asset Management Plan and Statement of Corporate Intent.
100% shareNon-trading 50% share 50% share 14.29% share
TASMAN ENERGY L I M I T E D
Network Tasman Ownership Structure

58
NETWORK TASMAN LIMITED & GROUPANNUAL REPORT 2017
Corporate Directory
DirectorsJohn McCliskieChairman
Annette Milligan
Tony Reilly
Roger Sutton
Sarah-Jane Weir
James Williamson
ExecutiveOliver Kearney Chief Executive Officer
Robert Derks Operations Manager
Kerry Haycock Corporate Services Manager
Murray Hendrickson Network Manager
Emma Lanigan Commercial Manager
Andrew Stanton Advanced Metering & Telecommunications Manager
Network Tasman TrustGwenny Davis – Chair
Trevor Tuffnell – Deputy Chair
Ian Barker
Peter Barr
Ian Kearney
Terry Kreft
Head Office52 Main Road Hope, 7020PO Box 3005, Richmond 7050Nelson
Telephone: 64 3 989 3600 or 0800 508 098
Facsimile: 64 3 989 3631
E-mail: [email protected]
Website: www.networktasman.co.nz
AuditorAudit New Zealand
BankersBank of New Zealand
SolicitorsPitt & Moore
Trust SecretaryPatrick AdamsonC/- Craig Anderson Limited
270A Queen Street, RichmondPO Box 3115, Richmond 7050Telephone: 64 3 544 6179
Facsimile: 64 3 544 5979
E-mail: [email protected]


Network Tasman Limited52 Main Road Hope, 7020 PO Box 3005, Richmond 7050, Nelson
Telephone: 64 3 989 3600 or 0800 508 098
Facsimile: 64 3 989 3631
E-mail: [email protected]
Website: www.networktasman.co.nz