annual report 2017 - nhs highland public health
TRANSCRIPT

The Annual Reportof the Director ofPublic Health
2017 Realistic Medicine

Director of Public Health Annual Report 20172

I would like to thank the following colleagues for their contributions:
Core Project Group and Contributors
Jane Chandler
Barry Collard
Catherine Flanigan
Stephanie Govenden
Beverley Green
Sara Huc
Fiona MacPherson
Noelle O’Neill
Cameron Stark
Cathy Steer
Susan Vaughan
Additional contributors
Ian Douglas
Andrew Evennett
David Garden
Simon Steer
Martin Wilson
Area Clinical Forum
Acknowledgements and list of contributors
Director of Public Health Annual Report 2017 3

Contents
Chapter One - Understanding the challenge Page 6
Chapter Two - Realistic care Page 22
Chapter Three - End of life care: what it means in NHS Highland Page 30
Chapter Four - Supporting high quality end of life care Page 42
Chapter Five - Frailty and its priority in Realistic Medicine Page 48
Chapter Six - Responding to frailty Page 56
Chapter Seven - Sustainable solutions Page 66
Director of Public Health Annual Report 20174

Significant financial constraints, accelerating health and social care
demand and the impact of wider political factors on the NHS have kept
health care firmly in the public and media spotlight1. This year’s annual
report reflects on these challenges both practically and ethically, using
the framework of Realistic Medicine.
Last year’s annual report focused on loneliness, recognising that 67%
of people aged 65 years and over in Highland feel lonely. The ‘Reach
Out’ campaign linked to that report has made significant progress
in mobilising a wider societal response to this issue. A grasp of the importance of Realistic
Medicine will also lead to a recognition that we have to respond to health and social care
needs as a society. The public sector cannot meet all of society’s needs and part of a realistic
approach will need to include empowering communities to increasingly develop approaches
to meeting their own needs.
Since July the 2nd 1948, when the NHS was born, it has operated on the principle of being
free at point of delivery to the whole population2. The NHS originated not from a legal
duty to provide healthcare but from a combination of moral conviction and economic
prudency3. However, prior to the commencement of the NHS, Aneurin Bevan predicted that,
“Expectations will always exceed capacity”4. Almost 70 years later this analysis remains
accurate. As a result, we must ensure that we maximise our available capacity to provide
valued, high quality care and to minimise harm, waste and unwarranted variation through
personalised and innovative patient centred care. This is the core message of Realistic
Medicine5.
The generosity of spirit underpinning the NHS has to be balanced against the need to allocate
scarce resources as efficiently as possible. Public health is often viewed as a utilitarian
discipline, seeking to maximise the greatest good for the greatest number. However, this is
overly simplistic: public health also champions equity, recognising that unequal need requires
unequal provision based on a moral duty to care for those in need.
Earlier this year the Scottish Public Health Network (ScotPHN) considered what contribution
public health could make to realising Realistic Medicine and highlighted the roles of ensuring
the wise use of available evidence, empowering communities and leading and supporting
innovation and implementation. All of these elements have been considered in this report.
I want to end by thanking the team who have put together this year’s report for their
professionalism and commitment to the population we serve.
Introduction
Professor Hugo van Woerden
Director of Public Health and Health Policy, NHS Highland
Stiùriche na Slàinte Phoblach, Bòrd Slàinte na Gàidhealtachd
Director of Public Health Annual Report 2017 5

Chapter One - Understanding the challenge
Director of Public Health Annual Report 20176

Why has the nomenclature of Realistic Medicine or Prudent Healthcare caught the imagination
of many so effectively? This chapter explores some of the drivers that have been building up
over many decades and that have led to the issue coming into focus.
The financial contextTotal healthcare expenditure in the United Kingdom (UK) has increased inexorably as a percentage
of GDP over the last 100 years. Healthcare spend is now over 8% of gross domestic product (GDP)
as shown in Figure 1.11. This could rise to as much as 19% of GDP by 20611. One of the drivers for
Realistic Medicine is a recognition that this trend has to be addressed if healthcare free at the point
of delivery is to be societally affordable over the long term.
Figure 1.1 - Percent of General Domestic Product for the UK spent on Health Source: ukpublicspending.co.uk2
There is no optimum amount of expenditure on health. However, there is some evidence that each
extra increment of expenditure beyond a certain point leads to diminishing returns. Many high
income economies are on the part of the curve where there are diminishing returns (Figure 1.2).
Figure 1.2 - Life expectancy at birth and health spending per capita, 2011 Source: OECD Health Statistics 20133
0
1
2
3
4
5
6
7
8
9
190
0
190
4
190
8
1912
1916
192
0
192
4
192
8
193
2
193
6
194
0
194
4
194
8
195
2
195
6
196
0
196
4
196
8
1972
1976
198
0
198
4
198
8
199
2
199
6
20
00
20
04
20
08
20
12
20
16
Perc
ent o
f GD
P
Chapter 1
R² = 0.51
65
70
75
80
85
0 2000 4000 6000 8000 10000
Health spending per capita (USD PPP)
Life
exp
ecta
ncy
in y
ears
AUS AUT
BEL
BRA
CAN
CHL
CHN
CZE
DNK
EST
FIN
FRA
DEUGRC
HUN
ISL
IND
IDN
IRL
ISR
ITA JPN
KOR LUX
MEX
NLD
NZLNOR
POL
PRT
RUS
SVK
SVN
ESPSUE
CHE
TUR
GBR
USA
Director of Public Health Annual Report 2017 7

Figure 1.2 indicates that there is a relationship between spending and health. A significant
proportion of the relationship is simply a reflection of the relationship between Gross Domestic
Product, or the wealth of a country and life expectancy, as income is one of the most important
determinants of health. However, the graph clearly demonstrates that beyond a certain point,
additional expenditure on health provides relatively little return, and that many wealthy countries
are on the part of curve. This suggests that from a realistic or prudent healthcare perspective, major
additional investment in healthcare may result in relatively modest benefit.
Scotland spends more per person on healthcare than the other nations of the United Kingdom
(UK), although this gap is reducing over time, as healthcare spend per person in other UK
jurisdictions is catching up4. In 2015/16, £11.2 billion was spent on Scottish health services. The
bulk of healthcare spend occurs in secondary care with more than 50% of the budget spent on
hospital care and less than 10% on General Practice as shown in Figure 1.35. Part of the Scottish
Government’s commitment is to reverse this trend and to increase the proportion of spending in
primary and community care; an initiative that is very much in line with Realistic Medicine. However,
this is extremely challenging in practice as the ‘drivers’ in the system have been in the opposite
direction for many decades. The ethos of Realistic Medicine is that providing more personalised and
appropriate care will lead to better value care and as a result more efficient spending.
Figure 1.3 - Percentage of Operating Costs by Healthcare Sector 2015-2016 Source: Information Services Division (ISD), Scottish Health Service Costs5
The cost of social care In Scotland between 2004 and 2014, social care spending has seen a 15% increase in real terms
for older people aged 65 and over, with 44% of the £4 billion spent in 2013/14 being on this group6.
Across England social care spending has also risen consistently as a percentage of national income
from 1977 to 20164. However, despite the growth in expenditure, due to the rapid growth in the
population aged 65 and over, there has been a 1% decrease in real terms per capita spending on
social care over the decade between 2004 and 2014. Although there are also changes in where
this money is spent the majority is still spent on care homes, which may not be the approach that
gives the best value for money. Across Scotland, 38% of the spend on adult social care was on care
homes and 25% on home care (2013/14 figures)6. There is a case for spending a greater proportion
on home care.
Drivers for health and social care costsThe ageing population has been described as a ‘population time bomb’ responsible for
continuously escalating health and social care costs. The truth is more nuanced. There are many
drivers for increased costs including:
0% 10% 20% 30% 40% 50% 60%
Other
Dental and Ophthalmic
General Practice
Primary Care Prescribing
Community
Hospital
Percentage Total Operating Costs
Director of Public Health Annual Report 20178

Chapter 1
• Increasing prevalence of patients with multiple co-morbidity (perhaps undiagnosed in past
generations and over diagnosed in our own)
• increases in the national minimum wage and greater competition with alternative occupations
• spiralling medication costs, largely driven by industry
• developments in high cost medical technology
• increasing life expectancy, extending the duration of treatment for long term conditions1,7
• earlier onset of chronic conditions associated with obesity such as osteoarthritis and diabetes7
• rising identification of cognitive decline, impaired mental function, and dementia against a
background of a world in which cognitive skills such as using the internet is increasingly essential
• changes in social cohesion and a common perspective around the social contract.
Some of these issues are explored further within this report. We must remain mindful of this
complex array of factors which are driving changes in healthcare cost and demand. The growth of
our older population is a success story of modern medicine and modern public health interventions
which have resulted in people living longer, healthier lives and should be celebrated. Our older
population are also a valued and vital part of our community and contribute a wealth of experience
and skills. Many of the older population are active members of the community, contribute to third
sector organisations and work as informal carers supporting the role of the NHS.
Ageing and co-morbidityA number of interacting factors related to ageing, co-morbidity, identification of sub-clinical levels of
disease and increased therapeutic options, which have driven costs upward, have perhaps resulted
in a desire to see the pendulum swing in the opposite direction and driven realistic or prudent
healthcare initiatives. Figure 1.4 presents some aspects of this complex relationship between
different long term conditions in our ageing Scottish population.
Figure 1.4 - Combinations of long term conditions that define multi-morbidity among GP patients in Scotland Source: The Scottish School of Primary Care Research Multi-morbidity in Scotland, slide five8
Director of Public Health Annual Report 2017 9

Old age is increasingly ‘medicalised’, as it is in the interests of pharmaceutical companies to support
the identification of multiple healthcare problems that would previously have been treated as simply
an inevitable part of ageing9. Each ‘diagnosis’ can then be subjected to a panoply of therapeutic
interventions that only make a minor improvement to survival or quality of life, but which are
sufficiently common to sell in large volumes, generating significant profits10. This is a global issue
related to the way in which we develop new medicines and the extent to which such development
should be leveraged via a profit motive. Current mechanisms encourage the develop of a ‘me too’
drugs, as opposed to genuine innovation, for example in relation to diseases of the developing
world, which will not yield big profits.
Caring for the elderly and vulnerableFree healthcare has probably been provided for the ‘destitute and dying’ in the Highlands since
the establishment of monasteries such as that in Iona in 563 AD, Applecross in 673 AD, and
Rosemarkie around 716 AD. A subsequent post-reformation growth in homes and care to the elderly
in almshouses occurred in the 16th century11. Table 1.5 charts the timeline of nursing homes and
residential homes from then to the present day12.
Table 1.5 - Historical Timeline of Care Provision in the UK from 16th Century To present Day12,13,14
16th Century Almshouses provide charitable care to ‘elderly, poor and insane’.
19th Century Workhouses and then poorhouses became main residences for these patients.
1880s • Nursing Homes emerge for paying customers including surgery and maternity,
numbers double every 10 years.
• The first district nurses are trained for the 18 districts of Liverpool.
1930s • Public Assistance institutions replace workhouses.
• District Nursing provided on provident basis through District Nursing Associations,
poor and elderly usual for free.
1948 • Home nursing provided through newly formed NHS.
• New duty on local authorities to provide residential accommodation. Formal
separation of nursing and residential homes.
1950s 1950s growth of NHS and emergence of geriatrics as a medical speciality, new
recognition of needs of older people.
1960s-1970s • Residential homes move from small 30 bedded homes to around 60 beds.
• National Assistance act requires local authorities to enable people to remain in own
home as long as possible.
1968 Social Work (Scotland) Act 1968. Local councils have a duty to assess a person’s
community care needs and take account of their preferences to inform assistance.
1980s New regulation allows public funding of private bed spaces for residential care. Private
sector expands but growth declines.
1980s-1990s • As inpatient geriatric beds close, nursing home beds continue to increase.
• Number of people receiving nursing and care at home declines as level of
assistance increases.
2000s Intermediate Care Teams and rehab services open as short stay residences. Both
residential and nursing homes are renamed as care homes.
2010s Level of need and cost for those in care homes increasing.
2014 The Public Bodies (Joint Working) Act 2014. Requires NHS boards and local authorities
to jointly submit an integration scheme for integrating health and social care.
Director of Public Health Annual Report 201710

In 1948, the government placed a duty on local authorities to provide residential care for their
population. From then until the 1980s the numbers of residents in care homes continued to
increase, followed by a similar growth in nursing home residents from the 1990s12.
A considerable expansion of the private sector accompanied the increasing numbers, so that by
2014, 74% of residential care home capacity and 86% of nursing home capacity was provided by the
private sector. However, a large proportion of private provision remains funded in part or in full by
local authorities (LAs), or in the case of the Highland Council area, via a commissioning arrangement
between Highland Council and NHS Highland15.
A realistic approach to care has to take account of the changes in the demography of those using
care homes. In Scotland, over the last decade, the number of long stay care home residents aged
85 years and over has increased by 12%, the number of residents with dementia has increased by
30% and the average level of assistance required by those in such facilities to support activities of
daily living (ADLs) has also increased15,16.
The population in care homes is changing. Those residing in care homes are older, frailer and
require more assistance than was the case in the past. In England, the population aged 65 years
and over increased by 11% over the last 10 years, but in contrast, the nursing home population
increased by only 0.3%. This suggests that only those with the highest levels of need are being
admitted to nursing homes. This shift has been paralleled by the emergence of 600,000 unpaid
carers (English data), who may receive Carer’s Allowance, but who are not formally employed in the
care industry. This emerging workforce has been integral to enabling more people to remain in their
own homes17.
In Scotland, estimates of the number of carers are derived from a combination of census data and
the Scottish Health Survey, with the most recent estimates from 2011 and 2012/13 publications
respectively18. The surveys found that 759,000 (17%) of the adult population (aged 16+) were
carers and 29,000 (4%) of these carers were aged less than 16 years17. Although the percentage
of the population in Scotland who are carers has been constant between 2001 and 2011, a higher
proportion of those caring are providing 20 or more hours of care and 13% fewer carers providing
19 or less hours of care17. In carers aged 65 and over 47% are providing care for 50 hours or more17.
Across Scotland 40% of carers had been caring for more than a year and a further 40% for between
5 and 20 years. Although the proportion of the population who are carers is the same regardless
of deprivation status, those in the most deprived areas were 23% more likely to be providing 35
or more hours of unpaid care, which is the threshold for receiving the maximum level of Carer’s
Allowance.
Caring has an impact on the carer’s wellbeing. While those providing up to 19 hours of unpaid care
have comparable self reported health to the rest of the general population, those providing care for
20 or more hours per week report increasing levels of poor health. This effect is compounded by
age.
Only 56% of carers are employed and this reduces to 35% in those who are providing 35+ hours
of care per week. Those receiving the maximum level of Carer’s Allowance are only allowed to
work 10 hours per week. Estimates suggest that fifty percent of carers are entitled to, but do not
receive, carers allowance, a figure which rises to over 95% of carers aged 65 and over. Across NHS
Highland females aged 50-64 years are most likely to be carers.
Chapter 1
Director of Public Health Annual Report 2017 11

NHS Highland contextAcross both Scotland and NHS Highland the population is ageing and over the next 20 years there
is likely to be a significant rise in the number of those aged over 70 years who have multi-morbidity
and high levels of frailty (see Figure 1.6).
Figure 1.6 - Current and projected population, NHS Highland Source: National Records of Scotland (NRS) Population Projections for Scottish Areas (2014-based)
As the population bulge shown in Figure 1.6 becomes older, new and imaginative solutions will
need to be developed to respond to the needs of this population.
High resource individualsHealth and social care resources are not utilised evenly by all individuals in the population. The
distribution of expenditure is very skewed. In north Highland, 2.2% of the population (3,903
individuals; 2015/16 data) utilised 50% of health and social care resources. Across NHS Highland
there were 16.7 High Resource Individuals (HRIs) per 1,000 population19. Expenditure on the
average person in HRI group across all age bands was £30,353 per person, whilst the average
expenditure on the rest of the population was £644.61 per year.
Analysis of the pattern of expenditure is useful in effective planning and exploring realistic
approaches to the management of service delivery. There is a strong correlation between having
a long term condition (LTC) and an increased risk of admission to hospital, or of being classed as a
High Resource Individual.
15000 1500010000 100005000 0 5000
00-04
05-09
10-14
15-19
20-24
25-29
30-34
35-39
40-44
45-49
50-54
55-59
60-64
65-69
70-74
75-79
80-84
85-89
90+
Male 2017 Female 2017
2039
Director of Public Health Annual Report 201712
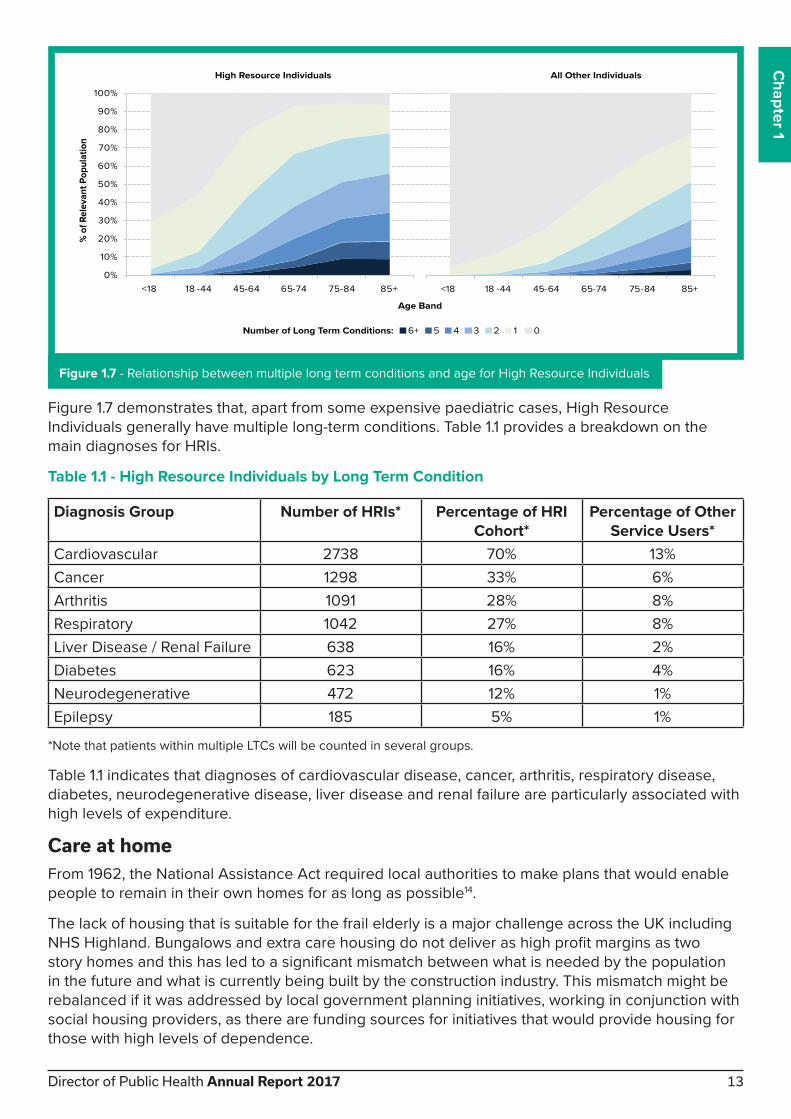
Figure 1.7 demonstrates that, apart from some expensive paediatric cases, High Resource
Individuals generally have multiple long-term conditions. Table 1.1 provides a breakdown on the
main diagnoses for HRIs.
Table 1.1 - High Resource Individuals by Long Term Condition
Diagnosis Group Number of HRIs* Percentage of HRI Cohort*
Percentage of Other Service Users*
Cardiovascular 2738 70% 13%
Cancer 1298 33% 6%
Arthritis 1091 28% 8%
Respiratory 1042 27% 8%
Liver Disease / Renal Failure 638 16% 2%
Diabetes 623 16% 4%
Neurodegenerative 472 12% 1%
Epilepsy 185 5% 1%
*Note that patients within multiple LTCs will be counted in several groups.
Table 1.1 indicates that diagnoses of cardiovascular disease, cancer, arthritis, respiratory disease,
diabetes, neurodegenerative disease, liver disease and renal failure are particularly associated with
high levels of expenditure.
Care at homeFrom 1962, the National Assistance Act required local authorities to make plans that would enable
people to remain in their own homes for as long as possible14.
The lack of housing that is suitable for the frail elderly is a major challenge across the UK including
NHS Highland. Bungalows and extra care housing do not deliver as high profit margins as two
story homes and this has led to a significant mismatch between what is needed by the population
in the future and what is currently being built by the construction industry. This mismatch might be
rebalanced if it was addressed by local government planning initiatives, working in conjunction with
social housing providers, as there are funding sources for initiatives that would provide housing for
those with high levels of dependence.
0%
10%
20%
30%
40%
50%
60%
70%
80%
90%
100%
<18 18 -44 45-64 65-74 75-84 85+
% o
f Rel
evan
t Pop
ulat
ion
Age Band
High Resource Individuals
6+ 5 4 3 2 1 0Number of Long Term Conditions:
<18 18 -44 45-64 65-74 75-84 85+
All Other Individuals
Figure 1.7 - Relationship between multiple long term conditions and age for High Resource Individuals
Chapter 1
Director of Public Health Annual Report 2017 13

It would be possible to model the required number of extra-care houses required for
each community across NHS Highland and take steps that facilitated the building of such
accommodation. The main advantage for the NHS would be that it could increase flow though
hospitals, allowing patients who are currently inappropriately stuck in hospital beds to move on to
accommodation that is more suitable. Hospitals can be dangerous places to be for those who are
frail, but not acutely ill, as such individuals are at particular risk of contracting ‘hospital acquired
infections’ that can be fatal. Housing provision is one element of the wider challenge of providing
appropriate care to individuals with high levels of dependence. The other challenge is providing
staff to care for such individuals, which is addressed elsewhere in this report.
Integration of health and social care National policy on integration of health and social care staff is aimed at improving seamless care
that wraps around the individual and responds to their needs. Different parts of NHS Highland
have approached integration in different ways. A lead agency model has been adopted in north
Highland, with Highland Council as the lead agency for children’s community health and social care
services and NHS Highland as the lead agency for adult health and care services. A body corporate
approach led by an Integrated Joint Board (IJB), has been taken in Argyll and Bute. The IJB and
Health and Social Care Partnership in Argyll and Bute has delegated responsibility, from both NHS
Highland and from Argyll and Bute Council, in relation to health and social care20. In the years since
integration, many benefits have been realised across both models, including the forming of joint
assessment teams and direct access for patients to a wide range of multidisciplinary teams.
Sustainable servicesOne of the aims of service integration is to reduce unnecessary admission to hospital and to
reduce the number of delayed discharges, delivering a more efficient and effective use of available
resources20. Progress has been made in this area, but more work remains to be done. Reducing the
number of bed days occupied by people who are ‘medically fit for discharge’ has the potential to
save money and deliver a more sustainable service. The costs associated with bed days occupied
due to delayed discharges in NHS Highland is significant. Between £1.8 to 2.2 million could be
saved if we were able to reach average practice in Scotland (based on 2015/16 figures).
Although this money might not be realised as ‘cash releasing savings’, it represents a significant
opportunity to create greater system capacity. Sustaining flow though hospitals is a challenge
across the world, but is particularly acute in a remote and rural area such as NHS Highland, as
patients who need ongoing care at home cannot be discharged to remote areas until suitable care
can be identified in that area. A realistic health and social care approach will require an ongoing
focus on maximising flow through acute care beds and the development of new care at home
models.
Residential or nursing home facilities are generally not financially viable unless they have at least
40 residents, but small rural communities do not justify facilities of this size. In addition, it is difficult
to find staff in remote and rural areas who are willing to work in care homes or to provide care at
home. These factors have resulted in some patients remaining inappropriately accommodated in
hospital for long periods of time whilst staff and families try to find a suitable solution. Some areas
have developed sustainable solutions, for example, the Howard Doris Centre in Lochcarron, which
delivers support for individuals with a range of different levels of need. Interestingly, this initiative
grew out of local initiative and vision rather than being driven by the public sector. It demonstrates
the value of communities considering their own needs, finding out what options have been tried
elsewhere in the world, and applying this to developing local solutions..
There are new sustainable models which provide care in remote and rural areas. One approach
being piloted by NHS Highland in conjunction with Albyn Housing, local universities and a local
housing manufacturer, is Fit Homes. These homes are an example of modular housing incorporating
Director of Public Health Annual Report 201714

high levels of technology which can be rapidly constructed and even transported to new locations
to meet changing need. Modular housing is designed to monitor the activities of residents who
have high levels of care needs intensively and trigger appropriate action when the technology
identifies a problem. Although this is currently being undertaken as a research project, there is an
urgent need to consider ways in which this strategy can be replicated across Highland.
The challenges of frailtyA major challenge in the context of Realistic Medicine or Prudent Healthcare is managing frailty.
No single definition of frailty exists but it is generally accepted as ‘a state of increased vulnerability
in which individuals have diminished ability to respond to stressors and are at an increased risk of
adverse outcomes’21.
In theory, early detection of frailty should facilitate interventions that reduce the risk of admission
to acute care, although there is a lack of robust research to that effect. There are a number of tools
that attempt to facilitate such a process. The Scottish Patients at Risk of Re-admission or Admission
(SPARRA) score calculates the probability that a patient will have an emergency admission within
the next 12 months. A 40% chance of admission or readmission is considered a high risk state22.
Figure 1.8 shows the SPARRA scores for NHS Highland showing how the risk of admission varies
with age and is highest among women aged 80-89 years old.
Figure 1.8 - Scottish Patients at Risk of Re-admission or Admission (SPARRA) scores in Highland by age and gender Source: NHS National Services Scotland (NSS) Discovery Portal
However in comparison to other health board areas NHS Highland has the lowest rate of
emergency admissions for those aged 75 and over, and has achieved a sustained reduction over
the last five years. This important quality outcome indicator reflects the success of focussing on
preventative and community based care for older adults.
6000 4000 2000 0 2000 4000 6000
Under 16
16-29
30-39
40-49
50-59
60-69
70-79
80-89
90+
Count of Male Population Count of Female Population
60%+ 40-59% 20-39%
SPARRA Risk Categories
Chapter 1
Director of Public Health Annual Report 2017 15

Social care provisionCare homes and nursing homes are being utilised less than in the past and those in such facilities
have, on average, greater levels of dependency. In some ways this trend is to be welcomed as
these type of facilities do not meet the needs of a large proportion of the population. The availability
of care home places, per 1,000 population, has reduced slightly across Scotland and Highland
over the last ten years as shown in Figure 1.915. The average weekly costs for Scotland have also
increased, with those self funding with nursing care placements seeing the greatest increase in cost
from £552 per week in 2007 to £814 per week in 201615.
Amongst longer stay adults in care homes in North NHS Highland the number requiring nursing
care has reduced by 15% over the last 10 years whilst the number with dementia or another physical
disability or chronic illness has increased as has the proportion aged 85 and older15. So whilst rates
of care home use have reduced, the residents are older and have more long term conditions than
was previously the case. It is not possible to determine whether this reflects changes in supply or
demand. It may be that need for nursing care has reduced with a healthier older population or that
the number of care home places and available nursing care has not kept pace with the increased
number of older people, so that only those with the greatest need are accessing this type of care.
Figure 1.9 - Number of Registered Places in Care Homes for Older People per 1,000 Population Aged 65+, 2006-2016 Source: Information Services Division (ISD) Scottish Care Home Census 2006-201615
The NHS Highland Public Health department has investigated what the situation could be in the
next 20 years in terms of the requirement for Care Home places, if current use per population aged
over 65 years remains the same in Highland. Unless we develop new ways of working, then twice
the number of care home places will be required by the year 203523.
This prediction assumes that the current proportions by dependency state remain the same, and
that two thirds of the population with high dependency are cared for in care homes (see Figure
1.10). A better way of thinking about this issue is to focus on levels of frailty or dependence that
can be expected in the population and to plan to design support mechanism, in conjunction with
communities, for the expected populations at each levels of frailty.
0
10
20
30
40
50
60
2006 2007 2008 2009 2010 2011 2012 2013 2014 2015 2016
Rate
Per
100
0 po
pula
tion
aged
65+
Year
Argyll and Bute
Highland
Scotland
Director of Public Health Annual Report 201716
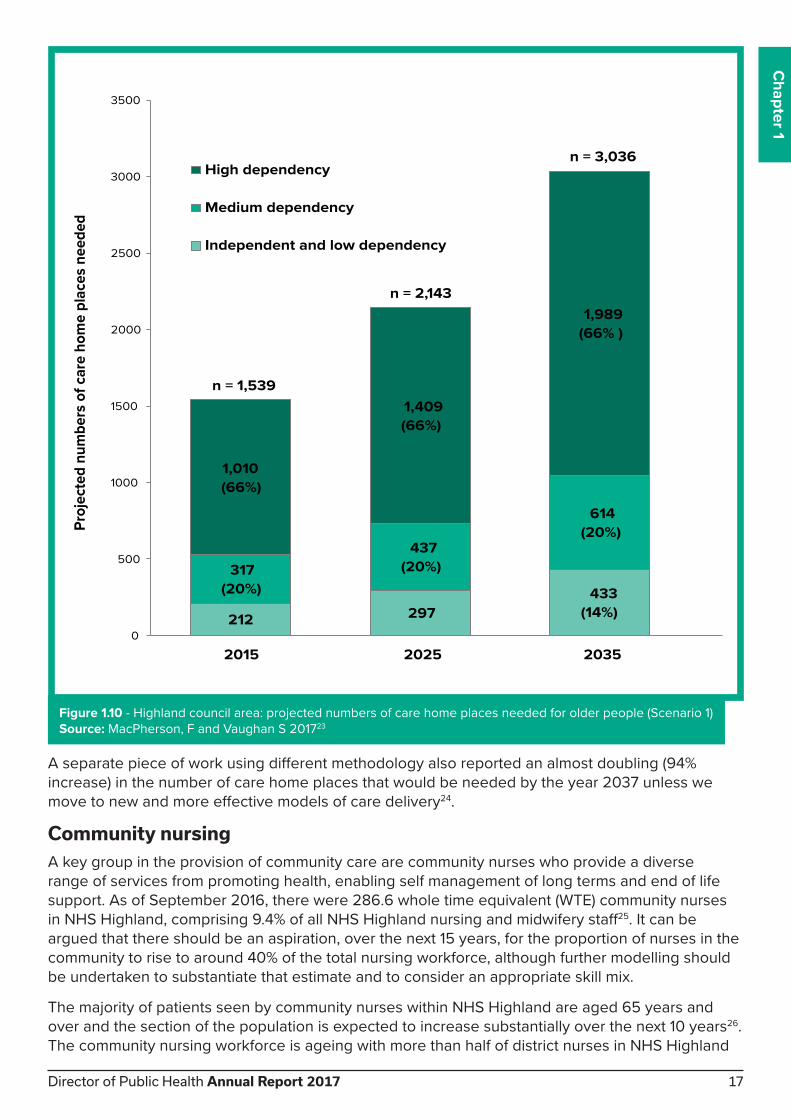
A separate piece of work using different methodology also reported an almost doubling (94%
increase) in the number of care home places that would be needed by the year 2037 unless we
move to new and more effective models of care delivery24.
Community nursingA key group in the provision of community care are community nurses who provide a diverse
range of services from promoting health, enabling self management of long terms and end of life
support. As of September 2016, there were 286.6 whole time equivalent (WTE) community nurses
in NHS Highland, comprising 9.4% of all NHS Highland nursing and midwifery staff25. It can be
argued that there should be an aspiration, over the next 15 years, for the proportion of nurses in the
community to rise to around 40% of the total nursing workforce, although further modelling should
be undertaken to substantiate that estimate and to consider an appropriate skill mix.
The majority of patients seen by community nurses within NHS Highland are aged 65 years and
over and the section of the population is expected to increase substantially over the next 10 years26.
The community nursing workforce is ageing with more than half of district nurses in NHS Highland
212 297433
(14%)
317(20%)
437(20%)
614(20%)
1,010(66%)
1,409(66%)
1,989(66% )
n = 1,539
n = 2,143
n = 3,036
0
500
1000
1500
2000
2500
3000
3500
2015 2025 2035
Proj
ecte
d nu
mbe
rs o
f car
e ho
me
plac
es n
eede
d
High dependency
Medium dependency
Independent and low dependency
Figure 1.10 - Highland council area: projected numbers of care home places needed for older people (Scenario 1)
Source: MacPherson, F and Vaughan S 201723
Chapter 1
Director of Public Health Annual Report 2017 17

aged 50 years or older. The per capita cost of community nursing provision in those aged 75 and
older is 12 times greater than that of those aged under 75 years.
NHS Highland is experimenting with new models of neighbourhood nursing, based on a Buurtzorg
model in the Netherlands, that will be key to meeting the needs of an ageing population. A recent
local review of district nursing services has reflected on the importance of skill mix within district
nursing and the need to increase the proportion of staff time that is utilised for face to face to
interventions, as opposed to other activities. There is a case for work to improve equity of access to
nursing care across NHS Highland, particularly out of hours, which could have a significant impact
on hospital admissions.
The cost of social care in Highland In 2013-2014, Highland Council and Argyll and Bute Council spent £72.5 million and £34.4 million
respectively on older people’s social care6. There is some evidence that the figure for Highland
Council is lower than in other parts of Scotland. The figure for north Highland is supplemented by
additional funding by NHS Highland to the tune of £34m since integration.
There is significant variation across Scotland in spend per capita on services for older people, as
shown in Figure 1.11. Some of the variation may be related to the fact that in Argyll and Bute and
in north Highland the cost per hour of providing care at home is high27. This reflects some of the
challenges in providing care in remote and rural settings. However Figure 1.11 shows that both
Highland and Argyll and Bute actually have lower expenditure per capita on older people’s social
care than the Scottish average when the full range of social care services provided is considered.
£0 £500 £1,000 £1,500 £2,000 £2,500 £3,000 £3,500 £4,000 £4,500 £5,000
Shetland Islands
Orkney Islands
Eilean Siar
Glasgow City
West Dunbartonshire
Aberdeen City
Inverclyde
Dundee City
North Ayrshire
Edinburgh, City of
Falkirk
East Dunbartonshire
Clackmannanshire
Scotland
East Ayrshire
Renfrewshire
South Ayrshire
South Lanarkshire
Midlothian
Argyll & Bute
East Renfrewshire
Angus
Stirling
Aberdeenshire
North Lanarkshire
Scottish Borders
East Lothian
Highland
Dumfries & Galloway
West Lothian
Fife
Moray
Perth & Kinross
Figure 1.11 - Expenditure Per Capita on Social Services for Older People (aged 65+) 2013-14
Source: Information Services Division. Gross Expenditure in Older People in NHS Highland, Tab 7A6
Director of Public Health Annual Report 201718

What does it mean for our older population?A 1962 report was the first on the conditions of residential homes. It stated that they “did not create
a substitute community or a network of social relationships which could sustain a sense of individual
purpose or pride”12. More than fifty years on this remains true and loneliness remains a significant
problem for people living in nursing homes with one study finding more than half of nursing home
residents reported feeling lonely, the effects of which were discussed in last year’s report28. A
Scandinavian study found loneliness to be 10% higher amongst older people living in an institution
compared to those living in their own homes29. There is clearly a need to find alternative solutions.
NHS Highland is taking part in work on intergenerational communities and experiments to combine
nursery education with care homes. Early evidence suggests that this is beneficial to both groups
and this is an intervention that merits wider implementation.
There can also be physical effects from living in a care home or other low activity environment.
Amongst healthy adults as little as one week of bed rest can cause muscle atrophy and this is
accelerated amongst older people30. Muscle atrophy and weakness (sarcopenia) has been found
to be present in 80% of nursing home residents. Muscle atrophy is associated with slower walking
speed and greater risk of falls31. Imaginative programmes to increase physical activity are being
pursued across NHS Highland to address this issue, but is remains a major challenge that needs
to be addressed, and which is very much in line with the aims of Realistic Medicine or Prudent
Healthcare.
In addition to the physical and mental effects, admission to a nursing home is in itself associated
with increased mortality. A study in Nottingham found that survival at one year was 76% in
residential homes compared to 66% in nursing homes. Other factors associated with decreased life
expectancy were: male gender, admission to a dual registered home, placement from hospital and
increased age32. Some of this effect may be due to selection bias, but it does suggest that there are
problems with current models of residential and nursing home care.
What does it mean for our society? Current models of care risk creating levels of dependency that are unsustainable in future
generations as both costs and demand continue to rise. Family support and informal caring is still
the single biggest contributor to caring for the older population but has decreased over the last few
generations. In many non-western cultures there is a higher level of respect for the elderly, and a
higher status for those who care for older family members.
Historic patterns of care in Scotland relied heavily on unpaid female members of the family to
provide care33. Wider changes in society have reduced intergenerational living, altered rates of
separation and divorce, increased the proportion of women in paid employment and led to family
members living further apart. All of these have contributed to challenges in delivering care. There
is a need for imaginative thinking to generate new ideas that can encourage support by families for
older members of their extended family.
Chapter 1
Director of Public Health Annual Report 2017 19

Realistic Medicine Case Study
Innovative use of Chaplain Services to prevent staff burnout The Chaplaincy service is working with the Occupational Health service to prevent burnout in staff using an innovative group discussion tool called “values based reflective practice”. There are 12 staff in NHS Highland who are trained or undergoing accredited training in the use of this approach. The model uses four key questions shown below:
Question Quality Strategy Values-based Practice1. What does this encounter say about my practice?
Safe? Effective? How was power used?
2. What does this encounter tell me about me as a person?
Person–centred? (enhance self awareness)
Do I inhabit the role with integrity?
3. How does this encounter sit with/raise questions about my beliefs, values, world view?
Person centred? (vocational motivation)
Dignity? Compassion? Whole person care?
4. Whose need was met in this encounter?
Person-centred? What was valued, over valued, under valued?
Source: Paterson and Kelly (2013), Values-based Reflective Practice: A Method Developed in Scotland for Spiritual
Care Practitioners in Practical Theology. Available at: http://bit.ly/2iV8Fak
Realistic Medicine Case Study
Integrated Services in Highland NHS Highland has been on a journey of transformational change in health and social care for the past 5 years. An Integrated Lead agency model has provided a platform to deliver realistic care.
Redesign work in Highland has been positive, including work across hospitals and communities, delivering continuity of care and improvements in patient flow across health and social care. NHS Highland’s Highland Quality Approach is working to apply a philosophy of service improvement, creating standard work to eliminate waste and minimise unnecessary variation in practice provided through integrated multidisciplinary teams delivering joined up services. This supports the philosophy of Realistic Medicine by delivering services which are person centred. Integration has included development of a single point of contact in each local area for initial management of referrals into integrated teams for triage and onward assessment and provision of care delivered by the appropriate professionals.
Work to support long term condition management has improved system flow with a more streamlined approach to care planning, supported self-management and carer support, keeping a person centred approach but with a strong focus on maximising independence. Finally, utilising available technology platforms has helped professionals work together more efficiently, helping to streamline services, improve access and reduce the waste of inefficient systems.
Director of Public Health Annual Report 201720

Key points• Around 2.2% of the population utilise 50% of health and social care resources.
• Provision of both health and social care is expensive and costs are increasing.
• There are multiple drivers for escalating health and social care costs including an ageing
population and increasing prevalence of long term conditions and multi-morbidity.
• Both care home residents and home care recipients have increasingly complex needs.
• The largest proportion of social care funds for older people are spent on care homes although
most people would prefer to be cared for at home.
• The lack of appropriate housing for those with frailty, such as extra care housing, is adversely
affecting discharge from hospital.
• New housing solutions for the frail elderly could reduce admission to hospital and help sustain
flow though acute care facilities.
Chapter 1
Director of Public Health Annual Report 2017 21

Chapter Two - Realistic care
Director of Public Health Annual Report 201722
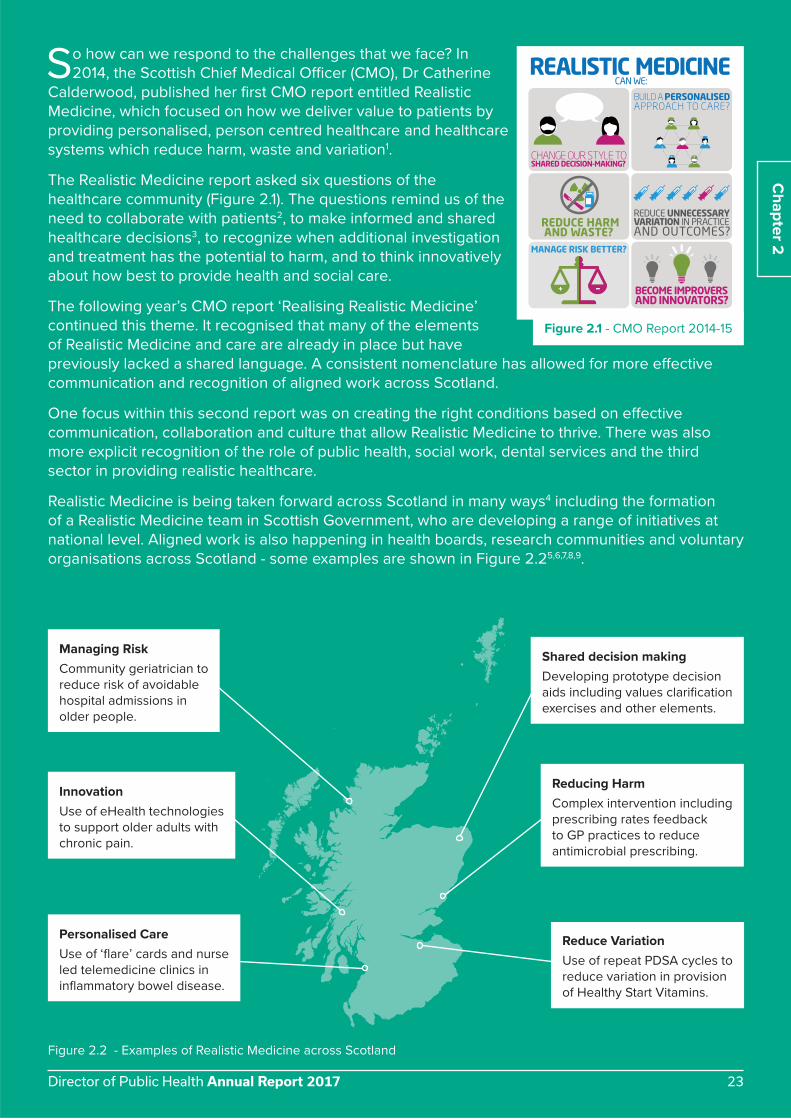
So how can we respond to the challenges that we face? In
2014, the Scottish Chief Medical Officer (CMO), Dr Catherine
Calderwood, published her first CMO report entitled Realistic
Medicine, which focused on how we deliver value to patients by
providing personalised, person centred healthcare and healthcare
systems which reduce harm, waste and variation1.
The Realistic Medicine report asked six questions of the
healthcare community (Figure 2.1). The questions remind us of the
need to collaborate with patients2, to make informed and shared
healthcare decisions3, to recognize when additional investigation
and treatment has the potential to harm, and to think innovatively
about how best to provide health and social care.
The following year’s CMO report ‘Realising Realistic Medicine’
continued this theme. It recognised that many of the elements
of Realistic Medicine and care are already in place but have
previously lacked a shared language. A consistent nomenclature has allowed for more effective
communication and recognition of aligned work across Scotland.
One focus within this second report was on creating the right conditions based on effective
communication, collaboration and culture that allow Realistic Medicine to thrive. There was also
more explicit recognition of the role of public health, social work, dental services and the third
sector in providing realistic healthcare.
Realistic Medicine is being taken forward across Scotland in many ways4 including the formation
of a Realistic Medicine team in Scottish Government, who are developing a range of initiatives at
national level. Aligned work is also happening in health boards, research communities and voluntary
organisations across Scotland - some examples are shown in Figure 2.25,6,7,8,9.
Chapter 2
Figure 2.1 - CMO Report 2014-15
Figure 2.2 - Examples of Realistic Medicine across Scotland
Reduce VariationUse of repeat PDSA cycles to
reduce variation in provision
of Healthy Start Vitamins.
Personalised CareUse of ‘flare’ cards and nurse
led telemedicine clinics in
inflammatory bowel disease.
Reducing HarmComplex intervention including
prescribing rates feedback
to GP practices to reduce
antimicrobial prescribing.
InnovationUse of eHealth technologies
to support older adults with
chronic pain.
Shared decision makingDeveloping prototype decision
aids including values clarification
exercises and other elements.
Managing RiskCommunity geriatrician to
reduce risk of avoidable
hospital admissions in
older people.
Director of Public Health Annual Report 2017 23

When Realistic Medicine concepts are applied in combination, there is the potential to amplify their
effectiveness. For example, the use of patient held ‘flare’ cards in Clyde Valley Hospital has helped
patients with Inflammatory Bowel Disease and their GPs to respond effectively to flare ups of
disease. This intervention has offered more personalised care, assisted in shared decision-making,
improved risk management, and minimised harm associated with unnecessary hospital visits.
Leadership of Realistic Medicine in NHS Highland In NHS Highland, Dr Rod Harvey, the Medical Director, has led the development of Realistic
Medicine in conjunction with the Area Clinical Forum, chaired by Dr Andrew Evennett. The Area
Clinical Forum is a formal sub-committee of the NHS Highland Board, bringing together a number
of professional groups. Each of the professions represented at the Clinical Forum have collated
examples of Realistic Medicine, which are presented as case studies throughout this report.
There is a very natural link between Realistic Medicine and the Highland Quality Approach. Figure
2.3 shows a driver diagram developed by the North and West Operational Unit, NHS Highland,
which demonstrates these links.
Driver Diagram: Realistic Medicine
AimTo deliver care under the new
paradigm of Realistic Medicine as
described in the CMO’s report
OutcomeBetter care, Better Health, Better
Value for people living in the North
and West Operational Unit
Primary DriverAim
Aim for all staff to work “at the top
of their license” to make best use
of available resources
Shift balance of care from hospital
to community enabling people
to access services from home or
homely environment
Develop shared decision making
and a personalised approach to
care
Reduce unnecessary variation
in outcome and process, reduce
harm and waste and become
innovators and improvers
Secondary Driver Change Concepts
• Audit avoidable appointments
to identify service needs
• Expand capacity of existing
staff (skills and hours)
• Pool clinical resources across
local 2c practices
• Tailor CPD events to meet
workforce learning needs
• Develop support roles such as
community links worker
• Explore new ways of
promoting job opportunities
• Increase awareness of referral
activity via cluster working
• Create local resource packs for
mental health
• Public engagement events to
promote RM approach
• Create SDM resource packs for
patients for home use
• Increase links to social
prescribing activities
• Maximise use of technology to
off er services in remote areas
• Promote learning from SAERs
via clinical bulletin
• Reduce DNAs via use of text
reminder
Develop role of GP as the expert
generalist co-ordinating extended
primary care team
Maximise existing staffi ng assets
and explore new roles to create
jobs for local people
Promote joint working between
primary care and integrated teams
via GP clusters and ITLs
Identify gaps in existing community
services and develop eff ective
response to this to ensure PPOC,
increase end of life provision
Raise public awareness of new
approach to care
Identify resources to support
clinicians with SDM
Use of telephone consultations
to signpost patients to most
appropriate clinician
Reduce unnecessary tests
Figure 2.3 - North and West Operational Unit Drive Diagram: Realistic Medicine
Director of Public Health Annual Report 201724

The international context The pursuit of Realistic Medicine in Scotland is part of a wider global movement recognising
common problems with the delivery of healthcare in high income economies. The International Consortium for Health Outcomes Measurement (ICHOM)10 is consolidating some of this thinking
by developing standard measuring of the quality of care. ICHOM state that their mission is to
“unlock the potential of value-based health care by defining global Standard Sets of outcome
measures” and thereby reduce health care costs, support informed decision-making, and improve
health care quality.
There are opportunities for us in NHS Highland to learn from best practice elsewhere. A number of
international examples of national and regional initiatives that are similar to Realistic Medicine are
therefore provided below.
Wales has developed a concept that is similar to Realistic Medicine called Prudent Healthcare11.
The initiative was developed to respond to rapidly rising health and social care costs and increasing
societal expectations, whilst maintaining high quality healthcare. The three primary objectives of
Prudent Healthcare are to:
• Do no harm
• Carry out the minimum appropriate intervention
• Promote equity between professionals and patients
In New Zealand, the Canterbury District Health Board12 has pursued a holistic approach (one
system, one budget) to health and social care delivery. As can be seen from the pictogram below,
the patient is very much at the centre of the model, with the hospital on the periphery of the health
and social care system, and not, as traditionally viewed, at its heart13.
Figure 2.4 - Pictogram of Canterbury’s health care system14
NB: Visualisation originally created by the Redbridge Primary Care Trust and developed by the Canterbury Health
System, New Zealand
Chapter 2
Director of Public Health Annual Report 2017 25

The Nuka System of Care of the Southcentral Foundation in Alaska, USA 15,16 is a system-wide,
community-led model with “customer-ownership” of care services, where the customer-owner takes
ownership of his or her own care. As in the Canterbury model of service delivery in New Zealand,
the emphasis is very much on a trust relationship between practitioners and patients, and on
engagement with the community in service planning, design and delivery.
The Buurtzorg, district nurse model in the Netherlands17 is another example of a community-
focused model where the district nurse provides
care in the community for a defined population
and where the emphasis is on providing patient-
centred care based on a high trust relationship
between the practitioner and the service-user.
The importance of patient-centred care is further
illustrated in the Esther Network18 which is part
of the healthcare system in Jönköping, Sweden.
This network approach evaluates services from the patient’s perspective, to understand what
matters most to them. The result appears to be increased patient and staff satisfaction, significantly
reduced waiting times, more effective treatment, and reduced costs.
In Finland, as part of the ICARE4EU project19 there has also been an emphasis on the development
of person-specific care plans, jointly developed between the patient and the nurse, which is then
agreed by the physician in charge. The Danish Clinic Silkeborg programme focuses on one-day/
one-stop consultations undertaken by a multidisciplinary team within a clinic, which is reported to
have resulted in time saved by the patient and improved collaboration between GPs and hospital
specialists.
Through a public/private sector finance initiative, the Alzira model of care in Spain20 has created
incentives that are reported as having increased patient satisfaction, reduced readmission rates and
saved the Valencia Health Agency 14 million Euros.
Figure 2.5 - The Alzira Model21
“The organisation has shown that a single, unhurried visit by a highly-trained district nurse is more effective than several visits by specialised care workers, each performing their allotted tasks.”
Buurtzorg model13
Director of Public Health Annual Report 201726

Choosing Wisely22 is an initiative led by
the American Bureau of Internal Medicine
Foundation, which encourages clinicians and
patients to take part in conversations about the
overuse of unnecessary tests and procedures.
The Choosing Wisely Initiative has been
influential in several countries including the
United Kingdom. Related initiatives established in different part of Europe include Smarter
Medicine in Switzerland and Slow Medicine in Italy3.
“It is estimated that as much as 30 per cent of US health care delivered was unnecessary duplication of earlier treatment or unnecessary itself”
Choosing Wisely Campaign17
Chapter 2
Realistic Medicine Case Study
Reducing variation in melatonin prescription and harm through unnecessary medication provisionA recent review of prescribing in NHS Highland noted that the rate of melatonin prescribing to treat delayed sleep onset in children and adolescents was rising sharply. Further investigation showed that the same pattern was seen in other health boards and across the UK. NHS Highland approached the issue in two ways:
1. Improving efficiency by changing prescribing policy from tablets to capsules which releases resource for other care
2. Asking specialists recommending melatonin to review patients and consider using non-pharmacological methods to manage delayed sleep onset. For example eg minimising TV or computer use in the hours before bedtime.
0
10
20
30
40
50
60
70
80
15/0
1/20
17
22/0
1/20
17
29/0
1/20
17
05/0
2/20
17
12/0
2/20
17
19/0
2/20
17
26/0
2/20
17
05/0
3/20
17
12/0
3/20
17
19/0
3/20
17
26/0
3/20
17
02/0
4/20
17
09/0
4/20
17
16/0
4/20
17
23/0
4/20
17
30/0
4/20
17
07/0
5/20
17
14/0
5/20
17
21/0
5/20
17
28/0
5/20
17
04/0
6/20
17
11/0
6/20
17
18/0
6/20
17
25/0
6/20
17
02/0
7/20
17
09/0
7/20
17
16/0
7/20
17
23/0
7/20
17
30/0
7/20
17
06/0
8/20
17
13/0
8/20
17
20/0
8/20
17
27/0
8/20
17
03/0
9/20
17
10/0
9/20
17
17/0
9/20
17
24/0
9/20
17
01/1
0/20
17
08/1
0/20
17
15/1
0/20
17
22/1
0/20
17
Num
ber o
f ite
ms (
disp
ense
d)
Melatonin 3mg Tablets
North & West Highland Operational Unit Inner Moray Firth Operational Unit Highland Health And Social Care Partnership
HH&SCP target 90% fall
Source: Ian Rudd, Director of Pharmacy, NHS Highland
Director of Public Health Annual Report 2017 27

Realistic Medicine Case Study
Reducing Polypharmacy and resultant harm and medication variationPolypharmacy relates to patients who are taking many medications. Addressing polypharmacy is a key role for Specialist Clinical Pharmacists linked to primary care and Care of the Elderly clinics.
A patient had a fall and a pharmacist was asked to visit him at home to provide a medication review. The pharmacist discovered that the patient had been started on heart failure medication pending further investigation. These investigations turned out to be negative but his medication had not been stopped 11 years later, increasing his risk of falls. The unnecessary heart failure medicines were reduced and then stopped. Pharmacists have a role is such contexts in reducing waste and variation in relation to medication.
Director of Public Health Annual Report 201728

Key points • Realistic Medicine is about providing value to patients through personalised healthcare, reducing
harm, waste, and variation and improving risk management.
• Significant progress has been made in implementing Realistic Medicine in NHS Highland, but
there is more that we can do.
• Internationally, there are many examples of models, which are similar to Realistic Medicine, which
could provide ideas that we can adopt or adapt.
• Common elements of international care models that have similarity to Realistic Medicine include:
― An emphasis on one whole system (adopting a holistic approach)
― High quality relationships between patient and professional (shared decision-making)
― Putting patient experience at the centre of the health and social care system (patient-centred
care)
― A recognition of the importance of patient and community engagement in service planning,
design and delivery
• However, there remains a lack of rigorous research and a lack of robust programme evaluations
for overarching paradigms such as Realistic Medicine.
• A major challenge in undertaking research into paradigms such as Realistic Medicine is that the
specific culture, context and the clinical circumstances within which a particular health care model
is delivered, often determine its success or failure.
• Given the importance of contextual factors, transferring models of care from one country to
another requires accompanying local evaluation using principles such as Plan, Do, Study, Act.
Chapter 2
Director of Public Health Annual Report 2017 29

Chapter Three - End of life care: what it means in NHS Highland
Director of Public Health Annual Report 201730

Chapter 3
In this chapter we describe the population within NHS Highland that is likely to have palliative or
end of life care needs and the epidemiology around place of death.
Healthy and disabled years of lifeThe majority of us will experience some degree of frailty in old age and will require some hands
on care. Unless as a society we take action to live healthier lives, as life expectancy increases we
can expect a greater proportion of our lives to be affected by some degree of disability. In a global
health study, life expectancy rose by 6.2 years between 1990 and 2013, but only 5.4 of those extra
years were in good health1. The concept of healthy and disabled life has been used extensively
by the World Health Organisation in their epidemiological reports. Although the concept can be
criticised as being overly simplistic, it is a useful model for comparative purposes. The components
of the model are shown in Figure 3.1.
Figure 3.1 - Healthy and disabled life years and potential years of life lost Source: Wikipedia2
Health system planning from a prudent or realistic approach requires an understanding of the
changing patterns of both morbidity and mortality and DALYS are one method of capturing this.
Figure 3.2 provides a useful graphical summary of the leading causes of death in Scotland, although
not all of these deaths would require end of life care.
Figure 3.2 - Deaths by Cause in Scotland in 2016 Source: National Records of Scotland3
Infectious/Parasitic dis.
Neoplasms
Blood diseases
Endocrine, nutritional and metabolic diseases
Mental & behavioural disorders
Nervous system diseases
Circulatory system diseases
Respiratory system diseases
Digestive system diseases
Skin diseases
Musculoskeletal diseases
Genitourinary diseases
Pregnancy-related
Perinatal conditions
Congenital conditions
(Not elsewhere classified)
External Causes
Director of Public Health Annual Report 2017 31

Place of death Information on different aspects of mortality is provided below. The data that is initially presented
relates to ‘all causes of death’, whereas data provided later in this report relates specifically to those
causes of death where it can be anticipated that they will require end of life care.
There is significant variation in the rates of death at home and in hospital across both Scotland and
NHS Highland. Areas with high rates of death at home and areas with high rates of death in hospital
in NHS Highland are presented in Figure 3.3. Those areas highlighted in green have significantly
higher rates of people dying at their usual place of residence (UPOR) and those areas in pink have
significantly higher rates of people dying in hospital. The pattern is probably the result of a complex
interplay between social and societal factors, GP practice catchments, district nursing services, care
services, proximity to care home, nursing home, community hospitals and acute hospitals.
The percentage of a person’s last six months of life spent at home or in a community setting has
been adopted in Scotland as a national quality outcome measure. This is to be monitored annually
as part of the strategic framework for action on palliative and end of life care in Scotland. An
increase in this measure is considered to reflect more people being offered their preferred place of
death.
Figure 3.3 - Areas with high rates (>2 or >3 standard deviations from the mean) of all cause of death (i) at home, (ii) in
hospital
Director of Public Health Annual Report 201732

Chapter 3
12016/17 deaths are provisional and exclude those from external causes, such as accidents
During 2016/17, the chart represented in Figure 3.4 demonstrates that, for those who died in 2016/17,
Highland has the 3rd highest percentage of time spent in the community rather than in a hospital
during the last six months of a person’s life.
80
82
84
86
88
90
92
94
96%
of l
ast 6
mon
ths
in c
omm
unity
Health Board of residence
Scotland
Figure 3.4 - Percentage of the last six months of life spent at home or in the community setting by Health Board of
residence during 2016/171
Source: SMR01, SMR04 and NRS Death Records: Health and Social Care Team, ISD: published 10/10/2017. Calculated
as 100-% time in hospital in last six months of life
Director of Public Health Annual Report 2017 33

Who needs end of life care?The National Institute for Clinical Excellence (NICE)4 has described end of life care as the care of
those who are likely to die within the next 12 months. This includes people whose death is imminent
(expected within a few hours or days) and those with:
• Advanced, progressive, incurable conditions
• general frailty and coexisting conditions that mean they are expected to die within 12 months
• existing conditions if they are at risk of dying from a sudden acute crisis in their condition
• life threatening acute conditions caused by sudden catastrophic events.
The problem with defining a timeframe is that accurately estimating prognosis is innately difficult.
In a review of 42 studies the accuracy of prognosis varied from 23% to 78% (see Figure 3.5)5. This
means that when a doctor thinks that a person has a specified time to live, they are probably wrong
at least half the time. There is evidence that nurses who have dealt with many terminal cases are
more accurate in their prognosis when death is only a few hours away. The general inaccuracy of
prognosis is a major challenge in the context of Realistic Medicine or Prudent Healthcare.
It is easy for a health professional to mistakenly think that further treatment for an individual is futile,
beause the health professional thinks that the patient does not have many months or years to live.
Many experienced health professional can recall incidents of patients where the general consensus
was that the person only had days or weeks to live, but where the patient went on to live for
another 10 or 20 years.
Study % Accuracy (95% Cl) Total Estimates Categories
0
Percentage of accurate estimates, %
25 50 75 100
Addington-Hall (1990) 78.4 (75.8, 80.7) 1128 2
Bruera (1992) 31.9 (22.7, 42.3) 94 2
Shah (2006) 30.2 (24.6, 36.4) 248 2
Buchan (1995) 38.5 (13.9, 68.4) 13 2
Brandt (2006) 55.8 (51.3, 60.1) 511 3
Muers (1996) 56.7 (49.5, 63.6) 203 3
Gripp (2007) 33.3 (29.4, 37.3) 580 3
Vigano (1999) 51.5 (44.9, 58.1) 233 3
Gwilliam (2013) 57.4 (54.3, 60.6) 987 3
Llobera (2000) 23.3 (20.0, 26.9) 600 4
Fairchild (2014) 27.6 (23.2, 32.3) 395 4
Fromme (2010) 57.6 (52.7, 62.3) 429 4
Kao (2011) 32.0 (19.5, 46.7) 50 5
Zibelman (2014) 41.0 (35.1, 47.1) 273 5
Glare (2001) 27.3 (15.0, 42.8) 44 6
Glare (2004) 45.0 (35.0, 55.3) 100 6
Thomas (2009) 72.8 (66.9, 78.2) 254 7
Stiel (2010) 31.7 (21.9, 42.9) 82 7
Hui (2011) 34.0 (31.8, 36.2) 1835 7
Selby (2011) 55.6 (38.1, 72.1) 36 7
Holmebakk (2011) 27.2 (21.7, 33.2) 243 8
Figure 3.5 - Summary of studies demonstrating large variation in the accuracy of prognosis by clinical staff
Source: White N et al.5
Director of Public Health Annual Report 201734

Any palliative care provided within the last 12 months of life can be regarded as end of life care,
although that is very much a retrospective definition, which is useful for epidemiological proposes
but less useful when considering the needs of an individual. In addition to managing physical
symptoms such as pain, breathlessness, nausea and increasing fatigue, it includes emotional, social
and spiritual care.
It has been reported that the majority of people (56-74%) in their last year of life express home
as their preferred place of death6. However, during the course of their illness, this preference
may change. For example, it has been found that for those with terminal cancer, the percentage
preferring home as their place of death decreased from 90% to 50% and the percentage preferring
hospice, increased from 10% to 40%6,7. Changes in preference may be influenced by many factors
including a desire not to be a burden to family members. The quality of the provision of care in the
community, therefore, impacts on preference for place of death.
Population in NHS Highland likely to need palliative care There is published research defining a set of diagnoses which are likely to require palliative care8.
Analysis is presented in Figure 3.6, which applies these criteria to the population of NHS Highland.
A report on this topic has been produced by the Public Health team9. Over the last three decades,
an increasing number of deaths are observed from cancer and pre-senile/senile conditions and
decreasing rates for circulatory conditions.
Figure 3.6 - Percent of death in NHS Highland residents from causes where end of life care would be expected, 1980 to 2015 Source: Analysis of Mortality data, (NRS) according to specific causes relevant to Palliative/End of Life care
1 Proportions for other deaths were: Nervous system, 2%; Liver; 2%; Renal, <1%
Cancer (36%*)
Circulatory System (35%*)
Respiratory System (11%*)
Senile/pre-senile (13%*)
0
500
1000
1500
2000
2500
1980 1982 1984 1986 1988 1990 1992 1994 1996 1998 2000 2002 2004 2006 2008 2010 2012 2014
Num
ber o
f ann
ual d
eath
s
Year of death
Chapter 3
Director of Public Health Annual Report 2017 35

The end of life care population, who had conditions that were likely to require palliative care,
remained fairly constant over the last fifteen years making up around three quarters of all cause
deaths in any given year (77%; 2,620/3,420). This percentage is within but at the higher end of the
range previously estimated for ‘high income’ countries of 69% - 82%8. The proportion of patients
requiring end of life care who are aged 85 years and older has increased over the last 15 years
(Figure 3.7). Health and social care services will need to adjust the way that care is provided to take
these changes into account over the next decade.
This trend is likely to continue and an ageing population will place increasing demands on palliative
care services, suggesting that there needs to be closer collaboration between care of the elderly
services and palliative care services.
0%
10%
20%
30%
40%
50%
60%
70%
80%
90%
100%
< < <
16%18%
16%18%
14%
1% 1%
16%
1% 1%
85 & Over
1% 1%
75-84
65-74
25-64
0-24
20%20%
19%19%
19%19%
33%32%
33%31%
31%30%
30% 29% 32% 31%36% 35%
EoLCare pop All deaths EoLCare pop All deaths EoLCare pop All deaths
2001/05 2006/10 2011/15
Perc
enta
ge o
f dea
ths
by a
ge b
and
*Annual
average
deaths
n =2,667* n = 3,408* n = 2,620* n = 3,380* n= 2,620* n = 3,419*
Age band (yrs)
Figure 3.7 - Comparison of deaths by age group in five-year bands, 2001 to 2015, NHS Highland
Source: Analysis of mortality data (NRS)
Director of Public Health Annual Report 201736

Chapter 3
Place of death for those with end of life care needs
The place of death also varied with time (Figure 3.8) where the percentage dying at home had
decreased from 39% in 1980 to 29% in 2015. In contrast, the percentage dying in an acute hospital
increased from 20% to 31% over the same period.
The place of death also varied with age group summed over the most recent five year period
(Figure 3.9). The younger age group (0-24 years) was more likely to die in acute hospital, the 25 to
64 year age group was the most likely to die at home (45%).
The oldest age group was more likely to die in a homely setting rather than in a hospital. For the
oldest group (85 years and over), 60% died at home or in a care home compared to 43-47% for
those aged 65 -74 and 75-84 years. Highland Hospice has supported care homes and home care
to provide end of life care and some examples of this work are considered in the following chapter.
Approximately one third (31-35%) of the end of life care population aged 25 to 84 years died in an
acute hospital. The proportion was lower (one quarter) in those aged 85 years and over.
The place of death also varied between men and women with men overall more likely to die in their
own home9. This pertained to all conditions other than to renal or ‘nervous & sensory’ conditions,
where women were more likely to die at home. The gender difference may reflect the longer life
expectancy of women with the greater likelihood of them caring for husbands and partners. In turn
these women are likely to be left living alone with no one to care for them to the same extent.
The place of death also varied according to the underlying causes of death (Figure 3.10). The
highest percentage dying at home was with cancer (35%) and the lowest was with senile/pre-
senile conditions (11%). Those dying from liver, renal or respiratory conditions were more likely to
die in an acute hospital (43-59%). Less than 10% of those with cancer died in a hospice but among
those dying from other causes, only those dying from kidney or nervous/sensory related conditions
recorded deaths in a hospice.
4% 21%
2%
38%17%
20%31%
39% 29%
0%
10%
20%
30%
40%
50%
60%
70%
80%
90%
100%
Perc
enta
ge o
f ann
ual d
eath
s by
pla
ce o
f dea
th
Year of death
OwnHome
Hospital - Acute
Hospital
Hospice
Care Home
Figure 3.8 - Percent of annual deaths with potential end of life care needs by place of death,
1980 to 2015, NHS Highland
Source: Analysis of mortality data (NRS)
Director of Public Health Annual Report 2017 37

1Summary data over the five years 2011 to 2015
1Summary for five year period 2011 to 2015
0% 3% 6%
19%
40%
22%
0%
7% 5%
3%
1%
3%
8%
13%18%
19%
17%
17%54%33%
35%
31%
23%
29%
38%45%
37%28%
20%29%
0%
10%
20%
30%
40%
50%
60%
70%
80%
90%
100%
0-24 25-64 65-74 75-84 85 & over all ages
Perc
enta
ge o
f dea
ths
by p
lace
of d
eath
Age band (years)
Own Home
Hospital - Acute
Hospital
Hospice
Care Home
Figure 3.9 - Deaths from causes relevant to End of Life care by age group and place of death: NHS Highland1
Source: Analysis of mortality data (NRS)
11%
13%
21%
23%
28%
29%
31%
35%
70%
19%
19%
35%
2%
22%
21%
8%
10%
24%
17%
15%
11%
17%
15%
23%
9%
43%
43%
24%
59%
29%
33%
26%
1%
3%
3%
8%
0% 10% 20% 30% 40% 50% 60% 70% 80% 90% 100%
Senile/Pre-senile (n=317)*
Renal (n=22)*
Respiratory (n=273)*
Nervous & sensory (n=45)*
Liver (n=54)*
All (n=2,620)*
Circulatory (n=964)*
Cancers (n=944)*
Percentage of deaths by place of death
Own Home Care Home Hospital Hospital - Acute Hospice* Annual average deaths from each cause
Figure 3.10 - Potential end of life care population by condition and place of death1
Source: Analysis of mortality data (NRS)
Director of Public Health Annual Report 201738

Chapter 3
Future need for end of life care in NHS HighlandAssuming that current rates of need for end of life care by gender and by age group apply over the
next 10 to 20 years, future numbers can be predicted in NHS Highland. An almost two-fold increase
in the number of deaths is expected. This is shown for the total end of life population and also by
the different categories of conditions for which end of life care is needed, (Figure 3.11).
1Actual age/sex End of Life annual death rates averaged for 2011-2015 applied to 2014-based mid year population
projections for NHS Health Boards (National Records of Scotland)
2,691
967 992
272 327
3,745
1,2611,423
396 499
4,870
1,505
1,905
539726
0
1000
2000
3000
4000
5000
6000
All EoL Cancers Circulatory Respiratory Senile/pre-senile
Ann
ual n
umbe
rs
Cause of EoL care
2014 baseline 2026 2036
Figure 3.11 - Baseline and projected numbers1 of the NHS Highland population with End of Life care need
Director of Public Health Annual Report 2017 39

Key points• It is possible to estimate the number of people requiring palliative care or end of life care in a
given population and the numbers used to plan services accordingly.
• The estimated number in NHS Highland who would potentially benefit from end of life care
during a year is equivalent to around three quarters of all deaths.
• Decreasing numbers of patients are needing end of life care for circulatory system disorders, but
increasing numbers are needing such care who have cancer, cognitive decline or dementia.
• Over the last 35 years there has been a fall in the proportion of patients dying at home and an
increase in the proportion dying in acute hospitals and in care homes.
• On average during the last five years, over one half of those needing end of life care died in their
own home or in a care home, and just under a third died in an acute hospitals.
• Those dying from dementia and related conditions or from conditions of the nervous/sensory
system were the most likely to die in community settings and those dying from renal or liver or
respiratory related conditions, more likely to die in an acute setting.
• Additional data9 also indicates that men overall were more likely to die in their own home than
women and this was the case for all conditions other than for renal or ‘nervous & sensory’
conditions where women were more likely to die at home. The gender difference may reflect
the longer life expectancy of women with the greater likelihood of them caring for husbands and
partners. In turn these women are likely to be left living alone with no one to care for them to the
same extent.
• Projections based on current estimates predicts almost a doubling of the number requiring end
of life care by 2036.
Director of Public Health Annual Report 201740

Chapter 3
Director of Public Health Annual Report 2017 41

Chapter Four - Supporting high quality end of life care
Director of Public Health Annual Report 201742

Chapter 4
Realistic Medicine or Prudent Healthcare includes effective palliative and end of life care from
a clinical and a community perspective, both of which are considered in this chapter which
considers the role of anticipatory care planning, compassionate communities and a range of related
interventions.
Transitioning to palliative careIn 2014, the World Health Assembly passed a resolution requiring all governments to recognise
and provide for palliative care in their national health policies. Against this backdrop, in 2015, the
Scottish Government published its Strategic Framework for Action on Palliative and End of Life Care
2016-2021. Its vision is to ensure everyone in Scotland, irrespective of age or condition, will have
access to palliative care if it will benefit them1.
The Scottish Government define palliative care as more than care in the last days and hours of
life, but include ensuring quality of life for both the person and their family at every stage of a life-
limiting disease1. Similarly, the Scottish Partnership for Palliative Care describe end of life care as
‘that which follows when it is clear a patient is entering the dying phase, whether or not they are in
receipt of palliative care’2.
The principles of palliative care and prudent or Realistic Medicine are well aligned. Both focus on a
holistic approach and appropriate person centred treatment3. These principles are supported by a
number of policies, tools and innovations in Scotland aimed at aiding the delivery of palliative and
end of life care and improving patient outcomes.
Anticipatory careA systematic review suggested that between 30% and 38% of patients near the end of life may
received non–beneficial treatments4 or end up dying in hospital rather than at home, which may
have been their preference5. Anticipatory care plans (ACPs) recommended for those with palliative
care needs, offer a means through which patient’s can record their treatment preferences and
enable health care professionals to plan appropriate clinical responses, as they evolve, over the
course of an illness6. They encourage exploration of end of life preferences and clarification of
a patients understanding of their prognosis, including preferred place of care and views about
interventions, treatments and cardiopulmonary resuscitation (CPR)7. Key Information Summaries and
shared electronic patient records, have also been pursued in Scotland8, enabling anticipatory care
plans to be written by GPs and shared electronically with secondary providers.
There is some evidence that anticipatory care planning may reduce futile invasive treatments and
hospital admissions9, Intensive Care Unit admissions and reduce length of stay10,11,12. Identifying
an individual who may benefit from palliative
care can be challenging13. A recent review of
Anticipatory Care Planning implementation
identified prognostic uncertainty as a key
factor influencing the decision to initiate this
discussion6,12,14.
ReSPECTReSPECT stands for Recommended Summary
Plan for Emergency Care and Treatment. It is an
alternative to Advance Care Planning, which is
perhaps more flexible.
As shown in Figure 4.1, it creates a summary of
personalised recommendations for a person’s
clinical care in a future emergency in which they
do not have capacity to make or express choices.Figure 4.1 - ReSPECT template
Director of Public Health Annual Report 2017 43

Compassionate communities
Compassionate communities are a holistic, population health approach to palliative care beyond
health and social care services. They were first described in 199915. A ‘compassionate community’
is one which formally agrees to offer support, comfort and care to people who may be dying or
suffering from a chronic condition such as dementia. A compassionate community recognises that
we all experience loss and death. Given that these experiences are universal, there is a need for
communities to help all of their members to care for each other.
The basis of compassionate communities is their reciprocal relationships with services. The
community is therefore supported by professionals such as palliative care staff, dementia nurses,
and other health and social care staff. There is a growing body of literature on their use.
Strong social relationships are one key to a healthier life. A meta-analysis showed that there was
a 50% increased likelihood of survival for participants with stronger social relationships for both
men and women16. Another study of people living with diabetes and heart disease17 found that
social involvement with a wider variety of people and groups supported personal self-management
and physical and mental well-being, and significantly reduced the need for people to make use of
hospital services. It is clear that increased levels of community engagement and the development
of positive social relationships help to sustain the health of all18.
There is some work underway in Highland to develop local Compassionate Community initiatives
and it is included in the Highland Hospice three year strategy. Some supporting work in this
direction includes:
Helping Hands – a service which trains and matches volunteers to support clients at home.
Volunteers essentially do what a ‘good neighbour’ might do providing befriending, offer a ‘sitting’
service to allow carers to get out of the house for short periods of time, help with simple household
tasks.
Last Aid – modelled on the format of First Aid training, this half day training session is designed for
workplaces and community organisations. It covers practical support as well as supporting people
to have a discussion about end of life and supporting people to talk about what they want from end
of life care. Helping the public to understand the realities and choices around palliative and end of
life care and bereavement will help our communities to build resilience and support each other at
this difficult time in their lives.
Project Echo – a telementoring system that connects care workers across the Highlands with
each other and with the Hospice to provide mutual support as well as training and development
in palliative and end of life care. This project is currently working with 35 care homes, community
pharmacists, out of hours services and specialist nurses across the Highlands in support of
compassionate communities.
The Dementia Friendly Community project that has been developed in Helmsdale is supporting
development of ‘compassionate communities’ across Highland. With some additional funding from
the Life Changes Trust, there are plans to roll out the model established in Helmsdale and learn
from experiences there over the next five years.
Director of Public Health Annual Report 201744

Realistic Medicine Case Study
Eco-mapping to support personalised approach to discharge planning
The need for social and practical support in relation to maintaining health, disease management and supporting someone to stay in their own home is well known, but little is known about how to investigate support networks, particularly in a clinical setting19. Patients are not isolated beings; rather they will have a network of support which if understood by practitioners, may help to plan and co-ordinate efforts to ensure that patients have the right support to improve their health, manage their condition and maintain independence20,21.
Eco-mapping is a tool that could help practitioners to plan what support patients might need by giving them the whole picture in relation to an individuals’ network of support and therefore enhancing practitioners understanding of the care giving context22. Eco-mapping was developed in 1975 by Dr Ann Hartmann and has mainly been used by social workers in relation to understanding family networks in order to provide the most appropriate support to children and families23.
An ecomap is a visual diagram that shows the social, personal, professional and organisational relationships that an individual or family has in their life. It is often depicted with the person or the family in a circle at the centre and the network of connections and support depicted with circles around the centre, like planets around the sun. It therefore quite literally puts the patient at the centre and builds a picture of their networks of support.
Ecomaps can provide useful information for practitioners and patients/clients and may be helpful in supporting development of care plans and discharge planning by identifying comprehensive networks of support for patients. They:
• provide a useful tool for assessment of relationships and networks and the quality and role of those relationships in supporting individuals in their day to day lives and supporting them to live independently and stay at home
• identify the network of support that an individual has, and can also be useful in identifying areas of need, disconnection or duplication
• identify connections to social support systems such as housing, fuel poverty or income maximisation
• describe connections to communities such as significant friends, neighbours, clubs, church etc.
• help to identify whether and how an individual’s needs are being met and their reliance on professional agencies, friends and neighbours
• highlight where there may need to be enhanced communication and co-ordination between services
• help to analyse the level and type of support provided to an individual, and whether it is adequate and appropriate to meet their needs
John & Jane
Doe
Jack and Kim
Neighbors
Chuck and
Mary
In Laws
Sarah
My friend
John’s Parents
Tina and Joe
Family friends
David’s babysitterJane’s friend from
work
Jessica at the
Post Office
John’s maternal
grandparents
Janet
Help Me Grow
contactLife Church
membership
Dr. Marcus the
pediatrician Martha the Cook
County LibrarianJane’s sister Lucy
Jane’s paternal
grandmother,
Monica
John’s sister
Samantha
Jane’s Mom
Pastor Bob from
Life Church
ECO MAP Example
Strong support (shown here in rose)
Support but not as frequent or consistent
Support but it is stressful (shown here in Yellow)
Informal Supports
Formal Supports
(Source: http://www.wcpeir.org )
Chapter 4
Director of Public Health Annual Report 2017 45

A pilot of the use of ecomaps to support discharge planning is underway in NHS Highland. Initial feedback has been that the tool is easy to use and engages patients on identifying and thinking about the network of formal and informal support that they have around them. For some patients, it was useful in reaffirming the level of support that they have at home and the discussion with patients also revealed patient’s wishes in relation to what kind of support they would like when discharged home, with patients often citing informal support as being the most important. Feedback to nursing staff after developing an ecomap with a patient has resulted in staff starting to identify local community based groups that could have a role in supporting patients when they go home, which they had previously been unaware of.
Realistic Medicine Case Study
Renal team’s approach to building a personalised approach to care and managing risk betterRenal services have developed an approach that ensures that patients are at the centre of their care by having realistic conversations about treatment options which includes discussions about the disadvantages as well as the advantages of treatments so that patients and their families are supported with clear information to make decisions.
After discussion with the patient, family and the renal team, a treatment escalation plan is developed to guide future choices and treatment, always keeping the patient in charge of decisions. Whether patients are on a conservative care programme or on dialysis, patients and their families are supported with regular advice and information about what to expect.
Director of Public Health Annual Report 201746

Key points • For healthcare practitioners identifying an individual who may benefit from palliative care can be
challenging with prognostic uncertainty and/or communication difficulties identified as key factors
influencing the decision to initiate a discussion around end of life care.
• Anticipatory care plans (ACPs) may be helpful in avoiding unnecessary and non beneficial
treatment.
• Key Information Summaries (KIS) and shared electronic patient records, which were implemented
in 2013 and widely used throughout Scotland6, enable shared care plans written by GPs to be
shared electronically and updated by providers of secondary and unscheduled care.
• A compassionate community is one which offers support, comfort and care to people who
may be dying or suffering from a chronic condition such as dementia. The form compassionate
communities take should be shaped through a participatory approach with communities.
• Compassionate communities are already forming in NHS Highland. Helmsdale has led the way
with their Dementia Friendly Community project and Highland Hospice is developing a range of
services to support a compassionate community approach to end of life care across volunteers
and services.
Chapter 4
Director of Public Health Annual Report 2017 47

Chapter Five - Frailty and its priority in Realistic Medicine
Director of Public Health Annual Report 201748
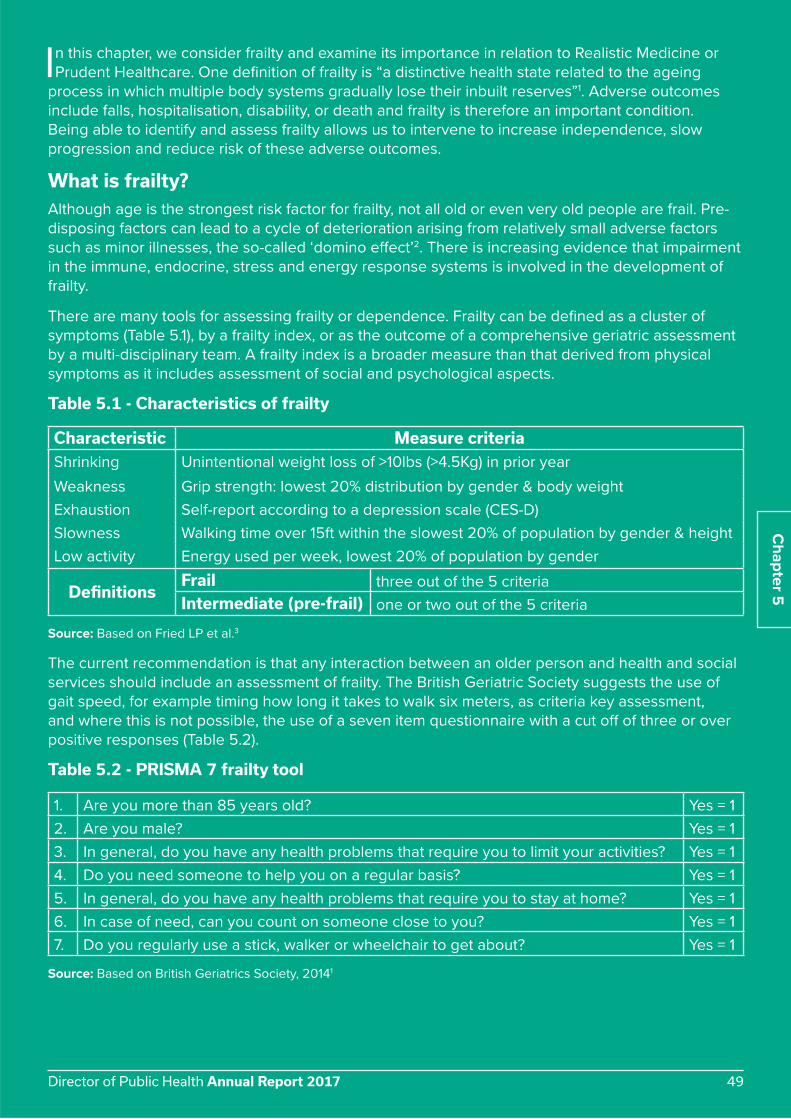
In this chapter, we consider frailty and examine its importance in relation to Realistic Medicine or
Prudent Healthcare. One definition of frailty is “a distinctive health state related to the ageing
process in which multiple body systems gradually lose their inbuilt reserves”1. Adverse outcomes
include falls, hospitalisation, disability, or death and frailty is therefore an important condition.
Being able to identify and assess frailty allows us to intervene to increase independence, slow
progression and reduce risk of these adverse outcomes.
What is frailty?Although age is the strongest risk factor for frailty, not all old or even very old people are frail. Pre-
disposing factors can lead to a cycle of deterioration arising from relatively small adverse factors
such as minor illnesses, the so-called ‘domino effect’2. There is increasing evidence that impairment
in the immune, endocrine, stress and energy response systems is involved in the development of
frailty.
There are many tools for assessing frailty or dependence. Frailty can be defined as a cluster of
symptoms (Table 5.1), by a frailty index, or as the outcome of a comprehensive geriatric assessment
by a multi-disciplinary team. A frailty index is a broader measure than that derived from physical
symptoms as it includes assessment of social and psychological aspects.
Table 5.1 - Characteristics of frailty
Characteristic Measure criteria
Shrinking Unintentional weight loss of >10lbs (>4.5Kg) in prior year
Weakness Grip strength: lowest 20% distribution by gender & body weight
Exhaustion Self-report according to a depression scale (CES-D)
Slowness Walking time over 15ft within the slowest 20% of population by gender & height
Low activity Energy used per week, lowest 20% of population by gender
DefinitionsFrail three out of the 5 criteria
Intermediate (pre-frail) one or two out of the 5 criteria
Source: Based on Fried LP et al.3
The current recommendation is that any interaction between an older person and health and social
services should include an assessment of frailty. The British Geriatric Society suggests the use of
gait speed, for example timing how long it takes to walk six meters, as criteria key assessment,
and where this is not possible, the use of a seven item questionnaire with a cut off of three or over
positive responses (Table 5.2).
Table 5.2 - PRISMA 7 frailty tool
1. Are you more than 85 years old? Yes = 1
2. Are you male? Yes = 1
3. In general, do you have any health problems that require you to limit your activities? Yes = 1
4. Do you need someone to help you on a regular basis? Yes = 1
5. In general, do you have any health problems that require you to stay at home? Yes = 1
6. In case of need, can you count on someone close to you? Yes = 1
7. Do you regularly use a stick, walker or wheelchair to get about? Yes = 1
Source: Based on British Geriatrics Society, 20141
Chapter 5
Director of Public Health Annual Report 2017 49

There is a sizable overlap between frailty, co-morbidity and disability. The overlaps between these
three states are depicted in the Venn diagram below (Figure 5.1)3. Although nearly 70% of those with
frailty have two or more long-term conditions (co-morbidity) less than 10% (249/2,576) who are co-
morbid are frail.
Figure 5.1 - The overlap of frailty with disability and co-morbidity Source: Fried LP et al.3
Another approach to identifying frailty is based on five syndromes that raise the suspicion that a
person may have frailty (Table 5.3). This is a relatively quick ‘rule of thumb’ method for use in a
clinical practice.
Table 5.3 - Frailty syndromes
1. Falls (e.g. collapse, legs give way, found lying on the floor)
2. Immobility (e.g. sudden change in mobility, “gone off legs”, “stuck in the toilet”)
3. Delirium (e.g. acute confusion, “muddleness”, sudden worsening of confusion in someone
with known dementia or known memory loss)
4. Incontinence (e.g. change in continence-new onset or worsening of urine or faecal
incontinence)
5. Susceptibility to side effects of medication (e.g. confusion with codeine, hypotension with
antidepressants).
Source: Based on British Geriatrics Society, 20141
For primary care, use of a recently available electronic Frailty Index, (eFI) may result in more
individuals identified as frail and thus provides the opportunity to optimise care and slow decline4.
The eFI is based on 36 different deficit variables that can be identified in GP computer systems. It
provides a categorisation of mild, moderate or severe frailty. The eFI is available on primary care
systems in England and is being tested in Scotland5.
Frailty26.6%(n = 98)
5.7%(n = 21)
21.5%(n = 79)
Co-morbidity(n = 2,131)
Disability: Help with Activities
of Daily Living(n = 67)
(n = 196)
46.2%(n = 170)
Director of Public Health Annual Report 201750

Chapter 5
One review6 has suggested frailty prevalence of 9.9% (and 44.2% for pre-frailty) amongst those
over 65 years, 15.7% in those aged 80-84 years, and 26.1% in those aged 85 years and over, with a
slightly higher prevalence in women.
Another systematic review of prevalence studies of frailty in nursing homes7 indicates higher
rates than the equivalent estimates amongst those in the community. Across nine studies, the rate
for frailty was 52.3% and across seven studies for pre-frailty, 40.2%. It is interesting to note that
approximately 48% of care home residents aged 60 years and over were found not to be frail. It is
not known to what degree institutionalisation in itself affects frailty.
A study assessing frailty amongst those aged 75 years and over admitted as an acute medical
admission to a district hospital in England, reported that 56% were frail8. Out of these, the majority
(81%) presented with lack of mobility for over 24 hours, 70% were admitted with falls and nearly
50% were admitted with known dementia or delirium. Overall, 45% were admitted from a nursing
home. Although this was a small study (n = 232) and did not include out of hours admissions, it does
indicate that a substantial proportion of admissions of older individuals are related to frailty and
raises the question as to whether earlier intervention could have been put in place which would
have prevented admission in at least some cases.
The three year outcomes of frailty are shown in Table 5.4.
Table 5.4 - Three-year outcomes in those with or without frailty, aged 65 years & over1
OutcomeIncidence over 3 years Hazard Ratio* Relative Risk#
Not frail Frail HR 95% CI RR 95% CI
Worsening ADLs 8% 39% 1.98 1.54-2.55 5.61 4.50-7.00
Worsening mobility 23% 51% 1.50 1.23-1.82 2.68 2.26-3.18
First fall 15% 28% 1.29 1.00-1.68 2.06 1.64-2.59
First hospitalisation 33% 59% 1.29 1.09-1.54 2.25 1.94-2.62
Death 3% 18% 2.24 1.51-3.33 6.47 4.63-9.03
1 From the results of Fried LP et al3
* correcting for factors also know to predict frailty e.g. age & gender
# based on the incidence measure at 3 years
Electronic Frailty Index, (eFI)4 which is based on Primary Care electronic records (see Table 5.5),
predicts adverse outcomes . Identification using the eFI affords the opportunity to put in place
evidence-based interventions to improve outcomes in a community setting.
Table 5.5 - Adverse outcomes in older patients identified as frail using the eFI in primary care
FrailtyHazard Ratio over one year
Mortality Hospital admission N. Home admission
Mild 1.92 (1.81-2.04) 1.93 (1.86-2.01) 1.89 (1.63-2.15)
Moderate 3.10 (2.91-3.31) 3.04 (2.90-3.19) 3.19 (2.73-3.73)
Severe 4.52 (4.16-4.91) 4.73 (4.43-5.06) 4.76 (3.92-5.77)
Source: Clegg A et al.4
Director of Public Health Annual Report 2017 51

Prevalence of frailty across NHS HighlandOn the basis of the published work considered in the previous sections, this section presents what
can be inferred for the population of NHS Highland in terms of the likely numbers with frailty in
different situations and settings.
Table 5.6 - Expected numbers of older frail persons living in the community by area in NHS Highland
Prevalence of
frailty
Expected numbers of persons with or without frailty
Argyll & Bute Council Highland Council NHS Highland
Age group Men Women Non-frail Frail Non-frail Frail Non-frail Frail
60-69 6.0% 7.0% 12,341 860 30,416 2,117 42,757 2,977
70-79 10.5% 14.5% 8,235 1,189 18,692 2,700 26,927 3,889
80-89 24.0% 37.0% 2,989 1,394 7,163 3,324 10,152 4,718
90 & over 65.0% 57.5% 351 515 789 1,174 1,139 1,690
All 12.0% 16.0% 23,916 3,958 57,059 9,316 80,975 13,274
Source: Gale CR et al.9 applied to 2016 mid-year population estimates
Overall, across NHS Highland there are an estimated 13,000 frail older people living in the
community and around 1,100 in residential care homes.
Table 5.7 - Expected numbers of older frail, long stay residents of care homes in NHS Highland
Age (years)Prevalence rate1
(95% CI)
Estimated prevalent numbers (95% CI)
Highland Council Argyll & Bute Council NHS Highland
60-69 49.0% (23.1%-75.2%) 116 (55-178) 17 (8-26) 133 (63-204)
70-79 45.5% (32.0%-59.4%) 208 (146-271) 85 (60-112) 293 (206-383)
80 & over 61.8% (48.0%-74.6%) 545 (424-658) 165 (128-199) 710 (552-857)
All ages 52.3% (37.9%-66.5%) 824 (597-1048) 256 (185-325) 1,080 (783-1373)
1From Kojima G7 prevalent rates applied to numbers of long-stay residents (defined as intended to be a permanent
resident at time of admission plus any short-term resident who is a still a resident after 6 week) in older peoples
(majority aged 65 years & over) Care Homes from the Scottish Care Homes Census, 2016.
During 2015/16, there were over 15,000 discharges of NHS Highland residents aged 65 years and
over from Scottish hospitals after an emergency admission. The majority (82%) were in hospitals
within NHS Highland. In turn, most of these admissions (82%) were to the four acute and rural
general hospitals (Table 5.8).
Application of the prevalence rate of frailty, as per a reported Scottish study10 to hospital emergency
stays in Raigmore District General Hospital and the Rural General Hospitals across NHS Highland
during 2015, provides an estimate of the number of emergency admissions involving older people
with frailty during a year.
There were over 1,700 admissions to the main four hospitals (Table 5.8). However, there were a
further 2,200 emergency admissions to our community hospitals and the prevalence of frailty
amongst those are likely to have been much higher in comparison to our four main hospitals (Table
5.8). It should be noted that emergency admissions are approximately fifty percent of the total
admissions.
Director of Public Health Annual Report 201752

Table 5.8 - Estimated emergency admissions, NHS Highland residents aged 65 years, 2015/16
HospitalsHospital admissions1 Estimated number
with frailty2NumberAcute and Rural General Hospitals
Belford Hospital 700 119
Lorn & Islands Hospital 991 168
Caithness General Hospital 1,420 241
Raigmore Hospital 9,944 1,180
Total 10,055 1,7091 Continuous Inpatient Stays (admissions coded as 30-36 inclusive and 38 & 39) 2 Average prevalence (17%) from Poots et al10 applied to SMR01 extract of NHS Highland residents
Frail older people with an ‘end of life condition’ in their last year of life in NHS Highland have been
estimated at around 2,500 (800 in Argyll & Bute and 1,700 in north Highland), 750 dying in an acute
hospital, the same number in their own homes, and under 600 in care homes.
The following chapter will consider how we can respond to frailty through considering effective
interventions and alternative models of care.
Chapter 5
Realistic Medicine Case Study
Attend Anywhere service which reduces waste and variation in practicePilots are underway using Attend Anywhere, which is a web-based platform that helps healthcare providers offer video call access to their services as part of their ‘business as usual’, day-to-day operations. It is designed to make the system more efficient for clinicians, patients, carers and families by reducing travel time and the stress associated with attending a medical facility.
The Pharmacy Anywhere project started because of difficulties recruiting pharmacists in remote and rural areas, but initial experience suggests some patients prefer the service because it is more convenient than attending an appointment in person. The pilot involves connecting the pharmacist with the GP practice, where the pharmacist uses Vision Anywhere to remotely access the patient’s medical records and connecting the pharmacist and the patient. The patient is given a choice of having an Attend Anywhere video consultation via their own computer/smartphone or a traditional telephone call.
“It is much more convenient to be able to have a private 1:1 conversation with a professional from the privacy of my own home.”
Director of Public Health Annual Report 2017 53

Realistic Medicine Case Study
ENT transformed service delivery model to improve their service, reduce waste and manage risk betterThe ENT department has made improvements to their outpatients service making more effective use of time and reducing waiting lists. Nurse led clinics have increased capacity and utilised expertise within the service. Implementation of balance clinics lead by Allied Health Professional Service has also resulted in more efficient use of staff skills and expertise.
Provision of joint audiology and ENT clinics has reduced appointment times for patients and improved flow. This has reduced waste through unnecessary hospital visits. Referrals are now vetted electronically, which helps to streamline the service improves risk management and frees up capacity to deal directly with patient care. This transformation work was started in October 2016 and by August 2017 the number of patients waiting more than 12 weeks for their first clinic appointment had reduced from 965 to 84.
Realistic Medicine Case Study
Allied Health Professionals (AHPs) support innovative interventions to reduce harm, manage risk and reduce variationOccupational therapists across Highland are working to support people to live with, and manage their own conditions; often by delivering rehabilitation programmes alongside self management information that maximises independence in day to day activity. This includes provision of specific advice and support into workplace and leisure activity to promote health and wellbeing.
• Physiotherapists and public health specialists are working with Hi-Life Highland to further develop a range of targeted exercise programmes and making these available in local communities for people with a range of health conditions, including cardiac rehabilitation. This work builds on the Otago classes that are delivered to people at risk of falls and aim to reduce harm and manage risk more effectively in the community.
• Speech and Language Therapists are continuing to develop the use of video-conferencing technology to support the remote delivery of one to one therapy and reduce variation in access.
• Speech and language therapists and occupational therapists have worked alongside teachers in Highland to develop a programme to better support the development of literacy skills in primary one children, providing a firm foundation for children’s education and reducing variation in literacy.
• AHPs in Argyll and Bute are working in partnership with 3rd sector organisations and community groups like Lorn Healthy Options and the Strachur Hub to refer people with long term health conditions or frailty to exercise classes in their community. These programmes have enabled participants to regain physical ability and have improved wellbeing. People taking part in the classes also benefit from peer support in group activities.
• Occupational therapists in Argyll and Bute work in partnership with community team support workers and homecare providers to help people regain independence in activities of daily living. This is called re-ablement and ensures people can regain as much ability as possible therefore minimising the need for ongoing care at home.
Director of Public Health Annual Report 201754

Key points• The strongest risk factor for frailty is age but not all old or very old adults are frail, nor is it always
associated with co-morbidity or disability.
• Frail individuals have up to ten times the rate of adverse outcomes such as falls, hospitalisation,
care home admission, procedure complications, and are less able to adapt to stressors such as
illness and trauma.
• Identification of frailty in older adults is important, as is a more structured approach to
interventions in this group, and depends on agreement on assessment tools and methods.
• Estimated frail populations in NHS Highland are:
― >13,000 living in the community
― >1,000 living in older peoples care homes
― ~2,000 admitted to NHS Highland hospitals per year
― ~2,500 in their last year of life with a defined end of life care condition.
Chapter 5
Realistic Medicine Case Study
Reducing falls and improving orthopaedic pathwaysThe Scottish Patient Safety Programme, with leadership by the Nurse Director and Senior Quality Improvement Lead (Patient Safety) have used a falls bundle, linked to quality improvement methods to substantially reduce the number of inpatient falls in NHS Highland.
New orthopaedic pathways have been developed for patients with foot and ankle problems, spinal, trauma conditions and post-operative arthroplasty care. This has reoriented the care provided to ensure that it is more patient-centred, uses the skills and abilities of the whole team and reduces variation in practice.
Jan
-20
14
Fe
b-2
014
Mar-
20
14
Ap
r-2
014
May-2
014
Ju
n-2
014
Ju
l-2
014
Au
g-2
014
Se
p-2
014
Oct-
20
14
No
v-2
014
De
c-2
014
Jan
-20
15
Fe
b-2
015
Mar-
20
15
Ap
r-2
015
May-2
015
Ju
n-2
015
Ju
l-2
015
Au
g-2
015
Se
p-2
015
Oct-
20
15
No
v-2
015
De
c-2
015
Jan
-20
16
Fe
b-2
016
Mar-
20
16
Ap
r-2
016
May-2
016
Ju
n-2
016
Ju
l-2
016
Au
g-2
016
Se
p-2
016
Oct-
20
16
No
v-2
016
De
c-2
016
Jan
-20
17
Fe
b-2
017
Mar-
20
17
Ap
r-2
017
May-2
017
Ju
n-2
017
Ju
l-2
017
Au
g-2
017
Se
p-2
017
Oct-
20
17
70
60
50
40
30
20
10
0
32% Reduction
NHS Highland Inpatient Falls With Harm, All Ward Areas, Jan 2014 – July 2017 Source: Maryanne Gillies, Senior Quality Improvement Lead, NHS Highland
Director of Public Health Annual Report 2017 55

Chapter Six - Responding to frailty
Director of Public Health Annual Report 201756

This section explores how we can respond to and manage frailty through specific interventions
and models of care. Such interventions can reduce the likelihood of frailty leading to adverse
outcomes such as loss of independence, falls and preventable hospital admissions.
Tackling muscle lossPerhaps the biggest contributor to frailty is sarcopenia, that is loss of muscle mass and function.
Most muscle loss does not seem to be an inevitable part of the ageing process but seems to be
associated with a Western lifestyle, where retirement is seen as a time when one would expect
to deteriorate physically and to undertake less activity. Hospitals have traditionally exacerbated
muscle loss by restricting the extent to which patients (in the recovery phase) move around and are
encouraged to act independently.
Perhaps one of the biggest challenges in terms of inpatient care in our current models is
reducing muscle loss during admission. The recent Nottingham University Hospital social media
#endPJParalysis campaign, endorsed in NHS Highland, has sought to increase the number of
hospital inpatients who are encouraged to get out of bed and dress in day clothes, to support their
rehabilitation and recovery1. Muscle mass and strength does peak in early adult life, but the rate at
which it declines thereafter has a significant effect on the risk of frailty in old age (Figure 6.1).
Figure 6.1 - Life course changes in muscle mass and strength Source: Based on Sayer AA et al.2
A Cochrane Systematic Review3 indicates that progressive resistance strength training (PRT)
improves physical functioning in older people. This involves participants exercising against
increasing external loads several times per week. Other types of exercise involving gait, balance,
co-ordination and functional exercise have also been associated with decreased risk and rate of
falls and with improvement of balance in older people1.
Amongst the exercises associated with better clinical balance outcomes are those with three
dimensional range including tai chi, qi gong, and dance4. Nutrition is also important, although the
evidence for supplements is poor1,5.
Chapter 6
Mus
cle
mas
s & st
reng
th
AGE
EARLY LIFE ADULT LIFE OLDER LIFE
Growth &developmentto maximisepeak
Maintainingpeak
Range of muscle massand strength betweenindividuals
Minimising
Director of Public Health Annual Report 2017 57

Models of specialist geriatric careOne method of responding to increasing levels of frailty is to consider alternative models of
delivering specialist geriatric care, within hospitals, across the hospital-community interface, and
in the community. A literature review of published evidence for different models by setting6 found
that in-hospital geriatric-specific rehabilitation is effective in increasing functionality and in reducing
discharge to nursing home. This is particularly so for orthopaedic patients.
Hospitalised patients have better outcomes with care delivered by geriatric-specific and multi-
disciplinary teams, particularly when these are delivered in designated units or wards. A local
example of this approach has been the integration of geriatric and surgical care for patients with
hip fractures. In 2017, the Ward 3A team in Raigmore Hospital, who have led on this work, won the
Golden Hip award for meeting the most audit targets in fractured hip management.
Across the hospital-community interface, most of the evidence has come from the care in the post-
acute phase. Models such as Geri-FITT include follow-up after discharge by telephone and by
communication with primary care providers within 48 hours of discharge. Overall, there appears to
be some evidence that patient outcomes may be improved across the hospital-community interface
by such models, but it is not clear which specific health inputs produce the improvements.
In the community, Medical Day Hospitals, when compared to no treatment, are associated with
better patient outcomes such as Activities of Daily Living and decreased use of hospital beds. There
is a paucity of research evaluating the effectiveness of direct input of specialist Geriatric services to
Care Homes, but assessment of people at risk of admission to nursing homes by a Geriatrician may
reduce deterioration of functions, lower stress for carers, and reduce service contacts and costs.
Medication reviews may also have some benefit for patients in nursing homes as demonstrated
in Hawaii, when undertaken by a geriatrician. This intervention resulted in reductions in poly-
pharmacy, ineffective medications and potential drug-interactions. The evidence for the role of
Geriatricians in Primary care is weak, although one study has demonstrated lower hospitalisations
and costs for patients assessed by a Geriatrician.
There is evidence for the effectiveness of multi-dimensional preventative home services (out with
discharge planning/rehabilitation/case management specific services) in improving functional status
when a clinical examination was included. There may also be benefit in screening for frailty in the
community. Further review of all of the above has been provided in a separate review by the NHS
Highland Public Health team6.
Examples of models of care in NHS HighlandThe acute hospital setting is in many cases, not the most appropriate setting for older people
who are frail or who have an end of life condition. Therefore a decrease in the rate of emergency
admissions and the associated length of stay is desirable in this population. Assistance with self-
management, urgent day care or ambulatory assessment, and a move towards more proactive,
anticipatory care and support in the community are expected to facilitate this. Supporting people
to be more confident in managing their long-term conditions and providing coordinated care and
support at home when it is safe and appropriate are key aspects of the Scottish Government’s
healthcare 2020 vision and of a Realistic Medicine approach.
The extension of secondary care into the community by using hospital based Geriatricians to
work directly with nine General Practices is being piloted in North Highland. The expectation is
that in addition to enhanced patient care, this arrangement will result in a reduction in the rates of
emergency admission to hospital for older people.
An initial evaluation of Geriatricians working with nine GP Practices in North Highland indicates
improvements in some GP practices but not in others (Figure 6.2).
Director of Public Health Annual Report 201758

Chapter 6
1The year of first involvement with the Geriatrician service in the GP Practices is shown in the right hand vertical axis
2015
2015
2015
2016
2016
2016
2016
2016
2016
2015
0 500 1000 1500 2000
0 100 200 300 400 500 600 700
Practice 1
Practice 2
Practice 3
Practice 4
Practice 5
Practice 6
Practice 7
Practice 8
Practice 9
HHSCP
Directly age and sex standardised rate per 1000
2014/15 2015/16 2016/17
Figure 6.2 - Annual emergency admission rates, standardised for age and sex, in those aged 75 years
and over by GP practices with Geriatrician involvement1, 2014 - 17
Source: Hospital activity from PMS and CHI populations: directly standardised to European standard
population 2013, provided by Public Health Intelligence, 2013
Director of Public Health Annual Report 2017 59

There is a wide variation in the rates of emergency hospitalisations of older people between GP
Practices with or without Geriatrician input (Figure 6.3) and an understanding of the reasons for
this may reveal what factors are involved in the lower and higher rates and lead to future areas of
improvement.
0
2000
4000
6000
8000
10000
12000
Bed
day
rate
per
100
0 po
pula
tion
General PracticePractice Involvement 2017Involvement 2015
Figure 6.3 - Directly standardised rates of emergency bed days of those aged 75 years & over for
General Practices in the Highland Health & Social Care Partnership: 1st April 2016 to 31st March 2017
Source: Hospital activity from PMS and CHI populations: directly standardised to European standard
population 2013, provided by Public Health Intelligence, NHS Highland
Realistic Medicine Case Study
Joint working with GPs in Community hospitalsGeriatricians are now aligned to Community Hospitals in North Highland. General Practitioners provide the majority of medical care in community hospitals, particularly for older adults. Consultants now link in on a regular basis to our community hospitals to work alongside GP’s, developing a hub and spoke approach to delivery of care, particularly in remote and rural areas.
This brings in specialist expertise when needed, and makes more efficient use of time as decisions about care can be made quicker and more efficiently. It also prevents patients having to travel long distances to attend acute hospital appointments. This approach has been developed in Invergordon Hospital, the Royal Northern Infirmary, Nairn and Ross Memorial hospitals.
Director of Public Health Annual Report 201760

Chapter 6
Reducing unscheduled care admissionsUnplanned hospital admissions account for nearly 50% of all admissions to acute hospitals in NHS
Highland and of these, 47% involve patients aged 65 years and over. A review of interventions to
address this unscheduled care admissions has been undertaken by the NHS Highland Public Health
team7. Some of the findings are summarised in Table 6.1.
Table 6.1 - Interventions involving older adults for which there is evidence of effectiveness in preventing admission to hospital
Intervention
Community Health & Social Care Integration with generic case management1
Telehealth Care in Long Term Conditions
Discharge Planning: hospital to home
Nurse-led units2
Prevention of falls in
community dwellers
Tai-Chi group exercise
Multi-factorial
Individualised, multi-component exercise at home
Gradual withdrawal of psychotropic medication
First eye cataract surgery
Vitamin D supplementation in care facilities
Prevention of falls in hospitalMulti-factorial
Supervised exercise
Case management of Heart Failure
Ambulance call out to fallers/minor injuries (Emergency Care Practitioners/Paramedics)3
1Involves assessment, planning and facilitation, usually by a case manager to obtain services to meet an individual’s
health needs. 2Based in community, acute or satellite hospitals, the care is managed by nurses and the lead therapy was nursing. 3Interventions included (i) specially trained paramedic attending older people with minor injury or illness for whom a 999
call had been made. (ii) Attendance by an Emergency Care Practitioner to older people who had fallen and received
an ambulance call-out. This resulted in 50% fewer being transported to hospital and over 50% avoiding subsequent
hospital admission within 72 hours.
Source: Based on the report of the Review of the evidence for the effectiveness of interventions to reduce hospital
admissions of older people (on NHS Highland internet site (http://bit.ly/2uKnL37))
The table indicates that some nurse-led units, tele-health care use in long-term conditions,
discharge planning from hospital to home, case management in heart failure and integration with
generic case management can reduce hospital admissions in those who are frail and elderly.
Realistic Medicine Case Study
Multidisciplinary team reviews in care homesThe care home sector is vital to the overall health and well being of a large number of frail adults. On any given day, across Scotland, more adults are looked after by Care Homes than Hospitals.
To try and support adults and those caring for them in what is effectively their own home a programme of regular Multidisciplinary Reviews of adults in care homes is rolling out steadily across Highland. The teams involve Consultants, GP’s, Care home staff and Allied Health Professionals who discuss and clarify medical and medication management on a planned basis.
Director of Public Health Annual Report 2017 61

Realistic Medicine Case Study
Florence Tele-health Technology to reduce variation in access, reduce resource waste and support a personalised approach to careFlorence is an automated, interactive text messaging service, used to deliver a programmed series of text messages to patients, supporting people with a wide range of health conditions – including asthma, COPD, diabetes and heart failure.
Florence’s messages provide tips, advice, reinforcement and reminders to patients, as well as prompting them to take readings such as peak flow, SATS, BP, blood glucose and weight, and smking cessation advice. In this way Florence promotes self-management, enabling patients to understand, monitor and manage their own health condition, while also giving healthcare staff the opportunity to monitor their progress remotely.
Since 2015, 1368 patients across NHS Highland have used Florence to manage chronic conditions or engage with health improvement techniques. The range of protocols Florence supports is shown in the graph.
Trials have also begun using the Florence automated texting service in the Invergordon Community Midwifery Team. Antenatal texts commence from 16 weeks, and include, reminders around appointments, foetal movements, maternity records, smoking and alcohol, and scans. Later prompts include information on baby’s development, healthy start vitamins, diet, appointments, foetal movements, and what to do if concerned.
The text service concludes with five evaluation questions being sent to women in order to monitor satisfaction and includes; whether they would recommend Florence, whether it helped them to remember appointments, whether it helped increase their awareness around foetal movements, and whether they have any ideas for improving the service. Finally they are asked whether they are happy to be contacted further.
While no women have yet reached the end of the trial, initial feedback is very positive, with only a tiny minority who are offered the service choosing not to engage. Staff report that women appear to be more proactive in making and keeping appointments and that there are fewer appointments missed. Staff also report increased awareness and understanding of foetal movement, and reporting of issues. Overall feedback is positive with a view that Florence is another valuable tool in the overall aim of improving ante-natal care.
Florence combines the expertise of health care teams with the convenience of using the patient’s own mobile phone. Using this service enables healthcare staff to offer a person-centred approach to healthcare while at the same time making best use of innovative healthcare resources.
Director of Public Health Annual Report 201762

Realistic Medicine Case Study
Video Conferenced Multidisciplinary Meetings to reduce variation in practice and minimise wasteInnovative approaches to care are being implemented in Ballachulish, Lochinver and Armadale where video-conferencing technology is being used for multidisciplinary patient reviews. This has allowed more efficient use of resources, particularly for some of the most remote practices where regular video conferencing meetings are held between primary care and other teams and professionals to discuss complex cases.
Realistic Medicine Case Study
Myth Busting Back Pain supports shared decision-making through information provisionBack pain is currently the largest reported reason for sickness absence in the UK and has the largest referral rate to physiotherapy service. The campaign explores and challenges beliefs about back pain and has created opportunities for conversations regarding back pain, reassuring people that short term back pain can be common and normal. This campaign also advises on self management of short term back pain.
Realistic Medicine Case Study
Supporting People Living with Chronic PainLong term conditions and ageing are often associated with chronic pain and this can be extremely debilitating for people. There is clear evidence that supporting people to self manage their health can reduce chronic pain and this approach is adopted in Argyll and Bute’s partnership response to pain management. The Public Health Department has engaged Arthritis Scotland to deliver a contract with two aspects:
• Recruiting and training volunteers to deliver Tai Ch’i for Health in their communities.
• Training and supporting front line health professional in delivering the Pain Toolkit with the people they provide health and social care for. The toolkit has 12 sections including goal setting, prioritisation, getting involved, physical activity and relaxation.
Chapter 6
Director of Public Health Annual Report 2017 63

Key points • To reduce frailty we need to promote interventions that improve physical functioning by
increasing muscle mass and strength, particularly progressive resistance strength training,
exercise involving gait, balance, co-ordination, and encourage walking on a daily basis.
• The effectiveness of dietary interventions are subject to more uncertainty but a healthy diet is
important in preventing and addressing frailty.
• A life-course approach to optimising peak muscle mass and strength in early life, maintaining this
in adulthood, and reducing their rate of loss in older adulthood presents a strategy for reducing
the rate of frailty in our population.
• For hospitalised patients, better outcomes for patients are associated with care delivered by
geriatric-specific and multi-disciplinary teams, particularly when these are delivered in designated
units or wards.
• Interventions that reduce hospitalisation include certain types of nurse-led unit, tele-health care
for long-term conditions, discharge planning from hospital to home, case management in heart
failure and integration with generic case management.
• We need to maximise the network of support around every patient using tools such as eco-
mapping, so that they have the right support to improve their health, manage their condition and
maintain independence.
Director of Public Health Annual Report 201764

Chapter 6
Director of Public Health Annual Report 2017 65

Chapter Seven - Sustainable solutions
Director of Public Health Annual Report 201766

We have seen that there are a range of related healthcare movements in the UK including
Realistic Medicine, Prudent Healthcare and Choosing Wisely and that these movements
can help create a more sustainable approach to health and social care over the next few
decades. We have reflected on the six key elements in Realistic Medicine: shared decision-
making; a personalised approach to care; managing risk well; reducing harm and waste; reducing
unnecessary variation and improving and innovating.
Realistic Medicine primarily uses a lens that focuses on individual care and the public health
challenge is to extend the principles of Realistic Medicine to decision making at the population
level, particularly in relation to harm and variation. From a public health perspective variation often
indicates inequality in access or health due to the wider socio-economic determinants of health.
Figure 7.1 shows a hierarchy of Realistic Medicine components which applies Realistic Medicine at a
population level. Shared decision-making, a personalised approach to care and good management
of risk can be considered as underlying principles in service design. Managing unnecessary
variation, and reducing waste and harm are actions that contribute to good, safe, care delivery.
Achieving all these actions also requires a focus on quality, improvement and innovation.
Figure 7.1 - Potential layers of Realistic Medicine from a population perspective Source: Dr Cameron Stark, NHS Highland
Sustainable qualityNHS Highland has developed a Highland Quality Approach (HQA), see Figure 7.2 on page 66, as its
basis for quality improvement. The HQA approach is based on methods used in business over the
last 70 years and which have been adopted by healthcare organisations such as Virginia Mason,
Bellin Health and ThedaCare.
Chapter 7
Principals
Shared decision makingPersonalised approach
to careGood management of
risk
Methods
Improvement and
innovation
Actions
Reduce harm and wasteReduce unnecessary
variation
Director of Public Health Annual Report 2017 67

The HQA triangle (Figure 7.2) puts care of the
individuals at the top of its aims but also has
a vision which is very population focused:
“Better Health, Better Care and Better Value”.
It is important to acknowledge that there
can be tensions between the principles of
personalised care and shared decision making
at an individual level and population level
actions taken to plan services which minimise
waste and harm and provides a sustainable
service for a population as a whole. A holistic
model, such as the HQA provides a basis for
bringing these together.
NHS Highland has invested in strong quality
improvement leadership, with a Director of
Transformation and Quality Improvement,
specialist improvement support staff,
ownership of the approach at executive level
and a training programme that has touched thousands of members of staff with key messages
around a sustainable approach to quality: removing waste, harm and excess variation to both
improve quality and reduce cost.
The organisation uses a large number of quality improvement tools including: Rapid Process
Improvement Workshops, process mapping, visual controls, huddles to inform daily management,
5S (Figure 7.3) and a range of related techniques
to improve and sustain quality. All of these have
a key role in delivering the goals of Realistic
Medicine or Prudent Healthcare.
Innovation is also a key component of sustainable
quality. The Research and Development
Department within NHS Highland is undertaking a
large number of innovative projects that provide
sustainable solutions based on the concepts
within Realistic Medicine, for example, a capsule
incorporating a camera that can be swallowed
and which photographs the intestine, removing
the need for an endoscopy, which is much more
invasive and utilises greater NHS resources.
NHS Highland has strong academic links with a
wide range of partner organisations. Joint working
with local government colleagues in Highland,
Argyll and Bute and increasingly at regional level,
provide an opportunity to learn from each other.
There is also the opportunity to benchmark performance using tools developed by National
Services Scotland such as Source and Discovery databases.
The delivery of a quality service involves considering a number of factors including the ‘opportunity
cost’. This is, the principle that any use of a resource forgoes alternative uses of that same resource.
For example, NHS Highland could prioritise one aspect of quality, the provision of specialist
treatment close to home, but at significant cost. However, as the volume of such a treatment would
be low, the technical quality would generally be less than that of a larger specialised centre and
Figure 7.3 - The 5S approach to Quality Improvement
Source: http://bit.ly/2hSNTo7
Figure 7.2 - The Highland Quality Approach
Director of Public Health Annual Report 201768

the costs would generally be much higher. Funding such a service may not be in the best interests
of the patients who receive it and may divert considerable resource from other patients, where
it would yield better value. In such circumstances most people prefer to have better care further
from home, even although this involves additional travel1. The language of ‘opportunity cost’ can be
useful in assessing such tradeoffs.
A commonly used model which similarly expresses the balance of different factors required to
deliver sustainable health service planning is the triangle of cost, quality and time (Figure 7.4).
Additional emphasis on one corner of the triangle can only be uncertaken at the expense of the
other two. Some of the trade-offs that need to be considered in delivering sustainable, prudent and
realistic services across NHS are provided below. It should be emphasised that these are illustrative
and that others could also have been chosen.
Sustainable CareCare homes have traditionally been used to provide care for the frail and the elderly. However,
there are major challenges in sustaining this model2. The reimbursement of places in care homes
is based on a National Care Home Costing Model. This model appears to make the financial
assumption that care homes have at least 48 beds, as care homes of this size have significantly
reduced costs per person.
In rural areas such as NHS Highland,
care homes can rarely be as large
as this, as local demand is not
sufficiently high to fill large care
homes, and it is extremely difficult to
get enough staff to support them. It
is almost impossible for a commercial
provider to deliver care in such an
area, resulting in the public sector
having to step in to provide this care
at a far higher cost per person.
The consequence of spending
money on high cost care in remote
and rural areas is that there is
an ‘opportunity cost’ involved
and less money is consequently
available to provide other services
for other individuals. This trade
off is widely recognised and it is
generally accepted that rural areas have to be subsidised. However, what is particularly difficult
is to differentiate a reasonable additional cost to ensure access in a remote or rural area from an
unreasonable additional cost to make services available locally in such a context.
At its most extreme, few of us would build a care home for one person on an island which had only
had five people. Doing so might cost 100 times as much as the average cost of a place in a care
home. But should we provide a care home in a small community that costs four times as much per
person as the average for a care home? What constitutes a reasonable additional subsidy for each
incremental step in remoteness?
Sustainability
Time
CostQuality
Figure 7.4 - Balancing Time, Quality and Cost to deliver sustainability
Chapter 7
Director of Public Health Annual Report 2017 69

Sustainable StaffingThe ratio of people of working age to people of retirement age is changing, with fewer working
age people relative to those above retirement age. In rural areas with low unemployment, other
sectors compete with the care sector for staffing. This is particularly the case during the summer
when tourism is at its height and there is a shortage of staff in the hospitality sector. This challenge
is likely to worsen as the age structure of the population continues to move towards a reduced
younger:older ratio (Figure 7.5).
Across Scotland there are 3.5 people of working age for every person aged 65 and over, this
reduces to 2.4 people of working age for Argyll and Bute.
Long term solutions need to be found to the care needs of an ageing western population. New
technological developments; examples of which include the use of robot companions in care
homes or semi-automated living environments, may revolutionise the way in which we live, in
sufficiently affluent societies. These are being piloted, particularly in Japan, but are still a number
of years away3. We also need to empower communities to find local solutions to caring for those in
their own communities and recognise that an approach which relies on the state to solve problems
by funding more and more services is unsustainable. The Community Empowerment Act, 2015, has
the potential to support such a societal change but will require significant support to ensure that it
does not increase social inequity4.
We need to recruit students locally and provide education locally, so that we train individuals who
then stay to live and work in the community they know. There is a need to use workforce planning
tools and work with local training providers, particularly the University of the Highlands and Islands
(UHI), which uniquely provides both further and higher education, to recruit, train and continually
professionally develop staff to undertake a range of health and social care roles. Remarkable
2.9
2.4
2.8
3.5
0.0
0.5
1.0
1.5
2.0
2.5
3.0
3.5
4.0
Highland Argyll & Bute NHS Highland ScotlandPeop
le o
f wor
king
age
for e
very
per
son
65
year
s an
d ol
der
People of working age (16 - 64 years) for every person 65 years and older in 2016
People of working age (16 - 64 years) for every person 65 years and older
Figure 7.5 - People of working age (16-64 years) for every person 65 years and older in 2016
Source: National Records of Scotland, 2016 mid-year population estimates. Available at: http://bit.ly/2yZWfSd
Director of Public Health Annual Report 201770

progress has been made in this regard with recent developments around a UHI School of Nursing,
training of medical students via ScotGEM, work towards a Care Academy, and the possibility of
training a range of Allied Health Professionals within the Highlands and Islands and Argyll and Bute.
Sustainable FinancingThere are a range of challenges in delivering sustainable financial models in a health board with the
geography of NHS Highland. Some of the challenges in creating a sustainable financial framework
that expresses the principles of Realistic Medicine or Prudent Healthcare are addressed below.
Existing health and social care infrastructure across Highland and Argyll and Bute reflect historic
rather than current or future need and creates distortions to expenditure contributing to large
geographical variations in cost per case. The historic location and configuration of primary and
secondary care buildings and facilities needs reviewed, particularly given the demographic changes
anticipated in this report.
The increasing availability of expensive technological solutions, which have a small incremental
benefit, presents a significant challenge in the context of Realistic Medicine or Prudent Healthcare.
Most individuals requiring expensive technological
solutions are not treated locally, but are reviewed
and agreed by a local ‘out of area referrals’ process.
Requests for treatment are considered by a
multidisciplinary panel, chaired by the Director of
Public Health, called the Clinical Advisory Group.
There can be a mismatch between personal hope
in an emerging treatment, and the evidence base.
This is particularly the case when significant sums
are required for a course of treatment that is highly
experimental, with only a slim chance of success.
Wherein such cases, the wishes of an individual,
however understandable, need to be carefully
assessed and balanced with the clinical evidence,
endeavouring to provide the best possible care for
each and every individual.
An excessive focus on cost can be harmful and
result in a loss of compassion and a failure to do the
best that can be done for each patient. On the other
hand, there is an opportunity cost in providing very
resource intensive care for one individual, or for a
small group of individuals, which is associated with
a more hidden but very real loss of an opportunity
to treat other patients. Figure 7.6 provides an
example of an initiative which encourages patients
to question clinical staff from a Realistic Medicine perspective.
Health economic approaches have been developed to address the challenge of assessing new
treatments against current options, using the concept of an incremental cost per Quality Adjusted
Life Year (QALY). This approach is open to a range of major criticisms around the measurement
techniques that are used by health economists, but the Incremental Cost Effectiveness Ratio (ICER)
is widely used as one of a number of factors guiding resource allocation decisions5.
It is not clear what ICER threshold should be used when considering new treatments. The National
Institute for Health and Care Excellence has traditionally used a threshold of £20-30,000 per QALY.
However, some research has suggested that an affordable threshold is probably around £13,0006,7.
treatments or tablets
Why is it important for me to do this?
What are the pros and cons if I don’t do anything?
What other things can I do to help my own health?
IT’S OKAY TO ASK
© NHS Highland Public Health 2017
Figure 7.6 - Poster for ‘Okay to ask’ initiative
Chapter 7
Director of Public Health Annual Report 2017 71

There are some odd anomalies in the way funding decisions are currently made, which do not sit
well with either a Realistic Medicine or Prudent Healthcare approach. Some extremely expensive
treatments are handled by the Specialised Services team in National Services Scotland, or at a
UK level8. The ICERs in some of these contexts are very high. It may be helpful to illustrate the
challenges by reference to a specific example:
An Enzyme Replacement Therapy for a Lysosomal Storage Disorder called Idursulfase which was
presented by a drug manufacturer for approval had an incremental cost per QALY of between £564,692
and £1,174,342, as it produced very little benefit to patients9,10.
Current mechanisms for determining what the drug manufacturer can charge for such medicines
are not fit for purpose11. There is little relationship between production cost and retail price, and
some evidence to suggest exploitation by the pharmaceutical industry12. A shorter duration of
patent or price caps could be used as part of a Realistic Medicine approach to addressing this
issue.
Sustainable planning toolsSustainable planning requires high quality data. There is a need for greater drivers to improve data
quality. Although not without its problems, the National Tariff and Payment by Results scheme that
operates in NHS England has driven up data quality and made it possible to benchmark services at
the level of individual patients, and has created a driver to measure costs at a granular level. There
is a case for considering an alternative approach in Scotland that might have a similar effect.
NHS Highland has had success with a tool called ‘the box score’, which has reduced costs at ward
level in local hospital pilot work, while maintaining quality13. The tool provides a method for pulling
together and visually managing quality, cost, and workforce capacity on a weekly basis. This
example delivers on a number of the aspirations of Realistic Medicine and Prudent Healthcare and
is now being shared widely.
Sustainable prioritiesHealth service planning always involves
prioritisation. There are many tools for
doing this, none of which are ideal and
some approaches have indeed gone
badly wrong14. Different frameworks
take into account different factors when
considering system level priorities;
one model is shown in Figure 7.7. The
model focuses on four helpful high level
questions, but still involves judgements
that have to be made by service
planners.
Another method of prioritisation is
to consider thresholds for treatment.
This approach has been used more in
England than in Scotland. and Figure
7.8 illustrates the effect of changing
thresholds over time. The data comes
from a study in Australia. The figure
demonstrates a rise in the number of
patients eligible for surgery from 660
patients in 1950. The rise in numbers
in this example is due to changes in
Figure 7.7 - Prioritisation model
Source: Specialised Services Workshop, Wales, 2011
Director of Public Health Annual Report 201772

visual acuity threshold and to demographic changes to an estimated 9,070 patients in 2020. The
figure also indicates that if the 1950 threshold was maintained until 2020 the number eligible for
surgery would only rise to 2,980 patients, as opposed to 9,070 patients. No one would suggest
using the visual acuity threshold used in 1950 today, but the example illustrates the way in which
technological changes and demographic changes combine to place increasing pressure on
healthcare services.
Figure 7.8 - Effect of changing thresholds and an ageing population on eligibility for cataract surgery Source: Arch Ophthalmol. 2006;124(12):1750-1753. doi:10.1001/archopht.124.12.175015
Decisions on treatment threshold can have significant effects on resource utilisation. It can be
argued that in some cases thresholds have fallen too far, for example, as many as one in five
patients who have a knee replacement regret having done so16. There is a question as to whether
such patients represent excessive treatment.
Some of the care we provide can do more harm than good, exposing patients to unnecessary risks.
This fact is compounded by the fact that the NHS has historically been poor at monitoring long
term outcomes, except as part of formal research. Better long term measurement of patient related
outcomes, combined with benchmarking would significantly aid a realistic or prudent approach to
healthcare.
Pendulum swingsAn emphasis on Realistic Medicine or Prudent Healthcare is welcome but there is a risk that, as
the concept takes hold, the pendulum will swing too far in the direction of ‘realism’, and that some
aspects of compassion and generosity may be lost17. The social contract underpinning a service free
at the point of delivery, where some pay and others benefit to improve equity overall, can easily
start to erode.
Totalitarian regimes in the past have argued that the best thing to do is to get rid of the weak and
the vulnerable. Thankfully, we are far removed from that position as a society but it would not be
too big a step for some in society to start to say that it is not ‘realistic’ to treat those individuals who
do not contribute to economic generation and that we would all be better off if such people were
not around.
Chapter 7
Director of Public Health Annual Report 2017 73

Some of the harsh restrictions that have been introduced in parts of England, for example, around
weight loss requirements before surgery for example, are an area for concern. We must ensure
continue to value every member of our population and advocate for access to healthcare for all,
regardless of the extent to which an individual may, or may not, have contributed to their condition.
This report has primarily focused on healthcare services however a truly holistic and realistic
approach requires recognising the need for complementary upstream as well as downstream
actions to reduce variation and inequality across the domains of health, social care, education and
income.
ConclusionRealistic Medicine, Prudent Healthcare and Choosing Wisely have important lessons for clinical
service delivery. The underlying principles are also relevant to decision making at population level.
Constructs such as social justice and inequality are not explicit in the Realistic Medicine model but
have been adopted by the Scottish Government and are central to public health work.
Income equality is particularly a challenge to health at a global level, see Figure 7.9. The richest
85 people on the planet own as much as the poorest half of humanity; a degree of skew in the
distribution of wealth that few of us would wish to condone and which must surely form part of any
approach to Realistic Medicine.18
The value of Realistic Medicine could be enhanced by incorporating these wider dimensions of care
and considering its application to population health as well as that to the individual. The approaches
outlined in this report are not a panacea, but clearly have the potential to contribute to a more
sustainability approach to health and social care in NHS Highland.
The challenges of Realistic Medicine are not new. There has always been a tightrope to walk
and judgements to be made in providing healthcare free at the point of access. The concepts
Each horizontal band
represents an equal fifth
of the world’s population
Persons below
$1.25/day
(22 percent)
Persons below
$2/day
(40 percent)
Q5
Q4
Q3
Q2
Q1
Po
pu
latio
n (i
n q
uin
tile
s)
Income ($)
Figure 7.9 - Global income by percentile of population (population in quintiles)
Source: Seery E, Caistor Arendar A. Even It Up: Time to end extreme inequality. London: Oxfam International; 2014
Director of Public Health Annual Report 201774

encapsulated in the story of the Good Samaritan are perhaps an ancient example of Realistic
Medicine. The story includes the idea of compassionate care, as someone risks their life to rescue
a social outcast, provides free first aid, free transport and pays up front for treatment. However,
the story also includes the concept of prudence as the payment is only for a fairly tight ‘estimated
length of stay’ supplemented by a post hoc payment adjustment mechanism.
A tight length of stay gave the care provider an incentive to support rapid recovery, whilst
recognising that the outcome at the point of admission was associated with a degree of uncertainty.
In summary, the story exemplifies generosity and financial prudence. It balances altruism,
compassion and courage. In many ways, the challenges we face in the health service today are just
the same.
Realistic Medicine Case Study
Rapid Process Improvement Workshops NHS Highland uses Rapid Process Improvement Workshops (RPIWs) as a quality improvement methodology. RPIWs are a way of bringing staff together to work on a number of related improvements. Wherever possible, service users take part in the event. The workshops use a range of methods including root cause analysis, problem solving, visual controls, focus on service flow, error proofing and Plan, Do, Study, Act cycles.
Examples of recent improvement work using these methods include:
• Delivery of meals at Campbeltown Hospital
• Assessment and allocation of mental health service referrals in Inverness
• Flow through the Emergency Department at Caithness General Hospital, Wick
• Management of people with respiratory problems at Raigmore Hospital, Inverness
• Patient flow at Lorn and the Isles Hospital, Oban
• Management of Long-Term staff absence, with work initially conducted in Invergordon
Chapter 7
Director of Public Health Annual Report 2017 75

Introduction1 Dunn, P., Mckenna, H., & Murry, R. Deficits in the NHS 2016. The Kings Fund Briefing. 2016
2 Delamothe, T. Founding Principles. 2008. BMJ, 1261-1218.
3 Harrington, J. Vision of utopia: markets, medicine and the NHS. 2009. Legal Studies.29(3):376-399
4 Rivett, G. National Health Service History. Available from: http://bit.ly/2gXkO7C [Accessed May 2017]
5 Chief Medical Officer’s Annual Report 2014-15. Realistic Medicine. 2016. The Scottish Government.
Chapter One1 The King’s Fund. Spending on health and social care over the next 50 years, why think long term? 2013.
Available at: http://bit.ly/2xms8Tk [Accessed 24th May 2017]
2 ukpublicspending.co.uk. Time series chart of public spending.
Available from: https://www.ukpublicspending.co.uk [Accessed 20th October 2017]
3 OECD Health Statistics. Health at a glance 2013. Available from: http://bit.ly/2iq2V4o [Accessed 18th October
2017]
4 Luchinskaya D, Simpson P and Stoye G. UK health and social care spending. In: the Institute for Fiscal Studies
(IFS) (Ed.). The IFS Green Budget 2017. IFS: 2017. p.141-176.
5 Information Services Division (ISD). Scottish Health Service Costs. 2016.
Available at: http://bit.ly/2xn7R0f [Accessed 24th May 2017]
6 Information Services Division. Expenditure on Adult Social Care Services. 2014.
Available at: http://bit.ly/2h8E74d [Accessed 26th June 2017]
7 Audit Scotland, NHS in Scotland 2016. Available at: http://bit.ly/2dKMgJ5 [Accessed 22nd June]
8 Scottish School of Primary Care. Multimorbidity in Scotland. Available at: http://bit.ly/2hAh3YZ [Accessed 26th
June 2017]
9 Goldacre, Ben. Bad pharma: how drug companies mislead doctors and harm patients. Macmillan, 2014.
10 Illich, Ivan. Medical nemesis. New York: Bantam Books, 1976.
11 Barton, A & Muley, G. History of the development of geriatric medicine in the UK. Postgraduate Medicine
Journal. 2002. 79:229-234. Available at: http://bit.ly/2zJJs5Q [Accessed 23rd June 2017]
12 Peace S. The development of residential and nursing home care in the United Kingdom. In: Sampson Katz, J
and Peace, S (eds) End of Life in Care Homes: A Palliative Care Approach. Oxford Scholarship Online 2003,
p15-41. Available at: http://bit.ly/2yPa202 [Accessed 22nd June 2017]
13 The Queen’s Nursing Institute. Timeline of District Nursing. Available at: http://bit.ly/2zUtgj2 [Accessed 27th
June 2017]
14 Thane, P. Memorandum submitted to the house of common health committee inquiry: Social Care October
2009. Available at: http://bit.ly/1Chw9TQ [Accessed 24th June 2017]
15 Information Services Division (ISD). Care home census for adults in Scotland. 2016.
Available at: http://bit.ly/2y34qA0 [Accessed 24th May 2017]
16 National Health Service Scotland. The changing functional needs and dependency of people living in care
homes. Evidence from use of indicator of relative need in Scotland. 2016.
Available at: http://bit.ly/2yI1Fnf [Accessed 26th May 2017]
17 Office for National Statistics. Changes in the older resident care home population between 2001 and 2011.
2014. Available at: http://bit.ly/21H0MRh [Accessed 24th June 2017]
18 Scottish Government. Scotland’s Carers Publication, Accompanying spreadsheet:
http://bit.ly/2AfyBRQ [Accessed 17th October 2017]
19 F Matthewson. Highland Health & Social Care Partnership Summary Analysis of High Resource Individuals.
2016. Inverness: National Services Scotland, Information Services Division
References
Director of Public Health Annual Report 201776

20 SPICe Briefing. Integration of Health and Social Care. 2016. Available at: http://bit.ly/2iEvjnb [Accessed 28th
September 2017]
21 Buckinx F, Rolland Y, Reginster J Y et al. Burden of frailty in the elderly population: perspectives for a public
health challenge. 2014. Archives of Public Health. 73(19): 1-7. Available at: http://bit.ly/2i8FZXf [Accessed 26th
June 2017]
22 Information Services Division. Scottish Patients at Risk of Admission and Re-admission(SPARRA). Available at:
http://bit.ly/2y8EhzS [Accessed 28th May 2017]
23 MacPherson, F and Vaughan S. Estimating the current and future need for care of older people in Highland by
setting of care and by dependency status. 2017. NHS Highland.
24 Matthewson F. Current & future care Home provision for older people in Highland HSCP. 2017.
Inverness: National Services Scotland, Information Services Division.
25 Information Service Division (ISD). Nursing and midwifery staff in post. 2016. Available at: http://bit.ly/1E4WU3g
26 Highland District nursing review steering group. District nursing services development plan. 2017. Currently
unpublished.
27 My Local Council Website. 2016. Available at: http://bit.ly/2i9TqpJ [Accessed 23rd June 2017]
28 Drageset, J., Kirkevold, M., Espehaug, B. Loneliness and social support among nursing home residents
without cognitive impairment: a questionnaire survey. 2011. Int J Nur Stud, 48, 611-619.
29 Nyqvist F, Cattan M and Andersson. Social capital and loneliness among the very old living at home and
institutional settings, a comparative study. 2013. Journal of Aging and Health. 25(6):1013-1035:
http://bit.ly/2hdYE4f [Accessed 26th June 2017]
30 Dirks M, Wall B T, Vande Valk, B, Holloway, T M et al. One week of bed rest least to substantial muscle atrophy
and induces whole-body insulin resistance in the absence of skeletal muscle lipid accumulation. 2016.
Diabetes. 65(10): 2862-2875. Available at: http://bit.ly/2A395P2 [Accessed 26th June 2017]
31 Alvarez Barbosa F, del Pozo-Cruz B, Pozo Cruz, Jesus et al. Factors associated with risk of falls in nursing
home residents aged 80 and over. 2015. Rehabiltation Nursing 41 (1): 16-25. Available at: http://bit.ly/2iDJecS
[Accessed 26th June 2017]
32 Rothera I C, Jones R, Harwood R, Avery Aj et al. Survival in a cohort of social services placements in nursing
and residential homes: factors associated with life expectancy and mortality. 2002. Public Health. 116(3): 160-
165. Available at: http://bit.ly/2hdAiaL [Accessed 26th June 2017]
33 Centre for Policy on Ageing-Rapid Review. The care and support of older people – an international
perspective. 2014. Available at: http://bit.ly/2i9qRJ8 [Accessed 28th June 2017]
Chapter Two1 Chief Medical Officer’s Annual Report 2014-15. Realistic Medicine. 2016. Scottish Government
2 Bolton J. Predicting and manging demand on social care. April 2016. Institute of Public Care, Brookes Oxford
University.
3 Schlesinger M, Grob R. Treating, Fast and Slow: Americans’ Understanding of and Responses to Low-Value
Care. The Milbank Quarterly 2017 Vol. 95, No. 1 (pp. 70-116)
4 Chief Medical Officer’s Annual Report 2015-16. Realising Realistic Medicine. 2017. Scottish Government
5 Hernandez-Sanchez V, Marwick C A, Patton A, Davey P G. Time series analysis of the impact of an
intervention in Tayside, Scotland to reduce primary care broad-spectrum antimicrobial use. 2015. Journal of
Antimicrobial Chemotherapy. Available at: http://bit.ly/2iEGR5X [Accessed 23rd June 2017]
6 Squires I S, Boal A J, Lamont S and Naismith G D. Implementing a self management strategy inflammatory
bowel disease (IBD): patient perceptions clinical outcomes and the impact on service. 2017. Frontline
Gastroenterology. Available at: http://bit.ly/2zp8AlM [Accessed 23rd of June 2017]
7 MacKenzie G and Dougall A. Increasing healthy start food and vitamin voucher uptake for low income
pregnant women (Early years Collaborative Leith Pioneer Site). 2015. BMJ Quality Improvement Programme.
Available at: http://bit.ly/2AswBGb [Accessed 23rd of June 2017]
8 Philip L, Roberts A, Currie M and Mort, A. Technology for Older Adults: Maximising personal and social
interaction, exploring opportunities for eHealth to support the older rural population with chronic pains. 2015.
Scottish Geographical Journal. Available at: http://bit.ly/2AlDkRA [Accessed 23rd of June 2017]
Director of Public Health Annual Report 2017 77

9 Gillies K, Skea Z c, Campbel M K. Decision aids for randomised controlled trials: a qualitative exploration of
stakeholders views. 2014. BMJ Open. Available at: http://bit.ly/2m7SHLd [Accessed 23rd of June]
10 Further information on the ICHOM is available at: http:\\www.ichom.org
11 Bradley P, Wilson A, Buss P, Harrhy S, Laing H, Shortland G, van Woerden H. Achieving prudent healthcare in
NHS Wales. 2014. Cardiff: Public Health Wales
12 More information on Canterbury District Health Board is available at: http://bit.ly/2zbIm6H and at Timmins, N.
& Ham, C. The quest for integrated health and social care A case study in Canterbury, New Zealand. 2013.
London: The King’s Fund.
13 Timmins, N. & Ham, C. The quest for integrated health and social care - A case study in Canterbury, New
Zealand. 2013. London: The King’s Fund
14 Pictogram reproduced with kind permission from the King’s Fund. Originally published in Timmins, N. & Ham,
C. The quest for integrated health and social care A case study in Canterbury, New Zealand. 2013. London:
The King’s Fund
15 Southcentral Foundation: Nuka System of Care. Further information available at: https://scfnuka.com/
16 Barnett, K. Applying Learning for Nuka’s System of Care. 29 July 2015
17 De Blok, J. Buurtzorg: better care for lower cost. 2013. [Presentation to The King’s Fund.
Available from http://bit.ly/1xHpHEB]; KPMG (2012)
18 Aylward M, Howson H, Matthias J. International examples of prudent approaches to healthcare. 2014.
Available at http://bit.ly/2ll9yti
19 van der Heide I, Snoeijs S, Boerma W, Schellevis F, Rijken M. On behalf of the ICARE4EU consortium. How
to strengthen patient-centredness in caring for people with multimorbidity in Europe? 2016. European
Observatory on Health Systems and Policies.
20 “Lessons from Spain: The Alzira Model”. The King’s Fund (2012)
21 Pictogram reproduced with kind permission from Price Waterhouse Cooper
22 Further information on the Choosing Wisely Campaign is available at: www.choosingwisely.org
Chapter Three1 Murray C.J. et al. Global, regional, and national disability-adjusted life years (DALYs) for 306 diseases and
injuries and healthy life expectancy (HALE) for 188 countries, 1990–2013: quantifying the epidemiological
transition. 2015. The Lancet. Dec 4;386(10009):2145-91.
2 Wikipedia By Original:PlanemadVector:Radio89 - This file was derived from DALY disability affected life year
infographic.png:, CC BY-SA 3.0, https://commons.wikimedia.org/w/index.php?curid=20278903
Available at: https://en.wikipedia.org/wiki/Disability-adjusted_life_year [Accessed 16th Oct 2017]
3 National Records of Scotland. Interactive data visualisations: cause of death.
Available at: http://bit.ly/2ng5V87 [Accessed 19th Oct 2017]
4 NICE Quality Standard [QS13.] End of life care for adults. Published November 2011, last updated: March 2017
Available from: http://bit.ly/1Md6sbP [Accessed 10th July 2017]
5 White N, Reid F, Harris A, Harries P, Stone P. A systematic review of predictions of survival in palliative care:
How accurate are clinicians and who are the experts?. 2016. PloS one. Aug 25;11(8):e0161407.
6 National Audit Office (NAO). End of Life care. Report by the comptroller and auditor general. Published 26
November 2008. Available from: http://bit.ly/2iXK6cC [Accessed 10th Jul 2017]
7 Hoare S, Morris ZS, Kelly MP, Kuhn I, Barclay S. Do Patients Want to Die at Home? A Systematic Review of
the UK Literature, Focused on Missing Preferences for Place of Death. 2015. PLOS ONE 10(11): e0142723.
Available from: http://bit.ly/2zth1g7 [Accessed 10th Jul 2017]
8 Murtagh FEM, Bausewein C, Verne J, Groeneveld EI, Kaloki YE, Higginson I. How many people need palliative
care? A study developing and comparing methods for population-based estimates. 2014. Palliative Medicine.
22(1): 49-58. Available from: http://bit.ly/2h8MZXK [Accessed 10th Jul 2017]
9 Vaughan S 2017, The level of need for palliative care in NHS Highland; update of the previous 2008
assessment
Director of Public Health Annual Report 201778

Chapter Four1 Scottish Government. Palliative and End of Life Care. 2015 [ONLINE] Available at: http://bit.ly/2iLXpNg
[Accessed 26th August 2017]
2 Scottish Partnership for Palliative Care. What is Palliative Care. 2017 [ONLINE] Available at: http://bit.
ly/2hobooO [Accessed 26th August 2017]
3 IHAPC. 6 Principles of palliative care - International Association for Hospice & Palliative Care. 2017 [ONLINE]
Available at: http://bit.ly/2yWZlZB [Accessed 26th August 2017]
4 Cardona – Morrell M., Kim JCH., Turner RM., and Anstey M. Non-beneficial treatments in hospital at the end.
2016. International Journal for Quality in Health Care. 28(4), 456-469.
5 Lund S., Richardson A., and May C. Barriers to Advance Care Planning at the end of life: An Explanatory
Systematic Review of Implementation Studies. 2015. Plos one. 10 (371/journal.pone.0116629), 1-15.
6 Scottish Government. Anticipatory Care planning frequently asked questions. 2010 [Online]
Available at: http://bit.ly/2A03Yjg [Accessed 11th September 2017]
7 Scottish Government. Do Not Attempt Cardio Pulmonary Resuscitation (DNACPR) Integrated adult policy
Decision making and Communication. 2010 [Online] Available at: http://bit.ly/2ltmJbK [Accessed 26th August
2017]
8 Tapsfield J., Hall C., Lunan C., McCutheon H., McLoughlin P., Rhee J., Rus A., Spiller J., Finucane A., and
Murray SA. Many people in Scotland now benefit from anticipatory care before they die: an after death
analysis and interviews with general practitioners. 2016. BMJ Supportive and Palliative Care. doi:10.1136/
bmjspcare-2015-001014
9 The Gold Standard Framework. Advance Care Planning. 2017 [Online] Available at http://bit.ly/2lsAQhn
[Accessed 26th September 2017]
10 Higginson IJ, Finlay IG, Goodwin DM, Hood K, Edwards AGK, Cook A, et al. Is there evidence that palliative
care teams alter end-of-life experiences of patients and their caregivers? 2003. J Pain Symptom Manage.
25(2):150–68.
11 Khandelwal N., Kross EK., Engelberg RA., Coe NB., Long AC., Curtis JR. Estimating the Effect of Palliative Care
Interventions and Advance Care Planning on ICU Utilization: A Systematic Review. 2015. Crit Care Med. 43(5):
1102 – 1111.
12 Temel JS., Greer JA., Muzikansky A., Gallagher ER., Admane S., Jackson VA., Dahlin CM., Blinderman CD.,
Jacobsen J., Pirl WF., Billings JA., and Lynch TJ. Early Palliative Care for Patients with Metastatic Non–Small-
Cell Lung Cancer. 2010. The New England Journal of Medicine. [ONLINE] Available at: http://bit.ly/2bVxUEG
[Accessed 27th August 2017]
13 Mason B., Buckingha, S., Finucane A., Hutchison P., Kendal M., McCutcheon H., Porteous L. and Murray
S. Improving primary palliative care in Scotland: lessons from a mixed methods study. 2015. BMC Family
Practice. 16: 176
14 Gogowska M., Sanders T., Johnson R. Kadam Umesh T., Lasserson Daniel S. and Purdy S. “Sometimes we
can’t fix things”: a qualitative study of health care professionals’ perceptions of end of life care for patients
with heart failure. 2014. BMC Palliative Care. [Online] Available at: http://bit.ly/2yWEMKr
15 Kellehear A. Compassionate Cities: Public Health and End of Life Care. 2005. London: Routledge.
16 Holt-Lunstad J., Smith TB., and Layton JB. Social relationships and mortality risk: a meta-analytic review. 2010.
PLoS Med. 7.7 : e1000316.
17 Reeves, D., et al. The contribution of social networks to the health and self-management of patients with long-
term conditions: a longitudinal study. 2014. PloS one. 9.6 : e98340.
18 National Institute for Health and Care Excellence. Community engagement: improving health and wellbeing
and reducing health inequalities. 2014. NICE guideline (NG44).
19 Ray R., Street A. Ecomapping: an innovative research tool for nurses. 2005. Journal of Advanced Nursing.
50(5), 545-552.
20 Jenson K., Cornelson B. Eco-maps: A systems tool for family physicians. 1987. Can Fam Physician. 33: 172-177.
21 Miller V., Fields N., Adorno G., Smith-Osborne A. Using the Eco-Map and Ecosystems Perspective to Guide
Skilled Nursing Facility Discharge Planning. 2017. Journal of Gerontological Social Work. 60, 504-518.
DOI: http://bit.ly/2h8Oe9m
Director of Public Health Annual Report 2017 79

22 Rempel G., Neufeld A., Kushner K. Interactive use of genograms and ecomaps in family caregiving research.
2007. Journal of Family Nursing. 13(4), 403-419. DOI: http://bit.ly/2zfo9Ma
23 Hartman A. Diagrammatic assessment of family relationships. 1995. Families in Society: The Journal of
Contemporary Human Services. 1, 111-122.
Chapter Five1 British Geriatric Society in association with the Royal College of General Practitioners and Age UK. Fit for
frailty. Consensus best practice guidance for the care of older people living with frailty in community and
outpatient settings. 2014 (Rebranded edition 2017) Available from: http://bit.ly/1jeosfc [Accessed 17th July
2017]
2 Heppenstall CP, Wilkinson TJ, Hager HC, Keeling S. Frailty: dominos or deliberations? 2009. New Zealand
Medical Journal. 122 (1299): 42-53. Available from: http://bit.ly/2yfzIUD [Accessed 17th July 2017]
3 Fried LP, Tanggen, CM, Watson J, Newman AB et al. Frailty in older adults: Evidence for a Phenotype. 2001.
Journal of Gerentology. 56A (3): M146-M156
4 Clegg A, Bates C, Young J, Ryan R et al. Development and validation of an electronic frailty index using
routine primary care electronic health record. Age and Ageing 2016; 45: 353-360
5 McNally L, Moss D, Devereux N, Monaghan T. Electronic Frailty Index: A population approach to improving
health and wellbeing in health and social care. Available from: http://bit.ly/2z01N1u [23/07/2017].
6 Collard RM, Boter H, Schoevers RA, Oude Voshaar R C. Prevalence of frailty in community-dwelling older
persons: A systematic review. J of Am Geriatr Soc 2012 60: 1487-1492
7 Kojima G. Prevalence of Frailty in Nursing Homes: A systematic Review and Meta-analysis. JAMDA 2015; 16:
940- 945. Available from: http://bit.ly/2h8Ok0I [Accessed at 24/07/2017]
8 Oo MT, Tencheva A, Khalid N, Chan YP, Ho SF. Assessing frailty in the acute medical admission of elderly
patients. J R Coll Physicians Edinb 2013; 43: 301-308. Available from: http://bit.ly/2h9DUxz [Accessed 24 July
2017]
9 Gale CR, Cooper C, Sayer AA. Prevalence of frailty and disability: findings from the English Longitudinal Study
of Ageing. Age and Ageing 2015; 44: 162-165
10 Poots AJ, Lovett D, Soong J, Bell D. Quantifying the prevalence of frailty in Scottish hospitals using geriatric
syndromes: a replication study. 2016. Collaboration for Leadership in Applied Health Research and Care
Northwest London. Available from: http://bit.ly/2iZ6ToB [Accessed 18th July 2017]
Chapter Six1 Oliver, D. Fighting pyjama paralysis in hospital wards. 2017. British Medical Journal. 357. Available from doi:
http://bit.ly/2xWtIf2
2 Sayer AA, Robinson SM, Patel HP, Shavlakadze T, Cooper C, Grounds MD. New horizons in the pathogenesis,
diagnosis and management of sarcopenia. 2013. Age and Ageing 42: 145-150. Available from doi: 10.1093/
ageing/afs191
3 Liu C-J, Latham NK Progressive resistance Strength Training for improving physical function in older adults.
2009. Cochrane Database Systematic Reviews (3): CD002759. doi: 10.1002/14651858.CD002759.pub2.
4 Howe TE, Rochester L, Neil F, Skelton DA, Ballinger C. Exercise for improving balance in older people. 2011.
Cochrane Database of Systematic Reviews Issue 11. Art. No.: CD004963. DOI: 10.1002/14651858.CD004963.
pub3.
5 Spira D., Walston J., Buchmann N., Nikolov J., Demuth I., Steinhagen-Thiessen E., Eckardt R., Norman K.
Angiotensin-Converting Enzyme Inhibitors and Parameters of Sarcopenia: Relation to Muscle Mass, Strength
and Function: Data from the Berlin Aging Study-II (BASE-II). 2016. Drugs and Aging 1-9. DOI: 10.1007/s40266-
016-0396-8
6 Vaughan S., Huc S. What models of specialist geriatric care best meets the needs of the population of NHS
Highland? 2012. Inverness: NHS Highland. http://bit.ly/2zXDMF5
7 Vaughan S., Huc S. Update of the previous review of the evidence for the effectiveness of interventions to
reduce hospital admissions of older people. 2016. Inverness: NHS Highland. http://bit.ly/2uKnL37
Director of Public Health Annual Report 201780

Chapter Seven1 Helen Bryers, Chris Abell, Joanne Thorpe. Model of Maternity Care for very Remote and Island Communities. 2010.
Inverness: Highland Health Board
2 Council’s Approved Rate for nursing care and residential care from April 2017 are £667.09 per resident per week
(£34,689/yr; £3.97/hr), and for nursing care and £574.42 per resident per week(£29,870/yr; £3.42/hr)
3 Vandemeulebroucke T, de Casterlé BD, Gastmans C. The use of care robots in aged care: A systematic review of
argument-based ethics literature. Archives of Gerontology and Geriatrics. 2017 Sep 6
4 Pugh M, Connolly J. A Review of Contemporary Linked Challenges for Scottish Local Government. Scottish Affairs.
2016; 25(3):317-36
5 Arnesen T, Trommald M. Roughly right or precisely wrong? Systematic review of quality-of-life weights elicited with
the time trade-off method. Journal of health services research & policy. 2004 Jan 1;9(1):43-50
6 Claxton K, Martin S, Soares MO, Rice N, Spackman DE, Hinde S, Devlin NJ, Smith PC, Sculpher MJ. Methods for the
estimation of the NICE cost effectiveness threshold. University of York, Centre for Health Economics; 2013 Nov
7 University of York. Research says approval of new drugs by NICE is ‘doing more harm than good’ 18 February 2015.
Available from http://bit.ly/2yj548I [Accessed 06/11/17]
8 Specialised Services, National Services Scotland, http://bit.ly/2zGOdkz [Accessed 3 Nov 2017]
9 All Wales Medicines Strategy Group. Final Appraisal Report: Idursulfase (Elaprase). 2007. Available at: http://bit.
ly/2zHhk7t [Accessed : 30-6-2011]
10 Muenzer J, Giugliani R, Scarpa M, Tylki-Szymańska A, Jego V, Beck M. Clinical outcomes in idursulfase-treated
patients with mucopolysaccharidosis type II: 3-year data from the hunter outcome survey (HOS). Orphanet journal of
rare diseases. 2017 Oct 3;12(1):161
11 Goldacre, Ben. Bad pharma: how drug companies mislead doctors and harm patients. Macmillan, 2014
12 Hughes DA, Tunnage B, Yeo ST. Drugs for exceptionally rare diseases: do they deserve special status for funding?.
Qjm. 2005 Oct 3;98(11):829-36
13 Kedar S. Mate, Jeffrey Rakover, Kay Cordiner, Brian Maskell. A Simple Way to Involve Frontline Clinicians in
Managing Costs. Harvard Buisness Review, 11 October 2017
14 Alexander, Christopher (1975). The Oregon Experiment. Center for Environmental Structure. III. Oxford University
Press, USA. ISBN 978-0195018240
15 Taylor HR, Vu HT, Keeffe JE. Visual acuity thresholds for cataract surgery and the changing Australian population.
Archives of Ophthalmology. 2006 Dec 1;124(12):1750-3
16 Gunaratne R, Pratt DN, Banda J, Fick DP, Khan RJ, Robertson BW. Patient Dissatisfaction Following Total Knee
Arthroplasty: A Systematic Review of the Literature. The Journal of Arthroplasty. 2017 Jul 21
17 Hemphill JC, White DB. Clinical nihilism in neuroemergencies. Emergency Medicine Clinics of North America. 2009
Feb 28;27(1):27-37
18 Seery E, Caistor Arendar A. Even It Up: Time to end extreme inequality. London: Oxfam International; 2014
Director of Public Health Annual Report 2017 81

Notes
Director of Public Health Annual Report 201782

Notes
Director of Public Health Annual Report 2017 83

Any enquiries regarding this publication should be sent to us at
Public Health Directorate
NHS Highland
Larch House
Stoneyfield Business Park
Inverness
IV2 7PA
Publication produced and published by NHS Highland Public Health, November 2017
ISBN: 978-1-901942-19-7