annual report 2017 transat a.t. inc.€¦ · our new hotel-management venture. ... for example,...
TRANSCRIPT
Annual Report 2017 Transat A.T. Inc.

That wine-tasting tour of Europe, that family vacation down south, that romantic cruise in the Caribbean… we were there for it all.
Thirty years of memories for thirty years of travel… and counting.
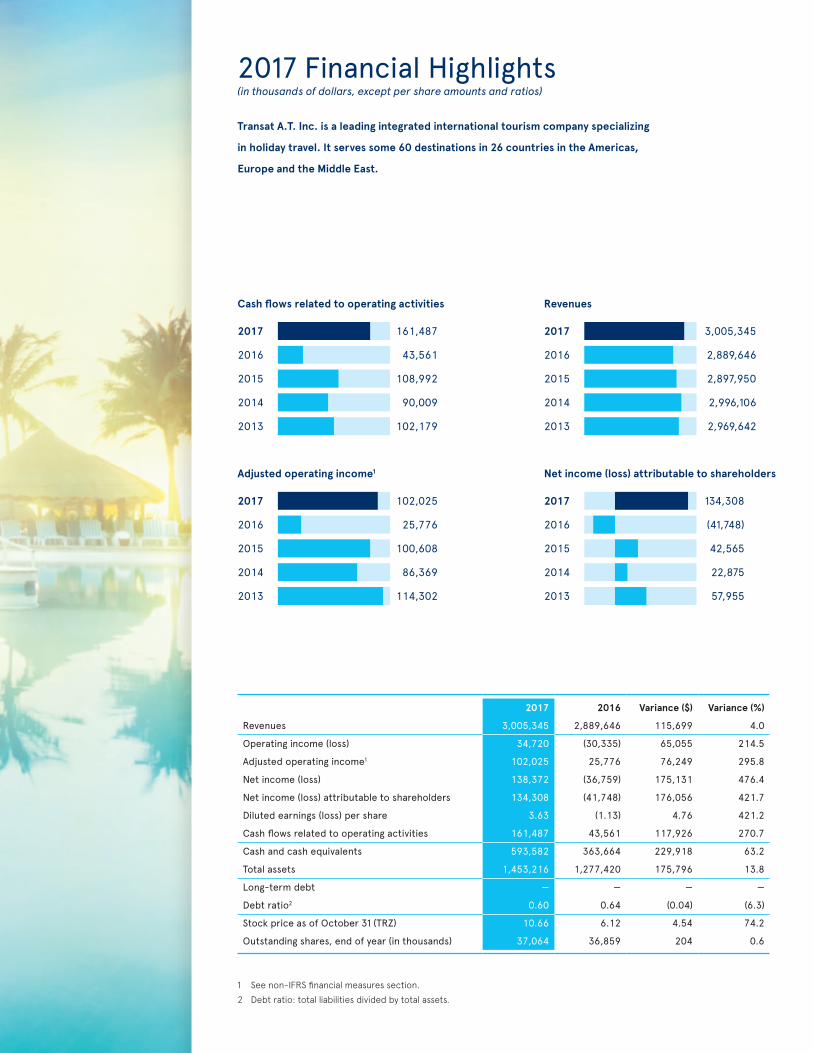
2017 Financial Highlights(in thousands of dollars, except per share amounts and ratios)
Transat A.T. Inc. is a leading integrated international tourism company specializing
in holiday travel. It serves some 60 destinations in 26 countries in the Americas,
Europe and the Middle East.
1 See non-IFRS financial measures section.
2 Debt ratio: total liabilities divided by total assets.
Cash flows related to operating activities Revenues
2017
2016
2015
2014
2013
161,487
43,561
108,992
90,009
102,179
Adjusted operating income1
2017
2016
2015
2014
2013
102,025
25,776
100,608
86,369
114,302
2017
2016
2015
2014
2013
3,005,345
2,889,646
2,897,950
2,996,106
2,969,642
2017 2016 Variance ($) Variance (%)
Revenues 3,005,345 2,889,646 115,699 4.0
Operating income (loss) 34,720 (30,335) 65,055 214.5
Adjusted operating income1 102,025 25,776 76,249 295.8
Net income (loss) 138,372 (36,759) 175,131 476.4
Net income (loss) attributable to shareholders 134,308 (41,748) 176,056 421.7
Diluted earnings (loss) per share 3.63 (1.13) 4.76 421.2
Cash flows related to operating activities 161,487 43,561 117,926 270.7
Cash and cash equivalents 593,582 363,664 229,918 63.2
Total assets 1,453,216 1,277,420 175,796 13.8
Long-term debt — — — —
Debt ratio2 0.60 0.64 (0.04) (6.3)
Stock price as of October 31 (TRZ) 10.66 6.12 4.54 74.2
Outstanding shares, end of year (in thousands) 37,064 36,859 204 0.6
Net income (loss) attributable to shareholders
2017
2016
2015
2014
2013
134,308
(41,748)
42,565
22,875
57,955

It’s our employees who make us soar to new heights.
GiulianaFlight attendantwith Air Transat since 2010
Jean-Marc Eustache
Chairman of the Board, President and Chief Executive Officer, Transat A.T. Inc.
Annick Guérard
Chief Operating Officer, Transat A.T. Inc.
President, Transat Tours Canada Inc.
Jean-François Lemay
President, Air Transat A.T. Inc.
Senior Management
Bernard Bussières
Vice-President, General Counsel and Corporate Secretary, Transat A.T. Inc.
Daniel Godbout
Senior Vice- President, Transport and Yield Management, Transat A.T. Inc.
Bruno Leclaire
Chief Information and Digital Officer, Transat A.T. Inc.
Christophe Hennebelle
Vice-President, Human Resources and Corporate Affairs, Transat A.T. Inc.
Denis Pétrin
Vice-President, Finance and Administration, and Chief Financial Officer, Transat A.T. Inc.

Jean-Marc Eustache
Chairman of the Board, President and Chief Executive Officer, Transat A.T. Inc.
1
Board of Directors
1 Executive Committee 2 Human Resources
and Compensation Committee 3 Audit Committee 4 Risk Management and Corporate
Governance Committee
Committees
Jean-Yves Leblanc
Lead Director
Corporate Director
1 2 3
Raymond Bachand
Strategic Advisor, Norton Rose Fulbright Canada S.E.N.C.R.L., s.r.l./LLP
3
Louis-Marie Beaulieu
Chairman of the Board, President and Chief Executive Officer, Groupe Desgagnés Inc.
2
Lucie Chabot
Vice-President and Chief Financial Officer, SAIL Outdoors Inc.
3
Lina De Cesare
Corporate Director
4
Jean-Pierre Delisle
Corporate Director
Executor of Estates
W. Brian Edwards
Corporate Director
1 2 4
Susan Kudzman
Executive Vice-President and Chief Risk and Corporate Affairs Officer, Laurentian Bank of Canada
2 4
Jacques Simoneau
President and Chief Executive Officer, Gestion Univalor, s.e.c.
1 3 4
Louise St-Pierre
Corporate Director
Philippe Sureau
Corporate Director
Chairman of the Board, President and
Chief Executive Officer
Message to ShareholdersA Pivotal Year
Jean-Marc EustacheDecember 13, 2017
Without a doubt, 2017 will be seen as a key year in our history. It not only marked the 30th anniversary of Transat’s founding as a public company but also featured several events that concluded our 2015–2017 strategic plan and that pave the way for our new 2018–2022 five-year plan. That plan, called Building Sustainable Profitability, lays the foundation for a Transat that will be even more financially sound and ready to prosper and develop over the next 30 years.
During 2017, we completed the strategic refocusing of our operations, with the sale in late November of Jonview Canada to Japanese group H.I.S. for $44 million. Jonview, the leading incoming tour operator in Canada, has benefited in recent years from the very favourable market for Canadian tourism, posting record income several years in a row, which helped grow its value considerably.
That transaction came at the end of a year that began with the sale of our France- and Greece-based tour operating business units for $93 million, and that also saw us divest ourselves of our minority interest in Ocean Hotels.
Having completed these transactions this past year, we are now ready to embark on a new year and new strategic cycle on two positive notes: we are a leaner company, focused on optimizing our primary business line—leisure travel; and we have gained the means to establish our new hotel-management venture.
We plan to continue optimizing our primary segment along the path laid out in recent years, as illustrated by
a number of initiatives that have seen progress these last few months.
First, we announced the upcoming implementation of a new fleet configuration. This will lead to improved leveraging of our flexible double fleet model, whereby we operate mainly narrow-body aircraft in winter and wide-body aircraft during the summer season. We will be leasing 10 Airbus A321neo LRs, the first of which will be delivered in early 2019; they will gradually replace our A310s.
In addition, in the next few years, we will replace our seasonal Boeing 737s with A321ceo’s, notably via an agreement with Thomas Cook Group. Lastly, our permanent narrow-body aircraft will also be phased out and replaced with planes from the A320 family, allowing us to reap the benefits of the Airbus shared-cockpit philosophy.
Eventually, Air Transat will have an all-Airbus fleet, comprising two or three aircraft types and enabling our pilots to switch from one to another much more easily—what Airbus calls Mixed Fleet Flying. The advantages are many: lower training costs, simplified flight operations, greater fuel economy and, for our passengers, a more standardized customer experience (with, for example, Club Class eventually available on all of our routes).
Furthermore, we took several important steps in terms of improving our revenue management and network planning, especially long-term, and we expect to continue in the same vein. The benefits

are beginning to show and are expected to strengthen in the coming years.
Our cost-reduction and margin-improvement initiatives, which allowed us to exceed our $100 million target during the most recent strategic plan period (thanks, in part, to strong growth in ancillary revenue), will, of course, continue.
On this list of achievements, I am not forgetting our customers, who are and will remain our primary focus. This past year, we rolled out a new customer relationship management (CRM) system in our call centres. Among other things, it allows our agents to recognize a caller and access their travel history with us. As a result, our interactions with customers are both more efficient and friendlier.
We have also continued to grow our online sales—revenues realized directly via our websites went up by 28% in Canada this year. We achieved this without hurting our agency sales, as evidenced by the fact that the sales of Transat products in our agencies have increased slightly year over year, on a comparable basis. And, of course, we are focusing more and more on mobile—as a sales channel and also as a means of interacting with the customer at every stage of the travel experience: before, during and after their trip.
In short, these are all efforts aimed at improving our existing core business, which we will be strengthening and developing in the years to come, and which has already led to improved results this year compared to last. After a challenging first quarter, we posted winter
results on par with those of the previous year, with an adjusted operating loss of $36 million in spite of the weak Canadian dollar, which put pressure on our costs. In the summer, we returned to the record levels recorded in 2015 and earlier years, posting an adjusted operating income of $138 million, well above that of 2016. Overall, we are ending the year with an adjusted operating income of $102 million and an adjusted net income of $29 million, while the operating income and the net income total $35 million and $138 million, respectively.
The Transat of tomorrow, moreover, will include our new hotel division, the foundations of which we are laying now. As I mentioned earlier, during 2017 we sold our interest in Ocean Hotels, for which we had partnered with H10 for 10 years. It was a fruitful venture, not only financially speaking (after acquiring our 35% stake in 2007 for $66.1 million, we sold it for $185.6 million), but also in terms of knowledge gained of the all-inclusive resort industry in the Caribbean and Mexico.
After discussions with our partner and after considering the possibility of acquiring a 100% interest in Ocean, we concluded that the best approach for Transat would be to create our own division, one hotel at a time, to our own specifications. We will buy and renovate some hotels; others will be built; still others will merely be managed by our team. We are beginning this project by recruiting a president, and we expect to begin operating our first hotel no later than 2019. Our goal is to have 5,000 rooms either owned or under management by 2024.
Message aux actionnaires A Pivotal Year

Message aux actionnaires A Pivotal Year
This past year also saw the appointment of Annick Guérard as Chief Operating Officer. In her new duties, Annick will hone the skills she has gained over the past 15 years with Transat, acquiring the experience necessary to succeed me when the time comes. This is the final step in reshaping Transat into a company ready to face a new decade, during which it will, no doubt, become even stronger and more profitable than in the past, especially in winter.
The year 2017 has also been one of recognition on many fronts. For the sixth year in a row, Air Transat was named Best North American Leisure Airline at the Skytrax World Airline Awards. Transat was again honoured as Best Tour Operator in Canada and Air Transat as Best Leisure/Charter Airline at the Agents’ Choice Awards presented by Baxter Travel Media.
Our company’s outstanding track record of corporate responsibility also continues: for the sixth consecutive year, Air Transat was ranked Most Climate-Efficient Carrier in North America by the Atmosfair Airline Index, and since 2014 Transat has been on the Corporate Knights list of Canada’s 50 Best Corporate Citizens.
In conclusion, I wish to thank our employees—who worked particularly hard this year to make all of these changes possible—the members of our Board of Directors and especially our customers, without whom we would not exist.

MANAGEMENT’S DISCUSSION & ANALYSIS
This Management’s Discussion and Analysis (“MD&A”) provides a review of Transat A.T. Inc.’s operations, performance and financial position for the year ended October 31, 2017, compared with the year ended October 31, 2016, and should be read in conjunction with the audited consolidated financial statements and notes thereto. The information contained herein is dated as of December 13, 2017. You will find more information about us on Transat’s website at www.transat.com and on SEDAR at www.sedar.com, including the Attest Reports for the year ended October 31, 2017 and Annual Information Form.
These financial statements have been prepared in accordance with International Financial Reporting Standards (“IFRS”). We occasionally refer to non-IFRS financial measures in the MD&A. See the Non-IFRS financial measures section for more information. All dollar figures in this MD&A are in Canadian dollars unless otherwise indicated. The terms “Transat,” “we,” “us,” “our” and the “Corporation” mean Transat A.T. Inc. and its subsidiaries, unless otherwise indicated. This Management’s Discussion and Analysis consists of the following sections:
CAUTION REGARDING FORWARD-LOOKING STATEMENTS ........................................................................................ 6
NON-IFRS FINANCIAL MEASURES ................................................................................................................................... 7
FINANCIAL HIGHLIGHTS .................................................................................................................................................. 10
OVERVIEW ........................................................................................................................................................................ 11
REVISITING OUR SEPTEMBER 6, 2017 OUTLOOK ....................................................................................................... 14
BUSINESS ACQUISITIONS AND DISPOSALS ................................................................................................................. 14
DISCONTINUED OPERATIONS ........................................................................................................................................ 15
CONSOLIDATED OPERATIONS ....................................................................................................................................... 16
FINANCIAL POSITION, LIQUIDITY AND CAPITAL RESOURCES ................................................................................... 22
OTHER ............................................................................................................................................................................... 27
ACCOUNTING ................................................................................................................................................................... 27
RISKS AND UNCERTAINTIES .......................................................................................................................................... 33
CONTROLS AND PROCEDURES ..................................................................................................................................... 39
OUTLOOK .......................................................................................................................................................................... 40
MANAGEMENT’S REPORT ............................................................................................................................................... 41
INDEPENDENT AUDITORS’ REPORT ............................................................................................................................. 42
5
Transat A.T. Inc. Management’s Discussion and Analysis 2017 Annual Report
CAUTION REGARDING FORWARD-LOOKING STATEMENTS
This MD&A contains certain forward-looking statements with respect to the Corporation. These forward-looking statements are identified by the use of terms and phrases such as “anticipate,” “believe,” “could,” “estimate,” “expect,” “intend,” “may,” “plan,” “potential,” “predict,” “project,” “will,” “would,” the negative of these terms and similar terminology, including references to assumptions. All such statements are made pursuant to applicable Canadian securities legislation. Such statements may involve but are not limited to comments with respect to strategies, expectations, planned operations or future actions.
Forward-looking statements, by their nature, necessarily involve risks and uncertainties that could cause actual results to differ materially from those contemplated by these forward-looking statements. Results indicated in forward-looking statements may differ materially from actual results for a number of reasons, including without limitation, extreme weather conditions, fuel prices, armed conflicts, terrorist attacks, general industry, market and economic conditions, disease outbreaks, changes in demand due to the seasonal nature of the business, the ability to reduce operating costs and employee counts, labour relations, collective bargaining and labour disputes, pension issues, exchange and interest rates, availability of financing in the future, statutory changes, adverse regulatory developments or procedures, pending litigation and actions by third parties, and other risks detailed from time to time in the Corporation’s continuous disclosure documents.
The reader is cautioned that the foregoing list of factors is not exhaustive of the factors that may affect any of the Corporation’s forward-looking statements. The reader is also cautioned to consider these and other factors carefully and not to place undue reliance on forward-looking statements.
The Corporation made a number of assumptions in making forward-looking statements in this MD&A such as certain economic, market, operational and financial assumptions and assumptions about transactions and forward-looking statements.
Examples of such forward-looking statements include, but are not limited to, statements concerning:
• The outlook whereby the Corporation should have the resources it needs to meet its 2018 objectives and continue building on its long-term strategies.
• The outlook whereby the Corporation expects revenues and total travellers to increase compared with 2017.
• The outlook whereby the Corporation expects to generate positive cash flows from operating activities in 2018.
• The outlook whereby additions to property, plant and equipment and intangible assets could amount to approximately $50.0 million.
• The outlook whereby the Corporation will be able to meet its obligations with cash on hand, cash flows from operations and drawdowns under existing credit facilities.
• The outlook whereby for the first six-month period of 2018, the Corporation expects to achieve better results than in the 2017 winter season.
In making these statements, the Corporation has assumed, among other things, that travellers will continue to travel, that credit facilities will continue to be made available as in the past, that management will continue to manage changes in cash flows to fund working capital requirements for the full fiscal year and that fuel prices, foreign exchange rates, selling prices and hotel and other costs will remain steady. If these assumptions prove incorrect, actual results and developments may differ materially from those contemplated by the forward-looking statements contained in this MD&A.
The Corporation considers the assumptions on which these forward-looking statements are based to be reasonable.
These statements reflect current expectations regarding future events and operating performance, speak only as of the date this MD&A is issued, and represent the Corporation’s expectations as of that date. The Corporation disclaims any intention or obligation to update or revise any forward-looking statements, whether as a result of new information, future events or otherwise, other than as required by applicable securities legislation.
6

Transat A.T. Inc. Management’s Discussion and Analysis 2017 Annual Report
NON-IFRS FINANCIAL MEASURES
This MD&A was prepared using results and financial information determined under IFRS. In addition to IFRS financial measures, management uses non-IFRS measures to assess the Corporation’s operational performance. It is likely that the non-IFRS financial measures used by the Corporation will not be comparable to similar measures reported by other issuers or those used by financial analysts as their measures may have different definitions. The measures used by the Corporation are furnished to provide additional information and should not be considered in isolation or as a substitute for IFRS financial performance measures.
Generally, a non-IFRS financial measure is a numerical measure of an entity’s historical or future financial performance, financial position or cash flows that is neither calculated nor recognized under IFRS. Management believes that such non-IFRS financial measures are important as they provide users of our consolidated financial statements with a better understanding of the results of our recurring operations and their related trends, while increasing transparency and clarity into our operating results. Management also believes these measures to be useful in assessing the Corporation’s capacity to discharge its financial obligations.
By excluding from results items that arise mainly from long-term strategic decisions and/or do not, in our opinion, reflect the Corporation’s operating performance for the period, such as the change in fair value of fuel-related derivatives and other derivatives, restructuring charges, impairment of goodwill, depreciation and amortization and other significant unusual items, we believe this MD&A helps users to better analyze the Corporation’s results and ability to generate cash flows from operations. Furthermore, the use of non-IFRS measures helps users by enabling better comparability of results from one period to another and better comparability with other businesses in our industry.
7
Transat A.T. Inc. Management’s Discussion and Analysis 2017 Annual Report
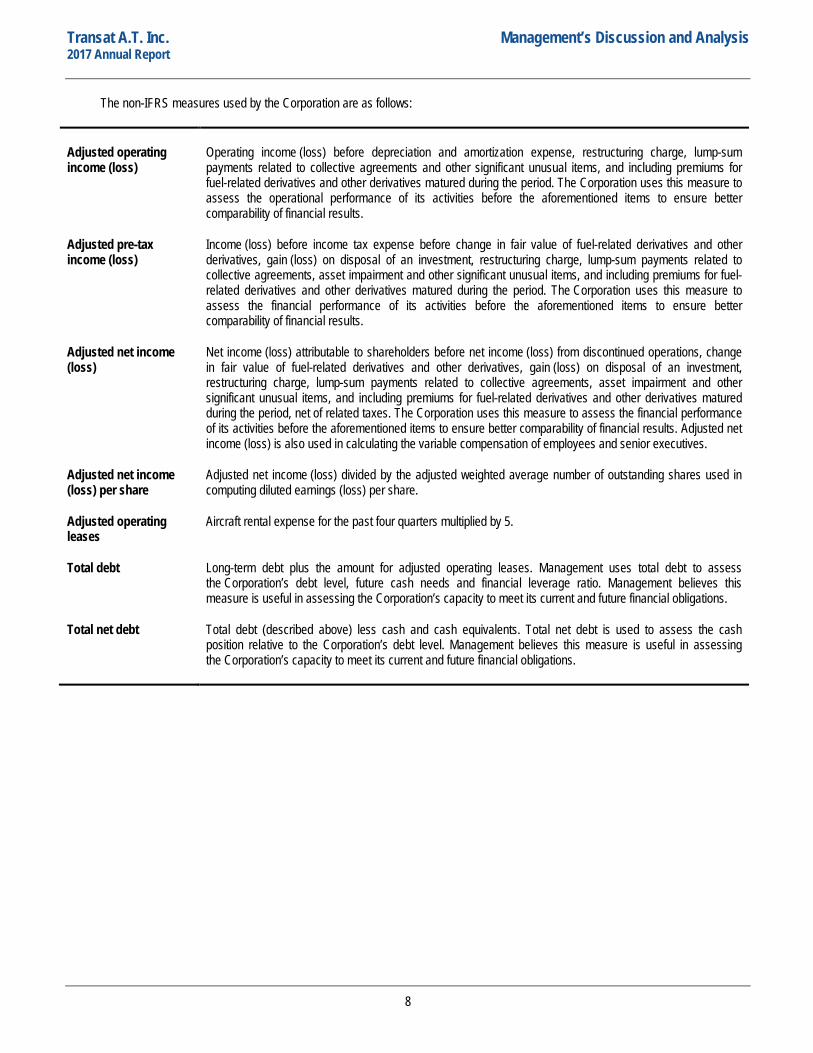
The non-IFRS measures used by the Corporation are as follows:
Adjusted operating income (loss)
Operating income (loss) before depreciation and amortization expense, restructuring charge, lump-sum payments related to collective agreements and other significant unusual items, and including premiums for fuel-related derivatives and other derivatives matured during the period. The Corporation uses this measure to assess the operational performance of its activities before the aforementioned items to ensure better comparability of financial results.
Adjusted pre-tax income (loss)
Income (loss) before income tax expense before change in fair value of fuel-related derivatives and other derivatives, gain (loss) on disposal of an investment, restructuring charge, lump-sum payments related to collective agreements, asset impairment and other significant unusual items, and including premiums for fuel-related derivatives and other derivatives matured during the period. The Corporation uses this measure to assess the financial performance of its activities before the aforementioned items to ensure better comparability of financial results.
Adjusted net income (loss)
Net income (loss) attributable to shareholders before net income (loss) from discontinued operations, change in fair value of fuel-related derivatives and other derivatives, gain (loss) on disposal of an investment, restructuring charge, lump-sum payments related to collective agreements, asset impairment and other significant unusual items, and including premiums for fuel-related derivatives and other derivatives matured during the period, net of related taxes. The Corporation uses this measure to assess the financial performance of its activities before the aforementioned items to ensure better comparability of financial results. Adjusted net income (loss) is also used in calculating the variable compensation of employees and senior executives.
Adjusted net income (loss) per share
Adjusted net income (loss) divided by the adjusted weighted average number of outstanding shares used in computing diluted earnings (loss) per share.
Adjusted operating leases
Aircraft rental expense for the past four quarters multiplied by 5.
Total debt Long-term debt plus the amount for adjusted operating leases. Management uses total debt to assess the Corporation’s debt level, future cash needs and financial leverage ratio. Management believes this measure is useful in assessing the Corporation’s capacity to meet its current and future financial obligations.
Total net debt Total debt (described above) less cash and cash equivalents. Total net debt is used to assess the cash position relative to the Corporation’s debt level. Management believes this measure is useful in assessing the Corporation’s capacity to meet its current and future financial obligations.
8
Transat A.T. Inc. Management’s Discussion and Analysis 2017 Annual Report
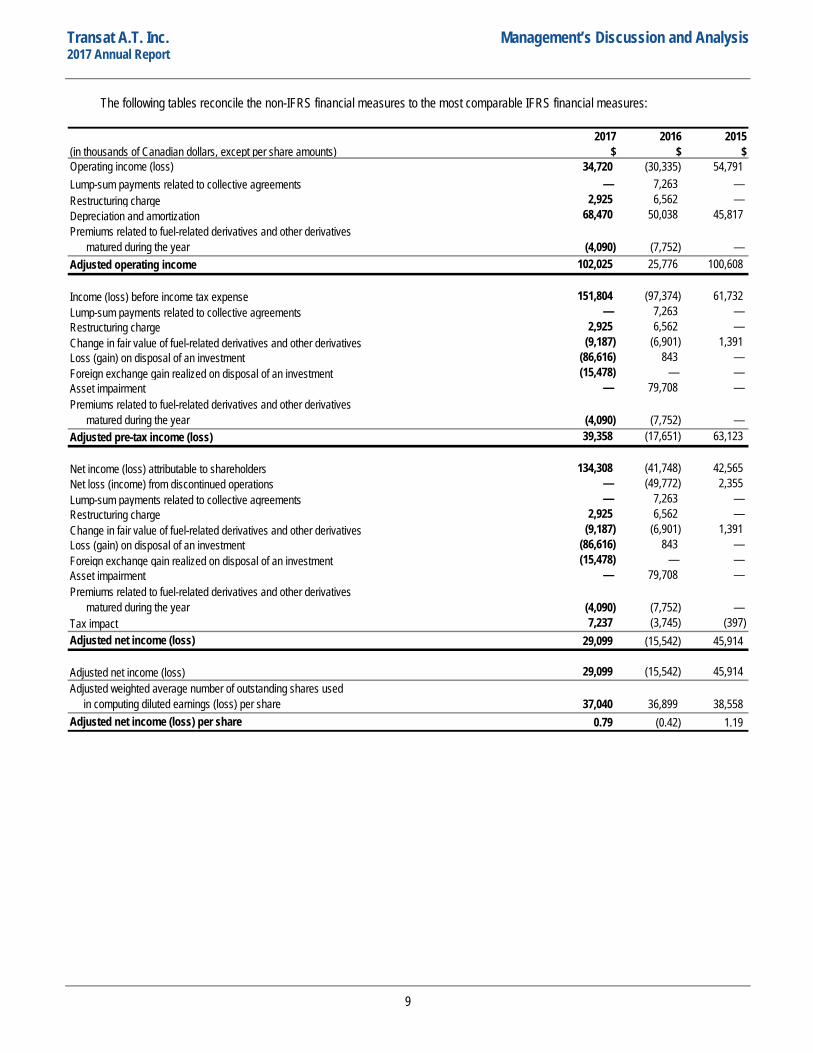
The following tables reconcile the non-IFRS financial measures to the most comparable IFRS financial measures:
2017 2016 2015(in thousands of Canadian dollars, except per share amounts) $ $ $
34,720 (30,335) 54,791 Lump-sum payments related to collective agreements — 7,263 — Restructuring charge 2,925 6,562 — Depreciation and amortization 68,470 50,038 45,817
(4,090) (7,752) — 102,025 25,776 100,608
151,804 (97,374) 61,732 Lump-sum payments related to collective agreements — 7,263 —
2,925 6,562 — Change in fair value of fuel-related derivatives and other derivatives (9,187) (6,901) 1,391
(86,616) 843 — Foreign exchange gain realized on disposal of an investment (15,478) — —
— 79,708 —
(4,090) (7,752) — 39,358 (17,651) 63,123
134,308 (41,748) 42,565 — (49,772) 2,355
Lump-sum payments related to collective agreements — 7,263 — 2,925 6,562 —
Change in fair value of fuel-related derivatives and other derivatives (9,187) (6,901) 1,391 (86,616) 843 —
Foreign exchange gain realized on disposal of an investment (15,478) — — — 79,708 —
(4,090) (7,752) — 7,237 (3,745) (397)
29,099 (15,542) 45,914
29,099 (15,542) 45,914
37,040 36,899 38,558 0.79 (0.42) 1.19
Tax impactAdjusted net income (loss)
Adjusted net income (loss) Adjusted weighted average number of outstanding shares used in computing diluted earnings (loss) per shareAdjusted net income (loss) per share
Operating income (loss)
Adjusted operating income
Net loss (income) from discontinued operations
Restructuring charge
Adjusted pre-tax income (loss)
Net income (loss) attributable to shareholders
Income (loss) before income tax expense
Loss (gain) on disposal of an investment
Asset impairment
Restructuring charge
Loss (gain) on disposal of an investment
Asset impairment
Premiums related to fuel-related derivatives and other derivatives matured during the year
Premiums related to fuel-related derivatives and other derivatives matured during the year
Premiums related to fuel-related derivatives and other derivatives matured during the year
9
Transat A.T. Inc. Management’s Discussion and Analysis 2017 Annual Report
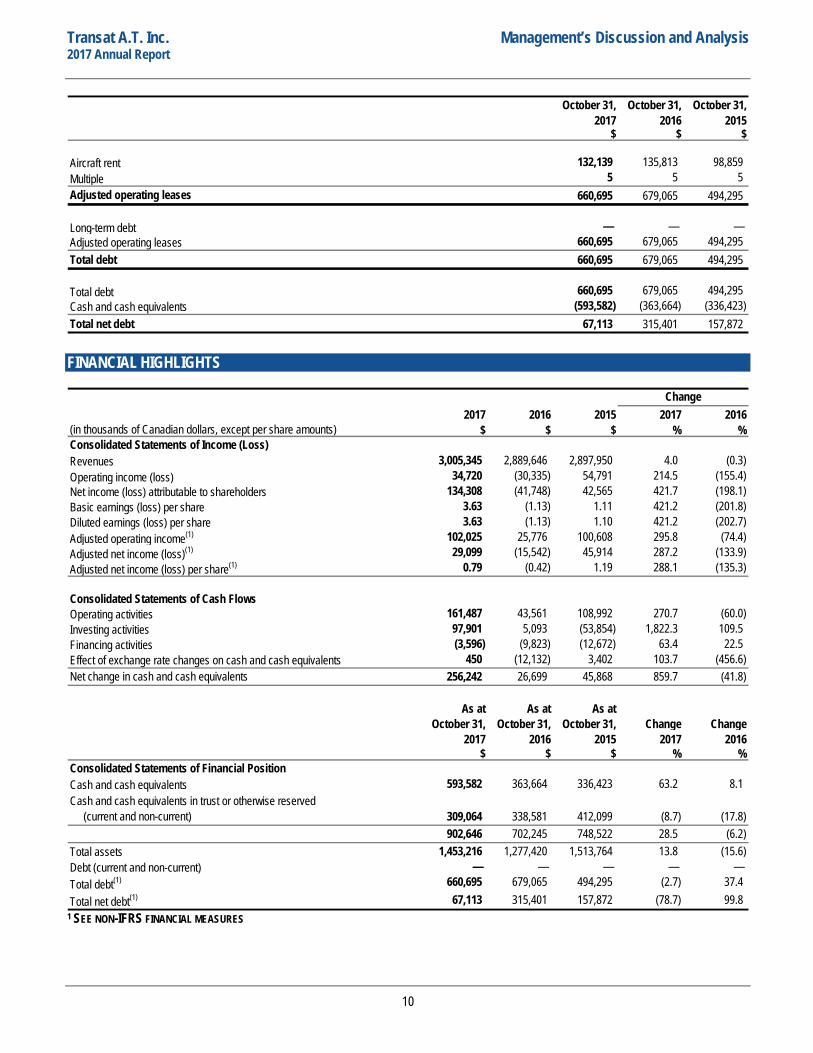
October 31, October 31, October 31,2017 2016 2015
$ $ $
132,139 135,813 98,859 Multiple 5 5 5
660,695 679,065 494,295
Long-term debt — — — 660,695 679,065 494,295
Total debt 660,695 679,065 494,295
Total debt 660,695 679,065 494,295 (593,582) (363,664) (336,423)
Total net debt 67,113 315,401 157,872
Aircraft rent
Adjusted operating leases
Adjusted operating leases
Cash and cash equivalents
FINANCIAL HIGHLIGHTS
2017 2016 2015 2017 2016$ $ $ % %
3,005,345 2,889,646 2,897,950 4.0 (0.3) Operating income (loss) 34,720 (30,335) 54,791 214.5 (155.4)
134,308 (41,748) 42,565 421.7 (198.1) 3.63 (1.13) 1.11 421.2 (201.8) 3.63 (1.13) 1.10 421.2 (202.7)
102,025 25,776 100,608 295.8 (74.4) 29,099 (15,542) 45,914 287.2 (133.9)
0.79 (0.42) 1.19 288.1 (135.3)
161,487 43,561 108,992 270.7 (60.0) 97,901 5,093 (53,854) 1,822.3 109.5 (3,596) (9,823) (12,672) 63.4 22.5
450 (12,132) 3,402 103.7 (456.6) 256,242 26,699 45,868 859.7 (41.8)
As at As at As at October 31, October 31, October 31, Change Change
2017 2016 2015 2017 2016$ $ $ % %
593,582 363,664 336,423 63.2 8.1
309,064 338,581 412,099 (8.7) (17.8) 902,646 702,245 748,522 28.5 (6.2)
Total assets 1,453,216 1,277,420 1,513,764 13.8 (15.6) — — — — —
Total debt(1) 660,695 679,065 494,295 (2.7) 37.4 Total net debt(1) 67,113 315,401 157,872 (78.7) 99.8
Diluted earnings (loss) per share
Net income (loss) attributable to shareholdersBasic earnings (loss) per share
Adjusted net income (loss)(1)
Adjusted net income (loss) per share(1)
Cash and cash equivalentsCash and cash equivalents in trust or otherwise reserved (current and non-current)
Consolidated Statements of Cash FlowsOperating activitiesInvesting activitiesFinancing activitiesEffect of exchange rate changes on cash and cash equivalentsNet change in cash and cash equivalents
Change
(in thousands of Canadian dollars, except per share amounts)Consolidated Statements of Income (Loss)Revenues
Adjusted operating income(1)
Consolidated Statements of Financial Position
Debt (current and non-current)
1 SEE NON-IFRS FINANCIAL MEASURES
10
Transat A.T. Inc. Management’s Discussion and Analysis 2017 Annual Report
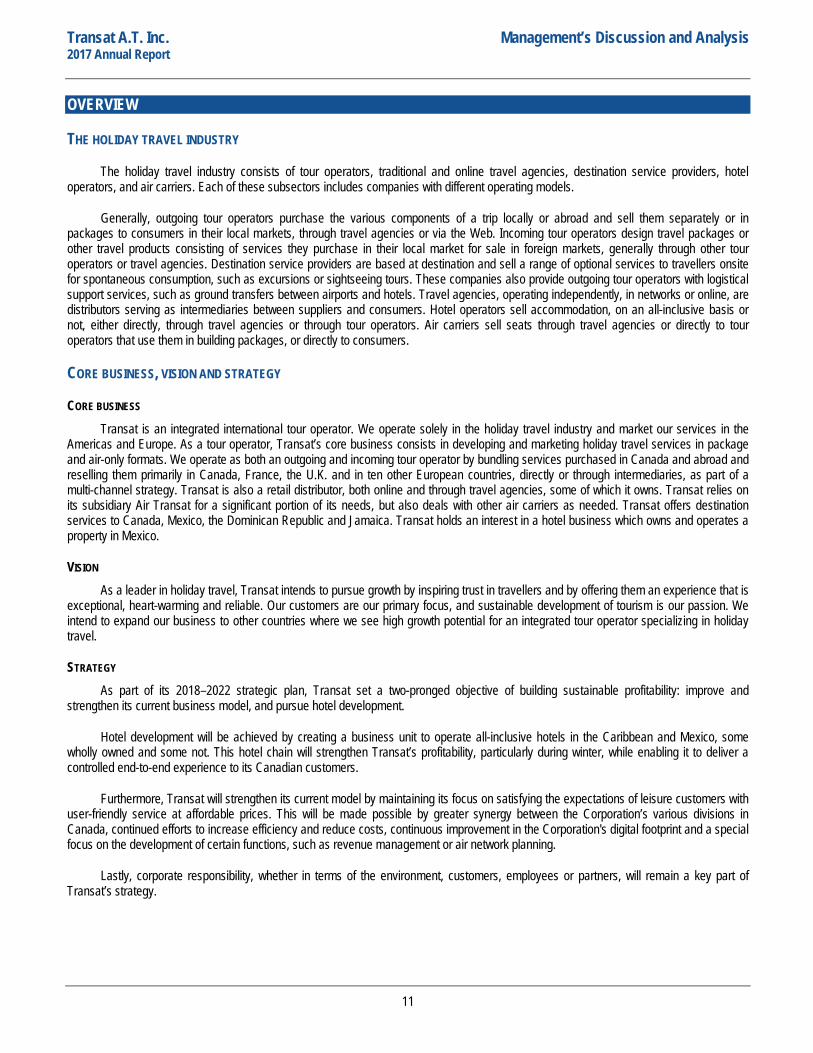
OVERVIEW
THE HOLIDAY TRAVEL INDUSTRY
The holiday travel industry consists of tour operators, traditional and online travel agencies, destination service providers, hotel operators, and air carriers. Each of these subsectors includes companies with different operating models.
Generally, outgoing tour operators purchase the various components of a trip locally or abroad and sell them separately or in packages to consumers in their local markets, through travel agencies or via the Web. Incoming tour operators design travel packages or other travel products consisting of services they purchase in their local market for sale in foreign markets, generally through other tour operators or travel agencies. Destination service providers are based at destination and sell a range of optional services to travellers onsite for spontaneous consumption, such as excursions or sightseeing tours. These companies also provide outgoing tour operators with logistical support services, such as ground transfers between airports and hotels. Travel agencies, operating independently, in networks or online, are distributors serving as intermediaries between suppliers and consumers. Hotel operators sell accommodation, on an all-inclusive basis or not, either directly, through travel agencies or through tour operators. Air carriers sell seats through travel agencies or directly to tour operators that use them in building packages, or directly to consumers.
CORE BUSINESS, VISION AND STRATEGY
CORE BUSINESS Transat is an integrated international tour operator. We operate solely in the holiday travel industry and market our services in the
Americas and Europe. As a tour operator, Transat’s core business consists in developing and marketing holiday travel services in package and air-only formats. We operate as both an outgoing and incoming tour operator by bundling services purchased in Canada and abroad and reselling them primarily in Canada, France, the U.K. and in ten other European countries, directly or through intermediaries, as part of a multi-channel strategy. Transat is also a retail distributor, both online and through travel agencies, some of which it owns. Transat relies on its subsidiary Air Transat for a significant portion of its needs, but also deals with other air carriers as needed. Transat offers destination services to Canada, Mexico, the Dominican Republic and Jamaica. Transat holds an interest in a hotel business which owns and operates a property in Mexico.
VISION As a leader in holiday travel, Transat intends to pursue growth by inspiring trust in travellers and by offering them an experience that is
exceptional, heart-warming and reliable. Our customers are our primary focus, and sustainable development of tourism is our passion. We intend to expand our business to other countries where we see high growth potential for an integrated tour operator specializing in holiday travel.
STRATEGY As part of its 2018–2022 strategic plan, Transat set a two-pronged objective of building sustainable profitability: improve and
strengthen its current business model, and pursue hotel development.
Hotel development will be achieved by creating a business unit to operate all-inclusive hotels in the Caribbean and Mexico, some wholly owned and some not. This hotel chain will strengthen Transat’s profitability, particularly during winter, while enabling it to deliver a controlled end-to-end experience to its Canadian customers.
Furthermore, Transat will strengthen its current model by maintaining its focus on satisfying the expectations of leisure customers with user-friendly service at affordable prices. This will be made possible by greater synergy between the Corporation’s various divisions in Canada, continued efforts to increase efficiency and reduce costs, continuous improvement in the Corporation's digital footprint and a special focus on the development of certain functions, such as revenue management or air network planning.
Lastly, corporate responsibility, whether in terms of the environment, customers, employees or partners, will remain a key part of Transat’s strategy.
11
Transat A.T. Inc. Management’s Discussion and Analysis 2017 Annual Report
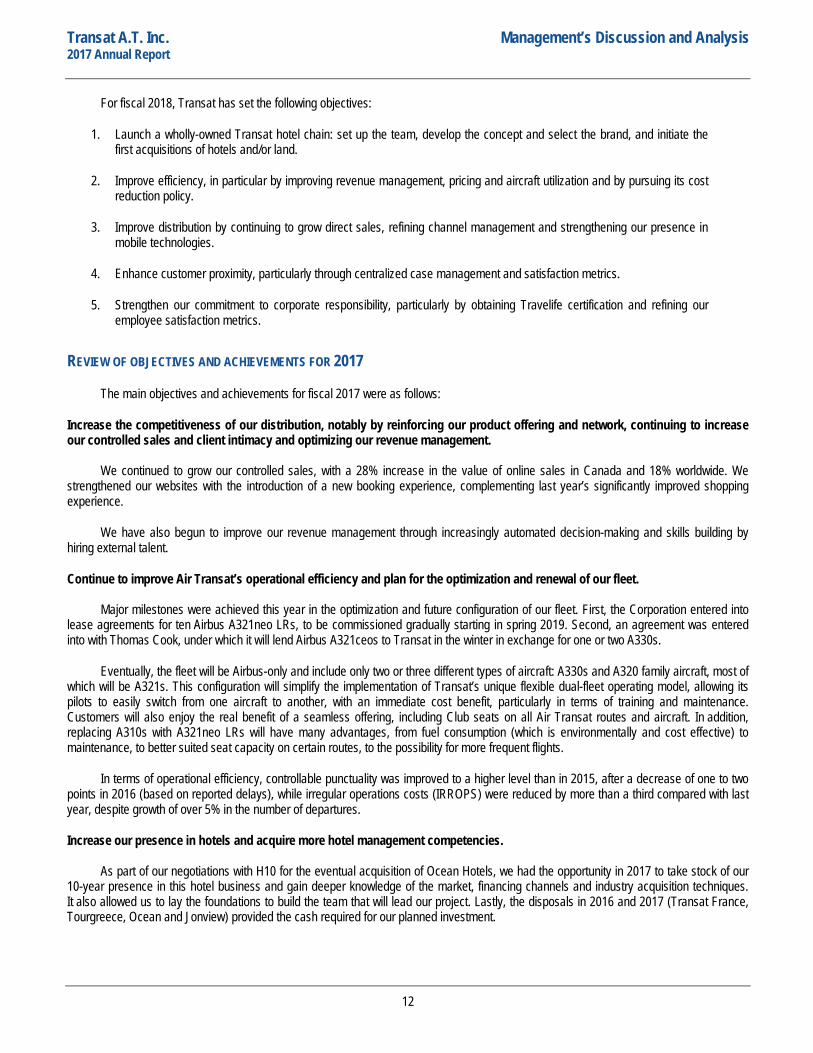
For fiscal 2018, Transat has set the following objectives:
1. Launch a wholly-owned Transat hotel chain: set up the team, develop the concept and select the brand, and initiate the first acquisitions of hotels and/or land.
2. Improve efficiency, in particular by improving revenue management, pricing and aircraft utilization and by pursuing its cost reduction policy.
3. Improve distribution by continuing to grow direct sales, refining channel management and strengthening our presence in mobile technologies.
4. Enhance customer proximity, particularly through centralized case management and satisfaction metrics.
5. Strengthen our commitment to corporate responsibility, particularly by obtaining Travelife certification and refining our employee satisfaction metrics.
REVIEW OF OBJECTIVES AND ACHIEVEMENTS FOR 2017
The main objectives and achievements for fiscal 2017 were as follows:
Increase the competitiveness of our distribution, notably by reinforcing our product offering and network, continuing to increase our controlled sales and client intimacy and optimizing our revenue management.
We continued to grow our controlled sales, with a 28% increase in the value of online sales in Canada and 18% worldwide. We strengthened our websites with the introduction of a new booking experience, complementing last year’s significantly improved shopping experience.
We have also begun to improve our revenue management through increasingly automated decision-making and skills building by hiring external talent.
Continue to improve Air Transat’s operational efficiency and plan for the optimization and renewal of our fleet.
Major milestones were achieved this year in the optimization and future configuration of our fleet. First, the Corporation entered into lease agreements for ten Airbus A321neo LRs, to be commissioned gradually starting in spring 2019. Second, an agreement was entered into with Thomas Cook, under which it will lend Airbus A321ceos to Transat in the winter in exchange for one or two A330s.
Eventually, the fleet will be Airbus-only and include only two or three different types of aircraft: A330s and A320 family aircraft, most of which will be A321s. This configuration will simplify the implementation of Transat’s unique flexible dual-fleet operating model, allowing its pilots to easily switch from one aircraft to another, with an immediate cost benefit, particularly in terms of training and maintenance. Customers will also enjoy the real benefit of a seamless offering, including Club seats on all Air Transat routes and aircraft. In addition, replacing A310s with A321neo LRs will have many advantages, from fuel consumption (which is environmentally and cost effective) to maintenance, to better suited seat capacity on certain routes, to the possibility for more frequent flights.
In terms of operational efficiency, controllable punctuality was improved to a higher level than in 2015, after a decrease of one to two points in 2016 (based on reported delays), while irregular operations costs (IRROPS) were reduced by more than a third compared with last year, despite growth of over 5% in the number of departures.
Increase our presence in hotels and acquire more hotel management competencies.
As part of our negotiations with H10 for the eventual acquisition of Ocean Hotels, we had the opportunity in 2017 to take stock of our 10-year presence in this hotel business and gain deeper knowledge of the market, financing channels and industry acquisition techniques. It also allowed us to lay the foundations to build the team that will lead our project. Lastly, the disposals in 2016 and 2017 (Transat France, Tourgreece, Ocean and Jonview) provided the cash required for our planned investment.
12
Transat A.T. Inc. Management’s Discussion and Analysis 2017 Annual Report
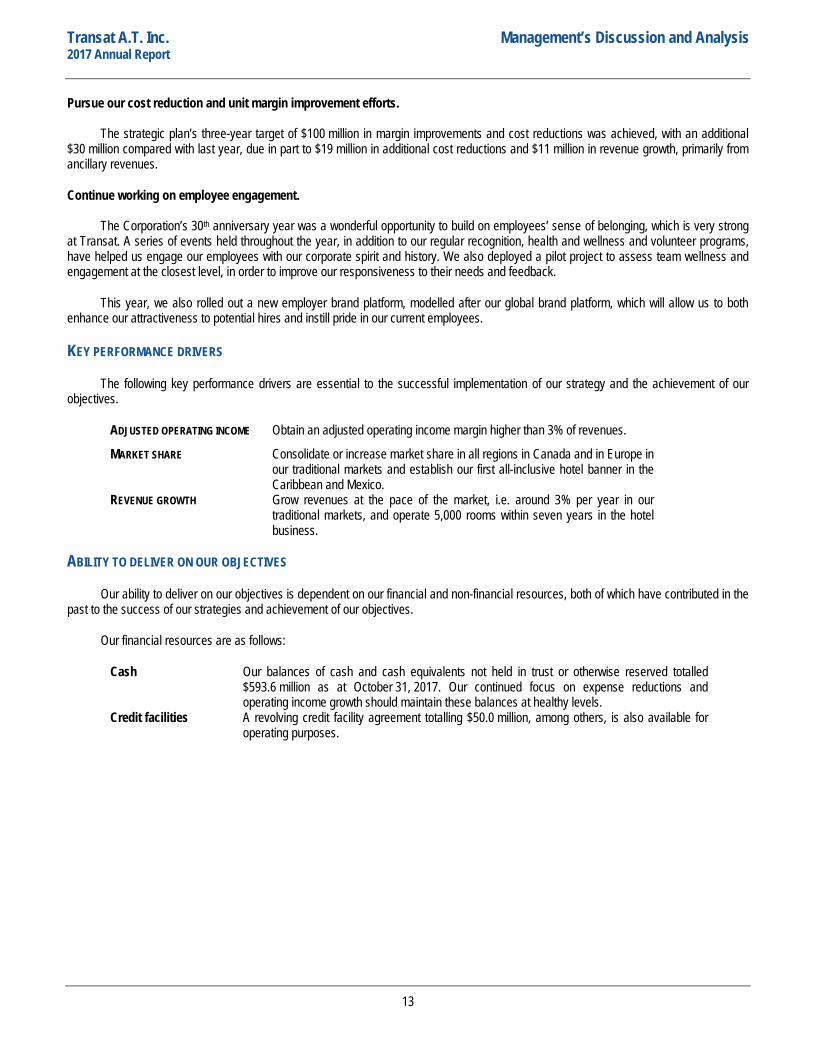
Pursue our cost reduction and unit margin improvement efforts.
The strategic plan’s three-year target of $100 million in margin improvements and cost reductions was achieved, with an additional $30 million compared with last year, due in part to $19 million in additional cost reductions and $11 million in revenue growth, primarily from ancillary revenues.
Continue working on employee engagement.
The Corporation’s 30th anniversary year was a wonderful opportunity to build on employees’ sense of belonging, which is very strong at Transat. A series of events held throughout the year, in addition to our regular recognition, health and wellness and volunteer programs, have helped us engage our employees with our corporate spirit and history. We also deployed a pilot project to assess team wellness and engagement at the closest level, in order to improve our responsiveness to their needs and feedback.
This year, we also rolled out a new employer brand platform, modelled after our global brand platform, which will allow us to both enhance our attractiveness to potential hires and instill pride in our current employees.
KEY PERFORMANCE DRIVERS
The following key performance drivers are essential to the successful implementation of our strategy and the achievement of our objectives.
ADJUSTED OPERATING INCOME Obtain an adjusted operating income margin higher than 3% of revenues.
MARKET SHARE Consolidate or increase market share in all regions in Canada and in Europe in our traditional markets and establish our first all-inclusive hotel banner in the Caribbean and Mexico.
REVENUE GROWTH Grow revenues at the pace of the market, i.e. around 3% per year in our traditional markets, and operate 5,000 rooms within seven years in the hotel business.
ABILITY TO DELIVER ON OUR OBJECTIVES
Our ability to deliver on our objectives is dependent on our financial and non-financial resources, both of which have contributed in the past to the success of our strategies and achievement of our objectives.
Our financial resources are as follows:
Cash Our balances of cash and cash equivalents not held in trust or otherwise reserved totalled $593.6 million as at October 31, 2017. Our continued focus on expense reductions and operating income growth should maintain these balances at healthy levels.
Credit facilities A revolving credit facility agreement totalling $50.0 million, among others, is also available for operating purposes.
13

Transat A.T. Inc. Management’s Discussion and Analysis 2017 Annual Report
Our non-financial resources include:
Brand The Corporation has taken the necessary steps to foster a distinctive brand image and raise its profile, including its sustainable tourism approach.
Structure Our vertically integrated structure enables us to ensure better quality control over our products and services and facilitates implementing programs to achieve gains in efficiency.
Employees Our employees work together as a team and are committed to ensuring overall customer satisfaction and contributing to improving the Corporation’s effectiveness. In addition, we believe that the Corporation has strong management.
Supplier relationships We have exclusive access to certain hotels at sun destinations as well as over 30 years of privileged relationships with many hotels at these destinations and in Europe.
Transat has the resources it needs to meet its 2018 objectives and continue building on its long-term strategies.
REVISITING OUR SEPTEMBER 6, 2017 OUTLOOK
What we said What we did
Fuel/foreign exchange effect – transatlantic market
1.3% decrease in operating expenses for the fourth quarter of 2017
For the fourth quarter of 2017, the favourable fuel/foreign exchange effect resulted in a $8.1 million decrease in operating expenses (1.4%). Operating expenses were up 9.2% owing primarily to an 8.5% increase in capacity in the transatlantic market, our main market during that period.
Fuel/foreign exchange effect – sun destination market
1.5% decrease in operating expenses for the fourth quarter of 2017
Adjusted operating income1
For the fourth quarter of 2017, adjusted operating income1 similar to 2015, which was $70.8 million for continuing operations.
For the fourth quarter of 2017, adjusted operating income1 amounted to $78.5 million, slightly higher than in 2015, mainly due to improved prices and load factors in the transatlantic market.
1 SEE NON-IFRS FINANCIAL MEASURES
BUSINESS ACQUISITIONS AND DISPOSALS
On December 21, 2016, following the exercise of a put option by the minority shareholder in the subsidiary Jonview Canada Inc. [“Jonview”], the Corporation completed the purchase of 19.93% of the shares of its subsidiary Jonview, which has an incoming tour operator business in Canada, thereby bringing its interest in the subsidiary to 100%. The cash consideration totalled $5.0 million, being the fair value of the put option at the time of the transaction. In addition, the non-controlling interest was derecognized with no impact on the consolidated statements of income (loss).
On November 30, 2017, the Corporation completed the sale of its wholly owned subsidiary Jonview to Japanese multinational H.I.S. Co. Ltd., which specializes in travel distribution, following approval of the transaction by the Competition Bureau of Canada and compliance with other customary conditions. The expected selling price of $44.0 million, received in cash on that date, may be adjusted subsequent to the final closing of accounts and completion of their audit within 90 days following the closing of the sale due to a working capital adjustment.
14
Transat A.T. Inc. Management’s Discussion and Analysis 2017 Annual Report
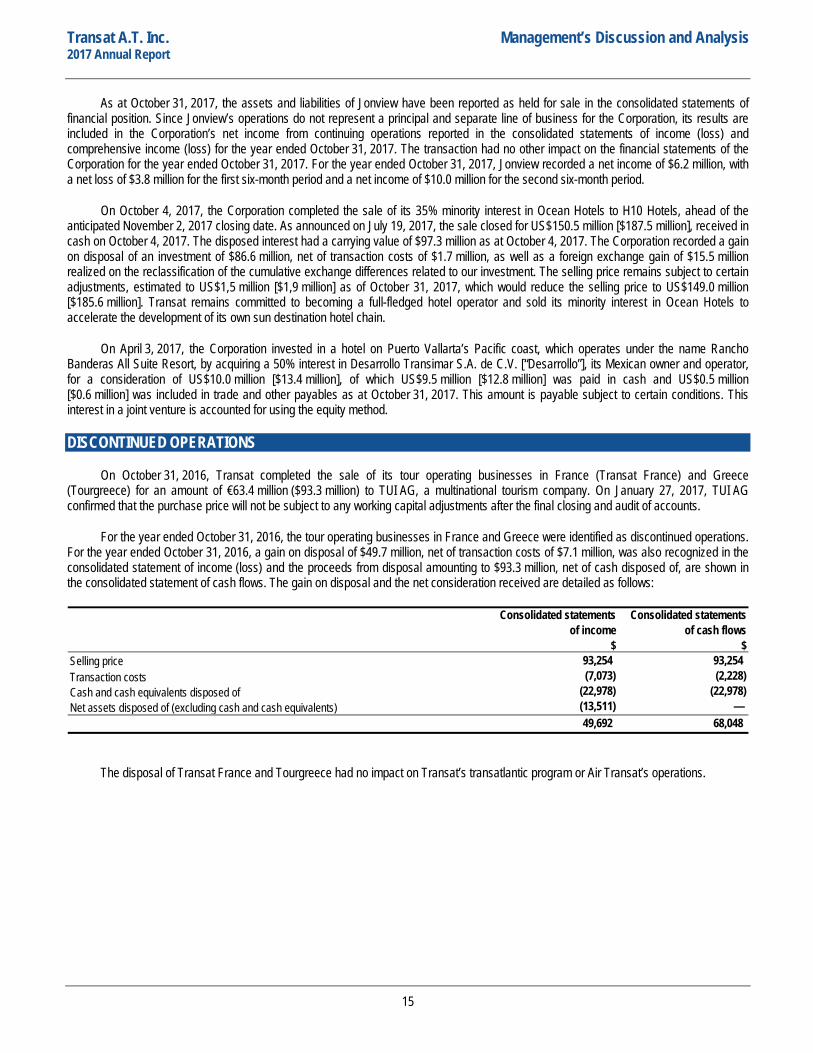
As at October 31, 2017, the assets and liabilities of Jonview have been reported as held for sale in the consolidated statements of financial position. Since Jonview’s operations do not represent a principal and separate line of business for the Corporation, its results are included in the Corporation’s net income from continuing operations reported in the consolidated statements of income (loss) and comprehensive income (loss) for the year ended October 31, 2017. The transaction had no other impact on the financial statements of the Corporation for the year ended October 31, 2017. For the year ended October 31, 2017, Jonview recorded a net income of $6.2 million, with a net loss of $3.8 million for the first six-month period and a net income of $10.0 million for the second six-month period.
On October 4, 2017, the Corporation completed the sale of its 35% minority interest in Ocean Hotels to H10 Hotels, ahead of the anticipated November 2, 2017 closing date. As announced on July 19, 2017, the sale closed for US$150.5 million [$187.5 million], received in cash on October 4, 2017. The disposed interest had a carrying value of $97.3 million as at October 4, 2017. The Corporation recorded a gain on disposal of an investment of $86.6 million, net of transaction costs of $1.7 million, as well as a foreign exchange gain of $15.5 million realized on the reclassification of the cumulative exchange differences related to our investment. The selling price remains subject to certain adjustments, estimated to US$1,5 million [$1,9 million] as of October 31, 2017, which would reduce the selling price to US$149.0 million [$185.6 million]. Transat remains committed to becoming a full-fledged hotel operator and sold its minority interest in Ocean Hotels to accelerate the development of its own sun destination hotel chain.
On April 3, 2017, the Corporation invested in a hotel on Puerto Vallarta’s Pacific coast, which operates under the name Rancho Banderas All Suite Resort, by acquiring a 50% interest in Desarrollo Transimar S.A. de C.V. [“Desarrollo”], its Mexican owner and operator, for a consideration of US$10.0 million [$13.4 million], of which US$9.5 million [$12.8 million] was paid in cash and US$0.5 million [$0.6 million] was included in trade and other payables as at October 31, 2017. This amount is payable subject to certain conditions. This interest in a joint venture is accounted for using the equity method.
DISCONTINUED OPERATIONS
On October 31, 2016, Transat completed the sale of its tour operating businesses in France (Transat France) and Greece (Tourgreece) for an amount of €63.4 million ($93.3 million) to TUI AG, a multinational tourism company. On January 27, 2017, TUI AG confirmed that the purchase price will not be subject to any working capital adjustments after the final closing and audit of accounts.
For the year ended October 31, 2016, the tour operating businesses in France and Greece were identified as discontinued operations. For the year ended October 31, 2016, a gain on disposal of $49.7 million, net of transaction costs of $7.1 million, was also recognized in the consolidated statement of income (loss) and the proceeds from disposal amounting to $93.3 million, net of cash disposed of, are shown in the consolidated statement of cash flows. The gain on disposal and the net consideration received are detailed as follows:
$ $Selling price 93,254 93,254 Transaction costs (7,073) (2,228) Cash and cash equivalents disposed of (22,978) (22,978) Net assets disposed of (excluding cash and cash equivalents) (13,511) —
49,692 68,048
Consolidated statements of income
Consolidated statements of cash flows
The disposal of Transat France and Tourgreece had no impact on Transat’s transatlantic program or Air Transat’s operations.
15
Transat A.T. Inc. Management’s Discussion and Analysis 2017 Annual Report
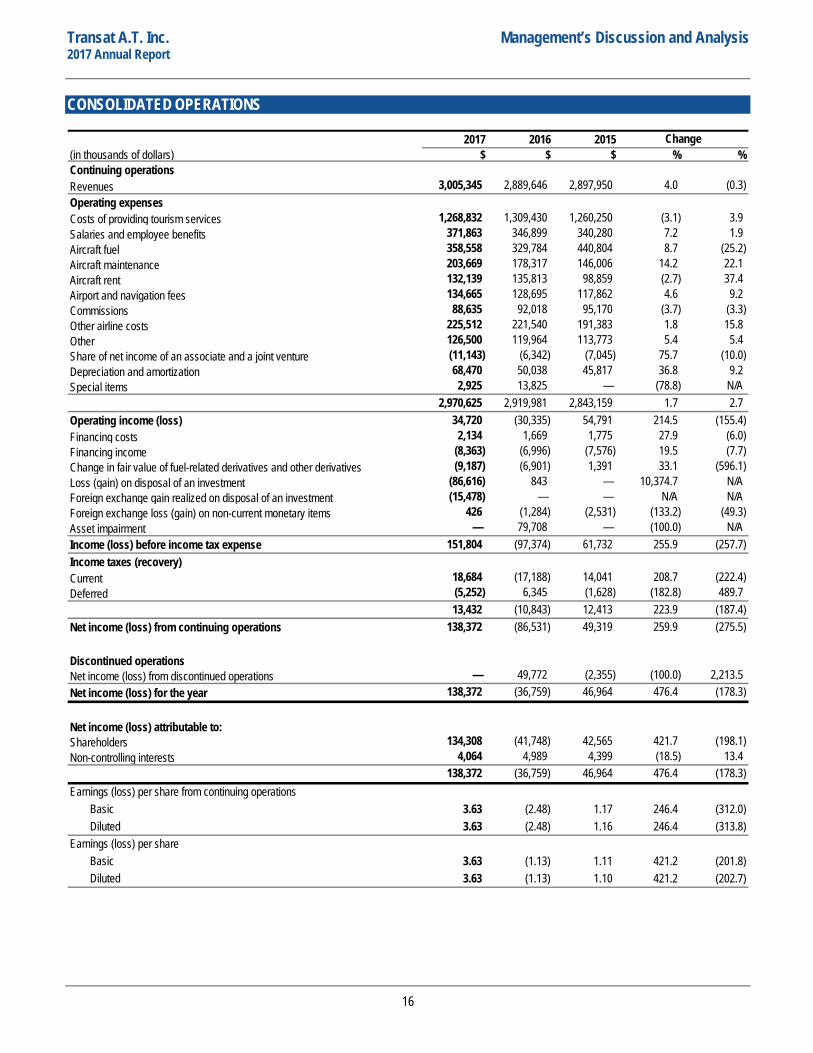
CONSOLIDATED OPERATIONS
2017 2016 2015(in thousands of dollars) $ $ $ % %Continuing operationsRevenues 3,005,345 2,889,646 2,897,950 4.0 (0.3) Operating expensesCosts of providing tourism services 1,268,832 1,309,430 1,260,250 (3.1) 3.9 Salaries and employee benefits 371,863 346,899 340,280 7.2 1.9 Aircraft fuel 358,558 329,784 440,804 8.7 (25.2) Aircraft maintenance 203,669 178,317 146,006 14.2 22.1 Aircraft rent 132,139 135,813 98,859 (2.7) 37.4 Airport and navigation fees 134,665 128,695 117,862 4.6 9.2 Commissions 88,635 92,018 95,170 (3.7) (3.3) Other airline costs 225,512 221,540 191,383 1.8 15.8 Other 126,500 119,964 113,773 5.4 5.4 Share of net income of an associate and a joint venture (11,143) (6,342) (7,045) 75.7 (10.0) Depreciation and amortization 68,470 50,038 45,817 36.8 9.2 Special items 2,925 13,825 — (78.8) N/A
2,970,625 2,919,981 2,843,159 1.7 2.7 Operating income (loss) 34,720 (30,335) 54,791 214.5 (155.4) Financing costs 2,134 1,669 1,775 27.9 (6.0) Financing income (8,363) (6,996) (7,576) 19.5 (7.7) Change in fair value of fuel-related derivatives and other derivatives (9,187) (6,901) 1,391 33.1 (596.1) Loss (gain) on disposal of an investment (86,616) 843 — 10,374.7 N/AForeign exchange gain realized on disposal of an investment (15,478) — — N/A N/AForeign exchange loss (gain) on non-current monetary items 426 (1,284) (2,531) (133.2) (49.3) Asset impairment — 79,708 — (100.0) N/AIncome (loss) before income tax expense 151,804 (97,374) 61,732 255.9 (257.7) Income taxes (recovery)Current 18,684 (17,188) 14,041 208.7 (222.4) Deferred (5,252) 6,345 (1,628) (182.8) 489.7
13,432 (10,843) 12,413 223.9 (187.4) Net income (loss) from continuing operations 138,372 (86,531) 49,319 259.9 (275.5)
Discontinued operationsNet income (loss) from discontinued operations — 49,772 (2,355) (100.0) 2,213.5 Net income (loss) for the year 138,372 (36,759) 46,964 476.4 (178.3)
Net income (loss) attributable to:Shareholders 134,308 (41,748) 42,565 421.7 (198.1) Non-controlling interests 4,064 4,989 4,399 (18.5) 13.4
138,372 (36,759) 46,964 476.4 (178.3)
3.63 (2.48) 1.17 246.4 (312.0) 3.63 (2.48) 1.16 246.4 (313.8)
3.63 (1.13) 1.11 421.2 (201.8) 3.63 (1.13) 1.10 421.2 (202.7)
Change
Earnings (loss) per share from continuing operations BasicDiluted
Earnings (loss) per shareBasicDiluted
16
Transat A.T. Inc. Management’s Discussion and Analysis 2017 Annual Report
REVENUES
We derive our revenues from outgoing tour operators, air transportation, travel agencies, distribution, incoming tour operators and services at travel destinations.
For the year ended October 31, 2017, our revenues were up $115.7 million (4.0%). This increase resulted mainly from our summer season, during which we recorded a higher volume in the transatlantic market, our main market during that season, following a 7.9% increase in capacity, as well as higher average selling prices across our markets. During the summer, total travellers increased by 14.3% across all our markets compared with 2016. The revenue increase during the year was partially offset by lower revenues in our winter season, owing primarily to a higher proportion of flight-only versus holiday package sales compared with 2016. During the winter, we recorded a 1.4% decrease in total travellers to sun destinations, our main market during that season, which resulted from our decision to reduce our product offering in that market by 2.3%. Overall, during the year, total travellers were up 8.2%.
For 2018, we expect revenues and total travellers to increase compared with 2017.
OPERATING EXPENSES
Our total operating expenses increased $50.6 million (1.7%) during the year compared with 2016. The increase resulted primarily from our summer season which saw a rise in total travellers, driven by our decision to increase our product offering in the transatlantic market by 7.9%. This increase was partially offset by lower operating expenses in our winter season, during which we sold a higher proportion of flight-only versus holiday packages compared with 2016, despite an unfavourable exchange rate effect that resulted in higher costs.
COSTS OF PROVIDING TOURISM SERVICES Costs of providing tourism services are incurred by our tour operators. They include hotel room costs and the cost of booking blocks of
seats or full flights with carriers other than Air Transat. The $40.6 million (3.1%) decrease was mainly due to a higher proportion of flight-only versus holiday package sales compared with 2016, the addition of two Airbus A330s and one Boeing 737 to our fleet compared with 2016, which resulted in a decrease in the Corporation’s flight purchases from air carriers other than Air Transat, and our decision to reduce our sun destination product offering by 2.3% during the winter.
SALARIES AND EMPLOYEE BENEFITS Salaries and employee benefits rose $25.0 million (7.2%) to $371.9 million for the year ended October 31, 2017. The increase
resulted from annual salary reviews, pilot and mechanic hires following the addition of Airbus A330s and Boeing 737s to our aircraft fleet and the rise in variable compensation compared with 2016.
AIRCRAFT FUEL Aircraft fuel expense for the year was up $28.8 million (8.7%), owing primarily to an increase in the number of flights compared with
2016. The higher fuel expense was also attributable to a rise in fuel price indices in financial markets.
AIRCRAFT MAINTENANCE Aircraft maintenance costs consist of the expenses incurred by Air Transat, such as for engine and airframe maintenance on leased
aircraft. Compared with 2016, these expenses rose $25.4 million (14.2%) during the year. This increase was driven primarily by the growth of our fleet compared with 2016 and, to a lesser extent, upward adjustments to certain planned maintenance costs.
17
Transat A.T. Inc. Management’s Discussion and Analysis 2017 Annual Report
AIRCRAFT RENT During winter 2017, Air Transat’s permanent fleet consisted of fourteen Airbus A330s, nine Airbus A310s and seven Boeing 737-800s.
Of this number, two Airbus A330s and three Boeing 737-800s were commissioned in summer 2016. For its flexible fleet, the Corporation had seasonal lease agreements for thirteen Boeing 737s compared with fifteen during winter 2016. During summer 2017, Air Transat’s permanent fleet consisted of sixteen Airbus A330s, nine Airbus A310s and seven Boeing 737-800s. Of those aircraft, two Airbus A330s were commissioned in summer 2017 and two Airbus A310s were retired from the fleet at the end of the season.
The $3.7 million (2.7%) decrease in aircraft rent during the year resulted from the renegotiation of lease agreements for Airbus A330s, partially offset by the addition of two Airbus A330s compared with 2016.
AIRPORT AND NAVIGATION FEES Airport and navigation fees consist mainly of fees charged by airports and air traffic control entities. During the year, these fees rose
$6.0 million (4.6%) compared with 2016. This increase resulted from a higher number of flights compared with 2016.
COMMISSIONS Commissions include the fees paid by tour operators to travel agencies for serving as intermediaries between tour operators and
consumers. Commissions amounted to $88.6 million, down $3.4 million (3.7%) compared with fiscal 2016. As a percentage of revenues, commissions decreased and accounted for 2.9% of our revenues for the year compared with 3.2% in 2016. This decrease was attributable to the lower revenue base used in calculating commissions and higher direct sales.
OTHER AIR COSTS Other air costs consist mainly of handling, crew and catering costs. Other air costs were up $4.0 million (1.8%) for the year, compared
with 2016. The increase was attributable to a higher number of flights compared with 2016, partly offset by lower crew costs.
OTHER Other expenses were up $6.4 million (5.3%) during the year, compared with 2016. The increase was driven by higher business
volume compared with 2016.
SHARE OF NET INCOME OF AN ASSOCIATE AND A JOINT VENTURE Our share of net income of an associate and a joint venture represents our share of the net income of Caribbean Investments B.V.
[“CIBV”], the sale of which closed on October 4, 2017, and Desarrollo, a hotel joint venture acquired in 2017. Our share of net income of an associate and a joint venture for the current fiscal year totalled $11.1 million compared with $6.3 million for 2016. The increase in our share resulted from CIBV’s higher operating profitability, coupled with an unfavourable foreign exchange effect in 2016.
DEPRECIATION AND AMORTIZATION Depreciation and amortization expense includes depreciation and amortization as well as impairment losses relating to property, plant
and equipment, intangible assets and deferred lease inducements. Depreciation and amortization expense was up $18.4 million in fiscal 2017. This increase was due to recent maintenance work on our Airbus A310s and improvements to our aircraft fleet.
SPECIAL ITEMS Special items include the restructuring charge, lump-sum payments related to collective agreements and other significant unusual
items. During the year ended October 31, 2107, a restructuring charge of $2.4 million was recognized for termination benefits. In 2016, lump-sum payments in the amount of $7.3 million were recognized in connection with the renewal of the collective agreement with cabin crews, in addition to a restructuring charge of $6.6 million, comprising mainly termination benefits related to the closure of call centres and a tour operator in the Netherlands.
18
Transat A.T. Inc. Management’s Discussion and Analysis 2017 Annual Report
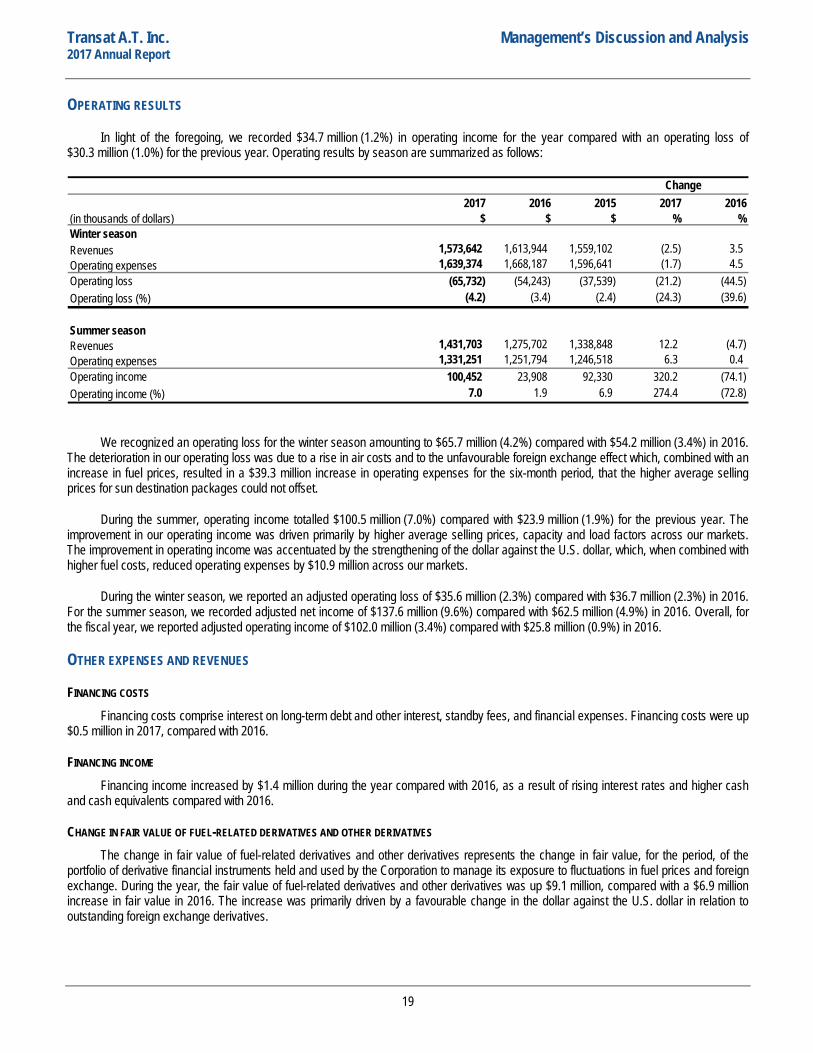
OPERATING RESULTS
In light of the foregoing, we recorded $34.7 million (1.2%) in operating income for the year compared with an operating loss of $30.3 million (1.0%) for the previous year. Operating results by season are summarized as follows:
2017 2016 2015 2017 2016(in thousands of dollars) $ $ $ % %Winter seasonRevenues 1,573,642 1,613,944 1,559,102 (2.5) 3.5 Operating expenses 1,639,374 1,668,187 1,596,641 (1.7) 4.5
(65,732) (54,243) (37,539) (21.2) (44.5) (4.2) (3.4) (2.4) (24.3) (39.6)
Summer seasonRevenues 1,431,703 1,275,702 1,338,848 12.2 (4.7) Operating expenses 1,331,251 1,251,794 1,246,518 6.3 0.4
100,452 23,908 92,330 320.2 (74.1) 7.0 1.9 6.9 274.4 (72.8)
Change
Operating lossOperating loss (%)
Operating incomeOperating income (%)
We recognized an operating loss for the winter season amounting to $65.7 million (4.2%) compared with $54.2 million (3.4%) in 2016. The deterioration in our operating loss was due to a rise in air costs and to the unfavourable foreign exchange effect which, combined with an increase in fuel prices, resulted in a $39.3 million increase in operating expenses for the six-month period, that the higher average selling prices for sun destination packages could not offset.
During the summer, operating income totalled $100.5 million (7.0%) compared with $23.9 million (1.9%) for the previous year. The improvement in our operating income was driven primarily by higher average selling prices, capacity and load factors across our markets. The improvement in operating income was accentuated by the strengthening of the dollar against the U.S. dollar, which, when combined with higher fuel costs, reduced operating expenses by $10.9 million across our markets.
During the winter season, we reported an adjusted operating loss of $35.6 million (2.3%) compared with $36.7 million (2.3%) in 2016. For the summer season, we recorded adjusted net income of $137.6 million (9.6%) compared with $62.5 million (4.9%) in 2016. Overall, for the fiscal year, we reported adjusted operating income of $102.0 million (3.4%) compared with $25.8 million (0.9%) in 2016.
OTHER EXPENSES AND REVENUES
FINANCING COSTS Financing costs comprise interest on long-term debt and other interest, standby fees, and financial expenses. Financing costs were up
$0.5 million in 2017, compared with 2016.
FINANCING INCOME Financing income increased by $1.4 million during the year compared with 2016, as a result of rising interest rates and higher cash
and cash equivalents compared with 2016.
CHANGE IN FAIR VALUE OF FUEL-RELATED DERIVATIVES AND OTHER DERIVATIVES The change in fair value of fuel-related derivatives and other derivatives represents the change in fair value, for the period, of the
portfolio of derivative financial instruments held and used by the Corporation to manage its exposure to fluctuations in fuel prices and foreign exchange. During the year, the fair value of fuel-related derivatives and other derivatives was up $9.1 million, compared with a $6.9 million increase in fair value in 2016. The increase was primarily driven by a favourable change in the dollar against the U.S. dollar in relation to outstanding foreign exchange derivatives.
19

Transat A.T. Inc. Management’s Discussion and Analysis 2017 Annual Report
LOSS (GAIN) ON DISPOSAL OF AN INVESTMENT On October 4, 2017, the Corporation completed the sale of its 35% minority interest in Ocean Hotels to H10 Hotels for a total cash
consideration of US$150.5 million [$187.5 million], paid in cash on that date. The Corporation recognized a gain on disposal of an investment of $86.6 million.
On April 1, 2016, the Corporation closed the sale of its Travel Superstore subsidiary for a total cash consideration of $0.3 million and recorded a $0.8 million loss on disposal of a subsidiary.
FOREIGN EXCHANGE GAIN ON DISPOSAL OF AN INVESTMENT The $15.5 million foreign exchange gain on disposal of an investment was realized on the reclassification of the cumulative exchange
differences related to the sale of our 35% minority interest in Ocean Hotels to H10 Hotels.
FOREIGN EXCHANGE LOSS (GAIN) ON NON-CURRENT MONETARY ITEMS The foreign exchange loss on non-current monetary items, amounting to $0.4 million for the year compared with a $1.3 million gain
in 2016, resulted mainly from an unfavourable foreign exchange effect on our foreign currency deposits.
ASSET IMPAIRMENT During the fiscal year ended October 31, 2016, the Corporation recognized a $79.7 million asset impairment charge consisting of
$15.8 million in impairment of trademarks and $63.9 million in impairment of goodwill.
The accounting policies adopted by the Corporation require that intangible assets with indefinite lives be tested for impairment annually on April 30. Accordingly, the Corporation performed an impairment test on April 30, 2016 to determine if the carrying amounts of the cash-generating units (“CGUs”), for the purposes of goodwill and trademarks, were higher than their recoverable amounts. After performing the test, the Corporation recognized a $15.8 million asset impairment charge in respect of its trademarks. The impairment resulted from the implementation of an integrated distribution and brand strategy, including the introduction of a new reservation platform which, for European travellers, favours the purchasing of seats directly from our Air Transat subsidiary instead of through our European subsidiaries, and the greater use of the Transat brand while decreasing the use of certain trademarks held by the Corporation.
As at October 31, 2016, important changes in the environment in which the Corporation operates, such as significant capacity increases in markets served by the Corporation and their effect on selling prices and load factors, volatile exchange rates and fuel prices and the deterioration in results of the 2016 summer season led management to review its assumptions for future cash flows and to perform a new impairment test. Following this impairment test, the Corporation recognized a goodwill impairment charge of $63.9 million, representing the balance of goodwill of its sole CGU.
INCOME TAXES
For the year ended October 31, 2017, income tax expense amounted to $13.4 million compared with an income tax recovery of $10.8 million for the previous fiscal year. Excluding the share of net income of an associate, the effective tax rate stood at 9.5% for the fiscal year ended October 31, 2017 and 10.5% for the preceding fiscal year. The change in tax rates between fiscal 2017 and 2016 resulted mainly from differences between countries in the statutory tax rates applied to taxable income or losses.
NET INCOME (LOSS) FROM CONTINUING OPERATIONS
In light of the items discussed in the Consolidated operations section, net income for the year ended October 31, 2017 amounted to $138.4 million, compared with a net loss from continuing operations of $86.5 million in 2016.
For the year ended October 31, 2017, adjusted net income amounted to $29.1 million ($0.79 per share) compared with an adjusted net loss of $15.5 million ($0.42 per share) in 2016.
20

Transat A.T. Inc. Management’s Discussion and Analysis 2017 Annual Report
NET INCOME (LOSS) FROM DISCONTINUED OPERATIONS
As mentioned in the Discontinued operations section, for the year ended October 31, 2016, the net income of our subsidiaries Transat France and Tourgreece, which is generated from sales made to clients in Europe and Canada, was reported as net income (loss) from discontinued operations.
For the year ended October 31, 2016, net income from discontinued operations amounted to $49.8 million.
NET INCOME (LOSS) ATTRIBUTABLE TO SHAREHOLDERS
Net income attributable to shareholders amounted to $134.3 million or $3.63 per share, basic and diluted, compared with a net loss attributable to shareholders of $41.8 million or $1.13 per share (basic and diluted) for the previous fiscal year. The weighted average number of outstanding shares used to compute basic per share amounts was 36,995,000 for fiscal 2017 and 36,899,000 for fiscal 2016 (37,040,000 and 36,899,000, respectively, for diluted per share amounts).
SELECTED QUARTERLY FINANCIAL INFORMATION
The Corporation’s operations are seasonal in nature; consequently, interim operating results do not proportionately reflect the operating results for a full year. Compared with the corresponding quarters of the previous year, quarterly revenues were lower in the winter season, yet higher in the summer season. For winter season, following our decision to reduce our product offering in the sun destination market, total travellers decreased and average selling prices increased. In the transatlantic market, we increased our product offering while average selling prices were down. For the summer season, total travellers and average selling prices were up across our markets compared with the previous year.
In terms of operating results, increases in average selling prices for sun destination packages in winter combined with cost reduction and margin improvement initiatives were not sufficient to offset the foreign exchange effect on our costs. For the summer season, the improvement in our operating income was driven by an increase in total travellers, combined with higher average selling prices and load factors across our markets. As a result, the following quarterly financial information may vary significantly from quarter to quarter.
Selected unaudited quarterly financial informationQ1-2016 Q2-2016 Q3-2016 Q4-2016 Q1-2017 Q2-2017 Q3-2017 Q4-2017
$ $ $ $ $ $ $ $ Revenues 725,723 888,221 663,591 612,111 689,332 884,310 733,152 698,551 Aircraft rent 32,275 38,749 31,946 32,843 36,103 37,361 32,390 26,285 Operating income (loss) (40,542) (13,701) (2,990) 26,898 (50,671) (15,061) 40,952 59,500 Net income (loss) (59,803) (23,817) 10,548 36,313 (31,054) (6,155) 27,168 148,413 Net income (loss) attributable to shareholders (61,155) (24,952) 9,439 34,920 (32,073) (8,354) 26,588 148,147 Basic earnings (loss) per share (1.64) (0.68) 0.26 0.95 (0.87) (0.23) 0.72 4.00 Diluted earnings (loss) per share (1.64) (0.68) 0.26 0.95 (0.87) (0.23) 0.72 3.97 Net income (loss) from continuing operations attributable to shareholders (53,394) (25,333) 7,704 (20,497) (32,073) (8,354) 26,588 148,147 Basic earnings (loss) per share from continuing operations (1.44) (0.69) 0.21 (0.56) (0.87) (0.23) 0.72 4.00 Diluted earnings (loss) per share from continuing operations (1.44) (0.69) 0.21 (0.56) (0.87) (0.23) 0.72 3.97 Adjusted operating income (loss)(1) (31,683) (5,002) 15,964 46,497 (37,079) 1,508 59,055 78,541 Adjusted net income (loss)(1) (30,380) (11,868) 2,523 24,183 (36,039) (8,100) 26,857 46,381 Adjusted net income (loss) per share(1) (0.82) (0.32) 0.07 0.66 (0.98) (0.22) 0.73 1.24
(in thousands of dollars, except per share data)
1 SEE NON-IFRS FINANCIAL MEASURES
21
Transat A.T. Inc. Management’s Discussion and Analysis 2017 Annual Report
FOURTH-QUARTER HIGHLIGHTS
For the fourth quarter, the Corporation generated $698.6 million in revenues, up $86.4 million (14.1%), from $612.1 million for the corresponding period of 2016. This increase was mainly due to an 8.7% increase in total travellers in the transatlantic market, our main market for that period, while average selling prices were up 4.0%. In this market, the Corporation increased capacity by 8.5% compared with 2016, while overall capacity was up nearly 5%. In the sun destination market, our capacity was down 3.8% compared with 2016 due to hurricanes Irma and Maria, which resulted in the repatriation of passengers particularly in Cuba and the Dominican Republic and the cancellation of certain flights. As a result, total passengers were down 2.7% in that market, while average selling prices rose 7.2%. Our operations generated operating income of $59.5 million, including a restructuring charge of $1.6 million, compared with operating income from continuing operations of $26.9 million in 2016, which reflected a restructuring charge of $5.9 million. The improvement in operating income was driven primarily by higher average selling prices across our markets, as well as by higher capacity and load factors in the transatlantic market.
For the fourth quarter of 2016, net income from discontinued operations from tour operator businesses in France and Greece amounted to $55.4 million, including a $49.7 million gain on disposal of subsidiaries Transat France and Tourgreece.
Fourth-quarter net income amounted to $148.4 million, compared with $35.9 million in 2016. Net income attributable to shareholders stood at $148.1 million ($4.00 per share, basic and $3.97 per share, diluted), compared with $34.9 million ($0.95 per share, basic and diluted) in 2016.
Fourth-quarter adjusted net income amounted to $46.4 million ($1.24 per share) compared with $24.2 million ($0.66 per share) in 2016.
FINANCIAL POSITION, LIQUIDITY AND CAPITAL RESOURCES
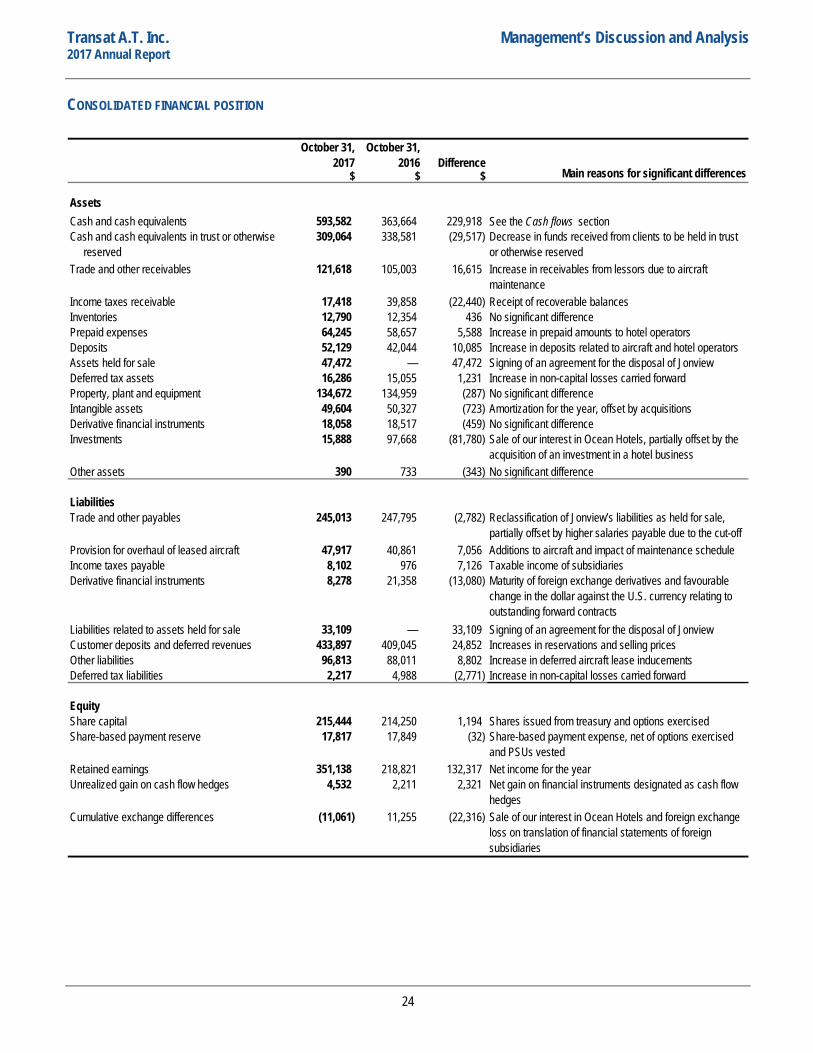
As at October 31, 2017, cash and cash equivalents totalled $593.6 million, compared with $363.7 million as at October 31, 2016. Cash and cash equivalents in trust or otherwise reserved amounted to $309.1 million as at the end of fiscal 2017, compared with $338.6 million as at the end of fiscal 2016. The Corporation’s statement of financial position reflected $386.6 million in working capital, for a ratio of 1.51, compared with $192.5 million and a ratio of 1.28 as at October 31, 2016.
Total assets increased by $175.8 million (13.8%) from $1,277.4 million as at October 31, 2016 to $1,453.2 million as at October 31, 2017. This increase was mainly attributable to higher cash and cash equivalents in trust or otherwise reserved as a result of the sale of our 35% minority interest in Ocean Hotels and positive cash flows generated from our operations. Equity increased $113.5 million from $464.4 million as at October 31, 2016 to $577.9 million as at October 31, 2017. This increase resulted primarily from our net income of $138.4 million, partially offset by the reversal of $15.5 million in cumulative exchange differences related to our 35% minority interest in Ocean Hotels following the sale of our interest and the $6.8 million foreign exchange loss on translation of the financial statements of our foreign subsidiaries.
22
Transat A.T. Inc. Management’s Discussion and Analysis 2017 Annual Report
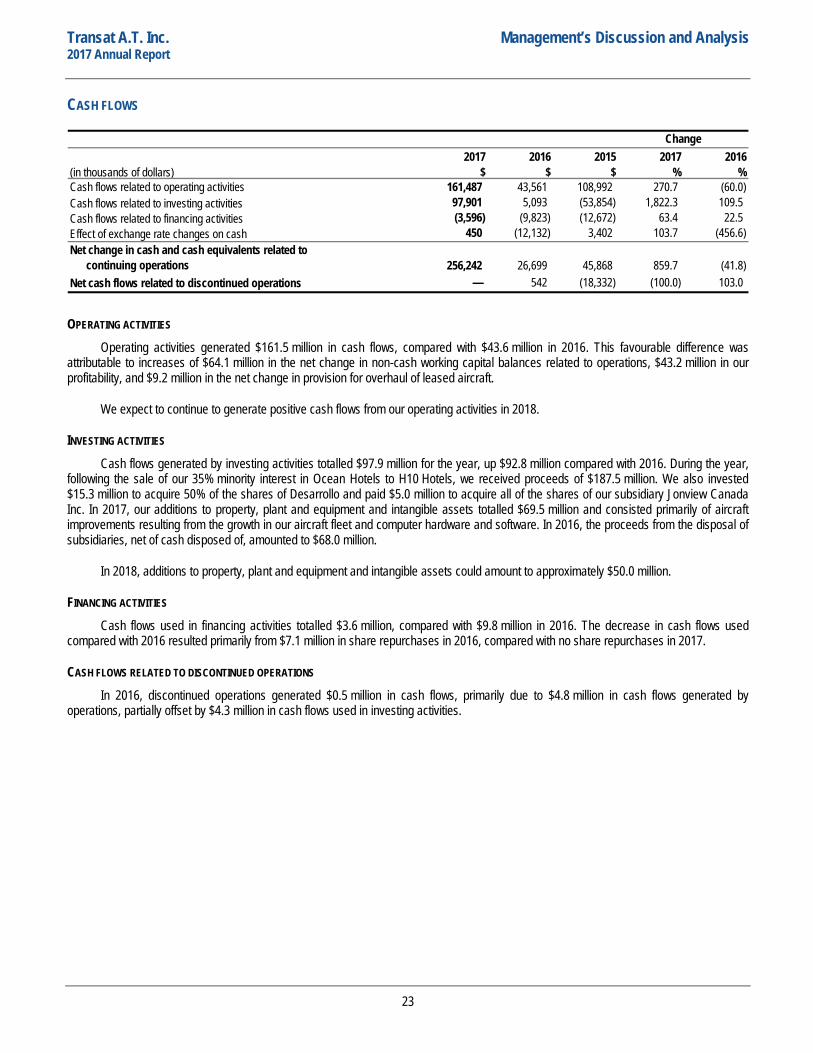
CASH FLOWS
2017 2016 2015 2017 2016(in thousands of dollars) $ $ $ % %
161,487 43,561 108,992 270.7 (60.0) 97,901 5,093 (53,854) 1,822.3 109.5 (3,596) (9,823) (12,672) 63.4 22.5
450 (12,132) 3,402 103.7 (456.6)
256,242 26,699 45,868 859.7 (41.8) — 542 (18,332) (100.0) 103.0
Cash flows related to financing activities
Net change in cash and cash equivalents related to continuing operationsNet cash flows related to discontinued operations
Effect of exchange rate changes on cash
Change
Cash flows related to operating activitiesCash flows related to investing activities
OPERATING ACTIVITIES
Operating activities generated $161.5 million in cash flows, compared with $43.6 million in 2016. This favourable difference was attributable to increases of $64.1 million in the net change in non-cash working capital balances related to operations, $43.2 million in our profitability, and $9.2 million in the net change in provision for overhaul of leased aircraft.
We expect to continue to generate positive cash flows from our operating activities in 2018.
INVESTING ACTIVITIES Cash flows generated by investing activities totalled $97.9 million for the year, up $92.8 million compared with 2016. During the year,
following the sale of our 35% minority interest in Ocean Hotels to H10 Hotels, we received proceeds of $187.5 million. We also invested $15.3 million to acquire 50% of the shares of Desarrollo and paid $5.0 million to acquire all of the shares of our subsidiary Jonview Canada Inc. In 2017, our additions to property, plant and equipment and intangible assets totalled $69.5 million and consisted primarily of aircraft improvements resulting from the growth in our aircraft fleet and computer hardware and software. In 2016, the proceeds from the disposal of subsidiaries, net of cash disposed of, amounted to $68.0 million.
In 2018, additions to property, plant and equipment and intangible assets could amount to approximately $50.0 million.
FINANCING ACTIVITIES Cash flows used in financing activities totalled $3.6 million, compared with $9.8 million in 2016. The decrease in cash flows used
compared with 2016 resulted primarily from $7.1 million in share repurchases in 2016, compared with no share repurchases in 2017.
CASH FLOWS RELATED TO DISCONTINUED OPERATIONS In 2016, discontinued operations generated $0.5 million in cash flows, primarily due to $4.8 million in cash flows generated by
operations, partially offset by $4.3 million in cash flows used in investing activities.
23
Transat A.T. Inc. Management’s Discussion and Analysis 2017 Annual Report
CONSOLIDATED FINANCIAL POSITION
October 31, October 31,2017 2016 Difference
$ $ $
Assets593,582 363,664 229,918 309,064 338,581 (29,517)
121,618 105,003 16,615
17,418 39,858 (22,440) 12,790 12,354 436 64,245 58,657 5,588 52,129 42,044 10,085
Assets held for sale 47,472 — 47,472 16,286 15,055 1,231
134,672 134,959 (287) 49,604 50,327 (723) 18,058 18,517 (459)
Investments 15,888 97,668 (81,780)
390 733 (343)
245,013 247,795 (2,782)
47,917 40,861 7,056 8,102 976 7,126 8,278 21,358 (13,080)
33,109 — 33,109 Customer deposits and deferred revenues 433,897 409,045 24,852
96,813 88,011 8,802 2,217 4,988 (2,771)
215,444 214,250 1,194 17,817 17,849 (32)
351,138 218,821 132,317 4,532 2,211 2,321
(11,061) 11,255 (22,316)
See the Cash flows section
Intangible assets
Other assets
No significant differenceAmortization for the year, offset by acquisitions
Increase in non-capital losses carried forward
No significant differenceSale of our interest in Ocean Hotels, partially offset by the acquisition of an investment in a hotel business
Derivative financial instruments
Deferred tax assetsProperty, plant and equipment
Liabilities related to assets held for sale
Cumulative exchange differences
Share-based payment reserve
Retained earningsUnrealized gain on cash flow hedges
EquityShare capital
Derivative financial instruments
Other liabilitiesDeferred tax liabilities
Provision for overhaul of leased aircraftIncome taxes payable
LiabilitiesTrade and other payables
No significant difference
Increase in receivables from lessors due to aircraft maintenance
No significant differenceReceipt of recoverable balances
Signing of an agreement for the disposal of Jonview
Increase in prepaid amounts to hotel operatorsIncrease in deposits related to aircraft and hotel operators
InventoriesPrepaid expenses
Cash and cash equivalents in trust or otherwise reservedTrade and other receivables
Income taxes receivable
Decrease in funds received from clients to be held in trust or otherwise reserved
Deposits
Main reasons for significant differences
Cash and cash equivalents
Additions to aircraft and impact of maintenance scheduleTaxable income of subsidiaries
Reclassification of Jonview’s liabilities as held for sale, partially offset by higher salaries payable due to the cut-off
Signing of an agreement for the disposal of Jonview
Increase in deferred aircraft lease inducementsIncreases in reservations and selling prices
Increase in non-capital losses carried forward
Sale of our interest in Ocean Hotels and foreign exchange loss on translation of financial statements of foreign subsidiaries
Net income for the year
Shares issued from treasury and options exercised
Net gain on financial instruments designated as cash flow hedges
Share-based payment expense, net of options exercised and PSUs vested
Maturity of foreign exchange derivatives and favourable change in the dollar against the U.S. currency relating to outstanding forward contracts
24
Transat A.T. Inc. Management’s Discussion and Analysis 2017 Annual Report
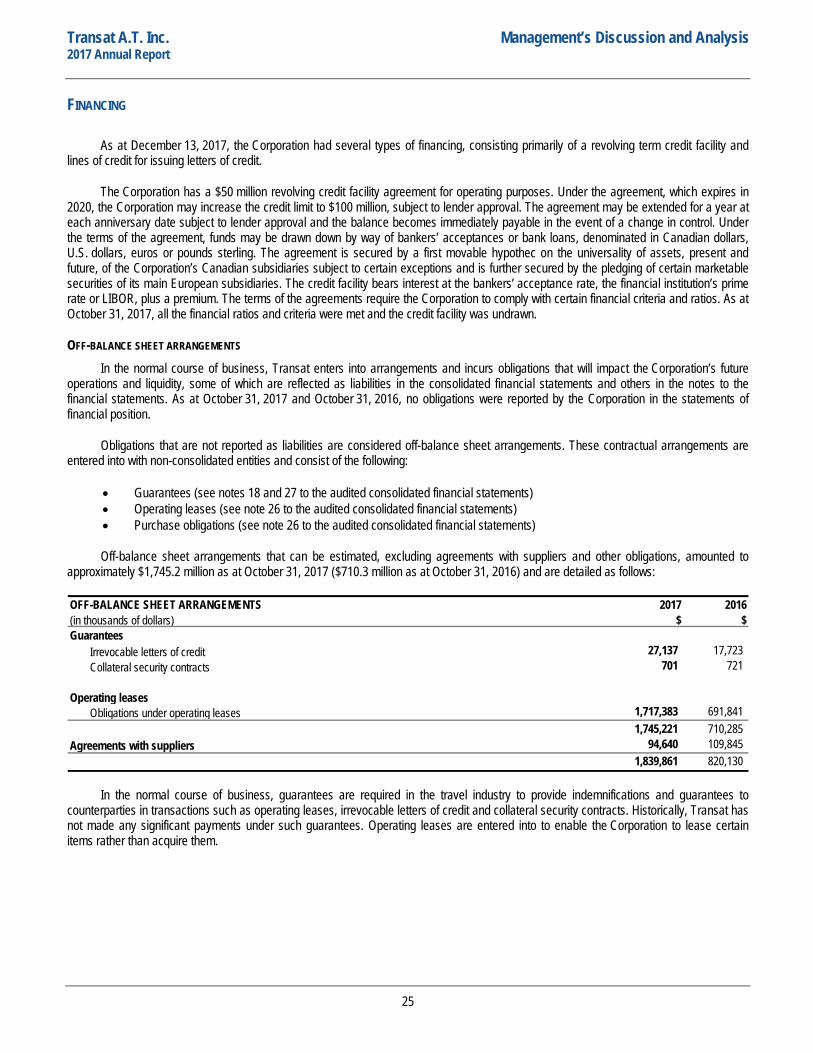
FINANCING
As at December 13, 2017, the Corporation had several types of financing, consisting primarily of a revolving term credit facility and lines of credit for issuing letters of credit.
The Corporation has a $50 million revolving credit facility agreement for operating purposes. Under the agreement, which expires in 2020, the Corporation may increase the credit limit to $100 million, subject to lender approval. The agreement may be extended for a year at each anniversary date subject to lender approval and the balance becomes immediately payable in the event of a change in control. Under the terms of the agreement, funds may be drawn down by way of bankers’ acceptances or bank loans, denominated in Canadian dollars, U.S. dollars, euros or pounds sterling. The agreement is secured by a first movable hypothec on the universality of assets, present and future, of the Corporation’s Canadian subsidiaries subject to certain exceptions and is further secured by the pledging of certain marketable securities of its main European subsidiaries. The credit facility bears interest at the bankers’ acceptance rate, the financial institution’s prime rate or LIBOR, plus a premium. The terms of the agreements require the Corporation to comply with certain financial criteria and ratios. As at October 31, 2017, all the financial ratios and criteria were met and the credit facility was undrawn.
OFF-BALANCE SHEET ARRANGEMENTS In the normal course of business, Transat enters into arrangements and incurs obligations that will impact the Corporation’s future
operations and liquidity, some of which are reflected as liabilities in the consolidated financial statements and others in the notes to the financial statements. As at October 31, 2017 and October 31, 2016, no obligations were reported by the Corporation in the statements of financial position.
Obligations that are not reported as liabilities are considered off-balance sheet arrangements. These contractual arrangements are entered into with non-consolidated entities and consist of the following:
• Guarantees (see notes 18 and 27 to the audited consolidated financial statements) • Operating leases (see note 26 to the audited consolidated financial statements) • Purchase obligations (see note 26 to the audited consolidated financial statements)
Off-balance sheet arrangements that can be estimated, excluding agreements with suppliers and other obligations, amounted to approximately $1,745.2 million as at October 31, 2017 ($710.3 million as at October 31, 2016) and are detailed as follows:
OFF-BALANCE SHEET ARRANGEMENTS 2017 2016(in thousands of dollars) $ $Guarantees
Irrevocable letters of credit 27,137 17,723 Collateral security contracts 701 721
Operating leasesObligations under operating leases 1,717,383 691,841
1,745,221 710,285 Agreements with suppliers 94,640 109,845
1,839,861 820,130
In the normal course of business, guarantees are required in the travel industry to provide indemnifications and guarantees to counterparties in transactions such as operating leases, irrevocable letters of credit and collateral security contracts. Historically, Transat has not made any significant payments under such guarantees. Operating leases are entered into to enable the Corporation to lease certain items rather than acquire them.
25
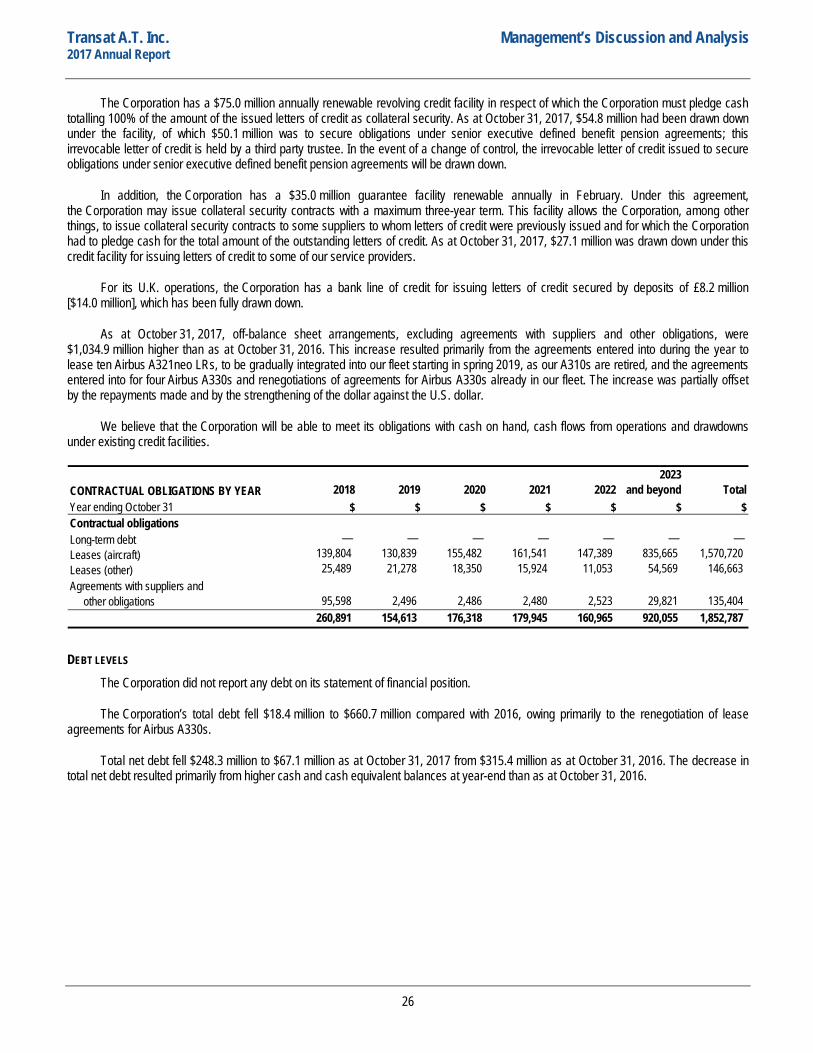
Transat A.T. Inc. Management’s Discussion and Analysis 2017 Annual Report
The Corporation has a $75.0 million annually renewable revolving credit facility in respect of which the Corporation must pledge cash totalling 100% of the amount of the issued letters of credit as collateral security. As at October 31, 2017, $54.8 million had been drawn down under the facility, of which $50.1 million was to secure obligations under senior executive defined benefit pension agreements; this irrevocable letter of credit is held by a third party trustee. In the event of a change of control, the irrevocable letter of credit issued to secure obligations under senior executive defined benefit pension agreements will be drawn down.
In addition, the Corporation has a $35.0 million guarantee facility renewable annually in February. Under this agreement, the Corporation may issue collateral security contracts with a maximum three-year term. This facility allows the Corporation, among other things, to issue collateral security contracts to some suppliers to whom letters of credit were previously issued and for which the Corporation had to pledge cash for the total amount of the outstanding letters of credit. As at October 31, 2017, $27.1 million was drawn down under this credit facility for issuing letters of credit to some of our service providers.
For its U.K. operations, the Corporation has a bank line of credit for issuing letters of credit secured by deposits of £8.2 million [$14.0 million], which has been fully drawn down.
As at October 31, 2017, off-balance sheet arrangements, excluding agreements with suppliers and other obligations, were $1,034.9 million higher than as at October 31, 2016. This increase resulted primarily from the agreements entered into during the year to lease ten Airbus A321neo LRs, to be gradually integrated into our fleet starting in spring 2019, as our A310s are retired, and the agreements entered into for four Airbus A330s and renegotiations of agreements for Airbus A330s already in our fleet. The increase was partially offset by the repayments made and by the strengthening of the dollar against the U.S. dollar.
We believe that the Corporation will be able to meet its obligations with cash on hand, cash flows from operations and drawdowns under existing credit facilities.
2018 2019 2020 2021 20222023
and beyond Total$ $ $ $ $ $ $
Contractual obligationsLong-term debt — — — — — — — Leases (aircraft) 139,804 130,839 155,482 161,541 147,389 835,665 1,570,720 Leases (other) 25,489 21,278 18,350 15,924 11,053 54,569 146,663 Agreements with suppliers and other obligations 95,598 2,496 2,486 2,480 2,523 29,821 135,404
260,891 154,613 176,318 179,945 160,965 920,055 1,852,787
CONTRACTUAL OBLIGATIONS BY YEARYear ending October 31
DEBT LEVELS
The Corporation did not report any debt on its statement of financial position.
The Corporation’s total debt fell $18.4 million to $660.7 million compared with 2016, owing primarily to the renegotiation of lease agreements for Airbus A330s.
Total net debt fell $248.3 million to $67.1 million as at October 31, 2017 from $315.4 million as at October 31, 2016. The decrease in total net debt resulted primarily from higher cash and cash equivalent balances at year-end than as at October 31, 2016.
26
Transat A.T. Inc. Management’s Discussion and Analysis 2017 Annual Report
OUTSTANDING SHARES As at October 31, 2017, the Corporation had three authorized classes of shares: an unlimited number of Class A Variable Voting
Shares, an unlimited number of Class B Voting Shares and an unlimited number of preferred shares. The preferred shares are non-voting and issuable in series, with each series including the number of shares, designation, rights, privileges, restrictions and conditions as determined by the Board of Directors.
As at December 8, 2017, there were 37,086,283 total voting shares outstanding.
Class A Variable Voting Shares and Class B Voting Shares of the Corporation are traded on the Toronto Stock Exchange under a single symbol: “TRZ.”
STOCK OPTIONS As at December 8, 2017, there were a total of 2,241,328 stock options outstanding, 1,909,981 of which were exercisable.
OTHER
FLEET
As of December 13, 2017, Air Transat’s fleet consisted of seventeen Airbus A330s (332, 345 or 375 seats), two of which were commissioned in the summer of 2017 and two will be commissioned in the winter of 2018, seven Airbus A310s (250 seats), following the retirement of two aircraft at the end of the 2017 summer season, and seven Boeing 737-800s (189 seats).
During winter 2017, the Corporation also benefited from seasonal lease agreements for ten Boeing 737-800s (189 seats) and three Boeing 737-700s (149 seats). Under current agreements, fourteen Boeing 737s will be added to the fleet for the 2018 winter season.
During the year ended October 31, 2017, the Corporation entered into agreements to lease ten Airbus A321neo LRs, to be commissioned gradually starting in spring 2019.
ACCOUNTING
CRITICAL ACCOUNTING ESTIMATES
The preparation of consolidated financial statements requires management to make estimates and judgments about the future. We periodically review these estimates, which are based on historical experience, changes in the business environment and other factors, including expectations of future events, that management considers reasonable under the circumstances. Our estimates involve judgments we make based on the information available to us. However, accounting estimates could result in outcomes that require a material adjustment to the carrying amount of the asset or liability affected in future periods.
The key assumptions concerning the future and other key sources of estimation uncertainty at the reporting date that have a significant risk of causing a material adjustment to the carrying amounts of assets and liabilities within the next fiscal year are described below. The Corporation based its assumptions and estimates on parameters available when the consolidated financial statements were prepared. However, existing circumstances and assumptions about future developments may change due to market events or to circumstances beyond the Corporation’s control. Such changes are reflected in the assumptions when they occur.
This discussion addresses only those estimates that we consider important based on the degree of uncertainty and the likelihood of a material impact if we had used different estimates. There are many other areas in which we use estimates about uncertain matters.
DEPRECIATION AND AMORTIZATION AND IMPAIRMENT OF PROPERTY, PLANT AND EQUIPMENT, AND INTANGIBLE ASSETS GOODWILL
Material amounts recorded under goodwill and intangible assets in the statement of financial position are calculated using the historical cost method. We are required to perform impairment tests on goodwill and intangible assets with indefinite lives, such as trademarks, annually or when events or circumstances indicate that the carrying amount may be impaired.
27
Transat A.T. Inc. Management’s Discussion and Analysis 2017 Annual Report
Impairment exists when the carrying amount of an asset or CGU, in the case of goodwill, exceeds its recoverable amount, which is the higher of fair value less costs to sell the asset or CGU and value in use. To identify CGUs, management has to take into account the contributions made by each subsidiary and the inter-relationships among them in light of the Corporation’s vertical integration and the goal of providing a comprehensive offering of tourism services in the markets served by the Corporation. The fair value less costs to sell calculation is based on available data from arm’s length transactions for similar assets or observable market prices less incremental costs to sell. The value in use calculation is based on a discounted cash flow model. Cash flows are generally derived from the budget or financial forecasts for the next five fiscal years and do not include restructuring activities that the Corporation is not yet committed to or significant future investments that will enhance the performance of the asset of the CGU being tested. The recoverable amount is most sensitive to the discount rate used for the discounted cash flow model as well as the expected future cash inflows and the growth rate used for extrapolation purposes. These analyses require us to make a variety of judgments concerning our future operations. The cash flow forecasts used to determine the values of assets of CGUs may change in the future due to market conditions, competition and other risk factors (see the Risks and uncertainties section).
As at October 31, 2016, important changes in the environment in which the Corporation operates, such as significant capacity increases in markets served by the Corporation and their effect on selling prices and load factors, volatile exchange rates and fuel prices and the deterioration in results of the 2016 summer season have led management to review the assumptions for future cash flows and to perform a new impairment test. Following this impairment test, the Corporation recognized a goodwill impairment charge of $63.9 million which corresponds to the balance of goodwill of its sole CGU as at October 31, 2016.
INTANGIBLE ASSETS
The Corporation performed an impairment test as at April 30, 2017 to determine whether the carrying amount of trademarks was higher than their recoverable amount.
The recoverable amount is determined based on value in use, using a discounted cash flow model. The Corporation prepares cash flow forecasts based on the most recently approved annual budgets and three-year plans of the relevant business. Cash flow forecasts reflect the risk associated with each asset, as well as the most recent economic indicators. Cash flow forecasts beyond three years are extrapolated based on nil growth rates. The cash flow forecasts used also reflect the effects of implementing the Corporation’s integrated distribution and brand strategy aiming to further expand the Transat brand, therefore decreasing the use of certain trademarks held by the Corporation.
As at April 30, 2017, after-tax discount rates used for impairment testing for trademarks ranged from 10.0% to 18.0% [between 10.3% and 18.0% as at April 30, 2016].
On April 30, 2017, a 1% increase in the after-tax discount rate used for impairment testing, assuming that all other variables had remained the same, would not have resulted in any impairment charge.
On April 30, 2017, a 10% decrease in the cash flows used for the impairment testing, assuming that all other variables had remained the same, would not have resulted in any impairment charge.
As at October 31, 2017, there was no indication that could lead us to believe that the conclusions of the test might have changed since April 30, 2017.
PROPERTY, PLANT AND EQUIPMENT AND INTANGIBLE ASSETS WITH FINITE LIVES
Property, plant and equipment reported in the statement of financial position represent material amounts based on historical costs. Property, plant and equipment and intangible assets with finite lives are reviewed for impairment annually or whenever events or changes in circumstances indicate that the carrying amount of an asset may not be recoverable.
28
Transat A.T. Inc. Management’s Discussion and Analysis 2017 Annual Report
Property, plant and equipment are depreciated over their estimated useful lives taking into account their residual value. Aircraft and aircraft components account for a major class of property, plant and equipment. Depreciation expense depends on several assumptions including the period over which the aircraft will be used, the fleet renewal schedule and the estimate of the residual value of aircraft and aircraft components at the time of their anticipated disposal. The amortization period is determined based on the fleet renewal schedule. The estimate of the residual value of aircraft and aircraft components at the time of their anticipated disposal is supported by periodically reviewed external valuations. Our fleet renewal schedule and the realizable value of our aircraft obtainable upon fleet renewal depend on numerous factors such as supply and demand for aircraft at the scheduled fleet renewal date. Changes in estimated useful life and residual value of aircraft could have a significant impact on depreciation expense. Generally speaking, the main assumptions would have to be reduced by 10% to produce a loss in value and have a material impact on our results and financial position. However, reducing these assumptions would not result in cash outflows and would not affect our cash flows.
No event or change in situation arising during the year ended October 31, 2017 could have required an impairment of property, plant and equipment and intangible assets with finite lives.
FAIR VALUE OF DERIVATIVE FINANCIAL INSTRUMENTS The fair value of derivative financial instruments is the amount for which the instrument could be exchanged between knowledgeable,
willing parties in an arm’s length transaction. The Corporation determines the fair value of its derivative financial instruments using the purchase or selling price, as appropriate, in the most advantageous active market to which the Corporation has immediate access. The Corporation also takes into account its own credit risk and the credit risk of the counterparty in determining fair value for its derivative financial instruments based on whether they are financial assets or financial liabilities. When the market for a derivative financial instrument is not active, the Corporation determines the fair value by applying valuation techniques, such as using available information on market transactions involving other instruments that are substantially the same, discounted cash flow analysis or other techniques, where appropriate. The Corporation ensures, to the extent practicable, that its valuation technique incorporates all factors that market participants would consider in setting a price and that it is consistent with accepted economic methods for pricing financial instruments, including the credit risk of the party involved.
PROVISION FOR OVERHAUL OF LEASED AIRCRAFT Under aircraft and engine operating leases, the Corporation is required to maintain the aircraft and engines in serviceable condition
and to follow the maintenance plan. The Corporation accounts for its leased aircraft and engine maintenance obligation based on utilization until the next maintenance activity. The obligation is adjusted to reflect any change in the related maintenance expenses anticipated. Depending on the type of maintenance, utilization is determined based on the cycles, logged flight time or time between overhauls. The estimates used to determine the provision for overhaul of leased aircraft are based on historical experience, historical costs and repairs, information from external suppliers, forecasted aircraft utilization, planned renewal of the aircraft fleet, leased aircraft return conditions, and other facts and reasonable assumptions in the circumstances. Generally speaking, the main assumptions used to calculate this provision would have to be reduced by 5% to 15% to result in additional expenses that could have a material impact on our results, financial position and cash flows.
NON-CONTROLLING INTERESTS Non-controlling interests in respect of which the shareholders may require the Corporation to buy back their shares are reclassified as
liabilities at their estimated redemption value, deeming exercise of this option. In the absence of a predetermined calculation formula, the estimated redemption value is established using fair value. The fair value calculation is based on a discounted cash flow model. The cash flows are derived from the budget and financial forecasts for the next five years and do not include restructuring activities that the Corporation is not yet committed to or significant future investments that will enhance the subsidiary’s performance. The fair value is most sensitive to the discount rate used for the discounted cash flow model as well as the expected future cash inflows and the growth rate used for extrapolation purposes. Generally speaking, the main assumptions used to calculate this provision would have to be adversely changed by over 15% to generate additional expenses that could have a material impact on our comprehensive income, financial position and cash flows.
EMPLOYEE FUTURE BENEFITS The Corporation offers defined benefit pension arrangements to certain senior executives. The pension expense for these employees
is determined from annual actuarial calculations using the projected unit credit method and management’s best estimate assumptions for the increase in eligible earnings and the retirement age of employees. Plan obligations are discounted using current market interest rates. Given that various assumptions are used in determining the cost and obligations associated with employee future benefits, the actuarial valuation process involves some inherent measurement uncertainty. Actual results will differ from estimated results based on assumptions.
29
Transat A.T. Inc. Management’s Discussion and Analysis 2017 Annual Report
A 0.25 percentage point increase in the actuarial assumptions below would have the following impacts, all other actuarial assumptions remaining the same:
Increase (decrease) $ $Discount rate (3) (1,223) Rate of increase in eligible earnings 13 65
Cost of retirement benefits for the year ended
October 31, 2017
Retirement benefit obligations as atOctober 31, 2017
TAXES From time to time, the Corporation is subject to audits by tax authorities that give rise to questions regarding the fiscal treatment of
certain transactions. Certain of these matters could entail significant costs that will remain uncertain until one or more events occur or fail to occur. Although the outcome of such matters is not predictable with assurance, the tax claims and risks for which there is a probable unfavourable outcome are recognized by the Corporation using the best possible estimates of the amount of the loss. The tax deductibility of losses reported by the Corporation in previous fiscal years with regard to investments in ABCP was challenged by tax authorities and notices of assessment in this regard were received during the year ended October 31, 2015. No provisions are made in connection with this issue, which could result in expenses of approximately $16.2 million, as the Corporation intends to defend itself vigorously with respect thereto and firmly believes it has sufficient facts and arguments to obtain a favourable final outcome. However, this resulted in outflows of $15.1 million during the year ended October 31, 2016. As there was no change in circumstances during fiscal 2017, this amount is recognized as income taxes receivable as at October 31, 2017.
FINANCIAL INSTRUMENTS
In the normal course of business, the Corporation is exposed to credit and counterparty risk, liquidity risk and market risk arising from changes in certain foreign exchange rates, changes in fuel prices and changes in interest rates. The Corporation manages these risk exposures on an ongoing basis. In order to limit the effects of changes in foreign exchange rates, fuel prices and interest rates on its revenues, expenses and cash flows, the Corporation can avail itself of various derivative financial instruments. The Corporation’s management is responsible for determining the acceptable level of risk and only uses derivative financial instruments to manage existing or anticipated risks, commitments or obligations based on its past experience.
FOREIGN EXCHANGE RISK MANAGEMENT The Corporation is exposed to foreign exchange risk, primarily as a result of its many arrangements with foreign-based suppliers,
aircraft and engine leases, fuel purchases, long-term debt and revenues in foreign currencies, and fluctuations in exchange rates mainly with respect to the U.S. dollar, the euro and the pound sterling against the Canadian dollar and the euro, as the case may be. Approximately 61% of the Corporation’s costs are incurred in a currency other than the measurement currency of the reporting unit incurring the costs, whereas approximately 16% of revenues are incurred in a currency other than the measurement currency of the reporting unit making the sale. In accordance with its foreign currency risk management policy and to safeguard the value of anticipated commitments and transactions, the Corporation enters into foreign exchange forward contracts, expiring in generally less than 18 months, for the purchase and/or sale of foreign currencies based on anticipated foreign exchange rate trends.
The Corporation documents certain foreign exchange derivatives as hedging instruments and regularly demonstrates that these instruments are sufficiently effective to continue using hedge accounting. These foreign exchange derivatives are designated as cash flow hedges.
All derivative financial instruments are recorded at fair value in the consolidated statement of financial position. For the derivative financial instruments designated as cash flow hedges, changes in value of the effective portion are recognized in Other comprehensive income in the consolidated statement of comprehensive income. Any ineffectiveness within a cash flow hedge is recognized through profit or loss as it arises in the account Change in fair value of fuel-related derivatives and other derivatives. Should the hedging of a cash flow hedge relationship become ineffective, previously unrealized gains and losses remain within Unrealized gain (loss) on cash flow hedges until the hedged item is settled and future changes in value of the derivative are recognized in income prospectively. The change in value of the effective portion of a cash flow hedge remains in Accumulated other comprehensive income (loss) until the related hedged item is settled, at which time amounts recognized in Unrealized gain (loss) on cash flow hedges are reclassified to the same income statement account in which the hedged item is recognized.
30
Transat A.T. Inc. Management’s Discussion and Analysis 2017 Annual Report
MANAGEMENT OF FUEL PRICE RISK The Corporation is particularly exposed to fluctuations in fuel prices. Due to competitive pressures in the industry, there can be no
assurance that the Corporation would be able to pass along any increase in fuel prices to its customers by increasing prices, or that any eventual price increase would fully offset higher fuel costs, which could in turn adversely impact its business, financial position or operating results. To mitigate fuel price fluctuations, the Corporation has implemented a fuel price risk management policy that authorizes using foreign exchange forward contracts, and other types of derivative financial instruments, expiring in generally less than 18 months.
The derivative financial instruments used for fuel purchases are measured at fair value at the end of each period, and the unrealized gains or losses arising from remeasurement are recorded and reported under Change in fair value of fuel-related derivatives and other derivatives in the consolidated statement of income. When realized, at maturity of fuel-related derivative financial instruments, any gains or losses are reclassified to Aircraft fuel.
CREDIT AND COUNTERPARTY RISK Credit risk is primarily attributable to the potential inability of customers, service providers, aircraft and engine lessors and financial
institutions, including the other counterparties to cash equivalents and derivative financial instruments, to discharge their obligations.
Trade accounts receivable included under Trade and other receivables in the statement of financial position totalled $39.6 million as at October 31, 2017. Trade accounts receivable consist of a large number of customers, including travel agencies. Trade accounts receivable generally result from the sale of vacation packages to individuals through travel agencies and the sale of seats to tour operators dispersed over a wide geographic area. No customer represented more than 10% of total accounts receivable. As at October 31, 2017, approximately 4% of accounts receivable were over 90 days past due, whereas approximately 84% were current, that is, under 30 days. Historically, the Corporation has not incurred any significant losses in respect of its trade accounts receivable.
Pursuant to certain agreements entered into with its service providers consisting primarily of hotel operators, the Corporation pays deposits to capitalize on special benefits, including pricing, exclusive access and room allotments. As at October 31, 2017, these deposits totalled $24.1 million and are generally offset by purchases of person-nights at these hotels. Risk arises from the fact that these hotels might not be able to honour their obligations to provide the agreed number of person-nights. The Corporation strives to minimize its exposure by limiting deposits to recognized and reputable hotel operators in its active markets. These deposits are spread across a large number of hotels and, historically, the Corporation has not been required to write off a considerable amount for its deposits with suppliers.
Under the terms of its aircraft and engine leases, the Corporation pays deposits when aircraft and engines are commissioned, particularly as collateral for remaining lease payments. These deposits totalled $28.0 million as at October 31, 2017 and will be returned on lease expiry. The Corporation is also required to pay cash security deposits to lessors over the lease term to guarantee the serviceable condition of aircraft. These cash security deposits with lessors are generally returned to the Corporation following receipt of documented proof that the related maintenance has been performed by the Corporation. As at October 31, 2017, the cash security deposits with lessors that had been claimed totalled $46.5 million and were included under Trade and other receivables. Historically, the Corporation has not written off any significant amount of deposits and claims for cash security deposits with aircraft and engine lessors.
For financial institutions including the various counterparties, the maximum credit risk as at October 31, 2017 related to cash and cash equivalents, including cash and cash equivalents in trust or otherwise reserved and derivative financial instruments accounted for in assets. These assets are held or traded with a limited number of financial institutions and other counterparties. The Corporation is exposed to the risk that the financial institutions and other counterparties with which it holds securities or enters into agreements could be unable to honour their obligations. The Corporation minimizes risk by entering into agreements only with large financial institutions and other large counterparties with appropriate credit ratings. The Corporation’s policy is to invest solely in products that are rated R1-Mid or better (by Dominion Bond Rating Service [“DBRS”]), A1 (by Standard & Poor’s) or P1 (by Moody’s) and rated by at least two rating firms. Exposure to these risks is closely monitored and maintained within the limits set out in the Corporation’s various policies. The Corporation revises these policies on a regular basis.
The Corporation does not believe it was exposed to a significant concentration of credit risk as at October 31, 2017.
31

Transat A.T. Inc. Management’s Discussion and Analysis 2017 Annual Report
LIQUIDITY RISK The Corporation is exposed to the risk of being unable to honour its financial commitments by the deadlines set out under the terms of
such commitments and at a reasonable price. The Corporation has a Treasury Department in charge, among other things, of ensuring sound management of available cash resources, financing and compliance with deadlines within the Corporation’s scope of consolidation. With senior management’s oversight, the Treasury Department manages the Corporation’s cash resources based on financial forecasts and anticipated cash flows. The Corporation has implemented an investment policy designed to safeguard its capital and instrument liquidity and generate a reasonable return. The policy sets out the types of allowed investment instruments, their concentration, acceptable credit rating and maximum maturity.
INTEREST RATE RISK The Corporation is exposed to interest rate fluctuations, primarily due to its variable-rate credit facility. The Corporation manages its
interest rate exposure and could potentially enter into swap agreements consisting in exchanging variable rates for fixed rates.
Furthermore, interest rate fluctuations could have an effect on the Corporation’s interest income derived from its cash and cash equivalents.
RELATED PARTY TRANSACTIONS AND BALANCES
In the normal course of business, the Corporation enters into transactions with related companies. These transactions are carried out at arm’s length. During the fiscal year, the Corporation recorded $24.8 million in person-nights purchased at hotels belonging to CIBV, an associate of the Corporation until October 4, 2017, compared with $32.3 million in 2016. As at October 31, 2017, following the sale of our interest in CIBV, no balance payable to CIBV was included in trade and other payables, compared with $0.9 million as at October 31, 2016.
CHANGE IN ACCOUNTING POLICY
IFRS, SHARE-BASED PAYMENT In June 2016, the International Accounting Standards Board [“IASB”] issued amendments included in IFRS 2, Share-based Payment.
The amendments are intended to provide changes that relate, in particular, to the accounting for share-based payment transactions that include net settlement terms to satisfy withholding tax obligations. The amendments to IFRS 2 will be effective for the Corporation’s fiscal year beginning on November 1, 2018, with earlier adoption permitted. The Corporation elected to early adopt the amendments to IFRS 2 for the year ended October 31, 2017. Early adoption of the amendments to IFRS 2 had no significant impact.
FUTURE CHANGES IN ACCOUNTING POLICIES
Standards issued but not yet effective are discussed below. The Corporation has not early adopted these new standards.
IFRS 9, FINANCIAL INSTRUMENTS In July 2014, the IASB completed its three-part project to replace IAS 39, Financial Instruments: Recognition and Measurement, by
issuing IFRS 9, Financial Instruments. IFRS 9 addresses the classification and measurement of financial assets and financial liabilities, and introduces a forward-looking expected-loss impairment model as well as a substantially-reformed approach to hedge accounting.
IFRS 9 uses a new approach to determine whether a financial asset is measured at amortized cost or fair value, replacing the many different rules in IAS 39. The approach recommended by IFRS 9 is based on how an entity manages its financial instruments and the contractual cash flow characteristics of the financial assets. Most of the requirements in IAS 39 for classification and measurement of financial liabilities were carried forward in IFRS 9. However, the portion of the changes in fair value related to the entity’s own credit risk, in measuring a financial liability at fair value through profit or loss, will be presented in other comprehensive income rather than in the statement of income.
IFRS 9 also introduces a new expected-loss impairment model that will require more timely recognition of expected credit losses. Specifically, entities will be required to account for expected credit losses when financial instruments are first recognized and to recognize full lifetime expected credit losses on a more timely basis.
32
Transat A.T. Inc. Management’s Discussion and Analysis 2017 Annual Report
Lastly, IFRS 9 introduces a new hedge accounting model, together with corresponding disclosures about risk management activities. The new hedge accounting model represents a substantial overhaul of hedge accounting that will enable entities to better reflect their risk management activities in their financial statements. The IFRS 9 transition rules include an exemption allowing companies to continue to apply current hedge accounting under IAS 39 until the final hedge model is effective.
Application of IFRS 9 will be effective from the Corporation’s fiscal year beginning on November 1, 2018, with earlier adoption permitted. Other than the potential impact of adopting optional hedge accounting in accordance with IFRS 9, the Corporation does not expect the adoption of IFRS 9 to have a material impact on its financial statements. The Corporation continues to assess the impact of the adoption of IFRS 9 on its financial statements, including the hedge accounting transition decision.
IFRS 15, REVENUE FROM CONTRACTS WITH CUSTOMERS In May 2014, the IASB issued IFRS 15, Revenue from Contracts with Customers, a new standard that specifies the steps and timing
for issuers to recognize revenue as well as requiring them to provide more relevant and comprehensive disclosures. The core principle of IFRS 15 is that an entity should recognize revenue in a manner that depicts the transfer of promised goods or services to customers in an amount that reflects the expected consideration receivable in exchange for those goods or services. IFRS 15 supersedes IAS 11, Construction Contracts, and IAS 18, Revenue, as well as various interpretations regarding revenue. The application of IFRS 15 is mandatory and will be effective for the Corporation’s fiscal year beginning on November 1, 2018, with earlier adoption permitted. The Corporation is currently assessing the impact of adopting this standard on its financial statements and expects to complete its analysis in the coming quarters.
IFRS 16, LEASES In January 2016, the IASB issued IFRS 16, Leases, which supersedes IAS 17, Leases. Leasing is an important and flexible source of
financing for many companies. However, under the current IAS 17 standard, it is difficult to obtain a clear picture of the assets and liabilities related to the leasing agreements of an entity. IFRS 16 introduces a single lessee accounting model under which most of lease-related assets and liabilities are recognized in the statement of financial position. For the lessor, substantially all the current accounting requirements remain unchanged. Certain exemptions will apply to short-term and low-value leases.
Considering that the Corporation is committed under numerous operating leases in accordance with IAS 17, the Corporation expects that the adoption of IFRS 16 will have a significant impact on its financial statements. The Corporation will be required to recognize an asset related to the right of use and a liability at the present value of future lease payments. Amortization of the right-of-use asset and interest expense on the lease obligation will replace rent expense related to operating leases.
The application of IFRS 16 is mandatory and will be effective for the Corporation’s fiscal year beginning on November 1, 2019, with earlier adoption permitted if the new IFRS 15 standard on revenue has also been applied. The Corporation continues to assess the impact of the adoption of this new standard on its financial statements and has not determined which transition method it will use.
RISKS AND UNCERTAINTIES
This section provides an overview of the general risks as well as specific risks to which Transat and its subsidiaries are exposed, and which are likely to have a significant impact on the Corporation’s financial position, operating results and activities. It does not purport to cover all contingencies or to describe all factors that are likely to affect the Corporation or its activities. Moreover, the risks and uncertainties described may or may not materialize, and may develop differently or have consequences other than those contemplated in this MD&A. Additional risks and uncertainties not currently known to the Corporation or that are currently considered immaterial could also materialize in the future and adversely affect the Corporation.
To improve its risk management capacities, the Corporation has set up a framework for identifying, assessing and managing the different risks applicable to its industry and to companies in general. This framework is based on the following principles:
• Promote a culture of risk awareness at the head office and in subsidiaries; and • Integrate risk management into strategic, financial and operating objectives.
For each risk, an owner has been designated as accountable for designing and implementing measures to mitigate the consequences
of risks for which he or she is responsible, and/or limit the likelihood of these risks materializing.
33
Transat A.T. Inc. Management’s Discussion and Analysis 2017 Annual Report
In addition, the Corporation has adopted an on-going risk management process that includes a quarterly assessment of risk exposures for the Corporation and its subsidiaries, under the oversight of the Audit Committee (financial risks), the Human Resources and Compensation Committee (human resource risks) and the Risk Management and Corporate Governance Committee (strategic and operational risks).
All business risks are also presented to the members of the Board of Directors using consistent mapping and language. Business risks are thus classified to facilitate an overall understanding of risks to which the Corporation is exposed. The different types of business risks are discussed below:
ECONOMIC AND GENERAL RISKS
The holiday travel industry is sensitive to global, national, regional and local economic conditions. Economic factors such as a significant downturn in the economy, a recession or a decline in consumer purchasing power or the employment rate in North America, Europe or key international markets could have a negative impact on our business and operating results by affecting demand for our products and services. Although there are signs of economic recovery in certain tourist areas served by the Corporation, financial markets could slide back into negative economic growth.
Seasonal planning of flight and person-night capacity is a risk in the tourism industry. For the Corporation, it entails forecasting traveller demand in advance and anticipating trends in future preferred destinations. Poor planning for those needs could unfavourably impact our business, financial situation and operating results.
Our operating results could also be adversely affected by factors beyond Transat’s control, including the following: extreme weather conditions, climate-related or geological disasters, war, political instability, terrorism whether actual or apprehended, epidemics or disease outbreaks, consumer preferences and spending patterns, consumer perceptions of destination-based service and airline safety, demographic trends, disruptions to air traffic control systems, and costs of safety, security and environmental measures. Furthermore, our revenues are sensitive to events affecting domestic and international air travel as well as the level of car rentals and hotel and cruise reservations.
COMPETITION RISKS
Transat operates in an industry in which competition has been intense for several years. Air carriers and tour operators have expanded their presence in markets long served by Transat. Some of them are larger, with strong brand name recognition and an established presence in specific geographic areas, substantial financial resources and preferred relationships with travel suppliers. We also face competition from travel suppliers selling directly to travellers at very competitive prices. The Corporation could thus be unable to compete successfully against existing or potential competitors, and intense competition could have a material adverse effect on its operations, prospects, revenues and profit margin.
In addition, traveller needs dictate how our industry evolves. In recent years, travellers have demanded higher value, better product selection and personalized service, all at competitive prices. Widespread adoption of the Internet now makes it easier for travellers to access information on travel products and services directly from suppliers, thus bypassing not only tour operators such as Transat, but also retail travel agents through whom we generate a portion of our revenues. Since our available seat capacity and person-nights are also influenced by market forces, our business model is called into question in some respects. The Corporation’s inability to rapidly meet those expectations in a proactive manner could adversely impact its competitive positioning while reducing profitability of its products.
Further, given that we rely to some extent on retail travel agencies for access to travellers and revenues, any consumer shift away from travel agencies and toward direct purchases from travel suppliers could impact the Corporation.
These competitive pressures could adversely impact our revenues and margins since we would likely have to match competitors’ prices. The Corporation’s performance in all of the countries in which it operates will depend on its continued ability to offer quality products at competitive prices.
34
Transat A.T. Inc. Management’s Discussion and Analysis 2017 Annual Report
REPUTATION RISK
The ability to maintain favourable relationships with its existing customers and attract new customers greatly depends on Transat’s service offering and its reputation. While the Corporation has already implemented sound governance practices, including a code of ethics, and developed certain mechanisms over the years to prevent its reputation from being adversely affected, there can be no assurance that Transat will continue to enjoy a good reputation or that events beyond its control will not tarnish its reputation. The loss or tarnishing of its reputation could have a material unfavourable effect on the Corporation’s operations, prospects, financial position and operating results.
FINANCIAL RISKS
The travel industry in general and our operations in particular are seasonal. As a result, our quarterly operating results are subject to fluctuations. In our view, comparisons of our operating results between quarters or between six-month periods are not necessarily meaningful and should not be relied on as indicators of future performance. Furthermore, due to the economic and general factors described herein, our operating results in future periods could fall short of the expectations of securities analysts and investors, thus affecting the market price of our shares.
While Transat has substantial cash on hand to respond to competitive pressures or capitalize on growth opportunities, the availability of financing under our existing credit facilities is subject to compliance with certain criteria and financial ratios. There can be no guarantee that, in the future, our ability to use our existing credit facilities or to obtain additional financing will not be jeopardized. Moreover, financial market volatility could limit access to credit and raise borrowing costs, hampering access to additional funding under satisfactory terms and conditions. Our business, financial position and operating results could thus be adversely affected.
Transat is particularly exposed to fluctuations in fuel costs. Due to competitive pressures in the industry, there can be no assurance that we would be able to pass along any increase in fuel prices to our customers by increasing fares, or that any such fare increase would offset higher fuel costs, which could in turn adversely impact our business, financial position or operating results.
Transat has significant non-cancellable lease obligations relating to its aircraft fleet. If revenues from aircraft operations were to decrease, the payments to be made under our existing lease agreements could have a substantial impact on our business.
Transat is exposed, due to its many arrangements with foreign-based suppliers, to fluctuations in exchange rates mainly concerning the U.S. dollar, the euro and the pound sterling against the Canadian dollar and the euro. These exchange rate fluctuations could increase our operating costs or decrease our revenues. Changes in interest rates could also impact interest income from our cash and cash equivalents as well as interest expenses on our variable-rate debt instruments, which in turn could affect our interest income and interest expenses.
In the normal course of business, we receive customer deposits and advance payments. If funds from advance payments were to diminish or be unavailable to pay our suppliers, we would be required to secure alternative capital funding. There could be no assurance that additional funding would be available under terms and conditions suitable to the Corporation, which could adversely affect our business. Moreover, these advance payments generate interest income for Transat. In accordance with our investment policy, we are required to invest these deposits and advance payments exclusively in investment-grade securities. Any failure of these investment securities to perform at historical levels could reduce our interest income.
As a Corporation that processes information with respect to credit cards used by our customers, we must comply with the regulatory requirements of our credit card processors. Failure to comply with certain financial ratios or certain rules regarding deposits or bank card data security may result in penalties or in the suspension of service by credit card processors. The inability to use credit cards could have a significant negative impact on our reservations and consequently on our operating results and profitability.
Last, it is sometimes difficult to foresee how certain Canadian or international tax laws will be interpreted by the appropriate tax authorities. Subsequent to interpretation of these laws by the different authorities, the Corporation may have to review its own interpretations of tax laws, which in turn could have an adverse impact on our profit margin.
35
Transat A.T. Inc. Management’s Discussion and Analysis 2017 Annual Report
KEY SUPPLIES AND SUPPLIER RISKS
Despite being well positioned due to our vertical integration, we depend on third parties who supply us with certain components of our packages. Any significant interruption in the flow of goods and services from these suppliers, which may be outside our control, could have a significant adverse impact on our business, financial position and operating results.
Our dependence, among others, on Airbus, Boeing, Rolls-Royce, General Electric, Lufthansa Technik and Safran means that we could be adversely affected by problems connected with Airbus and Boeing aircraft and Rolls-Royce or General Electric engines, including defective material, mechanical problems or negative perceptions among travellers. The Corporation also relies on certain suppliers for its information system security and maintenance. See the Technological risks section.
We are also dependent on non-group airlines and a large number of hotels, several of which are exclusive to the Corporation. In general, these suppliers can terminate or modify existing agreements with us on relatively short notice. The potential inability to replace these agreements, to find similar suppliers, or to renegotiate agreements at reduced rates could have an adverse effect on our business, financial position and operating results.
Furthermore, any decline in the quality of travel products or services provided by these suppliers, or any perception by travellers of such a decline, could adversely affect our reputation. Any loss of contracts, changes to our pricing agreements, access restrictions to travel suppliers’ products and services or negative shifts in public opinion regarding certain travel suppliers resulting in lower demand for their products and services could have a significant effect on our results.
AVIATION RISKS
To carry on business or extend its outreach, the Corporation requires access to aircraft that are largely operated by its subsidiary Air Transat. This fleet consists primarily of aircraft leased for several years, sometimes under renewable leases, with varying renewal dates and conditions. If the Corporation were unable to renew its leases, secure timely access to appropriate aircraft under adequate conditions or retire certain aircraft as anticipated, such an outcome could adversely affect the Corporation.
Our focus on three types of aircraft could result in significant downtime for part of our fleet if mechanical problems arise or if the regulator releases any mandatory inspection or maintenance directives applicable to our types of aircraft. If our operations are disrupted due to aircraft unavailability, the loss of associated revenues could have an adverse impact on our business, financial position and operating results.
An incident involving one of our aircraft during our operations could give rise to repair costs or major replacement costs for the damaged aircraft, service interruption, and claims. Consequently, such an event could have an unfavourable impact on the Corporation’s reputation.
The Corporation also requires access to airport facilities in its source markets and multiple destinations. In particular, the Corporation must have access to takeoff and landing slots and gates under conditions that allow it to be competitive. Accordingly, any difficulty in securing such access or disruptions in airport operations caused, for instance, by labour conflicts or other factors could adversely affect our business.
With the privatization of airports and air navigation authorities in Canada, airports and air navigation authorities have imposed significant increases in airport user fees and air navigation fees, particularly since some of these airports are located in U.S. border towns and are not subject to such fees. If these user and navigation fees were to increase substantially, our business, financial position and operating results could be adversely affected, which would result in certain routes being conceded to our U.S. competitors.
36
Transat A.T. Inc. Management’s Discussion and Analysis 2017 Annual Report
TECHNOLOGICAL RISKS
Transat relies heavily on various information and telecommunications technologies to operate its business, increase its revenues and reduce its operating expenses. Our business depends on our ability to manage reservation systems, including handling high telephone call volumes on a daily basis, monitor product profitability and inventory, adjust prices quickly, access and protect information, distribute our products to retail travel agents and other travel intermediaries, and stave off information system intrusions. Rapid changes in these technologies and growing demand for web-based or mobile reservations could require higher-than-anticipated capital expenditures to improve customer service, which could impact our operating results.
These technology systems may be vulnerable to a variety of sources of failure, interruption or misuse, including by reason of third-party suppliers’ acts or omissions, natural disasters, terrorist attacks, telecommunication systems failures, power failures, computer viruses, computer hacking, unauthorized or fraudulent users, and other operational and security issues. Furthermore, the exploitation of system vulnerabilities through cyberattacks is increasingly sophisticated and frequent and requires constant management of and developments in the measures taken. While Transat continues to invest in initiatives, including security initiatives and disaster recovery plans, these measures may not be adequate or implemented properly. Any systems failures or outages could materially and adversely affect the Corporation’s operations and its customer relationships and could have an adverse effect on its operating results and financial position.
Furthermore, several of those information technology systems depend on third-party providers, such as Softvoyage, Datalex and Radixx. Those suppliers sell more external solutions (through partnerships or cloud services) requiring additional control measures. If these providers were to become incapable of maintaining or improving efficient technology solutions in a profitable and timely manner, the Corporation would be unable to react effectively to information security attacks, obtain new systems to meet growth in its customer base or support new products offered by the Corporation. Consequently, such situations could generate additional expenses, which would unfavourably impact the Corporation’s financial position.
REGULATORY RISKS
The industry in which Transat operates is subject to extensive Canadian and foreign government regulations. These relate to, among other things, security, safety, consumer rights, permits, licensing, intellectual property rights, privacy, competition, pricing and the environment. Consequently, Transat’s future results may vary depending on the actions of government authorities with jurisdiction over our operations. These actions include the granting and timing of certain government approvals or licenses; the adoption of regulations impacting customer service standards (such as new passenger security standards); the adoption of more stringent noise restrictions or curfews; and the adoption of provincial regulations impacting the operations of retail and wholesale travel agencies. In addition, the adoption of new or different regulatory frameworks or amendments to existing legislation or regulations and tax policy changes could affect our operations, particularly as regards hotel room taxes, car rental taxes, airline taxes and airport fees.
In the fight against climate change, the International Civil Aviation Organization (ICAO) has established an international model whereby taxes would be imposed on greenhouse gas emissions to offset emissions. For domestic air travel, the federal government plans to introduce new legislation that would be accompanied by regulations to implement a carbon pricing system. The impact of this new legislation on the aviation industry is not clear at this time, nor the potential financial implications for Air Transat. However, if this legislation does materialize, additional costs could result, which the Corporation might be unable to fully pass on through its product selling prices. In such a scenario, its margin would be adversely affected.
In the course of our business in the air carrier and travel industry, the Corporation is exposed to claims and legal proceedings, including class action suits. Litigation and claims could adversely affect our business and operating results.
37

Transat A.T. Inc. Management’s Discussion and Analysis 2017 Annual Report
HUMAN RESOURCE RISKS
Labour costs constitute one of Transat’s largest operating cost items. There can be no assurance that Transat will be able to maintain such costs at levels that do not negatively affect its business, results from operations and financial position.
The Corporation’s ability to achieve its business plan is a function of the experience of its key executives and employees, and their expertise in the tourism, travel and air carrier industries. The loss of key employees could adversely affect our business and operating results. Further, our recruitment program, salary structure, performance management programs, succession plan, as well as our training plan carry risks that could have adverse effects on our ability to attract and retain the skilled resources needed to sustain the Corporation’s growth and success.
As at October 31, 2017, the Corporation had approximately 5,000 employees, almost 50% of whom are unionized personnel covered by six collective agreements. As at October 31, 2017, only one of the six collective agreements had not been renewed. Negotiations to renew this collective agreement could give rise to work stoppages or slowdowns or higher labour costs that could unfavourably impact our operations and operating income.
INSURANCE COVERAGE RISKS
The airline insurance market for risks associated with war and terrorist acts has undergone various changes. Our liability insurance for airline operations covers liability related to damages resulting from injury or death of passengers, as well as to damage suffered by third parties. The limit for any single event is US$1.25 billion with the exception of War Risk Bodily Injury/Property Damage to Third Parties excluding passengers where the limit is US$250 million for any single event and in the aggregate.
In this latter regard, additional insurance is carried and maintained for War Risk Bodily Injury/Property Damage to Third Parties excluding passengers covering the excess of US$250 million up to the limit of US$1 billion any single event and in the aggregate. Through our Audit Committee and our Risk Management and Corporate Governance Committee, our Board of Directors identifies and evaluates at least once annually the principal risk factors related to our business and approves strategies and systems proposed to manage such risks, including those specifically related to the aviation industry.
However, there can be no assurance of all risks being covered in this manner or our ability to secure coverage providing favourable levels and conditions at an acceptable cost.
We feel that we and our suppliers have adequate liability insurance to cover risks arising in the normal course of business, including claims for serious injury or death arising from accidents involving aircraft or other vehicles carrying our customers. Although we have never faced a liability claim for which we did not have adequate insurance coverage, there can be no assurance that our coverage will be sufficient to cover larger claims or that the insurer concerned will be solvent at the time of any covered loss. In addition, there can be no assurance that we will be able to obtain coverage at acceptable levels and cost in the future. These uncertainties could adversely affect our business and operating results.
38
Transat A.T. Inc. Management’s Discussion and Analysis 2017 Annual Report
CONTROLS AND PROCEDURES
The implementation of the Canadian Securities Administrators National Instrument 52-109 represents a continuous improvement process, which has prompted the Corporation to formalize existing processes and control measures and introduce new ones. Transat has chosen to make this a corporate-wide project, which will result in operational improvements and better management.
In accordance with this instrument, the Corporation has filed certificates signed by the President and Chief Executive Officer and the Vice-President, Finance and Administration and Chief Financial Officer that, among other things, report on the design and effectiveness of disclosure controls and procedures (DC&P) and the design and effectiveness of internal control over financial reporting (ICFR).
The President and Chief Executive Officer and the Vice-President, Finance and Administration and Chief Financial Officer have designed DC&P or caused them to be designed under their supervision to provide reasonable assurance that material information relating to the Corporation has been made known to them and that information required to be disclosed in the Corporation’s filings is recorded, processed, summarized and reported within the prescribed time periods under securities legislation.
Also, the President and Chief Executive Officer and the Vice-President, Finance and Administration and Chief Financial Officer have designed ICFR or have caused it to be designed under their supervision to provide reasonable assurance regarding the reliability of financial reporting and the preparation of financial statements for financial reporting purposes in accordance with IFRS.
EVALUATION OF DC&P AND ICFR
An evaluation of the design and operating effectiveness of DC&P and ICFR was carried out under the supervision of the President and Chief Executive Officer and the Vice-President, Finance and Administration and Chief Financial Officer. This evaluation consisted of a review of documentation, audits and other procedures that management considered appropriate in the circumstances. Among other things, the evaluation took into consideration the Corporate Disclosure Policy, the code of professional ethics, the sub-certification process and the operation of the Corporation’s Disclosure Committee.
Based on this evaluation and using the criteria set by the Committee of Sponsoring Organizations of the Treadway Commission on Internal Control – Integrated Framework (COSO-Framework 2013) and in connection with the preparation of its year-end financial statements, the two certifying officers concluded that the design of DC&P and ICFR were effective as at October 31, 2017.
Lastly, no significant changes in ICFR occurred during the fourth quarter ended October 31, 2017 that materially affected the Corporation’s ICFR.
39

Transat A.T. Inc. Management’s Discussion and Analysis 2017 Annual Report
OUTLOOK
For the first six-month period - In the sun destination market outbound from Canada, the Corporation’s main market segment during the winter, Transat’s capacity is up 8% compared with last year. To date, 50% of that capacity has been sold, bookings are ahead by 9.2%, and load factors are similar. Due to the strengthening of the Canadian dollar, offset by rising fuel costs, operating expenses are currently down 2.1%. Margins are currently up 2.0% from the same date last year.
In the transatlantic market, where it is low season, Transat’s capacity is up 20% from last winter. To date, 47% of that capacity has been sold, bookings are ahead by 15% and load factors are down 2%.Margins are currently down 1.6% from the same date last year.
If these trends continue, Transat expects to achieve better results than in the 2017 winter season.
40
Transat A.T. Inc. 2017 Annual Report
MANAGEMENT’S REPORT
The consolidated financial statements and MD&A of Transat A.T. Inc., and all other information in the financial report, are the responsibility of management and have been reviewed and approved by the Board of Directors.
The consolidated financial statements have been prepared by management in accordance with IFRS issued by the International Accounting Standards Board. The MD&A has been prepared in accordance with the requirements of the Canadian Securities Administrators. Management’s responsibility in these respects includes the selection of appropriate accounting principles as well as the exercise of sound judgment in establishing reasonable and fair estimates in accordance with IFRS and the requirements of the Canadian Securities Administrators, and which are adequate in the circumstances. The financial information presented throughout the MD&A and elsewhere in this Annual Report is consistent with that appearing in the financial statements.
The Corporation and its affiliated companies have set up accounting and internal control systems designed to provide reasonable assurance that the Corporation’s assets are safeguarded against loss or unauthorized use and that its books of account may be relied upon for the preparation of financial statements and the MD&A.
The Board of Directors is responsible for the financial information presented in the consolidated financial statements and the MD&A, primarily through its Audit Committee. The Audit Committee, which is appointed by the Board of Directors and comprised entirely of independent and financially literate directors, reviews the annual consolidated financial statements and the MD&A and recommends their approval to the Board of Directors. The Audit Committee is also responsible for analyzing, on an ongoing basis, the results of the audits by the external auditors, the accounting methods and policies used as well as the internal control systems set up by the Corporation. These consolidated financial statements have been audited by Ernst & Young LLP. Their report on the consolidated financial statements appears on the next page.
Chairman of the Board, President and Chief Executive Officer
Jean-Marc Eustache Vice-President, Finance and Administration and Chief Financial Officer
Denis Pétrin
41

Transat A.T. Inc. 2017 Annual Report
INDEPENDENT AUDITORS’ REPORT
To the Shareholders of Transat A.T. Inc.,
We have audited the accompanying consolidated financial statements of Transat A.T. Inc., which comprise the consolidated statements of financial position as at October 31, 2017 and 2016, and the consolidated statements of income (loss), comprehensive income (loss), changes in equity and cash flows for the years then ended, and a summary of significant accounting policies and other explanatory information.
Management’s responsibility for the consolidated financial statements Management is responsible for the preparation and fair presentation of these consolidated financial statements in accordance with International Financial Reporting Standards, and for such internal control as management determines is necessary to enable the preparation of consolidated financial statements that are free from material misstatement, whether due to fraud or error.
Auditors’ responsibility Our responsibility is to express an opinion on these consolidated financial statements based on our audits. We conducted our audits in accordance with Canadian generally accepted auditing standards. Those standards require that we comply with ethical requirements and plan and perform the audit to obtain reasonable assurance about whether the consolidated financial statements are free from material misstatement.
An audit involves performing procedures to obtain audit evidence about the amounts and disclosures in the consolidated financial statements. The procedures selected depend on the auditors’ judgment, including the assessment of the risks of material misstatement of the consolidated financial statements, whether due to fraud or error. In making those risk assessments, the auditors consider internal control relevant to the entity’s preparation and fair presentation of the consolidated financial statements in order to design audit procedures that are appropriate in the circumstances, but not for the purpose of expressing an opinion on the effectiveness of the entity’s internal control. An audit also includes evaluating the appropriateness of accounting policies used and the reasonableness of accounting estimates made by management, as well as evaluating the overall presentation of the consolidated financial statements.
We believe that the audit evidence we have obtained in our audits is sufficient and appropriate to provide a basis for our audit opinion.
Opinion In our opinion, the consolidated financial statements present fairly, in all material respects, the financial position of Transat A.T. Inc. as at October 31, 2017 and 2016 and its financial performance and its cash flows for the years then ended in accordance with International Financial Reporting Standards.
Montréal, Canada December 13, 2017 1 CPA auditor, CA, public accountancy permit No. A121006
42
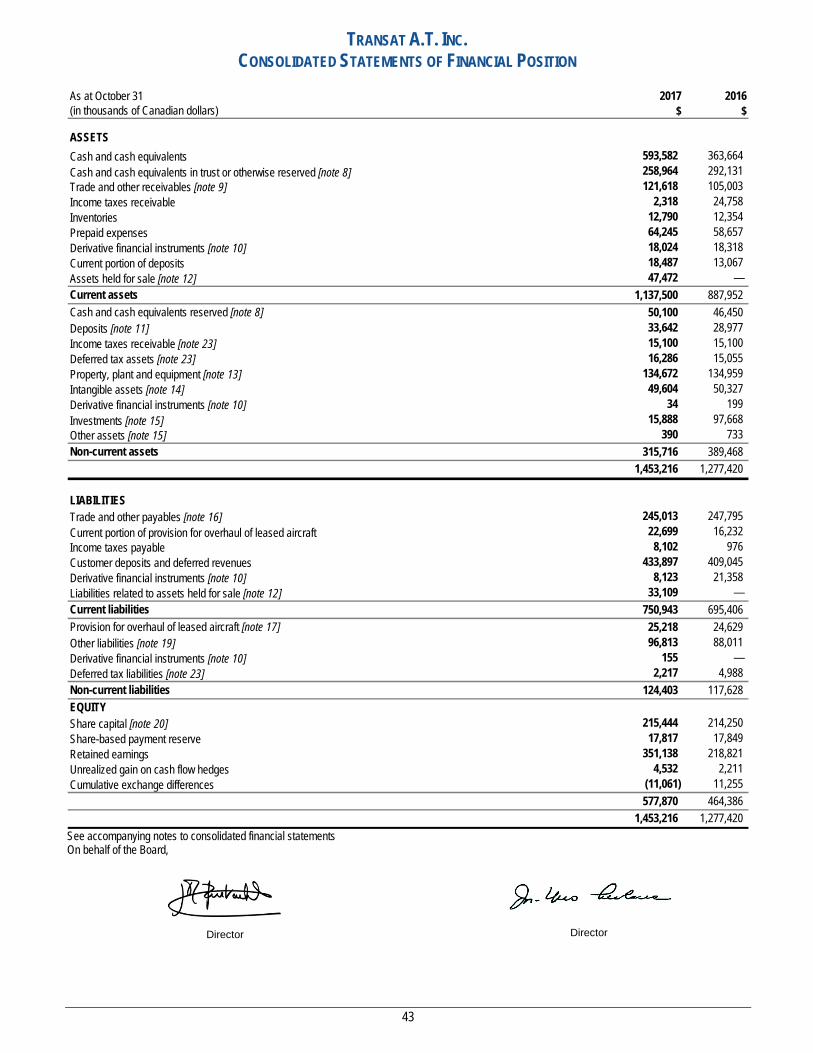
TRANSAT A.T. INC. CONSOLIDATED STATEMENTS OF FINANCIAL POSITION
As at October 31 2017 2016$ $
593,582 363,664 Cash and cash equivalents in trust or otherwise reserved [note 8] 258,964 292,131
121,618 105,003 2,318 24,758
12,790 12,354 64,245 58,657 18,024 18,318 18,487 13,067 47,472 —
1,137,500 887,952 50,100 46,450 33,642 28,977 15,100 15,100 16,286 15,055
134,672 134,959 49,604 50,327
34 199 Investments [note 15] 15,888 97,668
390 733 315,716 389,468
1,453,216 1,277,420
245,013 247,795 Current portion of provision for overhaul of leased aircraft 22,699 16,232
8,102 976 433,897 409,045
8,123 21,358 33,109 —
750,943 695,406 25,218 24,629 96,813 88,011
155 — 2,217 4,988
124,403 117,628
215,444 214,250 17,817 17,849
351,138 218,821 4,532 2,211
(11,061) 11,255 577,870 464,386
1,453,216 1,277,420
Trade and other receivables [note 9]
Derivative financial instruments [note 10]
Cash and cash equivalents reserved [note 8]Deposits [note 11]
Deferred tax assets [note 23]Property, plant and equipment [note 13]Intangible assets [note 14]
Income taxes receivable [note 23]
Income taxes receivableInventoriesPrepaid expenses
Current portion of deposits
Current assets
Income taxes payableCustomer deposits and deferred revenues
EQUITY
Share-based payment reserve Retained earningsUnrealized gain on cash flow hedgesCumulative exchange differences
Derivative financial instruments [note 10]
(in thousands of Canadian dollars)
ASSETSCash and cash equivalents
Assets held for sale [note 12]
Other assets [note 15]Non-current assets
LIABILITIES
Current liabilities
Non-current liabilities
Derivative financial instruments [note 10]
Trade and other payables [note 16]
Liabilities related to assets held for sale [note 12]
Provision for overhaul of leased aircraft [note 17]Other liabilities [note 19]
Deferred tax liabilities [note 23]Derivative financial instruments [note 10]
Share capital [note 20]
See accompanying notes to consolidated financial statements On behalf of the Board,
Director
Director
43
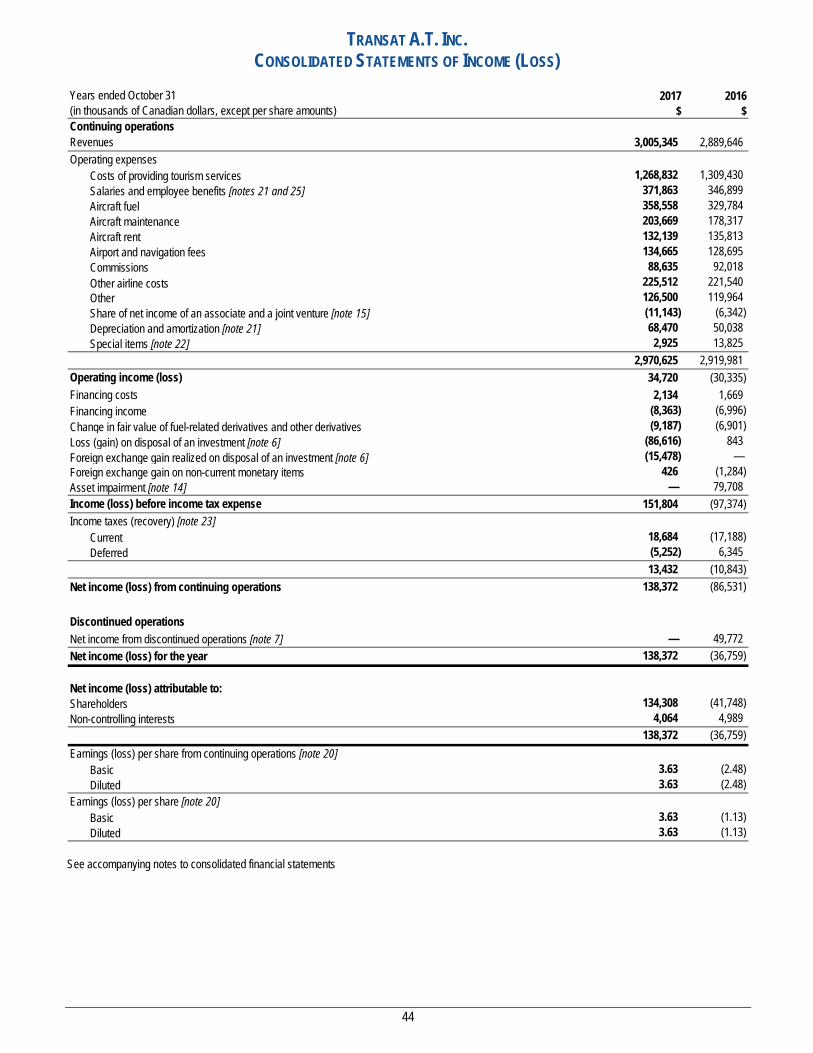
TRANSAT A.T. INC. CONSOLIDATED STATEMENTS OF INCOME (LOSS)
2017 2016$ $
Continuing operations3,005,345 2,889,646
1,268,832 1,309,430 371,863 346,899 358,558 329,784 203,669 178,317 132,139 135,813 134,665 128,695 88,635 92,018
Other airline costs 225,512 221,540 126,500 119,964 (11,143) (6,342) 68,470 50,038 2,925 13,825
2,970,625 2,919,981 34,720 (30,335) 2,134 1,669
(8,363) (6,996) Change in fair value of fuel-related derivatives and other derivatives (9,187) (6,901) Loss (gain) on disposal of an investment [note 6] (86,616) 843 Foreign exchange gain realized on disposal of an investment [note 6] (15,478) —
426 (1,284) — 79,708
151,804 (97,374)
18,684 (17,188) (5,252) 6,345 13,432 (10,843)
Net income (loss) from continuing operations 138,372 (86,531)
Discontinued operationsNet income from discontinued operations [note 7] — 49,772
138,372 (36,759)
134,308 (41,748) 4,064 4,989
138,372 (36,759)
3.63 (2.48) 3.63 (2.48)
3.63 (1.13) 3.63 (1.13)
Commissions
Aircraft maintenance
Airport and navigation feesAircraft rent
Other
(in thousands of Canadian dollars, except per share amounts)
RevenuesOperating expenses
Costs of providing tourism services
Aircraft fuelSalaries and employee benefits [notes 21 and 25]
Years ended October 31
Share of net income of an associate and a joint venture [note 15]
CurrentDeferred
Net income (loss) for the year
Net income (loss) attributable to:
Earnings (loss) per share from continuing operations [note 20]Basic
Foreign exchange gain on non-current monetary items
Income (loss) before income tax expenseIncome taxes (recovery) [note 23]
Operating income (loss)Financing costs Financing income
Depreciation and amortization [note 21]Special items [note 22]
Asset impairment [note 14]
Diluted
ShareholdersNon-controlling interests
Earnings (loss) per share [note 20]BasicDiluted
See accompanying notes to consolidated financial statements
44

TRANSAT A.T. INC. CONSOLIDATED STATEMENTS OF COMPREHENSIVE INCOME (LOSS)
Years ended October 31 2017 2016(in thousands of Canadian dollars) $ $
138,372 (86,531)
Other comprehensive income (loss) from continuing operations
Change in fair value of derivatives designated as cash flow hedges 12,537 (42,803) (9,352) 25,723
(864) 4,589 2,321 (12,491)
(6,838) (13,673)
(15,478) —
1,497 (3,230) (401) 870
1,096 (2,360) Total other comprehensive loss from continuing operations (18,899) (28,524) Comprehensive income (loss) from continuing operations 119,473 (115,055)
Net income from discontinued operations [note 7] — 49,772 Other comprehensive income (loss) from discontinued operations — 1,093 Comprehensive income from discontinued operations — 50,865 Comprehensive income (loss) for the year 119,473 (64,190)
116,714 (69,811) 2,759 5,621
119,473 (64,190)
Items that will be reclassified to net income (loss)
Net income (loss) from continuing operations
Attributable to:ShareholdersNon-controlling interests
Retirement benefits – Net actuarial gains (losses) [note 25]Deferred taxes [note 23]
Reclassification to net income (loss) Deferred taxes [note 23]
Foreign exchange loss on translation of financial statements of foreign subsidiaries
Items that will never be reclassified to net income (loss)
Reclass of foreign exchange gain realized on disposal of an investment [note 6]
See accompanying notes to consolidated financial statements
45

TRANSAT A.T. INC. CONSOLIDATED STATEMENTS OF CHANGES IN EQUITY
Share capital
Share-based
payment reserve
Retained earnings
Unrealized gain (loss)
on cash flow hedges
Cumulative exchange
differences
Reserve related to
assets held for sale Total
Non-controlling
interests Total
equity(in thousands of Canadian dollars) $ $ $ $ $ $ $ $ $Balance as at October 31, 2015 218,134 17,105 263,812 14,960 23,241 — 537,252 — 537,252 Net income (loss) for the year — — (41,748) — — — (41,748) 4,989 (36,759) Other comprehensive income (loss) — — (2,360) (12,491) (14,305) 1,093 (28,063) 632 (27,431) Comprehensive income (loss) for the year — — (44,108) (12,491) (14,305) 1,093 (69,811) 5,621 (64,190) Issued from treasury 1,219 — — — — — 1,219 — 1,219 Exercise of options 577 (177) — — — — 400 — 400 Share-based payment expense — 921 — — — — 921 — 921 Repurchase of shares (5,680) — (1,427) — — — (7,107) — (7,107) Dividends — — — — — — — (4,335) (4,335) Discontinued operations — — (336) (258) 1,687 (1,093) — — — Fair value changes in non-controlling interest liabilities — — 1,049 — — — 1,049 (1,049) — Other changes in non-controlling interest liabilities — — (169) — — — (169) 169 — Reclassification of non-controlling interest liabilities — — — — — — — 226 226 Reclassification of non-controlling interest exchange difference — — — — 632 — 632 (632) —
(3,884) 744 (883) (258) 2,319 (1,093) (3,055) (5,621) (8,676) Balance as at October 31, 2016 214,250 17,849 218,821 2,211 11,255 — 464,386 — 464,386 Net income for the year — — 134,308 — — — 134,308 4,064 138,372 Other comprehensive income (loss) — — 1,096 2,321 (21,011) — (17,594) (1,305) (18,899) Comprehensive income (loss) for the year — — 135,404 2,321 (21,011) — 116,714 2,759 119,473 Issued from treasury 1,094 — — — — — 1,094 — 1,094 Exercise of options 100 (31) — — — — 69 — 69 Vesting of PSUs — (312) — — — — (312) — (312) Share-based payment expense — 311 — — — — 311 — 311 Dividends — — — — — — — (4,447) (4,447) Fair value changes in non-controlling interest liabilities — — (3,087) — — — (3,087) 3,087 — Reclassification of non-controlling interest liabilities — — — — — — — (2,704) (2,704) Reclassification of non-controlling interest exchange difference — — — — (1,305) — (1,305) 1,305 —
1,194 (32) (3,087) — (1,305) — (3,230) (2,759) (5,989) Balance as at October 31, 2017 215,444 17,817 351,138 4,532 (11,061) — 577,870 — 577,870
Accumulated other comprehensive income (loss)
See accompanying notes to consolidated financial statements
46
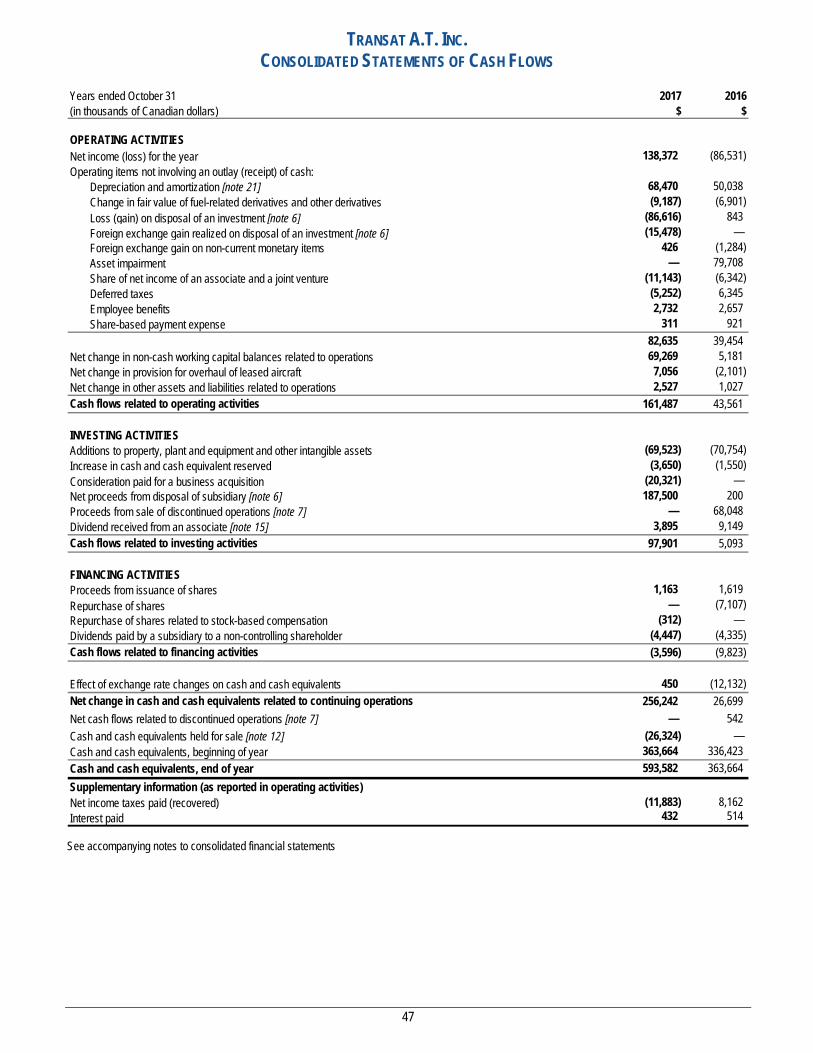
TRANSAT A.T. INC. CONSOLIDATED STATEMENTS OF CASH FLOWS
Years ended October 31 2017 2016(in thousands of Canadian dollars) $ $
138,372 (86,531)
68,470 50,038 (9,187) (6,901)
Loss (gain) on disposal of an investment [note 6] (86,616) 843 Foreign exchange gain realized on disposal of an investment [note 6] (15,478) —
426 (1,284) — 79,708
(11,143) (6,342) (5,252) 6,345 2,732 2,657
311 921 82,635 39,454 69,269 5,181 7,056 (2,101) 2,527 1,027
161,487 43,561
(69,523) (70,754) (3,650) (1,550)
Consideration paid for a business acquisition (20,321) — 187,500 200
— 68,048 3,895 9,149
97,901 5,093
1,163 1,619 Repurchase of shares — (7,107)
(312) — (4,447) (4,335) (3,596) (9,823)
450 (12,132) 256,242 26,699
Net cash flows related to discontinued operations [note 7] — 542 Cash and cash equivalents held for sale [note 12] (26,324) —
363,664 336,423 593,582 363,664
Supplementary information (as reported in operating activities)(11,883) 8,162
432 514
Net change in cash and cash equivalents related to continuing operations
Asset impairmentShare of net income of an associate and a joint venture Deferred taxes
OPERATING ACTIVITIES
Operating items not involving an outlay (receipt) of cash:Net income (loss) for the year
Depreciation and amortization [note 21]Change in fair value of fuel-related derivatives and other derivatives
Foreign exchange gain on non-current monetary items
Repurchase of shares related to stock-based compensation
Net income taxes paid (recovered)Interest paid
Dividends paid by a subsidiary to a non-controlling shareholderCash flows related to financing activities
Effect of exchange rate changes on cash and cash equivalents
Cash and cash equivalents, beginning of yearCash and cash equivalents, end of year
Net proceeds from disposal of subsidiary [note 6]Proceeds from sale of discontinued operations [note 7]Dividend received from an associate [note 15]Cash flows related to investing activities
FINANCING ACTIVITIESProceeds from issuance of shares
Net change in provision for overhaul of leased aircraftNet change in other assets and liabilities related to operationsCash flows related to operating activities
INVESTING ACTIVITIESAdditions to property, plant and equipment and other intangible assetsIncrease in cash and cash equivalent reserved
Employee benefitsShare-based payment expense
Net change in non-cash working capital balances related to operations
See accompanying notes to consolidated financial statements
47
Transat A.T. Inc. Notes to Consolidated Financial Statements 2017 Annual Report
October 31, 2017 and 2016 [Unless specified otherwise, amounts are expressed in thousands of Canadian dollars, except for per share amounts]
Note 1 CORPORATE INFORMATION
Transat A.T. Inc. [the “Corporation”], headquartered at 300 Léo-Pariseau Street, Montréal, Québec, Canada, is incorporated under the Canada Business Corporations Act. The Class A Variable Voting Shares and Class B Voting Shares are listed on the Toronto Stock Exchange. The Class A Variable Voting Shares and Class B Voting Shares of the Corporation are traded on the Toronto Stock Exchange under a single symbol, namely “TRZ.”
The Corporation is an integrated company specializing in the organization, marketing and distribution of holiday travel in the tourism industry. As at October 31, 2017, the core of its business consists of a tour operator based in Canada which is vertically integrated with its other services of air transportation, distribution through a dynamic travel agency network, value-added services at travel destinations and accommodations.
The consolidated financial statements of Transat A.T. Inc. for the year ended October 31, 2017 were approved by the Corporation’s Board of Directors on December 13, 2017.
Note 2 SIGNIFICANT ACCOUNTING POLICIES
BASIS OF PREPARATION These consolidated financial statements of the Corporation and its subsidiaries have been prepared in accordance with International
Financial Reporting Standards [“IFRS”], as issued by the International Accounting Standards Board [“IASB”] and as adopted by the Accounting Standards Board of Canada.
These consolidated financial statements are presented in Canadian dollars, the Corporation’s functional currency, except where otherwise indicated. Each entity of the Corporation determines its own functional currency and items included in the financial statements of each entity are measured using that functional currency.
These consolidated financial statements have been prepared on a going concern basis, using historical cost accounting, except for certain financial assets and liabilities classified as financial assets/liabilities at fair value through profit or loss and measured at fair value.
BASIS OF CONSOLIDATION The consolidated financial statements include the financial statements of the Corporation and its subsidiaries.
SUBSIDIARIES
Subsidiaries are entities over which the Corporation has control. Control is achieved where the Corporation has the power to govern the financial and operating policies of an investee entity so as to obtain benefits from its activities. Subsidiaries are fully consolidated from the date of acquisition, being the date on which the Corporation obtains control, and continue to be consolidated until the date when such control ceases.
The acquisition method of accounting is used to account for the acquisition of subsidiaries as follows:
• Cost is measured as the fair value of the assets acquired, equity instruments issued and liabilities incurred or assumed at the date of exchange, excluding transaction costs which are expensed as incurred;
• Identifiable assets acquired and liabilities assumed are measured at their fair values at the acquisition date; • The excess of acquisition cost over the fair value of the identifiable net assets acquired is recorded as goodwill; • If the acquisition cost is less than the fair value of the net assets acquired, the fair value of the net assets is re-assessed
and any remaining difference is recognized directly in the statement of income; • Contingent consideration is measured at fair value on the acquisition date, with subsequent changes in the fair value
recorded through the statement of income when the contingent consideration is a financial liability;
48
Transat A.T. Inc. Notes to Consolidated Financial Statements 2017 Annual Report
• Upon gaining control in a step acquisition, the existing ownership interest is re-measured to fair value through the statement of income; and
• For each business combination including non-controlling interests, the acquirer measures the non-controlling interest in the acquiree either at fair value or at the proportionate share of the acquiree’s identifiable net assets.
Non-controlling interests, which represent the portion of net income and net assets in subsidiaries that are not 100% owned by the Corporation, are reported separately within equity in the consolidated statement of financial position. Non-controlling interests in respect of which shareholders hold an option entitling them to require the Corporation to buy back their shares are reclassified from equity to liabilities, deeming exercise of the option. The carrying amount of reclassified interests is also adjusted to match the estimated redemption value. Any changes in the estimated redemption value are recognized as equity transactions in retained earnings.
The financial statements of the subsidiaries are prepared for the same reporting period as the parent company and using consistent accounting policies. All intragroup balances, transactions, unrealized gains and losses resulting from intragroup transactions and dividends are fully eliminated on consolidation.
INVESTMENTS IN AN ASSOCIATE AND A JOINT VENTURE
An associate is an entity over which the Corporation has significant influence, but no control. A joint venture is an entity in which the parties that have joint control over the entity have rights to the net assets of the entity. The Corporation’s investments in an associate and a joint venture are accounted for using the equity method as follows:
• Investment is initially recognized at cost; • Investment in an associate includes goodwill identified on acquisition, net of any accumulated impairment loss; • The Corporation’s share of post-acquisition net income (loss) is recognized in the statement of income and is also added to
(netted against) the carrying amount of the investment; and • Gains on transactions between the Corporation and its equity method investee and the joint venture are eliminated to the
extent of the Corporation’s interest in these entities and losses are eliminated unless the transaction provides evidence of an impairment of the asset transferred.
FOREIGN CURRENCY TRANSLATION TRANSACTIONS AND BALANCES
Foreign currency transactions are translated into the functional currency using the exchange rates prevailing at the dates of the transaction. Monetary assets and liabilities denominated in foreign currencies are translated using the functional currency spot rate of exchange at the reporting date.
Foreign exchange gains and losses resulting from the settlement of such transactions as well as from the translation of monetary assets and liabilities not denominated in the functional currency of the subsidiary are recognized in the statement of income, except for qualifying cash flow hedges, which are deferred and presented as Unrealized gain (loss) on cash flow hedges in Accumulated other comprehensive income (loss) in the statement of changes in equity.
GROUP COMPANIES
Assets and liabilities of entities with functional currencies other than the Canadian dollar are translated at the period-end rates of exchange, and the results of their operations are translated at average rates of exchange for the period. The exchange differences arising from translation are recognized in Cumulative exchange differences in Accumulated other comprehensive income in equity. On disposal of an interest, the exchange difference component relating to that particular interest is recognized in the consolidated statement of income.
CASH EQUIVALENTS Cash equivalents consist primarily of term deposits and bankers’ acceptances that are highly liquid and readily convertible into known
amounts of cash with initial maturities of less than three months.
49
Transat A.T. Inc. Notes to Consolidated Financial Statements 2017 Annual Report
INVENTORIES Inventories, consisting primarily of supplies and aircraft parts, are valued at the lower of cost, determined using the first-in, first-out
method, and net realizable value. Net realizable value is the estimated selling price in the normal course of business less estimated costs to sell. Replacement cost may be indicative of net realizable value.
PROPERTY, PLANT AND EQUIPMENT Property, plant and equipment are carried at cost less accumulated depreciation and provision for impairment, if any.
Depreciation on property, plant and equipment is calculated on a straight line basis, unless otherwise specified, and serves to write down the cost of the assets to their estimated residual value over their expected useful lives as follows:
Aircraft equipment, including spare engines and rotable spare parts 5–10 years or use Office furniture and equipment 3–10 years Leasehold improvements Lease term or useful life Administrative building 10–45 years
The fleet includes owned aircraft and improvements to aircraft under operating leases. A portion of the cost of owned aircraft is
allocated to the “major maintenance activities” subclass, which relates to airframe, engine and landing gear overhaul costs, and the remaining cost is allocated to Aircraft. Aircraft and major maintenance activities are depreciated taking into account their expected estimated residual value. Aircraft are depreciated on a straight-line basis over seven- to ten-year periods, and major maintenance activities are depreciated according to the type of maintenance activity on a straight-line basis or based on the use of the corresponding aircraft until the next related major maintenance activity, or their expected useful lives. Subsequent major maintenance activity expenses are capitalized as major maintenance activities and are depreciated according to their type. Expenses related to other maintenance activities, including unexpected repairs, are recognized in net income as incurred. Improvements to aircraft under operating leases are depreciated on a straight-line basis over the shorter of the corresponding lease term and their useful life.
Estimated residual values and useful lives are reviewed annually and adjusted as appropriate.
GOODWILL Goodwill represents the excess of the cost of an acquisition over the fair value of the identifiable net assets acquired at the date of
acquisition. Goodwill is tested at least annually for impairment and carried at cost less accumulated impairment losses. For the purposes of impairment testing, goodwill acquired in a business combination is, from the acquisition date, allocated to each of the Corporation’s cash-generating units [“CGUs”] that are expected to benefit from the combination, irrespective of whether other assets or liabilities of the acquiree are assigned to those units.
INTANGIBLE ASSETS Intangible assets are recorded at cost. The cost of intangible assets acquired in a business combination is recorded at fair value as at
the acquisition date. Internally generated intangible assets include developed or modified application software. These costs are capitalized when the following criteria are met:
• It is technically feasible to complete the software product and make it available for use; • Management intends to complete the software product and use it; • The Corporation has ability to use the software product; • It can be demonstrated how the software product will generate probable future economic benefits; • Adequate technical, financial and other resources to complete the development and use the software product are available; • The expenditures attributable to the software product during its development can be reliably measured.
Costs that qualify for capitalization include both internal and external costs, but are limited to those that are directly related to the specific project.
Following initial recognition, intangible assets are carried at cost less any accumulated depreciation and impairment losses.
The useful lives of intangible assets are assessed as either finite or indefinite.
50
Transat A.T. Inc. Notes to Consolidated Financial Statements 2017 Annual Report
Intangible assets with finite lives are amortized on a straight-line basis over their respective useful economic lives, as follows:
Software 3–10 years Customer lists 7–10 years
Intangible assets with finite useful lives are assessed for impairment whenever there is an indication that the intangible asset may be
impaired. The amortization period and the amortization method for an intangible asset with a finite useful life are reviewed at least annually and adjusted as appropriate.
Intangible assets with indefinite useful lives, consisting mainly of trademarks, are not amortized but are tested for impairment at least annually, either individually or at the CGU level. The indefinite useful life of those assets is reviewed annually, at a minimum, to determine whether events and circumstances continue to support an indefinite useful life assessment for the assets. If they do not, the change in useful life assessment from indefinite to finite is made on a prospective basis.
OPERATING LEASE AND DEFERRED LEASE INDUCEMENTS Leases where substantially all the risks and rewards of ownership of the asset are not transferred to the Corporation are classified as
operating leases. Operating lease payments are recognized as an expense on a straight-line basis over the related lease term.
Deferred lease inducements consist of lease incentive amounts received from landlords and rent-free lease periods. These lease inducements are recognized through other liabilities and are amortized over the life of the initial lease term on a straight-line basis as a reduction of amortization expense.
FINANCIAL INSTRUMENTS A financial instrument is any contract that gives rise to a financial asset of one party and a financial liability or equity instrument of
another party. Financial assets of the Corporation include cash and cash equivalents, cash and cash equivalents in trust or otherwise reserved, trade and other receivables other than amounts receivable due from government, deposits on leased aircraft and engines, and derivative financial instruments with a positive fair value. Financial liabilities of the Corporation include trade and other payables other than amounts due to government, long-term debt, derivative financial instruments with a negative fair value and put options held by non-controlling interests.
Financial assets and financial liabilities, including derivative financial instruments, are initially measured at fair value. Subsequent to initial recognition, financial assets and financial liabilities are measured based on their classification: financial assets/liabilities at fair value through profit or loss, loans and receivables, or other financial liabilities. Derivative financial instruments, including embedded derivative financial instruments that are not closely related to the host contract, are classified as financial assets or liabilities at fair value through profit or loss unless they are designated within an effective hedging relationship. Classification is determined by management on initial recognition based on the purpose for their acquisition.
CLASSIFICATION OF FINANCIAL INSTRUMENTS
Financial assets and financial liabilities at fair value through profit or loss Financial assets, financial liabilities and derivative financial instruments classified as financial assets or liabilities at fair value through
profit or loss are measured at fair value at the period-end date. Gains and losses realized on disposal and unrealized gains and losses from changes in fair value are reflected in the consolidated statement of income as incurred.
Loans and receivables and other financial liabilities Financial assets classified as loans and receivables and financial liabilities classified as other financial liabilities are recorded at
amortized cost using the effective interest method.
DERIVATIVE FINANCIAL INSTRUMENTS AND HEDGE ACCOUNTING
The Corporation uses derivative financial instruments to hedge against future foreign currency fluctuations in relation to its operating lease payments, receipts of revenues from certain tour operators and disbursements pertaining to certain operating expenses in foreign currencies. For hedge accounting purposes, the Corporation designates some of its foreign currency derivatives as hedging instruments.
51
Transat A.T. Inc. Notes to Consolidated Financial Statements 2017 Annual Report
The Corporation formally documents all relationships between the hedging instruments and hedged items, as well as its risk management objectives and strategy for undertaking various hedging transactions. This process includes linking all derivative financial instruments to forecasted cash flows or to a specific asset or liability. The Corporation also formally documents and assesses, both at the hedge’s inception and on an ongoing basis, whether the hedging instruments are highly effective in offsetting the changes in the fair value or cash flows of the hedged items.
These derivative financial instruments are designated as cash flow hedges.
All derivative financial instruments are recorded at fair value in the consolidated statement of financial position. For the derivative financial instruments designated as cash flow hedges, changes in the fair value of the effective portion are recognized in Other comprehensive income in the consolidated statement of comprehensive income. Any ineffective portion within a cash flow hedge is recognized in net income, as incurred, in the account Change in fair value of fuel-related derivatives and other derivatives. Should the cash flow hedge cease to be effective, previously unrealized gains and losses remain within Accumulated other comprehensive income (loss) as Unrealized gain (loss) on cash flow hedges until the hedged item is settled, and future changes in value of the derivative instrument are recognized in income prospectively. The change in value of the effective portion of a cash flow hedge remains in Accumulated other comprehensive income (loss) as Unrealized gain (loss) on cash flow hedges until the related hedged item is settled, at which time amounts recognized in Unrealized gain (loss) on cash flow hedges are reclassified to the same consolidated statement of income account in which the hedged item is recognized. For derivative financial instruments designated as fair value hedges, periodic changes in fair value are recognized in the same account in the consolidated statement of income as the hedged item.
DERIVATIVE FINANCIAL INSTRUMENTS THAT DO NOT QUALIFY FOR HEDGE ACCOUNTING
In the normal course of business, the Corporation also uses fuel-related derivatives to manage its exposure to unstable fuel prices as well as certain foreign currency derivatives to offset the future risks of fluctuations in foreign currencies that have not been designated for hedge accounting. These derivatives are measured at fair value at the end of each period, and the unrealized gains or losses on remeasurement are recorded and presented under Change in fair value of fuel-related derivatives and other derivatives in the consolidated statement of income. When realized, at maturity of fuel-related derivative financial instruments, any gains or losses are reclassified to Aircraft fuel.
It is the Corporation’s policy not to speculate on derivative financial instruments; accordingly, these instruments are normally purchased for risk management purposes and held to maturity.
TRANSACTION COSTS
Transaction costs related to financial assets and financial liabilities classified as financial assets or liabilities at fair value through profit or loss are expensed as incurred. Transaction costs related to financial assets classified as loans and receivables or to financial liabilities classified as other financial liabilities are reflected in the carrying amount of the financial asset or financial liability and are then amortized over the estimated useful life of the instrument using the effective interest method.
FAIR VALUE
The fair value of financial instruments that are actively traded in organized financial markets is determined by reference to quoted prices in an active market at the close of business on the reporting date. For financial instruments where there is no active market, fair value is determined using valuation techniques. Such techniques may include using recent arm’s length market transactions, reference to the current fair value of another instrument that is substantially the same, discounted cash flow analysis or other valuation models.
The Corporation categorizes its financial assets and liabilities measured at fair value into one of three different levels depending on the observability of the inputs used in the measurement.
Level 1: This level includes assets and liabilities measured at fair value based on unadjusted quoted prices for identical assets and liabilities in active markets accessible to the Corporation at the measurement date.
Level 2: This level includes valuations determined using directly or indirectly observable inputs other than quoted prices included within
Level 1. Derivative instruments in this category are valued using models or other industry standard valuation techniques derived from observable market inputs.
52
Transat A.T. Inc. Notes to Consolidated Financial Statements 2017 Annual Report
Level 3: This level includes valuations based on inputs which are less observable, unavailable or where the observable data does not support a significant portion of the instruments’ fair value.
IMPAIRMENT OF FINANCIAL ASSETS CLASSIFIED AS LOANS AND RECEIVABLES The Corporation assesses at each reporting date whether there is any objective evidence that a financial asset or a group of financial
assets classified as loans and receivables is impaired. A financial asset or a group of financial assets is deemed to be impaired if, and only if, there is objective evidence of impairment as a result of one or more events that occurred after the initial recognition of the asset [an incurred loss event] and that incurred loss event has an impact on the estimated future cash flows of the financial asset or the group of financial assets that can be reliably estimated. Impairment losses are recognized through profit or loss.
IMPAIRMENT OF NON-FINANCIAL ASSETS The Corporation assesses at each reporting date whether there is any indication that an asset may be impaired. If any indication
exists, or when annual impairment testing for an asset is required, the Corporation estimates the asset’s recoverable amount. An asset’s recoverable amount is the higher of an asset’s or CGU’s fair value less costs to sell and its value in use and is determined for an individual asset, unless the asset does not generate cash inflows that are largely independent of those from other assets or groups of assets. Value in use is calculated using estimated net cash flows, typically based on detailed projections over a five-year period with subsequent years extrapolated using a growth assumption. The estimated net cash flows are discounted to their present value using a discount rate before income taxes that reflects current market assessments of the time value of money and the risk specific to the asset or CGU. In determining fair value less costs to sell, recent market transactions are taken into account, if available. If no such transactions can be identified, an appropriate valuation model may be used. Where the carrying amount of an asset or CGU exceeds its recoverable amount, the asset is considered impaired and is written down to its recoverable amount. Impairment losses are recognized through profit or loss.
The following criteria are also applied in assessing impairment of specific assets:
GOODWILL
Goodwill is tested annually [as at April 30] for impairment and when circumstances indicate that the carrying value may be impaired. Impairment is determined by assessing the recoverable amount of each CGU [or group of CGUs] to which the goodwill relates. Where the recoverable amount of the CGU is less than its carrying amount, an impairment loss is recognized.
INTANGIBLE ASSETS
Intangible assets with indefinite useful lives are tested for impairment annually [as at April 30] either individually or at the CGU level, as appropriate, and when circumstances indicate that the carrying value may be impaired.
REVERSAL OF IMPAIRMENT LOSSES
For assets excluding goodwill, an assessment is made at each reporting date as to whether there is any indication that previously recognized impairment losses may no longer exist or have decreased. If such indication exists, the Corporation estimates the asset’s or CGU’s recoverable amount. A previously recognized impairment loss is reversed only if there has been a change in the assumptions used to determine the asset’s recoverable amount since the last impairment loss was recognized. The reversal is limited so that the carrying amount of the asset does not exceed its recoverable amount or exceed the carrying amount that would have been determined, net of depreciation or amortization, had no impairment loss been recognized for the asset in prior years. The reversal is recognized in the statement of income. Impairment losses relating to goodwill cannot be reversed in future periods.
PROVISIONS Provisions are recognized when the Corporation has a present, legal or constructive obligation as a result of a past event, it is
probable that an outflow of resources will be required to settle the obligation and the cost can be reliably estimated. Provisions are measured at their present value.
53

Transat A.T. Inc. Notes to Consolidated Financial Statements 2017 Annual Report
PROVISION FOR OVERHAUL OF LEASED AIRCRAFT
Under aircraft and engine operating leases, the Corporation is required to maintain the aircraft and engines in serviceable condition and adhere to the maintenance plan. The Corporation accounts for its leased aircraft and engine maintenance obligation based on utilization until the next maintenance activity. The obligation is adjusted to reflect any change in the related maintenance expenses anticipated. Depending on the type of maintenance, utilization is determined based on the cycles, logged flight time or time between overhauls. The excess of the maintenance obligation over maintenance deposits made to lessors and unclaimed is included in liabilities under Provision for overhaul of leased aircraft. All maintenance work done on aircraft engines under contracts with billing based on flight hours are charged to operating expenses in the statement of income are expensed as incurred.
EMPLOYEE FUTURE BENEFITS The Corporation offers defined benefit pension arrangements to certain senior executives. Certain non-Canadian employees also
benefit from post-employment benefits. The net periodic pension expense for these plans is actuarially determined on an annual basis by independent actuaries using the projected unit credit method. The determination of benefit expense requires assumptions such as the discount rate to measure obligations, expected mortality and expected rate of future compensation. Actual results will differ from estimated results based on assumptions. The vested portion of past service cost arising from plan amendments is recognized immediately in the statement of income. The unvested portion is amortized on a straight-line basis over the average remaining period until the benefits vest.
The liability recognized in the consolidated statement of financial position is the present value of the defined benefit obligation at the end of the reporting period less the fair value of plan assets, together with adjustments for unrecognized past service costs. The present value of the defined benefit obligation is determined by discounting the estimated future cash outflows using interest rates of high-quality corporate bonds that have terms to maturity approximating the term of the related pension liability. All actuarial gains and losses that arise in calculating the present value of the defined benefit obligation and the fair value of plan assets are recognized immediately in Retained earnings and included in the statement of comprehensive income.
Contributions to defined contribution pension plans are expensed as incurred, which is as the related employee service is rendered.
In certain jurisdictions, termination benefits are payable when employment is terminated by the Corporation before the normal retirement date, or whenever an employee accepts voluntary redundancy in exchange for the benefits. The Corporation recognizes termination benefits when it is demonstrably committed to either terminating the employment of current employees according to a detailed formal plan without possibility of withdrawal, or providing termination benefits as a result of an offer made to encourage voluntary redundancy.
REVENUE RECOGNITION The Corporation recognizes revenue once the service is rendered and all the significant risks and rewards of the service have been
transferred to the customer. As a result, revenue earned from passenger transportation is recognized when such transportation is provided. Revenue from tour operators and the related costs are recognized when passengers depart. Revenues from air transportation services are recognized when the corresponding service is rendered on the date of each flight. Commission revenue from travel agencies is recognized when travel is reserved. Amounts received from customers for services not yet rendered are included in current liabilities as Customer deposits and deferred revenues.
Revenue for which the Corporation provides multiple services such as air transportation, tour operator and travel agency services is recognized once the service is provided to the customer based on the Corporation’s accounting policy for revenue recognition. The Corporation treats these different services as separate units of accounting as each service has a value to the customer on a stand-alone basis and the consideration paid for these services is allocated using the relative fair value of each deliverable.
INCOME TAXES The Corporation provides for income taxes using the liability method. Under this method, deferred tax assets and liabilities are
calculated based on differences between the carrying value and tax basis of assets and liabilities and measured using substantively enacted tax rates and laws expected to be in effect when the differences reverse.
Deferred tax assets and liabilities are recognized directly through profit or loss, other comprehensive income, or equity based on the classification of the item to which they relate.
54
Transat A.T. Inc. Notes to Consolidated Financial Statements 2017 Annual Report
Deferred tax liabilities are recognized for all taxable temporary differences. Deferred tax assets are recognized for all deductible temporary differences, carryforwards of unused tax credits and unused tax losses, to the extent that it is probable that taxable income will be available against which the deductible temporary differences, and the carryforwards of unused tax credits and unused tax losses can be utilized.
Deferred tax assets and liabilities are offset if a legally enforceable right exists to set off current tax assets against current tax liabilities and the deferred taxes relate to the same taxable entity and the same taxation authority.
SHARE-BASED PAYMENT PLANS The Corporation operates a number of equity-settled and cash-settled share-based compensation plans under which it receives
services from employees as consideration for equity instruments of the Corporation or cash-settled payments.
EQUITY-SETTLED TRANSACTIONS
For equity-settled share-based compensation [stock option plan and performance share unit plan], including share-based payment transactions with a net settlement feature to satisfy withholding tax obligations, the compensation expense is based on the grant date fair value of the share-based awards expected to vest over the period in which the performance and/or service conditions are fulfilled, with a corresponding increase in the share-based payment reserve. Compensation expense related to the stock option plan is calculated using the Black-Scholes model, whereas the performance share unit expense is measured based on the closing price of the shares of the Corporation on the Toronto Stock Exchange at the grant date adjusted to take into account the terms and conditions upon which the units were granted. For awards with graded vesting, the fair value of each tranche is recognized through profit or loss over its respective vesting period. Any consideration paid by employees on exercising these awards and the corresponding portion previously credited to the share-based payment reserve are credited to share capital.
CASH-SETTLED TRANSACTIONS
For cash-settled share-based compensation [deferred share unit plan and restricted share unit plan], the expense is determined based on the fair value of the liability at the end of the reporting period until the award is settled. The value of the compensation is measured based on the closing price of the shares of the Corporation on the Toronto Stock Exchange adjusted to take into account the terms and conditions upon which the units were granted, and is based on the units that are expected to vest. The expense is recognized over the period in which the performance or service conditions are satisfied. At the end of each reporting period, the Corporation re-assesses its estimates of the number of awards that are expected to vest and recognizes the impact of the revisions through profit or loss.
EMPLOYEE SHARE PURCHASE PLANS
The Corporation’s contributions to the employee share purchase plans [stock ownership incentive and capital accumulation plan and permanent stock ownership incentive plan] consist of shares acquired in the marketplace by the Corporation. These contributions are measured at cost and are recognized over the period from the acquisition date to the date that the award vests to the participant. Any consideration paid by the participant to purchase shares under the share purchase plan is credited to share capital.
EARNINGS PER SHARE Basic earnings per share is computed based on net income attributable to shareholders of the Corporation, divided by the weighted-
average number of Class A Variable Voting Shares and Class B Voting Shares outstanding during the year.
Diluted earnings per share is calculated by adjusting net income attributable to shareholders of the Corporation for any changes in income or expense that would result from the exercise of dilutive elements. The weighted-average number Class A Variable Voting Shares and Class B Voting Shares outstanding is increased by the weighted-average number of additional Class A Variable Voting Shares and Class B Voting Shares that would have been outstanding assuming the exercise of all dilutive elements.
55
Transat A.T. Inc. Notes to Consolidated Financial Statements 2017 Annual Report
Note 3 SIGNIFICANT ACCOUNTING ESTIMATES AND JUDGMENTS
The preparation of consolidated financial statements requires management to make estimates and judgments about the future. Estimates and judgments are continually evaluated and are based on historical experience and other factors, including expectations of future events that are believed to be reasonable under the circumstances. However, accounting estimates could result in outcomes that require a material adjustment to the carrying amount of the asset or liability affected in future periods.
The key assumptions concerning the future and other key sources of estimation uncertainty at the reporting date that have a significant risk of causing a material adjustment to the carrying amounts of assets and liabilities within the next fiscal year are described below. The Corporation based its assumptions and estimates on parameters available when the consolidated financial statements were prepared. However, existing circumstances and assumptions about future developments may change due to market events or to circumstances beyond the Corporation’s control. Such changes are reflected in the assumptions when they occur.
DEPRECIATION AND AMORTIZATION AND IMPAIRMENT OF PROPERTY, PLANT AND EQUIPMENT, GOODWILL AND INTANGIBLE ASSETS Impairment exists when the carrying amount of an asset or CGU, in the case of goodwill, exceeds its recoverable amount, which is
the higher of fair value less costs to sell the asset or CGU and value in use. To identify CGUs, management has to take into account the contributions made by each subsidiary and the inter-relationships among them in light of the Corporation’s vertical integration and the goal of providing a comprehensive offering of tourism services in the markets served by the Corporation. The fair value less costs to sell calculation is based on available data from arm’s length transactions for similar assets or observable market prices less incremental costs to sell. The value in use calculation is based on a discounted cash flow model. Cash flows are derived from the budget or financial forecasts for the next five fiscal years and do not include restructuring activities that the Corporation is not yet committed to or significant future investments that will enhance the performance of the asset of the CGU being tested. The recoverable amount is most sensitive to the discount rate used for the discounted cash flow model as well as the expected future cash inflows and the growth rate used for extrapolation purposes. The key assumptions used to determine the recoverable amount for the various CGUs, including a sensitivity analysis, are discussed in note 14.
Property, plant and equipment are depreciated over their estimated useful lives taking into account their residual value. Aircraft, aircraft components and leasehold improvements account for a major subclass of property, plant and equipment. Depreciation expense depends on several assumptions including the period over which the aircraft will be used, the fleet renewal schedule and the estimate of the residual value of aircraft and aircraft components at the time of their anticipated disposal.
Changes in estimated useful life and residual value of aircraft could have a significant impact on depreciation expense. Property, plant and equipment and intangible assets with finite lives are reviewed for impairment whenever events or changes in circumstances indicate that the carrying amount of an asset may not be recoverable.
FAIR VALUE OF DERIVATIVE FINANCIAL INSTRUMENTS The fair value of derivative financial instruments is the amount for which the instrument could be exchanged between knowledgeable,
willing parties in an arm’s length transaction. The Corporation determines the fair value of its derivative financial instruments using the purchase or selling price, as appropriate, in the most advantageous active market to which the Corporation has immediate access. The Corporation also takes into account its own credit risk and the credit risk of the counterparty in determining fair value for its derivative financial instruments based on whether they are financial assets or financial liabilities. When the market for a derivative financial instrument is not active, the Corporation determines the fair value by applying valuation techniques, such as using available information on market transactions involving other instruments that are substantially the same, discounted cash flow analysis or other techniques, where appropriate. The Corporation ensures, to the extent practicable, that its valuation technique incorporates all factors that market participants would consider in setting a price and that it is consistent with accepted economic methods for pricing financial instruments, including the credit risk of the party involved.
PROVISION FOR OVERHAUL OF LEASED AIRCRAFT The estimates used to determine the provision for overhaul of leased aircraft are based on historical experience, historical costs and
repairs, information from external suppliers, forecasted aircraft utilization, planned renewal of the aircraft fleet, leased aircraft return conditions, the U.S. dollar exchange rate and other facts and reasonable assumptions in the circumstances. Given that various assumptions are used in determining the provision for overhaul of leased aircraft, the calculation involves some inherent measurement uncertainty. Actual results will differ from estimated results based on assumptions.
56
Transat A.T. Inc. Notes to Consolidated Financial Statements 2017 Annual Report
NON-CONTROLLING INTERESTS Non-controlling interests in respect of which the shareholders may require the Corporation to buy back their shares are reclassified as
liabilities at their estimated redemption value, deeming exercise of this option. In the absence of a predetermined calculation formula, the estimated redemption value is established using fair value. The fair value calculation is based on a discounted cash flow model. The cash flows are derived from the budget and financial forecasts for the next five years and do not include restructuring activities that the Corporation is not yet committed to or significant future investments that will enhance the subsidiary’s performance. The fair value is most sensitive to the discount rate used for the discounted cash flow model as well as the expected future cash inflows and the growth rate used for extrapolation purposes.
EMPLOYEE FUTURE BENEFITS The cost of defined benefit pension plans and other post-employment benefits and the present value of the associated obligations are
determined using actuarial valuations. These actuarial valuations require the use of assumptions such as the discount rate to measure obligations, expected mortality and expected rate of future compensation. Given that various assumptions are used in determining the cost and obligations associated with employee future benefits, the actuarial valuation process involves some inherent measurement uncertainty. Actual results will differ from estimated results based on assumptions.
TAXES Uncertainties exist with respect to the interpretation of complex tax regulations, changes in tax legislation and the amount and timing
of future taxable income. Given the Corporation’s wide range of international business relationships, differences arising between actual results and the assumptions made, or future changes in such assumptions, could give rise to future adjustments in the amounts of income taxes previously reported. Such interpretive differences may arise in a variety of areas depending on the conditions specific to the respective tax jurisdiction of the Corporation’s subsidiaries. The Corporation establishes provisions, based on reasonable estimates, for possible consequences of audits by the tax authorities of the respective countries in which it operates. The amount of such provisions is based on various factors, such as experience of previous tax audits and interpretations of tax regulations by the taxable entity and the responsible tax authority.
Deferred income tax assets are recognized for all unused tax losses to the extent that it is probable that taxable profit will be available against which the losses can be utilized. Significant judgment is required by management to determine the amount of deferred income tax assets that can be recognized, based upon the likely timing and the level of future taxable income together with future tax planning strategies.
Note 4 CHANGE IN ACCOUNTING POLICY
IFRS 2, SHARE-BASED PAYMENT In June 2016, the International Accounting Standards Board [“IASB”] issued amendments included in IFRS 2, Share-based Payment.
The amendments are intended to provide changes that relate, in particular, to the accounting for share-based payment transactions that include net settlement terms to satisfy withholding tax obligations. The amendments to IFRS 2 will be effective for the Corporation’s fiscal year beginning on November 1, 2018, with earlier adoption permitted. The Corporation elected to early adopt the amendments to IFRS 2 for the year ended October 31, 2017. Early adoption of the amendments to IFRS 2 had no significant impact.
Note 5 FUTURE CHANGES IN ACCOUNTING POLICIES
Standards issued but not yet effective are discussed below. The Corporation has not early adopted these new standards.
IFRS 9, FINANCIAL INSTRUMENTS In July 2014, the IASB completed its three-part project to replace IAS 39, Financial Instruments: Recognition and Measurement, by
issuing IFRS 9, Financial Instruments. IFRS 9 addresses the classification and measurement of financial assets and financial liabilities, and introduces a forward-looking expected-loss impairment model as well as a substantially-reformed approach to hedge accounting.
57
Transat A.T. Inc. Notes to Consolidated Financial Statements 2017 Annual Report
IFRS 9 uses a new approach to determine whether a financial asset is measured at amortized cost or fair value, replacing the many different rules in IAS 39. The approach recommended by IFRS 9 is based on how an entity manages its financial instruments and the contractual cash flow characteristics of the financial assets. Most of the requirements in IAS 39 for classification and measurement of financial liabilities were carried forward in IFRS 9. However, the portion of the changes in fair value related to the entity’s own credit risk, in measuring a financial liability at fair value through profit or loss, will be presented in other comprehensive income rather than in the statement of income.
IFRS 9 also introduces a new expected-loss impairment model that will require more timely recognition of expected credit losses. Specifically, entities will be required to account for expected credit losses when financial instruments are first recognized and to recognize full lifetime expected credit losses on a more timely basis.
Lastly, IFRS 9 introduces a new hedge accounting model, together with corresponding disclosures about risk management activities. The new hedge accounting model represents a substantial overhaul of hedge accounting that will enable entities to better reflect their risk management activities in their financial statements. The IFRS 9 transition rules include an exemption allowing companies to continue to apply current hedge accounting under IAS 39 until the final hedge model is effective.
Application of IFRS 9 will be effective from the Corporation’s fiscal year beginning on November 1, 2018, with earlier adoption permitted. Other than the potential impact of adopting optional hedge accounting in accordance with IFRS 9, the Corporation does not expect the adoption of IFRS 9 to have a material impact on its financial statements. The Corporation continues to assess the impact of the adoption of IFRS 9 on its financial statements, including the hedge accounting transition decision.
IFRS 15, REVENUE FROM CONTRACTS WITH CUSTOMERS In May 2014, the IASB issued IFRS 15, Revenue from Contracts with Customers, a new standard that specifies the steps and timing
for issuers to recognize revenue as well as requiring them to provide more relevant and comprehensive disclosures. The core principle of IFRS 15 is that an entity should recognize revenue in a manner that depicts the transfer of promised goods or services to customers in an amount that reflects the expected consideration receivable in exchange for those goods or services. IFRS 15 supersedes IAS 11, Construction Contracts, and IAS 18, Revenue, as well as various interpretations regarding revenue. The application of IFRS 15 is mandatory and will be effective for the Corporation’s fiscal year beginning on November 1, 2018, with earlier adoption permitted. The Corporation is currently assessing the impact of adopting this standard on its financial statements and expects to complete its analysis in the coming quarters.
IFRS 16, LEASES In January 2016, the IASB issued IFRS 16, Leases, which supersedes IAS 17, Leases. Leasing is an important and flexible source of
financing for many companies. However, under the current IAS 17 standard, it is difficult to obtain a clear picture of the assets and liabilities related to the leasing agreements of an entity. IFRS 16 introduces a single lessee accounting model under which most of lease-related assets and liabilities are recognized in the statement of financial position. For the lessor, substantially all the current accounting requirements remain unchanged. Certain exemptions will apply to short-term and low-value leases.
Considering that the Corporation is committed under numerous operating leases in accordance with IAS 17, the Corporation expects that the adoption of IFRS 16 will have a significant impact on its financial statements. The Corporation will be required to recognize an asset related to the right of use and a liability at the present value of future lease payments. Amortization of the right-of-use asset and interest expense on the lease obligation will replace rent expense related to operating leases.
The application of IFRS 16 is mandatory and will be effective for the Corporation’s fiscal year beginning on November 1, 2019, with earlier adoption permitted if the new IFRS 15 standard on revenue has also been applied. The Corporation continues to assess the impact of the adoption of this new standard on its financial statements and has not determined which transition method it will use.
58
Transat A.T. Inc. Notes to Consolidated Financial Statements 2017 Annual Report
Note 6 BUSINESS ACQUISITIONS AND DISPOSALS
On October 4, 2017, the Corporation completed the sale of its 35% minority interest in Ocean Hotels to H10 Hotels, ahead of the anticipated November 2, 2017 closing date. As announced on July 19, 2017, the sale closed for US$150,500 [$187,500], received in cash on October 4, 2017. The disposed interest had a carrying value of $97,252 as at October 4, 2017. The Corporation recorded a gain on disposal of an investment of $86,616, net of transaction costs of $1,697, as well as a foreign exchange gain of $15,478 realized on the reclassification of the cumulative exchange differences related to our investment. The selling price remains subject to certain adjustments, estimated to US$1,500 [$1,935] as of October 31, 2017, which would reduce the selling price to US$149,000 [$185,565].
On April 3, 2017, the Corporation acquired a 50% interest in Desarrollo Transimar S.A. de C.V. [“Desarrollo”], a Mexican company operating a hotel, for a consideration of US$10,000 [$13,425], of which US$9,500 [$12,754] was paid in cash and US$500 [$622] was included in trade and other payables as at October 31, 2017. This amount is payable subject to certain conditions. This interest in a joint venture is accounted for using the equity method [see note 15].
On December 21, 2016, following the exercise of a put option by the minority shareholder in the subsidiary Jonview Canada Inc. [“Jonview”], the Corporation completed the purchase of 19.93% of the shares of its subsidiary Jonview, which has an incoming tour operator business in Canada, thereby bringing its interest in the subsidiary to 100%. The cash consideration totalled $4,983, being the fair value of the put option at the time of the transaction. In addition, the non-controlling interest was derecognized with no impact on the consolidated statements of income (loss).
On April 1, 2016, the Corporation concluded the sale of its subsidiary Travel Superstore, which operates the website tripcentral.ca and 27 travel agencies. The cash consideration totalled $300 and the carrying value of net assets disposed of stood at $1,312, which resulted in a reversal of retained earnings of $169 and a loss on disposal of a subsidiary of $843.
Note 7 DISCONTINUED OPERATIONS
On October 31, 2016, the Corporation completed the sale of its tour operating business in France (Transat France) and Greece (Tourgreece) for an amount of €63,428 ($93,254) to TUI AG, a multinational tourism company. On January 27, 2017, TUI AG confirmed that the purchase price will not be subject to any working capital adjustments following the final closing and audit of accounts.
As at October 31, 2016, the tour operating businesses in France and Greece were identified as discontinued operations. Accordingly, the consolidated statements of income (loss) and comprehensive income (loss) present for fiscal 2016 after-tax net income from discontinued operations as a single amount, separately from continuing operations. Unless otherwise specified, all other notes to consolidated financial statements include amounts from continuing operations.
For the fiscal year ended October 31, 2016, a gain on disposal of $49,692, net of transaction costs of $7,073, was also recognized in the consolidated statement of income (loss) and the proceeds of disposal of $93,254, net of cash disposed of, are shown in the consolidated statement of cash flows.
59
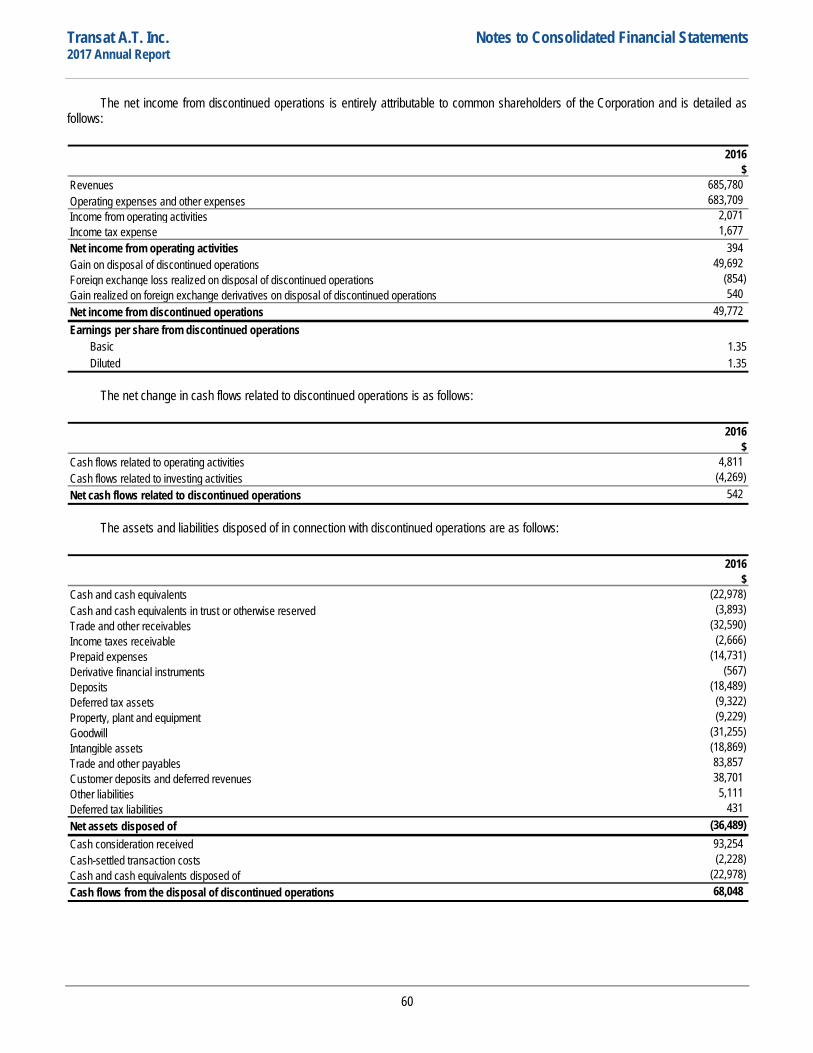
Transat A.T. Inc. Notes to Consolidated Financial Statements 2017 Annual Report
The net income from discontinued operations is entirely attributable to common shareholders of the Corporation and is detailed as follows:
2016$
Revenues 685,780 Operating expenses and other expenses 683,709 Income from operating activities 2,071 Income tax expense 1,677 Net income from operating activities 394 Gain on disposal of discontinued operations 49,692 Foreign exchange loss realized on disposal of discontinued operations (854) Gain realized on foreign exchange derivatives on disposal of discontinued operations 540 Net income from discontinued operations 49,772 Earnings per share from discontinued operations
Basic 1.35 Diluted 1.35
The net change in cash flows related to discontinued operations is as follows:
2016$
Cash flows related to operating activities 4,811 Cash flows related to investing activities (4,269) Net cash flows related to discontinued operations 542
The assets and liabilities disposed of in connection with discontinued operations are as follows:
2016$
Cash and cash equivalents (22,978) Cash and cash equivalents in trust or otherwise reserved (3,893) Trade and other receivables (32,590) Income taxes receivable (2,666) Prepaid expenses (14,731) Derivative financial instruments (567) Deposits (18,489) Deferred tax assets (9,322) Property, plant and equipment (9,229) Goodwill (31,255) Intangible assets (18,869) Trade and other payables 83,857 Customer deposits and deferred revenues 38,701 Other liabilities 5,111 Deferred tax liabilities 431 Net assets disposed of (36,489) Cash consideration received 93,254 Cash-settled transaction costs (2,228) Cash and cash equivalents disposed of (22,978) Cash flows from the disposal of discontinued operations 68,048
60
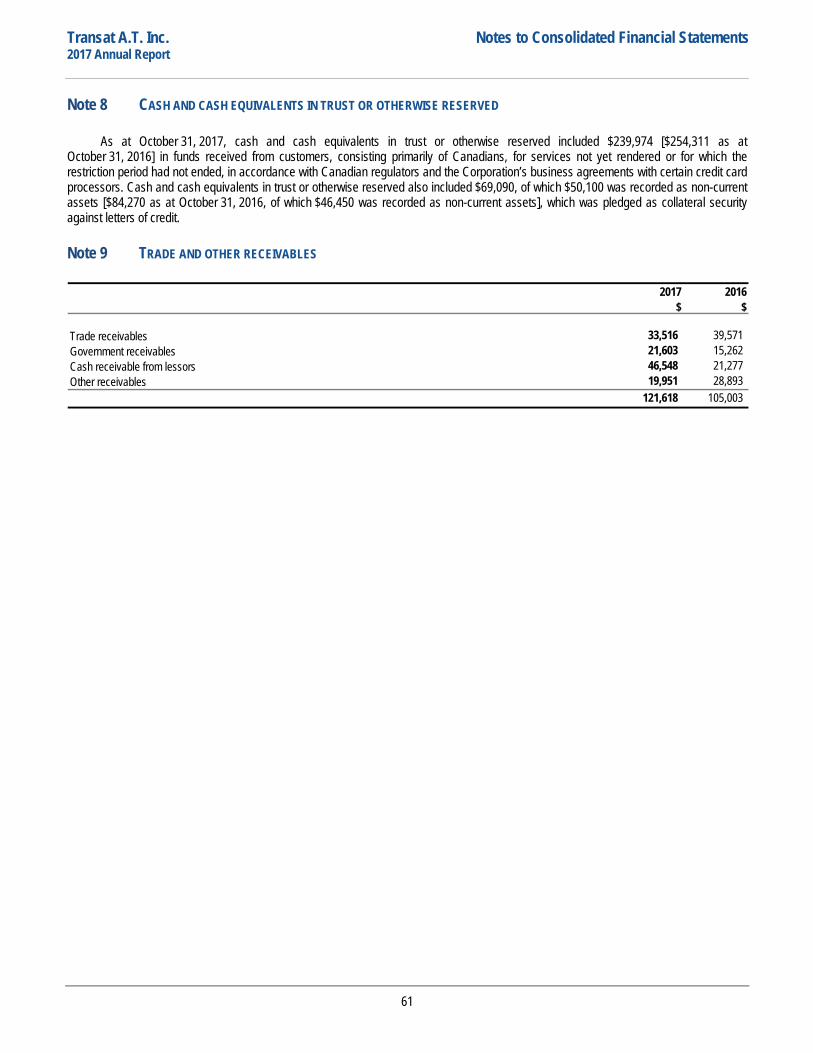
Transat A.T. Inc. Notes to Consolidated Financial Statements 2017 Annual Report
Note 8 CASH AND CASH EQUIVALENTS IN TRUST OR OTHERWISE RESERVED
As at October 31, 2017, cash and cash equivalents in trust or otherwise reserved included $239,974 [$254,311 as at October 31, 2016] in funds received from customers, consisting primarily of Canadians, for services not yet rendered or for which the restriction period had not ended, in accordance with Canadian regulators and the Corporation’s business agreements with certain credit card processors. Cash and cash equivalents in trust or otherwise reserved also included $69,090, of which $50,100 was recorded as non-current assets [$84,270 as at October 31, 2016, of which $46,450 was recorded as non-current assets], which was pledged as collateral security against letters of credit.
Note 9 TRADE AND OTHER RECEIVABLES
2017 2016$ $
33,516 39,571 21,603 15,262 46,548 21,277 19,951 28,893
121,618 105,003
Trade receivablesGovernment receivablesCash receivable from lessorsOther receivables
61
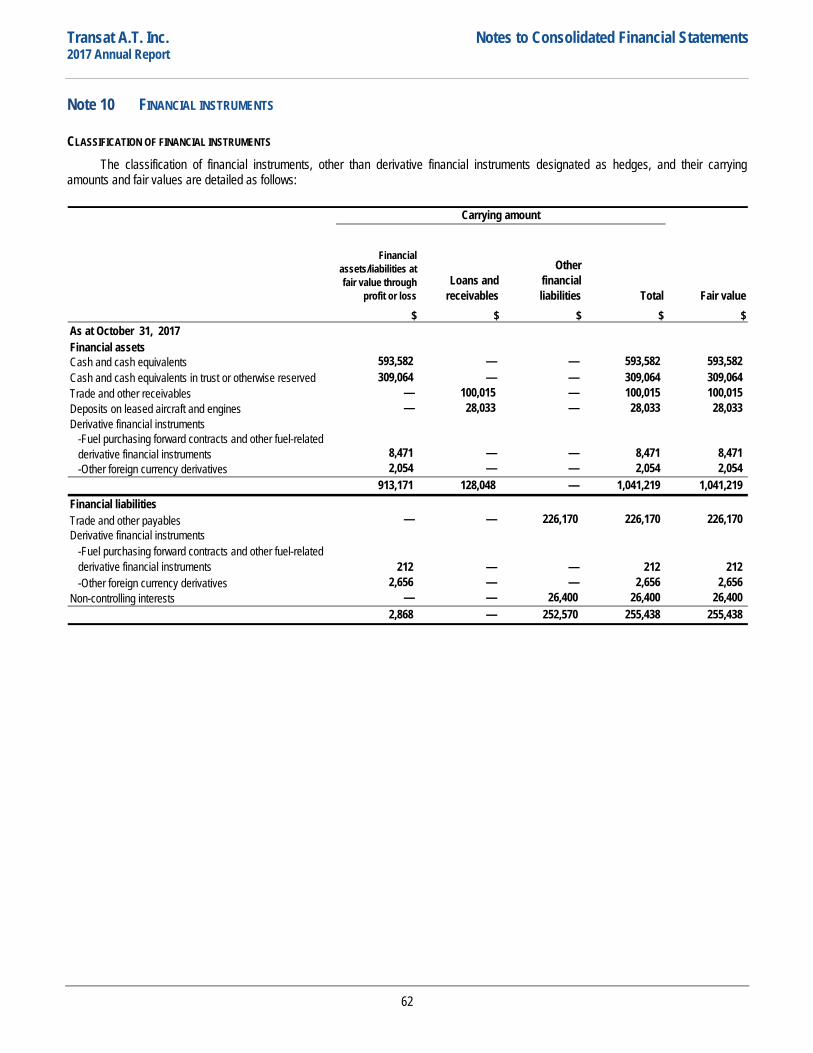
Transat A.T. Inc. Notes to Consolidated Financial Statements 2017 Annual Report
Note 10 FINANCIAL INSTRUMENTS
CLASSIFICATION OF FINANCIAL INSTRUMENTS The classification of financial instruments, other than derivative financial instruments designated as hedges, and their carrying
amounts and fair values are detailed as follows:
Financial assets/liabilities at fair value through
profit or lossLoans and
receivables
Otherfinancial liabilities Total Fair value
$ $ $ $ $As at October 31, 2017Financial assets
593,582 — — 593,582 593,582 309,064 — — 309,064 309,064
— 100,015 — 100,015 100,015 — 28,033 — 28,033 28,033
8,471 — — 8,471 8,471 2,054 — — 2,054 2,054
913,171 128,048 — 1,041,219 1,041,219 Financial liabilitiesTrade and other payables — — 226,170 226,170 226,170
212 — — 212 212 2,656 — — 2,656 2,656
— — 26,400 26,400 26,400 2,868 — 252,570 255,438 255,438
-Fuel purchasing forward contracts and other fuel-related derivative financial instruments
Derivative financial instruments -Fuel purchasing forward contracts and other fuel-related derivative financial instruments
-Other foreign currency derivatives
-Other foreign currency derivatives
Carrying amount
Cash and cash equivalentsCash and cash equivalents in trust or otherwise reserved
Non-controlling interests
Trade and other receivablesDeposits on leased aircraft and enginesDerivative financial instruments
62
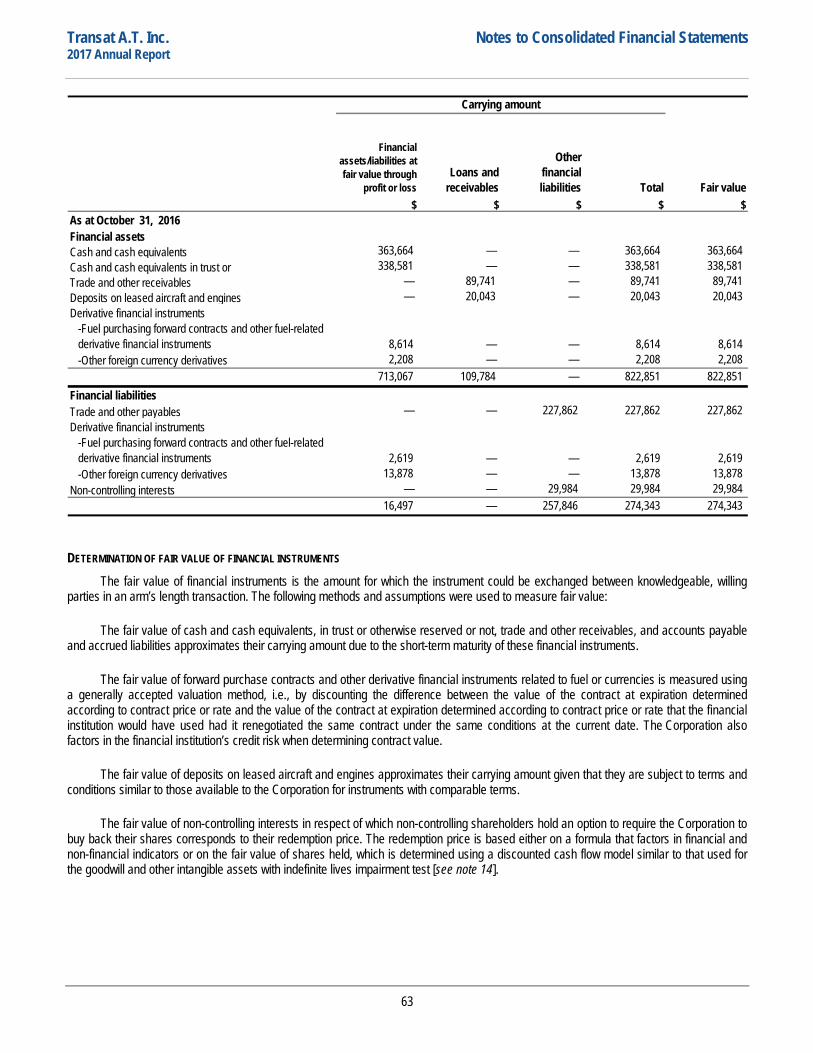
Transat A.T. Inc. Notes to Consolidated Financial Statements 2017 Annual Report
Financial assets/liabilities at fair value through
profit or lossLoans and
receivables
Otherfinancial liabilities Total Fair value
$ $ $ $ $As at October 31, 2016Financial assetsCash and cash equivalents 363,664 — — 363,664 363,664 Cash and cash equivalents in trust or 338,581 — — 338,581 338,581 Trade and other receivables — 89,741 — 89,741 89,741 Deposits on leased aircraft and engines — 20,043 — 20,043 20,043 Derivative financial instruments
8,614 — — 8,614 8,614 2,208 — — 2,208 2,208
713,067 109,784 — 822,851 822,851 Financial liabilitiesTrade and other payables — — 227,862 227,862 227,862 Derivative financial instruments
2,619 — — 2,619 2,619 13,878 — — 13,878 13,878
Non-controlling interests — — 29,984 29,984 29,984 16,497 — 257,846 274,343 274,343
-Other foreign currency derivatives
-Other foreign currency derivatives
Carrying amount
-Fuel purchasing forward contracts and other fuel-related derivative financial instruments
-Fuel purchasing forward contracts and other fuel-related derivative financial instruments
DETERMINATION OF FAIR VALUE OF FINANCIAL INSTRUMENTS The fair value of financial instruments is the amount for which the instrument could be exchanged between knowledgeable, willing
parties in an arm’s length transaction. The following methods and assumptions were used to measure fair value:
The fair value of cash and cash equivalents, in trust or otherwise reserved or not, trade and other receivables, and accounts payable and accrued liabilities approximates their carrying amount due to the short-term maturity of these financial instruments.
The fair value of forward purchase contracts and other derivative financial instruments related to fuel or currencies is measured using a generally accepted valuation method, i.e., by discounting the difference between the value of the contract at expiration determined according to contract price or rate and the value of the contract at expiration determined according to contract price or rate that the financial institution would have used had it renegotiated the same contract under the same conditions at the current date. The Corporation also factors in the financial institution’s credit risk when determining contract value.
The fair value of deposits on leased aircraft and engines approximates their carrying amount given that they are subject to terms and conditions similar to those available to the Corporation for instruments with comparable terms.
The fair value of non-controlling interests in respect of which non-controlling shareholders hold an option to require the Corporation to buy back their shares corresponds to their redemption price. The redemption price is based either on a formula that factors in financial and non-financial indicators or on the fair value of shares held, which is determined using a discounted cash flow model similar to that used for the goodwill and other intangible assets with indefinite lives impairment test [see note 14].
63
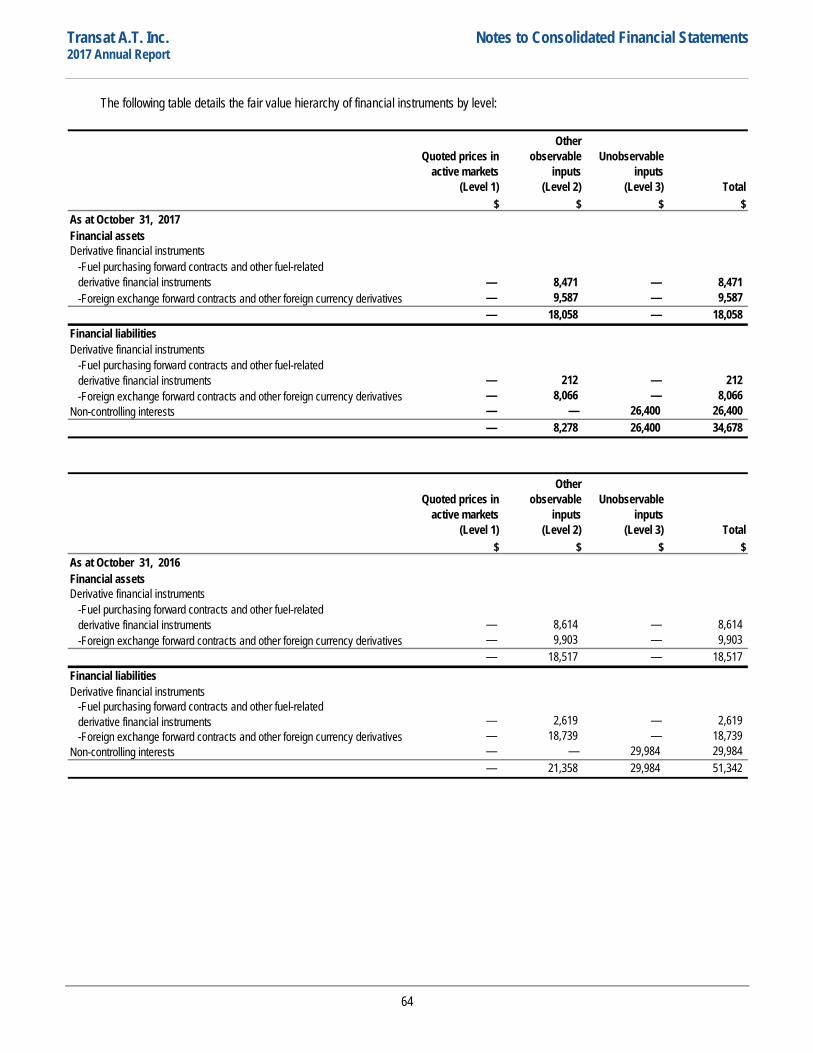
Transat A.T. Inc. Notes to Consolidated Financial Statements 2017 Annual Report
The following table details the fair value hierarchy of financial instruments by level:
Quoted prices in active markets
(Level 1)
Other observable
inputs(Level 2)
Unobservable inputs
(Level 3) Total$ $ $ $
As at October 31, 2017Financial assets
— 8,471 — 8,471 — 9,587 — 9,587 — 18,058 — 18,058
Financial liabilities
— 212 — 212 — 8,066 — 8,066 — — 26,400 26,400 — 8,278 26,400 34,678
-Fuel purchasing forward contracts and other fuel-related derivative financial instruments -Foreign exchange forward contracts and other foreign currency derivatives
Derivative financial instruments -Fuel purchasing forward contracts and other fuel-related derivative financial instruments -Foreign exchange forward contracts and other foreign currency derivatives
Derivative financial instruments
Non-controlling interests
Quoted prices in active markets
(Level 1)
Other observable
inputs(Level 2)
Unobservable inputs
(Level 3) Total$ $ $ $
As at October 31, 2016Financial assets
— 8,614 — 8,614 — 9,903 — 9,903 — 18,517 — 18,517
Financial liabilities
— 2,619 — 2,619 — 18,739 — 18,739 — — 29,984 29,984 — 21,358 29,984 51,342
-Fuel purchasing forward contracts and other fuel-related derivative financial instruments
Derivative financial instruments
-Foreign exchange forward contracts and other foreign currency derivatives
Derivative financial instruments -Fuel purchasing forward contracts and other fuel-related derivative financial instruments -Foreign exchange forward contracts and other foreign currency derivativesNon-controlling interests
64
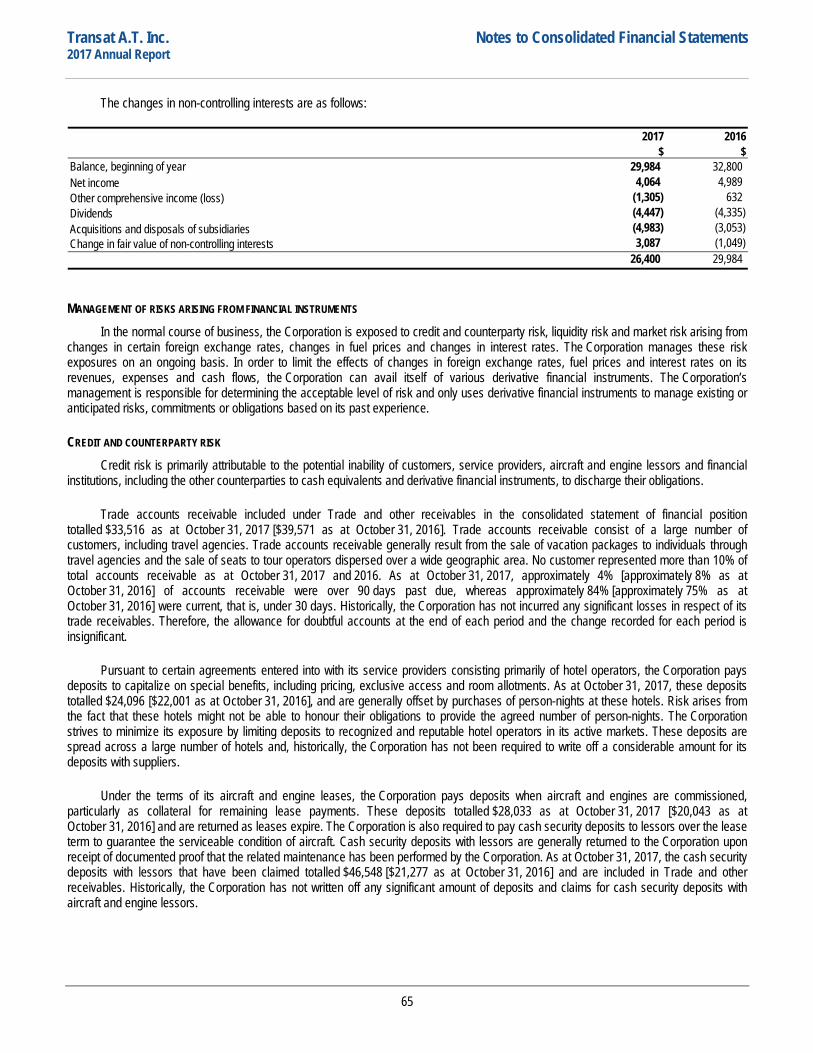
Transat A.T. Inc. Notes to Consolidated Financial Statements 2017 Annual Report
The changes in non-controlling interests are as follows:
2017 2016$ $
29,984 32,800 4,064 4,989
(1,305) 632 (4,447) (4,335)
Acquisitions and disposals of subsidiaries (4,983) (3,053) 3,087 (1,049)
26,400 29,984
Net incomeOther comprehensive income (loss)Dividends
Change in fair value of non-controlling interests
Balance, beginning of year
MANAGEMENT OF RISKS ARISING FROM FINANCIAL INSTRUMENTS In the normal course of business, the Corporation is exposed to credit and counterparty risk, liquidity risk and market risk arising from
changes in certain foreign exchange rates, changes in fuel prices and changes in interest rates. The Corporation manages these risk exposures on an ongoing basis. In order to limit the effects of changes in foreign exchange rates, fuel prices and interest rates on its revenues, expenses and cash flows, the Corporation can avail itself of various derivative financial instruments. The Corporation’s management is responsible for determining the acceptable level of risk and only uses derivative financial instruments to manage existing or anticipated risks, commitments or obligations based on its past experience.
CREDIT AND COUNTERPARTY RISK Credit risk is primarily attributable to the potential inability of customers, service providers, aircraft and engine lessors and financial
institutions, including the other counterparties to cash equivalents and derivative financial instruments, to discharge their obligations.
Trade accounts receivable included under Trade and other receivables in the consolidated statement of financial position totalled $33,516 as at October 31, 2017 [$39,571 as at October 31, 2016]. Trade accounts receivable consist of a large number of customers, including travel agencies. Trade accounts receivable generally result from the sale of vacation packages to individuals through travel agencies and the sale of seats to tour operators dispersed over a wide geographic area. No customer represented more than 10% of total accounts receivable as at October 31, 2017 and 2016. As at October 31, 2017, approximately 4% [approximately 8% as at October 31, 2016] of accounts receivable were over 90 days past due, whereas approximately 84% [approximately 75% as at October 31, 2016] were current, that is, under 30 days. Historically, the Corporation has not incurred any significant losses in respect of its trade receivables. Therefore, the allowance for doubtful accounts at the end of each period and the change recorded for each period is insignificant.
Pursuant to certain agreements entered into with its service providers consisting primarily of hotel operators, the Corporation pays deposits to capitalize on special benefits, including pricing, exclusive access and room allotments. As at October 31, 2017, these deposits totalled $24,096 [$22,001 as at October 31, 2016], and are generally offset by purchases of person-nights at these hotels. Risk arises from the fact that these hotels might not be able to honour their obligations to provide the agreed number of person-nights. The Corporation strives to minimize its exposure by limiting deposits to recognized and reputable hotel operators in its active markets. These deposits are spread across a large number of hotels and, historically, the Corporation has not been required to write off a considerable amount for its deposits with suppliers.
Under the terms of its aircraft and engine leases, the Corporation pays deposits when aircraft and engines are commissioned, particularly as collateral for remaining lease payments. These deposits totalled $28,033 as at October 31, 2017 [$20,043 as at October 31, 2016] and are returned as leases expire. The Corporation is also required to pay cash security deposits to lessors over the lease term to guarantee the serviceable condition of aircraft. Cash security deposits with lessors are generally returned to the Corporation upon receipt of documented proof that the related maintenance has been performed by the Corporation. As at October 31, 2017, the cash security deposits with lessors that have been claimed totalled $46,548 [$21,277 as at October 31, 2016] and are included in Trade and other receivables. Historically, the Corporation has not written off any significant amount of deposits and claims for cash security deposits with aircraft and engine lessors.
65
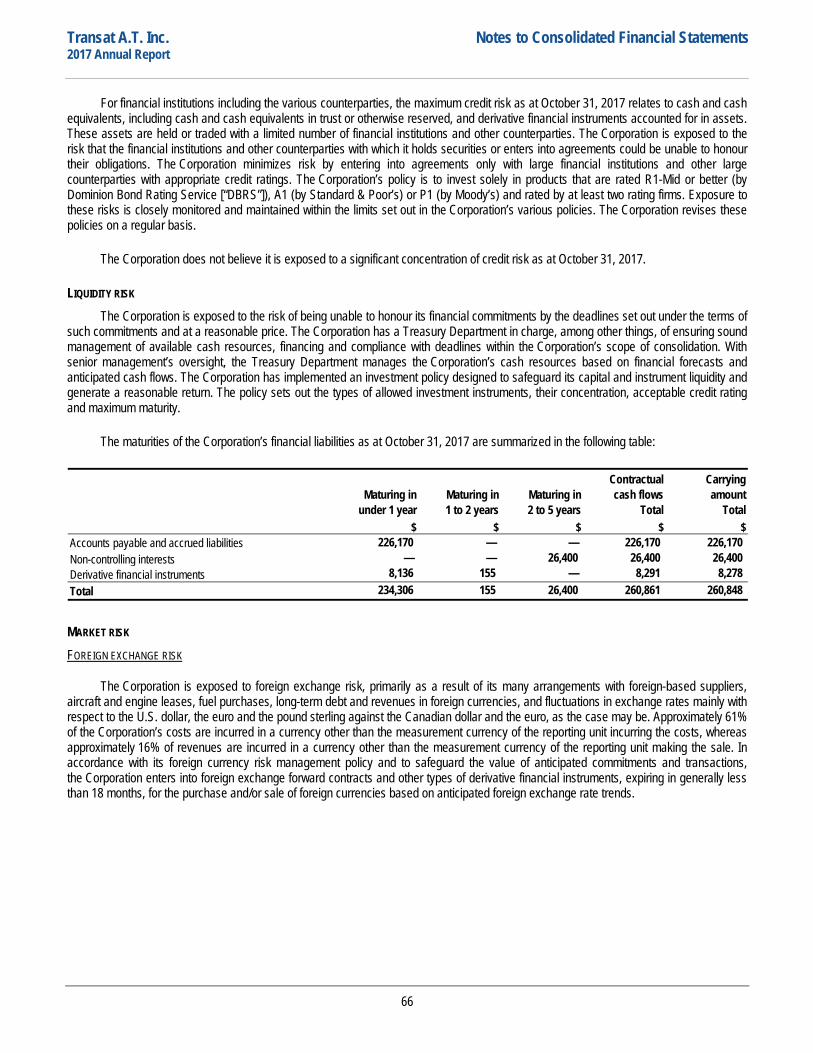
Transat A.T. Inc. Notes to Consolidated Financial Statements 2017 Annual Report
For financial institutions including the various counterparties, the maximum credit risk as at October 31, 2017 relates to cash and cash equivalents, including cash and cash equivalents in trust or otherwise reserved, and derivative financial instruments accounted for in assets. These assets are held or traded with a limited number of financial institutions and other counterparties. The Corporation is exposed to the risk that the financial institutions and other counterparties with which it holds securities or enters into agreements could be unable to honour their obligations. The Corporation minimizes risk by entering into agreements only with large financial institutions and other large counterparties with appropriate credit ratings. The Corporation’s policy is to invest solely in products that are rated R1-Mid or better (by Dominion Bond Rating Service [“DBRS”]), A1 (by Standard & Poor’s) or P1 (by Moody’s) and rated by at least two rating firms. Exposure to these risks is closely monitored and maintained within the limits set out in the Corporation’s various policies. The Corporation revises these policies on a regular basis.
The Corporation does not believe it is exposed to a significant concentration of credit risk as at October 31, 2017.
LIQUIDITY RISK The Corporation is exposed to the risk of being unable to honour its financial commitments by the deadlines set out under the terms of
such commitments and at a reasonable price. The Corporation has a Treasury Department in charge, among other things, of ensuring sound management of available cash resources, financing and compliance with deadlines within the Corporation’s scope of consolidation. With senior management’s oversight, the Treasury Department manages the Corporation’s cash resources based on financial forecasts and anticipated cash flows. The Corporation has implemented an investment policy designed to safeguard its capital and instrument liquidity and generate a reasonable return. The policy sets out the types of allowed investment instruments, their concentration, acceptable credit rating and maximum maturity.
The maturities of the Corporation’s financial liabilities as at October 31, 2017 are summarized in the following table:
Maturing in under 1 year
Maturing in1 to 2 years
Maturing in2 to 5 years
Contractual cash flows
Total
Carrying amount
Total$ $ $ $ $
Accounts payable and accrued liabilities 226,170 — — 226,170 226,170 Non-controlling interests — — 26,400 26,400 26,400 Derivative financial instruments 8,136 155 — 8,291 8,278 Total 234,306 155 26,400 260,861 260,848
MARKET RISK FOREIGN EXCHANGE RISK
The Corporation is exposed to foreign exchange risk, primarily as a result of its many arrangements with foreign-based suppliers, aircraft and engine leases, fuel purchases, long-term debt and revenues in foreign currencies, and fluctuations in exchange rates mainly with respect to the U.S. dollar, the euro and the pound sterling against the Canadian dollar and the euro, as the case may be. Approximately 61% of the Corporation’s costs are incurred in a currency other than the measurement currency of the reporting unit incurring the costs, whereas approximately 16% of revenues are incurred in a currency other than the measurement currency of the reporting unit making the sale. In accordance with its foreign currency risk management policy and to safeguard the value of anticipated commitments and transactions, the Corporation enters into foreign exchange forward contracts and other types of derivative financial instruments, expiring in generally less than 18 months, for the purchase and/or sale of foreign currencies based on anticipated foreign exchange rate trends.
66
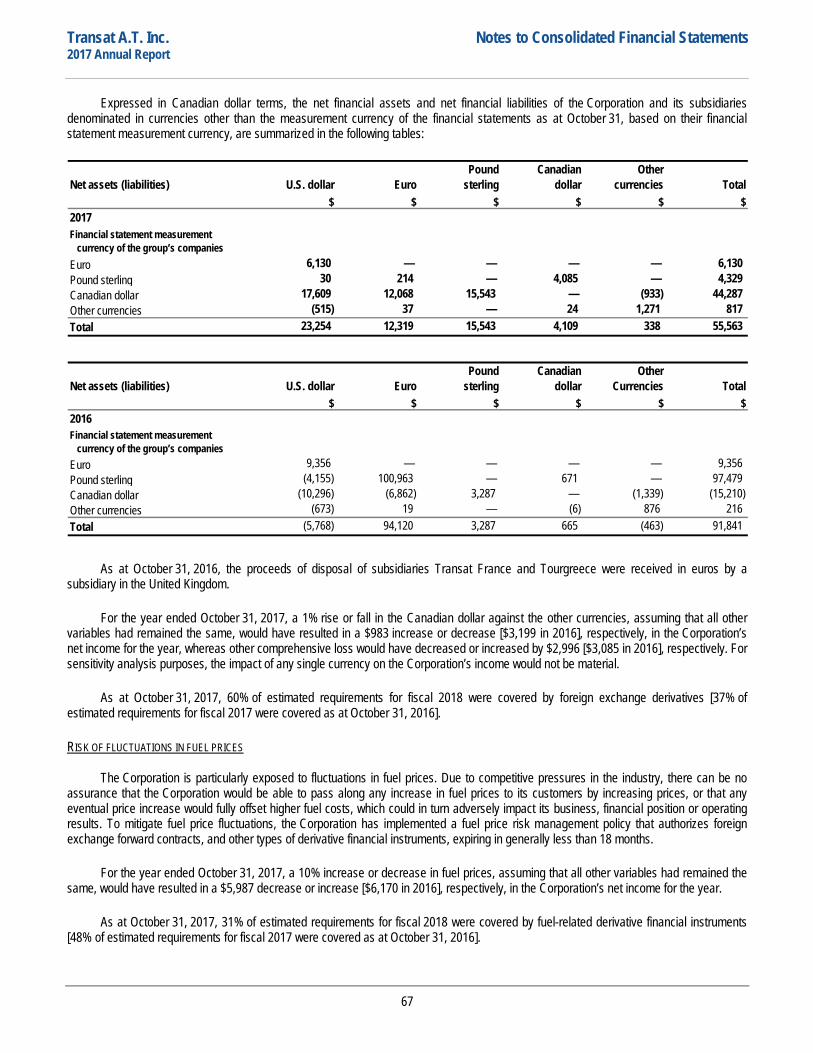
Transat A.T. Inc. Notes to Consolidated Financial Statements 2017 Annual Report
Expressed in Canadian dollar terms, the net financial assets and net financial liabilities of the Corporation and its subsidiaries denominated in currencies other than the measurement currency of the financial statements as at October 31, based on their financial statement measurement currency, are summarized in the following tables:
Net assets (liabilities) U.S. dollar EuroPound
sterlingCanadian
dollarOther
currencies Total$ $ $ $ $ $
2017Financial statement measurement currency of the group’s companiesEuro 6,130 — — — — 6,130 Pound sterling 30 214 — 4,085 — 4,329 Canadian dollar 17,609 12,068 15,543 — (933) 44,287 Other currencies (515) 37 — 24 1,271 817 Total 23,254 12,319 15,543 4,109 338 55,563
Net assets (liabilities) U.S. dollar EuroPound
sterlingCanadian
dollarOther
Currencies Total$ $ $ $ $ $
2016Financial statement measurement currency of the group’s companiesEuro 9,356 — — — — 9,356 Pound sterling (4,155) 100,963 — 671 — 97,479 Canadian dollar (10,296) (6,862) 3,287 — (1,339) (15,210) Other currencies (673) 19 — (6) 876 216 Total (5,768) 94,120 3,287 665 (463) 91,841
As at October 31, 2016, the proceeds of disposal of subsidiaries Transat France and Tourgreece were received in euros by a subsidiary in the United Kingdom.
For the year ended October 31, 2017, a 1% rise or fall in the Canadian dollar against the other currencies, assuming that all other variables had remained the same, would have resulted in a $983 increase or decrease [$3,199 in 2016], respectively, in the Corporation’s net income for the year, whereas other comprehensive loss would have decreased or increased by $2,996 [$3,085 in 2016], respectively. For sensitivity analysis purposes, the impact of any single currency on the Corporation’s income would not be material.
As at October 31, 2017, 60% of estimated requirements for fiscal 2018 were covered by foreign exchange derivatives [37% of estimated requirements for fiscal 2017 were covered as at October 31, 2016].
RISK OF FLUCTUATIONS IN FUEL PRICES
The Corporation is particularly exposed to fluctuations in fuel prices. Due to competitive pressures in the industry, there can be no assurance that the Corporation would be able to pass along any increase in fuel prices to its customers by increasing prices, or that any eventual price increase would fully offset higher fuel costs, which could in turn adversely impact its business, financial position or operating results. To mitigate fuel price fluctuations, the Corporation has implemented a fuel price risk management policy that authorizes foreign exchange forward contracts, and other types of derivative financial instruments, expiring in generally less than 18 months.
For the year ended October 31, 2017, a 10% increase or decrease in fuel prices, assuming that all other variables had remained the same, would have resulted in a $5,987 decrease or increase [$6,170 in 2016], respectively, in the Corporation’s net income for the year.
As at October 31, 2017, 31% of estimated requirements for fiscal 2018 were covered by fuel-related derivative financial instruments [48% of estimated requirements for fiscal 2017 were covered as at October 31, 2016].
67
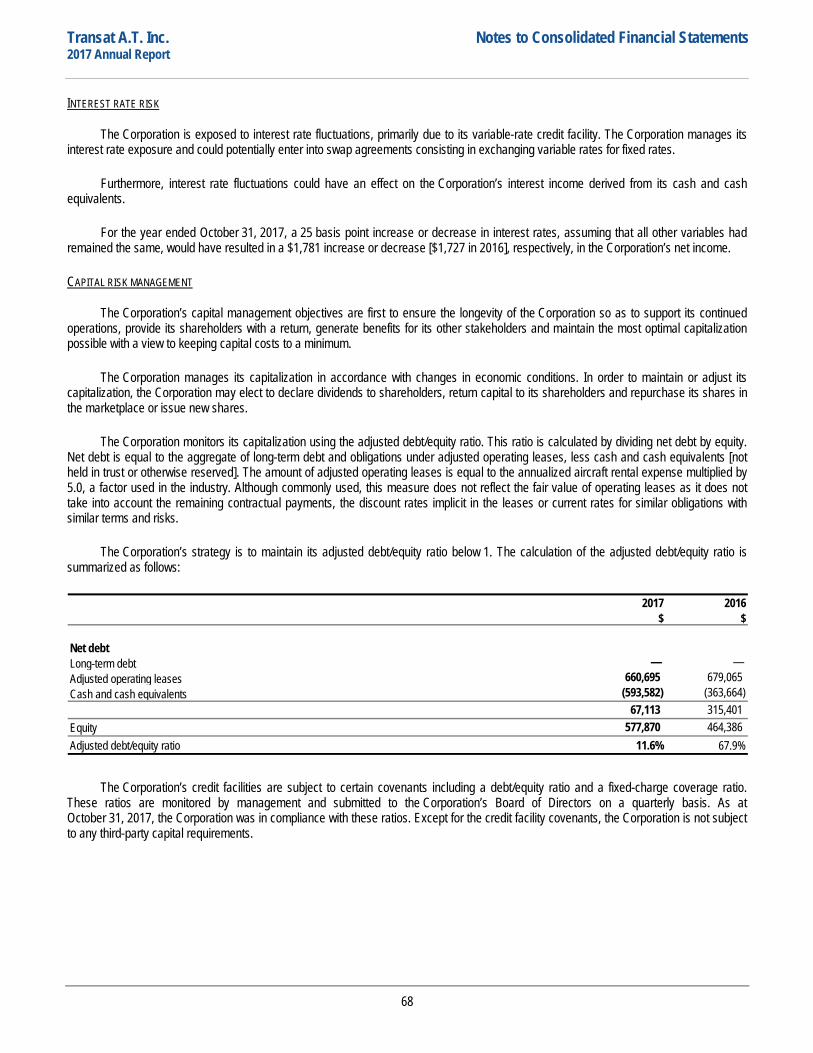
Transat A.T. Inc. Notes to Consolidated Financial Statements 2017 Annual Report
INTEREST RATE RISK
The Corporation is exposed to interest rate fluctuations, primarily due to its variable-rate credit facility. The Corporation manages its interest rate exposure and could potentially enter into swap agreements consisting in exchanging variable rates for fixed rates.
Furthermore, interest rate fluctuations could have an effect on the Corporation’s interest income derived from its cash and cash equivalents.
For the year ended October 31, 2017, a 25 basis point increase or decrease in interest rates, assuming that all other variables had remained the same, would have resulted in a $1,781 increase or decrease [$1,727 in 2016], respectively, in the Corporation’s net income.
CAPITAL RISK MANAGEMENT
The Corporation’s capital management objectives are first to ensure the longevity of the Corporation so as to support its continued operations, provide its shareholders with a return, generate benefits for its other stakeholders and maintain the most optimal capitalization possible with a view to keeping capital costs to a minimum.
The Corporation manages its capitalization in accordance with changes in economic conditions. In order to maintain or adjust its capitalization, the Corporation may elect to declare dividends to shareholders, return capital to its shareholders and repurchase its shares in the marketplace or issue new shares.
The Corporation monitors its capitalization using the adjusted debt/equity ratio. This ratio is calculated by dividing net debt by equity. Net debt is equal to the aggregate of long-term debt and obligations under adjusted operating leases, less cash and cash equivalents [not held in trust or otherwise reserved]. The amount of adjusted operating leases is equal to the annualized aircraft rental expense multiplied by 5.0, a factor used in the industry. Although commonly used, this measure does not reflect the fair value of operating leases as it does not take into account the remaining contractual payments, the discount rates implicit in the leases or current rates for similar obligations with similar terms and risks.
The Corporation’s strategy is to maintain its adjusted debt/equity ratio below 1. The calculation of the adjusted debt/equity ratio is summarized as follows:
2017 2016$ $
Net debtLong-term debt — — Adjusted operating leases 660,695 679,065 Cash and cash equivalents (593,582) (363,664)
67,113 315,401 Equity 577,870 464,386 Adjusted debt/equity ratio 11.6% 67.9%
The Corporation’s credit facilities are subject to certain covenants including a debt/equity ratio and a fixed-charge coverage ratio. These ratios are monitored by management and submitted to the Corporation’s Board of Directors on a quarterly basis. As at October 31, 2017, the Corporation was in compliance with these ratios. Except for the credit facility covenants, the Corporation is not subject to any third-party capital requirements.
68
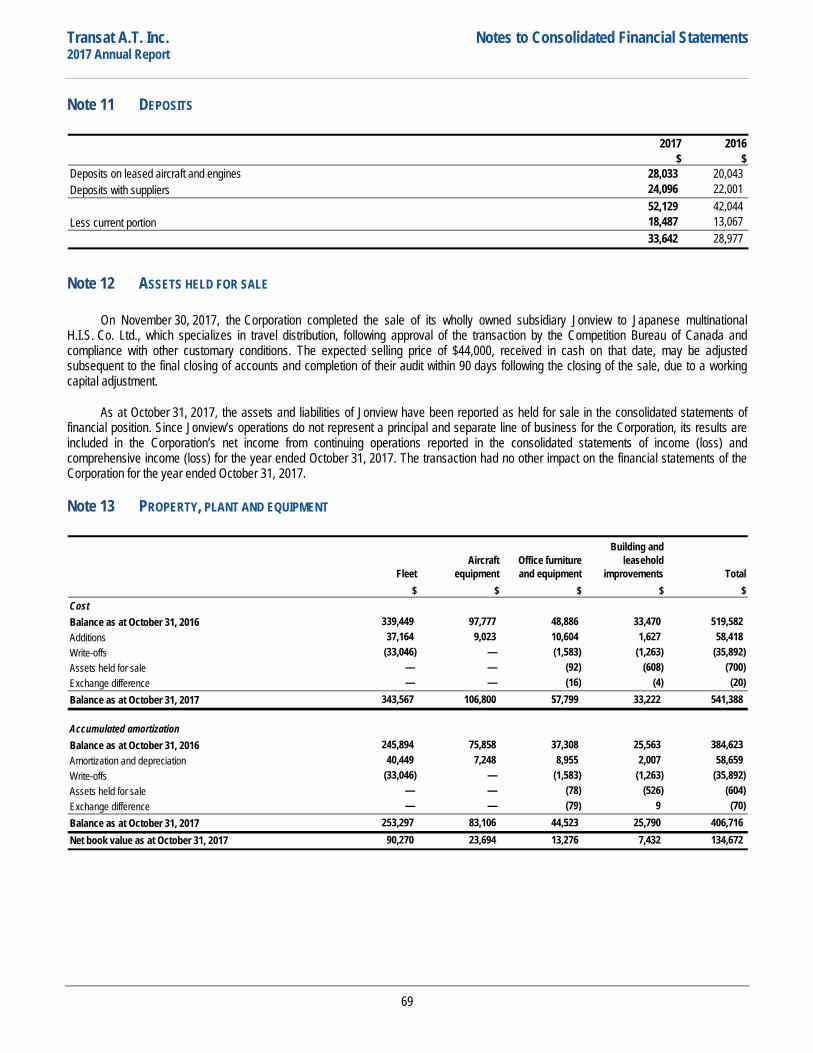
Transat A.T. Inc. Notes to Consolidated Financial Statements 2017 Annual Report
Note 11 DEPOSITS
2017 2016$ $
28,033 20,043 24,096 22,001 52,129 42,044 18,487 13,067 33,642 28,977
Deposits on leased aircraft and enginesDeposits with suppliers
Less current portion
Note 12 ASSETS HELD FOR SALE
On November 30, 2017, the Corporation completed the sale of its wholly owned subsidiary Jonview to Japanese multinational H.I.S. Co. Ltd., which specializes in travel distribution, following approval of the transaction by the Competition Bureau of Canada and compliance with other customary conditions. The expected selling price of $44,000, received in cash on that date, may be adjusted subsequent to the final closing of accounts and completion of their audit within 90 days following the closing of the sale, due to a working capital adjustment.
As at October 31, 2017, the assets and liabilities of Jonview have been reported as held for sale in the consolidated statements of financial position. Since Jonview’s operations do not represent a principal and separate line of business for the Corporation, its results are included in the Corporation’s net income from continuing operations reported in the consolidated statements of income (loss) and comprehensive income (loss) for the year ended October 31, 2017. The transaction had no other impact on the financial statements of the Corporation for the year ended October 31, 2017.
Note 13 PROPERTY, PLANT AND EQUIPMENT
FleetAircraft
equipmentOffice furniture and equipment
Building and leasehold
improvements Total$ $ $ $ $
CostBalance as at October 31, 2016 339,449 97,777 48,886 33,470 519,582 Additions 37,164 9,023 10,604 1,627 58,418 Write-offs (33,046) — (1,583) (1,263) (35,892) Assets held for sale — — (92) (608) (700) Exchange difference — — (16) (4) (20) Balance as at October 31, 2017 343,567 106,800 57,799 33,222 541,388
Balance as at October 31, 2016 245,894 75,858 37,308 25,563 384,623 Amortization and depreciation 40,449 7,248 8,955 2,007 58,659 Write-offs (33,046) — (1,583) (1,263) (35,892) Assets held for sale — — (78) (526) (604) Exchange difference — — (79) 9 (70) Balance as at October 31, 2017 253,297 83,106 44,523 25,790 406,716
90,270 23,694 13,276 7,432 134,672
Accumulated amortization
Net book value as at October 31, 2017
69
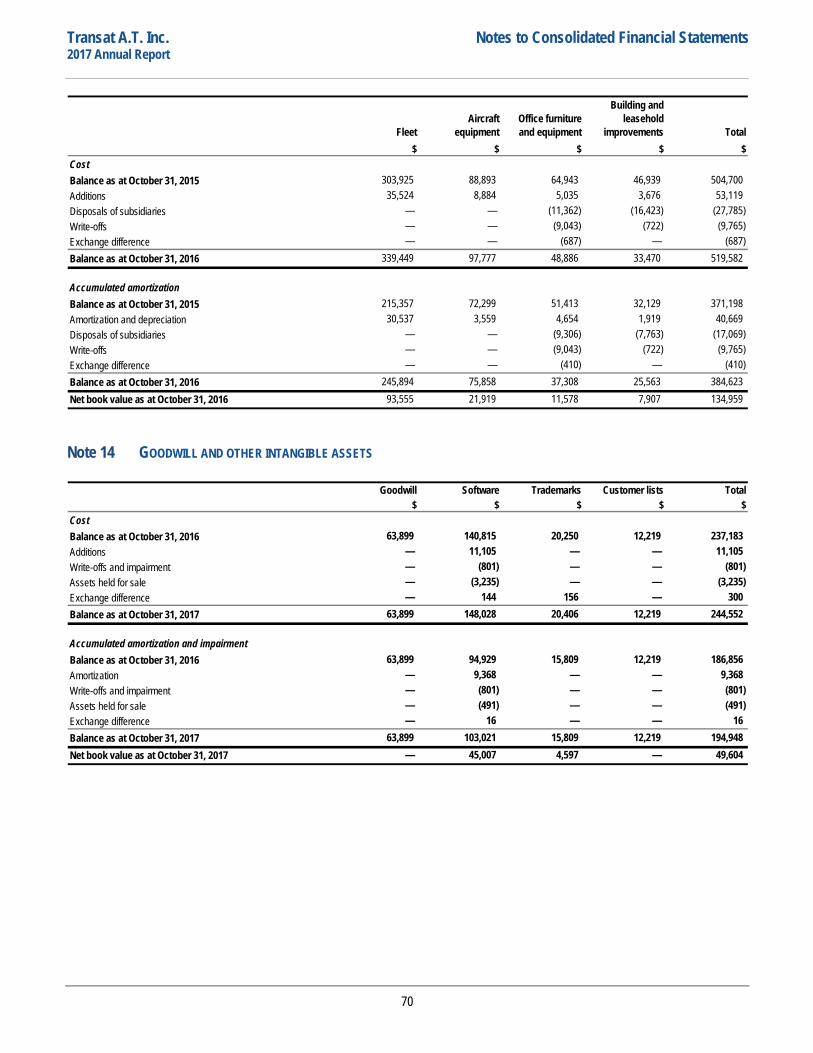
Transat A.T. Inc. Notes to Consolidated Financial Statements 2017 Annual Report
FleetAircraft
equipmentOffice furniture and equipment
Building and leasehold
improvements Total$ $ $ $ $
CostBalance as at October 31, 2015 303,925 88,893 64,943 46,939 504,700 Additions 35,524 8,884 5,035 3,676 53,119 Disposals of subsidiaries — — (11,362) (16,423) (27,785) Write-offs — — (9,043) (722) (9,765) Exchange difference — — (687) — (687) Balance as at October 31, 2016 339,449 97,777 48,886 33,470 519,582
Balance as at October 31, 2015 215,357 72,299 51,413 32,129 371,198 Amortization and depreciation 30,537 3,559 4,654 1,919 40,669 Disposals of subsidiaries — — (9,306) (7,763) (17,069) Write-offs — — (9,043) (722) (9,765) Exchange difference — — (410) — (410) Balance as at October 31, 2016 245,894 75,858 37,308 25,563 384,623
93,555 21,919 11,578 7,907 134,959
Accumulated amortization
Net book value as at October 31, 2016
Note 14 GOODWILL AND OTHER INTANGIBLE ASSETS
Goodwill Software Trademarks Customer lists Total$ $ $ $ $
CostBalance as at October 31, 2016 63,899 140,815 20,250 12,219 237,183 Additions — 11,105 — — 11,105 Write-offs and impairment — (801) — — (801) Assets held for sale — (3,235) — — (3,235) Exchange difference — 144 156 — 300 Balance as at October 31, 2017 63,899 148,028 20,406 12,219 244,552
Balance as at October 31, 2016 63,899 94,929 15,809 12,219 186,856 Amortization — 9,368 — — 9,368 Write-offs and impairment — (801) — — (801) Assets held for sale — (491) — — (491) Exchange difference — 16 — — 16 Balance as at October 31, 2017 63,899 103,021 15,809 12,219 194,948
— 45,007 4,597 — 49,604
Accumulated amortization and impairment
Net book value as at October 31, 2017
70
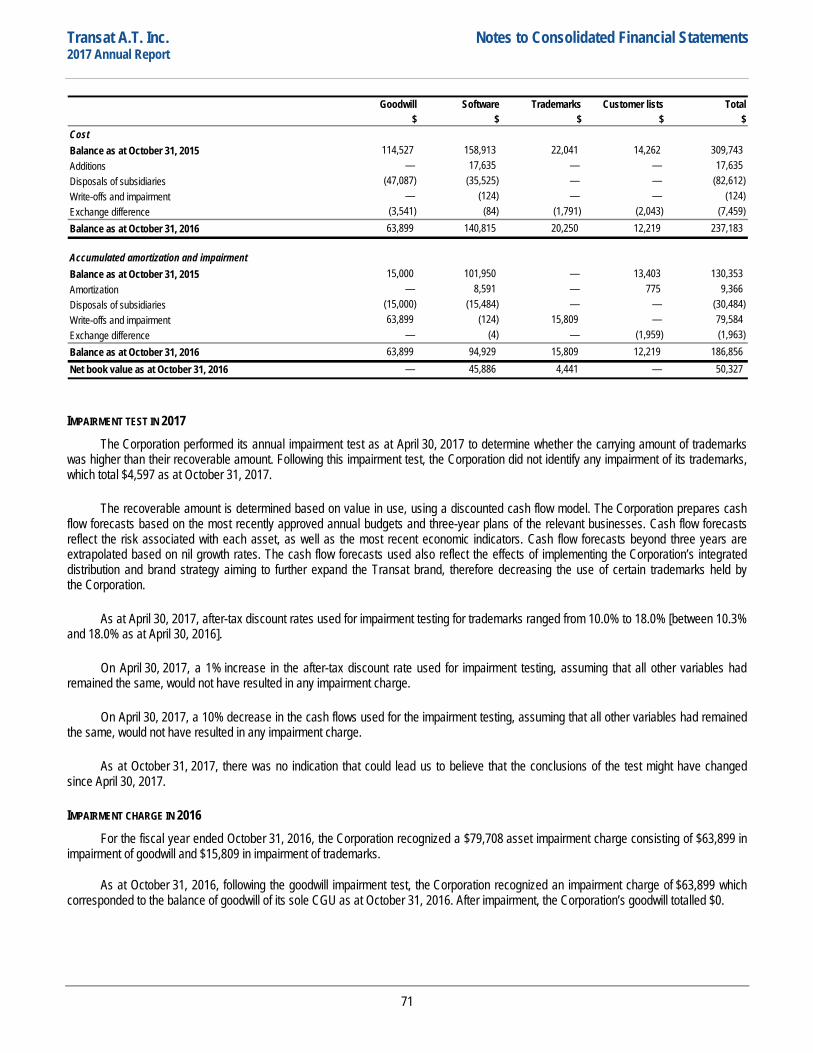
Transat A.T. Inc. Notes to Consolidated Financial Statements 2017 Annual Report
Goodwill Software Trademarks Customer lists Total$ $ $ $ $
CostBalance as at October 31, 2015 114,527 158,913 22,041 14,262 309,743 Additions — 17,635 — — 17,635 Disposals of subsidiaries (47,087) (35,525) — — (82,612) Write-offs and impairment — (124) — — (124) Exchange difference (3,541) (84) (1,791) (2,043) (7,459) Balance as at October 31, 2016 63,899 140,815 20,250 12,219 237,183
Balance as at October 31, 2015 15,000 101,950 — 13,403 130,353 Amortization — 8,591 — 775 9,366 Disposals of subsidiaries (15,000) (15,484) — — (30,484) Write-offs and impairment 63,899 (124) 15,809 — 79,584 Exchange difference — (4) — (1,959) (1,963) Balance as at October 31, 2016 63,899 94,929 15,809 12,219 186,856
— 45,886 4,441 — 50,327
Accumulated amortization and impairment
Net book value as at October 31, 2016
IMPAIRMENT TEST IN 2017 The Corporation performed its annual impairment test as at April 30, 2017 to determine whether the carrying amount of trademarks
was higher than their recoverable amount. Following this impairment test, the Corporation did not identify any impairment of its trademarks, which total $4,597 as at October 31, 2017.
The recoverable amount is determined based on value in use, using a discounted cash flow model. The Corporation prepares cash flow forecasts based on the most recently approved annual budgets and three-year plans of the relevant businesses. Cash flow forecasts reflect the risk associated with each asset, as well as the most recent economic indicators. Cash flow forecasts beyond three years are extrapolated based on nil growth rates. The cash flow forecasts used also reflect the effects of implementing the Corporation’s integrated distribution and brand strategy aiming to further expand the Transat brand, therefore decreasing the use of certain trademarks held by the Corporation.
As at April 30, 2017, after-tax discount rates used for impairment testing for trademarks ranged from 10.0% to 18.0% [between 10.3% and 18.0% as at April 30, 2016].
On April 30, 2017, a 1% increase in the after-tax discount rate used for impairment testing, assuming that all other variables had remained the same, would not have resulted in any impairment charge.
On April 30, 2017, a 10% decrease in the cash flows used for the impairment testing, assuming that all other variables had remained the same, would not have resulted in any impairment charge.
As at October 31, 2017, there was no indication that could lead us to believe that the conclusions of the test might have changed since April 30, 2017.
IMPAIRMENT CHARGE IN 2016 For the fiscal year ended October 31, 2016, the Corporation recognized a $79,708 asset impairment charge consisting of $63,899 in
impairment of goodwill and $15,809 in impairment of trademarks.
As at October 31, 2016, following the goodwill impairment test, the Corporation recognized an impairment charge of $63,899 which corresponded to the balance of goodwill of its sole CGU as at October 31, 2016. After impairment, the Corporation’s goodwill totalled $0.
71
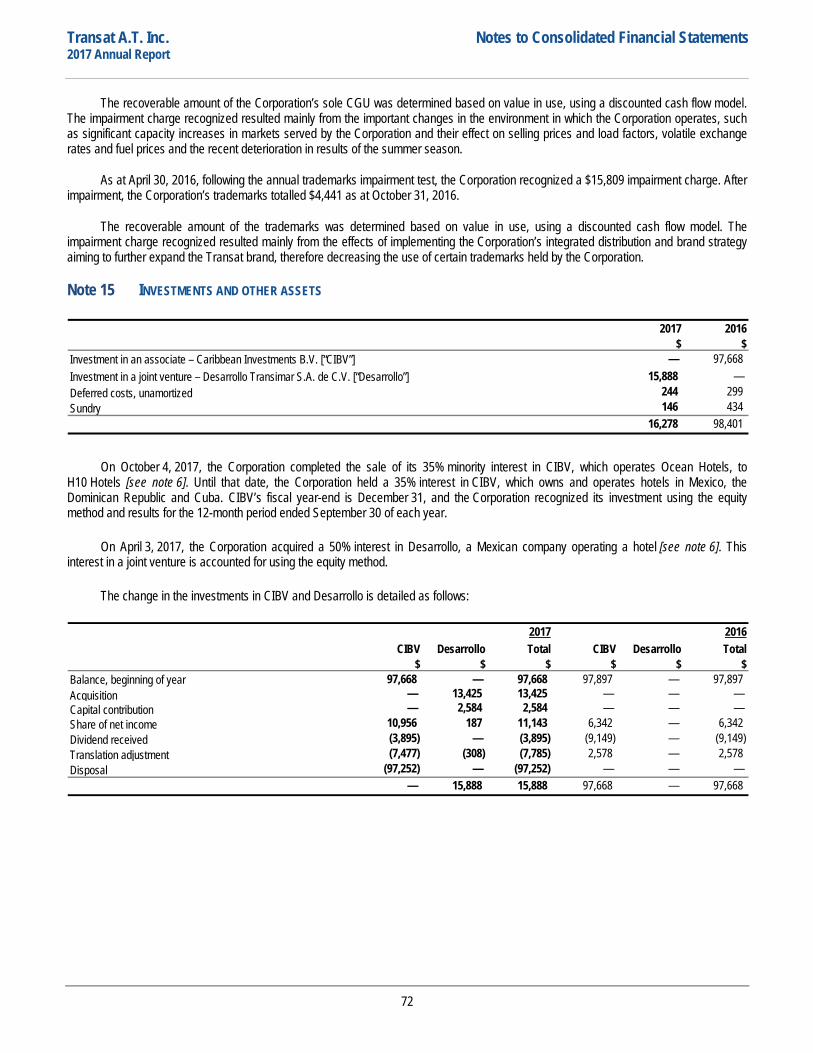
Transat A.T. Inc. Notes to Consolidated Financial Statements 2017 Annual Report
The recoverable amount of the Corporation’s sole CGU was determined based on value in use, using a discounted cash flow model. The impairment charge recognized resulted mainly from the important changes in the environment in which the Corporation operates, such as significant capacity increases in markets served by the Corporation and their effect on selling prices and load factors, volatile exchange rates and fuel prices and the recent deterioration in results of the summer season.
As at April 30, 2016, following the annual trademarks impairment test, the Corporation recognized a $15,809 impairment charge. After impairment, the Corporation’s trademarks totalled $4,441 as at October 31, 2016.
The recoverable amount of the trademarks was determined based on value in use, using a discounted cash flow model. The impairment charge recognized resulted mainly from the effects of implementing the Corporation’s integrated distribution and brand strategy aiming to further expand the Transat brand, therefore decreasing the use of certain trademarks held by the Corporation.
Note 15 INVESTMENTS AND OTHER ASSETS
2017 2016$ $
Investment in an associate – Caribbean Investments B.V. [“CIBV”] — 97,668 Investment in a joint venture – Desarrollo Transimar S.A. de C.V. [“Desarrollo”] 15,888 — Deferred costs, unamortized 244 299 Sundry 146 434
16,278 98,401
On October 4, 2017, the Corporation completed the sale of its 35% minority interest in CIBV, which operates Ocean Hotels, to H10 Hotels [see note 6]. Until that date, the Corporation held a 35% interest in CIBV, which owns and operates hotels in Mexico, the Dominican Republic and Cuba. CIBV’s fiscal year-end is December 31, and the Corporation recognized its investment using the equity method and results for the 12-month period ended September 30 of each year.
On April 3, 2017, the Corporation acquired a 50% interest in Desarrollo, a Mexican company operating a hotel [see note 6]. This interest in a joint venture is accounted for using the equity method.
The change in the investments in CIBV and Desarrollo is detailed as follows:
2017 2016CIBV Desarrollo Total CIBV Desarrollo Total
$ $ $ $ $ $Balance, beginning of year 97,668 — 97,668 97,897 — 97,897 Acquisition — 13,425 13,425 — — — Capital contribution — 2,584 2,584 — — — Share of net income 10,956 187 11,143 6,342 — 6,342 Dividend received (3,895) — (3,895) (9,149) — (9,149) Translation adjustment (7,477) (308) (7,785) 2,578 — 2,578 Disposal (97,252) — (97,252) — — —
— 15,888 15,888 97,668 — 97,668
72
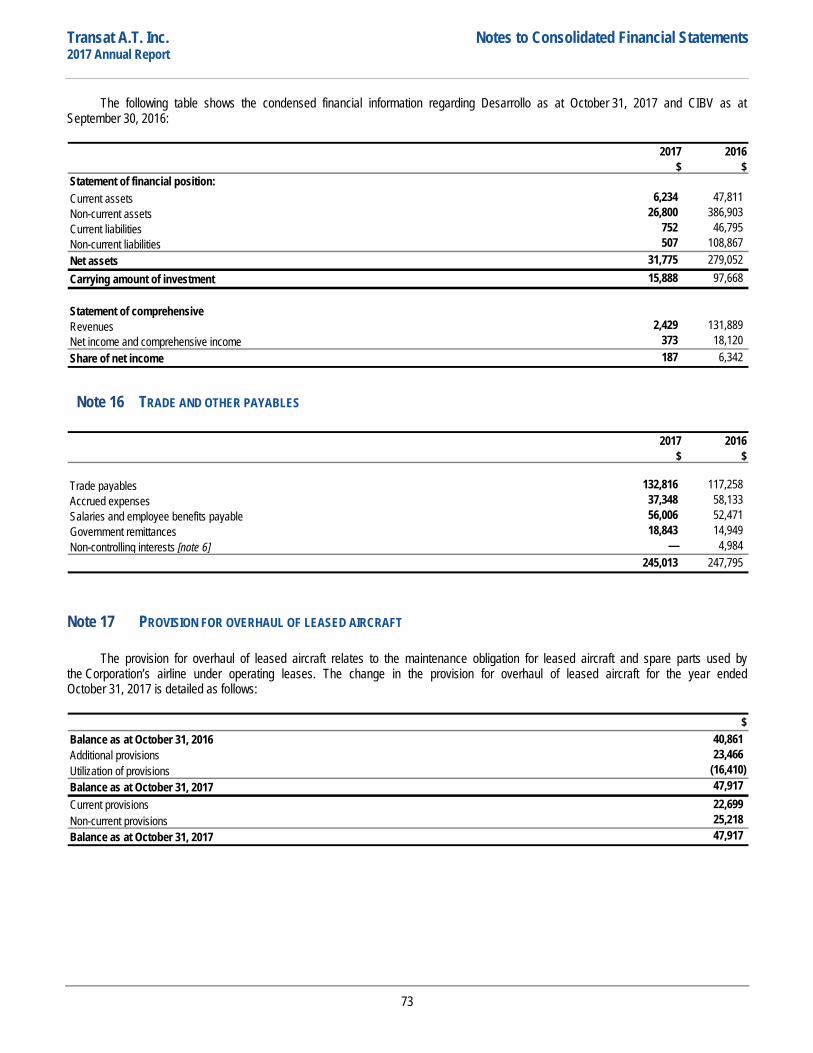
Transat A.T. Inc. Notes to Consolidated Financial Statements 2017 Annual Report
The following table shows the condensed financial information regarding Desarrollo as at October 31, 2017 and CIBV as at September 30, 2016:
2017 2016$ $
Current assets 6,234 47,811 Non-current assets 26,800 386,903 Current liabilities 752 46,795 Non-current liabilities 507 108,867 Net assets 31,775 279,052 Carrying amount of investment 15,888 97,668
Statement of comprehensive Revenues 2,429 131,889 Net income and comprehensive income 373 18,120 Share of net income 187 6,342
Statement of financial position:
Note 16 TRADE AND OTHER PAYABLES
2017 2016$ $
Trade payables 132,816 117,258 Accrued expenses 37,348 58,133 Salaries and employee benefits payable 56,006 52,471 Government remittances 18,843 14,949 Non-controlling interests [note 6] — 4,984
245,013 247,795
Note 17 PROVISION FOR OVERHAUL OF LEASED AIRCRAFT
The provision for overhaul of leased aircraft relates to the maintenance obligation for leased aircraft and spare parts used by the Corporation’s airline under operating leases. The change in the provision for overhaul of leased aircraft for the year ended October 31, 2017 is detailed as follows:
$Balance as at October 31, 2016 40,861
23,466 Utilization of provisions (16,410) Balance as at October 31, 2017 47,917 Current provisions 22,699 Non-current provisions 25,218 Balance as at October 31, 2017 47,917
Additional provisions
73
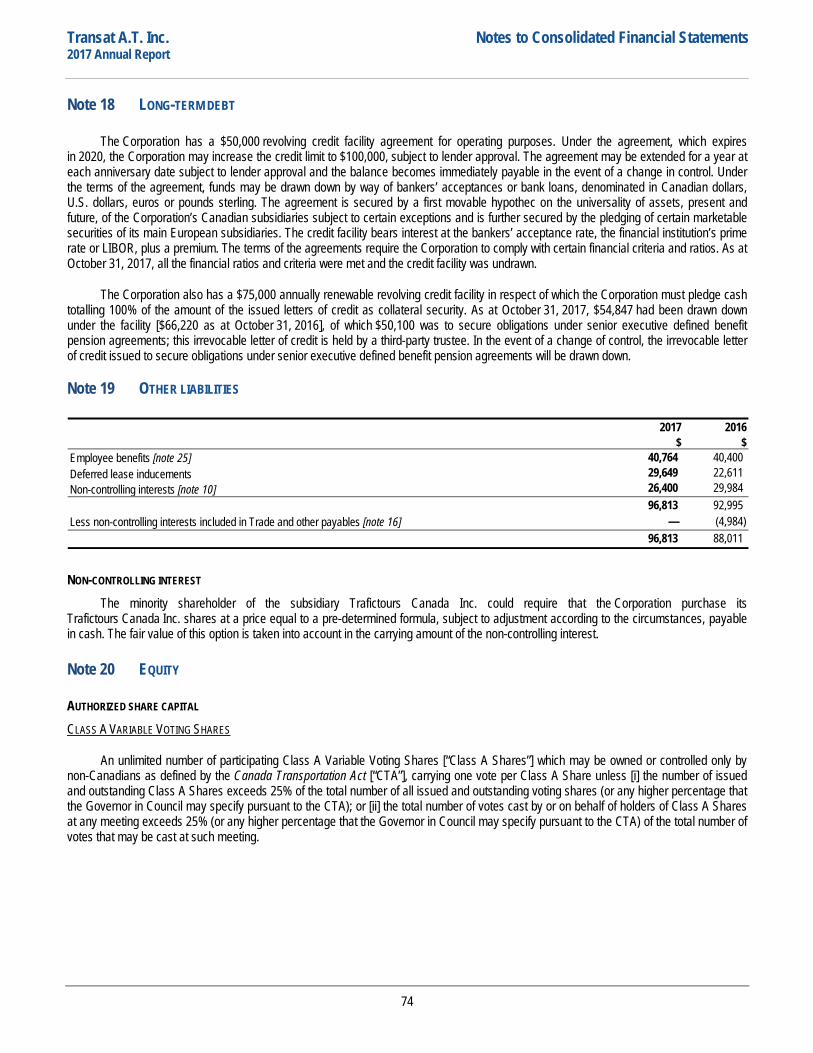
Transat A.T. Inc. Notes to Consolidated Financial Statements 2017 Annual Report
Note 18 LONG-TERM DEBT
The Corporation has a $50,000 revolving credit facility agreement for operating purposes. Under the agreement, which expires in 2020, the Corporation may increase the credit limit to $100,000, subject to lender approval. The agreement may be extended for a year at each anniversary date subject to lender approval and the balance becomes immediately payable in the event of a change in control. Under the terms of the agreement, funds may be drawn down by way of bankers’ acceptances or bank loans, denominated in Canadian dollars, U.S. dollars, euros or pounds sterling. The agreement is secured by a first movable hypothec on the universality of assets, present and future, of the Corporation’s Canadian subsidiaries subject to certain exceptions and is further secured by the pledging of certain marketable securities of its main European subsidiaries. The credit facility bears interest at the bankers’ acceptance rate, the financial institution’s prime rate or LIBOR, plus a premium. The terms of the agreements require the Corporation to comply with certain financial criteria and ratios. As at October 31, 2017, all the financial ratios and criteria were met and the credit facility was undrawn.
The Corporation also has a $75,000 annually renewable revolving credit facility in respect of which the Corporation must pledge cash totalling 100% of the amount of the issued letters of credit as collateral security. As at October 31, 2017, $54,847 had been drawn down under the facility [$66,220 as at October 31, 2016], of which $50,100 was to secure obligations under senior executive defined benefit pension agreements; this irrevocable letter of credit is held by a third-party trustee. In the event of a change of control, the irrevocable letter of credit issued to secure obligations under senior executive defined benefit pension agreements will be drawn down.
Note 19 OTHER LIABILITIES
2017 2016$ $
Employee benefits [note 25] 40,764 40,400 Deferred lease inducements 29,649 22,611 Non-controlling interests [note 10] 26,400 29,984
96,813 92,995 — (4,984)
96,813 88,011 Less non-controlling interests included in Trade and other payables [note 16]
NON-CONTROLLING INTEREST
The minority shareholder of the subsidiary Trafictours Canada Inc. could require that the Corporation purchase its Trafictours Canada Inc. shares at a price equal to a pre-determined formula, subject to adjustment according to the circumstances, payable in cash. The fair value of this option is taken into account in the carrying amount of the non-controlling interest.
Note 20 EQUITY
AUTHORIZED SHARE CAPITAL CLASS A VARIABLE VOTING SHARES
An unlimited number of participating Class A Variable Voting Shares [“Class A Shares”] which may be owned or controlled only by non-Canadians as defined by the Canada Transportation Act [“CTA”], carrying one vote per Class A Share unless [i] the number of issued and outstanding Class A Shares exceeds 25% of the total number of all issued and outstanding voting shares (or any higher percentage that the Governor in Council may specify pursuant to the CTA); or [ii] the total number of votes cast by or on behalf of holders of Class A Shares at any meeting exceeds 25% (or any higher percentage that the Governor in Council may specify pursuant to the CTA) of the total number of votes that may be cast at such meeting.
74
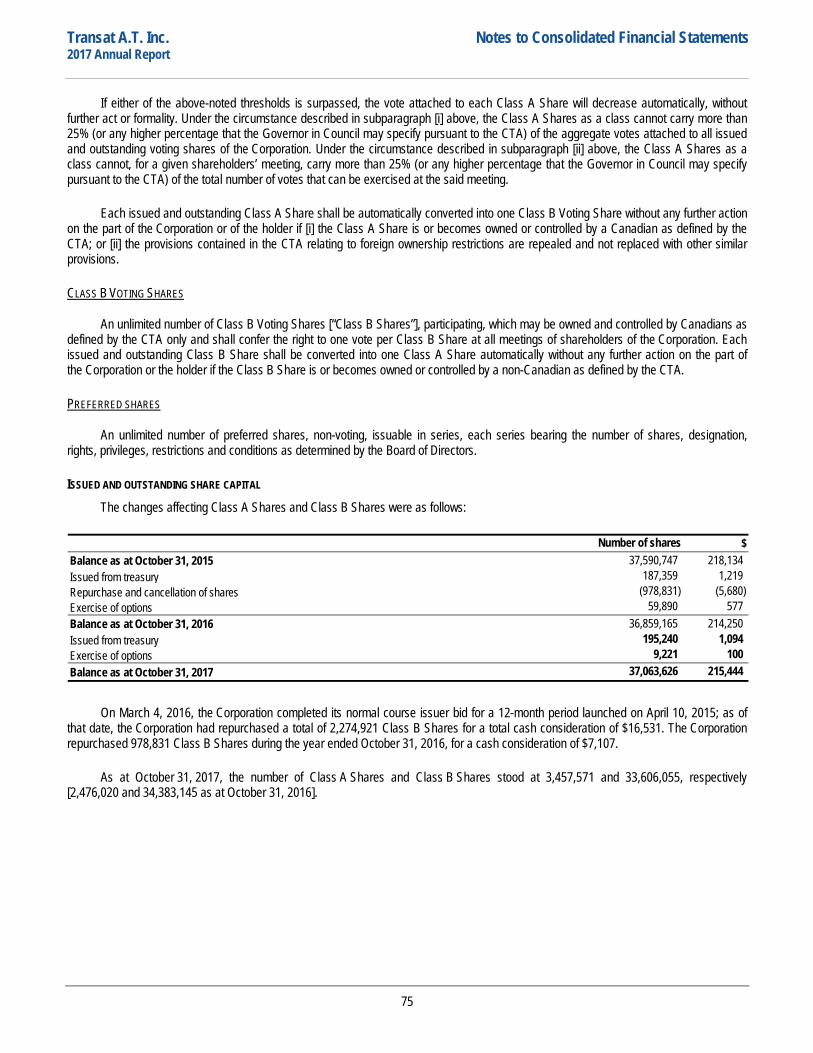
Transat A.T. Inc. Notes to Consolidated Financial Statements 2017 Annual Report
If either of the above-noted thresholds is surpassed, the vote attached to each Class A Share will decrease automatically, without further act or formality. Under the circumstance described in subparagraph [i] above, the Class A Shares as a class cannot carry more than 25% (or any higher percentage that the Governor in Council may specify pursuant to the CTA) of the aggregate votes attached to all issued and outstanding voting shares of the Corporation. Under the circumstance described in subparagraph [ii] above, the Class A Shares as a class cannot, for a given shareholders’ meeting, carry more than 25% (or any higher percentage that the Governor in Council may specify pursuant to the CTA) of the total number of votes that can be exercised at the said meeting.
Each issued and outstanding Class A Share shall be automatically converted into one Class B Voting Share without any further action on the part of the Corporation or of the holder if [i] the Class A Share is or becomes owned or controlled by a Canadian as defined by the CTA; or [ii] the provisions contained in the CTA relating to foreign ownership restrictions are repealed and not replaced with other similar provisions.
CLASS B VOTING SHARES
An unlimited number of Class B Voting Shares [“Class B Shares”], participating, which may be owned and controlled by Canadians as defined by the CTA only and shall confer the right to one vote per Class B Share at all meetings of shareholders of the Corporation. Each issued and outstanding Class B Share shall be converted into one Class A Share automatically without any further action on the part of the Corporation or the holder if the Class B Share is or becomes owned or controlled by a non-Canadian as defined by the CTA.
PREFERRED SHARES
An unlimited number of preferred shares, non-voting, issuable in series, each series bearing the number of shares, designation, rights, privileges, restrictions and conditions as determined by the Board of Directors.
ISSUED AND OUTSTANDING SHARE CAPITAL The changes affecting Class A Shares and Class B Shares were as follows:
$Balance as at October 31, 2015 37,590,747 218,134 Issued from treasury 187,359 1,219 Repurchase and cancellation of shares (978,831) (5,680) Exercise of options 59,890 577 Balance as at October 31, 2016 36,859,165 214,250 Issued from treasury 195,240 1,094 Exercise of options 9,221 100 Balance as at October 31, 2017 37,063,626 215,444
Number of shares
On March 4, 2016, the Corporation completed its normal course issuer bid for a 12-month period launched on April 10, 2015; as of that date, the Corporation had repurchased a total of 2,274,921 Class B Shares for a total cash consideration of $16,531. The Corporation repurchased 978,831 Class B Shares during the year ended October 31, 2016, for a cash consideration of $7,107.
As at October 31, 2017, the number of Class A Shares and Class B Shares stood at 3,457,571 and 33,606,055, respectively [2,476,020 and 34,383,145 as at October 31, 2016].
75
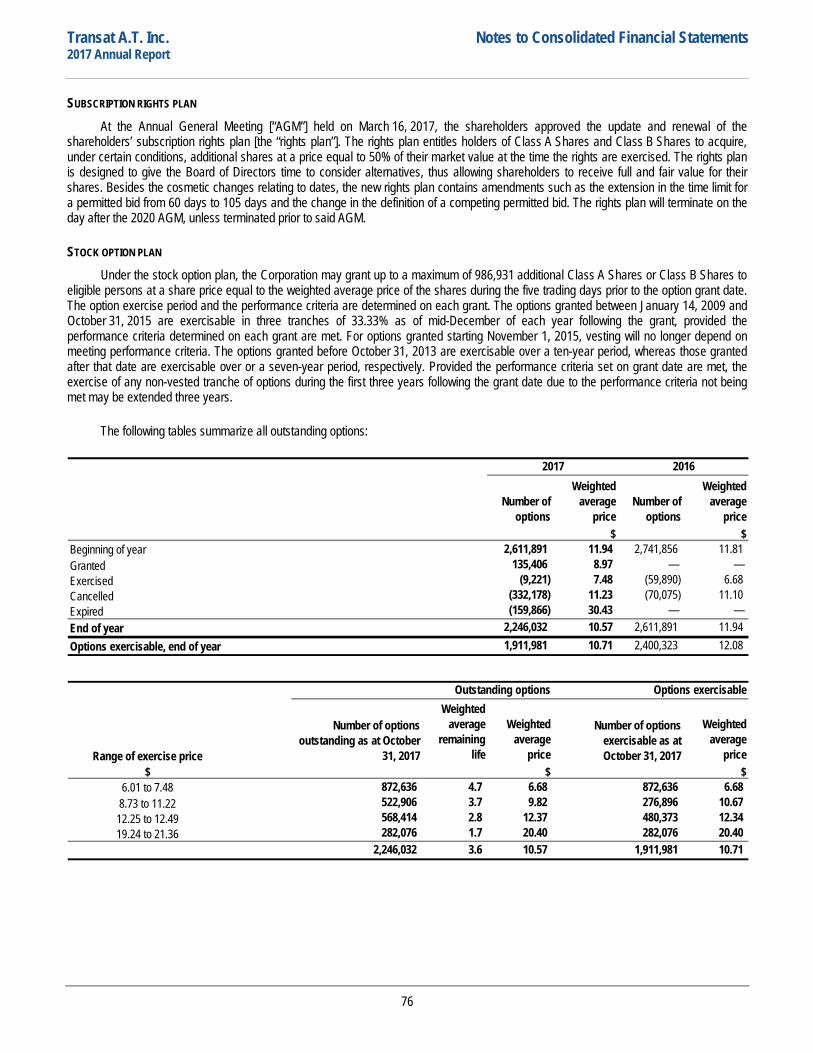
Transat A.T. Inc. Notes to Consolidated Financial Statements 2017 Annual Report
SUBSCRIPTION RIGHTS PLAN At the Annual General Meeting [“AGM”] held on March 16, 2017, the shareholders approved the update and renewal of the
shareholders’ subscription rights plan [the “rights plan”]. The rights plan entitles holders of Class A Shares and Class B Shares to acquire, under certain conditions, additional shares at a price equal to 50% of their market value at the time the rights are exercised. The rights plan is designed to give the Board of Directors time to consider alternatives, thus allowing shareholders to receive full and fair value for their shares. Besides the cosmetic changes relating to dates, the new rights plan contains amendments such as the extension in the time limit for a permitted bid from 60 days to 105 days and the change in the definition of a competing permitted bid. The rights plan will terminate on the day after the 2020 AGM, unless terminated prior to said AGM.
STOCK OPTION PLAN Under the stock option plan, the Corporation may grant up to a maximum of 986,931 additional Class A Shares or Class B Shares to
eligible persons at a share price equal to the weighted average price of the shares during the five trading days prior to the option grant date. The option exercise period and the performance criteria are determined on each grant. The options granted between January 14, 2009 and October 31, 2015 are exercisable in three tranches of 33.33% as of mid-December of each year following the grant, provided the performance criteria determined on each grant are met. For options granted starting November 1, 2015, vesting will no longer depend on meeting performance criteria. The options granted before October 31, 2013 are exercisable over a ten-year period, whereas those granted after that date are exercisable over or a seven-year period, respectively. Provided the performance criteria set on grant date are met, the exercise of any non-vested tranche of options during the first three years following the grant date due to the performance criteria not being met may be extended three years.
The following tables summarize all outstanding options:
Number of options
Weighted average
priceNumber of
options
Weighted average
price$ $
Beginning of year 2,611,891 11.94 2,741,856 11.81 Granted 135,406 8.97 — — Exercised (9,221) 7.48 (59,890) 6.68 Cancelled (332,178) 11.23 (70,075) 11.10 Expired (159,866) 30.43 — — End of year 2,246,032 10.57 2,611,891 11.94 Options exercisable, end of year 1,911,981 10.71 2,400,323 12.08
2017 2016
Range of exercise price
Weighted average
remaining life
Weighted average
price
Weighted average
price$ $ $
6.01 to 7.48 4.7 6.68 6.68 8.73 to 11.22 3.7 9.82 10.67 12.25 to 12.49 2.8 12.37 12.34 19.24 to 21.36 1.7 20.40 20.40
3.6 10.57 10.71
872,636 872,636 522,906 276,896 568,414 480,373
Outstanding options Options exercisable
Number of options outstanding as at October
31, 2017
Number of options exercisable as atOctober 31, 2017
282,076 282,076 2,246,032 1,911,981
76
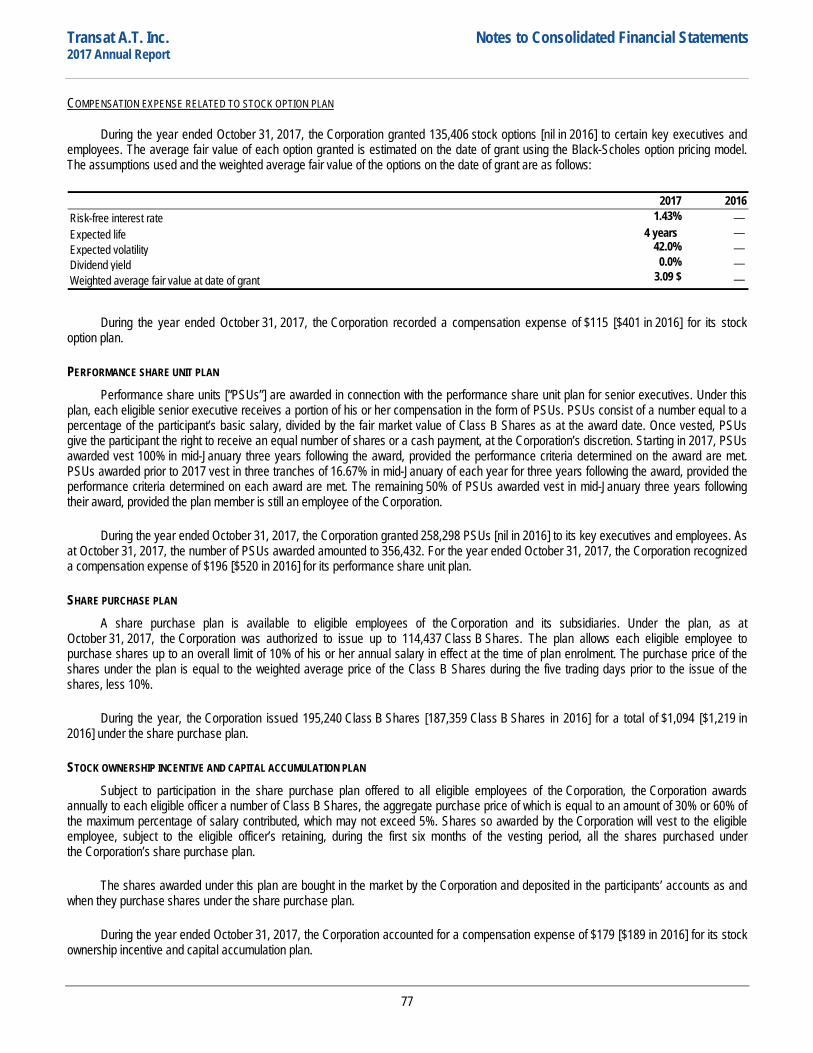
Transat A.T. Inc. Notes to Consolidated Financial Statements 2017 Annual Report
COMPENSATION EXPENSE RELATED TO STOCK OPTION PLAN
During the year ended October 31, 2017, the Corporation granted 135,406 stock options [nil in 2016] to certain key executives and employees. The average fair value of each option granted is estimated on the date of grant using the Black-Scholes option pricing model. The assumptions used and the weighted average fair value of the options on the date of grant are as follows:
2017 2016Risk-free interest rate 1.43% — Expected life 4 years — Expected volatility 42.0% — Dividend yield 0.0% —
3.09 $ — Weighted average fair value at date of grant
During the year ended October 31, 2017, the Corporation recorded a compensation expense of $115 [$401 in 2016] for its stock option plan.
PERFORMANCE SHARE UNIT PLAN Performance share units [“PSUs”] are awarded in connection with the performance share unit plan for senior executives. Under this
plan, each eligible senior executive receives a portion of his or her compensation in the form of PSUs. PSUs consist of a number equal to a percentage of the participant’s basic salary, divided by the fair market value of Class B Shares as at the award date. Once vested, PSUs give the participant the right to receive an equal number of shares or a cash payment, at the Corporation’s discretion. Starting in 2017, PSUs awarded vest 100% in mid-January three years following the award, provided the performance criteria determined on the award are met. PSUs awarded prior to 2017 vest in three tranches of 16.67% in mid-January of each year for three years following the award, provided the performance criteria determined on each award are met. The remaining 50% of PSUs awarded vest in mid-January three years following their award, provided the plan member is still an employee of the Corporation.
During the year ended October 31, 2017, the Corporation granted 258,298 PSUs [nil in 2016] to its key executives and employees. As at October 31, 2017, the number of PSUs awarded amounted to 356,432. For the year ended October 31, 2017, the Corporation recognized a compensation expense of $196 [$520 in 2016] for its performance share unit plan.
SHARE PURCHASE PLAN A share purchase plan is available to eligible employees of the Corporation and its subsidiaries. Under the plan, as at
October 31, 2017, the Corporation was authorized to issue up to 114,437 Class B Shares. The plan allows each eligible employee to purchase shares up to an overall limit of 10% of his or her annual salary in effect at the time of plan enrolment. The purchase price of the shares under the plan is equal to the weighted average price of the Class B Shares during the five trading days prior to the issue of the shares, less 10%.
During the year, the Corporation issued 195,240 Class B Shares [187,359 Class B Shares in 2016] for a total of $1,094 [$1,219 in 2016] under the share purchase plan.
STOCK OWNERSHIP INCENTIVE AND CAPITAL ACCUMULATION PLAN Subject to participation in the share purchase plan offered to all eligible employees of the Corporation, the Corporation awards
annually to each eligible officer a number of Class B Shares, the aggregate purchase price of which is equal to an amount of 30% or 60% of the maximum percentage of salary contributed, which may not exceed 5%. Shares so awarded by the Corporation will vest to the eligible employee, subject to the eligible officer’s retaining, during the first six months of the vesting period, all the shares purchased under the Corporation’s share purchase plan.
The shares awarded under this plan are bought in the market by the Corporation and deposited in the participants’ accounts as and when they purchase shares under the share purchase plan.
During the year ended October 31, 2017, the Corporation accounted for a compensation expense of $179 [$189 in 2016] for its stock ownership incentive and capital accumulation plan.
77
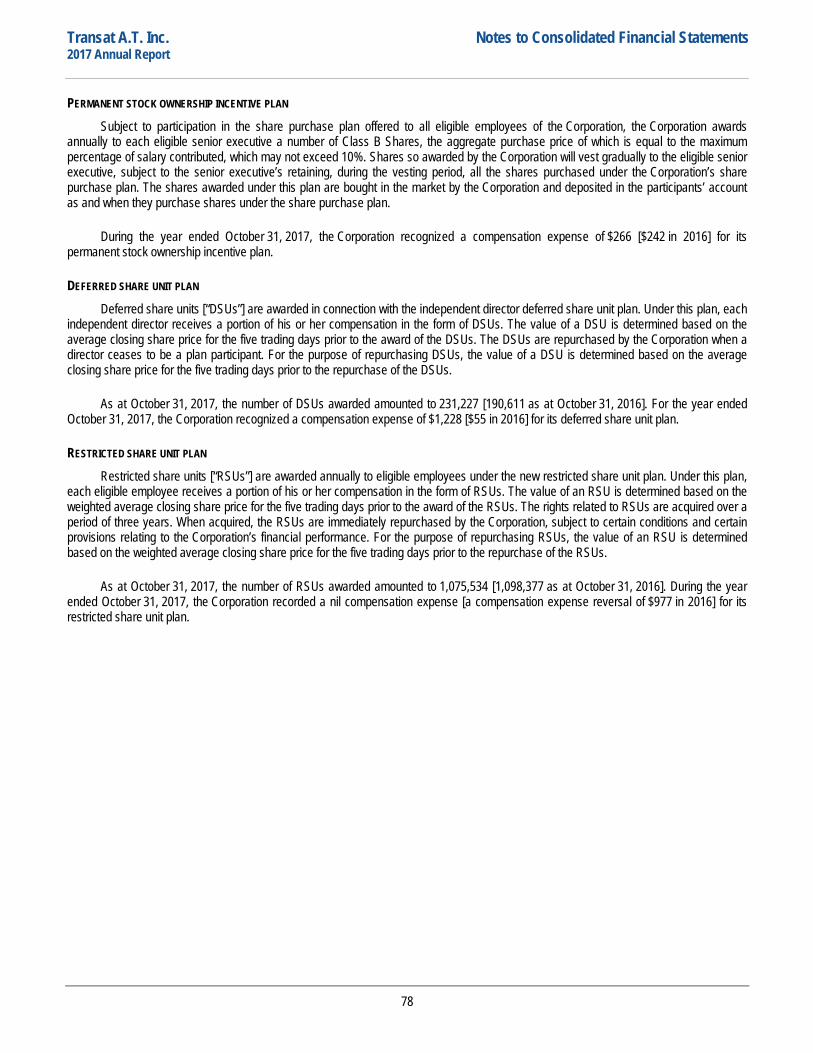
Transat A.T. Inc. Notes to Consolidated Financial Statements 2017 Annual Report
PERMANENT STOCK OWNERSHIP INCENTIVE PLAN Subject to participation in the share purchase plan offered to all eligible employees of the Corporation, the Corporation awards
annually to each eligible senior executive a number of Class B Shares, the aggregate purchase price of which is equal to the maximum percentage of salary contributed, which may not exceed 10%. Shares so awarded by the Corporation will vest gradually to the eligible senior executive, subject to the senior executive’s retaining, during the vesting period, all the shares purchased under the Corporation’s share purchase plan. The shares awarded under this plan are bought in the market by the Corporation and deposited in the participants’ account as and when they purchase shares under the share purchase plan.
During the year ended October 31, 2017, the Corporation recognized a compensation expense of $266 [$242 in 2016] for its permanent stock ownership incentive plan.
DEFERRED SHARE UNIT PLAN Deferred share units [“DSUs”] are awarded in connection with the independent director deferred share unit plan. Under this plan, each
independent director receives a portion of his or her compensation in the form of DSUs. The value of a DSU is determined based on the average closing share price for the five trading days prior to the award of the DSUs. The DSUs are repurchased by the Corporation when a director ceases to be a plan participant. For the purpose of repurchasing DSUs, the value of a DSU is determined based on the average closing share price for the five trading days prior to the repurchase of the DSUs.
As at October 31, 2017, the number of DSUs awarded amounted to 231,227 [190,611 as at October 31, 2016]. For the year ended October 31, 2017, the Corporation recognized a compensation expense of $1,228 [$55 in 2016] for its deferred share unit plan.
RESTRICTED SHARE UNIT PLAN Restricted share units [“RSUs”] are awarded annually to eligible employees under the new restricted share unit plan. Under this plan,
each eligible employee receives a portion of his or her compensation in the form of RSUs. The value of an RSU is determined based on the weighted average closing share price for the five trading days prior to the award of the RSUs. The rights related to RSUs are acquired over a period of three years. When acquired, the RSUs are immediately repurchased by the Corporation, subject to certain conditions and certain provisions relating to the Corporation’s financial performance. For the purpose of repurchasing RSUs, the value of an RSU is determined based on the weighted average closing share price for the five trading days prior to the repurchase of the RSUs.
As at October 31, 2017, the number of RSUs awarded amounted to 1,075,534 [1,098,377 as at October 31, 2016]. During the year ended October 31, 2017, the Corporation recorded a nil compensation expense [a compensation expense reversal of $977 in 2016] for its restricted share unit plan.
78
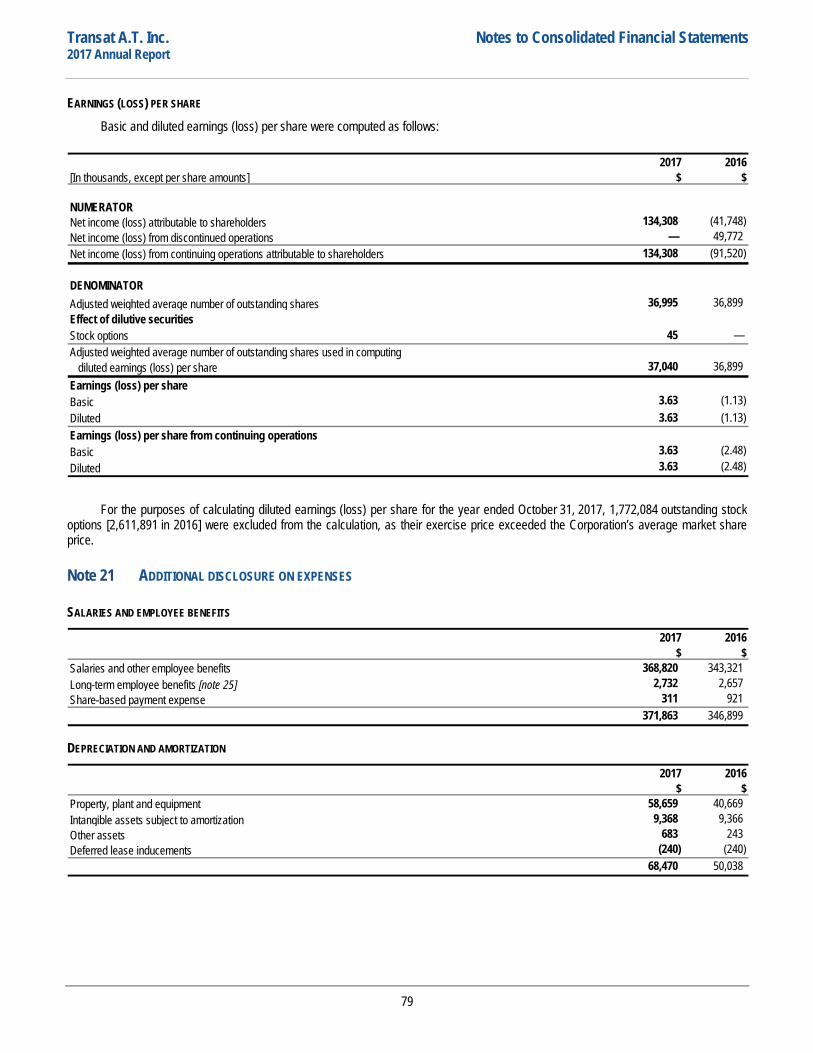
Transat A.T. Inc. Notes to Consolidated Financial Statements 2017 Annual Report
EARNINGS (LOSS) PER SHARE Basic and diluted earnings (loss) per share were computed as follows:
2017 2016[In thousands, except per share amounts] $ $
NUMERATORNet income (loss) attributable to shareholders 134,308 (41,748) Net income (loss) from discontinued operations — 49,772
134,308 (91,520)
DENOMINATORAdjusted weighted average number of outstanding shares 36,995 36,899 Effect of dilutive securitiesStock options 45 —
37,040 36,899 Earnings (loss) per shareBasic 3.63 (1.13) Diluted 3.63 (1.13) Earnings (loss) per share from continuing operationsBasic 3.63 (2.48) Diluted 3.63 (2.48)
Net income (loss) from continuing operations attributable to shareholders
Adjusted weighted average number of outstanding shares used in computing diluted earnings (loss) per share
For the purposes of calculating diluted earnings (loss) per share for the year ended October 31, 2017, 1,772,084 outstanding stock options [2,611,891 in 2016] were excluded from the calculation, as their exercise price exceeded the Corporation’s average market share price.
Note 21 ADDITIONAL DISCLOSURE ON EXPENSES
SALARIES AND EMPLOYEE BENEFITS
2017 2016$ $
Salaries and other employee benefits 368,820 343,321 Long-term employee benefits [note 25] 2,732 2,657 Share-based payment expense 311 921
371,863 346,899
DEPRECIATION AND AMORTIZATION
2017 2016$ $
Property, plant and equipment 58,659 40,669 Intangible assets subject to amortization 9,368 9,366 Other assets 683 243 Deferred lease inducements (240) (240)
68,470 50,038
79
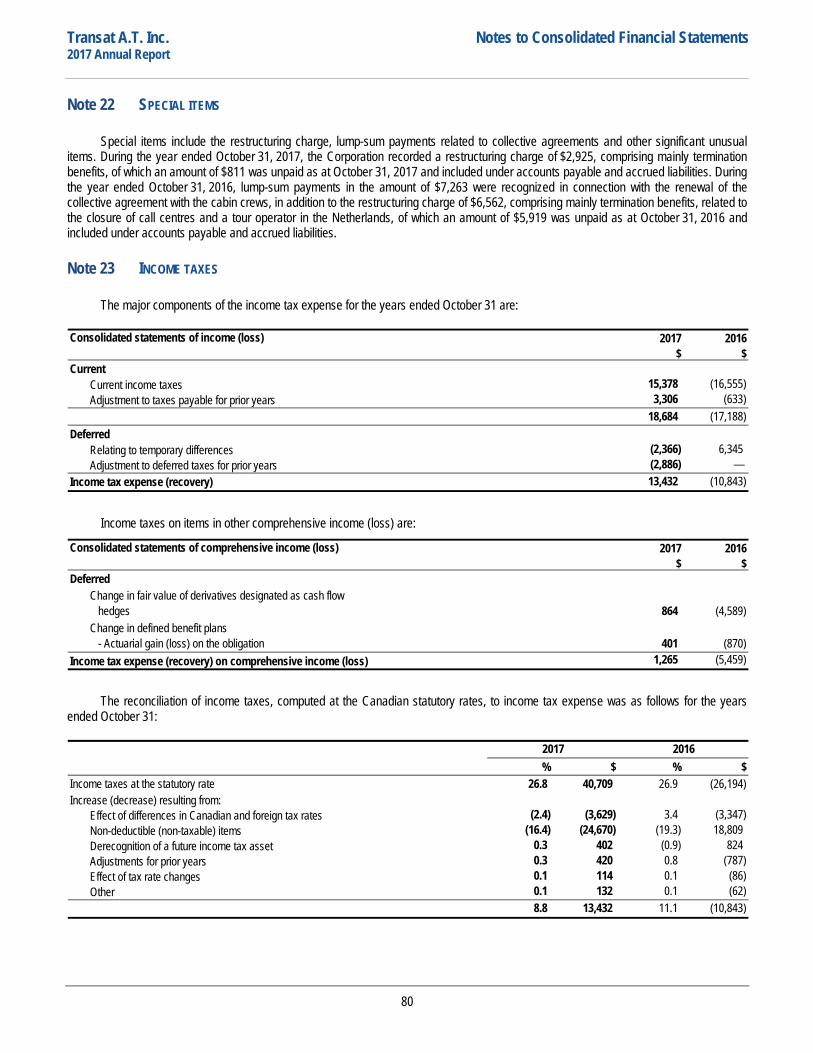
Transat A.T. Inc. Notes to Consolidated Financial Statements 2017 Annual Report
Note 22 SPECIAL ITEMS
Special items include the restructuring charge, lump-sum payments related to collective agreements and other significant unusual items. During the year ended October 31, 2017, the Corporation recorded a restructuring charge of $2,925, comprising mainly termination benefits, of which an amount of $811 was unpaid as at October 31, 2017 and included under accounts payable and accrued liabilities. During the year ended October 31, 2016, lump-sum payments in the amount of $7,263 were recognized in connection with the renewal of the collective agreement with the cabin crews, in addition to the restructuring charge of $6,562, comprising mainly termination benefits, related to the closure of call centres and a tour operator in the Netherlands, of which an amount of $5,919 was unpaid as at October 31, 2016 and included under accounts payable and accrued liabilities.
Note 23 INCOME TAXES
The major components of the income tax expense for the years ended October 31 are:
2017 2016$ $
Current15,378 (16,555) 3,306 (633)
18,684 (17,188) Deferred
(2,366) 6,345 (2,886) — 13,432 (10,843)
Adjustment to taxes payable for prior years
Consolidated statements of income (loss)
Current income taxes
Relating to temporary differences
Income tax expense (recovery)Adjustment to deferred taxes for prior years
Income taxes on items in other comprehensive income (loss) are:
2017 2016$ $
Deferred
864 (4,589)
401 (870) Income tax expense (recovery) on comprehensive income (loss) 1,265 (5,459)
Change in defined benefit plans - Actuarial gain (loss) on the obligation
Consolidated statements of comprehensive income (loss)
Change in fair value of derivatives designated as cash flow hedges
The reconciliation of income taxes, computed at the Canadian statutory rates, to income tax expense was as follows for the years ended October 31:
% $ % $26.8 40,709 26.9 (26,194)
(2.4) (3,629) 3.4 (3,347) (16.4) (24,670) (19.3) 18,809
0.3 402 (0.9) 824 0.3 420 0.8 (787) 0.1 114 0.1 (86) 0.1 132 0.1 (62) 8.8 13,432 11.1 (10,843)
2017 2016
Income taxes at the statutory rateIncrease (decrease) resulting from:
Effect of differences in Canadian and foreign tax ratesNon-deductible (non-taxable) itemsDerecognition of a future income tax assetAdjustments for prior yearsEffect of tax rate changesOther
80

Transat A.T. Inc. Notes to Consolidated Financial Statements 2017 Annual Report
The applicable statutory income tax rate was 26.8% for the year ended October 31, 2017 [26.9% for the year ended October 31, 2016]. The 0.1% rate decrease is due to the reduction in the applicable Québec tax rate which was lowered from 11.9% to 11.8%. The Corporation’s applicable statutory income tax rate is the applicable combined Canadian (federal and Québec) tax rate.
Deferred taxes reflect the net tax impact of temporary differences between the value of assets and liabilities for accounting and tax purposes. The main components of the deferred tax assets and liabilities were as follows:
2017 2016 2017 2016$ $ $ $
Deferred tax losses 1,467 112 1,360 (128)
(12,646) (13,537) 770 (2,001) 837 922 (82) 4,735
(2,750) 1,804 (3,690) (5,045) 1,289 953 337 (948)
13,151 8,288 4,863 (3,293) 10,802 10,868 335 68 1,919 657 1,359 267
Deferred tax 14,069 10,067 5,252 (6,345)
Consolidated statements of financial position
Consolidated statements of income (loss)
Property, plant and equipment and softwareIntangible assets, excluding software
Derivative financial instrumentsOther financial assets and other assetsProvisionsEmployee benefitsOther financial liabilities and other liabilities
Excess of tax value over net carrying value of:
The changes in net deferred tax assets are as follows:
2017 2016$ $
10,067 21,327 Recognized in the consolidated statements of income (loss) as continuing operations 5,252 (6,345) Recognized in the consolidated statements of income (loss) as discontinued operations — (1,246) Recognized in other comprehensive income (loss) as continuing operations (1,265) 4,589 Recognized in other comprehensive income (loss) as discontinued operations — 789 Assets held for sale 109 — Disposal of discontinued operations — (9,502)
(94) 455 14,069 10,067
Balance, beginning of year
Other
The deferred tax assets are detailed below:
2017 2016$ $
Deferred tax assets 16,286 15,055 Deferred tax liabilities (2,217) (4,988)
14,069 10,067 Net deferred tax assets
As at October 31, 2017, non-capital losses carried forward and other unrecognized tax deductions available to reduce future taxable income of certain subsidiaries in Mexico, totalled MXP 89,217 [$6,013] [MXP 87,451 [$6,191] as at October 31, 2016]. These losses and deductions expire in 2020 and thereafter.
81
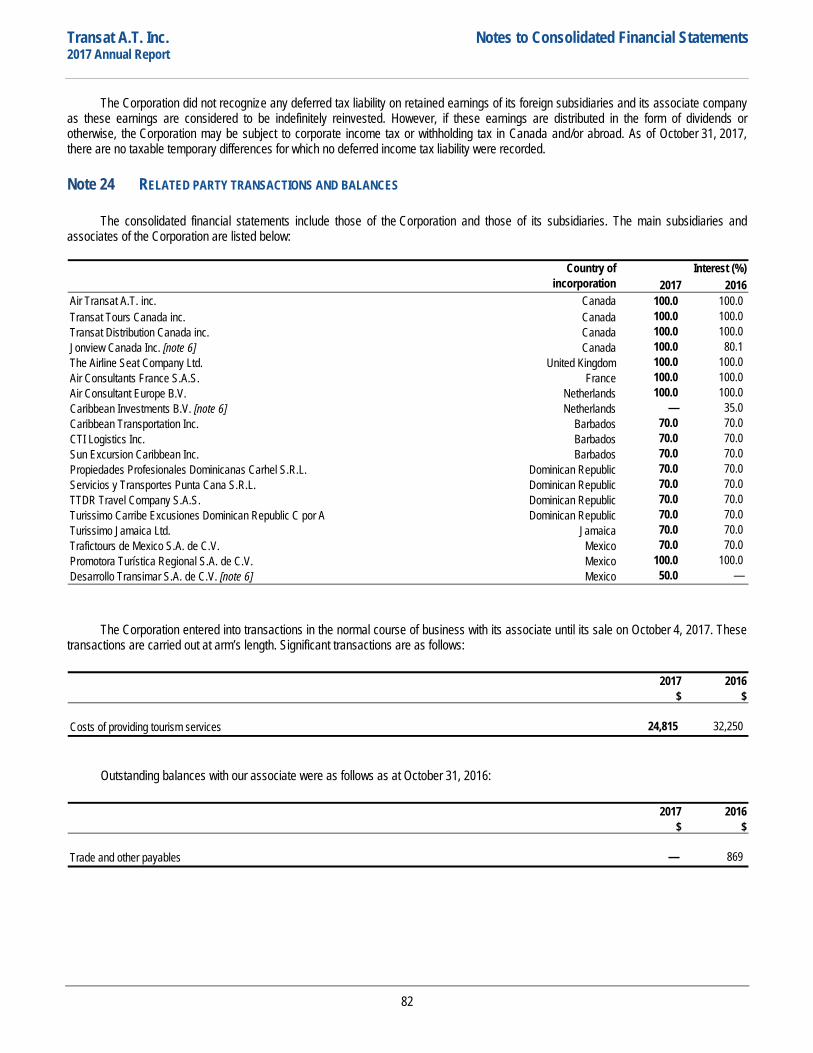
Transat A.T. Inc. Notes to Consolidated Financial Statements 2017 Annual Report
The Corporation did not recognize any deferred tax liability on retained earnings of its foreign subsidiaries and its associate company as these earnings are considered to be indefinitely reinvested. However, if these earnings are distributed in the form of dividends or otherwise, the Corporation may be subject to corporate income tax or withholding tax in Canada and/or abroad. As of October 31, 2017, there are no taxable temporary differences for which no deferred income tax liability were recorded.
Note 24 RELATED PARTY TRANSACTIONS AND BALANCES
The consolidated financial statements include those of the Corporation and those of its subsidiaries. The main subsidiaries and associates of the Corporation are listed below:
2017 2016100.0 100.0 100.0 100.0 100.0 100.0 100.0 80.1 100.0 100.0 100.0 100.0 100.0 100.0
— 35.0 70.0 70.0 70.0 70.0 70.0 70.0 70.0 70.0 70.0 70.0 70.0 70.0 70.0 70.0 70.0 70.0 70.0 70.0
100.0 100.0 50.0 —
Country ofincorporation
Interest (%)
Air Transat A.T. inc. Canada
Air Consultant Europe B.V. Netherlands
Jonview Canada Inc. [note 6] CanadaThe Airline Seat Company Ltd. United KingdomAir Consultants France S.A.S. France
Transat Tours Canada inc. CanadaTransat Distribution Canada inc. Canada
Dominican Republic
Mexico
Sun Excursion Caribbean Inc. Barbados
Turissimo Carribe Excusiones Dominican Republic C por A
Trafictours de Mexico S.A. de C.V.
Caribbean Investments B.V. [note 6] NetherlandsCaribbean Transportation Inc. BarbadosCTI Logistics Inc. Barbados
Servicios y Transportes Punta Cana S.R.L. Dominican Republic
Turissimo Jamaica Ltd. Jamaica
Propiedades Profesionales Dominicanas Carhel S.R.L.
TTDR Travel Company S.A.S.
Dominican Republic
Dominican Republic
MexicoMexico
Promotora Turística Regional S.A. de C.V.Desarrollo Transimar S.A. de C.V. [note 6]
The Corporation entered into transactions in the normal course of business with its associate until its sale on October 4, 2017. These transactions are carried out at arm’s length. Significant transactions are as follows:
2017 2016$ $
24,815 32,250 Costs of providing tourism services
Outstanding balances with our associate were as follows as at October 31, 2016:
2017 2016$ $
— 869 Trade and other payables
82
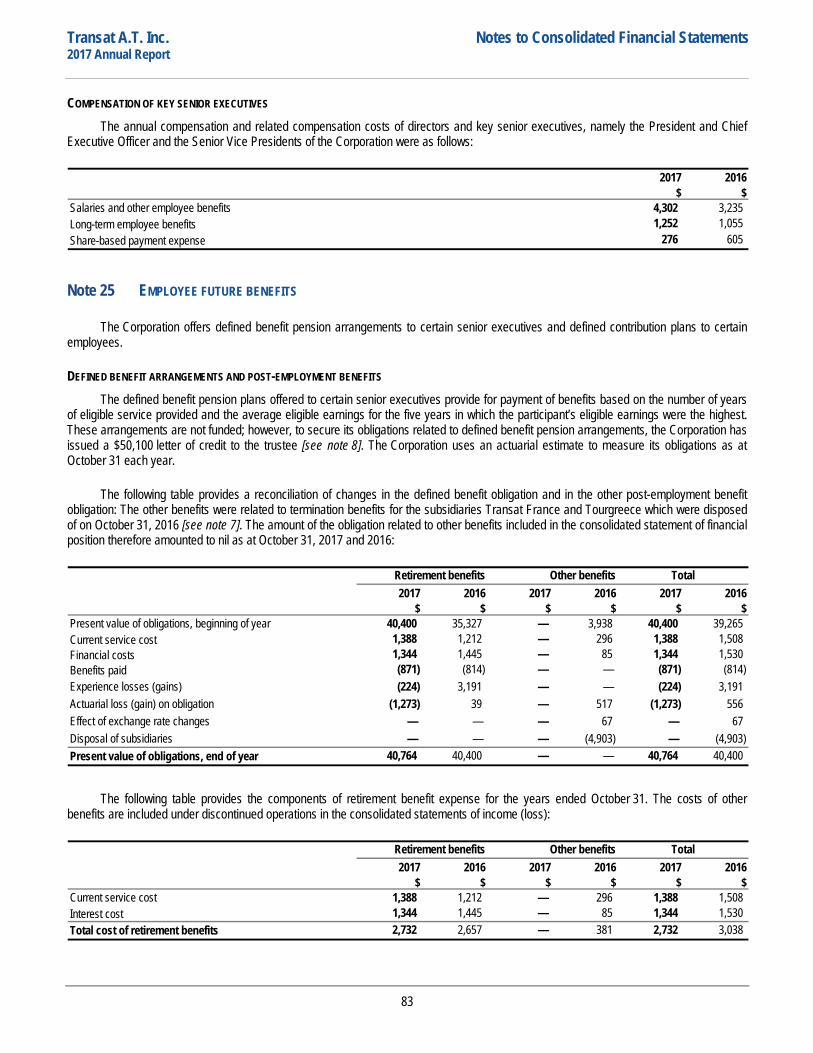
Transat A.T. Inc. Notes to Consolidated Financial Statements 2017 Annual Report
COMPENSATION OF KEY SENIOR EXECUTIVES The annual compensation and related compensation costs of directors and key senior executives, namely the President and Chief
Executive Officer and the Senior Vice Presidents of the Corporation were as follows:
2017 2016$ $
4,302 3,235 1,252 1,055
276 605 Share-based payment expense
Salaries and other employee benefitsLong-term employee benefits
Note 25 EMPLOYEE FUTURE BENEFITS
The Corporation offers defined benefit pension arrangements to certain senior executives and defined contribution plans to certain employees.
DEFINED BENEFIT ARRANGEMENTS AND POST-EMPLOYMENT BENEFITS The defined benefit pension plans offered to certain senior executives provide for payment of benefits based on the number of years
of eligible service provided and the average eligible earnings for the five years in which the participant’s eligible earnings were the highest. These arrangements are not funded; however, to secure its obligations related to defined benefit pension arrangements, the Corporation has issued a $50,100 letter of credit to the trustee [see note 8]. The Corporation uses an actuarial estimate to measure its obligations as at October 31 each year.
The following table provides a reconciliation of changes in the defined benefit obligation and in the other post-employment benefit obligation: The other benefits were related to termination benefits for the subsidiaries Transat France and Tourgreece which were disposed of on October 31, 2016 [see note 7]. The amount of the obligation related to other benefits included in the consolidated statement of financial position therefore amounted to nil as at October 31, 2017 and 2016:
2017 2016 2017 2016 2017 2016$ $ $ $ $ $
40,400 35,327 — 3,938 40,400 39,265 1,388 1,212 — 296 1,388 1,508 1,344 1,445 — 85 1,344 1,530 (871) (814) — — (871) (814) (224) 3,191 — — (224) 3,191
(1,273) 39 — 517 (1,273) 556 — — — 67 — 67 — — — (4,903) — (4,903)
40,764 40,400 — — 40,764 40,400
Retirement benefits Other benefits Total
Present value of obligations, beginning of yearCurrent service costFinancial costsBenefits paidExperience losses (gains)Actuarial loss (gain) on obligationEffect of exchange rate changesDisposal of subsidiariesPresent value of obligations, end of year
The following table provides the components of retirement benefit expense for the years ended October 31. The costs of other benefits are included under discontinued operations in the consolidated statements of income (loss):
2017 2016 2017 2016 2017 2016$ $ $ $ $ $
1,388 1,212 — 296 1,388 1,508 1,344 1,445 — 85 1,344 1,530 2,732 2,657 — 381 2,732 3,038
Total
Current service costInterest costTotal cost of retirement benefits
Retirement benefits Other benefits
83

Transat A.T. Inc. Notes to Consolidated Financial Statements 2017 Annual Report
The following table indicates projected payments under defined benefit pension plan arrangements as at October 31, 2017:
$958
One to five years 9,986 Between five and 10 years 13,139 Between 10 and 15 years 12,086
10,565 46,734
Under one year
Between 15 and 20 years
The weighted average duration of the defined benefit obligation related to pension arrangements was 12.9 years as at October 31, 2017.
The significant actuarial assumptions used to determine the Corporation’s retirement benefit obligation and expense were as follows:
2017 2016% %
3.50 3.25 2.75 2.75
3.25 4.00 2.75 2.75
Retirement benefit obligationDiscount rateRate of increase in eligible earnings
Retirement benefit costDiscount rateRate of increase in eligible earnings
A 0.25 percentage point increase in the actuarial assumptions below would have the following impacts, all other actuarial assumptions remaining the same:
Increase (decrease) $ $Discount rate (3) (1,223)
13 65
Retirement benefit obligations as atOctober 31, 2017
Retirement benefit expense for
the year endedOctober 31, 2017
Rate of increase in eligible earnings
The funded status of the benefits and the amounts recorded in the statement of financial position under other liabilities were as follows:
2017 2016$ $
Plan assets at fair value — — Accrued benefit obligation 40,764 40,400 Retirement benefit deficit 40,764 40,400
84
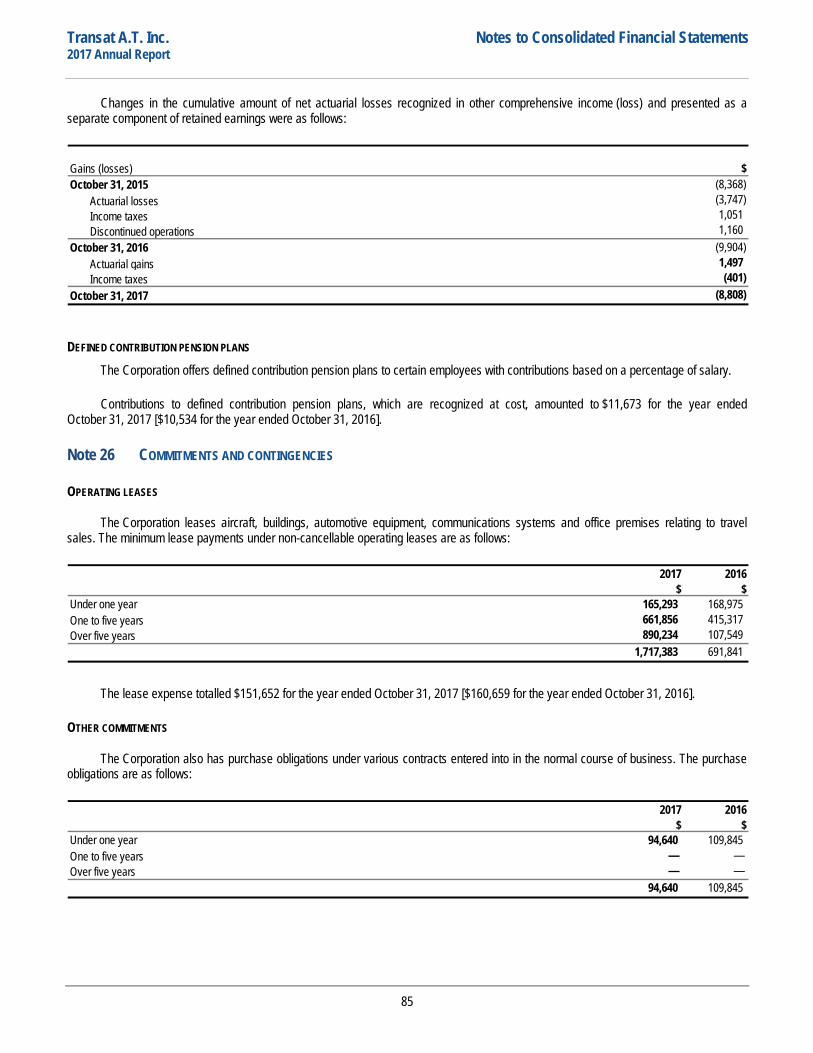
Transat A.T. Inc. Notes to Consolidated Financial Statements 2017 Annual Report
Changes in the cumulative amount of net actuarial losses recognized in other comprehensive income (loss) and presented as a separate component of retained earnings were as follows:
Gains (losses) $October 31, 2015 (8,368)
Actuarial losses (3,747) Income taxes 1,051 Discontinued operations 1,160
October 31, 2016 (9,904) Actuarial gains 1,497 Income taxes (401)
October 31, 2017 (8,808)
DEFINED CONTRIBUTION PENSION PLANS The Corporation offers defined contribution pension plans to certain employees with contributions based on a percentage of salary.
Contributions to defined contribution pension plans, which are recognized at cost, amounted to $11,673 for the year ended October 31, 2017 [$10,534 for the year ended October 31, 2016].
Note 26 COMMITMENTS AND CONTINGENCIES
OPERATING LEASES
The Corporation leases aircraft, buildings, automotive equipment, communications systems and office premises relating to travel sales. The minimum lease payments under non-cancellable operating leases are as follows:
2017 2016$ $
165,293 168,975 661,856 415,317 890,234 107,549
1,717,383 691,841
Under one yearOne to five yearsOver five years
The lease expense totalled $151,652 for the year ended October 31, 2017 [$160,659 for the year ended October 31, 2016].
OTHER COMMITMENTS
The Corporation also has purchase obligations under various contracts entered into in the normal course of business. The purchase obligations are as follows:
2017 2016$ $
94,640 109,845 — — — —
94,640 109,845
Under one yearOne to five yearsOver five years
85

Transat A.T. Inc. Notes to Consolidated Financial Statements 2017 Annual Report
LITIGATION
In the normal course of business, the Corporation is exposed to various claims and legal proceedings. These disputes often involve numerous uncertainties and the outcome of the individual cases is unpredictable. According to management, these claims and proceedings are adequately provided for or covered by insurance policies and their settlement should not have a significant negative impact on the Corporation’s financial position, subject to the paragraph hereunder. The Corporation has directors’ and officers’ liability insurance as well as professional liability insurance and the amount of coverage under said insurance policies is usually sufficient to pay the amounts the Corporation may be required to disburse in connection with these lawsuits. In all these lawsuits, the Corporation has and will continue to vigorously defend its position.
The Corporation is currently involved in a particular litigation in which Plaintiffs allege misappropriation of confidential information and solicitation of employees. Although the Amended Complaint fails to disclose a specific amount of monetary damages, Plaintiffs’ principal, during his deposition, asserted that the damages sought were at least US$30,000 [$38,700]. The Corporation is of the view that these proceedings are not well-founded and lack merit. As such, it will continue to vigorously defend this lawsuit. The Corporation is also of the view that Plaintiffs have not provided sufficient evidence to substantiate the whole of their claim or the quantum of damages being sought. Therefore, at this stage, it is not possible to determine with any degree of certainty the extent of any financial liability that may arise should the Corporation be unsuccessful in its defence of this lawsuit. No amounts have been accrued with respect to this lawsuit as of October 31, 2017.
OTHER
From time to time, the Corporation is subject to audits by tax authorities that give rise to questions regarding the fiscal treatment of certain transactions. Certain of these matters could entail significant costs that will remain uncertain until one or more events occur or fail to occur. Although the outcome of such matters is not predictable with assurance, the tax claims and risks for which there is a probable unfavourable outcome are recognized by the Corporation using the best possible estimates of the amount of the loss. The tax deductibility of losses reported by the Corporation in previous fiscal years with regard to investments in ABCP was challenged by tax authorities. No provisions are made in connection with this issue, which could result in expenses of approximately $16,200, as the Corporation intends to defend itself vigorously with respect thereto and firmly believes it has sufficient facts and arguments to obtain a favourable final outcome. However, the Corporation already paid $15,100 to the tax authorities in respect of this matter during the fiscal year ended October 31, 2015 and objected to the notices of assessment received. This amount is recognized as income taxes receivable as at October 31, 2017 and 2016.
86
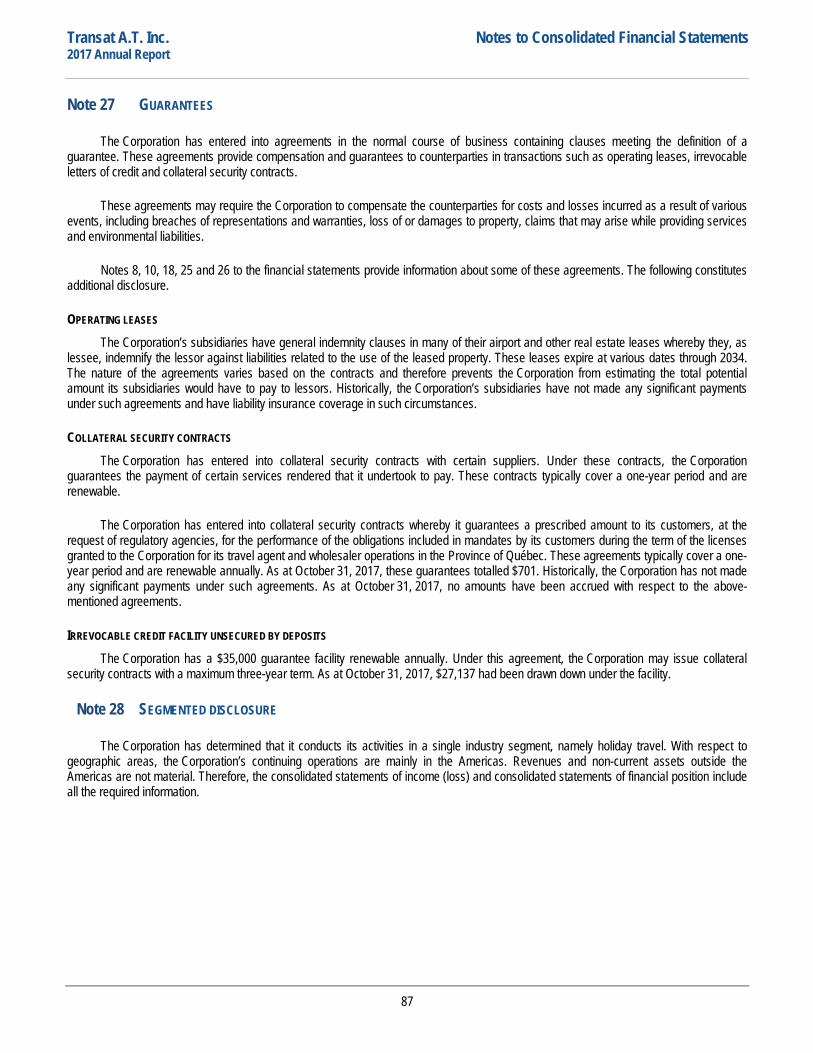
Transat A.T. Inc. Notes to Consolidated Financial Statements 2017 Annual Report
Note 27 GUARANTEES
The Corporation has entered into agreements in the normal course of business containing clauses meeting the definition of a guarantee. These agreements provide compensation and guarantees to counterparties in transactions such as operating leases, irrevocable letters of credit and collateral security contracts.
These agreements may require the Corporation to compensate the counterparties for costs and losses incurred as a result of various events, including breaches of representations and warranties, loss of or damages to property, claims that may arise while providing services and environmental liabilities.
Notes 8, 10, 18, 25 and 26 to the financial statements provide information about some of these agreements. The following constitutes additional disclosure.
OPERATING LEASES The Corporation’s subsidiaries have general indemnity clauses in many of their airport and other real estate leases whereby they, as
lessee, indemnify the lessor against liabilities related to the use of the leased property. These leases expire at various dates through 2034. The nature of the agreements varies based on the contracts and therefore prevents the Corporation from estimating the total potential amount its subsidiaries would have to pay to lessors. Historically, the Corporation’s subsidiaries have not made any significant payments under such agreements and have liability insurance coverage in such circumstances.
COLLATERAL SECURITY CONTRACTS The Corporation has entered into collateral security contracts with certain suppliers. Under these contracts, the Corporation
guarantees the payment of certain services rendered that it undertook to pay. These contracts typically cover a one-year period and are renewable.
The Corporation has entered into collateral security contracts whereby it guarantees a prescribed amount to its customers, at the request of regulatory agencies, for the performance of the obligations included in mandates by its customers during the term of the licenses granted to the Corporation for its travel agent and wholesaler operations in the Province of Québec. These agreements typically cover a one-year period and are renewable annually. As at October 31, 2017, these guarantees totalled $701. Historically, the Corporation has not made any significant payments under such agreements. As at October 31, 2017, no amounts have been accrued with respect to the above-mentioned agreements.
IRREVOCABLE CREDIT FACILITY UNSECURED BY DEPOSITS The Corporation has a $35,000 guarantee facility renewable annually. Under this agreement, the Corporation may issue collateral
security contracts with a maximum three-year term. As at October 31, 2017, $27,137 had been drawn down under the facility.
Note 28 SEGMENTED DISCLOSURE
The Corporation has determined that it conducts its activities in a single industry segment, namely holiday travel. With respect to geographic areas, the Corporation’s continuing operations are mainly in the Americas. Revenues and non-current assets outside the Americas are not material. Therefore, the consolidated statements of income (loss) and consolidated statements of financial position include all the required information.
87
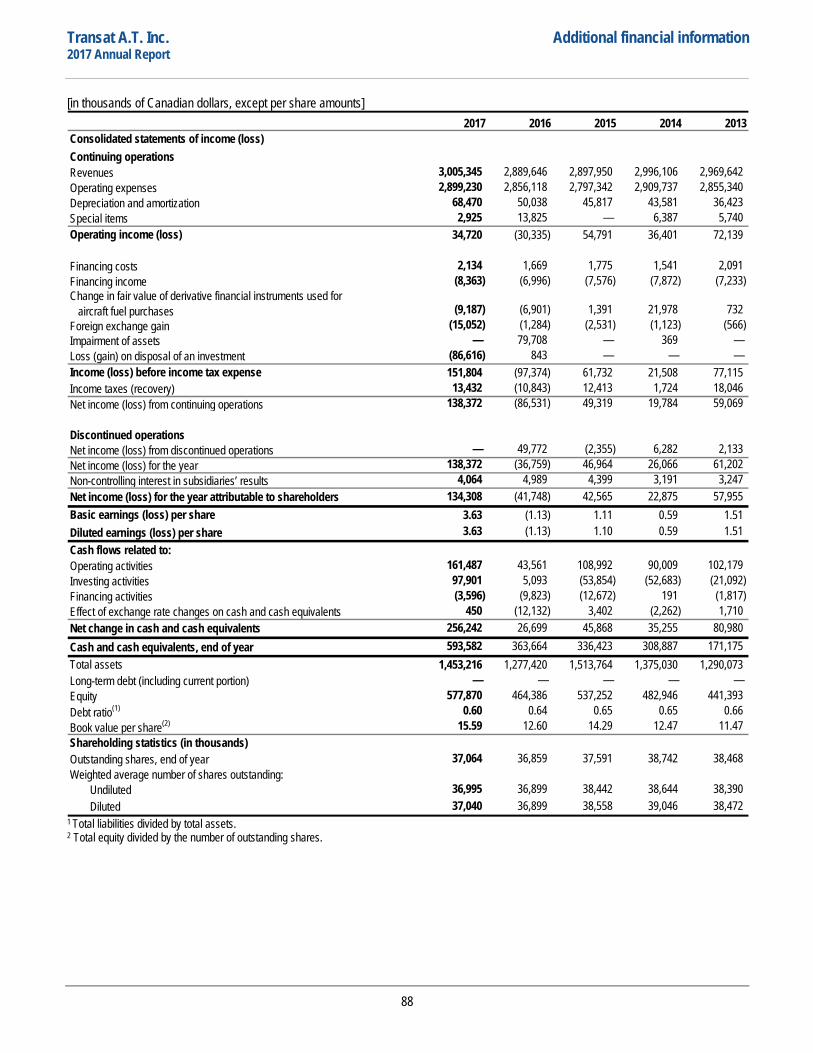
Transat A.T. Inc. Additional financial information 2017 Annual Report
[in thousands of Canadian dollars, except per share amounts] 2017 2016 2015 2014 2013
Continuing operations3,005,345 2,889,646 2,897,950 2,996,106 2,969,642 2,899,230 2,856,118 2,797,342 2,909,737 2,855,340
68,470 50,038 45,817 43,581 36,423 2,925 13,825 — 6,387 5,740
34,720 (30,335) 54,791 36,401 72,139
2,134 1,669 1,775 1,541 2,091 (8,363) (6,996) (7,576) (7,872) (7,233)
(9,187) (6,901) 1,391 21,978 732 Foreign exchange gain (15,052) (1,284) (2,531) (1,123) (566)
— 79,708 — 369 — (86,616) 843 — — — 151,804 (97,374) 61,732 21,508 77,115 13,432 (10,843) 12,413 1,724 18,046
Net income (loss) from continuing operations 138,372 (86,531) 49,319 19,784 59,069
Discontinued operationsNet income (loss) from discontinued operations — 49,772 (2,355) 6,282 2,133 Net income (loss) for the year 138,372 (36,759) 46,964 26,066 61,202 Non-controlling interest in subsidiaries’ results 4,064 4,989 4,399 3,191 3,247
134,308 (41,748) 42,565 22,875 57,955 3.63 (1.13) 1.11 0.59 1.51
Diluted earnings (loss) per share 3.63 (1.13) 1.10 0.59 1.51 Cash flows related to:
161,487 43,561 108,992 90,009 102,179 97,901 5,093 (53,854) (52,683) (21,092) (3,596) (9,823) (12,672) 191 (1,817)
450 (12,132) 3,402 (2,262) 1,710 256,242 26,699 45,868 35,255 80,980
Cash and cash equivalents, end of year 593,582 363,664 336,423 308,887 171,175 1,453,216 1,277,420 1,513,764 1,375,030 1,290,073
— — — — — 577,870 464,386 537,252 482,946 441,393
0.60 0.64 0.65 0.65 0.66 15.59 12.60 14.29 12.47 11.47
37,064 36,859 37,591 38,742 38,468
36,995 36,899 38,442 38,644 38,390 37,040 36,899 38,558 39,046 38,472
Depreciation and amortizationSpecial itemsOperating income (loss)
Diluted
EquityDebt ratio(1)
Book value per share(2)
Shareholding statistics (in thousands)
Investing activities Financing activities Effect of exchange rate changes on cash and cash equivalentsNet change in cash and cash equivalents
Total assetsLong-term debt (including current portion)
Outstanding shares, end of yearWeighted average number of shares outstanding:
Undiluted
Loss (gain) on disposal of an investmentIncome (loss) before income tax expenseIncome taxes (recovery)
Net income (loss) for the year attributable to shareholdersBasic earnings (loss) per share
Operating activities
Financing costsFinancing incomeChange in fair value of derivative financial instruments used for aircraft fuel purchases
Impairment of assets
Consolidated statements of income (loss)
RevenuesOperating expenses
1 Total liabilities divided by total assets. 2 Total equity divided by the number of outstanding shares.
88

Head Office
Transat A.T. Inc.
Place du Parc 300 Léo-Pariseau St. Suite 600 Montreal, Quebec H2X 4C2
Telephone: 514.987.1660
Fax: 514.987.8035
www.transat.com [email protected]
Information
www.transat.com
For additional information, write to the Vice-President, Finance and Administration, and Chief Financial Officer.Ce rapport annuel est disponible en français.
Stock Exchange
Toronto Stock Exchange (TSX) TRZ
Transfer Agent and Registrar
AST Trust Company (Canada) 2001 Robert-Bourassa Blvd. Suite 1600 Montreal, Quebec H3A 2A6
Toll-free: 1.800.387.0825 [email protected] www.astfinancial.com/ca-en
Auditors
Ernst & Young LLP Montreal, Quebec
Annual General Meeting of ShareholdersThursday, March 15, 2018 10:00 a.m. McGill - New Residence Hall Ballroom - Level C 3625 Parc Ave. Montreal, Quebec H2X 3P8

www.resp.transat.com www.transat.com