annual report 2018 - sgbl · michel fiani sgbj nadim abawat sgbcy khalil letayf richelieu gcc...
TRANSCRIPT
L e t ’s g e t t h i n g s m o v i n gAnnual Report 2018

Annual Report 2018L e t ’s g e t t h i n g s m o v i n g
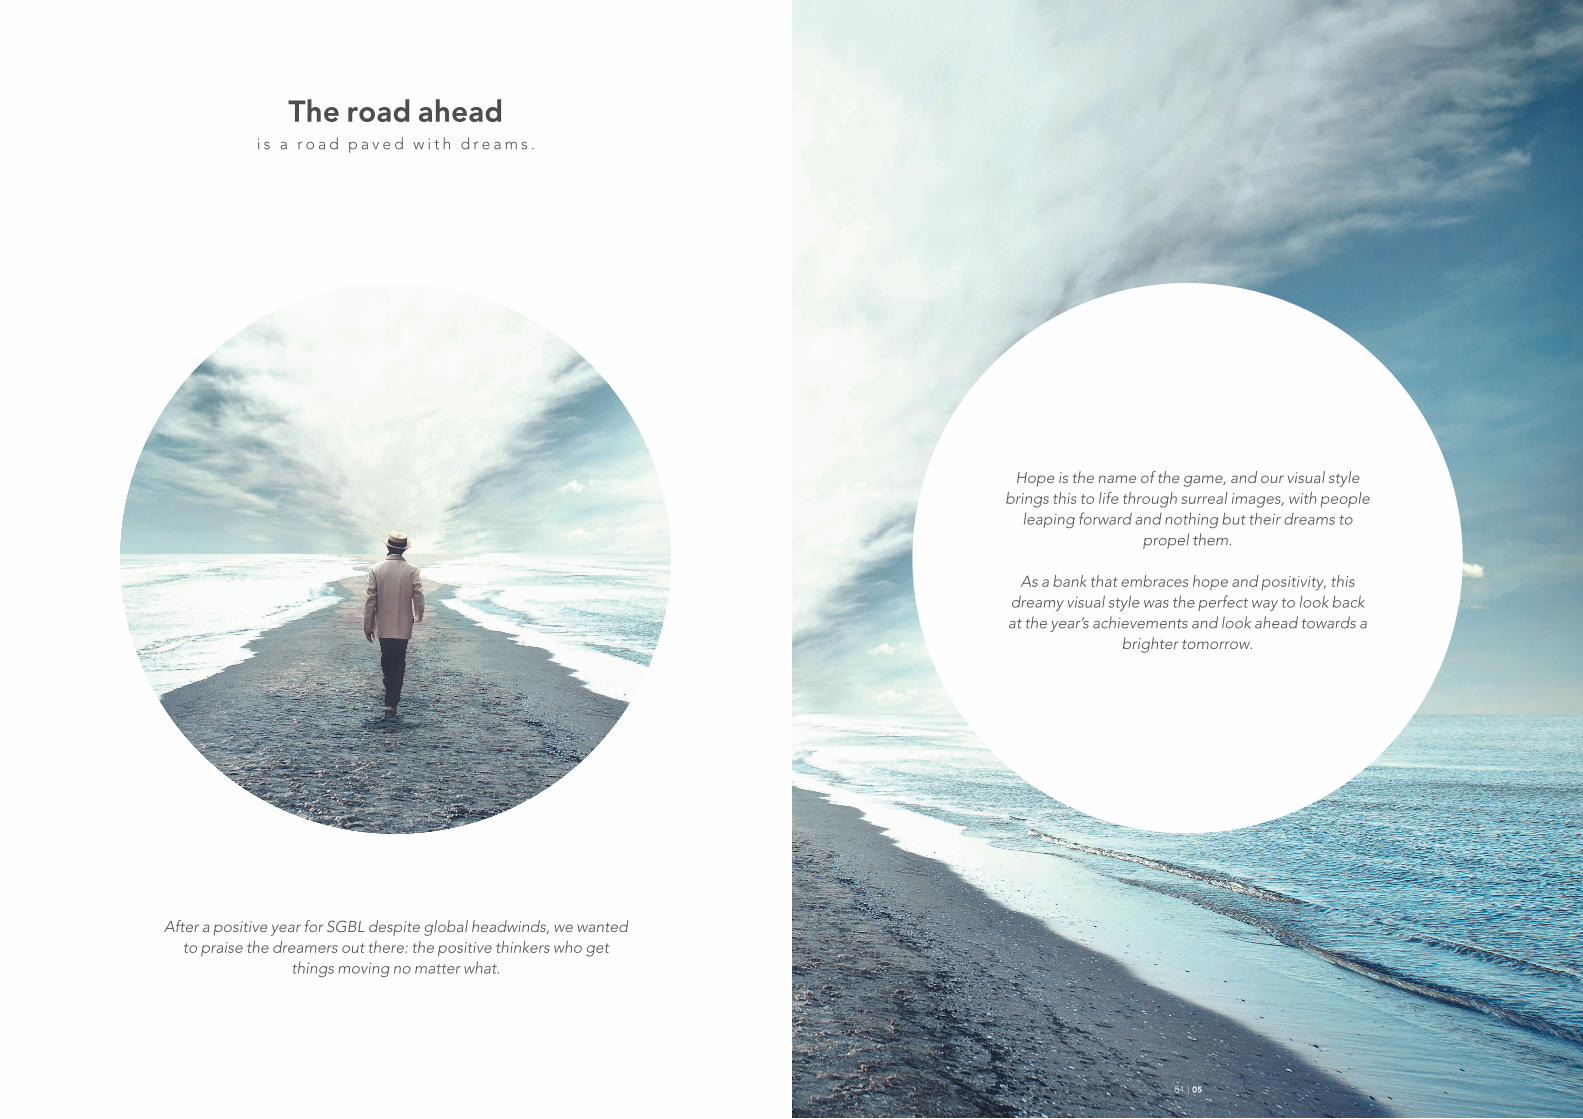
The road aheadi s a r o a d p a v e d w i t h d r e a m s .
After a positive year for SGBL despite global headwinds, we wanted to praise the dreamers out there: the positive thinkers who get
things moving no matter what.
Hope is the name of the game, and our visual style brings this to life through surreal images, with people
leaping forward and nothing but their dreams to propel them.
As a bank that embraces hope and positivity, this
dreamy visual style was the perfect way to look back at the year’s achievements and look ahead towards a
brighter tomorrow.
04 | 05

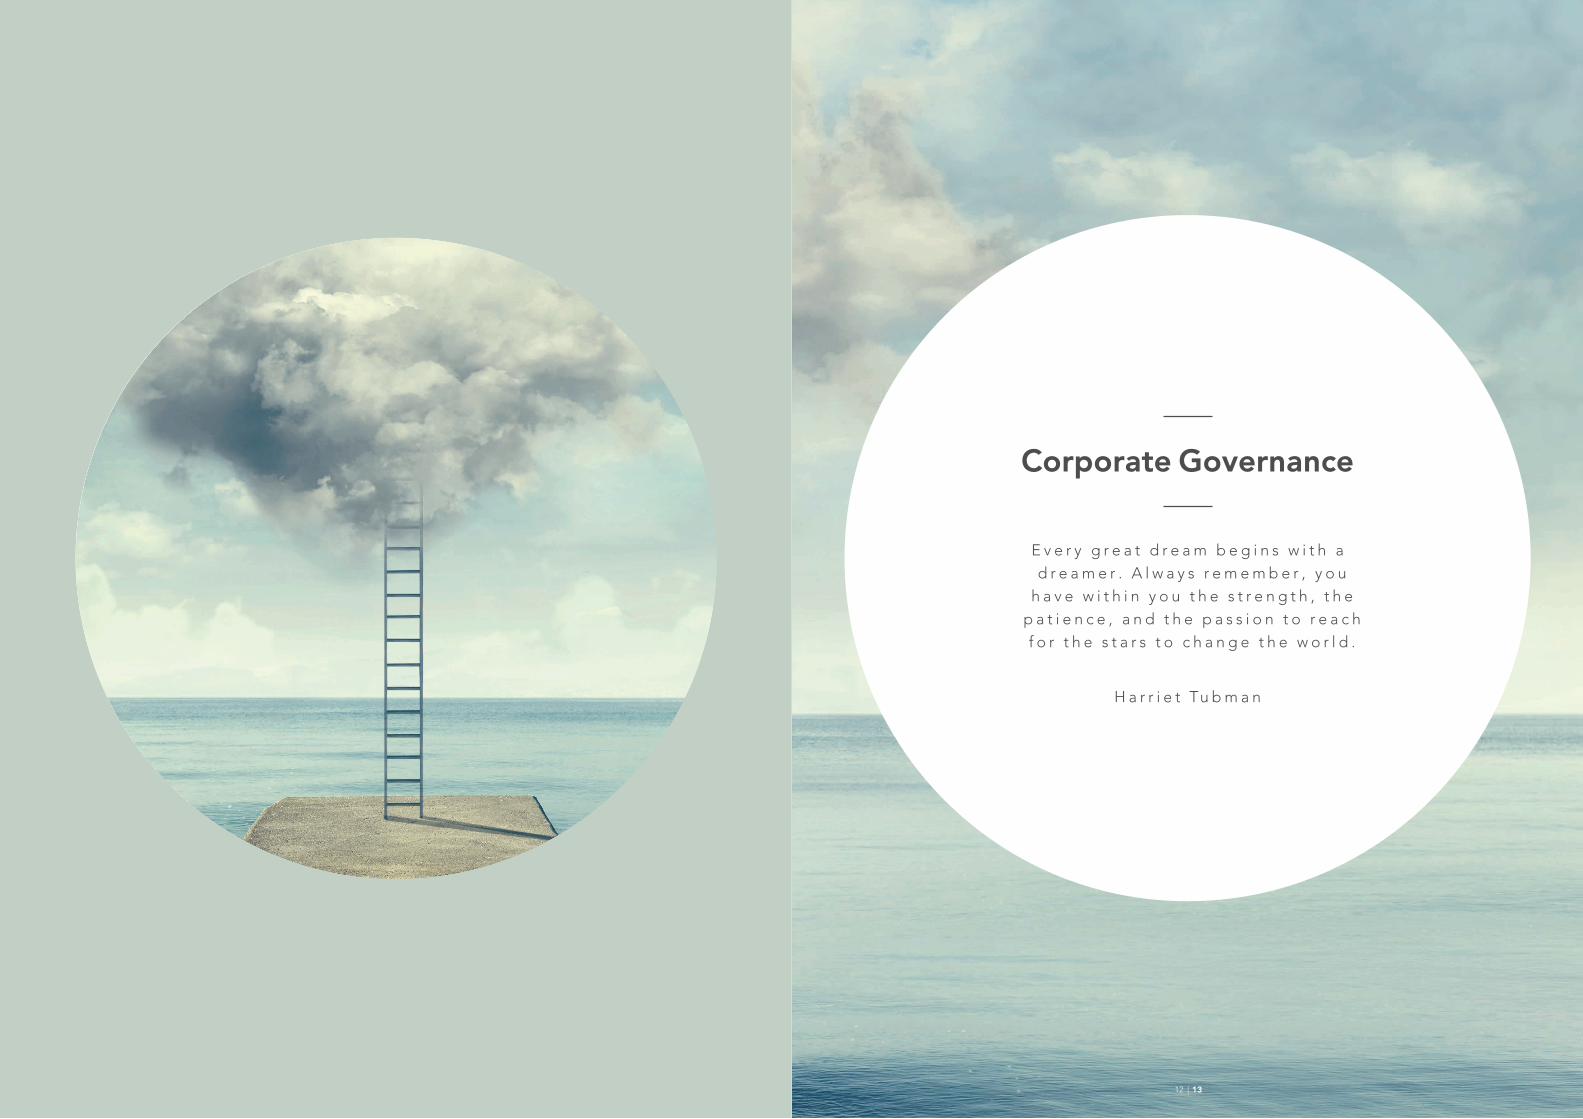
CorporateGovernance
10
22Consolidated
Financial Statements
136Group
Directory
06Financial Highlights
2018
08Group Profile
Table of contentsThe future belongs to those whob e l i e v e i n t h e b e a u t y o f t h e i r d r e a m s .
E l e a n o r R o o s e v e l t
06 | 07

11.95%Average ROE
after tax
0.82%Average ROA
after tax
16.14%Capital
adequacyratio
As at December 31, 2018
TotalAssets
USD
25,798M
Loans andAdvances toCustomers
USD
5,810M
Deposits fromCustomers
USD
18,699M
Equity
USD
1,919M
Net Banking Income
USD
477M
Net Profit
USD
195M
FinancialHighlights
08 | 09

SGBL InsuranceA life insurance company that ranks
among the top 10 life insurance companies in Lebanon, SGBL
Insurance offers a complete range of life insurance products based on
contingency and capitalization.
Sogelease LibanA provider of financial leasing
solutions, Sogelease Liban offers professionals, craftsmen and
enterprises of all sizes and solutions for financing their equipment.
FidusFidus is a financial institution that
provides a full range of investment, wealth management, brokerage, advisory and financial services to a diversified clientele, including
high-net-worth individuals, banks, corporations and financial institutions.
Centre De Traitement Monétique (CTM)Specialized in credit card
management, CTM is an electronic card processing company that is a joint
venture between SGBL and Banque Libano-Française.
Our VisionTo grow alongside our clients and shareholders against
all odds.
Our MissionAs bankers, we at SGBL endeavor to provide cutting
edge universal banking services to best serve our individual and corporate clients day after day.
Our Values• Team spirit
• Responsibility• Innovation
• Commitment
The group’s activity is concentrated around 4 core business lines:
• Retail Banking• Corporate Banking• Investment Banking
• Private Banking
The Group’s other businesses include: life insurance, leasing, financial brokerage and credit card processing.
Regional Network
Societe Generale de Banque - Jordanie (SGBJ) A universal bank, listed on the Amman Stock
Exchange, SGBJ operates 19 branches across the kingdom’s territory and focuses on the Jordanian
market’s main business lines.
Societe Generale Bank - Cyprus (SGBCy) SGBCy operates 4 branches across Cyprus and offers a wide range of products and services to
individuals and enterprises.
Banque Richelieu GCCLocated in Abu Dhabi Global Market (ADGM) – UAE, Banque Richelieu GCC is regulated by the Financial
Services Regulatory Authority (FSRA) of (ADGM) with a Category 1 License type.
AffiliatedCompanies
The SGBL group is a major player on the international banking scene, offering
universal banking services to all customer segments in Lebanon, Jordan, the United
Arab Emirates and Europe.
Societe Generale de Banque au Liban SAL (SGBL) is a joint stock company
incorporated in 1953, with a term of 99 years. It is registered with the Commercial
Registry of Beirut under No. 3696 and registered under No. 19 on the list of
banks licensed by Banque du Liban, the Central Bank of Lebanon.
Group Profile
2,283Employees
Staff members as at December 31, 2018 in Lebanon,
Jordan, Cyprus and UAE
157ATMs
BRANCHES IN LEBANON 70
BRANCHES IN JORDAN 19
BRANCHES IN CYPRUS 4
BRANCH IN UAE 1
SGBL group is strongly present in Europe through a private banking and asset management platform bringing
together Banque Richelieu France, Banque Richelieu Monaco, and
Richelieu Gestion.
This group of companies with an aggregate amount of assets under management of US$ 3.6 billion, is steered by Companie Financière
Richelieu (fully owned by SGBL) which manages this platform of private banking and asset management.
InternationalDevelopment
10 | 11
Corporate Governance
E v e r y g r e a t d r e a m b e g i n s w i t h a d r e a m e r . A l w a y s r e m e m b e r , y o u
h a v e w i t h i n y o u t h e s t r e n g t h , t h e p a t i e n c e , a n d t h e p a s s i o n t o r e a c h f o r t h e s t a r s t o c h a n g e t h e w o r l d .
H a r r i e t Tu b m a n
12 | 13
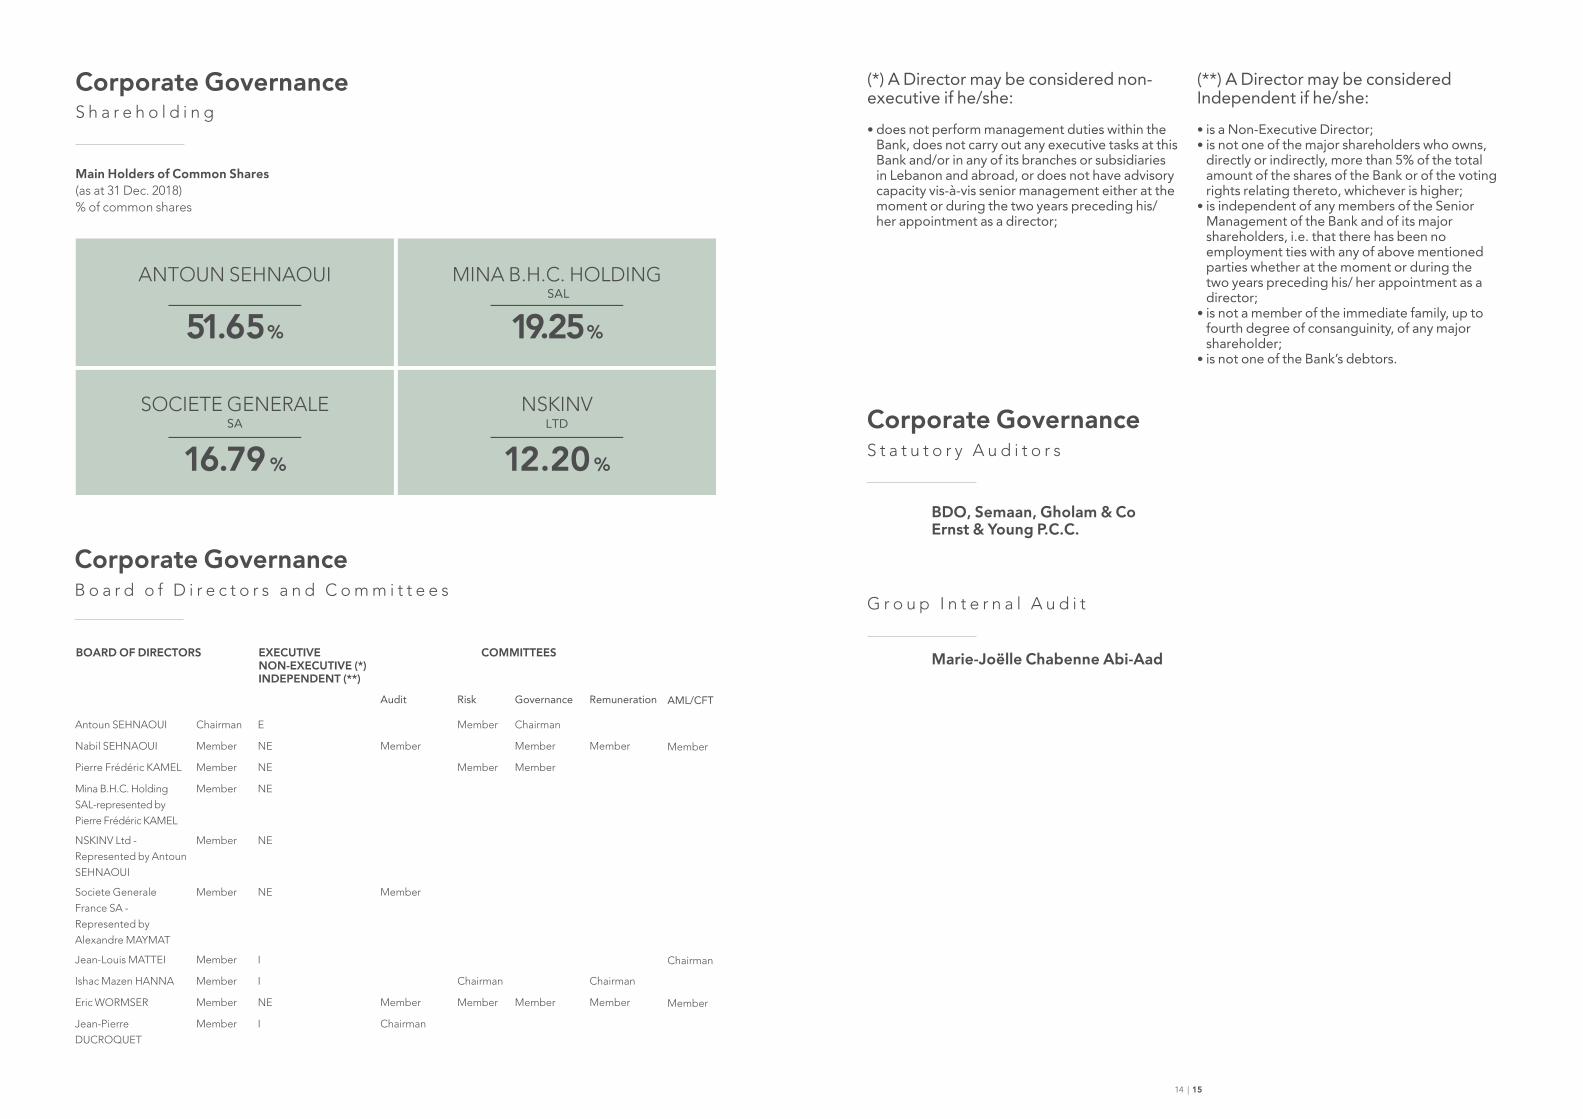
(*) A Director may be considered non-executive if he/she:
• does not perform management duties within the Bank, does not carry out any executive tasks at this Bank and/or in any of its branches or subsidiaries in Lebanon and abroad, or does not have advisory capacity vis-à-vis senior management either at the moment or during the two years preceding his/ her appointment as a director;
(**) A Director may be considered Independent if he/she:
• is a Non-Executive Director;• is not one of the major shareholders who owns,
directly or indirectly, more than 5% of the total amount of the shares of the Bank or of the voting rights relating thereto, whichever is higher;
• is independent of any members of the Senior Management of the Bank and of its major shareholders, i.e. that there has been no employment ties with any of above mentioned parties whether at the moment or during the two years preceding his/ her appointment as a director;
• is not a member of the immediate family, up to fourth degree of consanguinity, of any major shareholder;
• is not one of the Bank’s debtors.
BDO, Semaan, Gholam & CoErnst & Young P.C.C.
Main Holders of Common Shares(as at 31 Dec. 2018) % of common shares
BOARD OF DIRECTORS EXECUTIVENON-EXECUTIVE (*)INDEPENDENT (**)
COMMITTEES
Audit Risk Governance Remuneration AML/CFT
Antoun SEHNAOUI Chairman E Member Chairman
Nabil SEHNAOUI Member NE Member Member Member Member
Pierre Frédéric KAMEL Member NE Member Member
Mina B.H.C. Holding SAL-represented by Pierre Frédéric KAMEL
Member NE
NSKINV Ltd - Represented by Antoun SEHNAOUI
Member NE
Societe Generale France SA - Represented by Alexandre MAYMAT
Member NE Member
Jean-Louis MATTEI Member I Chairman
Ishac Mazen HANNA Member I Chairman Chairman
Eric WORMSER Member NE Member Member Member Member Member
Jean-Pierre DUCROQUET
Member I Chairman
MINA B.H.C. HOLDING
SA
SAL
16.79 %
SOCIETE GENERALELTD
12.20 %
NSKINV
51. 65 %
ANTOUN SEHNAOUI
19.25 %
Corporate GovernanceB o a r d o f D i r e c t o r s a n d C o m m i t t e e s
Corporate GovernanceS h a r e h o l d i n g
Corporate GovernanceS t a t u t o r y A u d i t o r s
Marie-Joëlle Chabenne Abi-Aad
G r o u p I n t e r n a l A u d i t
14 | 15

Head of the Systems, Projects, and Infrastructure Division
S. Maaraoui joined SGBL group in 2001 after holding several executive positions in the banking sector in France. He is actually a Board Member of CTM, the credit card processing company that is 50% owned by SGBL. Prior to heading the Systems, Projects and Infrastructure Division, Mr. Maaraoui was SGBL’s Head of Internal Audit and Inspection. He holds a Master’s degree in Economics – major in Finance from the University of Amiens (France).
Deputy General ManagerSleiman Maaraoui
A. Sehnaoui is SGBL’s Chairman and CEO since 2007. He is also the Chairman of Fidus- the Group’s financial institution, the Chairman of Compagnie Financière Richelieu, the Chairman of the Supervisory Board of Banque Richelieu France, the Chairman of Banque Richelieu Monaco and the Chairman of Banque Richelieu GCC. Mr. Sehnaoui holds a BA in Business Administration – major in International Finance and Banking from the University of Southern California (USA) and is a member of the Board of Directors of the Association of Banks in Lebanon.
Chairman & CEOAntoun Sehnaoui
Ph. Dubois joined SGBL group in 2014 and was appointed Deputy CEO by the board in March 2015. Prior to that, he was with Societe Generale group where he held several positions in Societe Generale’s network in France, before taking up executive positions within the international network (French Polynesia and Serbia) and later on, supervising the Retail banking activity in Russia. Mr. Dubois graduated from French business school ESLSCA (Ecole Supérieure Libre des Sciences Commerciales Appliquées) and holds a Master’s Degree in Management Control.
Deputy Chief Executive OfficerPhilippe Dubois
Head of the Commercial Division - Retail, Corporate and Private Banking
T. Chehab joined SGBL group in 1999 as General Manager of Fidus. Prior to that, Mr. Chehab held several executive positions in France in various businesses, among which as Group Financial Controller with Tractel Group and as Senior Consultant at United Group Consultants. Within SGBL group, Mr. Chehab also acts as Chairman of Sogelease Liban, the Group’s leasing company. He holds a Master’s degree in Management – major in Finance, from the University of Dauphine in Paris.
Deputy General ManagerTarek Chehab
Head of Strategy, Capital Markets, International Banking & Corporate Secretariat Group CFO
G. Saghbini joined SGBL group in 1996. He has since occupied several executive positions in the Bank and within the Group. Mr. Saghbini presently acts as Chairman of SGBL Insurance, the Group’s life insurance company, and is a Board Member of SGBJ and SGBCy, the Group’s subsidiary banks in Jordan and Cyprus respectively. He is also Vice-Chairman of the Supervisory Board of Banque Richelieu France, Chairman of Banque Richelieu Gestion and member of the Board of Banque Richelieu Monaco. He holds a Master’s degree in Economics from the Paris I – Sorbonne University and from Ecole Normale Supérieure in Paris, as well as a Post graduate diploma in Money, Banking and Finance from the Sorbonne University.
Deputy General ManagerGeorges Saghbini
CEO of Societe Generale Bank – Cyprus Ltd
K. Letayf joined SGBL group in 2008. Prior to that, he held different managerial positions in the e-payment and banking businesses in both France and Lebanon. Within SGBL group, and prior to heading SGBL’s subsidiary in Cyprus, Mr. Letayf acted as SGBL’s Head of the Resources and Services Division and occupied, on rotating presidency basis, the position of Chairman of CTM, the credit card processing company that is 50% owned by SGBL. He holds a degree in Engineering from Ecole Centrale de Paris.
Deputy General ManagerKhalil Letayf
Corporate GovernanceE x e c u t i v e C o m m i t t e e
16 | 17
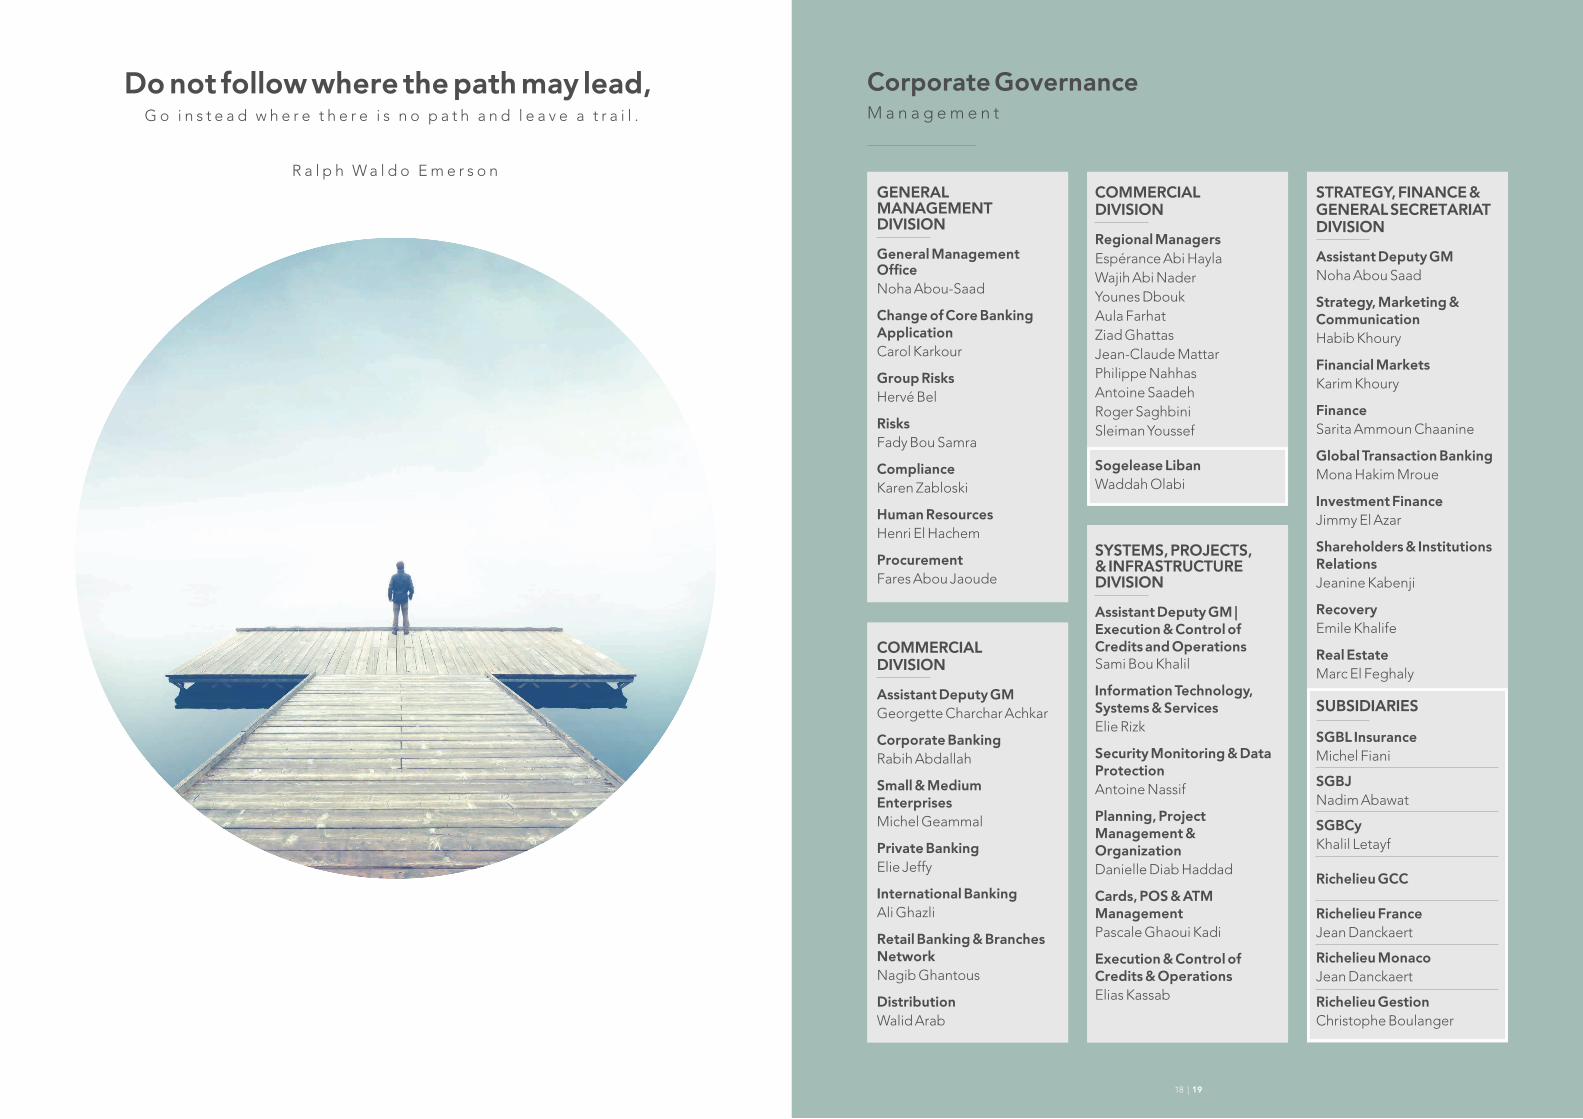
Do not follow where the path may lead,G o i n s t e a d w h e r e t h e r e i s n o p a t h a n d l e a v e a t r a i l .
R a l p h W a l d o E m e r s o n
Corporate GovernanceM a n a g e m e n t
GENERAL MANAGEMENT DIVISION
General Management Office Noha Abou-Saad
Change of Core Banking ApplicationCarol Karkour
Group Risks Hervé Bel
RisksFady Bou Samra
ComplianceKaren Zabloski
Human ResourcesHenri El Hachem
ProcurementFares Abou Jaoude
COMMERCIALDIVISION
Assistant Deputy GMGeorgette Charchar Achkar
Corporate BankingRabih Abdallah
Small & Medium EnterprisesMichel Geammal
Private BankingElie Jeffy
International BankingAli Ghazli
Retail Banking & Branches NetworkNagib Ghantous
DistributionWalid Arab
COMMERCIALDIVISION
Regional ManagersEspérance Abi HaylaWajih Abi Nader Younes DboukAula FarhatZiad GhattasJean-Claude MattarPhilippe NahhasAntoine SaadehRoger SaghbiniSleiman Youssef
Sogelease LibanWaddah Olabi
SYSTEMS, PROJECTS, & INFRASTRUCTURE DIVISION
Assistant Deputy GM | Execution & Control of Credits and OperationsSami Bou Khalil
Information Technology, Systems & ServicesElie Rizk
Security Monitoring & Data ProtectionAntoine Nassif
Planning, Project Management & OrganizationDanielle Diab Haddad
Cards, POS & ATM ManagementPascale Ghaoui Kadi
Execution & Control of Credits & OperationsElias Kassab
STRATEGY, FINANCE & GENERAL SECRETARIAT DIVISION
Assistant Deputy GMNoha Abou Saad
Strategy, Marketing & CommunicationHabib Khoury
Financial MarketsKarim Khoury
FinanceSarita Ammoun Chaanine
Global Transaction BankingMona Hakim Mroue
Investment FinanceJimmy El Azar
Shareholders & Institutions RelationsJeanine Kabenji
RecoveryEmile Khalife
Real EstateMarc El Feghaly
SUBSIDIARIES
SGBL InsuranceMichel Fiani
SGBJNadim Abawat
SGBCyKhalil Letayf
Richelieu GCC
Richelieu FranceJean Danckaert
Richelieu MonacoJean Danckaert
Richelieu GestionChristophe Boulanger
18 | 19
Corporate GovernanceF r a m e w o r k
The implementation of appropriate Corporate Governance guidelines allows for consolidating the Bank’s universal banking model that is geared towards customers, expanding the customer base, improving operational efficiency and developing human capital.
In addition to its obligations towards its shareholders, SGBL Group has the obligation of fulfilling its responsibilities towards depositors and other stakeholders. Setting up a sound corporate governance framework earns and maintains the trust and confidence of the public.
A Corporate Governance Charter was developed at SGBL in 2008. It evolves continuously in accordance with new local and international regulations, with the latest amendments introduced in 2017 in line with the Central Bank’s recently issued guidelines.
The organizational structure that was adopted by SGBL promotes the sound and proper functioning of the Bank in compliance with the fundamental principles of sound Corporate Governance. It also reflects and serves SGBL Group’s corporate culture, objectives and strategy.
This Structure Is Based On1. Internal stakeholders, primarily the Board of Directors, Senior Management Executives, Internal Audit,
Risk Management, and Compliance divisions for which a clear definition of roles and responsibilities is established while respecting the principle of the separation of powers through the creation of several committees serving that purpose;
2. The committees of the deliberative and decision making bodies as well as those deriving from these bodies, namely the Audit, Risk, Governance, Remuneration and AML/ CFT Committees;
3. External stakeholders, mainly shareholders, supervisory authorities and external auditors; 4. A risk management system stemming from the implementation of an overall risk management policy.
This policy has been devised in accordance with the provisions of the Banking Control Commission circulars. Furthermore, this policy has been detailed for each specific risk: credit risk, concentration risk, market risk and interest rate risk, liquidity risk and operational risks;
5. An internal monitoring system built on formal procedures, both at the continuous monitoring level (daily security and formal supervision) and at the level of periodic internal audit.
6. An efficient communication and information system specifying the communication channels between all levels of the hierarchy as well as the reporting process enabling all stakeholders to be up to date with policies, procedures and internal control systems adopted by the Bank.
The Board and its committees are governed by their own specific internal regulations. Moreover, each Director acknowledges and agrees to comply with the Director’s Charter as adopted by the Board of Directors.
Board of DirectorsThe Board of Directors consists of 10 Directors, the majority of whom are independent and non-executive. Board members are elected by an Ordinary General Shareholders’ Meeting for a period of three years.
The Board of Directors bears the ultimate responsibility of the Bank’s operations and financial soundness. Its main mission is to ensure that the Bank operates in accordance with the regulations to which it is subject, in line with the established strategy and in the best interests of the shareholders whom it represents.
In certain areas, the preparatory work for the deliberations of the Board is carried out by specialized Committees composed of directors appointed by the Board; these Committees examine matters within their remit and submit their opinions and proposals to the Board for approval.
These committees achieve their mission under the authority of the Board of Directors.
Risk CommitteeThe mission of the Risk Committee comprises i) periodically reviewing the organization and the performance of the Risk monitoring framework at SGBL, ii) supervising the effective application of the principles of risk management at the Bank and Group level, iii) examining the portfolio of credit and market risks borne by the Bank, iv) monitoring the portfolio breakdown and its evolution by category of limits/outstanding volumes and debtor clients, the regulatory ratios and key indicators (allocation of common equity per major risk, risk deterioration, concentration risks by sector, cost of risk, etc.), changes to the quality of loans etc, v) ensuring that IFRS9 requirements have been fulfilled.
Audit Committee The Audit Committee assists the Board of Directors in its missions and its supervisory role. Overall, the committee i) examines, at regular intervals, the operating conditions and the activities of periodic and permanent internal control, ii) ensures the consistency and effectiveness of the security control measures, of the mechanisms established for the internal control of procedures, risks, regulatory accounting and ethical standards as well as anti-money laundering and anti-terrorist financing mechanisms, iii) ensures that the Bank complies with all the laws, rules and standards that govern the banking industry, namely with the directives, circulars and recommendations of the Central Bank of Lebanon, the Banking Control Commission, the Special Investigation Commission and the Capital Markets Authority, iv) reports to the Board of Directors the delays detected and the potential discrepancies within the framework of critical or high-priority corrective actions, particularly deficiencies that might expose the Bank to significant risk, v) ensures that IFRS9 requirements have been fulfilled.
Remuneration Committee The Remuneration Committee is assigned the task of making recommendations to the board based on the review of the practices followed by SGBL Group. Its mission comprises i) to prepare the Remuneration Policy and the Remuneration System and submit them to the Board of Directors for approval, ii) to supervise the proper implementation of both the Remuneration Policy and Remuneration System, iii) to review at least once a year the rules/principles based on which the Remuneration Policy is implemented, iv) to assess periodically the efficiency of the Remuneration Policy and its effectiveness, v) to evaluate accurately the total remunerations granted, and compare them against the future expected revenues in order to avoid any likely negative results, vi) to submit to the Board of Directors specific proposals about the Senior Executive Management and holders of key positions remunerations, vii) the process of renewal and replacement of directors and members of Senior Management, viii) to propose long term incentives ix) to propose fees paid to directors and executives, x) to coordinate closely with the Risk Committee upon assessing the remuneration and their related risks and upon reviewing the Remuneration Policy.
AML/CFT Committee The mission of AML/CFT Committee is to i) to support the Board of Directors in its functions and supervisory role with respect to fighting money laundering and terrorist financing and understanding the related risks, and to assist it with making the appropriate decisions in this regard, and ii) to review, from a risk-based approach, the reports submitted by the Compliance Unit and the Internal Audit Unit on adopted procedures, unusual operations and high-risk accounts, regarding cash deposits and withdrawals, transfers, exemptions from filling Cash Transaction Slips (CTS) and the link between these operations and economic activities, and to also take the relevant decisions.
Governance Committee The mission of the Governance Committee is to i) oversee the effective functioning of the corporate governance structure, ii) evaluate and update this structure, iii) carry out preparatory work for the examination by the Board of Directors of corporate governance issues, and iv) conduct an annual assessment of the Board of Directors’ performance.
Executive Committee The Bank’s Executive Committee comprises: the Chairman and Chief Executive Officer, the Deputy Chief Executive Officer and the Deputy General Managers.
The Bank’s Executive Committee implements the strategy approved by the Board of Directors, delegates tasks and establishes an organizational structure that allows for appropriate operations; it monitors the responsibilities, and it is ultimately responsible before the Board for the effective operation of the Bank.
Management Committee The Management Committee is composed of members of executive committee, senior managers and managers representing the major functions and sectors of the Bank and whose responsibilities have a major impact on the activity of the Bank. This Committee is an instance for communication and exchanges on the strategy and the bank’s general interest issues. It promotes the exchange of information and thorough reflection as well as the emergence of positive initiatives for the development of the bank.
20 | 21
Frequency of Meetings The Board holds at least four meetings each year, and whenever required. At least once a year, an item of the agenda is dedicated to the evaluation of the performance of the Board of Directors.The frequency of the meetings of the Committees is set by the Board of Directors, taking into account local regulations. A minimum number of meetings is required as follows:• Four annual meetings of the Risk and Audit Committees at the rate of one committee per quarter of
which at least two are to be held in Lebanon, • Two annual Remuneration and AML/CFT Committees at the rate of one per semester, • One annual Corporate Governance Committee.
Internal Specialized CommitteesIn order to achieve an adequate level of protection against the risks faced by the Bank, Senior Management must hold on regular basis internal specialized committees that comprise officers in charge of handling the issues mentioned below. The following committees fall within the category of internal specialized committees:
Credit Committees Credit Committees approve loans which exceed the approval limits set for the commercial division.
Sensitive Risk CommitteesSensitive Risk Committees review sensitive and doubtful loans managed by the commercial entities.
Recovery CommitteesRecovery Committees are mandated to take decisions in respect of non-performing loans managed by the Recovery Department.
Asset/Liability Management Committee (ALCO) This committee’s mission is to prepare the decisions of the Management in terms of general tolerance to liquidity risks, validate the contingency funding plan to enable the bank to overcome liquidity crisis, monitor the evolution of the liquidity situation, validate the adequacy of the monitoring system, management and supervision of structural risks, and review developments of structural Group risk through consolidated reports.
Treasury Committee Delegated by the ALCO Management Committee, this committee assesses the Bank’s short-term liquidity and takes steering decisions in accordance with the market’s situation.
Correspondent Banking CommitteeThis Committee’s mission is to approve the files of correspondent banks that have been authorized by the Board of Directors according to the limits set.
Market Risk Monitoring Committee Its mission is i) to identify, assess and track market risk generated by operations carried out on behalf of his activities of proprietary trading, corporate and institutional clients and the financial department in relation to the ALCO Committee, ii) to define and follow up the alert procedures, and iii) to ensure the real independence between the back and the front offices.
Investment Committee Its mission is to approve any equity participation of the Bank in a company in Lebanon or abroad.
Operating Real estate Investment CommitteeIts mission is to approve i) any purchase or sale of real estate within the scope of article 153 of CMC and ii) any participation in a real estate company which activities are strictly limited to the acquisition of said real estate properties.
Operational Committee for Combatting Money Laundering and Terrorism Financing Its mission is to analyze AML/CFT Risk Cartography, follow the upgrade and development of new measures to take related to AML/CFT as well as the business plan through compliance reports concerning the implementation of decisions and AML/CFT regulations.
Operational Risks CommitteeThis committee ensures the proper implementation of policies and procedures pertaining to the management of operational risks as set by the Board of Directors and Senior Management.
IFRS 9 CommitteeThis committee ensures the classification of financials assets into 3 categories according to IFRS9 requirements, takes impairment decisions for expected credit losses and hold meetings with audit and risk committees in order to discuss IFRS9 reports and requirements.
Physical and IT Security CommitteeIts mission is to i) validate the IT and physical security policies following the recommendation of the Head of IT, ii) supervise the proper implementation of this policy, iii) decide on appropriate corrective actions and iv) recommend measures to be taken in case of breaches of any security rules.
Subsidiaries Monitoring CommitteeThis committee’s mission is to monitor the situation of subsidiaries both at the level of their performance and at the level of ongoing risk assessment and compliance with local regulations and with the directives of SGBL Group.
Projects Portfolio Monitoring CommitteeThis Committee is in charge of i) implementing the Bank transversal projects, ii) monitoring their progress, and iii) taking decisions on projects priorities and deadlines.
New Product CommitteeThis committee approves the concept and the proposal for a new product based on a feasibility study. It also gives the green light for launching a product based on a complete report detailing targets, marketing channels and the subsequent action plan.
Legal Affairs CommitteeThis committee makes an assessment of the coverage of legal risks at the Recovery and Legal Affairs departments.
Quality Monitoring CommitteeThis committee validates the quality policy to be validated by the Board and submits to the General Management periodic reports, at least quarterly, about customers’ claims, the nature, handling, and outcome of these claims, and the measures proposed to improve the policy relating to “The Principles of Banking and Financial Operations with Customers”.
Procurement CommitteeThe committee’s mission is to authorize purchases, orders or agreements pertaining to services or maintenance.
Corporate GovernanceF r a m e w o r k
22 | 23
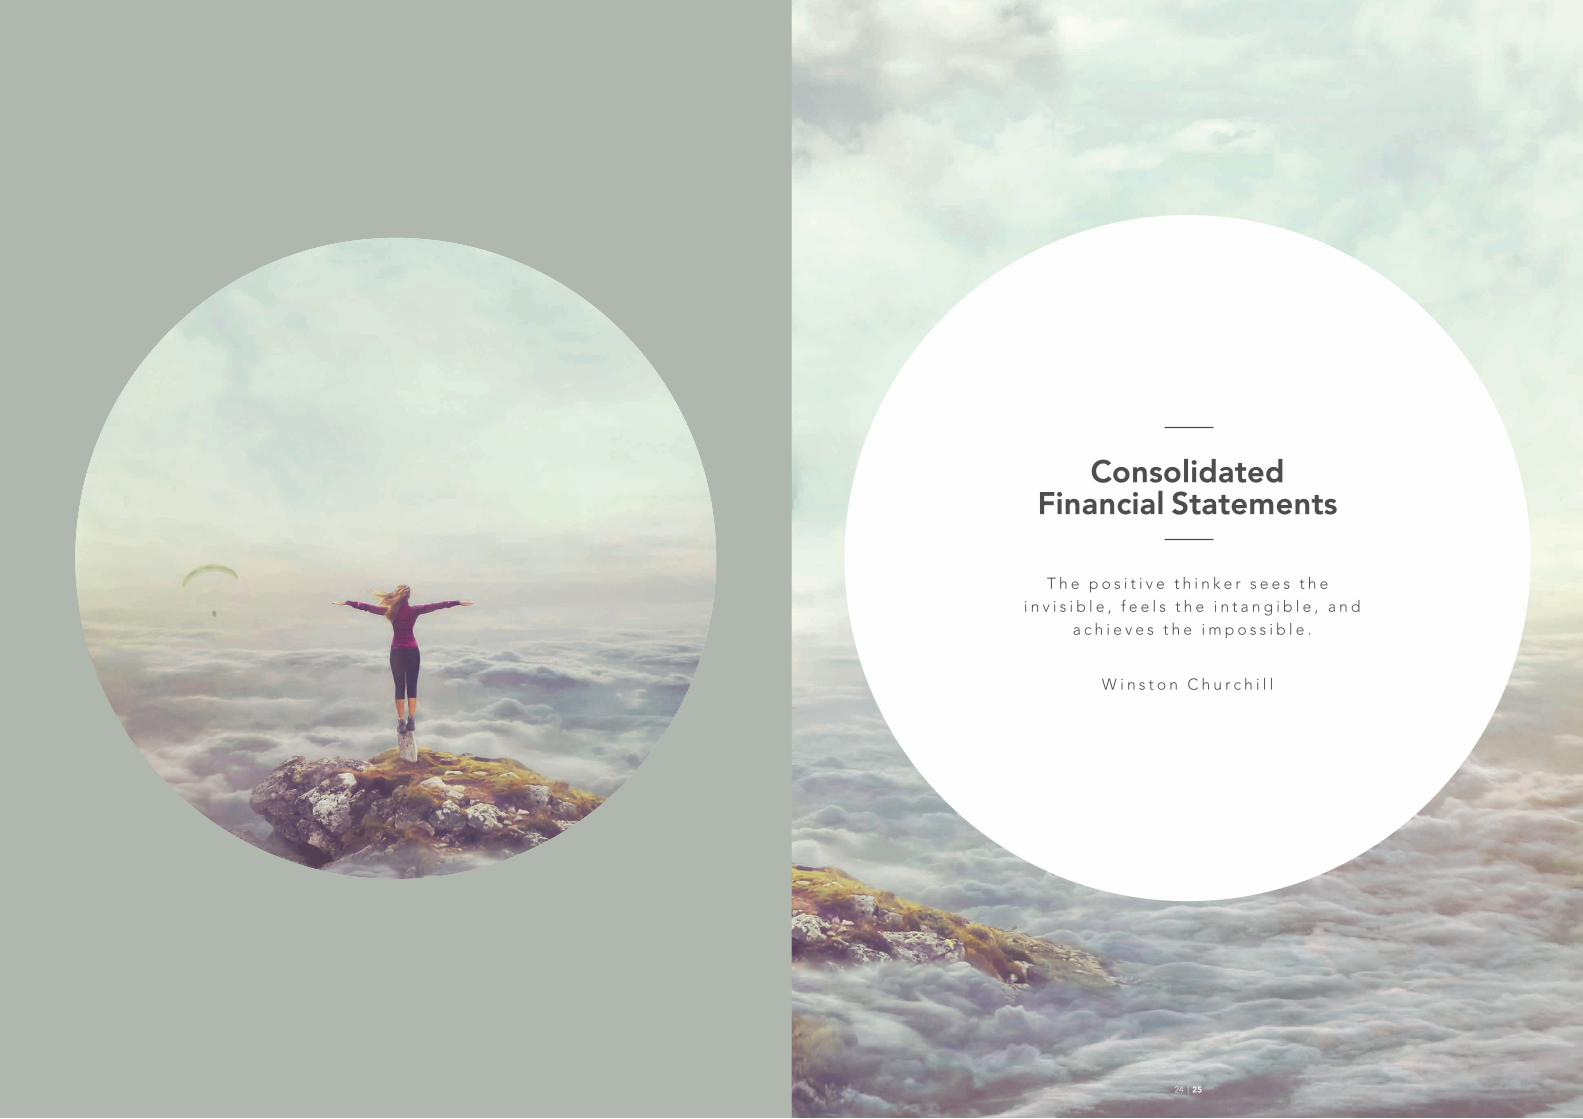
ConsolidatedFinancial Statements
T h e p o s i t i v e t h i n k e r s e e s t h e i n v i s i b l e , f e e l s t h e i n t a n g i b l e , a n d
a c h i e v e s t h e i m p o s s i b l e .
W i n s t o n C h u r c h i l l
24 | 25
INDEPENDENT AUDITORS’ REPORT TO THE SHAREHOLDERS OF SOCIÉTÉ GÉNÉRALE DE BANQUE AU LIBAN SAL
Qualified opinion We have audited the consolidated financial statements of Société Générale de Banque au Liban SAL (the “Bank”) and its subsidiaries (collectively the “Group”), which comprise the consolidated statement of financial position as at 31 December 2018, and the consolidated income statement, consolidated statement of comprehensive income, consolidated statement of changes in equity and consolidated statement of cash flows for the year then ended, and notes to the sonsolidated financial statements, including a summary of significant accounting policies.
In our opinion, except for the effects of the matter described in the “Basis for Qualified Opinion” section of our report, the accompanying consolidated financial statements present fairly, in all material respects, the consolidated financial position of the Group as at 31 December 2018, its consolidated financial performance and its consolidated cash flows for the year then ended in accordance with International Financial Reporting Standards (IFRSs).
Basis for qualified opinion As disclosed in notes 36 and 37 to the consolidated financial statements, due to regulatory requirements enacted since 2016, the Group carried excess provisions of LL 350,681 million (the “excess provisions”) as at 31 December 2017. This caused us to qualify our opinion on the consolidated financial statements relating to previous years affected by these regulatory requirements as these transactions constitute a departure from International Financial Reporting Standards (IFRS). Our audit opinion for the current year is also qualified due to the effect of these prior years transactions on the consolidated financial statements as at 31 December 2018. As disclosed in note 2.3 and in compliance with regulatory instructions, the Group used an amount of LL 121,585 million from the excess provisions to provide for additional amounts resulting from the first-time adoption of IFRS 9 Expected Credit Losses (ECL) model on 1 January 2018, instead of recognizing the impact within opening “Retained earnings” (as required by IFRS). The remaining excess provisions, net of reversals of LL 39,497 million recorded under “Other operating income” and LL 109,412 million recorded under “net gain from sale of amortized cost instruments” and net of “income tax expense” amounting to LL 16,412 million, amounted to LL 96,599 million as at 31 December 2018 and were classified under “Other liabilities”.
Accordingly, “Profit for the year” 2018 is overstated by LL 132,497 million, “Other liabilities” is overstated by LL 96,599 million and “Total equity” is understated by LL 96,599 million as at 31 December 2018 (2017: “Other liabilities” and “Provisions for risks and charges” were overstated by LL 184,856 million and LL 165,825 million respectively, and “Total equity” was understated by LL 350,681 million).
We conducted our audit in accordance with International Standards on Auditing (ISAs). Our responsibilities under those standards are further described in the Auditors’ Responsibilities for the Audit of the Consolidated Financial Statements section of our report. We are independent of the Group in accordance with the International Ethics Standards Board for Accountants’ Code of Ethics for Professional Accountants (IESBA Code) together with the ethical requirements that are relevant to our audit of the consolidated financial statements in Lebanon, and we have fulfilled our other ethical responsibilities in accordance with these requirements and the IESBA Code. We believe that the audit evidence we have obtained is sufficient and appropriate to provide a basis for our qualified opinion.
Key audit matters Key audit matters are those matters that, in our professional judgment, were of most significance in our audit of the consolidated financial statements for the year ended 31 December 2018. In addition to the matter described in the Basis for qualified opinion section, we have determined the matters described below to be the key audit matters to be communicated in our report. These matters were addressed in the context of our audit of the consolidated financial statements as a whole, and in forming our opinion thereon, and we do not provide a separate opinion on these matters. For each matter below, our description of how our audit addressed the matter is provided in that context.
We have fulfilled the responsibilities described in the Auditors’ responsibilities for the audit of the consolidated financial statements section of our report, including in relation to these matters. Accordingly, our audit included the performance of procedures designed to respond to our assessment of the risks of material misstatement of the consolidated financial statements. The results of our audit procedures, including the procedures performed to address the matters below, provide the basis for our qualified audit opinion on the accompanying consolidated financial statements.
Allowances for expected credit losses Refer to note 2.5 of the consolidated financial statements for a description of the accounting policy and note 51.1 for analysis of credit risk.
Due to the inherently judgmental nature of the computation of expected credit losses (“ECL”) for financial assets, there is a risk that the amount of ECL may be misstated. On adoption, the Group has applied the requirements of IFRS 9 retrospectively without restating the comparatives.
The key areas of judgement include:1. The identification of exposure with a significant deterioration in credit quality.2. Assumptions used in the ECL model such as financial condition of counterparty, expected future cash flows,
forward looking macroeconomic factors etc.3. The need to apply additional overlays to reflect current or future external factors that might not be captured
by the expected credit loss model.
How the matter was addressed during our audit:We performed the following procedures:1. We assessed the modelling techniques and methodology against the requirements of IFRS 9.2. We tested the data, both current and historical, used in determining the ECL.3. We tested the expected credit loss models including build, validation and governance of models.4. We tested the material modelling assumptions in addition to any overlays.5. We examined a sample of exposures and performed procedures to determine whether significant increase in
credit risk had been identified on a timely basis.6. We re-performed the ECL computation for sample of credit facilities.7. We assessed the adequacy of disclosures in the Consolidated financial statements.
Other information included in the Group’s 2018 Annual Report Other information consists of the information included in the Group’s 2018 Annual Report, other than the consolidated financial statements and our auditors’ report thereon. Management is responsible for the other information. The Group’s 2018 Annual Report is expected to be made available to us after the date of this auditors’ report.
Our opinion on the consolidated financial statements does not cover the other information and we will not express any form of assurance conclusion thereon.
In connection with our audit of the consolidated financial statements, our responsibility is to read the other information identified above when it becomes available and, in doing so, consider whether the other information is materially inconsistent with the consolidated financial statements or our knowledge obtained in the audit or otherwise appears to be materially misstated.
Responsibilities of Management and those Charged with Governance for the Consolidated Financial Statements Management is responsible for the preparation and fair presentation of the consolidated financial statements in accordance with IFRSs, and for such internal control as Management determines is necessary to enable the preparation of consolidated financial statements that are free from material misstatement, whether due to fraud or error.
26 | 27
The partners in charge of the audit resulting in this independent auditors’ report are Walid Nakfour for Ernst & Young and Nehme Semaan for BDO, Semaan, Gholam & Co.
20 April 2019Beirut, Lebanon
In preparing the consolidated financial statements, Management is responsible for assessing the Group’s ability to continue as a going concern, disclosing, as applicable, matters related to going concern and using the going concern basis of accounting unless Management either intends to liquidate the Group or to cease operations, or has no realistic alternative but to do so.
Those charged with governance are responsible for overseeing the Group’s financial reporting process.
Auditors’ Responsibilities for the Audit of the consolidated Financial Statements Our objectives are to obtain reasonable assurance about whether the consolidated financial statements as a whole are free from material misstatement, whether due to fraud or error, and to issue an auditors’ report that includes our opinion. Reasonable assurance is a high level of assurance, but is not a guarantee that an audit conducted in accordance with ISAs will always detect a material misstatement when it exists. Misstatements can arise from fraud or error and are considered material if, individually or in the aggregate, they could reasonably be expected to influence the economic decisions of users taken on the basis of these consolidated financial statements.
As part of an audit in accordance with ISAs, we exercise professional judgment and maintain professional skepticism throughout the audit. We also:
• Identify and assess the risks of material misstatement of the consolidated financial statements, whether due to fraud or error, design and perform audit procedures responsive to those risks, and obtain audit evidence that is sufficient and appropriate to provide a basis for our opinion. The risk of not detecting a material misstatement resulting from fraud is higher than for one resulting from error, as fraud may involve collusion, forgery, intentional omissions, misrepresentations, or the override of internal control.
• Obtain an understanding of internal control relevant to the audit in order to design audit procedures that are appropriate in the circumstances, but not for the purpose of expressing an opinion on the effectiveness of the Group’s internal control.
• Evaluate the appropriateness of accounting policies used and the reasonableness of accounting estimates and related disclosures made by Management.
• Conclude on the appropriateness of Management’s use of the going concern basis of accounting and, based on the audit evidence obtained, whether a material uncertainty exists related to events or conditions that may cast significant doubt on the Group’s ability to continue as a going concern. If we conclude that a material uncertainty exists, we are required to draw attention in our auditors’ report to the related disclosures in the consolidated financial statements or, if such disclosures are inadequate, to modify our opinion. Our conclusions are based on the audit evidence obtained up to the date of our auditors’ report. However, future events or conditions may cause the Group to cease to continue as a going concern.
• Evaluate the overall presentation, structure and content of the consolidated financial statements, including the disclosures, and whether the consolidated financial statements represent the underlying transactions and events in a manner that achieves fair presentation.
• Obtain sufficient appropriate audit evidence regarding the financial information of the entities or business activities within the Group to express an opinion on the consolidated financial statements. We are responsible for the direction, supervision and performance of the group audit. We remain solely responsible for our audit opinion.
We communicate with those charged with governance regarding, among other matters, the planned scope and timing of the audit and significant audit findings, including any significant deficiencies in internal control that we identify during our audit.
We also provide those charged with governance with a statement that we have complied with relevant ethical requirements regarding independence, and to communicate with them all relationships and other matters that may reasonably be thought to bear on our independence, and where applicable, related safeguards.
From the matters communicated with those charged with governance, we determine those matters that were of most significance in the audit of the consolidated financial statements of the current period and are therefore the key audit matters. We describe these matters in our auditors’ report unless law or regulation precludes public disclosure about the matter or when, in extremely rare circumstances, we determine that a matter should not be communicated in our report because the adverse consequences of doing so would reasonably be expected to outweigh the public interest benefits of such communication.
28 | 29

Societe Generale de Banque au Liban SAL
Consolidated Financial Statements
The attached notes 1 to 52 form part of these consolidated financial statements. 30 | 31
CONSOLIDATED INCOME STATEMENT For the year ended 31 December 2018
Notes2018
LL million2017
LL million
Interest and similar income 5 2,041,023 1,648,668
Interest and similar expense 6 (1,627,224) (1,210,167)
NET INTEREST INCOME 413,799 438,501
Fee and commission income 7 120,660 98,024
Fee and commission expense (44,398) (39,781)
NET FEE AND COMMISSION INCOME 76,262 58,243
Net gain from financial assets at fair value through profit or loss 8 20,036 12,476
Revenue from financial assets at fair value through other comprehensive income 9 5,260 1,715
Net gain from sale of financial assets at amortized cost 24 115,910 182,556
Other operating income 10 87,260 34,114
TOTAL OPERATING INCOME 718,527 727,605
Net credit losses 11 (13,239) (12,285)
NET OPERATING INCOME 705,288 715,320
Personnel expenses 12 (172,808) (142,058)
Other operating expenses 13 (177,003) (157,326)
Depreciation of property and equipment 24 (12,761) (11,955)
Amortization of intangible assets 25 (3,415) (3,336)
Provision for impairment on non-currrent assets held for sale 27 - (3,010)
TOTAL OPERATING EXPENSES (365,987) (317,685)
PROFIT BEFORE TAX 339,301 397,635
Income tax expense 14 (44,957) (64,573)
PROFIT FOR THE YEAR 294,344 333,062
Attributable to:
Equity holders of the parent 292,180 330,768
Non-controlling interest 2,164 2,294
294,344 333,062
CONSOLIDATED STATEMENT OF COMPREHENSIVE INCOME For the year ended 31 December 2018
2018LL million
2017LL million
PROFIT FOR THE YEAR 294,344 333,062
Other comprehensive loss
Other comprehensive (loss) income to be reclassified to profit or loss in subsequent periods (net of tax):Exchange differences on translation of foreign operations (10,160) 14,269
Net loss from financial assets at fair value through other comprehensive income (5,841) -
(16,001) 14,269
Other comprehensive loss not to be reclassified to profit or loss in subsequent periods(net of tax):Net loss from financial assets at fair value through other comprehensive income (21,005) (11,918)
Actuarial gain on defined benefits plans 1,091 -
Other comprehensive (loss) income for the year, net of tax (35,915) 2,351
TOTAL COMPREHENSIVE INCOME FOR THE YEAR, NET OF TAX 258,429 335,413
Attributable to:
Equity holders of the parent 256,303 333,136
Non-controlling interests 2,126 2,277
258,429 335,413
Notes2018
LL million2017
LL million
ASSETS
Cash and balances with the Central Banks 15 16,615,531 13,259,404
Due from banks and financial institutions 16 1,779,148 854,226
Amounts due from affiliated banks and financial institutions 17 226,416 590,385
Loans to banks and financial institutions 8,397 8,397
Derivative financial instruments 18 25,541 9,197
Financial assets at fair value through profit or loss 19 99,162 201,687
Loans and advances to customers at amortized cost 20 8,635,701 7,344,616
Loans and advances to related parties at amortized cost 21 123,229 111,065
Debtors by acceptances 843,212 445,375
Financial assets at amortized cost 22 9,172,652 8,642,264
Financial assets at fair value through other comprehensive income 23 360,213 161,514
Property and equipment 24 537,424 485,330
Intangible assets 25 61,941 48,019
Investment properties 26 1,226 1,478
Non-current assets held for sale 27 203,080 186,504
Other assets 28 157,297 134,084
Other intangible assets and goodwill arising on acquisition 3 37,029 -
Goodwill 29 3,405 3,405
Total assets 38,890,604 32,486,950

Societe Generale de Banque au Liban SAL
Consolidated Financial Statements
The attached notes 1 to 52 form part of these consolidated financial statements. 32 | 33
Notes2018
LL million2017
LL millionLIABILITIES AND EQUITYLIABILITIES
Due to the Central Banks 30 3,930,160 1,622,207
Loans and repurchase agreements 31 1,461,028 1,681,384
Due to banks and financial institutions 32 1,194,562 479,217
Amounts due to affiliated banks and financial institutions 33 7,553 6,844
Derivative financial instruments 18 27,212 164
Customers' deposits at amortized cost 34 28,064,058 24,690,508
Related parties’ deposits at amortized cost 35 124,574 165,282
Engagements by acceptances 849,560 445,375
Other liabilities 36 261,622 367,376
Provision for risks and charges 37 77,049 248,920
Total liabilities 35,997,378 29,707,277
EQUITY
Share capital – common shares 38 14,586 14,586
Share capital – preferred shares 38 9,675 9,675
Share premium – common shares 38 149,349 149,349
Share premium – preferred shares 38 565,279 563,200
Preferred shares under issuance 38 191,663 -
Preferred shares under redemption 38 (190,793) -
Cash contribution by shareholders 38 106,746 106,746
Non distributable reserves 39 1,179,389 961,685
Actuarial gain on defined benefit obligation 1,091 -
Distributable reserves 40 26,447 29,460
Revaluation reserve of property 41 3,934 3,934
Cumulative change in fair value of financial assets at fair value through other comprehensive Income 42 (38,526) (11,678)
Profit for the year 292,180 330,768
Foreign currency translation reserve (14,738) (4,618)
Retained earnings 545,668 573,600
Equity attributable to equity holders of parent 2,841,950 2,726,707
Non-controlling interests 51,276 52,966
Total equity 2,893,226 2,779,673
Total liabilities and equity 38,890,604 32,486,950
CONSOLIDATED STATEMENT OF FINANCIAL POSITION (Continued)As at 31 December 2017
Antoun SehnaouiChairman
Georges SaghbiniDeputy General Manager
The consolidated financial statements were authorized for issue in accordance with a resolution of the Board of Directors on 20 April 2019:C
ON
SOLI
DAT
ED S
TATE
MEN
T O
F C
HAN
GES
IN E
QUI
TYFo
r the
year
end
ed 3
1 D
ecem
ber 2
018
ATT
RIB
UTA
BLE
TO
EQ
UIT
Y H
OLD
ERS
OF
THE
PAR
ENT
LL M
ILLI
ON
Non
-con
trollin
g in
tere
st
LL m
illion
Tota
l eq
uity
LL
milli
on
Shar
e ca
pita
l –
com
mon
sh
ares
Shar
e ca
pita
l –
pref
erre
d
shar
es
Shar
e pr
emiu
m –
co
mm
on
shar
es
Shar
e pr
emiu
m –
pr
efer
red
sh
ares
Pref
erre
d
shar
es u
nder
is
suan
ce
Pref
erre
d
shar
es u
nder
re
dem
ptio
n
Cas
h
cont
ribut
ion by
sh
areh
olde
rs
shar
ehol
ders
Non
di
strib
utab
le
rese
rves
dist
ribut
able
re
serv
es
Reva
luat
ion
rese
rve
of
prop
erty
Cum
ulat
ive
chan
ge
in fa
ir va
lue
of
finan
cial
ass
ets a
t fai
r va
lue
thro
ugh
othe
r co
mpr
ehen
sive
inco
me
Fore
ign
curr
ency
tr
ansl
atio
n re
serv
e
Act
uaria
l ga
in o
n de
fined
be
nefit
ob
ligat
ion
Profi
t for
th
e ye
arRe
tain
ed
earn
ings
Tota
lN
otes
LL m
illio
nLL
mill
ion
LL m
illio
nLL
mill
ion
LL m
illio
nLL
mill
ion
LL m
illio
nLL
mill
ion
LL m
illio
nLL
mill
ion
LL m
illio
nLL
mill
ion
LL m
illio
nLL
mill
ion
LL m
illio
nLL
mill
ion
Bala
nce
at 3
1 D
ecem
ber 2
016
14,5
869,
675
149,
349
561,
171
--
106,
746
864,
648
20,5
323,
934
(218
)(1
8,86
2)-
286,
259
496,
250
2,49
4,07
065
,689
2,55
9,75
9Pr
ofit f
or th
e ye
ar
--
--
--
--
--
--
-33
0,76
8-
330,
768
2,29
433
3,06
2O
ther
com
preh
ensiv
e lo
ss-
--
--
--
--
-(1
1,87
6)14
,244
--
-2,
368
(17)
2,35
1To
tal c
ompr
ehen
sive
inco
me
--
--
--
--
--
(11,
876)
14,2
44-
330,
768
-33
3,13
62,
277
335,
413
Tran
sfer t
o re
tain
ed e
arni
ngs
--
--
--
--
--
416
--
(286
,259
)28
5,84
3-
--
Tran
sfer t
o no
n di
strib
utab
le re
serv
es39
--
--
--
-97
,536
--
--
--
(97,
536)
--
-
Tran
sfer t
o di
strib
utab
le re
serv
es40
--
--
--
--
8,92
8-
--
--
(8,9
28)
--
-Tr
ansfe
r to
shar
e pr
emiu
m
38-
--
2,02
9-
--
--
--
--
-(2
,029
)-
--
Divi
dend
s pai
d to
equ
ity h
olde
rs o
f th
e pa
rent
– pr
efer
red
shar
es-
--
--
--
--
--
--
-(3
9,76
3)(3
9,76
3)-
(39,
763)
Divi
dend
s pai
d to
equ
ity h
olde
rs o
f th
e pa
rent
– co
mm
on sh
ares
43-
--
--
--
--
--
--
-(6
0,58
8)(6
0,58
8)-
(60,
588)
Acqu
isitio
n of
non
cont
rollin
g in
tere
st
in S
GBL
insu
ranc
e-
--
--
--
--
--
--
-35
135
1(1
3,16
6)(1
2,81
5)
Divi
dend
s pai
d to
non
-con
trollin
g in
tere
st43
--
--
--
--
--
--
--
--
(1,8
34)
(1,8
34)
Adju
stm
ents
3-
- -
- -
- -
(499
)-
--
--
--
(499
)-
(499
)Ba
lanc
e at
31
Dec
embe
r 201
714
,586
9,67
514
9,34
956
3,20
0-
-10
6,74
696
1,68
529
,460
3,93
4(1
1,67
8)(4
,618
)-
330,
768
573,
600
2,72
6,70
752
,966
2,77
9,67
3Im
pact
of I
FRS
9 at
1 Ja
nuar
y-
--
--
--
--
--
--
-(2
3,15
4)(2
3,15
4)(1
,846
)(2
5,00
0)14
,586
9,67
514
9,34
956
3,20
0-
-10
6,74
696
1,68
529
,460
3,93
4(1
1,67
8)(4
,618
)-
330,
768
550,
446
2,70
3,55
351
,120
2,75
4,67
3
Profi
t for
the
year
--
--
--
-29
2,18
0-
292,
180
2,16
429
4,34
4
Oth
er co
mpr
ehen
sive
loss
--
--
--
--
--
(26,
848)
(10,
120)
1,09
1-
-(3
5,87
7)(3
8)(3
5,91
5)To
tal c
ompr
ehen
sive
inco
me
--
--
--
--
--
(26,
848)
(10,
120)
1,09
129
2,18
0-
256,
303
2,12
625
8,42
9
Issua
nce
of p
refe
renc
e sh
ares
38-
--
-18
8,43
8-
--
--
--
--
-18
8,43
8-
188,
438
Rede
mpt
ion
of p
refe
renc
e sh
ares
38-
--
--
(190
,793
)-
--
--
--
--
(190
,793
)-
(190
,793
)Tr
ansfe
r to
reta
ined
ear
ning
s-
--
--
--
(8,1
67)
--
--
-(3
30,7
68)
338,
935
--
-Tr
ansfe
r to
non
dist
ribut
able
rese
rves
39-
--
--
--
225,
871
--
--
--
(225
,871
)-
--
Tran
sfer t
o di
strib
utab
le re
serv
es40
--
--
--
--
212
--
--
-(2
12)
--
-Tr
ansfe
r to
shar
e pr
emiu
m38
--
-2,
079
--
--
--
--
--
(2,0
79)
--
-D
ivide
nds p
aid
to e
quity
hol
ders
of
the
pare
nt –
pref
erre
d sh
ares
43-
--
--
--
--
--
--
-(3
9,76
9)(3
9,76
9)-
(39,
769)
Divi
dend
s pai
d to
equ
ity h
olde
rs
of th
e p
aren
t – co
mm
on sh
ares
43-
--
--
--
--
--
--
-(7
5,75
1)(7
5,75
1)-
(75,
751)
Divi
dend
s pai
d to
non
-con
trollin
g in
tere
st-
--
--
--
--
-(1
,970
)(1
,970
)Tr
ansfe
rs38
--
--
3,22
5-
--
(3,2
25)
--
--
--
--
-
Adju
stm
ents
--
--
--
--
--
--
--
(31)
(31)
-(3
1)
Bal
ance
at 3
1 D
ecem
ber
201
814
,586
9,67
514
9,34
956
5,27
919
1,66
3(1
90,7
93)
106,
746
1,17
9,38
926
,447
3,93
4(3
8,52
6)(1
4,73
8)1,
091
292,
180
545,
668
2,84
1,95
051
,276
2,89
3,22
6
Con
solid
ated
Fin
anci
al S
tate
men
ts
Societe Generale de Banque au Liban SAL
Consolidated Financial Statements
The attached notes 1 to 52 form part of these consolidated financial statements. 34 | 35
Notes2018
LL million2017
LL million
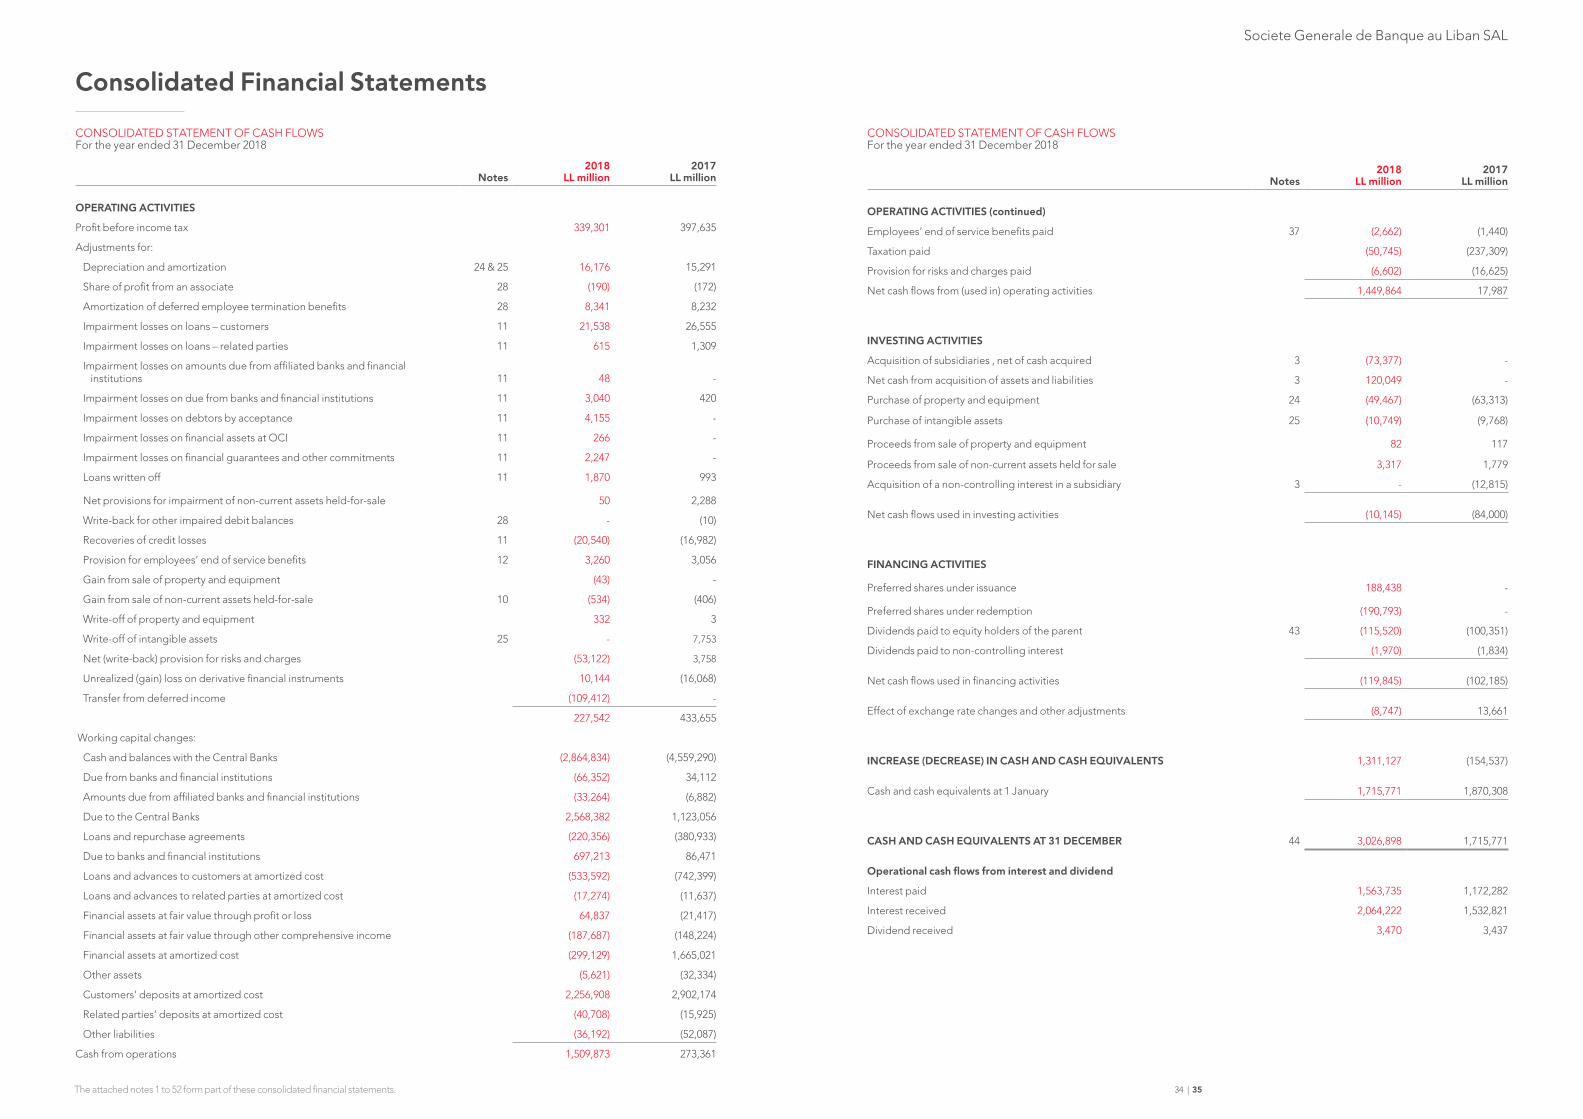
OPERATING ACTIVITIES
Profit before income tax 339,301 397,635
Adjustments for:
Depreciation and amortization 24 & 25 16,176 15,291
Share of profit from an associate 28 (190) (172)
Amortization of deferred employee termination benefits 28 8,341 8,232
Impairment losses on loans – customers 11 21,538 26,555
Impairment losses on loans – related parties 11 615 1,309
Impairment losses on amounts due from affiliated banks and financial institutions 11 48 -
Impairment losses on due from banks and financial institutions 11 3,040 420
Impairment losses on debtors by acceptance 11 4,155 -
Impairment losses on financial assets at OCI 11 266 -
Impairment losses on financial guarantees and other commitments 11 2,247 -
Loans written off 11 1,870 993
Net provisions for impairment of non-current assets held-for-sale 50 2,288
Write-back for other impaired debit balances 28 - (10)
Recoveries of credit losses 11 (20,540) (16,982)
Provision for employees’ end of service benefits 12 3,260 3,056
Gain from sale of property and equipment (43) -
Gain from sale of non-current assets held-for-sale 10 (534) (406)
Write-off of property and equipment 332 3
Write-off of intangible assets 25 - 7,753
Net (write-back) provision for risks and charges (53,122) 3,758
Unrealized (gain) loss on derivative financial instruments 10,144 (16,068)
Transfer from deferred income (109,412) -
227,542 433,655
Working capital changes:
Cash and balances with the Central Banks (2,864,834) (4,559,290)
Due from banks and financial institutions (66,352) 34,112
Amounts due from affiliated banks and financial institutions (33,264) (6,882)
Due to the Central Banks 2,568,382 1,123,056
Loans and repurchase agreements (220,356) (380,933)
Due to banks and financial institutions 697,213 86,471
Loans and advances to customers at amortized cost (533,592) (742,399)
Loans and advances to related parties at amortized cost (17,274) (11,637)
Financial assets at fair value through profit or loss 64,837 (21,417)
Financial assets at fair value through other comprehensive income (187,687) (148,224)
Financial assets at amortized cost (299,129) 1,665,021
Other assets (5,621) (32,334)
Customers’ deposits at amortized cost 2,256,908 2,902,174
Related parties’ deposits at amortized cost (40,708) (15,925)
Other liabilities (36,192) (52,087)
Cash from operations 1,509,873 273,361
CONSOLIDATED STATEMENT OF CASH FLOWS For the year ended 31 December 2018
Notes2018
LL million2017
LL million
OPERATING ACTIVITIES (continued)
Employees’ end of service benefits paid 37 (2,662) (1,440)
Taxation paid (50,745) (237,309)
Provision for risks and charges paid (6,602) (16,625)
Net cash flows from (used in) operating activities 1,449,864 17,987
INVESTING ACTIVITIES
Acquisition of subsidiaries , net of cash acquired 3 (73,377) -
Net cash from acquisition of assets and liabilities 3 120,049 -
Purchase of property and equipment 24 (49,467) (63,313)
Purchase of intangible assets 25 (10,749) (9,768)
Proceeds from sale of property and equipment 82 117
Proceeds from sale of non-current assets held for sale 3,317 1,779
Acquisition of a non-controlling interest in a subsidiary 3 - (12,815)
Net cash flows used in investing activities (10,145) (84,000)
FINANCING ACTIVITIES
Preferred shares under issuance 188,438 -
Preferred shares under redemption (190,793) -
Dividends paid to equity holders of the parent 43 (115,520) (100,351)
Dividends paid to non-controlling interest (1,970) (1,834)
Net cash flows used in financing activities (119,845) (102,185)
Effect of exchange rate changes and other adjustments (8,747) 13,661
INCREASE (DECREASE) IN CASH AND CASH EQUIVALENTS 1,311,127 (154,537)
Cash and cash equivalents at 1 January 1,715,771 1,870,308
CASH AND CASH EQUIVALENTS AT 31 DECEMBER 44 3,026,898 1,715,771
Operational cash flows from interest and dividend
Interest paid 1,563,735 1,172,282
Interest received 2,064,222 1,532,821
Dividend received 3,470 3,437
CONSOLIDATED STATEMENT OF CASH FLOWS For the year ended 31 December 2018
Societe Generale de Banque au Liban SAL
Consolidated Financial Statements
The attached notes 1 to 52 form part of these consolidated financial statements. 36 | 37
NOTES TO THE CONSOLIDATED FINANCIAL STATEMENTS31 December 2018
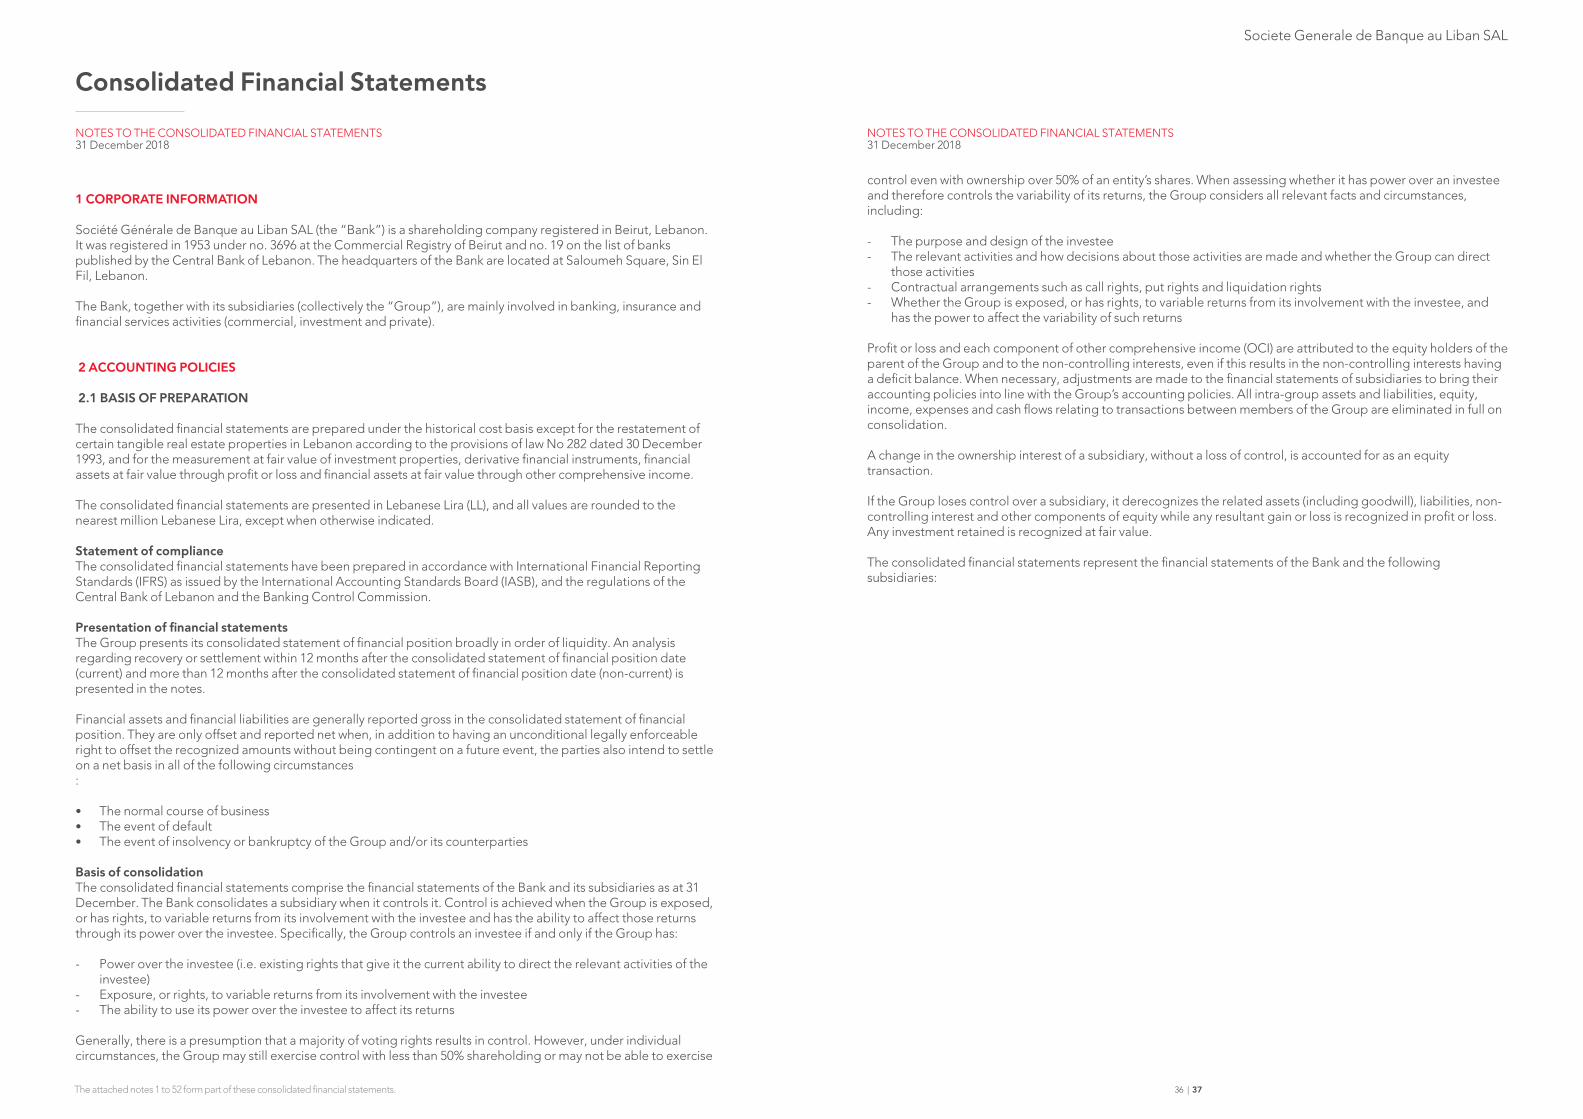
1 CORPORATE INFORMATION Société Générale de Banque au Liban SAL (the “Bank”) is a shareholding company registered in Beirut, Lebanon. It was registered in 1953 under no. 3696 at the Commercial Registry of Beirut and no. 19 on the list of banks published by the Central Bank of Lebanon. The headquarters of the Bank are located at Saloumeh Square, Sin El Fil, Lebanon. The Bank, together with its subsidiaries (collectively the “Group”), are mainly involved in banking, insurance and financial services activities (commercial, investment and private).
2 ACCOUNTING POLICIES 2.1 BASIS OF PREPARATION
The consolidated financial statements are prepared under the historical cost basis except for the restatement of certain tangible real estate properties in Lebanon according to the provisions of law No 282 dated 30 December 1993, and for the measurement at fair value of investment properties, derivative financial instruments, financial assets at fair value through profit or loss and financial assets at fair value through other comprehensive income. The consolidated financial statements are presented in Lebanese Lira (LL), and all values are rounded to the nearest million Lebanese Lira, except when otherwise indicated. Statement of complianceThe consolidated financial statements have been prepared in accordance with International Financial Reporting Standards (IFRS) as issued by the International Accounting Standards Board (IASB), and the regulations of the Central Bank of Lebanon and the Banking Control Commission.
Presentation of financial statementsThe Group presents its consolidated statement of financial position broadly in order of liquidity. An analysis regarding recovery or settlement within 12 months after the consolidated statement of financial position date (current) and more than 12 months after the consolidated statement of financial position date (non-current) is presented in the notes.
Financial assets and financial liabilities are generally reported gross in the consolidated statement of financial position. They are only offset and reported net when, in addition to having an unconditional legally enforceable right to offset the recognized amounts without being contingent on a future event, the parties also intend to settle on a net basis in all of the following circumstances:
• The normal course of business• The event of default• The event of insolvency or bankruptcy of the Group and/or its counterparties Basis of consolidation The consolidated financial statements comprise the financial statements of the Bank and its subsidiaries as at 31 December. The Bank consolidates a subsidiary when it controls it. Control is achieved when the Group is exposed, or has rights, to variable returns from its involvement with the investee and has the ability to affect those returns through its power over the investee. Specifically, the Group controls an investee if and only if the Group has:
- Power over the investee (i.e. existing rights that give it the current ability to direct the relevant activities of the investee)
- Exposure, or rights, to variable returns from its involvement with the investee- The ability to use its power over the investee to affect its returns
Generally, there is a presumption that a majority of voting rights results in control. However, under individual circumstances, the Group may still exercise control with less than 50% shareholding or may not be able to exercise
NOTES TO THE CONSOLIDATED FINANCIAL STATEMENTS31 December 2018
control even with ownership over 50% of an entity’s shares. When assessing whether it has power over an investee and therefore controls the variability of its returns, the Group considers all relevant facts and circumstances, including:
- The purpose and design of the investee- The relevant activities and how decisions about those activities are made and whether the Group can direct
those activities- Contractual arrangements such as call rights, put rights and liquidation rights- Whether the Group is exposed, or has rights, to variable returns from its involvement with the investee, and
has the power to affect the variability of such returns
Profit or loss and each component of other comprehensive income (OCI) are attributed to the equity holders of the parent of the Group and to the non-controlling interests, even if this results in the non-controlling interests having a deficit balance. When necessary, adjustments are made to the financial statements of subsidiaries to bring their accounting policies into line with the Group’s accounting policies. All intra-group assets and liabilities, equity, income, expenses and cash flows relating to transactions between members of the Group are eliminated in full on consolidation.
A change in the ownership interest of a subsidiary, without a loss of control, is accounted for as an equity transaction.
If the Group loses control over a subsidiary, it derecognizes the related assets (including goodwill), liabilities, non-controlling interest and other components of equity while any resultant gain or loss is recognized in profit or loss. Any investment retained is recognized at fair value.
The consolidated financial statements represent the financial statements of the Bank and the following subsidiaries:
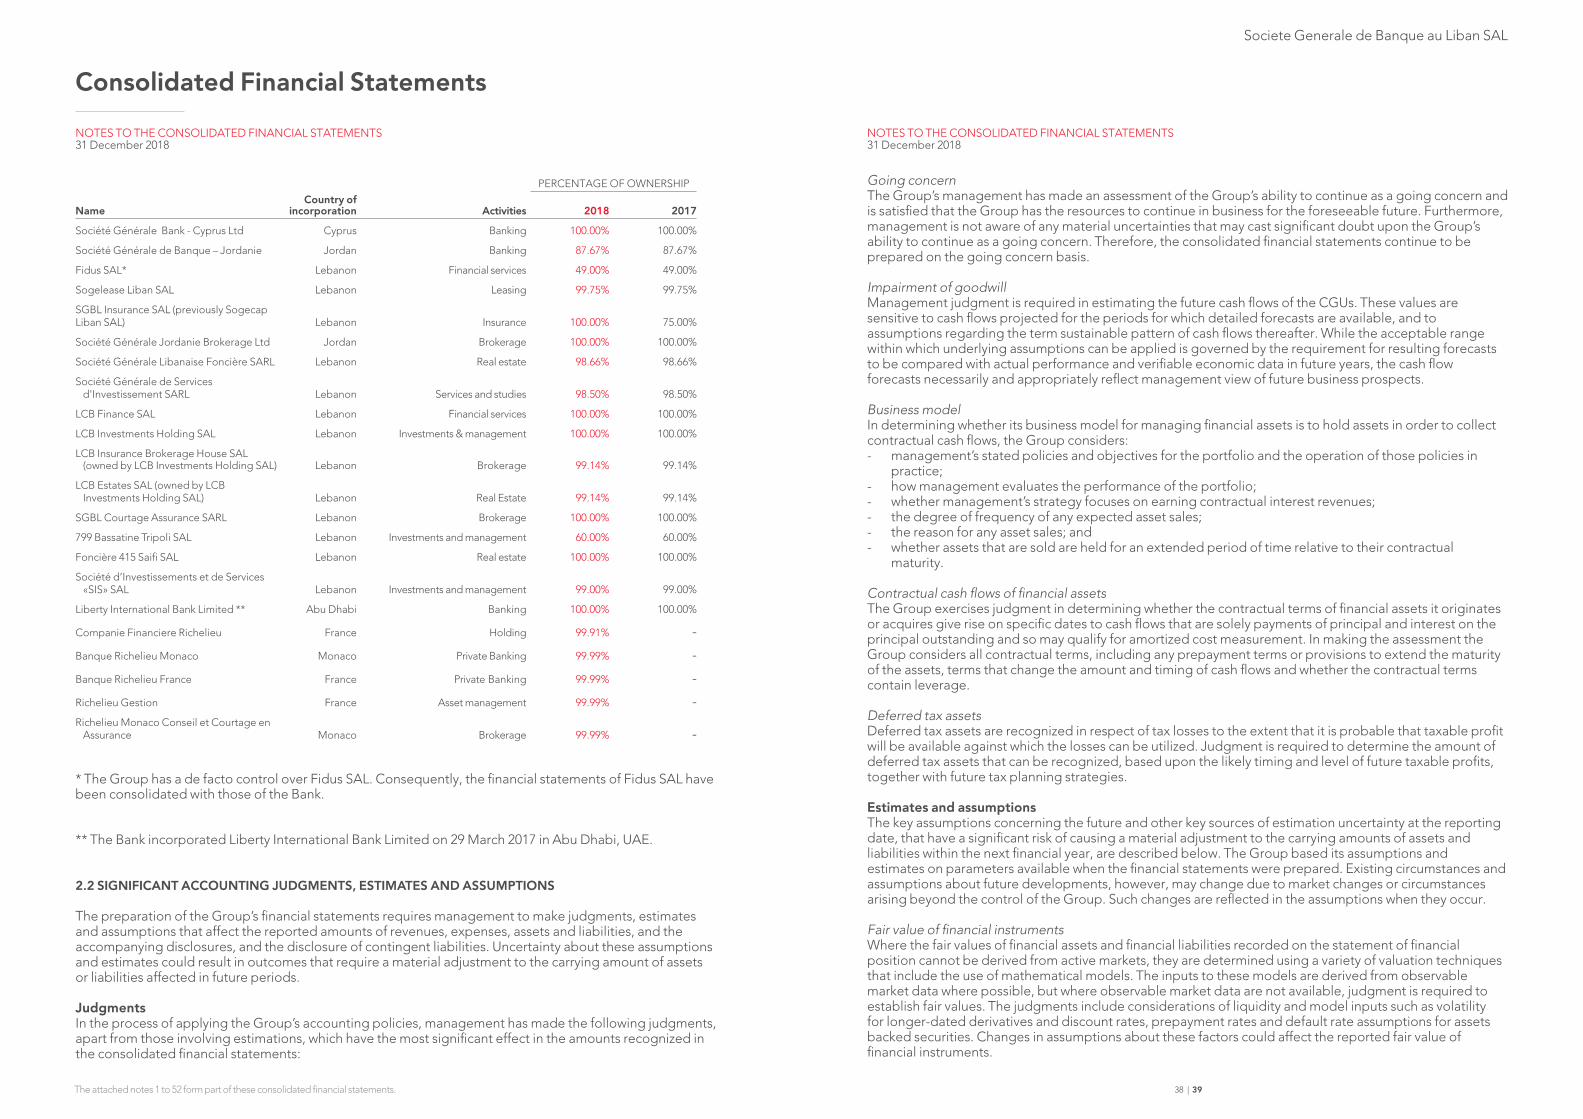
Societe Generale de Banque au Liban SAL
Consolidated Financial Statements
The attached notes 1 to 52 form part of these consolidated financial statements. 38 | 39
PERCENTAGE OF OWNERSHIP
Name Country of
incorporation Activities 2018 2017
Société Générale Bank - Cyprus Ltd Cyprus Banking 100.00% 100.00%
Société Générale de Banque – Jordanie Jordan Banking 87.67% 87.67%
Fidus SAL* Lebanon Financial services 49.00% 49.00%
Sogelease Liban SAL Lebanon Leasing 99.75% 99.75%
SGBL Insurance SAL (previously Sogecap Liban SAL) Lebanon Insurance 100.00% 75.00%
Société Générale Jordanie Brokerage Ltd Jordan Brokerage 100.00% 100.00%
Société Générale Libanaise Foncière SARL Lebanon Real estate 98.66% 98.66%
Société Générale de Services d'Investissement SARL Lebanon Services and studies 98.50% 98.50%
LCB Finance SAL Lebanon Financial services 100.00% 100.00%
LCB Investments Holding SAL Lebanon Investments & management 100.00% 100.00%
LCB Insurance Brokerage House SAL (owned by LCB Investments Holding SAL) Lebanon Brokerage 99.14% 99.14%
LCB Estates SAL (owned by LCB Investments Holding SAL) Lebanon Real Estate 99.14% 99.14%
SGBL Courtage Assurance SARL Lebanon Brokerage 100.00% 100.00%
799 Bassatine Tripoli SAL Lebanon Investments and management 60.00% 60.00%
Foncière 415 Saifi SAL Lebanon Real estate 100.00% 100.00%
Société d’Investissements et de Services «SIS» SAL Lebanon Investments and management 99.00% 99.00%
Liberty International Bank Limited ** Abu Dhabi Banking 100.00% 100.00%
Companie Financiere Richelieu France Holding 99.91% -Banque Richelieu Monaco Monaco Private Banking 99.99% -Banque Richelieu France France Private Banking 99.99% -Richelieu Gestion France Asset management 99.99% -Richelieu Monaco Conseil et Courtage en
Assurance Monaco Brokerage 99.99% -
* The Group has a de facto control over Fidus SAL. Consequently, the financial statements of Fidus SAL have been consolidated with those of the Bank.
** The Bank incorporated Liberty International Bank Limited on 29 March 2017 in Abu Dhabi, UAE.
2.2 SIGNIFICANT ACCOUNTING JUDGMENTS, ESTIMATES AND ASSUMPTIONS
The preparation of the Group’s financial statements requires management to make judgments, estimates and assumptions that affect the reported amounts of revenues, expenses, assets and liabilities, and the accompanying disclosures, and the disclosure of contingent liabilities. Uncertainty about these assumptions and estimates could result in outcomes that require a material adjustment to the carrying amount of assets or liabilities affected in future periods.
JudgmentsIn the process of applying the Group’s accounting policies, management has made the following judgments, apart from those involving estimations, which have the most significant effect in the amounts recognized in the consolidated financial statements:
NOTES TO THE CONSOLIDATED FINANCIAL STATEMENTS31 December 2018
NOTES TO THE CONSOLIDATED FINANCIAL STATEMENTS31 December 2018
Going concernThe Group’s management has made an assessment of the Group’s ability to continue as a going concern and is satisfied that the Group has the resources to continue in business for the foreseeable future. Furthermore, management is not aware of any material uncertainties that may cast significant doubt upon the Group’s ability to continue as a going concern. Therefore, the consolidated financial statements continue to be prepared on the going concern basis.
Impairment of goodwillManagement judgment is required in estimating the future cash flows of the CGUs. These values are sensitive to cash flows projected for the periods for which detailed forecasts are available, and to assumptions regarding the term sustainable pattern of cash flows thereafter. While the acceptable range within which underlying assumptions can be applied is governed by the requirement for resulting forecasts to be compared with actual performance and verifiable economic data in future years, the cash flow forecasts necessarily and appropriately reflect management view of future business prospects.
Business modelIn determining whether its business model for managing financial assets is to hold assets in order to collect contractual cash flows, the Group considers: - management’s stated policies and objectives for the portfolio and the operation of those policies in
practice; - how management evaluates the performance of the portfolio;- whether management’s strategy focuses on earning contractual interest revenues;- the degree of frequency of any expected asset sales;- the reason for any asset sales; and- whether assets that are sold are held for an extended period of time relative to their contractual
maturity.
Contractual cash flows of financial assets The Group exercises judgment in determining whether the contractual terms of financial assets it originates or acquires give rise on specific dates to cash flows that are solely payments of principal and interest on the principal outstanding and so may qualify for amortized cost measurement. In making the assessment the Group considers all contractual terms, including any prepayment terms or provisions to extend the maturity of the assets, terms that change the amount and timing of cash flows and whether the contractual terms contain leverage.
Deferred tax assetsDeferred tax assets are recognized in respect of tax losses to the extent that it is probable that taxable profit will be available against which the losses can be utilized. Judgment is required to determine the amount of deferred tax assets that can be recognized, based upon the likely timing and level of future taxable profits, together with future tax planning strategies.
Estimates and assumptionsThe key assumptions concerning the future and other key sources of estimation uncertainty at the reporting date, that have a significant risk of causing a material adjustment to the carrying amounts of assets and liabilities within the next financial year, are described below. The Group based its assumptions and estimates on parameters available when the financial statements were prepared. Existing circumstances and assumptions about future developments, however, may change due to market changes or circumstances arising beyond the control of the Group. Such changes are reflected in the assumptions when they occur.
Fair value of financial instrumentsWhere the fair values of financial assets and financial liabilities recorded on the statement of financial position cannot be derived from active markets, they are determined using a variety of valuation techniques that include the use of mathematical models. The inputs to these models are derived from observable market data where possible, but where observable market data are not available, judgment is required to establish fair values. The judgments include considerations of liquidity and model inputs such as volatility for longer-dated derivatives and discount rates, prepayment rates and default rate assumptions for assets backed securities. Changes in assumptions about these factors could affect the reported fair value of financial instruments.
Societe Generale de Banque au Liban SAL
Consolidated Financial Statements
The attached notes 1 to 52 form part of these consolidated financial statements. 40 | 41
Impairment Losses on Financial Instruments (Applicable after 1 January 2018)The measurement of impairment losses across all categories of financial assets requires judgement, in particular, the estimation of the amount and timing of future cash flows and collateral values when determining impairment losses and the assessment of a significant increase in credit risk. These estimates are driven by a number of factors, changes in which can result in different levels of allowances.
The Group’s ECL calculations are outputs of complex models with a number of underlying assumptions regarding the choice of variable inputs and their interdependencies. Elements of the ECL models that are considered accounting judgements and estimates include:- The Group’s internal credit grading model, which assigns PDs to the individual grades;- The Group’s criteria for assessing if there has been a significant increase in credit risk;- The segmentation of financial assets when their ECL is assessed on a collective basis;- Development of ECL models, including the various formulas and the choice of inputs;- Determination of associations between macroeconomic scenarios and, economic inputs and their
impact on ECL calculation; and; and- Selection of forward-looking macroeconomic scenarios and their probability weightings, to derive the
economic inputs into the ECL models.
It has been the Group’s policy to regularly review its models in the context of actual loss experience and adjust when necessary.
Impairment losses on loans and advances (Applicable before 1 January 2018)The Group reviews its individually significant loans and advances at each consolidated statement of financial position date to assess whether an impairment loss should be recorded in the consolidated income statement. In particular, judgment by management is required in the estimation of the amount and timing of future cash flows when determining the impairment loss. In estimating these cash flows, the Group makes judgments about the borrower’s financial situation and the net realizable value of collateral. These estimates are based on assumptions about a number of factors and actual results may differ, resulting in future changes to the allowance.
Loans and advances that have been assessed individually and found not to be impaired and all individually insignificant loans and advances are then assessed collectively, in groups of assets with similar risk characteristics, to determine whether provision should be made due to incurred loss events for which there is objective evidence but whose effects are not yet evident. The collective assessment takes account of data from the loan portfolio (such as credit quality, levels of arrears, credit utilization, loan to collateral ratios etc.), and judgments to the effect of concentrations of risks and economic data (including levels of unemployment, real estate prices indices, country risk and the performance of different individual groups).
Revaluation of investment propertiesThe Group carries its investment properties at fair value, with changes in fair value being recognized in the consolidated income statement. The Group engaged an independent valuation specialist to assess fair value as at 31 December. Investment properties were valued by reference to market-based evidence, using comparable prices adjusted for specific market factors such as nature, location and condition of the property.
Impairment of non-financial assetsImpairment exists when the carrying value of an asset or cash generating unit exceeds its recoverable amount, which is the higher of its fair value less costs of disposal and its value in use. The fair value less costs of disposal calculation is based on available data from binding sales transactions, conducted at arm’s length, for similar assets or observable market prices less incremental costs for disposing of the asset. The value in use calculation is based on a DCF model. The cash flows are derived from the budget for the next five years and do not include restructuring activities that the Group is not yet committed to or significant future investments that will enhance the asset’s performance of the CGU being tested. The recoverable amount is sensitive to the discount rate used for the DCF model as well as the expected future cash-inflows and the growth rate used for extrapolation purposes. These estimates are most relevant to goodwill and other intangibles with indefinite useful lives recognised by the Group.
NOTES TO THE CONSOLIDATED FINANCIAL STATEMENTS31 December 2018
NOTES TO THE CONSOLIDATED FINANCIAL STATEMENTS31 December 2018
Pensions ObligationThe cost of the defined benefit pension plan is determined using an actuarial valuation. The actuarial valuation involves making assumptions about discount rates, expected rates of return on assets, future salary increases, mortality rates and future pension increases. Due to the long-term nature of these plans, such estimates are highly sensitive to changes in these assumptions.
2.3 CHANGES IN ACCOUNTING POLICY AND DISCLOSURES
New and amended standards and interpretations effective after 1 January 2018The Group applied for the first time certain amendments to the standards, which are effective for annual periods beginning on or after 1 January 2018. The nature and the impact of each amendment is described below:
IFRS 9 Financial InstrumentsIn July 2014, the IASB issued the final version of IFRS 9 Financial Instruments that replaces IAS 39 Financial Instruments and all previous versions of IFRS 9 (2009, 2010 and 2013). The standard introduces new requirements for classification and measurement, impairment, and hedge accounting. The new version, IFRS 9 (2014) is effective for annual periods beginning on or after 1 January 2018. The Group adopted the new standard on the required effective date, along with the provisions of the Central Bank of Lebanon basic circular No. 143 and the Banking Control Commission circular No. 293.
The Group has not restated comparative information for 2017 for financial instruments in the scope of IFRS 9 (2014). Therefore, the comparative information for 2017 is reported under IFRS 9 (2009, 2010 and 2013) and IAS 39 impairment requirements and is not comparable to the information presented for 2018. Differences arising from the adoption of IFRS 9 (2014) have been recognised directly in retained earnings or reserves (as applicable) as of 1 January 2018 and are disclosed in V below.
I. Classification and measurementThe Group has early adopted classification and measurement requirements as issued in IFRS 9 (2009) and IFRS 9 (2010). In the July 2014 publication of IFRS 9, the new measurement category fair value though other comprehensive income was introduced for financial assets that satisfy the contractual cash flow characteristics (SPPI test). This category is aimed at portfolio of debt instruments for which amortised cost information, as well as fair value information is relevant and useful. A debt financial asset is measured at fair value through OCI if:- it is held in a business model whose objective is achieved by both holding assets to collect contractual
cash flows and selling the assets, and- it satisfies the contractual cash flow characteristics (SPPI test).
At the date of application of IFRS 9 (2014), the Group reassessed the classification and measurement category for all financial assets debt instruments that satisfy the contractual cash flow characteristics (SPPI test) and classified them within the category that is consistent with the business model for managing these financial assets on the basis of facts and circumstances that existed at that date.
The classification and measurement requirements for financial assets that are equity instruments or debt instruments that do not meet the contractual cash flow characteristics (SPPI test) and financial liabilities remain unchanged from previous versions of IFRS 9.
The Group’s classification of its financial assets and liabilities is explained in Note 2.5. The impact on the classification of the Group’s financial assets and their carrying values and equity is discussed in V below.
II. Expected Credit Losses The adoption of IFRS 9 has fundamentally changed the Group’s accounting for loan loss impairments by replacing IAS 39’s incurred loss approach with a forward-looking expected credit loss (ECL) approach. IFRS 9 requires the Group to record an allowance for ECLs for all loans and other debt financial assets not held at FVPL, together with loan commitments and financial guarantee contracts.
The allowance is based on the ECLs associated with the probability of default in the next twelve months
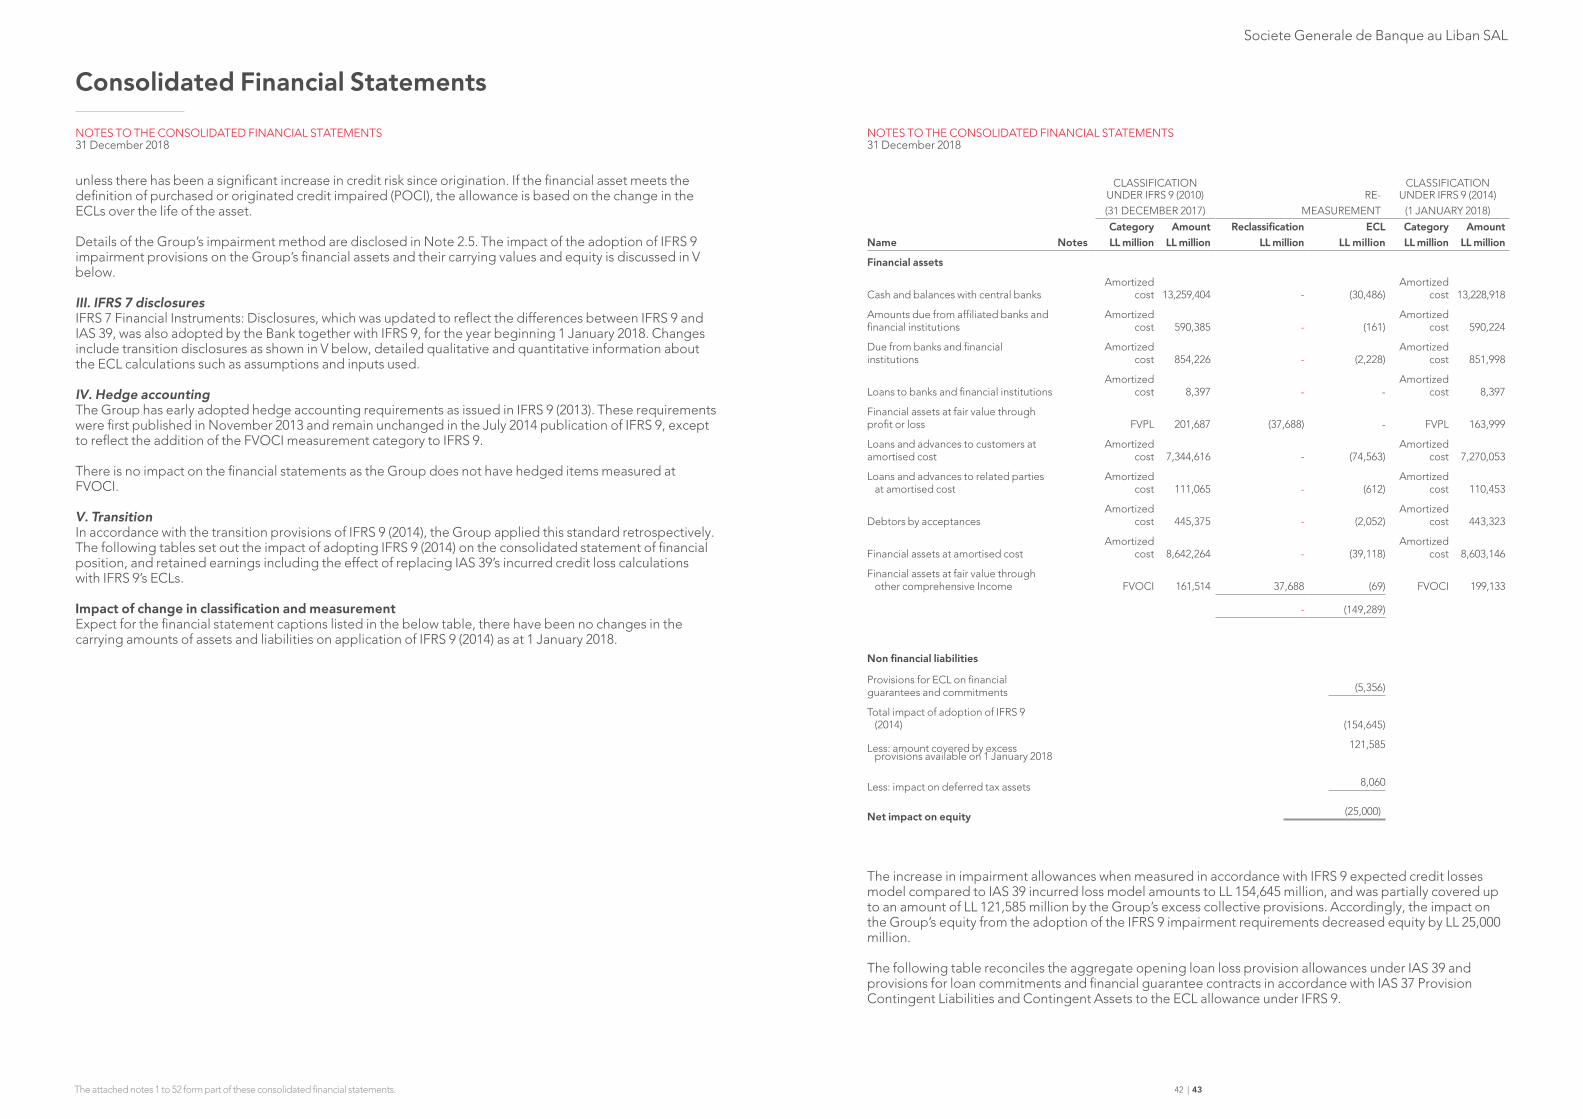
Societe Generale de Banque au Liban SAL
Consolidated Financial Statements
The attached notes 1 to 52 form part of these consolidated financial statements. 42 | 43
NOTES TO THE CONSOLIDATED FINANCIAL STATEMENTS31 December 2018
unless there has been a significant increase in credit risk since origination. If the financial asset meets the definition of purchased or originated credit impaired (POCI), the allowance is based on the change in the ECLs over the life of the asset.
Details of the Group’s impairment method are disclosed in Note 2.5. The impact of the adoption of IFRS 9 impairment provisions on the Group’s financial assets and their carrying values and equity is discussed in V below.
III. IFRS 7 disclosuresIFRS 7 Financial Instruments: Disclosures, which was updated to reflect the differences between IFRS 9 and IAS 39, was also adopted by the Bank together with IFRS 9, for the year beginning 1 January 2018. Changes include transition disclosures as shown in V below, detailed qualitative and quantitative information about the ECL calculations such as assumptions and inputs used.
IV. Hedge accountingThe Group has early adopted hedge accounting requirements as issued in IFRS 9 (2013). These requirements were first published in November 2013 and remain unchanged in the July 2014 publication of IFRS 9, except to reflect the addition of the FVOCI measurement category to IFRS 9.
There is no impact on the financial statements as the Group does not have hedged items measured at FVOCI.
V. TransitionIn accordance with the transition provisions of IFRS 9 (2014), the Group applied this standard retrospectively. The following tables set out the impact of adopting IFRS 9 (2014) on the consolidated statement of financial position, and retained earnings including the effect of replacing IAS 39’s incurred credit loss calculations with IFRS 9’s ECLs.
Impact of change in classification and measurementExpect for the financial statement captions listed in the below table, there have been no changes in the carrying amounts of assets and liabilities on application of IFRS 9 (2014) as at 1 January 2018.
NOTES TO THE CONSOLIDATED FINANCIAL STATEMENTS31 December 2018
CLASSIFICATION UNDER IFRS 9 (2010)(31 DECEMBER 2017)
RE-MEASUREMENT
CLASSIFICATION UNDER IFRS 9 (2014)
(1 JANUARY 2018)
Name NotesCategoryLL million
AmountLL million
ReclassificationLL million
ECLLL million
CategoryLL million
AmountLL million
Financial assets
Cash and balances with central banksAmortized
cost 13,259,404 - (30,486)Amortized
cost 13,228,918
Amounts due from affiliated banks and financial institutions
Amortized cost 590,385 - (161)
Amortized cost 590,224
Due from banks and financial institutions
Amortized cost 854,226 - (2,228)
Amortized cost 851,998
Loans to banks and financial institutionsAmortized
cost 8,397 - -Amortized
cost 8,397
Financial assets at fair value through profit or loss FVPL 201,687 (37,688) - FVPL 163,999
Loans and advances to customers at amortised cost
Amortized cost 7,344,616 - (74,563)
Amortized cost 7,270,053
Loans and advances to related parties at amortised cost
Amortized cost 111,065 - (612)
Amortized cost 110,453
Debtors by acceptancesAmortized
cost 445,375 - (2,052)Amortized
cost 443,323
Financial assets at amortised cost Amortized
cost 8,642,264 - (39,118)Amortized
cost 8,603,146
Financial assets at fair value through other comprehensive Income FVOCI 161,514 37,688 (69) FVOCI 199,133
- (149,289)
Non financial liabilities
Provisions for ECL on financial guarantees and commitments (5,356)
Total impact of adoption of IFRS 9 (2014) (154,645)
Less: amount covered by excess provisions available on 1 January 2018
121,585
Less: impact on deferred tax assets 8,060
Net impact on equity (25,000)
The increase in impairment allowances when measured in accordance with IFRS 9 expected credit losses model compared to IAS 39 incurred loss model amounts to LL 154,645 million, and was partially covered up to an amount of LL 121,585 million by the Group’s excess collective provisions. Accordingly, the impact on the Group’s equity from the adoption of the IFRS 9 impairment requirements decreased equity by LL 25,000 million.
The following table reconciles the aggregate opening loan loss provision allowances under IAS 39 and provisions for loan commitments and financial guarantee contracts in accordance with IAS 37 Provision Contingent Liabilities and Contingent Assets to the ECL allowance under IFRS 9.
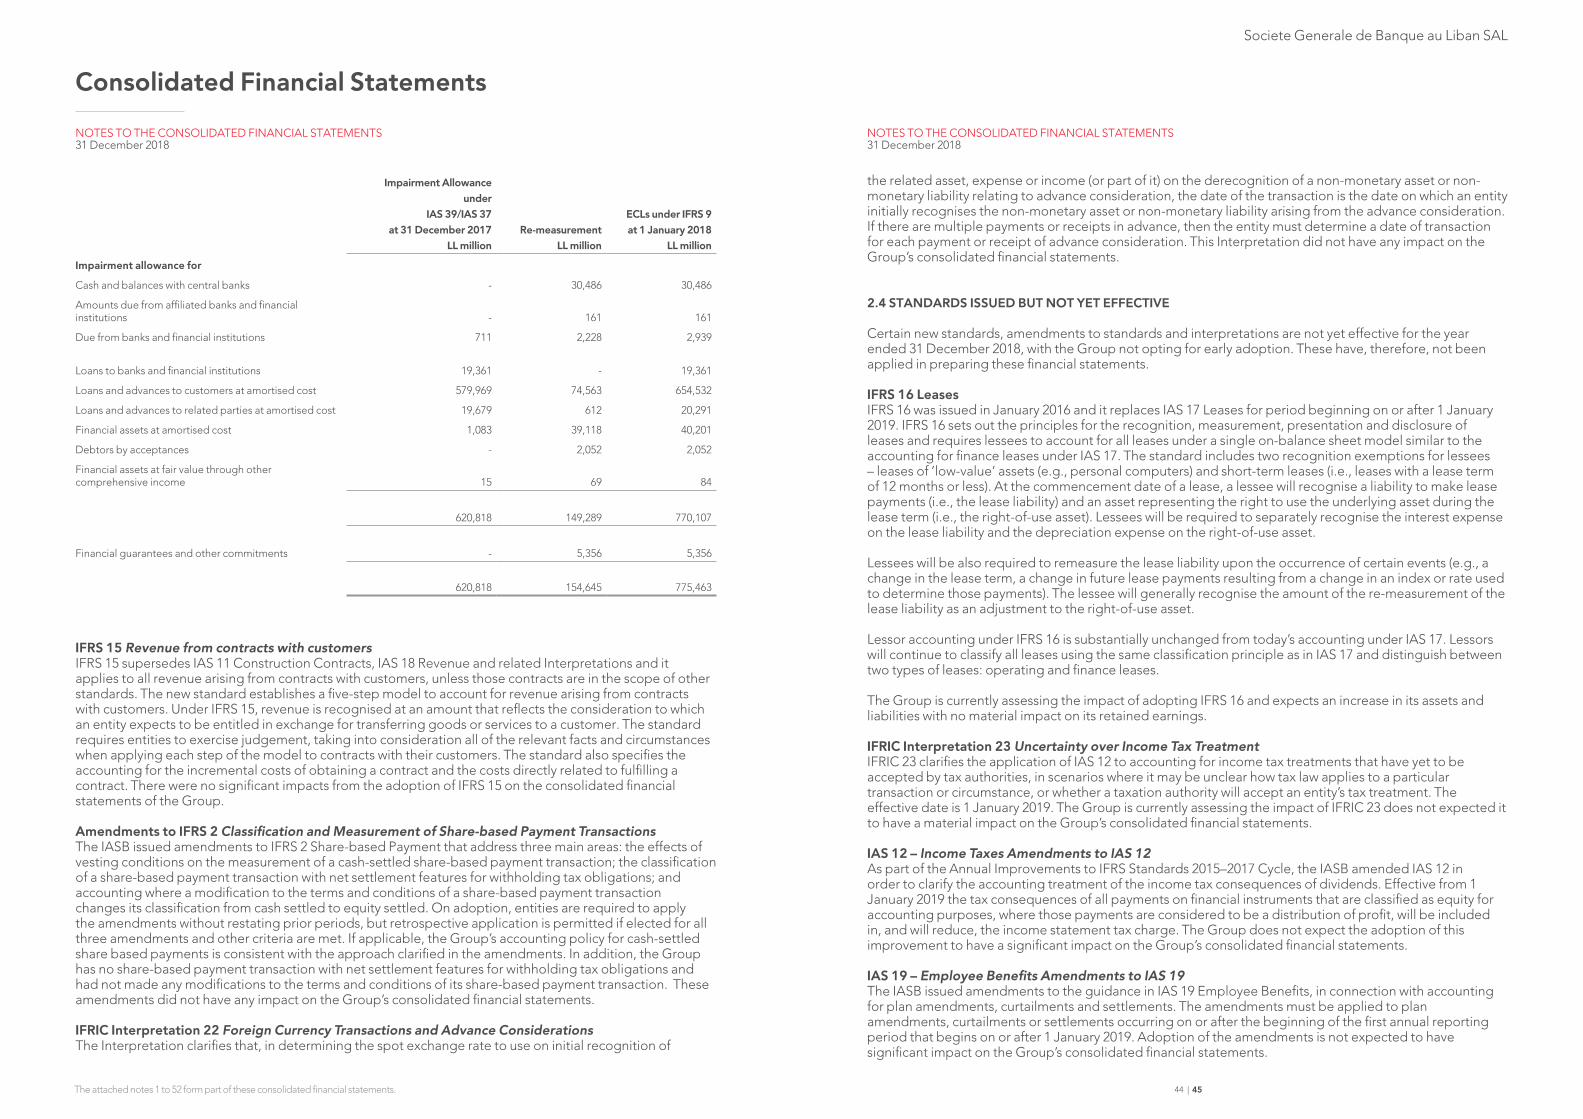
Societe Generale de Banque au Liban SAL
Consolidated Financial Statements
The attached notes 1 to 52 form part of these consolidated financial statements. 44 | 45
Impairment Allowanceunder
IAS 39/IAS 37at 31 December 2017
LL millionRe-measurement
LL million
ECLs under IFRS 9at 1 January 2018
LL million
Impairment allowance for
Cash and balances with central banks - 30,486 30,486
Amounts due from affiliated banks and financial institutions - 161 161
Due from banks and financial institutions 711 2,228 2,939
Loans to banks and financial institutions 19,361 - 19,361
Loans and advances to customers at amortised cost 579,969 74,563 654,532
Loans and advances to related parties at amortised cost 19,679 612 20,291
Financial assets at amortised cost 1,083 39,118 40,201
Debtors by acceptances - 2,052 2,052
Financial assets at fair value through other comprehensive income 15 69 84
620,818 149,289 770,107
Financial guarantees and other commitments - 5,356 5,356
620,818 154,645 775,463
IFRS 15 Revenue from contracts with customersIFRS 15 supersedes IAS 11 Construction Contracts, IAS 18 Revenue and related Interpretations and it applies to all revenue arising from contracts with customers, unless those contracts are in the scope of other standards. The new standard establishes a five-step model to account for revenue arising from contracts with customers. Under IFRS 15, revenue is recognised at an amount that reflects the consideration to which an entity expects to be entitled in exchange for transferring goods or services to a customer. The standard requires entities to exercise judgement, taking into consideration all of the relevant facts and circumstances when applying each step of the model to contracts with their customers. The standard also specifies the accounting for the incremental costs of obtaining a contract and the costs directly related to fulfilling a contract. There were no significant impacts from the adoption of IFRS 15 on the consolidated financial statements of the Group.
Amendments to IFRS 2 Classification and Measurement of Share-based Payment TransactionsThe IASB issued amendments to IFRS 2 Share-based Payment that address three main areas: the effects of vesting conditions on the measurement of a cash-settled share-based payment transaction; the classification of a share-based payment transaction with net settlement features for withholding tax obligations; and accounting where a modification to the terms and conditions of a share-based payment transaction changes its classification from cash settled to equity settled. On adoption, entities are required to apply the amendments without restating prior periods, but retrospective application is permitted if elected for all three amendments and other criteria are met. If applicable, the Group’s accounting policy for cash-settled share based payments is consistent with the approach clarified in the amendments. In addition, the Group has no share-based payment transaction with net settlement features for withholding tax obligations and had not made any modifications to the terms and conditions of its share-based payment transaction. These amendments did not have any impact on the Group’s consolidated financial statements.
IFRIC Interpretation 22 Foreign Currency Transactions and Advance ConsiderationsThe Interpretation clarifies that, in determining the spot exchange rate to use on initial recognition of
NOTES TO THE CONSOLIDATED FINANCIAL STATEMENTS31 December 2018
the related asset, expense or income (or part of it) on the derecognition of a non-monetary asset or non-monetary liability relating to advance consideration, the date of the transaction is the date on which an entity initially recognises the non-monetary asset or non-monetary liability arising from the advance consideration. If there are multiple payments or receipts in advance, then the entity must determine a date of transaction for each payment or receipt of advance consideration. This Interpretation did not have any impact on the Group’s consolidated financial statements.
2.4 STANDARDS ISSUED BUT NOT YET EFFECTIVE
Certain new standards, amendments to standards and interpretations are not yet effective for the year ended 31 December 2018, with the Group not opting for early adoption. These have, therefore, not been applied in preparing these financial statements.
IFRS 16 Leases IFRS 16 was issued in January 2016 and it replaces IAS 17 Leases for period beginning on or after 1 January 2019. IFRS 16 sets out the principles for the recognition, measurement, presentation and disclosure of leases and requires lessees to account for all leases under a single on-balance sheet model similar to the accounting for finance leases under IAS 17. The standard includes two recognition exemptions for lessees – leases of ’low-value’ assets (e.g., personal computers) and short-term leases (i.e., leases with a lease term of 12 months or less). At the commencement date of a lease, a lessee will recognise a liability to make lease payments (i.e., the lease liability) and an asset representing the right to use the underlying asset during the lease term (i.e., the right-of-use asset). Lessees will be required to separately recognise the interest expense on the lease liability and the depreciation expense on the right-of-use asset.
Lessees will be also required to remeasure the lease liability upon the occurrence of certain events (e.g., a change in the lease term, a change in future lease payments resulting from a change in an index or rate used to determine those payments). The lessee will generally recognise the amount of the re-measurement of the lease liability as an adjustment to the right-of-use asset.
Lessor accounting under IFRS 16 is substantially unchanged from today’s accounting under IAS 17. Lessors will continue to classify all leases using the same classification principle as in IAS 17 and distinguish between two types of leases: operating and finance leases.
The Group is currently assessing the impact of adopting IFRS 16 and expects an increase in its assets and liabilities with no material impact on its retained earnings.
IFRIC Interpretation 23 Uncertainty over Income Tax TreatmentIFRIC 23 clarifies the application of IAS 12 to accounting for income tax treatments that have yet to be accepted by tax authorities, in scenarios where it may be unclear how tax law applies to a particular transaction or circumstance, or whether a taxation authority will accept an entity’s tax treatment. The effective date is 1 January 2019. The Group is currently assessing the impact of IFRIC 23 does not expected it to have a material impact on the Group’s consolidated financial statements.
IAS 12 – Income Taxes Amendments to IAS 12As part of the Annual Improvements to IFRS Standards 2015–2017 Cycle, the IASB amended IAS 12 in order to clarify the accounting treatment of the income tax consequences of dividends. Effective from 1 January 2019 the tax consequences of all payments on financial instruments that are classified as equity for accounting purposes, where those payments are considered to be a distribution of profit, will be included in, and will reduce, the income statement tax charge. The Group does not expect the adoption of this improvement to have a significant impact on the Group’s consolidated financial statements.
IAS 19 – Employee Benefits Amendments to IAS 19The IASB issued amendments to the guidance in IAS 19 Employee Benefits, in connection with accounting for plan amendments, curtailments and settlements. The amendments must be applied to plan amendments, curtailments or settlements occurring on or after the beginning of the first annual reporting period that begins on or after 1 January 2019. Adoption of the amendments is not expected to have significant impact on the Group’s consolidated financial statements.
NOTES TO THE CONSOLIDATED FINANCIAL STATEMENTS31 December 2018
Societe Generale de Banque au Liban SAL
Consolidated Financial Statements
The attached notes 1 to 52 form part of these consolidated financial statements. 46 | 47
2.5 SUMMARY OF SIGNIFICANT ACCOUNTING POLICIES
(1) Foreign currency translationThe consolidated financial statements are presented in Lebanese Lira. For each entity in the Group, the Bank determines the functional currency and items included in the financial statements of each entity are measured using that functional currency. The Group uses the direct method of consolidation.
(i) Transactions and balancesTransactions in foreign currencies are initially recorded at the functional currency rate of exchange ruling at the date of the transaction.
Monetary assets and liabilities denominated in foreign currencies are retranslated at the functional currency rate of exchange at the date of the statement of financial position. All differences are taken to “net gain on financial assets at fair value through profit or loss” in the consolidated income statement, except for monetary items that are designated as part of the hedge of the Group’s net investment in a foreign operation. These are recognised in OCI until the net investment is disposed of, at which time, the cumulative amount is reclassified to profit or loss. Tax charges and credits attributable to exchange differences on those monetary items are also recorded in OCI.
Non-monetary items that are measured in terms of historical cost in a foreign currency are translated using the exchange rates as at the dates of the initial transactions. Non-monetary items measured at fair value in a foreign currency are translated using the exchange rates at the date when the fair value was determined. The gain or loss arising on translation of non-monetary items measured at fair value is treated in line with the recognition of gain or loss on change in fair value of the item (i.e. translation differences on items whose fair value gain or loss is recognised in other comprehensive income or profit or loss are also recognised in other comprehensive income or profit or loss, respectively).
(ii) Group CompaniesOn consolidation, the assets and liabilities of subsidiaries and overseas branches are translated into the Bank’s presentation currency at the rate of exchange as at the reporting date, and their income statements are translated at the monthly average exchange rates for the year. Exchange differences arising on translation are recognised in OCI. On disposal of a foreign entity, the deferred cumulative amount recognised in OCI relating to that particular foreign operation is reclassified to the consolidated income statement.
Any goodwill arising on the acquisition of a foreign operation and any fair value adjustments to the carrying amounts of assets and liabilities arising on the acquisition are treated as assets and liabilities of the foreign operations and translated at the exchange rate on the reporting date. (2) Financial Instruments – Initial recognition(i) Date of recognition All financial assets and liabilities are initially recognised on the settlement date. This includes “regular way trades”: purchases or sales of financial assets that require delivery of assets within the time frame generally established by regulation or convention in the market place. (ii) Initial measurement of financial instrumentsFinancial instruments are initially measured at their fair value, plus or minus, in the case of a financial instrument not at fair value through profit or loss, transaction costs that are directly attributable to the acquisition or issue of the financial instrument. In the case of a financial instrument measured at fair value, with the change in fair value being recognised in profit or loss, the transaction costs are recognised as revenue or expense when the instrument is initially recognised. When the fair value of financial instruments at initial recognition differs from the transaction price, the Group accounts for the Day 1 profit or loss, as described below. (iii) Day 1 Profit or LossWhen the transaction price differs from the fair value at origination and the fair value is based on a valuation technique using only observable inputs in market transactions, the Group immediately recognises the
NOTES TO THE CONSOLIDATED FINANCIAL STATEMENTS31 December 2018
difference between the transaction price and fair value (a “Day 1” profit or loss) in the consolidated income statement. In cases where fair value is based on models for which some of the inputs are not observable, the difference between the transaction price and the fair value is deferred and is only recognised in the consolidated income statement when the inputs become observable, or when the instrument is derecognised.
(3) Financial Assets – Classification and MeasurementOn initial recognition, financial assets are classified as measured at: amortised cost, fair value through other comprehensive income or fair value through profit or loss on the basis of two criteria:
(i) The business model within which financial assets are measured; and(ii) Their contractual cash flow characteristics (whether the cash flows represent “solely payments of principal and interest” (SPPI)).
Financial assets measured at amortised cost if they are held within a business model whose objective is to hold assets to collect contractual cash flows, and their contractual cash flows represent SPPI.
Financial assets measured at fair value through other comprehensive income if they are held within a business model whose objective is achieved by both collecting contractual cash flows and selling financial assets, and their contractual cash flows represent SPPI.
All other financial assets are classified as measured at fair value through profit or loss.
On initial recognition of an equity investment that is not held for trading, the Group may irrevocably elect to present subsequent changes in fair value in other comprehensive income. This election is made on an investment-by-investment basis.
On initial recognition, the Group may irrevocably designate a financial asset as measured at fair value through profit or loss if doing so eliminates or significantly reduces a measurement or recognition inconsistency (sometimes referred to as an “accounting mismatch”) that would otherwise arise from measuring assets or liabilities or recognising the gains and losses on them on different bases. The Group is required to disclose such financial assets separately from those mandatorily measured at fair value.
Business ModelThe Group determines its business model at the level that best reflects how it manages groups of financial assets to achieve its business objective. Generally, a business model is a matter of fact which can be evidenced by the way business is managed and the information provided to Management. The Group’s business model is not assessed on an instrument-by-instrument basis, but at a higher level of aggregated portfolios and is based on observable factors such as:How the performance of the business model and the financial assets held within that business model are evaluated and reported to the entity’s key management personnel The risks that affect the performance of the business model (and the financial assets held within that business model) and, in particular, the way those risks are managed- How managers of the business are compensated (for example, whether the compensation is based on
the fair value of the assets managed or on the contractual cash flows collected)- The expected frequency, value and timing of sales are also important aspects of the Group’s assessment
The business model assessment is based on reasonably expected scenarios without taking ‘worst case’ or ‘stress case’ scenarios into account.
The Group’s business model can be to hold financial assets to collect contractual cash flows even when sales of financial assets occur. However, if more than an infrequent number of sales are made out of a portfolio, the Group needs to assess whether and how such sales are consistent with an objective of collecting contractual cash flows. If the objective of the Group’s business model for managing those financial assets changes, the Group is required to reclassify financial assets.
NOTES TO THE CONSOLIDATED FINANCIAL STATEMENTS31 December 2018

Societe Generale de Banque au Liban SAL
Consolidated Financial Statements
The attached notes 1 to 52 form part of these consolidated financial statements. 48 | 49
The SPPI TestAs a second step of its classification process the Group assesses the contractual terms of financial assets to identify whether they meet the SPPI test.
‘Principal’ for the purpose of this test is defined as the fair value of the financial asset at initial recognition and may change over the life of the financial asset (for example, if there are repayments of principal or amortisation of the premium/discount).
The most significant elements of interest within a lending arrangement are typically the consideration for the time value of money and credit risk. To make the SPPI assessment, the Group applies judgement and considers relevant factors such as the currency in which the financial asset is denominated, and the period for which the interest rate is set.
In contrast, contractual terms that introduce a more than de minimis exposure to risks or volatility in the contractual cash flows that are unrelated to a basic lending arrangement do not give rise to contractual cash flows that are solely payments of principal and interest on the amount outstanding. In such cases, the financial asset is required to be measured at fair value though profit and loss.
Financial assets at amortized costBalances with the Central Banks, due from banks and financial institutions, loans to banks and financial institutions, reverse repurchase agreements, amounts due from affiliated banks and financial institutions and loans and advances to customers and related parties – at amortized costThese financial assets are initially recognised at cost, being the fair value of the consideration paid for the acquisition of the investment. All transaction costs directly attributed to the acquisition are also included in the cost of investment. After initial measurement, these are subsequently measured at amortised cost using the EIR, less expected credit losses. Amortised cost is calculated by taking into account any discount or premium on acquisition and fees and costs that are an integral part of the EIR. The amortisation is included in “interest and similar income” in the consolidated income statement. The losses arising from impairment are recognised in the consolidated income statement in “net impairment losses on financial assets”. Gains and losses arising from the derecognition of financial assets measured at amortised cost are reflected under “net gain on sale of financial assets at amortised cost” in the consolidated income statement. Financial assets at fair value through profit or lossIncluded in this category are those debt instruments that do not meet the conditions in “financial assets at amortized cost” above and “financial assets through other comprehensive income”debt instruments designated at fair value through profit or loss upon initial recognition and equity instruments at fair value through profit or loss. Management only designates a financial asset at fair value through profit and loss upon initial recognition when the designation eliminates, significantly reduces, the inconsistent treatment that would otherwise arise from measuring assets or recognising gains and losses on them on a different basis. i. Debt instruments at fair value through profit or lossThese financial assets are recorded in the consolidated statement of financial position at fair value. Changes in fair value and interest income are recorded under “Net gain (loss) from financial assets at fair value through profit or loss” in the consolidated income statement showing separately, those related to financial assets designated at fair value upon initial recognition from those mandatorily measured at fair value.
Gains and losses arising from the derecognition of debt instruments at fair value through profit or loss are also reflected under “Net gain (loss) from financial assets at fair value through profit or loss” in the consolidated income statement showing separately, those related to financial assets designated at fair value upon initial recognition from those mandatorily measured at fair value. ii. Equity instruments at fair value through profit or lossInvestments in equity instruments are classified at fair value through profit or loss, unless the Group designates at initial recognition an investment that is not held for trading as at fair value through other comprehensive income.
These financial assets are recorded in the consolidated statement of financial position at fair value. Changes
NOTES TO THE CONSOLIDATED FINANCIAL STATEMENTS31 December 2018
NOTES TO THE CONSOLIDATED FINANCIAL STATEMENTS31 December 2018
in fair value and dividend income are recorded under “Net gain (loss) from financial assets at fair value through profit or loss” in the consolidated income statement.
Gains and losses arising from the derecognition of equity instruments at fair value through profit or loss are also reflected under “Net gain (loss) from financial assets at fair value through profit or loss” in the consolidated income statement.
Financial assets at fair value through other comprehensive income Debt Instruments at Fair Value through Other Comprehensive Income (policy applicable from 1 January 2018)The Group applies the new category under IFRS 9 of debt instruments measured at fair value through other comprehensive income when both of the following conditions are met:• The instrument is held within a business model, the objective of which is achieved by both collecting
contractual cash flows and selling financial assets; and• The contractual terms of the financial assets meet the SPPI test.
Fair value through other comprehensive income debt instruments are subsequently measured at fair value with gains and losses arising due to changes in fair value recognized in other comprehensive income. Interest income and foreign exchange gains and losses are recognized in profit or loss in the same manner as for financial assets measured at amortized cost. The ECL calculation for debt instruments at fair value through other comprehensive income is explained below. Where the Group holds more than one investment in the same security, they are deemed to be disposed of on a first-in first-out basis. On derecognition, cumulative gains or losses previously recognized in other comprehensive income are reclassified from other comprehensive income to profit or loss.
Equity Instruments at Fair Value through Other Comprehensive IncomeUpon initial recognition, the Group can elect to classify irrevocably some of its investments in equity instruments at fair value through other comprehensive income when they are not held for trading. Such classification is determined on an instrument-by-instrument basis.
These financial assets are initially measured at fair value plus transaction costs. Subsequently, they are measured at fair value, with gains and losses arising from changes in fair value recognized in other comprehensive income and accumulated under equity. The cumulative gain or loss will not be reclassified to the consolidated income statement on disposal of the investments.
Dividends on these investments are recognised under “revenue from financial assets at fair value through other comprehensive income” in the consolidated income statement when the Group’s right to receive payment of dividend is established in accordance with IFRS 15: “Revenue from contracts with customers”, unless the dividends clearly represent a recovery of part of the cost of the investment. Equity instruments at FVOCI are not subject to an impairment assessment.
(4) Financial liabilities (other than financial guarantees, letters of credit and loan commitments)Liabilities are initially measured at fair value, plus particular transaction costs in the case of a financial liability not classified at fair value through profit or loss. Liabilities are subsequently measured at amortized cost or fair value.The Group classifies all financial liabilities as subsequently measured at amortized cost using the effective interest rate method, except for: • financial liabilities at fair value through profit or loss (including derivatives); • financial liabilities that arise when a transfer of a financial asset does not qualify for derecognition or
when the continuing involvement approach applies;• Contingent consideration recognised in a business combination in accordance with IFRS 3.
Fair value optionAn entity may, at initial recognition, irrevocably designate a financial liability as measured at fair value through profit or loss when:• doing so results in more relevant information, because it either eliminates or significantly reduces a
measurement or recognition inconsistency (sometimes referred to as “an accounting mismatch”) that would otherwise arise from measuring assets or liabilities or recognizing the gains and losses on them on different bases; or
Societe Generale de Banque au Liban SAL
Consolidated Financial Statements
The attached notes 1 to 52 form part of these consolidated financial statements. 50 | 51
• a group of financial liabilities or financial assets and financial liabilities is managed and its performance is evaluated on a fair value basis, in accordance with a documented risk management or investment strategy, and information about the group is provided internally on that basis to the entity’s key management personnel.
• A group of financial liabilities contains one or more embedded derivatives, unless they do not significantly modify the cash flows that would otherwise be required by contract, or it is clear with little or no analysis when a similar instruments is first considered that separation of the embedded derivatives is prohibited.
Financial liabilities at fair value though profit and loss are recorded in the consolidated statement of financial position at fair value. Changes in fair value are recorded in profit and loss with the exception of movements in fair value of liabilities designated at though profit and loss due to changes in the Group’s own credit risk. Such changes in fair value are recognised in other comprehensive income, unless such recognition would create an accounting mismatch in the consolidated income statement. Changes in fair value attributable to changes in credit risk do not get recycled to the consolidated income statement.
Interest incurred on financial liabilities designated at fair value through profit and loss is accrued in interest expense using the EIR, taking into account any discount/ premium and qualifying transaction costs being an integral part of instrument.
Due to the Central Banks, loans and repurchase agreements, due to banks and financial institutions, amounts due to affiliated banks and financial institutions and customers’ deposits and related parties’ depositsAfter initial measurement, “due to the Central Banks”, “loans and repurchase agreements”, “due to banks and financial institutions”, “amounts due to affiliated banks and financial institutions” and “customers’ and related parties’ deposits” are measured at amortized cost less amounts repaid using the effective interest rate method. Amortized cost is calculated by taking into account any discount or premium on the issue and costs that are an integral part of the effective interest rate method. (5) Derivatives recorded at fair value through profit or lossA derivative is a financial instrument or other contract with all three of the following characteristics:a. Its value changes in response to the change in a specified interest rate, financial instrument price,
commodity price, foreign exchange rate, index of prices or rates, credit rating or credit index, or other variable, provided in the case of a non-financial variable that the variable is not specific to a party to the contract (aka the “underlying”).
b. It requires no initial net investment or an initial net investment that is smaller than would be required for other types of contracts that would be expected to have a similar response to changes in market factors.
c. It is settled at a future date. The Group uses derivatives such as forward foreign exchange contracts and interest rate swaps.
Derivatives are recorded at fair value and carried as assets when their fair value is positive and as liabilities when their fair value is negative. The notional amount and fair value of such derivatives are disclosed separately in the notes. Changes in the fair value of derivatives are included in “net gain (loss) from financial assets at fair value through profit or loss” in the consolidated income statement.
(6) Embedded derivativesAn embedded derivative is a component of a hybrid instrument that also includes a non-derivative host contract with the effect that some of the cash flows of the combined instrument vary in a way similar to a stand-alone derivative. An embedded derivative causes some or all of the cash flows that otherwise would be required by the contract to be modified according to a specified interest rate, financial instrument price, commodity price, foreign exchange rate, index of prices or rates, credit rating or credit index, or other variable, provided that, in the case of a non-financial variable, it is not specific to a party to the contract. A derivative that is attached to a financial instrument, but is contractually transferable independently of that instrument, or has a different counterparty from that instrument, is not an embedded derivative, but a separate financial instrument.
NOTES TO THE CONSOLIDATED FINANCIAL STATEMENTS31 December 2018
An embedded derivative is separated from the host and accounted for as a derivative if, and only if:d. the hybrid contract contains a host that is not an asset within the scope of IFRS 9;e. the economic characteristics and risks of the embedded derivative are not closely related to the
economic characteristics and risks of the host;f. a separate instrument with the same terms as the embedded derivative would meet the definition of a
derivative; andg. the hybrid contract is not measured at fair value with changes in fair value recognized in profit or loss.
(7) Financial Guarantees, Letters of Credit and Undrawn Loan CommitmentsThe Group issues financial guarantees, letters of credit and loan commitments.
Financial guarantees are initially recognised in the consolidated financial statements at fair value, being the premium received. Subsequent to initial recognition, the Group’s liability under each guarantee is measured at the higher of the amount initially recognised less cumulative amortisation recognised in the consolidated income statement, and an ECL provision. The premium received is recognised in the income statement in “Net fees and commission income” on a straight line basis over the life of the guarantee.
Undrawn loan commitments and letters of credits are commitments under which, over the duration of the commitment, the Group is required to provide a loan with pre-specified terms to the customer. Similar to financial guarantee contracts, these contracts are in the scope of ECL requirements.
The nominal contractual value of financial guarantees, letters of credit and undrawn loan commitments, where the loan agreed to be provided is on market terms, are not recorded on in the statement of financial position. The nominal values of these instruments together with the corresponding ECLs are disclosed in the notes.
(8) Reclassification of financial assetsThe Group reclassifies financial assets if the objective of the business model for managing those financial assets changes. Such changes are expected to be very infrequent. Such changes are determined by the Group’s senior management as a result of external or internal changes when significant to the Group’s operations and demonstrable to external parties. If financial assets are reclassified, the reclassification is applied prospectively from the reclassification date, which is the first day of the first reporting period following the change in business model that results in the reclassification of financial assets. Any previously recognized gains, losses or interest are not restated. If a financial asset is reclassified so that it is measured at fair value, its fair value is determined at the reclassification date. Any gain or loss arising from a difference between the previous carrying amount and fair value is recognized in profit or loss. If a financial asset is reclassified so that it is measured at amortized cost, its fair value at the reclassification date becomes its new carrying amount.
(9)Derecognition of financial assets and financial liabilities
(i) Financial assetsDerecognition due to substantial modification of terms and conditionsIf the terms of a financial asset are modified, then the Group evaluates whether the cash flows of the modified asset are substantially different. If the cash flows are substantially different, then the contractual rights to cash flows from the original financial asset are deemed to have expired. In this case, the original financial asset is derecognised and a new financial asset is recognised at fair value plus any eligible transaction costs. Any fees received as part of the modification are accounted for as follows:- fees that are considered in determining the fair value of the new asset and fees that represent
reimbursement of eligible transaction costs are included in the initial measurement of the asset; and - other fees are included in profit or loss as part of the gain or loss on derecognition.
If the modification of a financial asset measured at amortised cost or fair value through other comprehensive income does not result in derecognition of the financial asset, then the Group first recalculates the gross carrying amount of the financial asset using the original effective interest rate of the asset and recognises the resulting adjustment as a modification gain or loss in profit or loss. For floating-rate financial assets, the original effective interest rate used to calculate the modification gain or loss is adjusted to reflect current
NOTES TO THE CONSOLIDATED FINANCIAL STATEMENTS31 December 2018

Societe Generale de Banque au Liban SAL
Consolidated Financial Statements
The attached notes 1 to 52 form part of these consolidated financial statements. 52 | 53
market terms at the time of the modification. Any costs or fees incurred and fees received as part of the modification adjust the gross carrying amount of the modified financial asset and are amortised over the remaining term of the modified financial asset.
If such a modification is carried out because of financial difficulties of the borrower, then the gain or loss is presented together with impairment losses. In other cases, it is presented as interest income calculated using the effective interest rate method.
Derecognition other than for substantial modificationA financial asset (or where applicable, a part of a financial asset or part of a group of similar financial assets) is derecognised when the rights to receive cash flows from the financial asset have expired. The Group also derecognises the financial asset if it has both transferred the financial asset and the transfer qualifies for derecognition.
The Group has transferred the financial asset if, and only if, either:• The Group has transferred its contractual rights to receive cash flows from the financial asset; or• The Group retains the rights to the cash flows, but has assumed an obligation to pay the received cash
flows in full without material delay to a third party under a “pass-through” arrangement.
Pass-through arrangements are transactions whereby the Group retains the contractual rights to receive the cash flows of a financial asset (the ‘original asset’), but assumes a contractual obligation to pay those cash flows to one or more entities (the ‘eventual recipients’), when all of the following three conditions are met:• The Group has no obligation to pay amounts to the eventual recipients unless it has collected equivalent
amounts from the original asset, excluding short-term advances with the right to full recovery of the amount lent plus accrued interest at market rates;
• The Group cannot sell or pledge the original asset other than as security to the eventual recipients;• The Group has to remit any cash flows it collects on behalf of the eventual recipients without material
delay. In addition, the Group is not entitled to reinvest such cash flows, except for investments in cash or cash equivalents including interest earned, during the period between the collection date and the date of required remittance to the eventual recipients
A transfer only qualifies for derecognition if either:• The Group has transferred substantially all the risks and rewards of the asset; or• The Group has neither transferred nor retained substantially all the risks and rewards of the asset, but
has transferred control of the asset
The Group considers control to be transferred if and only if, the transferee has the practical ability to sell the asset in its entirety to an unrelated third party and is able to exercise that ability unilaterally and without imposing additional restrictions on the transfer.
When the Group has neither transferred nor retained substantially all the risks and rewards and has retained control of the asset, the asset continues to be recognised only to the extent of the Group’s continuing involvement, in which case, the Group also recognises an associated liability. The transferred asset and the associated liability are measured on a basis that reflects the rights and obligations that the Group has retained.
Continuing involvement that takes the form of a guarantee over the transferred asset is measured at the lower of the original carrying amount of the asset and the maximum amount of consideration the Group could be required to pay.
If continuing involvement takes the form of a written or purchased option (or both) on the transferred asset, the continuing involvement is measured at the value the Group would be required to pay upon repurchase. In the case of a written put option on an asset that is measured at fair value, the extent of the entity’s continuing involvement is limited to the lower of the fair value of the transferred asset and the option exercise price.
(ii) Financial liabilitiesA financial liability is derecognized when the obligation under the liability is discharged or cancelled or
NOTES TO THE CONSOLIDATED FINANCIAL STATEMENTS31 December 2018
expires. Where an existing financial liability is replaced by another from the same lender on substantially different terms, or the terms of an existing liability are substantially modified, such an exchange or modification is treated as a derecognition of the original liability and the recognition of a new liability. The difference between the carrying value of the original financial liability and the consideration paid is recognized in the consolidated income statement.
If the modification of a financial liability is not accounted for as derecognition, then the amortised cost of the liability is recalculated by discounting the modified cash flows at the original effective interest rate and the resulting gain or loss is recognised in profit or loss. For floating-rate financial liabilities, the original effective interest rate used to calculate the modification gain or loss is adjusted to reflect current market terms at the time of the modification. Any costs and fees incurred are recognised as an adjustment to the carrying amount of the liability and amortised over the remaining term of the modified financial liability by re-computing the effective interest rate on the instrument.
(10) Repurchase and reverse repurchase agreementsSecurities sold under agreements to repurchase at a specified future date are not derecognized from the consolidated statement of financial position as the Group retains substantially all the risks and rewards of ownership. The corresponding cash received is recognized in the consolidated statement of financial position as an asset with a corresponding obligation to return it, including accrued interest as a liability within “loans and repurchase agreements”, reflecting the transaction’s economic substance as a loan to the Group. The difference between the sale and repurchase prices is treated as interest expense and is accrued over the life of agreement using the effective interest rate. When the counterparty has the right to sell or repledge the securities, the Group reclassifies those securities in its consolidated statement of financial position to “Financial assets pledged as collateral”.
Conversely, securities purchased under agreements to resell at a specified future date are not recognized in the consolidated statement of financial position. The consideration paid, including accrued interest, is recorded in the consolidated statement of financial position within “Reverse repurchase agreements”, reflecting the transaction’s economic substance as a loan by the Group. The difference between the purchase and resale prices is recorded in “Net interest income” and is accrued over the life of the agreement using the effective interest rate.
If securities purchased under agreement to resell are subsequently sold to third parties, the obligation to return the securities is recorded as a short sale within “Financial liabilities at fair value through profit or loss” and measured at fair value with any gains or losses included in “net gain from financial assets at fair value through profit or loss” in the consolidated income statement.
(11) Securities lending and borrowingSecurities lending and borrowing transactions are usually collateralized by securities or cash. The transfer of the securities to counterparties is only reflected on the consolidated statement of financial position if the risks and rewards of ownership are also transferred. Cash advanced or received as collateral is recorded as an asset or liability.
Securities borrowed are not recognized on the consolidated statement of financial position, unless they are then sold to third parties, in which case the obligation to return the securities is recorded as a trading liability and measured at fair value with any gains or losses included in “Net trading income”.
(12) Determination of fair valueThe Group measures financial instruments such as derivatives, and non-financial assets such as investment properties, at fair value at each statement of financial position date. Also, fair values of financial instruments measured at amortized cost are disclosed in the notes.
Fair value is the price that would be received to sell an asset or paid to transfer a liability in an orderly transaction between market participants at the measurement date. The fair value measurement is based on the presumption that the transaction to sell the asset or transfer the liability takes place either:
• In the principal market for the asset or liability, or• In the absence of a principal market, in the most advantageous market for the asset or liability
NOTES TO THE CONSOLIDATED FINANCIAL STATEMENTS31 December 2018
Societe Generale de Banque au Liban SAL
Consolidated Financial Statements
The attached notes 1 to 52 form part of these consolidated financial statements. 54 | 55
The principal or the most advantageous market must be accessible by the Group. The fair value of an asset or a liability is measured using the assumptions that market participants would use when pricing the asset or liability, assuming that market participants act in their economic best interest.
A fair value measurement of a non-financial asset takes into account a market participant’s ability to generate economic benefits by using the asset in its highest and best use or by selling it to another market participant that would use the asset in its highest and best use.
The Group uses valuation techniques that are appropriate in the circumstances and for which sufficient data are available to measure fair value, maximizing the use of relevant observable inputs and minimizing the use of unobservable inputs.
All assets and liabilities for which fair value is measured or disclosed in the consolidated financial statements are categorized within the fair value hierarchy, described as follows, based on the lowest level input that is significant to the fair value measurement as a whole:
- Level 1 — Quoted (unadjusted) market prices in active markets for identical assets or liabilities- Level 2 — Valuation techniques for which the lowest level input that is significant to the fair value
measurement is directly or indirectly observable- Level 3 — Valuation techniques for which the lowest level input that is significant to the fair value
measurement is unobservable
For assets and liabilities that are recognized in the consolidated financial statements on a recurring basis, the Group determines whether transfers have occurred between Levels in the hierarchy by re-assessing categorization (based on the lowest level input that is significant to the fair value measurement as a whole) at the end of each reporting period.
The Group’s management determines the policies and procedures for both recurring fair value measurement and for non-recurring measurement. At each reporting date, the management analyses the movements in the values of assets and liabilities which are required to be re-measured or re-assessed as per the Group’s accounting policies. For this analysis, the management verifies the major inputs applied in the latest valuation by agreeing the information in the valuation computation to contracts and other relevant documents.
For the purpose of fair value disclosures, the Group has determined classes of assets and liabilities on the basis of the nature, characteristics and risks of the asset or liability and the level of the fair value hierarchy as explained above.
(13) Impairment of Financial Assets (Policy applicable from 1 January 2018)(i) Overview of the ECL Principles As described in Note 2.3, the adoption of IFRS 9 has fundamentally changed the Group’s loan loss impairment method by replacing IAS 39’s incurred loss approach with a forward-looking ECL approach. From 1 January 2018, the Group has been recording the allowance for expected credit losses for all loans and other financial assets not held at FVPL, together with loan commitments and financial guarantee contracts, in this section all referred to as ‘financial instruments’. Equity instruments are not subject to impairment under IFRS 9.
The ECL allowance is based on the credit losses expected to arise over the life of the asset (the lifetime expected credit loss), unless there has been no significant increase in credit risk since origination, or the debt instrument is determined to have low credit risk at the reporting date, in which cases, the allowance is based on the 12 months’ expected credit loss (12mECL). The 12mECL is the portion of lifetime ECLs that represent the ECLs that result from default events on a financial instrument that are possible within the 12 months after the reporting date.
(ii) Measurement of ECLsThe Group measures ECLs based on a three probability-weighted scenarios to measure the expected cash shortfalls, discounted at an approximation to the EIR as follows:• Financial assets that are not credit-impaired at the reporting date: as the present value of all cash
NOTES TO THE CONSOLIDATED FINANCIAL STATEMENTS31 December 2018
NOTES TO THE CONSOLIDATED FINANCIAL STATEMENTS31 December 2018
shortfalls (i.e. the difference between the cash flows due to the entity in accordance with the contract and the cash flows that the Group expects to receive);
• Financial assets that are credit-impaired at the reporting date: as the difference between the gross carrying amount and the present value of estimated future cash flows;
• Undrawn loan commitments: as the present value of the difference between the contractual cash flows that are due to the Group if the commitment is drawn down and the cash flows that the Group expects to receive; and
• Financial guarantee contracts: the expected payments to reimburse the holder less any amount that the Group expects to recover.
They key inputs into the measurements of ECL are:• PD: The Probability of Default is an estimate of the likelihood of default over a given time horizon. A
default may only happen at a certain time over the assessed period, if the facility has not been previously derecognised and is still in the portfolio.
• EAD: The Exposure at Default is an estimate of the exposure at a future default date, taking into account expected changes in the exposure after the reporting date, including repayments of principal and interest, whether scheduled by contract or otherwise, and expected drawdowns on committed facilities.
• LGD: The Loss Given Default is an estimate of the loss arising in the case where a default occurs at a given time. It is based on the difference between the contractual cash flows due and those that the Group would expect to receive, including from the realisation of any collateral. It is usually expressed as a percentage of the EAD.
These parameters are generally derived from statistical models and other historical data. Forward looking information are incorporated in ECL measurements.
The Group measures ECLs using a three-stage approach based on the extent of credit deterioration since origination:• Stage 1 – Where there has not been a significant increase in credit risk (SICR) since initial recognition of
a financial instrument, an amount equal to 12 months expected credit loss is recorded. The expected credit loss is computed using a probability of default occurring over the next 12 months. For these instruments with a remaining maturity of less than 12 months, probability of default corresponding to remaining term to maturity is used.
• Stage 2 – When a financial instrument experiences a SICR subsequent to origination but is not considered to be impaired, it is included in Stage 2. This requires the computation of expected credit loss based on the probability of default over the remaining estimated life of the financial instrument.
• Stage 3 – Financial instruments that are considered to be impaired are included in this stage, the allowance for credit losses captures the lifetime expected credit losses, similar to Stage 2.
(iii) Forborne and modified loansThe Group sometimes makes concessions or modifications to the original terms of loans as a response to the borrower’s financial difficulties, rather than taking possession or to otherwise enforce collection of collateral. The Group considers a loan forborne when such concessions or modifications are provided as a result of the borrower’s present or expected financial difficulties and the Group would not have agreed to them if the borrower had been financially healthy. Indicators of financial difficulties include defaults on covenants, or significant concerns raised by the Credit Risk Department. Forbearance may involve extending the payment arrangements and the agreement of new loan conditions. Once the terms have been renegotiated, any impairment is measured using the original EIR as calculated before the modification of terms. It is the Group’s policy to monitor forborne loans to help ensure that future payments continue to be likely to occur. Derecognition decisions and classification between Stage 2 and Stage 3 are determined on a case-by-case basis. If these procedures identify a loss in relation to a loan, it is disclosed and managed as an impaired Stage 3 forborne asset until it is collected or written off.
From 1 January 2018, when the loan has been renegotiated or modified but not derecognised, the Group also reassesses whether there has been a significant increase in credit risk. The Group also considers whether the assets should be classified as Stage 3. Once an asset has been classified as forborne, it will remain forborne for a minimum 12-month probation period. In order for the loan to be reclassified out of the forborne category, the customer has to meet all of the following criteria:
Societe Generale de Banque au Liban SAL
Consolidated Financial Statements
The attached notes 1 to 52 form part of these consolidated financial statements. 56 | 57
- At least a 12-month probation period has passed, - Three consecutive payments under the new repayment schedule have been made, - The borrower has no past dues under any obligation to the Group, - All the terms and conditions agreed to as part of the restructuring have been met.
If modifications are substantial, the loan is derecognised, as explained above.
(iv) Credit-impaired financial assetsAt each reporting date, the Group assesses whether financial assets carried at amortised cost and debt financial assets carried at fair value through other comprehensive income, and finance lease receivables are credit-impaired (referred to as “Stage 3 financial assets”). A financial asset is “credit impaired” when one or more events that have detrimental impact on the estimated future cash flows of the financial asset have occurred. Evidence that a financial asset is credit-impaired includes the following observable information:- Significant financial difficulty of the borrower or issuer;- A breach of contract such as a default or past due event;- The restructuring of a loan or advance by the Group on terms that the Group would not consider
otherwise;- It is becoming probable that the borrower will enter bankruptcy or other financial reorganisation; or- The disappearance of an active market for a security because of financial difficulties.
(v) Write OffsThe Group’s accounting policy under IFRS 9 remains the same as it was under IAS 39. Financial assets are written off either partially or in their entirety only when the Group has stopped pursuing the recovery. If the amount to be written off is greater than the accumulated loss allowance, the difference is first treated as an addition to the allowance that is then applied against the gross carrying amount. Any subsequent recoveries are credited to “Net impairment losses on financial assets”.
(vi) Debt Instruments at Fair Value through Other Comprehensive IncomeThe ECLs for debt instruments measured at FVOCI do not reduce the carrying amount of these financial assets in the statement of financial position, which remains at fair value. Instead, an amount equal to the allowance that would arise if the assets were measured at amortised cost is recognised in OCI as an accumulated impairment amount, with a corresponding charge to profit or loss. The accumulated loss recognised in OCI is recycled to the profit and loss upon derecognition of the assets.
(vii) Collateral repossessedThe Group’s accounting policy under IFRS 9 remains the same as it was under IAS 39. The Group occasionally acquires properties in settlement of loans and advances. Upon initial recognition, those assets are measured at fair value as approved by the regulatory authorities. Subsequently, these properties are measured at the lower of carrying value or net realisable value.
Upon sale of repossessed assets, any gain or loss realised is recognised in the consolidated income statement under “other operating income” or “other operating expenses”. Gains resulting from the sale of repossessed assets are transferred to “reserves appropriated for capital increase” in the following financial year.
(14) Impairment of financial assets (Policy applicable before 1 January 2018)The Group assesses at each consolidated statement of financial position date whether there is any objective evidence that a financial asset or a group of financial assets is impaired. A financial asset or a group of financial assets is deemed to be impaired if, and only if, there is objective evidence of impairment as a result of one or more events that have occurred after the initial recognition of the asset (an incurred ‘loss event’) and that loss event (or events) has an impact on the estimated future cash flows of the financial asset or the group of financial assets that can be reliably estimated.
Evidence of impairment may include indications that the borrower or a group of borrowers is experiencing significant financial difficulty, the probability that they will enter bankruptcy or other financial reorganization, default or delinquency in interest or principal payments and where observable data indicates that there is a measurable decrease in the estimated future cash flows, such as changes in arrears or economic conditions that correlate with defaults.
NOTES TO THE CONSOLIDATED FINANCIAL STATEMENTS31 December 2018
(i) Financial assets carried at amortized costFor financial assets carried at amortized cost, the Group first assesses individually whether objective evidence of impairment exists for financial assets that are individually significant, or collectively for financial assets that are not individually significant. If the Group determines that no objective evidence of impairment exists for an individually assessed financial asset, it includes the asset in a group of financial assets with similar credit risk characteristics and collectively assesses them for impairment. Assets that are individually assessed for impairment and for which an impairment loss is, or continues to be, recognized are not included in a collective assessment of impairment.
If there is objective evidence that an impairment loss has been incurred, the amount of the loss is measured as the difference between the asset’s carrying amount and the present value of estimated future cash flows (excluding future expected credit losses that have not yet been incurred). The carrying amount of the asset is reduced through the use of an allowance account and the amount of the loss is recognized in the consolidated income statement.
Loans together with the associated allowance are written off when there is no realistic prospect of future recovery and all collateral has been realized or has been transferred to the Group. If, in a subsequent year, the amount of the estimated impairment loss increases or decreases because of an event occurring after the impairment was recognized, the previously recognized impairment loss is increased or reduced by adjusting the allowance account. If a future write-off is later recovered, the recovery is credited to the “Net credit losses” in the consolidated income statement.
The present value of the estimated future cash flows is discounted at the financial asset’s original effective interest rate. If a loan has a variable interest rate, the discount rate for measuring any impairment loss is the current effective interest rate. The calculation of the present value of the estimated future cash flows of a collateralized financial asset reflects the cash flows that may result from foreclosure less costs of obtaining and selling the collateral, whether or not the foreclosure is probable.
For the purpose of a collective evaluation of impairment, financial assets are grouped on the basis of the Group’s internal credit grading system, that considers credit risk characteristics such as asset type, industry, geographical location, collateral type, past-due status and other relevant factors.
Future cash flows on a group of financial assets that are collectively evaluated for impairment are estimated on the basis of historical loss experience for assets with credit risk characteristics similar to those in the group. Historical loss experience is adjusted on the basis of current observable data to reflect the effects of current conditions on which the historical loss experience is based and to remove the effects of conditions in the historical period that do not exist currently.
Estimates of changes in future cash flows reflect, and are directionally consistent with, changes in related observable data from year to year (such as changes in unemployment rates, property prices, commodity prices, payment status, or other factors that are indicative of incurred losses in the group and their magnitude). The methodology and assumptions used for estimating future cash flows are reviewed regularly to reduce any differences between loss estimates and actual loss experienced.
(ii) Renegotiated loansWhere possible, the Group seeks to restructure loans rather than to take possession of collateral. This may involve extending the payment arrangements and the agreement of new loan conditions. Once the terms have been renegotiated any impairment is measured using the original effective interest rate as calculated before the modification of terms and the loan is no longer considered past due. Management continuously reviews renegotiated loans to ensure that all criteria are met and that future payments are likely to occur. The loans continue to be subject to an individual or collective impairment assessment, calculated using the loan’s original effective interest rate.
(iii) Collateral repossessedThe Group’s policy is to determine whether a repossessed asset is best used for its internal operations or should be sold. Assets determined to be useful for the internal operations are transferred to their relevant asset category at the lower of their repossessed value or the carrying value of the original secured asset. Assets that are determined better to be sold, are immediately transferred to assets held for sale at their fair value at the repossessed date in line with the Group’s policy.
NOTES TO THE CONSOLIDATED FINANCIAL STATEMENTS31 December 2018
Societe Generale de Banque au Liban SAL
Consolidated Financial Statements
The attached notes 1 to 52 form part of these consolidated financial statements. 58 | 59
(15) Hedge accountingThe Group makes use of derivative instruments to manage exposures to interest rate, foreign currency and credit risks, including exposures arising from highly probable forecast transactions and firm commitments. In order to manage particular risks, the Group applies hedge accounting for transactions which meet the specified criteria.
At inception of the hedge relationship, the Group formally documents the relationship between the hedged item and the hedging instrument, including the nature of the risk, the objective and strategy for undertaking the hedge and the method that will be used to assess the effectiveness of the hedging relationship.
At each hedge effectiveness assessment date, a hedge relationship must be expected to be highly effective on a prospective basis and demonstrate that it was effective (retrospective effectiveness) for the designated period in order to qualify for hedge accounting. A formal assessment is undertaken to ensure the hedging instrument is expected to be highly effective in offsetting the designated risk in the hedged item both at inception and at each quarter end on an ongoing basis.
A hedge is expected to be highly effective if the changes in fair value or cash flows attributable to the hedged risk during the period for which the hedge is designated are expected to offset in a range of 80% to 125% and are expected to achieve such offset in future periods. Hedge ineffectiveness is recognized in the consolidated income statement in “Net gain (loss) from financial assets at fair value through profit or loss”. For situations where that hedged item is a forecast transaction, the Group assesses whether the transaction is highly probable and presents an exposure to variations in cash flows that could ultimately affect the consolidated income statement.
(i) Fair value hedgesFor designated and qualifying fair value hedges, the cumulative change in the fair value of a hedging derivative is recognized in the consolidated income statement in “Net gain (loss) from financial instruments at fair value through profit or loss”. Meanwhile, the cumulative change in the fair value of the hedged item attributable to the risk hedged is recorded as part of the carrying value of the hedged item in the consolidated statement of financial position and is also recognized in “Net gain from financial assets at fair value through profit or loss” in the consolidated income statement.
If the hedging instrument expires or is sold, terminated or exercised, or where the hedge no longer meets the criteria for hedge accounting, the hedge relationship is discontinued prospectively. For hedged items recorded at amortized cost, the difference between the carrying value of the hedged item on termination and the face value is amortized over the remaining term of the original hedge using the recalculated effective interest rate (EIR). If the hedged item is derecognized, the unamortized fair value adjustment is recognized immediately in the consolidated income statement.
(ii) Cash flow hedgesFor designated and qualifying cash flow hedges, the effective portion of the gain or loss on the hedging instrument is initially recognized directly in equity in the “Cash flow hedge reserve”. The ineffective portion of the gain or loss on the hedging instrument is recognized immediately in the consolidated income statement.
When the hedged cash flow affects the consolidated income statement, the gain or loss on the hedging instrument is recorded in the corresponding income or expense line of the consolidated income statement. When the forecast transaction subsequently results in the recognition of a non-financial asset or a non-financial liability, the gains and losses previously recognized in the other comprehensive income are removed from the reserve and included in the initial cost of the asset or liability.
When a hedging instrument expires, or is sold, terminated, exercised, or when a hedge no longer meets the criteria for hedge accounting, any cumulative gain or loss existing in other comprehensive income at that time remains in other comprehensive income and is recognized when the hedged forecast transaction is ultimately recognized in the consolidated income statement. When a forecast transaction is no longer expected to occur, the cumulative gain or loss that was reported in other comprehensive income is immediately transferred to the consolidated income statement.
(iii) Hedge of a net investment Hedges of net investments in a foreign operation, including a hedge of a monetary item that is accounted
NOTES TO THE CONSOLIDATED FINANCIAL STATEMENTS31 December 2018
NOTES TO THE CONSOLIDATED FINANCIAL STATEMENTS31 December 2018
for as part of the net investment, are accounted for in a way similar to cash flow hedges. Gains or losses on the hedging instrument relating to the effective portion of the hedge are recognized directly in other comprehensive income while any gains or losses relating to the ineffective portion are recognized in the consolidated income statement. On disposal of the foreign operation, the cumulative value of any such gains or losses recognized directly in other comprehensive income is transferred to the consolidated income statement.
(16) Offsetting financial instrumentsFinancial assets and financial liabilities are offset and the net amount reported in the consolidated statement of financial position if, and only if, there is a currently enforceable legal right to offset the recognized amounts and there is an intention to settle on a net basis, or to realize the asset and settle the liability simultaneously. This is not generally the case with master netting agreements. Therefore, the related assets and liabilities are presented gross in the consolidated statement of financial position.
(17) LeasingThe determination of whether an arrangement is a lease, or it contains a lease, is based on the substance of the arrangement and requires an assessment of whether the fulfillment of the arrangement is dependent on the use of a specific asset or assets and the arrangement conveys a right to use the asset.
Group as a lesseeLeases which do not transfer to the Group substantially all the risks and benefits incidental to ownership of the leased items are operating leases. Operating lease payments are recognized as an expense in the consolidated income statement on a straight line basis over the lease term. Contingent rents payable are recognized as an expense in the period in which they are incurred.
Group as a lessorLeases where the Group does not transfer substantially all the risk and benefits of ownership of the asset are classified as operating leases. Initial direct costs incurred in negotiating operating leases are added to the carrying amount of the leased asset and recognized over the lease term on the same basis as rental income. Contingent rents are recognized as revenue in the period in which they are earned.
(18) Recognition of income and expenseRevenue is recognized to the extent that it is probable that the economic benefits will flow to the Group and the revenue can be reliably measured. The following specific recognition criteria must also be met before revenue is recognized.
(i) Interest and similar income and expenses The effective interest rate Interest income and expense are recognized in the income statement applying the EIR method for all financial instruments measured at amortised cost, financial instruments designated at fair value through profit or loss and interest bearing financial assets measured at fair value through other comprehensive income. The EIR is the rate that exactly discounts estimated future cash payments or receipts through the expected life of the financial asset or financial liability to the gross carrying amount of a financial asset or to the amortised cost of a financial liability. When calculating the EIR for financial instruments other than purchased or originated credit impaired, an entity shall take into account all the contractual terms of the financial instrument (for example, prepayment, extension, call and similar options) but shall not consider the expected credit losses. For purchased or originated credit impaired financial assets, a credit adjusted effective interest rate is calculated using estimated future cash flows and expected credit losses. The calculation includes all fees and points paid or received between parties to the contract that are an integral part of the effective interest rate, transaction costs, and all other premiums or discounts.
Interest income and interest expenseThe effective interest rate of a financial asset or a financial liability is calculated on initial recognition of the financial asset or financial liability. In determining interest income and expense, the EIR is applied to the gross carrying amount of the financial asset (unless the asset is credit-impaired) or the amortized cost of a financial liability. The effective interest rate is revised as a result of periodic re-estimation of cash flows of floating rate instruments to reflect movements in market rates of interest. The effective interest rate is also revised for fair value hedge adjustments at the date amortisation of the hedge adjustment begins.
Societe Generale de Banque au Liban SAL
Consolidated Financial Statements
The attached notes 1 to 52 form part of these consolidated financial statements. 60 | 61
NOTES TO THE CONSOLIDATED FINANCIAL STATEMENTS31 December 2018
NOTES TO THE CONSOLIDATED FINANCIAL STATEMENTS31 December 2018
The calculation includes all fees and points paid or received between parties to the contract that are an integral part of the effective interest rate, transaction costs, and all other premiums or discounts, unless the financial instrument is measured at fair value, with the change in fair value being recognised in profit or loss. In those cases, the fees are recognised as revenue or expense when the instrument is initially recognised
Interest income and interest expense (continued)When a financial asset becomes credit-impaired after initial recognition, interest income is determined by applying EIR to the net amortized cost of the instrument. If the financial asset cures and is no longer credit-impaired, the Group reverts back to calculating interest income on a gross basis. Furthermore, for financial assets that were credit-impaired on initial recognition, interest is determined by applying a credit-adjusted EIR to the amortized cost of the instrument. The calculation of interest income does not revert to a gross basis, even if the credit risk of the asset improves. PresentationInterest income calculated using the effective interest method presented in the consolidated income statement includes:- interest on financial assets at amortised cost;- interest on debt instruments measured at fair value through other comprehensive income;- the effective portion of fair value changes in qualifying hedging derivatives designated in cash flow
hedges of variability in interest cash flows, in the same period as the hedged cash flows affect interest income/expense; and
- the effective portion of fair value changes in qualifying hedging derivatives designated in fair value hedges of interest rate risk.
Interest expense presented in the consolidated income statement includes:- financial liabilities measured at amortised cost; and- the effective portion of fair value changes in qualifying hedging derivatives designated in cash flow
hedges of variability in interest cash flows, in the same period as the hedged cash flows affect interest income/expense.
Interest income and expense on financial instruments measured at fair value through profit or loss are presented under “Net gain on financial assets at fair value through profit or loss” in the consolidated income statement.
(ii) Fee and commission incomeThe Group earns fee and commission income from a diverse range of services it provides to its customers. Fee income can be divided into the following two categories:
Fee income earned from services that are provided over a certain period of timeFees earned for the provision of services over a period of time are accrued over that period. These fees include commission income and asset management, custody and other management and advisory fees.
Loan commitment fees for loans that are likely to be drawn down and other credit related fees are deferred (together with any incremental costs) and recognized as an adjustment to the effective interest rate on the loan. When it is unlikely that a loan be drawn down, the loan commitment fees are recognized as revenues on expiry.
Fee income from providing transaction servicesFees arising from negotiating or participating in the negotiation of a transaction for a third party, such as the arrangement of the acquisition of shares or other securities or the purchase or sale of businesses, are recognized on completion of the underlying transaction. Fees or components of fees that are linked to a certain performance are recognized after fulfilling the corresponding criteria.
Fee and commission income from providing insurance servicesInsurance and investment contract policyholders are charged for policy administration services, investment management services, surrenders and other contract fees. These fees are recognized as revenue over the period in which the related services are performed. If the fees are for services provided in future periods, then they are deferred and recognized over those future periods.
(iii) Dividend incomeDividend income is recognized when the Group’s right to receive the payment is established.
(iv) Net gain (loss) on financial instruments at fair value through profit or lossNet income from financial instruments at fair value through profit or loss comprises gains and losses related to trading assets and liabilities, non-trading derivatives held for risk management purposes that do not form part of qualifying hedging relationships, financial assets and financial liabilities designated as at fair value through profit or loss and, also non-trading assets mandatorily measured at fair value through profit or loss. The line item includes fair value changes, interest, dividends and foreign exchange differences.
(19) Cash and cash equivalentsCash and cash equivalents as referred to in the consolidated statement of cash flows comprise balances with original maturities of a period of three months or less including cash and balances with the Central Banks, deposits with banks and financial institutions, reverse repurchase agreements, amounts due from affiliated banks and financial institutions, due to the Central Banks, loans and repurchase agreements, due to banks and financial institutions and amounts due to affiliated banks and financial institutions.
(20) Investments in an associateAn associate is an entity over which the Group has significant influence. Significant influence is the power to participate in the financial and operating policy decisions of the investee, but is not control or joint control over those policies.
The considerations made in determining significant influence are similar to those necessary to determine control over subsidiaries.
The Group’s investments in its associate is accounted for using the equity method. Under the equity method, the investment in an associate is initially recognized at cost. The carrying amount of the investment is adjusted to recognize changes in the Group’s share of net assets of the associate since the acquisition date. Goodwill relating to the associate is included in the carrying amount of the investment and is not tested for impairment individually.
The statement of profit or loss reflects the Group’s share of the results of operations of the associate. Any change in OCI of this investee is presented as part of the Group’s OCI. In addition, when there has been a change recognized directly in the equity of the associate, the Group recognizes its share of any changes, when applicable, in the statement of changes in equity. Unrealized gains and losses resulting from transactions between the Group and the associate are eliminated to the extent of the interest in the associate.
The financial statements of the associate are prepared for the same reporting period as the Group. When necessary, adjustments are made to bring the accounting policies in line with those of the Group.
After application of the equity method, the Group determines whether it is necessary to recognize an impairment loss on its investment in its associate. At each reporting date, the Group determines whether there is objective evidence that the investment in the associate is impaired. If there is such evidence, the Group calculates the amount of impairment as the difference between the recoverable amount of the associate and its carrying value, and then recognizes the loss in the statement of profit or loss.
(21) Property and equipment Property and equipment are initially recorded at cost less accumulated depreciation and any impairment in value. Buildings acquired prior to 1 January 1994 were restated for the changes in the general purchasing power of Lebanese Lira after the approval of the Central Bank of Lebanon. Net surplus arising on restatement is credited to “Revaluation reserve of property”. Changes in the expected useful life are accounted for by changing the depreciation period or method, as appropriate, and treated as changes in accounting estimates.
Depreciation is calculated using the straight line method to write-down the cost of property and equipment to their residual values over their estimated useful lives. Land is not depreciated. The estimated useful lives are as follows:
• Buildings 50 years• Furniture and fixtures 5 to 12.5 years• Installations 16.67 years• Vehicles 10 years

Societe Generale de Banque au Liban SAL
Consolidated Financial Statements
The attached notes 1 to 52 form part of these consolidated financial statements. 62 | 63
NOTES TO THE CONSOLIDATED FINANCIAL STATEMENTS31 December 2018
NOTES TO THE CONSOLIDATED FINANCIAL STATEMENTS31 December 2018
Property and equipment is derecognized on disposal or when no future economic benefits are expected from its use. Any gain or loss arising on derecognition of the asset (calculated as the difference between the net disposal proceeds and the carrying amount of the asset) is recognized in “Net profit from sale and write-off of other assets” in the consolidated income statement in the year the asset is derecognized.
The assets’ residual lives and methods of depreciation are reviewed at each financial year end and adjusted prospectively if applicable.
(22) Business combinations and goodwillBusiness combinations are accounted for using the acquisition method. The cost of an acquisition is measured as the aggregate of the consideration transferred, measured at acquisition date fair value and the amount of any non-controlling interest in the acquiree. For each business combination, the Group elects whether to measure the non controlling interest in the acquiree at fair value or at the proportionate share of the acquiree’s identifiable net assets. Acquisition costs incurred are expensed and included in administrative expenses.
When the Group acquires a business, it assesses the financial assets and liabilities assumed for appropriate classification and designation in accordance with the contractual terms, economic circumstances and pertinent conditions as at the acquisition date. This includes the separation of embedded derivatives in host contracts by the acquiree.
If the business combination is achieved in stages, the previously held equity interest in the acquiree is remeasured at fair value at the acquisition date through the consolidated income statement.
Any contingent consideration to be transferred by the acquirer will be recognized at fair value at the acquisition date. Subsequent changes to the fair value of the contingent consideration which is deemed to be an asset or liability will be recognized either in profit or loss or as a change to other comprehensive income. If the contingent consideration is classified as equity, it should not be remeasured until it is finally settled within equity.
Goodwill is initially measured at cost being the excess of the aggregate of the consideration transferred and the amount recognized for non-controlling interests, and any previous interest held, over the net identifiable assets acquired and liabilities assumed. If the fair value of the net assets acquired is in excess of the aggregate consideration transferred, the Group re-assesses whether it has correctly identified all of the assets acquired and all of the liabilities assumed and reviews the procedures used to measure the amounts to be recognized at the acquisition date. If the re-assessment still results in an excess of the fair value of net assets acquired over the aggregate consideration transferred, then the gain is recognized in profit or loss.
Following initial recognition, goodwill is measured at cost less any accumulated impairment losses. Goodwill is reviewed for impairment annually, or more frequently, if events or changes in circumstances indicate that the carrying value may be impaired. For the purpose of impairment testing, goodwill acquired in a business combination is, from the acquisition date, allocated to each of the Bank’s cash– generating units (CGUs) or group of CGUs, which are expected to benefit from the synergies of the combination, irrespective of whether other assets or liabilities of the acquiree are assigned to those units. Each unit to which the goodwill is allocated represents the lowest level within the Bank at which the goodwill is monitored for internal management purposes, and is not larger than an operating segment in accordance with IFRS 8 Operating Segments.
Where goodwill forms part of a cash-generating unit and part of the operation within that unit is disposed of, the goodwill associated with the operation disposed of is included in the carrying amount of the operation when determining the gain or loss on disposal of the operation. Goodwill disposed of in this circumstance is measured based on the relative values of the operation disposed of and the portion of the cash-generating unit retained. (23) Intangible assetsAn intangible asset is recognized only when its cost can be measured reliably and it is probable that the expected future economic benefits that are attributable to it will flow to the Group.
Intangible assets acquired separately are measured on initial recognition at cost. The cost of intangible assets acquired in a business combination is their fair value as at the date of acquisition. Following initial recognition, intangible assets are carried at cost less any accumulated amortization and any accumulated impairment losses.
The useful lives of intangible assets are assessed to be either finite or indefinite. Intangible assets with finite lives are amortized over the useful economic life. The amortization period and the amortization method for an intangible asset with a finite useful life are reviewed at least at each financial year-end. Changes in the expected useful life or the expected pattern of consumption of future economic benefits embodied in the asset are accounted for by changing the amortization period or method, as appropriate, and treated as changes in accounting estimates. The amortization expense on intangible assets with finite lives is recognized in the consolidated income statement in the expense category consistent with the function of the intangible asset.
Amortization is calculated using the straight line method to write down the cost of intangible assets to their residual values. The estimated useful lives are as follows:
Software 5 yearsKey money 5 yearsCustomer relationship – core deposits 12.5 yearsCustomer relationship – loans and advances 12.5 years
Intangible assets with indefinite useful lives are not amortized, but are tested for impairment annually, either individually or at the cash-generating unit level. The assessment of indefinite life is reviewed annually to determine whether the indefinite life continues to be supportable. If not, the change in useful life from indefinite to finite is made on a prospective basis.
Gains or losses arising from de-recognition of an intangible asset are measured as the difference between the net disposal proceeds and the carrying amount of the asset and are recognized in the consolidated income statement when the asset is derecognized.
The Group does not have intangible assets with indefinite economic life.
(24) Investment propertiesInvestment properties are measured initially at cost, including transaction costs. Subsequent to initial recognition, investment properties are stated at fair value, which reflects market conditions at the reporting date. Gains or losses arising from changes in the fair values of investment properties are included in profit or loss in the period in which they arise, including the corresponding tax effect. Fair values are determined based on the evaluation performed by independent qualified valuers on the basis of current market values and if any, by reference to sale agreements entered into by the Group for the disposal of the property subsequent to year end.
Investment properties are derecognized either when they have been disposed of or when they are permanently withdrawn from use and no future economic benefit is expected from their disposal. The difference between the net disposal proceeds and the carrying amount of the asset is recognized in the consolidated income statement in the period of derecognition.
Transfers are made to (or from) investment property only when there is a change in use. For a transfer from investment property to owner-occupied property, the deemed cost for subsequent accounting is the fair value at the date of change in use. If owner-occupied property becomes an investment property, the Group accounts for such property in accordance with the policy stated under property and equipment up to the date of change in use.
(25) Non-current assets held for saleNon-current assets classified as held for sale are measured at the lower of their carrying amount and fair value less costs to sell. Non-current assets are classified as held for sale if their carrying amounts will be recovered principally through a sale transaction rather than through continuing use. This condition is regarded as met only when the sale is highly probable and the asset is available for immediate sale in its present condition, management has committed to the sale, and the sale is expected to have been completed within one year from the date of classification.
A discontinued operation is a component of an entity that either has been disposed of, or is classified as held for sale, and:
- Represents a separate major line of business or geographical area of operations
Societe Generale de Banque au Liban SAL
Consolidated Financial Statements
The attached notes 1 to 52 form part of these consolidated financial statements. 64 | 65
NOTES TO THE CONSOLIDATED FINANCIAL STATEMENTS31 December 2018
NOTES TO THE CONSOLIDATED FINANCIAL STATEMENTS31 December 2018
- Is part of a single coordinated plan to dispose of a separate major line of business or geographical area of operations
Or- Is a subsidiary acquired exclusively with a view to resale
In the consolidated statement of comprehensive income of the reporting period, and of the comparable period of the previous year, income and expenses from discontinued operations are reported separately from income and expenses from continuing operations, down to the level of profit after taxes, even when the Group retains a non-controlling interest in the subsidiary after the sale.
The Group assesses at each reporting date whether there is an indication that an asset may be impaired. If any indication exists, or when annual impairment testing for an asset is required, the Group estimates the asset’s recoverable amount. An asset’s recoverable amount is the higher of an asset’s or cash-generating unit’s (CGU) fair value less costs to sell and its value in use. Where the carrying amount of an asset or CGU exceeds its recoverable amount, the asset is considered impaired and is written down to its recoverable amount. In assessing value in use, the estimated future cash flows are discounted to their present value using a pre-tax discount rate that reflects current market assessments of the time value of money and the risks specific to the asset. In determining fair value less costs to sell, an appropriate valuation model is used. These calculations are corroborated by valuation multiples, quoted share prices for publicly traded subsidiaries or other available fair value indicators.
(26) Impairment of non-financial assetsFor assets excluding goodwill, an assessment is made at each reporting date as to whether there is any indication that previously recognized impairment losses may no longer exist or may have decreased. If such indication exists, the Group estimates the asset’s or CGU’s recoverable amount. A previously recognized impairment loss is reversed only if there has been a change in the assumptions used to determine the asset’s recoverable amount since the last impairment loss was recognized. The reversal is limited so that the carrying amount of the asset does not exceed its recoverable amount, nor exceeds the carrying amount that would have been determined, net of depreciation, had no impairment loss been recognized for the asset in prior years. Such reversal is recognized in the consolidated income statement.
Impairment losses relating to goodwill cannot be reversed in future periods. (27) Financial guaranteesIn the ordinary course of business, the Group gives financial guarantees, consisting of letters of credit, guarantees and acceptances. Financial guarantees are initially recognized in the consolidated financial statements (within “Other liabilities”) at fair value, being the premium received. Subsequent to initial recognition, the Group’s liability under each guarantee is measured at the higher of the amount initially recognized less, when appropriate, cumulative amortization recognized in the consolidated income statement, and the best estimate of expenditure required to settle any financial obligation arising as a result of the guarantee.
Any increase in the liability relating to financial guarantees is recorded in the consolidated income statement in “Net credit losses”. The premium received is recognized in the consolidated income statement in “Net fees and commission income” on a straight line basis over the life of the guarantee. (28) TaxTaxes are provided for in accordance with regulations and laws that are effective in the countries where the Group operates. (i) Current taxCurrent tax assets and liabilities for the current and prior years are measured at the amount expected to be recovered from or paid to the taxation authorities. The taxation rates and tax law used to compute the amount are those that are enacted or substantively enacted by the statement of financial position date. (ii) Deferred taxDeferred tax is provided on temporary differences at the statement of financial position date between the tax bases of assets and liabilities and their carrying amounts for financial reporting purposes. Deferred tax liabilities are recognized for all taxable temporary differences, except:
• Where the deferred tax liability arises from the initial recognition of goodwill or of an asset or liability in a transaction that is not a business combination and, at the time of the transaction, affects neither the accounting profit nor taxable profit or loss;
• In respect of taxable temporary differences associated with investments in subsidiaries, where the timing of the reversal of the temporary differences can be controlled and it is probable that the temporary differences will not reverse in the foreseeable future.
Deferred tax assets are recognized for all deductible temporary differences, carry forward of unused tax credits and unused tax losses, to the extent that it is probable that taxable profit will be available against which the deductible temporary differences, and the carry forward of unused tax credits and unused tax losses can be utilized except:• Where the deferred tax asset relating to the deductible temporary difference arises from the initial
recognition of an asset or liability in a transaction that is not a business combination and, at the time of the transaction, affects neither the accounting profit nor taxable profit or loss;
• In respect of deductible temporary differences associated with investments in subsidiaries, deferred tax assets are recognized only to the extent that it is probable that the temporary differences will reverse in the foreseeable future and taxable profit will be available against which the temporary differences can be utilized.
The carrying amount of deferred tax assets is reviewed at each statement of financial position date and reduced to the extent that it is no longer probable that sufficient taxable profit will be available to allow all or part of the deferred tax asset to be utilized. Unrecognized deferred tax assets are reassessed at each statement of financial position date and are recognized to the extent that it has become probable that future taxable profit will allow the deferred tax asset to be recovered.
Deferred tax assets and liabilities are measured at the tax rates that are expected to apply in the year when the asset is realized or the liability is settled, based on tax rates (and tax laws) that have been enacted or substantively enacted at the statement of financial position date.
Current tax and deferred tax relating to items recognized directly in other comprehensive income are also recognized in other comprehensive income and not in the consolidated income statement.
Deferred tax assets and deferred tax liabilities are offset if a legally enforceable right exists to net off current tax assets against current tax liabilities and the deferred taxes relate to the same taxable entity and the same taxation authority. (29) Provision Provision are recognized when the Group has a present obligation (legal or constructive) as a result of a past event, and it is probable that an outflow of resources embodying economic benefits will be required to settle the obligation and a reliable estimate can be made of the amount of the obligation. (30) Pensions and Other Post-employment BenefitsThe Group provides retirement benefits obligation to its employees under defined benefit plans, which requires contributions to be made to separately administered funds. The cost of providing these benefits is determined using the projected unit credit method which involves making actuarial assumptions about discount rates and future salary increases. Those assumptions are unbiased and mutually compatible.
Re-measurements, comprising of actuarial gains and losses, the effect of the asset ceiling, excluding net interest and the return on plan assets (excluding net interest), are recognised immediately in the statement of financial position with a corresponding debit or credit to retained earnings through OCI in the period in which they occur. Re-measurements are not reclassified to profit or loss in subsequent periods.
Past service costs are recognised in profit or loss on the earlier of:
• The date of the plan amendment or curtailment; and• The date that the Group recognises restructuring-related costs.
Net interest is calculated by applying the discount rate to the net defined benefit liability or asset. The Group recognises the following changes in the net defined benefit obligation under “personnel expenses” in consolidated statement of income:
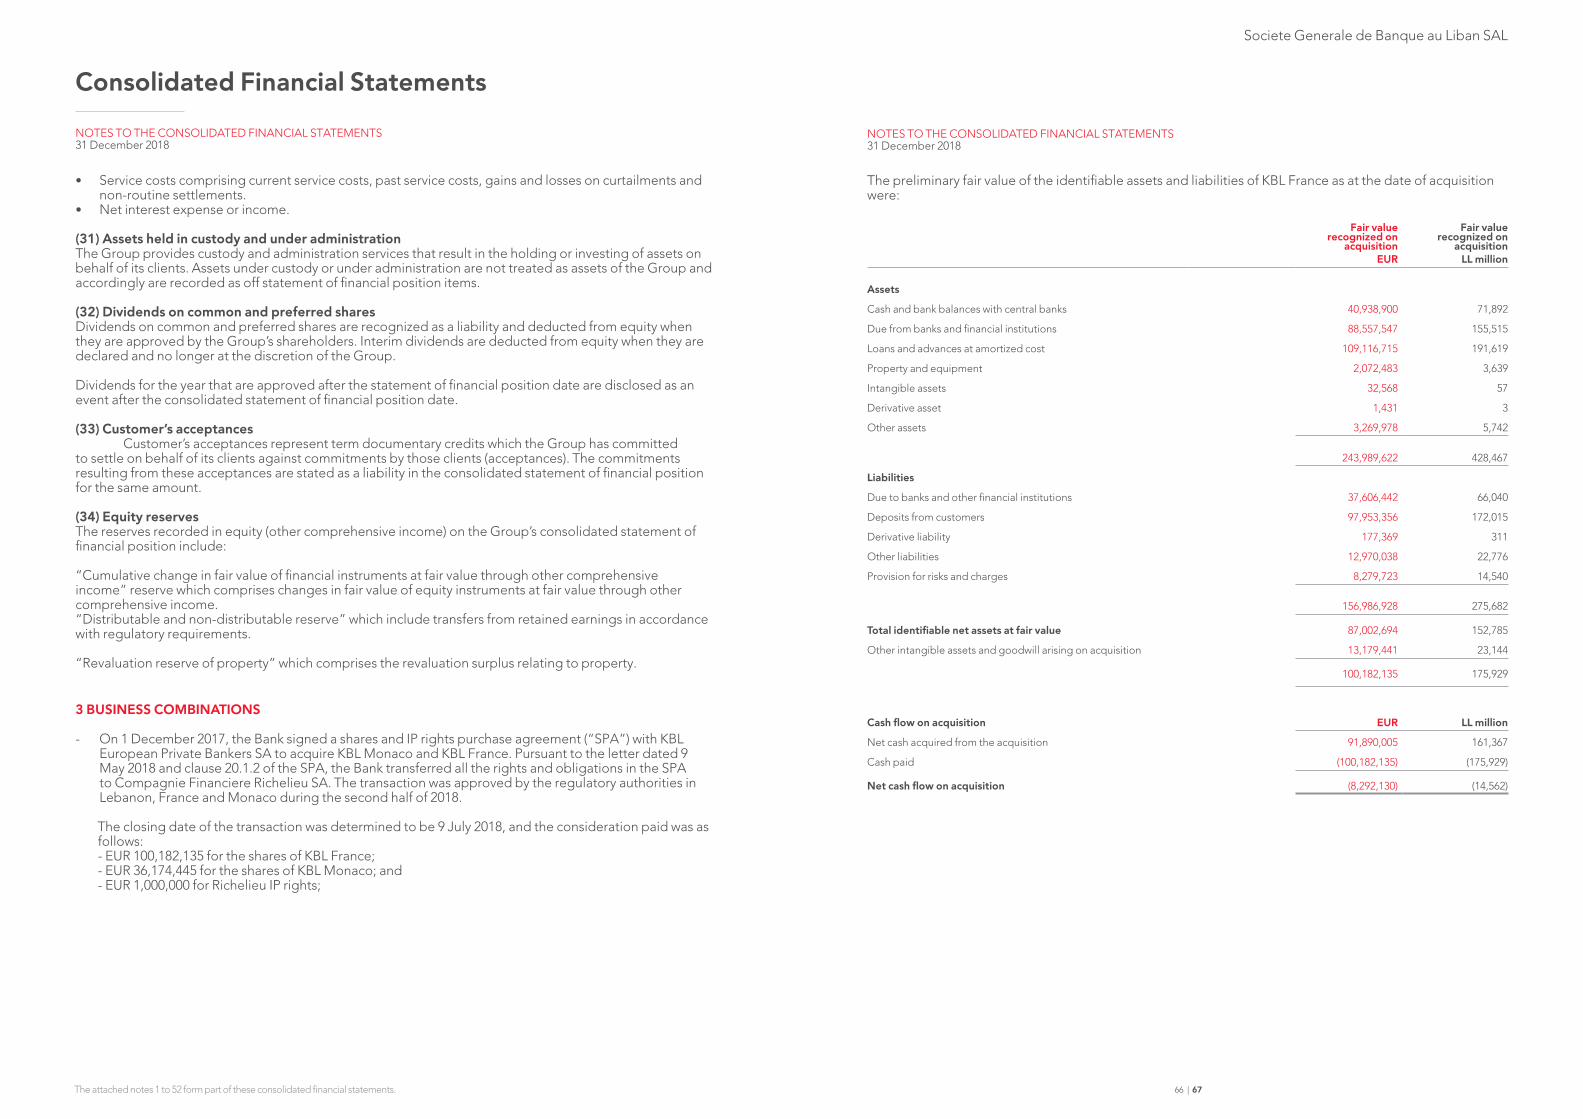
Societe Generale de Banque au Liban SAL
Consolidated Financial Statements
The attached notes 1 to 52 form part of these consolidated financial statements. 66 | 67
NOTES TO THE CONSOLIDATED FINANCIAL STATEMENTS31 December 2018
• Service costs comprising current service costs, past service costs, gains and losses on curtailments and non-routine settlements.
• Net interest expense or income.
(31) Assets held in custody and under administration The Group provides custody and administration services that result in the holding or investing of assets on behalf of its clients. Assets under custody or under administration are not treated as assets of the Group and accordingly are recorded as off statement of financial position items.
(32) Dividends on common and preferred sharesDividends on common and preferred shares are recognized as a liability and deducted from equity when they are approved by the Group’s shareholders. Interim dividends are deducted from equity when they are declared and no longer at the discretion of the Group. Dividends for the year that are approved after the statement of financial position date are disclosed as an event after the consolidated statement of financial position date.
(33) Customer’s acceptances Customer’s acceptances represent term documentary credits which the Group has committed to settle on behalf of its clients against commitments by those clients (acceptances). The commitments resulting from these acceptances are stated as a liability in the consolidated statement of financial position for the same amount. (34) Equity reservesThe reserves recorded in equity (other comprehensive income) on the Group’s consolidated statement of financial position include:
“Cumulative change in fair value of financial instruments at fair value through other comprehensive income” reserve which comprises changes in fair value of equity instruments at fair value through other comprehensive income.“Distributable and non-distributable reserve” which include transfers from retained earnings in accordance with regulatory requirements.
“Revaluation reserve of property” which comprises the revaluation surplus relating to property.
3 BUSINESS COMBINATIONS
- On 1 December 2017, the Bank signed a shares and IP rights purchase agreement (“SPA”) with KBL European Private Bankers SA to acquire KBL Monaco and KBL France. Pursuant to the letter dated 9 May 2018 and clause 20.1.2 of the SPA, the Bank transferred all the rights and obligations in the SPA to Compagnie Financiere Richelieu SA. The transaction was approved by the regulatory authorities in Lebanon, France and Monaco during the second half of 2018.
The closing date of the transaction was determined to be 9 July 2018, and the consideration paid was as follows: - EUR 100,182,135 for the shares of KBL France; - EUR 36,174,445 for the shares of KBL Monaco; and - EUR 1,000,000 for Richelieu IP rights;
The preliminary fair value of the identifiable assets and liabilities of KBL France as at the date of acquisition were:
Fair value recognized on
acquisitionEUR
Fair value recognized on
acquisitionLL million
Assets
Cash and bank balances with central banks 40,938,900 71,892
Due from banks and financial institutions 88,557,547 155,515
Loans and advances at amortized cost 109,116,715 191,619
Property and equipment 2,072,483 3,639
Intangible assets 32,568 57
Derivative asset 1,431 3
Other assets 3,269,978 5,742
243,989,622 428,467
Liabilities
Due to banks and other financial institutions 37,606,442 66,040
Deposits from customers 97,953,356 172,015
Derivative liability 177,369 311
Other liabilities 12,970,038 22,776
Provision for risks and charges 8,279,723 14,540
156,986,928 275,682
Total identifiable net assets at fair value 87,002,694 152,785
Other intangible assets and goodwill arising on acquisition 13,179,441 23,144
100,182,135 175,929
Cash flow on acquisition EUR LL million
Net cash acquired from the acquisition 91,890,005 161,367
Cash paid (100,182,135) (175,929)
Net cash flow on acquisition (8,292,130) (14,562)
NOTES TO THE CONSOLIDATED FINANCIAL STATEMENTS31 December 2018
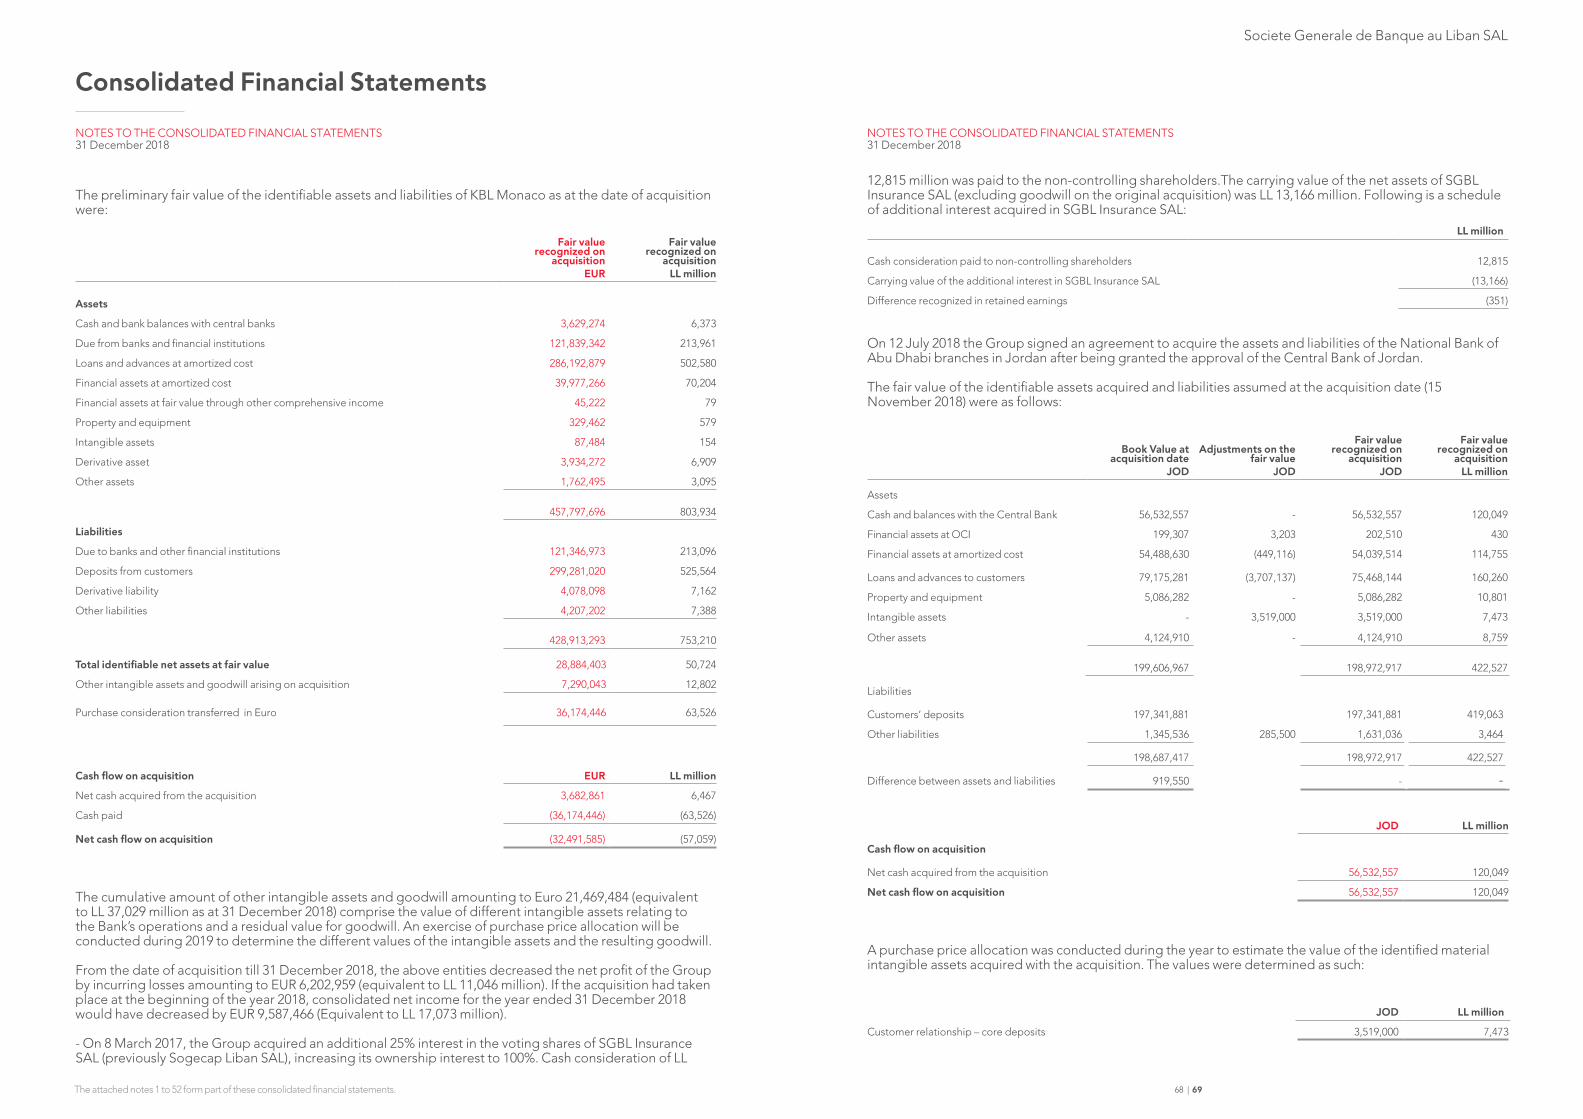
Societe Generale de Banque au Liban SAL
Consolidated Financial Statements
The attached notes 1 to 52 form part of these consolidated financial statements. 68 | 69
The preliminary fair value of the identifiable assets and liabilities of KBL Monaco as at the date of acquisition were:
Fair value recognized on
acquisitionEUR
Fair value recognized on
acquisitionLL million
Assets
Cash and bank balances with central banks 3,629,274 6,373
Due from banks and financial institutions 121,839,342 213,961
Loans and advances at amortized cost 286,192,879 502,580
Financial assets at amortized cost 39,977,266 70,204
Financial assets at fair value through other comprehensive income 45,222 79
Property and equipment 329,462 579
Intangible assets 87,484 154
Derivative asset 3,934,272 6,909
Other assets 1,762,495 3,095
457,797,696 803,934
Liabilities
Due to banks and other financial institutions 121,346,973 213,096
Deposits from customers 299,281,020 525,564
Derivative liability 4,078,098 7,162
Other liabilities 4,207,202 7,388
428,913,293 753,210
Total identifiable net assets at fair value 28,884,403 50,724
Other intangible assets and goodwill arising on acquisition 7,290,043 12,802
Purchase consideration transferred in Euro 36,174,446 63,526
Cash flow on acquisition EUR LL million
Net cash acquired from the acquisition 3,682,861 6,467
Cash paid (36,174,446) (63,526)
Net cash flow on acquisition (32,491,585) (57,059)
The cumulative amount of other intangible assets and goodwill amounting to Euro 21,469,484 (equivalent to LL 37,029 million as at 31 December 2018) comprise the value of different intangible assets relating to the Bank’s operations and a residual value for goodwill. An exercise of purchase price allocation will be conducted during 2019 to determine the different values of the intangible assets and the resulting goodwill.
From the date of acquisition till 31 December 2018, the above entities decreased the net profit of the Group by incurring losses amounting to EUR 6,202,959 (equivalent to LL 11,046 million). If the acquisition had taken place at the beginning of the year 2018, consolidated net income for the year ended 31 December 2018 would have decreased by EUR 9,587,466 (Equivalent to LL 17,073 million).
- On 8 March 2017, the Group acquired an additional 25% interest in the voting shares of SGBL Insurance SAL (previously Sogecap Liban SAL), increasing its ownership interest to 100%. Cash consideration of LL
NOTES TO THE CONSOLIDATED FINANCIAL STATEMENTS31 December 2018
NOTES TO THE CONSOLIDATED FINANCIAL STATEMENTS31 December 2018
12,815 million was paid to the non-controlling shareholders.The carrying value of the net assets of SGBL Insurance SAL (excluding goodwill on the original acquisition) was LL 13,166 million. Following is a schedule of additional interest acquired in SGBL Insurance SAL:
LL million
Cash consideration paid to non-controlling shareholders 12,815
Carrying value of the additional interest in SGBL Insurance SAL (13,166)
Difference recognized in retained earnings (351)
On 12 July 2018 the Group signed an agreement to acquire the assets and liabilities of the National Bank of Abu Dhabi branches in Jordan after being granted the approval of the Central Bank of Jordan.
The fair value of the identifiable assets acquired and liabilities assumed at the acquisition date (15 November 2018) were as follows:
Book Value at acquisition date
JOD
Adjustments on the fair value
JOD
Fair value recognized on
acquisitionJOD
Fair value recognized on
acquisitionLL million
Assets
Cash and balances with the Central Bank 56,532,557 - 56,532,557 120,049
Financial assets at OCI 199,307 3,203 202,510 430
Financial assets at amortized cost 54,488,630 (449,116) 54,039,514 114,755
Loans and advances to customers 79,175,281 (3,707,137) 75,468,144 160,260
Property and equipment 5,086,282 - 5,086,282 10,801
Intangible assets - 3,519,000 3,519,000 7,473
Other assets 4,124,910 - 4,124,910 8,759
199,606,967 198,972,917 422,527
Liabilities
Customers’ deposits 197,341,881 197,341,881 419,063
Other liabilities 1,345,536 285,500 1,631,036 3,464
198,687,417 198,972,917 422,527
Difference between assets and liabilities 919,550 - -
JOD LL million
Cash flow on acquisition
Net cash acquired from the acquisition 56,532,557 120,049
Net cash flow on acquisition 56,532,557 120,049
A purchase price allocation was conducted during the year to estimate the value of the identified material intangible assets acquired with the acquisition. The values were determined as such:
JOD LL million
Customer relationship – core deposits 3,519,000 7,473
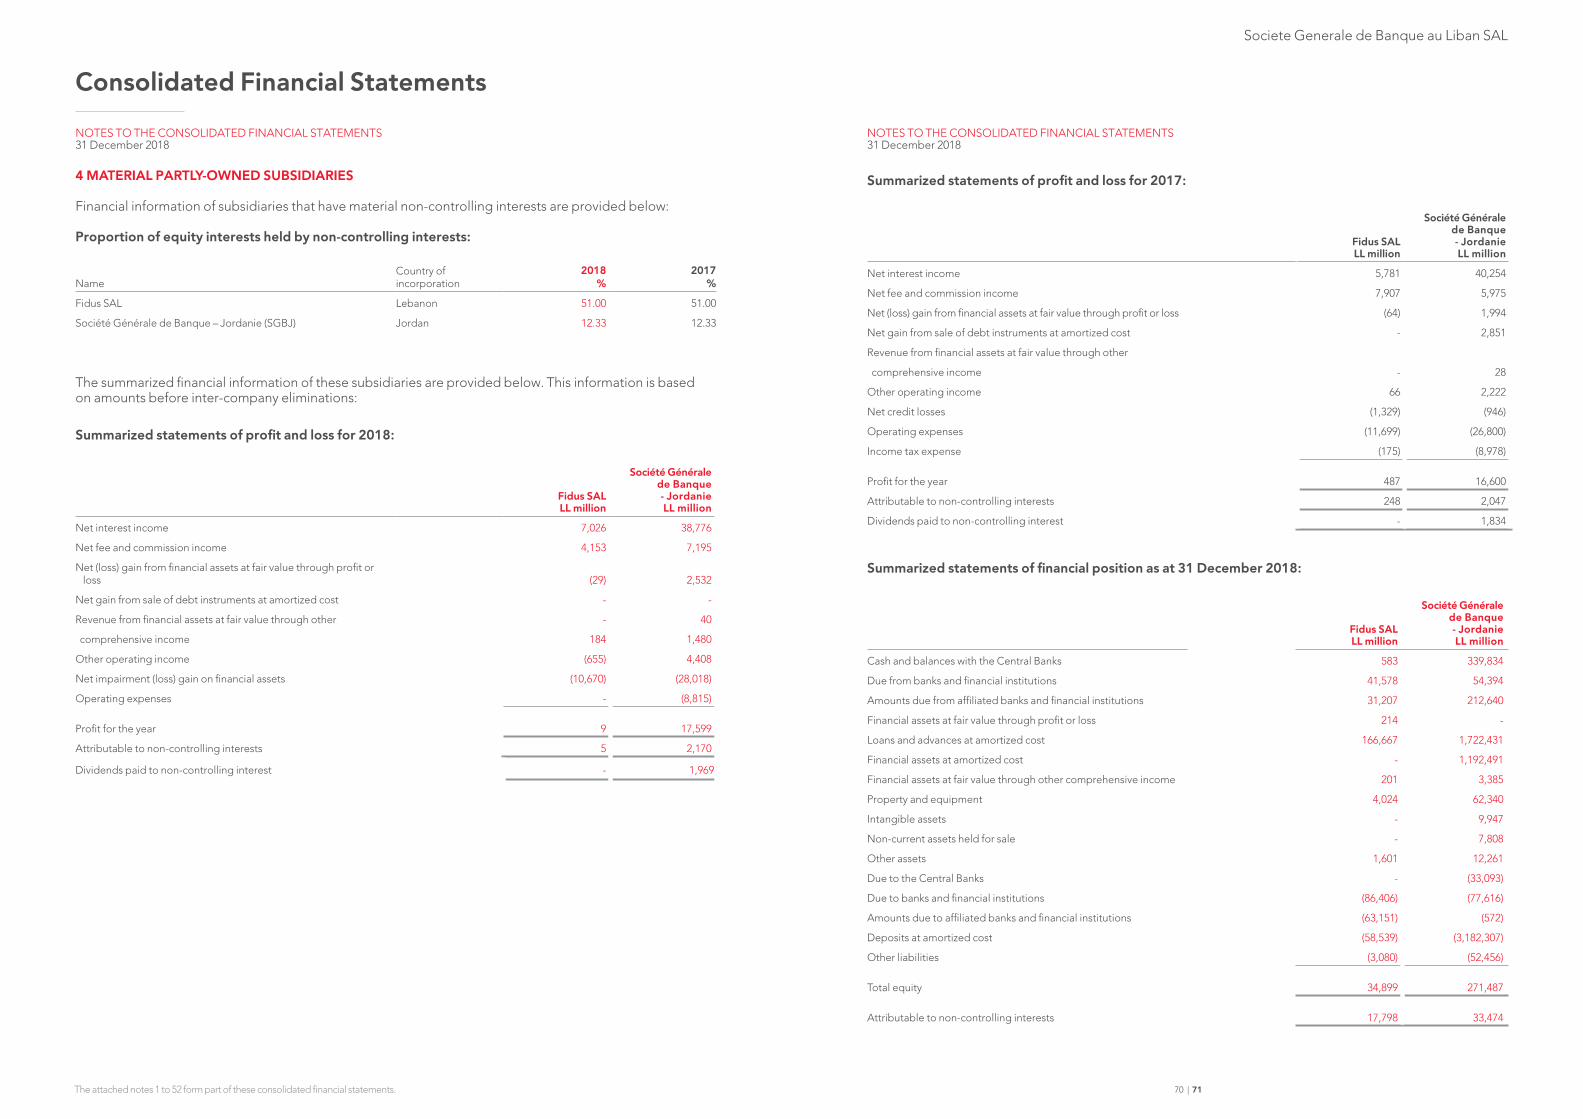
Societe Generale de Banque au Liban SAL
Consolidated Financial Statements
The attached notes 1 to 52 form part of these consolidated financial statements. 70 | 71
4 MATERIAL PARTLY-OWNED SUBSIDIARIES
Financial information of subsidiaries that have material non-controlling interests are provided below:
Proportion of equity interests held by non-controlling interests:
NameCountry of incorporation
2018%
2017%
Fidus SAL Lebanon 51.00 51.00
Société Générale de Banque – Jordanie (SGBJ) Jordan 12.33 12.33
The summarized financial information of these subsidiaries are provided below. This information is based on amounts before inter-company eliminations:
Summarized statements of profit and loss for 2018:
Fidus SAL LL million
Société Générale de Banque - Jordanie LL million
Net interest income 7,026 38,776
Net fee and commission income 4,153 7,195
Net (loss) gain from financial assets at fair value through profit or loss (29) 2,532
Net gain from sale of debt instruments at amortized cost - -
Revenue from financial assets at fair value through other - 40
comprehensive income 184 1,480
Other operating income (655) 4,408
Net impairment (loss) gain on financial assets (10,670) (28,018)
Operating expenses - (8,815)
Profit for the year 9 17,599
Attributable to non-controlling interests 5 2,170
Dividends paid to non-controlling interest - 1,969
Summarized statements of profit and loss for 2017:
Fidus SAL LL million
Société Générale de Banque - Jordanie LL million
Net interest income 5,781 40,254
Net fee and commission income 7,907 5,975
Net (loss) gain from financial assets at fair value through profit or loss (64) 1,994
Net gain from sale of debt instruments at amortized cost - 2,851
Revenue from financial assets at fair value through other
comprehensive income - 28
Other operating income 66 2,222
Net credit losses (1,329) (946)
Operating expenses (11,699) (26,800)
Income tax expense (175) (8,978)
Profit for the year 487 16,600
Attributable to non-controlling interests 248 2,047
Dividends paid to non-controlling interest - 1,834
Summarized statements of financial position as at 31 December 2018:
Fidus SAL LL million
Société Générale de Banque - Jordanie LL million
Cash and balances with the Central Banks 583 339,834
Due from banks and financial institutions 41,578 54,394
Amounts due from affiliated banks and financial institutions 31,207 212,640
Financial assets at fair value through profit or loss 214 -
Loans and advances at amortized cost 166,667 1,722,431
Financial assets at amortized cost - 1,192,491
Financial assets at fair value through other comprehensive income 201 3,385
Property and equipment 4,024 62,340
Intangible assets - 9,947
Non-current assets held for sale - 7,808
Other assets 1,601 12,261
Due to the Central Banks - (33,093)
Due to banks and financial institutions (86,406) (77,616)
Amounts due to affiliated banks and financial institutions (63,151) (572)
Deposits at amortized cost (58,539) (3,182,307)
Other liabilities (3,080) (52,456)
Total equity 34,899 271,487
Attributable to non-controlling interests 17,798 33,474
NOTES TO THE CONSOLIDATED FINANCIAL STATEMENTS31 December 2018
NOTES TO THE CONSOLIDATED FINANCIAL STATEMENTS31 December 2018

Societe Generale de Banque au Liban SAL
Consolidated Financial Statements
The attached notes 1 to 52 form part of these consolidated financial statements. 72 | 73
Summarized statements of financial position as at 31 December 2017:
Fidus SAL LL million
Société Générale de Banque - Jordanie LL million
Cash and balances with the Central Banks 233 170,859
Due from banks and financial institutions 45,962 79,799
Amounts due from affiliated banks and financial institutions 38,097 127,111
Financial assets at fair value through profit or loss 241 -
Loans and advances at amortized cost 109,926 1,387,102
Financial assets at amortized cost - 1,045,438
Financial assets at fair value through other comprehensive income 373 1,109
Property and equipment 4,425 47,825
Intangible assets - 2,721
Non-current assets held for sale - 6,140
Other assets 345 6,670
Due to the Central Banks - (22,528)
Due to banks and financial institutions (86,132) (41,051)
Amounts due to affiliated banks and financial institutions (1,145) (518)
Deposits at amortized cost (71,289) (2,504,258)
Other liabilities (6,146) (21,309)
Total equity 34,890 285,110
Attributable to non-controlling interests 17,794 35,154
Summarized cash flow information for the year ended 31 December 2018:
Fidus SAL LL million
Société Générale de Banque - Jordanie LL million
Operating (73,201) 34,491
Investing (3) 163,758
Financing - 13,478
Net (decrease) increase in cash and cash equivalents (73,204) 211,727
Summarized cash flow information for the year ended 31 December 2017:
Fidus SAL LL million
Société Générale de Banque - Jordanie LL million
Operating (42,784) (36,897)
Investing (47) (42,039)
Financing - (19,329)
Net decrease in cash and cash equivalents (42,831) (98,265)
5 INTEREST AND SIMILAR INCOME
2018LL million
2017LL million
Balances with the Central Banks 1,075,326 601,578
Financial assets at amortized cost 530,655 590,563
Loans and advances to customers at amortized cost 510,671 440,477
Due from banks and financial institutions 15,796 7,423
Loans and advances to related parties at amortized cost 5,656 5,696
Amounts due from affiliated banks and financial institutions 884 2,810
Reverse repurchase agreements 1,184 121
2,140,172 1,648,668
Tax on interest
Balances with the Central Bank of Lebanon (78,462) -
Financial assets at amortized cost (20,645) -
Due from banks and financial institutions (42) -
Interest and similar income, net of tax 2,041,023 1,648,668
6 INTEREST AND SIMILAR EXPENSE
2018LL million
2017LL million
Customers’ deposits at amortized cost 1,474,541 1,079,985
Due to banks and financial institutions 84,944 83,111
Due to the Central Banks 57,973 38,048
Related parties’ deposits at amortized cost 9,312 7,021
Amounts due to affiliated banks and financial institutions 454 2,002
1,627,224 1,210,167
7 FEE AND COMMISSION INCOME
2018LL million
2017LL million
Credit-related fees and commissions 40,981 37,196
Maintenance of accounts 25,285 22,414
Brokerage and custody income 21,279 12,153
Other commissions 11,867 5,896
Trade finance income 11,809 9,132
Commercial banking income 8,686 9,188
Insurance brokerage income 753 2,045
120,660 98,024
NOTES TO THE CONSOLIDATED FINANCIAL STATEMENTS31 December 2018
NOTES TO THE CONSOLIDATED FINANCIAL STATEMENTS31 December 2018
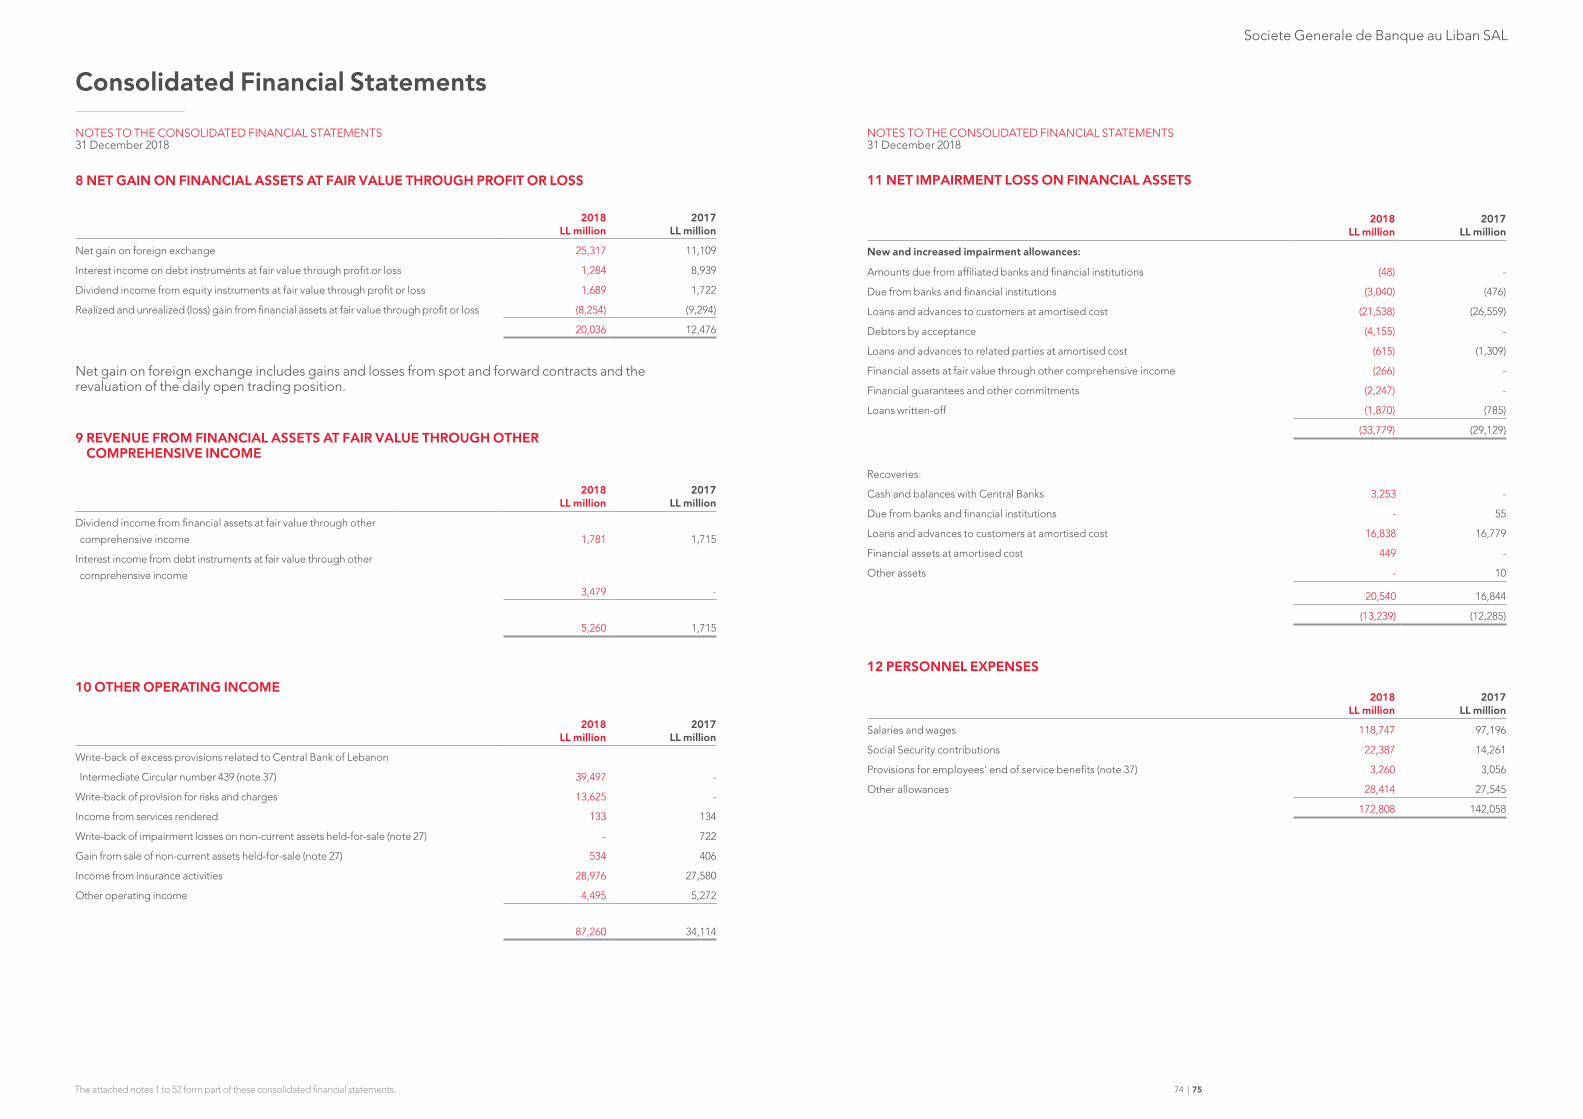
Societe Generale de Banque au Liban SAL
Consolidated Financial Statements
The attached notes 1 to 52 form part of these consolidated financial statements. 74 | 75
8 NET GAIN ON FINANCIAL ASSETS AT FAIR VALUE THROUGH PROFIT OR LOSS
2018LL million
2017LL million
Net gain on foreign exchange 25,317 11,109
Interest income on debt instruments at fair value through profit or loss 1,284 8,939
Dividend income from equity instruments at fair value through profit or loss 1,689 1,722
Realized and unrealized (loss) gain from financial assets at fair value through profit or loss (8,254) (9,294)
20,036 12,476
Net gain on foreign exchange includes gains and losses from spot and forward contracts and the revaluation of the daily open trading position.
9 REVENUE FROM FINANCIAL ASSETS AT FAIR VALUE THROUGH OTHER COMPREHENSIVE INCOME
2018LL million
2017LL million
Dividend income from financial assets at fair value through other comprehensive income 1,781 1,715
Interest income from debt instruments at fair value through other comprehensive income
3,479 -
5,260 1,715
10 OTHER OPERATING INCOME
2018LL million
2017LL million
Write-back of excess provisions related to Central Bank of Lebanon
Intermediate Circular number 439 (note 37) 39,497 -
Write-back of provision for risks and charges 13,625 -
Income from services rendered 133 134
Write-back of impairment losses on non-current assets held-for-sale (note 27) - 722
Gain from sale of non-current assets held-for-sale (note 27) 534 406
Income from insurance activities 28,976 27,580
Other operating income 4,495 5,272
87,260 34,114
NOTES TO THE CONSOLIDATED FINANCIAL STATEMENTS31 December 2018
11 NET IMPAIRMENT LOSS ON FINANCIAL ASSETS
2018LL million
2017LL million
New and increased impairment allowances:
Amounts due from affiliated banks and financial institutions (48) -
Due from banks and financial institutions (3,040) (476)
Loans and advances to customers at amortised cost (21,538) (26,559)
Debtors by acceptance (4,155) -
Loans and advances to related parties at amortised cost (615) (1,309)
Financial assets at fair value through other comprehensive income (266) -
Financial guarantees and other commitments (2,247) -
Loans written-off (1,870) (785)
(33,779) (29,129)
Recoveries:
Cash and balances with Central Banks 3,253 -
Due from banks and financial institutions - 55
Loans and advances to customers at amortised cost 16,838 16,779
Financial assets at amortised cost 449 -
Other assets - 10
20,540 16,844
(13,239) (12,285)
12 PERSONNEL EXPENSES
2018LL million
2017LL million
Salaries and wages 118,747 97,196
Social Security contributions 22,387 14,261
Provisions for employees’ end of service benefits (note 37) 3,260 3,056
Other allowances 28,414 27,545
172,808 142,058
NOTES TO THE CONSOLIDATED FINANCIAL STATEMENTS31 December 2018
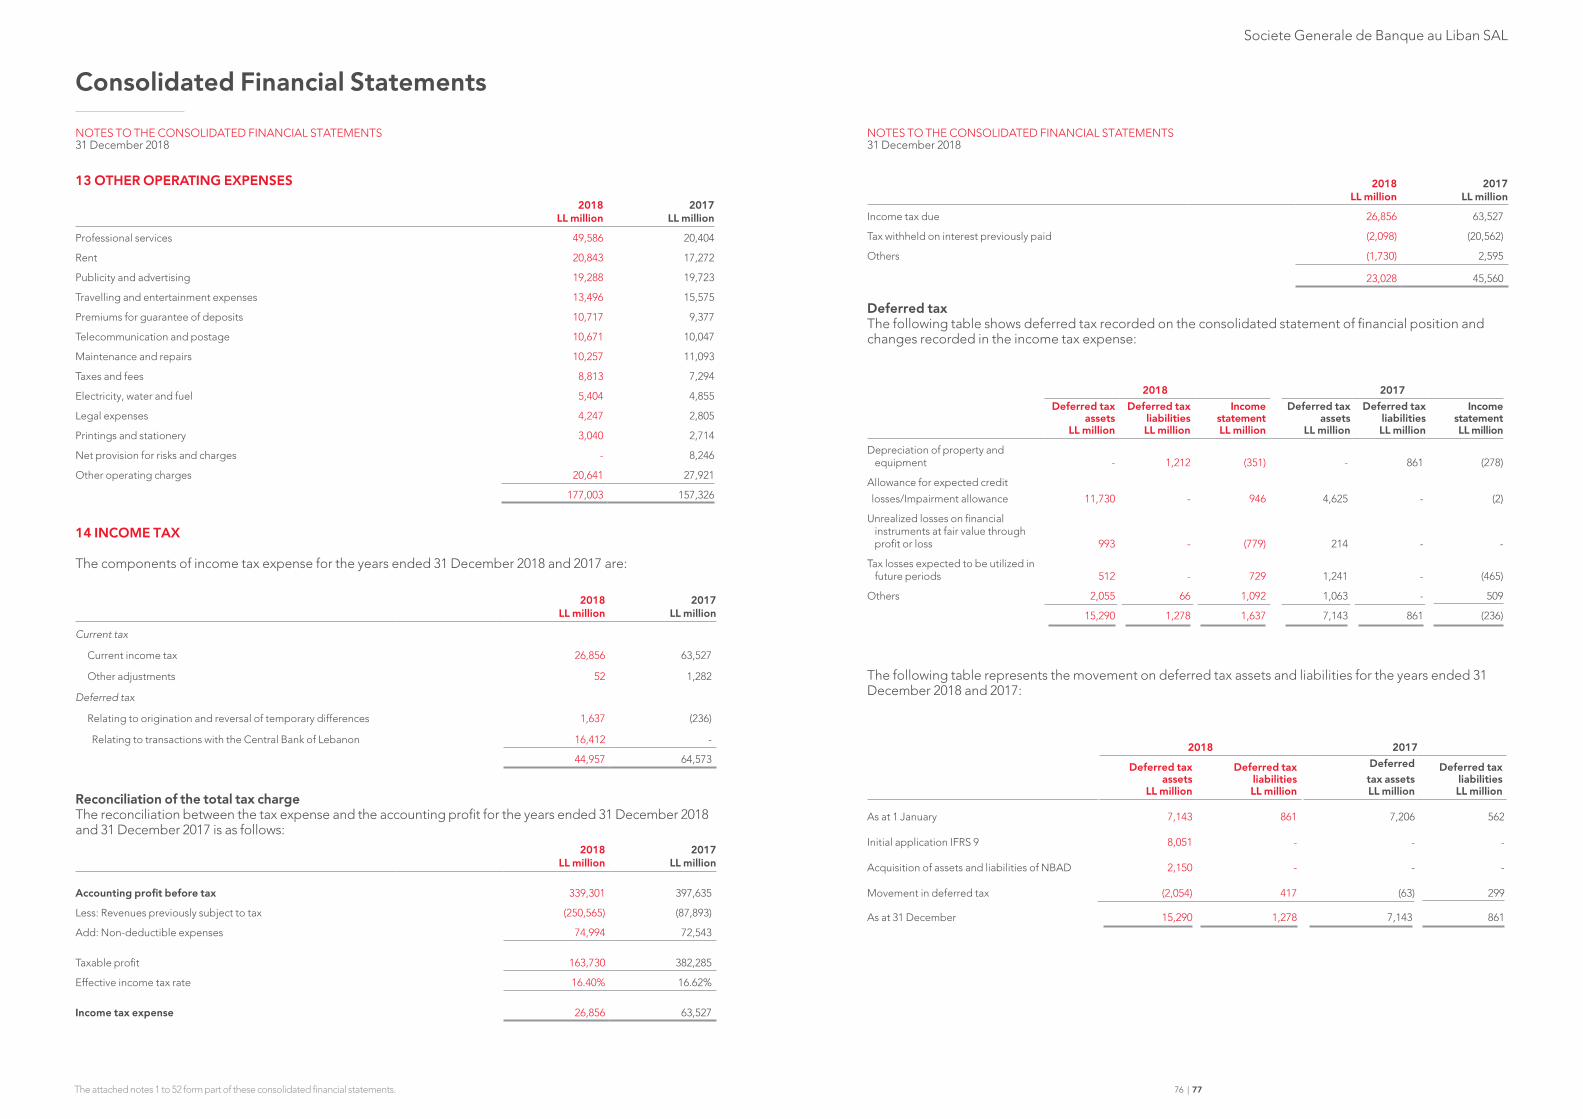
Societe Generale de Banque au Liban SAL
Consolidated Financial Statements
The attached notes 1 to 52 form part of these consolidated financial statements. 76 | 77
13 OTHER OPERATING EXPENSES
2018LL million
2017LL million
Professional services 49,586 20,404
Rent 20,843 17,272
Publicity and advertising 19,288 19,723
Travelling and entertainment expenses 13,496 15,575
Premiums for guarantee of deposits 10,717 9,377
Telecommunication and postage 10,671 10,047
Maintenance and repairs 10,257 11,093
Taxes and fees 8,813 7,294
Electricity, water and fuel 5,404 4,855
Legal expenses 4,247 2,805
Printings and stationery 3,040 2,714
Net provision for risks and charges - 8,246
Other operating charges 20,641 27,921
177,003 157,326
14 INCOME TAX
The components of income tax expense for the years ended 31 December 2018 and 2017 are:
2018LL million
2017LL million
Current tax
Current income tax 26,856 63,527
Other adjustments 52 1,282
Deferred tax
Relating to origination and reversal of temporary differences 1,637 (236)
Relating to transactions with the Central Bank of Lebanon 16,412 -
44,957 64,573
Reconciliation of the total tax chargeThe reconciliation between the tax expense and the accounting profit for the years ended 31 December 2018 and 31 December 2017 is as follows:
2018LL million
2017LL million
Accounting profit before tax 339,301 397,635
Less: Revenues previously subject to tax (250,565) (87,893)
Add: Non-deductible expenses 74,994 72,543
Taxable profit 163,730 382,285
Effective income tax rate 16.40% 16.62%
Income tax expense 26,856 63,527
2018LL million
2017LL million
Income tax due 26,856 63,527
Tax withheld on interest previously paid (2,098) (20,562)
Others (1,730) 2,595
23,028 45,560
Deferred taxThe following table shows deferred tax recorded on the consolidated statement of financial position and changes recorded in the income tax expense:
2018 2017Deferred tax
assets LL million
Deferred tax liabilities LL million
Income statement LL million
Deferred tax assets
LL million
Deferred tax liabilities
LL million
Income statement LL million
Depreciation of property and equipment - 1,212 (351) - 861 (278)
Allowance for expected credit losses/Impairment allowance 11,730 - 946 4,625 - (2)
Unrealized losses on financial instruments at fair value through profit or loss 993 - (779) 214 - -
Tax losses expected to be utilized in future periods 512 - 729 1,241 - (465)
Others 2,055 66 1,092 1,063 - 509
15,290 1,278 1,637 7,143 861 (236)
The following table represents the movement on deferred tax assets and liabilities for the years ended 31 December 2018 and 2017:
2018 2017
Deferred tax assets
LL million
Deferred tax liabilities LL million
Deferredtax assets LL million
Deferred tax liabilities
LL million
As at 1 January 7,143 861 7,206 562
Initial application IFRS 9 8,051 - - -
Acquisition of assets and liabilities of NBAD 2,150 - - -
Movement in deferred tax (2,054) 417 (63) 299
As at 31 December 15,290 1,278 7,143 861
NOTES TO THE CONSOLIDATED FINANCIAL STATEMENTS31 December 2018
NOTES TO THE CONSOLIDATED FINANCIAL STATEMENTS31 December 2018
Societe Generale de Banque au Liban SAL
Consolidated Financial Statements
The attached notes 1 to 52 form part of these consolidated financial statements. 78 | 79
15 CASH AND BALANCES WITH THE CENTRAL BANKS2018
LL million2017
LL million
Cash 127,677 121,535
Current accounts with the Central Banks 1,301,046 419,844
Time deposits with the Central Banks 15,214,055 12,718,025
(27,247) -
Less: Allowance for expected credit losses/Impairment allowance 16,615,531 13,259,404
Cash and balances with the Central Bank include non-interest bearing balances held at the Central Bank of Lebanon in coverage of the compulsory reserve requirements for all banks operating in Lebanon. This compulsory reserve is calculated on the basis of 25% of sight commitments and 15% of term commitments after taking into account certain waivers relating to subsidized loans denominated in Lebanese Lira. Accordingly, the compulsory reserve amounted to LL 465,121 million at 31 December 2018 (2017: LL 222,555 million).
In addition a 15% of total deposits in foreign currencies regardless of nature is required. These placements amounted to US$ 1,311 million (equivalent to LL 1,975,735 million) as at 31 December 2018 (2017: US$ 1,224 million equivalent to LL 1,844,754 million).
Société Générale de Banque – Jordanie, Société Générale Bank – Cyprus Ltd and Banque Richelieu Monaco and France are also subject to compulsory reserve requirements with varying percentages, according to the banking rules and regulations of the Kingdom of Jordan, the Republic of Cyprus, France and Monaco.
Time deposits include placements of LL 2,829,601 million blocked in the favor of the Central Bank of Lebanon against loans granted by the latter as at 31 December 2018 (2017: LL 1,096,176 million) (notes 30 & 31).
16 DUE FROM BANKS AND FINANCIAL INSTITUTIONS
2018LL million
2017LL million
Current accounts 865,108 238,437
Time deposits 445,191 431,870
Checks for collection 52,907 75,178
Discounted bills - 103
Pledged accounts (i) 421,212 108,768
Debtor accounts against creditor accounts, net 1,199 581
1,785,617 854,937
Less: Allowance for expected credit losses/Impairment allowance (6,469) (711)
1,779,148 854,937
(i) Included under pledged accounts an amount of US$ 268,807,795 (equivalent to LL 405,228 million) placed as collateral against repurchase agreements as at 31 December 2018 (2017: US$ 61,546,407 equivalent to LL 92,782 million) (note 31).
17 AMOUNTS DUE FROM AFFILIATED BANKS AND FINANCIAL INSTITUTIONS
2018LL million
2017LL million
Sight deposits 161,283 465,143
Time deposits 65,326 125,242
226,609 590,385
Less: Allowance for expected credit losses/Impairment allowance (193) -
226,416 590,385
Time deposits include an amount of LL 51,741 million (equivalent to Euro 30 million) as of 31 December 2018 (2017: Euro 30 million, equivalent to LL 54,198 million) pledged in favour of Société Générale SA Paris in guarantee of documentary letters of credit and guarantees issued in favor of the Bank’s clients.
18 DERIVATIVE FINANCIAL INSTRUMENTS
The table below shows the fair values of derivative financial instruments, recorded as assets or liabilities, together with their notional amounts. The notional amount, recorded gross, is the amount of a derivative’s underlying asset, reference rate or index and is the basis upon which changes in the value of derivatives are measured. The notional amounts indicate the volume of transactions outstanding at year-end and are indicative of neither the market risk nor the credit risk.
2018 2017
Assets LL million
Liabilities LL million
Total notional
amount LL million
Assets LL million
Liabilities LL million
Total notional
amount LL million
Derivatives held-for-tradingForward foreign exchange contracts 1,688 (2,583) 551,299 9,197 (164) 566,312
Equity options 23,851 (23,851) 80,200 - - -Derivatives held-for-trading
Forward foreign exchange contracts 2 (778) 44,310 - - -
25,541 (27,212) 675,809 9,197 (164) 566,312
Derivatives often involve at their inception only a mutual exchange of promises with little or no transfer of consideration. However, these instruments frequently involve a high degree of leverage and are very volatile. A relatively small movement in the value of the asset, rate or index underlying a derivative contract may have a significant impact on the profit or loss of the Group.
Over-the-counter derivatives may expose the Group to the risks associated with the absence of an exchange market on which to close out an open position.
The Group’s exposure under derivative contracts is closely monitored as part of the overall management of the Group’s market risk.
Derivative financial instruments held or issued for trading purposesMost of the Group’s derivative trading activities relate to deals with customers that are normally offset by transactions with other counterparties. Also included under this heading are any derivatives entered into for hedging purposes that do not meet the hedge accounting criteria.
NOTES TO THE CONSOLIDATED FINANCIAL STATEMENTS31 December 2018
NOTES TO THE CONSOLIDATED FINANCIAL STATEMENTS31 December 2018

Societe Generale de Banque au Liban SAL
Consolidated Financial Statements
The attached notes 1 to 52 form part of these consolidated financial statements. 80 | 81
Fair value hedgesFair value hedges are used by the Group to protect it against changes in the fair value of financial assets and financial liabilities due to movements in exchange rates and interest rates. The financial instruments hedged for interest rate risk include loans and advances. The Group uses interest rate swaps to hedge interest rate risk.
19 FINANCIAL ASSETS AT FAIR VALUE THROUGH PROFIT OR LOSS
2018LL million
2017LL million
Quoted
Shares 14,844 77,294
Funds 20,962 23,720
Lebanese treasury bills – Eurobonds 19,146 11,418
54,952 112,432
Unquoted
Shares 43,126 50,477
Lebanese treasury bills – denominated in LL 1,084 1,090
Debt securities issued by banks - 37,688
44,210 89,255
99,162 201,687
Effective 1 January 2018, upon adoption of IFRS 9, financial assets at fair value through profit or loss with a fair value of LL 37,688 million were reclassified at fair value through comprehensive income (Notes 2 and 23).
20 LOANS AND ADVANCES TO CUSTOMERS AT AMORTIZED COST
2018LL million
2017LL million
Corporate lending 5,252,196 4,800,919
Retail lending 4,093,437 3,123,666
9,345,633 7,924,585
Less: Allowance for expected credit losses/Impairment allowance (709,932) (579,969)
8,635,701 7,344,616
The table for the movement in allowances for expected credit losses of loans and advances to customers at amortized cost under IFRS 9 is presented in the Credit Risk section (Note 51).
An analysis of the allowance for impairment losses under IAS 39 for loans and advances, by class, for the year ended 31 December 2017 is, as follows:
(i) The movement of unrealized interest on substandard, doubtful, and bad loans is as follows:
2017Corporate
LL millionRetail
LL millionTotal
LL million
Balance at 1 January 297,801 82,712 380,513
Unrealized interest for the year 44,447 27,337 71,784
Less: Write-back during the year (note 11) (3,246) (3,827) (7,073)
Less: Unrealized interest written off (89,873) (18,369) (108,242)
Transfers from off-statement of financial position 62,209 10,927 73,136
Transfers to off-statement of financial position (65,660) (1,952) (67,612)
Transfer from retail to corporate 2,859 (2,859) -
Difference of exchange 3,745 5,382 9,127
Balance at 31 December 252,282 99,351 351,633
(ii) The movement of the impairment allowances during the year was as follows:
2017Corporate
LL millionRetail
LL millionTotal
LL million
Balance at 1 January 110,197 121,253 231,450
Charge for the year (note 11) 5,429 21,126 26,555
Less: Write-back of provision (note 11) (4,242) (5,667) (9,909)
Less: Provisions written off (11,292) (10,004) (21,296)
Transfers from off-statement of financial position 8,870 5,625 14,495
Transfers to off-statement of financial position (18,795) (2,589) (21,384)
Transfer from retail to corporate 789 (789) -
Difference of exchange 3,476 4,949 8,425
Balance at 31 December 94,432 133,904 228,336
Specific provisions 85,486 111,865 197,351
Collective provisions 8,946 22,039 30,985
94,432 133,904 228,336
Gross amount of loans individually determined to be impaired, before deducting the individually assessed impairment allowance 453,260 309,415 762,675
According to the Central Bank regulations and Banking Control Commission Circular no. 240 dated 8 January 2004, bad debts and related allowance for credit losses meeting the criteria set out in the circular have been transferred to the off-statement of financial position accounts.
NOTES TO THE CONSOLIDATED FINANCIAL STATEMENTS31 December 2018
NOTES TO THE CONSOLIDATED FINANCIAL STATEMENTS31 December 2018
Societe Generale de Banque au Liban SAL
Consolidated Financial Statements
The attached notes 1 to 52 form part of these consolidated financial statements. 82 | 83
21 LOANS AND ADVANCES TO RELATED PARTIES AT AMORTIZED COST
2018LL million
2017LL million
Corporate lending 89,168 83,568
Retail lending 59,810 47,176
148,978 130,744
Less: Allowance for expected credit losses/Impairment allowance (25,749) (19,679)
123,229 111,065
An analysis of the allowance for impairment losses under IAS 39 for loans and advances, by class, for the year ended 31 December 2017 is, as follows:
(i) The movement of unrealized interest on substandard, doubtful, and bad loans is as follows:
2017Corporate
LL millionRetail
LL millionTotal
LL million
Balance at 1 January 339 - 339
Unrealized interest for the year 55 - 55
Difference of exchange 10 - 10
Balance at 31 December 404 - 404
(ii) The movement of the impairment allowances during the year was as follows:
2017Corporate
LL millionRetail
LL millionTotal
LL million
Balance at 1 January 20,709 - 20,709
Charge for the year (note 11) 1,309 - 1,309
Less: provisions written off (2,771) - (2,771)
Difference of exchange 28 - 28
Balance at 31 December 19,275 - 19,275
Gross amount of loans individually determined to be impaired, before deducting the individually assessed impairment allowance 23,776 - 23,776
22 FINANCIAL ASSETS AT AMORTIZED COST
2018LL million
2017LL million
Quoted – pledged
Lebanese treasury bills – Eurobonds pledged as collateral against repurchase agreements 2,761,694 2,176,089
Corporate bonds pledged as collateral against repurchase Agreements 41,518 42,261
Foreign governmental debt securities pledged as collateral against repurchase agreements
25,388 25,290
2,828,600 2,243,640
Quoted
Lebanese treasury bills – Eurobonds 45,277 62,642
Foreign governmental debt securities 70,090 -
Debt securities issued by banks 7,566 9,204
122,933 71,846
Gross quoted investments at amortized cost 2,951,533 2,315,486
Less: Allowance for expected credit losses/Impairment allowance (25,685) -
2,925,848 2,315,486
Unquoted – pledged / blocked
Lebanese treasury bills – denominated in LL blocked in favour of the Central Bank of Lebanon (i) 444,527 444,440
Lebanese treasury bills – denominated in LL pledged in favour of the Central Bank of Lebanon (i) 172,574 172,776
Lebanese certificates of deposit – denominated in LL pledged in favour of the Central Bank of Lebanon (ii) 19,507 19,554
Lebanese certificates of deposit – EuroCDs pledged in favour of the Central Bank of Lebanon (ii) 310,906 309,388
Lebanese certificates of deposit – EuroCDs pledged in favour of a customer (iii) 778,576 669,674
Lebanese certificates of deposit – EuroCDs pledged as collateral against repurchase agreements - 45,390
Governmental bonds pledged in favor of Social Security of Jordan 454,141 400,424
Governmental bonds pledged in favor of the Central Bank of Jordan 16,079 2,318
2,196,310 2,063,964
Unquoted
Lebanese treasury bills – denominated in LL 1,476,208 996,572
Lebanese certificates of deposit – denominated in LL 332,655 333,754
Lebanese certificates of deposit – EuroCDs 1,532,477 2,289,792
Certificates of deposits issued by foreign Central Banks 137,095 52,126
Corporate bonds 53,448 21,723
Foreign governmental debt securities 532,695 569,930
4,064,578 4,263,897
NOTES TO THE CONSOLIDATED FINANCIAL STATEMENTS31 December 2018
NOTES TO THE CONSOLIDATED FINANCIAL STATEMENTS31 December 2018
Societe Generale de Banque au Liban SAL
Consolidated Financial Statements
The attached notes 1 to 52 form part of these consolidated financial statements. 84 | 85
Gross unquoted investments at amortized cost 6,260,888 6,327,861
Less: Allowance for expected credit losses/Impairment allowance (14,084) (1,083)
6,246,804 6,326,778
9,172,652 8,642,264
(i) These Lebanese treasury bills are pledged / blocked against soft loans granted by the Central Bank of Lebanon (note 30).
(ii) During 2016, the Bank obtained the approval of the Central Bank of Lebanon to release an amount of US$ 200 million (equivalent LL 301,500 million) from obligatory reserves provided that this amount is invested in governmental bonds pledged in the favor of the Central Bank of Lebanon. The Bank pledged Eurobonds with a nominal amount of US$ 200 million (equivalent to LL 301,500 million) from 13 January 2016 until 18 August 2016, and subsequently two certificates of deposits with a total nominal amount of US$ 200 million (equivalent to LL 301,500 million).
During 2017, in addition to previous amounts pledged to the Central Bank of Lebanon, the Bank pledged certificates of deposits with a nominal amount of LL 15,000 million against soft loans granted by the latter (note 30).
(iii) The Bank mortgaged and registered certificates of deposit in favor of a customer as a guarantee for the deposit placed at the Bank by the latter (note 34).
The Group derecognized some debt instruments classified at amortized cost during the years ended 31 December 2018 and 2017 due to the following reasons:- Deterioration of the credit rating below the ceiling allowed in the Group’s investment policy;- Liquidity gap and yield management;- Exchange of certificates of deposit by the Central Bank of Lebanon; or- Currency risk management as a result of change in the currency base of deposits.
The schedule below details the net gain from sale of financial assets at amortized cost:
2018 2017
Gains LL million
Losses
LL millionNet
LL million
Gains
LL million
Losses
LL millionNet
LL millionLebanese sovereign and Central Bank of Lebanon
Certificates of deposit 71,143 - 71,143 20,737 - 20,737
Treasury bills 44,047 - 44,047 140,288 (98) 140,190
Eurobonds 756 (36) 720 15,633 (962) 14,671
115,946 (36) 115,910 176,658 (1,060) 175,598
Other sovereign
Other governmental securities - - - 6,958 - 6,958
115,946 (36) 115,910 183,616 (1,060) 182,556
During 2017, the Group entered into certain financial transactions with the Central Bank of Lebanon relating to treasury bills denominated in Lebanese Lira, whereby the Central Bank purchased treasury bills denominated in LL with a nominal of LL 1,950,000 million. As a result of this sale, the Group realized a gain of LL 131,248 million in the consolidated income statement and deposited US$ 1,300 million with the Central Bank of Lebanon.
During 2018, the Group transferred an amount of LL 93,000 million from deferred income to the consolidated income statement. An amount of LL 109,412 was recorded under “net gain from sale of
financial assets at amortized cost” and the corresponding tax expense amounting to LL 16,412 was recorded under “income tax expense”.
23 FINANCIAL ASSETS AT FAIR VALUE THROUGH OTHER COMPREHENSIVE INCOME
2018LL million
2017LL million
Quoted
Shares 189,759 148,418
Governmental debt securities 123,708 -
313,467 148,418
Unquoted
Shares 14,900 13,096
Debt securities issued by banks 31,846 -
46,746 13,096
360,213 161,514
Effective 1 January 2018, upon adoption of IFRS 9, financial assets at fair value through profit or loss with a fair value of LL 37,688 million were reclassified at fair value through other comprehensive income (Notes 2 and 19).
Instruments at fair value through other comprehensive income:The Bank classified the following investments in private sector securities and debt instruments at fair value through other comprehensive income as it holds them for strategic reasons.
2018 2017
Carrying amount
LL million
Cumulative fair value changes
LL millionFair ValueLL million
Carrying amount
LL million
Cumulative fair value changes
LL millionFair ValueLL million
Unquoted instruments:
Byblos convertible bonds 37,688 (5,842) 31,846 - - -
Bank al Salam- Algeria 8,374 1,764 10,138 8,374 1,764 10,138
Others 4,543 219 4,762 2,739 219 2,958
Quoted instruments:
Solidere A 108,849 (18,954) 89,895 72,437 (5,983) 66,454
Solidere B 104,316 (17,805) 86,511 77,807 (7,385) 70,422
Republic of Cyprus debt securities 86,240 496 86,736 - - -
Republic of Portugal debt securities 13,103 308 13,411 - - -
Republic of Spain debt securities 12,814 246 13,060 - - -
Holcim 8,015 2,204 10,219 8,015 1,519 9,534
Bank of Italy 2.8% 1 December 2028 4,845 364 5,209 - - -
BTPs Italia 2% 1 December 2025 4,784 312 5,096 - - -
Others 5,241 (1,911) 3,330 3,884 (1,876) 2,008
398,812 (38,599) 360,213 173,256 (11,742) 161,514
NOTES TO THE CONSOLIDATED FINANCIAL STATEMENTS31 December 2018
NOTES TO THE CONSOLIDATED FINANCIAL STATEMENTS31 December 2018
Societe Generale de Banque au Liban SAL
Consolidated Financial Statements
The attached notes 1 to 52 form part of these consolidated financial statements. 86 | 87
Income recognized in the income statement from financial assets at fair value through other comprehensive income is as follows:
2018LL million
2017LL million
Dividend income from equity instruments 1,781 1,715
Interest income from debt instruments 3,479 -
5,260 1,715
24 PROPERTY AND EQUIPMENT
Advances on purchase of
property and equipment
LL million
Land and buildings LL million
Furniture and fixtures
LL millionInstallations
LL millionVehicles
LL millionTotal
LL million
Cost:
At 1 January 2018 123,243 293,668 131,926 82,587 2,639 634,063
Acquisition of subsidiaries (note 3) - 7,474 10,733 - - 18,207
Acquisition of NBAD assets and liabilities (note 3) - 9,563 3,737 2,896 35 16,231
Additions 43,270 422 3,928 1,919 70 49,609
Disposals - (5,236) (4,190) - (52) (9,478)
Transfers (25,016) 15,152 1,488 8,376 - -
Write-off (332) - (266) (84) - (682)
Transfers from intangible assets - - 850 - - 850
Exchange differences (16) (120) (688) (156) (10) (990)
At 31 December 2018 141,149 320,923 147,518 95,538 2,682 707,810
Depreciation:
At 1 January 2018 - 26,225 75,361 44,136 1,654 147,376
Acquisition of subsidiaries (note 3) - 5,412 8,577 - - 13,989
Acquisition of NBAD assets and liabilities (note 3) - 1,009 1,605 2,781 35 5,430
Provided during the year - 2,983 5,715 3,810 253 12,761
Relating to disposals - (5,236) (4,190) - (13) (9,439)
Relating to write-off - - (266) (84) - (350)
Exchange differences - (88) (555) (87) (8) (738)
At 31 December 2018 - 30,305 86,247 50,556 1,921 169,029
Impairment: At 1 January 2018 and 31 December
2018- 1,357 - - - 1,357
Net carrying amount:At 31 December 2018 141,149 289,261 61,271 44,982 761 537,424
Advances on purchase of
property and equipment
LL million
Land and buildings LL million
Furniture and fixtures
LL millionInstallations
LL millionVehicles
LL millionTotal
LL million
Cost:
At 1 January 2017 86,204 282,999 124,567 73,843 2,282 569,895
Additions 57,253 76 3,408 2,443 133 63,313
Disposals - - (100) - (155) (255)
Transfers (20,257) 10,573 3,357 5,973 354 0
Write-off - - (102) - - (102)
Exchange differences 43 20 796 328 25 1,212
At 31 December 2017 123,243 293,668 131,926 82,587 2,639 634,063
Depreciation:
At 1 January 2017 - 23,601 69,079 40,681 1,392 134,753
Provided during the year - 2,623 5,751 3,298 283 11,955
Relating to disposals - - (99) - (39) (138)
Relating to write-off - - (99) - - (99)
Exchange differences - 1 729 157 18 905
At 31 December 2017 - 26,225 75,361 44,136 1,654 147,376
Impairment: At 1 January 2017 and 31 December
2017- 1,357 - - - 1,357
Net carrying amount:At 31 December 2017 123,243 266,086 56,565 38,451 985 485,330
25 INTANGIBLE ASSETS
Advances on intangible
assets LL million
Customer
relationships LL million
Key money
LL million
Licenses and
software LL million
Total LL million
Cost:
At 1 January 2018 32,500 20,600 2,196 21,828 77,124
Acquisition of subsidiaries (note 3) - - - 13,813 13,813
Acquisition of NBAD assets and liabilities (note 3) - 7,473 - - 7,473
Additions 8,675 - - 1,932 10,607
Write-off - - - (988) (988)
Transfers (186) - - 186 -
Transfers to property plant and equipment (850) - - - (850)
Exchange differences (4) 2 - (557) (559)
At 31 December 2018 40,135 28,075 2,196 36,214 106,620
NOTES TO THE CONSOLIDATED FINANCIAL STATEMENTS31 December 2018
NOTES TO THE CONSOLIDATED FINANCIAL STATEMENTS31 December 2018
Societe Generale de Banque au Liban SAL
Consolidated Financial Statements
The attached notes 1 to 52 form part of these consolidated financial statements. 88 | 89
Advances on intangible
assets LL million
Customer
relationships LL million
Key money
LL million
Licenses and
software LL million
Total LL million
Amortization:
At 1 January 2018 - 10,301 1,934 16,870 29,105
Acquisition of subsidiaries (note 3) - - - 13,602 13,602
Provided during the year - 1,717 - 1,698 3,415
Related to write-off - - - (988) (988)
Exchange differences - - - (455) (455)
At 31 December 2018 - 12,018 1,934 30,727 44,679
Net carrying amount: At 31 December 2018 40,135 16,057 262 5,487 61,941
Advances on intangible
assets LL million
Customer
relationships LL million
Key money
LL million
Licenses and
software LL million
Total LL million
Cost:
At 1 January 2017 24,084 20,600 9,861 20,257 74,802
Additions 8,504 - - 1,264 9,768
Write off - - (7,753) - (7,753)
Transfers (88) - 88 - -
Exchange differences - - - 307 307
At 31 December 2017 32,500 20,600 2,196 21,828 77,124
Amortization:
At 1 January 2017 - 8,584 1,934 14,967 25,485
Provided during the year - 1,717 - 1,619 3,336
Exchange differences - - - 284 284
At 31 December 2017 - 10,301 1,934 16,870 29,105
Net carrying amount: At 31 December 2017 32,500 10,299 262 4,958 48,019
Customer relationships represents the intangibles resulting from the acquisition of assets and liabilities of the Lebanese Canadian Bank SAL (under liquidation) in prior years and assets and liabilities of NBAD branches in Jordan in the the year ended 31 December 2018.
26 INVESTMENT PROPERTIES
2018LL million
2017LL million
Investment properties 1,226 1,478
The movement of investment properties recognized in the consolidated statement of financial position is as follows:
2018LL million
2017LL million
At 1 January 1,478 1,483
Exchange difference (252) (5)
At 31 December 1,226 1,478
The Group’s investment properties consist of properties in Lebanon held by the Group for capital appreciation.
As at 31 December 2018 and 2017, the fair values of the properties are based on valuations performed by accredited independent valuers specialized in valuing these types of properties.
The Group did not generate any rental income nor incurred any expenses relating to investment properties during the years ended 31 December 2018 and 31 December 2017.
The Group has no restrictions on the realizability of its investment properties and no contractual obligations to either purchase, construct or develop investment properties or for repairs, maintenance and enhancements.
27 NON-CURRENT ASSETS HELD FOR SALE
2018LL million
2017LL million
Assets obtained in settlement of debts (i) 203,080 186,504
(i) The movement of the assets obtained in settlement of debts held for sale recognized in the consolidated statement of financial position is as follows:
2018LL million
2017LL million
Cost:
At 1 January 206,545 193,679
Additions 19,816 14,866
Disposals (2,783) (1,373)
Exchange differences (407) (627)
At 31 December 223,171 206,545
Impairment:
At 1 January 20,041 17,760
Additions 50 3,010
Write-back during the year - (722)
Exchange differences - (7)
At 31 December 20,091 20,041
Net carrying amount: At 31 December 203,080 186,504
NOTES TO THE CONSOLIDATED FINANCIAL STATEMENTS31 December 2018
NOTES TO THE CONSOLIDATED FINANCIAL STATEMENTS31 December 2018
Societe Generale de Banque au Liban SAL
Consolidated Financial Statements
The attached notes 1 to 52 form part of these consolidated financial statements. 90 | 91
Assets obtained in settlement of debt held-for-sale represent primarily land and buildings acquired by the Group in settlement of certain loans and advances.
During the year, the Group disposed of assets obtained in settlement of debts held for sale with a cost of LL 2,783 million (2017: LL 1,373 million) and recognized a gain of LL 534 million (2017: LL 406 million) there was no write-back of impairment during the year (2017: a write-back of impairment losses amounting to LL 722 million) (refer to note 10), in addition to the release of reserve for non-current assets held for sale amounting to LL 866 million to reserve for capital increase (2017: LL 371 million). This amount relates to appropriations previously booked on reserve for non-current assets held for sale (refer to note 39).
28 OTHER ASSETS
2017LL million
2016LL million
Deferred employee termination benefits (i) 4,187 12,528
Due from the National Social Security Fund 20,027 17,841
Prepaid expenses 28,264 23,267
Deferred tax assets (note 14) 15,290 7,143
Investment in an associate (ii) 2,087 1,897
Receivable from sale of non-current assets held for sale 3,595 4,731
Other debtors 90,391 73,221
Provision (iii) (6,544) (6,544)
157,297 134,084
(i) Deferred employee termination benefitsDeferred employee termination benefits amounting to LL 4,187 million as at 31 December 2018 (2017: LL 12,528 million), represent compensations paid to employees whose contracts were terminated as a result of the acquisition of the assets and liabilities of the Lebanese Canadian Bank SAL and their related taxes.
These compensations were calculated on the basis provided for in the staff compensation arbitrary decision dated 29 August 2011.
These benefits were deferred up to an amount of LL 60,300 million (equivalent to US$ 40 million). As a compensation for the employee termination benefits, the Central Bank of Lebanon exempted the Bank from part of the compulsory reserves denominated in Lebanese Lira. Part of these reserves were invested in Lebanese treasury bills whose nominal value amounted to LL 80,000 million and maturing on 1 December 2016.
During June 2012, the Central Bank of Lebanon granted the Bank a soft loan amounting to LL 170,000 million (note 30) in substitute of the exemption from part of the compulsory reserves granted during 2011. The proceeds from the soft loan were invested in Lebanese treasury bills. These treasury bills were pledged as collateral against the settlement of the soft loan. The interest income generated from these treasury bills will be offset against these deferred compensations over the period of the future economic benefits of these treasury bills.
During the year ended 31 December 2018, deferred employee termination benefits of LL 8,341 million (2017 LL 8,232 million) were amortized to the consolidated income statement against a net spread between the interest income from the Lebanese treasury bills and interest expense on the soft loan.
(ii) Investment in an associateAs of 31 December 2018 and 2017 the Group had 50% equity interest in Centre de Traitement Monetique SAL. The Group’s share of profit from the associate amounted to LL 190 million for the year ended 31 December 2017 (2017: LL 172 million).
(iii) ProvisionThe movement of the provision recognized in the consolidated statement of financial position is as follows:
2018LL million
2017LL million
Provision at 1 January 6,544 7,136
Write-off of provision - (582)
Written-back during the year (note 11) - (10)
Provision at 31 December 6,544 6,544
29 GOODWILL
2018LL million
2017LL million
Cost:
At 1 January and 31 December 169,128 169,128
Impairment:
At 1 January and 31 December 165,723 165,723
Net book value: At 1 January and 31 December 3,405 3,405
Impairment testing of goodwillGoodwill acquired through business combinations has been allocated to three individual cash generating units (CGUs) for impairment testing as follows:
2018LL million
2017LL million
Société Générale de Banque – Jordanie 2,393 2,393
Fidus SAL 199 199
SGBL insurance SAL (previously Sogecap Liban SAL) 813 813
3,405 3,405
30 DUE TO THE CENTRAL BANKS
2018LL million
2017LL million
Current account 21 14
Term soft loans 3,915,996 1,617,526
Accrued interest 14,143 4,667
3,930,160 1,622,207
NOTES TO THE CONSOLIDATED FINANCIAL STATEMENTS31 December 2018
NOTES TO THE CONSOLIDATED FINANCIAL STATEMENTS31 December 2018

Societe Generale de Banque au Liban SAL
Consolidated Financial Statements
The attached notes 1 to 52 form part of these consolidated financial statements. 92 | 93
Term soft loans include:
- Term loans amounting to LL 483 million as at 31 December 2017 were granted by the Central Bank of Lebanon to cover 60% of the replacement costs of the Bank’s damaged buildings and installations and to cover 60% of the Bank’s credit losses relating to debtors directly affected by July 2006’s war. The effective interest rate for year ended 31 December 2017. The loan is secured by the pledge on lebanese treasury bills with a nominal of LL 483 million included under financial assets at amortized cost (note 22). The loan was settled during the year ended 31 December 2018.
- Term loan amounting to LL 170,000 million granted during June 2012 from the Central Bank of Lebanon after the acquisition of the assets and liabilities of the Lebanese Canadian Bank SAL for a ten years period. The effective interest rate is 2% for the first 5 years and 1.85% for the remaining 5 years. The loan is secured by the pledge on lebanese treasury bills with a nominal of LL 170,000 million (2017: LL 170,000 million) included under financial assets at amortized cost (note 22).
- Term loans totaling to LL 303,293 million as at 31 December 2018 (31 December 2017: LL 292,990 million) were granted by the Central Bank of Lebanon to subsidize the loans granted to customers under cicular 313 of the Central Bank of Lebanon. The term loans are subject to a 1% interest rate payable on a monthly basis. Part of these term loans are secured by the pledge on Lebanese treasury bills with a nominal of LL 2,302 million (31 December 2017: LL 2,050 million) and certificates of deposits denominated in LL with a nominal of LL 15,000 million as at 31 December 2018 (2017: the same). These instruments are included under financial assets at amortized cost (note 22).
- Term loans totaling to LL 3,263,747 million as at 31 December 2018 (2017: LL 1,108,583 million) were granted by the Central Bank of Lebanon. The term loans are subject to a 2% interest rate payable on a monthly basis. Lebanese treasury bills with a nominal of LL 436,783 million included under financial assets at amortized cost (note 22) (2017: LL 436,783 million) and long-term placements held with the Central Bank of Lebanon amounting to LL 2,829,601 as at 31 December 2018 (2017: LL 674,437 million) (note 15) were blocked against these term loans.
31 LOANS AND REPURCHASE AGREEMENTS
2018LL million
2017LL million
Central Bank of Lebanon - 431,476
Banks and financial institutions 1,461,028 1,249,908
1,461,028 1,681,384
The Group has a program to sell securities under agreements to repurchase (‘repos’). The securities sold under agreements to repurchase are transferred to third parties and the Group receives cash in exchange. If the securities decrease in value, the Group may be required to pay additional cash collateral. The Group has determined that it retains substantially all the risks and rewards of these securities, which include credit risk and market risk, and therefore has not derecognized them. In addition, it recognizes a financial liability for cash received as collateral.
The carrying amount and fair value of securities sold under agreements to repurchase at 31 December 2018 was LL 2,828,600 million and LL 2,493,749 million respectively (2017: LL 2,289,030 million and LL 2,246,197 million respectively). Those securities are presented in the statement of financial position under “Financial assets at amortized cost” (note 22).
The following tables provide a summary of financial instruments that have been transferred in such a way that part or all of the transferred financial assets do not qualify for derecognition or were pledged against facilities granted, together with the associated liabilities:
2018
Transferred financial asset
Foreign govern-mental debt
securities LL million
Certificates of deposit – EuroCDs
& bank place-ments
LL million
Corporate bonds
LL million
Lebanese Trea-sury bills –
Eurobonds LL million
Total LL million
Carrying amount of assets
Securities lending and repos 25,388 - 41,518 2,761,694 2,828,600
Fair value of assetsSecurities lending and repos 25,459 - 41,786 2,426,504 2,493,749
Carrying amount of associated liabilities
Securities lending and repos 22,345 - 39,910 1,398,773 1,461,028
2017
Transferred financial asset
Foreign govern-mental debt
securities LL million
Certificates of deposit–
EuroCDs & bank placements
LL million
Corporate bonds
LL million
Lebanese Treasury bills –
Eurobonds LL million
Total LL million
Carrying amount of assets
Securities lending and repos 25,290 467,129 42,261 2,176,089 2,710,769
Fair value of assetsSecurities lending and repos 26,249 465,546 42,894 2,133,247 2,667,936
Carrying amount of associated liabilities
Securities lending and repos 22,344 431,478 39,905 1,187,657 1,681,384
In addition to the above an amount of US$ 268,807,795 (equivalent to LL 405,228 million) is pledged as additional collateral against repurchase agreements as at 31 December 2018 (2017: US$ 61,546,407 equivalent to LL 92,782 million). These collaterals are placed upon the request of the counterparty to cover any decrease in fair value of the pledged assets. These placements are included under “Due from banks and financial institutions” (note 16).
32 DUE TO BANKS AND FINANCIAL INSTITUTIONS
2018LL million
2017LL million
Sight deposits 158,512 110,698
Time deposits 1,036,050 368,519
1,194,562 479,217
33 AMOUNTS DUE TO AFFILIATED BANKS AND FINANCIAL INSTITUTIONS
2018LL million
2017LL million
Sight deposits 5,550 6,844
Time deposits 2,003 -
7,553 6,844
NOTES TO THE CONSOLIDATED FINANCIAL STATEMENTS31 December 2018
NOTES TO THE CONSOLIDATED FINANCIAL STATEMENTS31 December 2018
Societe Generale de Banque au Liban SAL
Consolidated Financial Statements
The attached notes 1 to 52 form part of these consolidated financial statements. 94 | 95
34 CUSTOMERS’ DEPOSITS AT AMORTIZED COST
2018Corporate
LL millionRetail
LL millionTotal
LL million
Sight deposits 1,248,861 2,158,575 3,407,436
Net creditor accounts against debtor accounts 12 812 824
Blocked margins 1,172,573 207,317 1,379,890
2,421,446 2,366,704 4,788,150
Time deposits 4,862,792 11,127,767 15,990,559
Savings accounts 340,401 6,944,948 7,285,349
7,624,639 20,439,419 28,064,058
2017Corporate
LL millionRetail
LL millionTotal
LL million
Sight deposits 765,575 1,307,593 2,073,168
Net creditor accounts against debtor accounts 763 1,147 1,910
Blocked margins 326,064 161,216 487,280
1,092,402 1,469,956 2,562,358
Time deposits 5,084,658 10,276,492 15,361,150
Savings accounts 352,704 6,414,296 6,767,000
6,529,764 18,160,744 24,690,508
Included in customers’ deposits as at 31 December 2018 are coded accounts amounting to LL 35,052 million (2017: LL 55,521 million). These accounts are opened in accordance with article 3 of the Banking Secrecy Law dated 3 September 1956.
Included under customers’ deposits an amount of LL 631,260 million maturing during 2019, 2020, and 2022 guaranteed by certificates of deposit with a nominal amount of LL 764,152 (2017: deposits amounting to LL 583,073 million maturing during 2018, 2019 and 2020 guaranteed by certificates of deposit with a nominal amount of LL 661,190 million) (note 22).
35 RELATED PARTIES’ DEPOSITS AT AMORTIZED COST
2018Corporate
LL millionRetail
LL millionTotal
LL million
Sight deposits 979 5,693 6,672
Time deposits 955 116,947 117,902
1,934 122,640 124,574
2017Corporate
LL millionRetail
LL millionTotal
LL million
Sight deposits 2,102 10,543 12,645
Time deposits 10,283 142,354 152,637
12,385 152,897 165,282
36 OTHER LIABILITIES
2018LL million
2017LL million
Deferred income (i) 91,856 184,856
Excess provisions to comply with the Central Bank of Lebanon
Intermediate Circular number 439 dated 8 November 2016 (note 37) 4,743 -
Current tax liabilities (note 14) 23,028 45,560
Redeemed preferred shares payable to third parties (ii) - 21,859
Accrued expenses 31,245 26,649
Payable to the shareholders of the Lebanese Canadian Bank SAL (iii) - 12,060
Customers’ transactions between Head Office and branches 17,582 18,989
Other taxes payable 24,492 15,626
Interest and commissions received in advance 12,457 10,631
Allowance for ECL / Impairment allowance on off-statement of
financial position 8,755 -
Due to the National Social Security Fund 4,370 1,931
Deferred tax liabilities (note 14) 1,278 861
Other creditors 41,816 28,354
261,622 367,376
(ii) During 2016, the Central Bank of Lebanon issued Intermediate Circular number 446 dated 30 December 2016 relating to the gain realized by banks from certain financial transactions with the Central Bank of Lebanon, consisting of the sale of financial instruments denominated in Lebanese Lira and the purchase of financial instruments denominated in US Dollars. In accordance with the provisions of this circular, banks should recognize in the income statement, only part of the gain net of tax, caped to the extent of the losses recorded to comply with recent regulatory provisioning requirements (note 35), the impairment losses on subsidiaries and goodwill recorded in accordance with IAS 36 and IFRS 3 respectively and the shortage needed to comply with the capital adequacy requirements. Lebanese banks may further recognize up to 70% of the remaining balance of the gain realized net of tax in the income statement as non-distributable profits to be appropriated to reserves for capital increase, qualifying for inclusion within regulatory Common Equity Tier One.
During 2017, the Group transferred an amount of LL 31,657 million (net of associated costs) from the deferred income to net gain from sale of financial assets at amortized cost in the consolidated income statement. As at 31 December 2017, the Group carried an amount of LL 184,856 million (net of tax) in gains realized from certain financial transactions with the Central Bank of Lebanon that it did not recognize in the consolidated income statement for the year ended 31 December 2016.
During 2018, the Group transferred an amount of LL 93,000 million from deferred income to the consolidated income statement. An amount of LL 109,412 was recorded under “net gain from sale of financial assets at amortized cost” and the corresponding tax expense amounting to LL 16,412 was
NOTES TO THE CONSOLIDATED FINANCIAL STATEMENTS31 December 2018
NOTES TO THE CONSOLIDATED FINANCIAL STATEMENTS31 December 2018
Societe Generale de Banque au Liban SAL
Consolidated Financial Statements
The attached notes 1 to 52 form part of these consolidated financial statements. 96 | 97
recorded under “income tax expense”. (ii) Redeemed preferred shares payable to third parties represent liabilities acquired with the acquisition of
the Lebanese Canadian Bank SAL and relating to preferred shares redeemed by the Lebanese Canadian Bank SAL and not yet claimed by the holders of those shares. These amounts were paid during the year ended 31 December 2018.
(iii) This represents the balance of the cash collateral deposited by the shareholders of the Lebanese Canadian Bank SAL and amounting to US$ 8 million (equivalent to LL 12,060 million) as a guarantee against default of the loans of an acquired subsidiary. This amount is refundable to the shareholders of the Lebanese Canadian Bank SAL, since the initial consideration paid for the acquisition was reduced by the same amount. The amounts were refunded to the shareholders during the year ended 31 December 2018.
37 PROVISION FOR RISKS AND CHARGES
2018LL million
2017LL million
Technical reserve for insurance contracts 26,017 22,812
Employees’ end of service benefits (i) 27,699 27,424
Provision for contingencies and charges 9,148 3,276
Excess provisions to comply with the Central Bank of Lebanon
Intermediate Circular number 439 dated 8 November 2016 (ii) - 165,825
Other provisions 14,185 29,583
77,049 248,920
(i) Banking entities operating in Lebanon have two defined benefit plans covering all their employees. The first requires contributions to be made to the National Social Security Fund whereby the entitlement to and level of these benefits depend on the employees’ length of service, the employees’ salaries and contributions paid to the fund among other requirements. Under the second plan, no contributions are required to be made, however a fixed end of service lump sum amount should be paid for long service employees. The entitlement to and level of these end of service benefits provided depend on the employees’ length of service, the employees’ salaries and other requirements outlined in the Workers’ Collective Agreement. The first plan described above also applies to non-banking entities operating in Lebanon. Defined benefit plans for employees at foreign subsidiaries and branches are set in line with the laws and regulations of the respective countries in which these subsidiaries are located. The movement of provision for staff retirement benefit obligation is as follows:
2018Corporate
LL millionRetail
LL millionTotal
LL million
Balance at 1 January 2018 27,424 - 27,424
Acquisition of a subsidiary - 786 786
Charge for the year (Note 12) 3,489 41 3,530
Paid during the year (2,662) - (2,662)
Actuarial gain on obligation-experience (867) (224) (1,091)
Provision no more required (Note 12) (163) (107) (270)
Foreign exchange difference (6) (12) (18)
Balance at 31 December 2018 27,215 484 27,699
2017Corporate
LL millionRetail
LL millionTotal
LL million
Balance at 1 January 2017 25,808 - 25,808
Charge for the year (Note 12) 3,479 - 3,479
Paid during the year (1,440) - (1,440)
Actuarial loss (gain) on obligation-experience - - -
Provision no more required (Note 12) (423) - (423)
Balance at 31 December 2017 27,424 - 27,424
Defined benefit plans in Lebanon constitute more than 75% of the Group’s required obligation. The key assumptions used in the calculation of Lebanese retirement benefit obligation are as follows:
The principal assumptions used in determining the end of service benefit obligations of these plans are shown below:
2018 2017
Economic assumptions
Discount rate 8.0% 8.5%
Future salary increase 8% for 20196% for future years
8% for 2018 and 20196% for future years
Future expected return on contributions 5.0% 5.0%
Demographic assumptions
Retirement age Earliest of 64 or completion of 20
contribution years
Earliest of 64 or completion of 20
contribution years
Mortality rate None None
Turnover rate 2.0% for the NSSF EOSI 4% for the WCA EOSI
2.0% for the NSSF EOSI 4% for the WCA EOSI
A quantitative sensitivity analysis as a result of an increase/decrease of 50 basis points in the significant assumptions as at 31 December 2018 and 2017 is shown as below:
Discount Rate Future Salary Increase
% IncreaseLBP Million
% DecreaseLBP Million
% IncreaseLBP Million
% DecreaseLBP Million
Impact on net defined benefit Obligations
2018 (1,128) 1,217 2,435 (2,284)
2017 (1,126) 1,213 2,325 (2,177)
(ii) On 8 November 2016, the Central Bank of Lebanon issued Intermediate Circular number 439 which required banks operating in Lebanon to constitute additional collective provisions. As such, provisions
NOTES TO THE CONSOLIDATED FINANCIAL STATEMENTS31 December 2018
NOTES TO THE CONSOLIDATED FINANCIAL STATEMENTS31 December 2018
Societe Generale de Banque au Liban SAL
Consolidated Financial Statements
The attached notes 1 to 52 form part of these consolidated financial statements. 98 | 99
for risks and charges as at 31 December 2017 and 31 December 2016 include an amount of LL 165,825 million in excess of the provisioning requirements of IAS 39 (note 34). During 2018, the Bank utilized part of this provision to cover an amount of LL 121,585 million resulting from the impact of first-time adoption of IFRS 9 Expected Credit Loss (ECL) model on 1 January 2018. In addition, the Bank released an amount of LL 39,497 million from “Provisions for risks and charges” to “Other operating income”. The remaining amount was included under “other liabilities” (note 36),
38 SHARE CAPITAL
a) Common sharesThe authorized, issued and fully paid share capital as of 31 December 2018 comprised 56,535 shares of nominal value LL 258,000 each (2017: 56,535 shares of nominal value LL 258,000 each).
b) Preferred shares- On 28 March 2013, the Bank issued 12,500 preferred shares (Series 2012) for a nominal amount of
LL 212,400 each (a total of LL 2,655 million) plus a share premium denominated in US Dollars of US$ 9,859 per share. Accordingly, the total share premium resulting from the issuance amounted to US$ 123,238,806 (or LL 185,782 million) less issuance costs of LL 395 million.
- On 13 September 2013, the Bank issued 15,000 preferred shares (Series 2013) for a nominal amount of LL 212,400 each (a total of LL 3,186 million) plus a share premium denominated in US Dollars of US$ 9,859 per share. Accordingly, the total share premium resulting from the issuance amounted to US$ 147,886,567 (or LL 222,939 million) less issuance costs of LL 385 million.
- On 2 July 2015, the Bank issued 10,000 preferred shares (Series 2015) for a nominal amount of LL 233,000 each (a total of LL 2,330 million) plus a share premium denominated in US Dollars of US$ 9,845 per share. Accordingly, the total share premium resulting from the issuance amounted to US$ 98,454,395 (or LL 148,420 million) less issuance costs of LL 194 million.
The payment of dividends for preferred shareholders is dependent on:1. The availability of non-consolidated net income for a specific year after appropriation of legal and other
regulatory reserves;2. The continuous compliance with regulations issued by the Central Bank of Lebanon and the Banking
Control Commission; and3. The approval of the ordinary general assembly of shareholders to distribute those dividends.
During 2018, the Bank transferred LL 2,079 million (2017: LL 2,029 million) from “retained earnings” to the “share premium – preferred shares”. These represent the appropriation of transaction costs incurred on preferred shares and additional premiums of 1.25% relating to preferred shares – Series 2012, 2% relating to preferred shares – Series 2013 and 1.5% relating to preferred shares – Series 2015.
c) Preferred shares under subsicription and redemption:On 26 April 2018, the Board of Directors of the Bank resolved to reacquire all the 12,500 Series 2012 preferred shares in order to cancel them and simultaneously replace their nominal value amounting to LL 3,225 million through an increase of the nominal value per share from LL 258,000 to LL 293,000 by a transfer from distributable reserves. The Central Bank of Lebanon approved the reaquisition on 7 September 2018. The Bank settled LL 190,793 million to the holders of these shares on 19 September 2018.
The Extraordinary General Assembly of shareholders held on 2 July 2018 resolved to increase the capital of the Bank from LL 24,261 million to LL 27,486 million through the issuance of 12,500 Series 2018/A preferred shares. The Central Bank of Lebanon approved the increase on 9 September 2018. On 3 September 2018, the Board of Directors of the Bank resolved to open the subscription in the Series 2018/A preferred shares during 18 and 19 September 2018. As at 31 December 2018, the preferred shares were fully subscribed for a total amount of LL 188,438 million.
The Extraordinary General Assembly of shareholders held on 19 October 2018 resolved the following:• to issue the Series 2018/A preferred shares.• to cancel 12,500 Series 2012 preferred shares for a total nominal amount to LL 3,225 million. • to increase the par value of each share from LL 258,000 to LL 293,000 through transfers from the
distributable reserves to share capital.
As at 31 December 2018 the transaction was pending the final approval of the Central Bank of Lebanon, which was received on 12 March 2019, and the release of funds.
d) Cash contribution by shareholdersCash contribution to capital amounted to US$ 9,855,900 and EUR 46,229,259 as at 31 December 2017 totaling to LL 106,746 million (2016: US$ 9,855,900 and EUR 46,229,259 totaling LL 106,746 million). These contributions were granted by the shareholders of the Bank in order to support and develop the activities of the Bank, in accordance with the following conditions:- Every shareholder is committed to retain the contributions during the lifetime of the Bank;- The shareholders commit to cover any loss using their contributions according to the provisions of
article 3-8 of circular N° 44 of the of the Central Bank of Lebanon and article 134 of the Money and Credit Act; and
- The shareholders have the right to use or not to use these contributions in case of a capital increase.
Both the Central Council of the Central Bank of Lebanon and the ordinary general assembly of the Bank approved these contributions.
39 NON DISTRIBUTABLE RESERVES
Legal reserve
LL million
Reserve for general
banking risks LL million
Reserve against
doubtful and impaired loans
LL million
Reserve for capital
increase LL million
Reserve for non-current assets held
for sale LL million
Reserve for retail and
corporate loans
LL million
General reserve
LL millionTotal
LL million
At 31 December 2016 154,680 154,856 583 488,672 47,696 18,161 - 864,648
Appropriation during the year 28,836 26,945 - 3,005 22,466 16,284 - 97,536
Transfers - - - 371 (371) - - -
Adjsutments - - (499) - - - - (499)
At 31 December 2017 183,516 181,801 84 492,048 69,791 34,445 - 961,685
Appropriation during the year 33,152 28,316 - 316 21,344 - 142,743 225,871
Transfers - (210,117) - 866 (866) (34,445) 236,395 (8,167)
At 31 December 2018 216,668 - 84 493,230 90,269 - 379,138 1,179,389
a) Legal reserveAs required by local regulations where the Group operates, a percentage of the net profit for the year should be transferred to legal reserve. This reserve is not available for dividend distribution.
b) Reserve for capital increaseIn compliance with the circular No. 167 issued by the Banking Control Commission, the Bank is required to appropriate the net write-back of provisions for doubtful debts in a particular year to the reserve for capital increase when the net results are positive.
NOTES TO THE CONSOLIDATED FINANCIAL STATEMENTS31 December 2018
NOTES TO THE CONSOLIDATED FINANCIAL STATEMENTS31 December 2018
Societe Generale de Banque au Liban SAL
Consolidated Financial Statements
The attached notes 1 to 52 form part of these consolidated financial statements. 100 | 101
In compliance with the circular No. 173 issued by the Banking Control Commission, the Bank is required to appropriate the gain realized from the sales of non-current assets held for sale to the reserve for capital increase when the net results are positive.
c) Reserve for non-current assets held for saleIn compliance with pronouncements of the Banking Control Commission, when properties acquired in settlement of debts are not sold within the timeframe required by local regulators, the Bank should appropriate an amount equal to 5% or 20% of the carrying value of such properties. The annual appropriation, which is from the net profit of the respective year after appropriations to legal reserve and reserve for general banking risks, is reported under “reserve for non-current assets held for sale”.
The Bank shall make a transfer from this reserve into the “Reserve for capital increase” when:- The reserve appropriated in prior years related to a property disposed off; or- The reserve appropriated in prior years (equal or up to) an impairment loss recognized in the income
statement against the acquired property.
d) General reserveAccording to the Central Bank of Lebanon Main Circular 143, Banks in Lebanon are required to transfer to General Reserves, the balance of Reserves for General Banking Risks and General Reserves for Loans and Advances previously appropriated in line with the requirements of decision 7129 and decision 7776 respectively. This reserve is part of the Group’s equity and is not available for distribution.
40 DISTRIBUTABLE RESERVES
2018LL million
2017LL million
Balance at 1 January 29,460 20,532
Appropriation during the year 212 8,928
Transfers (3,225) -
Balance at 31 December 26,447 29,460
41 REVALUATION RESERVE OF PROPERTY
2018LL million
2017LL million
Revaluation amount 5,499 5,499
Book value (945) (945)
Sale of real estate (620) (620)
Revaluation variance 3,934 3,934
The Central Bank of Lebanon and the tax authorities approved on 29 March 1995 and on 18 April 1995 respectively, the revaluation of some of the buildings owned by the Bank and used for operating purposes in accordance with the law no. 282 dated 30 December 1993.
42 CUMULATIVE CHANGE IN FAIR VALUE OF FINANCIAL ASSETS AT FAIR VALUE THROUGH OTHER COMPREHENSIVE INCOME
2018LL million
2017LL million
Balance at 1 January (11,678) (218)
Net realized loss on financial instruments transferred to retained earnings - 416
Net unrealized loss on financial assets at fair value through other comprehensive income,net of tax (26,848) (11,876)
Balance at 31 December (38,526) (11,678)
43 DIVIDENDS PAID TO EQUITY HOLDERS OF THE PARENT
According to the resolution of the ordinary general assembly of shareholders held on 26 April 2018 the following dividends were declared and paid:
2018
Number of sharesDividend
per share in LLTotal
LL million
Dividends for preferred shares – 2012 issue 12,500 1,060,500 13,256
Dividends for preferred shares – 2013 issue 15,000 1,060,500 15,908
Dividends for preferred shares – 2015 issue 10,000 1,060,500 10,605
Dividends for common shares 56,535 1,339,900 75,751
115,520
According to the resolution of the ordinary general assembly of shareholders held on 25 April 2017 the following dividends were declared and paid:
2017
Number of sharesDividend
per share in LLTotal
LL million
Dividends for preferred shares – 2012 issue 12,500 1,060,325 13,255
Dividends for preferred shares – 2013 issue 15,000 1,060,325 15,905
Dividends for preferred shares – 2015 issue 10,000 1,060,325 10,603
Dividends for common shares 56,535 1,071,700 60,588
100,351
NOTES TO THE CONSOLIDATED FINANCIAL STATEMENTS31 December 2018
NOTES TO THE CONSOLIDATED FINANCIAL STATEMENTS31 December 2018
Societe Generale de Banque au Liban SAL
Consolidated Financial Statements
The attached notes 1 to 52 form part of these consolidated financial statements. 102 | 103
44 CASH AND CASH EQUIVALENTS2018
LL million2017
LL million
Cash and balances with the Central Banks 16,615,531 13,259,404
Financial instruments – Certificates of deposits issued by foreign Central Banks 137,095 52,126
Due from banks and financial institutions 1,779,148 854,226
Amounts due from affiliated banks and financial institutions 226,416 590,385
Due to the Central Banks (3,930,160) (1,622,207)
Loans and repurchase agreements (1,461,028) (1,681,384)
Due to banks and financial institutions (1,194,562) (479,217)
Amounts due to affiliated banks and financial institutions (7,553) (6,844)
12,164,887 10,966,489
Less: balances with maturities exceeding 3 months
Cash and balances with the Central Banks 15,175,444 12,337,843
Due from banks and financial institutions 108,235 46,381
Amounts due from affiliated banks and financial institutions 99,673 66,618
Due to the Central Banks (3,897,046) (1,328,664)
Loans and repurchase agreements (1,461,028) (1,681,384)
Due to banks and financial institutions (887,289) (190,076)
9,137,989 9,250,718
Cash and cash equivalents at 31 December 3,026,898 1,715,771
45 RELATED PARTY TRANSACTIONS
Parties are considered to be related if one party has the ability to control the other party or exercise significant influence over the other party in making financial or operation decisions, or one other party controls both. The definition includes subsidiaries, key management personnel and their close family members, as well as entities controlled or jointly controlled by them.
A list of the Group’s principal subsidiaries is shown in note 2. Transactions between the Bank and its subsidiaries meet the definition of related party transactions. However, where these are eliminated on consolidation, they are not disclosed in the Group’s consolidated financial statements.
Key Management Personnel are defined as those persons having authority and responsibility for planning, directing and controlling the activities of the Group, directly or indirectly, including the Directors of the Bank and the Officers of the Group.
Entities under common directorships are defined as those entities for which members of the Bank’s board also serve as directors.
Terms and conditions of transactions with related partiesThe Group enters into transactions with major related parties in the ordinary course of business at normal commercial interest and commission rates. As at 31 December 2018, the Group has made provisions and suspended interest for doubtful debts relating to amounts owed by related parties totaling to LL 25,447 million (2017: LL 19,679 million).
The following table provides the total amount of transactions and the amount of outstanding balances (including commitments) with related parties for the relevant financial year.
2018 2017Outstanding
balance LL million
Income (expense) LL million
Outstanding balance
LL million
Income (expense) LL million
Key management personnel
Net loans and advances 112,314 4,546 105,116 4,792
Deposits 74,759 (5,905) 109,126 (5,238)
Guarantees given 1,144 - 1,524 -
Commitments 17 - 14 -
Entities under common directorship
Net loans and advances 11,103 1,086 5,870 904
Deposits 48,111 (2,397) 54,990 (1,788)
Guarantees given 73 - 137 -
Shareholder – Bank
Net loans and advances 220,417 (95) 588,834 1,211
Deposits 504 (155) 492 (9)
Guarantees given 14,356 - 19,616 -
Guarantees received 423 - 443 -
Commitments 1,291 - - -
Associate
Deposits 1,094 (12) 679 (18)
Technical assistance fees paid to Société Générale – Paris, shareholder, amounted to LL 755 million for the year ended 31 December 2018 (2017: LL 755 million).
The Bank rented offices from board members for LL 516 million for the year ended 31 December 2018 (2017: LL 511 million).
Compensation of the key management personnel is as follows:
2018LL million
2017LL million
Short-term benefits (i) 19,155 19,914
Termination benefits 247 653
19,402 20,567
(i) Short-term benefits comprise of salaries, bonuses, attendance fees and other short-term benefits to Key Management Personnel.
NOTES TO THE CONSOLIDATED FINANCIAL STATEMENTS31 December 2018
NOTES TO THE CONSOLIDATED FINANCIAL STATEMENTS31 December 2018
Societe Generale de Banque au Liban SAL
Consolidated Financial Statements
The attached notes 1 to 52 form part of these consolidated financial statements. 104 | 105
46 FIDUCIARY ACCOUNTS
2018LL million
2017LL million
Deposits with banks 222,446 12,960
Loans and advances 4,795 10,703
Bonds 1,079,378 128,138
1,306,619 151,801
47 ASSETS HELD IN CUSTODY AND UNDER ADMINISTRATION
2018LL million
2017LL million
Deposits with banks 1,057,613 -
Lebanese treasury bills and Eurobonds 28,284 86,067
Bonds and other debt instruments 315,692 75,093
Equity instruments 1,129,248 298,567
Funds 204,131 27,217
2,734,968 486,944
48 CONTINGENT LIABILITIES, COMMITMENTS AND LEASING ARRANGEMENTS
Credit-related commitments and contingent liabilitiesTo meet the financial needs of customers, the Group enters into various commitments, guarantees and other contingent liabilities, which are mainly credit-related instruments including both financial and other guarantees and commitments to extend credit. Even though these obligations may not be recognized on the consolidated statement of financial position, they do contain credit risk and are therefore part of the overall risk of the Group.
The table below discloses the nominal principal amounts of credit-related commitments and contingent liabilities. Nominal principal amounts represent the amount at risk should the contracts be fully drawn upon and clients default. As a significant portion of guarantees and commitments is expected to expire without being withdrawn, the total of the nominal principal amount is not indicative of future liquidity requirements.
2018Banks
LL millionCustomers
LL millionTotal
LL million
Guarantee and contingent liabilities
Financial guarantees 95,669 263,509 359,178
Other guarantees 15,970 321,434 337,404
111,639 584,943 696,582
Commitments
Documentary credits 218,604 48,904 267,508
Undrawn credit lines - 1,279,163 1,279,163
218,604 1,328,067 1,546,671
2017Banks
LL millionCustomers
LL millionTotal
LL million
Guarantee and contingent liabilities
Financial guarantees 56,067 109,238 165,305
Other guarantees 10,172 307,811 317,983
66,239 417,049 483,288
Commitments
Documentary credits 270,934 11,358 282,292
Undrawn credit lines - 1,248,497 1,248,497
270,934 1,259,855 1,530,789
Guarantees Guarantees are given as security to support the performance of a customer to third parties. The main types of guarantees provided are: • Financial guarantees given to banks and financial institutions on behalf of customers to secure loans,
overdrafts, and other banking facilities; and• Other guarantees provided include mainly performance guarantees, advance payment guarantees,
tender guarantees, customs guarantees and retention guarantees.
Legal claimsLitigation is a common occurrence in the industries where the Group operates due to the nature of the businesses undertaken. The Group has formal controls and policies for managing legal claims. Once professional advice has been obtained and the amount of loss is reasonably estimated, the Group makes adjustments to account for any adverse effects which the claims may have on its financial standing. At year end, the Group had several unresolved legal claims. Based on advice from the legal counsel, management believes that legal claims not provided for will not result in any financial loss to the Group.
Capital commitmentsAt 31 December 2018, the Group had capital commitments in respect of premises and equipment purchases amounting to LL 91,577 million (2017: LL 75,122 million).
Operating lease commitments – Group as lesseeThe Group enters into commercial leases on premises. There are no restrictions placed upon the lessee by entering into these leases.
Future minimum lease payments under non-cancelable operating leases as at 31 December are as follow:
2018LL million
2017LL million
Within one year 7,886 9,948
After one year but not more than five years 28,004 27,222
More than five years 1,256 1,841
37,146 39,011
NOTES TO THE CONSOLIDATED FINANCIAL STATEMENTS31 December 2018
NOTES TO THE CONSOLIDATED FINANCIAL STATEMENTS31 December 2018
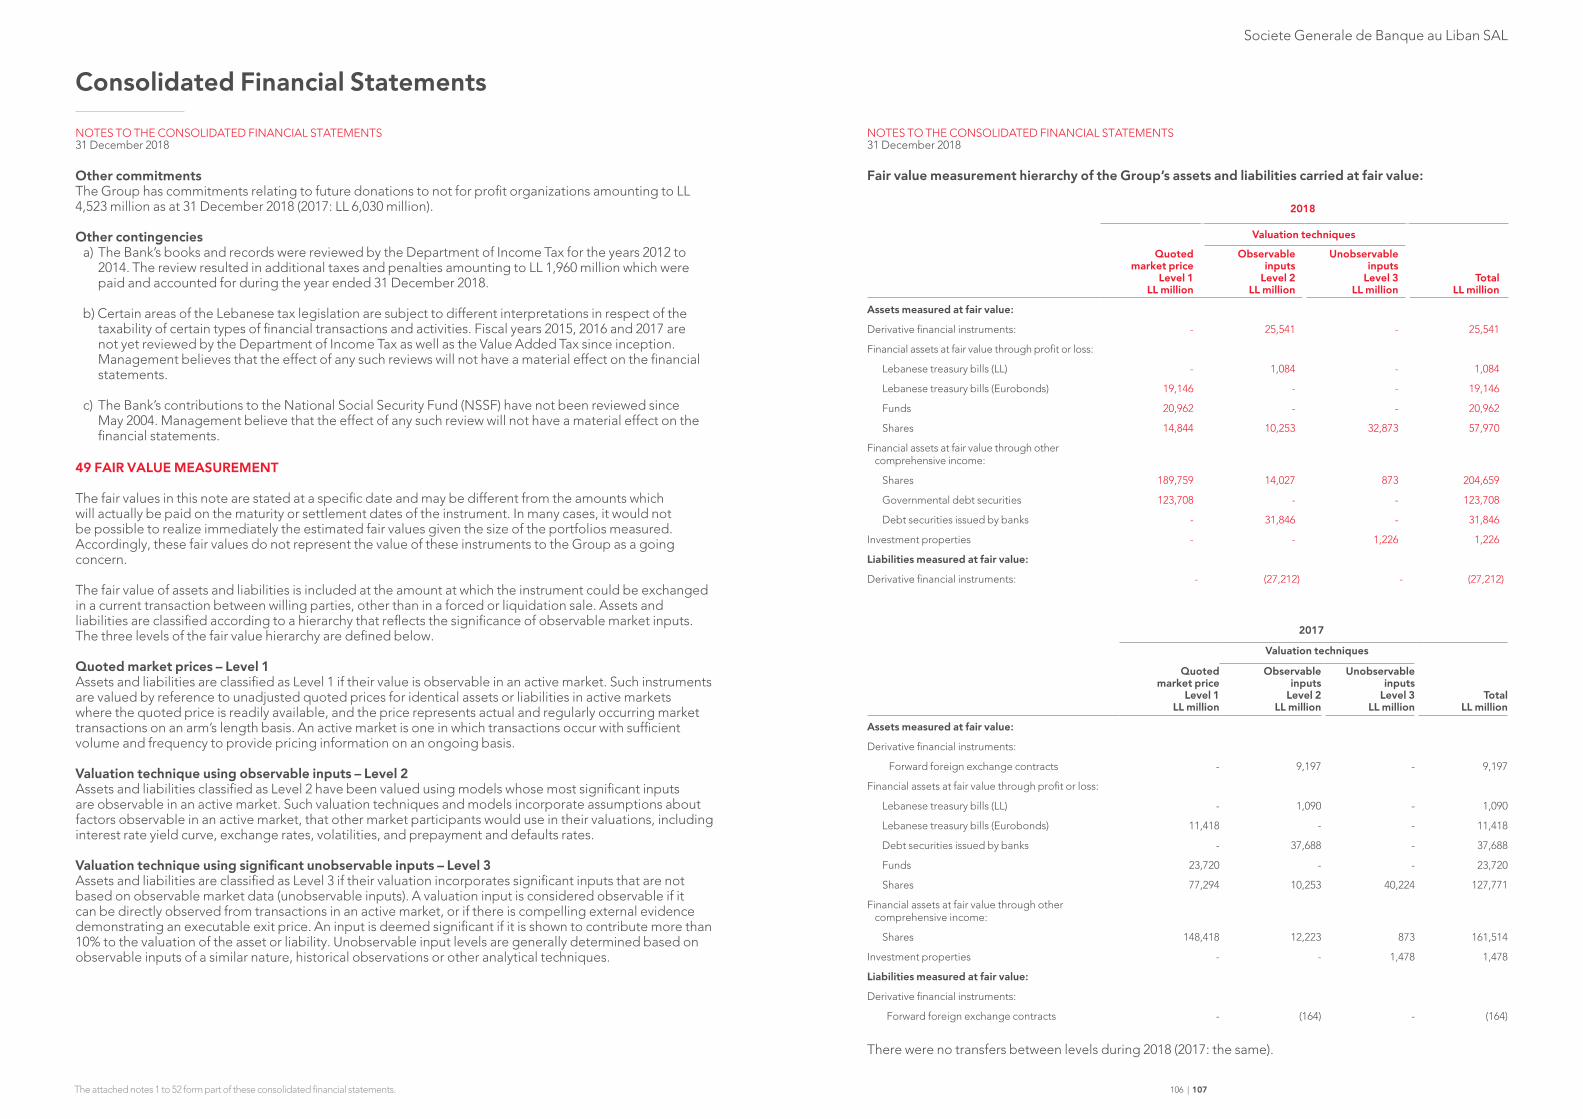
Societe Generale de Banque au Liban SAL
Consolidated Financial Statements
The attached notes 1 to 52 form part of these consolidated financial statements. 106 | 107
Other commitmentsThe Group has commitments relating to future donations to not for profit organizations amounting to LL 4,523 million as at 31 December 2018 (2017: LL 6,030 million).
Other contingencies a) The Bank’s books and records were reviewed by the Department of Income Tax for the years 2012 to
2014. The review resulted in additional taxes and penalties amounting to LL 1,960 million which were paid and accounted for during the year ended 31 December 2018.
b) Certain areas of the Lebanese tax legislation are subject to different interpretations in respect of the taxability of certain types of financial transactions and activities. Fiscal years 2015, 2016 and 2017 are not yet reviewed by the Department of Income Tax as well as the Value Added Tax since inception. Management believes that the effect of any such reviews will not have a material effect on the financial statements.
c) The Bank’s contributions to the National Social Security Fund (NSSF) have not been reviewed since May 2004. Management believe that the effect of any such review will not have a material effect on the financial statements.
49 FAIR VALUE MEASUREMENT
The fair values in this note are stated at a specific date and may be different from the amounts which will actually be paid on the maturity or settlement dates of the instrument. In many cases, it would not be possible to realize immediately the estimated fair values given the size of the portfolios measured. Accordingly, these fair values do not represent the value of these instruments to the Group as a going concern.
The fair value of assets and liabilities is included at the amount at which the instrument could be exchanged in a current transaction between willing parties, other than in a forced or liquidation sale. Assets and liabilities are classified according to a hierarchy that reflects the significance of observable market inputs. The three levels of the fair value hierarchy are defined below.
Quoted market prices – Level 1Assets and liabilities are classified as Level 1 if their value is observable in an active market. Such instruments are valued by reference to unadjusted quoted prices for identical assets or liabilities in active markets where the quoted price is readily available, and the price represents actual and regularly occurring market transactions on an arm’s length basis. An active market is one in which transactions occur with sufficient volume and frequency to provide pricing information on an ongoing basis.
Valuation technique using observable inputs – Level 2Assets and liabilities classified as Level 2 have been valued using models whose most significant inputs are observable in an active market. Such valuation techniques and models incorporate assumptions about factors observable in an active market, that other market participants would use in their valuations, including interest rate yield curve, exchange rates, volatilities, and prepayment and defaults rates.
Valuation technique using significant unobservable inputs – Level 3Assets and liabilities are classified as Level 3 if their valuation incorporates significant inputs that are not based on observable market data (unobservable inputs). A valuation input is considered observable if it can be directly observed from transactions in an active market, or if there is compelling external evidence demonstrating an executable exit price. An input is deemed significant if it is shown to contribute more than 10% to the valuation of the asset or liability. Unobservable input levels are generally determined based on observable inputs of a similar nature, historical observations or other analytical techniques.
Fair value measurement hierarchy of the Group’s assets and liabilities carried at fair value:
2018
Valuation techniques
Quoted market price
Level 1 LL million
Observable inputs
Level 2 LL million
Unobservable inputs
Level 3 LL million
Total LL million
Assets measured at fair value:
Derivative financial instruments: - 25,541 - 25,541
Financial assets at fair value through profit or loss:
Lebanese treasury bills (LL) - 1,084 - 1,084
Lebanese treasury bills (Eurobonds) 19,146 - - 19,146
Funds 20,962 - - 20,962
Shares 14,844 10,253 32,873 57,970
Financial assets at fair value through other comprehensive income:
Shares 189,759 14,027 873 204,659
Governmental debt securities 123,708 - - 123,708
Debt securities issued by banks - 31,846 - 31,846
Investment properties - - 1,226 1,226
Liabilities measured at fair value:
Derivative financial instruments: - (27,212) - (27,212)
2017
Valuation techniques
Quoted market price
Level 1 LL million
Observable inputs
Level 2 LL million
Unobservable inputs
Level 3 LL million
Total LL million
Assets measured at fair value:
Derivative financial instruments:
Forward foreign exchange contracts - 9,197 - 9,197
Financial assets at fair value through profit or loss:
Lebanese treasury bills (LL) - 1,090 - 1,090
Lebanese treasury bills (Eurobonds) 11,418 - - 11,418
Debt securities issued by banks - 37,688 - 37,688
Funds 23,720 - - 23,720
Shares 77,294 10,253 40,224 127,771
Financial assets at fair value through other comprehensive income:
Shares 148,418 12,223 873 161,514
Investment properties - - 1,478 1,478
Liabilities measured at fair value:
Derivative financial instruments:
Forward foreign exchange contracts - (164) - (164)
There were no transfers between levels during 2018 (2017: the same).
NOTES TO THE CONSOLIDATED FINANCIAL STATEMENTS31 December 2018
NOTES TO THE CONSOLIDATED FINANCIAL STATEMENTS31 December 2018
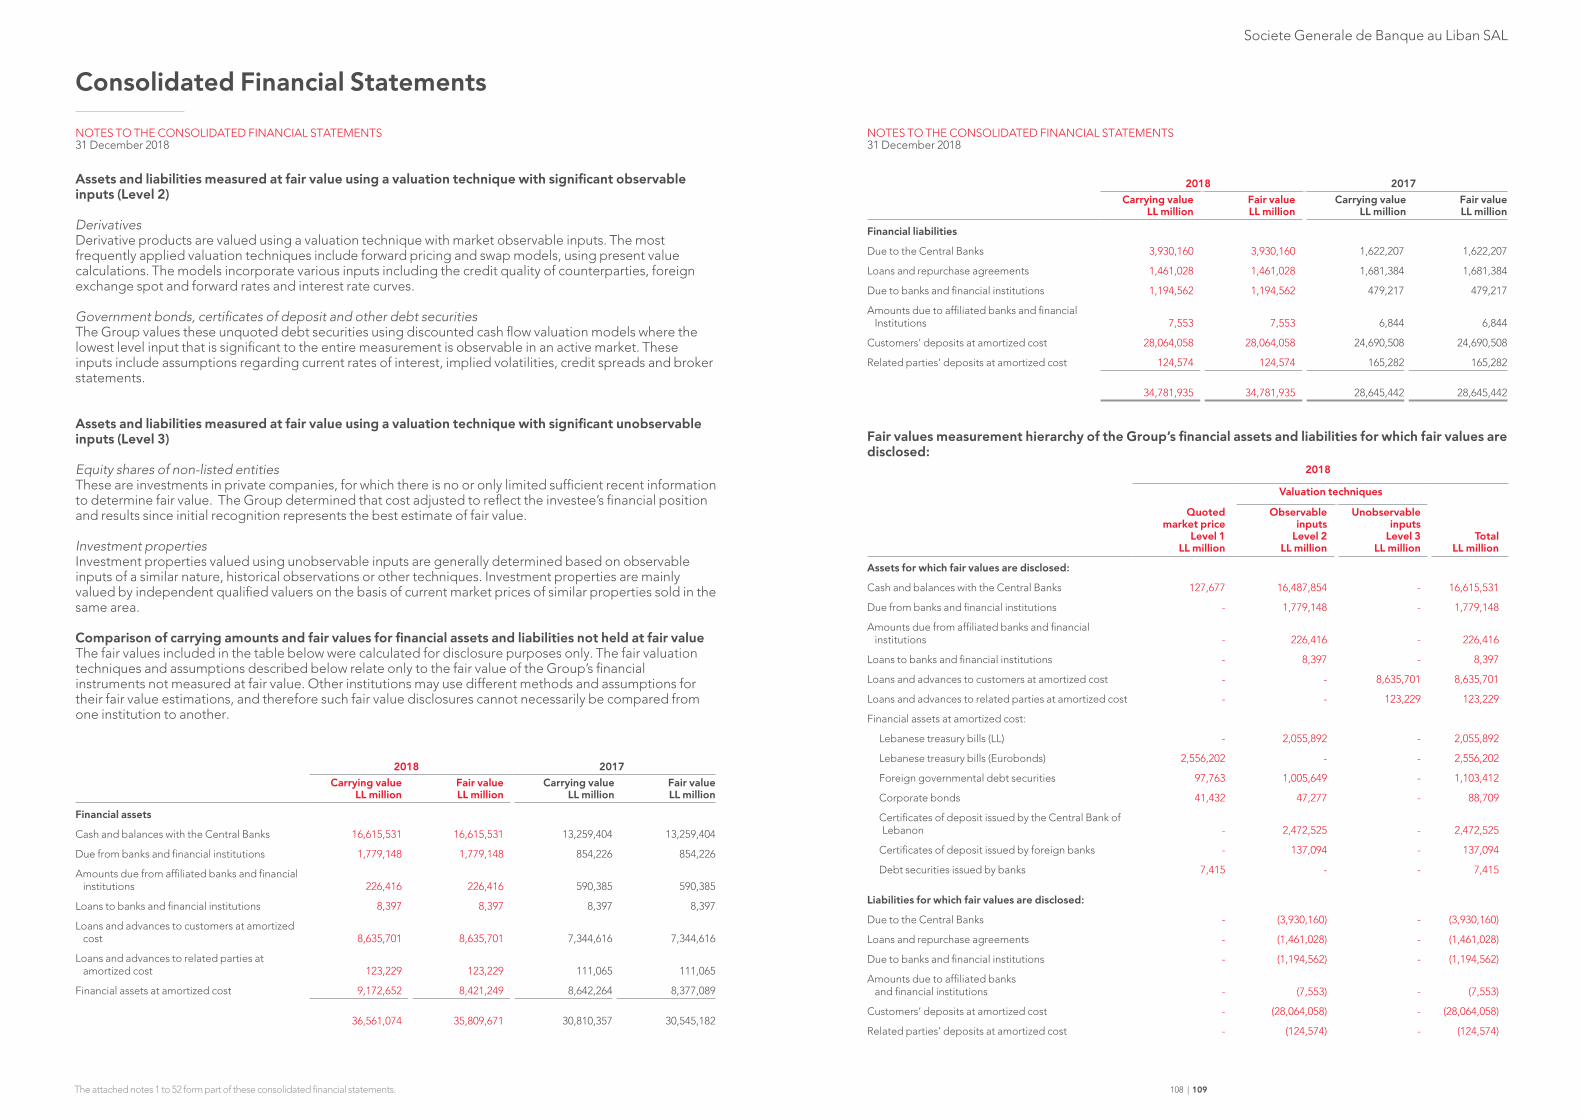
Societe Generale de Banque au Liban SAL
Consolidated Financial Statements
The attached notes 1 to 52 form part of these consolidated financial statements. 108 | 109
Assets and liabilities measured at fair value using a valuation technique with significant observable inputs (Level 2)
DerivativesDerivative products are valued using a valuation technique with market observable inputs. The most frequently applied valuation techniques include forward pricing and swap models, using present value calculations. The models incorporate various inputs including the credit quality of counterparties, foreign exchange spot and forward rates and interest rate curves.
Government bonds, certificates of deposit and other debt securitiesThe Group values these unquoted debt securities using discounted cash flow valuation models where the lowest level input that is significant to the entire measurement is observable in an active market. These inputs include assumptions regarding current rates of interest, implied volatilities, credit spreads and broker statements.
Assets and liabilities measured at fair value using a valuation technique with significant unobservable inputs (Level 3)
Equity shares of non-listed entitiesThese are investments in private companies, for which there is no or only limited sufficient recent information to determine fair value. The Group determined that cost adjusted to reflect the investee’s financial position and results since initial recognition represents the best estimate of fair value.
Investment propertiesInvestment properties valued using unobservable inputs are generally determined based on observable inputs of a similar nature, historical observations or other techniques. Investment properties are mainly valued by independent qualified valuers on the basis of current market prices of similar properties sold in the same area. Comparison of carrying amounts and fair values for financial assets and liabilities not held at fair valueThe fair values included in the table below were calculated for disclosure purposes only. The fair valuation techniques and assumptions described below relate only to the fair value of the Group’s financial instruments not measured at fair value. Other institutions may use different methods and assumptions for their fair value estimations, and therefore such fair value disclosures cannot necessarily be compared from one institution to another.
2018 2017Carrying value
LL millionFair value LL million
Carrying value LL million
Fair value LL million
Financial assets
Cash and balances with the Central Banks 16,615,531 16,615,531 13,259,404 13,259,404
Due from banks and financial institutions 1,779,148 1,779,148 854,226 854,226
Amounts due from affiliated banks and financial institutions 226,416 226,416 590,385 590,385
Loans to banks and financial institutions 8,397 8,397 8,397 8,397
Loans and advances to customers at amortized cost 8,635,701 8,635,701 7,344,616 7,344,616
Loans and advances to related parties at amortized cost 123,229 123,229 111,065 111,065
Financial assets at amortized cost 9,172,652 8,421,249 8,642,264 8,377,089
36,561,074 35,809,671 30,810,357 30,545,182
2018 2017Carrying value
LL millionFair value LL million
Carrying value LL million
Fair value LL million
Financial liabilities
Due to the Central Banks 3,930,160 3,930,160 1,622,207 1,622,207
Loans and repurchase agreements 1,461,028 1,461,028 1,681,384 1,681,384
Due to banks and financial institutions 1,194,562 1,194,562 479,217 479,217
Amounts due to affiliated banks and financial Institutions 7,553 7,553 6,844 6,844
Customers’ deposits at amortized cost 28,064,058 28,064,058 24,690,508 24,690,508
Related parties’ deposits at amortized cost 124,574 124,574 165,282 165,282
34,781,935 34,781,935 28,645,442 28,645,442
Fair values measurement hierarchy of the Group’s financial assets and liabilities for which fair values are disclosed:
2018
Valuation techniques
Quoted market price
Level 1 LL million
Observable inputs
Level 2 LL million
Unobservable inputs
Level 3 LL million
Total LL million
Assets for which fair values are disclosed:
Cash and balances with the Central Banks 127,677 16,487,854 - 16,615,531
Due from banks and financial institutions - 1,779,148 - 1,779,148
Amounts due from affiliated banks and financial institutions - 226,416 - 226,416
Loans to banks and financial institutions - 8,397 - 8,397
Loans and advances to customers at amortized cost - - 8,635,701 8,635,701
Loans and advances to related parties at amortized cost - - 123,229 123,229
Financial assets at amortized cost:
Lebanese treasury bills (LL) - 2,055,892 - 2,055,892
Lebanese treasury bills (Eurobonds) 2,556,202 - - 2,556,202
Foreign governmental debt securities 97,763 1,005,649 - 1,103,412
Corporate bonds 41,432 47,277 - 88,709
Certificates of deposit issued by the Central Bank of Lebanon - 2,472,525 - 2,472,525
Certificates of deposit issued by foreign banks - 137,094 - 137,094
Debt securities issued by banks 7,415 - - 7,415
Liabilities for which fair values are disclosed:
Due to the Central Banks - (3,930,160) - (3,930,160)
Loans and repurchase agreements - (1,461,028) - (1,461,028)
Due to banks and financial institutions - (1,194,562) - (1,194,562)
Amounts due to affiliated banks and financial institutions - (7,553) - (7,553)
Customers’ deposits at amortized cost - (28,064,058) - (28,064,058)
Related parties’ deposits at amortized cost - (124,574) - (124,574)
NOTES TO THE CONSOLIDATED FINANCIAL STATEMENTS31 December 2018
NOTES TO THE CONSOLIDATED FINANCIAL STATEMENTS31 December 2018

Societe Generale de Banque au Liban SAL
Consolidated Financial Statements
The attached notes 1 to 52 form part of these consolidated financial statements. 110 | 111
2017
Valuation techniquesQuoted
market price Level 1
LL million
Observable inputs
Level 2 LL million
Unobservable inputs
Level 3 LL million
Total LL million
Assets for which fair values are disclosed:
Cash and balances with the Central Banks 121,535 13,137,869 - 13,259,404
Due from banks and financial institutions - 854,226 - 854,226
Amounts due from affiliated banks and financial institutions - 590,385 - 590,385
Loans to banks and financial institutions - 8,397 - 8,397
Loans and advances to customers at amortized cost - - 7,344,616 7,344,616
Loans and advances to related parties at amortized cost - - 111,065 111,065
Financial assets at amortized cost: Lebanese treasury bills (LL) - 1,581,040 - 1,581,040 Lebanese treasury bills (Eurobonds) 2,198,117 - - 2,198,117 Foreign governmental debt securities 26,249 964,863 - 991,112 Corporate bonds 42,895 20,775 - 63,670 Certificates of deposit issued by the Central Bank of Lebanon - 3,481,970 - 3,481,970 Certificates of deposit issued by foreign banks - 52,126 - 52,126 Debt securities issued by banks 9,054 - - 9,054
Liabilities for which fair values are disclosed:
Due to the Central Banks - (1,597,408) - (1,597,408)Loans and repurchase agreements - (1,681,384) - (1,681,384)Due to banks and financial institutions - (479,217) - (479,217)Amounts due to affiliated banks and financial
institutions - (6,844) - (6,844)Customers’ deposits at amortized cost - (24,690,508) - (24,690,508)Related parties’ deposits at amortized cost - (165,282) - (165,282)
Assets and liabilities for which fair value is disclosed using a valuation technique with significant observable inputs (Level 2) and / or significant unobservable inputs (Level 3)
Deposits with banks and loans and advances to banksFor the purpose of this disclosure there is minimal difference between fair value and carrying amount of these financial assets as they are short-term in nature or have interest rates that re-price frequently. The fair value of deposits with longer maturities are estimated using discounted cash flows applying market rates for counterparties with similar credit quality.
Government bonds, certificates of deposits and other debt securitiesThe Bank values these unquoted debt securities using discounted cash flow valuation models where the lowest level input that is significant to the entire measurement is observable in an active market. These inputs include assumptions regarding current rates of interest, implied volatilities, credit spreads and broker statements.
Loans and advances to banks and customersFor the purpose of this disclosure, fair value of loans and advances is estimated using discounted cash flows by applying current rates for new loans granted during the year with similar remaining maturities and to counterparties with similar credit quality.
Deposits from banks and customersIn many cases, the fair value disclosed approximates carrying value because these financial liabilities are short-term in nature or have interest rates that re-price frequently. The fair value for deposits with long-term maturities, such as time deposits, are estimated using discounted cash flows, applying either market rates or current rates for deposits of similar remaining maturities.
50 MATURITY ANALYSIS OF ASSETS AND LIABILITIES
The table below shows an analysis of assets and liabilities analyzed according to when they are expected to be recovered or settled.
At 31 December 2018 Less than one year
LL million
More than one year
LL millionTotal
LL million
ASSETS
Cash and balances with the Central Banks 2,923,347 13,692,184 16,615,531
Due from banks and financial institutions 1,727,230 51,918 1,779,148
Amounts due from affiliated banks and financial institutions 226,416 - 226,416
Loans to banks and financial institutions - 8,397 8,397
Derivative financial instruments 25,541 - 25,541
Financial assets at fair value through profit or loss 77,981 21,181 99,162
Loans and advances to customers at amortized cost 3,793,687 4,842,014 8,635,701
Loans and advances to related parties at amortized cost 68,838 54,391 123,229
Debtors by acceptances 746,213 96,999 843,212
Financial assets at amortized cost 1,537,548 7,635,104 9,172,652
Financial assets at fair value through other comprehensive income 175,559 184,654 360,213
Property and equipment 101,950 435,474 537,424
Intangible assets 12,866 49,075 61,941
Investment properties - 1,226 1,226
Non-current assets held for sale 193,783 9,297 203,080
Other assets 130,386 26,911 157,297
Other intangible assets and goodwill arising on acquisition - 37,029 37,029
Goodwill - 3,405 3,405
TOTAL ASSETS 11,741,345 27,149,259 38,890,604
LIABILITIES
Due to the Central Banks 171,670 3,758,490 3,930,160
Loans and repurchase agreements 360,495 1,100,533 1,461,028
Due to banks and financial institutions 670,481 524,081 1,194,562
Amounts due to affiliated banks and financial institutions 7,164 389 7,553
Derivative financial instruments 27,212 - 27,212
Customers’ deposits at amortized cost 26,191,399 1,872,659 28,064,058
Related parties’ deposits at amortized cost 124,574 - 124,574
Engagements by acceptances 752,561 96,999 849,560
Other liabilities 169,695 91,927 261,622
NOTES TO THE CONSOLIDATED FINANCIAL STATEMENTS31 December 2018
NOTES TO THE CONSOLIDATED FINANCIAL STATEMENTS31 December 2018

Societe Generale de Banque au Liban SAL
Consolidated Financial Statements
The attached notes 1 to 52 form part of these consolidated financial statements. 112 | 113
Provision for risks and charges 36,900 40,149 77,049
TOTAL LIABILITIES 28,512,151 7,485,227 35,997,378
NET (16,770,806) 19,664,032 2,893,226
At 31 December 2017 Less than one year
LL million
More than one year
LL millionTotal
LL million
ASSETS
Cash and balances with the Central Banks 1,463,770 11,795,634 13,259,404
Due from banks and financial institutions 828,784 25,442 854,226
Amounts due from affiliated banks and financial institutions 590,385 - 590,385
Loans to banks and financial institutions - 8,397 8,397
Derivative financial instruments 9,197 - 9,197
Financial assets at fair value through profit or loss 177,965 23,722 201,687
Loans and advances to customers at amortized cost 4,173,844 3,170,772 7,344,616
Loans and advances to related parties at amortized cost 94,171 16,894 111,065
Debtors by acceptances 348,376 96,999 445,375
Financial assets at amortized cost 318,390 8,323,874 8,642,264
Financial assets at fair value through other comprehensive income 1,109 160,405 161,514
Property and equipment 11,955 473,375 485,330
Intangible assets 3,434 44,585 48,019
Investment properties - 1,478 1,478
Non-current assets held for sale 177,521 8,983 186,504
Other assets 129,388 4,696 134,084
Goodwill - 3,405 3,405
TOTAL ASSETS 8,328,289 24,158,661 32,486,950
LIABILITIES
Due to the Central Banks 31,604 1,590,603 1,622,207
Loans and repurchase agreements 450,974 1,230,410 1,681,384
Due to banks and financial institutions 434,985 44,232 479,217
Amounts due to affiliated banks and financial institutions 6,844 - 6,844
Derivative financial instruments 164 - 164
Customers’ deposits at amortized cost 23,029,860 1,660,648 24,690,508
Related parties’ deposits at amortized cost 165,282 - 165,282
Engagements by acceptances 348,376 96,999 445,375
Other liabilities 182,520 184,856 367,376
Provision for risks and charges 25,931 222,989 248,920
TOTAL LIABILITIES 24,676,540 5,030,737 29,707,277
NET (16,348,251) 19,127,924 2,779,673
51 RISK MANAGEMENT
The Group devotes significant resources to the ongoing adaptation of its risk management framework, in order to keep pace with the increasing diversification of its activities. Risk management is implemented in compliance with the two following fundamental principles:• risk assessment departments are completely independent from the operating divisions• a consistent approach to risk assessment and monitoring is applied at the Group level
a) Risk management structureThe Board of Directors is ultimately responsible for identifying and controlling risks; however, there are separate independent bodies responsible for managing and monitoring risks.
Board of DirectorsThe Board of Directors is responsible for the overall risk management approach and for approving risk strategies and principles.
Risk ManagementThe Risk Management Unit is responsible for implementing and maintaining risk related procedures to ensure an independent control process.
Group TreasuryGroup Treasury is responsible for managing the Group’s assets and liabilities and the overall financial structure. It is also primarily responsible for the funding and liquidity risks of the Group.
Internal AuditRisk management processes throughout the Group are audited annually by the internal audit function, that examines both the adequacy of the procedures and the Group’s compliance with the procedures. Internal Audit discusses the results of all assessments with management, and reports its findings and recommendations to the Board of Directors.
b) Risk measurement and reporting systemsThe Group is using a RAROC (Risk-Adjusted Return on Capital) approach to quantify its credit risk. One of the main objectives is to establish, using quantitative methods, the level of loss expected on credit transactions over the course of the business cycle.
Monitoring and controlling risks is primarily performed based on limits established by the Group. These limits reflect the business strategy and market environment of the Group as well as the level of risk that the Group is willing to accept, with additional emphasis on selected industries. In addition, the Group monitors and measures the overall risk-bearing capacity in relation to the aggregate risk exposure across all risk types and activities.
c) Risk mitigationAs part of its overall risk management, the Group uses derivatives and other instruments to manage exposures resulting from changes in interest rates, foreign currencies, credit risks, and exposures arising from forecast transactions.
The Group actively uses collateral to reduce its credit risks.
d) Excessive concentrationThe Group also attempts to control credit risk by regular monitoring of its credit exposures and continuous assessment of the creditworthiness of counterparties by the credit risk committee.
51.1 CREDIT RISK
Credit risk is the risk that the Group will incur a loss because its customers or counterparties fail to discharge their contractual obligations. The Group manages and controls credit risk by setting limits on the amount of risk it is willing to accept for individual counterparties and for geographical and industry concentrations, and by monitoring exposures in relation to such limits.
NOTES TO THE CONSOLIDATED FINANCIAL STATEMENTS31 December 2018
NOTES TO THE CONSOLIDATED FINANCIAL STATEMENTS31 December 2018

Societe Generale de Banque au Liban SAL
Consolidated Financial Statements
The attached notes 1 to 52 form part of these consolidated financial statements. 114 | 115
The Group has established a credit quality review process to provide early identification of possible changes in the creditworthiness of counterparties, including regular collateral revisions. Counterparty limits are established by the use of a credit risk classification system, which assigns each counterparty a risk rating. Risk ratings are subject to regular revision. The credit quality review process aims to allow the Group to assess the potential loss as a result of the risks to which it is exposed and take corrective actions. Derivative financial instrumentsCredit risk arising from derivative financial instruments is, at any time, limited to those with positive fair values, as recorded on the consolidated statement of financial position. In the case of credit derivatives, the Group is also exposed to or protected from the risk of default of the underlying entity referenced by the derivative.
With gross-settled derivatives, the Group is also exposed to a settlement risk, being the risk that the Group honors its obligation but the counterparty fails to deliver the counter-value.
Credit-related commitments riskThe Group makes available to its customers guarantees which may require that the Group makes payments on their behalf and enters into commitments to extend credit lines to secure their liquidity needs. Letters of credit and guarantees (including standby letters of credit) commit the Group to make payments on behalf of customers in the event of a specific act, generally related to the import or export of goods. Such commitments expose the Group to similar risks as loans and are mitigated by the same control processes and policies.
Impairment assessmentThe references below show where the Group’s impairment assessment and measurement approach is set out in this report. It should be read in conjunction with the Summary of significant accounting policies.
Definition of default and cureThe Group considers a financial instrument defaulted and therefore Stage 3 (credit-impaired) for ECL calculations when:- The borrower is unlikely to pay its credit obligations to the Group in full, without recourse by the Group
to actions such as realising security (if any is held);- The borrower is more than 90 days past due on any material credit obligation to the Group; or- It is becoming probable that the borrower will restructure the asset as a result of bankruptcy due to the
borrower’s inability to pay its credit obligations.
Inputs into the assessment of whether a financial instrument is in default and their significance may vary over time to reflect changes in circumstances.
As a part of a qualitative assessment of whether a customer is in default, the Group carefully considers whether the events listed above should result in classifying the exposures as Stage 3 for ECL calculations or whether Stage 2 is appropriate.
It is the Group’s policy to consider a financial instrument as ‘cured’ and therefore re-classified out of Stage 3 when none of the default criteria have been present for a specific period of time. The decision whether to classify an asset as Stage 2 or Stage 1 once cured is dependent on the absence of SICR criteria compared to initial recognition and is examined on a case by case basis. Once SICR factors are no longer met, a probation period equivalent to three consecutive installments will be applied before moving an account from Stage 2 to Stage 1. If the facility experienced SICR due to a restructuring, it must remain a minimum period equivalent to six successive consecutive monthly installments (or four consecutive quarterly installments) as Stage 2 from the date of restructuring.
The Bank’s internal rating and PD estimation process
Treasury, trading and interbank relationships For non-loan exposures, external credit ratings are used and mapped to the corresponding PDs reported by credit rating agencies. These are continuously monitored and updated.
Non-Retail Loans:The Risk function, which is independent from business lines, is responsible for the development of internal rating models, and for the estimation of Probability of Default (PD). The Group uses an internal rating scale comprised of 7 performing grades and 4 non-performing grades. The grades generated by internal rating models are mapped to PDs using historical default observations. The mapping of rating to PD, which is done initially on a through-the-cycle basis is then adjusted to a point-in-time basis in line with IFRS 9 requirements.
These internal rating models for the Group’s key lending portfolios incorporate both qualitative and quantitative criteria such as:
• Historical and projected financial information including debt service coverage, operations, liquidity and capital structure;
• Account behaviour, payment history in the Group and outside and non-financial information such as management quality, company standing and industry risk;
• Any publicly available information related to the clients from external parties. This includes external rating grades issued by rating agencies, independent analyst reports and other market disclosures;
• Any other objectively supportable information on the obligor’s willingness and capacity of repayment.
Internal ratings are initially assigned by the credit origination functions and are approved and validated by the Credit Risk function, which are independent from business lines. Credit Risk function is responsible for ensuring that ratings assigned to obligors are accurate and updated at all times.
Retail lending Consumer lending comprises unsecured personal loans, credit cards and overdrafts. These products along with retail mortgages and some of the less complex small business lending are rated by an automated scorecard tool primarily driven by days past due. Other key inputs into the models are:• Consumer lending products: use of limits and volatility thereof, GDP growth, unemployment rates,
changes in personal income/salary levels based on records of current accounts, personal indebtedness and expected interest repricing
• Retail mortgages: GDP growth, unemployment rates, changes in personal income/salary levels based on records of current accounts, personal indebtedness and expected interest repricing
Exposure at defaultEAD represents the expected exposure in the event of a default. The Group derives the EAD from the current exposure to the counterparty and potential changes to the current amount allowed under the contract and arising from amortisation. The EAD of a financial asset is its gross carrying amount at the time of default. For lending commitments, the EADs are potential future amounts that may be drawn under the contract. For financial guarantees, the EAD represents the amount of the guaranteed exposure when the financial guarantee becomes payable. Loss given defaultLGD is the magnitude of the likely loss if there is a default. The Group estimates LGD based on the history of recovery rates of claims against defaulted counterparties. It is estimated based on the counterparty, the collateral type and coverage, recovery costs of any collateral that is integral to the financial asset and other criteria. For portfolios in respect of which the Group has limited historical data, external benchmark information is used to supplement the internally available data.
Significant increase in credit riskThe Group continuously monitors all its credit risk exposures. In order to determine whether an instrument or a portfolio of instruments is subject to 12 months ECL or Lifetime ECL, the Group assesses whether there has been a significant increase in credit risk since initial recognition, considering reasonable and supportable information that is relevant and available without undue cost or effort. This includes both quantitative and qualitative information and analysis, based on the Group’s historical experience and expert credit assessment including forward-looking information. The Group’s assessment of significant increase in credit risk is being performed at least quarterly based on the following:
NOTES TO THE CONSOLIDATED FINANCIAL STATEMENTS31 December 2018
NOTES TO THE CONSOLIDATED FINANCIAL STATEMENTS31 December 2018

Societe Generale de Banque au Liban SAL
Consolidated Financial Statements
The attached notes 1 to 52 form part of these consolidated financial statements. 116 | 117
Non-retailMigration of obligor risk rating by a certain number of notches from origination to reporting date a key indicator of the change in the risk of default at origination with the risk of default at reporting date
RetailThresholds have been based on historical default rates and historical payment behaviour to determine significant increase in credit risk.
Qualitative criteriaFor non-retail loans, the Group also considers in its assessment of significant increase in credit risk, various qualitative factors like significant adverse changes in business, extension of terms granted, breach of certain debt covenants, actual and expected forbearance or restructuring, early signs of cash flows and liquidity problems, classification of a loan under the “Follow-up and regularization” supervisory classification. For retail loans, the Group considers specific events that might be indicative of a significant increase in credit risk such as the event of restructuting.
Backstop A backstop is applied and the financial instrument considered to have experienced a significant increase in credit risk if the instruments is more than 30 days past due on its contractual payments. Movements between Stage 2 and Stage 3 are based on whether financial assets are credit-impaired at the reporting date.
Expected LifeWith the exception of credit cards and other revolving facilities the maximum period for which the credit losses are determined is the contractual life of a financial instrument unless the Group has the legal right to call it earlier. With respect to credit cards and other revolving facilities, the Group does not limit its exposure to credit losses to the contractual notice period, but, instead calculates ECL over a period that reflects the Group’s expectations of the customer behaviour, its likelihood of default and the Group’s future risk mitigation procedures, which could include reducing or cancelling the facilities.
Forward Looking InformationThe Group incorporates forward-looking information into both the assessment of whether the credit risk of an instrument has increased significantly since its initial recognition and the measurement of ECL.
The Group formulates three economic scenarios: a baseline, which is the median scenario assigned with a certain probability of occurring, and two less likely scenarios, one optimistic and one pessimistic, each assigned a specific probability of occurring. The baseline scenario is aligned with information used by the Group for other purposes such as strategic planning and budgeting. The Group relies on economists within its Research Department for the forecast of these three scenarios including the weight attributable to each scenario. The scenario weighting are determined by an expert credit judgment. Scenario design and probability weights are updated at least annually (if required).
The Group has identified the GDP growth and inflation rate as the key driver of ECL, among other, and using an analysis of historical data, has estimated relationships between macro-economic variables and credit losses. The ECL estimates have been assessed for sensitivity to changes to forecasts of the macro-variable and also together with changes to the weights assigned to the scenarios. The impact on ECL is not material.
Overview of modified and forborne loans
From 1 January 2018The contractual terms of a loan may be modified for a number of reasons, including changing market conditions, customer retention and other factors not related to a current or potential credit deterioration of the customer. An existing loan whose terms have been modified may be derecognised and the renegotiated loan recognised as a new loan at fair value in accordance with the accounting policy set out in.the Summary of significant accounting policies above.
When modification results in derecognition, a new loan is recognised and allocated to Stage 1 (assuming it is not credit-impaired at that time).
NOTES TO THE CONSOLIDATED FINANCIAL STATEMENTS31 December 2018
NOTES TO THE CONSOLIDATED FINANCIAL STATEMENTS31 December 2018
The Group renegotiates loans to customers in financial difficulties (referred to as ‘forbearance activities’a) to maximise collection opportunities and minimise the risk of default. Under the Group’s forbearance policy, loan forbearance is granted on a selective basis if the debtor is currently in default on its debt or if there is a high risk of default, there is evidence that the debtor made all reasonable efforts to pay under the original contractual terms and the debtor is expected to be able to meet the revised terms. The revised terms usually include extending the maturity, changing the timing of interest payments and amending the terms of loan covenants. Both retail and corporate loans are subject to the forbearance policy. Generally, forbearance is a qualitative indicator of a significant increase in credit risk.
The table below includes Stage 2 and 3 assets that were modified and, therefore, treated as forborne during the period:
2018LL million
Amortised cost of financial assets modified during the period 99,022
There are no previously modified financial assets for which loss allowance has changed to 12mECL measurement as at 31 December 2018. There are no previously modified financial assets for which loss allowance had changed to 12mECL measurement and reverted to LTECL as at 31 December 2018.
Before 1 January 2018Restructuring activity aims to manage customer relationships, maximize collection opportunities and, if possible, avoid foreclosure or repossession. Such activities include extended payment arrangements, deferring foreclosure, modification, loan rewrites and/or deferral of payments pending a change in circumstances.
Restructuring policies and practices are based on indicators or criteria which, in the judgment of local management, indicate that repayment will probably continue. The application of these policies varies according to the nature of the market and the type of the facility.
2017LL million
Corporate loans 49,896
Retail loans 14,322
64,218
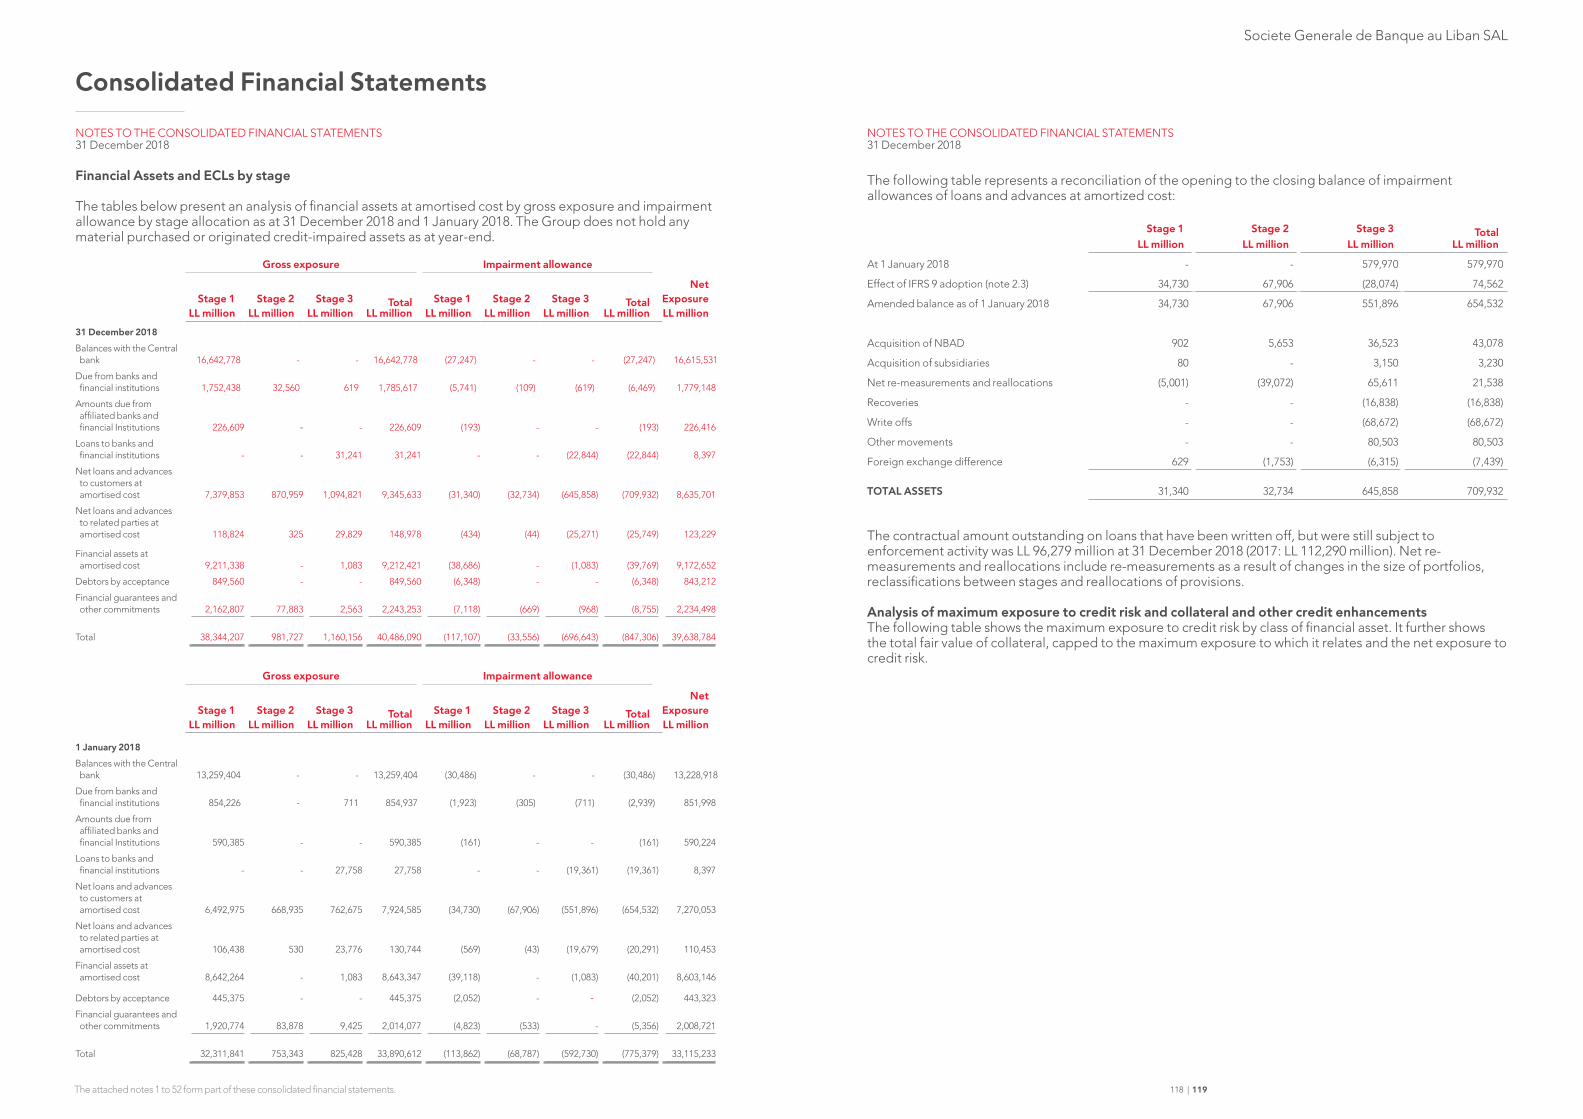
Societe Generale de Banque au Liban SAL
Consolidated Financial Statements
The attached notes 1 to 52 form part of these consolidated financial statements. 118 | 119
Financial Assets and ECLs by stage
The tables below present an analysis of financial assets at amortised cost by gross exposure and impairment allowance by stage allocation as at 31 December 2018 and 1 January 2018. The Group does not hold any material purchased or originated credit-impaired assets as at year-end.
Gross exposure Impairment allowance
Stage 1LL million
Stage 2LL million
Stage 3LL million
Total LL million
Stage 1LL million
Stage 2LL million
Stage 3LL million
Total LL million
NetExposureLL million
31 December 2018
Balances with the Central bank 16,642,778 - - 16,642,778 (27,247) - - (27,247) 16,615,531
Due from banks and financial institutions 1,752,438 32,560 619 1,785,617 (5,741) (109) (619) (6,469) 1,779,148
Amounts due from affiliated banks and financial Institutions 226,609 - - 226,609 (193) - - (193) 226,416
Loans to banks and financial institutions - - 31,241 31,241 - - (22,844) (22,844) 8,397
Net loans and advances to customers at amortised cost 7,379,853 870,959 1,094,821 9,345,633 (31,340) (32,734) (645,858) (709,932) 8,635,701
Net loans and advances to related parties at amortised cost 118,824 325 29,829 148,978 (434) (44) (25,271) (25,749) 123,229
Financial assets at amortised cost 9,211,338 - 1,083 9,212,421 (38,686) - (1,083) (39,769) 9,172,652
Debtors by acceptance 849,560 - - 849,560 (6,348) - - (6,348) 843,212Financial guarantees and
other commitments 2,162,807 77,883 2,563 2,243,253 (7,118) (669) (968) (8,755) 2,234,498
Total 38,344,207 981,727 1,160,156 40,486,090 (117,107) (33,556) (696,643) (847,306) 39,638,784
Gross exposure Impairment allowance
Stage 1LL million
Stage 2LL million
Stage 3LL million
Total LL million
Stage 1LL million
Stage 2LL million
Stage 3LL million
Total LL million
NetExposureLL million
1 January 2018
Balances with the Central bank 13,259,404 - - 13,259,404 (30,486) - - (30,486) 13,228,918
Due from banks and financial institutions 854,226 - 711 854,937 (1,923) (305) (711) (2,939) 851,998
Amounts due from affiliated banks and financial Institutions 590,385 - - 590,385 (161) - - (161) 590,224
Loans to banks and financial institutions - - 27,758 27,758 - - (19,361) (19,361) 8,397
Net loans and advances to customers at amortised cost 6,492,975 668,935 762,675 7,924,585 (34,730) (67,906) (551,896) (654,532) 7,270,053
Net loans and advances to related parties at amortised cost 106,438 530 23,776 130,744 (569) (43) (19,679) (20,291) 110,453
Financial assets at amortised cost 8,642,264 - 1,083 8,643,347 (39,118) - (1,083) (40,201) 8,603,146
Debtors by acceptance 445,375 - - 445,375 (2,052) - - (2,052) 443,323Financial guarantees and
other commitments 1,920,774 83,878 9,425 2,014,077 (4,823) (533) - (5,356) 2,008,721
Total 32,311,841 753,343 825,428 33,890,612 (113,862) (68,787) (592,730) (775,379) 33,115,233
The following table represents a reconciliation of the opening to the closing balance of impairment allowances of loans and advances at amortized cost:
Stage 1LL million
Stage 2LL million
Stage 3LL million
Total LL million
At 1 January 2018 - - 579,970 579,970
Effect of IFRS 9 adoption (note 2.3) 34,730 67,906 (28,074) 74,562
Amended balance as of 1 January 2018 34,730 67,906 551,896 654,532
Acquisition of NBAD 902 5,653 36,523 43,078
Acquisition of subsidiaries 80 - 3,150 3,230
Net re-measurements and reallocations (5,001) (39,072) 65,611 21,538
Recoveries - - (16,838) (16,838)
Write offs - - (68,672) (68,672)
Other movements - - 80,503 80,503
Foreign exchange difference 629 (1,753) (6,315) (7,439)
TOTAL ASSETS 31,340 32,734 645,858 709,932
The contractual amount outstanding on loans that have been written off, but were still subject to enforcement activity was LL 96,279 million at 31 December 2018 (2017: LL 112,290 million). Net re-measurements and reallocations include re-measurements as a result of changes in the size of portfolios, reclassifications between stages and reallocations of provisions.
Analysis of maximum exposure to credit risk and collateral and other credit enhancementsThe following table shows the maximum exposure to credit risk by class of financial asset. It further shows the total fair value of collateral, capped to the maximum exposure to which it relates and the net exposure to credit risk.
NOTES TO THE CONSOLIDATED FINANCIAL STATEMENTS31 December 2018
NOTES TO THE CONSOLIDATED FINANCIAL STATEMENTS31 December 2018
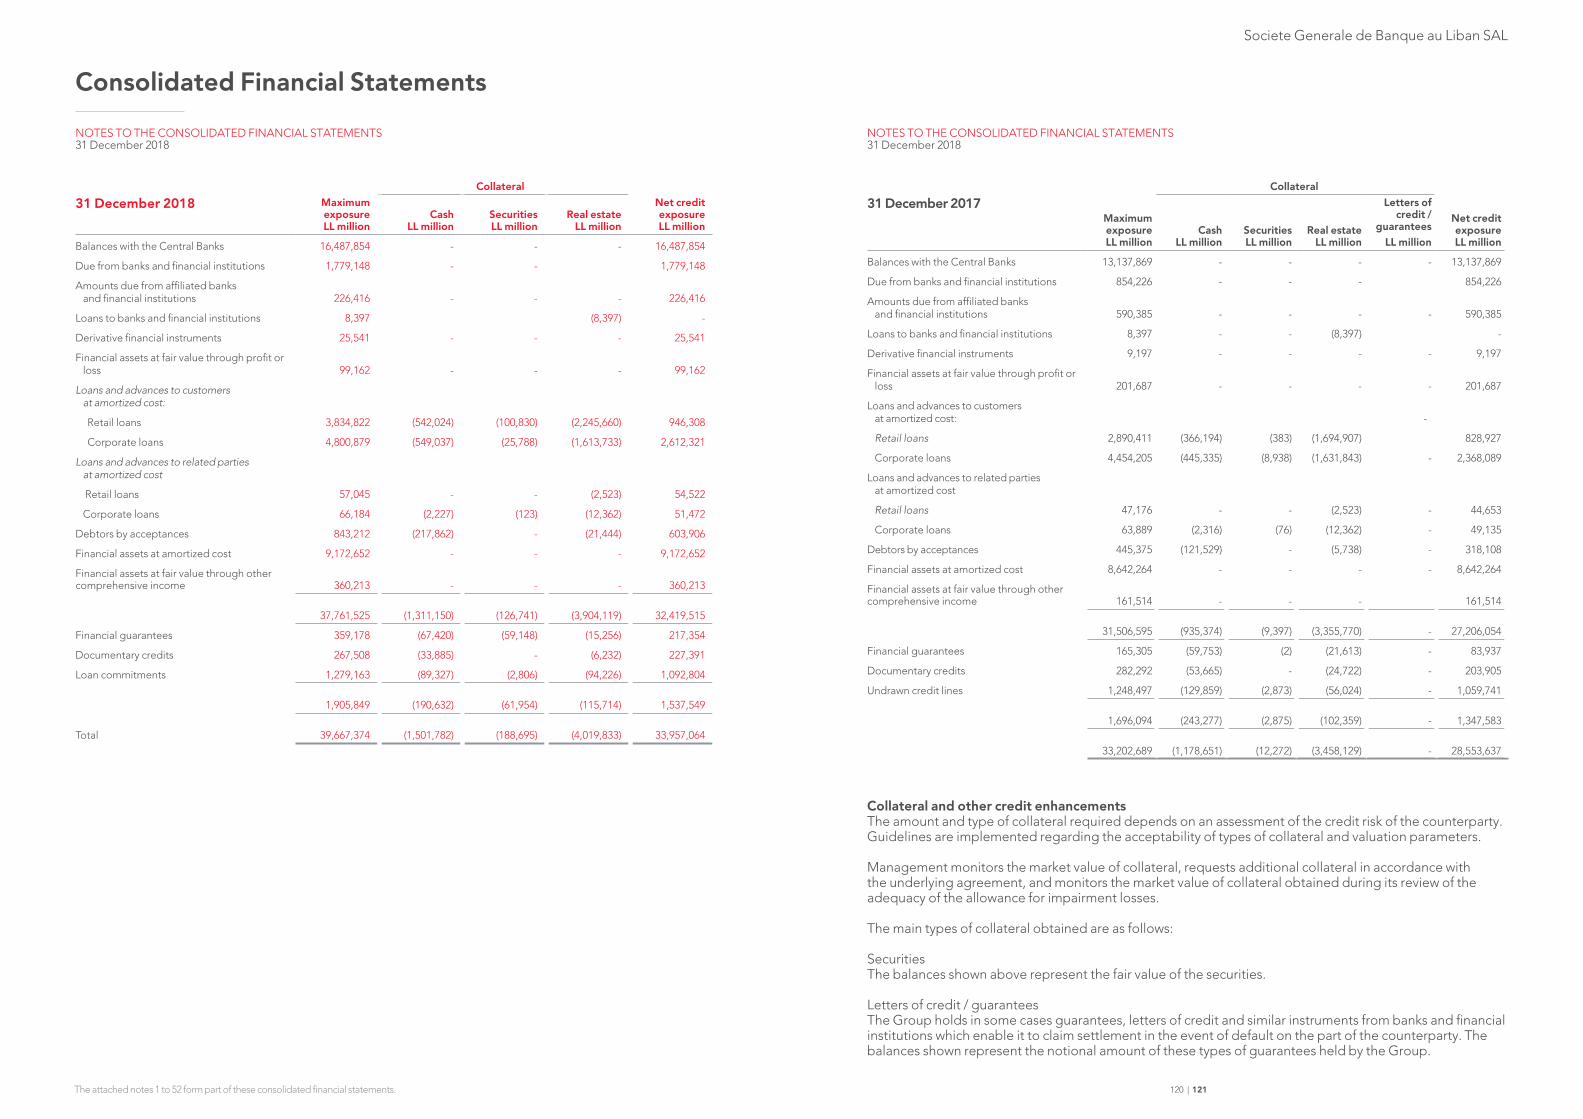
Societe Generale de Banque au Liban SAL
Consolidated Financial Statements
The attached notes 1 to 52 form part of these consolidated financial statements. 120 | 121
Collateral
31 December 2018 Maximum exposure LL million
Cash LL million
Securities LL million
Real estate LL million
Net credit exposure LL million
Balances with the Central Banks 16,487,854 - - - 16,487,854
Due from banks and financial institutions 1,779,148 - - 1,779,148
Amounts due from affiliated banks and financial institutions 226,416 - - - 226,416
Loans to banks and financial institutions 8,397 (8,397) -
Derivative financial instruments 25,541 - - - 25,541
Financial assets at fair value through profit or loss 99,162 - - - 99,162
Loans and advances to customers at amortized cost:
Retail loans 3,834,822 (542,024) (100,830) (2,245,660) 946,308
Corporate loans 4,800,879 (549,037) (25,788) (1,613,733) 2,612,321
Loans and advances to related parties at amortized cost
Retail loans 57,045 - - (2,523) 54,522
Corporate loans 66,184 (2,227) (123) (12,362) 51,472
Debtors by acceptances 843,212 (217,862) - (21,444) 603,906
Financial assets at amortized cost 9,172,652 - - - 9,172,652
Financial assets at fair value through other comprehensive income 360,213 - - - 360,213
37,761,525 (1,311,150) (126,741) (3,904,119) 32,419,515
Financial guarantees 359,178 (67,420) (59,148) (15,256) 217,354
Documentary credits 267,508 (33,885) - (6,232) 227,391
Loan commitments 1,279,163 (89,327) (2,806) (94,226) 1,092,804
1,905,849 (190,632) (61,954) (115,714) 1,537,549
Total 39,667,374 (1,501,782) (188,695) (4,019,833) 33,957,064
Collateral
31 December 2017Maximum exposure LL million
Cash LL million
Securities LL million
Real estate LL million
Letters of credit /
guaranteesLL million
Net credit exposure LL million
Balances with the Central Banks 13,137,869 - - - - 13,137,869
Due from banks and financial institutions 854,226 - - - 854,226
Amounts due from affiliated banks and financial institutions 590,385 - - - - 590,385
Loans to banks and financial institutions 8,397 - - (8,397) -
Derivative financial instruments 9,197 - - - - 9,197
Financial assets at fair value through profit or loss 201,687 - - - - 201,687
Loans and advances to customers at amortized cost: -
Retail loans 2,890,411 (366,194) (383) (1,694,907) 828,927
Corporate loans 4,454,205 (445,335) (8,938) (1,631,843) - 2,368,089
Loans and advances to related parties at amortized cost
Retail loans 47,176 - - (2,523) - 44,653
Corporate loans 63,889 (2,316) (76) (12,362) - 49,135
Debtors by acceptances 445,375 (121,529) - (5,738) - 318,108
Financial assets at amortized cost 8,642,264 - - - - 8,642,264
Financial assets at fair value through other comprehensive income 161,514 - - - 161,514
31,506,595 (935,374) (9,397) (3,355,770) - 27,206,054
Financial guarantees 165,305 (59,753) (2) (21,613) - 83,937
Documentary credits 282,292 (53,665) - (24,722) - 203,905
Undrawn credit lines 1,248,497 (129,859) (2,873) (56,024) - 1,059,741
1,696,094 (243,277) (2,875) (102,359) - 1,347,583
33,202,689 (1,178,651) (12,272) (3,458,129) - 28,553,637
Collateral and other credit enhancementsThe amount and type of collateral required depends on an assessment of the credit risk of the counterparty. Guidelines are implemented regarding the acceptability of types of collateral and valuation parameters.
Management monitors the market value of collateral, requests additional collateral in accordance with the underlying agreement, and monitors the market value of collateral obtained during its review of the adequacy of the allowance for impairment losses.
The main types of collateral obtained are as follows:
SecuritiesThe balances shown above represent the fair value of the securities.
Letters of credit / guaranteesThe Group holds in some cases guarantees, letters of credit and similar instruments from banks and financial institutions which enable it to claim settlement in the event of default on the part of the counterparty. The balances shown represent the notional amount of these types of guarantees held by the Group.
NOTES TO THE CONSOLIDATED FINANCIAL STATEMENTS31 December 2018
NOTES TO THE CONSOLIDATED FINANCIAL STATEMENTS31 December 2018
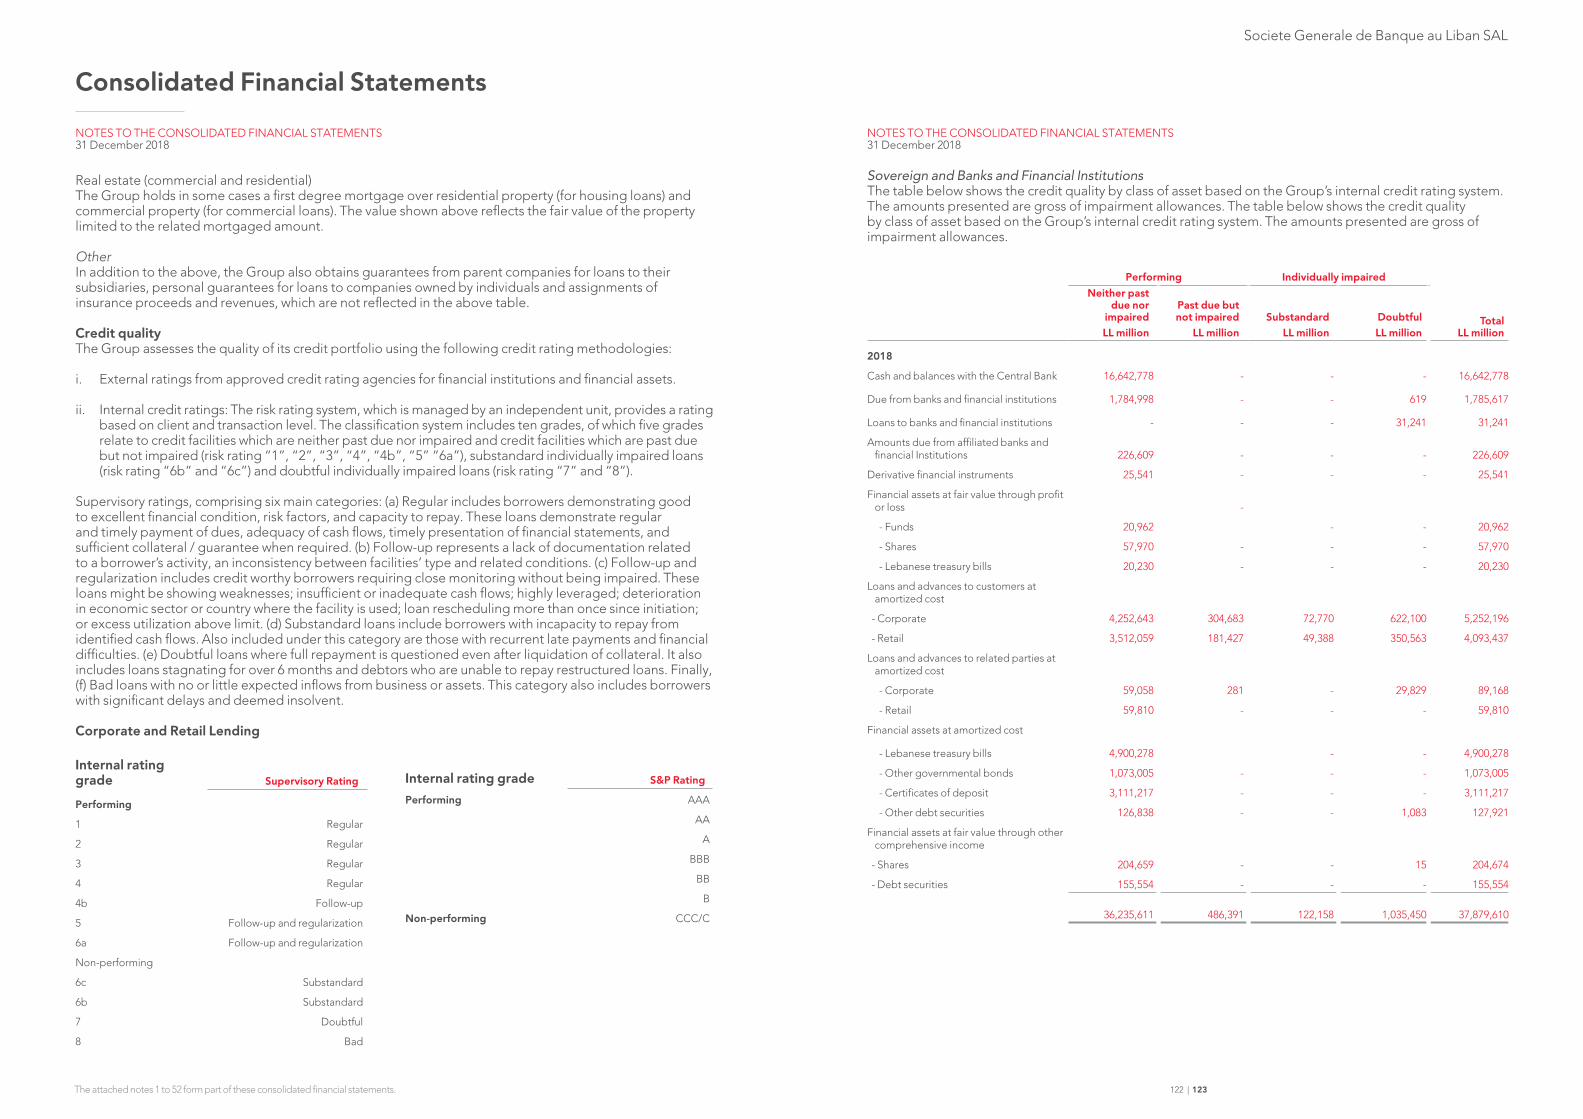
Societe Generale de Banque au Liban SAL
Consolidated Financial Statements
The attached notes 1 to 52 form part of these consolidated financial statements. 122 | 123
Real estate (commercial and residential)The Group holds in some cases a first degree mortgage over residential property (for housing loans) and commercial property (for commercial loans). The value shown above reflects the fair value of the property limited to the related mortgaged amount.
OtherIn addition to the above, the Group also obtains guarantees from parent companies for loans to their subsidiaries, personal guarantees for loans to companies owned by individuals and assignments of insurance proceeds and revenues, which are not reflected in the above table.
Credit qualityThe Group assesses the quality of its credit portfolio using the following credit rating methodologies:
i. External ratings from approved credit rating agencies for financial institutions and financial assets.
ii. Internal credit ratings: The risk rating system, which is managed by an independent unit, provides a rating based on client and transaction level. The classification system includes ten grades, of which five grades relate to credit facilities which are neither past due nor impaired and credit facilities which are past due but not impaired (risk rating “1”, “2”, “3”, “4”, “4b”, “5” “6a”), substandard individually impaired loans (risk rating “6b” and “6c”) and doubtful individually impaired loans (risk rating “7” and “8”).
Supervisory ratings, comprising six main categories: (a) Regular includes borrowers demonstrating good to excellent financial condition, risk factors, and capacity to repay. These loans demonstrate regular and timely payment of dues, adequacy of cash flows, timely presentation of financial statements, and sufficient collateral / guarantee when required. (b) Follow-up represents a lack of documentation related to a borrower’s activity, an inconsistency between facilities’ type and related conditions. (c) Follow-up and regularization includes credit worthy borrowers requiring close monitoring without being impaired. These loans might be showing weaknesses; insufficient or inadequate cash flows; highly leveraged; deterioration in economic sector or country where the facility is used; loan rescheduling more than once since initiation; or excess utilization above limit. (d) Substandard loans include borrowers with incapacity to repay from identified cash flows. Also included under this category are those with recurrent late payments and financial difficulties. (e) Doubtful loans where full repayment is questioned even after liquidation of collateral. It also includes loans stagnating for over 6 months and debtors who are unable to repay restructured loans. Finally, (f) Bad loans with no or little expected inflows from business or assets. This category also includes borrowers with significant delays and deemed insolvent.
Corporate and Retail Lending
Internal rating grade Supervisory Rating
Performing
1 Regular
2 Regular
3 Regular
4 Regular
4b Follow-up
5 Follow-up and regularization
6a Follow-up and regularization
Non-performing
6c Substandard
6b Substandard
7 Doubtful
8 Bad
Sovereign and Banks and Financial InstitutionsThe table below shows the credit quality by class of asset based on the Group’s internal credit rating system. The amounts presented are gross of impairment allowances. The table below shows the credit quality by class of asset based on the Group’s internal credit rating system. The amounts presented are gross of impairment allowances.
Performing Individually impairedNeither past
due nor impairedLL million
Past due but not impaired
LL millionSubstandard
LL millionDoubtfulLL million
Total LL million
2018
Cash and balances with the Central Bank 16,642,778 - - - 16,642,778
Due from banks and financial institutions 1,784,998 - - 619 1,785,617
Loans to banks and financial institutions - - - 31,241 31,241
Amounts due from affiliated banks and financial Institutions 226,609 - - - 226,609
Derivative financial instruments 25,541 - - - 25,541
Financial assets at fair value through profit or loss -
- Funds 20,962 - - 20,962
- Shares 57,970 - - - 57,970
- Lebanese treasury bills 20,230 - - - 20,230
Loans and advances to customers at amortized cost
- Corporate 4,252,643 304,683 72,770 622,100 5,252,196
- Retail 3,512,059 181,427 49,388 350,563 4,093,437
Loans and advances to related parties at amortized cost
- Corporate 59,058 281 - 29,829 89,168
- Retail 59,810 - - - 59,810
Financial assets at amortized cost
- Lebanese treasury bills 4,900,278 - - 4,900,278
- Other governmental bonds 1,073,005 - - - 1,073,005
- Certificates of deposit 3,111,217 - - - 3,111,217
- Other debt securities 126,838 - - 1,083 127,921
Financial assets at fair value through other comprehensive income
- Shares 204,659 - - 15 204,674
- Debt securities 155,554 - - - 155,554
36,235,611 486,391 122,158 1,035,450 37,879,610
NOTES TO THE CONSOLIDATED FINANCIAL STATEMENTS31 December 2018
NOTES TO THE CONSOLIDATED FINANCIAL STATEMENTS31 December 2018
Internal rating grade S&P Rating
Performing AAA
AA
A
BBB
BB
B
Non-performing CCC/C

Societe Generale de Banque au Liban SAL
Consolidated Financial Statements
The attached notes 1 to 52 form part of these consolidated financial statements. 124 | 125
Performing Individually impaired
Neither past due nor impaired
LL million
Past due but not impairedLL million
SubstandardLL million
DoubtfulLL million
Total LL million
2017
Cash and balances with the Central Bank 13,259,404 - - - 13,259,404
Due from banks and financial institutions 854,226 - - 711 854,937
Loans to banks and financial institutions - - - 27,758 27,758
Amounts due from affiliated banks and financial Institutions 590,385 - - - 590,385
Derivative financial instruments 9,197 - - - 9,197
Financial assets at fair value through profit or loss
- Shares 127,771 - - - 127,771
- Funds 23,720 - - - 23,720
- Lebanese treasury bills 12,508 - - - 12,508
- Debt securities issued by banks 37,688 - - - 37,688
Loans and advances to customers at amortized cost
- Corporate 3,938,080 409,579 74,197 379,063 4,800,919
- Retail 2,605,087 209,164 29,282 280,133 3,123,666
Loans and advances to related parties at amortized cost
- Corporate 59,792 - - 23,776 83,568
- Retail 47,176 - - - 47,176
Financial assets at amortized cost
- Lebanese treasury bills 3,852,519 - - - 3,852,519
- Other governmental bonds 997,962 - - - 997,962
- Certificates of deposit 3,719,678 - - - 3,719,678
- Other debt securities 72,105 - - 1,083 73,188
Financial assets at fair value through other comprehensive income
- Shares 161,514 - - 15 161,529
30,368,812 618,743 103,479 712,539 31,803,573
It is the Group’s policy to maintain accurate and consistent risk rating across the credit portfolio. This facilitates focused management of the applicable risks and the comparison of credit exposures across all lines of business, geographic regions and products. The rating system is supported by a variety of financial analytics, combined with processed market information to provide the main inputs for the measurement of counterparty risk. All internal risk ratings are tailored to the various categories and are derived in accordance with the Group’s rating policy. The attributable risk is assessed and updated regularly.
The classification of loans and advances to customers and related parties at amortized cost in accordance with the ratings of Central Bank of Lebanon circular 58 is as follows:
2018
Gross balance LL million
ECL Stage 3
LL million
Net balance
LL million
Regular 7,076,290 - 7,076,290
Follow up 797,786 - 797,786
Follow up and regularization 495,885 - 495,885
Substandard 122,158 (24,684) 97,474
Doubtful 725,486 (374,273) 351,213
Bad 277,006 (272,172) 4,834
9,494,611 (671,129) 8,823,482
ECL Stages 1 and 2 - (64,552) (64,552)
9,494,611 (735,681) 8,758,930
2017
Gross balance LL million
Unrealized interest
LL million
Impairment allowances
LL million
Net balance
LL million
Regular 6,427,102 - - 6,427,102
Follow up 513,069 - - 513,069
Follow-up and regularization 328,707 - - 328,707
Substandard 103,479 (35,905) - 67,574
Doubtful 493,980 (195,756) (151,467) 146,757
Bad 188,992 (120,376) (65,159) 3,457
8,055,329 (352,037) (216,626) 7,486,666
Collective impairment - - (30,985) (30,985)
8,055,329 (352,037) (247,611) 7,455,681
Risk concentrations: maximum exposure to credit risk without taking account of any collateral and other credit enhancementsThe Group’s concentrations of risk are managed by client/counterparty and by geographical region. The maximum credit exposure to any client as at 31 December 2018 was LL 375,998 million (2017: LL 375,597 million) before taking account of collateral or other credit enhancements and LL 134,764 million (2017: LL 134,363 million) net of such protection.
The following table shows the maximum exposure to credit risk for the components of the statement of financial position, including derivatives, by geography of counterparty before the effect of mitigation through the use of master netting and collateral agreements. Where financial instruments are recorded at fair value, the amounts shown represent the current credit risk exposure but not the maximum risk exposure that could arise in the future as a result of changes in values.
NOTES TO THE CONSOLIDATED FINANCIAL STATEMENTS31 December 2018
NOTES TO THE CONSOLIDATED FINANCIAL STATEMENTS31 December 2018
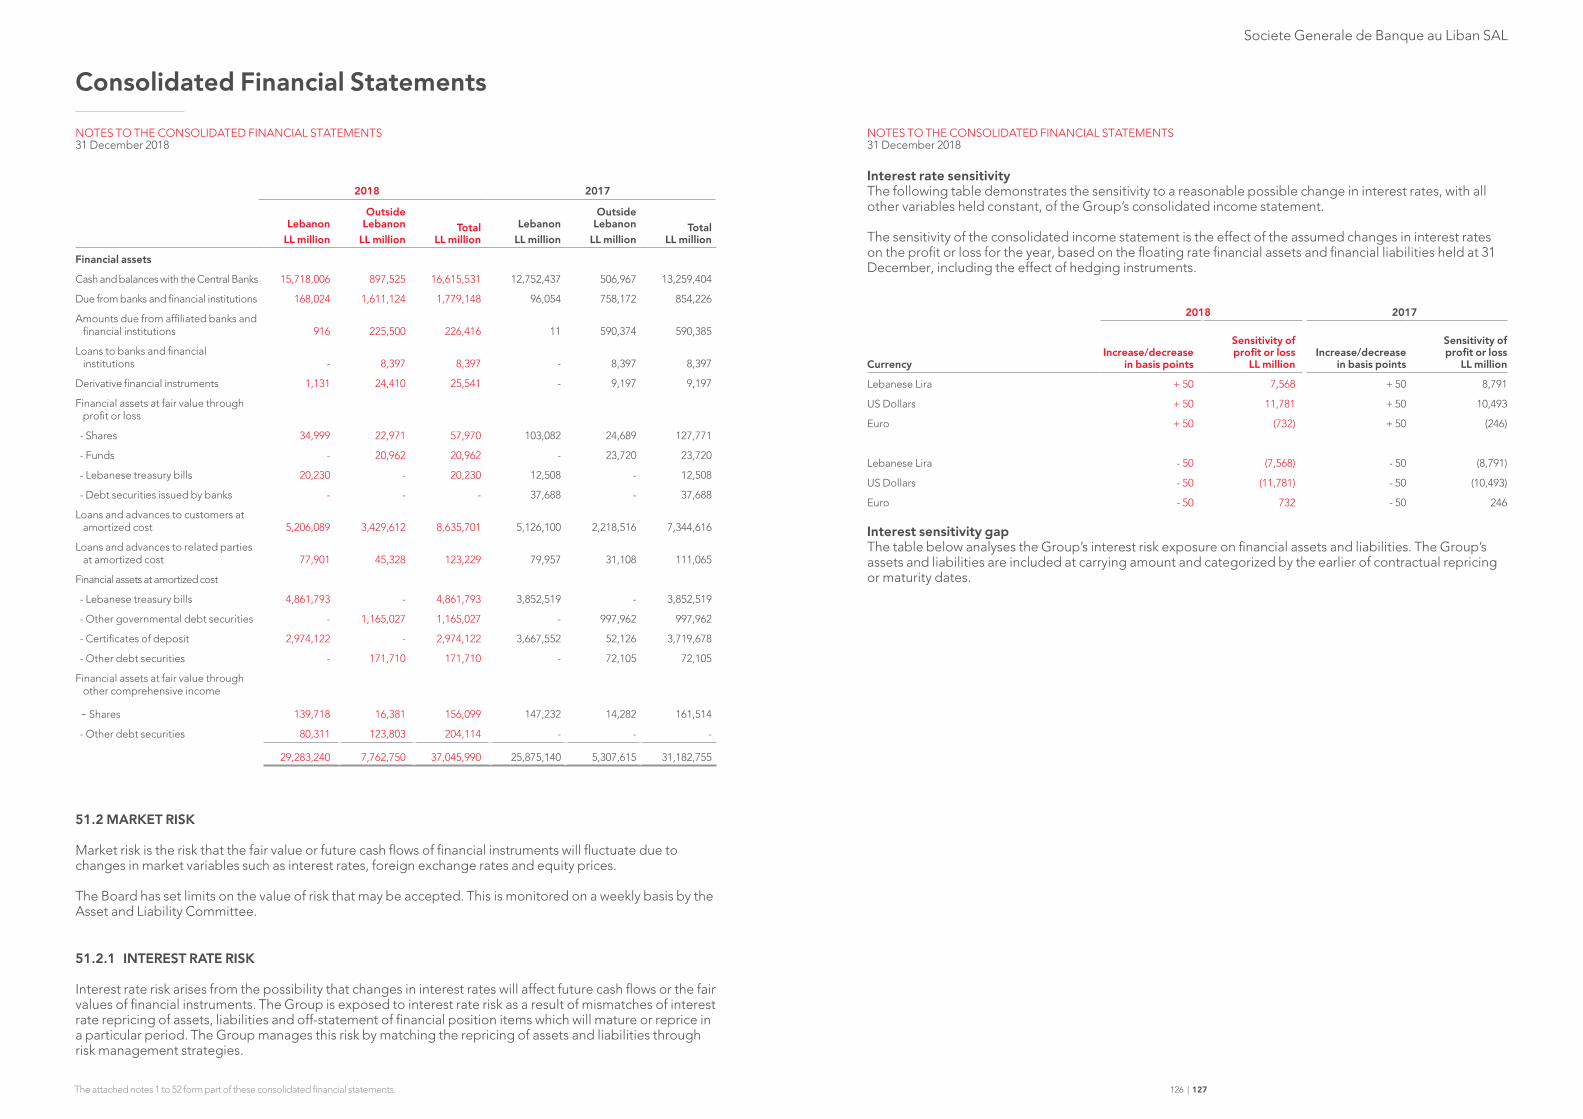
Societe Generale de Banque au Liban SAL
Consolidated Financial Statements
The attached notes 1 to 52 form part of these consolidated financial statements. 126 | 127
2018 2017
LebanonLL million
Outside Lebanon
LL millionTotal
LL millionLebanon
LL million
Outside Lebanon
LL millionTotal
LL million
Financial assets
Cash and balances with the Central Banks 15,718,006 897,525 16,615,531 12,752,437 506,967 13,259,404
Due from banks and financial institutions 168,024 1,611,124 1,779,148 96,054 758,172 854,226
Amounts due from affiliated banks and financial institutions 916 225,500 226,416 11 590,374 590,385
Loans to banks and financial institutions - 8,397 8,397 - 8,397 8,397
Derivative financial instruments 1,131 24,410 25,541 - 9,197 9,197
Financial assets at fair value through profit or loss
- Shares 34,999 22,971 57,970 103,082 24,689 127,771
- Funds - 20,962 20,962 - 23,720 23,720
- Lebanese treasury bills 20,230 - 20,230 12,508 - 12,508
- Debt securities issued by banks - - - 37,688 - 37,688
Loans and advances to customers at amortized cost 5,206,089 3,429,612 8,635,701 5,126,100 2,218,516 7,344,616
Loans and advances to related parties at amortized cost 77,901 45,328 123,229 79,957 31,108 111,065
Financial assets at amortized cost
- Lebanese treasury bills 4,861,793 - 4,861,793 3,852,519 - 3,852,519
- Other governmental debt securities - 1,165,027 1,165,027 - 997,962 997,962
- Certificates of deposit 2,974,122 - 2,974,122 3,667,552 52,126 3,719,678
- Other debt securities - 171,710 171,710 - 72,105 72,105
Financial assets at fair value through other comprehensive income
- Shares 139,718 16,381 156,099 147,232 14,282 161,514
- Other debt securities 80,311 123,803 204,114 - - -
29,283,240 7,762,750 37,045,990 25,875,140 5,307,615 31,182,755
51.2 MARKET RISK
Market risk is the risk that the fair value or future cash flows of financial instruments will fluctuate due to changes in market variables such as interest rates, foreign exchange rates and equity prices.
The Board has set limits on the value of risk that may be accepted. This is monitored on a weekly basis by the Asset and Liability Committee.
51.2.1 INTEREST RATE RISK
Interest rate risk arises from the possibility that changes in interest rates will affect future cash flows or the fair values of financial instruments. The Group is exposed to interest rate risk as a result of mismatches of interest rate repricing of assets, liabilities and off-statement of financial position items which will mature or reprice in a particular period. The Group manages this risk by matching the repricing of assets and liabilities through risk management strategies.
NOTES TO THE CONSOLIDATED FINANCIAL STATEMENTS31 December 2018
Interest rate sensitivityThe following table demonstrates the sensitivity to a reasonable possible change in interest rates, with all other variables held constant, of the Group’s consolidated income statement.
The sensitivity of the consolidated income statement is the effect of the assumed changes in interest rates on the profit or loss for the year, based on the floating rate financial assets and financial liabilities held at 31 December, including the effect of hedging instruments.
2018 2017
CurrencyIncrease/decrease
in basis points
Sensitivity of profit or loss
LL millionIncrease/decrease
in basis points
Sensitivity of profit or loss
LL million
Lebanese Lira + 50 7,568 + 50 8,791
US Dollars + 50 11,781 + 50 10,493
Euro + 50 (732) + 50 (246)
Lebanese Lira - 50 (7,568) - 50 (8,791)
US Dollars - 50 (11,781) - 50 (10,493)
Euro - 50 732 - 50 246
Interest sensitivity gapThe table below analyses the Group’s interest risk exposure on financial assets and liabilities. The Group’s assets and liabilities are included at carrying amount and categorized by the earlier of contractual repricing or maturity dates.
NOTES TO THE CONSOLIDATED FINANCIAL STATEMENTS31 December 2018
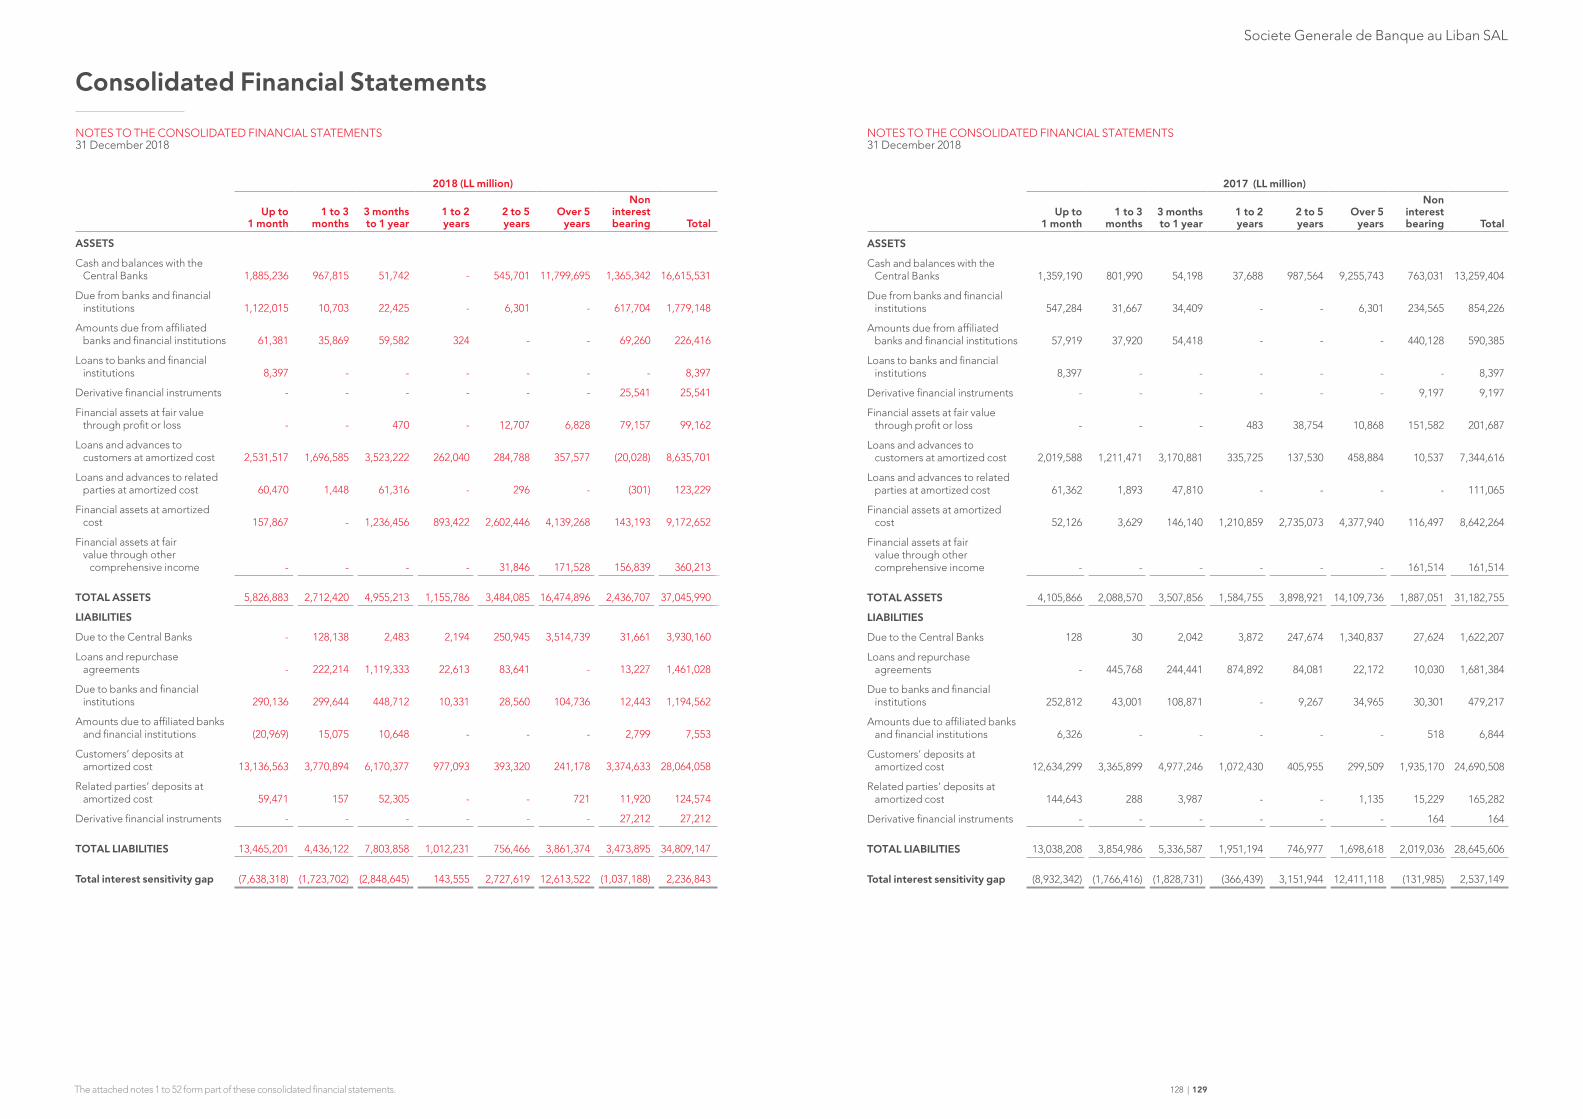
Societe Generale de Banque au Liban SAL
Consolidated Financial Statements
The attached notes 1 to 52 form part of these consolidated financial statements. 128 | 129
2018 (LL million)
Up to 1 month
1 to 3 months
3 months to 1 year
1 to 2 years
2 to 5 years
Over 5
years
Non interest bearing Total
ASSETS
Cash and balances with the Central Banks 1,885,236 967,815 51,742 - 545,701 11,799,695 1,365,342 16,615,531
Due from banks and financial institutions 1,122,015 10,703 22,425 - 6,301 - 617,704 1,779,148
Amounts due from affiliated banks and financial institutions 61,381 35,869 59,582 324 - - 69,260 226,416
Loans to banks and financial institutions 8,397 - - - - - - 8,397
Derivative financial instruments - - - - - - 25,541 25,541
Financial assets at fair value through profit or loss - - 470 - 12,707 6,828 79,157 99,162
Loans and advances to customers at amortized cost 2,531,517 1,696,585 3,523,222 262,040 284,788 357,577 (20,028) 8,635,701
Loans and advances to related parties at amortized cost 60,470 1,448 61,316 - 296 - (301) 123,229
Financial assets at amortized cost 157,867 - 1,236,456 893,422 2,602,446 4,139,268 143,193 9,172,652
Financial assets at fair value through other comprehensive income - - - - 31,846 171,528 156,839 360,213
TOTAL ASSETS 5,826,883 2,712,420 4,955,213 1,155,786 3,484,085 16,474,896 2,436,707 37,045,990
LIABILITIES
Due to the Central Banks - 128,138 2,483 2,194 250,945 3,514,739 31,661 3,930,160
Loans and repurchase agreements - 222,214 1,119,333 22,613 83,641 - 13,227 1,461,028
Due to banks and financial institutions 290,136 299,644 448,712 10,331 28,560 104,736 12,443 1,194,562
Amounts due to affiliated banks and financial institutions (20,969) 15,075 10,648 - - - 2,799 7,553
Customers’ deposits at amortized cost 13,136,563 3,770,894 6,170,377 977,093 393,320 241,178 3,374,633 28,064,058
Related parties’ deposits at amortized cost 59,471 157 52,305 - - 721 11,920 124,574
Derivative financial instruments - - - - - - 27,212 27,212
TOTAL LIABILITIES 13,465,201 4,436,122 7,803,858 1,012,231 756,466 3,861,374 3,473,895 34,809,147
Total interest sensitivity gap (7,638,318) (1,723,702) (2,848,645) 143,555 2,727,619 12,613,522 (1,037,188) 2,236,843
NOTES TO THE CONSOLIDATED FINANCIAL STATEMENTS31 December 2018
NOTES TO THE CONSOLIDATED FINANCIAL STATEMENTS31 December 2018
2017 (LL million)
Up to 1 month
1 to 3 months
3 months to 1 year
1 to 2 years
2 to 5 years
Over 5
years
Non interest bearing Total
ASSETS
Cash and balances with the Central Banks 1,359,190 801,990 54,198 37,688 987,564 9,255,743 763,031 13,259,404
Due from banks and financial institutions 547,284 31,667 34,409 - - 6,301 234,565 854,226
Amounts due from affiliated banks and financial institutions 57,919 37,920 54,418 - - - 440,128 590,385
Loans to banks and financial institutions 8,397 - - - - - - 8,397
Derivative financial instruments - - - - - - 9,197 9,197
Financial assets at fair value through profit or loss - - - 483 38,754 10,868 151,582 201,687
Loans and advances to customers at amortized cost 2,019,588 1,211,471 3,170,881 335,725 137,530 458,884 10,537 7,344,616
Loans and advances to related parties at amortized cost 61,362 1,893 47,810 - - - - 111,065
Financial assets at amortized cost 52,126 3,629 146,140 1,210,859 2,735,073 4,377,940 116,497 8,642,264
Financial assets at fair value through other comprehensive income - - - - - - 161,514 161,514
TOTAL ASSETS 4,105,866 2,088,570 3,507,856 1,584,755 3,898,921 14,109,736 1,887,051 31,182,755
LIABILITIES
Due to the Central Banks 128 30 2,042 3,872 247,674 1,340,837 27,624 1,622,207
Loans and repurchase agreements - 445,768 244,441 874,892 84,081 22,172 10,030 1,681,384
Due to banks and financial institutions 252,812 43,001 108,871 - 9,267 34,965 30,301 479,217
Amounts due to affiliated banks and financial institutions 6,326 - - - - - 518 6,844
Customers’ deposits at amortized cost 12,634,299 3,365,899 4,977,246 1,072,430 405,955 299,509 1,935,170 24,690,508
Related parties’ deposits at amortized cost 144,643 288 3,987 - - 1,135 15,229 165,282
Derivative financial instruments - - - - - - 164 164
TOTAL LIABILITIES 13,038,208 3,854,986 5,336,587 1,951,194 746,977 1,698,618 2,019,036 28,645,606
Total interest sensitivity gap (8,932,342) (1,766,416) (1,828,731) (366,439) 3,151,944 12,411,118 (131,985) 2,537,149
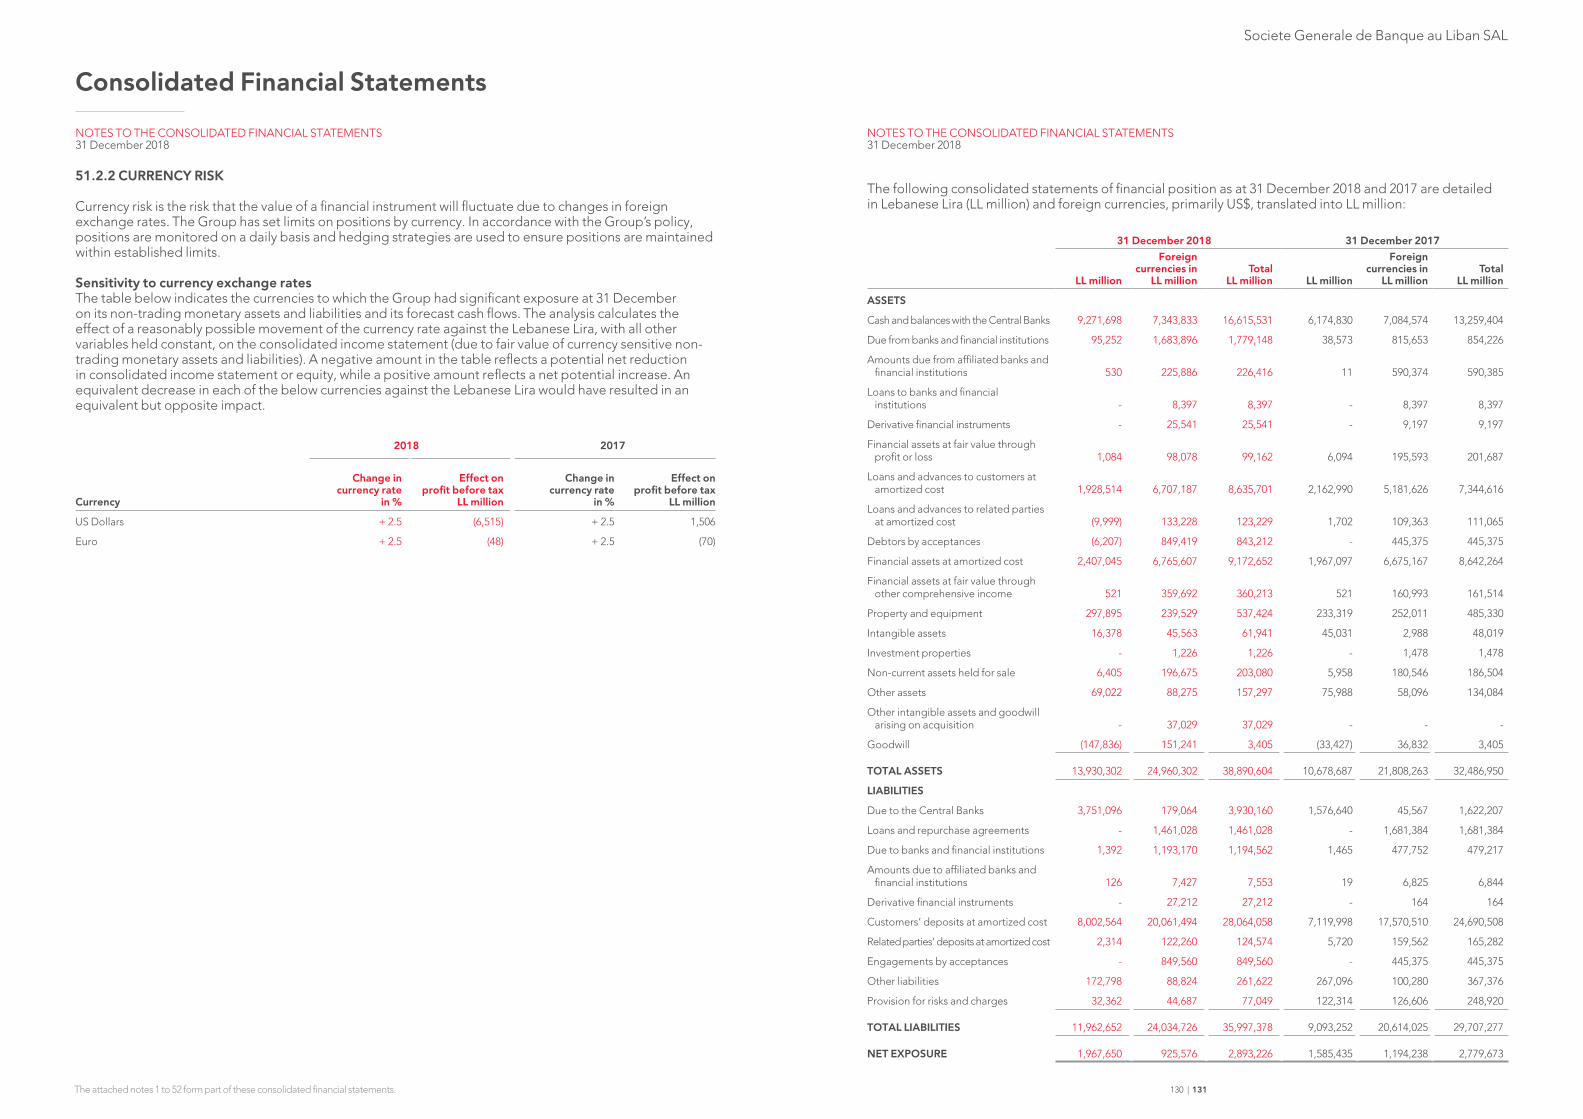
Societe Generale de Banque au Liban SAL
Consolidated Financial Statements
The attached notes 1 to 52 form part of these consolidated financial statements. 130 | 131
51.2.2 CURRENCY RISK
Currency risk is the risk that the value of a financial instrument will fluctuate due to changes in foreign exchange rates. The Group has set limits on positions by currency. In accordance with the Group’s policy, positions are monitored on a daily basis and hedging strategies are used to ensure positions are maintained within established limits.
Sensitivity to currency exchange ratesThe table below indicates the currencies to which the Group had significant exposure at 31 December on its non-trading monetary assets and liabilities and its forecast cash flows. The analysis calculates the effect of a reasonably possible movement of the currency rate against the Lebanese Lira, with all other variables held constant, on the consolidated income statement (due to fair value of currency sensitive non-trading monetary assets and liabilities). A negative amount in the table reflects a potential net reduction in consolidated income statement or equity, while a positive amount reflects a net potential increase. An equivalent decrease in each of the below currencies against the Lebanese Lira would have resulted in an equivalent but opposite impact.
2018 2017
Currency
Change in currency rate
in %
Effect on
profit before tax LL million
Change in currency rate
in %
Effect on
profit before tax LL million
US Dollars + 2.5 (6,515) + 2.5 1,506
Euro + 2.5 (48) + 2.5 (70)
NOTES TO THE CONSOLIDATED FINANCIAL STATEMENTS31 December 2018
NOTES TO THE CONSOLIDATED FINANCIAL STATEMENTS31 December 2018
The following consolidated statements of financial position as at 31 December 2018 and 2017 are detailed in Lebanese Lira (LL million) and foreign currencies, primarily US$, translated into LL million:
31 December 2018 31 December 2017
LL million
Foreign currencies in
LL millionTotal
LL million LL million
Foreign currencies in
LL millionTotal
LL million
ASSETS
Cash and balances with the Central Banks 9,271,698 7,343,833 16,615,531 6,174,830 7,084,574 13,259,404
Due from banks and financial institutions 95,252 1,683,896 1,779,148 38,573 815,653 854,226
Amounts due from affiliated banks and financial institutions 530 225,886 226,416 11 590,374 590,385
Loans to banks and financial institutions - 8,397 8,397 - 8,397 8,397
Derivative financial instruments - 25,541 25,541 - 9,197 9,197
Financial assets at fair value through profit or loss 1,084 98,078 99,162 6,094 195,593 201,687
Loans and advances to customers at amortized cost 1,928,514 6,707,187 8,635,701 2,162,990 5,181,626 7,344,616
Loans and advances to related parties at amortized cost (9,999) 133,228 123,229 1,702 109,363 111,065
Debtors by acceptances (6,207) 849,419 843,212 - 445,375 445,375
Financial assets at amortized cost 2,407,045 6,765,607 9,172,652 1,967,097 6,675,167 8,642,264
Financial assets at fair value through other comprehensive income 521 359,692 360,213 521 160,993 161,514
Property and equipment 297,895 239,529 537,424 233,319 252,011 485,330
Intangible assets 16,378 45,563 61,941 45,031 2,988 48,019
Investment properties - 1,226 1,226 - 1,478 1,478
Non-current assets held for sale 6,405 196,675 203,080 5,958 180,546 186,504
Other assets 69,022 88,275 157,297 75,988 58,096 134,084
Other intangible assets and goodwill arising on acquisition - 37,029 37,029 - - -
Goodwill (147,836) 151,241 3,405 (33,427) 36,832 3,405
TOTAL ASSETS 13,930,302 24,960,302 38,890,604 10,678,687 21,808,263 32,486,950
LIABILITIES
Due to the Central Banks 3,751,096 179,064 3,930,160 1,576,640 45,567 1,622,207
Loans and repurchase agreements - 1,461,028 1,461,028 - 1,681,384 1,681,384
Due to banks and financial institutions 1,392 1,193,170 1,194,562 1,465 477,752 479,217
Amounts due to affiliated banks and financial institutions 126 7,427 7,553 19 6,825 6,844
Derivative financial instruments - 27,212 27,212 - 164 164
Customers’ deposits at amortized cost 8,002,564 20,061,494 28,064,058 7,119,998 17,570,510 24,690,508
Related parties’ deposits at amortized cost 2,314 122,260 124,574 5,720 159,562 165,282
Engagements by acceptances - 849,560 849,560 - 445,375 445,375
Other liabilities 172,798 88,824 261,622 267,096 100,280 367,376
Provision for risks and charges 32,362 44,687 77,049 122,314 126,606 248,920
TOTAL LIABILITIES 11,962,652 24,034,726 35,997,378 9,093,252 20,614,025 29,707,277
NET EXPOSURE 1,967,650 925,576 2,893,226 1,585,435 1,194,238 2,779,673
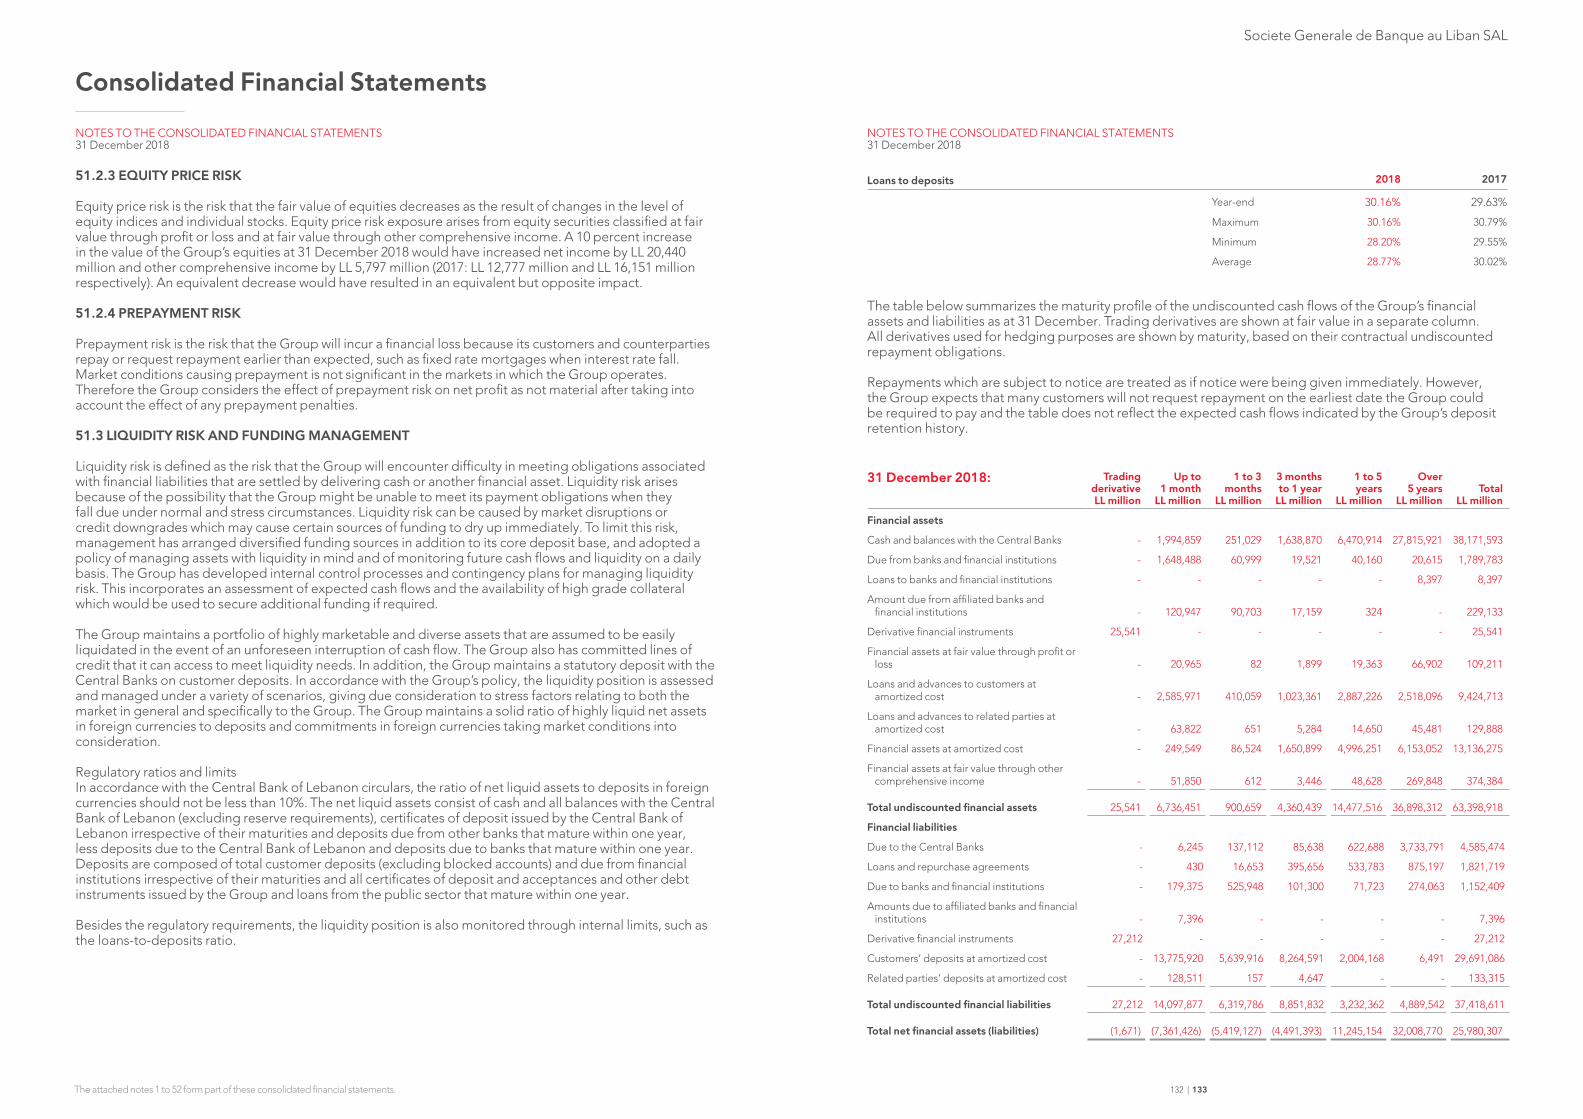
Societe Generale de Banque au Liban SAL
Consolidated Financial Statements
The attached notes 1 to 52 form part of these consolidated financial statements. 132 | 133
51.2.3 EQUITY PRICE RISK
Equity price risk is the risk that the fair value of equities decreases as the result of changes in the level of equity indices and individual stocks. Equity price risk exposure arises from equity securities classified at fair value through profit or loss and at fair value through other comprehensive income. A 10 percent increase in the value of the Group’s equities at 31 December 2018 would have increased net income by LL 20,440 million and other comprehensive income by LL 5,797 million (2017: LL 12,777 million and LL 16,151 million respectively). An equivalent decrease would have resulted in an equivalent but opposite impact.
51.2.4 PREPAYMENT RISK
Prepayment risk is the risk that the Group will incur a financial loss because its customers and counterparties repay or request repayment earlier than expected, such as fixed rate mortgages when interest rate fall. Market conditions causing prepayment is not significant in the markets in which the Group operates. Therefore the Group considers the effect of prepayment risk on net profit as not material after taking into account the effect of any prepayment penalties.
51.3 LIQUIDITY RISK AND FUNDING MANAGEMENT
Liquidity risk is defined as the risk that the Group will encounter difficulty in meeting obligations associated with financial liabilities that are settled by delivering cash or another financial asset. Liquidity risk arises because of the possibility that the Group might be unable to meet its payment obligations when they fall due under normal and stress circumstances. Liquidity risk can be caused by market disruptions or credit downgrades which may cause certain sources of funding to dry up immediately. To limit this risk, management has arranged diversified funding sources in addition to its core deposit base, and adopted a policy of managing assets with liquidity in mind and of monitoring future cash flows and liquidity on a daily basis. The Group has developed internal control processes and contingency plans for managing liquidity risk. This incorporates an assessment of expected cash flows and the availability of high grade collateral which would be used to secure additional funding if required.
The Group maintains a portfolio of highly marketable and diverse assets that are assumed to be easily liquidated in the event of an unforeseen interruption of cash flow. The Group also has committed lines of credit that it can access to meet liquidity needs. In addition, the Group maintains a statutory deposit with the Central Banks on customer deposits. In accordance with the Group’s policy, the liquidity position is assessed and managed under a variety of scenarios, giving due consideration to stress factors relating to both the market in general and specifically to the Group. The Group maintains a solid ratio of highly liquid net assets in foreign currencies to deposits and commitments in foreign currencies taking market conditions into consideration.
Regulatory ratios and limitsIn accordance with the Central Bank of Lebanon circulars, the ratio of net liquid assets to deposits in foreign currencies should not be less than 10%. The net liquid assets consist of cash and all balances with the Central Bank of Lebanon (excluding reserve requirements), certificates of deposit issued by the Central Bank of Lebanon irrespective of their maturities and deposits due from other banks that mature within one year, less deposits due to the Central Bank of Lebanon and deposits due to banks that mature within one year. Deposits are composed of total customer deposits (excluding blocked accounts) and due from financial institutions irrespective of their maturities and all certificates of deposit and acceptances and other debt instruments issued by the Group and loans from the public sector that mature within one year.
Besides the regulatory requirements, the liquidity position is also monitored through internal limits, such as the loans-to-deposits ratio.
Loans to deposits 2018 2017
Year-end 30.16% 29.63%Maximum 30.16% 30.79%
Minimum 28.20% 29.55%
Average 28.77% 30.02%
The table below summarizes the maturity profile of the undiscounted cash flows of the Group’s financial assets and liabilities as at 31 December. Trading derivatives are shown at fair value in a separate column. All derivatives used for hedging purposes are shown by maturity, based on their contractual undiscounted repayment obligations.
Repayments which are subject to notice are treated as if notice were being given immediately. However, the Group expects that many customers will not request repayment on the earliest date the Group could be required to pay and the table does not reflect the expected cash flows indicated by the Group’s deposit retention history.
31 December 2018: Trading derivative LL million
Up to 1 month
LL million
1 to 3 months
LL million
3 months to 1 year
LL million
1 to 5 years
LL million
Over 5 years
LL millionTotal
LL million
Financial assets
Cash and balances with the Central Banks - 1,994,859 251,029 1,638,870 6,470,914 27,815,921 38,171,593
Due from banks and financial institutions - 1,648,488 60,999 19,521 40,160 20,615 1,789,783
Loans to banks and financial institutions - - - - - 8,397 8,397
Amount due from affiliated banks and financial institutions - 120,947 90,703 17,159 324 - 229,133
Derivative financial instruments 25,541 - - - - - 25,541
Financial assets at fair value through profit or loss - 20,965 82 1,899 19,363 66,902 109,211
Loans and advances to customers at amortized cost - 2,585,971 410,059 1,023,361 2,887,226 2,518,096 9,424,713
Loans and advances to related parties at amortized cost - 63,822 651 5,284 14,650 45,481 129,888
Financial assets at amortized cost - 249,549 86,524 1,650,899 4,996,251 6,153,052 13,136,275
Financial assets at fair value through other comprehensive income - 51,850 612 3,446 48,628 269,848 374,384
Total undiscounted financial assets 25,541 6,736,451 900,659 4,360,439 14,477,516 36,898,312 63,398,918
Financial liabilities
Due to the Central Banks - 6,245 137,112 85,638 622,688 3,733,791 4,585,474
Loans and repurchase agreements - 430 16,653 395,656 533,783 875,197 1,821,719
Due to banks and financial institutions - 179,375 525,948 101,300 71,723 274,063 1,152,409
Amounts due to affiliated banks and financial institutions - 7,396 - - - - 7,396
Derivative financial instruments 27,212 - - - - - 27,212
Customers’ deposits at amortized cost - 13,775,920 5,639,916 8,264,591 2,004,168 6,491 29,691,086
Related parties’ deposits at amortized cost - 128,511 157 4,647 - - 133,315
Total undiscounted financial liabilities 27,212 14,097,877 6,319,786 8,851,832 3,232,362 4,889,542 37,418,611
Total net financial assets (liabilities) (1,671) (7,361,426) (5,419,127) (4,491,393) 11,245,154 32,008,770 25,980,307
NOTES TO THE CONSOLIDATED FINANCIAL STATEMENTS31 December 2018
NOTES TO THE CONSOLIDATED FINANCIAL STATEMENTS31 December 2018
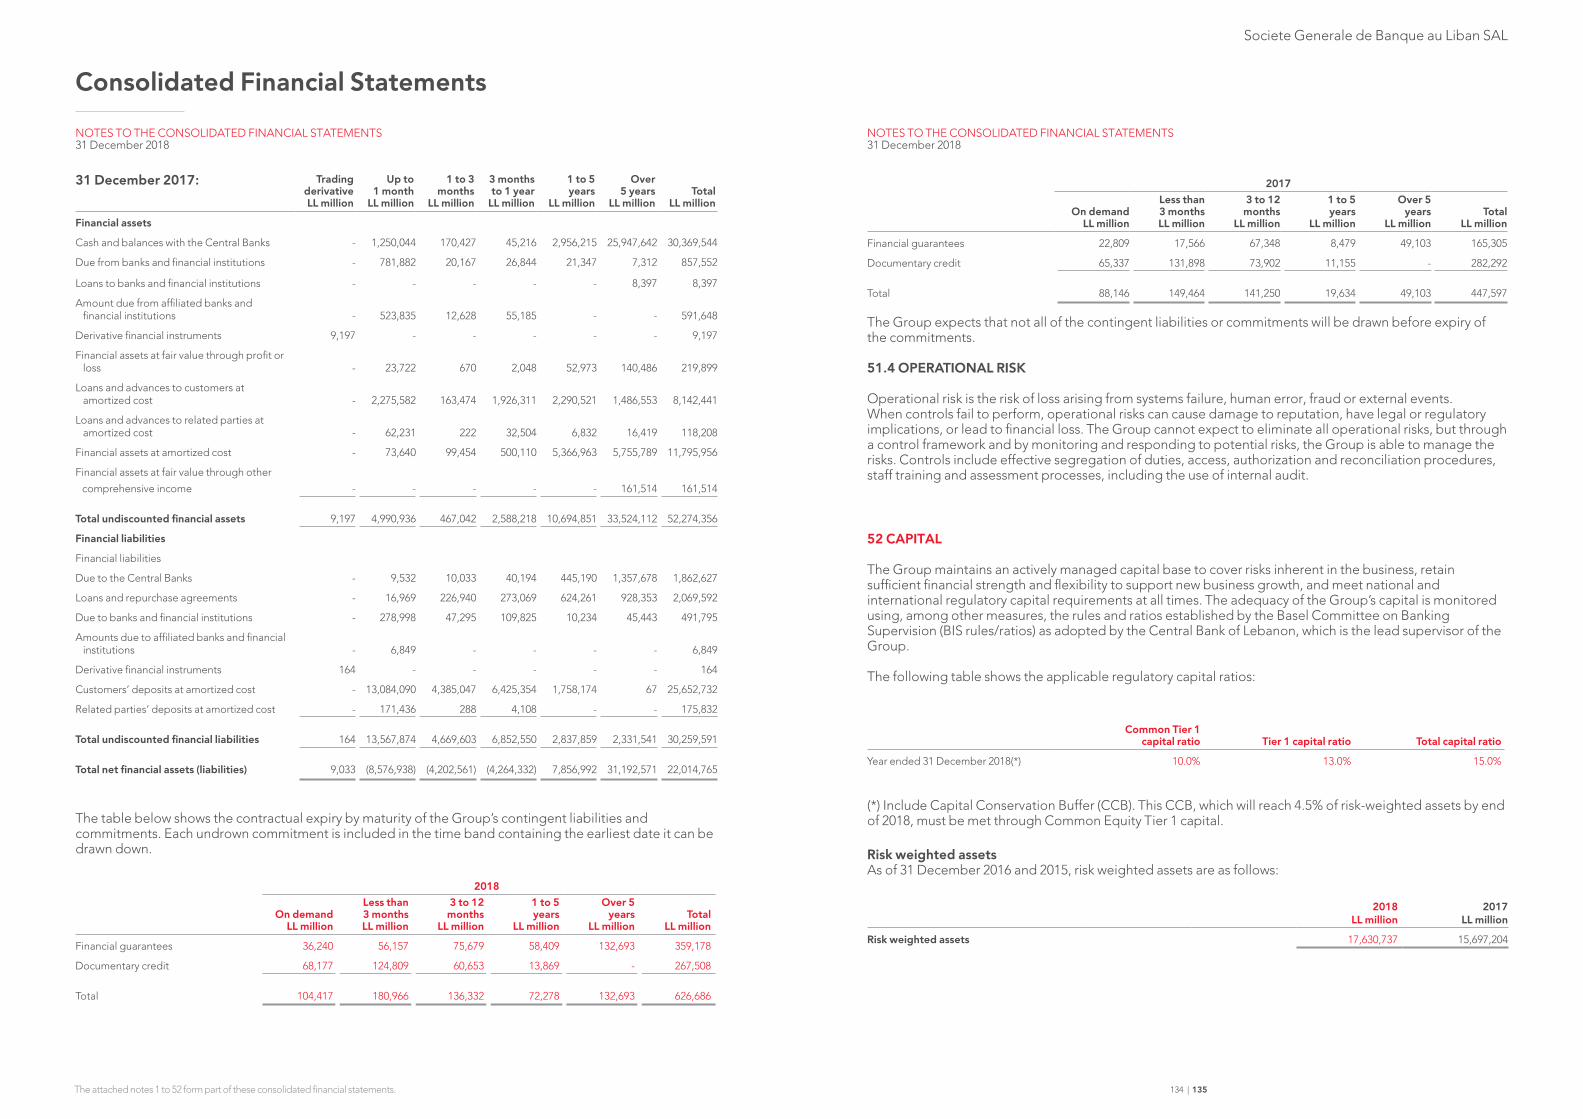
Societe Generale de Banque au Liban SAL
Consolidated Financial Statements
The attached notes 1 to 52 form part of these consolidated financial statements. 134 | 135
31 December 2017: Trading derivative LL million
Up to 1 month
LL million
1 to 3 months
LL million
3 months to 1 year
LL million
1 to 5 years
LL million
Over 5 years
LL millionTotal
LL million
Financial assets
Cash and balances with the Central Banks - 1,250,044 170,427 45,216 2,956,215 25,947,642 30,369,544
Due from banks and financial institutions - 781,882 20,167 26,844 21,347 7,312 857,552
Loans to banks and financial institutions - - - - - 8,397 8,397
Amount due from affiliated banks and financial institutions - 523,835 12,628 55,185 - - 591,648
Derivative financial instruments 9,197 - - - - - 9,197
Financial assets at fair value through profit or loss - 23,722 670 2,048 52,973 140,486 219,899
Loans and advances to customers at amortized cost - 2,275,582 163,474 1,926,311 2,290,521 1,486,553 8,142,441
Loans and advances to related parties at amortized cost - 62,231 222 32,504 6,832 16,419 118,208
Financial assets at amortized cost - 73,640 99,454 500,110 5,366,963 5,755,789 11,795,956
Financial assets at fair value through other comprehensive income - - - - - 161,514 161,514
Total undiscounted financial assets 9,197 4,990,936 467,042 2,588,218 10,694,851 33,524,112 52,274,356
Financial liabilities
Financial liabilities
Due to the Central Banks - 9,532 10,033 40,194 445,190 1,357,678 1,862,627
Loans and repurchase agreements - 16,969 226,940 273,069 624,261 928,353 2,069,592
Due to banks and financial institutions - 278,998 47,295 109,825 10,234 45,443 491,795
Amounts due to affiliated banks and financial institutions - 6,849 - - - - 6,849
Derivative financial instruments 164 - - - - - 164
Customers’ deposits at amortized cost - 13,084,090 4,385,047 6,425,354 1,758,174 67 25,652,732
Related parties’ deposits at amortized cost - 171,436 288 4,108 - - 175,832
Total undiscounted financial liabilities 164 13,567,874 4,669,603 6,852,550 2,837,859 2,331,541 30,259,591
Total net financial assets (liabilities) 9,033 (8,576,938) (4,202,561) (4,264,332) 7,856,992 31,192,571 22,014,765
The table below shows the contractual expiry by maturity of the Group’s contingent liabilities and commitments. Each undrown commitment is included in the time band containing the earliest date it can be drawn down.
2018
On demand LL million
Less than 3 months LL million
3 to 12 months
LL million
1 to 5 years
LL million
Over 5 years
LL millionTotal
LL million
Financial guarantees 36,240 56,157 75,679 58,409 132,693 359,178
Documentary credit 68,177 124,809 60,653 13,869 - 267,508
Total 104,417 180,966 136,332 72,278 132,693 626,686
NOTES TO THE CONSOLIDATED FINANCIAL STATEMENTS31 December 2018
NOTES TO THE CONSOLIDATED FINANCIAL STATEMENTS31 December 2018
2017
On demand LL million
Less than 3 months LL million
3 to 12 months
LL million
1 to 5 years
LL million
Over 5 years
LL millionTotal
LL million
Financial guarantees 22,809 17,566 67,348 8,479 49,103 165,305
Documentary credit 65,337 131,898 73,902 11,155 - 282,292
Total 88,146 149,464 141,250 19,634 49,103 447,597
The Group expects that not all of the contingent liabilities or commitments will be drawn before expiry of the commitments.
51.4 OPERATIONAL RISK
Operational risk is the risk of loss arising from systems failure, human error, fraud or external events. When controls fail to perform, operational risks can cause damage to reputation, have legal or regulatory implications, or lead to financial loss. The Group cannot expect to eliminate all operational risks, but through a control framework and by monitoring and responding to potential risks, the Group is able to manage the risks. Controls include effective segregation of duties, access, authorization and reconciliation procedures, staff training and assessment processes, including the use of internal audit.
52 CAPITAL
The Group maintains an actively managed capital base to cover risks inherent in the business, retain sufficient financial strength and flexibility to support new business growth, and meet national and international regulatory capital requirements at all times. The adequacy of the Group’s capital is monitored using, among other measures, the rules and ratios established by the Basel Committee on Banking Supervision (BIS rules/ratios) as adopted by the Central Bank of Lebanon, which is the lead supervisor of the Group.
The following table shows the applicable regulatory capital ratios:
Common Tier 1 capital ratio Tier 1 capital ratio Total capital ratio
Year ended 31 December 2018(*) 10.0% 13.0% 15.0%
(*) Include Capital Conservation Buffer (CCB). This CCB, which will reach 4.5% of risk-weighted assets by end of 2018, must be met through Common Equity Tier 1 capital.
Risk weighted assetsAs of 31 December 2016 and 2015, risk weighted assets are as follows:
2018LL million
2017LL million
Risk weighted assets 17,630,737 15,697,204
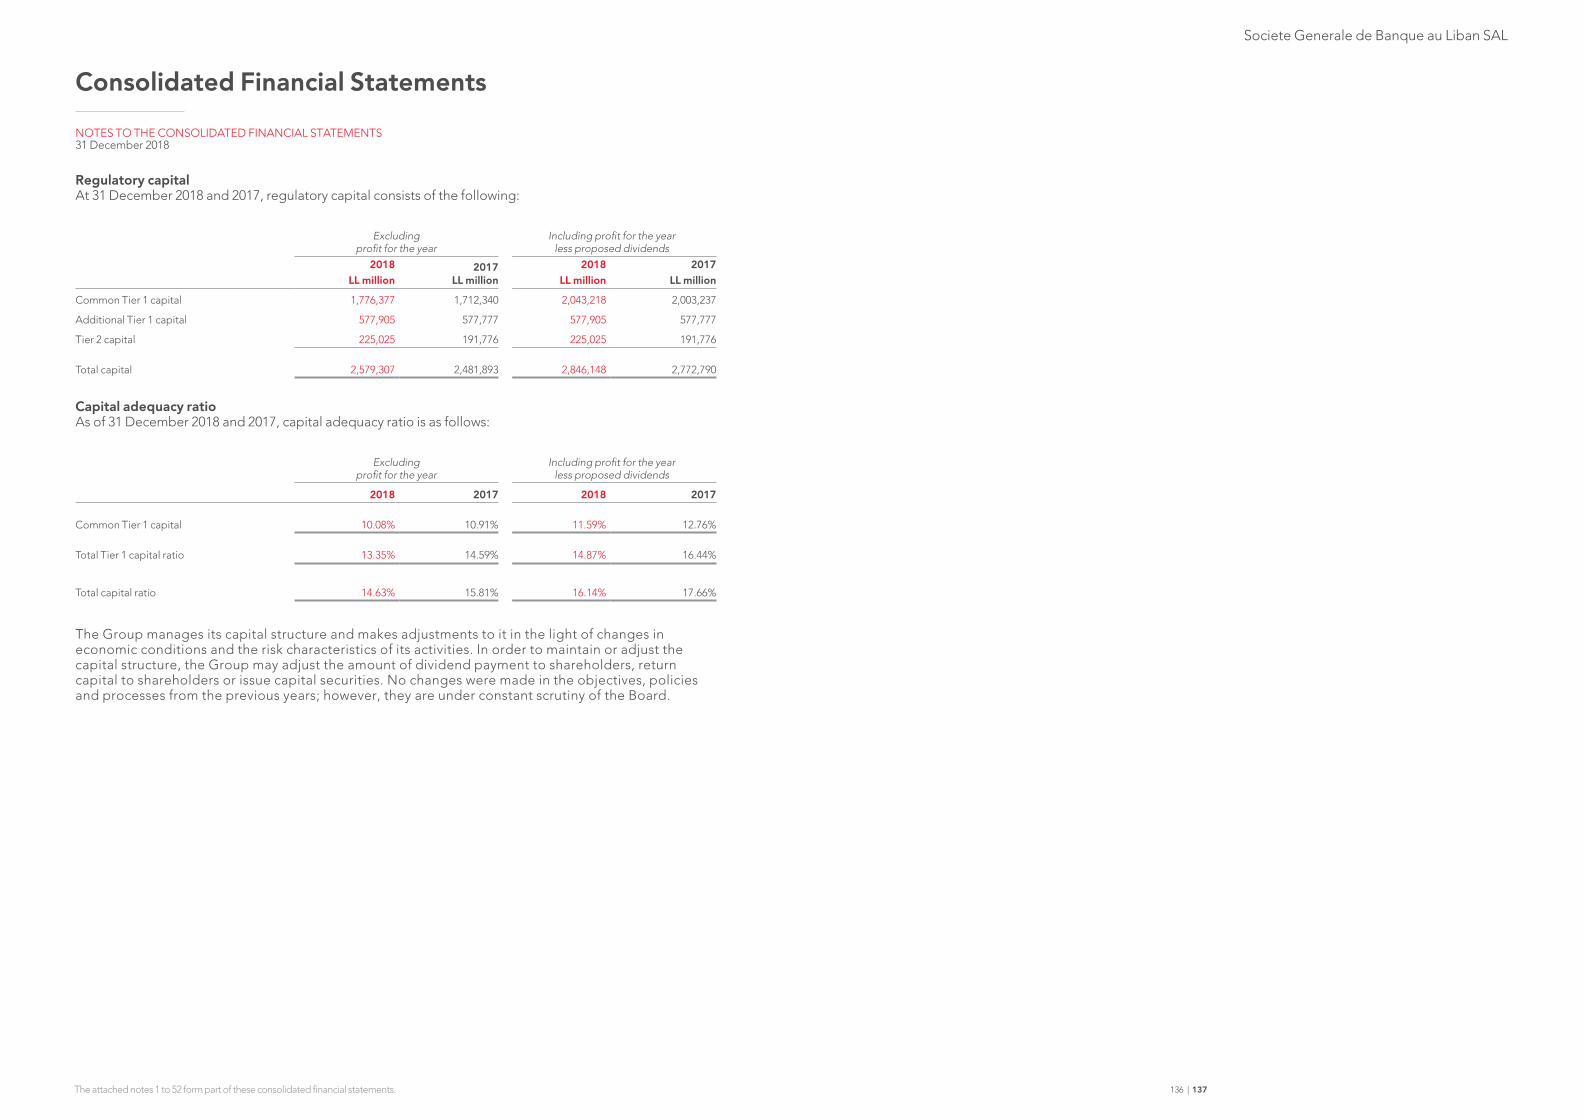
Societe Generale de Banque au Liban SAL
Consolidated Financial Statements
The attached notes 1 to 52 form part of these consolidated financial statements. 136 | 137
NOTES TO THE CONSOLIDATED FINANCIAL STATEMENTS31 December 2018
Regulatory capitalAt 31 December 2018 and 2017, regulatory capital consists of the following:
Excluding profit for the year
Including profit for the year less proposed dividends
2018LL million
2017LL million
2018LL million
2017LL million
Common Tier 1 capital 1,776,377 1,712,340 2,043,218 2,003,237
Additional Tier 1 capital 577,905 577,777 577,905 577,777
Tier 2 capital 225,025 191,776 225,025 191,776
Total capital 2,579,307 2,481,893 2,846,148 2,772,790
Capital adequacy ratioAs of 31 December 2018 and 2017, capital adequacy ratio is as follows:
Excluding profit for the year
Including profit for the year less proposed dividends
2018 2017 2018 2017
Common Tier 1 capital 10.08% 10.91% 11.59% 12.76%
Total Tier 1 capital ratio 13.35% 14.59% 14.87% 16.44%
Total capital ratio 14.63% 15.81% 16.14% 17.66%
The Group manages its capital structure and makes adjustments to it in the light of changes in economic conditions and the risk characteristics of its activities. In order to maintain or adjust the capital structure, the Group may adjust the amount of dividend payment to shareholders, return capital to shareholders or issue capital securities. No changes were made in the objectives, policies and processes from the previous years; however, they are under constant scrutiny of the Board.

GroupDirectory
Ye s t e r d a y i s b u t t o d a y ’s m e m o r y , t o m o r r o w i s t o d a y ’s d r e a m .
K h a l i l G i b r a n
138 | 139

Societe Generale de Banque au Liban SAL
140 | 141
The Group’s Contact Information
Electronic BankingOnline Banking: www.e-sgbl.com Website (EN & FR): www.sgbl.comSGBL Mobile Application
Call Center1274 / (+961) 3 477 777
General ManagementSaloumeh-Dekwaneh, Saloumeh Roundabout, SGBL Bldg., PO Box 11 2955, T +961 1 499 813F +961 1 502 820, Telex 44453 44368 LE – Swift SGLILBBX, Email [email protected]
HeadquartersRiad el Solh, Riad el Solh Street, T +961 1 980 783 / 4, F +961 1 980 785
The Network in Lebanon
GREATER BEIRUT
Achrafieh - Hotel Dieu, Facing Hotel Dieu de France, Sehnaoui Bldg., GF T 01 427 541 - 422 558 / 9 F 01 427 541
Airport Road, Airport Boulevard, Allied Center T 01 453 000 F 01 451 192
Ashrafieh – Sagesse, Sagesse street, facing Sagesse college T 01 200528 / 9 F 01 200528/9
Badaro, Main Road, Middle East Bldg., GF T 01 386 295 - 386 297 F 01 386 296
Barbir, Main Road, Barbir Hospital Bldg. T 01 630 983 - 659 693 F 01 647 305
Bourj El Barajneh, Ain El Sekke Street T 01 451 137 / 8 F 01 451 139
Chiah - Al Ariss, Mar Mekhael Church Street T 01 277 832 F 01 277 835
Chiah - Moucharrafieh, Taleb Bldg. T 01 277 311 / 2 / 3 F 01 545 993
Ghobeiry, Main Road, Mahdi Nasser Bldg. T 01 856 116 / 7 F 01 841 431
Hamra, Banque du Liban Street T 01 350 020 / 1 F 01 751 764
Hamra - Makdessi, Makdessi Street, Serhal and Massabki Bldg. T 01 346 090 F 01 346 090
Jnah, Khalil Moutran & Ahmad El-Assaad streets, Building no. 4055 T 01 852 811 / 2 / 3 / 4 F 01 852811 / 4
Kafaat, Borj El Barajneh-El Kafaat, El Sayyed Hadi Nasrallah Highway T 01 465 084 / 5 - 466399 F 01 465 084
Group DirectoryKfarchima, Old Saida Road, Kfarchima bridge T 05 470 091 F 05 470 091
Khaldeh, Khaldeh highway, Coop Bldg. T 05 800 184 - 803 990 F 05 803 151
Mar Elias, Mar Elias Street, Hamzeh Sabeh Center T 01 312 223 / 4 F 01 309 231
Mazraa, El Mama Street, Saeb Salam Corniche T 01 818 155 / 6 F 01 314 794
Riad El Solh, Banks Street T 01 980 783 / 4 F 01 980 785
Sadat, Hamra, Lagos Center T 01 743 075 / 7 F 01 743 076
Sassine, Achrafieh, Sassine Square, Independence Avenue T 01 200 525 - 215 513 F 01 200 526
Saydeh, Father Youssef Cherfan Street, Debs Bldg. T 01 219 070 / 1 / 2 F 01 219073
St.Charles - Mina El Hosn, Omar Daouk Street, St. Charles Center T 01 366 337 F 01 366 337
St. Nicolas, Achrafieh, Wadih Naim Street T 01 322740 / 1 / 2 F 01 322 740
Unesco, Moussaitbeh, Unesco Intersection, Hamadeh Bldg. T 01 796 200 F 01 786 056
Verdun, Main road, Debes and Ammar Bldg. T 01 860 703 / 4 F 01 860 706
MOUNT LEBANON
Ajaltoun, Main Road T 09 230 683 / 4 F 09 231 065
Antelias, Internal Road, near Saint Elie Church T 04 410 480 / 1 F 04 402 137
Baabda, Main Road, Bassil building, GF T 05 468 135 - 468 770 F 05 468 065
Bikfaya, Bikfaya Square, Saint-Coeur Bldg. T 04 986 271 / 2 F 04 981 392
Bourj Hammoud, Municipality Square T 01 258 883 / 4 - 255 993 - 259 991 F 01 259 992
Broumana, Main Road, Elias Kenaan Center T 04 961 538 - 963 652 F 04 961 539
Dbayeh, Road Leading to the Outside Parking of Le Mall Dbayeh from Beirut, Mouawad Bldg., GF
T 04 402 312 F 04 402 312
Dhour Choueir, Dhour El Choueir Square T 04 390 352 - 391 129 F 04 390 574
Dora, Dora Highway, Ghantous Bldg. T 01 250 222 F 01 250 222
Furn El Chebbak, Main Road, Gharios Center T 01 289 143 - 291 992 F 01 293 631
Ghazir, Jounieh Highway, Ghazir Junction, Slaiby Bldg. T 09 856051 / 2 / 3 / 4 T 09 856051 / 2 / 3 / 4
Horch Tabet, Tayyar Center T 01 512 550 / 3 F 01 512 552
Jal El Dib, Main road, Oscar Center T 04 713 000 F 04 713 000
Jbeil - Municipality, Near Municipality T 09 542 900 F 09 542 900
Jbeil - Souk, Old Souk, Saliba Bldg. T 09 541 170 - 949 316 F 09 540 877
Jdeideh, Nahr El Mot, Monte Libano Bldg. T 01 893 555 - 895 044 F 01 884 237
Jounieh -Apôtres, Apôtres school street,Mar Youhanna bldg T 09 643 510 F 09 643 510
Jounieh - BDL, Haret Sakher, Banque du Liban Street, Stella Maris Bldg. T 09 936 522 - 936 801 F 09 831 714
Kaslik, Sarba Highway, La Perla Bldg. T 09 640 037 - 640 716 F 09 831 715
Mansourieh - Boulevard, Main Road T 04 533 281 F 04 533 281
Mar Takla - Hazmieh, Gardenia Street, GF T 05 455900 - 455800 F 05 455 900
Mazraat Yachouh, Main road, Karam bldg facing Burger King T 04 916 551 / 2 F 04 916 553
Saloumeh - Dekwaneh, Saloumeh Roundabout T 01 483 001 - 499 813 F 01 502 820
Sin El Fil - Boulevard, Horch Tabet Area T 01 482 430 F 01 482 430
Zouk Mosbeh, Jeita Roundabout, Facing NDU T 09 226 640 F 09 226 640
SOUTH
Nabatieh - Mahmoud Fakih Street, Daher Center T 07 760 256 F 07 760 256
Nabatieh - Main Road, Al Biyad Area T 07 764 204 / 5 F 07 768 288
Saida - Jezzine Street, Golden Tower Bldg. T 07 725 549 - 724 704 F 07 753 945
Saida - Riad El Solh Street, Riad El Solh Square, Fakhoury Bldg. T 07 753 001 F 07 753 001
Sour - Al Massaref Street, Banks Street, Maarouf Sahily Bldg. T 07 343 420 F 07 343 420
Sour - Al Ramel, Al Istiraha Street T 07 741 702 - 349 437 F 07 740 614
NORTH
Abdeh, Main Road T 06 471 041 / 3 F 06 471 044
Amioun, Main Road, Obeid Bldg. T 06 950 962 / 723 F 06 952 762
Batroun, Main Entrance, Najem Bldg. T 06 744 288 F 06 744 288
Halba, Main Road, Massoud Bldg. T 06 692 743 F 06 692 743
Kfaraaka, Koura Main Road T 06 953 535 - 952 900 F 06 952 901
Tripoli - Al Maarad, Mouawad Street, Tripoli Center T 06 435 222 F 06 435 221
Tripoli - Bechara El Khoury, Boulevard Street, Ghanem Bldg. T 06 442084 / 5 - 411872 F 06 442 148
Tripoli - Fouad Chehab, Boulevard Street, Facing CNSS T 06 441 043 - 624 988 F 06 430 321
Tripoli - Mina, El Mina Street, Farah Center T 06 442 549 - 424 048 F 06 442 594
BEKAA
Chtaura, Main Road, SGBL Bldg. T 08 540 125 - 542 898 F 08 543 034
Hermel, Main Road, Chahine Center T 08 200 600 F 08 200 600
Laboueh, Main Road T 08 230 231 F 08 230 222
Zahle - Serail, Near Serail, St. Georges Street T 08 809 700 F 08 809 700
142 | 143
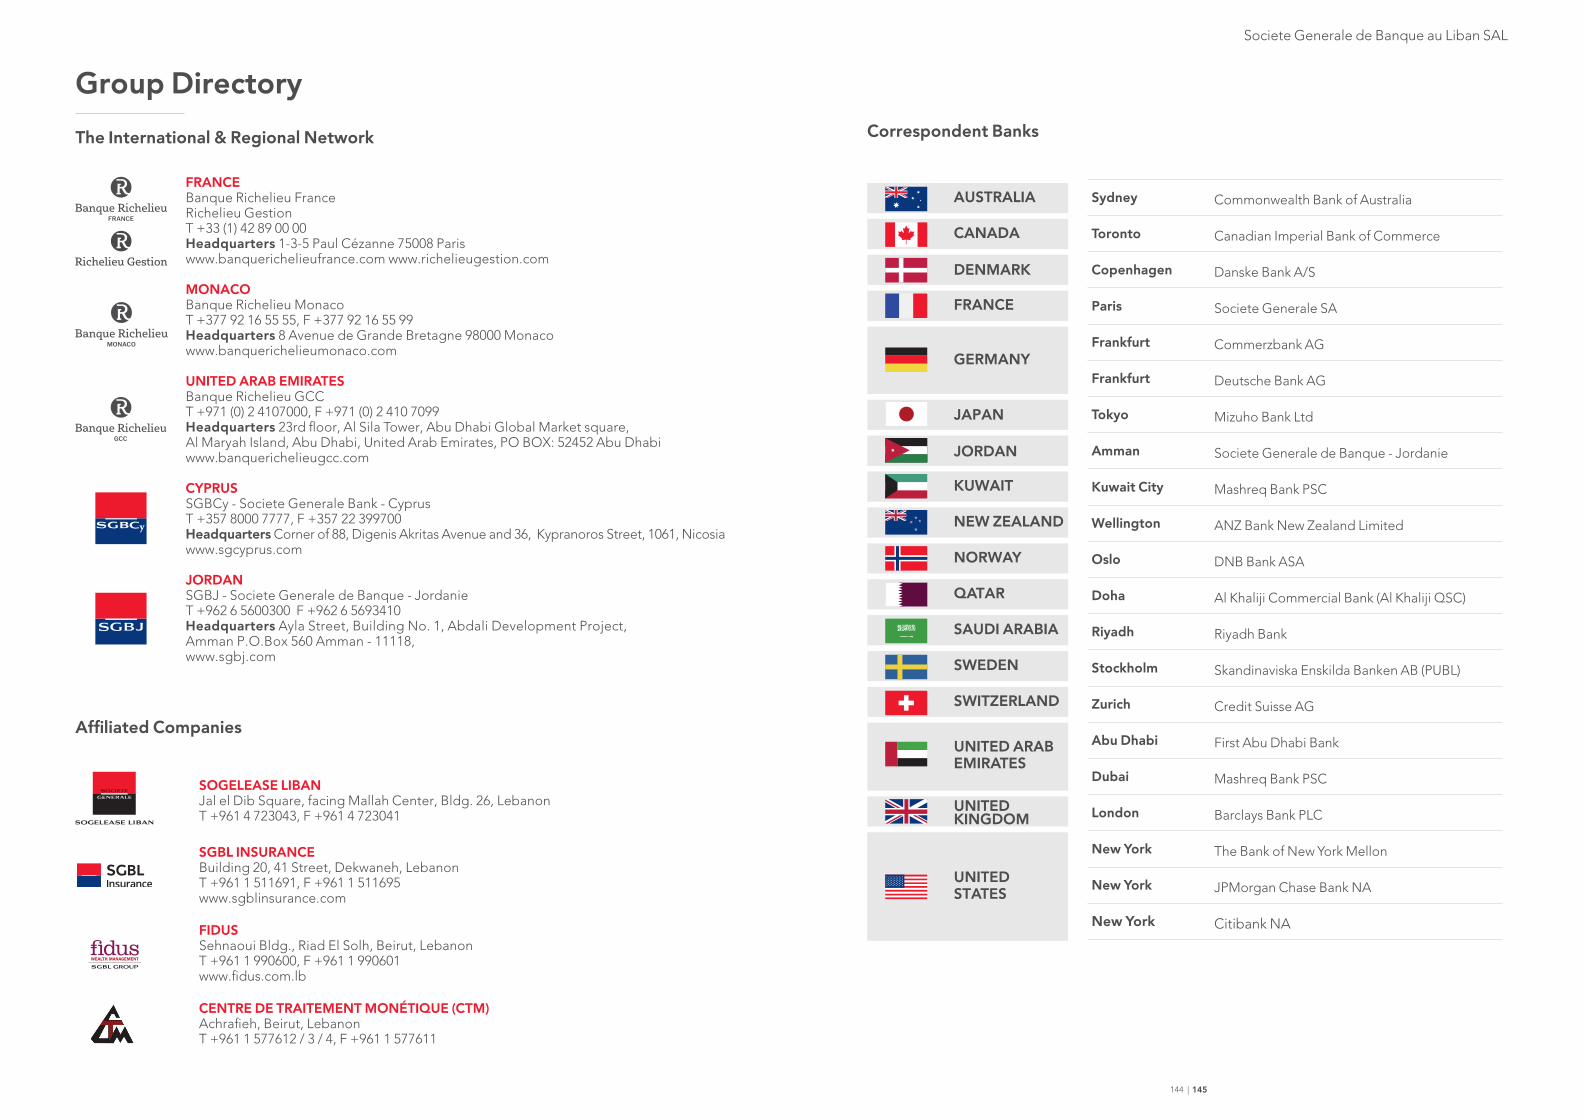
Societe Generale de Banque au Liban SAL
144 | 145
The International & Regional Network
SOGELEASE LIBANJal el Dib Square, facing Mallah Center, Bldg. 26, LebanonT +961 4 723043, F +961 4 723041
CENTRE DE TRAITEMENT MONÉTIQUE (CTM)Achrafieh, Beirut, LebanonT +961 1 577612 / 3 / 4, F +961 1 577611
SGBL INSURANCEBuilding 20, 41 Street, Dekwaneh, LebanonT +961 1 511691, F +961 1 511695www.sgblinsurance.com
FIDUSSehnaoui Bldg., Riad El Solh, Beirut, LebanonT +961 1 990600, F +961 1 990601www.fidus.com.lb
Group Directory
FRANCEBanque Richelieu FranceRichelieu Gestion T +33 (1) 42 89 00 00Headquarters 1-3-5 Paul Cézanne 75008 Pariswww.banquerichelieufrance.com www.richelieugestion.com
MONACOBanque Richelieu MonacoT +377 92 16 55 55, F +377 92 16 55 99Headquarters 8 Avenue de Grande Bretagne 98000 Monacowww.banquerichelieumonaco.com
UNITED ARAB EMIRATES Banque Richelieu GCCT +971 (0) 2 4107000, F +971 (0) 2 410 7099Headquarters 23rd floor, Al Sila Tower, Abu Dhabi Global Market square,Al Maryah Island, Abu Dhabi, United Arab Emirates, PO BOX: 52452 Abu Dhabiwww.banquerichelieugcc.com
CYPRUSSGBCy - Societe Generale Bank - Cyprus T +357 8000 7777, F +357 22 399700Headquarters Corner of 88, Digenis Akritas Avenue and 36, Kypranoros Street, 1061, Nicosiawww.sgcyprus.com
JORDANSGBJ - Societe Generale de Banque - Jordanie T +962 6 5600300 F +962 6 5693410Headquarters Ayla Street, Building No. 1, Abdali Development Project,Amman P.O.Box 560 Amman - 11118, www.sgbj.com
Sydney Commonwealth Bank of Australia
Toronto Canadian Imperial Bank of Commerce
Copenhagen Danske Bank A/S
Paris Societe Generale SA
Frankfurt Commerzbank AG
Frankfurt Deutsche Bank AG
Tokyo Mizuho Bank Ltd
Amman Societe Generale de Banque - Jordanie
Kuwait City Mashreq Bank PSC
Wellington ANZ Bank New Zealand Limited
Oslo DNB Bank ASA
Doha Al Khaliji Commercial Bank (Al Khaliji QSC)
Riyadh Riyadh Bank
Stockholm Skandinaviska Enskilda Banken AB (PUBL)
Zurich Credit Suisse AG
Abu Dhabi First Abu Dhabi Bank
Dubai Mashreq Bank PSC
London Barclays Bank PLC
New York The Bank of New York Mellon
New York JPMorgan Chase Bank NA
New York Citibank NA
AUSTRALIA
CANADA
DENMARK
FRANCE
GERMANY
JAPAN
JORDAN
KUWAIT
NEW ZEALAND
NORWAY
QATAR
SAUDI ARABIA
SWEDEN
SWITZERLAND
UNITED ARAB EMIRATES
UNITED STATES
UNITED KINGDOM
Correspondent Banks
Affiliated Companies

Publishing, Conception And CopywritingCorporate Communication Department, SGBL Design And LayoutAtelier Photography:
Chairman & CeoCéline Nieszawer
Executive CommitteeRoger Moukarzel
Societe Generale de Banque au LibanLebanese Joint-Stock Company with a Capital of LBP 27.552.255.000, fully paid, C.R. 3696 Beirut, List of banks No.19, Fiscal No. 3518
Saloumeh-Dekwaneh, Saloumeh Roundabout, PO Box 112955 Beirut, LebanonT +961 1 499 813, 1274
sgbl.com
AR/0
6/19