annual report 2018 - oneview healthcare
TRANSCRIPT

ANNUAL REPORT 2018
We see a better way.

Table of Contents
DIRECTORS AND OTHER INFORMATION 1
CORPORATE DIRECTORY 4
CHAIRMAN’S LETTER 7
CEO REPORT 9
REMUNERATION REPORT 13
DIRECTORS’ REPORT 23
STATEMENT OF DIRECTORS’ RESPONSIBILITIES 26
AUDITOR’S REPORT 27
FINANCIAL REPORT 31
NOTES 38
ADDITIONAL ASX INFO 65
APPENDIX: RISKS (UNAUDITED) 68
Directors Nationality
Joseph Rooney Irish
Mark McCloskey Irish
James Fitter Australian
John Kelly Irish (Resigned 4 January 2019)
Michael Kaminski USA (Appointed 22 August 2018)
Mark Cullen Australian (Resigned 4 January 2019)
Daniel Petre Australian (Resigned 4 January 2019)
Dr. Lyle Berkowitz USA
James William Vicars Australian (Resigned 22 August 2018)
Christina Boyce Australian (Resigned 22 November 2018)
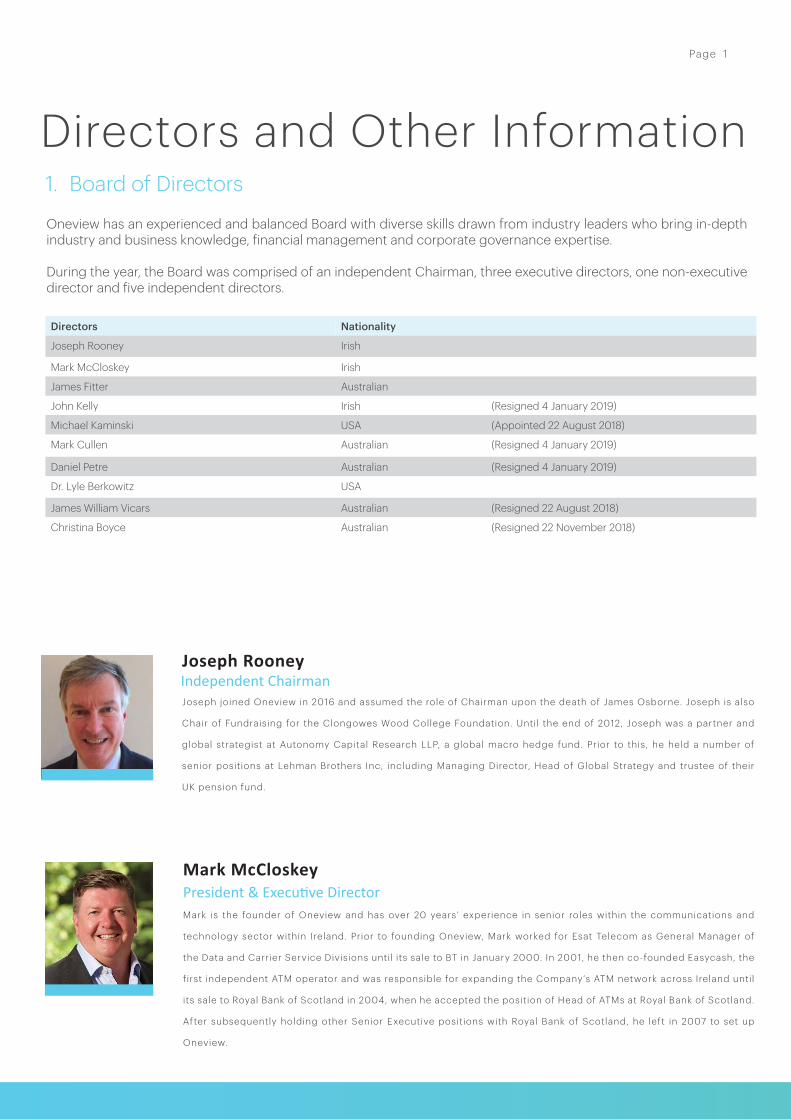
Oneview has an experienced and balanced Board with diverse skills drawn from industry leaders who bring in-depth industry and business knowledge, financial management and corporate governance expertise.
During the year, the Board was comprised of an independent Chairman, three executive directors, one non-executive director and five independent directors.
1. Board of Directors
Directors and Other Information
Mark McCloskeyPresident & Executive DirectorMark is the founder of Oneview and has over 20 years’ experience in senior roles within the communications and
technology sector within Ireland. Prior to founding Oneview, Mark worked for Esat Telecom as General Manager of
the Data and Carrier Service Divisions until its sale to BT in January 2000. In 2001, he then co-founded Easycash, the
f irst independent ATM operator and was responsible for expanding the Company’s ATM network across Ireland until
its sale to Royal Bank of Scotland in 2004, when he accepted the position of Head of ATMs at Royal Bank of Scotland.
After subsequently holding other Senior Executive positions with Royal Bank of Scotland, he left in 2007 to set up
Oneview.
Joseph RooneyIndependent ChairmanJoseph joined Oneview in 2016 and assumed the role of Chairman upon the death of James Osborne. Joseph is also
Chair of Fundraising for the Clongowes Wood College Foundation. Until the end of 2012, Joseph was a partner and
global strategist at Autonomy Capital Research LLP, a global macro hedge fund. Prior to this, he held a number of
senior positions at Lehman Brothers Inc, including Managing Director, Head of Global Strategy and trustee of their
UK pension fund.
Page 1

James FitterCEO & Executive DirectorJames has been CEO of Oneview Healthcare since January 2013, helping transition what was then a 10 person
start-up into a a publicly traded compnay in just over three years. He has over 25 years’ experience in the global
f inancial markets during which time he has l ived and worked in Sydney, New York, London, Monaco and Dubai.
James founded and managed an independent asset management company in Dubai and spent over ten years as a
professional investor and an independent advisor prior to joining Oneview. James holds a Bachelor of Commerce
from the University of New South Wales, Sydney, Australia.
John KellyCFO & Executive DirectorJohn joined Oneview in 2013 as Chief Financial Officer and has over 20 years’ experience in senior management
positions. Previously, John held senior international f inance management roles with a number of public and
private companies, including Fyffes PLC, Logica PLC and Alltracel PLC. John is a chartered accountant and trained
and qualif ied with Coopers & Lybrand (now PwC). He is a Fellow of Chartered Accountants Ireland (FCA) and has a
business degree from Trinity College Dublin (BSc Mgmt).
Michael Kaminski Non-Executive DirectorMichael is a Chicago-based senior healthcare executive with over 35 years of experience in innovative
technology-based companies. He has a proven and successful track record operating across multiple stages of the
business cycle from start-up entrepreneurial organisations to large global enterprises. Michael was most recently
the CEO of Landauer Inc. where he delivered signif icant EPS growth and share price gains during his tenure.
Daniel PetreIndependent DirectorDaniel joined Oneview in 2015. He has been a leading participant in Australia’s technology industry for more than
25 years and has held leadership positions in technology-based businesses including Microsoft Corporation
as Vice President of Workgroup Applications, Director of Advanced Technology. He has also been a successful
Venture Capitalist founding three Venture organisations over the last 18 years (ecorp, netus and AirTree Ventures).
Daniel hols a BSc with majors in Computer Science and Statistics from UNSW, an MBA from the University of
Sydney and an Hon DBus from UNSW.
Mark CullenIndependent DirectorMark joined Oneview in 2015. He has enjoyed a distinguished career at Deutsche Bank for over 25 years and is
currently the Global Head of Group Audit for Deutsche Bank AG. Mark has held a range of senior management
positions at Deutsche Bank including Global Head of Emerging Market Equities, Global Chief Operating Officer
Global Equities and Deutsche Asset Management, and most recently was responsible for the Chief Information
Security Office (CISO) and Corporate Security and Business Continuity (CSBC).
Page 2

James (Will) VicarsNon-Executive DirectorWill resigned from the board of Oneview in August 2018. He has been replaced by Michael Kaminski, who has been
appointed as his representative – see page 2. He currently serves as Chief Investment Officer at Caledonia and
sits on the boards of Caledonia (Private) Investments Pty Limited, DFO Investments Pty Limited and The Caledonia
Foundation. Prior to joining Caledonia in 1998, Will worked as a Senior Portfolio Manager at NRMA Investments and a
Portfolio Manager at Bankers Trust in Sydney. Will ’s other board positions include vice-chairman and non-executive
director of the St Luke’s Hospital Foundation, non-executive director of Oroton Group and non-executive director
of Grays eCommerce Group. Will graduated with a Bachelor of Arts, majoring in Economics, from the University of
Sydney in 1986.
Christina BoyceIndependent Director
Christina (Christy) brings over 20 years management and consulting experience to Oneview Healthcare. She is
currently a director of Port Jackson Partners, a boutique strategy f irm which focuses on strategic direction setting
in the context of industry economics and competition and regulatory policy. She is also a non-executive Director
of ASX-listed companies Greencross Limited and Monash IVF. Christy previously held the role of senior executive
at the government business enterprise, NBN Co during its establishment where she led initial discussions with the
ACCC and acted as the company’s representative on the Federal Government’s Implementation Study. Prior to
this, Christy spent 14 years with McKinsey & Co, where she was elected Partner at 32 years of age. During her time
there Christy co-led McKinsey’s Asia Pacif ic telecommunications and retail practices. Christy holds a Master of
Management (with distinction) from the Kellogg Graduate School of Management at Northwestern University and
a Bachelor of Economics from the University of Sydney.
Dr. Lyle BerkowitzIndependent DirectorLyle Berkowitz, MD, FACP, FHIMSS is a primary care physician, a digital healthcare innovator and a health tech
entrepreneur. Lyle has a long history of intersecting clinical, information technology and innovation responsibil ities
with executive management, business and entrepreneurial roles. For much of the past 20 years, Dr. Berkowitz has
helped lead IT and Innovation at Northwestern Medicine, a top 15 US healthcare system based out of Chicago. He
has additionally helped start and manage several healthcare IT companies in that time frame, and current sits on
the boards of MDLive, healthfinch and Intell igent Locations. He additionally serves on the Advisory Boards of the
Innovation Learning Network (ILN) and the Association of Medical Directors of Information Systems (AMDIS), is a
member of the Editorial Board for Clinical Innovation + Technology, and is the author of Innovation with Information
Technologies in Healthcare. He has been listed as one of HealthLeader’s “Twenty People Who Make Healthcare
Better”; Healthspottr ’s “Future Health Top 100”, and Modern Healthcare’s “Top 25 Clinical Informaticists”. He
graduated with a Biomedical Engineering degree from the University of Pennsylvania and is an Associate Professor
of Clinical Medicine at the Feinberg School of Medicine at Northwestern University. He has been elected to
Fellowship in both the American College of Physicians (ACP) and the Healthcare Information Management Systems
Society (HIMSS).
Page 3
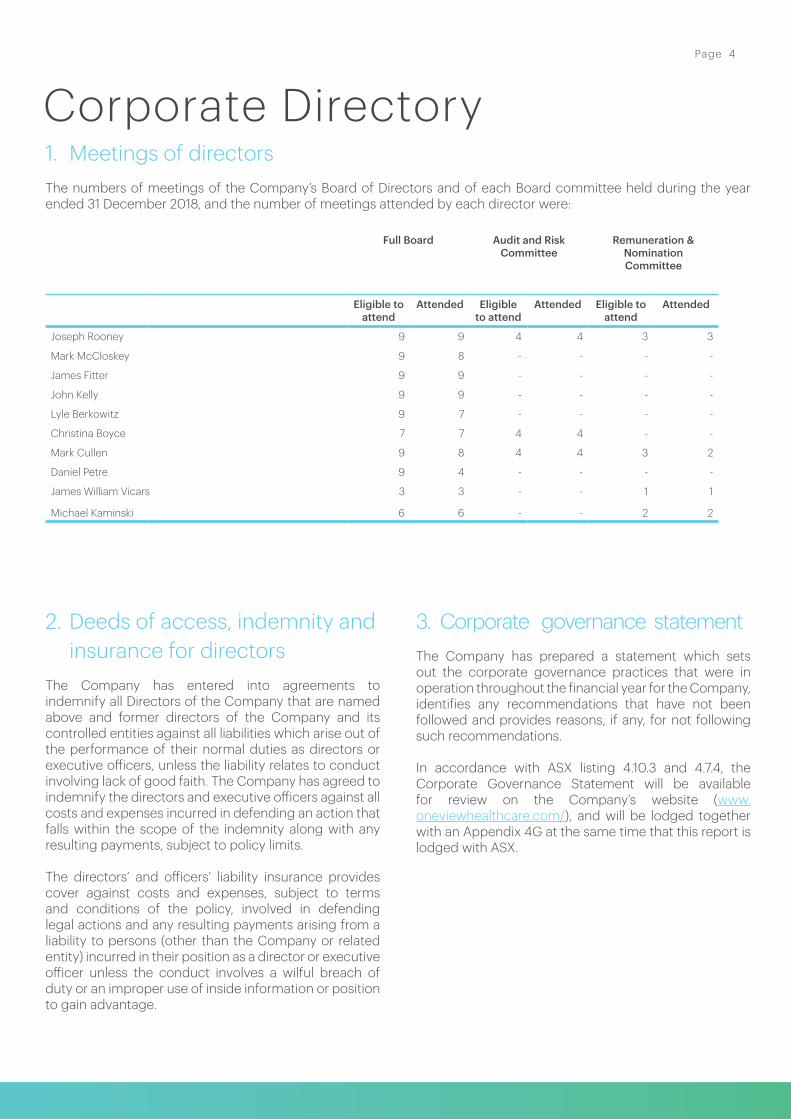
1. Meetings of directorsThe numbers of meetings of the Company’s Board of Directors and of each Board committee held during the year ended 31 December 2018, and the number of meetings attended by each director were:
Full Board Audit and RiskCommittee
Remuneration & NominationCommittee
Eligible to attend
Attended Eligible to attend
Attended Eligible to attend
Attended
Joseph Rooney 9 9 4 4 3 3
Mark McCloskey 9 8 - - - -
James Fitter 9 9 - - - -
John Kelly 9 9 - - - -
Lyle Berkowitz 9 7 - - - -
Christina Boyce 7 7 4 4 - -
Mark Cullen 9 8 4 4 3 2
Daniel Petre 9 4 - - - -
James William Vicars 3 3 - - 1 1
Michael Kaminski 6 6 - - 2 2
2. Deeds of access, indemnity and insurance for directors
The Company has entered into agreements to indemnify all Directors of the Company that are named above and former directors of the Company and its controlled entities against all liabilities which arise out of the performance of their normal duties as directors or executive officers, unless the liability relates to conduct involving lack of good faith. The Company has agreed to indemnify the directors and executive officers against all costs and expenses incurred in defending an action that falls within the scope of the indemnity along with any resulting payments, subject to policy limits.
The directors’ and officers’ liability insurance provides cover against costs and expenses, subject to terms and conditions of the policy, involved in defending legal actions and any resulting payments arising from a liability to persons (other than the Company or related entity) incurred in their position as a director or executive officer unless the conduct involves a wilful breach of duty or an improper use of inside information or position to gain advantage.
3. Corporate governance statementThe Company has prepared a statement which sets out the corporate governance practices that were in operation throughout the financial year for the Company, identifies any recommendations that have not been followed and provides reasons, if any, for not following such recommendations.
In accordance with ASX listing 4.10.3 and 4.7.4, the Corporate Governance Statement will be available for review on the Company’s website (www. oneviewhealthcare.com/), and will be lodged together with an Appendix 4G at the same time that this report is lodged with ASX.
Corporate DirectoryPage 4
Registered office & business address Independent AuditorBlock 2 KPMG
Blackrock Business Park Chartered AccountantsCarysfort Avenue Blackrock 1 Stokes PlaceCo. Dublin St. Stephen’s GreenIreland Dublin 2
Ireland
Solicitors BankersA&L Goodbody HSBC Bank Ltd25-28 North Wall Quay Guildford and Weybridge Commercial CentreDublin 1 Edgeborough RoadIreland Guildford
Surrey GU12BJClayton Utz United Kingdom Level 151 Bligh Street Company NumberSydney 513842NSW 2000Australia ABRN
610 611 768
Registry ASX CodeComputershare Investor Services Pty Ltd ASX: ONELevel 460 Carrington Street Company WebsiteSydney www.oneviewhealthcare.comNSW 2000Australia
Company SecretariesPatrick MastersonNicholas Brown (Resigned 4 January 2019)
5. Corporate directory
Page 5


Fellow Shareholders,
On behalf of your Board of Directors, it is my pleasure to present the Oneview Healthcare PLC Annual Report for the financial year ended 31 December 2018.
We were delighted with the support we received from both existing and new investors who supported the company in raising fresh equity of approximately A$30 million in December 2017. This fresh equity provided us with the financial flexibility to execute on our business plan in 2018. Oneview saw a 75% increase in the number of live beds, a 19% increase in total contracted beds and a 35% increase in our recurring revenue.
Oneview’s objective is enabling healthcare organisations to make use of consumer technologies to drive cost efficiencies, improvements in clinical outcomes and enhanced patient satisfaction, leading to overall excellence in healthcare economics and the quality of care. Oneview’s product offering covers two core products: Inpatient and Senior Living.
Inpatient: The Inpatient Platform allows for active collaboration between patients and clinical staff. Enriching the overall patient experience, the Oneview Inpatient Platform enables patients to view tailored educational content, exchange messages with their care team, monitor their own progress against assigned goals, stay connected with friends and family via video communication and access
Chairman’s Letter
Page 7

premium entertainment. The Inpatient Platform can also help clinical staff save time, avoid waste, improve staff efficiency and improve quality of care by providing staff with real-time patient information, digitised nurse rounding processes, electronic meal ordering, room readiness notifications and data and analytics which enable staff to identify areas for improvement. The Inpatient Platform is live and installed at 6,258 beds in healthcare facilities in the United States, Australia, the United Arab Emirates, Thailand and Ireland, with a further 4,452 beds contracted but yet to be installed.
Senior Living: Our Senior Living solution is an entirely new product scheduled for delivery in 2019. It is based on some of the founding principles of our Inpatient Platform targeting resident experience, communication with clinicians and family members as well as monitoring through ambient sensors. It represents an exciting market for development, with very limited penetration of technology to date and an addressable market 2.5x to 3x the size of the acute hospital market. Oneview deployed a hybrid version of our inpatient product at its first Senior Living facility in 120 beds in Australia in 2018 to gather some initial product feedback. We look forward to the delivery of the expanded senior living solution in the year ahead.
I would like to acknowledge the invaluable contribution my colleagues, Dr Lyle Berkowitz and
Mike Kaminski have made to the Board and say a special thank you to the departing non-executive directors, Christy Boyce, Daniel Petre and Mark Cullen, for their valuable advice and service over the past few years. Similarly, I would like to thank John Kelly for his contribution to the Board and his ongoing commitment as CFO.
We are fortunate to have a stable and skilled group of senior leaders across the company. I would like to thank them for their enthusiasm and commitment to the Company and for their professionalism in confronting some of the challenges we endured in realigning the strategic direction of the company. I would also like to thank our devoted employees across all aspects of the business who have worked so hard to ensure our technology platform is genuinely impacting patients’ lives. Finally, I would like to thank our hospital and healthcare clients who constantly challenge us and rank among the most respected and discerning providers in their respective fields across the world.
Thank you all for your continued support.
Sincerely yours,
Joe RooneyChairman
Page 8
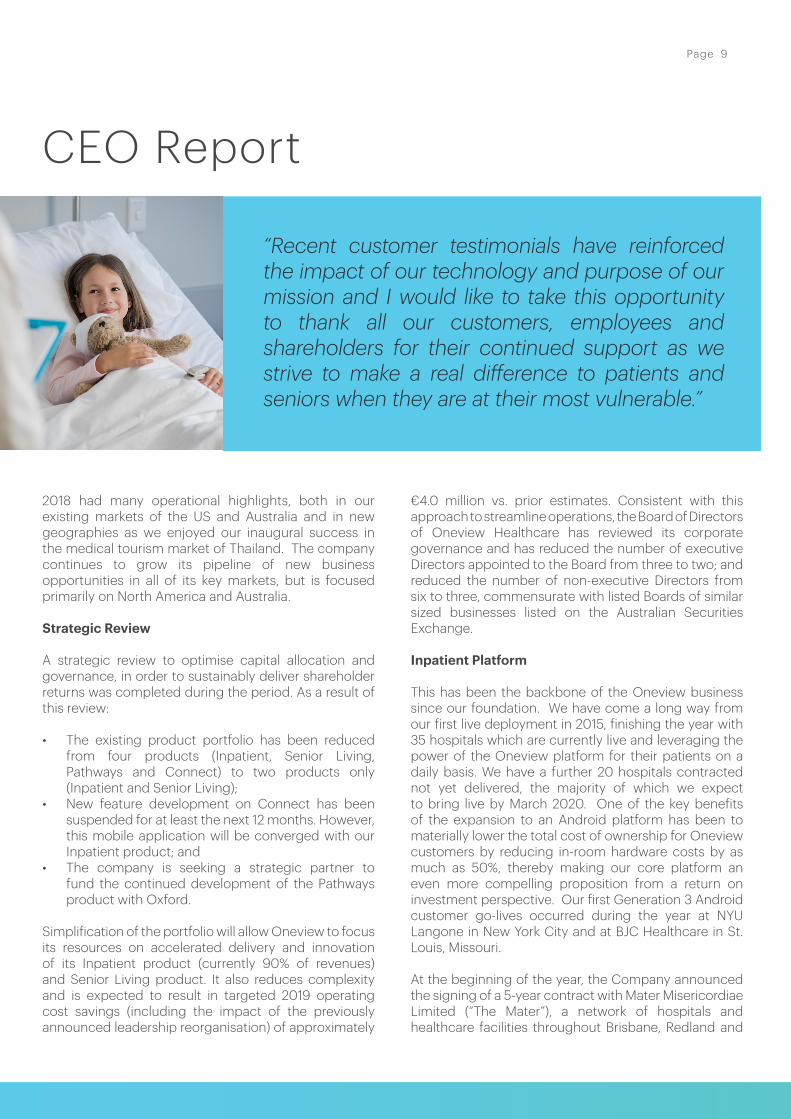
CEO Report
“Recent customer testimonials have reinforced the impact of our technology and purpose of our mission and I would like to take this opportunity to thank all our customers, employees and shareholders for their continued support as we strive to make a real difference to patients and seniors when they are at their most vulnerable.”
2018 had many operational highlights, both in our existing markets of the US and Australia and in new geographies as we enjoyed our inaugural success in the medical tourism market of Thailand. The company continues to grow its pipeline of new business opportunities in all of its key markets, but is focused primarily on North America and Australia.
Strategic Review
A strategic review to optimise capital allocation and governance, in order to sustainably deliver shareholder returns was completed during the period. As a result of this review:
• The existing product portfolio has been reduced from four products (Inpatient, Senior Living, Pathways and Connect) to two products only (Inpatient and Senior Living);
• New feature development on Connect has been suspended for at least the next 12 months. However, this mobile application will be converged with our Inpatient product; and
• The company is seeking a strategic partner to fund the continued development of the Pathways product with Oxford.
Simplification of the portfolio will allow Oneview to focus its resources on accelerated delivery and innovation of its Inpatient product (currently 90% of revenues) and Senior Living product. It also reduces complexity and is expected to result in targeted 2019 operating cost savings (including the impact of the previously announced leadership reorganisation) of approximately
€4.0 million vs. prior estimates. Consistent with this approach to streamline operations, the Board of Directors of Oneview Healthcare has reviewed its corporate governance and has reduced the number of executive Directors appointed to the Board from three to two; and reduced the number of non-executive Directors from six to three, commensurate with listed Boards of similar sized businesses listed on the Australian Securities Exchange.
Inpatient Platform
This has been the backbone of the Oneview business since our foundation. We have come a long way from our first live deployment in 2015, finishing the year with 35 hospitals which are currently live and leveraging the power of the Oneview platform for their patients on a daily basis. We have a further 20 hospitals contracted not yet delivered, the majority of which we expect to bring live by March 2020. One of the key benefits of the expansion to an Android platform has been to materially lower the total cost of ownership for Oneview customers by reducing in-room hardware costs by as much as 50%, thereby making our core platform an even more compelling proposition from a return on investment perspective. Our first Generation 3 Android customer go-lives occurred during the year at NYU Langone in New York City and at BJC Healthcare in St. Louis, Missouri.
At the beginning of the year, the Company announced the signing of a 5-year contract with Mater Misericordiae Limited (“The Mater”), a network of hospitals and healthcare facilities throughout Brisbane, Redland and
Page 9
Springfield, Australia, to deploy the Oneview patient engagement and clinical workflow solution in 904 beds across 9 facilities. Implementation of the project commenced in the second half of the year with a small number of beds going live prior to year-end. The remainder of the project will be delivered in 2019. Our first Australian Gen 3 customers will be The Mater and Sydney Children’s Hospital, Randwick, both of which are scheduled to go live during the first half of 2019.
In the first quarter of the year, we also agreed terms with the high-profile NYU Langone Medical Center in New York City, to expand the scope of our implementation to include an additional 124 beds across a number of perioperative bays and paediatric rooms.
In May, we announced an expansion in our global footprint with the signing of a new contract with Bumrungrad International Hospital (“Bumrungrad”) in Bangkok, Thailand. This is our first entry into the medical tourism market in South East Asia and it was one of the strategic priorities announced at the time of our initial public offering. This win serves to reaffirm the global appeal of the Oneview platform and the fact that patient experience is an international priority. The inaugural three-year contract involves deployment of the Oneview solution in 497 beds and 110 digital signage locations at Bumrungrad’s flagship hospital at Sukhumvit 3 in Bangkok, with initial go-live being achieved in December 2018.
In the first half of the year, Mediclinic Middle East in the UAE, (part of Mediclinic International PLC, a private healthcare company with operations in Southern Africa, Switzerland and the United Arab Emirates), signed an expansion agreement to deploy the Oneview inpatient solution at their new Mediclinic Parkview Hospital. The new hospital was opened to the public in November 2018 with the Oneview solution being deployed across 168 patient rooms and 144 digital signage locations.
In the second half of the year, the company achieved a number of expansion deals with existing customers including:
• BJC HealthCare signed an expansion agreement to expand the Oneview platform across an additional 126 beds at their BJC South facility and 103 beds at their BJC West County hospital.
• UCSF signed an agreement to expand the Oneview solution to their new Precision Cancer Medical Building (PCMB). This is a new state of the art building opening in early 2019 on the Mission Bay campus. Oneview will be deployed across 60 end points including infusion chairs, individual chemotherapy bays and common areas.
During the high profile HIMSS (Healthcare Information and Management Systems Society) event in Las Vegas early in the year, Oneview, along with the Sydney Children’s Hospital Network, were jointly announced as winners of the Microsoft 2018 Health Innovation Award for “Engage Your Patients.” The award recognises health organisations and their technology solution partners for using Microsoft’s Azure technology in innovative ways that help engage patients, empower care teams, optimise clinical and operational effectiveness and transform health. In announcing the award, Microsoft stated that the 2018 winners are impacting the industry by creating breakthrough solutions that empower health and life sciences organisations, while meeting global, local and industry specific compliance and security standards.
Patient Pathways
As outlined above, arising from the strategic review carried out during the year, the decision was made to seek a strategic partner to fund the continued development of the Pathways product with the University of Oxford and Oxford University Hospitals NHS Foundation Trust. We have identified a number of potential partners with whom we are actively engaged.
Senior Living
Our Senior Living solution achieved a number of important milestones during 2018:
• In September, we deployed the Senior Living product at our first residential aged care facility in Australia, with the opening of the new 120-bed Thomas Holt facility at Kirrawee in Sydney.
• Subsequent to year-end, the company announced our inaugural Senior Living contract in the critical US market with Christian Living Communities in Denver, Colorado. The initial deployment of this product is scheduled for 2019.
Dr. Joan Cahill is a Research Fellow and Principal Investigator at the Center for Innovation in Human Systems (CIHS), at the School of Psychology, Trinity College Dublin, Ireland. Since September 2016, Dr. Cahill has been leading a research study in the area of assisted living (AL) at Oneview Healthcare, linking to the specification of the Senior Living product. Most recently, Dr Cahill’s research has focused on embedding a theoretical framework for monitoring and evaluating wellness in AL environments, in the design and application of IoT/sensor-based infrastructures.
Page 10

2018 Operational & Financial Review
+35%
35% increase in recurring revenue to €3.4m in 2018.
Recurring revenue55Contracted hospitals
IPO Dec 2016Dec-17 Jan-18
1,9982,515 3,292
5,181
1,896
4,5105,508
7,704 7,404
12,214
ContractedNot Yet Installed
Total Contracted
Preferred Tendered/In Contract
Submitted an RFP
Total Under RFP Process
IPO
Dec 2016
Contracted Bed & Pipeline Developments
Contracted Bed & Pipeline DevelopmentsIPO Dec-17 Dec-18
Live & Installed Contracted But Not Yet Installed
Total Under Contract In Contract Nego�a�on Submi�ed or Preparing to Submit a Tender
1,294
3,582
6,258
1,998
5,416
4,452
3,292
8,998
10,710
1,896
4,923
9,667
5,508
12,990
9,193
Oneview achieved 35% year over year growth in recurring revenue to €3.4m in 2018. This growth will continue to accelerate in 2019 as we implement our existing contracted book of business.
Oneview finished the year with €9.3m in cash reserves. The impact of the cost reductions arising from the strategic review is having a positive impact on cash outflows. Notwithstanding the material improvements in cash-flow since the strategic review, the company
is currently working with its advisors to evaluate a number of alternative funding strategies to strengthen its balance sheet as it pursues these opportunities.
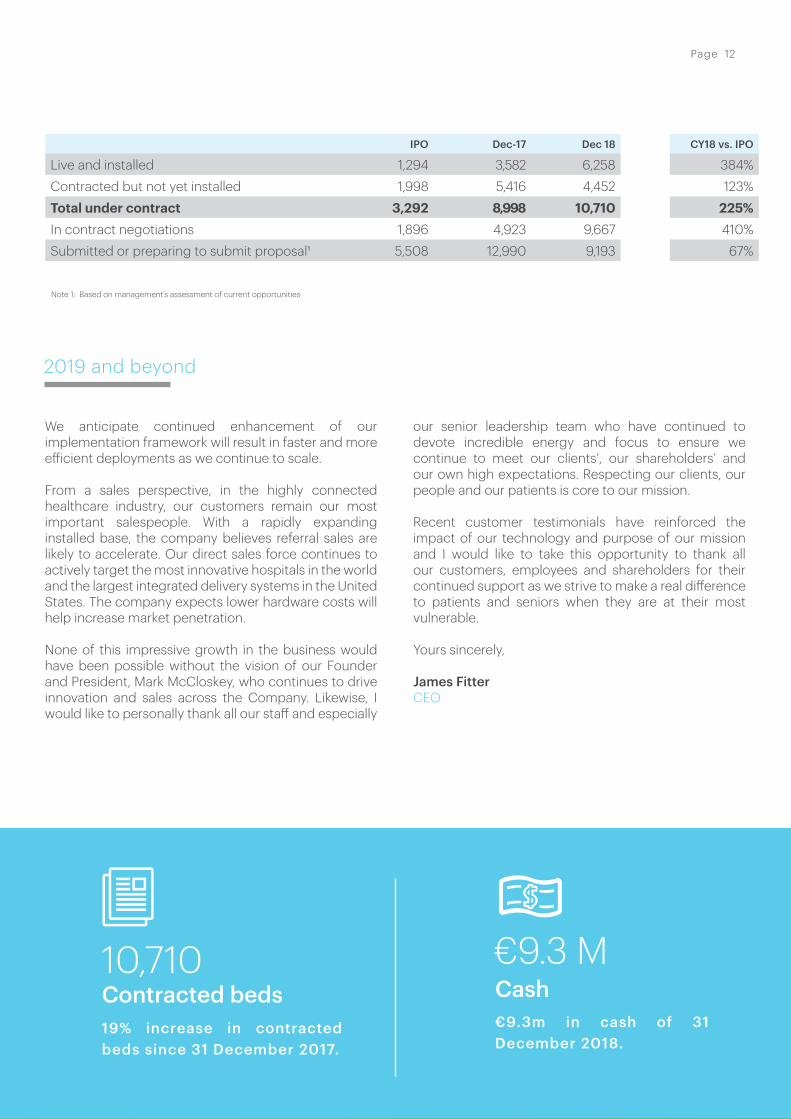
As of 31 December 2018, we have achieved a 19% increase in contracted beds since 31 December 2017 with 10,710 beds contracted. At 31 December 2018, we were in contract negotiation for 9,667 beds and had submitted a request for pricing (“RFP”) for a further 9,193 beds.
Page 11
€9.3 MCash€9.3m in cash of 31 December 2018.
2019 and beyond
We anticipate continued enhancement of our implementation framework will result in faster and more efficient deployments as we continue to scale. From a sales perspective, in the highly connected healthcare industry, our customers remain our most important salespeople. With a rapidly expanding installed base, the company believes referral sales are likely to accelerate. Our direct sales force continues to actively target the most innovative hospitals in the world and the largest integrated delivery systems in the United States. The company expects lower hardware costs will help increase market penetration.
None of this impressive growth in the business would have been possible without the vision of our Founder and President, Mark McCloskey, who continues to drive innovation and sales across the Company. Likewise, I would like to personally thank all our staff and especially
our senior leadership team who have continued to devote incredible energy and focus to ensure we continue to meet our clients’, our shareholders’ and our own high expectations. Respecting our clients, our people and our patients is core to our mission.
Recent customer testimonials have reinforced the impact of our technology and purpose of our mission and I would like to take this opportunity to thank all our customers, employees and shareholders for their continued support as we strive to make a real difference to patients and seniors when they are at their most vulnerable.
Yours sincerely,
James FitterCEO
10,71019% increase in contracted beds since 31 December 2017.
Contracted beds
IPO Dec-17 Dec 18 CY18 vs. IPO
Live and installed 1,294 3,582 6,258 384%Contracted but not yet installed 1,998 5,416 4,452 123%Total under contract 3,292 8,998 10,710 225%In contract negotiations 1,896 4,923 9,667 410%Submitted or preparing to submit proposal1 5,508 12,990 9,193 67%
Note 1: Based on management’s assessment of current opportunities
Page 12

The Remuneration and Nomination Committee set out its report1 as follows:
1 There is no regulatory requirement, other than the Companies Act 2014 disclosure requirements, for the Company to disclose information on the remuneration arrangements in place for Directors and Executives of Oneview Healthcare PLC. However, the Remuneration and Nomination Committee is committed to good corporate standards and has disclosed information considered relevant to shareholders.
1. Principles used to determine the nature and amount of remuneration
i. Objectives & framework
The objectives of the Group’s executive reward framework are to ensure that reward for performance is competitive and appropriate for the results delivered. The framework aligns reward with achievement of strategic objectives and the creation of value for shareholders, and conforms to market practice for delivery of reward. The Board has ensured that executive reward satisfies the following key criteria for good reward governance practices:
• Competitiveness and awareness• Acceptability to shareholders• Performance linkage / alignment of executive
compensation• Transparency• Capital management
The Group has structured an executive remuneration framework that is market competitive and complimentary to the reward strategy of the organisation. The Board is satisfied remuneration recommendations are made free from undue influence by the members of the key management personnel.
Alignment to shareholders’ interests• Has economic profitability as a core component of
the plan • Focuses on sustained growth in shareholder wealth
comprising growth in share price and dividends (when available)
• Delivering constant return on assets as well as focusing the executive on key non-financial drivers of value
• Attracts and retains high calibre executives
Alignment to program participants’ interests• Rewards capability and experience• Reflects competitive reward for contribution to
growth in shareholder wealth• Provides a clear structure for earning rewards• Provides recognition for contribution
The framework provides a mix of fixed pay and long term incentives comprising an employee share option scheme and a long term incentive plan. The company currently does not operate a variable pay arrangement.
ii. Remuneration & Nomination Committee
The Board has established a Remuneration and Nomination Committee. During the year, the committee comprised Joseph Rooney (Chairman), Mark Cullen and James (Will) Vicars. On 22 August 2018, Michael Kaminski replaced James (Will) Vicars and assumed the position of chair of the committee. On 4 January 2019, Lyle Berkowitz replaced Mark Cullen. Effective 4 January 2019, the committee comprises Michael Kaminski (Chairman), Joseph Rooney and Lyle Berkowitz.
The purpose of the Committee is to assist the Board by providing advice on remuneration and incentive policies and practices and specific recommendations on remuneration packages and other terms of employment for executive directors, other senior executives and non-executive directors. Specifically:• the Company’s remuneration policy, including as it
applies to Directors and the process by which any pool of Directors’ fees approved by shareholders is allocated to Directors;
• Board succession issues and planning;• the appointment and re election of members of the
Board and its committees;• induction of Directors and continuing professional
development programs for Directors;• remuneration packages of senior executives, non
executive Directors and executive Directors, equity based incentive plans and other employee benefit programs;
• the Company’s superannuation arrangements;• the Company’s recruitment, retention and
termination policies;• succession plans of the CEO, senior executives and
executive Directors;• the process for the evaluation of the performance
of the Board, its Board Committees and individual Directors;
• the review of the performance of senior executives and members of the Board, which should take place at least annually;
• those aspects of the Company’s remuneration policies and packages, including equity based incentives, which should be subject to shareholder
Remuneration ReportPage 13
approval; and• the size and composition of the Board and strategies
to address Board diversity and the Company’s performance in respect of the Company’s Diversity Policy, including whether there is any gender or other inappropriate bias in remuneration for Directors, senior executives or other employees.
iii. Non-executive directors
Fees and payments to non-executive directors reflect the demands, which are made on, and the responsibilities of, the directors. Non-executive directors’ fees and payments are reviewed annually by the Board. The Chairman’s fees are determined independently to the fees of non-executive directors based on comparative roles in the external market. The Chairman is not present at any discussions relating to determination of his own remuneration. Non-executive directors have also received share options under the Oneview Share Option Plan.
a. Non-executive directors’ feesThe current base remuneration was reviewed immediately prior to the company listing on the Australian Stock Exchange. The Chairman’s remuneration is inclusive of committee fees while other non-executive directors who chair a committee may receive additional annual fees.
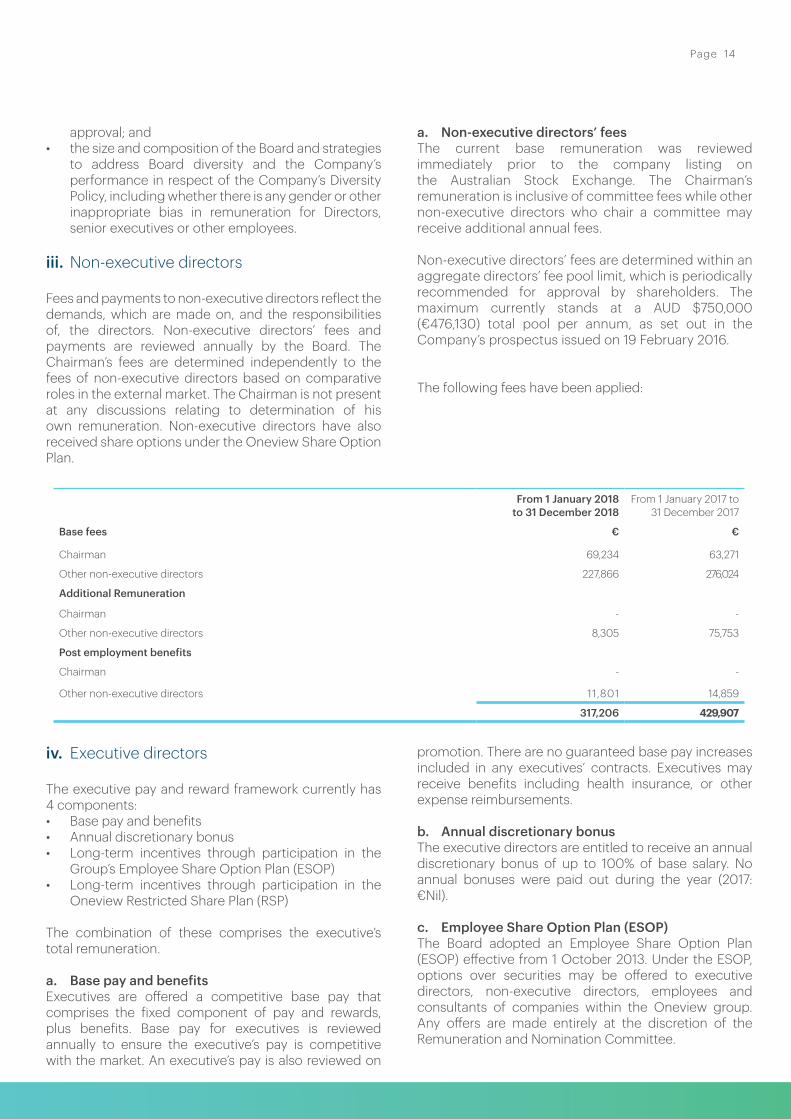
Non-executive directors’ fees are determined within an aggregate directors’ fee pool limit, which is periodically recommended for approval by shareholders. The maximum currently stands at a AUD $750,000 (€476,130) total pool per annum, as set out in the Company’s prospectus issued on 19 February 2016.
The following fees have been applied:
From 1 January 2018
to 31 December 2018From 1 January 2017 to
31 December 2017
Base fees € €
Chairman 69,234 63,271
Other non-executive directors 227,866 276,024
Additional Remuneration
Chairman - -
Other non-executive directors 8,305 75,753
Post employment benefits
Chairman - -
Other non-executive directors 11,801 14,859
317,206 429,907
iv. Executive directors
The executive pay and reward framework currently has 4 components:• Base pay and benefits• Annual discretionary bonus• Long-term incentives through participation in the
Group’s Employee Share Option Plan (ESOP)• Long-term incentives through participation in the
Oneview Restricted Share Plan (RSP)
The combination of these comprises the executive’s total remuneration.
a. Base pay and benefitsExecutives are offered a competitive base pay that comprises the fixed component of pay and rewards, plus benefits. Base pay for executives is reviewed annually to ensure the executive’s pay is competitive with the market. An executive’s pay is also reviewed on
promotion. There are no guaranteed base pay increases included in any executives’ contracts. Executives may receive benefits including health insurance, or other expense reimbursements.
b. Annual discretionary bonusThe executive directors are entitled to receive an annual discretionary bonus of up to 100% of base salary. No annual bonuses were paid out during the year (2017: €Nil).
c. Employee Share Option Plan (ESOP)The Board adopted an Employee Share Option Plan (ESOP) effective from 1 October 2013. Under the ESOP, options over securities may be offered to executive directors, non-executive directors, employees and consultants of companies within the Oneview group. Any offers are made entirely at the discretion of the Remuneration and Nomination Committee.
Page 14
d. Restricted Share Plan (RSP)The Company operates a Restricted Share Plan which was established on 16 March 2016. Executive directors and employees are eligible to participate in the RSP at the discretion of the Remuneration and Nomination Committee. The RSP is an employee share scheme as defined in section 64 of the Companies Act 2014 and is established in accordance with Section 128D of the Taxes Consolidation Act 1997 (as amended). Awards under the RSP will be in the form of an award of “Restricted Shares” (RSU’s) which are subject to restrictions and forfeiture. Shares awarded are held by an independent trustee based in Ireland, Goodbody Trustees Limited. No payment is required by the Participant for the grant of an award of RSUs.
Awards to executive directors in the year and the preceding year under the RSP are subject to performance conditions over a performance period as set out in the Remuneration report, and as per their contract of award. Performance conditions include:• Continuing employment throughout the vesting
period;• Continuing compliance throughout the vesting
period in all material respects of the Company’s accounting and reporting requirements under the Corporations Act, the ASX Listing Rules and Irish company law;
• Compound annual growth rate in TSR whereby the Company achieves a target compound percentage growth rate in the stock price of the Company as quoted on the ASX, plus dividends as measured by reference to a five day VWAP for the five trading days commencing on the day of release of the audited financial statements for each of FY2018,
FY2019, FY2020, FY2021 and FY2022 (‘test dates’), against the Offer Price;
• Compound annual growth in TSR whereby the Company achieves a target compound percentage growth rate in the stock price of the Company as quoted on the ASX, plus dividends, as measured by reference to the share price on the last trading day of the FY2017, FY2018, FY2019 and FY2020 (‘test dates’), against the Offer Price;
• Recurring revenue growth test measured by the compound annual percentage growth rate in recurring revenue per the audited Consolidated financial statements for FY2017, FY2018, FY2019 and FY2020 (‘test dates’), against the audited Consolidated financial statements for FY2015;
• Total hospital beds contracted by reference to a target number of contracted hospital beds to be met by 31 December 2017, 2018 and 2019 respectively (‘test dates’);
• Total Assisted Living / Senior Living beds contracted by reference to a target number of contracted Assisted Living / Senior Living beds to be met by 31 December 2017, 2018 and 2019 respectively (‘test dates’).
Tests for total shareholder return (TSR), recurring revenue growth (RRG), hospital beds and assisted living / Senior Living beds contracted are set annually by the Remuneration and Nominations Committee, following completion of the financial year.
At the end of each test period, the Remuneration and Nomination Committee will determine the extent to which the performance conditions have been met.
Page 15
2. Details of remuneration
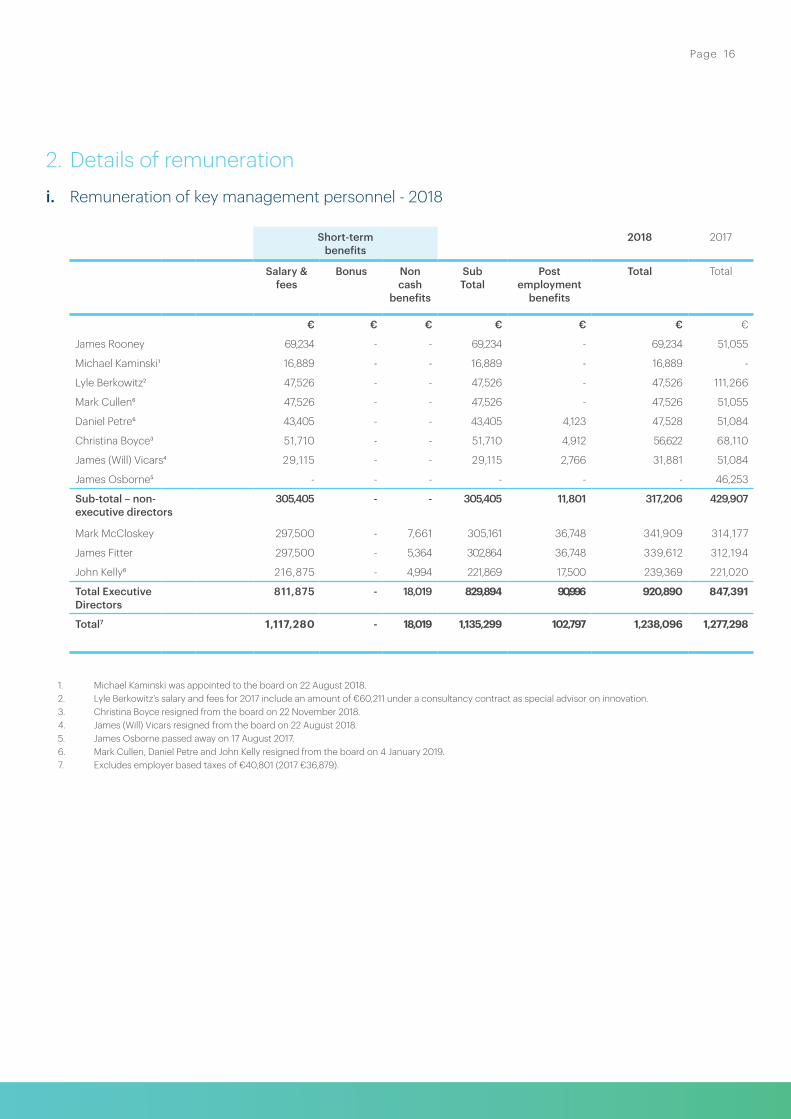
i. Remuneration of key management personnel - 2018
Short-termbenefits
2018 2017
Salary & fees
Bonus Non cash
benefits
SubTotal
Postemployment
benefits
Total Total
€ € € € € € €
James Rooney 69,234 - - 69,234 - 69,234 51,055
Michael Kaminski1 16,889 - - 16,889 - 16,889 -
Lyle Berkowitz2 47,526 - - 47,526 - 47,526 111,266
Mark Cullen6 47,526 - - 47,526 - 47,526 51,055
Daniel Petre6 43,405 - - 43,405 4,123 47,528 51,084
Christina Boyce3 51,710 - - 51,710 4,912 56,622 68,110
James (Will) Vicars4 29,115 - - 29,115 2,766 31,881 51,084
James Osborne5 - - - - - - 46,253
Sub-total – non-executive directors
305,405 - - 305,405 11,801 317,206 429,907
Mark McCloskey 297,500 - 7,661 305,161 36,748 341,909 314,177
James Fitter 297,500 - 5,364 302,864 36,748 339,612 312,194
John Kelly6 216,875 - 4,994 221,869 17,500 239,369 221,020
Total Executive Directors
811,875 - 18,019 829,894 90,996 920,890 847,391
Total7 1,117,280 - 18,019 1,135,299 102,797 1,238,096 1,277,298
1. Michael Kaminski was appointed to the board on 22 August 2018.2. Lyle Berkowitz’s salary and fees for 2017 include an amount of €60,211 under a consultancy contract as special advisor on innovation. 3. Christina Boyce resigned from the board on 22 November 2018. 4. James (Will) Vicars resigned from the board on 22 August 2018.5. James Osborne passed away on 17 August 2017.6. Mark Cullen, Daniel Petre and John Kelly resigned from the board on 4 January 2019.7. Excludes employer based taxes of €40,801 (2017 €36,879).
Page 16

iii. Performance related remuneration metrics
The relative proportions of remuneration that are linked to performance and those that are fixed are as follows:
Fixed Remuneration At Risk
2018%
2017%
2018%
2017%
Joseph Rooney 73% 67% 27% 33%
Michael Kaminski 100% - 0% -
Lyle Berkowitz 53% 72% 47% 28%
Mark Cullen 66% 67% 34% 33%
Daniel Petre 66% 66% 34% 34%
Christina Boyce 100% 61% 0% 39%
James (Will) Vicars 67% 67% 33% 33%
James Osborne - 50% - 50%
Mark McCloskey1 100% 44% 0% 56%
James Fitter1 100% 39% 0% 61%
John Kelly 53% 46% 47% 54%
78% 48% 22% 52%
2018 2017
€ €
Joseph Rooney 24,986 24,986
James Osborne - 45,465
Christina Boyce - 42,901
Lyle Berkowitz 42,901 42,901
Mark Cullen 24,917 24,986
Daniel Petre 24,917 26,654
James (Will) Vicars 16,043 24,986
Michael Kaminski - -
Sub-total – non-executive directors 133,764 232,879
Mark McCloskey1 (58,073) 398,488
James Fitter1 (43,541) 483,105
John Kelly 211,256 263,739
Total Executive Directors 109,642 1,145,332
Total 243,406 1,378,211
ii. Options & RSUs
In addition, key management personnel have been awarded share options under the ESOP and restricted stock units under the RSP, as highlighted earlier in this report. The fair value charges associated with these awards are as follows:
1. As noted in 2.ii above, for Mark McCloskey and James Fitter, the non-cash accounting charge in respect of their restricted stock units under the RSP is a negative charge in 2018
Page 17
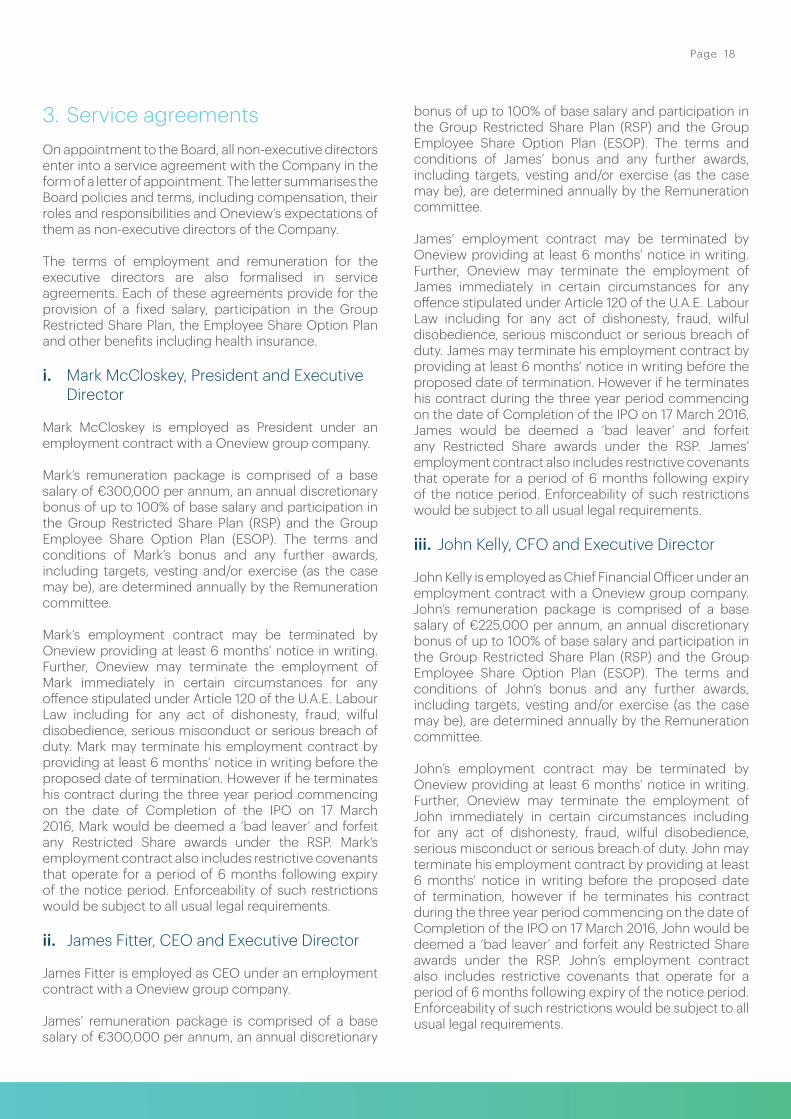
3. Service agreementsOn appointment to the Board, all non-executive directors enter into a service agreement with the Company in the form of a letter of appointment. The letter summarises the Board policies and terms, including compensation, their roles and responsibilities and Oneview’s expectations of them as non-executive directors of the Company.
The terms of employment and remuneration for the executive directors are also formalised in service agreements. Each of these agreements provide for the provision of a fixed salary, participation in the Group Restricted Share Plan, the Employee Share Option Plan and other benefits including health insurance.
i. Mark McCloskey, President and Executive Director
Mark McCloskey is employed as President under an employment contract with a Oneview group company.
Mark’s remuneration package is comprised of a base salary of €300,000 per annum, an annual discretionary bonus of up to 100% of base salary and participation in the Group Restricted Share Plan (RSP) and the Group Employee Share Option Plan (ESOP). The terms and conditions of Mark’s bonus and any further awards, including targets, vesting and/or exercise (as the case may be), are determined annually by the Remuneration committee.
Mark’s employment contract may be terminated by Oneview providing at least 6 months’ notice in writing. Further, Oneview may terminate the employment of Mark immediately in certain circumstances for any offence stipulated under Article 120 of the U.A.E. Labour Law including for any act of dishonesty, fraud, wilful disobedience, serious misconduct or serious breach of duty. Mark may terminate his employment contract by providing at least 6 months’ notice in writing before the proposed date of termination. However if he terminates his contract during the three year period commencing on the date of Completion of the IPO on 17 March 2016, Mark would be deemed a ‘bad leaver’ and forfeit any Restricted Share awards under the RSP. Mark’s employment contract also includes restrictive covenants that operate for a period of 6 months following expiry of the notice period. Enforceability of such restrictions would be subject to all usual legal requirements.
ii. James Fitter, CEO and Executive Director
James Fitter is employed as CEO under an employment contract with a Oneview group company.
James’ remuneration package is comprised of a base salary of €300,000 per annum, an annual discretionary
bonus of up to 100% of base salary and participation in the Group Restricted Share Plan (RSP) and the Group Employee Share Option Plan (ESOP). The terms and conditions of James’ bonus and any further awards, including targets, vesting and/or exercise (as the case may be), are determined annually by the Remuneration committee.
James’ employment contract may be terminated by Oneview providing at least 6 months’ notice in writing. Further, Oneview may terminate the employment of James immediately in certain circumstances for any offence stipulated under Article 120 of the U.A.E. Labour Law including for any act of dishonesty, fraud, wilful disobedience, serious misconduct or serious breach of duty. James may terminate his employment contract by providing at least 6 months’ notice in writing before the proposed date of termination. However if he terminates his contract during the three year period commencing on the date of Completion of the IPO on 17 March 2016, James would be deemed a ‘bad leaver’ and forfeit any Restricted Share awards under the RSP. James’ employment contract also includes restrictive covenants that operate for a period of 6 months following expiry of the notice period. Enforceability of such restrictions would be subject to all usual legal requirements.
iii. John Kelly, CFO and Executive Director
John Kelly is employed as Chief Financial Officer under an employment contract with a Oneview group company. John’s remuneration package is comprised of a base salary of €225,000 per annum, an annual discretionary bonus of up to 100% of base salary and participation in the Group Restricted Share Plan (RSP) and the Group Employee Share Option Plan (ESOP). The terms and conditions of John’s bonus and any further awards, including targets, vesting and/or exercise (as the case may be), are determined annually by the Remuneration committee.
John’s employment contract may be terminated by Oneview providing at least 6 months’ notice in writing. Further, Oneview may terminate the employment of John immediately in certain circumstances including for any act of dishonesty, fraud, wilful disobedience, serious misconduct or serious breach of duty. John may terminate his employment contract by providing at least 6 months’ notice in writing before the proposed date of termination, however if he terminates his contract during the three year period commencing on the date of Completion of the IPO on 17 March 2016, John would be deemed a ‘bad leaver’ and forfeit any Restricted Share awards under the RSP. John’s employment contract also includes restrictive covenants that operate for a period of 6 months following expiry of the notice period. Enforceability of such restrictions would be subject to all usual legal requirements.
Page 18

4. Share Based Compensation
i. Employee Share Option Plan
The Board adopted an Employee Share Option Plan (ESOP) effective from 1 October 2013. Under the ESOP, options over shares may be offered to executive directors, non-executive directors, employees and consultants of companies within the Oneview group. Any offers are made entirely at the discretion of the Remuneration and Nomination Committee.
Page 19

The following options were outstanding as at 31 December 2018 in respect of the Directors.
Name Date Number of Options Strike Price Vesting Date
Joseph Rooney Grant 7 February 2016 50,000 €0.001 6 February 2019
Outstanding as at 31 December 2018 50,000
Exercisable as at 31 December 2018 -
Estate of James Osborne Grant 31 December 2014 50,000 €0.001 31 December 2017
Estate of James Osborne Grant 31 December 2015 50,000 €0.001 31 December 2018
Outstanding as at 31 December 2018 100,000
Exercisable as at 31 December 2018 50,000
Mark McCloskey Grant 9 October 2013 133,340 €0.001 8 October 2014
Mark McCloskey Grant 9 October 2013 133,330 €0.001 8 October 2015
Mark McCloskey Grant 9 October 2013 133,330 €0.001 8 October 2016
Mark McCloskey Grant 31 December 2014 450,000 €0.001 31 December 2017
Mark McCloskey Exercise 31 December 2015 (266,670) €0.001
Mark McCloskey Grant 31 December 2015 200,000 €0.750 31 December 2018
Mark McCloskey Replaced for RSU’s 31 December 2015 (200,000) €0.750 31 December 2018
Outstanding as at 31 December 2018 583,330
Exercisable as at 31 December 2018 583,330
James Fitter Grant 9 October 2013 233,340 €0.001 8 October 2014
James Fitter Grant 9 October 2013 233,330 €0.001 8 October 2015
James Fitter Grant 9 October 2013 233,330 €0.001 8 October 2016
James Fitter Grant 31 December 2014 500,000 €0.001 31 December 2017
James Fitter Exercise 31 December 2015 (466,670) €0.001
James Fitter Grant 31 December 2015 200,000 €0.750 31 December 2018
James Fitter Replaced for RSU’s 31 December 2015 (200,000) €0.750 31 December 2018
Outstanding as at 31 December 2018 733,330
Exercisable as at 31 December 2018 733,330
John Kelly Grant 9 October 2013 50,000 €0.001 8 October 2014
John Kelly Grant 9 October 2013 50,000 €0.001 8 October 2015
John Kelly Grant 9 October 2013 50,000 €0.001 8 October 2016
John Kelly Grant 31 December 2014 150,000 €0.001 31 December 2017
John Kelly Grant 31 December 2015 100,000 €0.750 31 December 2018
John Kelly Replaced for RSU’s 31 December 2015 (100,000) €0.750 31 December 2018
Outstanding as at 31 December 2018 300,000
Exercisable as at 31 December 2018 300,000
James (Will) Vicars Grant 31 December 2015 50,000 €0.001 31 December 2018
Outstanding as at 31 December 2018 50,000
Exercisable as at 31 December 2018 50,000
Daniel Petre Grant 31 December 2014 40,000 €1.233 31 December 2017
Daniel Petre Grant 31 December 2015 50,000 €0.001 31 December 2018
Outstanding as at 31 December 2018 90,000
Exercisable as at 31 December 2018 90,000
Mark Cullen Grant 31 December 2015 50,000 €0.001 31 December 2018
Outstanding as at 31 December 2018 50,000
Exercisable as at 31 December 2018 50,000
Christina Boyce Grant 19 April 2016 50,000 €0.001 18 April 2019
Christina Boyce Forfeit 7 November 2018 (50,000) €0.001
Outstanding as at 31 December 2018 -
Exercisable as at 31 December 2018 -
Lyle Berkowitz Grant 27 April 2017 50,000 €0.001 9 September 2019
Outstanding as at 31 December 2018 50,000
Exercisable as at 31 December 2018 -
Page 20

ii. Restricted Stock Share Plan
On 16 March 2016, the Company adopted the Restricted Share Unit Plan pursuant to which the Remuneration Committee of the Company’s board of directors may make an award under the plan to certain executive directors. On 16 March 2016, an aggregate of 2,585,560 new shares of €0.001 each were issued to Goodbody Trustees Ltd as restricted stock units on behalf of certain directors, with a range of performance conditions attaching to their vesting. The RSUs shall vest over a 3 to 5 year period, dependent on achievement of performance conditions which are set annually by the Remuneration and Nominations Committee following completion of the financial year.
For the year ended 31 December 2018, 400,000 RSU’s vested following achievement of performance conditions relating to continuing employment, as set by the Remuneration and Nomination Committee when the scheme was adopted. These were transferred by the trustee, Goodbody Trustees Ltd to the beneficiaries, Mark McCloskey and James Fitter on 18 January 2019. The year 2 performance conditions for CAGR in TSR, recurring revenue growth, hospital bed targets and Assisted Living bed targets were not achieved and in accordance with the terms and conditions established by the Remuneration and Nominations Committee, the RSUs allocated to these unachieved performance conditions in respect of the year ended 31 December 2018, along with any RSUs allocated to unachieved performance conditions from the prior year shall be aggregated with the award pool for the subsequent year ended 31 December 2019, with updated performance conditions being set.
For the year ended 31 December 2017, 109,820 RSUs vested following achievement of year 1 performance conditions for recurring revenue growth (RRG) as previously set by the Remuneration and Nominations Committee. These were transferred by the trustee, Goodbody Trustees Ltd to the beneficiaries, Mark McCloskey and James Fitter on 18 January 2019. The year 1 performance conditions for CAGR in TSR, hospital bed targets and Assisted Living bed targets were not achieved and in accordance with the terms and conditions established by the Remuneration and Nominations Committee, the RSUs allocated to these unachieved performance conditions in respect of the year ended 31 December 2017 shall be aggregated with the award pool for the subsequent year ended 31 December 2018, with updated performance conditions being set.
The RSU shares were awarded at a price of €0.001 with vesting over a service period as follows:
Recipient Award Date RSUs Vested 2018 Vested 2017 Vesting Term Performance Conditions
Mark McCloskey 16 March 2016 200,000 200,000 - 3 Years Continued employment
Mark McCloskey 16 March 2016 205,910 - 3 Years CAGR in TSR*
Mark McCloskey 16 March 2016 274,560 54,910 3 Years Recurring revenue growth targets
Mark McCloskey 16 March 2016 102,960 - 3 Years Hospital beds targets
Mark McCloskey 16 March 2016 205,910 - 3 Years Assisted living beds targets
989,340 200,000 54,910
James Fitter 16 March 2016 200,000 200,000 - 3 Years Continued employment
James Fitter 16 March 2016 525,510 - 5 Years CAGR in TSR*
James Fitter 16 March 2016 205,910 - 3 Years CAGR in TSR*
James Fitter 16 March 2016 274,560 54,910 3 Years Recurring revenue growth targets
James Fitter 16 March 2016 102,960 - 3 Years Hospital beds targets
1,308,940 200,000 54,910
John Kelly 16 March 2016 100,000 - 3 Years Continued employment
John Kelly 16 March 2016 187,280 - 3 Years Compliance performance
287,280 -
Sub total 2,585,560 400,000 109,820
RSU’s vested 509,820
Total outstanding RSU’s 2,075,740*Compound Annual Growth Rate in Total Shareholder Return
Page 21

The tests for hospital beds contracted and Assisted Living/Senior Living beds contracted along with recurring revenue growth for 2018 and future years was based at a level approximating to 60% achievability. This was based on a review of quotas set for sales personnel across the Company’s US, Australia and MENA regions and reflecting the likely timing of expected commencement dates for planned future sales headcount and other factors.
5. Additional Information
i. Loans to director
During 2016, the Company advanced an unsecured loan to a director, John Kelly, on an interest free basis for €252,469 in order to settle upfront tax charges associated with the
issue of restricted shares under the Restricted Share Plan. The loan is repayable on demand in the event of disposal of restricted shares under the RSP upon lifting of the relevant restrictions attached to shares. To calculate the notional interest on this loan the director believes an interest rate of 5% is appropriate. This equates to notional interest of €28,403 over the term, which is considered directors’ remuneration, and is in addition to the amounts disclosed in section 2 (i). The loan value represents 0.3% of net assets of Oneview Healthcare PLC company as at 31 December 2018.
On behalf of the board
Michael Kaminski 29 March 2019Chairman of the Remuneration Committee
Page 22
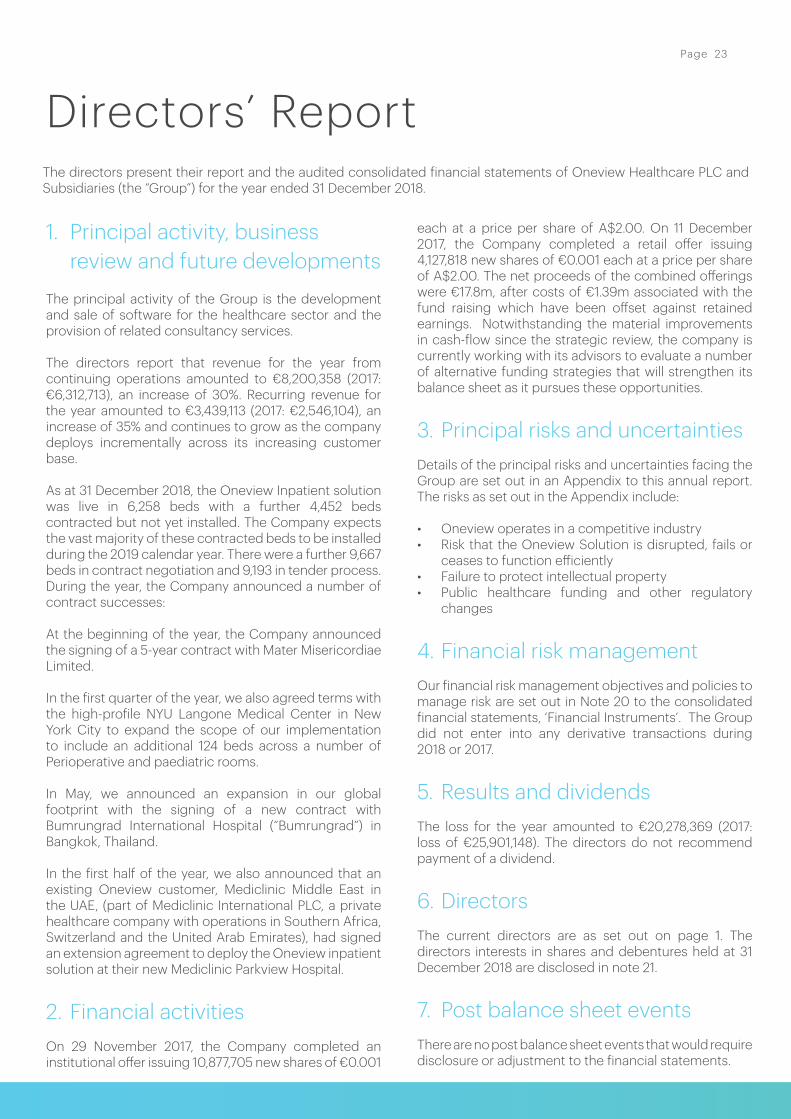
1. Principal activity, business review and future developments
The principal activity of the Group is the development and sale of software for the healthcare sector and the provision of related consultancy services.
The directors report that revenue for the year from continuing operations amounted to €8,200,358 (2017: €6,312,713), an increase of 30%. Recurring revenue for the year amounted to €3,439,113 (2017: €2,546,104), an increase of 35% and continues to grow as the company deploys incrementally across its increasing customer base.
As at 31 December 2018, the Oneview Inpatient solution was live in 6,258 beds with a further 4,452 beds contracted but not yet installed. The Company expects the vast majority of these contracted beds to be installed during the 2019 calendar year. There were a further 9,667 beds in contract negotiation and 9,193 in tender process. During the year, the Company announced a number of contract successes:
At the beginning of the year, the Company announced the signing of a 5-year contract with Mater Misericordiae Limited.
In the first quarter of the year, we also agreed terms with the high-profile NYU Langone Medical Center in New York City to expand the scope of our implementation to include an additional 124 beds across a number of Perioperative and paediatric rooms.
In May, we announced an expansion in our global footprint with the signing of a new contract with Bumrungrad International Hospital (“Bumrungrad”) in Bangkok, Thailand.
In the first half of the year, we also announced that an existing Oneview customer, Mediclinic Middle East in the UAE, (part of Mediclinic International PLC, a private healthcare company with operations in Southern Africa, Switzerland and the United Arab Emirates), had signed an extension agreement to deploy the Oneview inpatient solution at their new Mediclinic Parkview Hospital.
2. Financial activities On 29 November 2017, the Company completed an institutional offer issuing 10,877,705 new shares of €0.001
each at a price per share of A$2.00. On 11 December 2017, the Company completed a retail offer issuing 4,127,818 new shares of €0.001 each at a price per share of A$2.00. The net proceeds of the combined offerings were €17.8m, after costs of €1.39m associated with the fund raising which have been offset against retained earnings. Notwithstanding the material improvements in cash-flow since the strategic review, the company is currently working with its advisors to evaluate a number of alternative funding strategies that will strengthen its balance sheet as it pursues these opportunities.
3. Principal risks and uncertainties Details of the principal risks and uncertainties facing the Group are set out in an Appendix to this annual report. The risks as set out in the Appendix include:
• Oneview operates in a competitive industry• Risk that the Oneview Solution is disrupted, fails or
ceases to function efficiently• Failure to protect intellectual property• Public healthcare funding and other regulatory
changes
4. Financial risk management Our financial risk management objectives and policies to manage risk are set out in Note 20 to the consolidated financial statements, ‘Financial Instruments’. The Group did not enter into any derivative transactions during 2018 or 2017.
5. Results and dividends The loss for the year amounted to €20,278,369 (2017: loss of €25,901,148). The directors do not recommend payment of a dividend.
6. Directors The current directors are as set out on page 1. The directors interests in shares and debentures held at 31 December 2018 are disclosed in note 21.
7. Post balance sheet eventsThere are no post balance sheet events that would require disclosure or adjustment to the financial statements.
Directors’ ReportThe directors present their report and the audited consolidated financial statements of Oneview Healthcare PLC and Subsidiaries (the “Group”) for the year ended 31 December 2018.
Page 23

8. Political contributionsThe Group and Company did not make any disclosable political donations during the year.
9. Research and development The Group is involved in research and development activities and during the year incurred €656,449 in development costs that were capitalised and a further €1,725,998 of research costs that were expensed as they do not meet the current accounting criteria for capitalisation.
10. Going concern The Group financial statements have been prepared on a going concern basis and this has been set out in note 1 of the Accounting Policies.
11. Acquisition of the Company’s own shares
In accordance with a shareholders’ resolution of 16 March 2016, the Company acquired, for purposes of the Long Term Incentive Plan (LTIP), 2,585,560 of its own shares with a nominal value of €2,586, and representing 5% of the Company’s called-up share capital, for a total consideration of €2,586. These shares are currently held by Goodbody Trustees Limited in trust, pending vesting conditions being met.
12. Audit committee The Group has established an Audit Committee with responsibility for assisting the board of the Company in fulfilling its corporate governance and oversight responsibilities in relation to the Company’s financial reports and financial reporting process and internal control structure, risk management systems (financial and non financial) and the external statutory audit process. The Committee meets on a regular basis to:• review and approve internal audit and external
statutory audit plans;• review and approve financial reports; and• review the effectiveness of the Company’s
compliance and risk management functions.
13. Directors’ compliance statement
The directors, in accordance with Section 225(2) of the Companies Act 2014, acknowledge that they are responsible for securing the Company’s compliance with certain obligations specified in that section arising from the Companies Act 2014, and Tax laws (‘relevant obligations’). The directors confirm that:• a compliance policy statement has been drawn up
setting out the Company’s policies with regard to such compliance;
• appropriate arrangements and structures that, in their opinion, are designed to secure material compliance with the Company’s relevant obligations, have been put in place; and
• a review has been conducted, during the financial year, of the arrangements and structures that have been put in place to secure the Company’s compliance with its relevant obligations.
14. Relevant audit information The directors believe that they have taken all steps necessary to make themselves aware of any relevant audit information and have established that the Group’s statutory auditors are aware of that information. In so far as they are aware, there is no relevant audit information of which the Group’s statutory auditors are unaware.
15. Accounting records To ensure that adequate accounting records are kept in accordance with Sections 281 to 285 of the Companies Act 2014, the directors have employed appropriately qualified accounting personnel and have maintained appropriate computerised accounting systems. The accounting records are located at the company’s office at Block 2, Blackrock Business Park, Blackrock, County Dublin.
16. Auditor In accordance with Section 383(2) of the Companies Act 2014 the auditors, KPMG, Registered Auditors, will continue in office.
On behalf of the board
James Fitter Mark McCloskey 29 March 2019 Director Director
Page 24

Page 25

The directors are responsible for preparing the directors’ report and the Group and Company financial statements in accordance with applicable law and regulations.
Company law requires the directors to prepare Group and Company financial statements for each financial year. Under that law they have elected to prepare the Group and company financial statements in accordance with International Financial Reporting Standards (IFRS) as adopted by the EU and applicable law.
Under company law the directors must not approve the Group and company financial statements unless they are satisfied that they give a true and fair view of the assets, liabilities and financial position of the Group and Company and of the Group profit or loss for that year. In preparing each of the Group and Company financial statements, the directors are required to:
• select suitable accounting policies and then apply them consistently;
• make judgements and estimates that are reasonable and prudent;
• state whether applicable Accounting Standards have been followed, subject to any material departures disclosed and explained in the financial statements;
• assess the Company’s ability to continue as a going concern, disclosing, as applicable, matters related to going concern; and
• use the going concern basis of accounting unless they either intend to liquidate the Company or to cease operations, or have no realistic alternative but to do so.
The directors are responsible for keeping adequate accounting records which disclose with reasonable accuracy at any time the assets, liabilities, financial position and profit or loss of the Company and which enable them to ensure that the financial statements of the Group are prepared in accordance with applicable IFRS, as adopted by the EU and comply with the provisions of the Companies Act 2014. They have general responsibility for taking such steps as are reasonably open to them to safeguard the assets of the Group and to prevent and detect fraud and other irregularities. Under applicable law, the directors are also responsible for preparing a Directors’ Report that complies with the Companies Act 2014.
The directors are responsible for the maintenance and integrity of the corporate and financial information included on the Company’s website. Legislation in the Republic of Ireland governing the preparation and dissemination of financial statements may differ from legislation in other jurisdictions.
On behalf of the board
James Fitter Mark McCloskey 29 March 2019Director Director
Statement of Directors’ Responsibilities
Page 26

1. Opinion We have audited the financial statements of Oneview Healthcare PLC (‘the Company’) for the year ended 31 December 2018 set out on pages 31 to 64, which comprise the Consolidated statement of total comprehensive income, the Consolidated statement of financial position, the Company statement of financial position, the Consolidated statement of changes in equity, the Company statement of changes in equity, the Consolidated statement of cash flows, the Company statement of cash flows and related notes, including the summary of significant accounting policies set out in note 1. The financial reporting framework that has been applied in their preparation is Irish Law and International Financial Reporting Standards (IFRS) as adopted by the European Union.
In our opinion:
• the Group financial statements and Company financial statements give a true and fair view of the assets, liabilities and financial position of the Group and the Company as at 31 December 2018 and of the Group’s loss for the year then ended;
• the Group financial statements and the Company financial statements have been properly prepared in accordance with IFRS as adopted by the European Union; and
• the Group financial statements and the Company financial statements have been properly prepared in accordance with the requirements of the Companies Act 2014.
Basis for opinionWe conducted our audit in accordance with International Standards on Auditing (Ireland) (ISAs
(Ireland)) and applicable law. Our responsibilities under those standards are further described in the Auditor’s responsibilities for the audit of the financial statements section of our report. We have fulfilled our ethical responsibilities under, and we remained independent of the Company in accordance with ethical requirements that are relevant to our audit of financial statements in Ireland, including the Ethical Standard issued by the Irish Auditing and Accounting Supervisory Authority (IAASA), as applied to listed entities.
We believe that the audit evidence we have obtained is sufficient and appropriate to provide a basis for our opinion.
2. Key audit matters: our assessment of risks of material misstatement
Key audit matters are those matters that, in our professional judgment, were of most significance in the audit of the financial statements and include the most significant assessed risks of material misstatement (whether or not due to fraud) identified by us, including those which had the greatest effect on: the overall audit strategy; the allocation of resources in the audit; and directing the efforts of the engagement team. These matters were addressed in the context of our audit of the financial statements as a whole, and in forming our opinion thereon, and we do not provide a separate opinion on these matters.
In addition to the matter described in the Material uncertainty related to going concern section, in arriving at our audit opinion above, there was one key audit matter, in the charts on page 28.
Auditor’s ReportIndependent auditor’s report to the members of Oneview Healthcare PLC
Page 27

Revenue recognition €8.2 million (2017 - €6.3 million)Refer to note 1 (accounting policy) and note 2 (financial disclosures)
The key audit matter
We identified a significant risk of error related to revenue recognition.
There are several areas of judgment in determining the appropriate revenue recognition. The main issues are:
• Whether contracts can be separated into individual performance obligations or whether the contract is to be treated as a single performance obligation for revenue recognition purposes;
• The fair value of those components that are separated; and
• The evidence of delivery and appropriate point of revenue recognition for the specific contract.
Our assessment of the risk has been amended to reflect the updated accounting policies arising from the implementation of IFRS 15 – Revenue from Contracts with Customers.
How the matter was addressed in our audit
Our audit procedures included, among others, performing the following audit tests for a sample of contracts selected based on the magnitude of the individual contact and/or amount of revenue recognised in the year:
• Obtaining and documenting our understanding of the process around the transition to IFRS 15 and the determination of revenue to be recognised in line with the new standard and testing the design and implementation of the relevant controls therein
• We assessed that revenue and expenses were recognised in the correct period by agreeing individual transactions to underlying financial records.
• Where a contract contained multiple performance obligations, we challenged the Group’s judgments as to whether there were performance obligations that should be accounted for separately. We did this by:• analysing the terms of the contracts to ensure the contract
specifically identified separate performance obligations or that there existed an expectation of performance obligations based on contracted deliverables;
• obtaining an understanding of the nature of each performance obligation through discussions with the business’ management team and comparison to similar contracts;
• and assessing the contract terms, in particular any specific terms related to acceptance by the customer that might impact the timing of revenue recognition.
• We then considered whether the Group could reliably determine the fair value of each performance obligation. We considered this by reference to either the standalone value, as demonstrated by sales to other customers, or by reference to the expected cost plus a suitable margin.
• Assessed the adequacy of the group’s disclosures when compared to the requirements of IFRS 15.
Based on the evidence obtained from the procedures performed, we considered that the judgements made in relation to revenue are reasonable.
Parent Company Key Audit Matter – Valuation of Investment in subsidiaries and expected credit losses of Intercompany Receivables €80.2 million
Refer to financial statements note 1 (accounting policy) and note 10 and note 12 to the Parent Company financial statements.
The key audit matter
We identified a significant risk of error related to the impairment test for the Parent Company’s investment in subsidiaries and carrying value of intercompany receivables, as the fair values used for the impairment test information are dependent on projected financial information.
How the matter was addressed in our audit
We obtained an understanding of the process related to development of projected financial information, including the preparation of the impairment test.
We performed audit procedures to evaluate the appropriateness of the Company’s projected financial information, including assessment of significant assumptions against externally derived data and internal source data.
We considered the financial statement disclosures for completeness and accuracy.
Based on the evidence obtained we found that the inputs to the Parent Company investment in subsidiaries and intercompany receivables impairment calculation and related disclosures to be reasonable.
Parent company key audit matters Due to the nature of the parent company’s activities, there are no key audit matters that we are required to communicate in accordance with ISAs (Ireland). In arriving at our Parent Company audit opinion, there was one key audit matter as follows:
Page 28
3. Our application of materiality and an overview of the scope of our audit
The materiality for the group financial statements as a whole was set at €0.27 million (2017: €0.32 million). This has been calculated with a reference to group expenses, excluding depreciation, foreign exchange gains or losses and share-based payment expenses. Materiality represents 1% of this benchmark. We consider group expenses to be the most appropriate benchmark as it provides a more stable measure year on year than the group revenue or loss before tax, given the phase of the company’s development. We report to the Audit and Risk Committee all corrected and uncorrected misstatements we identified through our audit with a value in excess of €0.01 million (2017: €0.02 million).
Material uncertainty related to going concernWe draw attention to note 1 to the financial statements which indicates that the Group may not have sufficient working capital to fund its operations for a period of at least 12 months from the date of signing of the financial statements. These events and conditions, along with the other matters explained in note 1, constitute a material uncertainty that may cast significant doubt on the Group’s and the Company’s ability to continue as a going concern. Our opinion is not modified in respect of this matter.
Other informationThe directors are responsible for the other information presented in the Annual Report together with the financial statements. The other information comprises the information included in the directors’ report, Chairmans’ Letter, CEO Report, Remuneration Report, Additional ASX Information and Specific Risks. The financial statements and our auditor’s report thereon do not comprise part of the other information. Our opinion on the financial statements does not cover the other information and, accordingly, we do not express an audit opinion or, except as explicitly stated below, any form of assurance conclusion thereon.
Our responsibility is to read the other information and, in doing so, consider whether, based on our financial statements audit work, the information therein is materially misstated or inconsistent with the financial statements or our audit knowledge. Based solely on that work we have not identified material misstatements in the other information.
Based solely on our work on the other information, we report that:
• we have not identified material misstatements in the directors’ report;
• in our opinion, the information given in the directors’
report is consistent with the financial statements; • in our opinion, the directors’ report has been
prepared in accordance with the Companies Act 2014.
Our opinions on other matters prescribed by the Companies Act 2014 are unmodifiedWe have obtained all the information and explanations which we consider necessary for the purpose of our audit.
In our opinion, the accounting records of the Company were sufficient to permit the financial statements to be readily and properly audited and the Company’s financial statements are in agreement with the accounting records.
We have nothing to report on other matters on which we are required to report by exceptionThe Companies Act 2014 requires us to report to you if, in our opinion, the disclosures of directors’ remuneration and transactions required by Sections 305 to 312 of the Act are not made.
4. Respective responsibilities and restrictions on use
Directors’ responsibilitiesAs explained more fully in their statement set out on page 26, the directors are responsible for: the preparation of the financial statements including being satisfied that they give a true and fair view; such internal control as they determine is necessary to enable the preparation of financial statements that are free from material misstatement, whether due to fraud or error; assessing the Company’s ability to continue as a going concern, disclosing, as applicable, matters related to going concern; and using the going concern basis of accounting unless they either intend to liquidate the Company or to cease operations, or have no realistic alternative but to do so.
Auditor’s responsibilities for the audit of the financial statementsOur objectives are to obtain reasonable assurance about whether the financial statements as a whole are free from material misstatement, whether due to fraud or error, and to issue an auditor’s report that includes our opinion. Reasonable assurance is a high level of assurance, but is not a guarantee that an audit conducted in accordance with ISAs (Ireland) will always detect a material misstatement when it exists. Misstatements can arise from fraud or error and are considered material if, individually or in the aggregate, they could reasonably be expected to influence the economic decisions of users taken on the basis of these financial statements.
Page 29

A fuller description of our responsibilities is provided on IAASA’s website at https://www.iaasa.ie/getmedia/b2389013-1cf6-458b-9b8f-a98202dc9c3a/Description_of_auditors_responsiblities_for_audit.pdf
The purpose of our audit work and to whom we owe our responsibilitiesOur report is made solely to the Company’s members, as a body, in accordance with Section 391 of the Companies Act 2014. Our audit work has been undertaken so that we might state to the Company’s members those matters we are required to state to them in an auditor’s report and for no other purpose. To the fullest extent permitted by law, we do not accept
or assume responsibility to anyone other than the Company and the Company’s members, as a body, for our audit work, for our report, or for the opinions we have formed.
Sean O’Keefe 29 March 2019 for and on behalf ofKPMGChartered Accountants, Statutory Audit Firm1 Stokes PlaceSt. Stephen’s GreenDublin 2
Page 30

Financial Report
2018 2017
Note € €
Continuing Operations
Revenue 2 8,200,358 6,312,713
Cost of sales (4,153,811) (2,760,649)
Gross profit 4,046,547 3,552,064
Sales and marketing expenses (7,864,255) (8,946,216)
Product development and delivery expenses (12,637,659) (13,802,849)
General and administrative expenses (3,949,785) (4,869,978)
Operating loss 3,4 (20,405,152) (24,066,979)
Finance charges 5 (23,297) (1,738,626)
Finance income 5 208,882 1,492
Loss before tax (20,219,567) (25,804,113)
Income tax 6 (58,802) (97,035)
Loss for the year (20,278,369) (25,901,148)
Attributable to ordinary shareholders (20,278,369) (25,901,148)
Loss per share
Basic 7 (0.29) (0.47)
Diluted 7 (0.29) (0.47)
Other comprehensive (loss)/profit
Items that will or may be reclassified to profit or loss
Foreign currency translation differences on
foreign operations (no tax impact) (292,481) 263,691
Other comprehensive (loss)/profit, net of tax (292,481) 263,691
Total comprehensive loss for the year (20,570,850) (25,637,457)
The total comprehensive loss for the year is entirely attributable to equity holders of the Group.
Consolidated statement of comprehensive incomefor the year ended 31 December 2018
Page 31
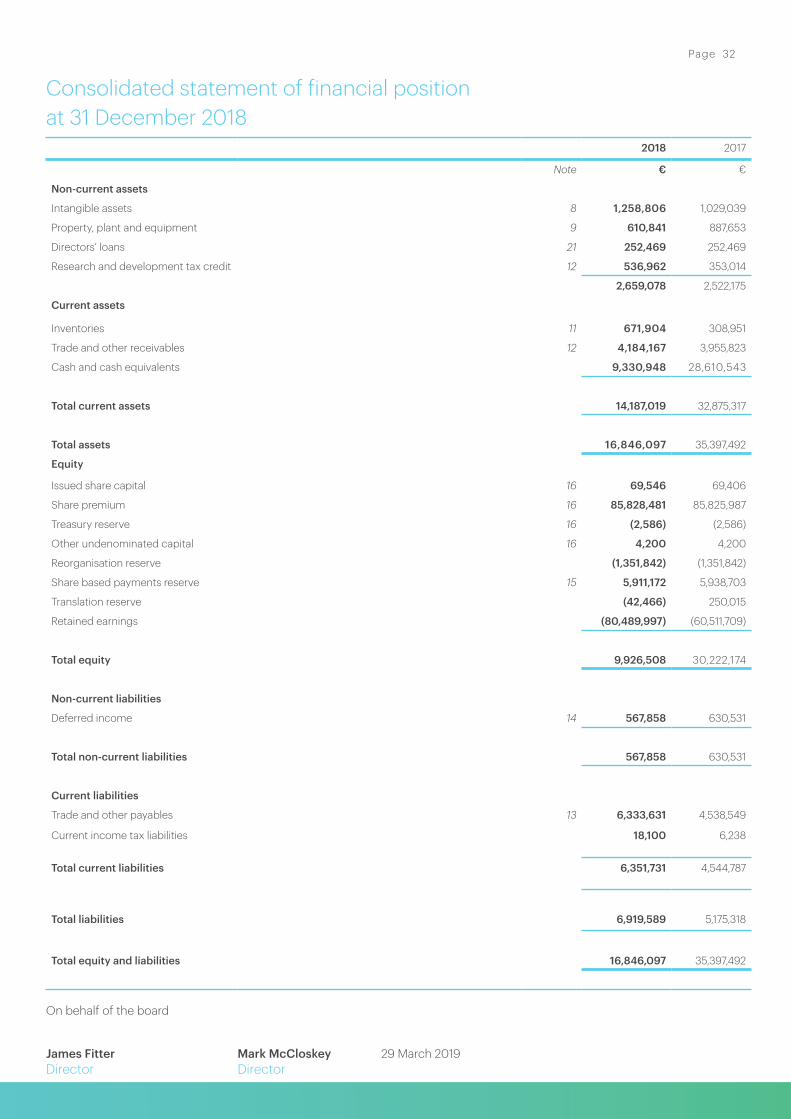
2018 2017
Note € €
Non-current assets
Intangible assets 8 1,258,806 1,029,039
Property, plant and equipment 9 610,841 887,653
Directors’ loans 21 252,469 252,469
Research and development tax credit 12 536,962 353,014
2,659,078 2,522,175
Current assets
Inventories 11 671,904 308,951
Trade and other receivables 12 4,184,167 3,955,823
Cash and cash equivalents 9,330,948 28,610,543
Total current assets 14,187,019 32,875,317
Total assets 16,846,097 35,397,492
Equity
Issued share capital 16 69,546 69,406
Share premium 16 85,828,481 85,825,987
Treasury reserve 16 (2,586) (2,586)
Other undenominated capital 16 4,200 4,200
Reorganisation reserve (1,351,842) (1,351,842)
Share based payments reserve 15 5,911,172 5,938,703
Translation reserve (42,466) 250,015
Retained earnings (80,489,997) (60,511,709)
Total equity 9,926,508 30,222,174
Non-current liabilities
Deferred income 14 567,858 630,531
Total non-current liabilities 567,858 630,531
Current liabilities
Trade and other payables 13 6,333,631 4,538,549
Current income tax liabilities 18,100 6,238
Total current liabilities 6,351,731 4,544,787
Total liabilities 6,919,589 5,175,318
Total equity and liabilities 16,846,097 35,397,492
On behalf of the board
James Fitter Mark McCloskey 29 March 2019Director Director
Consolidated statement of financial position at 31 December 2018
Page 32
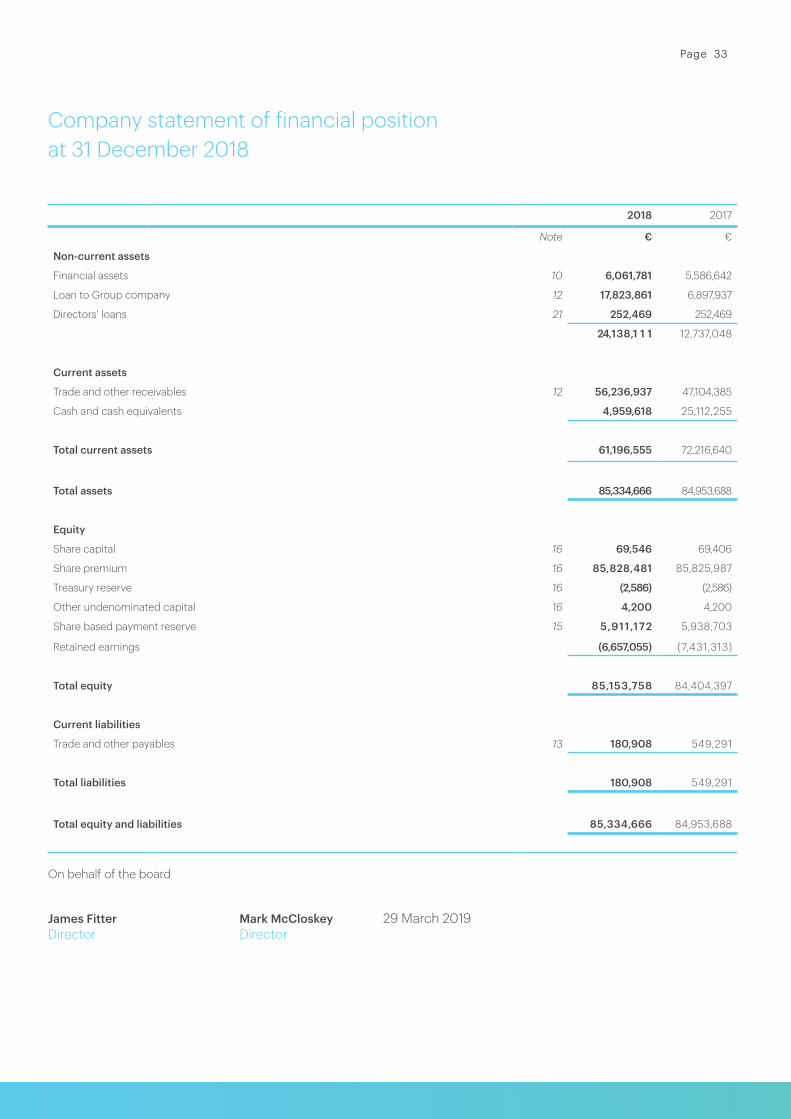
2018 2017
Note € €
Non-current assets
Financial assets 10 6,061,781 5,586,642
Loan to Group company 12 17,823,861 6,897,937
Directors’ loans 21 252,469 252,469
24,138,1 1 1 12,737,048
Current assets
Trade and other receivables 12 56,236,937 47,104,385
Cash and cash equivalents 4,959,618 25,112,255
Total current assets 61,196,555 72,216,640
Total assets 85,334,666 84,953,688
Equity
Share capital 16 69,546 69,406
Share premium 16 85,828,481 85,825,987
Treasury reserve 16 (2,586) (2,586)
Other undenominated capital 16 4,200 4,200
Share based payment reserve 15 5,911,172 5,938,703
Retained earnings (6,657,055) (7,431,313)
Total equity 85,153,758 84,404,397
Current liabilities
Trade and other payables 13 180,908 549,291
Total liabilities 180,908 549,291
Total equity and liabilities 85,334,666 84,953,688
On behalf of the board
James Fitter Mark McCloskey 29 March 2019Director Director
Company statement of financial positionat 31 December 2018
Page 33Page 33
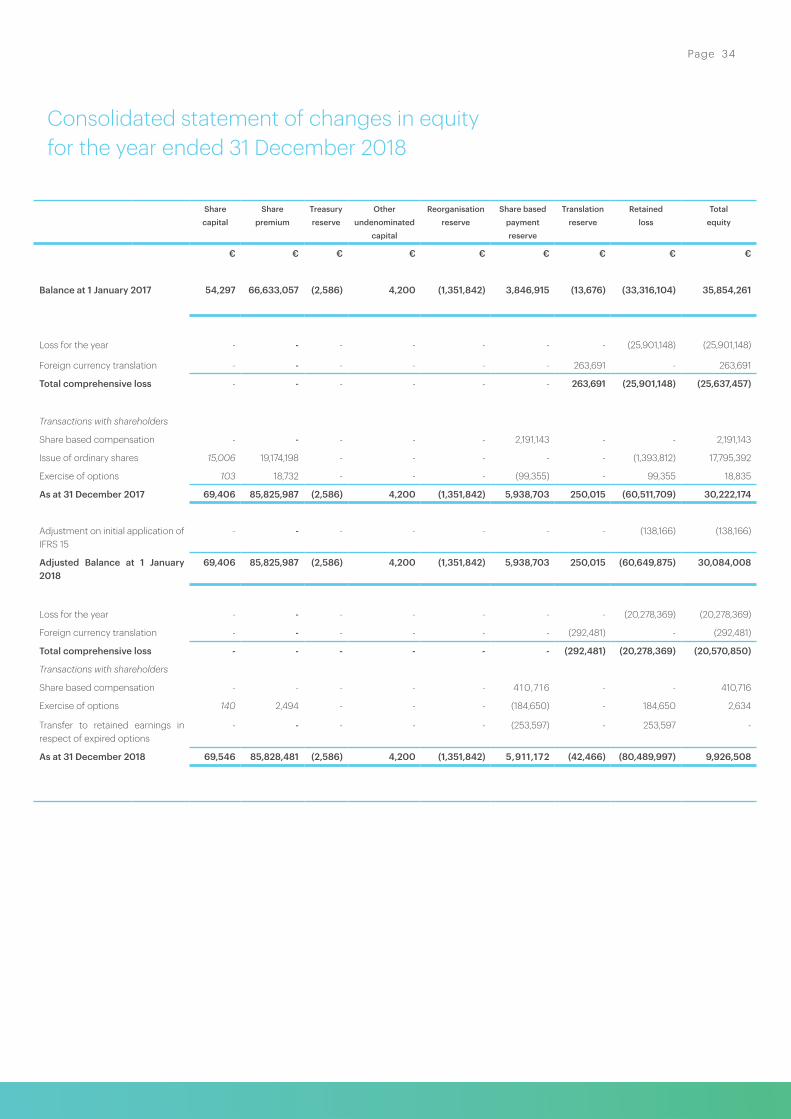
Sharecapital
Sharepremium
Treasuryreserve
Otherundenominated
capital
Reorganisationreserve
Share basedpayment reserve
Translationreserve
Retainedloss
Totalequity
€ € € € € € € € €
Balance at 1 January 2017 54,297 66,633,057 (2,586) 4,200 (1,351,842) 3,846,915 (13,676) (33,316,104) 35,854,261
Loss for the year - - - - - - - (25,901,148) (25,901,148)
Foreign currency translation - - - - - - 263,691 - 263,691
Total comprehensive loss - - - - - - 263,691 (25,901,148) (25,637,457)
Transactions with shareholders
Share based compensation - - - - - 2,191,143 - - 2,191,143
Issue of ordinary shares 15,006 19,174,198 - - - - - (1,393,812) 17,795,392
Exercise of options 103 18,732 - - - (99,355) - 99,355 18,835
As at 31 December 2017 69,406 85,825,987 (2,586) 4,200 (1,351,842) 5,938,703 250,015 (60,511,709) 30,222,174
Adjustment on initial application of IFRS 15
- - - - - - - (138,166) (138,166)
Adjusted Balance at 1 January 2018
69,406 85,825,987 (2,586) 4,200 (1,351,842) 5,938,703 250,015 (60,649,875) 30,084,008
Loss for the year - - - - - - - (20,278,369) (20,278,369)
Foreign currency translation - - - - - - (292,481) - (292,481)
Total comprehensive loss - - - - - - (292,481) (20,278,369) (20,570,850)
Transactions with shareholders
Share based compensation - - - - - 410,7 16 - - 410,716
Exercise of options 140 2,494 - - - (184,650) - 184,650 2,634
Transfer to retained earnings in respect of expired options
- - - - - (253,597) - 253,597 -
As at 31 December 2018 69,546 85,828,481 (2,586) 4,200 (1,351,842) 5,911,172 (42,466) (80,489,997) 9,926,508
Consolidated statement of changes in equityfor the year ended 31 December 2018
Page 34
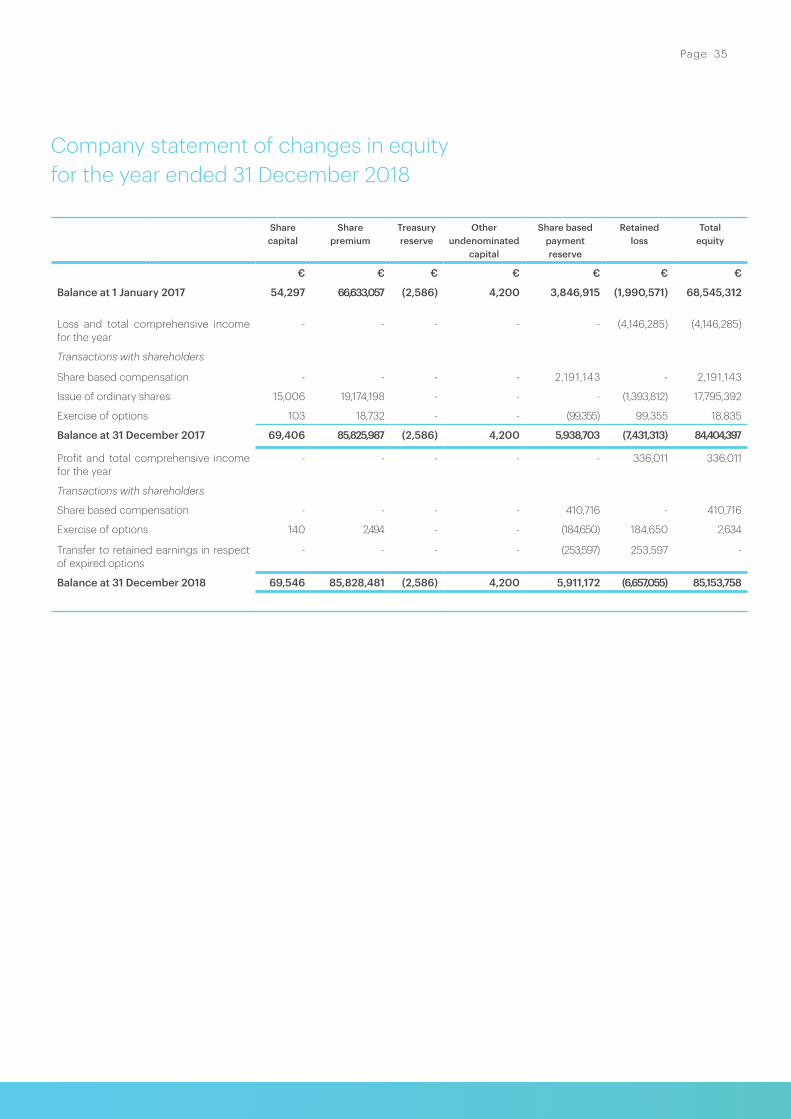
Sharecapital
Sharepremium
Treasuryreserve
Otherundenominated
capital
Share basedpayment reserve
Retainedloss
Totalequity
€ € € € € € €
Balance at 1 January 2017 54,297 66,633,057 (2,586) 4,200 3,846,915 (1,990,571) 68,545,312
Loss and total comprehensive income for the year
- - - - - (4,146,285) (4,146,285)
Transactions with shareholders
Share based compensation - - - - 2,191,143 - 2,191,143
Issue of ordinary shares 15,006 19,174,198 - - - (1,393,812) 17,795,392
Exercise of options 103 18,732 - - (99,355) 99,355 18,835
Balance at 31 December 2017 69,406 85,825,987 (2,586) 4,200 5,938,703 (7,431,313) 84,404,397
Profit and total comprehensive income for the year
- - - - - 336,011 336,011
Transactions with shareholders
Share based compensation - - - - 410,716 - 410,716
Exercise of options 140 2,494 - - (184,650) 184,650 2,634
Transfer to retained earnings in respect of expired options
- - - - (253,597) 253,597 -
Balance at 31 December 2018 69,546 85,828,481 (2,586) 4,200 5,911,172 (6,657,055) 85,153,758
Company statement of changes in equityfor the year ended 31 December 2018
Page 35
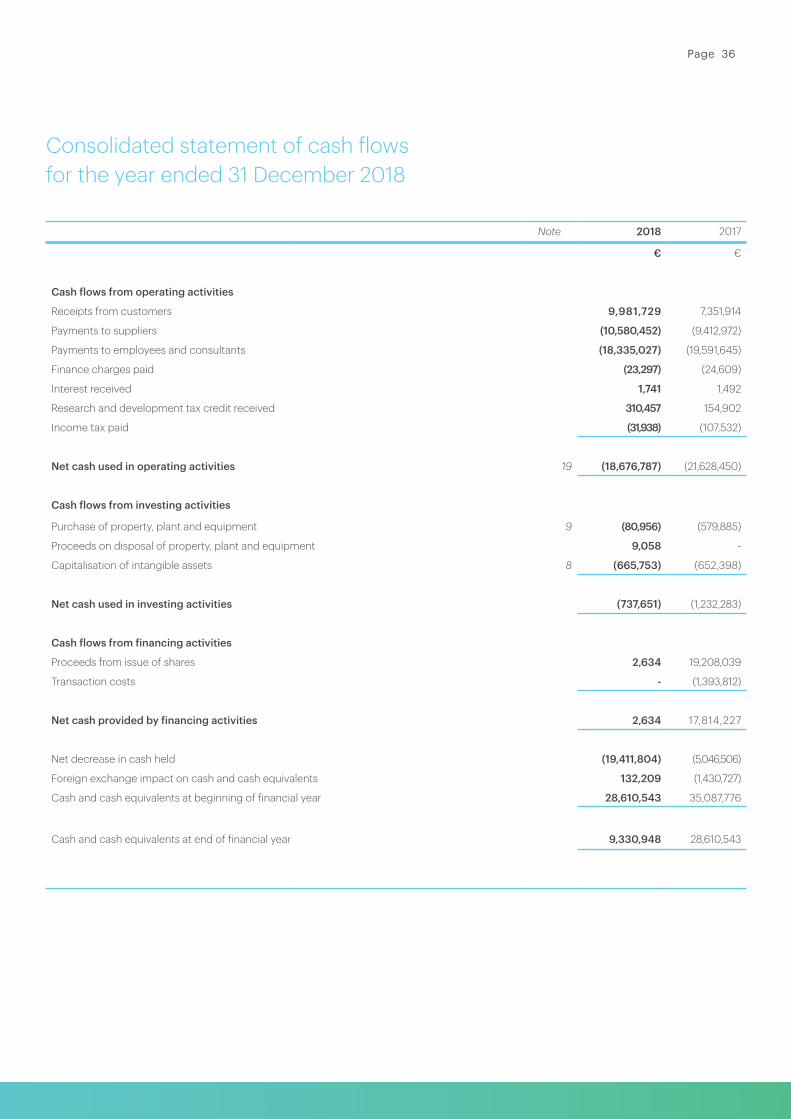
Note 2018 2017
€ €
Cash flows from operating activities
Receipts from customers 9,981,729 7,351,914
Payments to suppliers (10,580,452) (9,412,972)
Payments to employees and consultants (18,335,027) (19,591,645)
Finance charges paid (23,297) (24,609)
Interest received 1,741 1,492
Research and development tax credit received 310,457 154,902
Income tax paid (31,938) (107,532)
Net cash used in operating activities 19 (18,676,787) (21,628,450)
Cash flows from investing activities
Purchase of property, plant and equipment 9 (80,956) (579,885)
Proceeds on disposal of property, plant and equipment 9,058 -
Capitalisation of intangible assets 8 (665,753) (652,398)
Net cash used in investing activities (737,651) (1,232,283)
Cash flows from financing activities
Proceeds from issue of shares 2,634 19,208,039
Transaction costs - (1,393,812)
Net cash provided by financing activities 2,634 17,814,227
Net decrease in cash held (19,411,804) (5,046,506)
Foreign exchange impact on cash and cash equivalents 132,209 (1,430,727)
Cash and cash equivalents at beginning of financial year 28,610,543 35,087,776
Cash and cash equivalents at end of financial year 9,330,948 28,610,543
Consolidated statement of cash flowsfor the year ended 31 December 2018
Page 36Page 36
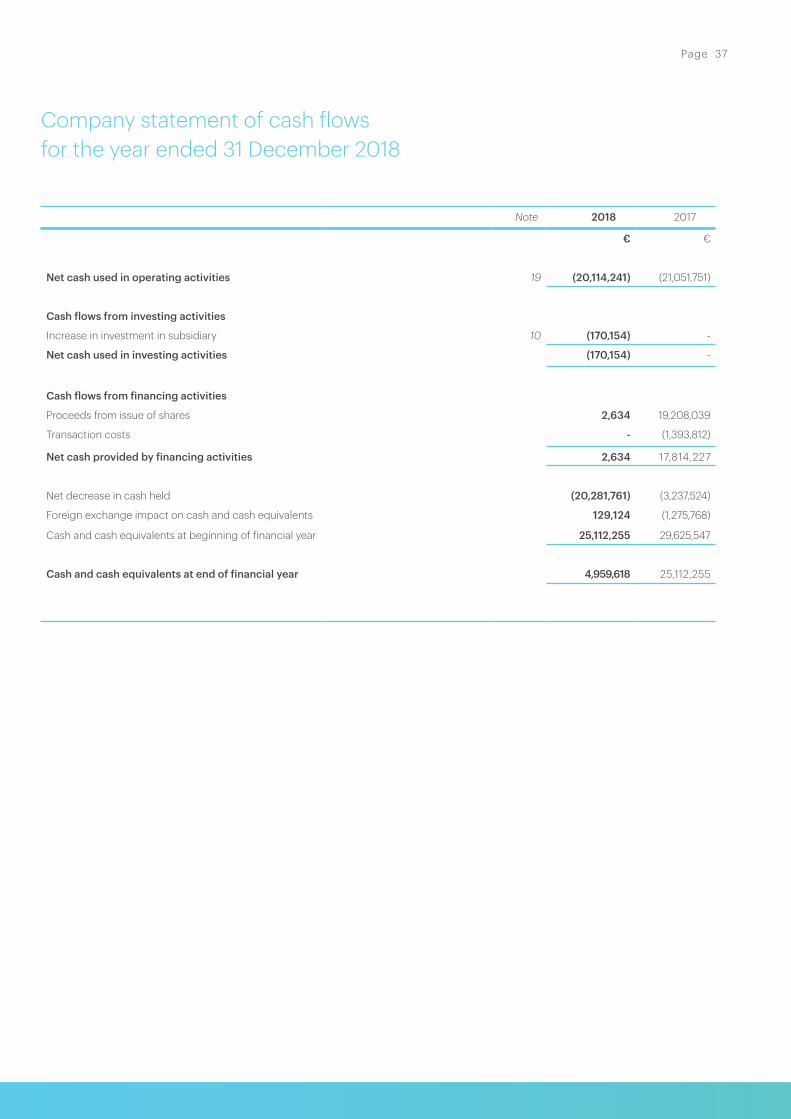
Note 2018 2017
€ €
Net cash used in operating activities 19 (20,114,241) (21,051,751)
Cash flows from investing activities
Increase in investment in subsidiary 10 (170,154) -
Net cash used in investing activities (170,154) -
Cash flows from financing activities
Proceeds from issue of shares 2,634 19,208,039
Transaction costs - (1,393,812)
Net cash provided by financing activities 2,634 17,814,227
Net decrease in cash held (20,281,761) (3,237,524)
Foreign exchange impact on cash and cash equivalents 129,124 (1,275,768)
Cash and cash equivalents at beginning of financial year 25,112,255 29,625,547
Cash and cash equivalents at end of financial year 4,959,618 25,112,255
Company statement of cash flowsfor the year ended 31 December 2018
Page 37
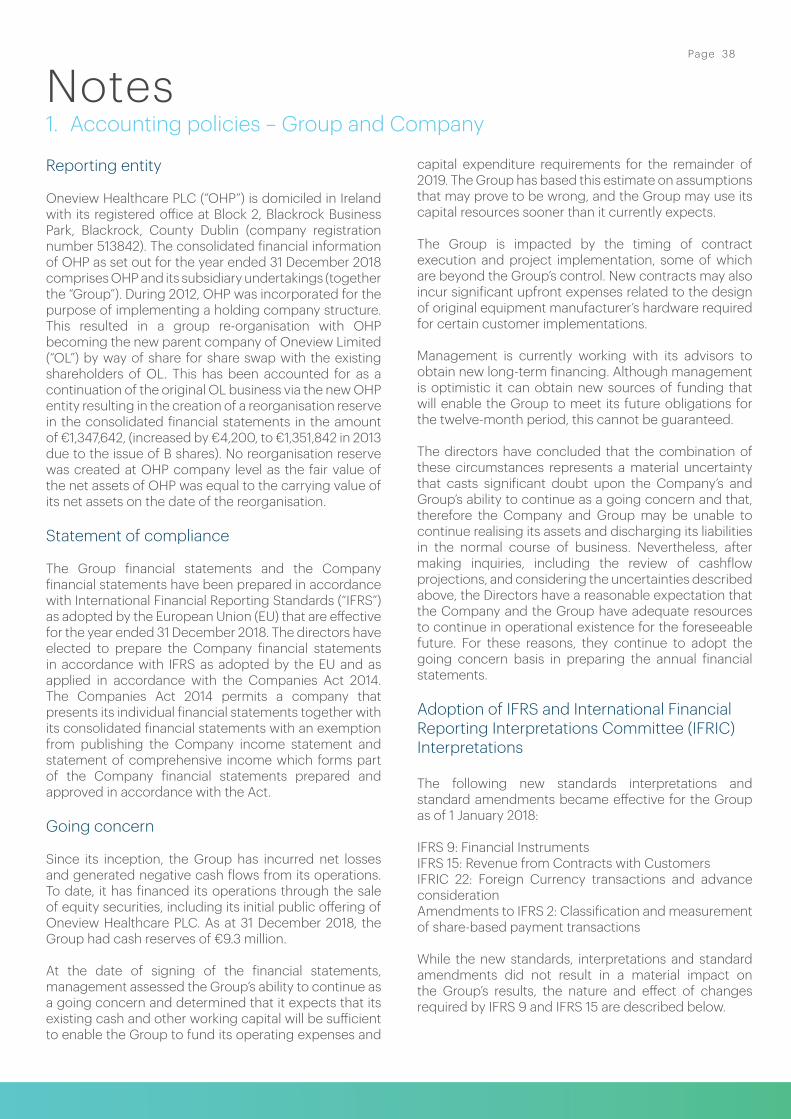
Reporting entity
Oneview Healthcare PLC (“OHP”) is domiciled in Ireland with its registered office at Block 2, Blackrock Business Park, Blackrock, County Dublin (company registration number 513842). The consolidated financial information of OHP as set out for the year ended 31 December 2018 comprises OHP and its subsidiary undertakings (together the “Group”). During 2012, OHP was incorporated for the purpose of implementing a holding company structure. This resulted in a group re-organisation with OHP becoming the new parent company of Oneview Limited (“OL”) by way of share for share swap with the existing shareholders of OL. This has been accounted for as a continuation of the original OL business via the new OHP entity resulting in the creation of a reorganisation reserve in the consolidated financial statements in the amount of €1,347,642, (increased by €4,200, to €1,351,842 in 2013 due to the issue of B shares). No reorganisation reserve was created at OHP company level as the fair value of the net assets of OHP was equal to the carrying value of its net assets on the date of the reorganisation.
Statement of compliance
The Group financial statements and the Company financial statements have been prepared in accordance with International Financial Reporting Standards (“IFRS”) as adopted by the European Union (EU) that are effective for the year ended 31 December 2018. The directors have elected to prepare the Company financial statements in accordance with IFRS as adopted by the EU and as applied in accordance with the Companies Act 2014. The Companies Act 2014 permits a company that presents its individual financial statements together with its consolidated financial statements with an exemption from publishing the Company income statement and statement of comprehensive income which forms part of the Company financial statements prepared and approved in accordance with the Act.
Going concern
Since its inception, the Group has incurred net losses and generated negative cash flows from its operations. To date, it has financed its operations through the sale of equity securities, including its initial public offering of Oneview Healthcare PLC. As at 31 December 2018, the Group had cash reserves of €9.3 million.
At the date of signing of the financial statements, management assessed the Group’s ability to continue as a going concern and determined that it expects that its existing cash and other working capital will be sufficient to enable the Group to fund its operating expenses and
capital expenditure requirements for the remainder of 2019. The Group has based this estimate on assumptions that may prove to be wrong, and the Group may use its capital resources sooner than it currently expects.
The Group is impacted by the timing of contract execution and project implementation, some of which are beyond the Group’s control. New contracts may also incur significant upfront expenses related to the design of original equipment manufacturer’s hardware required for certain customer implementations.
Management is currently working with its advisors to obtain new long-term financing. Although management is optimistic it can obtain new sources of funding that will enable the Group to meet its future obligations for the twelve-month period, this cannot be guaranteed.
The directors have concluded that the combination of these circumstances represents a material uncertainty that casts significant doubt upon the Company’s and Group’s ability to continue as a going concern and that, therefore the Company and Group may be unable to continue realising its assets and discharging its liabilities in the normal course of business. Nevertheless, after making inquiries, including the review of cashflow projections, and considering the uncertainties described above, the Directors have a reasonable expectation that the Company and the Group have adequate resources to continue in operational existence for the foreseeable future. For these reasons, they continue to adopt the going concern basis in preparing the annual financial statements.
Adoption of IFRS and International Financial Reporting Interpretations Committee (IFRIC) Interpretations
The following new standards interpretations and standard amendments became effective for the Group as of 1 January 2018:
IFRS 9: Financial InstrumentsIFRS 15: Revenue from Contracts with CustomersIFRIC 22: Foreign Currency transactions and advance considerationAmendments to IFRS 2: Classification and measurement of share-based payment transactions
While the new standards, interpretations and standard amendments did not result in a material impact on the Group’s results, the nature and effect of changes required by IFRS 9 and IFRS 15 are described below.
Notes1. Accounting policies – Group and Company
Page 38
New/Revised International Financial Reporting Standards Effective date ¹
IFRS 16 Leases 1 January 2019
¹ The effective dates are those applying to EU endorsed IFRS if later than the IASB effective dates and relate to periods beginning on or after those dates detailed above.
IFRS 16 Leases
IFRS 16 Leases addresses the definition of a lease, recognition and measurement of leases and establishes principles for reporting useful information to users of financial statements about the leasing activities of both lessees and lessors. A key change arising from IFRS 16 is that most operating leases will be accounted for on statement of financial position for lessees. The standard replaces IAS 17 Leases, and related interpretations. The standard is effective for annual periods beginning on or after 1 January 2019 and earlier application is permitted. The Group is currently considering the impact of IFRS 16 on future consolidated financial statements.
New standards adopted
IFRS 9 ‘Financial Instruments’
As of 1 January 2018, the Group changed its accounting policies to adopt IFRS 9 ‘Financial Instruments’. IFRS 9 introduces new requirements for 1) the classification and measurement of financial assets and financial liabilities, 2) impairment for financial assets and 3) general hedge accounting. Details of these new requirements as well as their impact on the Group’s consolidated financial statements are described below.
a. Classification and measurement of financial assets
The date of initial application (i.e. the date on which the Group has assessed its existing financial assets and financial liabilities in terms of the requirements of IFRS 9) is 1 January 2018. Accordingly, the Group has applied the requirements of IFRS 9 to instruments that have not been derecognised as at 1 January 2018 and has not applied the requirements to instruments that had already been derecognised as at 1 January 2018. Comparative amounts have not been restated. All recognised financial assets that are within the scope of IFRS 9 are required to be subsequently measured at amortised cost or fair value on the basis of the entity’s business model for managing the financial assets and the contractual cash flow characteristics of the financial assets.
The Directors of the Company reviewed and assessed
the Group’s existing financial assets as at 1 January 2018 based on the facts and circumstances that existed at that date and concluded that on initial application of IFRS 9 the impact on the Group’s financial assets as regards classification and measurement was that:
• Financial assets previously classified as held-to-maturity and loans and receivables under IAS 39 that were measured at amortised cost continue to be measured at amortised cost under IFRS 9 as they are held within a business model to collect contractual cash flows and these cash flows consist solely of payments of principal and interest on the principal amount outstanding.
• The Group does not hold any financial assets which meet the criteria for classification at fair value reported in other comprehensive income or fair value reported in profit and loss.
b. Impairment of financial assets In relation to the impairment of financial assets, IFRS 9 requires the application of an expected credit loss model as opposed to an incurred credit loss model under IAS 39. The expected credit loss model requires the Group to account for expected credit losses and changes in those expected credit losses at each reporting date to reflect changes in credit risk since initial recognition of the financial assets. In other words, it is no longer necessary for a credit event to have occurred before credit losses are recognised.
As at 1 January 2018, the directors of the Company reviewed and assessed the Group’s existing financial assets for impairment using reasonable and supportable information that is available without undue cost or effort in accordance with the requirements of IFRS 9 to determine the credit risk of the respective items at the date they were initially recognised. In respect of trade receivables, the Group applied the simplified approach to measuring expected credit losses using a lifetime expected loss allowance. The application of the expected credit loss model has not resulted in any material change to the previously reported carrying value of financial assets.
The Company adopted the general approach in calculating ECLs on its intercompany loans. As there was an indicator of a significant increase in credit risk as a result of negative cash flows and net liabilities in
Standards and interpretations in issue but not effective and not applied
The IASB and the International Financial Reporting Interpretations Committee (IFRIC) have issued the following standards, amendments to existing standards and interpretations that are not yet effective for the Group:
Page 39
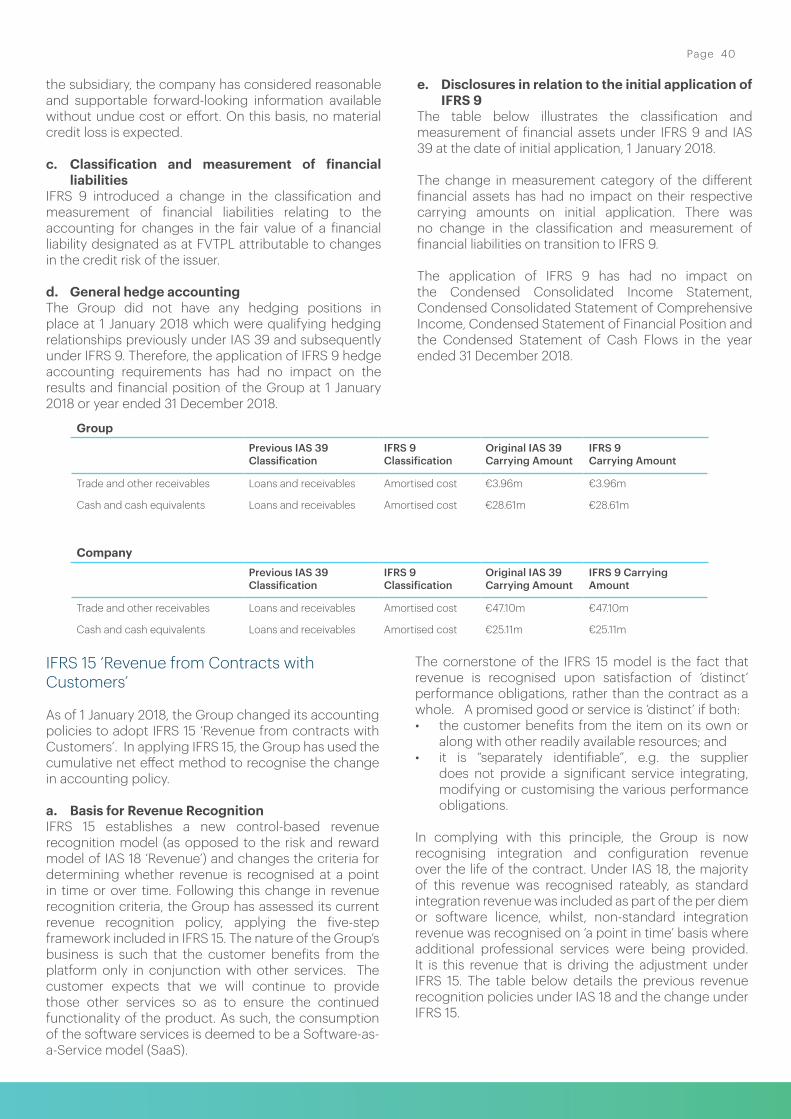
the subsidiary, the company has considered reasonable and supportable forward-looking information available without undue cost or effort. On this basis, no material credit loss is expected.
c. Classification and measurement of financial liabilities
IFRS 9 introduced a change in the classification and measurement of financial liabilities relating to the accounting for changes in the fair value of a financial liability designated as at FVTPL attributable to changes in the credit risk of the issuer.
d. General hedge accounting The Group did not have any hedging positions in place at 1 January 2018 which were qualifying hedging relationships previously under IAS 39 and subsequently under IFRS 9. Therefore, the application of IFRS 9 hedge accounting requirements has had no impact on the results and financial position of the Group at 1 January 2018 or year ended 31 December 2018.
e. Disclosures in relation to the initial application of IFRS 9
The table below illustrates the classification and measurement of financial assets under IFRS 9 and IAS 39 at the date of initial application, 1 January 2018.
The change in measurement category of the different financial assets has had no impact on their respective carrying amounts on initial application. There was no change in the classification and measurement of financial liabilities on transition to IFRS 9.
The application of IFRS 9 has had no impact on the Condensed Consolidated Income Statement, Condensed Consolidated Statement of Comprehensive Income, Condensed Statement of Financial Position and the Condensed Statement of Cash Flows in the year ended 31 December 2018.
GroupPrevious IAS 39 Classification
IFRS 9 Classification
Original IAS 39 Carrying Amount
IFRS 9 Carrying Amount
Trade and other receivables Loans and receivables Amortised cost €3.96m €3.96m
Cash and cash equivalents Loans and receivables Amortised cost €28.61m €28.61m
CompanyPrevious IAS 39 Classification
IFRS 9 Classification
Original IAS 39 Carrying Amount
IFRS 9 Carrying Amount
Trade and other receivables Loans and receivables Amortised cost €47.10m €47.10m
Cash and cash equivalents Loans and receivables Amortised cost €25.11m €25.11m
IFRS 15 ‘Revenue from Contracts with Customers’
As of 1 January 2018, the Group changed its accounting policies to adopt IFRS 15 ‘Revenue from contracts with Customers’. In applying IFRS 15, the Group has used the cumulative net effect method to recognise the change in accounting policy.
a. Basis for Revenue RecognitionIFRS 15 establishes a new control-based revenue recognition model (as opposed to the risk and reward model of IAS 18 ‘Revenue’) and changes the criteria for determining whether revenue is recognised at a point in time or over time. Following this change in revenue recognition criteria, the Group has assessed its current revenue recognition policy, applying the five-step framework included in IFRS 15. The nature of the Group’s business is such that the customer benefits from the platform only in conjunction with other services. The customer expects that we will continue to provide those other services so as to ensure the continued functionality of the product. As such, the consumption of the software services is deemed to be a Software-as-a-Service model (SaaS).
The cornerstone of the IFRS 15 model is the fact that revenue is recognised upon satisfaction of ‘distinct’ performance obligations, rather than the contract as a whole. A promised good or service is ‘distinct’ if both:• the customer benefits from the item on its own or
along with other readily available resources; and• it is “separately identifiable”, e.g. the supplier
does not provide a significant service integrating, modifying or customising the various performance obligations.
In complying with this principle, the Group is now recognising integration and configuration revenue over the life of the contract. Under IAS 18, the majority of this revenue was recognised rateably, as standard integration revenue was included as part of the per diem or software licence, whilst, non-standard integration revenue was recognised on ‘a point in time’ basis where additional professional services were being provided. It is this revenue that is driving the adjustment under IFRS 15. The table below details the previous revenue recognition policies under IAS 18 and the change under IFRS 15.
Page 40
b. ImpactIn applying IFRS 15, the Group has not restated comparatives and has instead applied the cumulative effect method. The impact on the Consolidated Statement of Financial Position is to increase Retained losses by €138,166 and to increase Deferred income by €138,166 as at 1 January 2018.
c. Revised Revenue Accounting PolicyThe Group’s revenue consists primarily of revenues from its customer contracts with healthcare providers for the provision and support of the Oneview Solution. Revenue comprises the fair value of the consideration received or receivable for the sale of products and services in the ordinary course of the Group’s activities. Revenue is shown net of value-added-tax (VAT) and discounts. The Group recognises revenue when the amount of revenue can be reliably measured, it is probable that future economic benefits will flow to the entity and when specific criteria have been met for each of the Group’s activities as described below. Where a performance obligation is satisfied but the customer has not yet been billed, this is recognised as a deferred contract asset within Trade and Other Receivables. When consideration is received in advance of work being performed, or amounts billed to a customer are in excess of revenue recognised on the contract, this is recognised as deferred income.
i. Software usage and content revenueSoftware usage and content revenue is earned from the use of the Group’s solution by its customers. Revenue is earned by charging a fee based on the number of beds for which the Oneview Solution is installed, and
is charged on a daily basis. The daily charge may vary depending on the level of functionality and content provided.
Contracts for the use of the Oneview Solution are typically five years in duration with fees typically billable annually in advance. Software usage and content revenue are recognised on a daily basis.
Revenue is recognised rateable over the life of the contract and commences following completion of user acceptance testing (UAT) by the customer.
ii. Support incomeSupport income relates to email and phone support, bug fixes and unspecified software updates and upgrades released during the maintenance term. Support services for hardware relates to phone and/or onsite support. The level of support varies depending on the contract.
The Company receives an annual fee, payable in advance, for hardware and software support services and is recognised on a daily basis over the term of the contract. The fee is based on the number of devices on which the Oneview Solution is installed.
iii. License feesLicense fees represent an upfront access license fee, payable in advance. The fee is based on the number of devices for which the Oneview Solution is installed. The license fee is recognised over the life of the original contract term, typically five years, as the upfront delivery of the license does not have stand-alone value to the
Non-recurring revenueRevenue Stream Revenue Recognition under IAS 18 Nature of change in accounting policy
Hardware Recognised rateably over the term of the contract once User Acceptance Testing (“UAT”) has been obtained and commencing at the point of software go-live.
No change
On delivery No change
Services Income Revenue is recognised evenly over the period that the services are contracted to be provided for.
No change, except as noted above at ‘Configuration and Integration Services’ revenue stream.
Recurring RevenueRevenue Stream Revenue Recognition under IAS 18 Nature of change in accounting policy
Software usage and content revenue
Recognised rateably over the term of the contract once User Ac-ceptance Testing (“UAT”) has been obtained and commencing at the point of software go-live.
No change
Support services Recognised rateably over the term of the contract. No change
Licence fee Recognised rateably over the term of the contract once UAT has been obtained and commencing at the point of software go-live.
No change
Configuration and Integration Services
Where this service is bundled as part of the licence fee, revenue is recognised over the term of the contract once UAT has been obtained.
Software licence, software configuration and integration, software support are now deemed a single performance obligation. Therefore, revenue is recognised rateably over the term of the contract once UAT has been obtained and commencing at the point of software go-live.
Page 41
customer. There is no stand-alone value as the licence cannot be used on its own without customisation or implementation. The licence is a right to access and future upgrades are necessary for the customer to retain continued functionality of the software.
iv. HardwareHardware revenue is earned from fees charged to customers for the hardware supplied to operate the Oneview Solution. The Company is deemed to act as the principal to an arrangement when it controls a promised good or service before transferring it to a customer. Where the Company acts as the principal in the supply of hardware, hardware revenue is recognised gross upon delivery of the hardware to the customer. Where the Company acts as an agent in the supply of hardware, the fee paid to the Company is recognised when earned, per the terms of the contract. Revenue from hardware in the years presented in the financial statements is recognised on a gross basis because the Company has acted as the principal.
v. Services incomeInstallation and professional services revenue is earned from fees charged to deploy the Oneview Solution and install hardware at customer sites. If the service is on a contracted time and material basis, then the revenue is recognised as and when the services are performed. If it is a fixed fee, then the professional services revenue is recognised by reference to the stage of completion accounting method. The Group measures percentage of completion based on labour hours incurred to date as a proportion of total hours allocated to the contract, or for installation of hardware based on units installed as a proportion of the total units to install. If circumstances arise that may change the original estimates of revenues, costs or extent of progress toward completion, estimates are revised. These revisions may result in increases or decreases in estimated revenues or costs and are reflected in the period in which the circumstances that give rise to the revision become known by management.
Use of estimates and judgementsThe preparation of financial statements in conformity with IFRS requires management to make judgements, estimates and assumptions that affect the application of policies and reported amounts of assets and liabilities, income and expenses. Estimates and underlying assumptions are reviewed on an ongoing basis. Revisions to accounting estimates are recognised in the period in which the estimates are revised and in any future periods affected.
JudgementsInformation about critical judgements in applying accounting policies that have the most significant effect on the amounts recognised in the consolidated financial statements are included in the following notes:
• Revenue• Intangible assets and amortisation• Going concern• Share based payments• Company only financial assets
Assumptions and estimation uncertaintiesInformation about assumptions and uncertainties at 31 December 2018 that have a significant risk of resulting in a material adjustment to the carrying amounts of assets and liabilities in the next financial year is included in the following notes:
• Revenue • Tax• Trade and other payables
a. Basis of consolidationThe Group financial statements consolidate the financial statements of Oneview Healthcare PLC and its subsidiaries.
Subsidiaries are all entities over which the Group has control. The Group controls an entity when the Group is exposed to, or has rights to, variable returns from its involvement with the entity and has the power to affect those returns through its power over the entity. Subsidiaries are fully consolidated from the date on which control is transferred to the Group. They are deconsolidated from the date that control ceases.
Financial statements of subsidiaries are prepared for the same reporting year as the company and where necessary, adjustments are made to the results of subsidiaries to bring their accounting policies into line with those used by the Group.
All intercompany balances and transactions, including unrealised profits arising from inter-group transactions, have been eliminated in full. Unrealised losses are eliminated in the same manner as unrealised gains except to the extent that there is evidence of impairment.
b. Transactions eliminated on consolidationIntra-Group balances, and any unrealised income and expenses arising from intra-Group transactions, are eliminated in preparing the consolidated financial statements.
c. Investments in subsidiariesIn the company’s financial statements, investments in subsidiaries are carried at cost less any provision made for impairment
d. Translation of foreign currenciesThe presentation currency of the Group and Company is euro (€). The functional currency of the Company is
Page 42
euro. Results of non-euro denominated subsidiaries are translated into euro at the actual exchange rates at the transaction dates or average exchange rates for the year where this is a reasonable approximation. The related statements of financial position are translated at the rates of exchange ruling at the reporting date. Adjustments arising on translation of the results of non-euro subsidiaries at average rates, and on the restatement of the opening net assets at closing rates, are dealt with in a separate translation reserve within equity.
Transactions in currencies different to the functional currencies of operations are recorded at the rate of exchange ruling at the date of the transaction. Monetary assets and liabilities denominated in foreign currencies are retranslated into the functional currency at the rate of exchange at the reporting date. All translation differences are taken to the income statement through the finance expense line.
e. Income taxIncome tax expense in the income statement represents the sum of income tax currently payable and deferred income tax.
Income tax currently payable is based on taxable profit for the year. Taxable profit differs from net profit as reported in the income statement because it excludes items of income or expense that are taxable or deductible in other years and further excludes items that are not taxable or deductible. The Group’s liability for income tax is calculated using rates that have been enacted or substantively enacted at the reporting date. Income tax is recognised in the income statement except to the extent that it relates to items recognised directly in other comprehensive income or equity.
Deferred income tax is provided, using the liability method, on all differences between the carrying amounts of assets and liabilities for financial reporting purposes and the amounts used for taxation purposes except those arising from non-deductible goodwill or on initial recognition of an asset or liability which affects neither accounting nor taxable profit.
Deferred income tax assets and liabilities are measured at the tax rates that are expected to apply in the year when the asset is expected to be realised or the liability to be settled.
Deferred tax assets are recognised for all deductible differences, carry forward of unused tax credits and unused tax losses, to the extent that it is probable that taxable profit will be available against which the deductible temporary differences and the carry forward of unused tax credits and unused tax losses can be utilised. The carrying amount of deferred income tax assets is reviewed at each reporting date and derecognised to the extent that it is no longer probable
that sufficient taxable profit would be available to allow all or part of the deferred income tax asset to be utilised.
f. Property, plant and equipmentProperty, plant and equipment are stated at cost, less accumulated depreciation and impairment losses.
Depreciation is calculated on a straight line basis over the estimated useful life of the asset and any profit or loss is recognised in the statement of total comprehensive income for each part of an item of property, plant and equipment. Depreciation methods and useful lives are reassessed at each reporting date. The estimated useful lives for additions during the current period are as follows:
Fixtures, fittings and equipment 10% - 33% straight line
Gains and losses on disposal of an item of property, plant and equipment are determined by comparing the proceeds from disposal with the carrying amount of property, plant and equipment, and are recognised net through profit or loss in the consolidated statement of total comprehensive income.
g. Intangible assets Computer software Acquired computer software licenses are capitalised on the basis of the costs incurred to acquire and bring to use the specific software. These costs are amortised over their estimated useful lives of three to five years.
Internally generated intangible assets – research and development Expenditure on research activities undertaken with the prospect of gaining new technical knowledge and understanding is recognised in the income statement as an expense as incurred. Expenditure on development activities, whereby research findings are applied to a plan or design for new or substantially improved products or processes is capitalised if the product or process is (i) technically and commercially feasible; (ii) future economic benefits are probable; and (iii) the company intends to and has sufficient resources to complete the development. Capitalised expenditure includes direct labour and an appropriate proportion of overheads. Other development expenditure is recognised through profit or loss in the consolidated income statement as an expense as incurred. Capitalised development expenditure is stated at cost less accumulated amortisation and impairment losses.
Amortisation is recognised through profit or loss in the consolidated income statement on a straight-line basis over the estimated useful lives of intangible assets and amortisation commences in the year of capitalisation, as this best reflects the expected pattern of consumption of the future economic benefits embodied in the asset. The estimated useful lives for the current and comparative periods are as follows:
Page 43
Capitalised development costs 5 years straight line
Amortisation methods, useful lives and residual values are reviewed at each financial year-end and adjusted if appropriate.
The carrying values of intangible assets are reviewed for indicators of impairment at each reporting date and are subject to impairment testing when events or changes in circumstances indicate that the carrying values may not be recoverable.
h. Government grantThe Group recognises a government grant related to capitalised development costs in the form of research and development (R&D) tax credits. Government grants are initially recognised as deferred income at fair value, if there is reasonable assurance that they will be received, they are then recognised through profit or loss as other income on a systematic basis over the useful life of the asset. Grants that compensate the Group for expenses incurred are recognised through profit or loss on a systematic basis in the periods in which the expenses are recorded.
i. Share capitalOrdinary shares are classified as equity. Incremental costs directly attributable to the issue of new shares or options are shown in equity as a deduction, net of tax, from the proceeds. Where ordinary shares are repurchased by the company they are cancelled or held as treasury shares and the nominal value of the shares is transferred to an undenominated capital reserve fund within equity.
j. Cash and cash equivalents Cash and cash equivalents comprise cash balances and cash deposits with an original maturity of three months or less.
k. InventoriesInventories are stated at the lower of cost and net realisable value. Cost is based on the first-in/first-out principle and includes all expenditure incurred in acquiring the inventories and bringing them to their present location and condition.
Net realisable value is the estimated proceeds of sale, less all further costs to completion, and less all costs to be incurred in marketing, selling and distribution. Estimates of realisable value are based on the most reliable evidence available at the time the estimates are made.
l. Employee BenefisDefined contribution plans and other long term employee benefitsA defined contribution plan is a post-employment benefit plan under which the company pays fixed contributions into a separate entity and has no legal
or constructive obligation to pay further amounts. Obligations for contributions to defined contribution retirement benefit plans are recognised as an expense in the profit and loss account in the periods during which services are rendered by employees.
Share based payments The grant date fair value of share-based payments awards granted to employees is recognised as an employee expense, with a corresponding increase in equity, over the period in which the performance conditions are fulfilled, ending on the date on which the relevant employees become fully entitled to the award (‘vesting date’). The fair value of the awards granted is measured at grant date based on an observable market price using an option valuation model, taking into account the terms and conditions upon which the awards were granted. The amount recognised as an expense is adjusted to reflect the actual number of awards for which the related service and non-market vesting conditions are expected to be met, such that the amount ultimately recognised as an expense is based on the number of awards that do meet the related service and non-market performance conditions at the vesting date. For share-based payment awards with non-vesting conditions or market conditions, the grant date fair value of the share-based payment is measured to reflect such conditions and there is no true-up for differences between expected and actual outcomes.
Long term incentive plan (‘LTIP’)In 2016, the Company established an LTIP Scheme under which certain employees were granted the opportunity to participate in this LTIP Scheme, which contains both performance and service conditions. The fair value of the employee services received in exchange for the grant of the ownership interest is recognised as an expense. The total amount to be expensed over the vesting period is determined by reference to the fair value of the awards granted after adjusting for market based conditions and non-vesting conditions. Service and non-market vesting conditions including recurring revenue growth and number of beds are included in assumptions about the number of awards that are expected to become full ownership interests. At each reporting date, the estimate of the number of awards that are expected to vest is revised. The impact of the revision of original estimates, if any, is recognised in the income statement, with a corresponding adjustment to equity. The total expense is recognised over the vesting period which is the period over which all the specified vesting conditions are satisfied. Modifications of the performance conditions are accounted for as a modification under IFRS 2. Where a modification increases the fair value of the equity instruments granted, the Group has included the incremental fair value granted in the measurement of the amount recognised for the services received over the remainder of the vesting period.
Page 44

We are managed as a single business unit engaged in the provision of interactive patient care, accordingly, we operate in one reportable segment which provides a patient engagement solution for the healthcare sector.
Our operating segment is reported in a manner consistent with the internal reporting provided to the
Chief Operating Decision Maker (CODM). Our CODM has been identified as our executive management team. The executive management team comprises of the Company President, CEO, CFO and CCO. The CODM assess the performance of the business, and allocates resources, based on the consolidated results of the company.
Recurring revenue: 2018 2017
€ €
Software usage and content 2,233,666 1,353,453
Support income 953,532 845,762
Licence fee 251,915 346,889
3,439,113 2,546,104
Non-recurring revenue:
Hardware 3,438,126 2,176,149
Services income 1,323,119 1,590,460
4,761,245 3,766,609
Total revenue 8,200,358 6,312,713
Revenue attributable to geographic region of customers: 2018 2017
€ €
Ireland 4,659 4,659
United States 3,587,000 3,942,776
Australia 4,115,030 2,268,463
Middle East and North Africa 493,669 96,815
Total revenue 8,200,358 6,312,713
Non-current assets by geographic region: 2018 2017
€ €
Ireland 2,351,700 2,104,812
United States 152,243 209,245
Australia 151,762 202,659
Middle East and North Africa 3,373 5,459
2,659,078 2,522,175
Major customerRevenues from customer A, B, C and D represented 23% (2017: 27%), 12% (2017: 20%), 12% (2017: 13%) and 11% (2017: 7%).
Revenue by type and geographical region is as follows:
2. Segment Information
m. Lease paymentsPayments made under operating leases are recognized in profit or loss on a straight-line basis over the term of the lease.
n. Finance income and finance costsThe Group’s finance income and finance costs include:• Interest income
• Interest expense• Foreign currency translation expense• Bank chargesInterest income or expense is recognised using the effective interest method.
Page 45
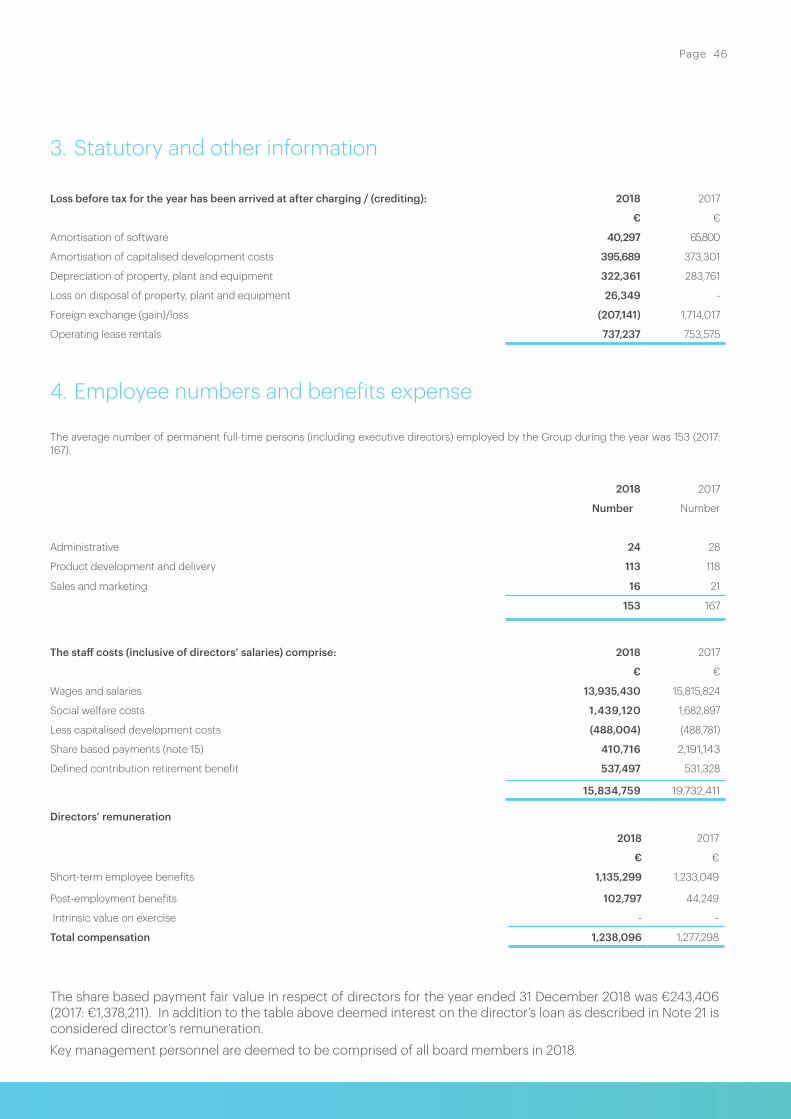
3. Statutory and other information
Loss before tax for the year has been arrived at after charging / (crediting): 2018 2017
€ €
Amortisation of software 40,297 65,800
Amortisation of capitalised development costs 395,689 373,301
Depreciation of property, plant and equipment 322,361 283,761
Loss on disposal of property, plant and equipment 26,349 -
Foreign exchange (gain)/loss (207,141) 1,714,017
Operating lease rentals 737,237 753,575
4. Employee numbers and benefits expense
The average number of permanent full-time persons (including executive directors) employed by the Group during the year was 153 (2017: 167).
2018 2017
Number Number
Administrative 24 28
Product development and delivery 113 118
Sales and marketing 16 21
153 167
The staff costs (inclusive of directors’ salaries) comprise: 2018 2017
€ €
Wages and salaries 13,935,430 15,815,824
Social welfare costs 1,439,120 1,682,897
Less capitalised development costs (488,004) (488,781)
Share based payments (note 15) 410,716 2,191,143
Defined contribution retirement benefit 537,497 531,328
15,834,759 19,732,411
Directors’ remuneration
2018 2017
€ €
Short-term employee benefits 1,135,299 1,233,049
Post-employment benefits 102,797 44,249
Intrinsic value on exercise - -
Total compensation 1,238,096 1,277,298
The share based payment fair value in respect of directors for the year ended 31 December 2018 was €243,406 (2017: €1,378,211). In addition to the table above deemed interest on the director’s loan as described in Note 21 is considered director’s remuneration.Key management personnel are deemed to be comprised of all board members in 2018.
Page 46

5. Finance (charges) / income
2018 2017
€ €
Bank charges (23,297) (24,609)
Foreign exchange loss - (1,714,017)
Finance charges (23,297) (1,738,626)
Foreign exchange gain 207,141 -
Interest income 1,741 1,492
Finance income 208,882 1,492
6. Income taxThe components of the income tax charge for the years ended 31 December 2018 and 2017 were as follows:
2018 2017
€ €
Current tax expense
Corporation tax for the year - (10,526)
Foreign tax for the year (58,802) (86,509)
Income tax charge in Consolidated statement of total comprehensive income
(58,802) (97,035)
Reconciliation of effective tax rate
A reconciliation of the expected tax credit, computed by applying the standard Irish tax rate to loss before tax to the actual tax credit, is as follows:
2018 2017
€ €
Loss before tax (20,219,567) (25,804,113)
Irish standard tax rate 12.5% 12.5%
Tax at Irish standard tax rate (2,527,446) (3,225,514)
Permanent items (96,581) 574,391
Current year unrecognised deferred tax 2,597,077 2,594,984
Effect of foreign tax 147,839 234,298
Income/(losses) taxed at higher rate (2,687) 24,047
Tax relief at source - 10,526
Prior year adjustment - (52,919)
Non-taxable income (59,400) (62,778)
Total tax charge 58,802 97,035
Page 47

No tax charge has been credited or charged directly to other comprehensive income or equity.
The company has an unrecognised deferred tax asset carried forward of €9,129,032 (31 December 2017: €6,531,955). The deferred tax asset only accrues in Ireland and therefore has no expiry date. As the Company has a history of losses a deferred tax asset will not be recognised until the company can predict future taxable profits with sufficient certainty.
The unrecognised deferred tax asset at 31 December 2018 and 2017 was as follows:
2018 2017
€ €
Unrecognised deferred tax asset
Net operating losses carried forward 8,696,378 6,174,740
Income taxable in future periods (90,397) (34,973)
PPE and intangible assets temporary differences 34,729 28,706
Excess management expenses 228,534 124,943
Stock based compensation 259,788 238,539
Total unrecognised deferred taxation asset 9,129,032 6,531,955
7. Earnings per share
2018 2017
€ €
Basic earnings per share
Loss attributable to ordinary shareholders (20,278,369) (25,901,148)
Weighted average number of ordinary shares outstanding (i) 69,476,964 55,499,315
Basic loss per share (0.29) (0.47)
2018 2017
No. No.
(i) Weighted-average number of ordinary shares (basic)
Issued ordinary shares at 1 January (adjusted for bonus issue) 69,405,583 54,296,700
Effect of shares issued 71,381 1,202,615
Weighted average number of ordinary shares at 31 December 69,476,964 55,499,315
Basic loss per share is calculated by dividing the loss for the year after taxation attributable to ordinary shareholders by the weighted average number of ordinary shares in issue during the year.
Page 48
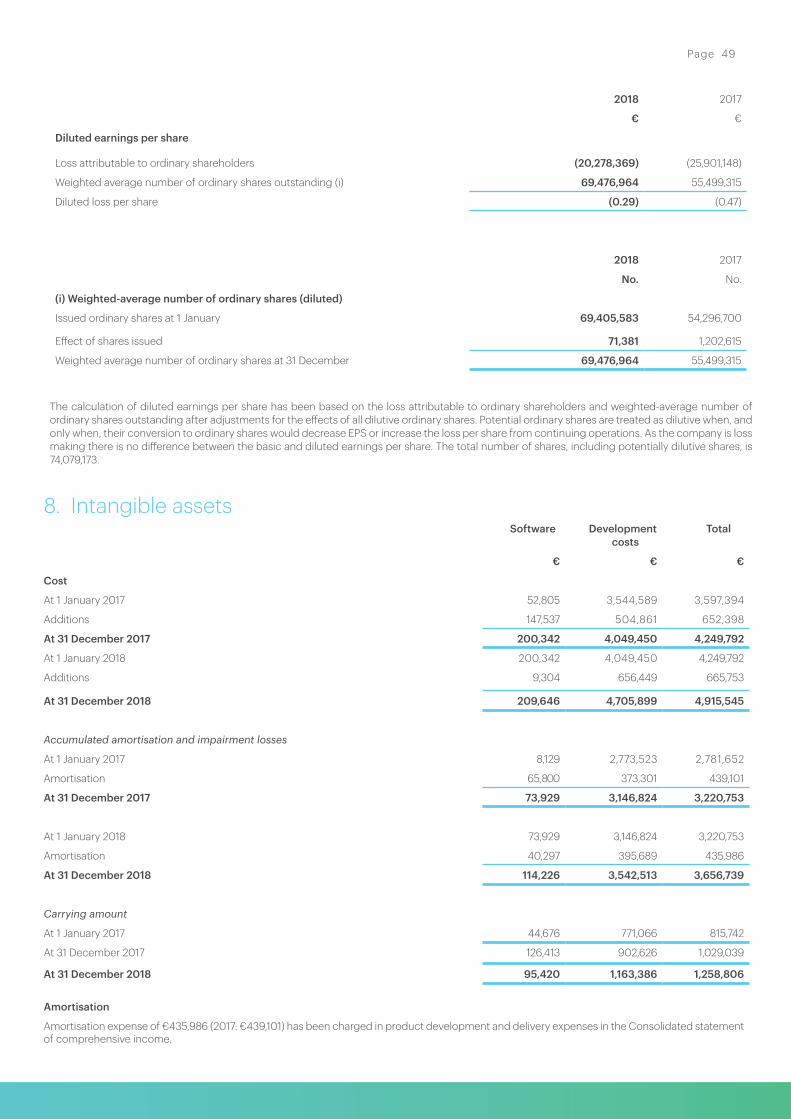
8. Intangible assets Software Development
costs Total
€ € €
Cost
At 1 January 2017 52,805 3,544,589 3,597,394
Additions 147,537 504,861 652,398
At 31 December 2017 200,342 4,049,450 4,249,792
At 1 January 2018 200,342 4,049,450 4,249,792
Additions 9,304 656,449 665,753
At 31 December 2018 209,646 4,705,899 4,915,545
Accumulated amortisation and impairment losses
At 1 January 2017 8,129 2,773,523 2,781,652
Amortisation 65,800 373,301 439,101
At 31 December 2017 73,929 3,146,824 3,220,753
At 1 January 2018 73,929 3,146,824 3,220,753
Amortisation 40,297 395,689 435,986
At 31 December 2018 114,226 3,542,513 3,656,739
Carrying amount
At 1 January 2017 44,676 771,066 815,742
At 31 December 2017 126,413 902,626 1,029,039
At 31 December 2018 95,420 1,163,386 1,258,806
Amortisation
Amortisation expense of €435,986 (2017: €439,101) has been charged in product development and delivery expenses in the Consolidated statement of comprehensive income.
2018 2017
€ €
Diluted earnings per share
Loss attributable to ordinary shareholders (20,278,369) (25,901,148)
Weighted average number of ordinary shares outstanding (i) 69,476,964 55,499,315
Diluted loss per share (0.29) (0.47)
2018 2017
No. No.
(i) Weighted-average number of ordinary shares (diluted)
Issued ordinary shares at 1 January 69,405,583 54,296,700
Effect of shares issued 71,381 1,202,615
Weighted average number of ordinary shares at 31 December 69,476,964 55,499,315
The calculation of diluted earnings per share has been based on the loss attributable to ordinary shareholders and weighted-average number of ordinary shares outstanding after adjustments for the effects of all dilutive ordinary shares. Potential ordinary shares are treated as dilutive when, and only when, their conversion to ordinary shares would decrease EPS or increase the loss per share from continuing operations. As the company is loss making there is no difference between the basic and diluted earnings per share. The total number of shares, including potentially dilutive shares, is 74,079,173.
Page 49
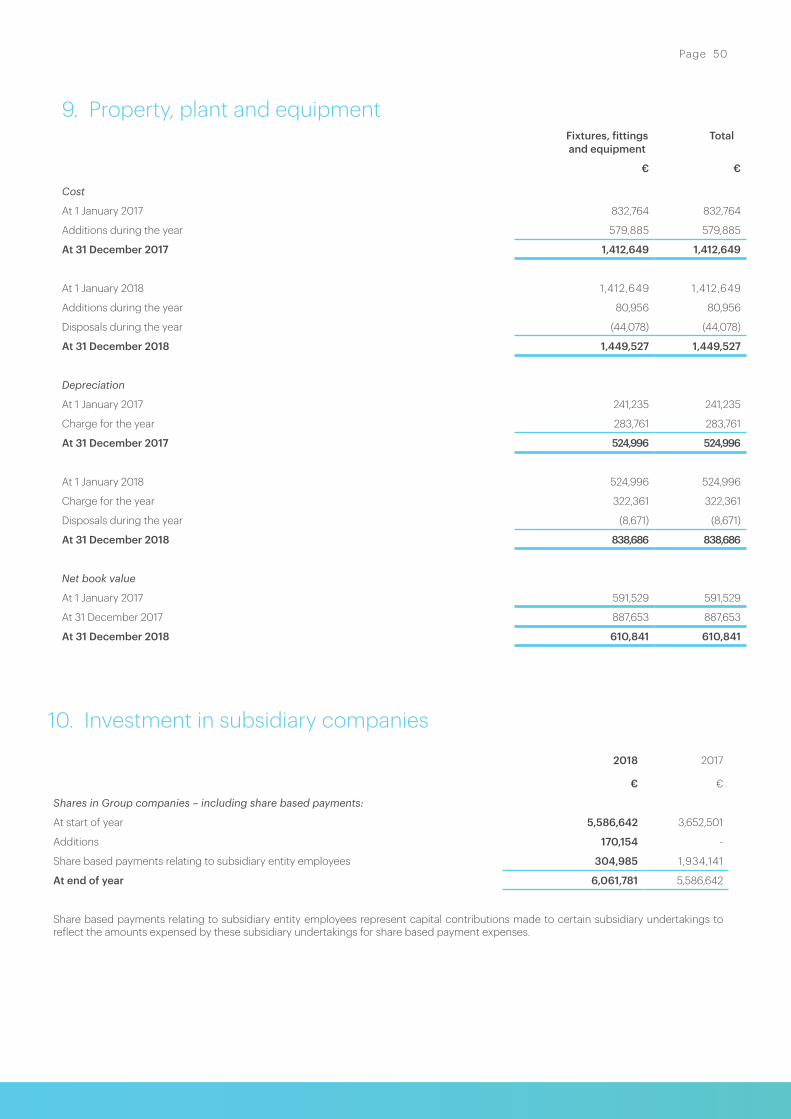
9. Property, plant and equipment Fixtures, fittings and equipment
Total
€ €
Cost
At 1 January 2017 832,764 832,764
Additions during the year 579,885 579,885
At 31 December 2017 1,412,649 1,412,649
At 1 January 2018 1,412,649 1,412,649
Additions during the year 80,956 80,956
Disposals during the year (44,078) (44,078)
At 31 December 2018 1,449,527 1,449,527
Depreciation
At 1 January 2017 241,235 241,235
Charge for the year 283,761 283,761
At 31 December 2017 524,996 524,996
At 1 January 2018 524,996 524,996
Charge for the year 322,361 322,361
Disposals during the year (8,671) (8,671)
At 31 December 2018 838,686 838,686
Net book value
At 1 January 2017 591,529 591,529
At 31 December 2017 887,653 887,653
At 31 December 2018 610,841 610,841
2018 2017
€ €
Shares in Group companies – including share based payments:
At start of year 5,586,642 3,652,501
Additions 170,154 -
Share based payments relating to subsidiary entity employees 304,985 1,934,141
At end of year 6,061,781 5,586,642
Share based payments relating to subsidiary entity employees represent capital contributions made to certain subsidiary undertakings to reflect the amounts expensed by these subsidiary undertakings for share based payment expenses.
10. Investment in subsidiary companies
Page 50
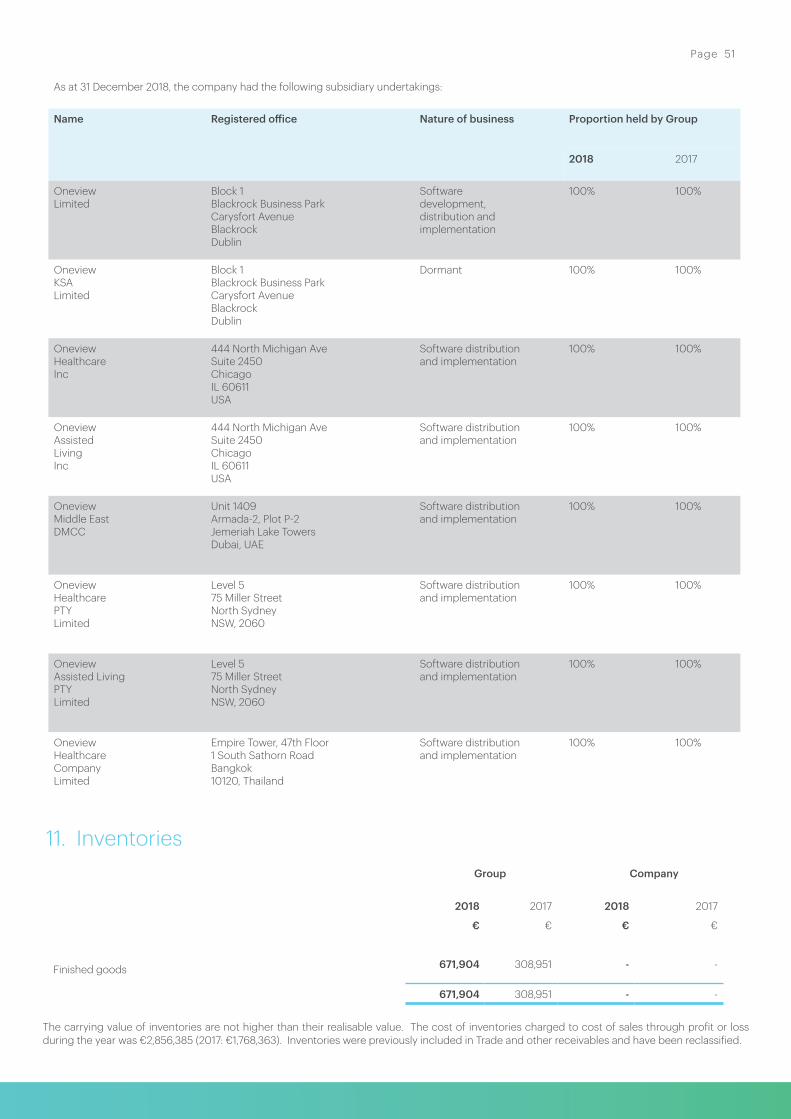
2018 2017
€ €
Shares in Group companies – including share based payments:
At start of year 5,586,642 3,652,501
Additions 170,154 -
Share based payments relating to subsidiary entity employees 304,985 1,934,141
At end of year 6,061,781 5,586,642
Share based payments relating to subsidiary entity employees represent capital contributions made to certain subsidiary undertakings to reflect the amounts expensed by these subsidiary undertakings for share based payment expenses.
As at 31 December 2018, the company had the following subsidiary undertakings:
Name Registered office Nature of business Proportion held by Group
2018 2017
Oneview Limited
Block 1Blackrock Business ParkCarysfort AvenueBlackrockDublin
Softwaredevelopment,distribution andimplementation
100% 100%
Oneview KSALimited
Block 1Blackrock Business ParkCarysfort AvenueBlackrockDublin
Dormant 100% 100%
Oneview Healthcare Inc
444 North Michigan AveSuite 2450ChicagoIL 60611USA
Software distributionand implementation
100% 100%
Oneview Assisted LivingInc
444 North Michigan AveSuite 2450ChicagoIL 60611USA
Software distributionand implementation
100% 100%
Oneview Middle EastDMCC
Unit 1409Armada-2, Plot P-2Jemeriah Lake TowersDubai, UAE
Software distributionand implementation
100% 100%
Oneview HealthcarePTYLimited
Level 575 Miller StreetNorth SydneyNSW, 2060
Software distributionand implementation
100% 100%
Oneview Assisted LivingPTYLimited
Level 575 Miller StreetNorth SydneyNSW, 2060
Software distributionand implementation
100% 100%
Oneview HealthcareCompanyLimited
Empire Tower, 47th Floor1 South Sathorn RoadBangkok10120, Thailand
Software distribution and implementation
100% 100%
11. Inventories Group Company
2018 2017 2018 2017
€ € € €
Finished goods 671,904 308,951 - -
671,904 308,951 - -
The carrying value of inventories are not higher than their realisable value. The cost of inventories charged to cost of sales through profit or loss during the year was €2,856,385 (2017: €1,768,363). Inventories were previously included in Trade and other receivables and have been reclassified.
Page 51

Group Company
2018 2017 2018 2017
€ € € €
Amounts falling due within one year:
Trade receivables 1 ,806,541 1,583,458 - -
Prepaid expenses and other current assets 437,316 637,680 70,987 66,756
Deferred contract assets 1,449,178 1,045,194 - -
Corporation tax receivable - 16,668 - -
Research and development tax credit 435,279 238,534 - -
Amounts due from group companies*** - - 55,660,835 46,511,224
Amount due from Oneview Limited** - - 500,399 500,399
Sales tax recoverable 55,853 434,289 4,716 26,006
4,184,167 3,955,823 56,236,937 47,104,385
Amounts falling due after more than one year:
Research and development tax credit 536,962 353,014 - -
Amounts due from Group Companies* - - 17,823,861 6,897,937
4,721,129 4,308,837 74,060,798 54,002,322
12. Trade and other receivables
Aging analysis of trade receivables
Less than 30 days
Between 31-60 days
Between 61-90 Days
More than 90 days
CreditImpaired
Total
€ € € € € €
As at December 2018 1,037,214 119,745 209,376 440,206 - 1,806,541
As at December 2017 897,600 197,286 488,177 395 - 1,583,458
The Group’s customers are primarily state controlled public hospitals in their relevant jurisdictions and have at least a Moodys credit rating of Aa2. Accordingly, any expected credit loss is not material. As at 31 December 2018, a significant portion of the trade receivables related to a limited number of customers as follows: Customer A 22% (2017: 51%), Customer B 19% (2017: 14%) and Customer C 9% (2017: 12%).
* Amounts due from group companies’ bear interest at the US risk free rate plus a margin. Loans are repayable in 2020. Upon maturity, the Directors expect to rollover these agreements for another 24 months.
** Enterprise Ireland acquired convertible shares in Oneview Ltd in 2009 and 2011. These shares had a right to an interest coupon and other conversion features. On 19 December 2013, Oneview Healthcare plc, the Company’s parent company, acquired these shares from Enterprise Ireland.
On the same date, Oneview Healthcare plc waived all rights to interest and convertible features. These shares are redeemable. This loan is payable on demand and is not incurring any interest.
***Amounts due from group companies are interest free and repayable on demand.
The fair value of trade receivables approximates to the values shown above. The maximum exposure to credit risk at the reporting date is the carrying value of each class of receivable mentioned above.
The Group does not hold collateral as security. The aging analysis of past due trade receivables is set out below:
Page 52
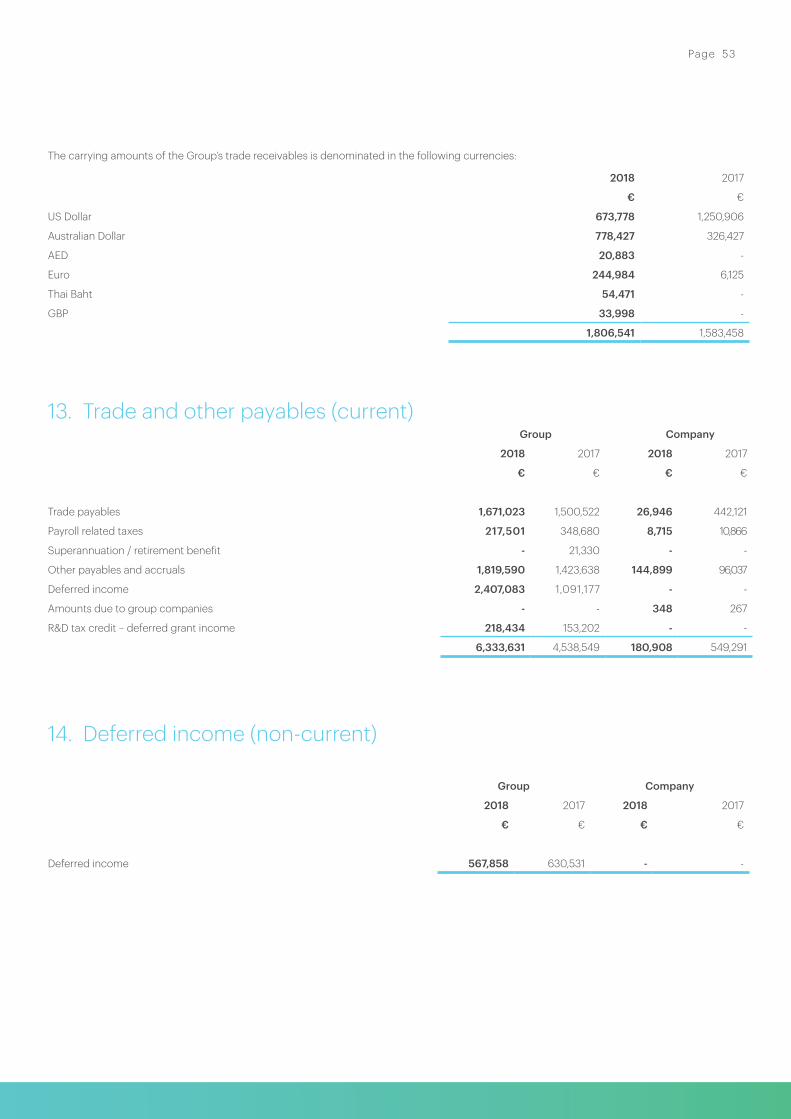
The carrying amounts of the Group’s trade receivables is denominated in the following currencies:
2018 2017
€ €
US Dollar 673,778 1,250,906
Australian Dollar 778,427 326,427
AED 20,883 -
Euro 244,984 6,125
Thai Baht 54,471 -
GBP 33,998 -
1,806,541 1,583,458
13. Trade and other payables (current) Group Company
2018 2017 2018 2017
€ € € €
Trade payables 1,671,023 1,500,522 26,946 442,121
Payroll related taxes 217,501 348,680 8,715 10,866
Superannuation / retirement benefit - 21,330 - -
Other payables and accruals 1,819,590 1,423,638 144,899 96,037
Deferred income 2,407,083 1,091,177 - -
Amounts due to group companies - - 348 267
R&D tax credit – deferred grant income 218,434 153,202 - -
6,333,631 4,538,549 180,908 549,291
14. Deferred income (non-current)
Group Company
2018 2017 2018 2017
€ € € €
Deferred income 567,858 630,531 - -
Page 53
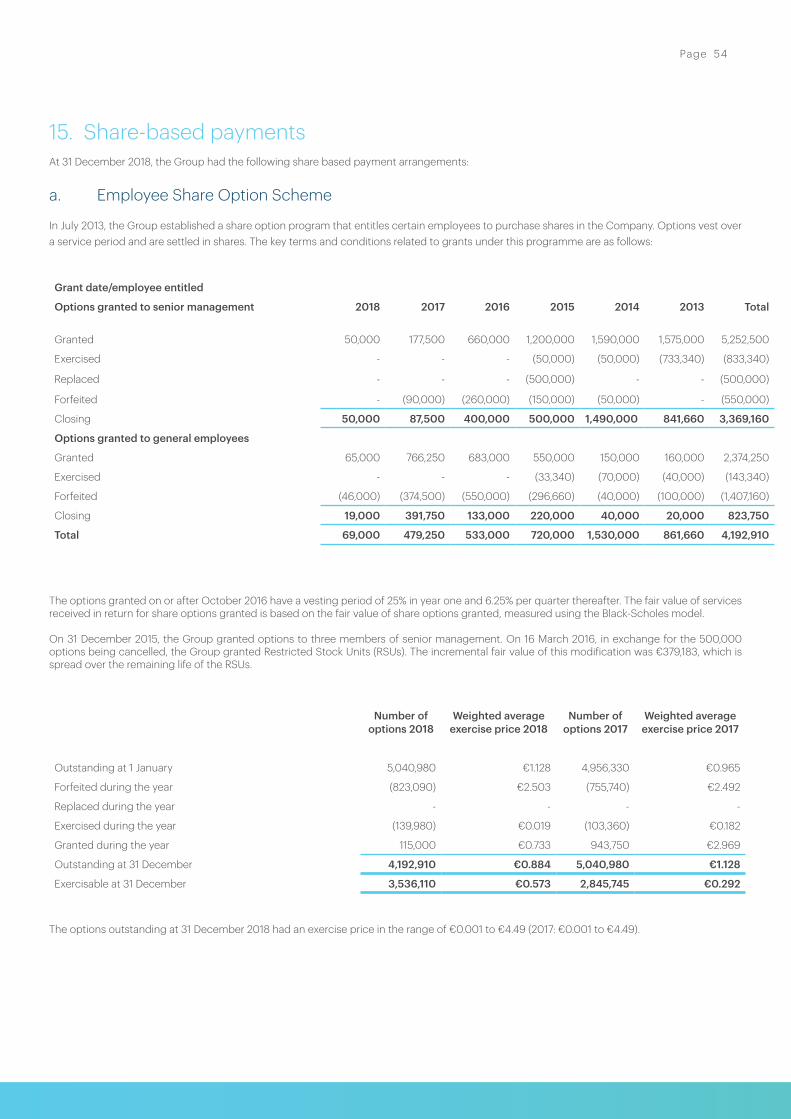
15. Share-based paymentsAt 31 December 2018, the Group had the following share based payment arrangements:
a. Employee Share Option Scheme
In July 2013, the Group established a share option program that entitles certain employees to purchase shares in the Company. Options vest over a service period and are settled in shares. The key terms and conditions related to grants under this programme are as follows:
Grant date/employee entitled
Options granted to senior management 2018 2017 2016 2015 2014 2013 Total
Granted 50,000 177,500 660,000 1,200,000 1,590,000 1,575,000 5,252,500
Exercised - - - (50,000) (50,000) (733,340) (833,340)
Replaced - - - (500,000) - - (500,000)
Forfeited - (90,000) (260,000) (150,000) (50,000) - (550,000)
Closing 50,000 87,500 400,000 500,000 1,490,000 841,660 3,369,160
Options granted to general employees
Granted 65,000 766,250 683,000 550,000 150,000 160,000 2,374,250
Exercised - - - (33,340) (70,000) (40,000) (143,340)
Forfeited (46,000) (374,500) (550,000) (296,660) (40,000) (100,000) (1,407,160)
Closing 19,000 391,750 133,000 220,000 40,000 20,000 823,750
Total 69,000 479,250 533,000 720,000 1,530,000 861,660 4,192,910
The options granted on or after October 2016 have a vesting period of 25% in year one and 6.25% per quarter thereafter. The fair value of services received in return for share options granted is based on the fair value of share options granted, measured using the Black-Scholes model.
On 31 December 2015, the Group granted options to three members of senior management. On 16 March 2016, in exchange for the 500,000 options being cancelled, the Group granted Restricted Stock Units (RSUs). The incremental fair value of this modification was €379,183, which is spread over the remaining life of the RSUs.
Number of options 2018
Weighted average exercise price 2018
Number of options 2017
Weighted average exercise price 2017
Outstanding at 1 January 5,040,980 €1.128 4,956,330 €0.965
Forfeited during the year (823,090) €2.503 (755,740) €2.492
Replaced during the year - - - -
Exercised during the year (139,980) €0.019 (103,360) €0.182
Granted during the year 115,000 €0.733 943,750 €2.969
Outstanding at 31 December 4,192,910 €0.884 5,040,980 €1.128
Exercisable at 31 December 3,536,110 €0.573 2,845,745 €0.292
The options outstanding at 31 December 2018 had an exercise price in the range of €0.001 to €4.49 (2017: €0.001 to €4.49).
Page 54
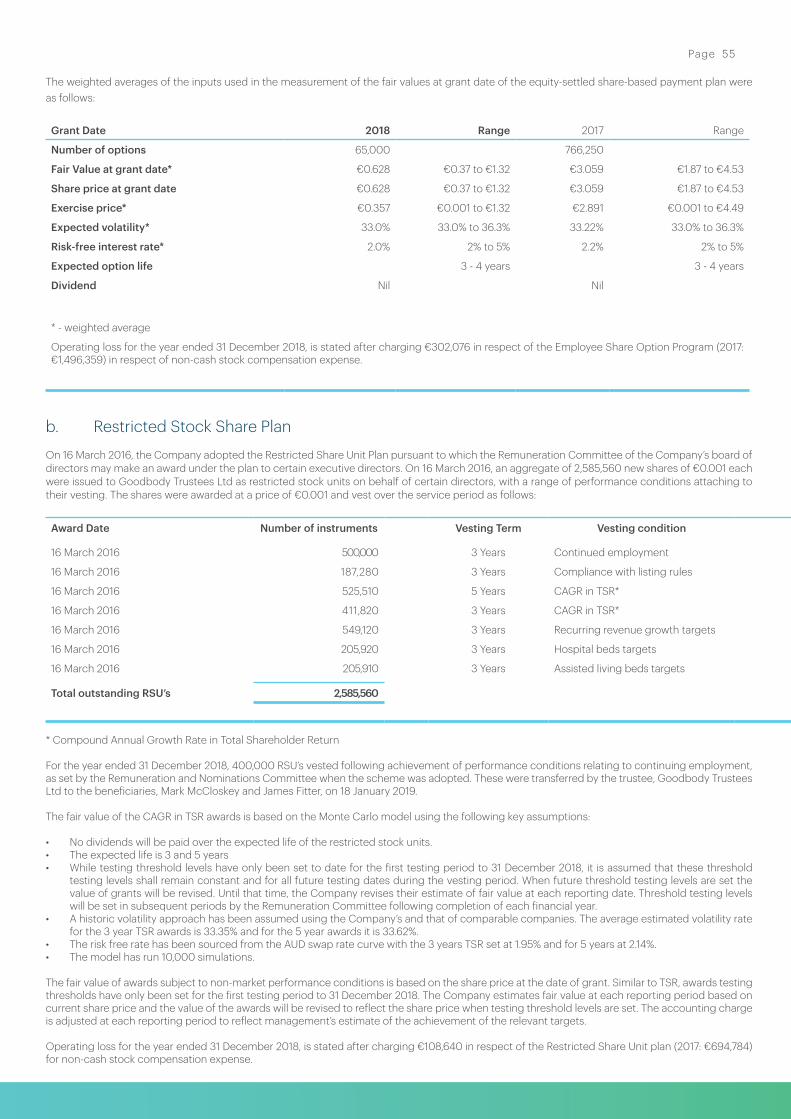
The weighted averages of the inputs used in the measurement of the fair values at grant date of the equity-settled share-based payment plan were as follows:
Grant Date 2018 Range 2017 Range
Number of options 65,000 766,250
Fair Value at grant date* €0.628 €0.37 to €1.32 €3.059 €1.87 to €4.53
Share price at grant date €0.628 €0.37 to €1.32 €3.059 €1.87 to €4.53
Exercise price* €0.357 €0.001 to €1.32 €2.891 €0.001 to €4.49
Expected volatility* 33.0% 33.0% to 36.3% 33.22% 33.0% to 36.3%
Risk-free interest rate* 2.0% 2% to 5% 2.2% 2% to 5%
Expected option life 3 - 4 years 3 - 4 years
Dividend Nil Nil
* - weighted average
Operating loss for the year ended 31 December 2018, is stated after charging €302,076 in respect of the Employee Share Option Program (2017: €1,496,359) in respect of non-cash stock compensation expense.
b. Restricted Stock Share Plan
On 16 March 2016, the Company adopted the Restricted Share Unit Plan pursuant to which the Remuneration Committee of the Company’s board of directors may make an award under the plan to certain executive directors. On 16 March 2016, an aggregate of 2,585,560 new shares of €0.001 each were issued to Goodbody Trustees Ltd as restricted stock units on behalf of certain directors, with a range of performance conditions attaching to their vesting. The shares were awarded at a price of €0.001 and vest over the service period as follows:
Award Date Number of instruments Vesting Term Vesting condition
16 March 2016 500,000 3 Years Continued employment
16 March 2016 187,280 3 Years Compliance with listing rules
16 March 2016 525,510 5 Years CAGR in TSR*
16 March 2016 411,820 3 Years CAGR in TSR*
16 March 2016 549,120 3 Years Recurring revenue growth targets
16 March 2016 205,920 3 Years Hospital beds targets
16 March 2016 205,910 3 Years Assisted living beds targets
Total outstanding RSU’s 2,585,560
* Compound Annual Growth Rate in Total Shareholder Return
For the year ended 31 December 2018, 400,000 RSU’s vested following achievement of performance conditions relating to continuing employment, as set by the Remuneration and Nominations Committee when the scheme was adopted. These were transferred by the trustee, Goodbody Trustees Ltd to the beneficiaries, Mark McCloskey and James Fitter, on 18 January 2019.
The fair value of the CAGR in TSR awards is based on the Monte Carlo model using the following key assumptions:
• No dividends will be paid over the expected life of the restricted stock units.• The expected life is 3 and 5 years• While testing threshold levels have only been set to date for the first testing period to 31 December 2018, it is assumed that these threshold
testing levels shall remain constant and for all future testing dates during the vesting period. When future threshold testing levels are set the value of grants will be revised. Until that time, the Company revises their estimate of fair value at each reporting date. Threshold testing levels will be set in subsequent periods by the Remuneration Committee following completion of each financial year.
• A historic volatility approach has been assumed using the Company’s and that of comparable companies. The average estimated volatility rate for the 3 year TSR awards is 33.35% and for the 5 year awards it is 33.62%.
• The risk free rate has been sourced from the AUD swap rate curve with the 3 years TSR set at 1.95% and for 5 years at 2.14%.• The model has run 10,000 simulations.
The fair value of awards subject to non-market performance conditions is based on the share price at the date of grant. Similar to TSR, awards testing thresholds have only been set for the first testing period to 31 December 2018. The Company estimates fair value at each reporting period based on current share price and the value of the awards will be revised to reflect the share price when testing threshold levels are set. The accounting charge is adjusted at each reporting period to reflect management’s estimate of the achievement of the relevant targets.
Operating loss for the year ended 31 December 2018, is stated after charging €108,640 in respect of the Restricted Share Unit plan (2017: €694,784) for non-cash stock compensation expense.
Page 55
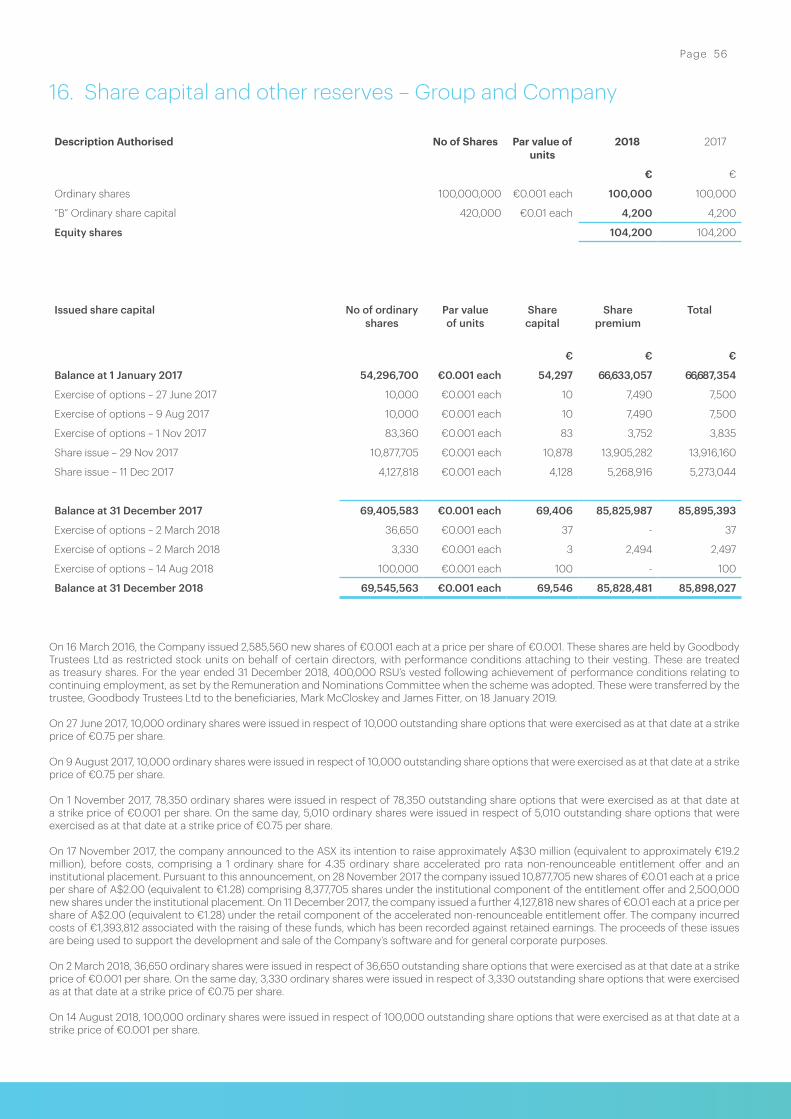
16. Share capital and other reserves – Group and Company
Description Authorised No of Shares Par value of units
2018 2017
€ €
Ordinary shares 100,000,000 €0.001 each 100,000 100,000
“B” Ordinary share capital 420,000 €0.01 each 4,200 4,200
Equity shares 104,200 104,200
Issued share capital No of ordinaryshares
Par value of units
Sharecapital
Sharepremium
Total
€ € €
Balance at 1 January 2017 54,296,700 €0.001 each 54,297 66,633,057 66,687,354
Exercise of options – 27 June 2017 10,000 €0.001 each 10 7,490 7,500
Exercise of options – 9 Aug 2017 10,000 €0.001 each 10 7,490 7,500
Exercise of options – 1 Nov 2017 83,360 €0.001 each 83 3,752 3,835
Share issue – 29 Nov 2017 10,877,705 €0.001 each 10,878 13,905,282 13,916,160
Share issue – 11 Dec 2017 4,127,818 €0.001 each 4,128 5,268,916 5,273,044
Balance at 31 December 2017 69,405,583 €0.001 each 69,406 85,825,987 85,895,393
Exercise of options – 2 March 2018 36,650 €0.001 each 37 - 37
Exercise of options – 2 March 2018 3,330 €0.001 each 3 2,494 2,497
Exercise of options – 14 Aug 2018 100,000 €0.001 each 100 - 100
Balance at 31 December 2018 69,545,563 €0.001 each 69,546 85,828,481 85,898,027
On 16 March 2016, the Company issued 2,585,560 new shares of €0.001 each at a price per share of €0.001. These shares are held by Goodbody Trustees Ltd as restricted stock units on behalf of certain directors, with performance conditions attaching to their vesting. These are treated as treasury shares. For the year ended 31 December 2018, 400,000 RSU’s vested following achievement of performance conditions relating to continuing employment, as set by the Remuneration and Nominations Committee when the scheme was adopted. These were transferred by the trustee, Goodbody Trustees Ltd to the beneficiaries, Mark McCloskey and James Fitter, on 18 January 2019.
On 27 June 2017, 10,000 ordinary shares were issued in respect of 10,000 outstanding share options that were exercised as at that date at a strike price of €0.75 per share.
On 9 August 2017, 10,000 ordinary shares were issued in respect of 10,000 outstanding share options that were exercised as at that date at a strike price of €0.75 per share.
On 1 November 2017, 78,350 ordinary shares were issued in respect of 78,350 outstanding share options that were exercised as at that date at a strike price of €0.001 per share. On the same day, 5,010 ordinary shares were issued in respect of 5,010 outstanding share options that were exercised as at that date at a strike price of €0.75 per share.
On 17 November 2017, the company announced to the ASX its intention to raise approximately A$30 million (equivalent to approximately €19.2 million), before costs, comprising a 1 ordinary share for 4.35 ordinary share accelerated pro rata non-renounceable entitlement offer and an institutional placement. Pursuant to this announcement, on 28 November 2017 the company issued 10,877,705 new shares of €0.01 each at a price per share of A$2.00 (equivalent to €1.28) comprising 8,377,705 shares under the institutional component of the entitlement offer and 2,500,000 new shares under the institutional placement. On 11 December 2017, the company issued a further 4,127,818 new shares of €0.01 each at a price per share of A$2.00 (equivalent to €1.28) under the retail component of the accelerated non-renounceable entitlement offer. The company incurred costs of €1,393,812 associated with the raising of these funds, which has been recorded against retained earnings. The proceeds of these issues are being used to support the development and sale of the Company’s software and for general corporate purposes.
On 2 March 2018, 36,650 ordinary shares were issued in respect of 36,650 outstanding share options that were exercised as at that date at a strike price of €0.001 per share. On the same day, 3,330 ordinary shares were issued in respect of 3,330 outstanding share options that were exercised as at that date at a strike price of €0.75 per share.
On 14 August 2018, 100,000 ordinary shares were issued in respect of 100,000 outstanding share options that were exercised as at that date at a strike price of €0.001 per share.
Page 56
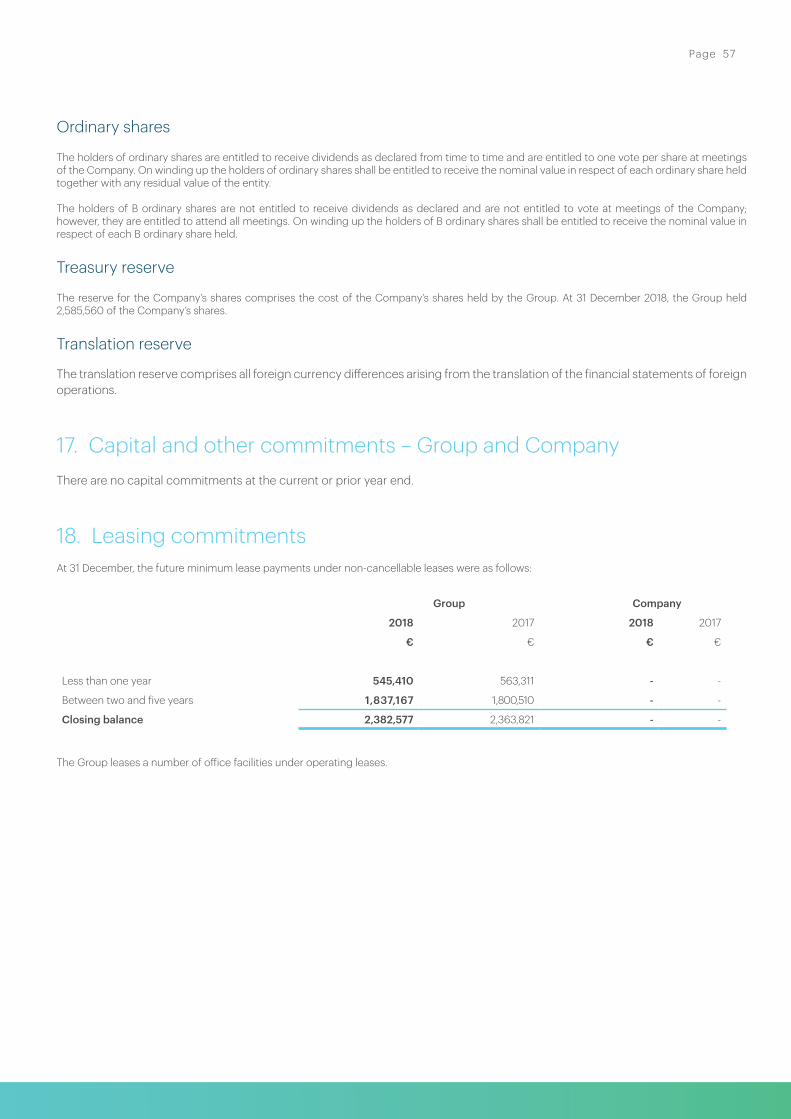
Ordinary shares
The holders of ordinary shares are entitled to receive dividends as declared from time to time and are entitled to one vote per share at meetings of the Company. On winding up the holders of ordinary shares shall be entitled to receive the nominal value in respect of each ordinary share held together with any residual value of the entity.
The holders of B ordinary shares are not entitled to receive dividends as declared and are not entitled to vote at meetings of the Company; however, they are entitled to attend all meetings. On winding up the holders of B ordinary shares shall be entitled to receive the nominal value in respect of each B ordinary share held.
Treasury reserve
The reserve for the Company’s shares comprises the cost of the Company’s shares held by the Group. At 31 December 2018, the Group held 2,585,560 of the Company’s shares.
Translation reserve
The translation reserve comprises all foreign currency differences arising from the translation of the financial statements of foreign operations.
17. Capital and other commitments – Group and CompanyThere are no capital commitments at the current or prior year end.
18. Leasing commitmentsAt 31 December, the future minimum lease payments under non-cancellable leases were as follows:
Group Company
2018 2017 2018 2017
€ € € €
Less than one year 545,410 563,311 - -
Between two and five years 1,837,167 1,800,510 - -
Closing balance 2,382,577 2,363,821 - -
The Group leases a number of office facilities under operating leases.
Page 57
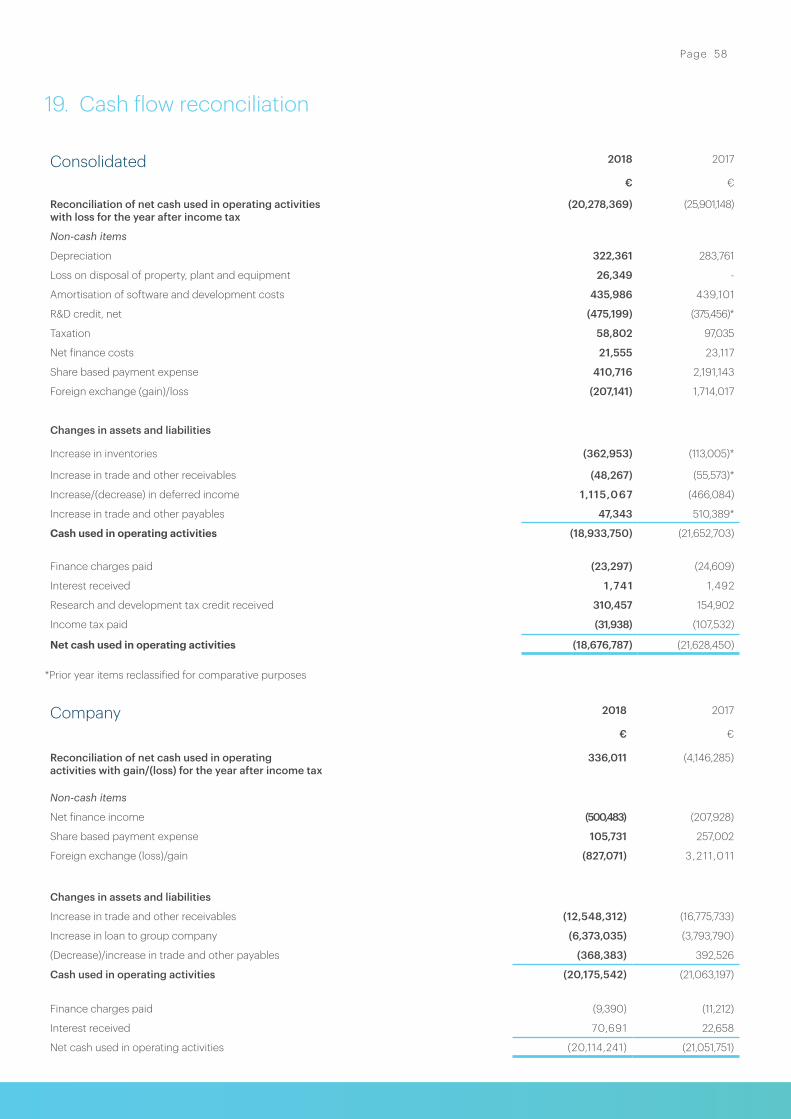
19. Cash flow reconciliation
Consolidated 2018 2017
€ €
Reconciliation of net cash used in operating activitieswith loss for the year after income tax
(20,278,369) (25,901,148)
Non-cash items
Depreciation 322,361 283,761
Loss on disposal of property, plant and equipment 26,349 -
Amortisation of software and development costs 435,986 439,101
R&D credit, net (475,199) (375,456)*
Taxation 58,802 97,035
Net finance costs 21,555 23,117
Share based payment expense 410,716 2,191,143
Foreign exchange (gain)/loss (207,141) 1,714,017
Changes in assets and liabilities
Increase in inventories (362,953) (113,005)*
Increase in trade and other receivables (48,267) (55,573)*
Increase/(decrease) in deferred income 1,115,067 (466,084)
Increase in trade and other payables 47,343 510,389*
Cash used in operating activities (18,933,750) (21,652,703)
Finance charges paid (23,297) (24,609)
Interest received 1 ,741 1,492
Research and development tax credit received 310,457 154,902
Income tax paid (31,938) (107,532)
Net cash used in operating activities (18,676,787) (21,628,450)
*Prior year items reclassified for comparative purposes
Company 2018 2017
€ €
Reconciliation of net cash used in operating activities with gain/(loss) for the year after income tax
336,011 (4,146,285)
Non-cash items
Net finance income (500,483) (207,928)
Share based payment expense 105,731 257,002
Foreign exchange (loss)/gain (827,071) 3, 211 ,0 11
Changes in assets and liabilities
Increase in trade and other receivables (12,548,312) (16,775,733)
Increase in loan to group company (6,373,035) (3,793,790)
(Decrease)/increase in trade and other payables (368,383) 392,526
Cash used in operating activities (20,175,542) (21,063,197)
Finance charges paid (9,390) (11,212)
Interest received 70,691 22,658
Net cash used in operating activities (20,114,241) (21,051,751)
Page 58

20. Financial instruments
In terms of financial risks, the Group has exposure to credit risk, liquidity risk and foreign currency risk. This note presents information about the Group’s exposure to each of the above risks together with the Group’s objectives, policies and processes for measuring and managing those risks.
The board of directors has overall responsibility for the establishment and oversight of the Group’s risk management framework. The Group’s risk management policies are established to identify and analyse the risks faced by the Group, to set appropriate risk limits and controls and to monitor risks and adherence to the limits. Risk management systems and policies will be reviewed regularly as the Group expands its activities and resource base to take account of changing conditions.
Credit risk
The Group’s exposure to significant credit risk relates to cash on deposit and trade receivables (note 12). The Group maintained its cash balances with its principal financial institution throughout the periods covered by this financial information.
The Group held cash and cash equivalents of €9.3 million at 31 December 2018 (2017: €28.6 million). The cash and cash equivalents are held with bank and financial institution counterparties, which are AA- based on Moody’s rating agency ratings.
Expected credit loss assessment for customers as at 1 January and 31 December 2018The Group allocates each exposure to a credit risk grade based on data that is determined to be predictive of the risk of loss (including but not limited to external ratings, audited financial statements, management accounts and cash flow projections and available press information about customers) and applying experienced credit judgment. Credit risk grades are defined using qualitative and quantitative factors that are indicative of the risk of default and are aligned to external credit rating definitions from credit rating agencies.
Exposures within each credit risk grade are segmented by geographic region and industry classification and an ECL rate is calculated for each segment based on delinquency status and actual credit loss experience over the past seven years.
The Group’s customers are primarily state controlled public hospitals in their relevant jurisdictions and have at least a Moodys credit rating of Aa2. Accordingly, any expected credit loss is not material.
Liquidity risk
The principal operating cash requirements of the Group include payment of salaries, suppliers, office rents and travel expenditures. The Group primarily finances its operations and growth through the issuance of ordinary shares and receipts from customers.
The Group’s primary objectives in managing its liquid and capital resources are as follows:
• to maintain adequate resources to fund its continued operations;• to ensure availability of sufficient resources to sustain future development and growth of the business;• to maintain sufficient resources to mitigate risks and unforeseen events which may arise.
The Group manages risks associated with liquid and capital resources through ongoing monitoring of actual and forecast cash balances and by reviewing the existing and future cash requirements of the business.
The following table sets out details of the maturity of the Group’s financial liabilities into the relevant maturity groupings based on the remaining period from the financial year end date to contractual maturity date:
Group
Year ended 31 December 2018
Carryingamount
Contractual cashflows
6 monthsor less
6-12months
1-2years
2-5years
More than5 years
€ € € € € € €
Trade and other payables (3,726,214) (3,726,214) (3,726,214) - - - -
Year ended 31 December 2017
Carryingamount
Contractualcashflows
6 monthsor less
6-12months
1-2years
2-5years
More than5 years
€ € € € € € €
Trade and other payables (3,294,170) (3,294,170) (3,294,170) - - - -
Page 59

Company
Year ended 31 December 2018
Carryingamount
Contractualcashflows
6 monthsor less
6-12months
1-2years
2-5years
More than5 years
€ € € € € € €
Trade and other payables (180,908) (180,908) (180,908) - - - -
Year ended 31 December 2017
Carryingamount
Contractualcashflows
6 monthsor less
6-12months
1-2years
2-5years
More than5 years
€ € € € € € €
Trade and other payables (549,291) (549,291) (549,291) - - - -
Currency risk
Group
Exposure to currency risk
The table below shows the Group’s currency exposure. The Group is exposed to currency risk to the extent that there is a mismatch between the currencies in which sales and purchases are denominated and the respective functional currencies of Group companies. The functional currencies of Group companies are primarily euro, US dollars and Australian dollars.
The following table sets out the Group’s transaction risk in relation to financial assets and liabilities at 31 December 2018:
U.S.
Dollar2018
AustralianDollar
2018
AED
2018
Thai Baht2018
GBP
2018
€ € €
Cash and cash equivalents 2,245,405 2,778,056 187,554 186,287 7,813
Trade and other payables (647,963) (284,012) (5,171) (12,221) (6,018)
Total transaction risk 1,597,442 2,494,044 182,383 174,066 1,795
Foreign exchange gains and losses recognised on the above balances are recorded in “finance (charges)/income”. The total foreign exchange gain reported during the year ending 31 December 2018 amounted to €207,141 (2017: loss of €1,714,017).
The following table sets out the Group’s transaction risk in relation to financial assets and liabilities at 31 December 2017:
U.S. Australian
Dollar Dollar
2017 2017
€ €
Cash and cash equivalents 6,324,746 2,911,551
Trade and other payables (183,165) (542,122)
Total transaction risk 6,141,581 2,369,429
Page 60
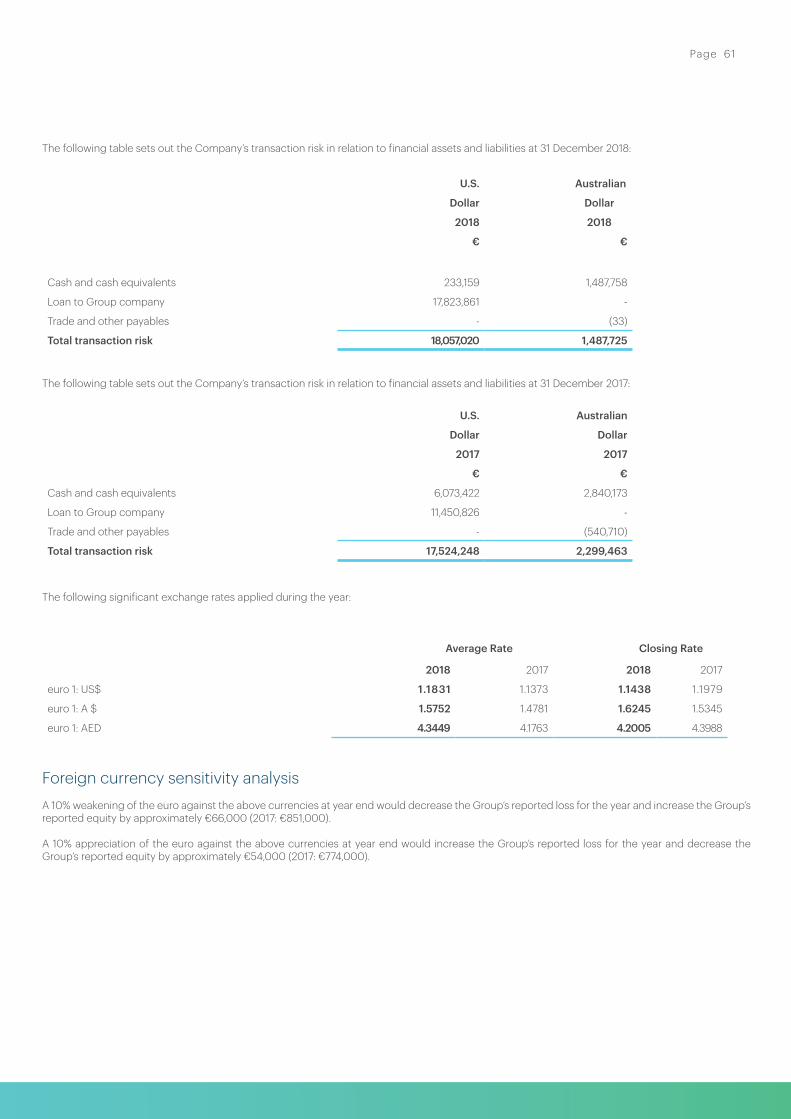
The following table sets out the Company’s transaction risk in relation to financial assets and liabilities at 31 December 2018:
U.S. Australian
Dollar Dollar
2018 2018
€ €
Cash and cash equivalents 233,159 1,487,758
Loan to Group company 17,823,861 -
Trade and other payables - (33)
Total transaction risk 18,057,020 1,487,725
The following table sets out the Company’s transaction risk in relation to financial assets and liabilities at 31 December 2017:
U.S. Australian
Dollar Dollar
2017 2017
€ €
Cash and cash equivalents 6,073,422 2,840,173
Loan to Group company 11,450,826 -
Trade and other payables - (540,710)
Total transaction risk 17,524,248 2,299,463
The following significant exchange rates applied during the year:
Average Rate Closing Rate
2018 2017 2018 2017
euro 1: US$ 1.1831 1.1373 1.1438 1.1979
euro 1: A $ 1.5752 1.4781 1.6245 1.5345
euro 1: AED 4.3449 4.1763 4.2005 4.3988
Foreign currency sensitivity analysisA 10% weakening of the euro against the above currencies at year end would decrease the Group’s reported loss for the year and increase the Group’s reported equity by approximately €66,000 (2017: €851,000).
A 10% appreciation of the euro against the above currencies at year end would increase the Group’s reported loss for the year and decrease the Group’s reported equity by approximately €54,000 (2017: €774,000).
Page 61

Fair values of financial assets and liabilities
Group
The fair values of financial assets and liabilities by class and category, together with their carrying amounts shown in the statement of financial position, are as follows:
31 December 2018 31 December 2017
Carrying amount
Fair value
Carrying amount
Fair value
€ € € €
Financial assets – amortised cost
Cash and cash equivalents 9,330,948 9,330,948 28,610,543 28,610,543
Trade and other receivables 4,184,167 4,184,167 3,955,823 3,955,823
Loan to director 252,469 252,469 252,469 252,469
13,767,584 13,767,584 32,818,835 32,818,835
Financial liabilities
Trade and other payables (3,726,214) (3,726,214) (3,294,170) (3,294,170)
For cash and cash equivalents, the nominal amount is deemed to reflect fair value. For receivables and payables, the carrying value is deemed to reflect fair value, where appropriate.
Company 31 December 2018 31 December 2017
Carrying amount
Fair value
Carrying amount
Fair value
€ € € €
Financial assets – amortised cost
Cash and cash equivalents 4,959,618 4,959,618 25,112,255 25,112,255
Amounts due from subsidiaries 55,660,835 55,660,835 41,958,335 41,958,335
Amounts due from Oneview Limited 500,399 500,399 500,399 500,399
Trade and other receivables 75,703 75,703 92,762 92,762
Loans to Director 252,469 252,469 252,469 252,469
Loan to Group company 17,823,861 17,823,861 11,450,826 11,450,826
79,272,885 79,272,885 79,367,046 79,367,046
31 December 2018 31 December 2017
Carrying amount
Fair value
Carrying amount
Fair value
€ € € €
Financial liabilities
Amounts due to subsidiaries (348) (348) (267) (267)
Trade and other payables (180,560) (180,560) (549,024) (549,024)
(180,908) (180,908) (549,291) (549,291)
For cash, cash equivalents and payables, the carrying value is deemed to reflect fair value, where appropriate. For amounts due from/due to subsidiaries the carrying value is deemed to be fair value as the amounts are repayable on demand. For amounts due from Oneview Limited the carrying value is deemed to be fair value as the loans are repayable on demand at year end, or shortly thereafter. The loan to Group company has a maturity of April 2020, however, as the loan was issued in December 2016 and rolled over in 2018, the fair value has been deemed to be the same as the carrying amount.
Page 62
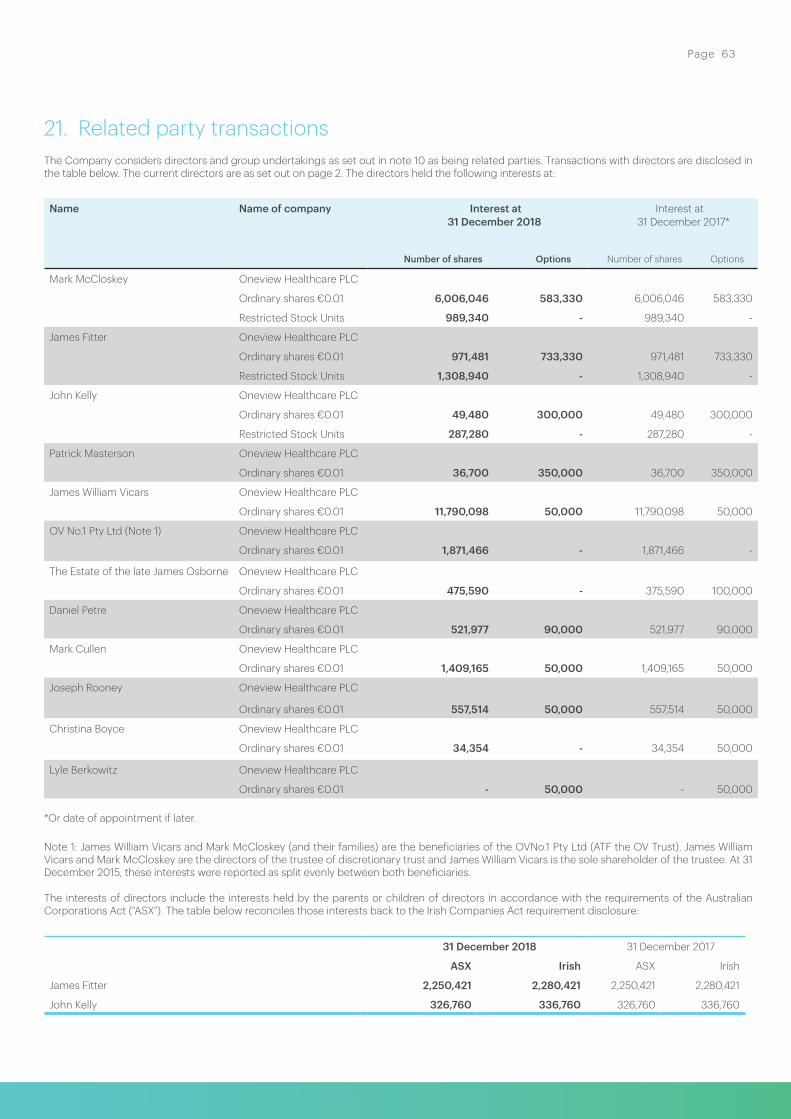
21. Related party transactions The Company considers directors and group undertakings as set out in note 10 as being related parties. Transactions with directors are disclosed in the table below. The current directors are as set out on page 2. The directors held the following interests at:
Name Name of company Interest at 31 December 2018
Interest at 31 December 2017*
Number of shares Options Number of shares Options
Mark McCloskey Oneview Healthcare PLC
Ordinary shares €0.01 6,006,046 583,330 6,006,046 583,330
Restricted Stock Units 989,340 - 989,340 -
James Fitter Oneview Healthcare PLC
Ordinary shares €0.01 971,481 733,330 971,481 733,330
Restricted Stock Units 1,308,940 - 1,308,940 -
John Kelly Oneview Healthcare PLC
Ordinary shares €0.01 49,480 300,000 49,480 300,000
Restricted Stock Units 287,280 - 287,280 -
Patrick Masterson Oneview Healthcare PLC
Ordinary shares €0.01 36,700 350,000 36,700 350,000
James William Vicars Oneview Healthcare PLC
Ordinary shares €0.01 11,790,098 50,000 11,790,098 50,000
OV No.1 Pty Ltd (Note 1) Oneview Healthcare PLC
Ordinary shares €0.01 1,871,466 - 1,871,466 -
The Estate of the late James Osborne Oneview Healthcare PLC
Ordinary shares €0.01 475,590 - 375,590 100,000
Daniel Petre Oneview Healthcare PLC
Ordinary shares €0.01 521,977 90,000 521,977 90,000
Mark Cullen Oneview Healthcare PLC
Ordinary shares €0.01 1,409,165 50,000 1,409,165 50,000
Joseph Rooney Oneview Healthcare PLC
Ordinary shares €0.01 557,514 50,000 557,514 50,000
Christina Boyce Oneview Healthcare PLC
Ordinary shares €0.01 34,354 - 34,354 50,000
Lyle Berkowitz Oneview Healthcare PLC
Ordinary shares €0.01 - 50,000 - 50,000
*Or date of appointment if later.
Note 1: James William Vicars and Mark McCloskey (and their families) are the beneficiaries of the OVNo.1 Pty Ltd (ATF the OV Trust). James William Vicars and Mark McCloskey are the directors of the trustee of discretionary trust and James William Vicars is the sole shareholder of the trustee. At 31 December 2015, these interests were reported as split evenly between both beneficiaries.
The interests of directors include the interests held by the parents or children of directors in accordance with the requirements of the Australian Corporations Act (“ASX”). The table below reconciles those interests back to the Irish Companies Act requirement disclosure:
31 December 2018 31 December 2017
ASX Irish ASX Irish
James Fitter 2,250,421 2,280,421 2,250,421 2,280,421
John Kelly 326,760 336,760 326,760 336,760
Page 63
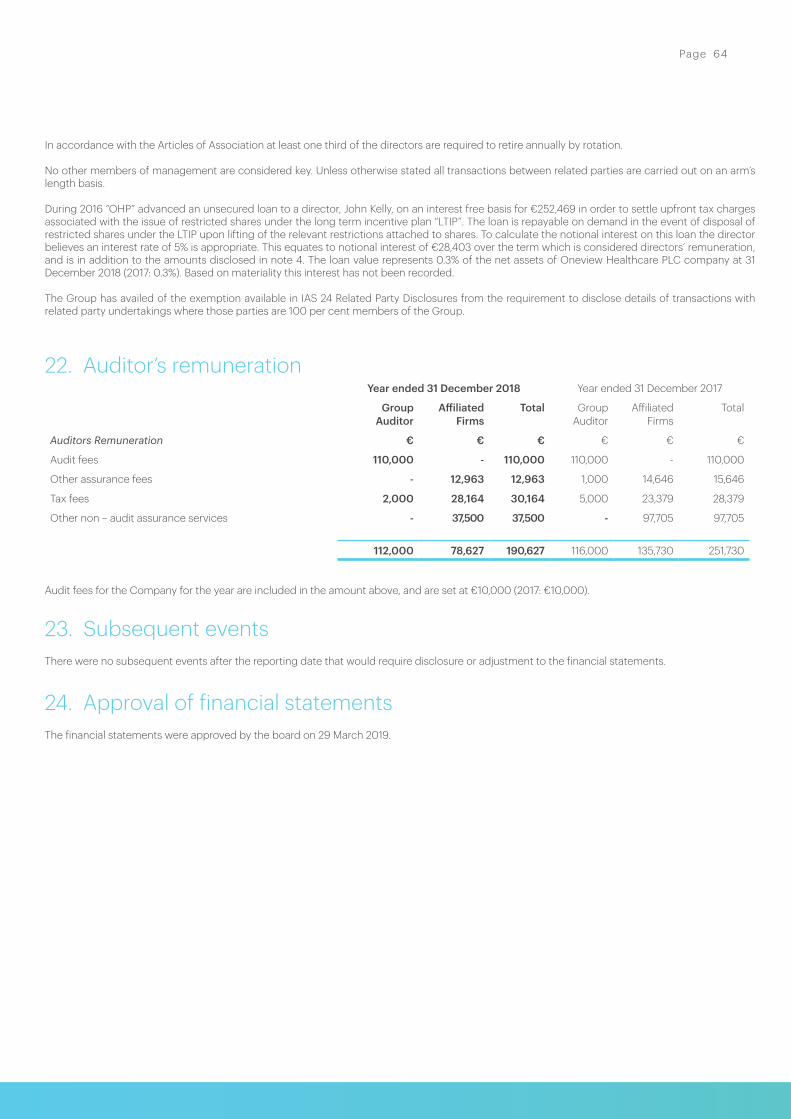
In accordance with the Articles of Association at least one third of the directors are required to retire annually by rotation.
No other members of management are considered key. Unless otherwise stated all transactions between related parties are carried out on an arm’s length basis.
During 2016 “OHP” advanced an unsecured loan to a director, John Kelly, on an interest free basis for €252,469 in order to settle upfront tax charges associated with the issue of restricted shares under the long term incentive plan “LTIP”. The loan is repayable on demand in the event of disposal of restricted shares under the LTIP upon lifting of the relevant restrictions attached to shares. To calculate the notional interest on this loan the director believes an interest rate of 5% is appropriate. This equates to notional interest of €28,403 over the term which is considered directors’ remuneration, and is in addition to the amounts disclosed in note 4. The loan value represents 0.3% of the net assets of Oneview Healthcare PLC company at 31 December 2018 (2017: 0.3%). Based on materiality this interest has not been recorded.
The Group has availed of the exemption available in IAS 24 Related Party Disclosures from the requirement to disclose details of transactions with related party undertakings where those parties are 100 per cent members of the Group.
22. Auditor’s remuneration Year ended 31 December 2018 Year ended 31 December 2017
Group Auditor
Affiliated Firms
Total Group Auditor
Affiliated Firms
Total
Auditors Remuneration € € € € € €
Audit fees 110,000 - 110,000 110,000 - 110,000
Other assurance fees - 12,963 12,963 1,000 14,646 15,646
Tax fees 2,000 28,164 30,164 5,000 23,379 28,379
Other non – audit assurance services - 37,500 37,500 - 97,705 97,705
112,000 78,627 190,627 116,000 135,730 251,730
Audit fees for the Company for the year are included in the amount above, and are set at €10,000 (2017: €10,000).
23. Subsequent eventsThere were no subsequent events after the reporting date that would require disclosure or adjustment to the financial statements.
24. Approval of financial statementsThe financial statements were approved by the board on 29 March 2019.
Page 64
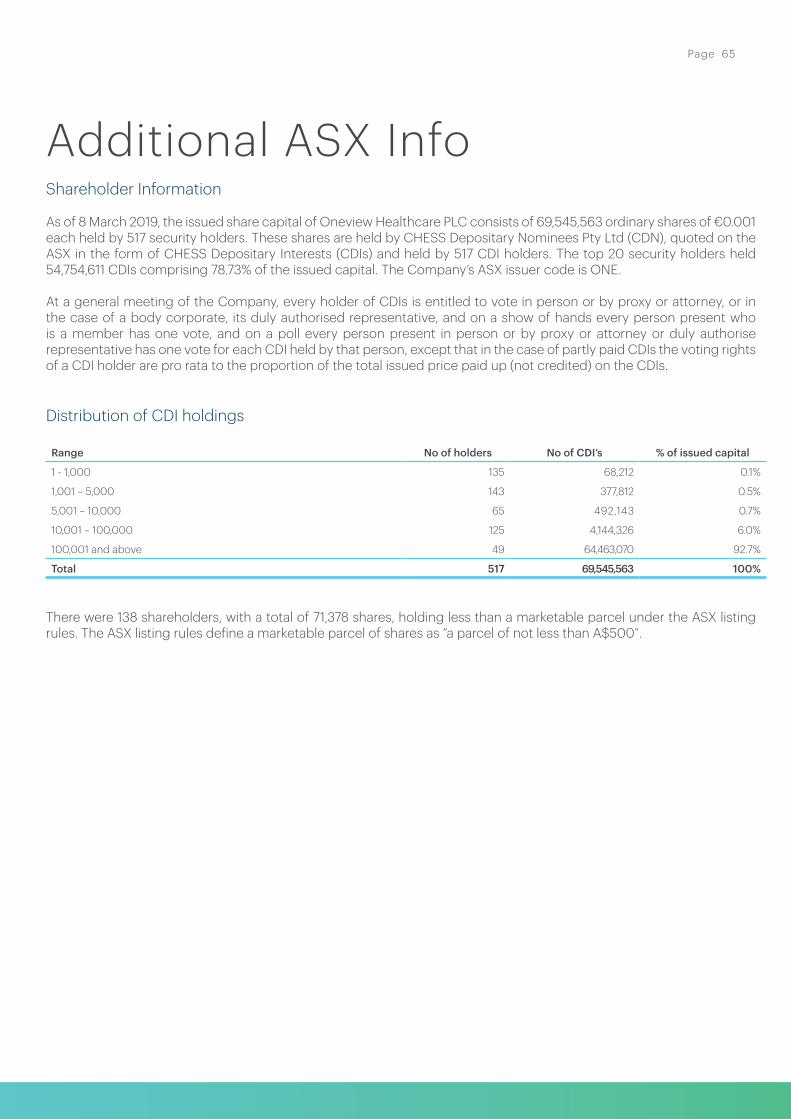
Additional ASX InfoShareholder Information
As of 8 March 2019, the issued share capital of Oneview Healthcare PLC consists of 69,545,563 ordinary shares of €0.001 each held by 517 security holders. These shares are held by CHESS Depositary Nominees Pty Ltd (CDN), quoted on the ASX in the form of CHESS Depositary Interests (CDIs) and held by 517 CDI holders. The top 20 security holders held 54,754,611 CDIs comprising 78.73% of the issued capital. The Company’s ASX issuer code is ONE. At a general meeting of the Company, every holder of CDIs is entitled to vote in person or by proxy or attorney, or in the case of a body corporate, its duly authorised representative, and on a show of hands every person present who is a member has one vote, and on a poll every person present in person or by proxy or attorney or duly authorise representative has one vote for each CDI held by that person, except that in the case of partly paid CDIs the voting rights of a CDI holder are pro rata to the proportion of the total issued price paid up (not credited) on the CDIs.
Distribution of CDI holdings
Range No of holders No of CDI’s % of issued capital
1 - 1,000 135 68,212 0.1%
1,001 – 5,000 143 377,812 0.5%
5,001 – 10,000 65 492,143 0.7%
10,001 – 100,000 125 4,144,326 6.0%
100,001 and above 49 64,463,070 92.7%
Total 517 69,545,563 100%
There were 138 shareholders, with a total of 71,378 shares, holding less than a marketable parcel under the ASX listing rules. The ASX listing rules define a marketable parcel of shares as “a parcel of not less than A$500”.
Page 65

Twenty largest holders of CDI securities
Rank Holder No of CDI’s % of issued capital
1 HSBC Custody Nominees (Australia) Limited 12,673,233 18.2%
2 Mark McCloskey1 6,252,800 9.0%
3 UBS Nominees Pty Ltd 6,201,557 8.9%
4 Manderrah Pty Limited 3,831,480 5.5%
5 HSBC Custody Nominees (Australia) Limited - A/C 2 3,431,795 4.9%
6 BNP Paribas Nominees Pty Ltd 2,395,026 3.4%
7 J P Morgan Nominees Australia Pty Limited 2,328,762 3.4%
8 Goodbody Trustees Limited 2,075,740 3.0%
9 Citicorp Nominees Pty Limited 2,063,135 3.0%
10 OV No.1 Pty Ltd - The OV Trust 1,871,466 2.7%
11 Cicerone Pty Limited 1,574,120 2.3%
12 Freshwater Superannuation Pty Limited 1,545,230 2.2%
13 CJH Holdings Pty Limited 1,439,391 2.1%
14 Golden Growth Limited 1,409,165 2.0%
15 James Fitter1 1,185,940 1.7%
16 CJH Holdings Pty 966,410 1.4%
17 Top 4 Pty Ltd 957,425 1.4%
18 Narron Pty Ltd 891,504 1.3%
19 HSBC Custody Nominees (Australia) Limited-GSI Eda 865,500 1.3%
20 Mr Peter Langley Faulkner 794,932 1.1%
Top 20 holders of CDIs 54,754,611 78.8%
Total remaining holders 14,790,952 21.2%
Total CDIs on issue 69,545,563 100.0%
1 Excludes disclosure of the interests held by parents and children of directors in accordance with the requirements of the Australian Corporations Act. Refer to Note 21 of the Financial Statements
Substantial shareholders
As of 8 March 2019, there were 4 shareholders who held a substantial shareholding within the meaning of the Corporations Act. A person has a substantial holding if the total votes they or their associates have relevant interests in is 5% or more of the total number of votes.
Range No of CDI’s % of issued capital
James William Vicars 11,790,098 17.0%
Mark McCloskey 6,995,386 10.1%
FIL Investment Management 6,638,932 9.6%
OV No.1 Pty Ltd (ATF the OV Trust) (Note 1) 1,871,466 2.7%
Total 27,295,882 39.4%
Note 1: James William Vicars and Mark McCloskey (and their families) are the beneficiaries of the OV No.1 Pty Ltd (ATF the OV Trust). James William Vicars and Mark McCloskey are the directors of the trustee of discretionary trust and James William Vicars is the sole shareholder of the trustee.
Page 66
On-market buyback
The Company is not currently conducting an on-market buyback
Securities purchase on-market
No securities were purchased on-market in the period from 1 January 2018 under or for the purpose of an employee incentive scheme or to satisfy the entitlements of holders of options or other rights to acquire securities granted under an employee incentive scheme.
Shareholder information
The name of the Company Secretary is Patrick Masterson. The address of the registered office is in Ireland at Block 2, Blackrock Business Park, Blackrock, Co Dublin, Ireland. Our principal business address in Australia is Level 5, 75 Miller Street, North Sydney, NSW 2060. The Company is listed on the Australian Securities Exchange. Registers of securities are held by Computershare Investor Services Pty Ltd, Level 4, 60 Carrington Street, Sydney, NSW 2000, Australia. Their local call number is 1300 850 505 with international call number being +61 3 9415 4000.
Page 67
A. Specific risks
Oneview operates in a competitive industry
Oneview’s operating performance is influenced by a number of competitive factors including the success and awareness of its brand, its sophisticated technology and its commitment to ongoing product innovation.
The industry in which Oneview operates, within Australia, the U.S., the U.A.E. and globally, is subject to increasing domestic and global competition and any change in the foregoing competitive factors, or others, may impact Oneview’s ability to execute its growth strategy. As such, there is a risk that:
• Oneview may fail to anticipate and adapt to technology changes or client expectations at the same rate as its competitors;
• existing competitors could increase their competitive position through aggressive marketing, product innovation or price discounting;
• existing or new competitors could offer software with less functionality but at a more competitive price, which may affect Oneview’s ability to sustain or increase prices;
• customers who currently utilise current Patient Engagement Solutions systems offered by existing competitors (including local operators in specific markets or those with a greater market share in certain markets), which have often been in place for a considerable period of time or have onerous termination clauses, may determine that it is prohibitively costly and/or time consuming to adopt the Oneview Solution.
• new competitors, including large global Electronic Health Records “EHR” corporations or large software vendors operating in adjacent industries, enter the market. These corporations may have well recognised brands, longer operating histories or pre-existing contract relationships, or greater financial and other resources to apply to R&D and sales marketing, which may make them able to expand in the Patient Engagement Solutions industry more aggressively than Oneview and/or better withstand any downturns in the market.
Failure to protect intellectual property
Oneview relies on its intellectual property rights and there is a risk that Oneview may fail to protect its rights
for a number of reasons. Oneview has historically used a mixture of legal (e.g. confidentiality agreements and code of conduct agreements) and technical (e.g. data encryption) methods to protect its intellectual property. As Oneview grows and spreads out geographically, there is a risk that these actions may not be adequate and may not prevent the misappropriation of its intellectual property or deter independent development of similar products by others.
If Oneview fails to protect its intellectual property rights adequately, competitors may gain access to its technology which would in turn harm its business, financial performance and operations.
Risk that the Oneview Solution is disrupted, fails or ceases to function efficiently
Oneview depends on the performance and reliability of its technology platform. There is a risk that the Oneview Solution contains defects or errors, which become evident when the software is implemented for new customers or new versions or enhancements are rolled out to existing customers, which could harm Oneview’s reputation and its ability to generate new business. Further, Oneview typically warrants its software for the life of the customer contract so defects in existing or future developed products and services may lead to warranty claims by customers which could have a material adverse effect on Oneview’s financial performance.
Failure to retain existing customers and attract new business
Oneview’s business is dependent on its ability to retain its existing customers and attract new customers. There is a risk that existing Oneview customers terminate their contracts without cause on short notice and without financial penalty or do not renew their contracts when the initial contract term comes to an end (generally 3 to 5 years after commencement). There is also a risk of delay or cancellation of projects that Oneview successfully tendered for and/or termination of customer contracts that Oneview has entered into but not yet commenced implementing. If this was to occur in relation to a number of different new customer relationships, it would have a negative impact on Oneview’s successful implementation of its business strategy, having an adverse impact on its business, financial performance and operations.
Appendix: Risks (Unaudited)
Page 68

Reliance on attracting and retaining skilled personnel
Oneview is reliant on the talent, effort, expertise, industry experience and contacts, and leadership of its Management. Whilst Oneview has entered into employment contracts with all Management personnel, their retention cannot be guaranteed, and the loss of any senior members of management and the inability to recruit suitable replacements represents a material risk to Oneview, which may have a material impact on its business, financial performance and operations.
There is also a risk that, as Oneview grows, it cannot attract and retain personnel with the necessary industry experience, expertise and ability to execute its strategy, such that its future growth may be restricted and the quality of its services and revenues reduced, with a corresponding adverse impact on its business, financial performance and operations.
Failure to successfully implement its business strategy
Oneview is an early stage company with limited trading history. There is a risk that Oneview’s business strategy or any of its growth initiatives will not be successfully implemented, deliver the expected returns or ultimately be profitable.
Implementing the Oneview Solution for a large number of new customers will test the business’ execution capabilities. If Oneview is unable to successfully implement the Oneview Solution for new customers, or if implementation is unexpectedly delayed or implementation costs overrun, Oneview may not generate the financial returns it intends. There is also a risk that Oneview is unable to scale fast enough to secure and implement all the opportunities that may present themselves in the future. Growth into new markets may be inhibited by unforeseen issues particular to a territory or sector, including the need to invest significant resources and management attention to the expansion, and the possibility that the desired level of return on its business will not be achieved. Public healthcare funding and other regulatory changes
Oneview’s business plan and strategy has been formulated based on prevailing healthcare policy in its current target markets (i.e. the U.S, Australia and the U.A.E). It is possible that governments in Oneview’s target markets implement healthcare policy changes that have an effect on Oneview’s business and, whilst
such changes can create opportunities for Oneview, there is also potential for these changes to favour competitor offerings or to require Oneview to re-engineer its products.
There is also a risk that government policy changes result in a reduction in healthcare funding, including specific funding for Healthcare Information Technologies “HCIT” initiatives. If funding is reduced or discontinued, this could influence the extent to which customers purchase the Oneview Solution, which would have an unfavourable impact on Oneview’s future financial performance.
For example, there is a risk that macroeconomic factors, such as the current low price of oil in the Middle East, could have an effect on public spending policies in the U.A.E which could, in turn, impact public spending on Patient Engagement Solutions, impeding Oneview’s ability to execute its growth strategy and expand its presence in the U.A.E.
Issues associated with implementation, installation and hardware procurement services
Customers have frequently required Oneview to contract with third party suppliers to source and install the appropriate hardware to operate the Oneview Solution. There is a risk that Oneview is required to fund the hardware procurement costs where it is unable to negotiate preferential payment terms with its customers or alternatively encourage its customers to enter into direct contracts with third party hardware providers. A requirement to fund hardware procurement costs has an initial negative cash-flow impact and any interruptions in the timing for hardware installation can result in further delayed realisation of cash flows.
Oneview’s reliance on third parties to deliver and support its products also exposes it to risks where those third party suppliers do not satisfy their obligations in accordance with their contract with Oneview. For example, where the product delivered and installed by a third party hardware provider does not match contracted requirements, this can lead to disruptions in the implementation process, operational or business delays, damage to Oneview’s reputation, claims against Oneview by its customers and potential customer disputes and/or the eventual termination of customer contracts. Oneview’s third party technology supplier contracts may also not entitle the Company to recover all of the losses it may suffer.
Page 69
Reliance on its core product and failure to develop new products
Oneview derives all of its revenue from the sale and associated installation of the Oneview Solution and relies on its ability to develop new products, features and enhancements to the Oneview Solution. There is a risk that upgrading the Oneview Solution or introducing new products, such as the Digital Care Management Platform may result in unforeseen costs, may fail to achieve anticipated revenue or may not achieve the intended outcomes. A failure by Oneview to develop successful new products, features and enhancements to the Oneview Solution would have an adverse impact on its ability to develop customer relationships and maintain current relationships.
Loss or theft of data and failure of data security systems
There is a risk that the Oneview Solution is the subject of a cyber-attack which could compromise or even breach the technology rendering the Oneview Solution unavailable for a period until the software is restored and/or resulting in the loss, theft or corruption of sensitive data (including patient’s data). The effect of such a cyber-attack could extend to claims by patients, reputational damage. Such circumstances could negatively impact upon Oneview’s business, financial performance and operations.
Market adoption of Patient Engagement Solutions
If the Company’s Patient Engagement Solutions platform is not widely accepted for use by healthcare providers, including as a result of the Company’s failure to prove return on investment, or if the market for Patient Engagement Solutions in the healthcare industry fails to grow at the expected rate, demand for the Oneview Solution could be negatively impacted and the Company’s ability to sustain and grow its business may be adversely affected.
Exchange rate risk for international operations
Oneview’s financial reports are prepared in Euro. However, revenue, expenditure and cashflows, and assets and liabilities from Oneview’s Australian, U.S., Thai
and U.A.E operations are denominated in Australian Dollars, U.S. Dollars, Thai Baht and U.A.E. Dirham, respectively. Oneview is therefore exposed to the risk of fluctuations in the Euro against those currencies, and adverse fluctuations in exchange rates may negatively impact the translation of account balances and profitability from these offshore operations.
B. General risks
Economic and government risks
The future viability of the Company is also dependent on a number of other factors affecting performance of all industries and not just the technology industry, including, but not limited to, the following:
• general economic conditions in jurisdictions in which the Company operates;
• changes in government policies, taxation and other laws in jurisdictions in which the Company operates;
• the strength of the equity and share markets in Australia and throughout the world, and in particular investor sentiment towards the technology sector;
• movement in, or outlook on, interest rates and inflation rates in jurisdictions in which the Company operates; and
• natural disasters, social upheaval or war in jurisdictions in which the Company operates.
Ability to access debt and equity markets on attractive terms
In the future, Oneview is likely to be required to raise capital through public or private financing or other arrangements. Such financing may not be available on acceptable terms, or at all, and a failure to raise capital when needed could harm Oneview’s business. If Oneview cannot raise funds on acceptable terms, it may not be able to grow its business or respond to competitive pressures.
Page 70

We see a better way.
United StatesChicago +1 312 763 6800
Middle EastDubai +971 4 399 8399
oneviewhealthcare.com
IrelandDublin+353 1 524 1677
AustraliaSydney+61 2 9922 2720
ThailandBangkok +353 1 524 1677