annual report 2018 - assaabloy.com · opening solutions asia pacific 32 global technologies 33...
TRANSCRIPT

Our purpose is to every day help people feel safe, secure and experience a more open world
Annual Report 2018

Report on operationsASSA ABLOY in brief tabStatement by the President and CEO 2Goals and outcomes 5Value creation strategy 7Market growth 8Product leadership 14Cost-efficiency 20People 24Profitable growth 26
DivisionsASSA ABLOY’s divisions 28Opening Solutions EMEA 30Opening Solutions Americas 31Opening Solutions Asia Pacific 32Global Technologies 33Entrance Systems 35
Sustainability reportValue-creating model 38Sustainable development 40
Report of the Board of DirectorsReport of the Board of Directors 42
Significant risks and risk management 44Corporate governance 48Board of Directors 52Executive Team 54Internal control – financial reporting 56Remuneration guidelines for senior management 57
Financial statementsSales and income 58Consolidated income statement and Statement of comprehensive income 59Comments by division 60Results by division 61Financial position 62Consolidated balance sheet 63Cash flow 64Consolidated statement of cash flows 65Changes in consolidated equity 66Parent company financial statements 67Notes 69Comments on five years in summary 98Five years in summary 99Quarterly information 100Definitions of key ratios 101Proposed distribution of earnings 102Auditor’s report 103
Shareholder informationThe ASSA ABLOY share 108Information for shareholders 111
ContentsP 2
P 7
P 28
P 40
P 42
Innovation and product development drive growthASSA ABLOY showed strong growth driven by new innovative products.
Value creation strategyThe Group’s overall strategic direction is to lead the trend toward increased security with a product-driven offering centered around the customer.
Developments in the divisions 2018Most divisions showed continued good organic growth with a strong development for electromechanical solutions.
Sustainable developmentASSA ABLOY’s sustainability initiatives continued to make good progress in 2018, with advances in line with the five-year sustainability plan.
Report of the Board of Directors, corporate governance and financial statements
The formal audited part of this document is on pages 42–102.

ASSA ABLOY in brief
Who are we?The ASSA ABLOY Group is the global leader in access solutions. The offering covers products and services related to openings, such as locks, doors, gates and entrance automation solutions. The Group also has expertise in controlling identities, with keys, cards, tags, mobile and biometric identity verification systems as parts of the offering.
What do we do?Every day, ASSA ABLOY helps billions of people experi-ence a more open world through innovations thatenable safe, secure and convenient access to physicaland digital places.
For whom?The ASSA ABLOY Group provides access solutions, trusted identities, entrance automation and service for institutional and commercial customers, as well as for the residential market. The Group has the largest installed base of products in the world, with a large share of sales in the stable aftermarket.
Where are we?The Group has leading positions in most of Europe, North and South America, Asia and Oceania.
Share of Group sales by region 2018
North America 42% (40)South America 3% (3)Europe 38% (38)Asia 13% (14)Oceania 3% (4)Africa 1% (1)
#1 SEK 84 billion 48,500 employees

Our divisionsThe regional divisions manufacture and sell mechanical and electromechanical locks, digital door locks, cylin-ders and security doors adapted to the local market’s standards and security requirements.
The global divisions manufacture and sell electronic access control, identification products and entrance automation on the global market.
Our brandsThe ASSA ABLOY Group has considerable value in its well-known brands. ASSA ABLOY is the Group’s master brand and is often combined with local brands that are well established in the local markets. Global brands offer additional markets that complement ASSA ABLOY’s main segments.
SALES BY DIVISION OPERATING INCOME BY DIVISION
LegendLegendLegendLegendLegend
LegendLegendLegendLegendLegend
EMEA, 24% (23)Americas, 23% (23)Asia Pacific, 11% (11)Global Technologies, 14% (14)Entrance Systems, 28% (29)
EMEA, 24% (24)Americas, 29% (30)Asia Pacific, 4% (7)Global Technologies, 18% (15)Entrance Systems, 25% (24)

Financials in brief 2018• Sales increased 10 percent during the year to SEK 84,048 M
(76,137) driven by continued strong growth for electro-mechanical products.
• 19 acquisitions were completed during the year, con tributing to net acquired growth of 2 percent for the year.
• Continued good earnings and strong cash flow achieved during the year. Operating margin excluding items affecting comparability was 15.4 percent (16.2).
• Investments in product development continued at a high pace. About 27 percent (28) of sales was generated by products launched during the last three years.
Key figures 2017 2018 ChangeSales, SEK M 76,137 84,048 10%of which: Organic growth, % 4 5of which: Acquired growth, net total, % 2 2of which: Exchange rate effects, % 1 3Operating income (EBIT), SEK M 1 12,341 12,909 5%Operating margin, % 1 16.2 15.4Income before tax (EBT), SEK M 1 11,673 12,110 4%Operating cash flow, SEK M2 10,929 11,357 4%Return on capital employed, % 1 16.6 16.2
Data per share 2017 2018 ChangeEarnings per share after tax and dilution (EPS), SEK/share 1 7.77 8.09 4%Equity per share diluted, SEK/share 45.60 46.71 2%Dividend, SEK/share 3.30 3.503 6%Weighted average number of shares, diluted, thousands 1,110,776 1,110,7761 Excluding impairment of goodwill and other
intangible assets of SEK 5,595 M and restruc-turing costs of SEK 1,218 M in 2018.
2 Excluding restructuring payments.3 As proposed by the Board of Directors.
30,000
45,000
60,000
75,000
90,000
181716151413121110095,000
7,500
10,000
12,500
15,000
Sales, SEK M EBIT, SEK M
1 Excluding items affecting comparability.2 Reclassification has been made.
Sales Operating income (EBIT)
1, 2 1 1 1 1
SALES AND OPERATING INCOME (EBIT)
EARNINGS PER SHARE 1 SALES IN EMERGING MARKETS
SEK
0
1
2
3
4
5
6
7
8
18171615141312111009
SEK M
0
5,000
10,000
15,000
20,000
18171615141312111009
1 Earnings per share has been restated due to the 3:1 share split in 2015.
2 Excluding items affecting comparability.
2 2 2 2 2
ASSA ABLOY ANNUAL REPORT 2018 1

Global leader in access solutions
2018 was once again a good year for ASSA ABLOY. We strengthened our position as the market leader with strong growth for electromechanical products, new smart and sustainable access solutions and acquisition of 19 companies. We continued our operational efficiency initiatives and accelerated our innovation efforts during the year. Sales increased to SEK 84,048 M, with organic growth of 5 percent driven by strong growth in Americas and Global Technologies. Operating income increased to SEK 13,309 M1, the operating margin was 15.8 percent1 and cash flow from operation reached SEK 11,357 M.
Financial overviewSales growth accelerated and total sales grew by 10 per-cent versus last year, including 5 percent organic growth, 2 percent net growth through acquisitions and divest-ments (4 percent gross) and 3 percent from currency fluctuations. The growth was particularly strong in Americas and Global Technologies and within electro-mechanical and smart locks, but was moderate in Asia Pacific due to the challenging situation in China.
There are significant growth opportunities in our industry, which is why, during the year, we reaffirmed that our target to grow over a business cycle by 5 percent organically and by 5 percent through acquisitions remains unchanged.
The technology shift from mechanical to electro-mechanical and smart locks drives strong demand both
in advanced mature markets as well as in many emerging markets. Digital door opening solutions have become mainstream in the commercial segment, but the mechanical locks business remains an important part of our overall business and a significant cash generator in which the Group continues to invest. We completed 19 acquisitions during the year, mainly strengthening and expanding our core, but the acquisition of Cross-match also reinforced our position in biometrics and extended HID Global’s market leadership in the trusted identity solutions.
Our operating income for 2018 increased by 8 percent to SEK 13,309 M1, and the operating margin was 15.8 per-cent1. Operating cash flow was SEK 11,357 M, supported by constant focus on operational efficiency. Good profit-ability requires good cost control. Our restructuring
1 Excluding impairment of goodwill, other intangible assets and write-down of operating assets in China of SEK 5,995 M and restructuring costs of SEK 1,218 M.
ASSA ABLOY ANNUAL REPORT 20182
STATEMENT BY THE PRESIDENT AND CEO

program continued to deliver according to plan, as did the Group-wide programs for more efficient processes at every stage in the value chain from innovation, purchas-ing, across production and administration to sales and service. But price increases and operational efficiency measures only partly compensated for the strong mate-rial price increases in general and steel price increases in particular. They had a dilutive effect on our margins, mainly in the first part of the year. The target of an operat-ing margin of 16–17 per cent on average over a business cycle remains unchanged.
The situation in China remained challenging and resulted in a required write-down of SEK 5,595 M for impairment of goodwill and other intangible assets. We are committed to China and are now implementing a new comprehensive strategy around three consolidated brands and a new key account organization. During 2018 we also put a new leadership in place and I look forward to working closely with them in 2019.
Global leader in access solutionsOur purpose is to help people feel safe, secure and expe-rience a more open world. Door openings, trusted identi-ties and entrance automation are important in a world with increasing needs for safe, secure and convenient movement of people and things. Our divisions address these areas with a specialized and focused approach, as well as combining them into joint systems and solutions. By combining them, we create access solutions address-ing specific end user needs across a large breadth of applications and business verticals.
Market growth through customer relevance, product leadership, cost-efficiency and evolution through people form the cornerstones of our strategy to maintain our leadership in access solutions. During 2018 we contin-ued to reinforce our customer focus by allocating more resources to marketing and sales, and by improving our service to customers. About 75 percent of our sales is related to the commercial and institutional customer segment, while the residential segment represents 25 percent of our sales. We have identified services, includ-ing field services and Software as a Service, and the shift from mechanical to electromechanical and smart solutions as key drivers for accelerating our profitable growth.
We will also look for more opportunities to grow our core business in adjacent areas. During the year we changed the name of ASSA ABLOY Hospitality to ASSA ABLOY Global Solutions. This reflects ASSA ABLOY Global Solutions’ broadened scope of its business, focusing on more specific verticals and its role as service provider, which is reflected in strong services growth.
Security, including locks, is considered by end-users to be one of the more important parts of smart home eco-systems. We have a strong position in the residential smart lock market and our trusted brands enable us to be a significant contributor to the strong development in this segment. To maintain our leadership in this field, we established a global organization to gain speed and realize synergies between our divisions.
There are several growth trends that create strong underlying demand. Besides urbanization, digitization and sustainability, the need for safe, secure and conven-ient solutions, drives demand for the Group’s customer offerings. Sustainable access solutions add customer value as they enable customers to improve cost-effi-ciency, reduce energy consumption and lower the envi-ronmental impact of their operations significantly. The number of new sustainable building projects continues to increase, driving higher end solutions. ASSA ABLOY is leading in offering efficient, sustainable solutions ena-bling us to win high profile and important projects.
Innovation as an enablerIn 2018 ASSA ABLOY was for the fourth time ranked on Forbes’ list of the world’s 100 most innovative compa-nies. Product innovation is an enabler, driving our organic growth and supporting our margin ambition. In 2018 we invested SEK 2,893 M in R&D and we have some 2,400 R&D engineers. The main driver for innovation and prod-uct development is the ongoing rapid technological evo-lution. We constantly update our existing product and solutions offering and complement this with break-through innovations. Every new product and solution must add additional customer benefits at a reduced overall cost.
In 2018 sales of new products launched during the last three years accounted for 27 percent of total sales, or above the target of 25 percent. In the EMEA division, we launched a new mechanical door closer range with
“Market growth through customer relevance, product leadership, cost-efficiency and evolution through people form the cornerstones of our strategy.”
ASSA ABLOY ANNUAL REPORT 2018 3
STATEMENT BY THE PRESIDENT AND CEO

ASSA ABLOY’s Executive Team.
Standing from the left: Erik Pieder, Chief Financial Officer, Christophe Sut, Head of the ASSA ABLOY Global solutions business unit, Maria Romberg Ewerth, Chief Human Resource Officer, Lucas Boselli, Head of Americas division, Mogens Jensen, Head of Entrance Systems division, Anders Maltesen, Head of Asia Pacific division and Chris Bone, Chief Technology Officer.
Sitting from the left: Neil Vann, Head of EMEA division, Stefan Widing, Head of the HID Global business unit and Nico Delvaux, President and CEO.
“During the year we launched our core values: Empowerment, Innovation and Integrity.”
a distinctive and contemporary design that won the 2018 German Design Council Iconic Awards. EMEA also launched Pulse, an innovative energy harvesting key solution making batteries for smart locks obsolete. In the Americas division, Yale strengthened its position and developed for, and in collaboration with, Nest, a smart lock that brings a new level of security and con-venience to the market. During the year we also linked the Yale smart locks to the August cloud-based software, which means that we can now use the advanced August Software for smart residential Yale applications on a global level. In Global Technologies, HID Global demonstrated its product leadership in combating ticket fraud by providing four million smart tickets for the FIFA World Cup.
Our innovation capacity is reflected not only in our products and solutions but also in our processes. Our ambition is to increase efficiency in all parts of the value chain by digitization. We constantly update our software solutions and processes and for example our e-procure-ment ratio is increasing steadily. Our operations are becoming more seamless and our sales via digital chan-nels are also increasing significantly.
People make the differenceFinally, a few important words on values, purpose and beliefs. During the year we launched our core values: Empowerment, Innovation and Integrity. The Group mission is to build sustainable shareholder value, but also to be an attractive company to our employees and to conduct business in an ethical, compliant and sustain-able way. For me, the employees and the competence they possess are our most important asset. It is our employees who bring everything together and I would like to take this opportunity to thank all our employees for the effort they have invested in ASSA ABLOY in 2018, for making the difference, and for making my first year such a remarkable one.
Thank you!
Stockholm, 4 February 2019
Nico DelvauxPresident and CEO
ASSA ABLOY ANNUAL REPORT 20184
STATEMENT BY THE PRESIDENT AND CEO

Goals and outcomes
Goal Outcome
Growth through customer relevance
Group sales in 2018:North America 42%, South America 3%, Europe 38%Asia Pacific 16%, Africa 1%
The Group is active in over 70 countries, both in mature and emerging markets. This enables ASSA ABLOY to stay close to its customers and customize its solutions and grow sales.
SEK M
0
5,000
10,000
15,000
20,000
18171615141312111009
Growth and profitability 10%
annual growth through a combination of organic and acquired growth
16–17% operating margin
Average annual growth over the past ten years has been over 9 percent. The Group’s growth in 2018 was 10 percent, including 5 percent organic growth and 2 percent from acquisitions.
Average operating margin over the past ten years was about 16 percent, excluding items affecting comparability.
SEK M
0
20,000
40,000
60,000
80,000
100,000
18171615141312111009
%
10
12
14
16
18
20
18171615141312111009
Product leadership 25%
of sales from new products
The goal of having at least 25 percent of total sales from products less than three years old has been exceeded in recent years. In 2018 the share was 27 percent.
%
05
101520253035
1817161514
Cost-efficiency –27%reduction in number of suppliers
Reducing the number of suppliers is important for reducing costs and improving quality. Active efforts have reduced the total number of suppliers by 27 percent over the past five years.
Number
0
2,000
4,000
6,000
8,000
10,000
12,000
1817161514
Environment –20%greenhouse gas emissions
The target is to reduce the intensity of greenhouse gas emissions related to the Group’s energy consumption by 20 percent from 2015 to 2020. In 2018 the reduction was 6 percent and the reduction since 2015 is 14 percent.
Tons/SEK M
0
2
4
6
8
10
1817161514
People 30%women in management positions
The target is to have 30 percent of management positions held by women by 2020. In 2018 the share was 24 percent.
%
0
5
10
15
20
25
1817161514
Social KPI –55%injury rate
The target is to reduce the injury rate by 55 percent from 2015 to 2020. In 2018 the injury rate decreased by 11 percent and totaled 3.7 injuries per million hours worked. Since 2015 the injury rate has declined by 45 percent.
Injury rate
0
2
4
6
8
1817161514
ASSA ABLOY ANNUAL REPORT 2018 5
GOALS AND OuTCOMES

ASSA ABLOY’s brands
ASSA ABLOY has considerable value in its well-known brands. ASSA ABLOY is the Group’s master brand and is increasingly becoming the leading product brand for commercial door solutions. Approximately 70 percent of Group sales are under the ASSA ABLOY brand or a
combination of ASSA ABLOY and local brands. The local brands are well established in the local markets and play an important role in creating trust, loyalty, value and differentiation.
The master brand is complemented by global brands, which are all leaders in their respective market segments, some examples are: Yale in the residential market, HID in access control, secure card issuance and identification
technology, and ABLOY in high security locks. The Group also has product brands that are not associated with ASSA ABLOY, such as Entrematic in entrance automation, to further drive sales.
ASSA ABLOY ANNUAL REPORT 20186

Strategic objectivesFinancial targetsPurpose
To every day help people feel safe, secure and experience a more open world
Vision
To be the leader in providing innovative access solutions that help people feel safe and secure so that they can experi-ence a more open world
Mission
• Building sustainable shareholder value
• Providing added value to our customers, partners and end-users
• Being a world leading organization where people succeed
• Conducting business in an ethical, compliant and sustainable way
IntegrityWe stand up for
what’s right
InnovationWe have the
courage to change
EmpowermentWe have trust
in people
Growth
5% organic
5% acquired
=
10%total
EBIT
16–17%
Core values & beliefs
Growth through customer relevance
Product leadership through innovation
Cost-efficiency in everything we do
Evolution through people
Value creation strategy
The Group’s strategic direction is to lead the trend towards the world’s most innovative and well-designed access solutions. Our purpose is to help people feel safe, secure and experience a more open world. Our core values, beliefs and strategic objectives help guide our way.
ASSA ABLOY ANNUAL REPORT 2018 7
VALuE CREATION STRATEGY

Value creation strategy #1 Growth through customer relevance
Market presence creates opportunities and gives possibilities toincrease customer value. A world-leading market presence is achieved by expanding into new markets and segments organically and through acquisitions. ASSA ABLOY has a unique global reach with brands represented in all major regions, in both mature and emerging markets worldwide, and with leading positions in much of Europe and North America, Asia and the Pacific. Customer relevance is based on local presence, the strength of the brand portfolio and efficient segmentation of sales channels – while addressing the demands for safety, security, convenience and sustainability.
No. 1Global leader in access solutions.
x523 percent of sales are in emerging markets, a five-fold increase in ten years.
57%The percentage of electro mechanical products and entrance automation has increased from 34 percent to 57 percent of sales in ten years.
MARKET GROWTH
ASSA ABLOY ANNUAL REPORT 20188

Global market leader with growing demand
Demand for security, electromechanical, digital and smart access solutions, as well as for sustainable products, continues to increase. The combination of global growth trends, such as urbanization and digitization, and new technology, has resulted in stable and growing demand for ASSA ABLOY’s access solutions and form good prerequisites for underlying profitable growth. The Group has a unique global market reach with its own presence in over 70 countries.
Institutional and commercial markets – service offering and total access solutionsASSA ABLOY’s large installed base drives organic growth. Some 75 percent of ASSA ABLOY’s total sales derive from the institutional and commercial markets. Buildings related to education, health care, public administration, private offices, shopping centers, stores and warehouses – are all environments where ASSA ABLOY’s access solu-tions can be found. These projects are often large and complex. This provides ASSA ABLOY with an advantage as a supplier of total access solutions.
Customers are competent and demanding and the Group is in dialogue with many different stakeholders in the value chain. The Group’s focused and segmented sales forces develop products for the multifaceted cus-tomer needs, while distribution and installation are largely handled by channel partners, installers, system integrators and locksmiths.
Residential market – smart residential in focus Residential sales account for about 25 percent of total sales. The increased demand for security and the meg-atrends of urbanization, digitization and increased wealth drive demand for secure access solutions as well as for smart door locks. ASSA ABLOY is leading the devel-opment of smart door locks for the residential market, where demand is very strong.
There is also a demand for professional advice and installation assistance. Depending on the geographic market, ASSA ABLOY cooperates with door and window manufacturers or specialist distribution channels such as
home improvement stores and locksmiths – and is often developing residential products in partnership with suppliers of other smart residential products for the connected home.
Aftermarket – a significant contributor to sales For ASSA ABLOY the aftermarket accounts for two thirds of total sales and is therefore a significant contributor to sales both in the residential as well as in the institutional and commercial markets. Renovations, remodeling and additions, replacements and upgrades of existing door opening installations as well as ongoing service provide a stable demand, enabling the Group to capitalize on the world’s largest installed base and its global market presence. New service concepts, based on longer-term contracts, including preventive maintenance and modernization efforts, strengthen customer relation-ships and provide further opportunities for the Group going forward.
The increased demand for electromechanical, digital and smart solutions also drives growth in the aftermarket. These products have shorter life spans and are more frequently replaced, supplemented and upgraded than mechanical solutions. The products are supported by software platforms which enable customers to con-stantly upgrade their security with more and new features. While contributing to stronger customer relationships, connected products, service products and subscription services will also contribute to an increase in recurring revenues.
Breakdown of ASSA ABLOY’s sales
Working and shoppingInstitutional and commercial market – share of sales
75%
LivingPrivate customers and residential market – share of sales
25%
New constructionNew buildings – share of sales
33%
AftermarketRenovations, remodeling and additions, replacements and upgrades of existing access solutions, as well as ongoing service – share of sales
67%ASSA ABLOY ANNUAL REPORT 2018 9
MARKET GROWTH

Strategies for a world-leading global market presenceASSA ABLOY’s strategies for a world-leading global market presence include leveraging the strength of its brand portfolio, increasing growth in the core business and expanding into new markets and segments. The strategies are based on constantly increasing customer relevance, through effective market and customer segmentation, specification, a strong brand portfolio and acquisitions.
Customer relevance through segmentationASSA ABLOY aims to build relationships, generate demand and achieve the industry’s best understanding of customer needs, and to be an expert in total access solutions in each segment. This increases customer rele-vance and allows ASSA ABLOY to offer solutions that meet customer requirements for safety, security, conven-ience and sustainability. The solutions need to meet local requirements, rules and standards, as well as the need for integration into new or existing security systems.
To reach the different segments, ASSA ABLOY’s market organization works closely with architects, security con-sultants, large end users and distributors. A substantial portion of ASSA ABLOY’s business processes are digitized – including product information, design and configura-tion and smart specification tools. The digitization of business processes – including order management, logis-tics and payments, and Seamless Flow – has also resulted in a shift of resources from indirect sales to direct sales.
Growth through acquisitionsAs an important part of its strategy, ASSA ABLOY’s ambi-tion is to achieve 5 percent acquired growth per year. The aim is to further increase its market presence, comple-ment existing operations and increase its offering of elec-tromechanical, digital and smart solutions. On average the latest ten years acquisitions have contributed to an annual growth of about 6 percent. In 2018, 19 acquisi-tions were consolidated and 2 were divested. In 2018 the Group’s acquired gross growth was 4 percent and the net growth (acquisitions and divestments) was 2 percent corresponding to a sales increase of SEK 1,793 M.
Leveraging the strength of the brand portfolio The Group’s brand portfolio, which includes valuable, leading and well-known brands, is also a reflection of the acquisition strategy. To optimize the advantages of the brand portfolio both locally and globally, the brands are continuously consolidated in parallel with the market and customer segmentation.
ASSA ABLOY is the Group’s global master brand. The master brand is often combined with individual brands that are well established locally and adjusted to local regulations and security standards. The ASSA ABLOY brands account for roughly 70 percent of Group sales.
The global brands, which are all leaders in their respec-tive market segments, represent another 20 percent of Group sales: HID in secure identity and access manage-ment, Yale in the residential market, and ABLOY in high-security locks.
In addition, the Group has brands that are not associ-ated with ASSA ABLOY. These brands, representing some 10 percent of Group sales, have leading expertise in specialty products and service, and are important complements to ASSA ABLOY’s market presence and positioning. These brands are usually sold through distributors and installers.
Sales processes with a stronger sales forceASSA ABLOY’s ambition is to gradually move an increas-ing amount of resources forward in the value chain to strengthen the sales processes and the sales force and to increase customer value. To constantly enhance cus-tomer relevance in all dimensions, the initiative empha-sizes streamlining the Group’s sales processes with strong support in digital tools. Through its Commercial Excellence team, ASSA ABLOY is developing and stream-lining its processes for pricing, brand positioning, mar-keting and sales. This involves branding and marketing to e-commerce, developing value-based pricing models and implementing digital tools such as CRM (customer relationship management), BIM (building information modeling) and architectural marketing systems. The aim is to improve ASSA ABLOY’s commercial capabilities and interactions with customers, thereby enhancing the cus-tomers’ experience of doing business with ASSA ABLOY.
The Group has identified a number of sales sub- processes that differ depending on if it is sales based on specifications, sales to consumers or sales based on OEM delivery. Although the sales processes in ASSA ABLOY’s global organization also vary because of rules, norms and traditions, the Group has developed a structured and effi-cient approach to supply chain and sales management. Knowledge and experience are shared in the Group through Group-wide work groups for the various sales channels – and the different sales approaches and tech-niques are regularly analyzed, along with a large number of customer transactions. Among other things this approach improves the understanding of customer needs and behaviors.
SALES BY PRODuCT GROuP
Mechanical locks, lock systems and fittings, 26% Entrance automation, 28%Electromechanical andelectronic locks, 30%Security doors andhardware, 16%
The Group sees fast-growing demand for electromechanical products, as well as electronic and digital solutions. Since 2008 these have sharply increased from 34 percent to 57 percent of Group sales. Mechanical products con-tinue to increase, but electrome-chanical products are growing considerably faster.
ASSA ABLOY ANNUAL REPORT 201810
MARKET GROWTH
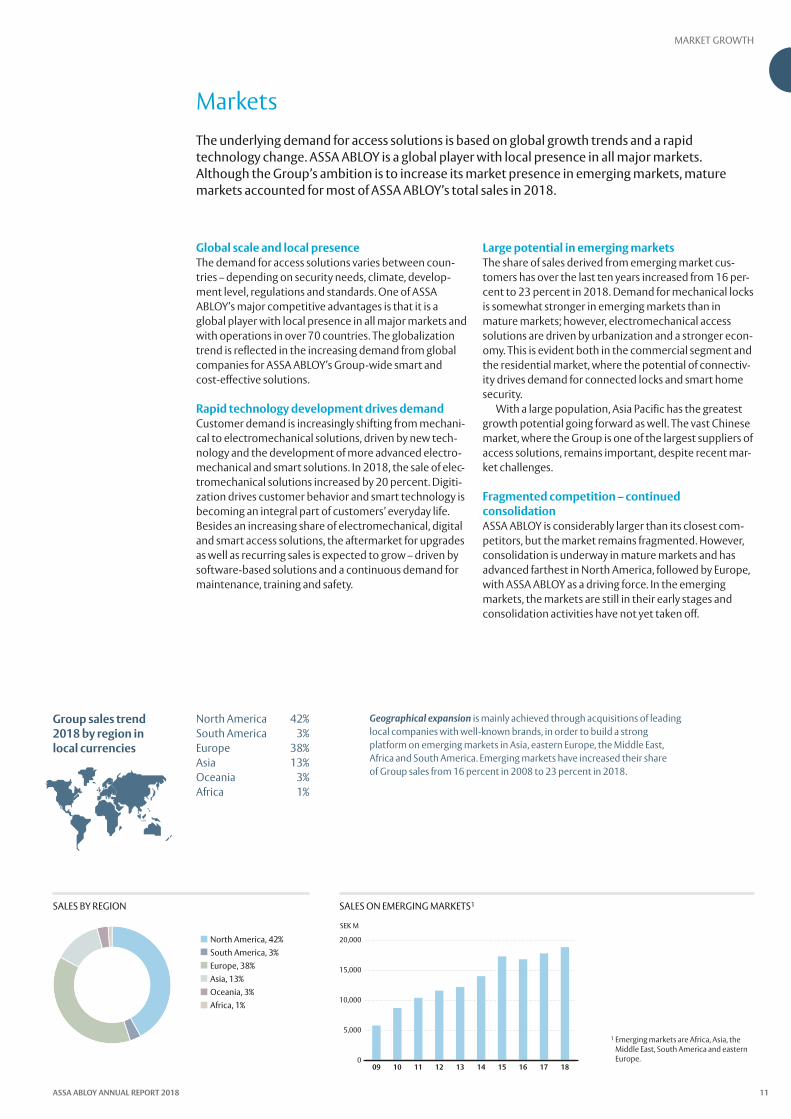
MarketsThe underlying demand for access solutions is based on global growth trends and a rapid technology change. ASSA ABLOY is a global player with local presence in all major markets. Although the Group’s ambition is to increase its market presence in emerging markets, mature markets accounted for most of ASSA ABLOY’s total sales in 2018.
Global scale and local presence The demand for access solutions varies between coun-tries – depending on security needs, climate, develop-ment level, regulations and standards. One of ASSA ABLOY’s major competitive advantages is that it is a global player with local presence in all major markets and with operations in over 70 countries. The globalization trend is reflected in the increasing demand from global companies for ASSA ABLOY’s Group-wide smart and cost-effective solutions.
Rapid technology development drives demandCustomer demand is increasingly shifting from mechani-cal to electromechanical solutions, driven by new tech-nology and the development of more advanced electro-mechanical and smart solutions. In 2018, the sale of elec-tromechanical solutions increased by 20 percent. Digiti-zation drives customer behavior and smart technology is becoming an integral part of customers’ everyday life. Besides an increasing share of electromechanical, digital and smart access solutions, the aftermarket for upgrades as well as recurring sales is expected to grow – driven by software-based solutions and a continuous demand for maintenance, training and safety.
Large potential in emerging marketsThe share of sales derived from emerging market cus-tomers has over the last ten years increased from 16 per-cent to 23 percent in 2018. Demand for mechanical locks is somewhat stronger in emerging markets than in mature markets; however, electromechanical access solutions are driven by urbanization and a stronger econ-omy. This is evident both in the commercial segment and the residential market, where the potential of connectiv-ity drives demand for connected locks and smart home security.
With a large population, Asia Pacific has the greatest growth potential going forward as well. The vast Chinese market, where the Group is one of the largest suppliers of access solutions, remains important, despite recent mar-ket challenges.
Fragmented competition – continued consolidation ASSA ABLOY is considerably larger than its closest com-petitors, but the market remains fragmented. However, consolidation is underway in mature markets and has advanced farthest in North America, followed by Europe, with ASSA ABLOY as a driving force. In the emerging markets, the markets are still in their early stages and consolidation activities have not yet taken off.
Group sales trend 2018 by region in local currencies
North America 42%South America 3%Europe 38%Asia 13%Oceania 3%Africa 1%
Geographical expansion is mainly achieved through acquisitions of leading local companies with well-known brands, in order to build a strong platform on emerging markets in Asia, eastern Europe, the Middle East, Africa and South America. Emerging markets have increased their share of Group sales from 16 percent in 2008 to 23 percent in 2018.
SALES BY REGION SALES ON EMERGING MARKETS1
North America, 42% South America, 3%Europe, 38%Asia, 13%Oceania, 3%Africa, 1%
1 Emerging markets are Africa, Asia, the Middle East, South America and eastern Europe.
SEK M
0
5,000
10,000
15,000
20,000
18171615141312111009
ASSA ABLOY ANNUAL REPORT 2018 11
MARKET GROWTH

DistributionDistribution plays a key role in ASSA ABLOY’s value creation. ASSA ABLOY’s products and services reach the customers through many different distribution channels. The distribution channel depends on customer segment and if it is specifications based, sales to consumers, or sales based on OEM delivery. Supported by digitization and improved sales processes, the shift in resources to direct sales from indirect sales continues to increase.
Value creation in distributionASSA ABLOY’s ambition is to deliver well-designed, safe, secure and convenient access solutions. In close collabo-ration with customers and their advisers, the Group’s effi-cient distribution process creates good customer rela-tions, market demand and increases the entry barriers for competitors.
Distributors are also important in their roles as provid-ers of service and support after installation. In the com-mercial and institutional segment, distributors in some markets act as advisers and project managers. They have a deep understanding of customer needs and ensure that ASSA ABLOY’s solutions comply with the local market’s standards and security requirements. In the residential segment, the buying decision is less rational and the competence of the buyer is often lower.
Electromechanical solutions are distributed to end-users mainly through security installers and specialist distribu-tors. The solutions are also sold through systems inte-grators, who offer total solutions for installation of perimeter protection, access control, and access to computers and other connected devices.
Specification – advice and digital toolsRapid technological development and the growing number of rules and standards, especially in the area of sustainability, are constantly increasing complexity for builders and other customers. This trend applies to everything from components to prefabricated door openings and advanced access solutions. This is also increasing the competence required by distributors. A central role in marketing is therefore played by ASSA
DISTRIBuTION CHANNELS FOR THE SECuRITY MARKET
DISTRIBUTION takes place through many different players depending on customer segment and stage in the supply chain:
ASSA ABLOY representative Distributor
ASSA ABLOY DISTRIBUTION / PARTNERS
Building and lock wholesalers, security consultants and locksmiths have a key role in delivering and installing the products specified for various construction projects.
The distribution process provides opportunities for ASSA ABLOY to create considerable value for customers. The Group’s advisers, the specifiers, provide specialist advice on security solutions. Architects, building and security consultants can use ASSA ABLOY’s BIM technology to specify and test solutions in 3D on computer screen for 3D models of buildings and door openings.
security systems integrators, locksmiths, security installers, building and lock wholesalers, retailers, home improvement stores, hardware and security stores, OEMs, door and window manufacturers.
ASSA ABLOY ANNUAL REPORT 201812
MARKET GROWTH

DISTRIBuTION CHANNELS FOR THE SECuRITY MARKET
END CUSTOMERS Large institutional and commercial customers• Healthcare • Education • Retail• Hospitality • Offices • Industry
Small and medium-sized customers• Offices • Stores
Residential market• Apartments • Houses
STAKEHOLDERS Such as architects, security consultants, government agencies responsible for security standards, and other stakeholders.
SPECIFICATION involves configuration, checking and testing proposed solutions. ASSA ABLOY provides support in the form of specialist advice and smart tools for digital drawings and 3D models.
ASSA ABLOY representative ASSA ABLOY
representative
END CUSTOMERS
CODES AND SECURITY STANDARDS
ASSA ABLOY has developed close cooperation with customers, architects and security consultants to specify appropriate products and a well-functioning security solution. Many door and window manufacturers install lockcases, hardware and other fittings in their products before delivery to customers.
More advanced electronic and digital security solutions mainly reach the end-user through security installers and specialist distributors. These products and solutions are also sold through systems integrators, who often offer total solutions for the installation of perimeter protection, access control and computer security.
INSTALLERS
STAKEHOLDERS
ABLOY’s specifiers, who have increased sharply over the past few years and continue to increase rapidly, especially in emerging markets.
Specification teams work as specialist advisers to cus-tomers, helping them specify products that provide total security solutions that meet all rules and standards. They also collaborate with other key groups early in the distri-bution chain, such as building consultants, architects, security consultants and building standards agencies, to educate them regarding new, innovative security solu-tions and to create demand with their business-driving competence.
The Group is leading the industry trend for product configurations and 3D modeling using building informa-tion modeling (BIM), which facilitates the work of archi-tects and building consultants. BIM technology makes it possible to create digital models of buildings into which ASSA ABLOY products can be dropped in 3D. A door design can then be checked and tested on the computer screen, and the solution’s products can be ordered online. Distributors have constant access to advice.
The complex information in BIM creates good oppor-tunities for repeat business, since the customer can
quickly see exactly which products are installed in the building, along with their location. This simplifies the upgrade, service and repair processes.
Partners and distributorsBuilding and lock wholesalers, security consultants and locksmiths have key roles in delivering the products specified for different construction projects. Many door and window manufacturers install lock cases and hard-ware in their products before delivery to customers. ASSA ABLOY also shares competence with locksmiths, who are key distributors of mechanical and electrome-chanical security products in many markets. Locksmiths buy direct from ASSA ABLOY or through wholesalers and provide advice, delivery, installation and service. Some locksmiths have an increased focus on electronics, while IT integrators are increasingly offering physical security solutions.
ASSA ABLOY ANNUAL REPORT 2018 13
MARKET GROWTH

Value creation strategy #2 Product leadership through innovation
ASSA ABLOY is a product-driven company where product leader-ship is achieved through a high rate of innovation and reliability. Product leadership enhances customer value and quality, and reduces product costs. The innovation process is carried out in close cooperation with end-users on a continuous base with the objective of exceeding customer expectations.
No. 1The most innovative supplier of access solutions.
57%The percentage of electro mechanical products and entrance automation has increased from 34 percent to 57 percent of sales in ten years.
27%Products launched in the past three years account for 27 percent of total sales.
The strategy for product leadership is based on four points:
1 2 3 4Developing and exploiting the advantages of a Group-wide, structured innova-tion process.
Applying Lean principles and deep customer insight to product management and development.
Developing and using com-mon modular platforms and common technologies.
Continuing to invest in our R&D competence centers.
PRODuCT LEADERSHIP
ASSA ABLOY ANNUAL REPORT 201814

World-leading technology for digital and smart solutions
A constant flow of new, enhanced, innovative and sustainable products is an important driver for ASSA ABLOY’s target of 5 percent organic growth. Products launched during the last three years accounted for 27 percent of total sales in 2018, exceeding the Group target of at least 25 percent of total sales. The outcome reflects the Group’s product leadership, the high innovation rate, as well as the Group’s ability to meet the needs of the connected society for smart and connected access solutions.
Strategies for a high innovation rateASSA ABLOY’s strategies for a high innovation rate form the Group’s vision to be the leader in providing innova-tive access solutions that help people feel safe and secure. The Group’s innovation process has its roots in a modular and sustainable approach to product develop-ment based on the Group-wide global technology plat-forms. Shared Technologies add skills and scale and develop the product platforms that the local engineering teams adapt to local standards, requirements and brands. The Group has 114 competence centers close to the customers, including product development, in all divisions. R&D investment amounted to SEK 2,893 M in 2018, representing some 3 percent of total sales. Some 2,400 employees are engaged in product development.
Technology development and new technologiesTogether with the global mega trends, the main driver of innovation and product development is the rapid tech-nology development. Sales of mechanical products con-tinue to increase, but electromechanical products are growing considerably faster. In the residential segment, the demand for smart door locks is rapidly increasing. In 2018 ASSA ABLOY sold 2.5 million smart locks, up from 2 million smart locks in 2017.
Technology development of access solutions is grad-ual, usually originating from a solid mechanical product. An electromechanical solution enables digital control of the bolt, door and the entire entrance environment for more efficient and convenient operation. Adding soft-ware or even cloud-based access management systems creates additional value for the customer, not only through added security but also through convenience. A connected lock, for example, can be remotely con-trolled and monitored while being linked to a network of other products and solutions with multiple security features. ASSA ABLOY’s global platforms currently provide customers with a complete, intelligent ecosystem that coordinates multidimensional security solutions for whole complexes of buildings, with user identification and preventive and acute signaling of security risks.
The platforms give the Group increased capabilities for scaling and with the possibility to connect the products for increased synergies. Demand for these global connected products is high with strong annual growth rates globally.
With the customer trends towards convenience and speed, together with the low penetration of electronic digital access solutions in the market, there is a huge potential enabled by the rapid technology development.
ASSA ABLOY’s technology leadership provides a sub-stantial platform for robust profitable growth. To ensure leadership in all product areas, the Group also continues to invest in innovative mechanical solutions. More elec-tronics also means increased sales growth per door and more customer value. The rapid technological develop-ment requires more frequent replacements and upgrades which provide opportunities for increasing recurring revenue and services through software licens-ing and maintenance.
ASSA ABLOY’s Global Technologies division, with its technology development relating to identification and authentication, is a key asset and offers a competitive edge. The division, comprising of HID and Global Solu-tions, is the global market leader for products and solu-tions for secure identities for physical access to buildings and areas, as well as logical access to computers and other connected devices. This is a core competence in the development of digital access solutions.
Sustainable solutionsAnother important driver for product development is the sharply rising demand for sustainable solutions. There is strong growth in investment in sustainable buildings, with requirements for energy savings, lower materials consumption, and renewable or recycled materials becoming increasingly important. The various openings of a building can account for up to 20 percent of energy consumption. ASSA ABLOY offers a growing selection of products with environmental declarations, with focus on energy savings, as well as reduced consumption of mate-rials and other resources used in production.
Product leadership
ASSA ABLOY ANNUAL REPORT 2018 15
PRODuCT LEADERSHIP

Value creation with customer insightEach new product and product solution should create additional customer value through improved functional-ity, usability, security and cost efficiency. All new projects are based on insight into underlying customer needs and requirements. Broad monitoring and collection of data, analysis and surveys of different customer segments are conducted on an ongoing basis, to uncover future and underlying needs. Cost savings are achieved through improved designs, new materials, software and compo-nents, as well as continuous improvement of the devel-opment and production process.
Sustainability Sustainability is an integral part of product innovation and is hence integrated into the development process from the concept stage to end of life. The Group uses a tool called the Sustainability Compass which outlines the sustainability vision for individual products and includes eight focus areas: raw materials, water, virgin material, end-of-life reusability, recyclability, in-life energy con-sumption, carbon footprint and financial cost. The mod-ular approach and the technology platforms enable the Group to standardize materials, reduce the number of components, constantly improve quality, and considera-bly reduce the costs of each new product. The modular approach is also supportive in component procurement and development, enabling the group to source compo-nents that are sustainable.
Design and design languageThe Group has established a unit for the development of industrial design and a common design language. Plan-ning of a Group-wide design center is the next step in the
development, to create an even clearer expression of ASSA ABLOY’s basic values and the physical experience of products with common guidelines for design, location of brand names, colors and visuals. Design, especially of residential door locks, is also increasing in importance as door locks are seen more as lifestyle products. The Group also has a Concept Lab where the product development teams can test prototypes and conduct user tests of technologies for the future.
Product management and product developmentProduct management ensures that each product group has a vision-based, long-term plan founded on market insight, technology development, customer value and the strengths of each product. These plans form the basis for the integrated and cross-functional balancing and optimization of the product portfolio throughout the product life-cycle. Projects are planned and executed according to Lean principles, where a clear vision and a visual overview are important components.
Product development is continuous and has three phases: pre-development projects, new product devel-opment and continuous improvements of products already in the market.
Efficient development is achieved through clear long-term product strategies and a modular development approach, providing an opportunity to reuse designs, make improvements and substitute parts of a product or solution. Shared Technologies, the Group’s joint develop-ment center for global product platforms, in which a modular approach to both hardware and software is the basis for the joint solutions, plays a key role to achieve this objective.
Continuous improvement of the innovation processASSA ABLOY’s product leadership is based on the Group’s joint innovation process. Guiding principles are deep insights into customer and market needs, product development based on long-term planning and active portfolio management throughout the product life-cycle to enable innovative, sustainable and cost-efficient products. Shared Technologies, the Group’s joint development center, plays a key role to achieve this objective.
PERCENTAGE OF SALES OF PRODuCTS LAuNCHED IN PAST THREE YEARS%
0
5
10
15
20
25
30
35
1817161514
INVESTMENTS IN RESEARCH AND DEVELOPMENTSEK M
0
500
1,000
1,500
2,000
2,500
3,000
1817161514
NEW PRODuCTS
HID Global scores in world’s greatest soccer eventHID Global delivered more than 4 million secure RFID tickets for 2018 FIFA World Cup. The smart tickets contained a Radio Frequency Identification (RFID) inlay with several security features designed to prevent forgery. Data that was stored in a ticket’s RFID chip was encrypted and digitally signed.
ASSA ABLOY ANNUAL REPORT 201816
PRODuCT LEADERSHIP

CLIQ™ CLIQ is a secure locking sys-tem with advanced micro-electronics in programmable keys and cylinders. The system offers a large number of com-binations of mechanical and electronic products, which satisfy various requirements for secure, flexible access con-trol. Most types of locks can be fitted with CLIQ technology, which together with various software programs provides the global market with cus-tomized, flexible access con-trol solutions.
Seos™Seos is an identification tech-nology solution that allows the customer to use various devices, from smart cards to cell phones, for secure access to applications. Seos’ applica-tions range from building access control, computer login and cashless payments to IoT (Internet of Things) applications, time and attend-ance reporting, and secure printing.
Aperio™ Aperio is a technology devel-oped as a complement to existing electronic access con-trol systems. It is a convenient solution for end- users to improve the security and con-trol of their premises. Central to Aperio is a wireless commu-nications protocol, which functions at short distances and can connect an online access control system to an Aperio-com patible mechani-cal lock.
Accentra™Accentra is a cloud-based access control system that focuses on solutions for multi- family buildings and small and medium-sized enterprises. A scalable infrastructure through a cloud provider pro-vides a high level of service and full control over informa-tion in a centrally based secu-rity system. Accentra supports multiple global products at door level (Aperio, Yale, ASSA and HID readers) and is devel-oped for, and deployed in, a true cloud environment for a global reach, while complying with local demands.
Hi-O™Hi-O (Highly intelligent Open-ing) is a concept that simpli-fies installation, service and maintenance of connected doors thanks to advanced technology and the plug-and-play principle. Hi-O is a stand-ardized technology for control and security of door environ-ments. The technology enables communication between all the components included in a door opening solution.
Product platforms
Excellent energy efficiency The new overhead sectional door reduces energy usage while also cutting costs with an increased focus on reducing energy waste and meeting building regulations. With a full 82 mm of insulation the door delivers exceptional thermal separation. The U-value is more than two times as effective compared to a standard overhead sectional door.
Global Solutions expands innovative RFID Lock Technology Varying configurations of doors found within office and hotel staff areas often limit the ability to implement newer door lock solutions. The VingCard E100 serves to sidestep such issues, thanks to its narrow and minimalistic design. By offering both DIN and SIS compatibility, the E100 can be implemented on doors that feature narrow lock cases in aluminum frames and can also be installed on sliding doors.
Ergonomically designed smart lockX300-FH is a premium push-pull digital door lock designed to improve user experi-ence by reducing door opening process compared to lever type locks. It is designed ergonomically by placing the fingerprint scanner in an area where the thumb natu-rally ends up when grabbing the handle. This small difference is a unique value which makes the lock stand out in the market.
NEW PRODuCTS
ASSA ABLOY ANNUAL REPORT 2018 17
PRODuCT LEADERSHIP

The technology shift for access solutions in the con-nected society is accelerating, providing ASSA ABLOY with major growth opportunities. Home services and other services that are logically connected to the Group’s products are experiencing strong demand. Strong growth is expected for services both in home delivery of products and services as well as in home care. Broad-ening and deepening demand are boosting revenue with more value per product, faster replacements and upgrades, more recurrent revenues and new business opportunities.
E-commerce, shared economy and home servicesA smart home or office space starts with a smart front door lock. ASSA ABLOY’s offering entails smart door locks and access management systems with technology that enables the creation and management of digital identi-ties. This digital identity is programmed to only apply for a certain person and a certain door during a certain time period, and can only be shared with trusted individuals or companies, who thereby gain access to the space at a certain point in time. The code or “digital key” – an encrypted digital token – is transmitted via a smart phone.
In simple cases, smart door locks provide secure and convenient access to a single door. In some cases, how-ever, service providers need access to a gate, a garage or other area to perform services such as laundry or picking up the mail. E-commerce is a major driver. Buying prod-ucts and services through online services or over the internet means that many end-users want the goods they acquire on the web to be physically delivered to their homes, workplaces or cars. The applications are relevant in many daily life situations in the shared economy, including sharing housing, vacation homes, vehicles and other equipment. Secure identification and digital iden-tities enable secure and convenient access to whatever is shared.
Home services, such as residential home care, is rapidly growing in many mature markets. Sharing the digital identity through a smart phone provides secure and convenient access to the home on a regular basis. In the example of residential home care, caregivers, home care providers and relatives need to be able to enter the homes of residents on a regular basis. ASSA ABLOY has developed a product platform for multi-family buildings and small and medium enterprises which enables easy and intuitive management of access to housing and other areas using digital keys, smart phones or other con-nected devices – while providing the safety and security that small businesses, care providers and their customers demand.
Taking the stance in its products, the Group works in partnership with both local and global organizations and businesses to create an end-to-end experience in deliveries, home services, care and other services in the connected ecosystem. One example is the partnership with Amazon, enabling convenient and secure in-home delivery and home access for guests and service appointments.
Internet of Things (IoT) ASSA ABLOY’s products and technologies are well-posi-tioned to grow with IoT. The number of connected resi-dential and industrial devices and machines are rapidly increasing, enabling the identification, communication, control and monitoring of functions and production of the things connected. The IoT enables the formation of ecosystems connecting, for example, homes, devices, cars, robots, shipping containers, traffic systems and transport systems.
The Group has world-leading technology and solu-tions for secure digital and mobile management of identity and authentication to determine who should have access when, where and how, with various layers of security and control. This includes a flexible and modular
Future security solutions – convenient, secure, digitalHuman needs in the connected society serve as an important starting point for ASSA ABLOY’s innovation and product development. Secure, convenient and smart access solutions that interact with people and products play a major role in the continued development of successful e-services and e-commerce. They add to the development of the sharing economy and the connected society of the Internet of Things.
Intelligent connected products and cloud-based systems
Next evolutionary stage
Electromechanical and electronic products
Higher value per productIncreased replacement rate
Higher value per product Increased replacement rateNew business opportunitiesIncrease in recurring revenues
Today mechanical and electromechanical access solutions are predominant world-wide. But development is now entering a third technology phase, the digital and connected phase. This means that the necessary basic function of a mechanical lock cylinder, door and entrance environ-ment can be digitally controlled for more effective and convenient function, and lower operating costs in large multi-functional systems. Shorter life cycles with more frequent additions of new technology solutions create business opportunities for ASSA ABLOY.Mechanical products
ASSA ABLOY ANNUAL REPORT 201818
PRODuCT LEADERSHIP

identification technology platform that serves as an eco-system of connected products and services, enabling the collection and analyzing of disparate data, in real-time or over time.
A significant value-add for the customers in the future, and as a source of revenue for the Group, is hence the data that the connected ASSA ABLOY products and solu-tions generate. This data can be collected and analyzed and used by the customers to develop, for example, new business models. Movement patterns as people enter and leave buildings provide valuable information about how different areas are used at different times.
IoT can also be used as a cost efficiency tool, as analyzing the data provides information about both security needs and energy needs – one of the largest cost items for property operations – for efficient climate con-trol and use of various areas of the building. Control may also include opening and closing doors, surveillance of high-security areas and goods and transport flows.
More recurrent services and revenueAs ASSA ABLOY’s product portfolio contains more digital electronics, software and data, revenues will shift toward recurrent services in the Group’s offering. Subscription-
based agreements for upgrades, data and analysis, as well as software licenses, are increasing. The trend toward complex, multifunctional systems creates new business opportunities, promotes close customer relationships, and generates stronger recurring revenue streams, often with long-term contracts for supply and service including cloud solutions.
Entrance automation In entrance automation, ASSA ABLOY has gained global market leadership with its Entrance Systems division, through acquisitions, innovation and organic growth. Hospitals, schools, airports, offices, warehouses, com-mercial buildings and industrial buildings are typical facilities with many entrances and doors of various types. The total market for entrance automation is estimated at about SEK 200 billion, with a robust growth rate. Con-nected products enable the facility manager to collect data and apply analytics to the data coming from the entrance systems. The facility manager receives data about what has happened and what spare parts are needed to fix the problem. This approach allows pro-active service and cost efficiency, while generating substantial customer value.
Yale Assure Lock Connected by AugustYale Assure Locks, Connected by August are the first product collaborations between the two ASSA ABLOY brands August and Yale. The Assure Lock with the Con-nected by August Upgrade Kit combines Yale’s secure lock hardware with August’s app and cloud-based software to create the most full-featured smart locks. The Yale Assure Locks, Connected by August, and the Connected by August Upgrade Kit for existing Assure Lock owners, are available on Amazon.com, August.com, ShopYaleHome.com and in Best Buy stores.
Redesigned door closer winner of the 2018 Iconic Awards – Innovative ArchitectureThe respected design award is given to products and buildings that contribute to innovation in architecture. The award-winning door controls provide innovative solutions for all door opening scenarios. With innovative Cam-Motion® technology inside, the range delivers an outstanding and accessible door opening experience with quiet, safe and secure door closing.
NEW PRODuCTS
ASSA ABLOY ANNUAL REPORT 2018 19
PRODuCT LEADERSHIP

Value creation strategy #3 Cost-efficiency in everything we do
ASSA ABLOY aims to continuously increase its cost-efficiency through the implementation of operational improvements and sustainable operations. Rigid cost control is achieved by streamlining manufacturing, professional sourcing and processes. The increased focus on professional sourcing adds competitiveness through quality and cost efficiency.
48%Share of total pur-chases in low-cost countries.
–27%The number of suppliers has been reduced by 27 percent over the past five years.
7th manufacturing footprint program launched in 2018 with an expected payback time of less than three years.
COST-EFFICIENCY
ASSA ABLOY ANNUAL REPORT 201820

Increased efficiency through automation and digitization
ASSA ABLOY’s strategy to increase efficiency is fundamental to continue to drive profitable growth by investing in market presence through customer relevance, product leadership through innovation , technology and in evolution through people. This will contribute to achieving the target of an operating margin of 16–17 percent. In 2018, the Group launched its seventh manufacturing footprint program (MFP), which will further improve efficiency going forward. In parallel, ASSA ABLOY also, on an ongoing basis, implements other efficiency measures such as professional sourcing to offset price pressure, including raw material prices, which was in focus during 2018. Initiatives to improve efficiency through -digitalization of processes and automation of production also remain top priority.
ASSA ABLOY’s production structure and overall efficiency continues to evolve through recurring multi-year struc-tural programs. A significant part of synergy effects in acquisitions is related to the streamlining of manufactur-ing sites as well as efficient integration. In addition, reducing the number of offices to increase efficiency in the organizational structure is also an important element in the ambition to drive profitable growth and enhance performance. Improved global logistics result in lower costs, increased flexibility, improved added value for customers and a better work environment.
The goal is to concentrate product assemblies to sophisticated plants close to customers, primarily in mature markets. Production of the more strategic com-ponents, such as cylinders, rim locks and some electro-mechanical products, is concentrated in the Group’s own production plants in low-cost countries, while other components are increasingly sourced from production partners.
Since the first MFP in 2006, 88 production plants have been closed, more than 143 plants have been remodeled into assembly plants, and about 60 offices have closed. The majority of the remaining production units in high-cost countries have switched to mainly final assembly
lines and customization centers. In 2018, the restructur-ing programs have proceeded according to plan and led to efficiency improvements and a reduction of 1,798 employees. Including acquisitions, the number of employees in low-cost countries was about 21,000 in 2018, representing 44 percent of the total workforce compared with 38 percent in 2008. Since the MFP’s were launched back in 2006, the number of employees has been reduced by 15,362, largely related to produc-tion in high-cost countries.
In 2018 the seventh Group-wide MFP was launched. The program will have an expected payback time of less than three years and includes the closure of 15 produc-tion plants and about 30 offices. The estimated total cost of the program is SEK 1,500 M, of which SEK 1,218 M was accounted for in 2018.
A review of ASSA ABLOY’s logistics structure con-tinued in 2018. Work is underway to reduce the number of logistic providers, while creating a more efficient structure for logistics centers with a high degree of standardization of materials and products. Standardized digital processes enable fast, efficient and secure trans-portation solutions.
Production structure
PLANTS IN LOW-COST COuNTRIES
Brazil
South Africa
ChinaIndia
PolandRomaniaBulgaria
Czech RepublicHungary
Croatia
Colombia
Chile
Malaysia
Mexico
ASSA ABLOY ANNUAL REPORT 2018 21
COST-EFFICIENCY
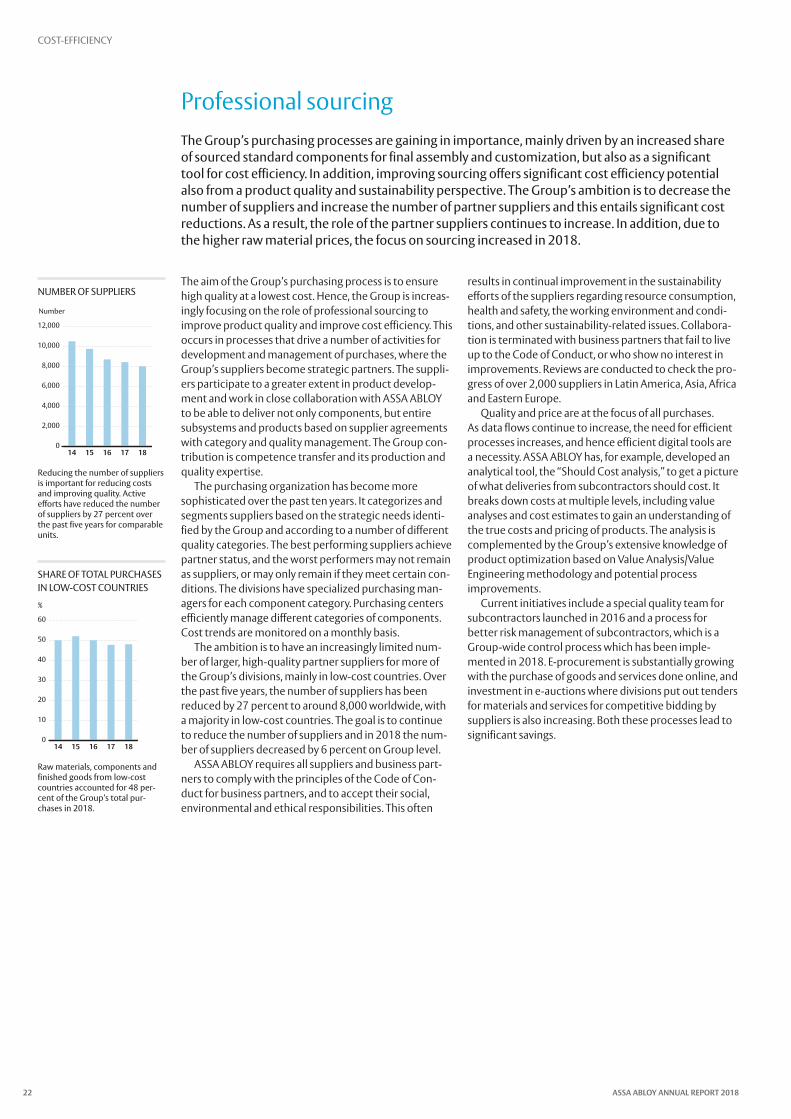
The aim of the Group’s purchasing process is to ensure high quality at a lowest cost. Hence, the Group is increas-ingly focusing on the role of professional sourcing to improve product quality and improve cost efficiency. This occurs in processes that drive a number of activities for development and management of purchases, where the Group’s suppliers become strategic partners. The suppli-ers participate to a greater extent in product develop-ment and work in close collaboration with ASSA ABLOY to be able to deliver not only components, but entire subsystems and products based on supplier agreements with category and quality management. The Group con-tribution is competence transfer and its production and quality expertise.
The purchasing organization has become more sophisticated over the past ten years. It categorizes and segments suppliers based on the strategic needs identi-fied by the Group and according to a number of different quality categories. The best performing suppliers achieve partner status, and the worst performers may not remain as suppliers, or may only remain if they meet certain con-ditions. The divisions have specialized purchasing man-agers for each component category. Purchasing centers efficiently manage different categories of components. Cost trends are monitored on a monthly basis.
The ambition is to have an increasingly limited num-ber of larger, high-quality partner suppliers for more of the Group’s divisions, mainly in low-cost countries. Over the past five years, the number of suppliers has been reduced by 27 percent to around 8,000 worldwide, with a majority in low-cost countries. The goal is to continue to reduce the number of suppliers and in 2018 the num-ber of suppliers decreased by 6 percent on Group level.
ASSA ABLOY requires all suppliers and business part-ners to comply with the principles of the Code of Con-duct for business partners, and to accept their social, environmental and ethical responsibilities. This often
results in continual improvement in the sustainability efforts of the suppliers regarding resource consumption, health and safety, the working environment and condi-tions, and other sustainability-related issues. Collabora-tion is terminated with business partners that fail to live up to the Code of Conduct, or who show no interest in improvements. Reviews are conducted to check the pro-gress of over 2,000 suppliers in Latin America, Asia, Africa and Eastern Europe.
Quality and price are at the focus of all purchases. As data flows continue to increase, the need for efficient processes increases, and hence efficient digital tools are a necessity. ASSA ABLOY has, for example, developed an analytical tool, the “Should Cost analysis,” to get a picture of what deliveries from subcontractors should cost. It breaks down costs at multiple levels, including value analyses and cost estimates to gain an understanding of the true costs and pricing of products. The analysis is complemented by the Group’s extensive knowledge of product optimization based on Value Analysis/Value Engineering methodology and potential process improvements.
Current initiatives include a special quality team for subcontractors launched in 2016 and a process for better risk management of subcontractors, which is a Group-wide control process which has been imple-mented in 2018. E-procurement is substantially growing with the purchase of goods and services done online, and investment in e-auctions where divisions put out tenders for materials and services for competitive bidding by suppliers is also increasing. Both these processes lead to significant savings.
Professional sourcingThe Group’s purchasing processes are gaining in importance, mainly driven by an increased share of sourced standard components for final assembly and customization, but also as a significant tool for cost efficiency. In addition, improving sourcing offers significant cost efficiency potential also from a product quality and sustainability perspective. The Group’s ambition is to decrease the number of suppliers and increase the number of partner suppliers and this entails significant cost reductions. As a result, the role of the partner suppliers continues to increase. In addition, due to the higher raw material prices, the focus on sourcing increased in 2018.
NuMBER OF SuPPLIERS
SHARE OF TOTAL PuRCHASES IN LOW-COST COuNTRIES
Number
0
2,000
4,000
6,000
8,000
10,000
12,000
1817161514
%
0
10
20
30
40
50
60
1817161514
Reducing the number of suppliers is important for reducing costs and improving quality. Active efforts have reduced the number of suppliers by 27 percent over the past five years for comparable units.
Raw materials, components and finished goods from low-cost countries accounted for 48 per-cent of the Group’s total pur-chases in 2018.
ASSA ABLOY ANNUAL REPORT 201822
COST-EFFICIENCY

With the strong growth in data flows, the Group’s focus is on improving its digital processes. Digitalization of pro-cesses is a prerequisite to deliver products and services to customers and according to customers’ requirements and needs. The Seamless Flow automation program, in conjunction with Lean methods, is central in achieving fully automated production logistics and seamless pro-duction – which means that production becomes trans-parent, with better material cost control, improved deci-sion-making procedures, shorter development times, and increased collaboration with the marketing and sales staff. Today, Seamless Flow automation and Lean meth-ods are applied in all of the Group units and the number of projects is increasing each year.
Seamless Flow encompasses the entire Group, and enables seamless transaction flows between divisions, regions, suppliers and customers. The aim is to achieve full automation and to streamline processes, especially in sales support, production and supply chain, enabling a seamless customer experience throughout all interac-tions with the Group. Standardized product databases and efficient product data management, together with
an efficient ERP (Enterprise Resource Planning) system enable the Group to improve the quality of administra-tive flows and processes, whilst freeing up resources that can be dedicated to direct customer relationships instead of support functions and other back-end admin-istrative functions. By the end of 2018, more than 150 companies have implemented one of the six divisional ERP systems.
Value Analysis (VA) is a structured process for optimiz-ing cost and customer value in existing products. The same applies to Value Engineering (VE), which is part of the product development process. Value Analysis/Value Engineering (VA/VE) entails an in-depth analysis of the product’s design, components and production methods, which systematically reduces costs and enhances customer value with improved quality.
Investments in increased automation of production flows have accelerated in recent years. E-procurement processes as well as e-commerce are also important elements in the ambition to automate and digitalize the processes throughout the value chain.
Process developmentA constant effort is underway to apply and develop methods and processes in all stages of the value chain to improve cost efficiency and add customer value. Lean methodology also encompasses all internal processes in all divisions. The automation and digitization of all of the Group’s administrative flows is a prerequisite for process efficiency.
ASSA ABLOY’s Seamless Flow objective is to achieve an efficient flow in all support functions, an automated flow of information and products across the whole value chain.
LOGISTICS / WAREHOuSE FREIGHT
PRODuCTION
PuRCHASES
PRODuCTCONFIGuRATION
ORDERS
PDM CAD
CuSTOMERS
SuPPLIERS & PARTNERS
SEAMLESS FLOW – A MORE EFFICIENT FLOW THROuGHOuT THE VALuE CHAIN
ASSA ABLOY ANNUAL REPORT 2018 23
COST-EFFICIENCY

Value creation strategy #4 Evolution through people
Employee commitment and expertise are crucial for the Group’s success. In 2018, ASSA ABLOY developed core values and beliefs to support a common ASSA ABLOY Group culture. A global workforce also requires digital platforms and tools to provide innovative and efficient ways of working seamlessly.
28different nationalities in senior manage-ment positions.
87%of the employees participated in the employee survey 2018.
3.6injuries per million hours worked. Since 2015 injury rate decreased with 46 percent.
The human resources framework is based on three foundations:• Increase diversity and inclusion • Improve talent management• Improve health and safety
Core values • Empowerment • Innovation • Integrity
Beliefs• We have trust in people• We have the courage to change• We stand up for what’s right
PEOPLE
ASSA ABLOY ANNUAL REPORT 201824

Employees lead the way
During the year, ASSA ABLOY lunched core values and beliefs that will be activated throughout the Group in 2019. They form the base for the human resources vision, strategy and framework that were updated during the year. This will support the work toward being the Employer of Choice. The business-oriented strategy with a clear focus on people creates an environment that ena-bles employees to make a difference and to act with authority. ASSA ABLOY believes that the right people in the right place is the driving force for growth. By improv-ing the Group’s processes and structures, ASSA ABLOY’s aim is to create a culture that adds value to the business and encourages internal mobility, diversity and knowl-edge sharing.
Increasing diversity and inclusionASSA ABLOY’s Code of Conduct states that gender, nationality, social or ethnic origin, age, religion, physical disability, sexual orientation and political opinion must not be the basis for negative discrimination. ASSA ABLOY has a performance culture based on the diversity of per-spectives and is set to lead by example.
Diversity of perspectives is an important aspiration for ASSA ABLOY, contributing to more dynamic structures – promoting creativity and an open exchange of ideas. ASSA ABLOY’s extensive experience of working with more diverse teams has shown that they often provide a more holistic approach and better results, particularly in terms of innovation and business process.
The participants of ASSA ABLOY’s executive manage-ment program consists of a diverse group of employees to promote multiple perspectives.
The Group’s target is to have 30 percent of manage-ment positions held by women. In 2018 the share was 24 percent and currently there are 28 different nationali-ties in senior management positions. During 2018 several female appointments to executive positions were made.
Improving talent managementASSA ABLOY believes that people can achieve great things. Combined with the opportunity to work together and an environment with diverse perspectives, ASSA ABLOY has the ability to innovate the business, the prod-ucts and the industry. The Group actively invests in opportunities to learn, grow and achieve results that make a positive impact.
Every other year ASSA ABLOY conducts a Group-wide Employee Survey: an important tool to understand how employees feel about their workplace and role. The sur-vey for 2018 had a response rate of 87 percent and with overall positive results, specifically concerning innova-tion, employee development and work processes.
The Group operates on all levels to strengthen internal mobility and cross-level development opportunities. ASSA ABLOY’s recruitment policy gives priority to inter-nal candidates provided they have equal qualifications to external applicants. Job vacancies are published on the Group’s intranet to encourage internal mobility and there are several common programs for increased commitment and personal growth.
The Group has a global development process for senior managers, which is aimed at ensuring that the Group has the expertise it needs to meet future demands. Its foun-dation consists of two development programs for senior managers: ASSA ABLOY MMT and ASSA ABLOY IMD, “Leading the future.” About 620 of the Group’s senior managers from 35 countries have participated in the IMD training program. It includes a customized IMD program in collaboration with the Swiss management school, the International Institute for Management Development (IMD) in Lausanne, with 30 participants per session.
Improving health and safetyASSA ABLOY works for a workplace free of injuries in all its operations. With a Group-wide safety culture that promotes safe behavior, workplace hazards and risk taking are reduced. The objective is to have zero acci-dents in the workplace.
Digital workplace With a global workforce that requires working from any-where at any time requires a robust, secure and allowing IT infrastructure. To provide innovative and more effi-cient ways to work as well as effective access to informa-tion in a secure and compliant way, ASSA ABLOY invests in digital platforms, identity & access management and self-service tools. For example, cloud computing pre-sents opportunities for ASSA ABLOY to realize tangible benefits including scalability, reliability, resilience and a more agile organization. It also offers multiple benefits to ASSA ABLOY by leveraging economies of scale, commod-itizing IT infrastructure, and a paying per-use model.
Leveraging integration can be a source of competitive differentiation to provide effective access to information, cope with fast technology innovation and accelerated pace of business. By combining technology and IT tools with step changes to processes and ways of working, the Group achieves improved information flow, visibility, speed and efficiency.
ASSA ABLOY ANNUAL REPORT 2018 25
PEOPLE

The result of ASSA ABLOY’s strategyProfitable growth
ASSA ABLOY’s strategic objectives are customer relevance, product leadership through innovation, cost-efficiency in everything we do and evolution through people. This has resulted in strong growth and earnings trends that have created significant value for customers, shareholders and employees.
141%Sales growth since 2008.
164%Increase in earnings per share since 2008.
134%Increase in operating income since 2008.
Sales Operating income (EBIT)
09 10 11 12 13 14 15 16 17 18
PROFITABLE GROWTH
ASSA ABLOY ANNUAL REPORT 201826

Focus on long-term value-creation
ASSA ABLOY’s focus is on long-term value-creation. Average annual sales growth over the last ten years has been over 9 percent, while operating income grew by an average of 9 percent per year during the same period. The Group targets to grow over a business cycle by 5 percent organically and 5 percent through acquisitions remains firm as well as the operating margin target of 16–17 percent.
ASSA ABLOY was formed in 1994 through the merger of Swedish ASSA and Finnish ABLOY. The Group grew rapidly during its first decade – mainly through acquisi-tions – from being a regional lock company in the Nordic countries into a leading global player.
Market presence through customer relevanceASSA ABLOY’s growth rests on a strong long-term trend: the growing human need for safety, security and conven-ient solutions for locks and doors. The Group is currently represented in over 70 countries and has rapidly expanded in the emerging markets, which represented some 23 percent of total sales in 2018. The market driv-ers, including urbanization, digitalization and sustain-ability, contribute to growing demand for mechanical, electromechanical, digital and smart access and identifi-cation solutions, as well as increasingly sustainable and energy-saving products and solutions. Electromechani-cal solutions are rapidly growing with a growth in 2018 of 20 percent and now account for 30 percent of Group sales.
Another significant factor for ASSA ABLOY’s stable growth is the Group’s installed base of locks and doors, and a product range which is the largest in the world. It provides a continuous flow of profitable and recurring business. Organic growth is supplemented with an acqui-sition strategy to strengthen the Group’s market pres-ence geographically, and to expand with more access solutions and new technology in selected areas. Over the past decade, ASSA ABLOY has completed 146 acquisi-tions that have contributed with an average of 6 percent growth annually. In 2018, acquisitions contributed a net 2 percent growth. As a result of several major acquisi-tions in entrance automation and in industrial, ware-house and garage doors, ASSA ABLOY’s Entrance Systems division has become the market leader and the Group’s largest division with sales of SEK 23,762 M, representing 28 percent of total sales.
Product leadership through innovationASSA ABLOY is an innovative product leader and spends annually about 3 percent of the Group’s sales on Research & Development. This is becoming more impor-
tant as part of the move to more electromechanical, digi-tal and mobile solutions. Products that are less than three years old accounted for 27 percent of the Group’s total sales in 2018 compared with the Group target of 25 percent. The continuous investments in product devel-opment and innovation is a main driver for achieving the target of 5 percent annual organic growth.
Cost-efficiency in everything we doConstant efficiency enhancements are essential for good and stable profitability, as well as a sustainable business and products. The Group continually streamlines the global production structure through recurring multiyear restructuring programs. An effect of this is that the Group’s external sourcing has increased substantially and been concentrated to fewer and larger partner suppliers. The purpose of the manufacturing footprint programs is to concentrate assembly lines while keeping customiza-tion close to the major customer markets and to relocate component production to low-cost countries. A seventh program was launched in 2018. The ongoing programs resulted during 2018 in efficiency improvements and a reduction of 1,798 employees.
In addition to the manufacturing footprint programs, ASSA ABLOY runs several other efficiency improvement and customer benefit initiatives. All units operate based on Lean processes with professional teams for smarter production flows, and Seamless Flow covers the entire Group. The Group is making major investments in com-mon IT systems, standardized databases as well as in automation and robotics in production processes, all with the aim to improve efficiency and allow for further profitable organic growth and growth through acquisitions.
Evolution through peopleThe employees are the most important asset and the development of their expertise is crucial for the ASSA ABLOY Group’s future success. In 2018, ASSA ABLOY developed core values to support a common culture that unites the Group across geographies, divisions, brands and companies. The values are: Empowerment, Innova-tion and Integrity.
ASSA ABLOY ANNUAL REPORT 2018 27
PROFITABLE GROWTH

ASSA ABLOY’s divisions
Regional divisionsThe regional divisions manufacture and sell mechanical and electromechanical locks, digital door locks, cylinders and security doors adapted to the local market’s standards and security requirements.
FinAnCiALS in BRiEF 2018
• Sales: SEK 20,201 M (18,081) with 2 percent organic growth.
• Operating income (EBIT): SEK 3,256 M (2,990).1
• Operating margin: 16.1 percent (16.5).1
FinAnCiALS in BRiEF 2018
• Sales: SEK 19,817 M (17,940) with 9 percent organic growth.
• Operating income (EBIT): SEK 3,941 M (3,815).1
• Operating margin: 19.9 percent (21.3).1
FinAnCiALS in BRiEF 2018
• Sales: SEK 9,949 M (9,211) with 4 percent organic growth.
• Operating income (EBIT): SEK 492 M (934).1• Operating margin: 4.9 percent (10.1).1
Share of sales
Share of operating income
Asia
Share of sales
Share of operating income
Americas
23% 29% 11% 4%
Share of sales
Share of operating income
emea
24% 24%
Opening SolutionsAmericas
Opening SolutionsAsia Pacific
Opening SolutionsEMEA
SALES BY PRODUCT GROUP
Mekaniska lås, låssystem och tillbehör, 54%Elektromekaniska och elektroniska, 31%Säkerhetsdörrar och beslag, 15%
Mechanical locks, lock systems and fittings, 50%Electromechanical and electronic, 35%Security doors and hardware, 15%
SALES BY PRODUCT GROUP
Mechanical locks, lock systems and fittings, 39%Electromechanical and electronic, 20%Security doors and hardware, 41%
Mekaniska lås, låssystem och tillbehör, 41%Elektromekaniska och elektroniska, 15%Säkerhetsdörrar och beslag, 44%
SALES BY PRODUCT GROUP
Mechanical locks, lock systems and fittings, 50%Electromechanical and electronic, 24%Security doors and hardware, 26%
Mekaniska lås, låssystemoch tillbehör, 51%Elektromekaniskaoch elektroniska, 20%Säkerhetsdörraroch beslag, 29%
Sales Operating income1
1 Excluding items affecting comparability.
P 30 P 31 P 32
SEK MSales
SEK M
10,000
12,000
14,000
16,000
18,000
20,000
22,000
1817161514
SalesOperating income1
2,000
2,250
2,500
2,750
3,000
3,250
3,500
Operating income1
1
SEK MSales
SEK M
10,000
12,000
14,000
16,000
18,000
20,000
1817161514
SalesOperating income1
1,500
2,000
2,500
3,000
3,500
4,000
Operating income1
1
SEK MSales
SEK M
2,000
4,000
6,000
8,000
10,000
12,000
1817161514
SalesOperating income1
0
300
600
900
1,200
1,500
Operating income1
1
ASSA ABLOY ANNUAL REPORT 201828
ASSA ABLOY’S DiViSiOnS
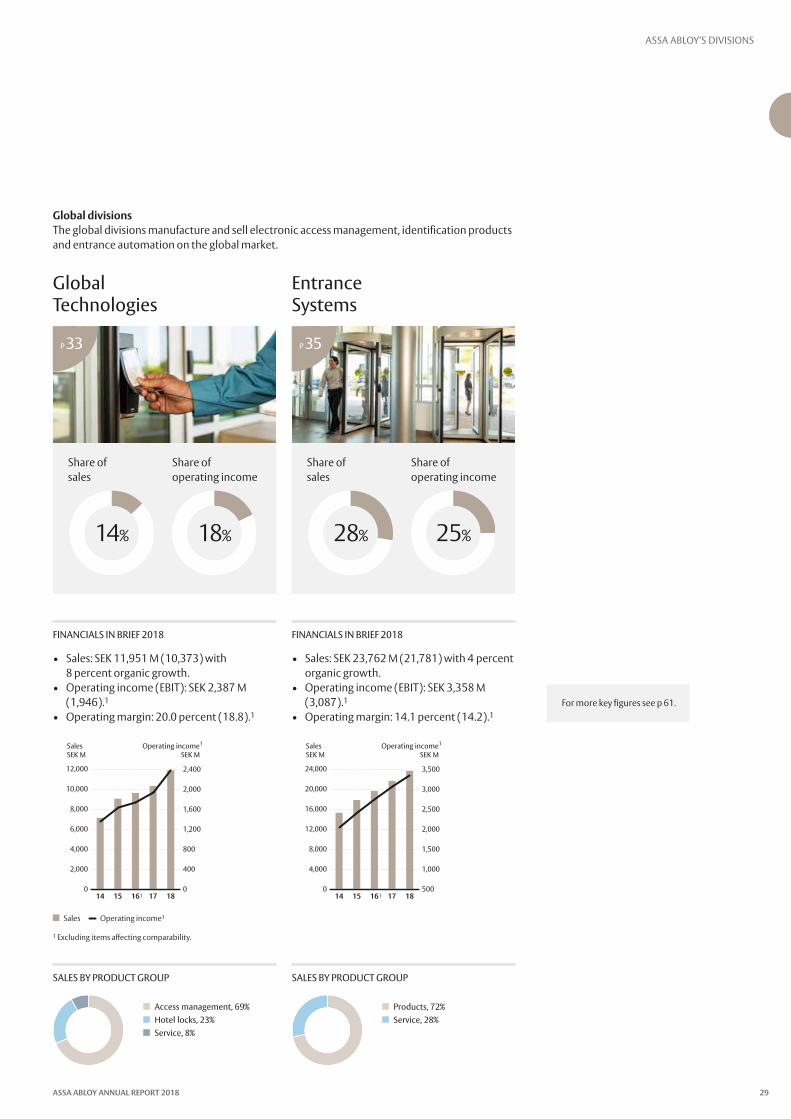
Global divisionsThe global divisions manufacture and sell electronic access management, identification products and entrance automation on the global market.
FinAnCiALS in BRiEF 2018
• Sales: SEK 11,951 M (10,373) with 8 percent organic growth.
• Operating income (EBIT): SEK 2,387 M (1,946).1
• Operating margin: 20.0 percent (18.8).1
FinAnCiALS in BRiEF 2018
• Sales: SEK 23,762 M (21,781) with 4 percent organic growth.
• Operating income (EBIT): SEK 3,358 M (3,087).1
• Operating margin: 14.1 percent (14.2).1
Share of sales
Share of operating income
entre
Share of sales
Share of operating income
global
14% 18% 28% 25%
Entrance Systems
Global Technologies
SALES BY PRODUCT GROUP
Access management, 69%Hotel locks, 23%Service, 8%
Passerkontroll, 71%Hotellås, 22%Service, 7%
SALES BY PRODUCT GROUP
Products, 72%Service, 28%
Produkter, 73%Service, 27%
Sales Operating income1
1 Excluding items affecting comparability.
For more key figures see p 61.
P 33 P 35
SEK MSales
SEK M
0
2,000
4,000
6,000
8,000
10,000
12,000
1817161514
SalesOperating income1
0
400
800
1,200
1,600
2,000
2,400
Operating income1
1
SEK MSales
SEK M
0
4,000
8,000
12,000
16,000
20,000
24,000
1817161514
SalesOperating income1
500
1,000
1,500
2,000
2,500
3,000
3,500
Operating income1
1
ASSA ABLOY ANNUAL REPORT 2018 29
ASSA ABLOY’S DiViSiOnS

Opening Solutions EMEA
Demand in the region was good with organic sales growth close to 2 percent. Sales of electromechanical locks with digital and mobile solutions increased sharply. Growth was good in many markets in Europe. Product development continued at a high pace and efficiency and streamlining programs continue to produce good results, driven by robotics and the continued consolidation of suppliers.
Good growth and a high innovation rate
Market trendIn 2018 growth was strong in Germany, Eastern Europe and Finland and good in Scandinavia, the UK and South-ern Europe. Africa/ Middle East and France also reported growth while sales in Benelux declined. Electromechani-cal products showed very strong growth. Commercial products driven by specification remain the largest part of the business, while consumer awareness, consistent and innovative product development including quality and service, are key drivers in the residential market. In EMEA demand for sustainable solutions continues to grow strongly.
Brand development, value-based pricing, recurring revenue and specification are major cornerstones in EMEA’s strategy to increase customer relevance. The divi-sion has over 200 specifiers and the number of projects specified continued to increase sharply. The customer offerings are adapted to the local market’s standards and security requirements, supported by local knowledge of the Group’s brands. In EMEA, these include some of the most respected in the industry, such as ABLOY, Yale, Mul-T-Lock, TESA, IKON and Vachette, amongst others. Whilst digital products are providing significant growth, mechanical locks still play a significant role and are growing.
Acquisition principles include a strategic fit, new tech-nology, geographical expansion or growth into adjacent sectors. In 2018 the Group acquired HKC and Planet. Both are examples of acquisitions in adjacent sectors which expanded the addressable market.
Product leadershipThe share of new products introduced over the past three years was 29 percent of total sales. In 2018 EMEA launched its first energy harvesting product, Pulse, which features a cutting-edge electronic cylinder that requires no batteries or power supply. In product development, the division is also committed to developing environ-mental product declarations which enable customers to fully understand the environmental impact of any new product. This is a significant competitive advantage. The software share of the offering is also constantly increas-ing and the service offering is developed in the areas of maintenance, training and safety.
Cost-efficiencyThe division’s restructuring program to reduce the num-ber of plants and to concentrate on assemblies close to customers continued according to plan, with continued
consolidation of sub-suppliers to fewer and larger part-ners. In Scandinavia the division has consolidated its operational sites, which will be reflected in improved efficiency and service improvements across the product portfolio. Automation of production continued at a high pace. Here, advanced robotics with intelligent vision sys-tems play a key role. The number of robots has increased by 75 percent over three years and in 2018 they increased by 30 percent. The commercial excellence program made good progress in several areas, such as pricing, recurring revenue and digitalization. One example is the business-to-business web shop. During the year the division increased the number of order lines received seamlessly by over 10 percent as the focus on customer experience continues at full pace.
Neil Vann Executive Vice President and Head of EMEA division
Offering: Mechanical and electromechanical locks, digital door locks, security doors and fire doors, as well as hardware.
Markets: EMEA is the leader in its product areas in Europe, the Middle East and Africa. The commercial segment accounts for around 60 percent of sales and the residential segment for 40 percent. EMEA comprises a large number of Group companies with a good knowledge of their local and in many respects diverse markets. Products are sold primarily through a num-ber of distribution channels, but also directly to end-users.
Acquisitions 2018: Dale & Excel, Lorient and Exidor in the UK, HKC in Ireland, LOB in Poland, Lukkoaitta in Finland, Luleå Låskonsult in Sweden, Marenco in Holland and Planet GDZ in Switzerland.
The sale of electromechanical locks increased by 18 percent during 2018. What are the drivers for this growth?The growth was mainly driven by the continued focus on critical infrastructure and the conver-sion of commercial mechanical Master Key systems into flexible digital solutions. You acquired the door seal company Planet in 2018. How will you integrate it?This acquisition delivers on our strategy to expand our core business as Planet is a leading supplier of door drop down seals and finger protection covers. Planet will be fully integrated into EMEA’s Switzerland set-up which is part of our DACH mar-ket region. This includes the integration of shared services, endorsing the Planet brand and applying best practices, whilst maintaining the location and operations in Tagelswangen just outside Zurich. A dedicated inte-gration manager on the ground ensures the execution to plan. Making Planet our competence centre for drop down seals and finger protection technology, the integration is also centred around maximising revenue syn-ergy potential, particularly through ASSA ABLOY’s interna-tional network, cross-sell and specification.
In which geographical areas did you grow the most in 2018?Our largest growth from a geo-graphical point of view has come from Eastern Europe, particularly in Poland. We also had strong growth in Germany and Finland.
EMEA’s offering includes door and window systems, access control and service.
ASSA ABLOY ANNUAL REPORT 201830
ASSA ABLOY’S DiViSiOnS
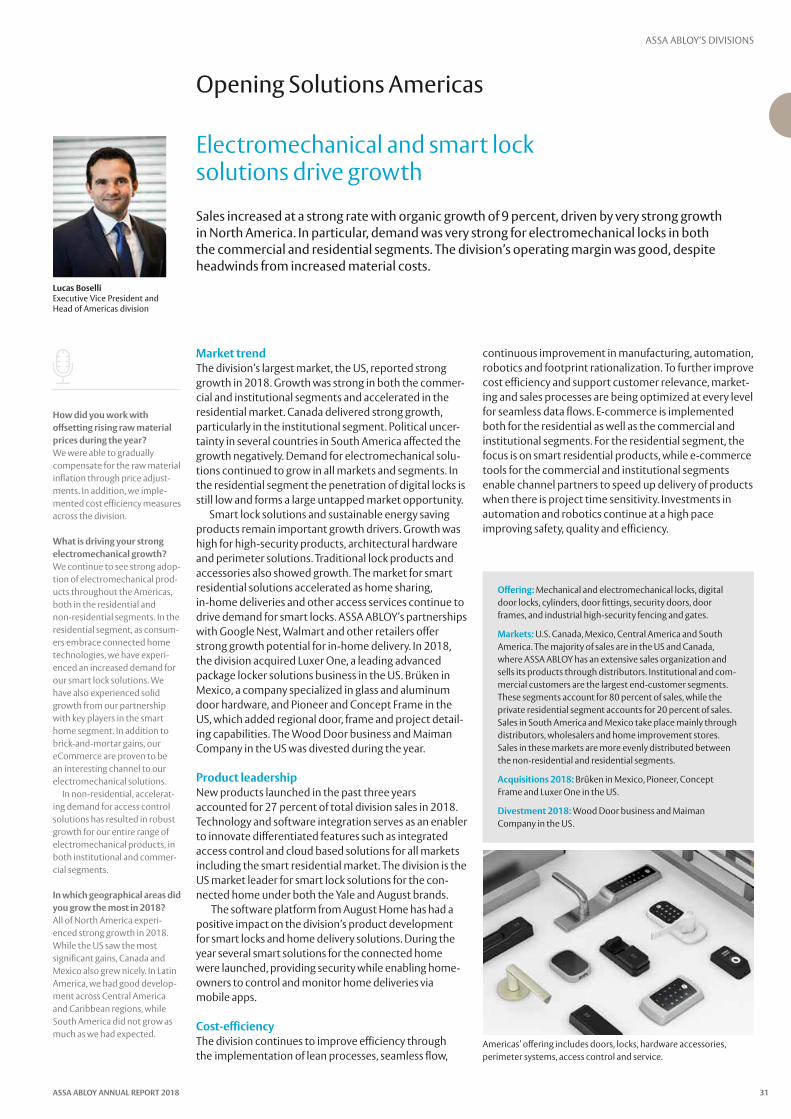
Market trendThe division’s largest market, the US, reported strong growth in 2018. Growth was strong in both the commer-cial and institutional segments and accelerated in the residential market. Canada delivered strong growth, particularly in the institutional segment. Political uncer-tainty in several countries in South America affected the growth negatively. Demand for electromechanical solu-tions continued to grow in all markets and segments. In the residential segment the penetration of digital locks is still low and forms a large untapped market opportunity.
Smart lock solutions and sustainable energy saving products remain important growth drivers. Growth was high for high-security products, architectural hardware and perimeter solutions. Traditional lock products and accessories also showed growth. The market for smart residential solutions accelerated as home sharing, in-home deliveries and other access services continue to drive demand for smart locks. ASSA ABLOY’s partnerships with Google Nest, Walmart and other retailers offer strong growth potential for in-home delivery. In 2018, the division acquired Luxer One, a leading advanced package locker solutions business in the US. Brüken in Mexico, a company specialized in glass and aluminum door hardware, and Pioneer and Concept Frame in the US, which added regional door, frame and project detail-ing capabilities. The Wood Door business and Maiman Company in the US was divested during the year.
Product leadershipNew products launched in the past three years accounted for 27 percent of total division sales in 2018. Technology and software integration serves as an enabler to innovate differentiated features such as integrated access control and cloud based solutions for all markets including the smart residential market. The division is the US market leader for smart lock solutions for the con-nected home under both the Yale and August brands.
The software platform from August Home has had a positive impact on the division’s product development for smart locks and home delivery solutions. During the year several smart solutions for the connected home were launched, providing security while enabling home-owners to control and monitor home deliveries via mobile apps.
Cost-efficiencyThe division continues to improve efficiency through the implementation of lean processes, seamless flow,
continuous improvement in manufacturing, automation, robotics and footprint rationalization. To further improve cost efficiency and support customer relevance, market-ing and sales processes are being optimized at every level for seamless data flows. E-commerce is implemented both for the residential as well as the commercial and institutional segments. For the residential segment, the focus is on smart residential products, while e-commerce tools for the commercial and institutional segments enable channel partners to speed up delivery of products when there is project time sensitivity. Investments in automation and robotics continue at a high pace improving safety, quality and efficiency.
Opening Solutions Americas
Sales increased at a strong rate with organic growth of 9 percent, driven by very strong growth in north America. in particular, demand was very strong for electromechanical locks in both the commercial and residential segments. The division’s operating margin was good, despite headwinds from increased material costs.
Electromechanical and smart lock solutions drive growth
Lucas Boselli Executive Vice President and Head of Americas division
Offering: Mechanical and electromechanical locks, digital door locks, cylinders, door fittings, security doors, door frames, and industrial high-security fencing and gates.
Markets: U.S. Canada, Mexico, Central America and South America. The majority of sales are in the US and Canada, where ASSA ABLOY has an extensive sales organization and sells its products through distributors. Institutional and com-mercial customers are the largest end-customer segments. These segments account for 80 percent of sales, while the private residential segment accounts for 20 percent of sales. Sales in South America and Mexico take place mainly through distributors, wholesalers and home improvement stores. Sales in these markets are more evenly distributed between the non-residential and residential segments.
Acquisitions 2018: Brûken in Mexico, Pioneer, Concept Frame and Luxer One in the US.
Divestment 2018: Wood Door business and Maiman Company in the US.
How did you work with offsetting rising raw material prices during the year?We were able to gradually compensate for the raw material inflation through price adjust-ments. In addition, we imple-mented cost efficiency measures across the division. What is driving your strong electromechanical growth?We continue to see strong adop-tion of electromechanical prod-ucts throughout the Americas, both in the residential and non-residential segments. In the residential segment, as consum-ers embrace connected home technologies, we have experi-enced an increased demand for our smart lock solutions. We have also experienced solid growth from our partnership with key players in the smart home segment. In addition to brick-and-mortar gains, our eCommerce are proven to be an interesting channel to our electromechanical solutions. In non-residential, accelerat-ing demand for access control solutions has resulted in robust growth for our entire range of electromechanical products, in both institutional and commer-cial segments.
In which geographical areas did you grow the most in 2018?All of North America experi-enced strong growth in 2018. While the US saw the most significant gains, Canada and Mexico also grew nicely. In Latin America, we had good develop-ment across Central America and Caribbean regions, while South America did not grow as much as we had expected.
Americas’ offering includes doors, locks, hardware accessories, perimeter systems, access control and service.
ASSA ABLOY ANNUAL REPORT 2018 31
ASSA ABLOY’S DiViSiOnS

Opening Solutions Asia Pacific
Overall sales growth in the division was good with strong growth in South Korea, Japan and for electromechanical products in particular. The Group has a new business strategy in place in China to transform it into a more focused organization to respond to the rapidly changing business environment. The development of new products continues at a high level in the division, with strong demand – especially for smart door locks in the residential market.
Good growth in APAC – transforming China
Market trendDemand in large parts of the APAC region was good. Sales growth was strong in South Korea, Japan and South East Asia and good in the Pacific. Demand in China, which accounts for about half of the division’s sales, remained weak. Sales continued to decline for fire and security doors. Organic sales in China declined by 1 percent, com-pared with 4 percent in 2017.
In APAC, demand for digital and mobile solutions is strong and rapidly growing, as is the adoption of new technology. This is also reflected in the division’s sales by product group, where sales of mechanical locks and system fittings decreased to below 50 percent in 2018. Demand for smart door locks continues to grow with strong double-digit figures, as does demand for sustain-able solutions. Market transformation, urbanization, as well as new regulations promoting environmentally- rated and energy-efficient products, drive demand.
In China, smart locks are increasingly regarded as con-sumer electronics, even lifestyle products, and are rap-idly spreading beyond early adopters. The business in China has been reorganized to focus on meeting the spe-cific needs of different market channels and has consoli-dated a number of brands into Pan Pan, Yale and ASSA ABLOY with separate sales organizations. The new brand strategy will support the division’s growth ambitions also in the replacement market. In addition to the brand strategy, to better serve the construction market, a key- account organization has been established in China.
Product leadershipThe division continued to launch new products at a high pace. The share of products launched in the past three years increased to 40 percent of total sales, compared with the Group target of 25 percent. By increasing invest-ments in innovation and new products, the division con-tinues to strengthen its product leadership. The Group is reducing the number of product platforms, as a means of simplification, while the share of software is increasing, enabling customer offerings entailing differentiated fea-tures and comprehensive solutions for the residential market. Attractive design is also increasing in impor-tance. The number of development engineers continued to increase in the division’s 15 development centers, including in China, where products are also developed for the entire region. The division has the widest range of “green” products with a rapidly growing number of environmental product declarations.
Cost-efficiencyThe new construction market in China is expected to grow at a slower pace and consolidation of the construc-tion developers continue. As the operating margin in China is expected to remain low for the next few years, the Group took a write-down of SEK 5,595 M for impair-ment of goodwill and other intangible assets in 2018. The Group also made provisions of SEK 400 M for receivables and inventory in China.
In China, the Group continues to optimize the manu-facturing footprint to fit the market demand. These efforts include increasing specialization and streamlining production structure as well as optimizing the size of the manufacturing plants. The ambition is to improve efficiency throughout the value chain.
The Seamless Flow initiative also continued. Over 60 percent of the division is now working in a common business system.
Anders MaltesenExecutive Vice President and Head of Asia Pacific division
Offering: Mechanical and electromechanical locks, digital door locks, high-security doors, fire doors and hardware.
Markets: The Asian countries are predominately emerging markets without established security standards. New con-struction accounts for around three-quarters of sales. In the Chinese market the same types of lock, handle and hardware are often used in both homes and workplaces. The produc-tion units in China also produce for ASSA ABLOY’s other divi-sions. Australia and New Zealand are mature markets with established lock standards, where renovations and upgrades account for the majority of sales.
Acquisitions 2018: Pacific Door Systems in New Zealand.
How is the implementation of the new strategy in China progressing? The new strategy in China is pro-gressing well. The organizational structure allows the teams to be more focused by allocating dedi-cated employees to serve differ-ent customer segments with specialized solutions and brands. We are also further streamlining our production which will improve our competi-tiveness going forward.
How is the adoption of digital locks progressing in the different markets?South Korea currently has the highest digital lock adoption rate in Asia Pacific. Most new res-idential buildings have smart door solutions, and the Gateman brand from ASSA ABLOY is lead-ing the market. With this high penetration rate, we are focus-ing on more advanced functions and smart locks for the replace-ment and upgrade markets. China is another fast-growing market for digital and smart locks, and our extensive product range helps us effectively pene-trate different market segments.
In which geographical areas did you grow the most in 2018?We achieved strong growth in South Korea in 2018, especially with our digital and architec-tural solutions. We are also happy to see steady growth in some other south east Asia mar-kets.
Asia Pacific’s offering includes mechanical and smart door locks, window systems, access control, and service.
ASSA ABLOY ANNUAL REPORT 201832
ASSA ABLOY’S DiViSiOnS

HiD GlobalMarket trendTrusted digital identities are key enablers in the digital society to underpin security, safety and convenience. Hence, underlying global demand in the identity market continued to be strong, driven by growing security needs, upgrades and rapid technology developments.
Sales were strong in Physical Access Control Solutions, Extended Access Technologies, Identity & Access Man-agement Solutions and Identification Technologies. Secure Issuance reported good growth while Citizen ID declined. Driven by the very strong growth in North America, sales growth in the mature markets was as strong as in the emerging markets.
During the year HID Global acquired Crossmatch in the US. Crossmatch’s product portfolio includes biomet-ric identity management hardware and software that complement HID Global’s product portfolio. The acquisi-tion makes HID Global one of the world’s major providers of fingerprint biometric technologies and strengthens its ability to offer innovative biometric identity solutions.
Product leadershipWhile innovation and product development continued on a high level, the share of products launched in the past three years was about 21 percent, or close to the Group’s target of 25 percent.
The division’s identity and access management prod-ucts undergo constant development with new features and platform adaptations, addressing the increasing demand for updates and modifications. Supported by software, HID Global’s trusted identity products and ser-vices can handle all aspects of the lifecycle of an identity. The increasing share of software in the products also allows HID Global to complement its existing physical products with software solutions. One example is com-plementing a printing product with Financial Instant Issu-ance. This creates recurring revenue and added customer value.
HID Location Services has showed strong growth in 2018, driven by the fast growing enterprise IoT market. HID Location Services provides real-time location aware-ness and improves organizations’ ability to manage assets and people within buildings and enables the loca-tion of people in a facility. Analyzing room usage, map-ping the flow of people for better building management and security as well as increased operational efficiency are some of the value-added features.
Cost efficiency Efficiency initiatives continued, both through stream-lining of operations, but also by improving processes. During the year the Group announced the intent to con-solidate HID Global’s credential manufacturing footprint and shared services footprint in Europe to Ireland. This will be reflected in cost savings and improved flexibility going forward.
Global Technologies
Global Technologies, which consists of HiD Global and ASSA ABLOY Global Solutions, reported strong organic sales growth of 8 percent. Demand for HiD Global’s products and services was strong, especially in north America, driven by upgrades and large investments in the institutional and commercial market. Global Solutions continued to report strong growth, reflecting the strong demand for hotel locks with mobile access and strong demand also in the other verticals: marine, elderly care and student accommodation.
Strong sales and earnings trend
Stefan Widing Executive Vice President and Head of Global Technologies business unit HiD Global
Offering: HID Global is a worldwide leader in trusted identity solutions, dedicated to powering the trusted identities of the world’s people, places and things.
Markets: Millions of people around the world use HID prod-ucts and services to navigate their everyday lives, and over 2 billion things are connected through HID-technology. Customers comprise companies, healthcare, education, financial, government and state institutions. Customers are mainly in the institutional and commercial sectors world-wide.
Acquisitions 2018: Crossmatch in the US and ISLOG in France.
What products were driving your strong sales growth during 2018?We had good growth across many product lines. One high-light is Location Services where we have had breakthrough wins in several important customer segments. We are now getting key references and customer success stories that will drive continued growth in this area. Also, Mobile Access continues to develop very well with contin-ued triple-digit growth in user adoption and with several foun-dational aspects being put in place in 2018 that will enable us to scale even better in the future. And then, finally, our Authentication and Threat Detection solution that we launched this year, that is based on machine learning technol-ogy, has enjoyed significant early market traction that bodes well for the future.
How will you develop and integrate Crossmatch going forward?Crossmatch will be integrated into the three HID Business Units that aligns with their three product segments. Some core technology and other functional areas move into HID’s global functions. The main develop-ment will be on the commercial side by leveraging HID’s market footprint, and on the innovation side where we will increase investments into Crossmatch’s biometric technologies.
In which geographical areas did you grow the most in 2018?North America grew the most in 2018.
HID’s offering include trusted identity and access solutions.
ASSA ABLOY ANNUAL REPORT 2018 33
ASSA ABLOY’S DiViSiOnS

Global SolutionsMarket trendIn 2018 ASSA ABLOY Hospitality changed its name to Global Solutions to reflect the Group’s expansion into new verticals beyond hospitality. The strong growth con-tinued, in combination with high operating income and very good margin growth. Global Solutions continues to strengthen its market presence, expand into new geo-graphical areas and digitize the customer offering.
Renovations, upgrades, solutions and software sales continue to drive growth. The focus is on understanding the customer’s journey and the way to create added cus-tomer value. Electromechanical locks are the enablers: creating potential for the customers to add value to their clients by applying cloud based services, software solu-tions and introducing keyless mobile access. Several major global hotel chains have installed and continue to install the Group’s high-end systems, while new verticals – including multi-family housing, care, education, and student accommodation – are markets where Global Solutions’ product portfolio offers additional growth potential. Cloud-based solutions allow the customers to streamline their operations and improve both property and data security – thereby adding value.
Integrated service solutions, including applications such as lighting and security, as well as recurring revenue by selling software licenses, are also steadily increasing as a share of total sales.
During 2018, the Group acquired Phoniro, a major player in elderly care solutions for homecare and nursing homes in the Nordic region. Its business model is similar to that used in hospitality: that is, offering electro-mechanical and digital products with the capability for the care providers to launch cloud-based mobile access services.
Product leadershipInnovation and product development are central ele-ments to drive product leadership and continue at a high level. The share of sales from products launched in the past three years was about 34 percent; significantly higher than the Group target of 25 percent. Software is constantly updated and R&D investments consist to a large extent of software development.
Global Solutions addresses the full life-cycle of a prod-uct, including software updates, upgrades and service. The products undergo constant development with new features and platform adaptations. Physical products are complemented with software solutions which, over time, generate recurring revenue and added customer value. In 2018 Global Solutions launched a cloud-based, maintenance free, access management system that requires no local servers.
Cost efficiencyEfficiency initiatives continued during the year, both through streamlining of operations, but also by improv-ing processes. Global Solutions has a focus on lean processes and a streamlined production structure – including the reuse of common functions and IT systems, continuous streamlining of administrative processes and seamless flows. For example, there is only one dedicated plant, in Shanghai. Products are sold primarily directly to customers, with the resources constantly being adjusted to the development of the market.
The electromechanical lock – an enabler of growth
Christophe Sut Executive Vice President and Head of Global Technologies business unit Global Solutions
Markets: ASSA ABLOY Global Solutions are leading the devel-opment within safe and secure access solutions for hotels, cruise ships, student accommodations and elderly care facili-ties. ASSA ABLOY Global solutions’ systems and products are installed in over seven million hotel rooms in more than 42,000 hotels worldwide. Customers are mainly in the institutional and hospitality sectors worldwide.
Acquisitions 2018: Phoniro in Sweden.
What products were driving your strong sales growth in 2018?Mobile key has really become a priority for the hotel industry and has been materializing dur-ing 2018. Most of the locks deliv-ered during the year have been with mobile key capabilities as well as the number of properties where the service is enable. This is the first step of the digitaliza-tion of our offering. We have also presented Vostio and Bluvision and have had a lot of interest for those solutions even if sales are not significant yet. How did your recurring revenues develop?We are having a very positive development of our Credential and Software as a service based recurring revenue, driven by an accelerating conversion to Mobile access technology. In which areas did you grow the most in 2018?The growth was spread across most geographical markets and verticals. It is pleasing that our marine business developed strongly with our customer migrating to better guest experi-ence. North America grew faster than ever. At the same time, China came back with double digit growth while Europe remained strong.
Global Solutions’ offering include access solutions for hotels, cruise ships, student accommodations and elderly care facilities.
ASSA ABLOY ANNUAL REPORT 201834
ASSA ABLOY’S DiViSiOnS

Market trendThe division’s sales grew organically by 4 percent. Acquired growth was 1 percent. There was strong growth in North America and good growth in EMEA driven by a strong development in Eastern Europe. In China the mar-ket conditions were challenging and the sale in many emerging markets outside Europe declined.
In services, connected products and solutions drive growth, and electromechanical and sustainable solu-tions are major drivers of growth in all product seg-ments. Sliding doors, entrance automation, and industrial doors are all products that are achieving good or strong growth. Another driving force is the growth in e-commerce that helps to increase demand for warehouse and logistics door opening solutions.
The service offering, which accounts for 28 percent of the division’s sales, showed strong growth. The division is investing in its service offering both in sales people specializing in services, and technicians. New service concepts based on long-term contracts, with efficient data flow and analysis for preventive maintenance and modernization, strengthen customer relationships and provide good growth opportunities.
Acquisitions are an important part of growth. In 2018, the Group acquired Door Systems in the US and K.A.D. in South Korea. Door Systems is a distributor of commercial and residential doors in the Chicago metropolitan area with a strong service organization.
Product leadershipInnovation and product development continued at a high level. New products launched in the past three years accounted for 25 percent of sales. The division has a com-petitive and comprehensive offering, and continues to launch new products and solutions which encompass, essentially, all product segments. Entrance Systems has also launched new service offerings with enhanced user experience, strong features and improved maintenance. The division has a large and growing range of energy- saving solutions and launched a new insulated door with strong thermal performance, measured in heat loss, ahead of new building regulations. During the year, a new compact revolving door built for improved user experi-ence with enhanced ease and comfort was also intro-duced. The division also launched a new range of garage products with smart digital app-based solutions and con-nected doors which shorten lead times for maintenance and service if the doors fail. Digitization has resulted in a strong focus on smart solutions and connectivity, while sustainability drives product development in the direc-tion of energy savings and climate control.
Entrance Systems
in 2018 good organic growth continued in the Entrance Systems division with strong growth in north America and good growth in EMEA. The service offering showed strong growth. Sustainable solutions were in high demand. The restructuring programs for a more efficient production structure proceeded according to plan.
Strong growth in services
Mogens Jensen Executive Vice President and Head of Entrance Systems division
Offering: Products, service and components in entrance automation. The product range includes automatic swing, sliding and revolving doors, industrial doors, garage doors, high-performance doors, docking solutions, hangar doors, gate automation, components for overhead sectional doors and sensors.
Markets: Entrance Systems is a global leader with sales world-wide. It has sales companies in 35 countries and distributors in 90 countries. Service operations account for nearly one-third of sales. The products are sold through three channels. In the direct channel, new equipment and comprehensive service are sold directly to end-customers under the ASSA ABLOY brand. The indirect channel mainly targets large and medium-sized distributors under the Entrematic brand. The third channel, Cardo, sells components and fittings for indus-trial doors in the industrial and residential segments, as well as sensors for the door and elevator industries.
Acquisitions 2018: Door Systems in the US and K.A.D in South Korea.
Your organic growth was 4 percent in 2018. Which markets performed best? Geographically, Entrance Systems had a strong development in North America and Emerging Markets Europe. Western Europe had a moderate growth but in Asia/Pacific and Latin America the growth was negative due to the challenging development in China mainly in our component business. The decline in Latin America was mostly due to some big projects in 2017 that did not reoccur in 2018. On the product side we had a very strong development in loading dock equipment where the demand in the distribution and logistics segment continues to be strong in both North America and Europe. The growth was also strong in the US for Residential Doors. High Performance Doors and Residential Doors in Europe had a negative development.
How did the Service Business develop during the year? We have started to invest more in our service business during 2018 and saw an improvement of growth in service from previ-ous years, especially in our industrial service business. In addition to investing more, we have also done organizational changes to get an increased focus on service and for 2019 our ambition is to further increase the sales.
How did the sale of your newly developed products develop during the year? Sales of new products reached the target of 25% of sales in 2018 and we have launched a number of new products both in the industrial and pedestrian seg-ment during the year.
Entrance Systems’ offering includes automatic doors, industrial doors, loading dock equipment, high-performance doors and service.
Cost-efficiencyConsolidation of the production structure and organiza-tional resources continued according to plan. The divi-sion continued to pursue efficiency initiatives with investments in robotics, implementation of Lean prac-tices and by reducing purchasing and production costs through VA/VE analyses. The division’s Commercial Excel-lence initiative includes improvements in its work with customer segmentation, specification projects and sales processes, including increased digitization. In addition, the transition to use only the ASSA ABLOY brand in direct sales channels continues.
ASSA ABLOY ANNUAL REPORT 2018 35
ASSA ABLOY’S DiViSiOnS

Customer solutions around the world
Safety, security and sustainability at Australian school CUSTOMER: Beaumaris Secondary College, servicing Year 7–12 students for Beaumaris and the surrounding area. As part of the design for their brand new facilities, the school was dedicated to environmental awareness, including development of a wetland area to provide educational opportu-nities and environmental benefits.
CHALLENGE: Create the ideal education building for students and administrators that minimizes energy usage, water usage, and waste generation, while offering easy access, yet maintaining security and accountability. This delicate balance between safety and security while improving sustainability and energy efficiency called for careful selection of door hardware and the means by which it was provided.
SOLUTION: ASSA ABLOY provided a variety of prod-ucts and services that are environmentally sound throughout the entire production process and product life cycle, and several of the products had with Environmental Product Declarations (EPD’s). Furthermore, ASSA ABLOY provided Australian made products that exceeded expectations for safety and security. Services included utilizing ASSA ABLOY’s Openings Studio software program, which created workflow efficiencies, helped reduce costs, and reduced the environmental impact of construction documentation.
Hotel guests and staff benefit from Mobile AccessCUSTOMER: Nordic Choice Hotels is one of the largest hotel groups in Scandinavia, operating 190 properties.
CHALLENGE: With today’s tech-savvy climate in the hospitality industry, Nordic Choice Hotels required a mobile key solution for six of its hotels in Stock-holm. The company wanted minimal upgrades to the existing RFID-enabled locks and easy integra-tion with Nordic Choice Hotels’ mobile application.
SOLUTION: Looking to implement a digital key offering that is as convenient as it is secure, Nordic Choice Hotels chose ASSA ABLOY Global Solutions Mobile Access – a solution that brings benefits to both guests and staff.
As ASSA ABLOY Global Solutions is a long-term partner of Nordic Choice Hotels, it was able to swiftly and efficiently upgrade more than 3,000 existing electronic locks to allow for mobile keys.
With Mobile Access, hotel guests can bypass the front desk by checking in with the hotel’s mobile app and leverage ASSA ABLOY’s secure Seos tech-nology to open their room with a quick swipe of their mobile device.
The solution allows hotel staff to focus their time on customer service. Now that guests no longer need to wait at the front desk for a keycard to enter their room, staff can more efficiently provide other guests with the assistance they need.
ASSA ABLOY brings its star power to Los Angeles’ grandest new hotel CUSTOMER: The Wilshire Grand InterContinental Hotel is the marquee tenant for the LA Financial District’s new Wilshire Grand, the tallest building west of the Mississippi River. The hotel includes nearly 1,000 guest rooms, plus a swanky rooftop bar, numerous restaurants, a health club, ballroom, conference space and more.
CHALLENGE: The luxury property commanded the highest level of aesthetics, but the solutions had to be functional and safe as well as decorative. Featur-ing a wide range of products from a utilitarian look in the parking garage to unique, upscale elements in the common areas, consistency was key.
SOLUTION: Working across divisions, ASSA ABLOY was able to offer a complete suite of products that met the requirements for design aesthetics, func-tionality and safety. Among the key solutions was an mortise lock with an integrated card reader featur-ing HID technology. This lock allows the hotel to use mixed credentials. The same principle applied with the ASSA ABLOY Global Solutions lock used on the guest room doors. Guest rooms’ door closers were replaced with a concealed closer, which met the needs for both fire safety and aesthetics. Elevator lobby doors and stairwell doors were equipped with the ASSA ABLOY surface mounted door opera-tor, which has the ability to power close as well as power open, a necessity to meet fire ratings on the project. Sound seal acoustic gaskets and door bot-toms contributed to better acoustics, and many of the products chosen were endorsed with Health Product Declarations (HPD).
Throughout the design and implementation, collaboration among multiple ASSA ABLOY divi-sions kept the project on schedule and provided the desired consistent finishes across the entire spectrum of products.
Photo © Terri Meyer Boake
ASSA ABLOY ANNUAL REPORT 201836
ASSA ABLOY’S DIVISIONS

E-passport solution for Tanzania makes travel simplerCUSTOMER: With a population of over 55 million, the country of Tanzania shares borders with eight neighboring African states.
CHALLENGE: As part of a transformative e-immigra-tion program, the government of Tanzania wanted to modernize its passports to improve the traveling experience for its citizens and to prevent the use of counterfeit passports.
SOLUTION: Tanzania’s government selected a com-plete electronic passport solution from HID Global.
The new e-passport makes travel easier for the country’s citizens, such as simply scanning their passports electronically at border control stations upon entry and exit. The e-passport conforms to all international standards as set out by the Interna-tional Civil Aviation Organization, ensuring that its features can be used by Tanzanians as they travel around the world.
A notable benefit is that an e-passport holder can be issued with an emergency passport on their smartphone if their passport is stolen or lost. This convenient solution is enabled using HID’s award-winning Seos technology for mobile citizen IDs, called HID goID.
The new Tanzania e-passport contains a contact-less chip embedded in its polycarbonate data page, which is proven as tamper-proof.
HID Global has established a lasting relationship with the government of Tanzania to ensure the highest levels of security for many years to come.
Service agreement keeps doors open for businessCUSTOMER: Decathlon, a world-leading sporting goods retailer, has 27 stores in Belgium, including a flagship store in Brussels with around 14,000 cus-tomers every week.
CHALLENGE: At all the Decathlon stores it is vital to ensure that the front doors always function to allow a seamless flow of customers, while the rear doors operate smoothly to receive regular deliveries of merchandise.
SOLUTION: Decathlon has peace of mind thanks to a service agreement with ASSA ABLOY Entrance Systems.
under the agreement, in the event of a break-down, a specialized ASSA ABLOY service technician is on hand to get the door back up and running and keep business moving. This is particularly helpful in the case of automatic doors, where Decathlon’s maintenance manager doesn’t have the specialist skills required to carry out repairs.
The agreement means that there’s no need for the maintenance manager to know the state of every door, how it works, or how to fix it. All the Decathlon staff can feel safe and secure at work, confident that an ASSA ABLOY technician will swiftly attend to any door-related issue.
CLIQ’s flexibility meets museum’s high security demandsCUSTOMER: The Design Museum, in London, hosts exhibitions related to architectural, fashion, graphic, industrial and product design. Founded in 1989, it moved to a new site in Kensington in 2016.
CHALLENGE: It took a EuR 90 M investment to cre-ate a new London site for the Design Museum. This new space needed an access control system suited to such a high-profile project, designed to protect high-value exhibits. The solution had to be flexible to meet the security requirements of three galler-ies, a café and an events space, with 100 permanent staff and hundreds of daily visitors.
SOLUTION: CLIQ access control has an established track record in the museums and heritage sector, and when the museum’s construction company was asked to recommend the best solution, it picked CLIQ.
CLIQ is an easy-to-use access control system based on mechanical high-security cylinders com-bined with encrypted electronic locking and identi-fication. CLIQ PROTEC2 electromechanical locks control access through 56 doors. Staff carry one battery-powered CLIQ key, programmed with the appropriate, pre-authorized access permissions.
using intuitive CLIQ software, security managers can change or cancel a user’s permissions at any time. Contractors are issued with temporary pro-grammable keys, which saves time formerly wasted escorting them around the building.
ASSA ABLOY ANNUAL REPORT 2018 37
ASSA ABLOY’S DIVISIONS

Value-creation for all stakeholders
The Group’s strategic direction is to lead the trend towards the world’s most innovative and well-designed access solutions. Our purpose is to everyday help people feel safe, secure and experience a more open world. Our core values, beliefs and strategic objectives help guide our way.
Strategic objectives: Growth through customer relevance
Product leadership through innovation
Cost-efficiency in everything we do
Evolution through people
Overall strategy
ASSA ABLOY’s most important
activities
Marketing, sales, advisory, service
and support
Innovation and product development
Sourcing, manufacturing, and streamlining of
processes
Acquisitions and integration
Financial capital
48 ,500 employees in over 70 countries
Strong common processes in a decentralized customer- focused organization
Sustainability is an integrated part of all business processes within the Group
Efficient production and assembly facilities all over the world
Strategic and cost-effective suppliers
Strong brands, patents and well-diversified product port-folio that meets local regula-tions and standards
Customers all over the world with a large installed base
Resources
• Growing security needs• Urbanization• Digitization • Automation• Sustainability
External factors
• Customers• Suppliers and partners• Shareholders and investors • Employees • Society
Stakeholders
ASSA ABLOY ANNUAL REPORT 201838
ASSA ABLOY’S VALuE-CREATING MODEL
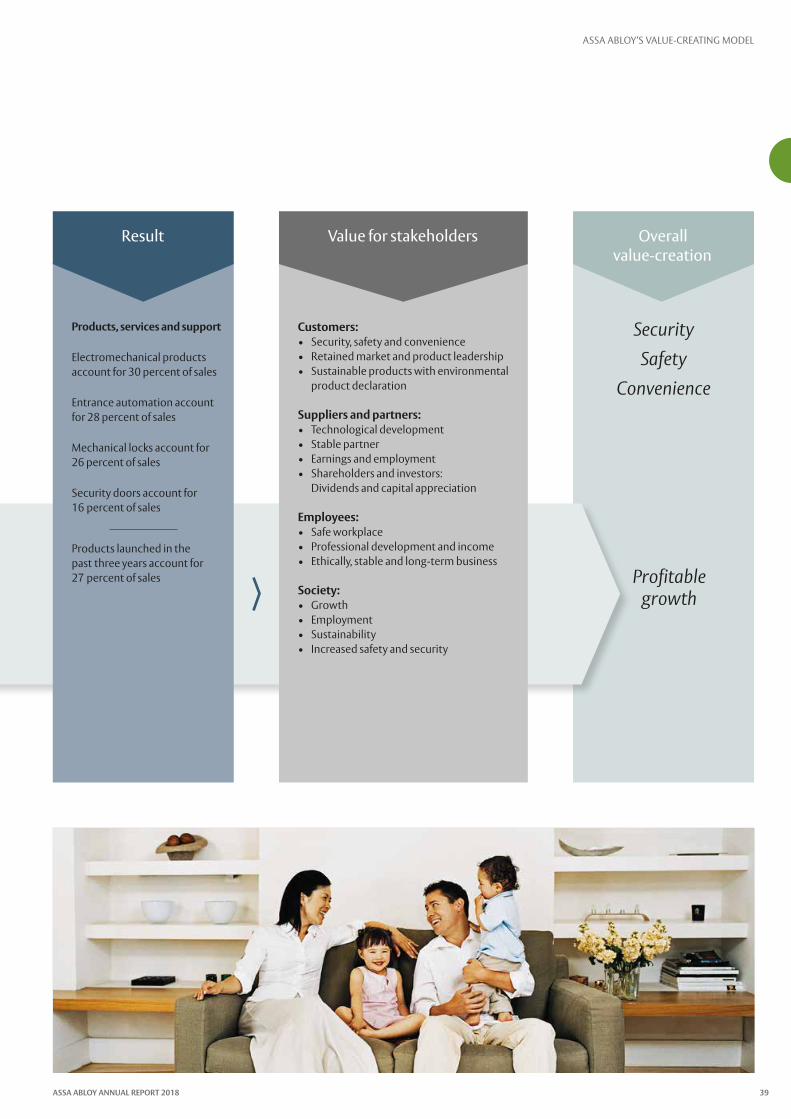
Security Safety
Convenience
Profitable growth
Overall value- creation
Products, services and support
Electromechanical products account for 30 percent of sales
Entrance automation account for 28 percent of sales
Mechanical locks account for 26 percent of sales
Security doors account for 16 percent of sales
Products launched in the past three years account for 27 percent of sales
Result
Customers: • Security, safety and convenience• Retained market and product leadership• Sustainable products with environmental
product declaration
Suppliers and partners: • Technological development• Stable partner• Earnings and employment• Shareholders and investors:
Dividends and capital appreciation
Employees:• Safe workplace• Professional development and income• Ethically, stable and long-term business
Society: • Growth• Employment• Sustainability• Increased safety and security
Value for stakeholders
ASSA ABLOY ANNUAL REPORT 2018 39
ASSA ABLOY’S VALuE-CREATING MODEL
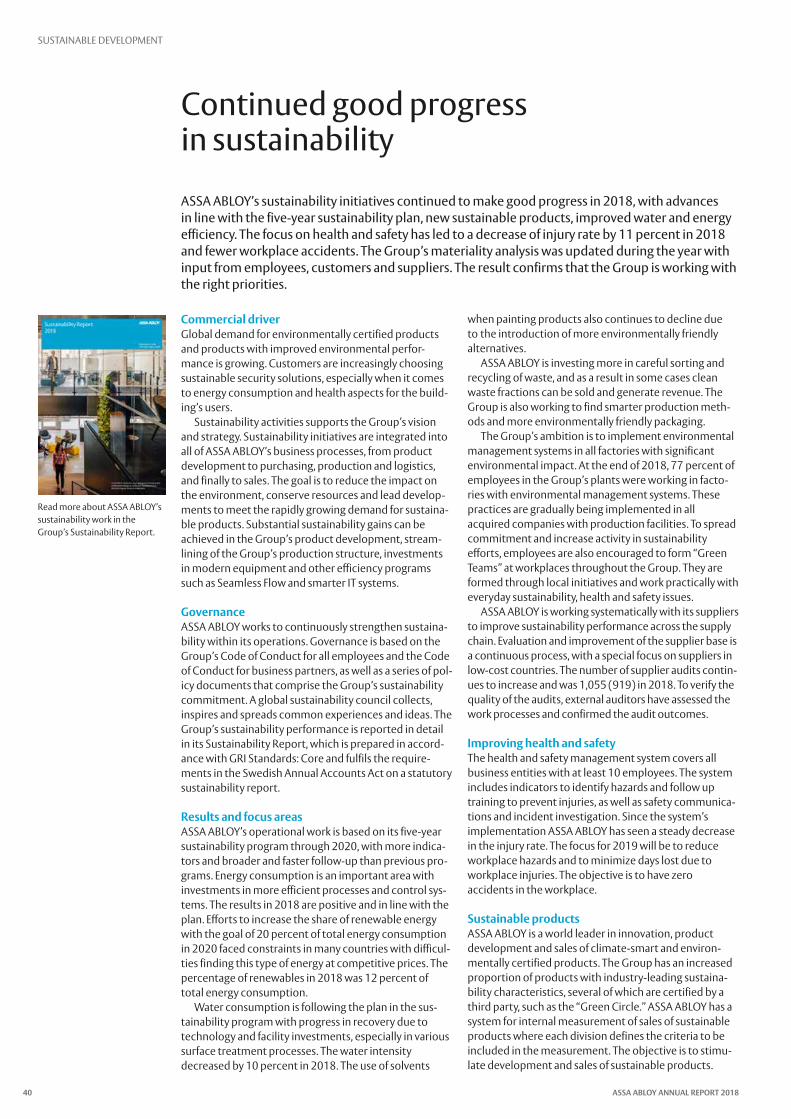
Continued good progress in sustainability
ASSA ABLOY’s sustainability initiatives continued to make good progress in 2018, with advances in line with the five-year sustainability plan, new sustainable products, improved water and energy efficiency. The focus on health and safety has led to a decrease of injury rate by 11 percent in 2018 and fewer workplace accidents. The Group’s materiality analysis was updated during the year with input from employees, customers and suppliers. The result confirms that the Group is working with the right priorities.
Commercial driverGlobal demand for environmentally certified products and products with improved environmental perfor-mance is growing. Customers are increasingly choosing sustainable security solutions, especially when it comes to energy consumption and health aspects for the build-ing’s users.
Sustainability activities supports the Group’s vision and strategy. Sustainability initiatives are integrated into all of ASSA ABLOY’s business processes, from product development to purchasing, production and logistics, and finally to sales. The goal is to reduce the impact on the environment, conserve resources and lead develop-ments to meet the rapidly growing demand for sustaina-ble products. Substantial sustainability gains can be achieved in the Group’s product development, stream-lining of the Group’s production structure, investments in modern equipment and other efficiency programs such as Seamless Flow and smarter IT systems.
Governance ASSA ABLOY works to continuously strengthen sustaina-bility within its operations. Governance is based on the Group’s Code of Conduct for all employees and the Code of Conduct for business partners, as well as a series of pol-icy documents that comprise the Group’s sustainability commitment. A global sustainability council collects, inspires and spreads common experiences and ideas. The Group’s sustainability performance is reported in detail in its Sustainability Report, which is prepared in accord-ance with GRI Standards: Core and fulfils the require-ments in the Swedish Annual Accounts Act on a statutory sustainability report.
Results and focus areasASSA ABLOY’s operational work is based on its five-year sustainability program through 2020, with more indica-tors and broader and faster follow-up than previous pro-grams. Energy consumption is an important area with investments in more efficient processes and control sys-tems. The results in 2018 are positive and in line with the plan. Efforts to increase the share of renewable energy with the goal of 20 percent of total energy consumption in 2020 faced constraints in many countries with difficul-ties finding this type of energy at competitive prices. The percentage of renewables in 2018 was 12 percent of total energy consumption.
Water consumption is following the plan in the sus-tainability program with progress in recovery due to technology and facility investments, especially in various surface treatment processes. The water intensity decreased by 10 percent in 2018. The use of solvents
when painting products also continues to decline due to the introduction of more environmentally friendly alternatives.
ASSA ABLOY is investing more in careful sorting and recycling of waste, and as a result in some cases clean waste fractions can be sold and generate revenue. The Group is also working to find smarter production meth-ods and more environmentally friendly packaging.
The Group’s ambition is to implement environmental management systems in all factories with significant environmental impact. At the end of 2018, 77 percent of employees in the Group’s plants were working in facto-ries with environmental management systems. These practices are gradually being implemented in all acquired companies with production facilities. To spread commitment and increase activity in sustainability efforts, employees are also encouraged to form “Green Teams” at workplaces throughout the Group. They are formed through local initiatives and work practically with everyday sustainability, health and safety issues.
ASSA ABLOY is working systematically with its suppliers to improve sustainability performance across the supply chain. Evaluation and improvement of the supplier base is a continuous process, with a special focus on suppliers in low-cost countries. The number of supplier audits contin-ues to increase and was 1,055 (919) in 2018. To verify the quality of the audits, external auditors have assessed the work processes and confirmed the audit outcomes.
Improving health and safetyThe health and safety management system covers all business entities with at least 10 employees. The system includes indicators to identify hazards and follow up training to prevent injuries, as well as safety communica-tions and incident investigation. Since the system’s implementation ASSA ABLOY has seen a steady decrease in the injury rate. The focus for 2019 will be to reduce workplace hazards and to minimize days lost due to workplace injuries. The objective is to have zero accidents in the workplace.
Sustainable productsASSA ABLOY is a world leader in innovation, product development and sales of climate-smart and environ-mentally certified products. The Group has an increased proportion of products with industry-leading sustaina-bility characteristics, several of which are certified by a third party, such as the “Green Circle.” ASSA ABLOY has a system for internal measurement of sales of sustainable products where each division defines the criteria to be included in the measurement. The objective is to stimu-late development and sales of sustainable products.
Read more about ASSA ABLOY’s sustainability work in the Group’s Sustainability Report.
ASSA ABLOY ANNUAL REPORT 201840
SuSTAINABLE DEVELOPMENT

Report of the Board of Directors and Financial statementsContentsReport of the Board of Directors 42
Significant risks and risk management 44Corporate governance 48Board of Directors 52Executive Team 54Internal control – financial reporting 56 Remuneration guidelines for senior management 57
Sales and income 58Consolidated income statement and Statement of comprehensive income 59Comments by division 60Results by division 61Financial position 62Consolidated balance sheet 63Cash flow 64Consolidated statement of cash flows 65Changes in consolidated equity 66Parent company financial statements 67
Notes 1 Significant accounting and valuation principles 69 2 Sales 76 3 Auditors’ fees 77 4 Other operating income and expenses 77 5 Share of earnings in associates 77 6 Operating leases 77 7 Expenses by nature 78 8 Depreciation and amortization 78 9 Exchange differences in the income statement 7810 Financial income 7811 Financial expenses 7812 Tax on income 7813 Earnings per share 7814 Intangible assets 7915 Property, plant and equipment 8116 Shares in subsidiaries 8217 Investments in associates 8218 Deferred tax 8319 Other financial assets 8320 Inventories 8321 Trade receivables 8322 Parent company’s equity 8323 Share capital, number of shares and
dividend per share 8324 Post-employment employee benefits 8425 Other provisions 8626 Other current liabilities 8627 Accrued expenses and deferred income 8628 Contingent liabilities 8629 Assets pledged against liabilities to
credit institutions 8630 Business combinations 8731 Cash flow 8832 Reserves 8833 Employees 8834 Financial risk management and financial
instruments 91
Comments on five years in summary 98Five years in summary 99Quarterly information 100Definitions of key ratios 101Proposed distribution of earnings 102Auditor’s report 103
ASSA ABLOY ANNUAL REPORT 2018 41
REPORT OF THE BOARD OF DIRECTORS
Report of the Board of DirectorsThe Annual Report of ASSA ABLOY AB (publ.), corporate identity number 556059-3575, contains the consolidated financial statements for the fiscal year January 1 through December 31, 2018. ASSA ABLOY is the global leader in access solutions, dedicated to satisfying end-user needs for security, safety and convenience.
Significant eventsSales and incomeSales increased by 10 percent and totaled SEK 84,048 M (76,137). The increase consisted of organic growth of 5 per-cent (4), acquired growth of 4 percent (3) and discontinued growth of –2 percent (–1). The exchange rate impact on sales was 3 percent (1).
Operating income (EBIT) excluding items affecting com-parability increased by 5 percent to SEK 12,909 M (12,341), equivalent to an operating margin of 15.4 percent (16.2). Impairment of operating assets within Asia Pacific reduced operating income by SEK 400 M. Items affecting comparabil-ity relate to impairment of goodwill, other intangible assets of SEK 5,595 M (–) and costs for the new restructuring pro-gram that was launched at year-end 2018 of SEK 1,218 M (–).
Net financial items were SEK –799 M (–668). Income before tax excluding items affecting comparability totaled SEK 12,110 M (11,673), an increase of 4 percent. Operating cash flow increased by 4 percent to SEK 11,357 M (10,929). Earnings per share after full dilution, excluding items affect-ing comparability, increased 4 percent to SEK 8.09 (7.77).
RestructuringA new restructuring program that covers all divisions was launched during the year. About fifty closures of plants and offices are planned and some production will be outsourced, as well as continued automation. The new program affects approximately net1,600 people. The total cost of the pro-gram is estimated at SEK 1,500 M before tax, of which SEK 1,218 M was expensed in 2018. The payback period is expected to be less than three years. Activities related to the previous programs continued with effective cost-cutting measures during the year.
At year-end 2018, 15,362 employees had left the Group, including 1,798 employees who left during the year, as a result of the changes in the production structure since the restructuring programs began in 2006. A total of 88 plant closures have been implemented, including 11 closures in 2018. A large number of plants in high-cost countries have switched from production to final assembly.
The Group is increasingly concentrating production to its own plants in Asia, Central Europe and Eastern Europe, as well as to outsourcing to external suppliers in low-cost countries.
Payments for the restructuring programs totaled SEK 793 M (612) for the year. At year-end 2018, the remaining provisions for restructuring measures amounted to SEK 1,190 M (944).
Acquisitions and divestmentsIn February 2018 the Group acquired Phoniro, the leading company in integrated solutions for digital key management and alarms in home services and senior housing in the Nordic countries. The acquisition is viewed as strategic and strengthens the Group’s position in the healthcare and long-term care market. The company is headquartered in Halmstad, Sweden.
In June 2018, ASSA ABLOY acquired HKC, a leading Irish provider of alarms and cloud-based monitoring services.
The product offering includes an extensive portfolio of wired and wireless alarm products, as well as monitoring services that are a good complement to ASSA ABLOY’s offering on the Irish market. The company is headquartered in Dublin, Ireland.
In September 2018 ASSA ABLOY acquired 100 percent of the share capital in the US company Crossmatch Inc., a leader in biometric identity management and secure authentication solutions. The acquisition of Crossmatch strengthens the ability to offer innovative biometric solu-tions to hundreds of millions of users worldwide and expands HID’s market leadership in secure identity solu-tions. The company is headquartered in Palm Beach Gardens, Florida, USA.
In December 2018, ASSA ABLOY acquired 100 percent of the share capital of Luxer One, a leading provider of advanced package locker solutions in the US. The acquisition further strengthens ASSA ABLOY’s market position in home delivery solutions and provides excellent opportunities for synergies in vertical segments, such as education and com-mercial properties. The company is headquartered in Sacra-mento, California, USA.
Other acquisitions during the year include Lorient in the UK and Planet in Switzerland, which complement the prod-uct portfolio with innovative door sealing systems and finger protection covers, as well as Brüken, a leading Mexican com-pany in locks, hardware and accessories for glass and alu-minum products.
A total of 19 businesses, including minor acquisitions, were consolidated during the year. The total purchase price of these acquisitions, including adjustments for acquisitions from previous years, was SEK 7,300 M on a debt-free basis, and the acquisition analyses indicate that goodwill and other intangible assets with an indefinite useful life amounted to SEK 5,329 M. Estimated deferred consideration were SEK 1,150 M.
Additional acquisitions of non-controlling interests occurred during the year for SEK 229 M (130). The holdings were previously 100 percent consolidated.
In June 2018 the US wooden door business within the Americas was sold to Masonite. The business, consisting of the two companies Graham Wood Doors and the Maiman Company, had sales of about SEK 600 M in 2017. The disposal resulted in a small capital gain and had a positive impact on ASSA ABLOY’s operating margin moving forward, all else being equal. A small business in Norway within EMEA was also sold at the beginning of the year.
Research and developmentASSA ABLOY’s expenditure on research and development during the year totaled SEK 2,893 M (2,244), equivalent to 3.4 percent (2.9) of sales.
The pace of innovation remained high throughout the year, including in areas such as digital door opening solu-tions, products with increased sustainability and energy- saving products. New products launched in the past three years accounted for 27 percent of sales for the year.
ASSA ABLOY ANNUAL REPORT 201842
REPORT OF THE BOARD OF DIRECTORS

Sustainable developmentA number of ASSA ABLOY units outside Sweden carry on licensable activities and hold equivalent licenses under local legislation. ASSA ABLOY’s units worldwide are working sys-tematically and purposefully to reduce their environmental impact.
In accordance with the Swedish Annual Accounts Act, Chapter 6. section 11, ASSA ABLOY opted to prepare the Sustainability Report as a separate report from the Annual Report. The Sustainability Report has been submitted to the auditor at the same time as the Annual Report.
The 2018 Sustainability Report, reporting on the Group’s prioritized environmental activities and providing other information on sustainable development, is available on the company’s website, www.assaabloy.com.
Internal control and financial reportingASSA ABLOY strengthened the internal audit and internal control functions in terms of staffing during the year. More reviews were conducted, and work continued during the year to strengthen internal control and compliance in the business in general. Special emphasis has been placed on financial reporting and internal control compliance issues related to the internal control framework that has been in effect for some time.
Tax mattersIn 2015 the Finnish Tax Administration decided not to allow tax deductions for interest expenses in the Finnish opera-tions for the years 2008–2012. The decision was appealed to a higher court. In 2017, the earlier decision was reconsidered to ASSA ABLOY’s advantage. The decision has since been appealed by the Finnish tax authority. The total tax exposure amounts to just over SEK 800 M.
Transactions with related partiesNo transactions occurred between ASSA ABLOY and related parties that significantly affected the company’s financial position and performance.
Significant events after the financial year-endNo significant events occurred after the financial year-end and up to the date of adoption of the Annual Report for ASSA ABLOY AB.
Proposed distribution of earningsThe Board of Directors and the President and CEO propose that the 2019 Annual General Meeting should approve a dividend of SEK 3.50 (3.30) per share, representing an increase of 6 percent. The proposal for profit distribution can be found in its entirety on page 102 of the Annual Report.
OutlookLong-term outlookASSA ABLOY anticipates an increase in demand for security solutions in the long term. A focus on customer value and innovations as well as leverage on ASSA ABLOY’s strong position will accelerate growth and increase profitability.
Organic sales growth is expected to continue at a good rate. The operating margin (EBIT) and operating cash flow are expected to develop well.
ASSA ABLOY ANNUAL REPORT 2018 43
REPORT OF THE BOARD OF DIRECTORS

Significant risks and risk management
Risk managementUncertainty about future developments and the course of events is a natural risk for any business. Risk-taking in itself provides opportunities for continued economic growth, but naturally the risks may also have a negative impact on busi-ness operations and company goals. It is therefore essential to have a systematic and efficient risk assessment process and an effective risk management program in general. The purpose of risk management at ASSA ABLOY is not to avoid risks, but to take a controlled approach to identifying, man-aging and minimizing the effects of these risks. This work is based on an assessment of the probability of the risks and their potential impact on the Group.
ASSA ABLOY is an international Group with a wide geo-graphical spread, involving exposure to various forms of strategic, operational and financial risks. Strategic risks refer to changes in the business environment with potentially significant effects on ASSA ABLOY’s operations and business objectives. Operational risks comprise risks directly attribut-able to business operations, entailing a potential impact on the Group’s financial position and performance. Financial risks mainly comprise financing risk, currency risk, interest rate risk, credit risk, and risks associated with the Group’s pension obligations.
OrganizationASSA ABLOY’s Board of Directors has overall responsibility for risk management within the Group and determines the Group’s strategic focus based on recommendations from the Executive Team. In view of the decentralized structure of ASSA ABLOY, and to keep risk analysis and risk management as close as possible to the actual risks, a large proportion of operational risk management takes place at division and business unit levels.
ResponsibilityASSA ABLOY’s Board of Directors has overall responsibility for the Group’s strategic direction in close consultation with the Executive Team. Divisions and business units have overall responsibility for management of operational risks, in accordance with the ASSA ABLOY’s decentralized approach to organization, responsibility and authority. In the case of financial risks, allocation of responsibilities and control of the Group’s financing activities are regulated in a financial policy adopted by the Board of Directors. Treasury then has the main responsibility for financial risks within the frame-work established in the financial policy, with the exception of credit risks relating to operational business activities, which are managed locally at company level and monitored at division level.
Review processStrategic risks, such as competitors, brand positioning and so on, are regularly reviewed at ASSA ABLOY AB’s board meetings. The Group’s operational risk management is con-tinuously monitored by the Executive Team through divi-sional reporting and divisional board meetings. For further information on monitoring and management of operational risks, see page 46.
Financial operations are centralized in a Treasury function, which manages most financial transactions as well as finan-cial risks with a Group-wide focus. ASSA ABLOY’s Treasury monitors the Group’s short- and long-term financing, finan-cial cash management, currency risk and other financial risk management.
ASSA ABLOY ANNUAL REPORT 201844
REPORT OF THE BOARD OF DIRECTORS
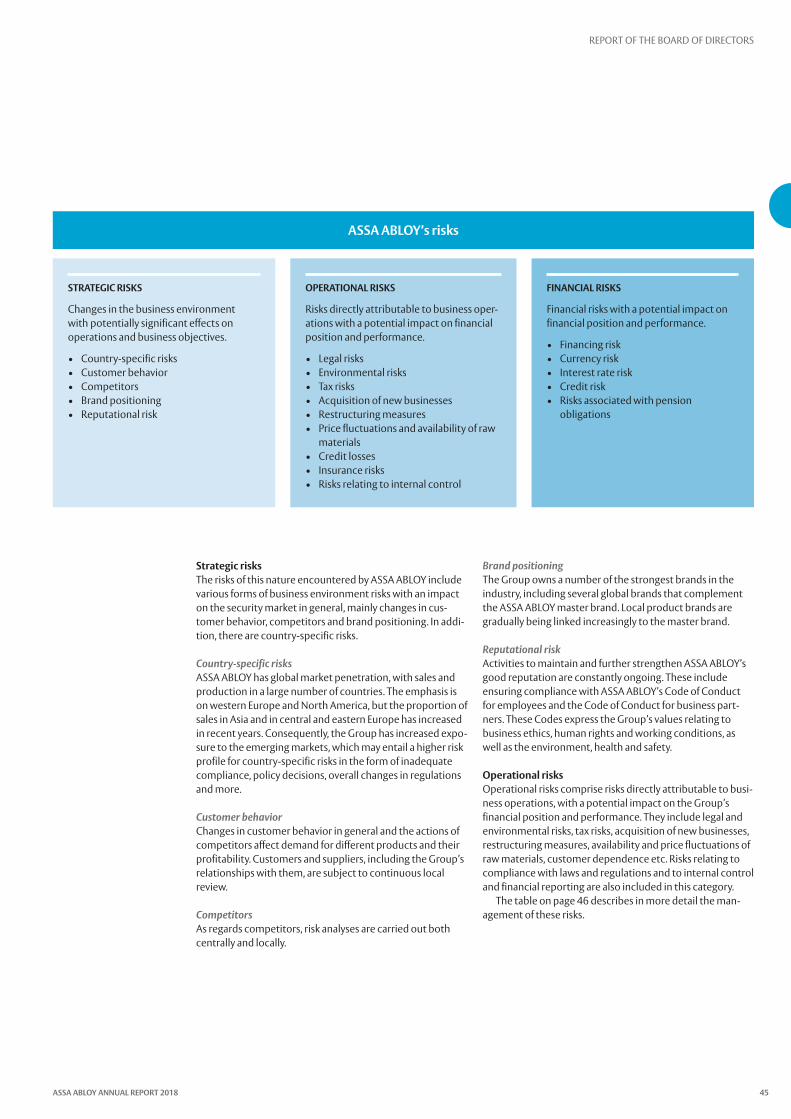
Strategic risksThe risks of this nature encountered by ASSA ABLOY include various forms of business environment risks with an impact on the security market in general, mainly changes in cus-tomer behavior, competitors and brand positioning. In addi-tion, there are country-specific risks.
Country-specific risksASSA ABLOY has global market penetration, with sales and production in a large number of countries. The emphasis is on western Europe and North America, but the proportion of sales in Asia and in central and eastern Europe has increased in recent years. Consequently, the Group has increased expo-sure to the emerging markets, which may entail a higher risk profile for country-specific risks in the form of inadequate compliance, policy decisions, overall changes in regulations and more.
Customer behaviorChanges in customer behavior in general and the actions of competitors affect demand for different products and their profitability. Customers and suppliers, including the Group’s relationships with them, are subject to continuous local review.
CompetitorsAs regards competitors, risk analyses are carried out both centrally and locally.
Brand positioningThe Group owns a number of the strongest brands in the industry, including several global brands that complement the ASSA ABLOY master brand. Local product brands are gradually being linked increasingly to the master brand.
Reputational riskActivities to maintain and further strengthen ASSA ABLOY’s good reputation are constantly ongoing. These include ensuring compliance with ASSA ABLOY’s Code of Conduct for employees and the Code of Conduct for business part-ners. These Codes express the Group’s values relating to business ethics, human rights and working conditions, as well as the environment, health and safety.
Operational risksOperational risks comprise risks directly attributable to busi-ness operations, with a potential impact on the Group’s financial position and performance. They include legal and environmental risks, tax risks, acquisition of new businesses, restructuring measures, availability and price fluctuations of raw materials, customer dependence etc. Risks relating to compliance with laws and regulations and to internal control and financial reporting are also included in this category.
The table on page 46 describes in more detail the man-agement of these risks.
STRATEGIC RISKS
Changes in the business environment with potentially significant effects on operations and business objectives.
• Country-specific risks• Customer behavior• Competitors• Brand positioning• Reputational risk
OPERATIONAL RISKS
Risks directly attributable to business oper-ations with a potential impact on financial position and performance.
• Legal risks• Environmental risks• Tax risks• Acquisition of new businesses• Restructuring measures• Price fluctuations and availability of raw
materials• Credit losses• Insurance risks• Risks relating to internal control
FINANCIAL RISKS
Financial risks with a potential impact on financial position and performance.
• Financing risk• Currency risk• Interest rate risk• Credit risk• Risks associated with pension
obligations
ASSA ABLOY’s risks
ASSA ABLOY ANNUAL REPORT 2018 45
REPORT OF THE BOARD OF DIRECTORS

Significant risks and risk management
Operational risks Risk management Comments
Legal risks The Group continuously monitors anticipated and implemented changes in legislation in the countries in which it operates. Ongoing and potential disputes and other legal matters are reported regularly to the Group’s central legal function.
Policies and guidelines on compliance with applica-ble competition, export control, anti-corruption and data protection legislation have been implemented.
At year-end 2018, there are considered to be no outstanding legal disputes that may lead to significant costs for the Group.
Environmental risks Ongoing and potential environmental risks are regu-larly monitored in the operations. External expertise is brought in for environmental assessments when necessary.
Prioritized environmental activities and other information on sustainable development are reported in the Group’s Sustainability Report.
Tax risks Ongoing and potential tax cases are regularly reported to the Group’s central tax function.
At year-end 2018, there are considered to be no ongoing tax cases with a significant impact on the Group’s earnings. A tax-related case in Finland from previously has been appealed to a higher court. For further information see the Report of the Board of Directors.
Acquisition of new businesses Acquisitions are carried out by a number of people with considerable acquisition experience and with the support of, for example, legal and financial con-sultants.
Acquisitions are carried out according to a uniform and predefined Group-wide process. This consists of four documented phases: strategy, evaluation, implementation and integration.
During the year ASSA ABLOY acquired 19 busi-nesses. The Group’s acquisitions in 2018 are reported in the Report of the Board of Direc-tors and in Note 30, Business combinations.
Restructuring measures
The restructuring programs mainly entail some production units changing direction prin-cipally to final assembly, while certain units are closed.
The restructuring programs are carried on as a series of projects with stipulated activities and schedules. The various projects in the respective restructuring program are systematically monitored on a regular basis.
A new restructuring program was launched at the end of 2018 involving the closure of about fifty factories and offices. The scope, costs and savings of the restructuring programs are pre-sented in more detail in the Report of the Board of Directors.
Price fluctuations and availability of raw materials
Raw materials are purchased and handled primarily at division and business unit level. Regional commit-tees coordinate these activities with the help of sen-ior coordinators for selected material components.
For further information about procurement of materials, see Note 7, Expenses by nature.
Credit losses Trade receivables are spread across a large number of customers in many markets. No individual cus-tomer in the Group accounts for more than 1 per-cent of sales.
Commercial credit risks are managed locally at company level and monitored at division level.
Receivables from each customer are relatively small in relation to total trade receivables. The risk of significant credit losses for the Group is considered to be limited, but has increased somewhat in pace with the Group’s expansion in recent years in emerging markets, mainly regarding China.
Insurance risks A Group-wide insurance program is in place, mainly relating to property, business interruption and liabil-ity risks. This program covers all business units.
The Group’s exposure to the risk areas listed above is regulated by means of its own captive insurance company.
The Group’s insurance cover is considered to be generally adequate, providing a reasonable balance between assessed risk exposure and insurance costs.
Risks relating to internal control
The organization is considered to be relatively trans-parent, with a clear allocation of responsibilities. A well-established Controller organization at both division and Group level monitors financial report-ing quality.
Instructions about the allocation of responsibilities, authorization and procedures for ordering, sourcing and plant management are laid down in an internal control manual. Compliance is evaluated annually for all operating companies, combined with an action plan for concrete improvements.
An annual internal audit of financial reporting is per-formed for selected Group companies on a rotating basis.
ASSA ABLOY strengthened the internal audit and internal control functions in terms of staff-ing in 2018 and more audits were carried out. Internal control and other related issues are reported in more detail in the Report of the Board of Directors, section on Corporate governance.
Further information on risk management relating to financial reporting can be found in the Report of the Board of Directors, section on Corporate governance. See also the section ‘Basis of preparation’ in Note 1.
ASSA ABLOY’s operational risks and risk management
ASSA ABLOY ANNUAL REPORT 201846
REPORT OF THE BOARD OF DIRECTORS

Financial risksThe Group’s financial risks mainly comprise financing risk, currency risk, interest rate risk, credit risk, and risks associ-ated with the Group’s pension obligations. A large number of financial instruments are used to manage these risks. Accounting principles, risk management and risk exposure are described in more detail in Notes 1 and 34, as well as Note 24, Post-employment employee benefits.
Financing riskFinancing risk refers to the risk that financing the Group’s capital requirements and refinancing outstanding loans become more difficult or more expensive. It can be reduced by maintaining an even maturity profile for borrowing and a solid credit rating. The risk is further reduced by substantial unutilized confirmed credit facilities.
Currency riskSince ASSA ABLOY sells its products in countries worldwide and has companies in a large number of countries, the Group is exposed to the effects of exchange rate fluctuations. These fluctuations affect Group earnings when the income state-ments of foreign subsidiaries are translated to Swedish kro-nor (translation exposure), and when products are exported and sold in countries outside the country of production (transaction exposure). Translation exposure is primarily related to earnings in USD and EUR. This type of exposure is not hedged. Currency risk in the form of transaction expo-sure, i.e. the relative values of exports and imports of goods, is expected to increase over time due to rationalization of production and sourcing. In accordance with financial policy, the Group only hedged a very limited part of current cur-rency flows in 2018. As a result, exchange rate fluctuations had a direct impact on business operations.
Exchange rate fluctuations also affect the Group’s debt-equity ratio and equity. The difference between the assets and liabilities of foreign subsidiaries in the respective foreign currency is affected by exchange rate fluctuations and causes a translation difference, which affects the Group’s compre-hensive income. A general weakening of the Swedish krona leads to an increase in net debt, but at the same time increases the Group’s equity. At year-end, the largest foreign net assets were denominated in USD and EUR.
Interest rate riskWith respect to interest rate risks, interest rate changes have a direct impact on ASSA ABLOY’s net interest expense. The net interest expense is also impacted by the size of the Group’s net debt and its currency composition. Net debt was SEK 29,246 M (25,275) at year-end 2018. Debt was mainly denominated in USD and EUR. Group Treasury analyzes the Group’s interest rate exposure and calculates the impact on income of interest rate changes on a rolling 12-month basis. In addition to raising variable-rate and fixed-rate loans, various interest rate swaps are used to adjust interest rate sensitivity.
Credit riskCredit risk arises in ordinary business activities and as a result of financial transactions. Trade receivables are spread across a large number of customers, which reduces credit risk. Credit risks relating to operational business activities are managed locally at company level and monitored at division level.
Financial risk management exposes ASSA ABLOY to cer-tain counterparty risks. Such exposure may arise, for exam-ple, as a result of the placement of surplus cash, borrowings and derivative financial instruments. Counterparty limits are set for each financial counterparty and are continuously monitored.
Pension obligationsAt year-end 2018, ASSA ABLOY had obligations for pensions and other post-employment benefits of SEK 8,107 M (8,014). The Group manages pension assets valued at SEK 5,227 M (5,081). Provisions in the balance sheet for defined benefit and defined contribution plans and post-employment medi-cal benefits totaled SEK 2,880 M (2,933). Changes in the value of assets and liabilities from year to year are due partly to the development of equity and debt capital markets and partly to the actuarial assumptions made. Significant remeasurement of obligations and plan assets is recognized on a current basis in the balance sheet and in other compre-hensive income. The assumptions made include discount rates and anticipated inflation and salary increases.
ASSA ABLOY ANNUAL REPORT 2018 47
REPORT OF THE BOARD OF DIRECTORS

Corporate governance
ASSA ABLOY is a Swedish public limited liability company with registered office in Stockholm, Sweden, whose Series B share is listed on the Nasdaq Stockholm.
The Group’s corporate governance is based on the Swedish Companies Act, the Annual Accounts Act, the Nasdaq Stockholm’s Rule Book for Issuers and the Swedish Corporate Governance Code, as well as other applicable external laws, rules and regulations, and internal rules and regulations.
This Corporate Governance Report has been prepared as part of ASSA ABLOY’s application of the Swedish Corporate Governance Code. The report is examined by ASSA ABLOY’s auditor.
ASSA ABLOY’s objective is that its activities should gener-ate good long-term returns for its shareholders and other stakeholders. An effective scheme of corporate governance for ASSA ABLOY can be summarized in a number of interact-ing components, which are described below.
Corporate governance structure
1 Shareholders
2 General Meeting
4 Board of Directors
3 Nomination Committee
5 Remuneration Committee
9 Auditor
6 Audit Committee
7 CEO
7 Executive Team
8 Divisions
Important external rules and regulations• Swedish Companies Act• Annual Accounts Act• Nasdaq Stockholm’s Rule Book for Issuers• Swedish Corporate Governance Code
(www.bolagsstyrning.se)
Important internal rules and regulations• Articles of Association• Board of Directors’ rules of procedure• Financial Policy• Accounting Manual• Communication Policy• Insider Policy • Internal control procedures• Code of Conduct and Anti-Bribery Policy
1 ShareholdersAt year-end 2018, ASSA ABLOY had 31,143 share-
holders (33,811). The principal shareholders are Investment AB Latour (9.5 percent of the share capital and 29.5 percent of the votes) and Melker Schörling AB (3.4 percent of the share capital and 11.1 percent of the votes). Foreign share-holders accounted for 70.5 percent (66.6) of the share capital and 48.1 percent (45.4) of the votes. The ten largest shareholders accounted for 36.9 percent (40.3) of the share capital and 56.9 percent (59.3) of the votes. For further information on shareholders, see page 109.
ASSA ABLOY’s Articles of Association contains a pre- emption clause for owners of Series A shares regarding Series A shares. A shareholders’ agreement exists between Gustaf Douglas, Melker Schörling and related companies and includes an agreement on right of first refusal if any party disposes of Series A shares. The Board of Directors of ASSA ABLOY is not aware of any other shareholders’ agreements or other agreements between shareholders in ASSA ABLOY.
Share capital and voting rightsASSA ABLOY’s share capital at the end of 2018 amounted to SEK 370,858,778 distributed among a total of 1,112,576,334 shares, comprising 57,525,969 Series A shares and 1,055,050,365 Series B shares. The total number of votes amounted to 1,630,310,055. Each Series A share carries ten votes and each Series B share one vote. All shares have a par value of around SEK 0.33 and give shareholders equal rights to the company’s assets and earnings.
Repurchase of own sharesSince 2010, the Board of Directors has requested and received a mandate from the Annual General Meeting to repurchase and transfer ASSA ABLOY Series B shares. The aim has been, among other things, to secure the company’s undertakings in connection with its long-term incentive programs (LTI). The 2018 Annual General Meeting authorized the Board of Directors to acquire, during the period until the next Annual General Meeting, a maximum number of Series B shares so
ASSA ABLOY ANNUAL REPORT 201848
REPORT OF THE BOARD OF DIRECTORS

that after each repurchase ASSA ABLOY holds a maximum 10 percent of the total number of shares in the company.
ASSA ABLOY holds a total of 1,800,000 (1,800,000) Series B shares after repurchase. These shares account for around 0.2 percent (0.2) of the share capital and each share has a par value of around SEK 0.33. The purchase consideration amounted to SEK 103 M (103). No shares were repurchased in 2018.
Share and dividend policyASSA ABLOY’s Series B share is listed on Nasdaq Stockholm, Large Cap. At the end of 2018, ASSA ABLOY’s market capitali-zation amounted to SEK 175,954 M, calculated on both Series A and Series B shares. The Board of Directors’ objective is that, in the long term, the dividend should be equivalent to 33–50 percent of income after standard tax, but always taking into account ASSA ABLOY’s long-term financing requirements.
2 General MeetingShareholders’ rights to decide on the affairs of ASSA
ABLOY are exercised at the General Meeting. Shareholders who are registered in the share register on the record date and have duly notified their intent to attend are entitled to take part in the General Meeting, either in person or by proxy. Resolutions at the General Meeting are normally passed by simple majority. For certain matters, however, the Swedish Companies Act prescribes that a proposal should be supported by a higher majority. Individual shareholders who wish to submit a matter for consideration at the General Meeting can send such request to ASSA ABLOY’s Board of Directors at a special address published on the company’s website well before the Meeting.
The Annual General Meeting should be held within six months of the end of the company’s financial year. Matters considered at the Annual General Meeting include: dividend; adoption of the income statement and balance sheet; dis-charge of the Board of Directors and the CEO from liability; election of members of the Board of Directors, Chairman of the Board of Directors and auditor; and determination of remuneration guidelines for senior management and fees for the Board of Directors and auditor. An Extraordinary Gen-eral Meeting may be held if the Board of Directors considers this necessary or if ASSA ABLOY’s auditor or shareholders holding at least 10 percent of the shares so request.
2018 Annual General MeetingThe Annual General Meeting in April 2018 was attended by shareholders representing 52.7 percent of the share capital and 67.8 percent of the votes.The Annual General Meeting’s resolutions included the following.• Dividend of SEK 3.30 per share.• Lars Renström, Carl Douglas, Ulf Ewaldsson, Eva Karlsson,
Birgitta Klasén, Sofia Schörling Högberg and Jan Svensson were re-elected as members of the Board of Directors and Lena Olving was elected as new member of the Board of Directors. Further, Lars Renström was re-elected as Chairman of the Board of Directors, and Carl Douglas was re-elected as Vice Chairman.
• PricewaterhouseCoopers AB (PwC) was re-appointed as the company’s auditor.
• Remuneration of the Board of Directors.• Remuneration guidelines for senior management.• Authorization to the Board of Directors regarding
repurchase and transfers of own Series B shares.• A long-term incentive program for senior executives
and other key employees in the Group (LTI 2018).• Instructions for appointment of the Nomination
Committee and its assignment.
For more information about the Annual General Meeting, including the minutes, please see www.assaabloy.com.
3 Nomination CommitteeAccording to the instructions adopted by the Nomi-
nation Committee at the 2018 Annual General Meeting the Nomination Committee shall be composed of representa-tives of the five largest shareholders in terms of voting rights registered in the shareholders’ register maintained by Euro-clear Sweden AB as of 31 August the year before the Annual General Meeting who wish to participate on the Nomination Committee.
The Nomination Committee prior to the 2019 Annual Gen-eral Meeting comprises Carl Douglas (Investment AB Latour), Mikael Ekdahl (Melker Schörling AB), Liselott Ledin (Alecta), Marianne Nilsson (Swedbank Robur funds) and Anders Oscarsson (AMF and AMF funds). Carl Douglas is Chairman of the Nomination Committee. Carl Douglas is also Vice Chair-man of ASSA ABLOY’s Board of Directors. The Nomination Committee thus deviates from the Swedish Corporate Gov-ernance Code in that the Vice Chairman of the Board of Direc-tors is also Chairman of the Nomination Committee. The rea-son for this deviation is that the major shareholders consider it to be important to have the representative from the largest shareholder as Chairman of the Nomination Committee.
Should the ownership structure change, the composition of the Nomination Committee may change to reflect such changes.
The Nomination Committee has the task of preparing, on behalf of the shareholders, proposals regarding the election of Chairman of the General Meeting, members of the Board of Directors, Chairman of the Board, Vice Chairman of the Board, auditor, fees for the board members including divi-sion between the Chairman, the Vice Chairman, and the other board members, as well as fees for committee work, fees to the company’s auditor and changes of the instruc-tions for the Nomination Committee. The Audit Committee assists the Nomination Committee in work associated with the proposal regarding appointment of the auditor.
Prior to the 2019 Annual General Meeting, the Nomination Committee makes an assessment of whether the current Board of Directors is appropriately composed and fulfills the requirements imposed on the Board of Directors by the com-pany’s present situation and future direction. The annual eval-uation of the Board of Directors and its work is part of the basis for this assessment. Moreover, the Nomination Committee applies ASSA ABLOY’s diversity policy for the Board of Direc-tors, which is based on Rule 4.1 of the Swedish Corporate Governance Code, when preparing its proposal for election of members of the Board of Directors. The search for suitable board members is carried on throughout the year and propos-als for new board members are based in each individual case on a profile of requirements established by the Nomination Committee.
Shareholders wishing to submit proposals to the Nomination Committee can do so by e-mailing: [email protected].
The Nomination Committee’s proposals for the 2019 Annual General Meeting are published at the latest in conjunc-tion with the formal notification of the Annual General Meet-ing, which is expected to be issued around 21 March 2019.
4 Board of DirectorsIn accordance with the Swedish Companies Act, the
Board of Directors is responsible for the organization and administration of the Group and for ensuring satisfactory control of bookkeeping, asset management and other finan-cial circumstances. The Board of Directors decides on the Group’s overall objectives, strategies, significant policies, acquisitions and divestments as well as investments of major
ASSA ABLOY ANNUAL REPORT 2018 49
REPORT OF THE BOARD OF DIRECTORS

importance. Acquisitions and divestments with a value (on a debt-free basis) exceeding SEK 200 M are decided by the Board of Directors. This amount presumes that the matter relates to acquisitions or divestments in accordance with the strategy agreed by the Board of Directors. The Board of Direc-tors approves the Annual Report and Interim Reports, pro-poses a dividend and remuneration guidelines for senior man-agement to the Annual General Meeting, and makes decisions concerning the Group’s financial structure.
The Board of Directors’ other ongoing duties include:• appointing, evaluating and if necessary dismissing the CEO,• approving the CEO’s significant assignments outside the
company,• establishing appropriate guidelines to govern the compa-
ny’s conduct in society with the aim of ensuring long-term value-creating capability,
• ensuring that appropriate systems are in place for monitor-ing and control of the company’s operations and the risks for the company associated with its operations,
• ensuring that there is satisfactory control of the company’s compliance with laws and other regulations relevant to the company’s operations, and its compliance with internal guidelines, and
• ensuring that external information provided by the com-pany is transparent, accurate, relevant and reliable.
Each year, the Board of Directors reviews and adopts the Board of Directors’ rules of procedure, which is the document that governs the work of the Board and the distribution of duties between the Board of Directors and the CEO. The rules of proce-dure include instructions for the CEO, instructions relating to financial reporting and internal control, and instructions to the Remuneration Committee and the Audit Committee.
Included in the rules of procedure is a description of the role of Chairman of the Board. In addition to organizing and leading the work of the Board of Directors, the Chairman’s duties include maintaining contact with the CEO to continuously monitor the Group’s operations and development, consulting with the CEO on strategic issues, representing the company in matters con-cerning the ownership structure, ensuring that the Board receives satisfactory information on which to base decisions and ensuring that Board decisions are implemented. In addition, the Chairman shall ensure that the work of the Board of Directors is evaluated annually.
The Board of Directors has at least four ordinary meetings and one statutory meeting per year. An ordinary meeting is always held in connection with the company’s publication of its Year-end Report and Interim Reports. At least once a year the Board of Directors visits one of the Group’s businesses, combined with a board meeting. In addition, extraordinary board meetings are held when necessary. All meetings follow an approved agenda. Prior to each meeting, a draft agenda, including documentation, is provided to all members of the Board of Directors.
The Board of Directors has a Remuneration Committee and an Audit Committee. The purpose of these Committees is to deepen and streamline the work of the Board of Directors and to prepare matters in these areas. The members of the Committees are appointed annually by the Board of Directors at the statutory board meeting.
Board of Directors’ compositionThe Board of Directors is elected annually at the Annual Gen-eral Meeting for the period until the end of the next Annual General Meeting and shall, according to the Articles of Associ-ation, comprise a minimum of six and a maximum of ten mem-bers elected by the Meeting. Two of the members are appointed by the employee organizations in accordance with Swedish law. The employee organizations also appoint two deputies. The Board of Directors has consisted of eight elected members and two employee representatives since the 2018 Annual General Meeting. No board members are included in the Executive Team.
The diversity policy that ASSA ABLOY applies with respect to the company’s Board of Directors is based on Rule 4.1 of the Swedish Corporate Governance Code. The objective is that the composition of the Board of Directors, taking into account the company’s operations, phase of development and other cir-cumstances, shall be appropriate, characterized by versatility and breadth regarding the qualifications, experience and back-ground of the elected members, and strive to achieve gender equality. In 2018 the Nomination Committee has taken the diversity policy into account when preparing its proposal for election of members of the Board of Directors prior to the Annual General Meeting. After the election at the 2018 Annual General Meeting, four of eight elected board members are women. In addition, in-depth reviews of operations were con-ducted during the year at selected divisions in order to broaden the expertise of the Board of Directors within ASSA ABLOY. The Board also completed a training at the Group’s common devel-opment center, Shared Technologies, to gain further under-standing of ASSA ABLOY’s new technological solutions.
Board of Directors’ work in 2018The Board of Directors held ten meetings during the year. At the ordinary board meetings the CEO reported on the Group’s performance and financial position, including the outlook for the coming quarters. Acquisitions and divestments were also discussed to the extent they arose.
More important questions that the Board of Directors addressed during the year include impairment of goodwill and other intangible assets, as well as operating assets in the Chinese operation in the Asia Pacific division. In addition, the Board of Directors addressed a number of acquisitions, including HKC, Crossmatch and Luxer One, as well as the divestment of the US wooden door business in the Americas division, consisting of the two companies Graham Wood Doors and Maiman Company, to Masonite. During the year,
Corporate governance
Extraordinary board meeting Notice Annual General Meeting
Remuneration Committee meeting
Audit Committee meeting
Audit Committee meeting
Statutory board meeting Appointment committee membersAdoption Board of Directors’ rules of procedure and significant policies Signatory powers
Ordinary board meetingYear-end resultsProposed distribution of earningsApproval Annual ReportFinal Audit ReportProposals to Annual General MeetingEvaluation Executive TeamAcquisitions
Ordinary board meeting Interim Report Q1AcquisitionsPresentation HID Global
SUMMARY OF BOARD OF DIRECTORS’ WORK AND COMMITTEE MEETINGS IN 2018
January February March April May June
At the ordinary board meetings the CEO also reported on the Group’s performance and financial position, including the outlook for the coming quarters.
ASSA ABLOY ANNUAL REPORT 201850
REPORT OF THE BOARD OF DIRECTORS

the Board of Directors also conducted in-depth reviews of the Group’s operations in Global Technologies division’s HID Global business unit, the Entrance Systems division and the Asia Pacific division, and visited the EMEA division’s opera-tions in Albstadt and Berlin, Germany. The Board of Directors’ work is summarized in the timeline on pages 50–51.
An evaluation of the Board of Directors’ work is conducted annually in the form of a web-based survey, which each board member responds to individually. A summary of the results is presented to the Board of Directors. Board members who wish can access the complete results of the evaluation. The Secretary to the Board of Directors presents the complete results of the evaluation to the Nomination Committee.
5 Remuneration CommitteeIn 2018 the Remuneration Committee comprised
Lars Renström (Chairman) and Jan Svensson.The Remuneration Committee has the task of drawing up
remuneration guidelines for senior management, which the Board of Directors proposes to the Annual General Meeting for resolution. The Board of Directors’ proposal for guidelines prior to the 2019 Annual General Meeting is set out on page 57.
The Remuneration Committee also prepares, negotiates and evaluates matters regarding salaries, bonus, pension, sever-ance pay and incentive programs for the CEO and other senior executives. The Committee has no decision-making powers.
The Committee held two meetings in 2018. Its work included preparing a proposal for the remuneration of the Executive Team, evaluating existing incentive programs, and preparing a proposal for a new long-term incentive program. Remuneration Committee meetings are minuted; a copy of the minutes is enclosed with the materials provided to the Board and a verbal report is given at board meetings.
6 Audit CommitteeIn 2018 the Audit Committee comprised Jan Svensson
(Chairman), Birgitta Klasén and Sofia Schörling Högberg.The duties of the Audit Committee include continuous
monitoring and quality assurance of ASSA ABLOY’s financial reporting. Regular communication is maintained with the company’s auditor, including on the focus and scope of the audit. The Audit Committee is also responsible for evaluating the audit assignment and obtaining the results of the Swed-ish Inspectorate of Auditors’ quality control of the auditor, as well as informing the Board of Directors of the results of the evaluation. The Audit Committee also has the task of sup-porting the Nomination Committee in providing a proposal for the appointment of auditor. Furthermore, the Audit Com-mittee shall review and monitor the impartiality and inde-pendence of the auditor, paying particular attention to
whether the auditor provides the company with services other than auditing services. The Audit Committee sets guidelines for procurement of services other than audit services from the company’s auditor, but otherwise, the Committee has no decision-making powers.
The Committee held four meetings in 2018. The compa-ny’s auditor and representatives from senior management also participated at these meetings. More important matters dealt with by the Audit Committee during the year included internal control, financial statements and valuation matters, tax matters, insurance and risk management matters and legal risk areas. Audit Committee meetings are minuted; a copy of the minutes is enclosed with the materials provided to the Board and a verbal report is given at board meetings.
Remuneration of the Board of DirectorsThe General Meeting passes a resolution on the remunera-tion to be paid to board members. The 2018 Annual General Meeting passed a resolution on board fees totaling SEK 6,780,000 (excluding remuneration for committee work) to be allocated between the members as follows: SEK 2,100,000 to the Chairman, SEK 900,000 to the Vice Chair-man, and SEK 630,000 to each of the other members elected by the Annual General Meeting. As remuneration for com-mittee work, the Chairman of the Audit Committee is to receive SEK 275,000, the Chairman of the Remuneration Committee SEK 150,000, members of the Audit Committee (except the Chairman) SEK 200,000 each, and members of the Remuneration Committee (except the Chairman) SEK 75,000 each.
The Chairman and other board members have no pension benefits or severance pay agreements. The employee repre-sentatives do not receive board fees. For further information on the remuneration of board members in 2018, see Note 33.
Attendance 2018, Board of Directors and Committees
Board members Board of
DirectorsAudit
CommitteeRemuneration
CommitteeLars Renström 10/10 2/2Carl Douglas 9/10Ulf Ewaldsson 10/10Eva Karlsson 10/10Birgitta Klasén 10/10 4/4Eva Lindqvist 3/3Johan Molin 2/3Lena Olving 7/7Sofia Schörling Högberg 9/10 3/4Jan Svensson 10/10 4/4 2/2Rune Hjälm 9/10Mats Persson 9/10The maximum number of meetings varies due to appointment and resignation in 2018.
July August September October November December
Extraordinary board meeting Impairment China, Asia Pacific
Audit Committee meeting
Remuneration Committee meeting
Audit Committee meeting
Ordinary board meetingInterim Report Q2Acquisitions
Ordinary board meetingAcquisitions
Ordinary board meeting and visit to operationsVisit EMEAPresentation Entrance SystemsPresentation Shared TechnologiesStrategyAcquisitions
Ordinary board meeting Interim Report Q3
Ordinary board meeting Presentation Asia PacificAcquisitionsRestructuring program
ASSA ABLOY ANNUAL REPORT 2018 51
REPORT OF THE BOARD OF DIRECTORS

Board of DirectorsBoard members elected by the 2018 Annual General Meeting
Lars Renström Carl Douglas Eva KarlssonUlf Ewaldsson Birgitta Klasén
Lena Olving Sofia Schörling Högberg Jan Svensson
Lars RenströmChairman.Board member since 2008.Born 1951.Master of Science in Engineering and Master of Science in Business and Economics.President and CEO of Alfa Laval AB 2004–2016. President and CEO of Seco Tools AB 2000–2004. President and Head of Division of Atlas Copco Rock Drilling Tools 1997–2000. Previ-ously a number of senior positions at ABB and Ericsson.Other appointments: Chairman of Tetra Laval Group.Shareholdings (including through companies and related natural parties): 30,000 Series B shares.
Carl DouglasVice Chairman.Board member since 2004.Born 1965.BA (Bachelor of Arts) and D. Litt (h.c.) (Doctor of Letters).Self-employed.Other appointments: Vice Chairman of Securitas AB. Board member of Investment AB Latour.Shareholdings (including through com panies and related natural parties): 41,595,729 Series A shares and 63,900,000 Series B shares through Investment AB Latour.
Ulf EwaldssonBoard member since 2016.Born 1965.Master of Science in Engineering and Business Management.Advisor to the President and CEO of Ericsson 1 February–31 December 2018. Senior Vice President and Head of the Business Area Digi-tal Services at Ericsson April 2017–January 2018. Various managerial positions within the Ericsson Group since 1990, including Chief Technology Officer, Head of Strategy and Head of Group Function Strategy and Technology September 2016–March 2017, Chief Technol-ogy Officer and Head of Group Function Tech-nology 2012–September 2016, and Head of Product Area Radio within the Business Unit Networks 2007–2012.
Other appointments: Chairman of KTH Royal Institute of Technology. Member of the Royal Swedish Academy of Engineering Sciences (IVA). Shareholdings (including through companies and related natural parties): –
Eva KarlssonBoard member since 2015.Born 1966.Master of Science in Engineering.President and CEO of Armatec AB since 2014. CEO of SKF Sverige AB and Global Manufactur-ing Manager 2011–2013, Director of Industrial Marketing & Product Development Industrial Market AB SKF 2005–2010, various positions within the SKF Group primarily within Manu-facturing Management.Other appointments: Board member of Bräcke diakoni and Valcon A/S.Shareholdings (including through companies and related natural parties): –
Birgitta KlasénBoard member since 2008.Born 1949.Master of Science in Engineering and degree in Business and Economics.Independent IT consultant (Senior IT Advisor). CIO and Head of Information Management at EADS (European Aeronautics Defence and Space Company) 2004–2005. CIO and Senior Vice President at Pharmacia 1996–2001 and previously CIO at Telia. Various positions at IBM 1976–1994.Other appointments: Board member of Avanza and Benefie Ltd.Shareholdings (including through companies and related natural parties): 21,000 Series B shares.
Lena OlvingBoard member since 2018.Born 1956.Master of Science in Mechanical Engineering. President and CEO of Mycronic AB (publ) since 2013. COO and Deputy CEO of SAAB AB 2008–2013. Various positions within Volvo Car Cor-poration 1980–1991 and 1995–2008 of which five years as Senior Vice President of Volvo Cars Asia Pacific and seven years in the Executive Management Team. CEO of Samhall Högland AB 1991–1995.
Other appointments: Chairman of the Royal Swedish Opera. Board member of Investment AB Latour, Munters Group AB, the Association of Swedish Engineering Industries (Teknikföretagen) and the Swedish Corporate Governance Board (Kollegiet för svensk bolagsstyrning). Member of the Royal Swedish Academy of Engineering Sciences (IVA) and board member of IVA’s Business Executives Council (IVA:s Näringslivsråd).Shareholdings (including through companies and related natural parties): –
Sofia Schörling HögbergBoard member since 2017.Born 1978.BSc (Bachelor of Science) in Business Adminis-tration.Other appointments: Board member of Melker Schörling AB, Securitas AB and Hexagon AB.Shareholdings (including through companies and related natural parties): 15,930,240 Series A shares and 21,654,104 Series B shares through Melker Schörling AB as well as 463,800 Series B shares through Edeby-Ripsa Skogsförvaltning Aktiebolag.
Jan SvenssonBoard member since 2012.Born 1956.Degree in Mechanical Engineering and Master of Science in Business and Economics.President and CEO of Investment AB Latour since 2003. Previously CEO of AB Sigfrid Stenberg 1986–2002.Other appointments: Chairman of AB Fager-hult, Nederman Holding AB, Troax Group AB, Alimak Group AB and Tomra Systems ASA. Board member of Investment AB Latour, Loomis AB and Oxeon AB.Shareholdings (including through companies and related natural parties): 6,000 Series B shares.
Appointments and shareholdings as at 31 December 2018.
ASSA ABLOY ANNUAL REPORT 201852
REPORT OF THE BOARD OF DIRECTORS

Board members appointed by employee organizations
Mats Persson Nadja WikströmRune Hjälm Bjarne Johansson
Rune HjälmBoard member since 2017.Born 1964.Employee representative, IF Metall. Chairman of European Works Council (EWC) in the ASSA ABLOY Group.Shareholdings (including through companies and related natural parties): –
Mats PerssonBoard member since 1994.Born 1955.Employee representative, IF Metall.Shareholdings (including through companies and related natural parties): –
Bjarne JohanssonDeputy board member since 2015.Born 1966.Employee representative, IF Metall.Shareholdings (including through companies and related natural parties): –
Nadja WikströmDeputy board member since 2017.Born 1959.Employee representative, Unionen.Shareholdings (including through companies and related natural parties): –
The Board of Directors’ composition and shareholdingsName Position Elected Born
Remuneration Committee
Audit Committee Series A shares1 Series B shares1
Lars Renström Chairman 2008 1951 Chairman – – 30,000Carl Douglas Vice Chairman 2004 1965 – – 41,595,729 63,900,000Ulf Ewaldsson Board member 2016 1965 – – – –Eva Karlsson Board member 2015 1966 – – – –Birgitta Klasén Board member 2008 1949 – Member – 21,000Lena Olving Board member 2018 1956 – – – –Sofia Schörling Högberg Board member 2017 1978 – Member 15,930,240 22,117,904Jan Svensson Board member 2012 1956 Member Chairman – 6,000Rune Hjälm Board member, employee representative 2017 1964 – – – –Mats Persson Board member, employee representative 1994 1955 – – – –Bjarne Johansson Deputy, employee representative 2015 1966 – – – –Nadja Wikström Deputy, employee representative 2017 1959 – – – –1 Shareholdings through companies and related natural parties.
Appointments and shareholdings as at 31 December 2018.
ASSA ABLOY’s Board of Directors fulfills the requirements for independ-ence in accordance with the Swedish Corporate Governance Code.
Independence of the Board of DirectorsName Position
Independent of the company and its management
Independent of the company’s major shareholders
Lars Renström Chairman Yes YesCarl Douglas Vice Chairman Yes NoUlf Ewaldsson Board member Yes YesEva Karlsson Board member Yes YesBirgitta Klasén Board member Yes YesLena Olving Board member Yes NoSofia Schörling Högberg Board member Yes NoJan Svensson Board member Yes No
ASSA ABLOY ANNUAL REPORT 2018 53
REPORT OF THE BOARD OF DIRECTORS

Executive Team
Nico Delvaux Erik Pieder Chris Bone Lucas Boselli Mogens Jensen
Nico DelvauxPresident and CEO and Head of Global Technologies division since 2018. Born 1966.Master of Engineering in Electromechanics and MBA.Previous positions: President and CEO of Metso Corporation August 2017–February 2018. Previously various positions in the Atlas Copco Group, including Business Area Presi-dent Compressor Technique 2014–2017, Business Area President Construction Tech-nique 2011–2014, and various positions in sales, marketing, service, acquisition-integra-tion management and general manager in markets including Benelux, Italy, China, Canada, and the United States 1991–2011.Shareholdings (including through companies and related natural parties): 27,248 Series B shares and 94,787 call options.
Erik PiederExecutive Vice President and Chief Financial Officer (CFO) since 2019.Born 1968.MBA and Master of Laws.Previous positions: Various positions in the Atlas Copco Group 1996–2019, including Vice President Business Control Compressor Technique.Shareholdings: –
Chris BoneExecutive Vice President and Chief Technology Officer (CTO) since 2018.Born 1965.Degree in Industrial Management and Electrical Engineering.Previous positions: Vice President of Digital and Access Solutions, ASSA ABLOY EMEA 2010–2017. Previously various positions in Honeywell Inc. globally, including District General Manager Honeywell Building Solu-tions London and South East UK 2008–2010, Honeywell Security Systems Group Marketing Director 2005–2008. Previous to that various product management and technical roles with Honeywell and eight years in the Royal Aus-tralian Army.Shareholdings: 7,800 Series B shares.
Lucas BoselliExecutive Vice President and Head of Americas division since 2018.Born 1976.Bachelor of Science in Industrial Engineering.Previous positions: Various positions in the ASSA ABLOY Group, including President of ASSA ABLOY Central and South America 2014–2018 and President of Yale Latin America 2012–2014. Previously various positions in Ingersoll Rand 2000–2010.Shareholdings: 12,035 Series B shares.
Mogens JensenExecutive Vice President and Head of Entrance Systems division since 2018.Born 1958.Master of Science in Mechanical Engineering and Master of Business Administration.Previous positions: Various positions in the ASSA ABLOY Group, including BA President Industrial Door and Docking Solutions, Entrance Systems division 2016–2017, Market Region Manager Scandinavia, EMEA division 2006–2016 and Managing Director Ruko A/S Denmark. Previously various Managing Direc-tor positions.Shareholdings: 13,802 Series B shares.
Shareholdings as at 31 December 2018.
7 OrganizationCEO and Executive Team
The Executive Team consists of the CEO, the Heads of the Group’s divisions, the Chief Financial Officer, the Chief Technology Officer and the Chief Human Resources Officer. For a presentation of the CEO and the other members of the Executive Team, see pages 54–55.
8 Divisions – decentralized organizationASSA ABLOY’s operations are decentralized. Opera-
tions are organizationally divided into five divisions: EMEA, Americas, Asia Pacific, Global Technologies and Entrance Systems. The fundamental principle is that the divisions should be responsible, as far as possible, for business opera-tions, while various functions at ASSA ABLOY’s Group Centre are responsible for coordination, monitoring, policies and guidelines at an overall level. Decentralization is a deliberate strategic choice based on the industry’s local nature and a conviction of the benefits of a divisional control model. The Group’s structure results in a geographical and strategic spread of responsibility ensuring short decision-making paths.
ASSA ABLOY’s operating structure is designed to create max-imum transparency, to facilitate financial and operational monitoring, and to promote the flow of information and communication across the Group. The five divisions are divided into around 50 business units. These consist in turn of a large number of sales and production units, depending on the structure of the business unit concerned. Apart from monitoring by unit, monitoring of products and markets is also carried out.
Policies and guidelinesSignificant policies and guidelines in the Group include finan-cial control, communication issues, insider issues, the Group’s brands, environmental issues, business ethics, data protection and export control. ASSA ABLOY’s financial policy and accounting manual provide the framework for financial control and monitoring. The Group’s communication policy aims to ensure that information is provided at the right time and in compliance with applicable rules and regulations. ASSA ABLOY has adopted an insider policy to complement applicable insider legislation. This policy applies to individu-
ASSA ABLOY ANNUAL REPORT 201854
REPORT OF THE BOARD OF DIRECTORS

Anders Maltesen Maria Romberg Ewerth Neil VannChristophe Sut
Anders MaltesenExecutive Vice President and Head of Asia Pacific division since 2017.Born 1965.Bachelor’s degree in Marketing and Bachelor’s degree in Financial and Management Accounting.Previous positions: Regional General Manager and President, Asia Pacific, GE Energy, Power Services 2015–2017, Managing Director, Asia Pacific, Alstom Thermal Services 2014–2015, Vice President, East Asia, Alstom Thermal Services 2011–2014, General Manager, board member, Tianjin Alstom Hydro Co. Ltd 2003–2011. Previously various positions within Alstom.Shareholdings: 3,904 Series B shares.
Maria Romberg EwerthExecutive Vice President and Chief Human Resources Officer (CHRO) since 2019.Born 1978.Bachelor’s degree in Human Resources and MBA. Previous positions: Senior Vice President Human Resources ASSA ABLOY AB 2013–2019, Vice President Human Resources ASSA ABLOY Entrance Systems 2011–2013. HR-manager and HR-director ASSA ABLOY Entrance Systems 2008–2011. Previously to that HR-positions in various companies: JELD-WEN Sverige AB, VALEO Engine Cooling AB and Swedish Meats 2003–2008. Shareholdings: 9,896 Series B shares.
Christophe SutExecutive Vice President and Head of Global Technologies business unit ASSA ABLOY Global Solutions since 2016.Born 1973. Master of Science in Business and Marketing, Bachelor of Science in Language and Mathematics.Previous positions: Various positions in the ASSA ABLOY Group, 2001–2010 and 2012–2014, including CTO and Vice President Busi-ness Development ASSA ABLOY Hospitality and Platform Director for ASSA ABLOY AB. Niscayah Group 2010–2012. SPIT France (ITW group) 1999–2001 and SAM Outillage 1997–1999.Shareholdings: 6,470 Series B shares.
Neil VannExecutive Vice President and Head of EMEA division since 2018.Born 1971.Degree in Manufacturing Engineering.Previous positions: Various positions in the ASSA ABLOY Group, including Market Region Manager ASSA ABLOY UK 2014–2018, Market Region Manager Italy and Greece 2012–2014 and Vice President Operations EMEA 2011–2012. Previously various positions within ASSA ABLOY, Yale and Chubb 1987–2001.Shareholdings: 10,435 Series B shares.
Stefan WidingExecutive Vice President and Head of Global Technologies business unit HID Global since 2015.Born 1977. Master of Science in Applied Physics and Electrical Engineering and Bachelor of Social Science in Business Administration.Previous positions: Various positions in the ASSA ABLOY Group, including Director of Product Management and General Manager of Shared Technologies Unit 2006–2015. Previously various positions in the Saab Group 2001–2006.Shareholdings: 16,209 Series B shares.
als in managerial positions at ASSA ABLOY AB (including sub-sidiaries) as well as certain other categories of employees. Brand guidelines aim to protect and develop the major assets that the Group’s brands represent.
ASSA ABLOY had adopted a Code of Conduct for employ-ees and a separate ASSA ABLOY Code of Conduct for busi-ness partners. The Codes, which are based on a set of inter-nationally accepted conventions, define the values and guidelines that should apply both within the Group and for ASSA ABLOY’s business partners with regard to matters such as business ethics, human rights and working conditions, as well as the environment, health and safety. Moreover, ASSA ABLOY has adopted policies and guidelines on compliance with competition, export control, anti-corruption and data protection legislation applicable to the Group.
9 Auditor At the 2018 Annual General Meeting, Pricewater-
houseCoopers (PwC) was re-appointed as the company’s external auditor up to the end of the 2019 Annual General Meeting. In connection with the 2018 Annual General
Meeting, PwC notified that the authorized public accountant Bo Karlsson would remain the auditor in charge. In addition to ASSA ABLOY, Bo Karlsson, born 1966, is responsible for auditing SKF, Scania and Investment AB Latour.
PwC has been the Group’s auditor since its formation in 1994. PwC submits the audit report for ASSA ABLOY AB, the Group and a large majority of the subsidiaries worldwide. The audit of ASSA ABLOY AB also includes the administration by the Board of Directors and the CEO. The auditor in charge attends all Audit Committee meetings as well as the Febru-ary board meeting, at which he reports his observations and recommendations concerning the Group audit for the year.
The external audit is conducted in accordance with Inter-national Standards in Auditing (ISA), and generally accepted auditing standards in Sweden. The audit of the financial statements for legal entities outside Sweden is conducted in accordance with statutory requirements and other applica-ble rules in each country. For information about the fees paid to auditors and other assignments carried out in the Group in the past three financial years, see Note 3 and the Annual Report for 2017, Note 3.
Stefan Widing
Changes in the Executive Team Nico Delvaux assumed the position of President and CEO on 15 March 2018. He succeeded Johan Molin. Chris Bone assumed the position of Executive Vice President and CTO on 1 March 2018. He succeeded Ulf Södergren. Lucas Boselli assumed the position of Executive Vice President and Head of Americas division on 2 April 2018. He succeeded Thanasis Molokotos. Neil Vann assumed the position of Executive Vice President and Head of the EMEA division on 12 July 2018. He succeeded Tzachi Wiesenfeld Erik Pieder was appointed Executive Vice President and CFO with effect from 14 Jan-uary 2019. He succeeds Carolina Dybeck Happe, who left the Group on 31 December 2018. Maria Romberg Ewerth joined the Executive Team on 1 February 2019 as Executive Vice President and Chief Human Resources Officer.
ASSA ABLOY ANNUAL REPORT 2018 55
REPORT OF THE BOARD OF DIRECTORS

ASSA ABLOY’s internal control process for financial reporting is designed to provide reasonable assurance of reliable finan-cial reporting, which is in compliance with generally accepted accounting principles, applicable laws and regula-tions, and other requirements for listed companies.
Control environmentThe Board of Directors is responsible for effective internal control and has therefore established fundamental docu-ments of significance for financial reporting. These docu-ments include the Board of Directors’ rules of procedure and instructions to the CEO, the Code of Conduct, financial pol-icy, an annual financial evaluation plan etc. Regular meetings are held with the Audit Committee. The Group has an inter-nal audit function whose primary objective is ensuring relia-ble financial reporting and good internal control.
All units in the Group apply uniform accounting and reporting instructions. Internal control guidelines have been established and are reviewed annually for all operating com-panies. These Group-wide guidelines have a relatively broad scope and concern various processes such as ordering, sourcing, financial statements, plant management, compli-ance with various policies, legal matters, and HR matters.
The Code of Conduct has been regularly reviewed and updated, and compliance is monitored systematically in operations.
Risk assessmentRisk assessment includes identifying and evaluating the risk of material errors in accounting and financial reporting at Group, division and local levels. A number of previously established documents govern the procedures to be used for accounting, finalizing accounts, financial reporting and review. A major focus has been on auditing the reconciliation between local accounts and consolidated reporting in recent years. The entire Group uses a financial reporting system with pre-defined report templates.
Control activitiesThe Group’s controller and accounting organization at both central and division levels plays a significant role in ensuring reliable financial information. It is responsible for complete, accurate and timely financial reporting. A global financial internal audit function has been established and carries out annual financial evaluations in accordance with the plan
annually adopted by the Audit Committee. The results of the financial evaluations are submitted to the Audit Committee and the auditors.
In 2018 ASSA ABLOY further strengthened the internal audit and internal control functions in terms of staffing and expanded the number of audits at the local level. Each divi-sion will employ full-time internal auditors who will audit the companies and monitor internal control.
Information and communicationReporting and accounting manuals as well as other financial reporting guidelines are available to all employees con-cerned on the Group’s intranet. A regular review and analysis of financial outcomes is carried out at both business unit and division levels and as part of the Board of Directors’ estab-lished operating structure. The Group also has established procedures for external communication of financial informa-tion, in accordance with the rules and regulations for listed companies.
Review processThe Board of Directors and the Audit Committee evaluate and review the Annual Report and Interim Reports prior to publication. The Audit Committee monitors the financial reporting and other related issues, and regularly discusses these issues with the external auditors. All business units report their financial results monthly in accordance with the Group’s accounting principles. This reporting serves as the basis for quarterly reports and a monthly legal and operating review. Operating reviews conform to a structure in which sales, earnings, cash flow, capital employed and other impor-tant key figures and trends for the Group are compiled, and form the basis for analysis and actions by management and controllers at different levels.
Financial reviews take place quarterly at divisional board meetings, monthly in the form of performance reviews and through more informal analysis. Other important Group-wide components of internal control are the annual business planning process and regular forecasts.
The Group-wide internal control guidelines are reviewed during the year in all operating companies through self-assessment and in some cases a second opinion from external auditors. An action plan focused on concrete measures was implemented several years ago to further improve basic pro-cesses with an impact on the company’s financial position.
Internal control – financial reporting
ASSA ABLOY ANNUAL REPORT 201856
REPORT OF THE BOARD OF DIRECTORS

The Board of Directors’ proposal for guidelines for remuneration to senior managementThe Board of Directors of ASSA ABLOY proposes that the Annual General Meeting adopts the following guidelines for the remuneration and other employment conditions of the President and CEO and other members of the ASSA ABLOY Executive Team (the Executive Team). The proposed guide-lines below do not involve any material change, compared with the guidelines adopted by the 2018 Annual General Meeting. The basic principle is that the remuneration and other employment conditions shall be in line with market conditions and be competitive. ASSA ABLOY takes into account both global remuneration practice and practice in the home country of each member of the Executive Team. The total remuneration of the Executive Team shall consist of base salary, variable components in the form of annual and long-term variable remuneration, other benefits and pension.
The total expensed remuneration of the Executive Team, including previous commitments not yet due for payment, is reported in Note 33.
Fixed and variable remunerationThe base salary shall be competitive and reflect responsibil-ity and performance. The variable part consists of remunera-tion paid partly in cash and partly in the form of shares. The Executive Team shall have the opportunity to receive varia-ble cash remuneration, based on the outcome in relation to financial targets and, when applicable, individual targets. This remuneration shall be equivalent to a maximum of 75 percent of the base salary (excluding social security costs).
In addition, the Executive Team shall, within the frame-work of the Board of Directors’ proposal for a long-term incentive program, be able to receive variable remuneration in the form of shares, based on the annual development of ASSA ABLOY’s earnings per share in relation to target levels, as defined by the Board of Directors, during the measure-ment period 1 January 2019 – 31 December 2021, where each year during the measurement period is compared to the previous year. The outcome is calculated yearly, whereby one third of the maximum outcome is measured against the outcome for 2019, one third is measured against the out-come for 2020 and one third is measured against the out-come for 2021. The remuneration shall, if the share price is unchanged, be equivalent to a maximum of 90 per cent of the base salary (excluding social security costs).
The company’s annual cost of variable remuneration for the Executive Team as above, assuming maximum outcome, can amount to a total of approximately SEK 55 M (excluding social security costs and financing cost). This calculation is made on the basis of the current members of the Executive Team.
Other benefits and pensionOther benefits, such as company car, extra health insurance or occupational healthcare, should be payable to the extent this is considered to be in line with market conditions in the market concerned. All members of the Executive Team shall be covered by defined contribution pension plans, for which pension premiums are based on the executive’s base salary and paid by the company during the period of employment.
Notice and severance payIf the CEO is given notice, the company is liable to pay the equivalent of maximum 24 months’ base salary and other employment benefits. If one of the other members of the Executive Team is given notice, the company is liable to pay a maximum of six months’ base salary and other employment benefits plus an additional twelve months’ base salary.
Deviation from the guidelinesThe Board of Directors shall have the right to deviate from the guidelines for remuneration to senior management adopted by the Annual General Meeting, if there are parti-cular reasons for doing so in an individual case.
Remuneration guidelines for senior management
ASSA ABLOY ANNUAL REPORT 2018 57
REPORT OF THE BOARD OF DIRECTORS
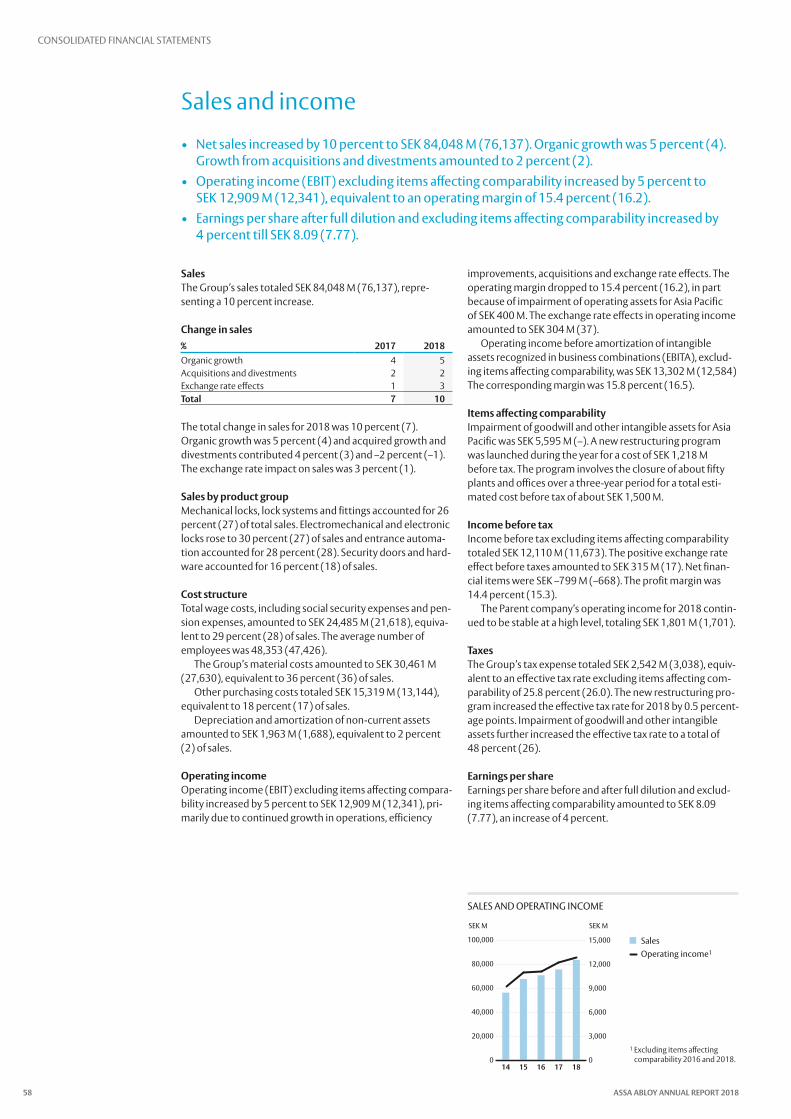
Sales and income
• Net sales increased by 10 percent to SEK 84,048 M (76,137). Organic growth was 5 percent (4). Growth from acquisitions and divestments amounted to 2 percent (2).
• Operating income (EBIT) excluding items affecting comparability increased by 5 percent to SEK 12,909 M (12,341), equivalent to an operating margin of 15.4 percent (16.2).
• Earnings per share after full dilution and excluding items affecting comparability increased by 4 percent till SEK 8.09 (7.77).
SalesThe Group’s sales totaled SEK 84,048 M (76,137), repre-senting a 10 percent increase.
Change in sales% 2017 2018Organic growth 4 5Acquisitions and divestments 2 2Exchange rate effects 1 3Total 7 10
The total change in sales for 2018 was 10 percent (7). Organic growth was 5 percent (4) and acquired growth and divestments contributed 4 percent (3) and –2 percent (–1). The exchange rate impact on sales was 3 percent (1).
Sales by product groupMechanical locks, lock systems and fittings accounted for 26 percent (27) of total sales. Electromechanical and electronic locks rose to 30 percent (27) of sales and entrance automa-tion accounted for 28 percent (28). Security doors and hard-ware accounted for 16 percent (18) of sales.
Cost structureTotal wage costs, including social security expenses and pen-sion expenses, amounted to SEK 24,485 M (21,618), equiva-lent to 29 percent (28) of sales. The average number of employees was 48,353 (47,426).
The Group’s material costs amounted to SEK 30,461 M (27,630), equivalent to 36 percent (36) of sales.
Other purchasing costs totaled SEK 15,319 M (13,144), equivalent to 18 percent (17) of sales.
Depreciation and amortization of non-current assets amounted to SEK 1,963 M (1,688), equivalent to 2 percent (2) of sales.
Operating incomeOperating income (EBIT) excluding items affecting compara-bility increased by 5 percent to SEK 12,909 M (12,341), pri-marily due to continued growth in operations, efficiency
improvements, acquisitions and exchange rate effects. The operating margin dropped to 15.4 percent (16.2), in part because of impairment of operating assets for Asia Pacific of SEK 400 M. The exchange rate effects in operating income amounted to SEK 304 M (37).
Operating income before amortization of intangible assets recognized in business combinations (EBITA), exclud-ing items affecting comparability, was SEK 13,302 M (12,584) The corresponding margin was 15.8 percent (16.5).
Items affecting comparabilityImpairment of goodwill and other intangible assets for Asia Pacific was SEK 5,595 M (–). A new restructuring program was launched during the year for a cost of SEK 1,218 M before tax. The program involves the closure of about fifty plants and offices over a three-year period for a total esti-mated cost before tax of about SEK 1,500 M.
Income before taxIncome before tax excluding items affecting comparability totaled SEK 12,110 M (11,673). The positive exchange rate effect before taxes amounted to SEK 315 M (17). Net finan-cial items were SEK –799 M (–668). The profit margin was 14.4 percent (15.3).
The Parent company’s operating income for 2018 contin-ued to be stable at a high level, totaling SEK 1,801 M (1,701).
TaxesThe Group’s tax expense totaled SEK 2,542 M (3,038), equiv-alent to an effective tax rate excluding items affecting com-parability of 25.8 percent (26.0). The new restructuring pro-gram increased the effective tax rate for 2018 by 0.5 percent-age points. Impairment of goodwill and other intangible assets further increased the effective tax rate to a total of 48 percent (26).
Earnings per shareEarnings per share before and after full dilution and exclud-ing items affecting comparability amounted to SEK 8.09 (7.77), an increase of 4 percent.
SALES AND OPERATING INCOME
SEK M SEK M
0
20,000
40,000
60,000
80,000
100,000
1817161514
OmsättningRörelseresultat1
0
3,000
6,000
9,000
12,000
15,000 SalesOperating income1
1 Excluding items affecting comparability 2016 and 2018.
ASSA ABLOY ANNUAL REPORT 201858
CONSOLIDATED FINANCIAL STATEMENTS

Consolidated income statement and Statement of comprehensive income
SEK M Note 2017 2018Sales 2 76,137 84,048Cost of goods sold –46,148 –51,345Gross income 29,988 32,703
Selling expenses –12,008 –13,594Administrative expenses 3 –3,680 –4,395Research and development costs –2,244 –2,893Other operating income and expenses 4 156 –296Impairment of goodwill and other intangible assets 14 – –5,595Share of earnings in associates 5 129 167Operating income 6–9, 24, 33 12,341 6,096
Financial income 10 19 20Financial expenses 9, 11, 24 –687 –819Income before tax 11,673 5,297
Tax on income 12 –3,038 –2,542Net income 8,635 2,755
Net income attributable to: Parent company’s shareholders 8,633 2,753Non-controlling interests 2 2
Earnings per share Before and after dilution, SEK 13 7.77 2.48Before and after dilution and excluding items affecting comparability, SEK 13 7.77 8.09
SEK M Note 2017 2018Net income 8,635 2,755
Other comprehensive income:Items that will not be reclassified to profit or lossActuarial gain/loss on post-employment benefit obligations 24 26 39Deferred tax from actuarial gain/loss on post-employment benefit obligations –77 –34Total –51 6
Items that may be reclassified subsequently to profit or lossShare of other comprehensive income of associates 50 87Cash flow hedges 8 2Net investment hedges 15 –8Exchange rate differences –1,864 2,089Tax attributable to items that may be reclassified subsequently to profit or loss 4 –8Total –1,788 2,163
Total comprehensive income 6,796 4,923
Total comprehensive income attributable to:Parent company’s shareholders 6,794 4,923Non-controlling interests 2 1
SALES BY PRODuCT GROuP, 2018 EARNINGS PER SHARE BEFORE AND AFTER DILuTION
Mekaniska lås, låssystem och tillbehör, 28% (29) Entréautomatik, 28% (27)Elektromekaniska ochelektroniska lås, 26% (23)Säkerhetsdörrar ochbeslag, 18% (20)
Mechanical locks, lock systems and fittings, 26% (27) Entrance automation, 28% (28) Electromechanical and electronic locks, 30% (27) Security doors and hardware, 16% (18)
SEK
0
2
4
6
8
10
1817161514
Vinst per aktie efterskatt och utspädning1
Earnings per share before and after dilution1
1 Excluding items affecting comparability 2016 and 2018.
Consolidated income statement
Consolidated statement of comprehensive income
ASSA ABLOY ANNUAL REPORT 2018 59
CONSOLIDATED FINANCIAL STATEMENTS

LegendLegendLegendLegendLegend
EMEA, 24% (23)Americas, 23% (23)Asia Pacific, 11% (11)Global Technologies, 14% (14)Entrance Systems, 28% (29)
EXTERNAL SALES, 2018
Comments by divisionASSA ABLOY is organized into five divisions. EMEA (Europe, Middle East and Africa), Americas (North and South America) and Asia Pacific (Asia and Oceania) manufacture and sell mechanical and electromechanical locks, security doors and hardware in their respective geographical markets. Global Technologies operates worldwide in the product areas of access control systems, secure card issuance, identification technology and hotel locks. Entrance Systems is a global supplier of entrance automation products and service.
EMEASales totaled SEK 20,201 M (18,081), with organic growth of 2 percent (4). Acquired units contributed 5 percent (3) net to sales. Operating income excluding items affecting compa-rability amounted to SEK 3,256 M (2,990), with an operating margin (EBIT) of 16.1 percent (16.5). Return on capital employed was 20.1 percent (21.4). Operating cash flow before interest paid was SEK 2,819 M (2,977).
Growth was robust in the EMEA on several markets, with total organic growth of 2 percent. Sales of electro-mechanical locks with digital and mobile solutions con-tinued to increase sharply during the year. Initiatives focused on innovation and new products continued during the year, at the same time that initiatives focused on efficiency, automation of production, and other areas continued to contribute to the high operating margin for EMEA.
AmericasSales totaled SEK 19,817 M (17,940), with organic growth of 9 percent (4). Acquired units contributed 1 percent (1) net to sales. Operating income excluding items affecting compa-rability amounted to SEK 3,941 M (3,815), with an operating margin (EBIT) of 19.9 percent (21.3). Return on capital employed was 22.5 percent (24.2). Operating cash flow before interest paid was SEK 3,903 M (3,491).
Demand was strong in North America and robust in Latin America for most markets. Growth was extremely strong in the US for electromechanical locks in both the commercial and institutional customer segments, as well as in the private residential market. Profitability continued to be strong despite increased material costs.
Asia PacificSales totaled SEK 9,949 M (9,211), with organic growth of 4 percent (0). Acquired units contributed 1 percent (0) to sales. Operating income excluding items affecting com-parability amounted to SEK 492 M (934), with an operating margin (EBIT) of 4.9 percent (10.1). Impairment of operating assets reduced operating income by a total of SEK 400 M. Return on capital employed was 4.8 percent (7.8). Operating cash flow before interest paid was SEK 811 M (859).
Growth was strong in South Korea, Japan and Southeast Asia, as well as for internal sales to other business areas. Stable growth in Pacific. Meanwhile, demand remained weak in China. A new business strategy and organization was implemented in China to strengthen the market position moving forward. The operating margin declined because of impairment of operating assets. A larger impairment loss was reported for goodwill and other intangible assets during the year.
Global TechnologiesSales totaled SEK 11,951 M (10,373), with organic growth of 8 percent (7). Acquired units contributed 4 percent (0) net to sales. Operating income excluding items affecting compa-rability amounted to SEK 2,387 M (1,946), with an operating margin (EBIT) of 20.0 percent (18.8). Return on capital employed was 14.0 percent (14.4). Operating cash flow before interest paid was SEK 2,463 M (1,732).
Growth for the HID Global business unit was generally strong in the US, while the emerging markets continued to show good growth. The market position was strengthened by the Crossmatch acquisition. ASSA ABLOY Global Solutions showed strong growth and good profitability, driven by con-tinued increased demand for electromechanical door open-ing solutions with mobile technology.
Entrance SystemsSales totaled SEK 23,762 M (21,781), with organic growth of 4 percent (4). Acquired units contributed 1 percent (6) to sales. Operating income excluding items affecting compara-bility amounted to SEK 3,358 M (3,087), with an operating margin (EBIT) of 14.1 percent (14.2). Return on capital employed was 16.9 percent (16.4). Operating cash flow before interest paid was SEK 2,772 M (3,065).
Strong growth was seen in North America, as well as for service in general. Growth in Europe was robust, driven by a strong trend in central and eastern Europe. Sales were weaker in the emerging markets. New product launches, a strong service offering and continued consolidation of the production structure were contributing factors to the trend of continued robust growth, and maintained operating margins.
OtherThe costs of Group-wide functions, such as corporate man-agement, accounting and finance, supply management and Group-wide product development, totaled SEK 525 M (432). Elimination of sales between the Group’s segments is included in “Other”.
ASSA ABLOY ANNUAL REPORT 201860
CONSOLIDATED FINANCIAL STATEMENTS

Results by division
EMEA Americas Asia PacificGlobal
TechnologiesEntrance Systems Other Total
SEK M 2017 2018 2017 2018 2017 2018 2017 2018 2017 2018 2017 2018 2017 2018Sales, external 17,729 19,908 17,873 19,737 8,553 8,875 10,301 11,864 21,681 23,665 0 0 76,137 84,048Sales, internal 351 293 67 79 658 1,074 72 87 100 97 –1,2492 –1,6312 – –Sales 18,081 20,201 17,940 19,817 9,211 9,949 10,373 11,951 21,781 23,762 –1,249 –1,630 76,137 84,048
Organic growth 4% 2% 4% 9% 0% 4% 7% 8% 4% 4% – – 4% 5%Acquisitions and disposals 3% 5% 1% 1% 0% 1% 0% 4% 6% 1% – – 2% 2%Exchange-rate effects 0% 5% 0% 0% 0% 3% 0% 3% 0% 4% – – 1% 3%
Share of earnings in associates – 0 – – 25 17 – 3 104 147 – – 129 167
Operating income (EBIT) excluding items affecting comparability 2,990 3,256 3,815 3,941 934 492 1,946 2,387 3,087 3,358 –432 –525 12,341 12,909Operating margin (EBIT) excluding items affecting comparability1 16.5% 16.1% 21.3% 19.9% 10.1% 4.9% 18.8% 20.0% 14.2% 14.1% – – 16.2% 15.4%Restructuring costs – –438 – –225 – –130 – –218 – –108 – –100 – –1,218Impairment goodwill and other intangible assets – – – – – –5,595 – – – – – – – –5,595
Operating income (EBIT) 2,990 2,818 3,815 3,716 934 –5,233 1,946 2,170 3,087 3,250 –432 –625 12,341 6,096Operating margin (EBIT) 16.5% 13.9% 21.3% 18.8% 10.1% –52.6% 18.8% 18.2% 14.2% 13.7% – _ 16.2% 7.3%Net financial items –668 –799Tax on income –3,038 –2,542Net income 8,635 2,755
Capital employed 13,865 16,883 16,095 18,506 12,048 7,455 15,615 18,511 18,379 20,742 –71 –951 75,932 81,146– of which goodwill 8,571 10,709 11,190 13,327 7,752 3,892 11,121 13,245 11,696 12,240 – – 50,330 53,413– of which other intangible assets and
property, plant and equipment 3,567 4,041 3,310 3,813 3,789 2,345 4,064 4,866 4,273 4,422 140 151 19,144 19,637– of which investments in associates 9 9 – – 519 587 17 19 1,699 1,819 – – 2,243 2,434Return on capital employed excluding items affecting comparability1 21.4% 20.1% 24.2% 22.5% 7.8% 4.8% 14.4% 14.0% 16.4% 16.9% – – 16.6% 16.2%
Operating income (EBIT) 2,990 2,818 3,815 3,716 934 –5,233 1,946 2,170 3,087 3,250 –432 –625 12,341 6,096Restructuring costs – 438 – 225 – 130 – 218 – 108 – 100 – 1,218Impairment of goodwill, etc. – – – – – 5,595 – – – – – – – 5,595Depreciation and amortization 421 464 333 367 310 292 353 522 255 294 15 24 1,688 1,963Net capital expenditure –571 –500 –466 –327 –337 –6 –297 –281 –273 –170 –30 –36 –1,975 –1,319Change in working capital 136 –401 –191 –78 –48 33 –271 –165 –4 –709 30 244 –347 –1,076Cash flow 2,977 2,819 3,491 3,903 859 811 1,732 2,463 3,065 2,772 –417 –293 11,706 12,477
Non-cash items –221 –458 –221 –458Interest paid and received –557 –662 –557 –662Operating cash flow 10,929 11,357
Average number of employees 11,033 11,717 8,836 8,768 11,756 11,492 4,328 4,624 11,211 11,463 264 288 47,426 48,3531 Items affecting comparability relate to restructuring costs as well as impairment of goodwill and other intangible assets.2 Of which eliminations SEK 1,631 M (1,249).
OPERATING INCOME, 20181, 2 AVERAGE NuMBER OF EMPLOYEES, 2018
LegendLegendLegendLegendLegend
LegendLegendLegendLegendLegend
EMEA, 24% (24)Americas, 29% (30)Asia Pacific, 4% (7)Global Technologies, 18% (15)Entrance Systems, 25% (24)
1 “Other” is not included in the calcula-tion. See section Comments by division for what is included in “Other”.
2 Excluding items affecting comparability.
EMEA, 24% (23)Americas, 18% (19)Asia Pacific, 24% (25)Global Technologies, 10% (9)Entrance Systems, 24% (24)
The segments have been determined on the basis of report-ing to the CEO, who monitors the overall performance and makes decisions on resource allocation.
The different segments generate their revenue from the manufacture and the sale of mechanical, electromechanical and electronic locks, lock systems and fittings, and security doors and hardware.
The breakdown of sales is based on customer sales in the respective country. Sales between segments are carried out at arm’s length.
For further information on sales, see Note 2.
ASSA ABLOY ANNUAL REPORT 2018 61
CONSOLIDATED FINANCIAL STATEMENTS

SEK M 2017 2018Capital employed 75,932 81,146– of which goodwill 50,330 53,413Net debt 25,275 29,246Equity 50,657 51,900– of which
non-controlling interests 9 10
Capital employedCapital employed in the Group, defined as total assets less interest-bearing assets and non-interest-bearing liabilities including deferred tax liabilities, amounted to SEK 81,146 M (75,932). The return on capital employed excluding items affecting comparability was 16.2 percent (16.6).
Intangible assets amounted to SEK 64,861 M (61,409). The increase is mainly due to the effects of completed acqui-sitions. During the year, goodwill and other intangible assets with an indefinite useful life have arisen to a preliminary value of SEK 5,753 M as a result of completed acquisitions and adjustments of acquisitions made in previous years. A valuation model, based on discounted future cash flows, is used for impairment testing of goodwill and other intangible assets with an indefinite useful life.
Property, plant and equipment amounted to SEK 8,189 M (8,065). Capital expenditure on property, plant and equip-ment and intangible assets, less sales of property, plant and equipment and intangible assets, totaled SEK 1,319 M (1,975). Total depreciation and amortization amounted to SEK 1,963 M (1,688).
Trade receivables amounted to SEK 14,496 M (13,068) and inventories totaled SEK 11,316 M (9,430). The average collection period for trade receivables was 52 days (54). Material throughput time was 96 days (92). The Group is making systematic efforts to increase capital efficiency.
Net debtNet debt amounted to SEK 29,246 M (25,275), of which pen-sion commitments and other post-employment benefits accounted for SEK 2,880 M (2,933).
Net debt was increased by acquisitions, the dividend to shareholders and exchange rate effects during the year, while it was reduced by a continued strong positive operat-ing cash flow. Over the whole period net debt changed marginally although it fluctuated during the year.
External financingThe Group’s long-term loan financing mainly consists of a Private Placement Program in the US totaling USD 320 M, of which USD 295 M (320) is long-term, a GMTN program of SEK 14,229 M (10,700), of which SEK 12,996 M (9,329) is long-term, a loan from the European Investment Bank of EUR 37 M (55) and USD 121 M (137), and a loan from the Nordic Investment Bank of EUR 55 M (110). During the year, ten new issues were made under the GMTN program for a total amount of SEK 4,445 M. In addition, the company took out a somewhat smaller long-term loan. Other changes in long-term loans are mainly due to some of the originally long-term loans now having less than 1 year to maturity. The size of the loans increased substantially due to currency fluc-tuations, especially regarding the USD. A total of SEK 4,492 M was raised in new long-term loans, while SEK 2,849 M in originally long-term loans matured during the year.
The Group’s short-term loan financing mainly consists of two Commercial Paper Programs for a maximum USD 1,000 M (1,000) and SEK 5,000 M (5,000) respectively. At year-end, SEK 2,752 M (1,307) of the Commercial Paper Programs had been utilized. In addition, substantial credit facilities are available, mainly in the form of a Multi-Currency Revolving Credit Facility of EUR 900 M (900), which was wholly unuti-lized at year-end. The interest coverage ratio, defined as income before tax excluding items affecting comparability plus net interest, divided by net interest, was 17.1 (19.1). Fixed interest terms increased during the year, with an average term of 26 months (25) at year-end.
Cash and cash equivalents amounted to SEK 459 M (552). and are invested in banks with high credit ratings.
Some of the Group’s main financing agreements contain a customary Change of Control clause. This clause means that lenders have the right in certain circumstances to demand the renegotiation of conditions or to terminate the agreements should control of the company change.
EquityConsolidated equity was SEK 51,900 M (50,657) at year-end. The return on equity was 5.4 percent (17.6). The equity ratio was 48.7 percent (49.6). The debt/equity ratio, defined as net debt divided by equity, was 0.56 (0.50).
Financial position• Capital employed amounted to SEK 81,146 M (75,932).• Return on capital employed remained high at 16.2 percent (16.6).• The net debt/equity ratio was 0.56 (0.50).
CAPITAL EMPLOYED AND RETuRN ON CAPITAL EMPLOYEDNET DEBT
Net debtNet debt/equity ratio
Capital employedReturn on capital employed1
1 Excluding items affecting comparability 2016 and 2018.
SEK M
0
6,000
12,000
18,000
24,000
30,000
1817161514
NettoskuldsättningNettoskuldsättning/Eget kapital
0.0
0.2
0.4
0.6
0.8
1.0
SEK M %
0
20,000
40,000
60,000
80,000
100,000
1817161514
Sysselsatt kapitalAvkastning på sysselsatt kapital1
0
5
10
15
20
25
ASSA ABLOY ANNUAL REPORT 201862
CONSOLIDATED FINANCIAL STATEMENTS

SEK M Note 2017 2018ASSETSNon-current assetsIntangible assets 14 61,409 64,861Property, plant and equipment 15 8,065 8,189Investments in associates 17 2,243 2,434Other financial assets 19 227 152Deferred tax assets 18 1,355 1,354Total non-current assets 73,299 76,991
Current assetsInventories 20 9,430 11,316Trade receivables 21 13,068 14,496Current tax receivables 472 457Other current receivables 1,552 1,327Prepaid expenses and accrued income 1,015 1,256Derivative financial instruments 34 107 117Short-term investments 34 43 71Cash and cash equivalents 34 459 538Total current assets 26,145 29,577TOTAL ASSETS 99,444 106,568
EQUITY AND LIABILITIESEquity Parent company’s shareholdersShare capital 23 371 371Other contributed capital 9,675 9,675Reserves 32 2,932 5,096Retained earnings 37,670 36,748Equity attributable to the Parent company’s shareholders 50,648 51,890Non-controlling interests 9 10Total equity 50,657 51,900
Non-current liabilitiesLong-term loans 34 16,859 19,489Deferred tax liabilities 18 2,218 1,764Pension provisions 24 2,933 2,880Other non-current provisions 25 1,447 745Other non-current liabilities 836 1,406Total non-current liabilities 24,293 26,283
Current liabilitiesShort-term loans 34 6,151 7,594Derivative financial instruments 34 112 116Trade payables 7,811 7,893Current tax liabilities 751 1,943Current provisions 25 699 891Other current liabilities 26 3,446 3,551Accrued expenses and deferred income 27 5,524 6,396Total current liabilities 24,494 28,385TOTAL EQUITY AND LIABILITIES 99,444 106,568
Consolidated balance sheet
ASSA ABLOY ANNUAL REPORT 2018 63
CONSOLIDATED FINANCIAL STATEMENTS
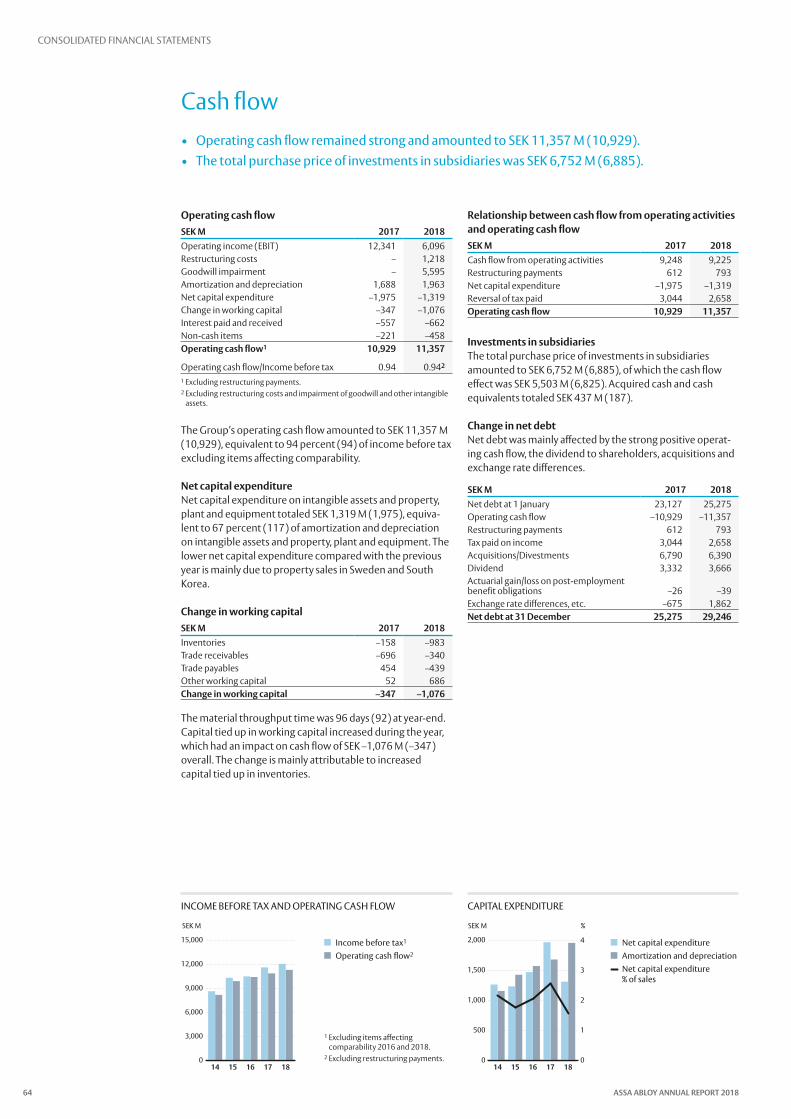
Operating cash flowSEK M 2017 2018Operating income (EBIT) 12,341 6,096Restructuring costs – 1,218Goodwill impairment – 5,595Amortization and depreciation 1,688 1,963Net capital expenditure –1,975 –1,319Change in working capital –347 –1,076Interest paid and received –557 –662Non-cash items –221 –458Operating cash flow1 10,929 11,357
Operating cash flow/Income before tax 0.94 0.942
1 Excluding restructuring payments. 2 Excluding restructuring costs and impairment of goodwill and other intangible
assets.
The Group’s operating cash flow amounted to SEK 11,357 M (10,929), equivalent to 94 percent (94) of income before tax excluding items affecting comparability.
Net capital expenditureNet capital expenditure on intangible assets and property, plant and equipment totaled SEK 1,319 M (1,975), equiva-lent to 67 percent (117) of amortization and depreciation on intangible assets and property, plant and equipment. The lower net capital expenditure compared with the previous year is mainly due to property sales in Sweden and South Korea.
Change in working capitalSEK M 2017 2018Inventories –158 –983Trade receivables –696 –340Trade payables 454 –439Other working capital 52 686Change in working capital –347 –1,076
The material throughput time was 96 days (92) at year-end. Capital tied up in working capital increased during the year, which had an impact on cash flow of SEK –1,076 M (–347) overall. The change is mainly attributable to increased capital tied up in inventories.
Relationship between cash flow from operating activities and operating cash flowSEK M 2017 2018Cash flow from operating activities 9,248 9,225Restructuring payments 612 793Net capital expenditure –1,975 –1,319Reversal of tax paid 3,044 2,658Operating cash flow 10,929 11,357
Investments in subsidiariesThe total purchase price of investments in subsidiaries amounted to SEK 6,752 M (6,885), of which the cash flow effect was SEK 5,503 M (6,825). Acquired cash and cash equivalents totaled SEK 437 M (187).
Change in net debtNet debt was mainly affected by the strong positive operat-ing cash flow, the dividend to shareholders, acquisitions and exchange rate differences.
SEK M 2017 2018Net debt at 1 January 23,127 25,275Operating cash flow –10,929 –11,357Restructuring payments 612 793Tax paid on income 3,044 2,658Acquisitions/Divestments 6,790 6,390Dividend 3,332 3,666Actuarial gain/loss on post-employment benefit obligations –26 –39Exchange rate differences, etc. –675 1,862Net debt at 31 December 25,275 29,246
Cash flow• Operating cash flow remained strong and amounted to SEK 11,357 M (10,929).• The total purchase price of investments in subsidiaries was SEK 6,752 M (6,885).
CAPITAL EXPENDITuREINCOME BEFORE TAX AND OPERATING CASH FLOW
Income before tax1
Operating cash flow2
1 Excluding items affecting comparability 2016 and 2018.
2 Excluding restructuring payments.
Net capital expenditureAmortization and depreciationNet capital expenditure % of sales
SEK M
0
3,000
6,000
9,000
12,000
15,000
1817161514
Resultat före skatt1
Operativt kassaflöde2
SEK M %
0
500
1,000
1,500
2,000
1817161514
NettoinvesteringarAvskrivningarNettoinvesteringar i % av omsättningen
0
1
2
3
4
ASSA ABLOY ANNUAL REPORT 201864
CONSOLIDATED FINANCIAL STATEMENTS

SEK M Note 2017 2018OPERATING ACTIVITIESOperating income 12,341 6,096Amortization and depreciation 8 1,688 1,963Impairment of goodwill and other intangible assets 14 – 5,595Reversal of restructuring costs – 1,218Restructuring payments –612 –793Other non-cash items 32 –221 –458Cash flow before interest and tax 13,196 13,621
Interest paid –570 –675Interest received 13 14Tax paid on income –3,044 –2,658Cash flow before changes in working capital 9,595 10,302
Change in working capital 32 –347 –1,076Cash flow from operating activities 9,248 9,225
INVESTING ACTIVITIESInvestments in property, plant and equipment and intangible assets 14, 15 –2,105 –1,793Sales of property, plant and equipment and intangible assets 14, 15 130 474Investments in subsidiaries 30 –6,825 –5,503Investments in associates 0 0 Divestments of subsidiaries 32 139 395Other investments 0 0Cash flow from investing activities –8,661 –6,427
FINANCING ACTIVITESDividend –3,332 –3,666Long-term loans raised 34 3,226 4,483Long-term loans repaid 34 –2,637 –2,849Purchase of shares in subsidiaries from non-controlling interest –130 –229Stock purchase plans –74 –60Change in short-term loans, etc. 2,085 –408Cash flow from financing activities –861 –2,728CASH FLOW –274 70
CASH AND CASH EQUIVALENTSCash and cash equivalents at 1 January 750 459Cash flow –274 70Effect of exchange rate differences –17 9Cash and cash equivalents at 31 December 34 459 538
Consolidated statement of cash flows
ASSA ABLOY ANNUAL REPORT 2018 65
CONSOLIDATED FINANCIAL STATEMENTS
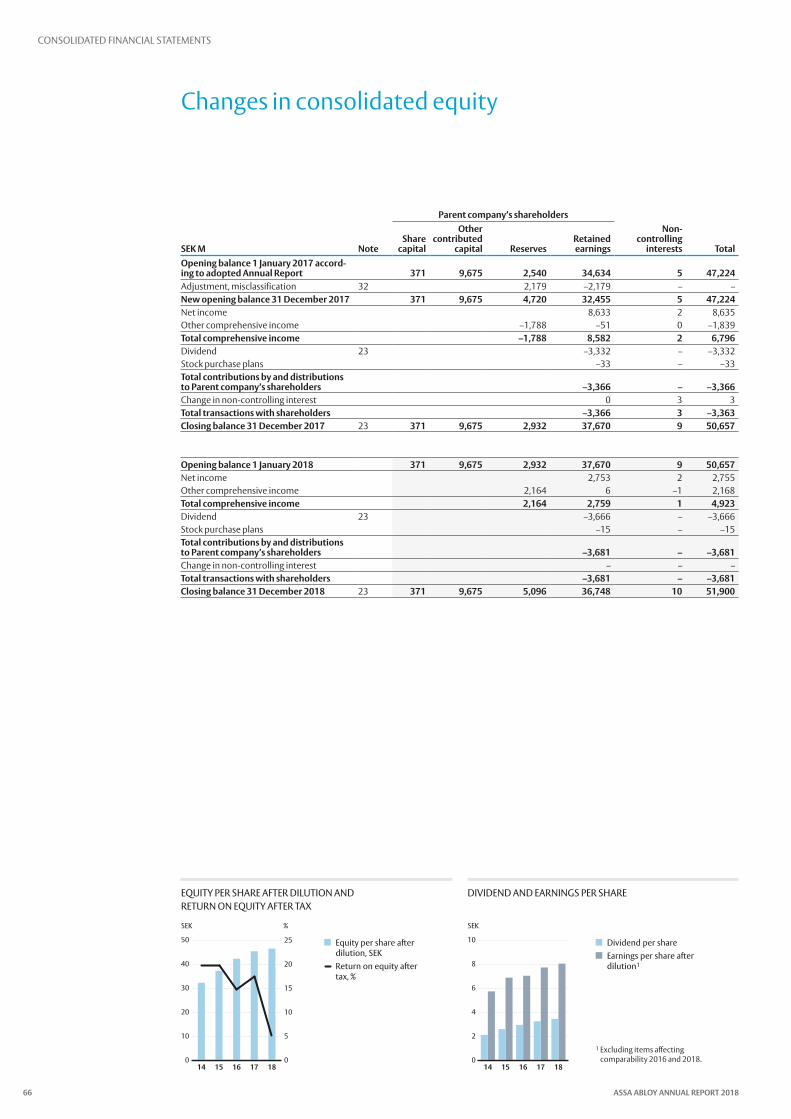
Parent company’s shareholders
SEK M NoteShare
capital
Other contributed
capital ReservesRetained earnings
Non- controlling
interests TotalOpening balance 1 January 2017 accord-ing to adopted Annual Report 371 9,675 2,540 34,634 5 47,224Adjustment, misclassification 32 2,179 –2,179 – –New opening balance 31 December 2017 371 9,675 4,720 32,455 5 47,224Net income 8,633 2 8,635Other comprehensive income –1,788 –51 0 –1,839Total comprehensive income –1,788 8,582 2 6,796Dividend 23 –3,332 – –3,332Stock purchase plans –33 – –33Total contributions by and distributions to Parent company’s shareholders –3,366 – –3,366Change in non-controlling interest 0 3 3Total transactions with shareholders –3,366 3 –3,363Closing balance 31 December 2017 23 371 9,675 2,932 37,670 9 50,657
Opening balance 1 January 2018 371 9,675 2,932 37,670 9 50,657Net income 2,753 2 2,755Other comprehensive income 2,164 6 –1 2,168Total comprehensive income 2,164 2,759 1 4,923Dividend 23 –3,666 – –3,666Stock purchase plans –15 – –15Total contributions by and distributions to Parent company’s shareholders –3,681 – –3,681Change in non-controlling interest – – –Total transactions with shareholders –3,681 – –3,681Closing balance 31 December 2018 23 371 9,675 5,096 36,748 10 51,900
Changes in consolidated equity
DIVIDEND AND EARNINGS PER SHAREEQuITY PER SHARE AFTER DILuTION AND RETuRN ON EQuITY AFTER TAX
Dividend per shareEarnings per share after dilution1
1 Excluding items affecting comparability 2016 and 2018.
Equity per share after dilution, SEKReturn on equity after tax, %
SEK %
0
10
20
30
40
50
1817161514
Eget kapital per aktieefter utspädning, SEKAvkastning på eget kapital efter skatt, %
0
5
10
15
20
25
SEK
0
2
4
6
8
10
1817161514
Utdelning per aktieVinst per aktie efter utspädning1
ASSA ABLOY ANNUAL REPORT 201866
CONSOLIDATED FINANCIAL STATEMENTS

Parent company financial statements
SEK M Note 2017 2018Administrative expenses 3, 6, 8, 9 –1,524 –1,911Research and development costs 6, 8, 9 –911 –1,119Capitalized work for own account 73 81Other operating income and expenses 4 4,063 4,750Operating income 9, 33 1,701 1,801
Financial income 10 2,955 2,805Financial expenses 9, 11 –418 –654Income before appropriations and tax 4,238 3,951
Group contributions 1,300 1,608Change in excess depreciation and amortization –565 –113Tax on income 12 –303 –650Net income 4,670 4,796
Income statement – Parent company
SEK M 2017 2018Net income 4,670 4,796
Other comprehensive income – –Total comprehensive income 4,670 4,796
Statement of comprehensive income – Parent company
SEK M Note 2017 2018ASSETSNon-current assets Intangible assets 14 3,497 2,997Property, plant and equipment 15 32 37Shares in subsidiaries 16 34,242 34,738Other financial assets 19 1,808 1,782Total non-current assets 39,579 39,554
Current assets Receivables from subsidiaries 12,716 17,169Other current receivables 14 17Prepaid expenses and accrued income 10 9Cash and cash equivalents 0 0Total current assets 12,740 17,195TOTAL ASSETS 52,319 56,749
EQUITY AND LIABILITIES Equity 22Restricted equity Share capital 23 371 371Revaluation reserve 275 275Statutory reserve 8,905 8,905Fund for development expenses 139 219Non-restricted equity Share premium reserve 787 787Retained earnings including net income for the year 12,017 13,053Total equity 22,494 23,610
Untaxed reserves 565 678
Non-current liabilities Long-term loans 34 10,491 13,771Other non-current liabilities 90 50Total non-current liabilities 10,581 13,821
Current liabilitiesShort-term loans 34 1,371 1,697Trade payables 116 198Current liabilities to subsidiaries 16,805 16,228Current tax liabilities 5 94Other current liabilities 10 5Accrued expenses and deferred income 27 372 419Total current liabilities 18,679 18,641TOTAL EQUITY AND LIABILITIES 52,319 56,749
Balance sheet – Parent company
ASSA ABLOY ANNUAL REPORT 2018 67
PARENT COMPANY FINANCIAL STATEMENTS

SEK M Note 2017 2018OPERATING ACTIVITIESOperating income 1,701 1,801Depreciation and amortization 8 339 609Cash flow before interest and tax 2,040 2,410
Interest paid and received –285 –287Dividends received 2,832 2,479Tax paid and received –614 –556Cash flow before changes in working capital 3,973 4,046
Change in working capital 1,431 1,326Cash flow from operating activities 5,404 5,372
INVESTING ACTIVITIESInvestments in tangible and intangible assets –3,431 –115Investments in subsidiaries –630 –526Other investments 0 0Cash flow from investing activities –4,061 –641
FINANCING ACTIVITESDividend –3,332 –3,666Loans raised 2,977 5,249Loans repaid –988 –6,314Cash flow from financing activities –1,343 –4,731CASH FLOW 0 0
CASH AND CASH EQUIVALENTSCash and cash equivalents at 1 January 0 0Cash flow 0 0Cash and cash equivalents at 31 December 0 0
Restricted equity Non-restricted equity
SEK MShare
capitalRevaluation
reserveStatutory
reserve
Fund for development
expenses
Share premium
reserveRetained earnings Total
Opening balance 1 January 2017 371 275 8,905 – 787 10,852 21,190Net income 4,670 4,670Total comprehensive income 4,670 4,670Dividend for 2016 –3,332 –3,332Stock purchase plans –33 –33Reclassifications 139 –139 –Total transactions with shareholders 139 –3,505 –3,366Closing balance 31 December 2017 371 275 8,905 139 787 12,017 22,494
Opening balance 1 January 2018 371 275 8,905 139 787 12,017 22,494Net income 4,796 4,796Total comprehensive income 4,796 4,796Dividend for 2017 –3,666 –3,666Stock purchase plans –15 –15Reclassifications 80 –80 –Total transactions with shareholders 219 –3,757 –3,680Closing balance 31 December 2018 371 275 8,905 219 787 13,053 23,610
Cash flow statement – Parent company
Change in equity – Parent company
ASSA ABLOY ANNUAL REPORT 201868
PARENT COMPANY FINANCIAL STATEMENTS

Notes
Note 1 Significant accounting and valuation principlesGroup ASSA ABLOY applies International Financial Reporting Stand-ards (IFRS) as adopted by the European Union (EU), the Swedish Annual Accounts Act and the Swedish Financial Reporting Board’s RFR 1 Supplementary Accounting Rules for Corporate Groups. The accounting principles are based on IFRS as endorsed by 31 December 2018 and have been applied to all years presented, unless stated otherwise. This Note describes the most significant accounting principles that have been applied in the preparation of the financial statements, which comprise the information provided on pages 42–102.
Basis of preparationASSA ABLOY’s consolidated financial statements have been prepared in accordance with IFRS as endorsed by the EU. The consolidated financial statements have been prepared in accordance with the cost method, except for financial assets and liabilities (including derivatives) measured at fair value through profit or loss.
The total amount in tables and statements might not always summarize as there are rounding differences. The aim is to have each line item corresponding to the source and it might therefore be rounding differences in the total.
Key estimates and assessments for accounting purposesThe preparation of financial statements requires estimates and assessments to be made for accounting purposes. The management also makes assessments when applying the Group’s accounting principles. Estimates and assessments may affect the income statement and balance sheet as well as the supplementary information provided in the financial statements. Consequently, changes in estimates and assess-ments may lead to changes in the financial statements.
Estimates and assessments play an important part in the measurement of items such as identifiable assets and liabili-ties in acquisitions, in impairment testing of goodwill and other assets, as well as in determining actuarial assumptions for calculating employee benefits. Estimates and assess-ments also affect valuation of deferred taxes, other provi-sions and deferred considerations. Estimates and assess-ments are continually evaluated and are based on both his-torical experience and reasonable expectations about the future.
The Group considers that estimates and assessments relating to impairment testing of goodwill and other intangi-ble assets with indefinite useful life are of material impor-tance to the consolidated financial statements. The Group tests carrying amounts for impairment on an annual basis. The recoverable amounts of cash generating units are deter-mined by calculating their values in use. The calculations are based on certain assumptions about the future which, for the Group, are associated with the risk of material adjust-ments in carrying amounts during the next financial year. Material assumptions and the effects of reasonable changes in them are described in Note 14.
The actuarial assumptions made when calculating post-employment employee benefits also have material impor-tance for the consolidated financial statements. For informa-tion on these actuarial assumptions, see Note 24.
New and revised standards applied by the GroupThe Group has applied the following standards for the first time for the financial year beginning 1 January 2018:• IFRS 9 Financial Instruments• IFRS 15 Revenue from contracts with customers
IFRS 9 addresses classification, measurement and recogni-tion of financial assets and liabilities and replaces the parts of IAS 39 that relate to these areas. IFRS 9 entails implementa-tion of a new impairment model based on expected credit losses rather than incurred losses. For the Group, the new model will entail a new procedure for measurement of credit losses, though the Standard have not had any material impact on the Group’s performance and financial position.
IFRS 15 supersedes IAS 11 Construction contracts and IAS 18 Revenue and includes a new single model for revenue recognition related to customer contracts. The new Stand-ard introduces a five-step process that must be applied before revenue can be recognized from customer contracts. The Standard prescribes that an entity shall recognize reve-nue when the entity satisfies a performance obligation by transferring a promised good or service to a customer. The good or service is transferred when the customer acquires control over the asset, which may happen either over time or at a particular point in time. In all important respects the Group’s previous revenue recognition practices conform with IFRS 15 and the new Standard will therefore have no impact on the Group’s performance and financial position. However, additional information about the disaggregation of revenue, contract assets and contract liabilities, as well as remaining performance obligations can be found in Note 2.
New and revised IFRS not yet effectiveThe following new standards and interpretations have been published but were not yet effective as of the closing date, and have not been applied in the preparation of the financial statements.• IFRS 16 Leases• IFRIC 23 Accounting for uncertainty over income tax
treatments
The Group has applied IFRS 16 from 1 January 2019. During the transition, all leases, except short-term leases and leases for low-value assets, are recognized in the consolidated balance sheet. Under the standard, an asset (the right to use the leased item) and a financial liability representing the obligation to make lease payments are recognized. The Group’s lease liability as of 1 January 2019 is SEK 3,802 M. Additional information about the financial effects of the transition to IFRS 16 can be found in Note 6. The Group has applied the cumulative catch-up approach as transition method and does not restate any comparative information. In addition, the Group has chosen not to recognize right-of-use and lease liability regarding obli-gations for short-term leases and low-value leases.
IFRIC 23 explains how an entity should determine the method with which a transaction should be measured and recognized when there is uncertainty over income tax treat-ments. The Group applies the new guidance commencing on 1 January 2019. In conjunction with the application, the Group reassessed its uncertain tax positions based on the new guidance, which resulted in an increased provision for uncertain income taxes of SEK 234 M. The Group has chosen a modified retrospective approach for initial application of the interpretation, in which comparative figures is not restated. The effect of initial application is recognized as an adjustment to equity in the first quarter of 2019.
ASSA ABLOY ANNUAL REPORT 2018 69
NOTES

Consolidated financial statementsThe consolidated financial statements include ASSA ABLOY AB (the Parent company) and all companies over which the Group has control. The Group controls an entity when the Group is exposed to, or has the rights to, variable returns from its involvement with the entity and has the ability to affect those returns through its power over the entity. Com-panies acquired during the year are included in the consoli-dated financial statements with effect from the date when a controlling interest arose. Companies divested during the year are included in the consolidated financial statements up to the date when a controlling interest ceased.
The consolidated financial statements have been pre-pared in accordance with the purchase method, which means that the cost of shares in subsidiaries was eliminated against their equity at the acquisition date. In this context, equity in subsidiaries is determined on the basis of the fair value of assets, liabilities and contingent liabilities at the acquisition date. Consequently, only that part of the equity in subsidiaries that has arisen after the acquisition date is included in consolidated equity. The Group determines on an individual basis for each acquisition whether a non-con-trolling interest in the acquired company shall be recognized at fair value or at the interest’s proportional share of the acquired company’s net assets. Any negative difference, neg-ative goodwill, is recognized as revenue immediately after determination.
Deferred considerations are classified as financial liabili-ties and revalued through profit or loss in operating income. Significant deferred considerations are discounted to pre-sent value. Acquisition-related transaction costs are expensed as incurred.
Intra-Group transactions and balance sheet items, and unrealized profits on transactions between Group compa-nies are eliminated in the consolidated financial statements.
Non-controlling interestsNon-controlling interests are based on the subsidiaries’ accounts with application of fair value adjustments resulting from a completed acquisition analysis. Non-controlling interests’ share in subsidiaries’ earnings is recognized in the income statement, in which net income is attributed to the Parent company’s shareholders and to non-controlling inter-ests. Non-controlling interests’ share in subsidiaries’ equity is recognized separately in consolidated equity. Transactions with non-controlling interests are recognized as transac-tions with the Group’s shareholders in equity.
AssociatesAssociates are defined as companies which are not sub sidi-aries but in which the Group has a significant (but not a con-trolling) interest. This generally refers to companies in which the Group’s shareholding represents between 20 and 50 percent of the voting rights.
Investments in associates are accounted for in accord-ance with the equity method. In the consolidated balance sheet, shareholdings in associates are recognized at cost, and the carrying amount is adjusted for the share of associ-ates’ earnings after the acquisition date. Dividends from associates are recognized as a reduction in the carrying amount of the holdings. The share of associates’ earnings is recognized in the consolidated income statement in operating income as the holdings are related to business operations.
Segment reportingOperating segments are reported in accordance with inter-nal reporting to the chief operating decision maker. Chief operating decision maker is the function that is responsible for allocation of resources and assessing performance of the
operating segments. The divisions form the operational structure for internal control and reporting and also consti-tute the Group’s segments for external financial reporting. The Group’s business is divided into five divisions. Three divi-sions are based on products sold in local markets in the respective division: EMEA, Americas and Asia Pacific. Global Technologies and Entrance Systems consist of products sold worldwide.
Foreign currency translationFunctional currency corresponds to local currency in each country where Group companies operate. Transactions in foreign currencies are translated to functional currency by application of the exchange rates prevailing on the transac-tion date. Foreign exchange gains and losses arising from the settlement of such transactions are normally recognized in the income statement, as are those arising from translation of monetary balance sheet items in foreign currencies at the year-end rate. Exceptions are transactions relating to qualify-ing cash flow hedges, which are recognized in other compre-hensive income. Receivables and liabilities are measured at the year-end rate.
In translating the accounts of foreign subsidiaries pre-pared in functional currencies other than the Group’s pres-entation currency, all balance sheet items except net income are translated at the year-end rate and net income is trans-lated at the average rate. The income statement is translated at the average rate for the period. Exchange differences aris-ing from the translation of foreign subsidiaries are recog-nized as translation differences in other comprehensive income.
The table below shows the weighted average rate and the closing rate for important currencies used in the Group, relative to the Group’s presentation currency (SEK).
Average rate Closing rate
Country Currency 2017 2018 2017 2018United Arab Emirates AED 2.33 2.37 2.25 2.45Argentina ARS 0.51 0.33 0.43 0.23Australia AUD 6.54 6.49 6.43 6.34Brazil BRL 2.67 2.39 2.49 2.32Canada CAD 6.57 6.71 6.57 6.60Switzerland CHF 8.67 8.91 8.44 9.12Chile CLP 0.013 0.014 0.013 0.013China CNY 1.27 1.31 1.27 1.31Czech Republic CZK 0.37 0.40 0.39 0.40Denmark DKK 1.30 1.38 1.32 1.38Euro zone EUR 9.64 10.27 9.86 10.29United King-dom GBP 11.03 11.57 11.11 11.37Hong Kong HKD 1.10 1.11 1.06 1.15Hungary HUF 0.031 0.032 0.032 0.032Israel ILS 2.38 2.42 2.38 2.38India INR 0.131 0.128 0.129 0.128Kenya KES 0.083 0.086 0.080 0.088South Korea KRW 0.0076 0.0079 0.0077 0.0081Mexico MXN 0.45 0.4522 0.42 0.4561Malaysia MYR 1.99 2.15 2.03 2.16Norway NOK 1.03 1.06 1.00 1.03New Zealand NZD 6.07 6.01 5.86 6.03Poland PLN 2.26 2.41 2.36 2.40Romania RON 2.11 2.21 2.12 2.21Thailand THB 0.25 0.27 0.25 0.28Turkey TRY 2.36 1.88 2.18 1.71US USD 8.55 8.70 8.25 8.98South Africa ZAR 0.64 0.66 0.67 0.62
RevenueThe Group recognizes revenue from contracts with custom-ers based on the five-step process described in IFRS 15. Reve-nue is recognized when the entity satisfies a performance obligation by transferring a promised good or service to a
Note 1 cont.
ASSA ABLOY ANNUAL REPORT 201870
NOTES

customer. The good or service is transferred when the cus-tomer acquires control over the asset, which may happen either over time or at a particular point in time.
Under the five-step process an entity must complete the following steps before revenue can be recognized: Identify contracts with customers, identify performance obligations, determine the transaction price, allocate the transaction price to each of the separate performance obligations, and finally recognize the revenue attributable to each perfor-mance obligation.
At the beginning of the customer contract ASSA ABLOY determines whether the goods and/or services that are promised in the agreement comprise one performance obligation or several separate performance obligations.
A performance obligation is defined as a distinct promise to transfer a good or a service to the customer. A promised good or service is distinct if both of the following criteria are met:a) the customer can benefit from the good or service sepa-
rately or together with other resources that are readily available to the customer and
b) the Group's promise to transfer the good or service to the customer is separately identifiable from other promises in the contract.
When determining the transaction price, which is the amount of consideration promised in the contract, the Group takes into account any variable considerations, such as cash discounts, volume-based discounts, and right of returns. The transaction price includes variable considera-tion only if it is highly probable that a significant reversal of the revenue is not expected to occur in a future period.
ASSA ABLOY receives payment in advance from custom-ers to a limited extent. No customer contracts within the Group relating to the sale of goods or services are assessed to contain a significant financing component. The Group does not recognize any contract costs since the Group applies the practical expedient permitted by the standard, under which incremental costs of obtaining a contract are recognized as an expense when incurred if the amortization period of the asset that the Group otherwise would have recognized is one year or less.
ASSA ABLOY allocates the transaction price for each per-formance obligation on the basis of a stand-alone selling price. The stand-alone selling price is the price for which the Group would sell the good or service separately to a cus-tomer. In cases where a stand-alone selling price is not directly observable, it is usually calculated based on the adjusted market assessment approach or the expected cost plus a margin approach.
Any discounts are allocated proportionately to all perfor-mance obligations in the contract, provided there is not observable evidence that the discount does not relate to all performance obligations.
ASSA ABLOY recognizes revenue when the Group satisfies a performance obligation by transferring a good or service to a customer, i.e. as the customer gains control over the asset. A performance obligation is met either over time or at a par-ticular point in time. ASSA ABLOY recognizes revenue over time if any of the following criteria are met:a) the customer simultaneously receives and consumes the
benefits provided by the Group’s performance as the Group performs an obligation
b) the Group’s performance creates or enhances an asset that the customer controls as the asset is created or enhanced
c) the Group’s performance does not create an asset with an alternative use to the Group and the Group has an enforceable right to payment for performance completed to date.
Revenue that is not recognized over time is recognized at a given point in time, i.e. the point in time when the customer gains control over the asset.
The Group’s revenue mainly consists of product sales. Service related to products sold represents a limited share of revenue. Revenue for the sale of the Group’s products is recognized at a given point in time when the customer gains control over the product, usually at the time of delivery. ASSA ABLOY also carries out installation services, which are recognized over time. For shorter installation jobs, revenue is recognized in practice upon completion of installation. Revenue from service contracts is recognized over time.
For product sales, a receivable is recognized when the goods have been delivered, since this is usually the point in time when the consideration becomes unconditional. Pay-ment terms for trade receivables differ among geographic markets. The average collection period for trade receivables in 2018 was 52 days.
Intra-Group salesTransactions between Group companies are carried out at arm’s length and thus at market prices. Intra-Group sales are eliminated from the consolidated income statement, and profits on such transactions have been eliminated in their entirety.
Government grantsGrants and support from governments, public authorities and the like are recognized when there is reasonable assur-ance that the company will comply with the conditions attaching to the grant and that the grant will be received. Grants relating to assets are recognized after reducing the carrying amount of the asset by the amount of the grant.
Research and developmentResearch expenditure is expensed as incurred. Development expenditure is recognized in the balance sheet to the extent that it is expected to generate future economic benefits for the Group and provided such benefits can be reliably meas-ured.
Capitalized development expenditure is amortized over the expected useful life. Such intangible assets, which are not yet in use, are tested annually for impairment. Expenditure on the further development of existing products is expensed as incurred.
Borrowing costsBorrowing costs are interest expenses and other expenses directly related to borrowing. Borrowing costs directly attributable to the acquisition, construction or production of a qualifying asset (an asset that necessarily takes a sub-stantial period of time to get ready for its intended use or sale) are included in the cost of the asset. Other borrowing costs are recognized as an expense in the period in which they are incurred.
Tax on incomeThe income statement includes all tax that is to be paid or received for the current year, adjustments relating to tax due for previous years, and changes in deferred tax. These taxes have been calculated at nominal amounts, in accordance with the tax regulations in each country, and in accordance with tax rates that have either been decided or have been notified and can confidently be expected to be confirmed. For items recognized in the income statement, associated tax effects are also recognized in the income statement. The tax effects of items recognized directly against equity or in other com-prehensive income are themselves recognized against equity or in other comprehensive income. The liability method is used in accounting for deferred tax. This means that deferred
Note 1 cont.
ASSA ABLOY ANNUAL REPORT 2018 71
NOTES

tax is recognized on all temporary differences between the carrying amounts of assets and liabilities and their respective tax bases. Deferred tax assets relating to tax losses carried for-ward or other future tax allowances are recognized to the extent that it is probable that the allowance can be offset against taxable income in future taxation. Deferred tax liabili-ties for temporary differences relating to investments in sub-sidiaries are not recognized in the consolidated financial statements, since the Parent company can control the time at which the temporary differences are reversed, and it is not considered likely that such reversal will occur in the foreseea-ble future. Deferred tax assets and deferred tax liabilities are offset when there is a legal right to do so and when deferred taxes relate to the same tax authority.
Cash flow statement The cash flow statement has been prepared according to the indirect method. The recognized cash flow includes only transactions involving cash payments.
Cash and cash equivalentsCash and cash equivalents include cash and bank balances, and short-term financial investments that mature within three months of the acquisition date.
Goodwill and acquisition-related intangible assetsGoodwill represents the positive difference between the acquisition cost and the fair value of the Group’s share of the acquired company’s identifiable net assets at the acquisition date, and is recognized at cost less accumulated impairment losses. Goodwill is allocated to cash generating units (CGU) and is tested annually to identify any impairment loss. Cash generating units are subject to systematic annual impair-ment testing using a valuation model based on discounted future cash flows. Deferred tax assets based on local tax rates are recognized in terms of tax-deductible goodwill (with corresponding reduction of the goodwill value). Such deferred tax assets are expensed as the tax deduction is uti-lized. Other acquisition-related intangible assets consist chiefly of various types of intellectual property rights, such as brands, technology and customer relationships. Identifiable acquisition-related intellectual property rights are initially recognized at fair value at the acquisition date and subse-quently at cost less accumulated amortization and impair-ment losses. Amortization is on a straight-line basis over the estimated useful life and amounts to 5–12 years for technol-ogy and 8–15 years for customer relationships. Acquisition-related intangible assets with an indefinite useful life are tested for impairment annually in the same way as goodwill.
Other intangible assetsAn intangible asset that is not acquisition-related is recog-nized only if it is likely that the future economic benefits associated with the asset will flow to the Group, and if the cost of the asset can be reliably measured. Such an asset is initially recognized at cost and is amortized over its esti-mated useful life, usually between three and five years. The carrying amount is the cost less accumulated amortization and impairment losses.
Property, plant and equipmentProperty, plant and equipment are recognized at cost less accumulated depreciation and impairment losses. Cost includes expenditure directly attributable to acquisition of the asset. Subsequent expenditure is capitalized if it is proba-ble that economic benefits associated with the asset will flow to the Group, and if the cost can be reliably measured. Expend-iture on repairs and maintenance is expensed as incurred. Depreciable amount is the cost of an asset less its estimated residual value. Land is not depreciated. For other assets, cost is
depreciated over the estimated useful life, which for the Group results in the following average depreciation periods:• Buildings 25–50 years• Land improvements 10–25 years.• Machinery 7–10 years• Equipment 3–6 years
The residual value and useful life of assets are reviewed at each reporting date and adjusted when necessary. Gain or loss on the disposal of property, plant and equipment is recognized in the income statement as ‘Other operating income’ or ‘Other operating expenses’, and consists of the difference between the selling price and the carrying amount.
LeasingThe Group’s leasing is chiefly operating leasing. The lease payments are expensed on a straight-line basis over the term of the lease and are recognized as operating expenses.
ImpairmentAssets with an indefinite useful life are not amortized but are tested for impairment on an annual basis. For impairment testing purposes, assets are grouped at the lowest organiza-tional level where there are separate identifiable cash flows, so-called cash generating units (CGU).
For assets that are depreciated/amortized, impairment testing is carried out when events or circumstances indicate that the carrying amount may not be recoverable.Impairment losses are recognized in the amount by which the carrying amount of the asset exceeds the recoverable amount. The recoverable amount is the higher of an asset’s fair value less selling expenses and its value in use.
InventoriesInventories are valued in accordance with the ‘first in, first out’ principle at the lower of cost and net realizable value at the reporting date. Deductions are made for internal profits arising from deliveries between Group companies. Work in progress and finished goods include both direct costs incurred and a fair allocation of indirect production costs.
Trade receivablesTrade receivables are recognized initially at fair value and subsequently measured at amortized cost using the effective interest method.
Regarding provisions for expected credit losses on trade receivables, see the section Impairment of financial assets. The year’s change in expected credit losses is recognized in the income statement as selling expenses.
Financial assetsFinancial assets include cash and cash equivalents, trade receivables, short-term investments, derivatives and other financial assets. The Group applies IFRS 9 from 1 January 2018, but has chosen not to restate comparative figures. Comparative figures are therefore presented in accordance with previous accounting principles. Information about accounting principles for financial assets until 31 December 2017 can be found at the end of Note 1.
Under IFRS 9, the Group classifies financial assets in the categories financial assets at amortized cost, financial assets at fair value through profit or loss, or financial assets at fair value through other comprehensive income.
Financial assets at amortized costFinancial assets at amortized cost mainly comprise trade receivables and cash and cash equivalents. A financial asset is measured at amortized cost if the asset is held within a busi-ness model whose objective is to hold financial assets to col-
Note 1 cont.
ASSA ABLOY ANNUAL REPORT 201872
NOTES

lect their contractual cash flows, and the contractual terms of the financial asset give rise, on specified dates, to cash flows that are solely payments of principal and interest on the principal amount outstanding.
Financial assets in this category are initially recognized at fair value plus transaction costs that are directly related to the purchase and then at amortized cost.
Financial assets at fair value through other comprehensive incomeA financial asset is measured at fair value through other comprehensive income if the asset is held within a business model whose objective is achieved by both collecting con-tractual cash flows and selling financial assets, and also the contractual terms of the financial asset give rise on specified dates to cash flows that are solely payments of principal and interest on the principal amount outstanding.
Financial assets in this category are initially recognized at fair value plus transaction costs that are directly related to the purchase and then at fair value through other compre-hensive income. As of the reporting date the Group has no financial assets in this category.
Financial assets at fair value through profit or lossFinancial assets that are not recognized in any of the other categories are measured at fair value through profit or loss. Financial assets in this category are initially recognized at fair value. Transaction costs related to financial assets recog-nized in this category are expensed directly in the income statement. As of the reporting date, this category comprises shares and participations.
Impairment of financial assetsFrom 1 January 2018 the Group has applied the IFRS 9 simpli-fied approach to measuring expected credit losses for trade receivables. Under this approach, a provision is made for life-time expected credit losses for the trade receivable. For cal-culation of expected credit losses, the trade receivables are grouped based on the number of days past due. Expected credit losses on trade receivables that are not past due are primarily based on actual credit losses from recent years.
Impairment that would be considered for other financial assets that are within the scope of expected credit losses have been assessed to be immaterial.
Financial liabilitiesFinancial liabilities include deferred considerations, loan liabilities, trade payables and derivative instruments. Recog-nition depends on how the liability is classified. The Group classifies financial liabilities in the categories: financial liabili-ties at amortized cost and financial liabilities at fair value through profit or loss.
Financial liabilities are initially measured at fair value less, for a financial liability that is not measured at fair value through profit or loss, transaction costs that are directly related to the acquisition or issue of the financial liability. After initial recognition, financial liabilities are recognized either at amortized cost or at fair value through profit or loss, depending on the classification of the financial liability.
Financial liabilities at fair value through profit or lossThis category includes derivatives with a negative fair value that are not used for hedge accounting and deferred consid-erations. Liabilities are measured at fair value on a continu-ous basis and changes in value are recognized in the income statement.
Loan liabilitiesLoan liabilities are initially valued at fair value, net of transac-tion costs, and subsequently at amortized cost. Amortized cost is determined based on the effective interest rate calcu-lated when the loan was raised. Accordingly, surplus values and negative surplus values as well as direct issue expenses are allocated over the term of the loan. Non-current loan lia-bilities have an anticipated term of more than one year, while current loan liabilities have a term of less than one year.
Trade payablesTrade payables are initially valued at fair value, and sub-sequently at amortized cost using the effective interest method.
Recognition and measurement of financial assets and liabilitiesAcquisitions and sales of financial assets are recognized on the trade date, the date on which the Group commits to pur-chase or sell the asset. Transaction costs are initially included in fair value for all financial instruments, except for those rec-ognized at fair value through profit or loss where the transac-tion cost is recognized through profit or loss. The fair value of quoted investments is based on current bid prices. In the absence of an active market for an investment, the Group applies various measurement techniques to determine fair value. These include use of available information on current arm’s length transactions, comparison with equivalent assets and analysis of discounted cash flows. A financial asset is derecognized from the balance sheet when the right to receive cash flows from the asset expires or is transferred to another party through the transfer of all the risks and bene-fits associated with the asset to the other party. A financial liability is derecognized from the balance sheet when the obligation is fulfilled, cancelled or expires, see above.
Financial assets and liabilities are offset against each other and the net amount is recognized in the balance sheet when there is a legal right of set-off and there is an intention to set-tle the items by a net amount. See note 34 for disclosures about offsetting of financial assets and liabilities.
Derivative instruments and hedgingDerivative instruments are recognized in the balance sheet at the transaction date and are measured at fair value, both initially and in subsequent revaluations. The method for rec-ognizing profit or loss depends on whether the derivative instrument is designated as a hedging instrument, and if so, the nature of the hedged item. For derivatives not desig-nated as hedging instruments, changes in value are recog-nized on a continuous basis through profit or loss under financial items, either as income or expense.
The Group designates derivatives as follows:i) Fair value hedge: a hedge of the fair value of an identified liability;ii) Cash flow hedge: a hedge of a certain risk associated with a forecast cash flow for a certain transaction; oriii) Net investment hedge: a hedge of a net investment in a foreign subsidiary.
When entering into the hedge transaction, the Group docu-ments the relationship between the hedging instrument and hedged items, as well as its risk management strategy for the hedge. The Group also documents its assessment, both on inception and on a regular basis, of whether the derivative instruments used in hedge transactions are effective in offset-ting changes in fair value attributable to the hedged items.
The fair value of forward exchange contracts is calculated at net present value based on prevailing forward rates on the reporting date, while interest rate swaps are measured by estimating future discounted cash flows.
Note 1 cont.
ASSA ABLOY ANNUAL REPORT 2018 73
NOTES

For information on the fair value of derivative instruments, see Note 34, ‘Financial risk management and financial instru-ments’. Derivatives at fair value, with a maturity of more than 12 months, are classified as non-current interest-bearing lia-bilities or receivables. Other derivatives are classified as cur-rent interest-bearing liabilities and investments respectively.
Fair value hedgesFor derivatives that are designated and qualify as fair value hedges, changes in value of both the hedged item and the hedging instrument are recognized on a continuous basis in the income statement (under financial items). Fair value hedges are used to hedge interest rate risk in borrowing linked to fixed interest terms. If the hedge would no longer qualify for hedge accounting, the fair value adjustment of the carrying amount is dissolved through profit or loss over the remaining term using the effective interest method.
Cash flow hedgesFor derivatives that are designated and qualify as cash flow hedges, changes in value of the hedging instrument are rec-ognized on a continuous basis in other comprehensive income for the part relating to the effective portion of the hedges. Gain or loss arising from ineffective portions of derivatives is recognized directly in the income statement under financial items. When a hedging instrument expires, is sold or no longer qualifies for hedge accounting, and accu-mulated gains or losses relating to the hedge are recognized in equity, these gains/losses remain in equity and are taken to income, while the forecast transaction is finally recog-nized in the income statement. When a forecast transaction is no longer expected to occur, the accumulated gain or loss recognized in equity is immediately transferred to Other comprehensive income in the income statement. When a forecast transaction is no longer expected to occur, the gain or loss recognized in Other comprehensive income is recognized directly under financial items.
Net investment hedgesFor derivatives that are designated and qualify as net invest-ment hedges, the portion of value changes in fair value des-ignated as effective is recognized in other comprehensive income. The ineffective portion of the gain or loss is recog-nized directly in profit or loss for the period under financial items. Accumulated gain or loss in other comprehensive income is recognized in the income statement when the foreign operation, or part thereof, is sold.
ProvisionsA provision is recognized when the Group has a legal or con-structive obligation resulting from a past event and it is prob-able that an outflow of resources will be required to settle the obligation, and that a reliable estimate of the amount can be made. Provisions are recognized at a value equivalent to the outflow of resources that will probably be required to settle the obligation. The amount of a provision is dis-counted to present value where the effect of time value is considered material.
Assets and liabilities of disposal group classified as held for saleAssets and liabilities are classified as held for sale when their carrying amounts will principally be recovered through a sale and when such a sale is considered highly probable. They are recognized at the lower of carrying amount and fair value less selling expenses.
Remuneration of employeesThe Group operates both defined contribution and defined benefit pension plans. Comprehensive defined benefit plans
are found chiefly in the US, the UK and Germany. Post-employ-ment medical benefits are also provided, mainly in the US, and are reported in the same way as defined benefit pension plans. Calculations relating to the Group’s defined benefit plans are performed by independent actuaries and are based on a num-ber of actuarial assumptions such as discount rate, future infla-tion and salary increases. Obligations are valued on the report-ing date at their discounted value. For funded plans, obliga-tions are reduced by the fair value of the plan assets. Actuarial gains and losses resulting from experience-based adjustments and changes in actuarial assumptions are recognized in other comprehensive income during the period they arise. The pen-sion expense for defined benefit plans is spread over the employee’s service period. The Group’s payments relating to defined contribution pension plans are recognized as an expense in the period to which they relate, based on the ser-vices performed by the employee. Swedish Group companies calculate tax on pension costs based on the difference between pension expense determined in accordance with IAS 19 and pension expense determined in accordance with the regulations applicable in the legal entity.
Equity-based incentive programsThe Group has equity-based remuneration plans in the form of ASSA ABLOY’s long-term incentive program presented for the first time at the 2010 Annual General Meeting. Detailed information about the structure of the various programs can be found in Note 33 Employees. For the long-term incentive program, personnel costs during the vesting period are rec-ognized based on the shares’ fair value on the allotment date, that is, when the company and the employees entered into an agreement on the terms and conditions for the pro-gram. The long-term incentive program through 2017 com-prised two parts: a matching part where the employee receives one share for every share the latter invests during the term of the program, and a performance-based part where the outcome is based on the company’s financial results (EPS target) during the period. The program requires that the employee continues to invest in the long-term incentive program and that the latter remains employed in the ASSA ABLOY Group. Beginning in 2018, no matching por-tion is included in the long-term incentive programs.
Fair value is based on the share price on the allotment date; a reduction in fair value relating to the anticipated divi-dend has not been made as the participants are compen-sated for this. The employees pay a price equivalent to the share price on the investment date. The vesting terms are not stock market based and affect the number of shares that ASSA ABLOY will give to the employee when matching. If an employee stops investing in the program, all remaining per-sonnel costs are immediately recognized in the income statement. Personnel costs for shares relating to the perfor-mance-based program are calculated on each accounting date based on an assessment of the probability of the perfor-mance targets being achieved. The costs are calculated based on the number of shares that ASSA ABLOY expects to need to settle at the end of the vesting period. When match-ing shares, social security contributions must be paid in some countries to the value of the employee’s benefit. This value is based on fair value on each accounting date and recognized as a provision for social security contributions.
The long-term incentive programs are essentially equity settled and an amount equivalent to the personnel cost is recognized against retained earnings in equity. In the income statement, the personnel cost is allocated to the respective function.
Earnings per shareEarnings per share before dilution is calculated by dividing the net income attributable to the Parent company’s share-
Note 1 cont.
ASSA ABLOY ANNUAL REPORT 201874
NOTES

Note 1 cont. holders by the weighted average number of outstanding shares (less treasury shares). Earnings per share after dilution is calculated by dividing the net income attributable to the Parent company’s shareholders by the sum of the weighted average number of ordinary shares and potential ordinary shares that may give rise to a dilutive effect. The dilutive effect of potential ordinary shares is only recognized if their conversion to ordinary shares would lead to a reduction in earnings per share after dilution.
DividendDividend is recognized as a liability after the Annual General Meeting has approved the dividend.
Financial assets – Accounting principles applied through 31 December 2017Financial assets are classified in the following categories: financial assets at fair value through profit or loss, available-for-sale financial assets, and loans and receivables. Manage-ment determines the classification of financial assets at ini-tial recognition.
Financial assets at fair value through profit or lossThis category is divided into two sub-categories: financial assets held for trading, and those classified on acquisition as financial assets at fair value through profit or loss. A financial asset is classified in this category if acquired principally for the purpose of selling in the short term or if classified as such by management. Derivatives are also classified as held for trading provided they are not defined as hedges. Assets in this category are classified as current assets.
Available-for-sale financial assetsAvailable-for-sale financial assets are non-derivative assets that have been identified as available for sale or assets that have not been classified in any other category. They are included in non-current assets, unless management intends to sell the asset within 12 months of the end of the reporting period. Changes in fair value are recognized in Other com-prehensive income.
Loans and receivablesLoans and receivables are non-derivative financial assets with fixed or determinable payment streams, which are not quoted in an active market. They are recognized in current assets, except for receivables maturing more than 12 months after the reporting date, which are classified as non-current assets.
Loans and receivables are initially recognized at fair value and subsequently carried at amortized cost using the effec-tive interest method.
Parent companyThe Group’s Parent company, ASSA ABLOY AB, is responsible for Group management and provides Group-wide functions. The Parent company’s revenue consists of intra-Group fran-chise and royalty revenues. The significant balance sheet items consist of shares in subsidiaries, intra-Group receiva-bles and liabilities, and external borrowing. The Parent com-pany has prepared its annual accounts in accordance with the Swedish Annual Accounts Act (1995:1554) and the Swedish Financial Reporting Board’s RFR 2 Accounting for Legal Entities. RFR 2 requires the Parent company, in its annual accounts, to apply all the International Financial Reporting Standards (IFRS) adopted by the EU in so far as this is possible within the framework of the Annual Accounts Act and with regard to the relationship between accounting and taxation. The recommendation states which exceptions from and additions to IFRS should be made.
RevenueThe Parent company’s revenue consists of intra-Group franchise and royalty revenues. These are recognized in the income statement as ‘Other operating income’ to make clear that the Parent company has no product sales like other Group companies with external operations.
DividendDividend revenue is recognized when the right to receive payment is considered certain.
Research and development costsResearch and development costs are expensed as incurred.
Intangible assetsIntangible assets comprise patented technology and other intangible assets. They are amortized over 4–5 years.
Property, plant and equipmentProperty, plant and equipment owned by the Parent com-pany are recognized at cost less accumulated depreciation and any impairment losses in the same way as for the Group. They are depreciated over their estimated useful life, which is 5–10 years for equipment and 4 years for IT equipment.
Trade receivablesTrade receivables are recognized initially at fair value and subsequently measured at amortized cost using the effective interest method. From 1 January 2018 the Parent company has applied the IFRS 9 simplified approach to measuring the expected credit loss allowance for trade receivables. How-ever, the expected credit losses attributable to the Parent company’s trade receivables have been assessed to be immaterial.
Pension obligationsThe Parent company’s pension obligations are accounted for in accordance with FAR RedR 4 and are covered by taking out insurance with an insurance company.
LeasingIn the Parent company all lease agreements are classified as operating leases.
Shares in subsidiariesShares in subsidiaries are recognized at cost less impairment losses. When there is an indication that the value of shares and interests in subsidiaries or associates has fallen, the recoverable amount is calculated. If this is lower than the carrying amount, an impairment loss is recognized. Impair-ment losses are recognized in Financial expenses in the income statement.
Financial instrumentsDerivative instruments are recognized at fair value. Changes in the value of derivatives are recognized in profit or loss.
Group contributionsThe Parent company recognizes Group contributions in accordance with RFR 2. Group contributions received and paid are recognized under appropriations in the income statement. The tax effect of Group contributions is recog-nized in accordance with IAS 12 in the income statement.
Contingent liabilitiesThe Parent company has guarantees on behalf of its subsidi-aries. Such an obligation is classified as a financial guarantee in accordance with IFRS. For these guarantees, the Parent company applies the alternative rule in RFR 2, reporting these guarantees as a contingent liability.
ASSA ABLOY ANNUAL REPORT 2018 75
NOTES

Contract assets and contract liabilitiesThe Group recognizes the following revenue-related contract assets and contract liabilities:
Contract assetsGroup
SEK M 2017 2018Accrued revenue 231 272Total 231 272
Contract liabilitiesGroup
SEK M 2017 2018Long-term advances from customers and deferred revenue 28 31Short-term advances from customers and deferred revenue 1,241 1,722Total 1,270 1,753
Contract liabilities during the year have increased by SEK 483 M. Acquired companies account for SEK 81 M of this increase. Divested companies have not had any effect on this item. The total contract liability as at 31 December 2017 of SEK 1,270 M has in all important respects been recognized in 2018.
Remaining performance obligationsThe total transaction price allocated to unsatisfied perfor-mance obligations at the reporting date amounts to SEK 12,282 M. Of this amount, SEK 11,572 M is expected to be recognized as revenue in 2019, while an estimated SEK 710 M will be recognized as revenue in 2020 or later.
In accordance with the transition provisions in IFRS 15, the Group does not disclose information about the total transaction price allocated to unsatisfied performance obligations as at 31 December 2017.
Customer sales by countryGroup
SEK M 2017 2018US 26,940 30,970China 4,853 4,768Sweden 4,203 4,551France 3,714 3,960United Kingdom 3,134 3,728Germany 3,193 3,310Canada 2,420 2,659Australia 2,145 2,100Netherlands 1,866 2,090Finland 1,761 1,964South Korea 1,556 1,736Norway 1,580 1,657Belgium 1,423 1,550Denmark 1,308 1,449Mexico 1,274 1,407Spain 1,057 1,223Poland 697 1,014Brazil 922 945Switzerland 784 902Italy 811 889India 621 624United Arab Emirates 585 609Austria 632 609South Africa 488 592New Zealand 484 490
Group
SEK M 2017 2018Czech Republic 447 451Ireland 278 427Saudi Arabia 406 374Chile 365 373Singapore 300 311Hong Kong 280 298Israel 297 294Turkey 362 277Philippines 221 247Thailand 215 239Colombia 243 238Malaysia 251 237Japan 200 220Hungary 182 219Russia 211 212Portugal 189 208Romania 166 206Tanzania 79 202Estonia 161 182Indonesia 158 172Slovakia 138 158Kazakhstan 100 126Croatia 113 126Vietnam 97 121Other countries 2,224 2,335Total 76,137 84,048
Note 2 Sales revenue
Disaggregation of revenue from contracts with customers
Sales by product groupEMEA Americas Asia Pacific
Global Technologies
Entrance Systems Other Group
SEK M 2017 2018 2017 2018 2017 2018 2017 2018 2017 2018 2017 2018 2017 2018Mechanical locks, lock systems and fittings 9,391 10,076 7,304 7,650 4,711 4,978 32 11 9 9 –651 –678 20,796 22,046Electromechanical and electronic locks 5,624 6,605 2,659 3,876 1,827 2,332 10,340 11,938 704 891 –436 –779 20,717 24,863Security doors and hardware 2,760 3,155 7,935 8,220 2,662 2,627 – 2 – – –56 –70 13,301 13,933Entrance automation 306 365 42 70 12 12 – – 21,068 22,862 –105 –103 21,322 23,205Total 18,081 20,201 17,940 19,817 9,211 9,949 10,373 11,951 21,781 23,762 –1,249 –1,630 76,137 84,048
Sales by continentEMEA Americas Asia Pacific
Global Technologies
Entrance Systems Other Group
SEK M 2017 2018 2017 2018 2017 2018 2017 2018 2017 2018 2017 2018 2017 2018Europe 15,677 17,597 49 43 485 551 2,725 3,016 10,611 11,397 –587 –663 28,961 31,941North America 582 606 16,160 18,071 563 923 4,510 5,718 9,239 10,405 –420 –688 30,635 35,036Central and South America 98 100 1,619 1,582 43 48 363 493 84 89 –31 –35 2,176 2,278Africa 686 840 23 14 9 15 349 441 57 60 –24 –28 1,099 1,342Asia 943 951 83 99 6,311 6,610 2,106 2,008 1,269 1,302 –95 –126 10,617 10,843Oceania 93 106 6 8 1,800 1,802 319 275 521 508 –90 –91 2,649 2,608Total 18,081 20,201 17,940 19,817 9,211 9,949 10,373 11,951 21,781 23,762 –1,249 –1,630 76,137 84,048
ASSA ABLOY ANNUAL REPORT 201876
NOTES

Note 3 Auditors’ feesGroup Parent company
SEK M 2017 2018 2017 2018Audit assignmentPwC 52 56 5 5Others 16 16 – –
Audit-related services in addition to audit assign-mentPwC 1 1 0 0
Tax advicePwC 10 8 1 0Others 9 9 1 1
Other servicesPwC 32 17 1 1Others 6 14 0 0Total 126 122 8 7
The auditors’ fee for PwC in Sweden during the year was SEK 8 M (8) and the fee for extra services was SEK 2 M (8).
Note 4 Other operating income and expensesGroup
SEK M 2017 2018Rental income 6 14Business-related taxes –40 –54Profit on sales of non-current assets 45 265Profit/loss on sales of subsidiaries –42 11Transaction expenses from acquisitions –86 –107Exchange rate differences –2 –51Impairment operating assets, etc., in China –191 –400Restructuring costs – –142Revalued Earnout 300 296Other, net 165 –128Total 156 –296
Parent companyOther operating income in the Parent company consists mainly of franchise and royalty revenues from subsidiaries.
Note 5 Share of earnings in associatesGroup
SEK M 2017 2018Agta Record AG 91 146Goal Co., Ltd 25 17PT Jasuindo Arjo Wiggins Security – 3 SARA Loading Bay Ltd 0 –1Saudi Crawford Doors Factory Ltd 12 2Others 0 –Total 129 167
The share of earnings in Agta Record AG has been estimated on the basis of the associated company’s latest available financial report, which is the published Interim Report for the first half of 2018.
Note 6 Operating leasesGroup Parent company
SEK M 2017 2018 2017 2018Lease payments during the year 1,029 1,084 19 11Total 1,029 1,084 19 11
Nominal value of agreed future lease payments:Due for payment in:(2018) 2019 904 1,144 23 13(2019) 2020 726 943 23 11(2020) 2021 542 727 24 4(2021) 2022 398 480 25 0(2022) 2023 276 334 26 0(2023) 2024 or later 373 517 26 0Total 3,218 4,144 147 28
Lease payments during the year consist of fees for assets that are held as operating leases such as rented premises, machinery, and computer equipment. The Group has no single substantial operating leases since the lease agree-ments are spread over a large number of subsidiaries.
Effects of the transition to IFRS 16From 1 January 2019 the Group has applied IFRS 16 Leases. For the transition to the new standard, the Group’s liability arising from obligations for operating leases is SEK 3,718 M. Adjusted for advance lease payments, the liability is SEK 3,711 M. The Group’s total lease liability at the beginning of 2019, including financial lease liability recognized in accordance with IAS 17, is SEK 3,802 M.
The lease liability based on the Group's operating lease obligations as at 31 December 2018 is derived as shown in the table below.
Group
SEK M 2018Obligations, operating leases, as at 31 December 2018 4,144Less: Obligations, short-term leases and low-value leases –187Less: Reclassifications, new assessments, etc. –8Adjusted lease obligations as at 31 December 2018 3,950
Effect of discount at incremental borrowing rate –231Less: Advance lease payments –7Plus: Liabilities, financial leases, as at 31 December 2018 91 Lease liability as at 1 January 2019 3,802
The carrying amount for right-of-use attributable to operat-ing leases measured according to IFRS 16 as at 1 January 2019 is SEK 3,718 M. This amount includes SEK 3,043 M for buildings and land, while the remainder is primarily attribut-able to cars and other vehicles. The Group has chosen to measure right of use for an amount equal to the lease liabil-ity as at the reporting date, adjusted for accrued and advance lease payments. The value of operating leases recognized in accordance with IAS 17 as at 31 December 2018 is SEK 119 M. The total value of the Group’s right-of-use assets as at 1 January 2019 is therefore SEK 3,837 M.
When measuring right-of-use and lease liability, the Group made estimates and assumptions such as whether any options to extend or terminate a lease agreement will be exercised. The discount rate was determined based on the Group’s incremental borrowing rate in different currencies.
The Group’s assessment is that the new rules will have a slight positive impact on operating income. No significant effect on the year´s net income is expected.
ASSA ABLOY ANNUAL REPORT 2018 77
Notes

Note 7 Expenses by natureIn the income statement costs are broken down by function. Below, these same costs are broken down by nature:
Group
SEK M 2017 2018Remuneration of employees (note 33) 21,618 24,485Direct material costs 27,630 30,461Depreciation and amortization (notes 8, 14, 15) 1,688 1,963Other purchase expenses 13,144 15,319Total 64,081 72,228
Note 8 Depreciation and amortizationGroup Parent company
SEK M 2017 2018 2017 2018Intangible assets 598 802 329 593Machinery 528 549 – –Equipment 334 364 10 16Buildings 210 220 – –Land improvements 7 10 – –Finance leases 11 18 – –Total 1,688 1,963 339 609
Note 9 Exchange differences in the income statementGroup Parent company
SEK M 2017 2018 2017 2018Exchange differences rec-ognized in operating income –2 –51 –13 –41Exchange differences recognized in financial expenses (note 11) 20 7 8 –18Total 18 –44 –5 –59
Note 10 Financial incomeGroup Parent company
SEK M 2017 2018 2017 2018Earnings from investments in subsidiaries – – 2,783 2,551Earnings from investments in associates – – 49 64Intra-Group interest income – – 123 190Other financial income 1 3 0 0External interest income and similar items 18 17 0 –Total 19 20 2,955 2,805
Note 11 Financial expensesGroup Parent company
SEK M 2017 2018 2017 2018Intra-Group interest expenses – – –263 –284Interest expenses, other liabilities1 –584 –633 –132 –194Interest expenses, interest rate swaps 31 30 –4 –Interest expenses, currency derivatives –111 –169 – –Exchange rate differences on financial instruments 20 7 8 –18Fair value adjustments on shares and interests – – 0 –136Other financial expenses –43 –54 –27 –22Total –687 –819 –418 –6541 Of which –23 (–14) is fair value adjustments on derivatives, non-hedge
accounting, for the Group.
Note 12 Tax on incomeGroup Parent company
SEK M 2017 2018 2017 2018Current tax –3,025 –3,069 –484 –640Tax attributable to prior years 279 82 – 18Withholding tax –52 –34 –6 –2Deferred tax –240 479 187 –26Total –3,038 –2,542 –303 –650
Explanation for the difference between nominal Swedish tax rate and effective tax rate based on income before tax:
Group Parent company
Percent 2017 2018 2017 2018Swedish income tax rate 22 22 22 22Effect of foreign tax rates 8 3 – –Non-taxable income/non-deductible expenses –1 2 –16 –8Exercised/new, not yet meas-ured tax loss carryforwards –1 2 – –Effect of impairment of intan-gible assets – 22 – –Other –2 –3 – –Effective tax rate in income statement 26 48 6 14
Note 13 Earnings per share
Earnings per share before and after dilutionGroup
SEK M 2017 2018Earnings attributable to the Parent company’s shareholders 8,633 2,753Net profit 8,633 2,753Weighted average number of shares issued (thousands) 1,110,776 1,110,776Earnings per share (SEK) 7.77 2.48
None of the Group’s outstanding long-term incentive programs are expected to result in significant dilution in the future.
Earnings per share before and after dilution and excluding items affecting comparability
Group
SEK M 2017 2018Earnings attributable to the Parent company’s shareholders 8,633 2,753Items affecting comparability after tax1 – 6,229Net profit 8,633 8,982Weighted average number ofshares issued (thousands) 1,110,776 1,110,776Earnings per share excluding items affecting comparability (SEK) 7.77 8.091 Items affecting comparability relate to restructuring costs and impairment of
goodwill and other intangible assets
ASSA ABLOY ANNUAL REPORT 201878
NOTES

Note 14 Intangible assetsGroup Parent company
2018, SEK M Goodwill Brands
Other intangible
assets Total Intangible
assetsOpening accumulated acquisition cost 50,394 6,344 8,833 65,571 6,775Purchases – 1 599 600 93Acquisitions of subsidiaries 5,455 300 1,128 6,883 –Divestments of subsidiaries –100 – 0 –100 –Sales, disposals and adjustments – – –170 –170 –Reclassifications – –2 114 112 –Exchange rate difference 1,897 281 438 2,616 –Closing accumulated acquisition cost 57,646 6,924 10,942 75,512 6,868
Opening accumulated amortization/impairment –64 –101 –3,998 –4,163 –3,278Sales, disposals and adjustments – – 144 144 –Reclassifications – 0 –8 –8 –Amortization – –2 –800 –802 –593Impairment –4,199 –1,142 –286 –5,627 –Exchange rate difference 30 6 –231 –195 –Closing accumulated amortization/impairment –4,233 –1,239 –5,179 –10,651 –3,871Carrying amount 53,413 5,685 5,763 64,861 2,997
Group Parent company
2017, SEK M Goodwill Brands
Other intangible
assets Total Intangible
assetsOpening accumulated acquisition cost 47,609 6,451 6,743 60,804 3,357Purchases – 1 555 556 3,279Acquisitions of subsidiaries 4,962 101 1,742 6,805 –Divestments of subsidiaries –76 – – –76 –Sales, disposals and adjustments – 0 –25 –25 –Reclassifications – – 34 34 139Exchange rate difference –2,100 –209 –216 –2,527 –Closing accumulated acquisition cost 50,394 6,344 8,833 65,571 6,775
Opening accumulated amortization/impairment –65 –98 –3,544 –3,708 –2,949Sales, disposals and adjustments – 0 15 14 –Reclassifications – – –5 –5 –Amortization – –2 –596 –598 –329Exchange rate difference 2 0 133 135 –Closing accumulated amortization/impairment –64 –101 –3,998 –4,163 –3,278Carrying amount 50,330 6,243 4,835 61,409 3,497
Other intangible assets consist mainly of customer relations and technology. The carrying amount of intangible assets with an indefinite useful life, excluding goodwill, amounts to SEK 5,640 M (6,197) and relates to brands.
Useful life has been defined as indefinite where the time period, during which an asset is deemed to contribute eco-nomic benefits, cannot be determined.
Because of the continued challenging market in China, during the year the Group took an impairment charge of SEK 5,595 M on goodwill and other intangible assets related to China. The impairment charge is attributable in its entirety to the Asia Pacific cash-generating unit. Of the total impairment charge, SEK 4,199 M relates to goodwill impair-ment, while the remaining SEK 1,396 M is primarily attributa-ble to brands.
Impairment of goodwill and intangible assets of SEK 5,595 M is recognized as a separate line item in the income statement, while other amortization and impairment of intangible assets are mainly recognized as cost of goods sold in the income state-ment. Impairment losses for the year totaled SEK 5,627 M (–), of which SEK 25 M (–) related to restructuring programs.
Impairment testing of goodwill and intangible assets with indefinite useful lifeGoodwill and intangible assets with an indefinite useful life are allocated to the Group’s Cash Generating Units (CGUs), which consist of the Group’s five divisions.
For each cash-generating unit, the Group annually tests goodwill and intangible assets with an indefinite useful life for impairment, in accordance with the accounting principle described in Note 1. Recoverable amounts for Cash Generat-ing Units have been determined by calculating value in use. These calculations are based on estimated future cash flows, which in turn are based on financial budgets for a three-year period approved by management. Cash flows beyond the three-year period are extrapolated using estimated growth rates according to the information below.
Material assumptions used to calculate values in use:• Budgeted operating margin. • Growth rate for extrapolating cash flows beyond the
budget period.• Discount rate after tax used for estimated future
cash flows.
Management has determined the budgeted operating margin based on previous results and expectations of future market development. A growth rate of 3 percent (3) has been used for all CGUs to extrapolate cash flows beyond the budget period. This growth rate is considered to be a con-servative estimate. Further, an average discount rate in local currency after tax has been used in the calculations. The dif-ference in value compared with using a discount rate before tax is not deemed to be material. The discount rate has been determined by calculating the weighted average cost of capital (WACC) for each division.
ASSA ABLOY ANNUAL REPORT 2018 79
NOTES
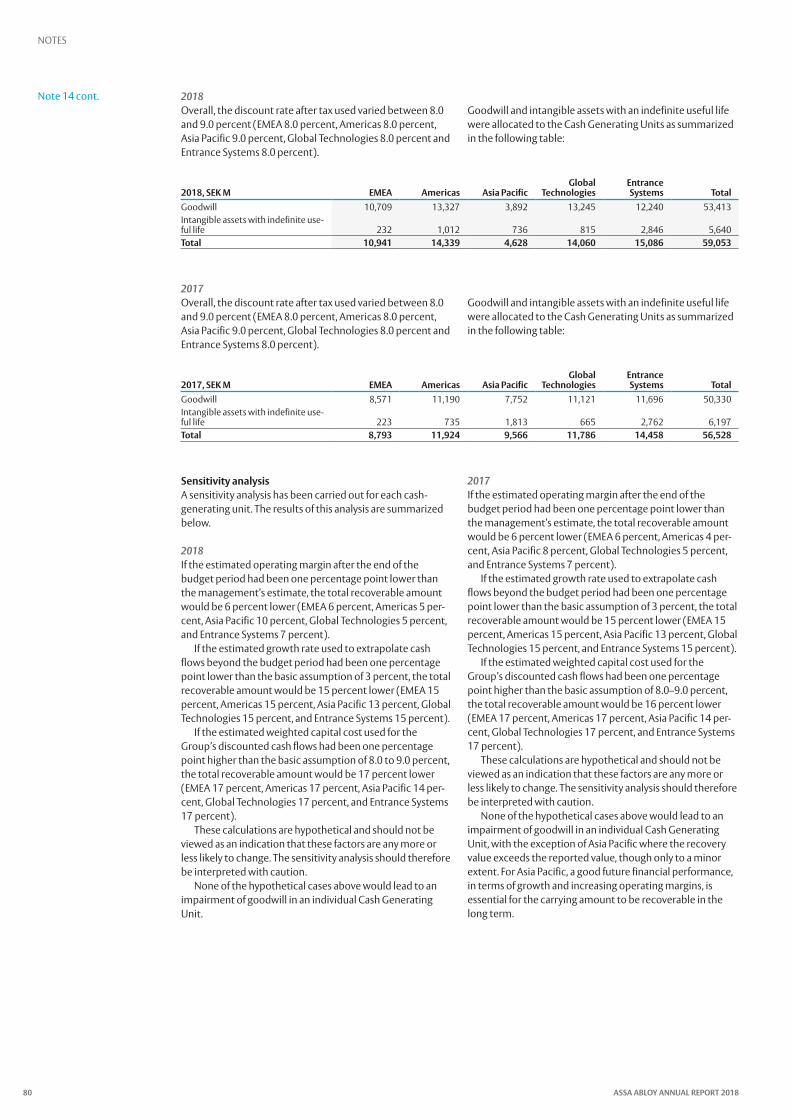
2018Overall, the discount rate after tax used varied between 8.0 and 9.0 percent (EMEA 8.0 percent, Americas 8.0 percent, Asia Pacific 9.0 percent, Global Technologies 8.0 percent and Entrance Systems 8.0 percent).
Goodwill and intangible assets with an indefinite useful life were allocated to the Cash Generating Units as summarized in the following table:
2018, SEK M EMEA Americas Asia PacificGlobal
TechnologiesEntrance Systems Total
Goodwill 10,709 13,327 3,892 13,245 12,240 53,413Intangible assets with indefinite use-ful life 232 1,012 736 815 2,846 5,640Total 10,941 14,339 4,628 14,060 15,086 59,053
2017Overall, the discount rate after tax used varied between 8.0 and 9.0 percent (EMEA 8.0 percent, Americas 8.0 percent, Asia Pacific 9.0 percent, Global Technologies 8.0 percent and Entrance Systems 8.0 percent).
Goodwill and intangible assets with an indefinite useful life were allocated to the Cash Generating Units as summarized in the following table:
2017, SEK M EMEA Americas Asia PacificGlobal
TechnologiesEntrance Systems Total
Goodwill 8,571 11,190 7,752 11,121 11,696 50,330Intangible assets with indefinite use-ful life 223 735 1,813 665 2,762 6,197Total 8,793 11,924 9,566 11,786 14,458 56,528
Sensitivity analysisA sensitivity analysis has been carried out for each cash- generating unit. The results of this analysis are summarized below.
2018If the estimated operating margin after the end of the budget period had been one percentage point lower than the management’s estimate, the total recoverable amount would be 6 percent lower (EMEA 6 percent, Americas 5 per-cent, Asia Pacific 10 percent, Global Technologies 5 percent, and Entrance Systems 7 percent).
If the estimated growth rate used to extrapolate cash flows beyond the budget period had been one percentage point lower than the basic assumption of 3 percent, the total recoverable amount would be 15 percent lower (EMEA 15 percent, Americas 15 percent, Asia Pacific 13 percent, Global Technologies 15 percent, and Entrance Systems 15 percent).
If the estimated weighted capital cost used for the Group’s discounted cash flows had been one percentage point higher than the basic assumption of 8.0 to 9.0 percent, the total recoverable amount would be 17 percent lower (EMEA 17 percent, Americas 17 percent, Asia Pacific 14 per-cent, Global Technologies 17 percent, and Entrance Systems 17 percent).
These calculations are hypothetical and should not be viewed as an indication that these factors are any more or less likely to change. The sensitivity analysis should therefore be interpreted with caution.
None of the hypothetical cases above would lead to an impairment of goodwill in an individual Cash Generating Unit.
2017If the estimated operating margin after the end of the budget period had been one percentage point lower than the management’s estimate, the total recoverable amount would be 6 percent lower (EMEA 6 percent, Americas 4 per-cent, Asia Pacific 8 percent, Global Technologies 5 percent, and Entrance Systems 7 percent).
If the estimated growth rate used to extrapolate cash flows beyond the budget period had been one percentage point lower than the basic assumption of 3 percent, the total recoverable amount would be 15 percent lower (EMEA 15 percent, Americas 15 percent, Asia Pacific 13 percent, Global Technologies 15 percent, and Entrance Systems 15 percent).
If the estimated weighted capital cost used for the Group’s discounted cash flows had been one percentage point higher than the basic assumption of 8.0–9.0 percent, the total recoverable amount would be 16 percent lower (EMEA 17 percent, Americas 17 percent, Asia Pacific 14 per-cent, Global Technologies 17 percent, and Entrance Systems 17 percent).
These calculations are hypothetical and should not be viewed as an indication that these factors are any more or less likely to change. The sensitivity analysis should therefore be interpreted with caution.
None of the hypothetical cases above would lead to an impairment of goodwill in an individual Cash Generating Unit, with the exception of Asia Pacific where the recovery value exceeds the reported value, though only to a minor extent. For Asia Pacific, a good future financial performance, in terms of growth and increasing operating margins, is essential for the carrying amount to be recoverable in the long term.
Note 14 cont.
ASSA ABLOY ANNUAL REPORT 201880
NOTES

Note 15 Property, plant and equipmentGroup Parent company
2018, SEK M Buildings
Land and land
improve-ments Machinery Equipment
Construc-tion in
progressFinance
leases Total EquipmentOpening accumulated acquisition cost 5,811 1,191 9,503 3,763 849 194 21,311 63Purchases 32 10 277 249 625 15 1,208 22Acquisitions of subsidiaries 61 7 81 47 2 15 214 –Divestments of subsidiaries –82 –10 –281 –19 –3 – –395 –Sales and disposals –357 –106 –791 –498 –2 –2 –1,765 –Reclassifications 139 2 583 36 –844 –31 –115 –Exchange rate difference 354 48 654 227 57 11 1,351 –Closing accumulated acquisition cost 5,958 1,142 10,026 3,805 684 203 21,817 85
Opening accumulated amortization, depreciation and impairment –2,909 –151 –7,241 –2,890 – –55 –13,246 –31Sales and disposals 289 18 771 485 – 0 1,563 –Divestments of subsidiaries 28 2 232 15 – – 278 –Impairment incl. reversals –46 0 –72 –33 – – –151 –Depreciation and amortization –220 –10 –549 –364 – –18 –1,160 –16Reclassifications –4 1 –80 98 – –5 11 –Exchange rate difference –191 –6 –519 –200 – –6 –923 –Closing accumulated amortization, depreciation and impairment –3,053 –145 –7,458 –2,889 – –84 –13,628 –47Carrying amount 2,905 997 2,568 916 684 119 8,189 37
Group Parent company
2017, SEK M Buildings
Land and land
improve-ments Machinery Equipment
Construc-tion in
progressFinance
leases Total EquipmentOpening accumulated acquisition cost 6,143 1,215 9,766 3,663 564 – 21,351 51Purchases 119 67 237 214 912 14 1,562 12Acquisitions of subsidiaries 23 12 34 25 1 – 94 –Divestments of subsidiaries – – –3 0 – – –3 –Sales and disposals –251 –52 –412 –150 –8 –1 –873 –Reclassifications –14 –29 290 129 –589 181 –32 –Exchange rate difference –209 –23 –410 –119 –30 1 –790 –Closing accumulated acquisition cost 5,811 1,191 9,503 3,763 849 194 21,311 63
Opening accumulated depreciation and impairment –2,937 –138 –7,399 –2,811 – – –13,286 –21Sales and disposals 141 0 388 137 – 1 667 –Divestments of subsidiaries – – – 0 – – 0 –Impairment incl. reversals 11 –6 –28 –7 – – –29 –Depreciation and amortization –210 –7 –528 –334 – –11 –1,090 –10Reclassifications 5 – 16 28 – –46 3 –Exchange rate difference 82 –1 311 96 – 1 488 –Closing accumulated amortization, depreciation and impairment –2,909 –151 –7,241 –2,890 – –55 –13,246 –31Carrying amount 2,902 1,040 2,261 873 849 140 8,065 32
Impairment losses for the year totaled SEK 151 M (29), of which SEK 89 M (11) related to restructuring programs.
ASSA ABLOY ANNUAL REPORT 2018 81
NOTES

Note 16 Shares in subsidiariesParent company
Company nameCorporate identity number, Registered office
Number of shares
Share of equity
Carrying amount, SEK M
ASSA Sverige AB 556061-8455, Eskilstuna 70 100 197ASSA ABLOY Entrance Systems AB 556204-8511, Landskrona 1,000 100 192ASSA ABLOY Global Solutions AB 556666-0618, Stockholm 1,306,891 100 475ASSA ABLOY Kredit AB 556047-9148, Stockholm 400 100 6,036 ASSA ABLOY Holding AB 559180-8646, Stockholm 6,500 100 0ASSA ABLOY Försäkrings AB 516406-0740, Stockholm 60,000 100 145ASSA ABLOY Asia Holding AB 556602-4500, Stockholm 1,000 100 189ASSA ABLOY OY 1094741-7, Joensuu 800,000 100 4,257ASSA ABLOY Norge A/S 979207476, Moss 150,000 100 538ASSA ABLOY Danmark A/S CVR 10050316, Herlev 60,500 100 376ASSA ABLOY Deutschland GmbH HR B 66227, Berlin 1 100 1,086ASSA ABLOY Nederland Holding B.V. 52153924, Raamsdonksveer 180 100 771Pan Pan DOOR Co LTD 210800004058002, Dashiqiao – 661 2,228ASSA ABLOY France SAS 412140907, R.C.S. Versailles 15,184,271 100 1,964Interlock Holding AG CH-020.3.913.588-8, Zürich 211,000 981 0HID Global Switzerland S.A. CH-232-0730018-2, Granges 2,500 100 47ASSA ABLOY Holding GmbH FN 273601f, A-6175, Kematen 1 100 109ASSA ABLOY Ltd 2096505, Willenhall 1,330,000 100 3,091HID Global Ireland Teoranta 364896, Galway 501,000 100 293Mul-T-Lock Ltd 520036583, Yavne 13,787,856 901 901ASSA ABLOY Holdings (SA) Ltd 1948/030356/06, Roodepoort 100,220 100 217ASSA ABLOY Inc 039347-83, Oregon 100 100 2,410ABLOY Canada Inc. 1148165260, Montreal 1 100 0ASSA ABLOY of Canada Ltd 104722749 RC0003, Ontario 9,621 100 138ASSA ABLOY Australia Pacific Pty Ltd ACN 095354582, Oakleigh, Victoria 48,190,000 100 242Cerramex, S.A de C.V CER8805099Y6, Mexico 4 0 0ASSA ABLOY Mexico, S.A de CV AAM961204CI1, Mexico 50,108,549 100 762Cerraduras y Candados Phillips S.A de C.V CCP910506LK2, Mexico 112 0 0ASSA ABLOY Colombia S.A.S 860009826-8, Bogota 3,115,080 100 203WHAIG Limited EC21330, Bermuda 100,100 100 303ASSA ABLOY Asia Pacific Ltd 53451, Hong Kong 1,000,000 100 72ASSA ABLOY Entrance Systems IDDS AB 556071-8149, Landskrona 25,000,000 100 5,093ASSA ABLOY Portugal, Unipessoal, Lda (Portugal) PT500243700, Alfragide 1 100 0ASSA ABLOY Mobile Services AB 556909-5929, Stockholm 50,000 100 25ASSA ABLOY Holding Italia S.p.A. IT01254420597, Rome 650,000 100 974HID SA (Argentina) CUIT 30-61783980-2, Buenos Aires 2,400 21 0HID Global SAS FR21341213411, Nanterre 1,000,000 100 679CEDES AG CHE-101.321-677, Landquart 300,000 100 635ASSA ABLOY East Africa Ltd C.20402, Nairobi 13,500 100 90Total 34,7381 The Group’s holdings amount to 100 percent.
Note 17 Investments in associatesGroup
2018 Company name Country of registration
Number of shares
Share of equity, %
Carrying amount, SEK M
Agta Record AG Switzerland 5,166,945 39 1,800Goal Co., Ltd Japan 2,778,790 46 587PT Jasuindo Arjo Wiggins Security Indonesia 1,533,412 49 19SARA Loading Bay Ltd United Kingdom 4,990 50 14Talleres Agui S.A. Spain 4,800 40 9Saudi Crawford Doors Ltd Saudi Arabia 800 40 5Others 1Total 2,434
The share of equity in Agta Record AG has been estimated on the basis of the associated company’s latest available financial report, which is the published Interim Report for the first half of 2018. For the period January to June, the company’s revenue totaled SEK 1,817 M (1,682) and income after tax was SEK 136 M (98). The company’s assets totaled SEK 3,622 M (3,199) and total liabilities amounted to SEK 1,095 M (1,033).
Group
2017 Company name Country of registration
Number of shares
Share of equity, %
Carrying amount, SEK M
Agta Record AG Switzerland 5,166,945 39 1,679Goal Co., Ltd Japan 2,778,790 46 519PT Jasuindo Arjo Wiggins Security Indonesia 1,533,412 49 17 SARA Loading Bay Ltd United Kingdom 4,990 50 14Talleres Agui S.A. Spain 4,800 40 8Saudi Crawford Doors Ltd Saudi Arabia 800 40 5Others 1Total 2,243
ASSA ABLOY ANNUAL REPORT 201882
NOTES

Note 18 Deferred taxGroup
SEK M 2017 2018Deferred tax assetsNon-current assets – 104Pension provisions 572 330Tax loss carryforwards and other tax credits 191 149Other deferred tax assets 592 770Deferred tax assets 1,355 1,354
Deferred tax liabilitiesNon-current assets 1,652 1,523Other deferred tax liabilities 566 242Deferred tax liabilities 2,218 1,764Deferred tax assets, net –862 –410
Change in deferred taxOpening balance –445 –862Acquisitions and divestments –172 52Recognized in income statement –240 529Deferred tax from actuarial gain/loss on post-employment benefit obligations –77 –34Exchange rate differences 71 –95Closing balance –862 –410
The Group has tax loss carryforwards and other tax credits of SEK 3,234 M (2,562) for which deferred tax assets have not been recognized, as it is uncertain whether they can be offset against taxable income in future taxation.
Note 19 Other financial assetsGroup Parent company
SEK M 2017 2018 2017 2018Investments in associates, Parent company – – 1,621 1,621Other shares and interests 11 8 – –Non-current interest- bearing liabilities 171 106 – –Other non-current receivables 44 37 187 161Total 227 152 1,808 1,782
Note 20 InventoriesGroup
SEK M 2017 2018Materials and supplies 2,750 3,057Work in progress 1,861 2,291Finished goods 4,563 5,640Advances paid 256 328Total 9,430 11,316
Impairment of inventories during the year amounted to SEK 230 M (269).
Note 21 Trade receivablesGroup
SEK M 2017 2018Trade receivables 14,228 15,674Loss allowance –1,160 –1,178Total 13,068 14,496
Maturity analysis
Current trade receivables 9,316 10,615Trade receivables due:< 3 months 3,173 3,2213–12 months 859 930>12 months 880 908
4,912 5,059Impaired trade receivables:Current –35 –65Trade receivables due:< 3 months –104 –1103–12 months –220 –133>12 months –802 –870
–1,160 –1,178Total 13,068 14,496
Trade receivables by currency 2017 2018USD 4,201 5,083EUR 3,335 3,478CNY 1,310 1,216GBP 599 762SEK 589 659KRW 399 448CAD 219 325AUD 312 269Other currencies 2,104 2,265Total 13,068 14,496
Change in loss allowance for trade receivables 2017 2018Opening balance 959 1,160Acquisitions and divestments of subsidiaries 48 15Receivables written off –103 –262Reversal of unused amounts –46 –85Provision for bad debts 335 306Exchange rate differences –33 45Closing balance 1,160 1,178
The closing loss allowance as at 31 December 2017, calcu-lated under IAS 39, was SEK 1,160 M. Opening loss allowance as at 1 January 2018 was calculated under IFRS 9. The recal-culation did not affect the size of the loss allowance.
Note 22 Parent company’s equityThe Parent company’s equity is split between restricted and non-restricted equity. Restricted equity consists of share capital, revaluation reserve, statutory reserve and the fund for development expenses. The statutory reserve contains premiums (amounts received from share issues that exceed the nominal value of the shares) relating to shares issued up to 2005.
Non-restricted equity consists of share premium reserves, retained earnings and net income for the year.
Note 23 Share capital, number of shares and dividend per share
Number of shares, thousands Share capital,
SEK KSeries A
sharesSeries B
shares TotalOpening balance at 1 January 2017 57,525 1,055,052 1,112,576 370,859Closing balance at 31 December 2017 57,525 1,055,052 1,112,576 370,859
Number of votes, thousands 575,259 1,055,052 1,630,311
Opening balance at 1 January 2018 57,525 1,055,052 1,112,576 370,859Closing balance at 31 December 2018 57,525 1,055,052 1,112,576 370,859
Number of votes, thousands 575,259 1,055,052 1,630,311
All shares have a par value of around SEK 0.33 (0.33) and give shareholders equal rights to the company’s assets and earnings. All shares are entitled to dividends subsequently determined. Each Series A share carries ten votes and each Series B share one vote. All issued shares are fully paid.
The weighted average number of shares was 1,110,776 (1,110,776) during the year. None of the Group’s outstand-ing long-term incentive programs are expected to result in significant dilution in the future.
The total number of treasury shares as at 31 December 2018 amounted to 1,800,000. No shares have been repur-chased during the year.
Dividend per shareThe dividend paid during the financial year totaled SEK 3,666 M (3,332), equivalent to SEK 3.30 (3.00) per share. A dividend for 2018 of SEK 3.50 per share, a total of SEK 3,888 M, will be proposed at the Annual General Meeting on 25 April 2019.
ASSA ABLOY ANNUAL REPORT 2018 83
NOTES

Note 24 Post-employment employee benefitsPost-employment employee benefits include pensions and medical benefits. Pension plans are classified as either defined benefit plans or defined contribution plans. Pension obligations in the balance sheet mainly relate to defined benefit plans. ASSA ABLOY has defined benefit pension plans in a number of countries. The most comprehensive defined benefit plans are found in the US, the UK and Germany.
The defined benefit plans in the US and the UK are secured by assets in pension funds, while the plans in Germany are chiefly unfunded. In the US, there are also unfunded plans for post-employment medical benefits.
The operations of pension funds are regulated by national regulations and practice. The responsibility for monitoring the pension plans and their assets rests mainly with the boards of the pension funds, but can also rest more directly with the company. The Group has an overall policy for the limits within which asset allocation should be made. Each pension fund adjusts its local asset allocation according to the nature of the local pension obligation, particularly the remaining term and the breakdown between active mem-bers and pensioners. The Group has not changed the pro-cesses used for managing these risks compared with previous periods.
The investments are well diversified so that depreciation of an individual investment should not have any material impact on the plan assets. The majority of assets are invested in shares as the Group considers that shares produce the best long-term return at an acceptable risk level. The total allocation to shares should not, however, exceed 60 percent of total assets. Fixed income assets are invested in a combi-nation of ordinary government bonds and corporate bonds but also in inflation-indexed bonds. The average term of these is normally somewhat shorter than the term of the underlying liability. Bonds should not account for less than 30 percent of assets. A small proportion of assets is also invested in real estate and alternative investments, mainly hedge funds.
As at 31 December 2018, shares accounted for 43 percent (45) and fixed income securities for 35 percent (33) of plan assets, while other assets accounted for 23 percent (22). The actual return on plan assets in 2018 was SEK –230 M (386).
Amounts recognized in the income statementPension costs, SEK M 2017 2018Defined contribution pension plans 566 647Defined benefit pension plans 147 175Post-employment medical benefit plans 30 28Total 744 849
of which, included in:Operating income 658 771Net financial items 86 79
Amounts recognized in the balance sheetPension provisions, SEK M 2017 2018Provisions for defined benefit pension plans 2,350 2,296Provisions for post-employment medical benefit plans 573 571Provisions for defined contribution pen-sion plans 10 12Total 2,933 2,880
Pensions with AlectaCommitments for old-age pensions and family pensions for salaried employees in Sweden are secured in part through insurance with Alecta. According to UFR 10, this is a defined benefit plan that covers many employers. For the 2018 finan-cial year, the company has not had access to information making it possible to report this plan as a defined benefit plan. Pension plans in accordance with ITP secured through insurance with Alecta are therefore reported as defined contribution plans. The year’s pension contributions that are contracted to Alecta total SEK 30 M (33), of which SEK 13 M (11) relates to the Parent company. Pension contributions are expected to remain largely unchanged in 2019.
Alecta’s surplus can be distributed to policyholders and/or the insured. As at 30 September 2018, Alecta’s surplus expressed as the collective consolidation level amounted preliminarily to 159 percent (154 percent as at 31 Decem-ber 2017). The collective consolidation level consists of the market value of Alecta’s assets as a percentage of its insur-ance commitments calculated according to Alecta’s actuar-ial calculation assumptions, which do not comply with IAS 19. The collective consolidation level is normally allowed to vary between 125 and 155 percent. If the consolidation level deviates from this range, measures in the form of an adjust-ment of the premium level should be taken to return to the normal range.
Specification of defined benefit pension plans, post-employment medical benefits and plan assets by countryUnited Kingdom Germany US Other countries Total
Specification of defined benifits, SEK M 2017 2018 2017 2018 2017 2018 2017 2018 2017 2018Present value of funded obligations 2,878 2,790 95 99 2,046 1,968 1,179 1,352 6,199 6,209
Fair value of plan assets –2,658 –2,514 –21 –21 –1,604 –1,735 –799 –958 –5,081 –5,227Net value of funded plans 220 276 75 79 443 234 380 394 1,118 982
Present value of unfunded obligations – – 689 735 – – 543 580 1,232 1,314Present value of unfunded medical benefits – – – – 568 567 5 5 573 571Net value of defined benefit pension plans 220 276 764 813 1,011 800 928 978 2,923 2,868
Provisions for defined contribution pension plans – – – – – – 10 12 10 12Total 220 276 764 813 1,011 800 938 990 2,933 2,880
ASSA ABLOY ANNUAL REPORT 201884
NOTES

Movement in obligations2018, SEK M
Post-employment medical benefits
Defined benefitpension plans Plan assets Total
Opening balance 1 January 2018 573 7,431 –5,081 2,923
Acquisitions and divestments – 120 91 29Reclassifications 64 –64 – –
Recognized in the income statement:Current service cost 6 118 – 124Past service cost – 15 – 15Impairment/reversal of pension receivables – –15 – –15Interest expense/income 21 197 –140 79Total recognized in the income statement 28 315 –140 202
Recognized in other comprehensive income:Return on plan assets,excluding amounts included above – – 369 369Gain/loss from change in demographic assumptions –112 –163 – –275Gain/loss from change in financial assumptions – –125 – –125Experience-based gains/losses – –8 – –8Remeasurement of net pension obligationsExchange rate differences 48 356 –262 142Total recognized in other comprehensive income –63 59 107 378
Contributions and payments:Employer contributions – – –296 –296Employee contributions 0 19 –19 0Payments –30 –320 257 –94Settlements – –37 37 –Total payments –30 –338 –22 –390Closing balance 31 December 2018 571 7,523 –5,227 2,868
2017, SEK MPost-employment
medical benefitsDefined benefit
pension plans Plan assets TotalOpening balance 1 January 2017 610 7,560 –5,063 3,107
Acquisitions and divestments – 6 – 6
Recognized in the income statement:Current service cost 7 108 – 115Past service cost – 3 – 3Impairment/reversal of pension receivables – –26 – –26Interest expense/income 23 199 –136 86Total recognized in the income statement 30 284 –136 178
Recognized in other comprehensive income:Return on plan assets,excluding amounts included above – – –254 –254Gain/loss from change in demographic assumptions 22 87 – 109Gain/loss from change in financial assumptions – 116 – 116Experience-based gains/losses – 2 – 2Remeasurement of net pension obligations 22 206 –254 –26Exchange rate differences –58 –248 214 –92Total recognized in other comprehensive income –36 –43 –40 –118
Contributions and payments:Employer contributions – – –161 –161Employee contributions 0 17 –17 0Payments –32 –351 294 –89Settlements – –43 43 –Total payments –31 –377 158 –250Closing balance 31 December 2017 573 7,431 –5,081 2,923
Plan assets allocationPlan assets 2017 2018Publicly traded shares 2,309 2,244Government bonds 689 651Corporate bonds 736 842Inflation-linked bonds 250 312Property 302 345Cash and cash equivalents 22 41Alternative investments 86 65Other assets 687 727Total 5,081 5,227
Note 24 cont.
ASSA ABLOY ANNUAL REPORT 2018 85
NOTES

Key actuarial assumptionsUnited Kingdom Germany US
Key actuarial assumptions (weighted average), % 2017 2018 2017 2018 2017 2018Discount rate 2.5 2.8 1.8 1.8 3.6 4.3Expected annual salary increases n/a n/a 2.8 2.8 n/a n/aExpected annual pension increases 2.1 2.0 1.3 1.5 2.0 2.0Expected annual medical benefit increases n/a n/a n/a n/a 6.9 6.4Expected annual inflation 2.4 2.4 1.3 1.5 3.0 3.0
Sensitivity analysis of defined benefit obligations and post-employment medical benefitsThe effect on defined benefit obligations and post-employment medical benefits of a 1.0 percentage change in some actuarial assumptions, change in percent +1.0% –1.0 %
Discount rate –15.1% 14.6%Expected annual medical benefit increases 8.3% –7.0%
Note 25 Other provisionsGroup
SEK M
Restruc-turing
reserve Other TotalOpening balance at 1 January 2018 944 1,202 2,146Provisions for the year 1,218 106 1,324Acquisitions of subsidiaries – 7 7Reversal of non-utilized amounts – –14 –14Payments –793 –53 –845Utilized during the year, without cash flow impact –209 – –209Reclassifications – –807 –807Exchange rate differences 30 2 32Closing balance at 31 December 2018 1,190 445 1,635
Group
SEK M
Restruc-turing
reserve Other TotalOpening balance at 1 January 2017 1,572 1,170 2,742Provisions for the year – 848 848Acquisitions of subsidiaries – –1 –1Reversal of non-utilized amounts – –38 –38Payments –612 –772 –1,384Utilized during the year, without cash flow impact –11 – –11Exchange rate differences –5 –6 –11Closing balance at 31 December 2017 944 1,202 2,146
Group
Balance sheet breakdown: 2017 2018Other non-current provisions 1,447 745Other current provisions 699 891Total 2,146 1,635
The restructuring reserve at year-end relates mainly to the ongoing restructuring program launched during the year. The restructuring reserve is expected to be used over the next two years. The non-current part of the reserve totaled SEK 339 M. For further information on the restructuring programs, see the Report of the Board of Directors.
Other provisions mainly relate to legal obligations includ-ing future environment-related measures. During the year a provision for taxes was reclassified to the item Current tax liabilities on the balance sheet.
Note 26 Other current liabilitiesGroup
SEK M 2017 2018VAT and excise duties 626 651Employee withholding tax 110 145Advances received 889 1,170Social security contributions and other taxes 89 111Deferred considerations 1,177 1,021Other current liabilities 554 454Total 3,446 3,551
Note 27 Accrued expenses and deferred incomeGroup Parent company
SEK M 2017 2018 2017 2018Personnel-related expenses 2,728 3,227 279 285Customer-related expenses 972 1,022 – –Deferred income 352 553 – –Accrued interest expenses 113 138 54 82Other 1,358 1,457 39 52Total 5,524 6,396 372 419
Note 28 Contingent liabilitiesGroup Parent company
SEK M 2017 2018 2017 2018Guarantees 113 121 – –Guarantees on behalf of subsidiaries – – 11,015 11,522Total 113 121 11,015 11,522
In addition to the guarantees shown in the table above, the Group has a large number of minor bank guarantees for per-formance of obligations in operating activities. No material liabilities are expected as a result of these guarantees.
Group
Maturity profile – guarantees, SEK M 2017 2018<1 year 61 41>1 <2 years 16 42>2 <5 years 19 13>5 years 17 16Total 113 113
Note 29 Assets pledged against liabilities to credit institutions
Group Parent company
SEK M 2017 2018 2017 2018Real estate mortgages 114 97 – –Other mortgages 131 65 – –Total 244 162 – –
Note 24 cont.
ASSA ABLOY ANNUAL REPORT 201886
NOTES
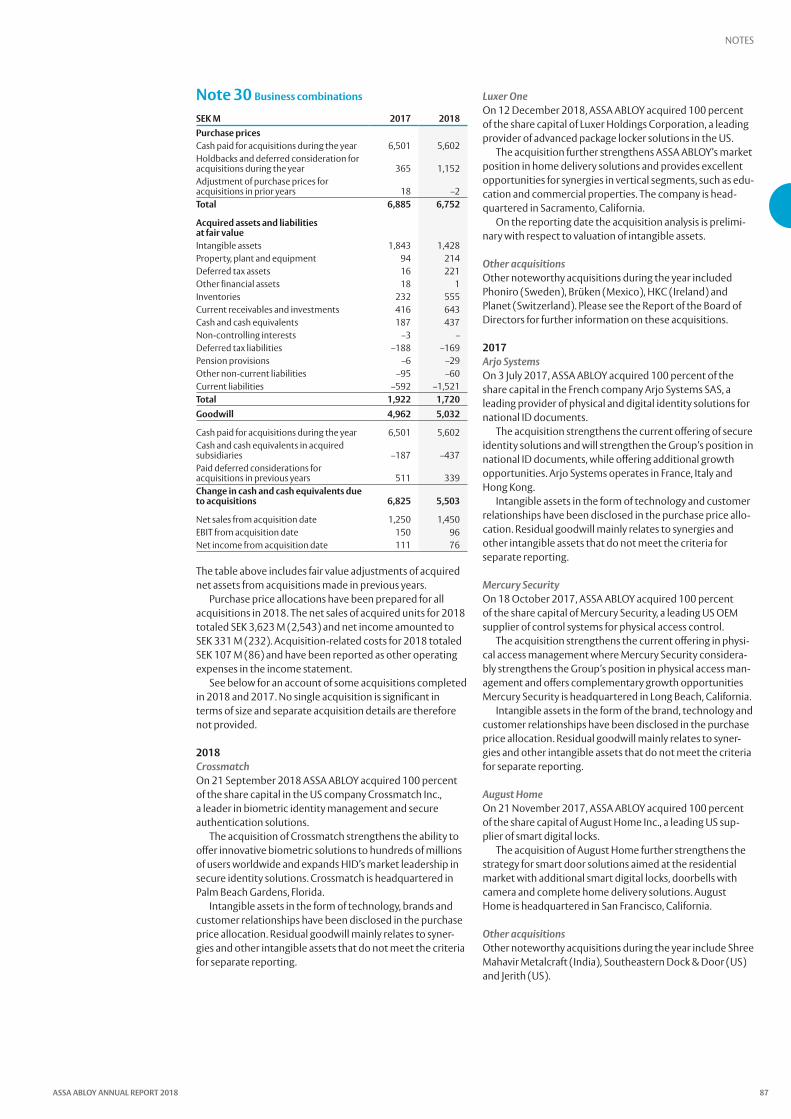
Note 30 Business combinations
SEK M 2017 2018Purchase pricesCash paid for acquisitions during the year 6,501 5,602Holdbacks and deferred consideration for acquisitions during the year 365 1,152Adjustment of purchase prices for acquisitions in prior years 18 –2Total 6,885 6,752
Acquired assets and liabilities at fair valueIntangible assets 1,843 1,428Property, plant and equipment 94 214Deferred tax assets 16 221Other financial assets 18 1Inventories 232 555Current receivables and investments 416 643Cash and cash equivalents 187 437Non-controlling interests –3 –Deferred tax liabilities –188 –169Pension provisions –6 –29Other non-current liabilities –95 –60Current liabilities –592 –1,521 Total 1,922 1,720Goodwill 4,962 5,032
Cash paid for acquisitions during the year 6,501 5,602Cash and cash equivalents in acquired subsidiaries –187 –437Paid deferred considerations for a cquisitions in previous years 511 339Change in cash and cash equivalents due to acquisitions 6,825 5,503
Net sales from acquisition date 1,250 1,450EBIT from acquisition date 150 96Net income from acquisition date 111 76
The table above includes fair value adjustments of acquired net assets from acquisitions made in previous years.
Purchase price allocations have been prepared for all acquisitions in 2018. The net sales of acquired units for 2018 totaled SEK 3,623 M (2,543) and net income amounted to SEK 331 M (232). Acquisition-related costs for 2018 totaled SEK 107 M (86) and have been reported as other operating expenses in the income statement.
See below for an account of some acquisitions completed in 2018 and 2017. No single acquisition is significant in terms of size and separate acquisition details are therefore not provided.
2018CrossmatchOn 21 September 2018 ASSA ABLOY acquired 100 percent of the share capital in the US company Crossmatch Inc., a leader in biometric identity management and secure authentication solutions.
The acquisition of Crossmatch strengthens the ability to offer innovative biometric solutions to hundreds of millions of users worldwide and expands HID’s market leadership in secure identity solutions. Crossmatch is headquartered in Palm Beach Gardens, Florida.
Intangible assets in the form of technology, brands and customer relationships have been disclosed in the purchase price allocation. Residual goodwill mainly relates to syner-gies and other intangible assets that do not meet the criteria for separate reporting.
Luxer OneOn 12 December 2018, ASSA ABLOY acquired 100 percent of the share capital of Luxer Holdings Corporation, a leading provider of advanced package locker solutions in the US.
The acquisition further strengthens ASSA ABLOY’s market position in home delivery solutions and provides excellent opportunities for synergies in vertical segments, such as edu-cation and commercial properties. The company is head-quartered in Sacramento, California.
On the reporting date the acquisition analysis is prelimi-nary with respect to valuation of intangible assets.
Other acquisitionsOther noteworthy acquisitions during the year included Phoniro (Sweden), Brüken (Mexico), HKC (Ireland) and Planet (Switzerland). Please see the Report of the Board of Directors for further information on these acquisitions.
2017Arjo SystemsOn 3 July 2017, ASSA ABLOY acquired 100 percent of the share capital in the French company Arjo Systems SAS, a leading provider of physical and digital identity solutions for national ID documents.
The acquisition strengthens the current offering of secure identity solutions and will strengthen the Group’s position in national ID documents, while offering additional growth opportunities. Arjo Systems operates in France, Italy and Hong Kong.
Intangible assets in the form of technology and customer relationships have been disclosed in the purchase price allo-cation. Residual goodwill mainly relates to synergies and other intangible assets that do not meet the criteria for separate reporting.
Mercury SecurityOn 18 October 2017, ASSA ABLOY acquired 100 percent of the share capital of Mercury Security, a leading US OEM supplier of control systems for physical access control.
The acquisition strengthens the current offering in physi-cal access management where Mercury Security considera-bly strengthens the Group’s position in physical access man-agement and offers complementary growth opportunities Mercury Security is headquartered in Long Beach, California.
Intangible assets in the form of the brand, technology and customer relationships have been disclosed in the purchase price allocation. Residual goodwill mainly relates to syner-gies and other intangible assets that do not meet the criteria for separate reporting.
August HomeOn 21 November 2017, ASSA ABLOY acquired 100 percent of the share capital of August Home Inc., a leading US sup-plier of smart digital locks.
The acquisition of August Home further strengthens the strategy for smart door solutions aimed at the residential market with additional smart digital locks, doorbells with camera and complete home delivery solutions. August Home is headquartered in San Francisco, California.
Other acquisitionsOther noteworthy acquisitions during the year include Shree Mahavir Metalcraft (India), Southeastern Dock & Door (US) and Jerith (US).
ASSA ABLOY ANNUAL REPORT 2018 87
NOTES

Note 31 Cash flowGroup
SEK M 2017 2018Adjustments for non-cash items Profit on sales of non-current assets –45 –265Profit/loss on sales of subsidiaries 42 –11Change in pension provisions 92 124Share of earnings in associates –129 –167Dividend from associates 61 66Remeasurement of earn out provisions related to acquisitions –300 –296Other 58 92Adjustments for non-cash items –221 –458
Change in working capitalInventories increase/decrease (–/+) –158 –983Trade receivables increase/decrease (–/+) –696 –340Trade payables increase/decrease (+/–) 454 –439Other working capital increase/decrease (–/+) 52 686Change in working capital –347 –1,076
Divestments of subsidiariesPurchase prices received, net 140 406Cash and cash equivalents in divested subsidiaries –1 –11Change in consolidated cash and cash equivalents due to divestments 139 395
Note 32 ReservesHedging reserve
SEK MNet investment
hedgesCash flow
hedgesExchange rate
difference TotalOpening balance 1 January 2017 according to adopted Annual Report –247 –7 2,795 2,540Adjustment, misclassification 2,179 2,179New opening balance 1 January 2017 –247 –7 4,974 4,720Share of other comprehensive income of associates 50 50Cash flow hedges 8 8Net investment hedges 15 15Exchange rate differences –1,864 –1,864Deferred tax –4 –2 9 4Closing balance 31 December 2017 –236 –2 3,170 2,932
Opening balance 1 January 2018 –236 –2 3,170 2,932Share of other comprehensive income of associates 87 87Cash flow hedges 2 2Net investment hedges –8 –8Exchange rate differences 2,090 2,090Deferred tax 1 0 –9 –8Closing balance 31 December 2018 –243 – 5,339 5,096
Of the item Net investment hedges, SEK –28 M relates to current hedge relationships, while the remainder, SEK –215 M, relates to closed hedge relationships for which hedged objects remain.
During the year a historic misclassification was identified in the Group’s equity involving the item Reserves and the item Retained earnings. The misclassification has no effect on the total equity in the Group. The Group’s reserves have been cor-rected through an adjustment of the opening balance established as at 1 January 2017.
Note 33 Employees
Salaries, wages, other remuneration and social security costsGroup Parent company
SEK M 2017 2018 2017 2018Salaries, wages and other remuneration 16,804 19,200 231 278Social security costs 4,814 5,284 137 132– of which pensions 658 771 36 49Total 21,618 24,485 368 410
ASSA ABLOY ANNUAL REPORT 201888
NOTES
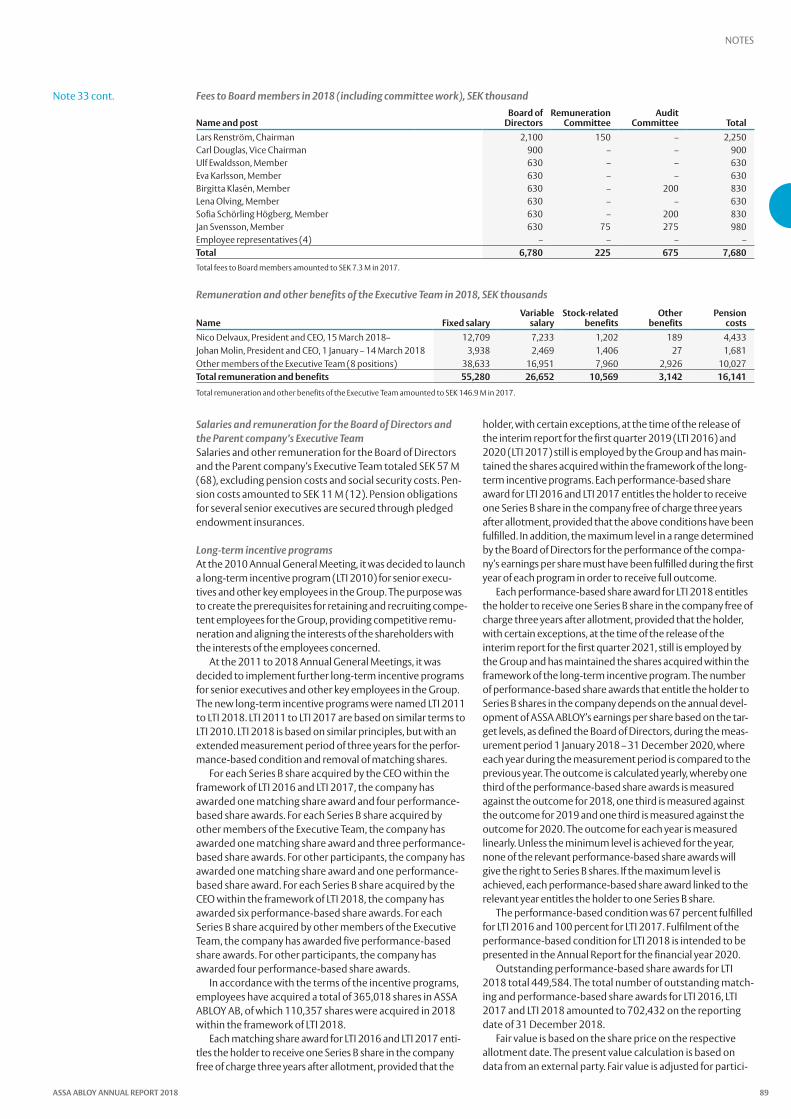
Salaries and remuneration for the Board of Directors and the Parent company’s Executive TeamSalaries and other remuneration for the Board of Directors and the Parent company’s Executive Team totaled SEK 57 M (68), excluding pension costs and social security costs. Pen-sion costs amounted to SEK 11 M (12). Pension obligations for several senior executives are secured through pledged endowment insurances.
Long-term incentive programsAt the 2010 Annual General Meeting, it was decided to launch a long-term incentive program (LTI 2010) for senior execu-tives and other key employees in the Group. The purpose was to create the prerequisites for retaining and recruiting compe-tent employees for the Group, providing competitive remu-neration and aligning the interests of the shareholders with the interests of the employees concerned.
At the 2011 to 2018 Annual General Meetings, it was decided to implement further long-term incentive programs for senior executives and other key employees in the Group. The new long-term incentive programs were named LTI 2011 to LTI 2018. LTI 2011 to LTI 2017 are based on similar terms to LTI 2010. LTI 2018 is based on similar principles, but with an extended measurement period of three years for the perfor-mance-based condition and removal of matching shares.
For each Series B share acquired by the CEO within the framework of LTI 2016 and LTI 2017, the company has awarded one matching share award and four performance-based share awards. For each Series B share acquired by other members of the Executive Team, the company has awarded one matching share award and three performance-based share awards. For other participants, the company has awarded one matching share award and one performance-based share award. For each Series B share acquired by the CEO within the framework of LTI 2018, the company has awarded six performance-based share awards. For each Series B share acquired by other members of the Executive Team, the company has awarded five performance-based share awards. For other participants, the company has awarded four performance-based share awards.
In accordance with the terms of the incentive programs, employees have acquired a total of 365,018 shares in ASSA ABLOY AB, of which 110,357 shares were acquired in 2018 within the framework of LTI 2018.
Each matching share award for LTI 2016 and LTI 2017 enti-tles the holder to receive one Series B share in the company free of charge three years after allotment, provided that the
holder, with certain exceptions, at the time of the release of the interim report for the first quarter 2019 (LTI 2016) and 2020 (LTI 2017) still is employed by the Group and has main-tained the shares acquired within the framework of the long-term incentive programs. Each performance-based share award for LTI 2016 and LTI 2017 entitles the holder to receive one Series B share in the company free of charge three years after allotment, provided that the above conditions have been fulfilled. In addition, the maximum level in a range determined by the Board of Directors for the performance of the compa-ny’s earnings per share must have been fulfilled during the first year of each program in order to receive full outcome.
Each performance-based share award for LTI 2018 entitles the holder to receive one Series B share in the company free of charge three years after allotment, provided that the holder, with certain exceptions, at the time of the release of the interim report for the first quarter 2021, still is employed by the Group and has maintained the shares acquired within the framework of the long-term incentive program. The number of performance-based share awards that entitle the holder to Series B shares in the company depends on the annual devel-opment of ASSA ABLOY’s earnings per share based on the tar-get levels, as defined the Board of Directors, during the meas-urement period 1 January 2018 – 31 December 2020, where each year during the measurement period is compared to the previous year. The outcome is calculated yearly, whereby one third of the performance-based share awards is measured against the outcome for 2018, one third is measured against the outcome for 2019 and one third is measured against the outcome for 2020. The outcome for each year is measured linearly. Unless the minimum level is achieved for the year, none of the relevant performance-based share awards will give the right to Series B shares. If the maximum level is achieved, each performance-based share award linked to the relevant year entitles the holder to one Series B share.
The performance-based condition was 67 percent fulfilled for LTI 2016 and 100 percent for LTI 2017. Fulfilment of the performance-based condition for LTI 2018 is intended to be presented in the Annual Report for the financial year 2020.
Outstanding performance-based share awards for LTI 2018 total 449,584. The total number of outstanding match-ing and performance-based share awards for LTI 2016, LTI 2017 and LTI 2018 amounted to 702,432 on the reporting date of 31 December 2018.
Fair value is based on the share price on the respective allotment date. The present value calculation is based on data from an external party. Fair value is adjusted for partici-
Note 33 cont. Fees to Board members in 2018 (including committee work), SEK thousand
Name and postBoard of
DirectorsRemuneration
CommitteeAudit
Committee TotalLars Renström, Chairman 2,100 150 – 2,250Carl Douglas, Vice Chairman 900 – – 900Ulf Ewaldsson, Member 630 – – 630Eva Karlsson, Member 630 – – 630Birgitta Klasén, Member 630 – 200 830Lena Olving, Member 630 – – 630Sofia Schörling Högberg, Member 630 – 200 830Jan Svensson, Member 630 75 275 980Employee representatives (4) – – – –Total 6,780 225 675 7,680Total fees to Board members amounted to SEK 7.3 M in 2017.
Remuneration and other benefits of the Executive Team in 2018, SEK thousands
Name Fixed salaryVariable
salaryStock-related
benefitsOther
benefitsPension
costsNico Delvaux, President and CEO, 15 March 2018– 12,709 7,233 1,202 189 4,433Johan Molin, President and CEO, 1 January – 14 March 2018 3,938 2,469 1,406 27 1,681Other members of the Executive Team (8 positions) 38,633 16,951 7,960 2,926 10,027Total remuneration and benefits 55,280 26,652 10,569 3,142 16,141
Total remuneration and other benefits of the Executive Team amounted to SEK 146.9 M in 2017.
ASSA ABLOY ANNUAL REPORT 2018 89
NOTES

Average number of employees per country, broken down by genderGroup
2017 2018
Totalof which women
of which men Total
of which women
of which men
US 10,188 2,723 7,464 10,339 2,742 7,597China 10,337 4,552 5,784 9,483 3,970 5,514Sweden 2,154 535 1,619 2,252 580 1,672France 1,939 596 1,343 1,934 603 1,331United Kingdom 1,688 508 1,180 1,851 552 1,299Mexico 1,518 419 1,099 1,660 504 1,156India 972 84 888 1,655 148 1,058Germany 1,611 471 1,141 1,452 455 997Brazil 1,435 663 773 1,392 419 973Czech Republic 1,094 345 749 1,203 375 828Poland 692 131 561 1,182 315 867Finland 1,216 348 868 1,173 329 844Netherlands 1,034 158 876 1,050 171 879Romania 802 320 482 878 347 531Malaysia 873 434 439 870 437 433Canada 815 238 577 814 192 622Belgium 674 132 542 698 142 556Norway 710 133 577 690 145 545South Korea 676 257 418 681 191 491Australia 669 204 465 674 195 479South Africa 581 260 321 650 306 344Denmark 595 171 424 601 165 436Switzerland 565 183 382 584 181 402Spain 538 131 407 535 133 402Italy 461 135 326 453 121 332United Arab Emirates 416 32 384 399 33 365Hungary 321 55 267 315 52 264Chile 336 99 237 307 89 218New Zealand 294 101 193 293 99 194Israel 303 89 214 292 99 193Hong Kong 183 77 106 210 85 125Colombia 215 145 70 199 56 143Ireland 193 52 142 195 50 144Others 1,329 343 986 1,388 465 923Total 47,426 15,122 32,304 48,353 14,746 33,606
Parent company2017 2018
Totalof which women
of which men Total
of which women
of which men
Sweden 208 49 159 231 56 175Total 208 49 159 231 56 175
Gender distribution of Board of Directors and Executive Team2017 2018
Totalof which women
of which men Total
of which women
of which men
Board of Directors1 9 4 5 9 4 5Executive Team 9 1 8 9 1 8– of which Parent company’s Executive Team 4 1 3 4 1 3Total 18 5 13 18 5 131 Excluding employee representatives.
Note 33 cont. pants who do not retain their holding of shares for the dura-tion of the respective program. In the case of performance-based shares, the company assesses the probability of the performance targets being met when calculating the com-pensation expense.
The fair value of ASSA ABLOY’s Series B share on the allot-ment date for LTI 2018, 25 May 2018, was SEK 191.63. The fair value of ASSA ABLOY’s Series B share on the allotment date for LTI 2017, 26 May 2017, was SEK 192.10. The fair value of ASSA ABLOY’s Series B share on the allotment date for LTI 2016, 26 May 2016, was SEK 171.24.
The total cost of the Group’s long-term incentive programs (LTI 2015–LTI 2018) excluding social security costs amounted to SEK 45 M (40) in 2018. In April 2018 vesting of LTI 2015, as well as parts of LTI 2016 and LTI 2017, took place and 313,744
shares (395,304) at a total market value at the time of vesting of SEK 60 M (74) were transferred to the participants of the program. Parts of the vesting of LTI 2015, LTI 2016 and LTI 2017 were settled through endowment insurances. The payment as above for the transferred shares in LTI 2015 and parts of LTI 2016 and LT1 2017 was recognized in equity.
Notice and severance payIf the CEO is given notice, the company is liable to pay the equivalent of maximum 24 months’ base salary and other employment benefits. If one of the other members of the Executive Team is given notice, the company is liable to pay a maximum six months’ base salary and other employment benefits plus an additional twelve months’ base salary.
ASSA ABLOY ANNUAL REPORT 201890
NOTES

Note 34 Financial risk management and financial instruments
Financial risk managementASSA ABLOY is exposed to a variety of financial risks due to its international business operations. Financial risk management for ASSA ABLOY’s units has been implemented in accordance with the ASSA ABLOY Group’s financial policy. The principles for financial risk management are described below.
Organization and activitiesASSA ABLOY’s financial policy, which is determined by the Board of Directors, provides a framework of guidelines and regulations for the management of financial risks and financial activities.
ASSA ABLOY’s financial activities are coordinated centrally and the majority of financial transactions are conducted by the subsidiary ASSA ABLOY Financial Services AB, which is the Group’s internal bank. External financial transactions are con-ducted by Treasury. Treasury achieves significant economies of scale when negotiating borrowing agreements, using interest rate derivatives and managing currency flows.
Capital structureThe objective of the Group’s capital structure is to safeguard its ability to continue as a going concern, and to generate good returns for shareholders and benefits for other stake-holders. Maintaining an optimal capital structure enables the Group to keep capital costs as low as possible. The Group can adjust the capital structure based on the requirements that arise by varying the dividend paid to shareholders, returning capital to shareholders, issuing new shares or selling assets to reduce debt. The capital requirement is assessed on the basis of factors such as the net debt/equity ratio.
Net debt is defined as interest-bearing liabilities, including negative market values of derivatives, plus pension provisions,
less cash and cash equivalents, and other interest-bearing investments including positive market values of derivatives. The table ‘Net debt and equity’ shows the position as at December 31.
Net debt and equityGroup
SEK M 2017 2018Non-current interest-bearing liabilities –171 –106Current interest-bearing investments incl. positive market values of derivatives –150 –188Cash and cash equivalents –459 –538Pension provisions 2,933 2,880Other non-current interest-bearing liabilities 16,859 19,489Current interest-bearing liabilities incl. negative market values of derivatives 6,263 7,710Total 25,275 29,246Equity 50,657 51,900Net debt/equity ratio 0.50 0.56
RatingAnother important variable in the assessment of the Group’s capital structure is the credit rating assigned by credit rating agencies to the Group’s debt. It is essential to maintain a solid credit rating in order to have access to both long-term and short-term financing from the capital markets when needed. ASSA ABLOY maintains both long-term and short-term credit ratings from Standard & Poor’s and a short-term rating from Moody’s. The Group’s credit rating remained unchanged during the year.
Agency Short-term Outlook Long-term OutlookStandard & Poor’s A2 Stable A – StableMoody’s P2 Stable n/a
Maturity profile – financial instruments1 December 31, 2017 December 31, 2018
SEK M2 <1 year>1 <2 years
>2 <5 years >5 years <1 year
>1 <2 years
>2 <5 years >5 years
Long-term bank loans –343 –1,421 –2,904 –566 –1,437 –744 –2,738 –489Long-term capital market loans –2,694 –1,609 –5,659 –5,852 –1,844 –3,000 –6,621 –7,523Short-term bank loans –1,907 –2,199Commercial papers and short-term capital market loans –1,545 –2,752Derivatives (outflow) –9,295 –26 –75 –73 –13,656 –53 –152 –68Total by period –15,784 –3,056 –8,638 –6,491 –21,888 –3,798 –9,511 –8,080
Cash and cash equivalents incl. interest- bearing receivables 502 610Non-current interest-bearing liabilities 90 57 30 108Derivatives (inflow) 9,242 56 143 148 13,609 77 189 110Deferred considerations –1,177 –264 –118 –1,021 –507 –371Trade receivables 13,068 14,496Trade payables –7,811 –7,893Net total –1,870 –3,207 –8,584 –6,343 –2,087 –4,121 –9,693 –7,970
Confirmed credit facilities 8,874 –8,874 9,265 –9,265Credit facilities maturing <1 year –681 –690Adjusted maturity profile1 6,322 –3,207 –17,457 –6,343 6,488 –13,386 –9,693 –7,9701 For maturity structure of guarantees, see Note 28.2 The amounts in the table are undiscounted and include future known interest payments. The exact amounts are therefore not found in the balance sheet.
Financing risk and maturity profile Financing risk is defined as the risk of being unable to meet payment obligations as a result of inadequate liquidity or diffi-culties in obtaining external financing. ASSA ABLOY manages financing risk at Group level. Treasury is responsible for exter-nal borrowings and external investments. ASSA ABLOY strives to have access on every occasion to both short-term and long-term loan facilities. In accordance with financial policy, the available loan facilities, including available cash and cash equivalents, should include a reserve (facilities available but not utilized) equivalent to 10 percent of the Group’s total annual sales.
Maturity profile The table ‘Maturity profile’ above shows the maturities for ASSA ABLOY’s financial instruments, including confirmed credit facilities. The maturities are not concentrated to a par-ticular date in the immediate future. An important compo-nent of liquidity planning is the Group’s Multi-Currency Revolving Credit Facility, which matures in June 2020. This credit facility was wholly unutilized at year-end. Moreover, existing financial assets are also taken into account. The table shows undiscounted cash flows relating to the Group’s finan-cial instruments at the reporting date, and these amounts are therefore not found in the balance sheet.
ASSA ABLOY ANNUAL REPORT 2018 91
NOTES

External financing/net debt
Credit lines/facilitiesAmount,
SEK M Maturity
Carrying amount,
SEK M CurrencyAmount
2017Amount
2018Of which Parent company, SEK M
US Private Placement Program 629 May 2020 629 USD 70 70US Private Placement Program 1,372 Aug 2022 1,372 USD 150 150US Private Placement Program 674 Aug 2024 674 USD 75 75Multi-Currency RCF 9,265 Jun 2020 – EUR 900 900Bank loan EIB 377 May 20202 377 EUR 55 37Bank loan EIB 1,079 Apr 20222 1,079 USD 137 120Bank loan NIB 566 Dec 2021 566 EUR 55 55Global MTN Program 24,500 Feb 2020 515 EUR 50 50 515
Jun 2020 127 AUD 20 20 127Sep 2020 720 EUR 70 70 720Nov 2020 3721 EUR 35 35Dec 2020 3181 EUR 30 30 308Feb 2021 450 USD 50 50 450Jul 2021 500 SEK 500 500
Aug 2021 90 USD 10 10 90Oct 2021 154 EUR 15 15 154Feb 2022 180 USD 20 180Mar 2022 514 EUR 50 50 514Apr 2022 90 USD 10 10 90Jun 2022 103 EUR 10 10 103Jul 2022 45 USD 5 5 45
Mar 2023 156 EUR 15 156Oct 2023 205 EUR 20 205Nov 2023 2271 USD 25 25Nov 2023 9061 USD 100 897Dec 2023 898 USD 100 898May 2024 179 USD 20 20 179
Jul 2024 270 USD 30 30 270Sep 2024 1,025 EUR 100 100 1,025Feb 2025 514 EUR 50 50 514Mar 2025 3421 EUR 30 30 342Jun 2025 513 EUR 50 513Jun 2025 269 USD 30 269
Dec 2025 4331 USD 50 50 449Feb 2027 305 EUR 30 30 305Feb 2027 515 EUR 50 515Jun 2027 3051 NOK 300 300 307Oct 2027 2041 NOK 200 200 204Oct 2029 2891 EUR 28 28 289Oct 2029 266 EUR 26 26 266Mar 2030 307 EUR 30 307Apr 2030 715 EUR 70 70 715
Other long-term loans 1,773 1,773 1,387Total long-term loans/facilities 40,235 19,489 13,771
Global MTN Program 1,235 Jan 2019 90 USD 10 10 90Aug 2019 449 USD 50 50 449Sep 2019 180 USD 20 20 180Nov 2019 516 EUR 50 50 516
US Private Placement Program 224 Aug 2019 224 USD 122 25Global CP Program 8,984 1,419 USD 25 158
824 EUR 80Swedish CP Program 5,000 500 SEK 1,100 500Other bank loans 2,113 2,113 463Overdraft facility 2,716 1,277Total short-term loans/facilities 20,272 7,594 1,697Total loans/facilities 60,507 27,083 15,468
Cash and cash equivalents –538Current interest-bearing investments –71Non-current interest-bearing liabilities –106Market value of derivatives 0Pension provisions 2,880 Net debt 29,2461 The loans are subject to hedge accounting, in whole or in part.2 The loans are amortizing. In the table the average dates of maturity of the loans have been stated.
Note 34 cont.
ASSA ABLOY ANNUAL REPORT 201892
NOTES

Interest-bearing liabilitiesThe Group’s long-term loan financing mainly consists of a Private Placement Program in the US totaling USD 320 M, of which USD 295 M (320) is long-term, a GMTN program of SEK 14,229 M (10,700), of which SEK 12,996 M (9,329) is long-term, a loan from the European Investment Bank of EUR 37 M (55) and USD 121 M (137), and a loan from the Nordic Investment Bank of EUR 55 M (110). During the year, ten new issues were made under the GMTN program for a total amount of SEK 4,445 M. In addition, the company took out a smaller long-term loan. Other changes in long-term loans are mainly due to some of the originally long-term loans now having less than 1 year to maturity. The size of the loans increased substantially due to currency fluctuations, especially regarding the USD. A total of SEK 4,492 M was raised in new long-term loans, while SEK 2,849 M in originally long-term loans matured during the year.
The Group’s short-term loan financing mainly consists of two Commercial Paper Programs for a maximum USD 1,000 M (1,000) and SEK 5,000 M (5,000) respectively. At year-end, SEK 2,752 M (1,307) of the Commercial Paper Programs had been utilized. In addition, substantial credit facilities are available, mainly in the form of a Multi-Currency Revolving Credit Facility of EUR 900 M (900). At year-end the average time to maturity for the Group’s interest-bearing liabilities, excluding the pension provision, was 42 months (44).
Some of the Group’s main financing agreements contain a customary Change of Control clause. This clause means that lenders have the right in certain circumstances to demand the renegotiation of conditions or to terminate the agreements should control of the company change.
Currency compositionThe currency composition of ASSA ABLOY’s borrowing depends on the currency composition of the Group’s assets and other liabilities. Currency swaps are used to achieve the desired currency composition. See the table ‘Net debt by currency’ below.
Cash and cash equivalents and other interest-bearing receivablesShort-term interest-bearing investments totaled SEK 71 M (43) at year-end. In addition, ASSA ABLOY has long-term interest-bearing receivables of SEK 106 M (171) and financial derivatives with a positive market value of SEK 117 M (107) which, in addition to cash and cash equivalents, are included in the definition of net financial debt. Cash and cash equiva-lents are mainly invested in bank accounts or interest-bear-ing instruments with high liquidity from issuers with a credit rating of at least A–, according to Standard & Poor’s or similar rating agency. The average term for cash and cash equiva-lents was 22 days (21) at year-end 2018.
The Parent company’s cash and cash equivalents are held in a sub-account to the Group account.
Group Parent company
SEK M 2017 2018 2017 2018Cash and bank balances 362 456 0 0Short-term investments with maturity less than 3 months 97 81 – –Cash and cash equivalents 459 538 0 0
Short-term investments with maturity more than 3 months 43 71 – –Non-current interest- bearing liabilities 171 106 – –Positive market value of derivatives 107 117 – –Total 321 832 0 0
Note 34 cont.SEK M Long-term loans
Short-term loans Total
Opening balance 1 January 2017 16,901 3,929 20,829
Cash flow from financing activitiesLong-term loans raised 3,226 – 3,226Long-term loans repaid – –2,637 –2,637Other changes in cash flow short-term loans – 2,414 2,414Total 3,226 –223 3,003
Changes in non-cash itemsAcquisitions of subsidiaries 93 83 176Reclassifications –2,698 2,698 –Unrealized exchange rate differences –663 –335 –998Total –3,268 2,446 –822Closing balance 31 December 2017 16,859 6,151 23,010
SEK M Long-term loansShort-term
loans TotalOpening balance 1 January 2018 16,859 6,151 23,010
Cash flow from financing activitiesLong-term loans raised 4,483 – 4,483Long-term loans repaid – –2,849 –2,849Other changes in cash flow short-term loans – 553 553Total 4,483 –2,296 2,187
Changes in non-cash itemsAcquisitions of subsidiaries 23 933 957Reclassifications –2,660 2,660 –Unrealized exchange rate differences 806 155 960Other changes in non-cash items –22 –9 –31Total –1,853 3,739 1,886Closing balance 31 December 2018 19,489 7,594 27,083
ASSA ABLOY ANNUAL REPORT 2018 93
NOTES

Net debt by currencyDecember 31, 2017 December 31, 2018
SEK MNet debt excluding
currency swapsNet debt including
currency swapsNet debt excluding
currency swapsNet debt including
currency swapsUSD 8,522 12,236 10,875 14,442EUR 12,074 7,241 14,150 7,575CNY 451 1,764 635 1,609GBP 258 –157 288 874NOK 565 645 563 688CHF 214 259 190 653CZK 21 449 27 592PLN 50 325 49 472SEK 2,185 1,171 1,466 416MXN –11 –36 5 396AUD 134 357 135 336Other 812 1,021 862 1,194Total 25,275 25,275 29,246 29,246
Interest rate risks in interest-bearing assetsTreasury manages interest rate risk in interest-bearing assets. Derivative instruments such as interest rate swaps and FRAs (forward rate agreements) may be used to manage interest rate risk. These interest-bearing assets are mostly short-term. The term for the majority of these investments is three months or less, although the share with a longer maturity rose during the year. The fixed interest term for these short-term investments was 210 days (136) at year-end 2018. A downward change in the yield curve of one percentage point would reduce the Group’s interest income by around SEK 1 M (7) and consolidated equity by SEK 0 M (5).
Interest rate risks in borrowingChanges in interest rates have a direct impact on ASSA ABLOY’s net interest expense. Treasury is responsible for identifying and managing the Group’s interest rate exposure. Treasury analyzes the Group’s interest rate exposure and cal-culates the impact on income of changes in interest rates on a rolling 12-month basis. The Group strives for a mix of fixed rate and variable rate borrowings, and uses interest rate swaps to adjust the fixed interest term. The financial policy stipulates that the average fixed interest term should nor-mally be 24 months. At year-end, the average fixed interest term on gross debt, excluding pension liabilities, was around 28 months (25). An upward change in the yield curve of one percentage point would increase the Group’s interest expense by around SEK 126 M (118) and reduce consoli-dated equity by SEK 93 M (87).
Currency riskCurrency risk affects ASSA ABLOY mainly through translation of capital employed and net debt, translation of the income of foreign subsidiaries, and the impact on income of flows of goods between countries with different currencies.
Transaction exposureCurrency risk in the form of transaction exposure, or exports and imports of goods respectively, is relatively limited in the Group, even though it can be significant for individual busi-ness units. The main principle is to allow currency fluctua-tions to have an impact on the business as quickly as pos-sible. As a result of this strategy, current currency flows are not normally hedged.
Transaction flows relating to major currencies (import + and export –)
Currency exposure
Currency, SEK M 2017 2018AUD 535 557CAD 766 944CNY –1,316 –1,825DKK 160 244EUR 2,033 2,400GBP 438 571RON –373 –445SEK –2,637 –3,518USD 979 1,410
Translation exposure in incomeThe table below shows the impact on the Group’s income before tax of a 10 percent weakening of the Swedish krona (SEK) in relation to the major currencies, with all other variables constant.
Impact on income before tax of a 10 percent weakening of SEKCurrency, SEK M 2017 2018AUD 43 41CHF 30 33CNY 28 27DKK 11 9EUR 151 191GBP 22 20HKD 76 95KRW 18 33USD 545 611
Translation exposure in the balance sheetThe impact of translation of equity is limited by the fact that a large part of financing is in local currency.
The capital structure in each country is optimized based on local legislation. Whenever possible, according to local conditions, gearing per currency should generally aim to be the same as for the Group as a whole to limit the impact of fluctuations in individual currencies. Treasury uses currency derivatives and loans to achieve appropriate financing and to eliminate undesirable currency exposure.
The table ‘Net debt by currency’ above shows the use of forward exchange contracts in relation to financing in major currencies. Forward exchange contracts are used to neutral-ize the exposure arising between external debt and internal requirements.
Note 34 cont.
ASSA ABLOY ANNUAL REPORT 201894
NOTES

Note 34 cont. Financial credit riskFinancial risk management exposes ASSA ABLOY to certain counterparty risks. Such exposure may arise from the invest-ment of surplus cash as well as from investment in debt instruments and derivative instruments.
ASSA ABLOY’s policy is to minimize the potential credit risk relating to surplus cash by using cash flow from subsidi-aries to repay the Group’s loans. This is primarily achieved through cash pools put in place by Treasury. Around 96 per-cent (93) of the Group’s sales were settled through cash pools in 2018. Smaller amounts may be held in other local banks for shorter time periods depending on how customers choose to pay. The Group can also invest surplus cash in the short term in banks to match borrowing and cash flow. The banks in which surplus cash is deposited have a high credit rating. In light of this and the short terms of the investments the effect of the calculated credit risk is assessed to be negligible.
Derivative instruments are allocated between banks based on risk levels defined in the financial policy, in order to limit counterparty risk. Treasury only enters into derivative contracts with banks that have a high credit rating.
ISDA agreements (full netting of transactions in case of counterparty default) have been entered into with respect to interest rate and currency derivatives. The table on page 96 shows the impact of this netting.
Commercial credit riskThe Group’s trade receivables are distributed across a large number of customers who are spread globally. No single cus-tomer accounts for more than 1 percent of the Group’s sales. The concentration of credit risk associated with trade receiv-ables is considered limited, but increased slightly in pace with increased activity in emerging markets, mainly with respect to China. The fair value of trade receivables is equiva-lent to the carrying amount. Credit risks relating to operating activities are managed locally at company level and moni-tored at division level. For more information see Note 21 and the section “impairment of financial assets” in the informa-tion on accounting principles.
Commodity riskThe Group is exposed to price risks relating to purchases of certain commodities (primarily metals) used in production. Forward contracts are not used to hedge commodity pur-chases.
Fair value of financial instrumentsDerivative financial instruments such as forward exchange contracts and forward rate agreements are used to the extent necessary. The use of derivative instruments is limited to reducing exposure to financial risks.
The positive and negative fair values in the table ‘Out-standing derivative financial instruments’ on page 96 show the fair values of outstanding instruments at year-end, based on available fair values, and are the same as the carrying amounts in the balance sheet. The nominal value is equiva-lent to the gross value of the contracts.
For accounting purposes, financial instruments are classi-fied into measurement categories in accordance with IFRS 9. Financial instruments from the comparative year are classi-fied in accordance with IAS 39. The table ‘Financial instru-ments’ on page 96 provides an overview of financial assets and liabilities, measurement category, and carrying amount and fair value per item.
Risk management through hedge accountingDuring the year the Group used hedge accounting in its financial risk management. These can be divided into cash flow hedges, fair value hedges and net investment hedges. Changes in these hedges can be seen in the table below. For information regarding the effects of net investment hedges and cash flow hedges terminated during the year in other comprehensive income, see Note 32. Net investment hedges are used to manage currency risk that arise through invest-ments in foreign subsidiaries. Fair value hedges are used to manage interest rate risk that arises when the Group takes out loans at a fixed interest rate. Cash flow hedges for inter-est rate risk in loans with variable interest rates have also been used during the year.
Interest rate risk related to the long-term loans are hedged through hedge accounting using interest rate swaps. In cases where the loans are denominated in a currency other than SEK, they are not included in the applied hedge accounting. For risks related to net investments in foreign subsidiaries, hedge accounting is only applied to manage currency risk; no other related risks are managed by the hedges that are applied. ASSA ABLOY does not hedge 100% of its long-term loans or its net investments. Instead, the decision on when hedge accounting is appropriate is taken on a case-by-case basis, in accordance with the risk levels described in the financial policy.
For fair value hedges the Group uses interest rate swaps with critical terms that are equivalent to the hedged object, such as reference rate, settlement days, maturity date and nominal amounts. This approach ensures an economic rela-tionship between the hedging objects and the hedging instruments. Hedging relationship effectiveness is tested through periodic forward-looking evaluation to ensure that an economic relationship still exists. Examples of identified sources of ineffectiveness in the hedging relationship include if a credit risk adjustment in the interest rate swap is not matched by an equivalent adjustment to the loan, or if for some reason differences in the critical terms between the interest rate swap and the loan should arise. All critical terms matched during the year. For this reason, the economic rela-tionship has been 100% effective.
Hedging instruments
SEK MFair value
2018Net invest-
ments 2018Carrying amount of hedged item 2,749 392Nominal amount of hedging instrument 2,749 392Maturity 2020 to 2029 2020 to 2022Hedge ratio 1:1 1:1Total effect of hedging on hedged item 50 –28Accrued remaining amount for terminated hedges –24 –215Change in value, hedging instruments since 1 January –11 –8Change in value, hedge item 11 8Ineffectiveness recognized in profit or loss 0 0
Changes in the value of fair value hedged items are recog-nized against long-term loans, changes in value of hedging instruments are recognized against accrued revenue or expenses, respectively; ineffectiveness, if any, is recognized against interest income or expenses, respectively. Changes in value of hedge instruments in net investment hedges are recognized in the hedging reserve in equity.
ASSA ABLOY ANNUAL REPORT 2018 95
NOTES

Note 34 cont. Disclosures of offsetting of financial assets and liabilities2017 2018
SEK MGross
amount
Amounts netted
in the balance
sheet
Net amounts
in the balance
sheet
Amount covered
by netting agree-
ment but not offset
Net amount
Gross amount
Amounts netted
in the balance
sheet
Net amounts
in the balance
sheet
Amount covered
by netting agree-
ment but not offset
Net amount
Financial assets 107 – 107 39 68 117 – 117 53 64Financial liabilities 112 – 112 39 73 116 – 116 53 63Netted financial assets and financial liabilities only consist of derivative instruments.
Outstanding derivative financial instruments at December 31December 31, 2017 December 31, 2018
Instrument, SEK MPositive fair
value2Negative
fair value2Nominal
value Positive fair
value2Negative
fair value2Nominal
valueForeign exchange forwards, funding 39 –45 7,076 49 –99 8,105Interest rate swaps1, cash flow hedges 1 –6 528 – – –Interest rate swaps1, fair value hedges 67 –6 2,182 68 –18 2,749Cross currency swaps – –55 527 – – –Total 107 –112 10,313 117 116 10,8541 For interest rate swaps, only one leg is included in nominal value.2 Assets are recognized against accrued revenue and liabilities against accrued expenses.
Financial instruments: carrying amounts and fair values by measurement category2017 2018
SEK MCarrying amount Fair value
Carrying amount Fair value
Financial assets at amortized costTrade receivables 13,068 13,068 14,496 14,496Other financial assets at amortized cost – – 177 177Other loans and receivables 258 258 – –Cash and cash equivalents 459 459 538 538
Financial assets at fair value through profit or lossShares and interests – – 8 8
Available-for-sale financial assets 11 11 – –
Derivative financial instrumentsHedge accounting 68 68 68 68Held for trading 39 39 49 49Total financial assets 13,904 13,904 15,374 15,374
Financial liabilities at amortized cost Trade payables and other liabilities 7,811 7,811 7,893 7,893Long-term loans – hedge accounting 2,237 2,237 2,790 2,790Long-term loans – non-hedge accounting 14,622 14,632 16,699 16,729Short-term loans – non-hedge accounting 6,151 6,151 7,594 7,594
Financial liabilities at fair value through profit or lossDeferred considerations 1,559 1,559 1,899 1,899
Derivative financial instrumentsHedge accounting 11 11 18 18Held for trading 100 100 99 99Total financial liabilities 32,491 32,501 36,991 37,021
The fair value of long-term borrowing is based on observable data by discounting cash flows to market rate, while the fair value of current receivables and current liabilities is considered to correspond to the carrying amount.
ASSA ABLOY ANNUAL REPORT 201896
NOTES

Note 34 cont. Financial instruments: measured at fair value2017 2018
SEK MCarrying amounts
Quoted prices
Observable data
Non-observable
dataCarrying amounts
Quoted prices
Observable data
Non-observable
dataFinancial assetsDerivative financial instruments 107 – 107 – 117 – 117 –
Financial liabilitiesDerivative financial instruments 112 – 112 – 116 – 116 –Deferred considerations 1,559 – – 1,559 1,899 – – 1,899
Deferred considerations relate to additional payments for acquired companies. The size of a deferred consideration is usually linked to the earnings and sales trend in an acquired company during a specific period of time. Deferred consideration is measured on the day of acquisition based on the best judgment of management regarding future outcomes. Discounting takes place in the case of significant amounts.
For derivatives, the present value of future cash flows is calculated based on observable yield curves and exchange rates on the balance sheet date.
ASSA ABLOY ANNUAL REPORT 2018 97
NOTES

Comments on five years in summary
2014ASSA ABLOY continued to grow rapidly during the year, with total sales growth of 17 percent. Demand was strong in the USA, while growth in Europe was more unevenly distributed between the different regions. Emerging markets showed a slowdown, partly due to a credit crunch.
The Group’s continued focus on market presence and inno-vation within ASSA ABLOY during the year took the form of a strengthened sales force and the launch of many new products. Integration of acquisitions made and continued efficiencies contributed to maintaining good earning capacity.
Operating income, excluding items affecting comparability, increased by 17 percent compared with 2013, and cash flow remained strong. Earnings per share after full dilution, excluding items affecting comparability, increased by 17 percent.
A total of 20 acquisitions were consolidated during the year, which both strengthened the market position in key emerging markets such as China, India and Brazil, and comple-mented the customer offering in fast-growing new segments such as biometrics.
2015ASSA ABLOY’s good performance continued during the year despite challenging market conditions and relatively weak underlying growth worldwide. The Group’s growth remained strong during the year, with total sales growth of 7 percent excluding exchange rate effects. The global market showed a divided picture with strong demand in the USA and much of Asia, while growth in Europe was more unevenly distributed. Emerging markets showed a slowdown, particularly China.
The focus in recent years on product development, innova-tion and sustainability yielded positive results during the year. ASSA ABLOY has established leadership in the ongoing indus-try shift from mechanical solutions to electronics, digitization and mobile. Growth remained strong for electromechanical products and entrance automation, whose share of sales exceeded 50 percent.
Operating income increased by 20 percent compared with 2014, and cash flow remained very strong. Earnings per share after full dilution increased by 20 percent.
A total of 16 acquisitions were consolidated during the year, which strengthened the market position in important emerging markets such as Brazil, and complemented the customer offering in key areas for the Group such as entrance automation and secure identity solutions.
2016Demand for door opening solutions was relatively good during the year despite the weakened global economy. The Group’s growth remained strong during the year, with total sales growth of 5 percent excluding exchange rate effects. The mature mar-kets, primarily in Europe and the US, showed robust growth, while the trend in the emerging markets in Asia, Africa, the Middle East and parts of South America was more subdued in general, affected by factors such as the low prices for oil and other commodities. For ASSA ABLOY, the weak demand in these markets was most pronounced in China.
A new restructuring program was launched during the year. About fifty production plants and offices are set to close over a three-year period, with an estimated payback period of less than three years.
The focus in recent years on product development, innova-tion and sustainability continued at a high level during 2016. The ongoing technology shift toward an increased share of electromechanics with more digital and mobile solutions is expected to benefit ASSA ABLOY in the long term, and the
proportion of sales of electromechanical products exceeded 50 percent.
Operating income for the year, excluding items affecting comparability, increased by 2 percent compared with 2015, and cash flow continued to be strong. Earnings per share after full dilution, excluding items affecting comparability, increased 2 percent.
A total of 13 acquisitions were consolidated during the year, which strengthened the market position for the Group in key areas such as entrance automation and secure identity solutions. ASSA ABLOY’s car locks operation was sold.
2017Sales growth continued to be robust during the year. Organic growth was 4 percent, driven by growing demand for electro-mechanical and digital door opening solutions. For ASSA ABLOY, the mature markets primarily in Europe and the US demon-strated continued robust growth, while the trend in the emerg-ing markets was weaker, especially in China, Brazil and the Mid-dle East. Growth in Asia outside China continued to be robust.
The Group-wide programs to improve efficiency in all pro-cesses continue to deliver good results according to plan, as do the restructuring programs.
Product development continues to focus on areas such as digital and mobile technologies, which are believed to provide substantial potential for robust profitable growth for some time to come. ASSA ABLOY also has a growing selection of products with environmental product declarations as part of its sustainable solutions initiative.
Operating income for the year, excluding items affecting comparability, increased by 10 percent compared with 2016, and cash flow remained strong. Earnings per share after full dilution, excluding items affecting comparability, increased 10 percent.
A total of 16 acquisitions were consolidated during the year, which strengthened the market position in areas such as smart door locks, physical access management and identity solutions. ASSA ABLOY divested its project operation within HID Global, AdvanIDe, in its entirety.
2018Growth was strong during the year, with organic growth of 5 percent driven by continued successes for electromechani-cal and digital solutions, as well as strong growth in North and South America. The mature markets continued to demon-strate a favorable trend, with the US and Europe demonstrat-ing strong and robust growth, respectively, during the year. The trend in the emerging markets was weaker, especially in Asia and the Middle East.
A new restructuring program was launched during the year. About fifty production plants and offices are set to close over a three-year period, with an estimated payback period of less than three years.
Product development continued at a high level with large investments in R&D, as reflected by 27 percent of sales for the year which relate to products that are less than three years old.
Operating income for the year, excluding items affecting comparability, increased by 5 percent compared with 2017, and cash flow remained strong. Earnings per share after full dilution, excluding items affecting comparability, increased 4 percent. An impairment charge of SEK 6 billion was taken during the year for goodwill, other intangible assets and operating assets.
A total of 19 acquisitions were consolidated during the year, which strengthened the market position for HID in secure identity solutions. ASSA ABLOY sold its wood door business within the Americas division during the year.
ASSA ABLOY ANNUAL REPORT 201898
COMMENTS ON FIVE YEARS IN SuMMARY

RETuRN ON CAPITAL EMPLOYED1 OPERATING MARGIN (EBIT)1 AVERAGE NuMBER OF EMPLOYEES
Five years in summary
Amounts in SEK M unless stated otherwise 2014 2015 2016 2017 2018Sales and incomeSales 56,843 68,099 71,293 76,137 84,048Organic growth, % 3 4 2 4 5Acquisitions and disposals, % 9 3 3 2 2Operating income before depreciation and amortization (EBITDA)1 10,419 12,512 12,833 14,029 14,872Depreciation and amortization –1,163 –1,433 –1,580 –1,688 –1,963Operating income (EBIT)1 9,257 11,079 11,254 12,341 12,909Income before tax (EBT) 8,698 10,382 8,952 11,673 5,297Net income 6,436 7,693 6,653 8,635 2,755
Cash flowCash flow from operating activities 6,679 8,572 8,575 9,248 9,225Cash flow from investing activities –3,524 –4,412 –4,063 –8,661 –6,427Cash flow from financing activities –2,908 –4,335 –4,271 –861 –2,728Cash flow 247 –175 240 –274 70Operating cash flow3 8,238 9,952 10,467 10,929 11,357
Capital employed and financingCapital employed 58,425 63,848 70,351 75,932 81,146– of which goodwill 39,778 42,777 47,544 50,330 53,413– of which other intangible assets and property, plant and equipment 14,990 16,649 17,618 19,144 19,637– of which shares and interests in associates 1,861 1,910 2,109 2,243 2,434Net debt 22,327 22,269 23,127 25,275 29,246Non-controlling interests 2 4 5 9 10Shareholders’ equity, excluding non-controlling interest 36,096 41,575 47,220 50,648 51,890
Data per share, SEK4
Earnings per share before and after dilution 5.79 6.93 5.99 7.77 2.48Earnings per share before and after dilution and excluding items affecting comparability1 5.79 6.93 7.09 7.77 8.09Shareholders’ equity per share after dilution 32.50 37.43 42.51 45.60 46.71Dividend per share 2.17 2.65 3.00 3.30 3.502
Price of Series B share at year-end 138.27 178.00 169.10 170.40 156.55
Key figuresOperating margin (EBITDA), %1 18.3 18.4 18.0 18.4 17.7Operating margin (EBIT), % 1 16.3 16.3 15.8 16.2 15.4Profit margin (EBT), % 15.3 15.2 12.6 15.3 6.3Return on capital employed, % 16.9 17.8 14.1 16.6 7.6Return on capital employed excluding items affecting comparability, % 16.9 17.8 16.5 16.6 16.2Return on shareholders’ equity, % 19.8 19.8 15.0 17.6 5.4Equity ratio, % 45.1 48.2 49.6 50.9 48.7Net debt/equity ratio 0.62 0.54 0.49 0.50 0.56Interest coverage ratio, times 17.4 16.7 14.1 19.1 8.0Total number of shares, thousands4 1,112,576 1,112,576 1,112,576 1,112,576 1,112,576Number of outstanding shares, thousands4 1,110,776 1,110,776 1,110,776 1,110,776 1,110,776Weighted average number of shares issued, before and after dilution, thousands4 1,110,776 1,110,776 1,110,776 1,110,776 1,110,776Average number of employees 44,269 45,994 46,928 47,426 48,3531 Excluding items affecting comparability 2016 and 2018.2 Dividend proposed by the Board of Directors.3 Excluding restructuring payments.4 Comparatives have been recalculated for all historical periods prior to 2015 reflecting the stock split (3:1) in 2015.
1 Excluding items affecting comparability 2016 and 2018.
%
0
5
10
15
20
1817161514
Number
0
10,000
20,000
30,000
40,000
50,000
1817161514
%
0
5
10
15
20
1817161514
ASSA ABLOY ANNUAL REPORT 2018 99
FIVE YEARS IN SuMMARY

Quarterly informationTHE GROUP IN SUMMARY Amounts in SEK M unless stated otherwise
Q 12017
Q 22017
Q 32017
Q 42017
Full year 2017
Q 12018
Q 22018
Q 32018
Q 42018
Full year 2018
Sales 18,142 19,387 18,499 20,109 76,137 18,550 21,140 21,191 23,167 84,048Organic growth 6% 2% 3% 5% 4% 4% 5% 5% 6% 5%Gross income excluding items affecting comparability 7,190 7,581 7,293 7,924 29,988 7,372 8,345 8,392 9,134 33,243Gross margin excluding items affecting comparability 39.6% 39.1% 39.4% 39.4% 39.4% 39.7% 39.5% 39.6% 39.4% 39.6%Operating income before depreciation and amortization (EBITDA), excluding items affecting comparability 3,208 3,543 3,488 3,789 14,029 3,297 3,407 3,912 4,256 14,872Operating margin (EBITDA) 17.7% 18.3% 18.9% 18.8% 18.4% 17.8% 16.1% 18.5% 18.4% 17.7%Depreciation and amortization excluding amortization attributable to business combinations –370 –376 –355 –344 –1,444 –376 –400 –396 –397 –1,570Operating income before amortization (EBITA), excluding items affecting comparability 2,839 3,168 3,132 3,446 12,584 2,921 3,007 3,516 3,858 13,302Operating margin (EBITA) 15.6% 16.3% 16.9% 17.1% 16.5% 15.7% 14.2% 16.6% 16.7% 15.8%Amortization attributable to business combinations –52 –54 –52 –87 –244 –92 –97 –91 –113 –393Operating income (EBIT) excluding items affecting comparability 2,787 3,114 3,080 3,359 12,341 2,829 2,911 3,424 3,746 12,909Operating margin (EBIT) 15.4% 16.1% 16.7% 16.7% 16.2% 15.3% 13.8% 16.2% 16.2% 15.4%Items affecting comparability2 – – – – – – –5,595 – –1,218 –6,813Operating income (EBIT) 2,787 3,114 3,080 3,359 12,341 2,829 –2,685 3,424 2,528 6,096Operating margin (EBIT) 15.4% 16.1% 16.7% 16.7% 16.2% 15.3% –12.7% 16.2% 10.9% 7.3%Net financial items –195 –170 –171 –133 –668 –175 –191 –203 –230 –799Income before tax (EBT) 2,593 2,944 2,910 3,226 11,673 2,654 –2,876 3,221 2,297 5,297Profit margin (EBT) 14.3% 15.2% 15.7% 16.0% 15.3% 14.3% –13.6% 15.2% 9.9% 6.3%Tax on income –674 –765 –757 –842 –3,038 –690 –344 –838 –670 –2,542Net income 1,918 2,179 2,153 2,385 8,635 1,964 –3,220 2,384 1,627 2,755
Net income attributable to:Parent company’s shareholders 1,919 2,178 2,153 2,384 8,633 1,964 –3,222 2,384 1,627 2,753Non-controlling interests 0 1 1 1 2 0 2 0 0 2
OPERATING CASH FLOWQ 1
2017Q 2
2017Q 3
2017Q 4
2017Full year
2017Q 1
2018Q 2
2018Q 3
2018Q 4
2018Full year
2018Operating income (EBIT) 2,787 3,114 3,080 3,359 12,341 2,829 –2,685 3,424 2,528 6,096Restructuring costs – – – – – – – – 1,218 1,218Impairment of goodwill, etc. – – – – – – 5,595 – – 5,595Depreciation and amortization 421 429 407 430 1,688 468 497 488 510 1,963Net capital expenditure –373 –593 –448 –561 –1,975 –356 –411 –429 –124 –1,319Change in working capital –1,882 –207 –319 2,061 –347 –2,136 127 –296 1,229 –1,076Interest paid and received –93 –198 –77 –189 –557 –122 –220 –105 –215 –662Non-cash items –36 28 11 –224 –221 –107 –49 –78 –224 –458Operating cash flow1 824 2,575 2,654 4,876 10,929 575 2,855 3,004 4,923 11,357Operating cash flow/Income before tax excluding items affecting comparability2 0.32 0.87 0.91 1.51 0.94 0.22 1.05 0.93 1.40 0.94
CHANGE IN NET DEBTQ 1
2017Q 2
2017Q 3
2017Q 4
2017Full year
2017Q 1
2018Q 2
2018Q 3
2018Q 4
2018Full year
2018Net debt at beginning of period 23,127 23,339 24,970 25,180 23,127 25,275 27,219 31,454 31,372 25,275Operating cash flow –824 –2,575 –2,654 –4,876 –10,929 –575 –2,855 –3,004 –4,923 –11,357Restructuring payments 84 136 106 286 612 173 166 103 351 793Tax paid on income 629 961 1,656 –203 3,044 609 986 576 487 2,658Acquisitions and divestments 461 268 1,741 4,319 6,790 986 1,097 2,610 1,697 6,390Dividend – 3,332 – – 3,332 – 3,666 – – 3,666Actuarial gain/loss on post-employment benefit obligations –34 99 –50 –40 –26 –35 20 –21 –3 –39Exchange rate differences, etc. –104 –590 –590 608 –675 787 1,157 –348 266 1,862Net debt at end of period 23,339 24,970 25,180 25,275 25,275 27,219 31,454 31,372 29,246 29,246Net debt/equity ratio 0.48 0.54 0.53 0.50 0.50 0.50 0.65 0.63 0.56 0.56
NET DEBTQ 1
2017Q 2
2017Q 3
2017Q 4
2017Q 1
2018Q 2
2018Q 3
2018Q 4
2018Non-current interest-bearing receivables –41 –39 –212 –171 –113 –120 –96 –106Current interest-bearing investments including derivatives –113 –211 –161 –150 –277 –284 –211 –188Cash and cash equivalents –697 –844 –440 –459 –551 –496 –559 –538Pension provisions 3,058 3,109 2,929 2,933 2,971 3,102 2,873 2,880Other non-current interest-bearing liabilities 16,232 17,450 16,728 16,859 18,425 20,194 19,067 19,489Current interest-bearing liabilities including derivatives 4,901 5,505 6,336 6,263 6,763 9,059 10,297 7,710Total 23,339 24,970 25,180 25,275 27,219 31,454 31,372 29,2461 Excluding restructuring payments.2 Items affecting comparability relate to restructuring costs as well as impairment of goodwill and other intangible assets.
ASSA ABLOY ANNUAL REPORT 2018100
QuARTERLY INFORMATION

CAPITAL EMPLOYED AND FINANCINGQ 1
2017Q 2
2017Q 3
2017Q 4
2017Q 1
2018Q 2
2018Q 3
2018Q 4
2018Capital employed 72,333 71,349 72,477 75,932 81,139 79,733 81,412 81,146– of which goodwill 47,438 46,252 46,573 50,330 51,956 50,590 52,169 53,413– of which other intangible assets and pro-
perty, plant and equipment 17,595 17,309 17,032 19,144 20,019 19,011 19,052 19,637– of which investments in associates 2,176 2,193 2,147 2,243 2,385 2,391 2,383 2,434Net debt 23,339 24,970 25,180 25,275 27,219 31,454 31,372 29,246Non-controlling interests 4 5 5 9 9 11 11 10Equity attributable to the Parent company’s shareholders 48,989 46,374 47,292 50,648 53,911 48,268 50,030 51,890
DATA PER SHARE, SEKQ 1
2017Q 2
2017Q 3
2017Q 4
2017Full year
2017Q 1
2018Q 2
2018Q 3
2018Q 4
2018Full year
2018Earnings per share before and after dilution 1.73 1.96 1.94 2.15 7.77 1.77 –2.90 2.15 1.46 2.48Earnings per share before and after dilution and excluding items affecting comparability2 1.73 1.96 1.94 2.15 7.77 1.77 1.84 2.15 2.33 8.09Shareholders’ equity per share after dilution 44.10 41.75 42.58 45.60 45.60 48.53 43.45 45.04 46.71 46.71
NUMBER OF SHARESQ 1
2017Q 2
2017Q 3
2017Q 4
2017Full year
2017Q 1
2018Q 2
2018Q 3
2018Q 4
2018Full year
2018Total number of shares, millions 1,112.6 1,112.6 1,112.6 1,112.6 1,112.6 1,112.6 1,112.6 1,112.6 1,112.6 1,112.6Weighted average number of outstanding shares, before and after dilution, millions 1,110.8 1,110.8 1,110.8 1,110.8 1,110.8 1,110.8 1,110.8 1,110.8 1,110.8 1,110.81 Excluding restructuring payments.2 Items affecting comparability relate to restructuring costs as well as impairment of goodwill and other intangible assets.
Organic growthChange in sales for comparable units after adjustments for acquisitions and exchange rate effects.
Operating margin (EBITDA)Operating income before depreciation and amortization as a percentage of sales.
Operating margin (EBITA)Operating income before amortization of intangible assets recognized in business combinations, as a precentage of sales.
Operating margin (EBIT)Operating income as a percentage of sales.
Profit margin (EBT)Income before tax as a percentage of sales.
Operating cash flowSee the table on operating cash flow for detailed infor-mation.
Net capital expenditureInvestments in, less disposals of, intangible assets and property, plant and equipment.
Depreciation and amortizationDepreciation and amortization of intangible assets and property, plant and equipment.
Net debtInterest-bearing liabilities less interest-bearing assets.
Capital employedTotal assets less interest-bearing assets and non-interest-bearing liabilities including deferred tax liability.
Equity ratioShareholders’ equity as a percentage of total assets.
Interest coverage ratioIncome before tax plus net interest divided by net interest.
Return on shareholders’ equityNet income attributable to parent company’s shareholdersas a percentage of average parent company’s shareholders equity.
Return on capital employedIncome before tax plus net interest as a percentage of aver-age capital employed, excluding restructuring reserves.
Earnings per share after tax and before dilutionNet income excluding non-controlling interests divided by weighted average number of outstanding shares before dilution.
Earnings per share after tax and dilutionNet income excluding non-controlling interests divided by weighted average number of outstanding shares after any potential dilution.
Shareholders’ equity per share after dilutionEquity excluding non-controlling interests in relation to number of outstanding shares after any potential dilution.
Definitions of key ratios
ASSA ABLOY ANNUAL REPORT 2018 101
QuARTERLY INFORMATION

Proposed distribution of earnings
The following earnings are at the disposal of the general meeting of shareholders:
Share premium reserve: SEK 787 MRetained earnings brought forward: SEK 8,257 MNet income for the year: SEK 4,796 MTOTAL: SEK 13,840 M
The Board of Directors and the President and CEO propose that a dividend of SEK 3.50 per share, a total of SEK 3,888 M, be distributed to shareholders and that the remainder, SEK 9,952 M, be carried forward to the new financial year. The dividend amount is calculated on the number of outstanding shares as per 4 February 2019.
No dividend is payable on ASSA ABLOY AB’s holding of treasury shares, the exact number of which is determined on the record date for payment of dividend. ASSA ABLOY AB held 1,800,000 treasury shares as at 4 February 2019.
Monday, 29 April 2019 has been proposed as the record date for dividends. If the Annual General Meeting approves this proposal, dividends are expected to be distributed by Euroclear Sweden AB on Friday, 3 May 2019.
The Board of Directors and the President and CEO declare that the consolidated accounts have been prepared in accordance with International Financial Reporting Standards, IFRS, as adopted by the EU and give a true and fair view of the Group’s financial position and results. The Parent company’s annual accounts have been prepared in accordance with generally accepted accounting principles in Sweden and give a true and fair view of the Parent company’s financial position and results.
The Report of the Board of Directors for the Group and the Parent company gives a true and fair view of the development of the Group’s and the Parent company’s business operations, financial position and results, and describes material risks and uncertainties to which the Parent company and the other companies in the Group are exposed.
Stockholm, 4 February 2019
Lars RenströmChairman
Carl DouglasVice Chairman
Nico DelvauxPresident and CEO
Ulf EwaldssonBoard member
Eva KarlssonBoard member
Birgitta KlasénBoard member
Lena OlvingBoard member
Sofia Schörling HögbergBoard member
Jan SvenssonBoard member
Rune HjälmBoard member
Employee representative
Mats PerssonBoard member
Employee representative
Our audit report was issued on 4 February 2019
PricewaterhouseCoopers AB
Bo Karlsson Linda Corneliusson Authorized Public Accountant Authorized Public Accountant Auditor in charge
ASSA ABLOY ANNUAL REPORT 2018102
PROPOSED DISTRIBuTION OF EARNINGS

Auditor’s report
To the general meeting of the shareholders of ASSA ABLOY AB (publ), corporate identity number 556059-3575
Report on the annual accounts and consolidated accounts
OpinionsWe have audited the annual accounts and consolidated accounts of ASSA ABLOY AB (publ) for the year 2018 except for the corporate governance statement on pages 48–56. The annual accounts and consolidated accounts of the com-pany are included on pages 41–97 and 102 in this document.
In our opinion, the annual accounts have been prepared in accordance with the Annual Accounts Act and present fairly, in all material respects, the financial position of the Parent company as of 31 December 2018 and its financial performance and cash flow for the year then ended in accordance with the Annual Accounts Act. The consolidated accounts have been prepared in accordance with the Annual Accounts Act and present fairly, in all material respects, the financial position of the Group as of 31 December 2018 and their financial performance and cash flow for the year then ended in accordance with Inter national Financial Reporting
Standards (IFRS), as adopted by the EU, and the Annual Accounts Act.
Our opinions do not cover the corporate governance statement on pages 48–56. The statutory administration report is consistent with the other parts of the annual accounts and consolidated accounts.
We therefore recommend that the general meeting of shareholders adopts the income statement and statement of comprehensive income and balance sheet for the Parent company and the Group.
Our opinions in this report on the annual accounts and consolidated accounts are consistent with the content of the additional report that has been submitted to the Parent company’s audit committee in accordance with the Audit Regulation (537/2014) Article 11.
Basis for OpinionsWe conducted our audit in accordance with International Standards on Auditing (ISA) and generally accepted auditing standards in Sweden. Our responsibilities under those stand-ards are further described in the Auditor’s Responsibilities section. We are independent of the Parent company and the Group in accordance with professional ethics for account-ants in Sweden and have otherwise fulfilled our ethical responsibilities in accordance with these requirements. This
includes that, based on the best of our knowledge and belief, no prohibited services referred to in the Audit Regulation (537/2014) Article 5.1 have been provided to the audited company or, where applicable, its Parent company or its controlled companies within the EU.
We believe that the audit evidence we have obtained is sufficient and appropriate to provide a basis for our opinions.
Our audit approachAudit scopeWe designed our audit by determining materiality and assessing the risks of material misstatement in the consoli-dated financial statements. In particular, we considered where management made subjective judgements; for exam-ple, in respect of significant accounting estimates that involved making assumptions and considering future events that are inherently uncertain. As in all of our audits, we also addressed the risk of management override of internal con-trols, including among other matters consideration of whether there was evidence of bias that represented a risk of material misstatement due to fraud.
We tailored the scope of our audit in order to perform sufficient work to enable us to provide an opinion on the consolidated financial statements as a whole, taking into account the structure of the Group, the accounting pro-cesses and controls, and the industry in which the Group operates.
The ASSA ABLOY Group is comprised of a large number of companies. None of these companies have, individually, been deemed to be of major significance in the audit of the Group. For the Group audit, we have selected the Parent company and the treasury company and some 80 companies spread across the Group’s five divisions, which are audited according to a Group-wide audit program. The audit program includes the assessment of the design and operating effectiveness of selected controls in processes significant to the financial reporting and also includes audit procedures in the form of
test of details supplemented with analytical procedures applied to the Group’s significant income statement and balance sheet items. The majority of the subsidiaries in the Group are also the subject of statutory audits according to local requirements. During 2018, we visited the audit teams in China and the US to participate, on site, in the audit, and to take part in the meetings with representatives from ASSA ABLOY’s local companies and ASSA ABLOY’s head office. The operations in China and the US have been selected as they are the countries with the largest external sales.
MaterialityThe scope of our audit was influenced by our application of materiality. An audit is designed to obtain reasonable assur-ance whether the financial statements are free from material misstatement. Misstatements may arise due to fraud or error. They are considered material if individually or in aggre-gate, they could reasonably be expected to influence the economic decisions of users taken on the basis of the consol-idated financial statements.
Based on our professional judgement, we determined certain quantitative thresholds for materiality, including the overall Group materiality for the consolidated financial statements as a whole. These, together with qualitative con-siderations, helped us to determine the scope of our audit and the nature, timing and extent of our audit procedures and to evaluate the effect of misstatements, both individu-ally and in aggregate on the financial statements as a whole.
ASSA ABLOY ANNUAL REPORT 2018 103
AuDITOR’S REPORT
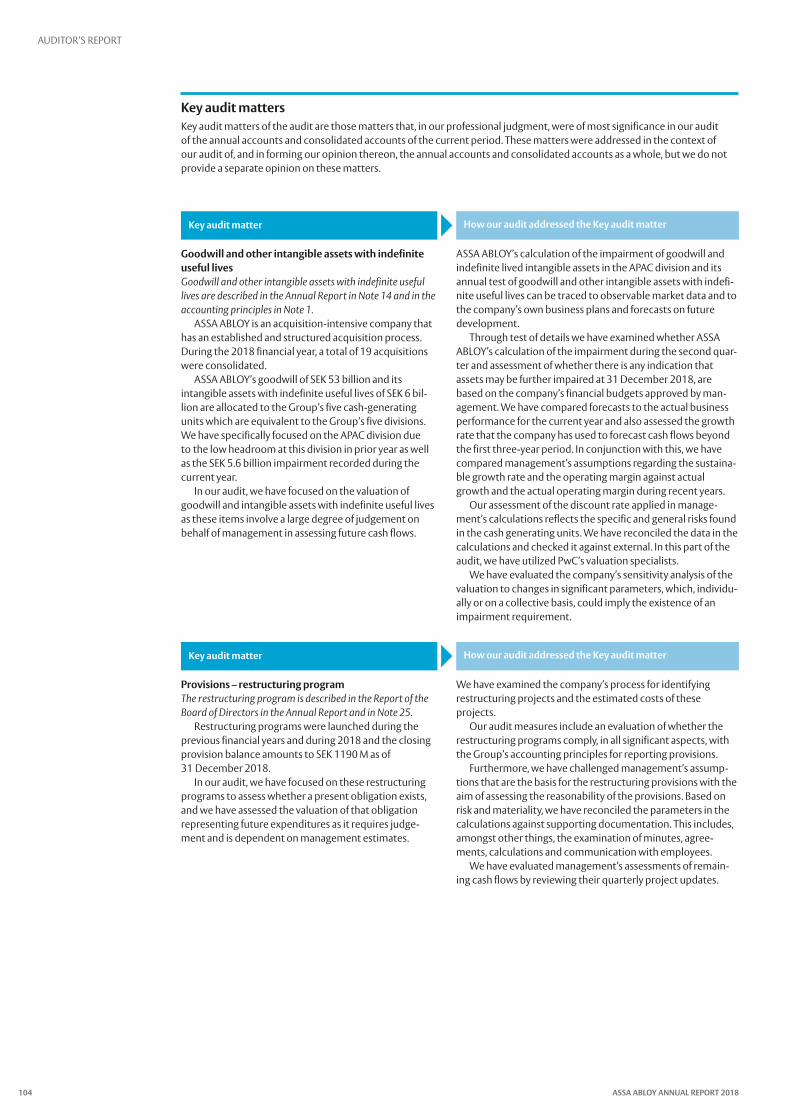
Key audit mattersKey audit matters of the audit are those matters that, in our professional judgment, were of most significance in our audit of the annual accounts and consolidated accounts of the current period. These matters were addressed in the context of our audit of, and in forming our opinion thereon, the annual accounts and consolidated accounts as a whole, but we do not provide a separate opinion on these matters.
Key audit matter How our audit addressed the Key audit matter
Goodwill and other intangible assets with indefinite useful livesGoodwill and other intangible assets with indefinite useful lives are described in the Annual Report in Note 14 and in the accounting principles in Note 1.
ASSA ABLOY is an acquisition-intensive company that has an established and structured acquisition process. During the 2018 financial year, a total of 19 acquisitions were consolidated.
ASSA ABLOY’s goodwill of SEK 53 billion and its intangible assets with indefinite useful lives of SEK 6 bil-lion are allocated to the Group’s five cash-generating units which are equivalent to the Group’s five divisions.We have specifically focused on the APAC division due to the low headroom at this division in prior year as well as the SEK 5.6 billion impairment recorded during the current year.
In our audit, we have focused on the valuation of goodwill and intangible assets with indefinite useful lives as these items involve a large degree of judgement on behalf of management in assessing future cash flows.
ASSA ABLOY’s calculation of the impairment of goodwill and indefinite lived intangible assets in the APAC division and its annual test of goodwill and other intangible assets with indefi-nite useful lives can be traced to observable market data and to the company’s own business plans and forecasts on future development.
Through test of details we have examined whether ASSA ABLOY’s calculation of the impairment during the second quar-ter and assessment of whether there is any indication that assets may be further impaired at 31 December 2018, are based on the company’s financial budgets approved by man-agement. We have compared forecasts to the actual business performance for the current year and also assessed the growth rate that the company has used to forecast cash flows beyond the first three-year period. In conjunction with this, we have compared management’s assumptions regarding the sustaina-ble growth rate and the operating margin against actual growth and the actual operating margin during recent years.
Our assessment of the discount rate applied in manage-ment’s calculations reflects the specific and general risks found in the cash generating units. We have reconciled the data in the calculations and checked it against external. In this part of the audit, we have utilized PwC’s valuation specialists.
We have evaluated the company’s sensitivity analysis of the valuation to changes in significant parameters, which, individu-ally or on a collective basis, could imply the existence of an impairment requirement.
Key audit matter How our audit addressed the Key audit matter
Provisions – restructuring programThe restructuring program is described in the Report of the Board of Directors in the Annual Report and in Note 25.
Restructuring programs were launched during the previous financial years and during 2018 and the closing provision balance amounts to SEK 1190 M as of 31 December 2018.
In our audit, we have focused on these restructuring programs to assess whether a present obligation exists, and we have assessed the valuation of that obligation representing future expenditures as it requires judge-ment and is dependent on management estimates.
We have examined the company’s process for identifying restructuring projects and the estimated costs of these projects.
Our audit measures include an evaluation of whether the restructuring programs comply, in all significant aspects, with the Group’s accounting principles for reporting provisions.
Furthermore, we have challenged management’s assump-tions that are the basis for the restructuring provisions with the aim of assessing the reasonability of the provisions. Based on risk and materiality, we have reconciled the parameters in the calculations against supporting documentation. This includes, amongst other things, the examination of minutes, agree-ments, calculations and communication with employees.
We have evaluated management’s assessments of remain-ing cash flows by reviewing their quarterly project updates.
ASSA ABLOY ANNUAL REPORT 2018104
AuDITOR’S REPORT

Other Information than the annual accounts and consolidated accountsThis document also contains other information than the annual accounts and consolidated accounts and is found in sections Report on Operations, Divisions, Sustainability Report, Shareholder Information and the sections Com-ments on five years in summary, Five years in summary, Quar-terly information and Definitions of key ratios. The Board of Directors and the Managing Director are responsible for this other information.
Our opinion on the annual accounts and consolidated accounts does not cover this other information and we do not express any form of assurance conclusion regarding this other information.
In connection with our audit of the annual accounts and consolidated accounts, our responsibility is to read the infor-mation identified above and consider whether the informa-tion is materially inconsistent with the annual accounts and consolidated accounts. In this procedure we also take into account our knowledge otherwise obtained in the audit and assess whether the information otherwise appears to be materially misstated.
If we, based on the work performed concerning this infor-mation, conclude that there is a material misstatement of this other information, we are required to report that fact. We have nothing to report in this regard.
Responsibilities of the Board of Director’s and the Managing DirectorThe Board of Directors and the Managing Director are responsible for the preparation of the annual accounts and consolidated accounts and that they give a fair presentation in accordance with the Annual Accounts Act and, concern-ing the consolidated accounts, in accordance with IFRS as adopted by the EU. The Board of Directors and the Managing Director are also responsible for such internal control as they determine is necessary to enable the preparation of annual accounts and consolidated accounts that are free from material misstatement, whether due to fraud or error.
In preparing the annual accounts and consolidated accounts, The Board of Directors and the Managing Director
are responsible for the assessment of the company’s and the Group’s ability to continue as a going concern. They disclose, as applicable, matters related to going concern and using the going concern basis of accounting. The going concern basis of accounting is however not applied if the Board of Direc-tors and the Managing Director intend to liquidate the com-pany, to cease operations, or has no realistic alternative but to do so.
The Audit Committee shall, without prejudice to the Board of Director’s responsibilities and tasks in general, among other things oversee the company’s financial report-ing process.
Auditor’s responsibilityOur objectives are to obtain reasonable assurance about whether the annual accounts and consolidated accounts as a whole are free from material misstatement, whether due to fraud or error, and to issue an auditor’s report that includes our opinions. Reasonable assurance is a high level of assurance, but is not a guarantee that an audit conducted in accordance with ISAs and generally accepted auditing stand-ards in Sweden will always detect a material misstatement when it exists. Misstatements can arise from fraud or error
and are considered material if, individually or in the aggre-gate, they could reasonably be expected to influence the economic decisions of users taken on the basis of these annual accounts and consolidated accounts.
A further description of our responsibility for the audit of the annual accounts and consolidated accounts is available on Revisorsinspektionen’s website: www.revisorsinspek-tionen.se/revisornsansvar. This description is part of the auditor´s report.
Report on other legal and regulatory requirements
OpinionsIn addition to our audit of the annual accounts and consoli-dated accounts, we have also audited the administration of the Board of Director’s and the Managing Director of ASSA ABLOY AB (publ) for the year 2018 and the proposed appro-priations of the company’s profit or loss.
We recommend to the general meeting of shareholders that the profit be appropriated in accordance with the proposal in the statutory administration report and that the members of the Board of Director’s and the Managing Director be dis-charged from liability for the financial year.
Basis for OpinionsWe conducted the audit in accordance with generally accepted auditing standards in Sweden. Our responsibilities under those standards are further described in the Auditor’s Responsibilities section. We are independent of the Parent company and the Group in accordance with professional ethics for accountants in Sweden and have otherwise ful-filled our ethical responsibilities in accordance with these requirements.
We believe that the audit evidence we have obtained is suffi-cient and appropriate to provide a basis for our opinions.
ASSA ABLOY ANNUAL REPORT 2018 105
AuDITOR’S REPORT

Stockholm, 4 February 2019
PricewaterhouseCoopers AB
Bo Karlsson Linda Corneliusson Authorized Public Accountant Authorized Public Accountant Auditor in charge
Responsibilities of the Board of Director’s and the Managing DirectorThe Board of Directors is responsible for the proposal for appropriations of the company’s profit or loss. At the pro-posal of a dividend, this includes an assessment of whether the dividend is justifiable considering the requirements which the company’s and the Group’s type of operations, size and risks place on the size of the Parent company’s and the Group’ equity, consolidation requirements, liquidity and position in general.
The Board of Directors is responsible for the company’s organization and the administration of the company’s affairs. This includes among other things continuous assessment of
the company’s and the Group’s financial situation and ensur-ing that the company´s organization is designed so that the accounting, management of assets and the company’s finan-cial affairs otherwise are controlled in a reassuring manner. The Managing Director shall manage the ongoing adminis-tration according to the Board of Directors’ guidelines and instructions and among other matters take measures that are necessary to fulfill the company’s accounting in accord-ance with law and handle the management of assets in a reassuring manner.
Auditor’s responsibilityOur objective concerning the audit of the administration, and thereby our opinion about discharge from liability, is to obtain audit evidence to assess with a reasonable degree of assurance whether any member of the Board of Directors or the Managing Director in any material respect:• has undertaken any action or been guilty of any omission
which can give rise to liability to the company, or• in any other way has acted in contravention of the Com-
panies Act, the Annual Accounts Act or the Articles of Association.
Our objective concerning the audit of the proposed appro-priations of the company’s profit or loss, and thereby our opinion about this, is to assess with reasonable degree of
assurance whether the proposal is in accordance with the Companies Act.
Reasonable assurance is a high level of assurance, but is not a guarantee that an audit conducted in accordance with generally accepted auditing standards in Sweden will always detect actions or omissions that can give rise to lia-bility to the company, or that the proposed appropriations of the company’s profit or loss are not in accordance with the Companies Act.
A further description of our responsibility for the audit of the administration is available on Revisorsinspektionen’s website: www.revisorsinspektionen.se/revisornsansvar. This description is part of the auditor’s report.
The auditor’s examination of the corporate governance statementThe Board of Directors is responsible for that the corporate governance statement on pages 48–56 has been prepared in accordance with the Annual Accounts Act.
Our examination of the corporate governance state-ment is conducted in accordance with FAR’s auditing stand-ard RevU 16 The auditor’s examination of the corporate governance statement. This means that our examination of the corporate governance statement is different and sub-stantially less in scope than an audit conducted in accord-ance with International Standards on Auditing and gener-
ally accepted auditing standards in Sweden. We believe that the examination has provided us with sufficient basis for our opinions.
A corporate governance statement has been prepared. Disclosures in accordance with chapter 6 section 6 the sec-ond paragraph points 2–6 of the Annual Accounts Act and chapter 7 section 31 the second paragraph the same law are consistent with the other parts of the annual accounts and consolidated accounts and are in accordance with the Annual Accounts Act.
PricewaterhouseCoopers AB, 113 97 Stockholm, was appointed auditor of ASSA ABLOY AB (publ) by the general meeting of the shareholders on the 26 April 2018 and has been the company’s auditor since the 1994.
ASSA ABLOY ANNUAL REPORT 2018106
AuDITOR’S REPORT

Shareholder information
Content
The ASSA ABLOY share 108Information for shareholders 111
ASSA ABLOY ANNUAL REPORT 2018 107
SHAREHOLDER INFORMATION
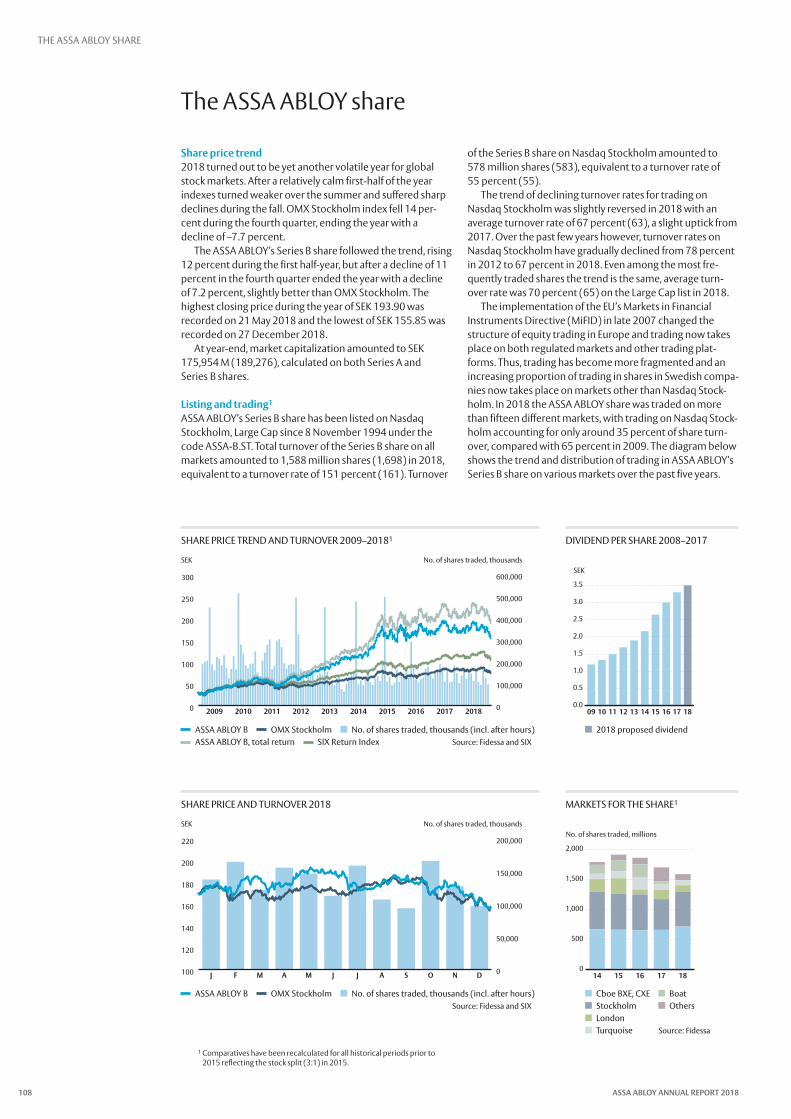
The ASSA ABLOY share
Share price trend2018 turned out to be yet another volatile year for global stock markets. After a relatively calm first-half of the year indexes turned weaker over the summer and suffered sharp declines during the fall. OMX Stockholm index fell 14 per-cent during the fourth quarter, ending the year with a decline of –7.7 percent.
The ASSA ABLOY’s Series B share followed the trend, rising 12 percent during the first half-year, but after a decline of 11 percent in the fourth quarter ended the year with a decline of 7.2 percent, slightly better than OMX Stockholm. The highest closing price during the year of SEK 193.90 was recorded on 21 May 2018 and the lowest of SEK 155.85 was recorded on 27 December 2018.
At year-end, market capitalization amounted to SEK 175,954 M (189,276), calculated on both Series A and Series B shares.
Listing and trading1
ASSA ABLOY’s Series B share has been listed on Nasdaq Stockholm, Large Cap since 8 November 1994 under the code ASSA-B.ST. Total turnover of the Series B share on all markets amounted to 1,588 million shares (1,698) in 2018, equivalent to a turnover rate of 151 percent (161). Turnover
of the Series B share on Nasdaq Stockholm amounted to 578 million shares (583), equivalent to a turnover rate of 55 percent (55).
The trend of declining turnover rates for trading on Nasdaq Stockholm was slightly reversed in 2018 with an average turnover rate of 67 percent (63), a slight uptick from 2017. Over the past few years however, turnover rates on Nasdaq Stockholm have gradually declined from 78 percent in 2012 to 67 percent in 2018. Even among the most fre-quently traded shares the trend is the same, average turn-over rate was 70 percent (65) on the Large Cap list in 2018.
The implementation of the EU’s Markets in Financial Instruments Directive (MiFID) in late 2007 changed the structure of equity trading in Europe and trading now takes place on both regulated markets and other trading plat-forms. Thus, trading has become more fragmented and an increasing proportion of trading in shares in Swedish compa-nies now takes place on markets other than Nasdaq Stock-holm. In 2018 the ASSA ABLOY share was traded on more than fifteen different markets, with trading on Nasdaq Stock-holm accounting for only around 35 percent of share turn-over, compared with 65 percent in 2009. The diagram below shows the trend and distribution of trading in ASSA ABLOY’s Series B share on various markets over the past five years.
SHARE PRICE AND TuRNOVER 2018
SHARE PRICE TREND AND TuRNOVER 2009–20181
0
50,000
100,000
150,000
200,000
DNOSAJJMAMFJ100
120
140
160
180
200
220
SEK No. of shares traded, thousands
0
100,000
200,000
300,000
400,000
500,000
600,000
20182017201620152014201320122011201020090
50
100
150
200
250
300
SEK No. of shares traded, thousands
MARKETS FOR THE SHARE1
DIVIDEND PER SHARE 2008–2017
Cboe BXE, CXE Boat Stockholm Others London Turquoise Source: Fidessa
2018 proposed dividend
ASSA ABLOY B OMX Stockholm No. of shares traded, thousands (incl. after hours)Source: Fidessa and SIX
ASSA ABLOY B OMX Stockholm No. of shares traded, thousands (incl. after hours) ASSA ABLOY B, total return SIX Return Index Source: Fidessa and SIX
SEK
0.0
0.5
1.0
1.5
2.0
2.5
3.0
3.5
18171615141312111009
No. of shares traded, millions
0
500
1,000
1,500
2,000
1817161514
1 Comparatives have been recalculated for all historical periods prior to 2015 reflecting the stock split (3:1) in 2015.
ASSA ABLOY ANNUAL REPORT 2018108
THE ASSA ABLOY SHARE

Data per share
SEK/share 1 2009 2010 2011 2012 2013 2014 2015 2016 2017 2018Earnings after tax and dilution 3,072 3.63 4,102 4.66 4,952 5.79 6.93 7.092 7.77 8.092
Dividend 1.20 1.33 1.50 1.70 1.90 2.17 2.65 3.00 3.30 3.503
Dividend yield, % 4 2.6 2.1 2.6 2.1 1.7 1.6 1.5 1.8 1.9 2.2Dividend, % 5 47.8 37.0 36.6 36.8 38.4 37.4 38.2 42.3 42.5 43.3Share price at year-end 45.93 63.17 57.53 80.97 113.27 138.27 178.00 169.10 170.40 158.15Highest share price 47.50 66.40 64.97 81.60 114.07 139.17 189.00 190.10 197.10 193.90Lowest share price 23.83 42.20 44.50 57.23 79.33 105.63 135.00 148.40 163.80 155.85Equity 18.25 19.55 21.85 23.29 25.94 32.50 37.43 42.51 45.60 46.71Number of shares, millions 6 1,118.8 1,118.2 1,113.6 1,112.6 1,112.6 1,112.6 1,112.6 1,112.6 1,112.6 1,112.61 Adjustments made for new issues and stock split (3:1) in 2015 for all historical
periods prior to 2015.2 Excluding items affecting comparability 2008, 2009, 2011, 2013, 2016 and 2018.3 Dividend proposed by the Board of Directors.
4 Dividend as percentage of share price at year-end.5 Dividend as percentage of earnings per share after tax and dilution, excluding
items affecting comparability.6 After full dilution.
ASSA ABLOY’s ten largest shareholdersBased on the share register at 31 December 2018.
Shareholders Series A shares Series B shares Total number of shares Share capital1, % Votes1, %Latour 41,595,729 63,900,000 105,495,729 9.5 29.5Melker Schörling AB 15,930,240 21,654,104 37,584,344 3.4 11.1Government of Singapore 51,230,631 51,230,631 4.6 3.1Capital Group 42,012,171 42,012,171 3.8 2.6BlackRock 36,469,288 36,469,288 3.3 2.2Fidelity Investments 33,090,837 33,090,837 3.0 2.0Vanguard 29,864,644 29,864,644 2.7 1.8Norges Bank 26,845,606 26,845,606 2.4 1.6Swedbank Robur Funds 23,697,324 23,697,324 2.1 1.5Alecta Pension Insurance 23,695,000 23,695,000 2.1 1.5Other shareholders 702,590,760 702,590,760 63.1 43.1Total number 57,525,969 1,055,050,365 1,112,576,334 100.0 100.01 Based on the number of outstanding shares and votes of 1,110,776,334 and 1,628,510,055 respectively, excluding shares held by ASSA ABLOY.Source: Modular Finance AB and Euroclear Sweden AB.
OWNERSHIP STRuCTuRE (SHARE CAPITAL) OWNERSHIP STRuCTuRE (VOTES)
Share capital and voting rightsThe share capital amounted to SEK 370,858,778 at year-end 2018, distributed among a total of 1,112,576,334 shares, comprising 57,525,969 Series A shares and 1,055,050,365 Series B shares. All shares have a par value of around SEK 0.33 and give shareholders equal rights to the company’s assets and earnings. The total number of votes amounted to 1,630,310,055. Each Series A share carries ten votes and each Series B share one vote.
Repurchase of own sharesSince 2010, the Board of Directors has requested and received a mandate from the Annual General Meeting to repurchase and transfer ASSA ABLOY Series B shares. The aim has been, among other things, to secure the company’s undertakings in connection with its long-term incentive programs (LTI).
The 2018 Annual General Meeting authorized the Board of Directors to acquire, during the period until the next Annual General Meeting, a maximum number of Series B
Ownership structureThe number of shareholders at the end of 2018 was 31,143 (33,811) and the ten largest shareholders accounted for 36.9 percent (40.3) of the share capital and 56.9 percent (59.3) of the votes. Shareholders with more than 50,000 shares, a total
of 481 shareholders, accounted for 97 percent (97) of the share capital and 98 percent (98) of the votes.
Investors outside Sweden owned 70.5 percent (66.6) of the share capital and accounted for 48.1 percent (45.4) of the votes, and were mainly in the US and the UK.
LegendLegendLegendLegendLegendLegend
LegendLegendLegendLegendLegendLegend
Latour, 29.5%Melker Schörling AB, 11.1%Government of Singapore, 3.1%Capital Group, 2.6%BlackRock, 2.2%Fidelity Investments, 2.0%Vanguard, 1.8%Norges Bank, 1.6%Swedbank Robur Funds 1.5%Alecta Pension Insurance, 1.5%Other shareholders, 43.1%
Latour, 9.5%Government of Singapore, 4.6%Capital Group, 3.8%Melker Schörling AB, 3.4%BlackRock, 3.3%Fidelity Investments, 3.0%Vanguard, 2.7%Norges Bank, 2.4%Swedbank Robur Funds, 2.1%Alecta Pension Insurance, 2.1%Other shareholders, 63.1%
ASSA ABLOY ANNUAL REPORT 2018 109
THE ASSA ABLOY SHARE

Common questions from the capital market to ASSA ABLOY
How will you achieve the 10 percent annual sales growth target?The 10 percent growth target is an ambitious, but achievable target. The target is a combination of organic and acquired growth over a business cycle. During the last ten years, ASSA ABLOY has grown by slightly more than 9 percent annually. In 2018, the organic growth was 5 percent and the gross acquired growth was 4 percent. Over time this industry is growing more than GDP and the digitization of the industry provides further growth opportunities. By investing in prod-uct development, combined with acquisitions, and growing in both new and mature markets, the target can be achieved.
In what product segments are you growing the most?In 2018, sales growth was very strong in electromechanical products. In particular, the sale of smart locks grew strongly in the US, driven by Yale, August and new partnerships devel-oped with Amazon and Nest. The digitization of the locks provides many opportunities going forward.
Which was the most important acquisition during 2018?All acquisitions are an important, but in particular, the acqui-sition of Crossmatch was the largest acquisition ASSA ABLOY has completed in five years. In total, 19 acquisitions were completed with annualized sale of about SEK 3.8 billion. Two businesses were also divested.
ASSA ABLOY wrote down SEK 6bn in China during 2018. How will you turn around the operation in China?During 2018, ASSA ABLOY implemented a new strategy that consolidates the broad range of brands in the Chinese market as well as production sites. Three sales organizations have been established around the local brand PanPan, the international brand Yale and ASSA ABLOY. A key account organization has also been established to focus on the larg-est construction developers. The turnaround will take time, but with the new team in place we are confident we will start to see the first results already in 2019.
Changes in share capital
Year TransactionSeries A
sharesSeries C
sharesSeries B
sharesShare capital,
SEK1
1989 20,000 2,000,0001994 Split 100:1 2,000,000 2,000,0001994 Bonus issue1994 Non-cash issue 1,746,005 1,428,550 50,417,555 53,592,1101996 New share issue 2,095,206 1,714,260 60,501,066 64,310,5321996 Conversion of Series C shares into Series A shares 3,809,466 60,501,066 64,310,5321997 New share issue 4,190,412 66,541,706 70,732,1181998 Converted debentures 4,190,412 66,885,571 71,075,9831999 Converted debentures before split 4,190,412 67,179,562 71,369,9741999 Bonus issue1999 Split 4:1 16,761,648 268,718,248 285,479,8961999 New share issue 18,437,812 295,564,487 314,002,2991999 Converted debentures after split and new share issues 18,437,812 295,970,830 314,408,6422000 Converted debentures 18,437,812 301,598,383 320,036,1952000 New share issue 19,175,323 313,512,880 332,688,2032000 Non-cash issue 19,175,323 333,277,912 352,453,2352001 Converted debentures 19,175,323 334,576,089 353,751,4122002 New share issue 19,175,323 344,576,089 363,751,4122002 Converted debentures 19,175,323 346,742,711 365,918,0342010 Converted debentures 19,175,323 347,001,871 366,177,1942011 Converted debentures 19,175,323 349,075,055 368,250,3782012 Converted debentures 19,175,323 351,683,455 370,858,7782015 Split 3:1 57,525,969 1,055,050,365 370,858,7781 SEK 1 per share before split in 2015 – number of shares at the end of the period and around SEK 0.33 per share after split in 2015. Number of shares at the end of the
period 1,112,576,334 (including repurchase of own shares).
shares so that after each repurchase ASSA ABLOY holds a maximum 10 percent of the total number of shares in the company. ASSA ABLOY holds a total of 1,800,000 (1,800,000) Series B shares after repurchase. These shares account for around 0.2 percent (0.2) of the share capital and each share has a par value of around SEK 0.33. The purchase consideration amounted to SEK 103 M.
No shares were repurchased in 2018.
Dividend and dividend policyThe objective of the dividend policy is that, in the long term, the dividend should be equivalent to 33–50 percent of income after standard tax, but always taking into account ASSA ABLOY’s long-term financing requirements.
The Board of Directors and the President and CEO propose that the dividend to shareholders be raised by 6 percent to SEK 3.50 per share (3.30) for the 2018 financial year, equivalent to a dividend yield on the Series B share of 2.2 percent (1.9).
In 2018 the total return on the ASSA ABLOY share, defined as market price movement plus reinvested dividends, was 5.4 percent, compared with the reinvested SIX Return Index, which was down 4.6 percent. Over the ten-year period 2008–2018, the total return on ASSA ABLOY’s Series B share was 745 percent, compared with a 249 percent rise in the SIX Return Index and a 157 percent rise in OMX Stockholm.
ASSA ABLOY ANNUAL REPORT 2018110
THE ASSA ABLOY SHARE

Information for shareholders
Annual General Meeting The Annual General Meeting of ASSA ABLOY AB will be held at Moderna Museet (Museum of Modern Art), Skepps-holmen, Stockholm, Sweden, at 3.30 p.m. on Thursday 25 April 2019. Shareholders who wish to attend the Annual General Meeting must:• Be recorded in the share register kept by Euroclear
Sweden AB on Wednesday 17 April 2019.• Notify ASSA ABLOY AB of their intent to attend no later
than Wednesday 17 April 2019.
Notice of attendance• Website www.assaabloy.com• Telephone +46 (0)8 506 485 14• Address ASSA ABLOY AB,
“Annual General Meeting 2019”, c/o Euroclear Sweden AB Box 191, 101 23 Stockholm, Sweden
The notice of attendance should state:• Name• Personal or corporate identification number• Address and telephone number (daytime)• Number of shares• Any assistants attending
If participation is by proxy, the proxy should be submitted in connection with the notice of attendance and the proxy must be presented in original at the latest at the Annual General Meeting. Proxy forms are available at: www. assaabloy.com.
Nominee registered sharesShareholders whose shares are nominee registered must, in addition of giving notice of attendance, request that their shares be temporarily registered in their own name in the share register (so-called voting right registration) in order to have the right to attend the Annual General Meeting. Such registration must be effected by Wednesday 17 April 2019, and shareholders should contact their bank or nominee well in advance of this date.
Nomination CommitteeThe Nomination Committee has the task of preparing, on behalf of the shareholders, proposals regarding the election of Chairman of the General Meeting, members of the Board of Directors, Chairman of the Board, Vice Chairman of the Board, auditor, fees for the board members including divi-sion between the Chairman, the Vice Chairman, and the other board members, as well as fees for committee work, fees to the company’s auditor and changes of the instruc-tions for the Nomination Committee.
The Nomination Committee prior to the 2019 Annual General Meeting comprises Carl Douglas (Investment AB Latour), Mikael Ekdahl (Melker Schörling AB), Liselott Ledin (Alecta), Marianne Nilsson (Swedbank Robur funds) and Anders Oscarsson (AMF and AMF funds). Carl Douglas is Chairman of the Nomination Committee.
DividendMonday 29 April 2019 has been proposed as the record date for dividends. If the Annual General Meeting approves the proposal, dividend is expected to be distributed by Euroclear Sweden AB on Friday 3 May 2019.
Further informationHedvig WennerholmTelephone +46 (0)8 506 485 [email protected]
Reports can be ordered from ASSA ABLOY AB• Website www.assaabloy.com• Telephone +46 (0)8 506 485 00• Email [email protected]• Mail ASSA ABLOY AB
Box 70340 SE-107 23 Stockholm
Financial reportingFirst quarter: 25 April 2019Second quarter: 17 July 2019Third quarter: 18 October 2019Fourth quarter and Year-end report: February 2020Annual Report 2019: March 2020
ASSA ABLOY ANNUAL REPORT 2018 111
INFORMATION FOR SHAREHOLDERS

ASSA ABLOY’s access solutions are installed in all types of buildings all over the world
The ASSA ABLOY Group is the global leader in access solutions. Every day, the Group helps billions of people to experience a more open world. ASSA ABLOY’s innovations enable safe, secure and convenient access to physical and digital places. The Group has leading positions in areas such as efficient door openings, trusted identities and entrance automation.
Securing buildings from the perimeter …
1 Bollards and other safety devices protect pedes-trians from motor vehicles. The various models
can be permanently installed, portable or retractable, and they can be integrated in security and alarm sys-tems.
2 High-security fences and gates protect against unauthorized entry. The doors can be integrated
with security systems, sensors and surveillance cameras.
3 ASSA ABLOY has a complete offering for service, maintenance and modernization of automatic
entrances and docks.
4 Automatic sliding doors are particularly suitable for entrances and indoor areas with large pedes-
trian flows. Automatic sliding doors allow you to enter a building without manually open doors – and conveni-ently pass through even if you are pushing a shopping or carrying suitcases.
5 Inside the building, mechanical and electrome-chanical key systems, software and solutions for
access control. System to integrate access control sys-tems for e.g. authorization, logistics, personnel, etc. Solutions for secure issuance and management of identi-ties for access to various systems with Specific security requirements, such as staff ID cards. Positioning solu-tions inform the building security system about who is at
a certain place to ensure that no unauthorized individu-als, temporary contractors, etc., have access to the wrong part of the building. At the same time, the staff can keep track of security personnel to see where they are located in the building.
Enterprise
6 Mobile keys, physical access control systems including readers and controllers to manage
access in the building.
7 Security-rated doors and frames. Electromechani-cal locks and other hardware work together with
physical access control systems, including readers and controllers to manage access.
Hotel/retail
8 With Mobile Access for hotels guests can use a smart phone to directly book a room. Secure Seos
technology then sends a digital key directly to the guest’s mobile phone, enabling the guest to go directly to the room and unlock the door. The solution is connected to the hotel’s booking and security systems, and the key will be deleted at check-out.
9 Total door opening solutions for retail premises.
10 Revolving doors create spacious and welcoming entrances with room for luggage carts or wheel-
chairs. Revolving doors are ideal when climate control is a priority. Advanced sensor technology ensures functionality in the door’s features, while con veniently controlling safe traffic flows and providing superior sep-aration of indoor and outdoor climates. Side doors are added for increased accessibility and rapid evacuation.
11 Complete solutions for hotel rooms, including door solution, safes and energy management
systems.
12 Garage doors, bars and gates are secure and easy to connect to the buildings access control system.
Multi-family building
13 Complete solutions for multi-famility buildings, ranging from mechanical locks to sophisticated,
customized access control systems. Digital door locks can easily be opened with a code or a smart phone app. The app enables controlling the lock remotely to let in visitors, and receiving notifications when children come home. In the future, online locks make it possible to safely and securely open the door for service and deliveries directly into the home.
Hotel / retail
Multi-family buildingEnterprise
4
52
13

… to shell …
… to core …
Enterprise
4
6
Enterprise 7
Door closers
Hinges
Air louvers Steel doors & frames
Key pads, push buttons, key switches, touch bars
Floor closersWireless
locksCabinet
locks
Electric strikes
Mechanical & electro-mechanical locks & keys
Power supplies
Magnetic locks
Panic bars
Kick plates
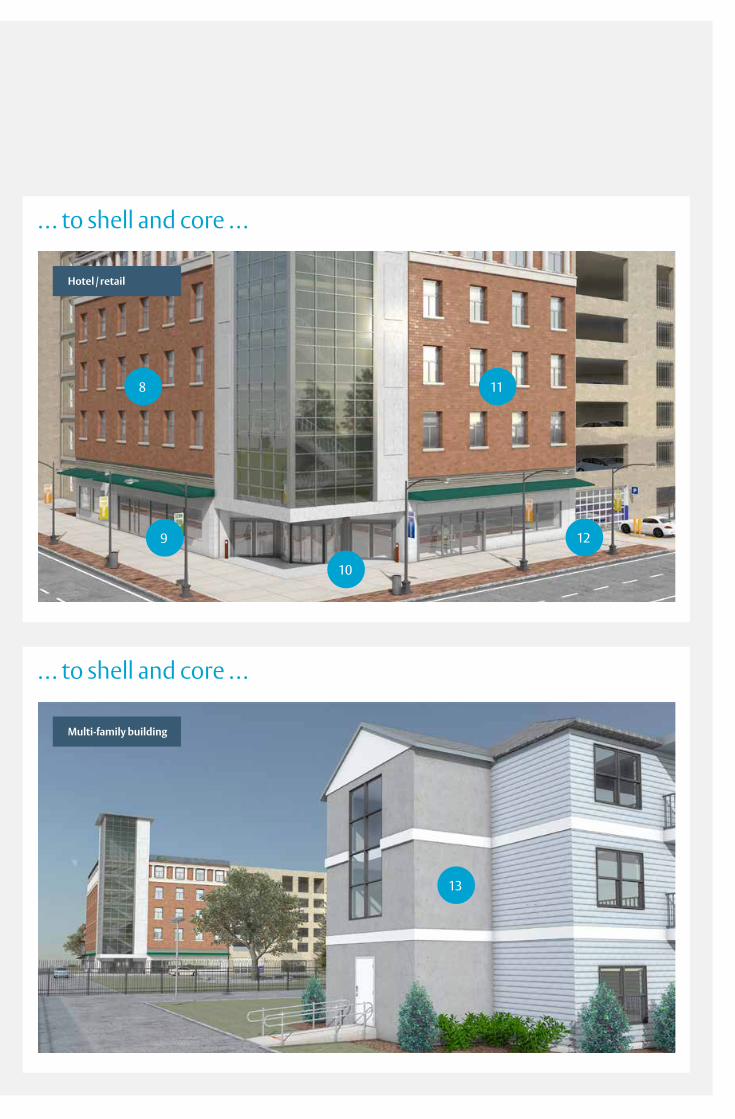
… to shell and core …
… to shell and core …
Hotel / retail
8 11
129
10
Multi-family building
13

Production: ASSA ABLOY in cooperation with Hallvarsson & Halvarsson.Photo: Peter Hoelstad/Molly & Co, Kristian Älegård, Getty Images and ASSA ABLOY’s image bank, etc.Printing: Göteborgstryckeriet in March 2019.
ASSA ABLOY is the global leader in access solutions.

The ASSA ABLOY Group is the global leader in access solutions. Every day we help people feel safe, secure and experience a more open world.
ASSA ABLOY ABBox 70340SE-107 23 StockholmSwedenVisiting address:Klarabergsviadukten 90Tel +46 (0)8 506 485 00Fax +46 (0)8 506 485 85Reg. No. 556059-3575www.assaabloy.com