annual report 2019 - homepage | nipro
TRANSCRIPT

Annual Report 2019Year Ended March 31, 2019
⦁ Businesses⦁ Financial HighlightsAbout NIPRO
DisclaimerThis report contains forward-looking statements regarding business indices, strategies and performance representing the expectations and judgments of the management, based on information available to the Company and publishable at the time this report was prepared. When reading this report, please understand that forward-looking statements involve potential risks and uncertainties; actual future business performance and forecasts may therefore differ materially from those contained in these statements, given the possible emergence of new factors or changes in economic circumstances and/or the business environment.
In this report, fiscal 2019 represents the year ended March 31, 2019.
How to use navigation buttons
Click to go to first page of each category
24Financial/Data Section
Financial Review 24
Ten-Year Summary 28
Consolidated Balance Sheets 30
Consolidated Statements of Income 31
Consolidated Statements of Comprehensive Income 31
Consolidated Statements of Changes in Net Assets 32
Consolidated Statements of Cash Flows 33
Notes to Consolidated Financial Statements 34
Corporate Information 52
02About NIPRO
Businesses 02
Financial Highlights 03
04Management Message
15Management Foundation
Research and Development Activities 15
Progress of Research and Development 16
Status of Corporate Governance 19
Outside Directors’ Messages 21
Board of Directors and Audit & Supervisory Board Members 22
09Review of Operations
Medical-Related Business 09
Pharmaceutical-Related Business 11
PharmaPackaging Business 13
01Contents
Contents
04A Message from the President
08A Message from the CFO
Using Category Tabs Using Navigation Button Link Button
Go to the appropriate page
Go to the appropriate website
Go to the appropriate date pages
Contents
Return one page
Return to previously viewed page
Forward one page
Return to top page
Search PDF content
01NIPRO Annual Report 2019
Medical-Related Business
Pharmaceutical-Related Business
PharmaPackaging Business
Injection Products
Infusion Products
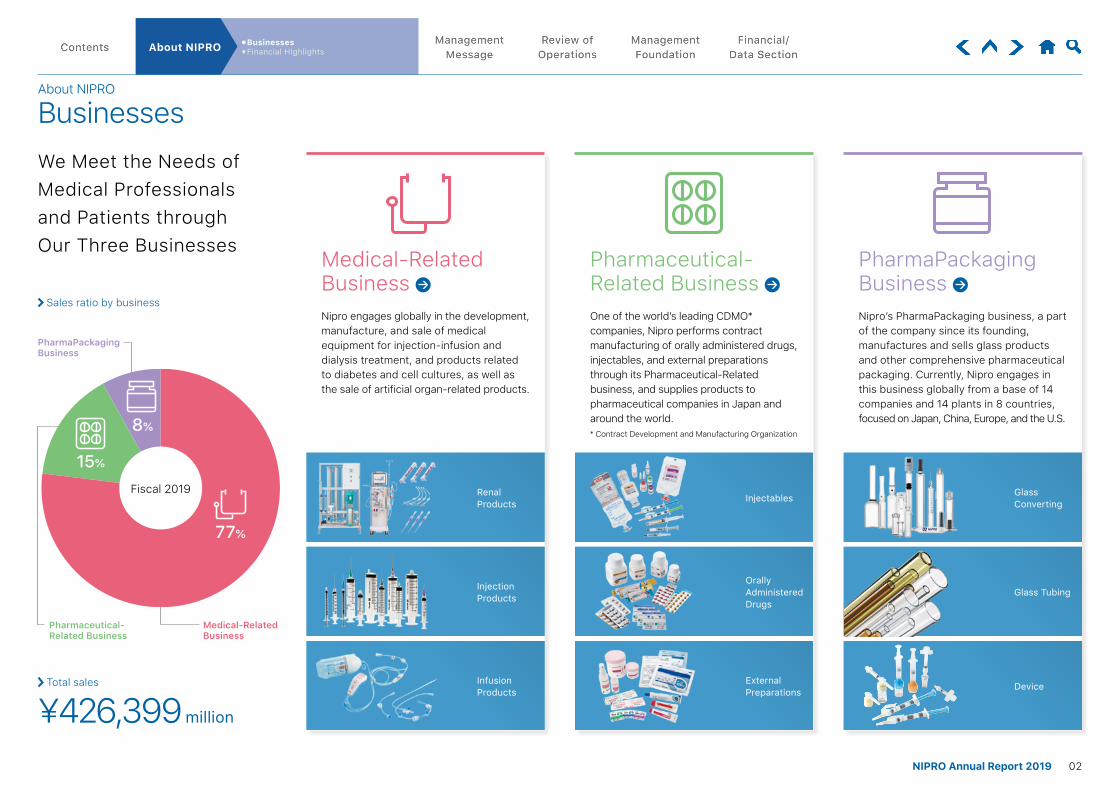
We Meet the Needs ofMedical Professionalsand Patients throughOur Three Businesses
About NIPRO
Businesses
Medical-RelatedBusiness Nipro engages globally in the development, manufacture, and sale of medical equipment for injection-infusion and dialysis treatment, and products related to diabetes and cell cultures, as well as the sale of artificial organ-related products.
Pharmaceutical-Related Business One of the world’s leading CDMO* companies, Nipro performs contract manufacturing of orally administered drugs, injectables, and external preparations through its Pharmaceutical-Related business, and supplies products to pharmaceutical companies in Japan and around the world.* Contract Development and Manufacturing Organization
PharmaPackaging Business Nipro’s PharmaPackaging business, a part of the company since its founding, manufactures and sells glass products and other comprehensive pharmaceutical packaging. Currently, Nipro engages in this business globally from a base of 14 companies and 14 plants in 8 countries, focused on Japan, China, Europe, and the U.S.
¥426,399 million
Sales ratio by business
Total sales
Orally Administered Drugs
Glass Tubing
External Preparations Device
RenalProducts Injectables Glass
Converting
⦁ Businesses⦁ Financial HighlightsAbout NIPRO
77%
15%
8%
Fiscal 2019
02NIPRO Annual Report 2019
426,399395,397
359,699366,650325,084
20172015 20182016 2019
23,82727,08828,770
24,205
16,572
20172015 20182016 2019
12,13611,82911,346
19,719
12,470
20172015 20182016 2019
16,52616,113
11,51710,269
8,646
20172015 20182016 2019
56,27657,71853,826
49,91043,511
20172015 20182016 2019
845,821826,759752,839708,883695,307
24.1 23.4 22.1 20.9 19.1
20172015 20182016 2019
171,830183,485176,408175,508178,810
8.5
11.8
6.8 7.0 7.3
20172015 20182016 2019
28.028.529.033.532.5
20172015 20182016 2019
(Millions of yen)
Total assets (Millions of yen) Net assets (Millions of yen)
(Yen)Equity ratio (%) Return on equity (%)
(Millions of yen) (Millions of yen) (Millions of yen) (Millions of yen)
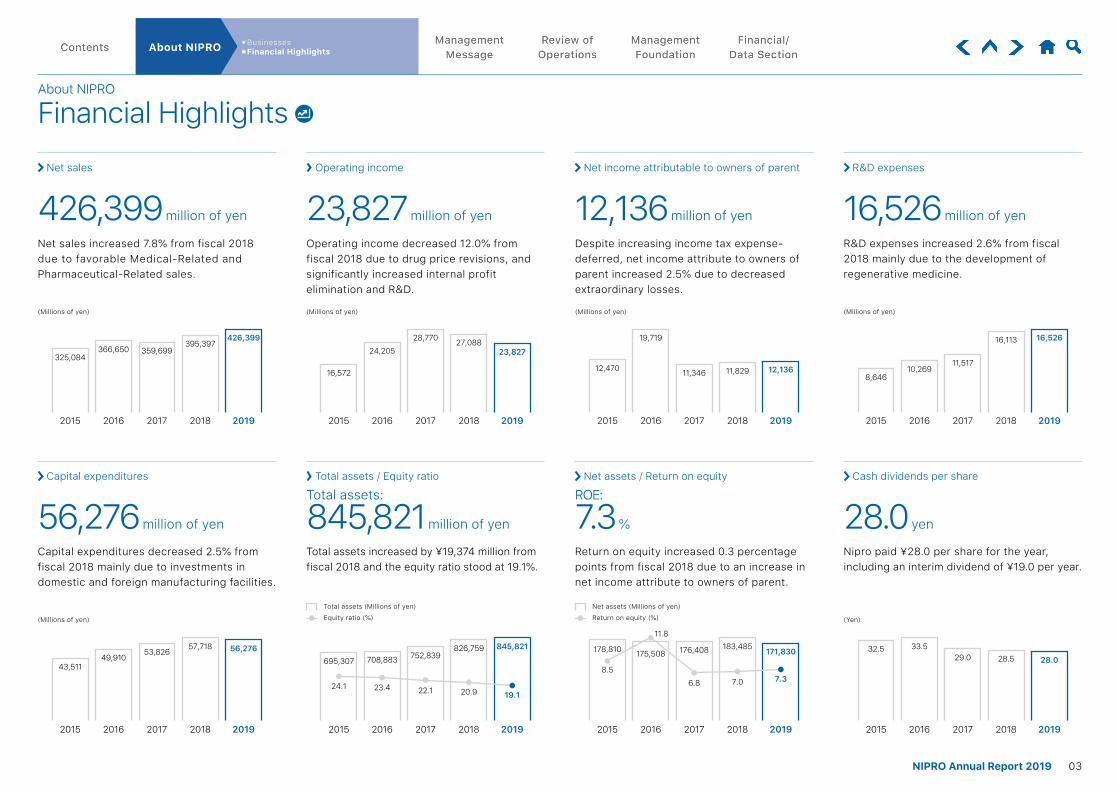
Capital expenditures decreased 2.5% from fiscal 2018 mainly due to investments in domestic and foreign manufacturing facilities.
Net sales increased 7.8% from fiscal 2018 due to favorable Medical-Related and Pharmaceutical-Related sales.
Total assets increased by ¥19,374 million from fiscal 2018 and the equity ratio stood at 19.1%.
Operating income decreased 12.0% from fiscal 2018 due to drug price revisions, and significantly increased internal profit elimination and R&D.
Return on equity increased 0.3 percentage points from fiscal 2018 due to an increase in net income attribute to owners of parent.
Despite increasing income tax expense- deferred, net income attribute to owners of parent increased 2.5% due to decreased extraordinary losses.
Nipro paid ¥28.0 per share for the year, including an interim dividend of ¥19.0 per year.
R&D expenses increased 2.6% from fiscal 2018 mainly due to the development of regenerative medicine.
56,276 million of yen
426,399 million of yen
Total assets:
845,821 million of yen
23,827 million of yen
ROE:
7.3 %
12,136 million of yen
28.0 yen
16,526 million of yen
Capital expenditures
Net sales
Total assets / Equity ratio
Operating income
Net assets / Return on equity
Net income attributable to owners of parent
Cash dividends per share
R&D expenses
About NIPRO
Financial Highlights
⦁ Businesses⦁ Financial HighlightsAbout NIPRO
03NIPRO Annual Report 2019

Management Message
A Message from the President
Results
⦁ A Message from the President⦁ A Message from the CFO
Management Message
Net sales
Total
¥426,399million
7.8% increase from fiscal 2018
Operating income
Total
¥23,827million
12.0% decrease from fiscal 2018
Net income attributable to owners of parent
Total
¥12,136million
2.5% increase from fiscal 2018
Successful increase in revenue in all segments and regionsSales for the fiscal year ended March 2020 increased by 7.8% from the previous period, to ¥426,399 million. We have achieved an increase in revenue, both in Japan and overseas, in our Medical-Related business, Pharmaceutical-Related business, and PharmaPackaging business. However, we could not achieve the increased rate of revenue expected at the beginning of this fiscal year, which has been a concern in this year. We aim to further increase the revenue in the next period, as such we will analyze issues in each business.
In terms of the Medical-Related business, sales increased by 9.1% over the previous period, to ¥327,359 million. Dialyzer, our main product, sold well both in Japan and overseas, and production at present is struggling to keep up with the increasing demands. In North America, sales got on track through the Canadian agent, CardioMed Supplies INC., acquired in 2018; we also renewed the long-term sales contract with a major dialysis provider in the United States. We can thus expect further growth in sales. Since we are in a similar situation in other countries, our Dialyzer has already demonstrated its high product competitiveness. The only issue is how to increase global production capacity.
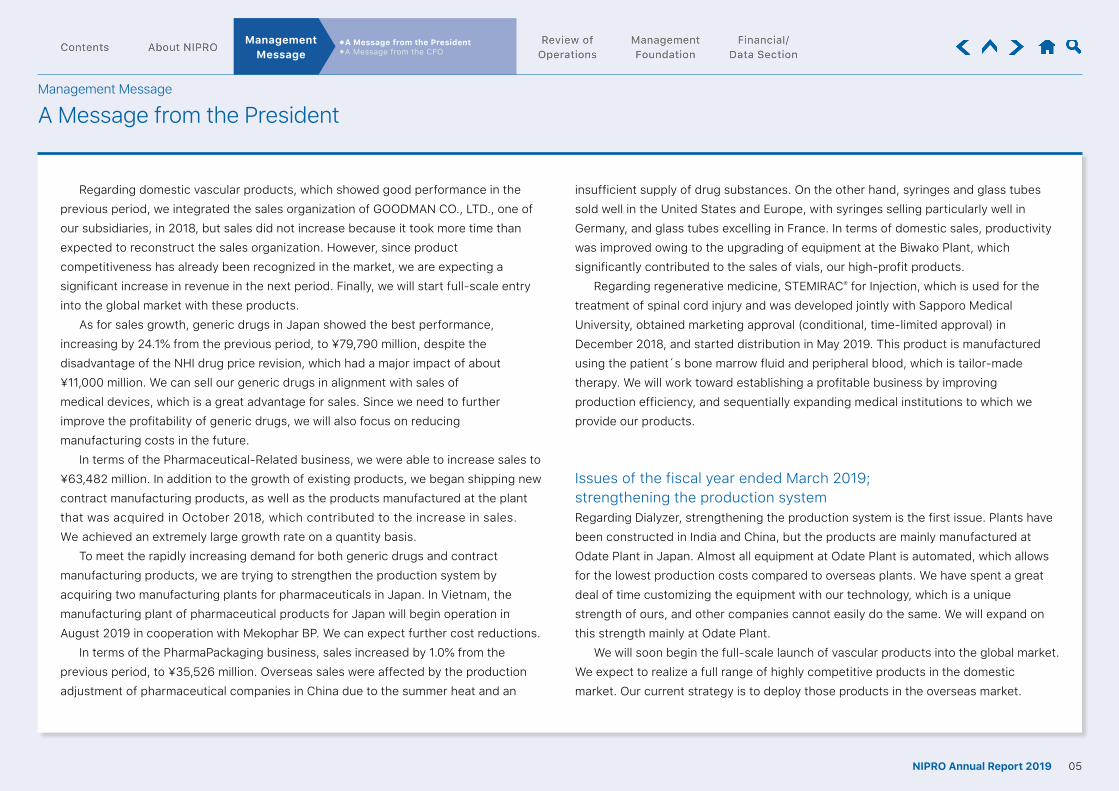
Yoshihiko SanoPresident & Representative Director
“ Achieving business
goals by further
accelerating global
sales and production”
04NIPRO Annual Report 2019
Management Message
A Message from the President
⦁ A Message from the President⦁ A Message from the CFO
Management Message
Regarding domestic vascular products, which showed good performance in the previous period, we integrated the sales organization of GOODMAN CO., LTD., one of our subsidiaries, in 2018, but sales did not increase because it took more time than expected to reconstruct the sales organization. However, since product competitiveness has already been recognized in the market, we are expecting a significant increase in revenue in the next period. Finally, we will start full-scale entry into the global market with these products.
As for sales growth, generic drugs in Japan showed the best performance, increasing by 24.1% from the previous period, to ¥79,790 million, despite the disadvantage of the NHI drug price revision, which had a major impact of about ¥11,000 million. We can sell our generic drugs in alignment with sales of medical devices, which is a great advantage for sales. Since we need to further improve the profitability of generic drugs, we will also focus on reducing manufacturing costs in the future.
In terms of the Pharmaceutical-Related business, we were able to increase sales to ¥63,482 million. In addition to the growth of existing products, we began shipping new contract manufacturing products, as well as the products manufactured at the plant that was acquired in October 2018, which contributed to the increase in sales. We achieved an extremely large growth rate on a quantity basis.
To meet the rapidly increasing demand for both generic drugs and contract manufacturing products, we are trying to strengthen the production system by acquiring two manufacturing plants for pharmaceuticals in Japan. In Vietnam, the manufacturing plant of pharmaceutical products for Japan will begin operation in August 2019 in cooperation with Mekophar BP. We can expect further cost reductions.
In terms of the PharmaPackaging business, sales increased by 1.0% from the previous period, to ¥35,526 million. Overseas sales were affected by the production adjustment of pharmaceutical companies in China due to the summer heat and an
insufficient supply of drug substances. On the other hand, syringes and glass tubes sold well in the United States and Europe, with syringes selling particularly well in Germany, and glass tubes excelling in France. In terms of domestic sales, productivity was improved owing to the upgrading of equipment at the Biwako Plant, which significantly contributed to the sales of vials, our high-profit products.
Regarding regenerative medicine, STEMIRAC® for Injection, which is used for the treatment of spinal cord injury and was developed jointly with Sapporo Medical University, obtained marketing approval (conditional, time-limited approval) in December 2018, and started distribution in May 2019. This product is manufactured using the patient´s bone marrow fluid and peripheral blood, which is tailor-made therapy. We will work toward establishing a profitable business by improving production efficiency, and sequentially expanding medical institutions to which we provide our products.
Issues of the fiscal year ended March 2019; strengthening the production systemRegarding Dialyzer, strengthening the production system is the first issue. Plants have been constructed in India and China, but the products are mainly manufactured at Odate Plant in Japan. Almost all equipment at Odate Plant is automated, which allows for the lowest production costs compared to overseas plants. We have spent a great deal of time customizing the equipment with our technology, which is a unique strength of ours, and other companies cannot easily do the same. We will expand on this strength mainly at Odate Plant.
We will soon begin the full-scale launch of vascular products into the global market. We expect to realize a full range of highly competitive products in the domestic market. Our current strategy is to deploy those products in the overseas market.
05NIPRO Annual Report 2019

Management Message
A Message from the President
⦁ A Message from the President⦁ A Message from the CFO
Management Message
In this period, we promoted the commercialization and market introduction of the Makoto™ Intravascular Imaging System and the Dualpro™ IVUS + NIRS catheter, manufactured by Infraredx, Inc., one of our subsidiaries in the US. This is the only device in the world that has obtained FDA approval in the US as a device for diagnosing the risk of acute myocardial infarction. We will promote the expansion of our vascular products overseas by proposing innovative diagnostic technologies for clinical settings, and introducing our unique treatment device into the market.
Regarding the organization, we will proceed with the establishment of overseas managing companies. We have already done so in Europe and China, and will establish one in North America within the next fiscal period. By placing companies responsible for the product business department under the managing company with head office functions, we can allow the companies in each region to make more autonomic decisions while keeping control as a group, which is one advantage of establishing an overseas managing company. While problems related to intellectual property, finance, and laws and regulations are handled by the managing company, the product value will be decided by the regional companies. Business operations can thus be tailored to local users’ needs.
Regarding pharmaceuticals, profitability is expected to improve in 2019 since there will be no major NHI drug price revision like the one in 2018. Regarding generic drugs, in addition to the continuous development of new products and sales channels, early operation of overseas factories will be a major theme in the future. Regarding contract manufacturing, we will expand our production capacity even further, and will expand our business as a leading Japanese contract manufacturing company group.
Setting sales goals for the next decadeWe aim to achieve sales of ¥500 billion for the fiscal year ending March 2021 and ¥1 trillion for the fiscal year ending March 2031. For this purpose, we need to work on the development of safer and more valuable products from the users’ viewpoint by effectively using our original technologies and management resources for regenerative medicine—a new business—in addition to the 3 existing businesses of Medical-Related, Pharmaceutical-Related, and PharmaPackaging.
To ensure the competitiveness and high quality of our products, the Product Development & Technical Sales Headquarters is striving to review existing products, improve quality, and reduce costs as a department with a special mission. At the same time, it is important that this new business captures new medical needs and conducts R&D for new products. We established the New Business Development Headquarters in 2018, which selects and carries out new business in the company. In this way, we can support the development of innovation.
These activities work effectively because we have our own “payment-by-results” system. We have a system to measure the contribution of employees for all businesses, regardless of their department, which promotes cross-departmental cooperation.
06NIPRO Annual Report 2019
Management Message
A Message from the President
⦁ A Message from the President⦁ A Message from the CFO
Management Message
Creating an employee-friendly environmentOur management focuses on securing human resources with superior retention because it takes time to acquire the knowledge necessary for business operations due to the characteristics of the medical industry. Therefore, we are making efforts to promote long-term employment and expand opportunities for women to work actively. This prompted us to make the Nipro Health Declaration, and to establish measures to maintain and promote the health of employees, such as smoking cessation programs, mental health care, work-style reforms, and the promotion of workplace activation. In addition, we established the “Job Return Program”, which allows retired employees to return to work under certain conditions. Also, we are working on creating a more family-friendly environment in several ways, such as opening a new nursery at Odate Plant following the NIPRO Life Science Site in Kusatsu City, and increasing the childcare allowance.
As to our plans to relocate the head office in the future, we have concluded a land sales agreement for Kento Innovation Park in Suita City. We are planning to construct an office building with more robust BCP measures so that we can supply necessary products as a medical device manufacturer even in the event of an earthquake or flood. The introduction of the latest office layout is expected to facilitate information-sharing among employees. We will make efforts to strengthen the functions of the head office, contribute to community healthcare, and improve the workplace environment for employees.
To shareholdersFollowing our basic policy for shareholder returns, we are focusing on increasing dividends by increasing profits. We work hard to develop our company by improving product competitiveness to ensure more dividends to shareholders. In this fiscal year, we bought back stock totaling ¥5 billion. If there is an opportunity, we will implement flexible shareholder returns in addition to dividends.
Although trade friction between the US and China increases the sense of uncertainty in the world economy, healthcare-related products are less affected by economic trends than other products because of their clear and strong needs. Therefore, we can expand our sales by continuously improving on our product competitiveness.
We have established our own dialysis center and training center in Guatemala, and a new dialysis center in Ecuador. We are preparing for large-scale demand in the future by providing high-quality healthcare services in these developing countries. The base of the pyramid (BOP) layer in the world accounts for approximately 70% of the world’s population, primarily in developing countries, and its market size is said to be 5 trillion dollars, so the business for the BOP layer has great potential*.
We will continue providing the world’s top share of products, one after the other, by developing products that are truly needed from the users’ viewpoint. We appreciate our shareholders’ continued support in the future.
August 2019
Yoshihiko SanoPresident & Representative Director
* Source: THE NEXT 4 BILLION (2007 World Resource Institute, International Finance Corporation)
07NIPRO Annual Report 2019
Management Message
A Message from the CFO
⦁ A Message from the President⦁ A Message from the CFO
Management Message
Forecast of consolidated performance for the fiscal year ended March 2020With regard to the next-term forecast of consolidated performance, net sales are expected to grow by 8.2% from this term to ¥461,500 million. Although the NHI drug price revision implemented in April 2018 led to a decrease in income and profit by ¥15,000 million in medical devices (about ¥4,000 million) and medicines (about ¥11,000 million), income rose to ¥31,001 million. Therefore, the expected value for the next term appears to be sufficiently achieved. Operating profit is expected to increase by 15.4% from the previous term to ¥27,500 million. The major factors for the increased operating profit include increased sales volume of high-profit products, mainly renal products, improved vascular business, and cost reductions thanks to increased plant operation rate. Ordinary profit is expected to increase by 16.4% from the previous term to ¥26,100 million, and net income attributable to owners of parent is expected to increase by 23.6% from the previous term to ¥15,000 million.
The exchange rates considered for these performance forecasts are ¥110 to the dollar and ¥125 to the euro. The Nipro Group has operations in 56 countries and present overseas sales account for 39% of total sales. Therefore, measures to mitigate the impact of foreign exchange rate fluctuations will be continuously reviewed in response to foreign exchange risks.
In addition, financial health that supports investments is important for each of the various businesses to capture growth opportunities and correspond to the expansion of global demand, especially for the main business of renal products. We have established a regional management company for each major region and will work to improve the cash conversion cycle by managing closer to the field site. Furthermore, we are attempting to improve our financial health that enhances the efficiency of fund operations by introducing cash pooling and to improve our credit rating.
Status of capital investmentThe Nipro Group focuses on product and R&D areas that have bright future prospects and also invests to save labor, streamline work, improve quality, and increase productivity. The amount of capital investment in the term under review was ¥56,276 million—a 2.5% decrease from the previous term.
In Japan, we invested ¥1,574 million mainly for the enhancement of dialyzer manufacturing facilities at Odate Plant; ¥1,128 million mainly in the nested syringe manufacturing facilities and vial molding machines at Biwako Plant; and ¥1,509 million mainly in Regenerative Medicine R&D Center. Nipro Pharma Corporation also invested ¥8,582 million mainly in the pre-filled syringe manufacturing facilities at Odate Plant; ¥8,274 million mainly in the new half-kit and new vial manufacturing facilities, and
construction of the new distribution building at Ise Plant to strengthen the production capacity of the injection plants. Overseas investments extended to ¥4,814 million in the expansion of the dialyzer manufacturing line at NIPRO INDIA CORPORATION and ¥3,794 million mainly in the construction of a plant at NIPRO VIETNAM COMPANY.
The amount of capital investment for the next fiscal year is budgeted to be ¥26,300 million for Medical-Related business; ¥15,400 million for the Pharmaceutical-Related business; ¥4,700 million for the PharmaPackaging business; and ¥2,800 million for the Regenerative medicine business, that is, ¥52,000 million in total.
Dividend policySince redistribution of profits is considered as one of the important management measures, we distribute the proceeds to shareholders. Internal reserve funds will be used to expand the management foundation, actively invest in capital investments and R&D to develop long-term businesses, ensure stable profits, and realize sustainable and consistent growth in the future.
In this term, three-fourths of the consolidated current net profit and one-fourth of the nonconsolidated current net profit shall be the base profit amount of dividends. The annual dividend per share shall be ¥28 under the policy to allocate 39% of the profit amount to dividends.
Going forward, we plan to reduce the distribution ratio of the source of dividends by 1% each fiscal year, while paying attention to strengthening our financial structure and stabilizing dividends, to around 35% in approximately four years’ time. Therefore, the annual dividend per share in the next term is expected to be ¥33.
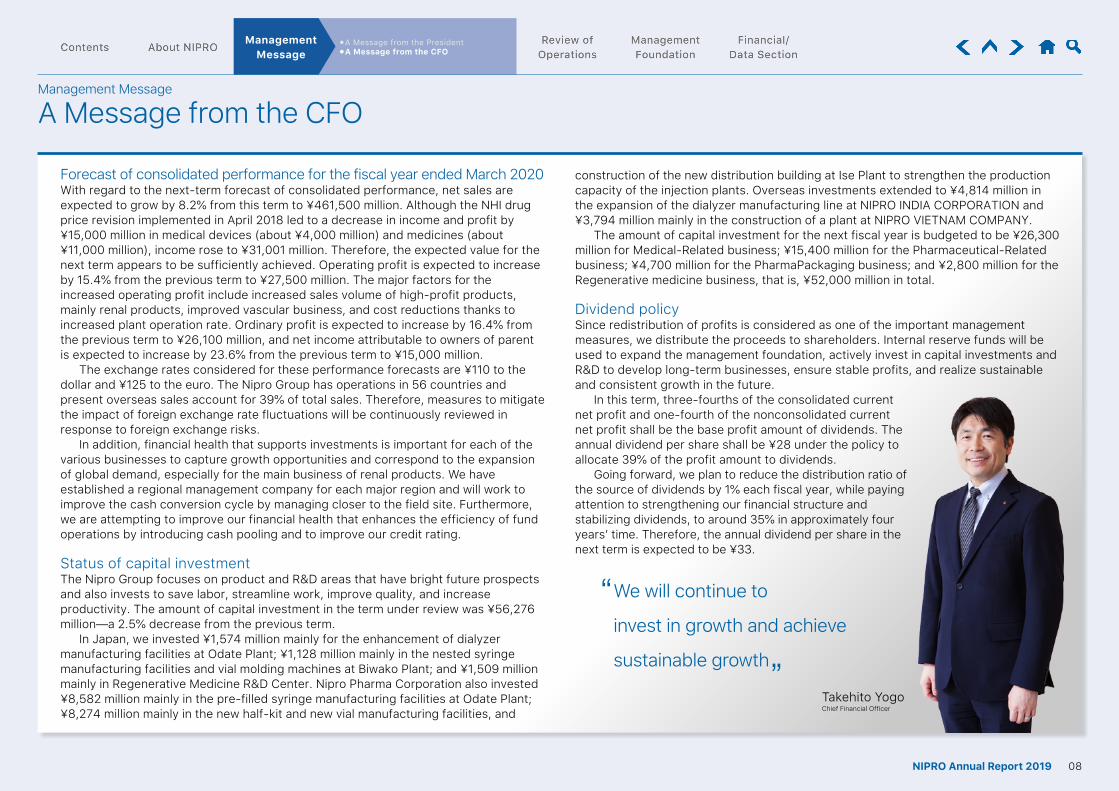
Takehito YogoChief Financial Officer
“ We will continue to
invest in growth and achieve
sustainable growth”
08NIPRO Annual Report 2019
262,198
300,117
327,359
30,638
36,522
36,722
2017 20172018 20182019 2019
Strategy and Outlook for Fiscal 2020
Japan
57.2%
Overseas
42.8%
Total¥327,359 million
Renal Products
33.9%
Infusion Products
4.3%
Diabetic Products
3.5%
Others
10.1%
Nipro Brand Generic Drugs
28.6%
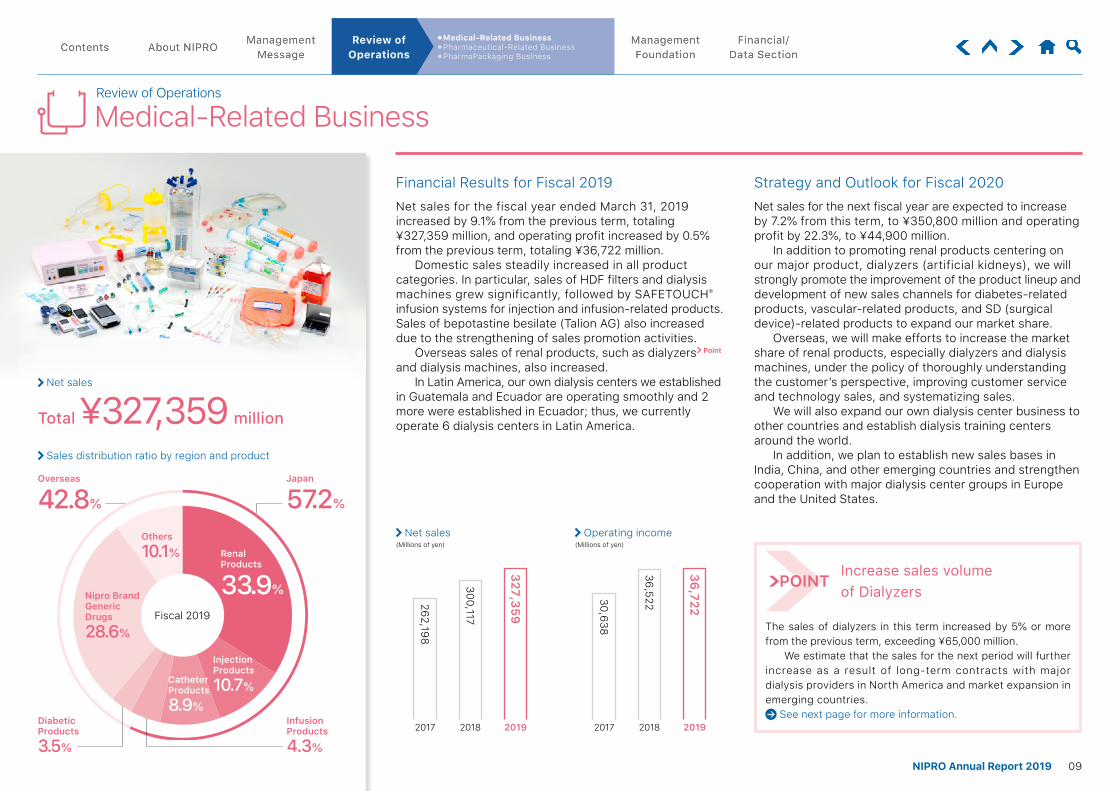
Net sales for the fiscal year ended March 31, 2019 increased by 9.1% from the previous term, totaling ¥327,359 million, and operating profit increased by 0.5% from the previous term, totaling ¥36,722 million.
Domestic sales steadily increased in all product categories. In particular, sales of HDF filters and dialysis machines grew significantly, followed by SAFETOUCH® infusion systems for injection and infusion-related products. Sales of bepotastine besilate (Talion AG) also increased due to the strengthening of sales promotion activities.
Overseas sales of renal products, such as dialyzers Point and dialysis machines, also increased.
In Latin America, our own dialysis centers we established in Guatemala and Ecuador are operating smoothly and 2 more were established in Ecuador; thus, we currently operate 6 dialysis centers in Latin America.
Financial Results for Fiscal 2019
Fiscal 2019
Net sales(Millions of yen)
Net sales
Operating income(Millions of yen)
Sales distribution ratio by region and product
⦁ Medical-Related Business⦁ Pharmaceutical-Related Business⦁ PharmaPackaging Business
Review of Operations
The sales of dialyzers in this term increased by 5% or more from the previous term, exceeding ¥65,000 million.
We estimate that the sales for the next period will further increase as a result of long-term contracts with major dialysis providers in North America and market expansion in emerging countries.
See next page for more information.
Increase sales volume of Dialyzers
POINT
Net sales for the next fiscal year are expected to increase by 7.2% from this term, to ¥350,800 million and operating profit by 22.3%, to ¥44,900 million.
In addition to promoting renal products centering on our major product, dialyzers (artificial kidneys), we will strongly promote the improvement of the product lineup and development of new sales channels for diabetes-related products, vascular-related products, and SD (surgical device)-related products to expand our market share.
Overseas, we will make efforts to increase the market share of renal products, especially dialyzers and dialysis machines, under the policy of thoroughly understanding the customer’s perspective, improving customer service and technology sales, and systematizing sales.
We will also expand our own dialysis center business to other countries and establish dialysis training centers around the world.
In addition, we plan to establish new sales bases in India, China, and other emerging countries and strengthen cooperation with major dialysis center groups in Europe and the United States.
Review of Operations
Medical-Related Business
Injection Products
10.7%Catheter Products
8.9%
09NIPRO Annual Report 2019
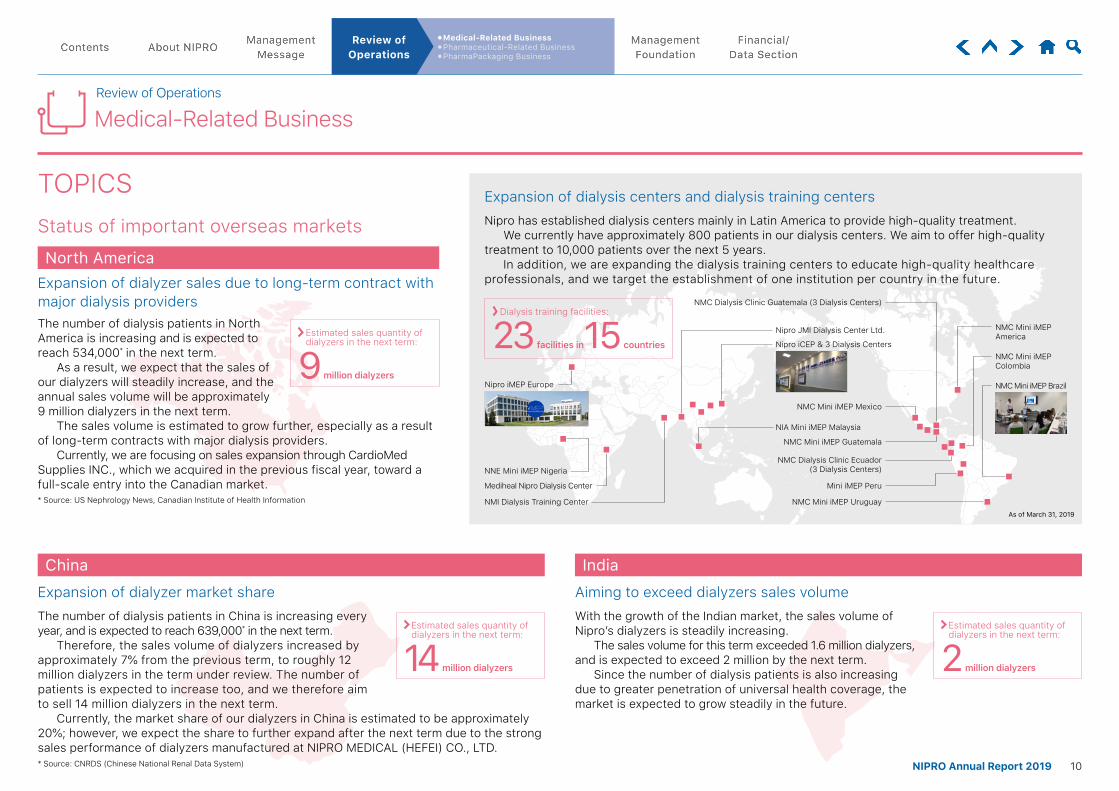
The number of dialysis patients in North America is increasing and is expected to reach 534,000* in the next term.
As a result, we expect that the sales of our dialyzers will steadily increase, and the annual sales volume will be approximately 9 million dialyzers in the next term.
The sales volume is estimated to grow further, especially as a result of long-term contracts with major dialysis providers.
Currently, we are focusing on sales expansion through CardioMed Supplies INC., which we acquired in the previous fiscal year, toward a full-scale entry into the Canadian market.
The number of dialysis patients in China is increasing every year, and is expected to reach 639,000* in the next term.
Therefore, the sales volume of dialyzers increased by approximately 7% from the previous term, to roughly 12 million dialyzers in the term under review. The number of patients is expected to increase too, and we therefore aim to sell 14 million dialyzers in the next term.
Currently, the market share of our dialyzers in China is estimated to be approximately 20%; however, we expect the share to further expand after the next term due to the strong sales performance of dialyzers manufactured at NIPRO MEDICAL (HEFEI) CO., LTD.
With the growth of the Indian market, the sales volume of Nipro’s dialyzers is steadily increasing.
The sales volume for this term exceeded 1.6 million dialyzers, and is expected to exceed 2 million by the next term.
Since the number of dialysis patients is also increasing due to greater penetration of universal health coverage, the market is expected to grow steadily in the future.
* Source: US Nephrology News, Canadian Institute of Health Information
* Source: CNRDS (Chinese National Renal Data System)
Status of important overseas markets
Expansion of dialyzer sales due to long-term contract with major dialysis providers
Expansion of dialyzer market share Aiming to exceed dialyzers sales volume
North America
China India
TOPICS
Review of Operations
Medical-Related Business
Estimated sales quantity of dialyzers in the next term:
9 million dialyzers
Estimated sales quantity of dialyzers in the next term:
14 million dialyzers
Estimated sales quantity of dialyzers in the next term:
2 million dialyzers
⦁ Medical-Related Business⦁ Pharmaceutical-Related Business⦁ PharmaPackaging Business
Review of Operations
Expansion of dialysis centers and dialysis training centersNipro has established dialysis centers mainly in Latin America to provide high-quality treatment.
We currently have approximately 800 patients in our dialysis centers. We aim to offer high-quality treatment to 10,000 patients over the next 5 years.
In addition, we are expanding the dialysis training centers to educate high-quality healthcare professionals, and we target the establishment of one institution per country in the future.
As of March 31, 2019
Nipro iMEP Europe
NNE Mini iMEP Nigeria
Mediheal Nipro Dialysis Center
NMC Mini iMEP Mexico
NMC Mini iMEP America
NMC Dialysis Clinic Guatemala (3 Dialysis Centers)
NMC Mini iMEP Colombia
NMC Mini iMEP Brazil
NMC Mini iMEP Guatemala
NMC Dialysis Clinic Ecuador(3 Dialysis Centers)
Mini iMEP Peru
NMC Mini iMEP Uruguay
Nipro JMI Dialysis Center Ltd.
NMI Dialysis Training Center
NIA Mini iMEP Malaysia
Nipro iCEP & 3 Dialysis Centers
Dialysis training facilities:
23 facilities in15 countries
10NIPRO Annual Report 2019
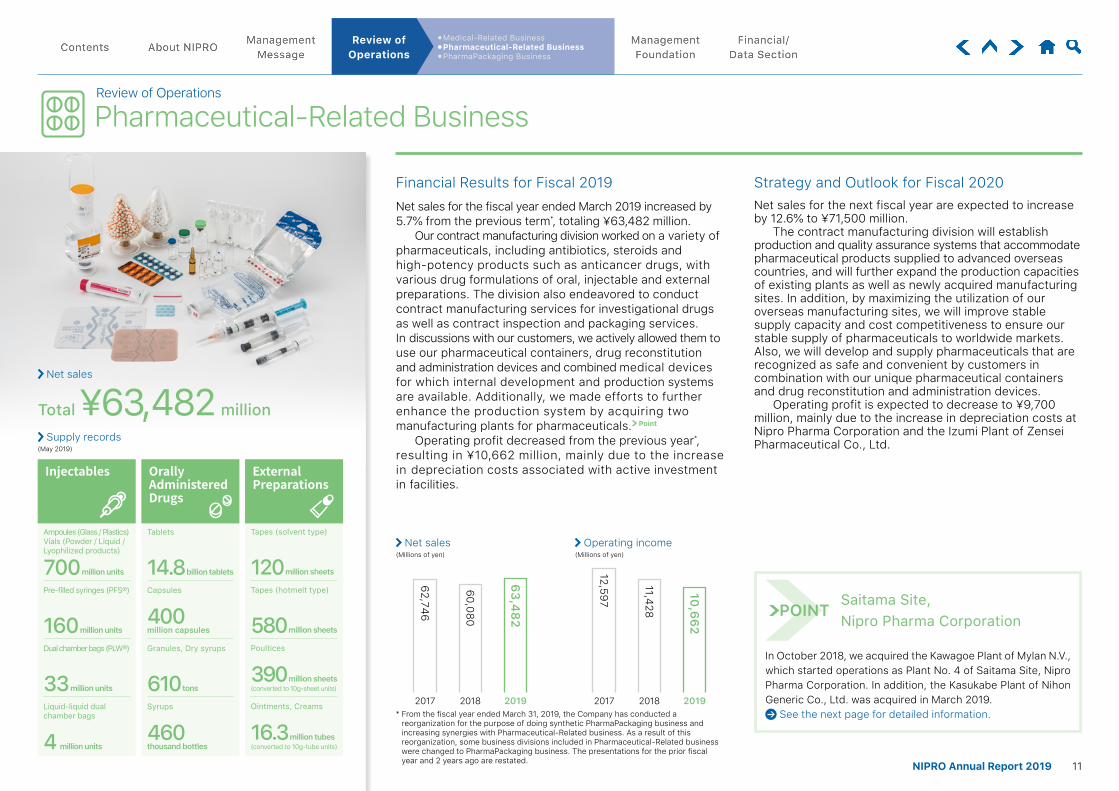
62,746
60,080
63,482
12,597
11,428
10,662
2017 20172018 20182019 2019
Review of Operations
Pharmaceutical-Related Business
Supply records(May 2019)
Net sales(Millions of yen)
Operating income(Millions of yen)
Total¥63,482 million
Net sales
Injectables Orally Administered Drugs
External Preparations
Tapes (solvent type)
120 million sheets
Tapes (hotmelt type)
580 million sheets
Poultices
390 million sheets(converted to 10g-sheet units)
Ointments, Creams
16.3 million tubes(converted to 10g-tube units)
Tablets
14.8 billion tablets
Granules, Dry syrups
610 tons
Syrups
460thousand bottles
Capsules
400 million capsules
Ampoules (Glass / Plastics)Vials (Powder / Liquid / Lyophilized products)
700 million units
Pre-filled syringes (PFS®)
160 million units
Dual chamber bags (PLW®)
33 million units
Liquid-liquid dual chamber bags
4 million units
⦁ Medical-Related Business⦁ Pharmaceutical-Related Business⦁ PharmaPackaging Business
Review of Operations
Strategy and Outlook for Fiscal 2020Net sales for the fiscal year ended March 2019 increased by 5.7% from the previous term*, totaling ¥63,482 million.
Our contract manufacturing division worked on a variety of pharmaceuticals, including antibiotics, steroids and high-potency products such as anticancer drugs, with various drug formulations of oral, injectable and external preparations. The division also endeavored to conduct contract manufacturing services for investigational drugs as well as contract inspection and packaging services. In discussions with our customers, we actively allowed them to use our pharmaceutical containers, drug reconstitution and administration devices and combined medical devices for which internal development and production systems are available. Additionally, we made efforts to further enhance the production system by acquiring two manufacturing plants for pharmaceuticals. Point
Operating profit decreased from the previous year*, resulting in ¥10,662 million, mainly due to the increase in depreciation costs associated with active investment in facilities.
Financial Results for Fiscal 2019
In October 2018, we acquired the Kawagoe Plant of Mylan N.V., which started operations as Plant No. 4 of Saitama Site, Nipro Pharma Corporation. In addition, the Kasukabe Plant of Nihon Generic Co., Ltd. was acquired in March 2019.
See the next page for detailed information.
Saitama Site, Nipro Pharma Corporation
Net sales for the next fiscal year are expected to increase by 12.6% to ¥71,500 million.
The contract manufacturing division will establish production and quality assurance systems that accommodate pharmaceutical products supplied to advanced overseas countries, and will further expand the production capacities of existing plants as well as newly acquired manufacturing sites. In addition, by maximizing the utilization of our overseas manufacturing sites, we will improve stable supply capacity and cost competitiveness to ensure our stable supply of pharmaceuticals to worldwide markets. Also, we will develop and supply pharmaceuticals that are recognized as safe and convenient by customers in combination with our unique pharmaceutical containers and drug reconstitution and administration devices.
Operating profit is expected to decrease to ¥9,700 million, mainly due to the increase in depreciation costs at Nipro Pharma Corporation and the Izumi Plant of Zensei Pharmaceutical Co., Ltd.
POINT
* From the fiscal year ended March 31, 2019, the Company has conducted a reorganization for the purpose of doing synthetic PharmaPackaging business and increasing synergies with Pharmaceutical-Related business. As a result of this reorganization, some business divisions included in Pharmaceutical-Related business were changed to PharmaPackaging business. The presentations for the prior fiscal year and 2 years ago are restated. 11NIPRO Annual Report 2019
TOPICS
Review of Operations
Pharmaceutical-Related Business
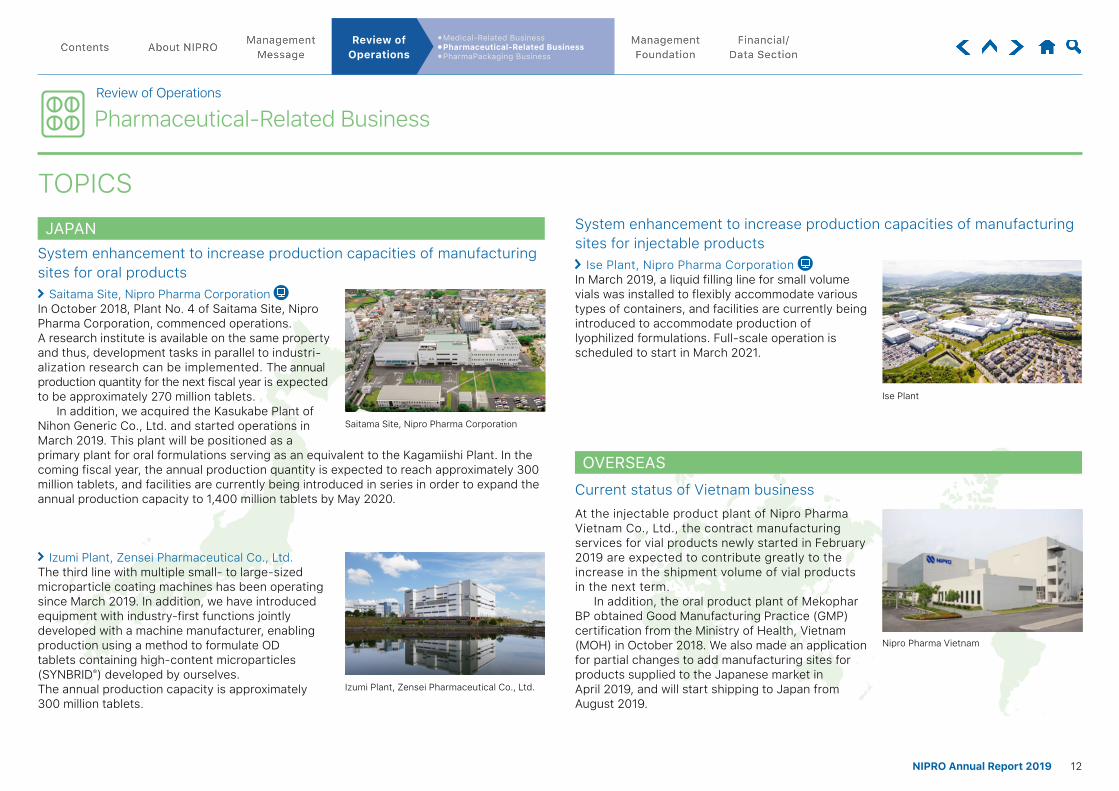
Saitama Site, Nipro Pharma Corporation In October 2018, Plant No. 4 of Saitama Site, Nipro Pharma Corporation, commenced operations. A research institute is available on the same property and thus, development tasks in parallel to industri-alization research can be implemented. The annual production quantity for the next fiscal year is expected to be approximately 270 million tablets.
In addition, we acquired the Kasukabe Plant of Nihon Generic Co., Ltd. and started operations in March 2019. This plant will be positioned as a primary plant for oral formulations serving as an equivalent to the Kagamiishi Plant. In the coming fiscal year, the annual production quantity is expected to reach approximately 300 million tablets, and facilities are currently being introduced in series in order to expand the annual production capacity to 1,400 million tablets by May 2020.
System enhancement to increase production capacities of manufacturing sites for oral products
System enhancement to increase production capacities of manufacturing sites for injectable products
Current status of Vietnam businessAt the injectable product plant of Nipro Pharma Vietnam Co., Ltd., the contract manufacturing services for vial products newly started in February 2019 are expected to contribute greatly to the increase in the shipment volume of vial products in the next term.
In addition, the oral product plant of Mekophar BP obtained Good Manufacturing Practice (GMP) certification from the Ministry of Health, Vietnam (MOH) in October 2018. We also made an application for partial changes to add manufacturing sites for products supplied to the Japanese market in April 2019, and will start shipping to Japan from August 2019.
Ise Plant, Nipro Pharma Corporation In March 2019, a liquid filling line for small volume vials was installed to flexibly accommodate various types of containers, and facilities are currently being introduced to accommodate production of lyophilized formulations. Full-scale operation is scheduled to start in March 2021.
Izumi Plant, Zensei Pharmaceutical Co., Ltd.The third line with multiple small- to large-sized microparticle coating machines has been operating since March 2019. In addition, we have introduced equipment with industry-first functions jointly developed with a machine manufacturer, enabling production using a method to formulate OD tablets containing high-content microparticles (SYNBRID®) developed by ourselves. The annual production capacity is approximately 300 million tablets.
Saitama Site, Nipro Pharma Corporation
Nipro Pharma Vietnam
Ise Plant
Izumi Plant, Zensei Pharmaceutical Co., Ltd.
OVERSEAS
⦁ Medical-Related Business⦁ Pharmaceutical-Related Business⦁ PharmaPackaging Business
Review of Operations
JAPAN
12NIPRO Annual Report 2019
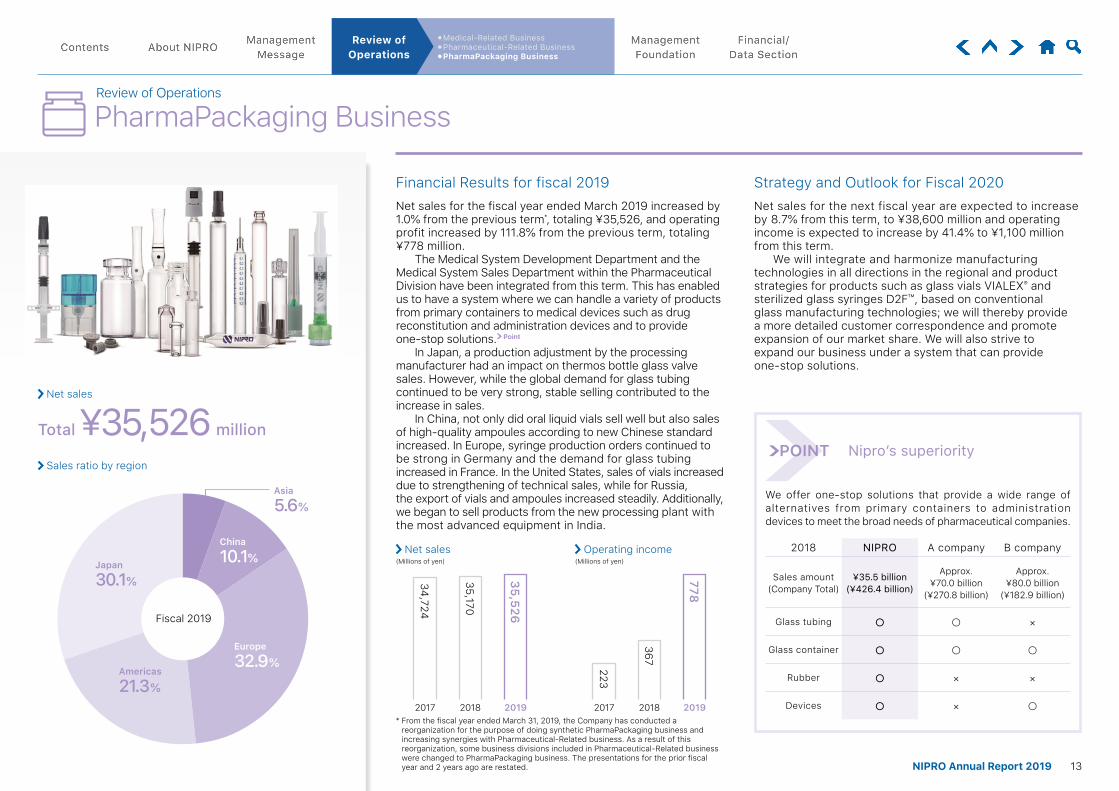
34,724
35,170
35,526
223
367
778
⦁ Medical-Related Business⦁ Pharmaceutical-Related Business⦁ PharmaPackaging Business
Review of Operations
Total¥35,526 million
China
10.1%
Asia
5.6%
Europe
32.9%
Japan
30.1%
Americas
21.3%
Fiscal 2019
Review of Operations
PharmaPackaging Business
Net sales
Sales ratio by region
We offer one-stop solutions that provide a wide range of alternatives from primary containers to administration devices to meet the broad needs of pharmaceutical companies.
Nipro’s superiorityPOINT
2018 NIPRO A company B company
Sales amount(Company Total)
¥35.5 billion(¥426.4 billion)
Approx. ¥70.0 billion
(¥270.8 billion)
Approx. ¥80.0 billion
(¥182.9 billion)
Glass tubing ○ ○ ×
Glass container ○ ○ ○
Rubber ○ × ×
Devices ○ × ○2017 2018 20192017 2018 2019
Net sales(Millions of yen)
Operating income(Millions of yen)
* From the fiscal year ended March 31, 2019, the Company has conducted a reorganization for the purpose of doing synthetic PharmaPackaging business and increasing synergies with Pharmaceutical-Related business. As a result of this reorganization, some business divisions included in Pharmaceutical-Related business were changed to PharmaPackaging business. The presentations for the prior fiscal year and 2 years ago are restated.
Net sales for the fiscal year ended March 2019 increased by 1.0% from the previous term*, totaling ¥35,526, and operating profit increased by 111.8% from the previous term, totaling ¥778 million.
The Medical System Development Department and the Medical System Sales Department within the Pharmaceutical Division have been integrated from this term. This has enabled us to have a system where we can handle a variety of products from primary containers to medical devices such as drug reconstitution and administration devices and to provide one-stop solutions. Point
In Japan, a production adjustment by the processing manufacturer had an impact on thermos bottle glass valve sales. However, while the global demand for glass tubing continued to be very strong, stable selling contributed to the increase in sales.
In China, not only did oral liquid vials sell well but also sales of high-quality ampoules according to new Chinese standard increased. In Europe, syringe production orders continued to be strong in Germany and the demand for glass tubing increased in France. In the United States, sales of vials increased due to strengthening of technical sales, while for Russia, the export of vials and ampoules increased steadily. Additionally, we began to sell products from the new processing plant with the most advanced equipment in India.
Net sales for the next fiscal year are expected to increase by 8.7% from this term, to ¥38,600 million and operating income is expected to increase by 41.4% to ¥1,100 million from this term.
We will integrate and harmonize manufacturing technologies in all directions in the regional and product strategies for products such as glass vials VIALEX® and sterilized glass syringes D2F™, based on conventional glass manufacturing technologies; we will thereby provide a more detailed customer correspondence and promote expansion of our market share. We will also strive to expand our business under a system that can provide one-stop solutions.
Financial Results for fiscal 2019 Strategy and Outlook for Fiscal 2020
13NIPRO Annual Report 2019
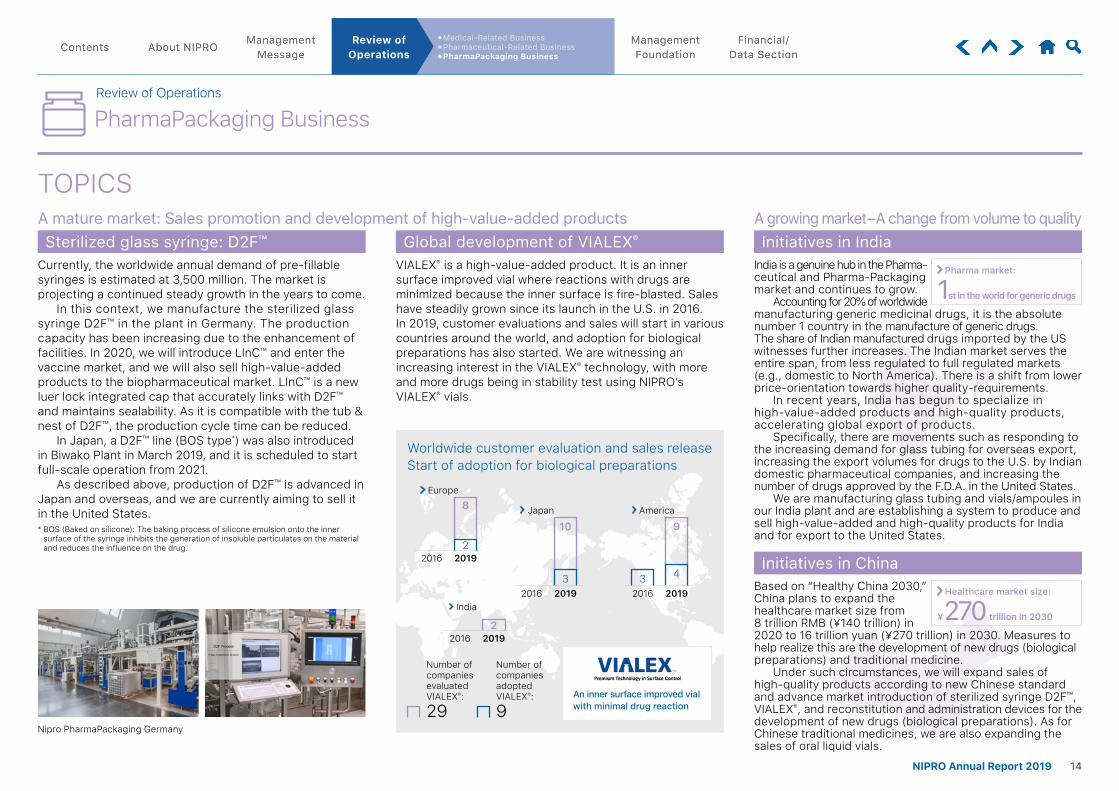
Number of companiesadopted VIALEX®:
9
Number of companiesevaluated VIALEX®:
29
2
8
2016 2019
Europe
43
9America
2016 2019
220192016
India
3
10
20192016
Japan
⦁ Medical-Related Business⦁ Pharmaceutical-Related Business⦁ PharmaPackaging Business
Review of Operations
Review of Operations
PharmaPackaging Business
Nipro PharmaPackaging Germany
An inner surface improved vial with minimal drug reaction
Worldwide customer evaluation and sales release Start of adoption for biological preparations
TOPICS
VIALEX® is a high-value-added product. It is an inner surface improved vial where reactions with drugs are minimized because the inner surface is fire-blasted. Sales have steadily grown since its launch in the U.S. in 2016. In 2019, customer evaluations and sales will start in various countries around the world, and adoption for biological preparations has also started. We are witnessing an increasing interest in the VIALEX® technology, with more and more drugs being in stability test using NIPRO’s VIALEX® vials.
India is a genuine hub in the Pharma-ceutical and Pharma-Packaging market and continues to grow.
Accounting for 20% of worldwide manufacturing generic medicinal drugs, it is the absolute number 1 country in the manufacture of generic drugs. The share of Indian manufactured drugs imported by the US witnesses further increases. The Indian market serves the entire span, from less regulated to full regulated markets (e.g., domestic to North America). There is a shift from lower price-orientation towards higher quality-requirements.
In recent years, India has begun to specialize in high-value-added products and high-quality products, accelerating global export of products.
Specifically, there are movements such as responding to the increasing demand for glass tubing for overseas export, increasing the export volumes for drugs to the U.S. by Indian domestic pharmaceutical companies, and increasing the number of drugs approved by the F.D.A. in the United States.
We are manufacturing glass tubing and vials/ampoules in our India plant and are establishing a system to produce and sell high-value-added and high-quality products for India and for export to the United States.
Currently, the worldwide annual demand of pre-fillable syringes is estimated at 3,500 million. The market is projecting a continued steady growth in the years to come.
In this context, we manufacture the sterilized glass syringe D2F™ in the plant in Germany. The production capacity has been increasing due to the enhancement of facilities. In 2020, we will introduce LInC™ and enter the vaccine market, and we will also sell high-value-added products to the biopharmaceutical market. LInC™ is a new luer lock integrated cap that accurately links with D2F™ and maintains sealability. As it is compatible with the tub & nest of D2F™, the production cycle time can be reduced.
In Japan, a D2F™ line (BOS type*) was also introduced in Biwako Plant in March 2019, and it is scheduled to start full-scale operation from 2021.
As described above, production of D2F™ is advanced in Japan and overseas, and we are currently aiming to sell it in the United States.* BOS (Baked on silicone): The baking process of silicone emulsion onto the inner
surface of the syringe inhibits the generation of insoluble particulates on the material and reduces the influence on the drug.
Pharma market:
1st in the world for generic drugs
A mature market: Sales promotion and development of high-value-added products A growing market – A change from volume to qualitySterilized glass syringe: D2F™ Initiatives in India
Based on “Healthy China 2030,” China plans to expand the healthcare market size from 8 trillion RMB (¥140 trillion) in 2020 to 16 trillion yuan (¥270 trillion) in 2030. Measures to help realize this are the development of new drugs (biological preparations) and traditional medicine.
Under such circumstances, we will expand sales of high-quality products according to new Chinese standard and advance market introduction of sterilized syringe D2F™, VIALEX®, and reconstitution and administration devices for the development of new drugs (biological preparations). As for Chinese traditional medicines, we are also expanding the sales of oral liquid vials.
Healthcare market size:
¥270 trillion in 2030
Initiatives in China
Global development of VIALEX®
14NIPRO Annual Report 2019
Research theme⦁ Cellular and regenerative medicine
products⦁ Orthopedic surgery-related products⦁ Dialysis-related and general medical
devices⦁ Circulatory organ- and intervention-
related products⦁ Artificial organs⦁ Test and diagnosis-related products⦁ High-performance medical containers⦁ Medical glass products
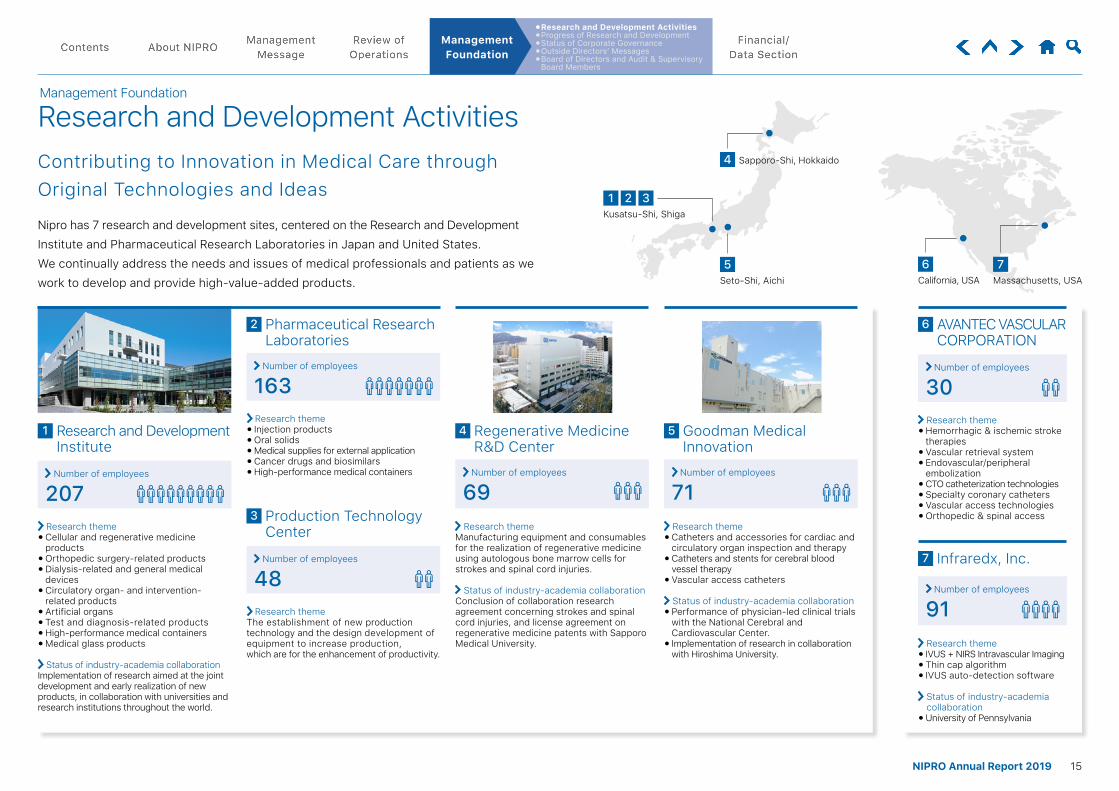
Status of industry-academia collaborationImplementation of research aimed at the joint development and early realization of new products, in collaboration with universities and research institutions throughout the world.
Research theme⦁ Injection products⦁ Oral solids⦁ Medical supplies for external application⦁ Cancer drugs and biosimilars⦁ High-performance medical containers
1 2 3Kusatsu-Shi, Shiga
4
5Seto-Shi, Aichi
Contributing to Innovation in Medical Care through Original Technologies and Ideas
Nipro has 7 research and development sites, centered on the Research and Development Institute and Pharmaceutical Research Laboratories in Japan and United States. We continually address the needs and issues of medical professionals and patients as we work to develop and provide high-value-added products.
Number of employees
207
Number of employees
30
Research and Development Institute
1
Pharmaceutical Research Laboratories
2
Research themeThe establishment of new production technology and the design development of equipment to increase production, which are for the enhancement of productivity.
Number of employees
48
Production Technology Center
3 Research theme
⦁ Catheters and accessories for cardiac and circulatory organ inspection and therapy
⦁ Catheters and stents for cerebral blood vessel therapy
⦁ Vascular access catheters
Status of industry-academia collaboration⦁ Performance of physician-led clinical trials
with the National Cerebral and Cardiovascular Center.
⦁ Implementation of research in collaboration with Hiroshima University.
Goodman Medical Innovation
5
Number of employees
71
Number of employees
91
Number of employees
163
⦁ Research and Development Activities⦁ Progress of Research and Development⦁ Status of Corporate Governance⦁ Outside Directors’ Messages⦁ Board of Directors and Audit & Supervisory
Board Members
Management Foundation
Management Foundation
Research and Development Activities
Research theme⦁ Hemorrhagic & ischemic stroke
therapies⦁ Vascular retrieval system⦁ Endovascular/peripheral
embolization⦁ CTO catheterization technologies⦁ Specialty coronary catheters⦁ Vascular access technologies⦁ Orthopedic & spinal access
Research theme⦁ IVUS + NIRS Intravascular Imaging⦁ Thin cap algorithm⦁ IVUS auto-detection software
Status of industry-academia collaboration
⦁ University of Pennsylvania
AVANTEC VASCULAR CORPORATION
6
Infraredx, Inc.7
Research themeManufacturing equipment and consumables for the realization of regenerative medicine using autologous bone marrow cells for strokes and spinal cord injuries.
Status of industry-academia collaborationConclusion of collaboration research agreement concerning strokes and spinal cord injuries, and license agreement on regenerative medicine patents with Sapporo Medical University.
Number of employees
69
Regenerative Medicine R&D Center
4
Sapporo-Shi, Hokkaido
6California, USA
7Massachusetts, USA
15NIPRO Annual Report 2019
Management Foundation
Progress of Research and Development
1. Medical-Related Business
Nipro conducts research and development (R&D) in the following fields, with our R&D Institute playing a pivotal role.Expenses related to R&D in this business segment were ¥8,291 million.
Positive results that may lead to new cell drug production have been obtained after the completion of an industry-academia-government collaboration research project (for the development of the cell production / processing system), in which we participated.
In addition, we are aiming at practical application of regenerative medicine using autologous bone marrow cells for the treatment of cerebral infarction and spinal cord injury. For early commercialization, we have entered into a license agreement with Sapporo Medical University, promoting joint research and development mainly at the Regenerative Medicine R&D Center.
This spring, STEMIRAC® for Injection, a regenerative medicine for spinal cord injury, was launched. We will promote our research and development of this product for stable supply and expansion of indications.
Anesthetics: New SUREFUSER™ + PCA SET was launched overseas in May 2018. This device is for the continuous infusion of an anesthetic controlled by a patient according to the level of pain. It is designed to be easy to grab and fit in a palm, with a larger button as the switch for injection of drug solution. In Latin America and Australia, SUREFUSER™ Amber Type was launched in September 2018. This was developed to provide light shielding effects to prevent drugs from generating deposits or deteriorating under ultraviolet rays.
Dialysis: A blood tubing set with a gamma sterilized needleless access port was launched in August 2018 for limited use in particular medical institutions.
A new half kit was launched in July 2018. This new product was developed to enhance the functionality of the old half kit, which has been on the market for more than 20 years. Compared to the previous one, the new half kit has additional features, such as preventive mechanisms against tilting vials and leakage due to a repelled needle during vial removal, as well as enhancements in bottle transparency and thermostability. In line with the product modification, a new production line, which can produce 20 million kits per year, was built to realize mass production.
The production of Alime Bag™ α was started in December 2018. The production of this new product has eliminated anxieties for the production line that is more than 30 years old, while reducing the chances of leakage during needle removal with the use of a rubber plug, instead of a membrane tube, for enteral infusion set connection. Change in the bag material from ethylene vinyl acetate (EVA) copolymer to polyethylene (PE) has enabled production in a clean environment with low costs.
A less invasive pharyngeal swab with adjusted handle strength and a device for dose adjustment for hemophilia drugs were also launched in fiscal 2018.
Division of Cell Drugs
Division of Medical Devices
Division of Diagnostics and Inspections
Division of Functional Pharmaceutical Containers
Diagnostic products:
A second-generation diagnostic agent for drug-resistant tuberculosis was approved for production and sales in Japan, Indonesia and Vietnam. We are also preparing to expand the supply network of this diagnostic product to overseas, which can detect the disease from sputum with few microbial colonies, mainly to Southeast Asia.
Inspection products:
A rheometer that can readily measure subcutaneous peripheral blood flow was approved for production and sales. The application for approval was submitted for Multileaf®, which can test different parameters with a drop of blood.
⦁ Research and Development Activities⦁ Progress of Research and Development⦁ Status of Corporate Governance⦁ Outside Directors’ Messages⦁ Board of Directors and Audit & Supervisory
Board Members
Management Foundation
16NIPRO Annual Report 2019
Management Foundation
Progress of Research and Development
Balloon catheters and drug-coated stents are used for the treatment of coronary artery diseases, including acute myocardial infarction and coronary occlusion. In this field of percutaneous coronary intervention (PCI), we have been selling GUIDEPLUS® as a rapid exchange (RX)-type catheter that penetrates the coronary artery stenosis and guides deliverability of balloon catheters and drug-coated stents. the treatment of stenosis.
GUIDE PLUS has now been improved to GUIDEPLUS® II ST™, with a larger inner diameter, which increases the applicability of penetrating devices (e.g., stents and intravascular ultrasound [IVUS] catheters) while maintaining the superior deliverability to distal lesions over competitors’ products, and GUIDEPLUS® II EL™ with an even larger inner diameter, a diameter comparable with the competitors’ products, and enhanced deliverability.
FILTRAP® is a thrombus-trapping catheter that prevents the phenomena called “no flow” or “slow flow” caused by scattered thrombi or debris to peripheral blood vessels in the treatment of stenosed lesions. For enhanced deliverability to distal lesions and easier removal of the filter through a stent, FILTRAP® II was developed and is now available in the market.
In the field of percutaneous peripheral intervention (PPI), Japan’s first tapered balloon catheter for percutaneous transluminal angioplasty (PTA) was approved. This device has enhanced applicability to balloon pulmonary angioplasty (BPA) in the treatment of pulmonary arterial hypertension.
The tapered balloon catheter is scheduled to be launched in fiscal 2019.
Division of Circulatory and Interventional Products Division of Artificial Organs
Surgical devices include products used for different types of surgeries, such as orthopedic, cardiac, and abdominal surgeries. In these fields, we mainly focus on the development of implantable medical devices. Using our proprietary technology for processing bioabsorbable materials, we have been developing regenerative medicine products without using cells.
Also, together with our affiliate, NexMed International Co., Ltd., we are developing orthopedic surgery products for less-invasive surgeries.
We are continuing the joint development of products for endoscopy with Machida Endoscope Co., Ltd., which has become one of our group companies.
Division of Surgical Devices
1. Medical-Related Business
Artificial Organs:
A one-year clinical trial for an extracorporeal continuous-flow ventricular assisting system for 30-day use was completed in October 2018. Application for the approval of this system is scheduled for early fiscal 2019. “The world’s smallest and lightest artificial heart-lung assisting machine (that is, an ultracompact heart-lung assisting machine)” is currently under devel-opment. This product is expected to be used for emergency cares, treating such urgent diseases as myocardial infarctions and acute respiratory failures. Clinical study of this product is planned to begin by the end of March 2020. This “ultracompact heart-lung machine” received a “Technology Award” from the Japanese Society for Artificial Organs at the Annual Meeting of 2018.
Hemo- catharsis:
A slow continuous hemodiafiltration system was launched in February 2019. It is characterized by high antithrombogenicity and human safety, used for prolonged corporeal circulation to treat acute renal insufficiency.
⦁ Research and Development Activities⦁ Progress of Research and Development⦁ Status of Corporate Governance⦁ Outside Directors’ Messages⦁ Board of Directors and Audit & Supervisory
Board Members
Management Foundation
17NIPRO Annual Report 2019
In addition to ordinary vial formulations and bag formulations, we are actively pursuing the development of kit formulations designed for better operational efficiency in clinical practice.
We are focusing on the development of extended release injections and other products that are relatively challenging to develop, such as our dual chamber pre-filled syringe containing leuprorelin acetate (one-month extended release product) for treating prostate cancer and premenopausal breast cancer, which is already on the market (Original: LEUPLIN® by Takeda Pharmaceutical Company Limited).
During the fiscal year under review, generic drugs for an infusion bag product, a vial product, and a pre-filled syringe product were launched.
In addition to ordinary oral drugs (e.g., tablets, granules), value-added products are currently being developed, such as orally disintegrating (OD) tablets or OD film preparations with reduced bitterness, which can be taken without water.
Meanwhile, in order to enhance improved efficiency in clinical practice, we also provide technically unique products, such as tablets printed with the name of active ingredients, and more useful packages, such as individual packages and aluminum pillows.
During the fiscal year ended March 2019, 6 compounds in 17 generic products were launched, including one OD-film preparation. Furthermore, manufacturing and marketing approval for 2 compounds in 7 products were obtained.
Several generic products, such as patches, are under development. Microneedles, characterized by the novel concept of a “transdermal injection”, are also under development. New production lines for investigational drugs have already been constructed.
While the biosimilar market is rapidly expanding in Japan, NHI (National Health Insurance) prices for biosimilars are generally high, and thus the need for much lower NHI prices is increasing, from the viewpoint of healthcare cost reduction.
Based on such circumstances, we have partnered with a biological drug substances company that can supply us with high quality and price-competitive biosimilars comparable to that of competitors’ products, and endeavor to develop in-house biosimilars.
During the fiscal year ended March 2019, manufacturing and marketing approval for an inhaler was obtained.
Management Foundation
Progress of Research and Development
Injectable Drugs
Oral Drugs
External Use Products
Biosimilars
Others
2. Pharmaceutical-Related Business
Nipro is conducting research and development (R&D) in the following fields, with our Pharmaceutical Research Laboratories playing a pivotal role. R&D expenditures were ¥8,235 million in fiscal 2019.
⦁ Research and Development Activities⦁ Progress of Research and Development⦁ Status of Corporate Governance⦁ Outside Directors’ Messages⦁ Board of Directors and Audit & Supervisory
Board Members
Management Foundation
18NIPRO Annual Report 2019
Management Foundation
Status of Corporate Governance
(1) Corporate Governance System and Reasons for AdoptionNipro Corporation has an established corporate governance system including organizations for the Meeting of Shareholders and directors as required under the Companies Act, in addition to a Board of Directors, Audit & Supervisory Board Members, Audit & Supervisory Board and an Accounting Auditor. Nipro has also established internal committees such as the Operational Risk Management Committee. This committee continuously maintains close coordination with external parties such as the company attorney, to enable effective monitoring and supervision of the efficiency and propriety of operations across the Company as a whole.
(5) Business Continuity Planning (BCP)At workplaces in Japan, we are improving our systems for disaster preparation and smooth continuity of business in the face of risks such as outbreaks of new types of influenza and large-scale natural disasters, including major (around magnitude 6) earthquakes originating in the Nankai Trough. At overseas workplaces, we are also preparing for risks including war, civil war, riots, terrorism, anti-Japanese demonstrations, and strikes.
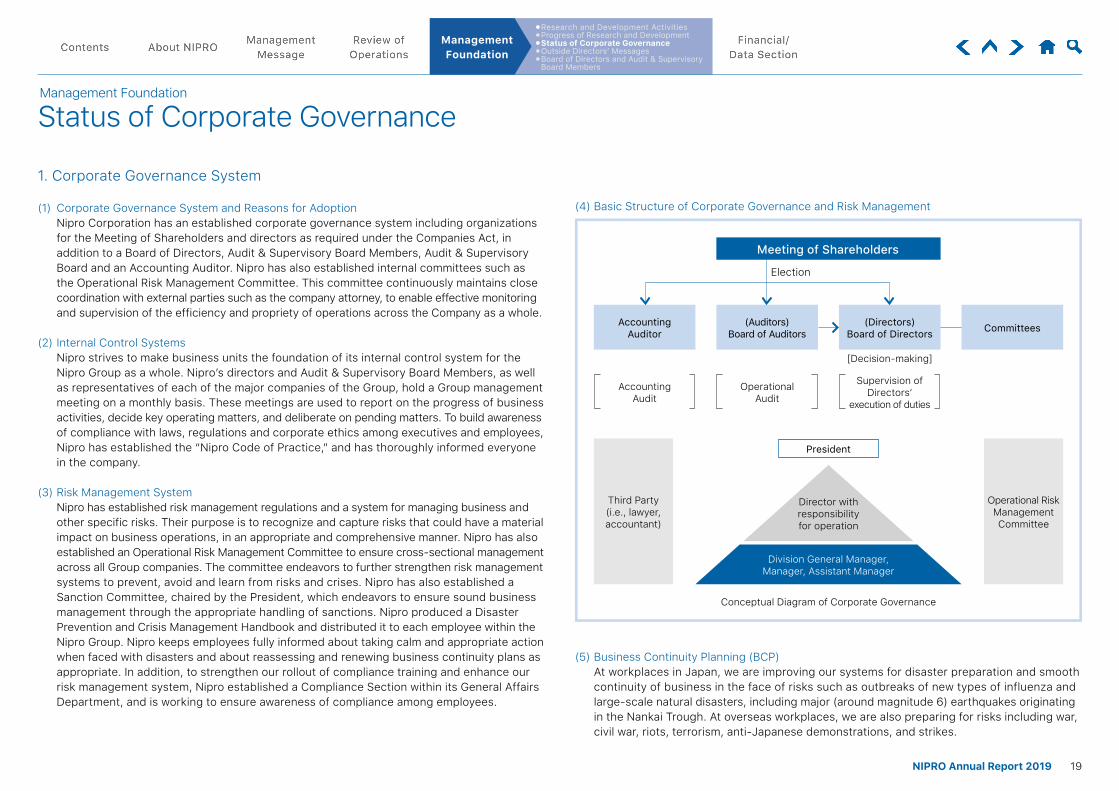
(4) Basic Structure of Corporate Governance and Risk Management
(2) Internal Control SystemsNipro strives to make business units the foundation of its internal control system for the Nipro Group as a whole. Nipro’s directors and Audit & Supervisory Board Members, as well as representatives of each of the major companies of the Group, hold a Group management meeting on a monthly basis. These meetings are used to report on the progress of business activities, decide key operating matters, and deliberate on pending matters. To build awareness of compliance with laws, regulations and corporate ethics among executives and employees, Nipro has established the “Nipro Code of Practice,” and has thoroughly informed everyone in the company.
(3) Risk Management SystemNipro has established risk management regulations and a system for managing business and other specific risks. Their purpose is to recognize and capture risks that could have a material impact on business operations, in an appropriate and comprehensive manner. Nipro has also established an Operational Risk Management Committee to ensure cross-sectional management across all Group companies. The committee endeavors to further strengthen risk management systems to prevent, avoid and learn from risks and crises. Nipro has also established a Sanction Committee, chaired by the President, which endeavors to ensure sound business management through the appropriate handling of sanctions. Nipro produced a Disaster Prevention and Crisis Management Handbook and distributed it to each employee within the Nipro Group. Nipro keeps employees fully informed about taking calm and appropriate action when faced with disasters and about reassessing and renewing business continuity plans as appropriate. In addition, to strengthen our rollout of compliance training and enhance our risk management system, Nipro established a Compliance Section within its General Affairs Department, and is working to ensure awareness of compliance among employees.
1. Corporate Governance System
Meeting of Shareholders
Accounting Auditor
Accounting Audit
Third Party(i.e., lawyer, accountant)
Director with responsibility for operation
Division General Manager, Manager, Assistant Manager
Operational Risk Management Committee
Operational Audit
President
Supervision of Directors’
execution of duties
(Directors)Board of Directors Committees(Auditors)
Board of Auditors
Election
[Decision-making]
Conceptual Diagram of Corporate Governance
⦁ Research and Development Activities⦁ Progress of Research and Development⦁ Status of Corporate Governance⦁ Outside Directors’ Messages⦁ Board of Directors and Audit & Supervisory
Board Members
Management Foundation
19NIPRO Annual Report 2019
⦁ Research and Development Activities⦁ Progress of Research and Development⦁ Status of Corporate Governance⦁ Outside Directors’ Messages⦁ Board of Directors and Audit & Supervisory
Board Members
Management Foundation
(1) Internal AuditingNipro has established the Internal Audit Division, consisting of the Audit Office and the Overseas Audit Office, and conducts audits of accounting and other operations based on internal audit protocols.
(2) Statutory AuditingFor each statutory audit, Audit & Supervisory Board Members attend key meetings such as those of the Board of Directors, in accordance with the auditing policy and roles determined by the Audit & Supervisory Board. Audit & Supervisory Board Members receive performance reports from directors and employees, and are able to request further explanation when necessary, and inspect key documents. Audit & Supervisory Board Members also undertake other auditing duties such as investigating the state of operations and assets in key places of business. Audit & Supervisory Board meetings are held regularly, or as necessary, in order to exchange views and hold discussions.
(1) Outside Directors and Outside Audit & Supervisory Board Members Two of the directors are Outside Directors and two of the three Audit & Supervisory Board Members are Outside Audit & Supervisory Board Members. The two Outside Directors and one of the Outside Audit & Supervisory Board Members have been designated as independent directors/Audit & Supervisory Board Members, and the Tokyo Stock Exchange has been notified of their designation.
(2) Policy and Criteria for Independence from the Filing Company in the Election of Outside Directors and Outside Audit & Supervisory Board MembersNipro determines the criteria for the independence of Outside Directors and Outside Audit & Supervisory Board Members as a part of separate corporate governance guidelines taking into consideration the provisions stipulated under the Financial Instruments and Exchange Act. In the event that either case does not fall within the scope of this criteria, Outside Directors and Outside Audit & Supervisory Board Members are deemed to be independent from the Company and that there is no possibility of a conflict of interest with general shareholders.
(3) Approach to the Election of Outside Directors and Outside Audit & Supervisory Board MembersClose coordination with the Internal Directors and the full-time Audit & Supervisory Board Members, employees of the Audit Office and assigned staff from the management section of the head office (as needed) ensures sufficient cover to implement the supervision and the audit function and role as required by the current corporate governance system.
Name of Accounting Auditor: Hibiki Audit CorporationNames of Certified Public Accountants conducting the Audit:Kazuhiro Bando, Miho Ishihara, Takanori Nakasuka
(4) Mutual Collaboration between Outside Audits and Internal, Statutory and Accounting Audits, and the Relationship between Internal Control DivisionsThe Outside Directors attend meetings of the Board of Directors and supervise our management based on their extensive knowledge and management experience from an independent standpoint. The Outside Audit & Supervisory Board Members carry out auditing activities including attending key meetings such as meetings of the Board of Directors in accordance with the audit policy and roles determined by the Audit & Supervisory Board. They are able to access reports via the full-time Audit & Supervisory Board Members or directly from directors and employees, and inspect key documents. The Outside Audit & Supervisory Board Members also attend periodic or occasional meetings of the Audit & Supervisory Board to contribute to discussions and exchange opinions from an objective and independent viewpoint. The Outside Audit & Supervisory Board Members strive to facilitate a smooth audit service through close collaboration with employees of the Audit Office, the full-time Audit & Supervisory Board Members, Audit & Supervisory Board Members of subsidiaries and the accounting auditor.
2. Internal and Statutory Auditing
3. Outside Directors and Outside Audit & Supervisory Board Members4. Accounting Audits
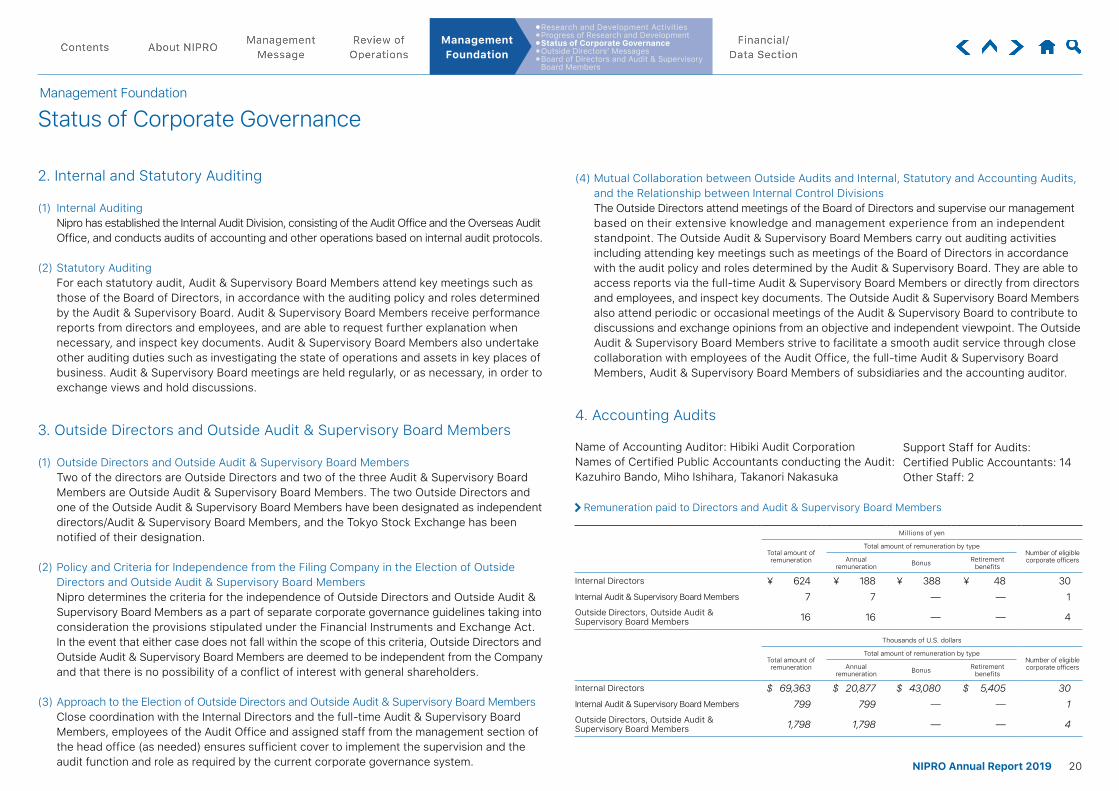
Remuneration paid to Directors and Audit & Supervisory Board Members
Millions of yen
Total amount of remuneration
Total amount of remuneration by typeNumber of eligiblecorporate officersAnnual
remuneration Bonus Retirement benefits
Internal Directors ¥ 624 ¥ 188 ¥ 388 ¥ 48 30Internal Audit & Supervisory Board Members 7 7 — — 1Outside Directors, Outside Audit & Supervisory Board Members 16 16 — — 4
Support Staff for Audits:Certified Public Accountants: 14Other Staff: 2
Thousands of U.S. dollars
Total amount of remuneration
Total amount of remuneration by typeNumber of eligible corporate officersAnnual
remuneration Bonus Retirement benefits
Internal Directors $ 69,363 $ 20,877 $ 43,080 $ 5,405 30Internal Audit & Supervisory Board Members 799 799 — — 1Outside Directors, Outside Audit & Supervisory Board Members 1,798 1,798 — — 4
20NIPRO Annual Report 2019
Management Foundation
Status of Corporate Governance
⦁ Research and Development Activities⦁ Progress of Research and Development⦁ Status of Corporate Governance⦁ Outside Directors’ Messages⦁ Board of Directors and Audit & Supervisory
Board Members
Management Foundation
Management Foundation
Outside Directors’ Messages
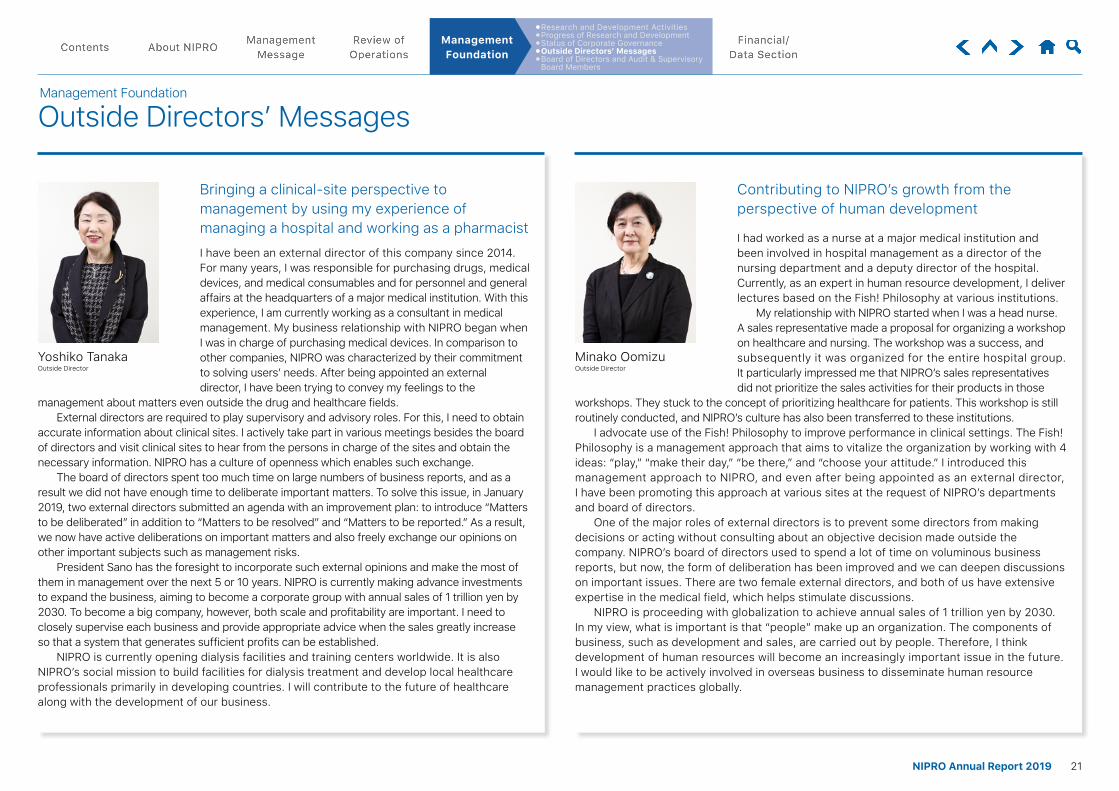
I have been an external director of this company since 2014. For many years, I was responsible for purchasing drugs, medical devices, and medical consumables and for personnel and general affairs at the headquarters of a major medical institution. With this experience, I am currently working as a consultant in medical management. My business relationship with NIPRO began when I was in charge of purchasing medical devices. In comparison to other companies, NIPRO was characterized by their commitment to solving users’ needs. After being appointed an external director, I have been trying to convey my feelings to the
management about matters even outside the drug and healthcare fields.External directors are required to play supervisory and advisory roles. For this, I need to obtain
accurate information about clinical sites. I actively take part in various meetings besides the board of directors and visit clinical sites to hear from the persons in charge of the sites and obtain the necessary information. NIPRO has a culture of openness which enables such exchange.
The board of directors spent too much time on large numbers of business reports, and as a result we did not have enough time to deliberate important matters. To solve this issue, in January 2019, two external directors submitted an agenda with an improvement plan: to introduce “Matters to be deliberated” in addition to “Matters to be resolved” and “Matters to be reported.” As a result, we now have active deliberations on important matters and also freely exchange our opinions on other important subjects such as management risks.
President Sano has the foresight to incorporate such external opinions and make the most of them in management over the next 5 or 10 years. NIPRO is currently making advance investments to expand the business, aiming to become a corporate group with annual sales of 1 trillion yen by 2030. To become a big company, however, both scale and profitability are important. I need to closely supervise each business and provide appropriate advice when the sales greatly increase so that a system that generates sufficient profits can be established.
NIPRO is currently opening dialysis facilities and training centers worldwide. It is also NIPRO’s social mission to build facilities for dialysis treatment and develop local healthcare professionals primarily in developing countries. I will contribute to the future of healthcare along with the development of our business.
I had worked as a nurse at a major medical institution and been involved in hospital management as a director of the nursing department and a deputy director of the hospital. Currently, as an expert in human resource development, I deliver lectures based on the Fish! Philosophy at various institutions.
My relationship with NIPRO started when I was a head nurse. A sales representative made a proposal for organizing a workshop on healthcare and nursing. The workshop was a success, and subsequently it was organized for the entire hospital group. It particularly impressed me that NIPRO’s sales representatives did not prioritize the sales activities for their products in those
workshops. They stuck to the concept of prioritizing healthcare for patients. This workshop is still routinely conducted, and NIPRO’s culture has also been transferred to these institutions.
I advocate use of the Fish! Philosophy to improve performance in clinical settings. The Fish! Philosophy is a management approach that aims to vitalize the organization by working with 4 ideas: “play,” “make their day,” “be there,” and “choose your attitude.” I introduced this management approach to NIPRO, and even after being appointed as an external director, I have been promoting this approach at various sites at the request of NIPRO’s departments and board of directors.
One of the major roles of external directors is to prevent some directors from making decisions or acting without consulting about an objective decision made outside the company. NIPRO’s board of directors used to spend a lot of time on voluminous business reports, but now, the form of deliberation has been improved and we can deepen discussions on important issues. There are two female external directors, and both of us have extensive expertise in the medical field, which helps stimulate discussions.
NIPRO is proceeding with globalization to achieve annual sales of 1 trillion yen by 2030. In my view, what is important is that “people” make up an organization. The components of business, such as development and sales, are carried out by people. Therefore, I think development of human resources will become an increasingly important issue in the future. I would like to be actively involved in overseas business to disseminate human resource management practices globally.
Bringing a clinical-site perspective to management by using my experience of managing a hospital and working as a pharmacist
Contributing to NIPRO’s growth from the perspective of human development
Yoshiko TanakaOutside Director
Minako OomizuOutside Director
21NIPRO Annual Report 2019
Yoshihiko SanoPresident & Representative Director
Kazuo WakatsukiManaging Director
Kyoetsu KobayashiManaging Director
Toshiaki MasudaManaging Director
Minako OomizuOutside Director
Yoshiko TanakaOutside Director
Kazuhiko SanoManaging Director
Yasushi OyamaManaging Director
Kenichi NishidaManaging Director
Takehito YogoManaging Director
Kimihito MinouraManaging Director
Tsuyoshi YamazakiManaging Director
Kiyotaka YoshiokaManaging Director
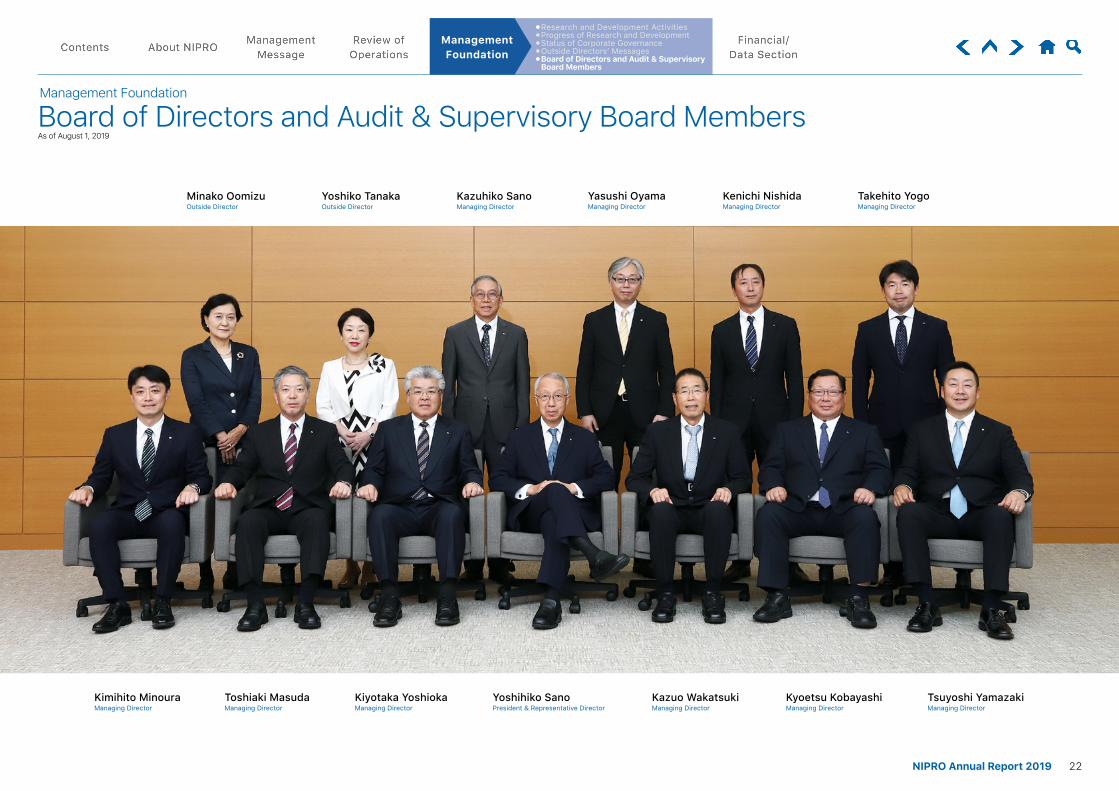
Management Foundation
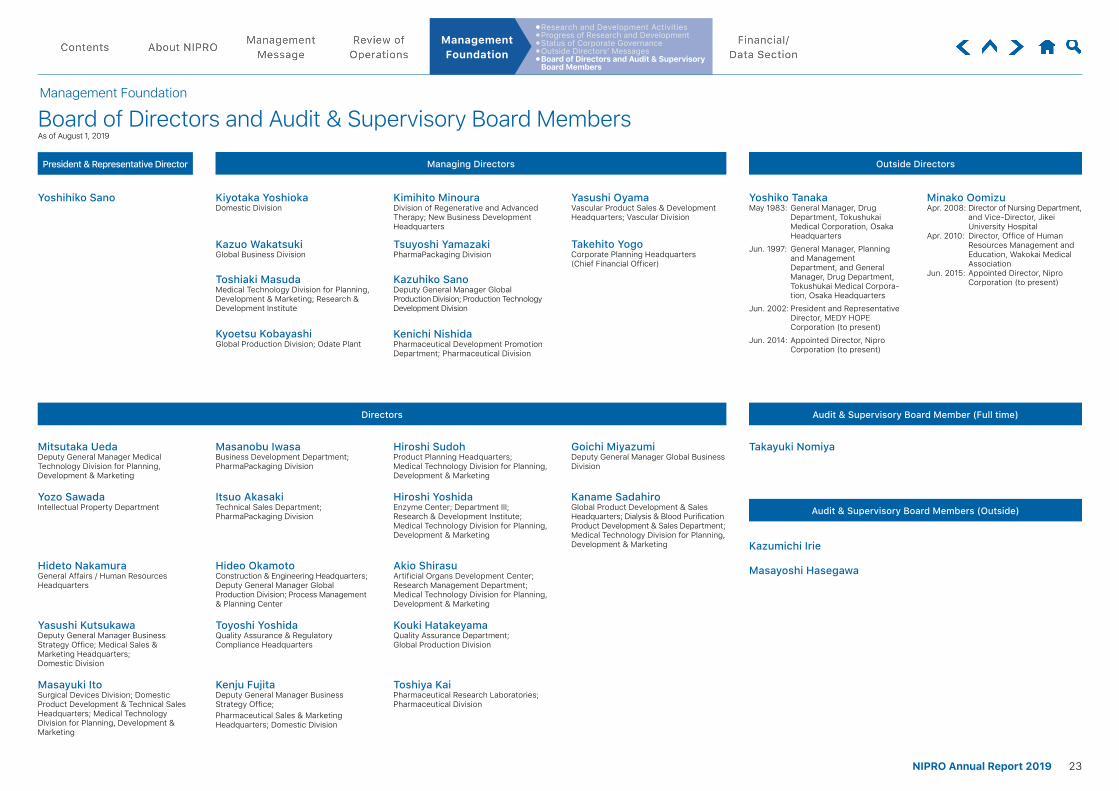
Board of Directors and Audit & Supervisory Board MembersAs of August 1, 2019
⦁ Research and Development Activities⦁ Progress of Research and Development⦁ Status of Corporate Governance⦁ Outside Directors’ Messages⦁ Board of Directors and Audit & Supervisory
Board Members
Management Foundation
22NIPRO Annual Report 2019
Yoshihiko Sano Kiyotaka YoshiokaDomestic Division
Kazuo WakatsukiGlobal Business Division
Toshiaki MasudaMedical Technology Division for Planning, Development & Marketing; Research & Development Institute
Kyoetsu KobayashiGlobal Production Division; Odate Plant
Tsuyoshi YamazakiPharmaPackaging Division
Kazuhiko SanoDeputy General Manager Global Production Division; Production Technology Development Division
Yasushi OyamaVascular Product Sales & Development Headquarters; Vascular Division
Takehito YogoCorporate Planning Headquarters (Chief Financial Officer)
Kenichi NishidaPharmaceutical Development Promotion Department; Pharmaceutical Division
Kimihito MinouraDivision of Regenerative and Advanced Therapy; New Business Development Headquarters
Yoshiko TanakaMay 1983: General Manager, Drug
Department, Tokushukai Medical Corporation, Osaka Headquarters
Jun. 1997: General Manager, Planning and Management Department, and General Manager, Drug Department, Tokushukai Medical Corpora-tion, Osaka Headquarters
Jun. 2002: President and Representative Director, MEDY HOPE Corporation (to present)
Jun. 2014: Appointed Director, Nipro Corporation (to present)
Minako OomizuApr. 2008: Director of Nursing Department,
and Vice-Director, Jikei University Hospital
Apr. 2010: Director, Office of Human Resources Management and Education, Wakokai Medical Association
Jun. 2015: Appointed Director, Nipro Corporation (to present)
President & Representative Director Managing Directors Outside Directors
Management Foundation
Board of Directors and Audit & Supervisory Board MembersAs of August 1, 2019
Takayuki Nomiya
Kazumichi Irie
Masayoshi Hasegawa
Toyoshi YoshidaQuality Assurance & Regulatory Compliance Headquarters
Kouki HatakeyamaQuality Assurance Department; Global Production Division
Yasushi KutsukawaDeputy General Manager Business Strategy Office; Medical Sales & Marketing Headquarters; Domestic Division
Kenju FujitaDeputy General Manager Business Strategy Office;Pharmaceutical Sales & Marketing Headquarters; Domestic Division
Toshiya KaiPharmaceutical Research Laboratories; Pharmaceutical Division
Masayuki ItoSurgical Devices Division; Domestic Product Development & Technical Sales Headquarters; Medical Technology Division for Planning, Development & Marketing
Goichi MiyazumiDeputy General Manager Global Business Division
Mitsutaka UedaDeputy General Manager Medical Technology Division for Planning, Development & Marketing
Hiroshi SudohProduct Planning Headquarters; Medical Technology Division for Planning, Development & Marketing
Masanobu IwasaBusiness Development Department; PharmaPackaging Division
Kaname SadahiroGlobal Product Development & Sales Headquarters; Dialysis & Blood Purification Product Development & Sales Department; Medical Technology Division for Planning, Development & Marketing
Hiroshi YoshidaEnzyme Center; Department III; Research & Development Institute; Medical Technology Division for Planning, Development & Marketing
Yozo SawadaIntellectual Property Department
Itsuo AkasakiTechnical Sales Department; PharmaPackaging Division
Akio ShirasuArtificial Organs Development Center; Research Management Department; Medical Technology Division for Planning, Development & Marketing
Hideto NakamuraGeneral Affairs / Human Resources Headquarters
Hideo OkamotoConstruction & Engineering Headquarters; Deputy General Manager Global Production Division; Process Management & Planning Center
Directors Audit & Supervisory Board Member (Full time)
Audit & Supervisory Board Members (Outside)
⦁ Research and Development Activities⦁ Progress of Research and Development⦁ Status of Corporate Governance⦁ Outside Directors’ Messages⦁ Board of Directors and Audit & Supervisory
Board Members
Management Foundation
23NIPRO Annual Report 2019
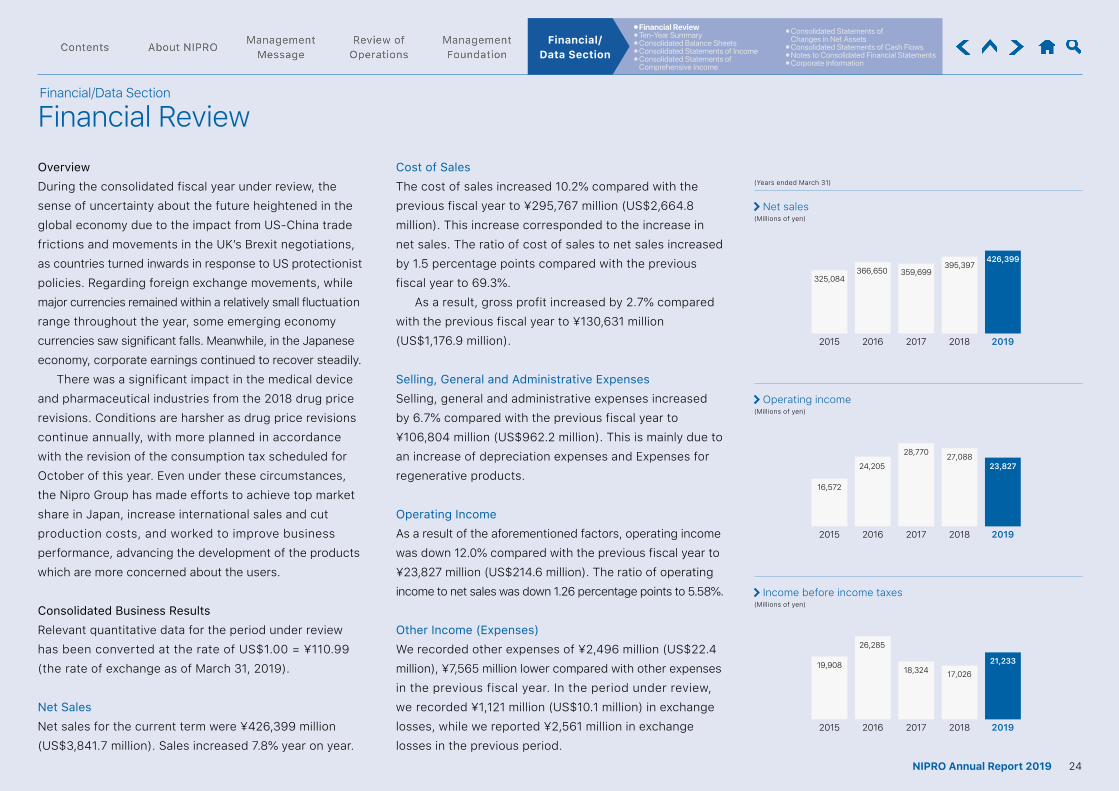
⦁ Financial Review⦁ Ten-Year Summary⦁ Consolidated Balance Sheets⦁ Consolidated Statements of Income⦁ Consolidated Statements of
Comprehensive Income
⦁ Consolidated Statements of Changes in Net Assets
⦁ Consolidated Statements of Cash Flows⦁ Notes to Consolidated Financial Statements⦁ Corporate Information
Financial/Data Section
OverviewDuring the consolidated fiscal year under review, the sense of uncertainty about the future heightened in the global economy due to the impact from US-China trade frictions and movements in the UK’s Brexit negotiations, as countries turned inwards in response to US protectionist policies. Regarding foreign exchange movements, while major currencies remained within a relatively small fluctuation range throughout the year, some emerging economy currencies saw significant falls. Meanwhile, in the Japanese economy, corporate earnings continued to recover steadily.
There was a significant impact in the medical device and pharmaceutical industries from the 2018 drug price revisions. Conditions are harsher as drug price revisions continue annually, with more planned in accordance with the revision of the consumption tax scheduled for October of this year. Even under these circumstances, the Nipro Group has made efforts to achieve top market share in Japan, increase international sales and cut production costs, and worked to improve business performance, advancing the development of the products which are more concerned about the users.
Consolidated Business ResultsRelevant quantitative data for the period under review has been converted at the rate of US$1.00 = ¥110.99 (the rate of exchange as of March 31, 2019).
Net SalesNet sales for the current term were ¥426,399 million (US$3,841.7 million). Sales increased 7.8% year on year.
426,399
325,084366,650 359,699
395,397
20172015 20182016 2019
23,827
16,572
24,205
28,770 27,088
20172015 20182016 2019
21,23319,908
26,285
18,324 17,026
20172015 20182016 2019
Net sales(Millions of yen)
Operating income(Millions of yen)
Income before income taxes(Millions of yen)
Cost of SalesThe cost of sales increased 10.2% compared with the previous fiscal year to ¥295,767 million (US$2,664.8 million). This increase corresponded to the increase in net sales. The ratio of cost of sales to net sales increased by 1.5 percentage points compared with the previous fiscal year to 69.3%.
As a result, gross profit increased by 2.7% compared with the previous fiscal year to ¥130,631 million (US$1,176.9 million).
Selling, General and Administrative ExpensesSelling, general and administrative expenses increased by 6.7% compared with the previous fiscal year to ¥106,804 million (US$962.2 million). This is mainly due to an increase of depreciation expenses and Expenses for regenerative products.
Operating IncomeAs a result of the aforementioned factors, operating income was down 12.0% compared with the previous fiscal year to ¥23,827 million (US$214.6 million). The ratio of operating income to net sales was down 1.26 percentage points to 5.58%.
Other Income (Expenses)We recorded other expenses of ¥2,496 million (US$22.4 million), ¥7,565 million lower compared with other expenses in the previous fiscal year. In the period under review, we recorded ¥1,121 million (US$10.1 million) in exchange losses, while we reported ¥2,561 million in exchange losses in the previous period.
Financial/Data Section
Financial Review
(Years ended March 31)
24NIPRO Annual Report 2019
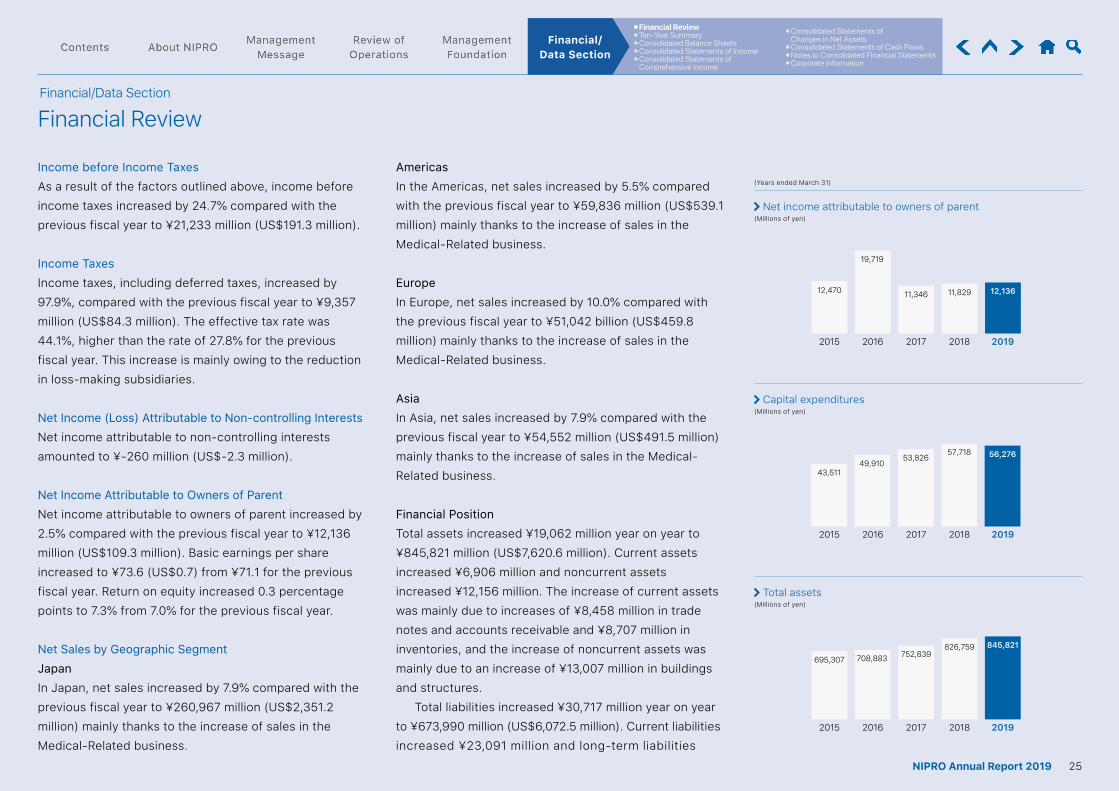
⦁ Financial Review⦁ Ten-Year Summary⦁ Consolidated Balance Sheets⦁ Consolidated Statements of Income⦁ Consolidated Statements of
Comprehensive Income
⦁ Consolidated Statements of Changes in Net Assets
⦁ Consolidated Statements of Cash Flows⦁ Notes to Consolidated Financial Statements⦁ Corporate Information
Financial/Data Section
Financial/Data Section
Financial Review
Income before Income TaxesAs a result of the factors outlined above, income before income taxes increased by 24.7% compared with the previous fiscal year to ¥21,233 million (US$191.3 million).
Income TaxesIncome taxes, including deferred taxes, increased by 97.9%, compared with the previous fiscal year to ¥9,357 million (US$84.3 million). The effective tax rate was 44.1%, higher than the rate of 27.8% for the previous fiscal year. This increase is mainly owing to the reduction in loss-making subsidiaries.
Net Income (Loss) Attributable to Non-controlling InterestsNet income attributable to non-controlling interests amounted to ¥-260 million (US$-2.3 million).
Net Income Attributable to Owners of ParentNet income attributable to owners of parent increased by 2.5% compared with the previous fiscal year to ¥12,136 million (US$109.3 million). Basic earnings per share increased to ¥73.6 (US$0.7) from ¥71.1 for the previous fiscal year. Return on equity increased 0.3 percentage points to 7.3% from 7.0% for the previous fiscal year.
Net Sales by Geographic SegmentJapanIn Japan, net sales increased by 7.9% compared with the previous fiscal year to ¥260,967 million (US$2,351.2 million) mainly thanks to the increase of sales in the Medical-Related business.
AmericasIn the Americas, net sales increased by 5.5% compared with the previous fiscal year to ¥59,836 million (US$539.1 million) mainly thanks to the increase of sales in the Medical-Related business.
EuropeIn Europe, net sales increased by 10.0% compared with the previous fiscal year to ¥51,042 billion (US$459.8 million) mainly thanks to the increase of sales in the Medical-Related business.
AsiaIn Asia, net sales increased by 7.9% compared with the previous fiscal year to ¥54,552 million (US$491.5 million) mainly thanks to the increase of sales in the Medical- Related business.
Financial PositionTotal assets increased ¥19,062 million year on year to ¥845,821 million (US$7,620.6 million). Current assets increased ¥6,906 million and noncurrent assets increased ¥12,156 million. The increase of current assets was mainly due to increases of ¥8,458 million in trade notes and accounts receivable and ¥8,707 million in inventories, and the increase of noncurrent assets was mainly due to an increase of ¥13,007 million in buildings and structures.
Total liabilities increased ¥30,717 million year on year to ¥673,990 million (US$6,072.5 million). Current liabilities increased ¥23,091 million and long-term liabilities
56,276
43,51149,910
53,82657,718
20172015 20182016 2019
845,821
695,307 708,883 752,839826,759
20172015 20182016 2019
Net income attributable to owners of parent(Millions of yen)
Capital expenditures(Millions of yen)
Total assets(Millions of yen)
(Years ended March 31)
12,13612,470
19,719
11,346 11,829
20172015 20182016 2019
25NIPRO Annual Report 2019
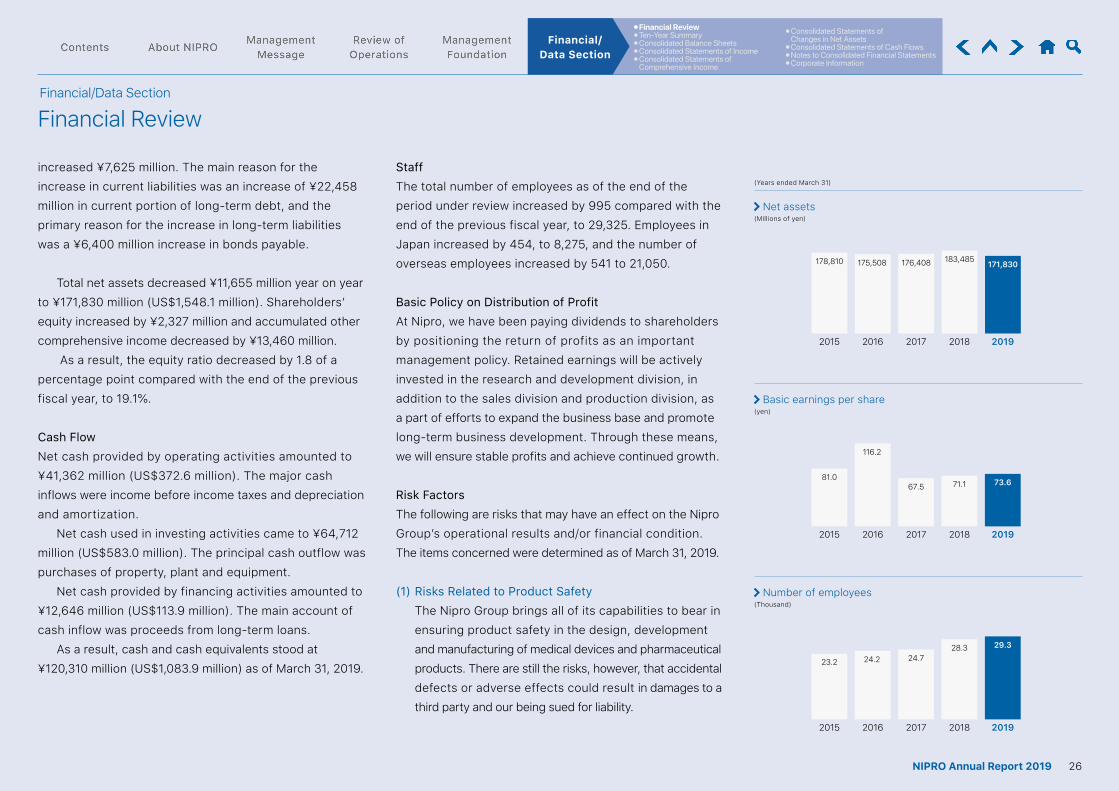
⦁ Financial Review⦁ Ten-Year Summary⦁ Consolidated Balance Sheets⦁ Consolidated Statements of Income⦁ Consolidated Statements of
Comprehensive Income
⦁ Consolidated Statements of Changes in Net Assets
⦁ Consolidated Statements of Cash Flows⦁ Notes to Consolidated Financial Statements⦁ Corporate Information
Financial/Data Section
increased ¥7,625 million. The main reason for the increase in current liabilities was an increase of ¥22,458 million in current portion of long-term debt, and the primary reason for the increase in long-term liabilities was a ¥6,400 million increase in bonds payable.
Total net assets decreased ¥11,655 million year on year to ¥171,830 million (US$1,548.1 million). Shareholders’ equity increased by ¥2,327 million and accumulated other comprehensive income decreased by ¥13,460 million.
As a result, the equity ratio decreased by 1.8 of a percentage point compared with the end of the previous fiscal year, to 19.1%.
Cash FlowNet cash provided by operating activities amounted to ¥41,362 million (US$372.6 million). The major cash inflows were income before income taxes and depreciation and amortization.
Net cash used in investing activities came to ¥64,712 million (US$583.0 million). The principal cash outflow was purchases of property, plant and equipment.
Net cash provided by financing activities amounted to ¥12,646 million (US$113.9 million). The main account of cash inflow was proceeds from long-term loans.
As a result, cash and cash equivalents stood at ¥120,310 million (US$1,083.9 million) as of March 31, 2019.
StaffThe total number of employees as of the end of the period under review increased by 995 compared with the end of the previous fiscal year, to 29,325. Employees in Japan increased by 454, to 8,275, and the number of overseas employees increased by 541 to 21,050.
Basic Policy on Distribution of ProfitAt Nipro, we have been paying dividends to shareholders by positioning the return of profits as an important management policy. Retained earnings will be actively invested in the research and development division, in addition to the sales division and production division, as a part of efforts to expand the business base and promote long-term business development. Through these means, we will ensure stable profits and achieve continued growth.
Risk FactorsThe following are risks that may have an effect on the Nipro Group’s operational results and/or financial condition. The items concerned were determined as of March 31, 2019.
(1) Risks Related to Product SafetyThe Nipro Group brings all of its capabilities to bear in ensuring product safety in the design, development and manufacturing of medical devices and pharmaceutical products. There are still the risks, however, that accidental defects or adverse effects could result in damages to a third party and our being sued for liability.
Financial/Data Section
Financial Review
171,830178,810 175,508 176,408 183,485
20172015 20182016 2019
73.681.0
116.2
67.5 71.1
20172015 20182016 2019
29.3
23.2 24.2 24.728.3
20172015 20182016 2019
Net assets(Millions of yen)
Basic earnings per share(yen)
Number of employees(Thousand)
(Years ended March 31)
26NIPRO Annual Report 2019
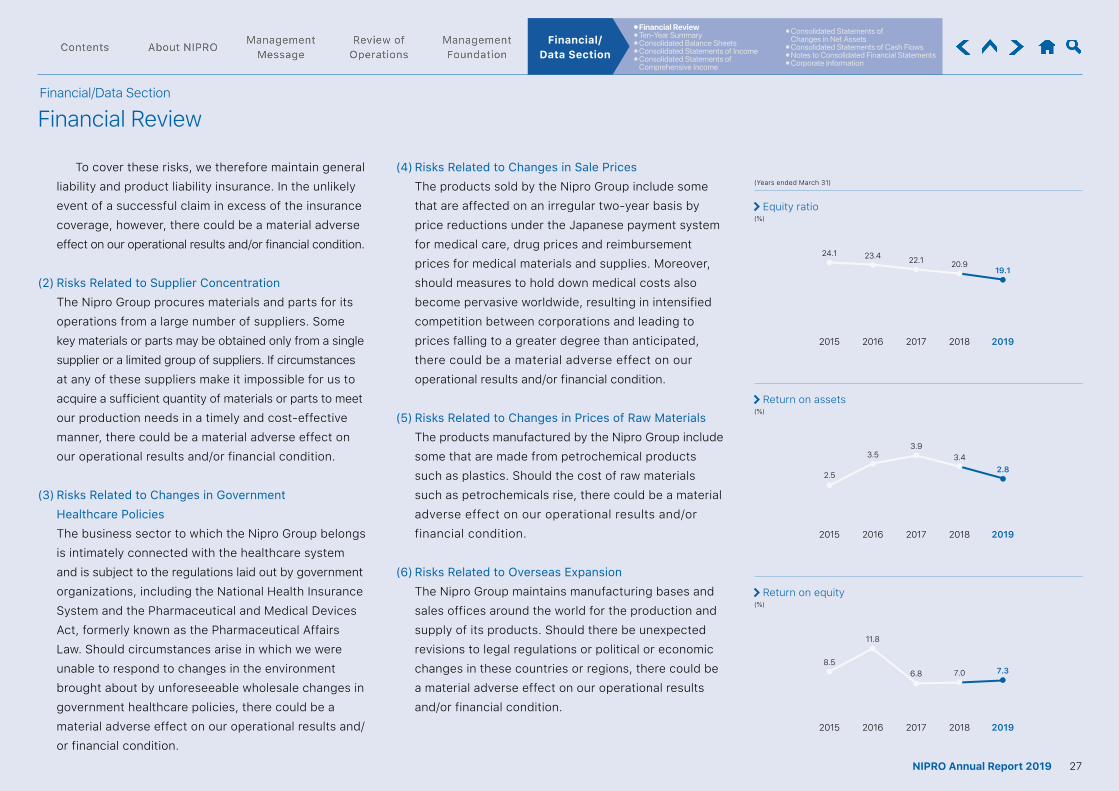
⦁ Financial Review⦁ Ten-Year Summary⦁ Consolidated Balance Sheets⦁ Consolidated Statements of Income⦁ Consolidated Statements of
Comprehensive Income
⦁ Consolidated Statements of Changes in Net Assets
⦁ Consolidated Statements of Cash Flows⦁ Notes to Consolidated Financial Statements⦁ Corporate Information
Financial/Data Section
To cover these risks, we therefore maintain general liability and product liability insurance. In the unlikely event of a successful claim in excess of the insurance coverage, however, there could be a material adverse effect on our operational results and/or financial condition.
(2) Risks Related to Supplier ConcentrationThe Nipro Group procures materials and parts for its operations from a large number of suppliers. Some key materials or parts may be obtained only from a single supplier or a limited group of suppliers. If circumstances at any of these suppliers make it impossible for us to acquire a sufficient quantity of materials or parts to meet our production needs in a timely and cost-effective manner, there could be a material adverse effect on our operational results and/or financial condition.
(3) Risks Related to Changes in Government Healthcare PoliciesThe business sector to which the Nipro Group belongs is intimately connected with the healthcare system and is subject to the regulations laid out by government organizations, including the National Health Insurance System and the Pharmaceutical and Medical Devices Act, formerly known as the Pharmaceutical Affairs Law. Should circumstances arise in which we were unable to respond to changes in the environment brought about by unforeseeable wholesale changes in government healthcare policies, there could be a material adverse effect on our operational results and/or financial condition.
Financial/Data Section
Financial Review
(4) Risks Related to Changes in Sale PricesThe products sold by the Nipro Group include some that are affected on an irregular two-year basis by price reductions under the Japanese payment system for medical care, drug prices and reimbursement prices for medical materials and supplies. Moreover, should measures to hold down medical costs also become pervasive worldwide, resulting in intensified competition between corporations and leading to prices falling to a greater degree than anticipated, there could be a material adverse effect on our operational results and/or financial condition.
(5) Risks Related to Changes in Prices of Raw MaterialsThe products manufactured by the Nipro Group include some that are made from petrochemical products such as plastics. Should the cost of raw materials such as petrochemicals rise, there could be a material adverse effect on our operational results and/or financial condition.
(6) Risks Related to Overseas ExpansionThe Nipro Group maintains manufacturing bases and sales offices around the world for the production and supply of its products. Should there be unexpected revisions to legal regulations or political or economic changes in these countries or regions, there could be a material adverse effect on our operational results and/or financial condition.
24.1 23.4 22.1 20.919.1
20172015 20182016 2019
2.5
3.53.9
3.42.8
20172015 20182016 2019
8.5
11.8
6.8 7.0 7.3
20172015 20182016 2019
Equity ratio(%)
Return on assets(%)
Return on equity(%)
(Years ended March 31)
27NIPRO Annual Report 2019
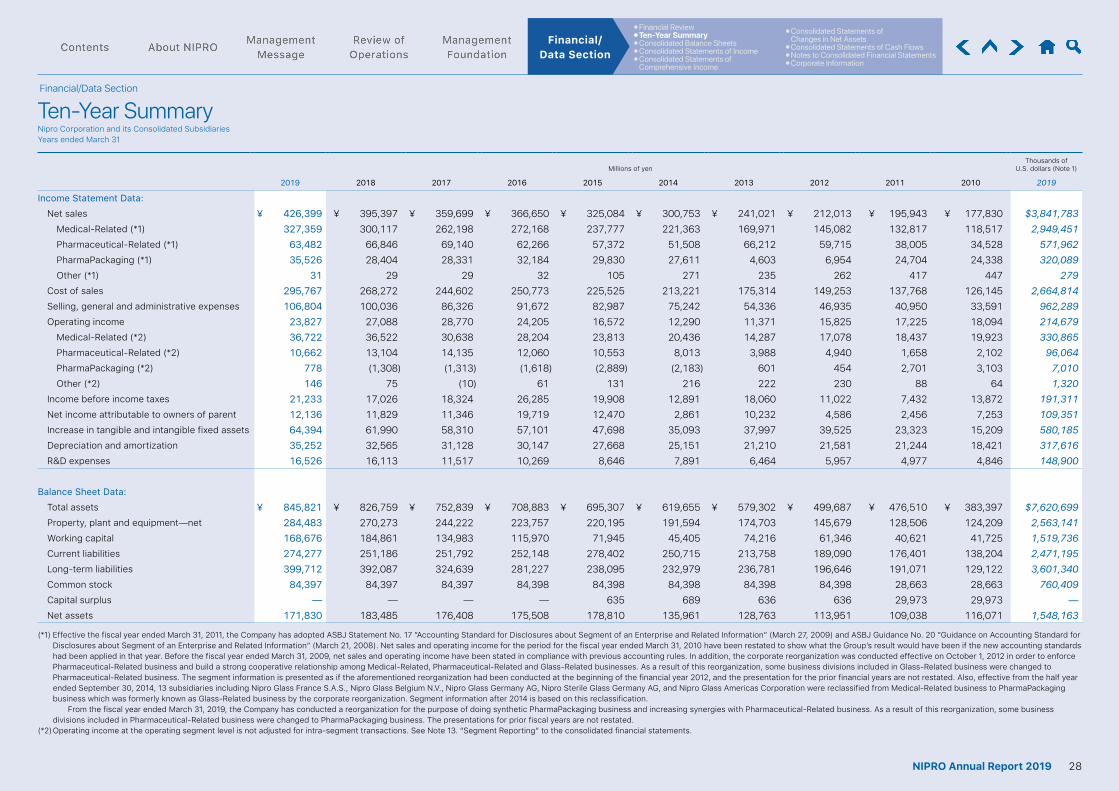
⦁ Financial Review⦁ Ten-Year Summary⦁ Consolidated Balance Sheets⦁ Consolidated Statements of Income⦁ Consolidated Statements of
Comprehensive Income
⦁ Consolidated Statements of Changes in Net Assets
⦁ Consolidated Statements of Cash Flows⦁ Notes to Consolidated Financial Statements⦁ Corporate Information
Financial/ Data Section
Millions of yenThousands of
U.S. dollars (Note 1)
2019 2018 2017 2016 2015 2014 2013 2012 2011 2010 2019
Income Statement Data:Net sales ¥ 426,399 ¥ 395,397 ¥ 359,699 ¥ 366,650 ¥ 325,084 ¥ 300,753 ¥ 241,021 ¥ 212,013 ¥ 195,943 ¥ 177,830 $3,841,783
Medical-Related (*1) 327,359 300,117 262,198 272,168 237,777 221,363 169,971 145,082 132,817 118,517 2,949,451 Pharmaceutical-Related (*1) 63,482 66,846 69,140 62,266 57,372 51,508 66,212 59,715 38,005 34,528 571,962 PharmaPackaging (*1) 35,526 28,404 28,331 32,184 29,830 27,611 4,603 6,954 24,704 24,338 320,089 Other (*1) 31 29 29 32 105 271 235 262 417 447 279
Cost of sales 295,767 268,272 244,602 250,773 225,525 213,221 175,314 149,253 137,768 126,145 2,664,814 Selling, general and administrative expenses 106,804 100,036 86,326 91,672 82,987 75,242 54,336 46,935 40,950 33,591 962,289 Operating income 23,827 27,088 28,770 24,205 16,572 12,290 11,371 15,825 17,225 18,094 214,679
Medical-Related (*2) 36,722 36,522 30,638 28,204 23,813 20,436 14,287 17,078 18,437 19,923 330,865 Pharmaceutical-Related (*2) 10,662 13,104 14,135 12,060 10,553 8,013 3,988 4,940 1,658 2,102 96,064 PharmaPackaging (*2) 778 (1,308) (1,313) (1,618) (2,889) (2,183) 601 454 2,701 3,103 7,010 Other (*2) 146 75 (10) 61 131 216 222 230 88 64 1,320
Income before income taxes 21,233 17,026 18,324 26,285 19,908 12,891 18,060 11,022 7,432 13,872 191,311 Net income attributable to owners of parent 12,136 11,829 11,346 19,719 12,470 2,861 10,232 4,586 2,456 7,253 109,351 Increase in tangible and intangible fixed assets 64,394 61,990 58,310 57,101 47,698 35,093 37,997 39,525 23,323 15,209 580,185 Depreciation and amortization 35,252 32,565 31,128 30,147 27,668 25,151 21,210 21,581 21,244 18,421 317,616 R&D expenses 16,526 16,113 11,517 10,269 8,646 7,891 6,464 5,957 4,977 4,846 148,900
Balance Sheet Data:Total assets ¥ 845,821 ¥ 826,759 ¥ 752,839 ¥ 708,883 ¥ 695,307 ¥ 619,655 ¥ 579,302 ¥ 499,687 ¥ 476,510 ¥ 383,397 $7,620,699 Property, plant and equipment—net 284,483 270,273 244,222 223,757 220,195 191,594 174,703 145,679 128,506 124,209 2,563,141 Working capital 168,676 184,861 134,983 115,970 71,945 45,405 74,216 61,346 40,621 41,725 1,519,736 Current liabilities 274,277 251,186 251,792 252,148 278,402 250,715 213,758 189,090 176,401 138,204 2,471,195 Long-term liabilities 399,712 392,087 324,639 281,227 238,095 232,979 236,781 196,646 191,071 129,122 3,601,340 Common stock 84,397 84,397 84,397 84,398 84,398 84,398 84,398 84,398 28,663 28,663 760,409 Capital surplus — — — — 635 689 636 636 29,973 29,973 —Net assets 171,830 183,485 176,408 175,508 178,810 135,961 128,763 113,951 109,038 116,071 1,548,163
(*1) Effective the fiscal year ended March 31, 2011, the Company has adopted ASBJ Statement No. 17 ”Accounting Standard for Disclosures about Segment of an Enterprise and Related Information” (March 27, 2009) and ASBJ Guidance No. 20 ”Guidance on Accounting Standard for Disclosures about Segment of an Enterprise and Related Information” (March 21, 2008). Net sales and operating income for the period for the fiscal year ended March 31, 2010 have been restated to show what the Group’s result would have been if the new accounting standards had been applied in that year. Before the fiscal year ended March 31, 2009, net sales and operating income have been stated in compliance with previous accounting rules. In addition, the corporate reorganization was conducted effective on October 1, 2012 in order to enforce Pharmaceutical-Related business and build a strong cooperative relationship among Medical-Related, Pharmaceutical-Related and Glass-Related businesses. As a result of this reorganization, some business divisions included in Glass-Related business were changed to Pharmaceutical-Related business. The segment information is presented as if the aforementioned reorganization had been conducted at the beginning of the financial year 2012, and the presentation for the prior financial years are not restated. Also, effective from the half year ended September 30, 2014, 13 subsidiaries including Nipro Glass France S.A.S., Nipro Glass Belgium N.V., Nipro Glass Germany AG, Nipro Sterile Glass Germany AG, and Nipro Glass Americas Corporation were reclassified from Medical-Related business to PharmaPackaging business which was formerly known as Glass-Related business by the corporate reorganization. Segment information after 2014 is based on this reclassification.
From the fiscal year ended March 31, 2019, the Company has conducted a reorganization for the purpose of doing synthetic PharmaPackaging business and increasing synergies with Pharmaceutical-Related business. As a result of this reorganization, some business divisions included in Pharmaceutical-Related business were changed to PharmaPackaging business. The presentations for prior fiscal years are not restated.
(*2) Operating income at the operating segment level is not adjusted for intra-segment transactions. See Note 13. “Segment Reporting” to the consolidated financial statements.
Financial/Data Section
Ten-Year SummaryNipro Corporation and its Consolidated Subsidiaries Years ended March 31
28NIPRO Annual Report 2019
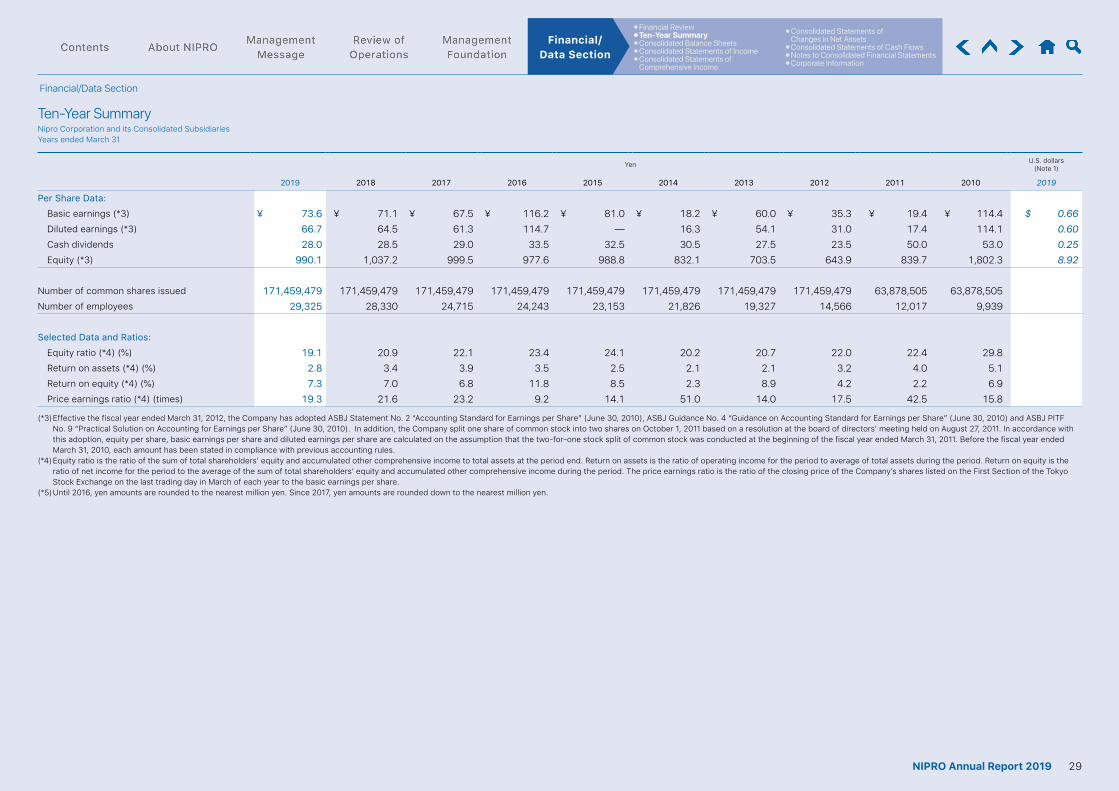
⦁ Financial Review⦁ Ten-Year Summary⦁ Consolidated Balance Sheets⦁ Consolidated Statements of Income⦁ Consolidated Statements of
Comprehensive Income
⦁ Consolidated Statements of Changes in Net Assets
⦁ Consolidated Statements of Cash Flows⦁ Notes to Consolidated Financial Statements⦁ Corporate Information
Financial/ Data Section
Yen U.S. dollars(Note 1)
2019 2018 2017 2016 2015 2014 2013 2012 2011 2010 2019
Per Share Data:Basic earnings (*3) ¥ 73.6 ¥ 71.1 ¥ 67.5 ¥ 116.2 ¥ 81.0 ¥ 18.2 ¥ 60.0 ¥ 35.3 ¥ 19.4 ¥ 114.4 $ 0.66 Diluted earnings (*3) 66.7 64.5 61.3 114.7 — 16.3 54.1 31.0 17.4 114.1 0.60 Cash dividends 28.0 28.5 29.0 33.5 32.5 30.5 27.5 23.5 50.0 53.0 0.25 Equity (*3) 990.1 1,037.2 999.5 977.6 988.8 832.1 703.5 643.9 839.7 1,802.3 8.92
Number of common shares issued 171,459,479 171,459,479 171,459,479 171,459,479 171,459,479 171,459,479 171,459,479 171,459,479 63,878,505 63,878,505 Number of employees 29,325 28,330 24,715 24,243 23,153 21,826 19,327 14,566 12,017 9,939
Selected Data and Ratios:Equity ratio (*4) (%) 19.1 20.9 22.1 23.4 24.1 20.2 20.7 22.0 22.4 29.8 Return on assets (*4) (%) 2.8 3.4 3.9 3.5 2.5 2.1 2.1 3.2 4.0 5.1 Return on equity (*4) (%) 7.3 7.0 6.8 11.8 8.5 2.3 8.9 4.2 2.2 6.9 Price earnings ratio (*4) (times) 19.3 21.6 23.2 9.2 14.1 51.0 14.0 17.5 42.5 15.8
(*3) Effective the fiscal year ended March 31, 2012, the Company has adopted ASBJ Statement No. 2 “Accounting Standard for Earnings per Share” (June 30, 2010), ASBJ Guidance No. 4 “Guidance on Accounting Standard for Earnings per Share” (June 30, 2010) and ASBJ PITF No. 9 “Practical Solution on Accounting for Earnings per Share” (June 30, 2010). In addition, the Company split one share of common stock into two shares on October 1, 2011 based on a resolution at the board of directors’ meeting held on August 27, 2011. In accordance with this adoption, equity per share, basic earnings per share and diluted earnings per share are calculated on the assumption that the two-for-one stock split of common stock was conducted at the beginning of the fiscal year ended March 31, 2011. Before the fiscal year ended March 31, 2010, each amount has been stated in compliance with previous accounting rules.
(*4) Equity ratio is the ratio of the sum of total shareholders’ equity and accumulated other comprehensive income to total assets at the period end. Return on assets is the ratio of operating income for the period to average of total assets during the period. Return on equity is the ratio of net income for the period to the average of the sum of total shareholders’ equity and accumulated other comprehensive income during the period. The price earnings ratio is the ratio of the closing price of the Company’s shares listed on the First Section of the Tokyo Stock Exchange on the last trading day in March of each year to the basic earnings per share.
(*5) Until 2016, yen amounts are rounded to the nearest million yen. Since 2017, yen amounts are rounded down to the nearest million yen.
Financial/Data Section
Ten-Year SummaryNipro Corporation and its Consolidated Subsidiaries Years ended March 31
29NIPRO Annual Report 2019
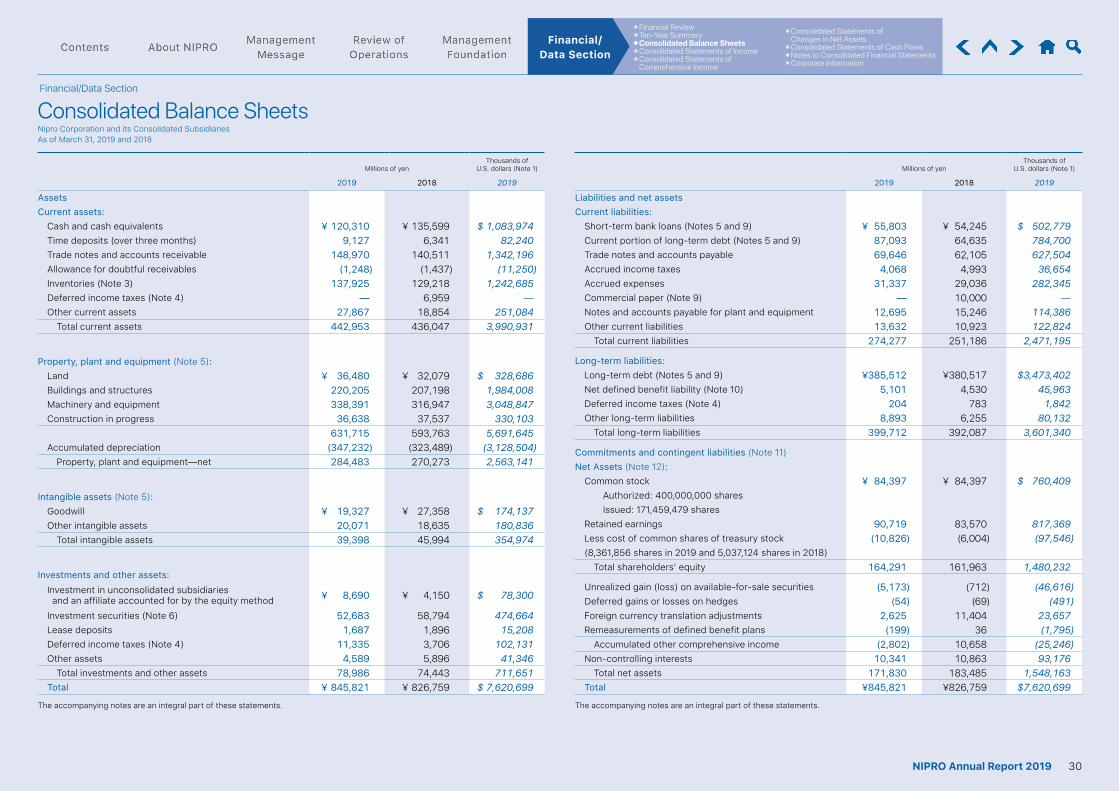
⦁ Financial Review⦁ Ten-Year Summary⦁ Consolidated Balance Sheets⦁ Consolidated Statements of Income⦁ Consolidated Statements of
Comprehensive Income
⦁ Consolidated Statements of Changes in Net Assets
⦁ Consolidated Statements of Cash Flows⦁ Notes to Consolidated Financial Statements⦁ Corporate Information
Financial/ Data Section
Millions of yenThousands of
U.S. dollars (Note 1)
2019 2018 2019
AssetsCurrent assets:
Cash and cash equivalents ¥ 120,310 ¥ 135,599 $ 1,083,974 Time deposits (over three months) 9,127 6,341 82,240 Trade notes and accounts receivable 148,970 140,511 1,342,196 Allowance for doubtful receivables (1,248) (1,437) (11,250)Inventories (Note 3) 137,925 129,218 1,242,685 Deferred income taxes (Note 4) — 6,959 — Other current assets 27,867 18,854 251,084
Total current assets 442,953 436,047 3,990,931
Property, plant and equipment (Note 5):Land ¥ 36,480 ¥ 32,079 $ 328,686 Buildings and structures 220,205 207,198 1,984,008 Machinery and equipment 338,391 316,947 3,048,847 Construction in progress 36,638 37,537 330,103
631,715 593,763 5,691,645 Accumulated depreciation (347,232) (323,489) (3,128,504)
Property, plant and equipment—net 284,483 270,273 2,563,141
Intangible assets (Note 5):Goodwill ¥ 19,327 ¥ 27,358 $ 174,137 Other intangible assets 20,071 18,635 180,836
Total intangible assets 39,398 45,994 354,974
Investments and other assets:Investment in unconsolidated subsidiaries and an affiliate accounted for by the equity method ¥ 8,690 ¥ 4,150 $ 78,300
Investment securities (Note 6) 52,683 58,794 474,664 Lease deposits 1,687 1,896 15,208 Deferred income taxes (Note 4) 11,335 3,706 102,131 Other assets 4,589 5,896 41,346
Total investments and other assets 78,986 74,443 711,651 Total ¥ 845,821 ¥ 826,759 $ 7,620,699
The accompanying notes are an integral part of these statements.
Millions of yenThousands of
U.S. dollars (Note 1)
2019 2018 2019
Liabilities and net assetsCurrent liabilities:
Short-term bank loans (Notes 5 and 9) ¥ 55,803 ¥ 54,245 $ 502,779 Current portion of long-term debt (Notes 5 and 9) 87,093 64,635 784,700 Trade notes and accounts payable 69,646 62,105 627,504 Accrued income taxes 4,068 4,993 36,654 Accrued expenses 31,337 29,036 282,345 Commercial paper (Note 9) — 10,000 — Notes and accounts payable for plant and equipment 12,695 15,246 114,386 Other current liabilities 13,632 10,923 122,824
Total current liabilities 274,277 251,186 2,471,195
Long-term liabilities:Long-term debt (Notes 5 and 9) ¥385,512 ¥380,517 $3,473,402 Net defined benefit liability (Note 10) 5,101 4,530 45,963 Deferred income taxes (Note 4) 204 783 1,842 Other long-term liabilities 8,893 6,255 80,132
Total long-term liabilities 399,712 392,087 3,601,340
Commitments and contingent liabilities (Note 11)Net Assets (Note 12):
Common stock ¥ 84,397 ¥ 84,397 $ 760,409 Authorized: 400,000,000 shares Issued: 171,459,479 shares
Retained earnings 90,719 83,570 817,369 Less cost of common shares of treasury stock (10,826) (6,004) (97,546)(8,361,856 shares in 2019 and 5,037,124 shares in 2018)
Total shareholders’ equity 164,291 161,963 1,480,232
Unrealized gain (loss) on available-for-sale securities (5,173) (712) (46,616)Deferred gains or losses on hedges (54) (69) (491)Foreign currency translation adjustments 2,625 11,404 23,657 Remeasurements of defined benefit plans (199) 36 (1,795)
Accumulated other comprehensive income (2,802) 10,658 (25,246)Non-controlling interests 10,341 10,863 93,176
Total net assets 171,830 183,485 1,548,163 Total ¥845,821 ¥826,759 $7,620,699
The accompanying notes are an integral part of these statements.
Financial/Data Section
Consolidated Balance SheetsNipro Corporation and its Consolidated Subsidiaries As of March 31, 2019 and 2018
30NIPRO Annual Report 2019
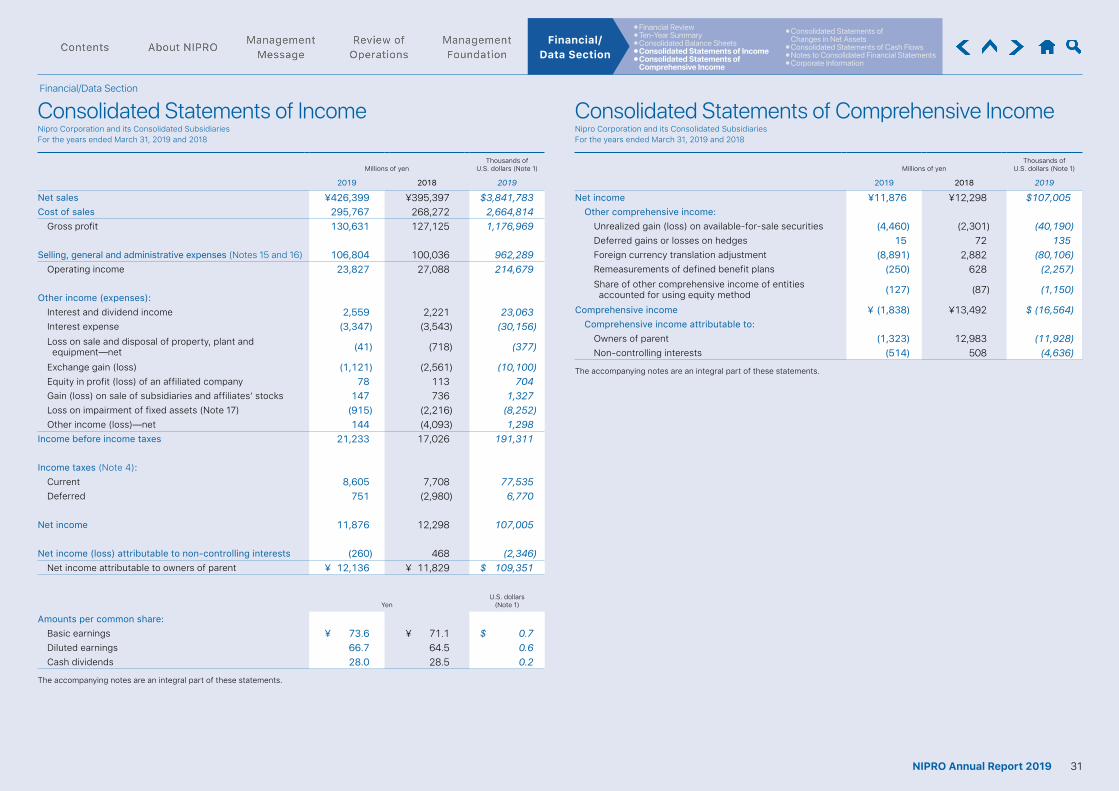
⦁ Financial Review⦁ Ten-Year Summary⦁ Consolidated Balance Sheets⦁ Consolidated Statements of Income⦁ Consolidated Statements of
Comprehensive Income
⦁ Consolidated Statements of Changes in Net Assets
⦁ Consolidated Statements of Cash Flows⦁ Notes to Consolidated Financial Statements⦁ Corporate Information
Financial/ Data Section
Millions of yenThousands of
U.S. dollars (Note 1)
2019 2018 2019
Net sales ¥426,399 ¥395,397 $3,841,783 Cost of sales 295,767 268,272 2,664,814
Gross profit 130,631 127,125 1,176,969
Selling, general and administrative expenses (Notes 15 and 16) 106,804 100,036 962,289 Operating income 23,827 27,088 214,679
Other income (expenses):Interest and dividend income 2,559 2,221 23,063 Interest expense (3,347) (3,543) (30,156)Loss on sale and disposal of property, plant and equipment—net (41) (718) (377)
Exchange gain (loss) (1,121) (2,561) (10,100)Equity in profit (loss) of an affiliated company 78 113 704 Gain (loss) on sale of subsidiaries and affiliates’ stocks 147 736 1,327 Loss on impairment of fixed assets (Note 17) (915) (2,216) (8,252)Other income (loss)—net 144 (4,093) 1,298
Income before income taxes 21,233 17,026 191,311
Income taxes (Note 4):Current 8,605 7,708 77,535 Deferred 751 (2,980) 6,770
Net income 11,876 12,298 107,005
Net income (loss) attributable to non-controlling interests (260) 468 (2,346)Net income attributable to owners of parent ¥ 12,136 ¥ 11,829 $ 109,351
YenU.S. dollars
(Note 1)
Amounts per common share:Basic earnings ¥ 73.6 ¥ 71.1 $ 0.7Diluted earnings 66.7 64.5 0.6Cash dividends 28.0 28.5 0.2
The accompanying notes are an integral part of these statements.
Millions of yenThousands of
U.S. dollars (Note 1)
2019 2018 2019
Net income ¥11,876 ¥12,298 $107,005 Other comprehensive income:
Unrealized gain (loss) on available-for-sale securities (4,460) (2,301) (40,190)Deferred gains or losses on hedges 15 72 135 Foreign currency translation adjustment (8,891) 2,882 (80,106)Remeasurements of defined benefit plans (250) 628 (2,257)Share of other comprehensive income of entities accounted for using equity method (127) (87) (1,150)
Comprehensive income ¥ (1,838) ¥13,492 $ (16,564)Comprehensive income attributable to:
Owners of parent (1,323) 12,983 (11,928)Non-controlling interests (514) 508 (4,636)
The accompanying notes are an integral part of these statements.
Financial/Data Section
Consolidated Statements of IncomeNipro Corporation and its Consolidated Subsidiaries For the years ended March 31, 2019 and 2018
Consolidated Statements of Comprehensive IncomeNipro Corporation and its Consolidated Subsidiaries For the years ended March 31, 2019 and 2018
31NIPRO Annual Report 2019
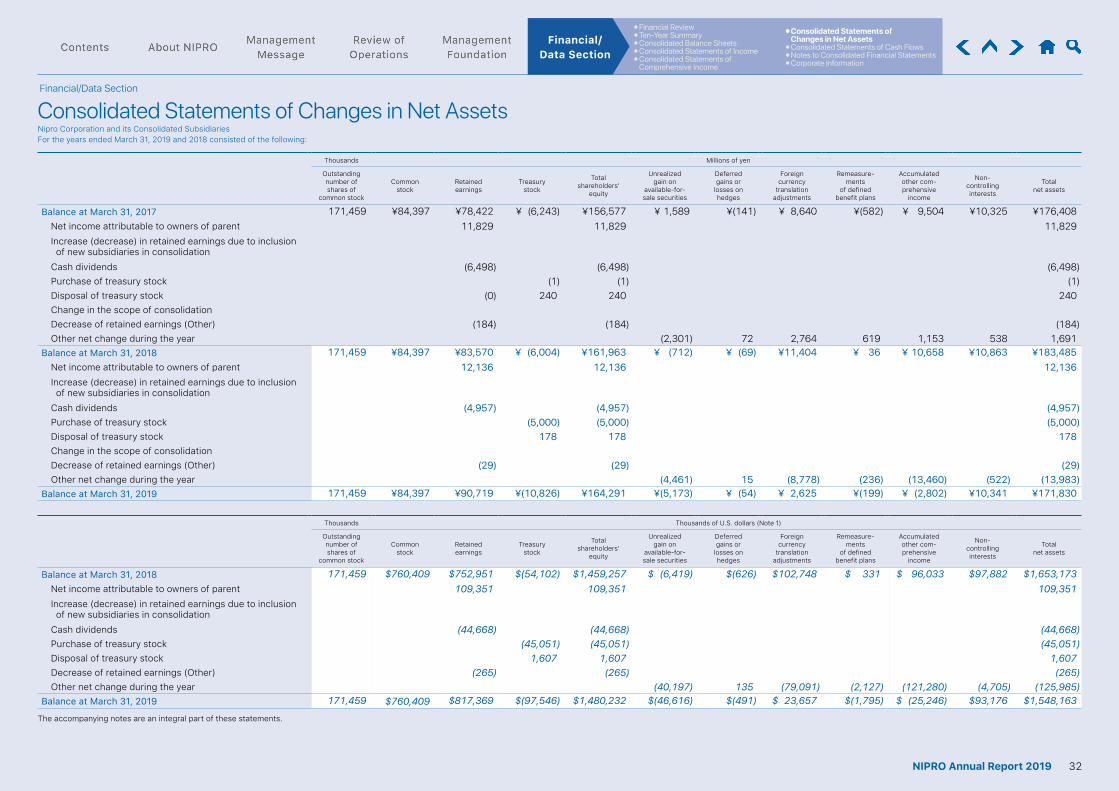
⦁ Financial Review⦁ Ten-Year Summary⦁ Consolidated Balance Sheets⦁ Consolidated Statements of Income⦁ Consolidated Statements of
Comprehensive Income
⦁ Consolidated Statements of Changes in Net Assets
⦁ Consolidated Statements of Cash Flows⦁ Notes to Consolidated Financial Statements⦁ Corporate Information
Financial/ Data Section
Thousands Millions of yen
Outstanding number of shares of
common stock
Commonstock
Retainedearnings
Treasurystock
Total shareholders’
equity
Unrealized gain on
available-for-sale securities
Deferred gains or
losses on hedges
Foreign currency
translation adjustments
Remeasure- ments
of defined benefit plans
Accumulated other com-prehensive
income
Non- controllinginterests
Totalnet assets
Balance at March 31, 2017 171,459 ¥84,397 ¥78,422 ¥ (6,243) ¥156,577 ¥ 1,589 ¥(141) ¥ 8,640 ¥(582) ¥ 9,504 ¥10,325 ¥176,408Net income attributable to owners of parent 11,829 11,829 11,829Increase (decrease) in retained earnings due to inclusion of new subsidiaries in consolidation Cash dividends (6,498) (6,498) (6,498)Purchase of treasury stock (1) (1) (1)Disposal of treasury stock (0) 240 240 240Change in the scope of consolidationDecrease of retained earnings (Other) (184) (184) (184)Other net change during the year (2,301) 72 2,764 619 1,153 538 1,691
Balance at March 31, 2018 171,459 ¥84,397 ¥83,570 ¥ (6,004) ¥161,963 ¥ (712) ¥ (69) ¥11,404 ¥ 36 ¥ 10,658 ¥10,863 ¥183,485Net income attributable to owners of parent 12,136 12,136 12,136Increase (decrease) in retained earnings due to inclusion of new subsidiaries in consolidation Cash dividends (4,957) (4,957) (4,957)Purchase of treasury stock (5,000) (5,000) (5,000)Disposal of treasury stock 178 178 178Change in the scope of consolidationDecrease of retained earnings (Other) (29) (29) (29)Other net change during the year (4,461) 15 (8,778) (236) (13,460) (522) (13,983)
Balance at March 31, 2019 171,459 ¥84,397 ¥90,719 ¥(10,826) ¥164,291 ¥(5,173) ¥ (54) ¥ 2,625 ¥(199) ¥ (2,802) ¥10,341 ¥171,830
Thousands Thousands of U.S. dollars (Note 1)
Outstanding number of shares of
common stock
Commonstock
Retainedearnings
Treasurystock
Total shareholders’
equity
Unrealized gain on
available-for-sale securities
Deferred gains or
losses on hedges
Foreign currency
translation adjustments
Remeasure- ments
of defined benefit plans
Accumulated other com-prehensive
income
Non- controllinginterests
Totalnet assets
Balance at March 31, 2018 171,459 $760,409 $752,951 $(54,102) $1,459,257 $ (6,419) $(626) $102,748 $ 331 $ 96,033 $97,882 $1,653,173Net income attributable to owners of parent 109,351 109,351 109,351Increase (decrease) in retained earnings due to inclusion of new subsidiaries in consolidation Cash dividends (44,668) (44,668) (44,668)Purchase of treasury stock (45,051) (45,051) (45,051)Disposal of treasury stock 1,607 1,607 1,607Decrease of retained earnings (Other) (265) (265) (265)Other net change during the year (40,197) 135 (79,091) (2,127) (121,280) (4,705) (125,985)
Balance at March 31, 2019 171,459 $760,409 $817,369 $(97,546) $1,480,232 $(46,616) $(491) $ 23,657 $(1,795) $ (25,246) $93,176 $1,548,163
The accompanying notes are an integral part of these statements.
Financial/Data Section
Consolidated Statements of Changes in Net AssetsNipro Corporation and its Consolidated Subsidiaries For the years ended March 31, 2019 and 2018 consisted of the following:
32NIPRO Annual Report 2019
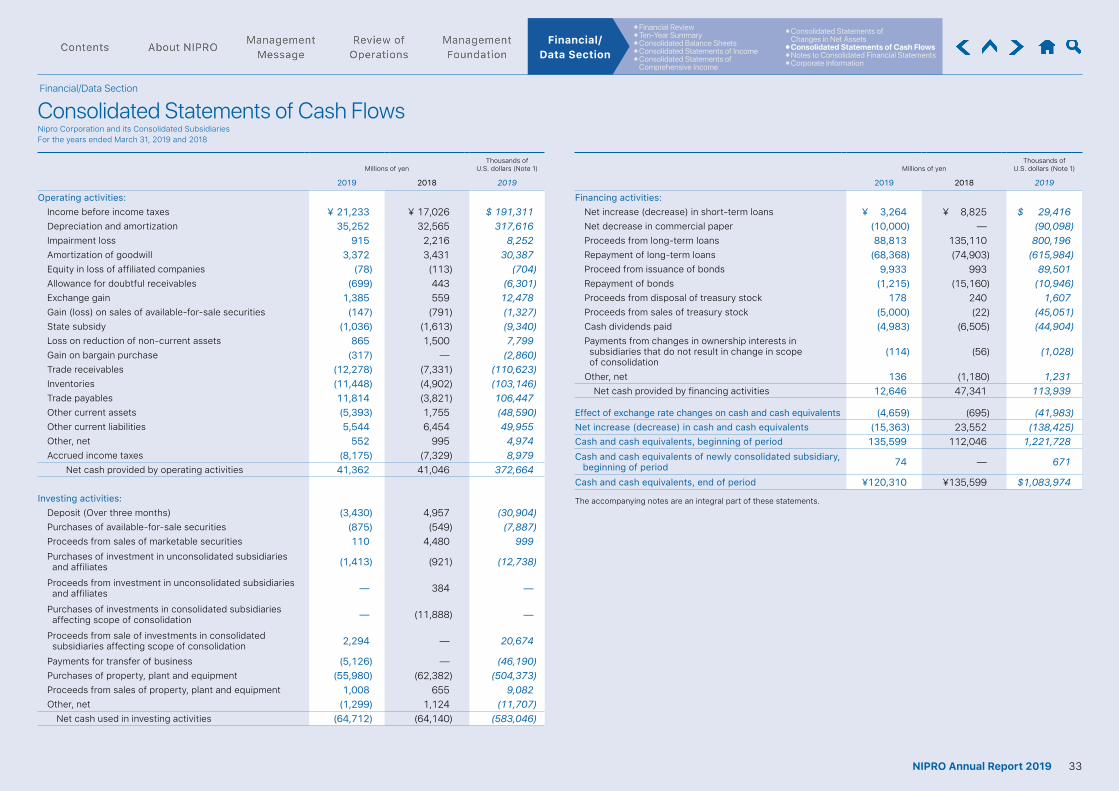
⦁ Financial Review⦁ Ten-Year Summary⦁ Consolidated Balance Sheets⦁ Consolidated Statements of Income⦁ Consolidated Statements of
Comprehensive Income
⦁ Consolidated Statements of Changes in Net Assets
⦁ Consolidated Statements of Cash Flows⦁ Notes to Consolidated Financial Statements⦁ Corporate Information
Financial/ Data Section
Millions of yenThousands of
U.S. dollars (Note 1)
2019 2018 2019
Operating activities:Income before income taxes ¥ 21,233 ¥ 17,026 $ 191,311Depreciation and amortization 35,252 32,565 317,616Impairment loss 915 2,216 8,252Amortization of goodwill 3,372 3,431 30,387Equity in loss of affiliated companies (78) (113) (704)Allowance for doubtful receivables (699) 443 (6,301)Exchange gain 1,385 559 12,478Gain (loss) on sales of available-for-sale securities (147) (791) (1,327)State subsidy (1,036) (1,613) (9,340)Loss on reduction of non-current assets 865 1,500 7,799Gain on bargain purchase (317) — (2,860)Trade receivables (12,278) (7,331) (110,623)Inventories (11,448) (4,902) (103,146)Trade payables 11,814 (3,821) 106,447Other current assets (5,393) 1,755 (48,590)Other current liabilities 5,544 6,454 49,955Other, net 552 995 4,974Accrued income taxes (8,175) (7,329) 8,979
Net cash provided by operating activities 41,362 41,046 372,664
Investing activities:Deposit (Over three months) (3,430) 4,957 (30,904)Purchases of available-for-sale securities (875) (549) (7,887)Proceeds from sales of marketable securities 110 4,480 999Purchases of investment in unconsolidated subsidiaries and affiliates (1,413) (921) (12,738)
Proceeds from investment in unconsolidated subsidiaries and affiliates — 384 —
Purchases of investments in consolidated subsidiaries affecting scope of consolidation — (11,888) —
Proceeds from sale of investments in consolidated subsidiaries affecting scope of consolidation 2,294 — 20,674
Payments for transfer of business (5,126) — (46,190)Purchases of property, plant and equipment (55,980) (62,382) (504,373)Proceeds from sales of property, plant and equipment 1,008 655 9,082Other, net (1,299) 1,124 (11,707)
Net cash used in investing activities (64,712) (64,140) (583,046)
Millions of yenThousands of
U.S. dollars (Note 1)
2019 2018 2019
Financing activities:Net increase (decrease) in short-term loans ¥ 3,264 ¥ 8,825 $ 29,416Net decrease in commercial paper (10,000) — (90,098)Proceeds from long-term loans 88,813 135,110 800,196Repayment of long-term loans (68,368) (74,903) (615,984)Proceed from issuance of bonds 9,933 993 89,501Repayment of bonds (1,215) (15,160) (10,946)Proceeds from disposal of treasury stock 178 240 1,607Proceeds from sales of treasury stock (5,000) (22) (45,051)Cash dividends paid (4,983) (6,505) (44,904)Payments from changes in ownership interests in subsidiaries that do not result in change in scope of consolidation
(114) (56) (1,028)
Other, net 136 (1,180) 1,231Net cash provided by financing activities 12,646 47,341 113,939
Effect of exchange rate changes on cash and cash equivalents (4,659) (695) (41,983)Net increase (decrease) in cash and cash equivalents (15,363) 23,552 (138,425)Cash and cash equivalents, beginning of period 135,599 112,046 1,221,728Cash and cash equivalents of newly consolidated subsidiary, beginning of period 74 — 671
Cash and cash equivalents, end of period ¥120,310 ¥135,599 $1,083,974
The accompanying notes are an integral part of these statements.
Financial/Data Section
Consolidated Statements of Cash FlowsNipro Corporation and its Consolidated Subsidiaries For the years ended March 31, 2019 and 2018
33NIPRO Annual Report 2019
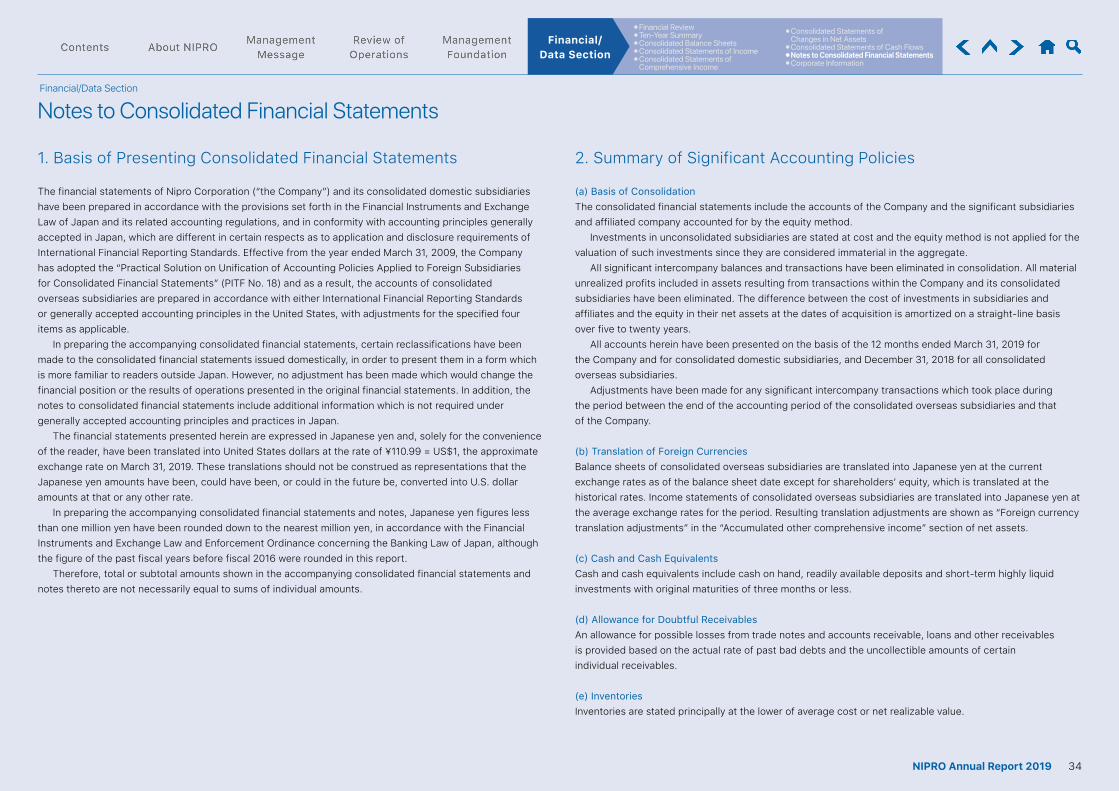
⦁ Financial Review⦁ Ten-Year Summary⦁ Consolidated Balance Sheets⦁ Consolidated Statements of Income⦁ Consolidated Statements of
Comprehensive Income
⦁ Consolidated Statements of Changes in Net Assets
⦁ Consolidated Statements of Cash Flows⦁ Notes to Consolidated Financial Statements⦁ Corporate Information
Financial/ Data Section
1. Basis of Presenting Consolidated Financial Statements
The financial statements of Nipro Corporation (“the Company”) and its consolidated domestic subsidiaries have been prepared in accordance with the provisions set forth in the Financial Instruments and Exchange Law of Japan and its related accounting regulations, and in conformity with accounting principles generally accepted in Japan, which are different in certain respects as to application and disclosure requirements of International Financial Reporting Standards. Effective from the year ended March 31, 2009, the Company has adopted the “Practical Solution on Unification of Accounting Policies Applied to Foreign Subsidiaries for Consolidated Financial Statements” (PITF No. 18) and as a result, the accounts of consolidated overseas subsidiaries are prepared in accordance with either International Financial Reporting Standards or generally accepted accounting principles in the United States, with adjustments for the specified four items as applicable. In preparing the accompanying consolidated financial statements, certain reclassifications have been made to the consolidated financial statements issued domestically, in order to present them in a form which is more familiar to readers outside Japan. However, no adjustment has been made which would change the financial position or the results of operations presented in the original financial statements. In addition, the notes to consolidated financial statements include additional information which is not required under generally accepted accounting principles and practices in Japan. The financial statements presented herein are expressed in Japanese yen and, solely for the convenience of the reader, have been translated into United States dollars at the rate of ¥110.99 = US$1, the approximate exchange rate on March 31, 2019. These translations should not be construed as representations that the Japanese yen amounts have been, could have been, or could in the future be, converted into U.S. dollar amounts at that or any other rate. In preparing the accompanying consolidated financial statements and notes, Japanese yen figures less than one million yen have been rounded down to the nearest million yen, in accordance with the Financial Instruments and Exchange Law and Enforcement Ordinance concerning the Banking Law of Japan, although the figure of the past fiscal years before fiscal 2016 were rounded in this report. Therefore, total or subtotal amounts shown in the accompanying consolidated financial statements and notes thereto are not necessarily equal to sums of individual amounts.
2. Summary of Significant Accounting Policies
(a) Basis of ConsolidationThe consolidated financial statements include the accounts of the Company and the significant subsidiaries and affiliated company accounted for by the equity method. Investments in unconsolidated subsidiaries are stated at cost and the equity method is not applied for the valuation of such investments since they are considered immaterial in the aggregate. All significant intercompany balances and transactions have been eliminated in consolidation. All material unrealized profits included in assets resulting from transactions within the Company and its consolidated subsidiaries have been eliminated. The difference between the cost of investments in subsidiaries and affiliates and the equity in their net assets at the dates of acquisition is amortized on a straight-line basis over five to twenty years. All accounts herein have been presented on the basis of the 12 months ended March 31, 2019 for the Company and for consolidated domestic subsidiaries, and December 31, 2018 for all consolidated overseas subsidiaries. Adjustments have been made for any significant intercompany transactions which took place during the period between the end of the accounting period of the consolidated overseas subsidiaries and that of the Company.
(b) Translation of Foreign CurrenciesBalance sheets of consolidated overseas subsidiaries are translated into Japanese yen at the current exchange rates as of the balance sheet date except for shareholders’ equity, which is translated at the historical rates. Income statements of consolidated overseas subsidiaries are translated into Japanese yen at the average exchange rates for the period. Resulting translation adjustments are shown as “Foreign currency translation adjustments” in the “Accumulated other comprehensive income” section of net assets.
(c) Cash and Cash EquivalentsCash and cash equivalents include cash on hand, readily available deposits and short-term highly liquid investments with original maturities of three months or less.
(d) Allowance for Doubtful ReceivablesAn allowance for possible losses from trade notes and accounts receivable, loans and other receivables is provided based on the actual rate of past bad debts and the uncollectible amounts of certain individual receivables.
(e) InventoriesInventories are stated principally at the lower of average cost or net realizable value.
Financial/Data Section
Notes to Consolidated Financial Statements
34NIPRO Annual Report 2019
⦁ Financial Review⦁ Ten-Year Summary⦁ Consolidated Balance Sheets⦁ Consolidated Statements of Income⦁ Consolidated Statements of
Comprehensive Income
⦁ Consolidated Statements of Changes in Net Assets
⦁ Consolidated Statements of Cash Flows⦁ Notes to Consolidated Financial Statements⦁ Corporate Information
Financial/ Data Section
Financial/Data Section
Notes to Consolidated Financial Statements
(f) Property, Plant and EquipmentDepreciation of property, plant and equipment of the Company and its consolidated domestic subsidiaries is computed principally by the declining-balance method. The straight-line method is applied to buildings acquired by the domestic companies after April 1, 1998 and buildings and accompanying facilities and structures acquired by the domestic companies after APR 1, 2016, and is principally applied to the property, plant and equipment of consolidated overseas subsidiaries.
(g) Intangible AssetsAmortization of intangible assets, including software for the Company’s own use, is computed by the straight-line method over the estimated useful life of the asset. Goodwill is amortized on a straight-line basis over the period the Company benefits from its use. If the amount is not significant, it is expensed when incurred.
(h) Investment SecuritiesInvestment securities are classified and accounted for, depending on management’s intent, as follows: i) held-to-maturity debt securities, which are expected to be held to maturity with the positive intent and
ability to hold to maturity are stated at amortized cost. ii) available-for-sale securities, which are not classified as the aforementioned securities, are stated at fair
value. Unrealized gains and losses, net of applicable taxes, are reported as “Accumulated other comprehensive income” of net assets.
Non-marketable available-for-sale securities are stated at cost determined by the average method. For other-than-temporary declines in fair value, investment securities are reduced to net realizable value by a charge to income.
(i) Allowance for Loss on Clearance of BusinessThe Company has withdrawn from retail business and a provision for anticipated losses of sales of related fixed assets is provided.
(j) Employees’ Retirement and Severance BenefitsMethod of Attributing Expected Benefit to PeriodsIn calculating retirement benefit obligation, the estimated amount of retirement benefit is attributed to the periods on the benefit formula basis.
Accounting Method of Actuarial Gains and Losses and Prior Service CostsPrior service costs are amortized on the straight-line basis over a certain period (mainly 5 years) which is within the average of the estimated remaining service years of the employees when they occur. Actuarial gains and losses are amortized on the straight-line basis over a certain period (mainly 5 years) which is within the average of the estimated remaining service years of the employees commencing from the following year in which they arise. Some consolidated subsidiaries amortize its actuarial gains and losses all at once in the fiscal year in which they arise.
(k) DerivativesDerivatives are stated at fair value, with changes in fair value included in net income or loss for the period in which they arise, unless derivatives are used for hedging purposes. Please see (m) Hedge Accounting below.
(l) LeasesFinance leases, except for certain immaterial leases, are capitalized in the balance sheet. Amortization of finance lease assets is calculated by the straight-line method over the lease period assuming no residual value. The Company and its consolidated domestic subsidiaries account for certain finance leases as operating leases, which do not transfer ownership to the lessee and existed prior to April 1, 2008. The information of such leases on an “as if capitalized” basis is presented in Note 7. “Leases”.
(m) Hedge Accounting<Method of hedge accounting>
The deferral hedge accounting method is applied in principle. The allocation method is applied to currency swaps and the exceptional accounting method is applied to interest rate swaps when certain hedging criteria are met.
<Hedge instrument and hedge items> (Hedging instruments) (Hedged items) Interest rate swap Interest on short-term and long-term debt<Hedge policy>
The Company uses interest rate swaps to reduce interest volatility risk.<Method for assessing hedge effectiveness>
Hedge effectiveness is not assessed when substantial items and conditions of hedging instruments and the hedged transactions are the same, and is not assessed when cash flow can be completely offset for whole hedge period.
35NIPRO Annual Report 2019
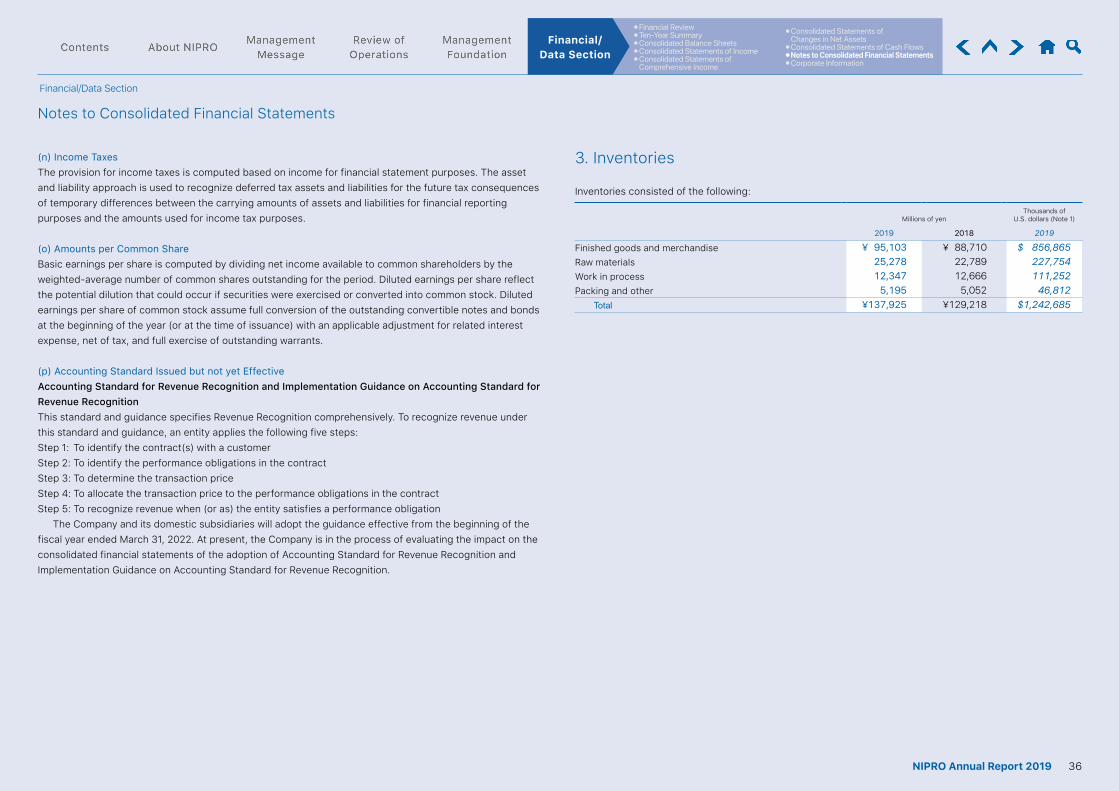
⦁ Financial Review⦁ Ten-Year Summary⦁ Consolidated Balance Sheets⦁ Consolidated Statements of Income⦁ Consolidated Statements of
Comprehensive Income
⦁ Consolidated Statements of Changes in Net Assets
⦁ Consolidated Statements of Cash Flows⦁ Notes to Consolidated Financial Statements⦁ Corporate Information
Financial/ Data Section
Financial/Data Section
Notes to Consolidated Financial Statements
3. Inventories(n) Income TaxesThe provision for income taxes is computed based on income for financial statement purposes. The asset and liability approach is used to recognize deferred tax assets and liabilities for the future tax consequences of temporary differences between the carrying amounts of assets and liabilities for financial reporting purposes and the amounts used for income tax purposes.
(o) Amounts per Common ShareBasic earnings per share is computed by dividing net income available to common shareholders by the weighted-average number of common shares outstanding for the period. Diluted earnings per share reflect the potential dilution that could occur if securities were exercised or converted into common stock. Diluted earnings per share of common stock assume full conversion of the outstanding convertible notes and bonds at the beginning of the year (or at the time of issuance) with an applicable adjustment for related interest expense, net of tax, and full exercise of outstanding warrants.
(p) Accounting Standard Issued but not yet EffectiveAccounting Standard for Revenue Recognition and Implementation Guidance on Accounting Standard for Revenue RecognitionThis standard and guidance specifies Revenue Recognition comprehensively. To recognize revenue under this standard and guidance, an entity applies the following five steps:Step 1: To identify the contract(s) with a customerStep 2: To identify the performance obligations in the contractStep 3: To determine the transaction priceStep 4: To allocate the transaction price to the performance obligations in the contractStep 5: To recognize revenue when (or as) the entity satisfies a performance obligation The Company and its domestic subsidiaries will adopt the guidance effective from the beginning of the fiscal year ended March 31, 2022. At present, the Company is in the process of evaluating the impact on the consolidated financial statements of the adoption of Accounting Standard for Revenue Recognition and Implementation Guidance on Accounting Standard for Revenue Recognition.
Inventories consisted of the following:
Millions of yenThousands of
U.S. dollars (Note 1)
2019 2018 2019
Finished goods and merchandise ¥ 95,103 ¥ 88,710 $ 856,865Raw materials 25,278 22,789 227,754Work in process 12,347 12,666 111,252Packing and other 5,195 5,052 46,812
Total ¥137,925 ¥129,218 $1,242,685
36NIPRO Annual Report 2019

⦁ Financial Review⦁ Ten-Year Summary⦁ Consolidated Balance Sheets⦁ Consolidated Statements of Income⦁ Consolidated Statements of
Comprehensive Income
⦁ Consolidated Statements of Changes in Net Assets
⦁ Consolidated Statements of Cash Flows⦁ Notes to Consolidated Financial Statements⦁ Corporate Information
Financial/ Data Section
Financial/Data Section
Notes to Consolidated Financial Statements
4. Income Taxes
The Company and its domestic subsidiaries are subject to several taxes based on income which, in aggregate, resulted in a normal statutory tax rate of approximately 30.6% and 30.8% for the years ended March 31, 2019 and 2018. The significant components of deferred tax assets and liabilities were as follows:
Millions of yenThousands of
U.S. dollars (Note 1)
2019 2018 2019
Deferred tax assetsTax loss carryforwards ¥ 10,898 ¥ 8,323 $ 98,196Intercompany profits 2,037 2,242 18,355Valuation loss on inventories 1,237 897 11,150Allowance for bonuses to employees 1,234 1,197 11,119Sales allowance 341 327 3,073Loss on impairment of fixed assets 395 184 3,564Excess of allowance for doubtful accounts over tax allowable amounts 1,272 1,801 11,464
Net defined benefit liability 1,366 1,275 12,313Accrued enterprise taxes 426 400 3,846Unrealized loss on available-for-sale securities 2,857 787 25,746Goodwill 54 242 495Loss on liquidation of business 257 283 2,315Other 4,045 3,752 36,452
Gross deferred tax assets 26,426 21,716 238,096Less: Valuation allowance for the Net Operating Loss Carry Forwards (*2) (8,173) — (73,640)
Less: Valuation allowance for the deductible temporary differences (3,464) — (31,213)
Total Less: Valuation allowance (*1) (11,637) (9,086) (104,853)Total deferred tax assets 14,788 12,630 133,242
Deferred tax liabilitiesUnrealized gain on available-for-sale securities 450 350 4,061Revaluation reserve for land 783 675 7,058Revaluation reserve for intangible assets — 2 —Revaluation reserve for fixed assets—other 687 1,068 6,198Retained earnings on foreign subsidiaries 551 51 4,966Other 1,184 599 10,669
Total deferred tax liabilities 3,657 2,748 32,953Net deferred tax assets (liabilities) (*1) ¥ 11,131 ¥ 9,881 $ 100,289
(*1) In fiscal year ended in 2018, March, Valuation allowance was increased by ¥2,551 million. The main reason of this increase is that Valuation allowance for the Net Operating Loss Carry Forwards was increased by ¥3,059 million (US$27,565 thousand) in Goodman Co., Ltd.
(*2) Balance of the deferred tax assets on the Net Operating Loss Carry Forwards by the expiration year.
Millions of yen
2018
Within 1 year
Over 1 yearwithin
2 years
Over 2 yearswithin
3 years
Over 3 yearswithin
4 years
Over 4 yearswithin
5 yearsOver 5 years Total
Net Operating Loss Carry Forwards (*A) ¥ 451 ¥ 550 ¥ 800 ¥1,191 ¥ 757 ¥ 7,147 ¥10,898
Valuation allowance (306) (334) (402) (704) (525) (5,899) (8,173)Deferred Tax Asset 144 216 398 486 231 1,247 2,725(*B)
Thousands of U.S. dollars (Note 1)
2018
Within 1 year
Over 1 yearwithin
2 years
Over 2 yearswithin
3 years
Over 3 yearswithin
4 years
Over 4 yearswithin
5 yearsOver 5 years Total
Net Operating Loss Carry Forwards $ 4,064 $ 4,959 $ 7,215 $10,732 $ 6,824 $ 64,399 $ 98,196
Valuation allowance (2,760) (3,011) (3,623) (6,349) (4,737) (53,157) (73,640)Deferred Tax Asset 1,303 1,948 3,592 4,383 2,086 11,242 24,556
(*A) Each Net Operating Loss Carry Forwards amount is multiplied by Statutory tax rate.(*B) We recorded ¥2,725 million (US$24,556 thousand) Deferred Tax Asset for ¥10,898 million (US$98,196 thousand) Net Operating
Loss Carry Forwards (multiplied by Statutory tax rate). This Deferred Tax Asset is mainly recognized for the balance of Net Operating Loss Carry Forwards in PT. NIPRO INDONESIA JAYA (multiplied by Statutory tax rate). We have not recognized Valuation allowance for this Net Operating Loss Carry Forwards because we assessed this amount is collectable as a result of tax scheduling.
Reconciliation of the differences between the statutory tax rates and the effective income tax rates was as follows:
2019 2018
Statutory tax rate 30.6% 30.8%Expenses not deductible for tax purposes 1.8 2.5Non-taxable dividend income (1.2) (1.3)Effect of tax rate change — 2.0Amortization of goodwill 3.0 6.3Tax credits primarily for research and development costs (4.3) (7.5)Valuation allowance 3.0 (9.1)Retained earnings on foreign subsidiaries 2.4 (0.6)Unrealized Gain 4.5 0.4Other 4.3 4.3
Effective income tax rate 44.1% 27.8%
37NIPRO Annual Report 2019
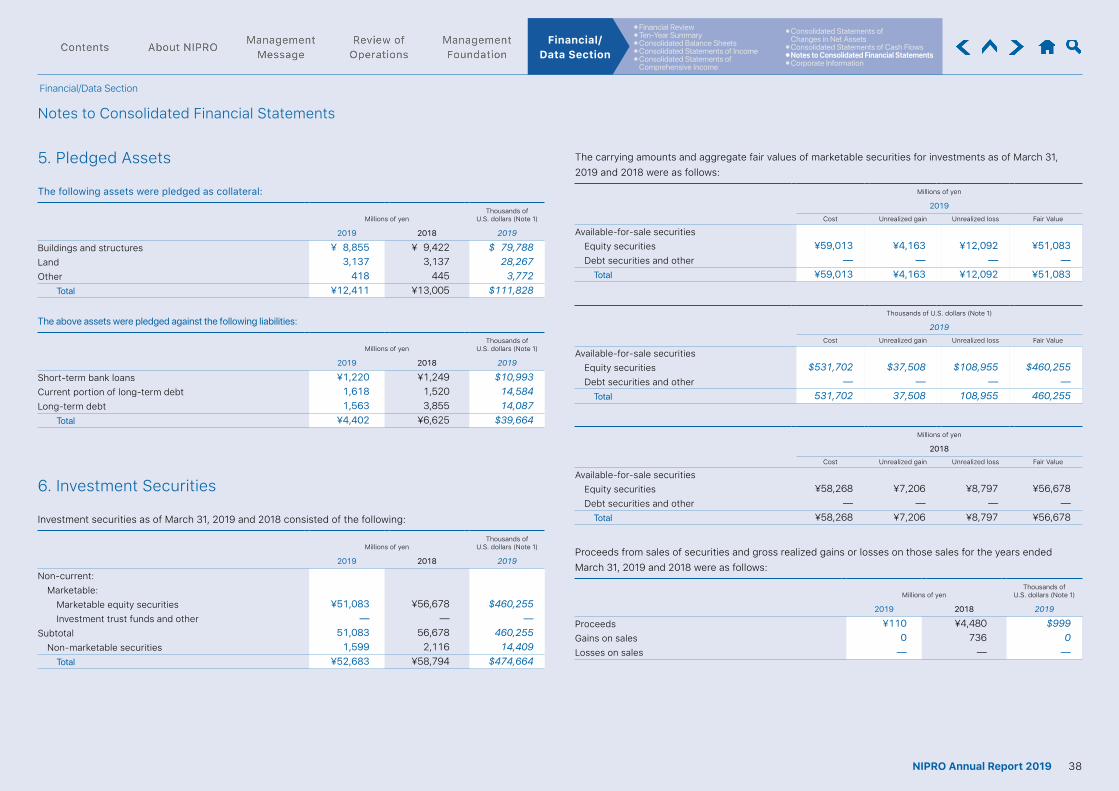
⦁ Financial Review⦁ Ten-Year Summary⦁ Consolidated Balance Sheets⦁ Consolidated Statements of Income⦁ Consolidated Statements of
Comprehensive Income
⦁ Consolidated Statements of Changes in Net Assets
⦁ Consolidated Statements of Cash Flows⦁ Notes to Consolidated Financial Statements⦁ Corporate Information
Financial/ Data Section
Financial/Data Section
Notes to Consolidated Financial Statements
5. Pledged Assets
The following assets were pledged as collateral:
Millions of yenThousands of
U.S. dollars (Note 1)
2019 2018 2019
Buildings and structures ¥ 8,855 ¥ 9,422 $ 79,788Land 3,137 3,137 28,267Other 418 445 3,772
Total ¥12,411 ¥13,005 $111,828
The above assets were pledged against the following liabilities:
Millions of yenThousands of
U.S. dollars (Note 1)
2019 2018 2019
Short-term bank loans ¥1,220 ¥1,249 $10,993Current portion of long-term debt 1,618 1,520 14,584Long-term debt 1,563 3,855 14,087
Total ¥4,402 ¥6,625 $39,664
6. Investment Securities
Investment securities as of March 31, 2019 and 2018 consisted of the following:
Millions of yenThousands of
U.S. dollars (Note 1)
2019 2018 2019
Non-current:Marketable:
Marketable equity securities ¥51,083 ¥56,678 $460,255Investment trust funds and other — — —
Subtotal 51,083 56,678 460,255Non-marketable securities 1,599 2,116 14,409
Total ¥52,683 ¥58,794 $474,664
The carrying amounts and aggregate fair values of marketable securities for investments as of March 31, 2019 and 2018 were as follows:
Millions of yen
2019Cost Unrealized gain Unrealized loss Fair Value
Available-for-sale securitiesEquity securities ¥59,013 ¥4,163 ¥12,092 ¥51,083Debt securities and other — — — —
Total ¥59,013 ¥4,163 ¥12,092 ¥51,083
Thousands of U.S. dollars (Note 1)
2019Cost Unrealized gain Unrealized loss Fair Value
Available-for-sale securitiesEquity securities $531,702 $37,508 $108,955 $460,255Debt securities and other — — — —
Total 531,702 37,508 108,955 460,255
Millions of yen
2018Cost Unrealized gain Unrealized loss Fair Value
Available-for-sale securitiesEquity securities ¥58,268 ¥7,206 ¥8,797 ¥56,678Debt securities and other — — — —
Total ¥58,268 ¥7,206 ¥8,797 ¥56,678
Proceeds from sales of securities and gross realized gains or losses on those sales for the years ended March 31, 2019 and 2018 were as follows:
Millions of yenThousands of
U.S. dollars (Note 1)
2019 2018 2019
Proceeds ¥110 ¥4,480 $999Gains on sales 0 736 0Losses on sales — — —
38NIPRO Annual Report 2019

⦁ Financial Review⦁ Ten-Year Summary⦁ Consolidated Balance Sheets⦁ Consolidated Statements of Income⦁ Consolidated Statements of
Comprehensive Income
⦁ Consolidated Statements of Changes in Net Assets
⦁ Consolidated Statements of Cash Flows⦁ Notes to Consolidated Financial Statements⦁ Corporate Information
Financial/ Data Section
Financial/Data Section
Notes to Consolidated Financial Statements
7. Financial Instruments
(1) Circumstances on financial instruments(a) Policy for financial instrumentsThe Company and its consolidated subsidiaries manage the temporary surplus funds by deposits with banks that have a high level of safety. Based on capital investment planning and financing planning, the Company and its consolidated subsidiaries raise funds for business operation with bank loans, commercial paper, corporate bonds, and issuing convertible bond-type corporate bonds with warrant of booking new stocks. The Company and its consolidated subsidiaries enter into derivative transactions for the purpose of reducing funding costs and hedging their exposures to foreign exchange fluctuations and interest rate fluctuations, but not for speculative purposes.
(b) Details and risk of financial instruments and its risk managementReceivables such as trade notes and accounts receivable are exposed to customer’s credit risk. Receivables denominated in foreign currencies are exposed to the market risk of fluctuation in foreign currency exchange rates. In order to reduce the customer’s risk, the Company monitors the dues and balances by customer in accordance with the Company’s credit administration regulations. Investment securities are exposed to market fluctuation risk, but mainly consist of equity of the companies which conduct business with the Company. The Company periodically reviews the market price of such securities. Payables such as trade notes, accounts payable and accounts payable other are due within 1 year. Payables denominated in foreign currency are exposed to the risk of fluctuation in foreign currency exchange rates. Short-term loans payable are mainly borrowed to raise operating capital and long-terms loans payable are mainly borrowed to make capital expenditures. A part of long-term loans with the floating interest rate has the risk of interest rate fluctuation, but the Company and its consolidated subsidiaries use interest rate swaps to solidify the interest rate. For some of the loans denominated in foreign currency, the Company and its consolidated subsidiaries use currency swaps to hedge the currency fluctuation risk. Bonds and commercial paper are mainly issued to raise the funds for the retirement of bonds. Lease obligations are mainly for capital expenditures, free from interest-rate risk because the interest rate is fixed. Payables, loans and bonds are exposed to liquidity risk, but the Company and its consolidated subsidiaries manage the risk by establishing cash planning. Regarding derivatives, the Company enters into forward exchange contracts to hedge against the risk of fluctuations in foreign currency exchange rates associated with trade receivables and payables denominated
in foreign currencies, interest rate swaps to hedge against the risk of fluctuations in interest rates associated with loans payable, and currency swaps to hedge against the risk of foreign exchange rate fluctuations. For more information on the use of hedge accounting, including hedging instruments, hedged items, the hedging policy, and the method for assessment of hedge effectiveness, please refer to “2. Summary of Significant Accounting Policies” (m) Hedge Accounting. As the Company manages its exposure to credit risk by limiting its funding to high-credit rating financial institutions, the Company recognizes that the exposure to credit risk is extremely low. The Company executes and manages derivative transactions under the corporate derivative management policy, which prescribes the authority and limitations on derivative transactions.
(c) Supplemental information on fair values of financial instrumentsFair values of financial instruments include values based on market price and reasonably estimated values when market price is not available. Because variable factors are counted in the estimation, the estimated values may vary by adopting different assumptions. With respect to the contract amounts related to derivative transactions in Note 8, the amounts do not reflect market risks to derivative transactions.
(2) Fair values of financial instrumentsThe book values, fair values and the differences between them as of March 31, 2019 and 2018 are as follows (Financial instruments for which the market value is extremely difficult to determine are not included as described in remark 2.):
Millions of yen
2019Book value Fair value Difference
Cash and cash equivalents, time deposits ¥129,438 ¥129,438 ¥ —Trade notes and accounts receivable, net of allowance for doubtful receivables 147,721 147,721 —
Investment securities 51,083 51,083 —Assets total ¥328,243 ¥328,243 ¥ —
Trade notes and accounts payable ¥ 69,646 ¥ 69,646 ¥ —Short-term bank loans, current portion of long-term debt, and commercial paper 142,897 142,897 —
Other notes and account payable (*1) 31,169 31,169 —Long-term debt 360,512 359,397 (1,115)Convertible bond 25,000 27,537 2,537Lease obligations (*2) 6,728 6,548 (180)Liabilities total ¥635,955 ¥637,196 ¥ 1,241Delivatives (*3) ¥ (51) ¥ (51) ¥ —
39NIPRO Annual Report 2019
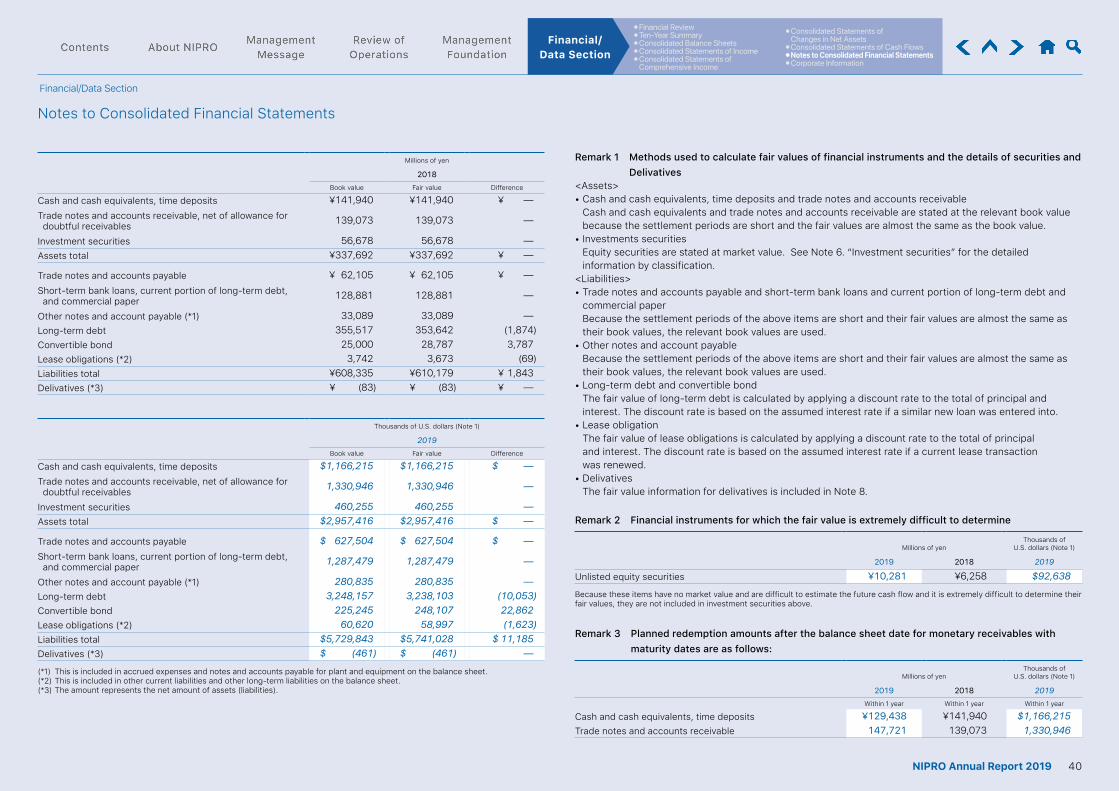
⦁ Financial Review⦁ Ten-Year Summary⦁ Consolidated Balance Sheets⦁ Consolidated Statements of Income⦁ Consolidated Statements of
Comprehensive Income
⦁ Consolidated Statements of Changes in Net Assets
⦁ Consolidated Statements of Cash Flows⦁ Notes to Consolidated Financial Statements⦁ Corporate Information
Financial/ Data Section
Financial/Data Section
Notes to Consolidated Financial Statements
Millions of yen
2018Book value Fair value Difference
Cash and cash equivalents, time deposits ¥141,940 ¥141,940 ¥ —Trade notes and accounts receivable, net of allowance for doubtful receivables 139,073 139,073 —
Investment securities 56,678 56,678 — Assets total ¥337,692 ¥337,692 ¥ —
Trade notes and accounts payable ¥ 62,105 ¥ 62,105 ¥ —Short-term bank loans, current portion of long-term debt, and commercial paper 128,881 128,881 —
Other notes and account payable (*1) 33,089 33,089 — Long-term debt 355,517 353,642 (1,874)Convertible bond 25,000 28,787 3,787Lease obligations (*2) 3,742 3,673 (69)Liabilities total ¥608,335 ¥610,179 ¥ 1,843 Delivatives (*3) ¥ (83) ¥ (83) ¥ —
Thousands of U.S. dollars (Note 1)
2019Book value Fair value Difference
Cash and cash equivalents, time deposits $1,166,215 $1,166,215 $ —Trade notes and accounts receivable, net of allowance for doubtful receivables 1,330,946 1,330,946 —
Investment securities 460,255 460,255 —Assets total $2,957,416 $2,957,416 $ —
Trade notes and accounts payable $ 627,504 $ 627,504 $ —Short-term bank loans, current portion of long-term debt, and commercial paper 1,287,479 1,287,479 —
Other notes and account payable (*1) 280,835 280,835 —Long-term debt 3,248,157 3,238,103 (10,053)Convertible bond 225,245 248,107 22,862Lease obligations (*2) 60,620 58,997 (1,623)Liabilities total $5,729,843 $5,741,028 $ 11,185Delivatives (*3) $ (461) $ (461) —
(*1) This is included in accrued expenses and notes and accounts payable for plant and equipment on the balance sheet.(*2) This is included in other current liabilities and other long-term liabilities on the balance sheet.(*3) The amount represents the net amount of assets (liabilities).
Remark 1 Methods used to calculate fair values of financial instruments and the details of securities and Delivatives
<Assets>• Cash and cash equivalents, time deposits and trade notes and accounts receivable Cash and cash equivalents and trade notes and accounts receivable are stated at the relevant book value
because the settlement periods are short and the fair values are almost the same as the book value.• Investments securities Equity securities are stated at market value. See Note 6. “Investment securities” for the detailed
information by classification.<Liabilities>• Trade notes and accounts payable and short-term bank loans and current portion of long-term debt and
commercial paper Because the settlement periods of the above items are short and their fair values are almost the same as
their book values, the relevant book values are used.• Other notes and account payable Because the settlement periods of the above items are short and their fair values are almost the same as
their book values, the relevant book values are used.• Long-term debt and convertible bond The fair value of long-term debt is calculated by applying a discount rate to the total of principal and
interest. The discount rate is based on the assumed interest rate if a similar new loan was entered into.• Lease obligation The fair value of lease obligations is calculated by applying a discount rate to the total of principal
and interest. The discount rate is based on the assumed interest rate if a current lease transaction was renewed.
• Delivatives The fair value information for delivatives is included in Note 8.
Remark 2 Financial instruments for which the fair value is extremely difficult to determine
Millions of yenThousands of
U.S. dollars (Note 1)
2019 2018 2019
Unlisted equity securities ¥10,281 ¥6,258 $92,638
Because these items have no market value and are difficult to estimate the future cash flow and it is extremely difficult to determine their fair values, they are not included in investment securities above.
Remark 3 Planned redemption amounts after the balance sheet date for monetary receivables with maturity dates are as follows:
Millions of yenThousands of
U.S. dollars (Note 1)
2019 2018 2019Within 1 year Within 1 year Within 1 year
Cash and cash equivalents, time deposits ¥129,438 ¥141,940 $1,166,215Trade notes and accounts receivable 147,721 139,073 1,330,946
40NIPRO Annual Report 2019

⦁ Financial Review⦁ Ten-Year Summary⦁ Consolidated Balance Sheets⦁ Consolidated Statements of Income⦁ Consolidated Statements of
Comprehensive Income
⦁ Consolidated Statements of Changes in Net Assets
⦁ Consolidated Statements of Cash Flows⦁ Notes to Consolidated Financial Statements⦁ Corporate Information
Financial/ Data Section
Financial/Data Section
Notes to Consolidated Financial Statements
Remark 4 Planned repayment amounts after the balance sheet date for monetary payables with maturity datesPlanned repayment amounts after the balance sheet date for monetary payables with maturity dates at March 31, 2019 are as follows:
Millions of yen
2019
Within 1 yearOver 1 year but within 2 years
Over 2 years but within 3 years
Over 3 years but within 4 years
Over 4 years but within 5 years Over 5 years
Short-term bank loans, current portion of long-term debt, and commercial paper ¥142,897 ¥ — ¥ — ¥ — ¥ — ¥ —Other notes and account payable — — — — — —Long-term debt — 55,797 70,203 57,897 33,230 143,382Convertible bond — 25,000 — — — —Lease obligations 1,693 1,231 1,031 565 1,727 477Total ¥144,591 ¥82,029 ¥71,235 ¥58,463 ¥34,958 ¥143,860
Thousands of U.S. dollars (Note 1)
2019
Within 1 yearOver 1 year but within 2 years
Over 2 years but within 3 years
Over 3 years but within 4 years
Over 4 years but within 5 years Over 5 years
Short-term bank loans, current portion of long-term debt, and commercial paper $1,287,479 $ — $ — $ — $ — $ —Other notes and account payable — — — — — —Long-term debt — 502,727 632,525 521,649 299,402 1,291,852Convertible bond — — — — — —Lease obligations 15,261 11,099 9,292 5,095 15,567 4,304Total $1,302,741 $513,826 $641,817 $526,745 $314,969 $1,296,156
Millions of yen
2018
Within 1 yearOver 1 year but within 2 years
Over 2 years but within 3 years
Over 3 years but within 4 years
Over 4 years but within 5 years Over 5 years
Short-term bank loans, current portion of long-term debt, and commercial paper ¥128,881 ¥ — ¥ — ¥ — ¥ — ¥ — Other notes and account payable — — — — — — Long-term debt — 76,507 46,394 64,203 42,557 125,854 Convertible bond — — 25,000 — — — Lease obligations 1,198 1,054 721 566 115 85 Total ¥130,079 ¥77,561 ¥72,116 ¥64,770 ¥42,673 ¥125,940
41NIPRO Annual Report 2019
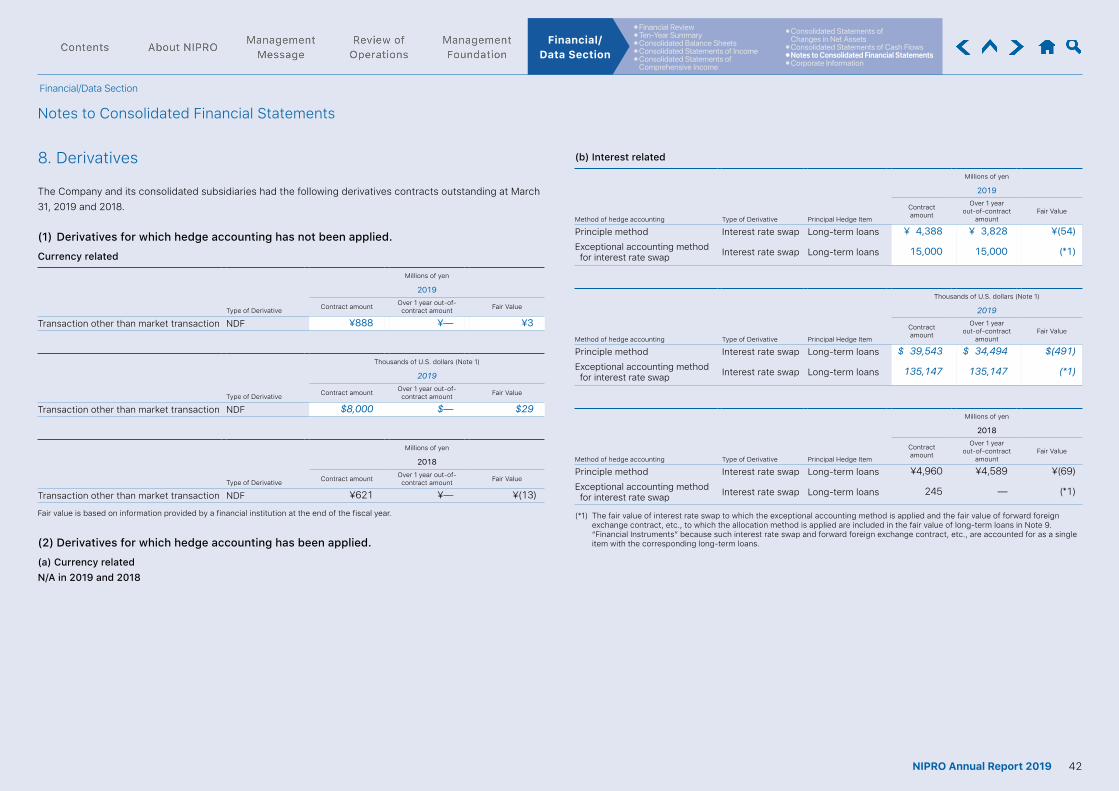
⦁ Financial Review⦁ Ten-Year Summary⦁ Consolidated Balance Sheets⦁ Consolidated Statements of Income⦁ Consolidated Statements of
Comprehensive Income
⦁ Consolidated Statements of Changes in Net Assets
⦁ Consolidated Statements of Cash Flows⦁ Notes to Consolidated Financial Statements⦁ Corporate Information
Financial/ Data Section
Financial/Data Section
Notes to Consolidated Financial Statements
8. Derivatives
The Company and its consolidated subsidiaries had the following derivatives contracts outstanding at March 31, 2019 and 2018.
(1) Derivatives for which hedge accounting has not been applied.Currency related
Millions of yen
2019
Type of Derivative Contract amount Over 1 year out-of-contract amount Fair Value
Transaction other than market transaction NDF ¥888 ¥— ¥3
Thousands of U.S. dollars (Note 1)
2019
Type of Derivative Contract amount Over 1 year out-of-contract amount Fair Value
Transaction other than market transaction NDF $8,000 $ — $29
Millions of yen
2018
Type of Derivative Contract amount Over 1 year out-of-contract amount Fair Value
Transaction other than market transaction NDF ¥621 ¥— ¥(13)
Fair value is based on information provided by a financial institution at the end of the fiscal year.
(2) Derivatives for which hedge accounting has been applied.(a) Currency relatedN/A in 2019 and 2018
(b) Interest related
Millions of yen
2019
Method of hedge accounting Type of Derivative Principal Hedge Item
Contract amount
Over 1 year out-of-contract
amountFair Value
Principle method Interest rate swap Long-term loans ¥ 4,388 ¥ 3,828 ¥(54)Exceptional accounting method for interest rate swap Interest rate swap Long-term loans 15,000 15,000 (*1)
Thousands of U.S. dollars (Note 1)
2019
Method of hedge accounting Type of Derivative Principal Hedge Item
Contract amount
Over 1 year out-of-contract
amountFair Value
Principle method Interest rate swap Long-term loans $ 39,543 $ 34,494 $(491)Exceptional accounting method for interest rate swap Interest rate swap Long-term loans 135,147 135,147 (*1)
Millions of yen
2018
Method of hedge accounting Type of Derivative Principal Hedge Item
Contract amount
Over 1 year out-of-contract
amountFair Value
Principle method Interest rate swap Long-term loans ¥4,960 ¥4,589 ¥(69)Exceptional accounting method for interest rate swap Interest rate swap Long-term loans 245 — (*1)
(*1) The fair value of interest rate swap to which the exceptional accounting method is applied and the fair value of forward foreign exchange contract, etc., to which the allocation method is applied are included in the fair value of long-term loans in Note 9. “Financial Instruments” because such interest rate swap and forward foreign exchange contract, etc., are accounted for as a single item with the corresponding long-term loans.
42NIPRO Annual Report 2019

⦁ Financial Review⦁ Ten-Year Summary⦁ Consolidated Balance Sheets⦁ Consolidated Statements of Income⦁ Consolidated Statements of
Comprehensive Income
⦁ Consolidated Statements of Changes in Net Assets
⦁ Consolidated Statements of Cash Flows⦁ Notes to Consolidated Financial Statements⦁ Corporate Information
Financial/ Data Section
Financial/Data Section
Notes to Consolidated Financial Statements
9. Short-Term Loans and Long-Term Debt
Short-term loans comprised overdrafts and promissory notes. The weighted-average interest rates of short-term bank loans for the years ended March 31, 2018 and 2017 were 0.8180% and 0.9293%, respectively. The weighted-average interest rates of commercial paper for the years ended March 31, 2018 and 2017 were 0.0010% and 0.011%, respectively. Long-term debt comprised the following:
Millions of yenThousands of
U.S. dollars (Note 1)
2019 2018 2019
0.61% unsecured bonds due 2019 (*1) ¥ — ¥ 400 $ —0.57% unsecured bonds due 2020 3,000 3,000 27,029
[3,000] — [27,029]0% unsecured bonds due 2021 25,000 25,000 225,2450.674% unsecured bonds due 2028 10,000 — 90,0980.021%~0.810% unsecured bonds due from 2017 to 2023 (*1) (*2) 2,000 2,800 18,019
[600] [800] [5,405]0.33% unsecured bonds due 2018 (*1) (*3) — 15 —
— [15] —Long-term bank loans due through 2077, with weighted- average interest rate of 0.5992% for the year ended March 31, 2019, and of 0.6433% for the year ended March 31, 2018
432,606 413,937 3,897,710
Less current portion of long-term debt (87,093) (64,635) (784,700)Total ¥385,513 ¥380,517 $3,473,402
(*1) [ ] is the amount of the current portion of bonds.(*2) This is the total amount of the bonds Goodman Co., Ltd. issued.(*3) This is the total amount of the bonds IMC Co., Ltd. issued.
In March 2014, the Company issued ¥2,000 million (US$18,019 thousand) of 0.61% unsecured bonds due 2019.In March 2015, the Company issued ¥3,000 million (US$27,029 thousand) of 0.57% unsecured bonds due 2020.In January 2016, the Company issued ¥25,000 million (US$225.245 thousand) of 0% unsecured bonds due 2021.In October 2018, the Company issued ¥10,000 million (US$90,098 thousand) of 0.674% unsecured bonds due 2028.In June 2013, IMC Co., Ltd. issued ¥45 million (US$4,235 thousand) of 0.33% privately placed bonds due 2018.From May 2012 to February 2018, Goodman Co., Ltd. issued ¥5,300 million (US$49,887 thousand) of 0.021% and 0.81% unsecured bonds due from 2017 to 2023.
The aggregate annual maturities of long-term debt outstanding at March 31, 2019 are as follows:
Millions of yenThousands of
U.S. dollars (Note 1)
2019 2019
2019 ¥ 87,093 $ 784,7002020 80,797 727,9732021 70,203 632,5252022 and thereafter 234,511 2,112,904
Total ¥472,604 $4,258,103
As is customary in Japan, long-term and short-term bank loans are made under general agreements which provide that additional securities and guarantees for present and future indebtedness will be given under certain circumstances at the request of the bank. In addition, the agreements provide that the bank has the right to offset cash deposits against any long-term and short-term bank loan that becomes due, and in case of default and certain other specified events, against all other loans payable to the bank.
10. Accrued Pension and Severance Liabilities
The Company and certain consolidated subsidiaries have defined benefit pension plans and unfunded retirement benefit plans, and defined contribution pension plan for employees. Certain consolidated subsidiaries have recorded liabilities for retirement benefit and assets for a retirement benefit based on the simplified method.
(1) Defined Benefit Plans(a) The reconciliation of beginning and ending balances of the benefit obligation (excluding the defined
benefit plans applied based on the simplified method) are as follows:
Millions of yenThousands of
U.S. dollars (Note 1)
2019 2018 2019
Obligation at April 1 ¥14,544 ¥14,184 $131,047Service cost 1,251 1,089 11,274Interest cost 94 94 855Actuarial gains and losses 291 142 2,626Prior service cost 0 (604) 0Benefit payments (631) (520) (5,687)Increasing by change from the simplified method to the principle method — 165 —
Other (foreign currency translation adjustments, etc.) (22) (6) (200)Obligation at March 31 ¥15,529 ¥14,544 $139,916
43NIPRO Annual Report 2019
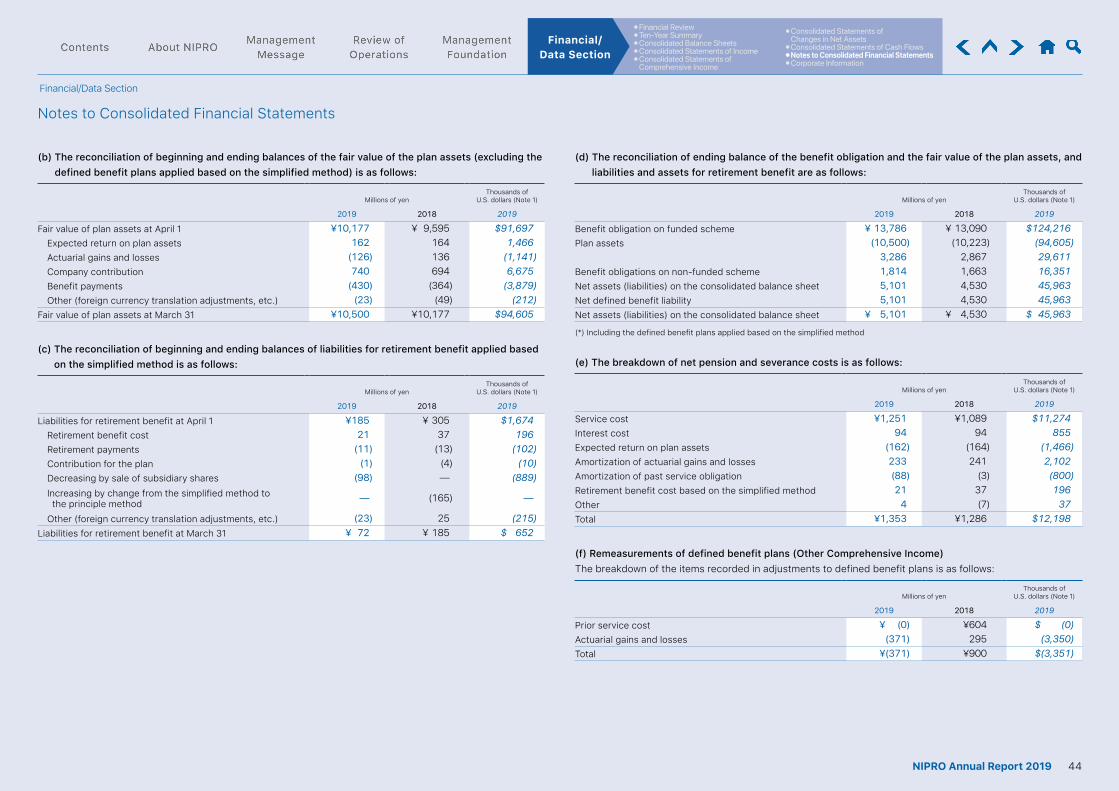
⦁ Financial Review⦁ Ten-Year Summary⦁ Consolidated Balance Sheets⦁ Consolidated Statements of Income⦁ Consolidated Statements of
Comprehensive Income
⦁ Consolidated Statements of Changes in Net Assets
⦁ Consolidated Statements of Cash Flows⦁ Notes to Consolidated Financial Statements⦁ Corporate Information
Financial/ Data Section
Financial/Data Section
Notes to Consolidated Financial Statements
(b) The reconciliation of beginning and ending balances of the fair value of the plan assets (excluding the defined benefit plans applied based on the simplified method) is as follows:
Millions of yenThousands of
U.S. dollars (Note 1)
2019 2018 2019
Fair value of plan assets at April 1 ¥10,177 ¥ 9,595 $91,697Expected return on plan assets 162 164 1,466Actuarial gains and losses (126) 136 (1,141)Company contribution 740 694 6,675Benefit payments (430) (364) (3,879)Other (foreign currency translation adjustments, etc.) (23) (49) (212)
Fair value of plan assets at March 31 ¥10,500 ¥10,177 $94,605
(c) The reconciliation of beginning and ending balances of liabilities for retirement benefit applied based on the simplified method is as follows:
Millions of yenThousands of
U.S. dollars (Note 1)
2019 2018 2019
Liabilities for retirement benefit at April 1 ¥185 ¥ 305 $1,674Retirement benefit cost 21 37 196Retirement payments (11) (13) (102)Contribution for the plan (1) (4) (10)Decreasing by sale of subsidiary shares (98) — (889)Increasing by change from the simplified method to the principle method — (165) —
Other (foreign currency translation adjustments, etc.) (23) 25 (215)Liabilities for retirement benefit at March 31 ¥ 72 ¥ 185 $ 652
(d) The reconciliation of ending balance of the benefit obligation and the fair value of the plan assets, and liabilities and assets for retirement benefit are as follows:
Millions of yenThousands of
U.S. dollars (Note 1)
2019 2018 2019
Benefit obligation on funded scheme ¥ 13,786 ¥ 13,090 $124,216Plan assets (10,500) (10,223) (94,605)
3,286 2,867 29,611Benefit obligations on non-funded scheme 1,814 1,663 16,351Net assets (liabilities) on the consolidated balance sheet 5,101 4,530 45,963Net defined benefit liability 5,101 4,530 45,963Net assets (liabilities) on the consolidated balance sheet ¥ 5,101 ¥ 4,530 $ 45,963
(*) Including the defined benefit plans applied based on the simplified method
(e) The breakdown of net pension and severance costs is as follows:
Millions of yenThousands of
U.S. dollars (Note 1)
2019 2018 2019
Service cost ¥1,251 ¥1,089 $11,274Interest cost 94 94 855Expected return on plan assets (162) (164) (1,466)Amortization of actuarial gains and losses 233 241 2,102Amortization of past service obligation (88) (3) (800)Retirement benefit cost based on the simplified method 21 37 196Other 4 (7) 37Total ¥1,353 ¥1,286 $12,198
(f) Remeasurements of defined benefit plans (Other Comprehensive Income)The breakdown of the items recorded in adjustments to defined benefit plans is as follows:
Millions of yenThousands of
U.S. dollars (Note 1)
2019 2018 2019
Prior service cost ¥ (0) ¥604 $ (0)Actuarial gains and losses (371) 295 (3,350)Total ¥(371) ¥900 $(3,351)
44NIPRO Annual Report 2019
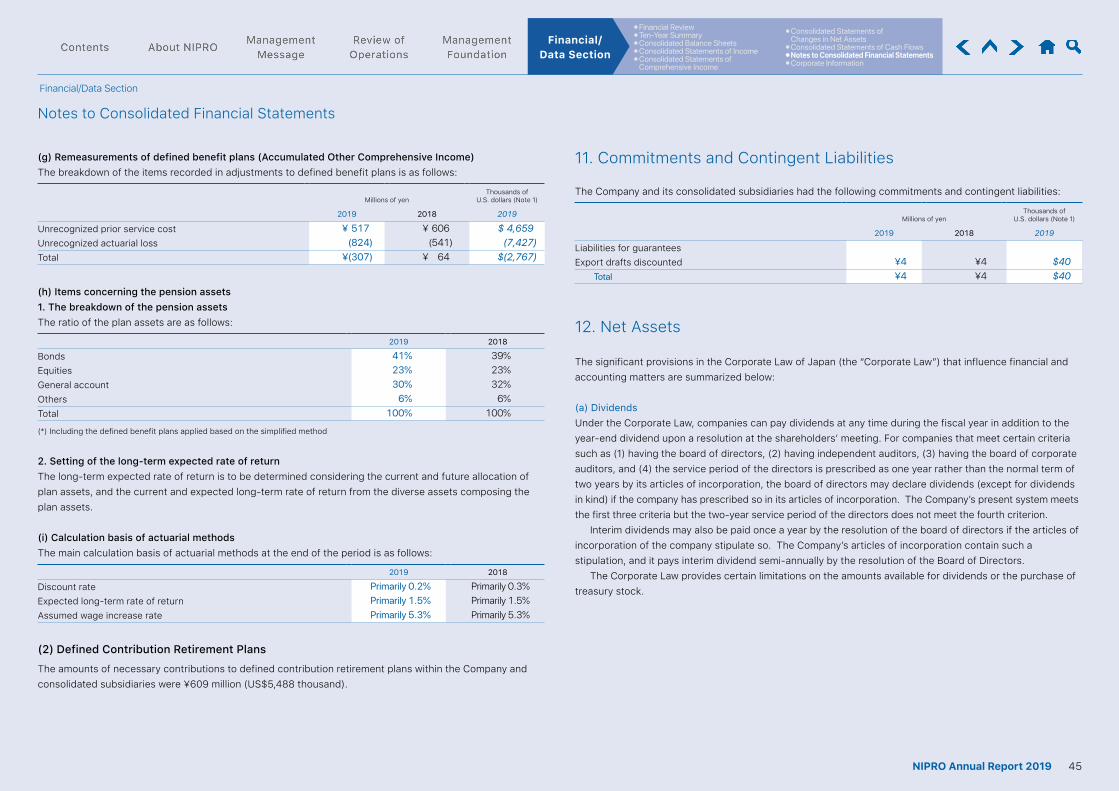
⦁ Financial Review⦁ Ten-Year Summary⦁ Consolidated Balance Sheets⦁ Consolidated Statements of Income⦁ Consolidated Statements of
Comprehensive Income
⦁ Consolidated Statements of Changes in Net Assets
⦁ Consolidated Statements of Cash Flows⦁ Notes to Consolidated Financial Statements⦁ Corporate Information
Financial/ Data Section
Financial/Data Section
Notes to Consolidated Financial Statements
11. Commitments and Contingent Liabilities
The Company and its consolidated subsidiaries had the following commitments and contingent liabilities:
Millions of yenThousands of
U.S. dollars (Note 1)
2019 2018 2019
Liabilities for guaranteesExport drafts discounted ¥4 ¥4 $40
Total ¥4 ¥4 $40
(g) Remeasurements of defined benefit plans (Accumulated Other Comprehensive Income)The breakdown of the items recorded in adjustments to defined benefit plans is as follows:
Millions of yenThousands of
U.S. dollars (Note 1)
2019 2018 2019
Unrecognized prior service cost ¥ 517 ¥ 606 $ 4,659Unrecognized actuarial loss (824) (541) (7,427)Total ¥(307) ¥ 64 $(2,767)
(h) Items concerning the pension assets1. The breakdown of the pension assetsThe ratio of the plan assets are as follows:
2019 2018
Bonds 41% 39%Equities 23% 23%General account 30% 32%Others 6% 6%Total 100% 100%
(*) Including the defined benefit plans applied based on the simplified method
2. Setting of the long-term expected rate of returnThe long-term expected rate of return is to be determined considering the current and future allocation of plan assets, and the current and expected long-term rate of return from the diverse assets composing the plan assets.
(i) Calculation basis of actuarial methodsThe main calculation basis of actuarial methods at the end of the period is as follows:
2019 2018
Discount rate Primarily 0.2% Primarily 0.3%Expected long-term rate of return Primarily 1.5% Primarily 1.5%Assumed wage increase rate Primarily 5.3% Primarily 5.3%
(2) Defined Contribution Retirement PlansThe amounts of necessary contributions to defined contribution retirement plans within the Company and consolidated subsidiaries were ¥609 million (US$5,488 thousand).
12. Net Assets
The significant provisions in the Corporate Law of Japan (the “Corporate Law”) that influence financial and accounting matters are summarized below:
(a) DividendsUnder the Corporate Law, companies can pay dividends at any time during the fiscal year in addition to the year-end dividend upon a resolution at the shareholders’ meeting. For companies that meet certain criteria such as (1) having the board of directors, (2) having independent auditors, (3) having the board of corporate auditors, and (4) the service period of the directors is prescribed as one year rather than the normal term of two years by its articles of incorporation, the board of directors may declare dividends (except for dividends in kind) if the company has prescribed so in its articles of incorporation. The Company’s present system meets the first three criteria but the two-year service period of the directors does not meet the fourth criterion. Interim dividends may also be paid once a year by the resolution of the board of directors if the articles of incorporation of the company stipulate so. The Company’s articles of incorporation contain such a stipulation, and it pays interim dividend semi-annually by the resolution of the Board of Directors. The Corporate Law provides certain limitations on the amounts available for dividends or the purchase of treasury stock.
45NIPRO Annual Report 2019
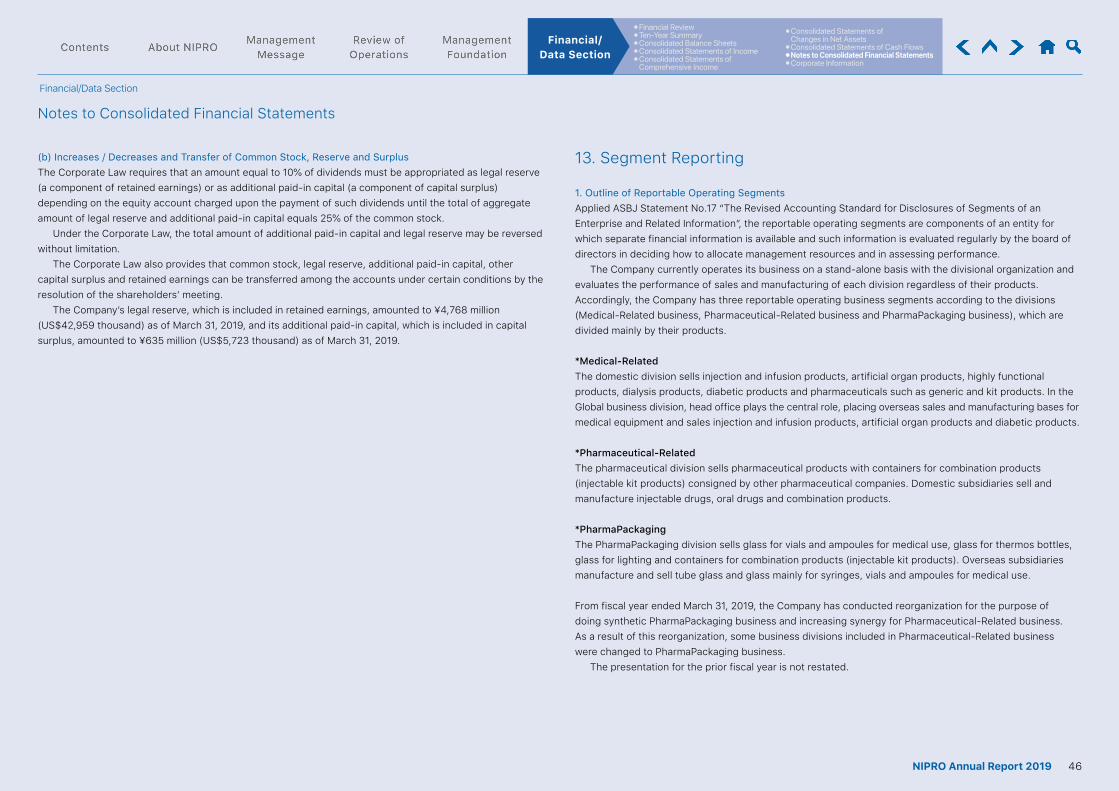
⦁ Financial Review⦁ Ten-Year Summary⦁ Consolidated Balance Sheets⦁ Consolidated Statements of Income⦁ Consolidated Statements of
Comprehensive Income
⦁ Consolidated Statements of Changes in Net Assets
⦁ Consolidated Statements of Cash Flows⦁ Notes to Consolidated Financial Statements⦁ Corporate Information
Financial/ Data Section
Financial/Data Section
Notes to Consolidated Financial Statements
(b) Increases / Decreases and Transfer of Common Stock, Reserve and SurplusThe Corporate Law requires that an amount equal to 10% of dividends must be appropriated as legal reserve (a component of retained earnings) or as additional paid-in capital (a component of capital surplus) depending on the equity account charged upon the payment of such dividends until the total of aggregate amount of legal reserve and additional paid-in capital equals 25% of the common stock. Under the Corporate Law, the total amount of additional paid-in capital and legal reserve may be reversed without limitation. The Corporate Law also provides that common stock, legal reserve, additional paid-in capital, other capital surplus and retained earnings can be transferred among the accounts under certain conditions by the resolution of the shareholders’ meeting. The Company’s legal reserve, which is included in retained earnings, amounted to ¥4,768 million (US$42,959 thousand) as of March 31, 2019, and its additional paid-in capital, which is included in capital surplus, amounted to ¥635 million (US$5,723 thousand) as of March 31, 2019.
13. Segment Reporting
1. Outline of Reportable Operating Segments Applied ASBJ Statement No.17 “The Revised Accounting Standard for Disclosures of Segments of an Enterprise and Related Information”, the reportable operating segments are components of an entity for which separate financial information is available and such information is evaluated regularly by the board of directors in deciding how to allocate management resources and in assessing performance. The Company currently operates its business on a stand-alone basis with the divisional organization and evaluates the performance of sales and manufacturing of each division regardless of their products. Accordingly, the Company has three reportable operating business segments according to the divisions (Medical-Related business, Pharmaceutical-Related business and PharmaPackaging business), which are divided mainly by their products.
*Medical-Related The domestic division sells injection and infusion products, artificial organ products, highly functional products, dialysis products, diabetic products and pharmaceuticals such as generic and kit products. In the Global business division, head office plays the central role, placing overseas sales and manufacturing bases for medical equipment and sales injection and infusion products, artificial organ products and diabetic products.
*Pharmaceutical-RelatedThe pharmaceutical division sells pharmaceutical products with containers for combination products (injectable kit products) consigned by other pharmaceutical companies. Domestic subsidiaries sell and manufacture injectable drugs, oral drugs and combination products.
*PharmaPackagingThe PharmaPackaging division sells glass for vials and ampoules for medical use, glass for thermos bottles, glass for lighting and containers for combination products (injectable kit products). Overseas subsidiaries manufacture and sell tube glass and glass mainly for syringes, vials and ampoules for medical use.
From fiscal year ended March 31, 2019, the Company has conducted reorganization for the purpose of doing synthetic PharmaPackaging business and increasing synergy for Pharmaceutical-Related business. As a result of this reorganization, some business divisions included in Pharmaceutical-Related business were changed to PharmaPackaging business. The presentation for the prior fiscal year is not restated.
46NIPRO Annual Report 2019
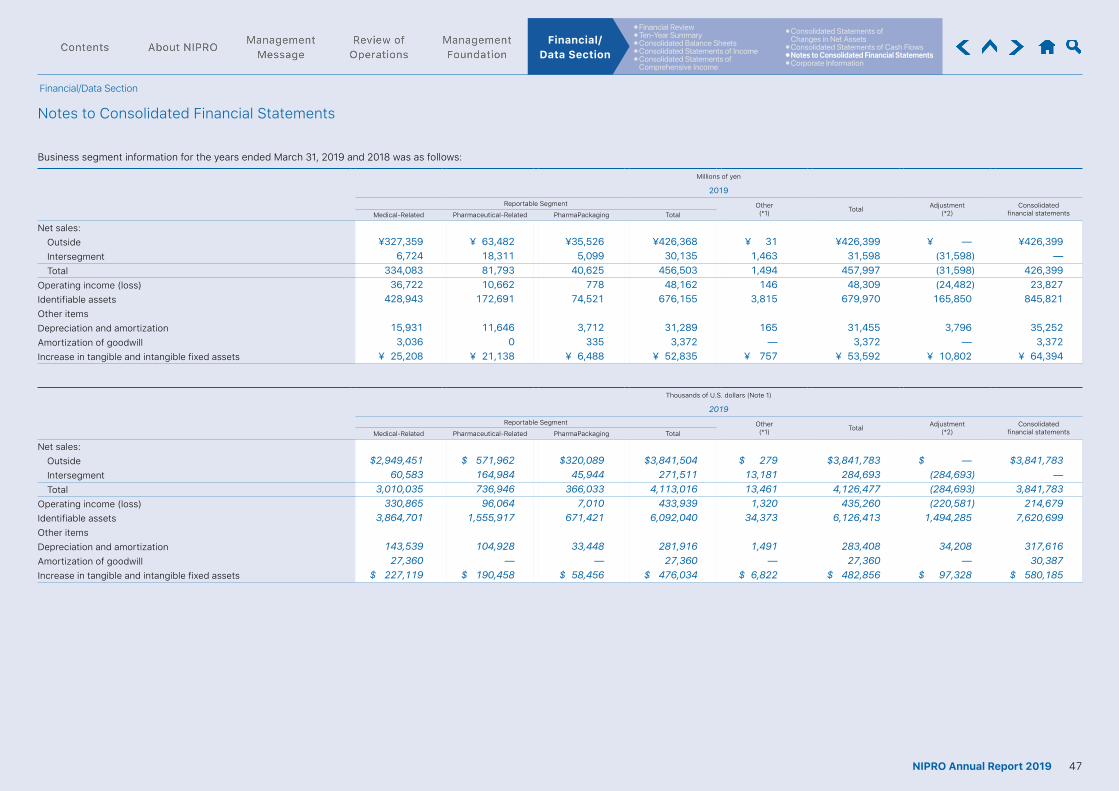
⦁ Financial Review⦁ Ten-Year Summary⦁ Consolidated Balance Sheets⦁ Consolidated Statements of Income⦁ Consolidated Statements of
Comprehensive Income
⦁ Consolidated Statements of Changes in Net Assets
⦁ Consolidated Statements of Cash Flows⦁ Notes to Consolidated Financial Statements⦁ Corporate Information
Financial/ Data Section
Financial/Data Section
Notes to Consolidated Financial Statements
Business segment information for the years ended March 31, 2019 and 2018 was as follows:
Millions of yen
2019Reportable Segment Other
(*1) Total Adjustment(*2)
Consolidatedfinancial statementsMedical-Related Pharmaceutical-Related PharmaPackaging Total
Net sales:Outside ¥327,359 ¥ 63,482 ¥35,526 ¥426,368 ¥ 31 ¥426,399 ¥ — ¥426,399Intersegment 6,724 18,311 5,099 30,135 1,463 31,598 (31,598) —Total 334,083 81,793 40,625 456,503 1,494 457,997 (31,598) 426,399
Operating income (loss) 36,722 10,662 778 48,162 146 48,309 (24,482) 23,827Identifiable assets 428,943 172,691 74,521 676,155 3,815 679,970 165,850 845,821Other itemsDepreciation and amortization 15,931 11,646 3,712 31,289 165 31,455 3,796 35,252Amortization of goodwill 3,036 0 335 3,372 — 3,372 — 3,372Increase in tangible and intangible fixed assets ¥ 25,208 ¥ 21,138 ¥ 6,488 ¥ 52,835 ¥ 757 ¥ 53,592 ¥ 10,802 ¥ 64,394
Thousands of U.S. dollars (Note 1)
2019Reportable Segment Other
(*1) Total Adjustment(*2)
Consolidatedfinancial statementsMedical-Related Pharmaceutical-Related PharmaPackaging Total
Net sales:Outside $2,949,451 $ 571,962 $320,089 $3,841,504 $ 279 $3,841,783 $ — $3,841,783Intersegment 60,583 164,984 45,944 271,511 13,181 284,693 (284,693) —Total 3,010,035 736,946 366,033 4,113,016 13,461 4,126,477 (284,693) 3,841,783
Operating income (loss) 330,865 96,064 7,010 433,939 1,320 435,260 (220,581) 214,679Identifiable assets 3,864,701 1,555,917 671,421 6,092,040 34,373 6,126,413 1,494,285 7,620,699Other itemsDepreciation and amortization 143,539 104,928 33,448 281,916 1,491 283,408 34,208 317,616Amortization of goodwill 27,360 — — 27,360 — 27,360 — 30,387Increase in tangible and intangible fixed assets $ 227,119 $ 190,458 $ 58,456 $ 476,034 $ 6,822 $ 482,856 $ 97,328 $ 580,185
47NIPRO Annual Report 2019
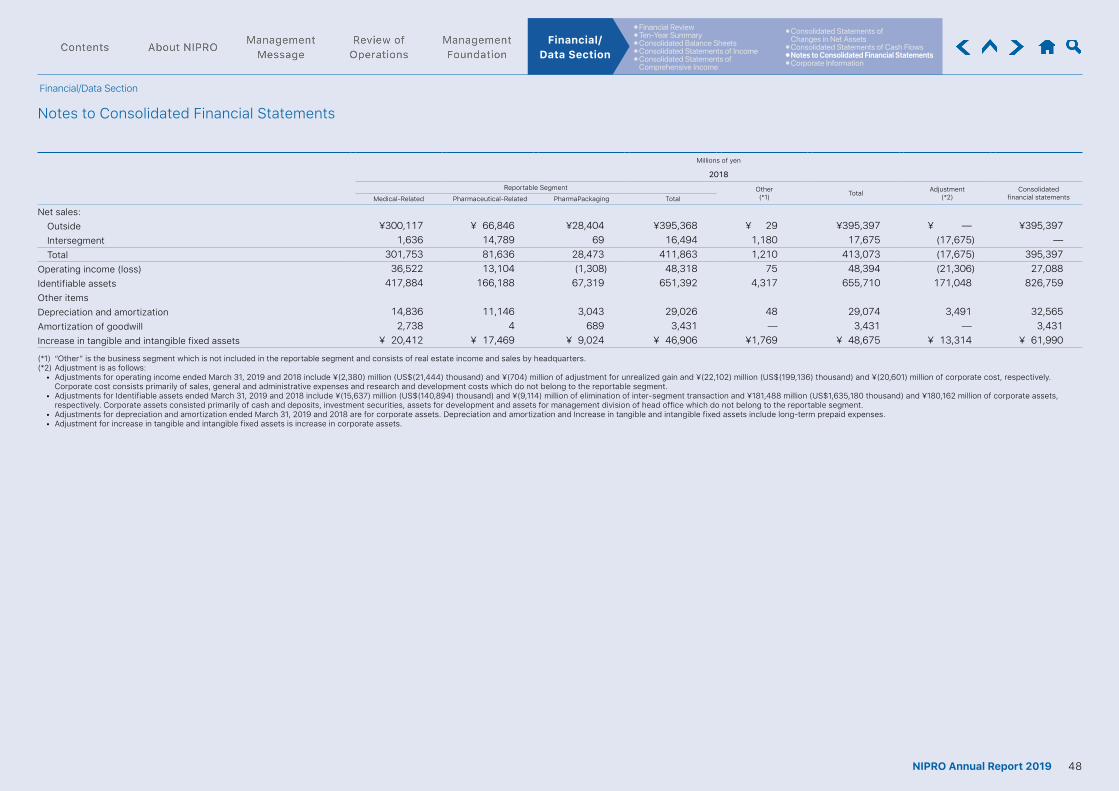
⦁ Financial Review⦁ Ten-Year Summary⦁ Consolidated Balance Sheets⦁ Consolidated Statements of Income⦁ Consolidated Statements of
Comprehensive Income
⦁ Consolidated Statements of Changes in Net Assets
⦁ Consolidated Statements of Cash Flows⦁ Notes to Consolidated Financial Statements⦁ Corporate Information
Financial/ Data Section
Financial/Data Section
Notes to Consolidated Financial Statements
Millions of yen
2018Reportable Segment Other
(*1) Total Adjustment(*2)
Consolidatedfinancial statementsMedical-Related Pharmaceutical-Related PharmaPackaging Total
Net sales:Outside ¥300,117 ¥ 66,846 ¥28,404 ¥395,368 ¥ 29 ¥395,397 ¥ — ¥395,397Intersegment 1,636 14,789 69 16,494 1,180 17,675 (17,675) —Total 301,753 81,636 28,473 411,863 1,210 413,073 (17,675) 395,397
Operating income (loss) 36,522 13,104 (1,308) 48,318 75 48,394 (21,306) 27,088Identifiable assets 417,884 166,188 67,319 651,392 4,317 655,710 171,048 826,759Other itemsDepreciation and amortization 14,836 11,146 3,043 29,026 48 29,074 3,491 32,565Amortization of goodwill 2,738 4 689 3,431 — 3,431 — 3,431Increase in tangible and intangible fixed assets ¥ 20,412 ¥ 17,469 ¥ 9,024 ¥ 46,906 ¥1,769 ¥ 48,675 ¥ 13,314 ¥ 61,990
(*1) “Other” is the business segment which is not included in the reportable segment and consists of real estate income and sales by headquarters.(*2) Adjustment is as follows: • Adjustments for operating income ended March 31, 2019 and 2018 include ¥(2,380) million (US$(21,444) thousand) and ¥(704) million of adjustment for unrealized gain and ¥(22,102) million (US$(199,136) thousand) and ¥(20,601) million of corporate cost, respectively.
Corporate cost consists primarily of sales, general and administrative expenses and research and development costs which do not belong to the reportable segment. • Adjustments for Identifiable assets ended March 31, 2019 and 2018 include ¥(15,637) million (US$(140,894) thousand) and ¥(9,114) million of elimination of inter-segment transaction and ¥181,488 million (US$1,635,180 thousand) and ¥180,162 million of corporate assets,
respectively. Corporate assets consisted primarily of cash and deposits, investment securities, assets for development and assets for management division of head office which do not belong to the reportable segment. • Adjustments for depreciation and amortization ended March 31, 2019 and 2018 are for corporate assets. Depreciation and amortization and Increase in tangible and intangible fixed assets include long-term prepaid expenses. • Adjustment for increase in tangible and intangible fixed assets is increase in corporate assets.
48NIPRO Annual Report 2019
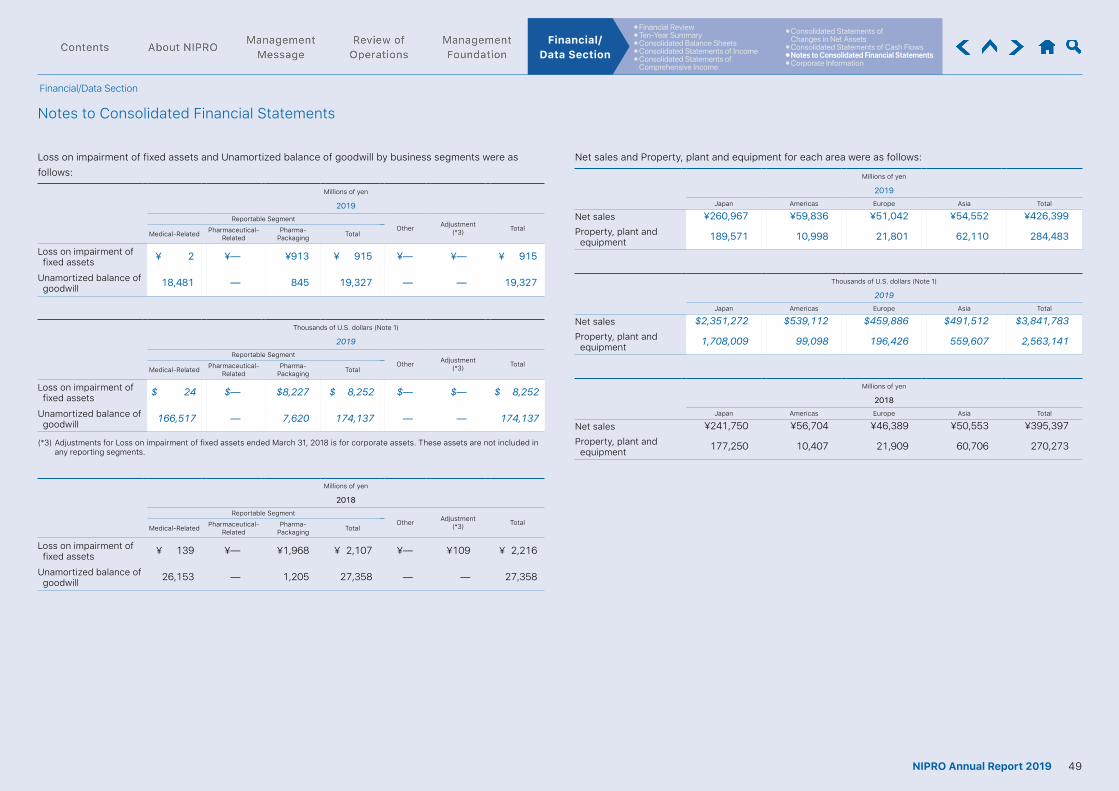
⦁ Financial Review⦁ Ten-Year Summary⦁ Consolidated Balance Sheets⦁ Consolidated Statements of Income⦁ Consolidated Statements of
Comprehensive Income
⦁ Consolidated Statements of Changes in Net Assets
⦁ Consolidated Statements of Cash Flows⦁ Notes to Consolidated Financial Statements⦁ Corporate Information
Financial/ Data Section
Financial/Data Section
Notes to Consolidated Financial Statements
Loss on impairment of fixed assets and Unamortized balance of goodwill by business segments were as follows:
Millions of yen
2019Reportable Segment
Other Adjustment(*3) Total
Medical-Related Pharmaceutical-Related
Pharma-Packaging Total
Loss on impairment of fixed assets ¥ 2 ¥— ¥913 ¥ 915 ¥— ¥— ¥ 915
Unamortized balance of goodwill 18,481 — 845 19,327 — — 19,327
Thousands of U.S. dollars (Note 1)
2019Reportable Segment
Other Adjustment(*3) Total
Medical-Related Pharmaceutical-Related
Pharma-Packaging Total
Loss on impairment of fixed assets $ 24 $— $8,227 $ 8,252 $— $— $ 8,252
Unamortized balance of goodwill 166,517 — 7,620 174,137 — — 174,137
(*3) Adjustments for Loss on impairment of fixed assets ended March 31, 2018 is for corporate assets. These assets are not included in any reporting segments.
Millions of yen
2018Reportable Segment
Other Adjustment(*3) Total
Medical-Related Pharmaceutical-Related
Pharma-Packaging Total
Loss on impairment of fixed assets ¥ 139 ¥— ¥1,968 ¥ 2,107 ¥— ¥109 ¥ 2,216
Unamortized balance of goodwill 26,153 — 1,205 27,358 — — 27,358
Net sales and Property, plant and equipment for each area were as follows:
Millions of yen
2019Japan Americas Europe Asia Total
Net sales ¥260,967 ¥59,836 ¥51,042 ¥54,552 ¥426,399Property, plant and equipment 189,571 10,998 21,801 62,110 284,483
Thousands of U.S. dollars (Note 1)
2019Japan Americas Europe Asia Total
Net sales $2,351,272 $539,112 $459,886 $491,512 $3,841,783Property, plant and equipment 1,708,009 99,098 196,426 559,607 2,563,141
Millions of yen
2018Japan Americas Europe Asia Total
Net sales ¥241,750 ¥56,704 ¥46,389 ¥50,553 ¥395,397Property, plant and equipment 177,250 10,407 21,909 60,706 270,273
49NIPRO Annual Report 2019
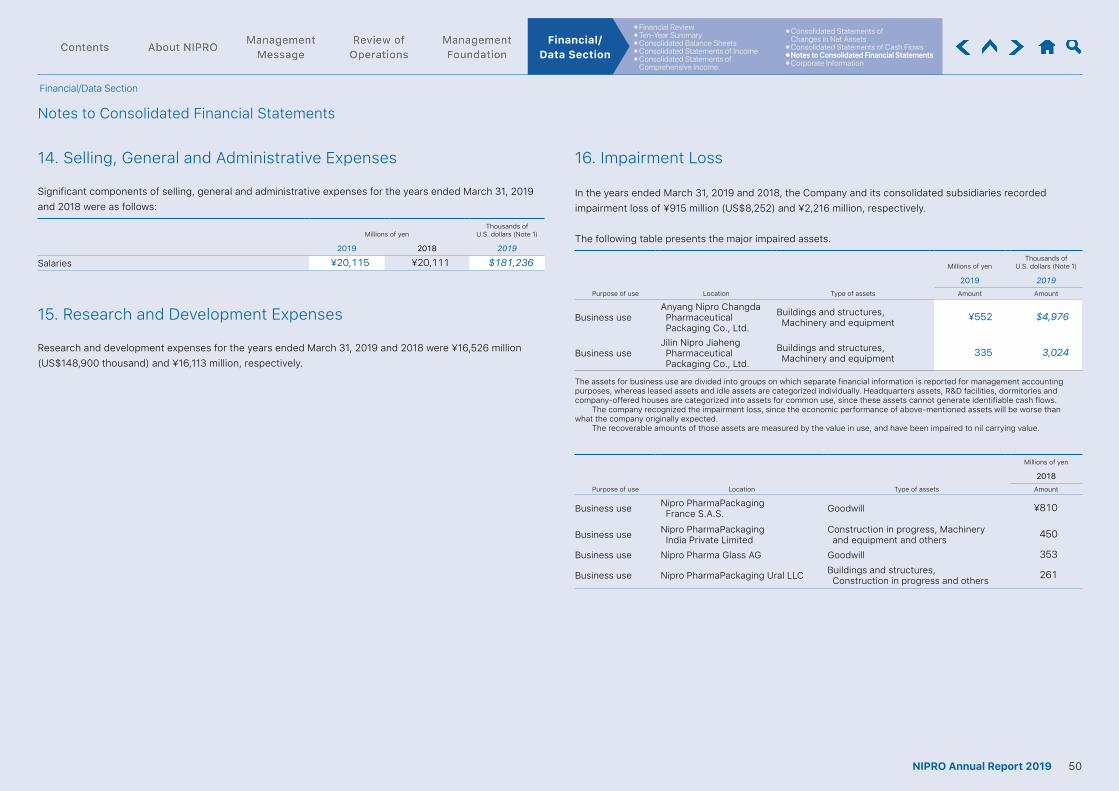
⦁ Financial Review⦁ Ten-Year Summary⦁ Consolidated Balance Sheets⦁ Consolidated Statements of Income⦁ Consolidated Statements of
Comprehensive Income
⦁ Consolidated Statements of Changes in Net Assets
⦁ Consolidated Statements of Cash Flows⦁ Notes to Consolidated Financial Statements⦁ Corporate Information
Financial/ Data Section
Financial/Data Section
Notes to Consolidated Financial Statements
In the years ended March 31, 2019 and 2018, the Company and its consolidated subsidiaries recorded impairment loss of ¥915 million (US$8,252) and ¥2,216 million, respectively.
The following table presents the major impaired assets.
Millions of yenThousands of
U.S. dollars (Note 1)
2019 2019Purpose of use Location Type of assets Amount Amount
Business useAnyang Nipro Changda Pharmaceutical Packaging Co., Ltd.
Buildings and structures, Machinery and equipment ¥552 $4,976
Business useJilin Nipro Jiaheng Pharmaceutical Packaging Co., Ltd.
Buildings and structures, Machinery and equipment 335 3,024
The assets for business use are divided into groups on which separate financial information is reported for management accounting purposes, whereas leased assets and idle assets are categorized individually. Headquarters assets, R&D facilities, dormitories and company-offered houses are categorized into assets for common use, since these assets cannot generate identifiable cash flows. The company recognized the impairment loss, since the economic performance of above-mentioned assets will be worse than what the company originally expected. The recoverable amounts of those assets are measured by the value in use, and have been impaired to nil carrying value.
Millions of yen
2018Purpose of use Location Type of assets Amount
Business use Nipro PharmaPackaging France S.A.S. Goodwill ¥810
Business use Nipro PharmaPackaging India Private Limited
Construction in progress, Machinery and equipment and others 450
Business use Nipro Pharma Glass AG Goodwill 353
Business use Nipro PharmaPackaging Ural LLC Buildings and structures, Construction in progress and others 261
16. Impairment Loss
15. Research and Development Expenses
Research and development expenses for the years ended March 31, 2019 and 2018 were ¥16,526 million (US$148,900 thousand) and ¥16,113 million, respectively.
14. Selling, General and Administrative Expenses
Significant components of selling, general and administrative expenses for the years ended March 31, 2019 and 2018 were as follows:
Millions of yenThousands of
U.S. dollars (Note 1)
2019 2018 2019
Salaries ¥20,115 ¥20,111 $181,236
50NIPRO Annual Report 2019
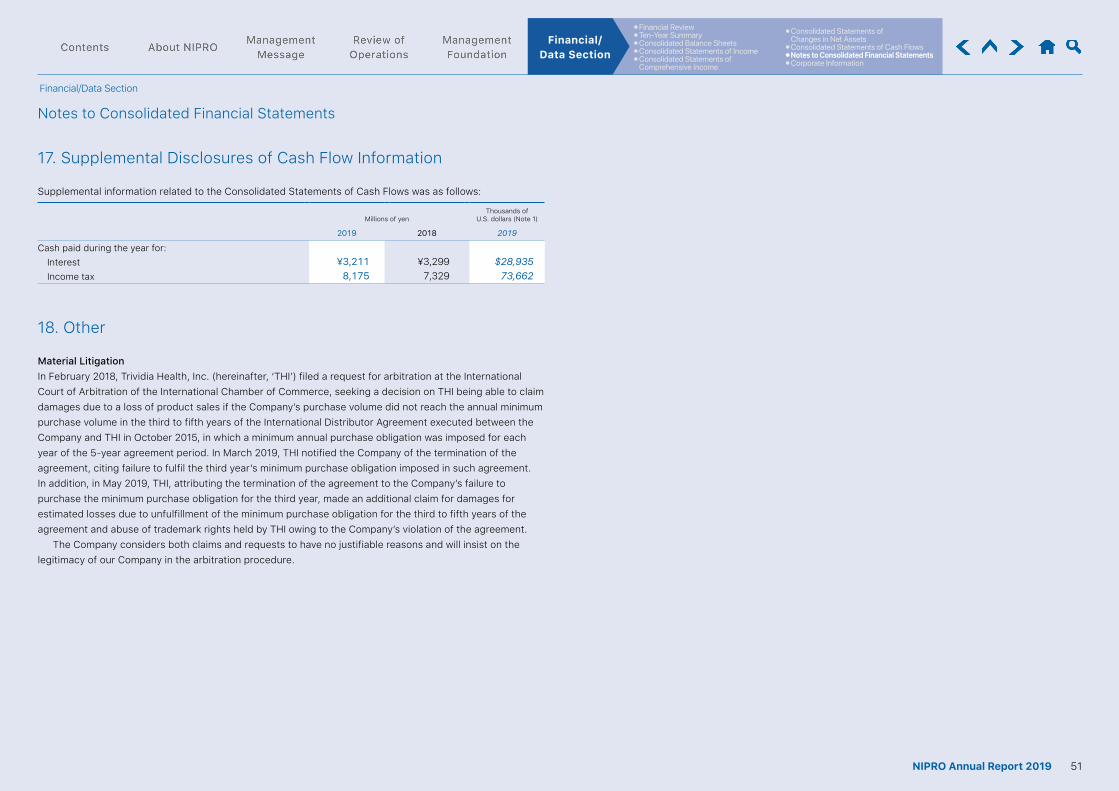
⦁ Financial Review⦁ Ten-Year Summary⦁ Consolidated Balance Sheets⦁ Consolidated Statements of Income⦁ Consolidated Statements of
Comprehensive Income
⦁ Consolidated Statements of Changes in Net Assets
⦁ Consolidated Statements of Cash Flows⦁ Notes to Consolidated Financial Statements⦁ Corporate Information
Financial/ Data Section
Financial/Data Section
Notes to Consolidated Financial Statements
17. Supplemental Disclosures of Cash Flow Information
Supplemental information related to the Consolidated Statements of Cash Flows was as follows:
Millions of yenThousands of
U.S. dollars (Note 1)
2019 2018 2019
Cash paid during the year for:Interest ¥3,211 ¥3,299 $28,935Income tax 8,175 7,329 73,662
18. Other
Material LitigationIn February 2018, Trividia Health, Inc. (hereinafter, ‘THI’) filed a request for arbitration at the International Court of Arbitration of the International Chamber of Commerce, seeking a decision on THI being able to claim damages due to a loss of product sales if the Company’s purchase volume did not reach the annual minimum purchase volume in the third to fifth years of the International Distributor Agreement executed between the Company and THI in October 2015, in which a minimum annual purchase obligation was imposed for each year of the 5-year agreement period. In March 2019, THI notified the Company of the termination of the agreement, citing failure to fulfil the third year’s minimum purchase obligation imposed in such agreement. In addition, in May 2019, THI, attributing the termination of the agreement to the Company’s failure to purchase the minimum purchase obligation for the third year, made an additional claim for damages for estimated losses due to unfulfillment of the minimum purchase obligation for the third to fifth years of the agreement and abuse of trademark rights held by THI owing to the Company’s violation of the agreement. The Company considers both claims and requests to have no justifiable reasons and will insist on the legitimacy of our Company in the arbitration procedure.
51NIPRO Annual Report 2019
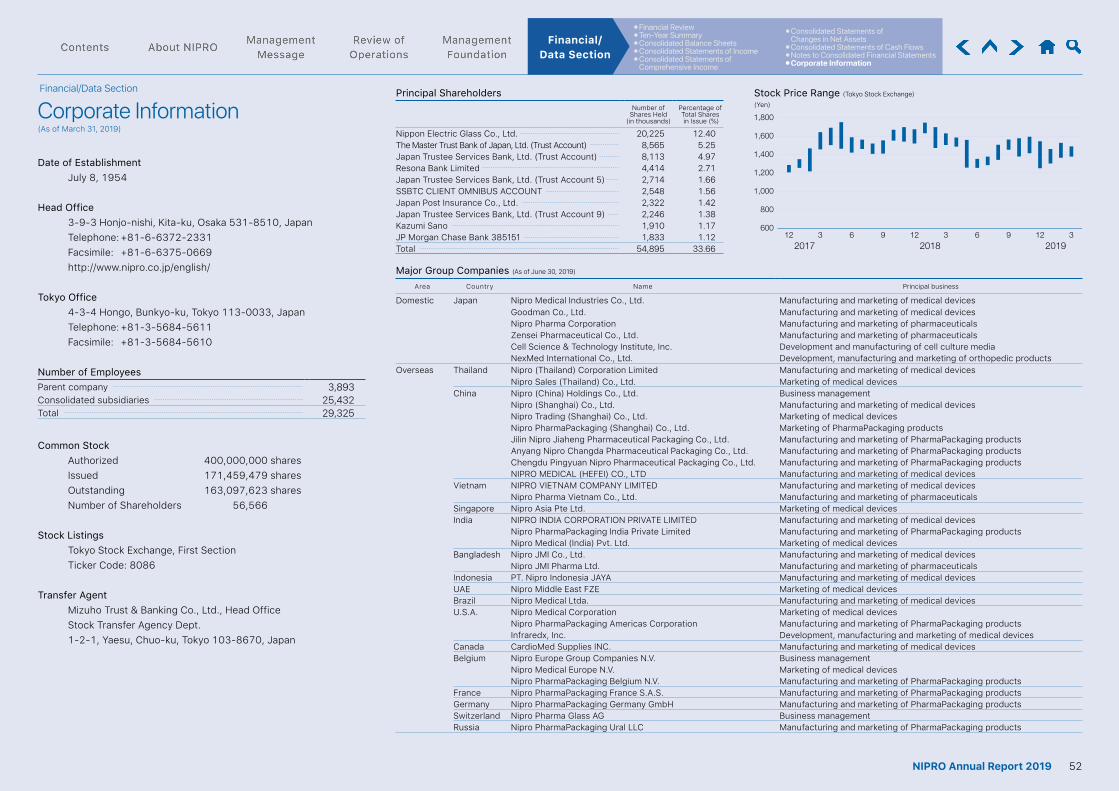
60012
2017 2018 20193 6 9 12 3 6 9 12 3
800
1,000
1,200
1,400
1,600
1,800
Date of EstablishmentJuly 8, 1954
Head Office3-9-3 Honjo-nishi, Kita-ku, Osaka 531-8510, JapanTelephone: +81-6-6372-2331Facsimile: +81-6-6375-0669http://www.nipro.co.jp/english/
Tokyo Office4-3-4 Hongo, Bunkyo-ku, Tokyo 113-0033, JapanTelephone: +81-3-5684-5611Facsimile: +81-3-5684-5610
Number of EmployeesParent company 3,893Consolidated subsidiaries 25,432 Total 29,325
Common StockAuthorized 400,000,000 sharesIssued 171,459,479 sharesOutstanding 163,097,623 sharesNumber of Shareholders 56,566
Stock ListingsTokyo Stock Exchange, First SectionTicker Code: 8086
Transfer AgentMizuho Trust & Banking Co., Ltd., Head OfficeStock Transfer Agency Dept.1-2-1, Yaesu, Chuo-ku, Tokyo 103-8670, Japan
Principal Shareholders Stock Price Range (Tokyo Stock Exchange)(Yen)Number of
Shares Held(in thousands)
Percentage of Total Shares in Issue (%)
Nippon Electric Glass Co., Ltd. 20,225 12.40The Master Trust Bank of Japan, Ltd. (Trust Account) 8,565 5.25Japan Trustee Services Bank, Ltd. (Trust Account) 8,113 4.97Resona Bank Limited 4,414 2.71Japan Trustee Services Bank, Ltd. (Trust Account 5) 2,714 1.66SSBTC CLIENT OMNIBUS ACCOUNT 2,548 1.56Japan Post Insurance Co., Ltd. 2,322 1.42Japan Trustee Services Bank, Ltd. (Trust Account 9) 2,246 1.38Kazumi Sano 1,910 1.17JP Morgan Chase Bank 385151 1,833 1.12Total 54,895 33.66
Major Group Companies (As of June 30, 2019)
Area Country Name Principal business
Domestic Japan Nipro Medical Industries Co., Ltd. Manufacturing and marketing of medical devicesGoodman Co., Ltd. Manufacturing and marketing of medical devicesNipro Pharma Corporation Manufacturing and marketing of pharmaceuticalsZensei Pharmaceutical Co., Ltd. Manufacturing and marketing of pharmaceuticalsCell Science & Technology Institute, Inc. Development and manufacturing of cell culture mediaNexMed International Co., Ltd. Development, manufacturing and marketing of orthopedic products
Overseas Thailand Nipro (Thailand) Corporation Limited Manufacturing and marketing of medical devicesNipro Sales (Thailand) Co., Ltd. Marketing of medical devices
China Nipro (China) Holdings Co., Ltd. Business managementNipro (Shanghai) Co., Ltd. Manufacturing and marketing of medical devicesNipro Trading (Shanghai) Co., Ltd. Marketing of medical devicesNipro PharmaPackaging (Shanghai) Co., Ltd. Marketing of PharmaPackaging productsJilin Nipro Jiaheng Pharmaceutical Packaging Co., Ltd. Manufacturing and marketing of PharmaPackaging productsAnyang Nipro Changda Pharmaceutical Packaging Co., Ltd. Manufacturing and marketing of PharmaPackaging productsChengdu Pingyuan Nipro Pharmaceutical Packaging Co., Ltd. Manufacturing and marketing of PharmaPackaging productsNIPRO MEDICAL (HEFEI) CO., LTD Manufacturing and marketing of medical devices
Vietnam NIPRO VIETNAM COMPANY LIMITED Manufacturing and marketing of medical devicesNipro Pharma Vietnam Co., Ltd. Manufacturing and marketing of pharmaceuticals
Singapore Nipro Asia Pte Ltd. Marketing of medical devicesIndia NIPRO INDIA CORPORATION PRIVATE LIMITED Manufacturing and marketing of medical devices
Nipro PharmaPackaging India Private Limited Manufacturing and marketing of PharmaPackaging productsNipro Medical (India) Pvt. Ltd. Marketing of medical devices
Bangladesh Nipro JMI Co., Ltd. Manufacturing and marketing of medical devicesNipro JMI Pharma Ltd. Manufacturing and marketing of pharmaceuticals
Indonesia PT. Nipro Indonesia JAYA Manufacturing and marketing of medical devicesUAE Nipro Middle East FZE Marketing of medical devicesBrazil Nipro Medical Ltda. Manufacturing and marketing of medical devicesU.S.A. Nipro Medical Corporation Marketing of medical devices
Nipro PharmaPackaging Americas Corporation Manufacturing and marketing of PharmaPackaging productsInfraredx, Inc. Development, manufacturing and marketing of medical devices
Canada CardioMed Supplies INC. Manufacturing and marketing of medical devicesBelgium Nipro Europe Group Companies N.V. Business management
Nipro Medical Europe N.V. Marketing of medical devicesNipro PharmaPackaging Belgium N.V. Manufacturing and marketing of PharmaPackaging products
France Nipro PharmaPackaging France S.A.S. Manufacturing and marketing of PharmaPackaging productsGermany Nipro PharmaPackaging Germany GmbH Manufacturing and marketing of PharmaPackaging productsSwitzerland Nipro Pharma Glass AG Business managementRussia Nipro PharmaPackaging Ural LLC Manufacturing and marketing of PharmaPackaging products
⦁ Financial Review⦁ Ten-Year Summary⦁ Consolidated Balance Sheets⦁ Consolidated Statements of Income⦁ Consolidated Statements of
Comprehensive Income
⦁ Consolidated Statements of Changes in Net Assets
⦁ Consolidated Statements of Cash Flows⦁ Notes to Consolidated Financial Statements⦁ Corporate Information
Financial/ Data Section
Financial/Data Section
Corporate Information(As of March 31, 2019)
52NIPRO Annual Report 2019