annual report & accounts 2017 - a2dominion … · highlights chair’s report welcome to...
TRANSCRIPT

ANNUAL REPORT & ACCOUNTS
2017

Our vision is simple – to improve people’s lives through high-quality homes and services.
HIGHLIGHTS4 Chair’s report 6 A2Dominion at a glance8 Providing new high-quality homes10 Case study: shared ownership 13 Delivering customer-led services14 Case study: private rent 17 Investing in homes and local communities18 Strengthening our business20 Development portfolio
STRATEGIC REPORT27 Overview of the business28 Strategic objectives29 Governance and regulation30 Investment30 Development31 The future32 Risk34 Performance summary35 Operational performance 37 Stockprofile38 Value for money at A2Dominion42 Financial review
REPORT OF THE BOARD46 Board of management48 Executiveofficers50 Report of the Board53 Independent auditor’s report to the members
of A2DominionHousingGroupLimited
FINANCIAL STATEMENTS56 Consolidated statement of comprehensive income57 Association statement of comprehensive income58 Consolidatedstatementoffinancialposition59 Associationstatementoffinancialposition60 Consolidated statement of changes in equity62 Association statement of changes in equity63 Consolidatedstatementofcashflows64 Notestothefinancialstatements Canons Gate,
Bristol A waterfront regeneration scheme featuring 147 homes for private rent.

HIGHLIGHTS4 CHAIR’S REPORT
6 A2DOMINION AT A GLANCE
8 PROVIDING NEW HIGH-QUALITY HOMES
10 CASE STUDY: SHARED OWNERSHIP
13 DELIVERING CUSTOMER-LED SERVICES
14 CASE STUDY: PRIVATE RENT
17 INVESTING IN HOMES AND LOCAL COMMUNITIES
18 STRENGTHENING OUR BUSINESS
20 DEVELOPMENT PORTFOLIO

HIGHLIGHTS
CHAIR’S REPORT
Welcome to A2Dominion’s Annual Report & Accounts.
4 5
OVERVIEW
Centenary Quay, SouthamptonA scheme of 102 new apartments, part of A2Dominion’s growing portfolio of private rented homes.
This has been another very successful year for the Group as we have continued to grow and strengthen our business.
Our core objectives are to provide a range of well-managed homes to fit the incomes and lifestyles of people living in the areas we serve and in 2016/17, we exceeded our two-year target to create 1,800 new homes.
As availability of government grants and subsidised land for affordable homes is limited, the profits we make from our private development and private lettings are used to cross-subsidise our affordable housing.
I am pleased to report that the surplus for the year was £84.1m, which has enabled us to continue to meet our objectives. This was achieved despite the government requiring our affordable rents to reduce by
1% per annum, before taking inflation into account.
The other key funding stream is our borrowing and both the availability of finance and the interest rates we pay are critical. The Group’s positive credit rating ensures new funding is achieved at the keenest rate, and during the year the first tranche of £250m was drawn from a newly arranged £1bn Euro Medium Term Note Programme platform.
We monitor property management and overhead costs and have a continuing cost reduction programme which needs to be achieved without a diminution in service provision to customers. Social housing management costs during the year were reduced by 6.7%.
In 2016/17, we launched our three-year business change programme,
Fit for the Future, and are investing £20m into transforming the way we work and improving services we provide for our customers.
Looking ahead, there are clearly uncertainties relating to both the property market and the impact of the Brexit negotiations. However, A2Dominion has continued to build its asset base and financial strength. We are confident that we are well-prepared to deal with any eventuality.
This report is an opportunity for me to publicly thank all my board and committee colleagues, our executive and staff, and all the partners and customers with whom we work.
On a personal note, this will be my last Chair’s report. The Chair’s tenure is limited to six years and my term ends July 2017.
My able replacement will be Ian Cox, who has already served on the Board for three years, and comes with a wealth of development knowledge.
It has been a wonderful experience both for me personally and for the success of the Group. My heartfelt thanks to all those who have supported and advised me. I do not need to wish the Group good fortune in the future as the people in the organisation are already geared up to succeed.
Derek JosephChair
A2DOMINION ANNUAL REPORT & ACCOUNTS 20174 5HIGHLIGHTS

A2Dominion is a residential property group with almost 37,000 homes across London and southern England, and thousands more in the development pipeline.We provide affordable, private and social rented homes, student, NHS and temporary accommodation, as well as supported housing and homes for older people.We also offer high-quality sustainable homes for sale and shared ownership, available through our FABRICA by A2Dominion brand.Whilst we take a commercial approach to housebuilding, all of the surpluses the Group generates are reinvested into supporting our social purpose, helping to deliver more homes and services for customers. A2Dominion is also part of the g15, a group of the largest housing providers in London.www.a2dominion.co.uk
A2DOMINION AT A GLANCE
WHO?
36,739 properties owned or managed
6,398 homes in development
£371.9m turnover
£8.7bn open market asset base
Pyramid Plus is the name of our asset management companies that provide services to the private, public and not-for-profit sectors.
www.pyramidplus.co.uk
FABRICA by A2Dominion is our brand for marketing many of our new homes which are available for private sale and shared ownership.
www.fabrica.co.uk
HOW?
WHY?
WE ARE COMMITTED TO WORKING
TOWARDS OUR FOUR KEY
BUSINESS OBJECTIVES
PROVIDE NEW HIGH-QUALITY HOMES AND PLACES
DELIVER CU
STOM
ER-LED
SERVICES
INVEST IN OUR HOMES AND LOCAL COMMUNITIES
STRE
NG
THEN
OU
R BU
SIN
ESS
1
2
3
4
To improve people’s lives through quality homes and services
WHERE?
1,000+
100-999
0-99
No activity at present
Number of properties in management and development
A2DOMINION ANNUAL REPORT & ACCOUNTS 20176 7HIGHLIGHTS
HIGHLIGHTS
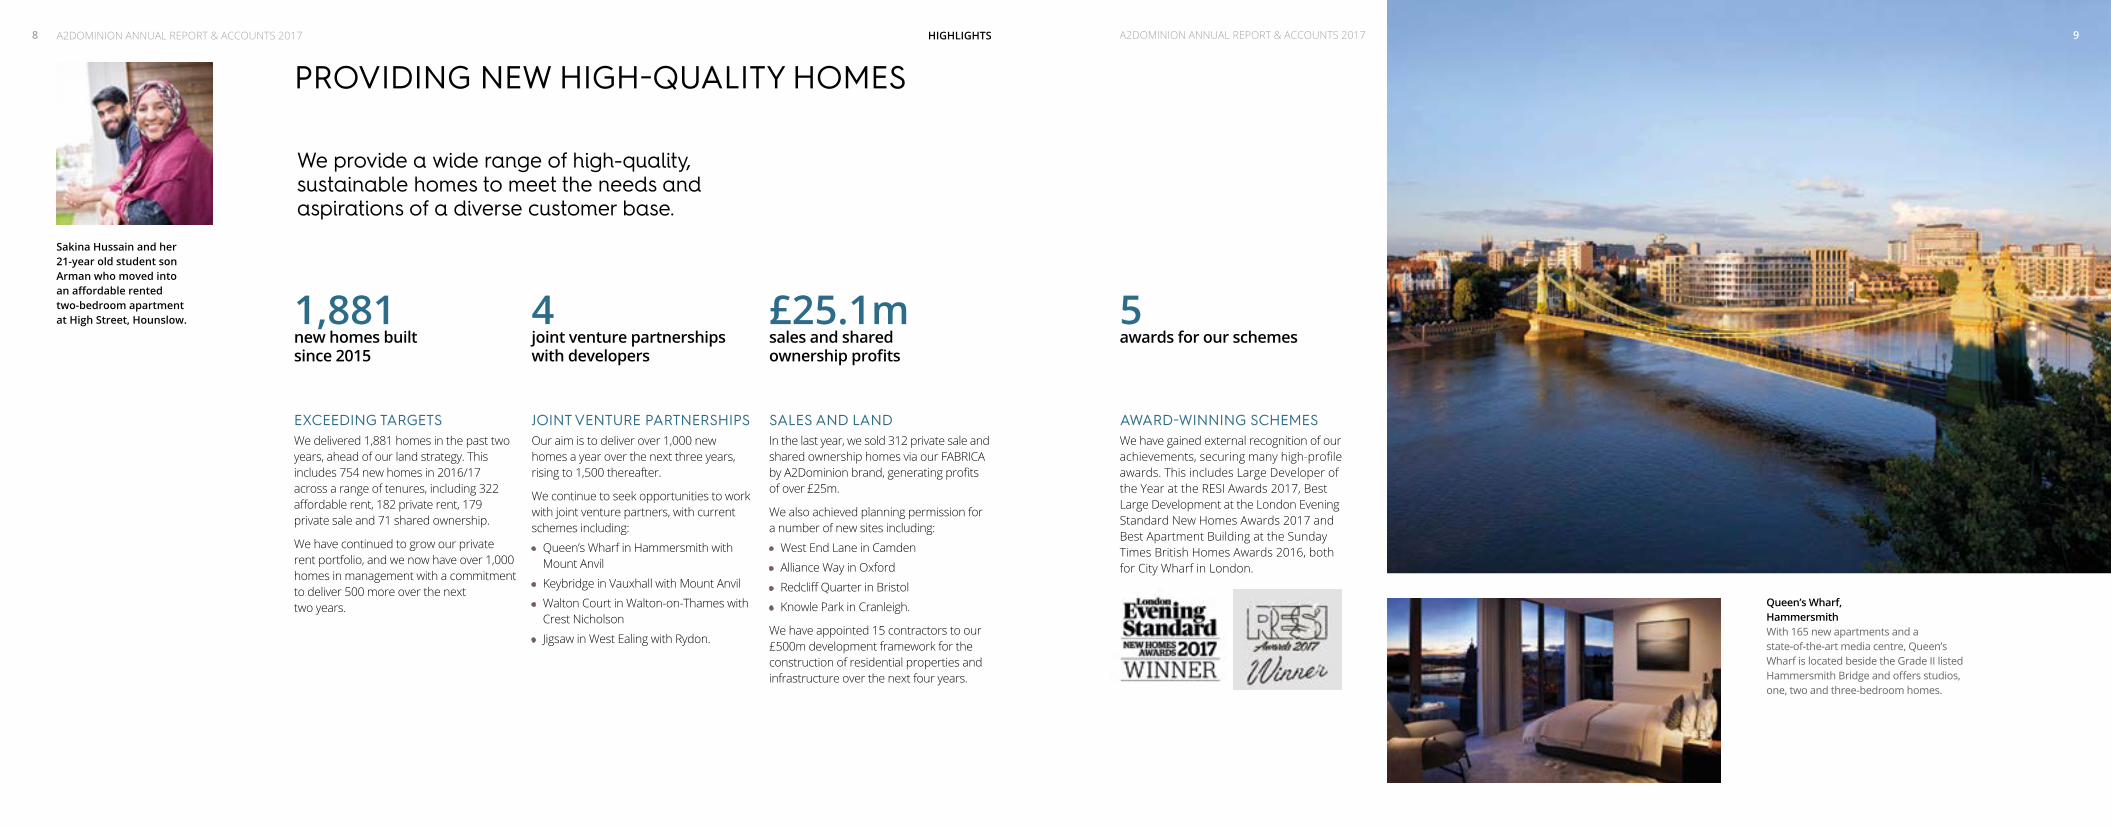
EXCEEDING TARGETSWe delivered 1,881 homes in the past two years, ahead of our land strategy. This includes 754 new homes in 2016/17 across a range of tenures, including 322 affordable rent, 182 private rent, 179 private sale and 71 shared ownership.
We have continued to grow our private rent portfolio, and we now have over 1,000 homes in management with a commitment to deliver 500 more over the next two years.
JOINT VENTURE PARTNERSHIPSOur aim is to deliver over 1,000 new homes a year over the next three years, rising to 1,500 thereafter.
We continue to seek opportunities to work with joint venture partners, with current schemes including:
• Queen’s Wharf in Hammersmith with Mount Anvil
• Keybridge in Vauxhall with Mount Anvil
• Walton Court in Walton-on-Thames with Crest Nicholson
• Jigsaw in West Ealing with Rydon.
SALES AND LANDIn the last year, we sold 312 private sale and shared ownership homes via our FABRICA by A2Dominion brand, generating profits of over £25m.
We also achieved planning permission for a number of new sites including:
• West End Lane in Camden
• Alliance Way in Oxford
• Redcliff Quarter in Bristol
• Knowle Park in Cranleigh.
We have appointed 15 contractors to our £500m development framework for the construction of residential properties and infrastructure over the next four years.
PROVIDING NEW HIGH-QUALITY HOMES
Sakina Hussain and her 21-year old student son Arman who moved into an affordable rented two-bedroom apartment at High Street, Hounslow. 1,881
new homes built since 2015
4 joint venture partnerships with developers
£25.1msales and shared ownership profits
We provide a wide range of high-quality, sustainable homes to meet the needs and aspirations of a diverse customer base.
AWARD-WINNING SCHEMESWe have gained external recognition of our achievements, securing many high-profile awards. This includes Large Developer of the Year at the RESI Awards 2017, Best Large Development at the London Evening Standard New Homes Awards 2017 and Best Apartment Building at the Sunday Times British Homes Awards 2016, both for City Wharf in London.
5awards for our schemes
Queen’s Wharf, HammersmithWith 165 new apartments and a state-of-the-art media centre, Queen’s Wharf is located beside the Grade II listed Hammersmith Bridge and offers studios, one, two and three-bedroom homes.
8 A2DOMINION ANNUAL REPORT & ACCOUNTS 2017A2DOMINION ANNUAL REPORT & ACCOUNTS 2017 9

Case study
SHARED OWNERSHIP Our diverse development programme includes creating new homes for shared ownership, giving first-time buyers the opportunity to get onto the property ladder.
Gemma Marsh and her husband David, both 35, have upsized from their small two-bedroom flat in Stanwell to a three-bedroom shared ownership home in Kingston Crescent, Ashford.
The couple, who both work at Heathrow Airport and have a two-year-old daughter Auraya, are delighted with their new home, in which they own a 45% share.
It is part of a collection of three-bedroom houses, and comes with a private garden and off-street parking.
Gemma said: “We were looking for a location that was convenient to shops, restaurants, and other local amenities whilst also being an easy commute to our work at Heathrow Airport. That’s exactly what we found with Kingston Crescent.
“After making an immediate offer, we had moved in within a few months. It was great moving into a brand new house in a lovely neighbourhood, and we’ve been able to put our own stamp on it making it a beautiful home for our family.”
“ The moment we walked in we fell in love with it. It’s a very quiet and peaceful neighbourhood and the perfect size.”
LONDON
KINGSTON CRESCENT ASHFORD (SURREY)
Gemma Marsh
11A2DOMINION ANNUAL REPORT & ACCOUNTS 201710

HIGHLIGHTS
“ I’m delighted with this apartment as my first proper home. The sales process was seamless, quick and easy, and all completed within a month. A2Dominion was fantastic.”
First-time buyer Patrick Evans, 31, who has purchased an apartment at Jigsaw, a regeneration scheme in West Ealing.
Top Customer, Erin Hinson.
Right Elmsbrook,NW Bicester.
Far right Jigsaw,West Ealing.
CUSTOMER SATISFACTIONSatisfaction with our Customer Service Centre has increased to 83%.
We continually use customer feedback to help us improve our services, with over 20,000 people giving us their views last year.
A total of 96% of customers were satisfied with the performance of our defects team and 92% with the performance of contractors for affordable new homes.
DIGITAL SERVICESWe are providing more online services for our customers and now have over 10,000 people registered to our improved online customer portal, My Account, which provides access to many online services, including requesting repairs, checking statements and reporting issues.
We also provided digital training to over 250 customers ahead of the introduction of Universal Credit, the government’s new online benefit system.
TENANCY SUPPORTWe helped our customers to receive £5.5m in housing benefit, discretionary housing payments and other sources, up from £4.7m the previous year.
OUTSTANDING LANDLORD RECOGNITION At the UK Housing Awards 2016, we were highly commended in the categories of Outstanding Landlord of the Year and Outstanding Approach to Income Management. We were also Highly Commended in the Landlord of the Year category at the RESI Awards 2016.
DELIVERING CUSTOMER-LED SERVICES
83% customer satisfaction
10,000 people using our online customer portal
£5.5m financial support for customers
We offer services that meet a variety of needs, and our focus is to consistently deliver an excellent customer experience.
A2DOMINION ANNUAL REPORT & ACCOUNTS 201712 13HIGHLIGHTS A2DOMINION ANNUAL REPORT & ACCOUNTS 2017

Case study
PRIVATE RENT
We are meeting a growing demand for high-quality private rented homes by expanding our portfolio, adding 182 new properties in 2016/17. With more than 1,000 private rented homes now in management, we have committed to providing 500 more over the next two years.
“ Everyone at A2Dominion’s rental team was very helpful at every stage and were quick to give information on any queries I had.”
Retiree Clive Hillman, 69, lives in a private rented apartment at Centenary Quay, a waterside scheme in Southampton.
Moving in just six weeks after first viewing the two-bedroom home, Clive said: “It was by far the most straight-forward and easy moving process I have encountered.”
Situated next to the River Itchen and with views of the marina, Clive added: “Nothing can beat the beautiful river views and the south-facing outlook.
“The convenience of the property is also perfect for my lifestyle and is in close proximity to my son who lives nearby. I’m absolutely delighted.”
CENTENARY QUAY SOUTHAMPTON
Clive Hillman
15A2DOMINION ANNUAL REPORT & ACCOUNTS 201714 HIGHLIGHTS
HIGHLIGHTS
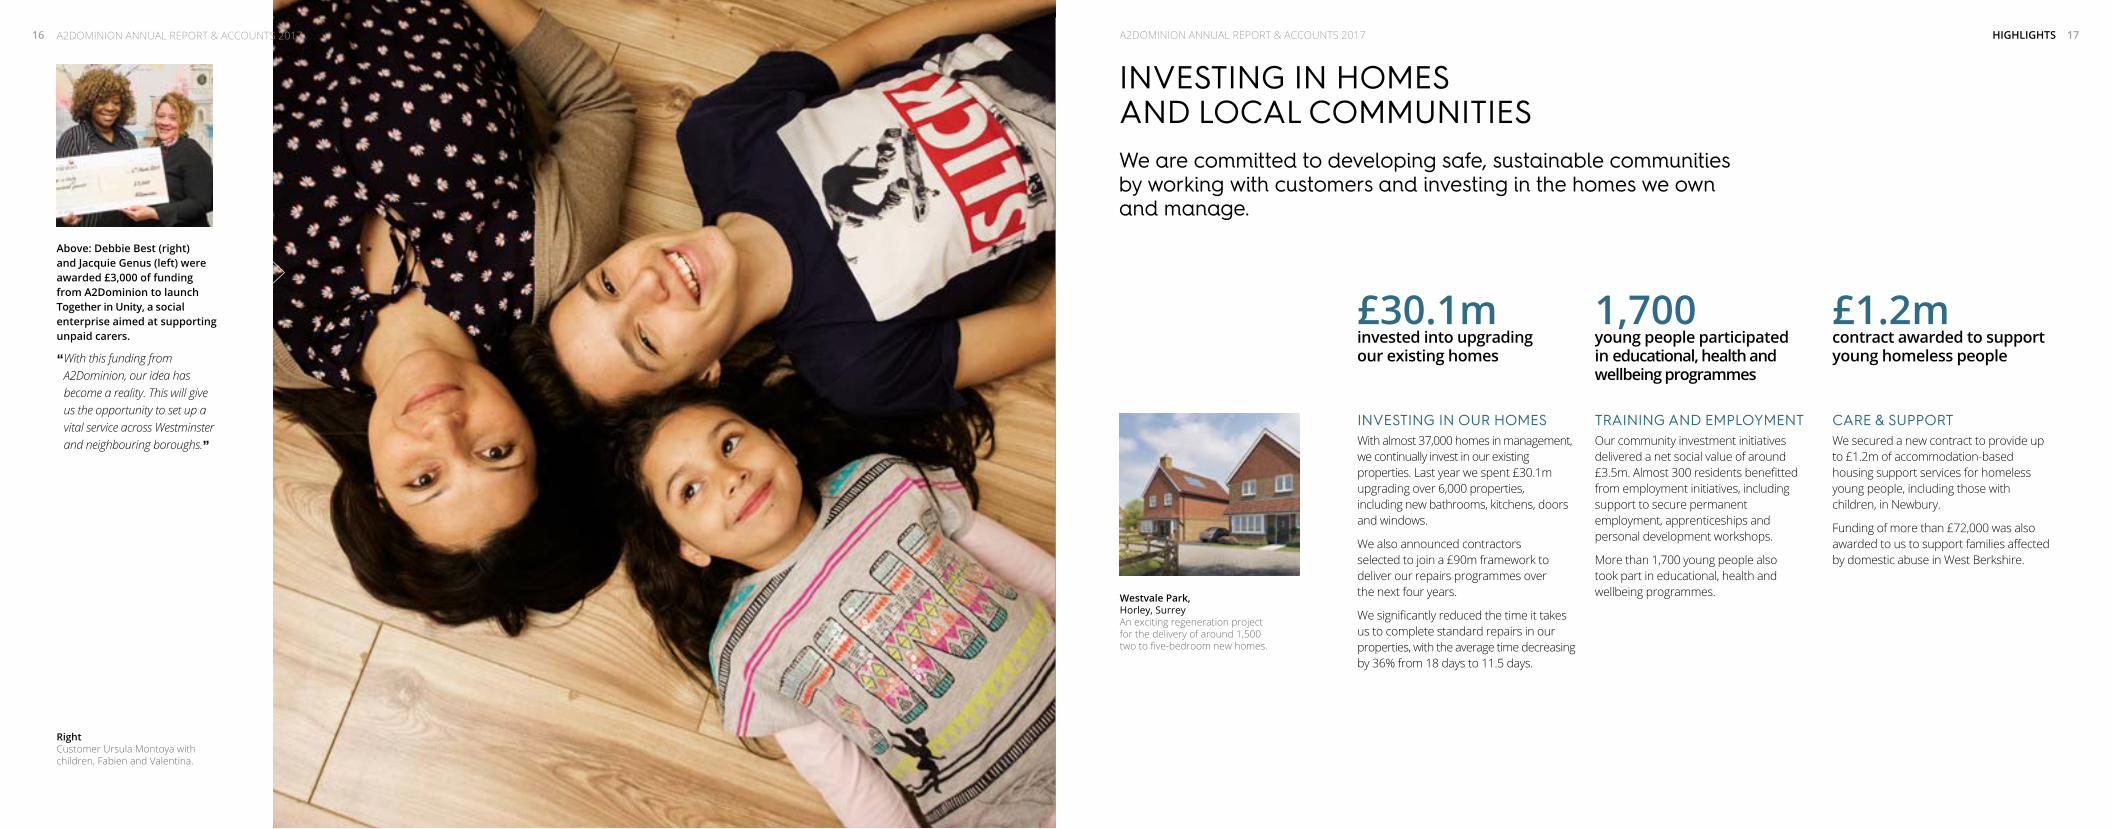
Above: Debbie Best (right) and Jacquie Genus (left) were awarded £3,000 of funding from A2Dominion to launch Together in Unity, a social enterprise aimed at supporting unpaid carers.
“ With this funding from A2Dominion, our idea has become a reality. This will give us the opportunity to set up a vital service across Westminster and neighbouring boroughs.”
INVESTING IN OUR HOMESWith almost 37,000 homes in management, we continually invest in our existing properties. Last year we spent £30.1m upgrading over 6,000 properties, including new bathrooms, kitchens, doors and windows.
We also announced contractors selected to join a £90m framework to deliver our repairs programmes over the next four years.
We significantly reduced the time it takes us to complete standard repairs in our properties, with the average time decreasing by 36% from 18 days to 11.5 days.
TRAINING AND EMPLOYMENT Our community investment initiatives delivered a net social value of around £3.5m. Almost 300 residents benefitted from employment initiatives, including support to secure permanent employment, apprenticeships and personal development workshops.
More than 1,700 young people also took part in educational, health and wellbeing programmes.
CARE & SUPPORT We secured a new contract to provide up to £1.2m of accommodation-based housing support services for homeless young people, including those with children, in Newbury.
Funding of more than £72,000 was also awarded to us to support families affected by domestic abuse in West Berkshire.
INVESTING IN HOMES AND LOCAL COMMUNITIES
£30.1m invested into upgrading our existing homes
1,700 young people participated in educational, health and wellbeing programmes
£1.2m contract awarded to support young homeless people
We are committed to developing safe, sustainable communities by working with customers and investing in the homes we own and manage.
Westvale Park, Horley, SurreyAn exciting regeneration project for the delivery of around 1,500 two to five-bedroom new homes.
Right Customer Ursula Montoya with children, Fabien and Valentina.
17A2DOMINION ANNUAL REPORT & ACCOUNTS 2017A2DOMINION ANNUAL REPORT & ACCOUNTS 201716
STRENGTHENING OUR BUSINESS continued
HIGHLIGHTSHIGHLIGHTS
STRENGTHENING OUR BUSINESS
£84.1m surplus
£371.9m turnover
£250m raised from the bond market
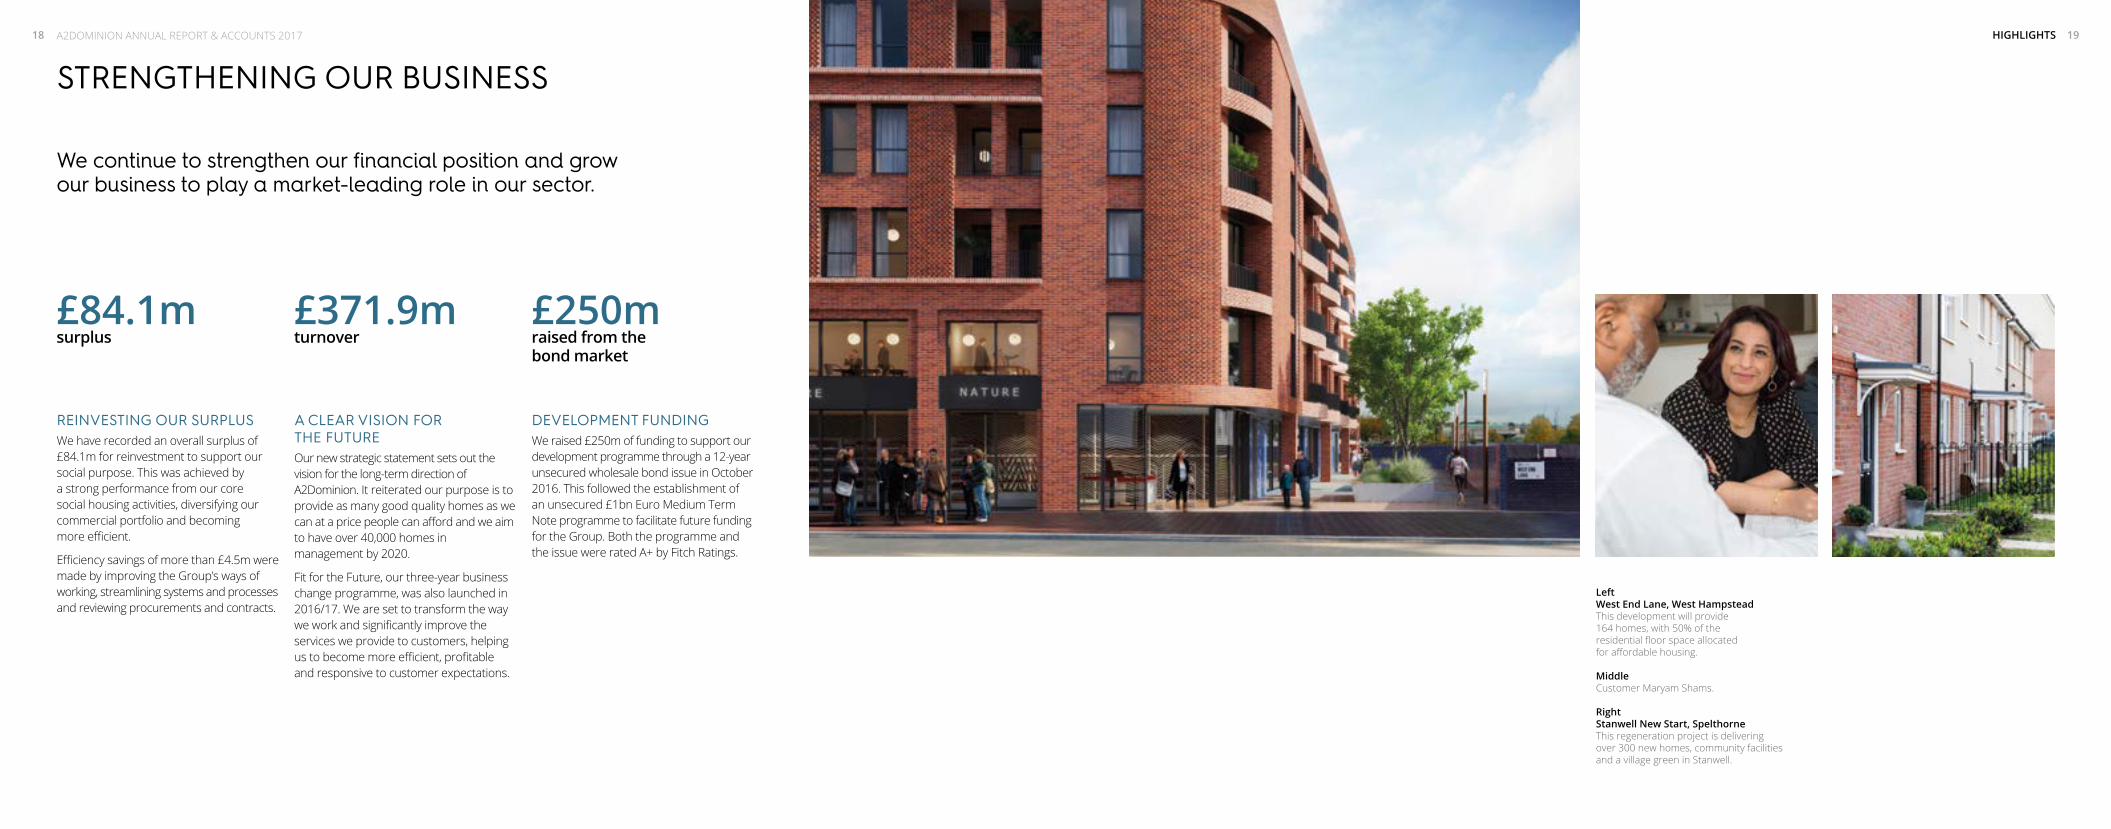
REINVESTING OUR SURPLUSWe have recorded an overall surplus of £84.1m for reinvestment to support our social purpose. This was achieved by a strong performance from our core social housing activities, diversifying our commercial portfolio and becoming more efficient.
Efficiency savings of more than £4.5m were made by improving the Group’s ways of working, streamlining systems and processes and reviewing procurements and contracts.
A CLEAR VISION FOR THE FUTUREOur new strategic statement sets out the vision for the long-term direction of A2Dominion. It reiterated our purpose is to provide as many good quality homes as we can at a price people can afford and we aim to have over 40,000 homes in management by 2020.
Fit for the Future, our three-year business change programme, was also launched in 2016/17. We are set to transform the way we work and significantly improve the services we provide to customers, helping us to become more efficient, profitable and responsive to customer expectations.
DEVELOPMENT FUNDINGWe raised £250m of funding to support our development programme through a 12-year unsecured wholesale bond issue in October 2016. This followed the establishment of an unsecured £1bn Euro Medium Term Note programme to facilitate future funding for the Group. Both the programme and the issue were rated A+ by Fitch Ratings.
We continue to strengthen our financial position and grow our business to play a market-leading role in our sector.
LeftWest End Lane, West Hampstead This development will provide 164 homes, with 50% of the residential floor space allocated for affordable housing.
MiddleCustomer Maryam Shams.
Right Stanwell New Start, SpelthorneThis regeneration project is delivering over 300 new homes, community facilities and a village green in Stanwell.
A2DOMINION ANNUAL REPORT & ACCOUNTS 201718 19

DEVELOPMENT PORTFOLIO continued
HIGHLIGHTSHIGHLIGHTS
DEVELOPMENT PORTFOLIO
City Wharf, HackneyCity Wharf provides 327 new homes in a tranquil waterside location in north London. With a unique weathered steel façade and warehouse brick and timber features, the apartments are arranged across four buildings overlooking Wenlock Basin. The scheme has won a raft of awards, including Best Apartment Building at The Sunday Times British Home Awards and Best Exterior Design at the What House? Awards.
Elmsbrook, NW BicesterElmsbrook is the initial phase of the country’s first eco-town at NW Bicester, Oxfordshire. Comprising 393 highly sustainable new homes, it is the first true zero carbon development of its size in the UK. The scheme is one of just 16 projects worldwide to have been awarded BioRegional’s One Planet Community status, and the homes meet Code for Sustainable Homes Level 5.
Canons Gate and Invicta, Bristol This is a waterfront regeneration scheme that has been developed in collaboration with Crest Nicholson. The scheme enjoys a tranquil harbourside location and features 147 homes for private rent, ranging from one-bedroom to three-bedroom apartments. Residents benefit from modern interiors, landscaped communal gardens and a location close to transport links and a variety of bars, restaurants and shops.
Redcliff Quarter, Bristol We are providing 128 apartments for private rent at the major Redcliff Quarter regeneration project in Bristol. Part of a £180m, 600,000 sq ft development with Change Real Estate, it is our third private rent scheme in Bristol and will be one of our largest in the south west region. Photograph courtesy of Lyons+Sleeman+Hoare Ltd
Our development programme delivers a diverse range of homes, from small boutique schemes to large-scale regeneration projects.We continue to increase the number of homes we own and manage, with over 6,000 properties in our development pipeline.
A2DOMINION ANNUAL REPORT & ACCOUNTS 201720 21

HIGHLIGHTS
Fellows Square, CricklewoodFellows Square is a 230-home development with commercial space on the site of a former postal depot. The scheme, bordering major regeneration projects in Brent Cross and Cricklewood, will feature landscaped gardens and amenities, an on-site concierge and gym. The scheme includes homes for sale, private rent, shared ownership and affordable rent.
Camberwell Road, SouthwarkWe have developed plans to create 84 new homes at a site on the corner of Wyndham Road and Camberwell Road in Southwark. Subject to planning, the scheme is set to provide properties for private sale, affordable rent and shared ownership. In addition there will be commercial space to attract new businesses to the area.
Westvale Park, HorleyWestvale Park is an exciting regeneration project for the delivery of around 1,500 two to five-bedroom homes in Horley, Surrey. We are working as part of a consortium of developers including Crest Nicholson, Taylor Wimpey and Charles Church. Formerly known as Meath Green, this major new community will include a neighbourhood centre, primary school, public space and play facilities.
Carlton House, PutneySituated in the heart of Putney, Wandsworth, we are transforming a former office building into 73 new apartments along with commercial space. A large space on the fourth floor will include a children’s play area and ground floor commercial units will provide an attractive frontage to the scheme.
Jigsaw, West EalingPhase three of the transformation of the Green Man Lane estate in West Ealing is starting in autumn 2017, delivering new apartments, maisonettes and houses.
The regeneration scheme will provide up to 800 homes once complete along with an eco-friendly energy centre, community café, public parks, play areas and a primary school.
The scheme, which was a finalist for Best Regeneration Project at the London Evening Standard New Homes Awards, is a joint venture with Rydon and has been designed by Conran and Partners.
156 West End Lane, West HampsteadWe have secured planning permission for a major homes-led regeneration scheme in West Hampstead, north west London. The development, 156 West End Lane, will provide 164 homes, with 50% of the residential floor space allocated for affordable housing. The scheme will include workspace for local small businesses and start-ups, helping to bring investment and jobs to the area.
The Lamptons, HounslowA disused 1970s office block has been transformed to provide 155 new apartments, supporting a multi-million pound regeneration of Hounslow town centre. The Lamptons provides homes for shared ownership, private rent and affordable rent, all with balconies and terraces. The development includes landscaped gardens, a communal landscaped roof terrace and a children’s play area.
Queen’s Wharf, HammersmithWe are redeveloping the site of the former Riverside Studios and a neighbouring office block to create 165 new apartments, as well as a state-of-the-art media centre. A joint venture with Mount Anvil, Queen’s Wharf is located beside the Grade II listed Hammersmith Bridge and offers studios, one, two and three-bedroom homes.
Keybridge, VauxhallWe are working in partnership with Mount Anvil to redevelop a striking 36-storey former BT office block within the Nine Elms Battersea Opportunity Area in London. The scheme will create the UK’s tallest residential brick tower and provide 470 new homes from studios to three-bedroom apartments and commercial space. Completion of the project is expected by April 2019.
A2DOMINION ANNUAL REPORT & ACCOUNTS 201722 23HIGHLIGHTSA2DOMINION ANNUAL REPORT & ACCOUNTS 2017

STRATEGIC REPORT27 OVERVIEW OF THE BUSINESS
28 STRATEGIC OBJECTIVES
29 GOVERNANCE AND REGULATION
30 INVESTMENT
30 DEVELOPMENT
31 THE FUTURE
32 RISK
34 PERFORMANCE SUMMARY
35 OPERATIONAL PERFORMANCE
37 STOCK PROFILE
38 VALUE FOR MONEY AT A2DOMINION
42 FINANCIAL REVIEW

A2DOMINION ANNUAL REPORT & ACCOUNTS 201726 27SECTION HEADER A2DOMINION ANNUAL REPORT & ACCOUNTS 2017 STRATEGIC REPORT
Other key office locations are Ealing, Bromley and Oxford from where A2Dominion Homes operates, and Staines-upon-Thames and Winchester from where A2Dominion South operates.
A2Dominion Housing Group Limited, as the parent association, provides the strategic direction, along with central, financial and development services. During the year ended 31 March 2017 the Group consisted of three social landlords:
A2Dominion Homes and A2Dominion South, which are charitable organisations operating within these main business areas:
• long-term rented housing for people who are unable to afford to rent or buy in the open market;
• housing for older people, supported housing and care for those who need additional support;
• temporary housing for those who would otherwise be homeless;
• low-cost home ownership housing, particularly shared ownership; and
• student accommodation, NHS accommodation and private rented homes.
A2Dominion Housing Options, a non-charitable organisation providing low-cost home ownership homes, particularly shared ownership.
The commercial division consists of A2Dominion Developments Limited, developing homes for private sale and homes for affordable rent, shared ownership and private rent that are sold to members of the Group to manage. These activities generate profits which are reinvested in the provision of affordable housing, enabling the Group to grow organically through the development of mixed tenure schemes
The Group has established A2Dominion Residential Limited to provide private rental homes to the open market with an ongoing management service for the residents. This also incorporates an active asset management approach for these homes.
The Group’s new homes for private sale and shared ownership are marketed under its FABRICA by A2Dominion brand.
At 31 March 2017 the Group looked after 36,739 homes including offices, commercial space, garages and community spaces.
The full open market value of these homes owned is £8.7bn, significantly in excess of the homes original historic cost of £2.5bn.
OVERVIEW OF THE BUSINESS
The A2Dominion Group is one of the largest housing organisations in southern England, operating in London and throughout the South East with its head office in central London.
2013 2014 2015 2016 2017
34,343
3,509
34,818
4,641
35,399
4,428
36,130
3,856
36,739
5,402
Homes owned and in management Homes in development (for capital commitment purposes only)
Centenary Quay, Southampton A new development of one and two bedroom apartments located next to the banks of River Itchen.
A2DOMINION ANNUAL REPORT & ACCOUNTS 201728 29A2DOMINION ANNUAL REPORT & ACCOUNTS 2017 STRATEGIC REPORTSTRATEGIC REPORT
STRATEGIC OBJECTIVES continuedSTRATEGIC OBJECTIVES
The Group is committed to continue working towards its four key business objectives in order to achieve the business strategy up to 2020. These objectives and priorities are as follows:
Providing new high-quality homes and places:
• developing up to 1,500 new homes each year by leveraging its resources.
• retention of its current 36,000 plus properties under management with no anticipated further stock rationalisation.
Investing in homes and local communities:
• continuing with current plans to build around 40% for private sale and 60% split between rented (affordable and private) and shared ownership properties.
• focusing on building great places to live by providing well-designed larger housing schemes with a strong sense of community regardless of tenure.
Delivering customer-led services:
• developing a clear, simple and consistently well-delivered customer offer regardless of tenure, scheme or location.
• providing more flexible services to suit its different customers’ needs by responding quicker when things go wrong and offering greater choice.
• providing subsidised services with wider community benefits by delivering care and support for vulnerable people and investment in the local communities.
Strengthening the business:
• continuing to invest in developing, retaining and attracting great people to create a talented workforce.
• continuing to enhance its approach to risk management and compliance, maintaining a strong position by taking a sensible and pragmatic approach to opportunities and threats.
• investing in technology and standardising business processes in order to improve customer experience as well as increasing efficiency and integration across the business.
To support the delivery of these objectives the Board agreed to invest significantly into a business transformation programme, “the Fit for the Future Programme”. This programme will transform the way the organisation works and significantly improve the services it provides to its customers over the next few years. A2Dominion will become more efficient, profitable and responsive to customer expectations whilst making it easier for its staff to do their roles. The benefits from this programme form part of the Group’s value for money long-term targets.
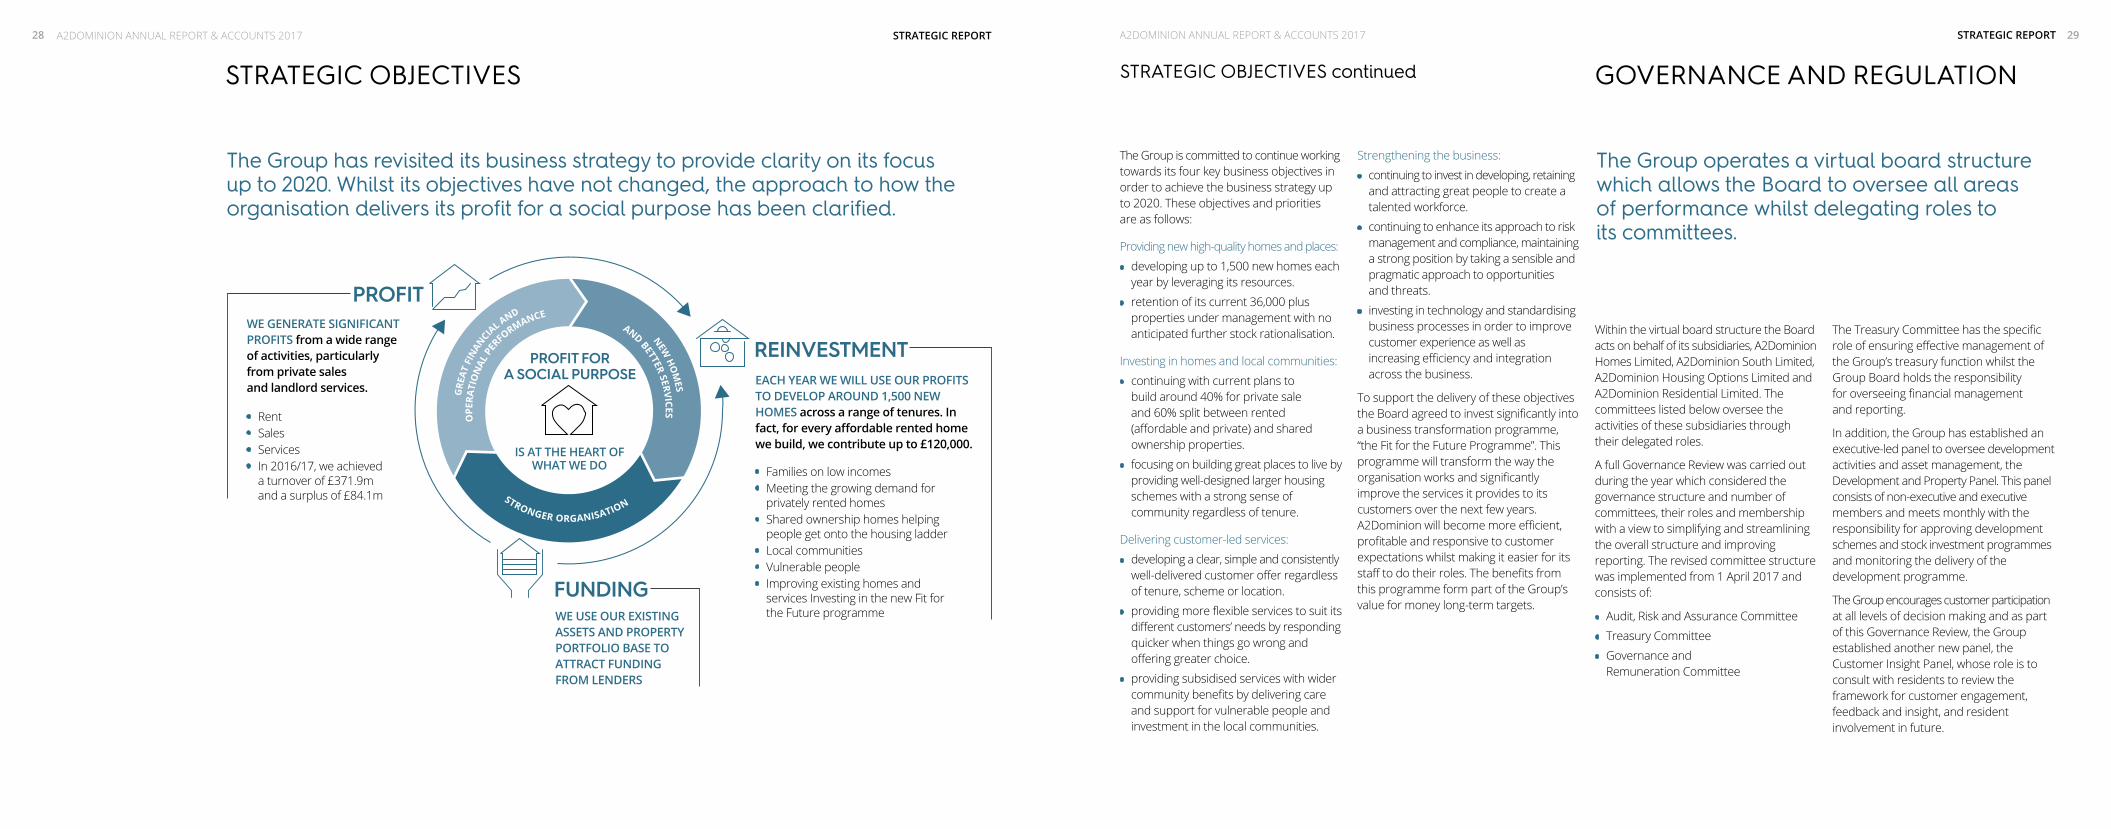
The Group has revisited its business strategy to provide clarity on its focus up to 2020. Whilst its objectives have not changed, the approach to how the organisation delivers its profit for a social purpose has been clarified.
Within the virtual board structure the Board acts on behalf of its subsidiaries, A2Dominion Homes Limited, A2Dominion South Limited, A2Dominion Housing Options Limited and A2Dominion Residential Limited. The committees listed below oversee the activities of these subsidiaries through their delegated roles.
A full Governance Review was carried out during the year which considered the governance structure and number of committees, their roles and membership with a view to simplifying and streamlining the overall structure and improving reporting. The revised committee structure was implemented from 1 April 2017 and consists of:
• Audit, Risk and Assurance Committee
• Treasury Committee
• Governance and Remuneration Committee
The Treasury Committee has the specific role of ensuring effective management of the Group’s treasury function whilst the Group Board holds the responsibility for overseeing financial management and reporting.
In addition, the Group has established an executive-led panel to oversee development activities and asset management, the Development and Property Panel. This panel consists of non-executive and executive members and meets monthly with the responsibility for approving development schemes and stock investment programmes and monitoring the delivery of the development programme.
The Group encourages customer participation at all levels of decision making and as part of this Governance Review, the Group established another new panel, the Customer Insight Panel, whose role is to consult with residents to review the framework for customer engagement, feedback and insight, and resident involvement in future.
GOVERNANCE AND REGULATION
The Group operates a virtual board structure which allows the Board to oversee all areas of performance whilst delegating roles to its committees.
WE GENERATE SIGNIFICANT PROFITS from a wide range of activities, particularly from private sales and landlord services.
WE USE OUR EXISTING ASSETS AND PROPERTY PORTFOLIO BASE TO ATTRACT FUNDING FROM LENDERS
EACH YEAR WE WILL USE OUR PROFITS TO DEVELOP AROUND 1,500 NEW HOMES across a range of tenures. In fact, for every affordable rented home we build, we contribute up to £120,000.
• Rent• Sales• Services• In 2016/17, we achieved
a turnover of £371.9m and a surplus of £84.1m
• Families on low incomes• Meeting the growing demand for
privately rented homes• Shared ownership homes helping
people get onto the housing ladder• Local communities• Vulnerable people• Improving existing homes and
services Investing in the new Fit for the Future programme
GRE
ATFI
NAN
CIAL AND
OPE
RATI
ON
ALPE
RFORMANCE
NEWH
OM
ES
AND
BETTERSERVICES
STRONGER ORGANISATION
PROFIT
PROFIT FOR A SOCIAL PURPOSE
REINVESTMENT
FUNDING
IS AT THE HEART OF WHAT WE DO
A2DOMINION ANNUAL REPORT & ACCOUNTS 201730 STRATEGIC REPORT 31A2DOMINION ANNUAL REPORT & ACCOUNTS 2017
DEVELOPMENT continued
STRATEGIC REPORT
A total investment of £30.1m was made during the year with £25.1m of this being invested into improving over 6,000 of A2Dominion’s homes with the upgrade of hundreds of new bathrooms, kitchens, doors and windows, as well as 10 major refurbishment schemes.
Through the Corporate Social Responsibility programme and staff fundraising initiatives the Group has donated over £33,000 to communities and charity groups. This included £10,085 which was awarded to The Alzheimer’s Society.
During the year the Group secured £729,000 through fundraising and income generation for community initiatives. This included £286,000 from the Money Advice Service in partnership with Deloitte Digital to extend financial advice services and develop an app for residents. The Group launched Love London Working, an EU funded training programme to increase the availability of employment initiatives in partnership with Clarion Housing Group.
The priority neighbourhood strategy delivers a range of projects and programmes with the aim of improving the lives of residents. 1,778 young people participated in educational, health and wellbeing programmes in nine of the Group’s key neighbourhoods this year.
Community investment initiatives delivered a net social value of around £3.4m. 297 customers benefitted from employment initiatives. 89 residents secured permanent employment in the Group’s Pathways to Work initiative, 53 attended personal development and employability workshops and nine secured apprenticeships.
Customer segmentation work and a recent contact review, highlighted a number of opportunities within the Group to increase first time resolution of customer contact, reduce inefficient hand-offs and improve the customer journey. The improvements identified have been incorporated into the Group’s Fit for the Future programme.
To enable this growth, the Group develops schemes with multiple tenures allowing the outright sale homes to generate surpluses to support the development of the affordable homes. The number of homes in A2Dominion’s development pipeline is at its highest level, reaching to over 5,000 homes at the end of the year. These have been identified and secured using the Group’s financial resources derived from utilising the strong asset base it has.
The development strategy remains the same as previous years and reflects the expectation that government grant levels are likely to remain low. The mix of this programme requires the private sale units to be at 40% with the remaining 60% split between rented (affordable and private) and shared ownership properties. The profits from the private sales provide the subsidy needed for the development and ongoing management of the Group’s affordable homes. These currently require a subsidy of up to £120,000 each in order to be financially viable.
Over the next two years, the aim is to increase private rented homes as well as affordable homes provision. At the end of the year, the Group had over 1,000 private rent homes in management, a 116% increase since 2014. One of the reasons why A2Dominion wants to increase the number of private rent homes is to be able to respond to the increasing demand for high-quality private rented homes. This demand comes from those who are not eligible for affordable rent, people who aspire to buy but can’t yet get onto the housing ladder, and individuals choosing to rent privately for lifestyle reasons.
To support its development activities the Group has entered into several partnerships with housebuilders to jointly develop schemes, sharing expertise and risks. Two of the Group’s joint ventures are with Mount Anvil; Queen’s Wharf is a redevelopment of the site of the famous Riverside Studios in Hammersmith which will provide 165 private apartments and a state-of-the-art media centre and Keybridge is a large development in Vauxhall, London that alongside private homes will deliver affordable and private rent homes that A2Dominion will purchase and manage for the long term. The Group also has a joint venture with Crest Nicholson that will provide over 300 new homes in Walton, Surrey of which 25% will be affordable and purchased by A2Dominion to manage going forward.
A2Dominion has delivered 1,881 homes in the past two years against a target of 1,800. This included 509 properties for private sale, 450 for private rent, 71 for shared ownership and 851 affordable homes.
INVESTMENT DEVELOPMENT THE FUTURE
A2Dominion works with customers to develop safe, sustainable communities and continues to invest in and upgrade the homes owned and managed.
A2Dominion continues to place emphasis on maximising its income and becoming more efficient.
The Group continues to increase the number of new homes it owns and manages through its development programme, with a target to build 1,200 homes each year over the next three years rising to 1,500 in subsequent years.
The continued focus on increasing the Group’s surplus is essential, as this generates the funds needed to continue developing affordable housing.
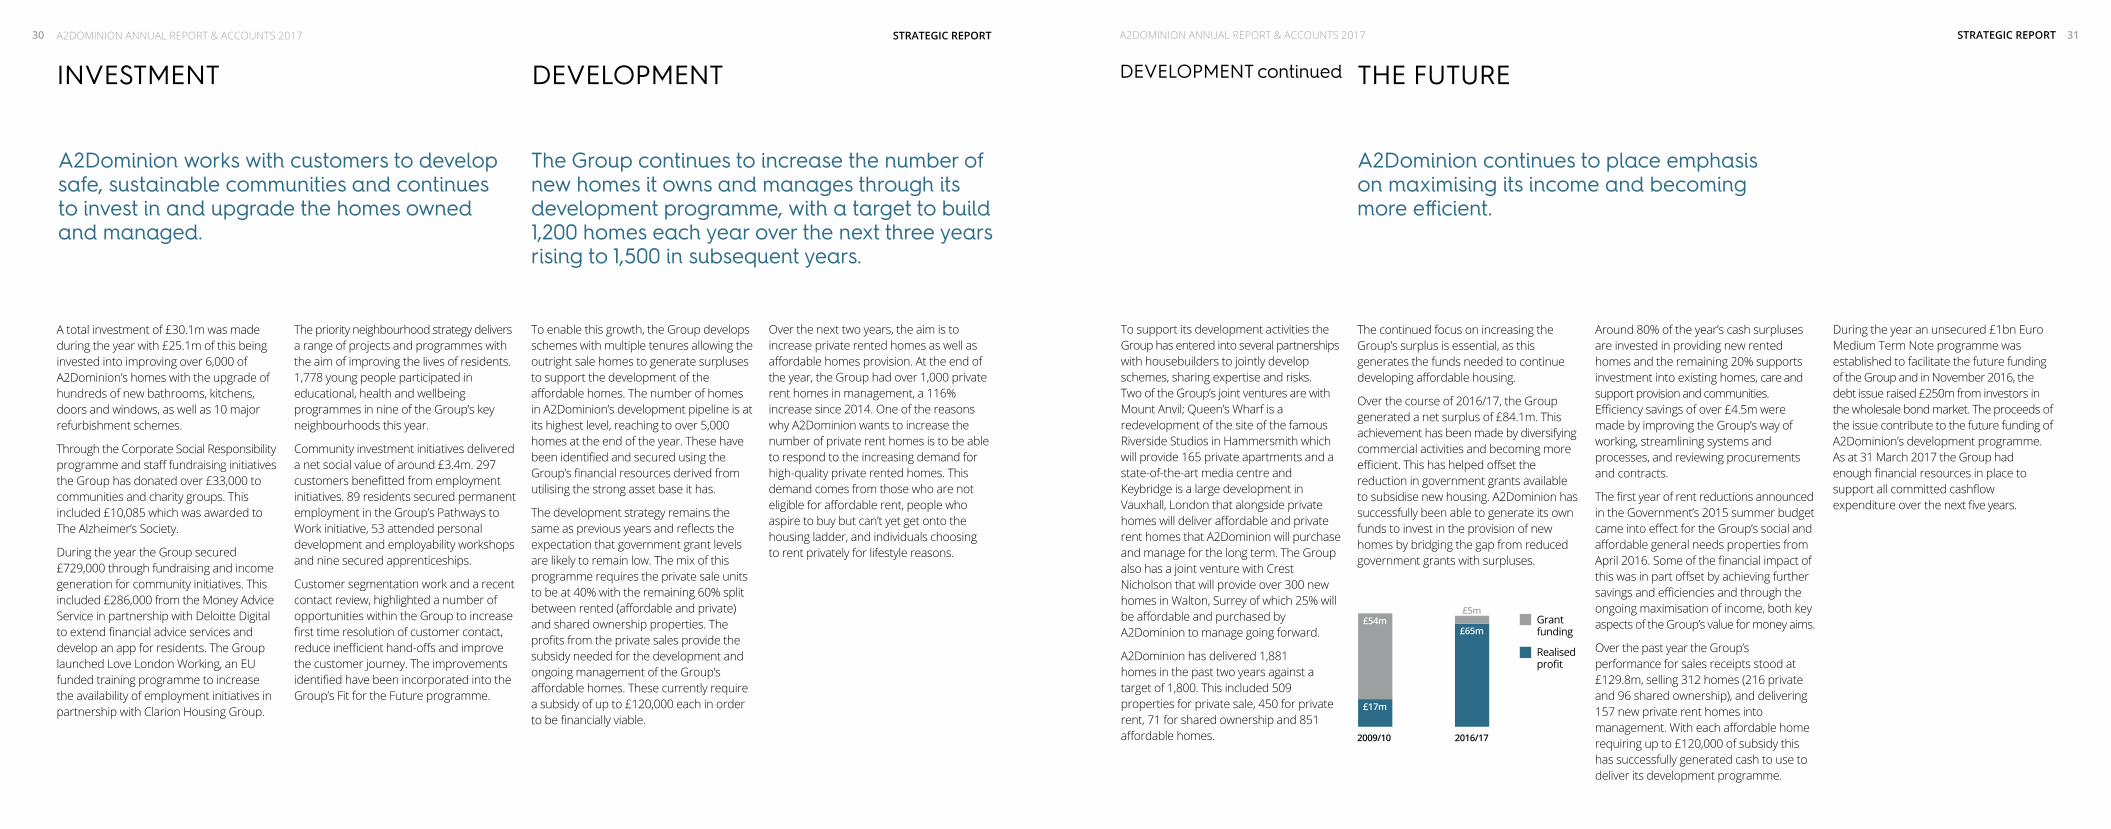
Over the course of 2016/17, the Group generated a net surplus of £84.1m. This achievement has been made by diversifying commercial activities and becoming more efficient. This has helped offset the reduction in government grants available to subsidise new housing. A2Dominion has successfully been able to generate its own funds to invest in the provision of new homes by bridging the gap from reduced government grants with surpluses.
Around 80% of the year’s cash surpluses are invested in providing new rented homes and the remaining 20% supports investment into existing homes, care and support provision and communities. Efficiency savings of over £4.5m were made by improving the Group’s way of working, streamlining systems and processes, and reviewing procurements and contracts.
The first year of rent reductions announced in the Government’s 2015 summer budget came into effect for the Group’s social and affordable general needs properties from April 2016. Some of the financial impact of this was in part offset by achieving further savings and efficiencies and through the ongoing maximisation of income, both key aspects of the Group’s value for money aims.
Over the past year the Group’s performance for sales receipts stood at £129.8m, selling 312 homes (216 private and 96 shared ownership), and delivering 157 new private rent homes into management. With each affordable home requiring up to £120,000 of subsidy this has successfully generated cash to use to deliver its development programme.
During the year an unsecured £1bn Euro Medium Term Note programme was established to facilitate the future funding of the Group and in November 2016, the debt issue raised £250m from investors in the wholesale bond market. The proceeds of the issue contribute to the future funding of A2Dominion’s development programme. As at 31 March 2017 the Group had enough financial resources in place to support all committed cashflow expenditure over the next five years.
2009/10 2016/17
£17m
£54m£65m
£5mGrant funding
Realised profit

A2DOMINION ANNUAL REPORT & ACCOUNTS 201732 33A2DOMINION ANNUAL REPORT & ACCOUNTS 2017
RISK continued
STRATEGIC REPORTSTRATEGIC REPORT
RISK
The definition of risk for this purpose is an event that could prevent the Group Business Plan from being achieved if the risk were to materialise.
The risk register records key controls to manage each risk, who is responsible for the control and how the control effectiveness is monitored. Risks are analysed according to their potential impact and probability, i.e. critical, high, medium and low, given the current control environment.
Through the process of regular review, risks which present a significant threat to the Group are reviewed at the Audit, Risk and Assurance Committee and reported to all other committees and to the Board. These risks are also reviewed, monitored and updated by senior management on a quarterly basis.
Action plans are regularly updated to mitigate any risks with both high impact and probability, in order to reduce the net future risk profile.
Risk management supports the achievement of business objectives by:
• enhancing the quality of decision-making, planning and prioritisation;
• contributing to effective allocation of resources; and
• protecting and enhancing the Group’s financial viability, assets and reputation.
Effective management of risk is a high priority within the Group because of its growth plans and the rapidly changing environment in which it operates. In order to grow and improve services, the Group needs to take some risks whilst ensuring that these are well-managed and that appropriate controls and contingencies are in place. The Group has a statement of risk appetite in place. This identifies the main risk areas for the Group and provides clarity on how much risk A2Dominion is willing to take.
The Group is affected by changes in government policy and the associated consequences that follow. As and when these are known the assessment of the risk and controls required are updated within the
Group Risk Register and monitored through the risk management cycle. The Group has identified the potential risks resulting from changes to rent policy, welfare benefit reforms and the reduction in public funding for new homes, and established appropriate actions to help mitigate their impact.
A2Dominion strives to maximise its surpluses so that it can invest in the provision of new homes and its existing portfolio, whilst continuing to support its customers. The Group is anticipating achieving its forecasted surpluses in the coming years. However there is a risk that these surpluses may fluctuate due to the introduction of the accounting framework FRS 102 which requires any movement in the value of financial and non-financial investments to be accounted for within the statement of comprehensive income.
The Group tests its resilience to risk by running scenarios on its long-term financial forecast. This includes multi-variable scenarios which test amongst other things, liquidity and covenant compliance to assess that the Group’s protection of social housing assets remains robust.
The Group has a framework in place for the Board and senior managers on A2Dominion’s approach to risk management, and a Group Risk Register is maintained.
STRATEGIC OBJECTIVE RISK AREA CONTROLS AND ACTIONS
PROVIDE NEW QUALITY HOMES AND PLACES
• Uncertainty in the housing market could impact on sustaining a large, viable residential development programme across all tenures, including:
• land availability and price; • planning delays and planning conditions;• shortage of adequately skilled labour;• sales prices, mortgage rates and mortgage availability• grant and funding conditions; and• reduced material and goods availability and price rises.
• Weekly sales reporting of performance and market projections.• Monthly cashflow reporting reflecting current sales and build costs,
split into committed and uncommitted against available funding.• Bi-annual review of land acquisition assumptions.• Impact assessments using market intelligence which includes
government policy implications.• Full quarterly reporting to committees on cashflow, treasury, scheme
delivery performance and sales performance.• Monthly contract build costs monitoring reports and project
team meetings • Continuous engagement with site managers and core subcontractors.
INVEST IN HOMES AND LOCAL COMMUNITIES
• Failure to have accurate stock condition information and programme planning could result in incorrect assessment of the long-term repairs costs.
• Failure to achieve compliance with health and safety regulations could lead to death or injury of residents.
• Inadequately managed joint ventures for repairs could lead to increased costs, failure to improve service delivery and reduced profitability.
• Reductions in Supporting People funding and failure to retain existing contracts and win new care and support contracts could lead to financial and service pressures.
• Implementation of the Group Asset Management Strategy, assessing returns on investment for the Group’s stock portfolio.
• Annual review of the long-term financial forecast repair costs.• Weekly monitoring of performance relating to gas safety and fire
safety obligations with an embedded escalation procedure identifying properties by risk profile.
• Clearly defined joint venture management and reporting structure with Group’s residents engaged through the Customer Insight Panel.
• All Supported People existing contracts and new business opportunities fully evaluated for service risk and financial risk with hurdles set.
STRENGTHEN OUR BUSINESS
• Adverse changes in the Government’s policy on rents and/or welfare reform could result in a reduction in rental income which could have an effect on customers and the Group’s long term financial forecast, risk profile and ability to develop certain types of homes.
• Adverse changes in the global economic environment such as interest rates, inflation and house prices could lead to decreased profitability and could have an impact on the long-term financial viability of the Group.
• Failure to deliver the IT strategy and associated organisation change successfully could result in non-delivery of significant service improvements and service disruption and/or staff dissatisfaction for the Group.
• Failure to be able to access financing options and maintain sufficient loan security would have an adverse effect on the funding of the development programme and future growth of the Group.
• Failure to ensure Group has appropriate cyber security arrangements in place could lead to data losses, damage to our reputation and sanctions from the Information Commissioner’s Office.
• Prudent assumptions used in the Group’s long term financial forecasting and stress testing incorporating changes to the Group’s income.
• Liquid asset register maintained. • Buffers and trigger limits established monitoring available funding,
on-lending limits and covenant compliance using projected cashflows, reported monthly to the Group Board.
• A change management team operates to monitor implementation and compliance with the Group’s IT and change strategies.
• Funding in place to meet the Group’s cashflow requirements over a three year forecast period with additional funding secured to create a buffer for the impact of changes to the economic environment.
• Annual review of the Group’s structure and specialist external advice sought for significant investments or changes.
• Virus protection, email scanning, backup processes and phishing protection in place and monitored regularly and updated as required.
• Critical Security Control Framework used to assess security risk annually.
The table below shows risks which have been identified as critical or high to the Group and which pose a threat even after mitigating action has been taken.

A2DOMINION ANNUAL REPORT & ACCOUNTS 201734 35A2DOMINION ANNUAL REPORT & ACCOUNTS 2017STRATEGIC REPORT STRATEGIC REPORT
OPERATIONAL PERFORMANCE
A number of key performance indicators are used to monitor the achievement of the Group’s strategic objectives. These are reported and reviewed on a quarterly basis by senior management and the Board and aligned to the Group’s four business objectives:
Sales receipts has exceeded the target by £0.7m. New homes provision has the target to deliver 1,800 homes over a two-year period, which has been exceeded both in terms of what has actually been delivered in the last two years and in what has been secured in the development programme to be delivered in the next two years.
Satisfaction with the service customers receive from the Group’s Customer Services Centre and with its repairs service were above target at the end of the year. Strong performance by its repairs joint venture, Pyramid Plus South has contributed to the increased satisfaction levels. The Group still has higher levels of customers who are contacting us to chase up on a query or repair than it would like. This is a particular focus for the Group to improve over the next year.
Income management via its arrears collection remains strong, despite many of the Group’s residents being impacted by welfare reform changes. Re-let turnaround times fell just below the Group’s target due to delays in tenancy sign ups, but the result still remains in the upper quartile of performance when compared to the Group’s peers (g15 housing providers).
The number of homes refurbished fell below the target for the year. This was partly due to the Group re-procuring its external contracts during the year to deliver this work. These commenced from 1 April 2017 allowing this work to be caught up and undertaken in 2017/18. Decent homes and gas safety compliance is partly reliant on being able to gain access to properties and this is the main reason why these targets were not met during the year. The Group has a comprehensive access policy to help ensure it can fulfil its health and safety responsibilities, with legal action taken against residents if necessary. 32 properties were overdue due to non-access, all of which are being progressed through the necessary legal processes.
Staff sickness levels and turnover both decreased during the year and remain strong compared with the Group’s peers.
PERFORMANCE SUMMARY
GROUP STATEMENT OF COMPREHENSIVE INCOME AND EXPENDITURE
2017 2016 £M £M
Turnover 371.9 378.4
Cost of sales (99.3) (102.4)
Operating costs (166.4) (163.0)
Operating surplus before sale of fixed assets 106.2 113.0
Surplus on sale of fixed assets 13.7 15.3
Operating surplus 119.9 128.3
Operating margin 32.2% 33.9%
Share of jointly controlled entity operating (deficit)/ surplus (1.2) 2.7
Net interest charges (49.4) (47.3)
Change in fair value of investments 0.5 0.1
Movement in fair value of financial instruments (3.4) 1.9
Movement in fair value of investment properties 18.7 30.1
Taxation (0.2) (0.5)
Non-controlling interest (0.8) (0.8)
Net surplus for the year 84.1 114.5
The Group’s net surplus of £84.1m (2016: £114.5m) included £15.8m (2016: £32.1m) of unrealised gains from the movement in value of its investment properties, investments and financial instruments.
The Group sets aside 80% of its cash surpluses for re-investment in the provision of new housing. The results this year will enable approximately 600 new rented homes to be built which require levels of cash surplus/subsidy of up to £120,000 per home. The Group’s operating margin will fluctuate over the forthcoming years as it is largely impacted by the flow of the Group’s outright sales programme and its mix of developments which in turn is affected by economic conditions.
GROUP STATEMENT OF FINANCIAL POSITION
2017 2016 £M £M
Tangible fixed assets and investments 3,060.7 2,992.8
Current assets 578.1 352.6
Total creditors including loans and borrowings (2,802.5) (2,595.8)
Non-controlling interest (0.8) (0.8)
Total reserves 835.5 748.8
In preparing the financial statements key judgements have been made, as detailed on page 69.
OPERATIONAL KEY PERFORMANCE INDICATORS PERFORMANCE
OPERATIONAL PERFORMANCE AREA
PERFORMANCE INDICATOR TARGET 2017
ACTUAL 2017
ACTUAL 2016
PROVIDE NEW QUALITY HOMES AND PLACES
Sales receipts against projection £129.1m £129.8m £139.7mNumber of units in development forecast to complete in the next two years 1,800 2,120 1,967New homes completed over past two years 1,800 1,881 1,127
DELIVER CUSTOMER-LED SERVICES
Overall satisfaction with service received from the Customer Services Centre >80% 82.8% 81.8%Overall satisfaction with responsive repairs service >80% 83.0% 78.1%Repair chaser calls <25% 33% 28%Rental arrears – general needs homes <3.70% 3.52% 3.70%Re-let turnaround times <16 days 20 days 19 days
INVEST IN HOMES AND LOCAL COMMUNITIES
Number of homes refurbished (planned works) 1,456 692 1,133Decent Homes compliance 100.0% 98.6% 99.0%Number of homes with a valid gas safety record 100.0% 99.8% 99.9%
STRENGTHEN OUR BUSINESS
Gearing*Interest cover (excluding 1st tranche sales)Results vs. budget – net surplus Staff turnoverStaff sickness levels
<85%>120%
> Budget<13.0%
<7.0 days
47.7%206.5%
Yes15.1%
6.6 days
49.6%283.9%
Yes15.2%
7.5 days
One of the mechanisms in place to ensure the Group delivers its strategic objectives is A2Dominion’s performance management framework.
* The above gearing ratio is representative of the most onerous loan covenants applicable to the Group.
A2DOMINION ANNUAL REPORT & ACCOUNTS 201736 37A2DOMINION ANNUAL REPORT & ACCOUNTS 2017 STRATEGIC REPORTSTRATEGIC REPORT
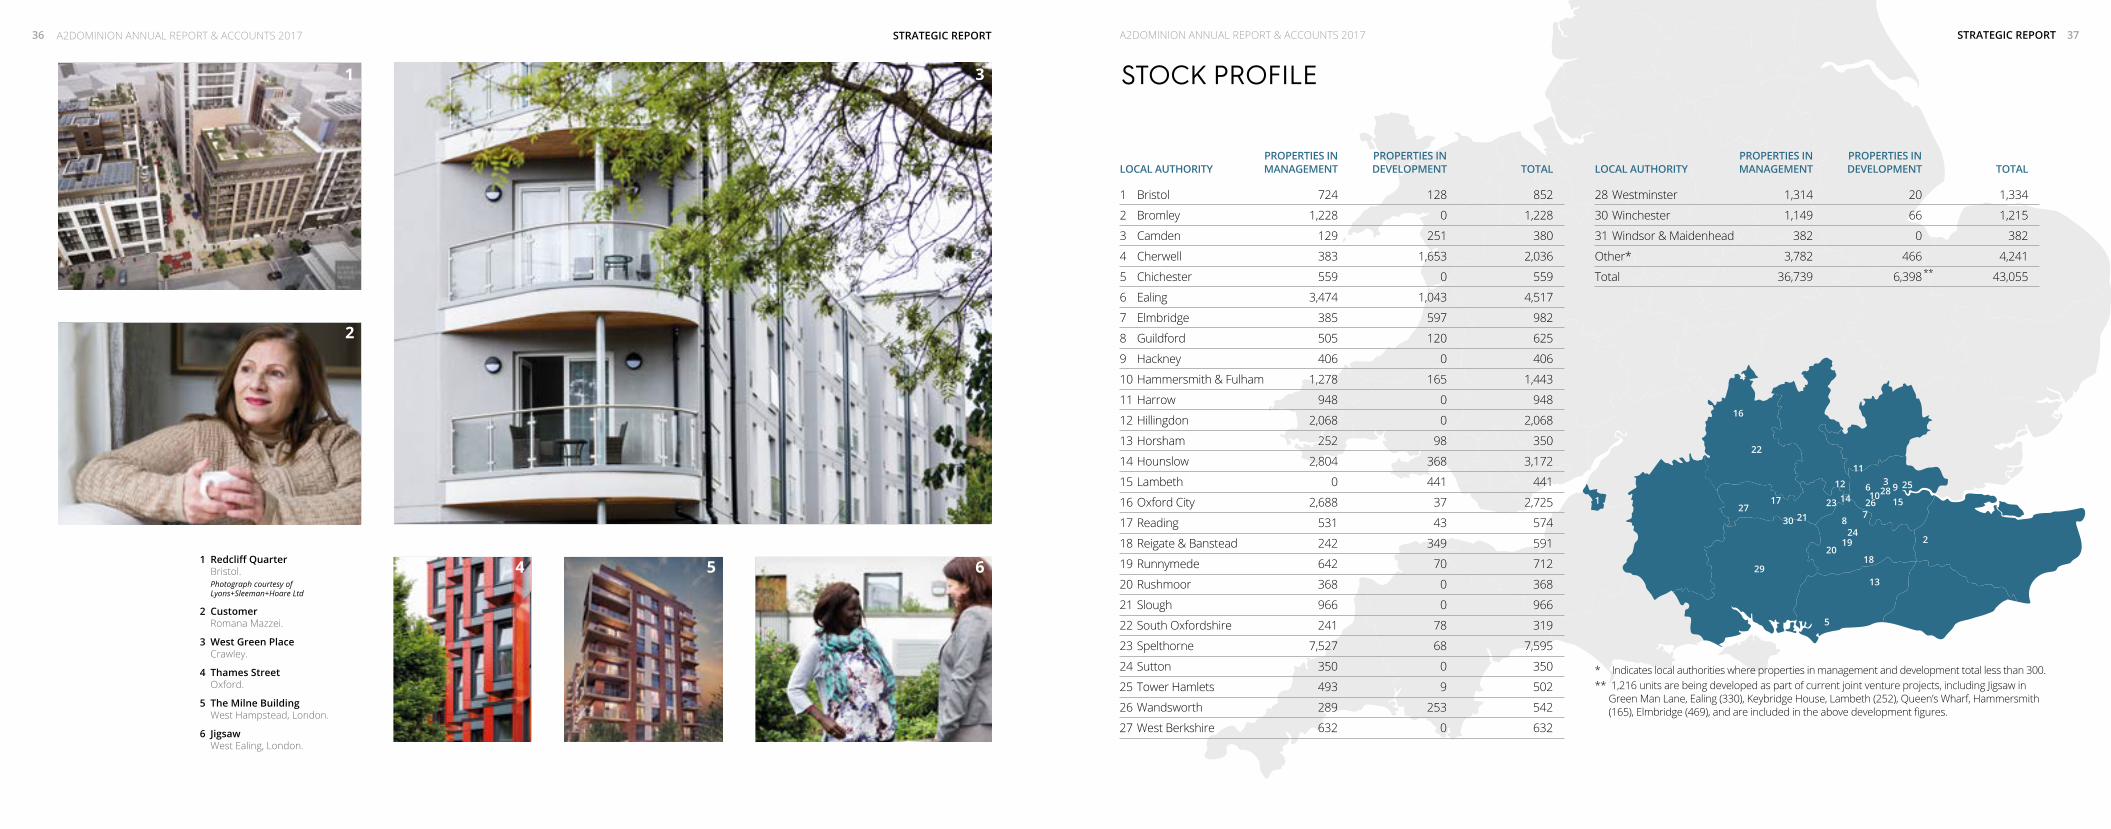
STOCK PROFILE
1 Redcliff Quarter Bristol.
Photograph courtesy of Lyons+Sleeman+Hoare Ltd
2 Customer Romana Mazzei.
3 West Green Place Crawley.
4 Thames Street Oxford.
5 The Milne Building West Hampstead, London.
6 Jigsaw West Ealing, London.
1
2
3
4
5
6
78
910
11
12
13
14 15
16
17
18
1920
21
22
23
24
2628
27
29
30
25
PROPERTIES IN PROPERTIES IN LOCAL AUTHORITY MANAGEMENT DEVELOPMENT TOTAL
1 Bristol 724 128 852
2 Bromley 1,228 0 1,228
3 Camden 129 251 380
4 Cherwell 383 1,653 2,036
5 Chichester 559 0 559
6 Ealing 3,474 1,043 4,517
7 Elmbridge 385 597 982
8 Guildford 505 120 625
9 Hackney 406 0 406
10 Hammersmith & Fulham 1,278 165 1,443
11 Harrow 948 0 948
12 Hillingdon 2,068 0 2,068
13 Horsham 252 98 350
14 Hounslow 2,804 368 3,172
15 Lambeth 0 441 441
16 Oxford City 2,688 37 2,725
17 Reading 531 43 574
18 Reigate & Banstead 242 349 591
19 Runnymede 642 70 712
20 Rushmoor 368 0 368
21 Slough 966 0 966
22 South Oxfordshire 241 78 319
23 Spelthorne 7,527 68 7,595
24 Sutton 350 0 350
25 Tower Hamlets 493 9 502
26 Wandsworth 289 253 542
27 West Berkshire 632 0 632
PROPERTIES IN PROPERTIES IN LOCAL AUTHORITY MANAGEMENT DEVELOPMENT TOTAL
28 Westminster 1,314 20 1,334
30 Winchester 1,149 66 1,215
31 Windsor & Maidenhead 382 0 382
Other* 3,782 466 4,241
Total 36,739 6,398 43,055
* Indicates local authorities where properties in management and development total less than 300.** 1,216 units are being developed as part of current joint venture projects, including Jigsaw in
Green Man Lane, Ealing (330), Keybridge House, Lambeth (252), Queen’s Wharf, Hammersmith (165), Elmbridge (469), and are included in the above development figures.
1
2
3
4 5 6
**

A2DOMINION ANNUAL REPORT & ACCOUNTS 201738 39A2DOMINION ANNUAL REPORT & ACCOUNTS 2017
VALUE FOR MONEY AT A2DOMINION continued
STRATEGIC REPORTSTRATEGIC REPORT
VALUE FOR MONEY AT A2DOMINION
The Group therefore has a framework for driving VFM which includes a five-year strategy, VFM indicators and targets, and an annual VFM action plan and progress report, all overseen by the Group Board.
The overarching VFM aim is to contribute to the delivery of the Group’s vision with efficiencies and savings, maximising income and surpluses to invest in new and existing homes. This has become an even more important part of our strategy since changes in government funding have significantly reduced grant funding for new homes, and social and affordable rental income is impacted by a rent reduction of 1% per year over the next three years.
VFM is not simply about lower cost but about achieving more from business activities and investments. As the organisation continues to grow, capitalising on the opportunities for efficiency and other benefits through economies of scale, harnessing our buying power, technology, simplification and self-regulation is key.
The approach is shaped by five strategic VFM objectives:
• maximising income and the use of the Group’s assets;
• maximising VFM through a range of procurement and joint venture approaches;
• ensuring efficiency and simplicity across all business activity;
• working with customers to prioritise investment in services and communities; and
• ensuring managers understand and are accountable for delivering return on investment and that the Group has a well-developed culture for achieving and demonstrating VFM.
The main priorities for A2Dominion’s VFM are:
• Business change: To become more efficient, profitable and responsive to our customers’ expectations through the successful delivery of a new three-year change programme, Fit for the Future. In 2016/17, the Group decided to invest £20m over the next three years into the programme in order to transform the way we work and significantly improve the services we provide to our customers.
The programme encompasses:
– Customer Experience: To develop clear and simple services for customers that are delivered well – regardless of tenure, scheme or location.
– Technology: To streamline, improve and introduce new technology that will support our new ways of working and improve our ability to offer our customers good services.
– Digital: To introduce new and improved online services to support improvements to customer experience, helping to ensure we become a ‘digital first’ organisation.
– People: To develop our staff and organisational structures to align to the new processes, technology and services we’ll be introducing, and to provide staff with access to better tools and information.
– Business Preparation: To support the organisation to deliver the changes within the programme, including streamlining our processes to help improve turnaround times and efficiency, and improvements to data on our assets and customers.
• Commercial activities: To generate surpluses for reinvestment in our social purpose programmes.
• Procurement: To test value for money in all major areas of expenditure.
• Asset management: To maximise return on investment on our portfolio.
HEADLINE RESULTS 2016/17• Delivering an above target operating surplus of £119.9m, enabling the Group to
increase the number of new homes it provides and bringing our total accumulated operating surplus to £606.3m since 2011. This was achieved through a strong performance from the Group’s core social housing activities, the sale of new homes and increasing capacity through efficiencies.
• Achieving savings of £4.5m, up from £2.6m in 2015/16, by continuing to build on savings in overhead costs, procurement and benefit realisation of projects within our strategic work programme. Savings across the business now total £23.0m with an aim to save a further £19.4m over the next three years.
• Improving the operating investment return in each of our main property portfolios, including social housing, shared ownership and non-social rented homes.
PORTFOLIO NET ASSETS EMPLOYED
BOOK VALUE
ANNUAL RENTAL
TURNOVER
ANNUAL OPERATING
SURPLUS
OPERATING RETURN2016/17
OPERATING RETURN2015/16
OPERATING RETURN2014/15
£M £M £M
Social housing 1,062.3 185.8 61.2 6% 6% 5%
Shared ownership 184.1 25.9 12.2 7% 6% 4%
Non-social housing 256.0 21.1 11.7 5% 4% 4%
• Delivering £3.5m of social value to our local communities, a 10% increase on last year, through our financial, welfare and employment support initiatives.
• We maintained strong income collection performance over the past five years, achieving our lowest-ever level of arrears of 3.52%.
• We invested £30.1m into upgrading and maintaining 6,498 of our existing homes, compared with £36.9m in 2015/16 for over 5,000 homes.
The Group also has a clear investment policy which sets out the returns for each asset opportunity. This ranges from operating margin targets for private sale homes, income yield targets for private rental homes and a requirement for affordable homes to breakeven within their first year of management. These have all been met or exceeded during the year. This year’s assessment against the aim to maximise the social, environmental and financial returns from the Group’s investments and activities is:
• Social – strong and improving
• Environmental – average and stable
• Financial – strong and stable.
The future success of the organisation is partly dependent on its ability to achieve Value for Money (VFM) in all aspects of its business.
These priorities are reflected in a series of indicators, targets and actions for each of the Group’s strategic objectives and the results help influence our investment decisions and in turn provide value for our stakeholders:
• Customers: Better services, well-maintained homes, reasonable service charges.
• Government: Delivery of new homes, employment opportunities, lower costs to the taxpayer.
• Local authority partners: Provision of new homes, management and maintenance of existing homes, care and support services and investment in local communities.
• Homes & Communities Agency: Compliance with the regulatory VFM standard, mitigation of economic risk to protect social housing assets.
ANNUAL VFM SELF-ASSESSMENTEach year A2Dominion evaluates its VFM performance in a comprehensive VFM self-assessment. We use a range of data to measure VFM progress and report findings against each of the Group’s four business objectives. Based on a range of performance and cost information, our judgement is that we comply with the regulatory requirements for value for money, as set out in the Homes & Communities Agency’s VFM Standard.
Our full self-assessment is available to view online at www.a2dominion.co.uk/vfm with headline results summarised as follows.

A2DOMINION ANNUAL REPORT & ACCOUNTS 201740 41A2DOMINION ANNUAL REPORT & ACCOUNTS 2017
VALUE FOR MONEY AT A2DOMINION continued VALUE FOR MONEY AT A2DOMINION continued
STRATEGIC REPORTSTRATEGIC REPORT
Elmsbrook, NW BicesterComprising 393 highly sustainable new homes this scheme is the first true zero carbon development of its size in the UK.
SECTOR SCORECARD INFORMATION A2DOMINION ACTUALS
A2DOMINON ACTUALS
G15 AVERAGE
2016/17 2015/16 2015/16
Business health
Operating margin before sale of fixed assets 28.6% 29.9% 32.5%
Social housing margin 34.7% 34.1% 35.6%
EBITDMRI 160.5% 172.4% 191.7%
Development capacity
Units developed 754 1,127 781
Units developed (as a % of units owned) 2.4% 3.0% 2.3%
Gearing 61.6% 53.9% 44.7%
Outcomes delivered
Customer satisfaction 82.8% 81.8% 75.8%
£s invested for every £ generated 1.1 1.0 1.2
Effective asset management
Ratio of responsive repairs to planned maintenance 41.5% 48.4% 64.2%
ROCE 3.4% 4.0% 4.5%
Operating efficiencies
Overheads as a % of income (Housemark)* N/A 11.2% 11.7%
Overall social housing cost per unit (£k) 4,089 4,037 4,933
Management cost per unit (£k) 1,083 1,360 1,320
Service charge cost per unit (£k) 748 677 613
Maintenance cost per unit (£k) 1,115 991 1,084
Major repairs cost per unit (£k) 613 523 855
Other social housing costs per unit (£k) 531 485 860
Rent collected 100.4% 98.0% 98.1%
* Results are to be derived from Housemark benchmarking data released in autumn 2017.
EFFICIENCY INDICATORSThe Group is trialling the adoption of a sector wide efficiency scorecard. This has been developed to allow for consistent measures to be used to highlight how an organisation is performing against key efficiency measures. The comparator group being used is the g15 group of housing associations which operate in the same geographical areas as A2Dominion.
These indicators provide an overview of efficiency in relation to business health, development capacity, outcomes delivered, effective asset management and operating efficiencies.
Business health: the Group’s operating margin reflects the operating efficiency of the Group’s rented business and sales performance. The timing of the completion of new development schemes alongside the investment made into maintaining homes will influence this measure. The additional indicator for the Group’s core social housing business helps demonstrate the performance of the underlying business margin and this has increased during 2016/17. The EBITDA MRI measure is an approximation of cash generated. For A2Dominon our results reflect the investment being made into new developments and private rented homes, which result in increasing debt levels to achieve this. Whilst the result is below our peers it is at a level that still indicates strong financial health.
Development capacity: the two measures relating to units in development and units developed as a % of homes owned highlights the contribution made in the year to the supply of new homes. The phasing of development programmes will result in peaks and troughs and as a result A2Dominion target to complete 1,800
homes over a two year period, which has been achieved. The gearing indicator shows the proportion of borrowing in relation to the size of asset base. A2Dominion’s result which is higher than the G15 average demonstrates that it is using its capacity effectively to leverage its assets more than others.
Outcomes delivered: the indicators that help to demonstrate this area are the customer satisfaction measure and the £s invested measure. A2Dominon’s customer satisfaction measure for 2016/17 of 82.8% is significantly above its peers and has also improved from the prior year. The £s invested for every £ generated from operations demonstrates the extent to which the Group is investing its own money in new supply, which at 1.1 for 2016/17 helps show that the Group is efficiently reinvesting all of its own cash generated together with other sources for future investment.
Effective asset management: the return on capital employed measure indicates how well A2Dominion is using its capital and debt to generate a financial return. Whilst this measure provides an organisation wide metric, A2Dominion measures the return
for each of its key business areas which are summarised within its Value for Money overview. The 2016/17 result of 3.4% reflects the decision to secure funding for future use for the organisation. The additional £250m received following the successful bond issue is to be used over the next year and thus currently suppresses the overall return until these funds are used and the associated assets come into operation. The ratio of responsive to planned repairs of 41.5% for 2016/17 helps demonstrate the success that A2Dominion has had in ensuring its level of investment in long-term improvements to its homes continues.
Operating efficiencies: the results for 2016/17 indicate a strong performance from A2Dominion in this area. The overall cost per unit for the social housing activities is considerably below the peer group, even after an update to the Group’s overhead apportionment approach (note 4). The measures for the repairs cost per unit will fluctuate depending on the maintenance programmes during the year. The efficiencies targeted and delivered that are referenced in the VFM section have led to the Group’s overhead as a % of its turnover falling below its peer group in 2015/16.
FUTURE VFM PRIORITIES Going forward, the main focus for Value For Money will continue to be on the successful delivery of the Fit for the Future change programme. By transforming the way the business works and significantly improving the services provided to customers, the programme is set to provide a payback return for the organisation within four years of its full implementation and generate operating efficiencies of approximately £4.6m a year from 2020.
As such, the programme is a key enabler for achieving the Group’s future strategic ambitions for customers, assets and staff, supported by a robust, integrated, sustainable technology platform. This includes a reduction in repeat contact and high cost to serve customers, improved first-time resolution of calls, and the ability to manage more assets with the same or fewer staff.

A2DOMINION ANNUAL REPORT & ACCOUNTS 201742 43A2DOMINION ANNUAL REPORT & ACCOUNTS 2017
FINANCIAL REVIEW continued
STRATEGIC REPORTSTRATEGIC REPORT
FIXED OR INDEX LINKED %
A2Dominion Homes Limited 88.5
A2Dominion South Limited 92.5
A2Dominion Residential Limited 100.0
Average for Group 92.9
CASH FLOWSThe statement of cash flows is on page 63.
CURRENT LIQUIDITYIt is the Group’s normal policy not to hold significant cash balances but to ensure that loan facilities are in place to fund future liquidity requirements. However, following the £250m bond issue in November 2016, the proceeds were used to repay £50m of credit facilities and the remaining funds were invested with several counterparties for up to one year at competitive rates of interest. This is until the funds will be drawn to meet the commitments within the Group’s development programme.
Cash and bank balances at 31 March were £148.1m (2016: £37.3m). Net current assets were £443.7m (2016: £245.6m). Additionally, as at 31 March 2017, the Group had facilities in place to borrow a further £358.3m (2016: £353.2m).
The main factor affecting the amount and timing of borrowing is the pace of the development programme.
Loan covenants are primarily based on interest cover and gearing ratios. Interest cover is after adding back housing property depreciation, interest capitalisation, impairment and includes surpluses from sales. Interest cover and gearing covenants were met throughout the year and at the year-end for all facilities. FRS 102 has had no impact on the Group’s loan covenants as the covenants contain a frozen UK GAAP clause.
ACCOUNTING POLICIESThe principal accounting policies of the Group are set out on pages 64 to 70. The policies with most impact on the financial statements are the treatment of capital grant, holding value of housing properties, the calculation of housing property depreciation and the capitalisation of interest payable and major repairs.
STATEMENT OF COMPLIANCEThe Board confirms that this Strategic Report has been prepared in accordance with the principles set out in the Statement of Recommended Practice “Accounting by registered social housing providers 2014”.
D Joseph S Dickinson Z Ollerearnshaw Chair Board Member Company Secretary
21
Group turnover totalled £371.9m of which £211.7m was from social housing lettings and £15.6m from the sale of first tranche shared ownership properties. Surplus for the year was £84.1m. Key features of the results were as follows:
CAPITAL STRUCTURE AND TREASURY STRATEGYThe Group has a formal treasury management policy, which is regularly reviewed and was last approved by the Group’s Finance Committee in November 2016 and will be reviewed again in November 2017. The purpose of the policy is to establish the framework within which the Group seeks to protect and control risk and exposure in respect of its borrowings and cash holdings. The treasury policy addresses funding and liquidity risk, covenant compliance and interest rate management. The Group holds floating rate loans which expose the Group to interest rate risk, to mitigate this risk the Group uses interest rate swaps (page 91).
The Group has three active borrowers: A2Dominion Homes Limited, A2Dominion South Limited, and A2Dominion Residential Limited. The Group has two funding vehicles, A2Dominion Finance Limited and A2Dominion Treasury Limited, both of which on-lend to the above borrowers. In addition, the Group’s parent company, A2Dominion Housing Group Limited, has loan facilities and has issued bonds, the proceeds of which are on-lent to the above borrowers.
Borrowings and arranged facilities as at 31 March 2017 can be summarised as follows:
ARRANGED DRAWN£M £M
A2Dominion Housing Group Limited (1.5) (1.5)
A2Dominion Homes Limited 897.9 675.8
A2Dominion South Limited 790.2 654.0
A2Dominion Residential Limited 222.8 222.8
Total 1,909.4 1,551.1
Fair value adjustment of loans arising on consolidation 18.6
Loan issue costs (8.1)
Net debt excluding overdraft (note 28) 1,561.6
During the year the Group issued £250m unsecured 12 year bonds on the wholesale market with coupon of 3.5%. As at 31 March 2017 the percentage of fixed and index linked loans to variable was as follows:
FINANCIAL REVIEWSummary of results for the year ended 31 March 2017
Group operating surplus of
£119.9man operating margin of 32.2%
Surplus on first tranche sales of
£6.1mwith a margin of 39.1%
Surplus on homes for outright sale of
£19.0mwith a margin of 16.7%
Expenditure on planned and major repairs of
£30.1mof which £9.3m was capitalised
Depreciation on housing properties of
£29.3mSurplus from staircasing sales of shared ownership properties of
£12.3mUunrealised gains on increases in values of investment properties of
£18.7m

REPORT OF THE BOARD46 BOARD OF MANAGEMENT
48 EXECUTIVE OFFICERS
50 REPORT OF THE BOARD
53 INDEPENDENT AUDITOR’S REPORT TO THE MEMBERS OF A2DOMINION HOUSING GROUP LIMITED

A2DOMINION ANNUAL REPORT & ACCOUNTS 201746 47A2DOMINION ANNUAL REPORT & ACCOUNTS 2017
BOARD OF MANAGEMENT continued
REPORT OF THE BOARDREPORT OF THE BOARD
BOARD OF MANAGEMENT
The Group Board steers and directs the activities of the organisation. Members of the Board are chosen to ensure a broad cross-section of skills and experience within the housing sector.
DEREK JOSEPH (Chair – until 31 July 2017)Derek has over 30 years’ experience in the housing sector and significant knowledge of social housing finance and governance. A former director of the HACAS Group Plc and Tribal Treasury Services, Derek is currently a non-executive director of a number of quoted and private companies. He is a voluntary director of the charities Homeless International and the London Housing Federation.
IAN COX (Chair – from 1 August 2017)Ian has worked within the property industry for over 35 years, holding senior-level development and regeneration roles at Bellway Homes and Redrow. He is Managing Partner and shareholder of Cox Development Partners, developing mixed-use projects in partnership with landowners and local authorities.
DAVID COATESDavid has worked as a finance and treasury professional in the retail sector for over 25 years, holding a number of Finance Director roles at companies including Sainsbury’s and Debenhams. He currently manages his own property portfolio and prior to this was Group Finance Director at New Look. David is Chair of Audit, Risk & Assurance Committee.
TERENCE COOKTerence was previously an A2Dominion resident and Chair of A2Dominion’s Customer Services Committee, a representative on A2 Housing’s Resident Executive Group (South) and the founding member of Winchester Residents Forum. Terence currently works at Hampshire County Council in its Drug and Alcohol Action Team.
SARA DICKINSONSara has worked in financial roles for the past 20 years and is Chair of the Group’s Treasury Committee. She has previously worked as Group Financial Controller for Sage Group PLC and as Vice President & Finance Director of eBookers Group, a pan European online travel agency. She is currently CFO for Expedia Affiliate Network, a business within the Expedia Inc. Group.
CAROLINE TILLERCaroline has over 30 years’ housing experience and is Chair of the Customer Services Committee. Most recently, Caroline was Chief Executive of Central and Cecil Housing Trust – a post she held for six years. Prior to that, Caroline held a number of director level positions, with a focus on customer-facing operations, in large and medium sized housing associations.
CAROLINE TOLHURSTCaroline has 30 years’ experience in the property and investment management sectors, within surveying, compliance and governance. She was Company Secretary at Grosvenor for over 10 years, and has been a Company Secretary at New River Retail and Compliance Officer at Knight Frank. Caroline currently sits as Chair of A2Dominion’s Governance and Remuneration Committee.
DARRELL MERCERDarrell has 40 years’ experience in the housing sector and was previously Assistant Director of Housing for the London Borough of Islington. He is the former Chief Executive of Acton Housing Association and the Dominion Housing Group and is currently Group Chief Executive at A2Dominion. In 2017, he became a non-executive board member for Homes for Reading Ltd.
JOHN KNEVETTJohn has worked in the housing sector for over 30 years, in addition to his extensive experience as a structural and civil engineer. He was previously Chief Executive of A2 Housing Group and is currently Group Commercial Officer and Deputy Chief Executive of A2Dominion.

A2DOMINION ANNUAL REPORT & ACCOUNTS 201748 49A2DOMINION ANNUAL REPORT & ACCOUNTS 2017
EXECUTIVE OFFICERS continued
REPORT OF THE BOARDREPORT OF THE BOARD
EXECUTIVE OFFICERS
DARRELL MERCER Group Chief ExecutiveSee previous page.
JOHN KNEVETT Group Commercial Officer and Deputy Chief ExecutiveSee previous page.
ANDREW BOYESExecutive Director (Change & IT)Andrew has over 30 years’ experience in IT working across a broad range of business sectors, including housing, insurance, retail and distribution. Andrew joined A2Dominion in 2009 as Group Director of IT and became Executive Director (IT & Facilities) in 2014. He has been an IT Director since 1998, holding three other IT Director roles at insurance firms Castle Cover Ltd and RIAS Plc. and convenience retailer Alldays Plc.
KATHRYN BULLExecutive Director (Projects)Kathryn has significant senior management experience in the housing sector. Prior to her current role, she was Executive Director (Corporate Services) at A2Dominion and Group Director of Risk & Planning at Dominion Housing Group. She was also Assistant Director of Housing at the London Borough of Croydon and was at the London Borough of Wandsworth for six years.
ANDREW EVANSExecutive Director (Operations)Andrew has over 25 years’ service delivery experience in both the private and public sectors. Andrew was previously Group Operations Director for A2 Housing Group for 12 years and was Spelthorne Housing Association’s Deputy Chief Executive. Andrew is a member of the Institute of Management.
NICK HUTCHINGSExecutive Director (Commercial, South East)Nick has over 30 years’ experience in the housebuilding industry and formerly worked at the Berkeley Group where he held senior management posts including Land Director. Nick’s other roles include Managing Director of St George Central London and then Development Director at St William – both part of the Berkeley Group and some of the most respected house building brands in the industry.
DEAN TUFTSExecutive Director (Finance & Strategy)Dean is a chartered accountant and has worked in the housing industry for over 30 years. Previously Dean was Group Finance Director of Dominion Housing Group for four years. Prior to that he was Finance Director of its forerunner Acton Housing Association for 11 years, joining the Association from sheltered housebuilder McCarthy & Stone Plc. Dean is an Associate of the Institute of Chartered Accountants in England and Wales.
ANNE WATERHOUSEExecutive Director (Central & Financial Services)Anne is a chartered accountant with over 20 years’ finance experience. Prior to her current role, Anne was Deputy Group Finance Director at Dominion Housing Group and then Executive Director (Financial Services) at A2Dominion. She is a member of the Chartered Institute of Management Accountants and has also worked in finance within the housebuilding industry.
NICHOLAS YEELESExecutive Director (Commercial, London)Nicholas’ career encompasses over 25 years’ experience in the social housing sector, with an emphasis on business development. Prior to his current role at A2Dominion, Nicholas was Chief Executive of Cherwell Housing Trust, part of Dominion Housing Group. He has held various executive posts in management and development and has worked as a freelance consultant.
ZOË OLLEREARNSHAW Group Company Secretary
AUDITORSBDO LLP 55 Baker Street London W1U 7EU
BANKERSBarclays Bank Plc Floor 28 1 Churchill Place London E14 5HP
SOLICITORSWinckworth Sherwood Minerva House 5 Montague Close London SE1 9BB
Devonshires Solicitors LLP 30 Finsbury Circus London EC2M 7DT

A2DOMINION ANNUAL REPORT & ACCOUNTS 201750 51A2DOMINION ANNUAL REPORT & ACCOUNTS 2017
REPORT OF THE BOARD continued
REPORT OF THE BOARDREPORT OF THE BOARD
With the support of an independent consultant, the Group undertook a comprehensive Governance Review in 2016 which looked at governance effectiveness and the roles, responsibilities and membership of the Group Board and its committees, with a view to embedding more time for strategic review by the Group Board whilst increasing the efficiency of the governance structure. That review is now complete and a revised committee structure is in place. This is set out within the Strategic Report.
The Board has carried out its annual assessment of compliance against the HCA’s regulatory framework for registered providers, and reports full compliance.
The Board has also reviewed its governance arrangements for compliance against its adopted code of governance, the National Housing Federation Code of Governance published in 2015. The Board is fully compliant with the Code.
The Board is confident that its regulatory judgement from the HCA and the work of its Governance Review, together with the self-assessments against the regulatory framework and its code of governance, provide assurance that the governance framework across the organisation is strong.
CUSTOMER INVOLVEMENTThe Group actively encourages residents’ involvement providing feedback and informing decision making through the Group’s new Customer Insight Panel and other active resident groupings which promote resident involvement. There are clear reporting arrangements between the resident groups and the Board and committees.
COMPLAINTSThe Group has a clear, accessible complaints policy for its residents that has been designed to enable residents to follow a simple process.
INTERNAL CONTROLS ASSURANCEThe Board acknowledges its overall responsibility for establishing and maintaining the whole system of internal control and for reviewing its effectiveness. This responsibility applies to all organisations within the Group.
The system of internal control is designed to manage, rather than eliminate, the risk of failure to achieve business objectives, and to provide reasonable, but not absolute, assurance against material misstatement or loss.
The process for identifying, evaluating and managing the significant risks faced by the Group is on-going and has been in place throughout the period commencing 1 April 2016 up to the date of approval of the annual report and financial statements.
Key elements of the control framework during the year included:
• Board-approved terms of reference and delegated authorities for Audit and Risk Committee, Finance Committee, Governance and Remuneration Committee, Development Committee and Customer Services Committee;
• clearly defined management responsibilities for the identification, evaluation and control of significant risks;
• robust strategic and business planning processes, with detailed financial budgets and forecasts;
• comprehensive three-year programme of internal audit;
• formal recruitment, retention, training and development policies for all staff;
• established authorisation and appraisal procedures for all significant new initiatives and commitments;
• a prudent approach to treasury management which is subject to external review on an annual basis;
• regular reporting to the appropriate committee on key business objectives, targets and outcomes;
• Board-approved whistle-blowing, anti-theft and anti-corruption policies; and
• formal money laundering and fraud policy and register.
From 1 April 2017, the Audit and Risk Committee’s remit widened to oversee the Group’s performance of its landlord services and health and safety reporting and compliance. The committee is now known as the Audit, Risk and Assurance Committee.
The Board cannot delegate ultimate responsibility for the system of internal control, but it can, and has, delegated authority to the Audit, Risk and Assurance Committee to regularly review the effectiveness of the system of internal control.
The Audit, Risk and Assurance Committee reviews the Group Risk Register quarterly to ensure all risks are fully assessed with actions identified to mitigate risks. In addition each of the Group’s committees review risks and actions specific to their areas of responsibility. The Audit, Risk and Assurance Committee regularly reviews the fraud register. Any control weaknesses or fraud identified during the year are reported to and monitored by the Audit, Risk and Assurance Committee, who review the mitigating actions and the timescales for their completion.
The Audit, Risk and Assurance Committee and the Board have received the chief executive’s annual review of the effectiveness of the system of internal control for the Group and the annual report of the internal auditor.
The Board presents its report and the Group’s audited financial statements for the year ended 31 March 2017.
PRINCIPAL ACTIVITIESA2Dominion Housing Group Limited is a social landlord administered by a board of directors with a broad range of expertise and experience. It is also the parent entity of the A2Dominion Group (“the Group”) and all further references to the Group refer to the consolidated Group rather than the Association. The subsidiaries of the Group are listed in note 18 to the financial statements and their activities detailed within the Strategic Report on page 27.
BUSINESS REVIEWDetails of the Group’s performance for the year and its future plans are set out in the Strategic Report on pages 24-43.
HOUSING PROPERTY AND OTHER FIXED ASSETSDetails of changes to the Group’s fixed assets are shown in notes 14 to 18 to the financial statements.
RESERVESAfter transfer of the surplus for the year of £84.1m (2016: £114.5m) and other movements in reserves, the Group’s year-end reserves amounted to £835.5m (2016: £748.8m).
DONATIONSThe Group donated £33,888 to charitable entities (2016: £80,200) and made no political donations.
POST BALANCE SHEET EVENTSThe present board members (“the Board”) consider that there have been no events since the year-end that have had a significant effect on the Group’s financial position.
FINANCIAL INSTRUMENTSThe Group’s approach to financial risk management is outlined in the Strategic Report.
EMPLOYEESThe strength of the Group lies in the quality of its employees. In particular, it is their contribution that gives the Group the ability to meet its objectives and commitments to residents in an efficient and effective manner.
The Group shares information on its objectives, progress and activities through regular briefings, seminars and meetings involving board members, the senior management team and staff.
The Group is committed to equal opportunities and in particular supporting the employment of people with disabilities, both in recruitment and in the retention of employees who become disabled whilst in the employment of the Group.
HEALTH AND SAFETYThe Board is aware of its responsibilities on all matters relating to health and safety. Members of the Board together with the executive officers have undertaken external accredited health and safety training appropriate to their role. The Group has established a new executive led Health & Safety Committee which is responsible for monitoring all health & safety activities and reporting on these. The Group has also prepared detailed health and safety policies and provides staff training and education on health and safety matters.
BOARD MEMBERS AND EXECUTIVE OFFICERSThe Board and the executive officers of the Group are set out on page 46-49. The Board are drawn from a wide background bringing together professional and commercial experience. The executive officers are the chief executive and the other members of the Group’s senior management team.
The executive officers hold no interest in the Group’s shares and act as executives within the authority delegated by the Board. Group insurance policies indemnify the Board and officers against liability when acting for the Group.
SERVICE CONTRACTSExecutive officers are employed on the same terms and conditions as other staff, save that their notice periods are between six and 12 months.
PENSIONSExecutive officers are members of either the Social Housing Pension Schemes or Oxfordshire County Council Schemes, which are either defined benefit final salary pension schemes or defined contribution schemes. They participate in the schemes on the same terms as all other eligible staff and the Group contributes to the schemes on behalf of its employees.
OTHER BENEFITSExecutive officers are entitled to other benefits such as health care insurance. Details of their total remuneration are included in note 8 to the financial statements.
GOVERNANCEFollowing an In Depth Assessment by the Homes & Communities Agency (HCA) in 2015, the A2Dominion Group received a rating of G1/V1 in February 2016; this rating was confirmed by a stability check in November 2016. This judgement is the highest rating achievable and covers A2Dominion Housing Group Limited, A2Dominion Homes Limited, A2Dominion Housing Options Limited, and A2Dominion South Limited.
REPORT OF THE BOARD

A2DOMINION ANNUAL REPORT & ACCOUNTS 201752 53A2DOMINION ANNUAL REPORT & ACCOUNTS 2017 REPORT OF THE BOARD
REPORT OF THE BOARD continued
REPORT OF THE BOARD
INDEPENDENT AUDITOR’S REPORT TO THE MEMBERS OF A2DOMINION HOUSING GROUP LIMITED
We have audited the financial statements of A2Dominion Housing Group Limited for the year ended 31 March 2017 which comprise the consolidated and Association statement of comprehensive income, the consolidated and Association statement of financial position, the consolidated and Association statement of changes in reserves, the consolidated statement of cash flows and the related notes. The financial reporting framework that has been applied in their preparation is applicable law and United Kingdom Accounting Standards (United Kingdom Generally Accepted Accounting Practice).
This report is made solely to the Association’s members, as a body, in accordance with the Housing and Regeneration Act 2008 and Section 87 of the Co-operative and Community Benefit Societies Act 2014. Our audit work has been undertaken so that we might state to the Association’s members those matters we are required to state to them in an auditor’s report and for no other purpose. To the fullest extent permitted by law, we do not accept or assume responsibility to anyone other than the Association and the Association’s members as a body, for our audit work, for this report, or for the opinions we have formed.
RESPECTIVE RESPONSIBILITIES OF THE BOARD AND AUDITORSAs explained more fully in the statement of board member responsibilities, the board members are responsible for the preparation of the financial statements and for being satisfied that they give a true and fair view. Our responsibility is to audit and express an opinion on the financial statements in accordance with applicable law and International Standards on Auditing (UK and Ireland). Those standards require us to comply with the Financial Reporting Council’s (FRC’s) Ethical Standards for Auditors.
SCOPE OF THE AUDIT OF THE FINANCIAL STATEMENTSA description of the scope of an audit of financial statements is provided on the FRC’s website at www.frc.org.uk/auditscopeukprivate.
OPINION ON FINANCIAL STATEMENTSIn our opinion the financial statements:
• give a true and fair view of the state of the Group’s and parent association’s affairs as at 31 March 2017 and of the Group’s and parent association’s surplus for the year then ended;
• have been properly prepared in accordance with United Kingdom Generally Accepted Accounting Practice; and
• have been prepared in accordance with the requirements of the Co-operative and Community Benefit Societies Act 2014, the Co-operative and Community Benefit Societies (Group Accounts) Regulations 1969, the Housing and Regeneration Act 2008 and the Accounting Direction for Private Registered Providers of Social Housing 2015.
MATTERS ON WHICH WE ARE REQUIRED TO REPORT BY EXCEPTIONWe have nothing to report in respect of the following matters where we are required to report to you if, in our opinion:
• the information given in the Strategic Report and the Report of the Board for the financial year for which the financial statements are prepared is not consistent with the financial statements;
• adequate accounting records have not been kept by the parent association, or returns adequate for our audit have not been received from branches not visited by us; or
• a satisfactory system of control has not been maintained over transactions; or
• the parent association financial statements are not in agreement with the accounting records and returns; or
• we have not received all the information and explanations we require for our audit.
BDO LLP, statutory auditor London United Kingdom 31 July 2017BDO LLP is a limited liability partnership registered in England and Wales (with registered number OC305127).
The Board has reviewed and evaluated the effectiveness of the internal controls as well as the fraud register and the annual report of the internal auditor as reported to them by the Audit, Risk and Assurance Committee.
In line with the Financial Reporting Council Guidance on Audit Committees, the Audit, Risk and Assurance Committee carried out a separate exercise to review its independence, performance and effectiveness, and agreed actions to further improve its effectiveness.
BOARD MEMBERS’ RESPONSIBILITIESThe Board is responsible for preparing the Report of the Board and the financial statements in accordance with applicable law and regulations.
Co-operative and Community Benefit Society and social housing legislation require the Board to prepare financial statements for each financial year for the Group and Association in accordance with United Kingdom Generally Accepted Accounting Practice (United Kingdom Accounting Standards and applicable law).
In preparing these financial statements, the Board is required to:
• select suitable accounting policies and then apply them consistently;
• make judgements and accounting estimates that are reasonable and prudent;
• state whether applicable UK Accounting Standards and the Statement of Recommended Practice: Accounting by registered social housing providers 2014 have been followed, subject to any material departures disclosed and explained in the financial statements; and
• prepare the financial statements on the going concern basis unless it is inappropriate to presume that the Association will continue in business.
The Board is responsible for keeping adequate accounting records that are sufficient to show and explain the Group and Association’s transactions and disclose with reasonable accuracy at any time the financial position of the Group and Association and enable the Board to ensure that the financial statements comply with the Co-operative and Community Benefit Societies Act 2014, the Co-operative and Community Benefit Societies (Group Accounts) Regulations 1969, the Housing and Regeneration Act 2008 and the Accounting Direction for Private Registered Providers of Social Housing 2015. The Board is also responsible for safeguarding the assets of the Group and Association and hence for taking reasonable steps for the prevention and detection of fraud and other irregularities.
The Board is responsible for ensuring that the Report of the Board is prepared in accordance with the Statement of Recommended Practice: Accounting by registered social housing providers 2014.
Financial statements are published on the Group’s website in accordance with legislation in the United Kingdom governing the preparation and dissemination of financial statements, which may vary from legislation in other jurisdictions. The maintenance and integrity of the Group’s website is the responsibility of the Board. The Board’s responsibility also extends to the on-going integrity of the financial statements contained therein.
GOING CONCERNAfter making enquiries, the Board has a reasonable expectation that the Group has adequate financial resources to continue in operational existence for the foreseeable future, being a period of 12 months after the date on which the report and financial statements are signed. For this reason, it continues to adopt the going concern basis in the financial statements.
ANNUAL GENERAL MEETINGThe Annual General Meeting will be held on 26 July 2017 at The Point, 37 North Wharf Road, London, W2 1BD.
DISCLOSURE OF INFORMATION TO AUDITORSAt the date of making this report each of the Group’s board members, as set out on page 46, confirm the following:
• so far as each board member is aware, there is no relevant information needed by the Group’s auditors in connection with preparing their report of which the Group’s auditors are unaware; and
• each board member has taken all the steps that they ought to have taken as a board member in order to make themselves aware of any relevant information needed by the Group’s auditors in connection with preparing their report and to establish that the Group’s auditors are aware of that information.
EXTERNAL AUDITORSBDO LLP has indicated their willingness to continue in office and a resolution to re-appoint them for the coming year is proposed at the Annual General Meeting.
The Report of the Board was approved by the Board on 26 July 2017 and signed on its behalf by:
D Joseph Chair
S Dickinson Board Member
Z Ollerearnshaw Company Secretary

FINANCIAL STATEMENTS56 CONSOLIDATED STATEMENT OF COMPREHENSIVE INCOME
57 ASSOCIATION STATEMENT OF COMPREHENSIVE INCOME
58 CONSOLIDATED STATEMENT OF FINANCIAL POSITION
59 ASSOCIATION STATEMENT OF FINANCIAL POSITION
60 CONSOLIDATED STATEMENT OF CHANGES IN EQUITY
61 CONSOLIDATED STATEMENT OF CHANGES IN EQUITY
62 ASSOCIATION STATEMENT OF CHANGES IN EQUITY
63 CONSOLIDATED STATEMENT OF CASH FLOWS
64 NOTES TO THE FINANCIAL STATEMENTS

A2DOMINION ANNUAL REPORT & ACCOUNTS 201756 57A2DOMINION ANNUAL REPORT & ACCOUNTS 2017FINANCIAL STATEMENTS FINANCIAL STATEMENTS
ASSOCIATION STATEMENT OF COMPREHENSIVE INCOMEFOR THE YEAR ENDED 31 MARCH 2017
CONSOLIDATED STATEMENT OF COMPREHENSIVE INCOMEFOR THE YEAR ENDED 31 MARCH 2017
NOTE 2017 2016£M £M
Turnover 4 41.4 41.0
Operating costs 4 (40.8) (48.0)
Operating surplus/(deficit) 4, 6 0.6 (7.0)
Interest receivable and other income 11 10.4 6.8
Interest payable and similar charges 12 (10.1) (6.8)
Other finance costs 31 (0.8) (0.5)
Surplus/(deficit) on ordinary activities before taxation 0.1 (7.5)
Tax on surplus on ordinary activities 13 - -
Surplus/(deficit) for the financial year 0.1 (7.5)
Actuarial (losses)/gains on defined benefit pension scheme 31 (0.2) 0.4
Total comprehensive income/(loss) for the year (0.1) (7.1)
All amounts relate to continuing activities.
The notes on pages 64 to 104 form part of these financial statements.
NOTE 2017 2016£M £M
Turnover 4 371.9 378.4
Cost of sales 4 (99.3) (102.4)
Operating costs 4 (166.4) (163.0)
Operating surplus before sale of fixed assets 4 106.2 113.0
Surplus on sale of fixed assets – housing properties 10 13.7 15.3
Operating surplus 4,6 119.9 128.3
Share of jointly controlled entity operating (loss)/profit 18 (1.2) 2.7
Interest receivable and other income 11 6.4 2.4
Interest payable and similar charges 12 (55.0) (49.1)
Other finance costs 31 (0.8) (0.6)
Change in fair value of investments 18 0.5 0.1
Movement in fair value of financial instruments (3.4) 1.9
Movement in fair value of investment properties 16 18.7 30.1
Surplus on ordinary activities before taxation 85.1 115.8
Tax on surplus on ordinary activities 13 (0.2) (0.5)
Surplus on ordinary activities after taxation 84.9 115.3
Non-controlling interest (0.8) (0.8)
Surplus for the financial year 84.1 114.5
Actuarial (losses)/gains on defined benefit pension scheme 31 (0.8) 1.0
Movement in fair value of hedged financial instrument 3.5 (2.5)
Total comprehensive income for year 86.8 113.0
Surplus for the year attributable to:
Non-controlling interest 0.8 0.8
Parent association 84.1 114.5
84.9 115.3
Total comprehensive income attributable to:
Non-controlling interest 0.8 0.8
Parent association 86.0 112.2
86.8 113.0
All amounts relate to continuing activities.
The notes on pages 64 to 104 form part of these financial statements.

A2DOMINION ANNUAL REPORT & ACCOUNTS 201758 59A2DOMINION ANNUAL REPORT & ACCOUNTS 2017FINANCIAL STATEMENTS FINANCIAL STATEMENTS
ASSOCIATION STATEMENT OF FINANCIAL POSITIONAT 31 MARCH 2017
NOTE 2017 2016£M £M
Current assets
Debtors due within one year 20 16.3 20.1
Debtors due after one year 20 376.7 131.3
Investments 21 - 8.0
Cash and cash equivalents 22 114.9 16.2
507.9 175.6
Creditors: Amounts falling due within one year 23 (139.8) (48.6)
Net current assets 368.1 127.0
Total assets less current liabilities 368.1 127.0
Creditors: Amounts falling due after more than one year 24 (387.1) (146.2)
Provision for liabilities and charges 30 (3.2) (3.0)
Net assets excluding pension liability (22.2) (22.2)
Pension liability 31 (1.8) (1.7)
Net assets (24.0) (23.9)
Capital and reserves
Non-equity share capital - -
Revenue reserve (24.0) (23.9)
Association’s deficit (24.0) (23.9)
Co-operative and Community Benefit Society (FCA) 28985R.
The financial statements were approved by the Board and authorised for issue on 26 July 2017 and signed on its behalf by:
D Joseph S Dickinson Z Ollerearnshaw Chair Board Member Company SecretaryThe notes on pages 64 to 104 form part of these financial statements.
CONSOLIDATED STATEMENT OF FINANCIAL POSITIONAT 31 MARCH 2017
NOTE 2017 2016£M £M
Fixed assetsTangible fixed assets – housing properties 14 2,534.8 2,530.6Tangible fixed assets – other 15 20.8 21.3Investment properties 16 427.9 361.5Investments – Homebuy loans 17 2.6 2.9Investments – other 18 19.8 18.3Investments – jointly controlled entities 18 54.8 58.2
3,060.7 2,992.8Current assetsProperties for sale 19 221.9 201.2Debtors less than one year 20 79.7 41.8Debtors more than one year 20 58.4 64.3Investments 21 70.0 8.0Cash and cash equivalents 22 148.1 37.3
578.1 352.6Creditors: Amounts falling due within one year 23 (134.4) (107.0)Net current assets 443.7 245.6Total assets less current liabilities 3,504.4 3,238.4Creditors: Amounts falling due after more than one year 24 (2,657.9) (2,479.0)Provision for liabilities and charges 30 (4.5) (4.9)Net assets excluding pension liability 842.0 754.5Pension liability 31 (5.7) (4.9)Net assets 836.3 749.6Capital and reservesNon-equity share capital - -Cash flow hedge reserve (43.9) (47.4)Income and expenditure reserve 833.8 749.9Designated reserve 45.1 45.8Restricted reserve 0.5 0.5Consolidated funds 835.5 748.8Non-controlling interest 0.8 0.8
836.3 749.6
Co-operative and Community Benefit Society (FCA) 28985R.
The financial statements were approved by the Board and authorised for issue on 26 July 2017 and signed on its behalf by:
D Joseph S Dickinson Z Ollerearnshaw Chair Board Member Company SecretaryThe notes on pages 64 to 104 form part of these financial statements.

A2DOMINION ANNUAL REPORT & ACCOUNTS 201760 61A2DOMINION ANNUAL REPORT & ACCOUNTS 2017FINANCIAL STATEMENTS FINANCIAL STATEMENTS
CONSOLIDATED STATEMENT OF CHANGES IN EQUITYFOR THE YEAR ENDED 31 MARCH 2016
CASH FLOW HEDGE RESERVE
INCOME AND EXPENDITURE
RESERVE
DESIGNATED AND
RESTRICTED RESERVE
TOTAL EXCLUDING
NON-CONTROLLING
INTERESTS
NON – CONTROLLING
INTERESTS
TOTAL INCLUDING
NON – CONTROLLING
INTERESTS£M £M £M £M £M £M
Balance at 1 April 2015 (44.9) 630.6 50.1 635.8 1.0 636.8
Surplus for the year - 114.5 - 114.5 0.8 115.3
Other comprehensive income:
Actuarial losses on defined benefit pension scheme - 1.0 - 1.0 - 1.0
Movement in fair value of hedged financial instrument (2.5) - - (2.5) - (2.5)
Other comprehensive income for the year (2.5) 1.0 - (1.5) - (1.5)
Reserves transfers:
Capital contribution and distributions - - - - (1.0) (1.0)
Transfer of designated expenditure from income and expenditure reserve - (8.0) 8.0 - - -
Transfer of designated expenditure to income and expenditure reserve - 11.8 (11.8) - - -
Balance at 31 March 2016 (47.4) 749.9 46.3 748.8 0.8 749.6
The notes on pages 64 to 104 form part of these financial statements.
CONSOLIDATED STATEMENT OF CHANGES IN EQUITYFOR THE YEAR ENDED 31 MARCH 2017
CASH FLOW HEDGE
RESERVE
INCOME AND EXPENDITURE
RESERVE
DESIGNATED AND
RESTRICTED RESERVE
TOTAL EXCLUDING
NON-CONTROLLING
INTERESTS
NON – CONTROLLING
INTERESTS
TOTAL INCLUDING
NON – CONTROLLING
INTERESTS£M £M £M £M £M £M
Balance at 1 April 2016 (47.4) 749.9 46.3 748.8 0.8 749.6
Surplus for the year - 84.1 - 84.1 0.8 84.9
Movement in restricted reserve - - (0.1) (0.1) - (0.1)
Other comprehensive income:
Actuarial losses on defined benefit pension scheme - (0.8) - (0.8) - (0.8)
Movement in fair value of hedged financial instrument 3.5 - - 3.5 - 3.5
Other comprehensive income for the year 3.5 (0.8) - 2.7 - 2.7
Reserves transfers:
Capital contribution and distributions - - - - (0.8) (0.8)
Transfer of designated expenditure from income and expenditure reserve - (13.7) 13.7 - - -
Transfer of designated expenditure to income and expenditure reserve - 14.3 (14.3) - - -
Balance at 31 March 2017 (43.9) 833.8 45.6 835.5 0.8 836.3
The notes on pages 64 to 104 form part of these financial statements.

A2DOMINION ANNUAL REPORT & ACCOUNTS 201762 63A2DOMINION ANNUAL REPORT & ACCOUNTS 2017FINANCIAL STATEMENTS FINANCIAL STATEMENTS
CONSOLIDATED STATEMENT OF CASH FLOWSFOR THE YEAR ENDED 31 MARCH 2017
2017 2016£M £M
Cash flows from operating activitiesSurplus for the financial year 84.1 114.5Adjustments for:Depreciation of fixed assets – housing properties 29.3 26.0Depreciation of fixed assets – other 3.1 2.7Accelerated depreciation on replaced components 4.1 5.4Amortised grant (16.9) (16.1)Share of deficit /(surplus) in jointly controlled entities 1.2 (2.7)Net fair value losses/(gains) recognised in statement of comprehensive income (15.8) (32.1)Interest and finance costs 55.8 49.7Interest received (6.4) (2.4)Surplus on the sale of fixed assets – housing properties (13.7) (15.3)Taxation expense 0.2 0.5Non-controlling interest 0.8 0.8Decrease/(increase) in trade and other debtors 3.2 (3.7)(Increase)/decrease in stocks (12.4) 56.8Increase/(decrease) in creditors 16.6 (0.8)(Decrease)/increase in provisions (0.4) 3.8Cash from operations 132.8 187.1Tax paid - (0.1)Net cash generated from operating activities 132.8 187.0Cash flows from investing activitiesPurchase of fixed assets – housing properties (51.9) (116.4)Receipt of grant 4.9 7.7Repayment of grant - (0.2)Purchase of fixed assets – other (2.6) (2.5)Purchase of fixed asset investments (54.0) (55.7)Sale of fixed asset investments 5.2 10.1Sale of current asset investments - 1.0Purchase of current asset investments (62.0) -Investment in jointly controlled entities - (11.9)Repayment of jointly controlled entities capital 2.2 6.4Distribution of jointly controlled entities profits 0.1 4.3Proceeds from sale of fixed assets – housing properties 40.2 40.5Loans advanced to jointly controlled entities (38.4) (15.0)Interest received 6.4 2.4Net cash from investing activities (149.9) (129.3)Cash flows used in financing activitiesInterest paid (69.4) (65.7)New loans – bank 70.0 50.0New loans – other 248.5 -Repayment of loans – bank (121.2) (34.1)Net cash from financing activities 127.9 (49.8)Net increase in cash and cash equivalents 110.8 7.9Cash and cash equivalents at the beginning of year 37.3 29.4Cash and cash equivalents at end of year 148.1 37.3
The notes on pages 64 to 104 form part of these financial statements.
ASSOCIATION STATEMENT OF CHANGES IN EQUITY
FOR THE YEAR ENDED 31 MARCH 2017
INCOME AND EXPENDITURE
RESERVE£M
Balance at 1 April 2016 (23.9)
Surplus for the year 0.1
Other comprehensive income:
Actuarial losses on defined benefit pension scheme (0.2)
Other comprehensive income for the year (0.2)
Balance at 31 March 2017 (24.0)
FOR THE YEAR ENDED 31 MARCH 2016
INCOME AND EXPENDITURE
RESERVE£M
Balance at 1 April 2015 (16.8)
Deficit for the year (7.5)
Other comprehensive income:
Actuarial gains on defined benefit pension scheme 0.4
Other comprehensive income for the year 0.4
Balance at 31 March 2016 (23.9)
The notes on pages 64 to 104 form part of these financial statements.

A2DOMINION ANNUAL REPORT & ACCOUNTS 201764 65A2DOMINION ANNUAL REPORT & ACCOUNTS 2017
NOTES TO THE FINANCIAL STATEMENTS continued
FINANCIAL STATEMENTSFINANCIAL STATEMENTS
2. ACCOUNTING POLICIES CONTINUED
The consolidated statement of comprehensive income includes the Group’s share of the operating results, interest, pre-tax results and attributable taxation of such undertakings applying accounting policies consistent with those of the group. In the consolidated statement of financial position, the interests in jointly controlled entity undertakings are shown as the Group’s share of the identifiable net assets, including any unamortised premium paid on acquisition.
TURNOVERTurnover comprises rental income receivable in the year, income from property developed for sale including shared ownership first tranche sales, other services included at the invoiced value (excluding VAT) of goods and services supplied in the year, donations received and revenue grants receivable in the year. Rental income is recognised at the point properties become available for letting and income from first tranche sales and developed for sale properties are recognised at the point of legal completion. Other income is recognised in the period it is receivable.
OPERATING SEGMENTSThere are publically traded securities within the Group and therefore a requirement to disclose information about the Group operating segments under IFRS 8. Segmental information is disclosed in note 4 and as part of the analysis of housing properties in note 14. Information about income, expenditure and assets attributable to material operating segments are presented on the basis of the nature and function of housing assets held by the group rather than geographical location. As permitted by IFRS 8 this is appropriate on the basis of the similarity of the services provided, the nature of the risks associated, the type of customer and the nature of the regulatory environment across all of the geographical locations in which the Group operates. The Group Board do not routinely receive segmental information disaggregated by geographical location.
LONG TERM CONTRACTSThe amount of profit attributable to the stage of completion of a long term contract is recognised when the outcome of the contract can be foreseen with reasonable certainty. Income earned from such contracts is stated at the amount appropriate to their stage of completion calculated using the percentage of completion method plus attributable profits, less amounts recognised in previous years. Provision is made for any losses as soon as they are foreseen.
Contract work in progress is stated at costs incurred, less those transferred to the statement of comprehensive income, after deducting foreseeable losses and payments on account not matched with turnover. Amounts recoverable on contracts are included in debtors and represent turnover recognised in excess of payments on account.
SUPPORTING PEOPLE INCOME AND EXPENDITUREIncome receivable and costs incurred from contracts are recognised in the period they relate to on a receivable basis and included within other social housing activities in the statement of comprehensive income. Any excess of cost over the grant received is borne by the Group where it is not recoverable from tenants.
SUPPORTED HOUSING MANAGED BY AGENCIESSocial Housing Grants and other revenue grants for supported housing claimed by the Group are included in the statement of comprehensive income. The treatment of other income and expenditure in respect of supported housing depends on whether the Group or its partner carries the financial risk.
Where the Group carries the financial risk, all the supported housing schemes’ income and expenditure is included in the statement of comprehensive income.
SERVICE CHARGESService charges receivable are recognised in turnover. Expenditure is recorded when a service is provided and charged to the relevant service charge account or to a sinking fund. Income is recorded based on the estimated amounts chargeable. The Group adopts the variable method for calculating and charging service charges to its leaseholders and shared owners. Tenants are charged a fixed service charge.
MANAGEMENT OF UNITS OWNED BY OTHERSManagement fees receivable and reimbursed expenses are shown as income and included in management fees receivable. Costs of carrying out the management contracts and rechargeable expenses are included in operating costs.
SCHEMES MANAGED BY AGENTSIncome is shown as rent receivable and management fees payable to agents are included in operating costs.
CURRENT AND DEFERRED TAXATIONThe tax expense for the period comprises current and deferred tax. Tax is recognised in profit or loss, except that a change attributable to an item of income or expense recognised as other comprehensive income or to an item recognised directly in equity is also recognised in other comprehensive income or directly in equity respectively. The current income tax charge is calculated on the basis of tax rates and laws that have been enacted or substantively enacted by the reporting date in the countries where the company’s subsidiaries operate and generate taxable income.
NOTES TO THE FINANCIAL STATEMENTS
1. LEGAL STATUSThe Association is registered with the Financial Conduct Authority under the Co-operative and Community Benefits Societies Act 2014 and is registered with the Homes and Communities Agency in England as a social landlord. The Association is a Public Benefit Entity.
2. ACCOUNTING POLICIES BASIS OF ACCOUNTINGThe financial statements have been prepared in accordance with applicable law and UK accounting standards (United Kingdom Generally Accepted Accounting Practice) which for the Group includes the Cooperative and Community Benefit Societies Act 2014 (and related group accounts regulations), the Housing and Regeneration Act 2008, FRS 102 “the Financial Reporting Standard applicable in the United Kingdom and the Republic of Ireland” the Statement of Recommended Practice (SORP) for Registered Social Housing Providers 2014, “Accounting by registered social housing providers” 2014, the Accounting Direction for Private Registered Providers of Social Housing 2015.
These financial statements are the prepared under FRS 102.
The preparation of financial statements in compliance with FRS 102 requires the use of certain critical accounting estimates. It also requires Group management to exercise judgement in applying the Group’s accounting policies.
PARENT COMPANY DISCLOSURE EXEMPTIONSIn preparing the separate financial statements of the parent company, advantage has been taken of the following disclosure exemptions available in FRS 102:
• only one reconciliation of the number of shares outstanding at the beginning and end of the period has been presented as the reconciliations for the group and the parent company would be identical;
• no cash flow statement has been presented for the parent company; and
• no disclosure has been given for the aggregate remuneration of the key management personnel of the company as their remuneration is included in the totals for the Group as a whole.
BASIS OF CONSOLIDATIONAs required by the Statement of Recommended Practice: Accounting by registered social housing providers 2014, the Group has prepared consolidated financial statements. The Group consolidated financial statements present the results of the Association and its subsidiaries as if they formed a single entity. Intercompany transactions and balances between group companies are therefore eliminated in full.
As required by FRS 102 section 9 paragraph 11 Special Purpose Entities (SPE) are fully consolidated in the Group’s financial statements where the Group controls that entity. An entity is controlled by the Group where the Group retains the risks, receives the majority of the benefits, has ultimate decision making powers and the activities of the SPE are being conducted on behalf of the Group.
In the consolidated financial statements, the items of subsidiaries are recognised in full. On initial recognition, non-controlling interests are measured at the proportionate share of the acquired business’ identified assets and liabilities. The minority interests’ proportionate shares of the subsidiaries’ results and equity are recognised separately in the statement of comprehensive income and statement of financial position, respectively.
BUSINESS COMBINATIONS THAT ARE GIFTSWhere there is a business combination that is in substance a gift, any excess of fair value over the assets received over the fair value of the liabilities assumed is recognised as a gain in statement of comprehensive income. This gain represents the gift of the value of one entity to another and shall be recognised as income. Where the fair value of the liabilities exceeds the fair value of the assets, the loss represents net obligations assumed and shall be recognised as an expense.
JOINTLY CONTROLLED ENTITIESAn entity is treated as a jointly controlled entity where the group is party to a contractual agreement with one or more parties from outside the group to undertake an economic activity that is subject to joint control.
In the consolidated accounts, interests in jointly controlled entities are accounted for using the equity method of accounting. Under this method an equity investment is initially recognised at the transaction price (including transaction costs) and is subsequently adjusted to reflect the investor’s share of the profit or loss, other comprehensive income and equity of the jointly controlled entities.

A2DOMINION ANNUAL REPORT & ACCOUNTS 201766 67A2DOMINION ANNUAL REPORT & ACCOUNTS 2017
NOTES TO THE FINANCIAL STATEMENTS continued NOTES TO THE FINANCIAL STATEMENTS continued
FINANCIAL STATEMENTSFINANCIAL STATEMENTS
2. ACCOUNTING POLICIES CONTINUED
HOUSING PROPERTIES Housing properties are principally properties available for rent and shared ownership.
Housing properties under construction are stated at cost. Cost includes the cost of acquiring land and buildings, development costs, interest charges incurred during the development period and expenditure incurred in respect of improvements.
Shared ownership properties are split proportionally between current and fixed assets based on the element relating to expected first tranche sales. The first tranche proportion is classed as a current asset and related sales proceeds included in turnover, and the remaining element is classed as a fixed asset and included in housing properties at cost, less any provisions needed for impairment.
General needs housing properties for rent are split between their land and structure costs and a specific set of major components which require periodic replacement. On replacement the new major works component is capitalised with the related net book value of replaced components expensed through the statement of comprehensive income as accelerated depreciation. Component accounting is not applicable to shared ownership housing properties.
Improvements to existing properties which are outside the normal capitalisation policy of component additions, are works which result in an increase in the net rental income, such as a housing properties reduction in future maintenance costs, or result in a significant extension of the useful economic life of the property in the business and that provide an enhancement to the economic benefits in excess of the standard of performance anticipated when the asset was first acquired, constructed or last replaced.
Only the directly attributable overhead costs associated with new developments or improvements are capitalised.
DEPRECIATION OF HOUSING PROPERTIES Freehold land is not depreciated. Depreciation is charged so as to write down the cost of freehold housing properties other than freehold land to their estimated residual value on a straight line basis over their estimated useful economic lives at the following annual rates:
Major components:
Building 75 years Kitchens 15 years
Bathrooms 25 years Heating 15 years
Roofs 50 years Windows and doors 25 years
Lifts 20 years Electrical 30 years
The portion of shared ownership property retained or expected to be retained is not depreciated on account of the high residual value. Neither the depreciable amount nor the annual expected depreciation charge for such assets is considered material, individually or in aggregate.
Assets in the course of construction are not depreciated until they are completed and ready for use to ensure that they are depreciated only in periods in which economic benefits are expected to be consumed.
Properties held on leases are amortised over the life of the lease or their estimated useful economic lives in the business, if shorter.
DONATED LANDLand donated by local authorities and others is added to cost at the fair value of the land at the time of the donation, taking into account any restrictions on the use of the land.
LAND OPTIONSThe premium payable on an option to acquire land at a future date is amortised over the life of the option. The options are regularly reviewed to assess the likelihood of the option being exercised and at the early stages the majority of the associated expenses are charged to the statement of comprehensive income.
SHARED OWNERSHIP AND STAIRCASINGUnder shared ownership arrangements, the Group disposes of a long lease of shared ownership housing units to persons who occupy them, for an amount of between 25% and 75% of the open market value (the “first tranche”). The occupier has the right to purchase further proportions at the current valuation at that time up to 100% (“staircasing”).
A shared ownership property comprises two assets: that to be disposed of in the first tranche sale, which is recorded as a current asset; and that retained by the Group, which is recorded as a fixed asset in the same manner as for general needs housing properties.
Proceeds of sale of first tranches are accounted for as turnover in the statement of comprehensive income, with the apportioned cost being shown within operating results as the cost of sale.
Subsequent tranches sold (“staircasing sales”) are disclosed in the statement of comprehensive income as a surplus or deficit on sale of fixed assets. Such staircasing sales may result in capital grant being recycled, deferred or abated and this is credited in the statement of comprehensive income in arriving at the surplus or deficit.
2. ACCOUNTING POLICIES CONTINUED
Deferred balances are recognised in respect of all timing differences that have originated but not reversed by the balance sheet date, except:
• the recognition of deferred tax assets is limited to the extent that it is probable that they will be recovered against the reversal of deferred tax liabilities or other future taxable profits;
• any deferred tax balances are reversed if and when all conditions for retaining associated tax allowances have been met; and
• where timing differences relate to interests in subsidiaries, associates and joint ventures and the Group can control their reversal and such reversal is not considered probable in the foreseeable future.
Deferred tax balances are not recognised in respect of permanent differences except in respect of business combinations, when deferred tax is recognised on the differences between the fair values of assets acquired and the future tax deductions available for them and the differences between the fair values of liabilities acquired and the amount that will be assessed for tax.
Deferred income tax is determined using tax rates and laws that have been enacted or substantively enacted by the reporting date.
VALUE ADDED TAXThe Group charges value added tax (VAT) on some of its income and is able to recover part of the VAT it incurs on expenditure. The statement of comprehensive income includes VAT to the extent that it is suffered by the Group and not recoverable from HM Revenue and Customs. Recoverable VAT arises from partially exempt activities and is credited to the statement of comprehensive income. The balance of VAT payable or recoverable at the year-end is included as a current liability or asset in the statement of financial position.
FINANCE COSTSFRS 102 requires finance costs to be charged to the profit or loss over the term of the debt using the effective interest rate method so that the amount charged is at a constant rate on the carrying amount after initially recognising issue costs as a reduction in the proceeds of the associated capital instrument.
Interest is capitalised on borrowings to finance developments to the extent that it accrues in respect of the period of development if it represents either:
• interest on borrowings specifically financing the development programme after deduction of interest on social housing grant (SHG) in advance; or
• interest on borrowings of the Group as a whole after deduction of interest on SHG in advance to the extent that they can be deemed to be financing the development programme.
Other interest payable is charged to the statement of comprehensive income in the year.
The Group’s funding, liquidity and exposure to interest rate risks are managed by the Group’s treasury department. Treasury operations are conducted within a framework of policies and guidelines authorised by the Board. To manage interest rate risk the Group manages its proportion of fixed to variable rate borrowings within approved limits and where appropriate utilises interest rate swap agreements. Amounts payable or receivable in respect of these agreements are recognised as adjustments to interest rate expense.
The Group’s policy is to have a loan portfolio which is complementary to each Group member’s overall objectives. This is achieved by creating a balance between fixed and variable borrowing.
PENSIONSContributions to the Group’s defined contribution pension schemes are charged to the statement of comprehensive income in the year in which they become payable.
The Group participates in three funded multi-employer defined benefit schemes, the Social Housing Pension Scheme (SHPS), the Surrey County Council Scheme and the Oxfordshire County Council Scheme.
For the SHPS, it has not been possible to identify the share of underlying assets and liabilities belonging to individual participating employers and therefore SHPS has been accounted for under FRS 102 as if it were a defined contribution pension scheme. The deficit repayments of SHPS have been measured at the present value of the contributions payable discounted at a rate with reference to market yields on high-quality corporate bonds at the reporting date.
For the Surrey and Oxfordshire County Council Schemes, the operating costs of providing retirement benefits to participating employees are recognised in the accounting periods in which the benefits are earned. The related finance costs and any other changes in fair value of the assets and liabilities are recognised in the accounting period in which they arise. The operating costs and finance costs with any actuarial gains and losses are recognised in the consolidated statement of comprehensive income. The difference between the fair value of the assets held in the Group’s defined benefit pension scheme and the scheme’s liabilities are recognised in the Group’s statement of financial position.
HOLIDAY PAY ACCRUALA liability is recognised to the extent of any unused holiday pay entitlement which has accrued at the balance sheet date and carried forward to future periods. This is measured at the undiscounted salary cost of the future holiday entitlement so accrued at the balance sheet date.

A2DOMINION ANNUAL REPORT & ACCOUNTS 201768 69A2DOMINION ANNUAL REPORT & ACCOUNTS 2017
NOTES TO THE FINANCIAL STATEMENTS continued NOTES TO THE FINANCIAL STATEMENTS continued
FINANCIAL STATEMENTSFINANCIAL STATEMENTS
2. ACCOUNTING POLICIES CONTINUED
VALUATION OF INVESTMENTSInvestments in subsidiaries are measured at cost, less any provision for impairment.
Cash and unlisted investments classified as fixed asset investments are measured at cost.
Listed investments classified as fixed asset investments are remeasured to fair value at each balance sheet date. Gains and losses on remeasurement are recognised in the statement of comprehensive income.
IMPAIRMENTThe housing property portfolio for the Group is assessed for indicators of impairment at each balance sheet date. Where indicators are identified then a detailed assessment is undertaken to compare the carrying amount of assets or cash generating units for which impairment is indicated to their recoverable amounts. The recoverable amount is taken to be the higher of the fair value less costs to sell or value in use of an asset or cash generating unit. The assessment of value in use may involve considerations of the service potential of the assets or cash generating units concerned or the present value of future cash flows to be derived from them appropriately adjusted to account for any restrictions on their use.
The Group defines cash generating units as schemes except where its schemes are not sufficiently large in size or where it is geographically sensible to group schemes into larger cash generating units. Where the recoverable amount of an asset or cash generating unit is lower than its carrying value an impairment is recorded through a charge to income and expenditure.
PROPERTIES FOR SALEHousing properties that are built with the intention that they are to be transferred to another association are dealt with in current assets and are carried at cost and described as agency schemes for sale.
Shared ownership first tranche and commercial outright sale developments, both completed and under construction, are carried on the statement of financial position at the lower of cost and net realisable value. Cost comprises materials, direct labour, interest charges incurred during the development period and direct development overheads. Net realisable value is based on estimated sales price obtained from independent valuers and after allowing for all further costs of completion and disposal.
DEBTORS AND CREDITORSDebtors and creditors with no stated interest rate and receivable and payable within one year are recorded at transaction price. Any losses arising from impairment are recognised in the statement of comprehensive income in operating costs.
RECOVERABLE AMOUNT OF RENTAL AND OTHER TRADE RECEIVABLESThe Group estimates the recoverable value of rental and other receivables and impairs the debtor based on the age profile of the debt, historical collection rates and the class of debt.
CONCESSIONARY LOANSConcessionary loans are those loans made or received by the Group that are made:
• to further its public benefit objectives;
• at a rate of interest which is below the prevailing market rate of interest; and
• not repayable on demand.
These loans are measured at the amount advanced at the inception of the loan less amounts received and any provisions for impairment. Any associated grant is recognised as deferred income until the loan is redeemed.
The Group has a number of arrangements that are considered concessionary loans:
Equity loans, Homebuy loans and grantUnder these arrangements the Group receives Social Housing Grant (Homebuy only) representing a maximum of 30% of the open market purchase price of a property in order to advance interest free loans of the same amount to a homebuyer. The buyer meets the balance of the purchase price from a combination of personal mortgage and savings. Loans advanced by the Group under these arrangements are disclosed in the investments section of the statement of financial position.
In the event that the property is sold on, the Group recovers the equivalent loaned percentage value of the property at the time of the sale. The grant becomes recyclable when the loans are repaid and the amount of grant to be recycled is capped at the amount received when the loan was first advanced. If there is a fall in the value of the property, the shortfall of proceeds is offset against the recycled grant. There are no circumstances in which the Group will suffer any capital loss.
2. ACCOUNTING POLICIES CONTINUED
MIXED TENURE DEVELOPMENTSCosts are allocated to the appropriate tenure where it is possible to specify which tenure the expense relates to. Where it is not possible to relate costs to a specific tenure costs are allocated on a floor area or unit basis depending on appropriateness for each scheme.
OTHER TANGIBLE FIXED ASSETSTangible fixed assets are stated at cost less accumulated depreciation.
Depreciation is provided evenly on the cost of other tangible fixed assets to write them down to their estimated residual values over their expected useful lives. No depreciation is provided on freehold land.
Furniture, fixtures and fittings 20% – 25% per annum
Freehold offices 2% per annum
Freehold alterations 10% per annum
Leasehold offices Length of the lease
Computers, office equipment and motor vehicles Between 141/3% and 331/3% per annum
Properties held on leases are amortised over the life of the lease or their estimated useful economic lives in the business, if shorter.
SOCIAL HOUSING GRANT (SHG)Grant received in relation to newly acquired or existing housing properties is accounted for using the accrual model set out in FRS 102 and the SORP for Registered Social Housing Providers 2014. Grant is carried as deferred income in the statement of financial position and released to the statement of comprehensive income on a systematic basis over the useful economic lives of the asset for which it was received. In accordance with SORP for Registered Social Housing Providers 2014 the useful economic life of the housing property structure has been selected (see table of useful economic lives above).
Where SHG funded property is sold, the grant becomes recyclable and is transferred to a recycled capital grant fund until it is reinvested in a qualifying new development and moved to work in progress. When the new development is completed the SHG is moved back into deferred income and amortised. If there is no requirement to recycle or repay the grant on disposal of the assets any unamortised grant remaining within creditors is released and recognised as income within the statement of comprehensive income.
Grants relating to revenue are recognised in the statement of comprehensive income over the same period as the expenditure to which they relate once performance related conditions have been met.
OTHER GRANTSOther grants are receivable from local authorities and other organisations. Capital grants are carried as deferred income in the statement of financial position and released to the statement of comprehensive income on a systematic basis over the useful economic lives of the asset for which it was received. Grants in respect of revenue expenditure are credited to the statement of comprehensive income in the same period as the expenditure to which they relate.
RECYCLED CAPITAL GRANT FUNDFollowing certain relevant events, primarily the sale of dwellings, the HCA can direct the Group to recycle the capital grant (SHG) or to repay the recoverable capital grant back to the HCA. Where the grant is recycled the recoverable capital grant is credited to a Recycled Capital Grant Fund which is included as a creditor due within one year or due after more than one year as appropriate.
DISPOSAL PROCEEDS FUNDReceipts from Right to Acquire sales are required to be retained in a ring fenced fund that can only be used for providing replacement housing. These sales receipts less eligible expenses are credited to the Disposal Proceeds Fund.
SALES UNDER RIGHT TO BUYSurpluses and deficits arising from the disposal of properties under the Right to Buy legislation are included within surplus on sale of fixed assets on the face of the statement of comprehensive income. The surpluses or deficits are calculated by reference to the carrying value of the properties. On the occurrence of a sale of properties that were originally transferred to Spelthorne Housing Association (now owned by A2Dominion South Limited), a relevant proportion of the proceeds is payable back to Spelthorne Borough Council.
INVESTMENT PROPERTIESInvestment properties consist of commercial, student accommodation and market rent properties not held for social benefit or for use in the business. Investment properties are measured at cost on initial recognition and subsequently carried at fair value determined annually by external valuers and derived from the current market rents and investment property yields for comparable real estate, adjusted if necessary for any difference in the nature, location or condition of the specific asset. No depreciation is provided. Changes in fair value are recognised in the statement of comprehensive income.
Investment properties under construction are carried at cost.

A2DOMINION ANNUAL REPORT & ACCOUNTS 201770 71A2DOMINION ANNUAL REPORT & ACCOUNTS 2017
NOTES TO THE FINANCIAL STATEMENTS continued NOTES TO THE FINANCIAL STATEMENTS continued
FINANCIAL STATEMENTSFINANCIAL STATEMENTS
3 . JUDGEMENTS IN APPLYING ACCOUNTING POLICIES AND KEY SOURCES OF ESTIMATION UNCERTAINTYIn preparing these financial statements, the key judgements have been made in respect of the following:
• whether there are indicators of impairment of the Group’s tangible assets. Factors taken into consideration in reaching such a decision include the economic viability and expected future financial performance of the asset and where it is a component of a larger cash-generating unit, the viability and expected future performance of that unit. The members have considered the measurement basis to determine the recoverable amount of assets where there are indicators of impairment based on EUV-SH or depreciated replacement cost. The members have also considered impairment based on their assumptions to define cash or asset generating units.
• the critical underlying assumptions in relation to the estimate of the pension defined benefit scheme obligation such as standard rates of inflation, mortality, discount rate and anticipated future salary increases. Variations in these assumptions have the ability to significantly influence the value of the liability recorded and annual defined benefit expense.
• whether leases entered into by the company either as a lessor or a lessee are operating leases or finance leases. These decisions depend on an assessment of whether the risks and rewards of ownership have been transferred from the lessor to the lessee on a lease by lease basis.
• the appropriate allocation of costs for mixed tenure developments, and furthermore the allocation of costs relating to shared ownership between current and fixed assets.
• the categorisation of housing properties as investment properties or property, plant and equipment based on the use of the asset.
• the categorisation of financial instruments as basic or other.
• what constitutes a cash generating unit when indicators of impairment require there to be an impairment review.
OTHER KEY SOURCES OF ESTIMATION UNCERTAINTY• Tangible fixed assets (see note 14 and 15)
Tangible fixed assets, other than investment properties, are depreciated over their useful lives taking into account residual values, where appropriate. The actual lives of the assets and residual values are assessed annually and may vary depending on a number of factors. In re-assessing asset lives, factors such as economic conditions are taken into account. Residual value assessments consider issues such as future market conditions, the remaining life of the asset and projected disposal values.
For housing property assets, the assets are broken down into components based on management’s assessment of the properties. Individual useful economic lives are assigned to these components.
Market Rent investment properties are professionally valued annually using a discounted cash flow method, in nominal terms, in line with the traditional approach used by private investors when appraising an opportunity. In each case, a 10 year holding period has been used, with reversion of an exit value defined by the type of asset. Appropriate assumptions have been used as set as below, and have had regard for the investors’ target rates of return and appropriate costs of servicing the buildings and tenancies. In each model the assumption for rent and house price growth is either 3.5% (in London) or 2.5% (everywhere else).
• Discount rate – 7.75% - 8.25%
• Average cost per unit per annum – £2,781
• Exit yield – 4.6% - 4.9%
• Investments (see notes 16, 17 and 18)
The most critical estimates, assumptions and judgements relate to the determination of carrying value of investments at fair value through income and expenditure. In determining this amount, the Group follows the International Private Equity and Venture Capital Valuation Guidelines, applying the overriding concept that fair value is the amount for which an asset can be exchanged between knowledgeable willing parties in an arm’s length transaction. The nature, facts and circumstances of the investment drive the valuation methodology.
• Rental and other trade receivables (debtors) (see note 20)
The estimate for receivables relates to the recoverability of the balances outstanding at year end. A review is performed on an individual debtor basis to consider whether each debt is recoverable.
• Recovery of properties developed for sale
Properties developed for sale are carried on the statement of financial position at the lower of cost or net realisable value. It is estimated that 40% of the value of the shared ownership property will be sold at first tranche and is based on historic trends.
• Fair value measurement of derivatives
These instruments are measured at fair value (mark-to-market) at each reporting date. Each instrument’s mark-to-market is calculated with reference to mid-market rates.
2. ACCOUNTING POLICIES CONTINUED
LOANSAll loans, investments and short term deposits held by the Group are classified as basic financial instruments in accordance with FRS 102. These instruments are initially recorded at the transaction price less any transaction costs (historical cost), and subsequently measured at amortised cost. Loans and investments that are payable or receivable within one year are not discounted.
CASH AND CASH EQUIVALENTSCash and cash equivalents consist of cash at bank and in hand, deposits and short term investments with an original maturity date of three months or less.
DERIVATIVE INSTRUMENTS AND HEDGE ACCOUNTINGThe Group holds floating rate loans which expose the Group to interest rate risk, to mitigate against this risk the Group uses interest rate swaps. These instruments are measured at fair value (mark-to-market) at each reporting date. Each instrument’s mark-to-market value is calculated with reference to mid-market rates. They are carried as assets when the fair value is positive and as liabilities when the fair value is negative.
The Group has designated each of the swaps against either existing drawn floating rate debt or against highly probable future floating rate debt. Hedge effectiveness is assessed using the hypothetical derivative method. To the extent the hedge is effective movements in fair value adjustments (other than adjustments for Group or counter party credit risk) are recognised in other comprehensive income and presented in a separate cash flow hedge reserve. Any movements in fair value relating to ineffectiveness and adjustments for credit risk (whether relating to Group or the counterparty) are recognised in income and expenditure.
LEASED ASSETSRentals payable under operating leases are charged to the statement of comprehensive income on a straight-line basis over the lease term.
LEASEHOLD SINKING FUNDSUnexpended amounts collected from leaseholders for major repairs on leasehold schemes and any interest received are included in creditors.
PROVISIONSThe Group recognises provisions for liabilities of uncertain timing or amounts. Provision is made for specific and quantifiable liabilities, measured at the best estimate of expenditure required to settle the obligation at the balance sheet date.
Where the time value of money is material the amount expected to be required to settle the obligation is recognised at the present value using a discount rate. The unwinding of the discount is recognised as finance cost in the statement of comprehensive income in the year it arises.
CONTINGENT LIABILITIESA contingent liability is disclosed for a possible obligation, for which it is not yet confirmed that a present obligation exists that could lead to an outflow of resources; or for a present obligation that does not meet the definitions of a provision or a liability as it is not probable that an outflow of resources will be required to settle the obligation or when a sufficiently reliable estimate of the amount cannot be made. This includes a contingent liability reflecting the potential future obligation to repay SHG where properties are disposed of.
DESIGNATED RESERVESDesignated reserves are held to provide reserves in respect of future major repairs spend. The Group maintains a reserve that covers the next three years forecasted major repairs expenditure. Annually a transfer from designated reserves directly to the income and expenditure reserve is made for the value of the repairs expenditure incurred during that year.
RESTRICTED FUNDSRestricted funds are funds that can only be used for particular restricted purposes within the objects of the Group. Restrictions arise when specified by a donor or grant maker or when funds are raised for particular restricted purposes.
The donations fund was created from charitable donations received by the Group and from investment income from the fund’s investments.
GOING CONCERNThe Group and Association’s financial statements have been prepared on the going concern basis. The Association is supported by its asset owning subsidiaries. A2Dominon Housing Group Limited’s Board has effective control over these subsidiaries and their assets. These subsidiaries provide ongoing support to their parent which will continue to allow A2Dominion Housing Group Limited to meet its liabilities as they fall due.

A2DOMINION ANNUAL REPORT & ACCOUNTS 201772 73A2DOMINION ANNUAL REPORT & ACCOUNTS 2017
NOTES TO THE FINANCIAL STATEMENTS continued NOTES TO THE FINANCIAL STATEMENTS continued
FINANCIAL STATEMENTSFINANCIAL STATEMENTS
4. TURNOVER, COST OF SALES, OPERATING COSTS AND OPERATING SURPLUS CONTINUED
PARTICULARS OF INCOME AND EXPENDITURE FROM SOCIAL HOUSING LETTINGSGROUP
2017 2016
GENERAL NEEDS HOUSING
SUPPORTEDHOUSING
TEMPORARY HOUSING
KEY WORKER LOW COST HOME
OWNERSHIP
TOTAL TOTAL
£M £M £M £M £M £M £M
Turnover from social housing lettings
Rent receivable net of identifiable service charges 117.1 11.6 11.2 16.4 15.2 171.5 170.7
Service charges income 7.1 4.9 - 0.8 7.7 20.5 20.1
Amortised government grants 12.5 2.0 0.3 0.3 1.8 16.9 16.1
Net rental income 136.7 18.5 11.5 17.5 24.7 208.9 206.9
Nomination fees - - 0.7 - 0.3 1.0 1.1
Other income 0.6 0.1 - 0.2 0.9 1.8 1.5
Turnover from social housing lettings 137.3 18.6 12.2 17.7 25.9 211.7 209.5
Expenditure on social housing lettings
Management (14.5) (11.1) (1.0) (6.3) (4.3) (37.2) (46.0)
Service charge costs (13.1) (4.3) (0.4) (0.8) (7.1) (25.7) (22.9)
Routine maintenance (12.3) (2.2) (0.8) (1.3) (0.7) (17.3) (16.7)
Planned maintenance and major repairs expenditure (18.0) (0.6) (0.1) (0.8) (1.3) (20.8) (16.8)
Bad debts (0.6) (0.1) (0.1) - (0.2) (1.0) (1.0)
Property lease charges (0.1) (0.2) (2.6) - - (2.9) (3.2)
Depreciation of housing properties (24.3) (2.2) (1.0) (1.8) - (29.3) (26.0)
Accelerated depreciation on asset components (2.7) (1.1) (0.1) (0.1) (0.1) (4.1) (5.4)
Operating costs on social housing lettings (85.6) (21.8) (6.1) (11.1) (13.7) (138.3) (138.0)
Operating surplus on social housing lettings 51.7 (3.2) 6.1 6.6 12.2 73.4 71.5
Void losses (0.6) (0.5) (0.2) (0.8) (0.2) (2.3) (2.1)
The Group updated its apportionment methodology during the year to ensure that all entities receive a proportionate and fair allocation of central overheads reflecting the Group’s current activities which has resulted in a reduction of approx. £6m in management costs between 2016 and 2017.
4. TURNOVER, COST OF SALES, OPERATING COSTS AND OPERATING SURPLUSGROUP
2017
TURNOVER COST OF SALES OPERATING COSTS
OPERATING SURPLUS
BEFORE SALE OF FIXED ASSETS
£M £M £M £M
Social housing lettings 211.7 - (138.3) 73.4
Other social housing activities
Supporting people 2.2 - (2.4) (0.2)
Management services 0.8 - (0.2) 0.6
First tranche sales 15.6 (9.5) - 6.1
Agency sale 2.0 (2.0) - -
Other 3.1 - (8.4) (5.3)
23.7 (11.5) (11.0) 1.2
Non-social housing activities
Lettings 21.1 - (9.4) 11.7
Developments for sale 114.2 (87.8) (7.4) 19.0
Pension provision - - (0.3) (0.3)
Other 1.2 - - 1.2
136.5 (87.8) (17.1) 31.6
371.9 (99.3) (166.4) 106.2
2016
TURNOVER COST OF SALES OPERATING COSTS
OPERATING SURPLUS
BEFORE SALE OF FIXED ASSETS
£M £M £M £M
Social housing lettings 209.5 - (138.0) 71.5
Other social housing activities
Supporting people 1.8 - (1.9) (0.1)
Management services 0.8 - (0.8) -
First tranche sales 26.1 (15.2) - 10.9
Agency sale 4.1 (4.1) - -
Other 4.6 - (5.1) (0.5)
37.4 (19.3) (7.8) 10.3
Non-social housing activities
Lettings 17.1 - (7.6) 9.5
Developments for sale 113.6 (83.1) (1.7) 28.8
Pension provision - - (7.1) (7.1)
Other 0.8 - (0.8) -
131.5 (83.1) (17.2) 31.2
378.4 (102.4) (163.0) 113.0

A2DOMINION ANNUAL REPORT & ACCOUNTS 201774 75A2DOMINION ANNUAL REPORT & ACCOUNTS 2017
NOTES TO THE FINANCIAL STATEMENTS continued NOTES TO THE FINANCIAL STATEMENTS continued
FINANCIAL STATEMENTSFINANCIAL STATEMENTS
6. OPERATING SURPLUSTHIS IS ARRIVED AT AFTER CHARGING (CREDITING):
GROUP ASSOCIATION
2017 2016 2017 2016£M £M £M £M
Depreciation of housing properties 29.3 26.0 - -
Accelerated depreciation on replaced components 4.1 5.4 - -
Depreciation of other tangible fixed assets 3.0 2.7 - -
Operating lease rentals
- land and buildings 5.5 5.5 1.6 1.6
- office equipment, computers and vehicles 0.2 0.3 0.2 0.3
Auditor’s remuneration (exclusive of VAT)
- fees payable for the audit of the group’s annual accounts 0.2 0.2 - 0.2
- fees for the audit of associated entities - 0.1 - -
- fees for tax computations - - - -
- fees for tax advice - - - -
- fees for other non-audit services 0.1 - 0.1 -
7. EMPLOYEESAVERAGE MONTHLY NUMBER OF EMPLOYEES EXPRESSED IN FULL TIME EQUIVALENTS:A full time equivalent is based on a 35 hour week.
GROUP ASSOCIATION
2017 2016 2017 2016NO. NO. NO. NO.
Administration 196 184 195 182
Development 88 100 88 100
Housing, support and care 740 744 562 574
1,024 1,028 845 856
EMPLOYEE COSTS:
GROUP ASSOCIATION
2017 2016 2017 2016£M £M £M £M
Wages and salaries 36.1 35.5 30.9 30.4
Social security costs 3.9 3.3 3.3 2.9
Pension costs 1.5 1.5 1.4 1.4
Pension provision (note 31)1 1.1 7.9 1.1 7.9
42.6 48.2 36.7 42.6
1 The current year includes a £0.6m (2016: £5.4m) movement on the present value of future SHPS pension deficit payments and £0.5m (2016: £2.1m) provision for the local government pension schemes.
8. DIRECTORS AND SENIOR EXECUTIVE REMUNERATION
GROUP
2017 2016£’000 £’000
Total emoluments paid to executive officers (including pension contributions) 1,886 1,823
Emoluments of the highest paid executive officer (excluding pension contributions and pay in lieu thereof1 but including performance related pay and benefits in kind) 266 263
1 A payment in lieu of £17,960 (2016: £18,256), the equivalent employer’s contribution was received by the highest paid director.
The Group defines key management personnel as the Board, the Chief Executive and the Executive Management Team. There were no payments to key management personnel for compensation for loss of office during the year (2016: £nil). The executive officers participate in the pension schemes on the same terms as all other eligible staff.
The emoluments of the executive officers are reviewed and agreed on an annual basis by the Group Governance and Remuneration Committee. A three year performance incentive scheme has been in operation for the Group’s executive and operational management team since 2016 and the payments will be reported next year when the scheme matures.
4. TURNOVER, COST OF SALES, OPERATING COSTS AND OPERATING SURPLUS CONTINUED
Particulars of turnover from non-social housing lettings
GROUP
2017 2016£M £M
Market rental 11.8 8.3
Student accommodation 8.5 8.0
Other 0.8 0.8
21.1 17.1
ASSOCIATION 2017
TURNOVER OPERATING COSTS
OPERATING SURPLUS/
(DEFICIT)£M £M £M
Other social housing activities
Management services 40.3 (40.8) (0.5)
Other 1.1 - 1.1
41.4 (40.8) 0.6
2016
TURNOVER OPERATING COSTS
OPERATING SURPLUS/
(DEFICIT)£M £M £M
Other social housing activities
Management services 39.6 (47.5) (7.9)
Other 1.4 (0.5) 0.9
41.0 (48.0) (7.0)
5. ACCOMMODATION IN MANAGEMENT AND DEVELOPMENTGROUPAt the end of the year accommodation in management for each class of accommodation was as follows:
2017 2016NO. NO.
Social housing
General needs housing 17,522 17,573
Affordable housing 737 424
Supported housing and housing for older people 2,293 2,375
Shared ownership 3,835 3,905
Key worker accommodation 2,697 2,692
Temporary accommodation 452 440
Other 1,248 1,250
Total owned 28,784 28,659
Accommodation managed for others 5,475 5,152
Total owned and managed 34,259 33,811
Non-social housing
Student accommodation 1,378 1,378
Market rent 1,009 852
Other – commercial 93 89
Total owned 2,480 2,319
Overall
Total owned 31,264 30,978
Total managed for others 5,475 5,152
Total owned and managed 36,739 36,130
Accommodation in development 5,402* 3,856
The Association does not own or manage any accommodation.*For capital commitment purposes only.

A2DOMINION ANNUAL REPORT & ACCOUNTS 201776 77A2DOMINION ANNUAL REPORT & ACCOUNTS 2017
NOTES TO THE FINANCIAL STATEMENTS continued NOTES TO THE FINANCIAL STATEMENTS continued
FINANCIAL STATEMENTSFINANCIAL STATEMENTS
9. BOARD MEMBERSFees of £171,840 (2016: £174,080) were paid to non-executive board members during the year. Taxable travel allowances paid during the year to board members amounted to £12,840 (2016: £13,400). Non-executive board members during the year ended 31 March 2017 were paid as follows:
BOARD/COMMITTEE MEMBER MEMBER OF
MEMBERSHIP PAY AUDIT & RISK COMMITTEE
CUSTOMER SERVICES
COMMITTEE
DEVELOPMENT COMMITTEE
FINANCE COMMITTEE
GOVERNANCE & REMUNERATION
COMMITTEE
GROUP BOARD
Suzanne Avery 4,000 •
Peter Braithwaite 4,000 •
Jane Clarke 6,000 •
David Coates 14,000 • • •
Terence Cook 9,000 •
Ian Cox 14,000 • • •
Jan Czezowski 1 4,000 • •
Sara Dickinson 12,000 • •
Mark Gallagher 6,000 • •
Martin Huckerby 6,000 • •
Derek Joseph (Chair) 22,000 • •
Nick Martin 1 6,000 • •
Pauline McMichael 4,000 •
Carl Rudd 4,000 •
Ingrid Temmerman 6,000 •
Caroline Tiller 14,000 • • •
Caroline Tolhurst 14,000 • • •
Peter Walker 4,000 •
Peter Wyeth 6,000 •1 These board members resigned during the year ended 31 March 2017.
8. DIRECTORS AND SENIOR EXECUTIVE REMUNERATION CONTINUED
EXECUTIVE OFFICERS 2017TOTAL
REMUNERATION1
2016TOTAL
REMUNERATION1
£’000 £’000
A Boyes Executive Director (Change & IT) 191 177
K Bull Executive Director (Projects) 143 143
A Evans Executive Director (Operations) 192 179
J Knevett Group Commercial Officer 253 250
D Mercer Group Chief Executive 266 263
S Potts Executive Director (Commercial, South East) 2 83 166
D Tufts Executive Director (Finance & Strategy) 191 177
A Waterhouse Executive Director (Central & Financial Services) 191 177
N HutchingsN Yeeles
Executive Director (Commercial, South East) 2
Executive Director (Commercial, London)
77166
-165
1 Total remuneration includes performance related pay and benefits in kind of life insurance, private medical and company car where applicable but excludes pension contributions.
2 Total remuneration is shown for the periods during the year that the individuals were in their positions.
Salary banding for all employees earning over £60,000 (includes salary and performance related pay and pension contributions paid by the Group).
SALARY BANDING 2017 2016NO. NO.
£60,000 to £70,000 31 22
£70,001 to £80,000 20 14
£80,001 to £90,000 7 13
£90,001 to £100,000 9 8
£100,001 to £110,000 5 8
£110,001 to £120,000 7 5
£120,001 to £130,000 2 5
£130,001 to £140,000 - 1
£140,001 to £150,000 1 1
£150,001 to £160,000 1 1
£170,001 to £180,000 1 1
£180,001 to £190,000 1 5
£200,001 to £210,000 4 -
£260,001 to £270,000 - 1
£270,001 to £280,000 1 -
£280,001 to £290,000 1 1
91 86

A2DOMINION ANNUAL REPORT & ACCOUNTS 201778 79A2DOMINION ANNUAL REPORT & ACCOUNTS 2017
NOTES TO THE FINANCIAL STATEMENTS continued NOTES TO THE FINANCIAL STATEMENTS continued
FINANCIAL STATEMENTSFINANCIAL STATEMENTS
13. TAX ON SURPLUS ON ORDINARY ACTIVITIES
GROUP ASSOCIATION
2017 2016 2017 2016£M £M £M £M
Current taxUK corporation tax on surplus for the year - 0.1 - -Adjustments in respect of prior years (0.1) - - -Total current tax charge (0.1) 0.1 - -Deferred taxAdjustment in respect of prior periods - - - -Origination and reversal of timing differences 0.3 0.7 - -Effect of tax rate change on opening balance - (0.3) - -Total deferred tax charge 0.3 0.4 - -Total charge in the year 0.2 0.5 - -Movement in deferred tax chargeProvision at start of year 3.5 3.1 - -Deferred tax charged in the income and expenditure account for the year 0.3 0.4 - -Provision at end of year 3.8 3.5 - -
A reconciliation of the tax charge to the surplus on ordinary activities before tax is provided below:
GROUP ASSOCIATION
2017 2016 2017 2016£M £M £M £M
Surplus on ordinary activities before tax: 85.1 114.5 0.1 (7.5)UK corporation tax at 20% 17.0 22.9 0.0 (1.5)Effects of:Other tax adjustments, reliefs and transfers (0.4) 1.1 - -Capital gains - 0.9 - -Deferred tax not recognised (0.2) 0.5 - -Effect of indexation of deferred tax provision (0.9) - - -Adjust closing deferred tax to average rate (0.2) (0.2) - -Expenses not deductible for tax purposes 57.2 51.1 10.3 12.6Income not taxable for tax purposes (72.2) (75.6) (10.3) (11.1)Fixed asset differences (0.1) (0.2) - -Current tax charge for year 0.2 0.5 - -
10. SURPLUS ON SALE OF FIXED ASSETSGROUP
2017 2016
SHARED OWNERSHIP
SALES TO OTHER
REGISTERED PROVIDERS
OTHER HOUSING
PROPERTIES
INVESTMENTS (HOMEBUY AND EQUITY LOANS)
TOTAL TOTAL
£M £M £M £M £M £M
Housing propertiesDisposal proceeds 29.2 5.3 4.6 1.1 40.2 40.5Cost of disposals (15.8) (5.2) (2.7) (0.3) (24.0) (23.9)Selling costs (0.2) - - - (0.2) (0.3)Grant recycled (0.9) (0.3) (0.8) (0.3) (2.3) (1.0)Surplus on disposal of fixed assets 12.3 (0.2) 1.1 0.5 13.7 15.3
11. INTEREST RECEIVABLE AND OTHER INCOME
GROUP ASSOCIATION
2017 2016 2017 2016£M £M £M £M
Interest receivable and similar income 6.4 2.4 0.3 -Received from other Group entities - - 10.1 6.8
6.4 2.4 10. 4 6.8
12. INTEREST PAYABLE AND SIMILAR CHARGES
GROUP ASSOCIATION
2017 2016 2017 2016£M £M £M £M
Loans and bank overdrafts (on liabilities at amortised cost) 66.8 65.3 10.0 6.8Finance related costs 2.2 1.8 0.1 -Recycled capital grant fund 0.2 0.1 - -
69.2 67.2 10.1 6.8Interest payable capitalised on housing properties under construction (14.2) (18.1) - -
55.0 49.1 10.1 6.8Capitalisation rates used to determine the finance costs capitalised during the year 4.8% - 5.8% 4.8% - 6.1% - -Other financing costs through other comprehensive incomeGain/(loss) on fair value of hedged derivative instruments 3.5 (2.5) - -

A2DOMINION ANNUAL REPORT & ACCOUNTS 201780 81A2DOMINION ANNUAL REPORT & ACCOUNTS 2017
NOTES TO THE FINANCIAL STATEMENTS continued NOTES TO THE FINANCIAL STATEMENTS continued
FINANCIAL STATEMENTSFINANCIAL STATEMENTS
14. TANGIBLE FIXED ASSETS – PROPERTIES
HOUSING PROPERTIES SOCIAL HOUSING COMPLETED
SOCIAL HOUSING UNDER
CONSTRUCTION
SHARED OWNERSHIP COMPLETED
SHARED OWNERSHIP
UNDER CONSTRUCTION
KEYWORKER COMPLETED
TOTAL
£M £M £M £M £M £M
Cost or valuationAt 1 April 2016 2,239.3 120.1 306.1 24.1 126.6 2,816.2Reclassification (2.2) - 2.3 - (0.1) -Additions at costConstruction works 0.1 36.1 0.1 18.1 - 54.4Works to existing properties 8.8 - - - 0.5 9.3Transfer to investment properties (1.2) - - - - (1.2)Transfer to current assets - (0.2) (0.2) (6.3) - (6.7)Schemes completed 72.6 (72.6) 18.2 (18.2) - -DisposalsPlanned disposals (2.9) - - - - (2.9)Replaced components (7.1) - - - (0.4) (7.5)Sales to other registered providers (0.1) - - - - (0.1)Staircasing sales - - (15.7) - - (15.7)Right to buy sales (0.1) - - - - (0.1)At 31 March 2017 2,307.2 83.4 310.8 17.7 126.6 2,845.7Depreciation and impairment At 1 April 2016 262.5 2.6 0.4 - 20.1 285.6Charge for the year 27.5 - - - 1.8 29.3DisposalsPlanned disposals (0.6) - - - - (0.6)Replaced components (3.1) - - - (0.3) (3.4)At 31 March 2017 286.3 2.6 0.4 - 21.6 310.9Net book value At 31 March 2017 2,020.9 80.8 310.4 17.7 105.0 2,534.8At 31 March 2016 1,976.8 117.5 305.7 24.1 106.5 2,530.6
The amount of cumulative interest capitalised in housing properties since 2009 is £37.9m (2016: £31.1m). Reclassifications represent the reapportionment of base costs between tenures. Prior to the adoption of FRS 102 Social Housing grant was classified within fixed assets; under those accounting rules Social Housing and Keyworker accumulated depreciation would have been £168.5m (2016: £135.4m).
14. TANGIBLE FIXED ASSETS – PROPERTIES CONTINUED
HOUSING PROPERTIES BOOK VALUE, NET OF DEPRECIATION COMPRISES:
GROUP
2017 2016£M £M
Freehold land and buildings 1,756.7 1,785.4
Long leasehold land and buildings 757.2 671.7
Short leasehold land and buildings 20.9 73.5
2,534.8 2,530.6
EXPENDITURE ON WORKS TO EXISTING PROPERTIES
GROUP
2017 2016£M £M
Amounts capitalised 9.3 20.1
Amounts charged to income and expenditure account 20.8 16.8
Total 30.1 36.9
The amount of assets given as security (EUV basis of valuation) as at 31 March 2017 is £1.7bn (2016: £1.7bn).
VALUATION FOR DISCLOSURE ONLY
2017£M
Completed housing properties at valuation 2,706
Revaluation reserve – completed housing properties 1,037
The completed housing properties at valuation disclosed above includes housing properties held as investment properties (note 16).
For information purposes only, completed housing properties are valued at 31 March 2017 by Jones Lang LaSalle Limited and Savills (L&P), qualified professional independent external valuers.
The valuation of the properties was undertaken in accordance with the Appraisal and Valuation Manual of the Royal Institution of Chartered Surveyors. Properties are valued either at Existing Use Value for Social Housing (EUV-SH), for all social housing and shared ownership properties, or Market Value Tenanted (MV- T) for all non-social housing.
In valuing housing properties, discounted cash flow methodology was adopted with key assumptions:
SOCIAL HOUSING AND SHARED OWNERSHIP ONLY
Discount rate 5.0% -8.0%
Rent Assumptions
Social rented (including supported housing and housing for older people)
Current rent minus 1% for the next four years and CPI + 1.0% thereafter
Shared ownership RPI +0.5%
Other rents RPI +1.0% or in accordance with any relevant lease or nominations agreements.

A2DOMINION ANNUAL REPORT & ACCOUNTS 201782 83A2DOMINION ANNUAL REPORT & ACCOUNTS 2017
NOTES TO THE FINANCIAL STATEMENTS continued NOTES TO THE FINANCIAL STATEMENTS continued
FINANCIAL STATEMENTSFINANCIAL STATEMENTS
15. OTHER TANGIBLE FIXED ASSETSGROUP
FURNITURE, FIXTURES AND
FITTINGS
LEASEHOLD OFFICES
FREEHOLD ALTERATIONS
COMPUTERS, OFFICE
EQUIPMENT AND MOTOR
VEHICLES
FREEHOLDOFFICES
TOTAL
£M £M £M £M £M £M
CostAt 1 April 2016 4.7 2.0 0.6 7.8 17.6 32.7Additions 0.2 - - 2.3 - 2.5At 31 March 2017 4.9 2.0 0.6 10.1 17.6 35.2DepreciationAt 1 April 2016 2.4 1.1 0.6 5.2 2.1 11.4Charged in year 0.6 0.1 - 2.0 0.3 3.0At 31 March 2017 3.0 1.2 0.6 7.2 2.4 14.4Net book valueAt 31 March 2017 1.9 0.8 - 2.9 15.2 20.8Net book valueAt 31 March 2016 2.3 0.9 - 2.6 15.5 21.3
16. INVESTMENT PROPERTIESGROUP
STUDENT ACCOMMODATION
MARKET RENT COMMERCIAL PROPERTIES UNDER
CONSTRUCTION AT COST
TOTAL
£M £M £M £M £M
At 1 April 2016 96.7 221.1 17.7 26.0 361.5Additions - 14.1 0.1 37.7 51.9Disposals - (4.3) - - (4.3)Schemes completed - 18.8 3.1 (21.9) -Transfer from fixed asset properties - 1.2 - 1.2Transfer to current assets - - - (1.0) (1.0)Transfer to other investments - - (0.1) - (0.1)Revaluation 3.8 16.4 (1.5) - 18.7At 31 March 2017 100.5 267.3 19.3 40.8 427.9
The Group’s investment properties are valued annually on 31 March at fair value, determined by Jones Lang LaSalle Limited, qualified professional independent external valuers. The valuations were undertaken in accordance with the Royal Institution of Chartered Surveyors’ Appraisal and Valuation Manual.
16. INVESTMENT PROPERTIES CONTINUED
In valuing investment properties, a discounted cash flow methodology was adopted with the following key assumptions:
Discount rate 7.25% - 8.25%
Annual inflation rate 2.5%
Level of long term annual rent increase RPI + 1.00%
Commercial properties have been valued using a term and reversion method (where the current rental stream has been capitalised for the term certain of the lease and thereafter the market rent has been capitalised into perpetuity).
Full vacant possession value for the market rent properties at 31 March 2017 is £306.6m. This gives an indication of the worth of these if they were to be sold individually in the open property market.
Student accommodation has been valued using a market based approach, where each asset has been valued on an individual basis.
The surplus on revaluation of investment property of £18.7m (2016: £30.1m) has been credited to the statement of comprehensive income for the year.
If investment properties had been accounted for under the historic cost accounting rules, the properties would have been measured as follows:
STUDENT ACCOMMODATION
MARKET RENT
COMMERCIAL 2017 2016
£M £M £M £M £M
Historic cost 63.9 197.6 12.3 273.8 233.2
Accumulated depreciation (10.8) (6.4) (0.6) (17.8) (16.4)
53.1 191.2 11.7 256.0 216.8
17. INVESTMENTS – HOMEBUY LOANS
GROUP 2017 2016£M £M
At 1 April 2.9 3.2
Loans redeemed (0.3) (0.3)
At 31 March 2.6 2.9
Investments in Homebuy loans represent an equity stake in third party properties purchased under the Homebuy scheme. Security for the loans is provided by the assets the loans relate to. Terms of repayment for all loans are on redemption.
18. FIXED ASSET INVESTMENTS
GROUP EQUITY LOANS OTHER TOTAL£M £M £M
Cost
At 1 April 2016 6.0 12.3 18.3
Additions 0.1 2.0 2.1
Transfer from investment properties - 0.1 0.1
Disposal/redeemed (0.6) - (0.6)
Transfer to current assets - (0.6) (0.6)
Movement in fair value - 0.5 0.5
At 31 March 2017 5.5 14.3 19.8
Equity loans are advances made in relation to discounted sales of housing and are secured on the properties sold. They are stated at cost and independent valuers have confirmed the value at 31 March 2017 is not less than the cost.

A2DOMINION ANNUAL REPORT & ACCOUNTS 201784 85A2DOMINION ANNUAL REPORT & ACCOUNTS 2017
NOTES TO THE FINANCIAL STATEMENTS continued NOTES TO THE FINANCIAL STATEMENTS continued
FINANCIAL STATEMENTSFINANCIAL STATEMENTS
18. FIXED ASSET INVESTMENTS CONTINUED
Other investments relate to the following, representing fair value remeasurements:
31 MARCH 2017 31 MARCH 2016
COST MARKET VALUE COST MARKET VALUE£M £M £M £M
Investments listed on a recognised stock exchange 1.0 1.0 1.2 1.3
British government securities 3.2 5.4 3.2 5.0
Cash and similar investments 7.5 7.6 5.5 5.5
Other 0.2 0.3 0.5 0.5
11.9 14.3 10.4 12.3
GROUP JOINTLY CONTROLLED ENTITIES£M
Cost
At 1 April 2016 62.2
Additions -
Disposal/redeemed (2.1)
At 31 March 2017 60.1
Share of retained profits
At 1 April 2016 (4.0)
Loss for the year (1.2)
Distributions (0.1)
31 March 2017 (5.3)
Net book value
At 31 March 2017 54.8
At 31 March 2016 58.2
There was no premium on acquisition relating to the jointly controlled entities.
The Group holds an interest in five jointly controlled entities through A2Dominion Developments Limited:
ENTITY COUNTRY OF INCORPORATION OR REGISTRATION
PARTNERGROUP
INTERESTGROUP
VOTING RIGHTS
Essex Wharf Homes LLP England Sherry Green Homes Limited 50% 50%
Green Man Lane LLP England Real (Ealing) Limited 50% 50%
Queen’s Wharf Riverside LLP England Hammersmith Developments Holdco Limited 50% 50%
Keybridge House LLP England Mount Anvil (Keybridge) Limited 50% 50%
Crest A2D (Walton Court) LLP England Crest Nicholson Operations Limited 50% 50%
A2Dominion Developments Limited has completed its joint venture partnership with Essex Wharf Homes LLP with all of the private development units legally complete and all profits distributed.
18. FIXED ASSET INVESTMENTS CONTINUED
The amount included in respect of jointly controlled entities includes the following:
ESSEX WHARF HOMES LLP
GREEN MAN LANE LLP
QUEEN’S WHARF RIVERSIDE LLP
KEYBRIDGE HOUSE LLP
CREST A2D (WALTON
COURT) LLP
TOTAL
£M £M £M £M £M £M
Turnover - 8.7 - - - 8.7
Cost of sales and administration expenses - (7.7) - - - (7.7)
Other finance costs - - (2.0) (0.2) - (2.2)
Surplus for the year - 1.0 (2.0) (0.2) - (1.2)
Share of:
Current assets - 16.1 58.8 78.6 10.7 165.0
Liabilities due within one year - (15.0) (43.7) (50.7) - (110.2)
Net assets - 1.1 15.1 27.9 10.7 54.8
Share of capital commitments - 6.1 16.1 79.6 - 101.8
The principal undertakings in which the Association has an interest are as follows:
COMPANY COUNTRY OF INCORPORATION OR REGISTRATION
GROUP’S SHARE OF ORDINARY SHARE CAPITAL
NATURE OF BUSINESS NATURE OF ENTITY
A2Dominion Enterprises Limited England 100% Dormant Company Incorporated CompanyA2Dominion Housing Options Limited England 100% Rents properties for affordable housing Non-charitable registered provider of social housingA2Dominion Housing Finance Limited England 100% Raise funds for the operational business Non-charitable Co-operative and Benefit SocietyA2Dominion South Limited England 100% Rents properties for social housing Registered provider of social housingA2Dominion Homes Limited England 100% Rents properties for social housing Registered provider of social housingA2Dominion Residential Limited England 100% Rents properties at market rents Incorporated CompanyA2Dominion Developments Limited England 100% Develops and sells properties Incorporated CompanyA2Dominion Treasury Limited England 100% Raise funds for the operational business Incorporated CompanyA2Dominion Investments Limited England 100% Dormant Company Incorporated CompanyAffordable Property Management Limited England 100% Dormant Company Incorporated CompanyHome Farm Exemplar Limited England 100% Non Trading Incorporated CompanyKingsbridge Residential Limited England 100% Dormant Company Incorporated CompanyPyramid Plus London LLP England 70% Property maintenance services Limited Liability PartnershipPyramid Plus South LLP England 70% Property maintenance services Limited Liability PartnershipUpper Richmond Buildings Limited England 100% Non Trading Incorporated CompanyA2D Funding PLC England - Issue retail bonds and lend proceeds Public Limited CompanyA2D Funding II PLC England - Issue retail bonds and lend proceeds Public Limited Company

A2DOMINION ANNUAL REPORT & ACCOUNTS 201786 87A2DOMINION ANNUAL REPORT & ACCOUNTS 2017
NOTES TO THE FINANCIAL STATEMENTS continued NOTES TO THE FINANCIAL STATEMENTS continued
FINANCIAL STATEMENTSFINANCIAL STATEMENTS
19. PROPERTIES FOR SALE
GROUP
2017 2016£M £M
Open market sale - completed properties 2.1 2.2
Open market sale - under construction 203.8 183.2
Shared ownership - completed properties 4.1 3.7
Shared ownership - under construction 5.0 7.1
Land held for development 6.9 0.6
Agency schemes for sale - 4.4
221.9 201.2
Capitalised interest included in the stock balances is £19.2m (2016: £19.7m).
20. DEBTORS
GROUP ASSOCIATION
2017 2016 2017 2016£M £M £M £M
Due within one year
Rent and service charges receivable 12.1 11.8 - -
Less: Provision for bad and doubtful debts (6.4) (6.0) - -
Net arrears 5.7 5.8 - -
Trade debtors 0.2 0.1 0.2 0.2
Other debtors 9.3 15.1 2.4 8.8
VAT recoverable 3.2 2.0 - -
Deposits on purchased schemes 0.8 3.0 - -
Prepayments and accrued income 10.4 9.1 1.5 0.9
Loans due from joint venture 40.3 - - -
Amounts due from Group entities - - 12.2 10.2
Capital and agency debtors 9.8 6.7 - -
79.7 41.8 16.3 20.1
Due after more than one year
Loans due from subsidiary undertakings under on-lending arrangements - - 376.7 131.3
Deposits on purchased schemes 23.0 27.1 - -
Loans due from joint ventures 32.8 34.7 - -
Capital and agency debtors 1.9 1.9 - -
Other debtors 0.7 0.6 - -
58.4 64.3 376.7 131.3
138.1 106.1 393.0 151.4
21. CURRENT ASSET INVESTMENTS
GROUP ASSOCIATION
2017 2016 2017 2016£M £M £M £M
Money market deposits - 8.0 - 8.0
Other investments 70.0 - - -
70.0 8.0 - 8.0
22. CASH AT BANK AND IN HAND
GROUP ASSOCIATION
2017 2016 2017 2016£M £M £M £M
Cash at bank 140.7 31.2 114.9 16.2
Sinking funds 7.4 6.1 - -
148.1 37.3 114.9 16.2
At 31 March 2017 £1.3m (2016: £1.3m) of cash balances were charged to lenders.
23. CREDITORS: AMOUNTS FALLING DUE WITHIN ONE YEAR
GROUP ASSOCIATION
2017 2016 2017 2016£M £M £M £M
Loans and borrowings (note 28) 33.9 29.2 5.9 7.3
Trade creditors 11.0 7.0 6.7 3.2
Rent and service charges received in advance 11.1 10.1 - -
Deferred capital grant (note 25) 15.5 15.0 - -
Recycled Capital Grant Fund (note 26) 7.6 6.6 - -
Disposal Proceeds Fund (note 27) 1.3 0.5 - -
Amounts owed to Group entities - - 115.3 29.4
Other taxation and social security 1.6 1.1 1.4 1.0
Other creditors 6.6 6.6 2.0 2.1
SHPS pension (note 31) 1.7 1.5 1.7 1.5
Accruals and deferred income 33.6 20.3 6.8 4.1
Interest accrued 5.4 5.7 - -
Capital creditors 5.1 3.4 - -
134.4 107.0 139.8 48.6
24. CREDITORS: AMOUNTS FALLING DUE AFTER MORE THAN ONE YEAR
GROUP ASSOCIATION
2017 2016 2017 2016£M £M £M £M
Loans and borrowings (note 28) 1,527.7 1,335.3 373.8 131.3
Deferred capital grant (note 25) 996.3 1,011.0 - -
Interest rate SWAP – cash flow hedge 84.7 84.8 - -
Recycled Capital Grant Fund (note 26) 14.4 14.4 - -
Sinking funds 7.5 6.6 - -
Disposal Proceeds Fund (note 27) 3.2 3.1 - -
SHPS pension (note 31) 13.3 14.9 13.3 14.9
Capital creditors 7.0 5.4 - -
Deferred tax (note 32) 3.8 3.5 - -
2,657.9 2,479.0 387.1 146.2

A2DOMINION ANNUAL REPORT & ACCOUNTS 201788 89A2DOMINION ANNUAL REPORT & ACCOUNTS 2017
NOTES TO THE FINANCIAL STATEMENTS continued NOTES TO THE FINANCIAL STATEMENTS continued
FINANCIAL STATEMENTSFINANCIAL STATEMENTS
25. DEFERRED CAPITAL GRANT
2017 2017 2017 2016 2016 2016
HOUSING PROPERTY
HOMEBUY TOTAL HOUSING PROPERTY
HOMEBUY TOTAL
£M £M £M £M £M £M
At 1 April 1,023.1 2.9 1,026.0 1,038.0 3.1 1,041.1
- Grants received during the year:
- Housing properties 4.9 - 4.9 7.7 - 7.7
- Recycled Capital Grant Fund 6.6 - 6.6 4.8 - 4.8
- Disposal Proceeds Fund 0.5 - 0.5 0.9 - 0.9
Grants recycled during the year:
- Recycled Capital Grant Fund (6.1) (0.3) (6.4) (5.9) (0.2) (6.1)
- Disposal Proceeds Fund (0.4) - (0.4) (0.6) - (0.6)
Amortised grant (16.9) - (16.9) (16.1) - (16.1)
Transfer on asset disposal to other registered provider (2.5) - (2.5) (5.7) - (5.7)
At 31 March 1,009.2 2.6 1,011.8 1,023.1 2.9 1,026.0
Due within one year 15.5 - 15.5 15.0 - 15.0
Due in more than one year 993.7 2.6 996.3 1,008.1 2.9 1,011.0
Without the amortisation of grant introduced under FRS 102, the amount of grant as at 31 March 2017 would have been £1,191.4m.
GROUP
2017 2016£M £M
Work in progress grant 28.5 38.7
Completed grant 1,162.9 1,148.3
1,191.4 1,187.0
26. RECYCLED CAPITAL GRANT FUND
GROUP 2017 2017 2017 2016 2016 2016
HCA GLA TOTAL HCA GLA TOTAL£M £M £M £M £M £M
At 1 April 3.6 17.4 21.0 4.1 14.8 18.9
Inputs to fund:
Grants recycled from deferred capital grants 1.6 4.8 6.4 0.8 5.3 6.1
Grants recycled from statement of comprehensive income 0.1 0.9 1.0 0.1 0.6 0.7
Interest accrued - 0.2 0.2 - 0.1 0.1
Recycling of grant:
New build properties (0.9) (5.7) (6.6) (1.4) (3.4) (4.8)
At 31 March 4.4 17.6 22.0 3.6 17.4 21.0
Due within one year 2.1 5.5 7.6 0.8 5.8 6.6
Due in more than one year 2.3 12.1 14.4 2.8 11.6 14.4
Withdrawals from the recycled capital grant fund were used for the purchase and development of new housing schemes for letting and for approved works to existing properties.
There are no amounts of 3 years or older where payment may be required.
27. DISPOSAL PROCEEDS FUND
GROUP 2017 2017 2017 2016 2016 2016
HCA GLA TOTAL HCA GLA TOTAL£M £M £M £M £M £M
At 1 April 0.6 3.0 3.6 0.6 2.1 2.7
Inputs to fund:
Funds recycled from deferred capital grants 0.2 0.2 0.4 0.3 0.3 0.6
Funds recycled from statement of comprehensive income 0.5 0.5 1.0 0.1 1.1 1.2
New build properties (0.2) (0.3) (0.5) (0.4) (0.5) (0.9)
At 31 March 1.1 3.4 4.5 0.6 3.0 3.6
Due within one year 0.3 1.0 1.3 0.2 0.3 0.5
Due in more than one year 0.8 2.4 3.2 0.4 2.7 3.1
Withdrawals from the disposal proceeds fund were used for approved works to existing properties.
There are no amounts of 3 years or older where payment may be required.

A2DOMINION ANNUAL REPORT & ACCOUNTS 201790 91A2DOMINION ANNUAL REPORT & ACCOUNTS 2017
NOTES TO THE FINANCIAL STATEMENTS continued NOTES TO THE FINANCIAL STATEMENTS continued
FINANCIAL STATEMENTSFINANCIAL STATEMENTS
28 LOANS AND BORROWINGS
GROUP ASSOCIATION
2017 2016 2017 2016£M £M £M £M
Due within one year
Bank overdraft - 0.1 - 0.1
Bank loans 32.6 27.8 5.9 7.2
Other loans 1.3 1.3 - -
33.9 29.2 5.9 7.3
2017 2016 2017 2016£M £M £M £M
Due after more than one year
Bank loans 969.9 1,024.0 126.7 131.3
Other loans 565.9 318.6 248.4 -
Loan issue costs (8.1) (7.3) (1.3) -
1,527.7 1,335.3 373.8 131.3
2017 2016 2017 2016£M £M £M £M
Within one year 33.9 29.2 5.9 7.3
Between one and two years 51.5 32.9 6.1 6.5
Between two and five years 91.3 128.6 19.9 19.1
After five years 1,393.0 1,181.1 349.1 105.7
Loan issue costs (8.1) (7.3) (1.3) -
1,561.6 1,364.5 379.7 138.6
Loans and borrowings consist of bank loans secured by fixed charges on individual properties and the proceeds from retail and wholesale bonds.
28 LOANS AND BORROWINGS CONTINUED
INTEREST RATE MARGIN
LOAN BALANCE PREMIUM/ (DISCOUNT)
LOWEST HIGHEST WEIGHTED AVERAGE
LOWEST HIGHEST
£M £M
Loans on floating rates 109.9 - LIBOR LIBOR LIBOR 0.23% 0.75%
Floating rate loans hedged with interest rate swaps 237.2 - 4.04% 4.96% 4.63% 0.22% 1.35%
Non-cancellable Floating rate loans hedged with embedded fixes 507.4 - 3.45% 5.97% 4.75% 0.23% 0.75%
Index linked loans 2.9 - 4.50% 5.50% 5.17% 0.00% 0.63%
Bond issue 694.9 (1.2) 1.96% 11.50% 4.75% 0.00% 0.00%
Total 1,552.3 (1.2)
The bank and other loans are repaid by bullet payments or in half-yearly and quarterly instalments and are fixed and variable rates of interest ranging from 0. 56% (LIBOR + margin) to 11.5%. The final instalments fall to be repaid in the period 2019 to 2045 as tabulated below:
INTEREST RATE LOAN REPAYMENTS
MATURITY LADDER1
BULLET INSTALMENT
£M £M £M
Within 1 year 101.1 5.0 27.5
2 to 5 years 141.9 23.5 114.0
6 to 10 years 362.4 300.0 215.3
11 to 15 years 352.4 250.0 251.9
16 to 20 years 228.5 56.1 170.1
21 to 25 years 288.3 50.0 78.3
More than 25 years 76.5 - 10.6
Total 1,551.1 684.6 867.71 The interest rate maturity ladder indicates the timeline of when periods of fixed interest rates within the Group’s loan portfolio end which is not necessarily the same timeline as the underlying borrowing.
At 31 March 2017 the Group had undrawn loan facilities of £358.3m (2016: £353.2m) which carry margins between 0.22% and 1.4%.
Cash balances held at 31 March 2017 include £1.3m (2016: £1.3m) charged to lenders.
LOAN SECURITYBorrowings consist of secured loan and club bond facilities totalling £1,002.6m and unsecured retail and wholesale bonds totalling £548.5m (net of discount).
Loan facilities are secured by fixed charges over properties. Properties are charged to lenders on the basis of either Market Value – Tenanted (MV-T) or Existing Use Value – Social Housing (EUV-SH), with asset cover ratios ranging between 105% to 150%. As at 31 March 2017, the overall charged value of properties was £2.5bn, with an equivalent EUV-SH value of £1.7bn.
Retail and wholesale bonds, while unsecured carry a pledge to bond holders to retain unencumbered assets to the value of 130% of all unsecured borrowings.

A2DOMINION ANNUAL REPORT & ACCOUNTS 201792 93A2DOMINION ANNUAL REPORT & ACCOUNTS 2017
NOTES TO THE FINANCIAL STATEMENTS continued NOTES TO THE FINANCIAL STATEMENTS continued
FINANCIAL STATEMENTSFINANCIAL STATEMENTS
28 LOANS AND BORROWINGS CONTINUED
As at 31 March 2017, unencumbered assets consist of:
VALUATION BASIS £M ASSET COVER
Development work in progress Cost 418.6
Fixed asset investments Fair Value 302.4
Social housing properties EUV-SH 743.9
1,464.9 266%
All completed properties are revalued annually by JLL LLP using the appropriate accounting valuation method; EUV-SH for social housing stock and fair value for fixed asset investments. As at 31 March 2017, the accounting value of all completed stock was £2.7bn, compared with an open market value of £8.7bn.
29 FINANCIAL INSTRUMENTSGROUP ASSOCIATION
2017 2016 2017 2016£M £M £M £M
Financial assets
Financial assets measured at historical cost:
- Trade receivables 0.2 0.1 0.2 0.2
- Rent and service charge 12.1 11.8 - -
- Other receivables 59.1 65.5 392.8 151.2
- Investments 22.4 21.2 - -
- Investments in short term deposits 70.0 8.0 - 8.0
- Cash and cash equivalents 148.1 37.3 114.9 16.2
Financial assets that are debt instruments measured at amortised cost:
- Loans receivable 73.1 34.7 - -
Total financial assets 385.0 178.6 507.9 175.6
Financial liabilities
Financial liabilities measured at historical cost:
- Trade creditors 11.0 7.0 6.7 3.2
- Other creditors 1,120.0 1,113.3 125.5 36.6
Derivative financial instruments designated as standalone interest rate swaps without options measured at fair value1 84.7 84.8 - -
Financial liabilities measured at amortised cost:
- Loans payable 1,561.6 1,364.5 379.7 138.6
Total financial liabilities 2,777.3 2,569.6 511.9 178.4
1 The fair value of the derivative financial instruments is estimated in accordance with FRS 102 section 11 paragraph 11.27 to 11.32 and are measured at market price.
29. FINANCIAL INSTRUMENTS CONTINUED
The Group holds floating rate loans which expose the Group to interest rate risk, to mitigate this risk the Group uses interest rate swaps. These are the interest rate swaps without options to receive floating/pay fixed rates for a fixed period:
ENTITY PROFILE NOTIONAL £M SWAP FIXED RATE START DATE END DATE PAYMENTS LIBOR BASIS
A2Dominion South Bullet 35.0 4.570% 30/05/2013 30/11/2037 Quarterly 3 Month
A2Dominion South Bullet 25.0 4.450% 01/04/2009 01/07/2035 Quarterly 3 Month
A2Dominion South Bullet 25.0 4.520% 21/05/2013 21/05/2038 Quarterly 3 Month
A2Dominion South Amortising 40.0 4.760% 30/06/2011 05/09/2030 Quarterly 3 Month
A2Dominion South Amortising 21.2 4.250% 30/06/2011 30/12/2022 Quarterly 3 Month
A2Dominion Homes Bullet 16.0 4.040% 01/01/2009 22/09/2036 Quarterly 3 Month
A2Dominion Homes Bullet 30.0 4.960% 30/09/2009 30/09/2018 Quarterly 3 Month
A2Dominion Homes Bullet 30.0 4.930% 30/09/2009 30/09/2019 Quarterly 3 Month
A2Dominion Housing Options Bullet 15.5 4.460% 01/07/2005 02/07/2035 Quarterly 3 Month
During the year the change in fair value of the interest rate swaps was a £0.1m profit (2016: £0.6m loss).
Of the total notional value, £61.2m are amortising in line with the underlying debt.

A2DOMINION ANNUAL REPORT & ACCOUNTS 201794 95A2DOMINION ANNUAL REPORT & ACCOUNTS 2017
NOTES TO THE FINANCIAL STATEMENTS continued NOTES TO THE FINANCIAL STATEMENTS continued
FINANCIAL STATEMENTSFINANCIAL STATEMENTS
29. FINANCIAL INSTRUMENTS CONTINUED
The Group has extended loan facilities to two LLPs which are joint ventures between A2Dominion Developments Limited and a third party. These are financed with proceeds of a retail bond issued by the Group (note 28). Any interest and other fees receivable are added to the loan and will be paid when the facility matures. Loan interest payable on monies borrowed to on-lend are paid as they fall due. At 31 March, amounts due and payable in respect of these loans are as follows:
2017 2016 £M £M
Financial assets
Loans to joint ventures, measured at amortised cost 66.2 25.9
Financial liabilities
Loans from external lenders, measured at amortised cost (56.0) (22.1)
Turnover and costs relating to these loans are as follows:
2017 2016£M £M
Turnover
Loans to joint ventures, measured at amortised cost 6.2 3.0
Costs
Loans from external lenders, measured at amortised cost (1.7) (1.0)
The loans are for use by the LLPs to develop units for sale in London.
The risks associated with these loans are as follows:
• Credit risk
The risk of default from a borrower failing to make required payments. The Group shares control of the LLPs and monitors their performance to assess that the loan obligations can be met. The loans are secured against the projects being developed under the LLP agreements and the market value of these projects is in excess of the value of the loans.
• Liquidity risk
Delays to the developments and associated income from the sales could impact on the LLP’s ability to meet the loan terms. The Group manages this risk by careful monitoring of cashflow requirements (both of the Group and of the joint ventures) which are updated to reflect sales expectations including sales delay scenarios, ensuring that it always has sufficient cash to meet obligations as they fall due. Further, Group policy requires it to have spare committed facilities to draw on in the event of a sales downturn.
• Market risk
The loans receivable are linked to LIBOR whilst those payable are fixed, therefore there is a risk that were LIBOR to fall further interest receivable may not cover interest payable on monies borrowed to on-lend. However, the Group receives other income related to the loans (setup and exit fees and commitment fees on undrawn facility) which result in the all-in turnover from loans receivable exceeding costs. Conversely, an increase in LIBOR would increase the interest receivable without affecting costs.
30. PROVISIONS FOR LIABILITIES
GROUP PENSION MAJOR WORKS & DEFECTS
LEGAL & CONTRACTUAL
HOLIDAY PAY
TOTAL
£M £M £M £M £M
At 1 April 2016 2.1 0.9 1.6 0.3 4.9
Additions 0.3 - - - 0.3
Utilised in the year - (0.6) (0.1) - (0.7)
At 31 March 2017 2.4 0.3 1.5 0.3 4.5
The pension provision relates to the provision for any future cessation events of the Oxford and Surrey LGPS schemes.
The major works & defects provision reflects the latent defect work contractually required by the company but yet to be completed. The provision relates to a number of schemes with work expected to be completed within 18 months and reflects the total cost the company expects to incur on its contractual liability.
30. PROVISIONS FOR LIABILITIES CONTINUED
The legal and contractual provision relates to an ongoing dispute and future contractual obligations.
ASSOCIATION PENSION CONTRACTUAL HOLIDAY PAY TOTAL£M £M £M £M
At 1 April 2016 2.1 0.6 0.3 3.0
Additions 0.3 - - 0.3
Utilised in the year - (0.1) - (0.1)
At 31 March 2017 2.4 0.5 0.3 3.2
31. PENSIONThe Group’s employees are members of the SHPS or the Surrey and Oxfordshire County Council Schemes or the Scottish Widows schemes. There are two Scottish Widows schemes which are defined contribution schemes. One scheme is operated by A2Dominion Housing Group Limited and has 1 member which is now closed to new entrants. The second Scottish Widows scheme is operated by Pyramid Plus London LLP and Pyramid Plus South LLP and has a total of 31 members. Further information on the other schemes is given below.
SOCIAL HOUSING PENSION SCHEME (GROUP AND ASSOCIATION)A2Dominion Housing Group Limited participates in both the SHPS defined benefit scheme (DB) and defined contribution scheme (DC). As at the balance sheet date there were 134 active members of the DB scheme employed by A2Dominion Housing Group Limited and 678 active members of the DC scheme.
During the year A2Dominion Housing Group Limited paid contributions at the rate of 8.7% into the DB scheme with member contributions varying between 8.0% and 11.9% depending on their age into the DB scheme. The Group and members contributed between a range of 2% and 8% into the DC scheme. The defined contributions cost for the year totalled £0.8m (2016: £0.7m) of which £0.1m (2016: £0.1m) was outstanding at the year end.
The long-term joint contribution rates that will apply from April 2017 required from the employers and members to meet the cost of future benefit accruals were assessed at:
BENEFIT STRUCTURE LONG-TERM JOINT CONTRIBUTION RATE(% OF PENSIONABLE SALARIES)
Final salary with a 1/60th accrual rate 20.6
Career average revalued earnings with a 1/60th accrual rate 16.7
The DB scheme is a multi-employer scheme which provides benefits to some 500 non-associated employers. The scheme is a defined benefit scheme in the UK. It is not possible for the company to obtain sufficient information to enable it to account for the scheme as a defined benefit scheme. Therefore it accounts for the scheme as a defined contribution scheme.
The scheme is subject to the funding legislation outlined in the Pensions Act 2004 which came into force on 30 December 2005. This, together with documents issued by the Pensions Regulator and Technical Actuarial Standards issued by the Financial Reporting Council, set out the framework for funding defined benefit occupational pension schemes in the UK.
The scheme is classified as a ‘last-man standing arrangement’. Therefore the company is potentially liable for other participating employers’ obligations if those employers are unable to meet their share of the scheme deficit following withdrawal from the scheme. Participating employers are legally required to meet their share of the scheme deficit on an annuity purchase basis on withdrawal from the scheme.
A full actuarial valuation for the scheme was carried out with an effective date of 30 September 2014. This actuarial valuation was certified on 23 November 2015 and showed assets of £3,123m, liabilities of £4,446m and a deficit of £1,323m. To eliminate this funding shortfall, the trustees and the participating employers have agreed that additional contributions will be paid, in combination from all employers, to the scheme as follows:
Deficit contributions
Tier 1 From 1 April 2016 to September 2020
£40.6m per annum Payable monthly and increasing by 4.7% each year on 1st April
Tier 2 From 1 April 2016 to September 2023
£28.6m per annum Payable monthly and increasing by 4.7% each year on 1st April
Tier 3 From 1 April 2016 to September 2026
£32.7m per annum Payable monthly and increasing by 3.0% each year on 1st April
Tier 4 From 1 April 2016 to September 2026
£31.7m per annum Payable monthly and increasing by 3.0% each year on 1st April

A2DOMINION ANNUAL REPORT & ACCOUNTS 201796 97A2DOMINION ANNUAL REPORT & ACCOUNTS 2017
NOTES TO THE FINANCIAL STATEMENTS continued NOTES TO THE FINANCIAL STATEMENTS continued
FINANCIAL STATEMENTSFINANCIAL STATEMENTS
31. PENSION CONTINUED
Note: the scheme’s previous valuation was carried out with an effective date of 30 September 2011; this valuation was certified on 17 December 2012 and showed assets of £2,062m, liabilities of £3,097m and a deficit of £1,035m. To eliminate this funding shortfall, payments consisted of the Tier 1, 2 & 3 deficit contributions. The financial assumptions underlying the valuation as at 30 September 2014 were as follows:
% PA
• Valuation discount rates:
Pre-retirement 5.9
Non-pensioner post retirement 3.3
Pensioner post retirement 3.3
• Pensionable earnings growth 4.2
• Price inflation 3.1
Where the scheme is in deficit and where the company has agreed to a deficit funding arrangement, the company recognises a liability for this obligation. The amount recognised is the net present value of the deficit reduction contributions payable under the agreement that relates to the deficit. The present value is calculated using the discount rate detailed in these disclosures. The unwinding of the discount rate is recognised as a finance cost.
PRESENT VALUES OF PROVISION
2017 2016 2015£M £M £M
Present value of provision (15.0) (16.4) (12.6)
RECONCILIATION OF OPENING AND CLOSING PROVISIONS
2017 2016£M £M
Provision at start of period (16.4) (12.6)
Unwinding of the discount factor (interest expense) (0.6) (0.4)
Deficit contribution 2.0 1.6
Remeasurements – impact of change in assumptions - -
Remeasurements – amendments to the contribution schedule - (5.0)
Provision at the end of period (15.0) (16.4)
INCOME AND EXPENDITURE IMPACT
2017 2016£M £M
Interest expense (0.6) (0.4)
Remeasurements – impact of change in assumptions - -
Remeasurements – amendments to the contribution schedule - (5.0)
ASSUMPTIONS
2017 2016 2015% % %
Rate of discount 4.1 4.1 4.1
The discount rates shown above are the equivalent single discount rates which, when used to discount the future recovery plan contributions due, would give the same results as using a full AA corporate bond yield curve to discount the same recovery plan contributions.
The following schedule details the deficit contributions agreed between the company and the scheme at each year end period:
DEFICIT CONTRIBUTIONS SCHEDULE
2017 2016 2015£M £M £M
Year 1 2.3 2.2 1.6
Year 2 2.4 2.3 1.7
Year 3 2.5 2.4 1.8
Year 4 2.1 2.5 1.8
Year 5 1.8 2.1 1.9
Year 6 1.9 1.8 1.6
Year 7 1.6 1.9 1.2
Year 8 1.3 1.6 1.2
Year 9 1.3 1.3 1.0
Year 10 0.7 1.3 0.6
Year 11 - 0.7 1.7
Year 12 - - 0.3
Year 13 - - -
Year 14 - - -
31. PENSION CONTINUED
The company must recognise a liability measured as the present value of the contributions payable that arise from the deficit recovery agreement and the resulting expense in the statement of comprehensive income i.e. the unwinding of the discount rate as a finance cost in the period in which it arises.
It is these contributions that have been used to derive the company’s statement of financial position liability. Employer participation in the scheme is subject to adherence with the employer responsibilities and obligations as set out in the “SHPS House Policies and Rules Employer Guide”.
The DB scheme operated a single benefit structure, final salary with a 1/60th accrual rate, to March 2007. From April 2007 there are three benefit structures available, namely:
• final salary with a 1/60th accrual rate.
• final salary with a 1/70th accrual rate.
• career average revalued earnings with a 1/60th accrual rate.
From April 2010 there are a further two benefits structures available, namely:
• final salary with a 1/80th accrual rate
• career average revalued earnings with a 1/80th accrual rate
The DC scheme was made available from 1 October 2010 which is the only scheme open to all new employees, as the Group closed its DB scheme to new entrants in 2010.
An employer can elect to operate different benefit structures for their active members (as at the first day of April in any given year) and their new entrants. An employer can only operate one open benefit structure at any one time. An open benefit structure is one which new entrants are able to join.
A2Dominion Housing Group Limited has operated the final salary structure with a 1/60th accrual rate and career average revalued earnings with a 1/60th accrual rate benefit structure for active members as at 31 March 2017.
The Trustee commissions an actuarial valuation of the scheme every three years. The main purpose of the valuation is to determine the financial position of the scheme in order to determine the level of future contributions required, in respect of each benefit structure, so that the scheme can meet its pension obligations as they fall due. From April 2007 the split of the total contribution rate between member and employer is set at individual employer level, subject to the employer paying no less than 50% of the total contribution. From 1 April 2010 the requirement for the employer to pay at least 50% of the total contributions no longer applied.
The actuarial valuation assesses whether the scheme’s assets at the valuation date are likely to be sufficient to pay the pension benefits accrued by members as at the valuation date. Asset values are calculated by reference to market levels. Accrued pension benefits are valued by discounting expected future benefit payments using a discount rate calculated by reference to the expected future investment returns.
If an actuarial valuation reveals a shortfall of assets compared to liabilities the Trustee must prepare a recovery plan setting out the steps to be taken to make up the shortfall.
Employers that participate in the scheme on a non-contributory basis pay a joint contribution rate (i.e. a combined employer and employee rate).
Employers that have closed the scheme to new entrants are required to pay an additional employer contribution loading of 2.5% to reflect the higher costs of a closed arrangement.
A small number of employers are required to contribute at a different rate to reflect the amortisation of a surplus or deficit on the transfer of assets and past service liabilities from another pension scheme into the scheme.
Employers joining the scheme after 1 October 2002 that do not transfer any past service liabilities to the scheme pay contributions at the on-going future service contribution rate. This rate is reviewed at each valuation and applies until the second valuation after the date of joining the scheme, at which point the standard employer contribution rate is payable. Contribution rates are changed on the 1 April that falls 18 months after the valuation date.
A copy of the recovery plan, setting out the level of deficit contributions payable and the period for which they will be payable, must be sent to the Pensions Regulator. The Regulator has the power under Part 3 of the Pensions Act 2004 to issue scheme funding directions where it believes that the actuarial valuation assumptions and/or recovery plan are inappropriate. For example the Regulator could require that the Trustee strengthens the actuarial assumptions (which would increase the scheme liabilities and hence impact on the recovery plan) or impose a schedule of contributions on the scheme (which would effectively amend the terms of the recovery plan).
As a result of pension scheme legislation there is a potential debt on the employer that could be levied by the Trustee of the scheme. The debt is due in the event of the employer ceasing to participate in the Scheme or the scheme winding up. The debt for the scheme as a whole is calculated by comparing the liabilities for the Scheme (calculated on a buy-out basis i.e. the cost of securing benefits by purchasing annuity policies from an insurer, plus an allowance for expenses) with the assets of the scheme. If the liabilities exceed assets there is a buy-out debt.

A2DOMINION ANNUAL REPORT & ACCOUNTS 201798 99A2DOMINION ANNUAL REPORT & ACCOUNTS 2017
NOTES TO THE FINANCIAL STATEMENTS continued NOTES TO THE FINANCIAL STATEMENTS continued
FINANCIAL STATEMENTSFINANCIAL STATEMENTS
31. PENSION CONTINUED
The leaving employer’s share of the buy-out debt is the proportion of the scheme’s liability attributable to employment with the leaving employer compared to the total amount of the scheme’s liabilities (relating to employment with all the currently participating employers). The leaving employer’s debt therefore includes a share of any ‘orphan’ liabilities in respect of previously participating employers. The amount of the debt therefore depends on many factors including total scheme liabilities, scheme investment performance, the liabilities in respect of current and former employees of the employer, financial conditions at the time of the cessation event and the insurance buy-out market. The amounts of debt can therefore be volatile over time.
A2Dominion Housing Group Limited has been notified by The Pensions Trust of the estimated employer debt on withdrawal from the Social Housing Pension Scheme based on the financial position of the scheme as at 30 September 2016. As of that date the estimated employer debt for A2Dominion Housing Group Limited was £137.5m.
LOCAL GOVERNMENT PENSION SCHEMESThe Group participates in two local government pension schemes: Surrey County Council Pension Fund and Oxfordshire County Council Local Government Pension Fund.
SURREY COUNTY COUNCIL PENSION FUND (SCCPF) (ASSOCIATION)The SCCPF is a multi-employer scheme, administered by Surrey County Council under regulations governing the Local Government Pension Scheme, a defined benefit scheme. The most recent formal actuarial valuation was completed on 31 March 2017. The employer’s contributions to the SCCPF by the Association for the year ended 31 March 2017 were £233,000 at a contribution rate of 26.4% of pensionable salaries, set until the next funding valuation. This scheme has 3 members and is closed to new entrants.
OXFORDSHIRE COUNTY COUNCIL LOCAL GOVERNMENT PENSION SCHEME (OCCLGPS) (GROUP)The Group also has 14 employees who participate in OCCLGPS. The scheme is a defined benefit scheme based on final salary. Pension benefits depend generally upon age, length of service and salary level. The Group also provides retirees with at least five years of service and who are at least 55 with other post-retirement benefits which include life insurance. This scheme is closed to new entrants.
RECONCILIATION OF PRESENT VALUE LIABILITIES
2017 2016
SCCPF OCCLGPS TOTAL SCCPF OCCLGPS TOTAL£M £M £M £M £M £M
At the beginning of the year (8.9) (10.8) (19.7) (9.7) (11.3) (21.0)
Current service cost - (0.2) (0.2) - (0.2) (0.2)
Interest cost (0.4) (0.4) (0.8) (0.3) (0.4) (0.7)
Actuarial gains/(losses) (1.1) (2.3) (3.4) 0.5 0.9 1.4
Benefits paid 0.3 0.2 0.5 0.6 0.2 0.8
At the end of the year (10.1) (13.5) (23.6) (8.9) (10.8) (19.7)
RECONCILIATION OF FAIR VALUE OF PLAN ASSETS
2017 2016
SCCPF OCCLGPS TOTAL SCCPF OCCLGPS TOTAL£M £M £M £M £M £M
At the beginning of the year 7.2 7.6 14.8 7.5 7.7 15.2
Interest income on plan assets 0.3 0.3 0.6 0.2 0.3 0.5
Actuarial gains/(losses) 0.9 1.7 2.6 (0.1) (0.3) (0.4)
Contributions by Group 0.2 0.2 0.4 0.2 0.2 0.4
Benefits paid (0.3) (0.2) (0.5) (0.6) (0.3) (0.9)
At the end of the year 8.3 9.6 17.9 7.2 7.6 14.8
31. PENSION CONTINUED
2017 2016
SCCPF OCCLGPS TOTAL SCCPF OCCLGPS TOTAL£M £M £M £M £M £M
Fair value of plan assets 8.3 9.6 17.9 7.2 7.6 14.8
Present value of plan liabilities (10.1) (13.5) (23.6) (8.9) (10.8) (19.7)
Net pension scheme liability (1.8) (3.9) (5.7) (1.7) (3.2) (4.9)
Amounts recognised in income and expenditure are as follows:
2017 2016
SCCPF OCCLGPS TOTAL SCCPF OCCLGPS TOTAL£M £M £M £M £M £M
Included in administrative expenses
Current service cost - (0.2) (0.2) - (0.2) (0.2)
Past service cost - - - - - -
- (0.2) (0.2) - (0.2) (0.2)
Amounts included in other finance costs (0.1) (0.1) (0.2) (0.1) (0.1) (0.2)
Net interest cost (0.1) (0.1) (0.2) (0.1) (0.1) (0.2)
Analysis of actuarial (loss)/gain recognised in other comprehensive income
2017 2016
SCCPF OCCLGPS TOTAL SCCPF OCCLGPS TOTAL£M £M £M £M £M £M
Actual return less interest income included in net interest income 0.9 1.7 2.6 (0.1) (0.3) (0.4)
Experience gains and losses arising on the scheme liabilities 0.2 0.5 0.7 0.1 - 0.1
Changes in assumptions underlying the present value of the scheme liabilities (1.3) (2.8) (4.1) 0.4 0.9 1.3
(0.2) (0.6) (0.8) 0.4 0.6 1.0
COMPOSITION OF PLAN ASSETS
2017 2016
SCCPF OCCLGPS TOTAL SCCPF OCCLGPS TOTAL£M £M £M £M £M £M
Equities 6.2 6.4 12.6 5.4 4.9 10.3
Bonds and gilts 1.3 1.4 2.7 1.2 1.3 2.5
Property 0.4 0.6 1.0 0.5 0.6 1.1
Cash 0.4 0.4 0.8 0.1 0.2 0.3
LLPs - 0.3 0.3 - 0.3 0.3
Diversified Growth Fund - 0.5 0.5 - 0.3 0.3
Total plan assets 8.3 9.6 17.9 7.2 7.6 14.8
Actual return on plan assets 1.7 - 1.7 0.1 - 0.1
PRINCIPAL ACTUARIAL ASSUMPTIONS USED AT THE BALANCE SHEET DATE
2017 2016
SCCPF OCCLGPS SCCPF OCCLGPS% % % %
Discount rates 2.5 2.8 3.4 3.7
Future salary increases 2.7 4.2 3.6 4.2
Future pension increases 2.4 2.7 2.1 2.4
Inflation assumption 2.1 2.7 2.1 2.4
MORTALITY RATES YEARS YEARS YEARS YEARS
For a male aged 65 now 22.5 23.4 22.5 23.3
At 65 for a male member aged 45 now 24.1 25.6 24.5 25.6
For a female aged 65 now 24.6 25.5 24.6 25.8
At 65 for a female member aged 45 now 26.4 27.8 26.9 28.1

A2DOMINION ANNUAL REPORT & ACCOUNTS 2017100 101A2DOMINION ANNUAL REPORT & ACCOUNTS 2017
NOTES TO THE FINANCIAL STATEMENTS continued NOTES TO THE FINANCIAL STATEMENTS continued
FINANCIAL STATEMENTSFINANCIAL STATEMENTS
32. DEFERRED TAX
GROUP
2017 2016£M £M
Deferred tax liabilities
Investment property revaluations 3.8 3.5
3.8 3.5
The net reversal of deferred tax assets and liabilities expected in 2017 is not possible to estimate. Further reversals or increases in deferred tax balance may arise as a result of revaluations of investment property and financial instruments. As the future deferred tax balances, if any, will be dependent on future changes in fair values of assets and liabilities, it is not possible to estimate any further future reversals.
33. NON-EQUITY SHARE CAPITAL
2017 2016£ £
Shares of £1 each issued and fully paid
At 1 April 5 7
Shares issued during the year - 1
Shares surrendered during the year - (3)
At 31 March 5 5
The shares provide members with the right to vote at general meetings, but do not provide any rights to dividends or distributions on a winding up.
34. CONTINGENT LIABILITIESThe Group receives grant from the Homes and Communities Agency and from the Greater London Authority, which is used to fund the acquisition and development of housing properties and their components. The Group has a future obligation to recycle such grant once the properties are disposed of. At 31 March 2017, the value of grant amortised in respect of these properties that had not been disposed of was £181.0m (2016: £142.4m).
As the timing of any future disposal is uncertain, no provision has been recognised in these financial statements.
35. OPERATING LEASESThe payments which the Group and Association are committed to make under operating leases are as follows:
GROUP ASSOCIATION
2017 2016 2017 2016£M £M £M £M
Land and buildings
Within one year 3.7 4.6 1.6 1.6
Two to five years 10.5 11.2 5.5 5.8
Over five years 13.4 13.9 8.5 9.7
27.6 29.7 15.6 17.1
Vehicles and other equipment 0.3 0.3 0.3 0.3
The Group had lease receivables under non-cancellable operating leases as set out below:
GROUP
2017 2016£M £M
Amounts receivable as lessor:
Not later than one year 14.3 12.7
Later than 1 year and not later than 5 years 30.2 32.8
Later than 5 years 94.9 94.8
139.4 140.3
2016 figures have been restated due to the inclusion of non-social income streams.
Amounts receivable as a lessor include only non-cancellable leases and exclude any lease that can be cancelled within a month by either party.
36. CAPITAL COMMITMENTS
GROUP
2017 2016£M £M
Capital expenditure
Expenditure contracted for but not provided in the financial statements 376.7 251.5
Expenditure authorised by the Board, but not contracted 493.0 340.3
Maintenance expenditure contracted and authorised by the Board 38.2 41.0
907.9 632.8
The Group expects to meet the above commitments from the following sources:
• Undrawn loan facilities totalling £358.3m (2016: £353.2m)
• Social housing grants and projected proceeds from first tranche sales of shared ownership dwellings and build for sale properties of £1,097.4m (2016: £646.0m).
37. RELATED PARTY TRANSACTIONSThe ultimate controlling party of the Group is A2Dominion Housing Group Limited. There is no ultimate controlling party of A2Dominion Housing Group Limited.
A2Dominion Housing Group consists of the companies listed in note 18. The Group also has interests in five joint ventures detailed in note 18.
A2Dominion Housing Group Limited provides management and administration services to the companies within the Group. The most significant element of this is staff costs as the subsidiaries within the Group do not have their own employees apart from A2Dominion Homes Limited which has a small number of employees. The management costs are apportioned on salary basis. During the year A2Dominion Housing Group Limited provided management services to other Group entities and charged £40.4m (2016: £39.7m). At 31 March 2017 A2Dominion Housing Group owed £103.1m to its subsidiaries (2016: £19.2m). This was in relation to working capital balances and management services.
Pyramid Plus London LLP and Pyramid Plus South LLP are apportioned management and administration services costs based on agreed values representing actual services provided.
The Group owns a 70% share in Pyramid Plus London LLP. The remaining 30% share is owned by Breyer Group PLC. The minority share of £0.2m (2016: £0.2m) relates to Breyer Group PLC’s 30% share of the LLP’s profit.
The Group owns a 70% share in Pyramid Plus South LLP. The remaining 30% share is owned by MITIE Property Services (UK) Limited. The minority share of £0.6m (2016: £0.6m) relates to MITIE Property Services (UK) Limited’s 30% share of the LLP’s profit.
The total management and administration costs apportioned in the year were:
2017 2016£M £M
A2Dominion South Limited 13.8 17.1
A2Dominion Homes Limited 12.9 14.7
A2Dominion Housing Options Limited 0.7 1.1
A2Dominion Residential Limited 1.1 1.2
A2Dominion Developments Limited 10.4 4.2
Pyramid Plus London LLP 0.8 0.7
Pyramid Plus South LLP 0.7 0.7
40.4 39.7

A2DOMINION ANNUAL REPORT & ACCOUNTS 2017102 103A2DOMINION ANNUAL REPORT & ACCOUNTS 2017
NOTES TO THE FINANCIAL STATEMENTS continued NOTES TO THE FINANCIAL STATEMENTS continued
FINANCIAL STATEMENTSFINANCIAL STATEMENTS
37. RELATED PARTY TRANSACTIONS CONTINUED
Intra-group transactions between the Group’s registered providers and its non-regulated subsidiaries for the year ended 31 March 2017 are summarised as follows:
2017 SERVICESPROVIDED
GIFTAID
LOAN INTERESTPAYABLE
LOANSRECEIVABLE
OTHER CREDITORS
DEBTORS CREDITORS DEBTORS
£M £M £M £M £M £M £M £M
A2Dominion Developments Limited
A2Dominion Homes Limited 17.8 (25.0) (6.8) - (129.5) - -
A2Dominion South Limited 9.3 - (6.8) - (129.5) - - -
A2Dominion Treasury Limited
A2Dominion Homes Limited - - - 2.7 - 38.7 - -
A2Dominion South Limited - - - 2.2 - 38.6 - -
A2Dominion Housing Options Limited - - - - - - -
A2Dominion Housing Group Limited - - - - - - (1.8) -
A2Dominion Housing Finance Limited
A2Dominion South Limited - - - 0.2 - 25.0 - -
Pyramid Plus London LLP
A2Dominion Housing Group Limited 8.6 - - - - - - 0.8
Pyramid Plus South LLP
A2Dominion Housing Group Limited 11.7 - - - - - - 1.0
37. RELATED PARTY TRANSACTIONS CONTINUED
A2Dominion Homes Limited and A2Dominion South Limited lend to A2Dominion Developments Limited at a fixed rate of 6% on a three year revolving facility. The loans are secured with floating charges.
A2Dominion Housing Finance Limited lends to A2Dominion South Limited at Libor + 0.4% - the facility is revolving until 2022 thereafter the drawn loan balance converts to term and is payable by instalments until 2033.
A2Dominion Treasury Limited lends to A2Dominion Homes Limited and A2Dominion South Limited at an all-in rate of 4.5875%. These are the proceeds of retail bond 2 which matures in 2026 and must be repaid in full on that date. Any company may repay any part of their loan prior to that date, in such a case another company in the group must borrow the funds to ensure that £150m remains due to A2Dominion Treasury Limited at all times. The loans are not secured.
TRANSACTIONS BETWEEN GROUP ENTITIES AND OTHER RELATED PARTIES ARE SUMMARISED AS FOLLOWS:A2Dominion Developments Limited is a 50% joint venture partner of Green Man Lane LLP. A2Dominion Developments Limited provided a loan facility of £15.0m to Green Man Lane LLP. As at 31 March 2017, £6.9m (2016: £8.2m) was due to A2Dominion Developments Limited.
Rydon Construction Limited provided a loan facility of £15.0m to Green Man Lane LLP. As at 31 March 2017, £6.6m (2016: £8.2m) was due to Rydon Construction Limited. Rydon Construction Limited is a wholly owned subsidiary of Rydon Holdings Limited.
Green Man Lane LLP entered into lease agreements with A2Dominion Homes Limited for the lease of housing blocks and a car park at premiums totalling £10.0m (2016: £6.0m). The contractual term of the lease is 250 years and the premium for each lease is to be paid in 30 monthly instalments until paid in full. As at 31 March 2017, the total amount due for payment is £2.0m.
A2Dominion Developments Limited is a 50% joint venture partner of Crest A2D (Walton Court) LLP. During the year no capital contributions were made to Crest A2D (Walton Court) LLP (2016: £11.9m). During the year capital repayment of £1.2m was received by A2Dominion Developments Limited (2016: nil).
A2Dominion Treasury Limited has been provided with a loan facility of £150.0m (2016: £150.0m) by A2D Funding PLC. As at 31 March 2017, £150.0m (2016: £150.0m) was owed by A2Dominion Treasury Limited.
A2Dominion Treasury Limited has been provided with a loan facility of £150.0m (2016: £150.0m) by A2D Funding II PLC. As at 31 March 2017, £150.0m (2016: £150.0m) was owed by A2Dominion Treasury Limited.
A2Dominion Housing Group guarantees both bond issues principal and interest in A2D Funding PLC and A2DFunding II PLC.
Pyramid Plus South LLP received services during the year from MITIE Property Services (UK) Limited with a value of £7.1m (2016: £7.0m). As at the 31 March 2017 £0.5m (2016: £0.5m) was owed by Pyramid Plus South LLP.
Pyramid Plus London LLP received services during the year from Breyer Group PLC with a value of £5.8m (2016: £5.4m). As at the 31 March 2017 £0.7m (2016: £0.5m) was owed by Pyramid Plus London LLP.
A2Dominion Residential Limited has entered into a funding agreement with Queen’s Wharf Riverside LLP a joint venture between A2Dominion Developments Limited and Hammersmith Developments Holdco Limited. As at the 31 March 2017 £33.7m (2016: £8.5m) was owed to A2Dominion Residential Limited. The interest and similar income receivable on this loan during the year was £4.7m (2016: £0.1m).
A2Dominion Residential Limited has entered into a funding agreement with Keybridge House LLP a joint venture between A2Dominion Developments Limited and Mount Anvil (Keybridge House) Limited. As at the 31 March 2017 £32.5m (2016: £17.8m) was owed to A2Dominion Residential Limited. The interest and similar income receivable on this loan during the year was £1.5m (2016: £2.8m). Additionally A2Dominion Residential Limited has paid a deposit of £23.0m (2016: £23.0m) for the purchase of properties to be held and used for market rent to Keybridge House LLP. A2Dominion Residential will purchase 159 private rent sales properties from Keybridge House LLP (2016: 164).

A2DOMINION ANNUAL REPORT & ACCOUNTS 2017104
NOTES TO THE FINANCIAL STATEMENTS continued
FINANCIAL STATEMENTS
37. RELATED PARTY TRANSACTIONS CONTINUED
Intra-group transactions between the Group’s registered providers and its non-regulated subsidiaries for the year ended 31 March 2016 are summarised as follows:
2016 SERVICES PROVIDED
GIFT AID LOAN INTEREST PAYABLE
LOAN INTEREST RECEIVABLE
LOANS CREDITORS
LOANS DEBTORS
OTHER CREDITORS
OTHER DEBTORS
£M £M £M £M £M £M £M £M
A2Dominion Developments Limited
A2Dominion Homes Limited 40.8 (3.2) (8.5) - (106.6) - (0.5) -
A2Dominion South Limited 27.6 - (7.8) - (106.6) - - -
A2Dominion Treasury Limited
A2Dominion Homes Limited - - - 5.2 - 77.2 - -
A2Dominion South Limited - - - 2.6 - 50.3 - -
A2Dominion Housing Options Limited - - - 0.2 - - - -
A2Dominion Housing Group Limited - - - - - - (2.1) -
A2Dominion Residential Limited
A2Dominion Homes Limited - (0.5) - - - - - -
A2Dominion Housing Finance Limited
A2Dominion South Limited - - 0.3 - 30.0 - -
Pyramid Plus London LLP
A2Dominion Housing Group Limited 8.8 - - - - - - 0.9
Pyramid Plus South LLP
A2Dominion Housing Group Limited 12.3 - - - - - - 1.5
The Lamptons, HounslowTransformation of a disused 1970s office block, delivering 155 homes as part of a multi-million pound regeneration of the town centre.

A2Dominion GroupThe Point37 North Wharf RoadLondon W2 1BDT 020 8825 1000F 020 8825 1963
0061-0717-CO
A2Dominion Housing Group Ltd(an exempt charity registered under the Co-operative & Community Benefit Societies Act 2014 Sco. No. 28985R, HCA Reg. L4240).
Registered Office: The Point, 37 North Wharf Road, London W2 1BD
Front cover imageCentenary Quay, Southampton.