annual report and accounts 1999 - nioclibrary.ir annual report and accounts...annual report and...
TRANSCRIPT

annual report and accounts 1999

Group chief executive Sir John Browne
explains the market context for BP Amoco’s
operations and outlines our strategy for
the next year and beyond
Introducing the fundamentals of BP Amoco’s
business, with a letter from the co-chairmen,
a look back at 1999’s key events and
a series of measures reporting both
financial and non-financial performance
obje
ctiv
es
basi
cs
p8
p2
contents2 bp amoco basics
Co-Chairmen’s Letter
8 bp amoco objectivesGroup Chief Executive’s Review
12 bp amoco worldwide14 Scotland18 Texas
23 bp amoco performance24 Business Operating Review28 Environmental and Social Review30 Financial Review36 Accounting Policies38 Financial Statements41 Notes on Accounts67 Directors’ Responsibilities
for the Accounts67 Report of the Auditors68 Oil and Natural Gas Reserves69 Five-Year Summary72 Operating Information73 US Accounting Principles74 Glossary
75 bp amoco governance & policy
75 Corporate Governance78 Board of Directors82 Executive Directors’ Remuneration88 Shareholdings and
Annual General Meeting89 Information for Ordinary or
Preference Shareholders90 Information for ADS Shareholders91 Further Information92 Acknowledgements
The Report of the Directors appears on pages 2-35 and 75-88.The Accounts appear on pages 36-74.
In this Report, words and phrasessuch as ‘BP Amoco’, ‘the company’,‘the group’, ‘we’, ‘us’ and derivativesof them are used generally andgenerically and are intended to refer to the relevant member company or companies within theBP Amoco group and not, exceptwhere the context otherwise requires, to BP Amoco p.l.c.

Location reports from
Scotland and Texas
show how our targets,
strategies and policies
come together to create
successful business
operations worldwide
wor
ldw
ide
Explains the work of the board
of directors and the company’s
relationships with its shareholders
gove
rnan
ce &
pol
icy
p75
p12Reporting our performance not
only in financial terms but also
against our commitments on
health, safety, environmental
care and social investmentperf
orm
ance
p23
www.bpamoco.com/alive
The millions of people who touch our businessaround the world change us and move us forward.We in turn must touch and change their lives in a positive way.
Our report for 1999, the last of the 20th century,is also a first – the first fully integrated reportBP Amoco has produced: recording our financial,social and environmental performance, and linkingour printed and online reports to create a livingwebsite – www.bpamoco.com/alive
www.bpamoco.com/alive – a place, not a page.A place where shareholders, analysts, fundmanagers, customers, commentators and otherscan access information and establish an ongoingdialogue with BP Amoco. This report is just the start.

This section introduces our business, with a messagefrom our co-chairmen, a calendar of the year’s keyevents and measures of both financial and non-financial performance. For more information, visitwww.bpamoco.com/alive
financial highlightsprofits 1999 1998
Replacement cost profit before exceptional items
after adjusting for special charges $6,206m $4,428m
Replacement cost profit before exceptional items $5,330m $3,959m
Replacement cost profit after exceptional items $3,280m $4,611m
Historical cost profit after exceptional items $5,008m $3,220m
Earnings per ordinary share on replacement cost profit
before exceptional items 27.48 cents 20.62 cents
external environment 1999 1998
BP Amoco average oil realizations $/barrel 16.74 12.06
BP Amoco average natural gas realizations $/thousand cubic feet 1.92 1.93
BP Amoco average indicative global refining margin $/barrel 0.91 1.74
Chemicals integrated margin DM/tonne 666 819
bpamocobasics
Co-chairmen Larry Fuller (left) and Peter Sutherland
2 BP Amoco 1999
950
2
4
6
8
9796 98 99
profitreplacement cost profitbefore exceptional items – $ billion
950
12
15
18
21
9796 98 99
dividendscents per share
6
9
3
950
3
6
9
12
9796 98 99
capital expenditureand acquisitions$ billion
950
5
10
15
9796 98 99
net debtend year – $ billion

BP Amoco 1999 3
BP Amoco 1999 3
business profileBP Amoco p.l.c. is the holding company
of one of the world’s largest petroleum
and petrochemicals groups. Our main
activities are exploration and production
of crude oil and natural gas; refining,
marketing, supply and transportation;
and manufacturing and marketing of
petrochemicals. We have a growing
activity in gas and power and in solar
power generation.
BP Amoco has well-established
operations in Europe, North and South
America, Australasia and Africa.
Dear ShareholderIt is our pleasure to report to you anotheryear of outstanding achievement andmeasurable progress toward our goals.
After the historic merger of BP and Amocoon 31 December 1998, our task has been toweld two large and proud companies into a unified, streamlined and efficient unit.
The benefits are already flowing through to you, our shareholders. Dividends rose to 12.339 pence per share ($1.20 per ADSshare). Since the merger, our market valuehas risen by approximately $40 billion.Total shareholder return over five yearsis approaching 250% – well ahead of ournearest rival in the industry.
That our employees delivered these resultsat a time of far-reaching internal changesand volatile external markets is a tribute to their skill and commitment.
This has been a year for solid anddisciplined work to make the best of ourcombined skills. Yet a sense of excitementremains strong as we work together tocapitalize on the great opportunities thathave been created.
The theme of the year was building, butwe remained open and alert to the rightstrategic moves. We agreed a significantacquisition – that of Atlantic Richfield(ARCO). We thank our investors for theiroverwhelming support for this transaction,which was also strongly endorsed byARCO’s shareholders. We believe thecombination will benefit both companies –and the communities within which weoperate. However, the US Federal TradeCommission has expressed its oppositionto the proposed combination and we arepreparing to argue our position vigorouslyin the US courts.
MarketsAfter the dramatic fall in crude oil prices in 1998 to their lowest levels in real termsfor a quarter of a century, 1999 saw a strongrecovery. As producing nations sought tolimit excess supply, the crude price morethan doubled.
This recovery helped our upstreamoperations, although the rise in raw materialcosts posed a stiff challenge to our refiningand marketing and chemicals businesses,which reacted with speed and resilience.
February 99 March 99
BP Amoco p.l.c. begins business. We launch our $100-million,40-city cleaner fuels programme worldwide. Group chief executiveSir John Browne addresses the Detroit Economic Club on ‘Mobilityand Choice’. A $100-million vapour recovery plant is commissionedat Hound Point terminal on the River Forth, Scotland.
Our chemicals business revealsplans to add 2 million tonnes of product to its manufacturing output during 1999 by adding and extending capacity andimproving plant reliability.The price of Brent crude oilslumps to $9.82 a barrel.
The $2-billion ETAP (Eastern Trough Area Project) development in the centralNorth Sea is inaugurated. A team at theBP Amoco-operated Wytch Farm oil fieldin southern England establishes a worldrecord for extended-reach drilling.
January 99

4 BP Amoco 1999
The business unit structure and devolvedculture we have created give us an adaptablemodel to cope with volatile markets andmore fundamental changes in the world’sdemographic and economic balance.
PeopleAs a board, we set our employees veryspecific targets. These were not only metbut exceeded. Fresh targets have now beenset and we aim to achieve these too.
Delivering high returns at a time ofsignificant change both internally andexternally places heavy demands on seniormanagement. We are proud to note that, throughout this period, morale hasremained high. The most difficult andperhaps most critical issue for the successof a merger is the rapid development of a common culture. Enormous strideshave been made and our thanks are due to employees from both Amoco and BP for their commitment and open-mindedapproach.
April 99
The first cargo of liquefied natural gas from our $1-billion plant in Trinidad isdelivered to US east coast customers. A production-sharing agreement is signedto develop Block 31 in Angola’s deepwater acreage. Chemicals sites in Germanyand Indonesia achieve safety milestones. A day-long environmental and socialforum involving 20 non-governmental organizations is held in London.
Agreement is reached to combine with ARCO. BP Amoco creates the world’slargest solar company by buying out its partner in Solarex. A two-yearprogramme to install solar panels in 200 new service stations in 11 countries is announced. The merged company holds its first AGM. In Vietnam we sign amemorandum of understanding to progress a $1.5-billion natural gas project.Sir John Browne receives an award for individual environmental leadership from the UN Environment Program and Earth Day New York. Air BP is named the world’s best international jet fuel marketer in a prestigious industry survey.
May 99
proposed key dates for dividends to be announced in 2000 on ordinary and American Depositary Shares (ADS shares)Perioda 4Q 1999 1Q 2000 2Q 2000 3Q 2000
Announcement 15 Feb 2000 9 May 2000 8 Aug 2000 7 Nov 2000Ex-dividend UK 21 Feb 2000 15 May 2000 14 Aug 2000 13 Nov 2000Ex-dividend USA 23 Feb 2000 17 May 2000 16 Aug 2000 15 Nov 2000Record or qualifyingb 25 Feb 2000 19 May 2000 18 Aug 2000 17 Nov 2000Payment 24 Mar 2000 12 Jun 2000 11 Sep 2000 11 Dec 2000
a Dividend payments are identified by reference to the quarterly earnings to which they relate.b This is also the date by which holders of ordinary shares must notify the BP Amoco Registrar of any change in dividend election between
cash and reinvestment.
a Foreign exchange rates may affect the sterling dividend amount paid. However, when setting the dividend the directors are mindful of dividendfluctuation in sterling terms.
b The figures in these tables have been adjusted to reflect the subdivision of ordinary share capital on 4 October 1999.c The Canadian dollar rates can be found on page 90.
cash dividend payable in pence per ordinary share a,b
pence/share 1Q 2Q 3Q 4Q Total
1995 1.500 2.000 2.000 2.125 7.6251996 2.125 2.500 2.500 2.625 9.7501997 2.625 2.750 2.750 2.875 11.0001998 2.875 3.000 3.000 3.059 11.9341999 3.069 3.112 3.033 3.125 12.339
cash dividend payable in US dollars per ADS share b,c
dollars/share 1Q 2Q 3Q 4Q Total
1995 0.153 0.204 0.201 0.207 0.7651996 0.203 0.246 0.262 0.273 0.9841997 0.271 0.286 0.294 0.299 1.1501998 0.305 0.311 0.319 0.300 1.2351999 0.300 0.300 0.300 0.300 1.200

BP Amoco 1999 5
Our aim as a board is to ensure thatsuccess is appropriately rewarded. Ourpolicy in this area is set out in the reporton executive directors’ remuneration onpages 82-87.
ResponsibilityOther issues are critical to the way inwhich our employees see themselves andtheir roles. Our aim is that those who workfor BP Amoco should be proud to be partof a corporation that not only succeeds butdoes so in a socially responsible fashion.
This responsibility to society is a definingelement in our corporate culture. It isembedded in the structure of our boardand in targets that affect staff at all levels.The development of new sources of energyand the environmental goals we setourselves are examples of our commitment.
We have a rich diversity of employees and operations across 100 countries, each with differing cultures and traditions.
We aim to treat these with sensitivity andunderstanding, while advancing our coreobjectives for shareholders.
In a year of many accolades to staffthroughout the organization, we weredelighted that, in the Financial TimesEnergy Awards, BP Amoco was chosen as both Energy Company of the Yearand Best Oil and Gas Company, and also that Sir John Browne was declared Chief Executive Officer of the Year.
The boardDoug Ford, chief executive of refining and marketing, was appointed an executivedirector with effect from 1 January 2000.
As was already reported, co-chairmanLarry Fuller will retire from the board on31 March after long service to Amoco andto the merged company for the past year.
The foundation stone ofthe cross-disciplinaryBP Amoco Institute at theUniversity of Cambridge,England, is laid. The saleof our Wilton olefinscracker in north-eastEngland is completed.
Major oil and natural gas finds are announced inAngola, Azerbaijan and the Gulf of Mexico. Newfinancial targets to the end of 2001 are unveiled,including plans to improve returns by 5-6 percentagepoints, cut annual costs by $4 billion, sell assetsworth $10 billion, boost capital spending to$26 billion over the period and reduce refining cover from 90% to nearer 60%.
August 99
The BP Amoco Chemicals Internet site goes live. Canadian oil propertiesare sold for $1 billion. Children inSoshanguve, a suburb of Pretoria,South Africa, move into newschool facilitiesunderwrittenby BP Amoco.Four endangeredspecies of Malaysianturtle receive extra protection withfunding from a BP Amoco joint venture.
June 99 July 99
-50
BP Amoco
Shell
ExxonMobil
Chevron
Texaco
ARCO
BP Amoco
Shell
ExxonMobil
Chevron
Texaco
ARCO
BP Amoco
Shell
Chevron
Texaco
ExxonMobil
ARCO
0-25 25 50
shareholder returnsrelative to the market%
10 years
-50 0-25 25 7550
5 years
-40 -10-30 -20 100 20
3 years
Shareholder returns compriseannual share price movements,with dividends reinvested, forinvestments held over theperiod shown.
Shareholder returns relative to themarket reflect the returns generatedabove or below returns fromequivalent investments in theoverall market.
This methodology is used in theLong Term Performance Planon page 85.

6 BP Amoco 1999
ShareholdersAs a global business we need constantly to monitor the effectiveness of ourcommunication with shareholders, who are spread across many countries.
Technology is enabling us to improve thisprocess by making full use of the Internetand other advances in informationtechnology which we already employ in our daily business. E-commerce and, for our shareholders, e-communication arelikely to become increasingly importanttools for improved information and access.
OutlookThe performance achieved by BP Amocoso far gives us great confidence for thefuture. Important issues remain – forexample, maximizing returns from ourretail position and product range –which are being actively tackled.
As we move into the new millennium,global change is sweeping away oldbarriers. As one commentator put it, the walls of the world have come tumblingdown. That poses both dangers andopportunities: you can depend on us to be alert to the first and to seize the second.
September 99
We announce the intention to set up a new business stream, Gas and Power.Our ultra-low sulphur diesel fuel goes on sale in Paris. BP Amoco and ARCOshareholders overwhelmingly back the planned combination at special meetings.The European Commission approves the proposed deal. BP Amoco facilities inNorth Carolina, Virginia, Florida and South Carolina are affected by Hurricane Floyd.
BP Amoco’s shares are sub-divided to improve theirliquidity. An agreement is signed with Sinopec(China Petrochemical Corporation) to study thefeasibility of a world-scale ethylene cracker inShanghai. E-business at BP Amoco moves aheadwith the launch of an Internet site to support themarketing of a commercial fuel card in Europe.Sir John Browne discusses ‘Science, Technologyand Progress’ at Israel’s Weizmann Institute.
October 99
www.bpamoco.com/alive/basics
visit
A word from Peter Sutherland I would like to pay a special tribute to my co-chairman, Larry Fuller, who retiresfrom BP Amoco at the end of March aftera career spanning 39 years. He led AmocoCorporation as chairman and chiefexecutive officer from February 1991 until the merger in December 1998. Hisvision was a crucial part of the successfulconclusion of the merger and the greatstrides BP Amoco has made since.
As co-chairmen we have worked closelytogether for the last 13 months, and I personally will miss his wise counsel,encyclopaedic knowledge of our industryand dedication to BP Amoco. On behalf of shareholders I thank Larry for hisinvaluable contributions and wish him all the best for the future.
Larry Fuller Peter SutherlandCo-Chairmen
15 February 2000

0
five or more training days per employee
vacancies at band E and below advertised
developmentconversations
360-degreefeedback
team leader upwardfeedback
appraisals
10020 40 8060
1999 performance measurestargets = 100%
HSE performance highlights a
1999 1998
Safety recordDays away from workcase frequencyb
Employees 0.17 0.18Contractors 0.35 0.38Total workforce 0.25 0.27
EnvironmentHydrocarbon emissions to air (’000 tonnes) 832 954
Discharges to water(’000 tonnes) 46 55
Oil spills(number over 1 barrelc
which reach land or water) 732 730d
Greenhouse gas emissions(million tonnes)e 80.1 82.8
a Full health, safety and environmental data is available on BP Amoco’swebsite www.bpamoco.com/alive
b An injury or illness that results in a person being unable to work for aday (shift) or more. The frequency is per 200,000 hours.
c 1 barrel = 159 litres = 42 US gallons.d Total of spills reported separately by BP and Amoco in 1998.
Definitions were harmonized on 1 January 1999.e BP Amoco share of emissions of carbon dioxide and methane,
expressed as an equivalent mass of carbon dioxide.
social investment a
$ million 1999 1998
By regionUK 10.4 12.2
(UK charities 5.3 5.1)Rest of Europe 3.5 2.6USA 36.4 37.0Rest of World 17.1 13.1
Total 67.4 64.9
By themeCommunity development 29.5 15.8Education 14.8 14.6Environment 4.7 6.1Arts and culture 11.0 13.6Other 7.4 14.8
Total 67.4 64.9
a Excludes BP Amoco’s operating costs and its own environmentalexpenditure, detailed on page 35 and fully reported on BP Amoco’swebsite www.bpamoco.com/alive
BP Amoco 1999 7
Ogilvy & Mather becomes BP Amoco’s globaladvertising communications agency. We endow aChair in Transatlantic Relations at the European UniversityInstitute in Florence, Italy. Top prize in the co-chairmen’s Health,Safety and Environmental Achievement Awards is won by the BP Solarex SolarShowcase. BP Amoco is voted Best Oil and Gas Company of the Year at the inaugural FT Energyawards in New York. Record third-quarter results, including profits of nearly $2 billion, areannounced. Professor Steve Jones’s book, Almost Like A Whale, wins the BP Natural World BookPrize for 1999. We announce a five-year, $650-million contract with MCI WorldCom for globaltelecoms services and sign a 10-year, $1.1-billion agreement with PricewaterhouseCoopers foraccounting services provision. The price of Brent crude oil peaks for the year at $26.85 a barrel.
non-financial performance
November 99
BP Amoco agrees to buy Mobil’s fuels business in Europefor $1.5 billion. BP Energy receives a UK award forinnovation. We help fund Stanford University’s newe-business centre. Agreement is reached with California-based Exult to manage some human resources processes inthe USA and UK. A second offshore operatorship is awardedto BP Amoco in Brazil.
December 99
$26.
85
Nov
Feb
$9.8
20
feelings about BP Amoco
creating distinctive company
team leader
pay and recognition
mutual trust/respect
personal contributions
innovation/teamwork
diversity
9015 30 756045
1999 employee attitude survey scorefavourable – %
employee profile%
males non-anglo americananglo americanfemales
10050 75250
graduate recruits
professional employees
middle management
senior management
people measures

bpamocoobjectivesThe world’s need for energy is growing steadily day by day. BP Amoco’s aim is to play a leading role in meeting this need from oil, natural gas,solar power and petrochemicals without damaging the natural environment.Our success depends on making, and being seen to make, a distinctivecontribution to every activity in which we are involved.
Group chief executive Sir John Browne explains the market context for our operations and outlines our strategy for the next year and beyond.
8 BP Amoco 1999

BP Amoco 1999 9
1999 was an exciting, dynamic and very successful
year for BP Amoco. We combined two great
companies into one, unifying our operations and
processes, and our team of people. As a result we were
able to deliver the financial benefits of the merger in
full and well ahead of schedule.
That success in turn gave us a strong base from which
to proceed with the purchase from ExxonMobil of its
share of the BP/Mobil joint venture in Europe and an
agreed combination with ARCO, which is currently
subject to legal challenge by the US Federal Trade
Commission.
We delivered excellent results in a volatile trading
environment. Oil prices averaged $12.5 a barrel in the
first six months of the year, rising to $21 a barrel in
the second half. Refining and chemicals margins were
generally weak and were squeezed still further as oil
prices rose. In such circumstances flexibility and low
costs are at a premium. The work done over the last
few years allowed us to deliver an outstanding rate
of return.www.bpamoco.com/alive/objectives
visit

Momentum is crucial. To maintain the pace, we announced in July a new set of targets taking us
through to the end of 2001. Our aim is to improve returns by around five to six percentage points
on the basis of cautious assumptions about the trading environment. We cannot, and do not,
rely on oil prices maintaining their current levels.
Even allowing for price fluctuation, we believe we can continue to improve performance through
selective upgrading of the portfolio, including sustained reductions in costs, a steady programme
of investment in the existing business amounting to some $24-26 billion over three years and
a programme to divest some $10 billion of assets by the end of 2001.
Our financial framework remains unchanged – on the basis of
a prudent ratio of net debt to net debt plus equity kept within
a range of around 25-30% and a dividend policy which aims to
return around 50% of replacement cost profit before exceptional
items to shareholders on a through-cycle basis. If circumstances
give us a larger surplus, cash will either be used to fund further
growth investment or be returned to shareholders.
Our new targets are grounded in the strategy which has evolved over
the last few years. Our goal is to have significant shares of the larger
oil and gas fields where our supply costs can be fully competitive with
all other producers. We achieved significant exploration success at a
number of locations in the Gulf of Mexico, of which the Crazy Horse
prospect is particularly exciting with potential for at least one billion
barrels. In gas, the $1-billion liquefied natural gas project in Trinidad
came on stream. We became the first foreign company to be licensed
to market natural gas to industrial customers in Spain.
We are developing a new business division – Gas and Power –
specifically designed to extend our interests as the mix of world energy consumption shifts
in favour of natural gas. In refining and marketing we intend to invest in the markets which
are growing, such as China and Eastern Europe, while limiting our position in refining.
In chemicals we are continuing to establish a set of highly advantaged sites distinguished
by excellence in manufacturing and close links to both the supply of resources and evolving
demand growth. Grangemouth in Scotland is the first such site.
10 BP Amoco 1999
key messages and targets• Merger is complete
$2-billion prize delivered by end 1999• Continued focus on costs
$4-billion reduction by end 2001• Rationalize portfolio
$10-billion divestments by end 2001• Improved returns
5-6 percentage points improvement in returnon average capital employed by end 2001
• Financial frameworkcash-neutral at bottom of cycle
• Gearing band25-30% (net debt/net debt plus equity)
• Dividend payout50% of through-cycle earnings
• Investing for growthcirca $25 billion to end 2001
• Continued focus on large shares of big fieldsGulf of Mexico big discovery
• Reduce refinery coveragefrom 90% to 60-70%
• Focus on high-growth petrochemicals productsideal sites and manufacturing
00'
NEW ORLEANS
NEPTUNE
MARS
MICA
EUROPA
URSA
CROSBY
TROIKA
POMPANO
RAMPOWELL
KING
MARLIN
KING’S PEAK
NA KIKA
CRAZY HORSE
HOLSTEIN
MAD DOG ATLANTIS
BP Amoco fields inthe Gulf of Mexico
new discoveriesdiscoveriesdevelopmentsexisting production

Across all these activities information technology is of growing
importance.We have established new teams dedicated to the
development of e-procurement and e-commerce. Our performance,
of course, is judged on many criteria. We invest for the long term,
and our business is not about a single transaction, conducted
in isolation. To do business again and again we have to develop
relationships built on trust and ensure that our track record justifies
the confidence of all those whose choices determine the scope of
our licence to operate.
1999 saw an improvement in our safety performance, with a 7%
better injury record. We are of course still working towards our
aim of no accidents. We also succeeded in reducing emissions to air
and water, including a 3.5% reduction in emissions of greenhouse gases in pursuit of our target
reduction of 10% from a 1990 base by 2010. Our goal remains to demonstrate that we can work
to meet the world’s growing needs for oil, natural gas and petrochemicals products without doing
harm to people or damage to the natural environment. In 1999 we also established a Global
Social Investment unit to bring new ideas to the way we support the many communities in which
we operate. Through the economic cycle we expect to invest some 1.25% of our replacement cost
profit before exceptional items in community activity. More details of all aspects of our business,
environmental and social performance can be seen on our website www.bpamoco.com/alive
Everything we do relies on people. No oil rig or refinery produces ideas. In a business
environment characterized by dramatic change, the creativity and commitment of a team of
people working together are key sources of competitive advantage. The merger has given us
the chance to bring together a newly diverse mixture of people and our success is a tribute to
their abilities and dedication. I am very proud to lead a team of such quality. This is their report,
and the performance of your company is their achievement.
Sir John BrowneGroup Chief Executive
15 February 2000
BP Amoco 1999 11
90
100
110
120
9689 959493929190 97 98
the primaryenergy mix isgetting lighterconsumption indexedto 1989
natural gasoilcoal
source:BP Amoco Statistical Review
100
120
110
130
140
9694 95 97 98
our petrochemicalshave grown fasterthan the industryproduction volume indexedto 1994
BP Amocototal industry
source:BP Amoco data

every minute of every day BP Amoco is at work around bpamocoworldwide
12 BP Amoco 1999

BP Amoco 1999 13
www.bpamoco.com/alive/locationreports
visit
the world
location reports
going liveTargets, strategies, policies and plansare only so many words on paper.In these location reports we aim to show what they mean in real life,describing how they come together tocreate successful business operationsin different places around the world.
Here we include location reports fromtwo of our most important centres ofbusiness operations, Scotland andTexas. For more detailed informationon these and to see brief locationreports from other parts of the world,visit our Living Report website atwww.bpamoco.com/alive
These reports set out to be more than illustrations. They aim to tell thewhole story, explaining the businessoperations and plans; giving insightand context on the place and what itmeans to do business there, both forour people and for those affected byour presence. As well as describingthe business operations, we highlightany special issues or challenges we face and describe some of ourenvironmental and communityinitiatives.
On the website www.bpamoco.com/alivethe location reports include contributionsfrom employees, business partnersand other members of the community.We also provide updates from locationsthat featured in our environmentaland social reporting for 1997 and1998. In most cases they include theresults of independently managedresearch into how others see us.
14 BP Amoco 1999
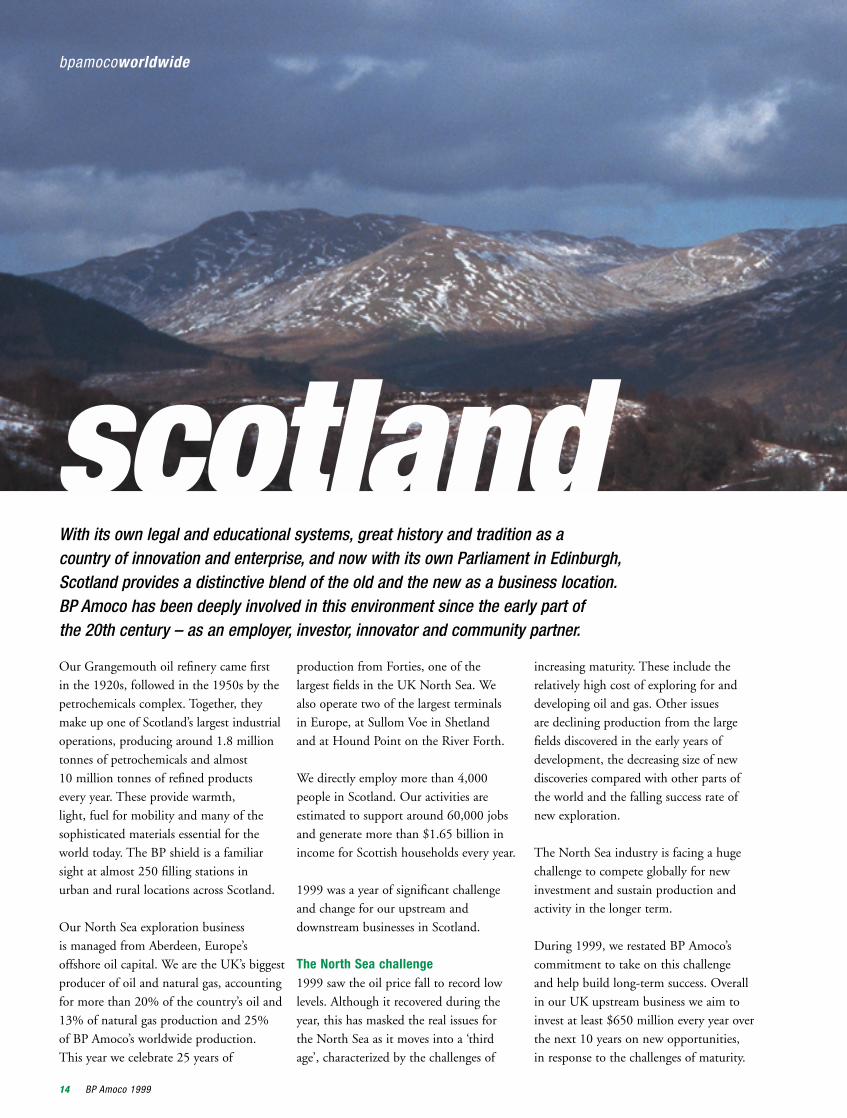
Our Grangemouth oil refinery came firstin the 1920s, followed in the 1950s by thepetrochemicals complex. Together, theymake up one of Scotland’s largest industrialoperations, producing around 1.8 milliontonnes of petrochemicals and almost10 million tonnes of refined productsevery year. These provide warmth,light, fuel for mobility and many of thesophisticated materials essential for theworld today. The BP shield is a familiarsight at almost 250 filling stations inurban and rural locations across Scotland.
Our North Sea exploration businessis managed from Aberdeen, Europe’soffshore oil capital. We are the UK’s biggestproducer of oil and natural gas, accountingfor more than 20% of the country’s oil and13% of natural gas production and 25%of BP Amoco’s worldwide production.This year we celebrate 25 years of
production from Forties, one of thelargest fields in the UK North Sea. Wealso operate two of the largest terminalsin Europe, at Sullom Voe in Shetlandand at Hound Point on the River Forth.
We directly employ more than 4,000people in Scotland. Our activities areestimated to support around 60,000 jobsand generate more than $1.65 billion inincome for Scottish households every year.
1999 was a year of significant challengeand change for our upstream anddownstream businesses in Scotland.
The North Sea challenge1999 saw the oil price fall to record lowlevels. Although it recovered during theyear, this has masked the real issues for the North Sea as it moves into a ‘thirdage’, characterized by the challenges of
increasing maturity. These include therelatively high cost of exploring for anddeveloping oil and gas. Other issues are declining production from the largefields discovered in the early years ofdevelopment, the decreasing size of newdiscoveries compared with other parts ofthe world and the falling success rate ofnew exploration.
The North Sea industry is facing a hugechallenge to compete globally for newinvestment and sustain production andactivity in the longer term.
During 1999, we restated BP Amoco’scommitment to take on this challengeand help build long-term success. Overallin our UK upstream business we aim toinvest at least $650 million every year overthe next 10 years on new opportunities,in response to the challenges of maturity.
bpamocoworldwide
With its own legal and educational systems, great history and tradition as a country of innovation and enterprise, and now with its own Parliament in Edinburgh,Scotland provides a distinctive blend of the old and the new as a business location.BP Amoco has been deeply involved in this environment since the early part of the 20th century – as an employer, investor, innovator and community partner.
scotland

The Grangemouth complex is ideally placed to add value to North Sea natural gas.
By most estimates, more than half the UK’s oil and natural gas resource has stillto be produced, though the challenge todevelop this will be much more difficultthan in the past. Much of this remainingresource is in small pools. It will have tobe won through enhanced recovery andinfill projects in existing mature fields, aswell as small satellite developments, theeffective application of new technologyand other initiatives linked to existingNorth Sea infrastructure, rather thanthrough large new developments.
This type of activity will help protect oilfield manufacturing and service jobs inScotland by stimulating demand for thesubsea and subsurface equipment andexpertise such projects require.
Extending the life of MagnusFor example, last August we announcedplans to invest in increasing reserves andextending the life of our Magnus field,240 kilometres (150 miles) north-east ofShetland. This Enhanced Oil Recovery(EOR) project involves importing naturalgas and gas liquids to the platform andinjecting them into the reservoir. Such aproject could increase the field’s recoverablereserves by some 50 million barrels ofoil and extend its life beyond 2015.The viability of the project depends onthe availability of gas for injection.
Our preferred option involves importingthe gas required for the EOR project fromour Foinaven and Schiehallion fields thatlie some 170 kilometres (110 miles) to thewest of Shetland. Currently Foinaven andSchiehallion reinject produced gas. If theproject went ahead, a gas line would runfrom west of Shetland to Sullom Voe andthen onwards to Magnus. The conceptualscheme would offer the opportunity ofincreased reserves at Magnus, a commercialexport route for west of Shetland gas andthe environmental benefits of reducedflaring west of Shetland and at SullomVoe terminal.
Grangemouth –building for the future
With increasing quantities of feedstocksavailable from the North Sea, ourGrangemouth refining and petrochemicalscomplex is becoming one of Europe’smost integrated, technologically advancedand environmentally responsible sites.
We have already invested more than$2 billion in the complex since 1990.Current and planned projects to expandthe petrochemicals operations account foran additional $750 million of investment.
The investment programme involvesimproving the productivity of the crudeprocessing plant, expansion of ethyleneand ethanol production capacity andconstruction of a new polyethylene andpolypropylene plant. To support thisexpansion, a new combined heat andpower plant is being constructed atGrangemouth which will be commissionedlater this year.
Designed to be the lowest-cost producerin Europe, the new Appryl polypropyleneplant will come on stream in early 2000,providing customers with the rawmaterials needed to produce a wide rangeof everyday goods such as food packagingand car components.
First production from the newpolyethylene plant, which will have theflexibility to change its product mix tomeet market demand, is scheduled tofollow only a few months later.
Both projects have brought significantconstruction employment into the areawhile also contributing to local roadimprovements.
Extending the life of fields such as Magnus is vital for the future of North Sea oil and gas production.
BP Amoco 1999 15

bpamocoworldwidescotland
clean fuels
Grangemouth’s ground-breaking production of the environmentally friendly fuel BP Greener Diesel has paved the way for BP Amoco to reduce vehicleemissions well ahead of legislation. The site’s refinery has the capacity to produce and distribute this unique brand of ultra-low sulphur diesel (ULSD) both for the UK market and for export.
ULSD emits 90% less sulphur dioxide and nearly one-third less particulatesand black smoke than standard diesel. The commissioning of the refinery’shydrofiner unit five years ago set the ball rolling. Now Grangemouth issetting the pace as one of the lowest-cost producers of ULSD in Europe.
ULSD is just part of a bigger clean fuels picture at Grangemouth. Anotherimportant contribution is being made by the site’s recently commissionedbenzene recovery plant which reduces benzene levels in petrol to less than1%. The plant also provides a valuable feedstock for the benzene plant on the neighbouring petrochemicals site.
Measuring all kinds of successInvestment and activity levels are keymeasures of success for our Scottish-basedbusinesses, but we judge the impact of our activities by other equally importantconsiderations.
Data and trends on our safety andenvironmental performance andcommunity investment priorities arefeatured on BP Amoco’s Living Reportwebsite at www.bpamoco.com/alive
Last year saw the completion of a majorproject to ensure cleaner air in the Forth estuary, the announcement of a$1.65-million investment in Scotland’sforests and the launch of a $1.65-millioninitiative to promote local economicdevelopment.
Cleaner airBP Amoco’s $99-million project to provide cleaner air in the River Forth was inaugurated by group chief executive
Sir John Browne last October.This Marine Vapour Recovery Plantcaptures the hydrocarbon vapoursnormally lost from crude oil during shiploading operations at BP Amoco’s exportterminal at Hound Point. These amountto around 30,000 tonnes annually.
The captured vapour is compressed andreturned to the group’s crude oil storagefacility a few kilometres inland atDalmeny, where a new processing plantputs it back into the crude oil.
The project is one of the biggest, mosttechnologically advanced and mostimportant environmental exercisesBP Amoco has ever undertaken. It required enormous amounts ofconsultation between BP Amoco and a wide range of statutory, non-statutory and advisory bodies. The goodwill and co-operation of the local community werekey factors in its successful completion.
Hound Point is now the UK’s biggest oil export terminal, handling around300 million barrels of crude oil a year.

BP Amoco 1999 17
Scottish Forest AllianceThe UK is now one of the least woodedcountries in Europe and only a tinyproportion (1%) of Scotland’s land hasnative woods of ancient origin.
The Scottish Forest Alliance is a novelcollaboration between BP Amoco, ForestEnterprise, the Royal Society for theProtection of Birds (RSPB) and theWoodland Trust Scotland. We willundertake sustainable forest managementprojects in Scotland that contribute eithersingly or in combination to the UK’stargets for biodiversity and make a realimpact on protecting and enhancing
Scotland’s native woodland habitats forfuture generations. We hope it will alsohelp the Scottish Forestry Strategy.
We will also use the initiative to increaseour understanding of carbon sequestrationscience, complementing our existing targetto reduce greenhouse gas emissions and oursupport for climate change policy research.
We hope this project will give local peopleacross Scotland better access to wellmanaged woodlands. The first investmentsin new and existing woodland sites areexpected to begin this year.
Enterprising FalkirkBP Amoco has pledged $1.65 million to a new project to promote the growth of local business start-ups that pursue atechnological or environmental theme.Group chief executive Sir John Browneannounced the ‘Enterprising Falkirk’initiative at a ceremony during his visit to Grangemouth in October 1999.
Forth Valley Enterprise has contributedfunding of $412,000, while Falkirk Councilhas provided the use of the renovatedEarlsgate Business Centre, now renamedthe ‘Grangemouth Enterprise Centre’.
The centre was opened by Nicol Stephen,Scotland’s deputy minister for Enterpriseand Lifelong Learning. He said: ‘Theproject is another excellent example ofbusiness working alongside local agencies to help increase economic growth andemployment within the community.’
BP Amoco’s support also includes thesecondment of a senior manager for twoyears and other management supportwhere required.
Investing in Scotland’s futureBP Amoco can look back over almost a century of successful investment inScotland, and also forward to the challengesof a new century.
Very few international businesses are asfirmly rooted in Scotland as BP Amoco.Very few countries enjoy the same scale and concentration of our major upstream,refining and marketing and petrochemicalsoperations. It is a distinctive and successfulcombination, a partnership fit for a newcentury.
Just as Scotland and the Scottish people are coming to terms with a new Parliament,new responsibilities and new opportunities,BP Amoco is looking for better ways ofassessing and explaining the social and
environmental impact of its activities; more effective ways of listening to andresponding to Scotland’s expectations ofbusiness; and a deeper understanding ofScotland’s aspirations and where we mightmake a difference. We are determined tofind the right answers.
From top to bottom:Opening our doors to the public at Grangemouthmeans welcoming visitors of all ages.We support science and technology educationthrough the BP Amoco Schools Link project.Monitoring oil and gas production west ofShetland in the control room of BP Amoco’sSchiehallion floating production vessel.At service stations such as Earlsgate, nearGrangemouth, BP Amoco meets the needsof customers throughout Scotland.
Above: BP Amoco is investing $1.65 million in forestryprojects in Scotland over the next 10 years.Left: The new Marine Vapour Recovery Plant at HoundPoint terminal on the River Forth.

18 BP Amoco 1999
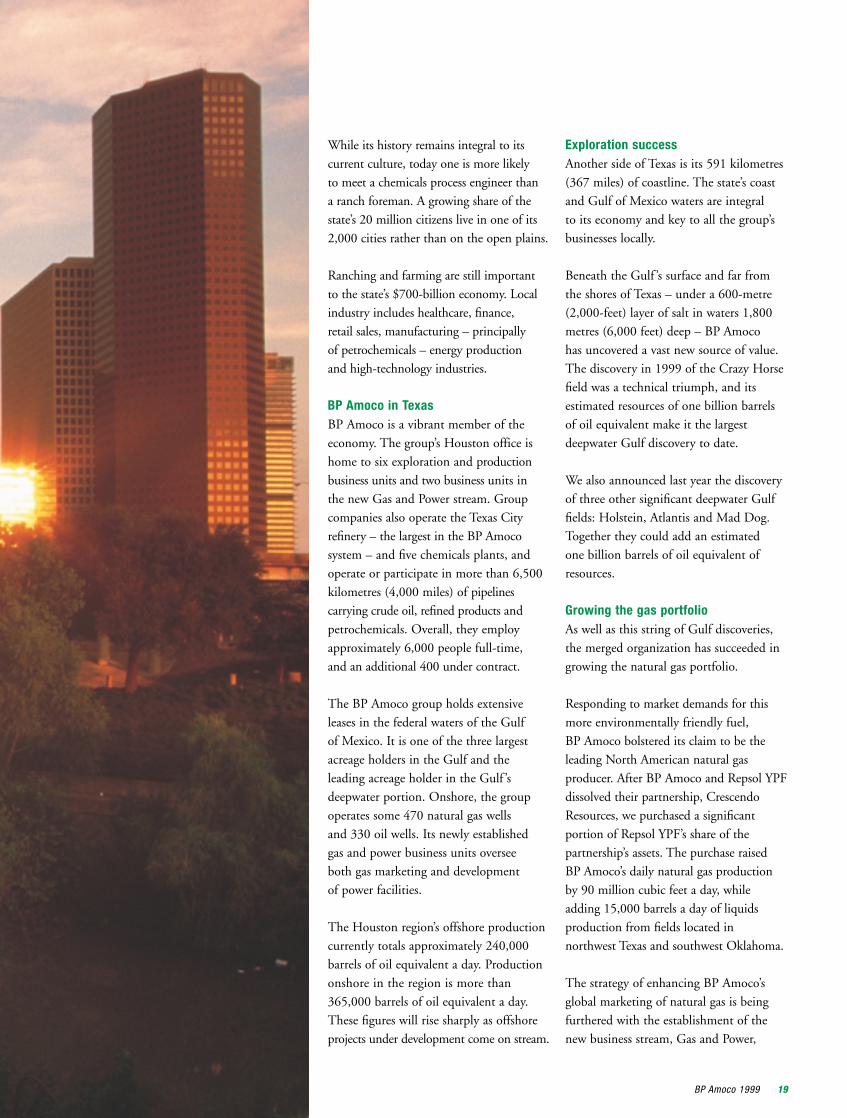
texasThe image of Texas, popularizedin countless motion pictures, is of an area of wide open spaces,populated mainly by cattle herdsdriven by cowboys on horseback.That’s understandable in a history-rich state that has seen six flagsflying over its vast territory, butTexas offers far more. Spanishexplorers who first settled therein 1519 gave the state its namethrough their pronunciationof the Native American word,‘Tejas’, meaning ‘friend’.Subsequently, Texas experiencedsuccessive settlements by Franceand Mexico, and existed for 10years as an independent republic.After becoming part of the UnitedStates in 1845, Texas joined theConfederacy during the Civil War,rejoining the Union in 1870.
bpamocoworldwide
Left: It takes teamwork totighten a valve on one ofthe world’s most complexprocess units at the TexasCity refinery.Below: BP Amocoemployees in Texasdedicated 69,000 hours tovolunteer activities, suchas building a playgroundfor children living at aSalvation Army shelter.
BP Amoco 1999 19
bpamocoworldwidestexas
Exploration successAnother side of Texas is its 591 kilometres(367 miles) of coastline. The state’s coastand Gulf of Mexico waters are integral to its economy and key to all the group’sbusinesses locally.
Beneath the Gulf ’s surface and far fromthe shores of Texas – under a 600-metre (2,000-feet) layer of salt in waters 1,800metres (6,000 feet) deep – BP Amoco has uncovered a vast new source of value.The discovery in 1999 of the Crazy Horsefield was a technical triumph, and itsestimated resources of one billion barrels of oil equivalent make it the largestdeepwater Gulf discovery to date.
We also announced last year the discoveryof three other significant deepwater Gulffields: Holstein, Atlantis and Mad Dog.Together they could add an estimated one billion barrels of oil equivalent of resources.
Growing the gas portfolioAs well as this string of Gulf discoveries,the merged organization has succeeded ingrowing the natural gas portfolio.
Responding to market demands for thismore environmentally friendly fuel,BP Amoco bolstered its claim to be theleading North American natural gasproducer. After BP Amoco and Repsol YPFdissolved their partnership, CrescendoResources, we purchased a significantportion of Repsol YPF’s share of thepartnership’s assets. The purchase raisedBP Amoco’s daily natural gas productionby 90 million cubic feet a day, whileadding 15,000 barrels a day of liquidsproduction from fields located innorthwest Texas and southwest Oklahoma.
The strategy of enhancing BP Amoco’sglobal marketing of natural gas is beingfurthered with the establishment of thenew business stream, Gas and Power,
While its history remains integral to itscurrent culture, today one is more likely to meet a chemicals process engineer than a ranch foreman. A growing share of thestate’s 20 million citizens live in one of its2,000 cities rather than on the open plains.
Ranching and farming are still importantto the state’s $700-billion economy. Localindustry includes healthcare, finance,retail sales, manufacturing – principallyof petrochemicals – energy productionand high-technology industries.
BP Amoco in Texas BP Amoco is a vibrant member of theeconomy. The group’s Houston office ishome to six exploration and productionbusiness units and two business units in the new Gas and Power stream. Groupcompanies also operate the Texas Cityrefinery – the largest in the BP Amocosystem – and five chemicals plants, andoperate or participate in more than 6,500kilometres (4,000 miles) of pipelinescarrying crude oil, refined products andpetrochemicals. Overall, they employapproximately 6,000 people full-time, and an additional 400 under contract.
The BP Amoco group holds extensiveleases in the federal waters of the Gulfof Mexico. It is one of the three largestacreage holders in the Gulf and theleading acreage holder in the Gulf ’sdeepwater portion. Onshore, the groupoperates some 470 natural gas wellsand 330 oil wells. Its newly establishedgas and power business units overseeboth gas marketing and developmentof power facilities.
The Houston region’s offshore productioncurrently totals approximately 240,000barrels of oil equivalent a day. Productiononshore in the region is more than365,000 barrels of oil equivalent a day.These figures will rise sharply as offshoreprojects under development come on stream.

20 BP Amoco 1999
bpamocoworldwidetexas
Contributing to cleaner airIn recent years, the Texas economyhas prospered but, with this economicgrowth, more vehicles have entered alreadycongested highways. Utilities, industrialplants and construction equipment alsocontribute to air-quality concerns.BP Amoco has a responsibility to controlemissions to the air, water and soil.
Carrying out these responsibilities is alegal requirement, but the group has madesignificant voluntary efforts of its own. The refinery and five chemicals plants in Texas recycled 235,000 tonnes ofhazardous wastes from their operationsinto hydrocarbon feedstocks and productsand road base. Most of the major groupsites are members of the Texas CleanIndustries programme and have pledged to reduce by half emissions that are listedon the federal government’s Toxic ReleaseInventory.
During 1999 a major polypropyleneexpansion at the Chocolate Bayou facilitynear Alvin brought the group’s NorthAmerican capacity to one million tonnesa year. Integration of propylene suppliesfrom the Alliance refinery in Louisianaallowed an additional 275,000 tonnesof propylene a year to be brought intothe market to supply acrylonitrileproduction at the Green Lake facilitynear Port Lavaca. This further supportsthe group’s number one market positionin acrylonitrile of 680,000 tonnes ayear worldwide.
Looking to the future, the Texas Cityand Chocolate Bayou chemicals facilitiesare committed to invest in upgradesvalued in excess of $100 million. By 2002these projects should produce a 25%reduction in operating costs whileincreasing productivity by 35%. Theupgrades will also improve the emissions,safety and efficiency of the operations.
Focusing on health, safety and the environment Equally important as business successesare the efforts to make BP Amoco a safer place to work and ensure we are meeting our environmentalobjectives and behaving in a sociallyresponsible manner.
Governments and private organizationsalike have recognized the group’sachievement of safety and environmentalgoals during the past year. BP Amocobusinesses in Texas have made goodprogress in reducing the numberof incidents among their employees,contractors and partners. We intendto continue 1999’s record of ‘gettingthe business right’, but our success willnot be complete unless we get healthand safety right too.
which has offices in Houston. Activitiesinclude a large gas trading facility thatmatches buyers and sellers of around7.5 billion cubic feet of natural gas a day.
Advantages of integration Blending of organizational efforts continuesat various levels. For example, a task forceis working to integrate the internal supplychain. This will maximize the value to thegroup when the deepwater Gulf discoveriesquadruple production by the middle of thedecade. The aim is to guarantee that ourinternal pipeline transportation, refiningand chemicals processing operations areall working together to create value fromthese resources.
During 1999, the management teams ofthe Texas City refinery and chemicals plantintegrated their operations and now jointlyplan daily production schedules and haveconsolidated site staff services.
Growth of chemicals operationsIn addition to initiatives to capitalize onfeedstock supply linkages with upstreamand refining operations in the state,chemicals operations in Texas set theirsights on growth last year.
An engineer oversees performance of subsea wells and equipment for the Troika development, located in822 metres (2,700 feet) of water in the Gulf of Mexico.Models such as these are used to help manage fielddevelopment.
The BP Amoco group is one of the three largest acreage holders in the Gulf of Mexico.

BP Amoco 1999 21
This co-operative spirit was particularlyevident in 1999. During the most recentTexas legislative session, a bill was passedallowing the state regulatory agency topermit so-called ‘grandfathered’ facilitieson a voluntary basis. These facilities, inexistence prior to the 1970 Texas CleanAir Act, were exempted from permittingrequirements implemented after that date.Most of the group’s chemicals plants inTexas are already fully permitted and theTexas City refinery has made a writtencommitment to permit its grandfatheredfacilities.
While 20% of the refinery’s facilities aregrandfathered, many of those already havewhat the state regulatory agency considersthe ‘best available’ emission controls.
Significant challenges lie ahead, however.Houston now leads the nation in thenumber of days its air failed to meetfederal ozone standards. As a result, thebusinesses in the Houston area may haveto reduce NOx (oxides of nitrogen) by as much as 90% over the next few years.
In response to this challenge, the group is reducing NOx emissions at its facilitiesand conducting a comprehensive review so that the most efficient controltechnologies are used to achieve emissionsreductions within the state’s deadlines.
The Texas City refinery is also playing akey role in the BP Amoco Clean Citiesprogramme. Texas City was the firstrefinery in the USA to produce gasoline
with sulphur reduced to 30 parts permillion. The refinery supplies the lower-sulphur fuel to Atlanta, Georgia, the EastCoast’s first location to participate in theClean Cities programme. Anticipating thefuture need for the more environmentallybenign gasoline in other areas, the TexasCity refinery has plans under way toincrease production.
Investing time and dollars Neighbourliness is a key part of the Texasculture and BP Amoco is doing its part to be a good neighbour in the state. Thegroup’s businesses there invest both humanand financial resources in a number ofeducational, environmental and economicdevelopment programmes and activities.
Total contributions to organizations inTexas were about $2.5 million in 1999. An annual charitable campaign, UnitedWay, received more than $1.1 millionfrom BP Amoco, about one-half of thatsum coming from employee contributions.
Financial support is important, but ourreal involvement in the community comesfrom our people. Employees logged about69,000 volunteer hours in 1999 as theydedicated their time and skills to charitableorganizations and participated in activitiesranging from repairing homes for low-income families to building playgroundsfor homeless children.
In addition, some 70 area schools areusing BP Amoco educational programmessuch as Celebrating Science, which aims toexcite students about science. Numerousemployees volunteer their time to supportschool programmes, act as tutors or serve asrole models for at-risk students. Investmentis also made in Junior Achievement as wellas other programmes that help studentsunderstand the free-market system.
In the environmental area, BP Amocoworks closely with the Nature Conservancy,the Center for Coastal Studies, the WildlifeHabitat Council and the Galveston BayFoundation, and has participated in beachsweeps on Galveston Island and recyclingprogrammes in many municipalities.
Finally, BP Amoco has for several yearssupported the Houston InternationalFestival, which promotes culturalunderstanding, as well as major artsorganizations, including museums, thelocal symphony orchestra, opera andtheatres that all contribute to makingTexas a better place to live and work.
From left to right:Threatened species such as the brown pelican are often sighted by participants in the wildlife habitatpreservation project at the Chocolate Bayou facilitylocated along the Texas coastal plains.The newly formed Gas and Power stream’s energytrading facility in Houston matches buyers and sellers of a range of energy products and services across North America.Wells such as Parlange #9 in the Judge Digby fieldcontribute to natural gas production of 350 million cubic feet a day in the Tuscaloosa Trend.
In recognition of exemplary safety performance, theGreen Lake chemicals plant was named a ‘star’ facilityby the Occupational Safety and Health Administration(OSHA) Voluntary Protection Program.

bpamocoworldwide
Our Living Report website atwww.bpamoco.com/alive is a radicaldeparture from conventional company
Visit the Location Reports section of the website to find:• More detailed versions of the Scotland
and Texas location reports, exploring the
potential of web-based reporting to bring
immediacy and impact at the same time
as added depth and insight
• Location reporting sites for those
places featured in our social reports for
1997 and 1998, including Alaska, Angola,
China, Colombia, Egypt, Poland and
South Africa
• Updated reports from Angola, Colombia
and Poland
Reports from other locations will be added
during 2000.
Selection of locationsWith 130 business units across six
continents it would not be practicable to
publish detailed reports for every location
in the Annual Report.
The places to be presented as location
reports in our published Annual Report
and Annual Review and on the Living
Report website were selected with a
number of criteria in mind.
We chose places which:• are significant units of business with
strategic importance for the group, which
make, or have the potential to make, a
significant contribution to group financial
performance
• together reflect to some degree the
geographic and business spread of the
group’s operations
• demonstrate how we conduct the
business in a range of environments
from mature operations in industrialized
countries, through economies in
transition, to new business opportunities
in developing countries.
We aim to add to and update our location
reporting through the year. We will continue
to take account of feedback from readers
in developing our plans.
living report
reporting. It covers financial, environmental and social performance togetherand offers frequent updating of key indicators and other material throughoutthe year. As the name ‘Living Report’ suggests, it aims to go well beyond thetraditional annual snapshot of the conventional company report. The aim is to give access to detailed, up-to-date and relevant material which offers real insightto anyone interested in BP Amoco into how the group works and how top-rateperformance is achieved.
22 BP Amoco 1999

bpamocoperformance
We report our performance not only in financial terms but also against our commitments on health, safety,environmental care and social investment.
BP Amoco 1999 23
visit
www.bpamoco.com/alive/performance

Average realized oil prices rose by 38% toaround $17 a barrel and North Americangas prices were 13% above their 1998 level.But there was constant pressure on refiningmargins in the downstream oil business,while petrochemicals margins remainedpoor, reflecting industry over-capacity and the stage in the global economic cycle.
Replacement cost profit before exceptionalitems totalled $5,330 million against
$3,959 million in 1998. After adjusting forspecial charges, details of which are givenin the Financial Review on pages 30-35,replacement cost operating profit of thebusinesses was as follows:
• Exploration and production profit roseby 102% to $7,493 million• Refining and marketing profit fell by19% to $2,082 million, reflecting the rise inthe price of crude oil and refined productsand consequent tightening of margins
• Chemicals profit fell by 19% to $933million despite a 6% increase in production.
Capital expenditure in 1999 was$7.3 billion. Operating cash flow was$10.3 billion. Net debt rose to $13 billionand the net debt to net debt plus equityratio was unchanged at 23%.
Substantial achievements were recorded in every part of our businesses.
• Exploration and production reservesreplacement exceeded production for thesixth consecutive year, with 1,172 millionbarrels of oil equivalent added to provedreserves. Finding and development costsaveraged $3.30 a barrel of oil equivalent –a substantial reduction on recent years.The proportion of gas in these reserveadditions was similar to that of last year at about 66%. Oil production increasedslightly, with rising output in the EasternTrough Area Project (ETAP) in the North
Sea and at Schiehallion and Foinaven,west of Shetland, more than offsettingdeclines in the more mature North Seafields and the sale of our Canadian oilinterests. Natural gas production increased4.5% to just over 6 billion standard cubicfeet a day with the start-up of a $1-billionliquefied natural gas plant in Trinidad.
Plans were announced in September tocreate a Gas and Power business to market
our substantial upstream gas reserves anddevelop a leading gas and power marketingand trading business. During the lastquarter of 1999 we made encouragingprogress in the marketing of futurereserves from Australia, Trinidad and the Caspian Sea and purchased ProGas, aCanadian gas aggregator. The first foreigncompany to be licensed to market gas inthe Spanish industrial market, we were alsofirst to launch an online gas trading facilityfor UK industrial customers.
24 BP Amoco 1999
business operating reviewThe robustness and flexibility of BP Amoco in a complex and rapidly changing business
environment were underlined in 1999 by an exceptional performance across the group.
Throughout the year our focus on performance improvement and a sustained assault on
costs following the merger of BP and Amoco produced substantial benefits. As a result
we achieved our projected savings of $2 billion significantly earlier than indicated.
production upOutput from fieldswest of Shetlandincreased by 44% to 180,000 barrels a day during 1999.
flying highAir BP had an excellent year,being recognized as the World’sBest Jet Fuel Marketer by anindustry survey.

main fields in developmentBP Amoco % interest
Alaska Northstar 98
Gulf of Mexico Diana 33Europa 33Hoover 33
Angola Girassol 17
Azerbaijan ACG (Apsheron) 34
Egypt Ha’py 29Temsah 25
Trinidad Amherstia 100
crude oil productionBP Amoco % BP Amoco share
Oil and NGLa interest of productionthousand b/d end-1999 1999 1998
UKForties 95.4 66 76Magnus 85.0 48 61Harding 70.0 58 60Foinaven 72.0 56 51Other Various 352 270
Total UK 580 518
Rest of Europe Various 100 105
USAPrudhoe Bay 51.2/13.8b 202 232Kuparuk 39.2 90 92Alaska other Various 113 130Altura Various 127 122Other Lower 48 onshore Various 133 140Gulf of Mexico Various 139 117
Total USA 804 833
Egypt Various 130 105Canada Various 56 68Colombia Various 66 53Trinidad 100.0 49 47Other Various 106 112
Total Rest of World 407 385
Sub-total 1,891 1,841
Associated undertakings(equity interest)Abu Dhabi Various 113 124Other Various 57 84
Total BP Amococ 2,061 2,049
b/d = barrels a day.a Natural gas liquid.b Oil rim/gas cap.c Includes NGL from processing plants in which an interest
is held of 54,000 b/d for 1999 and 67,000 b/d for 1998.
natural gas productionBP Amoco % BP Amoco share
Natural gas interest of productionmillion cf/d end-1999 1999 1998
UKBruce 37.0 175 182West Sole 100.0 97 102Ravenspurn South 100.0 87 103Other Various 942 871
Total UK 1,301 1,258
Rest of Europe Various 164 200
USASan Juan Coal Various 427 408Hugoton Various 162 170Moxa Arch Various 77 110Arkoma Various 111 129Tuscaloosa Various 175 156Altura Various 118 143Other Lower 48 onshore Various 624 627Alaska Various 10 10Gulf of Mexico Various 571 568
Total USA 2,275 2,321
Canada Various 689 767Trinidad
Mahogany 100.0 367 14Flamboyant 100.0 92 187Immortelle 100.0 207 125Other 100.0 115 113
Australia 16.7 215 219Sharjah
Sajaa 40.0 168 157Other 40.0 38 62
Indonesia 40.0 103 108Other Rest of World Various 69 56
Total Rest of World 2,063 1,808
Sub-total 5,803 5,587
Associated undertakings(equity interest) Various 264 221
Total BP Amoco 6,067 5,808
cf/d = cubic feet a day.
BP Amoco 1999 25

• Refining and marketing achieveda highly competitive adjusted return onfixed assets of 10% despite plummetingmargins on refining (down 48%). Retailvolumes rose while shop revenues grewfaster than the market at 9%, reflecting thestrength of our convenience retail businessin the USA and UK. More than 170 newretail sites were opened worldwide duringthe year, with 90 opened in Poland, China,Venezuela and Russia. Growth in aviation
was strong, and Air BP was recognized asthe World’s Best Jet Fuel Marketer by anauthoritative industry survey.
• Chemicals margins fell to new cyclicallows in several commodity productareas. At the same time the effects of thefinancial crisis in Asia continued to be felt,especially in Europe, where weakness ofthe euro also contributed to pressure onmargins. This adverse external environmentwas offset partially by a clear focus oncost reductions and releasing the valueof the merger with Amoco. Total volumeof product manufactured rose by 6% to
an all-time record of 21.9 million tonnesas new capacity came on stream andproduction reliability increased.
Our solar energy business was transformedinto BP Solarex in July after BP Amocopurchased Enron’s holdings in Solarex for$45 million. The new company has a 20%share of the global market and is one ofthe largest manufacturers of photovoltaicmodules and systems with plants in the
USA, Spain, Australia and India. In 1999BP Solarex revenues totalled $179 millionand solar module production grew 28%.Many of our successes in 1999 were basedon advanced technology. One major project,Plug in the Sun, involves installing solarmodules on 200 new service stations in11 countries. Another uses solar energy topower 665 houses in the Athlete’s Villageand 19 lighting towers in Sydney, Australia.
Technological innovation also underpinnedour most significant explorationachievement in 1999 – the discovery of thelargest deepwater field so far found in the
Gulf of Mexico. The Crazy Horse field,in which the group holds a 75% interest,is estimated to hold at least one billionbarrels of oil equivalent. Finding this fieldinvolved drilling through 1,800 metres(6,000 feet) of water and more than600 metres (2,000 feet) of salt to a recorddepth of 7,830 metres (25,770 feet).
Crazy Horse was only one of a number of major finds in 1999. In the Gulf of
Mexico we announced the discoveryof three other fields – Holstein, Atlantisand Mad Dog – with combined potentialof 600 million barrels of oil equivalent(boe). Following encouraging appraisaldrilling, we now believe this is more likelyto be about one billion boe. In Angolaour exploration success continued witheight new discoveries. Elsewhere therewere large natural gas finds in Azerbaijan’soffshore waters and in Australia’s NorthWest Shelf.
Capital investment continued across thegroup. In the downstream business we
26 BP Amoco 1999
joint venture in ChinaCommissioned early in 1999,the 150-tonnes-a-year acetic acidplant at Yaraco is one of a number of joint ventures with Sinopec.
plug in the sunFollowing highly successful trials last year, BP Solarex solarpanels are being installed on 200 new service stations in 11 countries.

completed the repositioning of our Toledo,Ohio, refinery with the commissioningof a new coker unit and began a projectat Sines, Portugal, to develop a liquefiedpetroleum gas storage cavern facility.
A number of new chemicals projectsaimed at strengthening our portfoliowere sanctioned or announced, includinga new 250,000-tonnes-a-year linear alpha-olefins plant in Alberta, Canada, and the
expansion of trimellitic anhydride capacityat our plant in Joliet, Illinois.
In China our 150,000-tonnes-a-year aceticacid joint venture at Yaraco with Sinopecwas commissioned early in the year.Another joint venture with Sinopec –the detailed planning phase of a world-scale 900,000-tonnes-a-year ethylenecracker and derivative product units nearShanghai – received official approval inthe autumn. Start-up is expected in 2005.
During the year we also began to upgradeour Bulwer Island refinery in Queensland
to produce low-sulphur fuels in Australia –one of a number of initiatives undertakenas part of our drive for cleaner fuels. Othersincluded the start of our worldwide CleanCities initiative to market cleaner fuels in40 cities. Fifteen launches had taken placeby 2000, including those in Paris, Atlanta,Chicago and Istanbul.
Following completion of the merger andin the context of low oil prices at the time,
BP Amoco undertook a strategic andportfolio review. A consequence of this wasthe development of an asset divestmentprogramme. Under this programme,the group disposed of its Canadian oilproperties but retained significant naturalgas resources, while in Venezuela wedivested our interest in the Pedernalesfield. In chemicals there were severaltransactions designed to strengthen ourfocus on petrochemicals, among themthe closure of our joint-ventureSingapore aromatics complex. Some136 retail sites in the USA were sold tocomply with the FTC-mandated terms
of the BP Amoco merger, and weoffered for sale our Alliance, Louisiana,refinery following a decision to reducerefining cover.
In December we announced an agreementwith ExxonMobil to dissolve the BP/MobilEuropean fuels and lubricants joint venture.Under this BP Amoco will purchase Mobil’s30% interest in the fuels business for about$1.5 billion and the two companies will
divide the assets of the lubricants businessin line with their equity stakes.
In 2000, projects coming on stream willinclude Amherstia in Trinidad and Ha’pyand Baltim in Egypt. Production willincrease from new developments in thedeepwater Gulf of Mexico. The CleanCities initiative will continue to roll outand another 200 new service stationswill be equipped with solar power. Wealso expect to increase production fromour polyethylene and polypropyleneunits at Grangemouth as work on a majorinvestment programme makes good progress.
BP Amoco 1999 27
tall towersThe Saturn tower is prepared for installation as part of theconstruction of BP Amoco’s linearalpha-olefins plant in Joffre, Alberta,Canada. At 76 metres (250 feet)high, Saturn will be the tallestof the plant’s towers.
a breath of fresh airIstanbul is one of 15 cities which by the start of 2000 had pioneeredBP Amoco’s Clean Cities initiative.We plan to extend the market for ourcleaner fuels to a total of 40 citiesaround the world in the near future.

28 BP Amoco 1999
Ethical conductOur multi-faceted ethics programme isfounded on the ethical conduct policy,supplemented by our Guidelines onBusiness Conduct.
Our approach to managing ethicalconduct emphasizes policy understanding,consultation and sound judgement.Workshops and other forums fosterunderstanding, openness and employeeinteraction. Our Internal Audit function,
together with our Legal and Security teams,works with the businesses to promote bestpractices and resolve ethical issues.
All employees in positions of responsibilitydown to team leader level attest personallyevery year to the progress made in applyingthe policy to their business activities, and bring issues of doubt and/or non-compliance into the open. Internal Auditreviews the rigour and completeness ofthe certification process.
Employees can use confidential telephonenumbers to request help or reportwrongdoing. Matters raised are referredfor investigation and resolution.
Restructuring following the merger resultedin job changes, relocation and redundancyfor significant numbers of employees.
We tried to minimize uncertainty bytelling individuals as soon as possible howthey were affected. Nearly everyone knewtheir position by the end of March.
Major activities have included harmonizinghuman resources systems such as pay andbenefits; creating a new framework for
staff development; and training to alignmanagers with the group’s new strategy.We also developed a comprehensivestrategy for diversity and inclusion.
RelationshipsOur relationships policy encompassesmany commercial, technical, political andcommunity relationships. Most are specificto the context in which they are formed.
Mapping and improving relationshipswith governments and communitiesis given highest priority at group level.Our Intranet provides guidelines onrelationships with contractors and suppliers.
environmental and social reviewBP Amoco’s Business Policies are the foundation on which we build and conduct
our business. Everyone who works for us is expected to live up to them.
This section reviews progress towards fulfilment of our business policy commitments on:
ethical conduct; employees; relationships; and health, safety and environmental performance.
(See page 91 for details of how to obtain the full text of the BP Amoco Business Policies)
solar showcaseThe distinctive G8 Solar Showcase– supreme winner in the 1999Chairmen’s Awards – was builtto demonstrate the potential ofrenewable solar energy to the G8heads of government summit inBirmingham, UK. It now serves asa visitor centre at the Baglan BayEnergy Park, South Wales.
EmployeesLine managers are responsible forimplementing our commitment toemployees. In 1999 the initiatives usedto support them included:
• people measures – performance targetsand measures for people managementprocesses
• employee surveys – listening andfeedback to gauge progress
• harmonization of human resourcesprocesses
• programmes to build a shared visionfor the merged organization
• leadership development initiatives.
We measured progress towards our peoplemeasures targets quarterly. Performancefor the year is detailed on page 7. During1999 these measures were extended tocover all staff worldwide.
Our annual People Assurance Survey was sent to 60,000 staff during October.Monthly telephone surveys also gatheredfeedback on issues such as staff morale and company direction. Findings aresummarized on page 7.
fuelled by natural gasA BP Amoco joint venture in Egypthas successfully commercializedcompressed natural gas (CNG) asa transportation fuel. Exhaust fromCNG vehicles typically contains85% fewer pollutants than thosefrom gasoline-powered vehicles.The project won a Chairmen’sAward in 1999.

greenhouse gas emissions tradingprogramme went live in BP Amocoon 1 January 2000. External accounting and environmental specialists will conduct an emissions verification process for the trading.
We have been a prominent contributor to the international environment debateand welcomed many opportunities fordiscussions with governments, environmentalgroups, companies and individuals.
Hundreds of our managers have beentrained to use a specialized safety auditingtool which addresses and removes safetyrisks immediately. This is one of manyinitiatives that drive our safety system.
Health, safety and the environment (HSE)Good HSE performance and the health,safety and security of everyone who worksfor the group are critical to our success.Performance improved through 1999, but we continue to strive to achieve ourgoals of no accidents, no harm to peopleand no damage to the environment.
Two priorities have dominated 1999. First,the environment management systems atabout half of our major operations have
been certified by external auditors ascompliant with international standard ISO 14001. The rest should achieve this by 2001. Second, in response to concernabout climate change, the first worldwide
BP Amoco 1999 29
A country risk assessment process helpsmanagement evaluate political, economicand social risks before major decisions aretaken to invest in new areas. We continueto develop social impact assessmenttechniques and use formal consultationprocesses for local social reporting andto support local external relations needs.At group level we maintain active dialoguewith human rights and developmentorganizations as well as with environmentalnon-governmental organizations.
After fundamental analysis of our approach to relationships withcommunities, we are moving from the philanthropic basis for corporatecommunity contributions to a socialinvestment model aligned with groupstrategy. This focuses on deliveringeconomic benefit through sustainable jobsand wealth creation to the communitieswhere we operate. The board approvedthis new approach in November.
See page 7 for details of our socialinvestment in 1999.
from grime to golf BP Amoco employees in Pumpherston,Scotland, devised an innovative clean-up strategy to reclaim land contaminatedby detergents and tars after a centuryof extracting oil from shale. The site isnow being used to extend a golf course.Not only a Chairmen’s Award winner,the project has won a UK Lottery grantas well as various other plaudits.
a new perspectiveChildren with special needs take part in a session on environmentalissues through our Schools Linkprogramme. Since 1968, theprogramme has attracted hundreds of BP Amoco volunteers who workwith local schools to bring a newperspective to learning.
people and performanceWe believe our employees’ motivation is integral to the way in which the group
performs. Empowered and committed people help create a competitive advantage.
Keeping all our 80,000 staff worldwide informed is a task to which we are committed.
BP Amoco’s goals are constructive two-way dialogue, upward feedback and peer review.
They provide an environment in which performance is objectively assessed and
employees recognize their contribution to performance. We aim to stimulate creative
opportunities for the group, business unit, team and individual and create a diverse
and inclusive organization in which people progress purely on merit.
Our strategy and business plans are widely shared with employees. In our European
operations, people are involved in Employee Consultation Councils. In all areas, team
briefings, presentations, e-mail and the company Intranet inform employees and create
opportunities to express views and communicate ideas. We encourage employees to
become shareholders of BP Amoco through our employee share ownership schemes.

30 BP Amoco 1999
BP Amoco’s 1999 operating performancereflected the substantial benefits ofrestructuring and integration following the merger, together with ongoing costcontrol. The trading environment wasbroadly neutral, with higher average oilprices offset by weaker downstream andchemicals margins. European currencies
were significantly weaker and sterling wasmarginally weaker against the US dollar in 1999.
Replacement cost operating profit was$10,080 million (1998 $7,106 million),after adjusting for special charges of$1,186 million (1998 $585 million).Replacement cost profit before exceptionalitems was $6,206 million, 40% higher than a year ago, after adjusting for specialcharges of $876 million after tax (1998$469 million). The major components of these charges are integration costs, costs associated with the restructuringprogramme, asset write-downs and projectcosts in respect of process improvementand outsourcing. The adjusted return on average capital employed was 13%, up three percentage points on 1998.
There was an exceptional charge of$2,280 million before tax (1998$850 million gain) which comprisesrestructuring costs of $1,943 million and a net loss on disposals and closures of $337 million. The restructuring costscomprise mainly severance payments andthe costs of eliminating surplus property.
Disposals during 1999 included the sale ofdistribution terminals and service stationsin the USA mandated by the Federal Trade Commission in connection with the BP Amoco merger. Also, followingcompletion of the merger and in thecontext of low oil prices at the time,BP Amoco undertook a strategic andportfolio review. A consequence of this wasthe development of an asset divestmentprogramme. Under this programme, the group disposed of its Canadian oilproperties, its interest in the Pedernales oilfield in Venezuela and certain chemicalsoperations. In addition, BP Amoco andExxonMobil decided to close the jointlyowned Singapore aromatics facility.
Interest expense was $1,292 millioncompared with $1,165 million in 1998,
after adjusting for special charges of$24 million and $12 million respectively,arising from the early redemption of bonds. The increase in group interestexpense in 1999 reflects lower capitalizedinterest and higher average debt, theeffects of which were partly offset bylower interest rates.
Corporate tax expense was $1,880 million(1998 $1,520 million), representing aneffective tax rate on replacement costprofit before exceptional items of 28%,compared with 25% in the previous year.The increase reflected the effects of tax on stock holding gains whereas 1998 hadbenefited from tax relief on stock holdinglosses.
Historical cost profit was $5,008 million,after the exceptional loss after tax of$2,050 million and stock holding gains of $1,728 million. The correspondingfigures for 1998 were $3,220 million,$652 million profit and $1,391 millionlosses respectively.
Capital expenditure and acquisitionsamounted to $7,345 million, 29% down
financial highlights$ million 1999 1998
Replacement cost operating profit 8,894 6,521
Replacement cost profit before exceptional items
after adjusting for special charges 6,206 4,428
Replacement cost profit before exceptional items 5,330 3,959
Historical cost profit after exceptional items 5,008 3,220
Capital expenditure 7,345 10,362
Dividends (cents per share) 20.0 19.8
Dividends (pence per share) 12.3 11.9
financial review
0
5
10
15 return on averagecapital employed
95 9796 98 99
based on replacement costprofit before exceptionalitems – %
0
5
10
15 net debtend year – $ billion
95 9796 98 99

BP Amoco 1999 31
on 1998, reflecting greater focus in thecapital programme. Expenditure in 1999included $400 million in respect ofthe group’s purchase of a significant part of Repsol YPF’s share of assets in theCrescendo Resources partnership. Disposalproceeds, arising primarily from thepost-merger asset divestment programme,amounted to $2,441 million. Capital
expenditure net of divestments was$4,904 million (1998 $8,195 million).Capital expenditure in 2000 is likely to bearound $10 billion, reflecting the growthagenda underpinned by continuing focusin the capital programme.
Net cash outflow for the year was$82 million compared with $906 millionin 1998. The change reflects improvedoperating results and lower net capitalexpenditure, partly offset by restructuringand integration costs and higher dividendpayments.
The group’s net debt, that is debt less cashand liquid resources, was $12,993 millionat the end of 1999, an increase of$113 million over the year. The ratio ofnet debt to net debt plus equity was 23%,the same as a year ago.
DividendsThe total dividends announced for 1999
were $3,884 million, against $4,121 million
for 1998. 1998 dividends included a
second fourth-quarterly dividend to former
Amoco shareholders to harmonize timing
of quarterly dividend payments as a result
of the merger. Dividends per share for 1999
were 20.0 cents ($1.20 per ADS) compared
with 19.8 cents per share ($1.19 per ADS)for 1998. BP Amoco intends to continueto pay dividends in the future of around50% of estimated average replacement costprofit before exceptional items through thebusiness cycle. The group also intends tocontinue the operation of the DividendReinvestment Plan (DRIP) for shareholderswho wish to receive their dividend in theform of shares rather than cash. The DRIPwas introduced in 1999 to replace theprevious share dividend plan which wasterminated owing to the abolition of UKadvance corporation tax. The BP AmocoDirect Access Plan for US and Canadianinvestors also includes a dividendreinvestment feature.
Share repurchasesThe group will seek authority fromshareholders at the April 2000 annualgeneral meeting for the repurchase andcancellation of shares. This will allow sharebuybacks as and when the group’s fundingposition permits.
Creditor payment policy and practiceStatutory regulations issued under the UKCompanies Act 1985 require companiesto make a statement of their policy andpractice in respect of the payment of tradecreditors. BP Amoco p.l.c. is a holdingcompany with no business activity otherthan the holding of investments in theBP Amoco group and therefore had notrade creditors at 31 December 1999.
In view of the international nature of the group’s operations there is no specificgroup-wide policy in respect of paymentsto suppliers. Relationships with suppliersare, however, governed by the group’s policycommitment to long-term relationshipsfounded on trust and mutual advantage.Within this overall policy, individualoperating companies are responsible foragreeing terms and conditions for their
income adjusted for special items1999 1998
0001111 110001111
Reported Special Adjusted Reported Special Adjusted$ million earnings items results earnings items results
Exploration and Production 7,194 299 7,493 3,231 485 3,716Refining and Marketing 1,840 242 2,082 2,564 – 2,564Chemicals 686 247 933 1,100 50 1,150Other businesses and corporate (826) 398 (428) (374) 50 (324)
Replacement cost operating profit 8,894 1,186 10,080 6,521 585 7,106
Interest expense (1,316) 24 (1,292) (1,177) 12 (1,165)Taxation (2,110) (334) (2,444) (1,322) (128) (1,450)Minority shareholders’ interest (138) – (138) (63) – (63)
Replacement cost profit before exceptional items 5,330 876 6,206 3,959 469 4,428
0
3
6
9
12 capital expenditureand acquisitions$ billion
95 9796 98 99
exploration and productionrefining and marketingchemicalsother businesses and corporate
0
6
12
18
24
36
30
earnings and dividends per shareearnings per share onreplacement cost profit before exceptional items – cents
earnings per sharedividends per share
95 9796 98 99

32 BP Amoco 1999
business transactions and ensuring thatsuppliers are aware of the terms of payment.These terms are adhered to when paymentsare made, subject to terms and conditionsbeing met by the supplier.
Internal financial controlIn accordance with the provisions of theCombined Code, we set out below ageneral description of BP Amoco’s internalfinancial control.
The process for internal financial controlhas been designed to allow the boardto monitor the group’s overall financialposition and to help protect its assets.Its purpose is to give reasonable assuranceagainst material financial misstatement orloss. The directors are responsible for thisprocess, and appropriate authorities andguidelines are in place.
The board approves the aggregate financialframework and performance targets withinwhich the executive has been delegatedauthority to operate and to formulatethe component financial objectives forindividual operating units. Performanceagainst these targets is reported quarterlyand variances analysed. Financial forecastsare reviewed monthly and include analysesof material sensitivities and changes.
The group’s policy on business conductunderpins our internal financial controlprocess. Compliance with the policy is assured by an annual compliancecertification process throughout the group.
The Audit Committee reviews theeffectiveness of internal financial controlwith management and with internal andexternal auditors and reports on it tothe board.
The directors consider the system fulfilledits purpose in 1999.
Financial risk managementThe group’s policy is to co-ordinate certainkey activities on a global basis in orderto optimize its financial position andperformance. These include themanagement of the currency, maturity and interest rate profile of borrowing, cash, other significant financial risks andrelationships with banks and other financialinstitutions. International oil trading andrisk management relating to the businesses’commercial operations are carried out bythe group’s oil trading division.
BP Amoco is exposed to financial risks,including market risk, credit risk andliquidity risk, arising from the group’s
normal business activities. These risks andthe group’s approach to dealing with themare discussed below.
Market risk
Market risks include the possibility thatchanges in currency exchange rates, interestrates or oil and gas prices will adverselyaffect the value of the group’s financialassets, liabilities or expected future cashflows. Market risks are managed using a range of financial and commodity
instruments including derivatives.We also trade derivatives in conjunctionwith these risk management activities.
Currency exchange rates: Fluctuationsin exchange rates can have significanteffects on the group’s operating results.The effects of most exchange ratefluctuations are subsumed within businessoperating results through changing costcompetitiveness, lags in market adjustmentto movements in rates, and conversiondifferences accounted for on specifictransactions. For this reason the total effect of exchange rate fluctuations is notidentifiable separately in the group’sreported results.
The main underlying economic currencyof the group’s cash flows is the US dollar
young artistsA display of artwork by localschoolchildren enlivens BP Amoco’sglobal headquarters in London

By contrast, where derivatives are held fortrading purposes, changes in market riskfactors give rise to realized and unrealizedgains and losses, which are recognized in the current period.
All financial instrument and derivativeactivity, whether for risk management or trading, is carried out by specialist teams which have the appropriate skills,experience and supervision. These teams are subject to close financial and
management control, meeting generallyaccepted industry practice and reflectingthe principles of the Group of ThirtyGlobal Derivatives Study recommendations.An independent control function monitorscompliance with BP Amoco’s policies. The control framework includes prescribedtrading limits that are reviewed regularly by senior management, daily monitoring of risk exposure, marking trading exposuresto market and reviewing open positions toassess the group’s exposure in potentiallyadverse situations.
Further details of the group’s use ofderivatives appear in Note 26 on theAccounts, pages 53-57.
Credit risk
Credit risk is the potential exposure of
BP Amoco 1999 33
and the group’s borrowings arepredominantly in US dollars. Our foreign exchange management policy is to minimize economic and materialtransactional exposures from currencymovements against the US dollar.The group co-ordinates the handling offoreign exchange risks centrally, by nettingoff naturally occurring opposite exposureswherever possible, to reduce the risk, andthen dealing with any material residualforeign exchange risks. Significant residual
non-dollar exposures are managed usinga range of derivatives.
Interest rates: The BP Amoco group isexposed to interest rate risk on short- and long-term floating rate instrumentsand as a result of the refinancing of fixedrate finance debt. Consequently, as well as managing the currency and the maturityof debt, the group manages interest coststhrough the balance between generallylower-cost floating rate debt, which hasinherently higher risk, and generally moreexpensive, but lower-risk, fixed rate debt.The group is exposed predominantly to US dollar LIBOR (London Inter-BankOffer Rate) interest rates as borrowings are mainly denominated in, or are swapped into, US dollars.
The BP Amoco group uses derivatives to achieve the required mix between fixedand floating rate debt. During 1999, debtpolicy was to keep floating rate debt belowan upper limit of 65% of total net debt.Actual floating rate debt for the year was in the range of 47-53%.
Oil and natural gas prices: BP Amoco’s oil trading division uses financial andcommodity derivatives as part of the overalloptimization of the value of the group’s
equity oil production and as part of theassociated trading of crude oil, productsand related instruments. The group alsouses financial and commodity derivativesto manage certain of its exposures to pricefluctuations on natural gas transactions.
Market risk management and trading: In marketrisk management and trading, only well-understood, conventional derivativeinstruments are used. These include futuresand options traded on regulated exchangesand ‘over-the-counter’ swaps, options andforward contracts.
Where derivatives constitute a hedge, the group’s exposure to market risk createdby the derivative is offset by the oppositeexposure arising from the asset, liability,cash flow or transaction being hedged.
gas from the Nile DeltaDemand for energy in Egypt isincreasingly being met by naturalgas. On the country’s Mediterraneancoast, 20 kilometres from Port Said,BP Amoco and its partners haveconstructed the West Harbour naturalgas plant which is processing gasfrom the Nile Delta.
e-trading places BP Amoco’s newly established Gas and Power business was the first to launch an online natural gas trading facility, ‘e-EnergyTrade’,for UK industrial customers.
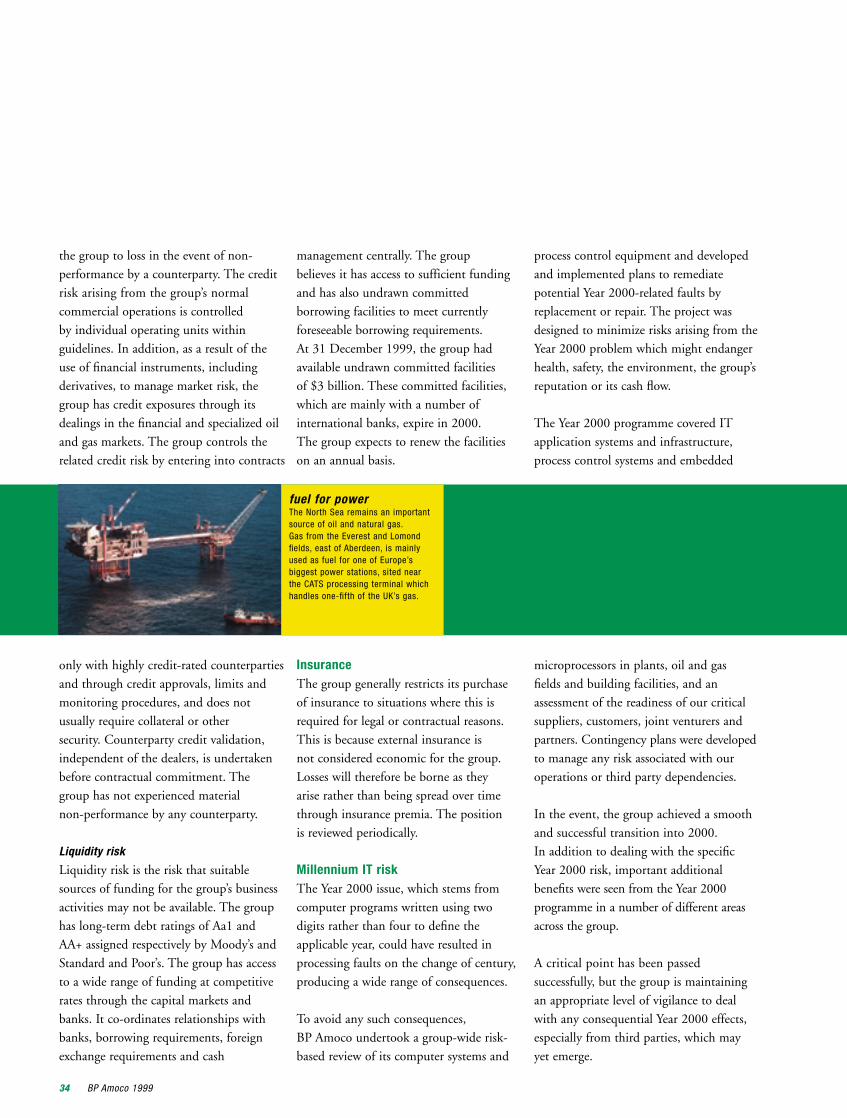
34 BP Amoco 1999
the group to loss in the event of non-performance by a counterparty. The creditrisk arising from the group’s normalcommercial operations is controlled by individual operating units withinguidelines. In addition, as a result of theuse of financial instruments, includingderivatives, to manage market risk, thegroup has credit exposures through itsdealings in the financial and specialized oiland gas markets. The group controls therelated credit risk by entering into contracts
only with highly credit-rated counterparties and through credit approvals, limits andmonitoring procedures, and does notusually require collateral or other security. Counterparty credit validation,independent of the dealers, is undertakenbefore contractual commitment. The group has not experienced material non-performance by any counterparty.
Liquidity risk
Liquidity risk is the risk that suitablesources of funding for the group’s businessactivities may not be available. The grouphas long-term debt ratings of Aa1 and AA+ assigned respectively by Moody’s andStandard and Poor’s. The group has accessto a wide range of funding at competitiverates through the capital markets andbanks. It co-ordinates relationships withbanks, borrowing requirements, foreignexchange requirements and cash
management centrally. The groupbelieves it has access to sufficient fundingand has also undrawn committedborrowing facilities to meet currentlyforeseeable borrowing requirements.At 31 December 1999, the group hadavailable undrawn committed facilitiesof $3 billion. These committed facilities,which are mainly with a number ofinternational banks, expire in 2000.The group expects to renew the facilitieson an annual basis.
InsuranceThe group generally restricts its purchaseof insurance to situations where this isrequired for legal or contractual reasons.This is because external insurance is not considered economic for the group.Losses will therefore be borne as theyarise rather than being spread over timethrough insurance premia. The position is reviewed periodically.
Millennium IT riskThe Year 2000 issue, which stems fromcomputer programs written using twodigits rather than four to define theapplicable year, could have resulted inprocessing faults on the change of century,producing a wide range of consequences.
To avoid any such consequences,BP Amoco undertook a group-wide risk-based review of its computer systems and
process control equipment and developedand implemented plans to remediatepotential Year 2000-related faults byreplacement or repair. The project wasdesigned to minimize risks arising from theYear 2000 problem which might endangerhealth, safety, the environment, the group’sreputation or its cash flow.
The Year 2000 programme covered ITapplication systems and infrastructure,process control systems and embedded
microprocessors in plants, oil and gasfields and building facilities, and anassessment of the readiness of our criticalsuppliers, customers, joint venturers andpartners. Contingency plans were developedto manage any risk associated with ouroperations or third party dependencies.
In the event, the group achieved a smooth and successful transition into 2000.In addition to dealing with the specificYear 2000 risk, important additionalbenefits were seen from the Year 2000programme in a number of different areasacross the group.
A critical point has been passedsuccessfully, but the group is maintainingan appropriate level of vigilance to dealwith any consequential Year 2000 effects,especially from third parties, which may yet emerge.
fuel for powerThe North Sea remains an importantsource of oil and natural gas.Gas from the Everest and Lomondfields, east of Aberdeen, is mainlyused as fuel for one of Europe’sbiggest power stations, sited near the CATS processing terminal whichhandles one-fifth of the UK’s gas.

BP Amoco 1999 35
The total cost of the group’s Year 2000programme was $335 million, whichincludes some minor expenditure in thefirst few months of 2000. These costs are charged against income in the period in which they are incurred.
The euroBP Amoco’s commercial and financialprocesses were successfully adapted to allow its European operations to undertaketransactions in the euro and capture
competitive advantage offered by the newcurrency, from 1 January 1999. In commonwith experience generally across Europe, the actual level of transactions in euros for our businesses has until now been low.The currency of accounting records and therelated systems will be converted during thetransition period, which ends on 1 January2002. The capability to conduct businessin national currencies will be retained as long as necessary. The costs associatedwith the euro programme are estimated at$100 million, of which some $26 millionhad been incurred and expensed by the end of 1999.
Environmental expenditureOperating and capital expenditure on the prevention, control, abatement orelimination of air, water and solid wastepollution is often not incurred as a
separately identifiable transaction. Instead,it forms part of a larger transaction whichincludes, for example, normal maintenanceexpenditure. The figures for environmentaloperating and capital expenditure in thetable above are therefore estimates, basedon the definitions and guidelines of theAmerican Petroleum Institute.
Environmental operating expenditure andamounts spent on clean-ups were slightlylower than in 1998. The reduction in
capital expenditure reflects the completionof a number of capital projects at the end of 1998. Similar levels of operating andcapital expenditure are expected in theforeseeable future. In addition to operatingand capital expenditure, we also createprovisions for future environmentalremediation. Expenditure against suchprovisions is normally incurred insubsequent periods and is not includedin environmental operating expenditurereported for such periods.
Provisions for environmental remediation are made when a clean-up is probable and the amount reasonably determinable.Generally, their timing coincides withcommitment to a formal plan of actionor, if earlier, on divestment or on closureof inactive sites. These provisions areusually set up on a discounted basis, as
required by Financial Reporting StandardNo. 12, ‘Provisions, Contingent Liabilitiesand Contingent Assets’.
The extent and cost of future remediationprogrammes are inherently difficult toestimate. They depend on the scale of any possible contamination, the timing and extent of corrective actions, and alsothe group’s share of the liability. Althoughthe cost of any future remediation couldbe significant, and may be material to the
result of operations in the period in whichit is recognized, we do not expect that suchcosts will have a material effect on thegroup’s financial position or liquidity.We believe our provisions are sufficient forknown requirements, and we do not believethat our costs will differ significantly fromthose of other companies engaged in similarindustries or that our competitive positionwill be adversely affected as a result.
With effect from 1 January 1999 BP Amocoadopted Financial Reporting Standard No.12. As a result the group now providesfully for the cost of decommissioning oiland gas production facilities and relatedpipelines on a discounted basis at thecommencement of production. Furtherdetails of our environmental anddecommissioning provisions appear inNote 25 on the Accounts on page 52.
environmental expenditure$ million 1999 1998
Operating expenditure 414 446
Clean-ups 92 129
Capital expenditure 246 426
oil spill exerciseBP Amoco employees in Abu Dhabiand BP Amoco Shipping played vitalroles in the largest oil spill exerciseever carried out in the Arabian Gulf.Exercise Ghazal, which took a year to plan, involved both local andinternational organizations andobservers. Here employees inflateone of the booms needed to controlthe imaginary slick.

36 BP Amoco 1999
Accounting standardsThese accounts are prepared in accordance with applicable UKaccounting standards. The group has adopted Financial ReportingStandard No. 12 ‘Provisions, Contingent Liabilities and ContingentAssets’ (FRS12) and Financial Reporting Standard No. 13 ‘Derivativesand Other Financial Instruments: Disclosures’ (FRS13) with effect from 1 January 1999.
The financial information for 1998 has been restated to comply withthe requirements of FRS12. See Note 44 for further information.
Group consolidationThe group financial statements comprise a consolidation of the accountsof the parent company and its subsidiary undertakings (subsidiaries).The results of subsidiaries acquired or sold are consolidated for theperiods from or to the date on which control passes.
An associated undertaking (associate) is an entity in which the grouphas a long-term equity interest and over which it exercises significantinfluence. The consolidated financial statements include the groupproportion of the operating profit or loss, exceptional items, stock holdinggains or losses, interest expense, taxation and net assets of associates(the equity method).
A joint venture is an entity in which the group has a long-term interestand shares control with one or more co-venturers. The consolidatedfinancial statements include the group proportion of turnover, operatingprofit or loss, exceptional items, stock holding gains or losses, interestexpense, taxation, gross assets and gross liabilities of the joint venture(the gross equity method).
Certain of the group’s activities are conducted through jointarrangements and are included in the consolidated financial statementsin proportion to the group’s interest in the income, expenses, assets andliabilities of these joint arrangements.
On the acquisition of a subsidiary, or of an interest in a joint ventureor associated undertaking, fair values reflecting conditions at the date ofacquisition are attributed to the identifiable net assets acquired. Whenthe cost of acquisition exceeds the fair values attributable to the group’sshare of such net assets the difference is treated as purchased goodwill.This is capitalized and amortized over its estimated useful economic life,limited to a maximum period of 20 years.
Accounting conventionThe accounts are prepared under the historical cost convention.Historical cost accounts show the profits available to shareholders andare the most appropriate basis for presentation of the group’s balancesheet. Profit or loss determined under the historical cost conventionincludes stock holding gains or losses and, as a consequence, does notnecessarily reflect underlying trading results.
Replacement costThe results of individual businesses and geographical areas arepresented on a replacement cost basis. Replacement cost operatingresults exclude stock holding gains or losses and reflect the average costof supplies incurred during the year, and thus provide insight intounderlying trading results. Stock holding gains or losses represent thedifference between the replacement cost of sales and the historical costof sales calculated using the first-in first-out method.
Stock valuationStocks are valued at cost to the group using the first-in first-out methodor at net realizable value, whichever is the lower. Stores are stated at orbelow cost calculated mainly using the average method.
Foreign currenciesOn consolidation, assets and liabilities of subsidiary undertakings aretranslated into US dollars at closing rates of exchange. Income andcash flow statements are translated at average rates of exchange.Exchange differences resulting from the retranslation of net investmentsin subsidiary and associated undertakings at closing rates, together withdifferences between income statements translated at average rates andat closing rates, are dealt with in reserves. Exchange gains and lossesarising on long-term foreign currency borrowings used to finance thegroup’s foreign currency investments are also dealt with in reserves.All other exchange gains or losses on settlement or translation at closingrates of exchange of monetary assets and liabilities are included in thedetermination of profit for the year.
Derivative financial instrumentsThe group uses derivative financial instruments (derivatives) to managecertain exposures to fluctuations in foreign currency exchange rates andinterest rates, and to manage some of its margin exposure from changesin oil and natural gas prices. Derivatives are also traded in conjunctionwith these risk management activities.
The purpose for which a derivative contract is used is identified atinception. To qualify as a derivative for risk management, the contractmust be in accordance with established guidelines which ensure thatit is effective in achieving its objective. All contracts not identified atinception as being for the purpose of risk management are designatedas being held for trading purposes, as are all oil price derivatives, andaccounted for using the fair value method.
The group accounts for derivatives using the following methods:Fair value method: derivatives are carried on the balance sheet at fairvalue (‘marked to market’) with changes in that value recognized inearnings of the period. This method is used for all derivatives whichare held for trading purposes. Interest rate contracts traded by the groupinclude futures, swaps, options and swaptions. Foreign exchangecontracts traded include forwards and options. Oil price contracts tradedinclude swaps, options and futures.Accrual method: amounts payable or receivable in respect ofderivatives are recognized ratably in earnings over the period of thecontracts. This method is used for derivatives held to manage interestrate risk. These are principally swap agreements used to manage thebalance between fixed and floating interest rates on long-term financedebt. Other derivatives held for this purpose may include swaptions andfutures contracts. Amounts payable or receivable in respect of thesederivatives are recognized as adjustments to interest expense over theperiod of the contracts. Changes in the derivative’s fair value are notrecognized.Deferral method: gains and losses from derivatives are deferred andrecognized in earnings or as adjustments to carrying amounts, asappropriate, when the underlying debt matures or the hedged transactionoccurs. This method is used for derivatives used to convert non-US dollarborrowings into US dollars, to hedge significant non-US dollar firmcommitments or anticipated transactions, and to manage some of thegroup’s exposure to natural gas price fluctuations. Derivatives used toconvert non-US dollar borrowings into US dollars include foreign currencyswap agreements and forward contracts. Gains and losses on thesederivatives are deferred and recognized on maturity of the underlyingdebt, together with the matching loss or gain on the debt. Derivativesused to hedge significant non-US dollar transactions include foreigncurrency forward contracts and options and to hedge natural gas priceexposures include swaps, futures and options. Gains and losses on thesecontracts and option premia paid are also deferred and recognized in the
Accounts
Accounting policies

Environmental liabilitiesEnvironmental expenditures that relate to current or future revenues areexpensed or capitalized as appropriate. Expenditures that relate to anexisting condition caused by past operations and that do not contributeto current or future earnings are expensed.
Liabilities for environmental costs are recognized when environmentalassessments or clean-ups are probable and the associated costs can bereasonably estimated. Generally, the timing of these provisions coincideswith the commitment to a formal plan of action or, if earlier, ondivestment or on closure of inactive sites. The amount recognized is thebest estimate of the expenditure required. Where the liability will not besettled for a number of years the amount recognized is the present valueof the estimated future expenditure.
LeasesAssets held under leases which result in group companies receivingsubstantially all risks and rewards of ownership (finance leases) arecapitalized as tangible fixed assets at the estimated present value ofunderlying lease payments. The corresponding finance lease obligationis included with borrowings. Rentals under operating leases are chargedagainst income as incurred.
ResearchExpenditure on research is written off in the year in which it is incurred.
InterestInterest is capitalized gross during the period of construction whereit relates either to the financing of major projects with long periods ofdevelopment or to dedicated financing of other projects. All other interestis charged against income.
Pensions and other post-retirement benefitsThe cost of providing pensions and other post-retirement benefits ischarged to income on a systematic basis, with pension surpluses anddeficits amortized over the average expected remaining service livesof current employees. The difference between the amounts charged toincome and the contributions made to pension plans is included withinother provisions or debtors as appropriate. The amounts accrued forother post-retirement benefits and unfunded pension liabilities areincluded within other provisions.
Deferred taxationDeferred taxation is calculated, using the liability method, in respect oftiming differences arising primarily from the difference between theaccounting and tax treatments of both depreciation and petroleumrevenue tax. Provision is made or recovery anticipated where timingdifferences are expected to reverse in the foreseeable future.
DiscountingThe unwinding of the discount on provisions is included within interestexpense. Any change in the amount recognized for environmental andother provisions arising through changes in discount rates is includedwithin interest expense.
Comparative figuresCertain previous years’ figures have been restated to conform with the1999 presentation.
BP Amoco 1999 37
income statement or as adjustments to carrying amounts, as appropriate,when the hedged transaction occurs.
Where derivatives used to manage interest rate risk or to convertnon-US dollar debt or to hedge other anticipated cash flows areterminated before the underlying debt matures or the hedged transactionoccurs, the resulting gain or loss is recognized on a basis which matchesthe timing and accounting treatment of the underlying debt or hedgedtransaction. When an anticipated transaction is no longer likely to occuror finance debt is terminated before maturity, any deferred gain or lossthat has arisen on the related derivative is recognized in the incomestatement together with any gain or loss on the terminated item.
DepreciationOil and gas production assets are depreciated using a unit-of-productionmethod based upon estimated proved reserves. Other tangible andintangible assets are depreciated on the straight line method over theirestimated useful lives. The average estimated useful lives of refineriesare 20 years, chemicals manufacturing plants 20 years and servicestations 15 years. Other intangibles are amortized over a maximumperiod of 20 years.
The group undertakes a review for impairment of a fixed asset orgoodwill if events or changes in circumstances indicate that the carryingamount of the fixed asset or goodwill may not be recoverable. To theextent that the carrying amount exceeds the recoverable amount, thatis the higher of net realizable value and value in use, the fixed asset orgoodwill is written down to its recoverable amount. The value in use isdetermined from estimated discounted future net cash flows.
Exploration expenditureExploration expenditure is accounted for in accordance with thesuccessful efforts method. Exploration and appraisal drilling expenditureis initially capitalized as an intangible fixed asset. When proved reservesof oil and natural gas are determined and development is sanctioned,the relevant expenditure is transferred to tangible production assets.All exploration expenditure determined as unsuccessful is chargedagainst income. Exploration licence acquisition costs are amortizedover the estimated period of exploration. Geological and geophysicalexploration costs are charged against income as incurred.
DecommissioningProvision for decommissioning is recognized in full at the commencementof oil and natural gas production. The amount recognized is the presentvalue of the estimated future expenditure determined in accordance withlocal conditions and requirements. A corresponding tangible fixed assetof an amount equivalent to the provision is also created. This issubsequently depreciated as part of the capital costs of the productionand transportation facilities. Any change in the present value of theestimated expenditure is reflected as an adjustment to the provision andthe fixed asset.
Petroleum revenue taxThe charge for petroleum revenue tax is calculated using a unit-of-production method.
Changes in unit-of-production factorsChanges in factors which affect unit-of-production calculations are dealtwith prospectively, not by immediate adjustment of prior years’ amounts.

38 BP Amoco 1999
$ millionFor the year ended 31 December Note 1999 1998
Turnover 101,180 83,732Less: Joint ventures 17,614 15,428
Group turnover 1 83,566 68,304Replacement cost of sales 68,615 56,270Production taxes 2 1,017 604
Gross profit 13,934 11,430Distribution and administration expenses 3 6,064 6,044Exploration expense 548 921
7,322 4,465Other income 4 414 709
Group replacement cost operating profit 5 7,736 5,174Share of profits of joint ventures 5 555 825Share of profits of associated undertakings 5 603 522
Total replacement cost operating profit 5 8,894 6,521Profit (loss) on sale of businesses 6 (421) 395Profit (loss) on sale of fixed assets 6 84 653Restructuring costs 6 (1,943) –Merger expenses 6 – (198)
Replacement cost profit before interest and tax 5 6,614 7,371Stock holding gains (losses) 5 1,728 (1,391)
Historical cost profit before interest and tax 8,342 5,980Interest expense 7 1,316 1,177
Profit before taxation 7,026 4,803Taxation 11 1,880 1,520
Profit after taxation 5,146 3,283Minority shareholders’ interest 138 63
Profit for the year 5,008 3,220Distribution to shareholders 12 3,884 4,121
Retained profit (deficit) for the year 1,124 (901)
Earnings per ordinary share – centsBasic 13 25.82 16.77Diluted 13 25.68 16.70
Replacement cost results
Historical cost profit for the year 5,008 3,220Stock holding (gains) losses (1,728) 1,391
Replacement cost profit for the year 3,280 4,611Exceptional items, net of tax 6 2,050 (652)
Replacement cost profit before exceptional items 5,330 3,959
Earnings per ordinary share – centsOn replacement cost profit before exceptional items 13 27.48 20.62
Financial statements
Group income statement

BP Amoco 1999 39
$ millionGroup Parent
51000000 051150
At 31 December Note 1999 1998 1999 199800000000000000 051150
Fixed assetsIntangible assets 17 3,344 3,037 – –Tangible assets 18 52,631 54,880 – –Investments
Joint ventures – Gross assets 9,948 9,053– Gross liabilities 4,744 4,048
05 05
– Net investment 19 5,204 5,005 – –Associated undertakings 19 4,334 4,162 3 3Other 19 571 605 8,675 7,508
05 05 05 05
10,109 9,772 8,678 7,51100000000000000 051150
Total fixed assets 66,084 67,689 8,678 7,51100000000000000 051150
Current assetsStocks 20 5,124 3,642 – –Debtors – amounts falling due:
Within one year 21 13,347 9,404 6,588 7,153After more than one year 21 3,455 3,305 2,645 2,634
Investments 22 220 470 – –Cash at bank and in hand 1,331 405 3 100000000000000 051150
23,477 17,226 9,236 9,788Creditors – amounts falling due within one yearFinance debt 23 4,900 4,114 – –Other creditors 24 18,375 15,329 1,076 1,81200000000000000 051150
Net current assets (liabilities) 202 (2,217) 8,160 7,97600000000000000 051150
Total assets less current liabilities 66,286 65,472 16,838 15,487Creditors – amounts falling due after more than one yearFinance debt 23 9,644 9,641 – –Other creditors 24 2,245 2,047 62 69Provisions for liabilities and chargesDeferred taxation 11 1,783 1,632 – –Other provisions 25 8,272 8,579 171 8500000000000000 051150
Net assets 44,342 43,573 16,605 15,333Minority shareholders’ interest – equity 1,061 1,072 – –00000000000000 051150
BP Amoco shareholders’ interest 43,281 42,501 16,605 15,333
Represented byCapital and reservesCalled up share capital 27 4,892 4,863 4,892 4,863Share premium account 28 3,354 3,056 3,354 3,056Capital redemption reserve 28 330 330 330 330Merger reserve 28 697 697 – –Profit and loss account 28 34,008 33,555 8,029 7,08400000000000000 051150
29 43,281 42,501 16,605 15,333
The financial statements on pages 36 to 66 were approved by a duly appointed and authorized committee of the board of directors on 15 February 2000and were signed on its behalf by:
Peter Sutherland, Co-Chairman
Sir John Browne, Group Chief Executive
Balance sheets

40 BP Amoco 1999
$ millionFor the year ended 31 December Note 1999 1998
Net cash inflow from operating activities 30 10,290 9,586
Dividends from joint ventures 949 544
Dividends from associated undertakings 219 422
Servicing of finance and returns on investmentsInterest received 179 223Interest paid (1,065) (961)Dividends received 34 43Dividends paid to minority shareholders (151) (130)
Net cash outflow from servicing of finance and returns on investments (1,003) (825)
TaxationUK corporation tax (559) (391)Overseas tax (701) (1,314)
Tax paid (1,260) (1,705)
Capital expenditure and financial investmentPayments for fixed assets (6,457) (8,431)Purchase of shares for employee share schemes (77) (254)Proceeds from the sale of fixed assets 15 1,149 1,387
Net cash outflow for capital expenditure and financial investment (5,385) (7,298)
Acquisitions and disposalsInvestments in associated undertakings (197) (396)Acquisitions 14 (102) (314)Net investment in joint ventures (750) 708Proceeds from the sale of businesses 15 1,292 780
Net cash inflow (outflow) for acquisitions and disposals 243 778
Equity dividends paid (4,135) (2,408)
Net cash outflow (82) (906)
Financing 30 (954) (377)Management of liquid resources 30 (93) (596)Increase in cash 30 965 67
(82) (906)
Statement of total recognized gains and losses
$ millionFor the year ended 31 December 1999 1998
Profit for the year 5,008 3,220Currency translation differences (921) 55
Total recognized gains and losses relating to the year 4,087 3,275
Prior year adjustment – change in accounting policy 44 715
Total recognized gains and losses 4,802
Financial statements
Group cash flow statement

BP Amoco 1999 41
1 Turnover $ million1999 1998
Sales and operating revenue 91,891 76,448Customs duties and sales taxes 8,325 8,144
Group turnover 83,566 68,304
Sales Sales to Sales Sales toTotal between third Total between third
Turnovera sales businesses parties sales businesses parties000000000000111 000051111
By businessExploration and Production 21,649 7,700 13,949 17,276 5,060 12,216Refining and Marketing 62,893 2,524 60,369 48,437 1,812 46,625Chemicals 9,392 342 9,050 9,691 379 9,312Other businesses and corporate 198 – 198 199 48 151000000000000111 000051111
Group turnover 94,132 10,566 83,566 75,603 7,299 68,304Share of joint venture sales 17,614 15,428000000000000111 000051111
101,180 83,732
Sales Sales to Sales Sales toTotal between third Total between thirdsales areas parties sales areas parties
000000000000111 000051111
By geographical areaUKb 30,223 4,406 25,817 22,510 2,848 19,662Rest of Europe 5,973 641 5,332 5,823 700 5,123USA 38,786 1,381 37,405 33,160 1,215 31,945Rest of World 19,465 4,453 15,012 14,032 2,458 11,574000000000000111 000051111
94,447 10,881 83,566 75,525 7,221 68,304
Share of joint venture salesUK 3,988 3,467Rest of Europe 16,114 14,186USA 155 43Rest of World 342 305000000000000111 000051111
20,599 18,001Sales between areas 2,985 2,573000000000000111 000051111
17,614 15,428aTurnover to third parties is stated by origin which is not materially different from turnover by destination. Transfers between group companies are made at market pricestaking into account the volumes involved.
bUK area includes the UK-based international activities of Refining and Marketing.
2 Production taxes $ million1999 1998
UK petroleum revenue tax 237 45Overseas production taxes 780 559
1,017 604
3 Distribution and administration expenses $ million1999 1998
Distribution 5,031 4,714Administration 1,033 1,330
6,064 6,044
4 Other income $ million1999 1998
Income from other fixed asset investments 66 74Other interest and miscellaneous income 348 635
414 709
Income from listed investments included above 14 10
Notes on accounts

42 BP Amoco 1999
5 Analysis of replacement cost profit $ million1999
Group Totalreplacement replacement Replacement
cost cost cost profitoperating Joint Associated operating Exceptional before interest
Profit profita ventures undertakings profita itemsb and tax
By businessExploration and Production 6,718 175 301 7,194 (1,097) 6,097Refining and Marketing 1,337 380 123 1,840 (334) 1,506Chemicals 561 – 125 686 (257) 429Other businesses and corporate (880) – 54 (826) (592) (1,418)
7,736 555 603 8,894 (2,280) 6,614
By geographical areaUKc 2,063 (1) 49 2,111 (237) 1,874Rest of Europe 548 381 238 1,167 (258) 909USA 2,803 13 185 3,001 (983) 2,018Rest of World 2,322 162 131 2,615 (802) 1,813
7,736 555 603 8,894 (2,280) 6,614
1998
By businessExploration and Production 2,987 65 179 3,231 396 3,627Refining and Marketing 1,712 760 92 2,564 394 2,958Chemicals 950 – 150 1,100 43 1,143Other businesses and corporate (475) – 101 (374) 17 (357)
5,174 825 522 6,521 850 7,371
By geographical areaUKc 1,796 127 8 1,931 (39) 1,892Rest of Europe 345 633 271 1,249 106 1,355USA 2,506 31 94 2,631 511 3,142Rest of World 527 34 149 710 272 982
5,174 825 522 6,521 850 7,371
Notes on accounts
aReplacement cost operating profit is before stock holding gains and losses andinterest expense, which is attributable to the corporate function. Transfersbetween group companies are made at market prices taking into account thevolumes involved.
bExceptional items comprise profit or loss on the sale of businesses and fixedassets and termination of operations and in addition for 1999 includerestructuring costs and for 1998 merger expenses.
cUK area includes the UK-based international activities of Refining andMarketing.
dIncludes $547 million stock holding gains in respect of joint ventures andassociated undertakings (1998 $330 million losses).
Stock holding gains (losses) 1999 1998
By businessExploration and Production (1) (17)Refining and Marketingd 1,613 (1,228)Chemicals 116 (146)
1,728 (1,391)
By geographical areaUK 151 (136)Rest of Europe 494 (283)USA 839 (720)Rest of World 244 (252)
1,728 (1,391)

BP Amoco 1999 43
7 Interest expense $ million1999 1998
Bank loans and overdrafts 119 158Other loans 854 762Finance leases 75 90
1,048 1,010Capitalized 43 119
Group 1,005 891Joint ventures 70 54Associated undertakings 131 108Unwinding of discount on provisions (Note 44) 130 124Change in discount rate for provisions (Note 44) (20) –
Total charged against profit 1,316 1,177
Interest expense includes a charge of $24 million ($12 million) relating to early redemption of debt.
6 Exceptional itemsExceptional items comprise profit (loss) on sale of businesses and fixedassets, restructuring costs and merger expenses as follows:
$ million1999 1998
Profit on sale of businesses– Group 427 310– Joint ventures 42 85
Loss on sale of businesses – Group (890) –
(421) 395Profit (loss) on sale of fixed assets – Group 84 653
(337) 1,048Restructuring costs – Group (1,900) –Restructuring costs – Joint ventures (43) –Merger expenses – Group – (198)
Exceptional items (2,280) 850Taxation credit (charge):Sale of businesses (21) (36)Sale of fixed assets (29) (185)Restructuring costs 280 –Merger expenses – 23
Exceptional items, net of tax (2,050) 652
Sale of businesses and fixed assets The profit on sale of businessesduring 1999 relates mainly to the divestment by the group of itsCanadian oil properties and certain chemicals businesses. These includedthe Verdugt acid salts business; the Plaskon electronics materialsbusiness located in the USA and Singapore; and the US Fibers and Yarnsbusiness. The profit on sale of businesses by joint ventures is mainlyattributable to the disposal by the BP/Mobil joint venture of its retailnetwork in Hungary.
In 1998 the principal sales of businesses were exploration and
production properties in the USA and Papua New Guinea, the retailnetwork in the Czech Republic, the Adibis fuel additives businessand a speciality chemicals distribution business. The profit on saleof businesses by joint ventures relates mainly to the disposal bythe BP/Mobil joint venture of its retail network in Belgium.
The major elements of the loss on sale of businesses or terminationof operations in 1999 are the disposal by the group of its interest in thePedernales oil field in Venezuela and the closure of its paraxylene jointventure in Singapore.
For 1999 the sale of fixed assets includes the Federal TradeCommission-mandated sale of distribution terminals and servicestations in the USA; the divestment by the group of its interest in anolefins cracker at Wilton in the UK and the sale and leaseback of USrailcars. In 1998 the profit on the sale of fixed assets arose principallyfrom the divestment of the refinery in Lima, Ohio, and the sale andleaseback of the Amoco building in Chicago.
Additional information on the sale of businesses and fixed assets isgiven in Note 15 – Disposals.Restructuring costs These costs arise from restructuring activityacross the group following the merger of BP and Amoco at the end of1998 and relate predominantly to the group’s US operations. The majorelements of the restructuring charges comprise employee severancecosts ($1,212 million) and provisions to cover future rental paymentson surplus leasehold office accommodation and other property($297 million). During 1999, some 16,000 employees left the groupthrough severance or outsourcing arrangements. Also included in therestructuring charges are office closure costs, contract terminationpayments and asset write-downs. The cash outflow for theserestructuring charges during the year was $976 million.Merger expenses BP Amoco incurred fees and expenses in 1998 of$198 million in connection with the merger. These costs relate principallyto investment banking fees as well as legal, accounting and regulatoryfiling fees.

44 BP Amoco 1999
8 Depreciation and amounts provided$ million
Included in the income statement under the following headings: 1999 1998
DepreciationReplacement cost of sales 4,185 4,666Distribution 408 335Administration 115 100Exceptional items 258 –
4,966 5,101
Depreciation of capitalized leased assets included above 70 71
Amounts provided against fixed asset investmentsExceptional items 84 –Replacement cost of sales (1) 200
83 200
The rationalization of office and other facilities in 1999 following the merger resulted in the write-off of redundant IT and other office equipmentand furnishings. This charge of $258 million has been included within exceptional items. In addition for 1999 the charge for depreciation includes$100 million for the impairment of the Badami field in Alaska and $123 million for the write-down of various Chemicals and Refining andMarketing assets.
The charge for depreciation in 1998 included $214 million for the impairment of the Opon field in Colombia and $61 million for the write-down ofvarious other oil and natural gas properties. The impairment of the Opon field reflected lower than anticipated natural gas production and related reserveestimates. The charge also reflected impairment of the adjacent power plant because of the unavailability of an economic fuel supply. As a result ofincreased economic uncertainty in Russia, the group wrote down the carrying value of its investment in A O Sidanco by $200 million.
In assessing the value in use of potentially impaired assets, a discount rate of 10% has been used.
9 Hire charges and expenditure on research $ million1999 1998
Hire charges under operating leases:Tanker charters 357 396Plant and machinery 509 429Land and buildings 271 315
1,137 1,140
Expenditure on research 310 412
10 Auditors’ remuneration $ million1999 1998
UK Total UK Total00000000000000 00011
Audit fees – Ernst & YoungGroup audit 5.5 13.5 5.8 12.1Local statutory audit and quarterly review 1.0 6.1 0.8 5.100000000000000 00011
6.5 19.6 6.6 17.200000000000000 00011
Audit fees – PricewaterhouseCoopersGroup audit – – 0.1 2.7Local statutory audit and quarterly review – – 0.2 0.900000000000000 00011
– – 0.3 3.600000000000000 00011
Total group 6.5 19.6 6.9 20.8
Group audit fees include $1.0 million ($1.0 million) in respect of the parent company.Fees for other services – Ernst & YoungAcquisitions and disposals 3.4 4.5 1.7 4.2Taxation services 1.4 5.9 0.8 2.6Consultancy and other 10.2 25.9 6.2 18.400000000000000 00011
15.0 36.3 8.7 25.2
1999 group audit fees include $1.1 million ($0.7 million) for excess of actual over estimated fees for 1998.Fees to major firms of accountants other than Ernst & Young for non-audit services amounted to $160 million ($181 million).
Notes on accounts

BP Amoco 1999 45
11 Taxation $ million1999 1998
United Kingdom corporation tax:Current at 30.25% (31%) 875 1,325Overseas tax relief (363) (566)
512 759Deferred at 30% (31%) 91 (188)
603 571Advance corporation tax – (76)
603 495
Overseas:Current 1,143 896Deferred 30 (4)Joint ventures 5 (15)Associated undertakings 99 148
1,277 1,025
Taxation charge for the year 1,880 1,520
Included in the charge for the year is a credit of $230 million ($198 million charge) relating to exceptional items.
$ millionProvisions Gross potential liabilityProvisions for deferred taxation
11000 051150
Analysis of movements during the year: 1999 1998 1999 199800000000000000 051150
At 1 January 1,632 1,183 6,618 5,817Exchange adjustments 30 37 (42) 20Charge (credit) for the year 121 (192) 563 177Deletions/transfers – 604 – 60400000000000000 051150
At 31 December 1,783 1,632 7,139 6,618
of which – United Kingdom 1,015 927 1,482 1,577– Overseas 768 705 5,657 5,041
00000000000000 051150
Analysis of provision:Depreciation 2,567 2,413 10,279 9,905Petroleum revenue tax (332) (420) (332) (420)Other timing differences (452) (328) (2,808) (2,834)Advance corporation tax – (33) – (33)00000000000000 051150
1,783 1,632 7,139 6,618
If provision for deferred taxation had been made on the basis of the gross potential liability, the taxation charge for the year would have been increased(decreased) as follows:
$ million1999 1998
United Kingdom (185) (40)Overseas 627 409
442 369
Deferred taxation is not generally provided in respect of liabilities which may arise on the distribution of accumulated reserves of overseas subsidiaries,joint ventures and associates.
%Reconciliation of the UK statutory tax rate to the effective tax rate: 1999 1998
UK statutory tax rate 30 31Increase (decrease) resulting from:Current year timing differences not provided (including current year losses unrelieved/prior year losses utilized) (10) (6)Tax on stock holding gains (relief for stock holding losses) 2 (3)Overseas taxes at higher rates 5 4Tax credits – (2)Advance corporation tax – (1)Other 1 2
Effective tax rate on replacement cost profit before exceptional items 28 25

46 BP Amoco 1999
12 Distribution to shareholderspence per share cents per share $ million
1999 1998 1999 1998 1999 1998000000000051 00011 00011
BP AmocoPreference dividends (non-equity) 2 –Dividends per ordinary share: First quarterly 3.069 – 5.00 – 970 –
Second quarterly 3.112 – 5.00 – 970 –Third quarterly 3.033 – 5.00 – 971 –Fourth quarterly 3.125 3.059 5.00 5.00 971 968
000000000051 00011 00011
12.339 3.059 20.00 5.00 3,884 968000000000051 00011 00011
BPPreference dividends (non-equity) – 1Dividends per ordinary share: First quarterly – 2.875 – 4.75 – 551
Second quarterly – 3.000 – 5.00 – 579Third quarterly – 3.000 – 5.00 – 584Fourth quarterly – – – – – –
000000000051 00011 00011
– 8.875 – 14.75 – 1,715000000000051 00011 00011
AmocoDividends per common stock: First quarterly – 18.75 – 362
Second quarterly – 18.75 – 360Third quarterly – 18.75 – 358Fourth quarterly – 18.75 – 358
000000000051 00011 00011
– 75.00 – 1,438000000000051 00011 00011
Total group 3,884 4,121000000000051 00011 00011
On an ordinary share equivalent basis, the Amoco quarterly dividends for 1998 were 4.7 cents.
Notes on accounts
shares million1999 1998
Weighted average numberof ordinary shares 19,386 19,192Ordinary shares issuable underemployee share schemes 111 84
19,497 19,276
In addition to basic earnings per share based on the historical cost profitfor the year, a further measure, based on replacement cost profit beforeexceptional items, is provided as it is considered that this measure givesan indication of underlying performance.
cents per share1999 1998
Profit for the year 25.82 16.77Stock holding (gains) losses (8.91) 7.25
Replacement cost profit for the year 16.91 24.02Exceptional items, net of tax 10.57 (3.40)
Replacement cost profit before exceptional items 27.48 20.62
13 Earnings per ordinary share cents per share1999 1998
Basic earnings per share 25.82 16.77Diluted earnings per share 25.68 16.70
The calculation of basic earnings per ordinary share is based on theprofit attributable to ordinary shareholders, i.e. profit for the year lesspreference dividends, related to the weighted average number of ordinaryshares in issue during the year. The weighted average number of shareshas been adjusted for the subdivision (2 for 1 share split) of ordinaryshares effective 4 October 1999. The profit attributable to ordinaryshareholders is $5,006 million ($3,219 million). The average numberof shares outstanding excludes the shares held by the Employee ShareOwnership Plans.
The calculation of diluted earnings per share is based on profitattributable to ordinary shareholders as for basic earnings per share.However, the number of shares outstanding is adjusted to show thepotential dilution if employee share options are converted into ordinaryshares. The number of ordinary shares outstanding for basic and dilutedearnings per share may be reconciled as follows:

BP Amoco 1999 47
14 AcquisitionsIn 1999 the group acquired the outstanding 83% of ProGas, a major Canadian natural gas supply aggregator, and 50% of Solarex, a manufacturer anddeveloper of photovoltaic products and systems, it did not already own. Also in 1999 the group purchased APEX, a solar electric company based inMontpellier, France.
During 1998 the group acquired Styrenix Kunststoffe, a plastics business based in Germany and a number of minor refining and marketing businesses.The cost of acquisitions in the group cash flow statement comprises:
$ million1999 1998
Book value Adjustment Fair value Fair value
Goodwill – 20 20 38Other intangible assets 3 – 3 1Tangible assets 109 10 119 194Fixed assets – investments 9 – 9 71Working capital 15 – 15 27MSI (1) – (1) –
135 30 165 331Finance debt (58) – (58) (17)
Cash consideration 77 30 107 314Cash acquired 5 – 5 –
Net cash outflow 72 30 102 314
15 DisposalsDisposals during 1999 included the sale of the group’s Canadian oil properties; the divestment of its interest in the Pedernales oil field in Venezuela;the Federal Trade Commission-mandated sale of distribution terminals and service stations in the USA and certain chemicals activities. These includedthe Verdugt acid salts business; its interest in an olefins cracker at Wilton in the UK; the Plaskon electronics materials business located in the USA andSingapore; the US Fibers and Yarns business; and the sale and leaseback of US railcars. In addition the group incurred a loss on the closure of itsparaxylene joint venture in Singapore.
In 1998 the major disposals were exploration and production properties in the USA and Papua New Guinea, the refinery in Lima, Ohio, the sale andleaseback of the Amoco building in Chicago, the retail network in the Czech Republic, the Adibis fuel additives business and a speciality chemicalsdistribution business.
Total proceeds received for disposals represent the following amounts shown in the cash flow statement:$ million
1999 1998
Proceeds from the sale of businesses 1,292 780Proceeds from the sale of fixed assets 1,149 1,387
2,441 2,167
$ millionThe disposals comprise the following: 1999 1998
Intangible assets 199 151Tangible assets 2,340 945Fixed assets – investments 206 157Working capital 175 88Other (94) (125)
2,826 1,216Profit (loss) on sale of businesses (463) 310Profit (loss) on sale of fixed assets 84 653
Total consideration 2,447 2,179Deferred consideration (12) (9)Cash transferred on sale 6 (3)
Net cash inflow 2,441 2,167

48 BP Amoco 1999
16 Group balance sheet analysis $ millionCapital expenditure and acquisitions Operating capital employed
1999 1998 1999 199800000000000000 00011
By businessExploration and Production 4,212 6,318 37,322 38,819Refining and Marketing 1,634 1,937 14,358 12,563Chemicals 1,215 1,606 10,048 10,178Other businesses and corporate 284 501 1,192 (579)00000000000000 00011
7,345 10,362 62,920 60,981
By geographical areaUKa 1,518 2,463 14,748 14,188Rest of Europe 831 1,248 4,434 5,053USA 2,963 3,720 27,426 26,629Rest of World 2,033 2,931 16,312 15,11100000000000000 00011
7,345 10,362 62,920 60,981
Includes the following amounts for the BP/Mobil joint venture 624 620
aUK area includes the UK-based international activities of Refining and Marketing. Operating capital employed 62,920 60,981Liabilities for current and deferred taxation (4,034) (3,653)
Capital employed 58,886 57,328
Financed by:Finance debt 14,544 13,755Minority shareholders’ interest 1,061 1,072BP Amoco shareholders’ interest 43,281 42,501
58,886 57,328
17 Intangible assets $ millionExploration Otherexpenditure Goodwill intangibles Total
CostAt 1 January 1999 3,601 139 338 4,078Exchange adjustments (14) (9) (3) (26)Acquisitions – 20 3 23Additions 757 6 181 944Transfers (118) – – (118)Deletions (446) (5) (12) (463)
At 31 December 1999 3,780 151 507 4,438
DepreciationAt 1 January 1999 715 79 247 1,041Exchange adjustments (7) (4) (3) (14)Charge for the year 304 6 44 354Transfers (23) – – (23)Deletions (261) (1) (2) (264)
At 31 December 1999 728 80 286 1,094
Net book amountAt 31 December 1999 3,052 71 221 3,344At 31 December 1998 2,886 60 91 3,037
Notes on accounts

BP Amoco 1999 49
18 Tangible assets – property, plant and equipment $ millionExploration Refining Other of which:
and and businesses Assets underProduction Marketing Chemicals and corporate Total construction
CostAt 1 January 1999 82,776 18,455 14,178 1,810 117,219 4,145Prior year adjustment – change
in accounting policy 1,823 – – – 1,823 –
Restated 84,599 18,455 14,178 1,810 119,042 4,145Exchange adjustments (972) 75 (436) (16) (1,349) (21)Acquisitions – 10 1 108 119 53Additions 2,964 871 1,078 140 5,053 1,531Transfers 355 (5) – – 350 (2,605)Deletions (3,215) (735) (714) (406) (5,070) (74)
At 31 December 1999 83,731 18,671 14,107 1,636 118,145 3,029
DepreciationAt 1 January 1999 46,648 8,744 6,435 927 62,754Prior year adjustment – change in accounting policy 1,408 – – – 1,408
Restated 48,056 8,744 6,435 927 64,162Exchange adjustments (691) 30 (189) (7) (857)Charge for the year 3,401 799 534 182 4,916Transfers 23 – – – 23Deletions (1,532) (457) (453) (288) (2,730)
At 31 December 1999 49,257 9,116 6,327 814 65,514
Net book amountAt 31 December 1999 34,474 9,555 7,780 822 52,631 3,029At 31 December 1998 36,543 9,711 7,743 883 54,880 4,145
Assets held under finance leases, capitalized interest and land at net book amount included above:$ million
Leased assets Capitalized interest000051111 005111100
Cost Depreciation Net Cost Depreciation Net00000001111000051111 005111100
At 31 December 1999 1,741 969 772 2,554 1,321 1,233At 31 December 1998 1,887 918 969 2,843 1,661 1,18200000001111000051111 005111100
Freehold land Leasehold land000051111 005111100
Over 50 years unexpired Other00000001111000051111 005111100
At 31 December 1999 942 47 38At 31 December 1998 963 42 29
19 Fixed assets – investmentsAssociated undertakings $ million
Share ofretained Joint Own
Group Shares Loans profit ventures Loans sharesa Otherb Total5111100000000 05 05 05 05 05
CostAt 1 January 1999 2,759 835 783 5,005 80 489 51 10,002Exchange adjustments (6) (11) (49) (395) (1) (16) (1) (479)Additions and net movements
in joint ventures 147 63 110 843 85 77 1 1,326Acquisitions 6 – – – – – 3 9Transfers 14 3 – (249) – – – (232)Deletions (54) (8) 19 – (68) (94) (3) (208)5111100000000 05 05 05 05 05
At 31 December 1999 2,866 882 863 5,204 96 456 51 10,4185111100000000 05 05 05 05 05
Amounts providedAt 1 January 1999 215 – – – 14 – 1 230Exchange adjustments (2) – – – – – – (2)Provided in the year 64 – – – 19 – – 83Transfers – – – – – – – –Deletions – – – – (2) – – (2)5111100000000 05 05 05 05 05
At 31 December 1999 277 – – – 31 – 1 3095111100000000 05 05 05 05 05
Net book amountAt 31 December 1999 2,589 882 863 5,204 65 456 50 10,109At 31 December 1998 2,544 835 783 5,005 66 489 50 9,7725111100000000 05 05 05 05 05

50 BP Amoco 1999
19 Fixed assets – investments continued $ millionSubsidiary
undertakingsc Associated undertakingsc05 00011
Parent Shares Shares Loans Own sharesa Total000000000051 05 05 05 05
CostAt 1 January 1999 7,024 3 2 489 7,518Exchange adjustments (2) – – (16) (18)Additions 1,210 – – 77 1,287Deletions (8) – – (94) (102)000000000051 05 05 05 05
At 31 December 1999 8,224 3 2 456 8,685000000000051 05 05 05 05
Amounts providedAt 1 January 1999 5 – 2 – 7Provided in the year – – – – –000000000051 05 05 05 05
At 31 December 1999 5 – 2 – 7000000000051 05 05 05 05
Net book amountAt 31 December 1999 8,219 3 – 456 8,678At 31 December 1998 7,019 3 – 489 7,511000000000051 05 05 05 05
aOwn shares are held in Employee Share Ownership Plans (ESOPs) to meet the future requirements of the Employee Share Schemes (see Note 32) and prior to award under theLong Term Performance Plan (see Note 33). At 31 December 1999 the ESOPs held 53,989,000 (62,768,000) shares for the Employee Share Schemes and 9,502,000(6,266,000) shares for the Long Term Performance Plan. The market value of these shares at 31 December 1999 was $640 million ($517 million).
bOther investments are unlisted.cSubstantially all the investments in subsidiary and associated undertakings are unlisted.
20 Stocks $ million1999 1998
Petroleum 3,517 1,896Chemicals 828 917Other 202 174
4,547 2,987Stores 577 655
5,124 3,642
Replacement cost 5,165 3,747
21 Debtors $ millionGroup Parent
00000051 00000051
1999 1998 1999 1998Within 1 year After 1 year Within 1 year After 1 year Within 1 year After 1 year Within 1 year After 1 year
000000011 00011 00011 00011
Trade 9,417 – 5,778 – – – – –Group undertakings – – – – 6,561 2,622 7,125 2,612Joint ventures 725 – 644 – – – – –Associated undertakings 60 45 153 7 – – – –Prepayments andaccrued income 1,229 459 786 509 – – – –Taxation recoverable 263 83 248 165 10 – 10 –Pension prepayment – 2,542 – 2,213 – – – –Other 1,653 326 1,795 411 17 23 18 22000000011 00011 00011 00011
13,347 3,455 9,404 3,305 6,588 2,645 7,153 2,634
22 Current assets – investments $ million1999 1998
Listed – UK 56 48– Foreign 42 33
98 81Unlisted 122 389
220 470
Stock exchange value of listed investments 99 83
Notes on accounts

BP Amoco 1999 51
23 Finance debt $ million1999 1998
51110000111 000051111
Within 1 year After 1 year Total Within 1 year After 1 year Total000000000000111 000051111
Bank loans and overdrafts 264 726 990 302 1,778 2,080Other loans 4,548 7,181 11,729 3,711 6,080 9,791000000000000111 000051111
Total borrowings 4,812 7,907 12,719 4,013 7,858 11,871Net obligations under finance leases 88 1,737 1,825 101 1,783 1,884000000000000111 000051111
4,900 9,644 14,544 4,114 9,641 13,755
Where a borrowing is swapped into another currency, the borrowing is accounted in the swap currency and not in the original currency of denomination.Total borrowings include $191 million ($86 million) for the carrying value of currency swaps and forward contracts.
Included within Other loans repayable within one year are US Industrial Revenue/Municipal Bonds of $1,376 million ($1,277 million) with maturityperiods ranging up to 35 years. They are classified as repayable within one year, as required under UK GAAP, as the bondholders typically have theoption to tender these bonds for repayment on interest reset dates. Any bonds that are tendered are usually remarketed and BP Amoco has notexperienced any significant repurchases. BP Amoco considers these bonds to represent long-term funding when assessing the maturity profileof its borrowings.
$ million1999 1998
000001 000051111
Bank loans Bank loansAnalysis of borrowings by year of repayment and overdrafts Other loans Total and overdrafts Other loans Total000000000000111 000051111
Due after 5 years 155 3,106 3,261 277 3,216 3,493Due within 5 years 410 722 1,132 201 365 566
4 years 36 377 413 785 1,081 1,8663 years 87 1,774 1,861 288 652 9402 years 38 1,202 1,240 227 766 993
000000000000111 000051111
726 7,181 7,907 1,778 6,080 7,8581 year 264 4,548 4,812 302 3,711 4,013
000000000000111 000051111
990 11,729 12,719 2,080 9,791 11,871
Amounts included above repayable by instalments part of which falls due after five years from 31 December are as follows:After 5 years 46 174Within 5 years 91 406
137 580
Interest rates on borrowings repayable wholly or partly more than five years from 31 December 1999 range from 6% to 9% with a weighted average of7%. The weighted average interest rate on finance debt is 6%.
At 31 December 1999 the group had substantial amounts of undrawn borrowing facilities available, including committed facilities of $3,000 million($2,800 million) expiring in 2000. These facilities are with a number of international banks and borrowings under them would be at pre-agreed rates.Certain of these facilities support the group’s commercial paper programme.
1999 1998111000000000511 05
Fixed rate debt Floating rate debt000051111 00011
Weighted Weighted Weightedaverage average time averageinterest for which interest
rate rate is fixed Amount rate Amount Total TotalAnalysis of borrowings by currency % Years $ million % $ million $ million $ million000000000051 000051111 05
US dollars 7 9 6,529 6 5,915 12,444 10,852Sterling – – – 6 49 49 613Other currencies 8 31 46 6 180 226 406000000000051 000051111 05
Total loans 6,575 6,144 12,719 11,871000000000051 000051111 05
The group aims for a balance between floating and fixed interest rates and, in 1999, the group’s upper limit for the proportion of floating rate debt was65% of total net debt outstanding. Aside from debt issued in the US municipal bond markets, interest rates on floating rate debt denominated in USdollars are linked principally to LIBOR, while rates on debt in other currencies are based on local market equivalents. The group monitors interest raterisk using a process of sensitivity analysis. Assuming no changes to the borrowings and hedges described above, it is estimated that a change of 1% inthe general level of interest rates on 1 January 2000 would change 2000 profit before tax by approximately $80 million.

52 BP Amoco 1999
23 Finance debt continued $ million1999 1998
11000 00011
Carrying CarryingFair values and carrying amounts of borrowings Fair value amount Fair value amount00000000000000 00011
Short-term borrowings 2,433 2,433 1,659 1,659Long-term borrowings 9,979 10,118 10,555 10,12600000000000000 00011
Total borrowings 12,412 12,551 12,214 11,78500000000000000 00011
The fair value and carrying amounts of borrowings shown above exclude the effects of currency swaps, interest rate swaps and forward contracts (whichare included for presentation in the balance sheet). Long-term borrowings include debt which matures in the year from 31 December 1999, whereas inthe balance sheet long-term debt of current maturity is reported under amounts falling due within one year. Long-term borrowings also include USIndustrial Revenue/Municipal Bonds classified on the balance sheet as repayable within one year. The carrying amounts of the group’s short-termborrowings, which mainly comprise commercial paper, bank loans and overdrafts, approximate their fair value. The fair value of the group’s long-termborrowings is estimated using quoted prices or, where these are not available, discounted cash flow analyses, based on the group’s current incrementalborrowing rates for similar types and maturities of borrowing.
$ millionObligations under finance leases 1999 1998
Minimum future lease payments payable within: 1 year 103 1192 to 5 years 725 736Thereafter 3,569 3,882
4,397 4,737Less finance charges 2,572 2,853
Net obligations 1,825 1,884
24 Other creditors $ millionGroup Parent
00000051 00000051
1999 1998 1999 199800011 00011 00011 00011
Within 1 year After 1 year Within 1 year After 1 year Within 1 year After 1 year Within 1 year After 1 year000000011 00011 00011 00011
Trade 8,203 – 5,091 – – – – –Group undertakings – – – – 12 62 16 69Joint ventures 278 – 205 – – – – –Associated undertakings 199 4 154 4 – – – –Production taxes 417 1,140 241 1,238 – – – –Taxation on profits 2,558 39 2,395 39 3 – 119 –Social security 14 – 14 – 14 – 12 –Accruals and deferred income 3,610 618 2,642 454 1 – 60 –Dividends 971 – 1,552 – 971 – 1,552 –Other 2,125 444 3,035 312 75 – 53 –000000011 00011 00011 00011
18,375 2,245 15,329 2,047 1,076 62 1,812 69
25 Other provisions $ millionUnfunded Other post-
Decom- pension retirementmissioning Environmental plans benefits Other Total
At 1 January 1999 3,310 1,157 1,767 2,311 272 8,817Prior year adjustment – change in accounting policy (Note 44) (229) (172) – – 163 (238)
Restated 3,081 985 1,767 2,311 435 8,579Exchange adjustments (57) (4) (224) – (5) (290)New provisions 80 145 160 42 500 927Unwinding of discount 94 25 – – 11 130Change in discount rate (280) (18) – – (2) (300)Utilized/deleted (133) (216) (108) (109) (208) (774)
At 31 December 1999 2,785 917 1,595 2,244 731 8,272
At 31 December 1999 the provision for the costs of decommissioning the group’s oil and natural gas production facilities and pipelines at the end oftheir economic lives was $2,785 million. These costs are expected to be incurred over the next 30 years. The provision has been estimated usingexisting technology, at current prices and discounted using a real discount rate of 3.5% (3%).
The provision for environmental liabilities at 31 December 1999 was $917 million. This represents primarily the estimated environmental restorationand remediation costs for closed sites or facilities that have been sold. These costs are expected to be incurred over the next 10 years. The provisionhas been estimated using existing technology, at current prices, and discounted using a real discount rate of 3.5% (3%).
The group also holds provisions for potential future awards under the long-term performance plan, expected rental shortfalls on surplus propertiesand sundry other liabilities. To the extent that these liabilities are not expected to be settled within the next three years, the provisions are discountedusing a real discount rate of 3.5% (3%).
Other includes parent company $171 million ($85 million).
Notes on accounts

BP Amoco 1999 53
26 Derivatives and other financial instrumentsAn outline of the group’s major financial risks and the policies and objectives pursued in relation to these risks is set out in the financial riskmanagement section of the Financial Review on pages 32-34.
In the normal course of business the group is a party to derivative financial instruments (derivatives) with off-balance sheet risk, primarily to manageits exposure to fluctuations in foreign currency exchange rates and interest rates, including management of the balance between floating rate and fixedrate debt. The group also manages certain of its exposures to movements in oil and natural gas prices. The underlying economic currency of the group’scash flows is mainly the US dollar. Accordingly, most of our borrowings are in US dollars, are hedged with respect to the US dollar or swapped intodollars where this achieves a lower cost of financing. Significant non-dollar cash flow exposures are hedged. Gains and losses arising on these hedgesare deferred and recognized in the income statement or as adjustments to carrying amounts, as appropriate, only when the hedged item occurs. Inaddition, we trade derivatives in conjunction with these risk management activities. The results of trading are recognized in income in the current period.
These derivatives involve, to varying degrees, credit and market risk. With regard to credit risk, the group may be exposed to loss in the event ofnon-performance by a counterparty. The group controls credit risk by entering into derivative contracts only with highly credit-rated counterparties andthrough credit approvals, limits and monitoring procedures and does not usually require collateral or other security. The group has not experiencedmaterial non-performance by any counterparty.
Market risk is the possibility that a change in interest rates, currency exchange rates or oil and natural gas prices will cause the value of a financialinstrument to decrease or its obligations to become more costly to settle. When derivatives are used for the purpose of risk management they do notexpose the group to market risk because the exposure to market risk created by the derivative is offset by the opposite exposure arising from the asset,liability, cash flow or transaction being hedged. When derivatives are held for trading purposes, the exposure of the group to market risk is representedby potential changes in their fair (market) values. The measurement of market risk in trading activities is discussed further below.
With the exception of the table of currency exposures shown on page 54, short-term debtors and creditors which arise directly from the group’soperations have been excluded from the disclosures contained in this note, as permitted by FRS13.
Interest rate riskThe interest rate and currency profile of the financial liabilities of the group at 31 December 1999, after taking into account the effect of interest rateswaps, currency swaps and forward contracts, are set out below.
1999501150115011501150115011501150
Fixed rate Floating rate Interest free5011501150 501150 501150
Weighted Weighted Weighted average time Weighted average time
average for which average untilAnalysis of financial interest rate rate is fixed Amount interest rate Amount maturity Amount Totalliabilities by currency % Years $ million % $ million Years $ million $ million00005011501150 501150 501150 50
US dollars 7 9 6,704 5 7,587 7 912 15,203Sterling – – – 6 49 4 217 266Other currencies 8 31 46 6 180 5 319 54500005011501150 501150 501150 50
6,750 7,816 1,448 16,01451100000511050 110505 00110 50
Analysis of the above financial liabilities by balance sheet caption:Creditors – amounts falling due within one year– Finance debt 4,900Creditors – amounts falling due after more than one year– Finance debt 9,644– Other creditors 1,062Provisions for liabilities and charges– Other provisions 408
16,014
The financial liabilities upon which interest is paid comprise principally borrowings and net obligations under finance leases.In managing its finance debt, the group aims for a balance between floating and fixed interest rates and, in 1999, the group’s upper limit for the
proportion of floating rate debt was 65% of total net debt outstanding. Interest rate swaps are used by the group to modify the interest characteristicsof its long-term borrowings from a fixed to a floating rate basis or vice versa. The following table indicates the types of swaps used and their weightedaverage interest rates as at 31 December 1999.

54 BP Amoco 1999
26 Derivatives and other financial instruments continued$ million
except percentages
Receive fixed rate swaps – notional amount 2,300Average receive fixed rate 6.3%Average pay floating rate 5.9%Pay fixed rate swaps – notional amount 3,221Average pay fixed rate 7.1%Average receive floating rate 6.0%
The financial liabilities which are interest-free comprise various accruals, sundry creditors and provisions relating to the group’s normal commercialoperations with payment dates spread over a number of years.
The following table shows the interest rate and currency profile of the group’s material financial assets at 31 December 1999.1999
501150115011501150115011501150
Fixed rate Floating rate Interest free5011501150 501150 501150
Weighted Weighted Weighted average time Weighted average time
average for which average untilAnalysis of financial interest rate rate is fixed Amount interest rate Amount maturity Amount Totalassets by currency % Years $ million % $ million Years $ million $ million00005011501150 501150 501150 50
US dollars 5 1 12 5 748 3 122 882Sterling 9 2 55 – – 1 357 412Other currencies 6 1 44 3 168 2 371 58300005011501150 501150 501150 50
111 916 850 1,87751100000511050 110505 00110 50
Analysis of financial assets by balance sheet caption:Current assets– Debtors – amounts falling due after more than one year 326– Investments 220– Cash at bank and in hand 1,331
1,877
The floating rate financial assets earn interest at various rates set principally with respect to LIBOR or the local market equivalent.
Maturity profile of financial liabilitiesThe profile of the maturity of the financial liabilities included in the group’s balance sheet at 31 December 1999 is shown in the table below.
$ millionCarrying amount of financial liabilities 1999
Due within: 1 year 4,9001 to 2 years 1,5052 to 5 years 3,845Thereafter 5,764
16,014
Foreign exchange rate riskThe table below shows the group’s principal currency exposures arising from normal trading activities. These exposures give rise to net currency gainsand losses recognized in the profit and loss account. Such exposures comprise the monetary assets and monetary liabilities of the group that are notdenominated in the functional currency of the operating unit involved, other than certain non-US dollar borrowings treated as hedges of net investmentsin overseas operations. As at 31 December 1999, these exposures were as shown below.
$ millionNet foreign currency monetary assets (liabilities)
511000000051
Functional currency of group operation US dollar Sterling Euro Other Total
US dollar – 747 460 (385) 822Sterling 141 – 264 (19) 386Other 205 (114) 1 26 118
Total 346 633 725 (378) 1,326
In accordance with its policy for managing its foreign exchange rate risk, the group enters into various types of foreign exchange contracts, such ascurrency swaps, forwards and options. The fair values and carrying amounts of these derivatives are shown in the fair value disclosures below.
Notes on accounts

BP Amoco 1999 55
26 Derivatives and other financial instruments continuedFair values of financial assets and liabilitiesThe estimated fair value of the group’s financial instruments is shown in the table below. The table also shows the ‘net carrying amount’ of the financialasset or liability. This amount represents the net book value, i.e. market value when acquired or later marked to market. The carrying amounts and fairvalues of finance debt shown below exclude the effects of interest rate swaps, currency swaps and forward contracts (which are included forpresentation in the balance sheet). Current maturities of long-term finance debt are included under long-term finance debt.
$ million1999
Net carryingNet fair value amountasset (liability) asset (liability)
Primary financial instrumentsCurrent assets– Debtors – amounts falling due after more than one year 326 326– Investments 221 220– Cash at bank and in hand 1,331 1,331Finance debt– Short-term borrowings (2,433) (2,433)– Long-term borrowings (9,979) (10,118)– Net obligations under finance leases (1,824) (1,802)Creditors – amounts falling due after more than one year – Other creditors (1,062) (1,062)Provisions for liabilities and charges – Other provisions (408) (408)
Derivative financial or commodity instrumentsRisk management – interest rate contracts 37 –
– foreign exchange contracts (209) (191)– oil price contracts – –– natural gas price contracts 2 –
Trading – interest rate contracts – –– foreign exchange contracts – –– oil price contracts (61) (61)
Interest rate contracts include futures contracts, swap agreements and options. Foreign exchange contracts include forward and futures contracts, swapagreements and options. Oil and natural gas price contracts are those which require settlement in cash and include futures contracts, swap agreementsand options and cash-settled commodity instruments (derivative commodity contracts that permit settlement either by delivery of the underlyingcommodity or in cash) such as forward contracts.
The following methods and assumptions were used by the group in estimating its fair value disclosures for its financial instruments:Current assets – Debtors – amounts falling due after more than one year: The fair value of other debtors due after one year is estimated not to bematerially different from its carrying value.Current assets – Investments and Cash at bank and in hand: The carrying amount reported in the balance sheet for unlisted current asset investmentsand cash at bank and in hand approximates their fair value. The fair value of listed current asset investments has been determined by reference tomarket prices.Finance debt: The carrying amount of the group’s short-term borrowings, which mainly comprise commercial paper, bank loans and overdrafts,approximates their fair value. The fair value of the group’s long-term borrowings and finance lease obligations is estimated using quoted prices or, wherethese are not available, discounted cash flow analyses, based on the group’s current incremental borrowing rates for similar types and maturities ofborrowing.Creditors – amounts falling due after more than one year – Other creditors: These liabilities are predominantly interest-free. In view of the shortmaturities, the reported carrying amount is estimated to approximate the fair value.Provisions for liabilities and charges – Other provisions: Where the liability will not be settled for a number of years the amount recognized is thepresent value of the estimated future expenditure. The carrying amount of provisions for onerous contracts thus approximates the fair value.Derivative financial or commodity instruments: The fair values of the group’s interest rate contracts (swaps) are based on pricing models which take intoaccount relevant market data. Fair values for the group’s foreign exchange contracts (forward contracts, swap agreements and options) are based onmarket prices of comparable instruments. The fair values of the group’s oil and natural gas price contracts (futures contracts, swap agreements, optionsand forward contracts) are based on market prices.

56 BP Amoco 1999
26 Derivatives and other financial instruments continuedRisk managementGains and losses on derivatives used for risk management purposes are deferred and recognized in earnings or as adjustments to carrying amounts, asappropriate, when the underlying debt matures or the hedged transaction occurs. When an anticipated transaction is no longer likely to occur or financedebt is terminated before maturity, any deferred gain or loss that has arisen on the related derivative is recognized in the income statement, togetherwith any gain or loss on the terminated item. Where such derivatives used for hedging purposes are terminated before the underlying debt matures orthe hedged transaction occurs, the resulting gain or loss is recognized on a basis which matches the timing and accounting treatment of the underlyinghedged item. The unrecognized and carried-forward gains and losses on derivatives used for hedging, and the movements therein, are shown in thefollowing table.
$ millionUnrecognized Carried forward in the balance sheet
000051111 005111100
Gains Losses Total Gains Losses Total00000001111000051111 005111100
Gains and losses at 1 January 1999 253 (402) (149) 143 (194) (51)of which accounted for in income in 1999 115 (95) 20 58 (66) (8)
Gains and losses at 31 December 1999 236 (215) 21 65 (283) (218)of which expected to be recognized in income:In 2000 53 (58) (5) 32 (45) (13)In 2001 or later 183 (157) 26 33 (238) (205)
00000001111000051111 005111100
Trading activitiesThe group maintains active trading positions in a variety of derivatives. This activity is undertaken in conjunction with risk management activities.Derivatives held for trading purposes are marked to market and any gain or loss recognized in the income statement. For traded derivatives, manypositions have been neutralized, with trading initiatives being concluded by taking opposite positions to fix a gain or loss, thereby achieving a zero netmarket risk.
The following table shows the fair value at the year end and the average net fair value of derivatives and other financial instruments held for tradingpurposes during the year.
$ million1999 1998
000051111 05
Year end Year end Average Averagefair value fair value net fair value net fair value
asset liability asset (liability) asset (liability)000050115011501150115011501150 50
Interest rate contracts – – – (8)Foreign exchange contracts 4 (4) – 21Oil price contracts 155 (216) 54 60000050115011501150115011501150 50
159 (220) 54 7351100000511050111105051100110 50
The group measures its market risk exposure, i.e. potential gain or loss in fair values, on its trading activity using a value at risk technique. Thistechnique is based on a variance/covariance model and makes a statistical assessment of the market risk arising from possible future changes inmarket values over a 24-hour period. The calculation of the range of potential changes in fair value takes into account a snapshot of the end-of-dayexposures, and the history of one-day price movements over the previous 12 months, together with the correlation of these price movements. Thepotential movement in fair values is expressed to three standard deviations which is equivalent to a 99.7% confidence level. This means that, in broadterms, one would expect to see an increase or a decrease in fair values greater than the value at risk on only one occasion per year if the portfolio wereleft unchanged.
Notes on accounts

BP Amoco 1999 57
26 Derivatives and other financial instruments continuedThe group calculates value at risk on all instruments that are held for trading purposes and that therefore give an exposure to market risk. The value atrisk model takes account of derivative financial instruments such as interest rate forward and futures contracts, swap agreements, options and swaptions,foreign exchange forward and futures contracts, swap agreements and options and oil price futures, swap agreements and options. Financial assets andliabilities and physical crude oil and refined products that are treated as trading positions are also included in these calculations. The value at riskcalculation for oil price exposure also includes derivative commodity instruments (commodity contracts that permit settlement either by delivery ofthe underlying commodity or in cash) such as forward contracts.
The following table shows values at risk for trading activities.$ million
1999 1998High Low Average Year end Average Year end
0000000000000115111 051150
Interest rate contracts 1 – 1 – 2 –Foreign exchange contracts 13 – 3 1 4 –Oil price contracts 15 5 9 10 8 120000000000000115111 00011
The presentation of trading results shown below includes certain activities of the group’s oil trading division which involve the use of derivative financialinstruments in conjunction with physical and paper trading of oil. It is considered that a more comprehensive representation of the group’s oil tradingactivities is given by the classification of the gains or losses on such derivatives along with those arising from the physical and paper trades to whichthey relate.
The following table shows the trading income arising from derivatives and other financial instruments. For oil price contract trading, this also includesincome or losses arising on trading of derivative commodity instruments and physical oil trades, representing the net result of the oil-trading portfolio.
$ millionNet gain (loss)
051150
1999 1998
Oil price derivative financial and commodity instruments 133 540Physical oil trades 151 (325)
Total oil trading 284 215Interest rate contracts – (26)Foreign exchange contracts 23 38
307 227
27 Called up share capitalOn 4 October 1999 the parent company’s authorized share capital of 12 billion ordinary shares of 50 cents each was subdivided into 24 billion ordinaryshares of 25 cents each amounting to $6 billion. Also outstanding are preference shares of £12,750,000 ($21 million). Further details of movements inshare capital are shown in Note 28.
The allotted, called up and fully paid share capital at 31 December was as follows:1999 1998
Group Shares $ million Shares $ million0000000000000115 111051150
Non-equity8% cumulative first preference shares of £1 each 7,232,838 12 7,232,838 129% cumulative second preference shares of £1 each 5,473,414 9 5,473,414 9EquityOrdinary shares of 50 cents each – – 9,683,010,023 4,842Ordinary shares of 25 cents each 19,484,024,424 4,871 –0000000000000115 111051150
4,892 4,8630000000000000115 11100011
Voting on substantive resolutions tabled at a general meeting is on a poll. On a poll, shareholders present in person or by proxy have two votes for every£5 in nominal amount of the first and second preference shares held and one vote for every ordinary share held. On a show of hands vote on otherresolutions (procedural matters) at a general meeting, shareholders present in person or by proxy have one vote each.
In the event of the winding up of the company preference shareholders would be entitled to a sum equal to the capital paid up on the preferenceshares plus an amount in respect of accrued and unpaid dividends and a premium equal to the higher of (i) 10% of the capital paid up on thepreference shares and (ii) the excess of the average market price of such shares on the London Stock Exchange during the previous six monthsover par value.

29 Reconciliation of movements in shareholders’ interest $ millionFor the year ended 31 December Note 1999 1998
Profit for the year 5,008 3,220Currency translation differences (921) 55Distribution to shareholders 10 (3,884) (4,121)Share dividend plan 311 1,243
Movement in group reserves 514 397Shares issued (repurchased) 266 (399)
Net increase (decrease) in shareholders’ interest 780 (2)Shareholders’ interest at 1 January 42,501 41,748
Shareholders’ interest at 31 December 43,281 41,746Prior year adjustment – change in accounting policy – 755
At 31 December 1998 – as restated 43,281 42,501
There were no unrealized currency translation differences for the year on long-term borrowings used to finance equity investments in foreign currencies(1998 $nil).
58 BP Amoco 1999
28 Capital and reserves $ millionShare Capital Profit
Share premium redemption Merger and losscapital account reserve reserve account Total
At 1 January 1999 4,863 3,056 330 697 32,840 41,786Prior year adjustment –
change in accounting policy (Note 44) – – – – 715 715
Restated 4,863 3,056 330 697 33,555 42,501Employee share schemes 16 311 – – (61) 266Share dividend plan 13 (13) – – 311 311Profit for the year – – – – 5,008 5,008Dividends – – – – (3,884) (3,884)Exchange adjustment – – – – (921) (921)
At 31 December 1999 4,892 3,354 330 697 34,008 43,281
Notes on accounts
Group reserves include the following amounts, the distribution of which islimited by statutory or other restrictions:
$ million1999 1998
Parent company 16 16Subsidiary undertakings 5,638 5,195Associated undertakings 1,649 1,162
7,303 6,373
Employee share schemes During the year 66,162,232 ordinaryshares were issued under employee share schemes. Certain of theseshares were issued via a QUEST. See Note 32 for further details.Share dividend plan 51,842,146 ordinary shares were issued underthe share dividend plan by capitalization of the share premium account.
Parent company As a consolidated income statement is presented, aseparate income statement for the parent company is not required to bepublished.
The profit for the year of the group dealt with by the parent companyand the reserves of the parent company are as follows:
$ million1999 1998
At 1 January 7,084 5,587Exchange adjustment – 47Profit for the year 4,579 2,932Distribution to shareholders (3,884) (2,683)QUEST (61) (42)Share dividend plan 311 1,243
At 31 December 8,029 7,084

BP Amoco 1999 59
30 Group cash flow statement analysis $ million(a) Reconciliation of historical cost profit before interest and tax to net cash inflow from operating activities 1999 1998
Historical cost profit before interest and tax 8,342 5,980Depreciation and amounts provided 4,965 5,301Exploration expenditure written off 304 373Share of (profits) losses of joint ventures and associated undertakings (1,704) (1,102)Interest and other income (217) (272)(Profit) loss on sale of businesses and fixed assets 379 (963)Charge for provisions 847 377Utilization of provisions (597) (460)Decrease (increase) in stocks (1,562) 584Decrease (increase) in debtors (4,013) 1,768(Decrease) increase in creditors 3,546 (2,000)
Net cash inflow from operating activities 10,290 9,586
(b) Exceptional itemsThe cash outflow in respect of the restructuring costs charged in 1999 was $976 million. The cash outflow relating to the merger expenses charged in1998 was $166 million ($32 million). Both amounts were included in the net cash inflow from operating activities.
$ million(c) Financing 1999 1998
Long-term borrowing (2,140) (2,078)Repayments of long-term borrowing 2,268 1,208Short-term borrowing (3,136) (631)Repayments of short-term borrowing 2,299 701
(709) (800)Issue of share capital (245) (161)Repurchase of share capital – 584
Net cash (inflow) outflow (954) (377)
(d) Management of liquid resourcesLiquid resources comprise current asset investments which are principally commercial paper issued by other companies. The net cash inflow from themanagement of liquid resources was $93 million ($596 million).
(e) Commercial paperNet movements in commercial paper are included within short-term borrowings or repayment of short-term borrowings as appropriate.
$ million1999 1998
Current CurrentFinance asset Net Finance asset Net
(f) Movement in net debt debt Cash investments debt debt Cash investments debt0000000111100011 000111100011
At 1 January (13,755) 405 470 (12,880) (12,877) 355 1,067 (11,455)Net cash flow (709) 965 (93) 163 (800) 67 (596) (1,329)Other movements (67) – (150) (217) (53) – – (53)Exchange adjustments (13) (39) (7) (59) (25) (17) (1) (43)0000000111100011 000111100011
At 31 December (14,544) 1,331 220 (12,993) (13,755) 405 470 (12,880)

60 BP Amoco 1999
Notes on accounts
31 Operating leases $ million1999 1998
Land and Land andAnnual commitments under operating leases buildings Other buildings Other00000000000000 00011
Expiring within: 1 year 19 107 50 1492 to 5 years 57 372 92 432Thereafter 163 250 174 99
00000000000000 00011
239 729 316 68000000000000000 00011
Minimum future lease payments Total Total00000000000000 00011
Payable within: 1 year 924 9092 to 5 years 2,597 2,047Thereafter 1,898 1,868
00000000000000 00011
5,419 4,824
employee share schemes. Funding is provided to the ESOP by thecompany. The assets and liabilities of the ESOP are recognized as assetsand liabilities of the company within these accounts. The ESOP haswaived its rights to dividends.
During 1999 the ESOP released 8,779,000 shares for the participatingshare schemes. The cost of shares released for these schemes has beencharged in these accounts. At 31 December 1999 the ESOP held53,989,000 shares (62,768,000).
BP Amoco has established a Qualifying Employee Share OwnershipTrust (QUEST) for the purposes of share option schemes for UK employeesand executive directors of the company and its subsidiaries. During theyear, contributions of $61 million ($42 million) were made by thecompany to the QUEST which, together with option-holder contributions,were used by the QUEST to subscribe for new ordinary shares at marketprice. The cost of this contribution has been transferred by the companydirectly to retained profits and the excess of the subscription price overnominal value has increased share premium account.
At 31 December 1999, all the 9,672,542 ordinary shares issued to theQUEST had been transferred to option holders exercising options underthe UK Group Savings Related Share Option Scheme.Employee share options grantedduring the year (options thousands) 1999 1998
BP Amoco savings related and similar schemes 8,828 9,734BP Amoco share option plan 41,054 –BP ESOS – 2,576Amoco Stock Option Plan – 60,696
49,882 73,006
The exercise prices for BP Amoco options granted during the year were£4.495/$7.28 (8,828,566 options) for savings-related and similarschemes and £5.02/$8.01 (weighted average price) for 41,053,562options granted under the share option plan.Shares issued in respect of options exercisedduring the year (shares thousands) 1999 1998
BP Amoco savings related and similar schemes 12,176 12,582BP ESOS 7,861 10,260Amoco Stock Option Plan 43,611 30,634
63,648 53,476
In addition, 2,514,000 shares (3,298,000 shares) were issued, and8,779,000 shares (8,518,000 shares) released from the ESOP forparticipating share schemes.Options outstanding at 31 December 1999 1998
BP Amoco options (shares thousands) 323,161 346,898Exercise period 2000-2009 1999-2008Price $2.09-$10.10 $1.85-$7.88
Details of directors’ individual participation in share schemes are givenin the report on executive directors’ remuneration on pages 82 to 87.All share numbers reflect the subdivision of ordinary share capitaleffective 4 October 1999.
32 Employee share schemesBP Amoco offers most of its employees the opportunity to acquire ashareholding in the company through savings related and matchingarrangements (participating share schemes and savings plans). BP Amocoalso uses a long-term performance plan (see Note 33) and the grantingof share options as elements of employee remuneration. See the reporton executive directors’ remuneration on pages 82 to 87 for furtherinformation on existing and future share schemes and share option schemes.
Under the UK Savings Related Share Option Scheme employees savemonthly over a three- or five-year period toward the purchase of sharesat a price fixed when the option is granted. The option price is usually setat a 20% discount to the market price at the time of grant. The optionmust be exercised within six months of maturity of the savings contractotherwise it lapses. Similar schemes are run in a number of overseascountries.
Under the UK Participating Scheme, BP Amoco matches employees’own contribution of shares, up to a predetermined limit, all of which arethen held in trust for defined periods before being released to theemployee. There are similar schemes in a number of overseas countries.
The company sponsors a number of savings plans covering most USemployees. Under these plans, employees may contribute up to 20% oftheir salary subject to certain regulatory limits. BP Amoco matchesemployee contributions up to 7%, depending upon length of service.The plans invest primarily in BP Amoco ADSs. The company’scontributions vest over a period of five years. Company contributions tosavings plans during the year were $95 million ($91 million).
During 1999, BP Amoco granted options under the BP Amoco ShareOption Plan to certain categories of employees. Prior to 1999, BP andAmoco granted options under the BP Executive Share Option Scheme(BP ESOS) and the Amoco Stock Option Plan respectively. Options weregranted to former Amoco employees who, under the terms of the mergeragreement between BP and Amoco, must, for 1999 and 2000, begranted options on a similar basis to the arrangements under the AmocoStock Option Plan. Options were also granted to certain former BP USemployees. The options were granted at the market price at the dateof grant. There are no performance conditions attaching to these grants.The options are exercisable one or two years after the date of grant,and lapse after 10 years.
Also in 1999, options were granted to non-US middle managers.In prior years these were granted under the BP ESOS. The options weregranted at market price at the date of grant and are not exercisable untila performance condition is satisfied. Before any options can be exercised,the Remuneration Committee will require the total return to shareholders(share price increase with all dividends reinvested) on an investment inBP Amoco shares to exceed the mean total return to shareholders of arepresentative group of UK companies by a margin set from time to timeby the committee. The performance period for each grant will normallybe three years. Subject to achievement of the performance conditions,the options are exercisable between the third and tenth anniversariesof the date of grant.
An Employee Share Ownership Plan (ESOP) has been established toacquire BP Amoco shares to satisfy future requirements of certain

BP Amoco 1999 61
The value of awards under the 1996-98 Plan made in 1999 was$52 million (1995-97 Plan $36 million).
Employee Share Ownership Plans (ESOPs) have been established toacquire BP Amoco shares to satisfy any awards made to participantsunder the Plan and then to hold them for the participants during theretention period of the Plan. In order to hedge the cost of potential futureawards the ESOPs may, from time to time over the performance period ofthe Plans, purchase BP Amoco shares in the open market. Funding isprovided to the ESOPs by the company. The assets and liabilities of theESOPs are recognized as assets and liabilities of the company withinthese accounts. The ESOPs have waived their rights to dividends.
At 31 December 1999 the ESOPs held 9,502,000 (6,266,000) sharesfor potential future awards.
35 Loans to officersMiss J C Hanratty has a low interest loan of $43,000 made to her prior to her appointment as Company Secretary on 1 October 1994.
36 Employee costs and numbers $ million1999 1998
(a) Employee costsWages and salaries 5,302 4,995Social security costs 359 412Pension costs (97) 139
5,564 5,546
1999 1998
(b) Number of employees at 31 DecemberExploration and Production 13,300 18,800Refining and Marketinga 45,250 52,100Chemicals 18,700 23,050Other businesses and corporate 3,150 2,700
80,400 96,650
1999 1998Rest of Rest of Rest of Rest of
UK Europe USA World Total UK Europe USA World Total000000000011115 111000000
(c) Average number of employeesExploration and Production 3,950 900 5,300 5,600 15,750 4,050 900 7,900 6,200 19,050Refining and Marketingb 9,600 10,050 20,700 8,150 48,500 10,300 9,700 23,600 9,150 52,750Chemicals 4,100 4,900 9,850 2,000 20,850 4,650 5,150 11,600 2,450 23,850Other businesses and corporate 1,150 350 1,000 500 3,000 950 300 1,550 450 3,250000000000011115 111000000
18,800 16,200 36,850 16,250 88,100 19,950 16,050 44,650 18,250 98,900aIncludes 18,050 (17,300) employees assigned to the BP/Mobil joint venture.bIncludes 7,800 (8,550) employees assigned to the BP/Mobil joint venture in the UK and 9,650 (9,350) employees in the Rest of Europe.
34 Directors’ remuneration $ thousand1999 1998
Total for all directorsEmolumentsa 13,309 6,870Compensation for loss of office 6,126 –Gains made on the exercise of share options 5,158 888Amounts awarded under long-termincentive schemes 7,594 4,434
Highest paid directorEmoluments 2,434 1,514Gains made on the exercise of share options 4,509 806Amount awarded under long-termincentive schemes – 1,331Accrued pension at 31 December 1,172 626
aFees of $45,730 in 1998 in respect of Mr H M P Miles’ services as anon-executive director were paid to his employer.
Emoluments These amounts comprise fees paid to the non-executiveco-chairman and the non-executive directors, and, for executivedirectors, salary and benefits earned during the relevant financial year,plus bonuses awarded for the year.Pension contributions Six executive directors participate in a non-contributory pension scheme established for UK staff by a separate trustfund to which contributions are made by BP Amoco based on actuarialadvice. There were no contributions to this pension scheme in 1999or 1998. Two executive directors participated in the Employee RetirementPlan for Amoco Corporation.Further information Full details of individual executive directors’remuneration are given in the report on executive directors’ remunerationon pages 82 to 87 and of the non-executive co-chairman and individualnon-executive directors in the report on corporate governance onpages 75 to 77.
33 Long term performance planSenior executives and the executive directors participate in the Long TermPerformance Plan (the Plan). This is an incentive scheme under which theRemuneration Committee may award shares to participants or fund thepurchase of shares for participants if long-term targets are met. The Planreplaced the granting of executive share options to participants, apartfrom those based in North America who will continue to receive shareoptions in line with local market practice. Further details of the Planare given in the 1999 report on executive directors’ remuneration onpages 82 to 87.
The cost of potential future awards is accrued over the three-yearperformance periods of each Plan. In any one year, three Plans are inoperation. The amount charged in 1999 was $128 million ($45 million).

62 BP Amoco 1999
Notes on accounts
38 Other post-retirement benefitsCertain group companies, principally in the USA, provide post-retirementhealthcare and life insurance benefits to their retired employees anddependants. The entitlement to these benefits is usually based on theemployee remaining in service until retirement age and completion ofa minimum period of service. The plans are partly funded and theaccrued net liability for post-retirement benefits is included withinother provisions.
The charge to income for post-retirement benefits in 1999 of$42 million ($101 million) was assessed in accordance with independent
39 Contingent liabilitiesThere were contingent liabilities at 31 December 1999 in respect ofguarantees and indemnities entered into as part of, and claims arisingfrom, the ordinary course of the group’s business, upon which nomaterial losses are likely to arise.
Approximately 200 lawsuits were filed in State and Federal Courts inAlaska seeking compensatory and punitive damages arising out of theExxon Valdez oil spill in Prince William Sound in March 1989. Most ofthose suits named Exxon (now ExxonMobil), Alyeska Pipeline ServiceCompany (Alyeska), which operates the oil terminal at Valdez, and theother oil companies which own Alyeska. Alyeska initially responded to thespill until the response was taken over by Exxon. BP Amoco owns a 50%interest in Alyeska through a subsidiary of BP America Inc. Alyeska andits owners have settled all of the claims against them under theselawsuits. Exxon has indicated that it may file a claim for contributionagainst Alyeska for a portion of the costs and damages which it hasincurred. If any claims are asserted by Exxon which affect Alyeska andits owners, BP Amoco would defend the claims vigorously.
The Internal Revenue Service (IRS) has challenged the application ofcertain foreign income taxes as credits against BP Amoco Corporation’sUS taxes that otherwise would have been payable for the years 1980 to1992. On 18 June 1992, the IRS issued a statutory Notice of Deficiencyfor additional taxes in the amount of $466 million, plus interest, relatingto 1980 to 1982. BP Amoco filed a petition in the US Tax Courtcontesting the IRS statutory Notice of Deficiency. Trial on the matter washeld in April 1995, and a decision was rendered by the US Tax Court inMarch 1996, in BP Amoco’s favour. The IRS appealed the Tax Court’sdecision to the US Court of Appeals for the Seventh Circuit and on11 March 1998 the Seventh Circuit affirmed the Tax Court’s priordecision. A comparable adjustment of foreign tax credits for each year
has been proposed for the years 1983 to 1992 based upon subsequentIRS audits. In November 1999, BP Amoco Corporation reached anagreement with the IRS that effectively resolves this issue at a minimaltax cost to the company. On 13 December 1999 the parties filed a statusreport with the US Tax Court for the years 1983-1989 advising the Courtthat a basis for settlement had been reached and that final calculationswere in the process of being prepared. Once these calculations arefinalized, the parties expect to file an agreed decision document for theCourt’s final approval, which will then conclude the litigation.
The group is subject to numerous national and local environmentallaws and regulations concerning its products, operations and otheractivities. These laws and regulations may require the group to takefuture action to remediate the effects on the environment of priordisposal or release of chemicals or petroleum substances by the groupor other parties. Such contingencies may exist for various sites includingrefineries, chemical plants, oil fields, service stations, terminals andwaste disposal sites. In addition, the group may have obligations relatingto prior asset sales or closed facilities. The ultimate requirement forremediation and its cost is inherently difficult to estimate. However, theestimated cost of known environmental obligations has been providedin these accounts in accordance with the group’s accounting policies.While the amounts of future costs could be significant and could bematerial to the group’s results of operations in the period in which theyare recognized, BP Amoco does not expect these costs to have amaterial effect on the group’s financial position or liquidity.
The parent company has issued guarantees under which amountsoutstanding at 31 December 1999 were $12,765 million ($7,252 million)including $12,708 million ($7,220 million) in respect of borrowings by itssubsidiary undertakings.
actuarial advice using the projected unit method. The charge for 1999is net of a curtailment gain of $62 million arising from the high levelof severance during the year. At 31 December 1999 the independentactuaries have reassessed the obligation for post-retirement benefits at$1,638 million ($1,814 million). The provision for post-retirement benefitsat 31 December 1999 was $2,244 million ($2,311 million).
The discount rate used to assess the obligation at 31 December 1999was 7.5% (6.5%). The assumed future healthcare cost trend rate for2000 and subsequent years is 5%.
1999 1998
UK and other EuropeanRate of return on assets 6.1% 7.0%Discount rate 6.1% 7.0%Future salary increases 4.3% 5.1%Future pension increases 2.5% 3.2%
USARate of return on assets 10.0% 10.0%Discount rate 6.5% 6.9%Future salary increases 4.0% 4.7%Future pension increases nil nil
At 1 January 1999, the date of the latest actuarial valuations or reviews,the market value of assets in the group’s major externally funded pensionplans in the UK and the USA was $23,209 million ($20,689 million).The actuarial value of the assets of these plans represented 125%(123%) of the benefits that had accrued to members of those plans,after allowing for expected future increases in salaries.
At 31 December 1999 the obligation for accrued benefits in respectof the principal unfunded schemes in Europe was $1,513 million($1,714 million). Of this amount, $1,234 million ($1,345 million) hasbeen provided in these accounts.
37 PensionsMost group companies have pension plans, the forms and benefits ofwhich vary with conditions and practices in the countries concerned.The main plans provide benefits that are computed based on anemployee’s years of service and final pensionable salary. In most casesgroup companies make contributions to separately administered trusts,based on advice from independent actuaries using actuarial methods,the objective of which is to provide adequate funds to meet pensionobligations as they fall due. In certain countries the plans are unfundedand the accrued liability for pension benefits is included within otherprovisions.
The net credit to income for pensions in 1999 was $97 million($139 million net charge). This was assessed in accordance withindependent actuarial advice using the projected unit method for thegroup’s major pension plans. The net credit for 1999 includes settlementand curtailment gains of $150 million arising from the high level ofseverance during the year.
The principal assumptions used in calculating the credit/charge for theprincipal plans were as follows:

BP Amoco 1999 63
40 Capital commitmentsAuthorized future capital expenditure by group companies for which contracts had been placed at 31 December amounted to $2,544 million($3,691 million).
41 Joint ventures and associated undertakingsSummarized financial information for the group’s joint ventures is shown below. The principal joint venture is the pan-European refining and marketingjoint venture with Mobil, which is jointly controlled. The other significant joint ventures of the BP Amoco group at 31 December 1999 are shown inNote 42.
$ million1999 1998
Turnover 17,614 15,428
Profit for the period before tax 1,037 546
Profit for the period after tax 1,032 561
Fixed assets 5,366 5,681Current assets 4,582 3,372
` 9,948 9,053Liabilities due within one year 4,172 3,586Liabilities due after one year 572 462
5,204 5,005
At 31 December 1999 the outstanding balances receivable and payablewere $725 million ($351 million) and $278 million ($144 million)respectively. In addition, there were net receipts of $527 million($675 million) outstanding at 31 December 1999.
The more significant associated undertakings of the BP Amoco groupat 31 December 1999 are shown in Note 42.
During the year the BP Amoco group purchased crude oil from twoassociated undertakings, Abu Dhabi Marine Areas and Abu DhabiPetroleum to the value of $935 million ($715 million). At 31 December1999 $119 million ($45 million) was payable in respect of thesepurchases.
During the year the BP Amoco group sold chemicals feedstockstotalling $460 million ($395 million) to Erdölchemie, an associatedundertaking, and bought petrochemicals, mainly polyethylene, to thevalue of $77 million ($76 million). At 31 December 1999 the outstandingbalance receivable from Erdölchemie was $1 million ($1 million).
Within the BP/Mobil joint venture, BP Amoco operates and has a 70%interest in the fuels refining and marketing operation and has a 49%interest in the lubricants business. Funding is provided to the jointventure by both BP Amoco and Mobil in proportion to their respectiveinterests as required. Surplus cash in the joint venture is returned toBP Amoco and Mobil on a regular, usually daily, basis.
BP Amoco has made available to the joint venture on a long-term basisthe tangible fixed assets formerly used by its European refining andmarketing operations. Staff working for the fuels business are BP Amocoemployees, while those working for the lubricants business are Mobilemployees. Staff costs for BP Amoco employees were $819 million($902 million).
During the year the BP Amoco group sold crude oil and productstotalling $3,398 million ($2,264 million) to the BP/Mobil joint ventureand purchased crude oil and products totalling $1,791 million($1,335 million).

64 BP Amoco 1999
42 Subsidiary and associated undertakings and joint venturesThe more important subsidiary and associated undertakings and joint ventures of the group at 31 December 1999 and the group percentage of equitycapital or joint venture interest (to nearest whole number) are set out below. The principal country of operation is generally indicated by the company’scountry of incorporation or by its name. Those held directly by the parent company are marked with an asterisk (*), the percentage owned being that ofthe group unless otherwise indicated. A complete list of investments in subsidiary and associated undertakings and joint ventures will be attached tothe parent company’s annual return made to the Registrar of Companies. Advantage has been taken of the exemption conferred by regulation 7 ofThe Partnerships and Unlimited Companies (Accounts) Regulations 1993 from the requirements to deliver to the Registrar of Companies and publish theannual accounts of the BP/Mobil joint ventures and CaTo Finance V Limited Partnership.
Notes on accounts
Subsidiary Country of undertakings % incorporation Principal activities
InternationalBP ChemicalsInvestments 100 England ChemicalsBP Exploration Co 100 Scotland Exploration and production
*BP International 100 England Integrated oil operationsBP Oil International 100 England Integrated oil operationsBP Exploration
Operating Company 100 England Exploration and production*BP Shipping 100 England Shipping
EuropeUKBP Amoco Capital 100 England FinanceBP Chemicals 100 England ChemicalsBP Oil UK 100 England Refining and marketing
*Britoil (parent 15%) 100 Scotland Exploration and production*The Tanker Insurance
Company 100 England InsuranceFranceBP France 100 France Refining and marketing
and chemicalsGermanyDeutsche BP 100 Germany Refining and marketing
and chemicalsNetherlandsBP Capital BV 100 Netherlands FinanceBP Nederland 100 Netherlands Refining and marketingSpainBP España 100 Spain Refining and marketing
Middle EastAmoco Egypt Gas 100 USA Exploration and productionAmoco Egypt Oil 100 USA Exploration and productionAmoco Sharjah LPG 100 USA Exploration and production
Subsidiary Country of undertakings % incorporation Principal activities
Middle East (continued)Amoco Sharjah Oil Co. 100 USA Exploration and production
*BP Middle East 100 England Marketing
Africa*BP Southern Africa 100 South Africa Refining and marketing
Far EastSingapore
*BP Singapore Pte 100 Singapore Refining and marketing
AustralasiaAustraliaBP Australia 100 Australia Integrated oil operationsBP Finance Australia 100 Australia FinanceBP Developments
Australia 100 Australia Exploration and productionNew ZealandBP Oil New Zealand 100 New Zealand Marketing
Western HemisphereCanadaAmoco Canada
Petroleum Company 100 Canada Exploration and productionTrinidadAmoco Energy
Company of Trinidad and Tobago 100 USA Exploration and production
Amoco Trinidad (LNG) B.V. 100 Netherlands Exploration and productionUSAAltura Energy 64 USA Exploration and productionBP Amoco Corporation Exploration and production,BP Amoco Company 100 USA refining and marketing,BP America pipelines and chemicalsStandard Oil Co.
� �Associated undertakings % Country of incorporation Principal activities
Abu DhabiAbu Dhabi Marine Areas 33 England Crude oil productionAbu Dhabi Petroleum Co. 24 England Crude oil productionGermanyErdölchemie 50 Germany ChemicalsRuhrgas AG 25 Germany Gas distributionRussiaSidancoa 10 Russia Integrated oil operationsRusia 25 Russia Exploration and productionTaiwanChina AmericanPetrochemical Co. 50 Taiwan Chemicals
a20% voting interest
Joint ventures % Principal place of business Principal activities
BP/Mobil 70/49b Europe Refining and marketingEmpresa Petrolera Chaco 30 Bolivia Exploration and productionPan American Energy 60 Argentina Exploration and productionCaTo Finance Partnership 50 UK Finance
bFuels/lubricants

BP Amoco 1999 65
43 Oil and natural gas exploration and production activitiesa $ million1999 1998
Rest of Rest of Rest of Rest ofUK Europe USA World Total UK Europe USA World Total
000000000011115 111000000
Capitalized costs at 31 DecemberGross capitalized costsProved properties 22,874 2,738 35,826 14,166 75,604 23,290 2,934 35,383 15,078 76,685 Unproved properties 412 79 741 2,067 3,299 400 76 890 1,915 3,281 000000000011115 111000000
23,286 2,817 36,567 16,233 78,903 23,690 3,010 36,273 16,993 79,966 Accumulated depreciation 13,160 1,890 20,751 8,279 44,080 12,470 1,865 20,741 8,183 43,459 000000000011115 111000000
Net capitalized costs 10,126 927 15,816 7,954 34,823 11,220 1,145 15,532 8,810 36,507 000000000011115 111000000
The group’s share of associated undertakings’ net capitalized costs at 31 December 1999 was $1,442 million ($2,212 million).
Costs incurredfor the year ended 31 DecemberAcquisition of propertiesProved – – 396 – 396 – – 3 54 57 Unproved – – 23 130 153 – 1 58 62 121 000000000011115 111000000
– – 419 130 549 – 1 61 116 178 Exploration and appraisal costsb 83 39 287 439 848 177 106 476 764 1,523 Development costs 676 71 1,212 956 2,915 1,432 100 1,670 1,569 4,771 000000000011115 111000000
Total costs 759 110 1,918 1,525 4,312 1,609 207 2,207 2,449 6,472 000000000011115 111000000
The group’s share of associated undertakings’ costs incurred in 1999 was $49 million ($282 million).
Results of operationsfor the year ended 31 DecemberTurnoverc
Third parties 2,258 644 4,738 2,216 9,856 2,481 520 2,027 905 5,933 Sales between businesses 2,251 108 1,283 2,938 6,580 1,063 73 2,782 2,133 6,051 000000000011115 111000000
4,509 752 6,021 5,154 16,436 3,544 593 4,809 3,038 11,984 000000000011115 111000000
Exploration expenditure 51 20 172 305 548 134 89 240 458 921 Production costs 734 98 1,387 756 2,975 878 146 1,548 888 3,460 Production taxes 167 2 283 495 947 15 6 233 320 574 Other costs (income)d 157 16 1,231 1,143 2,547 (50) (18) 780 384 1,096 Depreciation 1,306 138 1,113 651 3,208 1,183 169 1,168 1,072 3,592 000000000011115 111000000
2,415 274 4,186 3,350 10,225 2,160 392 3,969 3,122 9,643 000000000011115 111000000
Profit before taxatione 2,094 478 1,835 1,804 6,211 1,384 201 840 (84) 2,341 Allocable taxes 643 312 483 497 1,935 378 79 111 115 683 000000000011115 111000000
Results of operations 1,451 166 1,352 1,307 4,276 1,006 122 729 (199) 1,658 000000000011115 111000000
The group’s share of associated undertakings’ results of operations in 1999 was a profit of $204 million (profit $40 million) after adding a tax credit of$6 million ($19 million).
aThis note relates to the requirements contained within the UK Statement of Recommended Practice ‘Accounting for Oil and Gas Exploration, Development,Production and Decommissioning Activities’. Mid-stream activities of natural gasgathering and distribution and the operation of the main pipelines and tankers areexcluded. The main mid-stream activities are the Alaskan transportation facilities,the Forties Pipeline system, the Central Area Transmission System and Ruhrgas gasdistribution operations. Profits (losses) on sale of businesses and fixed assetsrelating to the oil and natural gas exploration and production activities, which havebeen accounted as exceptional items, are also excluded.
bExploration and appraisal drilling expenditure and licence acquisition costs areinitially capitalized within intangible fixed assets in accordance with BP Amocogroup accounting policy.
cTurnover represents sales of production excluding royalty oil where royalty ispayable in kind.
dIncludes cost of royalty oil not taken in kind and property taxes.eThe exploration and production total replacement cost operating profit comprises:
$ million1999 1998
Exploration and production activities – Group (as above) 6,211 2,341– Associated undertakings 198 21Mid-stream activities 785 869
Total replacement cost operating profit 7,194 3,231

66 BP Amoco 1999
44 New accounting standard for provisionsThe BP Amoco group adopted Financial Reporting Standard No.12 ‘Provisions, Contingent Liabilities and Contingent Assets’ (FRS12) with effect from1 January 1999. This standard changes the criteria for recognizing provisions for such costs as decommissioning, environmental liabilities, onerouscontracts and restructuring charges. It also requires provisions for liabilities which may not be settled for a number of years to be discounted to their netpresent value. The adoption of this standard has been treated as a change in accounting policy. Comparative figures have been restated to reflect thischange in accounting policy.The principal effects of the adoption of FRS12 are as follows:(a) Provisions for environmental liabilities are determined on a discounted basis as the effect of the time value of money is material. Previously these
liabilities were on an undiscounted basis.(b) Provisions for decommissioning are recognized in full, on a discounted basis, at the commencement of oil and natural gas production. The BP Amoco
group’s prior practice was to accrue the expected cost of decommissioning oil and natural gas production facilities on a unit-of-production basisover the life of the field. FRS12 also requires the BP Amoco group to capitalize an amount equivalent to the provision as a tangible fixed asset andto amortize this amount over the life of the field on a unit-of-production basis.
(c) The unwinding of the discount, which represents a period-by-period cost, is included within interest expense.(d) Liabilities in respect of certain onerous contracts have been recognized.The effect of the change in accounting policy has been for 1999 to increase total replacement cost operating profit and profit for the year, and for 1998to increase total replacement cost operating profit and reduce the profit for the year as set out below.
` $ million1999 1998
Total replacement cost operating profit 121 84 Restructuring costs 66 –Interest expense (110) (124)
Profit (loss) for the period 77 (40)
The adjustments to tangible assets and provisions for liabilities and charges at 31 December 1998 are as follows:` $ million
Tangible assets 415Other creditors 62Other provisions 238
BP Amoco shareholders’ interest 715
Notes on accounts

BP Amoco 1999 67
Directors’ statement and auditors’ report
Statement of directors’ responsibilities in respect of the accounts
Report of the auditors
Company law requires the directors to prepare accounts for eachfinancial year which give a true and fair view of the state of affairs ofthe company and the group and of the profit or loss of the group forthat period. In preparing those accounts, the directors are required:
• to select suitable accounting policies and then apply them consistently;• to make judgements and estimates that are reasonable and prudent;• to state whether applicable accounting standards have been followed,
subject to any material departures disclosed and explained in theaccounts;
• to prepare the accounts on the going concern basis unless it isinappropriate to presume that the group will continue in business.
The directors are also responsible for keeping proper accounting recordswhich disclose with reasonable accuracy at any time the financialposition of the group and which enable them to ensure that the accountscomply with the Companies Act 1985. They are also responsible fortaking reasonable steps to safeguard the assets of the group and toprevent and detect fraud and other irregularities.
The directors confirm that they have complied with theserequirements, and, having a reasonable expectation that the companyhas adequate resources to continue in operational existence for theforeseeable future, continue to adopt the going concern basis inpreparing the accounts.
To the Members of BP Amoco p.l.c.We have audited the accounts on pages 36 to 66, which have beenprepared under the historical cost convention and the accounting policiesset out on pages 36 and 37.
Respective responsibilities of directors and auditorsThe directors are responsible for preparing the Annual Report asdescribed above, including responsibility for preparing the accountsin accordance with applicable UK law and accounting standards.Our responsibilities, as independent auditors, are established in theUK by statute, the Auditing Practices Board, the Listing Rules of theLondon Stock Exchange and by our profession’s ethical guidance.
We report to you our opinion as to whether the accounts give atrue and fair view and are properly prepared in accordance with theCompanies Act. We also report to you if, in our opinion, the directors’report is not consistent with the accounts, if the company has not keptproper accounting records, if we have not received all the informationand explanations we require for our audit, or if the information specifiedby law or the Listing Rules regarding directors’ remuneration andtransactions with the group is not disclosed.
We review whether the corporate governance statement made onpage 77 reflects the company’s compliance with the seven provisionsof the Combined Code specified for our review by the London StockExchange, and we report if it does not. We are not required to considerwhether the board’s statements on internal control cover all risks andcontrols, or form an opinion on the effectiveness of either the group’scorporate governance procedures or its risk and control procedures.
We read the other information contained in the Annual Report,including the corporate governance statement, and consider whether itis consistent with the audited accounts. We consider the implications forour report if we become aware of any apparent misstatements or materialinconsistencies with the accounts.
Basis of audit opinionWe conducted our audit in accordance with Auditing Standards issuedby the Auditing Practices Board. An audit includes examination, on atest basis, of evidence relevant to the amounts and disclosures in theaccounts. It also includes an assessment of the significant estimatesand judgements made by the directors in the preparation of the accounts,and of whether the accounting policies are appropriate to the group’scircumstances, consistently applied and adequately disclosed.
We planned and performed our audit so as to obtain all the informationand explanations which we considered necessary in order to provide uswith sufficient evidence to give reasonable assurance that the accountsare free from material misstatement, whether caused by fraud or otherirregularity or error. In forming our opinion we also evaluated the overalladequacy of the presentation of information in the accounts.
OpinionIn our opinion the accounts give a true and fair view of the state ofaffairs of the company and of the group as at 31 December 1999 andof the profit of the group for the year then ended and have been properlyprepared in accordance with the Companies Act 1985.
Ernst & YoungRegistered AuditorLondon 15 February 2000

68 BP Amoco 1999
Movements in estimated net proved reserves 1999
Crude oila Natural gasa
millions of barrels billions of cubic feet5555555555555 5555555555555
Rest of Rest of Rest of Rest ofSubsidiary undertakings UK Europe USA World Total UK Europe USA World Total551115555555555555555551111 5555555555555
At 1 January 1999Developed 1,258 220 2,982 858 5,318 3,536 324 9,637 6,054 19,551Undeveloped 270 51 979 686 1,986 1,107 38 1,658 8,647 11,450551115555555555555555551111 5555555555555
1,528 271 3,961 1,544 7,304 4,643 362 11,295 14,701 31,001551115555555555555555551111 5555555555555
Changes attributable to:Revisions of previous estimates (10) 12 11 1 14 1 9 215 (107) 118Purchases of reserves-in-place 6 – 4 – 10 3 – – 12 15Extensions, discoveries and other additions 1 24 100 44 169 79 34 417 3,296 3,826Improved recovery 28 14 87 83 212 22 – 242 299 563Production (212) (36) (275) (149) (672) (475) (60) (907)c (752) (2,194)Sales of reserves-in-place – – (33) (476) (509) – – (143) (256) (399)Transfers from associated undertakings – – 7 – 7d – – 872 – 872d551115555555555555555551111 5555555555555
(187) 14 (99) (497) (769) (370) (17) 696 2,492 2,801551115555555555555555551111 5555555555555
At 31 December 1999Developed 1,158 190 2,930 550 4,828 3,354 282 10,439 6,423 20,498Undeveloped 183 95 932 497 1,707 919 63 1,552 10,770 13,304551115555555555555555551111 5555555555555
1,341 285 3,862 1,047 6,535 4,273 345 11,991 17,193 33,802551115555555555555555551111 5555555555555
Associated undertakingsBP Amoco shareAt 1 January 1999 1,128 1,766Net revisions and other additions (21) 549Purchases of reserves-in-place – 378Production (63) (97)Transfers to subsidiary undertakings (7)d (872)d551115555555555555555551111 5555555555555
At 31 December 1999 1,037 1,724551115555555555555555551111 5555555555555
Total group and BP Amoco share of associated undertakings 7,572 35,526551115555555555555555551111 5555555555555
aCrude oil includes natural gas liquid and condensate. Net proved reserves of crude oil and natural gas exclude production royalties due to others.bMinority interest in Altura Energy included 309 million barrels of crude oil and 155 billion cubic feet of natural gas.cIncludes 77 billion cubic feet of natural gas consumed in Alaskan operations.
Associated undertakingsdTransfers from associated to subsidiary undertakings comprise reserves in Crescendo Resources after the acquisition of the majority interest from Repsol YPF.
Oil and natural gas reserves
Supplementary information on oil and natural gas quantities

BP Amoco 1999 69
$ million1995 1996 1997 1998 1999
Turnover 84,216 102,064 108,564 83,732 101,180Less: joint ventures – – 16,804 15,428 17,614
Group turnover 84,216 102,064 91,760 68,304 83,566
Total replacement cost operating profit 8,264 10,634 10,683 6,521 8,894Exceptional items (1,256) (462) 128 850 (2,280)
Replacement cost profit before interest and tax 7,008 10,172 10,811 7,371 6,614Stock holding gains (losses) (31) 1,172 (939) (1,391) 1,728
Historical cost profit before interest and tax 6,977 11,344 9,872 5,980 8,342Interest expense 1,259 1,131 1,035 1,177 1,316
Profit before taxation 5,718 10,213 8,837 4,803 7,026Taxation 2,026 2,783 3,013 1,520 1,880
Profit after taxation 3,692 7,430 5,824 3,283 5,146Minority shareholders’ interest (MSI) (8) 13 151 63 138
Profit for the year 3,700 7,417 5,673 3,220 5,008Distribution to shareholders 2,540 3,007 3,452 4,121 3,884
Retained profit (deficit) for the year 1,160 4,410 2,221 (901) 1,124
Earnings per ordinary share – centsBasic 19.52 38.79 29.56 16.77 25.82Diluted 19.45 38.63 29.41 16.70 25.68
Dividends per ordinary share – cents 13.5 15.5 18.0 19.8 20.0
Replacement cost resultsHistorical cost profit 3,700 7,417 5,673 3,220 5,008Stock holding (gains) losses 31 (1,172) 939 1,391 (1,728)
Replacement cost profit for the year 3,731 6,245 6,612 4,611 3,280Exceptional items, net of tax and MSI 1,212 414 10 (652) 2,050
Replacement cost profit before exceptional items 4,943 6,659 6,622 3,959 5,330
Earnings per ordinary share – centsOn replacement cost profit before exceptional items 26.09 34.82 34.51 20.62 27.48
US dollar/sterling exchange ratesAverage exchange rates for the year 1.58 1.56 1.64 1.66 1.62Year end exchange rates 1.56 1.69 1.66 1.67 1.62
Five-year summary
Summarized group income statements

70 BP Amoco 1999
$ million1995 1996 1997 1998 1999
Fixed assets 58,809 61,937 65,553 67,689 66,084Stocks and debtors 20,679 25,134 19,304 16,351 21,926Cash and liquid resources 2,011 1,580 1,422 875 1,551
Total assets 81,499 88,651 86,279 84,915 89,561Creditors and provisions excluding finance debt 30,825 33,360 29,799 27,587 30,675
Capital employed 50,674 55,291 56,480 57,328 58,886
Financed by:Finance debt 13,602 12,848 12,877 13,755 14,544Minority shareholders’ interest 283 313 1,100 1,072 1,061BP Amoco shareholders’ interest 36,789 42,130 42,503 42,501 43,281
50,674 55,291 56,480 57,328 58,886
Summarized group cash flow statements
$ million1995 1996 1997 1998 1999
Net cash inflow from operating activities 12,682 13,679 15,558 9,586 10,290Dividends from joint ventures – – 190 544 949Dividends from associated undertakings 184 476 551 422 219Net cash outflow from servicing of finance and returns on investments (833) (880) (655) (825) (1,003)Tax paid (1,202) (2,431) (2,273) (1,705) (1,260)Net cash outflow for capital expenditure and financial investment (7,098) (7,965) (7,432) (7,298) (5,385)Net cash inflow (outflow) for acquisitions and disposals (85) (91) (2,624) 778 243Equity dividends paid (2,028) (2,411) (2,437) (2,408) (4,135)
Net cash inflow (outflow) 1,620 377 878 (906) (82)
Financing 1,695 828 1,012 (377) (954)Management of liquid resources (343) (147) (167) (596) (93)Increase (decrease) in cash 268 (304) 33 67 965
1,620 377 878 (906) (82)
Five-year summary
Summarized group balance sheets

BP Amoco 1999 71
$ million1995 1996 1997 1998 1999
By businessExploration and Production 5,261 6,433 7,879 6,318 4,212Refining and Marketing 1,586 1,731 1,824 1,937 1,634Chemicals 1,398 1,964 1,145 1,606 1,215Other businesses and corporate 135 160 572 501 284
8,380 10,288 11,420 10,362 7,345
By geographical areaUKa 1,725 2,280 2,413 2,463 1,518Rest of Europe 810 1,121 1,243 1,248 831USA 3,348 4,005 3,315 3,720 2,963Rest of World 2,497 2,882 4,449 2,931 2,033
8,380 10,288 11,420 10,362 7,345aUK area includes the UK-based international activities of Refining and Marketing.Cost of acquisitions included in this table includes the finance debt of acquired companies.
Ratios
The balance sheet elements shown on page 70 in $ million %are used in the following ratios: 1995 1996 1997 1998 1999
Return on average capital employed– replacement cost profit before exceptional items 12.3 14.7 14.0 9.1 11.7– historical cost profit after exceptional items 9.8 16.2 12.3 7.8 11.1(Based on profit after taxation before deducting interest expense)
Return on average BP Amoco shareholders’ interest– replacement cost profit before exceptional items 13.8 16.9 15.6 9.3 12.4– historical cost profit after exceptional items 10.3 18.8 13.4 7.6 11.7(Based on profit after taxation and minority shareholders’ interest)
Payout ratio– replacement cost profit before exceptional items 51.4 45.2 52.1 104.1 72.9– historical cost profit after exceptional items 68.6 40.5 60.8 128.0 77.6(Dividend: profit)
Debt to debt-plus-equity ratio 26.8 23.2 22.8 24.0 24.7(Finance debt: finance debt plus BP Amoco and minority shareholders’ interest)Debt to equity ratio 36.7 30.3 29.5 31.6 32.8(Finance debt: BP Amoco and minority shareholders’ interest)Net debt to net debt-plus-equity ratio 23.8 21.0 20.8 22.8 22.7Net debt to equity ratio 31.3 26.5 26.3 29.6 29.3(Net debt equals finance debt less cash and liquid resources)
Share price
Pence per 25 cent ordinary share1995 1996 1997 1998 1999
High 272 350 478 484 643Daily average 229 300 393 430 552Low 197 257 331 368 411End year 269 350 400 449 622
Capital expenditure and acquisitions
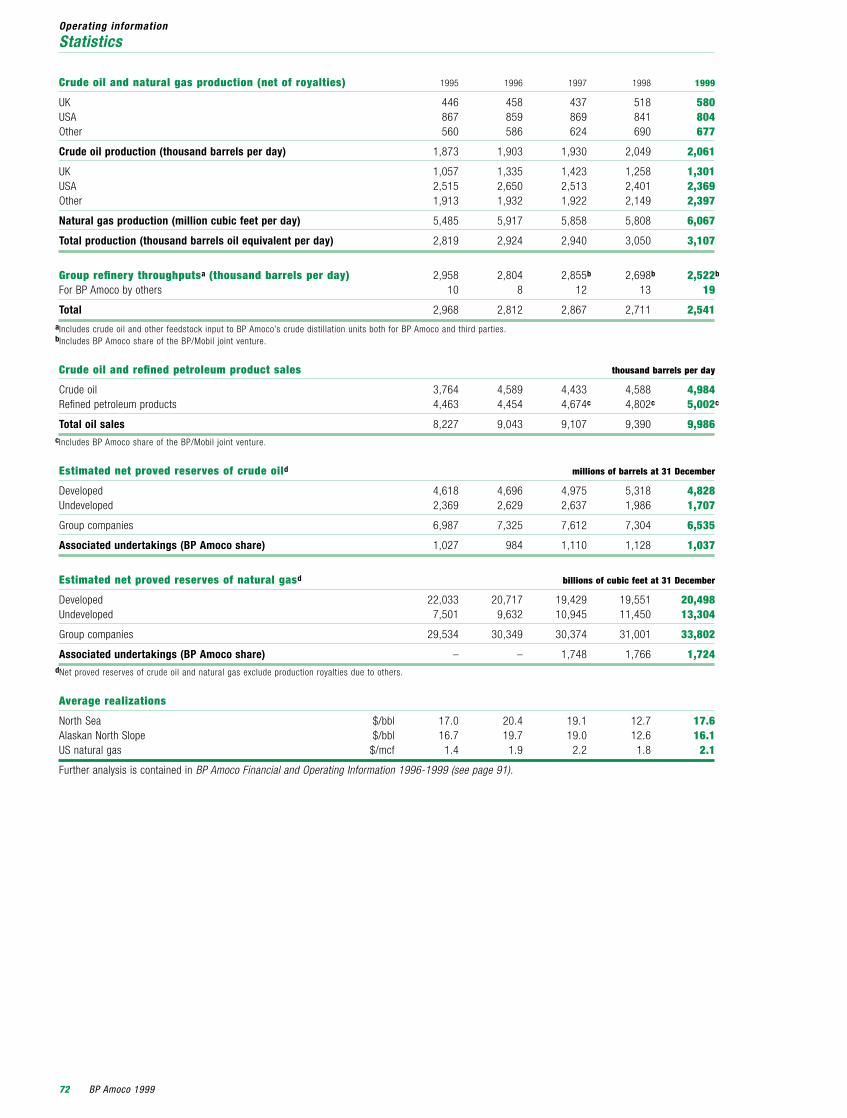
72 BP Amoco 1999
Crude oil and natural gas production (net of royalties) 1995 1996 1997 1998 1999
UK 446 458 437 518 580USA 867 859 869 841 804Other 560 586 624 690 677
Crude oil production (thousand barrels per day) 1,873 1,903 1,930 2,049 2,061
UK 1,057 1,335 1,423 1,258 1,301USA 2,515 2,650 2,513 2,401 2,369Other 1,913 1,932 1,922 2,149 2,397
Natural gas production (million cubic feet per day) 5,485 5,917 5,858 5,808 6,067
Total production (thousand barrels oil equivalent per day) 2,819 2,924 2,940 3,050 3,107
Group refinery throughputsa (thousand barrels per day) 2,958 2,804 2,855b 2,698b 2,522b
For BP Amoco by others 10 8 12 13 19
Total 2,968 2,812 2,867 2,711 2,541aIncludes crude oil and other feedstock input to BP Amoco’s crude distillation units both for BP Amoco and third parties.bIncludes BP Amoco share of the BP/Mobil joint venture.
Crude oil and refined petroleum product sales thousand barrels per day
Crude oil 3,764 4,589 4,433 4,588 4,984Refined petroleum products 4,463 4,454 4,674c 4,802c 5,002c
Total oil sales 8,227 9,043 9,107 9,390 9,986cIncludes BP Amoco share of the BP/Mobil joint venture.
Estimated net proved reserves of crude oild millions of barrels at 31 December
Developed 4,618 4,696 4,975 5,318 4,828Undeveloped 2,369 2,629 2,637 1,986 1,707
Group companies 6,987 7,325 7,612 7,304 6,535
Associated undertakings (BP Amoco share) 1,027 984 1,110 1,128 1,037
Estimated net proved reserves of natural gasd billions of cubic feet at 31 December
Developed 22,033 20,717 19,429 19,551 20,498Undeveloped 7,501 9,632 10,945 11,450 13,304
Group companies 29,534 30,349 30,374 31,001 33,802
Associated undertakings (BP Amoco share) – – 1,748 1,766 1,724dNet proved reserves of crude oil and natural gas exclude production royalties due to others.
Average realizations
North Sea $/bbl 17.0 20.4 19.1 12.7 17.6Alaskan North Slope $/bbl 16.7 19.7 19.0 12.6 16.1US natural gas $/mcf 1.4 1.9 2.2 1.8 2.1
Further analysis is contained in BP Amoco Financial and Operating Information 1996-1999 (see page 91).
Operating information
Statistics

BP Amoco 1999 73
The following is a summary of adjustments to profit for the year and to BP Amoco shareholders’ interest which would be required if generally acceptedaccounting principles in the USA (US GAAP) had been applied instead of those generally accepted in the United Kingdom (UK GAAP). The results arestated using the first-in first-out method of stock valuation.
$ million1999 1998
Profit for the year 5,008 3,220Adjustments:Depreciation chargea (81) (76)Decommissioning and environmental expense (165) (131)Onerous property leases 133 –Interest expense 110 124Sale and leaseback of fixed assets (37) (211)Deferred taxationa (378) (72)Other 6 (28)
Profit for the year as adjusted 4,596 2,826
Per ordinary share – centsBasic 23.70 14.72Diluted 23.56 14.66
Per American depositary shareb – centsBasic 142.20 88.32Diluted 141.36 87.96
$ million
BP Amoco shareholders’ interest 43,281 42,501Adjustments:Fixed assetsa 1,237 1,112Ordinary shares held for future awards to employees (456) (489)Sale and leaseback of Chicago office building (413) (413)Decommissioning and environmental provisions (499) (238)Onerous property leases 139 –Deferred taxationa (6,082) (5,776)Dividend 972 968Pension liability adjustment (144) (143)Other (197) (188)
BP Amoco shareholders’ interest as adjusted 37,838 37,334aUnder UK GAAP, provision for deferred taxation is made where timing differences are expected to reverse in the foreseeable future. Under US GAAP, deferred taxation isprovided on a full liability basis on all temporary differences as defined in US Statement of Financial Accounting Standard No. 109.As required by this standard assets and liabilities of acquired businesses have been adjusted from a net-of-tax to a pre-tax basis.
bOne American depositary share is equivalent to six 25 cent ordinary shares.
United States accounting principles
US GAAP

74 BP Amoco 1999
Further information
Glossary
Term used inBP Amoco Annual Report and Accounts US equivalent or definition Accounts Financial statements Acquisition accounting Purchase accountingAdvance corporation tax (ACT) No direct US equivalent. Tax payable on company distributions recoverable
from UK taxes due on incomeAssociated undertakings Equity affiliates
Called up share capital Ordinary shares, capital stock or common stock issued and fully paidCapital allowances Tax depreciationCapital redemption reserve Other additional capitalCash at bank CashCreditors Accounts payable and accrued liabilitiesCreditors: amounts falling due within one year Current liabilitiesCreditors: amounts falling due after more than one year Long-term liabilities
Debtors: amounts falling due after more than one year Other non-current assetsDecommissioning Dismantlement, restoration and abandonment
Employment costs Payroll costsEmployee share schemes Employee stock benefit plans
Finance lease Capital leaseFinancial year Fiscal yearFixed asset investment Non-current investmentsFreehold Ownership with absolute rights in perpetuity
Hire charges Rent
Interest payable Interest expenseInterest receivable Interest income
Merger accounting Pooling of interests accounting
Net asset value Book value
Other debtors Other current assetsOwn shares Treasury stock
Profit Income or earningsProfit and loss account (statement) Income statement Profit and loss account Retained earnings(under ‘capital and reserves’ in balance sheet)Profit for year Net incomeProfit on sale of fixed assets or business Gain on disposal of properties or long-term investmentsProvision for doubtful debts Allowance for doubtful accountsProvisions Non-current liabilities other than debt and specific accounts payable
Redundancy charges Severance costsReserves Retained earnings
Scrip dividend Stock dividendShareholders’ funds Shareholders’ equityShare premium account Amounts subscribed for share capital in excess of nominal valueStocks Inventories
Tangible fixed assets Property, plant and equipmentTrade debtors Accounts receivable (net)Turnover Sales and other operating revenue

BP Amoco 1999 75
Corporate governanceThe board adopted in 1997 a set of governance policies that cover its relationship with shareholders, the conduct by the board of its own affairs and its relationship with the group chief executive. The policies recognize that the board has a separate and unique role as the link in the chain of authority between the shareholders and the group chief executive.
In addition, they acknowledge in a number of ways the dual role played under the unitaryboard system by the group chief executive andexecutive directors, as both members of theboard and leaders of the executive management.
First, they require a majority of the board to becomposed of non-executive directors. Second,they delegate all aspects of the relationshipbetween the board and the group chiefexecutive to the non-executive directors. Third,the policies require the chairman and deputychairman to be non-executive directors.
As a consequence of the merger with AmocoCorporation, the office of chairman was sharedduring 1999 by a non-executive director,Mr P D Sutherland, and an executive director,Mr H L Fuller, formerly chairman and chiefexecutive officer of Amoco. However, owing
to Mr Fuller’s executive role and service contractwith the company, Mr Sutherland led the non-executive functions set down by the governancepolicies.
Sir Ian Prosser is deputy chairman and holdsthe role of senior independent non-executivedirector required by the Combined Code onCorporate Governance. Finally, the companysecretary reports to the non-executive chairmanand is not part of the executive management.
Relationship with shareholders The policies stress the importance of therelationship between the board and theshareholders. In them, the board acknowledgesthat its role is to represent and promote theinterests of shareholders. They recognize thatthe board is accountable to shareholders for the performance and activities of the group.
bpamocogovernance&policy
visit
www.bpamoco.com/alive/governance&policy

76 BP Amoco 1999
The board is required to be proactive inobtaining an understanding of shareholderpreferences and to evaluate systematically theeconomic, political, social and other matterswhich may influence or affect the interests of its shareholders. To ensure that shareholdershave the regular opportunity to reassess theirchoice of directors, directors are required toretire every three years and stand for re-election.
The formal channels of communication bywhich the board accounts to shareholders for the overall performance of the company’sbusiness activity are the Annual Report andAccounts, the Form 20-F report filed with the US Securities and Exchange Commissionand the yearly, half-yearly and quarterlyannouncements made through the stockexchanges on which the shares are listed.
In addition, at the annual general meeting of shareholders, an extensive presentation isgiven about the business, its performance andfuture prospects. At that meeting there is theopportunity for shareholders to ask questions orgive their views to the directors. With 863,000shareholders, however, many of whom areresident outside the UK, opportunities fordialogue with the board at annual generalmeetings are limited.
Presentations are made to representatives of theinvestment community at appropriate intervalsin the UK and the USA and are simultaneouslymade available to shareholders by live broadcastover the Internet. The constructive use oftechnology for communication with shareholdersis continually evaluated and implemented asappropriate.
Board process The board regulates its own activities through apolicy for board process that covers the conductof members at meetings; the cycle of boardactivities and the setting of agendas; boardofficers and their roles; board committees, theirtasks and composition; qualifications for boardmembership and the process of the NominationCommittee; the remuneration of non-executivedirectors; the appointment and role of the
company secretary; and the process for directors to obtain independent advice andthe assessment of the board’s performance. The board process policy places responsibilityfor training of directors on the chairman andcompany secretary.
The policy recognizes that the board’s capacity,as a group, is limited. It therefore reserves toitself the making of broad policy decisions,delegating the more detailed considerationsinvolved in meeting its stated requirementseither to its committees and officers, in thecase of its own processes, or to the group chiefexecutive, in the case of the management of the company’s business activity. On internalcontrol, for example, the board is responsiblefor establishing general policy and formonitoring whether the group chief executivecarries it out.
The relationship between the board and thegroup chief executive is critical to the board’swork. The policy allocates the tasks ofmonitoring executive actions and assessingreward to the following committees:
• Chairman’s Committee (co-chairmen and allnon-executive directors) – organization andsuccession planning and overall performanceassessment
• Audit Committee (six non-executive directors)– monitoring all reporting, accounting, controland the financial aspects of the company’sactivities
• Ethics and Environment Assurance Committee
(six non-executive directors) – monitoring allother non-financial aspects of the company’sactivities
• Remuneration Committee (six non-executivedirectors) – determining performance contractsand targets and the structure of the rewardsfor the group chief executive and the executivedirectors.
In addition there is a Nomination Committeewhich comprises the non-executive chairman,the group chief executive and three non-executive directors.
The board and corporate governance
The qualification for membership of the boardincludes a requirement that non-executivedirectors be free from any relationship withthe executive management of the company thatcould materially interfere with the exercise oftheir independent judgement. In the board’sview, all non-executive directors fulfil thisrequirement.
In carrying out its work, the board has toexercise judgement about how best to furtherthe interests of shareholders. Given theuncertainties inherent in the future of businessactivity, the board’s work is designed to maximizethe expected value of the shareholders’ interestin the group, not to eliminate the possibility of any adverse outcomes for shareholders.
Board/Executive relationshipThe board/executive relationship policy sets outhow the board delegates authority to the groupchief executive and the extent of that authority.
In its Goals Policy, the board states the long-term outcome it expects the group chiefexecutive to deliver. In addition, each yearit agrees the short- and medium-term targets,both financial and non-financial, that the groupchief executive should achieve. The restrictionson the manner in which the group chiefexecutive may achieve the required results areset out in the Executive Limitations Policy,which addresses ethics, health, safety, theenvironment, financial distress, internal control,risk preferences, treatment of employees andpolitical considerations. On these matters, the board’s role is to set general policy and to monitor the implementation of its policy by the group chief executive.
The board/executive relationship policy also setsout how the group chief executive’s performancewill be monitored and recognizes that, in themultitude of changing circumstances, judgementis always involved. The group chief executive is required through dialogue and systematicreview to discuss with the board all materialmatters currently or prospectively affecting thecompany and its performance and all strategicprojects or developments. This dialogue is a keyfeature of the relationship and an importantaspect of board work.

BP Amoco 1999 77
Remuneration of executive directors A separate report is given on pages 82 to 87setting out the reward policy established by theRemuneration Committee and the details of theremuneration for each of the executive directorsduring the year.
Remuneration of non-executive directors The Articles of Association provide that theremuneration paid to non-executive directorsshall be determined by the board within thelimits set by the shareholders. Non-executivedirectors do not have service contracts with the company.
During 1999 the non-executive co-chairman of BP Amoco received a fee of $259,000(£160,000). The non-executive directors ofBP Amoco received an annual fee of $65,000(£40,000) plus an allowance of $4,860 (£3,000)for each occasion on which a director travelsacross the Atlantic for a board meeting orcommittee meeting. During 1999 the boardmet 11 times, eight times in the UK and threetimes in the USA. Committee meetings are heldin conjunction with board meetings wheneverfeasible. Details of individual fees are set out in the table.
Compliance with Code Provisions of Section 1 of the Combined CodeBP Amoco complied throughout 1999 with theCode provisions of Section 1 of the CombinedCode on Corporate Governance of the LondonStock Exchange except A.5.1 (Appointments to the Board).
Not all the members of the NominationCommittee are identified in this report.Three of the committee’s members are selectedfrom among the non-executive directors whena meeting is arranged. Leaving part of thecommittee membership unspecified allowsthe board to reduce the occurrence of conflictsof interest in the committee’s work.
On Code provision D.2.1 (internal control),BP Amoco has adopted the transitionalapproach set out in the letter from the LondonStock Exchange dated 27 September 1999. Asan integral part of the board’s normal processes,it continually assesses whether the group chiefexecutive is carrying out the board’s policies,including those related to internal control.The board’s processes incorporate considerationof regular reports that enable it to review theeffectiveness of the systems of internal control.The group chief executive is makingenhancements at executive management level in the systems for assessing and reporting oninternal control. These enhancements will allowthe company to implement fully the guidancein Internal Control: Guidance for directors on theCombined Code (the ‘Turnbull report’) for theaccounting period ending 31 December 2000.
remuneration of non-executive directors $ thousand 1999a 1998
Current directors R S Block 89 90J H Bryan 84 90E B Davis, Jr 89 90R J Ferris 84 90C F Knight 79 51b
F A Maljers 70 90Dr W E Massey 89 90H M P Miles 79 61b,c
Sir Robin Nicholson 79d 46b,e
Sir Ian Prosser 122 55b
P D Sutherland 259f 266b
M H Wilson 94 90Sir Robert Wilson 79 18b
The Lord Wright of Richmond 75g 61b
Directors who retired before 1999D R Beall – 393h
Sir James Glover 81i 61b
Dr K N Horn 36i 51b
A C Martinez – 244j
M R Seger – 393h
Sir Patrick Sheehy 89i 51b
T M Solso – 214k
Total 1,577 2,595
a Sterling payments converted at the average 1999 exchange rateof £1 = $1.62.
b Sterling payments converted at the average 1998 exchange rateof £1 = $1.66.
c Paid in part to his employer.d Also received $32,000 (£20,000 converted at the average
1999 exchange rate of £1 = $1.62) for serving on the TechnicalAdvisory Council.
e Also received $22,687 (£13,667 converted at the average1998 exchange rate of £1 = $1.66) for serving on the TechnicalAdvisory Council.
f Also received other remuneration and benefits of $9,849 (£6,080converted at the average 1999 exchange rate of £1 = $1.62).
g Also received $1,458 (£900 converted at the average 1999exchange rate of £1 = $1.62) for serving as a director ofBP Pensions Trustees Limited.
h Includes standard Amoco Corporation non-executive directorremuneration of $89,762 and a special payment of $304,000 in recognition of service to the Amoco Corporation board.
i Ex gratia payment in lieu of superannuation in recognition ofcontribution to the board of The British Petroleum Company p.l.c.
j Includes standard Amoco Corporation non-executive directorremuneration of $89,762 and a special payment of $154,000 in recognition of service to the Amoco Corporation board.
k Includes standard Amoco Corporation non-executive directorremuneration of $89,762 and a special payment of $124,000 in recognition of service to the Amoco Corporation board.
non-executive directors’ interests in BP Amoco ordinary shares or calculated equivalents
Change in directors’At 1 Jan 99 or on interests from
At 31 Dec 99 appointmenta 31 Dec 99 to 15 Feb 00
R S Blockb 82,396 81,716 –J H Bryanb 98,760 98,838 –E B Davis, Jrb 60,972 60,298 –R J Ferrisb 260,808 260,812 –C F Knightb 28,790 27,946 –F A Maljersb 33,492 33,538 –Dr W E Masseyb 46,062 45,536 –H M P Miles 9,391 9,112 –Sir Robin Nicholson 3,469 3,370 –Sir Ian Prosser 826 826 –P D Sutherland 6,784 6,694 –M H Wilsonb 43,200 43,258 –Sir Robert Wilson 5,478 5,478 –The Lord Wright of Richmond 3,996 3,964 –
a Directors’ positions adjusted for October 1999 subdivision of ordinary share capital.b Shares held in ADS form.
In disclosing the above interests to the company under the Companies Act 1985, directors did not distinguish their beneficial andnon-beneficial interests.

Sir John BrowneGroup Chief Executive
Peter SutherlandNon-Executive Co-Chairman
The Lord Wright of RichmondNon-Executive Director
Richard OlverExecutive Director
John BryanNon-Executive Director
Bryan SandersonExecutive Director
H Laurance FullerExecutive Co-Chairman
Erroll Davis, JrNon-Executive Director
Michael WilsonNon-Executive Director
Floris MaljersNon-Executive Director
Rodney ChaseDeputy Group Chief Executive
Doug FordExecutive Director
78 BP Amoco 1999
The board and corporate governance
Board of directors

John BuchananExecutive Director
Michael MilesNon-Executive Director
Chris Gibson-SmithExecutive Director
Sir Robin NicholsonNon-Executive Director
Sir Ian ProsserDeputy Chairman
Charles KnightNon-Executive Director
Ruth BlockNon-Executive Director
Richard FerrisNon-Executive Director
Walter MasseyNon-Executive Director
Sir Robert WilsonNon-Executive Director
BP Amoco 1999 79

80 BP Amoco 1999
The board and corporate governance
Directors’ biographies
R S BlockNon-Executive DirectorRuth Block (69) joined Amoco’s board in1986. She retired as executive vice presidentand chief insurance officer of The Equitable in1987. She is a non-executive director of Ecolaband 35 Alliance Capital Mutual Funds.
Member of the Chairman’s Committee, Ethics and EnvironmentAssurance Committee and Remuneration Committee
Sir John Browne, F Eng Group Chief ExecutiveSir John (51) was appointed an executivedirector of BP in 1991 and group chiefexecutive in 1995. He is a non-executivedirector of Goldman Sachs Group and IntelCorporation, a trustee of the British Museumand a member of the supervisory board ofDaimlerChrysler. He is also vice president anda member of the board of the Prince of WalesBusiness Leaders Forum.
Member of the Nomination Committee
J H Bryan Non-Executive DirectorJohn Bryan (63) joined Amoco’s board in 1982.He is chairman and chief executive officer ofSara Lee Corporation and a non-executivedirector of Bank One Corporation, GeneralMotors Corporation and Goldman Sachs.
Member of the Chairman’s Committee and Audit Committee
Dr J G S Buchanan Chief Financial OfficerJohn Buchanan (56) was appointed anexecutive director of BP in 1996. He is a non-executive director of Boots and a memberof the UK Accounting Standards Board.
R F Chase Deputy Group Chief ExecutiveRodney Chase (56) was appointed an executivedirector of BP in 1992. He is a non-executivedirector of Diageo and the BOC Group.
E B Davis, Jr Non-Executive DirectorErroll B Davis, Jr (55) joined Amoco’s board in 1991. He is president and chief executiveofficer of Alliant Energy. He is a non-executivedirector of PPG Industries and a member ofthe American Society of Corporate Executives,Association of Edison Illuminating Companies,the Wisconsin Association of Manufacturersand Commerce, the Iowa Business Council, the Edison Electric Institute and the NuclearEnergy Institute. He is also a Trustee ofCarnegie Mellon University.
Member of the Chairman’s Committee, Audit Committee and Remuneration Committee
R J Ferris Non-Executive DirectorRichard Ferris (63) joined Amoco’s board in1981. He retired as co-chairman of DoubletreeCorporation in 1997. He is a non-executivedirector of The Procter & Gamble Company.
Member of the Chairman’s Committee andRemuneration Committee
W D Ford Chief Executive, Refining and MarketingDoug Ford (56) was appointed an executivedirector of BP Amoco in January 2000.Before the merger of BP and Amoco he hadbeen an executive vice president of Amocosince 1993. He is a non-executive director of USG Corporation.
H L Fuller Executive Co-ChairmanLarry Fuller (61) was appointed a director ofAmoco in 1981 and was elected chairman andchief executive officer in February 1991. He isa non-executive director of Chase ManhattanCorporation, Chase Manhattan Bank,Motorola, Security Capital Group and AbbottLaboratories. He also serves on the boards ofCatalyst, the American Petroleum Institute and the Rehabilitation Institute of Chicago,and is a trustee of The Orchestral Association.
Member of the Chairman’s Committee
Dr C S Gibson-Smith Executive Director, Policies and TechnologyChris Gibson-Smith (54) was appointed anexecutive director of BP in 1997. He is a non-executive director of Lloyds TSB.
C F Knight Non-Executive DirectorCharles Knight (64) joined BP’s board in 1987.He is chairman and chief executive officerof Emerson Electric and is a non-executivedirector of Anheuser-Busch, Morgan StanleyDean Witter, SBC Communications and IBM.
Member of the Chairman’s Committee andRemuneration Committee
F A Maljers Non-Executive DirectorFloris Maljers (66) joined Amoco’s boardin 1994. He is a member of the supervisoryboards of SHV Holding, Vendex N.V. andKLM Royal Dutch Airlines. He is chairmanof the supervisory board of the AmsterdamConcertgebouw N.V. and Rotterdam Schoolof Management, Erasmus University.
Member of the Chairman’s Committee and Ethics andEnvironment Assurance Committee
BP Amoco 1999 81
Dr W E Massey Non-Executive DirectorWalter Massey (61) rejoined Amoco’s board in1993, having previously been a director from1983 to 1991. He is president of MorehouseCollege and is a non-executive director ofMotorola, Bank of America, McDonald’sCorporation, the Mellon Foundation and theCommonwealth Fund.
Member of the Chairman’s Committee and chairman of the Ethics and Environment Assurance Committee
H M P Miles, OBE Non-Executive DirectorMichael Miles (63) joined BP’s board in 1994.He is chairman of Johnson Matthey and a non-executive director of ING Baring Holdingsand BICC.
Member of the Chairman’s Committee, Audit Committee and Ethics and Environment Assurance Committee
Sir Robin Nicholson, F Eng, FRS Non-Executive DirectorSir Robin (65) joined BP’s board in 1987. Heretired as chairman of Pilkington Optronics in1998. He is a non-executive director of Rolls-Royce and a member of the UK government’sCouncil for Science and Technology.
Member of the Chairman’s Committee
R L Olver Chief Executive, Explorationand ProductionDick Olver (53) was appointed an executivedirector of BP in 1998. He is a non-executivedirector of Reuters Group.
Sir Ian Prosser Deputy Chairman andNon-Executive DirectorSir Ian (56) joined BP’s board in 1997. He ischairman and chief executive of Bass, a non-executive director of SmithKline Beecham and vice president of the council of the Brewersand Licensed Retailers Association.
Member of the Chairman’s Committee and RemunerationCommittee and chairman of the Audit Committee
B K Sanderson, CBE Chief Executive, ChemicalsBryan Sanderson (59) was appointed anexecutive director of BP in 1992. He ischairman of Sunderland PLC, a non-executivedirector of Corus, president of CEFIC (theEuropean Chemical Industry Council) and vice president of the court of governors of the London School of Economics.
P D Sutherland, SC Non-Executive Co-ChairmanPeter Sutherland (53) rejoined BP’s board in1995, having previously been a non-executivedirector from 1990 to 1993. He was appointedchairman of BP in 1997. He is chairman ofGoldman Sachs International and a non-executive director of Telefonaktiebolaget LMEricsson, Investor AB and ABB. He is on theadvisory board of the Council on ForeignRelations and is chairman of the OverseasDevelopment Council.
Chairman of the Chairman’s Committee and chairman of the Nomination Committee
M H Wilson Non-Executive DirectorMichael Wilson (62) joined Amoco’s board in 1993. He is vice chairman and a director of RBC Dominion Securities. He is a non-executive director of Manufacturers LifeInsurance Company and Rio Algom.
Member of the Chairman’s Committee and Audit Committee
Sir Robert Wilson, KCMG Non-Executive DirectorSir Robert (56) joined BP’s board in 1998.He is chairman of Rio Tinto and a non-executive director of Diageo.
Member of the Chairman’s Committee, Audit Committee and Ethics and Environment Assurance Committee
The Lord Wright of Richmond, GCMG Non-Executive DirectorLord Wright (68) joined BP’s board in 1991,having been permanent under-secretary andhead of the UK Diplomatic Service. He is a non-executive director of De La Rue.
Member of the Chairman’s Committee and Ethics andEnvironment Assurance Committee and chairman of the Remuneration Committee
Changes to the boardMr W G Lowrie resigned as an executivedirector on 12 February 1999.
Mr H L Fuller will resign from the board on 31 March 2000.
Mr W D Ford was appointed an executivedirector with effect from 1 January 2000.

82 BP Amoco 1999
The board and corporate governance
Board report on executive directors’ remuneration
During the 12 months following the merger between BP and Amoco,the Remuneration Committee of the board has undertaken acomprehensive review of the way in which it determines theremuneration of executive directors and of the effectiveness of its policies for the needs of the merged company. BP Amococompetes globally for business and for customers, with eachbusiness stream of the company now exceeding most FTSEcompanies in size. It also competes globally for talent, with fewerthan half of its top management team being of British nationality.
In its review the committee was assisted by ateam of independent consultants in a study ofother global-scale companies, with a particularemphasis on those based in Europe. Havingtaken account of that study, and of thedevelopment of the company, the committeehas concluded that an individual director’shome nationality should be regarded as ofsecondary importance in setting remuneration.Therefore, in order to ensure greater equity at board level, all executive directors will nowhave their potential remuneration set againstglobal competitive comparisons, irrespective of their own nationality. The remuneration of BP Amoco’s directors will continue to becompared with the remuneration of directors in their own countries (in companies ofappropriate scale and global spread) to ensurethat remuneration policies and practices remaincompetitive in the home market. Furtherrigorous comparisons will then be made againstan international set of appropriate companies.
The committee has also decided that theremuneration of executive directors should in future be managed separately from that ofother senior executives. Shareholders’ agreementwill be sought for the creation of an ExecutiveDirectors’ Incentive Plan for their remuneration.Directors will then be excluded from futureparticipation in any other incentive plans.The following information relates specifically tothe reward of executive directors, unless statedotherwise.
Changes made during 1999There have been two immediate outcomesof the changes to the company’s rewardphilosophy for executive directors. The first hasbeen a set of adjustments to base salaries during1999, which have also affected annual incentivebonuses for the year. Secondly, long-termincentive grants in the 1997 and 1998 LongTerm Performance Plans (LTPPs) have beenadjusted to provide a means of reducing theimbalance in rewards between former BP andformer Amoco directors following the merger.These potential long-term plan awards are inline with plans approved by shareholders inlate 1998.
Proposed changes in 2000The major change proposed for 2000 is the introduction of the Executive Directors’Incentive Plan which will provide for thegranting of performance shares, share optionsand cash incentives at the discretion of theRemuneration Committee.
The committee proposes to introduce twocomponent plans under the umbrella of theExecutive Directors’ Incentive Plan – a long-term performance plan and a stock option plan.The first plan will mirror the existing plan forsenior executives in the company while theoption plan will be structured to extend thetimescale of the performance-reward linkage.The proposed target structure for the twocomponent plans is set out in the table on
page 83, which shows the updated competitorset for the long-term plan measure, and givesoutline details of the annual incentive plantargets for 2000 and of the performancecondition that is under consideration for the granting of share options.
No changes are proposed in the way theLong Term Performance Plan will operatefor executive directors. The rules of thecurrent Plan were approved by shareholdersin November 1998. Future grants to directorsunder the Executive Directors’ Incentive Planwill be managed in the same way and subject to the same targets and conditions, includingthe plan design feature which requires directorsto build up a personal shareholding in thecompany equal in value to at least five timestheir annual salary.
In 1998, when shareholders approved thecurrent BP Amoco Share Option Plan, it was considered appropriate to maintain thecompetitive focus on the oil sector, and it wastherefore unnecessary to grant share options to UK directors who participated in the LongTerm Performance Plan. Share options weregranted in addition to LTPP only to NorthAmerican directors, as is normal practice inNorth America. A number of factors have now changed.
reward philosophyThe remuneration of executive directors in BP Amoco will be based on the following guiding principles:• total potential rewards will be set at levels sufficient to retain high-calibre and high-potential staff who
will have alternative employment opportunities within a global market• total potential rewards will be earned by the achievement of demanding performance targets based on
measures which represent the best interests of the shareholders in the short, medium and long term (see graph)
• incentive plans, performance targets and participating conditions will be structured to ensure that directorswill be fully aligned with the best interests of the company at all stages of the business cycle
• levels of reward for meeting business targets will be fully competitive within the appropriate market whileoutstanding rewards will be given for delivering world-class results
• remuneration policies and incentive plans will be designed to meet the highest standards of internationalindustry
executivedirectors’ total
annualizedremuneration
globalcompanyleadership
sectorleadership
strongmedian
BP Amoco’s performance relative to sector and wider industry

BP Amoco 1999 83
First, to meet the board’s new emphasis onsetting the potential rewards of all executivedirectors at a more equitable level of globalcompetitiveness, there is a consequent need toincrease the scale of long-term incentive grantsfor some directors. In coming to the conclusionthat this could be best achieved through use ofshare options, in addition to the LTPP grants,the emphasis has been on how best to driveperformance forward in the coming years. The LTPP will still predominate as thecompany’s long-term incentive vehicle, and ithas already helped BP Amoco to achieve theaims of maximizing performance through allcycles in the oil sector.
In addition to maintaining that performance,it was felt appropriate to incorporate a newlevel of ‘stretch’ into long-term incentivesthrough the use of a new and very challengingperformance measure, the FTSE Global 100group of companies. This wider competitor setgives BP Amoco’s executive directors greaterexposure to competition with non-oil sectorperformance, as well as creating betteralignment with shareholders by giving increasedexposure to the absolute performance of theequity market itself. (The LTPP measuresrelative performance.)
Taking all this into account, the board favoursa policy of making a balance of grants underboth the three-year LTPP and the longer-termshare option plan, i.e. following the approachwhich is currently taken in respect of our USexecutive directors.
The remuneration policy for the most seniorexecutives below board level will be alignedwith the policy for executive directors, albeitwith a stronger focus on national marketcomparisons. In particular, share option grantsunder the 1998 Plan may be made to seniorexecutives in addition to their participation in the Long Term Performance Plan andirrespective of their nationality.
The remainder of this report contains details of awards made in 1999 to executive directorsunder the incentive compensation plans, andincludes the remuneration data required by the London Stock Exchange. It contains thefollowing sections:
• Performance measures and targets for 2000
• Reward process – The RemunerationCommittee
• Report on 1999 – Company performanceand remuneration data for executivedirectors
• Long-term incentives
• Other executive reward features.
performance measures and targets for 2000Annual Bonus targets focus on internal operating plans and are a mix of financial targets andperformance leadership objectives. The financial targets concentrate on savings in cash costs and bonus underlying performance improvement relative to competitors and market expectations,
while the leadership objectives include safety, environment, people, organization and investment issues.These targets are embedded within performance contracts which reflect the operatingplans of the company, and are subject to board decision.Each year’s performance provides the platform for the next year’s targets, providinga continuous drive to higher levels of achievement.
Long Term LTPP focuses on performance within the oil sector and looks at performance against Performance Plan demanding three-year shareholder return, profitability and growth targets.(LTPP) For all three measures BP Amoco’s performance is assessed in relation to the oil majors:
Chevron, ENI, ExxonMobil, Repsol YPF, Royal Dutch Shell, Texaco and TotalFina.The maximum award can be made only when performance has been ahead of thecompetitor group on all three performance measures. For second and lower rankingsprogressively lower awards are made. Participants benefit only when they deliverresults above the median for this group.
Share options Option grants will be related to performance comparisons with a wide selection of global companies. The Remuneration Committee will take into account the ranking of thecompany’s total shareholder return (TSR) against the TSR of the FTSE Global 100 group of companies over the three-year period preceding the date of grant in setting the scaleof grants.Options granted to former Amoco employees during 1999-2000 will not be subject to any additional performance conditions, in line with the practice followed previously in Amocoa.
a Under the terms of the merger agreement, options granted to former Amoco group employees must, for at least two years, be no less favourablethan their previous arrangements.
description of planBase salary Fixed sum, payable monthly in pensionable cash, recognizing ongoing market worth.
Salaries reviewed annually in line with global companies, and targeted at the median of the appropriate survey groups for fully effective job performance. Higher salaries onlypaid where justified by sustained higher level of individual contribution.Surveys are conducted on a regular basis by a leading remuneration consultancy andlook at remuneration levels in an international mix of companies with comparable size,complexity and global spread of operations.
Annual Variable sum, potentially awarded annually in non-pensionable casha.performance Recognizes performance against demanding annual targets set out in annual bonus performance contracts.
Target bonus level for executive directors is 70% of base salary in 2000.If contract levels of performance are achieved so that the target bonus is earned,executive annual remuneration levels reach a median position of the relevant globalemployment market.A stretch bonus level is also identified for when targets are substantially exceeded (for directors, this is 105% of salary in 2000).Outstanding performance may be recognized by bonus payments in excess of the stretch level at the discretion of the Remuneration Committee.
Long-term The Long Term Performance Plan (LTPP) consists of rolling three-year performance incentives periods, at the beginning of which participants receive a grant of performance units.
Any potential LTPP award is a variable, taxable sum, in sharesb, given after theperformance period.Share awards have a minimum of a further three years’ retention in trust and no shareswill be released until the director has a personal holding in BP Amoco shares, within thePlans, equivalent to 5 x base salary.
Share options Share options may be granted in proportion to the ranking of the company by totalshareholder return over a three-year period relative to the FTSE Global 100 set ofcompanies. Options will vest three years after grant without further performanceconditions.
a Bonuses to North American executives are pensionable/benefits-bearing.b Depending on the technical constraints in each country in which the Plan is operated, the committee may award shares to participants or fund
the purchase of shares by participants.

84 BP Amoco 1999
Reward process –The Remuneration CommitteeRoleThe Remuneration Committee’s role is to determine the terms of engagement andremuneration of the group chief executive andthe executive directors. The committee alsoestablishes the principles for the remunerationof other senior executives, which in turnprovide the framework for remunerating allemployees. At the beginning of the year thecommittee sets challenging and demandingperformance targets for the executive directorsand at the end of the year makes awards whichreflect the year’s performance.
MembershipMembership of the committee is shown onpages 80-81. The committee members haveno personal financial interests, other than asshareholders, in the matters to be decided.They have no conflicts arising from cross-directorships or day-to-day involvement inrunning BP Amoco.
The committee actively solicits professionaladvice from independent outside consultants.
ComplianceThe constitution and operation of thecommittee are in compliance with the‘Principles of Good Governance and Code of Best Practice’ set out by the London StockExchange (the ‘Combined Code’).
Ernst & Young have confirmed that the scopeof their report on the accounts covers thedisclosures contained in this report that arespecified for audit by the London StockExchange.
Report on 1999 – company performance,plan awards and remuneration data Company performance 1999 was the first year of operation of the newlymerged BP Amoco. A new strategy was createdfor the company and is being implemented.
1999 was a year of outstanding achievement.Operating performance reflected the substantialbenefits of restructuring and integrationfollowing the merger, together with ongoingcost control. Replacement cost profit beforeexceptional items was $5.3 billion.
The saving of cash costs was the mostimportant group objective in 1999, andperformance improvements (mainly cash costs)contributed $2.5 billion before tax to the resultsfor the year.
Return on average capital employed (ROACE)and earnings per share (EPS) were both strong,and very competitive in the sector.
Although oil prices were higher on averageduring 1999 (up from an average realization of $12.1 per barrel in 1998 to $16.7 in 1999),the effect of this on the company’s overallperformance was offset by reduced marginsin our chemicals and refining and marketingbusinesses.
From a non-financial perspective, excellentprogress has been made on many fronts, but two highlights stand out. First, ‘people’,where employee satisfaction polls show strongperformance on a wide range of externalbenchmarks, despite the uncertainty caused by the merger integration activities, and second,‘technology’, where integration benefits havebeen far stronger than anticipated.
Base salary awards in 1999Base salaries for executive directors wereadjusted in two steps during the year by a total average increase of 22% to reflect theincreased scale and complexity of directors’responsibilities.
Bonus awards for 1999 performanceBonus awards for executive directors weresignificantly higher in respect of 1999’s strong performance.
The board and corporate governance
BP Amoco performance1999 1998
Oil pricea $/barrel 16.7 12.1Cash from operations $ billion 10.3 9.6Net cash flow $ billion (0.1) (0.9)RCPb $ billion 5.3 4.0ROACEc % 12 9EPSd cents 28 21EPS growthe % 33 –Debt ratio % 23 23Bonus rating 148 75/65f
a BP Amoco average oil realizations.b Replacement cost profit before exceptional items.c Return on average capital employed.d Earnings per share based on replacement cost profit before
exceptional items.e EPS growth is year on year.f 75 for BP and 65 for Amoco.
1999 annual remunerationAnnual Benefits
performance and other 1999 1998$ thousand Base salary bonus emoluments total total
Sir John Browne 1,120 1,137 94 2,351 1,514Dr J G S Buchanan 657 673 70 1,400 899R F Chase 737 754 61 1,552 962H L Fuller 1,096 1,302 36 2,434 1,674Dr C S Gibson-Smith 579 590 62 1,231 838W G Lowrie 188 126 4 318 1,049R L Olver 587 596 68 1,251 948B K Sanderson 668 685 80 1,433 987
Totals 5,632 5,863 475 11,970 8,871
The table above represents annual remuneration earned by, and paid to, executive directors in the 1999 financial year, with the exception ofbonuses (which were earned in 1999 but paid in 2000). A conversion rate of £1 = $1.62 has been used for 1999, £1 = $1.66 for 1998.70% target bonus applied in 1999 to all executive directors except H L Fuller (80% target/120% maximum).

BP Amoco 1999 85
BP Amoco Long Term Performance PlanLong-term performance plansAwards made in 1999 under the BP Long TermPerformance Plan related to the 1996-98 Plan.Estimates of grant values were indicated inBP Amoco’s 1998 Annual Report.
Awards to be made in 2000 under the BPLong Term Performance Plan relate to the1997-99 Plan.
BP Amoco came first in the 1997-99 Plan, andthe Remuneration Committee expects to makea maximum award. The primary performancemeasure, BP Amoco’s shareholder return againstthe market (SHRAM), was 15%. BP Amocowas the only company in the peer group toexceed market returns during the three-yearperiod, and was more than 20% ahead of thenearest-ranked competitor.
Potential awards to executive directors,including an indicative range of potentialawards under the 1998 and 1999 Plans for which awards would be payable in 2001 and 2002, are set out in the table below.
At the time of the merger the RemunerationCommittee decided to set minimum awardlevels for all participants in the 1998 Plan,including executive directors. This decisionwas based on pre-merger announcementcomparisons of total shareholder returns, andprovides an indication for participants that thefinal outcome will be no less than the SHRAMperformance measure position which BP held,in relation to its peer group comparators, beforethe merger. As mentioned previously, someexecutive directors have also had additionalgrants, under these plans, to bring them closerto a common global standard of long-termincentive.
long-term performance plansPerformance period of Plan 1996-98 1997-99 1998-2000 1999-2001
0 005 0051 005
Year of award 1999 2000 2000 2001 2002Award Potential Award Range of potential awardsd
valuea awardb valuec (number of shares)000001111
$’000 (shares) $’000 Minimum Maximum Target Maximum
Current executive directorsSir John Browne 1,500 527,600 4,036 80,280 532,600 270,000 540,000Dr J G S Buchanan 1,188 323,400 2,474 47,700 319,800 160,000 320,000R F Chase 1,500 329,800 2,523 51,540 339,000 180,000 360,000W D Ford – – – – – 50,000 100,000H L Fuller – – – – – 135,000 270,000Dr C S Gibson-Smith 1,030 285,800 2,186 45,480 297,400 144,000 288,000R L Olver 876 285,800 2,186 45,480 297,400 144,000 288,000B K Sanderson 1,500 329,800 2,523 51,540 339,000 160,000 320,000
S J Ahearnee 500 – – – – – –K R Seale 1,000 54,200 415 – – –Dr R W H Stomberge 1,000 54,200 415 – – – –
a Based on average market price at date of award (£5.70/$9.23) at £1=$1.62.b Based on assessed performance and the other terms of the Plan.c Based on mid-market price of BP Amoco shares on 14 February 2000 (£4.81/$7.65 at £1=$1.59).d Minimum awards were determined for this Plan prior to the completion of the merger.
Actual awards will be determined at the end of each performance period.e S J Ahearne, K R Seal and Dr R W H Stomberg are former executive directors of BP.
Long-term incentive awards
The total number of shares that may beawarded to all directors under the 1997-99 Plan is 2,190,600 with a value of $16.8 millionbased on a share price of £4.81/$7.65 at £1=$1.59(mid-market price on 14 February 2000).
Serving recipients in the LTPP are obliged to have the balance of their 1997-99 awardsretained in trust for at least a further threeyears. This restriction also applies to futurePlans, together with additional shareownership requirements.
40
60
80
100
120
9796 98 99
shareholder return against the market – SHRAM %
BP Amoco range of other oil majors
BP Amoco +15%
highest competitor +4%
lowest competitor -30%
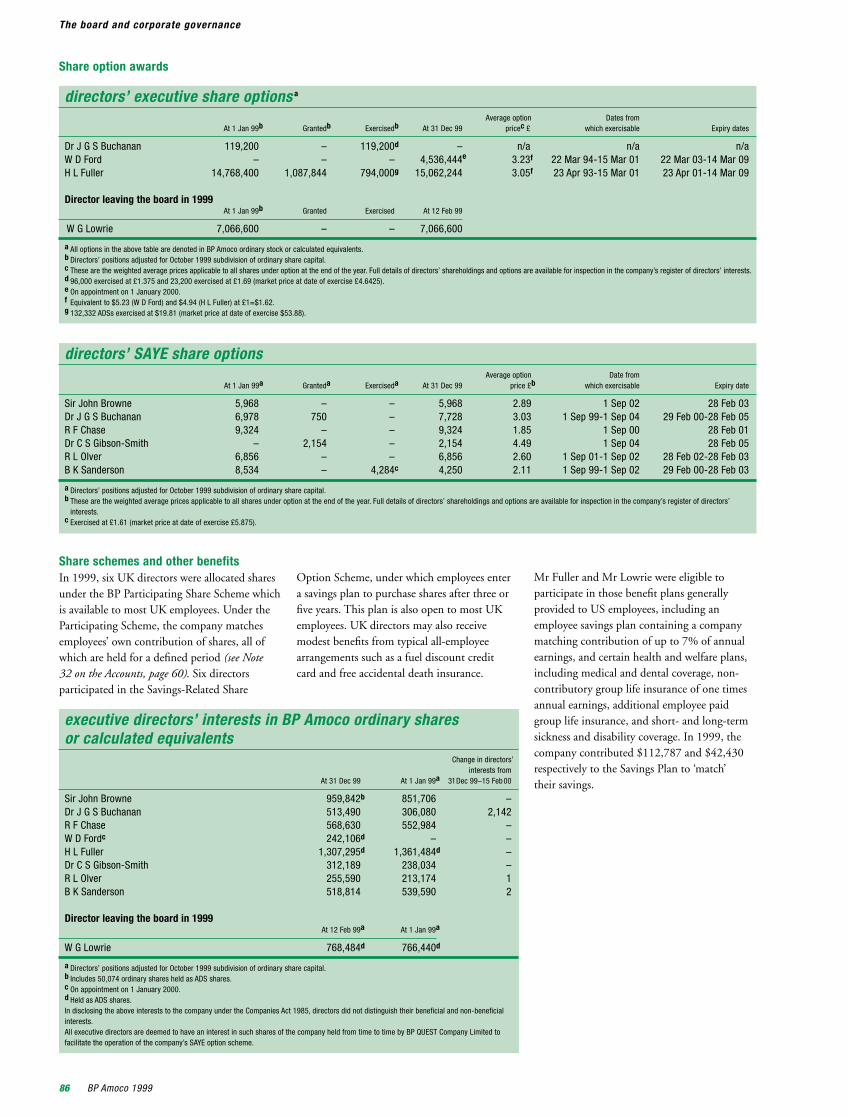
86 BP Amoco 1999
Share schemes and other benefitsIn 1999, six UK directors were allocated sharesunder the BP Participating Share Scheme whichis available to most UK employees. Under theParticipating Scheme, the company matchesemployees’ own contribution of shares, all ofwhich are held for a defined period (see Note32 on the Accounts, page 60). Six directorsparticipated in the Savings-Related Share
Option Scheme, under which employees entera savings plan to purchase shares after three orfive years. This plan is also open to most UKemployees. UK directors may also receivemodest benefits from typical all-employeearrangements such as a fuel discount creditcard and free accidental death insurance.
Mr Fuller and Mr Lowrie were eligible toparticipate in those benefit plans generallyprovided to US employees, including anemployee savings plan containing a companymatching contribution of up to 7% of annualearnings, and certain health and welfare plans,including medical and dental coverage, non-contributory group life insurance of one timesannual earnings, additional employee paidgroup life insurance, and short- and long-termsickness and disability coverage. In 1999, thecompany contributed $112,787 and $42,430respectively to the Savings Plan to ‘match’their savings.
The board and corporate governance
Share option awards
directors’ SAYE share optionsAverage option Date from
At 1 Jan 99a Granteda Exerciseda At 31 Dec 99 price £b which exercisable Expiry date
Sir John Browne 5,968 – – 5,968 2.89 1 Sep 02 28 Feb 03Dr J G S Buchanan 6,978 750 – 7,728 3.03 1 Sep 99-1 Sep 04 29 Feb 00-28 Feb 05R F Chase 9,324 – – 9,324 1.85 1 Sep 00 28 Feb 01Dr C S Gibson-Smith – 2,154 – 2,154 4.49 1 Sep 04 28 Feb 05R L Olver 6,856 – – 6,856 2.60 1 Sep 01-1 Sep 02 28 Feb 02-28 Feb 03B K Sanderson 8,534 – 4,284c 4,250 2.11 1 Sep 99-1 Sep 02 29 Feb 00-28 Feb 03
a Directors’ positions adjusted for October 1999 subdivision of ordinary share capital.b These are the weighted average prices applicable to all shares under option at the end of the year. Full details of directors’ shareholdings and options are available for inspection in the company’s register of directors’
interests.c Exercised at £1.61 (market price at date of exercise £5.875).
directors’ executive share options a
Average option Dates from At 1 Jan 99b Grantedb Exercisedb At 31 Dec 99 pricec £ which exercisable Expiry dates
Dr J G S Buchanan 119,200 – 119,200d – n/a n/a n/aW D Ford – – – 4,536,444e 3.23f 22 Mar 94-15 Mar 01 22 Mar 03-14 Mar 09H L Fuller 14,768,400 1,087,844 794,000g 15,062,244 3.05f 23 Apr 93-15 Mar 01 23 Apr 01-14 Mar 09
Director leaving the board in 1999At 1 Jan 99b Granted Exercised At 12 Feb 99
W G Lowrie 7,066,600 – – 7,066,600
a All options in the above table are denoted in BP Amoco ordinary stock or calculated equivalents.b Directors’ positions adjusted for October 1999 subdivision of ordinary share capital.c These are the weighted average prices applicable to all shares under option at the end of the year. Full details of directors’ shareholdings and options are available for inspection in the company’s register of directors’ interests.d 96,000 exercised at £1.375 and 23,200 exercised at £1.69 (market price at date of exercise £4.6425).e On appointment on 1 January 2000.f Equivalent to $5.23 (W D Ford) and $4.94 (H L Fuller) at £1=$1.62.g 132,332 ADSs exercised at $19.81 (market price at date of exercise $53.88).
executive directors’ interests in BP Amoco ordinary shares or calculated equivalents
Change in directors’interests from
At 31 Dec 99 At 1 Jan 99a 31Dec 99–15 Feb 00
Sir John Browne 959,842b 851,706 –Dr J G S Buchanan 513,490 306,080 2,142R F Chase 568,630 552,984 –W D Fordc 242,106d – –H L Fuller 1,307,295d 1,361,484d –Dr C S Gibson-Smith 312,189 238,034 –R L Olver 255,590 213,174 1B K Sanderson 518,814 539,590 2
Director leaving the board in 1999At 12 Feb 99a At 1 Jan 99a
W G Lowrie 768,484d 766,440d
a Directors’ positions adjusted for October 1999 subdivision of ordinary share capital.b Includes 50,074 ordinary shares held as ADS shares.c On appointment on 1 January 2000.d Held as ADS shares.In disclosing the above interests to the company under the Companies Act 1985, directors did not distinguish their beneficial and non-beneficialinterests.All executive directors are deemed to have an interest in such shares of the company held from time to time by BP QUEST Company Limited tofacilitate the operation of the company’s SAYE option scheme.

BP Amoco 1999 87
Other executive reward featuresPension entitlement – UK directorsPension and other benefits have regard tocompetitor practice in the home country ofeach senior executive.
In the UK, eligible staff can join the BP PensionScheme, which offers Inland Revenue-approvedretirement benefits, based on final salary.
Scheme members’ core benefits, which are non-contributory, comprise a pension accrual rateof 1/60th of final basic salary for each year ofservice, inclusive of a proportion of the basicstate pension, up to a limit of two-thirds of finalbasic salary; a lump-sum death-in-servicebenefit of three times salary; and a dependant’sbenefit of two-thirds of actual or prospectivepension. The link between the Scheme pensionand the basic state pension will cease for allmembers on 1 May 2000.
Normal retirement age is 60, but members who have 30 or more years’ service at the age of 55 can opt to retire early without an actuarialreduction to their pension.
Post-retirement pensions are reviewed annually,and increases are guaranteed equivalent to theRetail Price Index (up to 5%).
Directors who are members of the BP PensionScheme accrue pension at the enhanced rate of2/60ths of their final basic salary for each yearof service as managing directors (up to the sametwo-thirds limit). No contributions are payableby executive directors.
None of the directors is affected by the‘pensionable earnings cap’.
The BP Pension Scheme is the principal sectionof the BP Pension Fund, the latter beingestablished under a trust deed. Contributions to the Fund are made on the advice of theactuary appointed by the Trustee directors. No contributions were made to the Fund by the company in 1999 in respect of pensionsaccruing under the BP Pension Scheme.
Total emolumentsThe total emoluments figures reported in Note34 on the Accounts, page 61, include salary and benefits earned by and paid to executivedirectors during the relevant financial year, plus bonuses, which are paid in the followingyear, plus the value of the awards made in 1999under the 1996-98 LTPP in respect of the threeyears covered by that Plan.
Pension entitlement – US directorsAll current US directors participate in theEmployee Retirement Plan for AmocoCorporation. Under this retirement plan, theamount of the annuity which they are eligibleto receive on a single-life basis is determinedunder an annuity benefit formula.
The annuity benefit formula (including apercentage of US Social Security benefits) iscalculated at 1.67% x the employee’s years ofparticipation x average annual earnings. Suchearnings for Plan purposes are determined bytaking separately the three highest consecutivecalendar years’ earnings from salary and the three highest consecutive calendar years’bonus awards during the 10 years precedingretirement. The maximum annuity is 60%of such average annual earnings. Years ofparticipation in the Plan in excess of 36 do not result in additional benefits.
Normal pensionable age in the US Plan is 65.There is no actuarial reduction to the pensionwhich becomes payable between age 60 and 65,but a reduction of 5% a year is applied if paidbetween age 50 and 59.
In line with US tax regulations, benefits areprovided as appropriate through a combination oftax qualified and restoration/non-qualified plans.
Service contractsAll UK executive directors appointed since1996 hold a contract of service which includes a one-year period of notice. Sir John Browneand Mr Chase were appointed prior to 1996and have contracts which include a two-yearnotice period. The board does not consider it
in shareholders’ interests to renegotiate thesecontracts. Mr Sanderson’s contract is due toexpire in 2000 when he reaches the age of 60.Under each contract, the company reserves theright to make a payment in lieu of notice.
Dr Stomberg was a director of BP prior to hisretirement at the end of 1997 and served as aspecial adviser to the group chief executive onEuropean matters at a fixed annual salary ofDM1.1 million until the end of 1999.
Mr Fuller’s and Mr Lowrie’s secondments toBP Amoco p.l.c. commenced on 31 December1998. Their underlying US employmentagreements with BP Amoco Corporation have a three-year period. Mr Fuller is due to retire inMarch 2000. Mr Lowrie’s UK secondment wassubject to termination by mutual agreement,after which he would return to the USA and be subject to the terms of that US employmentagreement. His secondment terminated on1 April 1999, and he received a payment of$6,126,414 in line with the terms of his USagreement.
On his appointment as an executive director,Mr Ford’s contractual arrangements wereadjusted to provide for termination on oneyear’s notice and retirement at 60. Mr Ford’ssalary in this post is $620,000. If his contractis terminated by the company without cause,Mr Ford will be entitled to compensation of$1 million a year (pro rated for part years)for each year remaining between the date ofseverance and the date he turns 60. As anexpatriate, Mr Ford receives a resettlementallowance of $450,000 a year whichterminates on 31 December 2002.
pension entitlement – UK directors Additional Additional
pension earned pension earnedYears of Accrued during the during the
service at entitlement at year ended year ended$ thousanda 31 Dec 99 31 Dec 99 31 Dec 99 31 Dec 98
Sir John Browne 33 880 252 45Dr J G S Buchanan 30 447 118 32R F Chase 35 551 128 32Dr C S Gibson-Smith 29 393 95 27R L Olver 26 416 115 27B K Sanderson 35 486 63 32
a A conversion rate of £1 = $1.62 has been used for 1999, £1 = $1.66 for 1998.
pension entitlement – US directorsAdditional Additional
pension earned pension earnedYears of Accrued during the during the
service at entitlement at year ended year ended$ thousand 31 Dec 99 31 Dec 99 31 Dec 99 31 Dec 98
H L Fuller 38 1,172a 26 128W G Lowrie 33 491b 16 111
a Includes a temporary annuity payable until age 62 of $7,092.b Includes a temporary annuity payable until age 62 of $6,704. Accrued entitlement as at 1 April 1999 (date of retirement).

88 BP Amoco 1999
Shareholdings and annual general meeting
The tables above give an indication of holdingsof BP Amoco shareholders, stated in ordinaryshare equivalents. In addition, there wereapproximately 353,000 beneficial holders of BP Amoco ADS shares in a ‘Street Name’(e.g. bank or brokerage firm).
At 31 December 1999 there were also 2,147preference shareholders.
Substantial shareholdingsAt the date of this report, the company hasbeen notified that Morgan Guaranty TrustCompany of New York, as depositary forAmerican Depositary Shares (ADS shares),holds interests in 5,520,864,508 ordinaryshares (28.33% of the company’s ordinary share capital). Included in this total are partof the respective holdings of FMR Corp andFidelity International Limited (together FMR)and of the Kuwait Investment Offices (KIO).Either directly or through nominees, FMRholds interests in 590,789,583 ordinary shares(3.03% of the company’s ordinary share capital)and the KIO in 715,040,000 ordinary shares(3.67% of the company’s ordinary share capital).
Annual General MeetingThe 2000 annual general meeting will be held on Thursday 13 April 2000 at 11.00 a.m.at the Royal Festival Hall, Belvedere Road, London SE1 8XX, UK. The notice conveningthe meeting is sent to shareholders separatelywith this report, together with an explanationof the items of special business to be consideredat the meeting.
All substantive resolutions will be decided on a poll. Voting on a show of hands is reservedsolely for procedural matters and the efficientrunning of the meeting.
Ernst & Young have expressed their willingnessto continue in office as auditors and theirreappointment will be proposed at the annualgeneral meeting.
By order of the boardJudith C HanrattySecretary15 February 2000
PercentageNumber of of total
Category shareholders shareholders
UK 358,404 70.3USA 135,528 26.6Rest of World 15,690 3.1
Total shareholders 509,622 100.0
BP Amoco shareholdings at 31 December 1999 (ordinary share equivalents)Percentage Percentage Percentage Percentage
Number of of total of share Number of of total of shareRange of holdings shareholders shareholders capital Category shareholders shareholders capital
§0111100000001§ 11§1111000000005
1 – 100 60,407 11.9 0.0 Individuals 463,266 90.9 8.3101 – 200 24,015 4.7 0.0 Companies 5,990 1.2 1.4201 – 1,000 174,549 34.3 0.4 Trust companies 8,388 1.6 1.71,001 – 10,000 208,998 41.0 3.5 (pension funds etc.)10,001 – 100,000 37,860 7.5 4.8 Banks and nomineesa 31,462 6.2 87.2100,001 – 1,000,000 2,703 0.4 4.0 Insurance and assurance companies 50 0.0 1.4Over 1,000,000 1,090 0.2 87.3 Miscellaneous 466 0.1 0.0
§0111100000001§ 11§1111000000005
Total shareholders 509,622 100.0 100.0 Total shareholders 509,622 100.0 100.0§0111100000001§ 11§1111000000005
a Includes the 3.67% holding of the State of Kuwait.The total number of ordinary shares in issue at 31 December 1999 was 19,484,024,424 of which approximately 5,521,546,786 were represented byAmerican Depositary Shares (ADS shares). As at this date, 5,444,143,600 shares were held in bearer form, including 39,640,218 ordinary shares heldin respect of unexchanged Amoco shares (15,517 holders).

BP Amoco 1999 89
Information for ordinary or preference shareholders
With effect from 4 October 1999, BP Amocosubdivided (or split) its ordinary share capital.As a result, the number of ordinary shares heldat the close of business on Friday 1 October1999 doubled. New certificates representingthe total number of BP Amoco ordinary sharesheld immediately following the subdivisionwere dispatched to certificated holders duringOctober and replaced any certificates datedbefore 4 October 1999. Any certificates datedprior to 4 October 1999 are therefore nolonger valid.
Holders of ordinary shares in electronic formthrough CREST had their CREST accountscredited with the new shares on 4 October 1999.
The information in this section reflects thesubdivision.
Share price information BP Amoco ordinary shares are traded on stockexchanges in the UK, France, Germany,Switzerland and Japan. BP Amoco is listed onthese stock exchanges under the symbol ‘BPA’.
Details of trading activity and share priceinformation are published under ‘BP Amoco’in the share tables of most daily newspapersand on BP Amoco’s website atwww.bpamoco.com/investors
Dividend informationFor details of the cash dividends payable onordinary shares please refer to page 4. Dividendson first and second preference shares are paidon 31 January and 31 July of each year.
TaxationThis section is intended only for individualshareholders who are subject to UK taxation, and does not take into account overseas taxation.
As a result of changes announced by theChancellor of the Exchequer, from 6 April 1999the tax credit on dividends was reduced from20% to 10% of the gross amount. Lower andbasic rate taxpayers will continue to have nofurther tax liability. Non-taxpayers are no longerable to reclaim the tax credit on cash dividendspaid on or after 6 April 1999. Higher rate taxon dividend income has been reduced to 32.5%of the gross amount.
ordinary share market price range
1999 1998pence High Low High Low
1st Quarter 539.50 411.00 466.75 373.002nd Quarter 595.50 504.75 484.25 415.503rd Quarter 642.50 532.50 455.00 368.504th Quarter 643.50 538.00 478.25 407.50

90 BP Amoco 1999
With effect from 4 October 1999, BP Amocosplit (or subdivided) its ordinary share capital.This resulted in holders of ADS shares receivinga two-for-one stock split. Therefore, for everyADS share held before the stock split a holderreceived an additional ADS share.
Generally, ADS shareholders received theadditional shares in book-entry form, creditedto their shareholder account. Following the stocksplit, ADS holders were mailed either a book-entry statement or share certificate representingtheir additional ADS shares.
The information in this section reflects thestock split.
Share price information BP Amoco ADS shares are traded in NorthAmerica on the New York, Chicago, Pacificand Toronto stock exchanges. One ADS sharerepresents six ordinary shares. BP Amoco islisted on these stock exchanges under thesymbol ‘BPA’.
Details of trading activity and share priceinformation are published under ‘BP Amoco’in the share tables of most daily newspapersand on BP Amoco’s website atwww.bpamoco.com/investors
Information for ADS shareholders
Dividend informationFor details of the US dollar dividends payableplease refer to page 4. The table above gives theequivalent Canadian dollar amounts.
TaxationADS holders are generally eligible for alldividends or other entitlements attaching to theunderlying ordinary shares of BP Amoco andreceive all cash dividends in US dollars.
In addition, qualifying US ADS holders maybe entitled, under the United States-UnitedKingdom Income Tax Convention (the Treaty),to a UK tax credit, which is currently equal toone-ninth of the announced dividend. However,while most US ADS holders are deemed to havereceived the UK tax credit, it is entirely offset,under the Treaty, by an amount treated as a UKwithholding tax. Consequently, the net result forUS ADS holders is a dividend payment equal tothe announced dividend.
The IRS has recently confirmed that, in the caseof qualifying US ADS holders, subject to certainlimitations, the UK withholding tax as determinedby the Treaty will be treated as a foreign incometax that is eligible for credit against the holder’sfederal income tax.
To qualify for such credit, US ADS holdersmust make an election on Form 8833 (Treaty-based Return Position Disclosure), whichmust be filed with the shareholder’s tax return,in addition to any other filings that may berequired. At the end of the calendar year duringwhich the dividends are paid, US ADS holderswill receive a Form 1099 confirming theamount of dividends received. Shareholdersare encouraged to consult their financial or tax advisers regarding any taxation issue.
Information for unexchangedAmoco shareholdersAny Amoco shareholders who have not yetexchanged their holdings into the form ofBP Amoco ADS shares should immediatelycontact the Exchange Agent at MorganGuaranty Trust Company of New York,Corporate Reorganization, P. O. Box 842007,Boston, MA 02284-2007, USA (telephone toll-free +1 877 272 4321).
Until their Amoco shares have been exchanged,Amoco shareholders do not have the right toreceive dividends, vote or receive reports fromthe company. Under US regulations, anyaccrued dividend income may be taxable and willcontinue to be reported for the year in which thedividend is payable.
ADS share market price range1999 1998
US$ High Low High Low
1st Quarter 52.66 40.19 48.00 36.882nd Quarter 57.69 47.00 48.66 41.443rd Quarter 61.16 52.50 45.88 36.504th Quarter 62.63 51.38 47.69 40.72
cash dividend payable in Canadian dollars per ADS share
1Q 2Q 3Q 4Q Total
1995 0.207 0.277 0.272 0.284 1.0401996 0.277 0.338 0.350 0.369 1.3341997 0.374 0.394 0.412 0.429 1.6091998 0.437 0.470 0.491 0.449 1.8471999 0.438 0.451 0.438 0.436 1.763

BP Amoco 1999 91
AdministrationIf you have any queries about the administrationof shareholdings such as change of address,change of ownership, dividend payments,the dividend reinvestment plan or the ADSdirect access plan, please contact the Registrar or ADS Depositary:
UK – Registrar’s OfficeThe BP Amoco RegistrarLloyds TSB RegistrarsThe Causeway WorthingWest SussexBN99 6DATelephone: +44 (0)121 433 4346Freephone in UK: 0800 701107Fax: +44 (0)1903 833371
USA – ADS AdministrationMorgan Guaranty Trust Company of New YorkPO Box 842006 Boston, MA 02284-2006Telephone: +1 781 575 3346Toll-free in USA and Canada: +1 877 638 5672
Canada – ADS AdministrationCIBC Mellon Trust Company320 Bay Street, PO Box 1 Toronto, Ontario M5H 4A6Telephone: +1 416 643 5500Toll-free in Canada: +1 800 387 0825
JapanThe Mitsubishi Trust and Banking Corporation7-7 Nishi-Ikebukuro 1-chome Toshima-kuTokyo 171Telephone: +81 03 5391 7029Fax: +81 03 5391 1911
Further information
Shareholder enquiries
Other published information
PublicationsCopies of reports filed by the company withthe US Securities and Exchange Commission,together with a range of other publications,such as BP Amoco Business Policies, BP AmocoEnvironmental and Social Update 1999,BP Amoco Financial and Operating Information1996-1999 and BP Amoco Statistical Reviewof World Energy, can be obtained in the USA andCanada from BP Amoco Shareholder Services in Chicago (address above) and in the rest of the world from the following address:
BP Amoco Distribution ServicesPO Box 934, BournemouthDorset BH8 8YY, UK Telephone: +44 (0)1202 244030Fax: +44 (0)1202 246464 E-mail: [email protected]
InternetBP Amoco has a website on the Internet atwww.bpamoco.comThe Living Report can be found atwww.bpamoco.com/alive
Cassettes for visually impaired shareholdersHighlights from the BP Amoco Annual Reportare available on audio cassette. Copies can beobtained, free of charge, in the USA and Canadafrom BP Amoco Shareholder Services, Chicago,and in the rest of the world from BP AmocoDistribution Services, UK.
Registered OfficeBritannic House, 1 Finsbury CircusLondon EC2M 7BA, UKRegistered in England and Wales No. 102498
Other queriesAny other queries can be addressed to offices in the following countries:
UKBP Amoco Shareholder ServicesBritannic House, 1 Finsbury CircusLondon EC2M 7BATelephone: +44 (0)20 7496 5200Switchboard: +44 (0)20 7496 4000Fax: +44 (0)20 7496 5806E-mail: [email protected]
USABP Amoco Shareholder ServicesPO Box 87703Chicago, IL 60680-0703Switchboard: +1 312 256 6111Toll-free in USA and Canada: +1 800 638 5672Fax: +1 312 856 4883E-mail: [email protected]

92 BP Amoco 1999
Acknowledgements
Photography and illustrationsMost photography by BP Amoco Photographic ServicesPhotographers: Adel Abeed, Charles Archambault, Phil Babb,Gary Banks, Terry Beasley, Mike Ellis, Rodney Garrood, David Gold, Chuck Grieve, Barry Halton, Matt Harris, Ian Hunt, Ken Jones,Simon Kreitem, Chris Linton, Murdo MacLeod,Marc Morrison, Caroline Penn, Richard Price,Justin Pumfrey, John Rae, David Shepherd,Grant Smith, John Sundlof, Colin Underhill,David Wade
Other photography: Forest Life Picture Library, Tony Stone Images,The Woodland Trust
Data for employee attitude survey score on page 7 supplied by Sirota Consulting Corp.
PaperThe paper used for this report meets thestrictest environmental standards set by theNordic Swan Council and is fully recyclable.The pulp used to produce the paper isgenerated locally, fully sustainable and bleachedwithout the use of elemental chlorine.
Design and productionDesigned by Pauffley, LondonTypeset by Generator Limited, LondonPrinted in England by Burrups Limited, St Ives plc Printed in the USA by Sandy Alexander
© BP Amoco p.l.c. 2000
