annual report and accounts 2015 - serco · serco group plc annual report and accounts 2015 our...
TRANSCRIPT

Annual report and accounts
2015
Serco Group plc Annual Report and Accounts 2015
Our strategy is to be a superb provider of public services, by being the best managed business in our sector. We are a focused business to government (B2G) business, specialising across five sectors: Defence, Justice & Immigration, Transport, Health and Citizen Services. We deliver these services internationally from our operating units in the UK & Europe, North America, Asia Pacific and the Middle East.
Fina
ncia
l Sta
tem
ents
Dir
ecto
rs’ R
epo
rt
03
Stra
teg
ic R
epo
rt
Introduction
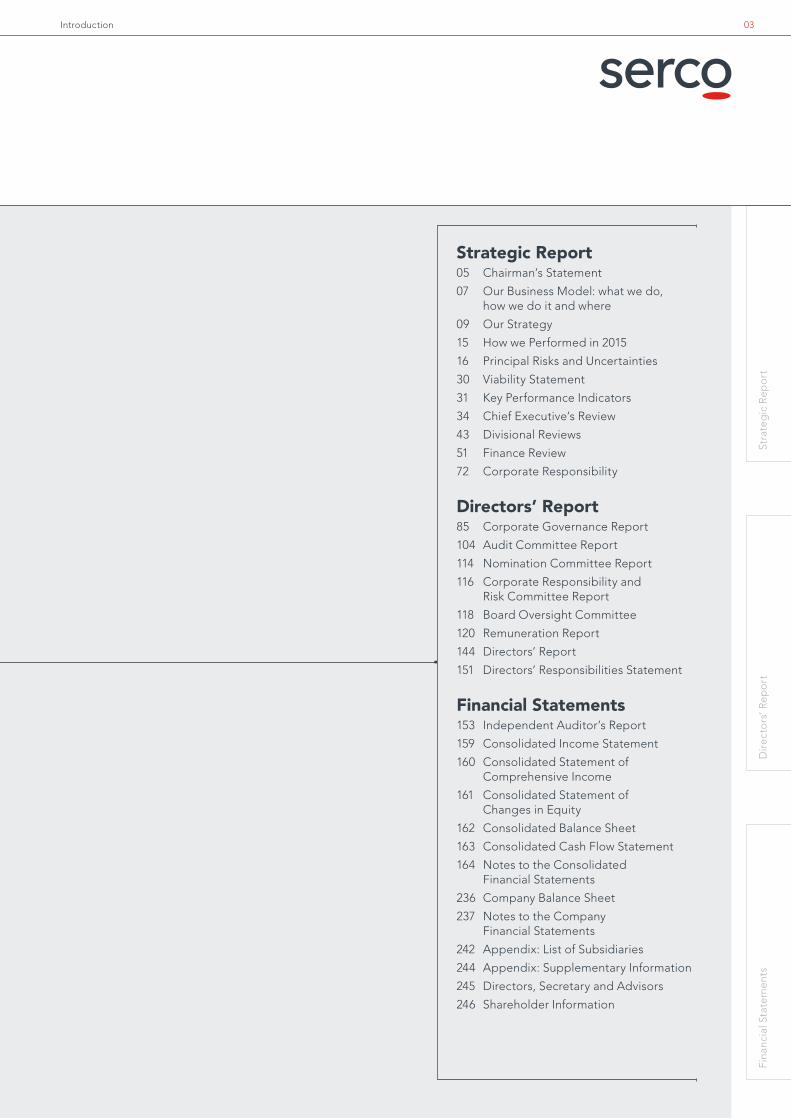
Strategic Report05 Chairman’s Statement
07 Our Business Model: what we do, how we do it and where
09 Our Strategy
15 How we Performed in 2015
16 Principal Risks and Uncertainties
30 Viability Statement
31 Key Performance Indicators
34 Chief Executive’s Review
43 Divisional Reviews
51 Finance Review
72 Corporate Responsibility
Directors’ Report85 Corporate Governance Report
104 Audit Committee Report
114 Nomination Committee Report
116 Corporate Responsibility and Risk Committee Report
118 Board Oversight Committee
120 Remuneration Report
144 Directors’ Report
151 Directors’ Responsibilities Statement
Financial Statements153 Independent Auditor’s Report
159 Consolidated Income Statement
160 Consolidated Statement of Comprehensive Income
161 Consolidated Statement of Changes in Equity
162 Consolidated Balance Sheet
163 Consolidated Cash Flow Statement
164 Notes to the Consolidated Financial Statements
236 Company Balance Sheet
237 Notes to the Company Financial Statements
242 Appendix: List of Subsidiaries
244 Appendix: Supplementary Information
245 Directors, Secretary and Advisors
246 Shareholder Information

Serco Group plc Annual Report and Accounts 201504
Strategic Report
05 Chairman’s Statement
07 Our Business Model: What we do, how we do it and where
09 Our Strategy
09 The historical context
10 New strategic focus
12 Our core sectors
13 Implementing the strategy
15 How we Performed in 2015
16 Principal Risks and Uncertainties
30 Viability Statement
31 Key Performance Indicators
34 Chief Executive’s Review
43 Divisional Reviews
44 UK Central Government
45 UK and Europe Local and Regional Government
46 Americas
47 AsPac
48 Middle East
49 Corporate Costs
49 Global Services (discontinued operations)
51 Finance Review
72 Corporate Responsibility

Fina
ncia
l Sta
tem
ents
Dir
ecto
rs’ R
epo
rtSt
rate
gic
Rep
ort
Strategic Report 05·
Chairman’s Statement
Sir Roy Gardner Chairman
Since joining Serco in June, I have seen first-hand the strong commitment of our people to delivering excellent public services. Much has been done in 2015 to implement Serco’s new strategy and strengthen the business, and we now have a good foundation upon which to build a successful future. There is much still to do to complete our transformation and restore Serco to appropriate growth and returns, and doing so whilst ensuring we meet the highest standards of operational performance, corporate governance, integrity and business ethics.
Serco is a remarkable company, supporting governments around the world in the delivery of essential public services. As your new Chairman, I am proud to be working with the management team and with every colleague throughout the Group to implement Serco’s new strategy and to create value for our shareholders and customers.
I joined Serco’s Board on 1 June 2015 and after a handover period with Alastair Lyons, your outgoing Chairman, I took over his responsibilities with effect from 1 July 2015. I was extremely thankful for the thorough handover I received from Alastair, and for all his hard work before my arrival in seeking to stabilise the business. It was Alastair’s recruitment of a strong executive management team, his work to improve the relationship with the UK Government, his steering of the Corporate Renewal Programme and his support for setting a new strategic direction and capital structure for Serco that has been an essential foundation to turn the Group around.
In the course of my career I have been fortunate to serve in executive, non-executive and chairman roles of large and complex companies, often serving governments around the world, and I have experienced a number of the challenges that Serco is seeking to address. I have learnt that you must be clear on the behaviours you expect from those you work with, and I am pleased with the refresh
of Serco’s values to Trust, Care, Innovation and Pride, which will sit at the very core of how the business operates. Above all, I feel very comfortable with Serco’s strategy of being a world-class provider of public services. Having seen the strong commitment of my new colleagues to delivering superb public service, and having seen contracts where we provide outstanding results for our clients and service users, I can see why management believe they can develop differentiated customer propositions that are focused on excelling in public service delivery.
The Group’s new strategy was presented to shareholders in March 2015, and since then a great deal of progress has been made in implementing that strategy. We have materially completed our exit from the offshore private sector Business Process Outsourcing business. Through a combination of raising new equity from our shareholders and the proceeds from disposals, net debt at year-end has been reduced substantially from a peak of £745m two years ago to £78m at 31 December 2015.
Chairman’s Statement

Serco Group plc Annual Report and Accounts 201506
With Underlying Trading Profit of £96m and a free cash outflow of just £16m, we have over-delivered against the guidance we gave at the beginning of 2015 and in connection with the Rights Issue. Vast improvements have been made to management information and financial reporting systems. Costs have been reduced, and our relationship with key government customers improved. The management team has been strengthened by the addition of talented new managers. These achievements are set out in more detail in Rupert Soames’ Chief Executive's Review on pages 34 to 42.
In our Corporate Governance Report on pages 85 to 143, you will be able to read about the actions, systems and processes put in place during 2015 to deliver stronger, more effective governance, organisational change and operational resilience. This also covers how Serco is overseeing delivery and alignment of responsibilities across all areas of governance, risk management and corporate responsibility.
As Chair of the Board Oversight Committee, one of my first tasks was to receive a detailed briefing on the Corporate Renewal Programme. I have been impressed by the actions being taken to deliver renewal, by the independent oversight we have put in place to ensure the programme is fully carried out, and that the responsibilities
of this Committee will include all material areas related to ethical standards. Similarly, our Corporate Responsibility and Risk Committee has demonstrated strong governance in action with Rachel Lomax, Non-Executive Director and Chair of this Committee, overseeing the independent and comprehensive investigation into the culture at Yarl’s Wood Immigration Removal Centre. We will continue to actively shape the terms of reference of the various committees over the course of 2016 and ensure the Board leads by example.
As part of my induction I have now visited a number of contracts and spent considerable time with divisional management teams and the executive committee. As well as being able to see first-hand the unwavering commitment to public service, this has helped me build an understanding of the operations themselves. In the last year your Board has also spent time seeing Serco in action as well as benefiting from involvement in dedicated sessions to appraise budgets, forecasts and strategic plans. My induction has also benefited from meeting a number of Serco’s major shareholders.
The need to recapitalise the business through the Rights Issue in early 2015, in order for Serco to be in a position to rebuild a future, has meant Serco’s shareholders have suffered greatly in terms of lost value. As set out at the time of the Rights Issue, 2016 will
be a further challenging year in terms of financial performance, and we have reiterated our recent guidance of revenue and Underlying Trading Profit reducing to approximately £2.8bn and £50m respectively. Your Board is, however, absolutely focused on long-term, sustainable shareholder value creation, and doing so by protecting the best interests of shareholders alongside those of our employees, customers, and the societies and communities in which we work. Serco has a highly effective executive management team, a deeply committed workforce that cares passionately about public service delivery, and a clear strategy to transform the business and position it for success in attractive markets. Once our transformation is completed over the course of 2016 and 2017, we expect to make good progress on restoring the growth, margins and returns of the business. I am confident that the collective actions being taken will ensure that Serco is fully restored as a superb provider of public services that everyone will be proud to be associated with.
Sir Roy Gardner Chairman
Chairman’s Statement continued

Fina
ncia
l Sta
tem
ents
Dir
ecto
rs’ R
epo
rtSt
rate
gic
Rep
ort
Strategic Report 07·
What we do, how we do it and where Serco serves governments and other bodies who serve the public or protect their nation’s interests. We focus on five sectors of public service: Defence, Justice & Immigration, Transport, Health and Citizen Services, and deliver these internationally from our operating units in the UK & Europe, North America, Asia Pacific and the Middle East. We have clear values of Trust, Care, Innovation and Pride which underpin how we operate.
Our Business Model
Since we were founded more than 50 years ago, we have delivered services through people, supported by effective processes, technology and skilled management. Our customers define what outcomes or services they want to deliver to their service users, and we find new and more effective ways to deliver them. Over the years we have delivered innovative solutions to some of the most complex challenges of the day, bringing our experience, innovation and scale to deliver the financial, service and policy outcomes our customers want. In partnership with our customers, we make a positive difference to the lives of millions of people around the world, and help nations safeguard their vital interests.
Nearly all governments are under intense pressure to do more, and better, with less, as a result of what we call the ‘Four Forces’. These are:
The more: The relentless increase, at rates above GDP growth, of demand for healthcare and social welfare, largely as a result of ageing populations.
The better: The increasing expectations citizens have of the quality, accountability and accessibility of services.
For less: High levels of public sector debt and debt service costs, combined with continued current account deficits, make cost reductions a necessity. By way of example, the UK Government expects to add some £75bn to the National Debt in 2015/16, and the current cost of servicing the National Debt is estimated at £45bn, which is more than state expenditure on either defence or education.
Our Business Model
For less: Citizens are highly resistant to providing governments with the means of deficit reduction by way of tax increases.
In the face of these challenges, governments have to find ever-more inventive and sophisticated ways of providing better public services at lower cost, and long experience tells them that people employed by the state do not have a monopoly of wisdom or expertise in terms of innovation and management of service delivery. Many companies choose to focus their intellectual and management energy on their core mission, and ask others to provide the support and execution of non-core activities. In a similar vein, a modern army or navy wants to concentrate its efforts on its fighting capability, not on running the facilities or payroll.

Serco Group plc Annual Report and Accounts 201508
Serco constantly looks for ways to improve the services we deliver. We can transfer our skills, insights and ideas from one sector or region to another, so we can anticipate and meet new challenges for customers. In our markets we are a rarity: a company that offers services covering front, middle, and back-office requirements, across multiple areas of government service, and we offer these internationally.
A key part of our value proposition is that we provide a bridge between the drive, energy and innovation of the private sector, and the very specific requirements of the public sector. Providing services to the public and being predominantly funded by taxpayers, is different, brings particular responsibility and in many ways is more demanding than only providing services to the private sector or direct to consumers. Influences such as politics, transparency and accountability to multiple stakeholders are seen only dimly in the private sector, but writ large in the public sector, and need skilful management. Serco has deep expertise in providing this bridge; overlaid on our private sector techniques, drive and energy, is
a public service ethos that means we gain the trust of our customers. As a consequence, we are granted contracts to provide services of the utmost sensitivity, from supporting strategic nuclear weapons to caring for asylum seekers to being responsible for healthcare facilities or transport systems.
Our business model starts with identifying a pipeline of opportunities that we anticipate will be procured by customers. The Serco Management System has policies and controls to ensure that the opportunities pursued are in line with the Group’s strategy, with review ‘gates’ to approve the risk profile and expected financial returns as a tender progresses through its various stages. Our services are ordinarily delivered through a commitment to a long-term contract with the customer, including specified pricing, service levels and scope of delivery. Throughout a contract’s life we would look to continuously improve our efficiencies and service outcomes. On contract expiry, we would either seek to secure an extension under existing contractual terms or to win a competitive rebid process, or be required to manage a contract exit process.
Throughout 2015 Serco operated through six divisions, five of which (UK Central Government, UK and Europe Local and Regional Government, Americas, Asia Pacific and the Middle East) provide a broad range of frontline public service operations to customers in various geographic regions, and one (being the Global Services Division) which provides private sector Business Process Outsourcing (BPO) services globally. On 31 December 2015, we completed the disposal of the majority of our Global Services division, and in 2016 we will operate exclusively through our five regional businesses. More information on our divisions and their performance in the year can be found in the Divisional Reviews on pages 43 to 50. More background on our markets, the Serco Management System and our business operations is available at www.serco.com.
Our Business Model continued
Fina
ncia
l Sta
tem
ents
Dir
ecto
rs’ R
epo
rtSt
rate
gic
Rep
ort
Strategic Report 09·
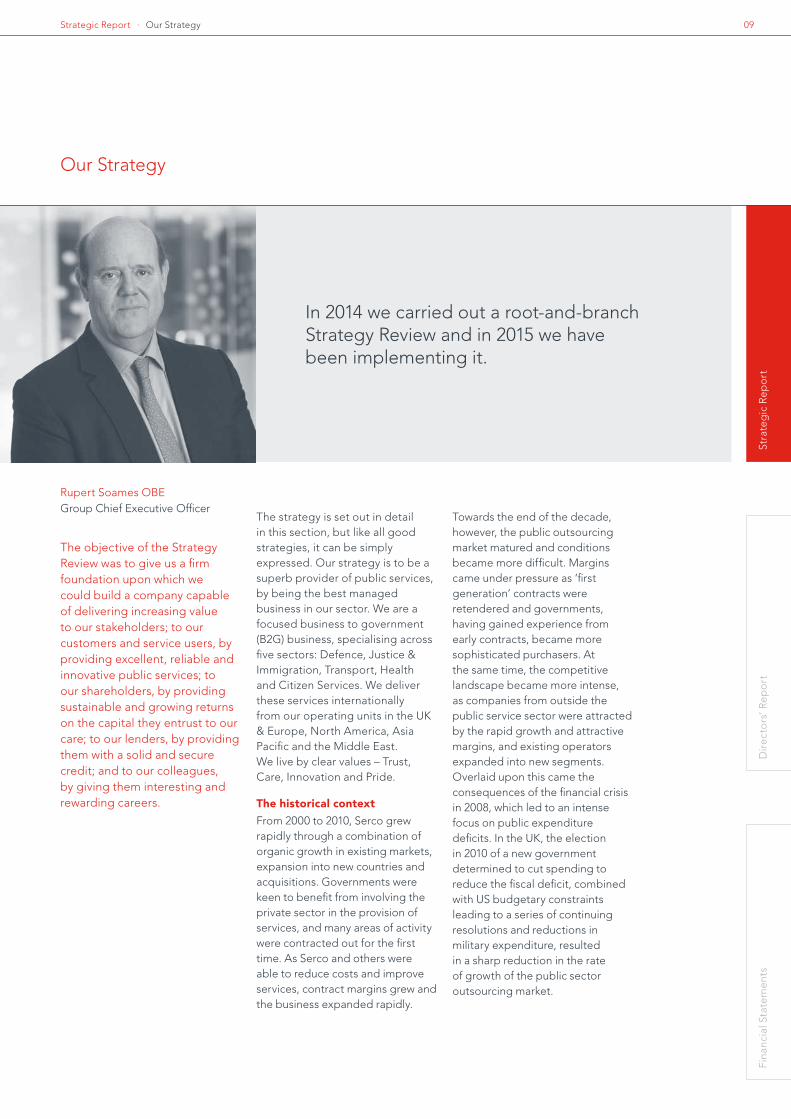
Our Strategy
The objective of the Strategy Review was to give us a firm foundation upon which we could build a company capable of delivering increasing value to our stakeholders; to our customers and service users, by providing excellent, reliable and innovative public services; to our shareholders, by providing sustainable and growing returns on the capital they entrust to our care; to our lenders, by providing them with a solid and secure credit; and to our colleagues, by giving them interesting and rewarding careers.
The strategy is set out in detail in this section, but like all good strategies, it can be simply expressed. Our strategy is to be a superb provider of public services, by being the best managed business in our sector. We are a focused business to government (B2G) business, specialising across five sectors: Defence, Justice & Immigration, Transport, Health and Citizen Services. We deliver these services internationally from our operating units in the UK & Europe, North America, Asia Pacific and the Middle East. We live by clear values – Trust, Care, Innovation and Pride.
The historical context
From 2000 to 2010, Serco grew rapidly through a combination of organic growth in existing markets, expansion into new countries and acquisitions. Governments were keen to benefit from involving the private sector in the provision of services, and many areas of activity were contracted out for the first time. As Serco and others were able to reduce costs and improve services, contract margins grew and the business expanded rapidly.
Rupert Soames OBE Group Chief Executive Officer
In 2014 we carried out a root-and-branch Strategy Review and in 2015 we have been implementing it.
Towards the end of the decade, however, the public outsourcing market matured and conditions became more difficult. Margins came under pressure as ‘first generation’ contracts were retendered and governments, having gained experience from early contracts, became more sophisticated purchasers. At the same time, the competitive landscape became more intense, as companies from outside the public service sector were attracted by the rapid growth and attractive margins, and existing operators expanded into new segments. Overlaid upon this came the consequences of the financial crisis in 2008, which led to an intense focus on public expenditure deficits. In the UK, the election in 2010 of a new government determined to cut spending to reduce the fiscal deficit, combined with US budgetary constraints leading to a series of continuing resolutions and reductions in military expenditure, resulted in a sharp reduction in the rate of growth of the public sector outsourcing market.
Our Strategy

Serco Group plc Annual Report and Accounts 201510
Faced by these challenges, in 2010 Serco devised a strategy to reduce its dependence on frontline services and the public sector by building, largely through acquisition, a private sector Business Process Outsourcing (BPO) business. The thinking was that a private sector business could bring skills and additional services to the public sector business, and the core Serco business could add sales team distribution, brand and scale to provide enhanced value to the private sector business. At the same time Serco sought to combat a slowing public sector market by bidding aggressively for new work, and entered new sectors such as clinical healthcare in the UK and providing housing for asylum seekers. Serco also sought to gain efficiencies and reduce costs by investing in an enterprise-wide SAP enterprise resource planning (ERP) system and building a shared services infrastructure covering information technology, human resources and finance.
Whilst this strategy was a logical reaction to challenging conditions, in practice it proved extremely difficult to implement because the synergies between the private and public sector businesses were not as expected, and the business also lost, or saw reductions in, some of its largest government contracts. In addition, some of the contracts we had won between 2010 and 2014 began to lose money; how many contracts, and how much money they were losing and likely to lose in the future only became truly apparent in the second half of 2014, following a comprehensive Contract and Balance Sheet Review that resulted in us taking provisions and write-downs amounting to £1.3bn in our accounts for 2014. In addition, in 2013, Serco suffered
reputational damage when it was alleged by the UK Government that it had overcharged on a major contract. A £64m settlement was paid to the customer, a large and profitable contract was taken away, and for a period of time, Serco was effectively unable to win material new work from the UK Government. The consequences of these factors are most obviously reflected in the financial performance and share price of the Group. Trading Profit fell from a high of £311m in 2012 to £113m before the impact of the Contract and Balance Sheet Review in 2014. The market capitalisation of the business over the same period fell from over £3bn to less than £1bn.
It was in this context that the new management team commenced a Strategy Review in May 2014 to analyse the current market and competitive situation, develop a strategy that would offer the greatest opportunity for value creation for shareholders, customers and employees, and identify how best to implement the strategy.
New strategic focus
In terms of strategic options, only two were worthy of detailed examination. First, we could continue with the existing strategy of operating both in the private and public sector; or we could focus on one and exit the other. This was a difficult decision, because our private sector operation was a high quality business, with some excellent prospects. However, it represented a very small proportion of our economic profit, and the hard fact was that Serco was not making a good job of owning it; our public sector customers have proved extremely resistant to moving middle or back office functions
outside their jurisdictions, and we had failed to add value to the private sector business by using our public sector distribution and brand. It became clear that the disciplines required for international success in the private and public sector BPO markets are different, and to build a business that could have the scale to be good at both would require significant investment. We therefore decided to focus investment and effort on our core market of serving governments, where we can further develop a strong and differentiated position.
Attractive public service markets
The 2014 Strategy Review identified that whilst the public service market presents a number of challenges, it also has many attractions. Most particularly, we see the market for the provision of public services by private companies as being underpinned by structural growth. There are only two things we need to believe for this hypothesis to be correct; first, that in many areas of public service provision, private companies, properly managed, can deliver services of higher quality and lower cost than governments can themselves. Second, we believe that governments will continue to face huge pressures to deliver more and better public services, for less, and that these pressures will lead them to focus relentlessly on value for money and the quality of service provision. As described on page 7, we have named these pressures the ‘Four Forces’.
Whilst there has been great focus on ‘austerity’ as a factor affecting public finances in the short-term, we believe that these Four Forces will continue to bear on public policy for many years to come, and
Our Strategy continued

Fina
ncia
l Sta
tem
ents
Dir
ecto
rs’ R
epo
rtSt
rate
gic
Rep
ort
Strategic Report 11·
will drive growth in private sector provision of public services in our sectors at a projected sector aggregate currently estimated to be 5–7%. Other factors that make the public services marketplace attractive to us are that it is unlikely to be disrupted by technology or other exogenous factors; absent catastrophe, we can be very confident that the world will still need prisons, will still need to manage immigration and provide healthcare and transport, and that these services will be highly people-intensive.
People will ask: how large is the market? Beyond saying that it is huge, truthfully, we don’t really know, as it is fiendishly hard to define. Does the support of a mainframe computer supplied by IBM but operated by government fall within our definition of the market? What about services provided by government-owned agencies operating on an arm’s-length basis? Within defence, do we count supply and support of missile systems, or just the types of services we supply (even if we could get a number for either)? And how do we disentangle wildly different definitions of expenditure used by the various governments with whom we deal?
If global market share was a determinant or measure of success, we might be more exercised by the question; but it is not, and with revenues from government of around £3bn, it would be so small against the total global market as to be not worth measuring. Within some segments – for example, prisons in the UK – we can be more precise, but then we get into issues of commercial sensitivity. We are not inclined to share with competitors how much
we are being paid for narrowly defined sectors, from which they might be able to extrapolate contract pricing.
So we ask stakeholders to accept the fact that while the markets in which we intend to focus are huge, our market share is generally small, although in some geographies and sectors it is large, and we have plenty of headroom to grow.
Diversified portfolio
Core to our strategy is the belief that having a diversified portfolio of exposures to different sectors and jurisdictions is an advantage. In a world where political priorities of changing governments can switch resources from defence to immigration to healthcare, and back again, being diversified by segment and jurisdiction is valuable in reducing risk and volatility, and enabling us to share best practice. Many of our closest competitors are specialists in either a particular sector, or within a geography. Although focused on public services, we feel we can deliver better risk-adjusted returns and lower volatility in the long-term if we have the capability to operate across more than one sector within the public services market, and in more than one jurisdiction.
But management of risk is only one reason we like a strategy of operating across a number of jurisdictions and sectors. We believe that governments across the world face similar challenges at many levels. At a detailed operational level, providing cleaning and catering services in a hospital is very similar in Western Australia and Abu Dhabi, likewise escorting prisoners to court. At a higher level, having
expertise in staff rostering and time management is globally applicable across sectors, as is project and case management. Yet higher, building deep capability in continuous improvement is globally applicable. Finally, will the fact that we have deep expertise in running urban transport in one territory give us credibility in another? Will the fact that the governments in the US and the UK trust us with some of their most secret and sensitive projects help us when bidding for defence projects in the Middle East? Will our proven track record in reducing recidivism amongst offenders in the UK and Australia be of interest to authorities in other countries? We believe the answer to all these questions is ‘yes’.
Our Strategy

Serco Group plc Annual Report and Accounts 201512
Our core sectorsOur business in the public sector is focused on five sectors: Defence, Justice & Immigration, Transport, Health and Citizen Services. In 2015, our revenues in each of these sectors were:
Defence
Total Revenues 2015 (continuing operations including joint ventures)
£3,914m
UK & Europe, Americas, Middle East, Asia Pacific
UK & Europe, Asia Pacific
UK & Europe, Americas, Middle East, Asia Pacific
UK & Europe, Americas, Middle East, Asia Pacific
UK & Europe, Middle East, Asia Pacific
TransportJustice &
ImmigrationHealth Citizen Services
Jurisdictions
Our Strategy continued
Revenues 2015 (continuing operations including joint ventures)
£1,069m27%
£837m21%
£529m14%
£416m11%
£1,063m27%

Fina
ncia
l Sta
tem
ents
Dir
ecto
rs’ R
epo
rtSt
rate
gic
Rep
ort
Strategic Report 13·
Implementing the strategy
Serco combines people, processes and technology to deliver superb services. Since the last two of these depend entirely on the first one, it can be simply said that the success of our strategy will depend upon how well we manage, organise, motivate, develop, select and enable people. So the answer to ‘how?’ is: ‘by being the best-managed business in our sector’.
Having such an ambition may sound trite, but we believe that it is a worthy and value-creating objective, and one that we can use to inspire our management teams. In any given circumstances, and
whatever the slings and arrows of fortune, well-managed businesses do better than poorly managed businesses, and the best-managed businesses do best of all.
So, we can define our ambition as wanting to be the best-managed business in our sector from a position where we believe that, through a process of continuous improvement and capacity-building, we can improve service delivery and efficiency to the benefit of both our customers and ourselves. We can use our ambition to be the ‘best-managed business in our sector’ to improve the way we manage contracts
and risk; to equip customers and colleagues with more accurate and timely information so that we can measure performance better; we can improve the efficiency of our internal processes; we can reduce costs; we can strengthen our business development capability; and we can invest more in developing innovative solutions to public service challenges. None of this comes easy or quickly, and we need to steer a tricky course between the urgent need to reduce our costs in line with reduced revenues in the short-term and investing in systems and processes that will produce sustainable benefits in the long-term.
Timeline of strategy implementation
At the time of reporting on the Strategy Review, we set out how we saw our strategy being delivered successfully over three distinct but dependent phases: ‘Stabilise’, ‘Transform’ and ‘Grow’.
2014 Stabilise 2015–2017 Transform 2018–2020 Grow
• Hire new management
• Identify issues
• Develop strategy and implementation plan
• Undertake Contract and Balance Sheet Review
• Stabilise morale
• Roll out corporate renewal
• Strengthen balance sheet
• Rebuild confidence and trust
• Improve risk management
• Rationalise portfolio
• Mitigate loss-making contracts
• Strengthen sector propositions
• Re-build business development and pipeline
• Build differentiated capability
• Improve execution and cost efficiency
• Harvest benefits of transformation
• Leverage scale and capability
• Build out geographical footprint
• Move into new sub-segments
• Continuously review portfolio
Our Strategy

Serco Group plc Annual Report and Accounts 201514
Those elements essential to stabilise the business were all delivered in 2014. Also critical to stabilisation, but the bedrock from which to properly fund the transformation stage, was the strengthening of the balance sheet, completed in early 2015 with the Rights Issue and refinancing. The ongoing exercise to rebuild confidence and trust was also cemented by the much improved financial standing of the business, as well as all the prior work to deliver corporate renewal and the ongoing operational and relationship improvements that we are implementing. Our Corporate Governance Report on pages 85 to 143 also provides details about the many steps being taken to improve risk management across the Group.
In 2015 we rationalised the portfolio with the conclusion of our disposal programme, which was an essential step to delivering a strategy focused on public service delivery. We also made inroads to mitigating loss-making contracts and other liabilities, resulting in a net credit of some £21m being achieved in 2015 as we were able to adjust some of the Contract and Balance Sheet Review items, including an improved view of some of the onerous contract provisions.
Transformation continues through 2016 and 2017, and increasingly this will be focused
on re-building Serco’s business development functions and bid pipeline, strengthening our sector propositions, and consolidating our differentiated capability in order to win. We will also continue to improve operational execution and drive further cost efficiencies. Only when these transformational elements are all in place will we be able to harvest the financial benefit.
You can read more about executing the strategy in 2015 and beyond in the Chief Executive’s Review on pages 34 to 42 and the Divisional Reviews on pages 43 to 50. More information is also included in our results and other presentations to investors, available at www.serco.com/investors.
What strategic success will look like
The tangible evidence of our success or otherwise will be a return to industry rates of growth and margins. Our current best estimate is that the market segments to be focused on are likely to grow at an aggregate of 5–7% per year and that industry operating margins across Serco’s mix of business are likely to be in the range of 5–6%. If this turns out to be correct, and markets turn out as expected, we believe that after the initial years of restructuring and transformation, it will be possible to achieve growth rates and margins towards the average of the Group’s peers.
Our Strategy continued

Fina
ncia
l Sta
tem
ents
Dir
ecto
rs’ R
epo
rtSt
rate
gic
Rep
ort
Strategic Report 15·
How we Performed in 2015
• Underlying Trading Profit of £96m, ahead of our guidance provided at the time of the Rights Issue of £90m.
• Reported Trading Profit of £138m, significantly higher than Underlying Trading Profit, benefiting from £21m net release of Onerous Contract Provisions and Contract and Balance Sheet Review items, £9m one-off profit on a contract termination and £12m beneficial impact of assets held for sale.
• Exceptional operating charge of £188m, of which £166m are non-cash losses on disposals and impairments.
• Free Cash Outflow of £16m, better than previously anticipated.
• Net Debt reduced by £605m to £78m, as a result of the Rights Issue and offshore BPO disposal proceeds. Net Debt: EBITDA around 0.5x.
• £1.8bn total value of signed contracts, representing more than 700 individual customer orders of which 10 are worth more than £50m each.
• Pipeline of larger new bid opportunities increases by approximately £1.5bn to £6.5bn.
• Operating costs reduced by over £330m, broadly in proportion with revenue reduction.
• Guidance for 2016 reiterated – Revenue expected to reduce to approximately £2.8bn and Underlying Trading Profit to around £50m as a result of BPO disposal and contract attrition.
Rupert Soames, Serco Group Chief Executive, said: “ The business has delivered a much better performance than we expected at the start of the year, which reflects the fact that we are making good progress in the first year of the implementation of our strategy.
“ Serco has achieved a great deal in 2015: we have a significantly stronger balance sheet with materially less debt, we have successfully disposed of the majority of our offshore BPO business, reduced costs, improved our internal reporting processes, recruited new management, improved the position on several of our largest loss-making contracts, and strengthened our pipeline. Our plan has survived first contact with the enemy.
“Looking ahead, and in line with our plan, we expect revenues and profits to decline in 2016, as a result of the disposal of our private sector BPO business and contract attrition. We have four priorities this year: further improve the operational and financial performance of our contracts; build our new business pipeline; reduce our costs; and improve and embed our new management information systems.”
Year ended 31 December 2015 2014
Revenue – including discontinued operations(1) £3,514.6m £3,955.0m
Reported Revenue(1) £3,177.0m £3,595.7m
Underlying Trading Profit(2) £96.0m £113.2m
Reported Trading Profit / (Loss)(2) £137.6m (£632.1m)
Operating Profit / (Loss) Before Exceptional Items – continuing and discontinued £132.7m (£655.8m)
Operating Loss – continuing and discontinued (£54.8m) (£1,317.3m)
Underlying EPS (basic)(3) 3.44p 4.73p
EPS Before Exceptional Items (basic) – continuing and discontinued 6.55p (107.43p)
EPS (basic) – continuing and discontinued (15.47p) (205.66p)
Dividend Per Share – 3.10p
Free Cash Flow (£16.2m) £62.2m
Net Debt (including that for assets and liabilities held for sale) £77.5m £682.2m
Note 1: Revenue is as defined under IFRS, which excludes Serco’s share of revenue of its joint ventures. Revenue includes that from discontinued operations for consistency with previous guidance.
Note 2: Reported Trading Profit is defined as IFRS Operating Profit adjusted for (i) amortisation and impairment of intangibles arising on acquisition and (ii) exceptional items. Consistent with IFRS, it includes Serco’s share of profit after tax of its joint ventures. Underlying Trading Profit excludes Contract and Balance Sheet Review adjustments (principally OCP releases or charges), the beneficial treatment of depreciation and amortisation of assets held for sale, and other material one-time items such as the profit on early termination of a UK local authority contract that occurred in 2015. Trading Profit measures include that from discontinued operations for consistency with previous guidance.
Note 3: Underlying EPS reflects the Underlying Trading Profit measure after deducting pre-exceptional net finance costs (including those for discontinued operations) and related tax effects.
Reconciliations and further detail of financial performance are included in the Finance Review on pages 51 to 71. The consolidated financial statements and accompanying notes are on pages 159 to 239.
How We Performed

Serco Group plc Annual Report and Accounts 201516
Principal Risks and Uncertainties
Serco faces many risks and uncertainties which we mitigate and manage through risk management processes (see pages 97 to 102). The Group Risk Register sets out the principal risks facing the Group and is set by the Executive Committee after taking into consideration the various divisional risk registers. The Group Risk Register is reported to the Board via the Corporate Responsibility and Risk Committee.
Following the completion of the Strategic Review, a robust and systematic assessment of the principal risks facing the Group was carried out. These include the principal risks that would threaten the execution of Serco’s strategy, business model, future performance, solvency and liquidity.
The resulting principal risks are each classified as strategic, reputational, financial, operational, legal or compliance. They are described on the following pages, together with the relevant strategic business objectives, key risk drivers; the Group-wide material controls, which are explained in more detail on pages 26 to 29, which have been put in place to mitigate the principal risks, and the mitigation actions to improve the effectiveness of the controls.
The risks are considered within the timeframe of three years which is the same time period that has been used in the Viability Statement (see page 30). The Viability Statement takes into account the principal risks in its assessment.
Risk appetite
In 2016, the Executive Committee will undertake an exercise to assess the risk appetite for each of the principal risks. The risk appetite represents the nature and amount of risk that the Group is willing to accept and facilitates decision making as to the level of resource that should be expended to mitigate the principal risks.
Risk appetite statements are being developed which will be reviewed and endorsed by the Corporate Responsibility and Risk Committee. These statements will be used to define the risk tolerance levels throughout the business, and along with our values, Code of Conduct and mandatory ethics training will provide clarity on the risk culture of the Group.
Strategic and reputational risks
Risk Key risk drivers Mitigation
Failure to attract and retain leaders fit for the future
Impact on business objectives:• Winning good business• Executing brilliantly• A place people are proud to work• Profitable and sustainable
People are at the core of our business at all levels of the organisation. Our success depends on the continued service and performance of highly qualified and experienced operational management and business development teams and their leaders.
If our leaders are not able to meet the needs of the business, this could impact our integrity, brand and reputation, and could have a material adverse impact on our financial condition and results of operations affecting the prospects of the business.
Good leadership underpins our ability to develop and deliver the services we provide to customers. The ability to plan for management succession and to attract, train and retain good leaders and other employees is a key driver for our success.
Failure to maintain a robust framework of people processes, systems and controls to enable attraction, selection, development and retention of the appropriate calibre of employees and leaders would compromise our ability to execute our strategy and achieve our business objectives. This would adversely affect employee pride in the organisation and prevent Serco from becoming an employer of choice for talented people.
Employee engagement is also critical to our success; engaged employees deliver better service to our customers, are more productive, and want to stay with us. Failure to attract, motivate and engage employees can create a decline in morale and an increase in staff turnover, which may adversely affect our ability to win new and retain existing contracts owing to a lack of appropriate skills and a reduction in customer satisfaction.
Material controls:
• Serco Management System• Serco Leadership Model• Centres of Excellence • Appropriately skilled /
trained resources
Current mitigation actions:
• Implementation of Serco Leadership Model
• Implementation of talent and succession processes
• Implementation of a robust framework of people processes and procedures that supports the acquisition and retention of the right calibre of staff
Future actions:
• Continued improvements to our Leadership Model
• Resourcing of the Centres of Excellence and functions with the intent to support the delivery of the Group strategy
• Improvements to our talent pooling capability
• Improvements to the ‘on boarding’ and induction processes and systems
• Improvements to short- and long-term incentive arrangements
• Establishment of our Leadership Academy

Fina
ncia
l Sta
tem
ents
Dir
ecto
rs’ R
epo
rtSt
rate
gic
Rep
ort
Strategic Report 17· Principal Risks and Uncertainties
Risk Key risk drivers Mitigation
Failure to transform and deliver the Group strategy
Impact on business objectives:
• Winning good business• Executing brilliantly• Profitable and sustainable
We have put in place transformation programmes to achieve lasting change in the way Serco operates. Concurrent programmes are being delivered in Finance, IT, HR, Procurement, Contract Management and Business Development.
Successful delivery of these in an integrated fashion will drive greater standardisation, achieve critical efficiencies and cost reductions, improve transparency and reinforce continuous improvement in our operational delivery.
Delivery of the Group strategy could be placed at risk because of too many competing programmes with complex interdependencies, poor programme and solution design, poor integration across activities (leading to operational inefficiency or incompatibility), or in the failure to achieve lasting cultural change (due to failure of buy-in or the setting of unrealistic or unclear expectations).
Affordability may place a constraint on resources, which could jeopardise or delay the transformation of the Group.
Note: The risk drivers and controls associated with achieving the objectives of the Group strategy are covered under other principal risk, for example the risk ‘Failure to grow profitably’ reflects the risk associated with failing to maintain a healthy pipeline of new contracts. The risk of failure to transform and deliver the Group strategy focuses on the delivery of the Group transformation programmes.
Material controls:
• Group strategy• Transformation programme design• Governance structure• Standardised Divisional Performance
Reviews
Current mitigation actions:
• Establishment of a central Programme Management Office (PMO) to monitor and coordinate the programmes
• Implementation of governance for transformation programmes. PMO reports delivery constraints to the Group Chief Operating Officer and the Executive Committee
Future actions:
• Coordination of a communication strategy to engage all individuals in the business so that they buy into the longer-term goals of the Group
• Ongoing review of Group strategy and internal delivery structures to ensure Serco is set to excel in its chosen markets and sectors
Serco Group plc Annual Report and Accounts 201518
Principal Risks and Uncertainties continued
Strategic and reputational risks continued
Risk Key risk drivers Mitigation
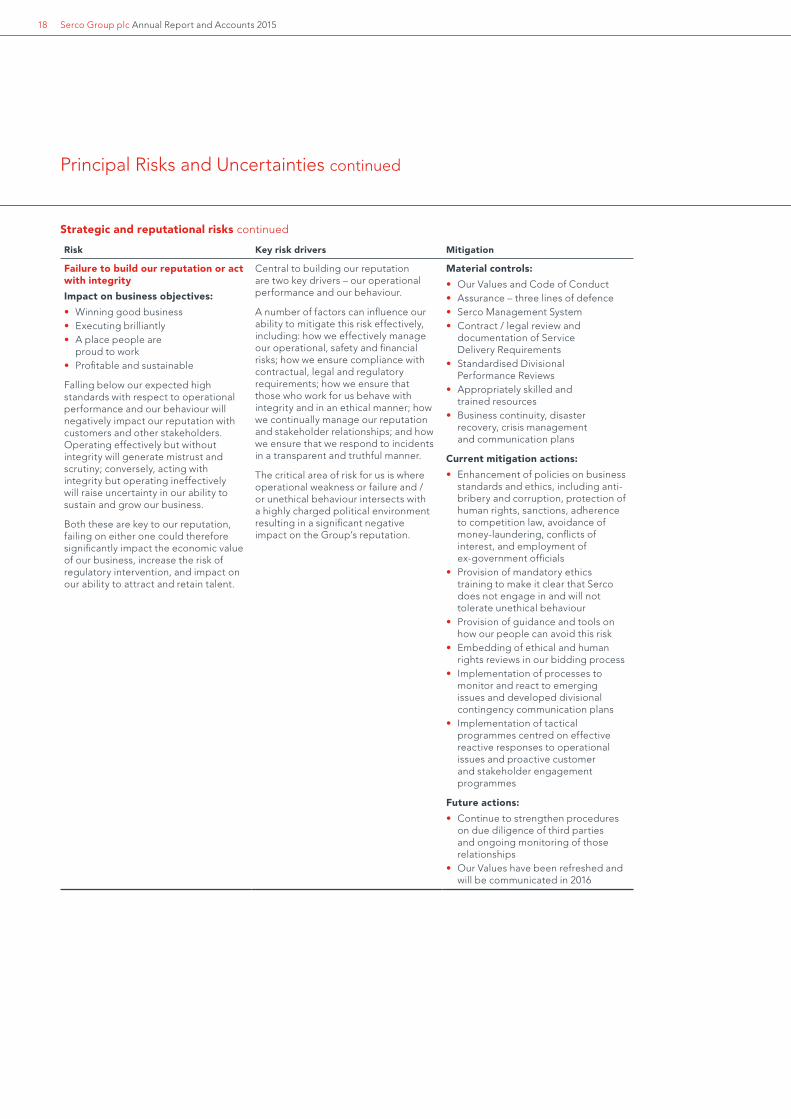
Failure to build our reputation or act with integrity
Impact on business objectives:
• Winning good business• Executing brilliantly• A place people are
proud to work• Profitable and sustainable
Falling below our expected high standards with respect to operational performance and our behaviour will negatively impact our reputation with customers and other stakeholders. Operating effectively but without integrity will generate mistrust and scrutiny; conversely, acting with integrity but operating ineffectively will raise uncertainty in our ability to sustain and grow our business.
Both these are key to our reputation, failing on either one could therefore significantly impact the economic value of our business, increase the risk of regulatory intervention, and impact on our ability to attract and retain talent.
Central to building our reputation are two key drivers – our operational performance and our behaviour.
A number of factors can influence our ability to mitigate this risk effectively, including: how we effectively manage our operational, safety and financial risks; how we ensure compliance with contractual, legal and regulatory requirements; how we ensure that those who work for us behave with integrity and in an ethical manner; how we continually manage our reputation and stakeholder relationships; and how we ensure that we respond to incidents in a transparent and truthful manner.
The critical area of risk for us is where operational weakness or failure and / or unethical behaviour intersects with a highly charged political environment resulting in a significant negative impact on the Group’s reputation.
Material controls:
• Our Values and Code of Conduct• Assurance – three lines of defence• Serco Management System• Contract / legal review and
documentation of Service Delivery Requirements
• Standardised Divisional Performance Reviews
• Appropriately skilled and trained resources
• Business continuity, disaster recovery, crisis management and communication plans
Current mitigation actions:
• Enhancement of policies on business standards and ethics, including anti-bribery and corruption, protection of human rights, sanctions, adherence to competition law, avoidance of money-laundering, conflicts of interest, and employment of ex-government officials
• Provision of mandatory ethics training to make it clear that Serco does not engage in and will not tolerate unethical behaviour
• Provision of guidance and tools on how our people can avoid this risk
• Embedding of ethical and human rights reviews in our bidding process
• Implementation of processes to monitor and react to emerging issues and developed divisional contingency communication plans
• Implementation of tactical programmes centred on effective reactive responses to operational issues and proactive customer and stakeholder engagement programmes
Future actions:
• Continue to strengthen procedures on due diligence of third parties and ongoing monitoring of those relationships
• Our Values have been refreshed and will be communicated in 2016

Fina
ncia
l Sta
tem
ents
Dir
ecto
rs’ R
epo
rtSt
rate
gic
Rep
ort
Strategic Report 19· Principal Risks and Uncertainties
Financial risks
Risk Key risk drivers Mitigation
Failure to grow profitably
Impact on business objectives:
• Winning good business• Profitable and sustainable
We depend heavily on large contracts with a relatively limited number of major government customers and other public sector bodies and agencies for a substantial proportion of our revenue.
If such customers decrease the amount of business they outsource to us for any reason, or if the relationship with such customers were to deteriorate, or we sustained damage to our reputation, or we were subject to negative publicity, then we could lose business across our customer base and face significant economic damage. Such damage could also include losing renewals and extensions of existing contracts.
Shortly after this report is published, the UK will hold a referendum on continued membership of the EU. We have contracts worth around £130m a year with European institutions such as the European Commission and the European Space Agency, and it is part of the strategy to build the business we do with European institutions. We believe that if Britain left the EU, it would be more difficult for us to win EU Government contracts, and we regard this as a risk to the business.
The sustainability of our existing and future business with governments is dependent on a favourable policy of private sector provision of public services.
Our government customers are affected by financial, regulatory and political constraints or policy changes. A substantial part of our business is, therefore, linked to changes in the global economy, fiscal and monetary policy, political stability, political leadership, budget priorities, and the perception and attitude of governments and the wider public to outsourcing. These could result in decisions not to outsource services or delays in placing work which might adversely impact our pipeline.
Where a healthy pipeline of new business exists, Serco needs to effectively compete for business. Failure to have the critical skills and references, a value proposition that customers will find compelling and a risk appetite appropriate for the markets in which we compete will put Serco at a disadvantage, and put the sustainable growth necessary in our business at risk. In addition, failure to execute our bids in a professional manner by not understanding the strategic needs of a client, or by mispricing bids, developing unworkable solutions, misunderstanding risks and other bidding failures will also prevent us from achieving our growth ambitions.
Material controls:
• Group strategy market sectors and geographical regions
• Centres of Excellence• Serco Management System• Business Lifecycle Gates Process• Appropriately skilled /
trained resources• Standardised Divisional
Performance Reviews• Contract / legal review and
documentation of service delivery requirements
Current mitigation actions:
• Set up Centres of Excellence to critically review the markets and geographies we operate in globally and develop compelling value propositions in each market
• Implemented improved bid management procedures
• Strengthened the criteria, processes and level of scrutiny for management’s review of all bids and rebids, and ensured stronger risk management earlier in the bid process to help identify potential onerous performance criteria or contract terms, and transition and operational risks, in advance
• Continued to invest in appointing high calibre people for our key bids, and training our bidding teams to improve competency and performance
Future actions:
• Implement regular pipeline and market reviews
• Embed Centres of Excellence and review sector drivers, market propositions and resource allocations
• Review of Business Development processes, capability and resourcing
• Review governance cycle to ensure lessons learned are embedded

Serco Group plc Annual Report and Accounts 201520
Principal Risks and Uncertainties continued
Financial risks continued
Risk Key risk drivers Mitigation
Financial control and finance IT systems failure
Impact on business objectives:
• Executing brilliantly• Profitable and sustainable• A place where people are proud
to work
Strong financial systems and controls are critical to the Group’s success and underpin many key aspects of our business, from transaction processing to both internal and external reporting.
Financial control failure or prolonged loss of financial IT systems may result in: an inability to accurately report timely financial results and meet contractual financial reporting obligations; a heightened risk of error and fraud; poor quality data leading to poor business decisions and an inability to forecast accurately; and an inability to make critical financial transactions that would lead to financial instability, potential business losses and negative reputational impact.
There are a number of critical elements driving the risk of financial control and finance IT systems failure. These include: a finance governance structure that sets the right tone from the top; adequate financial controls, including access controls to IT systems, which prevent instances of sabotage, fraud and error; the design and subsequent availability of critical financial IT systems; and the risk of information security breaches (see ‘major information security breach’ risk below).
Serco must communicate a clear Group Finance strategy supported by robust finance policies and standards that are embedded consistently throughout the Group.
The risk of financial control and systems IT failure is largely driven by inadequate controls and processes. If these are poorly designed and complex, they may lead to potential inaccuracies, fraudulent behaviour and inefficient use of resources.
The design of financial systems and access controls should ensure that key financial processes and systems are adequately protected from sabotage, fraud and error, and that instances of critical financial systems or locations not being available at critical times for prolonged periods is minimised.
Material controls:
• Standardised finance systems, processes and controls, and reporting
• Group strategy – Finance Transformation Programme
• Serco Management System• Business Lifecycle Gates Process• Appropriately skilled /
trained resources• Standardised Divisional Performance
Reviews• Contract / legal review and
documentation of Service Delivery Requirements
• Business continuity, disaster recovery, crisis management and communication plans
• Assurance – three lines of defence• IT security infrastructure, processes
and controls
Current mitigation actions:
• Embarked upon a major finance transformation programme to strengthen the financial control environment and to transform finance as a whole, with the goal of implementing standard processes and data hierarchies and common reporting language
• Updated the Group’s finance strategy and policies
• Roll out of the Serco Finance Academy to articulate the future direction of finance and set expectations
• Updated the delegated authorities matrix
• Reshaped the design of financial systems and access controls
• Strengthened the finance team and developed of a new Finance Compliance Assurance programme
Future actions:
• Finance transformation programme will continue to address the Group’s processes, targeting the improved effectiveness of its shared service operation
• Review of contingency plans in place, including data recovery procedures and business continuity plans
• Create of a Corporate Shared Services Crisis Management Team and Business Continuity Plan
• Ensure regular testing of back-up systems

Fina
ncia
l Sta
tem
ents
Dir
ecto
rs’ R
epo
rtSt
rate
gic
Rep
ort
Strategic Report 21· Principal Risks and Uncertainties
Operational risks
Risk Key risk drivers Mitigation
Major information security breach
Impact on business objectives:
• Winning good business• Executing brilliantly• Profitable and sustainable
We and our appointed third party service providers and sub-contractors are vulnerable to a major information security breach resulting in the loss or compromise of sensitive information or wilful damage resulting in loss of service.
A major information security breach could have a significant negative impact on our reputation and on the security of our customers. This impact could result in the loss of new or existing business by disqualification from future work, contract termination and heavy financial penalties causing a negative impact on our strategic objectives.
Such breaches are costly to rectify and could dilute shareholder returns and result in criminal or civil action; contract and business external accreditations being withdrawn; and significant media scrutiny, all of which could materially adversely affect the business, financial condition, results of operations and prospects.
This is a heightened risk, particularly with respect to government contracts, due to the sensitive and confidential nature of government data that we handle.
We collect and retain confidential information in computer systems regarding our business dealings and those of our customers, service end-users and suppliers. We provide high profile services, which adds to our attractiveness as a potential target.
The threats facing sensitive information managed by the Group have increased with malicious and high profile attacks against major brands around the globe by well-known ‘hacktivist’ groups. Alongside this threat is the more insidious and low profile attack instigated by certain foreign bodies and their proxies to obtain information for defence or economic advantage.
The secure processing, maintenance and transmission of information, and compliance with restrictions on the handling of sensitive information (including personal and customer information) is critical to our operations.
Material controls:
• Serco Management System• Governance structure• IT security infrastructure, process
and controls• Business Lifecycle Gates Process• Business continuity, disaster
recovery, crisis management and communication plans
• Appropriately skilled / trained resources
Current mitigation actions:
• Implemented information security policies and standards
• Implementation of Cyber Defence Programme
• Attainment of Cyber Essentials Plus (CES+) certification in the UK
• Mandatory security awareness training and security awareness campaigns
• Internal and external vulnerability scanning, risk and security impact assessments, and third-party due diligence assessment and penetration testing
• Implemented Computer Security Incident Response teams
Future actions:
Continued investment in Cyber Defence Programme to provide:
• Better visibility, monitoring and control of our security infrastructure
• A Global Security Operations Centre equipped with security software and tools to monitor network and systems, and to prioritise, remediate and repel attacks and then report and manage response on a Group-wide basis
• Feedback and monitoring of activities to drive user awareness and behaviour
• Enhanced awareness training to key personnel globally

Serco Group plc Annual Report and Accounts 201522
Principal Risks and Uncertainties continued
Operational risks continued
Risk Key risk drivers Mitigation
Catastrophic event
Impact on business objectives:
• Winning good business• Executing brilliantly• A place people are proud to work
Due to the nature of the services that the Group provides, many of our operations, if not properly managed, entail the risk of significant harm to employees, third parties, members of the public or the environment.
In the event that such a catastrophic event is found or perceived to be caused by the negligence of the Group, this could result in claims for personal injury, wrongful death or property damage by customers, subcontractors, governments, employees or members of the public, which could lead to the payment of extensive damages and result in significant adverse publicity and reputational harm.
Certain events, including those arising as a result of third party acts such as acts of terrorism or war, are not within the Group’s control, but may still result in losses and significant impact on customers and the public.
Prolonged disruption to service delivery due to an ineffective response to catastrophic events will adversely impact the Group’s reputation. Such adverse publicity and reputational harm could lead to loss of business.
Some of our operations are particularly high-risk; these include nuclear operations, aviation, rail, marine and custodial services. Although these are highly regulated, these carry inherent significant health, safety and environmental (HSE) risks, and the Group is exposed to the risk of material losses, liabilities and reputational damage from a catastrophic event, for example a major incident or accident.
A number of factors may influence this risk, including: capability and experience in delivering services in high-risk sectors; an organisational culture that prioritises HSE management; robustness of safety management to support safety critical industries; ability to assess, prepare for and manage safety requirements; and the impact of external factors (for example regulatory change, war, terrorist act); and robustness of business continuity plans and crisis management.
Material controls:
• Group strategy• Safety management systems• Serco Management System (SMS)• Business Lifecycle Gates Process• Governance structure• Business continuity, disaster
recovery, crisis management and communication plans
• Appropriately skilled / trained resources
• Contract / legal review and documentation of service delivery requirements
• Assurance – three lines of defence• Our Values and Code of Conduct• Insurance
Current mitigation actions:
• Implementation of HSE strategy with clearly defined objectives and performance targets and safety oversight structures and governance
• Policies, systems and procedures embedded in the SMS
• Implementation of competency framework and mandatory training programmes
• External and internal audits to confirm the effectiveness of these controls
Future actions:
• Regular review of processes and assurance of the controls to ensure continuous improvement
• Review and update of crisis management plans

Fina
ncia
l Sta
tem
ents
Dir
ecto
rs’ R
epo
rtSt
rate
gic
Rep
ort
Strategic Report 23· Principal Risks and Uncertainties
Risk Key risk drivers Mitigation
Misreporting of performance
Impact on business objectives:
• Winning good business• Executing brilliantly• A place people are proud to work
There may be incidents of employees not complying with the Group’s policies, which might result, for example, in accounting irregularities or accounting misstatements, and failures in the accurate monitoring and reporting of contract performance. This may result in inaccurate performance and billing information being provided to Serco management, our customers and other stakeholders.
If the misreporting is deliberate, it may constitute fraud, and the Group may be subject to litigation, inquiries or investigations that could divert management time and resources, and result in penalties, fines, sanctions, variation or revocation of permissions and authorisations, suspension or debarment from doing business with government customers.
Accidental or deliberate misreporting of operational, regulatory and financial performance, both internally and externally, would result in reputational damage, loss of goodwill or contracts.
The reporting of operational performance and its accuracy is an inherent risk that is increased due to the large number of employees, geographical diversity and the diversity of the operations that we run.
As a result, we are exposed to reputational and financial risks associated with employee errors, system errors, misunderstanding of requirements, inadequate quality of service provision and deliberate acts of misreporting of performance.
Material controls:
• Serco Management System• Our Values and Code of Conduct• Business Lifecycle Gates Process• Contract / legal review and
documentation of service delivery requirements
• Assurance – three lines of defence• Appropriately skilled /
trained resources
Current mitigation actions:
• Following allegations in 2013, in relation to the Company’s prisoner escort and electronic monitoring contracts with the Ministry of Justice, that the Group had overcharged the UK Government as a result of misreporting, the Group entered into a process of corporate renewal designed to mitigate the underlying risks of misreporting. Through the Corporate Renewal Programme, Group-wide controls that mitigate this risk are being implemented and are being embedded. These measures were introduced to reinforce the importance of data integrity and factual reporting down to the individual level, and diminish the risks in interpretation and understanding of our obligations.
Future actions:
• Contract management obligation mapping process to be implemented and used by all material contracts
• Compliance assurance programme to include review of data integrity compliance
• Review of annual performance review process to ensure incentives are aligned with our Values

Serco Group plc Annual Report and Accounts 201524
Principal Risks and Uncertainties continued
Legal and compliance risks
Risk Key risk drivers Mitigation
Contract non-compliance and contract non-performance
Impact on business objectives:
• Winning good business• Executing brilliantly• Profitable and sustainable
Our success depends on our ability to win and successfully deliver contracts that balance risk and reward. If we fail to negotiate performance criteria and contract provisions that can be delivered at the right price, or we do not fully understand and mitigate the risks involved, or we do not put in place appropriate capabilities required to deliver against our contractual obligations, contracts that we win are more likely to suffer from poor performance and may result in compliance challenges.
Not meeting our contractual obligations through either non-compliance with contractual requirements and / or failure to meet agreed service levels may result in significant financial or other penalties being levied, and in extreme circumstances, the termination of a contract with related compensation arrangements, which could extend to regulatory or other investigations. Apart from financial detriment, such failures could adversely affect our reputation and our ability to win new business.
There are a number of critical elements driving the risk of contractual non-compliance and non-performance, these include: failing to negotiate service levels and contract provisions that are appropriate for the level of reward; misunderstanding and / or not complying with contractual obligations, changes of scope, or incorrectly evaluating contractual assets; failure to properly manage contractual and operational risks; having insufficient transparency of performance and lack of capability (systems and people) to continually deliver against agreed service levels; and failure of sub-contractors and other suppliers in the performance of their obligations.
Contracted services are delivered through direct delivery of services, through the use of sub-contractors, or through joint venture consortium partners. As a result, these drivers apply to us as well as our sub-contractors or consortium partners, where they do not have the right expertise, tools and resources to manage and monitor compliance with contract obligations and expectations adequately.
These drivers span the full business lifecycle, including the bidding, transformation and operational phase through to contract close, and can result from insufficient discipline with respect to the development, implementation and adherence to corporate business processes, and inadequate programme governance.
Material controls:
• Serco Management System (SMS)• Our Values and Code of Conduct• Assurance – three lines of defence• Business Lifecycle Gates Process• Contract / legal review and
documentation of Service Delivery Requirements
• Appropriately skilled / trained resources
• Standardised Divisional Performance Reviews (DPR)
Current mitigation actions:
• Revision of Group policies and governance for bidding, transition, contract management, risk management and compliance
• Implementation of a new Compliance Assurance Programme to monitor compliance of contracts with respect to the SMS requirements
• Roll-out of SMS self-assessment questionnaires to check compliance against SMS requirements
• Business lifecycle gates process updated to include a requirement for make versus buy decisions (i.e. hire of staff versus use of sub-contractors)
• Targeted investment in the recruitment and training of staff to improve the capability of bid and contract management staff. This training provides contract managers with awareness of contract management requirements and the SMS requirements
• Trained key staff on the new risk management life cycle processes
• Roll-out of standardised DPRs
Future actions:
• Currently implementing the contract management obligation mapping process across the Group. This will be used to document and track all material contractual obligations across all contracts globally

Fina
ncia
l Sta
tem
ents
Dir
ecto
rs’ R
epo
rtSt
rate
gic
Rep
ort
Strategic Report 25· Principal Risks and Uncertainties
Risk Key risk drivers Mitigation
Material legal and regulatory compliance failure
Impact on business objectives:
• Winning good business• Executing brilliantly• A place people are proud to work• Profitable and sustainable
Operating across different sectors and geographies and working with national and local governments, public sector bodies and agencies, and government-regulated customers, the Group is required to comply with a complex and ever changing legal and regulatory environment. Failing to comply materially with these laws and regulations may cause significant loss to the Company.
Legal proceedings (including class actions) may be costly and if they are not determined in the Group’s favour, may divert management’s attention away from the running of the business. Losses or financial penalties resulting from any current or threatened legal actions may have a material adverse effect on the Group’s financial condition, results of operations and cash flows.
As a government contractor, the Group is subject to a greater risk of investigation, criminal prosecution, civil fraud, whistle-blower lawsuits and other legal actions and liabilities than companies with exclusively commercial customers.
As we have disclosed before, we are under investigation by the Serious Fraud Office. In November 2013, the UK’s Serious Fraud Office announced that it had opened an investigation, which remains ongoing, into our Group’s Electronic Monitoring Contract. We are cooperating fully with the Serious Fraud Office’s investigation but it is not possible to predict the outcome. However, in the event that the Serious Fraud Office decides to prosecute, the range of possible adverse outcomes is any one or a combination of the following:
(i) that the Serious Fraud Office prosecutes the individuals and / or the Serco Group entities involved - which may result in the individuals or entities involved defending the action successfully; or the individuals and the entities involved being convicted, which may result in significant financial penalties, an impact on existing contracts with the UK Government and Serco being subject to a period of discretionary debarment from future contracts with UK Government entities; or
(ii) that the Serious Fraud Office and the relevant Serco Group entities enter into a deferred prosecution agreement (DPA) – which may result in significant financial penalties and a period of discretionary debarment from future contracts with UK Government entities.
Such debarment would be discretionary in the sense that a contracting authority may consider it not to be relevant to a given bid or rebid or that Serco has provided sufficient evidence that it has addressed any issues identified in a DPA, but would also in any event be limited in time under the terms of the Public Contract Regulations 2015.
Upon any such conviction or DPA, the amount of additional work given to the Group by the UK Government may be reduced, and the Group may be subject to enhanced scrutiny with respect to its other contracts with the UK Government.
It is possible that further actions beyond those being implemented under the Corporate Renewal Programme may need to be taken by us under the terms of any DPA.
If the Group faces any criminal convictions, debarment consequences or enters into a DPA, any such outcome could result in significant fines and have a material adverse impact on the Group’s ability to contract with the UK Government and its reputation which would, in turn, materially adversely affect its business, financial condition, results of operations and prospects.
In addition, a criminal conviction of a Serco entity or of one or more of the Group’s current or former employees would in certain circumstances allow the Ministry of Justice to re-open the £64.3m settlement agreed in respect of certain issues arising under the Electronic Monitoring Contract. In those limited circumstances, the UK Government may seek additional payments from Serco.
We will continue to cooperate with the Serious Fraud Office’s investigation.
Material controls:
• Serco Management System• Assurance – three lines of defence• Business Lifecycle Gates Process• Contract / legal review and
documentation of Service Delivery Requirements
• Appropriately skilled / trained resources
• Standardised DPRs
Current mitigation actions:
• Improvements to the capability of the organisation to interpret and implement these requirements correctly including accessible legal expertise, subject matter experts and knowledgeable staff and clear policies and procedures on how we manage our legal and regulatory requirements
• Update to the business lifecycle gate process to include a requirement to identify the key material legal and regulatory requirements, and gain legal sign-off by contract and legal and contracts teams augmented by external legal counsel as appropriate
• Identification of policy owners and subject matter experts responsible for the identification and tracking of new and existing requirements
• Staff training on key material legal and regulatory requirements
Future actions:
A number of controls are currently being put in place to increase our ability to mitigate this risk these include:
• Review of mechanisms for the identification and management of key material legal and regulatory requirements
• Development of policy and guidelines on management of key material legal and regulatory requirements
• Implementation of Contract Management App (CMA) used to document and track all material contractual regulatory requirements and seek to ensure our requirements are met at all stages of the contract lifecycle including contract exit
Serco Group plc Annual Report and Accounts 201526
Principal Risks and Uncertainties continued
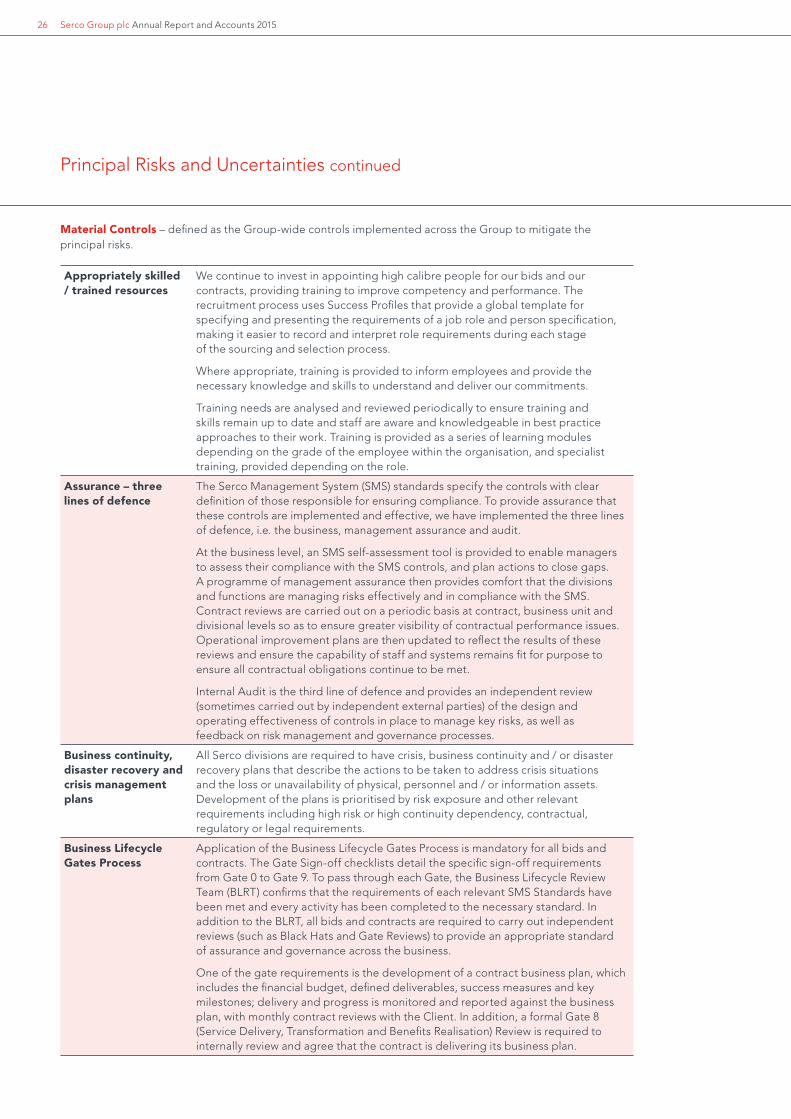
Material Controls – defined as the Group-wide controls implemented across the Group to mitigate the principal risks.
Appropriately skilled / trained resources
We continue to invest in appointing high calibre people for our bids and our contracts, providing training to improve competency and performance. The recruitment process uses Success Profiles that provide a global template for specifying and presenting the requirements of a job role and person specification, making it easier to record and interpret role requirements during each stage of the sourcing and selection process.
Where appropriate, training is provided to inform employees and provide the necessary knowledge and skills to understand and deliver our commitments.
Training needs are analysed and reviewed periodically to ensure training and skills remain up to date and staff are aware and knowledgeable in best practice approaches to their work. Training is provided as a series of learning modules depending on the grade of the employee within the organisation, and specialist training, provided depending on the role.
Assurance – three lines of defence
The Serco Management System (SMS) standards specify the controls with clear definition of those responsible for ensuring compliance. To provide assurance that these controls are implemented and effective, we have implemented the three lines of defence, i.e. the business, management assurance and audit.
At the business level, an SMS self-assessment tool is provided to enable managers to assess their compliance with the SMS controls, and plan actions to close gaps. A programme of management assurance then provides comfort that the divisions and functions are managing risks effectively and in compliance with the SMS. Contract reviews are carried out on a periodic basis at contract, business unit and divisional levels so as to ensure greater visibility of contractual performance issues. Operational improvement plans are then updated to reflect the results of these reviews and ensure the capability of staff and systems remains fit for purpose to ensure all contractual obligations continue to be met.
Internal Audit is the third line of defence and provides an independent review (sometimes carried out by independent external parties) of the design and operating effectiveness of controls in place to manage key risks, as well as feedback on risk management and governance processes.
Business continuity, disaster recovery and crisis management plans
All Serco divisions are required to have crisis, business continuity and / or disaster recovery plans that describe the actions to be taken to address crisis situations and the loss or unavailability of physical, personnel and / or information assets. Development of the plans is prioritised by risk exposure and other relevant requirements including high risk or high continuity dependency, contractual, regulatory or legal requirements.
Business Lifecycle Gates Process
Application of the Business Lifecycle Gates Process is mandatory for all bids and contracts. The Gate Sign-off checklists detail the specific sign-off requirements from Gate 0 to Gate 9. To pass through each Gate, the Business Lifecycle Review Team (BLRT) confirms that the requirements of each relevant SMS Standards have been met and every activity has been completed to the necessary standard. In addition to the BLRT, all bids and contracts are required to carry out independent reviews (such as Black Hats and Gate Reviews) to provide an appropriate standard of assurance and governance across the business.
One of the gate requirements is the development of a contract business plan, which includes the financial budget, defined deliverables, success measures and key milestones; delivery and progress is monitored and reported against the business plan, with monthly contract reviews with the Client. In addition, a formal Gate 8 (Service Delivery, Transformation and Benefits Realisation) Review is required to internally review and agree that the contract is delivering its business plan.

Fina
ncia
l Sta
tem
ents
Dir
ecto
rs’ R
epo
rtSt
rate
gic
Rep
ort
Strategic Report 27· Principal Risks and Uncertainties
Centres of Excellence To support the delivery of the Group strategy, Centres of Excellence (CoEs) have been set up with the objective of critically reviewing the markets and geographies we operate in globally, our sales propositions and the resources required to be successful. The CoEs develop a compelling value proposition in each market so as to develop a sufficiently robust pipeline of new business.
Contract / legal review and documentation of service delivery requirements
Operational teams are required to understand and document all service delivery requirements, including customer, contractual, regulatory or internal Serco requirements. Each operating contract is required to maintain a clear summary of current contractual requirements, prepared by the contracts / legal team. Changes to operating contracts are required to be reviewed, approved by the customer, documented, recorded and stored, managed and maintained by the divisional contract / legal team.
We are currently implementing the Contract Management Application (CMA) across the Group; this will be used to document and track all material obligations including material contractual and regulatory obligations across all material contracts globally.
Governance structure Our governance structure clearly defines roles and responsibilities at Board level and below to ensure that decisions throughout the organisation are soundly based and risks are appropriately controlled and monitored. The Board is responsible, among other matters for, the Group vision and strategy; annual financial and operating plans; effectiveness of the Group’s system of internal control and risk management. Key Board responsibilities are referred to by the Board committees.
The Executive Committee reviews risks, internal control and business assurance to ensure they are effectively managed and reviewed. Our processes of business review are intended to ensure that we meet customer expectations, regulatory requirements and performance criteria. The effectiveness of these processes is the focus of the Corporate Renewal Programme; the implementation of which is overseen by the Board Oversight Committee, which continues to monitor the embedding of the policies and procedures.
Divisional Executive Management Teams ensure appropriate governance and oversight of all aspects of staff, operational, financial, business development, customer relations, risk management, ethics and strategic performance of the Division. The Investment Committee provides governance for large or high risk bids, re-bids, acquisitions, disposals and strategic investments that are outside the delegated approval authority of the divisions.
A Global Information Assurance Board provides security leadership and oversight and Enterprise Architecture Boards ensure systems and information security controls are fit for purpose.

Serco Group plc Annual Report and Accounts 201528
Principal Risks and Uncertainties continued
Group strategy The Group strategy sets out the specific sectors and geographic markets that Serco will operate in and the key areas we need to focus on in order to deliver our core competencies and become the best run business in our sector.
Aligned with the Group strategy are divisional strategies and functional strategies including the health, safety and the environment, People, IT and Finance strategies.
These strategies outline the vision, the performance targets we have set ourselves and an overview of how we intend to deliver our business objectives. The strategies provide the basis of our business and operating plans, and also the various divisional continuous improvement programmes, rationalisation programmes, and global transformation programmes such as the Finance Transformation and IT Transformation programmes.
The overall coordination of the programmes is provided by a Group Programme Management Office (PMO) within the office of the Chief Operating Officer, which ensures effective prioritisation and tracking of benefits realisation to ensure we are delivering our overall Group strategy. The PMO seeks to ensure near-term financial and delivery targets are reviewed; programmes are executable within set timescales; and milestones, risks and interdependencies are identified and appropriately managed.
Insurance We maintain insurance policies against losses arising from circumstances such as damage or destruction of physical assets, theft, legal liability for third-party loss and professional advice, and we review the adequacy of our insurance cover at regular intervals to ensure alignment with our operational risks.
IT security infrastructure, process and controls
The Chief Information Officer is responsible for ensuring that systems, processes and controls are in place seek to ensure the confidentiality, integrity and availability of sensitive information and the associated information systems that support our business activities. The controls include access control policies to prevent fraud, errors, sabotage and system design and change control procedures to ensure the integrity of data.
Serco has been accredited with the UK Government Cyber Essentials Plus certification; this provides confidence to a number of our stakeholders that we are appropriately prepared and protected.
We are currently delivering the Cyber Defence Programme which will provide improvements to the UK IT security infrastructure to provide better visibility, monitoring and control of UK security infrastructure, and a Global Security Operations Centre for monitoring and dealing with cyber-attacks across the Group.
Our Values and Code of Conduct
Our Values and Code of Conduct define the behaviours we expect from staff to ensure we operate in a manner that is aligned with these principles and drives an organisation culture that enforces the Serco brand. The Code of Conduct is supported by corporate guidelines, mandatory training modules (Serco Essentials and Serco Essentials Plus training programmes), the ‘Say No’ Tool Kit, and the Decision Making Guidance.
Our policies are supported by our Code of Conduct (codeofconduct.serco.com), which applies to all employees from Board Directors to every member of front line staff, and also to suppliers.
Assurance that the Code of Conduct is deployed and is complied with is provided by the divisional in-country ethics teams as are the issues highlighted through the ‘Speak Up’ process which enables staff to report illegal, dangerous, dishonest or unethical activities anonymously.
In addition, we carry out surveys to understand the effectiveness of these controls in delivering the organisational culture we strive for. The Corporate Responsibility and Risk Committee has responsibility for the review of ethical issues that may arise from our current and future activities.

Fina
ncia
l Sta
tem
ents
Dir
ecto
rs’ R
epo
rtSt
rate
gic
Rep
ort
Strategic Report 29· Principal Risks and Uncertainties
Safety management systems
Operations are required to work under defined, documented safety management systems (including procedures and work instructions) which are appropriate and proportionate to the nature of the operation’s safety risks. Systems and procedures are reviewed (at least annually) to ensure they reflect material legal responsibilities associated with applicable material laws, regulations, approvals, licences and other material legal requirements, industry codes and best practice, contractual requirements and expectations of regulators and other interested parties. Operations in safety critical areas including rail, aviation, nuclear, marine and custodial are subject to regulatory requirements which include specific requirements around safety management systems. These are subject to review and audit by the relevant regulator, typically on an annual basis.
Serco Leadership Model
The Serco Leadership Model defines the capabilities required at each leadership tier to align with our strategic priorities and provides a single, global definition of leadership that applies to all employees. It provides a clear structure for our leadership development pipeline and helps us to identify, select and develop leadership talent. The model is embedded in our key people processes, including: recruitment and selection; induction; performance management; leadership development; talent reviews and success planning; internal promotion and appointments.
For our leadership and all our people, successful execution of our business is enabled by clear definition of what is expected and the provision of guidance to meet those expectations. Our Leadership Model defines our leadership capability requirement, aligned to our strategic priorities and applicable to all employees. For Serco, leadership is less about hierarchy and more about behaviour – building trust, relationships, networks, communities and working together.
Serco Management System (SMS)
The SMS defines the policies, standards and processes to be applied wherever we operate. The operating processes reflect the principles of clear delegation of authority and segregation of duties. We continue to improve the SMS standards and processes to ensure they provide clarity on the mandatory controls that the business is required to implement to manage our risks, but are fit for purpose for the business.
Through our integrated approach to Corporate Renewal, we have introduced a greater level of transparency with respect to our SMS internal controls. Significant volumes of training have been delivered both in the UK and globally to raise staff awareness of the SMS controls and to understand their roles and responsibilities. We have also continued to roll-out and train key staff in the adoption of a revised Risk Management operating model.
Standardised Divisional Performance Reviews (DPRs)
Divisional and contract performance is reported against a balanced scorecard of metrics contained in the Divisional Performance Review (DPR). DPR meetings are held periodically at different levels across the business and ultimately reviewed by the Group Chief Executive Officer, Chief Operating Officer and Chief Financial Officer on a monthly basis. These reviews enable leadership to assess the operational health of the business on a regular basis.
Standardised finance systems, processes, and controls and reporting
We have implemented a standardised reporting process (including the production of a core set of Management Accounts) to enable line of sight throughout the organisation and a standardised planning and forecasting process to ensure a consistent approach to business and financial planning across the Group. To support the implementation of these standardised processes we have refreshed and updated the finance control procedures and are currently delivering a Finance Transformation Programme which will enhance SAP to provide a unified financial platform with the aim of providing the ability to gain instant insight into our financial position and to carry out real-time planning.

Serco Group plc Annual Report and Accounts 201530
Viability Statement
In accordance with provision C2.2 of the UK Corporate Governance Code, published by the Financial Reporting Council in September 2014, the Directors have assessed the prospects of the Group over the three-year period to 31 December 2018. The Directors believe that the three-year period is appropriate for Serco since it reflects the fact that the Group has limited visibility of contract bidding opportunities beyond three years and that approximately 30% of current year revenue relates to contracts where the contract term comes to an end within three years. Furthermore, the Group is in the early stages of implementing a new strategy to turn its performance around. In addition, the three-year period also coincides with the maturity of the Revolving Credit Facility, which is in April 2019.
Assessing the longer-term viability of any company at this early stage of new strategy implementation is inevitably a challenge, particularly given the recent history of the Group as explained in previous shareholder communications (including the Prospectus issued by the Company in relation to the Rights Issue) and the onerous contracts that exist within the Group.
During 2015, the Board carried out a robust assessment of the principal risks facing the Group, including those that would threaten the execution of its strategy, business model, future performance, solvency and liquidity. Management and mitigations of those principal risks have been taken into consideration when considering the future viability of the Group. The Group’s principal risk review, as set out on pages 16 to 29, considers the impact of these principal risks and the mitigating controls that are in place.
In assessing the prospects of the Group over the three-year period, the Directors have also considered the Group’s current financial position as well as its financial projections in the context of the Group’s debt facilities and associated covenants. These financial projections are based on a ‘bottom up’ Budget exercise for 2016 and 2017, and a more ‘top down’ view for 2018.
The Group is delivering on the strategic priorities it set out at the time of the Rights Issue and continuing to embed these into the business. Crucially, the combination of the proceeds of the Rights Issue and the disposal of our offshore private sector BPO business has enabled us to reduce net debt from £682m to £78m meaning that we have greatly increased headroom on our key financial covenants. Going forward, given the weakness of the contract pipeline, the Group is likely to experience net revenue attrition for a period of time, which will in turn impact profit and cash generation. Our base projections indicate that our debt facilities and projected headroom are adequate to support the Group over the next three years.
The Group’s financial plan has been stress-tested against severe but plausible scenarios, on their own and in combination, to evaluate the future viability of the Group. It is unlikely, but not impossible, that the crystallisation of a single risk would test the future viability of the Group; however, unsurprisingly, and as with many companies, it is possible to construct scenarios where either multiple occurrences of the same risk, or single occurrences of different significant risks, could put pressure on the Group’s ability to meet its financial covenants. At
this point, the Group would look to address the issue by exploring a range of options including, amongst others, a temporary or permanent renegotiation of its debt covenants; disposals of parts of the Group’s operations to reduce net debt; and / or raising additional capital in the form of equity, subordinated debt or other such instruments.
Subject to these qualifications, and on the basis of the analysis undertaken, the Directors have a reasonable expectation that the Group will be able to continue in operation and meet its liabilities as they fall due over the three-year period of their assessment. In doing so, it is recognised that such future assessments are subject to a level of uncertainty that increases with time and, therefore, future outcomes cannot be guaranteed or predicted with certainty. The Directors have made the following key assumptions in connection with this assessment:
– there is no significant unexpected contract attrition and bid conversion rates are not significantly lower than anticipated;
– the Group is able to execute its new strategy and deliver forecast margin improvements; and
– the Group is not subject to any material penalties or direct and indirect costs and / or losses arising from the current SFO investigation.

Fina
ncia
l Sta
tem
ents
Dir
ecto
rs’ R
epo
rtSt
rate
gic
Rep
ort
Strategic Report 31· Key Performance Indicators
Key Performance Indicators
We use Key Performance Indicators (KPIs) to monitor our performance to ensure we have a balanced set of metrics that give appropriate emphasis to both financial and non-financial aspects. Alongside this, in 2015 we have improved significantly our management information, including the contract performance monitoring process, monthly management accounts and Division Performance Review process.
Financial Key Performance Indicators
1. Underlying Earnings per Share (EPS)Definition
Underlying EPS reflect the Underlying Trading Profit measure after deducting pre-exceptional net finance costs (including those for discontinued operations) and related tax effects. It excludes ‘non-controlling interests’ and divides the amount by the weighted average number of ordinary shares outstanding during the period in accordance with IFRS.
Trading Profit is defined as IFRS Operating Profit adjusted for (i) amortisation and impairment of intangibles arising on acquisition and (ii) exceptional items. Consistent with IFRS, it includes Serco’s share of profit after tax of its joint ventures. Underlying Trading Profit excludes Contract and Balance Sheet Review adjustments (principally OCP releases or charges), the beneficial impact of depreciation and amortisation of assets held for sale, and other one-time items such as the profit on early termination of a UK local authority contract that occurred in 2015. Trading Profit measures include that from discontinued operations.
Relevance to strategy
Underlying EPS reflects the combined ability to grow revenue and trading profit margin, together with the strength of funding and overall financial position.
2. Trading cash flow (£m) and Underlying Trading cash flow conversion rate Definition
Trading cash flow is defined as ‘net cash inflow from operating activities’ excluding exceptional items, as shown on the face of the Group’s Consolidated Cash Flow Statement and is stated after capital expenditure from tangible and intangible purchases less proceeds of tangible and intangible disposals, adding dividends we receive from joint ventures and adjusting to remove tax payments or receipts.
Relevance to strategy
Trading cash flow reflects our ability to generate funds to invest in our future growth and strategic development. The Underlying Trading cash flow conversion rate reflects the efficiency of the business in converting Underlying Trading Profit into cash.
25.43p
35.15p
28.64p
2011 2012 2013 20152014
Performance
Underlying EPS (pence per share)
89.8%
46.6%
20142013 2015
101.7m119.9m
282.9m
91.1%
229.0m
101.2%
201420132012
2012
2011
2011
2015
Performance
Trading Cash Flow (£m)
Underlying Trading Cash Flow Conversion Rate
3.44p20.7%
19.9m
4.73p

Serco Group plc Annual Report and Accounts 201532
Key Performance Indicators continued
3. Return on invested capital (ROIC) %Definition
ROIC is calculated as Underlying Trading Profit for the period divided by the invested capital balance. Invested capital represents the assets and liabilities considered to be deployed in delivering the trading performance of the business.
Invested capital assets are: goodwill and other intangible assets; property, plant and equipment; interests in joint ventures; trade and other receivables; inventories; and assets classified as held for sale. Invested capital liabilities are trade and other payables (current and non-current) and liabilities classified as held for sale.
Invested capital is calculated using the closing balance sheet position for 2014 given the impact of the Contract and Balance Sheet Review during that year; for 2015 it is calculated as a two-point average of the opening and closing balance sheets for the period.
Relevance to strategy
ROIC measures how efficiently the Group uses its capital to generate returns from its assets.
4. Major reportable incident rate (per 100,000 employees)Definition
Major reportable incidents are classed as fatalities, fractures, amputations, dislocations, loss of sight, chemical and hot metal burns, electrical burns, unconsciousness caused by asphyxia or exposure to a harmful substance, and acute illness resulting from substance inhalation or ingestion. The rate measures our success in providing a safe and secure working environment (excluding joint ventures).
Relevance to strategy
Delivering excellent service to our customers requires us to operate in the safest way possible. Safety also has a direct bearing on the commitment and engagement of our people.
Performance
The number of major reportable incidents reported in 2015 were 53 compared to 35 reported in 2014 (2014 reported number was 19.9 but as explained on page 79 this has been restated to 37.5), resulting in a rate of 57.7 per 100,000 employees, which falls short of our target of a rate set for 2015 of below 30. This can be broken down with rates for ‘frontline’ (higher risk) operations at 95.9 and our ‘back office’ operations at 11.9. The increase relates to an increase in serious physical assaults within our custodial and immigration business. This is not just a Serco issue but an industry issue and is one we take extremely seriously.
11.3%
13.9%
17.3%
12.0%11.1%
2014201320122011 2015
Non-financial Key Performance Indicators
Performance
Underlying Trading ROIC %
Performance
Major Reportable Incident Rate (per 100,000 employees)
51.5
67.0
37.533.4
57.7
2011 2012 20142013 2015
2014 reported number was 19.9 but as explained on page 79 this has been restated to 37.5

Fina
ncia
l Sta
tem
ents
Dir
ecto
rs’ R
epo
rtSt
rate
gic
Rep
ort
Strategic Report 33· Key Performance Indicators
5. Employee EngagementDefinition
We partner with Aon Hewitt to run our global employee engagement survey. This covers all employees, excluding our joint ventures, and focuses on three key areas: whether people say positive things about working at Serco (‘say’), people’s intention to stay with Serco (‘stay’) and their intention to give discretionary effort (‘strive’). Our engagement score shows how many employees exhibit strong levels of all three of these areas when we survey.
Relevance to strategy
We have completed extensive business linkage analysis across our divisions, including internationally, to show that high levels of employee engagement lead to higher customer satisfaction and lower levels of staff turnover and absenteeism. Therefore, to achieve our strategic aims, we need highly engaged employees to deliver outstanding customer service.
Performance
During 2015’s Viewpoint survey, our global engagement score is 53%, up 2% from 2014. Several divisions increased their engagement scores from 2014 whilst two remained stable at their previous scores. We were pleased that our four key engagement driver scores increased from 2014 as well. The Viewpoint results were cascaded to the organisation in Q4 2015 and we have a global plan of activity in place for 2016 to sustain and drive employee engagement in Serco, led by our Executive Committee through all Divisions.
6. Carbon emissions headcount intensity (tonnes CO2e per FTE)Definition
We report our greenhouse gas emissions as tonnes of CO2e per full time equivalent (FTE) employee. This normalises our emissions to the size of our business. We adopt ISO 14064-1 2012 to ensure we meet greenhouse gas reporting requirements and provide a fair and transparent picture of our greenhouse gas emissions.
Relevance to strategy
Our carbon dioxide emissions are directly related to our energy use, and hence to the efficiency of our operations.
Performance
Our frontline operations have an emissions intensity of 3.53 tonnes CO2e per FTE whilst our back office operations reported significantly less at 1.17 tonnes CO2e per FTE. Combined, our normalised emissions are 2.45 tonnes CO2e per FTE, which is a 35% improvement on 2014. This is due to changes in contributing contracts such as the removal of energy associated with the operation of Docklands Light Railway (December 2014) as well as reduced UK gas consumption as a result of mild weather and the impact of initiatives taken.
Historic employee engagement scores have been normalised with the exclusion of data from the Global Services private sector BPO division which Serco is exiting.
Group Frontline Operations Back Office Operations
Performance
Serco Employee Engagement
Performance
Tonnes CO2e per FTE
45%
3.80
2.45
6.86
3.53
51%
42%
53%
2012 20142013 2015
2015 2015 2015
1.17
2014 2014 2014
1.03

Serco Group plc Annual Report and Accounts 201534
Chief Executive’s Review
Underlying Trading Profit at £96m was ahead of the £90m we had forecast, and Reported Trading Profit was much higher still at £138m. Closing net debt of £78m was significantly lower than expected, and represented a year-on-year reduction of £605m. Revenue including discontinued operations was around the level we expected at £3.5bn; the discontinued operations comprise the private sector Business Process Outsourcing (BPO) business, the majority of which was disposed of at the end of December 2015. Not included in Underlying Trading Profit was a net positive movement of £21m in provisions for future losses on onerous contracts and other liabilities recognised at the end of 2014; although it has no impact on Underlying Trading Profit, it was also pleasing that Onerous Contract Provision (OCP) utilisation was £14m lower than expected at the beginning of the year. Looking ahead to 2016, and in line with our plan, we expect a further reduction in revenues and profits as we feel the impact of the disposal of our private sector BPO business, as well as further contract attrition.
To give some context to our performance in 2015, it is worth reflecting on where we have come from, and are going to. After a difficult period during which the business suffered a series of major setbacks, I joined the business in May 2014, and my colleague Angus Cockburn joined as Group Chief Financial Officer in October 2014. A thorough review of contracts in the business (the Contract and Balance Sheet Review) was carried out, resulting in an announcement in November 2014 that we anticipated a write-down of around £1.5bn, which included asset impairments, goodwill write-offs, and provisions against future losses on onerous contracts. This led to the requirement to refinance the business, which was completed by way of a Rights Issue and a renegotiation of our debt facilities in early 2015. In parallel with the Contract and Balance Sheet Review, we carried out a Strategy Review, which concluded that we should focus on being a leading supplier of public services to governments, and that the private sector outsourcing activities should be disposed of. At the same time as the Strategy Review, the business also undertook a
Rupert Soames OBE Group Chief Executive Officer
“ The business has delivered a much better performance than we expected at the start of the year, which reflects the fact that we are making good progress in the first year of the implementation of our strategy. Looking ahead to 2016, we have four priorities: further improve the operational and financial performance of our contracts; build our new business pipeline; reduce our costs; and improve and embed our new management information systems.”
The financial results for 2015 were much better than we expected both at the start of the year and at the time of the March 2015 Rights Issue.

Fina
ncia
l Sta
tem
ents
Dir
ecto
rs’ R
epo
rtSt
rate
gic
Rep
ort
Strategic Report 35·
thorough Corporate Renewal programme, in which new systems and processes were implemented to ensure that there would be no repeat of previous issues.
The Strategy Review, presented to investors in March 2015, identified three distinct phases in the turnaround of our business. The first phase, ‘Stabilisation’, involved developing a plan to take the business forward, refinancing the business, putting in place a new management team, and implementing new reporting processes. The end of this phase was marked by the successful completion of our Rights Issue and refinancing in April 2015. Since then we have been working hard on the second phase: ‘Transformation’. This will take us through to 2018, when we expect to see the business starting the third phase: ‘Growth’.
Within this context, significant progress has been made in 2015 against our plan. We now have a firm financial platform; our strategy – to be a leading international provider of public services operating in Defence, Justice & Immigration, Transport, Health and Citizen Services – has been well received by customers; our risk management and reporting processes have been hugely improved; we have made good progress mitigating the losses and improving service delivery on some of the largest onerous contracts; morale in the business, and most particularly amongst the management team, is much better; relationships with key customers are healthier; our pipeline of new business has started to grow again, and we have established our first Centres of Excellence; we have reduced the costs in the business by over £330m; and we have disposed of non-core businesses.
In summary, in 2015 we delivered on our promises, our plan has survived first contact with the enemy, and we go into 2016 in much better shape than we entered 2015. However, to paraphrase the Duke of Wellington at Waterloo, we know that much hard pounding lies ahead.
Summary of financial performanceRevenue and Trading Profit
Reported Revenue was £3,177m (2014: £3,596m); this measure excludes revenue from discontinued operations (our private sector BPO division) of £338m as well as Serco’s share of revenue from joint ventures of £737m. Revenue including discontinued operations was £3,515m (2014: £3,955m). At constant currency and adjusting for disposals and acquisitions, revenue including discontinued operations declined by 10%, largely as a result of the ending of contracts such as the Docklands Light Railway and National Physical Laboratory, as well as certain US intelligence agency support services and visa processing work; it also reflected the reduced volumes and rates in Australian immigration services. Partially offsetting these declines were the start of new contracts such as the Caledonian Sleeper and the start of full operations at Fiona Stanley Hospital in Australia.
Reported Trading Profit for the year was £137.6m (2014: loss of £632.1m). The difference between Reported Trading Profit of £137.6m and Underlying Trading Profit of £96.0m, is accounted for by three items. First, we have not included in Underlying Trading Profit £9.0m of profit arising from the early termination of a contract with Thurrock Council, on the basis that it is one-off in nature. Second, and in accordance with the accounting treatment of assets held for sale,
depreciation and amortisation charges related to assets held for sale at 31 December 2014 are required to be excluded from the Group accounts; this had the effect of increasing Reported Trading Profit by £11.7m, but has been excluded from Underlying Trading Profit. Third, we have also excluded from Underlying Trading Profit a net benefit of £20.9m arising from our year-end review of OCPs and other Contract and Balance Sheet Review items.
In 2014, it became clear that a number of contracts would be unprofitable during their life and required OCPs, and numerous future liabilities needed to be reflected in our Balance Sheet; together, these led to a charge of £745.3m to Reported Trading Profit in 2014. We said at the time we created these provisions that they should be viewed as a portfolio of liabilities and charges, and that as subsequent events interfered with the hundreds of judgements we made at the end of 2014, we expected that individual items would vary from our original estimates; however, we believed that in aggregate, the charge was a reasonable and prudent estimation of the likely total value of future liabilities. Whilst there have been numerous charges and releases against individual contracts and provisions, the overall net release of £20.9m against the £745.3m charged last year indicates that our overall judgement at the end of 2014 was broadly correct. Within the net release of £20.9m, OCP releases totalled £88.8m, additional OCP charges totalled £91.8m, and a net total benefit of £23.9m arose from movements in other balance sheet provisions and charges related to contracts taken in 2014.
Chief Executive’s Review

Serco Group plc Annual Report and Accounts 201536
Chief Executive’s Review continued
The single largest OCP release was £63m related to the Armidale Class Patrol Boat (ACPB) contract; this followed the agreement we reached in 2015 with the Australian Government to amend the terms of the ACPB contract. The largest OCP charge related to a new provision of £34m in respect of our contract with Lincolnshire County Council; in addition, we judged it necessary to increase the existing OCP against our UK Prisoner Escorting Contract (PECS) by £11m.
Underlying Trading Profit includes £114m of OCP utilisation, which reflects the neutralisation of the losses on contracts identified in the 2014 Contract and Balance Sheet Review. A further £11m of OCP utilisation was applied to items classified in 2014 as exceptional. Total OCP utilisation during 2015 of £125m was £14m less than the £139m we had expected at the start of the year. Currency movements during the year had no material impact on Underlying Trading Profit.
Underlying Trading Profit of £113m in 2014 included losses of £54m incurred in 2014 on contracts that were subsequently provided for and had their equivalent losses in 2015 neutralised by OCP utilisation. Therefore Underlying Trading Profit of £96m for 2015 is best compared to £167m in 2014. The significant drop in profits is driven by contract attrition, volume and rate reductions on some contracts and the challenge of reducing costs in line with revenues that were £440m lower in 2015 than in 2014.
Finance, tax and exceptional costs
Pre-exceptional net finance costs, including discontinued operations, were £32.0m (2014: £36.7m). The reduction in average net debt over the year reduced the Group’s net interest payable, but this was partially offset by the movement in the discount on provisions which, although a non-cash item, is recorded within overall finance costs. Cash net interest paid in the year was £32.7m (2014: £39.6m).
Pre-exceptional tax costs, including discontinued operations, were £36.6m (2014: £11.1m); on an underlying basis, tax costs were £30.5m and the effective rate was 47.7%; this rate reflects the combination of the current lack of a deferred tax credit in the UK to offset tax charges at locally prevailing rates in the international divisions (which tend to be higher than the UK’s rate). When we are able to show sufficient profits in our UK business, we will be able to reflect the value of a tax asset in the UK, and we would therefore expect that at some point our effective tax rate will drop substantially. Net cash tax paid in the year, at £2.7m (2014: net repayment of £0.6m), was much lower than the accounting charge.
The Group incurred a £187.5m net exceptional operating charge for the year, of which £165.5m relates to non-cash losses on disposals and impairments. There was a £77.6m charge on discontinued operations reflecting the impairment in the carrying value of businesses held for sale prior to disposal. There was
an £87.5m goodwill impairment related to the updated assessment for the Americas division. Exceptional restructuring and other incremental costs related to the development and implementation of the Strategy Review amounted to £21.9m. In addition to operating exceptionals, there was £32.8m of exceptional finance costs relating to the Rights Issue and debt refinancing, which included charges related to the early repayment of debt.
Earnings per share
Underlying Earnings Per Share, which reflects the Underlying Trading Profit measure after deducting pre-exceptional finance costs (including those for discontinued operations) and related tax effects, was 3.44p (2014: 4.73p); the reduction also reflects the movement in the weighted average number of shares in issue which increased to 986.5m shares (2014: 655.1m shares) as a consequence of the Rights Issue. Earnings before exceptional items, including those for discontinued operations, were 6.55p per share; including the impact of exceptional items, there was a loss of 15.47p per share.
Cash flow and net debt
In 2015 our ability to manage monthly cash flow far outstripped our ability to forecast it accurately, as we managed around poor cash forecasting systems and the unpredictable impact of our campaign to normalise working capital management. In previous years the focus was on optimising the net debt position at the end of reporting periods. The

Fina
ncia
l Sta
tem
ents
Dir
ecto
rs’ R
epo
rtSt
rate
gic
Rep
ort
Strategic Report 37· Chief Executive’s Review
consequence of this was significant volatility in monthly cash flows, with large net inflows in December and June, followed by equally large net outflows in January and July, with the result that average net debt over the year was often much higher than that reported at period ends. In 2013 this difference between reported and average net debt amounted to £149m; in 2014 and 2015, we worked to progressively reduce this difference; in 2015 it had dropped to £59m across the year, and was a mere £34m in the second half of 2015.
As a consequence, our estimates of cash flow at the start of the year were less than perfect, and the reported result – a Free Cash outflow of £16m – was significantly better than we forecast at the beginning of the year. Admittedly, there were numerous items which could not have been foreseen at the beginning of the year, such as the inflows from the ending of the Thurrock and Shop Direct contracts, lower-than-expected cash outflow from OCPs, and the quantum of other working capital movements as we normalised debtor and creditor cycles.
As a result of better-than-expected Free Cash outflow, net debt, including that for assets and liabilities held for sale, was also better than we expected, and stood at £77.5m at the end of the year. This represented a reduction of £605m from the £682.2m at 31 December 2014. The main drivers of this reduction were the net proceeds of approximately £530m from the April 2015 Rights Issue, together with the approximate £200m received following the completion of the BPO disposal at the end of December 2015.
Offsetting these inflows, there was an outflow of £88m related to exceptional items, £33m adverse currency impact and the £16m Free Cash outflow related to trading. The reduction in net debt results in our leverage for covenant purposes being 0.4x EBITDA; on a pro forma basis, removing the £35m of EBITDA associated with the BPO disposal, it would have been 0.5x, which compares with the requirement in our debt covenants to be lower than 3.5x.
Dividends
As indicated in March 2015, the Board is not recommending the payment of a dividend for 2015. The Board is committed to resuming dividend payments when it is prudent to do so. The decision as to when to declare a dividend and the amount to be paid will take into account the Group’s underlying earnings, cash flows and financial leverage, together with the requirement to maintain an appropriate level of dividend cover and the market outlook at the time.
The Revenue and Trading Profit performance are further described in the Divisional Reviews. More detailed analysis of earnings, cash flow, financing and related matters are described further in the Finance Review.
Contract awards, pipeline, order book and rebidsContract awards
The Group signed contracts with an aggregate total value of £1.8bn during the year; this excludes £0.3bn signed by the private sector BPO business that was sold in December 2015. As anticipated, the year was relatively quiet with few major bidding
outcomes announced. The value of new business won was £0.5bn, or approximately 30% of the total value signed, with the bulk of order intake represented by securing extensions or successfully rebidding existing work. Win rates by volume were around 50% for new bids and around 90% for rebids and extensions, but by value the win rates were around 20% and 75% respectively.
The largest new contracts signed were those to operate the North-South line for the Saudi Railway Company and to support the US Naval Facilities Engineering Command; these two were wins from our £5bn major opportunities pipeline at the start of the year. We were however unsuccessful on two larger new bids, one for Australian offshore immigration services and the other for Wellington metro rail service. It should be noted that in early February 2016, the Australian Government decided to re-tender the offshore immigration services contract, and as Reserve Bidder in the original tender, has invited Serco and the originally selected Preferred Bidder to re-tender for this opportunity, though we have not included the opportunity in our pipeline as at the time of reporting we have not decided whether to participate in the process. A third opportunity in the pipeline, the Icebreaker vessel to be used by the Australian Antarctic Division (AAD), saw Serco selected as Preferred Tenderer, but, as this contract is yet to be signed, it has not been included in the value of signed contracts and remains in the Group’s major bids pipeline.

Serco Group plc Annual Report and Accounts 201538
Chief Executive’s Review continued
Smaller new bids won included facilities management for the new district general hospital for NHS Dumfries and Galloway, supply chain support for the US Navy, and several contracts for our European Agencies business, including the provision of a multi-lingual call centre based in Brussels offering support in 24 languages.
Major rebids and extensions secured during 2015 included: facilities management services to Wishaw and Norfolk & Norwich University Hospitals; IT and contact centre support for European Agencies; air traffic control services for the Federal Aviation Administration and classification services for the US Patent and Trademark Office; cost analysis support to the US military and personnel identification support to the US Navy; traffic camera services in Victoria, Australia; defence logistics and base support services in the Middle East; Baghdad Air Navigation Services; and operating the Palm Jumeirah Monorail System in Dubai. Major rebids lost during 2015 included two defence support contracts in the UK and the National Benefits Center contract in the US. We will also experience attrition in 2016 from contracts where we have either decided not to rebid at the end of the contract because they were losing money (examples being Suffolk Community Healthcare and National Citizen Service) or where the customer has decided to take the work back in house (for instance MoD Defence Business Services, Thurrock Council and Virginia Department of Transport).
Order book
The Group’s order book, excluding the discontinued Global Services division, now stands at £10.0bn, a reduction of £1.6bn over the year. The value of signed contracts in the year increased the order book, but this was outweighed by the reductions to the order book due to revenue delivered in 2015 and adjustments for contracts ending early. There is £2.5bn of revenue already secured in the order book for 2016, equivalent to approximately 90% revenue visibility of our £2.8bn revenue guidance. The secured order book is £1.6bn for 2017 and £1.2bn for 2018.
Rebids
In terms of contracts potentially ending during 2016, there is an unusually small number subject to a rebid or extension decision; in aggregate these have annual revenue totalling around £90m, with an in-year ‘revenue at risk’ of approximately £60m. In 2017, there are a larger number of contracts that will potentially end or need to be re-bid or extended, with these having aggregate annual revenue of around £240m. In 2018, there is a further £460m. In total over the next three years therefore, there are around 40 contracts in our order book with annual revenue of over £5m across the Group where an extension or rebid will be required, representing annual revenue of approximately £790m or around 30% of the Group’s forecast revenue for 2016 of £2.8bn.
Pipeline
The definition we use for our reported pipeline is new bid opportunities with annual revenue of at least £10m, and which we expect to bid and to be decided within the next 24 months. The definition does not include rebids and extension opportunities. It is therefore a relatively small proportion of the total universe of opportunities we have in our prospect list, many of which either have annual revenues less than £10m, or are likely to be decided beyond the next 24 months, or are rebids and extensions. It should also be remembered that in the Americas in particular, we have numerous contracts which are classed as ‘IDIQ’ – Indefinite Delivery / Indefinite Quantity – which are essentially framework contracts under which the customer issues task orders one at a time; whilst the ultimate value of such a contract may be very large and run over many years, the value of it is only recorded in our order book as individual task orders are contracted, and few of them would appear in the pipeline as they tend to be contracted on short lead times.
The reported pipeline has seen significant decline over recent years – from around £12bn at the end of 2013 to around £5bn at the end of 2014. It is encouraging that for the first time in several years, it has shown an increase to around £6.5bn as at the end of 2015. There continues to be around 20–30 opportunities, with the annual contract value averaging around £30m and a typical length of contract being 5–10 years.

Fina
ncia
l Sta
tem
ents
Dir
ecto
rs’ R
epo
rtSt
rate
gic
Rep
ort
Strategic Report 39· Chief Executive’s Review
Guidance for 2016 and outlook beyond
Serco provided initial guidance in December 2015 for the 2016 financial year, and that guidance is unchanged at the date of reporting the results for the 2015 financial year. For 2016, we anticipate Revenue of approximately £2.8bn and Underlying Trading Profit of approximately £50m. This view of Underlying Trading Profit is before any future adjustments to OCPs should these arise during the year.
The exit of the private sector BPO operations is forecast to reduce Revenue by over £300m and Underlying Trading Profit by over £20m, driven by the absence of the £23m contribution from the offshore BPO operations which were disposed of at the very end of 2015. The Underlying Trading Loss from the residual UK private sector BPO operations up to the point of their assumed exit is forecast to be approximately £10m in 2016, which is broadly unchanged from the loss in 2015, given the effect of ‘stranded’ costs, which will take some time to work out of the business.
Revenue attrition across the rest of the Group is estimated to be up to £500m. As previously described, and covered in more detail in the Divisional Reviews, the greatest attrition is in the Local and Regional Government division, and in the Americas division. In the Central Government division, the end of the Northern Rail franchise in early 2016 will also reduce the profit contribution, although,
being a joint venture, will have no impact on revenues. In total, the impact of the profit contribution associated with contract attrition is approximately £40m, in addition to the £20m impact of the BPO disposal and wind-down of the private-sector BPO operations in the UK described above.
Our forecast for 2016 includes around £100m of incremental Revenue from already secured or potential new business. Limited progress on new growth in 2016 reflects the weakness in the bid pipeline during the last two years. The incremental profit contribution from this growth, together with retained cost efficiencies, will only partially mitigate the profit reductions from the BPO disposal and the significant amount of contract attrition.
In terms of cash flow and net debt movement, we anticipate an increased level of Free Cash outflow, as Underlying Trading Profit is expected to be significantly lower than in 2015, and we do not expect any one- off benefits such as the cash in-flows resulting from the end of the Shop Direct and Thurrock contracts. We also expect to see continued outflow related to the utilisation of OCPs and previously booked exceptional items. We therefore estimate that closing net debt at the end of 2016 could be around £200m, equivalent to leverage for covenant purposes of approximately 2x EBITDA.
For 2017, conditions remain uncertain and we do not expect anything more than limited financial progress. Rebuilding and ultimately converting our pipeline of new contract opportunities will take some time, as will delivering incremental net benefits of cost efficiency programmes. Our view of 2017 will clearly come more into focus as we progress through 2016.
Strategy implementation progress
In March 2015, we set out our new strategy, which is to focus on the public sector market and be a leading provider of public services to governments. Specifically, we intend to focus on five market sectors: Defence, Justice & Immigration, Transport, Health and Citizen Services; and to do so across four geographies: UK & Europe, North America, Asia Pacific and the Middle East. The strategy builds upon Serco’s long track record and expertise in the transformation and management of complex public services, and in supporting critical and sensitive activities central to the work of governments. We believe our chosen markets have long-term structural growth drivers and that Serco can play a central role in helping governments respond to the challenge of improving the quality and reducing the cost of public services, whilst earning for our shareholders sustainable and attractive risk-adjusted returns.

Serco Group plc Annual Report and Accounts 201540
Chief Executive’s Review continued
In our strategy presentation in March 2015, we identified three distinct phases in the turnaround of our business. The first phase – Stabilisation – involved identifying all the issues which had impacted the company, changing management, setting a new strategy, reducing net debt, disposing of non-core businesses, and repairing relations with our customers, most particularly the UK Government. This phase is now complete. The next phase – Transformation – is now in full swing as we navigate a path towards our ambition of becoming one of the best managed businesses in our sector. Whilst achieving this ambition will take many years, we expect it to enter the final phase – Growth – in 2018 - 2020; the precise moment the business starts to grow again in a meaningful way is hard to predict, and will depend on both our performance and external events. Some, such as the speed with which we can reduce costs without prejudicing service quality, and building compelling service propositions are in our control; others, such as the timing of contract awards, the behaviour of competitors and the macro-economic environment, are not. But with any plan, it is very helpful if it can deliver on early promises, and we feel that, with our performance in 2015, in which we have outperformed on almost every metric we set ourselves, we have done that.
Strengthening our balance sheet
Our strategy has to be properly funded, and a firm foundation is required to allow the Group to grow and flourish in the future as well as being an absolute necessity to retain customers’ confidence. To achieve a sustainable balance sheet with a prudent level of financial gearing, we therefore launched a Rights Issue during the year, which was successfully completed raising net proceeds of £530m. We subsequently reached agreement with our lending banks and US private placement noteholders to refinance our debt facilities; we have therefore achieved the necessary reduction in our borrowing, extended the time period of our Revolving Credit Facility and put in place more flexible financial covenants.
Disposing of non-core businesses
As a major part of reshaping our portfolio, we have concluded our programme of targeted disposals. In the first half of 2015, we sold the Great Southern Rail luxury tourist travel operation in Australia, which was losing money and could neither gain, nor deliver, synergies to the rest of the Group. Likewise, in September 2015, we reached agreement on the sale of our offshore private sector BPO operations for a gross consideration of approximately £250m. This business was acquired by Serco in 2011 on the premise that there were synergies between private and public outsourcing businesses;
whilst in some parts of public sector operations such as IT and back office systems this may be true, however, for the majority of our business, which is heavily biased towards frontline services, often of a highly sensitive nature, using low-cost labour in emerging markets is not a palatable or practical option for our customers, and we determined that these synergies could not in reality be achieved.
We had previously stated our intention to dispose of our Environmental and Leisure businesses; this was prompted by our urgent need to reduce our debt burden rather than any strategic necessity. These businesses provide frontline services to UK Local Authorities, are profitable, and align with our strategy of providing public services; they also give added breadth and depth to our offering to Local Authorities, which is an important business for us in the UK. Once we had certainty around the disposal of our Private Sector BPO business and the proceeds of the Rights Issue, we were able to review the decision to dispose of these businesses, and we concluded that for both strategic and financial reasons these businesses should be retained within Serco’s portfolio.
Mitigating loss-making contracts
We are working hard to mitigate our loss-making contracts throughout the Group in order to improve profitability and cash

Fina
ncia
l Sta
tem
ents
Dir
ecto
rs’ R
epo
rtSt
rate
gic
Rep
ort
Strategic Report 41· Chief Executive’s Review
performance whilst meeting our contractual service obligations. The adjustments required to the Contract and Balance Sheet Review charges taken last year were a net positive in 2015, and we will maintain an intense focus on each and every onerous contract to make further progress. During the year, the major improvement was the agreement reached on the ACPB contract to improve the scope of work, the service regime and, very importantly, to bring an earlier end (2017 rather than 2022) to this highly onerous contract. Other operational or negotiated improvements included the Future Provision of Marine Services (FPMS) and HMP Ashfield contracts; we have also successfully exited onerous contracts such as Suffolk Community Healthcare and the National Citizen Service, in both these cases at significantly lower cost than we initially expected. A small number of other contracts have had new provisions or increases to reflect the latest operational performance and trading conditions, but overall, and with the total OCP balance reducing to £300m from £447m a year earlier, we have made pleasing progress on one of our biggest challenges.
Reducing our costs
We have also made good progress reducing costs. In 2015, our operating costs were reduced by over £330m, broadly in proportion with the revenue reduction. Much of this was direct cost reduction resulting from contracts which we exited, or where volumes reduced
or businesses were sold; but we are also driving out cost to offset the effect of negative operating leverage as the Group becomes smaller. Our previously announced plans to extract £20m of overhead and procurement savings in 2015 from specific initiatives were soundly beaten.
Improving management information
Management information has improved noticeably, increasing our visibility of performance and strengthening our controls and governance. Additionally, the strengthening of our bid risk management through tightened procedures and more thorough commercial reviews is becoming more deeply embedded in the business. We now have high-quality monthly management accounts, which have become fundamental to the way in which monthly Divisional Performance Reviews now function, and the structure of these management accounts has been flowed down through the business units and to contract level. Our core SAP accounting platform has been both upgraded and better integrated with related systems. Further improvements will come in 2016 as we begin the year with new finance data structures and chart of accounts which have been reviewed, rationalised and standardised, and as we begin to fully utilise the power of new reporting tools. In addition, we have made significant investment in new Procurement and HR systems, which will go live during 2016, and we plan to continue
our investment in new systems to improve the efficiency of the business.
Rebuilding our pipeline and leveraging Centres of Excellence
The Strategy Review led us to conclude that we needed to focus on sectors of government expenditure which had applicability across a number of our regional operations, so we could leverage our international scale to provide customers innovation and operational excellence. Historically, Serco has not been great at sharing skills, best practice and intellectual property across our businesses. To tackle this, in 2015 we started to build Centres of Excellence in Health, Justice & Immigration and Transport. These Centres of Excellence comprise small teams of world-class people seconded from our businesses whose job it is to take a global view of opportunities, recommend resource allocation and bid prioritisation, build compelling propositions and support our regional operations in their bids. In time, as these Centres of Excellence become increasingly effective, we see us expanding the number of them to encompass a number of core operational, as well as market-centric, capabilities such as Workforce Management and Continuous Improvement. In all their activities, the principle behind the Centres of Excellence is to use a small number of high quality people, along with building a culture of sharing best practice around the world to enable us to excel at proposition development, bidding and operations.

Serco Group plc Annual Report and Accounts 201542
Chief Executive’s Review continued
Delivering greater cost efficiency
Serco over-achieved against our target of £20m in overhead and procurement savings in 2015. Whilst these will annualise to a higher figure in 2016, they will be offset in part by inflationary pressure on our labour costs, including the impact of the new National Living Wage, as well as further pressure from negative operating cost leverage as revenues decline. Across the business we are reducing the number of management layers, rolling out Continuous Improvement initiatives in our contract base, and making better use of our scale in procurement and the operation of shared services.
The total net Revenue reduction in 2016 is however expected to be approximately 20%, resulting from the exit of private sector BPO operations and the substantial amount of contract attrition. In the light of the associated reduction in profit contribution, we are targeting more significant cost reductions in both central support functions and other overheads. In our budgets we have set ourselves an increased target of achieving over £50m in further savings in 2016; this is to be delivered from a combined overhead and shared service centre cost base that in 2015 was approaching £500m. This cost base includes elements
that are fixed or semi-fixed in the short-term, or are areas of cost, such as business development and bidding, where we want to protect or even increase our spend in order to deliver a strategy for future growth.
Achieving over £50m in further cost savings is the level required to achieve our forecast of approximately £50m of Underlying Trading Profit. Even at this level, our cost base would not have reduced fully in line with the greater rate of revenue reduction, resulting in a further year of margin pressure. However, at the same time, we will be focused on developing a more efficient cost model for the longer-term; with an overarching plan to stabilise revenues and move back to growth, our aim is to ensure positive operating cost leverage which contributes strongly to our planned outcome of Serco achieving margins at least in line with our industry by the end of our 2020 Strategy Review time horizon.
Concluding thoughts
Having completed the Stabilisation phase of our plan in good order, and delivered on our promises for 2015, we are now focused on the hard work of Transformation. We are as serious about turning Serco into the best managed business in our
sector, as we are about repaying our investors, customers and colleagues for the confidence and support they have shown us over the recent difficult times. It will take years to achieve all we aspire to, and as we have consistently said there will bumps and mis-steps along the way. We are rightly cautious on the prospects for 2016 given further revenue attrition and profit pressure, but I am confident we are taking the necessary actions, and have the strategic plan, management team and stabilised financial position in place to succeed.
Rupert Soames OBE Group Chief Executive Officer
Serco – and proud of it.

Fina
ncia
l Sta
tem
ents
Dir
ecto
rs’ R
epo
rtSt
rate
gic
Rep
ort
Strategic Report 43·
Divisional Reviews
Year ended 31 December 2015 £m CG LRG Americas AsPac
Middle East
Corporate costs
Sub-total continuing
Global Services Total
Revenue including discontinued operations 742.1 905.8 693.0 544.7 291.4 – 3,177.0 337.6 3,514.6
Change (23%) (6%) (2%) (23%) +12% – (12%) (6%) (11%)
Constant currency change (23%) (4%) (8%) (15%) +6% – (11%) (8%) (11%)
Organic change (22%) (4%) (8%) (9%) +4% – (10%) N/a N/a
Discontinued operations adjustment* – – – – – – – (337.6) (337.6)
Revenue 742.1 905.8 693.0 544.7 291.4 – 3,177.0 – 3,177.0
Underlying Trading Profit / (Loss) 53.1 4.7 44.3 11.9 18.9 (51.2) 81.7 14.3 96.0
Change (8%) +38% +3% (66%) (1%) (3%) (23%) +111% (15%)
Change at constant currency (8%) +73% (3%) (62%) 0% (3%) (23%) +100% (15%)
Margin 7.2% 0.5% 6.4% 2.2% 6.5% N/a 2.6% 4.2% 2.7%
Contract and Balance Sheet Review adjustments 7.1 (28.2) (17.3) 46.9 8.5 3.3 20.3 0.6 20.9
Benefit from not depreciating and amortising assets held for sale** – – – – – – – 11.7 11.7
Other one-time items*** – 9.0 – – – – 9.0 – 9.0
Reported Trading Profit / (Loss) 60.2 (14.5) 27.0 58.8 27.4 (47.9) 111.0 26.6 137.6
Amortisation of intangibles arising on acquisition – (1.1) (2.5) (1.2) – – (4.8) (0.1) (4.9)
Discontinued operations adjustment* – – – – – – – (26.5) (26.5)
Operating profit / (loss) before exceptionals 60.2 (15.6) 24.5 57.6 27.4 (47.9) 106.2 – 106.2
* Statutory reporting only includes the post-tax result of discontinued operations as a single line in the Consolidated Income Statement.
** The total benefit from not depreciating and amortising assets held for sale is £11.8m including £0.1m of amortisation of intangibles arising on acquisition within Global Services.
*** Other one-time items in the year reflect the profit on early termination of a UK local authority contract.
Consistent with the reporting of the year ended 31 December 2014, this section is presented according to the management structure and internal reporting that Serco put in place for 2015 as a result of actions from the Corporate Renewal Programme and the Strategy Review.
The UK Central Government division (‘CG’) brings together Serco’s work for the UK Central Government, which is principally in the Defence, Justice & Immigration and Transport sectors, with the latter including that for devolved authorities. The UK and Europe Local and Regional Government (‘LRG’) division comprises our Health business and our Citizen Services operations, the latter including welfare, business support and BPO services for the public sector, our various support
operations to European Agencies, and other direct services such as our environmental and leisure services for local authorities.
Serco’s operations in the three other geographic regions are reported as separate divisions, being Americas (consisting principally of our operations in the USA, together with those in Canada), ‘AsPac’ (the Asia Pacific region, consisting our operations in Australia, together with those in New Zealand and Hong Kong) and the Middle East. The Global Services division consists of Serco’s private sector BPO operations, which for statutory reporting purposes are classified as discontinued operations following Serco’s previously announced strategic exit from this market. Serco’s underlying measures include the Revenue and Trading Profit of these discontinued
operations for the sake of consistency with previous guidance.
Aligned to statutory reporting and consistent with the reporting of the Year ended 31 December 2014, Serco’s share of revenue from its joint ventures is not included in divisional revenue, while Serco’s share of joint ventures’ profit after interest and tax costs is included in divisional Trading Profit. As previously disclosed and for consistency with guidance, Serco’s Underlying Trading Profit measure excludes Contract and Balance Sheet Review adjustments (principally OCP releases or charges), the beneficial treatment of depreciation and amortisation of assets held for sale, and any other one-time items such as the profit on early termination of a UK local authority contract that occurred in 2015.
Divisional Reviews

Serco Group plc Annual Report and Accounts 201544
UK Central Government
The UK Central Government division includes our frontline services in Defence, Justice & Immigration and Transport (including contracts for the Department for Transport as well as those for devolved authorities).
Revenue for the year was £742.1m (2014: £961.4m), a decline of 23%. At constant currency and excluding the impact of disposals (the Collectica debt collection business disposed in June 2014), the organic decline was 22%. The principal drivers of the significant revenue reduction were the end of the contracts for the Docklands Light Railway (DLR), National Physical Laboratory (NPL) and the Colnbrook immigration removal centre; together, these three contracts accounted for around 90% of the organic revenue decline. Other reductions included lower project or volume-related revenue, for example managing the Thameside prison expansion in 2014. There was limited growth elsewhere to offset these contract ends or reductions, with the largest
being the start of the Caledonian Sleeper contract which Serco began operating on 31 March 2015.
Underlying Trading Profit was £53.1m (2014: £58.0m), representing an implied margin of 7.2% (2014: 6.0%). Trading Profit includes the profit contribution from joint ventures (the vast majority of which for the Group are in this division), and if the £697m share of revenue was also included the overall divisional margin is 3.7% (2014: 3.5%); the joint venture profit contribution of £33.8m was £4.2m ahead of the prior year. Within Underlying Trading Profit there was £57m of Onerous Contract Provision (OCP) utilisation, which was broadly in line with our original expectations. This includes those for COMPASS, PECS and FPMS, which as previously disclosed were amongst the largest provisions taken as part of the Contract and Balance Sheet Review. While there was around an aggregate £28m of loss from these three contracts in 2014 which was neutralised by OCP utilisation in 2015, this
benefit was more than offset by the significant reduction in profit contribution from contract attrition and lower project-related profitability, as well as the disposal of the Collectica business.
The Contract and Balance Sheet Review charge taken in 2014 in Central Government was £300.8m. The net impact of adjustments to key assumptions and other related changes was a £7.1m net release in 2015. The key movements were OCP releases due to operational improvements on the FPMS and HMP Ashfield contracts, which contributed to more than offset additional charges that were required to be taken such as on the PECS contract where reassessment indicates higher costs to deliver our contractual commitments; reassessment of the OCP required for COMPASS did not result in a charge or release. After the Contract and Balance Sheet Review adjustments of £7.1m, Reported Trading Profit for the year increased to £60.2m.
Year ended 31 December 2014 £m CG LRG Americas AsPac
Middle East
Corporate costs
Sub-total continuing
Global Services Total
Revenue including discontinued operations 961.4 959.8 708.1 706.0 260.4 – 3,595.7 359.3 3,955.0
Discontinued operations adjustment* – – – – – – – (359.3) (359.3)
Revenue 961.4 959.8 708.1 706.0 260.4 – 3,595.7 – 3,595.7
Underlying Trading Profit / (Loss) 58.0 3.4 43.2 35.5 19.1 (52.8) 106.4 6.8 113.2
Margin 6.0% 0.4% 6.1% 5.0% 7.3% N/a 3.0% 1.9% 2.9%
Contract and Balance Sheet Review adjustments (300.8) (93.8) (26.7) (237.1) (19.3) (37.3) (715.0) (30.3) (745.3)
Reported Trading Profit / (Loss) (242.8) (90.4) 16.5 (201.6) (0.2) (90.1) (608.6) (23.5) (632.1)
Amortisation of intangibles arising on acquisition (0.1) (1.7) (2.3) (2.2) – – (6.3) (5.1) (11.4)
Impairment of intangibles arising on acquisition – (5.5) – (6.4) – – (11.9) (0.4) (12.3)
Discontinued operations adjustment* – – – – – – – 29.0 29.0
Operating profit / (loss) before exceptionals (242.9) (97.6) 14.2 (210.2) (0.2) (90.1) (626.8) – (626.8)
* Statutory reporting only includes the post-tax result of discontinued operations as a single line in the Consolidated Income Statement.
Divisional Reviews continued

Fina
ncia
l Sta
tem
ents
Dir
ecto
rs’ R
epo
rtSt
rate
gic
Rep
ort
Strategic Report 45·
UK Central Government represented around £100m of the Group’s aggregate total value of signed contracts during the year; there were a limited number of bids due for decision in 2015, with the majority of the value signed reflecting rebids or extensions such as our RAF Northolt and helicopter fleet support operations.
Looking ahead, the impact of known contract losses or other revenue reductions is currently anticipated to have a gross impact of around £100m or approximately 15% in 2016. The key drivers of this attrition are the transfer back of services that Serco had previously been providing to the Defence Science and Technology Laboratory (Dstl) and the end of the current Defence Business Services arrangement, together with a number of smaller contracts ending or reducing in scope. The end of the Northern Rail franchise in early 2016 will also result in a substantially lower joint venture profit contribution than the £8.2m received in 2015.
Additionally, of existing work where an extension or rebid will be required at some point during the next three years due to a scheduled contract end date before the end of 2018, there are 12 contracts with annual revenue of over £5m within the UK Central Government division; in aggregate, these represent approximately 40% of the current level of annual revenue for the division.
In terms of areas for future growth, there are two major bids currently under consideration, being the Defence Fire & Risk Management Organisation and the operation of the Clyde and Hebrides Ferries Services. Following the significant disruption to our customer relationships with UK Central
Government in 2013 and the subsequent Corporate Renewal process that was put in place over the course of 2014, we now believe that our relationships with our UK customers are on a firmer footing. We believe that a number of major opportunities will emerge over the next two years as the UK Government continues its efforts to save cost and improve services. In particular, as one of the leading suppliers of custodial services in the UK, we are obviously heartened by the declared intention of the UK Government to focus on reform and improvement of the prison system, and are hopeful that this policy may in time produce opportunities for us.
UK and Europe Local and Regional Government
The UK and Europe Local and Regional Government division includes our frontline services in the devolved public service delivery markets of Health, primarily hospital facilities management services, and Citizen Services, which includes welfare and business support operations, BPO services for the public sector, various support operations for European Agencies, and other direct services such our environmental and leisure services for local authorities.
Revenue for the year was £905.8m (2014: £959.8m), a decline of 6%. At constant currency and excluding the impact of disposals (the Braintree Community Hospital clinical healthcare services business disposed in March 2014), the organic decline was 4%. There was modest revenue growth from the start of new contracts such as Lincolnshire County Council BPO services and Havering environmental services, together with additional volume-related revenues in health procurement
services and a small number of other Citizen Services contracts. These areas of growth were offset by the end of contracts such as Westminster City Council BPO support, Suffolk Community Healthcare and private sector facilities management for an aviation industry customer, together with a number of other reductions in volume-related revenue predominantly in other Citizen Services operations.
Underlying Trading Profit was £4.7m (2014: £3.4m), representing a margin of 0.5% (2014: 0.4%). Within Underlying Trading Profit there was £11m of non-exceptional OCP utilisation, which was modestly better than our original expectations. The main movements in Underlying Trading Profit were the removal of loss on the National Citizen Service contract, together with some initial progress on reducing overhead costs, which were broadly offset by the reduction in profit contribution from the effect of contracts ending or reducing in scope and the in-year loss on the Lincolnshire County Council contract.
The Contract and Balance Sheet Review charge taken in LRG in 2014 was £93.8m. The net impact of adjustments to key assumptions and other related changes was a £28.2m net charge in 2015. The principal driver of this was the establishment of a new OCP, together with related impairments and charges, for our business process and contact centre services contract with Lincolnshire County Council; there has been significant operational challenge in the first year, predominantly related to our responsibility to implement a new ERP system, which is now expected to result in losses for the remaining contractual period.
Divisional Reviews

Serco Group plc Annual Report and Accounts 201546
Separately, there was a one-time profit of £9.0m relating to the Thurrock BPO services contract where settlement on early termination had been mutually agreed with the customer; the one-time profit represents a payment to Serco in lieu of anticipated profit in future years, net of direct costs, impairments and other charges. After these Contract and Balance Sheet Review adjustments and the one-time profit on early termination, the Reported Trading Loss for the year was £14.5m.
LRG represented approximately £400m of the Group’s aggregate total value of signed contracts during the year; the largest items were the successful rebids of Serco’s support services to Wishaw General Hospital and Norfolk & Norwich University Hospital, various IT support services for European agencies, the new win for facilities management services to the new district general hospital for NHS Dumfries and Galloway, an extension until the end of 2017 for the Child Maintenance Group (CMG) case management contract and a one-year extension to our operation of the Work Programme.
Looking ahead, the impact of known contract losses or other revenue reductions is currently anticipated to have a gross impact of around £200m or approximately 25% in 2016. The key drivers of this significant rate of attrition are the end of the Suffolk Community Healthcare and National Citizen Services contracts which were heavily loss-making and were not rebid, the early termination of the Thurrock BPO services contract, the ending of certain infrastructure services support to private sector customers, lower revenues on healthcare procurement
operations, the reducing scale of CMG operations and a number of other smaller contracts ending or reducing in scope.
Additionally, of existing work where an extension or rebid will be required at some point during the next three years due to a scheduled contract end date before the end of 2018, there are 10 contracts with annual revenue of over £5m within the LRG division; in aggregate, these represent approximately 20% of the current level of annual revenue for the division.
In terms of areas for future growth, we are focused on building our pipeline of opportunities in the UK in Citizen Services (which includes Environmental and Leisure) and Health. Sharply reduced Local Authority spending is having some unpredictable results: some Local Authorities are taking services back in-house, others are outsourcing them. Similar pressures apply in the Healthcare sector, where we have a strong position in non-clinical services. There are currently a number of environmental and hospital facilities management opportunities in the pipeline. We are working hard across all sectors of this market to develop compelling propositions, and are confident that they will appeal to customers. In our European business we continue to bid for major IT and operational support projects for government agencies, and are also looking for opportunities to offer other parts of our portfolio, such as immigration services.
Americas
Our Americas division provides professional, technology and management services focused on
Defence, Transport, and Citizen Services (principally process outsourcing for government agencies). The US federal government, including the military, civilian agencies and the national intelligence community, are our largest customers. We also provide services to the Canadian Government and to some US state and municipal governments.
Revenue for the year was £693.0m (2014: £708.1m), a decline of 2%. In US dollars, the main currency for operations of the division, revenue for the year was equivalent to US$1,061m. The strengthening particularly of the US dollar provided growth of £40m or 6%, with the decline at constant currency being 8%. This decline was driven by contract attrition from the end of various areas of operations on behalf of the US Federal Retirement Thrift Investment Board (FRTIB), certain US intelligence agency support services and visa processing work. There was partial offset from expansion in existing services such as the US Affordable Care Act (ACA) eligibility support services contract and naval installation task order work under the Sea Enterprise IDIQ framework.
Underlying Trading Profit was £44.3m (2014: £43.2m), representing a margin of 6.4% (2014: 6.1%). Within Underlying Trading Profit there was £10m of OCP utilisation, which was more than our original expectations. The main movements in Underlying Trading Profit were the benefits of cost reduction initiatives and the £2m favourable currency movement, which were largely offset by the reduction in profit contribution from contract attrition.
Divisional Reviews continued

Fina
ncia
l Sta
tem
ents
Dir
ecto
rs’ R
epo
rtSt
rate
gic
Rep
ort
Strategic Report 47·
The Contract and Balance Sheet Review charge taken in the Americas division in 2014 was £26.7m. The net impact of adjustments to key assumptions and other related changes was a £17.3m net charge in 2015. The principal drivers of this were the required provision, together with related impairments and charges, for the Virginia Department of Transport (VDOT) operations following operational challenges on the sub-contract related to implementing a new IT system, and an increase in the existing provision for the Ontario Driver Examination Services contract. After these Contract and Balance Sheet Review adjustments, Trading Profit for the year reduced to £27.0m.
Americas represented approximately £750m of the Group’s aggregate total value of signed contracts and order book progress during the year. The largest were: the successful re-compete of air traffic control services for the Federal Aviation Administration and rebid of classification services for the US Patent and Trademark Office; securing a third year of the expanded services providing eligibility support to the US Affordable Care Act (ACA); and winning a new contract to support the US Naval Facilities Engineering Command (NAVFAC). Amongst a large number of other smaller contract awards were a one-year extension to the 5 Wing Canadian Forces Base in Goose Bay contract, and rebids of cost analysis support to the US military and personnel identification support to the US Navy.
Looking ahead, the impact of known contract losses or other revenue reductions is currently
anticipated to have a gross impact of around £100m or approximately 15% in 2016. The key drivers of this significant rate of attrition are the early end of the VDOT contract, and the loss of the rebid for record processing at the National Benefits Center. Additionally, of existing work where an extension or rebid will be required at some point during the next three years due to a scheduled contract end date before the end of 2018, there are five contracts with annual revenue of over £5m within the Americas division; in aggregate, these represent approximately 40% of the current level of annual revenue for the division.
In terms of areas for future growth, our pipeline for the Americas division has remained more buoyant than the UK divisions. Major new bid opportunities due for decision over the next two years include passport processing for the Department of State and Department of Homeland Security and several opportunities to provide various support functions to the US Navy. Looking beyond, the market for defence services remains attractive in size and growth potential and other potential bids in transport operational support and Citizen Services are expected to progress through our longer-term prospects list. Options to develop Serco’s involvement in non-clinical health support and parts of the Justice & Immigration market will also be evaluated over the longer-term.
AsPac
Operations in the Asia Pacific division include Justice, Immigration, Defence, Health, Transport and Citizen Services. With Serco’s operations in Australia being by far the largest
element of the division, the country represents 16% of total Revenue for the Group.
Revenue for the year was £544.7m (2014: £706.0m), a decline of 23% in reported currency and 15% at constant currency. In Australian dollars, the main currency for operations of the division, revenue for the year was equivalent to A$1,106m. Local currency weakness, particularly the Australian dollar, contributed a decline of £57m or 8%. Excluding the impact of disposals (the Great Southern Rail business disposed in May 2015), the organic decline was 9%. This decline was driven almost entirely by a further reduction in the volume of work in Australian immigration services, which more than offset growth from the Fiona Stanley Hospital in Perth and the Auckland South Corrections Facility which both became fully operational in 2015, as well as some growth from other areas of scope expansion to existing services such as Acacia prison.
Underlying Trading Profit was £11.9m (2014: £35.5m), representing a margin of 2.2% (2014: 5.0%). Within Underlying Trading Profit, there was £20m of OCP utilisation, relating principally to the Armidale Class Patrol Boat (ACPB) contract and which was lower than our original expectations; in 2014, the losses on ACPB were not included within Underlying Trading Profit as they were included as part of the Contract and Balance Sheet Review charge. The main drivers of the reduction in Underlying Trading Profit reflect the impact of the significant scale reduction in Australian immigration services, the in-year loss incurred at Mount Eden Correctional Facility, together with a £2m adverse currency impact.
Divisional Reviews

Serco Group plc Annual Report and Accounts 201548
The Contract and Balance Sheet Review charge taken in 2014 was £237.1m. The net impact of adjustments to key assumptions and other related changes was a £46.9m net release in 2015. The agreement reached with the Australian Government to amend the terms of the ACPB contract, which was the Group’s single-largest OCP, resulted in a release of £63m, principally due to the contract now ending in June 2017 rather than running through to 2022. There was partial offset to this release from OCP charges being required on Serco’s operations in Hong Kong and in relation to the operational challenges faced on the Mount Eden Correctional Facility contract. After these Contract and Balance Sheet Review adjustments, Reported Trading Profit for the year increased to £58.8m.
AsPac represented approximately £300m of the Group’s aggregate total value of signed contracts and order book progress during the year; the single largest element of this reflects the order book increase to account for a rolling one-year estimate of volumes for Australian immigration services; additionally, a three-year extension for our traffic camera services contract in Victoria was awarded, while most of the other progress represented contracts for various Citizen Services processing support work.
Looking ahead, the impact of known contract losses or other revenue reductions is currently anticipated to have a gross impact of up to £50m or 10% in 2016; this includes the annualisation effect of the GSR disposal and a number of other small losses or reductions, though the result for 2016 will still
be susceptible to the prevailing volume of work in Australian immigration services as this single contract represents more than a quarter of the total revenue for the division. Additionally, of existing work where an extension or rebid will be required at some point during the next three years, due to a scheduled contract end date before the end of 2018, there are seven contracts with annual revenue of over £5m within the AsPac division; in aggregate, these represent approximately 15% of the current level of annual revenue for the division.
During the year, Serco was unsuccessful in the major new bid opportunities for Wellington’s metro rail service and Australian offshore immigration detention services. It should be noted that in early February 2016, the Australian Government decided to re-tender the offshore immigration services contract, and as Reserve Bidder in the original tender, has invited Serco and the originally selected Preferred Bidder to re-tender for this opportunity, though as yet we have not included the opportunity in our pipeline as at the time of reporting we have not decided whether to participate in this tender. A third opportunity in the pipeline, the Icebreaker vessel to be used by the Australian Antarctic Division (AAD), saw Serco selected as Preferred Tenderer, but, as this contract is yet to be signed, it has not been included in the value of signed contracts and remains in the Group’s major bids pipeline. In the short-term, there are few bids due for decision, however over the course of 2016 we expect more to enter the pipeline particularly in the areas of Justice and Immigration services.
Looking beyond, other potential opportunities are expected to be developed in Transport, Citizen Services and non-clinical health services.
Middle East
Operations in the Middle East division include Transport, Defence, Health and other Direct Services such as facilities management.
Revenue for the year was £291.4m (2014: £260.4m), an increase of 12%. Stronger local currency provided growth of 6% and a small health support services acquisition added 2%; organic growth at constant currency was therefore 4%. This revenue growth was driven by the start of the new contract for the Saudi Railway Company as well as growth from the annualisation of contracts won during 2014 or increases in scope of existing operations, which was partially offset by a small number of operations reducing in scope and the end of air traffic control operations in Erbil.
Underlying Trading Profit was £18.9m (2014: £19.1m), representing a margin of 6.5% (2014: 7.3%). Within Underlying Trading Profit, OCP utilisation was immaterial. While Underlying Trading Profit was held level with the prior year, there was margin pressure as a result of attrition and scope reductions being concentrated in areas that were higher margin.
The Contract and Balance Sheet Review charge taken in 2014 was £19.3m. The net impact of adjustments to key assumptions and other related changes was an £8.5m net release in 2015. This related to allowances for doubtful debts that had been charged in 2014 but subsequently collected
Divisional Reviews continued
Fina
ncia
l Sta
tem
ents
Dir
ecto
rs’ R
epo
rtSt
rate
gic
Rep
ort
Strategic Report 49·
in 2015. After these Contract and Balance Sheet Review adjustments, Reported Trading Profit for the year increased to £27.4m.
The Middle East represented approximately £200m of the Group’s aggregate total value of signed contracts during the year; the largest of these was the new win to support the Saudi Railway Company in the operation of the North-South Railway. Other wins included successfully securing existing work for logistics and base support services provided to the Australian Defence Force (ADF) in the region, facilities management at Abu Dhabi Global Market Square (formerly Sowwah Square), for Baghdad Air Navigation Services (ANS) and to operate and maintain the Palm Jumeirah Monorail System in Dubai.
Looking ahead, known contract losses or other revenue reductions are currently not anticipated to have a material impact in 2016. There is though some pressure resulting from the planned transition of certain ANS roles to customers in the region. Additionally, of existing work where an extension or rebid will be required at some point during the next three years due to a scheduled contract end before the end of 2018, there are seven contracts with annual revenue of over £5m within the Middle East division; in aggregate, these represent approximately 30% of the current level of annual revenue for the division.
In terms of areas for future growth, there remains a vibrant public service outsourcing market in the region and Serco has strong references to continue expanding; whilst the recent reductions in
the oil price may lead to some projects being delayed, we, as operators, tend to get involved only when the infrastructure build is at or near completion. Major pipeline opportunities due for award in 2016 or 2017 now include three major light rail and tram operations in the region, as well as further developments in defence training services and in non-clinical health and other facilities management support.
Corporate Costs
Corporate costs relate to typical central function costs of running the Group, including executive, governance and support functions such as HR, finance and IT. Where appropriate, these costs are stated after allocation of recharges to operating divisions. The costs of Group-wide programmes and initiatives are also incurred centrally, and these include the costs of the Corporate Renewal Programme.
Corporate costs in 2015, before Contract and Balance Sheet Review adjustments, were £51.2m (2014: £52.8m). While there was some one-time Corporate Renewal implementation work that occurred in 2014, and the benefit of actions taken during 2015 to reduce costs at the centre, these were partially offset by some increased costs in 2015 associated with implementing the Strategy Review and investment in improved management information, systems and processes.
The Balance Sheet Review charge taken in 2014 was £37.3m. The net impact of adjustments to key assumptions and other related changes was a £3.3m net release in 2015, reducing Corporate Costs within Reported Trading Profit to £47.9m.
Global Services (discontinued operations)
The Global Services division consists of Serco’s private sector BPO business, predominantly for customers in the UK, India and North America, following the transfer of public sector BPO operations to our other divisions. The operations consist of middle and back office skills and capabilities across customer contact, transaction and financial processing, and related consulting and technology services.
As part of Serco’s previously announced strategy to exit non-core markets and to focus on the provision of public services, Serco is seeking to exit its private sector BPO operations. On 31 December 2015, the transaction to dispose of the majority of the offshore private sector BPO operations was completed. Two smaller but separate transactions relating to some operations in the Middle East are expected to complete in 2016. The remaining private sector operations, which are predominantly UK onshore operations, will be exited either by further disposals, transfers, early termination or running-off the contracts over their remaining contractual period.
For statutory reporting purposes, the Global Services division is classified as discontinued operations, therefore only the post-tax result of these operations is included as a single line in the reporting of the Group’s Income Statement. However, for consistency with previous guidance, Serco’s underlying measures include the Revenue and Trading Profit of these discontinued operations.
Divisional Reviews

Serco Group plc Annual Report and Accounts 201550
Revenue was £337.6m (2014: £359.3m), a decline of 6%. Stronger local currency provided growth of 2%, with the decline at constant currency being 8%. The start of the new contract won in 2014 for multi-channel contact services for a major UK retailer provided revenue growth, as did expansion in domestic Indian BPO operations; however, this was more than offset by contract attrition, largely as a result of our managed exit of a number of smaller loss-making contracts in the UK.
Underlying Trading Profit was £14.3m (2014: £6.8m), representing a margin of 4.2% (2014: 1.9%). Within Underlying Trading Profit, there was £15m of onerous contract provision utilisation. Drivers of the improvement in Underlying Trading Profit include the benefit of provision utilisation and other actions taken to reduce the impact of loss- making operations.
The Contract and Balance Sheet Review charge taken in 2014 was £30.3m. The net impact of adjustments to key assumptions and other related changes was a £0.6m net release in 2015. As the division included assets designated as held for sale,
there is a benefit of not charging depreciation and amortisation of £11.7m. After these Contract and Balance Sheet Review adjustments and held for sale benefits, Reported Trading Profit for the year increased to £26.6m.
Given the disposal of the majority of the offshore operations completed on 31 December 2015, and because there was also good progress during 2015 in managing the exit from the loss-making contracts in the remaining UK onshore operations, the Revenue of £337.6m in 2015 reduces very substantially; Serco’s budget for 2016 includes approximately £20m of residual revenue contribution, which will vary depending on the timing of exiting remaining contracts. The residual operations are expected to contribute an Underlying Trading Loss of around £10m in 2016, reflecting contract losses up to the point of exit together with the effect of ‘stranded’ shared service centre costs and other overheads previously absorbed by the Global Services division. Serco is targeting to make progress reducing these stranded costs through additional cost savings over the course of 2016 and beyond.
Divisional Reviews continued

Fina
ncia
l Sta
tem
ents
Dir
ecto
rs’ R
epo
rtSt
rate
gic
Rep
ort
Strategic Report 51·
Revenue
Revenue declined by 11.6% in the year to £3,177.0m (2014: £3,595.7m), an 11.2% reduction in constant currency.
Revenue including that arising from operations classified as discontinued declined by 11.1% in the year to £3,514.6m (2014: £3,955.0m), an 11.1% reduction in constant currency.
Commentary on the revenue performance of the Group is provided in the Chief Executive’s Review and the Divisional Reviews sections above.
Trading Profit
Trading Profit is defined as operating profit as shown on the face of the Consolidated Income Statement before i) amortisation and impairment costs of intangibles arising on acquisitions and ii) exceptional items, adjusted to include the Trading Profit arising on discontinued operations.
Trading Profit increased in the year to £137.6m (2014: Trading Loss £632.1m). The improvement from 2014 is primarily attributable to the 2014 impact of the Contract and Balance Sheet Review that resulted in significant asset impairments, onerous contract provisions (OCPs) and other charges of £745.3m being recorded in that year.
Trading Profit for the Group includes that arising on discontinued operations of £26.6m.
Underlying Trading Profit
Underlying Trading Profit is defined as Trading Profit adjusted to exclude charges and releases made to OCPs, charges and releases made in respect of other items identified during the 2014 Contract and Balance Sheet Review, the beneficial treatment of depreciation and amortisation on assets held for sale and any other one-time items.
Underlying Trading Profit was £96.0m, a decline of 15.2% from 2014. At constant currency Underlying Trading Profit was £95.9m. Commentary on the trading performance of the Group is provided in the Chief Executive’s Review and the Divisional Reviews sections above.
Excluded from Underlying Trading Profit were net charges to OCPs of £3.0m following the annual reassessment undertaken as part of the budgeting process, which would have been a net release of £5.4m at constant currency. Also excluded from Underlying Trading Profit were net releases of £23.9m relating to other provisions and accruals for items identified during the 2014 Contract and Balance Sheet Review.
Underlying Trading Profit at £96m was ahead of the £90m we had forecast, and Reported Trading Profit was much higher still at £138m. Closing net debt of £78m was significantly lower than expected and represented a year-on-year reduction of £605m. Revenue including discontinued operations was around the level we expected at £3.5bn.
Angus Cockburn Group Chief Financial Officer
Finance Review
Finance Review

Serco Group plc Annual Report and Accounts 201552
Overview of Financial Performance
For the year ended 31 December2015
£m2014 £m
Revenue – including discontinued operations 3,514.6 3,955.0
Less: Revenue from discontinued operations (337.6) (359.3)
Revenue 3,177.0 3,595.7
Underlying Trading Profit 96.0 113.2
Onerous contract and Balance Sheet Review adjustments 20.9 (745.3)
Benefit from non-depreciation and non-amortisation of assets held for sale 11.7 –
Other one-time items 9.0 –
Trading Profit / (Loss) 137.6 (632.1)
Other expenses – amortisation and impairment of intangibles arising on acquisition (4.9) (23.7)
Operating profit / (loss) before exceptional items on continuing and discontinued operations 132.7 (655.8)
Less: Operating (loss) / profit before exceptional items arising on discontinued operations (26.5) 29.0
Operating profit / (loss) before exceptional items 106.2 (626.8)
Exceptional loss on disposal of subsidiaries and operations (2.6) (2.3)
Other exceptional operating items (107.3) (323.4)
Exceptional operating items (109.9) (325.7)
Operating loss (3.7) (952.5)
Investment income 6.1 4.6
Other finance costs (39.0) (42.6)
Exceptional finance costs (32.8) –
Total net finance costs (65.7) (38.0)
Loss before tax (69.4) (990.5)
Tax on profit / (loss) before exceptional items (17.9) (7.2)
Tax on exceptional items 0.4 8.2
Tax (17.5) 1.0
Loss for the year from continuing operations (86.9) (989.5)
Discontinued operations
Profit / (loss) for the year from discontinued operations (66.2) (357.6)
Loss for the year (153.1) (1,347.1)
Underlying earnings / (loss) per share (restated)* from continuing and discontinued operations 3.44p 4.73p
Underlying trading margin from continuing and discontinued operations 2.7% 2.9%
Earnings / (loss) per share before exceptional items (restated)* from continuing and discontinued operations 6.55p (107.43p)
Earnings / (loss) per share (restated)* from continuing and discontinued operations (15.47p) (205.66p)
Dividend per share – 3.10p
* Restatement of earnings per share reflects adjustment to the weighted average number of shares associated with the Rights Issue
Finance Review continued

Fina
ncia
l Sta
tem
ents
Dir
ecto
rs’ R
epo
rtSt
rate
gic
Rep
ort
Strategic Report 53·
Underlying Trading Profit excludes the benefit arising from the non-depreciation of assets classified as held for sale. In 2015 depreciation and amortisation of £10.0m and £1.7m respectively was not charged to operating profit on assets classified as held for sale relating to those businesses classified as discontinued operations.
Other one-time items relate to the early termination of a UK Local Authority contract where settlement has been mutually agreed with the customer. The one-time profit represents a payment to Serco in lieu of anticipated profits in future years, net of direct costs, impairments and other charges.
In 2014, Underlying Trading Profit of £113.2m excludes non-exceptional charges made in respect of OCPs, asset impairments and other provisions arising from the 2014 Contract and Balance Sheet Review of £745.3m.
Discontinued operations
Completion of the sale of the majority of the offshore private sector BPO business, which accounted for the bulk of the Global Services division, occurred on 31 December 2015. The disposal of operations based in the Middle East to the same purchaser is expected to complete in two tranches during 2016 following receipt of the necessary approvals; the balance sheet items associated with these operations remain within assets and liabilities held for sale at 31 December 2015.
During the course of 2015 the other predominantly UK onshore private sector BPO operations have either been sold or exited early, or will be in the near future. As a result, in 2015 the Global Services division is deemed to be a discontinued operation in accordance with IFRS. Those onshore BPO businesses which have not yet been exited are treated as assets held for sale and segregated from the other assets and liabilities on the balance sheet.
The results of discontinued operations were as follows:
For the year ended 31 December2015
£m2014
£m
Revenue 337.6 359.3
Underlying Trading Profit 14.3 6.8
Onerous contract and balance sheet review adjustments 0.6 (30.3)
Benefit from non-depreciation and non-amortisation of assets held for sale 11.7 –
Trading Profit / (Loss) 26.6 (23.5)
Other expenses – amortisation and impairment of intangibles arising on acquisition (0.1) (5.5)
Operating profit / (loss) before exceptional items 26.5 (29.0)
Exceptional gain / (loss) on disposal of subsidiaries and operations 5.4 (3.1)
Other exceptional operating items (83.0) (332.7)
Operating loss (51.1) (364.8)
Investment revenue 2.1 1.6
Finance costs (1.2) (0.3)
Loss before tax (50.2) (363.5)
Tax on profit / (loss) before exceptional items (18.8) (3.9)
Tax on exceptional items 2.8 9.8
Net loss of discontinued operations (attributable to equity owners of the Company) as presented in the income statement (66.2) (357.6)
Finance Review

Serco Group plc Annual Report and Accounts 201554
Joint ventures – share of results
The most significant joint ventures are the Atomic Weapons Establishment (AWE) and Northern Rail. Serco manages AWE in a consortium with Lockheed Martin and Jacobs Engineering Group in a 25-year contract that runs to 2025. In 2015 Serco’s share of revenue was £326.1m (2014: £329.8m) and profit after tax was £18.6m (2014: £16.9m). Northern Rail is a 50% joint venture with Abellio to operate a rail franchise that runs until 31 March 2016. In 2015 Serco’s share of revenue was £292.7m (2014: £288.7m) and profit after tax was £8.2m (2014: £6.5m). While the revenues and individual line items are not consolidated in the Group Income Statement, summary financial performance measures of the aggregate of all joint ventures are set out below for information purposes.
For the year ended 31 December 2015
£m2014
£m
Revenue 737.2 798.3
Operating profit 42.6 37.9
Net finance cost (0.4) (0.3)
Tax expense (5.2) (7.6)
Profit after tax 37.0 30.0
Dividends received from joint ventures 32.5 34.8
Exceptional items
Exceptional items are non-recurring items of financial performance that are outside normal operations and are material to the results of the Group either by virtue of size or nature. As such, the items set out below require separate disclosure on the face of the income statement to assist in the understanding of the underlying performance of the Group.
Exceptional items have arisen on both the continuing and discontinuing operations of the Group. Exceptional items arising on discontinued operations are disclosed on the face of the Consolidated Income Statement within the profit or loss attributable to discontinued operations. Those arising on continuing operations are disclosed on the face of the Consolidated Income Statement within exceptional operating items.
Finance Review continued

Fina
ncia
l Sta
tem
ents
Dir
ecto
rs’ R
epo
rtSt
rate
gic
Rep
ort
Strategic Report 55·
For the year ended 31 December2015
£m2014
£m
Exceptional items arising on continuing operations
Exceptional loss on disposal of subsidiaries and operations (2.6) (2.3)
Other exceptional operating items
Impairment of goodwill (87.5) (181.2)
Restructuring costs (19.7) (24.0)
Aborted transaction costs (1.7) –
Costs associated with UK Government review (1.2) (9.2)
UK frontline clinical health contract provisions 2.8 (16.1)
Provision for settlement relating to DLR pension deficit funding dispute – (35.6)
Other provision for legal claims – (20.1)
Impairment and related charges of Australian rail business – (37.2)
Other exceptional operating items (107.3) (323.4)
Exceptional operating items arising on continuing operations (109.9) (325.7)
Exceptional items arising on discontinued operations
Loss on disposal of discontinued operations prior to reserve recycling (45.6) (3.1)
Recycling of gains in hedging and translation reserves 51.0 –
Exceptional gain / (loss) on disposal 5.4 (3.1)
Other exceptional operating items
Restructuring costs (2.2) (8.7)
Impairment of goodwill (65.9) (284.8)
Impairment of other assets transferred to held for sale (14.9) (39.2)
Other exceptional operating items (83.0) (332.7)
Exceptional operating items arising on discontinued operations (77.6) (335.8)
Exceptional items arising on continuing and discontinued operations (187.5) (661.5)
Finance Review
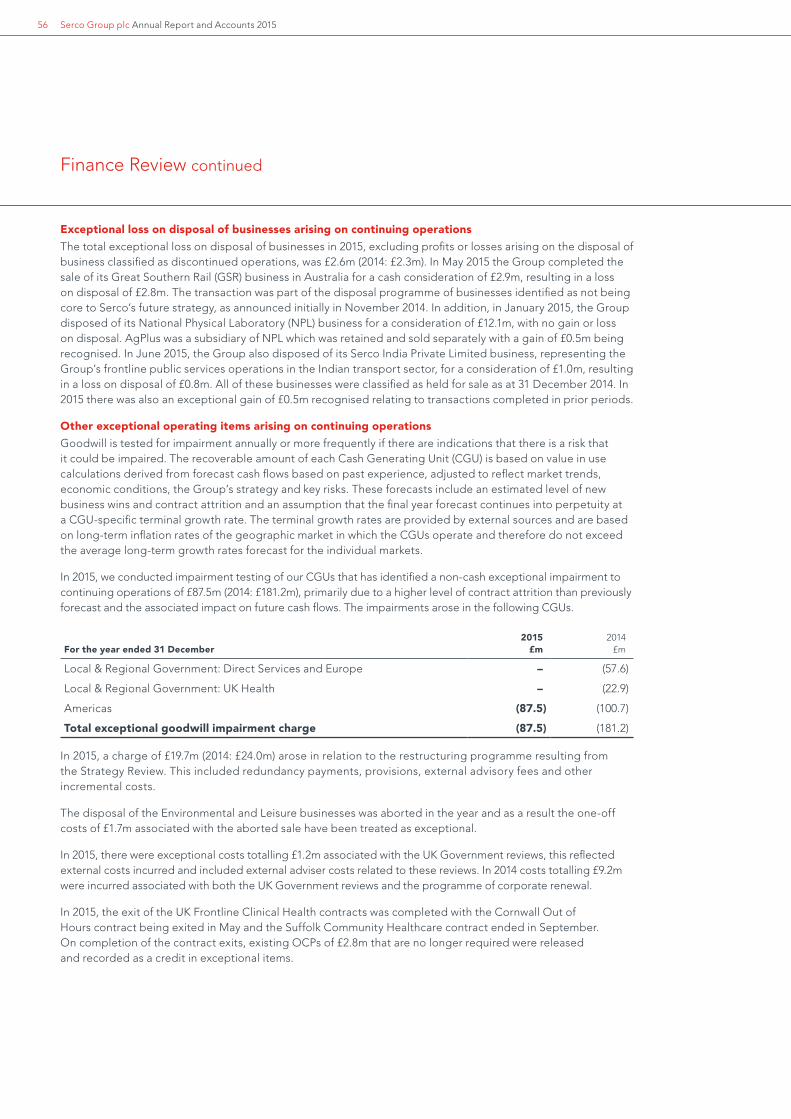
Serco Group plc Annual Report and Accounts 201556
Exceptional loss on disposal of businesses arising on continuing operations
The total exceptional loss on disposal of businesses in 2015, excluding profits or losses arising on the disposal of business classified as discontinued operations, was £2.6m (2014: £2.3m). In May 2015 the Group completed the sale of its Great Southern Rail (GSR) business in Australia for a cash consideration of £2.9m, resulting in a loss on disposal of £2.8m. The transaction was part of the disposal programme of businesses identified as not being core to Serco’s future strategy, as announced initially in November 2014. In addition, in January 2015, the Group disposed of its National Physical Laboratory (NPL) business for a consideration of £12.1m, with no gain or loss on disposal. AgPlus was a subsidiary of NPL which was retained and sold separately with a gain of £0.5m being recognised. In June 2015, the Group also disposed of its Serco India Private Limited business, representing the Group’s frontline public services operations in the Indian transport sector, for a consideration of £1.0m, resulting in a loss on disposal of £0.8m. All of these businesses were classified as held for sale as at 31 December 2014. In 2015 there was also an exceptional gain of £0.5m recognised relating to transactions completed in prior periods.
Other exceptional operating items arising on continuing operations
Goodwill is tested for impairment annually or more frequently if there are indications that there is a risk that it could be impaired. The recoverable amount of each Cash Generating Unit (CGU) is based on value in use calculations derived from forecast cash flows based on past experience, adjusted to reflect market trends, economic conditions, the Group’s strategy and key risks. These forecasts include an estimated level of new business wins and contract attrition and an assumption that the final year forecast continues into perpetuity at a CGU-specific terminal growth rate. The terminal growth rates are provided by external sources and are based on long-term inflation rates of the geographic market in which the CGUs operate and therefore do not exceed the average long-term growth rates forecast for the individual markets.
In 2015, we conducted impairment testing of our CGUs that has identified a non-cash exceptional impairment to continuing operations of £87.5m (2014: £181.2m), primarily due to a higher level of contract attrition than previously forecast and the associated impact on future cash flows. The impairments arose in the following CGUs.
For the year ended 31 December 2015
£m2014
£m
Local & Regional Government: Direct Services and Europe – (57.6)
Local & Regional Government: UK Health – (22.9)
Americas (87.5) (100.7)
Total exceptional goodwill impairment charge (87.5) (181.2)
In 2015, a charge of £19.7m (2014: £24.0m) arose in relation to the restructuring programme resulting from the Strategy Review. This included redundancy payments, provisions, external advisory fees and other incremental costs.
The disposal of the Environmental and Leisure businesses was aborted in the year and as a result the one-off costs of £1.7m associated with the aborted sale have been treated as exceptional.
In 2015, there were exceptional costs totalling £1.2m associated with the UK Government reviews, this reflected external costs incurred and included external adviser costs related to these reviews. In 2014 costs totalling £9.2m were incurred associated with both the UK Government reviews and the programme of corporate renewal.
In 2015, the exit of the UK Frontline Clinical Health contracts was completed with the Cornwall Out of Hours contract being exited in May and the Suffolk Community Healthcare contract ended in September. On completion of the contract exits, existing OCPs of £2.8m that are no longer required were released and recorded as a credit in exceptional items.
Finance Review continued

Fina
ncia
l Sta
tem
ents
Dir
ecto
rs’ R
epo
rtSt
rate
gic
Rep
ort
Strategic Report 57·
In November 2014 the Group agreed to settle a dispute with the Trustees of the Docklands Light Railway (DLR) Pension Scheme over the extent of its liability to fund the deficit on the scheme. The settlement resulted in a total exceptional charge inclusive of costs of £35.6m, consisting of the full and final settlement amount of £33.0m and costs of £2.6m. The settlement is to be paid over four equal annual instalments from January 2015 to January 2018 covering all past and any future DLR associated pension liabilities.
In 2014 an exceptional provision of £20.1m was recognised for legal claims made against Serco for commercial disputes. This provision was based on legal advice received by the Company. There have been no further charges in 2015 in relation to these disputes.
In 2014 an impairment review was performed on the Australian rail business, Great Southern Rail (GSR), resulting in a charge totalling £37.2m. This consisted of an impairment of £23.1m to reduce the carrying value of its net assets to the estimated recoverable amount and a charge of £14.1m in relation to the break costs of leases relating to the business. The GSR business was exited in May 2015, with the loss on disposal of £2.8m, included within loss on disposal of businesses.
Exceptional profit or loss on disposal of discontinued operations
Completion of the sale of the majority of the offshore private sector BPO business occurred on 31 December 2015. During the year the Group also disposed of businesses in relation to the predominantly UK onshore private sector BPO business. The net assets at the date of disposal of discontinued operations were:
Offshore£m
UK onshore£m
Total £m
Goodwill 156.7 – 156.7
Other intangible assets 30.4 – 30.4
Property, plant and equipment 35.1 0.8 35.9
Trade and other receivables 82.8 0.5 83.3
Deferred tax assets 3.1 – 3.1
Cash and cash equivalents 31.0 0.8 31.8
Trade and other payables (51.5) (0.5) (52.0)
Obligations under finance leases (1.1) (0.1) (1.2)
Provisions (16.8) (4.9) (21.7)
Corporation tax liabilities (26.0) (0.3) (26.3)
Deferred tax liabilities (5.1) – (5.1)
Minority interest disposed 0.4 – 0.4
Net assets / (liabilities) disposed 239.0 (3.7) 235.3
Finance Review
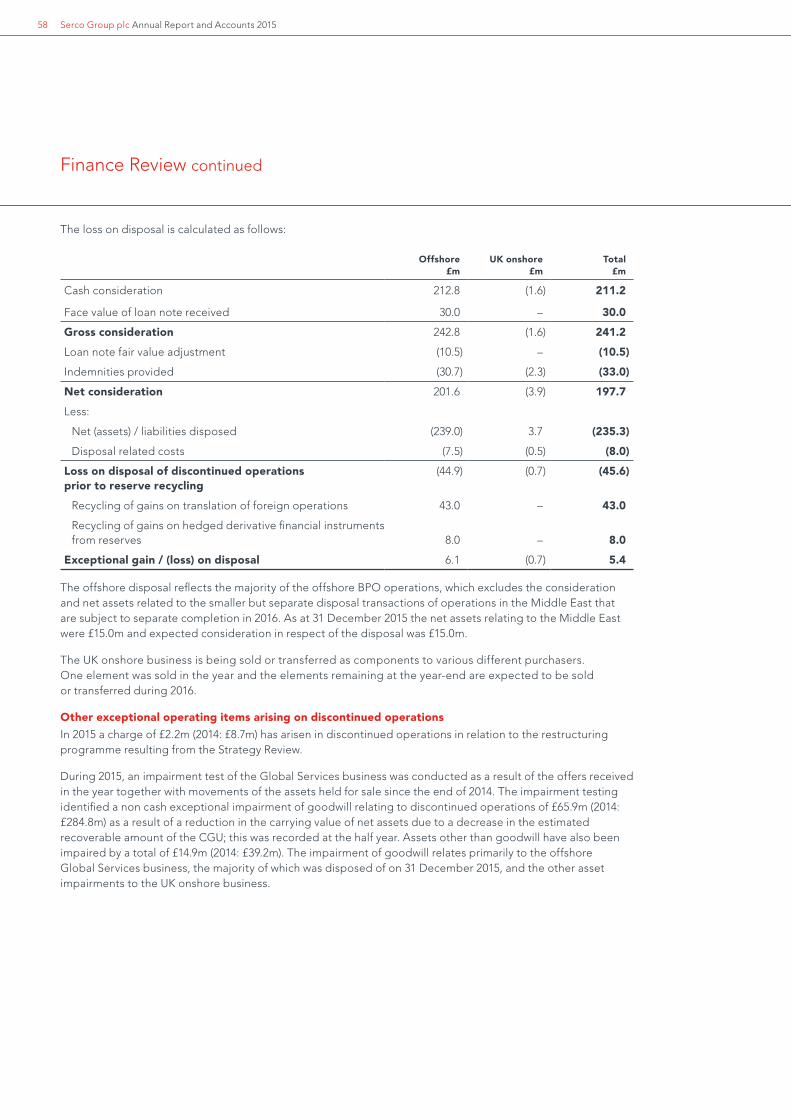
Serco Group plc Annual Report and Accounts 201558
The loss on disposal is calculated as follows:
Offshore £m
UK onshore £m
Total £m
Cash consideration 212.8 (1.6) 211.2
Face value of loan note received 30.0 – 30.0
Gross consideration 242.8 (1.6) 241.2
Loan note fair value adjustment (10.5) – (10.5)
Indemnities provided (30.7) (2.3) (33.0)
Net consideration 201.6 (3.9) 197.7
Less:
Net (assets) / liabilities disposed (239.0) 3.7 (235.3)
Disposal related costs (7.5) (0.5) (8.0)
Loss on disposal of discontinued operations prior to reserve recycling
(44.9) (0.7) (45.6)
Recycling of gains on translation of foreign operations 43.0 – 43.0
Recycling of gains on hedged derivative financial instruments from reserves 8.0 – 8.0
Exceptional gain / (loss) on disposal 6.1 (0.7) 5.4
The offshore disposal reflects the majority of the offshore BPO operations, which excludes the consideration and net assets related to the smaller but separate disposal transactions of operations in the Middle East that are subject to separate completion in 2016. As at 31 December 2015 the net assets relating to the Middle East were £15.0m and expected consideration in respect of the disposal was £15.0m.
The UK onshore business is being sold or transferred as components to various different purchasers. One element was sold in the year and the elements remaining at the year-end are expected to be sold or transferred during 2016.
Other exceptional operating items arising on discontinued operations
In 2015 a charge of £2.2m (2014: £8.7m) has arisen in discontinued operations in relation to the restructuring programme resulting from the Strategy Review.
During 2015, an impairment test of the Global Services business was conducted as a result of the offers received in the year together with movements of the assets held for sale since the end of 2014. The impairment testing identified a non cash exceptional impairment of goodwill relating to discontinued operations of £65.9m (2014: £284.8m) as a result of a reduction in the carrying value of net assets due to a decrease in the estimated recoverable amount of the CGU; this was recorded at the half year. Assets other than goodwill have also been impaired by a total of £14.9m (2014: £39.2m). The impairment of goodwill relates primarily to the offshore Global Services business, the majority of which was disposed of on 31 December 2015, and the other asset impairments to the UK onshore business.
Finance Review continued

Fina
ncia
l Sta
tem
ents
Dir
ecto
rs’ R
epo
rtSt
rate
gic
Rep
ort
Strategic Report 59·
Exceptional finance costs
In December 2014, agreement was reached for the Group to defer its December 2014 covenant test until 31 May 2015. As a result, costs were incurred in 2015 to preserve the existing finance facilities. In addition, payments were made to the US Private Placement (USPP) Noteholders as a result of early settlement following the Group refinancing. Total charges of £32.8m have been treated as exceptional items as they are outside of the normal financing arrangements of the Group and are significant in size.
Other finance costs and investment income on continuing and discontinuing operations
Investment income of £8.2m (2014: £6.2m) principally relates to interest earned on deposits during the period of £3.2m and interest accruing on net retirement benefit assets of £4.9m.
Other finance costs of £40.2m (2014: £42.9m) principally relate to interest incurred on the USPP loans and the Revolving Credit Facility (£24.7m), facility fees and other charges (£7.2m) and the movement in discount on provisions (£5.6m).
In total, pre-exceptional net finance costs were £32.0m (2014: £36.7m).
Taxation on continuing and discontinuing operations
Our tax strategy is to manage all taxes to ensure that we pay the appropriate amount in the countries in which we operate, while both respecting applicable tax legislation and utilising appropriate legislative reliefs. Our strategy is aligned with the Group’s business strategy and endorsed by the Board. Responsibility for tax strategy and risk management sits with the Chief Financial Officer. Day to day delivery of the strategy is executed by a global team of tax professionals who are aligned with our businesses and who work closely with local tax authorities and local advisers.
Tax charge
In 2015, we recognised a tax charge of £36.7m on a pre-tax and pre-exceptional profit of £100.7m representing an effective tax rate of 36.4%. The tax charge on an underlying basis, reflecting Underlying Trading Profit of £96.0m less pre-exceptional net finance costs of £32.0m, was £30.5m, representing an effective tax rate of 47.7%.
A £3.1m tax credit was also recognised on exceptional losses of £220.3m. The principal reasons for the absence of a tax credit on these exceptional costs is that no UK deferred tax asset is being recognised in respect of UK costs and no tax deduction is available for the impairment of goodwill in any territory. The credit of £3.1m represents tax relief on restructuring costs in overseas territories and the benefit of a tax credit from losses sold to joint venture partners.
The principal reasons why the effective tax rates are higher than the UK standard corporation tax rate of 20.25% are due to higher rates of tax on profits arising on our international operations, together with the absence of any deferred tax credit for losses incurred in the UK (which includes the result of UK divisions, the majority of corporate costs and certain interest costs). The increase in the effective tax rate has been partially offset by a tax credit on the recognition of additional deferred tax assets that were not previously recognised on provisions in Australia.
Our tax charge in future years will continue to be materially impacted by our accounting for UK deferred taxes. To the extent that future UK tax losses are not recognised, our effective tax rate will be higher than prevailing standard corporation tax rates as we will not be able to recognise the associated tax benefits arising. To the extent that our existing UK tax losses are subsequently recognised or utilised, our effective rate will be impacted by the associated tax benefit and will reduce accordingly.
Finance Review

Serco Group plc Annual Report and Accounts 201560
Contingent tax assets
At 31 December 2015, the Group has gross estimated unrecognised deferred tax assets of £1.05bn (£195m net), which are potentially available to offset against future taxable profits. These principally relate to tax losses of £890m. Of these tax losses, £761m arise in the UK business (net £137m) – £584m arising in Serco Limited, the Group’s principal UK trading entity; the remaining £177m of tax losses arise in other UK group companies. Of the net £137m of UK tax assets in respect of losses, only £10.5m is recognised on the balance sheet on the basis of forecast utilisation against future taxable profits, with the remaining £126.5m being a contingent asset not recognised.
Taxes paid
Net corporate income tax of £9.4m was paid during the year, relating primarily to our operations in Americas (£2.2m), India (£6.7m), Middle East (£1.3m), Europe (£3.6m) and offset by tax refunds arising in AsPac (£4.4m) in respect of prior years. The Group’s UK operations have been loss making overall and accordingly no tax payments have been due. During the year the Group has transferred tax losses to its profitable joint ventures in return for cash payments from the joint ventures of £6.7m, resulting in an overall tax paid figure in our cash flow of £2.7m.
Dividend
As indicated in March, the Board is not recommending the payment of a dividend in respect of the 2015 financial year. The Board is committed to resuming dividend payments when it is prudent to do so. The Directors’ decision as to when to declare a dividend and the amount to be paid will take into account the Group’s underlying earnings, cash flows and financial leverage, together with the requirement to maintain an appropriate level of dividend cover and the market outlook at the time.
Share count and earnings per share
The equity placing conducted in May 2014 and Rights Issue in April 2015 increased the weighted average number of shares for earnings per share (‘EPS’) purposes to 986.5m (2014: 655.1m). The annualising effect of the Rights Issue will further increase the weighted average number of shares to approximately 1,099m for 2016.
EPS before exceptional items from both continuing and discontinuing operations was 6.55p per share; including the impact of exceptional items there was a loss of 15.47p per share.
Underlying EPS was 3.44p per share. This measure reflects the Underlying Trading Profit £96.0m and deducts pre-exceptional net finance costs (including those for discontinued operations) and related tax effects.
Cash flow and reconciliation to net debt
The table below shows the operating loss and Free Cash Flow reconciled to movements in net debt. Free Cash Flow is the cash flow from subsidiaries and dividends received from joint ventures and is stated before exceptional items which are considered non-recurring in nature. Free Cash Flow for 2015 was an outflow of £16.2m compared to an inflow of £62.2m in 2014.
Operating cash flow (before movements in working capital, exceptional items and tax) was £82.5m, a reduction of £3.9m from the prior year; included within this are movements in provisions that in the year predominantly reflect the cash outflows in relation to onerous contracts whilst in the prior year the movement reflects the establishing of provisions for onerous contracts identified following the 2014 Contract and Balance Sheet Review. The year-on-year decrease in other non-cash movements is principally due to the 2014 impairment of working capital items that arose following the Contract and Balance Sheet Review.
2015 free cash flow reflects a £22.6m outflow in working capital from the continued normalisation of balances at the end of the statutory period compared to the average for the period, tax returning to a paid position compared with a small net refund received in 2014 and higher net purchases of tangible and intangibles assets of £36.0m.
The impact of the Contract and Balance Sheet Review was mostly non-cash in nature in 2014, relating principally to provision movements and other impairments.
Finance Review continued

Fina
ncia
l Sta
tem
ents
Dir
ecto
rs’ R
epo
rtSt
rate
gic
Rep
ort
Strategic Report 61·
Cash Flow: Year ended 31 December2015
£m2014
£m
Operating loss on continuing operations (3.7) (952.5)
Operating loss on discontinued operations (51.1) (364.8)
Less: exceptional items 187.5 661.5
Operating profit / (loss) before exceptional items on continuing and discontinued operations 132.7 (655.8)
Less: profit from joint ventures (37.0) (30.0)
Movement in provisions (116.0) 472.6
Other non-cash movements 102.8 299.6
Operating cash inflow before movements in working capital, exceptional items and tax 82.5 86.4
Working capital movements (22.6) 17.0
Tax (paid) / received (2.7) 0.6
Non-cash R&D expenditure (0.7) (0.5)
Cash flow from operating activities before exceptional items 56.5 103.5
Dividends from joint ventures 32.5 34.8
Interest received 3.4 2.7
Interest paid (36.1) (42.3)
Purchase of intangible and tangible assets net of proceeds from disposals (72.5) (36.5)
Free Cash Flow (16.2) 62.2
Net disposal / (acquisition) of subsidiaries 184.9 (4.6)
Costs of equity Rights Issue – (4.1)
Proceeds from Rights Issue and share placement 530.3 156.3
Purchase of own shares net of share option proceeds 4.4 2.3
Other movements on investment balances (1.3) (3.5)
Capitalisation and amortisation of loan costs (0.6) 3.6
Impairment of loan receivable – (4.6)
Non-recourse loan disposals, repayments and advances 24.0 (6.8)
New, acquired and disposed finance leases 0.5 (13.7)
Exceptional items (88.4) (40.4)
Dividends paid – (53.1)
Foreign exchange loss on net debt (32.9) (30.4)
Movement in net debt including assets and liabilities held for sale 604.7 63.2
Asset held for sale movement in net debt (44.2) 39.5
Net debt at 1 January (642.7) (745.4)
Net debt at 31 December (82.2) (642.7)
Net debt at 1 January including assets and liabilities held for sale (682.2) (745.4)
Net debt at 31 December including assets and liabilities held for sale (77.5) (682.2)
Average net debt for the year ended 31 December 2015, calculated on a daily basis, was £454.8m a reduction of (£323.8m) from the 2014 average net debt of £778.6m. The reduction in net debt was predominantly due to the Rights Issue and proceeds from the disposal of the offshore private sector BPO business.
The table below provides an analysis of trading cash flow and provides the pre-interest and pre-tax cash flows equivalent to Underlying Trading Profit. This is derived from the cash flow from operating activities excluding tax items and is shown after net capital expenditure and after dividends received from joint ventures.
Finance Review

Serco Group plc Annual Report and Accounts 201562
The percentage conversion of Underlying Trading Profit into trading cash flow is also provided in this table and this is a measure of the efficiency of the business in terms of converting profit into cash before taking account of the impact of interest, tax and exceptional items. This measure is impacted by provisions related to onerous contracts, and we would expect it to be impacted in future periods by the expected utilisation of OCPs.
Trading cash flow: Year ended 31 December2015
£m2014
£m
Free cash flow from operating activities before exceptional items (16.2) 62.2
Add back:
Tax paid / (received) 3.4 (0.1)
Interest received (3.4) (2.7)
Interest paid 36.1 42.3
Trading Cash Flow 19.9 101.7
Underlying Trading Profit 96.0 113.2
Underlying Trading Profit cash conversion 20.7% 89.8%
The Underlying Trading Profit conversion into trading cash flow was 20.7%. This was due primarily to the cash outflows on provisions movement, including assets held for sale £116.0m, the outflow of working capital of £22.6m in the year from the continued normalisation of balances at the end of the statutory period compared to the average for the period, and from the net purchase of tangible and intangible assets £72.5m. These reductions to cash were largely offset by the impact of depreciation, amortisation and impairments during the year, including the Underlying Trading Profit benefit relating to assets held for sale, £83.2m, the cash inflows arising from one-time items and the collection of bad debts provided for under the Contract and Balance Sheet review £18.4m and other non-cash items £31.3m.
Analysis of net debt
Net debt, including assets held for sale, reduced to £77.5m (2014: £682.8m), predominately due to the proceeds received from the Rights Issue and from the disposal of the offshore private sector BPO business.
As at 31 December
2015
As reported£m
Assets and liabilities held for sale adjustment
£m
Including assets and liabilities held for sale
£m
Cash and cash equivalents 323.6 5.2 328.8
Loans receivable 19.9 – 19.9
Other loans (381.9) – (381.9)
Obligations under finance leases (43.8) (0.5) (44.3)
Recourse net debt (82.2) 4.7 (77.5)
Non-recourse debt – – –
Net debt (82.2) 4.7 (77.5)
As at 31 December
2014
As reported£m
Assets and liabilities held for sale adjustment
£m
Including assets and liabilities held for sale
£m
Cash and cash equivalents 180.1 22.4 202.5
Loans receivable 1.0 – 1.0
Other loans (797.3) (0.8) (798.1)
Obligations under finance leases (26.5) (37.1) (63.6)
Recourse net debt (642.7) (15.5) (658.2)
Non-recourse debt – (24.0) (24.0)
Net debt (642.7) (39.5) (682.2)
Finance Review continued

Fina
ncia
l Sta
tem
ents
Dir
ecto
rs’ R
epo
rtSt
rate
gic
Rep
ort
Strategic Report 63·
Treasury operations and risk management
The Group’s operations expose it to a variety of financial risks that include liquidity, the effects of changes in foreign currency exchange rates, interest rates and credit risk. The Group has a centralised treasury function whose principal role is to ensure that adequate liquidity is available to meet the Group’s funding requirements as they arise and that the financial risk arising from the Group’s underlying operations is effectively identified and managed.
Treasury operations are conducted in accordance with policies and procedures approved by the Board and are reviewed annually. Financial instruments are only executed for hedging purposes - speculation is not permitted. A monthly report is provided to senior management outlining performance against the treasury policy and the treasury function is subject to periodic internal review.
Liquidity and funding
As at 31 December 2015, the Group had committed funding of £855m, comprising a £480m revolving credit facility with a syndicate of banks and £375m of private placement notes. In addition the Group had a receivables financing facility of £30m. The principal financial covenants attaching to these facilities are that the ratio of net debt to EBITDA should not exceed 3.5x and the ratio of EBITDA to interest expense should be greater than 3.0x.
In April 2015 the Group raised gross proceeds of £555m from the Rights Issue, of which £450m was used to reduce gross indebtedness (see Rights Issue, debt refinancing and covenants overleaf).
Following the disposal of the majority of the offshore private sector BPO operations, the Group was required to offer the net disposal proceeds to the debt holders in prepayment. Two thirds of the proceeds were offered to private placement note holders at par and one third to repay any outstanding drawdowns on the revolving credit facility (nil outstanding at 31 December 2015). As a result of this process, £113m of private placement notes were repaid on 16 February 2016, leaving £262m of private placement notes in issue at that date.
Interest rate risk
Given the nature of the Group’s business, we have a preference for fixed rate debt to reduce the volatility of net finance costs. Our treasury policies require us to maintain a minimum proportion of fixed rate debt as a proportion of overall net debt and for this proportion to increase as the ratio of EBITDA to interest expense falls. As at 31 December 2015, more than 100% of the Group’s net debt was at fixed rates. Interest on the revolving credit facility is at floating rate, however it was undrawn.
Foreign exchange risk
The Group is subject to currency exposure on the translation to GBP of its net investments in overseas subsidiaries. The Group manages this risk where appropriate by borrowing in the same currency as those investments. Group borrowings are predominantly denominated in GBP and USD.
The Group manages its currency flows to minimise foreign exchange risk arising on transactions denominated in foreign currencies and uses forward contracts where appropriate to hedge net currency flows.
Credit risk
Cash deposits and in-the-money financial instruments give rise to credit risk on the amounts due from counterparties. The Group manages this risk by adhering to counterparty exposure limits based on external credit ratings of the relevant counterparty.
Finance Review

Serco Group plc Annual Report and Accounts 201564
Rights Issue, debt refinancing and covenants
The Group announced in November 2014 plans for new equity to be raised through a Rights Issue and for the proceeds to be used primarily to reduce the Group’s indebtedness. This was launched on 12 March 2015 and received shareholder approval on 30 March 2015. The equity Rights Issue successfully completed in April 2015 raising approximately £555m of gross proceeds (£530m net after expenses), with trading in new shares commencing on 17 April 2015 and 549,265,547 new shares being issued.
On 30 April 2015, the Group concluded a refinancing with its lending banks and private placement noteholders. This included the reduction of gross indebtedness by £450m. The Group’s committed revolving credit facility was reduced in size from £730m to £480m and the maturity date extended by two years to April 2019. Financial covenants across the Group’s funding arrangements are unchanged, reflecting the strengthening of the Group’s balance sheet by the Rights Issue. Fees and expenses relating to the repayment of the Group’s borrowings and amendments to the existing finance agreements were £33m, and these included a premium of £25m on the early settlement of private placement notes. These expenses have been treated as exceptional finance costs. In accordance with the amended terms of Serco Group plc’s borrowing facilities, compliance certificates for the year to 31 December 2014 and 12 months to 30 June 2015 were submitted to its lenders in May and September 2015 respectively, and these showed the Group complied with the financial covenants.
For covenant purposes the definition of Consolidated Total Net Borrowings (CTNB) represents Group recourse net debt at the balance sheet date adjusted to exclude encumbered cash, loan receivable amounts, and also adjusted to reflect the impact of currency hedges associated with recourse loans. The covenant definition of EBITDA is the twelve month operating profit of the business before exceptional items, deducting profits from joint ventures and after adding back depreciation, intangible amortisation, share based payment charges and dividends received from joint ventures. The covenant test for 31 December 2014 was deferred until 31 May 2015. The covenant definition of EBITDA for 31 December 2014 and the 12 months to 30 June 2015 was amended to exclude the impact of charges arising from the Contract and Balance Sheet Review whilst CTNB was calculated after the proceeds less underwriting charges from the equity Rights Issue. The covenant test for the years ended 31 December 2014 and 2015 are shown below:
As at 31 December 2015
£m2014
£m
Operating (loss) / profit before exceptional items 132.7 (655.8)
Less: Joint venture post-tax profits (37.0) (30.0)
Add: Dividends from joint ventures 32.5 34.8
Amortisation of other intangible assets 40.5 38.7
Depreciation of property, plant and equipment 28.9 41.8
Impairment of property, plant and equipment 2.1 –
Share based payment expense 9.8 5.4
Balance sheet and contract write-downs in 2014 – 757.6
EBITDA per covenant 209.5 192.5
Net finance costs 32.0 36.7
Other adjustments (0.6) 0.2
Net finance costs per covenant 31.4 36.9
Recourse net debt (including assets and liabilities held for sale) 77.5 658.2
Encumbered cash and other items 14.2 –
Proceeds from rights issue less underwriting charge – (543.7)
Consolidated Total Net Borrowings (CTNB) 91.7 114.5
Covenant CTNB / EBITDA (not to exceed 3.5x) 0.44x 0.59x
Covenant EBITDA / Net finance costs (at least 3.0x) 6.67x 5.22x
Finance Review continued
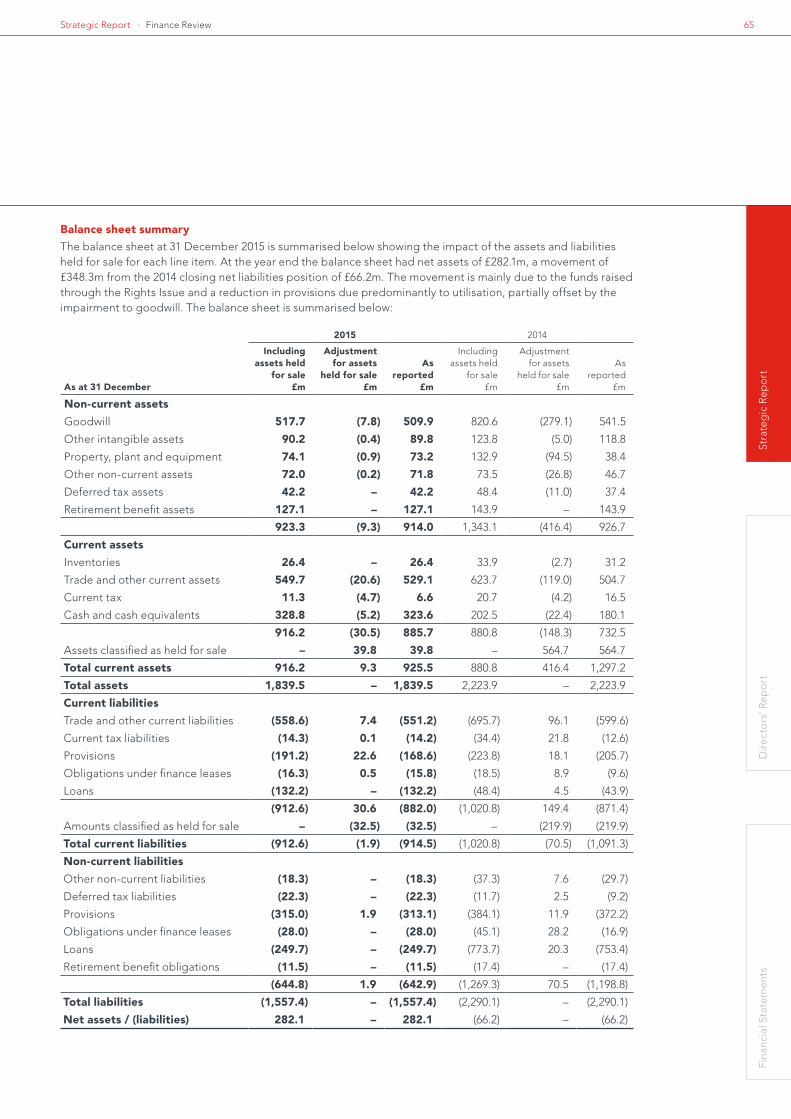
Fina
ncia
l Sta
tem
ents
Dir
ecto
rs’ R
epo
rtSt
rate
gic
Rep
ort
Strategic Report 65·
Balance sheet summary
The balance sheet at 31 December 2015 is summarised below showing the impact of the assets and liabilities held for sale for each line item. At the year end the balance sheet had net assets of £282.1m, a movement of £348.3m from the 2014 closing net liabilities position of £66.2m. The movement is mainly due to the funds raised through the Rights Issue and a reduction in provisions due predominantly to utilisation, partially offset by the impairment to goodwill. The balance sheet is summarised below:
As at 31 December
2015 2014
Including assets held
for sale£m
Adjustment for assets
held for sale£m
As reported
£m
Including assets held
for sale£m
Adjustment for assets
held for sale£m
As reported
£m
Non-current assets
Goodwill 517.7 (7.8) 509.9 820.6 (279.1) 541.5
Other intangible assets 90.2 (0.4) 89.8 123.8 (5.0) 118.8
Property, plant and equipment 74.1 (0.9) 73.2 132.9 (94.5) 38.4
Other non-current assets 72.0 (0.2) 71.8 73.5 (26.8) 46.7
Deferred tax assets 42.2 – 42.2 48.4 (11.0) 37.4
Retirement benefit assets 127.1 – 127.1 143.9 – 143.9
923.3 (9.3) 914.0 1,343.1 (416.4) 926.7
Current assets
Inventories 26.4 – 26.4 33.9 (2.7) 31.2
Trade and other current assets 549.7 (20.6) 529.1 623.7 (119.0) 504.7
Current tax 11.3 (4.7) 6.6 20.7 (4.2) 16.5
Cash and cash equivalents 328.8 (5.2) 323.6 202.5 (22.4) 180.1
916.2 (30.5) 885.7 880.8 (148.3) 732.5
Assets classified as held for sale – 39.8 39.8 – 564.7 564.7
Total current assets 916.2 9.3 925.5 880.8 416.4 1,297.2
Total assets 1,839.5 – 1,839.5 2,223.9 – 2,223.9
Current liabilities
Trade and other current liabilities (558.6) 7.4 (551.2) (695.7) 96.1 (599.6)
Current tax liabilities (14.3) 0.1 (14.2) (34.4) 21.8 (12.6)
Provisions (191.2) 22.6 (168.6) (223.8) 18.1 (205.7)
Obligations under finance leases (16.3) 0.5 (15.8) (18.5) 8.9 (9.6)
Loans (132.2) – (132.2) (48.4) 4.5 (43.9)
(912.6) 30.6 (882.0) (1,020.8) 149.4 (871.4)
Amounts classified as held for sale – (32.5) (32.5) – (219.9) (219.9)
Total current liabilities (912.6) (1.9) (914.5) (1,020.8) (70.5) (1,091.3)
Non-current liabilities
Other non-current liabilities (18.3) – (18.3) (37.3) 7.6 (29.7)
Deferred tax liabilities (22.3) – (22.3) (11.7) 2.5 (9.2)
Provisions (315.0) 1.9 (313.1) (384.1) 11.9 (372.2)
Obligations under finance leases (28.0) – (28.0) (45.1) 28.2 (16.9)
Loans (249.7) – (249.7) (773.7) 20.3 (753.4)
Retirement benefit obligations (11.5) – (11.5) (17.4) – (17.4)
(644.8) 1.9 (642.9) (1,269.3) 70.5 (1,198.8)
Total liabilities (1,557.4) – (1,557.4) (2,290.1) – (2,290.1)
Net assets / (liabilities) 282.1 – 282.1 (66.2) – (66.2)
Finance Review

Serco Group plc Annual Report and Accounts 201566
Provisions
The total of current and non-current provisions, excluding provisions related to businesses held for sale, has decreased by £96.2m since 31 December 2014, the majority of which relates to a reduction in contract provisions as a result of the utilisation and release of provisions against losses on onerous contracts, offset by new or additional onerous contract provision charges made in the year. Movements in contract provisions, including those related to businesses held for sale since the 31 December 2014 balance sheet date, are as follows:
Onerous Contract
Provisions £m
Other Contract
Provisions £m
Total contract provisions
including assets held for sale
£m
Held for sale adjustment
£m
Total contract provisions as
reported £m
At 31 December 2014 (447.1) (4.9) (452.0) 21.6 (430.4)
Charged to income statement (91.8) (10.1) (101.9) 12.8 (89.1)
Released to income statement 88.8 2.7 91.5 (1.3) 90.2
Released to income statement (exceptional) 2.8 – 2.8 – 2.8
Utilised during the year 114.1 16.6 130.7 (24.7) 106.0
Utilised during the year (exceptional) 10.8 – 10.8 – 10.8
Unwinding of discount (5.5) – (5.5) – (5.5)
Disposals 6.5 0.4 6.9 (6.9) –
FX 8.2 0.3 8.5 – 8.5
Transfer to trade payables – (4.5) (4.5) 4.5 –
Assets held for sale – – – 4.9 4.9
Reclassifications 13.3 (13.6) (0.3) – (0.3)
At 31 December 2015 (299.9) (13.1) (313.0) 10.9 (302.1)
Onerous Contract Provisions (OCPs) arising from the Contract and Balance Sheet Review in 2014 accounted for £447.1m of the 31 December 2014 contract provisions balance shown above. A full assessment of the forecasts that form the basis of the OCPs is conducted annually as part of the budgeting process.
In 2015, additional charges have been made in respect of future forecast losses on onerous contracts of £91.8m. This increase related to revisions to existing contracts of £53.1m and new provisions raised on contracts of £38.7m. New contract provisions include charges of £34.0m in respect of the Lincolnshire contract, details of which are provided below. In 2015, releases to the income statement from OCPs were £91.6m, including a release of £62.7m resulting from the renegotiation completed in November 2015 of our contract to operate and maintain a fleet of patrol boats for the Royal Australian Navy. This contract was the single largest OCP charged in 2014.
Utilisation of OCPs in 2015 was £124.9m; of this £10.8m was utilised against OCPs recorded as exceptional items. The OCPs arising as exceptional items relate solely to contracts within the UK Frontline Clinical Health sector following the decision in 2013 to exit this sector; this exit was completed in September 2015 when the Suffolk Community Healthcare contract ended.
Below is an update for the largest OCP contracts following the reassessment conducted as part of the annual budget process:
Finance Review continued
Fina
ncia
l Sta
tem
ents
Dir
ecto
rs’ R
epo
rtSt
rate
gic
Rep
ort
Strategic Report 67·
Armidale Class Patrol Boats (ACPB)
The ACPB contract relates to the operations and maintenance of a fleet of patrol boats for the Royal Australian Navy. This contract was entered into in December 2003 with an initial design and build phase, after which the fleet became operational in 2007. Serco’s key obligation is to have the fleet available for operations for a fixed number of days a year.
In November 2015, agreement was reached with the Australian Government customer to amend the terms of the ACPB contract. The main changes agreed within the amendment are for an improved service regime under an enhanced maintenance and remediation scope of works and schedule, for Serco to provide maintenance and remediation work on an agreed cost recovery basis subject to strict expenditure caps and audit processes, and that the contract will end in June 2017 rather than running through to 2022. Furthermore, under the terms of the Settlement and Amendment Deed, both parties agreed to a mutual release of claims they may have had against each other prior to the point of contract amendment. As a result of the agreement the OCP forecast has been reassessed resulting in a release of £62.7m.
Commercial and Operational Managers Procuring Asylum Support Services (COMPASS)
The COMPASS contract with the UK Home Office is for the provision of accommodation, transportation and subsistence payments for asylum seekers whilst their claims are being processed. Claim processing can take from a few months to several years. This contract commenced in 2012 and provides services in two of the six administrative regions of the contract in the UK; the North West, comprising fourteen Local Authority areas; and Scotland and Northern Ireland. The contract runs to December 2017, with a further extension of up to two years at the option of the customer.
In 2015, the numbers of service users continued to be volatile, however for the year as a whole utilisation of the onerous contract provision was in line with the forecast expectation. The forecasts for the contract have been reassessed with the result being that the remaining balance of the provisions as at 31 December 2015 of £89.1m, is considered sufficient to cover the anticipated losses over the remaining contract term. The final outcome over the contract life will be heavily dependent on the future number of asylum seekers, the volatility of numbers and our ability to find suitable accommodation.
Future Provision of Marine Services (FPMS)
The FPMS contract that commenced in 2007, which has a 15-year duration, provides marine support services to the UK Ministry of Defence (MOD) dockyard ports of Portsmouth, Plymouth and Faslane as well as support to military exercises and training to the Raasay Ranges.
In 2015 the contract has performed better than expected due largely to lower costs in respect of backfill vessel bookings and dockings, and the revenues from additional taskings from the customer. The forecasts for the contract have been reassessed with the result being a net release of £2.1m due to both the favourable performance in the year and savings expected in future years from a voluntary redundancy programme run in 2015; partially offset by lower RPI inflation on the contract than previously forecast and costs relating to the purchase of a new vessel.
Finance Review

Serco Group plc Annual Report and Accounts 201568
Prisoner Escort and Custody Services (PECS)
The contract provides prisoner transportation between courts and prisons and for the management of prisoner welfare when at court for the Ministry of Justice (MOJ). It was awarded in 2011 and runs for seven years.
In 2015, utilisation of the OCP was slightly higher than originally expected. The contract is operated with a very challenging KPI regime and in order to meet these KPIs we require a larger workforce than previous envisaged, along with the associated recruitment, training and contract management costs; the forecast for the contact has been reassessed with the result being an increase to the OCP of £11.3m. In the case of this contract, we have judged that it is unlikely that the customer will wish to extend this contract beyond its minimum term in 2018 on the current basis. If this judgement proves to be incorrect, further OCP charges may be required.
HMP Ashfield
The HMP Ashfield PFI contract commenced in 1999 and runs through to 2024. In 2013 the operational role of Ashfield changed from a Young Offender Institution to an adult male sex offenders’ prison, resulting in a changed cost base. Since the change of operational role of the prison the MoJ has imposed a level of pricing that we dispute, and which would result in substantial losses over the remaining life of the contract. Discussions with the MoJ around re-pricing proposals are expected to conclude in 2016.
In 2015 performance has been slightly better than expected due to the benefit of in year cost savings. The forecast for the contract has been reassessed with the result being a release of £8.7m due to the expected future ongoing benefits of the cost reductions and efficiencies delivered in 2015.
Lincolnshire County Council
The Lincolnshire contract commenced in April 2014 with a transition phase expected to complete in March 2015 before full operational services were due to commence in April 2015. The contract is for an initial five year term, commencing April 2015, with a further two extension periods of two years each exercisable at the customer’s option.
The contract scope is to provide the following outsourced services: information management and technology services and support; back office services including finance, HR and payroll services; and customer services acting as the internal and external point of contact for Lincolnshire County Council and all Council services.
In 2015 the contract had difficulties implementing a new Enterprise Resource Planning (ERP) system and resolving these issues has been more complex and protracted than originally anticipated. While we are making good progress, the full implementation of the new system is not expected until later this year. The delay has impacted our ability to make the wider service transformation changes needed to make the contract more efficient and also led to operational service difficulties, triggering service credits. The issues have also resulted in the requirement to increase and maintain additional management and support resources on the contract to remediate the problems faced.
As a result of these factors a charge totalling £34.0m was taken in 2015, comprising a provision for future losses over the remaining term of the contract. In 2015 £5.3m of the provision was utilised against the impairment of assets. The in-year losses incurred on the contract, of £5.2m, were recorded within Underlying Trading Profit.
The OCPs referred to above account for 76% of the total OCP balance as at 31 December 2015. Other OCP movements in the year occurred across multiple sectors and geographies in which Serco operates and at 31 December 2015 there were no other OCPs that have expected cumulative future losses in excess of £15m. The other movements include additional charges made in the Americas in respect of revised expectations and contract exits, additional charges relating to our Hong Kong operations, a further provision on a UK Transport contract and new charges made in respect of a Justice and Immigration contract in AsPac.
Finance Review continued

Fina
ncia
l Sta
tem
ents
Dir
ecto
rs’ R
epo
rtSt
rate
gic
Rep
ort
Strategic Report 69·
Other Contract and Balance Sheet Review items
In addition to the net charge of £3.0m impacting non-exceptional OCPs, there were other adjustments arising in the period on items identified during the Contract and Balance Sheet Review. These adjustments relate to a number of items including:
• The releases of other provisions and accruals of £26.5m where liabilities have either been settled for less than the amount provided or accrued or have lapsed due to the passage of time.
• The release of allowances for bad debts of £8.5m following the receipt of payments in respect of old outstanding balances.
• Additional charges made in the year of £11.1m to increase provisions or settle further liabilities arising on items identified during the Contract and Balance Sheet Review.
The overall net improvement to Trading Profit from OCPs and other Contract and Balance Sheet Review adjustments was therefore £20.9m in the year.
Pensions
At 31 December 2015, the net retirement benefit asset included in the balance sheet arising from our defined benefit pension scheme obligations was £94.8m (2014: £101.1m). The pension scheme asset base is £1.3bn (2014: £1.5bn).
Defined Benefit Pension SchemesAs at 31 December
2015 £m
2014 £m
Group schemes – non contract specific 115.6 130.5
Contract specific schemes (including franchise adjustment) – (4.0)
Net retirement benefit asset 115.6 126.5
Retirement benefit assets 127.1 143.9
Retirement benefit obligations (11.5) (17.4)
Deferred tax liabilities (20.8) (25.4)
Net retirement benefit asset (after tax) 94.8 101.1
Key assumptions:
Discount rate 3.80% 3.60%
Inflation rate of increase in pensions in payment
2.0% CPI and 3.0%
RPI
2.0% CPI and 3.0%
RPI
Life expectancy (years)
Current pensioners at 65 – male 87.6 87.5
Current pensioners at 65 – female 90.1 90.0
Future pensioners at 65 – male 89.4 89.3
Future pensioners at 65 – female 92.1 92.0
The Group provides a number of occupational defined benefit and defined contribution schemes for its employees. The Group’s principal defined benefit pension scheme is the Serco Pension and Life Assurance Scheme (SPLAS) and this had a surplus of £127.1m (2014: £143.9m) calculated under IAS19 rules and is shown in the non-contract specific section of the above table.
Finance Review

Serco Group plc Annual Report and Accounts 201570
The decrease in the surplus was driven principally by a decrease in the value of Liability Driven Investment (LDI) assets in the year. Certain LDI assets were transferred to a separate gilt portfolio in late December to back the longevity swap and those gilts (£50m) still contribute to the Scheme’s overall interest rate and inflation protection but do not fall under the classification of LDI. Assets have also been disinvested to meet cashflow requirements (particularly member benefits) over the year.
Of the total net retirement benefit asset of £115.6m (2014: £130.5m), of that related to non-contract specific schemes there was a surplus of £127.1m (2014: £143.9m) in SPLAS, a deficit of £11.1m (2014: £13.1m) in the Serco Section of the Railways Pension Scheme and a deficit of £0.4m (2014: £0.3m) in a small German pension scheme.
The last formal actuarial valuation of SPLAS was undertaken as at 5 April 2012 and showed a deficit of £24m. The estimated actuarial deficit at 31 December 2015 was approximately £28m (2014: deficit £5m). The principal difference between the actuarial valuation and the IAS19 valuation relates to the use of a lower discount rate applied to measure the scheme liabilities for the actuarial basis. The main investments of this scheme are LDI assets that seek to reduce volatility by matching the liabilities of the scheme for changes in interest and inflation rates through a combination of gilts and corporate bonds with inflation and interest swap overlays.
In the period, Serco Caledonian Sleepers Ltd began to trade and the Serco Caledonian Sleeper Shared Cost Section of the Railways Scheme became part of the Group. As at 31 December 2015 there was a nil deficit on the Serco Caledonian Sleeper Shared Cost Section of the Railways Scheme contract after the franchise adjustment.
Pre-tax ROIC
Pre-tax ROIC is calculated as Trading Profit divided by the Invested Capital balance. Invested Capital represents the assets and liabilities considered to be deployed in delivering the trading performance of the business. Of the total assets on the balance sheet, Invested Capital assets are: goodwill and other intangible assets; property, plant and equipment; interests in joint ventures; trade and other receivables; inventories; and assets classified as held for sale. All other assets are excluded from Invested Capital, being: retirement benefit assets; tax assets; derivative financial instruments; and cash and cash equivalents. Of the total liabilities on the balance sheet, Invested Capital liabilities are trade and other payables and liabilities classified as held for sale. All other liabilities are excluded from Invested Capital being: retirement benefit obligations; tax liabilities; provisions; obligations under finance leases; derivative financial instruments; and loans.
In 2015 Invested Capital is calculated using the two-point average of the opening and closing balance sheets for the year. For 2014 a single point was utilised due to the significant reduction in net assets during the year.
For 2015 the return from Underlying Trading Profit was 11.1%. The composition of Invested Capital and calculation of ROIC is summarised in the table below.
Finance Review continued

Fina
ncia
l Sta
tem
ents
Dir
ecto
rs’ R
epo
rtSt
rate
gic
Rep
ort
Strategic Report 71·
Invested Capital and Pre-tax ROIC %
As at 31 December 2015
£m2014 £m
Non-current assets
Goodwill 509.9 541.5
Other intangible assets 89.8 118.8
Property, plant and equipment 73.2 38.4
Interest in joint ventures 13.8 1.6
Trade and other receivables 50.2 38.1
736.9 738.4
Current assets
Inventory 26.4 31.2
Trade and other receivables 519.7 498.8
Assets classified as held for sale 39.8 564.7
585.9 1,094.7
Total invested capital assets 1,322.8 1,833.1
Current liabilities
Trade and other payables (548.8) (581.9)
Assets classified as held for sale (32.5) (219.9)
Non-current liabilities
Trade and other payables (18.3) (29.7)
Total invested capital liabilities (599.6) (831.5)
Invested capital 723.2 1,001.6
Trading profit / (loss) 137.6 (632.1)
ROIC % 16.0% N/a
Underlying Trading Profit 96.0 113.2
ROIC % 11.1% 11.3%
Profit Forecast
On 11 March 2015, we issued profit forecast guidance based on a number of forecasting assumptions that were published in the Group’s Rights Issue Prospectus. Our Trading Profit results for the year, prepared on a comparable basis to the profit forecast assumptions, are consistent with our reported Underlying Trading Profit of £96m. Hence, our results for the year are broadly in line with the published Trading Profit forecast of around £90m.
Angus Cockburn Group Chief Financial Officer
25 February 2016
Finance Review
Serco Group plc Annual Report and Accounts 201572
Corporate Responsibility
First and foremost Serco will live by its values – Trust, Care, Innovation, Pride. They form the foundation for how we operate and how we recognise our responsibilities to our customers, the public, our employees, partners, suppliers, communities and the environment.
Being a responsible business means ensuring that we:
• comply with the law as well as meet the standards we have set for ourselves;
• deliver on our commitments and are open and transparent;
• engage and motivate our people, act safely and with respect for the environment and the communities we work in; and
• understand and minimise business risk and achieve appropriate financial returns.
By being responsible, we will support the communities we serve, strengthen our reputation and brand, enhance our financial performance and create sustainable value for our shareholders. Corporate responsibility (CR) is built into the way we operate through the Serco Management System (SMS). The SMS defines the rules that govern the way we behave, operate and deliver our strategy. It encompasses a set of Group-wide policies and standards, covering subjects ranging from business conduct and ethics including human rights, health, safety and the environment, and people to procurement and supply chain. Every employee completes training on understanding the principles of the SMS when they join Serco. This is supported by our Code of Conduct (codeofoconduct.serco.com), which applies to all employees from Board Directors to every member of frontline staff. Our Code defines what we are committed to do and the standards we expect.
Our Governing Principles define the behaviours we expect throughout Serco. Alongside the review of our strategy we have worked with employees to review them. The view was that they needed to be refreshed and simplified to ensure consistent understanding. The result is a set of values – Trust, Care, Innovation and Pride. While our Code of Conduct defines ‘what’ we expect, our values define the ‘how’, and with this the behaviours we expect from those who work for us. These will be rolled out in 2016 with supporting communications and tools to enable managers to have conversations with their teams
on what they mean, where they work. They will be embedded in key people processes such as our leadership model and performance development reviews. We will monitor this through our annual ‘Viewpoint’ employee engagement survey. They sit at the core of how we operate and how we manage CR, details of which and our performance in the year are summarised below.
Managing corporate responsibility
Our CR framework encompasses: our people; health and safety; communities; the environment; our marketplace, which covers our relationships with our customers, suppliers and other parties; and our commitment to ethics, human rights and business conduct.
The Board has ultimate responsibility for the Group’s business strategy, which encompasses our approach to CR. Rachel Lomax is the Board sponsor for CR and chairs the Corporate Responsibility and Risk Committee (CRRC). More information on the CRRC can be found on pages 116 and 117.
This Board Committee has oversight of our approach to CR and its governance, ethics, risk management, security, and health, safety and environment matters. This Committee met four times during 2015, receiving at each meeting formal progress reports on the elements making up our CR framework. The CRRC Chair reports after each meeting to the Board on the Committee’s activities, raising any specific issues for Board consideration and action.

Fina
ncia
l Sta
tem
ents
Dir
ecto
rs’ R
epo
rtSt
rate
gic
Rep
ort
Strategic Report 73· Corporate Responsibility
The Group Chief Executive Officer is a member of the CRRC, and is responsible for promoting the Group’s approach to CR and its effective implementation across the Group. This is agreed with the Executive Committee, which oversees its implementation.
Each CR element has a designated Group Lead responsible for engaging with divisional leads to develop an appropriate strategy, objectives and performance indicators, and monitor and report on performance to the Executive Committee and CRRC. Each divisional Executive Management Team, under the direction of the divisional Chief Executive, then develops specific plans to address the elements within the CR framework relevant to their business operations and strategy. Delivery of these and performance against agreed indicators are reported to the division’s Executive Management Team and provided to the designated Group Lead for review, consolidation and Group reporting.
Ensuring ethical standards
At the heart of being a responsible business is a commitment to doing the right thing. We have continued to develop ethical governance through the divisional Ethics Leads, who report to the relevant divisional Executive Management Teams. They are responsible for the development and implementation of the division’s ethics and compliance programme, managing our whistleblowing ‘Speak Up’ process and investigating and resolving issues raised.
The divisional Ethics Leads also form the core of the Ethics Oversight Group, which meets at least quarterly to review initiatives, issues and share best practice. This has included the implementation of an online gifts and hospitality register; completion of an ethics and compliance risk assessment to better identify risks across the divisions; completion of an independent review to assess how current compliance requirements are managed; development of improved processes for the effective due diligence of third parties; and development of a new question set for our ‘Viewpoint’ employee engagement survey to create a sub-index on culture within the main index, which was included in the 2015 survey.
Following an initial culture assessment in 2013, Navex Global were asked to complete a full follow up assessment in 2015 of our UK operations. Their findings were positive with many factors identified in their 2013 report having been addressed. This is best reflected by the fact that they found that 91% of line managers and supervisors, and 85% of all staff, either agreed or strongly agreed that Serco is committed to ethical business conduct. There remain areas where further improvement would be beneficial, and plans are being developed to address these.
We have continued our focus on training with ethical and compliance topics included within our ‘Serco essentials’ (mandated for all staff) and ‘Serco essentials plus’ (mandated for all managers
and leaders) training. This has included training for all staff on our Code of Conduct, data protection, equal opportunity and diversity, and in addition for managers and leaders topics including competition law, anti-bribery and corruption, anti-money laundering and export controls and trade compliance.
We continue to operate our ‘Speak-Up’ process which is supported by an online whistleblowing case management system provided by an independent third party provider. Awareness of Speak Up continues to increase with the results of our employee engagement survey ‘Viewpoint’ showing that 83% felt they had received the information they needed to understand Serco’s Code of Conduct (79% in 2014), and with 71% (70% in 2014) feeling they can report unethical conduct without fear (above the Aon benchmark average of 67%).
Of the Speak Up cases closed in 2015, 96% had been investigated. 63% of cases resulted in some corrective action being taken, typically relating to process improvements, 24% resulted in disciplinary action being taken against some / all of those involved, and a further 6% resulted in one or more employees being dismissed. 48% of the cases were closed within three months of the issue being raised.

Serco Group plc Annual Report and Accounts 201574
Corporate Responsibility continued
An example of how we have sought to manage corporate responsibility is given on page 117 in the CRRC Report in relation to the independent investigation that was launched following a report by Channel 4 News in March 2015. This included undercover recording of staff at the Yarl’s Wood Immigration Removal Centre, which is operated by Serco on behalf of the UK Government, making seemingly unacceptable and derogatory comments. A full copy of the independent investigation report, its recommendations and Serco’s response is available on www.serco.com.
People
We are trusted to deliver essential and life-enhancing services that our communities depend on. Delivering great service starts with our colleagues. We depend on their skills and commitment to deliver the services our customers expect. They contribute directly to our reputation and ability to grow.
We recognise the privileged role we are given, and that we must enable our people to deliver great service. We must also make it easy to manage our workforce with standard, simple and intuitive systems and processes:
• We want our leaders to be fit for the future, agile and adaptable, and clear on the behaviours and results expected of them.
• We want our colleagues to be highly engaged and passionate about service. We want them to share our values and a sense of personal responsibility for
delivering great customer outcomes, and to achieve them time after time.
• We want our workforce and people management practices to have an unrivalled reputation for effectiveness and efficiency.
Leadership
We are seeking to continually raise the bar for the quality and capability of our leadership cadre. In part this has been done through the selection of new leaders and helping to clarify – for new leaders and those who have remained with Serco – what the requirements are for leaders in Serco. This will be driven through a Leadership Academy and specifically a programme designed as a gateway into a broader, ongoing curriculum for leadership development in partnership with a leading business school. The first cohorts will commence in 2016.
We recognise the importance to the business of attracting and retaining leaders, and the potential risk if we don’t. We have therefore driven greater accountability and responsibility for ensuring the calibre of our leadership through our Talent and Succession processes in 2015.
In 2015, our Annual Talent and Succession Review was supplemented by quarterly reviews held between the Group Chief Operating Officer, Group Human Resources Director and Divisional Chief Executive Officers and Human Resources Directors, to ensure that actions committed to in the annual review are delivered and issues dealt with along the way.
In addition, there has been a greater focus on deeper dives into specific groups. Regular Talent and Succession Planning Boards were introduced in the UK Region across a number of Functional / Business areas. The Boards serve to identify potential emerging talent; identify succession challenges, opportunities and critical role and people risks; calibrate performance and potential ratings; generate draft succession plans; and agree actions and monitor progress.
Employee Engagement
We measure engagement through our ‘Viewpoint’ employee survey and drive improvement through our annual engagement roadmap.
Our engagement roadmap for 2015 was structured around quarterly focus areas targeting the key drivers of engagement, Group-wide, as per the 2014 results (connection to Serco, recognition, acting on employee feedback and use of employee knowledge, skills and abilities). Divisional activity to address these was additionally supported by the coordination of global best practice sharing and the provision of resources and communications.
In 2015, the survey was updated to integrate a series of questions regarding our working culture enabling greater focus on ethics, integrity, diversity and inclusion. As referred to earlier, a ‘culture’ index was added to the reporting configuration for the survey results, enabling automated reporting of employee engagement specifically regarding Serco ‘culture’.

Fina
ncia
l Sta
tem
ents
Dir
ecto
rs’ R
epo
rtSt
rate
gic
Rep
ort
Strategic Report 75· Corporate Responsibility
The 2015 Viewpoint Survey was successfully launched and completed in Q3 2015 with a strong participation rate (76% across the Group, 92% for leaders). The results showed a 2% improvement in employee engagement and 5% improvement in leadership engagement. We will continue to focus on our priority engagement drivers: connection to Serco, learning and development, acting on employee feedback and recognition, in seeking to improve engagement further.
Developing systems and processes
During 2015 we continued work to identify and analyse opportunities for enhancement of our HR system’s (MyHR) functionality and enhancements with additional services.
Our Learning Management System (LMS), fundamental to delivering essential compliance and behavioural training, and successfully implemented in the UK, went live across our businesses in the Middle East and AsPac.
Use of the LMS has been strong. From September 2014 to December 2015, the total number of users globally has increased from 250 (original pilot population) to 38,743. The total number of courses hosted on the system has increased from 12 to 495, and the total number of course completions to date is 219,361 (UK – 124,754; Middle East – 6,829; AsPac – 87,778).
Adoption of the LMS for business-specific training has been driven in AsPac, where capability to manage and report all training has been built for Serco Immigration Services (contributing approximately 100 courses to the catalogue), while the same capability has been established in the UK for Serco Marine (contributing approximately 250 courses to the catalogue).
Following the successful pilot for a new global recruitment solution at Fiona Stanley Hospital in Australia, the project to implement the system across our businesses in the UK, Middle East and Australia launched in Q3 2015. The implementation will be completed during 2016, including robust candidate tracking, talent pooling to create a searchable database of prospective candidates, and an extensive reporting and analytical capability.
These two implementation programmes continue our journey to globally consistent learning and recruitment solutions that will greatly improve our capabilities in those areas. Both integrate with our existing HR systems, driving further value. Although not initially in scope, both our North American and European businesses have been engaged with the intent to bring them into scope in future phasing.
Meanwhile, other new technology is being rolled out in our North American business and in the UK.
In the US, we have successfully completed the implementation of a new employee performance management system, enabling our 8,500 US employees and managers to align individual goals with company business objectives and improving delivery of our annual performance review process.
In the UK, we have begun to implement a new absence management solution to drive improvements in managing planned and unplanned absence. The system went live to 4,500 employees in December and deployment of the system across our UK organisation will continue through 2016.
Diversity
Serco is a diverse business. We seek to value difference and work to create an inclusive and fair environment for all. We seek to treat people fairly and equally, accept and embrace diversity and, as far as is reasonably possible, reflect the local communities in which we work.
Serco seeks to ensure equality, diversity, inclusion, and anti-discriminatory practice in the workplace and community, offers fair treatment in every aspect of working life, and fosters a positive climate of employee relations with the intention that all employees are treated with respect and dignity. We adopt equality-proofed policies and processes to promote equality in the workforce and monitor its diversity (where allowed to do so by law).

Serco Group plc Annual Report and Accounts 201576
According to our 2015 engagement survey, 76% of employees believe that Serco values diversity. This is up 1% from 2014. By comparison, the Aon global average external benchmark is 71%.
The ‘Inspiring Women in Serco’ network launched in 2015, sponsored by divisional Chief Executive, Liz Benison. Principal objectives for the network have been proposed and a ‘Chapter-led’ governance framework is being established. This complements an existing affinity group for women in management in our North American business. Currently there are three chapters at three different locations across the US meeting monthly. These groups will represent a network for our female talent across the business, focusing on communication, development and support while encouraging mentoring, relationship-building and the establishment of career role models. The learning from these groups is being shared with our other regions.
The gender breakdown of our workforce is shown in the table below.
Human Rights
We clearly state in our Code of Conduct Serco’s commitment to the protection of human rights. Specifically, our Business Conduct
and Ethics policy and Group standard require us to respect the United Nations Declaration of Human Rights and the United Nations Guiding Principles on Business and Human Rights, and to comply with the national laws of the jurisdictions in which we operate. This includes recognising our obligations under the recently enacted UK Modern Slavery Act 2015.
We recognise that we can be a force for good and will consider operating in countries where there are known risks of potential human rights issues, provided we have an approach which we believe can be used to improve others respect for human rights.
We will not knowingly be connected to any direct breach of human rights and will seek to take corrective action if there are any breaches. We are committed to avoiding complicity in adverse human rights impacts or otherwise contributing to them, and where it is discovered that there is such complicity or a contribution we will take necessary steps to cease or prevent such contribution or use our leverage to mitigate any remaining impact to the greatest extent possible.
We use a Human Rights Decision Making Tree as a tool for evaluating the human rights impacts of the contracts we
bid for and stimulating thinking around how any adverse impacts can be avoided or mitigated. If a human rights issue is uncovered, the issue will be reviewed by the divisional Executive Management Team for appropriate action and if significant and has an implication across the Group, or represents a significant reputational risk to the Group or clarification is needed on the Company’s position, the issue may be raised to the Executive Committee for final decision.
The Investment Committee provides governance for large or high risk bids, rebids, acquisitions, disposals and strategic investments that are outside the delegated approval authority of the divisions. Included within this is determining Serco’s position in relation to new geographic markets, opportunities or activities. Where those activities have been identified as presenting an ethical dilemma which presents a significant reputational risk across the Group, such activities will be considered by the Corporate Responsibility and Risk Committee on behalf of the Board and any material outcome reported or raised to the Board.
Human rights considerations are included as part of risk management. In addition to this, during 2015 each division completed an ethics, compliance and human rights risk assessment
At 31 December 2015, the numbers of men and women employed by Serco were as follows:
Number Percentage
Male Female Male Female
Directors 7 3 70% 30%
Senior Managers 73 13 85% 15%
Employees 64,084 39,047 62% 38%
At 31 December 2015, we had 105,999 employees, of which we had gender information on 103,131. (Source: Serco global HR systems, figures provided on a total headcount basis; includes BPO).
Corporate Responsibility continued

Fina
ncia
l Sta
tem
ents
Dir
ecto
rs’ R
epo
rtSt
rate
gic
Rep
ort
Strategic Report 77·
which included for example, the risk of slavery and human trafficking taking place in our business and in our supply chain.
During 2016, we will continue to monitor the outcomes of our third party due diligence and review business practices in identified risk areas.
In 2016 we will be reviewing training in regards to the protection of human rights and prevention of slavery and human trafficking in particular. We will also review how we engage with our suppliers and joint venture and strategic partners on these issues.
MarketplaceCustomers
Our principal customers are national and local governments. We have more than 50 years’ experience of helping them to achieve their goals. By focusing on the needs of the people they serve, we enable our customers to deliver better outcomes. Our front line delivery involves us in vital areas of public life, including providing safe transport, finding sustainable jobs for the long-term unemployed, helping patients recover more quickly, improving the local environment, rehabilitating offenders, protecting borders and supporting the armed forces.
Our reputation with our existing customers is vital to our success and to our prospects of future growth. Many factors influence our reputation, including the quality of the services we provide, how we deliver our commitments and how we engage with our customers and other stakeholders, such as the local communities. Developing and improving the relationships we
have with our customers is central to us sustaining and growing our business. This is about living the values we stand by – Trust, Care, Innovation, Pride.
We continue to maintain relationships at all levels with our customers, so they are aware of how we can help them and we can anticipate their changing needs. These relationships lie with our divisional and Group leaders.
We have strengthened how we capture contractual obligations to ensure we are delivering on our commitments; we have improved operational performance reporting and review, both with our customers and internally; and looked at how we can strengthen and better manage customer relationships. These help us to ensure we can better identify and respond promptly to their concerns and confirm we are meeting commitments and expectations. We continue to place customer satisfaction at the core of our management reporting and incentive structures so we are fully focused on ensuring our customers receive the high quality services they deserve from us.
Suppliers
Our approach to procurement has four main strands: to make the most of the benefits of competitive supplier selection; to optimise the efficiency and effectiveness of our processes and resources; to drive sustainability throughout our supply chain; and to develop positive relationships with our suppliers. Our approach takes regulatory, statutory, ethical and sustainable factors into consideration when making decisions on the purchase of
goods and the commissioning of services. We aim to be professional in all our dealings with suppliers and those we work with.
We have a Procurement and Supply Chain function to ensure consistent procurement processes are applied in selecting and using suppliers; to manage the risk through appropriate procurement strategies and supplier selection criteria, ensuring that sourcing initiatives are fair and ethical to both Serco and the participating suppliers; and to ensure compliance with laws and regulations, our ethical standards, code of conduct and human rights throughout our supply chain.
The relationship between Serco and its suppliers is an important component to achieving high performance in our business. In selecting suppliers, Serco works hard to choose reputable business partners who are committed to ethical standards and business practices compatible with those of Serco. We continue to enhance our systems and processes for choosing and managing our suppliers.
Our approach to sustainable ethical procurement is included in our Procurement and Supply Chain Group Standard. It sets out the detailed requirements and minimum expectations of our policy of sustainable and ethical procurement. Specifically, it addresses the expectation that our staff and suppliers have a natural respect for our ethical standards in the context of their own particular culture and that relationships with our suppliers are based on the principle of fair and honest dealings at all times.
Corporate Responsibility

Serco Group plc Annual Report and Accounts 201578
Our Serco Supplier Code of Conduct, which supplements our Serco Code of Conduct, applies to all suppliers of Serco, including all of the Serco suppliers’ facilities. It formalises Serco’s practices and makes clear that, recognising differences in cultures and legal requirements, we expect that wherever our suppliers are located, producing products for us or delivering services for us, that they are produced and / or provided in a manner compatible with the high standards that contribute to the reputation of Serco.
Joint venture partners
Serco is involved in a number of joint ventures with commercial partners and customers. Strong relationships, based on mutual trust and respect and clarity of roles, are essential ingredients if a joint venture is to deliver excellent customer service.
Our divisional management teams are responsible for relationships with our joint venture partners, supported by members of the Executive Committee and Board as appropriate. This includes holding regular strategy and review meetings with our partners.
As with our suppliers, we continue to enhance the systems and processes to seek to ensure that our joint venture partners meet the standards we have set ourselves in our policies and through our values.
Strategic partners
We often deliver services as part of a consortium, either as prime contractor or as a subcontractor. This allows us to bring together companies with the skills to meet the precise requirements of a
bid. This includes working with voluntary sector organisations, which often lack the scale and experience to access major government programmes. Responsibility for relationships with our strategic partners lies with the relevant contract and divisional management.
Community
Our communities are primarily the people who live and work around our contracts, but our definition extends to include the third-sector organisations we partner with to deliver a number of our contracts.
We encourage our employees to volunteer their time to local projects. This not only benefits the community and builds the reputation of both Serco and our customers, but it also has a positive impact on the personal development of the volunteers. Working with communities contributes directly to our business success. It helps to enhance our reputation and build trust with our customers and the public, by demonstrating that Serco is a values-led organisation. It also helps us better understand community needs and to operate existing contracts successfully, particularly where we are delivering services directly to the public.
Our community activities are as diverse as our business, and we manage them at a local level. In 2015 they included support for: the Nepal earthquake disaster relief; heart research; cancer care; Royal Flying Doctor Services; schools and universities; rural communities; the elderly; and sport and community groups.
We believe it is important to recognise and celebrate exceptional achievements by our employees, including those made to the communities in which we live and work. The Serco Pulse Awards (which has categories in relation to community, operational excellence, heart and people)recognise people at every level and from every part of the company whose behaviours are making a difference, and providing role models that help shape our businesses in the future. In 2015, 14 divisional pulse community awards have been recognised of which six received a Global Pulse Community Award.
Serco Foundation
During 2015, the Serco Foundation Trustees developed a three-year strategy with a vision of being a pioneer in applying service business know-how to help charities deliver better outcomes for society. This will be delivered by supporting charities seeking improved performance, by giving access to Serco people, methodology and experience. In line with this, in February 2015 Serco and a global charity signed a collaborative agreement which enabled us to provide direct support to a project looking at the implementation of their routine immunisation supply chain strategy in India. The overall objective of this is to reduce the mortality rate in children under five.
We deployed two experienced members of our staff who, over a six-month period, worked with the supply chain strategy implementation partners in cold chain and vaccine logistics management to:
Corporate Responsibility continued

Fina
ncia
l Sta
tem
ents
Dir
ecto
rs’ R
epo
rtSt
rate
gic
Rep
ort
Strategic Report 79·
1. Develop a procurement manual for use by buying agencies across the supply chain and introducing a stronger governance, forecasting and performance management framework
2. Redesign the National Cold Chain Vaccine Logistics Action Plan, to prioritise and maximise its efficiency and effectiveness.
3. Introduce international best practice to cold chain equipment maintenance practices and provide a performance measurement framework with a focus on achieving service outcomes
Overall, when the outcomes of their work have been implemented, it is estimated that it will enable an additional 500,000 children to be fully immunised every year.
Health and safety
Our aspiration is zero harm. Nothing is so urgent or important that we cannot do it safely. A strong health and safety performance seeks to ensure the safety of our people and protects our reputation. Wherever they work and whatever their role, our people must adhere to stringent health and safety procedures. These procedures are embedded in the SMS and are the minimum standards that apply. A core element of this is understanding the safety risks we face as a business. During 2015 a review of the potential risks that could lead to a significant safety event were
re-assessed along with associated controls. We operate in a number of heavily regulated, safety-critical areas, which place stringent requirements upon us. We seek to have the systems in place to deliver these requirements, as reflected in the regulatory approvals and licences we operate under. This also means that we have regular regulatory oversight. Together, these factors give us a strong controls framework for managing our HSE responsibilities.
We have also reviewed and revised our health, safety and environment strategy for the next three years. We recognise that until we meet our aspiration of zero harm there will always be more we can do to improve our processes and management systems, reinforce leadership and commitment and train and develop the health and safety capabilities of our people. We have developed some strategic objectives and set ourselves targets to track our progress. These cover:
• a drive to improve and focus on safety culture to increase leader and employee engagement, which we will measure through the ‘Viewpoint’ employee engagement survey
• to raise visibility and apply a consistent approach to the management and reporting of third party incidents, particularly in regard to contractors;
• to review and improve consistency in approach to how incidents are managed and
reported with specific emphasis on lessons learnt and the sharing of these across the organisation
• to drive improvement and focus on environmental issues and management to support delivery of the Group’s environmental target.
We monitor and have objectives around a number of performance indicators including lost time incidents, physical assaults and major reportable incidents. In 2015 we reviewed and restated our safety performance indicator definitions which are recorded on our safety management system ‘Assure’. As a result of this and other system enhancements, we noted a number of anomalies in 2014 data which led to a full review of historical data. This identified a number of incidents which had been reported late and a number reclassified when the revised definitions were applied. We have therefore adjusted our 2014 data to reflect this along with resetting 2015 targets based on the revised 2014 baseline.
Reflecting the various safety risk profiles, we track our performance data for frontline operations separately from our BPO business which, whilst having a significant number of staff, is a low safety risk. This brings our safety KPI rates down. Given the offshore private sector BPO sale we will be basing our targets on the 2015 frontline baseline rather than the Group baseline, as this better reflects the risk profile of the Group moving forward.
Corporate Responsibility

Serco Group plc Annual Report and Accounts 201580
Overall performance across our main KPIs has seen a deterioration in performance against 2014. This has been driven by an increase (24%) in numbers of physical assaults which typically results in lost time and the more serious assaults in major reportable incidents. This predominantly relates to our custodial / immigration operations in the UK and AsPac. This is not just a Serco issue but an industry issue and is one we take extremely seriously. For example, in the UK the National Offender Management Service (NOMS) reports that over the last two years there has been just under a 50% increase in serious physical assaults.
During 2015 we completed a detailed review of the risks, controls and initiatives being undertaken in the UK and AsPac to better understand and manage the risks driving physical assaults. There is significant work being undertaken and a range of initiatives being implemented, however the environment continues to evolve and this will remain a significant area of management attention and continue to impact our broader safety KPIs.
We tragically had two employee fatalities in 2015. One was a call centre operative who was killed in a road traffic accident in India and the second in the UK when a Prison Custody Officer received fatal injuries during a physical assault. Such incidents are fully investigated and where
appropriate actions taken and learnings shared across the Company.
Lost time incidents
Lost time incidents (LTIs) relate to any work related occurrences incurring one full lost working day or more and provide a general overview of safety performance. The number of LTIs are normalised per 100,000 FTE to give the Lost Time Incident Rate (LTIR). In 2015 we saw a 10% increase in the number of LTIs compared to 2014. This has impacted our LTIR by 11%. This increase has mainly been driven by increases in physical assaults.
At 630 our LTIR is above our target for 2015 of 548. For just frontline staff, the last four quarter rate of 1,139 is also above our target of 981. The majority of physical assaults relate to our custodial / immigration operations. When these are removed slips / trips / falls and manual handling continue to be the highest contributors to LTIs with the underlying LTIR for the last four quarters for the Group at 346 and frontline operations at 673. This shows an underlying good safety performance across the business. Our target for 2016 is for a 5% reduction in our LTIR based on 2015 frontline baseline at 1,139 (2016 target 1,082).
Physical assaults
Physical assaults continue to be an area of significant management attention as we have seen across our custodial and immigration operations in both the UK and
AsPac an increase in the numbers of physical assaults reported. To better understand this, in 2015 we completed a reassessment of the risk factors that are impacting our operations and the industry as a whole. These include: increasing issues around new psychoactive substances, often referred to as ‘legal highs’; increasing gang-related violence; ethnicity, cultural mix and changing populations; consequence management; and the processing pathway for immigrants. Recognising this evolving risk profile we continue to drive a number of initiatives. These include five minute interventions to better manage initial contact; body worn cameras, placement strategy and heat map assessments. We work closely with our customers on this issue, for example in the UK we are active participants in the National Offender Management Service Violence Reduction Project.
As part of this review we have evolved our reporting to cover all physical assaults, as in previous years, but also now monitor those defined as serious physical assaults, i.e. those that result in physical injuries requiring medical treatment involving overnight hospitalisation in a medical facility or ongoing medical treatment.
For 2015 our physical assault rate at 689 (per 100,000 FTE) has increased by 25% against 2014, with 93% of all physical assaults coming from within our custodial and immigration operations. This falls short of our target (533) by 29%.
Corporate Responsibility continued

Fina
ncia
l Sta
tem
ents
Dir
ecto
rs’ R
epo
rtSt
rate
gic
Rep
ort
Strategic Report 81·
When just frontline performance is considered we still see a deterioration against 2014 of 26% in our rate and fall short by 30% against target (979). This reflects an erratic performance over the last five years which is reflective of the changing risk profile.
Within this the more ‘serious’ assaults make up 17% of all assaults. Our serious physical assault rate at 118 for 2015 is a 36% increase against 2014 (87). For 2016 our objective is for a 5% reduction in the 2015 serious physical assault rate at 218 based on 2015 frontline operations baseline (2016 target 207).
Major reportable incidents
Of the 581 LTIs reported in 2015, 53 (9%) were classified as ‘major’ incidents. This compares to 35 reported in 2014. The increase reflects the increase in serious physical assaults. Major Reportable Incidents (MRI) are classed as fatalities, fractures, amputations, dislocations, loss of sight, chemical and hot metal burns, electrical burns, unconsciousness caused by asphyxia or exposure to a harmful substance and acute illness resulting from substance inhalation or ingestion.
We normalise MRIs using the same base (100,000 FTE) as LTIs to produce a Major Reportable Incident Rate (MRIR). The MRIR for 2015 at 57.7 is a 54% increase against 2014 (37.5) and is above the target we set ourselves at the beginning of the year (30).
In regard to our frontline operations our MRIR is 95.9. As with the LTIs the principal contributors are those business units providing custodial or immigration services and specifically relating to either physical assaults on staff or injuries incurred during control and restraints, often intervening in violent incidents between prisoners. When these operations are removed the MRIR comes down to 31.2 which is just above our target of 30. Frontline operations excluding custodial /immigration operations MRIR is 51 which brings us closer to but still falls short of our target of 40. All MRIs are investigated and where identified corrective actions taken and lessons learned shared across the Company. Our target for 2016 is to achieve a MRIR for frontline operations of 91.
Environment
Serco’s aspiration for zero harm applies as much to the environment as it does to health and safety. It makes good business sense to protect our reputation and reduce our energy consumption and environmental impact.
Across more than two thirds of our business, we are working on our customers’ premises and are therefore not in direct control of the environment in which we operate. That is why collaborative working with our customers on environmental issues is important. Serco recognises its responsibility to ensure that any adverse impact
on the environment is reduced, or where possible, eliminated by applying the most appropriate management systems at contract level – whether designed by our customers or by us.
Serco’s activities are typically managed at a local level which means there are a wide range of initiatives in operation around the world. For example, in Americas in Arkansas we upgraded external lighting at our CMS contract and also completed environmental assessments at our fleet business unit facilities; in the Middle East our Dubai Metro operation received a Waste Management Award for a mobile phone recycling campaign; in our custodial estate in the UK we upgraded boiler and zone controls at Kilmarnock and upgraded building management systems at Dovegate, Lowdham Grange and Ashfield.
Where we are not in control of the working environment, we support our customers in applying their own environmental management systems and objectives.
Where environmental initiatives have been identified, specific indicators relevant to the project are agreed so that delivery and where possible impact can be assessed. This is monitored within the relevant division and managed locally to ensure appropriate ownership and sustainability of projects.
Corporate Responsibility

Serco Group plc Annual Report and Accounts 201582
In 2015 the introduction in the UK of the Energy Saving Opportunity Scheme (ESOS) regulations required Serco to present to the Executive Committee costed energy reduction initiatives for a representative section of the business. Examples are rainwater harvesting systems; variable speed pumps to boiler rooms; and early upgrades to dated heating plants.
In 2015 Serco again responded to the Carbon Disclosure Project FTSE 350 (CDP) request for information, achieving an improved score of 99% compared to 97% in 2014, retaining us in the Carbon Disclosure Leadership Index.
Greenhouse gas emissions
Our reporting year for greenhouse gas emissions is one quarter behind our financial year, namely 1 October 2014 to 30 September 2015. We report our emissions data using an operational control approach to defining our organisational boundary. This follows the greenhouse gas protocol and defines how we meet the Regulations’ requirements in respect of the emissions we are responsible for.
Serco quantifies and reports to ISO 14064-1 2012. We have used the Department for Environment, Food and Rural Affairs (DEFRA) 2015 conversion factors within our reporting methodology. We have also opted to use operational control as the consolidation approach, due to the nature of
our business, with employees who are often on customer sites where no operational control is possible. As this approach is inconsistent with the financial statements, we have described the classification of reporting boundaries in detail in our Basis of Reporting 2015 document, which is available on our website, www.serco.com.
We report all material emission sources for which we consider ourselves responsible and have set our materiality threshold at 5%. These sources align with where we consider we have operational control. The emissions that have not been included in this year’s report relate to refrigerant gases from air conditioning and refrigeration outside the UK. After analysis, we believe these emissions are immaterial.
We do not have responsibility for any emission sources that are beyond our operational control, for example, business travel other than by our own transport, and therefore do not report them here. Scope 3 emissions can be found in our annual Carbon Disclosure Project FTSE 350 submission.
In 2015 we achieved an overall materiality level of less than 5%, although not all divisions achieved it. Our objective for 2016 is for all divisions to achieve a materiality threshold of at least 5% for greenhouse gas emissions reporting.
In some cases, we have estimated emissions based on similar Serco facilities. This is done, for example, where our staff work in leased premises but have no access to actual consumption figures. In other cases, we have extrapolated total emissions by using available information from part of the reporting period and extending it to apply to the full reporting year. This occurs for the rare occasions where gaps are identified in our data.
The sum of all estimated emissions is below 5% of our global emissions, so we consider the potential for error to be immaterial.
In 2015 the total carbon dioxide equivalent (CO2e) was 226,008 tonnes. This compares favourably to last year’s emissions which were 368,012 of CO2e and represents a 38% reduction over last year. This is due to changes in contributing contracts such as the removal of energy associated with the operation of Docklands Light Railway (December 2014) as well as reduced UK gas consumption as a result of mild weather and the impact of initiatives taken. Figure 1 provides a breakdown of 2015 emissions by type. Figure 2 provides a comparison of 2015 and 2014 Global Scope 1 and 2 emissions.
Corporate Responsibility continued
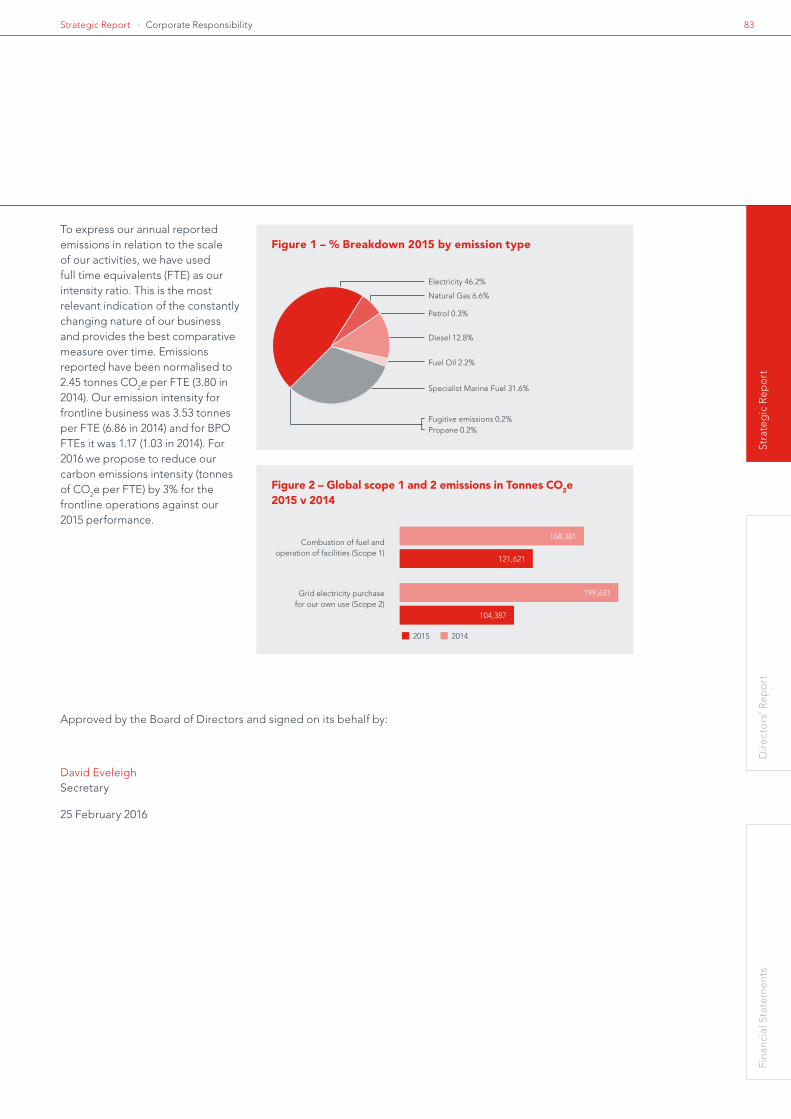
Fina
ncia
l Sta
tem
ents
Dir
ecto
rs’ R
epo
rtSt
rate
gic
Rep
ort
Strategic Report 83·
To express our annual reported emissions in relation to the scale of our activities, we have used full time equivalents (FTE) as our intensity ratio. This is the most relevant indication of the constantly changing nature of our business and provides the best comparative measure over time. Emissions reported have been normalised to 2.45 tonnes CO2e per FTE (3.80 in 2014). Our emission intensity for frontline business was 3.53 tonnes per FTE (6.86 in 2014) and for BPO FTEs it was 1.17 (1.03 in 2014). For 2016 we propose to reduce our carbon emissions intensity (tonnes of CO2e per FTE) by 3% for the frontline operations against our 2015 performance.
Specialist Marine Fuel 31.6%
Figure 1 – % Breakdown 2015 by emission type
Figure 2 – Global scope 1 and 2 emissions in Tonnes CO2e 2015 v 2014
Electricity 46.2%
Combustion of fuel and operation of facilities (Scope 1)
Grid electricity purchase for our own use (Scope 2)
Natural Gas 6.6%
Petrol 0.3%
Diesel 12.8%
Fuel Oil 2.2%
Fugitive emissions 0.2%Propane 0.2%
168,381
104,387
199,631
121,621
20142015
Corporate Responsibility
Approved by the Board of Directors and signed on its behalf by:
David Eveleigh Secretary
25 February 2016

Serco Group plc Annual Report and Accounts 201584
Directors' Report
85 Corporate Governance Report
85 Chairman's governance overview
87 Our governance framework
88 Leadership
88 Meet the Board
92 How the Board operates
94 Effectiveness
94 The work of the Board
94 Board effectiveness
97 Accountability
97 Managing business risks and internal control
101 Financial reporting process
101 Business conduct
102 Going concern
102 Engaging with shareholders
104 Audit Committee Report
114 Nomination Committee Report
116 Corporate Responsibility and Risk Committee Report
118 Board Oversight Committee Report
120 Remuneration Report
144 Directors' Report
151 Directors' Responsibilities Statement

Fina
ncia
l Sta
tem
ents
Dir
ecto
rs’ R
epo
rtSt
rate
gic
Rep
ort
Directors’ Report · 85
I strongly believe that high standards of corporate governance, integrity and business ethics are key to underpinning the success of all businesses and they protect the best interests of our customers, employees, shareholders and the societies and communities in which we work.
Chairman’s governance overviewDear Shareholder
This is my first Corporate Governance Report to you since I joined as Chairman. I strongly believe that high standards of corporate governance, integrity and business ethics are key to underpinning the success of all businesses and they protect the best interests of our customers, employees, shareholders, and the societies and communities in which we work. Other than my own appointment as Chairman, there were no other changes to the Board in 2015. The strength and depth of experience of the current Board and their commitment to the highest standards of governance mean that we believe we are well placed to further improve Serco's performance in the coming years.
Since joining the business, I have visited a number of operations in the UK and overseas and I have met a large number of people that want to do the right thing in the right way. That demonstrates to me that at its core, Serco wants to operate as a well governed organisation. I also see
what good actions have been taken and what progress is being made. Alastair Lyons reported last year that 2014 saw the implementation of a comprehensive programme of corporate renewal to deliver stronger, more effective governance, organisational change and operational resilience across the Group. Recognising the importance of the successful implementation of the Corporate Renewal Programme, in 2015 the Group continued to drive the embedding across the Group of the actions, systems and processes which form the Programme. Whilst I recognise that it will take time to fully embed all of the changes, significant inroads have been, and continue to be, made. In order to ensure that there remains strong oversight and focus on embedding these actions, the Board Oversight Committee will continue to closely monitor this. In my report as Chairman of that Committee on pages 118 and 119, I go into more detail on the activities of embedding corporate renewal, which I encourage you to read.
Sir Roy Gardner Chairman
Corporate Governance Report
Corporate Governance Report
Serco Group plc Annual Report and Accounts 201586
Compliance with the UK Corporate Governance Code
Throughout the financial year ended 31 December 2015, Serco Group plc complied fully with all relevant provisions of the UK Corporate Governance Code with the exception of B.6 which states that the Board should undertake a formal annual evaluation of Board performance. As explained in the Chairman’s governance review above, an externally-facilitated evaluation was conducted in early 2015 in respect of the year ended 31 December 2014 and an internal evaluation of Board effectiveness will take place during the summer of 2016 when the Chairman has been in post for a full year. A performance evaluation of the Chairman, led by the Non-Executive Directors, will also be included in the summer 2016 Board evaluation exercise. The Code can be found on the Financial Reporting Council’s website at frc.org.uk.
Chairman’s governance overview continued
The Board has reviewed the terms of reference of the different Board committees in order to ensure that the division of responsibilities and the terms of reference for each committee are properly aligned. As a result of that review, the Corporate Responsibility and Risk Committee (CRRC) will be renamed the Risk Committee following the AGM in May. The membership of the Risk Committee will be amended to ensure that all aspects of risk can be given full and proper consideration. The Heads of Risk and Internal Audit will also be invited to attend all Risk Committee meetings to ensure that there is full awareness of discussions across both functions. During the year under review, the Group has put a lot of emphasis on risk management and it felt appropriate that the Risk Committee be given additional time to ensure that risk management receives an appropriate level of attention at Board level. The Board recognises the importance of corporate responsibility matters and the relevant areas of responsibility have been picked up by either the Board, for example in relation to Health and Safety, or the Board Oversight Committee in relation to ethical and other corporate responsibility matters in addition to its existing responsibilities. As a result I feel it is appropriate to reflect this broadening of responsibilities and change its name from the Board Oversight Committee to the Corporate Responsibility Committee and increase its membership. Further information can be found in the individual Committee reports.
An independent external evaluation of the Board, its Committees and individual Directors was carried out in early 2015 in respect of the year ended 31 December 2014. The results were discussed by the Board and the outcomes were made available to me on appointment. This provided useful information following the significant changes to the Board during 2014. With my becoming Chairman in July, half way through the year, I felt that there would be limited value in carrying out another evaluation during 2015. However, I recognise the importance of continual and constructive evaluation of the Board's performance, and an internally facilitated evaluation of Board effectiveness will be conducted in the summer of 2016.
This report sets out the Company’s governance policies and practices and includes details of how the Company applies the principles of the UK Corporate Governance Code (the Code). In the following pages, we illustrate how our governance arrangements work in practice, focusing on the key elements of the Board’s role: leadership, effectiveness, accountability and engaging with shareholders.
Sir Roy Gardner Chairman
25 February 2016
Corporate Governance Report continued

Fina
ncia
l Sta
tem
ents
Dir
ecto
rs’ R
epo
rtSt
rate
gic
Rep
ort
Directors’ Report · 87
Governance in action
The raising of capital via a Rights Issue and the refinancing of our debt facilities was a significant event in 2015, requiring robust governance and oversight by the Board. A significant time commitment was required to collectively evaluate the potential options presented by management and a number of Board and Committee meetings were held over a short period of time. In reaching its decision on the best course of action and satisfying itself to the best of its knowledge and belief as to the adequacy of disclosures, the Board sought the views and detailed guidance of professional advisers and carefully considered the impact on the business model and strategy, customers and shareholders. In addition to the formal Board meetings, the Chairman worked closely with the management team responsible for execution of the project and ensured that other Board members were kept informed of progress.
Our governance frameworkThe Serco business is complex and our governance framework continuously evolves to ensure that business decisions and activities and any associated risks are carefully controlled and monitored. The Serco Management System (SMS) is a comprehensive system including policies and processes that gives clarity of roles and responsibilities, governance and reporting across the business.
The role of the Board
The Board is responsible to shareholders for creating and delivering sustainable shareholder value through the management of the Group’s businesses. The Board determines the strategic objectives and policies of the Group to deliver long-term value, providing overall
strategic direction within a framework of risk appetite and controls. The Board’s aim is to ensure that management strikes an appropriate balance between promoting long-term growth and delivering short-term objectives.
The Board is responsible for demonstrating ethical leadership and promoting the Company’s values, culture and behaviours, and for acting in a way that promotes the success of the Company for the benefit of the shareholders as a whole.
The Board is also responsible for ensuring that management maintains systems of internal control that provide assurance of effective and efficient operations, internal financial controls and compliance with law and regulations. In addition, the Board is responsible for ensuring that management maintains an effective risk management and oversight process at the highest level across the Group. In carrying out these responsibilities, the Board must have regard to what is appropriate for the Group’s business and reputation, the materiality of the financial and other risks inherent in the business and the relative costs and benefits of implementing specific controls. The Board is also responsible for deciding other matters of significance to the Group as a whole because of their strategic, financial or reputational implications or consequences.
Specific key decisions and matters have been reserved for approval by the Board. These include decisions on the Group’s strategy, approval of risk appetite, capital and liquidity matters, major bids, acquisitions, mergers or disposals, Board membership, financial results and governance issues including the corporate governance framework.
Board gender diversity
Board tenure
• Male 7
• Female 3
• < One year 1
• Between one and three years 7
• > Three years 2
Leadership
Corporate Governance Report

Serco Group plc Annual Report and Accounts 201588
Leadership – Meet the Board
Sir Roy Gardner (70) Chairman
Rupert Soames OBE (56) Group Chief Executive Officer
Angus Cockburn (52) Group Chief Financial Officer
Edward J Casey, Jr (57) Group Chief Operating Officer
Mike Clasper CBE (62) Non-Executive Director
Appointment
Sir Roy was appointed a Non-Executive Director of Serco Group plc on 1 June 2015, becoming Chairman on 1 July 2015.
Appointment
Rupert joined Serco as Group Chief Executive Officer in May 2014.
Appointment:
Angus joined Serco in October 2014 as Group Chief Financial Officer.
Appointment:
Ed was appointed Group Chief Operating Officer in May 2014 after serving as Acting Group Chief Executive Officer following his appointment to the Board in October 2013.
Appointment:
Mike joined Serco as a Non-Executive Director in March 2014 and is Senior Independent Director.
Responsibilities:
Sir Roy is responsible for the effective operation of the Board and oversight of corporate governance. He is Chair of the Nomination and Board Oversight Committees and a member of the Remuneration and Corporate Responsibility and Risk Committees.
Responsibilities:
Rupert is responsible for the formation and implementation of the Group’s global strategy, as well as the day-to-day management of the business operations and our relationships with investors and other key stakeholders. He provides leadership to the Group and represents Serco to major customers, shareholders and industry organisations. Rupert is a member of the Nomination Committee, the Corporate Responsibility and Risk Committee, the Executive Committee and the Approvals and Allotment Committee.
Responsibilities:
Angus is responsible for the Group’s financial strategy and management, including reporting, forecasting, treasury and tax. He shares responsibility with the Group Chief Executive Officer for our relationship with shareholders and the City. Angus is a member of the Executive Committee and the Approvals and Allotment Committee.
Responsibilities:
Ed is responsible for the day-to-day operations of the Group, ensuring that the business is efficient and effective and that proper service to customers is conducted. He is a member of the Board Oversight Committee, the Executive Committee and the Approvals and Allotment Committee.
Responsibilities:
Mike is Senior Independent Director and a member of the Corporate Responsibility and Risk, Audit and Nomination Committees.
Experience:
Previously, Sir Roy was the Chairman of Compass Group PLC, Chief Executive of Centrica plc, Managing Director of GEC-Marconi Limited and a Director of GEC plc.
He has also been the Non-Executive Chairman of Manchester United plc, Plymouth Argyle Football Club and Connaught plc and a Non-Executive Director of Laporte plc.
Sir Roy is the Chairman of the Advisory Board of the Energy Futures Lab at Imperial College London and is the former Chairman of the Apprenticeship Ambassadors Network.
Sir Roy is a Fellow of the Chartered Association of Certified Accountants, the Royal Aeronautical Society, the Royal Society of Arts, the City & Guilds Institute and the Energy Institute.
Experience:
Prior to joining Serco, Rupert served for 11 years as the Chief Executive of Aggreko plc, the FTSE 100 temporary power business. During his tenure at Aggreko, the market capitalisation of the business increased from £450m to over £5bn. Prior to Aggreko, he was with the software company Misys plc for five years, latterly as Chief Executive of its Banking and Securities Division. He spent the first 16 years of his career at GEC plc; in the last four years of his service at GEC he was responsible for the UK, African and Asian operations of Avery-Berkel. He studied Politics, Philosophy and Economics at Oxford University and was President of the Oxford Union.
Experience:
Angus joined Serco from Aggreko plc, the FTSE 100 temporary power business, where he served 14 years as Chief Financial Officer and latterly, Interim Chief Executive. Angus brings corporate finance and accounting experience, gained across a variety of sectors whilst working for highly competitive global companies. During his tenure at Aggreko he drove through a programme of continuous improvement within the finance function.
Prior to Aggreko, Angus spent three years as Managing Director of Pringle of Scotland, a Division of Dawson International Plc; five years at PepsiCo Inc. in a number of senior finance positions, including Regional Finance Director for Central Europe; and several years at KPMG working in the UK and USA. Angus is an Honorary Professor at the University of Edinburgh.
Experience:Ed has been with the company since 2005. Previous to his role as Group Chief Operating Officer, Ed was Chief Executive Officer of Serco’s Americas Division. Under Ed’s leadership, the Americas business tripled in size and successfully integrated two acquisitions: RCI in 2006 and SI International in 2008.
Prior to Serco, Ed worked for nine years in the energy business, including President and Chief Executive Officer of NP Energy Inc., an energy marketing business he founded and later sold; President and Chief Operating Officer of Tenneco Energy until it was sold for $4bn; and as Group President and Chief Financial Officer for LG&E Energy Corp. Previously, Ed worked over ten years in investment banking and private equity, including with The Blackstone Group and Fremont Group LLC.
Experience:
Mike was previously the Group Chief Executive of BAA plc from 2003 to 2006 and Chairman of HMRC from 2008 to 2012. Mike was previously the Senior Independent Director at ITV PLC from which he stepped down on 31 December 2013 after eight years on the ITV Board. Mike has an MA in Engineering from St John’s College, Cambridge. In 1995 he was granted the title CBE, and received an Honorary Doctorate from Sunderland University.
External appointments:
Sir Roy is the Senior Independent Director at William Hill plc, and Chairman of Mainstream Renewable Power Ltd. He is also a Senior Adviser to Credit Suisse. Until January 2016, Sir Roy was a Non-Executive Director of Willis Group Holdings Limited.
External appointments:
Rupert is Senior Independent Director of Electrocomponents plc and a member of its Remuneration, Nomination and Audit Committees.
External appointments:
Angus is an experienced Non-Executive Director and is currently serving on the Board of GKN plc where he is a member of the Audit, Remuneration and Nomination Committees.
External appointments:
Ed is a Director of Talen Energy Corporation where he is a member of the Audit Committee and the Compensation, Governance and Nominating Committee.
External appointments:
Mike is currently Chairman of Coats Group plc and Which? Limited and President of the Chartered Management Institute (CMI).
Corporate Governance Report continued

Fina
ncia
l Sta
tem
ents
Dir
ecto
rs’ R
epo
rtSt
rate
gic
Rep
ort
Directors’ Report · 89
Ralph D Crosby Jr (68) Non-Executive Director
Tamara Ingram (55) Non-Executive Director
Rachel Lomax (70) Non-Executive Director
Angie Risley (57) Non-Executive Director
Malcolm Wyman (69) Non-Executive Director
Appointment:
Ralph joined Serco as a Non-Executive Director in June 2011.
Appointment:
Tamara joined Serco as a Non-Executive Director in March 2014.
Appointment:
Rachel joined Serco as a Non-Executive Director in March 2014.
Appointment:
Angie joined Serco as a Non-Executive Director in April 2011.
Appointment:
Malcolm joined Serco as a Non-Executive Director in January 2013.
Responsibilities:
Ralph is a member of the Board Oversight Committee.
Responsibilities:
Tamara is a member of the Corporate Responsibility and Risk and Remuneration Committees.
Responsibilities:
Rachel is the Chair of the Corporate Responsibility and Risk Committee and a member of the Audit Committee.
Responsibilities:
Angie is Chair of the Remuneration Committee and a member of the Nomination Committee.
Responsibilities:
Malcolm is Chair of the Audit Committee and he is also a member of the Remuneration, Nomination and Board Oversight Committees.
Experience:Ralph was Chairman of EADS North America until his retirement from that position at the end of December 2011. He joined EADS in 2002 as Chairman and Chief Executive Officer of EADS North America and also served as a member of the EADS global Executive Committee until 2010. Previously, Ralph held numerous positions with Northrop Grumman Corporation, concluding over 20 years of service as President of their Integrated Systems Sector. Prior to his industry career, Ralph served as an Officer in the US Army. Ralph has an MA in Public Administration from Harvard, an MA in International Relations from the Graduate Institute of International Studies, Switzerland, and a BSc from the United States Military Academy at West Point, New York.
Experience:Tamara is Executive Vice President at WPP, where she is Managing Director at Grey Group and CEO, Team P&G. In 2013 Tamara stepped down after completing nine years as a Non-Executive Director of The Sage Group plc. Previously, Tamara chaired the Board of Visit London (formerly the London Tourist Board) from 2001 – 2011.
Experience:From 2003 to 2008 Rachel was Deputy Governor (Monetary Policy) of the Bank of England and was previously Permanent Secretary at the Department for Transport, the Department for Work and Pensions (formerly the Department of Social Security) and the Welsh Office.
Experience:Previously, Angie was Group HR Director at Lloyds Banking Group and prior to that she was Executive Director of Whitbread plc until May 2007, having joined the Whitbread Group in 1989. She has also been a member of the Low Pay Commission, and a Non-Executive Director of Biffa plc and Arriva plc.
Experience:Malcolm, a chartered accountant, was previously an Executive Director and the Chief Financial Officer of SABMiller plc, until his retirement in July 2011. Malcolm joined SABMiller in 1986 in South Africa and joined the Board as Group Corporate Finance Director in 1990. He was appointed to the Board of SABMiller upon its listing on the London Stock Exchange in 1999. He was Chief Financial Officer from 2001 until his retirement in July 2011.
External appointments:
Ralph is a Non-Executive Director of American Electric Power Co Inc. in the United States and Airbus Group, S.E. in the Netherlands.
External appointments:
Tamara is currently a Trustee of Save the Children (UK).
External appointments:Rachel is Senior Independent Director and Chair of the Conduct & Values Committee of HSBC Holdings plc. She is a Non-Executive Director of Heathrow Airport Holdings Limited, and a member of the supervisory board of Arcus European Infrastructure Fund.
Rachel is a Trustee / Board member of Imperial College London, the Institute of Fiscal Studies (of which she is also President), Ditchley Park, Breugel and City UK.
External appointments:
Angie is currently the Group Human Resources Director of J Sainsbury plc, and a member of the Sainsbury’s Operating Board.
External appointments:
Malcolm is a Non-Executive Director and Audit Committee Chairman of Imperial Tobacco Group plc and Senior Independent Director and Audit Committee Chairman of Nedbank Group Limited in South Africa.
Corporate Governance Report

Serco Group plc Annual Report and Accounts 201590
Leadership
Roles on the Board
The roles and responsibilities of the Directors and the Company Secretary are described in more detail below:
Chairman Group Chief Executive Officer
• Leads the Board and ensures that it is effective in all aspects of its role.
• Takes a leading role in determining the structure and composition of the Board, and its capabilities.
• Manages the business of the Board, ensuring that it facilitates the Board to fulfil its role and function and, in doing so, ensuring that:• the Directors receive timely, accurate, concise and clear
information.• the Board invests sufficient time on each matter for effective
consideration and decision-making, in keeping with the relative importance of each matter and especially for complex or strategically important issues.
• Provides appropriate counsel and support to the Group Chief Executive whilst respecting executive responsibility.
• Takes a leading role in the development and succession needs of the Board, and the effective performance of each Director, including:• promoting the effective contribution of the Non-Executive
Directors; and• ensuring that new Directors receive an effective induction.
• Leads the business to develop and deliver the Group’s strategy and business plans as agreed with the Board.
• Provides inspirational leadership across the Group, setting the tone from the top to promote the Company’s values and the highest ethical behaviour by all employees.
• Develops, motivates and retains a strong, professional and internationally-minded senior management team capable of meeting the challenges associated with the Company’s long-term growth strategy.
• Identifies strategic opportunities to enable the Group to grow and differentiate itself, and agrees with the Board a roadmap to realising those opportunities.
• Accountable for the Group’s performance and operational management, including its:• operational governance;• ethical compass;• profitability;• competitive market position; and• risk management and internal control systems.
• Maintains a close relationship of trust with the Chairman, seeking appropriate counsel and support whilst preserving executive responsibility.
• Leads the executive team, setting a personal example, building team spirit, ensuring clear lines of communication, developing individual and team capabilities, and ensuring that robust succession planning processes are in place.
• Acts as an effective ambassador for the Group, developing and maintaining strong relationships with current and potential customers, and key stakeholders.
• Proactively promotes the Group’s investment case to investors and listens to the views of major shareholders on key issues affecting the Group.
• Communicates both internally and externally the Group’s culture and values, key strategic imperatives and performance of the business, ensuring that a clear sense of purpose is conveyed.
Corporate Governance Report continued

Fina
ncia
l Sta
tem
ents
Dir
ecto
rs’ R
epo
rtSt
rate
gic
Rep
ort
Directors’ Report · 91
Roles on the Board
Group Chief Financial Officer Group Chief Operating Officer
• Provides leadership in the continuous evaluation of short and long-term strategic financial objectives.
• Provides accurate and timely financial information and analysis to ensure performance trends are clear and decision-making is based on rigorous financial analysis.
• Directs and oversees all aspects of the Finance and Accounting functions of the Group including the recruitment and development of the team; responsible for Tax, Treasury and Investor Relations.
• Provides administrative oversight of the Internal Audit function.• Evaluates and advises the Board on the impact of long range
planning, introduction of new programmes / strategies and accounting standards.
• Provides the Executive Committee with advice on the financial implications of business activities.
• Manages processes for financial forecasting, budgets and consolidation reporting.
• Ensures that effective internal controls are in place and ensures compliance with appropriate accounting regulations for financial and tax reporting.
• Leads the day-to-day implementation of the Group’s strategic and operational plans.
• Directs the following Group functions: Business Development and the Centres of Excellence, Information Technology, Corporate Shared Services, Mergers and Acquisitions, Compliance and Risk Management and Business Transformation.
• Provides oversight of the day-to-day operations of the business.• Alongside the Group Chief Financial Officer leads the monthly
Divisional Performance Reviews.• Supports the Group Chief Executive Officer in strategic planning
and developing and executing implementation plans, including plans to drive growth through the development of global capabilities and to achieve operational improvements and cost savings by better utilising corporate shared services and lean principles.
• Chairs the Group Investment Committee review and approval of investment decisions, including acquisitions and disposals, bid approvals and parent company support mechanisms.
• Accountable for delivery of the Corporate Renewal Programme, including responsibility for the Serco Management System, the accurate reporting of operational performance indicators and the adoption of robust compliance and risk management processes.
• Working with the Group Chief Information Officer, ensures that the information systems are appropriate to support the operational performance of the Group and the delivery of the strategic plan, and are robust in terms of data and information security.
• Has oversight over health and safety, insurance and pensions matters.
Senior Independent Director Non-Executive Directors
• Acts as a sounding board for the Chairman and assists him in the delivery of his objectives as requested.
• Provides an alternative point of contact for principal shareholders if they have any concerns that are unresolved through normal channels of communication.
• Seeks to maintain a balanced understanding of the views and concerns of principal shareholders.
• Takes a leading role in the performance evaluation of the Chairman.• Should it become necessary, leads an orderly succession process
for the Chairman.• In the unlikely event that there is a serious failure in Board
governance, or where normal Board functioning is seriously impaired or the Chairman is unable to act:• will act as an intermediary where necessary; and• will intervene to resolve the issues and restore the Board to
effective functioning.
• Constructively challenge and contribute to the development of the Group’s strategy and business plans.
• Ensure that the Group upholds high standards of integrity and probity with appropriate oversight over the effective embedding of the agreed culture, values, and ethical compass.
• Maintain effective oversight and review of the Group’s performance against agreed goals and objectives, and of the performance of the executive management.
• Maintain an effective understanding and oversight of the Group’s principal risks and the assurance in place around those risks including the results of the internal audit programme.
• Satisfy themselves as to:• the integrity of the financial statements and all other formal
announcements;• whether, taken as a whole, the Annual Report and Accounts is
fair, balanced and understandable;• whether the Group’s risk management and internal control
processes, including those relating to the financial reporting process, are robust and defensible; and
• whether the Board has robustly assessed the solvency and liquidity risks faced by the Group.
• Taking primary roles in:• appointing and, if necessary, removing Executive Directors, and
in Board succession planning.• the Board’s determination of remuneration policy for the
Chairman, the Executive Directors, the Executive Committee members and the Company Secretary.
Corporate Governance Report
Serco Group plc Annual Report and Accounts 201592
Leadership continued
Roles on the Board
Company Secretary
• Responsible for advising the Board on all corporate governance matters.• Assists the Chairman in ensuring that all Board procedures are
followed and that there are good information flows, together with facilitating induction programmes for newly appointed Directors.
Conflicts of interestThe Company’s Articles of Association include provisions reflecting recommended best practice concerning any Directors’ conflicts of interest. The Board has in place procedures for Directors to report any potential or actual conflicts to the other members of the Board for their authorisation where appropriate. In deciding whether to authorise a conflict or potential conflict of interest, only those Directors that have no interest in the matter under consideration are able to take the relevant decision acting in a way they consider, in good faith, is most likely to promote the Company’s success. The Directors may impose conditions or limitations when giving any authorisation, if they think this is appropriate.
The process of reviewing conflicts disclosed, and authorisations given, is repeated at least annually. Any conflicts or potential conflicts considered by the Board and any authorisations given are recorded in the Board minutes and in a register of Directors’ conflicts, which is maintained by the Company Secretary.
How the Board operates
The Board and its committeesCurrently the Board has ten members comprising the Chairman, three Executive Directors and six Non-Executive Directors. The Board organises itself with clear divisions of responsibility so that no individual or group of individuals has unfettered powers of decision-making. Whilst each constituent of the Board carries out distinct but complementary roles and responsibilities, collectively all Directors work for the long-term success of the Company.
Many key Board responsibilities are referred to four standing Board Committees: the Audit, Nomination, Remuneration and Corporate Responsibility and Risk Committees. This structure allows particularly detailed or complex matters to be given special scrutiny and oversight. The Board has a fifth committee, the Approvals and Allotments Committee. This Committee comprises the Executive Directors and the Company Secretary and meets on an ad hoc basis to approve proposals that have more operational significance but do not merit full Board consideration.
The Board Oversight Committee is an additional committee formed in 2013 to oversee the Corporate Renewal Programme. The Board Oversight Committee will remain in place to provide oversight and assurance, monitoring the further embedding of the initiatives, policies and procedures that have been put in place as part of the Corporate Renewal Programme. As a result of the changes to the Corporate Responsibility and Risk Committee outlined in the Chairman's governance overview above, including renaming it to be the Risk Committee, the Board Oversight Committee will also take on responsibility for some corporate responsibility related items and will be renamed the Corporate Responsibility Committee. More information can be found in the Board Oversight Committee report on pages 118 and 119.
Except where decisions are specifically delegated, each Committee reports and submits recommendations back to the Board for its review and, where necessary, decision. Each Committee operates within clearly defined terms of reference, which are reviewed annually by the respective Committees and, if necessary, approved by the Board to ensure they remain appropriate and reflect any changes in good practice and governance. The Terms of Reference of each Committee are all available online at www.serco.com.
The Board has approved a procedure for Directors to take independent professional advice at the Company’s expense and Committees are authorised to obtain outside legal or other independent professional advice if they consider it necessary.
The Board and the Committees meet with sufficient frequency to fulfil their respective responsibilities, using structured but flexible agendas to ensure that regular matters are addressed properly, while allowing time to discuss significant new issues. More information on the work and performance of the Board can be found in the following pages. Separate reports describing the activities of the Audit, Board Oversight, Corporate Responsibility and Risk, Nomination, and Remuneration Committees are presented on pages 104 to 143.
Corporate Governance Report continued
Fina
ncia
l Sta
tem
ents
Dir
ecto
rs’ R
epo
rtSt
rate
gic
Rep
ort
Directors’ Report · 93
Conduct of meetingsBoard meetings are scheduled eight times a year. The Company uses an electronic portal to ensure that papers are provided in a timely and secure manner. Board meetings are held over one, two or three days and are structured to allow open discussion of the strategy and trading and financial performance of the Group. To facilitate a proper understanding of the Group’s businesses at Board and Committee meetings the opportunity is used to combine the formal business of the Board with Divisional presentations and discussions. During 2015 the Board held a meeting in Dubai and received a presentation from the members of the Middle East Division management team and undertook a number of local contract site visits and reviews. Additional Board meetings are held as required.
Board decisions are usually taken by consensus. Exceptionally, if a decision is to be taken by vote, the Chairman has a second or casting vote.
Reserved mattersThere is a formal schedule of matters reserved to the Board. This schedule, which is reviewed annually, includes approval of:
• the Group strategy;
• annual financial and operating plans;
• major contract bid decisions, capital expenditure, acquisitions or divestments;
• annual and half-year financial results and satisfying itself as to the integrity of financial information;
• the Company’s dividend policy;
• ensuring there are adequate succession plans for the Board and senior management;
• appointing and removing Directors, the Company Secretary and committee members;
• setting and reviewing risk management and treasury policies;
• setting levels of operational delegated authorities;
• agreeing the Group’s culture, values, and ethical compass;
• reviewing the Group’s overall governance arrangements; and
• reviewing the effectiveness of the Group’s system of internal control and risk management processes.
Other specific responsibilities are delegated to Board Committees. Details of the responsibilities delegated to the Committees are given on pages 104 and 143. The membership of each Committee is reviewed regularly to ensure the appropriate balance of skills, experience, independence and knowledge of the Group.
Corporate Governance Report

Serco Group plc Annual Report and Accounts 201594
EffectivenessThe work of the Board
At each Board meeting, the Group Chief Executive Officer presents a comprehensive update on strategic and business issues across the Group together with an update on transformation and portfolio management activity; the Chief Operating Officer reports on contract performance, business development, strategy implementation and health and safety; and the Group Chief Financial Officer presents an analysis of the financial performance, both at Group and divisional levels. Other senior executives attend relevant parts of Board meetings in order to inform the Board of developments and activities in their areas of responsibility. This provides the Board with access to a broader group of executives and helps Directors make assessments of the Group’s emerging talent as potential succession to senior management roles. During the year, the Board conducted in-depth reviews of operations and strategy. A number of the Non-Executive Directors and the Chairman have spent time at contract site visits with local management in Hong Kong, USA, Australia and the UK. The Executive Directors regularly visit sites around the world. Further site and contract visits are planned for 2016.
At its meetings during the year, the Board discharged its responsibilities and, in particular, reviewed the areas detailed in the table below:
Strategy and transformation Group and divisional corporate strategies, including Centres of Excellence, exit of the private sector BPO business and portfolio management.
Funding and capital Approval and completion of the Rights Issue, debt refinancing; tax and treasury policy.
Investor relations Investor and analyst feedback following release of full year 2014 and half year 2015 results.
Business performance The operational performance of each of the divisional businesses and periodic updates presented by divisional management teams; health and safety reviews.
Governance Recruitment of a new Chairman and consideration of legal governance and compliance developments.
Financial and risk management The Group's business plans, presentations on the Group risk register and significant areas of risk.
Diversity, talent and succession Presentations from the Group Human Resources and Talent Directors on diversity and inclusion, succession and talent management and development across the Group.
Board effectiveness
BalanceTo be effective, the Board must understand the dynamics of Serco’s mix of complex businesses across many diverse markets, including the issues and factors upon which sustained success depends. A balance of experience, skills and viewpoints within the Board promotes overall Board effectiveness and enhances Company performance in the long-term. The Directors are drawn from different backgrounds and industries, and each has extensive experience of other international businesses in sectors that help inform and augment Board debate.
Induction, training and ongoing developmentOn joining the Board, each Director receives a personalised induction programme including:
• an overview of the Group’s businesses, risks, governance arrangements and relations with investors;
• structured meetings with a range of relevant senior managers from across the Group;
• meetings with key advisers and shareholders as appropriate to the Director’s role; and
• site and contract visits to gain first-hand insight into operational contracts with major customers.
Legal and regulatory updates are essential for good governance, to ensure that Directors understand the operational environment of the business. The Board and committee meetings incorporate briefings periodically on changes to the business, legislative and regulatory environment, and on other relevant topics, such as changes to the corporate and remuneration reporting landscape. External speakers are invited to present to the Board on current relevant issues.
Corporate Governance Report continued

Fina
ncia
l Sta
tem
ents
Dir
ecto
rs’ R
epo
rtSt
rate
gic
Rep
ort
Directors’ Report · 95
As part of its annual evaluation process, the Board considers the training needs of the Directors and the Company Secretary. Development needs fall within the remit of the Chairman, who reviews and agrees these with each individual. All Board members are encouraged to attend relevant external training courses at the Company’s expense. More information on Board evaluation can be found on page 96. An induction programme for the Chairman including site visits and meetings with stakeholders, senior executives of, and advisers to, the Group progressed throughout 2015. All Directors continue to undertake programmes of contract visits and meetings with senior executives as highlighted above.
Board independenceThe Board considers all of the Non-Executive Directors to be independent. In coming to this conclusion, it has determined that each Non-Executive Director is independent in character and judgement and there are no relationships or circumstances that are likely to affect, or could appear to affect, the Directors’ judgements. In particular, they are independent of management and have no cross-directorships or significant links that could materially interfere with the exercise of their independent judgement.
The Non-Executive Directors meet separately (without the Chairman or Executive Directors being present) at least once a year principally to appraise the Chairman’s performance. This meeting is chaired by the Senior Independent Director.
The Board considered the Chairman to be independent on his appointment in July 2015. The Nomination Committee keeps the Board’s diversity, balance and independence under review.
The terms and conditions of the appointment of the Directors are summarised in the Directors’ Remuneration Report on pages 130 and 131 and are available on request from the Company Secretary.
Re-election of DirectorsThe Company’s Articles of Association stipulate that each Director shall retire (but be eligible for re-election) at the Annual General Meeting (AGM) held in the third calendar year following the year in which he or she was elected or last re-elected by the Company. Any Directors appointed by the Board since the last AGM must stand for re-election at the next AGM. Any Non-Executive Directors, excluding the Chairman, who have served for more than nine years will be subject to annual re-election.
Notwithstanding the above, in accordance with provisions contained within the UK Corporate Governance Code, all Directors retired and stood for re-election at the 2015 AGM and will do so, on an annual basis, at each AGM. Their names will be set out in the Notice of Annual General Meeting.
Time commitment and external directorshipsAs part of the Board evaluation process, the available time commitment of each Director is considered. The Board considers that the Executive Directors can gain valuable experience and knowledge through appropriate and limited non-executive appointments in other listed companies or independent sector organisations. The Board is careful to ensure that any such appointments do not present any material conflicts of interest to Serco, or compromise the effective management of the Group, and these are approved in advance of any appointments being taken up. Details of the fees received by Executive Directors for external appointments can be found in the Directors’ Remuneration Report on page 140.
Sir Roy Gardner was appointed as Chairman with effect from 1 July 2015. Sir Roy is the Senior Independent Director at William Hill plc and Chairman of Mainstream Renewable Power Ltd. He is also a Senior Adviser to Credit Suisse. Prior to Sir Roy’s appointment the Board carefully considered these commitments and concluded that they would not have any material impact on his role as Chairman of Serco Group plc.
Corporate Governance Report

Serco Group plc Annual Report and Accounts 201596
Board attendanceThe frequency and content of Board meetings are reviewed by the Board annually. During the year there were eight scheduled Board meetings and one additional meeting; five scheduled Remuneration Committee meetings and one additional meeting; four scheduled Audit Committee meetings and four additional meetings; and four scheduled Nomination Committee meetings and two additional meetings.
The attendance of the individual Directors at Board and Committee meetings of which they were members during 2015 was as follows:
Board Audit Remuneration Nomination
Corporate Responsibility
and RiskBoard
Oversight
Number held 9 8 6 6 4 3
Edward J. Casey, Jnr 9 N/a N/a N/a N/a 3
Mike Clasper 9 8 N/a 5 4 N/a
Angus Cockburn 9 N/a N/a N/a N/a N/a
Ralph D. Crosby Jr. 8 N/a N/a N/a N/a 3
Sir Roy Gardner (a) 5 (5) N/a 1 (2) 1 (1) 2 (2) 2 (2)
Tamara Ingram 7 N/a 6 N/a 3 N/a
Rachel Lomax 8 7 N/a N/a 4 N/a
Alastair Lyons (b) 4 (4) N/a 4 (4) 2 (5) 2 (2) 1 (1)
Angie Risley 9 N/a 6 6 N/a N/a
Rupert Soames 9 N/a N/a 6 4 N/a
Malcolm Wyman 8 8 5 6 N/a 2
(a) Sir Roy Gardner joined the Board on 1 June 2015.
(b) Alastair Lyons retired from the Board on 1 July 2015. All the meetings of the Nomination Committee that he did not attend dealt with the appointment of his replacement and were chaired by Mike Clasper, the Senior Independent Director.
Notes: 1. The number of meetings held includes scheduled and additional meetings.
2. The table excludes the attendance of Directors who attended meetings by invitation only.
3. Where a number is given in brackets against a Director’s attendance, this is the number of meetings which took place during their tenure.
Performance evaluationA formal independent effectiveness review of the Board, its Committees and individual Directors was carried out in early 2015 in respect of the year ended 31 December 2014 and was facilitated externally by CTMC&A Limited, an independent company with no connections to the Board. CTMC&A Limited has previously facilitated an effectiveness review of the Board. The results have been discussed by the Board and shared with the Chairman following his appointment. An internal review of Board effectiveness will take place in summer 2016.
No review of the Chairman has been carried out since February 2014 as at the time of the last Board effectiveness review in 2015, Alastair Lyons had indicated his intention to step down and a review of Sir Roy Gardner is due to take place at the same time as the wider Board evaluation process that is scheduled for the summer of 2016.
Corporate Governance Report continued

Fina
ncia
l Sta
tem
ents
Dir
ecto
rs’ R
epo
rtSt
rate
gic
Rep
ort
Directors’ Report · 97
AccountabilityManaging business risks and internal control
Serco has a system of internal controls, including financial, operational and compliance controls and risk management controls, designed to manage and minimise risks that would adversely affect service levels to our customers, and safeguard shareholders’ investments, our assets, our people and our reputation (collectively ‘business risks’).
For each system of internal control, we have defined within the SMS Group Standards the processes and associated controls that must be in place together with clear definitions of those individuals responsible for ensuring compliance. To provide assurance that these controls are implemented and effective, we have implemented a three lines of defence model, i.e. the business, compliance assurance (via the Group Compliance Assurance Programme) and the internal audit programme.
First line of defence – We seek to minimise the probability and impact of business risks through the consistent implementation of the SMS, ensuring that appropriate process infrastructure and controls are in place and that appropriately trained staff are in place to monitor mitigation plans. While SMS controls are designed to mitigate and minimise business risks, these risks cannot be completely eliminated. Consequently, while SMS controls can provide reasonable assurance against misstatement or loss, this cannot be absolute.
Second line of defence – As part of the ongoing management of the SMS, we have introduced a specific set of standards and procedures on compliance assurance and implemented a Group Compliance Assurance Programme to ensure a consistent approach across the Group in assuring business compliance with SMS controls. In 2015 we also rolled out a self-assessment process to enable contracts to self-assess their compliance with the SMS and plan actions to close any gaps. As part of the requirements of the Group Compliance Assurance Programme, the self-assessments are validated through selective compliance assurance reviews and recommendations on future improvements are provided. This process will be repeated in future in order to reinforce and continually improve compliance levels.
Third line of defence – Internal audit provides an independent assessment of the design and operating effectiveness of the Group’s governance, risk management and controls that are in place to manage risk. The Internal Audit team carries out an annual programme of risk-based audits reporting findings to the Audit Committee. The audit programme is approved by the Audit Committee and is continually revised throughout the year to ensure it remains focused on appropriate areas of the business. The in-house Internal Audit team uses KPMG as a co-sourced resource where appropriate.
The Board confirms that the three lines of defence have been in place for the year under review and up to the date of approval of the 2015 Annual Report and Accounts.
Corporate Governance Report

Serco Group plc Annual Report and Accounts 201598
Roles and responsibilities
The following provides an overview of the roles and responsibilities across the Group with respect to the three lines of defence approach and the Executive Committee and Board oversight of the effectiveness of the controls in place.
First line of defence – the business
Functions and Divisions
The Functions and Divisions of Serco are responsible for identifying and managing the risks in line with the policy and standard defined within the SMS and implementing the controls defined in the SMS.
The SMS requires every contract, business unit and division to identify and assess their business risks, to implement mitigation actions and contingency plans to mitigate the probability and / or impact of their material risks (i.e. risks that are likely to have a significant impact on our business objectives), and to monitor and report on these material risks on a periodic basis.
Business leaders are responsible for the business activity and assign subject matter experts to material risks. They are supported by appointed risk register managers trained on the Group Risk standard and procedures. The subject matter experts are responsible for managing the risk and updating the risk on the risk register. Business leaders own the register and are responsible for the risks registered on it; they are also responsible for upward reporting of material risks to the next organisational level up on a periodic basis.
Subject matter experts for a material risk assess the effectiveness of the controls put in place and review the risk ratings by: monitoring the status of mitigation actions; reviewing the results of SMS self-assessment checklists completed by the business; reviewing the findings of the management assurance reviews and audits; monitoring the status of key performance indicators; and identifying any issues or events either internal or external that impact on the risk exposure or the ability of a control to mitigate a risk.
Divisional risk registers are developed by divisional Risk Directors and reviewed by the divisional Executive Management Teams on a monthly basis. Material risks are reported upwards to the Group Risk and Compliance Function on a quarterly basis to assist with the update of the status of the principal risks on the Group risk register.
Second line of defence – compliance assurance
Functions and Divisions
The Group Compliance Assurance Programme is delivered through the divisional Compliance Assurance Plans. These plans consist of the divisional compliance assurance reviews that will provide comfort that the business is compliant with the SMS, external laws and regulations and customer contract obligations. A divisional Compliance Lead is appointed by the divisional CEO with responsibility for developing and implementing the Divisional Compliance Assurance Plan.
The divisional Compliance Assurance Plan is developed at the end of each year for the following year’s delivery; it is reviewed and approved by the divisional Executive Management Team (EMT) and is signed off by the Group Risk and Compliance Function.
The results of the divisional compliance assurance reviews are reviewed by the divisional EMT, and progress against the plan is reported to the Group Risk and Compliance Function and Group Internal Audit on a quarterly basis. The Group Risk and Compliance Function then reports overall progress of the Group Compliance Assurance Programme to the Executive Committee and the Board’s sub-committees.
On an annual basis a compliance sign-off statement is received from each divisional CEO and reviewed by the Audit Committee to confirm Group internal controls are being implemented and that there are no known control failures that present an unmitigated material risk to the division or the Group.
Group Risk and Compliance Function
The Group Risk and Compliance Function is responsible for managing the SMS, and for the development and implementation of policies and standards associated with Risk Management and with Compliance Assurance.
The function is the custodian of the corporate enterprise risk management tool and is responsible for the management of the Group risk register and for reporting the status of the principal risks to the Executive Committee and the Corporate Responsibility and Risk Committee.
The function also provides assurance over the business – providing risk management oversight, assurance and challenge of the divisional and corporate function registers; overseeing the Group-wide Compliance Assurance Programme to ensure divisional and functional reviews take into account the Group principal risks; and is the custodian of the SMS self-assessment tool, providing overall coordination and assessment of the results of the annual completion of the checklists by the business.
Corporate Governance Report continued

Fina
ncia
l Sta
tem
ents
Dir
ecto
rs’ R
epo
rtSt
rate
gic
Rep
ort
Directors’ Report · 99
Third line of defence – internal audit programme
Group Internal Audit Function
The Group Head of Internal Audit leads the Internal Audit function reporting functionally to the Chair of the Audit Committee and is responsible for delivery of the internal audit programme, ensuring that it is risk-based and aligned with the overall strategy of the Group.
The Group Head of Internal Audit also makes regular reports to the Corporate Responsibility and Risk Committee and the findings of the overall internal audit programme are reported directly to the Audit Committee.
Executive Committee and Board Oversight
Executive Committee
The Executive Committee owns the principal risks on the Group risk register. Each principal risk is assigned to a senior executive who sponsors the management of the risk and assigns a subject matter expert to assist in the identification and monitoring of the material controls required to mitigate the risk.
The Executive Committee then reviews the Group Risk Register quarterly ahead of formal review by the Corporate Responsibility and Risk Committee and provides direction on the mitigation actions required to implement or improve the effectiveness of material controls put in place (see pages 26 to 29).
Board and sub-committees
The Board has overall responsibility for our risk management and internal control system and for reviewing its effectiveness. A formal review of the principal risks on the Group risk register is carried out on a quarterly basis by the Corporate Responsibility and Risk Committee and a formal review of the findings of the overall internal audit programme is carried out by the Audit Committee.
Risk management approach
Our risk management policies, standards, and risk management lifecycle processes align to the guidance contained within the UK Corporate Governance Code and form part of the SMS. They ensure that we identify, review and report risks at all levels of our business, reflecting the nature of the activities being undertaken at that level, the inherent business and operational risks, and the level of control considered necessary to protect our interests and those of our stakeholders.
The risk management lifecycle includes five key stages that aim to identify the key risks of our operations and to ensure we have a consistent approach to recording, analysing and mitigating them.
Risk identification – identifying the risks associated with the achievement of business objectives. In identifying the potential risks both external factors arising from the environment within which we operate, and internal risks arising from the nature of our business are considered as well as the associated controls, processes, and management decisions.
Risk analysis – assessing the level of risk exposure, based on an assessment of the probability of an identified risk materialising and the impact if it does using a standard risk scoring system. Inherent and residual risk ratings are assessed at this stage and risks are ranked according to both their ratings and their proximity. Risk registers are developed at this stage and maintained at contract, division and Group level. Registers are periodically analysed to assess threats to our business objectives.
Risk mitigation – identifying controls that will reduce material risks to a target risk rating that is aligned with our risk appetite, and implementing cost-effective mitigation actions that improve the effectiveness of the controls in mitigating the risk (including contingency plans which reduce the severity of the impact of the risks should they occur).
Risk monitoring – includes monitoring mitigation actions and their impact (so as to improve the effectiveness of controls and improving the residual risk rating) as well as monitoring changes to our business and the external environment, to ensure that we have sight of and respond appropriately to reduce the impact of emerging risks, and removing those risks from the register that are no longer relevant.
Risk reporting – reporting of the status of material risks up through the management chain to the next organisational level to provide assurance that business risks are being appropriately managed and the controls in place are effective. Risk reports are also used to provide insight on emerging risks which require additional management attention, as well as systematic risks which might require Group-wide controls as appropriate.
Risk reporting processes are both 'bottom-up', whereby principal risks are communicated to the divisional Risk Directors, divisional CEOs and the Executive Committee, and ‘top down’ assessment of the principal risks by the Executive Committee to ensure divisional risk registers are focusing on risks that are considered most important to the organisation from a strategic perspective.
The divisional risk registers are reported on a quarterly basis to the Group Risk and Compliance Function, and the Group risk registers are reported on a quarterly basis to both the Executive Committee and the Corporate Responsibility and Risk Committee.
Corporate Governance Report
Serco Group plc Annual Report and Accounts 2015100
Group Compliance Assurance Programme
A structured approach to compliance assurance is delivered through the Group Compliance Assurance Programme; this consists of individual divisional Compliance Assurance Plans, which are a series of formal reviews coordinated by divisional Compliance Leads.
A divisional Compliance Assurance Plan will cover the business units, functional areas and contracts; it includes a selection of legal and regulatory reviews, customer contract mandated reviews, process and control reviews, and any mandated Group and divisional reviews. The Plan is designed to provide sampled assurance of compliance to support the divisional CEO statement of internal control and risk management; improve the internal control environment through implementation of action plans following identification of internal control weaknesses, and promote sharing of best practice.
The reviews are carried out by independent assurance personnel and coordinated by the divisional Compliance Lead. At the end of each review, a report is provided to and discussed with the entity lead; this report provides the review findings and any agreed corrective action plans.
A quarterly report of progress against the plan is discussed and approved by the divisional EMT; common trends or issues found are highlighted to enable management to consider areas for improvement and ensure corrective action is taken.
These divisional reports are then consolidated at Group level by the Group Risk and Compliance Function for reporting to the Executive Committee, the Board and its sub-committees.
Internal Audit Programme
The 2015 Internal Audit programme consisted of a programme of audits covering a sample of contracts, functions and risk themes and has been delivered in full. Findings have been reported to the Audit Committee with senior management providing updates on the status of significant business actions where appropriate. Findings and common themes have also been presented to the Executive Committee to enable management to understand the themes and to ensure appropriate actions are being taken.
Improvements to the three lines of defence
During 2015, we have continued with the three-year programme established in 2014, refreshing our overall risk management approach to better support the development and ongoing performance of the global business. In 2015 we further enhanced our policies, processes and systems and gave more clarity on roles and responsibilities, governance and reporting.
During the year we have also continued training our business leaders and employees, improved risk management capacity and capability in our global business, and improved visibility of risk focusing on periodic management information and decision-making. Other improvements made in 2015 included:
• Executive Committee detailed review of principal risks and appointment of executive sponsors for each risk to oversee the deployment of controls and actions to mitigate;
• rolling out a global SMS self-assessment process the results of which has helped us identify areas where compliance is to be strengthened, inform changes needed to the SMS and inform compliance assurance reviews to be put in place for 2016;
• new Compliance Assurance procedures have been put in place which include specific divisional risk-based, regulatory or customer required reviews as well as group mandated reviews. Group mandated reviews are derived from the principal risks affecting the business;
• external review of the effectiveness of the Global Internal Audit function (GIA) was completed highlighting areas of good practice and areas to focus on developing to further improve internal audit services. This has been incorporated into a revised GIA strategy with the main focus on working with other lines of defence to provide a holistic approach to assurance and further refining the risk based audit approach; and
• external review of the divisional risk processes was also carried out, and the results used to improve risk management processes in 2016.
Corporate Governance Report continued

Fina
ncia
l Sta
tem
ents
Dir
ecto
rs’ R
epo
rtSt
rate
gic
Rep
ort
Directors’ Report · 101
Managing joint venture risks
We participate in a number of joint ventures and partnerships (JVs) with other companies or government enterprises in various markets around the world. These JV arrangements take various forms and include contractual agreements to work collaboratively and the setting up of special purpose vehicles (companies limited by shares, companies limited by guarantee, etc.) in order to bid for and / or operate service contracts.
Serco ensure that these JV investments are set up appropriately via the governance and ownership arrangements which typically include the following controls:
• partnership or JV Board – at the on-set a board is set up in line with the ownership and shareholder arrangements of a particular JV. These arrangements will include customary voting rights and minority protection provisions that are designed to appropriately protect Serco’s interests. Serco nominees participate in Board meetings on a periodic basis, and review the financial and operational performance of the JV or partnership.
• line management oversight – performance of a JV is reported on a periodic basis by the JV’s management through the normal line management which, depending on the nature of the JV, report to business unit MD or division CEO directly. Business issues and material risks are monitored this way and, where appropriate, reported through the Divisional Performance Review (DPR) processes.
• ethical compliance of third parties – due diligence checks are typically carried out on external parties, to ensure that Serco has a good understanding of JV partner(s) and to gather information to actively manage criminal, regulatory or other reputational risks that could arise.
Financial reporting process
The Company has a thorough assurance process in place in respect of the preparation, verification and approval of periodic financial statements. The process includes:
• the involvement of qualified, professional employees with an appropriate level of experience in Group Finance and across the Divisions;
• formal sign-offs from divisional Chief Executive Officers and Finance Directors;
• comprehensive review and, where appropriate, challenge from key internal Group functions;
• a transparent process to ensure full disclosure of information to the external auditor;
• engagement of a professional and experienced firm of external auditors; and
• oversight of the Audit Committee, involving amongst other duties:
• a detailed review of key financial reporting judgements which have been discussed by management; and
• review and where appropriate, challenge on matters including the consistency of, and any changes to, significant accounting policies and practices during the year; significant adjustments resulting from an external audit; the going concern assumption; and the Company’s statement on internal control systems, prior to endorsement by the Board.
The above processes provide comfort to the Board that the Group has undertaken an appropriate approach to include the necessary information for it to consider that the Annual Report and Accounts, taken as a whole, is fair, balanced and understandable and provides the information necessary for shareholders to assess the Company’s performance, business model and strategy.
Business conduct
Serco operates within a management system that defines the policies, standards and processes to be applied wherever we operate. Integral to this is our policy on Business Conduct and Ethics that applies to all business divisions, operating companies and business units throughout the Group. This policy outlines the Group’s position on a wide range of ethical and legal issues including conflicts of interest, financial inducements, human rights and legal and regulatory compliance. It applies to Directors and to all employees regardless of their position or location. Recognising that ethical dilemmas may arise in a growing company, the Group has an ethics consultation process that is to be followed to determine the Group’s position on particular issues. As the leadership of the Company, the Executive Committee will make judgements about what it considers acceptable with reference, where appropriate, to the Corporate Responsibility and Risk Committee.
Corporate Governance Report
Serco Group plc Annual Report and Accounts 2015102
The Corporate Responsibility and Risk Committee provides oversight of our approach to corporate responsibility and its governance, ethics, risk management, security and health, safety and environment matters. Each division has an Ethics Lead responsible for the development and implementation of the division’s ethics and compliance programme in line with Group strategy and assessed risks. Our Code of Conduct is provided to all staff (www.serco.com/codeofconduct) and included in induction training. In 2015 we further strengthened ethical governance across the business with a refresh of our assessment of ethical, human rights and compliance risks. We have revised and refreshed our Say No Toolkit (serco.saynotoolkit.net); and strengthened our due diligence processes for third parties.
Serco’s externally managed ‘Speak Up’ service operated throughout the year, which enabled employees to report any concerns, or report any wrongdoing that they did not feel able to raise with their line manager, human resources colleagues or through other reporting channels. In addition to the service, which is available 24 hours a day, toll-free worldwide in several languages, employees can also make reports via email or the internet. The Company Secretary independently investigates, with external specialist support where required, any issues raised and reports back to the Executive Committee, Corporate Responsibility and Risk Committee and, as appropriate, the Board.
The Group maintains a position of neutrality with respect to party politics. Accordingly, it does not contribute funds to any political party. It does, however, contribute to the public debate of policy issues that may affect the Group in the countries in which it operates.
Going concern
In assessing the basis of preparation of the financial statements for the year ended 31 December 2015, the Directors have considered the principles of the Financial Reporting Council’s ‘Guidance on Risk Management, Internal Control and Related Financial and Business Reporting, 2014’; namely assessing the applicability of the going concern basis, the review period and disclosures.
The Group’s current principal debt facilities at the year-end comprised a £480m revolving credit facility, and £375m of US private placement notes. Subsequent to year-end, the Group has repaid £113m of the US private placement notes, which left £262m of notes outstanding. As at 31 December 2015, the Group had £855m of committed credit facilities and committed headroom of £777m.
Assessment of going concern – The Directors have undertaken a rigorous assessment of going concern and liquidity, taking into account financial forecasts. In order to satisfy ourselves that we have adequate resources for the future, the Directors have reviewed the Group’s existing debt levels, the committed funding and liquidity positions under our debt covenants, and our ability to generate cash from trading activities.
Review period – In undertaking this review the Directors have considered the business plans which provide financial projections for the foreseeable future. For the purposes of this review, we consider that to be the period ending 30 June 2017. The Directors have also reviewed the principal risks considered on pages 16 to 25 of the Strategic Report and taken account of the results of sensitivity testing.
Assessment – The Directors have a reasonable expectation that the Company and the Group will be able to operate within the level of available facilities and cash for the foreseeable future and accordingly believe that it is appropriate to prepare the financial statements on a going concern basis.
Engaging with shareholdersHow we engage with shareholders
Serco uses a variety of means to gain insight into the views of shareholders and other stakeholders, and the Board is regularly briefed on the feedback received through these engagement channels.
Primary responsibility for engaging with shareholders rests with the Chairman, Group Chief Executive Officer and Group Chief Financial Officer. In addition, the Senior Independent Director is available to shareholders should these normal communication channels fail to resolve an issue, or are inappropriate for any reason.
We have formal arrangements for engaging with shareholders, including those described opposite.
Corporate Governance Report continued

Fina
ncia
l Sta
tem
ents
Dir
ecto
rs’ R
epo
rtSt
rate
gic
Rep
ort
Directors’ Report · 103
Investor meetings
The Executive Directors and the Investor Relations team regularly meet with analysts and major investors to maintain effective dialogue. The Chairman also offers to meet with the Company’s largest institutional investors each year. As part of an induction programme following his appointment in 2015, the Chairman engaged with our five largest shareholders.
The Board reviews an investor relations report each quarter. This highlights share price movements, changes in the share register, the Company’s recent and planned investor relations activities, analyst recommendations and financial forecasts for the Company, and significant news from the market and the support services sector. This report contributes significantly to the Board’s understanding of investors’ views.
Annual General Meetings (AGMs)
The AGM provides an opportunity to communicate with all shareholders, especially our private shareholders. Individual shareholders have the opportunity to question the Chairman and, through him, the Chairs of the various Board Committees and other Directors. The Notice of Meeting will set out the resolutions being proposed at the AGM to be held on 12 May 2016. It is the Company’s policy at present for all resolutions to be voted at a general meeting by way of a poll. A poll reflects the number of voting rights exercisable by each member and is considered by the Board to be a more democratic method of voting. Shareholders are advised of the total number of votes lodged for each resolution, in the categories ‘for’ and ‘against’ together with the number of ‘votes withheld’. This information is also posted on the Group’s website www.serco.com.
Formal consultations
When a material change in remuneration policy is being considered, the Chairman of the Remuneration Committee consults with major investors and seeks their views. From time to time, we seek the views of major shareholders on other Company proposals.
Direct communications initiated by shareholders and representative bodies
From time to time, we receive enquiries and circulars directly from major shareholders and representative bodies, such as the Investment Management Association, the National Association of Pension Funds (now known as the Pensions and Lifetime Savings Association) and Pensions Investment Research Consultants. We also review the various environmental, social and governance reports published about us annually and consider whether any changes are needed and to respond to any specific comments.
External advisers
Legal, financial, remuneration and communications advisers gain insights into shareholder attitudes in the course of conducting specific research or through their work with other clients. Relevant insights are shared with the Board and its committees.
Corporate website
The Group website www.serco.com is a primary source of information on the Group. The site includes an area tailored for investors, including information such as an archive of all reports, announcements, presentations and webcasts, share price tools, the terms of reference for all Board Committees, and information on voting at the Annual General Meeting. It also has a link directly to the Company’s registrars, allowing shareholders to view their shareholding online and to vote on the resolutions set out in the notice of Annual General Meeting.
Approved by the Board of Directors and signed on its behalf by:
David Eveleigh Secretary
25 February 2016
Corporate Governance Report

Serco Group plc Annual Report and Accounts 2015104
Chairman’s overview
The Audit Committee is an essential part of the Group’s governance framework. It is responsible for ensuring the integrity of the financial reporting process and internal control environment, promoting continuous improvement in accounting and reporting practices, overseeing the relationship with the external auditors and managing the internal audit function.
Committee’s responsibilities
The Committee’s detailed responsibilities are set out in its terms of reference, which are reviewed and approved annually by the Board and are available at www.serco.com. These responsibilities include the monitoring and reviewing of:
• the integrity of the financial statements of the Company and the significant financial reporting judgements contained in them;
• the Annual Report and Accounts, to assess whether, as a whole, it is fair, balanced and understandable and provides the information necessary for shareholders to assess the Company’s performance, business model and strategy;
• the activities, findings and effectiveness of the Internal Audit function;
• the effectiveness of the Group’s internal control systems;
• the Group’s relationship with the external auditors, including their fees and the provision of non-audit services; and
• the effectiveness of the external audit process, including consideration of the appointment, re-appointment or removal of the external auditor and assessment of their independence and objectivity.
During 2015 the Audit Committee discharged fully its responsibilities. This report describes the key issues considered by the Committee during the year and the actions taken in each of its areas of responsibility.
Financial Reporting
The following key matters were considered by the Committee during 2015 and in respect of the 2015 Financial Year:
• Monitoring the integrity of the Financial Statements of the Company for inclusion in the 2014 and 2015 Annual Report and Accounts and for inclusion in the 2015 Half Year Report.
• Accounting issues, judgements and information to support the financial statements, including but not limited to going concern, revenue recognition, onerous contract provisions (OCPs), impairments, tax provisions, discontinued operations and exceptional items.
Audit Committee Report

Fina
ncia
l Sta
tem
ents
Dir
ecto
rs’ R
epo
rtSt
rate
gic
Rep
ort
Directors’ Report · 105Audit Committee Report
Significant issues and key judgements
The following key issues were considered by the Audit Committee in respect of the financial year ended 31 December 2015:
Financial reporting control environment
Nature of the issue
In light of the significant provisions and impairments made in 2014 and 2015, the Audit Committee spent time considering the strength of the Group’s internal control environment with particular regard to the Group’s three lines of defence model.
Action taken Outcome
• With the support of the Audit Committee, management has made a number of key appointments to increase the capability and leadership within the Finance function.
• We are satisfied that key finance positions within the Group have been strengthened through the recruitment of experienced and qualified individuals.
• The Audit Committee has challenged management on the effectiveness of its second line of defence. The Audit Committee will continue to assess this through its monitoring of the 'financial control and financial systems failure' principal risk.
• The Audit Committee has reviewed management’s assessment of its current financial control environment with regard to its three lines of defence model.
• Key improvements made include the strengthening of the Serco Management System and associated assurance plans, and the Divisional Performance Reviews, which take place on a monthly basis and review the key financial and operational aspects of the business. The Audit Committee has also reviewed the plans to further improve the Group’s second line of defence and are comfortable with the initial proposals.
• The Audit Committee has promoted the strengthening of the in-house Internal Audit function, and in 2015 increased its focus on the wider controls operating within the Group.
• The internal audit plans and reports have been reviewed by the Audit Committee and it is comfortable with the progress made to date, the issues raised and the actions taken by management on significant issues.
• The Audit Committee has mandated a sign-off process to establish compliance with financial and non-financial controls across the Group.
• The material controls associated with the Group’s principal risks are reviewed by the Corporate Responsibility and Risk Committee (CRRC), and the Compliance Assurance Programme is reviewed by the Board Oversight Committee. The Audit Committee focuses on the financial internal controls.
• The Audit Committee has reviewed the results of the annual sign-off process across the Group to assess whether any areas of financial control non-compliance present a critical, severe or significant risk to the Group.
• The Audit Committee has reviewed internal audit’s testing of the control environment, which includes financial and non-financial controls.

Serco Group plc Annual Report and Accounts 2015106
Business disposals
Nature of the issue
As a result of the Strategy Review undertaken by the Board, a number of businesses were considered for disposal during the year with full details provided in notes 4 and 9 to the financial statements. The financial reporting for the business disposals required careful consideration to ensure that they are appropriately reflected in the financial statements.
Action taken Outcome
• The financial conclusions reached by management and the accounting treatment have been discussed and challenged, with particular focus on the treatment of the majority of the private sector BPO businesses as discontinued and the removal of the Leisure and Environmental Services businesses from assets held for sale.
• Following the Audit Committee review and discussion with the External Auditors, we are satisfied that it is appropriate to treat the onshore private sector BPO business as discontinued operations in the current and prior year income statement. We are also satisfied that, as a result of the decision not to sell the Leisure and Environmental Services businesses that it is correct that the private sector BPO operation should be the only business included in the balance sheet as assets held for sale as at 31 December 2015.
Onerous contract provisions
Nature of the issue
As part of the Strategy Review in 2014, material onerous contract provisions (OCPs) were established. The Audit Committee has focused on changes to those provisions as well as additional OCPs made in 2015, to understand and challenge as appropriate the significant assumptions, judgements, estimates and conclusions made by management during its review of contracts at the end of 2015.
Action taken Outcome
• Management presented to the Audit Committee their basis and process of assessing the level of provisions required. Our review of this process covered all major OCPs created as part of the Contract and Balance Sheet Review in 2014, together with any new contract provisions identified in the current year. The Committee also reviewed the levels of provisioning required particularly for long-term and / or complex contracts, and discussed these with the External Auditors.
• We satisfied ourselves that the overall level of provisions is appropriate when taking account of the range of possible outcomes particularly on complex, long-term contracts. The judgement made in regard to the Armidale Class Patrol Boat (ACPB) contract to release a significant portion of the OCPs, following the contract modifications agreed between the Company and the customer, was considered, and it was concluded that the provision release was appropriate.
• As part of our review of the significant OCPs, we challenged management on how the assessment process reflected other key judgements being made in respect of asset impairments, deferred tax asset recognition and future liquidity and viability.
• The Committee concluded that the assumptions and judgements made by management in the calculation of OCPs are consistent with those used in the models prepared by management for forecasting future profitability and cash flows.
Audit Committee Report continued

Fina
ncia
l Sta
tem
ents
Dir
ecto
rs’ R
epo
rtSt
rate
gic
Rep
ort
Directors’ Report · 107
Use of alternative performance measures
Nature of the issue
The Group’s key performance indicators include measures which are not defined or specified in International Financial Reporting Standards. During the year, a new measure was introduced, being Underlying Trading Profit, which is used by the Board of Directors to review current performance against the prior year by removing the impact of adjustments to OCPs, charges and releases made in respect of other items identified during the 2014 Contract and Balance Sheet Review, and other significant non trading items.
Action taken Outcome
• An assessment was made of the performance measures in light of whether they provide meaningful insight to the users of the Annual Report and Accounts.
• We concluded that the performance measures are appropriate as they are those which are being used by management in the assessment of the performance of the business and that sufficient information has been provided to shareholders on the changes made in the year.
• The new measure of Underlying Trading Profit was considered for relevance to the performance of the business through review of the Group’s management accounts and discussions with management.
• We consider the measure of Underlying Trading Profit to be a reasonable basis for the comparison of the performance of the business.
• We have reviewed the treatment of items considered as being exceptional and therefore requiring separate disclosure. Management prepared supporting documentation for exceptional items to support their treatment in the Financial Statements, which was reviewed and challenged by us in light of the guidance issued by the Financial Reporting Council in December 2013.
• The Audit Committee is satisfied with the appropriateness of items treated as exceptional. We consider it appropriate for restructuring costs connected to the Strategy Review to be treated as exceptional in the current year, as they represent a continuation of the ongoing major restructuring programme that commenced in 2013.
• The disclosures made in the Annual Report and Accounts were reviewed to ensure that the measures provide transparency to the performance of the Group, appropriate prominence is given to statutory measures and clear reconciliations to statutory measures are provided.
• It was concluded that clear and meaningful descriptions have been given for the alternative performance measures, and that statutory measures have been disclosed in sufficient detail to enable the users of the Annual Report and Accounts to make informed decisions.
Audit Committee Report

Serco Group plc Annual Report and Accounts 2015108
Goodwill impairment
Nature of the issue
In the year ended 31 December 2014 the goodwill balances associated with three of the Group’s cash generating units (CGUs) were impaired, and the low levels of headroom for the Health, Direct Services and Americas CGUs meant that a deterioration in performance for these businesses during the course of 2015 could result in further impairments. In the year ended 31 December 2015 such a deterioration was noted in the Americas CGU, which resulted in a further impairment of £87.5m. Details of the Group’s goodwill balances is provided in note 20 to the financial statements, and details of the judgements applied can be found in note 3 to the financial statements. Core to the assessment of the value of the goodwill is management’s estimate of the future cash flows associated with them, which is dependent on circumstances both within and outside of their control, and discount rates that are adjusted to reflect risks specific to individual assets.
Action taken Outcome
• The methodology and results of the impairment testing were presented to the Audit Committee and were subject to scrutiny and review. The Committee placed particular focus on changes in discount rates applied and ensuring that the underlying cash flows are consistent with the Board-approved forecasts.
• We are satisfied that the assumptions underlying the impairments made in the year are appropriate. In particular, the cash flow forecasts used include assumptions consistent with the reported contract attrition rates in the Americas.
• The underlying cash flow forecasts used for the assessment of goodwill impairment are also consistent with those used for the Group’s going concern and viability assessment and the assessment of recoverability of deferred tax assets.
• The disclosures made in the financial statements have been reviewed to ensure that they provide an appropriate level of information to its users.
• The Audit Committee concluded that the disclosures provided in the financial statements are transparent, appropriate, and in compliance with financial reporting requirements.
Audit Committee Report continued
Fina
ncia
l Sta
tem
ents
Dir
ecto
rs’ R
epo
rtSt
rate
gic
Rep
ort
Directors’ Report · 109
Tax exposures
Nature of the issue
The Group has historically been exposed to a number of claims raised by tax authorities in the normal course of business, generally in territories outside of the UK. The majority of these claims have arisen in India in respect of the offshore private sector BPO business, the majority of which was sold in December 2015. Where the likelihood of our position being challenged is more probable than not, the Group provides for the liability, including interest and penalties. Where the probability is assessed as less likely than not, the Group does not provide for any of the liability and discloses material individual items as contingent liabilities unless their likelihood is assessed as there being no present or possible obligation to pay tax or if there is, it is remote. As part of the agreement to dispose of the offshore private sector BPO business in December 2015, the Group offered a limited tax indemnity to the purchaser for general tax exposures that relate to historic tax claims. Accordingly, the Group continues to provide for the exposures that may arise under this limited indemnity. In addition, the Group provides a further indemnity in respect of withholding tax arising on an acquisition in India in 2011. Tax and interest thereon has been disclosed as a contingent liability and penalties have been considered as remote. Further details are provided in note 32 to the Group’s financial statements.
Action taken Outcome
• We reviewed the summary documentation prepared by management supporting the tax provisions made and that for significant claims not provided for.
• The documentation has been discussed, and challenged by the Committee. The Audit Committee is satisfied that the conclusions reached are appropriate. In particular, the Committee considered that the withholding tax exposure arising on the acquisition in India in 2011 is appropriately disclosed in note 32 to the financial statements.
• The Audit Committee has reviewed the general tax indemnity provided on the disposal of the majority of the offshore private sector BPO business, and the accounting treatment thereof.
• We are satisfied that management’s assessment of the likely outflows resulting from the indemnities is reasonable and consistent with historic treatment of the positions.
Deferred tax reporting
Nature of the issue
The Group recognises deferred tax assets in respect of temporary differences in relation to fixed assets and carried forward losses. At 31 December 2015 total deferred tax assets were £42.2m (2014: £37.4m). Recognising such assets requires an assessment of their likely recovery, which relies on judgement by management of the taxable profits expected to be made in each of the relevant jurisdictions in future years.
Action taken Outcome
• The Audit Committee considered whether it is appropriate to recognise the full value of the deferred tax asset at the year end and whether the recovery of the associated tax losses can be foreseen. We reviewed relevant management documentation in support of the conclusions reached, including the forecast financial information, challenged the assumptions underpinning the calculations and discussed the conclusions with management.
• The Audit Committee is satisfied that it is appropriate to recognise the deferred tax assets as shown in the Group’s balance sheet.
• Contingent deferred tax assets of £195m are appropriately not recognised on the balance sheet (gross £1.05bn).
• Deferred tax assets of £42.2m have been recognised in the balance sheet.
Audit Committee Report

Serco Group plc Annual Report and Accounts 2015110
Going concern and viability statement
Nature of the issue
Consideration of the going concern risk is a fundamental responsibility of the Board of Directors, and the Audit Committee supported the Board in considering this matter. The going concern assertion has a significant impact on the financial statements in terms of both the valuation and presentation of assets and liabilities. Further details of the Directors’ assessment of going concern is provided on page 102.
In addition to considering going concern, the Audit Committee has given due consideration to the requirements of the UK Corporate Governance Code and the associated viability statement, which is on page 30.
Action taken Outcome
• The Audit Committee has challenged the going concern assessment prepared by management and their identification of material uncertainties, and discussed its findings with the External Auditor.
• We consider the going concern review to have been rigorous and are satisfied that the conclusions reached are appropriate.
• Consideration was given by the Audit Committee to the period of review for going concern, which is expected to be a period of at least 12 months from the date of approval of the relevant financial statements.
• As the going concern review has been prepared for 16 months to June 2017, we have concluded that the period covered by the review is appropriate.
• The Audit Committee has reviewed and considered the work performed on assessing the viability of the Group and the period of assessment, after taking account of the Group’s current position, budget and forecasting periods and its principal risks.
• The assessment performed enabled the Board of Directors to produce the viability statement that is set out on page 30. The Committee concluded that an appropriate approach has been taken in:
i. Identifying the principal risks which could impact on future viability;
ii. Preparing the forecasts supporting the viability statement, the basis of which is set on page 30; and
iii. Sensitising these financial forecasts against the principal risks.
• The Audit Committee has given consideration to the period of assessment under the viability statement, which is expected to be a period that significantly exceeds 12 months.
• The Audit Committee considers the three-year period under which the viability statement has been prepared to be appropriate and concurs with the reasoning provided within the statement on page 30.
• The Audit Committee has reviewed the going concern and viability statement disclosures made in the Annual Report and Accounts. This review has taken into account the changes to the UK Corporate Governance Code.
• We are satisfied that pages 30, 102 and 164 of the Annual Report and Accounts include detailed disclosures regarding going concern and the viability statement.
Audit Committee Report continued

Fina
ncia
l Sta
tem
ents
Dir
ecto
rs’ R
epo
rtSt
rate
gic
Rep
ort
Directors’ Report · 111
Defined benefit pension schemes
Nature of issue
The Group is responsible for paying contributions into a number of defined benefit pension schemes directly linked to contracts in addition to the main Company scheme, Serco Pension and Life Assurance Scheme (SPLAS), and several other small non-contract specific schemes. SPLAS has a significant pension asset at the end of the year of £127.1m (2014: £143.9m) and the other contract specific schemes have a combined pension liability of £11.5m (2014: £17.4m). The value of the individual schemes fluctuates due to changes in underlying assumptions, which include the forecast bond yield rates and the forecast inflation rate.
Further details of the pension arrangements can be found in note 34 to the Group’s financial statements.
Action taken Outcome
• We considered both the process management undertook to finalise the assumptions for the main schemes, and how these assumptions benchmark against the market. Advice was taken from independent actuaries on the appropriateness of the assumptions used.
• We concluded that the process followed was appropriate and the resulting calculation appropriately balanced.
Internal audit
The Audit Committee’s responsibilities in respect of internal audit are to:
• exercise oversight over the internal audit function;
• review and approve the internal audit programme; and
• review reports issued, and monitor management’s actions to respond to findings and recommendations.
During the year the committee discussed:
• the implementation of the 2015 internal audit programme, changes to the 2015 programme particularly in light of the ongoing restructuring project and disposal of the offshore private sector BPO business, and the proposed 2016 internal audit programme, which were approved by the Committee;
• the effectiveness of the internal audit function; and
• during the year, an external effectiveness review was carried out by a third party which included reviewing and assessing how internal audit is positioned within the organisation, the effectiveness of the function, including the internal audit team and its processes; how it benchmarked against best practice; and compliance with the Institute of Internal Auditors Standards. This was reviewed in detail by the Committee.
The effectiveness review found that overall the internal audit function provides a good internal audit service and identified opportunities for further improvement which will be used in determining the strategy for the function.
Internal control and risk management
Information in relation to internal controls and risk management can be found in the accountability section of the Corporate Governance report on pages 97 to 102.
External auditors
During the year the committee considered the following matters:
• the annual audit plan of the external auditors and the 2015 external audit fees;
• pre-approving any fees in respect of non-audit services provided by the external auditors and ensuring that the provision of non-audit services did not impair the external auditors’ independence or objectivity; and
• the continuing independence of the external auditors and the effectiveness of the external audit process.
Audit Committee Report

Serco Group plc Annual Report and Accounts 2015112
External auditThe Audit Committee has responsibility for making a recommendation on the appointment, re-appointment and removal of external auditors. Deloitte LLP was re-appointed as auditor of the Group at the Annual General Meeting held in May 2015.
During the year, the Committee received and reviewed audit plans and reports from the external auditor. The external auditors also met privately with the Audit Committee without any member of management or the Executive Directors being present, and with the Chairman of the Audit Committee in between Audit Committee meetings.
Non-audit servicesThe Committee has reconfirmed its policy on the provision of audit and non-audit services by Deloitte LLP. It determined three categories of services: Approved (e.g. audit and related assurance services), Permitted (e.g. tax compliance and due diligence) and Not Permitted (e.g. design / implementation of financial information systems and quasi management services). The Committee, the Company and Deloitte LLP all monitor compliance with the policy and review at each meeting the fees earned and the estimates for the year.
The Committee acknowledges that the Group’s external auditors will have a significant understanding of the Group’s business and this knowledge and experience can be utilised to the Group’s advantage in many areas, thus ensuring efficiency in costs to the Group. They also operate to professional codes of conduct including the management of conflicts of interest. Accordingly, it considers that the external auditors may be engaged for the following non-audit services:
• assistance in tax compliance activities (including the preparation of tax returns);
• tax advisory services;
• accountants’ reports for any Stock Exchange purposes;
• ad hoc reporting on historic financial information for any other purpose and ad hoc accounting advisory services;
• due diligence activities associated with potential acquisitions or disposals of businesses;
• other corporate finance advisory services required in support of potential transactions or bids, including the review of financial models for internal consistency and compliance with Group financial accounting policies; and
• any other services which are not prohibited and are authorised by the Group Chief Financial Officer or Group Company Secretary.
Where such services are considered to be recurring in nature, approval of the Committee may be sought for the full financial year at the beginning of that year. Approval for other permitted non-audit services has to be sought on an ad hoc basis: where no Audit Committee meeting is scheduled within an appropriate time frame, approval is to be sought from the Chairman of the Committee (or his nominated alternate). The Committee may establish fee thresholds for pre-approved services and similar approvals are required for work awarded to accounting firms other than the Company’s auditor, where fees are expected to exceed pre-approved limits. The Group Company Secretary is nominated by the Audit Committee as the point of review and approval for the engagement of non-audit services. The Committee is currently targeting a cap on fees permitted for non-audit services of 70% of audit fees. In 2015 the non-audit fees paid to Deloitte totalled £3.0m (2014: £0.8m) and were 200% (2014: 38%) of the 2015 audit fee. The majority of non-audit fees in 2015 were incurred in respect of the Rights Issue, which completed in April 2015 and including work on the profit forecast, the working capital statement and a report on pro forma financial information. Excluding those fees, the non-audit fee was 33% of the 2015 audit fee.
The Group has complied with the policy throughout the year. Where appropriate, non-audit services have been provided by companies other than Deloitte LLP to safeguard auditor objectivity and independence. The fees paid to Deloitte LLP for audit, audit-related and non-audit services for 2015 can be found in Note 12 to the Consolidated Financial Statements. The principal areas of engagement of Deloitte LLP for audit-related and non-audit services were commissioned in full compliance with the above policy. The services principally related to the Rights Issue, taxation advice, audit related assurance services and due diligence and other corporate finance advisory services. In awarding this non-audit work to Deloitte, the Audit Committee took account of Deloitte’s knowledge of the Group and considered it able to provide an effective and cost efficient service.
Effectiveness of external auditorsThe Audit Committee reviewed the effectiveness of the external audit process during the year under review. An assessment of the process was undertaken by the Committee with input received from management associated with the audits undertaken (Group Finance and divisional Finance Directors). The assessment covered all aspects of the audit service provided by the audit firm. The Committee also obtained a report on the audit firm’s own internal quality control procedures and consideration of audit firms’ annual transparency reports.
Audit Committee Report continued

Fina
ncia
l Sta
tem
ents
Dir
ecto
rs’ R
epo
rtSt
rate
gic
Rep
ort
Directors’ Report · 113
The FRC’s Audit Quality Review team selected to review the audit of the 31 December 2014 Serco Group plc financial statements as part of their 2015 annual inspection of audit firms. The focus of the review and their reporting is on identifying areas where improvements are required rather than highlighting areas performed to or above the expected level. As Chairman of the Audit Committee, I received a full copy of the findings of the Audit Quality Review team and discussed these with the Audit Committee and Deloitte. The Audit Committee confirmed that there were no significant areas for improvement identified within the report. The Audit Committee is also satisfied that there is nothing within the report which might have a bearing on the audit appointment.
Audit tenderingThe Audit Committee has noted the Competition & Markets Authority’s final Order on mandatory tendering and audit committee responsibilities for FTSE 350 companies (the ‘Order’) as well as the BIS and FRC consultations on options for UK implementation of the EU Audit Directive (the ‘Consultation’).
The Order applies to financial years beginning on or after 1 January 2015 and is therefore applicable to the year under review. The Committee notes that the Order requires mandatory tendering every ten years in line with EU Regulation. As a result of Deloitte LLP being the Company’s auditor for in excess of 20 years, the transitional arrangements require that the Company must undertake a competitive tender process in respect of the external auditor appointment made on or after 17 June 2020. However, the independence and effectiveness of the External Auditor is considered annually by the Audit Committee and the assessment of the need to tender the audit is also kept under consideration by the Audit Committee, therefore it is possible that a tender process may take place before the required deadline.
Auditor independenceThe independence, objectivity and effectiveness of the external auditors have been examined by the Committee and discussions were held regarding their terms of engagement and remuneration. The Senior Statutory Auditor is Andrew Kelly, who was appointed to the role in respect of the audit for the year under review. There are no contractual obligations that restrict the Company’s current choice of external auditor. Following an assessment of the independence, objectivity and effectiveness of Deloitte LLP, the Committee recommended to the Board that Deloitte LLP be proposed for reappointment at the forthcoming 2016 Annual General Meeting. This recommendation has been accepted by the Board and will be proposed to shareholders.
Membership and meetingsThe members of the Audit Committee are myself (Chair), Mike Clasper and Rachel Lomax. All members are Non-Executive Directors who are regarded as being independent and have recent and relevant financial experience.
The Chairman, Group Chief Executive Officer, Group Chief Operating Officer, the Group Chief Financial Officer and the Group Financial Controller are invited to attend all Audit Committee Meetings. The Group Head of Internal Audit, KPMG LLP (the Group’s co-sourced internal audit provider), the Senior Statutory Auditor for Deloitte LLP, and other members of the management team are also invited as required. The Chairman of the Audit Committee reports to the Board on how the Committee had discharged its responsibilities.
The Group Head of Internal Audit, who functionally reports directly to the Chairman of the Audit Committee, has the opportunity to meet privately with the Audit Committee without any members of management present. The Chairman of the Audit Committee also meets and holds discussions with the Group Head of Internal Audit between Audit Committee meetings.
The Committee’s Terms of Reference provide that it will meet at least three times each year and in practice, the Committee meets at least four times each year to coincide with the key reporting cycle. The Committee held eight meetings during the 2015 financial year. Four meetings were called specifically to consider matters and announcements relating to the Strategic Review (as more fully set out in the Strategic Report) and the 2015 Rights Issue, whist these matters were also on the agenda of certain of the meetings held within our normal reporting cycle.
The minutes of Committee meetings are circulated to all Directors.
Malcolm Wyman Chair of the Audit Committee
25 February 2016
Audit Committee Report

Serco Group plc Annual Report and Accounts 2015114
Annual statement by the Chair of the Nomination Committee
The Nomination Committee was engaged in the early part of 2015 in managing the appointment of a new Chairman to replace Alastair Lyons. That process was run by Mike Clasper as Senior Independent Director. The process was an extremely thorough one which followed best practice. The Committee agreed the candidate specification and appointed Zygos Partnership, an external executive search consultancy (which is not connected with the Company in any way) to assist with the search for a new Chairman. The Senior Independent Director discussed the specification with key shareholders, prepared an induction schedule and led the Committee in the appraisal of candidates. The Committee discussed and agreed remuneration following discussion at the Remuneration Committee and recommended the final candidate to the Board leading to the Board approving my appointment. As part of the recruitment process I met with other members of the Board before I was pleased to be appointed in the summer of 2015.
In August, the Board received a detailed update on diversity and inclusion. It is clear that a lot of work is being done to improve all areas of diversity. In the Group’s employee engagement survey, diversity and inclusion was rated as one of the Group’s current global engagement strengths so we continue our efforts to develop in this area from a strong platform. There are a number of different plans that are being progressed across the Group and these are reported on in different sections of this Annual Report. In 2016, the Committee will keep these under review and will monitor progress both through the employee engagement survey and through general benchmarking that is relevant to the sectors we operate in.
Following the completion of my induction programme I will look to carry out a Board evaluation exercise to determine the effectiveness of the Board and its Committees and to also ensure that the skills are in place to enable the Group to successfully deliver its strategy and to ensure that the succession plans that are in place also meet the requirements of the Group as we progress through our strategy. The Nomination Committee will be responsible for implementing and monitoring any actions that result from these exercises and I will report back to you in next year’s Annual Report on the progress that is made during the year.
Committee’s responsibilitiesThe terms of reference of the Nomination Committee are available on the Company’s website at www.serco.com. The principal areas of responsibility are as follows:
• reviewing the size, structure and composition of the Board;
• recommending membership of Board Committees;
• undertaking succession planning for the Chairman, Group Chief Executive Officer and other Directors;
• searching for candidates for the Board, and recommending Directors for appointment;
• determining the independence of Directors;
• assessing whether Directors are able to commit enough time to discharge their responsibilities;
• reviewing induction and training needs of Directors; and
• recommending the process and criteria for assessing the effectiveness of the Board and Board Committees and the contribution of the Chairman and individual Directors to the effectiveness of the Board and helping to implement these assessments.
Process for Board appointmentsBefore making any appointment to the Board, the Nomination Committee will evaluate the balance of skills, knowledge and experience on the Board and, in the light of this evaluation, prepare a description of the experience and capabilities required for a particular appointment. The Committee will also make recommendations to the Board concerning the appointment of any Director or the Company Secretary and give full consideration to succession planning in the course of its work, taking into account the challenges and opportunities facing the Company and the necessary skills and expertise required on the Board.
Where external recruitment is appropriate, or to benchmark a suitable internal candidate, the Committee will engage the services of an independent search consultant. Specifications are drawn up for the roles, which include the personal attributes and experience that are felt to be essential for the effective performance of any new appointment. For the appointment of Non-Executive Directors and Chairman, consideration is also given to the time commitment that is required for a Director to fulfil the obligations to the Company.
The Board strongly supports the principle of diversity and recognises the benefits that diversity can have across all areas of the Group believing this adds to Serco’s continued success and advantage. The Board will always seek to appoint on merit against objective criteria, including diversity. When considering the optimum composition of the Board, the benefits of diversity of the Board are appropriately reviewed and balanced where possible, including in terms of differences of skills, industry experience, approach, gender, race, age, nationality, background and other contributions that individuals may bring.
Nomination Committee Report

Fina
ncia
l Sta
tem
ents
Dir
ecto
rs’ R
epo
rtSt
rate
gic
Rep
ort
Directors’ Report · 115
Governance in actionDuring the year Liz Benison, CEO of the UK and Europe Local and Regional Government Division and a member of the Executive Committee, established an ‘Inspiring Women in Serco’ network, which aims to support the progression of our female employees into senior roles and to promote Serco as being a good place for women to work.
The network, which is entirely self-selecting, has only been up and running for six months and already has over 200 active members who have been organised into seven regional groups. Each group was asked to identify various initiatives which drive the four overarching objectives: how the network can give benefit back to Serco; how it can advance individual development; how it can support social responsibility and how it can promote a positive image of public sector outsourcing in the market.
The progress made is reviewed at quarterly steering committee meetings which are attended by the leads for each region as well as Liz Benison. The network started in the UK and is growing with members now including overseas employees and employees in joint ventures. The network is fully endorsed by the Board, and both Angie Risley and Rupert Soames have been invited to speak at meetings, which are attended by a large number of employees and the recordings have also been made available afterwards. I look forward to following the network as it goes from strength to strength in 2016.
Membership and meetingsI chair the Nomination Committee and the other members are Mike Clasper, the Senior Independent Director, Angie Risley, Malcolm Wyman and Rupert Soames, the Group Chief Executive Officer. The majority of members are independent Non-Executive Directors. The Committee met six times in 2015.
The minutes of the Committee meetings are circulated to all Directors.
Sir Roy Gardner Chair of the Nomination Committee
25 February 2016
Nomination Committee Report

Serco Group plc Annual Report and Accounts 2015116
Annual statement by the Chair of the Corporate Responsibility and Risk Committee
2015 has been another busy year for the Corporate Responsibility and Risk Committee. There has been good progress in all areas, with particular focus on risk management. The Committee has had detailed discussions with divisional CEOs and risk and compliance teams to review the management of ethics; compliance; health, safety and the environment; risk management and assurance; and current business and other risks across the Group.
The Board has recently considered the responsibilities of each of the Board Committees, in particular focussing on the responsibilities of this Committee and the Board Oversight Committee. As set out in the Chairman’s Governance Overview on page 86, the responsibility of this Committee will change in 2016 and it will become the Risk Committee. This will ensure greater oversight of risk management across the Group as we look to further strengthen the Group's capabilities and processes in this area. The other responsibilities of the Committee will be moved to either the Board or the Board Oversight Committee as set out elsewhere in this Annual Report. This change is due to take effect after the AGM in May 2016.
Set out below is a summary of the Committee’s current responsibilities together with a summary of the key activities carried out in the year.
Committee’s responsibilities The terms of reference of the Corporate Responsibility and Risk Committee are available on the Company’s website at www.serco.com. The principal areas of responsibility are as follows:
• overseeing the effectiveness of the Group’s risk management framework including the principal risks facing the Group and the actions being taken by management to mitigate those risks;
• overseeing the Group’s approach to health, safety and the environment;
• overseeing the Group’s contribution to the communities in which its people live and work; and
• overseeing the impact on the environment in which the Group operates.
Principal activities during the year During the year under review, the principal activities of the Committee were as follows:
• reviewing of the Group Risk Register;
• receiving presentations from four of the five divisions to get greater insight into their management of ethics, compliance and risk management and assurance and to get a deeper understanding of current business and ethical risks;
• carrying out a detailed review of certain principal risks facing the Group, including cyber security, contract non-compliance and the management of brand integrity and reputation;
• reviewing quarterly health, safety and environment reports;
• reviewing and agreeing the 2016–2018 health, safety and environment strategy; and
• receiving reports on whistleblowing.
Corporate Responsibility and Risk Committee Report

Fina
ncia
l Sta
tem
ents
Dir
ecto
rs’ R
epo
rtSt
rate
gic
Rep
ort
Directors’ Report · 117Corporate Responsibility and Risk Committee Report
Governance in Action – Yarl’s Wood investigationFor a number of years the work of Yarl’s Wood Immigration Removal Centre has been the subject of intense scrutiny and criticism. In March 2015 a report by Channel 4 News included undercover recording of Serco staff at the Centre making unacceptable and derogatory comments. It is vital that the operation of such a sensitive part of the UK's immigration system has the confidence of the public and policy makers. It is also important for Serco and its staff that significant problems, if they exist, are recognised and promptly put right. Accordingly Serco asked Kate Lampard CBE to undertake an independent and comprehensive investigation into the culture at Yarl’s Wood, and how the culture and management of the centre affect the well being of residents.
As Chair of the CRRC, I oversaw the investigation, including setting up and agreeing the terms of reference, holding regular meetings with Kate and her team, and keeping the rest of the Board informed of progress.
The report of the independent investigation was published in January 2016. It highlighted the challenges of operating the facility and concluded that there was not an abusive culture at Yarl’s Wood. However it did identify deficiencies in staffing levels and training that needed to be addressed, and made a number of recommendations for improving the well being of residents, nearly all of which Serco has already accepted or implemented. A copy of the full report and Serco's response to each of its recommendations is available on www.serco.com.
Membership and meetings The Committee currently comprises myself as Chair, Mike Clasper, Tamara Ingram, Sir Roy Gardner and Rupert Soames. The majority of members are independent Non-Executive Directors. The Committee met four times in 2015.
The minutes of the Committee meetings are circulated to all Directors.
Rachel Lomax Chair of the Corporate Responsibility and Risk Committee
25 February 2016

Serco Group plc Annual Report and Accounts 2015118
Annual statement by the Chair of the Board Oversight Committee
After joining the Board in June 2015, one of my first tasks was to receive a detailed briefing on the Corporate Renewal Programme (Programme), which was developed in the last quarter of 2013 and started to be implemented in 2014. The key components of the Programme were as follows:
• revising Serco’s Code of Conduct, Values Statement and Governing Principles, supported by extensive training and formalised induction processes and appropriate performance management;
• comprehensively reassessing and reissuing the Serco Management System (SMS), being the Company’s framework of management control, to include more prescriptive guidance on required operational processes and procedures, and providing updated training on the SMS for management across the organisation;
• strengthening contract level governance, including improved contract bid processes to ensure appropriate levels of risk assessment, senior management scrutiny and technical and operational input;
• enhancing transparency, with robust reporting of operational and financial contract KPIs to both executive management and, in summary, to the Board and its Committees;
• achieving greater engagement of public sector customers at contract and government departmental level;
• creating a separate division for our UK Central Government work to achieve both focus on, and openness with, the UK Government as a collective customer;
• strengthening risk management compliance and internal audit processes and capabilities;
• appointing three additional Non-Executive Directors to the Board;
• creating the Corporate Responsibility and Risk Committee of the Board to formalise the process of guidance and decision-making on ethical issues;
• establishing Ethics Officers in each division, accompanied by the redesign and relaunch of our whistleblowing process;
• measuring the progress of attitudinal change throughout the organisation with ongoing independent culture and ethics reviews; and
• implementing a comprehensive set of global training programmes to reinforce the various elements of the Programme.
It is clear that a huge amount of progress has been made in delivering the Programme, which has been very important for the Group. As a direct result of the Programme, the Group now has significantly improved governance policies and procedures in place. I can see that there is still work to be done to ensure that these policies and procedures become fully embedded across the Group and it will naturally take time for this to happen but very good progress has been made to date. I can also see that all employees that I have had the pleasure to meet with want to do the right thing in the right way for our customers, which will ultimately be for the benefit of all of our stakeholders. The Board has retained the Board Oversight Committee to ensure that the embedding of the Programme continues to happen across the Group. As previously set out in this Annual Report, the responsibilities of the Committee will increase in 2016 to include governance and ethical standards, which is one of the elements that resulted from the Programme, as well as corporate responsibility matters, and the Committee will become the Corporate Responsibility Committee. This change to the Committee is due to be put in place after the AGM in May 2016.
Committee’s responsibilitiesThe principal areas of responsibility of the Committee are as follows:
• overseeing the embedding of the Corporate Renewal Programme across the Group;
• overseeing ethical standards across the Group;
• approving the Group’s Code of Conduct;
• overseeing the Group’s whistleblowing process; and
• overseeing the compliance and assurance of the Programme.
Board Oversight Committee Report

Fina
ncia
l Sta
tem
ents
Dir
ecto
rs’ R
epo
rtSt
rate
gic
Rep
ort
Directors’ Report · 119Board Oversight Committee
Principal activities during the yearDuring the year under review, the principal activities of the Board Oversight Committee were as follows:
• oversight of activities associated with the Programme including:
• the SMS self-assessment process;
• contract management performance management and reporting;
• compliance assurance;
• the global personnel training programmes; and
• the review of culture and values present in the business.
• assessing and reinforcing the Group’s ethical compass; and
• assessing the commitment of the Group’s leadership throughout the business to ‘do what is right’ in the way it conducts business with its customers and suppliers, and in the way it manages its employees and other stakeholders.
Governance in actionLord Gold is an independent third-party member of the Committee providing independent oversight of the planning and implementation of the Corporate Renewal Programme. In addition to his work on the Board Oversight Committee, Lord Gold assessed Serco’s approach to governance and ethics in the Group during 2015 and this will continue into 2016. Lord Gold has attended a meeting of the Executive Committee, he has met separately with each of the Executive Committee members and he has met with other key employees both in central functions and in operations. He also attended a conference at which approximately 250 senior managers from the UK were present. Lord Gold’s independent reporting to the Board Oversight Committee enables the Committee to better understand the depth to which the Corporate Renewal Programme is being embedded across the business.
Membership and meetingsThe Board Oversight Committee is chaired by me. The other members are Ed Casey, Ralph Crosby and Malcolm Wyman. In addition, Lord Gold is an independent third-party member of the Board Oversight Committee. The majority of members are independent Non-Executive Directors. The Committee met three times during 2015.
The minutes of the Committee meetings are circulated to all Directors.
Sir Roy Gardner Chair of the Board Oversight Committee
25 February 2016
Serco Group plc Annual Report and Accounts 2015120
Dear Shareholder
On behalf of your Board, I am pleased to present our Directors’ Remuneration Report for the year ended 31 December 2015.
The Remuneration Committee continues to focus on the need for a clear link between pay and performance and provides information on this in the Report by way of disclosures on our reward structure and on our remuneration decisions in line with the recommendations of the UK Corporate Governance Code and the requirements of the UKLA Listing Rules. This Report also complies with the provisions of the Companies Act 2006 and the Large and Medium-sized Companies and Groups (Accounts and Reports) (Amendment) Regulations 2013 (Regulations).
We have structured the Report into two sections:
1. Directors’ Remuneration Policy setting out all elements of our Company’s remuneration policy and the key factors that were taken into account in setting that policy. This policy received overwhelming support from shareholders under a binding shareholder vote at the General Meeting in May 2014 and will be resubmitted to shareholders for a vote at least every third year.
2. Annual Report on Remuneration setting out payments and awards made to our Directors and an explanation of the link between Company performance and remuneration for the financial year covered by the accounts. This report on remuneration, together with this letter is subject to an advisory shareholder vote at the Annual General Meeting on 12 May 2016.
2015 Overview
The first few months of the year were hugely challenging for the business as the new management team sought to stabilise Serco through the Rights Issue and refinancing of the group. These were exceptional circumstances and given the position of the Company at that time, the new Group Chief Executive, Rupert Soames, decided it would be in the best interests of the Company if he were to waive payment of his annual bonus in respect of 2014. Since then, and as reported in the Strategic Report (pages 5 to 83) a great deal of progress has been made in implementing the new strategy. The disposal of the offshore private sector (BPO) business was materially completed by year-end, net debt has been substantially reduced, and the management team has over-delivered on the guidance given at the beginning of 2015. Significant improvements have been made to management information and financial reporting systems, costs have been reduced and relationships with key government customers have been improved. Serco has a highly effective management team, who are committed to continuing to transform the business over the coming two years in line with the strategic plan; something the Committee has seen first-hand in our work with the management team in shaping in-year objectives and in our contract visits in the Middle East.
In addition to overseeing senior Executive remuneration, the Committee has been briefed on wider issues, most notably in 2015, the plans to deal with the implementation of the new National Living Wage; Serco welcomes any measure that addresses basic pay within the UK and provides a consistent approach to pay levels across the industry. Further detail on the Committee’s activities during the year can be found on page 142.
Rights Issue
Following the closure of the Rights Issue on 17 April 2015 the Remuneration Committee approved for the options and awards granted under the Serco Employee Share Schemes to be adjusted to compensate the option and award holders for the effects of the Rights Issue (as permitted by the rules of the relevant Serco Employee Share Schemes). The adjustments were carried out using a standard formula called the 'TERP' (Theoretical Ex Rights Price) formula and were approved by the Company’s auditors. Further details on the adjustments can be found on page 141.
Remuneration outcomes in respect of 2015
2015 Share AwardsOperating within our existing policy, in 2015 the Committee consulted with our major shareholders on some small changes to the performance measures with the intention of better aligning Serco’s incentive plans with the outcomes of the Group’s Strategy Review. The performance measures for the 2015 Performance Share Plan awards are Aggregate EPS, Relative TSR and ROIC and are described in more detail in the Implementation Report on page 138. These awards are subject to malus, clawback and a holding period.
2015 Bonus AwardsFollowing the Rights Issue, we consulted with major shareholders on some small changes to the performance measures for incentive plans in order to align with the Group’s Strategy Review. One of these was to increase the weighting on financial performance such that for 2015 70% of the annual bonus is driven by financial performance and 30% against non-financial performance. It is the view of the Remuneration Committee that the management team should be highly commended for the exceptional progress made in stabilising the business and delivering what was set out in the strategic plan during challenging circumstances. After thorough consideration there was unanimous support for the decision to make bonus awards to reflect the contribution that each member of the team has made to strengthening the business and ensuring a strong foundation on which to build a successful future.
As a result of the achievement of strong financial and non-financial performance over the year against the targets set, a bonus award of 87% of maximum (130% of salary) has been determined for Rupert in respect of 2015 performance. The corresponding bonus amounts for Angus and Ed are 87% of maximum (112% of salary) and 84% of maximum (125% of salary) respectively.
Remuneration Report
Fina
ncia
l Sta
tem
ents
Dir
ecto
rs’ R
epo
rtSt
rate
gic
Rep
ort
Directors’ Report · 121
The financial measures against which the outcome of the bonus were determined comprised Revenue, Free Cash Flow and Trading Profit. On both Free Cash Flow and Trading Profit, the achievements of the business over the year were in excess of the stretching maximum target set by the Committee at the beginning of the year, and these components of bonus have therefore paid out in full. The level of Revenue achieved over the period was between the threshold and maximum target set and as such 68% of this component of the bonus was achieved.
The financial bonus outcomes have been calculated after appropriate adjustments (agreed at the beginning of the year as part of the target-setting process) were made. These related to the Contract and Balance Sheet Review undertaken in December 2014, where a number of charges were taken in respect of Onerous Contract Provisions (OCPs). These provisions totalled £447m and relate to the multi-year net cash outflows to the end of each of the obligated periods for each of the individual contracts. The Committee believe that it is important that management be incentivised to minimise exposure on onerous contracts. However, variations to these can have a very material impact on Reported Trading Profit as under the accounting treatment, the multi-year effect of charges or releases are included in a single year. The Committee has spent considerable time reviewing the Trading Profit calculation for bonus purposes, initially working with management to determine a robust approach to decision-making, informed by a review of each individual contract and with cross-referencing to information shared with the Audit Committee. As a result of the rigour applied to this process, the Committee is satisfied that the annual bonus out-turn fairly reflects management performance in the year. Further detail can be found on pages 133 to 134.
On the non-financial metrics, the leadership team have, in their first full performance year together, shown strong and visible leadership in successfully delivering the Rights Issue, and delivering the transformation plan to achieve agreed in-year savings. The pipeline for new business is now growing again and there have been measurable increases in levels of employee and leadership engagement. The process of disposing of the offshore private sector (BPO) business was completed by the year end, despite numerous challenges. The Corporate Renewal Programme was implemented and continued to be embedded with new values being launched. The new Chairman regards the support that Rupert Soames and his team have provided to him, in becoming effective in role, as first class.
Vesting Share Awards
As a consequence of our financial performance falling short of where we wanted it to be, the long-term incentive awards made under the PSP and DBP in 2013, and due to vest in 2016 based on 2015 results, will lapse. We were below median against our peer group on a relative Total Shareholder Return basis and EPS growth fell short of the threshold of 5.5% p.a. compound.
These outcomes clearly demonstrate that our remuneration policy is effective in aligning pay with performance.
Remuneration for 2016
We are not making any changes to our remuneration policy this year.
The Committee conducted its regular review of salaries of the Executive Directors, with consideration given to the overall pay decisions for employees across the Group as a whole. Based on current conditions within the Company, it was agreed with the senior management team that with effect from 1 April 2016, the salaries for the Executive Directors will remain unchanged.
Shareholder engagement
I and the Committee believe it is important to continue to maintain effective channels of communication with our shareholders. The Committee takes the views of shareholders very seriously and these views have been influential in shaping our policy and practice. We welcome shareholder feedback on any aspect of Executive remuneration.
The voting outcome at the 6 May 2015 General Meeting in respect of the Annual Report on Remuneration for the year ending 31 December 2014 reflected very strong shareholder support with a 98.87% vote in favour.
Having been approved in May 2014, our remuneration policy will be resubmitted to shareholders for a binding vote in May 2017. In preparation for this, the Committee intends to review the policy during the course of 2016, and will discuss any possible changes with our major shareholders as part of this review.
Summary2015 has continued to be hugely challenging for the business. I believe that the Remuneration Committee has rigorously made the necessary decisions to ensure that reward is demonstrably linked to performance and shareholder interests. We will continue to engage with shareholders to ensure that our new leadership team are rewarded appropriately to incentivise them to realise Serco’s strategic objectives.
Angie Risley Chair of the Remuneration Committee
Remuneration Report

Serco Group plc Annual Report and Accounts 2015122
At a glance: implementation of remuneration policy for 2016 and key decisions for 2015The table below summarises how key elements of the remuneration policy will be implemented in 2016 and key decisions taken by the Remuneration Committee in relation to base pay and incentives for Executive Directors in respect of 2015 year-end.
ElementCEO
(Rupert Soames)CFO
(Angus Cockburn)COO
(Ed Casey)
Base salary from 1 April 2016 £850,000 £500,000 $1,061,690
Pension 30% of salary 30% of salary 30% of salary including cost of participation in US 401k plan
Annual bonus Max 150% of salary On-target 75% of salary
Max 130% of salary On-target 65% of salary
Max 150% of salary On-target 75% of salary
Annual bonus measures • 70% financial targets including Revenue, Trading Profit, Free Cash Flow.
• 30% non-financial targets.
Deferred Bonus Plan (DBP) Maximum of 50% of earned bonus can be deferred to purchase investment shares, each individual investment share purchased will be matched (on a gross investment basis) by a maximum of two ‘matching’ shares.
DBP measures EPS is the sole measure to determine the vesting of matching shares measured over three years.
Performance Share Plan (PSP) Maximum 200% of salary Maximum 175% of salary Maximum 175% of salary
PSP measures • Aggregate EPS – Statutory Earnings Per Share (EPS) before exceptional items (adjusted to reflect tax paid on a cash basis), measured as an aggregate over the three-year performance period.
• Relative TSR – Total Shareholder Return (TSR) when ranked relative to companies in the FTSE250 (excluding investment trusts).
• ROIC – Pre-tax Return on Invested Capital (ROIC), measured as an average over the three-year performance period.
Holding requirement Vested shares from the PSP to be held for two years post vesting (after payment of tax).
Shareholding requirement 200% of salary 150% of salary 150% of salary
Malus and clawback • Clawback provisions will apply to the annual bonus plan.
• Malus provisions will apply to PSP and DBP awards during the three-year performance period prior to vesting.
• Clawback provisions will apply during the two-year post-vesting holding period to shares arising from PSP awards.
• Clawback provisions will apply to matching shares awarded under the DBP.
Changes for 2016 No change
Year-end decisions made
Executive Directors
1 April 2016 salary review No change No change No change
2015 Bonus outcome:
• Currency value £1,103,130 £562,380 $1,330,085
• % of salary 129.78% 112.48% 125.28%
• % of maximum 86.52% 86.52% 83.52%
2013 PSP vesting N/a N/a Nil
Non-Executive Directors
Chairman fee effective 1 July 2015 £250,000 (previous Chairman £270,000)
Remuneration Report continued

Fina
ncia
l Sta
tem
ents
Dir
ecto
rs’ R
epo
rtSt
rate
gic
Rep
ort
Directors’ Report · 123
2015 actual single figure versus remuneration policy
The following charts show the actual single figure for remuneration for the Executive Directors against the remuneration policy scenarios applying for 2015:
6000
£ £ US$
Below Threshold
Below Threshold
Below Threshold
Min. Min. Min.Max. Max. Max.Actual Single Figure
Actual Single Figure
Actual Single Figure
2500 5000
0 0 0
1000 500 1000
20001000 2000
3000
1500 30004000
£1,128
Fixed elements of remuneration Annual Variable Multiple period variable
£3,070
£5,012
£2,226
£673 $1,405
$3,130
2000 40005000
Rupert Soames Angus Cockburn Ed Casey
£1,436
£2,198
£1,231
$4,855
$2,730
Notes: The scenarios in the above graphs are defined as follows:
Fixed elements of remuneration Base salary as at 1 April 2015
Estimated value of benefits provided under the remuneration policy
Cash allowance in lieu of pension 30% of salary for CEO and CFO
Cash allowance in lieu of pension 30% of salary for COO less the cost of participation in the US 401k plan
Ed Casey’s fixed elements of pay are converted into GBP with an exchange rate of USD 1 = GBP 0.65398
Below Threshold Target performance Maximum performance
Annual bonus (payout as a % of salary)
0% 75% CEO
65% CFO
75% COO
150% CEO
130% CFO
150% COO
Deferred Bonus Plan Nil 1:1 Matching Shares1 2:1 Matching Shares1
Performance Share Plan(as a % of face value)
Nil 50%1 100%1
Note:
1 The Deferred Bonus Plan and Performance Share Plan values reflect the target and maximum vesting scenarios for the 2015 awards, the CFO and COO did not participate in the Deferred Bonus Plan in 2015. The Deferred Bonus Plan and Performance Share Plan values in the actual single figure reflects the vesting of the 2013 awards which was zero. The CEO and CFO joined the Company in 2014 so did not receive awards in 2013. Share price movement and dividend equivalents have not been incorporated into the above figures.
Remuneration Report

Serco Group plc Annual Report and Accounts 2015124
In this section
Remuneration Policy Page Remuneration Report Page
Directors Remuneration Policy 124 Executive Single Figure 132
Remuneration Policy for Other Employees 128 Variable Pay Outcomes 133
Recruitment Policy 129 Non-Executive Director Single Figure 135
Service Contracts and Loss of Office Policy 130 2015 Share Awards 138
Non-Executive Director Policy 131 Directors Share Interests 140
Remuneration Committee 141
Directors’ Remuneration Policy
The following report details the remuneration policy and the decisions on remuneration of the Directors of the Group for the year ended 31 December 2015. This report has been drafted in compliance with the disclosure requirements of the UK Corporate Governance Code and the requirements of the UKLA Listing Rules. This Report also complies with the provisions of the Companies Act 2006 and the Large and Medium-sized Companies and Groups (Accounts and Reports) (Amendment) Regulations 2013 (Regulations).
The remuneration policy report was approved by shareholders at the 2014 AGM and will apply until shareholders next consider and vote on the Policy at the AGM in 2017.
The Directors’ Remuneration Policy is displayed on the Company’s website, in the investor area.
Remuneration Policy
Serco’s remuneration policy supports the achievement of the Company’s long-term strategic objectives. Serco’s approach to executive remuneration is designed to:
• Support Serco’s long-term future growth, strategy and values;
• Align the financial interests of executives and shareholders;
• Provide market competitive reward opportunities for performance in line with expectations and deliver significant financial rewards for sustained out-performance;
• Enable Serco to recruit and retain the best executives with the required skills and experience in all our chosen markets;
• Be based on a clear rationale which participants, shareholders and other stakeholders are able to understand and support.
Remuneration Report continued

Fina
ncia
l Sta
tem
ents
Dir
ecto
rs’ R
epo
rtSt
rate
gic
Rep
ort
Directors’ Report · 125
Future policy table
The remuneration package for Executive Directors consists of base salary, annual bonus, long-term share based incentives, pension and other benefits. The Company’s policy is to ensure that a significant proportion of the package is related to performance.
The following table sets out each element of reward and how it supports the Company’s short and long-term strategic objectives. Whilst the table is focused on Executive Directors, the table set out on page 128 provides further information of how pay policies are set for the broader employee population.
How the element supports our strategic objectives Operation of the element Maximum potential value
and payment at threshold
Performance metrics used, weighting and time period applicable
Base Salary
To help recruit and retain executives of the necessary calibre to execute Serco’s strategic objectives and to recognise an individual’s experience, responsibility and performance.
To ensure base salaries are competitive in the market in which the individual is employed.
Pay levels are designed to be competitive and fair and reflect the skills and performance of individuals.
Salaries are benchmarked from time to time against salaries for the Company’s relevant peer group, with the market positioning dependent on the scale of challenges intrinsic to the individual’s role and individual’s ability and experience. In some circumstances there may be phased movement to that positioning.
Salaries are reviewed annually and any changes are effective from 1 April in the financial year.
Over the policy period, base salaries for Executive Directors will be set at an appropriate level within the peer group and will normally increase at no more than the greater of inflation and salary increases made to the general workforce in the jurisdiction the Executive Director is based in.
Higher increases may be made in exceptional circumstances, for example when there is a change in role or responsibility.
None
Benefits
To provide a competitive level of benefits.
Serco pays the cost of providing the benefits on a monthly basis or as required for one-off events such as receiving financial advice.
These include but are not limited to car allowances, private medical insurance, permanent healthcare insurance, life cover, annual allowance for independent financial advice, and voluntary health checks every two years.
Relocation benefits will be provided in a manner that reflects individual circumstances and Serco’s relocation benefits policy. For example, relocation benefits could include temporary accommodation for the Executive and dependents and tax equalisation.
Benefits are reviewed annually against market practice and are designed to be competitive.
The maximum opportunity for benefits is defined by the nature of the benefits and the cost of providing them. As the cost of providing such benefits varies based on market rates and other factors, there is no formal maximum monetary value.
None
Remuneration Report

Serco Group plc Annual Report and Accounts 2015126
How the element supports our strategic objectives Operation of the element Maximum potential value
and payment at threshold
Performance metrics used, weighting and time period applicable
Annual Bonus
Incentivise executives to achieve specific, predetermined goals during a one-year period.
Reward ongoing stewardship and contribution to core values.
Bonus result is determined by the Committee after the year end, based on performance against objectives and targets.
Annual bonuses are paid after the end of the financial year end to which they relate. There is an optional deferral of 50% of the total earned bonus into Serco shares.
On change of control the Remuneration Committee may pay bonuses on a pro-rata basis measured on performance up to the date of change of control.
Maximum bonus opportunity:
150% of salary for CEO 130% of salary for CFO 150% of salary for COO
On-target bonus:
75% of salary for CEO 65% of salary for CFO 75% of salary for COO
Threshold bonus is 20% of maximum bonus opportunity.
Bonus is earned on the basis of achievement of a mix of financial and non-financial objectives of which at least 50% are financial.
Financial measures are based on the Company’s Key Performance Indicators (KPIs) and the non-financial measures are based on key strategic objectives.
Performance is measured over the financial year.
The Committee has discretion to vary the weighting of performance metrics over the life of this remuneration policy. Also the Committee has discretion in exceptional circumstances to vary performance measures part-way through a performance year if there is a significant event (such as a major transaction or transition in role) which causes the Committee to believe the original performance conditions are no longer appropriate.
Deferred Bonus Plan (DBP)
This plan is to incentivise executives to achieve superior returns for shareholders and to align executives to shareholder interests.
Executive Directors can elect to defer, for three financial years, up to 50% of their annual bonus by purchasing investment shares.
Each individual investment share purchased will be matched (on a gross investment basis) by up to a maximum of two ‘matching’ shares.
Dividends are reinvested and distributed only in respect of shares that vest at the end of the performance period.
The Committee, at its discretion may attach a post-vesting holding period for awards.
In circumstances such as fraud, misconduct and / or misstatement by a participant, the Company will be entitled to withhold before the vesting date the value of any shares to be released or the payment of cash equivalents under the DBP.
On a change of control, awards vest pro-rata for time and performance up to the date of change of control unless the Committee decides otherwise.
As provided in the plan rules approved by shareholders, the Committee has discretion to adjust awards in the event of, for example, corporate restructuring or capital events.
For maximum performance, each investment share is matched by two matching shares.
For threshold performance each investment share is matched by half a matching share.
Earnings Per Share (EPS) is the sole measure to determine the vesting of matching shares.
The performance condition is measured over three years.
In exceptional circumstances the Committee retains discretion to change performance measures and targets and the weightings attached to performance measures part-way through the performance period if there is a significant event (for example a major transaction) which causes the committee to believe the original measures, weightings or targets are no longer appropriate.
The Committee has discretion to vary the proportion of awards that vest, to ensure that the outcomes are fair and appropriate and reflect the underlying financial performance of the Group.
Remuneration Report continued

Fina
ncia
l Sta
tem
ents
Dir
ecto
rs’ R
epo
rtSt
rate
gic
Rep
ort
Directors’ Report · 127
How the element supports our strategic objectives Operation of the element Maximum potential value
and payment at threshold
Performance metrics used, weighting and time period applicable
Performance Share Plan (PSP)
To drive achievement of longer-term objectives, increase shareholder value aligned closely to creating shareholders’ interests.
Awards of nominal cost options / conditional shares made annually.
Dividends are reinvested and distributed only in respect of shares that vest at the end of the performance period.
The Committee, at its discretion may attach a post-vesting holding period for awards.
In circumstances such as fraud, misconduct and / or misstatement by a participant, the Company will be entitled to withhold before the end of the holding period the value of any shares to be released or the payment of cash equivalents under the PSP.
On a change of control awards vest pro-rata for time and performance up to the date of change of control unless the committee decides otherwise.
As provided in the plan rules approved by shareholders, the Committee has discretion to adjust awards in the event of, for example, corporate restructuring or capital events.
Face value on grant of 200% of base salary for the CEO and 175% for the CFO and COO.
25% of the award vests for threshold performance.
Vesting is dependent on at least two performance conditions chosen from:
• EPS• Relative TSR• Share Price or absolute TSR
The measures are independent, and are measured over three years. The weighting of each is determined prior to award. The Remuneration Committee has discretion to adopt other measures following consultation with major shareholders.
In exceptional circumstances the Committee retains discretion to change performance measures and targets and the weightings attached to performance measures part-way through the performance period if there is a significant event (such as a major transaction) which causes the committee to believe the original measures, weightings or targets are no longer appropriate.
The Committee has discretion to vary the proportion of awards that vest, to ensure that the outcomes are fair and appropriate and reflect the underlying financial performance of the Group.
Pension
To provide funding for retirement. Executive Directors may participate in tax-approved pension plans operated by the Company.
A cash allowance is available for those not participating in a pension scheme or whose participation exceeds one or more tax allowances.
Rupert Soames and Angus Cockburn receive a cash allowance in lieu of pension equal to 30% of base salary.
Ed Casey participates in the US 401k pension and receives a cash allowance in lieu of pension equal to 30% of base salary less the cost of participation in the US 401k plan.
None
Shareholding Requirement
To support long-term commitment to the Company and the alignment of employee interests with those of shareholders.
Unvested performance shares or options are not taken into account. Share price is measured at end of each financial year.
Executives are required to retain in shares 50% of the net value of any performance shares vesting or options exercised until they satisfy the shareholding requirement.
CEO – 200% of salaryCFO – 150% of salary COO – 150% of salary
The Committee has the discretion to increase the shareholding requirements of the Executive Directors.
None
Remuneration Report

Serco Group plc Annual Report and Accounts 2015128
Notes to the policy table:
Performance measures and targetsThe table below sets out a rationale for the performance conditions chosen for annual bonus, Deferred Bonus Plan and Performance Share Plans and how targets were set.
Element Performance measures and rationale How targets are set
Annual bonus • Financial and non-financial performance measures.
• The Committee selected the financial measures based on the Company’s Key Performance Indicators (KPIs) and the non-financial measures were individually set and based on key strategic goals.
• The performance targets are determined annually by the Committee taking into account analyst consensus and the Company’s forecasts.
Deferred Bonus Plan • EPS is the sole measure to determine the vesting of matching shares.
• The Committee selected EPS as it is a key performance indicator both for the Company and its major shareholders.
• The Committee believes EPS can be directly influenced by executive decision-making while also reflecting shareholder value.
• EPS targets are set in reference to analyst forecasts, company business plans, and levels of EPS required to support our share price goals.
• Share price targets reflect what the Committee determines as stretching, taking into account the recent fall in share price and historic share price levels, but also what is realistic and consistent with achievable levels of financial performance.
• The Committee consults with a selection of the largest shareholders and the voting guidance services when determining targets for the company’s LTI arrangements.
Performance Share Plan • EPS, Relative TSR and Share Price or absolute TSR.
• As set out above EPS is an important measure of shareholder value which can also be influenced by executive decision making.
• Relative TSR reflects our performance relative to other companies in which investors could chose to invest.
• The rationale for the share price measure is explicitly to recognise the recent falls in share price and to ensure that the full award is not delivered unless shareholders benefit from a significant recovery in value over the next 3 years.
Remuneration policy for other employees
The remuneration policy described in the previous table applies specifically to Executive Directors of the Group. The Committee believes that the structure of management reward at Serco should be linked to Serco’s strategy and performance. The table below explains how the remuneration policy has been cascaded below Executive Directors to achieve alignment of policy across the organisation.
Element Difference in remuneration policy for other employees
Base salary • The same principles and considerations that are applied to Executive Directors are, as far as possible, applied to all employees.
Benefits • Serco also has provisions for market-aligned benefits for all employees.
Pension • The Group operates a number of defined benefit schemes and defined contribution schemes. Individuals who have exceeded certain tax allowances may be offered cash allowances in lieu of pension benefits.
Annual bonus • Approximately 350 members of the Global Leadership Team are eligible for a bonus award under The Leadership Team Bonus Scheme.
Deferred Bonus Plan (DBP) • Members of the Executive Committee are invited to participate in the DBP on the same terms as the Executive Directors.
Performance Share Plan (PSP) • The PSP is awarded to approximately 350 employees in the Global Leadership Team.
Sharesave • An all-employee scheme. Options are normally granted at a discount of 10% to the market value and have no performance conditions. The Executive Directors do not participate in Sharesave.
Remuneration Report continued

Fina
ncia
l Sta
tem
ents
Dir
ecto
rs’ R
epo
rtSt
rate
gic
Rep
ort
Directors’ Report · 129
Considerations of conditions elsewhere in the Group
Although the Committee does not consult directly with employees on the Directors’ Remuneration Policy, the Committee does consider the general base salary increase, remuneration arrangements and employment conditions for the broader employee population when determining the remuneration policy for the Executive Directors.
Approach to recruitment remuneration
Serco operates in diverse markets and geographies and many of its competitors for talent are outside the UK. In the event of hiring a new Executive Director, the Committee will typically align the remuneration package with the above Remuneration Policy, which provides for a maximum total incentive under bonus, PSP and DBP combined of 500% of salary in any one year (assuming maximum bonus, maximum investment in the DBP and maximum achievement of all PSP and DBP performance conditions). This is the maximum level of incentives excluding buy-outs that will apply to new recruits. Different performance conditions may apply for new recruits from those set out in the policy, depending on the particular circumstances at the time (which could, for example, include the appointment of an interim Executive Director).
In determining appropriate base salary on hiring a new Executive Director, the Committee will take into account all factors it considers relevant, including their experience and calibre, current total remuneration, levels of remuneration for companies in the Committee’s chosen peer group, and the remuneration required to attract the best candidate for Serco. The Committee will seek to ensure that the arrangement is in the best interests of the Company and its shareholders without paying more than is necessary. New promotes or recruits to the Board may on occasion have their salaries set below the targeted policy level while they become established in their role. In such cases, salary increases may be higher than inflation or the general UK workforce increase until the targeted market positioning is achieved.
Where it is necessary to compensate a candidate for entitlements and / or unvested long-term incentive awards from an existing employer that are forfeited, the Committee will seek to match the quantum, structure and timeframe of the award with that of the awards forfeited. In determining the form and quantum of replacement awards, the Committee will consider whether existing awards are still subject to performance requirements, and the extent to which those are likely to be met, with the aim of providing an opportunity of broadly equivalent value. The principle will be to seek to replace awards that remain significantly at risk for performance at the candidate’s current employer with awards subject to performance at Serco and to seek to make any other replacement awards in the form of Serco shares, subject to appropriate vesting or holding requirements. Any compensation for awards forfeited is not taken into account in determining the maximum incentive award level.
The recruitment policy also includes the additional provision of benefits in kind, pensions and other allowances, such as relocation, education and tax equalisation in line with Serco policies as may be required in order to achieve a successful recruitment. The policy for recruitment also includes benefits that are either not significant in value or are required by legislation. It is anticipated that any new Executive Director would be offered a pension allowance equal to 30% of base salary in lieu of pension.
Where a new Executive Director is an internal promotion, the Committee reserves discretion to allow the new Executive Director to continue to benefit from existing awards granted, or benefit entitlements (such as pension) prior to appointment to the Board.
The policy on the recruitment of new Non-Executive Directors is to apply the same remuneration elements as for the existing Non-Executive Directors. It is not intended that day rates or benefits in kind be offered, although in exceptional circumstances such remuneration may be required in currently unforeseen circumstances.
The Committee will include in future Annual Reports details of the implementation of the Policy in respect of any such recruitment to the Board.
Element of remuneration Maximum percentage of salary
Maximum variable pay:
normally comprising:
• Annual bonus
• Long-term incentives
500%
150%
350%
Pension allowance 30% cash allowance in lieu of pension
Note: Maximum percentage of salary for annual bonus and long-term incentives excludes compensation for awards forfeited.
Remuneration Report

Serco Group plc Annual Report and Accounts 2015130
Service contracts and loss of office payments
The policy for service contracts for new Directors is shown in the table below. Ed Casey has a service contract which has aspects that differ from policy as highlighted underneath the table. The Committee may under this policy at any time, with the agreement of a Director, alter aspects of their existing contracts so that they are in line with the policy for new Directors. Copies of the Directors’ service contracts and letters of appointment are available for inspection at the Company’s registered office. The date of appointment for each Director is shown in the table below:
Provision Detailed terms
Notice period • 12 months notice from the Company • 12 months notice from the Director
Termination payment • Payment in lieu of notice comprising: – Base salary – Pension allowance – Selected benefits
• All of the above would be paid in instalments in accordance with the Director’s contractual payment schedule, subject to an obligation on the part of the Director to mitigate his loss such that payments will either reduce or cease completely, in the event that the Director gains new employment / remuneration. In the event of a compromise or severance agreement, the Committee may make payments it considers reasonable in settlement of potential legal claims. It may include in such payments reasonable reimbursement of professional fees incurred by the Director in connection with such agreements and reasonable payments in respect of restrictive undertakings.
• The Remuneration Committee may agree that if a Director steps down from the Board then for a transitional period notice (including payment in lieu of notice) would continue to be based on the equivalent of up to twelve months’ notice based on their rate of salary and benefits while a Director, payable in instalments and subject to mitigation.
• The reimbursement of repatriation costs or fees for professional or outplacement advice may also be included in the termination package, as deemed reasonable by the Committee, as may the continuation of benefits for a limited period.
Treatment of annual bonus on termination under plan rules
• No payment unless employed on date of payment of bonus except for ‘good leavers’: defined as death, disability, redundancy and other circumstances at the Committee’s discretion.
• ‘Good leavers’ are entitled to a bonus pro-rated to the period of service during the year, subject to the outcome of the performance metrics and paid at the usual time.
• The Committee has discretion to reduce the entitlement of a ‘good leaver’ in line with performance and the circumstances of the termination.
Treatment of unvested performance shares or options and unvested matching deferred share awards on termination under plan rules
• All awards lapse except for ‘good leavers’: ill-health, injury or disability, death, redundancy, retirement, change of control (as defined in the plan rules) and other circumstances at the Committee’s discretion (to the extent that they allow ‘good leaver’ treatment for particular awards).
• For ‘good leavers’ vesting is pro-rated on a time basis and is dependent on the achieved performance over the performance period.
• The Committee has the discretion to vary the level of vesting to reflect the individual performance, and may, depending on the circumstances of the departure, allow some awards to vest while lapsing others.
Provision Detailed terms
Change of control • Where the Director leaves the Company following a change of control, whether or not he is dismissed or he elects to leave on notice, he will be entitled to receive a payment equivalent to up to one year’s remuneration.
Exercise of discretion • Intended only to be used to prevent an outcome that is not consistent with performance. The Committee’s determination will take into account the particular circumstances of the Executive Director’s departure and the recent performance of the Company.
NEDs • Appointed for initial three-year term.• Appointment may be terminated on 3 months’ written notice.• All Non-Executive Directors are subject to annual re-election.• No compensation or other benefits are payable on early termination.
Notes: In respect of Ed Casey, operating within our existing policy, in 2014 the Committee increased the notice period to 12 months from the Company to align with the other directors, and 4 months from the Director to more closely align with US employment practice.
Whilst unvested Awards will normally lapse, the Committee may in its absolute discretion allow for Awards to continue until the normal vesting date and be satisfied, subject to achievement of the performance conditions. In such circumstances, Awards vesting will normally be prorated on a time apportioned basis, unless the Committee determines otherwise.
Any such discretion in respect of leavers would only be applied by the Committee to ‘good leavers’ where it considers that continued participation is justified, for example, by reference to past performance to the date of leaving, or by the requirement to achieve an orderly transition. The claw-back provisions would continue to apply in the event that such discretion were exercised.
Service contracts outline the components of remuneration paid to the individual but do not prescribe how remuneration levels may be adjusted from year to year.
Remuneration Report continued

Fina
ncia
l Sta
tem
ents
Dir
ecto
rs’ R
epo
rtSt
rate
gic
Rep
ort
Directors’ Report · 131
The Chairman and Non-Executive Directors’ fees
In accordance with the Company’s policy, the fees of the Chairman and the Non-Executive Directors, which are determined by the Board, are set at a level which is designed to attract individuals with the necessary experience and ability to make a substantial contribution to the Group’s affairs. The Chairman and Non-Executive Directors' letters of appointment are available for inspection at the Company's registered office.
How the element supports our strategic objectives
Operation of the element Maximum potential value and payment at threshold
Performance metrics used, weighting and time period applicable
To attract Non-Executive Directors with the necessary experience and ability to make a substantial contribution to the Group’s affairs.
The fees of the Chairman are determined and approved by the Remuneration Committee (excluding Chairman) and fees of the Non-Executive Directors, are determined and approved by the Board as a whole.
The Chairman receives a base fee.
The following fees are paid to Non-Executive Directors in addition to their base fee:
• SID fee • Committee Chairmanship fee • Committee membership fee
Fees are reviewed on an annual basis against a relevant peer group and taking into consideration market practice.
An allowance is payable to directors for attendance at meetings outside their country of residence where such meetings involve inter-continental travel.
In addition, reasonable travel and business related expenses are paid.
Non-Executive Directors are not entitled to receive incentives and pension.
Non-Executive Directors are encouraged to hold shares in the Group but are not subject to a shareholding requirement.
Over the policy period, base fees for current Non-Executive Directors will be set at an appropriate level within the peer group and increases will typically be broadly in line with market.
The base fees or fees for specific Non-Executive Directors roles may be reviewed at any time based on the anticipated responsibility and time commitment involved.
Current fee levels are shown in the section on implementation of policy.
Non-Executive Director fees are not performance related.
Dates of Director’s Service Contracts / Letters of Appointment
Director Date of appointment to the Board
Rupert Soames 8 May 2014
Angus Cockburn 27 October 2014
Ed Casey 25 October 2013
Sir Roy Gardner 1 June 2015
Angie Risley 1 April 2011
Ralph D. Crosby Jnr 30 June 2011
Malcolm Wyman 1 January 2013
Mike Clasper 3 March 2014
Tamara Ingram 3 March 2014
Rachel Lomax 3 March 2014
Notes: All Directors are put forward annually for re-election at the AGM.
Alastair Lyons was appointed to the Board on 16 March 2010 and ceased to be a Director on 1 July 2015.
Remuneration Report

Serco Group plc Annual Report and Accounts 2015132
Annual report on remuneration
The implementation of the remuneration policy for year ended 31 December 2015The remuneration policy for the year ended 31 December 2015 was consistent with the policy on which shareholders voted on at the 2014 AGM.
Single Figure – Directors remuneration (audited information)
Executive Director’s single figureThe following table shows a single total figure of remuneration in respect of qualifying services for 2015 for each Executive Director, together with comparative figures for 2014. Details of NEDs’ fees are set out in the next section.
Rupert Soames Angus Cockburn Ed Casey6
2015 2014 (part-year) 2015 2014 (part-year) 2015 2014
Salary and fees £ 850,000 566,667 500,000 83,333 694,324 733,604
Taxable benefits1 £ 18,154 10,988 18,154 103,031 20,836 9,960
Bonus2 £ 1,103,130 – 562,380 – 869,849 689,650
LTI3 £ N/a N/a N/a N/a – –
Pension4 £ 255,000 170,000 150,701 27,016 200,318 171,850
Other5 £ – – – 111,068 – –
Total £ 2,226,284 747,655 1,231,235 324,448 1,785,327 1,605,064
Notes: 1. The value of the taxable benefits relate to the provision of independent financial advice, provision of a car or car allowance (fully inclusive of all scheme costs including insurance
and maintenance), health-care, private medical assessments and expatriate benefits. Ed Casey’s 2015 benefits relate primarily to his expatriate status, including costs of £6,927 for accommodation and travel.
2. The bonuses shown include performance bonuses earned in the period under review, but not paid until the following financial year.
3. The 2013 PSP and DBP awards vested at zero.
4. The pension amount includes payments made in lieu of pension, calculated as a percentage of base salary, from which the Executive Directors make their own pension arrangements.
5. The amount shown is to compensate Angus for the pro-rated bonus that he would have received from Aggreko in respect of the final three months of 2014 had he not left to join Serco.
6. Ed Casey's remuneration is paid in US dollars, for the purpose of the 2015 single figure USD1 = GBP 0.65398. For the purpose of the 2014 single figure USD1 = GBP 0.60779.
The annual base salaries of the Executive Directors for the year ended 31 December 2015 were:
Director Base salary Effective Date Increase
Rupert Soames £850,000 8 May 2014 N/a
Angus Cockburn £500,000 27 October 2014 N/a
Ed Casey $1,061,690 1 April 2014 N/a
Remuneration Report continued

Fina
ncia
l Sta
tem
ents
Dir
ecto
rs’ R
epo
rtSt
rate
gic
Rep
ort
Directors’ Report · 133
Variable pay outcomes (audited information)
Performance-related annual bonusFor 2015, the Executive Director bonus was based on achieving a mix of financial and non-financial objectives which were weighted 70:30. The financial measures were based on Revenue (20%), Free Cash Flow (40%) and Trading Profit (40%) and the non-financial measures were individually set and based on key strategic goals.
The Remuneration Committee reviewed the achievements against the targets for the year and proposed annual incentive payments for the Executive Directors. The table below shows the achievement against the financial and non-financial measures.
Financial performance
Performance Measure
Weighting for 2015
(% maximum opportunity)
Threshold target
(m)
Maximum target
(m)
Actual performance
(m)
Achievement against
measure(% maximum opportunity)
Revenue 14% £3,365.0 £3,612.0 £3,522.0 68%
Free Cash Flow 28% -£159.0 -£135.0 -£16.2 100%
Trading Profit 28% £82.3 £96.9 £112.5 100%
Non-financial performance
See table below 30%Rupert
SoamesAngus
CockburnEd
Casey
70% 70% 60%
RupertSoames
Angus Cockburn
EdCasey
Total bonus payable as % of maximum 86.52% 86.52% 83.52%
Bonus opportunity as % of salary 150% 130% 150%
Bonus amount achieved as % of salary 129.78% 112.48% 125.28%
Bonus amount earned £1,103,130 £562,380 $1,330,085
As part of the Contract and Balance Sheet Review (CBSR) undertaken in December 2014, a number of charges were taken in respect of Onerous Contract Provisions (OCPs). These provisions totalled £447m and relate to the anticipated multi-year net cash outflows to the end of each of the obligated periods for each of the individual contracts. The Committee believe that it is important that management be incentivised to minimise exposure on onerous contracts. However, variations to these can have a very material impact on Reported Trading Profit as under the accounting treatment, the multi-year effect of charges or releases are included in a single year. The Committee has therefore decided to use a measure for bonus calculations which is effectively aligned to Underlying Trading Profit (Reported Trading Profit less foreign exchange and OCP charges and releases and other net movements on CBSR items), to which is added or subtracted an amount related to over or under-performance against the various CBSR items which fairly reflects management performance in the year. In coming to this judgement, the Committee has access to detailed reports providing reasons behind the various movements, which included reviews of individual contracts with cross-referencing to information shared with the Audit Committee.
Within Reported Trading Profit at constant currency of £137.1m, there is £41.2m credit relating to items, other than foreign exchange, which are not considered in Underlying Trading Profit; these include adjustments made to CBSR items. Excluding these, the constant currency Underlying Trading Profit is £95.9m. The Committee has considered how much of this £41.2m net benefit should be adjusted out of Reported Trading Profit for bonus purposes. A total of £24.6m has been adjusted out for management bonus purposes as these are not considered to be the result of management action. The resulting £112.5m therefore includes £16.6m to reflect for bonus purposes the in-year performance of management action which has improved the CBSR position.
The Revenue and Free Cash Flow actual performances reflect constant currency and includes discontinued operations, making them consistent with the basis on which the targets were set.
Remuneration Report

Serco Group plc Annual Report and Accounts 2015134
Non-Financial Performance
Rupert Soames
Rupert’s objectives focused on: • Leading the creation of effective Business
Development plans• Leading the delivery of the transformation plan with
agreed in-year savings • Implementing the Corporate Renewal Programme
ensuring commitments are delivered• Continuing to improve employee engagement through
transformation of culture• Achieving the planned Rights Issue and refinancing
of the Group• Executing the planned disposal of the offshore private
sector (BPO) business• Working with the new Chairman to ensure he became
effective in the shortest possible time
The Committee deemed performance to be very strong. Rupert has shown strong and visible leadership during 2015, successfully completing the Rights Issue, and delivering the transformation plan to achieve agreed in-year savings. The pipeline for new business is now growing again and there have been measurable increases in levels of employee and leadership engagement. The process of disposing of the offshore private sector (BPO) business was completed by year end, despite numerous challenges. The Corporate Renewal Programme was implemented and continued to be embedded with new values being launched. The new Chairman regards the support Rupert has provided to him in becoming effective in role as first class. Based on Rupert’s achievement the Committee has awarded above target performance for the non-financial element relating to these objectives.
Angus Cockburn
Angus’ objectives focused on: • Leading the assessment of contractual risk• Embedding improvements to management of financial
reporting and accounts• Reviewing the effectiveness of internal audit and risk
management • Leading the finance function transformation • Achieving the planned Rights Issue and refinancing of
the Group
The Committee deemed performance to be very strong against all objectives. Examples of successes include successfully completing the Rights Issue, embedding of formal monthly management accounts processes to deliver timely and accurate financial reporting, a review of the internal audit function with steps taken to develop an appropriately rigorous risk management framework, and the implementation of a new, improved finance model with strengthened capability. Based on Angus’ achievement the Committee has awarded above target performance for the non-financial element relating to these objectives.
Ed Casey Ed’s objectives focused on:
• Development of business development plans
• Leading delivery of a transformation plan to achieve cost savings
• Embedding new standards for bid governance and contract management
• Achieving the planned disposal of the offshore private sector (BPO) business
• Developing the approach to risk management
The Committee deemed performance to be very strong against all objectives. Examples of successes include delivery of the transformation plan to achieve agreed in-year savings. The process of disposing of the offshore private sector (BPO) business was completed by year end, despite numerous challenges and the pipeline for new business is now growing again. Good progress has been made in embedding new standards for bid governance and in developing the approach to risk management. Based on Ed’s achievement the Committee has awarded above target performance for the non-financial element relating to these objectives.
Note: 1. All Executive Directors are entitled to participate in the Deferred Bonus Plan (the DBP) in 2016, up to a maximum of 50% of the bonus determined in respect of 2015 performance.
Performance Share Plan (PSP)
The LTI amount included in the 2015 single total figure of remuneration includes the PSP award which was awarded in 2013. For the PSP awards which completed their performance period on 31 December 2015, achievement against the measure is shown in the table below:
Performance condition WeightingThreshold – 25%
vestingMaximum –
100% vesting ActualPercentage of max achieved
EPS growth. For threshold performance 25% of the award vests rising on a straight-line basis to 100% at maximum performance.
50% 5.5% 10.5% -53.31% 0%
Relative TSR. For median performance 25% of the award vests rising on a straight-line basis to 100% for upper quartile performance.
50% Median Upper Quartile Below Median 0%
Total 0%
The awards made to the Executive Directors were as follows:
2013 PSP share awardsNo of shares
awardedNo of shares
vestingVesting
date
Value of vesting
£
Ed Casey 93,553 0 15 April 2016 0
Notes: 1. Ed Casey’s PSP award was made prior to him being appointed to the Board.
2. Rupert Soames and Angus Cockburn joined the Company in 2014 and therefore do not have outstanding 2013 PSP awards.
Remuneration Report continued

Fina
ncia
l Sta
tem
ents
Dir
ecto
rs’ R
epo
rtSt
rate
gic
Rep
ort
Directors’ Report · 135
Single Figure – Non-Executive Directors remuneration (audited information)
Non-Executive Directors’ remuneration consists of cash fees paid monthly with increments for positions of additional responsibility. In addition, an inter-continental travel allowance and reasonable travel and related business expenses are paid. No bonuses are paid to Non-Executive Directors. Non-Executive Directors’ fees are not performance related.
Non-Executive Directors are encouraged to hold shares in the Group but are not subject to a shareholding requirement.
The fees and terms of engagement of Non-Executive Directors are reviewed on an annual basis, taking into consideration market practice and are approved by the Board.
Board fee (including Chairmanship fees)
£Allowances3
£Total
£
2015 2014 2015 2014 2015 2014
Roy Gardner1
Chairman; Chairman of Nomination Committee and Member of Audit, Remuneration, Nomination and Corporate Responsibility & Risk Committees 129,167 N/a 5,000 N/a 134,167 N/a
Alastair Lyons2
Prior to 1 July 2015: Chairman; Chairman of Nomination Committee and Member of Remuneration Committee 135,978 270,000 Nil 10,000 135,978 280,000
Mike Clasper
Senior Independent Director; Member of Audit and Nomination Committees 88,000 60,833 5,000 5,000 93,000 65,833
Ralph D. Crosby Jnr
50,000 50,000 35,000 30,000 85,000 80,000
Tamara Ingram
Member of Corporate Responsibility & Risk and Remuneration Committees 63,000 52,500 5,000 5,000 68,000 57,500
Rachel Lomax
Chairman of Corporate Responsibility & Risk Committee; Member of Audit Committee 70,000 58,333 5,000 5,000 75,000 63,333
Angie Risley
Chairman of Remuneration Committee; Member of Nomination Committee 60,000 60,000 5,000 5,000 65,000 65,000
Malcolm Wyman
Chairman of Audit Committee; Member of Nomination and Remuneration Committees 67,500 72,917 Nil 5.000 67,500 77,917
Total 663,645 624,583 60,000 65,000 723,645 689,583
Notes: 1. Sir Roy Gardner initially joined the Board on 1 June 2015 as a Non-Executive Director before being appointed as Non-Executive Chairman on 1 July. Fees shown are for the seven
months he served in 2015.
2. Alastair Lyons stepped down from the Board and left the Company on 1 July 2015, fees shown are for the six months he served in 2015.
3. £5,000 is payable for each occasion that requires inter-continental travel outside of the director’s country of residence.
Remuneration Report

Serco Group plc Annual Report and Accounts 2015136
Annual NED Fees
Role
Base fee 1 April 2015
£
Base fee 1 April 2014
£Percentage
change
Chairman1 250,000 270,000 (7.4%)
Senior Independent Director 25,000 25,000 No change
Board fees 50,000 50,000 No change
Audit Committee Chairmanship 12,500 12,500 No change
Audit Committee Membership 5,000 5,000 No change
Corporate Responsibility & Risk Committee Chairmanship 15,000 15,000 No change
Corporate Responsibility & Risk Committee Membership 8,000 8,000 No change
Remuneration Committee Chairmanship 10,000 10,000 No change
Remuneration Committee Membership 5,000 5,000 No change
Travel to international meetings 5,000 5,000 No change
Note:
1. The Chairman fee reduced when Roy Gardner was appointed on 1 July 2015.
Performance graph and table
This graph shows the value as at 31 December 2015, of a £100 investment in Serco on 31 December 2008 compared with £100 invested in the FTSE250 index on the same date. It has been assumed that all dividends paid have been reinvested. The TSR level shown at 31 December each year is the average of the closing daily TSR levels for the 30-day period up to and including that date. The Company chose the FTSE250 index as the comparator for this graph as Serco has been a constituent of that index throughout the period.
Serco Performance Graph
400
350
300
250
200
150
100
50
0
Dec 2008 Dec 2009 Dec 2010 Dec 2011
Serco FTSE250 Index
Dec 2012 Dec 2013 Dec 2014 Dec 2015
Remuneration Report continued

Fina
ncia
l Sta
tem
ents
Dir
ecto
rs’ R
epo
rtSt
rate
gic
Rep
ort
Directors’ Report · 137
CEO’s pay in last seven financial years
Year ended 31 December Group CEO
CEO single figure remuneration
(£)
Annual bonus outcome (as % of maximum
opportunity)
LTI vesting outcome (as % of maximum
opportunity)
2009 Christopher Hyman 3,625,830 90% 295.42%
2010 Christopher Hyman 2,646,894 91% 168.77%
2011 Christopher Hyman 2,826,038 81% 80%
2012 Christopher Hyman 2,582,185 72% 63.60%
2013 Christopher Hyman 893,451 N/a 0%
Ed Casey 294,782 74% 0%
2014 Ed Casey 1,605,064 71% 0%
Rupert Soames 747,655 0% N/a
2015 Rupert Soames 2,226,284 87% N/a
Percentage change in CEO’s remuneration
There were changes to the post-holder of CEO in 2014 and therefore a calculation of the change in CEO’s remuneration between 2014 and 2015 is not possible. Rupert Soames, CEO did not receive a base pay increase in 2015 (as agreed at appointment), and there was also no increase in his annualised rate of benefits. Rupert chose to waive his 2014 annual bonus so no payment was made to him. The average percentage changes for employees in the leadership team were 1.78%, 0% and a 7.13% decrease respectively. This group has been chosen as it represents the most appropriate comparator group for reward purposes for our UK-based CEO.
Relative importance of spend on pay
The table below details the percentage change in dividends and overall expenditure on pay compared with the previous financial year.
Serco considers overall expenditure on staff pay in the context of the general finances of the Company. This includes the determination of the annual salary increase budget, the annual grant of shares and annual bonus for the business.
2015 vs 2014 2015 2014
Dividend per share -100.0% Zero 3.10p
Overall expenditure on wages and salaries -6.4% £1541.8m £1646.8m
Dividend per share, and Overall expenditure on wages and salaries have the same meaning as in the Notes to the Company Financial Statements.
Pensions (audited information)
As at 31 December 2015, there were no Executive Directors actively participating in or accruing additional entitlement in the Serco Pension and Life Assurance Scheme which is a defined benefits scheme.
Payments for loss of office (audited information)
There were no loss of office payments in 2015.
Payments to Past Directors (audited information)
No payments were made in the year to past Directors other than the payments made to Andrew Jenner on him ceasing to be a Director, details of which can be found on the Company website in the investor area under Remuneration Information.
Remuneration Report

Serco Group plc Annual Report and Accounts 2015138
Awards made in 2015
Deferred Bonus Plan (DBP) (audited information)The CEO’s participation in the 2015 DBP is based on the Bonus which he was awarded but which he chose to waive payment of.
For matching share awards in 2015, Aggregate EPS is the sole measure. The range for the three-year performance period is 10.30p at threshold and 12.50p at maximum. No matching shares will vest where performance is below threshold. For threshold performance, each invested share will be matched by half a matching share. For maximum level performance each invested share will be matched (on a gross investment basis) by two shares. For performance between threshold and maximum, the number of matching shares will be determined on a straight line basis.
The definition of EPS is Statutory Earnings Per Share before exceptional items (adjusted to reflect tax paid on a cash basis), measured as an aggregate over the three-year performance period.
Director Scheme
Basis of Award
(% of salary)Award
date
Market price at award
(p)1
Face value £
Percentage vesting at threshold
performanceNumber
of shares
Performance period
end date
Rupert Soames
Deferred Bonus Plan (conditional share award) 106.87% 29 May '15 138 908,437 25% 658,288
31 December2017
Note:
1. Rupert Soames investment shares were already owned, 138 pence was used to determine the number of shares he was entitled to invest as this was the market price of the investment shares that were purchased for other participants in the DBP.
Performance Share Plan (PSP) (audited information)In 2015 the Executive Directors received awards equivalent to 200% of salary for the CEO and COO and 175% for the CFO.
The shares will normally only vest at the end of the performance period, if the Executive Directors are still in employment with Serco and the performance measures have been met. The measures are:
Performance Measure
Weighting of Measure Performance Target Performance period end date
Aggregate EPS 1/3rd Statutory Earnings Per Share (EPS) before exceptional items (adjusted to reflect tax paid on a cash basis) of 10.30p (threshold, 25% vesting) to 12.50p (maximum, 100% vesting), measured as an aggregate over the three-year performance period.
31 December 2017
Relative TSR 1/3rd Total Shareholder Return (TSR) of median (threshold, 25% vesting) to upper quartile (maximum, 100% vesting) when ranked relative to companies in the FTSE250 (excluding investment trusts), measured from the 30-day period following the completion of the Rights Issue to the 30-day period following announcement of the Company’s 2017 results.
30 days following the announcement of the Company’s 2017 results.
ROIC 1/3rd Pre-tax Return on Invested Capital (ROIC) of 8.4% (threshold, 25% vesting) to 10.2% (maximum, 100% vesting), measured as an average over the three-year performance period.
31 December 2017
The structure for vesting is the same for all measures and no shares vest where performance is below Threshold.
Remuneration Report continued

Fina
ncia
l Sta
tem
ents
Dir
ecto
rs’ R
epo
rtSt
rate
gic
Rep
ort
Directors’ Report · 139
Each element of the PSP award is subject to a post-vesting holding requirement that takes the total term of the award (i.e. performance period plus holding period) to a minimum of five years. Pre-vesting malus and post-vesting clawback is also applicable to these awards.
Directors Scheme
Basis of Award
(% of salary)Award
date
Market price at
award (pence)1
Face value
£
Percentage vesting at threshold
performanceNumber
of shares
Performance period
end date
Rupert Soames
Performance Share Plan (nominal cost options) 200% 29 May '15 136.9 1,700,000 25% 1,241,782 See above
Angus Cockburn
Performance Share Plan (nominal cost options) 175% 29 May '15 136.9 875,000 25% 639,152 See above
Ed Casey Performance Share Plan (conditional share award) 175% 29 May '15 136.9 1,210,863 25% 884,487 See above
Note:
1. The market price at award was the preceding day's Middle Market Quotation (MMQ).
Statement of voting at the general meeting
At the last annual general meeting, votes on the Remuneration Report were cast as follows:
For %
Number
Against %
Number
Withheld %
Number
2014 annual report on remuneration 98.87%
760,294,709
1.13%
8,671,241
N/a
24,080
2013 annual report on remuneration 99.61%
367,080,126
0.39%
1,442,674
N/a
2,302,116
2013 remuneration policy 98.08%
358,418,242
1.92%
7,033,412
N/a
5,373,262
2012 remuneration report 95.82%
346,071,397
4.18%
15,084,901
N/a
5,923,160
2011 remuneration report 93.72%
351,474,463
6.28%
23,547,217
N/a
8,299,355
Notes:
1. A 'Vote Withheld' is not a vote in law and is not counted in the calculation of the proportion of votes 'For' or 'Against' a Resolution.
Remuneration Report

Serco Group plc Annual Report and Accounts 2015140
External appointments
The Board believes that the Group can benefit from its Executive Directors holding appropriate non-executive directorships of companies or independent bodies. Such appointments are subject to the approval of the Board. Fees are retained by the Executive Director concerned.
During the year, Rupert Soames and Angus Cockburn served as Non-Executive Directors of Electrocomponents plc and GKN plc respectively. Ed Casey served as a Director of Talen Energy Corporation. Fees payable in the year were £55,000, £60,000 and USD61,250 and deferred stock with a face value of USD75,833 respectively.
No other fee-paying external positions were held by the Executive Directors.
Directors’ shareholding and share interests (audited information)
Current shareholdings are summarised in the table below. Shares are valued for these purposes at the year-end price, which was 94.5p per share at 31 December 2015.
Share ownership
requirements (% of salary)
Number of shares
owned outright
(including connected
persons)
Vested but unexercised
share options
Restricted share awards
subject to performance
conditions
Restricted share
awards not subject to
performance conditions
Share ownership
requirements met3
Weighted average exercise price of vested
options
Weighted average exercise price of
restricted share awards
Rupert Soames 200% 607,000 – 2,861,349 108,527 See note 3 N/a 0.02
Ed Casey 150% 125,840 – 1,401,389 – No N/a Nil
Angus Cockburn 150% 169,200 – 1,286,211 89,585 See note 3 N/a 0.02
Roy Gardner N/a 25,000 N/a N/a N/a N/a N/a N/a
Mike Clasper N/a 56,000 N/a N/a N/a N/a N/a N/a
Ralph D. Crosby Jnr N/a – N/a N/a N/a N/a N/a N/a
Tamara Ingram N/a – N/a N/a N/a N/a N/a N/a
Rachel Lomax N/a 40,000 N/a N/a N/a N/a N/a N/a
Angie Risley N/a 20,508 N/a N/a N/a N/a N/a N/a
Malcolm Wyman N/a – N/a N/a N/a N/a N/a N/a
Notes: 1. Ordinary shares are beneficial holdings which include the Directors’ personal holdings and those of their spouses and minor children.
2. Executives are required to retain in shares 50% of the net value of any performance shares vesting or options exercised until they satisfy the shareholding requirement.
3. Rupert Soames and Angus Cockburn were recruited to the Board in 2014, they have two and three years respectively from appointment to build their investment. On joining in 2014 Rupert invested 100% of salary, in May 2015 he invested a further 50% of salary ensuring his first two shareholding requirement hurdles were met. Angus invested 25% of salary on joining ensuring his first shareholding requirement hurdle was met.
Remuneration Report continued

Fina
ncia
l Sta
tem
ents
Dir
ecto
rs’ R
epo
rtSt
rate
gic
Rep
ort
Directors’ Report · 141
Gain on exercise of share awards
Number of options exercised Exercise price (p)
Market value on exercise (p)
Gain on exercise of share award £
Rupert Soames 19,911 0 103.6 20,628
Aggregate gain on exercise of share awards 20,628
Other shareholding information (audited information)
Shareholder dilutionAwards granted under the Serco Group plc share plans are met either by the issue of new shares or by shares held in trust when awards vest. The Committee monitors the number of shares issued under its various share plans and their impact on dilution limits. The relevant dilution limits established by the Investment Association (formerly the ABI) in respect of all share plans is 10% in any rolling ten-year period and in respect of discretionary share plans is 5% in any rolling ten-year period. Based on the Company’s issued share capital at 31 December 2015, our dilution level was 2.83% against all share plans and 1.79% against discretionary share plans.
The Group has an employee share ownership trust which is administered by an independent trustee and which holds ordinary shares in the Company to meet various obligations under the share plans.
The Trust held 10,659,290 and 10,540,181 ordinary shares at 1 January 2015 and 31 December 2015 respectively.
Rights Issue
The options and awards granted under the Serco Employee Share Plans were adjusted using a standard formula called the 'TERP' (Theoretical Ex Rights Price) formula. The TERP formula uses a theoretical ex-rights price and the last 'cum rights' share price (this is the last price when the shares were traded with the right to take part in the Rights Issue included).
The theoretical ex-rights price was calculated as 132.00p (the theoretical ex-rights price used here is not the same as the theoretical ex-rights price referred to in the Prospectus as it is based on the price on the last dealing day cum rights rather than the closing price on 11 March 2015) and the last cum rights price was 163.00p. The adjusted number of shares in each Award was increased by a factor of 1.23484848 and each exercise price was reduced by a factor of 0.80981595.
The Remuneration Committee
The Committee determines the overall remuneration policy for senior management and the individual remuneration of the Executive Directors and the members of the Executive Committee. This includes the base salary, bonus, long-term incentives, pensions and terms of employment (including those terms on which service may be terminated). The Committee also determines the remuneration of the Chairman.
Terms of reference
The terms of reference of the Committee, a copy of which can be found on the Group’s website, are reviewed annually to ensure that they remain appropriate. Details of the Directors’ attendance at meetings of the Committee can be found in the Corporate Governance Report on page 96.
Remuneration Report

Serco Group plc Annual Report and Accounts 2015142
Members of the Committee
All members of the Committee are independent. Non-Executive Directors of the Group are initially appointed for a three-year term, and that appointment may be terminated on three months’ written notice.
Remuneration Committee members and attendees (the Committee met six times during 2015):
Remuneration Committee members Position Comments
Angie Risley Chairman of Remuneration Committee from 14 May 2012
Roy Gardner Member from 1 June 2015
Alastair Lyons Member from 10 May 2011 Resigned from the Board on 1 July 2015
Malcolm Wyman Member from 1 January 2013
Tamara Ingram Member from 3 March 2014
Remuneration Committee attendees during the year Position Comments
Rupert Soames CEO Attended by invitation
Ed Casey COO Attended by invitation
Angus Cockburn CFO Attended by invitation
Geoff Lloyd Group HR Director Attends as an executive responsible for advising on the remuneration policy
Tara Gonzalez Group HR Director, Reward Attends as an executive responsible for advising on the remuneration policy
David Eveleigh Group General Counsel & Company Secretary Attends as the secretary to the Committee
Steve Williams Deputy Company Secretary Attends as the secretary to the Committee
No person is present during any discussion relating to their own remuneration arrangements.
Summary of the Committee’s activities during the financial year
Meeting Regular items Ad hoc items
February Consider salary review proposals for the Executive Directors and members of the Executive Committee; review the final draft of the Remuneration Report; confirmation of bonus payable; review of achievement of performance conditions for the LTI vesting.
Agree the treatment of the share awards under the Rights Issue; Approve changes to the PSP, DBP, EOP and Sharesave rules.
April Review the performance measures for the LTI awards; review bonus objectives. Consider the feedback from shareholder consultation.
May Approve the performance measures for the LTI awards; review bonus objectives. Update on the Rights Issue adjustments to share awards; Review of wider employee arrangements and conditions across the Group.
August Review bonus objectives; briefing on market trends and Corporate Governance update; update on in-flight share awards.
Consider the treatment of the Contract and Balance Sheet Review items for the bonus plan.
October Review performance of the Executive Directors against bonus objectives; review initial draft of the Remuneration Report; review Committee terms of reference; review the Committees annual programme of work.
Update on changes to National Living Wage.
Remuneration Report continued

Fina
ncia
l Sta
tem
ents
Dir
ecto
rs’ R
epo
rtSt
rate
gic
Rep
ort
Directors’ Report · 143
Advisers to the Remuneration Committee
The Committee has been advised during the year by PricewaterhouseCoopers LLP ('PwC'). PwC were selected as advisers to the Committee through a competitive tendering process in 2012 and no conflicts of interest were identified.
PwC have provided advice throughout the year mainly around the following key executive reward areas:
• Support in reviewing the Directors' Remuneration Report
• Advice on calibration of performance targets
• Advice on the impact of the Rights Issue on outstanding share awards
• Informing the Committee on market practice and governance issues
• Responding to general and technical reward queries.
The advisers attended each meeting of the Remuneration Committee. Consulting services have also been provided to the Group by PwC in relation to retirement benefits and pay data, accounting and taxation services.
Fees paid to PwC as advisers to the Committee during the year totalled £75,600, fees are charged on an hourly rate basis. PwC are members of the Remuneration Consultants’ Group, which oversees the voluntary code of conduct in relation to executive consulting in the UK.
The Committee reviews the objectivity and independence of the advice it receives from PwC each year. It is satisfied that PwC is providing robust and professional advice. In the course of its deliberations, the Committee considers the views of the Chief Executive on the remuneration and performance of the other members of the Executive Committee. The Committee have also received legal advice from Linklaters LLP and Clifford Chance LLP during the year.
Approved by the Board of Directors and signed on its behalf by:
David Eveleigh Secretary
25 February 2016
Remuneration Report

Serco Group plc Annual Report and Accounts 2015144
Annual Report and Accounts
The Directors present the Annual Report and Accounts of the Group for the year ended 31 December 2015. Comparative figures used in this report are for the year ended 31 December 2014 unless otherwise stated. The Corporate Governance Report set out on pages 85 to 143 forms part of the Statutory Directors’ Report.
The Chairman’s Statement on pages 5 to 6 and the Chief Executive's Review and Divisional Reviews on pages 34 to 50 report on the activities during the year and likely future developments. The information in these reports which is required to fulfil the requirements of the Business Review is incorporated in this Directors’ Report by reference.
Articles of Association
The rules relating to the appointment and replacement of Directors are contained in the Company’s Articles of Association. Changes to the Articles of Association must be approved by the shareholders in accordance with the legislation in force from time to time.
Share capital
The issued share capital of the Company, together with the details of shares issued during the year is shown in note 35 to the Consolidated Financial Statements. In April 2015, an additional 549,265,547 ordinary shares were issued, as a result of the Rights Issue, on a basis of one new ordinary share for every one existing share previously held. In addition, 28,687 shares have been issued in the year to 31 December 2015 to satisfy the exercises of options and vesting of awards pursuant to the terms of the Company's employee share and incentive schemes.
The powers of the Directors to issue or buy back shares are restricted to those approved at the Company’s Annual General Meeting.
At the 2015 Annual General Meeting, pursuant to Section 570 of the Companies Act 2006, shareholders approved the issue of shares for cash up to 5% of the existing issued share capital and an additional 5% (only to be used in connection with an acquisition or specified capital investment) in each case without the application of pre-emption rights. The Company intends to seek shareholder approval at the 2016 AGM to renew this authority for a further year and details will be contained in the Notice of AGM.
Rights attaching to shares
Each ordinary share of the Company carries one vote at general meetings of the Company. There are no restrictions on the transfer of ordinary shares in the capital of the Company other than certain restrictions which may from time to time be imposed by law. In accordance with the Listing Rules of the Financial Conduct Authority, certain employees are required to seek the approval of the Company to deal in its shares.
The Company is not aware of any agreement between shareholders that may result in restrictions on the transfer of securities and / or voting rights.
Dividends
No interim dividend was paid in respect of the 2015 financial year (2014: 3.10p per ordinary share). The Directors do not recommend a final dividend to be paid for 2015 (2014: Nil).
Directors' Report

Fina
ncia
l Sta
tem
ents
Dir
ecto
rs’ R
epo
rtSt
rate
gic
Rep
ort
Directors’ Report · 145
Interests in voting rightsAt 31 December 2015 the Company had been notified under Rule 5 of the Disclosure and Transparency Rules of the Financial Conduct Authority of the following holdings of voting rights in its shares:
Number of shares (millions)
as at date of notification
Nature of holding
% held as at 31
December 2015
GIC Private Limited 65.0 Direct 5.9
JPMorgan Chase & Co. 39.1 Indirect 3.6
9.4 Right of Recall 0.9
12.4 Equity Swap 1.1
Total 5.6
Lancaster Investment Management LLP 77.5 Swap 7.1
Majedie Asset Management Limited 56.0 Direct 5.1
Marathon Asset Management LLP 58.3 Indirect 5.3
MSD Partners, L.P. 109.9 Indirect 10.0
Odey Asset Management LLP 2.4 Direct 0.4
25.0 Contract for Difference
4.6
Total 5.0
Orbis Holdings Limited 33.1 Indirect 3.0
Templeton Global Advisors Limited 109.8 Indirect 9.99
Notes:
Between 1 January 2016 and the date of this report, the Company has been advised of the following changes of interests in shares:
– both Valarc Master Fund Ltd and Woodford Investment Management LLP notified that they no longer had a holding of shares, at 31 December 2015 or subsequently, that is notifiable under the Disclosure and Transparency Rules;
– on 13 January 2016 Tameside MBC re: Greater Manchester Pension Fund notified the Company that they have a 3.11% direct interest in voting rights;
– on 16 February 2016 JPMorgan Chase & Co. notified the Company that their interest in voting rights had changed to 5.9% (3.6% indirect and 2.3% cash settled equity swap); and
– on 18 February 2016 GIC Private Limited notified the Company that their holding had reduced from 5.9% to 4.81% direct interest in voting rights.
Directors' Report

Serco Group plc Annual Report and Accounts 2015146
Directors
The current members of the Board together with biographical details of each Director are set out on pages 88 to 89.
On 28 May 2015, the Company announced the appointment of Sir Roy Gardner as Non-Executive Chairman with effect from 1 July 2015, joining the Board as Non-Executive Director from 1 June 2015 to enable a handover period with the outgoing Chairman, Alastair Lyons. Alastair stepped down from the Board on 1 July 2015. Sir Roy will stand for election at the Company’s AGM on 12 May 2016.
As in previous years, and in accordance with the UK Corporate Governance Code, all other Directors will stand for re-election at the 2016 AGM.
Directors’ interests
With the exception of the Executive Directors’ service contracts and the Non-Executive Directors’ letters of appointment, there are no contracts in which any Director has an interest.
Certain change of control conditions are included in the service contracts of Directors which provide compensation or reduction of notice periods in the event of a change of control of the Company.
Details of the Directors’ interests in the ordinary shares and options over the ordinary shares of the Company as at 31 December 2015 are set out in the Directors’ Remuneration Report on page 140. Between 1 January 2016 and the date of this report there were no changes in Directors' interests in ordinary shares and options.
Directors’ indemnities
Directors’ and officers’ insurance cover has been established for all Directors to provide cover against their reasonable actions on behalf of the Company. As permitted under the Articles of Association and in accordance with best practice, deeds of indemnity were executed in 2015 indemnifying each of the Directors and Secretary of the Company in respect of their positions as officers of the Company as a supplement to the Directors’ and officers’ insurance cover. The indemnities, which constitute a qualifying third party indemnity provision as defined by Section 234 of the Companies Act 2006, remain in force for all current Directors and the Secretary of the Company.
Branch offices
In certain jurisdictions, the Group will operate through a branch.
Authority for the purchase of shares
As at the date of this report authority granted at the Company’s AGM in May 2015 remains in force, as set out in the 2015 Notice of Meeting which is available on the Company’s website.
Significant agreements that take effect, alter or terminate upon a change of control
Given the business to Government nature of many of the services provided by the Company and its subsidiaries, many agreements contain provisions entitling the other parties to terminate them in the event of a change of control, which can be triggered by a takeover of the Company. The following agreements are those individual agreements which the Company considers to be significant to the Group as a whole that contain provisions giving the other party a specific right to terminate them if the Company is subject to a change of control.
Directors' Report continued

Fina
ncia
l Sta
tem
ents
Dir
ecto
rs’ R
epo
rtSt
rate
gic
Rep
ort
Directors’ Report · 147
Material customer contracts• Australian Immigration Services: On 11 December 2014, Serco Australia Pty Limited entered into a contract with the
Commonwealth of Australia (acting through the Department of Immigration and Border Protection) for the provision of detention services at all onshore immigration facilities in Australia. The contract has an initial five-year term, with two available two-year extension options. In the event of a change in control or ownership of Serco Australia Pty Limited, which in the reasonable opinion of the Commonwealth adversely affects the Company’s ability to perform the Services, the contract may be terminated by the Commonwealth.
• AWE: Serco Holdings Limited is a shareholder in AWE Management Limited (the ‘AWE JV’). Serco Holdings Limited’s joint venture partners and the other shareholders in the AWE JV are UK subsidiary companies of Lockheed Martin Corporation and Jacobs Engineering Group. The AWE JV oversees the design, development, maintenance and manufacture of warheads for the UK’s strategic nuclear deterrent. This work is carried out by the AWE JV under a management and operation contract with the Secretary of State for Defence (the ‘AWE Contract’). The AWE Contract was entered into on 1 December 1999 and has a 25-year term. In the event that there is a change of control of Serco Holdings Limited or the Group then the other shareholders in the AWE JV are entitled to purchase the AWE JV shares and loans held by Serco Holdings Limited and any other member of the Serco Group.
• SSA: In order to bid and perform on certain classified contracts involving US national security, Serco Inc. was required to mitigate its foreign ownership through a Special Security Agreement (SSA) between the US Government, Serco Inc., and Serco Group plc. The effective date of the SSA is 18 June 2008. In the event of a sale of Serco Inc. to a company or person that is under Foreign Ownership, Control or Influence (FOCI), the SSA may be terminated by the US Department of Defense.
Financing facilities• Revolving credit facility: the Company has a £480,000,000 revolving credit facility dated 28 March 2012 (amended and restated
12 March 2015) with the Bank of America Securities Limited, Barclays Bank PLC, Commonwealth Bank of Australia, Credit Agricole Corporate and Investment Bank, DBS Bank Limited, HSBC Bank PLC, J.P. Morgan Limited, Lloyds TSB Bank PLC, The Bank of Tokyo-Mitsubishi UFJ. Limited and The Royal Bank of Scotland PLC as mandated lead arrangers, and Barclays Bank PLC as Facility Agent. The facility provides funds for general corporate and working capital purposes, and bonds to support the Group’s business needs. The facility agreement provides that in the event of a change of control of the Company each lender may, within a certain period, call for the prepayment of the amounts owed to it and cancel its commitments under the facility.
• US Notes: the Company has notes outstanding under three US Private Placement Note Purchase Agreements (the ‘USPP Agreements’) dated 9 May 2011, 20 October 2011 and 13 May 2013, respectively. The total amount of the notes outstanding under the three USPP Agreements was $551,873,649 at 31 December 2015, and their maturity is between 9 May 2016 and 14 May 2024. Following the disposal of the offshore private sector BPO operations, the Group was required to offer disposal proceeds less certain deductions to the debt holders in prepayment. Two thirds of the proceeds were offered to private placement note holders at par and one third to repay any outstanding drawdowns on the revolving credit facility (nil outstanding at 31 December 2015). As a result of this process, $166,566,681 of private placement notes were repaid on 16 February 2016, leaving $385,316,967 of private placement notes in issue at that date. Under the terms of the USPP Agreements, if a change of control of the Company occurs it is required to offer to prepay the entire principal amount of the notes together with interest to the prepayment date but without payment of any make-whole amount.
Directors' Report

Serco Group plc Annual Report and Accounts 2015148
Share plans
The Company’s share plans contain provisions in relation to a change of control. Outstanding options and awards may vest and become exercisable on a change of control of the Company, in accordance with the rules of the plans.
Annual General Meeting
The Annual General Meeting (AGM) of the Company will be held at the Institute of Directors, 116 Pall Mall, London, SW1Y 5ED on 12 May 2016 at 10.00am.
Financial risk policies
A summary of the Group’s treasury policies and objectives relating to financial risk management, including exposure to associated risks, is on pages 211 to 217.
Employment policiesThe Board is committed to maintaining a working environment where staff are individually valued and recognised. Group companies and divisions operate within a framework of human resources policies, practices and regulations appropriate to their own market sector and country of operation, whilst subject to Group-wide policies and principles.
The Group is committed to ensuring equal opportunity, honouring the rights of the individual, and fostering partnership and trust in every working relationship. Policies and procedures for recruitment, training and career development promote diversity, respect for human rights and equality of opportunity regardless of gender, sexual orientation, age, marital status, disability, race, religion or other beliefs and ethnic or national origin.
The Group promotes diversity so that all employees are able to be successful regardless of their background. The Group gives full consideration to applications for employment, career development and promotion received from the disabled, and offers employment when suitable opportunities arise. If employees become disabled during their service with the Group, arrangements are made wherever practicable to continue their employment and training.
The Group recognises the importance of protecting human rights. We respect the United Nations Declaration of Human Rights and its Guiding Principles on Business and Human Rights as well as the national laws of the jurisdictions in which we operate. These are embedded in the Company’s policies and standards and considered when reviewing business opportunities.
The Group remains proud of its record of managing employee relations and continues to believe that the structure of individual and collective consultation and negotiation is best developed at a local level.
Over the years, the Group has demonstrated that working with trade unions and creating effective partnerships allows improvements to be delivered in business performance as well as in terms and conditions of employment. Where employees choose not to belong to a trade union, employee communication forums such as works councils exist to ensure involvement of staff within the business. These mechanisms ensure employee’s views are considered in decision-making and that they have a common awareness of Group strategy, matters of concern to them and the financial and economic factors affecting the performance of the Company.
Participation by staff in the success of the Group is encouraged by the availability of a share option scheme, and long-term incentive arrangements for senior management, which effectively aligns their interests with those of shareholders by requiring that performance criteria are achieved prior to exercise.
Directors' Report continued

Fina
ncia
l Sta
tem
ents
Dir
ecto
rs’ R
epo
rtSt
rate
gic
Rep
ort
Directors’ Report · 149
Corporate responsibility
The Group maintains a focus on corporate responsibility through a model that is applied across the business focusing on our people, safety, the environment and the communities we serve. This model forms an integral part of our Serco Management System and is supported by defined policies in all of the areas it covers. More information on Corporate Responsibility, including Greenhouse Gas Emission reporting, can be found in the Strategic Report on pages 72 to 83.
Research and development
Serco undertakes a limited amount of research and development (R&D), given that our primary business model is the delivery of public services through our people. In 2015, we spent £4.3m on R&D on IT related projects, which compared to £21.5m in 2014, of which over 85% in 2014 was accounted for by our contract at the National Physical Laboratory, which was operated by Serco on behalf of the UK’s Department for Business Innovation and Skills (BIS) and which ended on 1 January 2015.
Political donations
During the year neither the Company nor the Group made political donations and they intend to continue with this policy. However, it is possible that certain routine activities may unintentionally fall within the broad scope of the Companies Act provisions relating to political donations and expenditure. As in previous years, the Company will therefore propose to shareholders that the authority granted at the 2015 AGM regarding political donations be renewed. Details will be included in the notice of AGM. Within the US business there exists a Political Action Committee (PAC), which is funded entirely by employees and their spouses. The Serco PAC and its contributions are administered in strict accordance with regulatory requirements. Employee contributions are entirely voluntary and no pressure is placed on employees to participate. Under US law, an employee-funded PAC must bear the name of the employing company.
Financial statements
At the date of this report, as far as each Director is aware, there is no relevant audit information of which the Group’s auditors are unaware. Each Director has taken all the steps that he or she ought to have taken as a Director in order to make himself or herself aware of any relevant audit information and to establish that the Group’s auditors are aware of that information.
Auditors
Deloitte LLP has expressed their willingness to continue in office as auditors and a resolution to reappoint them will be proposed at the forthcoming AGM.
Directors' Report

Serco Group plc Annual Report and Accounts 2015150
Directors' Report continued
Index of Directors’ Report disclosures
The information required to be disclosed in the Directors’ Report can be found in this Annual Report on the pages listed below. Pursuant to Listing Rule 9.8.4C, the information required to be disclosed in the Annual Report under Listing Rule 9.8.4R is marked with an asterisk (*).
Amendment of the Articles Page 144
Appointment and replacement of Directors Page 114
Board of Directors Pages 88 to 89
Change of control Pages 146 to 147
Community Pages 78 to 79
Directors’ insurance and indemnities Page 146
Directors’ inductions and training Pages 94 to 95
Directors’ responsibilities statement Page 151
Disclosure of information to auditors Page 151
Diversity Pages 75 to 76
Dividends Pages 37 and 144
Employee involvement Pages 74, 75 and 148
Corporate responsibility Pages 72 to 83
Employees with disabilities Page 148
Future developments of the business Pages 9 to 14
Going concern Pages 102 and 164
Greenhouse gas emissions Pages 33, 82 and 83
Independent auditors Pages 153 to 158
Long-term incentive plans under Listing Rule 9.4.3* Pages 120 to 143
Political donations Page 149
Powers for the Company to issue or buy back its shares Page 144
Powers of the Directors Pages 90 to 93
Research and development activities Page 149
Restrictions on transfer of securities Page 144
Rights attaching to shares Page 144
Risk management and internal control Pages 16 to 29 and 97 to 101
Share capital Page 144
Significant agreements Pages 146 to 147
Significant related party agreements* Page 231
Significant shareholders Page 145
Statement of corporate governance Pages 85 to 86
Strategic report Pages 5 to 83
Viability statement Page 30
Voting rights Page 144
Approved by the Board of Directors and signed on its behalf by:
David Eveleigh Secretary
25 February 2016
Fina
ncia
l Sta
tem
ents
Dir
ecto
rs’ R
epo
rtSt
rate
gic
Rep
ort
Directors’ Report · 151
The Directors are responsible for preparing the annual report and financial statements in accordance with applicable law and regulations.
Company law requires the Directors to prepare financial statements for each financial year. Under that law the Directors are required to prepare the Group financial statements in accordance with International Financial Reporting Standards (IFRS) as adopted by the European Union and Article 4 of the IAS Regulation and have elected to prepare the Parent Company financial statements in accordance with Financial Reporting Standard 101 Reduced Disclosure Framework. Under company law the Directors must not approve the accounts unless they are satisfied that they give a true and fair view of the state of affairs of the Company and of the profit or loss of the Company for that period.
In preparing the Parent Company financial statements, the Directors are required to:
• select suitable accounting policies and then apply them consistently;
• make judgements and accounting estimates that are reasonable and prudent;
• state whether Financial Reporting Standard 101 Reduced Disclosure Framework has been followed, subject to any material departures disclosed and explained in the financial statements; and
• prepare the financial statements on the going concern basis unless it is inappropriate to presume that the Company will continue in business.
In preparing the Group financial statements, International Accounting Standard 1 requires that Directors:
• properly select and apply accounting policies;
• present information, including accounting policies, in a manner that provides relevant, reliable, comparable and understandable information;
• provide additional disclosures when compliance with the specific requirements in IFRS are insufficient to enable users to understand the impact of particular transactions, other events and conditions on the entity’s financial position and financial performance; and
• make an assessment of the Company’s ability to continue as a going concern.
The Directors are responsible for keeping adequate accounting records that are sufficient to show and explain the Company’s transactions and disclose with reasonable accuracy at any time the financial position of the Company and enable them to ensure that the financial statements comply with the Companies Act 2006. They are also responsible for safeguarding the assets of the Company and hence for taking reasonable steps for the prevention and detection of fraud and other irregularities.
The Directors are responsible for the maintenance and integrity of the corporate and financial information included on the Company’s website. Legislation in the United Kingdom governing the preparation and dissemination of financial statements may differ from legislation in other jurisdictions.
Responsibility statement
We confirm that to the best of our knowledge:
1. The financial statements, prepared in accordance with International Financial Reporting Standards as adopted by the EU, give a true and fair view of the assets, liabilities, financial position and profit or loss of the Company and the undertakings included in the consolidation taken as a whole.
2. The Strategic Report includes a fair review of the development and performance of the business and the position of the Company and the undertakings included in the consolidation taken as a whole, together with a description of the principal risks and uncertainties that they face.
3. The annual report and financial statements, taken as a whole, are fair, balanced and understandable and provide the information necessary for shareholders to assess the Company’s performance, business model and strategy.
By order of the Board
Rupert Soames Angus Cockburn Group Chief Executive Officer Group Chief Financial Officer
25 February 2016
Directors' Responsibilities Statement
Directors' Responsibilities Statement

Serco Group plc Annual Report and Accounts 2015152
Financial Statements
153 Independent Auditor’s Report
159 Consolidated Income Statement
160 Consolidated Statement of Comprehensive Income
161 Consolidated Statement of Changes in Equity
162 Consolidated Balance Sheet
163 Consolidated Cash Flow Statement
164 Notes to the Consolidated Financial Statements
236 Company Balance Sheet
237 Notes to the Company Financial Statements
242 Appendix: List of Subsidiaries
244 Appendix: Supplementary Information
245 Directors, Secretary and Advisers
246 Shareholder Information

Fina
ncia
l Sta
tem
ents
Stra
teg
ic R
epo
rtD
irec
tors
’ Rep
ort
Financial Statements · 153Independent Auditor's Report
Opinion on financial statements of Serco Group plc
In our opinion:
• the financial statements give a true and fair view of the state of the Group’s and of the Parent company’s affairs as at 31 December 2015 and of the Group’s and the Parent company’s loss for the year then ended;
• the Group financial statements have been properly prepared in accordance with International Financial Reporting Standards (IFRS) as adopted by the European Union;
• the Parent company financial statements have been properly prepared in accordance with United Kingdom Generally Accepted Accounting Practice, including FRS 101 'Reduced Disclosure Framework'; and
• the financial statements have been prepared in accordance with the requirements of the Companies Act 2006 and, as regards the Group financial statements, Article 4 of the IAS Regulation.
The financial statements comprise the Consolidated Income Statement, the Consolidated Statement of Comprehensive Income, the Consolidated and Parent Company Balance Sheets, the Consolidated Cash Flow Statement, the Consolidated Statement of Changes in Equity and the related notes 1 to 57. The financial reporting framework that has been applied in the preparation of the Group financial statements is applicable law and IFRS, as adopted by the European Union. The financial reporting framework that has been applied in the preparation of the Parent company financial statements is applicable law and United Kingdom Accounting Standards (United Kingdom Generally Accepted Accounting Practice), including FRS 101 'Reduced Disclosure Framework'.
Going concern and the Directors’ assessment of the principal risks that would threaten the solvency or liquidity of the Group
As required by the Listing Rules, we have reviewed the Directors’ statement regarding the appropriateness of the going concern basis of accounting, contained within note 2 to the financial statements and the Directors’ statement on the longer-term viability of the Group contained within the strategic report, on page 30.
We have nothing material to add or draw attention to in relation to:
• the Directors' confirmation on page 16 that they have carried out a robust assessment of the principal risks facing the Group, including those that would threaten its business model, future performance, solvency or liquidity;
• the disclosures on pages 16 to 29 that describe those risks and explain how they are being managed or mitigated;
• the Directors’ statement in note 2 to the financial statements, about whether they considered it appropriate to adopt the going concern basis of accounting in preparing them and their identification of any material uncertainties to the Group’s ability to continue to do so over a period of at least twelve months from the date of approval of the financial statements; and
• the Directors' explanation on page 30 as to how they have assessed the prospects of the Group, over what period they have done so and why they consider that period to be appropriate, and their statement as to whether they have a reasonable expectation that the Group will be able to continue in operation and meet its liabilities as they fall due over the period of their assessment, including any related disclosures drawing attention to any necessary qualifications or assumptions.
We agreed with the Directors’ adoption of the going concern basis of accounting and we did not identify any such material uncertainties. However, because not all future events or conditions can be predicted, this statement is not a guarantee as to the Group’s ability to continue as a going concern.
Independence We are required to comply with the Financial Reporting Council’s Ethical Standards for Auditors and we confirm that we are independent of the Group and we have fulfilled our other ethical responsibilities in accordance with those standards. We also confirm we have not provided any of the prohibited non-audit services referred to in those standards.
Our assessment of risks of material misstatement
The assessed risks of material misstatement described below are those that had the greatest effect on our audit strategy, the allocation of resources in the audit and directing the efforts of the engagement team.
Independent Auditor's Report to the members of Serco Group plc

Serco Group plc Annual Report and Accounts 2015154
Independent Auditor's Report to the members of Serco Group plc continued
Risk How the scope of our audit responded to the risk
Revenue and profit recognition including onerous contract provisions
Revenue and profit recognition on contracts requires significant management judgement in the assessment of current and future financial performance. Complex areas in determining the Group’s right to recognise revenue and profit in the current period include:
• interpretation of contract terms and conditions, including the billing and cash flow arrangements
• consideration of onerous contract terms
• recognition and recoverability of pre contract costs
• assessment of stage of completion and forecast costs to complete
The Group is required to make an assessment of the stage of completion and costs to complete over periods that can extend up to 15 years into the future in order to estimate the onerous contract provisions. The prediction of future events contains inherent risk and a high degree of management judgement.
At 31 December 2014, the Group recognised provisions for a number of contracts that became onerous of £447.1m to cover the excess of unavoidable costs of meeting the obligations under the contracts over the economic benefits expected to be received over the remaining term of such contracts. Such provisions arose predominantly where contractual volume and / or price risk rest with the Group and forecast revenues are largely fixed.
During 2015, the Group has continued to assess both those contracts for which onerous contract provisions were made at 31 December 2014, and other contracts which may display similar characteristics and potential onerous outcomes. The total onerous contract provision at 31 December 2015 was £302.1m following utilisation of £116.8m, new provisions of £89.1m, release of £93.0m of provisions no longer required and net movement of £7.6m relating to foreign exchange, unwinding of discount, and reclassifications.
Refer to notes 2 and 3 for the Group’s accounting policy and critical accounting judgements over revenue and profit recognition and refer to note 30 for detailed disclosures of onerous contract provisions recognised by the Group as at 31 December 2015.
The key procedures we have performed are:
• Where we have taken a controls approach, we tested the operating effectiveness of controls over the contract lifecycle including tendering controls and estimating, contract monitoring, billings and approvals, contract ledger reconciliations and contract forecasting.
• We have challenged the right to recognise revenue through review of contractual terms and assessed management’s judgement regarding the appropriate timing of revenue recognition, including where a percentage of completion basis was applied. We obtained contract forecasts and compared the assumptions to contract terms and where relevant inspected correspondence with parties to the contract.
• We developed an expectation of revenue from contracts where the contracts stipulate fixed revenue on a regular basis or by using external volume data and applying the rates per unit as per the contract to test the revenue recognised by the Group.
• Where the revenue is not based on a fixed amount or fixed rates per unit, we have performed test of details by testing the underlying work order / change orders for the contracts and the actual expenses incurred to provide those services.
• We challenged management's judgements of specific contract forecasts and historic operational costs comparing contract forecasts to past performance versus contractual targets to assess whether contracts are deemed to be onerous and reviewed provisions for anticipated losses. This has included a review and challenge of evidence produced by third party experts, where used by management in determining certain future contract costs and the models for these onerous contracts.
• For contracts where onerous contract provisions have been recognised or released during the year, we have assessed whether the provisions or releases were a change of estimate arising from new circumstances in the year or whether they represented the correction of a prior period error.
• We have verified capitalised contract costs to underlying documentation and assessed the accounting treatment adopted by management.

Fina
ncia
l Sta
tem
ents
Stra
teg
ic R
epo
rtD
irec
tors
’ Rep
ort
Financial Statements · 155
Risk How the scope of our audit responded to the risk
Impairment of goodwill
The Group has previously recognised goodwill of £541.5m allocated to its various cash generating units (CGUs). In the current year, the Group has recognised an impairment of £87.5m of goodwill as a result of worsening cash flows experienced by the Americas division compared to the 2014 forecasts.
The Group is required to assess goodwill for impairment on an annual basis. In making that assessment, management estimate the recoverable amounts for the CGU to which the goodwill attaches. This requires management judgement to make assumptions in respect of forecast operating cash flows and discount rates. In so doing consideration will be given to anticipated revenue growth, cash conversion and wider economic inputs together with any changes in the Group's strategy.
Further details on the impairment can be found at notes 11 and 20 and notes 2 and 3 for the Group’s accounting policy and critical judgements over impairment of goodwill.
The key procedures we performed are:
• We have challenged the results of management’s strategy review and its implications on the carrying value of goodwill for certain CGUs through our review of the forecasts.
• We challenged management’s assumptions within the cash flow forecasts used in the value in use calculations for CGUs including revenue, growth, discount rates and economic assumptions such as long-term growth rates (by reference to independent data where possible) and by performing tests on historical forecasting accuracy.
• We have challenged the discount rate applied to the separate CGUs by utilising valuation experts, the prevailing Group cost of capital at the year end and our understanding of the future prospects of the Group.
• We have tested the consistency of forecasts used by management for assessment of contracts for onerous contract provisions, recoverability of deferred tax assets and going concern.
• We have challenged the sensitivity of changes to the various inputs into the impairment model by reperformance of the calculations using different levels of discount rates and other inputs.
• We have recalculated the goodwill balance to determine whether changes to the business in 2015 have been appropriately reflected.
• We also considered the adequacy of the Group’s disclosures in respect of its goodwill impairment testing and whether disclosures about the sensitivity of the outcome of the impairment assessment to reasonably possible changes in key assumptions properly reflected the risks inherent in such assumptions.
Independent Auditor's Report

Serco Group plc Annual Report and Accounts 2015156
Risk How the scope of our audit responded to the risk
Pension commitments
The Group has a net pension related asset of £115.6m as at 31 December 2015, comprising £1.308.9m assets and £1,196.4m liabilities adjusted by £1.9m for franchise arrangements and £1.2m for the members' share of scheme deficits. The net asset value is based on actuarial assumptions used in the measurement of the Group’s pension commitments which involves judgements in relation to mortality, price inflation, discount rates, and rate of pension and salary increases, around which there are inherent uncertainties. Judgement is also exercised in determining whether a pension surplus should be recognised as an asset, and the extent of the Group’s pension liability in respect of franchise and other contractual agreements.
Please refer to note 34 which details the valuation of the pension assets and the actuarial assumptions used in measuring the Group's pension commitments. The Group’s accounting policy and critical judgement disclosures in relation to recognition of pension assets and liabilities are set out in note 2 and 3.
The key procedures we performed are:
• We evaluated the appropriateness of the principal actuarial assumptions used in the calculation of the Group’s pension commitments, using our own actuarial experts, and by benchmarking certain assumptions to independent data.
• As part of our work we reviewed advice received by the Group from its external actuaries and used our actuaries to challenge the advice in relation to the Group’s unconditional right of refund and the recoverability of pension surplus amounts.
• We challenged contract specific pension commitments recorded including those arising from franchise arrangements.
• We performed substantive audit procedures on the data provided by management to their actuaries, to determine whether it is accurate and complete.
• We have substantively tested pension contributions to and from the pension scheme to determine whether they reflect payroll deductions and pension payments.
Changes in risk In the current year, we no longer present going concern and covenant compliance (for which there was an emphasis of matter) and presentation of exceptional items as risks.
The risk related to going concern and covenant compliance was removed following the successful completion of the Group’s rights issue and reduction in the Group’s net debt together with the conclusion of the Group’s strategy review. The risk with respect to exceptional items was removed as exceptional items are significantly lower and involve a lower level of judgement in the current year. As a result the impact on our audit strategy and allocation of audit resource has also changed.
The description of risks above should be read in conjunction with the significant issues considered by the Audit Committee discussed on page 105.
These matters were addressed in the context of our audit of the financial statements as a whole, and in forming our opinion thereon, and we do not provide a separate opinion on these matters.
Our application of materiality
We define materiality as the magnitude of misstatement in the financial statements that makes it probable that the economic decisions of a reasonably knowledgeable person would be changed or influenced. We use materiality both in planning the scope of our audit work and in evaluating the results of our work.
We determined materiality for the Group to be £9m (2014: £20m).
In the prior year, the materiality of £20m was around 3% of adjusted pre-tax loss. Pre-tax loss was based on adding back net exceptional costs of £661.5m; this base was used to reflect the particular circumstances of 2014, where the exceptional costs were one-off and did not represent the underlying performance of the business.
As part of the Rights Issue in April 2015, the Company provided Trading Profit guidance to the market for the year-ended 31 December 2015 of £90m. Trading Profit is a key measure of the business. The requirements of the London Stock Exchange are that any deviation of 10% from their estimate (£9m) would necessitate an announcement to the market. As such we considered £9m to be the most important measure for the shareholders and the best measure on which to base our materiality. Our selected materiality is less than 1% of total assets of the Group.
We agreed with the Audit Committee that we would report to the Committee all audit differences in excess of £0.18m (2014: £0.4m), as well as differences below that threshold that, in our view, warranted reporting on qualitative grounds. We also report to the Audit Committee on disclosure matters that we identified when assessing the overall presentation of the financial statements.
Independent Auditor's Report to the members of Serco Group plc continued

Fina
ncia
l Sta
tem
ents
Stra
teg
ic R
epo
rtD
irec
tors
’ Rep
ort
Financial Statements · 157
An overview of the scope of our audit
Our Group audit was scoped by obtaining an understanding of the Group and its environment, including Group-wide controls, and assessing the risks of material misstatement at the Group level. Based on that assessment, we focused our Group audit scope primarily on the audit work at seven (2014: seven) components, all of which were subject to a full scope audit. The seven components, and the levels of materiality applicable to each component, are described below:
ComponentComponent
auditor used2015 Materiality
(£ million)2014 Materiality
(£ million)
UK Central Government (CG) No 4.20 4.60
UK & Europe Local & Regional Government (LRG) No 4.20 3.90
Asia Pacific (AsPac) Yes 3.85 3.90
Middle East (ME) Yes 3.50 3.50
Serco Global Services (SGS) Yes 3.85 3.90
Americas Yes 3.85 3.90
Corporate No 3.50 3.50
The scope of work over the components above provided us with 100% coverage over the Group’s revenue and net assets.
The CG and LRG divisions were audited by the Group audit team.
The ME division has been audited using a component audit team under instructions from the Group team; in the prior year this was audited directly by the Group team.
The Group audit team continued to follow a programme of planned visits to the component audit teams, visiting America (Americas component), Australia (AsPac component) and the United Arab Emirates (ME component) during the current year audit. During the year we did not visit India (SGS component) however we included the component audit team in our team briefing, discussed their risk assessment, and reviewed documentation of the findings from their work.
In addition to the components described above, we have directed the performance of the audit procedures at the Group’s shared service centre in India, including visiting the audit team during the current year audit.
At the Parent entity level we also tested the consolidation process and carried out analytical procedures to confirm our conclusion that there were no significant risks of material misstatement of the aggregated financial information of the remaining components not subject to audit or audit of specified account balances.
Included within the components above are some joint ventures; the joint venture auditors report to the relevant component teams and we review the work of the component teams in respect of their supervision of the joint venture auditors.
Opinion on other matters prescribed by the Companies Act 2006
In our opinion:
• the part of the Directors’ Remuneration Report to be audited has been properly prepared in accordance with the Companies Act 2006; and
• the information given in the Strategic Report and the Directors’ Report for the financial year for which the financial statements are prepared is consistent with the financial statements.
Independent Auditor's Report

Serco Group plc Annual Report and Accounts 2015158
Matters on which we are required to report by exception
Adequacy of explanations received and accounting records
Under the Companies Act 2006 we are required to report to you if, in our opinion:
• we have not received all the information and explanations we require for our audit; or
• adequate accounting records have not been kept by the Parent company, or returns adequate for our audit have not been received from branches not visited by us; or
• the Parent company financial statements are not in agreement with the accounting records and returns.
We have nothing to report in respect of these matters.
Directors’ remuneration Under the Companies Act 2006 we are also required to report if in our opinion certain disclosures of Directors’ remuneration have not been made or the part of the Directors’ Remuneration Report to be audited is not in agreement with the accounting records and returns. We have nothing to report arising from these matters.
Corporate Governance Statement
Under the Listing Rules we are also required to review part of the Corporate Governance Statement relating to the company’s compliance with certain provisions of the UK Corporate Governance Code. We have nothing to report arising from our review.
Our duty to read other information in the Annual Report
Under International Standards on Auditing (UK and Ireland), we are required to report to you if, in our opinion, information in the annual report is:
• materially inconsistent with the information in the audited financial statements; or
• apparently materially incorrect based on, or materially inconsistent with, our knowledge of the Group acquired in the course of performing our audit; or
• otherwise misleading.
In particular, we are required to consider whether we have identified any inconsistencies between our knowledge acquired during the audit and the Directors’ statement that they consider the annual report is fair, balanced and understandable and whether the annual report appropriately discloses those matters that we communicated to the audit committee which we consider should have been disclosed. We confirm that we have not identified any such inconsistencies or misleading statements.
Respective responsibilities of Directors and auditor
As explained more fully in the Directors’ Responsibilities Statement, the Directors are responsible for the preparation of the financial statements and for being satisfied that they give a true and fair view. Our responsibility is to audit and express an opinion on the financial statements in accordance with applicable law and International Standards on Auditing (UK and Ireland). We also comply with International Standard on Quality Control 1 (UK and Ireland). Our audit methodology and tools aim to ensure that our quality control procedures are effective, understood and applied. Our quality controls and systems include our dedicated professional standards review team and independent partner reviews.
This report is made solely to the company’s members, as a body, in accordance with Chapter 3 of Part 16 of the Companies Act 2006. Our audit work has been undertaken so that we might state to the company’s members those matters we are required to state to them in an auditor’s report and for no other purpose. To the fullest extent permitted by law, we do not accept or assume responsibility to anyone other than the company and the company’s members as a body, for our audit work, for this report, or for the opinions we have formed.
Scope of the audit of the financial statements
An audit involves obtaining evidence about the amounts and disclosures in the financial statements sufficient to give reasonable assurance that the financial statements are free from material misstatement, whether caused by fraud or error. This includes an assessment of: whether the accounting policies are appropriate to the Group’s and the Parent company’s circumstances and have been consistently applied and adequately disclosed; the reasonableness of significant accounting estimates made by the Directors; and the overall presentation of the financial statements. In addition, we read all the financial and non-financial information in the annual report to identify material inconsistencies with the audited financial statements and to identify any information that is apparently materially incorrect based on, or materially inconsistent with, the knowledge acquired by us in the course of performing the audit. If we become aware of any apparent material misstatements or inconsistencies we consider the implications for our report.
Andrew J. Kelly FCA (Senior statutory auditor) for and on behalf of Deloitte LLP Chartered Accountants and Statutory Auditor London, UK
25 February 2016
Independent Auditor's Report to the members of Serco Group plc continued

Fina
ncia
l Sta
tem
ents
Stra
teg
ic R
epo
rtD
irec
tors
’ Rep
ort
Financial Statements · 159Consolidated Income Statement
Consolidated Income StatementFor the year ended 31 December
Continuing operations Note2015
£m2014
£m
Revenue 10 3,177.0 3,595.7
Cost of sales (2,849.1) (3,661.4)
Gross profit / (loss) 327.9 (65.7)
Administrative expenses
General and administrative expenses (253.9) (573.0)
Exceptional loss on disposal of subsidiaries and operations 9,11 (2.6) (2.3)
Other exceptional operating items 11 (107.3) (323.4)
Other expenses – amortisation and impairment of intangibles arising on acquisition (4.8) (18.1)
Share of profits in joint ventures, net of interest and tax 7 37.0 30.0
Operating loss (3.7) (952.5)
Operating profit / (loss) before exceptional items 106.2 (626.8)
Investment revenue 14 6.1 4.6
Finance costs 15 (39.0) (42.6)
Exceptional finance costs 11 (32.8) –
Total net finance costs (65.7) (38.0)
Loss before tax (69.4) (990.5)
Tax on profit / (loss) before exceptional items 16 (17.9) (7.2)
Tax credit on exceptional items 16 0.4 8.2
Tax (charge) / credit (17.5) 1.0
Loss for the year from continuing operations (86.9) (989.5)
Loss for the year from discontinued operations 4 (66.2) (357.6)
Loss for the year (153.1) (1,347.1)
Attributable to:
Equity owners of the Company (152.6) (1,347.3)
Non-controlling interests (0.5) 0.2
Earnings per share (EPS)
Basic EPS from continuing operations 19 (8.78p) (151.12p)
Diluted EPS from continuing operations 19 (8.78p) (151.12p)
Basic EPS from discontinued operations 19 (6.69p) (54.54p)
Diluted EPS from discontinued operations 19 (6.69p) (54.54p)
Basic EPS from continuing and discontinued operations 19 (15.47p) (205.66p)
Diluted EPS from continuing and discontinued operations 19 (15.47p) (205.66p)

Serco Group plc Annual Report and Accounts 2015160
Consolidated Statement of Comprehensive IncomeFor the year ended 31 December
Note2015
£m2014 £m
Loss for the year (153.1) (1,347.1)
Other comprehensive income for the year:
Items that will not be reclassified subsequently to profit or loss:
Net actuarial (loss) / gain on defined benefit pension schemes1 34 (15.8) 52.8
Actuarial (loss) / gain on reimbursable rights1 34 (0.4) 13.5
Tax relating to items not reclassified1 16 4.1 (12.9)
Share of other comprehensive income in joint ventures 7 5.0 1.9
Items that may be reclassified subsequently to profit or loss:
Net exchange gain on translation of foreign operations2 (40.9) 24.9
Fair value gain / (loss) on cash flow hedges during the year2 2.2 (2.7)
Share of other comprehensive expense in joint ventures 7 2.6 (3.8)
Total other comprehensive income for the year (43.2) 73.7
Total comprehensive expense for the year (196.3) (1,273.4)
Attributable to:
Equity owners of the Company (195.9) (1,273.7)
Non-controlling interest (0.4) 0.3
Notes:
1 Recorded in retirement benefit obligations reserve in the Consolidated Statement of Changes in Equity.
2 Recorded in hedging and translation reserve in the Consolidated Statement of Changes in Equity.

Stra
teg
ic R
epo
rtD
irec
tors
’ Rep
ort
Financial Statements · 161
Fina
ncia
l Sta
tem
ents
Consolidated Statement of Changes in Equity
Consolidated Statement of Changes in Equity
Share capital
£m
Share premium account
£m
Capital redemption
reserve£m
Retained earnings
£m
Retirement benefit
obligations reserve
£m
Share based
payment reserve
£m
Own shares
reserve£m
Hedging and
translation reserve
£m
Total shareholders’
equity£m
Non-controlling
interest£m
At 1 January 2014 10.0 327.8 0.1 941.0 (142.4) 70.2 (70.5) (41.0) 1,095.2 0.7
Total comprehensive (expense) for the year – – – (1,349.2) 53.4 – – 22.1 (1,273.7) 0.3
Issue of share capital 1.0 – – 155.3 – – – – 156.3 –
Shares transferred to option holders on exercise of share options – 0.1 – – – (3.8) 6.0 – 2.3 –
Dividends paid – – – (53.1) – – – – (53.1) –
Expense in relation to share based payments – – – – – 5.4 – – 5.4 –
Tax charge in relation to share based payments – – – – – (0.4) – – (0.4) –
Change in non-controlling interest – – – – – – – – – 0.8
At 1 January 2015 11.0 327.9 0.1 (306.0) (89.0) 71.4 (64.5) (18.9) (68.0) 1.8
Total comprehensive expense for the year – – – (145.0) (12.1) – – (38.8) (195.9) (0.4)
Issue of share capital1 11.0 – – 519.3 – – – – 530.3 –
Shares transferred to option holders on exercise of share options – – – – – (0.3) 4.7 – 4.4 –
Transfer on disposal – – – 0.2 (0.2) – – – – –
Expense in relation to share based payments – – – – – 9.8 – – 9.8 –
Change in non-controlling interest – – – – – – – – – 0.1
At 31 December 2015 22.0 327.9 0.1 68.5 (101.3) 80.9 (59.8) (57.7) 280.6 1.5
1 During the year the Group raised £530.3m via a Rights Issue. A cash box structure was used in such a way that merger relief was available under Companies Act 2006, section 612 and thus no share premium needed to be recorded. As the redemption of the cash box entity’s preference shares was in the form of cash, the transaction was treated as qualifying consideration and the premium is therefore considered to be a realised profit.
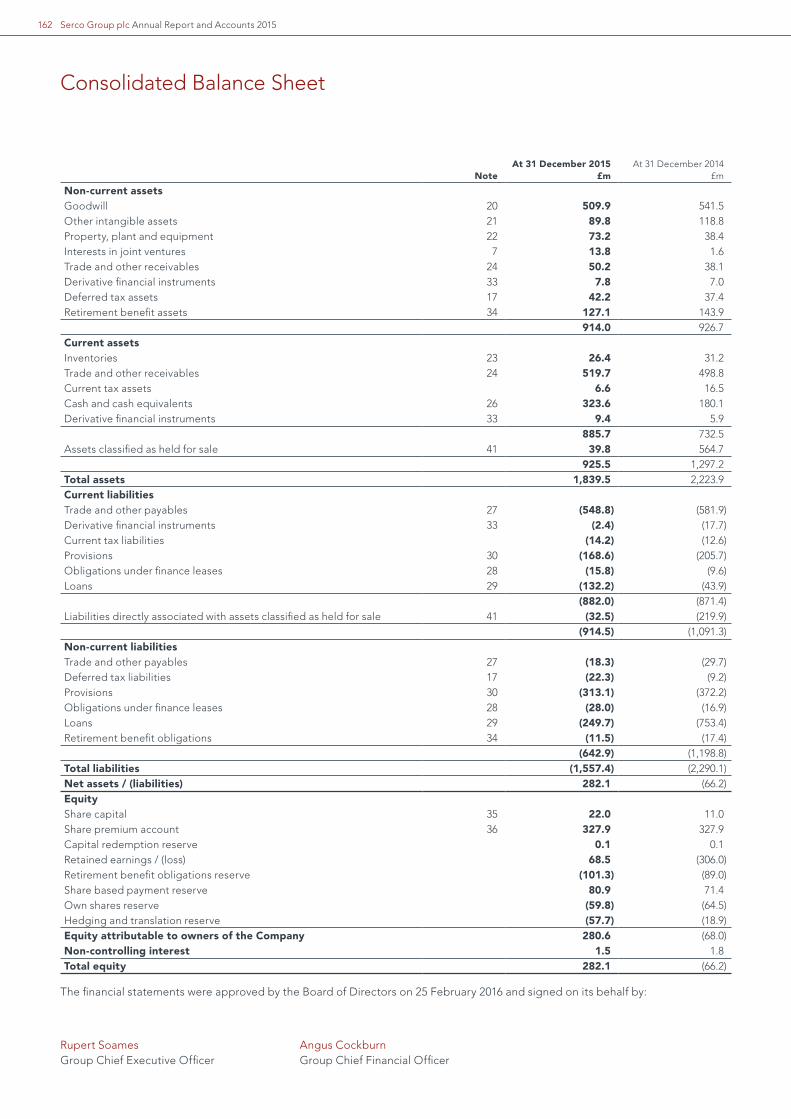
Serco Group plc Annual Report and Accounts 2015162
Consolidated Balance Sheet
NoteAt 31 December 2015
£mAt 31 December 2014
£m
Non-current assetsGoodwill 20 509.9 541.5Other intangible assets 21 89.8 118.8Property, plant and equipment 22 73.2 38.4Interests in joint ventures 7 13.8 1.6Trade and other receivables 24 50.2 38.1Derivative financial instruments 33 7.8 7.0Deferred tax assets 17 42.2 37.4Retirement benefit assets 34 127.1 143.9
914.0 926.7Current assetsInventories 23 26.4 31.2Trade and other receivables 24 519.7 498.8Current tax assets 6.6 16.5Cash and cash equivalents 26 323.6 180.1Derivative financial instruments 33 9.4 5.9
885.7 732.5Assets classified as held for sale 41 39.8 564.7
925.5 1,297.2Total assets 1,839.5 2,223.9Current liabilitiesTrade and other payables 27 (548.8) (581.9)Derivative financial instruments 33 (2.4) (17.7)Current tax liabilities (14.2) (12.6)Provisions 30 (168.6) (205.7)Obligations under finance leases 28 (15.8) (9.6)Loans 29 (132.2) (43.9)
(882.0) (871.4)Liabilities directly associated with assets classified as held for sale 41 (32.5) (219.9)
(914.5) (1,091.3)Non-current liabilitiesTrade and other payables 27 (18.3) (29.7)Deferred tax liabilities 17 (22.3) (9.2)Provisions 30 (313.1) (372.2)Obligations under finance leases 28 (28.0) (16.9)Loans 29 (249.7) (753.4)Retirement benefit obligations 34 (11.5) (17.4)
(642.9) (1,198.8)Total liabilities (1,557.4) (2,290.1)Net assets / (liabilities) 282.1 (66.2)EquityShare capital 35 22.0 11.0Share premium account 36 327.9 327.9Capital redemption reserve 0.1 0.1Retained earnings / (loss) 68.5 (306.0)Retirement benefit obligations reserve (101.3) (89.0)Share based payment reserve 80.9 71.4Own shares reserve (59.8) (64.5)Hedging and translation reserve (57.7) (18.9)Equity attributable to owners of the Company 280.6 (68.0)Non-controlling interest 1.5 1.8Total equity 282.1 (66.2)
The financial statements were approved by the Board of Directors on 25 February 2016 and signed on its behalf by:
Rupert Soames Angus Cockburn Group Chief Executive Officer Group Chief Financial Officer

Fina
ncia
l Sta
tem
ents
Stra
teg
ic R
epo
rtD
irec
tors
’ Rep
ort
Financial Statements · 163Consolidated Cash Flow Statement
Consolidated Cash Flow StatementFor the year ended 31 December
Note2015
£m2014
£m
Net cash inflow from operating activities before exceptional items 56.5 103.5
Exceptional items (56.6) (40.4)
Net cash (outflow) / inflow from operating activities 40 (0.1) 63.1
Investing activities
Interest received 3.4 2.7
Increase in security deposits 0.3 –
Dividends received from joint ventures 32.5 34.8
Proceeds from disposal of property, plant and equipment 0.8 5.8
Proceeds from disposal of intangible assets 0.9 1.1
Proceeds on disposal of subsidiaries and operations 4,9 165.6 1.9
Acquisition of subsidiaries, net of cash acquired (0.2) (6.5)
Acquisition of other investments – (3.5)
Purchase of other intangible assets (37.5) (20.0)
Purchase of property, plant and equipment (36.7) (23.4)
Net cash inflow / (outflow) from investing activities 129.1 (7.1)
Financing activities
Interest paid (34.7) (42.3)
Exceptional finance costs paid (31.8) –
Dividends paid 18 – (53.1)
Repayment of loans (448.4) (36.0)
Repayment of non recourse loans – (3.1)
Increase in loans to joint ventures (1.6) –
New loan advances – 17.4
Capital element of finance lease repayments (18.8) (18.2)
Costs of equity Rights Issue – (4.1)
Rights Issue and share placement net proceeds 530.3 156.3
Proceeds from issue of other share capital and exercise of share options 4.4 2.3
Net cash (outflow) / inflow from financing activities (0.6) 19.2
Net increase in cash and cash equivalents 128.4 75.2
Cash and cash equivalents at beginning of year 180.1 125.1
Net exchange (loss) / gain (2.1) 2.2
Cash reclassified to assets held for sale 17.2 (22.4)
Cash and cash equivalents at end of year 26 323.6 180.1

Serco Group plc Annual Report and Accounts 2015164
Notes to the Consolidated Financial Statements
1. General InformationSerco Group plc (the Company) is a company incorporated in the United Kingdom under the Companies Act 2006. The address of the registered office is Serco House, 16 Bartley Wood Business Park, Bartley Way, Hook, Hampshire, RG27 9UY.
These consolidated financial statements (the financial statements) are presented in pounds Sterling because this is the currency of the primary economic environment in which Serco operates. Foreign operations are included in accordance with the policies set out in note 2.
2. Significant Accounting PoliciesBasis of Accounting
These financial statements on pages 159 to 235 have been prepared in accordance with International Financial Reporting Standards adopted for use in the European Union (IFRS) and therefore comply with the requirements set out in Article 4 of the EU IAS regulation.
The financial statements have been prepared on the historical cost basis, except for the revaluation of financial instruments. Historical cost is generally based on the fair value of the consideration given in exchange for goods and services. The following principal accounting policies adopted have been applied consistently in the current and preceding financial year.
Going Concern
In assessing the basis of preparation of the financial statements for the year ended 31 December 2015, the Directors have considered the principles of the Financial Reporting Council’s ‘Guidance on Risk Management, Internal Control and Related Financial and Business Reporting, 2014’; namely assessing the applicability of the going concern basis, the review period and disclosures.
The Group’s current principal debt facilities at the year end comprised a £480m revolving credit facility, and £375m of US private placements notes. Subsequent to the year end, the Group has repaid £113m of the US private placement notes, which left £262m of notes outstanding. As at 31 December 2015, the Group had £855m of committed credit facilities and committed headroom of £777m.
Assessment of going concern
The Directors have undertaken a rigorous assessment of going concern and liquidity, taking into account financial forecasts. In order to satisfy ourselves that we have adequate resources for the future, the Directors have reviewed the Group’s existing debt levels, the committed funding and liquidity positions under our debt covenants, and our ability to generate cash from trading activities.
Review period
In undertaking this review the Directors have considered the business plans which provide financial projections for the foreseeable future. For the purposes of this review, we consider that to be the period ending 30 June 2017. The Directors have also reviewed the principal risks considered on pages 16 to 29 of the Strategic Report and taken account of the results of sensitivity testing.
Assessment
The Directors have a reasonable expectation that the Company and the Group will be able to operate within the level of available facilities and cash for the foreseeable future and accordingly believe that it is appropriate to prepare the financial statements on a going concern basis.

Stra
teg
ic R
epo
rtD
irec
tors
’ Rep
ort
Financial Statements · 165Notes to the Consolidated Financial Statements
Fina
ncia
l Sta
tem
ents
Basis of Consolidation
The consolidated financial statements incorporate the financial statements of the Company and entities controlled by the Company (together, the Group) up to 31 December each year. Control is achieved when the Company:
(i) has the power over the investee;
(ii) is exposed, or has rights to variable returns from its involvement with the investee; and
(iii) has the ability to use its power to affect the returns.
The Company reassesses whether or not it controls an investee if facts and circumstances indicate that there are changes to one or more of the three elements of control listed above.
The results of subsidiaries acquired or disposed of during the year are included in the consolidated income statement from the effective date of acquisition or up to the effective date of disposal as appropriate. Where necessary, adjustments are made to the financial statements of subsidiaries to bring accounting policies into line with those used by the Group. All intra-Group transactions, balances, income and expenses are eliminated on consolidation.
Non-controlling interests represent the portion of profits or losses and net assets in subsidiaries that is not held by the Group and is presented within equity in the consolidated balance sheet, separate from equity of shareholders of Serco Group plc.
Adoption of New and Revised Standards
The following changes to IFRS became effective in the current reporting period:
Title Type Background Impact on Serco
Annual Improvements to IFRS: 2011–2013 Cycle
Amendments Covers various matters:
• IFRS 1 First-time Adoption of International Financial Reporting Standards
• IFRS 3 Business Combinations
• IFRS 13 Fair Value Measurement
• IAS 40 Investment Property
Effective for annual periods beginning on or after 1 January 2015, following EU Adoption.
IFRS 1 is not relevant as IFRS have already been adopted.
IFRS 3 changes relate to accounting within joint arrangements themselves and are therefore not relevant.
IFRS 13 was amended to clarify the scope of the portfolio exception, which is not applied in the Group financial statements.
IAS 40 is not relevant to Serco as no investment properties are held.
IFRIC 21 Levies New interpretation The interpretation was issued to clarify the timing of recognition of a levy payment, being a payment to a government for which no specific goods or services are received.
No material levy payments are made by the Group.

Serco Group plc Annual Report and Accounts 2015166
Notes to the Consolidated Financial Statements continued
2. Significant Accounting Policies continuedNew Standards and Interpretations not Applied
At the date of authorisation of these financial statements, the following changes to IFRS have not been applied in these financial statements but could potentially have a significant impact:
Title Type Status Background Impact on Serco
IFRS 9 Financial Instruments
New standard
Pending EU endorsement, expected prior to the effective date of 1 January 2018
The standard replaces IAS 39 and introduces new requirements for classifying and measuring financial instruments and puts in place a new hedge accounting model that is designed to be more closely aligned with how entities undertake risk management activities when hedging financial and non-financial risk exposures.
IFRS 9 will impact both the measurement and disclosures of financial instruments and the total value of financial instruments at 31 December 2015 was £545.9m of assets (2014: £354.0m) and £521.7m of liabilities (2014: £941.3m), further detail of which can be seen in note 33. However, it is not practicable to provide a reasonable estimate of the effect of this standard until a detailed review has been completed.
IFRS 15 Revenue
New standard
Pending EU endorsement, expected prior to the effective date of 1 January 2018
The new standard supersedes all of the following:
• IAS 11 Construction contracts;
• IAS 18 Revenue;
• IFRIC 13 Customer loyalty programmes;
• IFRIC 15 Agreements for the construction of real estate;
• IFRIC 18 Transfers of assets from customers; and
• SIC-31 Revenue – Barter transactions involving advertising services.
The new standard is intended to bring greater transparency and comparability to financial reporting.
The new revenue standard could result in a delay of revenues and profits over those previously recognised, in particular with respect of percentage of completion accounting and where elements of revenues associated with transition activities (also referred to as 'phase in') have been recognised in the early stages of contracts. An ongoing project is being undertaken to assess the full impact of the new standard but we are unable to provide the quantum of any such impact at this time.
It is not anticipated that the standard will be adopted early, which would be permitted on endorsement by the EU.
IFRS 16 Leases
New standard
Pending EU endorsement, expected prior to the effective date of 1 January 2019
The standard replaces IAS 17 Leases and has been introduced in order to improve the comparability of financial statements through developing an approach that is more consistent with the conceptual framework definitions of assets and liabilities.
The key change will be in respect of leases currently classified as operating leases. Under the new standard leases will be recognised on the balance sheet as liabilities with corresponding assets being created, grossing up the balance sheet but with no net effect on net assets at the start of the lease. The income statement impact will be a new interest charge arising from the rate implicit in the liability and as currently the full impact is a charge to operating profit, the change will result in an improvement to operating results.
We have not assessed the likely impact of the new standard, nor concluded whether it will be adopted early which is allowed from the date IFRS 15 is adopted.

Stra
teg
ic R
epo
rtD
irec
tors
’ Rep
ort
Financial Statements · 167Notes to the Consolidated Financial Statements
Fina
ncia
l Sta
tem
ents
In addition to the items detailed above, the changes to IFRS listed below have not been applied in these financial statements and the Directors do not expect that the adoption of these standards will have a material impact on the Group’s financial statements in the period of initial application.
Title Type Status Background
Annual Improvements to IFRS: 2010–2012 cycle
Amendments Endorsed 17 December 2014. Effective for annual periods beginning on or after 1 February 2015
The amendments cover various matters:
• IAS 16 Property, Plant and Equipment
• IAS 24 Related Party Disclosures
• IAS 38 Intangible Assets
• IFRS 2 Share based Payment
• IFRS 3 Business Combinations
• IFRS 8 Operating Segments
• IFRS 13 Fair Value Measurement
Annual Improvements to IFRS: 2012–2014 cycle
Amendments Endorsed 15 December 2015. Effective for annual periods beginning on or after 1 January 2016
The amendments cover various matters:
• IAS 19 Employee Benefits
• IAS 34 Interim Financial Reporting
• IFRS 5 Non-current Assets Held for Sale and Discontinued Operations
• IFRS 7 Financial Instruments: Disclosures
IAS 1 Presentation of Financial Statements
Amendment Endorsed 18 December 2015. Effective for annual periods beginning on or after 1 January 2016
The changes are made as part of the disclosure initiative and make certain points of clarification, particularly that:
• Disclosures are only required for material matters.
• Items in the statement of other comprehensive income for equity accounted entities should be presented as single items based on whether or not they will subsequently be reclassified to profit or loss or not.
• Primary financial statement line items can be disaggregated or aggregated as relevant.
IAS 12 Income Taxes
Amendment Pending EU endorsement, expected prior to the effective date of 1 January 2017
The amendments clarify that unrealised losses on debt instruments measured at fair value in the financial statements but at cost for tax purposes can give rise to deductible temporary differences.
IAS 16 Property, Plant and Equipment and IAS 38 Intangible Assets
Amendment Endorsed 2 December 2015. Effective for annual periods beginning on or after 1 January 2016
Clarification is made of acceptable methods of depreciation and amortisation, including the prohibition of revenue based depreciation and limiting the use of revenue based amortisation.
IAS 19 Employee Benefits
Amendment Endorsed 17 December 2014. Effective for annual periods beginning on or after 1 February 2015
Clarification provided on accounting for employee contributions set out in the formal terms of a defined benefit plan.
IFRS 11 Joint Arrangements
Amendment Endorsed 24 November 2015. Effective for annual periods beginning on or after 1 January 2016
The accounting for acquisitions of interests in joint operations has been amended to follow the normal business combination accounting for acquisitions.

Serco Group plc Annual Report and Accounts 2015168
Notes to the Consolidated Financial Statements continued
2. Significant Accounting Policies continuedFair Value
Fair value is the price that would be received to sell an asset or paid to transfer a liability in an orderly transaction between market participants at the measurement date, regardless of whether that price is directly observable or is estimated using another valuation technique. There are certain transactions in these financial statements which are similar to fair value, but are determined by the treatment set out in their respective standards. These are share based payment transactions that are within the scope of IFRS 2 Share based Payment, leasing transactions that are within the scope of IAS 17 Leases, or the calculation of net realisable value under IAS 2 Inventories or value in use under IAS 36 Impairment of Assets.
Revenue Recognition
Revenue is measured as the fair value of the consideration received or receivable and represents amounts due for goods and services provided in the normal course of business, net of discounts, VAT and other sales related taxes. Calculating the fair value of revenue typically does not require a significant level of judgement, the exceptions to this are the following areas (further detail of which is provided in note 3):
• Uncontracted variations or claims.
• Payments by results contracts.
• Long-term project based contracts.
Revenue is deferred when payment is received in advance of performing the related service or delivering the associated goods, and released when the relevant contractual commitment is fulfilled.
Revenue Recognition: Repeat Service-based Contracts
Revenue on repeat service-based contracts is recognised as services are provided. Where initial contract costs (phase in costs) are paid for by the customer, revenue is recognised when the related costs are incurred.
Revenue Recognition: Long-Term Project-based Contracts
The Group has a number of long-term contracts for the provision of complex, project-based services. Where the outcome of such long-term project-based contracts can be measured reliably, revenue and costs are recognised by reference to the stage of completion of the contract activity at the balance sheet date in accordance with IAS 18 Revenue and IAS 11 Construction Contracts. This is normally measured by the proportion of contract costs incurred for work performed to date compared to the estimated total contract costs, but where a more accurate basis is available that alternative methodology is used. Contract costs include a rational allocation of overheads.
Where the outcome of a long-term project-based contract cannot be estimated reliably, contract revenue is recognised to the extent that it is probable that contract costs will be recovered. Contract costs are recognised as expenses in the period in which they are incurred.
When it is probable that the total contract costs will exceed total contract revenue, the expected loss is recognised as an expense immediately. Such amounts are not discounted.
Revenue Recognition: Other
Sales of goods are recognised when goods are delivered and title has passed.
Interest income is accrued on a time basis, by reference to the principal outstanding and at the effective interest rate applicable, which is the rate that exactly discounts estimated future cash receipts through the expected life of the financial asset to that asset’s net carrying amount.
Dividend income from investments is recognised when the right to receive payment has been established.

Stra
teg
ic R
epo
rtD
irec
tors
’ Rep
ort
Financial Statements · 169Notes to the Consolidated Financial Statements
Fina
ncia
l Sta
tem
ents
Bid Costs and Phase In Costs
All bid costs are expensed through the income statement up to the point where contract award (or full recovery of costs) is virtually certain, being the point at which the Group has at least reached preferred bidder status. Bid costs incurred after this point are then capitalised within trade and other receivables. On contract award these bid costs are amortised through the income statement over the contract period by reference to the stage of completion of the contract activity at the balance sheet date. Bid costs are only capitalised to the extent that it is expected that the related contract will generate sufficient future economic benefits to at least offset the amortisation charge.
Phase in costs that are incremental and directly related to the initial set-up of contracts are capitalised within trade and other receivables and are recognised on a straight line basis over the life of the contract, except where they are specifically reimbursed as part of the terms of the contract when they are recognised as revenue.
Determining whether bid and phase in costs are recoverable involves a high level of judgement as it requires a forecast to be prepared for the expected future profitability of the contract, taking into account the likely future costs and revenues associated with the services not yet performed. The level of bid and phase in costs can be seen in note 24 and further detail of the judgements can be seen in note 3.
Foreign Currencies
Transactions in currencies other than Sterling are recorded at the rates of exchange on the dates of the transactions. At each balance sheet date, monetary assets and liabilities that are denominated in foreign currencies are retranslated at the rates prevailing on the balance sheet date. Gains and losses arising on retranslation are included in the net profit or loss for the period, except for exchange differences arising on non-monetary assets and liabilities where the changes in fair value are recognised directly in equity through the consolidated statement of comprehensive income (SOCI).
On consolidation, the assets and liabilities of the Group’s overseas operations are translated at exchange rates prevailing on the balance sheet date. Income and expense items are translated at the average exchange rates for the period. Exchange differences arising, if any, are recognised directly within equity in the Group’s hedging and translation reserve. Such translation differences are recognised as income or expenses in the period in which the operation is disposed of. Goodwill and fair value adjustments arising on the acquisition of a foreign entity are treated as assets and liabilities of the foreign entity and translated at the closing rate.
Business Combinations
Acquisitions of subsidiaries and businesses are accounted for using the acquisition method. The consideration for each acquisition is measured at the aggregate of the fair values, at the date of exchange, of assets given, liabilities incurred or assumed, and equity instruments issued by the Group in exchange for control of the acquiree. Acquisition related costs are recognised in profit or loss as incurred.
Where applicable, the consideration for the acquisition includes any asset or liability resulting from a contingent consideration arrangement, measured at its acquisition date fair value. Subsequent changes in fair values are adjusted against the cost of acquisition where they qualify as measurement period adjustments (which is subject to a maximum of one year). All other subsequent changes in the fair value of contingent consideration classified as an asset or liability are accounted for in accordance with the relevant accounting standards. Changes in the fair value of contingent consideration classified as equity are not recognised.
The acquiree’s identifiable assets, liabilities and contingent liabilities that meet the conditions for recognition under IFRS 3 (2008) Business Combinations are recognised at their fair value at the acquisition date, except where a different treatment is mandated by another standard.
Assets Classified as Held For Sale
Non-current assets and disposal groups are classified as held for sale if their carrying amount will be recovered through a sale transaction rather than through continuing use. This condition is only met when the sale is highly probable, the asset or disposal group is available for immediate sale in its present condition and the Group expects the sale to be completed within one year. Amounts classified as held for sale are measured as the lower of the carrying amount and fair value less cost to sell.
Assessing whether the criteria are met requires judgement, in particular with regards to whether the subject of the assessment is in a suitable condition for sale. In addition, the calculation of the value of any goodwill to be allocated to the sale is dependent on an assessment of the likely sales proceeds and the likely structure of the transaction.
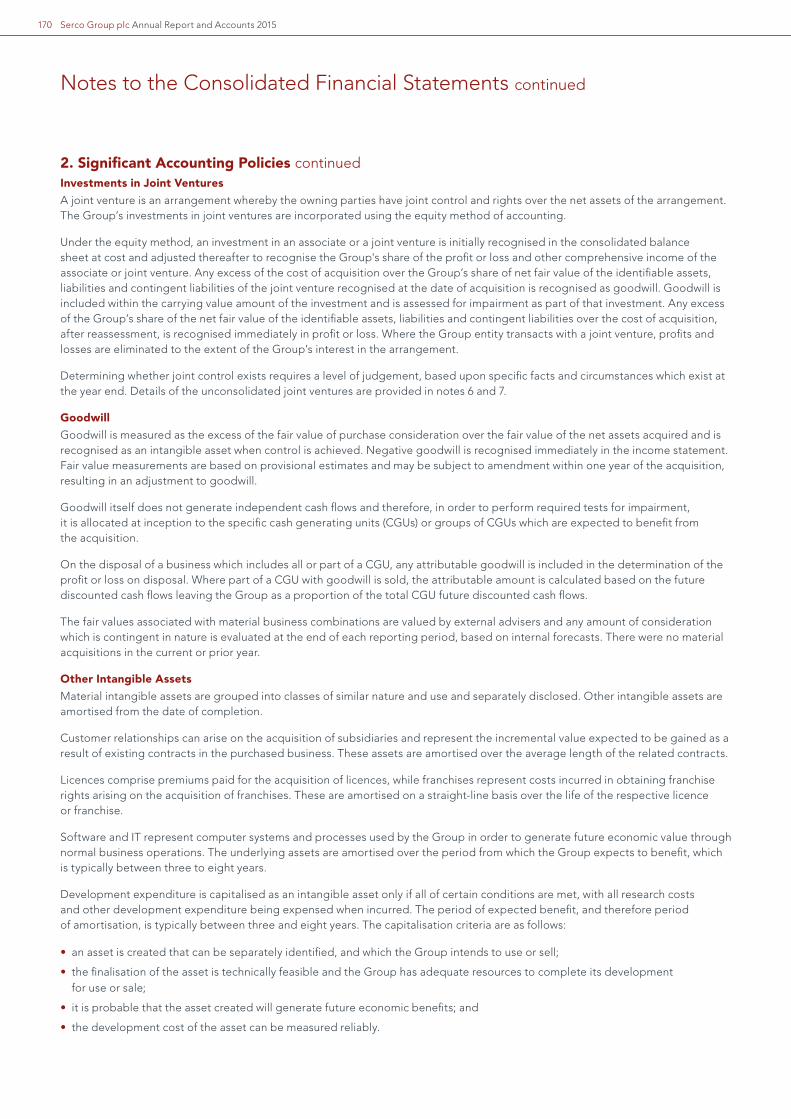
Serco Group plc Annual Report and Accounts 2015170
Notes to the Consolidated Financial Statements continued
2. Significant Accounting Policies continuedInvestments in Joint Ventures
A joint venture is an arrangement whereby the owning parties have joint control and rights over the net assets of the arrangement. The Group’s investments in joint ventures are incorporated using the equity method of accounting.
Under the equity method, an investment in an associate or a joint venture is initially recognised in the consolidated balance sheet at cost and adjusted thereafter to recognise the Group's share of the profit or loss and other comprehensive income of the associate or joint venture. Any excess of the cost of acquisition over the Group’s share of net fair value of the identifiable assets, liabilities and contingent liabilities of the joint venture recognised at the date of acquisition is recognised as goodwill. Goodwill is included within the carrying value amount of the investment and is assessed for impairment as part of that investment. Any excess of the Group’s share of the net fair value of the identifiable assets, liabilities and contingent liabilities over the cost of acquisition, after reassessment, is recognised immediately in profit or loss. Where the Group entity transacts with a joint venture, profits and losses are eliminated to the extent of the Group’s interest in the arrangement.
Determining whether joint control exists requires a level of judgement, based upon specific facts and circumstances which exist at the year end. Details of the unconsolidated joint ventures are provided in notes 6 and 7.
Goodwill
Goodwill is measured as the excess of the fair value of purchase consideration over the fair value of the net assets acquired and is recognised as an intangible asset when control is achieved. Negative goodwill is recognised immediately in the income statement. Fair value measurements are based on provisional estimates and may be subject to amendment within one year of the acquisition, resulting in an adjustment to goodwill.
Goodwill itself does not generate independent cash flows and therefore, in order to perform required tests for impairment, it is allocated at inception to the specific cash generating units (CGUs) or groups of CGUs which are expected to benefit from the acquisition.
On the disposal of a business which includes all or part of a CGU, any attributable goodwill is included in the determination of the profit or loss on disposal. Where part of a CGU with goodwill is sold, the attributable amount is calculated based on the future discounted cash flows leaving the Group as a proportion of the total CGU future discounted cash flows.
The fair values associated with material business combinations are valued by external advisers and any amount of consideration which is contingent in nature is evaluated at the end of each reporting period, based on internal forecasts. There were no material acquisitions in the current or prior year.
Other Intangible Assets
Material intangible assets are grouped into classes of similar nature and use and separately disclosed. Other intangible assets are amortised from the date of completion.
Customer relationships can arise on the acquisition of subsidiaries and represent the incremental value expected to be gained as a result of existing contracts in the purchased business. These assets are amortised over the average length of the related contracts.
Licences comprise premiums paid for the acquisition of licences, while franchises represent costs incurred in obtaining franchise rights arising on the acquisition of franchises. These are amortised on a straight-line basis over the life of the respective licence or franchise.
Software and IT represent computer systems and processes used by the Group in order to generate future economic value through normal business operations. The underlying assets are amortised over the period from which the Group expects to benefit, which is typically between three to eight years.
Development expenditure is capitalised as an intangible asset only if all of certain conditions are met, with all research costs and other development expenditure being expensed when incurred. The period of expected benefit, and therefore period of amortisation, is typically between three and eight years. The capitalisation criteria are as follows:
• an asset is created that can be separately identified, and which the Group intends to use or sell;
• the finalisation of the asset is technically feasible and the Group has adequate resources to complete its development for use or sale;
• it is probable that the asset created will generate future economic benefits; and
• the development cost of the asset can be measured reliably.

Stra
teg
ic R
epo
rtD
irec
tors
’ Rep
ort
Financial Statements · 171Notes to the Consolidated Financial Statements
Fina
ncia
l Sta
tem
ents
While customer relationship and licence assets will arise from specific transactions and can be clearly identified, both software and development type assets can include a significant level of internal costs and determining whether these are directly incremental to the creation of the specific asset requires a high level of judgement (further detail of which is provided in note 3).
Property, Plant and Equipment
Assets held for use in the rendering of services, or for administrative purposes, are stated in the balance sheet at cost, net of accumulated depreciation and any provision for impairment. Assets are grouped into classes of similar nature and use and separately disclosed except where this is not material.
Depreciation is provided on a straight-line basis at rates designed to reduce the assets to their residual value over their estimated useful lives.
The principal annual rates used are:
Freehold buildings 2.5%
Short leasehold assets The higher of 10% or the rate produced by the lease term
Machinery 15% – 20%
Motor vehicles 10% – 50%
Furniture 10%
Office equipment 20% – 33%
Leased equipment The higher of the rate produced by the lease term or useful life
The gain or loss arising on the disposal or retirement of an asset is determined as the difference between the sales proceeds and the carrying amount of the asset and is recognised in the income statement. Given that there is limited history of material gains or losses on disposal of fixed assets, the level of judgement involved in determining the depreciation rates is not considered to be significant.
Asset Impairment
The Group reviews the carrying amounts of its tangible and intangible assets (including goodwill) at each reporting period, together with any other assets under the scope of IAS 36 Impairment of Assets, in order to assess whether there is any indication that those assets have suffered an impairment loss. As the impairment of assets has been identified as both a key source of estimation uncertainty and a critical accounting judgement, further details around the specific judgements and estimates can be seen in note 3.
If any indication of impairment exists, the recoverable amount of the asset is estimated in order to determine if there is any impairment loss. Goodwill is assessed for impairment annually, irrespective of whether there are any indicators of impairment. Where the asset does not generate cash flows that are independent from other assets, the Group estimates the recoverable amount of the CGU to which the asset belongs.
Recoverable amount is defined as the higher of fair value less costs to sell and value in use. In assessing value in use, the estimated future cash flows are discounted to their present value with reference to pre-tax discount rates that reflect the risks specific to the asset for which the estimates of future cash flows have not been adjusted.
If the recoverable amount is estimated to be less than the carrying amount of the asset, the carrying amount is impaired to its recoverable amount. Impairment losses recognised in respect of CGUs are allocated first to reduce the carrying amount of any goodwill allocated to the CGU and then to reduce the carrying amount of the other assets in the CGU on a pro-rata basis.
An impairment loss in respect of goodwill is not reversed. In respect of other assets, impairment losses recognised in prior periods are assessed at each reporting date for indications that the loss has decreased or no longer exists. Where an impairment loss subsequently reverses, the carrying amount is increased to the revised estimate of its recoverable amount, but so that the increased carrying amount does not exceed the carrying amount that would have been determined, net of depreciation or amortisation, had no impairment loss been recognised in prior years.
Impairment losses and reversals are recognised immediately within administrative expenses within the income statement unless it is considered to be an exceptional item.

Serco Group plc Annual Report and Accounts 2015172
Notes to the Consolidated Financial Statements continued
2. Significant Accounting Policies continuedRetirement Benefit Costs
Payments to defined contribution pension schemes are charged as an expense as they fall due.
For defined benefit pension schemes, the cost of providing benefits is determined using the projected unit credit actuarial cost method, with actuarial valuations being carried out at each balance sheet date. Actuarial gains and losses are recognised in full in the period in which they occur. They are recognised outside the income statement and are presented in the SOCI.
Both current and past service costs are the amounts recognised in the income statement, reflecting the expense associated with the individuals. Current service cost represents the increase in the present value of the scheme liabilities expected to arise from employee service in the current period. Past service cost is recognised immediately to the extent that the benefits are already vested. Gains and losses on curtailments or settlements are recognised in the income statement in the period in which the curtailment or settlement occurs.
The retirement benefit obligation recognised in the balance sheet represents the present value of the defined benefit obligation as adjusted for unrecognised past service costs, and as reduced by the fair value of scheme assets. Any asset resulting from this calculation is limited to past service cost, plus the present value of available refunds (which is only recognised to the extent that the Group has an unconditional right to receive it) and reductions in future contributions to the scheme. To the extent that an economic benefit is available as a reduction in future contributions and there is a minimum funding requirement required of the Group, the economic benefit available as a reduction in contributions is calculated as the present value of the estimated future service cost in each year, less the estimated minimum funding contributions required in respect of the future accrual and benefits in that year.
Calculation of the amounts recognised in the consolidated financial statements in respect of defined benefit pension schemes requires a high level of judgement, as further explained in note 3.
Defined Benefit Obligations Arising from Contractual Obligations
Where the Group takes on a contract and assumes the obligation to contribute variable amounts to the defined benefit pension scheme throughout the period of the contract, the Group’s share of the defined benefit obligation less its share of the pension scheme assets that it will fund over the period of the contract is recognised as a liability at the start of the contract with a corresponding amount being recognised as an intangible asset. The intangible asset, which reflects the Group’s right to manage and operate the contract, is amortised over the contract period. The Group’s share of the scheme assets and liabilities is calculated by reducing the scheme assets and liabilities by a franchise adjustment. The franchise adjustment represents the estimated amount of scheme deficit that will be funded outside the contract period. Subsequent actuarial gains and losses in relation to the Group’s share of pension obligations are recognised outside the income statement and are presented in the SOCI.
Multi-employer Pension Schemes
Multi-employer pension schemes are classified as either a defined contribution pension scheme or a defined benefit pension scheme under the terms of the scheme.
Derivative Financial Instruments and Hedging Activities
The Group enters into a variety of derivative financial instruments to manage the exposure to interest rate, foreign exchange risk and price risk, including currency swaps, foreign exchange forward contracts, interest rate swaps and commodity future contracts. Further details of derivative financial instruments are given in note 33.
Derivatives are initially recognised at fair value at the date a derivative contract is entered into and are subsequently re-measured to their fair value at each balance sheet date. The resulting gain or loss is recognised in profit or loss immediately unless the derivative is designated and effective as a hedging instrument, in which event the timing of the recognition in profit or loss depends on the nature of the hedge relationship. The Group designates certain derivatives as either hedges of the fair value of recognised assets or liabilities (fair value hedges) or hedges of highly probable forecast transactions or hedges of firm commitments (cash flow hedges).
At the inception of the hedge relationship, the Group documents the relationship between the hedging instrument and the hedged item, along with its risk management objectives and its strategy for undertaking various hedge transactions. Both at the inception of the hedge and on a periodic basis, the Group assesses whether the hedging instrument that is used in a hedging relationship is highly effective in offsetting changes in fair values or cash flows of the hedged item.
A derivative is presented as a non-current asset or a non-current liability if the remaining maturity of the instrument is more than 12 months and it is not expected to be realised or settled within 12 months. Derivatives, which mature within 12 months, are presented as current assets or current liabilities.
Details of the fair values of the derivative instruments used for hedging purposes and movements in the hedging and translation reserve in equity are detailed in the SOCI and described in note 33.
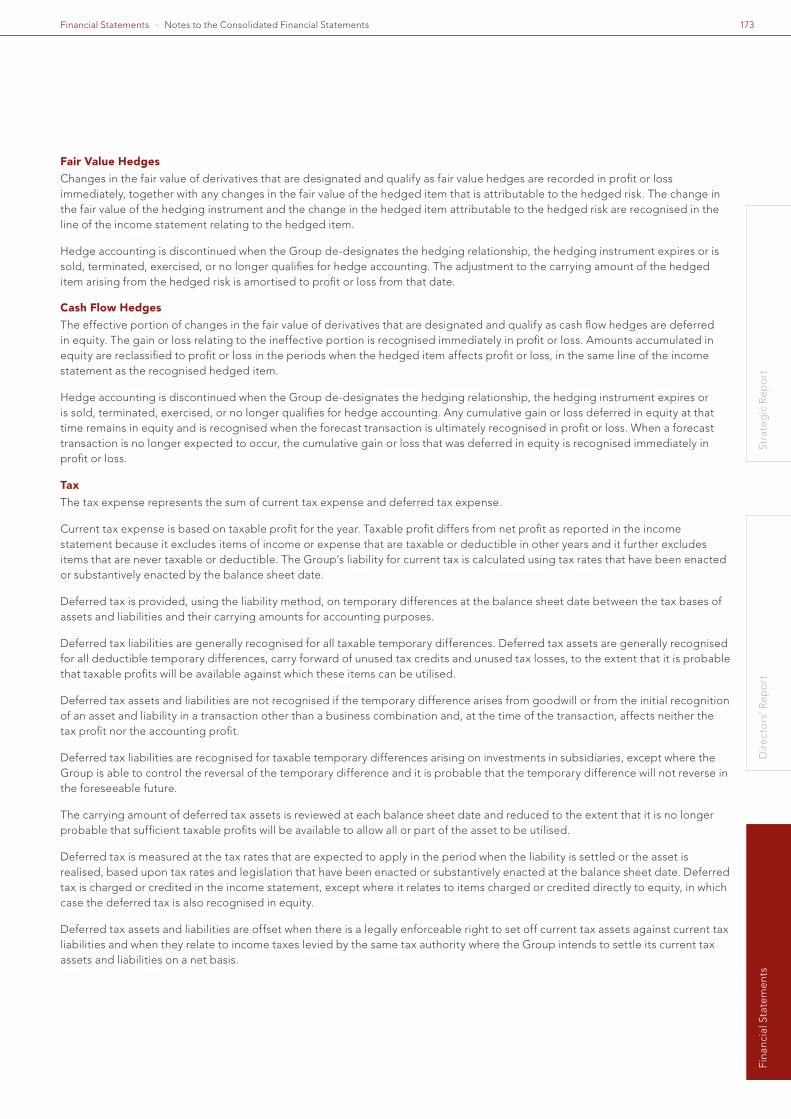
Stra
teg
ic R
epo
rtD
irec
tors
’ Rep
ort
Financial Statements · 173Notes to the Consolidated Financial Statements
Fina
ncia
l Sta
tem
ents
Fair Value Hedges
Changes in the fair value of derivatives that are designated and qualify as fair value hedges are recorded in profit or loss immediately, together with any changes in the fair value of the hedged item that is attributable to the hedged risk. The change in the fair value of the hedging instrument and the change in the hedged item attributable to the hedged risk are recognised in the line of the income statement relating to the hedged item.
Hedge accounting is discontinued when the Group de-designates the hedging relationship, the hedging instrument expires or is sold, terminated, exercised, or no longer qualifies for hedge accounting. The adjustment to the carrying amount of the hedged item arising from the hedged risk is amortised to profit or loss from that date.
Cash Flow Hedges
The effective portion of changes in the fair value of derivatives that are designated and qualify as cash flow hedges are deferred in equity. The gain or loss relating to the ineffective portion is recognised immediately in profit or loss. Amounts accumulated in equity are reclassified to profit or loss in the periods when the hedged item affects profit or loss, in the same line of the income statement as the recognised hedged item.
Hedge accounting is discontinued when the Group de-designates the hedging relationship, the hedging instrument expires or is sold, terminated, exercised, or no longer qualifies for hedge accounting. Any cumulative gain or loss deferred in equity at that time remains in equity and is recognised when the forecast transaction is ultimately recognised in profit or loss. When a forecast transaction is no longer expected to occur, the cumulative gain or loss that was deferred in equity is recognised immediately in profit or loss.
Tax
The tax expense represents the sum of current tax expense and deferred tax expense.
Current tax expense is based on taxable profit for the year. Taxable profit differs from net profit as reported in the income statement because it excludes items of income or expense that are taxable or deductible in other years and it further excludes items that are never taxable or deductible. The Group’s liability for current tax is calculated using tax rates that have been enacted or substantively enacted by the balance sheet date.
Deferred tax is provided, using the liability method, on temporary differences at the balance sheet date between the tax bases of assets and liabilities and their carrying amounts for accounting purposes.
Deferred tax liabilities are generally recognised for all taxable temporary differences. Deferred tax assets are generally recognised for all deductible temporary differences, carry forward of unused tax credits and unused tax losses, to the extent that it is probable that taxable profits will be available against which these items can be utilised.
Deferred tax assets and liabilities are not recognised if the temporary difference arises from goodwill or from the initial recognition of an asset and liability in a transaction other than a business combination and, at the time of the transaction, affects neither the tax profit nor the accounting profit.
Deferred tax liabilities are recognised for taxable temporary differences arising on investments in subsidiaries, except where the Group is able to control the reversal of the temporary difference and it is probable that the temporary difference will not reverse in the foreseeable future.
The carrying amount of deferred tax assets is reviewed at each balance sheet date and reduced to the extent that it is no longer probable that sufficient taxable profits will be available to allow all or part of the asset to be utilised.
Deferred tax is measured at the tax rates that are expected to apply in the period when the liability is settled or the asset is realised, based upon tax rates and legislation that have been enacted or substantively enacted at the balance sheet date. Deferred tax is charged or credited in the income statement, except where it relates to items charged or credited directly to equity, in which case the deferred tax is also recognised in equity.
Deferred tax assets and liabilities are offset when there is a legally enforceable right to set off current tax assets against current tax liabilities and when they relate to income taxes levied by the same tax authority where the Group intends to settle its current tax assets and liabilities on a net basis.

Serco Group plc Annual Report and Accounts 2015174
Notes to the Consolidated Financial Statements continued
2. Significant Accounting Policies continuedShare based Payment
The Group makes equity-settled share based payments to certain employees and operates an HMRC approved Save As You Earn (SAYE) share option scheme open to eligible employees which allows the purchase of shares at a discount. These are measured at fair value at the date of grant. The fair value is expensed on a straight-line basis over the vesting period, based on the Group’s estimate of shares that will eventually vest. SAYE options are treated as cancelled when employees cease to contribute to the scheme, resulting in an acceleration of the remainder of the related expense.
Where the fair value of share options requires the use of a valuation model, fair value is measured by use of the Binomial Lattice or Monte Carlo Simulation models depending on the type of scheme, as set out in note 38. The expected life used in the models has been adjusted, based on management’s best estimate, for the effects of non-transferability, exercise restrictions, and behavioural considerations. Where relevant, the value of the option has also been adjusted to take account of market conditions applicable to the option.
Inventories
Inventories are stated at the lower of cost and net realisable value and comprise service spares, parts awaiting installation and work in progress for projects undertaken for customers where payment is received on completion. Cost comprises direct materials and, where applicable, direct labour costs that have been incurred in bringing the inventories to their present location and condition.
Trade Receivables
Trade receivables are recognised initially at cost (being the same as fair value) and subsequently at amortised cost less any provision for impairment, to ensure that amounts recognised represent the recoverable amount.
A provision for impairment arises where there is evidence that the Group will not be able to collect amounts due, which is achieved by creating an allowance for doubtful debts recognised in the income statement within administrative expenses. Determining whether a trade receivable is impaired requires judgement to be applied based on the information available at each reporting date. Key indicators of impairment include disputes with customers over commercial positions, or where debtors have significant financial difficulties such as historic default of payments or information that suggests bankruptcy or financial reorganisation are a reasonable possibility. The majority of contracts entered into by the Group are with government organisations or are blue chip private sector companies and therefore historic levels of default are relatively low and as a result the risks associated with this judgement are not considered to be significant.
When a trade receivable is expected to be uncollectible, it is written off against the allowance for doubtful debts. Subsequent recoveries of amounts previously provided for or written off are credited against administrative expenses.
Cash and Cash Equivalents
Cash and cash equivalents comprise cash in hand and balances with banks and similar institutions, which are readily convertible to known amounts of cash and which are subject to insignificant changes in value and have a maturity of three months or less from the date of acquisition. This definition is also used for the consolidated cash flow statement.
Leases
Leases are classified as finance leases whenever the terms of the lease transfer substantially all the risks and rewards of ownership to the lessee. All other leases are classified as operating leases.
Assets held under finance leases are recognised as assets of the Group at fair value or, if lower, at the present value of minimum lease payments determined at the inception of the lease. The corresponding liability to the lessor is included in the balance sheet as a finance lease obligation. Lease payments are apportioned between finance charges and reduction of the lease obligation so as to achieve a constant rate of interest on the remaining balance of the liability. Finance charges are charged directly to the income statement, unless they are directly attributable to a qualifying asset, in which case they are capitalised in accordance with the Group’s general policy on borrowing costs (see below).
Total rentals payable under operating leases are charged to the income statement on a straight-line basis over the term of the relevant lease.

Stra
teg
ic R
epo
rtD
irec
tors
’ Rep
ort
Financial Statements · 175Notes to the Consolidated Financial Statements
Fina
ncia
l Sta
tem
ents
Loans
Loans are stated at amortised cost using the effective interest-rate method. Accrued interest is recorded separately from the associated borrowings within current liabilities.
Loans are described as non recourse loans and classified as such only if no Group company other than the relevant borrower has an obligation, under a guarantee or other arrangement, to repay the debt.
Borrowing Costs
Borrowing costs directly attributable to the acquisition, construction or production of qualifying assets, which are assets that necessarily take a substantial period of time to get ready for their intended use or sale, are added to the cost of those assets, until such time as the assets are substantially ready for their intended use or sale.
All other borrowing costs are recognised as an expense in the period in which they are incurred.
Provisions
Provisions are recognised when the Group has an obligation to make a cash outflow as a result of a past event. Provisions are measured at the best estimate of the expenditure required to settle the obligation at the balance sheet date when settlement is considered to be likely.
Onerous contract provisions (OCPs) arise when the unavoidable costs of meeting contractual obligations exceed the remuneration expected to be received. Unavoidable costs include total contract costs together with a rational allocation of shared costs that can be directly linked to fulfilling contractual obligations which have been systematically allocated to OCPs on the basis of key cost drivers except where this is impracticable, where contract revenue is used as a proxy to activity. The provision is calculated as the lower of the termination costs payable for an early exit and the expected loss over the remaining contract period. Where a customer has an option to extend a contract and it is likely that such an extension will be made, any loss expected to be made during the extension period, is included within the calculation. However, where a profit can be reasonably expected in the extension period, no credit is taken on the basis that such profits are uncertain given the potential for the customer to either not extend or offer an extension under lower pricing terms. Further details of the judgements can be seen in note 3.
Net Investments in Foreign Operations
Exchange differences arising on monetary items that form part of the Group’s net investment in foreign operations are initially recognised in equity and accumulated in the hedging and translation reserve and reclassified from equity to profit or loss on disposal of the net investment.
Dividends Payable
Dividends are recorded in the Group’s consolidated financial statements in the period in which they are declared, appropriately authorised and no longer at the discretion of the Company.
Segmental Information
Segmental information is based on internal reports about components of the Group that are regularly reviewed by the Group’s Chief Operating Decision Maker (CODM) in order to allocate resources to the segments and to assess their performance. The CODM is considered to be the Board of Directors as a body.
Segmental revenue is analysed on an external basis. Inter-segment revenue is not presented as it is not significant in the context of revenue as a whole. Net finance costs are not presented for each operating segment as they are reviewed on a consolidated basis by the CODM.
Specific corporate expenses are allocated to the corresponding segments. Segment assets comprise goodwill, other intangible assets, property, plant and equipment, inventories, trade and other receivables (excluding corporation tax recoverable) and any retirement benefit asset. Segment liabilities comprise trade and other payables and retirement benefit obligations.
Serco Group plc Annual Report and Accounts 2015176
Notes to the Consolidated Financial Statements continued
3. Critical Accounting Judgements and Key Sources of Estimation UncertaintyIn the process of applying the Group’s accounting policies, which are described in note 2 above, management has made the following judgements that have the most significant effect on the amounts recognised in the financial statements. As described below, many of these areas of judgement also involve a high level of estimation uncertainty.
Provisions for Onerous Contracts
Determining whether provisions are required for loss making contracts requires significant judgements to be made regarding the ability of the company to maintain or improve operational performance. Judgements can also be made regarding the outcome of matters dependent on the behaviour of the customer in question or other parties involved in delivering the contract.
The level of uncertainty in the estimates made, either in determining whether a provision is required, or in the calculation of a provision booked, is linked to the complexity of the underlying contract and the form of service delivery.
In the current year material revisions have been made to historic provisions, which have led to a charge to contract provisions of £89.1m (excluding £12.8m in respect of businesses held for sale) and releases of £93.0m (excluding £1.3m in respect of businesses held for sale). All of these revisions have resulted from triggering events in the current year, either through changes in contractual positions or changes in circumstances which could not have been reasonably foreseen at the previous balance sheet date. To mitigate the level of uncertainty is making these estimates Management regularly compares actual performance of the contracts against previous forecasts and considers whether there have been any changes to significant judgements. A detailed bottom up review of the provisions is performed as part of the Group’s formal annual budgeting process.
Impairment of Assets
Identifying whether there are indicators of impairment for assets involves a high level of judgement and a good understanding of the drivers of value behind the asset. At each reporting period an assessment is performed in order to determine whether there are any such indicators, which involves considering the performance of our business and any significant changes to the markets in which we operate. The total value of assets which are covered by this assessment process (after previous impairments) is £1,255.0m (2014: £1,252.9m), which is the maximum exposure related to this judgement. We mitigate the risk associated with this judgement by putting in place processes and guidance for the finance community and internal review procedures.
Determining whether assets with impairment indicators require an actual impairment involves an estimation of the expected value in use of the asset (or CGU to which the asset relates). The value in use calculation involves an estimation of future cash flows and also the selection of appropriate discount rates, both of which involve considerable judgement. The future cash flows are derived from approved forecasts, with the key assumptions being revenue growth, margins and cash conversion rates. Discount rates are calculated with reference to the specific risks associated with the assets and are based on advice provided by external experts. Our calculation of discount rates are performed based on a risk free rate of interest appropriate to the geographic location of the cash flows related to the asset being tested, which is subsequently adjusted to factor in local market risks and risks specific to Serco and the asset itself. Discount rates used for internal purposes are post tax rates, however for the purpose of impairment testing in accordance with IAS 36 Impairment of Assets we calculate a pre tax rate based on post tax targets.
During the year, goodwill associated with the Americas CGU was determined to be impaired, resulting in an exceptional charge in respect of continuing operations of £87.5m (2014: three CGUs impaired resulting in charges of £182.2m). In addition, a charge of £9.0m (2014: £32.4m) was recognised in respect of certain intangible assets. A charge of £2.0m (2014: £36.7m) was recognised in respect of certain items of property, plant and equipment and a credit of £6.8m (2014: charge of £17.4m) was recognised in respect of billed receivables.
Valuation of Assets Held for Sale
Held for sale assets are measured at the lower of their carrying amount and fair value less costs to sell and up to the point a sales price has been formally agreed a level of judgement is required in assessing the value of these assets. All assets included as held for sale are based on the latest offer received which is likely to be acceptable to us and the customer of the affected contract, but unforeseen events may lead to a change in this price prior to completion of the transaction. The total value of assets held for sale is £7.3m (2014: £344.8m) which is stated after an impairment charge for the year of £72.4m (2014: £39.2m), which corresponded to £65.9m in relation to goodwill and £6.5m for other assets (2014: all other assets).

Stra
teg
ic R
epo
rtD
irec
tors
’ Rep
ort
Financial Statements · 177Notes to the Consolidated Financial Statements
Fina
ncia
l Sta
tem
ents
Revenue and Recognition
Calculating the fair value of the Group’s revenue typically does not require a significant level of judgement, the exceptions to this are the following areas:
• Uncontracted variations or claims. Where work has been performed outside of the normal contracting framework at the request of the customer or a claim has been made for work performed but in a dispute, judgement is required in order to determine whether there is sufficient certainty that the Group will be financially compensated. Revenue is only recognised to the extent that they have been orally agreed by the customer or are virtually certain of being received.
• Payments by results contracts. When returns are directly linked to performance through cost savings or other customer driven key performance indicators over a period of time an estimate is made of the likelihood of achieving the necessary level of performance when the period covers a financial year end. Revenue is only recognised when we can be reasonably certain of achieving the required level of performance.
• Long-term contracts. Revenue and profit is recognised for certain long-term project-based contracts based on the stage of completion of the contract activity. The assessment of the stage of completion requires the exercise of judgement and is measured by the proportion of costs incurred to estimated whole-life contract costs, except where whole life contract costs exceed the contract value, in which case the excess is expensed immediately.
Separation of Income Statement Items from Underlying Results
IAS 1 requires material items to be disclosed separately in a way that enables users to assess the quality of a company's profitability. In practice, these are commonly referred to as 'exceptional' items, but this is not a concept defined by IFRS and therefore there is a level of judgement involved in determining what to include in underlying profit. We consider items which are material, non-recurring and outside of the normal operating practice of the company to be suitable for separate presentation.
Retirement Benefit Obligations
The calculation of retirement benefit obligations is dependent on material key assumptions including discount rates, mortality rates, inflation rates and future contribution rates (see note 34). The value of net retirement benefit obligations at the balance sheet date is an asset of £115.6m (2014: £126.5m). Details of the impact of changes in assumptions relating to retirement benefit obligations are disclosed in note 34.

Serco Group plc Annual Report and Accounts 2015178
Notes to the Consolidated Financial Statements continued
4. Discontinued operationsFollowing the transfer of the public sector Business Process Outsourcing (BPO) operations to the UK and Europe Local and Regional Government division in 2014, the Global Services division represented only onshore and offshore private sector BPO operations. While the exit of the whole of the private sector BPO operations had been planned and announced in 2014, certain UK onshore contracts were planned to be exited early rather than be sold and therefore it was not appropriate to treat these operations as discontinued in 2014.
On 16 September 2015 the disposal of the offshore private sector BPO operations was agreed and completion of the sale of the majority of these operations occurred on 31 December 2015. The disposal of the remaining offshore business to the same purchaser is expected to complete in 2016 following receipt of the necessary regulatory approval and the balance sheet items associated with these operations remain within items held for sale at 31 December 2015. As at 31 December the net assets relating to the remaining element, being the operations based in the Middle East, were equal to the expected consideration in respect of the disposal of £15.0m.
During the course of 2015 the UK onshore private sector BPO businesses have either been sold, are planned to be sold, or have been exited early and as a result the Global Services division is deemed to be a discontinued operation. Those UK onshore BPO businesses which have not yet been sold are also treated as held for sale.
The decision to exit these operations is a core element of the strategy to focus Serco on being a leading supplier of public services. This not only strengthens the balance sheet position but also enables the Group to focus on the five core markets.
The results of the discontinued operations were as follows:
For the year ended 31 December2015
£m2014
£m
Revenue 337.6 359.3
Expenses (311.1) (388.3)
Operating profit / (loss) before exceptional items 26.5 (29.0)
Exceptional gain / (loss) on disposal of subsidiaries and operations 5.4 (3.1)
Other exceptional operating items (83.0) (332.7)
Operating loss (51.1) (364.8)
Investment revenue 2.1 1.6
Finance costs (1.2) (0.3)
Loss before tax (50.2) (363.5)
Tax charge on profit / (loss) before exceptional items (18.7) (3.9)
Tax credit on exceptional items 2.7 9.8
Net loss attributable to discontinued operations presented in the income statement (66.2) (357.6)
Attributable to:
Equity owners of the Company (66.0) (357.3)
Non-controlling interests (0.2) (0.3)

Stra
teg
ic R
epo
rtD
irec
tors
’ Rep
ort
Financial Statements · 179Notes to the Consolidated Financial Statements
Fina
ncia
l Sta
tem
ents
Included above are items classified as exceptional as they are considered to be material, non recurring and outside of the normal course of business. These are summarised as follows:
For the year ended 31 December2015
£m2014 £m
Exceptional items arising on discontinued operations
Loss on disposal of discontinued operations prior to reserve recycling (45.6) (3.1)
Recycling of gains in hedging and translation reserves 51.0 –
Exceptional gain / (loss) on disposal 5.4 (3.1)
Other exceptional operating items
Restructuring costs (2.2) (8.7)
Impairment of goodwill (65.9) (284.8)
Impairment of other assets transferred to held for sale (14.9) (39.2)
Other exceptional operating items (83.0) (332.7)
Exceptional operating items arising on discontinued operations (77.6) (335.8)
In 2015 a charge of £2.2m (2014: £8.7m) has arisen in discontinued operations in relation to the restructuring programme resulting from the Strategy Review. This includes redundancy payments, provisions and other charges relating to the exit of the UK private sector BPO business, external advisory fees and other incremental costs.
During 2015, an impairment test of the Global Services business was conducted based on a level 3 fair value measurement, with reference to offers received less costs of disposal. The impairment testing identified a non-cash exceptional impairment of goodwill relating to discontinued operations of £65.9m (2014: £284.8m) which was recorded at the half year. Assets other than goodwill have also been impaired by a total of £14.9m (2014: £39.2m). The impairment of goodwill relates primarily to the offshore Global Services business, the majority of which was disposed of on 31 December 2015, with the other asset impairments relating to the UK onshore business.
The net assets at the date of disposal of discontinued operations were:
Offshore£m
UK onshore£m
Goodwill 156.7 –
Other intangible assets 30.4 –
Property, plant and equipment 35.1 0.8
Trade and other receivables 82.8 0.5
Deferred tax assets 9.1 –
Cash and cash equivalents 31.0 0.8
Trade and other payables (51.5) (0.5)
Obligations under finance leases (1.1) (0.1)
Provisions (16.8) (4.9)
Corporation tax liabilities (32.0) (0.3)
Deferred tax liabilities (5.1) –
Minority interest disposed 0.4 –
Net assets / (liabilities) disposed 239.0 (3.7)

Serco Group plc Annual Report and Accounts 2015180
Notes to the Consolidated Financial Statements continued
4. Discontinued operations continuedThe loss on disposal of discontinued operations is calculated as follows:
Offshore £m
UK onshore £m
Total £m
Cash consideration 212.8 (1.6) 211.2
Face value of Loan Note received 30.0 – 30.0
Gross consideration 242.8 (1.6) 241.2
Loan Note fair value adjustment (10.5) – (10.5)
Indemnities provided (30.7) (2.3) (33.0)
Net consideration 201.6 (3.9) 197.7
Less:
Net (assets) / liabilities disposed (239.0) 3.7 (235.3)
Disposal related costs (7.5) (0.5) (8.0)
Loss on disposal of discontinued operations prior to reserve recycling (44.9) (0.7) (45.6)
Recycling of gains on translation of foreign operations 43.0 – 43.0
Recycling of gains on hedged derivative financial instruments from reserves 8.0 – 8.0
Exceptional gain / (loss) on disposal 6.1 (0.7) 5.4
The recycling items relate to the cumulative gains taken through the Consolidated Statement of Comprehensive Income. These are in respect of the historic movements in exchange differences on the net investment held in these overseas operations and fair value movements on the hedged foreign exchange derivatives closed out prior to completion. The disposal has crystallised these gains previously recognised in reserves, resulting in their recognition in the income statement as an additive item to the normal losses made on disposal.
Offshore consideration includes £58.2m in respect of amounts owed by the disposed business to other parts of Serco which were settled by the purchaser at the point of completion.
The net cash inflow arising on disposal of discontinued operations and the impact on net debt is as follows:
Offshore £m
UK onshore £m
Total £m
Cash consideration 212.8 (1.6) 211.2
Less:
Cash and cash equivalents disposed (31.0) (0.8) (31.8)
Cash amounts on settlement of derivatives (7.0) – (7.0)
Disposal related costs (3.7) (0.1) (3.8)
Net cash flow on disposal 171.1 (2.5) 168.6
External debt disposed 1.1 0.1 1.2
Loan Note received 19.5 – 19.5
Movement in net debt 191.7 (2.4) 189.3

Stra
teg
ic R
epo
rtD
irec
tors
’ Rep
ort
Financial Statements · 181Notes to the Consolidated Financial Statements
Fina
ncia
l Sta
tem
ents
The net cash flows resulting from the discontinued operations were as follows:
For the year ended 31 December2015
£m2014
£m
Net cash inflow from operating activities before exceptional items 67.7 41.7
Exceptional items (1.5) (3.3)
Net cash inflow from operating activities 66.2 38.4
Net cash inflow / (outflow) from investing activities 93.5 (4.7)
Net cash outflow from financing activities (26.5) (1.6)
Net increase in cash and cash equivalents attributable to discontinued operations 133.2 32.1
5. Segmental InformationThe Group’s operating segments reflecting the information reported to the Board in 2015 under IFRS 8 Operating Segments are as set out below. The only material change on the prior year is the Global Services segment being reclassified as a discontinued operation.
Reportable segments Operating segments
UK Central Government Frontline services for sectors including Defence, Justice & Immigration and Transport delivered to UK Government and devolved authorities;
UK & Europe Local & Regional Government
Services for sectors including Health, Local Government Direct Services, Citizen Services and BPO services delivered to UK & European public sector customers;
Americas Professional, technology and management services for sectors including Defence, Transport and Citizen Services delivered to US federal and civilian agencies, selected state and municipal governments and the Canadian Government;
AsPac Frontline services for sectors including Defence, Justice & Immigration, Transport, Health and Citizen Services in the Asia Pacific region including Australia, New Zealand and Hong Kong;
Middle East Frontline services for sectors including Defence, Transport and Health in the Middle East region; and
Corporate Central and head office costs.
The accounting policies of the reportable segments are the same as the Group’s accounting policies described in note 2.
Geographic Information
Year ended 31 December
Revenue 2015
£m
Non-current assets*
2015 £m
Revenue 2014
£m
Non-current assets*
2014 £m
United Kingdom 1,529.2 259.2 1,789.4 464.7
United States 632.0 347.7 642.1 336.6
Australia 514.7 125.5 657.0 140.3
Middle East 291.3 16.2 260.4 14.6
Other countries 209.8 34.0 246.8 246.4
Total 3,177.0 782.6 3,595.7 1,202.6
*Non-current assets exclude financial instruments, deferred tax assets and loans to joint ventures and include assets of £1.2m (2014: £405.4m) reclassified as held for sale.
Revenues from external customers are attributed to individual countries on the basis of the location of the customer.

Serco Group plc Annual Report and Accounts 2015182
Notes to the Consolidated Financial Statements continued
5. Segmental Information continuedInformation about Major Customers
The Group has two major governmental customers which each represent more than 10% of Group revenues. The customers’ revenues were £1,480.9m (2014: £1,709.3m) for the UK Government across UK Central Government and UK & Europe Local & Regional Government, and £558.5m (2014: £574.6m) for the US Government within the Americas segment.
The following is an analysis of the Group’s revenue, results, assets and liabilities by reportable segment:
Year ended 31 December 2015CG
£mLRG £m
Americas £m
AsPac £m
Middle East
£mCorporate
£mTotal
£m
Revenue 742.1 905.8 693.0 544.7 291.4 – 3,177.0
Result
Trading profit / (loss)* 60.2 (14.5) 27.0 58.8 27.4 (47.9) 111.0
Amortisation and impairment of intangibles arising on acquisition – (1.1) (2.5) (1.2) – – (4.8)
Operating profit / (loss) before exceptional items 60.2 (15.6) 24.5 57.6 27.4 (47.9) 106.2
Exceptional profit / (loss) on disposal of subsidiaries and operations 0.5 0.3 – (2.6) – (0.8) (2.6)
Other exceptional operating items (0.2) (1.7) (87.5) (1.3) (1.8) (14.8) (107.3)
Operating profit / (loss) 60.5 (17.0) (63.0) 53.7 25.6 (63.5) (3.7)
Investment revenue 6.1
Finance costs (71.8)
Loss before tax (69.4)
Tax charge (17.5)
Loss for the year from continuing operations (86.9)
*Trading profit / (loss) is defined as operating (loss) / profit before exceptional items and amortisation and impairment of intangible assets arising on acquisition.
Supplementary Information
Share of profits in joint ventures, net of interest and tax 33.8 1.5 0.1 0.8 – 0.8 37.0
Depreciation of plant, property and equipment (1.9) (13.3) (3.0) (5.4) (1.1) (1.4) (26.1)
Impairment of plant, property and equipment (1.6) – (0.4) – – – (2.0)
Total depreciation and impairment of plant, property and equipment (3.5) (13.3) (3.4) (5.4) (1.1) (1.4) (28.1)
Amortisation of intangible assets arising on acquisition – (1.1) (2.5) (1.2) – – (4.8)
Amortisation of other intangible assets (0.4) (2.0) (1.1) (1.5) (0.7) (18.0) (23.7)
Impairment and write down of other intangible assets – (9.0) – – – – (9.0)
Total amortisation and impairment of intangible assets (0.4) (12.1) (3.6) (2.7) (0.7) (18.0) (37.5)
Segment assets
Interests in joint ventures 4.4 6.5 0.2 2.3 0.4 – 13.8
Other segment assets 126.0 202.2 473.6 235.0 100.7 218.9 1,356.4
Total segment assets 130.4 208.7 473.8 237.3 101.1 218.9 1,370.2
Unallocated assets, including assets held for sale 469.3
Consolidated total assets 1,839.5
Segment liabilities
Segment liabilities (104.3) (130.8) (63.7) (109.3) (60.0) (135.4) (603.5)
Unallocated liabilities, including liabilities linked to assets held for sale (953.9)
Consolidated total liabilities (1,557.4)

Stra
teg
ic R
epo
rtD
irec
tors
’ Rep
ort
Financial Statements · 183Notes to the Consolidated Financial Statements
Fina
ncia
l Sta
tem
ents
Year ended 31 December 2014 CG £m
LRG £m
Americas £m
AsPac £m
Middle East
£mCorporate
£mTotal
£m
Revenue 961.4 959.8 708.1 706.0 260.4 – 3,595.7
Result
Trading (loss) / profit)* (242.8) (90.4) 16.5 (201.6) (0.2) (90.1) (608.6)
Amortisation and impairment of intangibles arising on acquisition (0.1) (7.2) (2.3) (8.6) – – (18.2)
Operating (loss) / profit before exceptional items (242.9) (97.6) 14.2 (210.2) (0.2) (90.1) (626.8)
Exceptional (loss) / profit on disposal of subsidiaries and operations 1.9 0.4 – – – (4.6) (2.3)
Other exceptional operating items (42.7) (95.9) (101.7) (41.3) (1.7) (40.1) (323.4)
Operating loss (283.7) (193.1) (87.5) (251.5) (1.9) (134.8) (952.5)
Investment revenue 4.6
Finance costs (42.6)
Loss before tax (990.5)
Tax credit 1.0
Loss for the year from continuing operations (989.5)
*Trading (loss) / profit is defined as operating profit / (loss) before exceptional items and amortisation and impairment of intangible assets arising on acquisition.
Supplementary Information
Share of profits in joint ventures, net of interest and tax 29.6 1.2 0.1 (0.9) – – 30.0
Depreciation of plant, property and equipment (10.9) (13.1) (2.5) (6.4) (0.8) (0.7) (34.4)
Impairment of plant, property and equipment (17.5) (1.8) – (12.9) – (4.5) (36.7)
Total depreciation and impairment of plant, property and equipment (28.4) (14.9) (2.5) (19.3) (0.8) (5.2) (71.1)
Amortisation of intangible assets arising on acquisition (0.1) (1.6) (2.3) (2.2) – – (6.2)
Impairment of intangible assets arising on acquisition – (5.5) – (6.4) – – (11.9)
Amortisation of other intangible assets (1.5) (14.2) (1.5) (1.3) (0.9) (5.5) (24.9)
Impairment and write down of other intangible assets (2.9) (11.0) (3.1) (0.2) – (3.3) (20.5)
Total amortisation and impairment of intangible assets (4.5) (32.3) (6.9) (10.1) (0.9) (8.8) (63.5)
Segment assets
Interests in joint ventures (7.0) 5.0 0.2 3.0 0.4 – 1.6
Other segment assets 135.1 431.9 458.9 236.3 99.7 178.9 1,540.8
Total segment assets 128.1 436.9 459.1 239.3 100.1 178.9 1,542.4
Unallocated assets, including assets held for sale 681.5
Consolidated total assets 2,223.9
Segment liabilities
Segment liabilities (146.1) (247.5) (62.0) (99.2) (55.2) (93.3) (703.3)
Unallocated liabilities, including liabilities linked to assets held for sale (1,586.8)
Consolidated total liabilities (2,290.1)
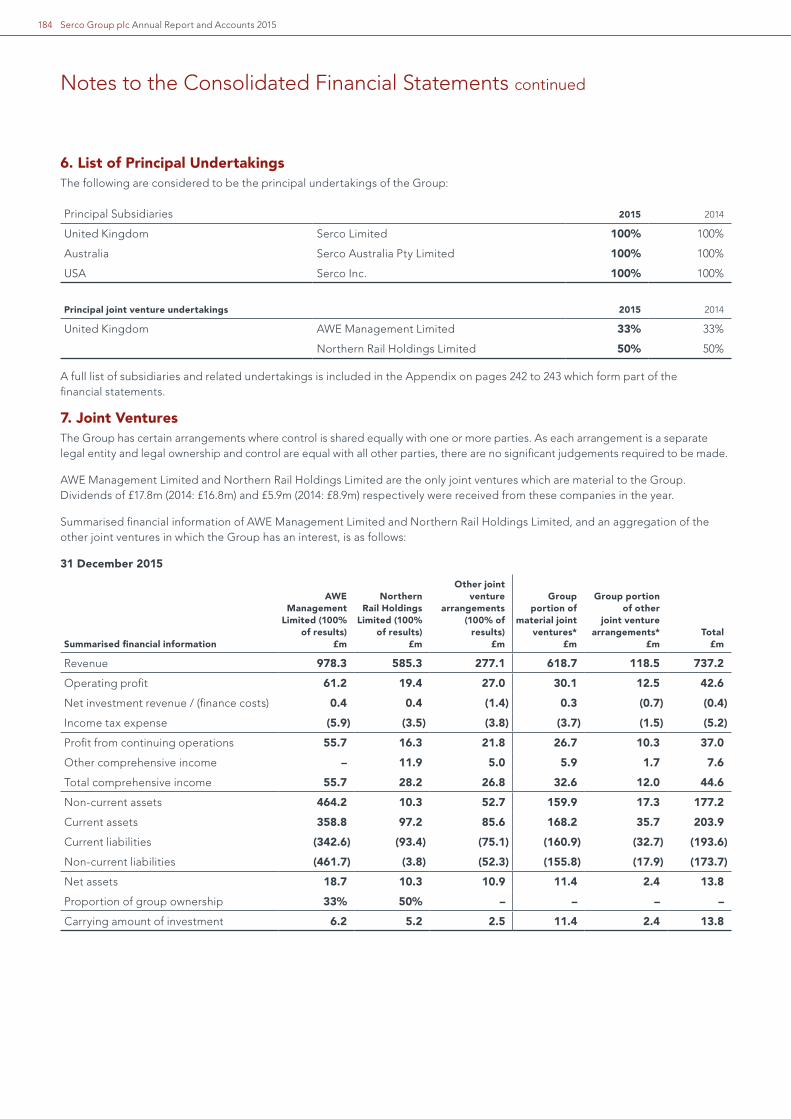
Serco Group plc Annual Report and Accounts 2015184
Notes to the Consolidated Financial Statements continued
6. List of Principal UndertakingsThe following are considered to be the principal undertakings of the Group:
Principal Subsidiaries 2015 2014
United Kingdom Serco Limited 100% 100%
Australia Serco Australia Pty Limited 100% 100%
USA Serco Inc. 100% 100%
Principal joint venture undertakings 2015 2014
United Kingdom AWE Management Limited 33% 33%
Northern Rail Holdings Limited 50% 50%
A full list of subsidiaries and related undertakings is included in the Appendix on pages 242 to 243 which form part of the financial statements.
7. Joint VenturesThe Group has certain arrangements where control is shared equally with one or more parties. As each arrangement is a separate legal entity and legal ownership and control are equal with all other parties, there are no significant judgements required to be made.
AWE Management Limited and Northern Rail Holdings Limited are the only joint ventures which are material to the Group. Dividends of £17.8m (2014: £16.8m) and £5.9m (2014: £8.9m) respectively were received from these companies in the year.
Summarised financial information of AWE Management Limited and Northern Rail Holdings Limited, and an aggregation of the other joint ventures in which the Group has an interest, is as follows:
31 December 2015
Summarised financial information
AWE Management
Limited (100% of results)
£m
Northern Rail Holdings
Limited (100% of results)
£m
Other joint venture
arrangements (100% of
results) £m
Group portion of
material joint ventures*
£m
Group portion of other
joint venture arrangements*
£mTotal
£m
Revenue 978.3 585.3 277.1 618.7 118.5 737.2
Operating profit 61.2 19.4 27.0 30.1 12.5 42.6
Net investment revenue / (finance costs) 0.4 0.4 (1.4) 0.3 (0.7) (0.4)
Income tax expense (5.9) (3.5) (3.8) (3.7) (1.5) (5.2)
Profit from continuing operations 55.7 16.3 21.8 26.7 10.3 37.0
Other comprehensive income – 11.9 5.0 5.9 1.7 7.6
Total comprehensive income 55.7 28.2 26.8 32.6 12.0 44.6
Non-current assets 464.2 10.3 52.7 159.9 17.3 177.2
Current assets 358.8 97.2 85.6 168.2 35.7 203.9
Current liabilities (342.6) (93.4) (75.1) (160.9) (32.7) (193.6)
Non-current liabilities (461.7) (3.8) (52.3) (155.8) (17.9) (173.7)
Net assets 18.7 10.3 10.9 11.4 2.4 13.8
Proportion of group ownership 33% 50% – – – –
Carrying amount of investment 6.2 5.2 2.5 11.4 2.4 13.8

Stra
teg
ic R
epo
rtD
irec
tors
’ Rep
ort
Financial Statements · 185Notes to the Consolidated Financial Statements
Fina
ncia
l Sta
tem
ents
Supplementary material
AWE Management
Limited (100% of results)
£m
Northern Rail Holdings
Limited (100% of results)
£m
Other joint venture
arrangements (100% of
results) £m
Group portion of
material joint ventures*
£m
Group portion of other
joint venture arrangements*
£mTotal
£m
Cash and cash equivalents 111.4 44.9 45.5 59.6 21.1 80.7
Current financial liabilities excluding trade and other payables and provisions (5.6) (4.3) (4.1) (4.0) (2.2) (6.2)
Non-current financial liabilities excluding trade and other payables and provisions (0.1) (1.3) (20.9) (0.7) (3.3) (4.0)
Depreciation and amortisation – (4.6) (5.9) (2.2) (2.3) (4.5)
Interest income 0.4 0.5 0.2 0.4 0.1 0.5
Interest expense – (0.1) (1.6) (0.1) (0.8) (0.9)
*Total results of the joint ventures multiplied by the respective proportion of Group ownership.
The financial statements of Northern Rail Holdings Limited are for a period which is different from that of the Group, being for the 53 week period ended 9 January 2016. The 53 week period reflects the joint venture’s internal reporting structure and is sufficiently close so as to not require adjustment to match that of the Group.
Certain employees of the groups headed by AWE Management Limited and Northern Rail Holdings Limited are members of sponsored defined benefit pension schemes. Given the significance of the schemes to understanding the position of the joint ventures the following key disclosures are made:
Main assumptions: 2015
AWE Management
Limited
Northern Rail Holdings
Limited
Rate of salary increases (%) 2.2% 3.0%
Inflation assumption (CPI %) 2.2% 2.1%
Discount rate (%) 4.0% 3.9%
Post-retirement mortality:
Current male industrial pensioners at 65 (years) 22.7 N/a
Future male industrial pensioners at 65 (years) 25.4 N/a
Retirement benefit funding position (100% of results) £m £m
Present value of scheme liabilities (1,649.6) (918.3)
Fair value of scheme assets 1,188.0 682.6
Net amount recognised (461.6) (235.7)
Members’ share of deficit – 94.3
Franchise adjustments* – 141.3
Related asset, right to reimbursement 461.6 –
Net retirement benefit obligation – (0.1)
* The franchise adjustment represents the amount of scheme deficit that is expected to be funded outside the contract period.
The Northern Rail defined benefit pension scheme uses a mortality rate multiplier of 96% based on the S1 normal males (heavy) table, adjusted for the geographic location of members.
AWE Management Limited is not liable for any deficiency in the defined benefit pension scheme under current contractual arrangements. The deficit reflected in the financial statements of Northern Rail Holdings Limited covers only that portion of the deficit that is expected to be funded over the term of the franchise arrangement the entity operates under. In addition, the defined benefit position reflects an adjustment in respect of funding required to be provided by employees.

Serco Group plc Annual Report and Accounts 2015186
Notes to the Consolidated Financial Statements continued
7. Joint Ventures continued31 December 2014
Summarised financial information
AWE Management
Limited (100% of
results) £m
Northern Rail Holdings
Limited (100% of results)
£m
Other joint venture
arrangements (100% of
results) £m
Group portion of
material joint ventures*
£m
Group portion of other
joint venture arrangements*
£m
Group portion
Total£m
Revenue 989.3 577.5 397.0 618.5 179.8 798.3
Operating profit 54.9 17.7 23.8 27.2 10.7 37.9
Net investment revenue / (finance costs) 0.3 0.4 (1.4) 0.3 (0.6) (0.3)
Income tax expense (4.6) (5.1) (7.0) (4.1) (3.5) (7.6)
Profit from continuing operations 50.6 13.0 15.4 23.4 6.6 30.0
Other comprehensive income / (expense) – 0.8 (4.3) 0.4 (2.3) (1.9)
Total comprehensive income 50.6 13.8 11.1 23.8 4.3 28.1
Non-current assets 583.7 10.5 44.9 199.8 18.1 217.9
Current assets 246.5 72.9 74.4 118.6 31.5 150.1
Current liabilities (230.1) (83.5) (65.7) (118.4) (29.4) (147.8)
Non-current liabilities (583.3) (6.0) (51.1) (197.5) (21.1) (218.6)
Net assets 16.8 (6.1) 2.5 2.5 (0.9) 1.6
Proportion of group ownership 33% 50% – – – –
Carrying amount of investment 5.5 (3.0) (0.9) 2.5 (0.9) 1.6
Supplementary material
AWE Management
Limited (100% of
results)£m
Northern Rail Holdings
Limited (100% of results)
£m
Other joint venture
arrangements (100% of
results) £m
Group portion of
material joint ventures*
£m
Group portion of other
joint venture arrangements*
£m
Group portion
Total £m
Cash and cash equivalents 106.1 33.5 41.0 52.1 19.1 71.2
Current financial liabilities excluding trade and other payables and provisions (2.2) (10.3) (3.6) (5.9) (1.8) (7.7)
Non-current financial liabilities excluding trade and other payables and provisions – (2.3) (16.0) (1.2) (4.2) (5.4)
Depreciation and amortisation – (4.3) (6.4) (2.2) (2.6) (4.8)
Interest income 0.3 0.5 0.3 0.4 0.1 0.5
Interest expense – (0.1) (1.7) (0.1) (0.7) (0.8)
*Total results of the joint ventures multiplied by the respective proportion of Group ownership.
The financial statements of Northern Rail Holdings Limited are for the 52 week period ended 3 January 2015.

Stra
teg
ic R
epo
rtD
irec
tors
’ Rep
ort
Financial Statements · 187Notes to the Consolidated Financial Statements
Fina
ncia
l Sta
tem
ents
Key disclosures with respect of the defined benefit pension schemes of material joint ventures:
Main assumptions: 2014
AWE Management
Limited
Northern Rail Holdings
Limited
Rate of salary increases (%) 3.0% 3.0%
Inflation assumption (CPI %) 2.1% 2.1%
Discount rate (%) 3.8% 3.7%
Post-retirement mortality:
Current male industrial pensioners at 65 (years) 22.9 N/a
Future male industrial pensioners at 65 (years) 24.6 N/a
Retirement benefit funding position (100% of results) £m £m
Present value of scheme liabilities (1,708.7) (902.9)
Fair value of scheme assets 1,125.6 640.6
Net amount recognised (583.1) (262.3)
Members’ share of deficit – 104.9
Franchise adjustments* – 156.0
Related asset, right to reimbursement 583.1 –
Net retirement benefit obligation – (1.4)
* The franchise adjustment represents the amount of scheme deficit that is expected to be funded outside the contract period.
The Northern Rail defined benefit pension scheme uses a mortality rate multiplier of 98% based on the S1 normal males (heavy) table, adjusted for the geographic location of members.
8. AcquisitionsDeferred consideration payments of £0.2m were made in the period in relation to the prior year acquisition of MENA Business Services LLC, which is part of discontinued operations. In addition, the fair value of deferred contingent consideration on this acquisition was finalised, resulting in a reduction of the provisional goodwill of £1.6m.

Serco Group plc Annual Report and Accounts 2015188
Notes to the Consolidated Financial Statements continued
9. DisposalsDisposals relating to discontinued operations are included in Note 4.
In May 2015 the Group completed the sale of its Great Southern Rail (GSR) business in Australia for a cash consideration of £2.9m, resulting in a loss on disposal of £2.8m. The transaction is part of the disposal programme of businesses identified as not being core to Serco's future strategy, as announced initially in November 2014. In addition, in January 2015, the Group disposed of its National Physical Laboratory (NPL) business for a consideration of £12.1m, with no gain or loss on disposal. AgPlus was a subsidiary of NPL which was retained and sold separately with a gain of £0.5m recognised. All of these businesses were classified as held for sale as at 31 December 2014.
In June 2015, the Group also disposed of its Serco India Private Limited business, representing the Group’s frontline public services operations in the Indian transport sector, for a consideration of £1.0m, resulting in a loss on disposal of £0.8m. Details of these transactions are given below:
The net assets at the date of disposal were:
Great Southern
Rail 2015
£m
National Physical
Laboratory 2015
£m
Other 2015
£m
Total 2015
£m
Total 2014
£m
Goodwill – – – – 3.4
Other intangible assets – – – – 0.2
Property, plant and equipment 0.9 25.4 – 26.3 0.2
Deferred tax assets – 1.1 – 1.1 –
Current tax assets – – 0.9 0.9 –
Inventories 1.2 – – 1.2 –
Trade and other receivables 9.7 13.9 0.8 24.4 6.3
Cash and cash equivalents 7.3 10.6 0.4 18.3 1.0
Trade and other payables (14.2) (14.9) – (29.1) (1.8)
Tax liabilities – – (0.4) (0.4) (0.1)
Non recourse loans – (24.0) – (24.0) –
Other loans – – (0.1) (0.1) –
Provisions (0.7) – – (0.7) –
Net assets disposed 4.2 12.1 1.6 17.9 9.2
The (loss) / profit on disposal is calculated as follows:
Cash consideration 2.9 12.1 1.4 16.4 6.3
Less:
Net assets disposed (4.2) (12.1) (1.6) (17.9) (9.2)
Non-controlling interest dispose of – – 0.4 0.4 –
Impairment of loan receivable in respect of prior year disposal – – – – (4.6)
Disposal related costs (1.5) – – (1.5) 5.2
(Loss) / profit on disposal (2.8) – 0.2 (2.6) (2.3)
The net cash inflow / (outflow) arising on disposals is as follows:
Consideration received 2.9 12.1 1.4 16.4 8.3
Less:
Deferred consideration – – – – 0.5
Cash and cash equivalents disposed (7.3) (10.6) (0.4) (18.3) (1.0)
Disposal related costs paid during the period (1.1) – – (1.1) (2.3)
Net cash (outflow) / inflow on disposal (5.5) 1.5 1.0 (3.0) 5.5

Stra
teg
ic R
epo
rtD
irec
tors
’ Rep
ort
Financial Statements · 189Notes to the Consolidated Financial Statements
Fina
ncia
l Sta
tem
ents
10. RevenueAn analysis of the Group’s revenue is as follows:
Year ended 31 December 2015
£m2014
£m
Rendering of services 3,141.2 3,564.6
Revenue from long-term project based contracts 35.8 31.1
Revenue as disclosed in the consolidated income statement 3,177.0 3,595.7
Investment revenue (note 14) 6.1 4.6
Operating lease income 0.8 0.3
Total revenue as defined in IAS 18 3,183.9 3,600.6
11. Exceptional ItemsExceptional items are non recurring items of financial performance that are outside normal operations and are material to the results of the Group either by virtue of size or nature. As such, the items set out below require separate disclosure on the face of the income statement to assist in the understanding of the underlying performance of the Group.
In the year exceptional items have arisen on both the continuing and discontinued operations of the Group. Exceptional items arising on discontinued operations are disclosed on the face of the income statement within the loss attributable to discontinued operations, those arising on continuing operations are disclosed on the face of the income statement within exceptional operating items. Further information regarding the exceptional items arising on discontinued operations can be seen in note 4.
Net (loss) / profit on disposal of subsidiaries and operations
The exceptional net loss on disposal of subsidiaries and operations is included in note 9.
Other Exceptional Operating Items arising on continuing operations
For the year ended 31 December2015
£m2014 £m
Impairment of goodwill (87.5) (181.2)
Restructuring costs (19.7) (24.0)
Aborted transaction costs (1.7) –
Costs associated with UK Government review (1.2) (9.2)
UK frontline clinical health contract provisions 2.8 (16.1)
Provision for settlement relating to DLR pension deficit funding dispute – (35.6)
Other provision for legal claims – (20.1)
Impairment and related charges of Australian rail business – (37.2)
Other exceptional operating items (107.3) (323.4)
Goodwill is tested for impairment annually or more frequently if there are indications that there is a risk that it could be impaired. The recoverable amount of each cash generating unit (CGU) is based on value in use calculations derived from forecast cash flows based on past experience, adjusted to reflect market trends, economic conditions, the Group’s strategy and key risks. These forecasts include an estimated level of new business wins and contract attrition and an assumption that the final year forecast continues into perpetuity at a CGU-specific terminal growth rate. The terminal growth rates are provided by external sources and are based on the long-term inflation rates of the geographic market in which the CGUs operate and therefore do not exceed the average long-term growth rates forecast for the individual markets.

Serco Group plc Annual Report and Accounts 2015190
Notes to the Consolidated Financial Statements continued
11. Exceptional Items continuedIn 2015, we conducted impairment testing of our CGUs that has identified a non-cash exceptional impairment to continuing operations of £87.5m (2014: £181.2m), due primarily to a higher level of contract attrition than previously forecast and the associated impact on future cash flows. This arose in the Americas CGU in the current year, which is also a reportable segment as defined in IFRS8. In the prior year, impairments arose in the Direct Services & Europe business and UK Health operations, both of which form part of the UK Local & Regional Government segment.
Year ended 31 December 2015
£m2014
£m
UK Local & Regional Government: Direct Services & Europe – (57.6)
UK Local & Regional Government: UK Health – (22.9)
Americas (87.5) (100.7)
Total exceptional goodwill impairment charge (87.5) (181.2)
In 2015, a charge of £19.7m (2014: £24.0m) arose in relation to the restructuring programme resulting from the Strategy Review. This included redundancy payments, provisions, external advisory fees and other incremental costs.
The disposal of the Environmental and Leisure businesses were aborted in the year and as a result one-off costs of £1.7m associated with the aborted sale have been treated as exceptional.
In 2014 there were exceptional costs totalling £9.2m associated with the UK Government reviews and the programme of Corporate Renewal. This reflected external costs related to these reviews and the Corporate Renewal Programme. In 2015, £1.2m of external adviser costs arose from dealing with these historical matters.
In 2015 the exit of the UK Frontline Clinical Health contracts was completed with the Cornwall Out of Hours contract exited in May and the Suffolk Community Healthcare contract exited in September. On completion of the contract exits, onerous contract provisions of £2.8m, for which the charges were recorded as exceptional costs and that are no longer expected to be utilised, were released as credits through exceptional items.
In November 2014 the Group agreed to settle a dispute with the Trustees of the Docklands Light Railway (DLR) Pension Scheme over the extent of its liability to fund the deficit on the scheme. The settlement resulted in a total exceptional charge inclusive of costs of £35.6m, consisting of the full and final settlement amount of £33.0m and costs of £2.6m. The settlement is to be paid over four equal annual instalments from January 2015 to January 2018 covering all past and any future DLR associated pension liabilities.
In 2014 an exceptional provision of £20.1m was recognised for legal claims made against Serco for commercial disputes. This provision was based on legal advice received by the Company. There have been no further charges in 2015 in relation to these disputes.
In 2014 an impairment review was performed on the Australian rail business, Great Southern Rail (GSR), resulting in a charge totalling £37.2m. This consisted of an impairment of £23.1m to reduce the carrying value of its net assets to the estimated recoverable amount and a charge of £14.1m in relation to the break costs of leases relating to the business. The GSR business was exited in May 2015, with the loss on disposal included within loss on disposal of businesses.
Exceptional Finance Costs
In December 2014, agreement was reached for the Group to defer its December 2014 covenant test until 31 May 2015. As a result, costs were incurred in 2015 to preserve the existing finance facilities. In addition, payments were made to the US Private Placement (USPP) Noteholders as a result of early settlement following the Group refinancing. Total charges of £32.8m have been treated as exceptional items as they are outside of the normal financing arrangements of the Group and are significant in size.
Tax Impact of above Items
The tax impact of these exceptional items was a tax credit of £0.4m (2014: £8.2m). Further details are provided in note 16.

Stra
teg
ic R
epo
rtD
irec
tors
’ Rep
ort
Financial Statements · 191Notes to the Consolidated Financial Statements
Fina
ncia
l Sta
tem
ents
12. Operating ProfitOperating profit is stated after charging / (crediting):
Year ended 31 December2015
£m2014
£m
Research and development costs 4.3 21.5
Exceptional goodwill impairment (note 11) 87.5 181.2
Loss / (profit) on disposal of property, plant and equipment 1.5 (1.0)
Loss on disposal of intangible assets 1.7 0.2
Depreciation and impairment of property, plant and equipment 28.1 71.1
Amortisation and impairment of intangible assets – arising on acquisition 4.8 18.1
Amortisation, write down and impairment of intangible assets – other 32.7 45.4
Exceptional net loss on disposal of subsidiaries and operations (note 9) 2.6 2.3
Staff costs (note 13) 1,532.2 1,672.0
Allowance for doubtful debts (credited) / charged to income statement (6.8) 17.4
Net foreign exchange charge 21.0 31.6
Movement on non-designated hedges and reclassified cash flow hedges (20.7) (42.0)
Minimum lease payments recognised as an operating lease expense 104.4 123.8
Operating lease income from sub-leases (note 10) (0.8) (0.3)
Included within 2014 general and administrative expenses on the face of the consolidated income statement were charges in relation to non-OCP items arising from the 2014 Contract and Balance Sheet review. In 2015, there was a credit of £17.5m, relating primarily to the release of accruals and other provisions where liabilities have either been settled for less than the amounts provided or accrued, or have lapsed due to the passage of time.
Amounts payable to Deloitte LLP and their associates by the Company and its subsidiary undertakings in respect of audit and non-audit services are shown below.
Year ended 31 December2015
£m2014 £m
Fees payable to the Company’s Auditor for the audit of the Company’s annual accounts 0.9 1.3
Fees payable to the Company’s Auditor and their associates for other services to the Group:
– audit of the Company’s subsidiaries pursuant to legislation 0.6 0.8
Total audit fees 1.5 2.1
– Audit–related assurance services 0.2 0.2
– Other taxation advisory services 0.2 0.4
– Other services 2.6 0.2
Total non-audit fees 3.0 0.8
Fees payable to Deloitte LLP and their associates for non-audit services to the Company are not required to be disclosed separately because the consolidated financial statements are required to disclose such fees on a consolidated basis.
Details of the Company’s policy on the use of auditors for non-audit services and how the auditor’s independence and objectivity was safeguarded are set out in the Audit Committee Report on page 112. No services were provided pursuant to contingent fee arrangements.

Serco Group plc Annual Report and Accounts 2015192
Notes to the Consolidated Financial Statements continued
13. Staff CostsThe average monthly number of employees (including Executive Directors) was:
Year ended 31 December 2015
Number
2014 (Restated*)
Number
UK Central Government 10,182 11,555
Local & Regional Government 11,357 11,799
Americas 9,727 9,479
AsPac 8,885 7,125
Middle East 3,996 3,406
Global Services** 48,169 46,733
Private Sector** 3,052 4,260
Unallocated 1,094 1,098
96,462 95,455
*restated to reflect new reportable segments adopted in 2015
** relates to discontinued operations
Aggregate remuneration comprised:
Year ended 31 December2015
£m2014
£m
Wages and salaries 1,337.5 1,444.1
Social security costs 100.7 117.3
Other pension costs (note 34) 85.1 106.3
1,523.3 1,667.7
Share based payment expense (note 38) 8.9 4.3
1,532.2 1,672.0
14. Investment Revenue
Year ended 31 December2015
£m 2014 £m
Interest receivable on other loans and deposits 1.1 1.5
Net interest receivable on retirement benefit obligations (note 34) 4.9 3.1
Movement in discount on other debtors 0.1 –
6.1 4.6

Stra
teg
ic R
epo
rtD
irec
tors
’ Rep
ort
Financial Statements · 193Notes to the Consolidated Financial Statements
Fina
ncia
l Sta
tem
ents
15. Finance Costs
Year ended 31 December2015
£m 2014 £m
Interest payable on non recourse loans – 0.8
Interest payable on obligations under finance leases 2.5 2.9
Interest payable on other loans 24.7 29.4
Facility fees and other charges 6.2 9.5
Movement in discount on provisions 5.6 –
39.0 42.6
16. Tax16 (a) Income Tax Recognised in the Income Statement
Year ended 31 December Continuing operations
Before exceptional
items 2015
£m
Exceptional items 2015
£m
Total 2015
£m
Before exceptional
items 2014 £m
Exceptional items 2014
£m
Total 2014
£m
Current income tax
Current income tax charge / (credit) 4.5 (0.4) 4.1 41.4 – 41.4
Adjustments in respect of prior years 6.0 – 6.0 (15.9) – (15.9)
Deferred tax
Current year charge / (credit) 12.7 – 12.7 (32.7) (8.2) (40.9)
Adjustments in respect of prior years (5.3) – (5.3) 14.4 – 14.4
17.9 (0.4) 17.5 7.2 (8.2) (1.0)
The tax expense for the year can be reconciled to the profit in the consolidated income statement as follows:
Year ended 31 December
Before exceptional
items2015
£m
Exceptional items 2015
£m
Total 2015
£m
Before exceptional
items 2014
£m
Exceptional items 2014
£m
Total 2014
£m
Profit / (loss) before tax 73.3 (142.7) (69.4) (664.8) (325.7) (990.5)
Tax calculated at a rate of 20.25% (2014: 21.5%) 14.9 (28.9) (14.0) (142.9) (70.1) (213.0)
Expenses not deductible for tax purposes 6.7 (0.2) 6.5 40.5 47.5 88.0
UK unprovided deferred tax 17.4 3.6 21.0 102.9 17.9 120.8
Other unprovided deferred tax (15.0) 24.9 9.9 28.2 0.4 28.6
Overseas rate differences 3.2 0.2 3.4 (13.1) (3.9) (17.0)
UK Branch exemption (2.7) – (2.7) (0.5) – (0.5)
Adjustments in respect of prior years 0.7 – 0.7 (1.5) – (1.5)
Adjustments in respect of equity accounted investments (7.3) – (7.3) (6.4) – (6.4)
Tax charge / (credit) 17.9 (0.4) 17.5 7.2 (8.2) (1.0)
The income tax charge / (credit) for the year is based on the blended UK statutory rate of corporation tax for the period of 20.25% (2014: 21.5%). Taxation for other jurisdictions is calculated at the rates prevailing in the respective jurisdictions.

Serco Group plc Annual Report and Accounts 2015194
Notes to the Consolidated Financial Statements continued
16. Tax continued16 (b) Income Tax Recognised in the SOCI
Year ended 31 December 2015
£m 2014
£m
Current tax
Taken to retirement benefit obligations reserve 0.1 0.6
Deferred tax
Relating to cash flow hedges – –
Taken to retirement benefit obligations reserve 4.0 (13.5)
4.1 (12.9)
16 (c) Tax on Items Taken Directly to Equity
Year ended 31 December2015
£m 2014
£m
Current tax
Recorded in share based payment reserve – –
Deferred tax
Recorded in share based payment reserve – (0.4)
– (0.4)
17. Deferred TaxDeferred income taxes are calculated in full on temporary differences under the liability method using local substantively enacted tax rates.
The movement in net deferred tax assets during the year was as follows:
2015 £m
2014 £m
At 1 January – asset (28.2) (23.5)
Income statement credit (note 16) 3.7 (30.3)
Items recognised in equity and in other comprehensive income (note 16) (4.2) 13.9
Eliminated on disposal of subsidiary 5.5 –
Exchange differences 3.3 3.2
Reclassified to assets held for sale – 8.5
At 31 December – asset (19.9) (28.2)

Stra
teg
ic R
epo
rtD
irec
tors
’ Rep
ort
Financial Statements · 195Notes to the Consolidated Financial Statements
Fina
ncia
l Sta
tem
ents
The movement in deferred tax assets and liabilities during the year was as follows:
Temporary differences on assets /intangibles
£m
Share based payment and
employee benefits
£m
Retirement benefit
schemes £m
Derivative financial
instruments £m
Tax losses
£m
Other temporary
differences £m
Total £m
At 1 January 2015 7.5 (9.5) 21.7 – (10.7) (37.2) (28.2)
(Credited) / charged to income statement (note 16a) 17.3 (0.5) 0.3 – (0.1) (13.3) 3.7
Items recognised in equity and in other comprehensive income (note 16b&c) – – (4.2) – – – (4.2)
Eliminated on disposal of subsidiary – – – – – 5.5 5.5
Exchange differences 2.0 0.3 – – – 1.0 3.3
At 31 December 2015 26.8 (9.7) 17.8 – (10.8) (44.0) (19.9)
Of the amount credited to the income statement, £0.3m has been taken to costs of sales in respect of the R&D Expenditure credit. Other temporary differences comprise mainly of onerous contract provisions which at 31 December 2015 amount to £28.3m (2014: £30.5m).
The movement in deferred tax assets and liabilities during the previous year was as follows:
Temporary differences on assets /intangibles
£m
Share based payment and
employee benefits
£m
Retirement benefit
schemes £m
Derivative financial
instruments (restated)
£m
Tax losses
£m
Other temporary
differences £m
Total £m
At 1 January 2014 8.6 (9.4) 6.9 (15.0) (25.2) 10.6 (23.5)
(Credited) / charged to income statement (note 16a) (1.9) (1.4) 0.5 6.3 15.4 (49.2) (30.3)
Items recognised in equity and in other comprehensive income (note 16b&c) – 0.4 14.4 – (0.9) – 13.9
Exchange differences 1.6 (0.1) (0.2) – – 1.9 3.2
Reclassified to assets held for sale (0.8) 1.0 0.1 8.7 – (0.5) 8.5
At 31 December 2014 7.5 (9.5) 21.7 – (10.7) (37.2) (28.2)
Deferred income tax assets and liabilities are offset when there is a legally enforceable right to set off current tax assets against current tax liabilities and when the deferred income taxes relate to the same fiscal authority. The following is the analysis of the deferred tax balances (after offset) for financial reporting purposes:
2015 £m
2014 £m
Deferred tax liabilities 22.3 9.2
Deferred tax assets (42.2) (37.4)
(19.9) (28.2)
The total deferred tax asset held by the Group at 31 December 2015 amounted to £42.2m (2014: £48.4m) The total deferred tax liability held by the Group at 31 December 2015 amounted to £22.3m (2014: £11.7m). Amounts held for sale on the balance sheet include £nil in respect of deferred tax assets (2014: £11.0m) and deferred tax liabilities (2014: £2.5m).

Serco Group plc Annual Report and Accounts 2015196
Notes to the Consolidated Financial Statements continued
17. Deferred Tax continuedAs at 31 December 2015 the Group has a gross unrecognised deferred tax asset of £1.05bn. The group has unused tax losses (excluding assets held for sale) of £890.1m (2014: £647.0m) available for offset against future profits. A deferred tax asset has been recognised in respect of £59.9m (2014: £53.5m) of such losses, of which £58.3m (net £10.5m) relates to losses incurred in the UK and £1.6m (net £0.3m) relates to other jurisdictions. Recognition has been based on forecast future taxable profits. No deferred tax asset has been recognised in respect of the remaining losses (net £153.2m) as there are expected to be insufficient taxable profits available.
Losses of £105.5m (2014: £0.9m) expire within five years, losses of £0.2m (2014: £nil) expire within 6–10 years and losses of £784.4m (2014: £646.1m) may be carried forward indefinitely.
In addition, as at the balance sheet date, the group has the following in relation to held for sale assets:
Unused tax losses of £7.3m (2014: £51.6) available for offset against future profits. No deferred tax asset has been recognised in respect of these losses (net £1.3m) as it is not probable that there will be future taxable profits available. Losses of £nil (2014: £20.7m) expire within 5 years, losses of £nil (2014 £16.6m) expire within 6–10 years, losses of £nil (2014: £1.9m) expire within 11–15 years, losses of £nil (2014: £12.4m) expire within 16–20 years and losses of £7.3m (2014: £nil) may be carried forward indefinitely.
18. Dividends2015
£m2014 £m
Amounts recognised as distributions to equity holders in the year:
Final dividend for the year ended 31 December 2014 of £nil per share (2014: Final dividend for the year ended 31 December 2013 of 7.45p per share on 487.4 million ordinary shares) – 36.4
Interim dividend for the year ended 31 December 2015 of £nil per share (2014: Interim dividend for the year ended 31 December 2014 of 3.10p per share on 538.4 million ordinary shares) – 16.7
– 53.1
Proposed final dividend for the year ended 31 December 2015 of £nil per share (2014: £nil per share) – –
A dividend waiver is effective for those shares held on behalf of the Company by its Employee Share Ownership Trust (note 37).
19. Earnings per ShareBasic and diluted earnings per ordinary share (EPS) have been calculated in accordance with IAS 33 Earnings per Share.
The calculation of the basic and diluted EPS is based on the following data:
Number of shares2015
Millions
2014 (restated*)
Millions
Weighted average number of ordinary shares for the purpose of basic EPS 986.5 655.1
Effect of dilutive potential ordinary shares: share options – –
Weighted average number of ordinary shares for the purpose of diluted EPS 986.5 655.1
*Restatement of earnings per share reflects adjustments associated with the Rights Issue
At 31 December 2015 options over 560,060 (2014 (restated): 1,855,924) shares were excluded from the weighted average number of shares used for calculating diluted earnings per share because their exercise price was above the average share price for the year and they were, therefore, anti-dilutive.

Stra
teg
ic R
epo
rtD
irec
tors
’ Rep
ort
Financial Statements · 197Notes to the Consolidated Financial Statements
Fina
ncia
l Sta
tem
ents
A further 26.5m shares are potentially dilutive but are not included in the above calculation due to the loss making position in the year.
Earnings per share Continuing and Discontinued
EPS
Earnings 2015
£m
Per share amount
2015 Pence
Earnings 2014
(restated*) £m
Per share amount
2014Pence
Earnings for the purpose of basic EPS (152.6) (15.47) (1,347.3) (205.66)
Effect of dilutive potential ordinary shares – – – –
Diluted EPS (152.6) (15.47) (1,347.3) (205.66)
Basic EPS Excluding Exceptional Items
Earnings for the purpose of basic EPS (152.6) (15.47) (1,347.3) (205.66)
Add back exceptional operating items 220.3 22.33 661.5 100.98
Add back tax on exceptional items (3.1) (0.31) (18.0) (2.75)
Earnings excluding exceptional operating items for the purpose of basic EPS 64.6 6.55 (703.8) (107.43)
*Restatement of earnings per share reflects adjustments associated with the rights issue
Earnings per share Continuing
EPS
Earnings 2015
£m
Per share amount
2015 Pence
Earnings 2014
(restated*) £m
Per share amount
2014 (restated*)
Pence
Earnings for the purpose of basic EPS (86.6) (8.78) (990.0) (151.12)
Effect of dilutive potential ordinary shares – – – –
Diluted EPS (86.6) (8.78) (990.0) (151.12)
Basic EPS Excluding Exceptional Items
Earnings for the purpose of basic EPS (86.6) (8.78) (990.0) (151.12)
Add back exceptional operating items 142.7 14.47 325.7 49.72
Add back tax on exceptional items (0.4) (0.04) (8.2) (1.25)
Earnings excluding exceptional operating items for the purpose of basic EPS 55.7 5.65 (672.5) (102.66)
*Restatement of earnings per share reflects adjustments associated with the rights issue
Earnings per shareDiscontinued
EPS
Earnings 2015
£m
Per share amount
2015 Pence
Earnings 2014
(restated*) £m
Per share amount
2014 (restated*)
Pence
Earnings for the purpose of basic EPS (66.0) (6.69) (357.3) (54.54)
Effect of dilutive potential ordinary shares – – – –
Diluted EPS (66.0) (6.69) (357.3) (54.54)
Basic EPS Excluding Exceptional Items
Earnings for the purpose of basic EPS (66.0) (6.69) (357.3) (54.54)
Add back exceptional operating items 77.6 7.87 335.8 51.26
Add back tax on exceptional items (2.7) (0.28) (9.8) (1.5)
Earnings excluding exceptional operating items for the purpose of basic EPS 8.9 0.90 (31.3) (4.78)
*Restatement of earnings per share reflects adjustments associated with the rights issue

Serco Group plc Annual Report and Accounts 2015198
Notes to the Consolidated Financial Statements continued
20. Goodwill
Cost £m
Accumulated impairment
losses £m
Carrying amount
£m
At 1 January 2014 1,270.8 – 1,270.8
Additions 4.4 – 4.4
Disposals (3.4) – (3.4)
Exchange differences 20.2 (5.4) 14.8
Impairment (exceptional) – (466.0) (466.0)
Transfer to held for sale (618.8) 339.7 (279.1)
At 1 January 2015 673.2 (131.7) 541.5
Exchange differences 17.6 (7.8) 9.8
Impairment (exceptional) – (87.5) (87.5)
Transfer from held for sale 108.3 (62.2) 46.1
At 31 December 2015 799.1 (289.2) 509.9
Further details of the exceptional impairment can be seen in note 11.
Movements in the balance since the prior year end can be seen as follows:
Goodwill balance 31 December
2014 £m
Additions 2015
£m
Disposals 2015
£m
Exchange differences
2015 £m
Impairment 2015
£m
Transfer from held
for sale 2015
£m
Goodwill balance
2015 £m
Headroom on
impairment analysis
2015 £m
Headroom on
impairment analysis
2014 £m
UK Central Government
Justice & Immigration 49.6 – – – – – 49.6 59.3 147.0
Local & Regional Government
UK Health 60.6 – – – – – 60.6 2.3 –
Direct Services & Europe 18.5 – – (0.9) – 46.1 63.7 83.5 –
Americas 303.6 – – 15.9 (87.5) – 232.0 – –
AsPac 100.4 – – (5.7) – – 94.7 161.6 314.8
Middle East 8.8 – – 0.5 – – 9.3 134.2 136.5
541.5 – – 9.8 (87.5) 46.1 509.9 440.9 598.3
Included above is the detail of the headroom on the CGUs existing at the year end. For the Americas CGU impaired in the year, no headroom exists and therefore any reduction in forecasts or unfavourable movements in key assumptions would lead to an additional impairment. Headroom shown in respect of the other CGUs reflects where future discounted cash flows are greater than the underlying assets and includes all relevant cash flows, including where provisions have been made for future costs and losses. The increase in the Direct Services & Europe headroom partly reflects the impact of the decision that the Environmental and Leisure businesses no longer be sold, reflecting the fact that the expected proceeds on disposal were less than the expected future cash flows.

Stra
teg
ic R
epo
rtD
irec
tors
’ Rep
ort
Financial Statements · 199Notes to the Consolidated Financial Statements
Fina
ncia
l Sta
tem
ents
The key assumptions applied in the impairment review are set out below:
Discount rate
2015 %
Discount rate
2014* %
Terminal growth
rates 2015
%
Terminal growth
rates 2014
%
UK Central Government
Justice & Immigration 10.3 9.2 2.0 1.9
Local & Regional Government
UK Health 10.1 9.7 2.0 1.9
Direct Services & Europe 10.1 9.7 2.0 1.9
Americas 10.3 11.3 2.4 2.0
AsPac 10.7 12.4 2.4 2.3
Middle East 9.7 9.0 2.1 2.2
* The Americas discount rate for 2014 of 11.3% has been amended from 13.3% to correct a typographical error.
Discount Rate
Pre-tax discount rates, derived from the Group’s post-tax weighted average cost of capital have been used in discounting the projected cash flows. These rates are reviewed annually with external advisers and are adjusted for risks specific to the market in which the CGU operates.
Short-term Growth Rates
The annual impairment test is performed immediately prior to the year end, based initially on five year cash flow forecasts approved by senior management. Short-term revenue growth rates used in each CGU five year plan are based on internal data regarding our current contracted position, the pipeline of opportunities and forecast growth for the relevant market.
Short-term profitability and cash conversion is based on our historic experiences and a level of judgement is applied to expected changes in both. Where businesses have been poor performers in recent history, turnaround has only been assumed where a detailed and achievable plan is in place and all forecasts include cash flows relating to contracts where onerous contract provisions have been made.
Terminal Growth Rates
The calculations include a terminal value based on the projections for the fifth year of the short-term plan, with a growth rate assumption applied which extrapolates the business into perpetuity. The terminal growth rates are based on long-term inflation rates of the geographic market in which the CGUs operate and therefore do not exceed the average long-term growth rates forecast for the individual markets. These are provided by external sources.
Sensitivity Analysis
Sensitivity analysis has been performed for each key assumption and the only CGUs impacted by a reasonably possible change in a key assumption are the Americas and Health. A 2% movement in discount rates and a 1% movement in terminal growth rates are considered to be reasonably possible.
The impact of changes in key assumptions on CGUs with marginal headroom is as follows:
• Health: The CGU represents the UK healthcare market segment. A 2% increase in the discount rate gives rise to an impairment of £8m and a 1% decline in the terminal growth rate by itself leads to an impairment of £7m. If there is both a 2% increase in the discount rate and a 1% decline in the terminal growth rates an impairment charge of £22m would occur.
• Americas: If the terminal growth rate were to fall by 1%, the impairment charge would increase by £114m, whereas a 2% increase in the discount rate results in an additional impairment charge of £92m. If both assumptions moved adversely by these rates, the impairment charge would increase by £161m.

Serco Group plc Annual Report and Accounts 2015200
Notes to the Consolidated Financial Statements continued
21. Other Intangible AssetsAcquisition related Other
Customer relationships
£m
Licences and
franchises£m
Software and IT
£m
Internally generated
development expenditure
£m
Pension related
intangibles£m
Total£m
Cost
At 1 January 2015 116.8 1.6 146.9 67.3 15.7 348.3
Eliminated on disposal – – (0.2) (2.7) – (2.9)
Additions from internal development – – 10.2 14.0 – 24.2
Additions from external acquisition – – 7.8 – – 7.8
Disposals (26.8) – (51.9) (14.7) (6.2) (99.6)
Reclassification to held for sale assets (38.5) (0.6) (3.8) (2.8) (9.5) (55.2)
Reclassification from / (to) other intangible asset categories – – 1.3 (1.3) – –
Reclassification to property, plant and equipment – – (0.3) – – (0.3)
Research and Development expenditure credit – – – (0.8) – (0.8)
Exchange differences 0.4 – 0.2 0.1 – 0.7
At 31 December 2015 51.9 1.0 110.2 59.1 – 222.2
Accumulated amortisation and impairment
At 1 January 2015 76.3 1.4 100.5 35.6 15.7 229.5
Eliminated on disposal – – (0.2) (0.2) – (0.4)
Impairment charge – – – 9.0 – 9.0
Amortisation charge – internal development – – 12.7 7.4 – 20.1
Amortisation charge – external 4.8 0.1 3.6 – – 8.5
Disposals (26.1) – (51.0) (14.0) (6.2) (97.3)
Reclassification to held for sale assets (22.2) (0.6) (2.6) (2.4) (9.5) (37.3)
Reclassification to property, plant and equipment – – (0.3) – – (0.3)
Exchange differences 0.3 – 0.2 0.1 – 0.6
At 31 December 2015 33.1 0.9 62.9 35.5 – 132.4
Net book value
At 31 December 2015 18.8 0.1 47.3 23.6 – 89.8

Stra
teg
ic R
epo
rtD
irec
tors
’ Rep
ort
Financial Statements · 201Notes to the Consolidated Financial Statements
Fina
ncia
l Sta
tem
ents
Acquisition related Other
Customer relationships
£m
Licences and
franchises£m
Software and IT
£m
Internally generated
development expenditure
£m
Pension related
intangibles£m
Total£m
Cost
At 1 January 2014 137.2 1.2 151.6 68.8 15.7 374.5
Eliminated on disposal (1.0) – – – – (1.0)
Additions from internal development – – 12.7 3.7 – 16.4
Additions from external acquisition – 0.4 4.6 – – 5.0
Disposals (19.8) – (3.4) (2.0) – (25.2)
Reclassification to held for sale assets (2.0) – (19.7) (0.2) – (21.9)
Reclassification from / (to) other intangible asset categories – – 0.2 (0.2) – –
Reclassification to property, plant and equipment – – (0.5) (0.1) – (0.6)
Write down of assets under construction – – – (2.9) – (2.9)
Exchange differences 2.4 – 1.4 0.2 – 4.0
At 31 December 2014 116.8 1.6 146.9 67.3 15.7 348.3
Accumulated amortisation and impairment
At 1 January 2014 69.6 0.8 79.5 24.2 14.7 188.8
Eliminated on disposal (0.8) – – – – (0.8)
Exceptional impairment charge 4.7 0.3 1.0 – – 6.0
Impairment charge 12.3 – 17.5 5.9 – 35.7
Amortisation charge – internal development – – 16.1 7.9 – 24.0
Amortisation charge – external 11.1 0.3 2.3 – 1.0 14.7
Disposals (19.8) – (3.1) (1.0) – (23.9)
Reclassification to held for sale assets (1.8) – (14.9) (0.2) – (16.9)
Reclassification from / (to) other intangible asset categories – – 1.6 (1.6) – –
Reclassification to property, plant and equipment – – (0.5) – – (0.5)
Exchange differences 1.0 – 1.0 0.4 – 2.4
At 31 December 2014 76.3 1.4 100.5 35.6 15.7 229.5
Net book value
At 31 December 2014 40.5 0.2 46.4 31.7 – 118.8
Included in Software and IT and other internally generated development expenditure is an amount of £11.8m (2014: £14.3m) in respect of leased intangibles.
Customer relationships are amortised over the average length of contracts acquired. The Group is carrying £18.8m (2014: £40.5m) in relation to Customer relationships. A further £nil (2014: £0.2m) is held within assets reclassified to held for sale. Amortisation of intangibles arising on acquisition consists of amortisation in relation to Customer relationships and Licences and franchises and totals £4.9m (2014: £11.4m).
The net book value of internally generated intangible assets as at 31 December 2015 was approximately £23.6m (2014: £31.7m) in development expenditure and £36.5m (2014: £43.1m) in software and IT, of which £0.2m (2014: £2.5m) is classified as held for sale.

Serco Group plc Annual Report and Accounts 2015202
Notes to the Consolidated Financial Statements continued
22. Property, Plant and Equipment
Freehold land and
buildings£m
Short- leasehold
assets£m
Machinery, motor vehicles,
furniture and equipment
£mTotal
£m
Cost
At 1 January 2015 5.7 42.3 117.6 165.6
Additions – 1.1 15.0 16.1
Reclassification (to) / from other plant, property and equipment categories (0.9) 0.9 – –
Reclassification from intangible assets – 0.3 – 0.3
Reclassification (to) / from held for sale assets – (2.8) 128.1 125.3
Disposals (0.1) (9.2) (22.1) (31.4)
Eliminated on disposal (0.7) (2.7) (24.7) (28.1)
Exchange differences – (0.1) (4.2) (4.3)
At 31 December 2015 4.0 29.8 209.7 243.5
Accumulated depreciation and impairment
At 1 January 2015 3.1 30.8 93.3 127.2
Charge for the year – impairment – 0.1 1.9 2.0
Charge for the year – depreciation 0.2 2.8 22.6 25.6
Reclassification (to) / from other plant, property and equipment categories (0.2) 0.2 – –
Reclassification from intangible assets – 0.3 – 0.3
Reclassification (to) / from held for sale assets – (2.0) 77.0 75.0
Disposals (0.1) (8.7) (20.1) (28.9)
Eliminated on disposal (0.7) (2.7) (23.9) (27.3)
Exchange differences – (0.1) (3.5) (3.6)
At 31 December 2015 2.3 20.7 147.3 170.3
Net book value
At 31 December 2015 1.7 9.1 62.4 73.2

Stra
teg
ic R
epo
rtD
irec
tors
’ Rep
ort
Financial Statements · 203Notes to the Consolidated Financial Statements
Fina
ncia
l Sta
tem
ents
Freehold land and
buildings£m
Short- leasehold
assets£m
Machinery, motor vehicles,
furniture and equipment
£mTotal
£m
Cost
At 1 January 2014 5.4 61.4 299.0 365.8
Arising on acquisition – 0.3 1.4 1.7
Additions 0.2 3.6 38.8 42.6
Reclassification from intangible assets – 0.1 0.5 0.6
Reclassification to held for sale assets – (18.5) (199.6) (218.1)
Disposals – (5.3) (21.0) (26.3)
Eliminated on disposal – (0.1) (0.4) (0.5)
Exchange differences 0.1 0.8 (1.1) (0.2)
At 31 December 2014 5.7 42.3 117.6 165.6
Accumulated depreciation and impairment
At 1 January 2014 2.1 31.9 155.0 189.0
Arising on acquisition – 0.3 0.9 1.2
Charge for the year – impairment (exceptional) 0.5 6.6 11.5 18.6
Charge for the year – impairment 0.2 2.9 19.0 22.1
Charge for the year – depreciation 0.3 5.9 35.6 41.8
Reclassification from intangible assets – – 0.5 0.5
Reclassification to held for sale assets – (12.4) (111.2) (123.6)
Disposals – (4.7) (16.2) (20.9)
Eliminated on disposal – (0.1) (0.2) (0.3)
Exchange differences – 0.4 (1.6) (1.2)
At 31 December 2014 3.1 30.8 93.3 127.2
Net book value
At 31 December 2014 2.6 11.5 24.3 38.4
The carrying amount of the Group’s Machinery, motor vehicles, furniture and equipment includes an amount of £36.5m (2014: £48.6m) in respect of assets held under finance leases, of which £nil (2014: £40.5m) is classified as held for sale.
The carrying amount of the Group’s Short-leasehold assets includes an amount of £0.3m (2014: £0.3m) in respect of assets held under finance leases.
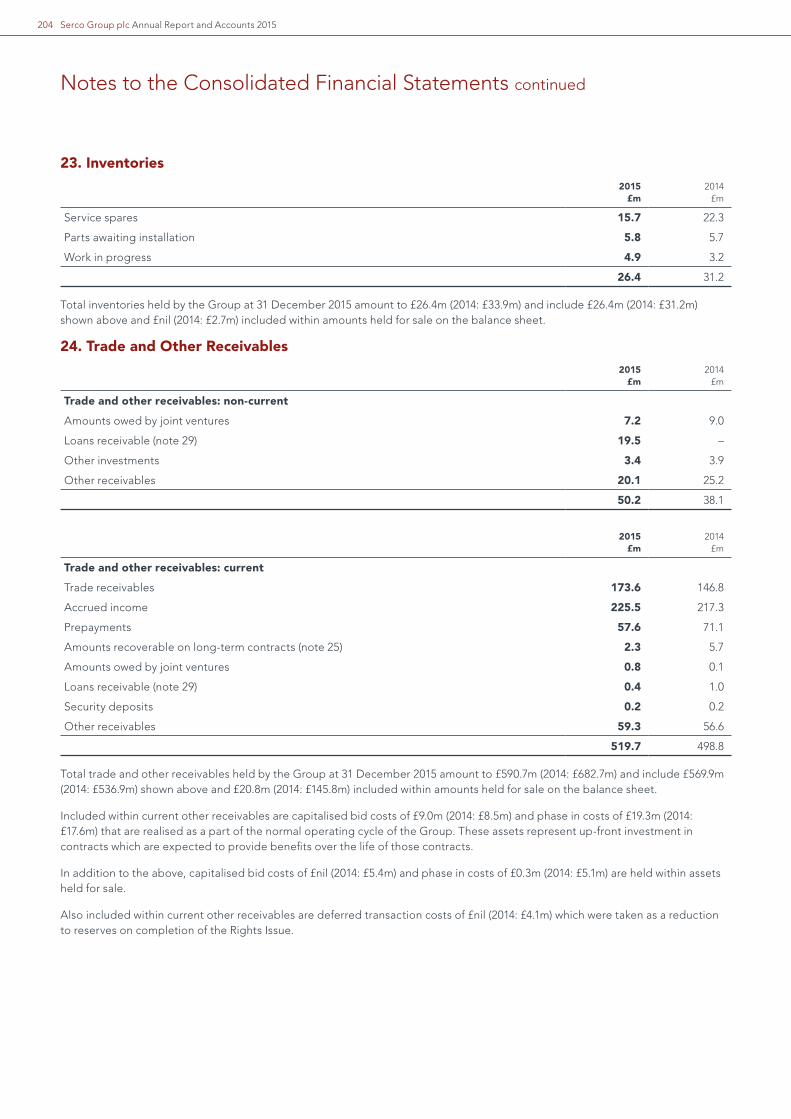
Serco Group plc Annual Report and Accounts 2015204
Notes to the Consolidated Financial Statements continued
23. Inventories2015
£m2014
£m
Service spares 15.7 22.3
Parts awaiting installation 5.8 5.7
Work in progress 4.9 3.2
26.4 31.2
Total inventories held by the Group at 31 December 2015 amount to £26.4m (2014: £33.9m) and include £26.4m (2014: £31.2m) shown above and £nil (2014: £2.7m) included within amounts held for sale on the balance sheet.
24. Trade and Other Receivables2015
£m2014 £m
Trade and other receivables: non-current
Amounts owed by joint ventures 7.2 9.0
Loans receivable (note 29) 19.5 –
Other investments 3.4 3.9
Other receivables 20.1 25.2
50.2 38.1
2015 £m
2014 £m
Trade and other receivables: current
Trade receivables 173.6 146.8
Accrued income 225.5 217.3
Prepayments 57.6 71.1
Amounts recoverable on long-term contracts (note 25) 2.3 5.7
Amounts owed by joint ventures 0.8 0.1
Loans receivable (note 29) 0.4 1.0
Security deposits 0.2 0.2
Other receivables 59.3 56.6
519.7 498.8
Total trade and other receivables held by the Group at 31 December 2015 amount to £590.7m (2014: £682.7m) and include £569.9m (2014: £536.9m) shown above and £20.8m (2014: £145.8m) included within amounts held for sale on the balance sheet.
Included within current other receivables are capitalised bid costs of £9.0m (2014: £8.5m) and phase in costs of £19.3m (2014: £17.6m) that are realised as a part of the normal operating cycle of the Group. These assets represent up-front investment in contracts which are expected to provide benefits over the life of those contracts.
In addition to the above, capitalised bid costs of £nil (2014: £5.4m) and phase in costs of £0.3m (2014: £5.1m) are held within assets held for sale.
Also included within current other receivables are deferred transaction costs of £nil (2014: £4.1m) which were taken as a reduction to reserves on completion of the Rights Issue.

Stra
teg
ic R
epo
rtD
irec
tors
’ Rep
ort
Financial Statements · 205Notes to the Consolidated Financial Statements
Fina
ncia
l Sta
tem
ents
The Group has a receivables financing facility of £30.0m (2014: £60.0m), of which £30.0m had been utilised at 31 December 2015 (31 December 2014: £32.8m utilised). This is a UK facility provided on a non-recourse basis with all relevant debtors requiring approval in advance by the facility provider.
The management of trade receivables is the responsibility of the operating segments, although they report to Group on a monthly basis on debtor days, debtor ageing and significant outstanding debts. The average credit period taken by customers is 20 days (2014: 21 days) and no interest is charged on overdue amounts.
Each customer has an external credit score which determines the level of credit provided. However, the majority of our customers either have a sovereign credit rating as a result of being government organisations or are blue chip private sector companies. Of the trade receivables balance at the end of the year, £39.6m (2014: £65.2m) is due from agencies of the UK Government, the Group’s largest customer. A further £nil (2014: £5.4m) of trade receivables due from agencies of the UK Government is held within assets held for sale. There are no other customers who represent more than 5% of the total balance of trade receivables. The maximum exposure to credit risk in relation to trade receivables at the reporting date is the fair value of trade receivables. The Group does not hold any collateral as security.
As at 31 December 2015, a total of £1.4m (2014: £4.4m) of trade receivables held by the Group were considered to be impaired and include £1.4m (2014: £1.8m) shown below and £nil (2014: £2.6m) included within amounts held for sale. Impairments to trade receivables are based on specific estimated irrecoverable amounts and provisions on outstanding balances greater than a year old unless there is firm evidence that the balance is recoverable. The total amount of the provision for the Group was £11.3m as of 31 December 2015 (2014: £26.1m) and included £11.3m (2014: £23.5m) as shown below and £nil (2014: £2.6m) of provision for trade receivables held for sale.
The ageing of trade receivables is as follows:
2015 £m
2014 £m
Neither impaired nor past due 99.0 97.3
Not impaired but overdue by less than 30 days 56.3 32.4
Not impaired but overdue by between 30 and 60 days 7.8 16.9
Not impaired but overdue by more than 60 days 20.4 21.9
Impaired 1.4 1.8
Allowance for doubtful debts (11.3) (23.5)
173.6 146.8
Of the total overdue trade receivable balance, 35.5% (2014: 24.4%) relates to the UK, US or Australian governments, and a further 34.4% (2014: 26.7%) relates to the government of the United Arab Emirates. The total allowance for doubtful debts is greater than the assets identified as impaired due to provision being made for partial impairment of balances held within one of the ageing categories.
Movements on the Group allowance for doubtful debts are as follows:
2015 £m
2014 £m
At 1 January 23.5 4.7
(Released) / charged to income statement (6.8) 22.0
Utilised (2.8) (1.6)
Exchange differences 0.8 1.0
Reclassified to held for sale (3.4) (2.6)
At 31 December 11.3 23.5
Included in the other receivables balance at the end of the year is a further £72.1m (2014: £79.7m) due to agencies of the UK Government; with a further £nil (2014: £4.4m) being reclassified to assets held for sale.

Serco Group plc Annual Report and Accounts 2015206
Notes to the Consolidated Financial Statements continued
25. Long-term Contracts2015
£m2014
£m
Contracts in progress at the balance sheet date:
Amounts due from long-term project-based contract customers included in trade and other receivables 2.3 5.7
2.3 5.7
Long-term project-based contract costs incurred plus recognised profits less recognised losses to date 109.9 113.9
Less: progress payments (107.6) (108.2)
2.3 5.7
As at 31 December 2015, the Group had £nil (2014: £nil) of contract retentions held by customers.
26. Cash and Cash Equivalents
Sterling 2015
£m
Other currencies
2015 £m
Total 2015
£m
Sterling 2014
£m
Other currencies
2014 £m
Total 2014
£m
Customer advance payments* – 3.1 3.1 – 0.2 0.2
Other cash and short-term deposits 293.7 26.8 320.5 82.3 97.6 179.9
Total cash and cash equivalents 293.7 29.9 323.6 82.3 97.8 180.1
* Customer advance payments totalling £3.1m (2014: £0.2m) are encumbered cash balances. A further £nil (2014: £8.4m) of encumbered cash has been reclassified as held for sale.
Cash and cash equivalents (which are presented as a single class of assets on the face of the balance sheet) comprise cash at bank and other short-term highly liquid investments with a maturity of three months or less.
Total cash and cash equivalents held by the Group at 31 December 2015 amount to £328.8m (2014: £202.5m) and include £323.6m (2014: £180.1m) shown above and £5.2m (2014: £22.4m) included within amounts held for sale on the balance sheet.
27. Trade and Other Payables2015
£m2014
£m
Trade and other payables: Current
Trade payables 93.6 99.8
Other payables 96.4 112.6
Accruals 303.1 308.3
Deferred income 55.7 61.2
548.8 581.9
The average credit period taken for trade purchases is 20 days (2014: 25 days).
2015 £m
2014 £m
Trade and other payables: Non-current
Other payables 18.3 29.7
18.3 29.7
Total trade and other payables held by the Group at 31 December 2015 amount to £574.5m (2014: £715.3m) and include £567.1m (2014: £611.6m) shown above and £7.4m (2014: £103.7m) included within amounts held for sale on the balance sheet.
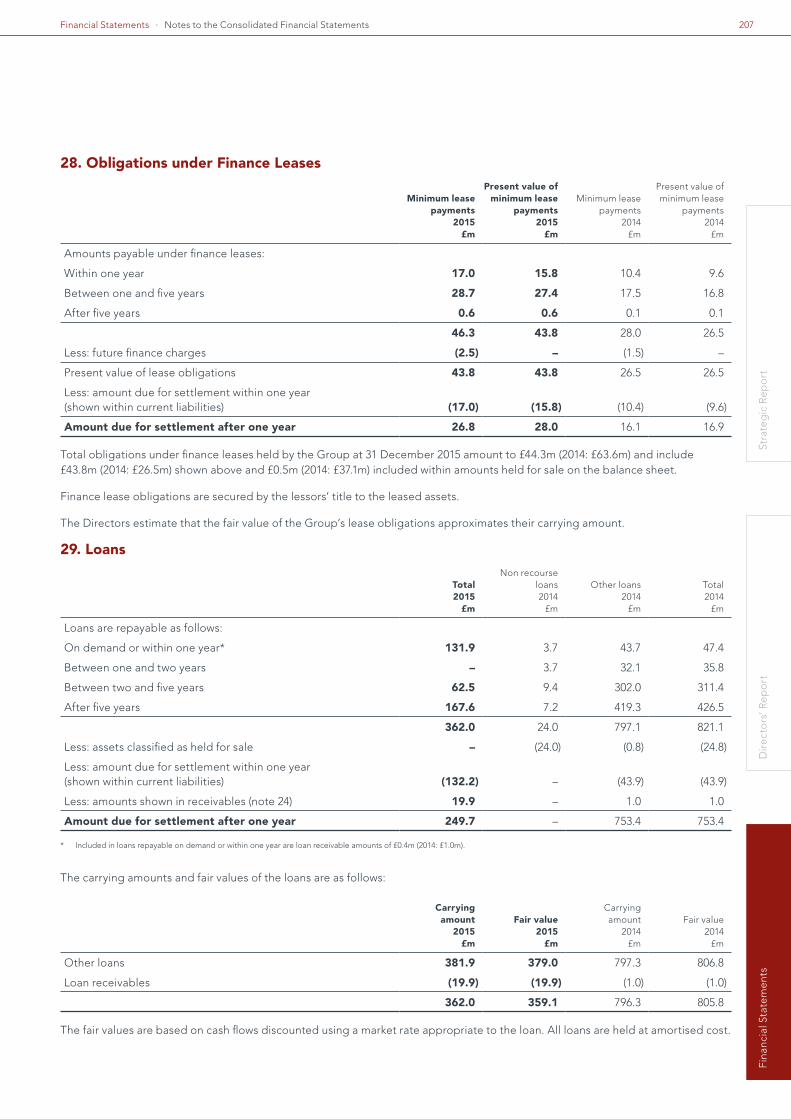
Stra
teg
ic R
epo
rtD
irec
tors
’ Rep
ort
Financial Statements · 207Notes to the Consolidated Financial Statements
Fina
ncia
l Sta
tem
ents
28. Obligations under Finance Leases
Minimum lease payments
2015 £m
Present value of minimum lease
payments 2015
£m
Minimum lease payments
2014 £m
Present value of minimum lease
payments 2014
£m
Amounts payable under finance leases:
Within one year 17.0 15.8 10.4 9.6
Between one and five years 28.7 27.4 17.5 16.8
After five years 0.6 0.6 0.1 0.1
46.3 43.8 28.0 26.5
Less: future finance charges (2.5) – (1.5) –
Present value of lease obligations 43.8 43.8 26.5 26.5
Less: amount due for settlement within one year (shown within current liabilities) (17.0) (15.8) (10.4) (9.6)
Amount due for settlement after one year 26.8 28.0 16.1 16.9
Total obligations under finance leases held by the Group at 31 December 2015 amount to £44.3m (2014: £63.6m) and include £43.8m (2014: £26.5m) shown above and £0.5m (2014: £37.1m) included within amounts held for sale on the balance sheet.
Finance lease obligations are secured by the lessors’ title to the leased assets.
The Directors estimate that the fair value of the Group’s lease obligations approximates their carrying amount.
29. Loans
Total 2015
£m
Non recourse loans 2014
£m
Other loans 2014
£m
Total 2014
£m
Loans are repayable as follows:
On demand or within one year* 131.9 3.7 43.7 47.4
Between one and two years – 3.7 32.1 35.8
Between two and five years 62.5 9.4 302.0 311.4
After five years 167.6 7.2 419.3 426.5
362.0 24.0 797.1 821.1
Less: assets classified as held for sale – (24.0) (0.8) (24.8)
Less: amount due for settlement within one year (shown within current liabilities) (132.2) – (43.9) (43.9)
Less: amounts shown in receivables (note 24) 19.9 – 1.0 1.0
Amount due for settlement after one year 249.7 – 753.4 753.4
* Included in loans repayable on demand or within one year are loan receivable amounts of £0.4m (2014: £1.0m).
The carrying amounts and fair values of the loans are as follows:
Carrying amount
2015 £m
Fair value 2015
£m
Carrying amount
2014 £m
Fair value 2014
£m
Other loans 381.9 379.0 797.3 806.8
Loan receivables (19.9) (19.9) (1.0) (1.0)
362.0 359.1 796.3 805.8
The fair values are based on cash flows discounted using a market rate appropriate to the loan. All loans are held at amortised cost.

Serco Group plc Annual Report and Accounts 2015208
Notes to the Consolidated Financial Statements continued
29. Loans continuedAnalysis of Net Debt
At 1 January
2015 £m
Cash flow
£m
Reclassified as held for
sale £m
Acquisitions* £m
Disposals £m
Exchange differences
£m
Non cash movements
£m
At 31 December
2015 £m
Cash and cash equivalents 180.1 128.8 17.2 – (0.4) (2.1) – 323.6
Loan receivables 1.0 (0.6) – – – – 19.5 19.9
Other loans (797.3) 449.0 (0.8) – – (30.8) (2.0) (381.9)
Obligations under finance leases (26.5) 9.3 (26.7) – – – 0.1 (43.8)
(642.7) 586.5 (10.3) – (0.4) (32.9) 17.6 (82.2)
At 1 January
2014 £m
Cash flow
£m
Reclassified as held for
sale £m
Acquisitions* £m
Disposals £m
Exchange differences
£m
Non cash movements
£m
At 31 December
2014 £m
Cash and cash equivalents 125.1 74.1 (22.4) 2.1 (1.0) 2.2 – 180.1
Loan receivables 5.8 (0.2) – – – – (4.6) 1.0
Non recourse loans (20.3) (3.7) 24.0 – – – – –
Other loans (788.0) 18.8 0.8 – – (32.5) 3.6 (797.3)
Obligations under finance leases (68.0) 18.2 37.1 – – (0.1) (13.7) (26.5)
(745.4) 107.2 39.5 2.1 (1.0) (30.4) (14.7) (642.7)
* Acquisitions represent the net cash / (debt) acquired on acquisition.
Total net debt held by the Group amounts to £77.5m (2014: £682.2m) of which £82.2m (2014: £642.7m) is shown above and £4.7m (asset) (2014: £39.5m (debt)) is included within amounts held for sale on the balance sheet.

Stra
teg
ic R
epo
rtD
irec
tors
’ Rep
ort
Financial Statements · 209Notes to the Consolidated Financial Statements
Fina
ncia
l Sta
tem
ents
30. ProvisionsEmployee
related £m
Property £m
Contract £m
Other £m
Total £m
At 1 January 2014 15.7 5.3 25.9 14.2 61.1
Reclassified from trade and other receivables – – (3.9) – (3.9)
Recognised on acquisition of subsidiary 0.2 0.1 – – 0.3
Charged to income statement – exceptional 8.8 2.2 19.4 57.7 88.1
Charged to income statement – other 19.8 15.1 456.7 41.5 533.1
Released to income statement (0.2) (0.1) (3.5) (4.2) (8.0)
Utilised during the year (7.7) (1.7) (36.3) (5.1) (50.8)
Transferred to trade payables – – – (8.2) (8.2)
Transfer to assets held for sale (1.7) – (21.5) (6.8) (30.0)
Unwinding of discount – 0.1 – – 0.1
Exchange differences 0.2 0.5 (6.4) 1.8 (3.9)
At 1 January 2015 35.1 21.5 430.4 90.9 577.9
Reclassified from trade and other payables – – – 15.9 15.9
Charged to income statement – exceptional 5.1 – – 30.7 35.8
Charged to income statement – other 16.6 3.1 89.1 14.0 122.8
Released to income statement – exceptional (1.4) – (2.8) (0.8) (5.0)
Released to income statement – other (1.0) (0.5) (90.2) (13.5) (105.2)
Utilised during the year (10.7) (6.0) (116.8) (16.6) (150.1)
Reclassification – (0.3) 0.3 – –
Transfer (to) / from assets held for sale (8.0) – (4.9) 2.6 (10.3)
Unwinding of discount – 0.1 5.5 – 5.6
Exchange differences 0.7 0.4 (8.5) 1.7 (5.7)
At 31 December 2015 36.4 18.3 302.1 124.9 481.7
Analysed as:
Current 14.2 5.7 90.5 58.2 168.6
Non-current 22.2 12.6 211.6 66.7 313.1
Total provisions held by the Group at 31 December 2015 amount to £506.2m (2014: £607.9m) and include £481.7m (2014: £577.9m) shown above and £24.5m (2014: £30.0m) included within amounts held for sale on the balance sheet.
Contract provisions relate to onerous contracts which will be utilised over the life of each individual contract, up to a maximum of 8 ¼ years from the balance sheet date. The present value of the estimated future cash outflows required to settle the contract obligations as they fall due over the respective contracts has been used in determining the provision. The individual provisions are discounted where the impact is assessed to be material.
A full analysis is performed at least annually of the future profitability of all contracts with marginal performances and of the balance sheet items directly linked to these contracts.
Due to the significant size of the balance and the inherent level of uncertainty over the amount and timing of the related cash flows upon which onerous contract provisions are based, if the expected operational performance varies from the best estimates made at the year end, a material change in estimate may be required. The key drivers behind operational performance is the level of activity required to be serviced, which is often directed by the actions of the UK Government, and the efficiency of Group employees and resources.

Serco Group plc Annual Report and Accounts 2015210
Notes to the Consolidated Financial Statements continued
30. Provisions continuedEmployee related provisions are for long-term service awards and terminal gratuities liabilities which have been accrued and are based on contractual entitlement, together with an estimate of the probabilities that employees will stay until retirement and receive all relevant amounts. There are also amounts included in relation to restructuring. The provisions will be utilised over various periods driven by local legal or regulatory requirements, the timing of which is not certain.
Property provisions relate to leased properties which are either underutilised or vacant and where the unavoidable costs associated with the lease exceed the economic benefits expected to be generated in the future. The provision has been calculated based on the discounted cash outflows required to settle the lease obligations as they fall due, with the longest running lease ending in April 2039.
Other provisions are held for indemnities given on disposed businesses, legal and other costs that the Group expects to incur over an extended period. These costs are based on past experience of similar items and other known factors and represent management’s best estimate of the likely outcome and will be utilised with reference to the specific facts and circumstances, with the majority expecting to be settled by 31 December 2021.
31. Capital and Other Commitments2015
£m2014
£m
Capital expenditure contracted but not provided:
– Property, plant and equipment 9.3 4.4
– Intangible assets 6.9 0.8
Of the above, £nil (2014: £2.6m) in relation to property, plant and equipment commitment is associated with assets which have been reclassified as held for sale.
At the balance sheet date, the Group had outstanding commitments for future minimum lease payments under non-cancellable operating leases, which fall due as follows:
2015 £m
2014 £m
Within one year 36.9 69.6
Between one and five years 64.1 160.3
After five years 12.3 57.5
113.3 287.4
Of the above, £0.5m (2014: £97.9m) is associated with assets which have been reclassified as held for sale. Of this £0.3m (2014: £14.2m) is due within one year, £0.2m (2014: £44.3m) is due between one and five years, and £nil (2014: £39.4m) is due after five years.

Stra
teg
ic R
epo
rtD
irec
tors
’ Rep
ort
Financial Statements · 211Notes to the Consolidated Financial Statements
Fina
ncia
l Sta
tem
ents
32. Contingent LiabilitiesThe Company has guaranteed overdrafts, finance leases, and bonding facilities of its joint ventures up to a maximum value of £21.1m (2014: £26.2m). The actual commitment outstanding at 31 December 2015 was £20.8m (2014: £21.4m).
The Company and its subsidiaries have provided certain guarantees and indemnities in respect of performance and other bonds, issued by its banks on its behalf in the ordinary course of business. The total commitment outstanding as at 31 December 2015 was £211.8m (2014: £192.1m).
The Group is aware of other claims and potential claims which involve or may involve legal proceedings against the Group. The Directors are of the opinion, having regard to legal advice received and the Group’s insurance arrangements, that it is unlikely that these matters will, in aggregate, have a material effect on the Group’s financial position.
On 31 May 2011 we filed a claim with the Authority for Advance Rulings (AAR) to seek confirmation that Serco was not obliged to withhold Indian income tax from the purchase price on the acquisition of Intelenet. The AAR declined to rule on the matter, so Serco filed a claim with the High Court to decide or direct the AAR to rule on the matter. The High Court has issued a judgement in favour of Serco, that is, there was no requirement to withhold income tax. Further litigation to a higher court is a possibility. Should the matter be decided against Serco, it would be liable for unprovided tax of £27m together with accrued interest to 31 December 2015 of £14m. Having taken appropriate professional advice, management considers it likely that Serco will ultimately be successful in this matter.
As we have disclosed before, we are under investigation by the Serious Fraud Office. In November 2013, the UK’s Serious Fraud Office announced that it had opened an investigation, which remains ongoing, into the Group’s Electronic Monitoring Contract. We are cooperating fully with the Serious Fraud Office’s investigation but it is not possible to predict the outcome. However, disclosed in the Principal Risks and Uncertainties in this Report is a description of the range of possible outcomes in the event that the Serious Fraud Office decides to prosecute the individuals and /or the Serco entities involved.
33. Financial Risk Management33. a) Fair Value of Financial Instrumentsi) Hierarchy of fair value
The classification of the fair value measurement falls into three levels, based on the degree to which the fair value is observable. The levels are as follows:
Level 1: inputs derived from unadjusted quoted prices in active markets for identical assets or liabilities;Level 2: inputs are inputs, other than quoted prices included within Level 1, that are observable for the asset or liability, either
directly or indirectly; andLevel 3: inputs are unobservable inputs for the asset or liability.
Based on the above, the derivative financial instruments held by the Group at 31 December 2015 and the comparison fair values for loans and finance leases, are all considered to fall into Level 2. Market prices are sourced from Bloomberg and third party valuations. The valuation models incorporate various inputs including foreign exchange spot and forward rates and interest rate curves. There have been no transfers between levels in the year.

Serco Group plc Annual Report and Accounts 2015212
Notes to the Consolidated Financial Statements continued
33. Financial Risk Management continued33. a) Fair Value of Financial Instruments continuedi) Hierarchy of fair value continued
The Group held the following financial instruments which fall within the scope of IAS 39 Financial Instruments: Recognition and Measurement at 31 December:
Carrying amount (measurement basis)
Comparison fair value
Carrying amount (measurement basis)
Comparison fair value
Amortised cost
2015£m
Fair value – Level 2
2015£m
Level 22015
£m
Amortised cost2014
£m
Fair value – Level 2
2014£m
Level 22014
£m
Financial assets
Financial assets – current
Cash and bank balances 323.6 – 323.6 180.1 – 180.1
Derivatives designated as FVTPL
Forward foreign exchange contracts – 6.6 – 5.6
Derivative instruments in designated hedge accounting relationships
Cross currency swaps – 2.6 – 0.1
Forward foreign exchange contracts – 0.2 – 0.2
Loans and receivables
Trade receivables (note 24) 173.6 – 173.6 146.8 – 146.8
Loan receivables (note 24) 0.4 – 0.4 1.0 – 1.0
Security deposits (note 24) 0.2 – 0.2 0.2 – 0.2
Amounts owed by joint ventures (note 24) 0.8 – 0.8 0.1 – 0.1
Financial assets – non-current
Derivative instruments in designated hedge accounting relationships
Cross currency swaps – 7.8 – 7.0
Loans and receivables
Loan receivables (note 24) 19.5 – 19.5 – – –
Other investments (note 24) 3.4 – 3.4 3.9 – 3.9
Amounts owed by joint ventures (note 24) 7.2 – 7.2 9.0 – 9.0
Financial liabilities – current
Derivatives designated as FVTPL
Forward foreign exchange contracts – (2.4) – (17.3)
Derivative instruments in designated hedge accounting relationships
Cross currency swaps – – – (0.3)
Forward foreign exchange contracts – – – (0.1)
Financial liabilities at amortised cost
Trade payables (note 27) (93.6) – (93.6) (99.8) – (99.8)
Loans (note 29) (132.2) – (132.2) (43.9) – (43.9)
Obligations under finance leases (note 28) (15.8) – (15.8) (9.6) – (9.6)
Financial liabilities – non-current
Financial liabilities at amortised cost
Loans (note 29) (249.7) – (246.8) (753.4) – (762.9)
Obligations under finance leases (note 28) (28.0) – (28.0) (16.9) – (16.9)

Stra
teg
ic R
epo
rtD
irec
tors
’ Rep
ort
Financial Statements · 213Notes to the Consolidated Financial Statements
Fina
ncia
l Sta
tem
ents
The Directors estimate that the carrying amounts of cash, trade receivables and trade payables approximate to their fair value due to the short-term maturity of these instruments.
The fair values of loans and finance lease obligations are based on cash flows discounted using a rate based on the borrowing rate associated with the liability.
The fair value of derivatives is calculated using a discounted cash flow approach applying discount factors derived from observable market data to actual and estimated future cash flows. Credit risk is considered in the calculation of these fair values.
ii) Fair value of derivative financial instruments
The fair valuation of derivative financial instruments results in a net asset of £14.8m (2014: net liability of £4.8m) comprising non-current assets of £7.8m (2014: £7.0m), current assets of £9.4m (2014: £5.9m), current liabilities of £2.4m (2014: £17.7m) and non-current liabilities of £nil (2014: £nil).
1 January 2015£m
Movement in fair value of derivatives
designated in hedge accounting relationships
£m
Movement in fair value of derivatives not
designated in hedge accounting relationships
£m
31 December 2015
£m
Currency swaps 6.8 3.6 – 10.4
Forward foreign exchange contracts (11.6) 0.1 15.9 4.4
(4.8) 3.7 15.9 14.8
1 January 2014£m
Movement in fair value of derivatives
designated in hedge accounting relationships
£m
Movement in fair value of derivatives not
designated in hedge accounting relationships
£m
31 December 2014
£m
Currency swaps (0.6) 7.4 – 6.8
Forward foreign exchange contracts (31.9) 0.2 20.1 (11.6)
Interest rate swaps (0.1) – 0.1 –
(32.6) 7.6 20.2 (4.8)
The fair value of financial liabilities at fair value through profit and loss is £2.4m (2014: £17.3m) and relates to derivatives that are not designated in hedge accounting relationships. The fair value of the derivatives and their credit risk adjusted fair value are not materially different, and are approximately equal to the amount contractually payable at maturity due to the short tenor of the instruments.
33 (b) Financial Risk
The Board is ultimately responsible for ensuring that financial and non-financial risks are monitored and managed within acceptable and known parameters. The Board delegates authority to the executive team to manage financial risks. The Group’s treasury function acts as a service centre and operates within clearly defined guidelines and policies that are approved by the Board. The guidelines and policies define the financial risks to be managed, specify the objectives in managing these risks, delegate responsibilities to those managing the risks and establish a control framework to regulate treasury activities to minimise operational risk.
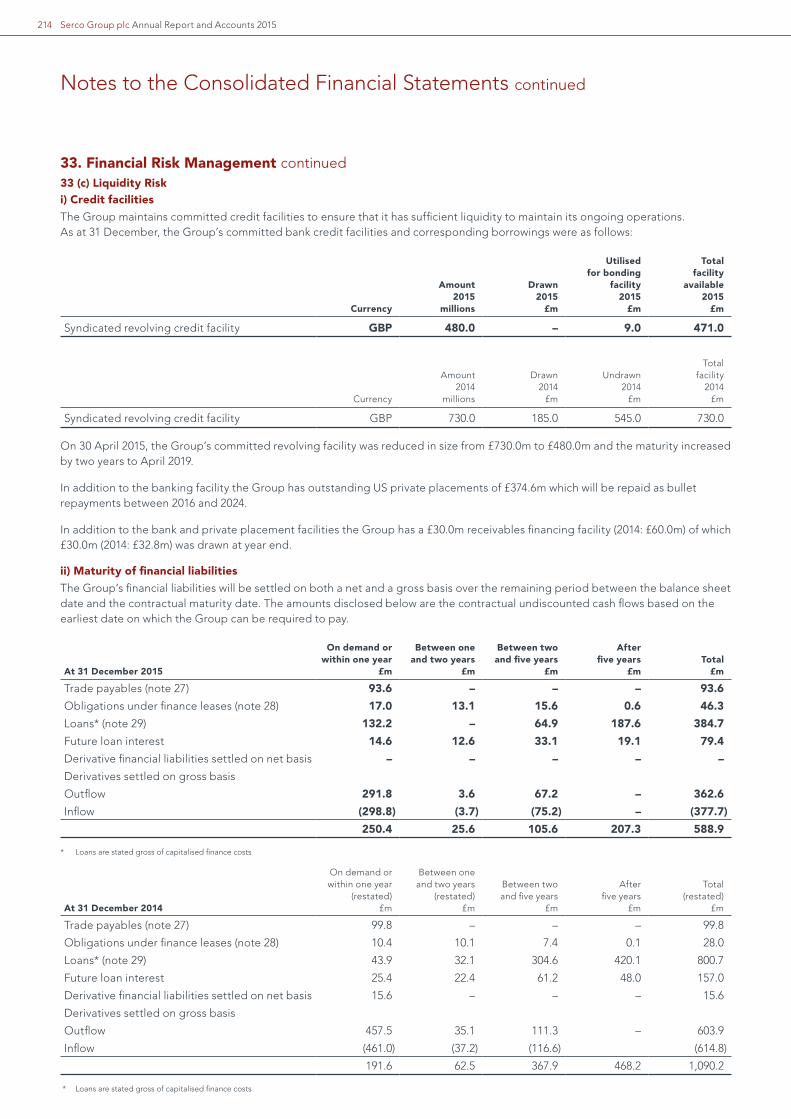
Serco Group plc Annual Report and Accounts 2015214
Notes to the Consolidated Financial Statements continued
33. Financial Risk Management continued33 (c) Liquidity Riski) Credit facilities
The Group maintains committed credit facilities to ensure that it has sufficient liquidity to maintain its ongoing operations. As at 31 December, the Group’s committed bank credit facilities and corresponding borrowings were as follows:
Currency
Amount2015
millions
Drawn2015
£m
Utilised for bonding
facility2015
£m
Total facility
available2015
£m
Syndicated revolving credit facility GBP 480.0 – 9.0 471.0
Currency
Amount2014
millions
Drawn2014 £m
Undrawn2014
£m
Total facility
2014 £m
Syndicated revolving credit facility GBP 730.0 185.0 545.0 730.0
On 30 April 2015, the Group’s committed revolving facility was reduced in size from £730.0m to £480.0m and the maturity increased by two years to April 2019.
In addition to the banking facility the Group has outstanding US private placements of £374.6m which will be repaid as bullet repayments between 2016 and 2024.
In addition to the bank and private placement facilities the Group has a £30.0m receivables financing facility (2014: £60.0m) of which £30.0m (2014: £32.8m) was drawn at year end.
ii) Maturity of financial liabilities
The Group’s financial liabilities will be settled on both a net and a gross basis over the remaining period between the balance sheet date and the contractual maturity date. The amounts disclosed below are the contractual undiscounted cash flows based on the earliest date on which the Group can be required to pay.
At 31 December 2015
On demand or within one year
£m
Between one and two years
£m
Between two and five years
£m
After five years
£mTotal
£m
Trade payables (note 27) 93.6 – – – 93.6
Obligations under finance leases (note 28) 17.0 13.1 15.6 0.6 46.3
Loans* (note 29) 132.2 – 64.9 187.6 384.7
Future loan interest 14.6 12.6 33.1 19.1 79.4
Derivative financial liabilities settled on net basis – – – – –
Derivatives settled on gross basis
Outflow 291.8 3.6 67.2 – 362.6
Inflow (298.8) (3.7) (75.2) – (377.7)
250.4 25.6 105.6 207.3 588.9
* Loans are stated gross of capitalised finance costs
At 31 December 2014
On demand or within one year
(restated) £m
Between one and two years
(restated) £m
Between two and five years
£m
After five years
£m
Total (restated)
£m
Trade payables (note 27) 99.8 – – – 99.8
Obligations under finance leases (note 28) 10.4 10.1 7.4 0.1 28.0
Loans* (note 29) 43.9 32.1 304.6 420.1 800.7
Future loan interest 25.4 22.4 61.2 48.0 157.0
Derivative financial liabilities settled on net basis 15.6 – – – 15.6
Derivatives settled on gross basis
Outflow 457.5 35.1 111.3 – 603.9
Inflow (461.0) (37.2) (116.6) (614.8)
191.6 62.5 367.9 468.2 1,090.2
* Loans are stated gross of capitalised finance costs

Stra
teg
ic R
epo
rtD
irec
tors
’ Rep
ort
Financial Statements · 215Notes to the Consolidated Financial Statements
Fina
ncia
l Sta
tem
ents
Gross cash flows in the table above relating to forward foreign exchange contracts total £274.0m (inflows) and £269.7m (outflows) on demand or within one year and £0.7m (inflows) and £0.7m (outflows) between one and two years (2014: £447.9m (inflow) and £444.2m (outflow) all on demand or within one year).
Total loans on demand or within one year for the Group amount to £132.2m (2014: £44.7m) at December 2015 of which £132.2m (2014: £43.9m) is included above and £nil (2014: £0.8m) is classified as held for sale.
33 (d) Foreign Exchange Riski) Transactional
It is the Group’s policy to hedge material transactional exposures using forward foreign exchange contracts to fix the functional currency value of non-functional currency cash flows. At 31 December 2015, there were no material unhedged non-functional currency monetary assets or liabilities, firm commitments or highly probable forecast transactions.
ii) Translational
Where possible the Group will raise external funding to match the currency profile of its foreign operations, in order to mitigate translation exposure. If matched funding is not possible, currency derivatives may be used to protect against movements in foreign exchange.
iii) Hedge accounting
For the purposes of hedge accounting, hedges are classified as either fair value hedges, cash flow hedges or hedges of net investments in foreign operations. Pages 172 and 173 detail the Group’s accounting policies in relation to derivatives qualifying for hedge accounting under IAS 39.
At 31 December 2015, the Group held cross currency swaps designated as cash flow hedges against $138.6m of the US Dollar private placements. Fixed interest cash flows denominated in US Dollars are exchanged for fixed interest cash flows denominated in Sterling.
The profile of these cross currency swaps held by the Group in the current and prior year is as follows:
Maturity
2015 Receivable 2014 Receivable
Notional amount
USDm
USD interest rate
%
Payable GBP interest rate
%
Notional a mount USDm
USD interest rate
%
Payable GBP interest rate
%
August 2015 – – – 11.0 5.7 5.7
May 2016 31.5 3.6 4.3 50.0 3.6 4.3
May 2018 63.0 4.4 4.9 100.0 4.4 4.9
October 2019 44.1 3.8 4.1 70.0 3.8 4.1
The Group also held a number of forward foreign exchange contracts designated as cash flow hedges. These derivatives are hedging highly probable forecast foreign currency trade payments in the UK business. The net notional amounts are summarised by currency below:
2015
£m2014
£m
Sterling (10.8) (8.5)
US Dollar – (2.9)
Euro 11.0 4.4
Indian Rupee – 7.0
All derivatives designated as cash flow hedges are highly effective and as at 31 December 2015 a net fair value loss of £2.7m (2014: £4.9m) has been deferred in the hedging reserve. During the course of the year to 31 December 2015, £0.6m (2014: £2.7m) of fair value gains were transferred to the hedging reserve and £2.8m (2014: £nil) reclassified to the consolidated income statement.

Serco Group plc Annual Report and Accounts 2015216
Notes to the Consolidated Financial Statements continued
33. Financial Risk Management continued33 (d) Foreign Exchange Risk continuediv) Currency sensitivity
The Group’s currency exposures in respect of monetary items at 31 December 2015 that result in net currency gains and losses in the income statement and equity arise principally from movement in US Dollar and Euro exchange rates. The impact is summarised below:
Pre-tax profits gain / (loss)
2015£m
Equity gain / (loss) 2015
£m
Pre-tax profits gain / (loss)
2014£m
Equity gain / (loss) 2014
£m
US Dollar 0.3 (0.7) 19.7 (0.4)
Euro – 1.0 – (0.4)
Indian Rupee – – (6.7) –
0.3 0.3 13.0 (0.8)
33 (e) Interest Rate Risk
The Group’s policy is to minimise the impact of interest rate volatility on earnings to provide an appropriate level of certainty to cost of funds. Exposure to interest rate risk arises principally on changes to US Dollar and Sterling interest rates.
i) Interest rate management
An analysis of financial assets and liabilities exposed to interest rate risk is set out below:
Financial assets
Floating rate 2015
£m
Fixed rate 2015
£m
Weighted average
interest rate 2015
%
Floating rate 2014
£m
Fixed rate 2014
£m
Weighted average interest
rate 2014%
Cash and cash equivalents 323.6 – – 180.1 – –
Other loan receivables 0.4 19.5 7.0 1.0 – –
324.0 19.5 181.1 –
Financial liabilities
Floating rate 2015
£m
Fixed rate 2015
£m
Weighted average
interest rate 2015
%
Floating rate 2014
£m
Fixed rate 2014
£m
Weighted average interest
rate 2014
%
Non recourse Sterling loans – – – – – –
Sterling loans – – – 205.3 16.6 2.72
US Dollar loans – 374.6 5.10 – 568.2 4.12
Other loans 10.1 – – 10.6 – –
10.1 374.6 215.9 584.8
Total cash and cash equivalents held by the Group at 31 December 2015 amount to £328.8m (2014: £202.5m) and include £323.6m (2014: £180.1m) shown above and £5.2m (2014: £22.4m) included within amounts held for sale on the balance sheet.
Total floating rate and fixed rate loans held by the Group at 31 December 2015 amount to £10.1m (2014: £216.7m) and £374.6m (2014: £608.8m) respectively and include £10.1m (2014: £215.9m) and £374.6m (2014: £584.8m) shown above and £nil (2014: £0.8m) and £nil (2014: £24.0m) included within amounts held for sale on the balance sheet.
Exposure to interest rate fluctuations is mitigated through the issuance of fixed rate debt and the use of interest rate derivatives. Excluded from the above analysis is £43.8m (2014: £26.5m) of amounts payable under finance leases, which are subject to fixed rates of interest.
ii) Interest rate sensitivity
The effect of a 100 basis point increase in LIBOR rates on the net financial liability position at the balance sheet date, with all other variables held constant, would have resulted in an increase in pre-tax loss for the year to 31 December 2015 of £3.2m (2014: £0.1m).

Stra
teg
ic R
epo
rtD
irec
tors
’ Rep
ort
Financial Statements · 217Notes to the Consolidated Financial Statements
Fina
ncia
l Sta
tem
ents
33 (f) Credit Risk
The Group’s principal financial assets are cash and cash equivalents and trade and other receivables.
Credit risk is the risk that a counterparty could default on its contractual obligations. In this regard, the Group’s principle exposure is to cash and cash equivalents, derivative transactions and trade receivables.
The Group’s trade receivables credit risk is relatively low given that a high proportion of our customer base are Government bodies with strong sovereign, or sovereign like, credit ratings. However, where the assessed credit worthiness of a customer, Government or non-government, falls below that considered acceptable, appropriate measures are taken to mitigate against the risk of contractual default using instruments such as credit guarantees.
The Group’s Treasury function only transacts with counterparties that comply with Board policy. The credit risk is measured by way of a counterparty credit rating from any two recognised rating agencies. Pre-approved limits are set based on a rating matrix and exposures monitored accordingly. The Group also employs the use of set-off rights in some agreements.
33 (g) Capital Risk
The Board’s objective is to maintain a capital structure that supports the Group’s strategic objectives, including but not limited to reshaping the portfolio through mergers, acquisitions and disposals. In doing so the Board seeks to manage funding and liquidity risk, optimise shareholder return and maintain an implied investment grade credit position. This strategy is unchanged from the prior year.
The Board reviews and approves at least annually a treasury policy document which covers, inter alia, funding and liquidity risk, capital structure and risk management. This policy details targets for committed funding headroom, diversification of committed funding and debt maturity profile.
The Group plans to maintain sufficient funds and distributable reserves to allow payments of projected dividends to shareholders.
The following table summarises the capital of the Group:
2015 £m
2014 £m
Cash and cash equivalents (323.6) (180.1)
Loans 362.0 796.3
Obligations under finance leases 43.8 26.5
Equity 282.1 (66.2)
Capital 364.3 576.5

Serco Group plc Annual Report and Accounts 2015218
Notes to the Consolidated Financial Statements continued
34. Retirement Benefit SchemesThe Group has accounted for pensions in accordance with IAS 19 Employee Benefits. The Group operates a number of defined benefit schemes and defined contribution schemes. The pension charge for the year ended 31 December 2015 (excluding pension arrangements operated by joint ventures), was £87.3m (2014: £108.8m).
34 (a) Defined Benefit Schemes
The Group operates defined benefit schemes for qualifying employees of its subsidiaries in the UK and Europe.
The assets of the funded schemes are held independently of the Group’s assets in separate trustee administered funds. The trustees of the pension fund are required by law to act in the interest of the fund and of all relevant stakeholders in the scheme. The trustees of the pension fund are responsible for the investment policy with regard to the assets of the fund. The Group’s major schemes are valued by independent actuaries annually using the projected unit credit actuarial cost method. This reflects service rendered by employees to the dates of valuation and incorporates actuarial assumptions primarily regarding discount rates used in determining the present value of benefits, projected rates of salary growth, and life expectancy of pension plan members. Discount rates are based on the market yields of high-quality corporate bonds in the country concerned. Pension assets and liabilities in different defined benefit schemes are not offset unless the Group has a legally enforceable right to use the surplus in one scheme to settle obligations in the other scheme and intends to exercise this right.
In accounting for the defined benefit schemes, the Group has applied the following principles.
• Asset recognised for SPLAS is based on the assumption that the full surplus will ultimately be available to the Group as a future refund of surplus.
• No foreign exchange item is shown in the disclosures as the non-UK liabilities are not material.
• No pension assets are invested in the Group’s own financial instruments or property.
The schemes in the UK typically expose the Group to actuarial risks such as: investment risk, interest rate risk, longevity risk and salary risk.
• Investment Risk
The present value of the defined benefit schemes’ liability is calculated using a discount rate determined by reference to high quality corporate bond yields; if the return on plan assets is below this rate, a deficit will be created.
• Interest risk
A decrease in the bond interest rate will increase the scheme liability but this will be partially offset by an increase in the return of the plan’s debt investments.
• Longevity risk
The present value of the defined benefit plan liability is calculated by reference to the best estimate of the mortality of plan participants both during and after their employment. An increase in the life expectancy of the plan participants will increase the plan’s liability.
• Salary risk
The present value of the defined benefit scheme liability is calculated by reference to the future salaries of plan participants, as such, an increase in the salary of the plan participants will increase the plan’s liability.
i) Balance sheet values
The amounts recognised in the balance sheet are grouped together as follows:
Contract specific
These are pre-funded defined benefit schemes. The Group has obligations to contribute variable amounts to the pension schemes over the terms of the related contracts. At rebid, any deficit or surplus would be expected to transfer to the next contractor. The Group has recognised as a liability the defined benefit obligation less the fair value of scheme assets that it will fund over the period of the contracts with a corresponding amount recognised as intangible assets at the start of the contracts. Subsequent actuarial gains and losses in relation to the Group’s share of the pension obligations have been recognised in the SOCI. The intangible assets are amortised over the term of the contracts.
Non contract specific
These consist of two pre-funded defined benefit schemes (the funding policy is to contribute such variable amounts, on the advice of the actuary, as will achieve 100% funding on a projected salary basis) and an unfunded defined benefit scheme. These schemes do not relate to any specific contract. Any liabilities arising are recognised in full.

Stra
teg
ic R
epo
rtD
irec
tors
’ Rep
ort
Financial Statements · 219Notes to the Consolidated Financial Statements
Fina
ncia
l Sta
tem
ents
ii) Triennial funding valuation
Among our non contract specific schemes, the largest is the Serco Pension and Life Assurance Scheme (SPLAS). The estimated actuarial deficit of SPLAS as at 31 December 2015 was approximately £28.0m (2014: £5.0m). The most recent full actuarial valuation of this scheme was undertaken as at 5 April 2012 and resulted in an actuarially assessed deficit of £24m. Following this review, the Group agreed with the trustees to make a small increase in contributions, bringing cash contributions of up to 33% of members’ pensionable salaries until 2021. An actuarial valuation of the scheme as at 5 April 2015 is being undertaken and is due to be released in July 2016. The level of benefits and contributions under the scheme is kept under continual review in light of the needs of the business and changes to pension legislation.
The assets and liabilities of the schemes at 31 December are:
Contract specific
2015£m
Non contract specific
2015£m
Total 2015
£m
Scheme assets at fair value
Equities 2.8 39.1 41.9
Bonds except LDI 0.3 – 0.3
Liability driven investments (LDI) – 1,144.4 1,144.4
Gilts – 68.1 68.1
Property 0.6 – 0.6
Cash and other 0.9 30.7 31.6
Annuity policies – 22.0 22.0
Fair value of scheme assets 4.6 1,304.3 1,308.9
Present value of scheme liabilities (7.7) (1,188.7) (1,196.4)
Net amount recognised (3.1) 115.6 112.5
Franchise adjustment* 1.9 – 1.9
Members' share of deficit 1.2 – 1.2
– 115.6 115.6
Analysed as:
Net pension liability – (11.5) (11.5)
Net pension asset – 127.1 127.1
* The franchise adjustment represents the amount of scheme deficit that is expected to be funded outside the contract period.
Contract specific
2014 £m
Non contract specific
2014 £m
Total 2014
£m
Scheme assets at fair value
Equities 48.1 38.5 86.6
Bonds except LDI 44.3 15.6 59.9
Liability driven investments (LDI) 12.8 1,252.8 1,265.6
Gilts 22.2 – 22.2
Property 3.5 – 3.5
Cash and other 3.5 31.0 34.5
Annuity policies – 23.9 23.9
Fair value of scheme assets 134.4 1,361.8 1,496.2
Present value of scheme liabilities (161.3) (1,231.3) (1,392.6)
Net amount recognised (26.9) 130.5 103.6
Franchise adjustment* 22.9 – 22.9
(4.0) 130.5 126.5
Analysed as:
Net pension liability (4.0) (13.4) (17.4)
Net pension asset – 143.9 143.9
* The franchise adjustment represents the amount of scheme deficit that is expected to be funded outside the contract period.

Serco Group plc Annual Report and Accounts 2015220
Notes to the Consolidated Financial Statements continued
34. Retirement Benefit Schemes continued34 (a) Defined Benefit Schemes continued
Liabilities in relation to unfunded schemes included above amount to £0.3m (2014: £0.3m).
The Serco Pension and Life Assurance Scheme (SPLAS) has a Liability Driven Investment (LDI) strategy which aims to reduce volatility risk by better matching assets to liabilities. The main asset classes that make up the LDI investments are gilts and corporate bonds with inflation and interest swap overlays. The value of these investments vary in line with gilt yields, which has dropped from 3.83% p.a. to 2.55% p.a. during 2015 resulting in a decrease in these assets. In addition, LDI assets were transferred to a separate gilt portfolio in late December to back a longevity swap. The decrease in the value of LDI investments was less than the increase in scheme liabilities and the increase in gilt yields was less than the fall in yields of high quality corporate bonds resulting in a decrease in the surplus in the year.
As required by IAS19, the Group has considered the extent to which the pension plan assets should be classified in accordance with the fair value hierarchy of IFRS13. Virtually all equity and debt instruments have quoted prices in active markets. Annuity policies and property assets can be classified as Level 3 instruments.
In some schemes, employee contributions vary over time to meet a specified proportion of the overall costs, including a proportion of any deficit. The liabilities recognised in the balance sheet for these schemes are net of the proportion attributed to employees. In addition, the amounts charged to the income statement for these schemes are net of the proportion attributed to employees. The amounts attributed to employees are shown separately in the reconciliation of changes in the fair value of scheme assets and liabilities.
The amounts recognised in the financial statements for the year are analysed as follows:
Contract specific
2015£m
Non contract specific
2015£m
Total 2015
£m
Recognised in the income statement
Current service cost – employer 1.5 8.4 9.9
Past service cost – 0.4 0.4
Settlement gain recognised (3.3) – (3.3)
Administrative expenses and taxes – 4.6 4.6
Recognised in arriving at operating profit (1.8) 13.4 11.6
Interest income on scheme assets – employer (1.1) (48.6) (49.7)
Interest on franchise adjustment – – –
Interest cost on scheme liabilities – employer 1.2 43.6 44.8
Finance income 0.1 (5.0) (4.9)
Included within the SOCI
Actual return on scheme assets 1.3 (18.5) (17.2)
Less: interest income on scheme assets (1.1) (48.6) (49.7)
0.2 (67.1) (66.9)
Effect of changes in demographic assumptions – (0.2) (0.2)
Effect of changes in financial assumptions 1.5 42.7 44.2
Effect of experience adjustments 0.5 6.6 7.1
Remeasurements recognised in the SOCI 2.2 (18.0) (15.8)
Change in franchise adjustment (0.1) – (0.1)
Change in members’ share (0.3) – (0.3)
Actuarial losses on reimbursable rights (0.4) – (0.4)
Total pension (loss) / gain recognised in the SOCI 1.8 (18.0) (16.2)

Stra
teg
ic R
epo
rtD
irec
tors
’ Rep
ort
Financial Statements · 221Notes to the Consolidated Financial Statements
Fina
ncia
l Sta
tem
ents
Contract specific
2014 £m
Non contract specific
2014 £m
Total 2014
£m
Recognised in the income statement
Current service cost – employer 7.7 8.8 16.5
Past service cost – 2.5 2.5
Administrative expenses and taxes 2.1 3.5 5.6
Recognised in arriving at operating profit 9.8 14.8 24.6
Interest income on scheme assets – employer (10.6) (51.3) (61.9)
Interest on franchise adjustment (1.6) – (1.6)
Interest cost on scheme liabilities – employer 12.1 48.3 60.4
Finance income (0.1) (3.0) (3.1)
Included within the SOCI
Actual return on scheme assets 29.8 242.4 272.2
Less: interest income on scheme assets (10.6) (52.2) (62.8)
19.2 190.2 209.4
Effect of changes in demographic assumptions – 3.2 3.2
Effect of changes in financial assumptions (42.9) (116.8) (159.7)
Effect of experience adjustments 4.2 (4.3) (0.1)
Remeasurements recognised in the SOCI (19.5) 72.3 52.8
Change in franchise adjustment 17.4 – 17.4
Change in members’ share – (3.9) (3.9)
Actuarial losses on reimbursable rights 17.4 (3.9) 13.5
Total pension gain / (loss) recognised in the SOCI (2.1) 68.4 66.3

Serco Group plc Annual Report and Accounts 2015222
Notes to the Consolidated Financial Statements continued
34. Retirement Benefit Schemes continued34 (a) Defined Benefit Schemes continued
Changes in the fair value of scheme liabilities are analysed as follows:
Contract specific
£m
Non contract specific
£mTotal
£m
At 1 January 2014 267.8 1,091.2 1,359.0
Current service cost – employer 7.7 8.8 16.5
Current service cost – employee – 0.2 0.2
Past service costs – 2.5 2.5
Scheme participants’ contributions 0.8 0.4 1.2
Interest cost – employer 12.1 48.3 60.4
Interest cost – employee – 1.1 1.1
Benefits paid (4.1) (39.1) (43.2)
Effect of changes in demographic assumptions – (3.2) (3.2)
Effect of changes in financial assumptions 42.9 116.8 159.7
Effect of experience adjustments (4.2) 4.3 0.1
Eliminated on disposal of a pension scheme (161.7) – (161.7)
At 31 December 2014 161.3 1,231.3 1,392.6
At 1 January 2015 161.3 1,231.3 1,392.6
Current service cost – employer 1.5 8.4 9.9
Current service cost – employee 0.2 – 0.2
Past service costs – 0.4 0.4
Scheme participants’ contributions 0.3 0.6 0.9
Interest cost – employer 1.2 43.6 44.8
Interest cost – employee 0.1 – 0.1
Benefits paid (0.8) (46.5) (47.3)
Effect of changes in demographic assumptions – 0.2 0.2
Effect of changes in financial assumptions (1.5) (42.7) (44.2)
Effect of experience adjustments (0.5) (6.6) (7.1)
Arising on acquisition 7.8 – 7.8
Plan settlements (34.4) – (34.4)
Disposal of scheme (127.5) – (127.5)
At 31 December 2015 7.7 1,188.7 1,196.4

Stra
teg
ic R
epo
rtD
irec
tors
’ Rep
ort
Financial Statements · 223Notes to the Consolidated Financial Statements
Fina
ncia
l Sta
tem
ents
Changes in the fair value of scheme assets are analysed as follows:
Contract specific
£m
Non contract specific
£mTotal
£m
At 1 January 2014 227.2 1,145.9 1,373.1
Interest income on scheme assets – employer 10.6 51.3 61.9
Interest income on scheme assets – employee – 0.9 0.9
Administrative expenses and taxes (2.1) (3.5) (5.6)
Employer contributions 13.3 15.4 28.7
Contributions by employees 0.8 0.7 1.5
Benefits paid (4.1) (39.1) (43.2)
Return on scheme assets less interest income 19.2 190.2 209.4
Eliminated on disposal of a pension scheme (130.5) – (130.5)
At 31 December 2014 134.4 1,361.8 1,496.2
At 1 January 2015 134.4 1,361.8 1,496.2
Interest income on scheme assets – employer 1.0 48.6 49.6
Interest income on scheme assets – employee – – –
Administrative expenses and taxes – (4.5) (4.5)
Employer contributions 0.6 11.5 12.1
Contributions by employees 0.3 0.6 0.9
Benefits paid (0.8) (46.5) (47.3)
Return on scheme assets less interest income 0.3 (67.2) (66.9)
Arising on acquisitions 4.5 – 4.5
Plan settlements (31.0) – (31.0)
Eliminated on disposal of a pension scheme (104.7) – (104.7)
At 31 December 2015 4.6 1,304.3 1,308.9

Serco Group plc Annual Report and Accounts 2015224
Notes to the Consolidated Financial Statements continued
34. Retirement Benefit Schemes continued34 (a) Defined Benefit Schemes continued
Changes in the franchise adjustment is analysed as follows:
Total £m
At 1 January 2014 35.1
Interest on franchise adjustment 1.6
Taken to SOCI 17.4
Eliminated on disposal of scheme (31.2)
At 31 December 2014 22.9
At 1 January 2015 22.9
Interest on franchise adjustment –
Taken to SOCI (0.1)
Arising on acquisition of scheme 2.0
Eliminated on disposal of scheme (22.9)
At 31 December 2015 1.9
On 1 April 2015 Serco Caledonian Sleepers Limited became part of the Serco Group. As a result of franchising obligations under the Caledonian Sleepers contract, the Group now sponsors a section of an industry wide defined benefit scheme, the Railways Pension Scheme (RPS). This has resulted in the addition of fair value of scheme assets of £4.5m, present value of scheme liabilities of £7.8m, a change in members’ share of £1.3m and a franchise adjustment of £2.0m.
The RPS section is required to be funded over the period for which the franchise is held with a defined benefit liability recognised on the balance sheet to the extent of that obligation in accordance with IAS 19. The RPS is a shared cost arrangement. All costs, and any deficit or surplus is shared 60% by the employer and 40% by the members. Furthermore, under the franchising obligations, the responsibility of the employer is to pay the contributions requested of the trustee whilst it operates the franchise. There is no residual liability or asset for any deficit, or surplus, which remains at the end of the franchise period. Under this scheme members build a 1/60th pension and 1/40th lump sum based upon their pensionable pay. Some members of the RPS are subject to Protected Persons legislation, which requires individual consent to changes to benefits, and certain rights upon transfer between sections of the scheme.
The NPL contract and its associated defined benefit pension scheme ceased to be part of the Serco Group on 1 January 2015. As at 31 December 2014, the group consolidated balance sheet included the scheme’s fair value of scheme assets of £104.6m, present value of scheme liabilities of £127.5m and franchise adjustment of £22.9m.
The normal contributions expected to be paid during the financial year ending 31 December 2016 are £11.9m (financial year ended 31 December 2015: £13.5m).
The average duration of the benefit obligation at the end of the reporting period is 16.7 years (2014: 18.3 years).

Stra
teg
ic R
epo
rtD
irec
tors
’ Rep
ort
Financial Statements · 225Notes to the Consolidated Financial Statements
Fina
ncia
l Sta
tem
ents
Assumptions in respect of the expected return on scheme assets are required when calculating the franchise adjustment for the contract-specific plans. These assumptions are based on market expectations of returns over the life of the related obligation. Due consideration has been given to current market conditions as at 31 December 2015 in respect to inflation, interest, bond yields and equity performance when selecting the expected return on assets assumptions.
The expected yield on bond investments with fixed interest rates is derived from their market value. The yield on equity investments contains an additional premium (an ‘equity risk premium’) to compensate investors for the additional anticipated risks of holding this type of investment, when compared to bond yields. Management have concluded that an appropriate equity risk premium is 4.6% (2014: 4.6%).
The overall expected return on assets is calculated as the weighted average of the expected returns for the principal asset categories held by the scheme.
2015 %
2014 %
Main assumptions:
Rate of salary increases 2.80 2.70
Rate of increase in pensions in payment 2.00 (CPI) and 3.00 (RPI) 2.00 (CPI) and 3.00 (RPI)
Rate of increase in deferred pensions 2.10 (CPI) and 3.10 (RPI) 2.10 (CPI) and 3.10 (RPI)
Inflation assumption 2.10 (CPI) and 3.10 (RPI) 2.10 (CPI) and 3.10 (RPI)
Discount rate 3.80 3.60
2015 Years
2014 Years
Post-retirement mortality:
Current pensioners at 65 – male 22.6 22.5
Current pensioners at 65 – female 25.1 25.0
Future pensioners at 65 – male 24.4 24.3
Future pensioners at 65 – female 27.1 27.0
Management considers the significant actuarial assumptions with regards to the determination of the defined benefit obligation to be the discount rate, inflation, the rate of salary increases and mortality.
Sensitivity analysis is provided below, based on reasonably possible changes of the assumptions occurring at the end of the reporting period, assuming all other assumptions are held constant.
The sensitivities have been derived in the same manner as the defined benefit obligation as at 31 December 2015 where the defined benefit obligation is estimated using the Projected Unit Credit method. Under this method each participant’s benefits are attributed to years of service, taking into consideration future salary increases and the scheme’s benefit allocation formula. Thus, the estimated total pension to which each participant is expected to become entitled at retirement is broken down into units, each associated with a year of past or future credited service.

Serco Group plc Annual Report and Accounts 2015226
Notes to the Consolidated Financial Statements continued
34. Retirement Benefit Schemes continued34 (a) Defined Benefit Schemes continued
The defined benefit obligation as at 31 December 2015 is calculated on the actuarial assumptions agreed as at that date. The sensitivities are calculated by changing each assumption in turn following the methodology above with all other things held constant. The change in the defined benefit obligation from updating the single assumption represents the impact of that assumption on the calculation of the defined benefit obligation.
AssumptionAssumption
2015Change in
assumption
Change in present value
of scheme liabilities
2015
Change in present value
of scheme liabilities
2014
Discount rate 3.8% +0.5% (9%) (9%)
(0.5%) +10% +10%
Inflation 2.1% (CPI) +0.5% +9% +9%
3.1% (RPI) (0.5%) (8%) (8%)
Rate of salary increase 2.6% +0.5% +1% +1%
(0.5%) (1%) (1%)
Mortality 22.6 – 27.1* Increase by one year +2% +2%
* Post retirement mortality range for male and female, current and future pensioners.
Management acknowledges that the method used of presuming that all other assumptions remaining constant has inherent limitation given that it is more likely for a combination of changes, but highlights the value of each individual risk and is therefore a suitable basis for providing this analysis.
34 (b) Defined Contribution Schemes
The Group paid employer contributions of £75.7m (2014: £84.2m) into UK and other defined contribution schemes and foreign state pension schemes.
Pre-funded defined benefit schemes treated as defined contribution
Serco accounts for certain pre-funded defined benefit schemes relating to contracts as defined contribution schemes because the contributions are fixed until the end of the current concession and at rebid any surplus or deficit would transfer to the next contractor. Cash contributions are recognised as pension costs and no asset or liability is shown on the balance sheet.

Stra
teg
ic R
epo
rtD
irec
tors
’ Rep
ort
Financial Statements · 227Notes to the Consolidated Financial Statements
Fina
ncia
l Sta
tem
ents
35. Share Capital
2015 £m
Number 2015
Millions2014 £m
Number 2014
Millions
Issued and fully paid:
549,265,547 (2014: 499,328,896) ordinary shares of 2p each at 1 January 11.0 549.3 10.0 499.3
Issued on the exercise of share options and the Rights Issue 11.0 549.3 1.0 50.0
1,098,559,781 (2014: 549,265,547) ordinary shares of 2p each at 31 December 22.0 1,098.6 11.0 549.3
The Company has one class of ordinary shares which carry no right to fixed income.
In April 2015 the Group successfully completed an equity Rights Issue, raising approximately £555m of gross proceeds (£530m net after expenses of £25m), with trading in new shares commencing on 17 April 2015 and 549,265,547 new shares being issued.
36. Share Premium Account2015
£m2014 £m
At 1 January 327.9 327.8
Premium on shares issued – 0.1
At 31 December 327.9 327.9
37. Reserves37 (a) Retirement Benefit Obligations Reserve
The retirement benefit obligations reserve represents the actuarial gains and losses recognised in respect of annual actuarial valuations for defined benefit retirement schemes, the fair value adjustments on reimbursable rights and the related movements in deferred tax balances.
37 (b) Share based Payment Reserve
The share based payment reserve represents credits relating to equity-settled share based payment transactions and any gain or loss on the exercise of share options satisfied by own shares.
37 (c) Own Shares Reserve
The own shares reserve represents the cost of shares in Serco Group plc purchased in the market and held by the Serco Group plc Employee Share Ownership Trust (ESOT) to satisfy options under the Group’s share options schemes. At 31 December 2015, the ESOT held 10,540,181 (2014: 10,659,290) shares equal to 1.0% of the current allotted share capital (2014: 1.9%). The market value of shares held by the ESOT as at 31 December 2015 was £10.1m (2014: £17.1m).
37 (d) Hedging and Translation Reserve
The hedging and translation reserve represents foreign exchange differences arising on translation of the Group’s overseas operations and movements relating to cash flow hedges.
Hedging reserve
£m
Translation reserve
£mTotal
£m
At 1 January 2014 (2.3) (38.7) (41.0)
Total comprehensive (expense) / income for the year (2.7) 24.8 22.1
At 1 January 2015 (5.0) (13.9) (18.9)
Total comprehensive income / (expense) for the year 2.2 (41.0) (38.8)
At 31 December 2015 (2.8) (54.9) (57.7)

Serco Group plc Annual Report and Accounts 2015228
Notes to the Consolidated Financial Statements continued
38. Share Based Payment ExpenseThe Group recognised the following expenses related to equity-settled share based payment transactions:
2015 £m
2014 £m
Long-term Incentive Scheme and Plan – 0.1
Performance Share Plan 9.9 5.5
Deferred Bonus Plan 0.3 –
Sharesave 2012 (0.4) (0.2)
9.8 5.4
Executive Option Plan (EOP)
Options granted under the EOP may be exercised after the third anniversary of grant, dependent upon the achievement of a financial performance target over three years. The options are granted at market value and awards made to eligible employees are based on between 50% and 100% of salary as at 31 December prior to grant. If the options remain unexercised after a period of ten years from the date of grant, the options expire. Furthermore, options may be forfeited if the eligible employee leaves the Group before the options vest. Details of the movement in all EOP options are as follows:
Number of options
2015 Thousands
Weighted average
exercise price 2015
£
Number of options
2014 Thousands
Weighted average
exercise price 2014
£
Outstanding at 1 January 336 4.16 1,469 3.24
Rights Issue adjustment 79 4.16 – –
Exercised during the year – – (536) 2.81
Lapsed during the year (228) 4.48 (597) 3.11
Outstanding at 31 December 187 3.77 336 4.16
Of these options 187,308 (2014: 335,886) were exercisable at the end of the year, with a weighted average exercise price of £3.77 (2014: £4.16).
The options outstanding at 31 December 2015 had a weighted average contractual life of 1.6 years (2014: 2.7 years).
The exercise prices for options outstanding at 31 December 2015 ranged from £3.39 to £4.55 (2014: £3.39 to £4.55).
The weighted average share price at the date of exercise approximates to the weighted average share price during the year, which was £3.30 (2014: £3.45).
The fair value of options granted under the EOP is measured by use of the Binomial Lattice model. The Binomial Lattice model is considered to be most appropriate for valuing options granted under this scheme as it allows exercise over a longer period of time between the vesting date and the expiry date.
There were no new options granted under Executive Option Plan during the year.

Stra
teg
ic R
epo
rtD
irec
tors
’ Rep
ort
Financial Statements · 229Notes to the Consolidated Financial Statements
Fina
ncia
l Sta
tem
ents
Long-Term Incentive Scheme (LTIS) and Long-Term Incentive Plan (LTIP)
Awards made to eligible employees under the above schemes are structured as options with a zero exercise price. The extent to which an award vests (and therefore becomes exercisable) is measured by reference to the growth in the Group’s earnings per share (EPS) or total shareholder return (TSR) over the performance period or service period conditions.
If the options remain unexercised after a period of ten years from the date of grant, the options expire. Furthermore, options may be forfeited if the eligible employee leaves the Group before the options vest. Details of the movement in all LTIS and LTIP options are as follows:
Number of options
2015 Thousands
Weighted average
exercise price 2015
£
Number of options
2014 Thousands
Weighted average
exercise price 2014
£
Outstanding at 1 January 276 Nil 488 Nil
Rights Issue adjustment 64 Nil – –
Exercised during the year (70) Nil (212) Nil
Lapsed during the year (30) Nil – Nil
Outstanding at 31 December 240 Nil 276 Nil
Of these options, 240,058 (2014: 275,831) were exercisable at the end of the year. The options outstanding at 31 December 2015 had a weighted average contractual life of 1.3 years (2014: 2.3 years).
There were no new options granted under either LTIS or LTIP during the year.
Performance Share Plan (PSP)
Under the PSP, eligible employees have been granted options with an exercise price of two pence. Awards vest after the performance period of three to five years and are subject to the achievement of four performance measures with the exception of new non-performance awards granted in 2014. These non-performance options are only subject to continued employment on vesting dates which vary from six months to three years after the grant dates.
On the performance related awards, the primary performance measure is TSR and the second performance measure is based on EPS growth. Two additional measures on new grants in 2014 were Absolute Share Price and Strategic Objectives.
If the options remain unexercised after a period of ten years from the date of grant, the options expire.
Number of options
2015 Thousands
Weighted average
exercise price 2015
£
Number of options
2014 Thousands
Weighted average
exercise price 2014
£
Outstanding at 1 January 10,743 0.02 10,471 0.02
Granted during the year 15,053 0.02 5,077 0.02
Rights Issue adjustment 2,565 0.02 – –
Exercised during the year (654) 0.02 (128) 0.02
Lapsed during the year (3,936) 0.02 (4,677) 0.02
Outstanding at 31 December 23,771 0.02 10,743 0.02
Of these options 23,771,076 (2014: 10,743,178) were exercisable at the end of the year. The options outstanding at 31 December 2015 had a weighted average contractual life of 2.0 years (2014: 8.6 years).

Serco Group plc Annual Report and Accounts 2015230
Notes to the Consolidated Financial Statements continued
38. Share Based Payment Expense continuedPerformance Share Plan (PSP) continued
In the year, six grants were made, of which one grant was a non-performance buy out award to an executive. The remaining five performance based awards are with Absolute Share Price and TSR and EPS performance conditions each attached to 33.3% of options.
The options subject to Absolute Share Price and TSR performance conditions were valued using the Monte Carlo Simulation model. The options subject to EPS growth and Strategic Objectives performance conditions were deemed to have fair values equal to their face value less the present value of any dividend payments not received over the vesting period.
The Monte Carlo Simulation model is considered to be the most appropriate for valuing options granted under schemes where there are changes in performance conditions by which the options are measured, such as for the Absolute Share Price or TSR based awards.
The inputs into the Monte Carlo Simulation model for options granted during the year with TSR performance conditions are:
2015
Weighted average share price 138p
Weighted average exercise price 2p
Expected volatility 41.6%
Annual dividend yield N/a
Expected life 3 years
Risk free rate 0.7%
Expected volatility was determined by calculating the historical volatility of the Group’s share price over the previous three years. The expected life used in the model has been adjusted, based on management’s best estimate, for the effects of non-transferability, exercise restrictions, and behavioural considerations.
The assumptions for options granted during the year with EPS and ROIC performance conditions are:
2015
Weighted average share price 138p
Weighted average exercise price 2p
Expected volatility N/a
Annual Dividend Yield N/a
Expected life 3 years
Risk free rate N/a
The weighted average fair value of options granted under this scheme in the year is £1.20 (2014: £2.23).

Stra
teg
ic R
epo
rtD
irec
tors
’ Rep
ort
Financial Statements · 231Notes to the Consolidated Financial Statements
Fina
ncia
l Sta
tem
ents
Deferred Bonus Plan (DBP)
Under the DBP, eligible employees are entitled to use up to 50% of their earned annual bonus to purchase shares in the Group at market price. Provided they remain in employment for this period, the shares are retained for that period and the performance measures have been met, the Group will make a matching share award, up to a maximum of two times the gross bonus deferred.
Number of options
2015 Thousands
Weighted average
exercise price 2015
£
Number of options
2014 Thousands
Weighted average
exercise price 2014
£
Outstanding at 1 January 351 Nil 825 Nil
Granted during the year 759 Nil – Nil
Rights issue adjustment 83 Nil – –
Lapsed during the year (287) Nil (474) Nil
Outstanding at 31 December 906 Nil 351 Nil
None of these options were exercisable at the end of the year (2014: none). The options outstanding at 31 December 2015 had a weighted average contractual life of 2.08 years (2014: 0.72 years).
There were 759,094 new options granted under the Deferred Bonus Plan in the year, with 100% of the deferred bonus subject to the same EPS performance conditions as the PSP.
The portion subject to EPS performance conditions was deemed to have a fair value equal to their face value less the present value of any dividend payments not received over the vesting period.
Expected volatility was determined by calculating the historical volatility of the Group’s share price over the previous three years. The expected life used in the model has been adjusted, based on management’s best estimate, for the effects of non-transferability, exercise restrictions and behavioural considerations.
The assumptions for options granted during the year with EPS performance conditions are:
2015
Weighted average share price 1.38
Weighted average exercise price Nil
Expected volatility N/a
Expected life 3 years
Risk free rate N/a
The weighted average fair value of options granted under this scheme in the year is £1.36.

Serco Group plc Annual Report and Accounts 2015232
Notes to the Consolidated Financial Statements continued
38. Share Based Payment Expense continuedSharesave 2012
The Sharesave 2012 scheme provides for a purchase price equal to the daily average market price on the date of grant less 10%. The options can be exercised for a period of six months following their vesting. Details of the movement in Sharesave 2012 options are as follows:
Number of options
2015 Thousands
Weighted average
exercise price 2015
£
Number of options
2014 Thousands
Weighted average
exercise price 2014
£
Outstanding at 1 January 2,875 5.14 5,132 5.14
Exercised during the year – 5.14 (1) 5.14
Rights issue adjustment 504 5.14 – –
Lapsed during the year (1,328) 5.14 (2,256) 5.14
Outstanding at 31 December 2,051 5.14 2,875 5.14
Of these options, none (2014: none) were exercisable at the end of the year. The options outstanding at 31 December 2015 had a weighted average contractual life of 0.4 years (2014: 1.4 years). Given that options granted under the Sharesave plan can be exercised at any time after vesting, management consider the Binomial Lattice model to be appropriate to value the options granted under this scheme. The Binomial Lattice model allows exercise over a window in time, from vesting date to expiry date and assumes option holders make economically rational exercise decisions.
There were no new options granted under Sharesave Plan in the year.
39. Related Party TransactionsTransactions between the Company and its wholly owned subsidiaries, which are related parties, have been eliminated on consolidation and are not disclosed in this note. Transactions between the Group and its joint venture undertakings are disclosed below.
Trading transactions
During the year, Group companies entered into the following material transactions with joint ventures:
2015 £m
2014 £m
Royalties and management fees receivable – 1.7
Dividends receivable 32.5 34.8
32.5 36.5

Stra
teg
ic R
epo
rtD
irec
tors
’ Rep
ort
Financial Statements · 233Notes to the Consolidated Financial Statements
Fina
ncia
l Sta
tem
ents
The following receivable balances were held relating to joint ventures:
2015 £m
2014 £m
Current:
Loans and other receivables 1.4 0.1
2015 £m
2014 £m
Non-current:
Loans and other receivables 7.2 9.0
Joint venture receivable and loan amounts outstanding have arisen from transactions undertaken during the general course of trading, are unsecured, and will be settled in cash. Interest arising on loans is based on LIBOR, or its equivalent, with an appropriate margin. No guarantee has been given or received. No provisions are required for doubtful debts in respect of the amounts owed by the joint ventures.
Remuneration of key management personnel
The Directors of Serco Group plc had no material transactions with the Group during the year other than service contracts and Directors’ liability insurance.
The remuneration of the key management personnel of the Group is set out below in aggregate for each of the categories specified in IAS 24 Related Party Disclosures:
2015 £m
2014 £m
Short-term employee benefits 8.4 8.4
Post-employment benefits – 0.1
Share based payment expense 1.1 0.9
9.5 9.4
The key management personnel comprise the Executive Directors, Non-Executive Directors and members of the Executive Committee (2015: 19 individuals, 2014: 19 individuals).

Serco Group plc Annual Report and Accounts 2015234
Notes to the Consolidated Financial Statements continued
40. Notes to the Consolidated Cash Flow StatementReconciliation of Operating Profit to Net Cash Inflow from Operating Activities
Year ended 31 December
2015 Before
Exceptional Items
£m
2015 Exceptional
Items £m
2015 Total
£m
2014 Before
Exceptional Items
£m
2014 Exceptional
Items £m
2014 Total
£m
Operating profit / (loss) for the year – continuing operations 106.2 (109.9) (3.7) (626.8) (325.7) (952.5)
Operating profit / (loss) for the year – discontinued operations 26.5 (77.6) (51.1) (29.0) (335.8) (364.8)
Operating profit / (loss) for the year 132.7 (187.5) (54.8) (655.8) (661.5) (1,317.3)
Adjustments for:
Share of profits in joint ventures (37.0) – (37.0) (30.0) – (30.0)
Share based payment expense 9.8 – 9.8 5.4 – 5.4
Exceptional impairment of goodwill – 153.4 153.4 – 466.0 466.0
Exceptional impairment of property, plant and equipment – 0.8 0.8 – 18.6 18.6
Exceptional impairment of intangible assets – (0.3) (0.3) – 6.0 6.0
Impairment and write down of intangible assets – other 11.5 – 11.5 38.6 – 38.6
Impairment of property, plant and equipment – other 2.1 – 2.1 22.1 – 22.1
Depreciation of property, plant and equipment 28.9 – 28.9 41.8 – 41.8
Amortisation of intangible assets 29.0 – 29.0 38.7 – 38.7
Exceptional profit on disposal of subsidiaries and operations – (2.8) (2.8) – 0.8 0.8
Exceptional impairment of loan receivable – – – – 4.6 4.6
Loss on disposal of property, plant and equipment 0.1 – 0.1 – – –
Loss on disposal of intangible assets 1.5 – 1.5 0.2 – 0.2
Non cash R&D expenditure offset against intangible assets 0.8 – 0.8 – – –
Increase / (decrease) in provisions (116.0) (9.5) (125.5) 472.6 85.5 558.1
Increase in deferred consideration in relation to prior year acquisition – – – 4.0 – 4.0
Other non cash movements 19.1 – 19.1 – – –
Impairment of working capital items (non cash) – – – 148.8 – 148.8
Total non cash items (13.2) 141.6 128.4 772.2 581.5 1,353.7
Operating cash inflow / (outflow) before movements in working capital 82.5 (45.9) 36.6 86.4 (80.0) 6.4
Decrease / (increase) in inventories 5.6 – 5.6 (1.4) – (1.4)
Decrease in receivables 20.6 – 20.6 8.7 18.8 27.5
(Decrease) / increase in payables (48.8) (10.7) (59.5) 9.7 20.8 30.5
Movements in working capital (22.6) (10.7) (33.3) 17.0 39.6 56.6
Cash generated by operations 59.9 (56.6) 3.3 103.4 (40.4) 63.0
Tax (paid) / repaid (2.7) – (2.7) 0.6 – 0.6
Non cash R&D expenditure (0.7) – (0.7) (0.5) – (0.5)
Net cash (outflow) / inflow from operating activities 56.5 (56.6) (0.1) 103.5 (40.4) 63.1
Additions to fixtures and equipment during the year amounting to £5.2m (2014: £12.5m) were financed by new finance leases.
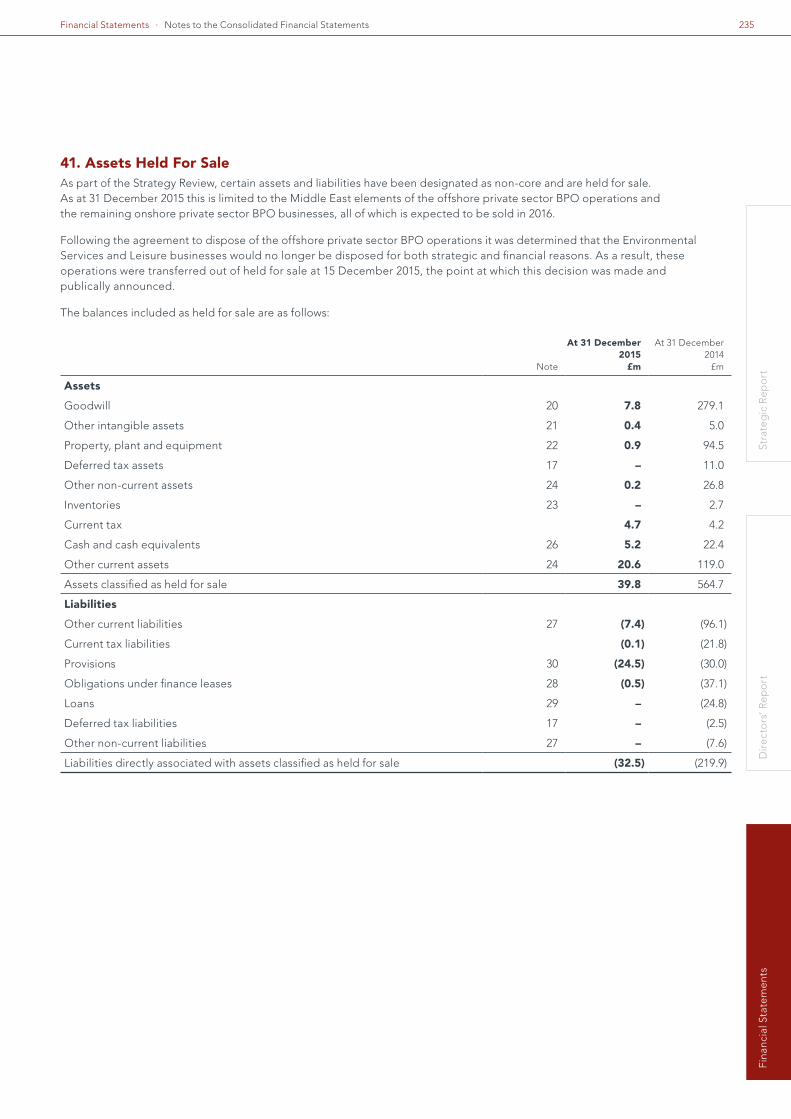
Stra
teg
ic R
epo
rtD
irec
tors
’ Rep
ort
Financial Statements · 235Notes to the Consolidated Financial Statements
Fina
ncia
l Sta
tem
ents
41. Assets Held For SaleAs part of the Strategy Review, certain assets and liabilities have been designated as non-core and are held for sale. As at 31 December 2015 this is limited to the Middle East elements of the offshore private sector BPO operations and the remaining onshore private sector BPO businesses, all of which is expected to be sold in 2016.
Following the agreement to dispose of the offshore private sector BPO operations it was determined that the Environmental Services and Leisure businesses would no longer be disposed for both strategic and financial reasons. As a result, these operations were transferred out of held for sale at 15 December 2015, the point at which this decision was made and publically announced.
The balances included as held for sale are as follows:
Note
At 31 December 2015
£m
At 31 December 2014
£m
Assets
Goodwill 20 7.8 279.1
Other intangible assets 21 0.4 5.0
Property, plant and equipment 22 0.9 94.5
Deferred tax assets 17 – 11.0
Other non-current assets 24 0.2 26.8
Inventories 23 – 2.7
Current tax 4.7 4.2
Cash and cash equivalents 26 5.2 22.4
Other current assets 24 20.6 119.0
Assets classified as held for sale 39.8 564.7
Liabilities
Other current liabilities 27 (7.4) (96.1)
Current tax liabilities (0.1) (21.8)
Provisions 30 (24.5) (30.0)
Obligations under finance leases 28 (0.5) (37.1)
Loans 29 – (24.8)
Deferred tax liabilities 17 – (2.5)
Other non-current liabilities 27 – (7.6)
Liabilities directly associated with assets classified as held for sale (32.5) (219.9)

Serco Group plc Annual Report and Accounts 2015236
Company Balance Sheet
At 31 December Note2015
£m2014
£m
Fixed assets
Investments in subsidiaries 43 1,994.9 1,963.8
Current assets
Debtors: amounts due within one year 44 3.1 10.1
Debtors: amounts due after more than one year 44 793.5 734.3
Derivative financial instruments due within one year 48 9.0 5.1
Derivative financial instruments due after more than one year 48 7.8 7.0
Cash at bank and in hand 147.6 –
961.0 756.5
Total assets 2,955.9 2,720.3
Creditors: amounts falling due within one year
Trade and other payables 45 (248.4) (236.6)
Borrowings 46 (132.2) (150.0)
Provisions 47 (3.2) –
Corporation tax liability (0.1) –
Derivative financial instruments 48 (0.9) (1.8)
(384.8) (388.4)
Net current assets 576.2 368.1
Creditors: amounts falling due after more than one year
Borrowings 46 (239.5) (742.8)
Amounts owed to subsidiary companies (1,265.7) (874.7)
Deferred tax liability 49 – –
Provisions 47 (27.9) –
(1,533.1) (1,617.5)
Total liabilities (1,917.9) (2,005.9)
Net assets 1,038.0 714.4
Capital and reserves
Called up share capital 50 22.0 11.0
Share premium account 51 327.9 327.9
Capital redemption reserve 0.1 0.1
Profit and loss account 52 673.6 364.8
Share based payment reserve 53 66.3 56.9
Own shares reserve (59.8) (64.5)
Hedging and translation reserve 55 7.9 18.2
Total shareholders' funds 1,038.0 714.4
The financial statements (registered number 02048608) were approved by the Board of Directors on 25 February 2016 and signed on its behalf by:
Rupert Soames Angus Cockburn Group Chief Executive Officer Group Chief Financial Officer

Stra
teg
ic R
epo
rtD
irec
tors
’ Rep
ort
Financial Statements · 237Notes to the Company Financial Statements
Fina
ncia
l Sta
tem
ents
Notes to the Company Financial Statements
42. Accounting PoliciesThe principal accounting policies adopted are set out below and have been applied consistently throughout the current and preceding year.
Basis of Accounting
The Company meets the definition of a qualifying entity under FRS 100 (Financial Reporting Standard 100) issued by the Financial Reporting Council. The financial statements have therefore been prepared in accordance with FRS 101 (Financial Reporting Standard 101) ‘Reduced Disclosure Framework’ as issued by the Financial Reporting Council.
As permitted by FRS 101, the Company has taken advantage of the disclosure exemptions available under that standard in relation to share based payments, financial instruments, capital management, presentation of comparative information in respect of certain assets, presentation of a cash-flow statement, standards not yet effective, impairment of assets and related party transactions.
The financial statements have been prepared on the historical cost basis and on the going concern basis, except for the revaluation of certain financial instruments. Historical cost is generally based on the fair value of the consideration given in exchange for the goods and services. The principal accounting policies adopted are the same as those set out in note 2 to the consolidated financial statements, except as noted below.
Fixed Asset Investments
Investments held as fixed assets are stated at cost less provision for any impairment in value.
43. Investments Held as Fixed Assets£m
Shares in subsidiary companies at cost:
At 1 January 2014 815.5
Options over parent’s shares awarded to employees of subsidiaries 4.6
Additions:
Serco Holdings Limited 1,143.7
Garden Funding Limited 156.6
Capital repayment – Garden Funding Limited (156.6)
At 1 January 2015 1,963.8
Options over parent’s shares awarded to employees of subsidiaries 8.7
Impairment (127.6)
Additions:
Serco Holdings Limited 150.0
At 31 December 2015 1,994.9
The Company directly owns 100% of the ordinary share capital of the following subsidiaries.
Name % ownership
Serco Holdings Limited 100%
Garden Funding Limited 100%
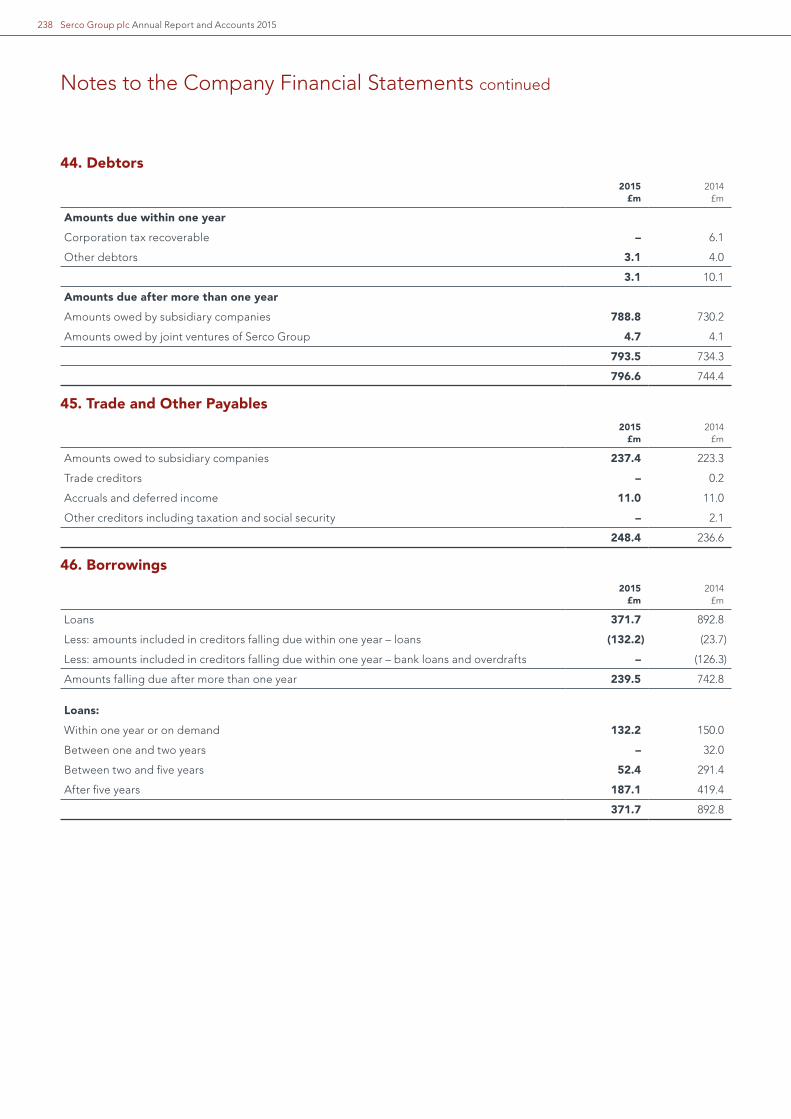
Serco Group plc Annual Report and Accounts 2015238
Notes to the Company Financial Statements continued
44. Debtors2015
£m2014
£m
Amounts due within one year
Corporation tax recoverable – 6.1
Other debtors 3.1 4.0
3.1 10.1
Amounts due after more than one year
Amounts owed by subsidiary companies 788.8 730.2
Amounts owed by joint ventures of Serco Group 4.7 4.1
793.5 734.3
796.6 744.4
45. Trade and Other Payables2015
£m2014 £m
Amounts owed to subsidiary companies 237.4 223.3
Trade creditors – 0.2
Accruals and deferred income 11.0 11.0
Other creditors including taxation and social security – 2.1
248.4 236.6
46. Borrowings2015
£m2014
£m
Loans 371.7 892.8
Less: amounts included in creditors falling due within one year – loans (132.2) (23.7)
Less: amounts included in creditors falling due within one year – bank loans and overdrafts – (126.3)
Amounts falling due after more than one year 239.5 742.8
Loans:
Within one year or on demand 132.2 150.0
Between one and two years – 32.0
Between two and five years 52.4 291.4
After five years 187.1 419.4
371.7 892.8

Stra
teg
ic R
epo
rtD
irec
tors
’ Rep
ort
Financial Statements · 239Notes to the Company Financial Statements
Fina
ncia
l Sta
tem
ents
47. ProvisionsEmployee
related£m
Other £m
Total £m
At 1 January 2015 – – –
Charged to income statement – exceptional 0.1 – 0.1
Charged to income statement – other 0.3 30.7 31.0
At 31 December 2015 0.4 30.7 31.1
Analysed as:
Current 0.4 2.8 3.2
Non-current – 27.9 27.9
Total provisions held by the Company at 31 December 2015 amount to £31.1m (2014: £nil).
Employee related provisions relate to restructuring. Other provisions are held for indemnities given on disposed businesses, legal and other costs that the Group expects to incur over an extended period. These costs are based on past experience of similar items and other known factors and represent management’s best estimate of the likely outcome.
48. Derivative Financial InstrumentsAssets
2015£m
Liabilities2015
£m
Assets2014
£m
Liabilities2014
£m
Currency swaps 10.4 – 7.1 (0.3)
Forward foreign exchange contracts 6.4 (0.9) 5.0 (1.5)
16.8 (0.9) 12.1 (1.8)
Analysed as:
Non-current 7.8 – 5.1 –
Current 9.0 (0.9) 7.0 (1.8)
16.8 (0.9) 12.1 (1.8)
The Company holds derivative financial instruments in accordance with the Group’s policy in relation to its financial risk management. Details of the disclosures are set out in note 33 of the Group’s consolidated financial statements
49. Deferred Tax Asset2015
£m2014
£m
Capital allowances in excess of depreciation – –
Short-term timing differences – –
– –
The movement in the deferred tax asset during the year was as follows:
2015 £m
2014 £m
At 1 January – 2.9
Charged to profit and loss account – (2.8)
Items taken directly to equity – (0.1)
At 31 December – –
The deferred tax not provided is as follows:
2015 £m
2014 £m
Capital allowances in excess of depreciation 0.3 0.2
Short-term timing differences 2.8 1.4
Losses 30.1 14.4
At 31 December 33.2 16.0

Serco Group plc Annual Report and Accounts 2015240
Notes to the Company Financial Statements continued
50. Called up Share Capital
2015 £m
Number 2015
Millions2014 £m
Number 2014
Millions
Issued and fully paid:
549,265,547 (2014: 499,328,896) ordinary shares of 2p each at 1 January 11.0 549.3 10.0 499.3
Issued on the exercise of share options and the share placement 11.0 549.3 1.0 50.0
1,098,559,781 (2014: 549,265,547) ordinary shares of 2p each at 31 December 22.0 1,098.6 11.0 549.3
The Company has one class of ordinary shares which carry no right to fixed income.
In April 2015 the Group successfully completed an equity Rights Issue, raising approximately £555m of gross proceeds (£530m net after expenses of £25m), with trading in new shares commencing on 17 April 2015 and 549,265,547 new shares being issued.
51. Share Premium Account2015
£m2014 £m
At 1 January 327.9 327.8
Premium on shares issued – 0.1
At 31 December 327.9 327.9
52. Profit and Loss Account2015
£m2014
£m
At 1 January 364.8 363.7
Reclassification to hedging and translation reserve – (21.4)
Loss for the year (210.5) (79.7)
Issue of shares from Rights Issue 519.3 155.3
Equity dividends – (53.1)
At 31 December 673.6 364.8
As permitted by Section 408 of the Companies Act 2006, the profit and loss account of the Company is not presented as part of these accounts.
53. Share based Payment Reserve2015
£m2014
£m
At 1 January 56.9 55.3
Options over parent’s shares awarded to employees of subsidiaries 8.7 4.6
Share based payment charge 1.1 0.8
Share options to holders on exercise (0.4) (3.8)
At 31 December 66.3 56.9
Details of the share based payment disclosures are set out in note 38 of the Group’s consolidated financial statements.
54. Own SharesThe own shares reserve represents the cost of shares in Serco Group plc purchased in the market and held by the Serco Group plc Employee Share Ownership Trust (ESOT) to satisfy options under the Group’s share options schemes. At 31 December 2015, the ESOT held 10,540,181 (2014: 10,659,290) shares equal to 1.0% of the current allotted share capital (2014: 1.9%). The market value of shares held by the ESOT as at 31 December 2015 was £10.1m (2014: £17.1m).
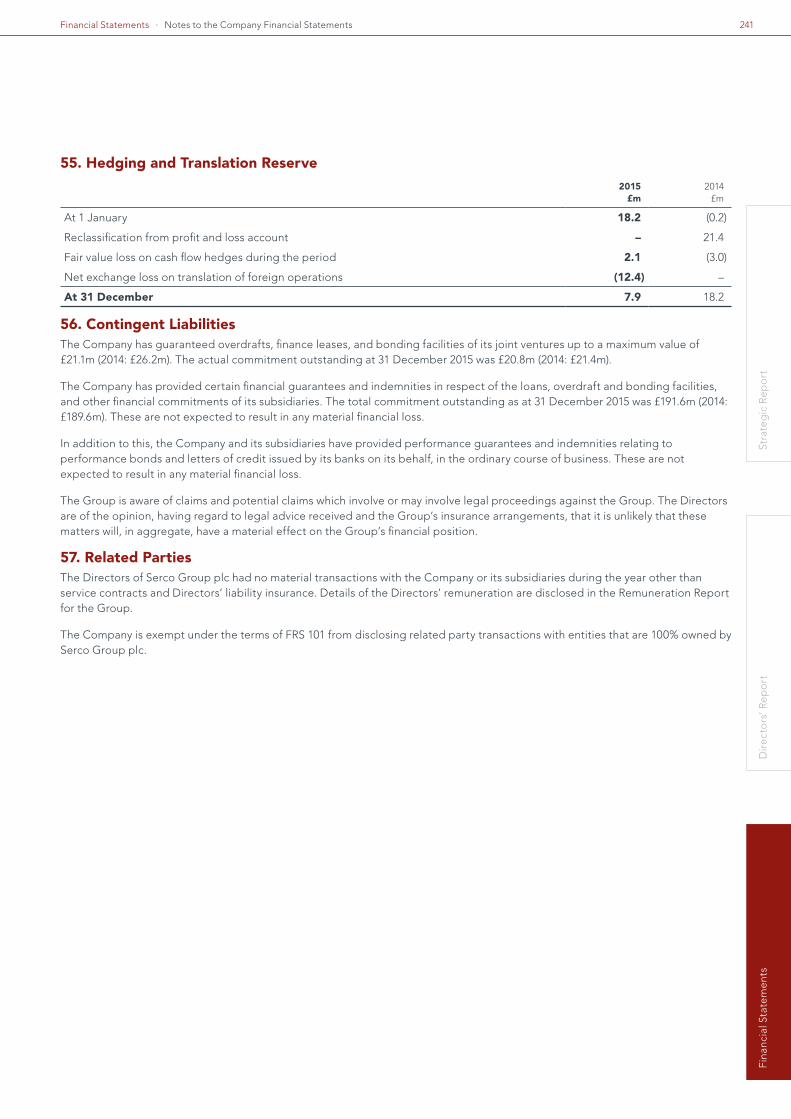
Stra
teg
ic R
epo
rtD
irec
tors
’ Rep
ort
Financial Statements · 241Notes to the Company Financial Statements
Fina
ncia
l Sta
tem
ents
55. Hedging and Translation Reserve2015
£m2014 £m
At 1 January 18.2 (0.2)
Reclassification from profit and loss account – 21.4
Fair value loss on cash flow hedges during the period 2.1 (3.0)
Net exchange loss on translation of foreign operations (12.4) –
At 31 December 7.9 18.2
56. Contingent LiabilitiesThe Company has guaranteed overdrafts, finance leases, and bonding facilities of its joint ventures up to a maximum value of £21.1m (2014: £26.2m). The actual commitment outstanding at 31 December 2015 was £20.8m (2014: £21.4m).
The Company has provided certain financial guarantees and indemnities in respect of the loans, overdraft and bonding facilities, and other financial commitments of its subsidiaries. The total commitment outstanding as at 31 December 2015 was £191.6m (2014: £189.6m). These are not expected to result in any material financial loss.
In addition to this, the Company and its subsidiaries have provided performance guarantees and indemnities relating to performance bonds and letters of credit issued by its banks on its behalf, in the ordinary course of business. These are not expected to result in any material financial loss.
The Group is aware of claims and potential claims which involve or may involve legal proceedings against the Group. The Directors are of the opinion, having regard to legal advice received and the Group’s insurance arrangements, that it is unlikely that these matters will, in aggregate, have a material effect on the Group’s financial position.
57. Related PartiesThe Directors of Serco Group plc had no material transactions with the Company or its subsidiaries during the year other than service contracts and Directors’ liability insurance. Details of the Directors’ remuneration are disclosed in the Remuneration Report for the Group.
The Company is exempt under the terms of FRS 101 from disclosing related party transactions with entities that are 100% owned by Serco Group plc.

Serco Group plc Annual Report and Accounts 2015242
Company Name Serco Group interest Country of incorporation
Aeradio Technical Services WLL4 49% Bahrain
Agbar Serco Technology Solutions Limited2 50% United Kingdom
Antab Operations & Contracting LLC 60% Saudi Arabia
AWE Management Limited3 33% United Kingdom
BAS-Serco Limited 10% Bermuda
Braintree Clinical Services Limited 100% United Kingdom
CCM Software Services Ltd2 100% Ireland
Djurgardens Farjetrafik AB 50% Sweden
DMS Maritime Pty Limited 100% Australia
Eagle BPO Mauritius 100% Mauritius
Equity Aviation Holdings (Pty) Ltd2 50% South Africa
Equity Aviation Investment Holdings (Pty) Ltd 50% South Africa
Equity-Serco (Pty) Limited2 50% South Africa
Garden Funding Limited1 100% Jersey
Hong Kong Parking Limited 40% Hong Kong
Integrated Clinical Services Limited 100% United Kingdom
International Aeradio (Emirates) LLC – Abu Dhabi 49% United Arab Emirates
International Aeradio (Emirates) LLC – Dubai 49% United Arab Emirates
JBI Properties Services Company LLC 49% United Arab Emirates
Khadamat Facilities Management LLC 49% United Arab Emirates
LOGTEC Inc. 100% United States
Mena Business Services LLC4 70% Saudi Arabia
Merseyrail Services Holding Company Limited 50% United Kingdom
Northern Rail Holdings Limited3 50% United Kingdom
Priority Properties North West Limited 100% United Kingdom
Serco (Jersey) Limited 100% Jersey
Serco Australia Pty Limited3 100% Australia
Serco Belgium S.A 100% Belgium
Serco Business Services LLC 49% Abu Dhabi
Serco Caledonian Ferries Limited 100% United Kingdom
Serco Caledonian Sleepers Limited 100% United Kingdom
Serco Canada Inc. 100% Canada
Serco Citizen Services Pty Ltd 100% Australia
Serco Consulting Bahrain WLL 100% Bahrain
Serco Corporate Services Limited 100% United Kingdom
Serco Environmental Services Limited 100% United Kingdom
Serco Ferries (Guernsey) Crewing Limited 100% Guernsey
Serco Ferries (HR) Limited 100% United Kingdom
Serco Geografix Limited 100% United Kingdom
Serco Gestion de Negocios SL 100% Spain
Serco Group (HK) Limited 100% Hong Kong
Serco Group Consultants (Shanghai) Company Limited2 100% China
Serco Group Pty Limited 100% Australia
Serco Holdings Limited1 100% United Kingdom
Serco Inc.3 100% United States
Appendix: List of Subsidiaries

Stra
teg
ic R
epo
rtD
irec
tors
’ Rep
ort
Financial Statements · 243
Fina
ncia
l Sta
tem
ents
Appendix: List of Subsidiaries
Company Name Serco Group interest Country of incorporation
Serco Insurance Company Limited 100% Guernsey
Serco Integrated Transport Private Limited 100% India
Serco International Limited 100% United Kingdom
Serco International S.à r.l 100% Luxembourg
Serco Leasing Limited 100% United Kingdom
Serco Leisure Operating Limited 100% United Kingdom
Serco Limited3 100% United Kingdom
Serco Listening Company Limited 100% United Kingdom
Serco Luxembourg S.A. 100% Luxembourg
Serco Manchester Leisure Limited 81% United Kingdom
Serco Nederland B.V. 100% Netherlands
Serco New Zealand (Asset Management Services) Limited 100% New Zealand
Serco New Zealand Limited 100% New Zealand
Serco New Zealand Training Limited 100% New Zealand
Serco North America (Holdings), Inc. 100% United States
Serco North America Limited 100% United Kingdom
Serco Paisa Limited 50% United Kingdom
Serco Pension Trustee Limited 100% United Kingdom
Serco Projects LLC 49% Qatar
Serco Public Services Limited2 100% United Kingdom
Serco Regional Services Limited 100% United Kingdom
Serco Sarl 100% France
Serco SAS 100% France
Serco Saudi Arabia LLC 100% Saudi Arabia
Serco Services GmbH 100% Germany
Serco Services Inc. 100% United States
Serco Services Ireland Limited 100% Ireland
Serco Societa per Azioni 100% Italy
Serco Sodexo Defence Services Pty Ltd 50% Australia
Serco Switzerland SA 100% Switzerland
Serco Traffic Camera Services (VIC) Pty Limited 100% Australia
Serco-IAL Limited 100% United Kingdom
Service Glasgow LLP 50% United Kingdom
VIAPATH Group LLP 33% United Kingdom
1 Serco Holdings Limited and Garden Funding Limited are directly owned by Serco Group plc. All other subsidiaries and associated undertakings are held indirectly via Group companies.
2 Companies in liquidation as at 31 December 2015.
3 Companies key to the consolidated numbers, all of which are engaged in the provision of support services.
4 Companies with a non-controlling interest

Serco Group plc Annual Report and Accounts 2015244
Appendix: Supplementary InformationFive-year Record (unaudited)
2015 £m
2014 £m
2013 £m
2012 £m
2011 £m
Adjusted Revenue 4,252 4,753 5,140 4,910 4,607
Less: Share of revenue of joint ventures (737) (798) (856) (853) (819)
Revenue 3,515 3,955 4,284 4,057 3,788
Trading profit / (loss)* 137.6 (632.1) 257.4 310.7 226.3
Amortisation and impairment of intangibles arising on acquisition (4.9) (23.7) (21.4) (24.1) (20.0)
Operating profit / (loss) before exceptional items 132.7 (655.8) 236.0 286.6 206.3
Exceptional profit / (loss) on disposal of subsidiaries and operations 2.8 (5.4) 19.2 5.6 –
Other exceptional operating items (190.3) (656.1) (109.7) (5.0) –
Operating (loss) / profit (54.8) (1,317.3) 145.5 287.2 206.3
Net finance costs (32.0) (36.7) (37.2) (42.2) (36.5)
Exceptional finance costs (32.8) – – – –
Exceptional other gain – – – 51.1 –
(Loss) / profit before tax (119.6) (1,354.0) 108.3 296.1 169.8
Tax (charge) / credit (33.5) 6.9 (9.9) (39.0) (28.7)
(Loss) / profit after tax (153.1) (1,347.1) 98.4 257.1 141.1
Recourse net debt (82.2) (642.7) (725.1) (606.9) (669.8)
Net debt (82.2) (642.7) (745.4) (632.0) (685.3)
Pence Pence Pence Pence Pence
(Loss) / earnings per share before exceptional items** 6.55 (107.43) 32.74 40.37 28.75
Basic (loss) / earnings per share** (15.47) (205.66) 20.12 52.22 28.75
Dividend per share – 3.10 10.55 10.10 8.40
* Included in 2014 Trading Loss were charges totalling £745.3m arising from the Contract and Balance Sheet Review undertaken in 2014, with £718.0m charged to Adjusted Operating Profit and £27.3m charged to Management estimate of items relating to UK Government reviews.
** 2014 is restated for effect of Rights Issue in April 2015

Financial Statements · 245
Fina
ncia
l Sta
tem
ents
Stra
teg
ic R
epo
rtD
irec
tors
’ Rep
ort
Directors, Secretary and Advisers
Chairman
Sir Roy Gardner
Directors
Mike Clasper CBE1,2 Rupert Soames OBE Edward J Casey Jr Angus Cockburn Ralph D Crosby Jr1 Tamara Ingram1 Rachel Lomax1 Angie Risley1 Malcolm Wyman1
1 Non-Executive Director
2 Senior Independent Director
Secretary
David Eveleigh
Auditor
Deloitte LLP 2 New Street Square London EC4A 3BZ
Investment Bankers
N M Rothschild & Sons Limited New Court St Swithin’s Lane London EC4N 8AL
Stockbrokers
J.P.Morgan Cazenove 25 Bank Street London E14 5JP
Bank of America Merrill Lynch 2 King Edward Street London EC1A 1HQ
Principal Bankers
HSBC Bank PLC 8 Canada Square London E14 5HQ
Solicitors
Clifford Chance LLP 10 Upper Bank Street London E14 5JJ
Registrars
Equiniti Aspect House Spencer Road Lancing West Sussex BN99 6DA
Directors, Secretary and Advisers

246
Serco Group plc Annual Report and Accounts 2015
Serco Group website
Shareholders are encouraged to visit the Serco website www.serco.com which has a wealth of information about the Company. There is a section designed specifically for investors at serco.com/investors. This year's Annual Report and Notice of AGM, together with prior year documents can be viewed there along with information on share price and avoiding shareholder fraud.
Registrar
The Company's shareholder register is maintained by its Registrar, Equiniti. Information on how to manage your shareholding(s) can be found at help.shareview.co.uk.
Shareholders can contact Equiniti in relation to all administrative enquiries relating to their shares, such as change of personal details, the loss of a share certificate, and out of date dividend cheques.
Shareholders who have not yet elected to receive shareholder documentation in electronic form can sign up by registering at shareview.co.uk, or by contacting.
Equiniti Aspect House Spencer Road Lancing West Sussex BN99 6DA
Telephone: 0371 384 2932
Telephone number from outside the UK: +44 (0)121 415 7047
Telephone lines are open 8.30am to 5.30pm Monday to Friday.
There is a text phone available on 0371 384 2255 for shareholders with hearing difficulties. Calls to an 03 number cost no more than a national rate call to an 01 or 02 number.
ShareGift
Shareholders who only have a small number of shares whose value make it uneconomic to sell them may wish to consider donating them to charity through ShareGift, the independent charity share donation scheme (registered charity no. 1052686). Further information may be obtained from ShareGift on 0207 930 3737, www.sharegift.org.
Share dealing
Serco does not endorse any one service for the buying and selling of its shares. However, arrangements have been made with Stocktrade, the independent share dealing provider to offer all shareholders competitive charges. See details below.
Alternatively, if shareholders hold a share certificate they can also use any bank, building society or stockbroker offering share dealing facilities. Shareholders in any doubt about buying or selling their shares should seek professional financial advice.
Warning to Shareholders
Please be very wary of any unsolicited contact about your investments or offers of free company reports. It may be from an overseas 'broker' who could sell you worthless or high risk shares. If you deal with an unauthorised firm, you would not be eligible to receive payment under the Financial Services Compensation Scheme. Further information and a list of unauthorised firms that have targeted UK investors is available from the Financial Conduct Authority at fca.org.uk/consumers/protect-yourself/unauthorised-firms
REMEMBER: if it sounds too good to be true, it probably is!
Ordinary shares
Ordinary shares in Serco Group plc are listed on the London Stock Exchange (Code: SRP, ISIN number GB0007973794).
Shareholder Information
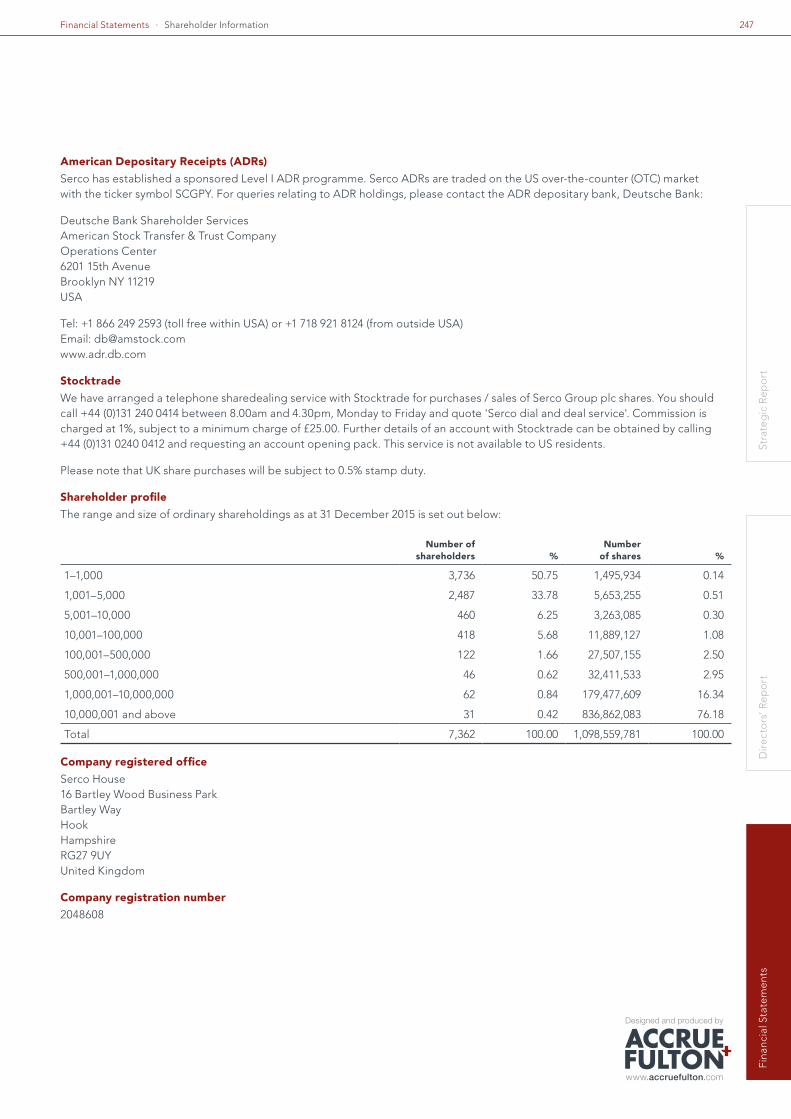
Financial Statements · 247
Fina
ncia
l Sta
tem
ents
Stra
teg
ic R
epo
rtD
irec
tors
’ Rep
ort
Shareholder Information
American Depositary Receipts (ADRs)
Serco has established a sponsored Level I ADR programme. Serco ADRs are traded on the US over-the-counter (OTC) market with the ticker symbol SCGPY. For queries relating to ADR holdings, please contact the ADR depositary bank, Deutsche Bank:
Deutsche Bank Shareholder Services American Stock Transfer & Trust Company Operations Center 6201 15th Avenue Brooklyn NY 11219 USA
Tel: +1 866 249 2593 (toll free within USA) or +1 718 921 8124 (from outside USA) Email: [email protected] www.adr.db.com
Stocktrade
We have arranged a telephone sharedealing service with Stocktrade for purchases / sales of Serco Group plc shares. You should call +44 (0)131 240 0414 between 8.00am and 4.30pm, Monday to Friday and quote 'Serco dial and deal service'. Commission is charged at 1%, subject to a minimum charge of £25.00. Further details of an account with Stocktrade can be obtained by calling +44 (0)131 0240 0412 and requesting an account opening pack. This service is not available to US residents.
Please note that UK share purchases will be subject to 0.5% stamp duty.
Shareholder profile
The range and size of ordinary shareholdings as at 31 December 2015 is set out below:
Number of shareholders %
Number of shares %
1–1,000 3,736 50.75 1,495,934 0.14
1,001–5,000 2,487 33.78 5,653,255 0.51
5,001–10,000 460 6.25 3,263,085 0.30
10,001–100,000 418 5.68 11,889,127 1.08
100,001–500,000 122 1.66 27,507,155 2.50
500,001–1,000,000 46 0.62 32,411,533 2.95
1,000,001–10,000,000 62 0.84 179,477,609 16.34
10,000,001 and above 31 0.42 836,862,083 76.18
Total 7,362 100.00 1,098,559,781 100.00
Company registered office
Serco House 16 Bartley Wood Business Park Bartley Way Hook Hampshire RG27 9UY United Kingdom
Company registration number
2048608

www.serco.com
Serco Group plc Serco House 16 Bartley Wood Business Park Bartley Way, Hook Hampshire, RG27 9UY
For general enquiries contact T: +44 (0)1256 745 900 E: [email protected]