annual report and accounts 2017 - kambi.com report and accounts 2017 kambi group plc 6. active in...
TRANSCRIPT
kambi.com
Annual report and accounts 2017


ContentsStrategic report 4
Kambi at a glance 6
Introduction 8
Chairman’s statement 10
A view from the CEO 11
Overview and highlights 12
What makes Kambi distinct 14
The sports betting market 18
Operator focus 23
Business model 26
Sustainable and responsible business 28
Our people 31
Share performance 34
Risk factors 36
Corporate governance 38
Board of directors 40
Senior executives 41
Corporate governance report 42
Directors’ report 44
Financial report 46
Independent auditor’s report 48
Financial review 52
Financial statements 54
AGM and company information 85
Glossary 86

01 Strategic report

Kambi at a glance
We deliver the ultimate Sportsbook service, from frontend user interface to customer intelligence, risk management and odds compiling, all built upon software we have developed in house.
Kambi’s vision is to work in close partnership with our customers to create unique and engaging sports betting experiences. This co-creation model not only sparks innovation, it also drives financial performance for us and our customers. Above all, our ability to produce and to act upon the insights required to develop a fully scalable and future-proofed Sportsbook makes us unique in our market place.
As the costs and complexity associated with developing and maintaining a high-quality and regulatory compliant Sportsbook continue to rise, so too does the demand for Kambi’s market-leading offering. As a result, the number of visionary operators competing in regulated markets across the globe to which we provide our services is growing fast. Currently active in six continents, our scalable model is
proving to be the most efficient and effective means of competing in today’s international market.
With more than 600 passionate and highly skilled people working across our six international offices, we possess the skills and strength of resource required to stay ahead of all competition.
Publicly-listed, licensed and fully compliant in every regulated territory where it operates, Kambi is the ultimate choice for operators wishing to win in a competitive space with a premium sports betting product.
Kambi Group plc is listed on the First North at Nasdaq Stockholm under the symbol ‘KAMBI’.
Creating premium sports betting experiences across the globeKambi Group is a multi-award-winning supplier of premium sports betting services delivered through its proprietary technology to licensed gaming operators.
Annual report and accounts 2017 Kambi Group plc
6

Active in six continents, our scalable model is the
most effective means of competing in today’s international market.
Introduction
Yet, within this demanding environment, consumers’ expectations continue to rise as they increasingly demand a quick, accessible and engaging sports betting experience. The breadth of choice for sports bettors means operators can ill afford to stand still. Restricted by legacy technology and rising costs, however, many have inevitably struggled to keep pace with change.
In short, the demands on operators today are vastly different from those of just a few years ago. As a consequence, operators everywhere are seeking new solutions, technologies and business models to provide the answers.
These factors have seen the demand for B2B sports betting services rise considerably – with Kambi becoming a leading player in this increasingly thriving and competitive space.
Kambi’s partners are visionary operators who realised the status-quo was no longer a realistic route to success. This was the case both with operators new to sports betting and those that were operating on legacy Sportsbook technology. With our Sportsbook at the core of our offer, we give our customers a data-enriched service that not only provides a market-
Springboarding visionary SportsbooksA revolution is sweeping through the sports betting industry. Fast expanding regulated markets, rapidly evolving technologies, changing consumer habits – these forces and more are conspiring to make operating a Sportsbook an increasingly complex and resource-heavy challenge.
leading sports betting platform but simultaneously acts as a powerful incubator for innovation and differentiation.
Through Kambi’s API-managed frontend and empowerment tools, visionary operators have a powerful twin opportunity. Firstly, they can mould the service to complement their individual marketing strategies. Secondly, they can manipulate and innovate upon the platform to develop exciting and unique experiences for their player base.
The end result is a cost-efficient, market-leading Sportsbook that gives operators the advantages of differentiation and benefits of scale, at just a fraction of the investment otherwise.
Our visionary Sportsbook is a powerful incubator for innovation and differentiation.
Annual report and accounts 2017 Kambi Group plc
8


Chairman’s statement Lars Stugemo
Annual report and accounts 2017 Kambi Group plc
10
Digitalisation is quickening the pace of change We’re in the midst of the Information Age, a period of increased knowledge and understanding of all around us. It’s a global phenomenon largely driven by continued technological advancements, which in turn has furthered the digitalisation of the world in which we live.
The advance of digitalisation is having palpable effects – rapidly changing the way businesses operate and consumers behave, with a more information-rich methodology delivering greater efficiencies, convenience and personalised approaches to product development and consumption.
The betting and gaming market in which Kambi operates has been at the forefront of this digital adoption and evolution. We are continuously raising the bar in our production of high-quality and entertaining experiences to meet the growing demands of the end user.
In the same way with which consumers interact with technologies and devices evolves, the boundaries of what was thought possible are forever being pushed. This has created a thriving technology and data-driven industry, one spurred on by the heightened competition created by its increased opportunities.
This reshaping of the gambling industry has seen it increasingly recognised and respected by regulators across the globe, with the wider adoption of regulatory
frameworks setting the high standards we see today. This means not only do we have a necessity to entertain the consumer, but also a duty to protect and ensure a sustainable industry.
Continued digitalisation, as well as greater knowledge and understanding of behavioural data, enables us to deliver on both counts, offering players an exciting and safe environment in which to play and enjoy.
Ever since its inception, Kambi has been one of the leading innovators in its space, with its data-driven technology focus providing the platform upon which we’ve successfully built an unrivalled sports betting experience.
Our growing operator network gives us vision over millions of players across six continents, painting an informed picture of how end users behave and interact with our product. This provides the scale of data required to draw increasingly accurate conclusions, informing Kambi on how best to lead and provide its customers with a crucial competitive edge.
This information-enriched approach ensures we consistently create the user experience and entertainment factor players seek, forever innovating and iterating our technology and products to meet their demands.
By doing so, Kambi is uniquely positioned to provide its network with the high quality and efficiency required to compete in regulated markets, with the effectiveness of our approach reflected in the proven success enjoyed by our customers.
Lars Stugemo Chairman

Reflecting on a year of achievements With four new customers added, four key accounts retained and a prestigious sports betting supplier award won, 2017 will long be remembered as a very successful year for Kambi. It is certainly one I look back on with pride.
The addition of these new customers meant Kambi had managed to win new business in eight consecutive quarters up to Q4 2017. This is an impressive run and one that I’m glad to say we have kept going into 2018. We’ve always believed in the scalability and differentiation capabilities of the Kambi Sportsbook; with each new customer we add to the network, we provide another piece of evidence to support this.
Three of our new customers – Colombia’s Corredor Empresarial, Bulgaria’s National Lottery AD and South Africa’s Sun International – enabled us to enter their respective regulated markets for the first time. As a result, the Kambi Sportsbook is now available in six continents, making us a truly global sports betting provider. Greentube, our fourth contract win of 2017, has already launched in Romania and Italy, illustrating the reach of the Kambi Sportsbook.
While new customer wins are important, retaining current business is equally crucial. At the start of 2017, we focused on extending deals with four key customers who were entering the later stages of their contracts. I’m delighted to report that we were successful. These contract renewals do not just reflect positively on the quality of service we provide to our customers. They have
also strengthened the relationship we have with each customer, not to mention securing valuable revenue streams for years to come.
Of course, it’s an easier task to retain customers when they are growing. Thanks to hard work and expertise on both sides, Kambi customers consistently outperformed the market. During 2017, the turnover among Kambi’s network of operators rose by 16% year-on-year – up against a period that included Euro 2016 and the summer Olympics.
The year wasn’t all plain sailing, however. In terms of operator trading margin, it was very much a year of two halves. Our operator trading margin in the first six months of the year suffered from a run of player-friendly results, although it bounced back strongly in the second half. We have always advised that betting margins will rise and fall but average around 7%. However, such was the run of favourable sporting results during the second half of the year that our 12-month operator trading margin came in at 7.4%.
We also carried out a strategic review of the business to ensure we were in the best possible shape to capitalise on what is a time of significant change across the global industry. The forces of change included a number of major markets moving towards regulation, the prospect of legal sports betting across the US, and operators in mature markets transitioning to third-party provision.
The review process also re-affirmed Kambi’s core belief that a scalable third-party solution is the best and most efficient method for enabling operators to achieve long-term success.
Overall, I believe the business has never been in better health. Exciting times lie ahead.
Kristian Nylen CEO
A view from the CEO Kristian Nylén
Annual report and accounts 2017 Kambi Group plc
11

Overview and highlights
185k live events
A new customer signedevery quarter
370 millioncombinations placed
325kpre-match events
Estimated 2.8 billion odds managed
Kambi operators recognised on EGR’s Power 50 list
sports covered worldwide65+
15 operators
A global supplier with a customer footprint acrosssix continents
6
Annual report and accounts 2017 Kambi Group plc
12
Annual report and accounts 2017 Kambi Group plc Strategic report
12

Offices in Bucharest, London, Malta, Manila, Stockholm, Sydney
604 employees
Sports Betting Supplier of the year
4 new clients integrated and live
16% Operator turnover growth
11% Revenue growth
net cash€26.9m
operating profit€7.7m €16m
EBITDA
Healthy balance sheet and strong cash flow
Annual report and accounts 2017 Kambi Group plc
13
Strategic report

At the heart of Kambi’s growth is our ability to offer a best-in-class, cost-efficient Sportsbook – one uniquely positioned to meet the common shared challenges faced by a wide spectrum of operators. In order to deliver this successfully, and continuously evolve the Sportsbook so that it remains ahead of the curve, Kambi has developed a business model unique to the market.
In essence, what sets Kambi apart from competitors is our continued ability to provide a Sportsbook which has the capacity to satisfy operators of all shapes and sizes. In our view, the large bulk of all sportsbook operations require the same sophisticated technology, expertise and skills to deliver a market-leading sports betting service. As a result, Kambi has focused, and continues to focus on these core elements, resulting in the delivery of a high-performance engine proven to drive the success of sports betting operators across the globe.
By building a platform which addresses all operators, and not one burdened by bespoke developments or individual instalments, Kambi is able to deliver its Sportsbook core in a scalable way. This ensures that every tweak, improvement and upgrade to the Sportsbook is felt across the Kambi network of operators. When Kambi builds once, it benefits all.
In parallel, Kambi recognises a one-size-fits-all approach is an outdated and ineffective solution in today’s environment. Heightened competition dictates operators must possess the
What makes Kambi distinct
Kambi’s network model provides the efficiency and scalability required for operators to compete in a global market.
flexibility to differentiate and innovate to remain relevant in the marketplace. This is why Kambi has built a layer of operator empowerment upon the Sportsbook core. This crucial empowerment ensures operators can simultaneously offer a tier-one sports betting service as well as a differentiated player experience, both at a product and frontend level.
This scalable differentiation currently enables Kambi to power 15 operators across six continents, including some of the largest gaming brands in the world, with many competing in the same local markets.
Annual report and accounts 2017 Kambi Group plc
14
Annual report and accounts 2017 Kambi Group plc Strategic report
14
As our vision became a reality, operators were presented with a myriad of challenges including rising costs, demanding compliance requirements, higher customer expectations, growth in live and mobile betting, and new market entrants unhindered by outdated and restrictive technologies. This combination broadly left operators with two strategic options: consolidate to achieve the scale required to invest in in-house solutions; or outsource to increase expertise, scalability and efficiencies.
Having foreseen the emergence of this complex landscape, Kambi created a strategy and a technology tightly focused on solving these industry-wide operational challenges. This culminated in a solution that did more than simply deliver a platform for immediate growth. It future-proofed the Sportsbook and gave operators the ability to differentiate in an increasingly competitive market. Crucially, the platform was, and continues to be, developed with scalable functionality at its core.
The journey to market leadership Kambi was founded in 2010, a time when the speed at which the sports betting market was maturing had started to accelerate and outsourced solutions were largely unavailable. Kambi could already see a clear route ahead for the industry. As we predicted then, this maturation phase would lead to an increasingly complex industry – one driven by evolving technologies, changing consumer habits and the adoption of licensed markets, creating a complicated and costly patchwork of regulation across Europe.
However, as the market continues to align with the shape we predicted years ago, the number of competitors within Kambi’s space has steadily increased. This is why, to ensure we remain best positioned to maintain market leadership, we carried out a strategic review of our business in 2017. The review led us to two broad conclusions. Firstly, Kambi’s model undoubtedly remains the most effective means of meeting the market challenges of today and tomorrow. Furthermore, it is a model unique to the market. This is because Kambi has developed its scalable differentiation – its ability to provide a sportsbook which meets common challenges and provides operator empowerment – over time. It is not a model easily replicated. Following the strategic review, Kambi has never been clearer about the path ahead. In 2018, the company will sharpen its focus on its scalable empowerment model, thereby ensuring our operators continue to have the market-leading Sportsbook, as well as the vital capability to create differentiated and exciting sports betting experiences.
Annual report and accounts 2017 Kambi Group plc
15
Strategic report

strategyevolving methods and technology focused on solving industry-wide operational challenges

Significant opportunities and exciting enhancementsThe current year looks set to be a significant one for Kambi. Not least, 2018 brings with it a number of high-profile sporting events, bringing additional betting interest from which Kambi and the wider industry is set to benefit.
The recent Winter Olympics saw Kambi deliver an unparalleled depth of pre-match and live offers, which provided a great opportunity for our customers to engage their players. The football World Cup, an event for which Kambi has been preparing for some time, takes place in Russia this summer. The Kambi Sportsbook is active in many of the countries competing in Russia and we will offer a market-leading experience in each.
The Kambi product development team has created and is still working on a range of improvements in preparation for the tournament. As well as delivering increased availability, these enhancements will primarily involve an extended offer of pre-match and in-play markets. For example, we have developed
a new penalty shoot-out model, which will greatly enhance the player experience during what is the most dramatic phase of a match.
Strategically, Kambi will continue looking to expand its geographic footprint into new markets. The company has already begun preparatory work for the US market. We are confident that, bar some relatively small modifications, we already have the product we need to compete successfully in the US. Furthermore, we believe our strong focus on sports and betting integrity should leave us well positioned when US markets begin to regulate.
Kambi will also seek to emphasise further our unique capacity to build a high-performance Sportsbook by leveraging insights generated by our customers and their players. While being able to do this has a number of important benefits, it ultimately enables operators to constantly outperform the market. Investing in this model will future-proof their Sportsbook systems, drive down costs and ensure they are able to offer a market-leading, scalable service proposition.
Annual report and accounts 2017 Kambi Group plc
17
Strategic report

The sports betting marketGrowing our share of a growing marketThe global sports betting market in which Kambi operates has grown considerably in recent years, and is now worth an estimated €53bn, according to H2 Gambling Capital.
Critically, the industry’s growth shows no signs of slowing with gross win expected to increase by a further 20% by 2022.
Kambi’s largest segment is online. This is also where the bulk of this growth will be generated, with the online industry anticipated to grow from €20.4bn in 2017 to €27.6bn in 2022 - 43% of the total global market. Retail is set to maintain its steady growth, rising from €32.9bn to €36.6bn over the same period.
As the size of the market increases, so too does Kambi’s international reach. In 2017, we extended our global footprint to six continents following market launches in Mexico, Colombia, South Africa and Bulgaria. Significantly, the online sports betting industries within these four countries are all expected to grow faster than their regional average.
2016 2017 2018 2019 2020 2021 2022
Betting
Casino
Poker
Lotteries10
20
30
Bingo
Global Online Gambling Gross Win by Product Vertical (€Bn)
In short, Kambi is partnering with operators in countries with thriving gambling markets. Additionally, in relation to the graph on the opposite page, growth is expected to take place in every region across the globe. And while online growth estimates range between 3% and 10%, Kambi’s customers have been growing, and are expected to grow, significantly faster than these rates.
Another positive pattern for Kambi is the increase in regulated markets. Regulatory frameworks, compliance requirements and new levies are placing additional pressures on the financial viability and scalability of operators, making the Kambi proposition even more attractive. Online global regulated revenues are expected to increase over the next five years from €11.4bn in 2017 to €15.8bn in 2022.
Source: H2 Gambling Capital
Annual report and accounts 2017 Kambi Group plc
18
Annual report and accounts 2017 Kambi Group plc Strategic report
18

3OceaniaOnline
7.1OceaniaRetail
9.2Latin AmericaCaribbeanOnline
1.4Latin AmericaCaribbeanRetail
0.4EuropeRetail
7.5EuropeOnline 6.8
AsiaMiddle EastOnline
3.6AsiaMiddle EastRetail
7.6AfricaOnline
2.4AfricaRetail
Betting Gross Win Growth by Region based on current known regulatory developments (%) 2016 – 2022
Source: H2 Gambling Capital

50,6202016
53,3662017
55,9722018
57,6362019
60,2372020
61,8272021
64,2242022
37%Online
63%Retail
38%Online
62%Retail
39%Online
61%Retail
40%Online
60%Retail
41%Online
59%Retail
42%Online
58%Retail
43%Online
57%Retail
Mobile
Retail
62%
2017 2022
19%
19%Desktop
Mobile
Retail
57%
16%
27%Desktop
Global Betting Gross Win 2016 – 2022 (€Bn)
Mobile proportion of online betting Estimated to 2022
Source: H2 Gambling Capital
Source: H2 Gambling Capital
Annual report and accounts 2017 Kambi Group plc
20
Annual report and accounts 2017 Kambi Group plc Strategic report
20

Regulation spreadsRegulated markets represent the future of the online gambling industry, and in the years ahead we expect to see additional markets, some of those of considerable size, consider and adopt licensed structures.
Although 2017 was relatively quiet in terms of newly regulated gambling frameworks being launched – Colombia and the Czech Republic being the most notable – significant strides were made in a number of other countries that are of interest to Kambi.
In March 2017, Sweden released a report recommending the creation of a liberalised framework, a move that would end the current duopoly in the market. A revenue-based taxation rate of 18% was also recommended, a rate that stakeholders have generally welcomed as palatable. Recent developments indicate a licensing process could begin in July 2018, with the market going live at the start of 2019.
2016 2017 2018 2019 2020 2021 2022
9,940Regulated
8,962Unregulated
11,365Regulated
9,099Unregulated
12,204Regulated
9,894Unregulated
13,242Regulated
10,068Unregulated
14,159Regulated
10,793Unregulated
14,867Regulated
11,104Unregulated
15,822Regulated
11,800Unregulated
The Netherlands continues to inch closer to a regulated market, albeit more slowly than originally anticipated. It had been hoped that 2017 would be the year the licensing window would open. However, this now looks to be delayed until at least the summer of 2018, with next year a more likely outcome. A tax rate of 29% could prove to be a high barrier to entry for some operators.
A number of countries in South America have also been considering bills to regulate online sports betting. At the time of writing, Brazil, Argentina and Peru all appear close to agreeing on their respective frameworks.
Regulated markets represent the future of the online gambling industry.
Global Online Betting Sector Gross Win Regulated vs Unregulated (€Bn)
Source: H2 Gambling Capital
Annual report and accounts 2017 Kambi Group plc
21
Strategic report

Poised to tackle US opportunitySince the Professional and Amateur Sports Protection Act (PASPA) was passed in 1992, sports betting in the US has been illegal in 46 of the 50 states. This law has done little to prevent America’s sports and betting enthusiasts from taking part in the activity, however – the American Gaming Association estimates black-market turnover to be in the region of €125bn a year.
Yet things may soon change. Following legal action taken by the state of New Jersey, which has consistently, albeit so far unsuccessfully, argued that the Act to be unconstitutional, the US Supreme Court heard oral arguments for and against PASPA in December 2017.
Number of US states to regulate within next seven years
The Supreme Court is expected to deliver its verdict in the second quarter of 2018. Such is the desire among states to offer sports betting that around 20 have already passed or prepared bills in anticipation of a New Jersey victory, some preparing to offer both retail and online betting. US-based gaming research firm Eilers & Krejick Gaming estimate a full repeal of PASPA could lead to sports betting in approximately 32 states within five years, potentially growing to 44 by 2025, which would present an attractive business opportunity for Kambi.
As a publically-listed company, Kambi is well positioned to offer its end-to-end multi-channel Sportsbook and services to operators looking to enter the US retail and online markets. Our transparent approach to business, coupled with our strong focus on sports and betting integrity – an issue integral to the passing of PASPA – should only strengthen our case when attempting to win business in the country.
By 2025
By 2020
+18
+12
14
32
44
By 2023
14 states which could offer sports betting within two years:
Colorado; Connecticut; Delaware; Indiana; Massachusetts; Michigan; Mississippi; Montana; New Jersey; Ohio; Nevada; Pennsylvania; Virginia; and West Virginia.
It is predicted 18 more could join within five years:
Arizona; California; Idaho; Illinois; Iowa; Kansas; Kentucky; Louisiana; Maine; Maryland; Missouri; New York; North Carolina; North Dakota; Oklahoma; Vermont; Washington and Wyoming.
And within seven years, another dozen could regulate:
Alabama; Arkansas; Florida; Georgia; Minnesota; Nebraska; New Hampshire; New Mexico; Oregon; Rhode Island; South Dakota and Wisconsin.
Source: Eilers & Krejcik Gaming
Annual report and accounts 2017 Kambi Group plc
22
Annual report and accounts 2017 Kambi Group plc Strategic report
22

A customer base of sports betting leadersIn 2017, Kambi continued to build a customer base of operators that share the same vision and ambition – to become leaders in the sports betting market. Exceeding the commercial heights set in 2016, we not only added a new customer in each quarter – we also successfully extended the contracts of four key existing customers.
The range of operators added last year underlines the relevance and flexibility of the Kambi Sportsbook. Each new customer – all in different geographies, under different regulatory regimes and at different phases of growth – selected Kambi to springboard them to the next level of success and beyond.
Deals with South Africa’s Sun International and Colombia’s Corredor Empresarial extended Kambi’s global coverage to six continents, making us a truly global sports betting supplier. Both deals were the result of the multi-channel capacity of the Kambi product, with service agreements covering online and retail environments.
Greentube, the interactive arm of the Novomatic Group, also contracted to receive the Kambi Sportsbook and services. Greentube’s desire to expand into international markets was in line with Kambi’s strategy. As a result of leveraging our scalable model, the operator has already launched sports betting in Romania and Italy, and further launches are planned for 2018.
Kambi also won a contract with National Lottery AD, the largest private gaming operator in Bulgaria. The customer has since moved away from the Sportsbook technology supplied by a Kambi competitor, going live with our Sportsbook in the first quarter of 2018. It is already generating revenues.
In terms of renewals, Kambi extended the contracts of four key customers during 2017: 888sport, LeoVegas, Paf and Napoleon Games. These extended deals illustrate the business growth these customers have achieved through deploying the Kambi Sportsbook. As a result, our relationships with each have been strengthened further.
In addition to our Sportsbook, the contract extensions speak to the market-leading customer service and support we provide to our operators. Kambi has a dedicated team of individuals advising and assisting our customers on a daily basis - analysing performance data to ensure each operator makes the right decisions to grow their sports betting revenues.
Kambi’s value proposition, combined with its empowerment ethos, continues to resonate with operators and the wider market. Our sales focus in 2018 will remain on regulated and re-regulating territories in Europe and North and South America, where tier-one private operators and government-regulated lotteries will continue to be our priority.
Operator focus
Annual report and accounts 2017 Kambi Group plc
23
Strategic report

888 Holdings:Since partnering with Kambi in 2013, 888’s betting brand 888sport has gone from strength to strength, highlighted by a 45% revenue increase in 2017. Such has been the success of the partnership, both parties agreed in 2017 to extend the contract for the long term, a deal which reflected 888sports’ emergence as a widely recognised sports betting brand. London-listed 888 Holdings was recently ranked 10th in EGR’s Power 50 list.
Corredor Empresarial: BetPlay is a new sports betting brand owned by Corredor Empresarial, Colombia’s biggest game-of-chance network operator. After signing with Kambi late in Q2 2017, BetPlay was launched into the recently regulated Colombian market just a few months later, highlighting Kambi’s rapid integration and scalable technology. Although an online product, players can deposit into and withdraw from their BetPlay account using more than 24,000 retail points of sale located throughout the country.
Kindred Group:Kindred Group is Kambi’s largest customer. The large bulk of Kindred’s revenues are derived via its flagship Unibet brand, one of the biggest betting brands in Europe, although in June 2017 Kindred acquired fellow Kambi customer 32Red. Listed on the Nasdaq Stockholm Large Cap, Kindred Group was ranked 6th on EGR’s Power 50 list.
LeoVegas:The LeoVegas Sportsbook continued to build momentum in 2017. It grew market share in its core Swedish and UK markets, leveraged Kambi’s scalable solution to enter new markets and won a number of industry Sportsbook awards just 18 months after launching with Kambi. LeoVegas recently extended its contract with Kambi for the long term. Listed on the First North Premier exchange, LeoVegas was ranked 14th on EGR’s Power 50 list.
Mr Green:Mr Green last year launched what it labelled ‘Sportsbook 2.0’ – a Sportsbook that uses the strengths of Kambi’s open API-managed frontend to integrate widgets and third-party content. The launch, which also focused on Kambi’s Instant Betting tennis product, highlighted what was achievable with Kambi’s Sportsbook core, particularly its ability to offer players differentiated sports-betting experiences. Listed on the main market of Nasdaq Stockholm, Mr Green was ranked 29th on EGR’s Power 50.
Our operators
Exceeding the heights we set in 2016, we added four new customers and extended the contracts of four key customers.
Annual report and accounts 2017 Kambi Group plc
24
Annual report and accounts 2017 Kambi Group plc Strategic report
24
NagaCorp:Kambi has supplied Naga’s NagaWorld casino with its flexible and configurable retail solution since 2014. This agreement was extended in 2017 to cover Naga’s brand new Naga 2 premises, with the supply of an additional six terminals to the Cambodia-based resort. The ‘plug and play’ simplicity of the Kambi retail product meant no additional infrastructure was required to extend the service. NagaCorp is listed on the Hong Kong Stock Exchange.
Napoleon Games:Napoleon Games has been offering Kambi’s retail and online products in Belgium since 2012. Since recently agreeing to a multi-year contract extension, it will continue to do so for years to come. Napoleon uses Kambi’s retail client to be compliant with local regulation and raise brand awareness to an offline segment.
National Lottery AD:National Lottery AD is Bulgaria’s largest privately-owned gaming operator. Having signed with Kambi in the third quarter of 2017, National Lottery’s popular 7777 brand went live with the Kambi Sportsbook in early 2018. Supported by a lottery-based TV show and former Bulgarian football star and brand ambassador Hristo Stoichkov, the Kambi-powered 7777 Sportsbook has quickly gained momentum as it looks to replicate the success it has enjoyed in gaming verticals.
NOVOMATIC:NOVOMATIC’s interactive division, Greentube, began working with Kambi in February 2017 with the objective of launching sports in a number of regulated markets. Greentube’s Admiral brand went live with the Kambi Sportsbook in Romania in July, shortly followed by the launch of Greentube’s StarVegas product in Italy. StarVegas also launched sports in Spain in early 2018 and further market-launches are planned for later in the year.
Paf: Based in Finland’s Åland archipelago, Paf has a tight focus on responsible gaming measures. These include using predictive behavioural modelling to prevent players from becoming problem gamblers. Paf works closely with Kambi to implement these procedures, and the data-led Kambi Sportsbook is able to provide Paf with real-time player data to support this goal. Paf recently extended its contract with Kambi for the long term. Paf is ranked 35th on EGR’s Power 50 list.
Rank Group:London-listed Rank Group’s Grosvenor brand has continued to build momentum within the sports betting vertical since signing with Kambi in the lead-up to Euro 2016. Focused on the UK market, Grosvenor signed a headline sponsorship with Fulham Football Club last year and took on a number of major horse-racing sponsorship packages to gain a foothold in the market. Rank Group was named 17th on EGR’s Power 50 list.
R Franco:Kambi signed with R Franco in 2016 and powers the gaming giant’s Spain-facing Wanabet brand. Having assumed Wanabet’s sport betting business and player base from its previous supplier, Kambi’s risk-management team rapidly applied all the processes needed to turnaround the performance of what had been an underperforming Sportsbook.
Televisa:Listed on the New York Stock Exchange, Mexican media company Televisa is the largest in Latin America, as well as the first of all the Spanish-speaking world. Televisa operates 18 land-based casinos in Mexico through its PlayCity brand, each with Kambi’s retail product suite. Following the successful retail-out, Kambi supported the operator with its online launch in 2017.
Sun International:South Africa-headquartered Sun International became Kambi’s 15th customer when signing in November 2017. Sun International, which is listed on the Johannesburg Stock Exchange, is the largest land-based casino operator in South Africa and has a growing retail presence in the Latin American region. The company also operates the South Africa-facing online sportsbook Sunbet, which is currently being migrated to the Kambi platform.
Annual report and accounts 2017 Kambi Group plc
25
Strategic report

Business model
How we create valueThe fully scalable SportsbookKambi has a strong record of providing a superior Sportsbook service that generates significant growth in revenues and market share for ourselves and for our operators. This owes much to the scalability of our business model – as there is little need to add extra resources when we add additional operators to the network, the number of users is independent of our service.
We continue to invest in people and technology to create and sustain our state-of-the-art Sportsbook. Through this investment programme, we are enabling operators to cost-efficiently offer their consumers a premium Sportsbook that delivers a leading end-user experience covering all channels – mobile, online and retail.
Our business model gives us strong operating leverage in a revenue-sharing model, driving Kambi’s earnings growth and margin expansion.
This model incentivises Kambi to provide odds that maximise our operators’ gross gambling revenue, so creating a natural alignment of interests. We also give our operators the flexibility to adjust pre-match odds up to a set level for certain events, enabling them to differentiate and optimise their marketing campaigns.
The Kambi Turnover IndexKambi aims to achieve optimal margin to maximise turnover growth and improve the financial performance of our customers, both in the short and the longer terms. We manage this by leveraging our sophisticated risk-management tools.
The turnover and margins of operators vary from quarter to quarter and are impacted by the outcome of sporting events. The Kambi Turnover Index (see opposite) illustrates the operators’ quarterly turnover and betting margin. The operator turnover of the first quarter of 2014, shown on the left-hand axis, is indexed at 100. The operator trading margin is shown on the right-hand axis.
The Kambi revenue modelKambi charges its operators a fee based on a number of variables. These include fixed fees, the number of live events offered, and commission (based on a share of an operator’s net gaming revenue). The most significant part of Kambi’s revenue comes from the revenue-share element. The graph at the bottom of the opposite page shows how the growth in operator turnover ultimately drives our own revenue growth.
While Kambi’s reporting currency is the Euro, our operators’ turnover originates in the currency of their end users. Excluding the impact of FX movements on the translation of these amounts, operator turnover grew by 17% in 2017. When the impact of FX movements is included, operator turnover grew by 16%.
As illustrated in the Kambi Turnover Index, the operator trading margin can fluctuate. Multiplying the margin by the turnover generates the operators’ gross gaming revenue (GGR). The 2017 operator trading margin stood at 7.4%, up from 6.9% in 2016. As a result of this higher margin, combined with a number of other factors, operator GGR increased by 24% year-on-year. As part of Kambi’s revenue model, we share certain costs with our operators. These include:
i) for some operators, costs for player incentives linked to sports betting, such as free bets.
ii) 50% (2016: 51%) of our operators’ GGR is subject to betting duties incurred in re-regulated markets. During the year, the addition (or full year effect) of certain other gaming-related taxes, added to additional deductions for player incentives, impacted the growth of operators’ net gaming revenue (that is GGR less deductible costs), to 22% in 2017. Kambi’s commission is based on a percentage of the operators’ net gaming revenue. To promote and support growth, some customer contracts include tiers with lower commission rates on the higher levels of their sports betting revenues. The tiered commission levels run on a yearly basis. The growth in the business of many of our operator partners resulted in a lower effective commission rate in 2017 than in 2016. This, along with the part of revenues which are fixed and not linked to the growth in operators’ businesses, resulted in Kambi’s revenues growing by 11% year-on-year.
Annual report and accounts 2017 Kambi Group plc
26
Annual report and accounts 2017 Kambi Group plc Strategic report
26

Strong leverage in a revenue-sharing model continues to drive earnings growth and margin expansion.
Operator turnover index and trading margin
Operator turnover & Kambi revenue growth 2017 vs 2016
The Kambi Turnover Index illustrates the operators’ quarterly turnover and betting margin. The operator turnover of the first quarter of 2014, shown on the left-hand axis, is indexed at 100. The operator trading margin is shown on the right-hand axis. Kambi charges its operators a commission based on their result, which is calculated as the margin on their turnover. The level of operator turnover is a stronger indicator of performance than margin, which can fluctuate in the short-term due to the outcome of certain events.
*Other includes the impact of volume-related commission tiers and fixed revenues
30%
25%
20%
15%
10%
5%
FX impact Operator turnover growth
Operator margin impact
Taxes/marketing deductibles impact
Other* Kambi revenue growth
Q1
100
150
200
250
300
75
125
175
225
275
6%
5.5%
7%
8%
9%
10%
6.5%
7.5%
8.5%
9.5%
Q2 Q3
2014
Q4 Q1 Q2 Q3
2015
Q4 Q1 Q2 Q3
2016
Q4 Q1 Q2 Q3
2017
Q4
Turnover Index Margin (%)
100119
109124
147163 160
203221
239219
242
281 277254 259
Annual report and accounts 2017 Kambi Group plc
27
Strategic report

For a listed company, operating in a responsible manner is an essential mainstay of business performance.This is why Kambi has long been at the forefront of innovations to deliver a secure service in a transparent way. By maintaining best practice at all times, we can protect players at risk of harm and keep crime out of gambling to help create a sustainable business.
Kambi’s network business model ensures it remains one step ahead of the competition in the detection of match fixing and corruption. The ability to see player activity across the network, all monitored by a Sportsbook Control team and a real-time alerts system, means we are quick to alert our customers and often first to notify sports governing bodies and regulators of any suspicious activity.
Sustainable and responsible business
Putting integrity at the heart of what we doKambi takes the integrity of sports and the betting industry seriously. A breakdown of public confidence in either area could have a negative impact on our business and that of our customers. This is why we choose to play a prominent role in the detection of sports manipulation worldwide, building close working relationships with sports’ governing bodies to proactively prevent and report instances of fixing and collusion.
We continued this process during 2017, forming cooperative arrangements, data-sharing agreements and, in some case, memoranda of understanding (MoUs) with relevant bodies. We also hosted a number of key organisations during the year, including the Great Britain’s Gambling Commission, Spain’s gaming regulator Dirección General de Ordenación del Juego, and the Council of Europe.
Some of the most notable agreements we entered during the year included a collaborative arrangement with ESSA (Sports Betting Integrity) and information-sharing MoUs with the Esports Integrity Coalition and the International Olympic Committee. We also automated our match-fixing detection alerts, enabling suspicious bets to be spotted and revealed at the earliest opportunity.
At the forefront of responsible gamingIn order to raise awareness of problem gambling, Kambi hosted Gambling Therapy, part of the Gordon Moody Association charity, at our London offices where our employees were presented with issues concerning problem gambling and problem gamblers.
Kambi has also been on the front foot in terms of using technology to detect early signs of problem gambling for our operators. Work in this area included the 2017 launch of an automated system to detect patterns of potentially harmful play.
Anti-corruption and anti-bribery — protecting our people and our business Kambi takes anti-bribery measures seriously. We have established systems and controls from the executive team downwards to facilitate the timely production of risk assessments and implementation of proactive measures to avoid bribery.
We ensure these processes are regularly reviewed by our legal and compliance teams. We also produce regular company-wide updates to ensure our people are always familiar with these policies.
In addition, Kambi is committed to ensuring that no employee suffers injustice as a result of reporting a suspicion that bribery or another corruption offence has occurred or may take place in the future. Our processes and internal teams enable confidential reporting, so supporting an environment that prioritises an employee’s protection when he or she reports a potential offence.
Kambi also gives all employees Anti Money Laundering (AML) training, teaching them about the suspicious behaviours to look out for and how to contact the nominated AML Officer.
During 2017, we also continued to adapt to significant regulatory change to ensure we comply with all licencing conditions and regulations, particularly in light of the fourth EU Anti-Money Laundering Directive. To ensure compliance, we have a number of
Annual report and accounts 2017 Kambi Group plc
28
Annual report and accounts 2017 Kambi Group plc Strategic report
28

By maintaining best practice, we can protect players at risk of harm, keep crime out of gambling and create a sustainable business.
systems that determine the risk involved in each transaction. A dedicated team checks higher-risk activity to assess the situation and take action when necessary.
We do not make any contributions to political parties, and we only make charitable donations that are legal and ethical under local laws and practices.
Regulation and licencesKambi holds business-to-business licences in a number of markets, and dedicated regulatory, legal and technical teams contribute to our commercial strategy. This enables us to keep up to date and relevant in a fast-changing legislative and regulatory landscape, mitigating the impact of changes in law that could otherwise adversely affect our operations. By taking a proactive approach and engaging with local regulators and authorities, we can provide a best-in-class product that prioritises uninterrupted service provision to our operators.
Kambi Group companies are licensed by the Great Britain’s Gambling Commission (combined remote operating licence 000-039076-R-319342-003), the Alderney Gambling Control Commission (category 2 eGambling licence 92C2), the Malta Gambling Authority (Class 4 licence MGA/CL4/659/2010), the Dirección General de Ordenación del Juego (licencia general apuestas 204-11/
GAIN0461269C/SGR) and the Romanian National Office for Gambling (class 2 licence - Decision 851/28.04.2016).
During 2017 Kambi worked closely with The British Standards Institution to achieve the WLA SCS:2016 and ISO 27001:2013 certifications, implementing the standards into our business processes and procedures across all locations.
General Data Protection Regulation (GDPR) Kambi is on course to be GDPR compliant before the regulation comes into effect on 25 May 2018. We have already carried out impact assessments on GDPR, taking into account the needs of our operators, the most frequent issues they encounter and the types of data-processing activities they perform.
Supporting local communities and charities Kambi and our employees support charities, on a company and an individual level, mainly focusing on the communities where we operate. Our people play a hands-on role supporting local charities and community-support projects on a voluntary basis, giving their time, raising funds and making other donations.
Every year, we also support with monetary donations registered charities that provide therapies for problem gambling, including GambleAware and Gambling Therapy (part of the UK-based Gordon Moody Association charity). GambleAware is one of the leading charities committed to minimising gambling-related harm in the UK. As well as funding education, prevention and treatment services, it also commissions research to broaden public understanding of gambling-related harm.
Gambling Therapy relies on charitable funding and is the only online service that provides free advice, support and information to people affected by problem gambling throughout the world. We strongly support the principles, aims and values of GambleAware and Gambling Therapy.
Annual report and accounts 2017 Kambi Group plc
29
Strategic report


Fostering talent and maximising potential As a sports betting and technology provider, Kambi’s use of data and machine learning to simplify many frequently repeated business processes is increasing. However, technology and systems alone can only take us so far. Ultimately, we are the sum of our people.
For Kambi to succeed long-term, decisions must be made, innovations thought through, products carefully designed and customer relationships maintained. To enable this, we continue to hire and foster talented individuals from around the world.
In 2017, we continued to focus on recruiting and nurturing smart, passionate, curious and action-orientated people to bring a diversity of knowledge, perspective and experience to the business. Through building a culturally diverse workforce, we can strengthen our distinctive scalable differentiation capability, driving the creation of our industry’s leading portfolio of products and services.
By the end of 2017, Kambi’s global workforce had passed the 600-mark, spread across six offices: Malta, London, Stockholm, Bucharest, Manila and Sydney. This staff count represents a 15% increase on 2016, as we continue to invest in great people to ensure we have the resources and skills we need to grow the company further in the years ahead.
Kambi’s workforce embraces 32 different nationalities, enabling us to benefit from a wealth of different perspectives and alternative ways of thinking. In short, the global and diverse workforce we have built is fully geared to deliver at scale.
Nurturing talent to be the bestAs the market becomes more competitive, Kambi is increasingly at risk of losing internal talent and potential candidates to other industries. This is why hiring and retaining the best talent is so vitally important to us. In 2017, we defined and implemented a unique Talent Management Strategy, which we now use to attract, select, on-board, develop and retain talent. This includes a structured Talent Management process via which we define and identify those with high potential, manage succession planning and action planning for our top performers.
Maximising potential – the Kambi AcademyWe developed and launched the Kambi Academy last year to nurture talent and bring through tomorrow’s leaders. This now offers all our people a more accessible and enhanced means of training, learning and improving to meet our current and future business needs. The Kambi Academy offers targeted leadership, education and coaching programmes to help our people improve their leadership capabilities and technical skills.
Since the Academy’s launch in September 2017, more than 450 Kambi employees have received training via around 80 individual full and half-day sessions. The Academy project has already had a positive impact on the engagement of our people while improving their skillset.
Our people
Annual report and accounts 2017 Kambi Group plc
31
Strategic report

Our business thrives on recruiting and nurturing
smart, passionate, curious and action-orientated people.

Company culture is the second most important reason our employees choose to stay with us.
Creating the right culture to thriveIn 2017, Kambi placed greater focus on ingraining our behaviours – ‘We Act, We Care, We Deliver’ – into the business. We embed these behaviours into all our processes: recruitment, performance, talent management, reward and recognition. And the data demonstrates the success of this approach. Our 2017 employee survey revealed that our company culture is the second most important reason for workers choosing to stay with us. The top four reasons were challenging work, company culture, interest in the area of work and colleagues.
Annual report and accounts 2017 Kambi Group plc
33
Strategic report

The closing price on the first trading day of the year, 2 January 2017, was SEK133.
Share performance
Shares traded 2017 Total volume (thousands)
50
60
70
80
90
100
110
120
130
140
100
200
300
400
500
600
700
800
900
1,000
Jan Feb Mar Apr May Jun Jul Aug Sep Oct Nov Dec
Jan Feb Mar Apr May Jun Jul Aug Sep Oct Nov Dec
50
60
70
80
90
100
110
120
130
140
100
200
300
400
500
600
700
800
900
1,000
Jan Feb Mar Apr May Jun Jul Aug Sep Oct Nov Dec
Jan Feb Mar Apr May Jun Jul Aug Sep Oct Nov Dec
The closing price on the last trading day of the year, 29 December 2017, was SEK96 with a market capitalisation of €293 million. The highest closing price during the year was SEK133.25, on 3 January. The lowest closing price during 2017 was SEK65.25 on 21 August. The average daily volume traded during 2017 was 85,412 shares and the average share price was SEK88.52. Kambi Group plc is listed on First North at Nasdaq Stockholm with the ticker code ‘KAMBI’ and ISIN code: MT0000780107. For information on analysts covering the Kambi stock, please see the company website www.kambi.com.
Annual report and accounts 2017 Kambi Group plc
34
Annual report and accounts 2017 Kambi Group plc Strategic report
34
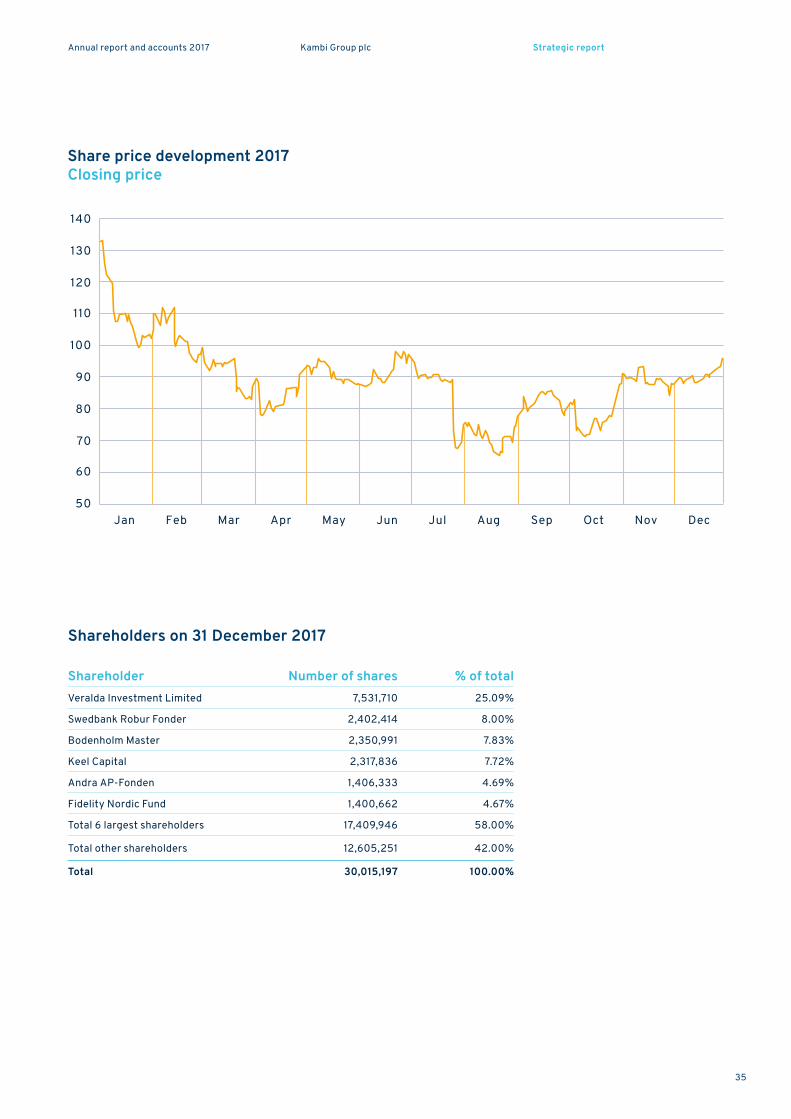
Share price development 2017 Closing price
Shareholders on 31 December 2017
Shareholder Number of shares % of totalVeralda Investment Limited 7,531,710 25.09%
Swedbank Robur Fonder 2,402,414 8.00%
Bodenholm Master 2,350,991 7.83%
Keel Capital 2,317,836 7.72%
Andra AP-Fonden 1,406,333 4.69%
Fidelity Nordic Fund 1,400,662 4.67%
Total 6 largest shareholders 17,409,946 58.00%
Total other shareholders 12,605,251 42.00%
Total 30,015,197 100.00%
50
60
70
80
90
100
110
120
130
140
100
200
300
400
500
600
700
800
900
1,000
Jan Feb Mar Apr May Jun Jul Aug Sep Oct Nov Dec
Jan Feb Mar Apr May Jun Jul Aug Sep Oct Nov Dec
50
60
70
80
90
100
110
120
130
140
100
200
300
400
500
600
700
800
900
1,000
Jan Feb Mar Apr May Jun Jul Aug Sep Oct Nov Dec
Jan Feb Mar Apr May Jun Jul Aug Sep Oct Nov Dec
Annual report and accounts 2017 Kambi Group plc
35
Strategic report

Regulatory and political environmentThe Group’s core business is strictly regulated by law in the markets where Kambi and our clients operate. Accordingly, political decisions, court rulings or changes in laws in the countries where Kambi or our operators have licences or commercial interests could have a material adverse effect on our business and operations. Regulatory changes can also have a positive impact, such as enabling us to access a market that becomes regulated or re-regulated.
Risks related to ITKambi’s business depends on our IT systems. System failures and other events that affect operations could have a material adverse effect on our business and its results. We mitigate this risk by using continuous monitoring to detect any problems as early as possible. All critical servers are duplicated, so that if one server fails another will immediately take over. We carry out detailed analysis following any downtime to ensure that the underlying reason for the outage is understood and rectified.
Match fixingMatch fixing is defined as ‘the manipulation of an event where the participants seek to fix the outcome for financial gain’. Kambi has internal systems and alerts in place to highlight any indications of match fixing and so reduce the financial impact of this risk. We also collaborate with industry watchdogs and regulators. If match fixing were to lead to changes in regulatory environments, this could have an impact on the results of operators and therefore our own financial performance.
Set out on these pages are some of the business and industry-related risk factors that we have identified as having potential consequences for Kambi’s future development. We have not arranged these in order of importance or potential economic impact.
Sport-specific IPR
In certain jurisdictions, regulators have begun to impose charges on licence holders for the right to offer odds, access data and use trademarks on certain sports. Any future changes in these charges could impact Kambi’s financial position.
Dependency on key operatorsA majority of Kambi’s revenue is currently generated from a few large operators. The loss of business with any or some of these could have a material adverse effect on our business.
Underlying performance of operatorsKambi’s financial performance depends on the underlying performance of our operators. This is a result of our business model, in which we receive a percentage-based commission on the operators’ net gaming revenue.
A decline in our operators’ financial performance could have a material effect on our own financial position. Operator trading margins can vary significantly from one period to the next, depending on the outcome of sporting events.
Dependence on key personnel and skilled employeesKambi’s future success will depend significantly on the full involvement of the Board of Directors, management and certain key individuals. If one or more of these individuals were to resign, or otherwise be unable to perform relevant duties, this might have an adverse effect on the Group’s financial performance and reputation.
Risk factors
Annual report and accounts 2017 Kambi Group plc
36
Annual report and accounts 2017 Kambi Group plc Strategic report
36

Competition and price pressureKambi’s growth depends on our ability to develop and sell competitive products and services. As the market matures, increased competition and price pressures may materialise. Our ambition is to continue striving to offer the best B2B Sportsbook in the market and to build further on our customer portfolio with successful and loyal operators.
Foreign currency riskTwo forms of foreign exchange risks exist: transaction risks and translation risks. When our operators handle transactions in a currency other than the Euro the invoice is issued in, currency movements can have an impact on our revenues. Transaction risks occur in conjunction with purchases and sales of products and services that are made in currencies other than the local currency of the company involved.
Translation risks occurs when the income statements and balance sheets of foreign subsidiaries are converted into Euros. Changes in the valuation of Euros in relation to other currencies can thus have positive and negative effects on the Group’s profit and financial position.
To some degree, we manage currency risk by holding funds on short-term deposit in the currencies of our principal cash outflows.
Tax risksKambi conducts its business in accordance with its interpretation and understanding of the applicable tax laws and treaties, case law and the requirements of relevant tax authorities in the countries where it operates. Changes to regulatory, legislative and fiscal regimes in key markets could have an adverse effect on our results due to the added cost of gaming-related taxes, which we share with operators. In managing our taxation affairs, including estimating the amounts of taxation due, we rely on the exercise of judgment concerning our understanding of and compliance with those laws, assisted by professional advice.
Risk related to convertible bondIn 2014, Kambi Group plc issued a €7.5 million convertible bond to a wholly owned subsidiary of Kindred Group plc.
According to the terms of the convertible bond, the Company is obliged to procure that certain events listed in the agreement do not take place unless with the prior consent of the lender. In case of a conversion, Kindred Group plc would obtain a controlling influence over Kambi and would consequently have the power to control the outcome of most matters to be decided by vote at a shareholders’ meeting.
Annual report and accounts 2017 Kambi Group plc
37
Strategic report

02 Corporate governance


Lars Stugemo, ChairmanLars is CEO, President and co-founder of HiQ International, an IT and management consultancy firm founded in 1995 and listed on NASDAQ OMX Stockholm. Lars has been a member of IVA (Kungliga vetenskapsakademien) and VI since 2013. He holds an MSc in Electronic Engineering from KTH Stockholm.
Lars Stugemo holds 28,180 shares in the company
Anders StrömAfter studying Mathematics, Statistics and Economics at Karlstad University, Anders founded sports-information company Trav-och Sporttjänsten in 1993. He was founder of Kindred Group plc in 1997, where he held various positions including Chief Executive Officer and Chairman of the Board. Anders was co-founder of Kambi Sports Solutions in 2010, Chairman of the Advisory Board of Kambi until May 2014 and then a Board member since Kambi’s listing in 2014. He is also a director of Veralda AB.
Anders Ström holds 7,531,710 shares in the company
Susan BallSusan qualified at Ernst & Young and has extensive experience in private and listed high-growth online businesses across all markets. She is a former CFO of Unibet Group plc (2003–08), including throughout its listing on Nasdaq OMX Stockholm. She has also worked for Cadbury Schweppes, Bookatable.com and MOO.com.
Susan Ball holds 14,980 shares in the company
Patrick ClasePatrick is Chief Investment Officer and a director of Veralda Investment Ltd. Highly experienced in the financial markets, Patrick has worked among other positions as a Financial Analyst with ABG Sundal Collier and with Alfred Berg. He holds a BSc in Economics from Lund University and a CEFA from the Stockholm School of Economics.
Patrick Clase holds 27,619 shares in the company
Cecilia WachtmeisterCecilia Wachtmeister is currently Vice President, Group Head of Sourcing & Procurement at Ericsson AB. She joined Ericsson in 1991, since when several international positions have given her experience of long B2B sales cycles. Cecilia holds an MSc in Industrial Engineering and Management from the Institute of Technology in Linköping, Sweden.
Cecilia Wachtmeister holds 4,000 shares in the company
Board of directors
Annual report and accounts 2017 Kambi Group plc
40
Annual report and accounts 2017 Kambi Group plc Corporate governance
40

Senior executivesKristian Nylén, Chief Executive OfficerFormerly a real estate analyst at Catella and Ernst & Young, Kristian followed his interest in sports to join Unibet in 2000. By 2003, he had assumed responsibility for the entire Sportsbook operation and was part of the Group management team. Kristian became CEO of Kambi upon its formation in 2010, and leads on all commercial aspects of the business.
Kristian Nylén holds 465,000 shares and 300,000 options in the company
David Kenyon, Chief Financial OfficerDavid qualified at KPMG and joined Unibet in 2002 as Group Financial Controller, working on Unibet’s NASDAQ OMX Stockholm listing. He then spent two years at the Capital Pub Company as CFO, where he floated the Company on AIM, before moving back to Unibet in 2008. David has been CFO of Kambi since its formation.
David Kenyon holds 42,330 shares and 60,000 options in the company
Erik Lögdberg, Deputy CEO, Chief Business Development OfficerErik joined Unibet in 2005 where he quickly became head of live betting with responsibilities including operations and product development. This coincided with the growth in live betting and the formation of Kambi. Erik is now deputy CEO, and leads on product and operational matters.
Erik Lögdberg holds 66,993 shares and 90,000 options in the company
Jonas Jansson, Chief Operating OfficerJonas joined Unibet almost two decades ago, becoming head of trading in 2003. He became COO of Kambi upon its formation in 2010. He leads all operational aspects of the Sportsbook, including pricing, risk management and market coverage. Jonas is also responsible for Kambi’s Sportsbook Operations team, which plays an active role in detecting and reporting suspicious betting activity.
Jonas Jansson holds 225,000 shares and 60,000 options in the company
Andreas Söneby, Chief Information Officer Andreas is responsible for managing and developing Kambi’s technology and systems, ensuring they meet business objectives and have the capacity to handle fast-growing transactional volumes. Andreas was previously chief technology officer at Unibet, where he led the development of a B2B sports betting segment within the Group. This went on to become Kambi.
Andreas Söneby holds 150,300 shares in the company
Max Meltzer, Chief Commercial Officer Leading Kambi’s commercial division, Max is responsible for the formalisation, execution and development of Kambi’s commercial strategy focusing on new business growth and customer retention. Max joined Kambi in 2016 from the Press Association where he was Head of Sales, prior to that he was a Co-Founder and Director of a successful sports agency representing Premier League footballers before selling his shares in 2014.
Christina Haralambous, Chief Communications OfficerAs the steward of the Kambi brand, Christina is responsible for leading a team covering issues from brand strategy to internal and external communications, go-to-market strategy and implementation, event management, campaign management and CSR. She joined Kambi in 2016 from WPP media agency MEC (now Wavemaker) where for five years she successfully contributed to the development and delivery of the agency’s marketing communications strategy.
Chris Fox, Chief Legal Officer Chris joined Kambi in 2016 as group head of legal and regulatory before promotion to chief legal officer last year. As CLO, Chris is responsible for leading the Legal and Regulatory functions at Kambi. Prior to joining Kambi, Chris gained more than 10 years of strategy consulting and legal experience at Accenture plc, Eversheds LLP and Vodafone Group plc.
Kamil Gajewski, Chief Strategy Officer Kamil is responsible for driving and supporting the Kambi strategy, in terms both of its development and its progression. He also directs the provision of intelligence to inform the company’s strategic decisions. Kamil previously spent five years as Kambi’s head of business development and business intelligence. Prior to joining the company in 2011, Kamil had spells at gaming companies bwin and Ongame.
Kamil Gajewski holds 25,000 options in the company
Annual report and accounts 2017 Kambi Group plc
41
Corporate governance

The Board The Board has five directors including the Chairman. The Board meets regularly to consider strategy, performance and the framework of internal controls.
The Board of Directors comprises a mix of the necessary skills, knowledge and experience required to provide leadership, control and oversight of the management of the Group and to contribute to the development and implementation of strategy. In particular, the Board combines a group of directors with diverse backgrounds within the technology, finance, gaming and other related sectors, which provide the Board with the resources and expertise to drive the continuing development of the Group and advance its commercial objectives.
In addition to being on the Board of Kambi, Anders Ström is also Chairman of the Board of Directors in Kindred Group plc. To avoid any potential conflict of interest, Anders is not present at, nor
does he participate in, any decision-making process which relates directly to the contract between Kambi and Kindred Group plc.
In 2017, the Board held eight meetings, where four meetings were held in connection to the quarterly reports and four were regular meetings spread evenly throughout the year. The regular Board meetings are prepared jointly by the Chairman of the Board and the CEO of the company. At every regular Board meeting an update is given on the business and financial situation.
The Audit CommitteeThe Audit Committee is responsible for ensuring that the financial performance of the Group is thoroughly reported on and monitored. In addition it reviews the reports from the auditors relating to accounts and internal control systems. It meets at least once a year with the auditors. The Audit Committee is comprised of Susan Ball and Patrick Clase and is chaired by Susan Ball.
Corporate governance reportKambi Group plc is listed on First North at Nasdaq Stockholm and is not required to follow all the provisions of the Swedish and/or Maltese Corporate Governance Code (the Code). The Board however recognises the importance and value of good corporate governance practice and accordingly has selected those procedures and committees of the Code that it considers relevant and appropriate to the Group, given its size and structure. Each of the committees meets regularly.
Directors’ remunerationFees/salary
€000Other €000
2017 €000
2016 €000
Anders Ström 47 - 47 47
Lars Stugemo 96 21 117 133
Patrick Clase 57 - 57 57
Susan Ball 57 14 71 57
Cecilia Wachtmeister 25 - 25 -
282 35 317 294
Kristian Nylen (CEO) 562 - 562 396
Management remuneration 1,368 - 1,368 1,393
2,212 35 2,247 2,083
T he basic salary per annum is €40,000 per director. The Chairman of the Board receives an additional fee of €50,000 and each member of the Remuneration and Audit Committee receives €6,500 per annum.
Annual report and accounts 2017 Kambi Group plc
42
Annual report and accounts 2017 Kambi Group plc Corporate governance
42

Members of the executive management take part in the Board meetings in order to report on matters within their specific areas when relevant and necessary. The CEO provides a monthly report to the Board. This report deals with markets, operations and financial development.
The Nomination Committee The Nomination Committee is responsible for reviewing the size, structure and composition of the Board, succession planning, the appointment of replacement and/or additional directors and for making the appropriate recommendations to the Board. The Committee also prepares proposals regarding Board remuneration and fees to the auditor.
The members of the Nomination Committee shall represent all shareholders and be appointed by the three or four largest shareholders as at 30 September each year, having expressed their willingness to participate in the Committee. Kambi’s Nomination Committee shall consist of not less than four and not more than five members, of which one shall be the Chairman of the Board.
The members are: Anders Ström — Veralda Investment Ltd, Lars Stugemo — Chairman of the Board, Evert Carlsson — Swedbank Robur Fonder, Per Johansson — Bodenholm Capital, and Mathias Svensson - Keel Capital. The Committee is chaired by Anders Ström.
The Remuneration Committee The Remuneration Committee reviews the performance of the senior managers and sets and reviews the scale and structure of their remuneration, the basis of their remuneration and the terms of their service agreements with due regard to the interests of shareholders. The Remuneration Committee is comprised of Anders Ström and Lars Stugemo and is chaired by Anders Ström. Details of the remuneration of the Board of Directors and senior executives are set out left.
Kambi Remuneration policy and report The policy of the Board is to attract, retain and motivate the best managers by rewarding them with competitive compensation packages linked to the Group’s financial and strategic objectives. The compensation packages need to be fair and reasonable in comparison with companies of a similar size, industry and international scope. The components of remuneration for executive managers comprise base salary, benefits, performance-related salary and long-term incentives.
The variable remuneration shall be in proportion to the executive’s responsibilities and authority. It shall also be subject to an upper limit and based on fulfilment of targets aligned with the shareholders’ long-term interests. Where appropriate, the variable element is based on quantitative and qualitative targets. The variable element of remuneration for the CEO and other members of the executive management are maximum 50% of the fixed salary cost, depending on the attainment of personal and company performance targets, such as new customer signings and financial goals. Salaries in 2017 were increased by an average of 3% compared to 2016. The CEO and the executive management are entitled to the same benefits as other local employees.
Termination and severance pay: in the case of the CEO, there is a reciprocal period of notice of 12 months. If employment is terminated by the Company, severance pay equivalent to 12 months’ salary is payable. If employment is terminated by
the CEO, salary and other benefits are paid for 12 months after cessation of employment, during which period the CEO is prohibited from entering into competing activities. In the case of other members of the executive management, there is a mutual period of notice of six months.
Issues concerning remuneration of the executive management are handled by the CEO. Decisions on remuneration of the CEO are taken by the Board of Directors.
The members of the Remuneration Committee have no personal interest in the outcome of their decisions and give due regard to the interests of shareholders and to the continuing financial and commercial health of the business.
Annual report and accounts 2017 Kambi Group plc
43
Corporate governance

Directors’ report
Principal activities Kambi Group plc is a B2B supplier of fully managed sports betting services on an in-house developed software platform, providing premium turnkey sports betting services to B2C gaming operators.
Results and dividends The consolidated income statement is set out on page 57. The profit after tax was €5.9 (€7.5) million. The Board does not propose a dividend.
Going concern As required by Listing Rule 5.62 issued by the Listing Authority, upon due consideration of the Company’s state of affairs, capital adequacy and solvency,
Statement of directors’ responsibilitiesThe directors present their report on the affairs of the Group, together with the audited consolidated financial statements and auditor’s report, for the year ended 31 December 2017.
the directors confirm the Company’s ability to continue in operational existence for the foreseeable future. For this reason, in preparing the financial statements, they continue to adopt the going concern basis.
Performance review The directors have performed a detailed review of the Group’s performance during the year, the highlights of which are disclosed on pages 12 and 13 of this annual report. Four new customer contracts were signed
The Group renewed four of its key customer contracts during the year, including 888 and Paf.
The directors have also performed a review of the Group’s Key Financial and Non-financial Performance Indictors, detailed here as follows:
FY 2017Operating (EBIT) margin, % 12%
EBITDA (€m) 16
EBITDA margin, % 26%
Equity/assets ration, % 70%
Employees at period end 604
Earnings per share (€) 0.198
Fully diluted earnings per share (€) 0.192
Annual report and accounts 2017 Kambi Group plc
44
Annual report and accounts 2017 Kambi Group plc Corporate governance
44

Post-reporting date events On 27 February, Kambi entered into an agreement to purchase 25.1% share capital of Midia Holding Group in exchange for €565,000.
On 13 March, Kambi signed a deal with innovative gaming company Casumo to deliver a gamified sports betting product that leverages Kambi’s market-leading operator empowerment technology.
Financial and non-financial risk management The directors have undertaken a thorough review of both the financial and non-financial risks faced by the Group and details thereof can be found on pages 20-21 of this annual report.
Future developments The Company intends to continue its investment in people and technology to develop its Sportsbook service.
Directors The following have served as directors during the year under review:
Lars Stugemo (Chairman) Anders Ström Susan Ball Patrick ClaseCecilia Wachtmeister Lars Stugemo, Anders Ström, Susan Ball, Cecilia Wachtmeister and Patrick Clase will seek re-election at the forthcoming AGM.
Statement of directors’ responsibilities The directors are required by the Maltese Companies Act (Chap. 386) to prepare financial statements in accordance with International Financial Reporting Standards as adopted by the EU which give a true and fair view of the state of affairs of the Group at the end of each financial year and of the profit or loss of the Group for the year then ended.
In preparing the financial statements, the directors are required to: select suitable accounting policies and apply them consistently; make judgments and estimates that are reasonable; and prepare the financial statements on a going concern basis, unless it is inappropriate to presume that the Group will continue in business as a going concern.
The directors are responsible for ensuring that proper accounting records are kept which disclose with reasonable accuracy at any time the financial position of the Group and which enable the directors to ensure that the financial statements comply with the Companies Act (Chap. 386).
This responsibility includes designing, implementing and maintaining such internal control as the directors determine is necessary to enable the preparation of financial statements that are free from material misstatement, whether due to fraud or error.
The directors are also responsible for safeguarding the assets of the Group, and hence for taking reasonable steps for the prevention and detection of fraud and other irregularities.
Disclosure of information to the auditor At the date of making this report, the directors confirm the following: As far as each director is aware, there is no relevant information needed by the independent auditor in connection with preparing the audit report of which the independent auditor is unaware, and each director has taken all steps that he/she ought to have taken as a director in order to make him/her-self aware of any relevant information needed by the independent auditor in connection with preparing the audit report and to establish that the independent auditor is aware of that information.
Independent auditor The auditor, Mazars, has indicated its willingness to continue in office and a resolution for its reappointment will be proposed at the Annual General Meeting
On behalf of the Board
Malta, 28 March 2018
Lars Stugemo Chairman
Patrick Clase Director
Annual report and accounts 2017 Kambi Group plc
45
Corporate governance

03 Financial report


To the shareholders of Kambi Group plc
Independent auditor’s report
Code of Ethics for Professional Accountants (IESBA Code) together with the ethical requirements that are relevant to our audit of the financial statements in accordance with the Accountancy Profession (Code of Ethics for Warrant Holders) Directive issued in terms of the Accountancy Profession Act (Cap. 281) in Malta, and we have fulfilled our other ethical responsibilities in accordance with these requirements and the IESBA Code. We believe that the audit evidence we have obtained is sufficient and appropriate to provide a basis for our opinion.
Key Audit Matters Key audit matters are those matters that, in our professional judgment, were of most significance in our audit of the financial statements of the current period. These matters were addressed in the context of our audit of the financial statements as a whole, and in forming our opinion thereon, and we do not provide a separate opinion on these matters.
Report on the Audit of the Financial StatementsWe have audited the consolidated financial statements of Kambi Group plc (the Group), set out on pages 54 to 84, which comprise the consolidated statement of financial position as at 31 December 2017, and the consolidated statement of comprehensive income, consolidated statement of changes in equity and consolidated statement of cash flows for the year then ended, and notes to the financial statements, including a summary of significant accounting policies.
OpinionIn our opinion, the consolidated financial statements give a true and fair view of the financial position of the Group as at 31 December 2017 and of its financial performance and its cash flows for the year then ended in accordance with International Financial Reporting Standards as adopted by the EU (EU IFRSs) and have been prepared in accordance with the requirements of the Companies Act (Cap. 386).
Basis for OpinionWe conducted our audit in accordance with International Standards on Auditing (ISAs). Our responsibilities under those standards are further described in the Auditor’s Responsibilities for the Audit of the Financial Statements section of our report. We are independent of the Group in accordance with the International Ethics Standards Board for Accountants’
Annual report and accounts 2017 Kambi Group plc
48
Annual report and accounts 2017 Kambi Group plc Financial report
48

Dependence on key customers
Risk description
As described in the Revenue and Segmental note 6 to the financial statements, the Group’s revenue is mainly dependent on two key customers. In 2017, such customers accounted for 79% of the Group’s revenue.
How the scope of our audit responded to the risk
We considered the risk associated to the dependence of two key customers and the board’s assessment of this risk. We reviewed the sales strategy of the Group, as well as new sales leads being addressed by the board and the Group budgets
Our review specifically focused on:
• Assessing the size of new leads.
• Assessing the successes of the Group in terms of new contracts signed during 2017.
• Considering budgeted increase in the company portfolio and the consequent reduction in the dependency on these two key clients.
Findings
We are satisfied that the approach being adopted by the board, the new clients won and the overall attainment of most of the sales targets to be appropriately addressing this risk.
Management override of controls
Risk description
Management has the ability to manipulate accounting records and prepare fraudulent financial statements by overriding controls that otherwise appear to be operating effectively. Due to the unpredictable way in which such override could occur, it is a risk of material misstatement due to fraud and thus a significant risk.
How the scope of our audit responded to the risk
We have maintained professional scepticism throughout the audit, considering the potential for management override of controls. We have designed and performed audit procedures as follows:
• Tested the appropriateness of journal entries recorded in the general ledger and other adjustments made in the preparation of financial statements by inquiring of individuals involved in the financial process and by selecting journal entries made during the year and towards the end of the reporting period.
• Reviewed the accounting estimates by evaluating whether judgements and decisions made by management in making the accounting estimates included in the financial statements, even if they are individually reasonable, indicate a possible bias on the part of the entity’s management that may represent a risk of material misstatement due to fraud.
• Tested a sample of internal controls and verified that there were no deficiencies within the said controls and management has abided to them.
Findings
We obtained reasonable assurance that the financial statements taken as a whole are free from material misstatement, whether caused by fraud or error.
Intangible assets
Risk description
One of the main assets of the Group, relates to intangible assets consisting of computer software, brands and development costs which amounts to €11,428,000 as per note 16 to the financial statements. Under IFRSs as adopted by the European Union the Group is required to annually test the amount of the Intangible asset for
impairment. One must note that the group however carries continuous impairment testing on such assets. The impairment test was significant to our audit because the assessment process is complex involves judgement and is based on assumptions that are affected by expected future market or economic conditions.
How the scope of our audit responded to the risk
We have performed the following tests so as to address the above mentioned risk:
• We have critically tested the forecasts adopted by the Group and evaluated the assumptions and methodologies used by the Group in preparing these forecasts. Particular emphasis was placed in reviewing the forecasted revenue growth and profit margins.
• We have adopted a margin cut on all forecasted revenue to ensure that the overall value was still in excess of the book value.
• We have reviewed correspondence and minutes were impairment charges were considered.
Findings
We obtained reasonable assurance that the value of the intangible assets is fairly reported.
Other Information The directors are responsible for the other information. The other information comprises the directors’ report, chairman’s statement, and chief executive officer review. Our opinion on the financial statements does not cover this information, including the directors’ report.
Annual report and accounts 2017 Kambi Group plc
49
Financial report

In connection with our audit of the financial statements, our responsibility is to read the other information and, in doing so, consider whether the other information is materially inconsistent with the financial statements or our knowledge obtained in the audit, or otherwise appears to be materially misstated.
With respect to the Directors’ Report, we also considered whether the Directors’ Report includes the disclosures required by Article 177 of the Maltese Companies Act (Cap. 386). Based on the work we have performed, in our opinion:
• the information given in the directors’ report for the financial year for which the financial statements are prepared is consistent with the financial statements; and
• the directors’ report has been prepared in accordance with the Maltese Companies Act (Cap.386).
In addition, in light of the knowledge and understanding of the Group and its environment obtained in the course of the audit, we are required to report if we have identified material misstatements in the directors’ report. We have nothing to report in this regard.
Responsibilities of the DirectorsThe directors are responsible for the preparation of the financial statements that give a true and fair view in accordance with IFRS, and for such internal control as the directors determine is necessary to enable the preparation of financial statements that are free from material misstatement, whether due to fraud or error.
In preparing the financial statements, the directors are responsible for assessing the Group’s ability to continue as a going concern, disclosing, as applicable, matters related to going concern and using the going concern basis of accounting unless the directors either intend to liquidate the Company or to cease operations, or has no realistic alternative but to do so.
Auditor’s Responsibilities for the Audit of the Financial StatementsOur objectives are to obtain reasonable assurance about whether the financial statements as a whole are free from material misstatement, whether due to fraud or error, and to issue an auditor’s report that includes our opinion. Reasonable assurance is a high level of assurance, but is not a guarantee that an audit conducted in accordance with ISAs will always detect a material misstatement when it exists. Misstatements can arise from fraud or error and are considered material if, individually or in the aggregate, they could reasonably be expected to influence the economic decisions of users taken on the basis of these financial statements.
As part of an audit in accordance with ISAs, we exercise professional judgment and maintain professional scepticism throughout the audit. We also:
• Identify and assess the risks of material misstatement of the financial statements, whether due to fraud or error, design and perform audit procedures responsive to those risks, and obtain audit evidence that is sufficient and appropriate to provide a basis for our opinion. The risk of not detecting a material misstatement resulting from fraud is higher than for one resulting from error, as fraud may involve collusion, forgery, intentional omissions, misrepresentations, or the override of internal control.
• Obtain an understanding of internal control relevant to the audit in order to design audit procedures that are appropriate in the circumstances, but not for the purpose of expressing an opinion on the effectiveness of the Company’s internal control.
• Evaluate the appropriateness of accounting policies used and the reasonableness of accounting estimates and related disclosures made by the directors.
• Conclude on the appropriateness of the directors’ use of the going concern basis of accounting and based on the audit evidence obtained, whether a material uncertainty exists related to events or conditions that may cast significant doubt on the Company’s ability to continue as a going concern. If we conclude that a material uncertainty exists, we are required to draw attention in our auditor’s report to the related disclosures in the financial statements or, if such disclosures are inadequate, to modify our opinion. Our conclusions are based on the audit evidence obtained up to the date of our auditor’s report. However, future events or conditions may cause the company to cease to continue as a going concern.
• Evaluate the overall presentation, structure and content of the financial statements, including the disclosures, and whether the financial statements represent the underlying transactions and events in a manner that achieves fair presentation.
• Obtain sufficient appropriate audit evidence regarding the financial information of the entities or business activities within the Group to express an opinion on the consolidated financial statements. We are responsible for the direction, supervision and performance of the group audit. We remain solely responsible for our audit opinion.
We communicate with the directors regarding, among other matters, the planned scope and timing of the audit and significant audit findings, including any significant deficiencies in internal control that we identify during our audit.
We also provide those charged with governance with a statement that we have complied with relevant ethical requirements regarding independence, and to communicate with them all relationships and other matters that may reasonably be thought to bear on our independence, and where applicable, related safeguards.
Annual report and accounts 2017 Kambi Group plc
50
Annual report and accounts 2017 Kambi Group plc Financial report
50
Report on Other Legal and Regulatory Requirements
Report on the statement of compliance with the Principles of Good Corporate GovernanceThe Listing Rules issued by the Malta Finance Services Authority require the directors to prepare and include in their annual report a Corporate Governance Statement providing an explanation of the extent to which they have adopted the Code of Principles of Good Corporate Governance and the effective measures that they have taken to ensure compliance throughout the accounting period with those Principles.
The Listing Rules also require the auditor to include a report on the Corporate Governance Statement prepared by the directors. We read the Corporate Governance Statement and consider the implications for our report if we become aware of any apparent misstatements or material inconsistencies with the financial statements included in the annual report. Our responsibilities do not extend to considering whether this statement is consistent with any other information included in the annual report.
We are not required to, and we do not, consider whether the board’s statements on internal control included in the Corporate Governance Statement cover all risks and controls, or form an opinion on the effectiveness of the company’s corporate governance procedures or its risk and control procedures.
In our opinion, the Corporate Governance Statement set out on pages 42 to 43 has been properly prepared in accordance with the requirements of the Listing Rules issued by the Malta Listing Authority.
Adequacy of explanations received and accounting recordsUnder the Maltese Companies Act (Cap. 386) we are required to report to you if, in our opinion:
• We have not received all the information and explanations we require for our audit.
• Adequate accounting records have not been kept, or that returns adequate for our audit have not been received from branches not visited by us.
• The financial statements are not in agreement with the accounting records and returns.
We have nothing to report to you in respect of these responsibilities.
This copy of the audit report has been signed by
Paul Giglio Partner
for and on behalf of Mazars Malta Certified Public Accountants Attard
28 March 2018
Annual report and accounts 2017 Kambi Group plc
51
Financial report

RevenueRevenue represents fees received for sports betting services rendered to Kambi’s operators. Kambi charges its operators a monthly fee, based on a number of variables, including fixed fees, commission based on the profits generated for operators and the number of live events offered.
Total revenue in 2017 increased to €62.1 (2016: €56.0) million. The increase of 11% year-on-year demonstrates Kambi’s continued growth, underpinned by the success of its operators.
Administrative expenses Administrative expenses for 2017 were €54.2 (2016: €46.8) million. Excluding depreciation and amortisation, ongoing administrative expenses were €45.9 (2016: €39.9) million, of which €24.1 (2016: €21.8) million were salaries and associated costs. The increase in salaries can be attributed to the planned increase in full-time staff, as part of the continued development of the Kambi service, as well as salary increases in line with the market.
Note 7 in the financial statements on page 66 provides more analysis of operating costs, including items affecting comparability.
EBITDA and operating profit Earnings before interest, tax and depreciation and amortisation (EBITDA) for the full year 2017 were €16.0 (2016: €15.6) million. Profit from operations for the full year 2017 was €7.7 (2016: €8.8) million.
Profit after tax Profit after tax for the full year 2017 was €5.9 (2016: €7.5) million.
Development and acquisition costs of intangible assets In the full year 2017, development expenditure of €8.2 (2016: €7.6) million was capitalised. The key elements of capitalised development costs during 2017 were system automation, frontend and retail service development.
Balance sheet Kambi’s strong balance sheet reflects the Group’s growth during the year.
Certain non-current assets of the Group relate to capitalised IT development costs. Other non-current assets include computer software, computer hardware, fixtures & fittings and deferred tax. The non-cash current assets on the balance sheet relate to trade receivables, other receivables and prepayments.
Significant liabilities on the balance sheet include the convertible bond (see note 22 on page 72) and trade and other payables (see note 21 on page 72).
Cash flow The net cash inflow for 2017 was €1.9 (2016: €4.9) million, increasing the total cash balance at the end of 2017 to €34.3 (2016: €32.4) million.
The Group demonstrated the ability to generate positive operating cash flows. A total of €4.7 (2016: €4.1) million in cash was generated from operating and investing activities (excluding working capital and financing activities) during 2017.
Financial review
Annual report and accounts 2017 Kambi Group plc
52
Annual report and accounts 2017 Kambi Group plc Financial report
52


The notes on pages 58-84 form an integral part of these consolidated financial statements.
Financial statementsStatement of consolidated profit or loss and other comprehensive income for the year ended 31 December 2017
Note 2017 €000
2016 €000
Revenue 6 62,066 56,003
Administrative expenses 7 (54,161) (46,770)
Other operating expenses 8 (212) (427)
Finance costs 9 (317) (313)
Investment income 10 9 14
Profit before items affecting comparability 7,385 8,507
Items affecting comparability - -
Profit before tax 11 7,385 8,507
Income tax expense 14 (1,483) (994)
Profit for the year 5,902 7,513
Other comprehensive income
Items that may be reclassified subsequently to profit or loss
Foreign currency translation adjustments 28 (594) (790)
(594) (790)
Items that may not be reclassified subsequently to profit or loss
Actuarial gain/(loss) on defined benefit scheme - 24
- 24
Other comprehensive income for the year (594) (766)
Total comprehensive income for the year 5,308 6,747
Earnings per share 29
Basic 0.198 0.253
Diluted 0.192 0.246
Annual report and accounts 2017 Kambi Group plc
54
Annual report and accounts 2017 Kambi Group plc Financial report
54

These consolidated financial statements were approved by the board of directors, authorised for issue on 28 March 2018 and signed on its behalf by:
Statement of consolidated financial position as at 31 December 2017
Note 2017 €000
2016 €000
Assets
Non-current assets
Intangible assets 16 11,428 10,025
Plant and equipment 17 3,883 3,760
Deferred tax assets 24 1,504 1,302
16,815 15,087
Current assets
Trade and other receivables 19 14,586 9,140
Cash and cash equivalents 20 34,303 32,388
48,889 41,528
Total assets 65,704 56,615
EQUITY AND LIABILITIES
Capital and reserves
Share capital 25 90 89
Share premium 25 53,660 53,273
Other equity & reserves 27 2,135 1,486
Currency translation reserve 28 (1,547) (953)
Accumulated losses (8,019) (13,921)
46,319 39,974
Non-current liabilities
Other financial liabilities 22 7,407 7,317
Deferred tax liabilities 24 218 154
Other liabilities 23 61 49
7,686 7,520
Creditors: Amounts falling due within one year
Trade and other payables 21 10,222 7,788
Current tax liabilities 1,477 1,333
11,699 9,121
Total equity and liabilities 65,704 56,615
The notes on pages 58 to 84 form an integral part of these consolidated financial statements.
Susan Ball Director
Patrick ClaseDirector
Annual report and accounts 2017 Kambi Group plc
55
Financial report

Statement of changes in equity for the year ended 31 December 2017
ShareCapital
€000
Share premium
€000
Other reserves
€000
Foreign currency
reserve €000
Accumulated losses €000
Total €000
Balance at 1 January 2016 89 53,273 625 (163) (21,434) 32,390
Changes in equity for 2016
Value of employee share options - - 350 - - 350
Deferred tax on share options - - 487 - - 487
Total comprehensive income for the year - - 24 (790) 7,513 6,747
Balance at 31 December 2016 89 53,273 1,486 (953) (13,921) 39,974
Changes in equity for 2017
Value of employee share options - - 318 - - 318
Deferred tax on share options - - 331 - - 331
Proceeds from issue of shares 1 387 - - - 388
Total comprehensive income for the year - - - (594) 5,902 5,308
Balance at 31 December 2017 90 53,660 2,135 (1,547) (8,019) 46,319
The notes on pages 58 to 84 form an integral part of these consolidated financial statements.
Annual report and accounts 2017 Kambi Group plc
56
Annual report and accounts 2017 Kambi Group plc Financial report
56

Consolidated cash flow statement for the year ended 31 December 2017
The notes on pages 58 to 84 form an integral part of these consolidated financial statements.
Note 2017 €000
2016 €000
Cash flows from operating activities
Profit before taxation 7,385 8,507
Depreciation 17 1,621 1,157
Amortisation 16 6,700 5,668
Finance costs 9 317 313
Investment income 10 (9) (14)
Share based payment expense 26 318 350
Movement in working capital:
Decrease/(increase) in trade and other receivables (5,447) 1,283
Increase/(decrease) in trade and other payables 2,435 527
Increase/(decrease) in other liabilities 12 (1)
Cash generated from/(used in) operations 13,332 17,790
Investment income received 9 14
Tax paid (1,157) (865)
Net cash generated from/(used in) operating activities 12,184 16,939
Cash flows from investing activities
Purchase of tangible fixed assets 17 (2,285) (3,428)
Development costs of intangible assets 16 (8,224) (7,577)
Net cash used in investing activities (10,509) (11,005)
Cash flows from financing activities
Proceeds from issuing new shares 387 -
Interest paid (248) (225)
Net cash generated from financing activities 139 (225)
Net movement in cash and cash equivalents 1,814 5,709
Cash and cash equivalents at the beginning of the year 32,388 27,481
Effect of foreign exchange rate changes 101 (802)
Cash and cash equivalents at the end of the year 20 34,303 32,388
Annual report and accounts 2017 Kambi Group plc
57
Financial report

Notes to the financial statements for the year ended 31 December 2017
1. General InformationKambi Group plc is the Group’s ultimate parent company and is incorporated and domiciled in Malta. Its registered office and principal place of business is 3rd Floor, 75, Quantum House, Abate Rigord Street, Ta’ Xbiex, XBX1120 Malta. The principal activity of Kambi Group plc and its subsidiaries (the Group) is the provision of managed sports betting services.
2. Application of new and revised International Financial Reporting Standards (IFRSs)
The accounting policies adopted are consistent with those of the previous financial period except as follows:
The Company has adopted the following new and amended IFRS and IFRIC interpretations as of 1 January 2017:
• IAS 7 Amendments – Disclosure Initiative (effective from 1 January 2017)
• IAS 12 Amendments – Recognition of Deferred Tax Assets for Unrealised Losses (effective from 1 January 2017)
• IFRS 12 Amendments – Disclosure of Interests in other Entities (effective from 1 January 2017)
The amendments to IAS 7 come with the objective to provide disclosures that enable users of financial statements to evaluate changes in liabilities arising from financing activities.
The amendments to IAS 12 clarify the following aspects:
• Unrealized losses on debt instruments measured at fair value and measured at cost for tax purposes give rise to a deductible temporary difference regardless of whether the debt instrument’s holder expects to recover the carrying amount of the debt instrument by sale or by use.
• The carrying amount of an asset does not limit the estimation of probable future taxable profits.
• Estimates for future taxable profits exclude tax deductions resulting from the reversal of deductible temporary differences.
• An entity assesses a deferred tax asset in combination with other deferred tax assets. Where tax law restricts the utilisation of tax losses, an entity would assess a deferred tax asset in combination with other deferred tax assets of the same type.
The amendments to IFRS 12 clarified the scope of the standard by specifying that the disclosure requirements in the standard apply to an entity’s interests classified as held for sale, as held for distribution or as discontinued operations.
The adoption of the amendments did not have material impact on the Group’s consolidated financial statements.
Standards, interpretations and amendments to published standards as adopted by the EU that are not yet effective up to 31 December 2017
Up to the date of the financial position, certain new standards, amendments and interpretations to existing standards have been published but are not yet effective for the current reporting period and which the Group has not yet adopted. None of the below mentioned standards is expected to have a material impact on the Group’s financial position and performance. These are as follows:
• IFRIC 19: (Amendments arising from IFRS 9) – Extinguishing Financial Liabilities with Equity Instruments (effective on adoption of IFRS 9)
• Introduction of IFRS 9 – Financial Instruments (effective from 1 January 2018)
• Introduction of IFRS 15 – Revenue from Contracts with Customers (effective from 1 January 2018)
• Introduction of IFRS 16 – Leases (effective from 1 January 2019)
• IFRS 1 amendments – First-time Adoption of International Financial Reporting Standards (effective from 1 January 2018)
• IFRS 2 narrow scope amendment – Share Based Payments (effective from 1 January 2018)
• IFRS 4 amendments – Insurance Contracts (effective on adoption of IFRS or from 1 January 2018)
• IAS 28 amendments - Investments in Associates and Joint Ventures (effective from 1 January 2018)
• IAS 40 amendments - Investment Property (effective from 1 January 2018)
IFRS 9 issued in November 2009 introduced new requirements for the classification and measurement of financial assets. IFRS 9 was subsequently amended in October 2010 to include requirements for the classification and measurement of financial liabilities and for de-recognition, and in November 2013 to include the new requirements for general hedge accounting. Another revised version of IFRS 9 was issued in July 2014 mainly to include a) impairment requirements for financial assets and b) limited amendments to the classification and measurement requirements by introducing a ‘fair value through other comprehensive income’ (FVTOCI) measurement category for certain simple debt instruments.
Key requirements of IFRS 9:
• all recognised financial assets that are within the scope of IAS 39 Financial Instruments: Recognition and Measurement are required to be subsequently measured at amortised cost or fair value. Specifically, debt investments that are held within a business model whose objective is to collect the contractual cash flows, and that have contractual cash flows that are solely payments of principal;
Annual report and accounts 2017 Kambi Group plc
58
Annual report and accounts 2017 Kambi Group plc Financial report
58

• and interest on the principal outstanding are generally measured at amortised cost at the end of subsequent accounting periods. Debt instruments that are held within a business model whose objective is achieved both by collecting contractual cash flows and selling financial assets, and that have contractual terms that give rise on specified dates to cash flows that are solely payments of principal and interest on the principal amount outstanding, are generally measured at FVTOCI. All other debt investments and equity investments are measured at their fair value at the end of subsequent accounting periods. In addition, under IFRS 9, entities may make an irrevocable election to present subsequent changes in the fair value of an equity investment (that is not held for trading) in other comprehensive income, with only dividend income generally recognised in profit or loss;
• with regard to the measurement of financial liabilities designated as at fair value through profit or loss, IFRS 9 requires that the amount of change in the fair value of the financial liability that is attributable to changes in the credit risk of that liability is presented in other comprehensive income, unless the recognition of the effects of changes in the liability’s credit risk in other comprehensive income would create or enlarge an accounting mismatch in profit or loss. Changes in fair value attributable to a financial liability’s credit risk are not subsequently reclassified to profit or loss. Under IAS 39, the entire amount of the change in the fair value of the financial;
• liability designated as fair value through profit or loss is presented in profit or loss;
• in relation to the impairment of financial assets, IFRS 9 requires an expected credit loss model, as opposed to an incurred credit loss model under IAS 39. The expected credit loss model requires an entity to account for expected credit losses and changes in those expected credit losses at each reporting date to reflect changes in credit risk since initial recognition. In other words, it is no longer necessary for a credit event to have occurred before credit losses are recognised;
• the new general hedge accounting requirements retain the three types of hedge accounting mechanisms currently available in IAS 39. Under IFRS 9, greater flexibility has been introduced to the types of transactions eligible for hedge accounting, specifically broadening the types of instruments that qualify for hedging instruments and the types of risk components of non-financial items that are eligible for hedge accounting. In addition, the effectiveness test has been overhauled and replaced with the principle of an ‘economic relationship’. Retrospective assessment of hedge effectiveness is also no longer required. Enhanced disclosure requirements about an entity’s risk management activities have also been introduced.
The directors have assessed the impact of IFRS 9 on the financial statements of the Group, and do not anticipate there to be any significant financial impact based on the modelling performed to assess any expected credit losses (of which there were none).
In May 2014, IFRS 15 was issued which establishes a single comprehensive model for entities to use in accounting for revenue arising from contracts with customers. IFRS 15 will supersede the current revenue recognition guidance including IAS 18, IAS 11 and the related Interpretations when it becomes effective (1 January 2018).
The core principle of IFRS 15 is that an entity should recognise revenue to depict the transfer of promised goods or services to customers in an amount that reflects the consideration to which the entity expects to be entitled in exchange for those goods or services. Specifically, the Standard introduces a 5-step approach to revenue recognition:
• Step 1: Identify the contract(s) with a customer.
• Step 2: Identify the performance obligations in the contract.
• Step 3: Determine the transaction price.
• Step 4: Allocate the transaction price to the performance obligations in the contract.
• Step 5: Recognise revenue when (or as) the entity satisfies a performance obligation.
Under IFRS 15, an entity recognises revenue when (or as) a performance obligation is satisfied, i.e. when ‘control’ of the goods or services underlying the particular performance obligation is transferred to the customer. Far more prescriptive guidance has been added in IFRS 15 to deal with specific scenarios. Furthermore, extensive disclosures are required by IFRS 15.
The directors of the Company have assessed the impact that the adoption of IFRS 15 would have on initial application as not significant based on a review of all contracts held with customers within the Kambi Group. No contracts were identified where there would be any material variances to the revenue recognition approach currently undertaken by the Group.
Annual report and accounts 2017 Kambi Group plc
59
Financial report
3. Basis of preparation & consolidationThe Group financial statements consolidate those of the parent company and of all of its subsidiaries as at 31 December 2017.
These financial statements have been prepared on the historical cost basis subject to modification where appropriate by the revaluation of financial assets and liabilities at fair value through profit or loss and in accordance with International Financial Reporting Standards as adopted by the EU. All references to IAS, IFRS or SIC/IFRIC interpretations refer to those adopted by the EU. The individual parent financial statements have been prepared separately.
Historical cost is generally considered to be the fair value of consideration paid in exchange for goods and services. Fair value is the price that would be received to sell an asset or paid to transfer a liability in an orderly transaction between market participants at the measurement date.
The Group has prepared financial statements which comply with IFRS applicable for periods ending on or after 31 December 2017, together with the comparative period data as at and for the year ended 31 December 2016, as described in the accounting policies. The significant accounting policies set out below have been consistently applied to all periods presented and have been applied consistently by the Group’s entities.
The directors believe that the Group will continue with its current growth and therefore the financial statements have been prepared on a going concern basis.
The consolidated financial statements comprise the financial statements of the Group and the entities it controls (its subsidiaries) as at 31 December 2017. An investor considers all relevant facts and circumstances when assessing whether it controls an investee. Control is achieved when the investor is exposed, or has rights, to variable returns from its involvement with the investee and has the ability to affect those returns through its power over the investee. The Group is considered to have power over an entity when it has existing rights that give it the current ability to direct the relevant activities of the investee. For the Group to have power over an entity, it must have the practical ability to exercise those rights. The entity reassesses whether or not it controls an investee if facts and circumstances indicate that there are changes to one or more of the elements of control identified above. Where necessary, adjustments are made to the financial statements of subsidiaries to bring the accounting policies used in line with those used by other members of the Group.
Consolidation of a subsidiary begins when the entity obtains control over the subsidiary and ceases when it loses control of the subsidiary. Specifically, income and expenses of a subsidiary acquired or disposed of during the year are included in the consolidated statement of profit or loss and other comprehensive income from the date the company gains control until the date the company ceases to control the subsidiary.
All intra-group assets and liabilities, equity, income, expenses and cash flows relating to transactions between members of the Group are eliminated in full in the consolidated financial statements. Unrealised losses are eliminated in the same way as unrealised gains, but only to the extent that there is no evidence of impairment.
4. Significant accounting policiesThe consolidated financial statements have been prepared using the significant accounting policies and measurement bases that are in effect at 31 December 2017, as summarised below. These were used throughout all periods presented.
Plant and equipment
The Group does not own property and its tangible non-current assets in the form of plant and equipment are classified into the following classes: office equipment, fixtures & fittings, computer hardware, and leasehold improvements.
Items of plant and equipment are initially measured at cost or manufacturing cost, including any costs directly attributable to bringing the assets to the location and in the condition necessary for these to be capable of being employed in the manner intended by the Group’s management. Subsequently they are stated at cost less accumulated depreciation and any accumulated impairment losses.
Subsequent costs are included in the asset’s carrying amount when it is probable that future economic benefits associated with the item will flow to the Group and the cost of the item can be measured reliably. Expenditure on repairs and maintenance is recognised as an expense when incurred.
Items of plant and equipment are derecognised on disposal or when no future economic benefits are expected from their use or disposal. Gains or losses arising from derecognition represent the difference between the net disposal proceeds, if any, and the carrying amount, and are included in profit or loss in the period of derecognition.
Depreciation
Depreciation commences when the depreciable assets are available for use and is charged to profit or loss so as to write off the cost, less any estimated residual value, over their estimated useful lives, using the straight-line method. The estimated useful lives for the current and comparative period are as follows:
Leasehold improvements: 5 years
Fixtures & fittings: 5 years
Office equipment: 5 years
Computer hardware: 3 years
Depreciation methods, useful lives and material residual values are reviewed at each reporting date with the effect of any change in estimate accounted for prospectively.
Intangible assets
An intangible asset is an identifiable non-monetary asset without physical substance. It is recognised if it is probable that the expected future economic benefits that are attributable to the asset will flow to the Group and the cost of the asset can be measured reliably. Intangible assets are initially measured at cost and subsequently stated at cost less accumulated amortisation and any accumulated impairment losses.
Annual report and accounts 2017 Kambi Group plc
60
Annual report and accounts 2017 Kambi Group plc Financial report
60

The useful life of intangible assets is assessed to determine whether it is finite or indefinite. Intangible assets with a finite useful life are amortised over their useful life on a systematic basis. Amortisation is charged to profit or loss on a straight line basis so as to write off the cost of intangible assets less any estimated residual value, over their estimated useful lives.
The amortisation method applied, the useful lives and material residual values are reviewed at each reporting date with the effect of any change in estimate accounted for prospectively.
Intangible assets with an indefinite useful life are not amortised but are tested for impairment annually. They are henceforth carried at cost less any accumulated impairment losses. The useful life of an intangible asset that is not being amortised is reviewed at each year-end in order to determine whether events and circumstances continue to support an indefinite useful life assessment. If they do not, the change in the useful life assessment from indefinite to finite is accounted for as a change in an accounting estimate. Intangible assets are classified into the following classes: Computer software, Development costs and Brands.
(i) Computer software
Acquired computer software licenses are capitalised on the basis of the costs incurred to acquire and install the specific software.
In determining the classification of an asset that incorporates both intangible and tangible elements, judgment is used in assessing which element is more significant. Computer software which is an integral part of the related hardware is classified under property, plant and equipment as computer hardware and accounted for in accordance with the Group’s accounting policy on property, plant and equipment. Where the software is not an integral part of the related hardware, this is classified as an intangible asset and carried at cost less any accumulated amortisation and any accumulated impairment losses. Computer software classified as an intangible asset is amortised on a straight-line basis over three years.
(ii) Research and development costs
Expenditure on research activities is recognised as an expense in the period in which it is incurred.
An internally-generated intangible asset arising from the Group’s development of a sportsbook product is recognised only if all of the following can be demonstrated by the Group:
— the technical feasibility of completing, and the intention to complete, the product so that it will be available for use or sale;
— the probability that the product will generate future economic benefits;
— the availability of adequate technical, financial and other resources to complete the development and to use or sell the product, and
— the ability to measure reliably the expenditure attributable to the product during its development.
The amount initially recognised for internally generated intangible assets is the total expenditure incurred from the date when the intangible asset first meets the recognition criteria listed above. Where no internally generated intangible asset can be recognised, development expenditure is recognised as an expense in the period in which it is incurred. After initial recognition, internally generated intangible assets are carried at cost less any accumulated amortisation and any accumulated impairment losses. Internally-generated intangible assets are amortised on a straight-line basis over their estimated useful lives, which is generally assumed to be three years.
(iii) Brands
Brands are capitalised on the basis of the costs incurred in relation to their development. Brands are classified as an intangible asset and are amortised on a straight-line basis over three years.
Derecognition of intangible assets: an intangible asset is derecognised upon disposal or when no future economic benefits are expected from use or disposal. Gains or losses arising from derecognition represent the difference between the net disposal proceeds, if any, and the carrying amount, and are included in profit or loss in the period of derecognition.
Financial instruments
Financial assets and financial liabilities are recognised when the Group becomes a party to the contractual provisions of the instrument.
Financial assets and financial liabilities are initially recognised at their fair value plus or minus, in the case of a financial asset or financial liability not at fair value through profit or loss, transaction costs that are directly attributable to the acquisition or issue of the financial asset or financial liability.
Financial assets are derecognised when the right to receive cash flows from the assets has expired or when the Group has transferred its contractual right to receive the cash flows of the financial assets, and either substantially all the risks and rewards of ownership have been transferred or substantially all the risks and rewards have neither been retained nor transferred but control is not retained.
Financial liabilities are classified as ‘other financial liabilities’ and include borrowings subsequently measured at amortised cost using the effective interest method. The effective interest method is a method of calculating the amortised cost of a financial liability and of allocating interest expense over the relevant period. The effective interest rate is the rate that exactly discounts estimated future cash payments (including all fees paid or received that form an integral part of the effective interest rate, transaction costs and other premiums or discounts) through the expected life of the financial liability, or where appropriate, a shorter period, to the net carrying amount on initial recognition.
Financial liabilities are derecognised when they are extinguished, that is when the obligation is discharged, is cancelled or expires.
Financial assets and financial liabilities are offset and the net amount reported in the statement of financial position when there is a legally enforceable right to offset the recognised amounts and there is an intention to settle on a net basis, or to realise the asset and settle the liability simultaneously.
Annual report and accounts 2017 Kambi Group plc
61
Financial report

An equity instrument is a contract that evidences a residual interest in the assets of an entity after deducting all of its liabilities. Equity instruments issued by a group entity are recognised as the proceeds received, net of direct issue costs. Repurchase of the entity’s own equity instruments is recognised and deducted directly in equity. No gain or loss is recognised in profit or loss on the purchase, sale, issue or cancellation of the entity’s own equity instruments.
Debt and equity instruments issued by the group are classified as either other financial liabilities or equity in accordance with the substance of the contractual agreements and the definitions of a financial liability and an equity instrument.
The component parts of compound instruments (the convertible bond) issued by the entity are classified separately as financial liabilities and equity in accordance with the substance of the contractual agreements and the definitions of a financial liability and an equity instrument.
At the date of issue, the fair value of the financial liability component is estimated using the prevailing market interest rate for similar risk non-convertible instruments. The amount is recognised as a liability on an amortised cost basis using the effective interest method until extinguished upon conversion or at the instrument’s maturity date.
The conversion option classified as equity is determined by deducting the amount of the liability component from the fair value of the compound instrument as a whole. This is recognised and included in equity, net of income tax effects, and is not subsequently remeasured. In addition, the conversion option classified as equity will remain in equity until the conversion option is exercised in which case; the balance recognised in equity will be transferred to other equity. When the conversion option remains unexercised at the maturity date of the convertible bond, the balance recognised in equity will be transferred to other equity. No gain or loss is recognised in profit or loss upon conversion or expiration of the conversion option. Changes in the fair value of the equity component are not recognised. Redemptions or refinancings of the equity component are recognised as changes in equity whereas gains or losses associated with redemptions or refinancings of the liability component are recognised in profit or loss.
(i) Trade receivables
Trade receivables comprise amounts due from customers for services performed in the ordinary course of business. If collection is expected in one year or less (or in the normal operating cycle of the business if longer), they are classified as current assets. If not, they are presented as non-current assets. Trade receivables are classified as current assets and are stated at their nominal value unless the effect of discounting is material, in which case trade receivables are measured at amortised cost using the effective interest method. Appropriate allowances for estimated irrecoverable amounts are recognised in profit or loss when there is objective evidence that the asset is impaired.
Receivables are tested for impairment annually and when there is objective evidence that the Group will not be able to collect all amounts due in accordance with the original terms, an allowance is recognised in profit or loss. Significant financial difficulties of the debtor, probability that the debtor will enter bankruptcy or financial reorganisation and default or delinquency in payments are considered indicators that
the receivable is impaired. The amount of the allowance is the difference between the carrying amount of the receivable and the present value of estimated future cash flows discounted at the original effective interest rate.
Loans and receivables are non-derivative financial assets with fixed or determinable payments that are not quoted in an active market other than those that are held for trading or are designated upon initial recognition as at fair value through profit or loss or as available-for-sale financial assets or those for which the Group may not recover substantially all of its initial investment other than because of credit deterioration.
(ii) Trade payables
Trade payables are classified as current liabilities and are stated at their nominal value unless the effect of discounting is material, in which case trade payables are measured at amortised cost using the effective interest method.
(iii) Shares issued by the Group
Ordinary shares issued by the Group are classified as equity instruments. Costs relating to an equity issue are offset against equity, as a deduction from the issue proceeds.
Revenue recognition
Revenue arises from the provision of services and is measured at the fair value of the consideration received or receivable for services provided in the normal course of business, net of value added tax, rebates and discounts, where applicable. Revenue is recognised when it is probable that future economic benefits will flow to the Group and the amount of revenue and the associated costs can be measured reliably.
(i) Provision of services
Revenue from the provision of services is recognised in profit or loss in the period in which the services are rendered, by reference to the stage of completion method of the specific transaction. This method is based on the actual service provided as a proportion of the total services to be provided. For practical purposes, when services are performed by an indeterminate number of acts over a specified period of time, revenue is recognised on a straight-line basis over the specified period unless there is evidence that some other method better represents the stage of completion.
(ii) Interest income and expense
Interest income and expense is recognised on an accruals basis by reference to the principal outstanding and by using the effective interest method when it is probable that the economic benefits will flow to or from the Group and the amount of income or expense can be measured reliably.
Income Tax
Income tax expense comprises current and deferred tax and is recognised in profit or loss, except to the extent that it relates to items recognised in other comprehensive income or directly in equity, in which case the current and deferred tax is also dealt with in other comprehensive income or in equity, as appropriate.
Current tax is based on the taxable income for the period using tax rates enacted or substantively enacted at the reporting date and any adjustment to tax payable in respect of previous years. The taxable result for the period differs from the result
Annual report and accounts 2017 Kambi Group plc
62
Annual report and accounts 2017 Kambi Group plc Financial report
62
as reported in profit or loss because it excludes items which are non-assessable or disallowed and it further excludes items that are taxable or deductible in other periods.
Deferred tax is recognised in respect of temporary differences between the carrying amounts of assets and liabilities for financial reporting purposes and the amounts used for taxation purposes. Deferred tax is measured at the tax rates that are expected to be applied to temporary differences when they reverse based on the laws that have been enacted or substantively enacted by the reporting date.
A deferred tax asset is recognised for unused tax losses and deductible temporary differences to the extent that it is probable that future taxable profits will be available against which they can be utilised. The carrying amount of deferred tax assets is reviewed at the end of each reporting period and reduced to the extent that it is no longer probable that sufficient taxable profit will be available to allow all or part of the asset to be utilised.
Deferred tax assets and liabilities are offset when the Group has a legally enforceable right to set off its current tax assets and liabilities and the deferred tax assets and liabilities relate to income taxes levied by the same taxation authority on either the same taxable entity or different taxable entities which intend either to settle current tax liabilities and assets on a net basis, or to realise the assets and settle the liabilities simultaneously, in each future period in which significant amounts of deferred tax liabilities or assets are expected to be settled or recovered.
Foreign currency translation
The financial statements of the Group are presented in its functional currency, the Euro, being the currency of the primary economic environment in which the Group operates. In preparing the financial statements of each individual group entity, transactions in currencies other than the Euro are translated at the rates of exchange prevailing at the dates of the transactions.
At the end of each reporting period, monetary items denominated in foreign currencies are re-translated to the presentation currency at the exchange rate prevailing at that date. Non-monetary assets and liabilities denominated in currencies other than the Euro that are measured at fair value are re-translated using the exchange rate ruling on the date the fair value was determined. Non-monetary items that are measured in terms of historical cost in a foreign currency are not retranslated. Exchange differences arising on the settlement and on the re-translation of monetary items are recognised in profit or loss.
For the purpose of presenting these consolidated financial statements, the assets and liabilities of the Group’s foreign operations are translated into Euro using exchange rates prevailing at the end of each reporting period. Income and expense items are translated at the average exchange rates for the period unless exchange rates fluctuate significantly during that period, in which case the exchange rates at the dates of the transactions are used. Exchange differences arising, if any, are recognised in other comprehensive income and accumulated in a foreign currency translation reserve in equity.
Exchange differences arising on the translation of non-monetary items carried at fair value are included in profit or loss for the period, except for differences arising on the
re-translation of non-monetary items in respect of which gains and losses are recognised in other comprehensive income. For such non-monetary items, any exchange component of that gain or loss is also recognised in other comprehensive income.
Foreign exchange gains and losses are included within Other Income and Expenses, except in the case of significant exchange differences arising on investing or financing activities, which are classified within investment income, investment losses or finance costs as appropriate. Foreign exchange gains and losses are reported on a net basis. Such gains and losses are, however, reported separately if they are material.
Cash and cash equivalents
Cash and cash equivalents comprise cash on hand and demand deposits, together with other short term highly liquid investments that are readily convertible into known amounts of cash and which are subject to an insignificant risk of change in value. Cash and cash equivalents are carried in the statement of financial position at face value. In the statement of cash flows, cash and cash equivalents comprise cash at bank, including deposits accessible on demand.
Provisions
Provisions are recognised when the Group has a present legal or constructive obligation as a result of a past event, it is probable that an outflow of resources embodying economic benefits will be required to settle the obligation and a reliable estimate can be made of the amount of the obligation. Provisions are measured at the directors’ best estimate of the expenditure required to settle the present obligation at the end of the reporting period taking into account the risks and uncertainties surrounding the obligation. If the effect of the time value of money is material, provisions are recognised at their present value by discounting the expected future cash flows at a pre-tax rate that reflects current market assessments of the time value of money and, where appropriate, the risks specific to the liability. When some or all of the economic benefits required to settle a provision are expected to be recovered from a third party, a receivable is recognised as an asset if it is virtually certain that reimbursement will be received and the amount of the receivable can be measured reliably.
Provisions are not recognised for future operating losses.
Items affecting comparability
The Group defines items affecting comparability as those items which, by their size or nature in relation to the Group, should be separately disclosed in order to give a full understanding of the Group’s underlying financial performance, and aid comparability of the Group’s results between periods.
Leases
The Group’s leases are all operating leases in which the Group is the lessee (leases in which a significant portion of the risks and rewards of ownership of the asset being leased are retained by the lessor). Operating lease payments are recognised as an expense on a straight-line basis over the term of the relevant lease (net of any incentive received from the lessor) except where another systematic basis is more representative of the time pattern in which economic benefits from the leased asset are consumed.
Annual report and accounts 2017 Kambi Group plc
63
Financial report

The aggregate benefit of lease-related incentives is recognised as a reduction of rental expense on a straight line basis except where another systematic basis is more representative of the time pattern in which economic benefits from the leased asset are consumed.
Share based payments
Share-based payment arrangements in which the Group receives goods or services as consideration for equity instruments are accounted for as equity settled share-based payment transactions by recognising in profit or loss the fair value of the awards with a corresponding increase in equity within other reserves.
The total amount to be expensed is measured by reference to the fair value at the grant date of the options granted, taking into account market performance conditions and the impact of any non-vesting conditions, and excluding the impact of any service or vesting conditions. Non-market performance and service conditions are included in assumptions about the number of options that are expected to vest. The total amount expensed is recognised over the vesting period of the options, which is usually three years. At each balance sheet date, the estimate of the number of options expected to vest is revised with the impact recognised in the statement of consolidated profit or loss and other comprehensive income and a corresponding adjustment to equity within other reserves.
Impairment
At the end of each reporting period, the Group reviews the carrying amounts of its tangible and intangible assets to determine whether there is any indication that those assets have suffered an impairment loss. If any such indication exists, an impairment test is carried out and the recoverable amount of the asset is estimated in order to determine the extent of the impairment loss (if any). Assets that have an indefinite useful life and are therefore not subject to amortisation or depreciation and intangible assets not yet available for use are tested annually for impairment and whenever there is an indication that the asset may be impaired. When it is not possible to estimate the recoverable amount of an individual asset, the Group estimates the recoverable amount of the cash-generating unit to which the asset belongs. When a reasonable and consistent basis of allocation can be identified, intangible assets are also allocated to individual cash generating units, or otherwise they are allocated to the smallest group of cash generating units for which a reasonable and consistent allocation basis can be identified.
An impairment loss is recognised if the carrying amount of an asset or its cash-generating unit exceeds its estimated recoverable amount. Impairment losses are recognised in profit or loss unless they relate to revalued assets where the impairment loss is treated as a revaluation decrease. The recoverable amount is the higher of an asset’s fair value less costs to sell and value in use. In assessing value in use the estimated future cash flows are discounted to their present value using a pre-tax discount rate that reflects current market assessments of the time value of money and the risks specific to the asset.
Impairment losses recognised in prior periods are assessed at each reporting date for any indications that the loss has decreased or no longer exists.
If in a subsequent period, the amount of the impairment loss decreases and the decrease can be related objectively to an event occurring after the impairment was recognised, the previously recognised impairment loss is reversed by adjusting the allowance account. The amount of the reversal is recognised in profit or loss unless it had previously been treated as a revaluation decrease. Reversal of impairment losses on goodwill is prohibited.
Post-employment benefits
The Group contributes towards the state pension in accordance with local legislation where required. The only obligation of the Group is to make the required contributions. Costs related to such contributions are expensed in the period in which they are incurred.
The Group also provides for certain additional post employment retirement benefits to employees in the Philippines. The cost of providing benefits under a defined benefit plan is determined using the projected unit credit method with actuarial valuations being carried out at the end of each annual reporting period. This cost is recognised in profit or loss and includes the service cost (including current service cost, past service cost and gains/losses on curtailments and settlements), net interest expense or income on the defined benefit liability or asset and re-measurement which comprises actuarial gains and losses, the effect of changes to the asset ceiling (if applicable) and the return on plan assets (excluding interest). The net defined benefit liability or asset includes actuarial gains and losses which are recognised in other comprehensive income in the period in which they arise.
Net interest is calculated by applying the discount rate to the net defined benefit liability or asset. The Group recognises the following changes in the net defined benefit obligation under Administrative Expenses in the Consolidated Statement of Profit or Loss and Other Comprehensive Income:
— Service costs
— Net interest expense or income
5. Judgments in applying accounting policies and key sources of estimation uncertainty
The amounts recognised in the financial statements are sensitive to the accounting policies, assumptions and estimates that underlie the preparation of financial statements. The judgments made by management in applying the Group’s accounting policies that have the most significant effect on the amounts recognised in the financial statements, together with information about the key assumptions concerning the future, and other key sources of estimation uncertainty at the end of the reporting period, that have a significant risk of causing a material adjustment to the carrying amounts of assets and liabilities within the next financial year are disclosed herein.
5.1 The following are the critical judgments, apart from those involving estimations (see note 5.2 below) that the directors have made in the process of applying the Group’s accounting policies and that have the most significant effect on the amounts recognised in the consolidated financial statements:
Annual report and accounts 2017 Kambi Group plc
64
Annual report and accounts 2017 Kambi Group plc Financial report
64

Deferred taxation
The recognition of deferred tax assets is based upon whether taxable profits will be available in the future against which the reversal of temporary differences can be deducted. To determine the future taxable profits, reference is made to the latest available profit forecasts. The amounts recognised in the consolidated financial statements are derived from the management’s best estimation and judgment of the above.
Convertible bond
The recognition of the liability component of the convertible bond requires an assessment of a discount rate which is assessed using the interest rate of an equivalent risk instrument that was not convertible. Management has estimated this rate based on historical experience with similar instruments that the Group has previously had in place.
5.2 The following are the key assumptions concerning the future and other key sources of estimation uncertainty at the end of the reporting period that may have a significant risk of causing a material adjustment to the carrying amounts of assets and liabilities within the next financial year.
Recoverability of internally generated intangible assets
IFRS requires management to undertake an annual test for impairment of internally generated intangible assets to determine if the carrying amount of any asset may not be recoverable. Impairment testing is an area involving management’s assessment that technological and economic feasibilities are achieved. In determining the amounts to be capitalised and for any impairment, management makes assumptions regarding the expected future cash generation of the project, discount rates to be applied and the expected period of benefits.
Useful lives of plant and equipment
The useful lives and residual values of the Group’s assets are determined by management at the time the asset is acquired and reviewed throughout the year for appropriateness. The lives are based on historical experience with similar assets as well as anticipation of future events which may impact their life. If the useful life of assets is reduced, depreciation increases and the carrying amount of the asset is reduced.
Fair value measurements and valuation processes
When the fair values of financial assets and financial liabilities recorded in the statement of financial position cannot be measured based on quoted prices in active markets, their fair value is measured using valuation techniques including the discounted cash flow (DCF) model. The variables in these models are taken from observable market inputs where possible, but where this is not feasible, a degree of estimation is required in establishing fair values.
Share options
Upon exercise of the share options disclosed in Note 26, the Group will have a liability to pay the employer’s National Insurance on any gains. The amounts recognised in the consolidated financial statements are derived from the management’s best estimation of the likely option vesting patterns and are based on the share price at the balance sheet date.
The Kambi Group Executive Share Option Plan (ESOP) was introduced in December 2013. Under the scheme, options will be exercisable over a seven year period, starting at the third anniversary of the date of grant and expiring at the tenth anniversary of the date of grant. Options are exercisable only to the extent that certain performance conditions in relation to free cash flow and EBITDA have been satisfied and are subject to the option holders remaining in continued employment with the Group.
Different numbers of options were issued under the scheme to various groups of staff. Management has made an estimation of the likely vesting patterns within the 7 year exercise window, based on the existing length of service of the option holders and other measures, for example, future share price.
The Kambi Group plc Share Option Plan 2015 was introduced in late December 2015, with a fixed exercise price equal to 110 per cent of the average share value, based on the average market value of a Kambi share on the First North Exchange, for the 10 business days before the options are granted. The options will be exercisable over a one year period, starting at the third anniversary of the date of grant and expiring at the fourth anniversary of the date of grant. Options are exercisable only to the extent that certain performance conditions in relation to EPS growth have been satisfied and are subject to the option holders remaining in continued employment with the Group.
Based on the above, an estimation of the employer’s National Insurance liability at each balance sheet date during the exercise window has been made and accounted for accordingly. The estimation is updated regularly according to various factors including attainment of the performance conditions, the number of options outstanding and the latest share price.
Post-employment benefit obligations
The cost of the defined benefit retirement plan in the Philippines is dependent on actuarial valuations. An actuarial valuation involves making various assumptions that may differ from actual developments in the future. These include the determination of the discount rate, future salary increases, mortality rates and future pension increases. Due to the complexities involved in the valuation and its long-term nature, a defined benefit obligation is highly sensitive to changes in these assumptions. All assumptions are reviewed at each reporting date and remeasurement gains and losses arising from such reviews are recognised in other comprehensive income.
Annual report and accounts 2017 Kambi Group plc
65
Financial report

2017 €000
2016 €000
Services rendered 62,066 56,003
6. Revenue and segmental informationRevenue and segmental information
Revenue represents the amount receivable for services rendered during the year, net of any discounts and indirect taxes, as follows:
The Group operates solely through one revenue stream, being the provision of managed sports betting services and this is not divided into operational segments for the Chief Decision Makers’ review.
Geographical information
The Group operates across multiple geographical locations; however, primarily its revenue is derived from external customers registered in Malta. The Group does not analyse non-current assets by location, nor do the Chief Decision Makers review revenue by geographical split. Revenue from external customers by geographical region is detailed below:
Information about major customers
Group revenue includes €48.8m (2016: €43.6m) of sales that cumulatively amount to 79% (2016: 78%) of total Group revenue arising from sales to the Group’s two largest customers (2016: two largest customers).
7. Expenses by nature
There were no fees paid to the statutory auditor for non-audit fees during 2017 and 2016.
Revenue from external customers
2017 €000
2016 €000
Malta 41,025 33,717
Rest of World 21,041 22,286
62,066 56,003
Administrative expenses
2017 €000
2016 €000
Marketing costs 884 771
Fees payable to statutory auditor 117 113
Operating lease rentals on buildings 2,083 1,715
Staff costs (note 13) 24,121 21,821
Other employee related costs 1,416 1,058
Facilities costs 3,561 3,117
Depreciation of property, plant and equipment 1,621 1,157
Amortisation of intangible assets 6,700 5,668
Travel costs 1,569 1,666
Consultants 5,366 4,367
Other 6,723 5,317
54,161 46,770
Annual report and accounts 2017 Kambi Group plc
66
Annual report and accounts 2017 Kambi Group plc Financial report
66

2017 €000
2016 €000
Foreign currency loss 212 427
2017 €000
2016 €000
Interest on convertible bond 315 311
Other interest 2 2
317 313
2017 €000
2016 €000
Interest income on bank deposits 9 14
2017 €000
2016 €000
The profit/(loss) before tax is after charging: Total remuneration payable to the Group’s auditors for the audit of the Group’s financial statements
117
113
8. Other operating expenses
12. Key management personnel compensation
9. Finance costs
10. Investment income
11. Profit/(loss) before tax
Directors’ remunerationFees/salary
€000Other €000
2017 €000
2016 €000
Anders Ström 47 - 47 47
Lars Stugemo 96 21 117 133
Patrick Clase 57 - 57 57
Susan Ball 57 14 71 57
Cecilia Wachtmeister 25 - 25 -
282 35 317 294
Kristian Nylen (CEO) 562 - 562 396
Management remuneration 1,368 - 1,368 1,393
2,212 35 2,247 2,083
The remuneration of the Directors and executive management is also disclosed on page 42.
Annual report and accounts 2017 Kambi Group plc
67
Financial report

13. Staff costs and employee information2017
€0002016
€000
Wages and salaries 18,872 16,825
Social security costs 3,464 3,324
Pension & retirement costs 1,467 1,322
Share based payments (note 26) 318 350
24,121 21,821
2017 €000
2016 €000
Current tax (expense)/credit (1,376) (389)
Deferred tax (expense)/credit (note 24) (107) (605)
(1,483) (994)
2017 €000
2016 €000
Profit/(loss) before tax 7,385 8,507
Tax (charge)/credit at the applicable rate of 35% (2,585) (2,978)
Tax effect of:
Items of income/expenditure not taxable/deductible (425) 635
Prior year (under) provision/over provision of tax (139) (5)
Overseas tax rates 1,266 765
Deferred tax recognised on unremitted earnings 385 588
Other 15 1
Tax (charge)/credit for the year (1,483) (994)
2017 Number
2016 Number
Operations 333 308
IT 127 106
Other 85 71
545 485
The average number of persons employed during the year was made up as follows:
Income tax in Malta is calculated at a basic rate of 35% (2016: 35%) of the estimated assessable profit for the year. Taxation for other jurisdictions is calculated at the rates prevailing in the respective jurisdictions.
The tax (expense)/credit for the year can be reconciled to the profit per the income statement as follows:
14. Income tax (expense)/creditOn taxable profit subject to income tax at 35%: -
Annual report and accounts 2017 Kambi Group plc
68
Annual report and accounts 2017 Kambi Group plc Financial report
68

15. DividendsThere were no dividends paid during 2017 (2016: nil).
The amortisation charge for the year of €6,700,000 (2016: €5,668,000) has been included in administrative expenses.
16. Intangible fixed assetsComputer
software €000
Development costs €000
Brands €000
Total €000
Cost
At 1 January 2016 743 31,249 19,095 51,087
Additions 39 7,447 91 7,577
Released on disposal - - - -
Foreign currency translation (63) 4 (10) (69)
At 31 December 2016 719 38,700 19,176 58,595
Additions 40 8,184 - 8,224
Released on disposal (18) - - (18)
Reclassification - - (69) (69)
Foreign currency translation (23) (25) (13) (61)
At 31 December 2017 718 46,859 19,094 66,671
Accumulated amortisation
At 1 January 2016 (647) (23,399) (18,943) (42,989)
Provision for the year (55) (5,557) (56) (5,668)
Released on disposal - - - -
Foreign currency translation 84 3 - 87
At 31 December 2016 (618) (28,953) (18,999) (48,570)
Provision for the year (63) (6,577) (60) (6,700)
Released on reclassification - - 5 5
Foreign currency translation 22 - - 22
At 31 December 2017 (659) (35,530) (19,054) (55,243)
Carrying amount
At 31 December 2017 59 11,329 40 11,428
At 31 December 2016 101 9,747 177 10,025
Annual report and accounts 2017 Kambi Group plc
69
Financial report

Office Equipment
€000
Fixtures & Fittings
€000
Computer Hardware
€000
Leasehold Improve
ments €000
Total €000
Cost
At 1 January 2016 525 323 4,049 1,039 5,936
Additions 66 264 1,174 1,924 3,428
Released on disposal - (108) - (388) (496)
Foreign currency translation (21) (14) (208) (91) (334)
At 31 December 2016 570 465 5,015 2,484 8,534
Additions 312 107 1,383 483 2,285
Released on disposal (32) - (118) - (150)
Foreign currency translation (26) - (20) (60) (106)
At 31 December 2017 824 572 6,260 2,907 10,563
Depreciation and impairment
At 1 January 2016 (341) (215) (3,100) (744) (4,400)
Provisions for the year (58) (67) (739) (293) (1,157)
Released on disposal - 108 - 388 496
Foreign currency translation 5 10 231 41 287
At 31 December 2016 (394) (164) (3,608) (608) (4,774)
Provisions for the year (126) (179) (803) (513) (1,621)
Released on disposal 32 - 118 - 150
Foreign currency translation (16) - (99) (320) (435)
At 31 December 2017 (504) (343) (4,392) (1,441) (6,680)
Carrying amount
At 31 December 2017 320 229 1,868 1,466 3,883
At 31 December 2016 176 301 1,407 1,876 3,760
17. Plant and equipment
Annual report and accounts 2017 Kambi Group plc
70
Annual report and accounts 2017 Kambi Group plc Financial report
70
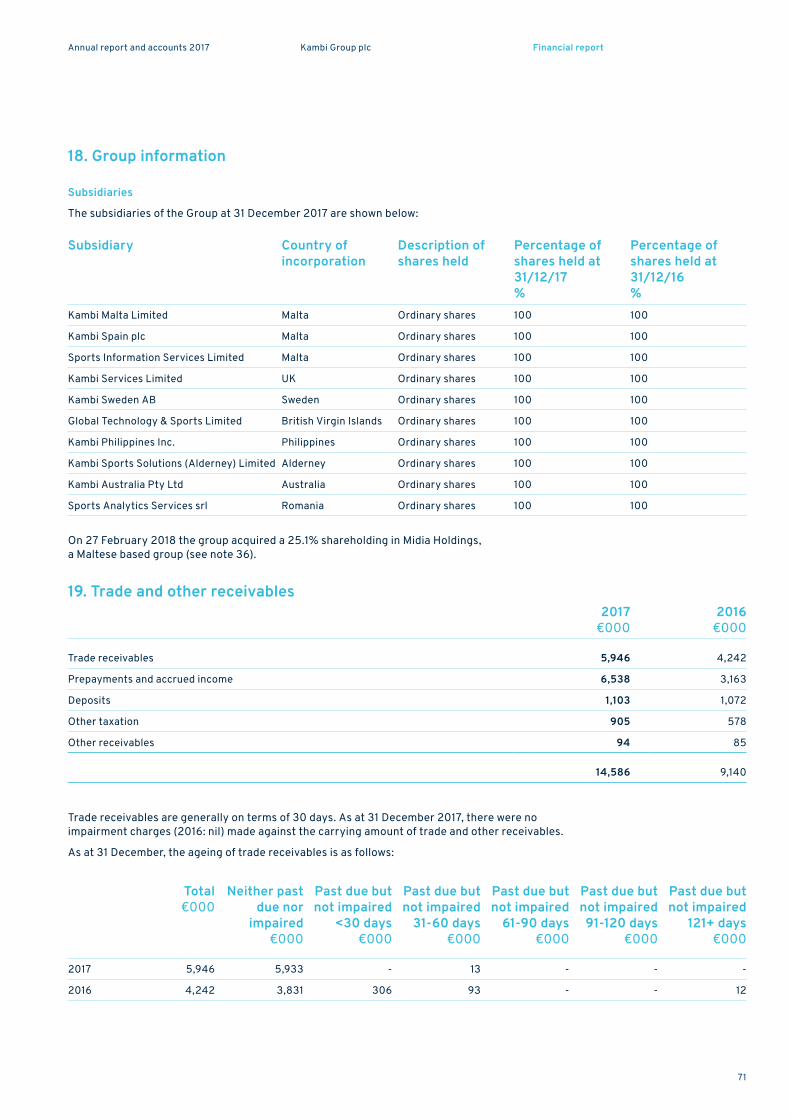
18. Group information
Subsidiaries
The subsidiaries of the Group at 31 December 2017 are shown below:
Trade receivables are generally on terms of 30 days. As at 31 December 2017, there were no impairment charges (2016: nil) made against the carrying amount of trade and other receivables.
As at 31 December, the ageing of trade receivables is as follows:
19. Trade and other receivables
Subsidiary Country ofincorporation
Description ofshares held
Percentage ofshares held at 31/12/17%
Percentage ofshares held at 31/12/16%
Kambi Malta Limited Malta Ordinary shares 100 100
Kambi Spain plc Malta Ordinary shares 100 100
Sports Information Services Limited Malta Ordinary shares 100 100
Kambi Services Limited UK Ordinary shares 100 100
Kambi Sweden AB Sweden Ordinary shares 100 100
Global Technology & Sports Limited British Virgin Islands Ordinary shares 100 100
Kambi Philippines Inc. Philippines Ordinary shares 100 100
Kambi Sports Solutions (Alderney) Limited Alderney Ordinary shares 100 100
Kambi Australia Pty Ltd Australia Ordinary shares 100 100
Sports Analytics Services srl Romania Ordinary shares 100 100
2017 €000
2016 €000
Trade receivables 5,946 4,242
Prepayments and accrued income 6,538 3,163
Deposits 1,103 1,072
Other taxation 905 578
Other receivables 94 85
14,586 9,140
Total €000
Neither past due nor
impaired €000
Past due but not impaired
<30 days €000
Past due but not impaired
31-60 days €000
Past due but not impaired
61-90 days €000
Past due but not impaired 91-120 days
€000
Past due but not impaired
121+ days €000
2017 5,946 5,933 - 13 - - -
2016 4,242 3,831 306 93 - - 12
On 27 February 2018 the group acquired a 25.1% shareholding in Midia Holdings, a Maltese based group (see note 36).
Annual report and accounts 2017 Kambi Group plc
71
Financial report
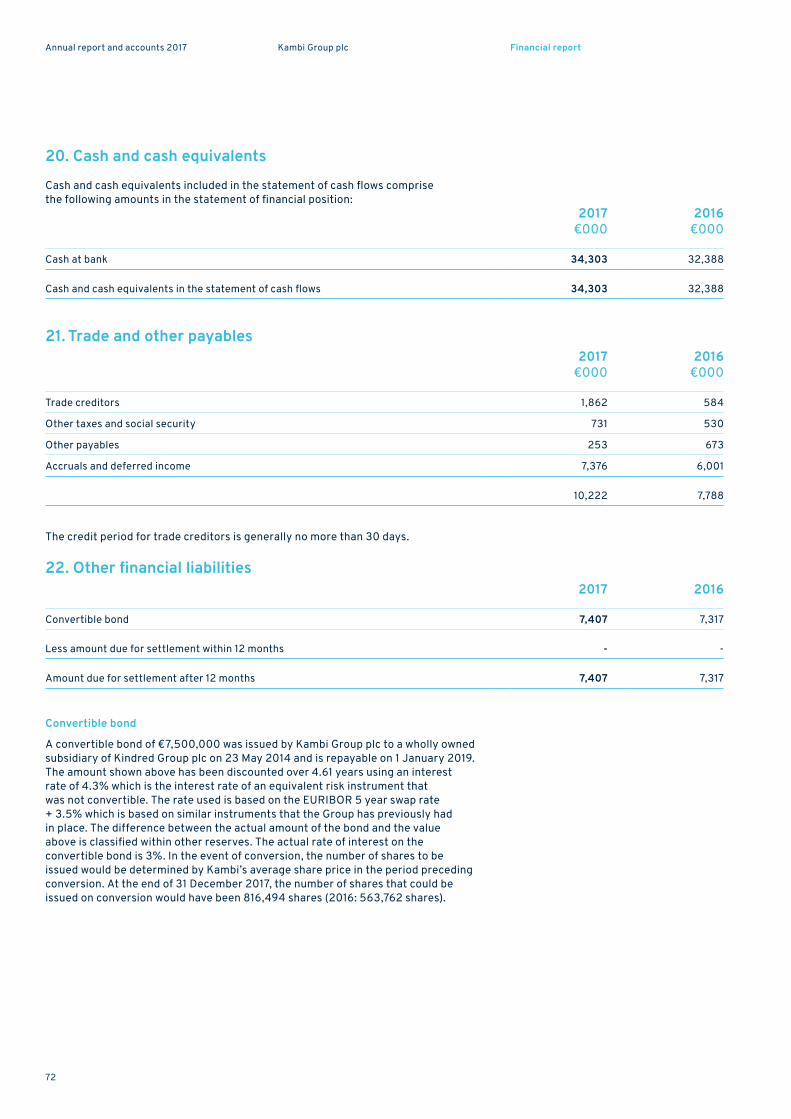
20. Cash and cash equivalentsCash and cash equivalents included in the statement of cash flows comprise the following amounts in the statement of financial position:
The credit period for trade creditors is generally no more than 30 days.
22. Other financial liabilities
Convertible bond
A convertible bond of €7,500,000 was issued by Kambi Group plc to a wholly owned subsidiary of Kindred Group plc on 23 May 2014 and is repayable on 1 January 2019. The amount shown above has been discounted over 4.61 years using an interest rate of 4.3% which is the interest rate of an equivalent risk instrument that was not convertible. The rate used is based on the EURIBOR 5 year swap rate + 3.5% which is based on similar instruments that the Group has previously had in place. The difference between the actual amount of the bond and the value above is classified within other reserves. The actual rate of interest on the convertible bond is 3%. In the event of conversion, the number of shares to be issued would be determined by Kambi’s average share price in the period preceding conversion. At the end of 31 December 2017, the number of shares that could be issued on conversion would have been 816,494 shares (2016: 563,762 shares).
21. Trade and other payables
2017 €000
2016 €000
Cash at bank 34,303 32,388
Cash and cash equivalents in the statement of cash flows 34,303 32,388
2017 €000
2016 €000
Trade creditors 1,862 584
Other taxes and social security 731 530
Other payables 253 673
Accruals and deferred income 7,376 6,001
10,222 7,788
2017 2016
Convertible bond 7,407 7,317
Less amount due for settlement within 12 months - -
Amount due for settlement after 12 months 7,407 7,317
Annual report and accounts 2017 Kambi Group plc
72
Annual report and accounts 2017 Kambi Group plc Financial report
72

The Group provides for certain post-employment retirement benefits to employees in the Philippines. This plan is governed by the employment laws of the Philippines, which require retirement benefits to be provided. The level of benefits provided depends on the member’s length of service and salary at retirement age and is determined by an amount equivalent to one half of a month’s salary for every year of service, with six months or more of service considered as one year.
The Group has used the actuary Institutional Synergy, Inc. based in the Philippines to determine the current liability. The fee paid to the actuary for these services in 2017 was €1,000 (2016: €1,000).
The following tables summarise the components of net benefit expense recognised in the statement of profit or loss and the funded status and amounts recognised in the statement of financial position for the plan:
23. Other liabilitiesNet employee defined benefit liabilities 2017
€0002016
€000
Philippines post-employment retirement plan 61 49
Total 61 49
Net benefit expense (recognised in profit or loss) 2017 2016
Current service cost 19 15
Past service cost - 7
Interest cost on benefit obligation - 3
19 25
Movement in the present value of the obligation (PVO)
2017
€000
2016
€000
PVO at beginning of year 49 50
Current service cost 19 15
Interest cost - 3
Actuarial loss due to:
Experience adjustments - (2)
Changes in financial assumptions - 2
Changes in demographic assumptions - (24)
Past service cost - 7
Movement in exchange rate (7) (2)
PVO at end of year 61 49
Annual report and accounts 2017 Kambi Group plc
73
Financial report

23. Other liabilities (continued)The principal assumptions used in determining retirement benefit obligations for the Group’s plans are shown below:
A quantitative sensitivity analysis for significant assumptions as at 31 December 2017 is as shown below:
The following payments are expected contributions to the defined benefit plan in future years:
The average duration of the defined benefit obligation at the end of the reporting period is 29.42 years (2016: 29.42 years). The entire obligation relates to active plan members.
Actuarial assumptions 2017 2016
Discount rate 6.01% 6.01%
Salary increase rate 3.00% 3.00%
Mortality rate 1994 GAM 1994 GAM
Turnover rate Scale Scale
Employees profile
Number of plan members 164 164
Total annual compensation €000 1,733 1,552
Average annual compensation €000 9 9
Average attained age 27.39 27.39
Average years of service 2.90 2.90
Average expected future service years 11.00 11.00
Discount rate Present Value Present Value
1% increase 48 38
Actual 68 49
1% decrease 79 63
Salary increase rate Present Value Present Value
1% increase 80 64
Actual 68 49
1% decrease 47 38
2017 €000
2016 €000
Less than one year - -
More than one year to five years - -
More than five years to 10 years - -
More than 10 years to 15 years - -
More than 15 years to 20 years 13 13
More than 20 years 2,115 2,115
Annual report and accounts 2017 Kambi Group plc
74
Annual report and accounts 2017 Kambi Group plc Financial report
74

24. Deferred taxDeferred income taxes are calculated on all temporary differences under the liability method using a principal tax rate of 35% (2016 - 35%). The following are the deferred tax liabilities and assets (prior to offset) recognised by the Group and movements thereon during the current and prior reporting period:
Certain deferred tax assets and liabilities may have been offset when there is a legally enforceable right to offset current tax assets against current tax liabilities and when the deferred income taxes and liabilities relate to income taxes levied by the same taxation authority on either the same taxable entity or different taxable entities where there is an intention to settle the balances on a net basis.
The movement for the year is reconciled as follows:
The following is the analysis of the deferred tax balances (after offset) for financial reporting purposes:
2015 €000
Movement for year
€000
2016 €000
Movement for year
€000
2017 €000
Unremitted Earnings 1,185 (798) 387 (131) 256
Tangible fixed assets 106 (36) 70 18 88
Unrealised exchange differences
(66) 143 77 (6) 71
Tax losses - - - - -
Other 77 537 614 257 871
1,302 (154) 1,148 138 1,286
2017 €000
2016 €000
(Charge)/Credit to income for the year (107) (605)
Credit directly to equity 247 487
Foreign currency translation (2) (36)
138 (154)
2017 €000
2016 €000
Deferred tax assets 1,504 1,302
Deferred tax liabilities (218) (154)
1,286 1,148
Annual report and accounts 2017 Kambi Group plc
75
Financial report

25. Share Capital and Share Premium
Ordinary “A” shares and Ordinary “B” shares carry rights to dividends. One Ordinary “B” share entitles the holder to one vote at shareholders’ meetings of the Company. Each Ordinary “A” share that might be issued upon conversion of the convertible bond would entitle the holder to a higher number of votes than Ordinary “B” shares, calculated according to a formula set out in the terms and conditions of the bond and in the Company’s articles of association.
26. Share based paymentsThe Group operates a share-based payment scheme as set out within this note. No options within the scheme have been exercised. The total charge for the year relating to employee share based payment schemes was €318,000 (2016: €350,000) all of which related to equity-settled share based payment transactions.
The information provided below relates to the share option scheme operated by Kambi Group plc, for the benefit of employees of the Group.
Kambi Group Executive Share Options Plan
The Kambi Group Executive Share Option Plan (ESOP) was introduced in December 2013. Under the scheme, the Board can grant options over shares in the Group entities to employees of any entity within the Kambi Group.
Options are granted with a fixed exercise price equal to 130 per cent of the average share value, based on an external valuation. Awards under the scheme are generally made to employees at a senior level. Options will be exercisable in accordance with a vesting schedule set at the date of grant and will expire not later than the tenth anniversary of the date of grant. Options are exercisable only to the extent that certain performance conditions in relation to free cash flow and EBITDA have been satisfied and are subject to continued employment.
Grants made under the ESOP are valued using the Black-Scholes option-pricing model. The fair value per option granted and the assumptions used in the calculation are as follows. The exercise price of the options was set in GBP as this was the functional currency of Kindred Group plc, which was the owner of the Group at the date of grant.
The expected volatility is based on the standard deviation of Kindred Group’s share price over a year, prior to the grant date. During 2013, Kambi Group plc was not publicly traded and therefore Kindred Group’s share price was used to calculate the expected volatility. The risk-free rates of return applied to the ESOP grant is the approximate implicit risk-free interest rate for the options’ term to maturity, based on the three-year maturity rate offered by Riksbanken at the date of each grant.
2017 €000
2016 €000
Authorised
750,000,000 Ordinary ‘A’ shares of €0.003 each 2,250 2,250
250,000,000 Ordinary ‘B’ shares of €0.003 each 750 750
Issued and fully paid up
30,015,197 Ordinary ‘B’ shares (29,741,197 Ordinary ‘B’) of €0.003 each 90 89
Share premium
Share premium reserve 53,660 53,273
Grant date 14 Dec 2013
Exercise price GBP 1.23
Number of employees 53
Shares under option 961,000
Vesting period (years) 3
Expected volatility % 21
Option life (years) 10
Expected life (years) 3.50
Risk-free rate % 1.23
Expected dividends expressed as dividend yield %
0
Fair value per option GBP 0.08
Annual report and accounts 2017 Kambi Group plc
76
Annual report and accounts 2017 Kambi Group plc Financial report
76

Kambi Group plc Share Option Plan 2015
The Kambi Group plc Share Option Plan 2015 was introduced in December 2015. Under the scheme, the Board can grant options over shares in the Group to employees of any entity within the Kambi Group.
Options are granted with a fixed exercise price equal to 110 per cent of the average share value, based on the average market value of a Kambi share on the First North Exchange, for the 10 business days before the options are granted. Awards under the scheme are generally made to employees at a senior level. Options will normally be exercisable in accordance with a vesting schedule set at the date of grant and will expire not later than the fourth anniversary of the date of grant. Options are exercisable only to the extent that certain performance conditions in relation to EPS growth have been satisfied and are subject to continued employment.
Grants made under this plan are valued using the Black-Scholes option-pricing model. The fair value per option granted and the assumptions used in the calculation are as follows:
A reconciliation of option movements over the year to 31 December 2017 is shown below:
Kambi Group Executive Share Option Plan
The future volatility assumption is an average of the Company’s share price performance over the 18 months immediately preceding grant, and Kindred’s share price performance over a period of 36 months immediately preceding grant. This reflects the Company’s own performance since its IPO in June 2014. However, the future vesting period for these options is 3 years. A 3 year volatility assumption should also reflect an historic 3 year period. The most appropriate historic 3 year volatility for Kambi is that of Kindred Group plc, Kambi’s former parent company.
Grant date 23 Dec 2015
Exercise price SEK 121.165
Number of employees 38
Shares under option 404,000
Vesting period (years) 3
Expected volatility % 33.17
Option life (years) 4
Expected life (years) 3.50
Risk-free rate % -0.06%
Expected dividends expressed as dividend yield %
0
Fair value per option EUR 2.60
2017 2016
Number
Weighted average exercise price GBP Number
Weighted average exercise price GBP
Outstanding at 1 January 930,000 1.23 942,000 1.23
Exercised (274,000) 1.23 - -
Granted - - - -
Lapsed - - - -
Forfeited - - (12,000) 1.23
Outstanding at 31 December 656,000 1.23 930,000 1.23
Annual report and accounts 2017 Kambi Group plc
77
Financial report
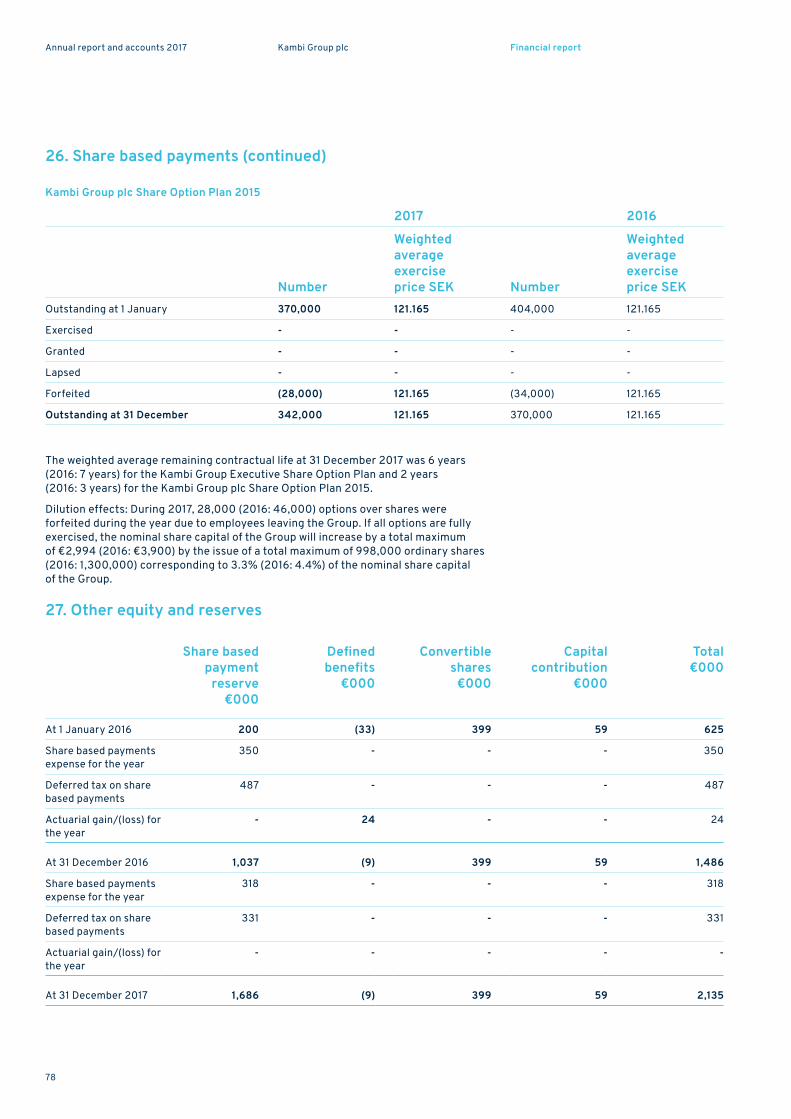
26. Share based payments (continued)
Kambi Group plc Share Option Plan 2015
2017 2016
Number
Weighted average exercise price SEK Number
Weighted average exercise price SEK
Outstanding at 1 January 370,000 121.165 404,000 121.165
Exercised - - - -
Granted - - - -
Lapsed - - - -
Forfeited (28,000) 121.165 (34,000) 121.165
Outstanding at 31 December 342,000 121.165 370,000 121.165
The weighted average remaining contractual life at 31 December 2017 was 6 years (2016: 7 years) for the Kambi Group Executive Share Option Plan and 2 years (2016: 3 years) for the Kambi Group plc Share Option Plan 2015.
Dilution effects: During 2017, 28,000 (2016: 46,000) options over shares were forfeited during the year due to employees leaving the Group. If all options are fully exercised, the nominal share capital of the Group will increase by a total maximum of €2,994 (2016: €3,900) by the issue of a total maximum of 998,000 ordinary shares (2016: 1,300,000) corresponding to 3.3% (2016: 4.4%) of the nominal share capital of the Group.
27. Other equity and reserves
Share based payment
reserve €000
Defined benefits
€000
Convertible shares
€000
Capital contribution
€000
Total €000
At 1 January 2016 200 (33) 399 59 625
Share based payments expense for the year
350 - - - 350
Deferred tax on share based payments
487 - - - 487
Actuarial gain/(loss) for the year
- 24 - - 24
At 31 December 2016 1,037 (9) 399 59 1,486
Share based payments expense for the year
318 - - - 318
Deferred tax on share based payments
331 - - - 331
Actuarial gain/(loss) for the year
- - - - -
At 31 December 2017 1,686 (9) 399 59 2,135
Annual report and accounts 2017 Kambi Group plc
78
Annual report and accounts 2017 Kambi Group plc Financial report
78

Share-based payments
The share-based payment reserve is used to recognise the value of equity-settled share-based payments provided to employees, including key management personnel, as part of their remuneration package.
Defined benefits
The defined benefits reserve is used to recognise any actuarial gain/(loss) from the employee defined benefits scheme in place.
Convertible shares
The convertible share reserve covers the equity component of the issued convertible bond. The liability component is reflected in other financial liabilities.
Capital contribution
The capital contribution is unsecured and interest-free and is repayable exclusively at the option of the Group.
28. Foreign currency translation reserve
The translation reserve of the Group comprises all foreign currency differences arising from the translation of the results and net assets of the Group’s foreign operations from their functional currencies to the Group’s presentation currency. This amount is recognised in other comprehensive income and accumulated in the foreign currency translation reserve. This reserve is non-distributable.
2017 €000
2016 €000
Opening balance (953) (163)
Movement for the year (594) (790)
Closing balance (1,547) (953)
Annual report and accounts 2017 Kambi Group plc
79
Financial report

29. Earnings per shareBasic EPS amounts are calculated by dividing the profit for the year attributable to ordinary equity holders of the parent by the weighted average number of ordinary shares outstanding during the year.
Diluted EPS amounts are calculated by dividing the profit attributable to ordinary equity holders of the parent (after adjusting for interest on the convertible preference shares) by the weighted average number of ordinary shares outstanding during the year plus the weighted average number of ordinary shares that would be issued on conversion of all the dilutive potential ordinary shares into ordinary shares. The following reflects the income and share data used in the basic and diluted EPS computations:
The convertible bond has been excluded from the earnings per share calculation as it is considered antidilutive. If the convertible bond was included in the calculation, profit attributable to ordinary equity holders on dilution would increase by €315,000 (2016: €311,000) and the weighted average number of ordinary shares on dilution would increase by 849,534 shares (2016: 587,140 shares).
30. Related party disclosuresThe Group has no transactions with related parties for the year ended 31 December 2017 and 2016 apart from Directors’ and Key Management Remuneration. For details of Directors’ and Key Management Remuneration, please refer to note 12.
2017€000
2016€000
Profit attributable to ordinary equity holders 5,902 7,513
Profit attributable to ordinary equity holders adjusted for the effect of dilution 5,902 7,513
2017 ‘000
2016 ‘000
Weighted average number of ordinary shares for basic EPS 30,015 29,741
Effects of dilution from:
Share options 720 842
Weighted average number of ordinary shares adjusted for the effect of dilution 30, 735 30,583
Earnings per share€ €
Basic 0.198 0.253
Diluted 0.192 0.246
Annual report and accounts 2017 Kambi Group plc
80
Annual report and accounts 2017 Kambi Group plc Financial report
80

31. Operating leases
At the end of the reporting period, the Group had outstanding commitments under non-cancellable operating leases, which fall due as follows:
Operating lease payments represent rentals payable by the Group for certain buildings. Leases are negotiated and rentals are fixed for a remaining average term of 5 years (2016: 5 years).
32. Capital commitmentsThere were no capital commitments at 31 December 2017 or 31 December 2016.
33. Contingent assets The 2016 contingent asset was settled for €275,000 during 2017 and recognized in the Consolidated Income Statement accordingly. There were no contingent assets at 31 December 2017 (2016: €558,000).
34. Contingent liabilitiesThere were no contingent liabilities at 31 December 2017 or 31 December 2016.
35. Financial risk management
Financial risk factors
The Group’s activities potentially expose it to a variety of financial risks: market risk (including unfavourable outcomes on the events where it offers odds, foreign exchange and interest rate risks), credit risk and liquidity risk. The Group’s overall risk management approach, covering risk exposures for all Group undertakings, focuses on the unpredictability of financial
markets and seeks to minimise potential adverse effects on the Group’s financial performance.
The exposures to risk and the way risks arise, together with objectives, policies and processes for managing and measuring these risks, are disclosed in more detail below. The objectives, policies and processes for managing financial risks and the methods used to measure such risks are subject to continual improvement and development.
(a) Market risk
Unfavourable outcomes on the events where the Group offers odds: The Group has adopted specific risk management policies that control the maximum risk level for each sport or event on which the Group offers odds. The results of the most popular teams in major football leagues comprise the predominant market risk. Through diversification, which is a key element of the Group’s business, the risk is spread across a large number of events and sports. The Kambi Compliance Officer is responsible for day-to-day monitoring of market risk. It is also their responsibility to advise the odds compilers and risk managers on appropriate levels for certain events. The Kambi Compliance Officer assesses risk levels for individual events as well as from a longer term perspective. The Group continuously monitors its risk limits for each operator and end user.
2017 €000
2016 €000
Recognised as expense for the year 2,098 1,725
2017 €000
2016 €000
Within one year 2,479 1,595
Between one and five years 7,714 5,357
Over five years 450 1,506
10,643 8,458
Annual report and accounts 2017 Kambi Group plc
81
Financial report

35. Financial risk management (continued)Foreign exchange: The Group undertakes transactions denominated in foreign currencies and is also exposed to foreign exchange risk from recognised assets and liabilities in foreign currency. Currency risk is managed by means of holding funds on short-term deposit in the currencies of the Group’s principal cash outflows. The carrying amounts of the Group’s foreign currency denominated monetary assets and monetary liabilities at the end of the reporting period are as follows:
Foreign currency sensitivity analysis: The Group is mainly exposed to the currencies of GBP and SEK. The following table details the Group’s sensitivity to a 2% increase and decrease in the EUR against the relevant foreign currencies. A 2% shock is the sensitivity rate used when reporting foreign currency risk internally to key management personnel and represents management’s assessment of the reasonably possible change in foreign exchange rates. The sensitivity analysis includes only outstanding foreign currency denominated monetary items and adjusts their translation at the period end for a 2% change in foreign currency rates.
The sensitivity analysis includes external cash flows as well as cash flows within the Group where the denomination of the loan is in a currency other than the functional currency of the lender or the borrower. A positive number below indicates an increase in profit or equity where the EUR strengthens by 2% against the relevant currency. For a 2% weakening of the EUR against the relevant currency, there would be a comparable negative impact on profit or equity.
The exposure is mainly attributable to the net outstanding value in GBP and SEK receivables, payables and cash of the Group at the end of the reporting period
Interest rate: The Group is exposed to the risk that the fair value or future cash flows of a financial instrument will fluctuate because of changes in market interest rates. The Group has managed this risk through the negotiation of a fixed interest rate on the convertible bond and has no other borrowings.
(b) Credit risk
Credit risk is the risk that one party to a financial instrument will cause a financial loss to the other party by failing to discharge an obligation.
Financial assets which potentially subject the Group to credit risk consist principally of receivables and cash at bank, which is all callable. The latter is placed with various reliable financial institutions. For receivables, an allowance would be made for doubtful debts if there was an identified loss event which, based on previous experience, is evidence of a reduction in the recoverability of the cash flows. Credit risk with respect to receivables is limited due to credit control procedures, ongoing credit evaluation and to a policy of only dealing with creditworthy counterparties. Moreover the debtor base comprises a number of customers spread across geographical areas thus serving to also mitigate concentration risk.
Liabilities Assets 31/12/17
€00031/12/16
€00031/12/17
€00031/12/16
€000GBP 5,013 3,256 7,573 6,638
SEK 3,268 3,026 4,646 6,817
PHP 450 327 250 717
RON 453 197 453 251
AUD 343 550 548 489
GBP Impact SEK Impact€m
2017 2016 2017 2016
Profit or loss 0.1 0.3 0.1 0.3
Equity 0.1 0.1 0.1 0.1
Annual report and accounts 2017 Kambi Group plc
82
Annual report and accounts 2017 Kambi Group plc Financial report
82
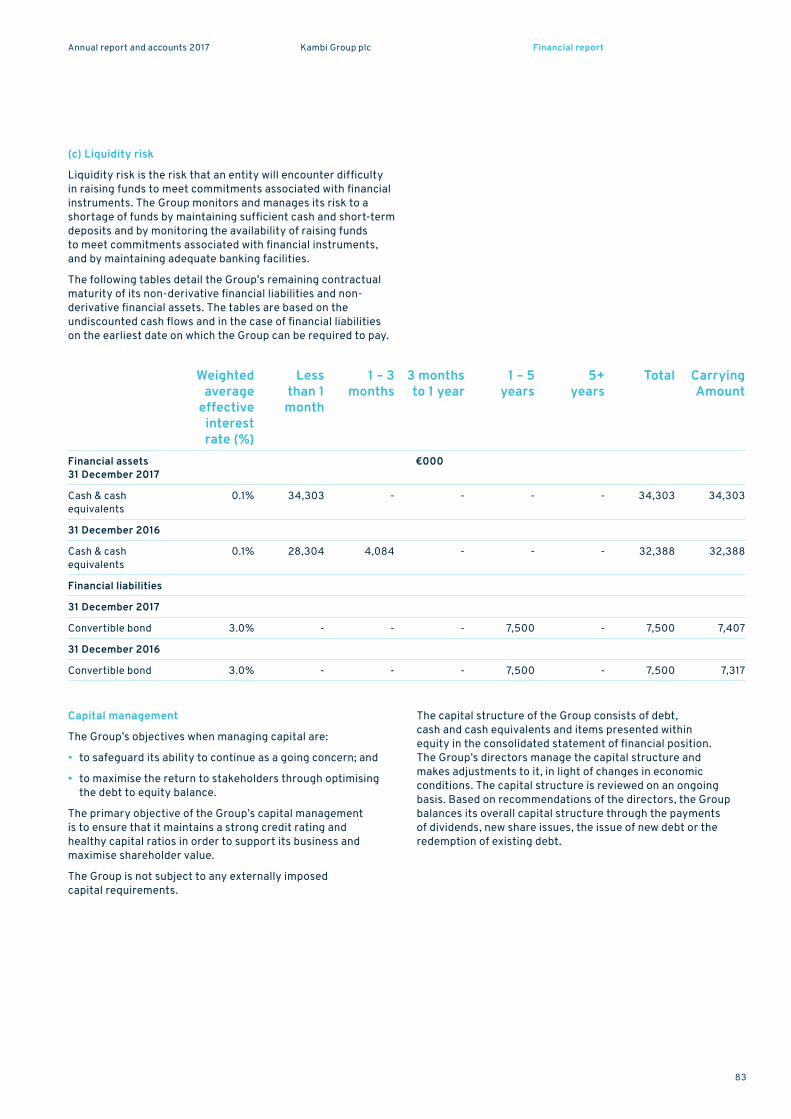
(c) Liquidity risk
Liquidity risk is the risk that an entity will encounter difficulty in raising funds to meet commitments associated with financial instruments. The Group monitors and manages its risk to a shortage of funds by maintaining sufficient cash and short-term deposits and by monitoring the availability of raising funds to meet commitments associated with financial instruments, and by maintaining adequate banking facilities.
The following tables detail the Group’s remaining contractual maturity of its non-derivative financial liabilities and non-derivative financial assets. The tables are based on the undiscounted cash flows and in the case of financial liabilities on the earliest date on which the Group can be required to pay.
Capital management
The Group’s objectives when managing capital are:
• to safeguard its ability to continue as a going concern; and
• to maximise the return to stakeholders through optimising the debt to equity balance.
The primary objective of the Group’s capital management is to ensure that it maintains a strong credit rating and healthy capital ratios in order to support its business and maximise shareholder value.
The Group is not subject to any externally imposed capital requirements.
The capital structure of the Group consists of debt, cash and cash equivalents and items presented within equity in the consolidated statement of financial position. The Group’s directors manage the capital structure and makes adjustments to it, in light of changes in economic conditions. The capital structure is reviewed on an ongoing basis. Based on recommendations of the directors, the Group balances its overall capital structure through the payments of dividends, new share issues, the issue of new debt or the redemption of existing debt.
Weighted average
effective interest rate (%)
Less than 1 month
1 – 3 months
3 months to 1 year
1 – 5 years
5+ years
Total Carrying Amount
Financial assets31 December 2017
€000
Cash & cash equivalents
0.1% 34,303 - - - - 34,303 34,303
31 December 2016
Cash & cash equivalents
0.1% 28,304 4,084 - - - 32,388 32,388
Financial liabilities
31 December 2017
Convertible bond 3.0% - - - 7,500 - 7,500 7,407
31 December 2016
Convertible bond 3.0% - - - 7,500 - 7,500 7,317
Annual report and accounts 2017 Kambi Group plc
83
Financial report

35. Financial risk management (continued)The gearing ratio at the end of the reporting period was as follows:
Fair values of financial instruments
The fair values of cash and short-term deposits, trade & other receivables, trade & other payables and other current liabilities approximate their carrying amounts largely due to the short-term maturities of these instruments.
Set out below is a comparison of the carrying amounts and fair value of the Group’s financial instruments, other than those with carrying amounts that are reasonable approximations of fair values:
The fair values of the Group’s convertible bond are determined by using the Discounted Cash Flow method using a discount rate that reflects the revised borrowing rate as at the end of the reporting period.
36. Post Balance sheet event On 27 February 2018, Kambi entered into an agreement to purchase 25.1% share capital of Midia Holding Ltd, owner of the Virtus Sports brand, in exchange for €565,000 cash, being the equivalent of the fair value of 25.1% of the Group on that date. The cash payments were funded by Kambi Group plc, the ultimate parent of the Group and shareholder in Midia Holding. This will be classified as an investment in an associate based upon 25.1% voting rights being allocated to Kambi and will be accounted for under the IAS 28 equity method accordingly.
2017 €000
2016 €000
Debt (7,407) (7,317)
Cash and cash equivalents 34,303 32,388
Net debt 26,896 25,071
Equity (46,319) (39,974)
Net debt to equity % -58% -63%
Carrying Amount2017
€000
Fair Value 2017
€000
Carrying Amount
2016 €000
Fair Value 2016
€000
Financial liabilities
Convertible bond 7,407 7,500 7,317 7,501
Annual report and accounts 2017 Kambi Group plc
84
Annual report and accounts 2017 Kambi Group plc Financial report
84

AGM and company informationShareholders in Kambi Group plc are invited to participate in the AGM on Thursday 31 May 2018 at 11:00 CET at Kambi, Wallingatan 2, 4tr, 111 60 Stockholm, Sweden.
Financial calendar25 April 2018 Q1 Report
31 May 2018 AGM
25 July 2018 Q2 Report
26 October 2018 Q3 Report
Company informationRegistered office Level 3, Quantum House
Abate Rigord Street Ta’ Xbiex XBX1120, Malta
Company registration number C 49768
Certified advisor Redeye AB, Stockholm
Company secretary Maureen Ehlinger
Auditors Mazars Malta, Sovereign Building Zaghfran Road 32, Attard ATD 9012, Malta
Corporate website kambi.com
Rights to participateHolders of Kambi Group plc who wish to attend the AGM must be entered on the Company’s register of members by Friday 27 April 2018.
In order to be entitled to participate in the proceedings at the AGM, shareholders who have their shares registered with a nominee account, must ensure their shares are temporarily registered in their own name latest by Friday 27 April 2018.
Annual report and accounts 2017 Kambi Group plc
85
Financial report

Glossary
AAverage number of employees Average number of employees based on headcount at each month end
BB2B Business-to-Business
B2C Business-to-Consumer
CCash flow per share Net increase/(decrease) in cash and cash equivalents, divided by the number of ordinary shares at the balance sheet date
Customer B2C operator to whom Kambi provides services
EEarnings per share, fully diluted Profit after tax adjusted for any effects of dilutive potential ordinary shares divided by the fully diluted weighted average number of ordinary shares for the period
EBIT Earnings before interest and taxation, equates to operating profit
EBIT margin EBIT as a percentage of revenue
EBITDA Operating profit before depreciation and amortisation charges
End user A player that places bets with an operator
Equity/assets ratio Total shareholders’ equity as a percentage of total assets
Equity per share Total shareholders’ equity divided by the number of ordinary shares at the balance sheet date
GGross Gaming Revenue (GGR) The amount wagered minus the winnings returned to players
GRL Government Regulated Lottery
IiBetting Online betting including mobile
Instant betting An instant bet is a bet that typically has a lifetime of around one minute
LLive betting Odds set and played during an event
NNet cash Total cash less debt at period end
Net Gaming Revenue (NGR) GGR less deductible costs
OOperating margin Operating profit as a percentage of revenue
Operator A B2C gambling operator
Operator Turnover and Margin Index This index shows Kambi’s operators’ turnover and margin based on the total stakes and payouts of their players
PPre-match odds Odds set and played on prior to the start of the event
RReturn on total assets Profit after tax as a percentage of average total assets
Revenue Income from Kambi’s operators based on fixed and variable elements
SSportsbook A platform where bets are placed and accepted on sporting and other events
WWeighted average number of shares Calculated as the weighted average number of ordinary shares outstanding during the year
Weighted average number of shares, fully diluted Calculated as the weighted average number of ordinary shares outstanding and potentially outstanding (i.e. including the effect of exercising all share options) during the year
UUX User Experience
Annual report and accounts 2017 Kambi Group plc
86
Annual report and accounts 2017 Kambi Group plc Financial report
86


For more information, contact: CEO Kristian Nylén
+44 (0)20 3617 7270 [email protected] www.kambi.com
Kambi Group plc Level 3, Quantum House Abate Rigord Street Ta’ Xbiex XBX1120, Malta