annual report and accounts for the year ended 31 … its two divisions time out digital and time out...
TRANSCRIPT

25887 11 April 2018 10:34 AM Proof 4 25887 11 April 2018 10:34 AM Proof 4
Time O
ut Group
plc A
nnual Rep
ort and A
ccounts for the year ended
31 Decem
ber 2017
Annual Report and Accounts for the year ended 31 December 2017
Stock code: TMO

25887 11 April 2018 10:34 AM Proof4 25887 11 April 2018 10:34 AM Proof 4
Time Out Group plc Annual Report 2017
About us
Time Out Group (“Time Out”, the “Company” or the “Group”) is the leading global media and entertainment business that
inspires and enables people to make the most of the city.
It all began in London in 1968 when Time Out helped people explore the exciting new urban cultures that started up all over the capital. Since then, it has consistently maintained its status as the go-to source of
inspiration for both locals and visitors alike. Today, Time Out is bringing its hunger for discovery and honest voice to 108 cities in 39 countries and has a global average monthly audience reach of 217 million.
Everything Time Out does helps people discover, book and share what the world’s cities have to offer. Millions of travel and leisure purchasing decisions are being influenced by Time Out’s unique and
trusted high-quality content - curated by professional journalists - about food, drink, entertainment, film, music, attractions, art, culture, shopping, night-life, hotels and travel.
With its two divisions Time Out Digital and Time Out Market, the Group aims to connect consumers and businesses in the leisure, travel and local entertainment sector through B2C and B2B offerings.
Time Out Digital is a multi-platform media, entertainment and e-commerce business with a global content distribution network comprising websites, mobile, apps, social channels, magazines, guides,
Live Events and international licensing agreements. The Company seeks to grow earnings from B2C and B2B relationships through on-site transactions and advertising from global brands and local businesses.
Time Out Market is a food and cultural market bringing the best of the city together under one roof: its best restaurants, bars and cultural experiences, based on Time Out’s editorial curation. Time Out
Market is currently present in Lisbon and the Group is rolling this successful format out to new cities.
*Proforma results adjusted to include a full year of trading of Time Out Market in 2016
Global average monthly audience reach of
217 million
Presence in 108 cities in 39 countries around the
world
Time Out Group
revenue grew 19%
YoY to £44.4 million*
Digital revenue up 15%
YoY (incl. e-commerce
up 57%)
Time Out Market revenue
growth of 62% YoY*

25887 11 April 2018 10:34 AM Proof 4
1
Strategic ReportGroup at a Glance 4Highlights - Progress in 2017 6Chairman’s Statement 7Q&A with the Group CEO 8Business Model 10Strategy 12Key Performance Indicators 14Business Review 15Principal Risks and Uncertainties 20
Contents
GovernanceBoard of Directors 24Corporate Governance Report 26Directors’ Report 29Directors’ Responsibility Statement 30Audit Committee Report 33Directors’ Remuneration Report 34Independent Auditors’ Report 37
Financial StatementsConsolidated Income Statement 44Consolidated Statement of other Comprehensive Income 45Consolidated and Company Statement of Financial Position 46Consolidated and Company Statement of Changes in Equity 48Consolidated Statement of Cash Flows 50Notes to the Financial Statement 51
3.6 million visitors to Time Out Market
Lisbon in 2017
16.7 million average monthly
unique visitors in O&O cities
403,000 e-commerce transactions in 2017 (up
33% YoY)
837,000 items sold via e-commerce (up 35% YoY)
1,230 Premium Profiles
active listers (up 60% YoY)

Strategic Report
STRATEGY IN ACTION
Monetising the audienceTime Out’s unique curated content about the best things to do in cities has a huge influence on travel and leisure purchase decisions of hundreds of millions of people around the world. In fact, 95% do something as a result of engaging with Time Out – selling to this experience-hungry, young audience is a growth opportunity for the Group’s e-commerce business.
In 2017, e-commerce growth of 57% year-on-year was driven by a particularly good performance from affiliate sales, with a focus on travel, and by tickets sold for Live Events arranged by the Group. Key events throughout the year were Battle of the Burger (Chicago, New York and Los Angeles), Passport to Portugal in New York (sponsored by TAP Air Portugal), Silent Discos in the Paris Zoo and The Shard in London, Outdoor Movie Pop Ups in Lisbon and Movies on the River in London, the first floating cinema on the River Thames. At the heart of these events was bringing to life unforgettable curated moments representing the best of the city for Time Out’s millennial audience. To further grow transactions of tickets and bookings, Time Out enhanced its e-commerce platform and expanded its e-commerce products, making more of its content bookable. The broad range of categories spans hotels and restaurant bookings, theatre and attraction tickets, offers and exclusive products only Time Out can deliver, based on editorial curation. In November 2017, a gift box including cards to enjoy 50% off food in twelve restaurants from Time Out’s annual list of the best 100 London restaurants, sold out quickly.
àRead more about ‘Monetising the audience’ on page 16
Pictured: Movies on the River, London


25887 11 April 2018 10:34 AM Proof4
4
Time Out Group plc Annual Report and Accounts for the year ended 31 December 2017 Stock code: TMO
GROUP
AT A GLANCE
The Time Out story so far
Time Out Group is present in 108 cities in 39 countries around the world and has a global average monthly audience reach of 217 million.In 2017, the Group owned and operated businesses in 20 countries and 76 cities such as London, New York, Chicago, Miami, Los Angeles, Hong Kong, Melbourne, Lisbon, Barcelona and Paris. In a further 20 countries and 32 cities such as Tokyo, Tel Aviv and Dubai the Group used international licensing arrangements with partners. When using the licensing model, Time Out Group retains ownership of rights, title and interest in the brand and content.
1971
Time Out magazinechanges format
Global expansionAcquisition of Spain and Australia franchise partners, and addition – at no cost – of Hong Kong, Singapore and Seoul.
New Time Out Marketannounced in cities such as Chicago and Boston.
Voice app on the Google AssistantTime Out launches conversational app so people can get instant recommendations.
Time Out HQ office move to King’s Cross, London
20172014
Launch of new mobile responsive website
Launch of business listings in London and Paris
Time Out MarketLaunched in Lisbon, bringing the best of the city together under one roof.
Time Out London magazine goes free
20122001
Time OutIstanbul
1995
Time Out New York
2015
Launch of new Time Out app
Time Out New Yorkmagazine goes free Weekly circulation reaches 300,000.
Launch of business listings in New York
20161968
Time Out magazine launches
2010
Time Outlaunches e-commerce platform
Tony Elliott launches the first issue of Time Out which was published in 1968, cover price of one shilling. Printed as a double-sided A2 sheet, it was folded down into an A5 magazine.
The magazine goes weekly and is re-sized to today’s recognisable format.
The first international franchisee launches. The magazine goes
free after 44 years with a cover price. Weekly circulation increases to 305,000.
Time Out goes stateside.
Acquisition of Portuguese Franchise
IPOTime Out Group launches on AIM on June 14 and acquires Time Out Market Limited as part of the admission process.
Refreshed brand identityTime Out acquires YPlanNew Time Out Marketannounced in cities such as London, Porto and Miami.

25887 11 April 2018 10:34 AM Proof 4
5
www.timeout.com STRATEGIC REPORT
OUR
KEYSTRENGTHS
Established international brand with an extensive audience reach: Time Out is one of the leading brands to inspire and enable people through curated content about how
to enjoy food, drink, culture, art, travel and entertainment in cities around the world. The Directors believe that the Group’s established brand – which launched in 1968 – and high brand awareness are key drivers of Time Out’s significant average global monthly audience reach of 217 million, and that this will help drive consumer traffic to the Group’s trusted digital platform and give users the confidence to execute e-commerce transactions.
1
Attractive unit economics driven by significant consumer demand for the Group’s independent, inspirational and curated content: The Directors believe that the Group’s average global
monthly audience reach of approximately 217 million lowers the marketing cost of acquiring users and makes it easier to transition users from content consumption to e-commerce. In the context of its increasing audience reach, the Directors believe that the Group is well-placed to continue to benefit from attractive unit economics, the reach it can obtain on social media platforms and the growth of its digital presence.
4
Strong relationships with brand and local advertising partners and sophisticated model for generating advertising revenue:The Group has established long-term, direct
relationships with global brands and local businesses and uses a number of solution-based advertising platforms, programmatic platforms and other creative channels, including native advertising, experiential advertising and multi-channel campaigns to generate advertising revenue.
2
Worldwide roll-out of Time Out Market:The first Time Out Market in Lisbon received approximately 1.9 million visitors in 2015, 3.1 million in 2016 and 3.6 million in 2017. It achieved positive
EBITDA within 18 months of opening. The Directors believe that the Lisbon market format presents a scalable opportunity that can be replicated in other cities, expanding the Group’s international presence and raising the profile of the Time Out brand.
5
Diverse content distribution network including technology with multi-channel scalability potential: The Directors believe that the scalable and flexible architecture of the Group’s digital platform will allow it
to develop ongoing improvements in functionality and expand to address new business opportunities.
3
Experienced management team: The Group has an experienced management team with a strong background in digital media, e-commerce and technology businesses as well as retail and hospitality.6Detailed and growing user data: The Group’s digital platforms, Flypay technology and free Wi-Fi in the Time Out Market in Lisbon will provide the Group with a source of valuable, high-quality user
data and information which the Group can leverage in order to increase its revenue from e-commerce.
7
1971
Time Out magazinechanges format
Global expansionAcquisition of Spain and Australia franchise partners, and addition – at no cost – of Hong Kong, Singapore and Seoul.
New Time Out Marketannounced in cities such as Chicago and Boston.
Voice app on the Google AssistantTime Out launches conversational app so people can get instant recommendations.
Time Out HQ office move to King’s Cross, London
20172014
Launch of new mobile responsive website
Launch of business listings in London and Paris
Time Out MarketLaunched in Lisbon, bringing the best of the city together under one roof.
Time Out London magazine goes free
20122001
Time OutIstanbul
1995
Time Out New York
2015
Launch of new Time Out app
Time Out New Yorkmagazine goes free Weekly circulation reaches 300,000.
Launch of business listings in New York
20161968
Time Out magazine launches
2010
Time Outlaunches e-commerce platform
Tony Elliott launches the first issue of Time Out which was published in 1968, cover price of one shilling. Printed as a double-sided A2 sheet, it was folded down into an A5 magazine.
The magazine goes weekly and is re-sized to today’s recognisable format.
The first international franchisee launches. The magazine goes
free after 44 years with a cover price. Weekly circulation increases to 305,000.
Time Out goes stateside.
Acquisition of Portuguese Franchise
IPOTime Out Group launches on AIM on June 14 and acquires Time Out Market Limited as part of the admission process.
Refreshed brand identityTime Out acquires YPlanNew Time Out Marketannounced in cities such as London, Porto and Miami.

25887 11 April 2018 10:34 AM Proof4
6
Time Out Group plc Annual Report and Accounts for the year ended 31 December 2017 Stock code: TMO
HIGHLIGHTS
PROGRESS IN 2017
Financial Highlights
• Group Revenue – increased by 19% year-on-year to £44.4m (2016: £37.1m*), driven by a combination of underlying** growth (12%) and the contribution from franchisee acquisitions in Australia and Spain
• Growth increasing - H2 revenue increased 25% (14% underlying and at constant currency) on the comparable period of 2016. Underlying revenue for H1 at constant currency was 5%
• Time Out Digital - revenue of £38.4m (+15%) was driven by e-commerce, up 57% and Premium Profiles, up 43% and acquisitions; in a declining advertising market, digital advertising was flat on an underlying basis (+19% post acquisitions) whilst print revenue reduced by 4% (+2% post acquisitions)
• Time Out Market - revenue grew 62%* to £6.0m driven by record 3.6 million visitors (2016: 3.1 million)
• Adjusted EBITDA – loss of £14.2m*** (2016: £10.6m) in line with expectations and primarily due to the higher costs associated with increased customer acquisition and development of the Time Out Digital business
• Operating loss – loss of £24.6m (2016: £17.9m)
• Cash – closing position of £28.8m (2016: £50.1m)
• New Debt Facilities – €9 million loan secured in the period and £20m credit facility entered into in March 2018 to fund Time Out Market expansion
Operational Highlights
• Audience – in 2017, Time Out achieved an average global monthly audience reach of 217 million across all platforms, growing 39% YoY
• E-commerce – further substantial e-commerce growth was driven by affiliates sales (+66%) and proprietary Live Events (+83%) resulting in 837k items sold in the period
• Global Expansion – successful integration of established Time Out franchises in Australia, Spain, Hong Kong and Singapore into the network of owned and operated businesses
• Time Out Market – conditional lease agreement signed for a new market in New York, which is set to open in 2018; as recently announced, plans are on track for new markets in Miami in Q4 2018 and in Chicago and Boston in 2019
* Time Out Market was acquired by the Group on 14 June 2016. All Group figures quoted in the Business Review include, on a proforma basis, 12 months of trading of Time Out Market
** Underlying results are presented excluding the contribution from the acquisitions of the Australia franchisee in June 2017 and the Spain franchisee in September 2017, and the addition of Singapore and Hong Kong. The businesses combined contributed a net revenue of £2.8m in the period. EBITDA contribution was a loss of £0.5m. The figures for Time Out Market in 2016 include the first six months of that year, prior to its acquisition by the Group, given that this is a separate reportable segment. The measure is used to show the performance of the business before the effects of other acquisitions
*** profit or loss before interest, taxation, depreciation, amortisation, share based payments, share of associate’s loss and one-off exceptional items. Used by management and analysts to assess the business before one off and non-cash items.

25887 11 April 2018 10:34 AM Proof 4
7
www.timeout.com STRATEGIC REPORT
CHAIRMAN’S
STATEMENT
ResultsFollowing a strong 2016, its first year as a listed company, Time Out Group continued to make substantial progress as it evolves into a transactional business. Group revenue increased by 19% year-on-year, driven by a combination of underlying growth (12%) and the contribution of the acquisitions of Time Out Australia and Time Out Spain. We saw revenue growth increasing in the second half of the year, demonstrating that the business strategy is on track. Both business divisions delivered good growth; in Time Out Digital, e-commerce revenue increased by 57% offsetting the anticipated weaker print revenue. Time Out Market performed particularly well with revenue growth of 62% and 3.6 million visitors in 2017 compared to 3.1 million in the prior year.
Key AchievementsI am very pleased that Time Out Group continued to consistently deliver against its core areas. A large, growing global audience and that audience’s desire to make the most of the city has been key to Time Out’s progress and evolving this unique brand as a digital, transactional business.
In 2017, Time Out’s average global monthly audience reach further grew by 39% year-on-year to 217 million across all platforms; geographic growth was driven by the Group’s continued global expansion of owned and operated businesses with the acquisition of franchises in Australia and Spain, and the addition, at no cost, of Hong Kong and Singapore.
This increased reach combined with Time Out Digital’s ongoing investment – in particular in its e-commerce platform – grew transactions across more and new verticals. Improvements included expanding e-commerce to new
cities, new affiliate agreements especially for travel offerings, content and commerce being increasingly connected with more booking options. We expanded our digital advertising presence through the integration of Time Out franchises in Australia, Spain and Asia. Around the globe, we see major advertising partners increasingly looking for the unique, bespoke multi-channel solutions we can offer within the positive brand-safe environment Time Out’s content provides.
Time Out Market Lisbon continues to be an incredible success story. In 2017, it delivered an excellent performance with continued revenue momentum and record visitor numbers, proving the strength of the format. We look forward to bringing Time Out Market to exciting cities, with near term plans on track to open sites in New York, Miami, Boston and Chicago.
PeopleI would like to take this opportunity to thank on behalf of our Board and our Shareholders everyone at Time Out Group, including our licensing partners, for the great progress we made in 2017. In 2018, we will celebrate this iconic brand’s 50th birthday – it was launched in London in 1968 to help people explore the exciting new urban cultures that started up all over the city. Today, this DNA is still completely intact thanks to our fantastic team around the world that has always been passionate about delivering insight and value to our consumers and partners. Together with my Board colleagues, I am looking forward to driving the continued success and growth of Time Out as we inspire and enable more and more people to make the most of cities around the world.
Peter DubensNon-Executive Chairman
Peter DubensNon-Executive Chairman
“ Time Out Group made good progress in 2017 across all of its key strategic areas. Both business divisions, Time Out Digital and Time Out Market, have embarked on a journey to successfully transact at scale with our large global audience, which continues to drive strong growth.”

25887 11 April 2018 10:34 AM Proof4
8
Time Out Group plc Annual Report and Accounts for the year ended 31 December 2017 Stock code: TMO
Q&A
WITH THE CEO
What is the most important milestone Time Out Group reached this year?2017 was our first full financial year as a listed company and achieving 59% growth in transaction levels driven by e-commerce and Time Out Market was one of our most important targets. By achieving substantial progress across our two business divisions we have met the high standards we set for ourselves, demonstrating the successful diversification of Time Out on our way to profitability. Time Out Digital has continued to deliver good progress and revenue growth across e-commerce and Premium Profiles; Time Out Market continued to go from strength to strength and within this context we will further expand the format to cities worldwide.
What were the key drivers of 2017 revenue growth?Increasingly selling to our global audience is the key driver behind our revenue growth which we saw increasing in the second half of the year, demonstrating that we are doing the right things. Looking at Time Out Digital, we are pleased that e-commerce substantially grew by 57% year-on-year as we launched new products, expanded into new markets and entered new affiliate agreements across more verticals, in particular in travel with its higher margins. The acquisitions of Time Out Australia and Time Out Spain further contributed to our revenue growth. Time Out Market, our other business division, had 3.6 million visitors in our Lisbon location in 2017 and 62% revenue growth year-on-year (2016: 115%) – the success of the concept as we roll it out globally offers a fantastic growth opportunity going forward.
How does Time Out intend to grow sales so rapidly in the highly competitive travel and leisure e-commerce market?We know that 95% of our audience do something as a result of engaging with Time Out and that over 60% are from outside of the city – this audience is looking to spend and that is a huge potential for e-commerce. As we are already inspiring millions of travel and leisure decisions every year we no longer just write about the best things to do in the city; we increasingly make them bookable. In 2017, our customers bought 837,000 items from us, up from 618,000 in the previous year. We aim to further grow bookings by rolling out e-commerce functionalities to more cities, by launching multi-language options to attract visits and bookings from new audiences, by further enhancing the product categories, by making more content bookable and with a website redesign focusing on a closer connection of content and e-commerce. To complement our broad affiliates offering and further monetise traffic, we have also launched exclusive products like our very successful recent restaurant gift box which sold out quickly – this is a unique product only Time Out can deliver as it is inspired by editorial curation of the best of the city.
Your audience keeps on growing - what are the key drivers?First, our audience values and trusts our content which is curated by professional journalists – it is this quality that attracts both locals and visitors, always looking for something new and exciting to do in cities around the world. Secondly, in 2017 we have again grown our average global monthly audience reach by 39% and it now stands at 217 million. This was driven by an increasing social media reach which helps us build our brand and drive traffic to our
“In 2017, we continued to drive growth for Time Out as we made substantial progress across our core areas. Increasing revenue growth in the second half demonstrates the successful implementation of our plan to transform this business.
“50 years after launching, Time Out is the only true global marketplace for city life. We are in the happiness business and that’s why we no longer just write about the best city experiences but also create and deliver them; every year, millions of customers book theatre tickets and hotels with us, buy exclusive offers or visit Time Out Market to enjoy the best of the city.”
Julio BrunoChief Executive Officer

25887 11 April 2018 10:34 AM Proof 4
9
www.timeout.com STRATEGIC REPORT
sites. Our audience has further grown as a result of our global expansion, namely the launch of new cities in the US and in Germany and new print magazines as well as the integration of former Time Out franchises in Australia, Spain, Hong Kong and Singapore into our owned and operated network.
Time Out is very well known for its magazines, but is Time Out now a digital business?Whilst digital revenues now account for a majority of the Group’s revenue and we are excited about the consistent growth of e-commerce and Premium Profiles, the physical nature of print and Time Out Market have a significant role to play in the future of Time Out as our global community chooses to use multiple channels to interact with us. Our content is platform agnostic and we deliver it to wherever our audience wants it - through our website, mobile, social, print, Live Events or Time Out Market. It is this unique ‘clicks and mortar’ approach that helps us raise the profile of our brand and expand our global presence.
Since the opening of Lisbon, six Time Out Market locations have been announced - when will the next open and can we expect more announcements?Time Out Market Lisbon continues to be an incredible success story; it is now Portugal’s most visited attraction and recognised to be at the forefront of the emerging global food hall trend. This is a trend which has been growing significantly around the world and consumers love this democratisation of fine food and the communal feel. We are proud to lead the charge in this sector and truly differentiate as we not only offer the best food of the city but also its culture.
This makes Time Out Market so much more than just a food hall. The fact that Time Out Market Lisbon saw 3.6 million visitors in 2017 shows how successful and popular this format is. As we are expanding Time Out Market globally, we are set to open Time Out Market New York and Miami in 2018, followed by Chicago and Boston in 2019. To capitalise on the exceptional growth opportunity Time Out Market offers we secured a loan of €9 million in 2017, a further £20 million in March 2018 and we continue to explore funding options.
What are the key challenges of the year ahead?The industry we are operating in is challenged by the so-called ‘duopoly’, Facebook and Google, which is now also joined by Amazon. The duopoly’s share of global advertising spend has more than doubled over the past four years and now stands at over 20%. However, what makes Time Out stand out in this competitive and fast-changing environment is its hugely trusted brand, real authenticity, quality content, a loyal and engaged audience, unique products and experiences we offer and differentiated, bespoke multi-channel solutions within a brand-safe environment for advertisers. This combination of assets is difficult to replicate for these tech giants but something advertising clients and consumers increasingly seek. We need to strengthen these assets further to continue to evolve as a digital, transactional business and to get to profitability. As for our second business division, Time Out Market, a key challenge will be the openings coming up of new sites in 2018 in New York and Miami, and in 2019 in Chicago and Boston. I am pleased to have a fantastic team in place who are highly experienced with managing a number of high-profile openings within a short period of time.
Time Out is 50 years old in 2018. A lot has changed but what still remains?It all began in London in 1968 when Time Out helped people explore the exciting things that happened all over the city. 50 years on, this is still at the heart of everything we do, we continue to inspire and enable people to make the most of the city. But today we are present in 108 cities in 39 countries around the world. Through all those years, this iconic brand has maintained its status as the go-to source of inspiration for both locals and visitors alike, making Time Out the only true global marketplace for city life. Our unique, curated content written by professional journalists remains as relevant now as when it first started – it is this authentic high-quality content people value in times of fake news more than ever before and that is why we are able to inspire millions of people to have a great time in cities around the world.
Julio BrunoChief Executive Officer

25887 11 April 2018 10:34 AM Proof4
10
Time Out Group plc Annual Report and Accounts for the year ended 31 December 2017 Stock code: TMO
BUSINESS
MODEL
The only true global marketplace for city life
Time Out Group’s core proposition is built around its trusted, iconic brand and unique, high-quality content about the best things to do in cities around the world. Professional journalists constantly curate and write about the food, drinks, theatre, art, film, music, travel and entertainment those cities have to offer, making Time Out the go-to source of inspiration for both locals and visitors alike.
To grow earnings and create sustainable value for its stakeholders, the Group is increasingly transacting with and advertising to this global, experience-hungry audience that is already looking to spend. Core growth areas are the global roll out of Time Out Market, e-commerce and advertisement. The Group’s business model positions Time Out as the only true global marketplace for city life.
UNIQUE CONTENT DISTRIBUTED VIA A MULTI-CHANNEL PLATFORM
Established, international brand and independent, high-quality content about the best things to do in the city written by
• Professional journalists: specialist curation such as ‘best of the city’, ‘latest exhibitions’ or ‘100 best dishes’
• Tastemakers: prolific reviewers and bloggers contributing content about the city
• User generated: un-paid reviews of things to do in the city from the Time Out community
DigitalMobile / Apps
Time Out Markets
Magazines
Live Events
Social Media
à • in 108 cities
• in 39 countries • in 13 languages
àTo attract & reach an
experience-hungry audience

25887 11 April 2018 10:34 AM Proof 4
11
www.timeout.com STRATEGIC REPORT
MONTHLY GLOBAL AUDIENCE REACH SPEAK TO THE AUDIENCE
217 millionAdvertising: Print, digital & experiential For global, national and local brands and businesses
Premium Profiles Highly focused local business listings
SELL TO THE AUDIENCE
Commerce via Time Out MarketBringing the best of the city together under one roof: the best restaurants, bars and culture - based on Time Out’s editorial curation
E-commerce via digital channelsMaking content about the best things to do in the city bookable with affiliates, exclusive offers and Live Events
Social media reach:
187 million
Website:
22.6 million unique visitors
Magazines:
7.4 million readers
Time Out Market:
300k visitors
(monthly averages)
àThe Group monetises
this audience and businesses in
two ways
Food & drink Theatre
Restaurants & bars
Offers
Entertainment
Attractions & things to do
Live Events
Hotels

25887 11 April 2018 10:34 AM Proof4
12
Time Out Group plc Annual Report and Accounts for the year ended 31 December 2017 Stock code: TMO
STRATEGY
Strategy IntroductionTime Out Group has three main strategic pillars to help deliver against the growth strategy.
Strategic pillar Commentary Progress in the year
Monetising the audience
Offer more booking opportunities, events, tickets and products to the Group’s audience
à See our Case Study on page 2
The Group intends to increase the number of transacting users on its e-commerce platform
• Further increased global monthly audience reach across all platforms
• Expanded global presence with the launch of new channels: new websites in Porto and four German cities, new free magazines in Austin, San Francisco, Philadelphia and magazine relaunch in Hong Kong, launch of Time Out content on voice activated platforms of Amazon Alexa and the Google Assistant
• New cities included in the Group’s network of owned and operated businesses have started to contribute revenue as e-commerce functionalities are being implemented
• Strong affiliate sales especially in the travel category, providing higher average booking values and margins
• To offer more bookable inventory and expand into new verticals the e-commerce offering has been enhanced through product launches, an improved offers proposition and new partnerships with Booking.com, HotelsCombined, Airbnb, Viator, La Fourchette, Clicktripz and Encore
• Optimised bookability: 25% of page views going to pages with bookable content and a book button (in December 2017)
• Integration of the checkout functionality from YPlan, acquired in 2016, has progressed
• More effective execution of the CRM strategy
• Continued enhancement of the experiential offering: 791 Live Events arranged for 155,000 attendees in cities such as London, Paris, Lisbon, New York and at Time Out Market
• Organisational review to align resources and skillsets with the objectives of the evolving business and a global strategy
Monetising businesses
Brand advertising, sponsorship and media opportunities
à See our Case Study on page 22
The Group intends to:
• Broaden its digital and other advertising propositions
• Improve the quality of the data and contents it provides to its local business partners
• Increase revenue through international licensing arrangements
• Highly visible and engaging branded moments spanning multiple touchpoints were created for major advertising partners including Budweiser, British Airways, Google, Marriott, Lexus, Three, TAP Air Portugal
• Improved viewability and user experience of the web and mobile sites enhancing digital revenue
• New Time Out website increased the available advertising estate
• Campaigns delivered for key advertising clients across new verticals and a roster of returning clients secured
• Further refinement of the existing Premium Profiles offering and value proposition, providing bespoke solutions that better suit customer type and size
• Advertising managed on a global basis, with the team increasingly sharing ideas and driving efficiencies
• The benefits of organisational changes and a number of key advertising deals resulted in good growth of digital advertising revenue in the second half of 2017 in the UK
• International licensing revenue declined in the year as the Group integrated five partners into its network of owned and operated businesses

25887 11 April 2018 10:34 AM Proof 4
13
www.timeout.com STRATEGIC REPORT
Strategic pillar Commentary Progress in the year
Roll out Time Out Market
Roll out the Time Out Market format to new cities
à See our Case Study on page 42
Market format has the potential to attract millions of customers and enhance customers’ physical and digital connection to the Time Out brand
• Record 3.6 million visitors to Time Out Market Lisbon
• Conditional lease agreements signed in 2017 in Chicago and Boston and in February 2018 in New York
• Time Out Market Miami set to open in 2018 with the first line-up of high-profile chefs announced and very positively received
• The Group – with the support of the landlord – appealed the declined planning permission in respect of the site in Spitalfields in London
• €9 million loan secured in the period and £20 million credit facility enterend into in March 2018 to fund the global Time Out Market expansion

25887 11 April 2018 10:34 AM Proof4
14
Time Out Group plc Annual Report and Accounts for the year ended 31 December 2017 Stock code: TMO
KEY
PERFORMANCE INDICATORS
KPI IntroductionThe following business performance and operating KPIs are used by the Group to assess its performance.
Financial KPIsKPI
Group Revenue**Proforma revenue, including a full year of the operations of Time Out Market (£’000)
Time Out Digital RevenueRevenue of the Group’s digital, print and international segments (£’000)
Time Out Market Revenue**Proforma, full year revenue of the Group’s Markets segment (£’000)
Adjusted EBITDA loss**Proforma earnings before interest, taxation, depreciation, and amortisation and excluding share based compensation charges and exceptional items (see note 6 to accounts) including a full year of the results of Time Out Market (£’000)
2017 £44,364
2016 £37,130
2015 £30,222
2017 £38,393
2016 £33,434
2015 £28,502
2017 £5,971
2016 £3,696
2015 £1,720
2017£14,217
2016£10,588
2015£13,091
Operating KPIsKPI
O&O* audience (monthly average)O&O audience is the sum of the website visitors, social media users, magazine readership, app users and visitors to Time Out Market in the month. The measure is the average of monthly figure for the past 12 months
Monthly unique visitors (monthly average)The number of unique visitors to the Group’s O&O websites and apps
E-commerce: transacting members (rolling 12 months)The number of unique customers transacting through Time Out, including booking tickets with affiliate partners, purchasing tickets for Live Events and purchasing offers
E-commerce: transactionsThe number of individual transactions including booking tickets with affiliate partners, purchasing tickets for Live Events and purchasing offers
2017 156.3m
2016 94.2m
2015 56.9m
2017 16.7m
2016 16.0m
2015 15.6m
2017 263k
2016 169k
2015 163k
2017 403k
2016 303k
2015 250k
KPI
Premium Profiles active listersThe number of businesses with a Premium Profile listing with Time Out at the period end
Time Out Market** total tenant turnoverThe revenue taken by the restaurants and bars in the Time Out Market. Time Out is paid a percentage of this revenue as fee by the restaurants tenants together with a fixed charge. This fee and the fixed charge are reported as revenue by Time Out (million)
2017 1,230
2016 770
2015 493
2017 €33.1
2016 €23.5
2015 €16.5
*O&O is the Time Out ‘owned and operated’ business operations in 76 cities across 20 countries; this does not include international licensing arrangements in a further 32 cities across 20 countries. Average for 12 months.
**Proforma results including full 12 months trading for Time Out Market

25887 11 April 2018 10:34 AM Proof 4
15
www.timeout.com STRATEGIC REPORT
BUSINESS
REVIEW
OverviewTime Out Group comprises two divisions; Time Out Digital and Time Out Market. Time Out Digital is a multi-platform media, entertainment and e-commerce business with a global content distribution network comprising websites, mobile apps, mobile web, social channels, magazines, Live Events and international licensing agreements. Time Out Market leverages the Time Out brand to bring a city’s best restaurants, bars and cultural experiences together under one roof. Time Out Market currently operates in Lisbon and has a pipeline of new venues globally.
Operational reviewThe following operating KPIs are used by the Group to assess its performance against these objectives.
Operating KPIsYear ended
31 December 2017
Year ended 31 December
2016 %Audience and Traffic:Global audience reach – monthly average 216.8m 155.9m 39%O&O† Audience – monthly average 156.3m 94.2m 66%O&O† unique visitors – monthly average 16.7m 16.0m 4%E-commerce:Items sold 837k 618k 35%Time Out Members 2,840k 1,997k 42%Transacting Members 263k 169k 56%Transactions 403k 303k 33%Premium Profiles:Active listers 1,230 770 60%Time Out Market*:Total tenant turnover €33.1m €23.5m 41%
* Proforma results including full twelve months trading for Time Out Market in 2016. Total tenant turnover is revenue earned by restaurants in the Time Out Market. Time Out’s revenue includes a percentage fee earned on this turnover.
† O&O is the Time Out ‘owned and operated’ business operations; global audience reach includes market visitors, website traffic, social media reach and magazine readership for both ‘owned and operated’ as well as international licensing networks. ‘Monthly average’ calculated as a rolling twelve month average.
Audience developmentDuring the year, the Group’s average global monthly audience reach grew by 39% to 217 million with O&O (owned and operated business operations) growing by 66%. Excluding acquisition countries, like-for-like growth in O&O was 65%. This growth was driven by an increasing Facebook reach, which in the UK rose 109% from an average reach of 38.0m per month in 2016 to 79.4m. Followers on Facebook grew by 30% YoY, with average website visits for the period increasing by one to two percent. The proportion of visits through mobile and tablet devices now exceeds 65%.
In 2017, Time Out further expanded its global presence through the launch of new cities within the US, new websites and magazines and the opportunities afforded from the acquisition of franchises. City websites were launched in Porto, Frankfurt, Munich, Dusseldorf and Hamburg, and magazines were launched in the cities of Austin, San Francisco and Philadelphia to complement the Group’s digital, mobile and social presence as it grows its national footprint and audience in North America. Hong Kong relaunched its magazine while two kids’ magazines were also launched in London enabling Time Out to expand its engagement with customers. Launching free magazines across key cities is part of Time Out’s continuing approach to print distribution and creates a halo effect on digital metrics, audience engagement and brand awareness.
Expanding the range of channels provides increasing value to advertisers. It allows them to reach Time Out’s audience through new creative opportunities across the brand’s global print, digital, mobile, social and event platforms. In the year, Time Out has successfully launched its content on the voice activated platforms of Alexa and the Google Assistant, offering advertisers another channel to connect with Time Out’s audience.
Business performanceThe performance of the Group including proforma trading of Time Out Market in 2016 for the full year is as follows:
Year ended 31 December
2017£’000
Year ended 31 December
2016*£’000 % change
% change under- lying**
Digital advertising 12,112 10,210 19% –Premium Profiles 2,071 1,444 43% 43%E-commerce 7,316 4,662 57% 54%Digital revenue 21,499 16,316 32% 19%Print 15,493 15,238 2% (4%)International 1,401 1,880 (25%) (14%)Time Out Digital 38,393 33,434 15% 7%Time Out Market* 5,971 3,696 62% 62%Group Revenue 44,364 37,130 19% 12%Gross profit 24,655 22,326 10% 1%Operating Expenditure (38,892) (32,914) (18%) (10%)Adjusted EBITDA (14,217) (10,588) (34%) (29%)
* Time Out Market was acquired by the Group on 14 June 2016. All Group figures quoted in this Business Review include, on a proforma basis, 12 months of trading of Time Out Market
** Underlying results are presented excluding the contribution from the acquisitions of the Australia franchisee in June 2017 and the Spain franchisee in September 2017, and the addition of Singapore and Hong Kong. The businesses combined contributed a net revenue of £2.8m in the period. EBITDA contribution was a loss of £0.5m. The figures for Time Out Market in 2016 include the first six months of that year, prior to its acquisition by the Group, given that this is a separate reportable segment. The measure is used to show the performance of the business before the effects of other acquisitions.

25887 11 April 2018 10:34 AM Proof4
16
Time Out Group plc Annual Report and Accounts for the year ended 31 December 2017 Stock code: TMO
BUSINESS
REVIEW CONTINUED
Time Out DigitalDigital and print advertising Digital advertising revenue grew 19% YoY, excluding the contribution from businesses acquired during the year revenue was flat. In the UK, the benefits of the organisational changes made during that period and a number of key advertising deals with partners such as Google and Marriott resulted in good growth in the second half. Digital advertising revenue in the US declined by 1%. In both the UK and US, advertising continues to move from premium digital to programmatic with programmatic revenue across the Group growing by 35%. Through investment in technology, good progress has been made in improving viewability and the user experience of the web and mobile sites so as to enhance digital revenue. Good growth has been seen in France and Portugal. The Time Out franchisee in Australia was acquired in June 2017 with offices in Melbourne and Sydney. It has a strong presence in digital advertising with total revenue growing 19% YoY. The franchisee in Spain was acquired in September 2017; it operates English, Spanish and Catalan language websites and magazines in Barcelona. Revenue in sterling has grown 28% (in euro 20%) compared to 2016. An office has been opened in Madrid with a website launched in Madrid in Q1 2018 and plans for a new magazine in April 2018.
Overall, print advertising increased 2% YoY. Excluding acquisitions, there was a decline of 4% YoY, however trends improved in the second half with a slow-down in the rate of decline. In the UK, revenue grew approximately 2% in a declining market aided by increased premium advertising and sponsored supplements and the organisational changes made in the first half. Overall revenue per page increased 11%. The US had a challenging year in a declining market with print revenue falling 13% due to a significant decline in page yields. Portugal’s revenue increased by 9% through increased advertising and subscriptions revenue.
Time Out’s positive, trusted content - curated by professional journalists - is of great value to advertising partners seeking brand safe environments and unique campaign approaches. The Group has seen good growth in revenue from this multi-media advertising solution strategy, with the team increasingly working globally to share ideas and drive efficiencies. Highly visible and engaging branded moments were created in 2017, spanning multiple touchpoints across digital, mobile, social, print and Live Events. The list of high-profile clients included Lexus, AMEX, TAP Air Portugal, Seamless, Budweiser and Google. Examples of campaigns were the UK’s first freesheet video-in-print magazine cover ad for Three, a holiday giveaway experiential with British Airways and a unique, multi territory partnership with Marriott that saw the partner sponsor the launch of four new German city websites for Time Out as well as Time Out London’s first standalone travel magazine. In addition to campaigns delivered for clients in new verticals such as tech and auto, Time Out has also secured a roster of returning clients.
Local businesses: Premium ProfilesRevenue from Premium Profiles grew by 43% and the number of active listers increased by 60% to 1,230 as of December 2017. New York grew revenue by 176% YoY and the more established offering in London continues to perform well, increasing revenue by 27%. During the year, enhancements such as video were introduced to drive sales and partners’ visibility.
E-commerce E-commerce revenue, including transactions to sell the Group’s own events and third-party tickets, grew 57% YoY, with underlying growth of 53% and revenue growth increasing in the second half. Growth was driven by a 66% increase in revenue from affiliate sales, 21% from offers and 83% from Live Events. The overall number of transactions grew 33% and revenue per transaction increased to £18.11 (2016: £15.39).
With experienced senior management joining the team in the year and continued development of the e-commerce offering, affiliate revenue grew in both London and New York, with particularly strong growth in New York, where 172% growth was achieved. During 2017, significant investment was made in cost-per-click acquisition marketing, particularly in the first half to develop the Group’s presence in a range of categories, especially in the hotels and travel vertical. The strength of results delivered from organic traffic compared to those from paid search led to the decision to focus efforts on organic and natural traffic with a subsequent reduction in acquisition spend in the fourth quarter.
The Group is continuing to grow its e-commerce segment, closely managing the return from traffic acquisition spend and the impact of website and partner technical developments. Progress achieved within the period:
• Expansion: 74 cities now have e-commerce functionality on the websites, and 15 cities have multi language options to attract visits and bookings from new audiences via Time Out’s unique content.
• Optimisation: Further enhancement of the product categories with higher average booking value and higher margins through partnerships with Booking.com, HotelsCombined, Airbnb, Viator, La Fourchette, Clicktripz and Encore.
• Bookability: Optimised bookability with 24% of page views going to pages with bookable content and a book button in December 2017, compared to 16% at the start of the year; a new homepage design launched at the beginning of 2018 further driving a closer connection of content and e-commerce.
• Integration of the checkout functionality from YPlan, acquired in October 2016, has progressed: allowing an improved customer checkout experience and reductions in processing costs.
Plans to focus product development on improving the visibility and distribution of offers have reaped rewards in 2017 with revenue increasing by 21%. The performance has been enhanced by the progress made in the more effective execution of the CRM strategy of the Group with the emails of Yplan customers being successfully integrated with those of Time Out and the quality and usability of data being further enhanced by a strengthened CRM team.
To further monetise customer traffic, exclusive products have been developed and launched. In November, the Group launched a limited edition, 1,000 run ‘restaurant gift box’ in London which sold out quickly. Called ‘Table for Two’, the curated luxury gift box was filled with cards giving diners 50% off food at twelve of Time Out’s 100 best restaurants in London throughout 2018. Plans are in place to expand this into other cities in 2018 and explore other exclusive products with another box having been launched in London in February 2018.

25887 11 April 2018 10:34 AM Proof 4
17
www.timeout.com STRATEGIC REPORT
E-commerce revenue growth was also driven by a particularly good performance from Live Events arranged and sold by the Group; an area which continues to expand across both US and European cities. Time Out continues to enhance its experiential offering throughout its global footprint with sponsored events having taken place in London, New York, Chicago, Los Angeles, Paris and Lisbon. The Group arranged 791 Live Events for 155k attendees in 2017, up from 250 and 80k attendees in 2016. In pursuing new revenue opportunities, the Group accepted lower margins on certain events during the second half of 2017, impacting the gross margin of the Group by over 150 basis points. Having established events in 2017, the Group is working closely with suppliers and sponsors to ensure that events in 2018 are undertaken at an improved margin.
International IIn addition to its owned and operated business operations in 76 cities across 20 countries, the Group has a presence in a further 32 cities across 20 countries through its international licensing arrangements. Rights are granted to third parties to publish print magazines and produce digital content under the Time Out brand, generating revenue through the payment of fees and royalties by third party licensees.
For the full year, revenue from licensees which are billed principally in dollars, decreased by 25%, mainly due to the acquisition of Australia and Spain and the addition, at no cost, of Hong Kong and Singapore and difficult trading conditions experienced by some of the incumbent franchisees.
Strengthening & aligning the Digital teamDuring the period, the Time Out Digital division reorganised its staff, resources and skill sets against the objectives of its evolving business and global strategy. Senior internal and external appointments were made to the Time Out Digital CEO (Christine Petersen) and other key roles including MD E-commerce and Chief Technology Officer. The reporting lines are now organised functionally and globally which has allowed a higher level of coordination, the sharing of best practice, content collaboration, the closer alignment of product development across the offices and has reduced the cost base. Excluding Time Out Market costs and the operating costs of the acquisitions, operating expenditure in H2 was £14.8 million (2016: £15.9 million) compared to £16.9 million (2016: £13.1 million) in the first half.
Time Out MarketTime Out Market in Lisbon has had another outstanding year, with a record 3.6 million visitors in the full year. Total tenant turnover has increased by 41% contributing to a 52% increase in local currency revenues YoY. This strong revenue growth has delivered an EBITDA of £2.3m from the Lisbon market.
The Group is on track to roll out Time Out Market to other cities globally:
• New York – A lease agreement for a new Time Out Market in New York was signed in February 2018, which is conditional on obtaining a license approval and building permits. With the location in a venue near other already operating restaurants, it is expected that the market will open in Q4 2018.
• Boston and Chicago – Conditional lease agreements have been signed for new locations in Chicago and Boston. With the benefits of planning for the sites already secured, openings are expected in 2019.
• Miami – Time Out Market Miami is expected to open in Q4 2018; the first line-up of high-profile chefs has been announced and was very positively received in the city.
• Porto – Local authority support and now waiting for final approval.
• London – With the support of the landlord, the Group appealed the declined planning permission in respect of the site in Spitalfields; if planning for the site is granted and runs to timetable it is expected that the site would open in late 2019 or early 2020; meanwhile the Group continues to explore other possible sites in London.
• The Group continues to consider proposals for new locations in other cities around the world, including a strong interest in management contracts.
In February 2018, a 5-year sponsorship agreement with a supplier of beer and soft drinks was signed in Lisbon.
Centrally the division has incurred costs of £2.0m (2016: £1.6m) as part of this rollout including start-up costs of £0.2m in respect of new markets.
Board ChangeThe Group is pleased to report that Adam Silver will be appointed Chief Financial Officer and to the Board of Directors from 29 March 2018. He joins from Just Eat where he was UK CFO, having joined prior to its listing on the main market of the London Stock Exchange. Prior to Just Eat, he was Group CFO and co-founder of The Karma Communications Group. Previously, Adam was an Investment Director at Ingenious Media and Hamilton Bradshaw, where he led growth capital investments in the media sector. Adam qualified as a Chartered Accountant at KPMG where he also spent a number of years within the Strategic & Commercial Intelligence practice in London and New York. Adam has a degree in Accounting and Finance from the University of Leeds. Richard Boult will step down at the same time to pursue new opportunities and the Group thanks him for his contribution.
OutlookClear progress has been made in 2017 evidenced by the revenue growth reported, particularly in e-commerce and Time Out Market, as the Group continues to evolve into a transactional business. The Group continues to execute on its stated growth strategy, with further progress anticipated throughout 2018 in both Time Out Digital and in Time Out Market.
The Group continued to make focused, strategic investment into the Time Out Digital business throughout 2017 to drive future growth and operating efficiencies, and has also developed an exciting pipeline of new sites for additional Time Out Markets in 2018 and thereafter.
Management remains confident that the Group will deliver against full year expectations.

25887 11 April 2018 10:34 AM Proof4
18
Time Out Group plc Annual Report and Accounts for the year ended 31 December 2017 Stock code: TMO
BUSINESS
REVIEW CONTINUED
Financial performanceRevenueReported Group revenue for the year has increased by 24% from £35.7m to £44.4m primarily through organic growth and the acquisition of Time Out franchise partners in Australia and Spain. Growth excluding acquisitions and the effect of currency was £3.6m. Time Out Market Limited was acquired by the Group on 14 June 2016 and therefore it has only been included in the accounts after that date. Accounting on a proforma basis for a full year of Time Out Market in 2016, Group revenue grew by 19%.
Gross marginThe overall gross margin (revenue less cost of sales) of the Group declined by three percentage points YoY to 56% (2016: 59%). This was predominantly driven by the traffic acquisition strategy in the e-commerce business for the hotel vertical and the expansion at a low margin of Live Events. The declines were offset in part by the higher gross margin of the businesses acquired in Spain and Australia.
The margin in Time Out Market declined by 4.4 percentage points principally due to the opening of the Time Out Bar in Lisbon. The bar, operated directly by Time Out, started in December 2016, and its first year of operation has contributed £0.8m of revenue.
Operating expenditureGroup operating expenditure before exceptional costs, share based payments, depreciation and amortisation, was £38.9m (2016: £32.9m). Excluding the effect of currency translation, total costs grew by £5.1m of which £2.5m relates to businesses acquired. Without the acquired businesses and at constant currency, H1 operating expenditure grew by 26% year on year and declined by 1% in H2 year on year as a result of the reorganisation undertaken in June 2017. Of the remainder, Time Out Market increased by £1.0m due to associated costs of expanding globally, the growth in the operations in Lisbon and the start-up costs for new markets.
Close attention continues to be paid to costs to ensure that both cost of sales and operating expenditure and skills of teams are aligned with the potential revenue and activities of the company.
Adjusted EBITDAAdjusted EBITDA represents the profit or loss before interest, taxation, depreciation, amortisation, share based payments, share of associate’s loss and one-off exceptional items.
Reported Adjusted EBITDA loss for the year was £14.2m (2016: £10.2m loss), a decline of £4.0m, due to cost of sales, the traffic acquisition strategy, the expansion of Time Out Digital activities and a full year of costs associated with being a listed company.
Exceptional costsOne-off exceptional costs include £1.8m (2016: £1.3m) of costs relating to redundancy and other payments to reorganise the Group, £0.2m of office relocation costs in London, £0.6m of non-cash charges for the revaluation of options to acquire the minority interest in Time
Out Market Lisbon and £0.5m of costs related to the acquisition of new countries.
Share based paymentsThe value of these options at issuance has been amortised over the time to vesting of the option. As at 31 December 2017, 10.9m options were outstanding.
Operating lossThe operating loss for the year was £24.6m (2016: £17.9m) including depreciation of £1.1m (2016: £0.7m) and amortisation of intangible assets of £4.4m (2016: £3.1m).
The amortisation of intangible assets included £2.3m (2016: £1.0m) relating to acquired intangible assets. Other intangible asset amortisation, primarily amortisation of software both acquired and internally developed, was £2.1m (2016: £2.2m).
Net finance costsNet finance costs in 2017 of £0.8m (2016: £1.1m) mainly comprise interest on third party loans and the foreign exchange loss on financial assets. The decrease in finance costs on loans is a result of the repayment of senior and mezzanine debt in 2016.
Foreign exchangeThe revenues and costs of Group entities reporting in dollars have been consolidated in these financial statements at an average exchange rate of $1.29 (2016: $1.36). The operations reporting in euros have been consolidated at a rate of €1.14 (2016: €1.22).
Currency effects for the year as a whole were not significant but there was a substantial change between each half. The impact on the revenues of the Group and its underlying revenue performance is as follows.
£ million 2016 f/x %
Underlying at
constant currency % Acquisitions 2017
H1 Revenue 16.6 1.0 6% 0.8 5% 0.3 18.7H2 Revenue 20.5 (0.1) (1%) 2.8 14% 2.5 25.7Full Year 37.1 0.9 2% 3.6 9% 2.8 44.4
AssociatesTime Out currently holds a 37.8% shareholding in Flypay. Flypay is a mobile technology platform providing solutions for ordering and payment within the hospitality sector. The investment is accounted for as an associate and the Group’s share of Flypay’s loss for 2017 of £1.0m is included as ‘Share of associate’s loss’ on the income statement. The investment in Flypay is recorded at £6.2m at 31 December 2017.

25887 11 April 2018 10:34 AM Proof 4
19
www.timeout.com STRATEGIC REPORT
Cash flowYear ended
31 December2017£’000
Year ended 31 December
2016£’000
Cash flows from operating activitiesAdjusted EBITDA (14,217) (10,231)Movement in working capital (3,528) (2,134)Other movements (197) (358)Cash use in operations (17,942) (12,723)Exceptional cash flows (2,877) (3,242)Capital expenditure (4,386) (3,497)Operating cashflow (25,205) (19,454)Net interest paid (389) (312)Tax credits received 3 8Free cashflow (25,591) (19,766)Pre-acquisition funding to Time Out Market - (150)Acquisition of subsidiaries, net of cash acquired (470) 1,222Proceeds of pre-IPO preference share issue - 4,000Proceeds from IPO - 90,000IPO costs - (5,281)Costs relating to share issue (5) -Advance of new borrowings 7,809 2,766Repayment of borrowings (1,169) (25,999)Repayment of finance leases (59) (26)Acquisition of minority interest (196) (1,408)Cash to restricted cash (1,093) -Movement in cash (20,774) 45,358
Operating cash flowThe cash used in operations before exceptional costs was £17.9m (2016: £12.7m) including a net working capital outflow of £3.5m (2016: £2.1m). Working capital balances have been impacted by the payment of a lease deposit on the new head office building, the deposit on the previous office being repaid in January 2018. This and other one off flows in 2017 were £2m including the seasonal growth in working capital of the business acquired in Australia. A strong last quarter for sales in the year led to a higher level of receivables than in prior periods and is the prime cause of the increase in the underlying cash out flow.
Capital expenditure of £4.4m (2016: £3.5m) includes £2.4m (2016: £1.8m) of capitalised software development costs relating to the teams working on the website and digital platforms, the cost of leasehold improvements and other equipment. Of the leasehold improvements, £1.5m was in respect of the development of new Time Out Market locations across the US, in London and Porto.
AcquisitionsThe Group undertook two business combinations in the period. It acquired the ordinary share capital of Print & Digital Publishing Pty Limited (“TO Australia”) for shares. The acquisition was completed on 2 June 2017.
On 14 August 2017, the Group acquired the entire issued share capital of 80 Mes Publicacions, S.L., a Spanish company which previously was a franchisee of the Group, in exchange for purchase consideration of cash of £905k and deferred consideration of £909k in the form of shares or cash at the discretion of Group management, with payment on the first anniversary of the acquisition date.
On 28 March and 16 June 2017 the Group took over the existing franchisee operations in Hong Kong and Singapore, respectively. No consideration was paid.
New borrowingsIn November 2017 Time Out Market received a loan from Incus Capital Advisors, S.L. of €9.0m denominated in Euros and repayable in instalments over 5 years. The loan has an interest rate of 11% over EURIBOR. It is subject to a financial covenant in respect of the EBITDA of Time Out Market Lisbon.
On 27 March 2018 the Company entered into a £20m term loan facility agreement with Oakley Capital Investments Limited (“OCI”). The facility is for a period of 19 months and has an interest rate of between 10% to 15% depending on amounts drawn. The proceeds of the new facilities are intended to be used by the Group to fund future Time Out Market developments.
OCI is a substantial shareholder in the Company as defined by the AIM Rules and as such entering into the facility constitutes a related party transaction pursuant to AIM Rule 13. With the exception of Peter Dubens, who is a director of OCI, the Directors of the Group consider that, having consulted with Liberum, the terms of the transaction are fair and reasonable insofar as shareholders are concerned.
Net cash and borrowingsNet cash at the period end was £19.3m (2016: £47.5m) as follows:
At 31 December
2017£’000
At 31 December
2016£’000
Cash and cash equivalents 28,746 50,082Borrowings (9,398) (2,598)Net cash 19,348 47,484
Julio BrunoGroup Chief Executive Officer27 March 2018

25887 11 April 2018 10:34 AM Proof4
20
Time Out Group plc Annual Report and Accounts for the year ended 31 December 2017 Stock code: TMO
PRINCIPAL RISKS
AND UNCERTAINTIES
The Board sets out below the principal risks and uncertainties that the Directors consider could impact the business. The Board continually reviews the potential risks facing the Group and the controls in place to mitigate any potential adverse impacts. The Board also recognises that the nature and scope of risks can change and that there may be other risks to which the Group is exposed. The list is therefore not intended to be exhaustive.
There is currently not a Risk Committee in place, so the Audit Committee reviews the risk register regularly as part of its annual agenda and, through discussions with management, identifies new potential risks as well as suggests implementation or improvement of existing controls.
Risk Mitigation Action/Control
Competition The Group operates in a highly competitive industry and the advent of new technologies and industry practices may adversely affect the Group’s business, results of operations and financial condition. The Group is subject to a number of factors relating to product demand, prices, recognition of the “Time Out” brand and the ability to attract and retain new customers.
To minimise these risks, the Group continues to invest significantly in the development of its digital offering to ensure that it remains innovative, competitive and attractive in the markets in which it operates. The focus on the quality of offerings means that the Group is able to respond to changes in the competitive landscape and respond to the needs of its readership audience and commercial partners.
Technological RiskIT Systems
The Group is particularly dependent on its IT infrastructure, and any system performance issues or shortcomings (for example, system, software or infrastructure failure, damage or denial of access) could cause serious business interruption. The efficient and uninterrupted operation of the systems, technology and networks on which the Group relies and its ability to provide consumers with reliable, real-time access to its products and services is fundamental to the success of the Group’s business. Back-up facilities are in place to ensure business interruptions are minimised and internal and customer data is protected from corruption or unauthorised use. Business recovery plans are also in place to minimise the effects of damage or denial of access to infrastructure or systems. The Group uses third party resources to assist with these areas where necessary.
Technological RiskTechnological Advancements
Time Out continues to grow at a fast pace and such growth requires ever more complex and sizeable technological systems. At the same time, technology itself continues to develop. Any failure to ensure that IT capacity and capability keep pace with the business could impair the Group’s ability to grow. To mitigate this risk, the Group makes ongoing investments in IT systems, security and people to ensure that they are sufficient for the needs of the business and do not become obsolete or compromised.
Privacy and Data Protection Risk
As the Group’s digital revenue offerings grow, the Group increasingly needs to gather and use customers’ personal data in order to transact with both businesses and customers. Unauthorised access to customer data could lead to reputational damage, compliance issues and a loss of customer confidence. The Group relies on third party contractors and its own employees to collect personal data and to maintain its databases and therefore the Group is exposed to the risk that such data could be wrongfully appropriated, lost or disclosed, damaged or processed in breach of data protection regulations. To mitigate this risk, the Group intends to implement a policy which adopts ISO 270001 principles including, the development and implementation of information security policies and procedures (for example, password policies and remote access policies), security monitoring software, access policies, password policies, physical access limitations and detection and monitoring of fraud from internal staff. Access to the network is protected by a firewall system supplied by Cisco. The Group also operates fraud detection systems which use various industry standard anti-fraud rules to prevent fraudulent transactions in real time. The Group encrypts sensitive data such as passwords and other certain information to ensure there is an additional layer of security.
The Group will operate under the General Data Protection Regulation (Regulation (EU) 2016/679) when the regulations become enforceable in May 2018. Significant progress has been made in respect of GDPR readiness and the Group anticipates no material issues with compliance on adoption. Compliance with these new regulations will be included on the Group risk register going forward and risk commentary updated at year end 2018.

25887 11 April 2018 10:34 AM Proof 4
21
www.timeout.com STRATEGIC REPORT
Risk Mitigation Action/Control
Economic Environment
The Group’s results of operations are affected by overall economic conditions in its key geographic markets via the demand for the content of the Group’s publications and websites in those markets as well as the prices which the Group can offer to potential advertisers and customers. If the local economy in a key market experiences a downturn, the Group’s publications, revenues and profitability could be adversely affected. Further, the UK’s exit from the European Union could lead to global political uncertainty and macro-economic uncertainty in the UK economy, as well as an impact on the availability of markets and market access across Europe. The geographic diversity of the business and the developing breadth in the business provides some mitigation from a downturn in a specific geographical location or part of the economy.
Foreign Exchange Risk
A substantial portion of the Group’s consolidated revenue is denominated in euros and US dollars. Since the Group reports its financial results in sterling, fluctuations in rates of exchange between sterling and the other currencies, particularly euros and US dollars, may have a material adverse effect on the Group’s results of operations. If sterling weakens as the UK exits the European Union, it may limit the Group’s ability to seek new opportunities and/or operate in other currencies.
Key Management
The Group’s success depends on its key personnel, particularly its senior management team, and its ability to retain them and hire other qualified employees. The loss of a significant number of key personnel may have a negative effect on the Group’s ability to deliver its products in a timely manner and would, amongst other things, require the remaining key personnel to divert immediate and substantial attention to seeking a replacement. In order to mitigate this risk, the HR department monitors employee satisfaction through employee surveys and forums, and uses the information to develop staff retention programmes. The Remuneration Committee also seeks to ensure that rewards correspond with performance and retention. Finally, the IPO has enabled the business to launch share-based incentives to assist in retaining key personnel.
Brand Protection
The Group depends on its brand name and any damage to its brand or reputation could impact the ability to attract and retain customers with a resultant impact on traffic and revenues, as well as impair the ability of the Group to attract employees. The Group has brand guidelines in place which are regularly communicated to all employees and key third parties to ensure consistency of voice and approach throughout all marketing activities. There is also a robust strategy in place for actively pursuing and defending the Time Out brand name and all supporting trademarks, domain names and other intellectual property in all key markets in all relevant classes. Furthermore, the Group employs internal and external legal personnel who are experts in intellectual property to manage the trademark and domain name portfolios and there are an ever-increasing number of trademarks and domain names applied for and registered across the world.
Other factors Other economic factors which may affect spending habits of consumers include, but are not limited to, acts of terrorism which could affect the willingness of consumers to continue existing spending habits and use of free time.
Operational riskTime Out Market
The Group intends to replicate the market concept in other cities across the world. The roll-out of new markets and the ongoing success of the Time Out Market in Lisbon could be negatively affected by a number of factors including:
• Terrorist or other visitor incidents, including fire, crowd control, or any other disaster or failure to comply with health and safety (including issues relating to food poisoning or other problems with food and/or beverages consumed at the Time Out market), security and environmental requirements. These incidents could affect the reputation and revenues of Time Out Market and of the Group, and may result in legal proceedings against the Company, TOM or another member of the Group.
• The roll-out of new markets may take longer than planned or ultimately not succeed, due to delays in or difficulties in agreeing commercial terms with landlords, problems in obtaining necessary planning permissions, delays in construction or significant inflation in costs; and difficulties in attracting premium restaurateurs on adequate financial terms.

25887 11 April 2018 10:34 AM Proof4
22
Time Out Group plc Annual Report and Accounts for the year ended 31 December 2017 Stock code: TMO
Governance
STRATEGY IN ACTION
Monetising businesses Time Out is connecting global and local brands and businesses with its engaged, valuable audience through a variety of solutions spanning advertising and sponsorship as well as Premium Profiles which allow venues such as restaurants, bars and hotels to improve their exposure on the platform.
It is Time Out’s positive, trusted content that is of great value for an audience craving authentic inspiration and for advertising partners craving brand safe environments. In 2017, Time Out delivered a number of high-impact campaigns across multiple touchpoints such as digital, mobile, social, print and Live Events. Clients included TAP Air Portugal, British Airways, Budweiser, Marriott, Lexus and many more. Bringing digital and print together, Time Out’s Creative Solutions team delivered the UK’s first freesheet video-in-print ad as part of a six-week multi-platform campaign for Three. The campaign spanned all of Time Out’s advertising channels leveraging the full strengths of its high-traffic channels with bespoke content and advertorials across print, digital and social media. It also included experiential elements, taking over ‘Movies on the River’ – a boat which sailed down the River Thames screening films as part of Time Out’s Live Events programme.
àRead more about ‘’Monetising businesses’ on page 16

25887 11 April 2018 10:34 AM Proof 4
23
www.timeout.com STRATEGIC REPORT

25887 11 April 2018 10:34 AM Proof4
24
Time Out Group plc Annual Report and Accounts for the year ended 31 December 2017 Stock code: TMO
BOARD OF
DIRECTORS
Peter Dubens,Non-Executive ChairmanMr Dubens joined the Group in November 2010 as a Non-Executive Director and was appointed Non-Executive Chairman in May 2016. Mr Dubens is the founder and Managing Partner of
the Oakley Capital Group, a privately owned asset management and advisory group comprising Private Equity, Venture Capital and Corporate Finance operations managing over €1.5 billion. Mr Dubens founded Oakley Capital in 2002 to be a best of breed, entrepreneurially driven investment house, creating an ecosystem that supports the companies the Oakley Capital Group invests in, whether they are early-stage companies or established businesses. The vision of Oakley Capital has always been to encourage and back entrepreneurship. To that end, Oakley Capital Private Equity invests in and supports the continued growth and development of some of Europe’s leading companies, including the iconic sailing brand, North Sails and Facile, Italy’s leading price comparison website. Mr Dubens has substantial AIM company experience, he is a director of Oakley Capital Investments plc and previously held the position of Chairman of Pipex Communications plc and 365 Media Group plc.
Julio Bruno,Group CEOMr Bruno joined Time Out Group in October 2015 as Executive Chairman and was appointed Group CEO in June 2016. In June 2016, he took the company public on London’s AIM. Mr Bruno has a successful international executive
career, spanning several countries and companies in sectors such as travel, technology, media and e-commerce. He previously was TripAdvisor’s Global Vice President of Sales (B2B) based in New York, Travelport’s Vice President for Canada, Latin America & the Caribbean and Cendant Corporation’s Managing Director (President) of Continental Europe & South America. Prior to this, Mr Bruno held senior international positions at Regus plc, Energizer and Diageo plc. He is involved with the start-up community as an investor and board adviser in several companies globally. Mr Bruno holds a master’s degree in International Business from the University of London, a BSc in Business and Economics from SUNY (State University of New York), and a postgraduate certificate on leadership from Wharton, University of Pennsylvania.
Richard Boult,Chief Financial OfficerMr Boult joined the Group in April 2016 as Chief Financial Officer. Mr Boult was previously Group Finance Director at BCA Marketplace plc, including at the time of its listing on the main market of the London
Stock Exchange. Prior to joining BCA Marketplace, Mr Boult held a number of senior finance roles at both group and regional levels in major listed companies including Wolseley plc, Darty plc and 21st Century Fox Inc. Mr Boult has a degree in Computer Science from the University of Cambridge and qualified as a Chartered Accountant with PricewaterhouseCoopers LLP in London.
Lord Rose of Monewden,Non-Executive DirectorLord Rose joined the Group in December 2015 as Chairman of Time Out Market Limited and was appointed as a Non-Executive Director in
June 2016. Lord Rose has led a distinguished 40-year career in retail, including as Chief Executive and then Chairman of Marks & Spencer plc (2004-2010). Lord Rose has also held Chief Executive positions at Arcadia Group plc, Booker plc, and Argos plc. Lord Rose is the current Chairman of Fat Face Group, Oasis Healthcare Group, Majid Al Futtaim Retail, Dressipi and Ocado and a Non-Executive Director of the Board of Woolworths Holdings Ltd (South Africa). Lord Rose was knighted for services to the retail industry and corporate social responsibility in 2008 and was elevated to the House of Lords in 2014. Lord Rose is a member of the Audit Committee and the Remuneration Committee.

25887 11 April 2018 10:34 AM Proof 4
25
www.timeout.com GOVERNANCE
Alexander Collins, Non-Executive DirectorMr Collins joined the Group in November 2010 as a Non-Executive Director. Mr Collins is a Partner at Oakley Capital Private Equity and
has 20 years of private equity investment and operational experience, including originating and structuring transactions in a range of sectors and geographies, including growth equity, MBOs, restructuring and turnaround situations. Mr Collins joined Oakley Capital Private Equity in 2007 as one of the founding partners and has been an Investment and Board Director of a range of international businesses, including Host Europe, Emesa, Intergenia, Verivox, North Sails and Facile. Prior to joining Oakley Capital Private Equity, Mr Collins started his career at GE Capital in 1995 before being seconded to Advent International for two years as an Associate Director. He subsequently joined Henderson Private Capital as Principal and was then a Partner at Wharfedale Capital, where he was involved in the purchase of secondary direct private equity assets. Mr Collins holds an MSc from the London School of Economics and a BA in Economic History from Union College, New York.
Christine Petersen, Time Out Digital CEOMs Petersen joined the Group in February 2016 as a Non-Executive Director and stepped in as the interim CEO of Time Out Digital in January 2017, in April
2017 she took over the role permanently. Most recently, she was the Chief Consumer Officer and CMO of Treato, an Israel-based venture-backed start-up company in the digital healthcare sector. She previously spent nine years with TripAdvisor, serving as President of TripAdvisor for Business from 2010 to 2013 and as Chief Marketing Officer from 2004 to 2010. Prior to working for TripAdvisor, Ms Petersen served in a variety of management roles in digital travel and financial services companies, including Preview Travel, Travelocity (upon Preview Travel’s acquisition by Travelocity), Charles Schwab and Co. and Fidelity Investments. Previously, she began her career with American Express in 1989. She serves as a Board Director to Bankrate, Inc. (a NYSE-listed company), sitting on both the Audit and Remuneration Committees, and acts as an adviser and/or investor in several start-up businesses. Ms Petersen is an MBA graduate of Columbia University and previously graduated from Colby College with a BA in Economics.
Matthew Riley,Non-Executive DirectorMr Riley joined the Group in January 2017 as a Non-Executive Director. Mr Riley is the Founder of the Daisy Group. He served as Chief Executive Officer at Daisy until 2015 and is now the group’s Chairman. Since founding Daisy in
2001, Mr Riley has driven the rapid growth of the company to create one of the UK’s leading business technology and communications service providers. He floated the company on the Alternative Investment Market in 2009, grew the business to revenues of £350m and, in January 2015, took it back into private ownership in a £494m deal. Mr Riley is Chairman of numerous start-up businesses, an award-winning entrepreneur and fervent advocate of UK enterprise, regional growth and entrepreneurship. Mr Riley is a member of and chairs each of the Group’s Audit Committee and the Remuneration Committee.
Tony Elliott, Non-Executive DirectorMr Elliott founded Time Out in 1968 with £70 during a summer break from Keele University. The Time Out magazine was initially a folded-down poster equivalent to eight pages of today’s printed format that Mr Elliott
handed out himself. The range of curated content sought to reflect the best of what was happening in London together with a focus on the issues of the day and laid the foundations for the Time Out brand’s coverage and culture today. Over the years, Mr Elliott transformed Time Out into a global media brand and, in November 2010, sold a controlling share of Time Out to Oakley Capital to provide operational support and investment to bring the brand back under common ownership and to develop the digital platform. Mr Elliott has been a Non-Executive Director of the Company since November 2010, having previously served as Executive Chairman of Time Out since its founding in 1968. Mr Elliott is currently a director and/or trustee of a number of cultural institutions including Human Rights Watch (UK charity), Granta Publications and Create London. At the end of 2017, he stepped down as director and/or trustee of The Roundhouse (where he also served as Vice Chair), Somerset House Trust and Somerset House Enterprises Ltd. In addition, Mr Elliott has previously acted as a director and/or trustee of Human Rights Watch’s London Committee (founding Chair), HRW International Board, Film London, Soho Theatre Company, The Photographer’s Gallery, The British Film Institute (Governor) and BFI Production Board (Chairman). In May 2014, Mr Elliott received the prestigious Goodman Award, which honours an individual who has made an outstanding long-term contribution to the arts in a voluntary capacity.

25887 11 April 2018 10:34 AM Proof4
26
Time Out Group plc Annual Report and Accounts for the year ended 31 December 2017 Stock code: TMO
CORPORATE
GOVERNANCE REPORT
IntroductionThis section of the report sets out the Group’s approach to governance and provides further information on how the Board and its committees operate.
The Directors acknowledge the importance of high standards of corporate governance. The Company is not required to comply with the UK Corporate Governance Code (“the Code”) however it intends to continue to adopt the principal provisions of the UK Corporate Governance Code (“the Code”) as appropriate for the size and nature of the Company and given the composition of the board. The Company is also mindful of the recommendations of the QCA Corporate Governance Code for Small and Mid-Size Quoted Companies (“QCA guidelines”).
Composition of the BoardThe Board is the link between the Shareholders and Executive management and is responsible for the successful stewardship of the Group. As such the Board plays a key role in the corporate governance process.
During the period 23 January to 31 December 2017, the Board comprised of eight Directors, three of whom were Executive Directors and five of whom were Non-Executive Directors, reflecting a blend of different experiences and backgrounds. Biographical details of current Board members are shown on page 24. The Board believes that the composition of the Board brings a desirable range of skills and experience in light of the Company’s challenges and opportunities, while at the same time ensuring that no individual (or small group of individuals) can dominate the Board’s decision making. Notwithstanding Lord Rose’s entitlements under the Time Out Market Equity Incentive Plan the Company regarded Lord Rose and Matthew Riley as “independent Non-Executive Directors” within the meaning of the QCA Code and free from any business or other relationship that could materially interfere with the exercise of their judgement.
From 1 January 2017 to 23 January 2017, when Mr Riley joined the Board and Ms Petersen became Executive Director, the Board comprised seven Directors, two of whom were Executive Directors and five of whom were Non-Executive Directors.
As of January 2017, Ms Petersen stepped in as the interim Chief Executive Officer of Time Out Digital before being appointed to the permanent role as of 12 April 2017. On interim appointment, she stepped down as the Chairman of the Audit Committee and Remuneration Committee and could no longer be considered an independent Non-Executive Director. She continues to serve on the Board as an Executive Director. Matthew Riley, who joined the Company as a Non-Executive Director in January 2017, replaced Ms Petersen in these Chairman roles.
The Board’s composition and skill set is considered appropriate for the Group’s current stage of development. The experience and knowledge of each of the Directors gives them the ability to constructively challenge strategy and to scrutinise performance. As the Board is small, there is not a separate Nominations Committee and recommendations for appointments to the Board will be considered by the Board as a whole after due evaluation.
Board Role and MeetingsThe Board is responsible for the Group’s strategy and for its overall management, as well as setting the Group’s values and standards. The operation of the Board is documented in a formal schedule of matters reserved for its approval which is reviewed annually. These matters relate to:
• All of the Group’s strategic aims and objectives;
• The structure and capital of the Group;
• Financial reporting, controls and policies including those around cyber protection;
• Setting budgets and forecasts;
• Internal controls;
• Approval of any significant contracts, expenditure, partnerships and/or ventures;
• Effective communication with shareholders;
• Any changes to the Board membership or structure, including delegation of authority;
• Approval for remuneration for Executive Directors; and
• Approval of appointment of Key Management Personnel and Directors
Non-Executive Directors communicate directly with Executive Directors and senior management between formal Board meetings.
The Board met eight times during 2017. Directors are expected to attend all meetings of the Board and committees on which they sit, and to devote sufficient time to their duties to the Group. In the event that Directors are unable to attend a meeting, their comments on papers to be considered at the meeting will be discussed in advance with the Chairmen so that their contribution can be included in the wider Board discussion.
The following table shows Directors’ attendance at scheduled Board and Committee meetings for the year to 31 December 2017:
BOARD AUDIT REMUNERATIONPeter Dubens 7/7 – –Christine Petersen 7/7 – –Lord Rose 5/7 3/3 1/1Alexander Collins 7/7 – –Tony Elliott 7/7 – –Matthew Riley 6/7 3/3 1/1Julio Bruno 7/7 – –Richard Boult 7/7 – –

25887 11 April 2018 10:34 AM Proof 4
27
www.timeout.com GOVERNANCE
Board CommitteesThe board has delegated specific responsibilities to the Audit Committee and the Remuneration Committee, details of which are set out below. Each committee has written terms of reference setting out its duties, authorities and reporting responsibilities.
Audit CommitteeThe Audit Committee has primary responsibility for monitoring the quality of internal controls to ensure that the financial performance of the Group is properly measured and reported. It receives and reviews reports from the Group’s management relating to the interim and annual accounts and the accounting and internal control systems in use throughout the Group. It meets with external Auditors throughout the year to discuss their findings in relation to the annual accounts. The Audit Committee aims to meet not less than three times in each financial year, and it has unrestricted access to the Group’s External Auditors.
Membership of the Audit Committee includes only independent Non-Executive Directors. Following the change in Ms Petersen’s role in January 2017, she resigned from this Committee. From the 23 January 2017, the Audit Committee comprised of Lord Rose and Matthew Riley and was chaired by Mr Riley.
More information about this Board committee can be found in the Audit Committee report on page 33.
Remuneration CommitteeThe Remuneration Committee reviews the performance of the Executive Directors and makes recommendations to the Board on matters relating to their remuneration and terms of service. The Remuneration Committee also makes recommendations to the Board on proposals for the granting of share options and other equity incentives pursuant to any employee share option scheme or equity incentive plans in operation from time to time.
The Remuneration Committee meets as and when necessary, but aims to meet at least twice each year. As part of the responsibility of the committee, the members have regard to the recommendations put forward in the QCA Code and, where appropriate, the QCA Remuneration Committee Guide and associated guidance.
Membership of the Remuneration Committee includes only independent Non-Executive Directors. Following the change in Ms Petersen’s role in January 2017, she resigned from this Committee. From the 23 January 2017, the Remuneration Committee comprised of Lord Rose and Matthew Riley and was chaired by Mr Riley.
More information about this Board Committee can be found in the Directors’ Remuneration report on page 34.
Board Effectiveness All Directors take part in a thorough induction process on joining the Board, tailored to the existing knowledge and experience of the Director concerned.
The performance of the Board is fundamental to the Company’s success. The performance of the Board and its Committees, including individual members, is evaluated regularly by the Chairman, with the aim of improving their effectiveness.
All Directors are able to take independent professional advice in the furtherance of their duties, if necessary, at the Company’s expense. In addition, the Directors have direct access to the advice and services of the Company Secretary and Chief Financial Officer.
Key ManagementThe Key Management roles that have been identified by the Board are as follows:
• Group Chief Executive Officer
• Chief Executive Officer, Time Out Digital
• Chief Executive Officer, Time Out Market
• Chief Financial Officer

25887 11 April 2018 10:34 AM Proof4
28
Time Out Group plc Annual Report and Accounts for the year ended 31 December 2017 Stock code: TMO
CORPORATE
GOVERNANCE REPORT CONTINUED
Internal controlsThe Board has ultimate responsibility for the Group’s system of internal control and for reviewing its effectiveness. However well the system is designed to manage risk, it cannot eliminate all risk, and therefore it provides reasonable, not absolute, assurance against material misstatement or loss. The Board considers that the internal controls in place are appropriate for the size, complexity and risk profile of the Group. The principal elements of the Group’s internal control system include:
• Close management of the day-to-day activities of the Group by the Executive Directors;
• An organisational structure with defined levels of responsibility, which promotes entrepreneurial decision making and rapid implementation whilst minimising risks;
• A comprehensive annual budgeting process, producing a detailed integrated profit and loss, balance sheet and cash flow, which is approved by the Board;
• Detailed monthly reporting of performance against budget; and
• Central control over key areas such as capital expenditure authorisation and banking facilities.
The Group continues to review its system of internal control to ensure compliance with best practice, whilst also having regard to its size and the resources available. The Board considers that the introduction of an internal audit function is not appropriate at the current time, however an internal review is completed by internal senior members of the finance function in order to ensure accuracy in the financial reporting.
During 2017, the Group took the opportunity to review their approach to business continuity and disaster recovery and towards the end of the year, entered in to a three year contract with a specialised third party solution provider. A recovery site has been in place since November 2017 with further testing and risk assessments scheduled through 2018 for both head office and overseas locations.
Relations with shareholdersCopies of the annual report are sent to all Shareholders. Copies of the annual and interim reports can be downloaded from the investors section on www.timeout.com. Other information for Shareholders and interested parties is also provided on that website. Written or e-mailed enquiries are handled by the Company Secretary. The Secretary can be reached at the registered address or at [email protected]. The Group has an ongoing programme of individual meetings with institutional Shareholders and analysts following the preliminary and half-year results presentations to the City. These meetings allow the Group Chief Executive Officer and the Chief Financial Officer to update shareholders on strategy and the Group’s performance. Additional meetings with institutional investors and/or analysts are arranged from time to time. All members of the Board receive copies of feedback reports from the City presentations and meetings, thus keeping them in touch with shareholder opinion.
Shareholders are given the opportunity to ask questions and raise issues at the Annual General Meeting (AGM); this can be done formally during the meeting or informally with the Directors after it. The AGM will be held on 8 June 2018 at 77 Wicklow Street, London, WC1X 9JY. The notice of the AGM accompanies this Annual Report and Accounts.
Approved by the Board and signed on behalf of the Board by
Richard BoultCompany Secretary

25887 11 April 2018 10:34 AM Proof 4
29
www.timeout.com GOVERNANCE
DIRECTORS’
REPORT
The Directors present their report together with the audited financial statements for the year ended 31 December 2017. The Corporate Governance report on pages 26 to 28 also forms part of the Directors’ Report.
General InformationThe Company referenced in the Annual Report and Accounts is Time Out Group plc, a UK registered company at 77 Wicklow Street, London WC1X 9JY. The Group referenced in the Annual Report and Accounts includes the Company as well as the subsidiaries listed in note 16 of the financial statements.
Principal ActivityTime Out Group is the leading global media and entertainment business that inspires and enables people to make the most of the city. Through powerful content, top-quality curation, enabling technology and exceptional experiences, Time Out helps discover, book and share what the world’s cities have to offer. Operating in 108 cities across 39 countries, this iconic brand has a monthly global audience reach of 217 million.
Across multiple platforms comprising digital, app, mobile, social and print and its physical presence via Live Events and Time Out Market, the Group aims to connect consumers and businesses in the leisure, travel and local entertainment sector through B2C and B2B offerings.
Review of BusinessThis Annual Report and Accounts has been prepared to provide Shareholders with a fair and balanced review of the Group’s business and the outlook for the future development of the Group as well as the principal risks and uncertainties which could affect the Group’s performance.
The table below identifies where to find specific information related to the business review:
Content Section PageQ&A with the CEO Strategic section 8Key Performance Indicators (“KPIs”) Strategic section 14Business Review including Outlook Strategic section 15Principal Risks & Uncertainties Strategic section 20Corporate Governance Governance section 26Accounts and Note Disclosure Financial statements 44
Branches outside the UKThe Group operates a branch in France and has subsidiaries in the UK, Portugal, Spain, Australia, Hong Kong, Singapore and the United States of America.
Future DevelopmentsA review of the Group’s outlook can be found in the Business Review on page 15.
Result and DividendsThe Group has reported its audited accounts in accordance with International Financial Reporting Standards as adopted by the European Union. The Group’s results are set out in the Consolidated Income Statement on page 44. The Company has prepared the individual Company accounts in accordance with FRS 101.
The Group loss for the year after taxation was £26.0m (2016: loss of £18.6m). The Directors do not recommend the payment of a dividend (2016: £nil).
Events Since the End of the YearInformation relating to events since the end of the year is given in note 31 of the accounts.
Directors The Directors of the Company who were in office during the year and up to the date of this Report, together with their biographical details is shown on page 24.
Following the change to her role in early 2017, Christine Petersen resigned as the Chairman of the Audit Committee and Remuneration Committee and Matthew Riley was appointed in her place. More information can be found in the Corporate Governance report on page 26.
Adam Silver will be appointed Group Chief Financial Officer and to the Board of Directors from 29 March 2018. Richard Boult will step down at same time.
Further information on Directors’ induction process can be found in the Corporate Governance report on page 26.
Directors’ InterestsThe Directors’ Interests in the Company’s shares and options over ordinary shares are shown in the Directors’ Remuneration report on page 34.
Lord Rose participates in an equity incentive plan in Time Out Market Limited. Under the plan, Lord Rose has subscribed for 3% of the equity in Time Out Market Limited, including direct subsidiaries, subject to provisions in respect of continued service. In the absence of an earlier exit event such as the disposal of Time Out Market Limited, the members of this plan may put their vested awards to the Company within three months of the publication of Time Out Group plc’s audited accounts in 2021 at a value determined by reference to the 2020 adjusted EBITDA of Time Out Market.
Except for the amounts disclosed in the Remuneration Report, no Director has any beneficial interest in the share capital of any subsidiary or associate undertaking.

25887 11 April 2018 10:34 AM Proof4
30
Time Out Group plc Annual Report and Accounts for the year ended 31 December 2017 Stock code: TMO
DIRECTORS’
REPORT CONTINUED
Directors’ Indemnity and Liability InsuranceThe Company has purchased and maintained throughout the financial year Directors’ and Officers’ liability insurance in respect of itself and its Directors.
The Directors also have the benefit of the indemnity provision contained in the Company’s Articles of Association which represents a qualifying third-party indemnity provision as defined by Section 234 of the Companies Act 2006. The indemnity was in force throughout the financial period and at the date of approval of the financial statements.
Statement of Directors’ Responsibilities in Respect of the Financial StatementsThe directors are responsible for preparing the Annual Report and the financial statements in accordance with applicable law and regulation.
Company law requires the directors to prepare financial statements for each financial year. Under that law the directors have prepared the Group financial statements in accordance with International Financial Reporting Standards (IFRSs) as adopted by the European Union and company financial statements in accordance with United Kingdom Generally Accepted Accounting Practice (United Kingdom Accounting Standards, comprising FRS 101 “Reduced Disclosure Framework”, and applicable law). Under company law the Directors must not approve the financial statements unless they are satisfied that they give a true and fair view of the state of affairs of the Group and Company and of the profit or loss of the Group and Company for that period. In preparing the financial statements, the Directors are required to:
• select suitable accounting policies and then apply them consistently;
• state whether applicable IFRSs as adopted by the European Union have been followed for the Group financial statements and United Kingdom Accounting Standards, comprising FRS 101, have been followed for the Company financial statements, subject to any material departures disclosed and explained in the financial statements;
• make judgements and accounting estimates that are reasonable and prudent; and
• prepare the financial statements on the going concern basis unless it is inappropriate to presume that the Group and Company will continue in business.
The Directors are responsible for keeping adequate accounting records that are sufficient to show and explain the Group and Company’s transactions and disclose with reasonable accuracy at any time the financial position of the Group and Company and enable them to ensure that the financial statements comply with the Companies Act 2006 and, as regards the Group financial statements, Article 4 of the IAS Regulation.
The Directors are also responsible for safeguarding the assets of the Group and Company and hence for taking reasonable steps for the prevention and detection of fraud and other irregularities.
The Directors are responsible for the maintenance and integrity of the company’s website. Legislation in the United Kingdom governing the preparation and dissemination of financial statements may differ from legislation in other jurisdictions.
The Directors consider that the Annual Report and Accounts, taken as a whole, is fair, balanced and understandable and provides the information necessary for shareholders to assess the Group and Company’s performance, business model and strategy.
Each of the Directors, whose names and functions are listed in Board of Directors confirm that, to the best of their knowledge:
• the Company financial statements, which have been prepared in accordance with United Kingdom Generally Accepted Accounting Practice (United Kingdom Accounting Standards, comprising FRS 101 “Reduced Disclosure Framework”, and applicable law), give a true and fair view of the assets, liabilities, financial position and loss of the company;
• the Group financial statements, which have been prepared in accordance with IFRSs as adopted by the European Union, give a true and fair view of the assets, liabilities, financial position and loss of the Group; and
• the Directors’ Report includes a fair review of the development and performance of the business and the position of the Group and Company, together with a description of the principal risks and uncertainties that it faces.
In the case of each Director in office at the date the Directors’ Report is approved:
• so far as the Director is aware, there is no relevant audit information of which the Group and Company’s auditors are unaware; and
• they have taken all the steps that they ought to have taken as a Director in order to make themselves aware of any relevant audit information and to establish that the Group and Company’s auditors are aware of that information.
Website PublicationThe Directors are responsible for ensuring the Annual Report and Accounts are made available on a website and are published on the Company’s website in accordance with legislation in the United Kingdom governing the preparation and dissemination of the Annual Report and Accounts, which may vary from legislation in other jurisdictions. The maintenance and integrity of the Company’s website is the responsibility of the Directors. The Directors’ responsibility also extends to the ongoing integrity of the Annual Report and Accounts contained therein.
Political DonationsThe Company made no political donations during the year (2016: £nil).

25887 11 April 2018 10:34 AM Proof 4
31
www.timeout.com GOVERNANCE
Financial Instruments and Related MattersThe financial risk management objectives and policies of the Group, including credit risk, interest rate risk and currency risk are provided in note 24 of the accounts.
Share CapitalThe Company’s share capital comprises one class of Ordinary Shares with a nominal value of £0.001 each. At 31 December 2017, 133,362,889 Ordinary Shares were in issue (2016: 131,166,644 Ordinary Shares).
Substantial ShareholdingsIn accordance with the Disclosure and Transparency Rules DTR 5, the Company as at 21 March 2018 (being the last practicable date before the publication of this report) has been notified of the following disclosable interests in its issued ordinary shares:
Shareholder Ordinary shares held% of
ownershipOakley Capital Private Equity 45,361,015 34.01Oakley Capital Investment Limited 31,436,385 23.57Woodford Investment Management 20,040,000 15.03Invesco Perpetual 16,083,334 12.06Insight Investment Management 7,521,327 5.64
Woodford Investment Management and Invesco Perpetual both have ownership interests in Oakley Capital Investment Limited that pre-date its ownership interest in the Company. Please refer to the admission document for more information.
Share Option SchemesDetails of employee share option schemes are set up in note 29 of the accounts.
Going ConcernThe Directors confirm they have a reasonable expectation that the Company and Group have adequate resources to continue in operation for the foreseeable future and at least 12 months from the date of signing these financial statements and consider it appropriate to adopt the going concern basis of accounting in preparing the Company and Group financial statements.
This confirmation is made having considered the financial position of the Group on the basis of the latest budgets and forecasts, the cash balance of £29.8 million at 31 December 2017 and the availability of future financing, including the £20 million credit facility entered into in March 2018, committed until October 2019, to help accelerate the roll-out of new markets. As new markets are opened the Directors will explore alternative financing options from a number of potential sources. The Directors have considered downside risks to the Group’s plans, together with options available to reduce the rate of cash burn in the short to medium term, and assessed the potential impact these would have on the Group’s liquidity. In evaluating these risks
the Directors have considered the Group’s history of operating losses and the cash outflows that are expected to continue as the Group undertakes the expansion of the Time Out Markets business.
Research & DevelopmentThe Group undertakes activity which could be classified as research and development. This is further explained in note 2 of the accounts.
Conflicts of InterestSave as set out below, there are no actual or potential conflicts of interest between the duties of the Directors of the Company and the private interests or other duties that they may also have.
Peter Dubens is a managing partner of and founder of Oakley Capital and has direct involvement in that company, its subsidiaries and associated companies.
Alexander Collins is also a partner of Oakley Capital.
Lord Rose has a minority interest in Time Out Market Limited as described in the Directors’ Interest section of this report.
Matthew Riley is a Director and significant shareholder in Daisy Group Holdings Limited. Time Out England Limited engage with a subsidiary company to provide IT services.
Further information is set out in note 30 of the accounts.
Relationships with Major Shareholders and AssociatesOn admission of its shares following the IPO in June 2016, the Company entered into a relationship agreement with TO (Bermuda) Limited, TONY (Bermuda) Limited, Oakley Capital Investment Limited, Oakley Capital Private Equity (“Oakley Entities”), the principal purpose of which is to ensure the Company is capable of carrying on, at all times, its business independently of them and their associates. Under the relationship agreement, providing that the Oakley Entities’ combined holdings are greater than 20%, they shall be entitled to appoint two Directors.
Employee InvolvementThe Group is committed to being an equal opportunities employer and opposes all forms of discrimination. Applications from people with disabilities will be considered fairly and if existing employees become disabled, every effort is made to retain them within the workforce wherever reasonable and practicable. The Group also endeavours to provide equal opportunities in the training, promotion and general career development of disabled employees.
The Group regularly provides employees with information of concern to them, which incorporates the Group’s current performance and its future aims and strategies. The Group conducts an Annual Employee Survey and uses the results of this survey to improve performance in areas that are important to staff. A monthly forum is held to ensure employees receive business updates and have the opportunity to communicate with senior management directly.

25887 11 April 2018 10:34 AM Proof4
32
Time Out Group plc Annual Report and Accounts for the year ended 31 December 2017 Stock code: TMO
DIRECTORS’
REPORT CONTINUED
DiversityThe Group is committed to reflecting diversity in its workforce and aims to improve this balance going forward.
As of 31 December 2017, the Group had the following employees:
Male Female TotalAll employees 180 222 402Senior managers 14 9 23Board of Directors 7 1 8
Independent AuditorPricewaterhouseCoopers LLP (PwC) has expressed willingness to continue in office as auditor and a resolution to reappoint them will be proposed at the Annual General Meeting.
Annual General Meeting (AGM)The AGM will be held on 8 June 2018. The ordinary business comprises receipt of the Directors’ report and the audited financial statements for the period ending 31 December 2017, the re-election of Directors, the reappointment of PwC as independent auditors and authorisation of the Directors to determine the Auditors’ remuneration. The Notice of Annual General Meeting and ordinary and special resolutions to be put to the meeting are included at the end of this Annual Report and Accounts.
Other Policies in PlaceThe Group has policies in place to mitigate risk surrounding fraud, bribery, modern slavery and whistle-blowing amongst other things. It operates a Code of Conduct.
The Directors Report was approved by the board on 27 March 2018 and signed on its behalf by
Richard BoultCompany Secretary

25887 11 April 2018 10:34 AM Proof 4
33
www.timeout.com GOVERNANCE
AUDIT
COMMITTEE REPORT
The Audit Committee is responsible for ensuring that the financial performance of the Group is properly reported and reviewed. Its role includes monitoring the integrity of the financial statements (including the Annual Report and Accounts and interim accounts and results announcements), reviewing internal control and risk management systems, reviewing any changes to accounting policies, reviewing and monitoring the extent of the non-audit services undertaken by external auditors and advising on the appointment of external auditors.
Composition and Role of the Audit CommitteeThe Audit Committee’s members during the year were Christine Petersen, who resigned from the Committee on 23 January 2017, Matthew Riley, who was appointed Chairman on 23 January 2017, and Lord Rose. Richard Boult also attended Committee meetings in his role as Chief Financial Officer. The Committee met three times in 2017 and aims to meet at least three times annually. Details on attendance for these meetings can be found in the Corporate Governance Report on page 26.
Following the change to Ms Petersen’s role in early 2017 and her resignation from the committee, Matthew Riley was appointed in her place. The Board is satisfied that the Chairmen and other members of the committee have senior Director experience in major listed companies and is therefore satisfied that members have recent and relevant financial experience. More information on Mr Riley and Lord Rose’s background can be found in the Directors’ Biographies on page 24.
The main duties of the Audit Committee are set out in its Terms of Reference which are available on the Company’s website www.timeout.com and are also available on request from the Company Secretary. The main items of business to be considered by the Audit Committee include:
• Review of the Annual Report and Accounts;
• Consideration of the external audit report and management representation letter;
• Going concern review;
• Review of the audit plan and audit engagement letter;
• Review of the suitability of the external Auditor;
• Review of the risk management and internal control systems;
• Review and approval of the interim results and dividend;
• Assessment of the need for an internal audit function; and
• Review of the regular whistleblowing reports.
Activities for the yearThe main activities for the year included:
• review of the FY17 audit plan and audit engagement letter;
• consideration of key audit matters and how they are addressed;
• review of the interim financial results and Annual Report and Accounts;
• consideration of the external audit report and management representation letter;
• going concern review;
• review levels of financial processes and procedures;
• meeting with the external auditor without management present; and
• review of whistleblowing and anti-bribery arrangements.
Role of the External AuditorThe Audit Committee monitors the relationship with the external Auditor, PricewaterhouseCoopers LLP who were appointed in 2013, to ensure that auditor independence and objectivity are maintained. As part of its review the Committee monitors the provision of non-audit services by the external Auditor. The breakdown of fees between audit and non-audit services is provided in note 7 of the Group’s accounts. The non-audit fees relate to a half-year review, company secretarial services and transfer pricing advice.
The Audit Committee also assesses the Auditor’s performance. Having reviewed the Auditor’s independence and performance, the Audit Committee has recommended that PricewaterhouseCoopers LLP be reappointed as the Company’s Auditor at the next AGM.
Audit ProcessThe Auditor prepares an audit plan for its review of the full year financial statements. The audit plan sets out the scope of the audit, areas to be targeted and the audit timetable. This plan is reviewed and agreed in advance by the Audit Committee. Following its review, the Auditor presents its finding to the Committee for discussion. Areas of significant risk and other matters of audit relevance are regularly communicated.
Internal AuditAt present, the Group does not have an internal audit function, and the Committee believes that management is able to derive assurance as to the adequacy and effectiveness of internal controls and risk management procedures without one. The Committee will continue to review this decision.
Risk Management and Internal ControlsAs described on page 28 of the Corporate Governance Report, the Group has established a framework of risk management and internal control systems, policies and procedures. The Audit Committee is responsible for reviewing the risk management and internal control framework and ensuring that it operates effectively. During the year, the Committee has reviewed the framework and the Committee is satisfied that the internal control systems in place are currently operating effectively.
WhistleblowingThe Group has in place a whistleblowing policy which sets out the formal process by which an employee of the Group may, in confidence, raise concerns about possible improprieties in financial reporting or other matters. Whistleblowing is a standing item on the Committee’s agenda and updates are provided at each meeting.
During the year there were no incidents for consideration.
Approved by the Board and signed on behalf of the Board by
Matthew RileyChairman of the Audit Committee

25887 11 April 2018 10:34 AM Proof4
34
Time Out Group plc Annual Report and Accounts for the year ended 31 December 2017 Stock code: TMO
DIRECTORS’
REMUNERATION REPORT
The Group is not required to prepare a Directors’ Remuneration report. The following disclosures are prepared on a voluntary basis for the Group.
Composition and RoleThe Remuneration Committee’s members during the year were Christine Petersen, who resigned from the Committee 23 January 2017, Matthew Riley, who was appointed Chairman on 23 January 2017, and Lord Rose. The Committee operated under the Terms of Reference and was responsible for reviewing the performance of the Executive Directors and for making recommendations to the Board on matters relating to their remuneration and terms of service. The Committee was also responsible for making recommendations to the Board on proposals for the granting of share options.
The Remuneration Committee met once during the year to 31 December 2017 and intends to meet at least two times a year in the future.
More information about the members of this Committee can be found on page 24 in the Director’s biographies.
Remuneration PolicyThe objective of the Group’s remuneration policy is to attract, motivate and retain high quality individuals who will contribute fully to the success of the Group. To achieve this objective, the Group provides competitive salaries and benefits to all employees. Executive Directors’ remuneration is set to create an appropriate balance between both fixed and performance-related elements. Remuneration is reviewed each year in light of the Group’s business objectives. It is the Remuneration Committee’s intention that remuneration should reward achievement of objectives and that these are aligned with Shareholders’ interests over the medium term.
No director has any involvement in setting their own remuneration.
Remuneration consists of the following elements:
• Basic salary;
• Performance-related annual bonus;
• Share options;
• Pensions; and
• Benefits including insurance and allowances.
Share OptionsThe Company operates a Long Term Incentive Plan (“LTIP”) which is a discretionary share plan.
The LTIP is designed to encourage continual improvement and to align the interests and objectives of senior management with those of shareholders in the medium term. More details of this scheme are in note 29 of the Consolidated Accounts. The Remuneration Committee supervises the operation of the LTIP and the grant of Awards to Executive Directors and the Board oversees LTIP for employees.
Service Contracts and Letters of AppointmentExecutive DirectorsThe service agreement of the Group Chief Executive Officer is terminable by the Company giving him 12 months’ notice in writing, or by the Group Chief Executive Officer giving the Company nine months’ notice in writing. The service agreement of the Chief Financial Officer and the Chief Executive Officer Time Out Digital is terminable by either party giving the other six months’ notice in writing.
Non-Executive DirectorsThe Non-Executive Directors’ letters of appointment may be terminated by either party giving three months’ written notice.

25887 11 April 2018 10:34 AM Proof 4
35
www.timeout.com GOVERNANCE
Directors’ Remuneration The following table summarises the actual total gross remuneration, for qualifying services, of the Directors who served during the year to 31 December 2017 and prior year. Bonus amounts included are calculated on an accruals basis and were actually paid in February 2018.
Year ended 31 December 2017
EXECUTIVESalary£’000
Benefits£’000
Pension£’000
Bonus£’000
Share Options
£’000Termination
£’000Total
£’000Julio Bruno1 300 9 28 297 106 – 740Richard Boult2 200 7 19 93 6 – 325Christine Petersen 276 21 3 260 95 – 655
NON-EXECUTIVEPeter Dubens – – – – – – –Lord Rose of Monewden3 35 – – – – – 35Alexander Collins – – – – – – –Tony Elliott 35 11 – – – – 46
Matthew Riley4 45 – – – – – 45
Year ended 31 December 2016
EXECUTIVESalary£’000
Benefits£’000
Pension£’000
Bonus£’000
Share Options
£’000Termination
£’000Total
£’000Julio Bruno 289 10 29 288 780 – 1,396 Richard Boult 133 5 13 67 25 – 243 Matthew White 71 4 5 – – 293 373 Noel Penzer5 272 14 24 – – 245 555
NON-EXECUTIVE Peter Dubens – – – – – – –Lord Rose of Monewden 44 – – – – – 44 Alexander Collins – – – – – – –Christine Petersen 38 – – – 6 – 44 Tony Elliott 25 11 – – – – 36
1 Julio Bruno received £11k in cash in lieu of pension contributions.2 Richard Boult received £7k in cash in lieu of pension contributions.3 In addition to the amounts disclosed above, Lord Rose of Monewden receives a consultancy fee of £45k per annum (2016: £45k per annum) for services provided to Time Out Market.4 Matthew Riley receives £10k per annum in respect of his committee chair fee (2016: Christine Petersen received £10k per annum in respect of her committee chair fee).5 Noel Penzer received £108k as part of the services as a Director and £447k for services for his continuing employment

25887 11 April 2018 10:34 AM Proof4
36
Time Out Group plc Annual Report and Accounts for the year ended 31 December 2017 Stock code: TMO
DIRECTORS’
REMUNERATION REPORT CONTINUED
Directors’ Shareholdings The Directors, who served in the year to 31 December 2017 and who held an interest in the ordinary shares of the Company, were as follows:
EXECUTIVE
Shareholding at 31 December 2016 and 2017
Julio Bruno 70,624Richard Boult –Christine Petersen –
NON-EXECUTIVEPeter Dubens –Lord Rose of Monewden –Alexander Collins –Tony Elliott 1,822,347Matthew Riley –
Director’s Interests Options granted to Directors in the years ended 31 December 2017 and 2016, together with details of the share option schemes, are set out in note 29.
No Director (2016: nil) exercised share options in the year to 31 December 2017.
Share PriceThe market price of the Company’s Ordinary shares at 31 December 2017 was £1.30 (2016: £1.40) and the range during the year was £1.30 to £1.45 (2016: £1.25 to £1.50).
Approved by the Board and signed on behalf of the Board by
Matthew RileyChairman of the Remuneration Committee

25887 11 April 2018 10:34 AM Proof 4
37
www.timeout.com GOVERNANCE
INDEPENDENT
AUDITORS’ REPORT
Report on the audit of the financial statementsOpinionIn our opinion:
• Time Out Group plc’s group financial statements and company financial statements (the “financial statements”) give a true and fair view of the state of the group’s and of the company’s affairs as at 31 December 2017 and of the group’s loss and cash flows for the year then ended;
• the group financial statements have been properly prepared in accordance with IFRSs as adopted by the European Union;
• the company financial statements have been properly prepared in accordance with United Kingdom Generally Accepted Accounting Practice (United Kingdom Accounting Standards, comprising FRS 101 “Reduced Disclosure Framework”, and applicable law); and
• the financial statements have been prepared in accordance with the requirements of the Companies Act 2006.
We have audited the financial statements, included within the Annual Report and Accounts (the “Annual Report”), which comprise: the consolidated and company statements of financial position as at 31 December 2017; the consolidated income statement and consolidated statement of other comprehensive income, the consolidated statement of cash flows, and the consolidated and company statements of changes in equity for the year then ended; and the notes to the financial statements, which include a description of the significant accounting policies.
Basis for opinionWe conducted our audit in accordance with International Standards on Auditing (UK) (“ISAs (UK)”) and applicable law. Our responsibilities under ISAs (UK) are further described in the Auditors’ responsibilities for the audit of the financial statements section of our report. We believe that the audit evidence we have obtained is sufficient and appropriate to provide a basis for our opinion.
IndependenceWe remained independent of the group in accordance with the ethical requirements that are relevant to our audit of the financial statements in the UK, which includes the FRC’s Ethical Standard, as applicable to listed entities, and we have fulfilled our other ethical responsibilities in accordance with these requirements.
Our audit approachOverview • Overall group materiality: £442,000 (2016: £357,000), based on
1% of total revenues. • Overall company materiality: £419,000 (2016: £339,000), based
on 1% of total assets, restricted to 95% of group materiality.
• The focus of the group team’s work was on the UK and US operations. We received reporting from Portugal on audits of the complete financial information.
• In addition, specified audit procedures were performed by the group team on the other UK non-operating subsidiaries.
• Valuation of goodwill and intangible assets (Group).
• Recoverability of Time Out Markets set up costs (Group).
• Ability of the group to continue as a going concern. (Group and Company).
• Capitalisation of internally generated intangible assets (Group).
The scope of our auditAs part of designing our audit, we determined materiality and assessed the risks of material misstatement in the financial statements. In particular, we looked at where the directors made subjective judgements, for example in respect of significant accounting estimates that involved making assumptions and considering future events that are inherently uncertain.
As in all of our audits we also addressed the risk of management override of internal controls, including evaluating whether there was evidence of bias by the directors that represented a risk of material misstatement due to fraud.

25887 11 April 2018 10:34 AM Proof4
38
Time Out Group plc Annual Report and Accounts for the year ended 31 December 2017 Stock code: TMO
INDEPENDENT
AUDITORS’ REPORT
Key audit mattersKey audit matters are those matters that, in the auditors’ professional judgement, were of most significance in the audit of the financial statements of the current period and include the most significant assessed risks of material misstatement (whether or not due to fraud) identified by the auditors, including those which had the greatest effect on: the overall audit strategy; the allocation of resources in the audit; and directing the efforts of the engagement team. These matters, and any comments we make on the results of our procedures thereon, were addressed in the context of our audit of the financial statements as a whole, and in forming our opinion thereon, and we do not provide a separate opinion on these matters. This is not a complete list of all risks identified by our audit.
Key audit matter How our audit addressed the key audit matter
Valuation of goodwill and intangible assets
Refer to notes 12 and 13
Goodwill is an intangible asset that arises on the acquisition of a business and reflects the portion of the consideration paid which cannot be allocated to separately identifiable acquired assets. Goodwill is not amortised but tested for impairment at least once a year or more frequently where there is an indication that it may be impaired.
The group has also recognised both acquired and internally generated intangible assets. Whilst these are amortised over their useful economic life, there is a risk that their value may need to impaired, and so they are included in the impairment testing.
We focused on this area because goodwill and intangible assets are material to the consolidated financial statements and the assumptions used in the impairment assessment are inherently subjective. In particular, the fair value less costs to sell model that forms the basis of management’s assessment contains a number of judgements, the most sensitive of which are the revenue projections for the group and the revenue multiple used, which is based on revenue multiples of other similar groups
Group
We assessed whether the selected revenue multiples were reasonable by comparing them to other data sources, including revenue multiples from a number of similar businesses. We also considered whether the revenue used in these calculations was reasonable in light of historic performance and industry projections. We considered whether there had been any changes to the business or to the market environment which could increase the level of uncertainty in the forecast.
We performed sensitivities to assess the level that revenue multiples and forecast revenue would need to decrease, either individually or in combination, in order to indicate an impairment.
Based on the work performed, we concluded that it was reasonable to conclude that the revenue forecasts and multiples would not decrease by the levels required to cause a material impairment in the model used by management.
Recoverability of Time Out Markets set up costs
Refer to note 14
In the process of expanding the Time Out Markets business into new locations the group has incurred material pre-opening costs which have been capitalised. There is judgement involved as to whether these assets will be recoverable in the future, in particular in relation to the costs incurred of £0.9 million in London and £0.8 million in Miami, both of which have been subject to objections during the planning process.
Group
We considered the accuracy and completeness of the costs by agreeing them back to supporting documentation and considered the appropriateness of capitalisation of the costs.
We have reviewed the economic forecasts of the markets to ensure that costs incurred are forecast to be recovered by the future economic benefits to flow to the group. We have compared these forecasts to the existing market in Lisbon and also other information indicating commercial interest in these two markets
Where there is uncertainty around the outcome of planning and licensing applications and appeals we have corresponded with planning advisors and external legal counsel to understand the expected outcomes of the cases.
Based on the work performed we have found that the forecasted cash flows for both the London and Miami markets indicate that the set-up costs will be recovered and that management’s assessment that it is still probable that planning will be approved for both sites is supported by our correspondence with external legal counsel.

25887 11 April 2018 10:34 AM Proof 4
39
www.timeout.com GOVERNANCE
Key audit matter How our audit addressed the key audit matter
Ability of the group to continue as a going concern
Refer to note 2
For the year ended 31 December 2017 the group made a loss of £26.0 million and had a cash outflow from operating activities of £21.3 million. The group is also expected to open a number of new market sites in the near future, which will require capital expenditure.
The directors performed a going concern assessment, based on their latest budgets and forecasts, and taking into account the credit facility of £20 million which is available until October 2019. The directors’ assessment included a number of downside sensitivities and identified mitigating actions that could be taken to reduce cash burn if necessary. The directors concluded that it was appropriate to prepare the group and company financial statements on a going concern basis.
We considered this to be a key audit matter because of the cash outflow in the year, and the potential impact on the Group’s liquidity of downside risks applied to management’s forecasts.
Group and Company
We examined the group’s cash flow forecast for the 12 month period 30 April 2019 and agreed that this are based on Board approved budgets. We also requested the directors to extend their forecast to October 2019. The forecast included key assumptions in relation to future revenue growth, as well as capital expenditure relating to the roll-out of new markets. We tested the key assumptions in the forecast by comparing the sales growth to historic performance and agreeing the capital expenditure assumptions on the markets to lease agreements and management estimates We also tested the mathematical accuracy of the forecast.
We held discussions with management to understand the nature of downside risks, and considered whether further risks should be applied to the forecasts. We used our understanding of the group and industry to assess the possibility of such risks arising and their potential impact. We examined documentation supporting the mitigating actions identified by management to reduce the rate of cash burn should downside risks arise. We inspected the credit facility agreement entered into in March 2018 with Oakley Capital Investments Limited, to check that it was committed until October 2019.
We examined the disclosure in note 2 and found it to be sufficient to inform members about the directors’ conclusions on the appropriateness of using the going concern basis of accounting.
Our conclusion on going concern is set out below.
Capitalisation of development costs
Refer to note 13
We focused on this area because of the significant level of judgement by the directors involved in determining whether internal time and external costs incurred in respect of development costs satisfy the requirements of the financial reporting framework (International Accounting Standard 38 Intangible assets) to be capitalised, including that they are separable from the other assets of the business and will provide future economic benefits for the group.
The internally generated intangible assets are all within the UK.
Group
We gained an understanding of the controls and review process over the capitalisation of development costs.
We discussed the future cash flow projections of each project with relevant personnel and obtained explanations for the assumptions made. We have reviewed management’s classification of costs between new projects, improvements and maintenance expenditure.
We have assessed whether any existing assets are impaired as a result of new developments in the year.
We selected a sample of projects and reviewed management’s assessment for these projects that they satisfied the recognition criteria in IAS 38. We also tested a sample of internal costs to work systems and supporting payroll records and verified the allocation of employee costs to the correct projects and external costs to invoices.
How we tailored the audit scopeWe tailored the scope of our audit to ensure that we performed enough work to be able to give an opinion on the financial statements as a whole, taking into account the structure of the group and the company, the accounting processes and controls, and the industry in which they operate.
The group reports its operating results and financial position in seven territories, being UK, USA, Portugal, Australia, Spain, Hong Kong and Singapore. The group Financial Statements are a consolidation of the group’s operating businesses and central functions. The group’s operating reporting units vary significantly in size, the most significant being the UK, US and Portugal. The group team performed the audits of the UK and USA. We also performed an audit of the complete financial information of Portugal. We issued instructions to our Portuguese team, which included guidance on the areas of focus for the audit. We then had regular communication with them and received reporting on their work. In addition, specified audit procedures were performed on the UK non-operating subsidiaries by the group team.
The group team assessed the appropriateness, completeness and accuracy of group journals and other adjustments performed on the consolidation and obtained an understanding of the internal control environment related to the financial reporting process.

25887 11 April 2018 10:34 AM Proof4
40
Time Out Group plc Annual Report and Accounts for the year ended 31 December 2017 Stock code: TMO
INDEPENDENT
AUDITORS’ REPORT
MaterialityThe scope of our audit was influenced by our application of materiality. We set certain quantitative thresholds for materiality. These, together with qualitative considerations, helped us to determine the scope of our audit and the nature, timing and extent of our audit procedures on the individual financial statement line items and disclosures and in evaluating the effect of misstatements, both individually and in aggregate on the financial statements as a whole.
Based on our professional judgement, we determined materiality for the financial statements as a whole as follows:
Group financial statementsCompany financial statements
Overall materiality £442,000 (2016: £357,000). £419,000 (2016: £339,000).
How we determined it 1% of total revenues. 1% of total assets.
Rationale for benchmark applied Based on the benchmarks used in the annual report, revenue is the primary measure used by the shareholders in assessing the performance of the group, and is a generally accepted auditing benchmark.
We believe that total assets are the primary measure used by the shareholders in assessing the performance of the entity, and is a generally accepted auditing benchmark. The materiality has been limited to 95% of overall group materiality.
For each component in the scope of our group audit, we allocated a materiality that is less than our overall group materiality. The range of materiality allocated across components was between £152,000 and £419,000. Certain components were audited to a local statutory audit materiality that was also less than our overall group materiality.
We agreed with the Audit Committee that we would report to them misstatements identified during our audit above £22,100 (Group audit) (2016: £17,000) and £22,100 (Company audit) (2016: £17,000) as well as misstatements below those amounts that, in our view, warranted reporting for qualitative reasons.
Conclusions relating to going concernWe have nothing to report in respect of the following matters in relation to which ISAs (UK) require us to report to you when:
• the directors’ use of the going concern basis of accounting in the preparation of the financial statements is not appropriate; or
• the directors have not disclosed in the financial statements any identified material uncertainties that may cast significant doubt about the group’s and company’s ability to continue to adopt the going concern basis of accounting for a period of at least twelve months from the date when the financial statements are authorised for issue.
However, because not all future events or conditions can be predicted, this statement is not a guarantee as to the group’s and company’s ability to continue as a going concern.
Reporting on other information The other information comprises all of the information in the Annual Report other than the financial statements and our auditors’ report thereon. The directors are responsible for the other information. Our opinion on the financial statements does not cover the other information and, accordingly, we do not express an audit opinion or, except to the extent otherwise explicitly stated in this report, any form of assurance thereon.
In connection with our audit of the financial statements, our responsibility is to read the other information and, in doing so, consider whether the other information is materially inconsistent with the financial statements or our knowledge obtained in the audit, or otherwise appears to be materially misstated. If we identify an apparent material inconsistency or material misstatement, we are required to perform procedures to conclude whether there is a material misstatement of the financial statements or a material misstatement of the other information. If, based on the work we have performed, we conclude that there is a material misstatement of this other information, we are required to report that fact. We have nothing to report based on these responsibilities.
With respect to the Strategic Report and Directors’ Report, we also considered whether the disclosures required by the UK Companies Act 2006 have been included.
Based on the responsibilities described above and our work undertaken in the course of the audit, ISAs (UK) require us also to report certain opinions and matters as described below.

25887 11 April 2018 10:34 AM Proof 4
41
www.timeout.com GOVERNANCE
Strategic Report and Directors’ ReportIn our opinion, based on the work undertaken in the course of the audit, the information given in the Strategic Report and Directors’ Report for the year ended 31 December 2017 is consistent with the financial statements and has been prepared in accordance with applicable legal requirements.
In light of the knowledge and understanding of the group and company and their environment obtained in the course of the audit, we did not identify any material misstatements in the Strategic Report and Directors’ Report.
Responsibilities for the financial statements and the auditResponsibilities of the directors for the financial statementsAs explained more fully in the Statement of Directors’ Responsibilities, the directors are responsible for the preparation of the financial statements in accordance with the applicable framework and for being satisfied that they give a true and fair view. The directors are also responsible for such internal control as they determine is necessary to enable the preparation of financial statements that are free from material misstatement, whether due to fraud or error.
In preparing the financial statements, the directors are responsible for assessing the group’s and the company’s ability to continue as a going concern, disclosing as applicable, matters related to going concern and using the going concern basis of accounting unless the directors either intend to liquidate the group or the company or to cease operations, or have no realistic alternative but to do so.
Auditors’ responsibilities for the audit of the financial statementsOur objectives are to obtain reasonable assurance about whether the financial statements as a whole are free from material misstatement, whether due to fraud or error, and to issue an auditors’ report that includes our opinion. Reasonable assurance is a high level of assurance, but is not a guarantee that an audit conducted in accordance with ISAs (UK) will always detect a material misstatement when it exists. Misstatements can arise from fraud or error and are considered material if, individually or in the aggregate, they could reasonably be expected to influence the economic decisions of users taken on the basis of these financial statements.
A further description of our responsibilities for the audit of the financial statements is located on the FRC’s website at: www.frc.org.uk/auditorsresponsibilities. This description forms part of our auditors’ report.
Use of this reportThis report, including the opinions, has been prepared for and only for the company’s members as a body in accordance with Chapter 3 of Part 16 of the Companies Act 2006 and for no other purpose. We do not, in giving these opinions, accept or assume responsibility for any other purpose or to any other person to whom this report is shown or into whose hands it may come save where expressly agreed by our prior consent in writing.
Other required reportingCompanies Act 2006 exception reportingUnder the Companies Act 2006 we are required to report to you if, in our opinion:
• we have not received all the information and explanations we require for our audit; or
• adequate accounting records have not been kept by the company, or returns adequate for our audit have not been received from branches not visited by us; or
• certain disclosures of directors’ remuneration specified by law are not made; or
• the company financial statements are not in agreement with the accounting records and returns.
We have no exceptions to report arising from this responsibility.
Sam Taylor (Senior Statutory Auditor)for and on behalf of PricewaterhouseCoopers LLP Chartered Accountants and Statutory Auditors London, 27 March 2018

25887 11 April 2018 10:34 AM Proof4
42
Time Out Group plc Annual Report and Accounts for the year ended 31 December 2017 Stock code: TMO
Financial Statements
STRATEGY IN ACTION
Rolling Out Time Out MarketWith Time Out Market Lisbon, the Group created the country’s most visited attraction with 3.6 million visitors in 2017. They came to enjoy affordable fine food from 32 restaurants and kiosks, and drinks from eight bars and cafes; they attended 245 events at the Chefs Academy and 123 events in the Time Out Market Studio. It is this unique mix of the best of the city, based on Time Out’s editorial curation, that continues to attract both locals and visitors alike and takes Time Out Market from strength to strength.
To capitalise on the growth opportunity Time Out Market offers, the Group has developed an exciting pipeline for new openings in 2018 and thereafter. This comes at a time when such experiences are increasingly popular around the world with Time Out Market spearheading this trend. In March 2018, the Group announced that later that year it would bring Time Out Market to New York. There will be 20 food offerings, three bars, a stage for cultural activities and around 520 seats across 21,000 sq ft; its waterfront location in Brooklyn will offer fantastic views of Manhattan’s skyline. Time Out Market Miami is set to open in Q4 2018 and a first, highly-anticipated line-up of some of the city’s most celebrated chefs was revealed for the curated mix of 17 kitchens. New markets are also set to open in Boston and Chicago in 2019. Time Out Market Boston will be located at the heart of the popular Fenway neighbourhood in a warehouse built in 1929; it is expected to have a footprint of 21,500 sq ft and 3,700 sq ft of outdoor space. Time Out Market Chicago, set within a stand-alone brick building, will showcase across nearly 50,000 sq ft 16 food offerings, three bars, a demonstration kitchen, a retail area and a spectacular rooftop with views of the skyline.
àRead more about ’’Rolling Out Time Out Market’’ on page 17

25887 11 April 2018 10:34 AM Proof 4
43
www.timeout.com GOVERNANCE

25887 11 April 2018 10:34 AM Proof4
44
Time Out Group plc Annual Report and Accounts for the year ended 31 December 2017 Stock code: TMO
CONSOLIDATED
INCOME STATEMENTYEAR ENDED 31 DECEMBER 2017
Note
Year ended 31 December
2017£’000
Year ended 31 December
2016£’000
Revenue 4 44,364 35,736Cost of sales 4 (19,709) (14,707)Gross profit 24,655 21,029Administrative expenses (49,293) (38,882)Operating loss (24,638) (17,853)Finance income 8 72 389Finance costs 8 (825) (1,531)Share of associate's loss and gain on investment 15 (954) 152Loss before income tax (26,345) (18,843)Income tax credit 9 325 203Loss for the year (26,020) (18,640)
Loss for the year attributable to:Owners of the parent (25,048) (18,462)Non-controlling interests (972) (178)
(26,020) (18,640)
Loss per share:Basic and diluted loss per share (pence) 10 19.0 18.9
All amounts relate to continuing operations
The notes on pages 51 to 89 are an integral part of these consolidated accounts.
The Company has elected to take the exemption under section 408 of the Companies Act of 2006 from presenting the parent company profit and loss account.

25887 11 April 2018 10:34 AM Proof 4
45
www.timeout.com FINANCIAL STATEMENTS
CONSOLIDATED STATEMENT
OF OTHER COMPREHENSIVE INCOMEYEAR ENDED 31 DECEMBER 2017
Year ended 31 December
2017£’000
Year ended 31 December
2016£’000
Loss for the year (26,020) (18,640)Other comprehensive income:Items that may be subsequently reclassified to the profit or loss:Currency translation differences (3,151) 7,087Other comprehensive income for the year, net of tax (3,151) 7,087Total comprehensive expense for the year (29,171) (11,553)
Total comprehensive expense for the year attributable to:Owners of the parent (28,169) (11,368)Non-controlling interests (1,002) (185)
(29,171) (11,553)

25887 11 April 2018 10:34 AM Proof4
46
Time Out Group plc Annual Report and Accounts for the year ended 31 December 2017 Stock code: TMO
CONSOLIDATED STATEMENT
OF FINANCIAL POSITIONAT 31 DECEMBER 2017
Note
31 December 2017£’000
31 December 2016
£’000AssetsFixed Assets and InvestmentsIntangible assets - Goodwill 12 50,057 49,230Intangible assets - Other 13 19,044 20,367Property, plant and equipment 14 8,834 7,982Investment in associate 15 6,199 7,153Trade and other receivables - non current 18 958 550
85,092 85,282Current assetsInventories 17 276 241
Trade and other receivables 18 14,602 11,987Cash and bank balances 19 29,839 50,082
44,717 62,310Total assets 129,809 147,592
LiabilitiesCurrent liabilitiesTrade and other payables 20 (17,839) (17,643)Provisions 21 (67) (186)Borrowings 22 (1,220) (1,083)
(19,126) (18,912)Non-current liabilitiesTrade and other payables 20 (2,291) (1,905)Provisions 21 – (149)Deferred tax liability 9 (2,623) (2,849)Borrowings 22 (8,178) (1,515)
(13,092) (6,418)Total liabilities (32,218) (25,330)
Net assets 97,591 122,262
EquityCalled up share capital 25 133 131Share premium 106,042 103,071Translation reserve 6,045 9,166Capital redemption reserve 1,105 1,105(Accumulated losses) / Retained earnings (14,496) 9,025Total parent shareholders' equity 98,829 122,498Non-controlling interest (1,238) (236)Total equity 97,591 122,262
The financial statements on pages 44 to 89 were authorised for issue by the board of directors on 27 March 2018 and were signed on its behalf.
Julio Bruno Richard Boult Chief Executive Chief Financial Officer
Time Out Group PLC Registered No: 07440171

25887 11 April 2018 10:34 AM Proof 4
47
www.timeout.com FINANCIAL STATEMENTS
COMPANY STATEMENT
OF FINANCIAL POSITIONAT 31 DECEMBER 2017
Note
31 December 2017£’000
31 December 2016
£’000
AssetsNon-current assetsInvestments 16 89,449 85,553
89,449 85,553Current assetsTrade and other receivables 18 100,380 100,419
100,380 100,419Total assets 189,829 185,972
LiabilitiesCurrent liabilitiesTrade and other payables 20 (1,245) (1,026)
(1,245) (1,026)Non-current liabilitiesBorrowings 22 – –
– –Total liabilities (1,245) (1,026)
Net assets 188,584 184,946
EquityCalled up share capital 25 133 131Share premium 106,042 103,071Capital redemption reserve 1,105 1,105Retained earnings 81,304 80,639Total equity 188,584 184,946
The company loss for the year was £862k (2016: loss of £1,568k).
The financial statements on pages 44 to 89 were authorised for issue by the board of directors on 27 March 2018 and were signed on its behalf.
Julio Bruno Richard Boult Chief Executive Chief Financial Officer
Time Out Group PLC Registered No: 07440171

25887 11 April 2018 10:34 AM Proof4
48
Time Out Group plc Annual Report and Accounts for the year ended 31 December 2017 Stock code: TMO
CONSOLIDATED STATEMENT
OF CHANGES IN EQUITYYEAR ENDED 31 DECEMBER 2017
Note
Called up share
capital£’000
Share premium
£’000
Translation reserve£’000
Capital redemption
reserve£’000
Retained earnings/
(Accumulated losses)£’000
Total parent Shareholders’
equity£’000
Non-controlling
interest£’000
Total equity£’000
Balance at 1 January 2016 957 77,427 2,072 – (54,311) 26,145 – 26,145Changes in equityLoss for the year – – – – (18,462) (18,462) (178) (18,640)Other comprehensive income – – 7,094 – – 7,094 (7) 7,087Total comprehensive income – – 7,094 – (18,462) (11,368) (185) (11,553)
Share based payments 29 – – – – 1,064 1,064 – 1,064Pre-IPO issue of preference shares 40 3,960 – – – 4,000 – 4,000Ordinary bonus shares issued 95 (95) – – – – – –Share capital reduction – (80,887) – – 80,887 – – –Preference bonus shares issued 72 (72) – – – – – –Share capital reorganisation (1,105) – – 1,105 – – – –Issue of shares for acquisitions 12 18,097 – – – 18,109 – 18,109Non-controlling interest acquired (“NCI”) – – – – – – (232) (232)Goodwill attributable to NCI – – – – – – 28 28Acquisition of minority interest – – – – (153) (153) 153 –IPO issue of share capital 60 89,940 – – – 90,000 – 90,000Costs associated with IPO – (5,299) – – – (5,299) – (5,299)Balance at 31 December 2016 131 103,071 9,166 1,105 9,025 122,498 (236) 122,262
Changes in equityLoss for the year – – – – (25,048) (25,048) (972) (26,020)Other comprehensive income – – (3,121) – – (3,121) (30) (3,151)Total comprehensive income – – (3,121) – (25,048) (28,169) (1,002) (29,171)
Share based payments 29 – – – – 1,527 1,527 – 1,527Issue of shares for acquisitions 2 2,971 – – – 2,973 – 2,973Balance at 31 December 2017 133 106,042 6,045 1,105 (14,496) 98,829 (1,238) 97,591

25887 11 April 2018 10:34 AM Proof 4
49
www.timeout.com FINANCIAL STATEMENTS
COMPANY STATEMENT
OF CHANGES IN EQUITYYEAR ENDED 31 DECEMBER 2017
Note
Called up share
capital£’000
Share premium
£’000
Capital redemption
reserve£’000
Retained earnings
£’000
Total equity£’000
Balance at 1 January 2016 957 77,427 – 256 78,640Changes in equityLoss for the year – – – (1,568) (1,568)Total comprehensive income – – – (1,568) (1,568)
Share based payments 29 – – – 1,064 1,064Pre-IPO issue of preference shares 40 3,960 – – 4,000Ordinary bonus shares issued 95 (95) – – –Share capital reduction – (80,887) – 80,887 –Preference bonus shares issued 72 (72) – – –Share capital reorganisation (1,105) – 1,105 – –Issue of shares for acquisitions 12 18,097 – – 18,109IPO issue of share capital 60 89,940 – – 90,000Costs associated with IPO – (5,299) – – (5,299)Balance at 31 December 2016 131 103,071 1,105 80,639 184,946
Changes in equityLoss for the year – – – (862) (862)Total comprehensive income – – – (862) (862)
Share based payments 29 – – – 1,527 1,527Issue of shares for acquisitions 2 2,971 – – 2,973Balance at 31 December 2017 133 106,042 1,105 81,304 188,584

25887 11 April 2018 10:34 AM Proof4
50
Time Out Group plc Annual Report and Accounts for the year ended 31 December 2017 Stock code: TMO
CONSOLIDATED STATEMENT
OF CASH FLOWS
Note
Year ended 31 December
2017£’000
Year ended 31 December
2016£’000
Cash flows from operating activitiesCash used in operations 26 (20,819) (15,965)Interest paid (459) (316)Tax credits received 3 8Net cash used in operating activities (21,275) (16,273)Cash flows from investing activitiesPurchase of property, plant and equipment (1,954) (1,641)Purchase of intangible assets (2,432) (1,856)Interest received 70 4
Pre-acquisition funding to Time Out Market – (150)Acquisition of subsidiaries, net of cash acquired 11 (470) 1,222Net cash used in investing activities (4,786) (2,421)Cash flows from financing activitiesProceeds of pre-IPO preference share issue – 4,000Proceeds from IPO – 90,000IPO transaction costs through share premium – (5,281)Costs relating to share issue (5) –Advance of new borrowings 7,809 2,766Repayment of borrowings (1,169) (25,999)Repayment of finance leases (59) (26)Acquisition of minority interest (196) (1,408)Cash to restricted cash (1,093)Net cash from financing activities 5,287 64,052(Decrease) / Increase in cash and cash equivalents (20,774) 45,358Cash and cash equivalents at beginning of year 50,082 4,282Effect of foreign exchange rate change (572) 442Cash and cash equivalents at end of year 28,746 50,082

25887 11 April 2018 10:34 AM Proof 4
51
www.timeout.com FINANCIAL STATEMENTS
NOTES TO THE
FINANCIAL STATEMENTS
1. Corporate informationThe consolidated financial statements of Time Out Group plc and its subsidiaries (the “Group”) for the year ended 31 December 2017 were authorised for issue in accordance with a resolution of the Directors on 27 March 2017. Time Out Group plc (the “Company”) is a public limited company incorporated in England and Wales whose shares are publicly traded on the Alternative Investment Market. The registered office is located at 77 Wicklow Street, London, WC1X 9JY.
The Company has taken advantage of the exemption from preparing a cash flow statement under paragraph 8(g) of the disclosure exemptions from EU-adopted IFRS for qualifying entities included in Financial Reporting Standard 101 Reduced Disclosure Framework (FRS 101). The Time Out Group plc consolidated financial statements for the year ended 31 December 2017 contain a consolidated statement of cash flows. The Company is exempt under paragraph 8(k) of the disclosure exemptions from EU-adopted IFRS included in FRS 101 for qualifying entities from disclosing related party transactions with entities that form part of the Time Out Group plc group of which Time Out Group plc is the ultimate parent undertaking. The Company’s financial statements are presented in Pounds Sterling (£), which is also the Company’s functional currency, and all values are rounded to the nearest thousand (£’000) except when otherwise indicated. The Company’s financial statements are individual entity financial statements.
The principal activities of the Group are described in the Strategic Report that accompanies these financial statements.
2. Accounting policiesTime Out Group is the leading global media and entertainment business that inspires and enables people to make the most of a city. Through powerful content, top-quality curation, enabling technology and exceptional experiences, Time Out helps discover, book and share what the world’s cities have to offer.
Across multiple platforms comprising digital, app, mobile, social and print and its physical presence via Live Events and Time Out Market, the Group aims to connect consumers and businesses in the leisure, travel and local entertainment sector through B2C and B2B offerings.
Significant accounting policiesThe principal accounting policies applied in the preparation of these consolidated financial statements are set out below. These policies have been consistently applied to all the years presented, unless otherwise stated.
Alternative performance measuresUnderlying results are presented excluding the contribution from the acquisitions of the Australia franchisee in June 2017 and the Spain franchisee in September 2017, and the addition of Singapore and Hong Kong. The businesses combined contributed a net revenue of £2.8m in the period. EBITDA contribution was a loss of £0.5m. For Business Review purposes, the figures for Time Out Market in 2016 include the first six months of that year, prior to its acquisition by the Group, given that this is a separate reportable segment. The measure is used to show the performance of the business before the effects of other acquisitions.
Adjusted EBITDA is profit or loss before interest, taxation, depreciation, amortisation, share based payments, share of associate’s loss and one-off exceptional items. Used by management and analysts to assess the business before one off and non-cash items. A reconciliation of adjusted EBITDA to operating loss is presented in note 4.
Basis of preparationThe consolidated financial statements of Time Out Group plc have been prepared under the historic cost convention except for certain financial liabilities measured at fair value and in accordance with International Financial Reporting Standards (IFRSs) as adopted by the European Union and interpretations issued by the IFRS Interpretations Committee (IFRS IC) as they apply to the financial statements of the Group for the year ended 31 December 2017 and applied in accordance with the Companies Act 2006.
The Company financial statements were prepared in accordance with FRS 101 and Companies Act 2006. The financial statements are prepared on a going concern basis under the historical cost convention except for certain financial liabilities measured at fair value. The accounting policies which follow in note 3 set out those policies which apply in preparing the financial statements for the year ended 31 December 2016 and have been applied consistently to all years presented. The Company has taken advantage of the following disclosure exemptions under FRS 101 in respect of:
a. IFRS 3 Business Combinations;
b. the requirements of IFRS 7 Financial Instruments: Disclosures;
c. IFRS 13 Fair Value Measurement;

25887 11 April 2018 10:34 AM Proof4
52
Time Out Group plc Annual Report and Accounts for the year ended 31 December 2017 Stock code: TMO
NOTES TO THE
FINANCIAL STATEMENTS
2. Accounting policies continuedd. Share-based payments;
e. Intra-Group-related party transactions;
f. Related party transactions.
g. IAS 7 Statement of cash flows
Going concernThe Group made a loss after tax of £26,020k (2016: loss of £18,640k). The Directors confirm they have a reasonable expectation that the Company and Group have adequate resources to continue in operation for the foreseeable future and at least 12 months from the date of signing these financial statements and consider it appropriate to adopt the going concern basis of accounting in preparing the Company and Group financial statements.
This confirmation is made having considered the financial position of the Group on the basis of the latest budgets and forecasts, the cash balance of £29.8 million at 31 December 2017 and the availability of future financing, including the £20 million credit facility entered into in March 2018, committed until October 2019, to help accelerate the roll-out of new markets. As new markets are opened the Directors will explore alternative financing options from a number of potential sources. The Directors have considered downside risks to the Group’s plans, together with options available to reduce the rate of cash burn in the short to medium term, and assessed the potential impact these would have on the Group’s liquidity. In evaluating these risks the Directors have considered the Group’s history of operating losses and the cash outflows that are expected to continue as the Group undertakes the expansion of the Time Out Market business.
New and amended standards adopted by the GroupThe accounting standards and policies adopted in these financial statements are consistent with those of the annual financial statements for the year ended 31 December 2016 as presented under IFRS. No new standards, amendments or interpretations, effective for the first time for the financial year beginning on or after 1 January 2017 have had a material impact on the Group or Company.
Basis of consolidationThe Group financial statements consolidate the financial statements of Time Out Group plc and all its subsidiary undertakings drawn up to 31 December each year.
As permitted by S408 of the Companies Act 2006, the income statement of the parent Company is not presented as part of these financial statements. The parent Company’s loss for the financial year was £862k (2016: £1,568k loss). The parent Company is primarily a holding company and had minimal cash flows during the year. It did not hold any cash or cash equivalents at the beginning or end of the year.
SubsidiariesSubsidiaries are all entities (including structured entities) over which the Group has control. The Group controls an entity when the Group is exposed to, or has rights to, variable returns from its involvement with the entity and has the ability to affect those returns through its power over the entity. Subsidiaries are fully consolidated from the date on which control is transferred to the Group. They are deconsolidated from the date that control ceases.
In the Group financial statements the acquisition method is adopted. Under this method, the results of subsidiary undertakings acquired or disposed of in the period are consolidated for the periods from or to the date on which control is passed. The consideration transferred for the acquisition of a subsidiary is the fair values of the assets transferred, the liabilities incurred to the former owners of the acquiree and the equity interests issued by the Group. The consideration transferred includes the fair value of any asset or liability resulting from a contingent consideration arrangement. Identifiable assets acquired and liabilities and contingent liabilities assumed in a business combination are measured initially at their fair values at the acquisition date. The Group recognises any non-controlling interest in the acquiree on an acquisition-by-acquisition basis, either at fair value or at the non-controlling interest’s proportionate share of the recognised amounts of the acquiree’s identifiable net assets.
Acquisition-related costs are expensed as incurred and presented as exceptional items.
If the business combination is achieved in stages, the acquisition date carrying value of the acquirer’s previously held equity interest in the
acquiree is remeasured to fair value at the acquisition date; any gains or losses arising from such remeasurement are recognised in profit or loss.

25887 11 April 2018 10:34 AM Proof 4
53
www.timeout.com FINANCIAL STATEMENTS
2. Accounting policies continued
Any contingent consideration to be transferred by the Group is recognised at fair value at the acquisition date. Subsequent changes to the fair value of the contingent consideration that is deemed to be an asset or liability is recognised in accordance with IAS 39; either in profit or loss or as a change to other comprehensive income. Contingent consideration that is classified as equity is not remeasured, and its subsequent settlement is accounted for within equity.
Inter-company transactions, balances and unrealised gains on transactions between Group companies are eliminated. Unrealised losses are also eliminated on consolidation. When necessary, amounts reported by subsidiaries have been adjusted to conform to the Group’s accounting policies.
Non-controlling interestsTransactions with non-controlling interests that do not result in a loss of control are accounted for as equity transactions – that is, as transactions with the owners in their capacity as owners. The difference between the fair value of any consideration paid and the relevant share acquired of the carrying value of net assets of the subsidiary is recorded in equity. Gains or losses on disposals to non-controlling interests are also recorded in equity.
Non-controlling interests in the net assets of consolidated subsidiaries are identified separately from the Group’s equity and consist of the amount of those interests at the date of the original business combination plus their share of changes in equity since that date.
AssociatesAn associate is an undertaking over which the Group exercises significant influence, usually from 20%–50% of the equity voting rights, in respect of the financial and operating policy. The Group accounts for its interests in associates using the equity method. Under the equity method, the investment in the associate is initially measured at cost. The carrying amount of the investment is adjusted to recognise changes in the Group’s share of net assets of associates since the acquisition date.
If the ownership interest in an associate is reduced but significant influence is retained, only a proportionate share of the amounts previously recognised in other comprehensive income is reclassified to profit or loss where appropriate.
The income statement reflects the Group’s share of the results of operations of the entity. The statement of comprehensive income includes the Group’s share of any other comprehensive income recognised by the associate. Dividend income is recognised when the right to receive the payment is established.
The Group determines at each reporting date whether there is any objective evidence that the investment in the associate is impaired. If this is the case, the Group calculates the amount of impairment as the difference between the recoverable amount of the associate and its carrying value and recognises the amount adjacent to ‘share of profit/(loss) of associates’ in the income statement.
Dilution gains and losses arising in investments in associates are recognised in the income statement.
Segmental reportingOperating segments are reported in a manner consistent with the internal reporting provided to the chief operating decision-maker. The chief operating decision-maker, who is responsible for allocating resources and assessing performance of the operating segments, has been identified as the group of key management personnel, as identified in the strategic report, that makes strategic decisions.
Foreign currenciesThe functional and presentational currency of the Group is sterling. Assets and liabilities of subsidiaries with a functional currency which is a foreign currency are translated into sterling at rates of exchange ruling at the end of the financial period and the result of foreign subsidiaries are translated at the average exchange rate for the period. All transactions denominated in foreign currency are translated at the rate of exchange ruling at the time of the transaction. All foreign exchange differences are taken to the income statement in the period in which they arise. At the statement of financial position date, monetary assets and liabilities denominated in foreign currencies are translated using the closing rate. Upon the translation of any subsidiary’s results for the year and financial position at any given year end, the foreign exchange differences which may arise are recognised directly in other comprehensive income as currency translation differences.
Property, plant and equipmentThe cost of property, plant and equipment includes the original purchase price of the asset and the costs attributable to bringing the asset to its working condition for its intended use. Depreciation is provided on all tangible fixed assets at rates calculated to write off the cost, less estimated residual value, of each asset over its expected useful life, as follows:

25887 11 April 2018 10:34 AM Proof4
54
Time Out Group plc Annual Report and Accounts for the year ended 31 December 2017 Stock code: TMO
2. Accounting policies continued
Computer equipment – over three years on a straight line basis
Fixtures and fittings – over five years on a straight line basis
Leasehold improvements – over the lease term or useful life, whichever is shorter
The Group operates in jurisdictions which have set useful lives for certain types of assets, and where different, local guidelines override the Group policies mentioned above. However, the Group confirms that this treatment does not materially change the accounts.
The assets’ residual values and useful lives are reviewed, and adjusted if appropriate, at the end of each reporting period.
Goodwill
Goodwill arises on the acquisition of subsidiaries and represents the excess of the consideration transferred over Time Out Group plc’s interest in the net fair value of the net identifiable assets, liabilities and contingent liabilities of the acquiree and the fair value of the non-controlling interest in the acquiree.
For the purpose of impairment testing, goodwill acquired in a business combination is allocated to each of the cash generating unit (“CGU”) that is expected to benefit from the synergies of the combination. Each CGU to which the goodwill is allocated represents the lowest level within the entity at which the goodwill is monitored for internal management purposes.
Goodwill impairment reviews are undertaken annually or more frequently if events or changes in circumstances indicate a potential impairment. The carrying value of the CGU containing the goodwill is compared to the recoverable amount, which is the higher of value in use and the fair value less costs of disposal. Any impairment is recognised immediately as an expense and is not subsequently reversed.
When the ownership of an acquired company is less than 100%, the non-controlling interest is measured at either the proportion of the recognised net assets attributable to the non-controlling interest or at the fair value of the acquired company at the date of acquisition. The excess of the cost of acquisition over the fair value of the Group’s share of identifiable net assets acquired is recorded as goodwill.
Intangible assets
Trademarks and copyrightsTrademark and copyright assets are amortised over a period of 15 years from the month of acquisition.
Development costsDevelopment costs comprising costs incurred relating to websites and other digital platform elements are written off over a period of two, three or four years, depending on the relevant project. The cost of internally generated and acquired technology is recognised as an intangible asset providing it satisfies all of the conditions set out in the research and development policy below. Assets are subsequently measured and amortised on a straight-line basis over their useful economic lives, from the month in which the expenditure is incurred.
Service concession arrangementsThe concession granted by the Municipality of Lisbon to occupy and operate an area within the Mercado da Ribeira in Lisbon is accounted for as a service concession arrangement under IFRIC 12 ‘Service Concession Arrangements’. The present value of all payments to the Municipality are capitalised and recognised as a separate intangible asset and a corresponding obligation is recognised. The intangible asset is amortised on a straight-line basis over the life of the concession arrangement.
Customer relationships and other intangible assetsThese intangible assets are comprised of customer and advertiser relationships and internally generated software related to the US business, acquired in 2014, reacquired trade-name rights and customer relationships relating to the Portuguese businesses acquired in 2015 and 2016 respectively, as well as the new assets which will be created relating to Australia and Spain.
NOTES TO THE
FINANCIAL STATEMENTS

25887 11 April 2018 10:34 AM Proof 4
55
www.timeout.com FINANCIAL STATEMENTS
2. Accounting policies continuedThe fair value of these assets was determined by agreement between the Directors and an independent valuation consultant, and was conducted in order to comply with IAS 3, ‘Business Combinations’. These assets are amortised over five years (internally generated software and customer relationships), 15 years (advertiser relationships), or two years (reacquired trade-name rights).
Research and development
Expenditure on the research phase of an internal project is recognised as an expense in the period in which it is incurred. Development costs incurred on specific projects are capitalised when all of the following conditions are satisfied:
• Completion of the asset is technically feasible so that it will be available for use or sale;
• The Group intends to complete the asset and use or sell it;
• The Group has the ability to use or sell the asset and it will generate probable future economic benefits;
• There are adequate technical, financial and other resources to complete the development and to use or sell the asset; and
• The expenditure attributable to the asset during its development can be measured reliably.
Development costs not meeting the criteria for capitalisation are expensed as incurred. The cost of an internally generated asset comprises all directly attributable costs necessary to create, produce and prepare the asset to be capable of operating in the manner intended by management. Directly attributable costs include employee (other than Director) costs incurred along with third party costs.
Impairment of non-financial assetsNon-financial assets that are not ready to use are not subject to amortisation and are tested annually for impairment. Assets that are subject to amortisation are reviewed for impairment whenever events or changes in circumstances indicate that the carrying amount may not be recoverable. An impairment loss is recognised for the amount by which the asset’s carrying amount exceeds its recoverable amount. The recoverable amount is the higher of an asset’s fair value less costs of disposal and value in use. For the purposes of assessing impairment, assets are grouped at the lowest levels for which there are largely independent cash inflows (CGUs). Prior impairments of non-financial assets (other than goodwill) are reviewed for possible reversal at each reporting date.
Government grantsGrants from the government are recognised at their fair value where there is a reasonable assurance that the grant will be received and that the group will comply with all attached conditions.
Government grants relating to costs are deferred and recognised in the income statement over the period necessary to match them with the costs that they are intended to compensate. Government grants relating to property, plant and equipment are included in non-current liabilities as deferred government grants, and they are credited to the income statement on a straight-line basis over the expected lives of the related assets.
Financial assets
ClassificationsThe Group classifies its financial assets in the following categories: at fair value through profit or loss, loans and receivables, and available for sale. The classification depends on the purpose for which the financial assets were acquired. Management determines the classification of its financial assets at initial recognition.
Financial assets at fair value through profit or lossFinancial assets at fair value through profit or loss are financial assets held for trading. A financial asset is classified in this category if acquired principally for the purpose of selling in the short-term. Derivatives are also categorised as held for trading unless they are designated as hedges. Assets in this category are classified as current assets if expected to be settled within 12 months, otherwise they are classified as non-current.
Loans and receivablesLoans and receivables are non-derivative financial assets with fixed or determinable payments that are not quoted in an active market. They are included in current assets, except for maturities greater than 12 months after the end of the reporting period. These are classified as non-current assets. The Group’s loans and receivables comprise of ‘trade and other receivables’ and ‘cash and cash equivalents’ in the balance sheet.

25887 11 April 2018 10:34 AM Proof4
56
Time Out Group plc Annual Report and Accounts for the year ended 31 December 2017 Stock code: TMO
2. Accounting policies continued
Available-for-sale financial assetsAvailable-for-sale financial assets are non-derivatives that are either designated in this category or not classified in any of the other categories. They are included in non-current assets unless the investment matures or management intends to dispose of it within 12 months of the end of the reporting period.
Recognition and measurementRegular purchases and sales of financial assets are recognised on the trade-date – the date on which the Group commits to purchase or sell the asset. Investments are initially recognised at fair value plus transaction costs for all financial assets not carried at fair value through profit or loss. Financial assets carried at fair value through profit or loss are initially recognised at fair value, and transaction costs are expensed in the income statement. Financial assets are derecognised when the rights to receive cash flows from the investments have expired or have been transferred and the Group has transferred substantially all risks and rewards of ownership. Available-for-sale financial assets and financial assets at fair value through profit or loss are subsequently carried at fair value. Loans and receivables are subsequently carried at amortised cost using the effective interest method.
Gains or losses arising from changes in the fair value of the ‘financial assets at fair value through profit or loss’ category are presented in the income statement in the period in which they arise. Changes in the fair value of monetary and non-monetary securities classified as available-for-sale are recognised in other comprehensive income.
Financial assets are derecognised when the right to receive cash flows from the assets has expired, or has been transferred, and the Group has transferred substantially all of the risks and rewards of ownership. When securities classified as available-for-sale are sold, or impaired, the accumulated fair value adjustments previously taken to reserves are included in the income statement.
Offsetting financial instrumentsFinancial assets and liabilities are offset and the net amount reported in the balance sheet when there is a legally enforceable right to offset the recognised amounts and there is an intention to settle on a net basis or realise the asset and settle the liability simultaneously. The legally enforceable right must not be contingent on future events and must be enforceable in the normal course of business and in the event of default, insolvency or bankruptcy of the Company or the counterparty.
Impairment of financial assets
Assets carried at amortised costThe Group assesses at the end of each reporting period whether there is objective evidence that a financial asset or group of financial assets is impaired. A financial asset or a group of financial assets is impaired and impairment losses are incurred only if there is objective evidence of impairment as a result of one or more events that occurred after the initial recognition of the asset (a ‘loss event’) and that loss event (or events) has an impact on the estimated future cash flows of the financial asset or group of financial assets that can be reliably estimated.
Evidence of impairment may include indications that the debtors or a group of debtors is experiencing significant financial difficulty, default or delinquency in interest or principal payments, the probability that they will enter bankruptcy or other financial reorganisation, and where observable data indicate that there is a measurable decrease in the estimated future cash flows, such as changes in arrears or economic conditions that correlate with defaults.
For loans and receivables, the amount of the loss is measured as the difference between the asset’s carrying amount and the present value of estimated future cash flows (excluding future credit losses that have not been incurred) discounted at the financial asset’s original effective interest rate. The carrying amount of the asset is reduced and the amount of the loss is recognised in the consolidated income statement. If a loan or held-to-maturity investment has a variable interest rate, the discount rate for measuring any impairment loss is the current effective interest rate determined under the contract. As a practical expedient, the Group may measure impairment on the basis of an instrument’s fair value using an observable market price.
If, in a subsequent period, the amount of the impairment loss decreases and the decrease can be related objectively to an event occurring after the impairment was recognised (such as an improvement in the debtor’s credit rating), the reversal of the previously recognised impairment loss is recognised in the income statement.
Assets classified as available-for-saleThe Group assesses at the end of each reporting period whether there is objective evidence that a financial asset or group of financial assets is impaired.
NOTES TO THE
FINANCIAL STATEMENTS
25887 11 April 2018 10:34 AM Proof 4
57
www.timeout.com FINANCIAL STATEMENTS
2. Accounting policies continued
Financial liabilitiesFinancial liabilities and equity instruments are classified according to the substance of the contractual arrangements entered into. An equity instrument is any contract that evidences a residual interest in the assets of the entity after deducting all of its financial liabilities.
Where the contractual obligations of financial instruments (including preference shares) are equivalent to a similar debt instrument, those financial instruments are classified as financial liabilities. Where the contractual terms of preference shares do not have any terms meeting the definition of a financial liability then this is classed as an equity instrument.
InvestmentsInvestments held as fixed assets are stated at cost less provision for impairment. The Company assesses these investments for impairment wherever events or changes in circumstances indicate that the carrying value of an investment may not be recoverable. If any such indication of impairment exists, the Company makes an estimate of the recoverable amount. If the recoverable amount is less than the value of the investment, the investment is considered to be impaired and is written down to its recoverable amount. An impairment loss is recognised immediately in the profit and loss account.
InventoriesInventories are valued at the lower of cost and net realisable value, after making due allowance for obsolete and slow moving items. Inventories are comprised of raw materials and goods held for resale. Cost is determined on a first-in, first-out (FIFO) method. Net realisable value is based on estimated selling price less further costs expected to be incurred to completion and disposal.
Trade receivablesTrade receivables are amounts due from customers for merchandise sold or services performed in the ordinary course of business. If collection is expected in one year or less (or in the normal operating cycle of the business if longer), they are classified as current assets. If not, they are presented as non-current assets.
Trade receivables are recognised initially at fair value and subsequently measured at amortised cost using the effective interest method, less provision for impairment.
Cash and bank balancesCash and bank balances comprises cash and cash equivalents, being cash at bank and in hand and short-term deposits with a maturity of three months or less, and monies held in restricted accounts and deposits which represent cash held by the Group in accounts with conditions that restrict the use of these monies by the Group and, as such, does not meet the definition of cash and cash equivalents.
Line of creditCertain of the Group’s accounts receivable balances are assigned, with recourse, to financial institutions. In return, the Group receives a cash advance of 80%–85% of eligible accounts receivable. Both financial assets and financial liabilities are recognised with regards to this arrangement.
Share capitalOrdinary shares are classified as equity, only to the extent that they do not meet the definition of a financial liability. Incremental costs directly attributable to the issue of new ordinary shares of options are shown in equity as a deduction, net of tax, from the proceeds.
Trade payablesTrade payables are obligations to pay for goods or services that have been acquired in the ordinary course of business from suppliers. Accounts payable are classified as current liabilities if payment is due within one year or less (or in the normal operating cycle of the business if longer). If not, they are presented as non-current liabilities.
Trade payables are recognised initially at fair value and subsequently measured at amortised cost using the effective interest method.

25887 11 April 2018 10:34 AM Proof4
58
Time Out Group plc Annual Report and Accounts for the year ended 31 December 2017 Stock code: TMO
2. Accounting policies continued
BorrowingsAll interest bearing loans and borrowings are initially recognised at fair value, net of transaction costs incurred. Borrowings are subsequently carried at amortised cost; any difference between the proceeds (net of transaction costs) and the redemption value is recognised in the income statement over the period of the borrowings using the effective interest rate method.
Fees paid on the establishment of loan facilities are recognised as transaction costs of the loan to the extent that it is probable that some or all of the facility will be drawn down. In this case, the fee is deferred until the draw-down occurs. To the extent there is no evidence that it is probable that some or all of the facility will be drawn down, the fee is capitalised as a pre-payment for liquidity services and amortised over the period to which it relates.
Preference shares that are mandatorily redeemable on a specific date are classified as liabilities. The dividends on these preference shares are recognised in the income statement as an interest expense.
Borrowing costsGeneral and specific borrowing costs directly attributable to the acquisition, construction or production of qualifying assets, which are assets that necessarily take a substantial period of time to get ready for their intended use or sale, are added to the cost of those assets until such time as the assets are substantially ready for their intended use or sale.
TaxationThe charge for taxation is based on profits for the year and takes into account taxation deferred because of temporary differences between the treatment of certain items for taxation and accounting purposes. Tax is recognised in the income statement, except to the extent that it relates to items recognised in other comprehensive income or directly in equity. In this case, the tax is also recognised in other comprehensive income or directly in equity, respectively.
Current and deferred taxThe tax expense for the period comprises current and deferred tax. Tax is recognised in the income statement, except to the extent that it relates to items recognised in other comprehensive income or directly in equity, respectively.
The current tax charge is calculated on the basis of the tax laws enacted or substantively enacted at the balance sheet date in the countries where the Company and its subsidiaries operate and generate taxable income. Management periodically evaluates positions taken in tax returns with respect to situations in which applicable tax regulation is subject to interpretation. It establishes provisions where appropriate on the basis of amounts expected to be paid to the tax authorities.
Deferred tax is recognised on temporary differences arising between the tax bases of assets and liabilities and their carrying amounts in the consolidated financial statements. However, deferred tax liabilities are not recognised if they arise from the initial recognition of goodwill; deferred tax is not accounted for if it arises from the initial recognition of an asset or liability in a transaction other than a business combination that at the time of the transaction affects neither accounting nor taxable profit or loss. Deferred tax is determined using tax rates (and laws) that have been enacted or substantially enacted by the balance sheet date and are expected to apply when the related deferred tax asset is realised or the deferred tax liability is settled.
Deferred tax assets are recognised only to the extent that it is probable that future taxable profit will be available against which the temporary differences can be utilised.
Deferred tax liabilities are provided on taxable temporary differences arising from investments in subsidiaries, associates and joint arrangements, except for any deferred tax liability where the timing of the reversal of the temporary difference is controlled by the Group and it is probable that the temporary difference will not reverse in the foreseeable future. Generally, the Group is unable to control the reversal of the temporary difference for associates. Only where there is an agreement in place that gives the Group the ability to control the reversal of the temporary difference is the deferred tax liability not recognised.
Deferred tax assets and liabilities are offset when there is legally enforceable right to offset current tax assets against current tax liabilities and when the deferred tax assets and liabilities relate to income taxes levied by the same taxation authority on either the same taxable entity or different taxable entities and there is no intention to settle the balances on a net basis.
Tax grants related to research and development expenditure are recognised under IAS 12 against expenditure and are recognised when reasonably certain estimates can be made.
NOTES TO THE
FINANCIAL STATEMENTS

25887 11 April 2018 10:34 AM Proof 4
59
www.timeout.com FINANCIAL STATEMENTS
2. Accounting policies continued
Employee benefit costsThe Group contributes to certain employees’ personal pension plans on a defined contribution basis. A defined contribution plan is a pension plan under which the Group and employee pay fixed contributions, on a mandatory, contractual or voluntary basis depending on the location, to a third party financial provider. The Group has no further payment obligations once the contributions have been paid. The contributions are recognised as an employee benefit expense in the income statement when due.
Share-based paymentsThe Group operates a number of equity-settled, share-based compensation plans, under which the entity receives services from employees as consideration for equity instruments (options) of the Group. The fair value of the employee services received in exchange for the grant of the options is recognised as an expense. The total amount to be expensed is determined by reference to the fair value of the options granted.
At the end of each reporting period, the Group revises its estimates of the number of options that are expected to vest based on the non-market vesting conditions and service conditions. It recognises the impact of the revision to original estimates, if any, in the income statement, with a corresponding adjustment to equity.
When the options are exercised, the Company issues new shares. The proceeds received net of any directly attributable transaction costs are credited to share capital (nominal value) and share premium.
The grant by the Company of options over its equity instruments to the employees of subsidiary undertakings in the Group is treated as a capital contribution. The fair value of employee services received, measured by reference to the grant date fair value, is recognised over the vesting period as an increase to investment in subsidiary undertakings, with a corresponding credit to equity in the parent entity accounts.
The social security contributions payable in connection with the grant of the share options is considered an integral part of the grant itself, and the charge will be treated as a cash-settled transaction.
ProvisionsProvisions are recognised when the Group has a present legal or constructive obligation as a result of past events, it is probable that an outflow of resources will be required to settle the obligation, and the amount has been reliably estimated.
Provisions are measured at the present value of the expenditures expected to be required to settle the obligation using a pre-tax rate that reflects current market assessments of the time value of money and the risks specific to the obligation. The increase in provision due to the passage of time is recognised as an interest expense.
Revenue recognitionRevenue, which is stated net of sales tax, represents the amounts derived from the sale of goods and services which fall within the Group’s ordinary activities.
• Advertising revenue is recognised at the time the advertisement is published.
• Subscription and Premium Profiles revenue is recognised evenly over the length of each subscription.
• Circulation revenue is recognised at the time of sale. Provision is made for returns of distributor returns.
• Ticket revenues for Time Out events are recognised in the month of the event. Tickets for Time Out offers and commissions for sales of tickets to external events and experiences are recognised at the point of sale.
• Licence/royalty revenue is recognised over the contract period in accordance with the substance of the underlying agreement. Where these revenues are uncertain, they are recognised only on receipt.
• Market related revenue is predominantly turnover related rent from restaurants in the markets and is recognised as the turnover is earned by the sub-letting restaurants. These are treated as operating leases and are recognised in the income statement on a straight-line basis over the period of the lease.
Interest income and expensesInterest income and expenses are recognised using the effective interest method.

25887 11 April 2018 10:34 AM Proof4
60
Time Out Group plc Annual Report and Accounts for the year ended 31 December 2017 Stock code: TMO
2. Accounting policies continued
Leases
Operating leasesWhere substantially all of the risks and rewards incidental to ownership are not transferred to the Group, the total rentals payable under the lease are charged to the consolidated statement of comprehensive income on a straight-line basis over the lease term.
The aggregate benefit of any lease incentive is recognised as a reduction of the rental expense over the lease term on a straight-line basis. Rentals paid under operating leases are charged to income on a straight-line basis over the lease term, even if the payments are not made on such a basis.
Finance leasesLeases of property, plant and equipment where the Group, as lessee, has substantially all the risks and rewards of ownership are classified as finance leases. Finance leases are capitalised at the lease’s inception at the fair value of the leased property or, if lower, the present value of the minimum lease payments. The corresponding rental obligations, net of finance charges, are included in other short-term and long-term payables.
Each lease payment is allocated between the liability and finance cost. The finance cost is charged to the income statement over the lease period so as to produce a constant periodic rate of interest on the remaining balance of the liability for each period. The property, plant and equipment acquired under finance leases is depreciated over the asset’s useful life or over the shorter of the asset’s useful life and the lease term if there is no reasonable certainty that the Group will obtain ownership at the end of the lease term.
Exceptional itemsExceptional items are disclosed separately in the financial statements where, given their nature or size, it is necessary to do so to provide further understanding of the financial performance of the Group. Exceptional items mainly relate to costs associated with a material restructuring (including termination payments and associated legal fees), costs relating to acquisitions, including legal and consultancy fees, costs arising from significant office moves and the revaluation of minority interests.
Critical accounting estimates and judgementsThe preparation of the Group’s consolidated financial statements requires management to make judgements, estimates and assumptions that affect the reported amounts of revenues, expenses, assets and liabilities, and the disclosure of contingent liabilities, at the end of the reporting period. However, uncertainty about these assumptions and estimates could result in outcomes that require a material adjustment to the carrying amount of the asset or liability affected in future periods.
The key assumptions and judgements concerning the future and other key sources of estimation uncertainty at the reporting date, that have a significant risk of causing a material adjustment to the carrying amounts of assets and liabilities within the next financial year, are described below. The Group based its assumptions, estimates and judgements on parameters available when the consolidated statements were prepared. Existing circumstances and assumptions about future developments, however, may change due to market changes or circumstances arising beyond the control of the Group. Such changes are reflected in the assumptions when they occur.
a) Impairment of goodwill and intangiblesThe Group tests annually whether goodwill has suffered any impairment i.e. when the carrying value of a CGU exceeds its recoverable amount, which is the higher of its fair value less costs of disposal and its value in use. The fair value less costs to sell calculation is based on available data from binding sales transactions in an arm’s length transaction of similar assets or observable market prices less incremental costs for disposing of the asset. The value in use calculation is based on a discounted cash flow model, where appropriate. The cash flows are derived from the business plan for the next five years and do not include restructuring activities that the Group is not yet committed to or significant future investments that will enhance the asset’s performance of the cash generating unit being tested. The recoverable amount is most sensitive to the discount rate used for the discounted cash flow model as well as the expected future cash inflows and the growth rate used for extrapolation purposes. The estimation uncertainty exists here due to a number of estimation factors applied to any model used.
b) Capitalisation of development costsCareful judgement by the Directors is applied when deciding whether the recognition requirements for capitalised development costs have been met under IAS 38 ‘Intangible Asset’. Before capitalisation commences on a specific project, a business plan is prepared and approved in order to ascertain that the project meets all criteria of the standard as well as to determine the asset’s useful life. Judgements and assumptions are made using all information known at the end of the reporting period.
NOTES TO THE
FINANCIAL STATEMENTS

25887 11 April 2018 10:34 AM Proof 4
61
www.timeout.com FINANCIAL STATEMENTS
2. Accounting policies continued
c) Business combinationsWhen acquiring a business, the Group has to make judgements and best estimates about the fair value allocation of the purchase price and the fair value of any contingent deferred consideration. Judgement is applied in determining what part of a business transaction relates to the acquisition of that business. Parts of a business transaction that do not relate to the acquisition (for example, employee costs) are accounted for in accordance with the relevant accounting standard.
d) Capitalisation of pre-opening expenditureWhen investing in the expansion of new Time Out Market sites, the Group makes a judgement as to when the new site has passed feasibility and reached development stage. During feasibility, all costs associated with the new site are expensed. When a site reaches development stage, which is normally determined following the agreement of Heads of Terms for a new lease, applicable costs incurred are capitalised as an item of property, plant and equipment. Impairment reviews are performed on the pre-opening expenditure balances at least every six months.
New standards and interpretations not yet adoptedThe following new standards and amendments to standards and interpretations are effective for annual periods beginning after 1 January 2018 and as such, have not been adopted in these financial statements but have been adopted by the Group from that date. None of these are expected to have a significant effect on the consolidated financial statements of the Group.
IFRS 9 ‘Financial instruments’ addresses the classification, measurement and recognition of financial assets and financial liabilities. It replaces the guidance in IAS 39 that relates to the classification and measurement of financial instruments.
• IFRS 9 retains but simplifies the mixed measurement model and establishes three primary measurement categories for financial assets: amortised cost; fair value through other comprehensive income; and fair value through profit or loss. The basis of classification depends on the entity’s business model and the contractual cash flow characteristics of the financial asset. Investments in equity instruments are required to be measured at fair value through profit or loss with the irrevocable option at inception to present changes in fair value in other comprehensive income, not recycling.
• An expected credit losses model replaces the incurred loss impairment model used in IAS 39. For financial liabilities, there are no changes to classification and measurement, except for the recognition of changes in own credit risk in other comprehensive income, for liabilities designated at fair value through profit or loss.
• IFRS 9 introduces changes to the requirements for hedge effectiveness.
The Directors anticipate that the classification and measurement basis for its financial assets and liabilities will be largely unchanged by adoption of IFRS 9. The main impact of adopting IFRS 9 is likely to arise from the implementation of the expected loss model. The expected impact at 1 January 2018 is to increase retained earnings by £52k. No material impact on results for future periods is expected.
IFRS 15, ‘Revenue from contracts with customers’ replaces IAS 18, ‘Revenue’, and IAS 11, ‘Construction contracts’, and related interpretations and deals with revenue recognition and establishes principles for reporting useful information to users of financial statements about the nature, amount, timing and uncertainty of revenue and cash flows arising from an entity’s contracts with customers. Revenue is recognised when a customer obtains control of a good or service and thus has the ability to direct the use and obtain the benefits from the good or service.
Following a review of existing contractual arrangements, the directors anticipate there will be no material impact for the group’s revenue streams.
The following standard is not yet effective and has not been adopted by the Group:
IFRS 16, ‘Leases’ applies for periods beginning on or after 1 January 2019. It replaces the current leasing standard, IAS 17, and requires all leases to be treated in a consistent way to the current rules on finance leases, requiring all leases, with limited exceptions, to be disclosed in the statement of financial position. The most significant effect of the new requirements will be an increase in lease assets and financial liabilities.
IFRS 16 changes the nature of expenses related to those leases, replacing the straight-line operating lease expense with a depreciation charge for the lease asset (included within operating costs) and an interest expense on the lease liability included within finance costs).
The group is working towards the implementation of IFRS 16 on 1 January 2019. Adoption of this new standard is likely to have an impact on the group and the Directors are yet to assess the impact.

25887 11 April 2018 10:34 AM Proof4
62
Time Out Group plc Annual Report and Accounts for the year ended 31 December 2017 Stock code: TMO
3. Exchange ratesThe significant exchange rates to UK Sterling for the Group are as follows:
2017 2016Closing
rateAverage
rateClosing
rateAverage
rateUS dollar 1.35 1.29 1.23 1.36Euro 1.13 1.14 1.17 1.22Hong Kong dollar 10.54 10.18Singaporean dollar 1.80 1.80Australian dollar 1.73 1.69
4. Segmental informationIn accordance with IFRS 8, the Group’s operating segments are based on the figures reviewed by the Board, which represents the chief operating decision maker. The Group is organised into four operating segments, having added a segment to report the acquired Markets business:
• Print – sale of print advertising and publications;
• Digital – sale of digital advertising (including premium profiles) and e-commerce and sales of live events commissions generated by online bookings and transactions;
• International – fees and royalties from third party licensees for the rights to publish print magazines and produce website content under the Time Out brand;
• Markets – predominantly turnover related rent from restaurants in the market and charges for services.
No information is provided at the segment level concerning interest income, interest expense, depreciation or amortisation, income taxes, profit/loss from associates or other material non-cash items. The Board of Directors do not review any measures of assets, liabilities or cash flows at a segment level.
Year ended 31 December 2017
Print£’000
Digital£’000
International£’000
Markets£’000
Total£’000
Revenue 15,493 21,499 1,401 5,971 44,364Cost of sales (9,824) (9,053) – (832) (19,709)Gross profit 5,669 12,446 1,401 5,139 24,655Administrative expenses (49,293)Operating loss (24,638)Analysed asAdjusted EBITDA loss (14,217)Share based payments (1,527)Exceptional items (3,155)EBITDA loss (18,899)Depreciation of property, plant and equipment (1,124)Amortisation of intangible assets (4,420)Loss on disposal of fixed assets (195)Operating loss (24,638)
Finance income 72Finance costs (825)Share of associate's loss (954)Loss before income tax (26,345)Income tax credit 325Loss for the year (26,020)
NOTES TO THE
FINANCIAL STATEMENTS

25887 11 April 2018 10:34 AM Proof 4
63
www.timeout.com FINANCIAL STATEMENTS
4. Segmental information continuedYear ended 31 December 2016
Print£’000
Digital£’000
International£’000
Markets£’000
Total£’000
Revenue 15,238 16,316 1,880 2,302 35,736Cost of sales (9,966) (4,488) (30) (223) (14,707)Gross profit 5,272 11,828 1,850 2,079 21,029Administrative expenses (38,882)Operating loss (17,853)Analysed asAdjusted EBITDA loss (10,231)Share based payments (1,064)Exceptional items (2,728)EBITDA loss (14,023)Depreciation of property, plant and equipment (710)Amortisation of intangible assets (3,120)Operating loss (17,853)
Finance income 389Finance costs (1,531)Gain on investment and share of associate’s loss 152Loss before income tax (18,843)Income tax credit 203Loss for the year (18,640)
Revenue is analysed geographically by origin as follows:
2017£’000
2016£’000
Europe 26,575 20,289Americas 14,313 13,567Rest of World 3,476 1,880
44,364 35,736
The Group earns its revenues by selling both goods and services. These can be analysed as follows:
2017£’000
2016£’000
Print advertising and circulation 15,493 15,238Digital advertising 12,112 10,210Premium profiles 2,071 1,444E-commerce 7,316 4,662International 1,401 1,880Markets 5,971 2,302
44,364 35,736
There are no revenues from any single customer that exceed 10% of the Group’s revenues.
The Group has applied the European Securities and Markets Authority (ESMA) ‘Guidelines on Alternative Performance Measures’ in these annual results. In the context of these results, an alternative performance measure (APM) is a financial measure of historical or future financial performance, position or cash flows of the Group which is not a measure defined or specified in IFRS. The reconciliation of adjusted EBITDA to operating profit is contained within the segmental reporting note above.

25887 11 April 2018 10:34 AM Proof4
64
Time Out Group plc Annual Report and Accounts for the year ended 31 December 2017 Stock code: TMO
5. Staff costsGroup
2017£’000
2016£’000
Wages and salaries 20,339 17,302Social security costs 2,254 1,992Other pension costs 545 496Share based payments 1,527 1,064
24,665 20,854
The average monthly number of employees, including Executive Directors, during the year was as follows:
2017£’000
2016£’000
Sales and Marketing 126 126Editorial and Production 148 111Product Development 41 44Administration 111 54
426 335
The Company has no employees (2016: nil).
The remuneration of the Executive Directors and Officers who are the key management personnel of the Group, is set out below in aggregate for each of the applicable categories specified in IAS 24 ‘Related Party Disclosures’. Further information about the remuneration of individual Executive Directors is provided in the Directors’ Remuneration report on page 34.
2017£’000
2016£’000
Short-term employee benefits 1,188 2,466Post-employment benefits 75 129Termination benefits – 538Share based payments 207 860
1,470 3,993
Information regarding the highest paid director or key manager is below:
2017£’000
2016£’000
Short-term employee benefits 309 587Post-employment benefits 28 29Share based payments 106 780
443 1,396
NOTES TO THE
FINANCIAL STATEMENTS

25887 11 April 2018 10:34 AM Proof 4
65
www.timeout.com FINANCIAL STATEMENTS
6. Exceptional itemsCosts are analysed as follows:
2017£’000
2016£’000
Restructuring costs 1,787 1,261Fees relating to acquisitions in the year 539 514Advisory fees in relation to the IPO 7 953Revaluation of put option in Time Out Markets 596 –Office relocation costs 226 –
3,155 2,728
All exceptional items are presented in Administrative expenses.
The 2017 restructuring costs include employee termination costs of £1,787k incurred to compensate members of senior management and other employees for loss of office and to reflect the Group’s new global organisation structure.
Restructuring costs are treated as exceptional only where they are as a result of fundamental changes in the operating structure of the Group and which management do not consider to be part of ongoing or underlying activities.
The acquisition fees are costs associated with the acquisition of subsidiaries and licensing partners in the year of £487k and fees related to corporate reorganisations of £52k. The revaluation of the put option relates to a minority interest held in Time Out Market.
Office relocation costs relate to the costs associated with the relocation of the head office. The balance also includes the partial release of the provision made in 2016 for an onerous lease following subletting part of the building.
The 2016 advisory fees in relation to the IPO include costs not directly related to the raising of finance, including a portion of advisory costs incurred, management bonuses related to the IPO and marketing costs.
The 2016 restructuring costs include employee termination costs of £847k incurred to compensate members of senior management for loss of office as part of the reorganisation of the Group structure required as part of the listing process. The prior year balance also includes a provision for an onerous lease of £371k relating to the office space previously occupied by the YPlan staff as well as associated legal and agent fees of £43k.

25887 11 April 2018 10:34 AM Proof4
66
Time Out Group plc Annual Report and Accounts for the year ended 31 December 2017 Stock code: TMO
7. Operating costs / (income)2017£’000
2016£’000
Cost of inventories recognised as cost of sales 2,965 2,742Staff costs 24,665 20,854Depreciation 1,124 710
Intangible amortisation 4,420 3,120Operating lease rentals – land and buildings 2,281 2,149Loss / (gain) on foreign exchange 22 (250)Other expenses 33,525 24,264
69,002 53,589
Analysed as:
2017£’000
2016£’000
Charged to cost of sales 19,709 14,707Administrative expenses 51,622 39,999
71,331 54,706Staff costs capitalised (2,329) (1,117)
69,002 53,589
2017£’000
2016£’000
Fees payable to the Company's auditors for the audit of the consolidated and parent Company financial statements 181 155Fees payable to the Company's auditors for the audit of the Company's subsidiaries 70 57
251 212
Fees payable to the Company's auditor for audit related assurance services 30 31Fees payable to the Company's auditor for non-audit services Advice in relation to the IPO – 1,067 Company secretarial services 46 21 Other services 22 4
349 1,335
Audit fees of the Group and Company are borne by Time Out Digital Ltd, a subsidiary company.
NOTES TO THE
FINANCIAL STATEMENTS

25887 11 April 2018 10:34 AM Proof 4
67
www.timeout.com FINANCIAL STATEMENTS
8. Finance income and costsFinance income
2017£’000
2016£’000
Bank interest receivable 72 4Interest on sponsorship contracts – 6Foreign exchange gain on financing items – 379
72 389
Finance costs2017£’000
2016£’000
Interest on line of credit 193 241Interest on finance leases 8 2Interest on loan stock and loan notes – 377Interest on senior and mezzanine debt – 778Interest on sponsorship loans 130 45Interest on bank loans 122 35Interest on short–term debt – 53Foreign exchange loss on financing items 227 –Other 145 –
825 1,531
9. TaxationAnalysis of income tax
2017£’000
2016£’000
Current tax Current tax charge 150 43Deferred taxDeferred tax credit (475) (246)
(325) (203)
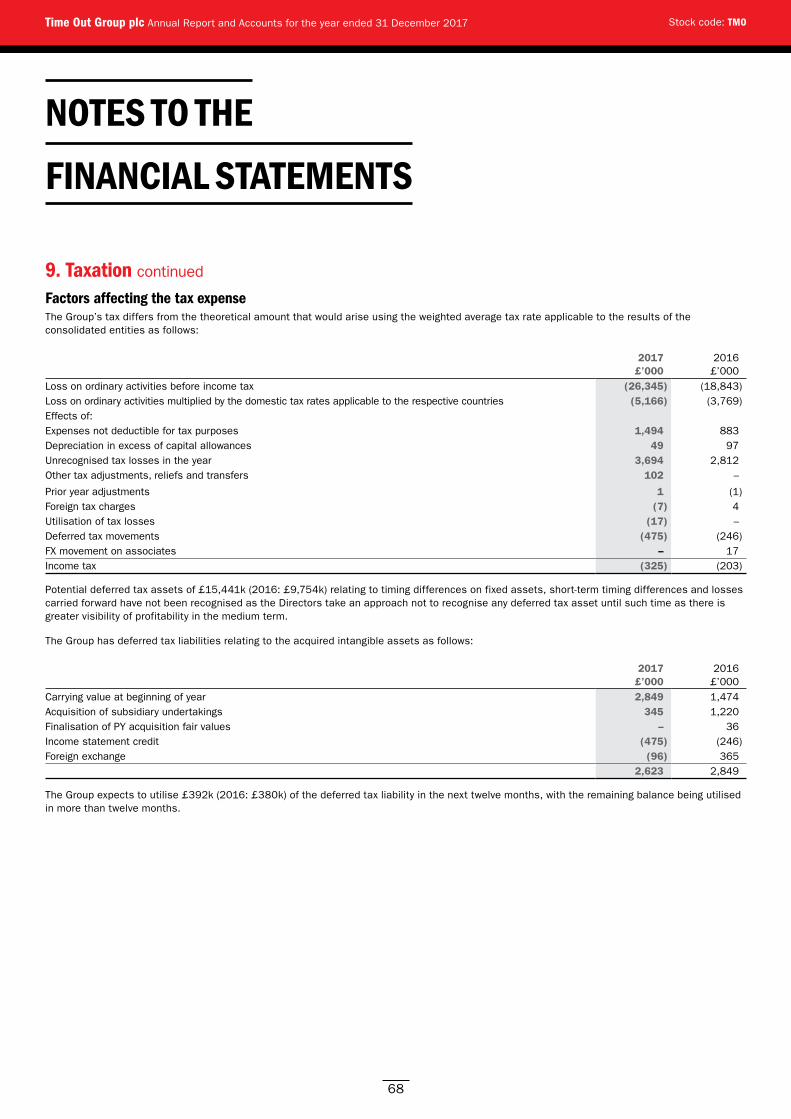
25887 11 April 2018 10:34 AM Proof4
68
Time Out Group plc Annual Report and Accounts for the year ended 31 December 2017 Stock code: TMO
9. Taxation continued
Factors affecting the tax expenseThe Group’s tax differs from the theoretical amount that would arise using the weighted average tax rate applicable to the results of the consolidated entities as follows:
2017£’000
2016£’000
Loss on ordinary activities before income tax (26,345) (18,843)Loss on ordinary activities multiplied by the domestic tax rates applicable to the respective countries (5,166) (3,769)Effects of:Expenses not deductible for tax purposes 1,494 883Depreciation in excess of capital allowances 49 97Unrecognised tax losses in the year 3,694 2,812Other tax adjustments, reliefs and transfers 102 –
Prior year adjustments 1 (1)Foreign tax charges (7) 4Utilisation of tax losses (17) –Deferred tax movements (475) (246)FX movement on associates – 17Income tax (325) (203)
Potential deferred tax assets of £15,441k (2016: £9,754k) relating to timing differences on fixed assets, short-term timing differences and losses carried forward have not been recognised as the Directors take an approach not to recognise any deferred tax asset until such time as there is greater visibility of profitability in the medium term.
The Group has deferred tax liabilities relating to the acquired intangible assets as follows:
2017£’000
2016£’000
Carrying value at beginning of year 2,849 1,474Acquisition of subsidiary undertakings 345 1,220Finalisation of PY acquisition fair values – 36Income statement credit (475) (246)Foreign exchange (96) 365
2,623 2,849
The Group expects to utilise £392k (2016: £380k) of the deferred tax liability in the next twelve months, with the remaining balance being utilised in more than twelve months.
NOTES TO THE
FINANCIAL STATEMENTS

25887 11 April 2018 10:34 AM Proof 4
69
www.timeout.com FINANCIAL STATEMENTS
10. Loss per shareBasic loss per share is calculated by dividing the loss attributable to shareholders by the weighted average number of shares during the year.
For diluted loss per share, the weighted average number of shares in issue is adjusted to assume conversion for all dilutive potential shares. All potential ordinary shares including options and deferred shares are anti-dilutive as they would decrease the loss per share, and are therefore not considered, diluted loss per share is equal to basic loss per share.
2017Number
2016Number
Weighted average number of ordinary shares for the purpose of basic and diluted loss per share 131,985,250 97,768,759
£’000 £’000Loss from continuing operations for the purpose of loss per share (25,048) (18,462)
Pence PenceBasic and diluted loss per share (19.0) (18.9)
11. Business combinationsDuring 2017, the Group acquired Print & Digital Publishing Pty (“Time Out Australia”) and 80 Mes 4 Publicacions (“Time Out Spain”). The Group had a presence in both locations prior to acquisition, through international licencing agreements. As a result of these acquisitions, the Group continues its global expansion program, allowing further growth and monetisation opportunities across e-commerce, advertising and Premium Profiles.
Time Out AustraliaOn 2 June 2017, the Group acquired 100% of the issued ordinary share capital of Print & Digital Publishing Pty Limited for the issue of 1,656,930 Ordinary Shares valued at £2,212k based on a share price of £1.335. Pre-acquisition international licensing revenues of £38k have been recognised as revenue directly in the income statement.
The fair value of the assets and liabilities acquired are as follows:
£’000Property, plant and equipment 8Customer relationships 593Trade and other receivables 201
Cash and cash equivalents 37Deferred tax liability (178)Trade and other payables (485)Net assets acquired 176Goodwill 2,036Consideration paid 2,212
Revenue of £1,734k and operating profit of £79k since the acquisition date have been included in the consolidated income statement. If the business combination had occurred at the beginning of the year the revenue contribution to the Group for the year would have been £2,891k and the operating loss contribution to the Group for the year would have been £209k.
The goodwill represents the value of the assembled workforce in the Australian business. None of the goodwill recognised is expected to be deductible for income tax purposes.
Acquisition-related costs of £255k have been charged to administrative expenses in the consolidated income statement for the year ended 31 December 2017.

25887 11 April 2018 10:34 AM Proof4
70
Time Out Group plc Annual Report and Accounts for the year ended 31 December 2017 Stock code: TMO
11. Business combinations continued
Time Out SpainOn 14 August 2017, the Group acquired 100% of the issued ordinary share capital of Time Out Spain Media SL (previously 80 Mes 4 Publicacions) in exchange for purchase consideration of cash of £905k and deferred consideration of £909k in the form of Time Out Group plc shares or cash, with payment on the first anniversary of the acquisition date. Pre-acquisition international licensing revenues of £53k have been recognised as revenue directly in the income statement.
The fair value of the assets and liabilities acquired are as follows:
£’000Property, plant and equipment 32Customer relationships 668Investments 16Trade and other receivables 830Cash and cash equivalents 398Deferred tax liability (167)Trade and other payables (501)Borrowings (362)Net assets acquired 914Goodwill 962
Consideration paid 905Deferred consideration 971Total consideration 1,876
Revenue of £911k and operating loss of £44k since the acquisition date have been included in the consolidated income statement. If the business combination had occurred at the beginning of the year the revenue contribution to the Group for the year would have been £2,546k and the operating loss contribution to the Group for the year would have been £20k.
The goodwill represents the value of the assembled workforce in the Spanish business. None of the goodwill recognised is expected to be deductible for income tax purposes.
Acquisition-related costs of £182k have been charged to administrative expenses in the consolidated income statement for the year ended 31 December 2017.
12. GoodwillGroup
2017£’000
2016£’000
CostAt 1 January 49,230 35,525Acquisitions 2,998 8,180Finalisation of PY acquisition fair values – (164)Exchange differences (2,171) 5,689
50,057 49,230
NOTES TO THE
FINANCIAL STATEMENTS

25887 11 April 2018 10:34 AM Proof 4
71
www.timeout.com FINANCIAL STATEMENTS
12. Goodwill continuedThe carrying value of the goodwill is analysed by business segment as follows:
2017£’000
2016£’000
2015£’000
Digital 33,333 33,231 28,340Print 8,586 8,180 7,185Market 8,138 7,819 –
50,057 49,230 35,525
There were no impairment losses relating to goodwill at the end of the year (2016: £nil).
Goodwill arises on the acquisition of subsidiaries and represents the excess of the consideration transferred over the Group’s interest in net fair value of the net identifiable assets, liabilities and contingent liabilities of the business acquired. Goodwill acquired in a business combination is allocated to each of the cash generating units (CGUs) that is expected to benefit from the synergies of the combination. The Group’s CGUs consist of: Digital, Print and Market. This represents the lowest level within the entity at which the goodwill is monitored for internal management purposes. There is no goodwill in respect to the Group’s international segment.
Goodwill impairment reviews are undertaken annually or more frequently if events or changes in circumstances indicate a potential impairment. The carrying value of goodwill is compared to the recoverable amount, which is the higher of value in use and the fair value less costs of disposal. Any impairment is recognised immediately as an expense and is not subsequently reversed.
An exercise was undertaken to establish whether there was any impairment of goodwill at 31 December 2017, determined by comparison of the carrying value to the fair value of the CGUs less costs of disposal using a market approach and assumptions reflecting a market participant view. The valuation applies multiples of 5.0x to 2017 Digital revenues, including acquired businesses, 8.0x 2017 Market revenues and 1.0x to 2018 forecast Print revenues including acquired businesses, which are based upon sensitised benchmarks for comparable businesses. The 2018 revenues were taken from the latest forecasts approved by the Board. For the Digital CGU the key assumptions were the growth in advertising revenues, the number of transacting members and the average revenue per user. For the Market CGU the key assumptions were relating to new markets worldwide and the continuing growth of the Lisbon market. For the Print CGU the key assumption was the ability of the Group to maintain print advertising revenues during the transition to digital. Since the forecast future revenues are based on significant unobservable inputs, the fair value less costs of disposal of the goodwill is classified as a level 3 fair value.
A full sensitivity analysis has not been disclosed as management believes that any reasonable change in assumptions would not cause the carrying value of the Digital or Market CGUs to exceed their recoverable amounts. For the Print CGU, which has the lowest amount of headroom, if either revenues decline by 18% in the next 12 months or the multiple used decreased to .82x, it would most likely lead to an impairment of the goodwill of that segment.
The Company has no goodwill (2016: £nil).

25887 11 April 2018 10:34 AM Proof4
72
Time Out Group plc Annual Report and Accounts for the year ended 31 December 2017 Stock code: TMO
13. Intangible assets – other
Group
Trademarks and copyright
£’000
Development costs
£’000
Service concession
arrangements£’000
Customer relationships
£’000
Other intangible
assets£’000
Total£’000
CostAt 1 January 2016 4,597 7,089 – – 5,637 17,323Acquisitions 28 10 1,212 3,275 2,227 6,752Finalisation of prior year acquisition fair values 201 – – – – 201Additions 27 1,829 – – – 1,856Disposals (6) (1,626) – – – (1,632)Exchange differences 760 – 97 263 1,126 2,246At 31 December 2016 5,607 7,302 1,309 3,538 8,990 26,746Acquisitions – – – 1,261 5 1,266Finalisation of prior year acquisition fair values – – – – – –Additions 60 2,367 – – 5 2,432Disposals – (2,035) – – – (2,035)Exchange differences (368) (24) 62 (430) 10 (750)At 31 December 2017 5,299 7,610 1,371 4,369 9,010 27,659AmortisationAt 1 January 2016 385 3,710 – – 509 4,604Charge for the year 456 1,705 22 384 553 3,120Eliminated on disposal – (1,624) – – – (1,624)Exchange differences 107 – 1 – 171 279At 31 December 2016 948 3,791 23 384 1,233 6,379Charge for the year 348 2,099 94 1,206 673 4,420Eliminated on disposal – (2,024) – – – (2,024)Exchange differences (69) (13) 11 (88) (1) (160)At 31 December 2017 1,227 3,853 128 1,502 1,905 8,615Net book valueAt 31 December 2017 4,072 3,757 1,243 2,867 7,105 19,044At 31 December 2016 4,659 3,511 1,286 3,154 7,757 20,367At 1 January 2016 4,212 3,379 – – 5,128 12,719
The Company has no intangible assets (2016: £nil).
NOTES TO THE
FINANCIAL STATEMENTS

25887 11 April 2018 10:34 AM Proof 4
73
www.timeout.com FINANCIAL STATEMENTS
14. Property, plant and equipmentGroup
Fixtures and fittings£’000
Computer equipment
£’000
Leasehold improvements
£’000Total
£’000CostAt 1 January 2016 295 711 346 1,352Acquisitions 406 97 4,662 5,165Additions 436 439 1,344 2,219Disposals (56) (114) (155) (325)Exchange differences 46 59 444 549At 31 December 2016 1,127 1,192 6,641 8,960Acquisitions 27 13 – 40Additions 187 286 1,481 1,954Disposals (353) (197) (466) (1,016)Exchange differences 38 (36) 150 152At 31 December 2017 1,026 1,258 7,806 10,090Depreciation At 1 January 2016 23 312 150 485Charge for the year 188 244 278 710Eliminated on disposal (52) (110) (155) (317)Exchange differences (16) 47 69 100At 31 December 2016 143 493 342 978Charge for the year 299 379 446 1,124Eliminated on disposal (233) (172) (416) (821)Exchange differences 15 (25) (15) (25)At 31 December 2017 224 675 357 1,256Net book valueAt 31 December 2017 802 583 7,449 8,834At 31 December 2016 984 699 6,299 7,982At 1 January 2016 272 399 196 867
GroupComputer equipment includes the following amounts where the Group is a lessee under a finance lease:
2017£’000
2016£’000
Cost 167 147Accumulated depreciation (68) (26)Net book value 99 121
Lease liabilities are effectively secured, as the rights to the leased asset revert to the lessor in the event of default.
2017£’000
2016£’000
Gross finance lease liabilities – minimum lease payments:No later than 1 year 80 54Later than 1 year and no later than 5 years 35 71
115 125Future finance charges on finance lease liabilities (10) (4)Present value of finance lease liabilities 105 121

25887 11 April 2018 10:34 AM Proof4
74
Time Out Group plc Annual Report and Accounts for the year ended 31 December 2017 Stock code: TMO
14. Property, plant and equipment continuedThe present value of finance lease liabilities is as follows:
2017£’000
2016£’000
No later than 1 year 72 52later than 1 year and no later than 5 years 33 69
105 121
The Company has no property, plant and equipment (2016: £nil).
15. Investment in associateGroupThe Group owns 37.8% of the ordinary share capital of Flypay Limited. Flypay is a market leader in innovative technology for the hospitality industry and the further investment is part of Time Out’s strategy to monetise local businesses and plays an important role in the Group’s transformation into a global multi-media and entertainment business.
2017£’000
2016£’000
Associate – Flypay Limited 6,199 7,1536,199 7,153
The Group’s share of post-tax losses from Flypay Limited accounted for using the equity method is £954k (2016: £577k)
The financial information of Flypay Limited as at and for the year ending is summarised below:
2017£’000
2016£’000
Non-current assets 108 67Current assets 3,756 6,188Gross assets 3,864 6,255Non-current liabilities – –Current liabilities (227) (33)Gross liabilities (227) (33)Net assets 3,637 6,222Revenue 292 111Operating loss (2,523) (1,439)Group's share of loss for the period (954) (577)
A reconciliation of the movement in the carrying value is as follows:
2017£’000
2016£’000
At 1 January 7,153 –Additions – 6,999Fair value gain – 730Share in loss of associate (954) (576)At 31 December 6,199 7,153
NOTES TO THE
FINANCIAL STATEMENTS

25887 11 April 2018 10:34 AM Proof 4
75
www.timeout.com FINANCIAL STATEMENTS
15. Investment in associate continuedThe cost of investment in Flypay is recognised on the statement of financial position as an investment in associate.
There is a risk that the Group will not be able to recover the value of this asset as Flypay Limited is currently loss-making. Management have considered growth projections of the business and their future business plans. On this basis they believe the carrying value of the investment is supportable. The Group will continue to assess the likelihood of recoverability.
Flypay Ltd is a company registered in England and Wales, who’s registered is address is 9th Floor 107 Cheapside, London, United Kingdom, EC2V 6DN.
Prior yearOn 14 June 2016, the Group acquired a further 41.5% of the ordinary share capital of Flypay Limited, having acquired 0.1% of their ordinary share capital during 2015. The Group issued 4,660,000 ordinary shares as consideration, with a total fair value of £6,990k. In October 2016, the Group’s share was diluted to 37.8% due to further investment from other investors. The dilution resulted in a fair value gain of £730k which was recognised in the income statement in the prior year.
16. Other investmentsCompany
Shares in Group undertakings2017£’000
2016£’000
Cost and Net Book ValueAt 1 January 85,553 79,146Additions 4,088 6,407Disposals (192) –At 31 December 89,449 85,553
The additions in 2017 relate to the acquisitions of Time Out Australia (£2,212k) and Time Out Spain (£1,876k) which took place in June and August respectively.
The additions in 2016 relate to a further investment in Time Out Group MC Limited of £4,000k (2015: £19,271k), a fellow Group undertaking and to the acquisition of Yplan (£2,407k) which took place in October 2016.

25887 11 April 2018 10:34 AM Proof4
76
Time Out Group plc Annual Report and Accounts for the year ended 31 December 2017 Stock code: TMO
16. Other investmentsAs at 31 December 2017, the Group held investments in the following undertakings. All are accounted for using the acquisition method):
Group and Company
Name of company Holding Nature of business Registered addressCountry of registration (or incorporation)
Direct subsidiaries:Time Out Group MC Limited 100% Holding company 77 Wicklow Street, London WC1X 9JY England and WalesTime Out New York Limited 100% Holding company 77 Wicklow Street, London WC1X 9JY England and WalesTime Out Spain Media SL 100% Publishing & e-commerce 7–9 Via Laietana, no 20 1st floor, Barcelona
08003Spain
Print & Digital Publishing Pty 100% Publishing & e-commerce 41 Bridge Rd, Glebe NSW 2037 Australia
Indirect subsidiaries:Time Out Group BC Limited 100% Holding company 77 Wicklow Street, London WC1X 9JY England and WalesTime Out Digital Limited 100% Holding company 77 Wicklow Street, London WC1X 9JY England and WalesTime Out Magazine Limited 100% Dormant 77 Wicklow Street, London WC1X 9JY England and WalesTime Out Nominees Limited 100% Dormant 77 Wicklow Street, London WC1X 9JY England and WalesTime Out England Limited 100% Publishing & e-commerce 77 Wicklow Street, London WC1X 9JY England and WalesTime Out International Limited 100% Dormant 77 Wicklow Street, London WC1X 9JY England and WalesTime Out Market Limited 85% Holding company 77 Wicklow Street, London WC1X 9JY England and WalesTime Out Market London Limited 100% Operator of cultural
market77 Wicklow Street, London WC1X 9JY England and Wales
Leanworks Limited 100% E–commerce 77 Wicklow Street, London WC1X 9JY England and WalesTONY HC Corp 100% Holding company 1540 Broadway, 42nd Floor New York, NY 10036 United States of AmericaTime Out New York MC LLC 100% Holding company 1540 Broadway, 42nd Floor New York, NY 10036 United States of AmericaTime Out Market US Holdings LLC 100% Holding company 1540 Broadway, 42nd Floor New York, NY 10036 United States of AmericaTime Out America LLC 100% Publishing & e-commerce 1540 Broadway, 42nd Floor New York, NY 10036 United States of AmericaTime Out Chicago LLC 100% Publishing & e-commerce 100 N LaSalle Dr Suite 700, Chicago, IL 60602 United States of AmericaTime Out Market Miami LLC 100% Operator of cultural
market1540 Broadway, 42nd Floor New York, NY 10036 United States of America
Time Out Market Chicago LLC 100% Operator of cultural market
1540 Broadway, 42nd Floor New York, NY 10036 United States of America
Time Out Market Boston LLC 100% Operator of cultural market
1540 Broadway, 42nd Floor New York, NY 10036 United States of America
Yplan Inc 100% Dormant 1540 Broadway, 42nd Floor New York, NY 10036 United States of AmericaTime Out Portugal, Unipessoal LDA 100% Publishing & e-commerce Avenida de Liberdade, no 10–4, 1250–144
LisboaPortugal
MC-Mercados da Capital, LDA 82% Operator of cultural market
Rua D. Luis, no 19–2 andar 1200–149 Lisboa Portugal
Time Out Market Porto, LDA 64% Operator of cultural market
Rua D. Luis, no 19–2 andar 1200–149 Lisboa Portugal
Time Out Iberia SL 100% Service company Cl Marie Curie 810, Building Parc Tecnologic Ba 08042
Spain
Time Out Hong Kong Company Limited
100% Publishing & e-commerce Rms 3201–3204, 32/F Harbour Ctr 25 Harbour Rd, Wanchai Hong Kong
Hong Kong
Time Out Media Singapore Pte Ltd 100% Publishing & e-commerce The Hive, 4/F 59 New Bridge Road, Singapore 059405
Singapore
All subsidiaries’ reporting periods are consistent with the Group, except for Print & Digital Publishing Pty, which reports at 30 June annually. Following acquisition of this subsidiary during 2017, the Group have been working to align reporting periods and expect this to be completed during 2018.
All subsidiary undertakings are included in the consolidation.
All of the dormant companies listed above are exempt from preparing individual financial statements by virtue of s394A of the Companies Act 2006.
NOTES TO THE
FINANCIAL STATEMENTS

25887 11 April 2018 10:34 AM Proof 4
77
www.timeout.com FINANCIAL STATEMENTS
17. InventoriesGroup
2017£’000
2016£’000
Raw materials 239 229Finished goods 37 12
276 241
The Company has no inventories (2016: £nil).
18. Trade and other receivablesGroup
2017£’000
2016£’000
Current:Trade debtors (net) 9,922 7,032Other debtors 2,717 2,517Prepayment and accrued income 1,963 2,438
14,602 11,987
2017£’000
2016£’000
Non-current:Other debtors 958 550
958 550
The fair values of all financial assets of the Group equate to their carrying value.
As at 31 December 2017, Group trade receivables of £2,593k (2016: £1,587k) were past due but not impaired. The past due receivables relate to a number of independent customers for whom there is no recent history of default. The ageing of these trade receivables is over three months (2016: over three months).
As at 31 December 2017, Group trade receivables of £409k (2016: £416k) were impaired and provided for. The individually impaired receivables mainly relate to international trade receivables. The ageing analysis of these trade receivables is over three months (2016: over three months).
The non-current balance relates to office lease deposits that will mature in 2019 and 2020.
Movements on the Group provision for the impairment of trade receivables are as follows:
2017£’000
2016£’000
At 1 January 416 157Acquisitions 10 146Provision for receivable impairment 290 260Receivables written off during the year as uncollectable (274) (162)Unused amounts reversed (45) –Exchange differences 12 15At 31 December 409 416
The creation and release of any provision for impaired receivables have been included in Administrative Expenses in the income statement. Amounts charged to the allowance account are generally written off when there is no expectation of recovering additional cash.

25887 11 April 2018 10:34 AM Proof4
78
Time Out Group plc Annual Report and Accounts for the year ended 31 December 2017 Stock code: TMO
18. Trade and other receivables continued
Company2017£’000
2016£’000
Amounts owed by group undertakings 100,346 100,374Prepayment and accrued income 34 45
100,380 100,419
All amounts due from Group companies relate to loans which are non-interest bearing, unsecured and repayable on demand.
19. Cash and bank balancesGroup
2017£’000
2016£’000
Cash and cash equivalents 28,746 50,082Monies held in restricted accounts and deposits 1,093 –
29,839 50,082
Monies held in restricted accounts and deposits represent cash held by the Group in accounts with conditions that restrict the use of these monies by the Group and, as such, does not meet the definition of cash and cash equivalents.
20. Trade and other payablesGroup
2017£’000
2016£’000
Current:Trade creditors 3,720 4,919Social security taxes 531 575Other creditors 1,849 1,764Deferred consideration 971 809Line of credit 3,733 3,424Accruals and deferred income 6,331 6,028Value Added Tax 704 124
17,839 17,643
2017£’000
2016£’000
Non-current:Option over minority interest 738 307Other creditors 1,553 1,598
2,291 1,905
Line of credit amounts included above represent the Group’s accounts receivable financing agreements with RBS Invoice Finance Limited in the UK and US which is automatically renewed each year if certain conditions are met. Under the agreement, accounts receivable are assigned, with recourse, to this financial institution. In return the Group receives an advance up to 80%-85% of eligible assigned accounts receivable.
NOTES TO THE
FINANCIAL STATEMENTS

25887 11 April 2018 10:34 AM Proof 4
79
www.timeout.com FINANCIAL STATEMENTS
20. Trade and other payables continuedThe interest rate in effect for the UK agreement for the year ended 31 December 2017 was 2.85% above the Bank of England Base Rate (2015: 2.85% above for the UK and around 10% for the US). At 31 December 2017, UK accounts receivable assigned to RBS Invoice Finance Limited were £3,317k (2016: £2,483k) and US accounts receivable assigned to RBS Invoice Finance Limited were £3,721k (2016: £2,222k assigned to Access Capital, Inc). The facility is secured by way of charges over certain of the Group’s assets.
Included within Other Creditors is an amount of £105k (2016: £121k) relating to finance leases undertaken for IT equipment. There were £42k (2016: £26k) of costs associated with these leases included in depreciation and £8k (2016: £2k) included in finance costs.
Deferred consideration comprises amounts payable in cash or ordinary shares of Time Out in respect of the Time Out Spain acquisition, of which further details can be found in note 11. Other creditors also includes liabilities for the e-commerce business.
The non-current balance relates to a lease concession for the Lisbon market expiring 2031 and the put and call options over the minority interests in the Lisbon market, which can be exercised by the minority shareholder or the Group in 2019.
Company2017£’000
2016£’000
Trade creditors 45 –Deferred consideration 971 782Accruals and deferred income 229 244
1,245 1,026
21. ProvisionsGroup
2017£’000
2016£’000
At 1 January 335 –Charged to the Income Statement – 516Used during the year (162) (37)Unused amounts reversed (106) (144)At 31 December 67 335
Analysis of total provisions:
Current 67 186Non-current – 149
67 335
The provision relates to an onerous lease contract on the office previously occupied by Leanworks Limited which was acquired in October 2016. The lease expires in July 2018.
The Company has no provisions (2016: £nil).

25887 11 April 2018 10:34 AM Proof4
80
Time Out Group plc Annual Report and Accounts for the year ended 31 December 2017 Stock code: TMO
22. BorrowingsGroup
2017£’000
2016£’000
Current:Loan stock and loan notes – 171Sponsorship loan 329 784Bank loans 891 128
1,220 1,083Non-current:Loan stock – 1194Bank loans 8,178 321
8,178 1,515
Borrowings repayable as follows:
2017£’000
2016£’000
Between nil and one year 1,220 1,083Between one and two years 936 491Between two and five years 6,887 512Over five years 355 512
9,398 2,598
GroupThe balance at 31 December 2017 consists of non interest bearing loans from major suppliers under exclusivity contracts of £329k, financing provided by a local Urban Development Fund as part of the Joint European Support for Sustainable Investment in City Areas (JESSICA) initiative of £1,244k, a loan entered in to in November 2017 of £7,495k and financing acquired with Time Out Spain of £330k.
The JESSICA loan is charged at a rate of the six-moth EURIBOR rate plus 1.75% repayable in instalments to 2024.
Time Out Market entered in to a new loan in November 2017 at a rate of 11% above EURIBOR, repayable in instalments annually through to November 2022.
The financing acquired with Time Out Spain consists of a bank loan charged at a rate of EURIBOR plus 3% subject to a minimum of 3% and maximum of 4%, maturing July 2021.
The fair value of all financial liabilities equate to their carrying value.
CompanyThe company had no borrowings (2016: £nil).
NOTES TO THE
FINANCIAL STATEMENTS

25887 11 April 2018 10:34 AM Proof 4
81
www.timeout.com FINANCIAL STATEMENTS
23. Financial risk management and policiesFinancial risk factors and managementThe Group’s activities expose it to a variety of financial risks: market risk, credit risk and liquidity risk. The Group’s overall risk management programme focuses on the unpredictability of financial markets and seeks to minimise potential adverse effects on the Group’s financial performance.
Foreign currencyThe Group is exposed to foreign exchange risk as it operates in overseas markets. The Group’s realised loss on foreign exchange for the year was £246k (2016: £250k gain). The Group does not hedge its foreign currency risk as the majority of the Group’s receivables, payables and borrowings are denominated in the functional currency of the relevant entity. Consequently, there are no material currency exposures to disclose (2016: £nil).
A sensitivity analysis was conducted at the end of the year ending 31 December 2017 in order to understand the exposure of the Group’s income statement to currency fluctuations. The analysis used the actual monthly average rates and appreciated/depreciated each of the rates by 10%. The main assumptions revolve around this 10% adjustment to the rates which was applied linearly across the months instead of for a specific time.
The effects of the analysis showed that if the euro and US dollar had appreciated by 10% during the year, reported revenue would be £47,270k and the adjusted EBITDA loss would be £15,071k. If, conversely, the euro and US dollar had depreciated by 10% during the year, reported revenue would be £41,987k and adjusted EBITDA loss would be £13,524k.
Credit riskCredit risk refers to the risk that a counterparty will default on its contractual obligations resulting in a financial loss to the Group. In order to minimise this risk the Group endeavours to only deal with companies which are demonstrably creditworthy. The maximum exposure to credit risk is the value of the outstanding trade receivables. The management do not consider that there is any concentration of risk within trade receivables.
The Group puts provisions in place for specific known bad debts. In addition, further provisions are made based on historical customer payment trends, current local market conditions and the normal average time taken to pay in each individual country. An analysis of the Group’s trade receivables and provision for bad debts is included in note 18. The maximum credit risk exposure of the Group is the gross carrying value of each of its financial assets.
As well as credit risk on accounts receivable balances with customers, credit risk arises on cash and cash equivalents and deposits with banks and financial institutions. For banks and financial institutions, only reputable institutions with a strong, independently rated credit rating are used.
Liquidity riskCash flow forecasting is performed by the operating entities of the Group and aggregated by Group finance. Group finance monitors rolling forecasts of the Group’s liquidity requirements to ensure it has sufficient cash to meet operational needs whilst maintaining sufficient headroom to meet any repayment requirements.
In June 2016, the Group raised gross proceeds of £90m from the IPO process. This funding was partially used to repay the existing shareholder debt at the time of listing. The remainder of the proceeds funded investment in the business. The maturity profile of the Group’s borrowings is set out in note 22.
The table below analyses the group’s non-derivative financial liabilities into relevant maturity groupings based on the remaining period at the balance sheet date to the contractual maturity date. Derivative financial liabilities are included in the analysis if their contractual maturities are essential for an understanding of the timing of the cash flows. The amounts disclosed in the table are the contractual undiscounted cash flows.
As at 31 December 2017
Within one year
£’000
Between one and two
years£’000
Between two and five
years£’000
Over five years
£’000Total
£’000Borrowings (ex finance lease liabilities) 1,220 936 6,887 355 9,398Finance lease liabilities 72 27 6 – 105Trade and other payables 17,839 893 155 1,243 20,130
19,131 1,856 7,048 1,598 29,633

25887 11 April 2018 10:34 AM Proof4
82
Time Out Group plc Annual Report and Accounts for the year ended 31 December 2017 Stock code: TMO
23. Financial risk management and policies continued
As at 31 December 2016
Within one year
£’000
Between one and two
years£’000
Between two and five
years£’000
Over five years
£’000Total
£’000Borrowings (ex finance lease liabilities) 1,099 499 534 564 2,696Finance lease liabilities 52 52 26 – 130Trade and other payables 15,620 464 157 1,252 17,493
16,771 1,015 717 1,816 20,319
Interest rate riskThe Group’s exposure to interest rates is low. Lines of credit are subject to increases in the Bank of England base rate and both the Time Out Market and Time Out Spain loans are subject to increases in EURIBOR, but all other debt is at a fixed rate. The Group has not completed a sensitivity analysis for this risk because the low debt levels would result in an immaterial impact to the accounts.
Capital risk managementThe Group’s capital management objective is to ensure the Group’s ability to continue as a going concern so that it can provide returns for shareholders and benefits for other stakeholders. To meet this objective the Group reviews the budgets and forecasts on a regular basis to ensure there is sufficient capital to meet the needs of the Group.
The capital structure of the Group consists of shareholders equity as set out in the Consolidated Statement of Changes in Equity. All working capital requirements are financed from existing cash resources and borrowings.
24. Financial instrumentsFair valuesThe table below illustrates the fair values of all financial assets and liabilities held by the Group at 31 December 2017 and 31 December 2016.
Loans and receivables are non-derivative financial assets with fixed or determinable payments that are not quoted in an active market. They are measured at amortised cost using the effective interest rate method and the carrying value in all cases approximates to the fair value.
The Group’s financial liability for the option over the non-controlling interests of MC-Mercados da Capital, LDA is measured at fair value through profit or loss. The initial recognition, as part of the acquisition of Time Out Market Limited, was at fair value and subsequent changes in fair value are charged to the Income Statement.
All other liabilities, including loans and trade and other payables are held at amortised cost. After initial fair value recognition, these instruments are measured at amortised cost using the effective interest rate method. The carrying value of these liabilities approximates to the fair value.
NOTES TO THE
FINANCIAL STATEMENTS

25887 11 April 2018 10:34 AM Proof 4
83
www.timeout.com FINANCIAL STATEMENTS
24. Financial instruments continued
Classification of financial instruments
Loans and receivables
£’000
Available for sale
assets£’000
Liabilities measured at
amortised cost
£’000
At fair value through
profit or loss£’000
Total£’000
As at 31 December 2017AssetsCash and cash equivalents 29,839 – – – 29,839
Trade and other receivables 14,239 – – – 14,23944,078 – – – 44,078
LiabilitiesFinancing – – (9,069) (329) (9,398)Finance lease obligations – – (99) – (99)Option over minority interest – – – (738) (738)Trade and other payables – – (17,822) – (17,822)Provisions – – (67) – (67)
– – (27,057) (1,067) (28,124)
Classification of financial instruments
Loans and receivables
£’000
Available for sale
assets£’000
Liabilities measured at
amortised cost
£’000
At fair value through
profit or loss£’000
Total£’000
As at 31 December 2016AssetsCash and cash equivalents 50,082 – – – 50,082Trade and other receivables 11,264 – – – 11,264Other investments – – – – –
61,346 – – – 61,346LiabilitiesFinancing – – (1,493) (1,105) (2,598)Finance lease obligations – – (121) – (121)Option over minority interest – – – (307) (307)Trade and other payables – – (16,862) – (16,862)Provisions – – (335) – (335)
– – (18,811) (1,412) (20,223)
The Group assesses at each year end reporting date whether a financial asset or group of financial assets is impaired. In the financial year 2017 there was no objective evidence that would have necessitated the impairment of loans and receivables or available for sale assets except the provision for impairment of receivables (see note 18).
The Company had financial asset investments held at amortised cost of £100,346k (2016: £100,374k) relating to intercompany debtors and also had financial liabilities measured at amortised cost of £1,200k (2016: £1,026k) related to deferred consideration and accruals.

25887 11 April 2018 10:34 AM Proof4
84
Time Out Group plc Annual Report and Accounts for the year ended 31 December 2017 Stock code: TMO
24. Financial instruments continued
Financial liabilities measured at fair value through profit and lossFinancing of
TO MarketMinority interest Total
Balance at 1 January 2016 – – –Acquisition of Time Out Market 1,755 1,627 3,382Purchase of minority interest – (1,322) (1,322)Debt repayments (420) – (420)Gains and losses recognised in profit or loss (230) 2 (228)Balance at 31 December 2016 1,105 307 1,412Purchase of minority interest – (195) (195)Debt repayments (904) – (904)Gains and losses recognised in profit or loss 128 626 754Balance at 31 December 2017 329 738 1,067
Financial liabilities measured at fair value through profit and loss Level 1 Level 2 Level 3 TotalFinancing of Time Out market – – 329 329Option over minority interest – – 738 738
– – 1,067 1,067
25. Called up share capitalAuthorised, issued and fully paid
Nominal value2017
Number2016
NumberOrdinary shares £0.001 133,362,889 131,166,644Aggregate amounts 133,362,889 131,166,644
Nominal value2017£’000
2016£’000
New ordinary shares £0.001 133 131Aggregate amounts 133 131
On 2 June 2017 the company issued 1,656,930 Ordinary shares of £0.001 to the owners of Print & Digital Publishing Pty Limited in consideration of the acquisition of Time Out Australia. The fair value of the shares issued was £2,212k.
On 19 October 2017, the company issued 539,315 Ordinary shares being the deferred consideration payable in relation to the acquisition of Leanworks Limited (“Yplan”). The fair value of the shares issued was £761k.
NOTES TO THE
FINANCIAL STATEMENTS

25887 11 April 2018 10:34 AM Proof 4
85
www.timeout.com FINANCIAL STATEMENTS
26. Notes to the cash flow statementGroup reconciliation of loss before income tax to cash used in operations
2017£’000
2016£’000
Loss before income tax (26,345) (18,843)Add back:Net finance costs 753 1,142Share based payments 1,527 1,064Depreciation charges 1,124 710Amortisation charges 4,420 3,120Fair value gain on investments 626 (730)Loss / (gain) on disposals of fixed assets 195 16Non-cash movements (256) 77Share of associate's loss 954 577Increase in inventories (51) (29)Increase in trade and other receivables (2,230) (1,982)Decrease in trade and other payables (1,536) (1,087)Cash used in operations (20,819) (15,965)
27. Operating lease commitmentsGroupAt the reporting date, the Group had outstanding commitments for future minimum lease payments under non-cancellable operating leases over land and buildings, which fall due as follows:
2017£’000
2016£’000
Within one year 1,986 2,200Between one and five years 5,011 5,932In more than five years 671 2,047
7,668 10,179
The leases relate to rental agreements in London, New York and other locations.
At the reporting date, the Group also had outstanding commitments for future minimum lease payments under cancellable operating leases related to Time Out Market locations in Miami, Chicago, Boston and London which fall due as follows:
2017£’000
2016£’000
Within one year 151 96Between one and five years 17,268 11,793In more than five years 34,577 22,477
51,996 34,367
If planning permissions are not received in each respective jurisdiction, these leases are cancellable without recourse.
The future minimum lease payments receivable under non-cancellable operating leases are as follows:
2017£’000
2016£’000
Within one year 817 916Between one and five years 2,239 1,914In more than five years 1,270 1,047
4,326 3,877
The receivables relate to the market in Lisbon.

25887 11 April 2018 10:34 AM Proof4
86
Time Out Group plc Annual Report and Accounts for the year ended 31 December 2017 Stock code: TMO
27. Operating lease commitments continued
Company
The Company does not have any operating leases (2016: £nil).
28. Pension commitmentsThe Group operates defined contribution pension schemes on behalf of its employees. During the year, contributions of £545k (2016: £496k) were made on behalf of employees and at the year end £90k (2016: £137k) remained outstanding.
29. Share based paymentsGroupThe charge in respect of share based payment transactions included in the Group’s Income Statement for the year is as follows:
2017£’000
2016£’000
Expense arising from share option plans 1,527 1,064
Long Term Incentive PlanAwards have been made to the Executive Directors as follows:
Director Exercise price (p) Date of grantNumber of
options awarded Vesting dates Expiry dateJulio Bruno 150p* 14/06/2016 2,166,666 14/06/2017 14/06/2026
150p* 2,166,666 14/06/2018 14/06/2026150p* 2,166,667 14/06/2019 14/06/2026nil 21/04/2017 100,000 21/04/2018 21/04/2027nil 100,000 21/04/2019 21/04/2027nil 100,000 21/04/2020 21/04/2027
Richard Boult 150p* 14/06/2016 266,667 09/05/2019 14/06/2026135p 21/04/2017 50,000 21/04/2018 21/04/2027135p 50,000 21/04/2019 21/04/2027135p 50,000 21/04/2020 21/04/2027135p 50,000 21/04/2021 21/04/2027
Christine Petersen 141p** 21/10/2016 37,500 23/08/2017 21/10/2026141p** 37,500 23/08/2018 21/10/2026141p** 37,500 23/08/2019 21/10/2026141p** 37,500 23/08/2020 21/10/2026135p 21/04/2017 212,500 21/04/2018 21/04/2027135p 212,500 21/04/2019 21/04/2027135p 212,500 21/04/2020 21/04/2027135p 212,500 21/04/2021 21/04/2027nil 50,000 21/04/2018 21/04/2027nil 50,000 21/04/2019 21/04/2027nil 50,000 21/04/2020 21/04/2027nil 50,000 21/04/2021 21/04/2027
* IPO awards. Julio Bruno award vests a third on each of the first, second and third anniversaries of grant and Richard Boult award vests on the third anniversary of appointment.
**Award made prior to Ms Petersen being appointed Executive Director
NOTES TO THE
FINANCIAL STATEMENTS

25887 11 April 2018 10:34 AM Proof 4
87
www.timeout.com FINANCIAL STATEMENTS
29. Share based payments continuedThe only specific performance condition attached to these awards is of continued service. Except for IPO Awards detailed above, a quarter of each award’s options vest each year on the anniversary date for four years after grant. There is a 12 month lock-up period following each vesting date. More information can be found in the Directors’ Report on page 29.
Other awards made during the year and prior year were as follows:
Exercise price
(p)
Number of options
awarded Expiry datesSenior managers - August 2016 141 825,000 23/08/2026Senior managers - October 2016* 141 1,916,667 21/10/2026YPlan employees - October 2016 nil 1,262,876 21/10/2026Senior managers - April 2017 nil–135 1,175,000 21/04/2027Senior managers - October 2017 144 350,000 03/10/2027
* Includes awards of £150,000 made to Ms Petersen prior to her being appointed Executive Director
The only specific performance condition attached to these awards is of continued service. A quarter of each award’s options vest each year on the anniversary date for the four years after grant. There is a 12 month lock-up period following each vesting date. More information can be found in the Directors’ Report on page 29.
The total movement during the year is as follows:
2017 2016Weighted
average exercise price
(pence per option)
Number of options
Weighted average
exercise price (pence per
option)Number of
optionsOutstanding at 1 January 137 9,785,189 – –Options exercised in the year – – – –Options lapsed in the year 101 (1,944,526) 64 (986,021)Options granted in the year 112 3,075,000 130 10,771,210Outstanding at 31 December 136 10,915,663 137 9,785,189Exercisable at 31 December 2,329,167 – –
The options which lapsed during the year relate to employees who have left the Group.
The fair value of the award was valued using the Black–Scholes model, the assumptions used in the valuation are:
IPO award Mgmt awardRisk-free interest rate 0.3% – 0.4% 0.03%–0.68%Peer group volatility 47.5% – 48.9% 10.90%–48.3%Expected option life in years 1–3 1–4Expected dividend yield nil nilShare price at grant date 150p 135p–144pExercise price at grant date 150p nil–144pWeighted average fair value of options at grant date 40p 7p–135p
The weighted average fair value of options granted during the year was 36p (2016: 47p).

25887 11 April 2018 10:34 AM Proof4
88
Time Out Group plc Annual Report and Accounts for the year ended 31 December 2017 Stock code: TMO
29. Share based payments continuedShare options outstanding at the end of the year have the following expiry date and exercise prices:
Share options
Expiry dateExercise price
(p) 2017 2016IPO award 14/06/2026 150 6,766,667 6,766,667 Senior managers – August 2016 23/08/2026 141 375,000 750,000 Senior managers – October 2016 21/10/2026 141 625,000 1,541,667 YPlan employees – October 2016 21/10/2026 nil 173,996 726,855 Senior managers – April 2017 21/04/2027 nil–135 2,725,000 – Senior managers – October 2017 03/10/2027 144 250,000 –
10,915,663 9,785,189
30. Related party transactionsGroupThe Group is controlled by Oakley Capital Limited and Oakley Capital Private Equity, who together owned 57.6% of the Company’s shares as at 31 December 2017. There is a summary of majority ownership interests in the Directors’ Report on page 31.
Subsequent to the year end, the Company entered into a £20m term loan facility agreement with Oakley Capital Investments Limited (“OCI”). The facility is for a period of 19 months and has an interest rate of between 10 -15% depending on amounts drawn. The proceeds of the new facilities are intended to be used by the Group to fund future Time Out Market developments.
OCI is a substantial shareholder in the Company as defined by the AIM Rules and as such entering into the revolving credit facility constitutes a related party transaction pursuant to AIM Rule 13. With the exception of Peter Dubens, who is a director of OCI, the Directors of the Group consider that, having consulted with Liberum, the terms of the transaction are fair and reasonable insofar as shareholders are concerned.
Management share awardsDetails of management share awards are contained in the Directors’ Remuneration report on page 34 and in note 29.
OtherThe Group engages with Oakley Advisory, a subsidiary of Oakley Capital Investment Limited, on a consultancy basis and pays it a fee of £55k per annum. Further to this, advisory fees of £125k were paid to Oakley Advisory during 2017 in relation to the 2016 Leanworks Limited acquisition.
The following transactions were carried out with related parties in the prior year:
Acquisition of Time Out Market LimitedOn 14 June 2016, the Group acquired the entire issued preference share capital and an additional 76.6% of the ordinary share capital of Time Out Market Limited from OCI, a controlling related party. The Group issued 6,353,281 ordinary shares as consideration, with a total fair value of £9,530k.
Other relating to Time Out Market LimitedTime Out Digital Limited had a debtor balance with Time Out Market Limited at the year end of £5,251k of which £3,147k related to funding. In addition to the funding, Time Out Digital Limited provided £1,750k in July 2016 in order to buy out a minority interest in the Lisbon market and pay off a shareholder loan in that company. The rest of the balance relates to transfer pricing charges and trading between companies.
Acquisition of associate interest in Flypay LimitedOn 14 June 2016, the Group acquired a further 41.5% of the ordinary share capital of Flypay Limited, from Oakley Capital Investments Limited, a controlling related party. The Group issued 4,660,000 ordinary shares as consideration, with a total fair value of £6,990k. In October 2016, the Group’s share was diluted to 37.8% due to further investment from other investors. The dilution resulted in a fair value gain of £730k which is recognised in the income statement.
NOTES TO THE
FINANCIAL STATEMENTS

25887 11 April 2018 10:34 AM Proof 4
89
www.timeout.com FINANCIAL STATEMENTS
30. Related party transactions continued
Other During the year, Time Out America paid $80k to Oakley Capital for 2012 Directors Fees. The cost of the fees were included in prior year results. The Group also engages with Oakley Advisory, a subsidiary of Oakley Capital Investments Limited, on a consultancy basis and pays a minimum fee of £60k per annum.
Financing transactions with related parties are detailed in note 21.
The issue of share capital to related parties is detailed in note 24.
CompanyThe Company had the following balances outstanding with related parties, all of whom are companies within the Group:
2017£’000
2016£’000
Time Out Group MC Limited 1,112 1,112Time Out Group BC Limited 20,731 20,731Time Out Digital Limited 65,317 63,954Time Out England Limited (1,738) (188)Time Out America LLC 63 (97)Time Out New York Limited 14,861 14,861
100,346 100,373
31. ContingenciesCompanyThe Company has guaranteed Time Out Market’s obligations under the lease for the new market in Boston which amounted to $1.5m at 31 December 2017 and has provided a guarantee in respect of subsidiary borrowings of €9m which is secured over shares in Time Out Market Limited.
The Company has provided a guarantee in respect of rental payments under the operating lease for the building at 77 Wicklow Street totalling £2.4m.
32. Events after the reporting periodTime Out Market
In February 2018, the Group entered in to a new five year exclusivity agreement in respect of the supply of beer and soft drinks to the Time Out Market in Lisbon, with minimum purchase commitments.
In February 2018, the Group signed a lease for 20,000 sqft of space in the Dumbo, Brooklyn district of New York, subject to planning. It is intended to start construction shortly and it is planned that the market will be open by Q4 2018.
Loan from Oakley Capital Investments
As set out in note 30, to fund the accelerating development of Time Out Market, the Group has entered in to a £20m loan facility with Oakley Capital Investments Limited.

25887 11 April 2018 10:34 AM Proof4
90
Time Out Group plc Annual Report and Accounts for the year ended 31 December 2017 Stock code: TMO
SHAREHOLDER NOTES

25887 11 April 2018 10:34 AM Proof 4 25887 11 April 2018 10:34 AM Proof 4
Registered OfficeTime Out Group plc 77 Wicklow Street London WC1X 9JY United Kingdom
Company Number: 07440171
Company website: www.timeout.com
AdvisersNominated Adviser and Broker: Liberum Capital Limited Ropemaker Place 25 Ropemaker Street London EC2Y 9LY United Kingdom
Legal Advisers: Ashurst LLP Broadwalk House 5 Appold Street London EC2A 2HA United Kingdom
Independent Auditor: PricewaterhouseCoopers LLP 1 Embankment Place London WC2N 6RH United Kingdom
Registrars: Equiniti Limited Aspect House Spencer Road Lancing West Sussex BN99 6DA United Kingdom
COMPANY
INFORMATION

25887 11 April 2018 10:34 AM Proof4 25887 11 April 2018 10:34 AM Proof 4
Time O
ut Group
plc A
nnual Rep
ort and A
ccounts for the year ended
31 Decem
ber 2017
Time Out Group plc | 77 Wicklow Street | London | WC1X 9JY | Tel: +44 (0) 207 813 3000
www.timeout.com