annual report - aspermont corporate · 1 2011 l annual report website registered office 613-619...
TRANSCRIPT

Your global print, online and conferencing solution
ANNUAL REPORT
ASX
: A
SP
www.aspermont.com

DirectorsAndrew Kent John Stark Lewis Cross Colm O’Brien David Nizol Charbel Nader
GroupChiefExecutiveOfficerColm O’Brien
ChiefFinancialOfficerandCompanySecretaryJohn Detwiler
ChiefExecutiveOfficer,AspermontUKDavid Nizol
GeneralManager,AustraliaTrish Seeney
GroupStrategyandConsultingMark Davies
Websitewww.aspermont.com
RegisteredOffice613-619 Wellington Street Perth WA 6000
SolicitorsWilliams and Hughes Level 1, 25 Richardson Street West Perth WA 6005
AuditorsBDO Audit (WA) Pty Ltd 38 Station Street, Subiaco WA 6008
ShareRegistryAdvanced Share Registry Services 150 Stirling Hwy, Nedlands WA 6009
BankersANZ Banking Group Limited 7/77 St Georges Terrace, Perth WA 6000
Chairman’s Review 01
Board of Directors 02
Financial Highlights 04
Group CEO’s Report 05
Year in Review 04
UK Report 07
Australia Report 09
Company Profile 10
Channels and Services 12
Outlook for 2011-12 14
Directors’ Report 17
Corporate Governance Report 28
Auditor’s Independence Declaration 30
Financial Statements 31
Notes to the Financial Statements 35
Directors’ Declaration 78
Independent Auditor’s Report 79
Additional Information 81
Notes 83
COntEntSASX:ASP

1
201
1 l
Annu
al R
epor
tWebsitewww.aspermont.com
Registered Office613-619 Wellington Street Perth WA 6000
SolicitorsWilliams and Hughes Level 1, 25 Richardson Street West Perth WA 6005
AuditorsBDO Audit (WA) Pty Ltd 38 Station Street, Subiaco WA 6008
Share RegistryAdvanced Share Registry Services 150 Stirling Hwy, Nedlands WA 6009
BankersANZ Banking Group Limited 7/77 St Georges Terrace, Perth WA 6000
Chairman’s Review 01
Board of Directors 02
Financial Highlights 04
Group CEO’s Report 05
Year in Review 04
UK Report 07
Australia Report 09
Company Profile 10
Channels and Services 12
Outlook for 2011-12 14
Directors’ Report 17
Corporate Governance Report 28
Auditor’s Independence Declaration 30
Financial Statements 31
Notes to the Financial Statements 35
Directors’ Declaration 78
Independent Auditor’s Report 79
Additional Information 81
Notes 83
chAiRmAn’S RevieW
Dear Shareholders,
Thank you for your kind support of Aspermont Limited, its board and management.
Aspermont has, in spite of significant general global trauma, enjoyed a highly productive 2010-2011.
Your board is of the view that Aspermont’s management executed our financial plan efficiently and with a considerable amount of tangible success.
This has permitted our company to produce sound organic revenue growth, improved margins and expanded profitability; and enabled us to establish the right platform for the delivery of greater sustained depth, breadth, and advancement from new products and acquisitions during the past year.
Brand development and brand acquisition saw the Mines and Money conference series find deeper footings in Hong Kong, China, the UK and Australia, while improving finances facilitated the 100 per cent acquisition of Kondinin Group, an icon in the Australian agricultural sector.
Joint ventures also continue to prove the value of working with best of breed.
Year-end group profits and cashflow have exceeded any of our past peaks. Cash at bank was circa 40 per cent of the residual bank debt and Aspermont’s debt/EBITA ratio drifted below x2s as it continues to degear for future opportunities.
The outlook for Aspermont during 2011/12 is to enjoy continued improvement, though this will be tempered with caution largely due to the lack of confidence in Pan European/Pan North American banks and politics, as well as a clear inability for developed countries to grasp the current and future blue collar unemployment bulge generated through the continued success of globalization.
Under such circumstances, it is little wonder that revered, classical and well diversified media giants search to combat falling revenue, audiences and margins in the face of rising tech publishing competition from the likes of Google.
During these times, Aspermont Limited looks to its executives and management to agree and execute its vision.
In closing, I take this opportunity to thank Aspermont’s non-executive board members and its professionals for being always visible, resourceful, hardworking and invariably available.
Yours sincerely,
Andrew Kent Executive Chairman Aspermont Limited
1
201
1 l
Annu
al R
epor
t

2
201
1 l
Annu
al R
epor
t
Andrew Kent l Chairman and ExecutiveDirector
Mr Andrew Kent, chairman and executive director, is an experienced business manager and corporate advisor with more than 30 years of experience in international equities and media. Mr Kent was the CEO of Aspermont Limited from 2000 to 2005 and holds considerable knowledge of its products and the market landscape. Mr Kent holds directorships in Magyar Mining Ltd, Water Resources Group Ltd, New Guinea Energy Ltd and Excalibur Mining Ltd. He is a member of the Australian Institute of Company Directors.
Lewis Cross l Non-Executive Director
Mr Lewis Cross, an independent non-executive Director, is the former principal of accounting firm CrossCorp Accounting. A board member since 2000, Mr Cross is also Executive Chairman of White Canyon Uranium Ltd and Non-Executive Chairman of Golden State Resources Ltd. He is chairman of Aspermont’s Audit and Risk Committee.
John Stark l Non-Executive Director
Mr John Stark, a non-executive director, is an experienced business manager with interests across various listed and unlisted companies. Mr Stark has been a board member since 2000 and is chairman of Aspermont’s Remuneration Committee.
Colm O’Brien l Executive Director
Mr Colm O’Brien has in-depth management consulting and banking experience through his previous roles and has held the position of Group CEO of Aspermont since October, 2005. Mr O’Brien currently sits on the Board of Directors for Publishers Australia, Magyar Mining and WME Media Pty Ltd. He joined the Aspermont Board in January, 2010.
David Nizol l Executive Director
Mr David Nizol has a wealth of publishing experience and has held senior executive positions and directorships in both public and private companies, including EMAP UK and Highbury House Communications Ltd. Joining the board in January 2010, Mr Nizol is CEO of Aspermont UK.
Structure of the BoardThe Board currently comprises six members. Board members possess a broad range of industry experience and business skills to appropriately govern the interests of our shareholders.The Board continues to actively guide the ongoing growth strategy of the Company. The Board actively involves, as appropriate, expert and independent advice on matters reserved for the Remuneration and Audit & Risk Committees.
BOArD Of DireCtOrS

3
201
1 l
Annu
al R
epor
t
Charbel Nader l Non-Executive Director
Mr Charbel Nader has extensive experience in corporate finance and strategic advisory roles. Joining the Board as a non-executive director in January, 2010, Mr Nader has a broad range of experience in the information, communications and media industries, having been a group executive with Village Roadshow Ltd, News Corp subsidiary e-Ventures, Ernst & Young and having been retained in-house by PBL/Nine Network and CPH Capital.
John Detwiler l Company Secretary
Mr Detwiler is a Certified Practising Accountant with more than 25 years of financial and corporate accounting experience at private and listed international companies. Joining Aspermont as Company Secretary and Chief Financial Officer in June, 2010, Mr Detwiler brings strong operational and strategic skills to the company.

Financial highlights
4
201
1 l
Annu
al R
epor
t
summary oF resultsmedia Business A$’000Revenue Up 19% 24,980EBITDA Up 390% 3,429
investment Portfolio A$’000
Change in fair value of investments Loss (2,277)
Realised gains on investments Gain 616
aspermont limited consolidated A$’000Revenue Up 19% 24,980Net profit attributable to equity holders of the parent entity
Down 85% 163
Dividends/distributionsAmount per security Franked amount
per securityFinal dividend N/A N/AInterim dividend N/A N/A
The results should be read in conjunction with details provided within this report.
Operating Revenue ($000)
(484)Reported
3,113Normalised*
0 1000 2000 3000 4000 5000 6000 7000 80000 5000 10000 15000 20000 25000
22,967
24,729
19,263
13,970
9,226
2010
24,9802011
2009
2008
2007
2006
879
4,222
2,806
1,145
1,611Reported
4,740Normalised*
0 500 1000 1500 2000 2500 3000 3500
1,076
2,345
1,966
1,358
2010
3,4292011
2009
2008
2007
2006
2010
1632011
2009
2008
2007
2006
0 1000020000300004000050000600007000080000
33,139
56,513
79,336
77,728
22,827
2010
18,8802011
2009
2008
2007
2006
Market Capitalisation ($000)
EBITDA ($000)
Net Profit After Tax ($000)
5
201
1 l
Annu
al R
epor
t
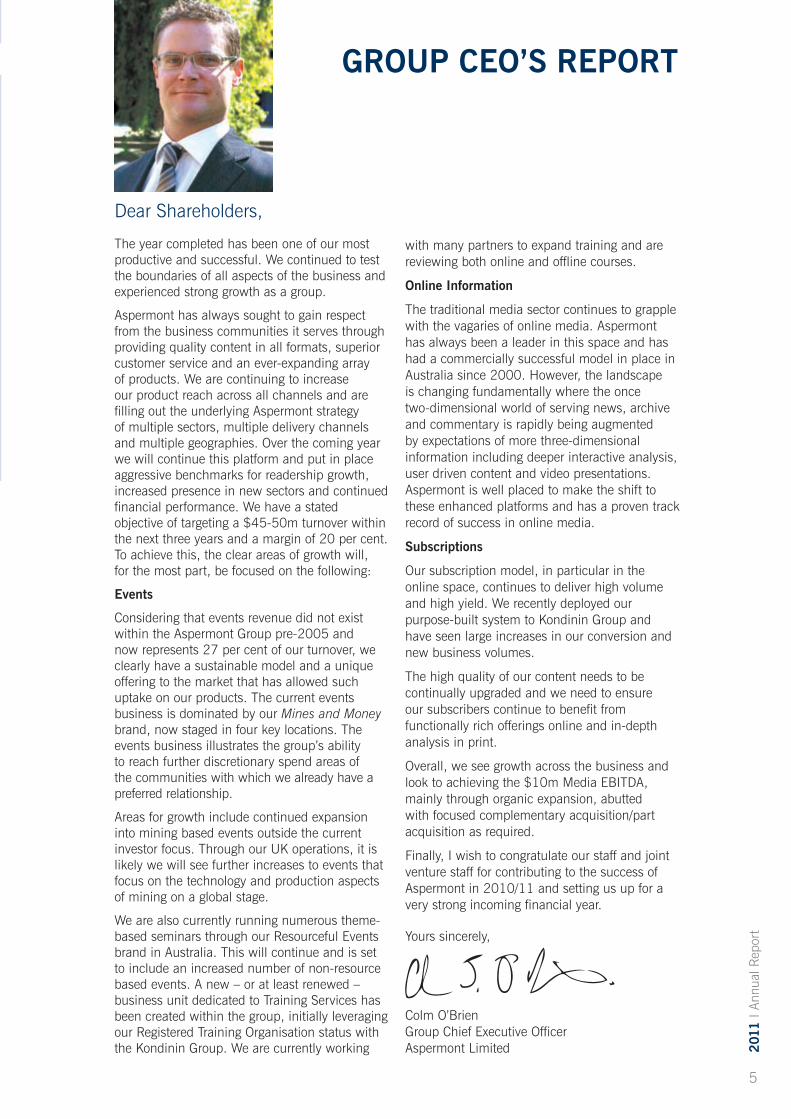
Dear Shareholders,
The year completed has been one of our most productive and successful. We continued to test the boundaries of all aspects of the business and experienced strong growth as a group.
Aspermont has always sought to gain respect from the business communities it serves through providing quality content in all formats, superior customer service and an ever-expanding array of products. We are continuing to increase our product reach across all channels and are filling out the underlying Aspermont strategy of multiple sectors, multiple delivery channels and multiple geographies. Over the coming year we will continue this platform and put in place aggressive benchmarks for readership growth, increased presence in new sectors and continued financial performance. We have a stated objective of targeting a $45-50m turnover within the next three years and a margin of 20 per cent. To achieve this, the clear areas of growth will, for the most part, be focused on the following:
Events
Considering that events revenue did not exist within the Aspermont Group pre-2005 and now represents 27 per cent of our turnover, we clearly have a sustainable model and a unique offering to the market that has allowed such uptake on our products. The current events business is dominated by our Mines and Money brand, now staged in four key locations. The events business illustrates the group’s ability to reach further discretionary spend areas of the communities with which we already have a preferred relationship.
Areas for growth include continued expansion into mining based events outside the current investor focus. Through our UK operations, it is likely we will see further increases to events that focus on the technology and production aspects of mining on a global stage.
We are also currently running numerous theme-based seminars through our Resourceful Events brand in Australia. This will continue and is set to include an increased number of non-resource based events. A new – or at least renewed – business unit dedicated to Training Services has been created within the group, initially leveraging our Registered Training Organisation status with the Kondinin Group. We are currently working
with many partners to expand training and are reviewing both online and offline courses.
Online Information
The traditional media sector continues to grapple with the vagaries of online media. Aspermont has always been a leader in this space and has had a commercially successful model in place in Australia since 2000. However, the landscape is changing fundamentally where the once two-dimensional world of serving news, archive and commentary is rapidly being augmented by expectations of more three-dimensional information including deeper interactive analysis, user driven content and video presentations. Aspermont is well placed to make the shift to these enhanced platforms and has a proven track record of success in online media.
Subscriptions
Our subscription model, in particular in the online space, continues to deliver high volume and high yield. We recently deployed our purpose-built system to Kondinin Group and have seen large increases in our conversion and new business volumes.
The high quality of our content needs to be continually upgraded and we need to ensure our subscribers continue to benefit from functionally rich offerings online and in-depth analysis in print.
Overall, we see growth across the business and look to achieving the $10m Media EBITDA, mainly through organic expansion, abutted with focused complementary acquisition/part acquisition as required.
Finally, I wish to congratulate our staff and joint venture staff for contributing to the success of Aspermont in 2010/11 and setting us up for a very strong incoming financial year.
Yours sincerely,
Colm O’Brien Group Chief Executive Officer Aspermont Limited
grOup cEO’S rEpOrt

EBITDA from Media Businessof $A3.4m (2010: $A0.9m)
Further bank debt reduction of $A1.625min the year to $A5.875m
Increase in cash at hand from $A0.77m in June 2010 to $A2.72m in June 2011
Growth across all mediachannels and geographies
Australia’s Mining Monthly
journalists receive national accolades
with Brooke Showers and Sam Jordan Jones winning
Association of Mining and Exploration Companies (AMEC)
awards for print journalism
year in review
Acquisition of
Kondinin Group– Australia’s leading agricultural information business
New joint venture with JobServecreates recruitment channel for the oil & gas sector
6
201
1 l
Annu
al R
epor
t
Major expansion of
Mines & Moneyconferences delivered largest contribution growth with record attendance at the Hong Kong event

7
201
1 l
Annu
al R
epor
t
UK report
Dear Fellow Shareholders,
And so, another year in the evolution of the Group finishes.
Another year of consolidation, growth, focus, investment – and success.
Revenues in London were up £949k (16.9 per cent) on budget, but more significantly, £1,490k, almost 30 per cent ahead of 2009/10.
Advertisement revenue was 12 per cent up on the previous year, circulation revenue up 6 per cent, and conference/events revenue, at £3,236k, was up 56 per cent and for the first time exceeded on-page advertisement monies.
Costs remained under tight control. Like for like, they were up £362.7k (6 per cent) on last year.
EBITDA at £2,258k was £1,100k better than last year and £946k ahead of budget – an increase of close to 100 per cent.
As a result, margin increased from 22.9 per cent in 2009/10 to 34.5 per cent.
Investment took place on a number of fronts.
Phase Three of our Web development program, an increase of over 3,000 copies for the BPA audited Mining Magazine (to specifically enlarge our footprint in North America) and the Events database all received investment.
Healthy operating profit contributions were made by the Mining Journal, Mining Magazine and WTTW magazines, and our conferencesin London and Hong Kong were outstanding. In addition, Mines and Money Beijing grew by50 per cent year on year.
2011/12 brings its own challenges and opportunities.
Newsprint costs are rising, postage costs have taken a huge hike, and we are planning further circulation increases to Mining Journal, Mining Magazine and WTTW.
There is also much development work planned with the group’s online mining portal, and additional headcount is required to further enhance our data management systems and to move a step further towards 24-hour news reporting.
Our partnership with Beacon Events grows from strength to strength, with Mines and Money Hong Kong 2012 looking to be the biggest event we have ever staged.
Also, the Mongolian Investment Summit in the autumn promises to break new ground and the former EME Sydney moves to the Sydney Convention Centre, and becomes the bigger and better Mines and Money Australia.
Other alliances are being progressed.
Forward bookings for on-page, on-line and conferencing/events – Mines and Money London in December 2011 is already sold out – are extremely positive.
The new financial year has started very well.
Yours sincerely,
David Nizol Chief Executive Officer Aspermont UK

8
201
1 l
Annu
al R
epor
t
Newsroom

9
201
1 l
Annu
al R
epor
t
australian report
Dear Shareholders,
The 2011 year was one of growth and opportunity with a strong focus on the improvement of print and online products, and the development of new product offerings.Changes made to reduce costs during the downturn were reviewed and investments were made in editorial and sales resources to position us strongly to take advantage of the improving market.
Strong revenue growth was achieved with 27 per cent growth year on year in Australia (excluding Kondinin Group). This was made up of 28 per cent growth in print, 29 per cent growth online and subscription growth of 24 per cent.
Cost management remains an important part of daily operations and our EBITDA margin increased from 11.71 per cent in 2009-2010 to 26.4 per cent in 2010-2011 in Australia (excluding Kondinin).
During the year, we renamed our oil and gas website from PetroleumNews.net to EnergyNewsBulletin.net and added a premium offering, EnergyNewsPremium.net. This change has enabled us to more comprehensively cover this diverse industry.
RESOURCESTOCKS, our investment publication, produced an additional issue in the last quarter and has returned to nine editions in 2011/2012. Our attention also turned to PNG with the launch of PNG Report, a bi-monthly magazine, and the relaunch of our PNGIndustryNews.net website.
The growth in subscription revenue in Australia (excluding Kondinin) of 24 per cent over the previous year reflects the full year impact of our subscriptions system ASMA, a stable sales team and the growing demand for B2B information across our sectors.
The acquisition of Kondinin in January 2011 and its integration into our operation in Wellington Street was one of the major highlights of the year. The experience and resources Aspermont can bring to the future development and growth of this Australian agricultural information icon and its potential over time to deliver strongly to our turnover and profit is starting to be felt in the first quarter of 2011/2012.
The team at Aspermont Australia have delivered record revenue results and above budget profits in the first quarter of the current financial year and we have the people and the products to continue to deliver sound results.
Yours sincerely,
Trish Seeney General Manager Aspermont Australia

10
201
1 l
Annu
al R
epor
t
Aspermont Presence (Products or Offices)

11
201
1 l
Annu
al R
epor
t
Aspermont Limited is a global provider of integrated media solutions for the Business to Business (B2B) and Business to Consumer (B2C) markets, delivered through print, online and conference channels.
These are accompanied by a suite of value-added services, including industry-specific search engines, archives and directories, graphic design capability and customised marketing and research services.
Aspermont is dedicated to providing readers with objective, analytical news and information, while offering advertising clients end-to-end, targeted marketing solutions. Our clients include decision-makers and high-income individuals across a diverse range of markets and industry sectors, including:
– Mining – Oil and gas – Construction – Agriculture – Finance – Investment – Superannuation – Environment – Lifestyle
The group has a significant global presence, directly employing circa 120 people across offices in Australia, the UK and America. Aspermont continues to expand its business and look for growth opportunities across both industries and geographies.
Recent research has suggested that consumers rely on print media for awareness of products and services, research online using trustworthy sources and purchase face to face.
This concept is core to Aspermont’s strategy. Our ability to bundle these products for advertisers and readers ensures we remain unique in our product offering and continue to see revenue growth in all channels.
Marketing Services
EventsOnline
Integrated Multi-Media B2B and B2C Proposition
Consumers rely on print media for awareness of products and services, research online using trustworthy sources and purchase face to face.
company profile
Mines and Money is Aspermont’s leading conference brand. Currently held annually in Beijing, Hong Kong and London, the events attract a large international audience of mining and exploration companies, financiers, investors and industry service providers.

12
201
1 l
Annu
al R
epor
t
Print Online
Aspermont produces 13 online news and search services, delivering
an average of two million email bulletins
direct to readers’ desktops every month.
Aspermont produces 17 print publications and guides, distributing more than
165,000 issues
energynewspremium.net
kondiningroup.com.au
on average
per month

13
201
1 l
Annu
al R
epor
t
PrintAspermont produces 14 print publications, distributing an average of 165,000 issues per month. Our print products provide comprehensive and up-to-date information, reviews and surveys.
Our established products, including Mining Journal, Australia’s Mining Monthly and RESOURCESTOCKS, are acknowledged as leaders in their sectors and have provided a unique platform for the launch of new publications and events.
The company continues to grow its print revenue by adding maps, supplements, directories and CDs to its existing range.
Suppliers GuidesAspermont also prints four annual Suppliers Guides for the mining, coal, oil and gas and construction industries. As valuable industry reference tools, the Suppliers Guides also offer a cost-effective advertising opportunity.
OnlineAspermont produces 10 online news services, delivering an average of two million email bulletins direct to readers’ desktops every month.
The services are renowned for their news presentation, quality and scope of reporting.
Aspermont’s online business has experienced strong growth, due to increased demand for timely and relevant information, as well as growing recognition among advertisers of the power of online advertising.
Industry Specific Search EnginesIn addition, Aspermont has a suite of vertical search engines that correlate directly with its key industry sectors: SearchMining.net, SearchPetroleum.net and SearchConstruction.net.
The engines offer users fast and accurate industry search analyses, while connecting advertisers with a highly targeted and captive online audience.
Conferencing Aspermont runs a broad range of events that continue to strengthen across all regions of operation. Mines and Money, Aspermont’s leading conference brand, brings together a large international audience of mining and exploration companies, financiers, investors and industry service providers. Due to the success of the London, Hong Kong and Beijing events, the inaugural Mines and Money Australia took place in Sydney in October 2011. The Mongolia Investment Summit in Hong Kong continues to build in popularity, bringing together international investors and the companies behind Mongolian-based projects.
The annual Mining Magazine Congress is a two-day conference held at different locations around the world each year. In 2011 it moves to Johannesburg, South Africa. The 20:20 Investor Series brings industry and investors together with each event providing a focus on specific commodities or regions. Given the success of the Sydney-based events, plans are afoot to expand these events to other key locations in Australia and/or abroad.
The annual GeoDrilling Show, held since 2005 in the UK, showcases key equipment, services and technology for the ground drilling, geotechnical, piling and geothermal industries. Aspermont’s Resourceful Events division continues to increase the number of events being staged across a broad range of subject areas, industry sectors and locations around Australia. An aggressive schedule is planned through 2011-12.
channels and services

14
201
1 l
Annu
al R
epor
t
Pablo Martin
Event Sales Director – UK
The events portfolio continues to grow all around with existing events increasing revenues and profits substantially and further new events coming on stream. Forward bookings are excellent with Mines and Money London and Hong Kong the stand out performers. The new Australian event has also produced a solid start in a competitive market. We expect continued growth and further reach and presence in the market place as we look to consolidate our healthy position.
Kathy Zdanowicz
National Sales Manager – Australia
The ongoing focus on building a stable and experienced sales team, as well as new partners, products and technologies, means significant opportunities for advertising over the next 12 months. New print and online offerings and the ability to publish to mobile and tablet devices means we look forward to developing more enhanced packages to benefit our clients.
Mark Davies
Group Strategy & Consulting
Continuing last year’s focus on development of new products and services, we can fully leverage our position as a trusted and respected provider of relevant news and information to our various communities. The development and ultimate expansion of our training capability is one such example. This ongoing creation of increased value-add options to our clients will provide the group with the potential to access an even greater slice of available discretionary spend.

15
201
1 l
Annu
al R
epor
t
Gareth Hector
Advertising, Subscriptions and Circulation Director – UK
2011/12 looks strong, with greater advertiser participation ensuring average order values continue to increase year on year. Our focus will be on improving the quality of our controlled circulation titles in order to increase advertising market shares whilst the paid subscription outlook remains positive.
James O’Hagan
Subscriptions Manager – Australia
Continuing on from last year’s new business growth, the subscriptions team has had a strong start to the financial year. Through a focus on dedicated team work, improved commission team structures, plus an increase in staff numbers, we are well positioned to continue increasing circulation in Australia and worldwide. We also continue to improve our retention figures through a focus on providing exceptional levels of customer service to our clients.
Simon Shepherdson
Marketing Manager – Australia
The planned growth and change through 2011/12 necessitates further refinement of our marketing strategy to ensure we approach all activities with a holistic view. High priorities include cross promoting our print, online and conferencing solutions and looking for efficient marketing channels to build readership, subscriptions and advertising sales opportunities. Building and diversifying skills in the marketing team, revitalising Aspermont Marketing Services and a continued push to develop strategic partnerships are on the agenda.
Chris Hinde
Editorial Director – UK
The London-based editorial department, managed through Aspermont UK, is planning a major expansion in its delivery of mining news early in 2012. This will include an around-the-clock (24/7) breaking-news service on a redesigned website. The enhanced content will come from an expanded Mining Journal team, with new editorial staff in Vancouver and Perth. There are also plans to extend the fully searchable Mining Journal archive.
Ron Berryman
Managing Editor – Australia
The Australian editorial department is looking to consolidate existing services and continue the expansion and development of online and print products over the next year. This includes the launch of a North American edition of InternationalLongwallNews with increased emphasis on international news; an increasing focus on South East Asian news with EnergyNewsBulletin.net; creating a greater differentiation in content and quality between us and our competitors; and a continued push with RESOURCESTOCKS into key global markets.
Alex Kent
Group Head – Online Strategy
The year ahead promises to be one of high productivity and innovation for the group’s online business. New product launches, existing product renovations and the extension of our complimentary services will help set a strong framework for audience build, engagement and continued monetisation. Augmenting our existing strengths with a broadening platform base will enable our users to access, interact and consume our products in faster, easier and more diverse ways. For our advertisers, developing behavioural statistics and improved campaign measurability will enable us to more tangibly show the positive ROIs of advertising through our channels.
OUTLOOK FOR 2011-12

16
201
1 l
Annu
al R
epor
t
Fresh start For rural icon
Paul MoleManaging Editor
Acquired by Aspermont in early 2011, Kondinin Group has made the swift transition from not-for-profit to commercial enterprise. With a new focus, new staff and new ideas, the business is well placed to take advantage of a booming rural sector driven by global demand for Australian farm products.
Founded in 1955 in Kondinin, Western Australia, the group has forged its reputation as an industry leader in agricultural publishing and key provider of technical extension information. In addition to working closely with Australia’s primary producers, Kondinin Group has strong alliances with a wide range of stakeholder organisations across government, private industry, research bodies and grower groups.
With a fiercely guarded reputation for independent research, the group has undergone swift change since acquisition, including a beefed-up engineering/research team which has embarked on an ambitious 2011-12 research program.
Expanded advertising and membership sales departments are already delivering tangible benefits including membership growth and increased revenue. There has also been a major push with the company’s contract publishing arm to key government and non-government clients, with several major projects already underway.
Kondinin Group also hosts the Australian Farmer of the Year Awards each September. The event showcases the best and brightest in farming and attracts significant industry backing. In only its second year, the event has gained a reputation as Australia’s leading accolade for agricultural excellence and become the premier social event on the rural calendar.
Throughout 2011-12 and beyond, Kondinin Group will continue to develop its stable of print products, including its flagship magazine Farming Ahead, as well as its online platform to ensure the business consolidates its market position and continues to grow.
17
201
1 l
Annu
al R
epor
t
Directors’ report For the year ending 30 June 2011 l Aspermont Limited ACN 000 375 048 & Controlled Entities
Your directors present their report on the consolidated entity (referred to hereafter as the Group) consisting of Aspermont Limited and the entities it controlled at the end of, or during, the year ended 30 June 2011.
DirectorsThe following persons were directors of Aspermont Limited during the financial year and up to the date of this report:
A.L. KentJ. StarkL.G. CrossC. O’BrienD. Nizol C. Nader
principal activitiesThe Group’s principal activities during the year were to develop and grow its various industry-leading mastheads through a combination of print, online and conference media channels.
operating resultsThe consolidated operating profit after tax was $0.163 million (2010: profit $1.076 million).
Dividends No dividend has been declared for the year (2010: no dividend).
review of operationsFiscal year 2010/11 has continued the positive trends seen in the previous year for the underlying media business. Overall revenue was up 19% on the previous year resulting in profit of $1.8 million in the current year versus a loss of $0.6 million in the previous year. The reported profit in the current year would be $0.3 million higher if we exclude the impairment and amortisation expenses associated with the acquisition of Kondinin.
The key growth areas continue to be the events and online aspects of the business. These remain high margin products and we have increased our offering to the market, particularly in the events space. The stable of print products continues to grow, notwithstanding market trends on the future of print products.
The investment portfolio on the other hand has seen a net loss of $1.5 million in the current year versus a net gain of $2.1 million in the previous year. This decline is unrealised and is the result of recent declines in the equity markets across the world.
We have further reduced our primary bank debt year on year from $7.5 million to $5.9 million in line with a planned debt reduction program implemented last year. This debt reduction will continue through FY2011/12 as we have principal payments of $1.25 million in the upcoming fiscal year.
The strong Australian dollar has had a significant negative impact on our key figures, given that circa 50% of our operations are based in the UK; therefore any eventual strengthening of Sterling will have an immediate positive impact.

For the year ending 30 June 2011 l Aspermont Limited ACN 000 375 048 & Controlled Entities
Directors’ report
18
201
1 l
Annu
al R
epor
t
significant changes in the state of affairsThe significant changes in the state of affairs of the Group during the financial year are outlined in the preceding review of operations.
Matters subsequent to the end of the financial yearSee note 24 of the Financial Report regarding events subsequent to 30 June 2011. No other matter or circumstance has arisen since 30 June 2011 that has significantly affected, or may significantly affect:
(a) The Group’s operations in future financial years, or(b) The result of those operations in future financial years, or(c) The Group’s state of affairs in future financial years.
Likely developments and expected results of operationsFurther information on likely developments in the operations of the Group and the expected results of operations have not been included in this annual financial report because the directors believe it would be likely to result in unreasonable prejudice to the Group.
environmental regulationsEnvironmental regulations do not have any impact on the Group, and the Group is not required to report under the National Greenhouse and Energy Reporting Act 2007.
information on directorsA.L. Kent AAicD chairman and executive director. Age 64Experience and expertiseMr. Kent is an experienced business manager and corporate advisor with over 30 years of experience in international equities and media. Mr. Kent was the CEO of Aspermont Limited from 2000 to 2005 and holds considerable knowledge of its products and the market landscape. Mr. Kent joined the Board in 1998.Other current directorshipsMr. Kent holds directorships in Magyar Mining Ltd (since 2008), Water Resources Group Ltd (since 2007), New Guinea Energy Ltd (since 2009) and Excalibur Mining Ltd (since 2009). Mr. Kent is a member of the Australian Institute of Company Directors.Former directorships in last 3 yearsNoneSpecial responsibilitiesChairman of the BoardInterest in shares and options116,925,000 ordinary shares in Aspermont Limited
J. stark AAicD Non-executive director. Age 65Experience and expertiseMr. Stark is an experienced business manager with experience and interests across various listed and unlisted companies. Mr. Stark has been a member of the Board since 2000.Other current directorshipsNoneFormer directorships in last 3 yearsNoneSpecial responsibilitiesChairman of Remuneration CommitteeInterest in shares and options24,695,000 ordinary shares in Aspermont Limited

201
1 l
Annu
al R
epor
t
19
L.G. cross B.com, cpA, FAicD Non-executive director. Age 63Experience and expertiseMr. Cross was the former principal of the accounting firm CrossCorp Accounting from 1979 to 2009. Mr. Cross has been a member of the Board since 2000.Other current directorshipsExecutive Chairman of White Canyon Uranium Ltd (since 2007)Non-Executive Chairman of Golden State Resources Ltd (since 2006)Special responsibilitiesChairman of Audit & Risk CommitteeMember of Remuneration CommitteeFormer directorships in last 3 yearsNon-Executive Chairman of Polaris Metals NL (resigned 2010)Interest in shares and options1,700,000 ordinary shares in Aspermont Limited
c. o’Brien BcL (Hons), AAicD executive director. Age 39 Experience and expertiseMr. O’Brien has in-depth management consulting and banking experience through previous roles, he has held the position of Group CEO since October 2005 and has a detailed knowledge of the products, strategy and media landscape. Mr. O’Brien joined the Board in January 2010.Other current directorshipsPublisher Australia (since 2009)Magyar Mining PlcWME Media Pty LtdSpecial responsibilitiesCEO – GroupMember of Remuneration CommitteeFormer directorships in last 3 yearsNoneInterest in shares and options1,575,417 ordinary shares in Aspermont Limited
D. Nizol, BA Business studies (Hons) executive director. Age 59 Experience and expertiseMr. Nizol has a wealth of publishing experience including holding senior executive positions and Directorships in both public and in private companies. Mr. Nizol joined the Board in January 2010.Other current directorshipsNoneSpecial responsibilitiesCEO – Aspermont UKFormer directorships in last 3 yearsNoneInterest in shares and options1,700,603 ordinary shares in Aspermont Limited
c. Nader B.com, M App Fin, cA Vice-chairman, Non-executive director. Age 42 Experience and expertiseMr. Nader has extensive experience in corporate finance and strategic advisory roles in various industries and is presently an Executive Vice President and co-founder of Nasdaq listed investment company Australia Acquisition Corp. Mr. Nader joined the Board in January 2010.Other current directorshipsNoneSpecial responsibilitiesMember of Audit & Risk CommitteeMember of Remuneration CommitteeFormer directorships in last 3 yearsNoneInterest in shares and optionsNone
The above directors have been in office since the start of the financial year to the date of this report unless otherwise stated.

For the year ending 30 June 2011 l Aspermont Limited ACN 000 375 048 & Controlled Entities
Directors’ report
20
201
1 l
Annu
al R
epor
t
company secretaryThe Company Secretary is Mr. J. Detwiler, B.Sc, CPA. Mr. Detwiler was appointed to the position of Company Secretary and Chief Financial Officer in June 2010, and has extensive financial management and corporate governance experience in prior roles.
Meetings of directorsThe number of meetings of the Company’s Board of Directors and of each Board committee held during the year ended 30 June 2011, and the number of meetings attended by each director were:
Full meetings of Directors
Meetings of committees
Audit & Risk Remuneration
A B A B A B
A Kent 6 6 ** ** ** **
J Stark 6 6 ** ** 2 2
L Cross 6 6 5 5 2 2
C O’Brien 6 6 ** ** 2 2
D Nizol 6 6 ** ** ** **
C Nader 5 6 5 5 1 2
In addition to the above, there were three meetings for directors that were independent with respect to related party matters and equity compensation for members of the board:
Committee Meetings of Directors
Meetings of committeesRelated Party Remuneration
A B A B A B
A Kent ** ** ** ** ** **
J Stark 1 1 ** ** 1 1
L Cross 3 3 2 2 1 1
C O’Brien 2 2 2 2 ** **
D Nizol 3 3 2 2 1 1
C Nader 2 2 2 2 ** **
A = Number of meetings attendedB = Number of meetings held during the time the director held office or was a member of the committee during the year** = Not a member of the relevant committee

201
1 l
Annu
al R
epor
t
21
remuneration report (Audited)The information provided in this remuneration report has been audited as required by section 308 (3C) of the Corporations Act 2001.
The remuneration report is set out under the following main headings:
A Principles used to determine the nature and amount of remunerationB Details of remunerationC Service agreementsD Share-based compensationE Additional information
A) Principles used to determine the nature and amount of remunerationThe objective of the Group’s executive reward framework is to ensure reward for performance is competitive and appropriate for the results delivered. The framework aligns executive reward with achievement of strategic objectives and the creation of value for shareholders, and conforms with market practice for delivery of reward. The Board ensures that executive reward satisfies the following criteria for good reward governance practices:
• competitiveness and reasonableness; • acceptability to shareholders;• performance linkage/ alignment of executive compensation;• transparency.
In consultation with external remuneration consultants, the Group has structured an executive remuneration framework that is market competitive and complementary to the reward strategy of the organisation.
Alignment to shareholders’ interests:
• has economic profit as a core component of plan design;• focuses on sustained growth in shareholder wealth, consisting of dividends and growth in share price, and
delivering constant return on assets as well as focusing the executive on key non-financial drivers of value;• attracts and retains high calibre executives.
Alignment to program participants’ interests:• rewards capability and experience;• reflects competitive reward for contribution to growth in shareholder wealth;• provides a clear structure for earning rewards;• provides a recognition for contribution.
The framework provides a mix of fixed and variable pay, and a blend of short and long-term incentives. As executives gain seniority within the Group, the balance of this mix shifts to a higher proportion of “at risk” rewards.
The Board has established a Remuneration Committee which provides advice on remuneration and incentive policies and practices, and specific recommendations on remuneration packages and other terms of employment for executive directors, other senior executives and non-executive directors.
Non-executive directorsFees and payments to non-executive directors reflect the demands which are made on, and the responsibilities of, the directors. Non-executive directors’ fees and payments are reviewed annually by the Board. The Board has also considered the advice of independent remuneration consultants to ensure non-executive directors’ fees and payments are appropriate and in line with the market. The Chair’s fees are determined independently to the fees of non-executive directors based on comparative roles in the external market. The Chair is not present at any discussions relating to the determination of his own remuneration.

For the year ending 30 June 2011 l Aspermont Limited ACN 000 375 048 & Controlled Entities
Directors’ report
22
201
1 l
Annu
al R
epor
t
Directors’ feesThe current base remuneration was reviewed in the current year and with effect from 1 July 2011 the directors’ fees are (inclusive of committee fees):
From 1 July 2011 From 1 July 2010 to 30 June 2011
Base FeesExecutive Chairman 200,000 136,000Non-executive Vice Chairman 100,000 -*Non-executive directors 45,000 26,000
* Director fees for Mr. Nader were $50,000 upon his appointment.
Executive payThe executive pay and reward framework has three components. The combination of these comprises an executive’s total remuneration.
Base PayThis is structured as a total employment cost package which may be delivered as a combination of cash and prescribed non-financial benefits at the executives’ discretion.
Executives are offered a competitive base pay that comprises the fixed component of pay and rewards. External remuneration consultants provide analysis and advice to ensure base pay is set to reflect the market for a comparable role. Base pay for executives is reviewed annually to ensure the executive’s pay is competitive with the market. An executive’s pay is also reviewed on promotion.
There are no guaranteed base pay increases in an executive’s contract.
BenefitsExecutives receive benefits including health insurance, car parking and allowance and financial planning services.
SuperannuationExecutives are paid the statutory contribution of 9%. Executives may elect to sacrifice base pay into superannuation at their discretion.
Short-term incentives (STI)The STI annual payment is reviewed annually against a combination of profit targets, strategic and operational objectives. Each executive STI is tailored to the achievement of objectives under that executive’s direct sphere of influence. The use of profit targets ensures variable reward is only available when value has been created for shareholders and when profit is consistent with the business plan. The annual bonus payments are approved by the Remuneration Committee.
The Company currently does not have a policy to limit “at risk” remuneration for executives.
Long-term incentivesLong-term incentives are provided to certain employees to incentivise long-term objectives and tenure.
B) Details of remuneration
Amounts of remunerationDetails of the remuneration of the directors, the key management personnel of the Group (as defined in AASB 124 Related Party Disclosures) and specified executives of Aspermont Limited and the Aspermont Limited Group are set out in the following tables.
The key management personnel of the Group, including the five highest paid executives, are the following:• Andrew Leslie Kent – Chairman and Executive Director• John Stark – Non-Executive Director• Lewis George Cross – Non-Executive Director• Charbel Nader – Non-Executive Director• Colm O’Brien – Chief Executive Officer (Group) and Executive Director• David Nizol – Chief Executive Officer (UK) and Executive Director• John Detwiler – Chief Financial Officer and Company Secretary• Trish Seeney – General Manager (Australia)
201
1 l
Annu
al R
epor
t
23
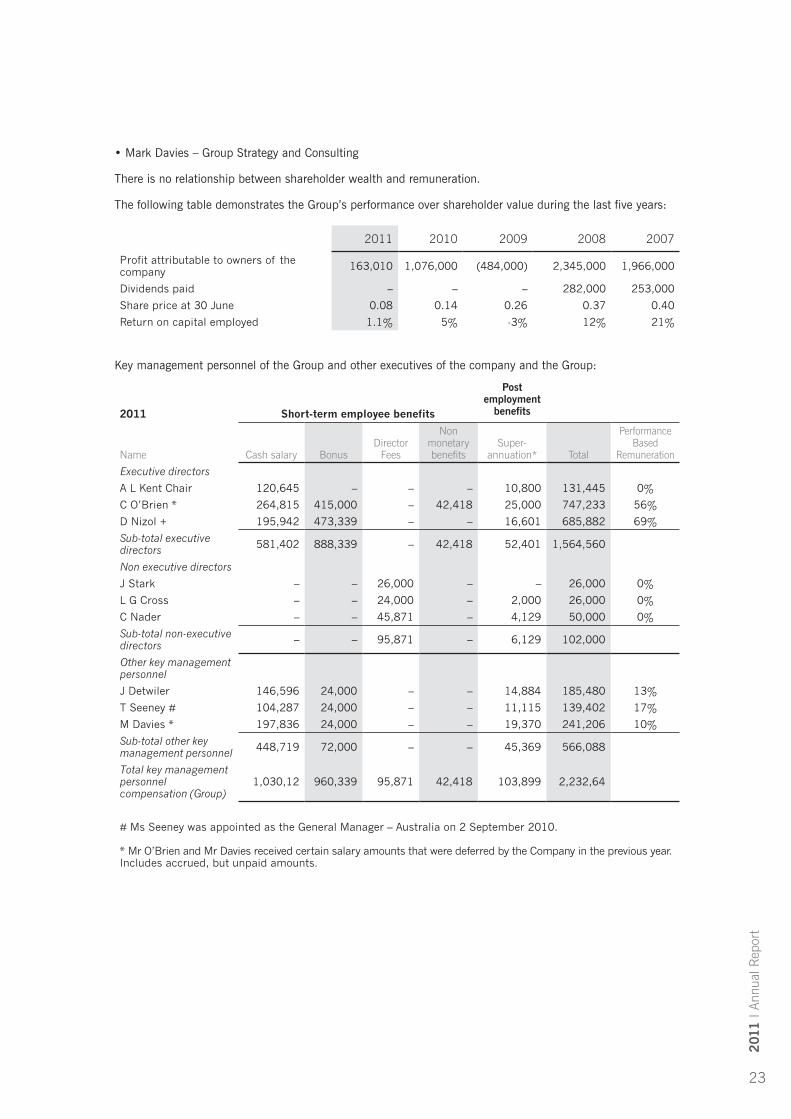
• Mark Davies – Group Strategy and Consulting
There is no relationship between shareholder wealth and remuneration.
The following table demonstrates the Group’s performance over shareholder value during the last five years:
2011 2010 2009 2008 2007
Profit attributable to owners of the company 163,010 1,076,000 (484,000) 2,345,000 1,966,000
Dividends paid – – – 282,000 253,000
Share price at 30 June 0.08 0.14 0.26 0.37 0.40
Return on capital employed 1.1% 5% -3% 12% 21%
Key management personnel of the Group and other executives of the company and the Group:
2011 Short-term employee benefits
post employment
benefits
Name Cash salary BonusDirector
Fees
Non monetary benefits
Super-annuation* Total
Performance Based
Remuneration
Executive directors
A L Kent Chair 120,645 – – – 10,800 131,445 0%
C O’Brien * 264,815 415,000 – 42,418 25,000 747,233 56%
D Nizol + 195,942 473,339 – – 16,601 685,882 69%
Sub-total executive directors 581,402 888,339 – 42,418 52,401 1,564,560
Non executive directors
J Stark – – 26,000 – – 26,000 0%
L G Cross – – 24,000 – 2,000 26,000 0%
C Nader – – 45,871 – 4,129 50,000 0%
Sub-total non-executive directors – – 95,871 – 6,129 102,000
Other key management personnel
J Detwiler 146,596 24,000 – – 14,884 185,480 13%
T Seeney # 104,287 24,000 – – 11,115 139,402 17%
M Davies * 197,836 24,000 – – 19,370 241,206 10%
Sub-total other key management personnel 448,719 72,000 – – 45,369 566,088
Total key management personnel compensation (Group)
1,030,12 960,339 95,871 42,418 103,899 2,232,64
# Ms Seeney was appointed as the General Manager – Australia on 2 September 2010.
* Mr O’Brien and Mr Davies received certain salary amounts that were deferred by the Company in the previous year.Includes accrued, but unpaid amounts.

For the year ending 30 June 2011 l Aspermont Limited ACN 000 375 048 & Controlled Entities
Directors’ report
24
201
1 l
Annu
al R
epor
t
2010 Short-term employee benefits
post employment
benefits
Name Cash salary BonusDirector
Fees
Non monetary benefits
Super-annuation Total
Performance Based
Remuneration
Executive directors
A L Kent Chair 120,727 – – – 10,800 131,527 0%
C O’Brien ** 178,922 – 18,958 49,069 16,336 263,286 0%
D Nizol ** + 213,683 220,611 20,833 – 21,368 476,495 45%
Sub-total executive directors 513,332 220,611 39,792 49,069 48,504 871,308
Non executive directors 0%
J Stark – – 24,000 – 2,160 26,160 0%
L G Cross – – 24,000 – 2,160 26,160 0%
C Nader ** – – 26,544 – 2,625 29,169 0%
Sub-total non-executive directors – – 74,544 – 6,945 81,489
Other key management personnel
H Thong * 258,329 – – 45,578 17,024 320,931 0%
J Detwiler ## 9,807 – – – 883 10,690 0%
C Bond 119,372 – – 32,140 12,150 163,662 0%
M Davies 159,786 – – – 13,810 173,596 0%
Sub-total other key management personnel 547,294 – – 77,718 43,867 668,879
Total key management personnel compensation (Group)
1,060,62 220,611 114,336 126,787 99,316 1,621,676
* Mr Thong resigned as Chief Financial Officer on 28 May 2010 and Company Secretary on 11 June 2010. The cash salary amount includes an accrued benefit of $95,505.
## Mr. Detwiler was appointed as Chief Financial Officer and Company Secretary on 27 May 2010 and 11 June 2010 respectively.
+ UK executive remuneration, paid in British Pounds, has been converted to Australian Dollars at the average exchange rate over the twelve months ending 30 June 2011 and 2010.
** Mr. O’Brien, Mr.Nizol and Mr. Nader were appointed Executive Director(s) and Non Executive Director, respectively, on 29 January 2010.
B) Details of remuneration (continued)

201
1 l
Annu
al R
epor
t
25
C) Service agreements
On appointment to the Board, all directors enter into a service agreement with the Company in the form of a letter of appointment. The letter summarises the Board policies and terms, including compensation, relevant to the office of the director.
Remuneration and other terms of employment for the Chief Executive Officer (Group) and other key management personnel are formalised and reviewed by the Remuneration Committee. Each of these agreements provides for the provision of performance-related cash bonuses, other benefits including certain expenses and allowances. For the year ended 29 January 2011, Mr. O’Brien and Mr. Nizol received board fees of $50,000 – these fees were discontinued as part of the current year’s remuneration review. Other major provisions of the agreements relating to remuneration are set out below.
All contracts with executives may be terminated early by either party with three months notice, subject to termination payments as detailed below.
c. o’Brien Chief Executive Officer (Group)
• Term of agreement – commencing 3 October 2005 and ending 2 October 2010 with a new contract in negotiation.
• Base salary, inclusive of superannuation and certain expenses, for the year ended 30 June 2011 of $265,000, increasing to $300,000 effective 1 July 2011. This amount to be reviewed annually by the remuneration committee.
• Payment of a benefit on early termination by the Company, other than for gross misconduct, equal to the base salary for the remaining term of the agreement.
D. Nizol Chief Executive Officer (UK)
• Term of agreement – ongoing, commencing 28 May 2008.
• Base salary, inclusive of pension contributions, for the year ending 30 June 2011 of GBP 110,000 (AUD $177,285), increasing to GBP 143,000 (AUD $216,700) effective 1 July 2011. This amount to be reviewed annually by the remuneration committee.
• Payment of a benefit on termination by the Company, other than for gross misconduct, equal to 6 months base salary.
J. Detwiler Chief Financial Officer & Company Secretary
• Term of agreement – ongoing, commencing 27 May 2010.
• Base salary, inclusive of superannuation and certain expenses, for the year ending 30 June 2011 of $168,500, increasing to $195,750 effective 1 July 2011. This amount to be reviewed annually by the remuneration committee.
• Payment of a benefit on termination by the Company, other than for gross misconduct, equal to 6 months base salary.
M. Davies Group Strategy and Consulting
• Term of agreement – ongoing, commencing 19 November 2007.
• Base salary, inclusive of superannuation and certain expenses, for the year ending 30 June 2011 of $201,840, increasing to $217,550 effective 1 July 2011. This amount to be reviewed annually by the remuneration committee.
• Payment of a benefit on termination by the Company, other than for gross misconduct, equal to 6 months base salary.
t. seeney General Manager
• Term of agreement – ongoing commencing 30 August 2010.
• Base salary, inclusive of superannuation and certain expenses, for the year ending 30 June 2011 of $146,700, increasing to $163,050 effective 1 July 2011. This amount to be reviewed annually by the remuneration committee.
• Payment of a benefit on early termination by the Company, other than for gross misconduct, equal to 6 months base salary.

For the year ending 30 June 2011 l Aspermont Limited ACN 000 375 048 & Controlled Entities
Directors’ report
26
201
1 l
Annu
al R
epor
t
D) Share-based compensation
OptionsNo options were granted or exercised in Aspermont Limited in 2010 and 2011.
OtherIn addition to the current year bonus for operational results, the remuneration committee has recommended a bonus of $311,000 to Mr. O’Brien, subject to shareholder approval, of which the after-tax amount of $166,385 will be applied by Mr. O’Brien to acquire 2 million shares of the Company at $0.083 per share (being the weighted average ASX market price for the 90 days preceding the remuneration committees meeting date). This amount has been accrued and included in the remuneration tables above.
E) Additional information
In the current year the remuneration committee approved annual bonus payments to Mr. O’Brien, Mr. Nizol, Mr. Davies, Mr. Detwiler and Ms. Seeney based on the financial and operational results achieved. Those bonus amounts have been accrued and included in the remuneration tables above.
In the previous year Mr. Nizol was paid a special performance-based bonus for the results of the integration of the UK business into the Group. No other bonuses were paid in 2010.
this is the end of the Audited remuneration report.
Loans to/from directors and executivesInformation on loans from directors and executives, including amounts, interest rates and repayment terms are set out in note 19 to the financial statements.
shares under optionThere are no unissued ordinary shares of Aspermont Limited under option at the date of this report.
insurance of officersDuring the financial year, Aspermont Limited paid a premium to insure the directors and officers of the Company and its Australian-based controlled entities.
The liabilities insured are legal costs that may be incurred in defending civil or criminal proceedings that may be brought against the officers in their capacity as officers of entities in the Group, and any other payments arising from liabilities incurred by the officers in connection with such proceedings. Not included are such liabilities that arise from conduct involving a wilful breach of duty by the officers or the improper use by the officers of their position or of information to gain advantage for themselves or someone else to cause detriment to the Company. It is not possible to apportion the premium between amounts relating to the insurance against legal costs and those relating to other liabilities.
indemnity of auditorsThe Company has not, during or since the end of the financial year, given an indemnity or entered into an agreement to indemnify, or paid insurance premiums in respect of the auditors of the Group.
proceedings on behalf of the companyNo person has applied to the Court under section 237 of the Corporations Act 2001 for leave to bring proceedings on behalf of the Company, or to intervene in any proceedings to which the Company is a party, for the purpose of taking responsibility on behalf of the Company for all or part of those proceedings.
No proceedings have been brought or intervened in on behalf of the Company with leave of the Court under section 237 of the Corporations Act 2001.

201
1 l
Annu
al R
epor
t
27
Non-audit servicesThe Company may decide to employ the auditor on assignments additional to their statutory audit duties where the auditor’s expertise and experience with the Company and/or the Group are important.
The Board of Directors has considered the position and, in accordance with advice received from the audit committee, is satisfied that the provision of the non-audit services is compatible with the general standard of independence for auditors imposed by the Corporations Act 2001.
The directors are satisfied that the provision of non-audit services by the auditor, as set out below, did not compromise the auditor independence requirements of the Corporations Act 2001 for the following reasons:
• All non-audit services have been reviewed by the audit committee to ensure they do not impact the impartiality and objectivity of the auditor.
• None of the services undermine the general principles relating to auditor independence as set out on APES 110 Code of Ethics for Professional Accountants.
During the year the following fees were paid or payable for non-audit services provided by the auditor of the parent entity, its related practices and non-related audit firms:
2011 2010$ $
Non-assurance servicesTax compliance – BDO UK 6,346 6,814
Tax advisory – BDO Corporate Tax (WA) Pty Ltd 22,715 0
Total non-assurance remuneration 29,061 6,814
Auditor’s independence declarationA copy of the auditor’s independence declaration as required under section 307C of the Corporations Act 2001 is set out on page 21.
This report of the directors incorporating the remuneration report is made in accordance with a resolution of the Board of Directors.
C. O’Brien Director
Perth 31 August 2011

28
201
1 l
Annu
al R
epor
tCorporate GovernanCe reportFor the year ending 30 June 2011 l Aspermont Limited ACN 000 375 048 & Controlled Entities
Corporate Governance
The primary role of the Aspermont Board (“Board”) is the protection and enhancement of long-term shareholder value. The Board is accountable to shareholders for the performance of the company. It directs and monitors the business and affairs of the company on behalf of shareholders and is responsible for the company’s overall corporate governance.
The company is committed to a governance framework using the Australian Securities Exchange’s (ASX) “Principles of Good Governance and Best Practice Recommendations”. Full details regarding the company’s corporate governance framework can be obtained from the corporate website at www.aspermont.com.
The company has complied with all the best practice recommendations of the ASX Corporate Governance Council for the year ended 30 June 2011 unless otherwise disclosed below:
a company should lay solid foundations for management and oversight
The company has developed a Board charter that determines the functions reserved for the Board and those delegated to executive management. The Board charter includes executive appointments, strategic direction, monitoring performance, risk management, approval of business plans and budgets and any other matter impacting business direction and shareholder interests.
Executive responsibilities are clearly defined through job descriptions, delegated authority guidelines and monitored through regular performance appraisals.
a company should structure the board to add value
The departures from ASX recommendations are:
i. Principle 2.1 Two of the six directors are considered to be independent.ii. Principle 2.2 Chairman is not an independent director.
Only a minority of the Board is independent. Both Mr. L.G. Cross and Mr. C. Nader are financially oriented, experienced independent company directors.
Mr. A.L. Kent and Mr. J. Stark have material interests in the company as shareholders. Both Mr. Kent and Mr. Stark have considerable industry and commercial experience and continue to provide guidance to the company’s strategic direction. The Chairman, Mr. Kent, is the company’s largest shareholder. Mr. Kent was the Chief Executive Officer of the company from 2000 to 2005 and has considerable knowledge of the company’s operations and products.
Mr. C. O’Brien and Mr. D. Nizol are the CEO Group and CEO Aspermont United Kingdom, respectively, and are Executive Directors of the Company. They bring day to day experience of managing the company’s Australian and United Kingdom operations to the Board.
The Board charter provides appropriate parameters to all board members on the scope and performance of their duties as custodians of shareholder interests. The Board is supported by the Remuneration Committee and Audit & Risk Committee which both support the Board in the discharge of Board responsibilities in specialist areas and whose respective committee charters allow for a high degree of external consultative involvement from independent advisors.
The directors have full access to the regular financial reports and budgets of the company. All members have unrestricted access to the Chairman, executive officers and, subject to prior consultation with the Chairman, may seek independent professional advice at the company’s expense.
The Board’s composition of six directors is currently appropriate to the size and scope of the company in its present form. The Board regularly consults with external advisors on specialist matters reserved for the Remuneration and Audit & Risk Committees. The skills and experience of each board member are outlined within the directors’ report.

201
1 l
Annu
al R
epor
t
29
a company should promote ethical and responsible decision making
The company has established policies regarding trading in securities by directors and executive officers. A code of conduct applies to all directors, executive officers and employees of the company.
a company should safeguard integrity in financial reporting
A separate Audit & Risk Committee has been established to ensure the appropriate amount of diligence is applied to the areas of financial reporting, internal controls, compliance and risk. The Chief Executive Officer and Chief Financial Officer provide certifications that the company’s financial reports are complete and present a true and fair view.
a company should make timely and balanced disclosures
The company seeks to provide relevant and timely disclosure to shareholders in accordance with the Corporations Act 2001 and ASX Listing Rules. The Company Secretary is nominated to ensure the company meets its obligations to the broader market for continuous disclosure.
a company should respect the right of shareholders
A robust communication structure is in place to ensure shareholders can access relevant and timely information through various mediums. All information disclosed to the ASX is posted on the company’s website as soon as it is disclosed to the ASX. The company website also has an option for shareholders to register their e-mail address for direct e-mail updates on company matters.
a company should recognise and manage risk
The Board, through the audit committee, is responsible for ensuring there are adequate policies in relation to risk management, compliance and internal control systems. In summary, the company policies are designed to ensure strategic, operational, legal, reputational and financial risks are identified, assessed, effectively and efficiently managed and monitored to enable achievement of the Group’s business objectives.
a company should remunerate fairly and responsibly
The Remuneration Committee of the Board whose scope includes obtaining independent input from external advisors determines remuneration levels for the Chairman and key executives with regard to market-based factors and achievement of performance targets. External advice is sought as necessary to ensure remuneration levels are fair and responsible having regard to the current size and scope of the company. Full disclosure of remuneration to directors and executives of the company are disclosed in the Remuneration Report.


31
201
1 l
Annu
al R
epor
t
StatementS of ComprehenSive inCome
The Consolidated Statements of Comprehensive Income should be read in conjunction with the notes to the Financial Statements.
For the year ending 30 June 2011 l Aspermont Limited ACN 000 375 048 & Controlled Entities
Consolidated2011 2010
Note $000 $000
Revenue from continuing operations 4 24,980 20,905
Cost of sales 5 (8,851) (8,122)
Gross profit 16,129 12,783
Distribution expenses (1,037) (974)
Marketing expenses (3,430) (3,610)
Occupancy expenses (976) (996)
Corporate and administration (4,954) (3,439)
Finance costs (932) (1,038)
Other expenses from ordinary activities (3,009) (3,360)
(14,338) (13,417)
1,791 (634)
Change in fair value of investments 4 (2,277) 592
Other income 776 1,470
Share of net profit in associates 9 (63) 306
Profit/(loss) from continuing operations before income tax expense 227 1,734
Income tax benefit/(expense) relating to continuing operations
6 (64) (658)
Profit/(loss) for the year 163 1,076
Net profit/(loss) attributable to equity holders of the parent entity 163 1,076
Other comprehensive income/(loss)
Foreign currency translation differences for foreign operations (6,607) 461
Net change in fair value of equity instruments measured at fair value through other comprehensive income
(1,097) (1,645)
Income tax benefit relating to other comprehensive income 323 493
Other – –
Total comprehensive income/(loss) for the period (net of tax) attributable to equity holders of the parent entity
(7,218) 385
Basic earnings/(loss) per share (cents per share) 22 0.07 0.46
Diluted earnings/(loss) per share (cents per share) 22 0.07 0.46

32
201
1 l
Annu
al R
epor
t
The Consolidated Statements of Financial Position should be read in conjunction with the notes to the Financial Statements.
StatementS of finanCial poSitionFor the year ending 30 June 2011 l Aspermont Limited ACN 000 375 048 & Controlled Entities
Consolidated2011 2010
Note $000 $000
CURRENT ASSETSCash and cash equivalents 18 2,718 774
Trade and other receivables 7 5,163 3,066
Financial assets 8 1,103 3,887
total CUrrent aSSetS 8,984 7,727
NON-CURRENT ASSETSTrade and other receivables 7 31 0
Financial assets 8 1,876 2,757
Investments accounted for using the equity method
9 329 1,783
Property, plant and equipment 10 391 338
Deferred tax assets 6 718 793
Intangible assets and goodwill 11 25,602 32,380
total non-CUrrent aSSetS 28,947 38,051
total aSSetS 37,931 45,778
CURRENT LIABILITIESTrade and other payables 12 4,700 4,018
Income in advance 13 5,126 2,823
Borrowings 14 1,276 2,125
Income tax payable 6 633 298
total CUrrent liaBilitieS 11,735 9,264
NON-CURRENT LIABILITIESBorrowings 14 7,849 8,788
Deferred tax liabilities 6 2,868 5,041
Provisions 15 171 159
total non-CUrrent liaBilitieS 10,888 13,988
total liaBilitieS 22,623 23,252
net aSSetS 15,308 22,526
EQUITYIssued capital 16 49,125 49,125
Reserves (7,939) (558)
Accumulated losses (25,878) (26,041)
total eQUitY 15,308 22,526
33
201
1 l
Annu
al R
epor
t
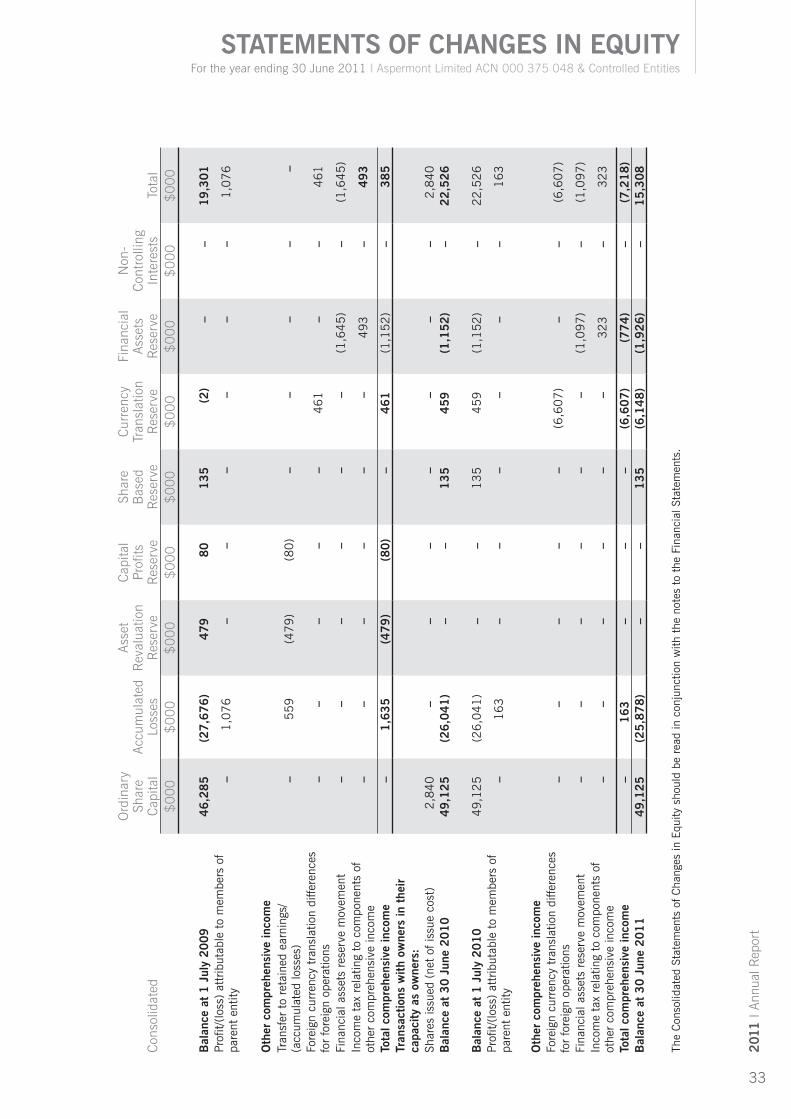
StatementS of ChangeS in equityFor the year ending 30 June 2011 l Aspermont Limited ACN 000 375 048 & Controlled Entities
Con
solid
ated
Ord
inar
y Sh
are
Cap
ital
Acc
umul
ated
Lo
sses
Ass
et
Rev
alua
tion
Res
erve
Cap
ital
Prof
its
Res
erve
Shar
e B
ased
R
eser
ve
Cur
renc
y Tr
ansl
atio
n R
eser
ve
Fina
ncia
l A
sset
s R
eser
ve
Non
-C
ontr
ollin
g In
tere
sts
Tota
l$
00
0$
00
0$
00
0$
00
0$
00
0$
00
0$
00
0$
00
0$
00
0
Bal
ance
at
1 J
uly
20
09
4
6,2
85
(2
7,6
76
)
47
9
8
0
1
35
(2
) –
–
19
,30
1
Prof
it/(lo
ss)
attr
ibut
able
to
mem
bers
of
pare
nt e
ntity
– 1
,07
6
– –
–
–
–
–
1
,07
6
oth
er c
ompr
ehen
sive
inco
me
Tran
sfer
to
reta
ined
ear
ning
s/(a
ccum
ulat
ed lo
sses
)–
55
9
(47
9)
(80
) –
–
–
–
–
Fore
ign
curr
ency
tra
nsla
tion
diffe
renc
es
for
fore
ign
oper
atio
ns–
––
– –
4
61
–
–
4
61
Fina
ncia
l ass
ets
rese
rve
mov
emen
t–
––
– –
–
(1
,64
5)
–
(1,6
45
)In
com
e ta
x re
latin
g to
com
pone
nts
of
othe
r co
mpr
ehen
sive
inco
me
––
––
–
–
49
3
–
49
3
tota
l com
preh
ensi
ve in
com
e–
1,6
35
(4
79
)(8
0)
–
46
1
(1,1
52
) –
3
85
tran
sact
ions
with
ow
ners
in t
heir
capa
city
as
owne
rs:
Shar
es is
sued
(ne
t of
issu
e co
st)
2,8
40
––
–
– –
–
–
2,8
40
B
alan
ce a
t 3
0 J
une
20
10
49
,12
5
(26
,04
1)
– –
1
35
4
59
(1,1
52
) –
2
2,5
26
Bal
ance
at
1 J
uly
20
10
4
9,1
25
(26
,04
1)
––
1
35
4
59
(1
,15
2)
–
22
,52
6
Prof
it/(lo
ss)
attr
ibut
able
to
mem
bers
of
pare
nt e
ntity
– 1
63
– –
–
–
–
–
1
63
oth
er c
ompr
ehen
sive
inco
me
Fore
ign
curr
ency
tra
nsla
tion
diffe
renc
es
for
fore
ign
oper
atio
ns–
––
–
–
(6,6
07
)–
–
(6,6
07
)
Fina
ncia
l ass
ets
rese
rve
mov
emen
t–
––
–
– –
(
1,0
97
) –
(1
,09
7)
Inco
me
tax
rela
ting
to c
ompo
nent
s of
ot
her
com
preh
ensi
ve in
com
e–
––
–
–
–
32
3
–
32
3
tota
l com
preh
ensi
ve in
com
e–
16
3
––
–(6
,60
7)
(77
4)
–(7
,21
8)
Bal
ance
at
30
Jun
e 2
01
1 4
9,1
25
(2
5,8
78
)–
– 1
35
(6
,14
8)
(1,9
26
) –
1
5,3
08
The
Con
solid
ated
Sta
tem
ents
of C
hang
es in
Equ
ity s
houl
d be
rea
d in
con
junc
tion
with
the
not
es t
o th
e Fi
nanc
ial S
tate
men
ts.

34
201
1 l
Annu
al R
epor
tStatementS of CaSh flowS
The Consolidated Statements of Cash Flows should be read in conjunction with the notes to the Financial Statements.
For the year ending 30 June 2011 l Aspermont Limited ACN 000 375 048 & Controlled Entities
Consolidated
2011 2010
Note $000 $000
Cash flows from operating activitiesCash receipts from customers 24,309 20,517
Cash payments to suppliers and employees (20,490) (20,260)
Interest and other costs of finance paid (847) (738)
Interest received 42 12
Income tax paid (573) (397)
net cash provided by/ (used in) operating activities
18(b) 2,441 (866)
Cash flows from investing activitiesNet cash received in acquisition of subsidiary 25(b) 458 –
Payments for investments (66) (746)
Proceeds (payments for) loans made 300 (300)
Proceeds from sale of equity investments 1,185 3,585
Payments for non-current assets (448) (531)
Dividends received 24 –
net cash provided by/ (used in) investing activities 1,453 2,008
Cash flows from financing activitiesProceeds from issue of shares, net of issue costs - 2,627
Proceeds of borrowings - 31
Repayment of borrowings (1,891) (3,776)
net cash provided by/ (used in) financing activities (1,891) (1,118)
Net increase/ (decrease) in cash held 2,003 24
Cash at the beginning of the year 774 797
Effects of exchange rate changes on the balance of cash held in foreign currencies (59) (47)
Cash at the end of the year 18(a) 2,718 774

35
201
1 l
Annu
al R
epor
t
Notes to the FiNaNcial statemeNtsFor the year ending 30 June 2011 l Aspermont Limited ACN 000 375 048 & Controlled Entities
1. General informationAspermont Limited is a listed public company, incorporated in Australia and operating in Australia.
Aspermont Limited’s registered office and its principal place of business are as follows:
Registered office Principal place of business Principal place of business australia United Kingdom613-619 Wellington Street 613-619 Wellington Street 1 Singer StreetPerth, WA 6000 Perth, WA 6000 London, United Kingdom EC2A 4BQTel: +61 8 6263 9100 Tel: +61 8 6263 9100 Tel: +44 (0) 207 216 6060
2. significant accounting policiesStatement of complianceThese financial statements are general purpose financial statements that have been prepared in accordance with Australian Accounting Standards, including Australian Accounting Interpretations, other authoritative pronouncements of the Australian Accounting Standards Board and the Corporations Act 2001.
The financial report covers the consolidated group of Aspermont Limited and controlled entities. Separate financial statements of Aspermont Limited, as an individual entity, are no longer presented as a consequence of a change to the Corporations Act 2001. Financial information for Aspermont Limited as an individual entity is included in note 3.
The financial report of Aspermont Limited and controlled entities comply with all International Financial Reporting Standards (IFRS) in their entirety.
Basis of preparationThe financial report has been prepared on an accruals basis and is based on historical costs modified by the revaluation of selected financial assets for which the fair value basis of accounting has been applied.
The Group early adopted AASB 9 Financial Instruments in the current fiscal year. This standard and its associated amending standard (AASB 2009-11), specifies new recognition and measurement requirements for financial assets within the scope of AASB 139 Financial Instruments: Recognition and Measurement.
The main changes from AASB 139 include:
All financial assets, except for certain equity instruments will be classified into two categories: 1) amortised cost, where the investment generates solely payments of interest and principal, or 2) fair value through profit and loss.
Certain non-trading equity instruments will be classified at fair value through profit and loss or fair value through other comprehensive income with dividends recognised in net income.
The accounting policies set out below have been consistently applied to all years presented, unless otherwise stated.
(a) Basis of consolidation
The consolidated accounts comprise the accounts of Aspermont Limited and all of its controlled entities, the “Group”. A controlled entity is any entity that Aspermont has the power to control the financial and operating policies of so as to obtain benefits from its activities.
A list of controlled entities is contained in note 17 to the financial statements.
All inter-company balances and transactions between entities in the consolidated group, including any unrealised profits or losses, have been eliminated on consolidation.
Where controlled entities have entered or left the economic entity during the year, their operating results have been included from the date control was obtained or until the date control ceased.

For the year ending 30 June 2011 l Aspermont Limited ACN 000 375 048 & Controlled Entities
Notes to the FiNaNcial statemeNts
36
201
1 l
Annu
al R
epor
t
Non-controlling interests in the equity and results of the entities that are controlled are shown as a separate item in the consolidated financial report.
In the parent entity the investments in the subsidiaries are carried at cost, less impairment.
Changes in ownership interestsThe Group treats transactions with non-controlling interests that do not result in a loss of control as transactions with equity owners of the Group. A change in ownership interest results in an adjustment between the carrying amounts of the controlling and non-controlling interests to reflect their relative interests in the subsidiary. Any difference between the amount of the adjustment to non-controlling interests and any consideration paid or received is recognised in a separate reserve within equity attributable to owners of Aspermont Limited.
When the Group ceases to have control, joint control or significant influence, any retained interest in the entity is remeasured to its fair value with the change in carrying amount recognised in the statement of comprehensive income. The fair value is the initial carrying amount for the purposes of subsequently accounting for the retained interest as an associate, jointly controlled entity or financial asset. Any amounts previously recognised in other comprehensive income in respect of that entity are accounted for as if the Group had directly disposed of the related assets or liabilities. This may mean that amounts previously recognised in other comprehensive income are reclassified to profit or loss.
If the ownership interest in a jointly-controlled entity or an associate is reduced but joint control or significant influence is retained, only a proportionate share of the amounts previously recognised in other comprehensive income are reclassified to the statement of comprehensive income where appropriate.
(b) Cash and cash equivalents
For the purpose of the statement of cash flows, cash includes:
i. cash on hand and at call deposits with banks or financial institutions, net of bank overdrafts; andii. investments in money market instruments with less than 14 days to maturity.
(c) Plant and equipment
Each class of plant and equipment is carried at cost less accumulated depreciation and impairment.
The carrying amount of plant and equipment is reviewed annually by directors to ensure it is not in excess of the recoverable amount from these assets. An asset’s carrying amount is written down immediately to its recoverable amount if the carrying amount is greater than the estimated recoverable amount.
Gains and losses on disposals are determined by comparing proceeds with the carrying amount. These gains and losses are included in the statement of comprehensive income. When revalued assets are sold, amounts included in the revaluation reserve relating to that asset are transferred to retained earnings.
The depreciable amounts of all plant and equipment are depreciated on a diminishing value basis over their useful lives to the economic entity commencing from the time an asset is held ready for use.
The depreciation rates used for depreciable assets are:
class of Fixed asset Depreciation RatePlant and equipment 13.5% - 40%
(d) Employee benefits
Provision is made for the company’s liability for employee entitlements arising from services rendered by employees to balance date. Employee entitlements expected to be settled within one year together with entitlements arising from wages and annual leave, which will be settled after one year, have been measured at their nominal amount. Other employee entitlements payable later than one year have been measured at the present value of the estimated future cash outflows to be made for those entitlements. Contributions are made by the Group to employee superannuation funds and are charged as expenses when incurred.
2. significant accounting policies (continued)

201
1 l
Annu
al R
epor
t
37
(e) Financial instruments
RecognitionThe Group recognises receivables on the date that they are originated. All other financial assets are recognised initially on the trade date at which the Group becomes a party to the contractual provisions of the instrument.
Financial assets are classified based on the objective of the Group’s business model for managing the financial assets and the characteristics of the contractual cash flows.
The Group derecognises a financial asset when the contractual cash flows from the asset expires, or it transfers the rights to receive the contractual cash flows such that substantially all the risks and rewards of ownership of the financial asset are transferred.
The Group has the following financial assets:
Financial assets at fair value Financial assets at fair value are non-derivative financial assets.
Financial assets at fair value are measured initially at fair value which includes transaction costs directly attributable to the acquisition of the financial asset. They are measured subsequently at fair value with movements in fair value being recognised in the profit or loss, unless:
• The financial asset is an equity investment, and• The Group has made an irrevocable election to present gains and losses on the financial asset in other
comprehensive income. This election has been made on an individual equity basis.
Where the Group is unable to determine a fair value, the assets are held at cost.
Dividends from equity investments are included in the profit or loss regardless of whether the election has been made to recognise movements in fair value in other comprehensive income.
Profit or loss arising on the sale of equity investments is recognised in the profit or loss unless the election has been made to recognise fair value movements in other comprehensive income.
ImpairmentImpairment losses on financial assets at fair value are recognised in profit or loss, unless the election has been made to recognise movements in fair value in other comprehensive income, in which case impairment losses are recognised in other comprehensive income.
(f) Income Tax
The charge for current income tax expense is based on the profit for the year adjusted for any non-assessable or disallowed items. It is calculated using the tax rates that have been enacted or are substantially enacted by the statement of financial position date.
Deferred tax is accounted for using the balance sheet liability method in respect of temporary differences arising between the tax bases of assets and liabilities and their carrying amounts in the financial statements. No deferred income tax will be recognised from the initial recognition of an asset or liability, excluding a business combination, where there is no effect on accounting or taxable profit or loss. Deferred tax is calculated at the tax rates that are expected to apply to the period when the asset is realised or liability is settled.
Deferred tax is credited in the statement of comprehensive income except where it relates to items that may be credited directly to equity, in which case the deferred tax is adjusted directly against equity. Deferred income tax assets are recognised to the extent that it is probable that future tax profits will be available against which deductible temporary differences can be utilised.
The amount of benefits brought to account or which may be realised in the future is based on the assumption that no adverse change will occur in income taxation legislation and the anticipation that the economic entity will derive sufficient future assessable income to enable the benefit to be realised and comply with the conditions of deductibility imposed by the law.
2. significant accounting policies (continued)

For the year ending 30 June 2011 l Aspermont Limited ACN 000 375 048 & Controlled Entities
Notes to the FiNaNcial statemeNts
38
201
1 l
Annu
al R
epor
t
The current income tax charge is calculated on the basis of the tax laws enacted or substantively enacted at the end of the reporting period in the countries where the company’s subsidiaries and associates operate and generate taxable income. Management periodically evaluates positions taken in tax returns with respect to situations in which applicable tax regulation is subject to interpretation. It establishes provisions where appropriate on the basis of amounts expected to be paid to the tax authorities.
Deferred tax liabilities and assets are not recognised for temporary differences between the carrying amount and tax bases of investments in controlled entities where the parent entity is able to control the timing of the reversal of the temporary differences and it is probable that the differences will not reverse in the foreseeable future.
Deferred tax assets and liabilities are offset when there is a legally enforceable right to offset current tax assets and liabilities and when the deferred tax balances relate to the same taxation authority. Current tax assets and tax liabilities are offset where the entity has a legally enforceable right to offset and intends either to settle on a net basis, or to realise the asset and settle the liability simultaneously.
Current and deferred tax is recognised in profit or loss, except to the extent that it relates to items recognised in other comprehensive income or directly in equity. In this case, the tax is also recognised in other comprehensive income or directly in equity, respectively.
Aspermont Limited and its wholly-owned Australian subsidiaries have formed an income tax consolidated group under the Tax Consolidation System. Aspermont Limited is responsible for recognising the current and deferred tax assets and liabilities for the tax consolidated group. The Group notified the ATO in April 2004 that it had formed an income tax consolidated group to apply from July 2002.
Tax consolidationAspermont and its wholly-owned Australian subsidiaries are a tax consolidated group. As a consequence, as the head entity in the tax consolidated group, Aspermont will recognise current and deferred tax amounts relating to transactions, events and balances of the wholly-owned Australian controlled entities in the Group in future financial statements as if those transactions, events and balances were its own, in addition to the current and deferred tax balances arising in relation to its own transactions, events and balances. These tax amounts are measured as if each entity in the tax consolidated group continues to be a standalone taxpayer in its own right.
Assets or liabilities arising under tax funding agreements with the tax consolidated entities are recognised as amounts receivable from or payable to other entities in the Group. Details about any tax funding agreement are disclosed in note 6.
(g) Foreign currency
Functional and Presentation Currency The functional currency of each of the Group’s entities is measured using the currency of the primary economic environment in which that entity operates. The consolidated financial statements are presented in Australian dollars which is the parent entity’s functional and presentation currency.
Transaction and Balances Foreign currency transactions are translated into functional currency using the exchange rates prevailing at the date of the transaction. Foreign currency monetary items are translated at the year-end exchange rate. Non-monetary items measured at historical cost continue to be carried at the exchange rate at the date of the transaction. Non-monetary items measured at fair value are reported at the exchange rate at the date when fair values were determined.
Exchange differences arising on the translation of monetary items are recognised in the statement of comprehensive income, except where deferred in equity as a qualifying cash flow or net investment hedge, in which case they are included in other comprehensive income.
Exchange differences arising on the translation of non-monetary items are recognised directly in other comprehensive income to the extent that the gain or loss is directly recognised in comprehensive income, otherwise the exchange difference is recognised in the statement of other comprehensive income.
2. significant accounting policies (continued)

201
1 l
Annu
al R
epor
t
39
Group Companies The financial results and position of foreign operations whose functional currency is different from the Group’s presentation currency are translated as follows:
Assets and liabilities are translated at year-end exchange rates at that reporting date.Income and expenses are translated at average exchange rates for the period.
Retained earnings are translated at the exchange rates prevailing at the date of the transaction.
Exchange differences arising on translation of foreign operations are transferred directly to the Group’s foreign currency translation reserve in the statement of financial position through other comprehensive income. These differences are recognised in the statement of comprehensive income in the period in which the operation is disposed.
(h) Investment in associates
Associates are all entities over which the Group has significant influence but not control or joint control, generally accompanying a shareholding of between 20% and 50% of the voting rights. Investments in associates are accounted for in the parent entity financial statements using the cost method and in the consolidated financial statements using the equity method of accounting, after initially being recognised at cost. The Group’s investment in associates includes goodwill (net of any accumulated impairment loss) identified on acquisition (refer to note 9).
The Group’s share of its associates’ post-acquisition profits or losses is recognised in the statement of comprehensive income, and its share of post-acquisition movements in reserves is recognised in other comprehensive income. The cumulative post-acquisition movements are adjusted against the carrying amount of the investment. Dividends receivable reduce the carrying amount of the investment.
When the Group’s share of losses in an associate equals or exceeds its interest in the associate, including any other unsecured long-term receivables, the Group does not recognise further losses, unless it has incurred obligations or made payments on behalf of the associate.Unrealised gains on transactions between the Group and its associates are eliminated to the extent of the Group’s interest in the associates. Unrealised losses are also eliminated unless the transaction provides evidence of an impairment of the asset transferred. Accounting policies of associates have been changed where necessary to ensure consistency with the policies adopted by the Group.
(i) Intangible Assets
GoodwillGoodwill and goodwill on consolidation are initially recorded at the amount by which the purchase price for a business exceeds the fair value attributed to its net assets at date of acquisition. Goodwill is tested annually for impairment and carried at cost less accumulated impairment losses. Goodwill on acquisitions of subsidiaries is included in intangible assets. Goodwill on acquisition of associates is included in investments in associates.
MastheadsMastheads acquired separately are capitalised at cost and from a business combination are capitalised at fair value as at the date of acquisition. Following initial recognition, the cost model is applied to the class of intangible assets.
Mastheads are tested for impairment where an indicator of impairment exists, and the carrying amount is reviewed annually by the directors to ensure that it is not in excess of the recoverable amount.
IT development and softwareCosts incurred in developing products or systems and costs incurred in acquiring software and licenses that will contribute to future period financial benefits through revenue generation and/or cost reduction are capitalised to software and systems. Costs capitalised include direct payroll and payroll related costs of employees time spent on the project. Amortisation is calculated on a diminishing value basis over periods generally ranging from 3 to 5 years.
IT development costs include only those costs directly attributable to the development phase and are only recognised following completion of technical feasibility and where the Group has an intention and ability to use the asset.
2. significant accounting policies (continued)

For the year ending 30 June 2011 l Aspermont Limited ACN 000 375 048 & Controlled Entities
Notes to the FiNaNcial statemeNts
40
201
1 l
Annu
al R
epor
t
Intangible assets acquired as part of an acquisitionIntangible assets acquired as part of an acquisition of a business are capitalised separately from goodwill if the asset is separable or arises from contractual or legal rights, and the fair value can be measured reliably on initial recognition. Purchased intangible assets are initially recorded at cost and finite life intangible assets are amortised over their useful economic lives on a straight line basis.
Where amortisation is calculated on a straight line basis, the following useful lives have been determined for classes of intangible assets:
Trademarks: 10 yearsCustomer & Subscription Contracts: 5 years
(j) Subscriptions in advance
Print magazine and internet news subscriptions are received in advance for the subscription period applied for. Subscriptions received during the financial year for issues expected to be published and news services to be provided after balance date have been deferred and will be brought to account and recognised in the accounting period in which the respective magazines or news services subscribed for are published.
(k) Revenue and other income
Advertising and subscription revenue is brought to account and recognised in the accounting period in which the respective magazines or news sites containing the booked advertisements are published or displayed. All revenue is stated net of the amount of goods and services tax (GST).
Conference revenue is brought to account and recognised in the accounting period in which the respective event occurs. Interest revenue is recognised on a proportional basis taking into account the interest rates applicable to the financial assets.
The company’s share of profit from associated companies has been recognised in accordance with AASB 128 Investments in Associates.
(l) Impairment of assets
At each reporting date, the Group reviews the carrying values of its tangible and intangible assets to determine whether there is any indication that those assets have been impaired. If such an indication exists, the recoverable amount of the asset, being the higher of the asset’s fair value less costs to sell and value in use, is compared to the asset’s carrying value. Any excess of the asset’s carrying value over its recoverable amount is expensed to the statement of comprehensive income.
Impairment testing is performed annually for goodwill and intangible assets with indefinite lives. Where it is not possible to estimate the recoverable amount of an individual asset, the Group estimates the recoverable amount of the cash-generating unit to which the asset belongs.
(m) Leases
Leases of fixed assets, where substantially all the risks and benefits incidental to the ownership of the assets (but not the legal ownership), are classified as finance leases.
Finance leases are capitalised by recording an asset and a liability at the lower of the amounts equal to the fair value of the leased property or the present value of the minimum lease payments, including any guaranteed residual values. Lease payments are allocated between the reduction of the lease liability and the lease interest expense for the period.
Leased assets are depreciated on a straight-line basis over the shorter of their estimated useful lives or the lease term. Lease payments for operating leases, where substantially all the risks and benefits remain with the lessor, are recognised on a straight line basis over the lease term.
(n) Rounding of amounts
The parent entity has applied the relief available to it under ASIC Class Order 98/100 and accordingly, amounts in the financial statements have been rounded off to the nearest $1,000.
2. significant accounting policies (continued)

201
1 l
Annu
al R
epor
t
41
(o) Borrowings
Borrowings are initially recognised at fair value, net of transaction costs incurred. Borrowings are subsequently measured at amortised cost. Fees paid on the establishment of loan facilities are recognised as transaction costs of the loan to the extent that it is probable that some or all of the facility will be drawn down. Borrowing costs incurred for the construction of any qualifying asset are capitalised during the period of time that is required to complete and prepare the asset for intended use or sale. Other borrowing costs are expensed.
Borrowings are classified as current liabilities unless the Group has an unconditional right to defer settlement of the liability for at least 12 months after reporting date.
(p) Goods and services tax (GST)
Revenues, expenses and assets are recognised net of the amount of GST, except where the amount of GST incurred is not recoverable from the Australian Tax Office. In these circumstances, the GST is recognised as part of the cost of acquisition of the asset or as part of an item of the expense. Receivables and payables in the statement of financial position are shown inclusive of GST.
(q) Government grants
Government grants are recognised at fair value where there is reasonable assurance that the grant will be received and all grant conditions will be met. Grants relating to expense items are recognised as income over the periods necessary to match the grant to the costs they are compensating. Grants relating to assets are credited to deferred income at fair value and are credited to income over the expected useful life of the asset on a straight-line basis.
(r) Share-based payment transactions
The company provides benefits to employees (including directors) whereby a component of remuneration includes the issue of share options. The cost of these transactions with employees is measured by reference to the fair value at the date at which they are granted. The cost is recognised together with a corresponding increase in equity, over the period in which the performance conditions are fulfilled, ending on the date on which the relevant employees become fully entitled to the award (vesting date).
(s) Critical accounting estimates and judgments
The directors evaluate estimates and judgments incorporated into the financial report based on historical knowledge and best available current information. Estimates assume a reasonable expectation of future events and are based on current trends and economic data, obtained both externally and within the Group.
Key Estimates — ImpairmentThe Group assesses impairment at each reporting date by evaluating conditions specific to the Group that may lead to impairment of assets. Where an impairment trigger exists, the recoverable amount of the asset is determined. An impairment of $225,699 has been recognised for the year ended 30 June 2011 related to our investment in Kondinin, see note 25 for further discussion.
Value-in-use calculations performed in assessing recoverable amounts incorporate a number of key estimates. Key assumptions used for value-in-use calculations are disclosed in note 11(b).
(t) Business combinations
The acquisition method of accounting is used to account for all business combinations, including business combinations involving entities or businesses under common control, regardless of whether equity instruments or other assets are acquired. The consideration transferred for the acquisition of a subsidiary comprises the fair values of the assets transferred, the liabilities incurred and the equity interests issued by the Group. The consideration transferred also includes the fair value of any contingent consideration arrangement and the fair value of any pre-existing equity interest in the subsidiary. Acquisition-related costs are expensed as incurred. Identifiable assets acquired and liabilities and contingent liabilities assumed in a business combination are, with limited exceptions, measured initially at their fair values at the acquisition date. On an acquisition-by-acquisition basis, the Group recognises any non-controlling interest in the acquiree either at fair value or at the non-controlling interest’s proportionate share of the acquiree’s net identifiable assets.
2. significant accounting policies (continued)

For the year ending 30 June 2011 l Aspermont Limited ACN 000 375 048 & Controlled Entities
Notes to the FiNaNcial statemeNts
42
201
1 l
Annu
al R
epor
t
The excess of the consideration transferred, the amount of any non-controlling interest in the acquiree and the acquisition-date fair value of any previous equity interest in the acquiree over the fair value of the Group’s share of the net identifiable assets acquired is recorded as goodwill. If those amounts are less than the fair value of the net identifiable assets of the subsidiary acquired and the measurement of all amounts has been reviewed, the difference is recognised directly in the statement of comprehensive income as a bargain purchase.
Where settlement of any part of cash consideration is deferred, the amounts payable in the future are discounted to their present value as at the date of exchange. The discount rate used is the entity’s incremental borrowing rate, being the rate at which a similar borrowing could be obtained from an independent financier under comparable terms and conditions.
(u) Earnings per share
(i) Basic earnings per shareBasic earnings per share is calculated by dividing:• the profit attributable to owners of the company, excluding any costs of servicing equity other than ordinary
shares• by the weighted average number of ordinary shares outstanding during the financial year, adjusted for
bonus entitlements in ordinary shares issued during the year and excluding treasury shares.
(ii) Diluted earnings per shareDiluted earnings per share adjusts the figures used in the determination of basic earnings per share to take into account:• the after income tax effect of interest and other financing costs associated with dilutive potential ordinary
shares, and• the weighted average number of additional ordinary shares that would have been outstanding assuming
the conversion of all dilutive potential ordinary shares.
(v) Trade receivables
Trade receivables are recognised at fair value and are generally due for settlement within 30 days.
Collectability of trade receivables is reviewed on an ongoing basis. Debts which are known to be uncollectable are written off by reducing the carrying amount directly. An allowance account (provision for impairment of trade receivables) is used when there is objective evidence that the Group will not be able to collect all amounts due according to the original terms of the receivables. Significant financial difficulties of the debtor, probability that the debtor will enter bankruptcy or financial reorganisation, and default or delinquency in payments are considered indicators that the trade receivable is impaired.
The amount of impairment loss is recognised in profit or loss within other expenses. When a trade receivable for which an impairment allowance had been recognised becomes uncollectible in a subsequent period, it is written off against the allowance account. Subsequent recoveries of amounts previously written off are credited against other expenses in profit or loss.
(w) Trade and other payables
These amounts represent liabilities for goods and services provided to the Group prior to the end of financial year which are unpaid. The amounts are unsecured and are usually paid within 30 days of recognition.
(x) Contributed equity
Ordinary shares are classified as equity. Incremental costs directly attributable to the issue of new shares or options are shown in equity as a deduction, net of tax, from the proceeds. Incremental costs directly attributable to the issue of new shares or options for the acquisition of a business are not included in the cost of the acquisition as part of the purchase consideration.
2. significant accounting policies (continued)

201
1 l
Annu
al R
epor
t
43
(y) Accounting standards issued not yet effective
The following standards and interpretations, which may impact the Group in the period of initial application, have been issued but are not yet effective:
Reference Title Summary
Effective DateFinancial Years
BeginningIFRS 10 Consolidated Financial
StatementsIntroduces certain changes to the consolidation principles, including the concept of de facto control and changes in relation to the special purpose entities. The AASB has not yet updated the Australian equivalent of IFRS 10.
1 January 2013
IFRS 11 Joint Arrangements Introduces certain changes to the accounting for joint arrangements. Joint arrangements will be classified as either joint operations (where parties with joint control have rights to assets and obligations for liabilities) or joint ventures (where parties with joint control have rights to the net assets of the arrangement). Joint arrangements structured as a separate vehicle will generally be treated as joint ventures and accounted for using the equity method. The AASB has not yet updated the Australian equivalent of IFRS 11.
1 January 2013
IFRS 13 Fair Value Measurement Establishes a single framework for measuring fair value of financial and non-financial items recognised at fair value on the balance sheet or disclosed in the notes to the financial statements. The AASB has not yet updated the Australian equivalent of IFRS 13.
1 January 2013
2009-12 Amendments to Australian Accounting Standards
Amends AASB 8 Operating Segments as a result of the revised AASB 124. Amends a number of standards and interpretations as a result of the annual improvements project.
1 January 2011
AASB 124 Related Party Disclosures Revised standard. The definition of a related party is simplified to clarify its intended meaning and eliminate inconsistencies from the application of the definition.
1 January 2011
IAS 1 Presentation of Financial Statements
IAS 1, amended in June 2011, introduces amendments to align the presentation items of other comprehensive income with US GAAP. When the standard is first adopted, there will be changes to the presentation of the statement of comprehensive income. However, there will be no impact on any of the amounts recognised in the financial statements.
1 July 2013
2. significant accounting policies (continued)

For the year ending 30 June 2011 l Aspermont Limited ACN 000 375 048 & Controlled Entities
Notes to the FiNaNcial statemeNts
44
201
1 l
Annu
al R
epor
t
The expected impact on the consolidated entity of the above standards and interpretations is currently being assessed by management. A final assessment has not been made on the expected impact of these standards and interpretations, however, it is expected that there will not be any significant changes to the accounting policies of the consolidated entity.
(z) Segment reporting
Operating segments are reported in a manner consistent with the internal reporting provided to the chief operating decision maker. The chief operating decision maker, who is responsible for allocating resources and assessing performance of the operating segments, has been identified as the Chief Executive Officer who makes strategic decisions.
3. Parent entity information
The following details relate to the parent entity, Aspermont Limited, at 30 June 2011. The information presented here has been prepared using consistent accounting policies as presented in note 2.
2011 2010
$000 $000
Current assets 3,533 5,763
Non-current assets 30,708 31,517
total assets 34,241 37,280
Current liabilities 5,197 5,899
Non-current liabilities 12,204 12,579
total liabilities 17,401 18,478
Contributed equity 49,125 49,125
Retained earnings/ (accumulated losses) (30,659) (29,240)
Option reserve 135 135
Other reserves (1,761) (1,218)
total equity 16,840 18,802
Profit/ (loss) for the year (1,254) 461
Other comprehensive income/ (loss) for the year (708) (1,187)
total comprehensive income/ (loss) for the year (1,962) (726)
All of the companies of the Group including the parent are a party to the ANZ loan described in note 20.
As detailed in note 24, there is a subsequent event and contingent liability in respect of compensation to related parties.
2. significant accounting policies (continued)

201
1 l
Annu
al R
epor
t
45
4. Revenue
Consolidated2011 2010$000 $000
Continuing operations:
Sales revenue – subscriptions & advertising 18,350 15,571Conferencing revenue 6,630 5,334
24,980 20,905Other income:
Interest 38 36Corporate advisory – 196Gain on sale of shares 616 1,309Net gain in fair value of financial assets at fair value through profit or loss (2,277) 592
Profit/ (loss) on sale of associate – (236)Other income 122 165
(1,501) 2,062
23,479 22,967
5. expenses
Profit/ (loss) before income tax includes the following specific expenses:
Consolidated2011 2010$000 $000
(a) Expenses:Cost of sales 8,851 8,122Bad debts written off 40 77Legal costs 55 64Interest expenses 932 1,038Consulting & accounting services 498 687Write-down of non-current investments to recoverable amount 226 –
Depreciation and amortisation of plant, equipment and intangible assets 480 475
Directors’ fees 220 241Rental expense on operating leases 715 786Movement in provisions for employee entitlements (33) (33)Superannuation 600 634
(b) Remuneration of auditors of the parent entity for:Auditing or reviewing the accounts – BDO Audit (WA) Pty Ltd 64 58
Auditing or reviewing the accounts – BDO UK 22 23Other services – technical consultation – BDO (WA) Pty Ltd 23 7
Other services – technical consultation – BDO UK 6 4Auditing or reviewing the accounts – MSI Marsdens – 43

For the year ending 30 June 2011 l Aspermont Limited ACN 000 375 048 & Controlled Entities
Notes to the FiNaNcial statemeNts
46
201
1 l
Annu
al R
epor
t
6. taxationConsolidated
2011 2010$000 $000
(a) Income tax expense/ (revenue)The components of tax expense/ (revenue) comprise: Current tax 675 310 Deferred tax (611) 286 Prior year adjustments - 62
64 658
The prima facie tax on profit/ (loss) before tax is reconciled to the income tax as follows:Profit/ (loss) from operations 227 1,734
Income tax expense calculated at 30% 68 520Tax effect of permanent differences:Increase in income tax expense due to:Non-deductible expenditure 43 182Prior year adjustments – 62
Decrease in income tax expense due to:Change in tax rates (65) (16)Non-assessable income 18 (90)
Income tax expense/ (benefit) attributable to profit from ordinary activities 64 658
effective tax rate 29% 38%
income tax payableOpening balance 298 411Charged to income 377 (101)Currency movements (42) (12)
633 298
(b) Deferred taxDeferred income tax at 30 June relates to the following:liabilitiesShare revaluation adjustments taken directly to equity (816) (493)Fair value gain adjustments 1,029 1,712Share revaluation adjustments taken in relation to business combinations 2,655 3,822
Total 2,868 5,041
assetsProvisions 171 190Future benefit of carried forward losses 529 569Other 18 34
718 793

201
1 l
Annu
al R
epor
t
47
Consolidated2011 2010$000 $000
(c) Reconciliations
The movement in deferred tax liability for each temporary difference during the year is as follows:
Share revaluation adjustments taken directly to equityAt 1 July 2010 (493) –Net revaluations during the current period (323) (493)At 30 June 2011 (816) (493)
Fair value gain adjustments At 1 July 2010 1,712 1,578Net revaluations during the current period (683) 134At 30 June 2011 1,029 1,712
OtherAt 1 July 2010 3,822 3,822Net foreign exchange reserve adjustment during the current period (1,167) –
At 30 June 2011 2,655 3,822
Total deferred tax liabilities 2,868 5,041
The movement in deferred tax assets for each temporary difference during the year is as follows:
Provisions At 1 July 2010 190 238Net changes during the current period (19) (48)At 30 June 2011 171 190
Recognition of carried forward losses At 1 July 2010 570 635Net changes during the current period (41) (65)At 30 June 2011 529 570
Other At 1 July 2010 34 32Net revaluations during the current period (16) 2At 30 June 2011 18 34
Total deferred tax assets 718 793
6. Taxation (continued)

For the year ending 30 June 2011 l Aspermont Limited ACN 000 375 048 & Controlled Entities
Notes to the FiNaNcial statemeNts
48
201
1 l
Annu
al R
epor
t
(d) Amounts recognised directly in equity
Aggregate current and deferred tax arising in the reporting period and not recognised in the statement of comprehensive income but directly debited or credited to equity:
Net deferred tax – debited/ (credited) directly to equity 323 493
(e) Tax expense/ (income) relating to items of other comprehensive income
Financial assets reserve 323 493
Tax consolidation
Aspermont and its wholly-owned Australian subsidiaries are a tax consolidated group. The accounting policy in relation to this legislation is set out in note 2 (f).
On adoption of the tax consolidation legislation, the entities in the tax consolidated group entered into a tax sharing agreement which limits the joint and several liability of the wholly-owned entities in the case of a default by the head entity, Aspermont Limited.
6. taxation (continued)
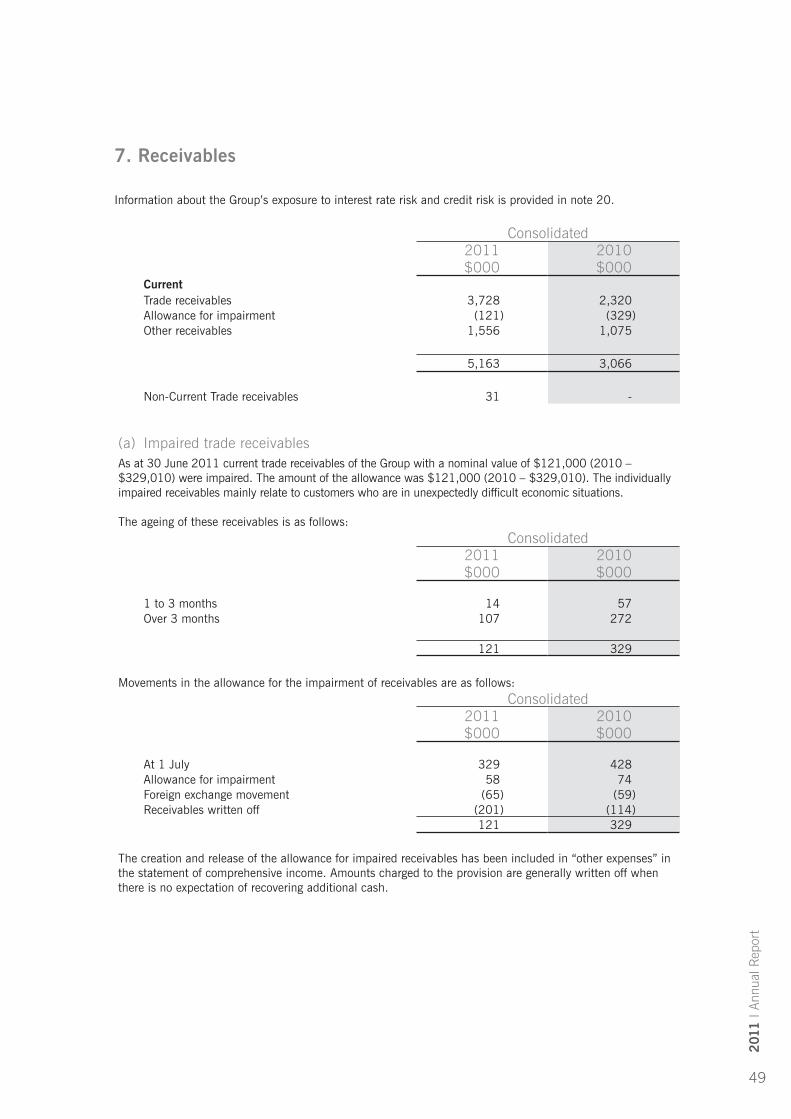
201
1 l
Annu
al R
epor
t
49
7. Receivables
Information about the Group’s exposure to interest rate risk and credit risk is provided in note 20.
Consolidated2011 2010$000 $000
currentTrade receivables 3,728 2,320Allowance for impairment (121) (329)Other receivables 1,556 1,075
5,163 3,066
Non-Current Trade receivables 31 -
(a) Impaired trade receivablesAs at 30 June 2011 current trade receivables of the Group with a nominal value of $121,000 (2010 – $329,010) were impaired. The amount of the allowance was $121,000 (2010 – $329,010). The individually impaired receivables mainly relate to customers who are in unexpectedly difficult economic situations.
The ageing of these receivables is as follows:Consolidated
2011 2010$000 $000
1 to 3 months 14 57Over 3 months 107 272
121 329
Movements in the allowance for the impairment of receivables are as follows:Consolidated
2011 2010$000 $000
At 1 July 329 428Allowance for impairment 58 74Foreign exchange movement (65) (59)Receivables written off (201) (114)
121 329
The creation and release of the allowance for impaired receivables has been included in “other expenses” in the statement of comprehensive income. Amounts charged to the provision are generally written off when there is no expectation of recovering additional cash.

For the year ending 30 June 2011 l Aspermont Limited ACN 000 375 048 & Controlled Entities
Notes to the FiNaNcial statemeNts
50
201
1 l
Annu
al R
epor
t
(b) Past due but not impairedAs at 30 June 2011, trade receivables of $1,797,000 (2010: $998,492) were past due but not impaired. The ageing analysis of these trade debtors is as follows:
Consolidated2011 2010$000 $000
1,682 819115 179
1,797 998
The other classes within trade and other receivables do not contain impaired assets and arenot past due. Based on the credit history of these other classes, it is expected that these amounts will be received when due. The Group does not hold any collateral in relation to these receivables.
Information about the Group’s exposure to foreign currency risk and interest rate risk in relation to trade and other receivables is provided in note 20.
Due to the short term nature of these receivables, their carrying amount is assumed to approximate their fair value. The maximum exposure to credit risk at the end of the reporting period is the carrying amount of each class of receivable mentioned above.
8. other financial assets
Consolidated2011 2010$000 $000
current
Financial assets at fair value through profit or loss (i) 1,101 3,877
Other 2 10
1,103 3,887
Non – current
Financial assets at fair value through other comprehensive income (i) 1,343 2,057
Financial assets at fair value through other comprehensive income (ii) 185
Financial assets at cost through other comprehensive income (iii) 323 675
Other 25 25
1,876 2,757
(i) Fair value measurements were obtained using quoted prices (unadjusted) in active markets for identical assets. (Level 1)
(ii) Fair value measurements were obtained using inputs other than quoted prices that are observable for the asset either directly (as prices) or indirectly (derived from prices). (Level 2)
(iii) Measurements are based on the purchase cost of the investments and therefore not on observable market data. (Level 3)
7. Receivables (continued)

201
1 l
Annu
al R
epor
t
51
In 2011 the former EnviroEnergy Resources Ltd was restructured and renamed Powerhouse Energy Group Plc which was listed on the United Kingdom’s AIM marketplace. In 2011 Water Resources Group Limited was listed on the ASX marketplace. These investments were thus reclassified to the Level 1 category.
Gains or losses on unlisted investments, wherein an irrevocable election has been made to recognise fair value changes in other comprehensive income, are recognised as a separate component of equity. Other gains or losses have been included in the profit or loss.
Information about the Group’s exposure to price risk is provided in note 20.
Equity instruments measured at fair value through other comprehensive income
The Group has classified most of its investments as fair value through other comprehensive income because they are investments that the Group intends to hold for the longer term. New Guineas Energy Limited is the only significant investment where the fair value is classified through profit or loss.
Equity investments held at year-end:
Consolidated2011$000
Fair Value
New Guinea Energy Limited 1,077
Water Resources Group Ltd 711
Advent Energy Ltd 100
Powerhouse Energy Group Plc (formerly EnviroEnergy Resources Ltd) 632
Private Media Group Pty Ltd 85
Other 26
2,631
cost
Magyar Mining Ltd 323
323
8. other financial assets (continued)

For the year ending 30 June 2011 l Aspermont Limited ACN 000 375 048 & Controlled Entities
Notes to the FiNaNcial statemeNts
52
201
1 l
Annu
al R
epor
t
9. investments accounted for using the equity method
(a) Movements in carrying amounts
Consolidated2011 2010$000 $000
Carrying amount at the beginning of the financial year 1,783 2,526 Acquisition of associates during the year 63 1,473 Sale of associates during the year – (2,482)Associates becoming a subsidiary during the year (1,430) – Dividends received (24) (40)Share of profits after income tax (63) 306
Carrying amount at the end of the financial year 329 1,783
(b) Summarised financial information of associates
2011Ownership
Interest Assets Liabilities Revenues Profit/ (Loss)
$000 $000 $000 $000
WME Media Pty Ltd 30% 441 112 401 (19)
Kondinin Information Services Pty Ltd ** 30% – – 558 (44)
441 112 959 (63)
2010Ownership
Interest Assets Liabilities Revenues Profit/ (Loss)
$000 $000 $000 $000
WME Media Pty Ltd 30% 488 116 372 28
Kondinin Information Services Pty Ltd 30% 1,799 388 680 (63)
Tonkin Corporation * 49% - - 2,769 341
2,287 504 3,821 306
The Group’s share of the results of its principal associates and it’s aggregated assets (including goodwill) and liabilities are as follows:
All of the above associates are incorporated in Australia.
* Tonkin Corporation purchased Aspermont’s 49% share in May 2010.** The Company became the sole shareholder of Kondinin Information Services in January 2011, see note 25.

201
1 l
Annu
al R
epor
t
53
10. Plant and equipmentConsolidated
2011 2010$000 $000
Plant and equipment – at cost 1,616 1,388
Accumulated depreciation (1,301) (1,149)
315 239
Equipment under finance lease – at cost 237 237
Accumulated depreciation (161) (138)
76 99
Total plant and equipment 391 338

For the year ending 30 June 2011 l Aspermont Limited ACN 000 375 048 & Controlled Entities
Notes to the FiNaNcial statemeNts
54
201
1 l
Annu
al R
epor
t
(a) Movements in carrying amounts
Movement in the carrying amounts for each class of property, plant and equipment between the beginning and the end of the current financial year.
ConsolidatedPlant and equipment
Leased plant & equipment Software Total
$000 $000 $000 $000Gross carrying amount
Balance at 1 July 2009 1,403 237 1,875 3,515
Additions 24 - - 24
Currency movements (39) - - (39)
Reclassed - - (1,875) (1,875)
Balance at 30 June 2010 1,388 237 - 1,625
Additions 162 - - 162
Currency movements (11) - - (11)
Acquisition of subsidiary 143 - - 143
Disposals (66) - - (66)
Balance at 30 June 2011 1,616 237 - 1,853
accumulated depreciation
Balance at 1 July 2009 (1,082) (106) (964) (2,152)
Depreciation expense (106) (32) - (138)
Currency movements 39 - - 39
Reclassified - - 964 964
Balance at 30 June 2010 (1,149) (138) (0) (1,287)
Depreciation expense (98) (23) - (121)
Currency movements (9) . - (9)
Acquisition of subsidiary (61) - - (61)
Disposals 16 - - 16
Balance at 30 June 2011 (1,301) (161) (0) (1,462)
Net book value
As at 30 June 2010 239 99 (0) 338
As at 30 June 2011 315 76 (0) 391
(b) Leased plant and equipment
The parent entity leases assets under a number of finance lease agreements. At 30 June 2011, the net carrying amount of leased plant and equipment was $75,614 (2010: $98,861). The leased equipment secures lease obligations.
10. Plant and equipment (continued)

201
1 l
Annu
al R
epor
t
55
11. Intangible assets
Consolidated2011 2010$000 $000
Goodwill on acquisition 16,262 16,262Software 1,063 1,053Purchased mastheads 12,284 12,284Other * 3,870 2,781Foreign exchange reserve movement (7,877) -
25,602 32,380
* The net movement after amortisation in other intangible assets of $1,089 is a result of the Company becoming the sole shareholder of Kondinin Information Services Pty Ltd in January 2011 – refer to note 25.
(a) Impairment tests for intangible assets
Intangible assets are allocated to the Group’s cash generating units (CGUs) identified according to business segment and country of operation. The recoverable amount of each CGU is based on value-in-use calculations.
2011 2011 Total 2010 2010 TotalAustralia UK Australia UK
$000 $000 $000 $000 $000 $000Goodwill
Conferencing 144 – 144 144 – 144
Publishing (print & online) 13,057 3,061 16,118 13,057 3,061 16,118
Foreign exchange reserve (3,901) (935) (4,836)
9,300 2,126 11,426 13,201 3,061 16,262
Software
Cost 2,575 28 2,603 2,320 – 2,320
Accumulated amortisation (1,512) (28) (1,540) (1,267) – (1,267)
1,063 (0) 1,063 1,053 – 1,053
Purchased mastheads
Mastheads (print & online) 2,324 9,960 12,284 2,324 9,960 12,284
Foreign exchange reserve – (3,041) (3,041) – – –
2,324 6,919 9,243 2,324 9,960 12,284

For the year ending 30 June 2011 l Aspermont Limited ACN 000 375 048 & Controlled Entities
Notes to the FiNaNcial statemeNts
56
201
1 l
Annu
al R
epor
t
other intangible assets
Acquired intangible assets 1,175 – 1,175 – – –
Accumulated amortisation (86) – (86) – – –
Other – 2,781 2,781 – 2,781 2,781
1,089 2,781 3,870 – 2,781 2,781
Total Intangible Assets 13,776 11,826 25,602 16,578 15,802 32,380
(b) Key assumptions used for value-in-use calculations
2011 2010Growth rate * Discount rate Growth
rate * Discount rate
Conferencing 10% 11% 10% 10%
Publishing (print & online) – UK 10% 11% 10% 10%
Publishing (print & online) – Australia 10% 12% 10% 11%
* The average growth rate used to extrapolate revenue cash flows. The average growth rate for expenses was 3%.
The discount rates used reflect specific risks relating to the relevant segments and the countries in which they operate.
These assumptions have been used for the analysis of each CGU within the business segment. Management determined budgeted gross margin based on past performance and its expectations for the future. If any of these assumptions were to change this could affect the carrying amounts of the goodwill and intangible assets.
(c) Impact of possible changes in key assumptions
Sensitivity analysis demonstrates that an increase in the discount rate applied of up to 300 basis points would not have any impact on the carrying value of the intangible assets.
(d) Impairment charge
The Company incurred an impairment charge of $225,699 as a result of becoming the sole shareholder of Kondinin Information Services Pty Ltd (2010: nil).
11. intangible assets (continued)

201
1 l
Annu
al R
epor
t
57
12. trade and other payables
Consolidated2011 2010
Current $000 $000Unsecured liabilities
Trade payables 1,094 865
Sundry creditors and accrued expenses 2,978 2,546
Annual leave payable 395 366
Dividend payable to related parties (see note 19) 233 241
4,700 4,018
Information about the Groups’ exposure to risk is provided in note 20.
Due to the short-term nature of these payables, their carrying value is assumed to approximate their fair value.
13. income in advanceConsolidated
2011 2010$000 $000
Opening balance 2,823 2,188
Movement during the year 2,303 635
5,126 2,823
Income in advance relates to subscription, advertising and event revenue received prior to services rendered.

For the year ending 30 June 2011 l Aspermont Limited ACN 000 375 048 & Controlled Entities
Notes to the FiNaNcial statemeNts
58
201
1 l
Annu
al R
epor
t
14. BorrowingsConsolidated
2011 2010$000 $000
CurrentFinance lease liability 26 25
Secured loans from bank 1,250 2,100
1,276 2,125
Non-CurrentUnsecured liabilities
Loans from related parties (see note 19) 3,035 3,155
secured liabilities
Finance lease liability 189 233
Secured loans from bank 4,625 5,400
7,849 8,788
(a) The carrying amount of the Group’s current and non-current borrowings approximates the fair value.
(b) Lease liabilities are secured by the asset leased.
(c) Loans from related parties are unsecured at interest rates of 9.5%. Repayment of these loans is subject to limitations and subordinated to the ANZ facility debt.
(d) The external party loan is secured by registered company charges and fixed and floating charges over the assets of the consolidated entity. The terms of the current facility expire on 31 December 2011 with the principal to be fully repaid by this time. At the date of this report the company was compliant with its banking and loan facility covenants.
(e) Information about the Groups’ exposure to interest rate risk is provided in note 20.

201
1 l
Annu
al R
epor
t
59
15. ProvisionsConsolidated
2011 2010$000 $000
Non-currentLong service leave entitlements 171 159
16. issued capital
Consolidated
2011 2010
$000 $000
236,710,493 fully paid ordinary shares (2010: 236,710,493) 49,125 49,125
(a) Ordinary sharesAt the beginning of the reporting period 49,125 46,285
Shares issued during the year:
19,351,984 fully paid ordinary shares issued as part of the rights issue and private placement - 2,903
Transaction costs - (63)
At reporting date 49,125 49,125
Ordinary shares participate in dividends and the proceeds on winding up of the parent entity in proportion to the number of shares held. At shareholders’ meetings each ordinary share is entitled to one vote when a poll is called, otherwise each shareholder has one vote on a show of hands.

For the year ending 30 June 2011 l Aspermont Limited ACN 000 375 048 & Controlled Entities
Notes to the FiNaNcial statemeNts
60
201
1 l
Annu
al R
epor
t
(b) Options
The establishment of the Executive Option Plan was approved by the directors in April 2000. The Executive Option Plan is designed to retain and attract skilled and experienced board members and executives and provide them with the motivation to make the company successful. Participation in the plan is at the Board’s discretion.
The exercise price of options issued will be not less than the greater of the minimum value set by the ASX Listing Rules and the weighted average closing sale price of the company’s shares on the ASX over the five days immediately preceding the day of the grant, plus a premium determined by the directors.
When shares are issued pursuant to the exercise of options, the shares will rank equally with all other ordinary shares of the company.
The table below is a summary of options granted under the plan:
Grant Date expiry Dateexercise
Price
Balance at start of the
year Number
Granted during the
year Number
exercised during the
year Number
Forfeited during the
year Number
Balance at end of the
year Number
Vested and exercisable
at end of the year
Number
consolidated and parent entity – 2011
01-Oct-05 30-Sep-10 22.5c 1,000,000 – – 1,000,000 – –
1,000,000 – – 1,000,000 – –
Grant Date expiry Date
exercise Price
Balance at start of the
year Number
Granted during the
year Number
exercised during the
year Number
lapsed during the
year Number
Balance at end of the
year Number
Vested and exercisable
at end of the year
Number
consolidated and parent entity – 2010
01-Jul-05 30-Jun-10 22.5c 9,000,000 – – 9,000,000 – –
01-Oct-05 30-Sep-10 22.5c 1,000,000 – – – 1,000,000 1,000,000
23-Aug-06 23-Aug-09 22.5c 750,000 – – 750,000 – –
02-Mar-07 02-Mar-10 45.0c 150,000 – – 150,000 – –
22-Aug-07 22-Aug-10 50.0c 500,000 – – 500,000 – –
11,400,000 – – 10,400,000 1,000,000 1,000,000
16. issued capital (continued)

201
1 l
Annu
al R
epor
t
61
(c) Reserves
The nature and purpose of the reserves are as follows:
Share based reserveThe share-based payments reserve is used to recognise the grant date fair value of options issued to employees but not yet exercised.
Currency translation reserveExchange differences arising on translation of the foreign controlled entity are taken to the currency translation reserve, as described in note 2. The current year reserve includes a $6.7 million adjustment related to goodwill and masthead intangible assets and related deferred tax liabilities denominated in British Pound Sterling which has declined in value against the Australian dollar. The reserve is recognised in profit or loss when the net investment is disposed of.
Financial assets reserveThe financial assets reserve recognises the gains and losses in fair value for those financial assets not held for trading and wherein an irrevocable election has been made to recognise fair value changes in other comprehensive income.
Asset revaluation reserveThe asset revaluation reserve is used to record increments and decrements on the revaluation of non-current assets, as described in note 2.
Capital profits reserveThe capital profits reserve arose from the consolidation of business interests in 2001.
(d) Capital risk management
The Group’s and parent entity’s objectives when managing capital are to safeguard their ability to continue as a going concern, so that they can continue to provide returns for shareholders and benefits for other stakeholders and to maintain an optimal capital structure to reduce the cost of capital.
In order to maintain or adjust the capital structure, the Group may adjust the amount of dividends paid to shareholders, return capital to shareholders, issue new shares or sell assets to reduce debt.
The Group monitors capital on the basis of the gearing ratio. This ratio is calculated as net debt (borrowings and trade and other payables less cash and cash equivalents) divided by total capital (equity).
The gearing ratios at 30 June 2011 and 2010 were as follows:
16. issued capital (continued)
Consolidated2011 2010$000 $000
Total borrowings 13,825 14,931
Less: cash and cash equivalents (2,718) (774)
Net debt 11,107 14,157
Total equity 15,308 22,526
Total capital 26,415 36,683
Gearing ratio 42% 39%
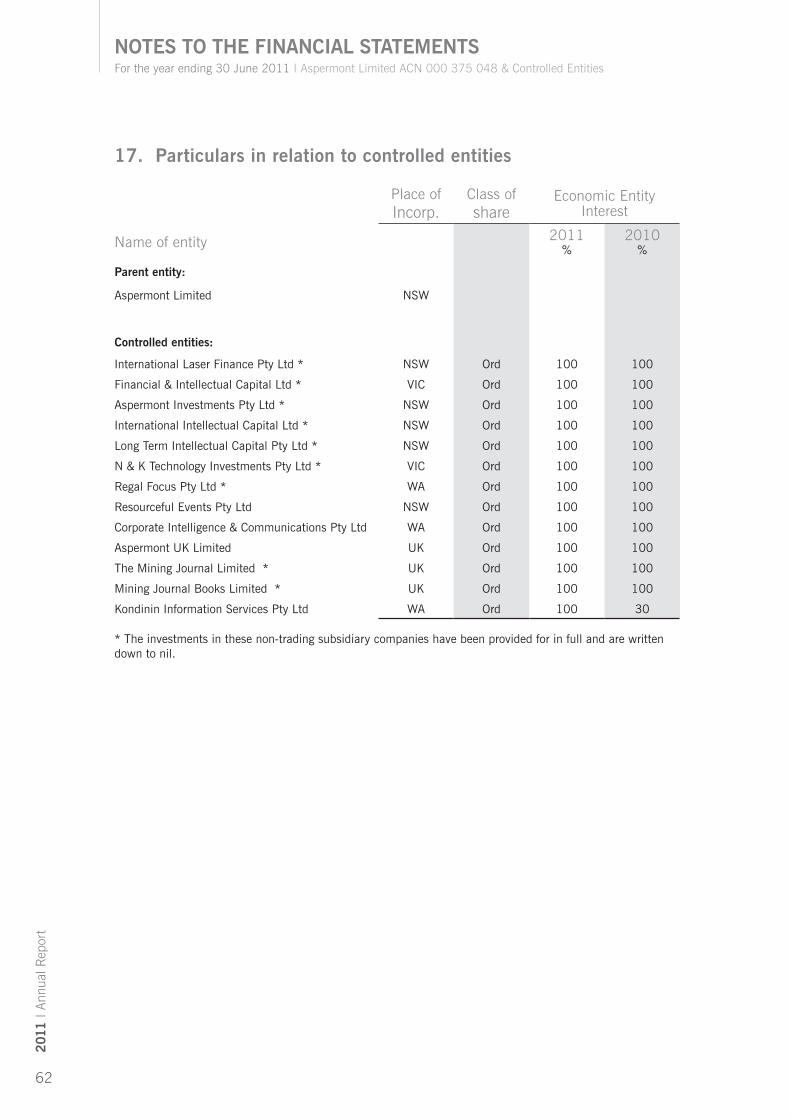
For the year ending 30 June 2011 l Aspermont Limited ACN 000 375 048 & Controlled Entities
Notes to the FiNaNcial statemeNts
62
201
1 l
Annu
al R
epor
t
17. Particulars in relation to controlled entities
Place of Incorp.
Class of share
Economic Entity Interest
Name of entity 2011 %
2010 %
Parent entity:
Aspermont Limited NSW
controlled entities:
International Laser Finance Pty Ltd * NSW Ord 100 100
Financial & Intellectual Capital Ltd * VIC Ord 100 100
Aspermont Investments Pty Ltd * NSW Ord 100 100
International Intellectual Capital Ltd * NSW Ord 100 100
Long Term Intellectual Capital Pty Ltd * NSW Ord 100 100
N & K Technology Investments Pty Ltd * VIC Ord 100 100
Regal Focus Pty Ltd * WA Ord 100 100
Resourceful Events Pty Ltd NSW Ord 100 100
Corporate Intelligence & Communications Pty Ltd WA Ord 100 100
Aspermont UK Limited UK Ord 100 100
The Mining Journal Limited * UK Ord 100 100
Mining Journal Books Limited * UK Ord 100 100
Kondinin Information Services Pty Ltd WA Ord 100 30
* The investments in these non-trading subsidiary companies have been provided for in full and are written down to nil.

201
1 l
Annu
al R
epor
t
63
18. cash flow information
Consolidated
2011 2010
$000 $000
(a) Reconciliation of cash and cash equivalents
Cash at the end of the financial year as shown in the Statement of Cash Flows is reconciled to items in the Statement of Financial Position as follows:
Cash at bank and on deposit 2,718 774
2,718 774
(b) Reconciliation of operating profit/ (loss) after tax to net cash provided by operating activities
Profit/ (loss) after income tax 163 1,076
Non-cash flows in profit/ (loss)
Profit on sale of non current assets (616) (1,072)
Depreciation 480 475
Write-downs to recoverable amount 263 –
Share of (profit)/ loss of associates net of dividends received
63 (306)
Shares consideration received – (48)
Net liabilities from acquisition excluding cash (429) –
Exchange rate movements 1,134 (26)
Unrealised gains on investments 2,277 (592)
Change in assets and liabilities:
(Increase) decrease in accounts receivable (2,128) (542)
(Decrease) increase in creditors & accruals 803 (384)
(Decrease) increase in unearned revenue 2,303 311
Increase (decrease) in provisions current (121) (24)
Increase (decrease) in provisions non-current 12 14
Increase (decrease) in income taxes payable 335 44
Increase (decrease) in deferred taxes payable (2,098) 208
Net cash provided/ (used in) operating activities 2,441 (866)
Non-cash financing for the year included $18,353 (2010: $520,000) of investment securities provided to directors to offset loans outstanding to the Group – as described in note 19.

For the year ending 30 June 2011 l Aspermont Limited ACN 000 375 048 & Controlled Entities
Notes to the FiNaNcial statemeNts
64
201
1 l
Annu
al R
epor
t
19. Key management personnel & related parties disclosures
(a) The following were key management personnel of the consolidated entity during the reporting period and unless otherwise indicated were employed by the parent entity:
DirectorsMr. A.L. Kent Chairman and Executive DirectorMr. L.G. Cross Non-Executive DirectorMr. J. Stark Non-Executive DirectorMr. C. O’Brien Chief Executive Officer (Group) and Executive Director Mr. D. Nizol Chief Executive Officer (UK) and Executive Director Mr. C. Nader Non-Executive Director
executivesMr. J. Detwiler Chief Financial Officer & Company SecretaryMs. T Seeney General Manager Mr. M. Davies Group Strategy and Consulting
(b) Key management personnel compensation
Consolidated2011 2010$000 $000
Short-term employee benefits 2,129 1,523 Post-employment benefits 104 99
2,233 1,622
Detailed remuneration disclosures are provided in the audited remuneration report on pages 11 to 16 of the Directors’ Report.
(c) Options and rights holdings held by directors and executives
The numbers of options over ordinary shares in the company held during the financial year by each director and other key management personnel, including their personally related parties, are set out below:
2011Balance
1/07/2010Received as
Remuneration exercised expiredBalance
30/06/2011DirectorsMr. A.L. Kent and beneficial interests 1,000,000 – – (1,000,000) –
2010 Balance 1/07/2009
Received as Remuneration exercised expired Balance
30/06/2010DirectorsMr. C.J. O’Brien 9,000,000 – – (9,000,000) – Mr. A.L. Kent and beneficial interests 1,000,000 – – – 1,000,000
executivesMr. H. Thong 500,000 – – (500,000) –
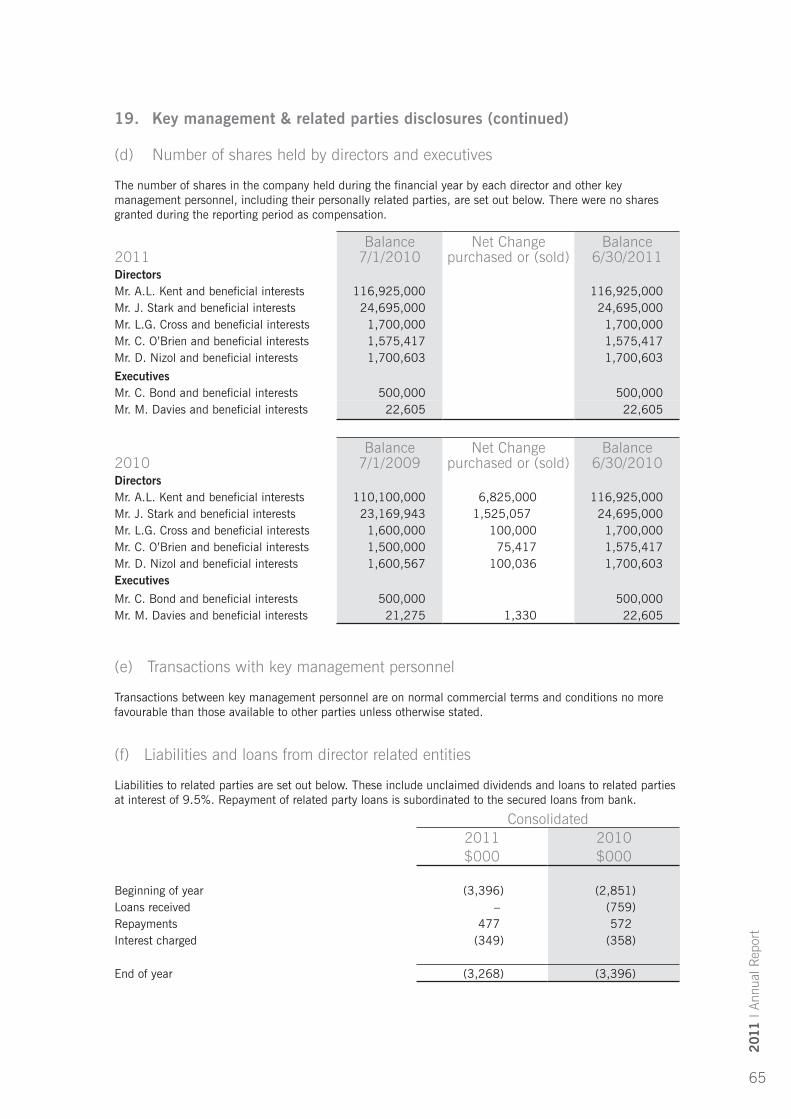
201
1 l
Annu
al R
epor
t
65
(d) Number of shares held by directors and executives
The number of shares in the company held during the financial year by each director and other key management personnel, including their personally related parties, are set out below. There were no shares granted during the reporting period as compensation.
2011Balance
7/1/2010Net Change
purchased or (sold)Balance
6/30/2011DirectorsMr. A.L. Kent and beneficial interests 116,925,000 116,925,000Mr. J. Stark and beneficial interests 24,695,000 24,695,000Mr. L.G. Cross and beneficial interests 1,700,000 1,700,000Mr. C. O’Brien and beneficial interests 1,575,417 1,575,417Mr. D. Nizol and beneficial interests 1,700,603 1,700,603
executivesMr. C. Bond and beneficial interests 500,000 500,000Mr. M. Davies and beneficial interests 22,605 22,605
2010Balance
7/1/2009Net Change
purchased or (sold)Balance
6/30/2010DirectorsMr. A.L. Kent and beneficial interests 110,100,000 6,825,000 116,925,000Mr. J. Stark and beneficial interests 23,169,943 1,525,057 24,695,000Mr. L.G. Cross and beneficial interests 1,600,000 100,000 1,700,000Mr. C. O’Brien and beneficial interests 1,500,000 75,417 1,575,417Mr. D. Nizol and beneficial interests 1,600,567 100,036 1,700,603executives
Mr. C. Bond and beneficial interests 500,000 500,000Mr. M. Davies and beneficial interests 21,275 1,330 22,605
(e) Transactions with key management personnel
Transactions between key management personnel are on normal commercial terms and conditions no more favourable than those available to other parties unless otherwise stated.
(f) Liabilities and loans from director related entities
Liabilities to related parties are set out below. These include unclaimed dividends and loans to related parties at interest of 9.5%. Repayment of related party loans is subordinated to the secured loans from bank.
Consolidated2011 2010$000 $000
Beginning of year (3,396) (2,851)Loans received – (759)Repayments 477 572Interest charged (349) (358)
End of year (3,268) (3,396)
19. Key management & related parties disclosures (continued)

For the year ending 30 June 2011 l Aspermont Limited ACN 000 375 048 & Controlled Entities
Notes to the FiNaNcial statemeNts
66
201
1 l
Annu
al R
epor
t
(g) Other transactions
Consolidated2011 2010$000 $000
The following fees were paid based on normal commercial rates for work performed:Payment to Ileveter Pty Ltd associated with a director, Mr. A.L. Kent, for office accommodation.
462 436
The company re-entered into an office lease agreement with Ileveter Pty Ltd, a company associated with Mr. A.L. Kent, on 31 March 2009. The three year term of the lease is within normal commercial rates and were determined by independent valuers and approved by the independent directors.
(h) Events subsequent to balance date – contingent liability
In September 2010 the Board of Directors of Aspermont Limited formed an independent committee to address a request for compensation that came from two members of the board, Mr. Andrew Kent and Mr. John Stark.
In July 2011 the independent committee reached an agreement to pay Mr. Kent and Mr. Stark $0.6 million each as an in-globo settlement of all claims, subject to shareholder approval in the upcoming annual general meeting. These amounts have not been brought to account in these financial reports. See note 24 for a summary of this matter.
20. Financial risk management
In the normal course of its operations, the consolidated entity is exposed to a variety of financial risks, including market risk, credit risk and liquidity risk.
The consolidated entity’s overall risk management focuses on the unpredictability of financial markets and seeks to minimise potential adverse effects on the financial performance of the business. The consolidated entity does not use derivative financial instruments such as foreign exchange contracts to hedge certain risk exposures. The consolidated entity uses different methods to measure different types of risk to which it is exposed. These methods include sensitivity analysis in the case of interest rate, foreign exchange and other price risks and ageing analysis for credit risk.
Risk management is carried out by the management team within the parameters thought prudent by the Audit & Risk Committee of the Board.
(a) Market risk
(i) Foreign exchange risk
The consolidated entity operates internationally and is exposed to foreign exchange risk arising from various currency exposures, primarily with respect to the United Kingdom pound and to a lesser extent the US dollar and the Euro.
Foreign exchange risk arises from future commercial transactions and recognised assets and liabilities that are denominated in a currency that is not the consolidated entity’s functional currency. The risk is measured using sensitivity analysis and cash flow forecasting.
The consolidated entity has approximately half of its revenues and business activities in United Kingdom pound functional currency entities. The remaining half is in Australian dollar functional currencies. Both the United Kingdom and Australian operations have small amounts of US dollar and Euro revenue and expense
19. Key management & related parties disclosures (continued)

201
1 l
Annu
al R
epor
t
67
transactions in their operations. The United Kingdom pound results are then translated into the Australian dollar for consolidated reporting in Australian dollars.Management has instituted a policy requiring group companies to manage their foreign exchange risk against their functional currency. The Group companies are required to bring significant foreign currency transactions to the attention of the central finance function for evaluation, if they occur.
At 30 June 2011, had the Australian dollar weakened/strengthened by 10% against the United Kingdom pound with all other variables held constant, post-tax profit for the year would have been $177,000 higher/lower (2010: $73,000 higher/lower), mainly as a result of the change in value of the net income earned by entities in the Group with the United Kingdom pound as their functional currency.
Equity would have been $1,930,000 higher/lower (2010: $2,476,000 higher/lower) had the Australian dollar weakened/ strengthened by 10% against the United Kingdom pound arising mainly as a result of the change in value of the net equity of entities in the Group with the United Kingdom pound as their functional currency.
The consolidated entity has revenues and resulting trade and other receivables in non-functional currencies as follows:
USD EUR USD EUR2011 2011 2010 2010$000 $000 $000 $000
Financial assets
Trade and other receivables 282 92 217 92
282 92 217 92
Based on the financial instruments held by the consolidated entity as at the reporting date, the sensitivity of the consolidated entity’s profit/(loss) after tax for the year and equity at the reporting date to movements in the Australian dollar to US dollar and Australian dollar to Euro exchange rates was:
• Had the Australian dollar weakened/strengthened by 5% against the US dollar with all other variables remaining constant, the consolidated entity’s profit after tax would have been $85,000 lower/higher (2010: $92,000 lower/higher).
• Had the Australian dollar weakened/strengthened by 5% against the Euro with all other variables remaining constant, the consolidated entity’s profit after tax would have been $27,000 lower/higher (2010: $39,000 lower/higher).
(ii) Equity price riskThe consolidated entity is exposed to equity securities price risk arising from investments classified on the statement of financial position as financial assets measured at fair value. Investments in equity securities are approved by the Board on a case-by-case basis.
20. Financial risk management (continued)
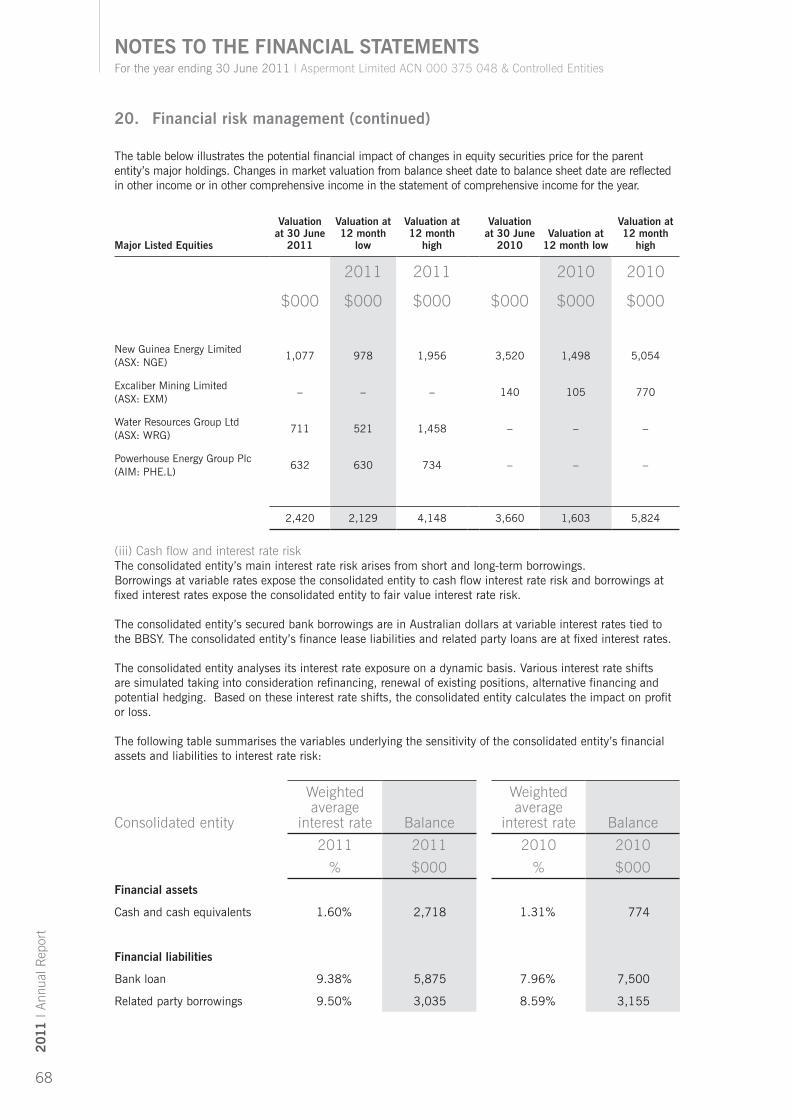
For the year ending 30 June 2011 l Aspermont Limited ACN 000 375 048 & Controlled Entities
Notes to the FiNaNcial statemeNts
68
201
1 l
Annu
al R
epor
t
The table below illustrates the potential financial impact of changes in equity securities price for the parent entity’s major holdings. Changes in market valuation from balance sheet date to balance sheet date are reflected in other income or in other comprehensive income in the statement of comprehensive income for the year.
major listed equities
Valuation at 30 June
2011
Valuation at 12 month
low
Valuation at 12 month
high
Valuation at 30 June
2010Valuation at
12 month low
Valuation at 12 month
high
2011 2011 2010 2010
$000 $000 $000 $000 $000 $000
New Guinea Energy Limited (ASX: NGE)
1,077 978 1,956 3,520 1,498 5,054
Excaliber Mining Limited (ASX: EXM)
– – – 140 105 770
Water Resources Group Ltd (ASX: WRG)
711 521 1,458 – – –
Powerhouse Energy Group Plc (AIM: PHE.L)
632 630 734 – – –
2,420 2,129 4,148 3,660 1,603 5,824
(iii) Cash flow and interest rate risk The consolidated entity’s main interest rate risk arises from short and long-term borrowings. Borrowings at variable rates expose the consolidated entity to cash flow interest rate risk and borrowings at fixed interest rates expose the consolidated entity to fair value interest rate risk.
The consolidated entity’s secured bank borrowings are in Australian dollars at variable interest rates tied to the BBSY. The consolidated entity’s finance lease liabilities and related party loans are at fixed interest rates.
The consolidated entity analyses its interest rate exposure on a dynamic basis. Various interest rate shifts are simulated taking into consideration refinancing, renewal of existing positions, alternative financing and potential hedging. Based on these interest rate shifts, the consolidated entity calculates the impact on profit or loss.
The following table summarises the variables underlying the sensitivity of the consolidated entity’s financial assets and liabilities to interest rate risk:
Consolidated entity
Weighted average
interest rate Balance
Weighted average
interest rate Balance
2011 2011 2010 2010
% $000 % $000Financial assets
Cash and cash equivalents 1.60% 2,718 1.31% 774
Financial liabilities
Bank loan 9.38% 5,875 7.96% 7,500
Related party borrowings 9.50% 3,035 8.59% 3,155
20. Financial risk management (continued)
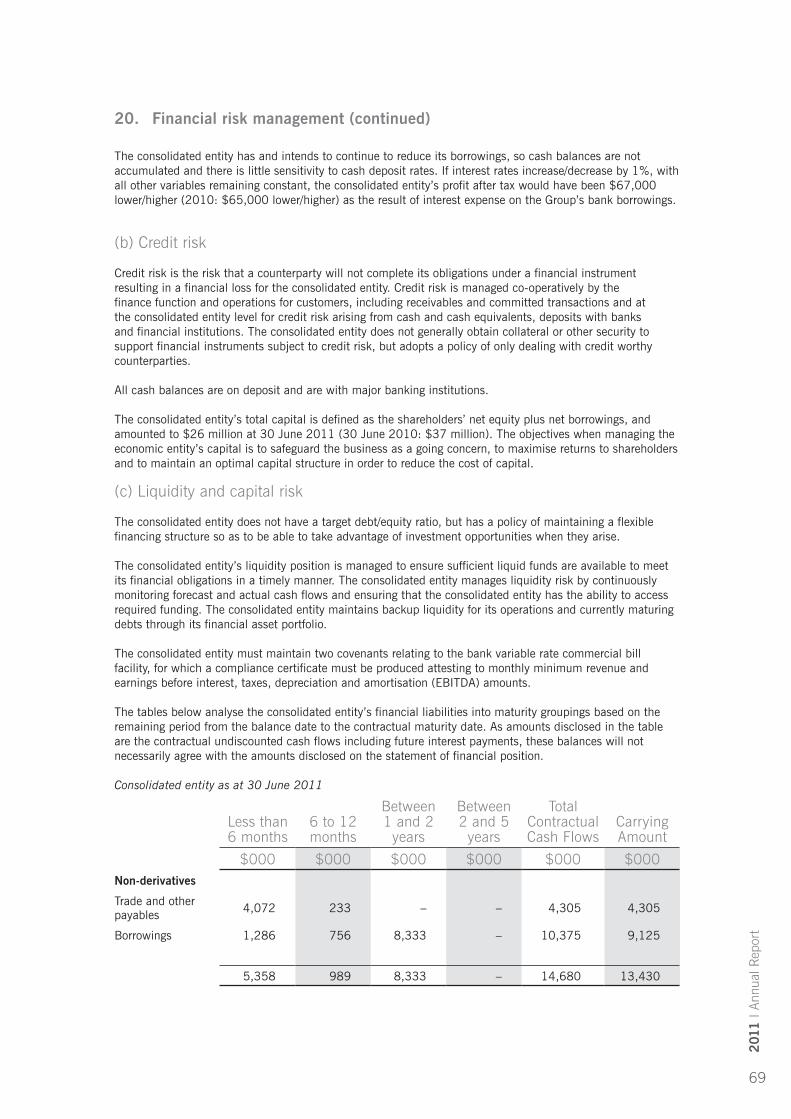
201
1 l
Annu
al R
epor
t
69
The consolidated entity has and intends to continue to reduce its borrowings, so cash balances are not accumulated and there is little sensitivity to cash deposit rates. If interest rates increase/decrease by 1%, with all other variables remaining constant, the consolidated entity’s profit after tax would have been $67,000 lower/higher (2010: $65,000 lower/higher) as the result of interest expense on the Group’s bank borrowings.
(b) Credit risk
Credit risk is the risk that a counterparty will not complete its obligations under a financial instrument resulting in a financial loss for the consolidated entity. Credit risk is managed co-operatively by the finance function and operations for customers, including receivables and committed transactions and at the consolidated entity level for credit risk arising from cash and cash equivalents, deposits with banks and financial institutions. The consolidated entity does not generally obtain collateral or other security to support financial instruments subject to credit risk, but adopts a policy of only dealing with credit worthy counterparties.
All cash balances are on deposit and are with major banking institutions. The consolidated entity’s total capital is defined as the shareholders’ net equity plus net borrowings, and amounted to $26 million at 30 June 2011 (30 June 2010: $37 million). The objectives when managing the economic entity’s capital is to safeguard the business as a going concern, to maximise returns to shareholders and to maintain an optimal capital structure in order to reduce the cost of capital.
(c) Liquidity and capital risk
The consolidated entity does not have a target debt/equity ratio, but has a policy of maintaining a flexible financing structure so as to be able to take advantage of investment opportunities when they arise.
The consolidated entity’s liquidity position is managed to ensure sufficient liquid funds are available to meet its financial obligations in a timely manner. The consolidated entity manages liquidity risk by continuously monitoring forecast and actual cash flows and ensuring that the consolidated entity has the ability to access required funding. The consolidated entity maintains backup liquidity for its operations and currently maturing debts through its financial asset portfolio.
The consolidated entity must maintain two covenants relating to the bank variable rate commercial bill facility, for which a compliance certificate must be produced attesting to monthly minimum revenue and earnings before interest, taxes, depreciation and amortisation (EBITDA) amounts.
The tables below analyse the consolidated entity’s financial liabilities into maturity groupings based on the remaining period from the balance date to the contractual maturity date. As amounts disclosed in the table are the contractual undiscounted cash flows including future interest payments, these balances will not necessarily agree with the amounts disclosed on the statement of financial position.
Consolidated entity as at 30 June 2011
Less than 6 months
6 to 12 months
Between 1 and 2
years
Between 2 and 5
years
Total Contractual Cash Flows
Carrying Amount
$000 $000 $000 $000 $000 $000Non-derivatives
Trade and other payables 4,072 233 – – 4,305 4,305
Borrowings 1,286 756 8,333 – 10,375 9,125
5,358 989 8,333 – 14,680 13,430
20. Financial risk management (continued)

For the year ending 30 June 2011 l Aspermont Limited ACN 000 375 048 & Controlled Entities
Notes to the FiNaNcial statemeNts
70
201
1 l
Annu
al R
epor
t
Consolidated entity as at 30 June 2010
Less than 6 months
6 to 12 months
Between 1 and 2
years
Between 2 and 5
years
Total Contractual Cash Flows
Carrying Amount
$000 $000 $000 $000 $000 $000Non-derivatives
Trade and other payables 2,838 241 – – 3,079 3,079
Borrowings 2,062 1,099 6,100 3,455 12,716 10,913
4,900 1,340 6,100 3,455 15,795 13,992
Interest payments are included in the borrowing amounts above and are projected using interest rates applicable at 30 June 2011 and 2010. As the bank borrowings are subject to variable interest rates, future interest payments are subject to change in line with market changes.
(d) Financial assets and liabilities by category
The financial instruments consist mainly of deposits with banks, accounts receivable and payable, bank loans, related party loans and leases. Investments accounted for using the equity method are excluded from the information provided below:
Consolidated2011 2010$000 $000
Financial assets
Cash and cash equivalents 2,718 774Trade and other receivables 5,163 3,066Listed securities 2,446 3,877Unlisted securities 508 2,732Other 25 35
10,860 10,484Financial liabilitiesTrade and other payables 4,305 3,079Borrowings 9,125 10,913
13,430 13,992
The fair value of cash and cash equivalents, trade and other receivables and trade and other payables is considered to be a reasonable approximation of their fair value due to their short-term nature. The fair value of borrowings as at the reporting date is considered to be a reasonable approximation of their fair value.
20. Financial risk management (continued)

201
1 l
Annu
al R
epor
t
71
21. segment information
The economic entity primarily operates in the media publishing industry as well as in conferencing and investments, within Australia and in the United Kingdom.
segment Reporting Print online conferencing investments
AUS UK AUS UK AUS UK AUS Total
2011 $’000 $’000 $’000 $’000 $’000 $’000 $’000 $’000Revenue
Sales 8,682 5,039 4,316 313 1,434 5,196 – 24,980
Other revenue 52 – 5 – 5 – (1,661) (1,599)
total segment revenue 8,734 5,039 4,321 313 1,439 5,196 (1,661) 23,381
Result
Segment result 1,810 1,914 1,223 (47) 150 2,438 (1,661) 5,827
assets and liabilities
segment assets 16,709 3,324 614 (82) 6,930 4,235 2,766 34,496
Corporate assets 3,435
total assets 37,931
segment liabilities 6,376 1,999 3,170 124 849 2,060 551 15,129
Corporate liabilities 7,494
total liabilities 22,623
other segment information
Investment in associates (note 9) 329 – – – – – – 329
Share of net profits of associates (note 9) (63) – – – – – – (63)
Acquisitions property, plant & equipment 101 6 47 – 3 5 – 162
Depreciation and amortisation expense 73 8 196 94 3 8 – 382

For the year ending 30 June 2011 l Aspermont Limited ACN 000 375 048 & Controlled Entities
Notes to the FiNaNcial statemeNts
72
201
1 l
Annu
al R
epor
t
segment Reporting Print online conferencing investments
AUS UK AUS UK AUS UK AUS Total
2010 $’000 $’000 $’000 $’000 $’000 $’000 $’000 $’000Revenue
Sales 5,963 6,050 3,304 254 1,368 3,966 – 20,905
Other revenue 34 – 46 – 2 – 1,860 1,942
total segment revenue 5,997 6,050 3,350 254 1,370 3,966 1,860 22,847
Result
Segment result 853 2,640 225 (145) 181 1,461 1,860 7,075
assets and liabilities
segment assets 22,735 3,576 3,041 (197) 6,471 1,979 6,608 44,213
Corporate assets 1,565
total assets 45,778
segment liabilities 4,413 1,603 2,445 67 581 1,051 551 10,711
Corporate liabilities 12,541
total liabilities 23,252
other segment information
Investment in associates (note 9) 1,783 – – – – – – 1,783
Share of net profits of associates (note 9) (35) – – – 341 – – 306
Acquisitions property, plant & equipment – 11 – – 5 7 – 23
Depreciation and amortisation expense 62 12 261 112 20 8 – 475
21. segment information (continued)

201
1 l
Annu
al R
epor
t
73
Reconciliation of reportable segment profit or loss:
2011 2010$000 $000
Total profit for reportable segments 5,827 7,075
Other income 97 120
Overheads (4,765) (4,423)
Interest (932) (1,038)
Consolidated profit/(loss) before income tax from continuing operations 227 1,734
Description of segments:Operating segments are reported in a manner consistent with the internal reporting provided to the chief operating decision maker. The chief operating decision maker has been identified as the Chief Executive Officer who makes strategic decisions.
The segments derive revenue from the following products and services:
• The print division derives subscription and advertising revenues from traditional print publications across a number of trade sectors including mining, construction, energy and the resources sector.
• The internet media segment develops and maintains web sites and daily news services covering various sectors including mining, energy and construction. Revenue is derived from subscription, advertising and sponsorships.
• The conferencing division derives revenues from running events and holding conferences in various locations and across a number of sectors.
• The investment division receives revenue from advisory fees and general investment income including fair value gains/losses on share investments held.
These segments are the basis on which the Group reports its segment information.
Segment revenue and expenses:Segment revenue and expenses are accounted for separately and are directly attributable to the segments.
Segment assets and liabilities:Segment assets include all assets used by a segment and consist principally of receivables and property, plant and equipment, net of allowances and accumulated depreciation and amortisation. While most such assets can be directly attributed to individual segments, the carrying amount of certain assets used jointly by two or more segments is allocated to the segments on a reasonable basis. Segment liabilities consist principally of accounts payable, wages and accrued expenses. Segment assets and liabilities do not include deferred income taxes.
Inter-segment transfers:There are no significant inter-segment transactions at this time.
21. Segment information (continued)

For the year ending 30 June 2011 l Aspermont Limited ACN 000 375 048 & Controlled Entities
Notes to the FiNaNcial statemeNts
74
201
1 l
Annu
al R
epor
t
22. earnings/ (loss) per share (ePs)
Consolidated
2011 2010
(a) Basic earnings/ (loss) per share (cents per share) 0.07 0.46
(b) Diluted earnings/ (loss) per share (cents per share) 0.07 0.46
(c) Earnings/ (loss) used in calculating earnings per share
Profit/ (loss) attributable to the ordinary equity holders of the company used in calculating basic earnings per share
163 1,076
Profit/ (loss) attributable to the ordinary equity holders of the company used in calculating diluted earnings per share
163 1,076
(d) Weighted average number of shares used as the denominator
Weighted average number of ordinary shares outstanding during the year used in calculation of basic and diluted EPS
236,710,493 233,281,096
Options – –
Weighted average number of ordinary shares outstanding during the year used in calculation of diluted EPS
236,710,493 233,281,096
Options granted to employees under the employee option scheme are considered to be potential ordinary shares and are included in the determination of diluted earnings per share to the extent they are dilutive. Details relating to the options are set out in note 16.

201
1 l
Annu
al R
epor
t
75
23. capital and leasing commitmentsThe operating lease commitments relate to the following:
Consolidated2011 2010$000 $000
Finance lease commitments
Payable – Minimum lease payments
Not later than 12 months 35 38
Between 12 months and 5 years 83 117
118 155
Minimum lease payments 118 155
Less future lease charges (11) (23)
Present value of minimum lease payments 107 132
operating lease commitments
Non-cancellable operating leases contracted for but not capitalised in the financial statements:
Not later than 12 months 727 730
Between 12 months and 5 years 1,104 824
1,831 1,554
A property lease at 613-619 Wellington Street, Perth, Western Australia which is a non-cancellable lease with a three-year term that commenced in April 2009.
A property lease at Albert House, 1 Singer Street, London, United Kingdom which is a non-cancellable lease with a nine year term that commenced in July 2004.
24. after balance date events
In September 2010 the Board of Directors of Aspermont Limited formed an independent committee to address a request for compensation that came from two members of the Board, Mr. Andrew Kent and Mr. John Stark.
The independent committee has reviewed and assessed transactions that occurred in 2006 with respect to investments made by Aspermont in debt and equity instruments of Mining Communications Limited (“MCL”). Aspermont made investments in MCL over a period of time beginning in January 2006 that led to the complete acquisition of MCL in June 2008. Some of these investments were made with financial support from Mr. Kent and Mr. Stark.
In July 2011 the independent committee reached an agreement to pay Mr. Kent and Mr. Stark $0.6 million each as an in-globo settlement of all claims, subject to shareholder approval in the upcoming annual general meeting. These amounts have not been brought to account in these financial reports.

For the year ending 30 June 2011 l Aspermont Limited ACN 000 375 048 & Controlled Entities
Notes to the FiNaNcial statemeNts
76
201
1 l
Annu
al R
epor
t
25. Business combinations(a) Summary of acquisition
On 17 January 2011 the parent entity became the sole shareholder of Kondinin Information Services Pty Ltd (“KIS”). This occurred when KIS repurchased all of the shares held by Grain Growers Limited (“GGL”). Previous to this transaction, the parent entity was a 30% shareholder in KIS and GGL was a 70% shareholder.
This transaction added revenue of $1,220,000 and a net loss of $203,000 to the Group’s results in the year. Transaction costs were not significant.
Using the valuation implied by the repurchase of shares from GGL, the parent entity recorded an impairment of $225,699 on the value of its investment in KIS. This impairment left a remaining investment balance in KIS of $1,203,491. This investment was funded with cash in the previous financial years:
Impairment of Group investment
in KIS$’000
Value of KIS investment at January 2011 1,429Valuation of KIS based on GGA share buy-back 1,203Impairment of KIS investment 226
The net investment in KIS of $1,203,491 was paid in cash in 2009 and 2010:
$’000
(b) Purchase consideration:Cash paid 1,203
Total purchase consideration 1,203
Fair value of net identifiable assets acquired – note (c) below
28
Customer/Membership base 831 Trademarks 344
1,203
Consolidated2011$’000
Outflow of cash to acquire subsidiary
Cash consideration paid * – Less: Cash balance acquired 458 Inflow of cash 458
* $1,429,190 cash paid in prior years
The parent entity will amortise the Customer / Membership base on a straight line basis over an estimated useful life of five years and the Trademarks over an estimated useful life of ten years. This resulted in amortisation expense of $86,000 in the current fiscal year.

201
1 l
Annu
al R
epor
t
77
(c) Assets and liabilities acquired
The assets and liabilities arising from the acquisition are as follows:
Fair Value – Provisional Net
Assets Purchased$’000
Cash 458 Trade receivables 417 Other current assets 210 Property, plant & equipment 82 Trade payables (255)Income in advance (681)Employee provisions (203)Net assets 28
There were no business combinations in the 2010 fiscal year.
25. Business combinations (continued)

78
201
1 l
Annu
al R
epor
t
In the directors’ opinion:
1. the financial statements and notes set out on pages 22 to 70 and the remuneration report set out on pages 11 to 16 of the Directors’ report are in accordance with the Corporations Act 2001, including:
(a) complying with Australian Accounting Standards, the Corporations Regulation 2001; and
(b) giving a true and fair view of the consolidated entity’s financial position as at 30 June 2011 and of its performance for the financial year ended on that date; and
2. there are reasonable grounds to believe that the company will be able to pay its debts as and when they become due and payable; and
3. at the date of this declaration, there are reasonable grounds to believe that the members of the extended closed group identified in note 17 will be able to meet any obligations or liabilities to which they are, or may become liable.
Note 2 confirms that the financial statements also comply with International Financial Reporting Standards as issued by the International Accounting Standards Board.
The directors have been given the declarations by the chief executive officer and chief financial officer required by section 295A of the Corporations Act 2001.
This declaration is made in accordance with a resolution of the directors.
C. O’Brien Director
Perth31 August 2011
DiRectoRs’ DeclaRatioN


201
1 l
Annu
al R
epor
t
81
The following additional information is required by the Australian Securities Exchange Limited in respect of listed companies:
a) Shareholding
Ordinary Share Capital
236,710,493 (2010: 236,710,493) shares are held by 370 (2010: 383) individual holders. All issued ordinary shares carry one vote per share.
Distribution of Shareholders Number
Ordinary shares
Category (size of holding) 2011 2010
1 – 1,000 45 46
1,001 – 5,000 30 32
5,001 – 10,000 81 81
10,001 – 100,000 112 124
100,001 – and over 102 100
370 383
The number of shareholdings held with less than marketable parcel is 79 (2010: 68).
b) Share Options (Unquoted)
Number of Options Number of Holders Exercise Price Date of Expiry
0 0 0
c) Company Secretary
The name of the Company Secretary is Mr. John R. Detwiler.
d) Principal Registered Office
The address of the principal registered office in Australia is:
613-619 Wellington Street, Perth, WA 6000Ph +61 8 6263 9100
e) Register of Securities
The register of securities is held at the following address:
Advanced Share Registry150 Stirling Highway, Nedlands, WA 6009
As at 15 August 2011 l Aspermont Limited ACN 000 375 048 & Controlled Entities
aDDitiONal iNfOrmatiON fOr liSteD publiC COmpaNieS

As at 15 August 2011 l Aspermont Limited ACN 000 375 048 & Controlled Entities
aDDitiONal iNfOrmatiON fOr liSteD publiC COmpaNieS
82
201
1 l
Annu
al R
epor
t
f) Stock Exchange Listing
Quotation has been granted for all of the ordinary shares of the company on all Member Exchanges of the Australian Securities Exchange Limited.
g) Substantial Shareholders
NameNumber of Ordinary
fully paid shares held% Held of Issued Ordinary Capital
1 Mr. Andrew Kent and beneficial interests 116,925,000 49.40%
2 Mr. John Stark and beneficial interests 24,695,000 10.43%
3 Cannavo Investments Pty Ltd 11,200,000 4.73%
h) 20 Largest Shareholders – Ordinary shares
Number of Ordinary fully paid shares held
% Held of Issued Ordinary Capital
Name
1 Drysdale Investments Limited 107,312,500 45.33%
2 Allan Dale Real Estate Pty Ltd 13,735,000 5.80%
3 Cannavo Investments Pty Ltd 11,200,000 4.73%
4 Annis Trading Limited 9,562,500 4.04%
5 Glacier Media Inc 8,637,317 3.65%
6 National Nominees Limited 5,201,010 2.20%
7 A & C Gal Investments Pty Limited 5,041,875 2.13%
8 Mr Alan Cowen 5,032,918 2.13%
9 Allan Dale Real Estate Pty Ltd 5,000,000 2.11%
10 Mr John Stark and Mrs Julie Stark 4,360,000 1.84%
11 Mr Robert Miller 3,481,353 1.47%
12 Chepan Pty Ltd 3,210,000 1.36%
13 Mr Rhoderic Charles Whyte 3,000,000 1.27%
14 Yarandi Investments Pty Ltd 2,473,158 1.04%
15 Mr Robert Barrowman 2,256,688 0.95%
16 Dr Carole Anne Jones 2,000,000 0.84%
17 B F A Pty Ltd 1,950,000 0.82%
18 Mr David Nizol 1,700,603 0.72%
19 Mr Thomas George Klinger 1,637,241 0.69%
20 Peterborough Nominees Pty Ltd 1,593,750 0.67%
198,385,913 83.79%

201
1 l
Annu
al R
epor
t
83
NOTES

84
201
1 l
Annu
al R
epor
t
NOTES


UK/eUrope/americas
aspermont United Kingdom
Albert House, 1 Singer StLondon, United Kingdom, EC2A 4BQ
t l +44 (0) 20 7216 6060F l +44 (0) 20 7216 6050
www.mining-journal.com
aUstraLia
pertH Head oFFice
613-619 Wellington StPErtH, Western Australia 6000
t l +61 8 6263 9100F l +61 8 6263 9148
www.aspermont.com
sydney
Level 4, 333 George StSYdnEY, new South Wales 2000
t l +61 2 9279 2222F l +61 2 9279 2477
www.resourcefulevents.com