annual report - bou.or.ug · 2014/2015 annual report vi ... kabale currency centre plot 137 : ......
TRANSCRIPT
Annual Report 2014/2015


ANNUAL REPORT 2014/2015
i

2014/2015 ANNUAL REPORT
ii
TABLE OF CONTENTS ............................................................................................................................................................................................................. II LIST OF FIGURES ..................................................................................................................................................................................................................... III LIST OF TABLES ....................................................................................................................................................................................................................... IV ABBREVIATIONS ...................................................................................................................................................................................................................... V REGISTERED ADDRESSES .................................................................................................................................................................................................... VII 1 GOVERNOR’S FOREWORD ........................................................................................................................................................................................ 1 2 BOARD OF DIRECTORS AND MANAGEMENT STRUCTURE............................................................................................................................ 2 3 CORPORATE GOVERNANCE ..................................................................................................................................................................................... 4 4 RISK MANAGEMENT OPERATIONS ..................................................................................................................................................................... 12 5 INTERNAL AUDIT....................................................................................................................................................................................................... 14 6 ECONOMIC DEVELOPMENTS AND PROSPECTS ............................................................................................................................................. 15 7 FINANCIAL MARKETS .............................................................................................................................................................................................. 33 8 FINANCIAL SECTOR SUPERVISION ..................................................................................................................................................................... 43 9 PETROLEUM REVENUE INVESTMENT FUND .................................................................................................................................................... 45 10 INFORMATION TECHNOLOGY DEVELOPMENTS ........................................................................................................................................... 47 11 BANKING, CURRENCY AND PAYMENT SYSTEMS ........................................................................................................................................... 48 12 AGRICULTURAL CREDIT FACILITY ........................................................................................................................................................................ 52 13 FINANCIAL RESULTS FOR THE YEAR ENDED 30 JUNE 2015 ....................................................................................................................... 55 14 DIRECTORS’ REPORT ................................................................................................................................................................................................ 64 15 STATEMENT OF THE DIRECTORS’ RESPONSIBILITIES ................................................................................................................................... 66 16 REPORT OF THE AUDITOR GENERAL TO PARLIAMENT ............................................................................................................................... 67 17 FINANCIAL STATEMENTS ....................................................................................................................................................................................... 69 18 NOTES TO THE FINANCIAL STATEMENTS FOR THE YEAR ENDED 30 JUNE 2015 ............................................................................... 73 19 LIST OF APPENDICES ............................................................................................................................................................................................. 141
TABLE OF CONTENTS
ANNUAL REPORT 2014/2015
iii
Figure 1: Commodity price developments ...................................................................................................................................... 17 Figure 2: Growth in volume of world merchandise trade and real GDP ............................................................................. 19 Figure 3: Central Bank Rate and 7-day Interbank Money Market Rate ............................................................................... 21 Figure 4: Government Bond Yield Curve .......................................................................................................................................... 22 Figure 5: Lending Interest Rates by Sector ...................................................................................................................................... 23 Figure 6: Growth in Commercial Banks Credit to the Private Sector .................................................................................... 24 Figure 7: Annual Percentage growth of Monetary Aggregates .............................................................................................. 25 Figure 8: Real Economic Growth .......................................................................................................................................................... 27 Figure 9: Volatility of Selected Currencies ....................................................................................................................................... 32 Figure 10: Real Effective Exchange Rate and Components ......................................................................................................... 32 Figure 11 Treasury Securities Outstanding Stock by Holder Category as at June 30, 2015 ........................................ 37 Figure 12 Government Securities Yield Curve Comparisons: June 2014 vs June 2015 .................................................. 38 Figure 13: Secondary Market Trades of Government Securities ............................................................................................... 39 Figure 14: Percentages of Areas funded as at 30 June 2015 (disbursed and committed funds) ................................ 54 Figure 15: Areas funded under the ACF ............................................................................................................................................. 54 Figure 16: Distribution of total interest income ............................................................................................................................... 56 Figure 17: Interest rate trends for the year ended 30 June 2015 ............................................................................................. 57 Figure 18: Exchange rate trends for the year ended 30 June 2015 ......................................................................................... 57 Figure 19: Distribution of actual expenditure ................................................................................................................................... 59
LIST OF FIGURES
2014/2015 ANNUAL REPORT
iv
Table 1: Attendance of the Board and Board Committees ....................................................................................................... 7 Table 2: Global Economic Performance and Outlook ................................................................................................................ 16 Table 3: Merchandise trade growth (volume) ............................................................................................................................... 19 Table 4: Commercial Banks’ Interest Rates..................................................................................................................................... 22 Table 5: Sectoral Distribution of Private Sector Credit .............................................................................................................. 24 Table 6: Demand for and Supply of Loans ..................................................................................................................................... 25 Table 7: Consumer Price Inflation ...................................................................................................................................................... 26 Table 8: Fiscal Operations ...................................................................................................................................................................... 28 Table 9: Public Debt Indicators ........................................................................................................................................................... 29 Table 10: Balance of Payments .............................................................................................................................................................. 30 Table 11: Winners for Primary Dealers in Uganda Government Securities since 2005 ................................................. 41 Table 12: Comparative transaction volumes and values for RTGS for FY 2014/15 and 2013/14 .............................. 49 Table 13: Ugandan shilling transaction volumes and values for FY 2014/15 .................................................................... 50 Table 14: Kenyan shilling transaction volumes and values for FY 2014/15 ........................................................................ 50 Table 15: Tanzanian shilling transaction volumes and values for FY 2014/15 .................................................................. 50 Table 16: Rwandan franc transaction volumes and values for FY 2014/15 ........................................................................ 50 Table 17: REPSS transaction volumes and values for FY 2014/15 .......................................................................................... 51 Table 18: Comparative transaction volumes and values for ECS for FY 2013/14 and 2014/15 ................................. 51 Table 19: Actual expenditure according to core functions of the Bank ............................................................................... 58 Table 20: Income and Expenditure trends over a period of 5 years ...................................................................................... 61 Table 21: Capital expenditure for the year ended 30 June 2015 ............................................................................................ 62 Table 22 Credit Risk Profile ................................................................................................................................................................. 123 Table 23 Credit risk exposure by credit ratings FY 2014/15 ................................................................................................. 124 Table 24 Credit risk exposure by credit ratings FY 2013/14 ................................................................................................. 125 Table 25 Credit risk exposure by sector FY2014/15 ................................................................................................................. 126 Table 26 Credit risk exposure by sector FY2013/14 ................................................................................................................. 126 Table 27 Credit risk exposure by geographical location FY 2014/15 ................................................................................ 126 Table 28 Credit risk exposure by geographical location FY 2013/14 ................................................................................ 127 Table 29 Liquidity profile 2014/15 ................................................................................................................................................... 127 Table 30 Liquidity profile 2013/14 ................................................................................................................................................... 128 Table 31 Interest risk analysis 2014/15 .......................................................................................................................................... 129 Table 32 Interest risk analysis 2013/14 .......................................................................................................................................... 129 Table 33 Interest risk sensitivity analysis FY 2014/15 .............................................................................................................. 130 Table 34 Interest risk sensitivity analysis FY 2013/14 .............................................................................................................. 131 Table 35 Currency risk profile 2014/15 .......................................................................................................................................... 132 Table 36 Currency risk profile 2013/14 .......................................................................................................................................... 133 Table 37 Currency Risk Sensitivity analysis FY 2014/15 .......................................................................................................... 134 Table 38 Currency Risk Sensitivity analysis FY 2013/14 .......................................................................................................... 134 Table 39: Fair value hierarchy as at 30 June 2015 ...................................................................................................................... 136 Table 40: Fair value hierarchy as at 30 June 2014 ...................................................................................................................... 137
LIST OF TABLES
ANNUAL REPORT 2014/2015
v
AfDB African Development Bank AFRACA African Rural and Agricultural Credit Association AGCB Audit and Governance Committee of the Board ALSI All Share Index AML Anti-Money Laundering ATM Automated Teller Machine Bank The Central Bank of Uganda BIS Bank for International Settlement BOP Balance of Payments BOU Bank of Uganda BRICS Brazil, Russia, India, China & South Africa BSA Bank Supervision Application CBR Central Bank Rate CGT Capital Gains Tax CIC Currency In Circulation COMESA Common Market for Eastern and Southern Africa CPCB Capital Projects Committee of the Board CPI Consumer Price Index CRB Credit Reference Bureau CSD Central Securities Depository DBS Defined Benefits Scheme DFS Development Finance Schemes DPF Deposit Protection Fund DRS Disaster Recovery Site EAC East African Community EAMU East African Monetary Union EAPS East African Payments System ECCS Electronic Cheque Clearing System ECGS Export Credit Guarantee Scheme EFT Electronic Funds Transfer EFTPOS Electronic Funds Transfer at Point of Sale EIB European Investment Bank EIR Effective Interest Rate EPA Economic Partnership Agreement ERS Export Refinance Scheme ERTRF Energy for Rural Transformation Refinance Scheme ESAF Enhanced Structural Adjustment Fund EU European Union ExCOM Executive Committee FCB Finance Committee of the Board FDEI Foreign Direct Equity Investment FDI Foreign Direct Investment FERMS Foreign Exchange Reserve Management System FIS Financial Institutions Statute FMDP Financial Markets Development Programme FPC Foreign Private Capital FY Financial Year
ABBREVIATIONS

2014/2015 ANNUAL REPORT
vi
GDP Gross Domestic Product GDS Gross Domestic Savings HIPC Highly Indebted Poor Countries HRRCB Human Resource and Remuneration Committee of the Board IAS International Accounting Standards IDA International Development Agency IFAD International Fund for Agricultural Development IFEM Inter-bank Foreign Exchange Market IFRS International Financial Reporting Standards IMF International Monetary Fund IT Information Technology ITL Inflation Targeting Lite LAN Local Area Network MAC Monetary Affairs Committee MPC Monetary Policy Committee MDI Microfinance Deposit Taking Institutions MFHP Monetary and Fiscal policy Harmonization Program MOFPED Ministry of Finance Planning & Economic Development NBFI Non-Bank Financial Institutions NDA Net Domestic Assets NEER Nominal Effective Exchange Rate NIC National Insurance Corporation NFA Net Foreign Assets NPV Net Present Value NSSF National Social Security Fund OMO Open Market Operations PD Primary Dealers PRIR Petroleum Revenue Investment Reserve PSI Policy Support Instrument PSIS Private Sector Investment Survey PSPC Payment System Policy Committee RMC Risk Management Committee REER Real Effective Exchange Rate Repo Repurchase Order Agreement RTGS Real Time Gross Settlement System SDR Special Drawing Rights SPF Special Provident Fund SWIFT Society for Worldwide Inter-bank Financial Telecommunication TSA Treasury Single Account UBOS Uganda Bureau of Statistics UCF Uganda Consolidated Fund UIA Uganda Investment Authority UNIS Uganda National Inter-bank Settlement System USE Uganda Securities Exchange WEO World Economic Outlook WTO World Trade Organization

ANNUAL REPORT 2014/2015
vii
REGISTERED ADDRESSES
PRINCIPAL PLACE OF BUSINESS & REGISTERED OFFICE
AUDITORS
Plot 37-45 Kampala Road P O Box 7120 Kampala Uganda
The Auditor General Office of the Auditor General P O Box 7083 Kampala Uganda
SOLICITORS DELEGATED AUDITORS MMAKS P O Box 7166 Kampala Uganda
Ernst & Young EY House 18, Clement Hill Road Shimoni Office Village P O Box 7215 Kampala
REGIONAL BRANCHES CURRENCY CENTRES Gulu Regional Branch Plot 7/9 Airfield Road P O Box 46 Gulu
Arua Currency Centre Plot 27/29 Avenue Road P O Box 152 Arua
Jinja Regional Branch Plot 3 Busoga Square P O Box 35 Jinja
Fort Portal Currency Centre Plot 1 Kaboyo Road P O Box 562 Fort Portal
Mbale Regional Branch Plot 34-38/40 Cathedral Avenue P O Box 2402 Mbale
Kabale Currency Centre Plot 137 Kisoro Road P O Box 966 Kabale
Mbarara Regional Branch Plot 2 High Street P O Box 1421 Mbarara
Masaka Currency Centre Plot 41 Kampala Road P O Box 1567 Masaka


ANNUAL REPORT 2014/2015
1
The performance of the Ugandan economy was relatively robust in 2014/15. Real Gross Domestic Product expanded by 5.0 percent from 4.7 percent in 2013/14 in the previous fiscal year.
Consumer price inflation remained subdued and below Bank of Uganda’s (BOU) medium-term target of 5.0 percent, with annual headline and core inflation averaging 2.7 percent and 3.3 percent, respectively in 2014/15. The low inflation is largely attributable to the low global commodity prices, declining domestic food prices and low global inflation. Services inflation, a proxy for “non-traded goods” inflation however was more elevated, averaging about 5.0 percent. The low inflation enabled the BOU to maintain the Central Bank Rate (CBR) in the range of 11 to 13 percent throughout the year.
The external position weakened with the current account deficit excluding official grants deteriorating to 11 percent of GDP
compared to 8.8 percent in 2013/14. The deterioration of the current account deficit was largely driven by the services deficit, which deteriorated to US$ 731 million in 2014/15 from USD 323 million in 2013/14 mainly on account of higher payments of government services related to infrastructure projects, particularly Karuma and Isimba hydro power projects. The overall balance of payments was a deficit of USD 378 million. The stock of reserves as at end June 2015 amounted to an equivalent of 4.1 months of import cover.
The banking system remained in a sound financial condition, and was well capitalised with most of the banks meeting the minimum capital adequacy requirements. The ratio of non-performing loans to total gross loans declined from 6.2 percent in March 2014 to 4.0 percent in June 2015. Nevertheless, BOU invoked the provisions of the Financial Institutions Act and resolved Global Trust Bank Ltd through a Purchase of Assets and Assumption of Liabilities Agreement with DFCU Bank Limited.
Prof Emmanuel Tumusiime-Mutebile
Governor
1 GOVERNOR’S FOREWORD

2014/2015 ANNUAL REPORT
2
Prof. Emmanuel Tumusiime-Mutebile Governor, Chairman of the Board of Directors
Louis Kasekende (PhD) Deputy Governor, Alternate Chairman of the Board, member of CPCB, HRRCB and FCB
Mr. C. Manyindo Kassami Chairman of the HRRCB, member of the FCB and AGCB.
William S. Kalema (PhD) Chaiman of FCB. Member of AGCB and CPCB
Mr. James Kahoza Chairman of the AGCB Member of : FCB, CPCB and HRRCB.
Mr. Ibrahim K. Kabanda Member of : FCB, AGCB,CPCB and HRRCB
Ms Judy Obitre-Gama Chairperson of CPCB Member of AGCB and HRRCB
BOARD OF DIRECTORS 2.1
2 BOARD OF DIRECTORS AND MANAGEMENT STRUCTURE
ANNUAL REPORT 2014/2015
3
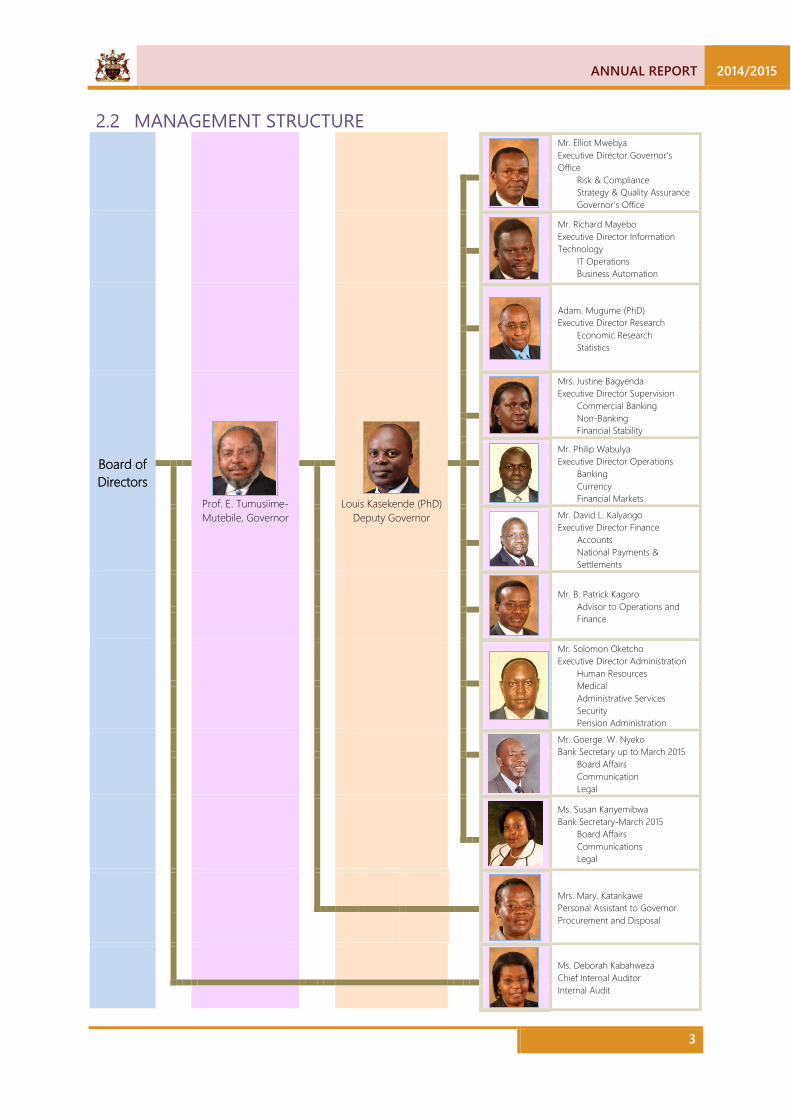
MANAGEMENT STRUCTURE 2.2
Mr. Elliot Mwebya Executive Director Governor’s Office
Risk & Compliance Strategy & Quality Assurance Governor’s Office
Mr. Richard Mayebo Executive Director Information Technology
IT Operations Business Automation
Adam. Mugume (PhD) Executive Director Research
Economic Research Statistics
Board of Directors
Prof. E. Tumusiime-Mutebile, Governor
Louis Kasekende (PhD)
Deputy Governor
Mrs. Justine Bagyenda Executive Director Supervision
Commercial Banking Non-Banking Financial Stability
Mr. Philip Wabulya Executive Director Operations
Banking Currency Financial Markets
Mr. David L. Kalyango Executive Director Finance
Accounts National Payments & Settlements
Mr. B. Patrick Kagoro Advisor to Operations and Finance
Mr. Solomon Oketcho Executive Director Administration
Human Resources Medical Administrative Services Security Pension Administration
Mr. Goerge. W. Nyeko Bank Secretary up to March 2015
Board Affairs Communication Legal
Ms. Susan Kanyemibwa Bank Secretary-March 2015
Board Affairs Communications Legal
Mrs. Mary. Katarikawe Personal Assistant to Governor Procurement and Disposal
Ms. Deborah Kabahweza Chief Internal Auditor Internal Audit

2014/2015 ANNUAL REPORT
4
REGULATORY FRAMEWORK 3.1The Bank of Uganda derives its mandate as the Central Bank of Uganda from the Constitution of the Republic of Uganda, 1995. Article 161 of the Constitution vests the authority of the Bank in the Board of Directors. The functions of Bank of Uganda are spelt out in Article 162 of the Constitution and Section 4 of the Bank of Uganda Act.
CORPORATE GOVERNANCE STATEMENT 3.2Bank of Uganda upholds, and is committed to international best practice and highest standards of business integrity, ethical values and governance. The Board of Directors of the Bank recognizes the responsibility of the Bank to conduct its affairs with prudence, and to be accountable by ensuring that the Bank complies with the law and business ethics, thereby safeguarding the interests of stakeholders. This is achieved through checks and balances and upholding the values of accountability, commitment, ethical behaviour, excellence, transparency and teamwork.
In its efforts to foster price stability and a sound financial system, Bank of Uganda carries out its work through Board and Management Committees. The Bank’s compliance with the principles of good corporate governance is reflected through a properly constituted governance structure comprised of the Board of Directors, Board Committees and Management Sub-Committees. Therefore, provisions impacting operations of the Bank are identified and addressed through work plans and regular monitoring and reporting to the appropriate governance structures.
The Corporate Governance Statement complies with the best practice disclosure including: the profiles of Directors, information on attendance of the individual Directors at Board and Board Committee meetings, brief descriptions of the functions of the Board and each of the Board Committees, remuneration of Directors and the Board performance evaluation.
THE BOARD OF DIRECTORS 3.3The Board of Directors of the Bank consists of:-
a) The Governor who is the Chairman; b) The Deputy Governor who is the Alternate Chairman; c) And not more than five Non-Executive Directors.
The Governor, Deputy Governor and all the Non-Executive Directors are appointed by the President with the approval of Parliament. The members of the Board hold office for a term of five-years but are eligible for re-appointment. All the Directors possess a wide range of professional knowledge, qualifications, skills and experiences and are persons of integrity. They are:-
i) Prof. Emmanuel Tumusiime-Mutebile He is the Governor and Chairman of the Board of Directors. He Chairs the Executive Committee; Payment System Policy Committee; Financial Stability Committee and Foreign Exchange Reserve Management Policy Committee. He is a member of the Board of Trustees of the BoU Defined Benefits Scheme.
3 CORPORATE GOVERNANCE

ANNUAL REPORT 2014/2015
5
ii) Louis Kasekende (PhD) He is the Deputy Governor and Alternate Chairman of the Board of Directors. He is a member of the Board of Trustees of the BoU Defined Benefits Scheme; member of the Finance Committee of the Board, Capital Projects Committee of the Board and Human Resources and Remuneration Committee of the Board. At management level he chairs the Strategy & Finance Committee, Human Resources Management Committee, Financial Markets Operations Sub-committee, Effective Information Management Committee and Risk Management Committee.
iii) Mr. Christopher M. Kassami He is a Non-Executive Director and Chairman of Human Resources and Remuneration Committee of the Board; member of Finance Committee of the Board and Audit & Governance Committee of the Board.
iv) Mr. James Kahoza He is a Non-Executive Director, and Chairman of Audit & Governance Committee of the Board; member of Finance Committee of the Board, Capital Projects Committee of the Board and Human Resources and Remuneration Committee of the Board.
v) Mr. Ibrahim K. Kabanda He is a Non-Executive Director and member of Finance Committee of the Board, Audit & Governance Committee of the Board, Capital Projects Committee of the Board and Human Resources and Remuneration Committee of the Board. He is Chairman of the Board of Trustees of the BoU Staff Retirement Benefits Scheme.
vi) William S. Kalema (PhD) He is a Non-Executive Director, and Chairman of Finance Committee of the Board; member of Audit & Governance Committee of the Board and Capital Projects Committee of the Board.
vii) Ms. Judy Obitre-Gama She is a Non-Executive Director, and Chairperson of Capital Projects Committee of the Board; member of Audit & Governance Committee of the Board and Human Resources and Remuneration Committee of the Board. She is a member of the Board of Trustees of the BoU Defined Benefits Scheme and Chairperson of the Investment Sub-Committee of the Defined Benefits Scheme.
SECRETARY TO THE BOARD 3.4The Bank/Board Secretary provides secretarial services and logistical support to the Board in order to facilitate and interface policy making with policy implementation. In liaison with Legal Counsel, the Bank Secretary advises the Board on legal and corporate governance matters. In consultation with the Chairman, the Secretary ensures good and timely information flow among the Board, the Board Committees and Management. All members of the Board and Management have access to the Bank Secretariat services. During the year, the Board of Directors appointed Mrs. Susan Wasagali Kanyemibwa as Bank Secretary, effective March 19, 2015. The appointment followed the retirement of Mr. George William Nyeko on March 16, 2015 after serving as Bank Secretary for six years.

2014/2015 ANNUAL REPORT
6
THE FUNCTIONS AND DUTIES OF THE BOARD 3.5Section 162 of the Constitution of the Republic of Uganda, 1995 provides for the functions of the Bank of Uganda, whose authority is invested in the Board of Directors as follows:
a) Promote and maintain the stability of the value of the currency in Uganda; b) Regulate the currency system in the interest of the economic progress of Uganda; c) Encourage and promote economic development and the efficient utilization of the resources
of Uganda through effective and efficient operation of a banking and credit system; and d) Do all such other things not inconsistent with the Constitution as may be prescribed by law.
In addition to the functions of the Board of Directors outlined in the Constitution of the Republic of Uganda, other statutory duties of the Board are provided for in the Bank of Uganda Act (Cap.51) Laws of Uganda. In guiding the strategic direction of the Bank, the Board:-
a) Is responsible for the general management of the affairs of the Bank; b) Ensures the functioning of the Bank and the implementation of its functions; c) Formulates the policies of the Bank; d) Does anything required to be done by the Bank under the BoU Act; and e) Does anything that is within, or incidental to the functions of the Bank.
THE BOARD OF DIRECTORS’ CHARTER AND CODE OF CONDUCT 3.6The Board is committed to highest standards of integrity and ethical conduct in carrying out its duties and dealing with all stakeholders. This commitment is confirmed by the endorsement of the Board of Directors’ Charter and Code of Conduct, an instrument which is referred to in the course of duty. The following are the obligations inferred from common law and articulated in the code of conduct:
a) Fiduciary obligation to act in the best interest of the Bank; b) Duty to act within powers; c) To promote the success of the Bank; d) Exercise independent judgement; e) Exercise reasonable care, skill and diligence; f) Avoid conflicts of interest; and g) Not to accept benefits from third parties.
MEETINGS OF THE BOARD 3.7According to the Bank of Uganda Act, at least 10 meetings of the Board must be held in one financial year. The Board and Board Committees meet quarterly as scheduled. Ad hoc or special meetings are convened as and when required. In total, the Board and Board Committee meetings held during the period under review were twenty five (25), and the attendance was as indicated below:
3.7.1 MEETINGS OF THE BOARD JULY 2014-JUNE 2015 The Audit and Governance Committee of the Board meetings included 2 special executive meetings; one with the Chief Internal Auditor and the other with the External Auditors. The non-full attendance by some Board Members during the year was attributed to factors beyond their control.
ANNUAL REPORT 2014/2015
7
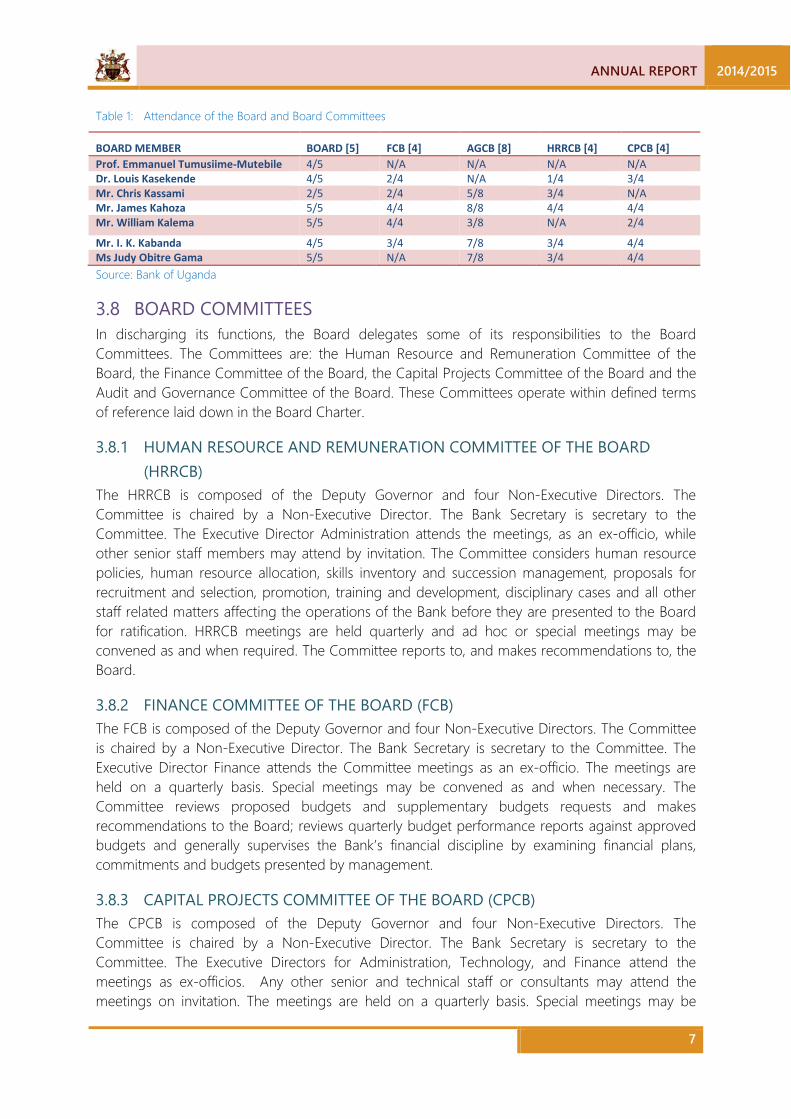
Table 1: Attendance of the Board and Board Committees
BOARD MEMBER BOARD [5] FCB [4] AGCB [8] HRRCB [4] CPCB [4] Prof. Emmanuel Tumusiime-Mutebile 4/5 N/A N/A N/A N/A Dr. Louis Kasekende 4/5 2/4 N/A 1/4 3/4 Mr. Chris Kassami 2/5 2/4 5/8 3/4 N/A Mr. James Kahoza 5/5 4/4 8/8 4/4 4/4 Mr. William Kalema 5/5 4/4 3/8 N/A 2/4
Mr. I. K. Kabanda 4/5 3/4 7/8 3/4 4/4 Ms Judy Obitre Gama 5/5 N/A 7/8 3/4 4/4 Source: Bank of Uganda
BOARD COMMITTEES 3.8In discharging its functions, the Board delegates some of its responsibilities to the Board Committees. The Committees are: the Human Resource and Remuneration Committee of the Board, the Finance Committee of the Board, the Capital Projects Committee of the Board and the Audit and Governance Committee of the Board. These Committees operate within defined terms of reference laid down in the Board Charter.
3.8.1 HUMAN RESOURCE AND REMUNERATION COMMITTEE OF THE BOARD (HRRCB)
The HRRCB is composed of the Deputy Governor and four Non-Executive Directors. The Committee is chaired by a Non-Executive Director. The Bank Secretary is secretary to the Committee. The Executive Director Administration attends the meetings, as an ex-officio, while other senior staff members may attend by invitation. The Committee considers human resource policies, human resource allocation, skills inventory and succession management, proposals for recruitment and selection, promotion, training and development, disciplinary cases and all other staff related matters affecting the operations of the Bank before they are presented to the Board for ratification. HRRCB meetings are held quarterly and ad hoc or special meetings may be convened as and when required. The Committee reports to, and makes recommendations to, the Board.
3.8.2 FINANCE COMMITTEE OF THE BOARD (FCB) The FCB is composed of the Deputy Governor and four Non-Executive Directors. The Committee is chaired by a Non-Executive Director. The Bank Secretary is secretary to the Committee. The Executive Director Finance attends the Committee meetings as an ex-officio. The meetings are held on a quarterly basis. Special meetings may be convened as and when necessary. The Committee reviews proposed budgets and supplementary budgets requests and makes recommendations to the Board; reviews quarterly budget performance reports against approved budgets and generally supervises the Bank’s financial discipline by examining financial plans, commitments and budgets presented by management.
3.8.3 CAPITAL PROJECTS COMMITTEE OF THE BOARD (CPCB) The CPCB is composed of the Deputy Governor and four Non-Executive Directors. The Committee is chaired by a Non-Executive Director. The Bank Secretary is secretary to the Committee. The Executive Directors for Administration, Technology, and Finance attend the meetings as ex-officios. Any other senior and technical staff or consultants may attend the meetings on invitation. The meetings are held on a quarterly basis. Special meetings may be
2014/2015 ANNUAL REPORT
8
convened depending on the Committee’s work programme. The terms of reference of the Committee are to oversee and monitor capital projects, including IT, plants, machinery, constructions; major maintenance works, property acquisition and disposal, and make recommendations to the Board.
3.8.4 AUDIT AND GOVERNANCE COMMITTEE (AGCB) The AGCB is composed of only Non-Executive Directors. The Bank Secretary is secretary to the Committee. The Chief Internal Auditor, the Executive Director Finance, the Executive Director Governor’s Office and a representative of the External Auditors attend the Committee meetings. Meetings are held on a quarterly basis. Special meetings may be convened whenever necessary. The terms of reference of the Committee are to assist the Board to fulfil its fiduciary responsibilities by providing assurance to the efficiency and effectiveness in utilizing Bank resources; setting an appropriate control culture, ensuring adequacy of internal control systems; monitoring compliance with laws and regulations and follow-up on non-compliance and overall effectiveness of internal controls and the risk management framework. The Committee reviews significant accounting and reporting issues and their impact on the financial reports and ensures that financial risk areas are managed properly. AGCB also reviews External Auditors’ proposed audit scope, plan and approach; the audit conduct and audit deliverables; obtains satisfactory assurance that the audit is conducted in accordance with International Standards on Auditing, and ensures that findings and recommendations made by the External Auditors are appropriately acted upon. The Committee reviews the activities of the Internal Audit Function and its effectiveness, and ensures that the Internal Audit Function has an appropriate standing and independence within the Bank. It also ensures that the internal audit plan addresses key areas of risks, and that recommendations made by Internal Auditors are appropriately acted upon.
REMUNERATION OF NON-EXECUTIVE DIRECTORS 3.9During the financial year, the Non-Executive Directors were adequately remunerated. The Directors were paid a retainer fee per month and a sitting allowance for each meeting attended. The retainer and sitting allowances were approved by the Minister of Finance, Planning and Economic Development.
ASSESSMENT OF BOARD PERFORMANCE 3.10The Board members were appointed in November, 2012 and assumed their duties in December 2012. Two (2) Board performance evaluations have been conducted for the years 2013 and 2014.
The purpose of the assessment is to enhance the effectiveness of the Directors, identify areas for improvement, discuss and agree on priorities for change which could be addressed in the short and long-term; and agree on an action plan. The evaluation exercise also involves the assessment of the effectiveness of the Board Chairman and the Audit and Governance Committee of the Board. The assessment is conducted annually by each member of the Board, and the Audit and Governance Committee of the Board (AGCB) is responsible to oversee the implementation of the agreed action plan. The evaluation of the Audit and Governance Committee involves the assessment of the Committee’s Structure and Operations, Oversight on Financial Reporting, relationships with Internal and External Auditors and Compliance with Laws, Regulations and Internal Policies.

ANNUAL REPORT 2014/2015
9
The Board Performance Evaluation Report for 2013 was approved and reviewed during the FY 2014/15. The 2014 Board Performance Evaluation exercise was guided by M/s Just Managing Consultants who have since completed the report, which will be presented to the Board in September, 2015.
THE BOARD’S ACHIEVEMENTS AND DEVELOPMENTS 3.11The following were some of the achievements of the Board during the period under review:
a) In fulfilling the BoU’s perspective of organizational capacity, the Board members attended capacity building programmes to enhance their knowledge and skills in areas of Strategic Thinking and Effective Decision Making for Board Members, Project Management, Sovereign Wealth Funds Management, Governance, Audit, Risk and Compliance for Board Members.
b) Passed various policies in accordance with the laws and best practices for purposes of improving Bank of Uganda operations.
c) Passed a number of key resolutions, and approved the BoU Budget for the Financial Year 2015/16.
d) Participated in the Board Performance evaluation exercise and identified areas of improvement.
e) The Board exercised close oversight on the external fund managers in respect of the reserves under their control and this involved periodic reporting, site visits and invitation of the respective fund managers to BoU to make presentations to the Board.
f) The Deputy Governor was re-appointed for another term of five (5) years, effective March, 2015
g) Appointment of Bank Secretary, effective March 2015.. h) The amendments to the BoU Act Cap 51 were concluded and submitted to the Hon.
Minister of Finance, Planning and Economic Development. i) The amendments to the Financial Institutions Act, 2004 were completed, submitted to the
Minister for consideration, and approved by Cabinet on 18th June. 2015. j) The amendments to the Anti-Terrorism (Amendment) Bill, 2015 were completed and
passed into law on 19th June, 2015.
BANK MANAGEMENT COMMITTEES 3.12It is a strategic objective of Bank of Uganda to have an organization structure which is conducive to outstanding performance. The Bank has in place Management Committees that form an integral part of the Bank’s organization structure. The Committees are composed of Senior Management of the Bank. They aid the Bank in pursuit of performance through facilitation of timely decision making. Management Committees ensure coordinated policy developments and implementation after Board approval. The Committees engender teamwork and tap expertise throughout the Bank. The Management Committees are:-
a) Executive Committee (EXCOM). b) Strategy and Finance Committee (SFC). c) Human Resources Management Committee (HRMC). d) Contracts Committee (CC). e) Monetary Policy Committee (MPC). f) Foreign Exchange Reserve Management Policy Committee (FERMPC).
2014/2015 ANNUAL REPORT
10
g) Payment Systems Policy Committee (PSPC). h) Effective Information Management Committee (EIMC). i) Risk Management Committee (RMC). j) Financial Stability Committee (FSC) k) Management Committee. l) Financial Markets Operations Sub-Committee (FMOS)
THE MEDICAL BOARD 3.13The Medical Board comprises seven external consultant doctors, one of them being the Chairman and the Director Medical Department is the Secretary. The Committee advises Management and the Board on medical policy issues and treatment of staff abroad.
CORPORATE SOCIAL RESPONSIBILITY 3.14Bank of Uganda engages in Corporate Social Responsibility to support institutional capacity building and social development causes. In the financial year 2014/2015, the BoU’s contributions were as follows:
3.14.1 INSTITUTIONAL CAPACITY BUILDING The Bank’s most significant CSR contribution remained in the area of support to institutions that contribute to generation of knowledge-driven policy, deepening of the financial sector as well enhanced professionalism in various disciplines. These included the African Economic Research Consortium (AERC), the Capital Markets Authority (CMA), the Uganda Securities Exchange (USE), the Institute of Corporate Governance of Uganda (ICGU), and the Institute of Certified Public Accountants of Uganda (ICPAU). In addition, the Bank annually provides support to Kabale University by sponsoring a Chair in Economics.
3.14.2 SOCIAL DEVELOPMENT CAUSES (HEALTH, AND SOCIAL WELFARE) The Bank continued to engage in social causes by supporting organisations involved in community based interventions. These included financial support to the Rotary movement for various causes including building a cancer ward in Nsambya Hospital, establishing a blood bank in Mengo Hospital, support to the Uganda Heart Institute, and the construction of a hospital in Mukono among others. The Bank also supported programmes of the Uganda Diabetes Association (UDA), as well other organisations involved with interventions against fistula and sickle cell disease in Uganda. During the financial year 2014/15, the Bank lent support to the country’s tourism sector by mobilising the banking sector to contribute to the development of Namugongo Martyrs Shrine into a destination for religious tourism.
3.14.3 PUBLIC EDUCATION The Bank carried out a number of awareness workshops targeting key stakeholders in order to empower them to engage the financial sector better, and particularly to promote understanding of monetary policy objectives under the inflation targeting-lite framework. During the financial year 2014/15, the Bank enhanced the “Know Your Rights” sensitisation campaign on financial consumer protection through radio talk shows and “DJ mention” radio programmes and these activities will be continued in the new financial year (2015/16).
In addition, the Bank inaugurated the Bank of Uganda Challenge (BOU Challenge). The BOU Challenge is a biennial infotainment programme aimed at improving the understanding of

ANNUAL REPORT 2014/2015
11
monetary policy and central banking by stakeholders of the Bank. The inaugural / pilot BOU Challenge was contested by eight (8) schools namely, Mt. St. Mary’s Namagunga, St. Henry’s College Kitovu, Ntare Senior School, Jinja College School, Standard College Ntungamo, Saints. Peter and Paul Pokea Seminary Arua, and Apostles of Jesus Seminary Moroto. Mt. St. Mary’s Namagunga emerged victorious. The seven (7) episodes of the BOU Challenge were aired on national televisions namely, NTV, NBS, and UBC. Apart from the primary audience of the participating secondary schools, the Challenge reached the viewership of these televisions which constitute 45 percent of the market share as per the 2014/15 Ipsos report. As an inaugural programme, the Challenge’s outreach was satisfactory. The Challenge coupled with other media outreaches by the Bank has helped anchor the message of the Bank.
2014/2015 ANNUAL REPORT
12
The Board of Directors is responsible for risk management at Bank of Uganda. This role is delegated to Management, which ensures smooth implementation of the risk management process. Risk is managed consistently with the Bank’s risk appetite and tolerance levels as defined by the Board.
The RMC provides strategic direction to the Bank’s risk management operations while Risk and Compliance Department co-ordinates the Bank wide risk management process. The Risk Management Committee (RMC) meets quarterly to discuss key risk issues and review the implementation of the Risk Management Framework. Risk management at BOU covers the following areas;
OPERATIONAL RISK 4.1The Bank manages operational risk by establishing and implementing policies, systems and internal control processes which are complimented by the Bank’s healthy corporate culture and value system.
The Bank is currently involved in implementing major projects hence effective management of project risk is accorded utmost priority. During the year, project risk management guidelines were developed for effective assessment and management of risks. The Bank has in place robust business continuity management arrangements to recover its critical business processes in the event of business disruption and/or disaster.
Under the EAC Monetary Affairs Committee, the Bank together with other partner Central Banks are working towards harmonisation of the risk management frameworks in the region.
FINANCIAL RISK 4.2Financial risk management at Bank of Uganda focuses on the risk exposures in both the foreign exchange reserves portfolio as well as other operational areas of the Bank. Notably, foreign exchange reserves account for over 86 percent (2014: 74 percent) of BOU’s assets. In line with the Foreign Exchange Reserve Management Policy, reserves management is premised on three objectives namely; capital preservation, liquidity, and reasonable and consistent returns subject to the first two objectives.
During the financial year, the key financial risks were adequately managed as elaborated below;
4.2.1 CREDIT RISK The adverse developments in the Euro area, in particular, the threat of Greece defaulting on its debt and exiting the Euro zone, in addition to the developments in the UK and USA continued to rock the global financial markets. While some of the Bank’s counterparties were exposed to the Greek financial system, this did not have any direct impact on the Bank’s investments.
Moody’s Investor Services, the Bank’s official rating agency introduced a new and more robust rating methodology during the period under review. As a result, the Bank carried out a review of the investment limits of counterparty banks to ensure that they remain of investable grade. This is in addition to regular monitoring of credit ratings of all countries where foreign exchange reserves
4 RISK MANAGEMENT OPERATIONS
ANNUAL REPORT 2014/2015
13
are invested to ensure that information is promptly provided to management for effective decision making.
4.2.2 MARKET RISK Market risk is the risk of fluctuation in the value of financial instruments due to changes in market prices. Market risk is comprised of foreign exchange risk and interest rate risk. Foreign exchange risk is managed by maintaining appropriate currency exposure limits to minimise losses arising from adverse foreign exchange movements. Over the period, Interest rate risk exposure increased following the reduction or tapering of the quantitative easing programs by the UK and US Central Banks. The Bank managed interest risk by maintaining a weighted average maturity of its money market investments at less than six months and similarly maintaining lower durations than the benchmark index for its fixed income portfolios. The shorter exposure period is to ensure that the bank is protected from decline in the value of its portfolios in case interest rates rise.
4.2.3 LIQUIDITY RISK As at June 30, 2015, liquidity risk was well managed and in accordance with the foreign exchange reserves management policy.
During the year, the following policy actions were undertaken to manage financial risks.
i) A review of the foreign exchange reserves policy was carried out in accordance with the investment objectives and the global financial developments;
ii) Review of the credit allocation methodology as well as the country eligibility criteria from G-7 to G-10 countries;
iii) Gradual reduction of the positions held in downgraded banks as deposits mature; and
iv) Approval to diversify into internally managed fixed income trading to enhance returns.
COMPLIANCE RISK 4.3Compliance risk is the risk of legal or regulatory sanctions, material financial loss, or loss to reputation a bank may suffer as a result of its failure to comply with laws, regulations, rules, related self–regulatory organization standards, and codes of conduct applicable to its banking activities ‘[Basel Committee on Banking Supervision; “Compliance and the compliance function in banks” April 2005]
During the financial year, compliance monitoring was conducted in the Bank to ensure adequate compliance to applicable laws, regulations and internal policies in line with the risk management framework.
The Bank regularly monitors the legal and regulatory environment for current and emerging compliance requirements in order to remain compliant.

2014/2015 ANNUAL REPORT
14
The Bank of Uganda Audit function designs audit programs to provide assurance over risk management, internal control environment and corporate governance to the Board and Management. The Bank applies the risk-based audit methodology in execution of the work-plan.
During the FY 2014/15, 84 percent of the approved audit work-plan was achieved in accordance with the Bank’s quality assurance and audit procedures.
Improvement was noted in the control environment as Management implemented enhanced action plans to strengthen internal controls in various operations. These included Currency Operations, Financial Reporting, IT Governance, Human Resources activities, Banking, Administrative Services, Accounts, Medical, Commercial Banking, Central Securities Depository, Payments Systems (RTGS, SWIFT), Agricultural Credit Facility, Risk Management and Foreign Exchange Reserves Management.
As part of the Quality Assurance and Improvement programs, Internal Audit conducted a self-assessment exercise during the year and hosted a forum for bench-marking of the audit methodology amongst the East African Central Banks.
The Bank’s audit function is independent and care was taken to maintain integrity, professionalism, confidentiality, due care and objectivity during the audit process. In line with Audit Standards, there was collaboration and information sharing with External Auditors and the Office of the Auditor General.
A satisfactory system of Internal Controls was generally maintained by the Bank for the achievement of its objectives.
5 INTERNAL AUDIT
ANNUAL REPORT 2014/2015
15
6 ECONOMIC DEVELOPMENTS AND PROSPECTS
EXTERNAL ECONOMIC ENVIRONMENT 6.1
6.1.1 ECONOMIC ACTIVITY The global economy is estimated to have expanded by 3.4 percent in 2014, and is projected to expand further by 3.3 percent and 3.8 percent in 2015 and 2016, respectively. Growth however remains uneven, with most of the thrust coming from Advanced Economies (AEs), as growth in Emerging Market and Developing Economies (EMDEs) remains soft. The AEs are projected to grow by 2.1 percent and 2.4 percent in 2015 and 2016, respectively, with the United States (US) accounting for a substantial share of this growth. Despite a setback in Q1-2015, the underlying drivers for acceleration in consumption and investment—favourable wage and labor market conditions, lower energy and commodity prices, easy financial conditions, and a strengthening housing market—remain steadfast in the United States.
The economic recovery in the Euro Zone also seems to be broadly on course, as the risk of a prolonged period of deflation appears to have receded with a pick-up in inflation expectations following the European Central Bank’s Quantitative Easing program. Retail sales and consumer sentiments have also picked up, in part because of the increasingly favourable financial conditions and low oil prices, which have increased real household incomes. Indicators of consumer confidence and economic activity in the Euro Area reached multi-year highs in Q1-2015. In Japan, growth in the first quarter of 2015 was stronger than expected, supported by a pick-up in capital investment. However, consumption remains sluggish and more than half of quarterly growth stemmed from changes in inventories. With weaker underlying momentum in real wages and consumption, the pick-up in growth in 2015 is now projected to be more modest.
Growth prospects in EMDEs remain cloudy, as economic activity is projected to slacken in commodity exporting EMDEs, in part due to falling commodity prices. Growth in EMDEs is projected to slow down from 4.6 percent in 2014 to 4.2 percent in 2015 on account of tighter external financial conditions; structural bottlenecks inherent in most of these economies; the softening impact of lower commodity prices; depreciation pressures on account of expectations of an interest rate hike in the US; the rebalancing in China; and economic distress related to geopolitical factors, particularly in the Russia, Ukraine, and the Middle East and North Africa region.
Sub-Saharan Africa (SSA) remained relatively resilient to the global economic distress, despite low export demand and falling commodity prices. Economic activity increased by 4.8 percent in 2014, supported by large public infrastructure investments, which are expected to provide more long-term growth benefits to these economies. Growth in 2015 is projected at 4.9 percent, contingent on continued macroeconomic stability and public infrastructure investment. The global economic growth performance and outlook is presented in Table 2.

2014/2015 ANNUAL REPORT
16
Table 2: Global Economic Performance and Outlook
Outturn Projection
2013 2014 2015 2016 World 3.4 3.4 3.3 3.8 Advanced economies 1.4 1.8 2.1 2.4 United States 2.2 2.4 2.5 3.0 Euro Area –0.4 0.8 1.5 1.7 Japan 1.6 -0.1 0.8 1.2 United Kingdom 1.7 2.9 2.4 2.2 Emerging market and developing economies 5.0 4.6 4.2 4.7 Russia 1.3 0.6 -3.4 0.2 China 7.7 7.4 6.8 6.3 India 6.9 7.3 7.5 7.5 Sub-Saharan Africa 5.2 5.0 4.4 5.1 South Africa 2.2 1.5 2.0 2.1 Source: IMF World Economic Outlook, July 2014.
The risks to global economic activity are however tilted to the downside. While in the near-term, increased financial market volatility and disruptive asset price shifts may continue to suppress economic activity, lower potential output growth remains an important medium-term risk in both AEs and EMDEs. The subdued commodity prices while a contributing factor to the resurgence in consumption and domestic demand in AEs, also poses a risk to the economic outlook in oil exporting EMDEs. The monetary policy normalization in the US, potential spillovers from geopolitical conflicts and persistent vulnerabilities in emerging economies also constitute a downside risk to global growth.
6.1.2 GLOBAL INFLATION AND COMMODITY PRICES
6.1.2.1 Global Inflation Global inflationary pressures remain muted, with global inflation averaging 3.2 percent in 2014. It is also projected to decline to 2.8 percent in 2015 on account of subdued global demand conditions and low commodity prices, which are expected to last at least through 2015. In most AEs, low commodity and energy prices, abundant spare capacity, low aggregate demand, and well-anchored inflation expectations have kept inflation muted and below the respective central banks’ medium-term targets. In 2014, inflation in AEs averaged 1.4 percent, and is expected to remain low in 2015.
Inflationary pressures, however, ensued in some EMDEs, largely driven by the pass-through of exchange rate depreciation to domestic prices. Inflation will remain elevated in many EMDEs owing to a variety of factors, including the exchange rate depreciation pressures on account of the ensuing monetary policy normalization in the US, financial markets volatility, and inflation inertia.
6.1.2.2 Global Commodity Prices Global commodity prices remain soft largely driven by sustained oversupply, relatively weak global demand, and the global strengthening of the United States dollar (USD). After a protracted decline in 2014 through Q1-2015, global oil prices recovered in Q2-2015, on account of higher demand and expectations of a slowdown in the US shale oil production. The Brent oil price fell by more than 50 percent between June 2014 and January 2015, dropping to a 5-year low of USD 47

ANNUAL REPORT 2014/2015
17
per barrel, before recovering moderately to fluctuate between USD 55 and USD 70 per Barrel. Crude oil prices are projected to average USD 60 and USD 70 per Barrel in 2015 and 2016, respectively. Nonetheless, there are downside risks to this outlook including the continued strong growth of North America’s shale oil production and a lifting of the economic sanctions against Iran, which may increase global crude oil output, thereby exerting a downward pressure on oil prices. The upside risks relate to the possibility of Organization of the Petroleum Exporting Countries (OPEC) cutting production and the escalation of conflicts in oil exporting countries, which may curtail global oil output. Global food prices have also remained relatively soft, largely on account of favorable weather conditions that have boosted global food supplies. Indeed, the Food and Agriculture Organization (FAO) food price index declined on an annual basis by 20.4 percent in June 2015. Global food prices are also projected to remain soft on account of abundant food supplies. The evolution of global commodity prices is shown in Figure 1.
Figure 1: Commodity price developments
Source: World Bank Statistics
Falling metal and energy prices have generated large negative terms of trade shocks in commodity exporting EMDEs, and increased pressure on fiscal revenues and exchange rates. The decline in prices has also disrupted new foreign investments and in some cases production in extractive-based industries.
For the near-term outlook, thus far, good harvests, robust remittances, and rising public investment have supported employment and cushioned the impact on activity of sharply weaker terms of trade among commodity exporting EMDEs. Growth should remain supported by rising output as past investments come on-stream and public infrastructure investments proceed, in some cases supported by Chinese financing. The medium term outlook is increasingly challenging. Prospects are for a protracted adjustment to lower and more volatile commodity prices, weaker
140
160
180
200
220
240
40
60
80
100
120
140
Jan-10 Jan-11 Jan-12 Jan-13 Jan-14 Jan-15
FAO
food
pric
e in
dex (
2002
- 04
= 10
0)
Ener
gy a
nd n
on-e
nerg
y ind
ices (
2005
= 10
0), a
vera
ge
crud
e oi
l pric
es ($
/bbl
)
Crude oil, average ($/bbl) Energy (2005 = 100, nominal $)
Non-energy (2005 = 100, nominal $) Food Price Index (2002-04 = 100)
2014/2015 ANNUAL REPORT
18
demand for exports, and reduced resource investment and production in the next few years. Over the medium term, persistently low commodity prices may reduce the attractiveness of mining, and oil and gas investment.
Further falls in commodity prices could force deeper fiscal adjustments than currently planned. It may also prompt some companies to delay or even cancel planned investments in the resource sector. Headwinds associated with the upcoming tightening of monetary policy in the United States could put pressure on exchange rates, and on debt service costs of countries that have tapped international capital markets. Those with low policy and reserve buffers and large macro-imbalances could face potentially disruptive adjustments.
6.1.3 FINANCIAL MARKETS Global financial markets continued to be relatively jittery, in part driven by expectations of an interest rate hike in the US, uncertainty surrounding the future trajectory of oil prices, future global growth prospects, uncertainty related to Greece and the Euro Area, and geo-political tensions in Ukraine, the Middle East and North Africa. Notwithstanding the on-going United States (US) tapering of its asset purchase program, monetary policy continued to be relatively accommodative in AEs in general, with the ECB and central bank of Japan instituting a number of accommodative monetary policy measures in an effort to revamp their economies.
The long-term bond yields in many AEs decreased on disinflation concerns and the prospect of continued monetary accommodation. In the Euro Zone, the yields of about one-third of sovereign bonds were negative, and the prolonged low interest rate environment posed severe challenges for a number of financial institutions, with some facing a rising risk of distress. Although accommodative monetary policies have helped improve private sector debt ratios by supporting inflation and growth, and by increasing asset prices, high private sector debt levels continue to hinder growth and financial stability in most AEs.
The expectations for monetary policy normalization in the US driven by the strong performance of the US economy and the push for additional monetary stimulus by other major economies have sparked rapid appreciation of the USD. EMDEs have been caught in this global dichotomy and face higher financial stability risks, as companies that borrowed heavily on international markets could face balance sheet problems. Most EMDEs experienced sustained depreciation pressures, which have kept their financial markets nervous. In an attempt to moderate the inflationary impact of the exchange rate depreciation, most of the central banks in the EMDEs tightened monetary policy.
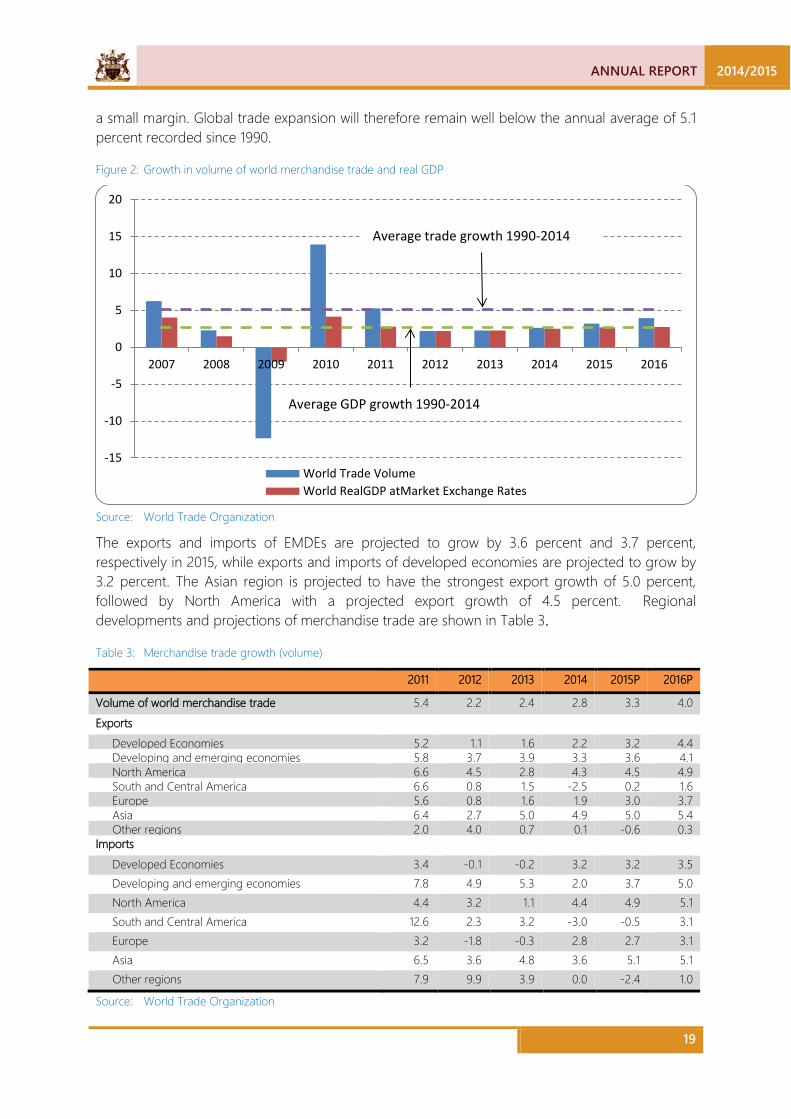
6.1.4 GLOBAL TRADE Global trade remained subdued in 2014, with merchandise trade growing by 2.8 percent on account of slowing growth and exchange rate fluctuations in emerging market economies, an uneven recovery in developed countries, declining commodity prices and rising geopolitical tensions. The modest gains in 2014 marked the third consecutive year in which merchandize trade grew by less than 3.0 percent. The volume of merchandise trade is projected to pick up only slightly over the next two years, growing by 3.3 percent and 4.0 percent in 2015 and 2016, respectively. As shown in Figure 2 trade expansion is not projected to far outstrip overall global economic growth, at least in the short term. Global trade expansion barely exceeded global GDP growth in 2014, and forecasts for 2015 and 2016 only surpass expected growth in global output by
ANNUAL REPORT 2014/2015
19
a small margin. Global trade expansion will therefore remain well below the annual average of 5.1 percent recorded since 1990.
Figure 2: Growth in volume of world merchandise trade and real GDP
Source: World Trade Organization
The exports and imports of EMDEs are projected to grow by 3.6 percent and 3.7 percent, respectively in 2015, while exports and imports of developed economies are projected to grow by 3.2 percent. The Asian region is projected to have the strongest export growth of 5.0 percent, followed by North America with a projected export growth of 4.5 percent. Regional developments and projections of merchandise trade are shown in Table 3.
Table 3: Merchandise trade growth (volume)
2011 2012 2013 2014 2015P 2016P
Volume of world merchandise trade 5.4 2.2 2.4 2.8 3.3 4.0 Exports Developed Economies 5.2 1.1 1.6 2.2 3.2 4.4 Developing and emerging economies 5.8 3.7 3.9 3.3 3.6 4.1 North America 6.6 4.5 2.8 4.3 4.5 4.9 South and Central America 6.6 0.8 1.5 -2.5 0.2 1.6 Europe 5.6 0.8 1.6 1.9 3.0 3.7 Asia 6.4 2.7 5.0 4.9 5.0 5.4 Other regions 2.0 4.0 0.7 0.1 -0.6 0.3 Imports Developed Economies 3.4 -0.1 -0.2 3.2 3.2 3.5 Developing and emerging economies 7.8 4.9 5.3 2.0 3.7 5.0 North America 4.4 3.2 1.1 4.4 4.9 5.1 South and Central America 12.6 2.3 3.2 -3.0 -0.5 3.1 Europe 3.2 -1.8 -0.3 2.8 2.7 3.1 Asia 6.5 3.6 4.8 3.6 5.1 5.1 Other regions 7.9 9.9 3.9 0.0 -2.4 1.0
Source: World Trade Organization
-15
-10
-5
0
5
10
15
20
2007 2008 2009 2010 2011 2012 2013 2014 2015 2016
World Trade VolumeWorld RealGDP atMarket Exchange Rates
Average GDP growth 1990-2014
Average trade growth 1990-2014
2014/2015 ANNUAL REPORT
20
6.1.5 IMPLICATIONS FOR THE UGANDAN ECONOMY The current external economic environment presents both opportunities and challenges for the Ugandan economy. Crude oil prices have fallen sharply since mid-2014, in part reflecting important supply-side developments and lower growth in global demand and there is a risk that oil prices could fall further, especially if major oil producers continue to expand supply in the current circumstances of moderate global economic growth. While low global inflation and declining commodity prices will keep domestic inflation in check, at least in the short-term, low commodity prices may worsen Uganda’s trade deficit by keeping export revenues at bay, which may more than offset its impact on the oil import bill.
The persistently lower-than-assumed oil prices could also have a material impact on investment and economic activity, as it could deter foreign direct investment inflows to the oil sector. There are already indications that FDI inflows to the oil sector have dwindled, and given Uganda’s weak current account position, which has largely been funded by surpluses in the capital and financial account of the balance of payments, a decline in FDI inflows will aggravate exchange rate depreciation pressures. This may further be exacerbated by the likely normalization of monetary policy in AEs, especially the US, which may trigger capital outflows from EMDEs including Uganda. This will not only invigorate inflation, but will also dent the growth prospects of the economy.
There is also a risk that growth in EMDEs could be much slower than expected. A slowdown in EMDEs would weigh on Uganda’s economic growth through trade, financial and confidence channels, including a further downward pressure on commodity prices. Furthermore, the continued slow growth in the Euro Zone while a downside risk to domestic inflation may have detrimental implications for Uganda’s export earnings, remittances and FDI, which is a downside risk to growth.
The geopolitical tensions and the threat of terrorism remain elevated, including the conflicts in the Middle East, Russia and Ukraine. This could have a significant impact on consumer and business confidence, as investors and consumers could hold back on spending, which could reduce aggregate demand thereby constraining global growth with adverse implications for exports. Secondly, a physical disruption of energy supply on account of the raging conflicts may push up international oil prices, posing a risk to global and domestic inflation and growth prospects.
DOMESTIC ECONOMY 6.2
6.2.1 MONETARY POLICY AND OPERATIONS The primary objective of BoU’s monetary policy is to achieve low and stable inflation, defined by the core inflation medium-term target of 5 percent. BoU continued to use the Inflation Targeting-Lite (ITL) monetary policy framework in guiding its monetary policy operations, adjusting its policy rate — the Central Bank Rate (CBR) — in line with aggregate demand and inflation outlook. Given that interbank money market rates influence commercial banks and other financial institutions’ marginal costs of funds, it is expected that other interest rates in the economy, including deposit and lending rates would trend in line with changes in the CBR.
During FY 2014/15, inflation remained subdued, with core inflation averaging 3.3 percent. The outlook also suggested that core inflation would fluctuate within BoU’s medium-term target of 5 percent over a 18-months forecast horizon. Nonetheless, there were potential risks of stronger inflationary pressures emanating from a mix of factors pertaining to continued exchange rate
ANNUAL REPORT 2014/2015
21
depreciation, growth acceleration and the spill-overs from the volatile international macroeconomic environment, which could change the inflation trajectory over the short-term.
The domestic and external risks to the projected inflation and output path however remained broadly balanced. Maintaining a cautious monetary policy stance was therefore critical, not only to support the continued recovery of the economy but also to insulate the economy from uncertainties and risks from the domestic and external economic environment. The Central Bank Rate (CBR) was consequently maintained at 11 percent, and increased by only 1 percentage point to 12 percent in April 2015 and to 13 percent in June 2015 on account of the ensuing inflationary pressures. The band on the CBR was maintained at plus/minus 2 percentage points and the margin on the rediscount rate at 3 percentage points on the CBR.
The Bank of Uganda continued to use Repurchase Agreements (REPOs), reverse REPOs and outright sales of recapitalization securities in the secondary market to align liquidity conditions in the domestic financial system with the desired monetary policy stance. During FY 2014/15, the net impact of the REPOs/reverse REPO instruments was an injection of UGX 755 billion. As at end June 2015, the outstanding stock of REPOs stood at UGX 187 billion, while the stock of recapitalisation securities was UGX 660 billion.
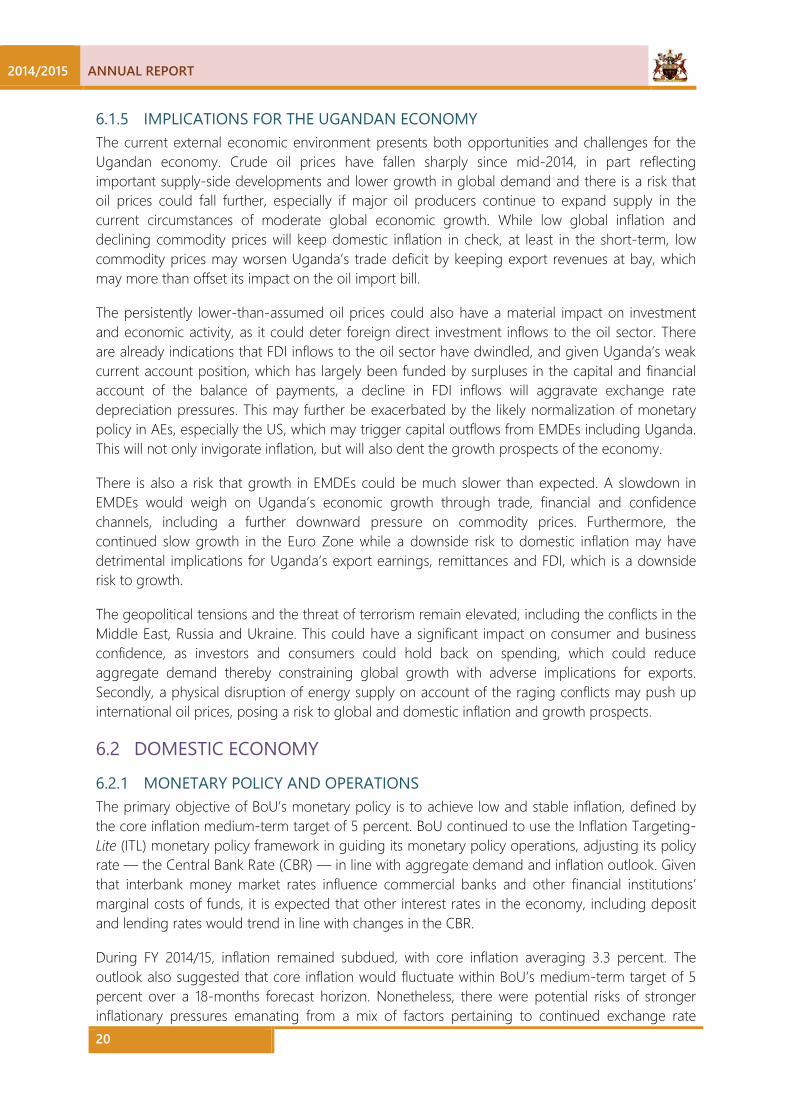
The 7-day interbank money market rate remained relatively stable and evolved in line with the desired monetary policy stance until Q3-2014/15, when it became relatively volatile in part due to the tight liquidity conditions that were warranted by the depreciation pressures in the domestic foreign exchange market. Developments in the 7-day interbank money market rate against the CBR are shown in Figure 3.
Figure 3: Central Bank Rate and 7-day Interbank Money Market Rate
Source: Bank of Uganda
6.2.2 INTEREST RATES
6.2.2.1 Yields on Treasury Bills and Bonds The BoU issued Treasury bills (T-bills) and Treasury bonds (T-bonds) in line with government’s financing requirements and the redemption profile for FY 2014/15. Yields on government securities however maintained an upward trend, increasing on average by about 2 percentage points (PPs) compared to yields obtaining in FY 2013/14, as shown in Figure 4. This is in part a reflection of
5.0
10.0
15.0
20.0
25.0
30.0
Mon
thly
Ave
rage
Ann
ualiz
ed
Yiel
d (P
erce
nt)
CBR upper bound lower bound 7 Day money market

2014/2015 ANNUAL REPORT
22
increased auction amounts to meet government borrowing requirements and heightened inflation expectations given the depreciation pressures in the domestic foreign exchange market.
Figure 4: Government Bond Yield Curve
Source: Bank of Uganda
The yield curve steepens in the short- to medium-term, but flattens over the horizon of the longer dated bonds in part reflecting a stable economic outlook. More importantly though, future economic growth is likely not to be associated with higher inflation, which in turn would not warrant the BoU to tighten monetary policy.
6.2.2.2 Lending and Deposit Rates Although the interest rate pass-through from the CBR to the interbank money market rates is high, fast and symmetric; the pass-through to commercial bank interest rates is imperfect. In effect, commercial bank lending rates remained elevated in FY 2014/15, averaging 22.0 percent. The deposit rates however declined compared to the deposit rates of June 2014, and with the lending rates barely unchanged, the spread between the lending and deposit rates increased from 11.7 to 12.0 percentage points. The weighted average lending rate on foreign currency denominated loans also remained relatively elevated as shown in Table 4.
Table 4: Commercial Banks’ Interest Rates
Jun-09 Jun-10 Jun-11 Jun-12 Jun-13 Jun-14 Jun-15
Local Currency Lending 21.8 20.07 19.94 27.02 22.72 21.55 22.34 Demand Deposit 1.26 1.24 1.13 1.32 1.51 1.79 1.50 Saving Deposit 2.36 2.43 2.3 3.27 3.12 2.31 3.26 Time Deposit 10.72 7.25 11.01 19.9 12.26 9.82 10.39 Spread 11.08 12.81 8.92 7.12 10.46 11.73 11.95 Foreign Currency Lending 10.37 10.8 9.43 8.44 10.11 9.03 9.87 Demand Deposit 1.01 0.96 1.09 0.95 1.01 0.96 0.96 Saving Deposit 1.51 1.65 1.49 1.66 1.66 1.52 1.51 Time Deposit 3.93 3.17 2.40 5.22 4.52 4.31 3.97 Spread 6.40 7.60 7.00 3.22 5.59 4.72 5.90
Source: Bank of Uganda
0.0
2.0
4.0
6.0
8.0
10.0
12.0
14.0
16.0
18.0
91-days 182-days 364-days 2-years 5-years 10-years 15-years
Annu
alise
d Yi
elds
(%)
2013/14 2014/15
ANNUAL REPORT 2014/2015
23
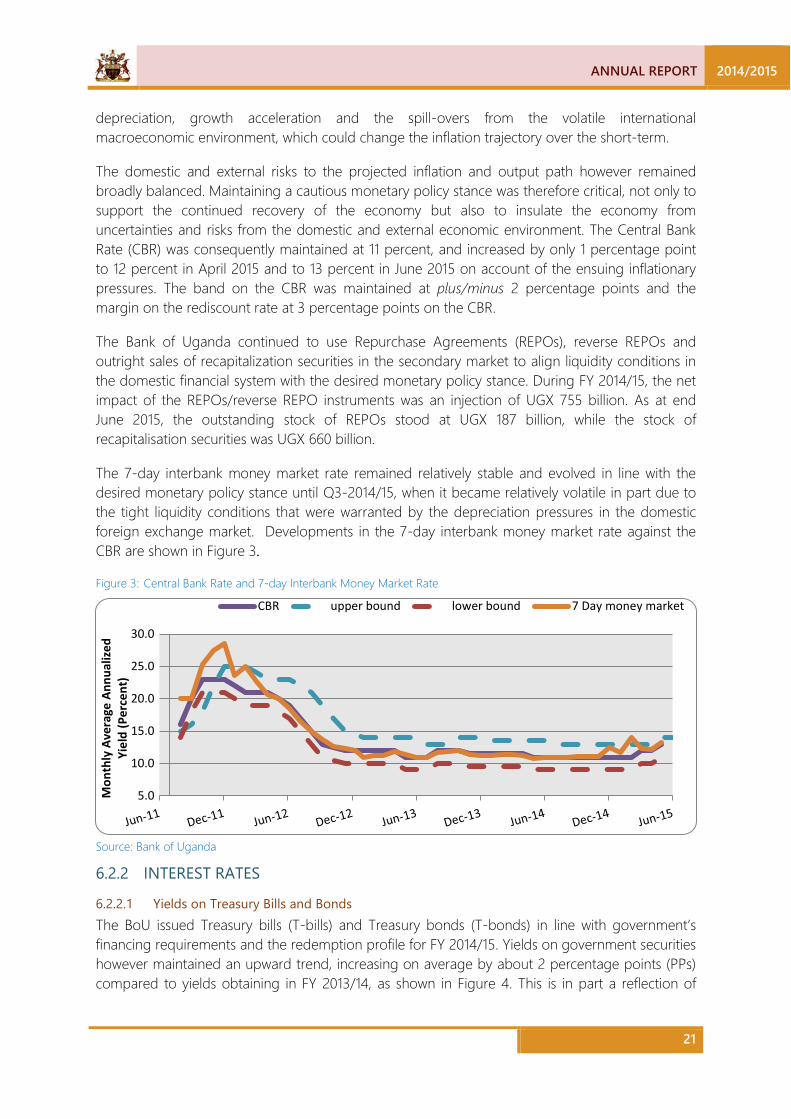
In terms of sectoral interest rates, transport and communication; building, construction and real estate; and mortgage and land purchase continued to attract higher than average market lending rates, which may in part suggest the existence of persistent inherent risks in these sectors. Developments in sectoral lending rates are shown in Figure 5.
Figure 5: Lending Interest Rates by Sector
Source: Bank of Uganda
6.2.3 CREDIT TO THE PRIVATE SECTOR AND MONETARY AGGREGATES
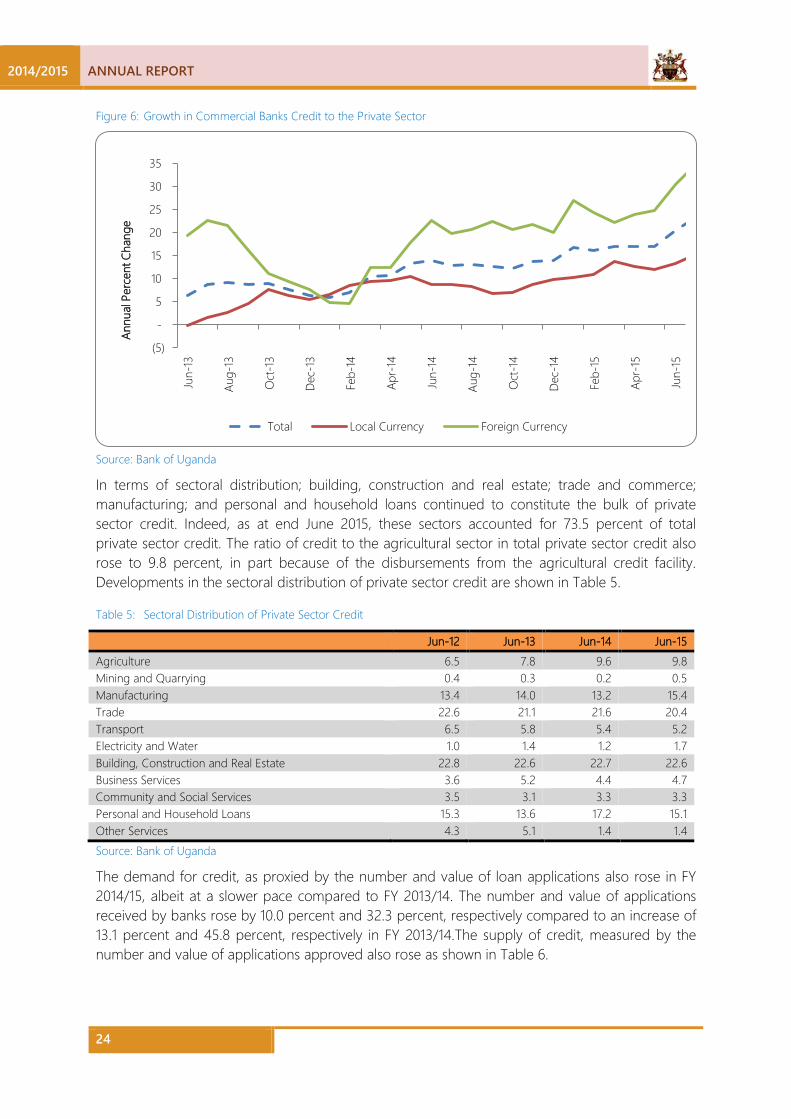
6.2.3.1 Credit to the Private sector Growth in private sector credit (PSC), a leading indicator of the financial sector’s contribution to economic activity, continued to pick up in FY 2014/15, in part reflecting buoyant domestic economic conditions. The annual growth in private sector credit rose to 20.4 percent in June 2015 from 14.1 percent in June 2014. Although the increase in credit to the private sector would augur well for economic growth, it nonetheless constitutes an upside risk to inflation, as it may generate demand pressures in the economy. Developments in private sector credit are shown in Figure 6.
10
14
18
22
26
Sep 2014 Dec 2014 May 2015 Jun 2015
Perc
ent
Manufacturing TradeTransport and Communication. Mortgage & Land Purchase Other (Building , Construction and real estate) Community, Social and Other ServicesOverall
2014/2015 ANNUAL REPORT
24
Figure 6: Growth in Commercial Banks Credit to the Private Sector
Source: Bank of Uganda
In terms of sectoral distribution; building, construction and real estate; trade and commerce; manufacturing; and personal and household loans continued to constitute the bulk of private sector credit. Indeed, as at end June 2015, these sectors accounted for 73.5 percent of total private sector credit. The ratio of credit to the agricultural sector in total private sector credit also rose to 9.8 percent, in part because of the disbursements from the agricultural credit facility. Developments in the sectoral distribution of private sector credit are shown in Table 5.
Table 5: Sectoral Distribution of Private Sector Credit
Jun-12 Jun-13 Jun-14 Jun-15 Agriculture 6.5 7.8 9.6 9.8 Mining and Quarrying 0.4 0.3 0.2 0.5 Manufacturing 13.4 14.0 13.2 15.4 Trade 22.6 21.1 21.6 20.4 Transport 6.5 5.8 5.4 5.2 Electricity and Water 1.0 1.4 1.2 1.7 Building, Construction and Real Estate 22.8 22.6 22.7 22.6 Business Services 3.6 5.2 4.4 4.7 Community and Social Services 3.5 3.1 3.3 3.3 Personal and Household Loans 15.3 13.6 17.2 15.1 Other Services 4.3 5.1 1.4 1.4 Source: Bank of Uganda
The demand for credit, as proxied by the number and value of loan applications also rose in FY 2014/15, albeit at a slower pace compared to FY 2013/14. The number and value of applications received by banks rose by 10.0 percent and 32.3 percent, respectively compared to an increase of 13.1 percent and 45.8 percent, respectively in FY 2013/14.The supply of credit, measured by the number and value of applications approved also rose as shown in Table 6.
(5)
-
5
10
15
20
25
30
35
Jun-
13
Aug-
13
Oct
-13
Dec-
13
Feb-
14
Apr-
14
Jun-
14
Aug-
14
Oct
-14
Dec-
14
Feb-
15
Apr-
15
Jun-
15
Total Local Currency Foreign Currency
Annu
al Pe
rcen
t Cha
nge
ANNUAL REPORT 2014/2015
25
Table 6: Demand for and Supply of Loans
2011/12 2012/13 2013/14 2014/15 Number of Loan Applications (‘000) 430 446 504 555 Number of Loan Approvals (‘000) 434 430 471 514 Value of Loan Applications (UGX. billions) 8,337 6,840 9,974 13,191 Value of Loan Approvals (UGX. billions) 5,854 5,311 6,168 7,570 Source: Bank of Uganda
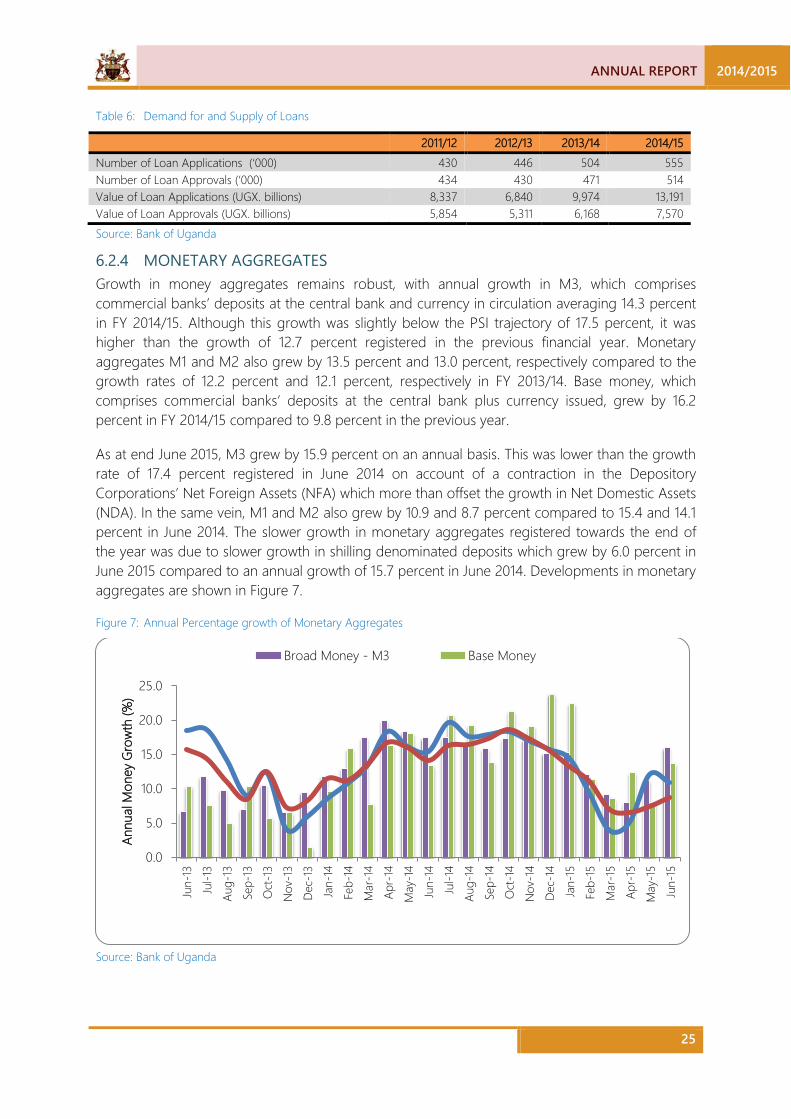
6.2.4 MONETARY AGGREGATES Growth in money aggregates remains robust, with annual growth in M3, which comprises commercial banks’ deposits at the central bank and currency in circulation averaging 14.3 percent in FY 2014/15. Although this growth was slightly below the PSI trajectory of 17.5 percent, it was higher than the growth of 12.7 percent registered in the previous financial year. Monetary aggregates M1 and M2 also grew by 13.5 percent and 13.0 percent, respectively compared to the growth rates of 12.2 percent and 12.1 percent, respectively in FY 2013/14. Base money, which comprises commercial banks’ deposits at the central bank plus currency issued, grew by 16.2 percent in FY 2014/15 compared to 9.8 percent in the previous year.
As at end June 2015, M3 grew by 15.9 percent on an annual basis. This was lower than the growth rate of 17.4 percent registered in June 2014 on account of a contraction in the Depository Corporations’ Net Foreign Assets (NFA) which more than offset the growth in Net Domestic Assets (NDA). In the same vein, M1 and M2 also grew by 10.9 and 8.7 percent compared to 15.4 and 14.1 percent in June 2014. The slower growth in monetary aggregates registered towards the end of the year was due to slower growth in shilling denominated deposits which grew by 6.0 percent in June 2015 compared to an annual growth of 15.7 percent in June 2014. Developments in monetary aggregates are shown in Figure 7.
Figure 7: Annual Percentage growth of Monetary Aggregates
Source: Bank of Uganda
0.0
5.0
10.0
15.0
20.0
25.0
Jun-
13Ju
l-13
Aug-
13Se
p-13
Oct
-13
Nov
-13
Dec-
13Ja
n-14
Feb-
14M
ar-1
4Ap
r-14
May
-14
Jun-
14Ju
l-14
Aug-
14Se
p-14
Oct
-14
Nov
-14
Dec-
14Ja
n-15
Feb-
15M
ar-1
5Ap
r-15
May
-15
Jun-
15
Annu
al M
oney
Gro
wth
(%)
Broad Money - M3 Base Money
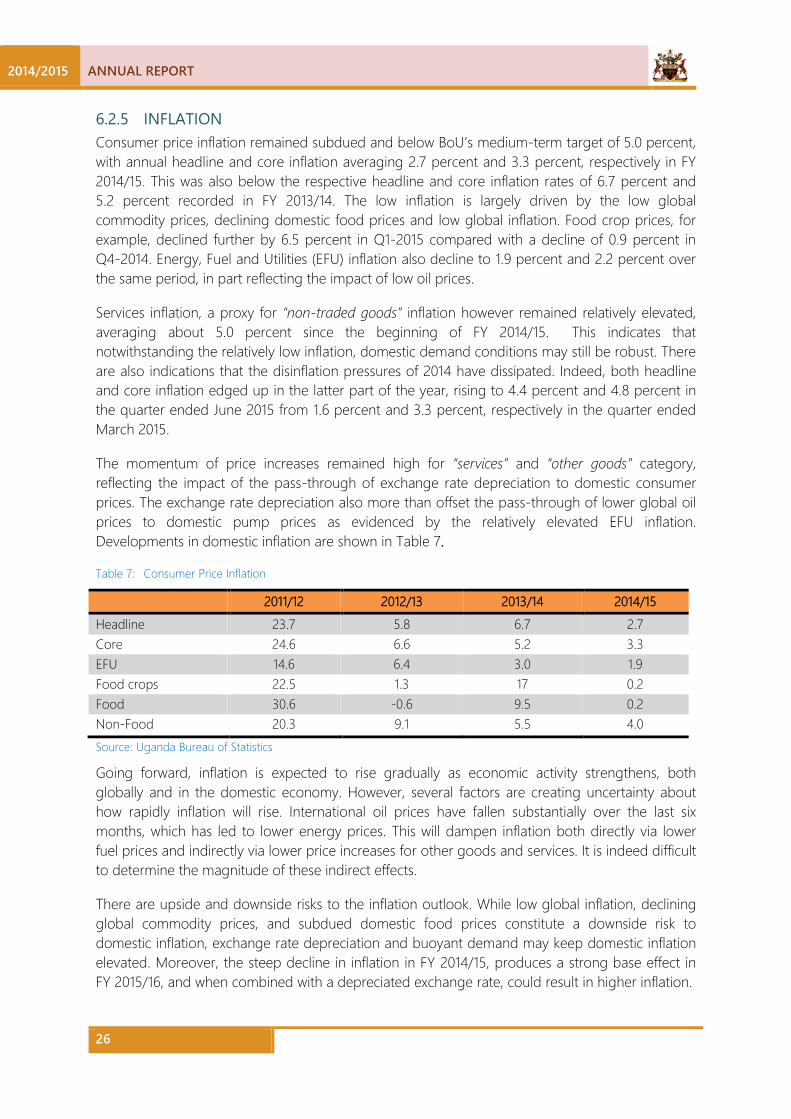
2014/2015 ANNUAL REPORT
26
6.2.5 INFLATION Consumer price inflation remained subdued and below BoU’s medium-term target of 5.0 percent, with annual headline and core inflation averaging 2.7 percent and 3.3 percent, respectively in FY 2014/15. This was also below the respective headline and core inflation rates of 6.7 percent and 5.2 percent recorded in FY 2013/14. The low inflation is largely driven by the low global commodity prices, declining domestic food prices and low global inflation. Food crop prices, for example, declined further by 6.5 percent in Q1-2015 compared with a decline of 0.9 percent in Q4-2014. Energy, Fuel and Utilities (EFU) inflation also decline to 1.9 percent and 2.2 percent over the same period, in part reflecting the impact of low oil prices.
Services inflation, a proxy for “non-traded goods” inflation however remained relatively elevated, averaging about 5.0 percent since the beginning of FY 2014/15. This indicates that notwithstanding the relatively low inflation, domestic demand conditions may still be robust. There are also indications that the disinflation pressures of 2014 have dissipated. Indeed, both headline and core inflation edged up in the latter part of the year, rising to 4.4 percent and 4.8 percent in the quarter ended June 2015 from 1.6 percent and 3.3 percent, respectively in the quarter ended March 2015.
The momentum of price increases remained high for “services” and “other goods” category, reflecting the impact of the pass-through of exchange rate depreciation to domestic consumer prices. The exchange rate depreciation also more than offset the pass-through of lower global oil prices to domestic pump prices as evidenced by the relatively elevated EFU inflation. Developments in domestic inflation are shown in Table 7.
Table 7: Consumer Price Inflation
2011/12 2012/13 2013/14 2014/15 Headline 23.7 5.8 6.7 2.7 Core 24.6 6.6 5.2 3.3 EFU 14.6 6.4 3.0 1.9 Food crops 22.5 1.3 17 0.2 Food 30.6 -0.6 9.5 0.2 Non-Food 20.3 9.1 5.5 4.0 Source: Uganda Bureau of Statistics
Going forward, inflation is expected to rise gradually as economic activity strengthens, both globally and in the domestic economy. However, several factors are creating uncertainty about how rapidly inflation will rise. International oil prices have fallen substantially over the last six months, which has led to lower energy prices. This will dampen inflation both directly via lower fuel prices and indirectly via lower price increases for other goods and services. It is indeed difficult to determine the magnitude of these indirect effects.
There are upside and downside risks to the inflation outlook. While low global inflation, declining global commodity prices, and subdued domestic food prices constitute a downside risk to domestic inflation, exchange rate depreciation and buoyant demand may keep domestic inflation elevated. Moreover, the steep decline in inflation in FY 2014/15, produces a strong base effect in FY 2015/16, and when combined with a depreciated exchange rate, could result in higher inflation.
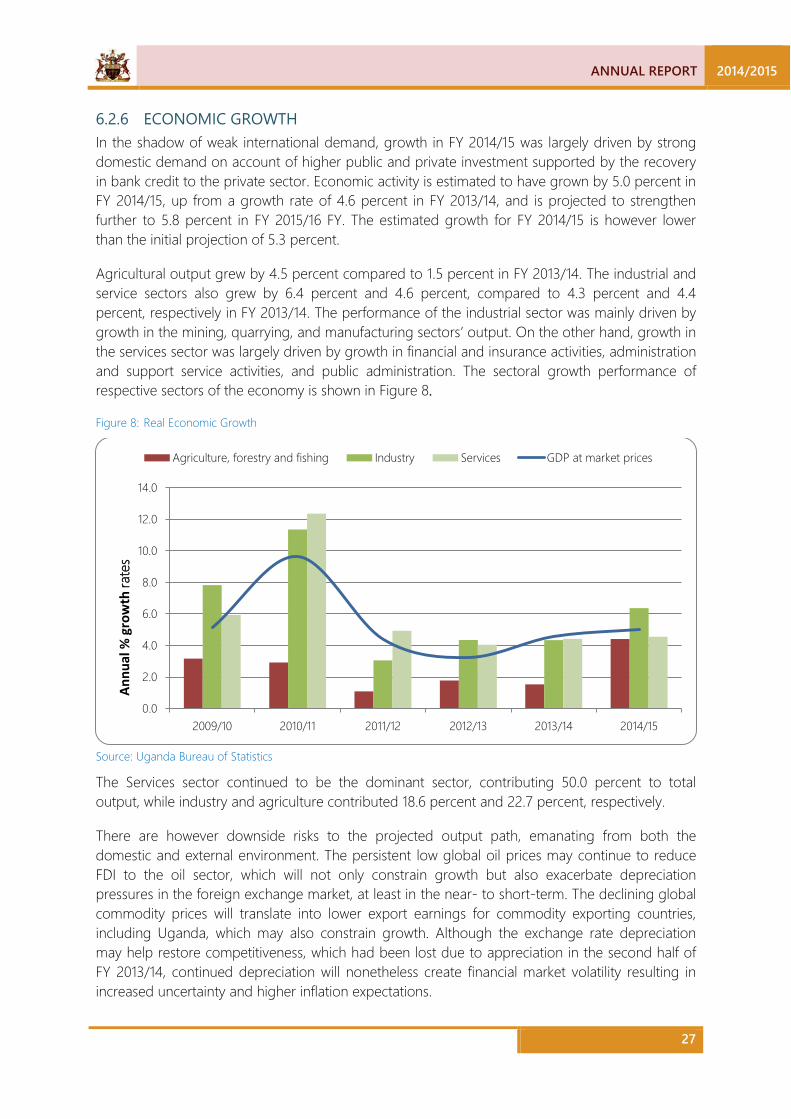
ANNUAL REPORT 2014/2015
27
6.2.6 ECONOMIC GROWTH In the shadow of weak international demand, growth in FY 2014/15 was largely driven by strong domestic demand on account of higher public and private investment supported by the recovery in bank credit to the private sector. Economic activity is estimated to have grown by 5.0 percent in FY 2014/15, up from a growth rate of 4.6 percent in FY 2013/14, and is projected to strengthen further to 5.8 percent in FY 2015/16 FY. The estimated growth for FY 2014/15 is however lower than the initial projection of 5.3 percent.
Agricultural output grew by 4.5 percent compared to 1.5 percent in FY 2013/14. The industrial and service sectors also grew by 6.4 percent and 4.6 percent, compared to 4.3 percent and 4.4 percent, respectively in FY 2013/14. The performance of the industrial sector was mainly driven by growth in the mining, quarrying, and manufacturing sectors’ output. On the other hand, growth in the services sector was largely driven by growth in financial and insurance activities, administration and support service activities, and public administration. The sectoral growth performance of respective sectors of the economy is shown in Figure 8.
Figure 8: Real Economic Growth
Source: Uganda Bureau of Statistics
The Services sector continued to be the dominant sector, contributing 50.0 percent to total output, while industry and agriculture contributed 18.6 percent and 22.7 percent, respectively.
There are however downside risks to the projected output path, emanating from both the domestic and external environment. The persistent low global oil prices may continue to reduce FDI to the oil sector, which will not only constrain growth but also exacerbate depreciation pressures in the foreign exchange market, at least in the near- to short-term. The declining global commodity prices will translate into lower export earnings for commodity exporting countries, including Uganda, which may also constrain growth. Although the exchange rate depreciation may help restore competitiveness, which had been lost due to appreciation in the second half of FY 2013/14, continued depreciation will nonetheless create financial market volatility resulting in increased uncertainty and higher inflation expectations.
0.0
2.0
4.0
6.0
8.0
10.0
12.0
14.0
2009/10 2010/11 2011/12 2012/13 2013/14 2014/15
Agriculture, forestry and fishing Industry Services GDP at market prices
Annu
al %
gro
wth
rate
s

2014/2015 ANNUAL REPORT
28
The depreciation of the exchange rate may also adversely impact public and private investment by making imported capital and intermediate goods more costly, which will deter economic growth. On the domestic scene, increased public investment in infrastructure may require substantial domestic financing, which may constrain private sector credit and investment.
6.2.7 FISCAL OPERATIONS AND DEVELOPMENTS
6.2.7.1 Government Expenditure and Revenue The fiscal stance for FY 2014/15 focused on supporting economic activity by addressing infrastructural constraints in the economy. Although most of the expenditure on infrastructural projects is of external nature, implying a lower multiplier effect on economic growth in the near- to short-term, it is nonetheless expected to boost growth in the medium-term. Preliminary estimates indicate that in FY 2014/15, total government expenditure and net lending amounted to UGX.14,487.0 billion, which was above the programmed amount by UGX. 499.0 billion largely on account of an over performance in development expenditure of UGX. 345.7 billion as shown in Table 8. Current expenditure also exceeded program levels by UGX. 133.5 billion, largely on account of higher than programmed expenditure on wages & salaries.
Table 8: Fiscal Operations
Item in billions of Shillings Actual: Prel. Budget Variation FY 2013/14 FY 2014/15 FY 2014/15 Revenue & Grants 8,870 10,866 10,884 -18 Revenue 8,168 9,935 9,782 153 Tax 8,031 9,714 9,417 297 Non- Tax 137 221 365 -144 Grants 702 931 1,102 -171 Expenditure & Lending 11,682 14,487 16,290 -1,803 Current Expenditure 6,706 7,683 7,499 183 Development Expenditure 4,937 5,228 5,997 -769 Net lending/repayments(1) 19 1,350 2,513 -1,163 Domestic arrears repayment 20 226 280 -54 Deficit (including grants) -2,812 -3,621 -5,405 1,785 Financing (net) 2,812 3,621 5,405 -1,785 External Financing (net) 887 919 2,663 -1,744 Total Domestic Financing(net) 1,650 2,479 2,743 -264 Issuance of Securities 1,715 1,386 1,386 0 Drawdown on savings -201 1,060 1,178 -118 Errors & Omissions 275 222 (1)Net lending includes recapitalization of BoU and expenditure on the Karuma and Isimba hydro power projects. Source: Ministry of Finance, Planning and Economic Development
The higher than programmed expenditure was partly compensated for by the over performance in government revenue. Total government revenue, including grants amounted to UGX. 10,866.0 billion, which was higher than target by UGX. 249.1 billion. Grants and domestic revenues over performed by UGX 112.0 billion and UGX. 173.0 billion, respectively.
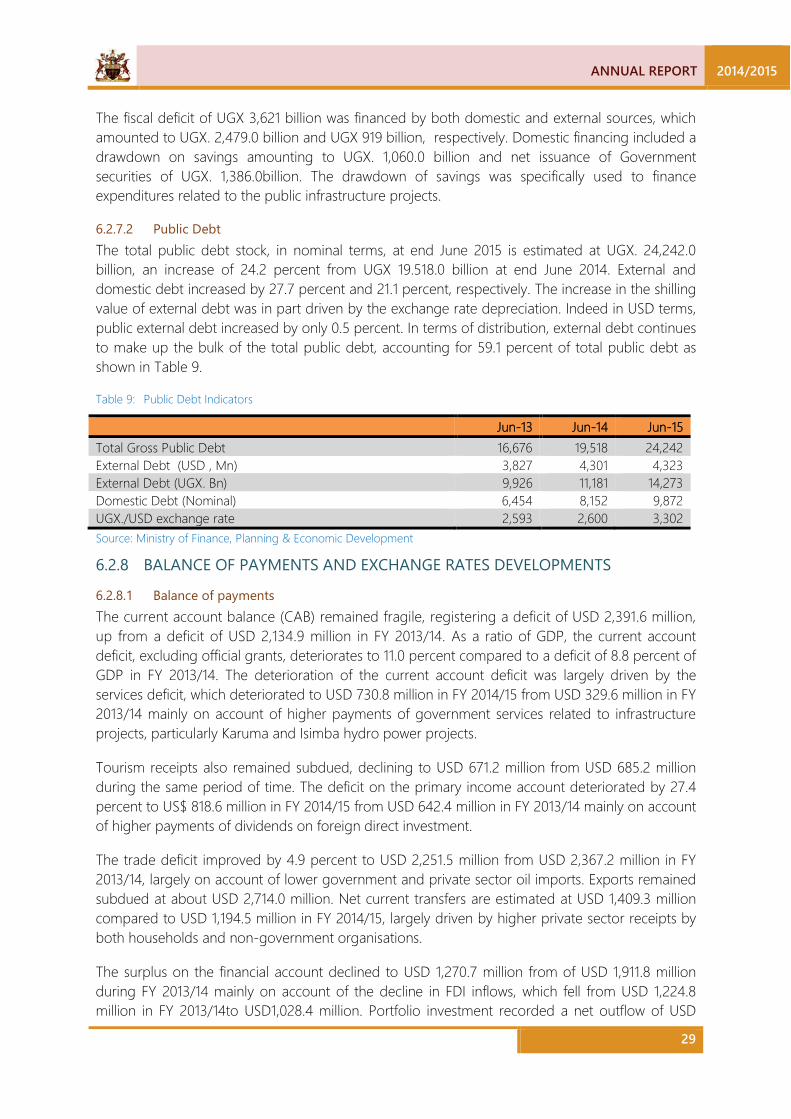
ANNUAL REPORT 2014/2015
29
The fiscal deficit of UGX 3,621 billion was financed by both domestic and external sources, which amounted to UGX. 2,479.0 billion and UGX 919 billion, respectively. Domestic financing included a drawdown on savings amounting to UGX. 1,060.0 billion and net issuance of Government securities of UGX. 1,386.0billion. The drawdown of savings was specifically used to finance expenditures related to the public infrastructure projects.
6.2.7.2 Public Debt The total public debt stock, in nominal terms, at end June 2015 is estimated at UGX. 24,242.0 billion, an increase of 24.2 percent from UGX 19.518.0 billion at end June 2014. External and domestic debt increased by 27.7 percent and 21.1 percent, respectively. The increase in the shilling value of external debt was in part driven by the exchange rate depreciation. Indeed in USD terms, public external debt increased by only 0.5 percent. In terms of distribution, external debt continues to make up the bulk of the total public debt, accounting for 59.1 percent of total public debt as shown in Table 9.
Table 9: Public Debt Indicators
Jun-13 Jun-14 Jun-15 Total Gross Public Debt 16,676 19,518 24,242 External Debt (USD , Mn) 3,827 4,301 4,323 External Debt (UGX. Bn) 9,926 11,181 14,273 Domestic Debt (Nominal) 6,454 8,152 9,872 UGX./USD exchange rate 2,593 2,600 3,302 Source: Ministry of Finance, Planning & Economic Development
6.2.8 BALANCE OF PAYMENTS AND EXCHANGE RATES DEVELOPMENTS
6.2.8.1 Balance of payments The current account balance (CAB) remained fragile, registering a deficit of USD 2,391.6 million, up from a deficit of USD 2,134.9 million in FY 2013/14. As a ratio of GDP, the current account deficit, excluding official grants, deteriorates to 11.0 percent compared to a deficit of 8.8 percent of GDP in FY 2013/14. The deterioration of the current account deficit was largely driven by the services deficit, which deteriorated to USD 730.8 million in FY 2014/15 from USD 329.6 million in FY 2013/14 mainly on account of higher payments of government services related to infrastructure projects, particularly Karuma and Isimba hydro power projects.
Tourism receipts also remained subdued, declining to USD 671.2 million from USD 685.2 million during the same period of time. The deficit on the primary income account deteriorated by 27.4 percent to US$ 818.6 million in FY 2014/15 from USD 642.4 million in FY 2013/14 mainly on account of higher payments of dividends on foreign direct investment.
The trade deficit improved by 4.9 percent to USD 2,251.5 million from USD 2,367.2 million in FY 2013/14, largely on account of lower government and private sector oil imports. Exports remained subdued at about USD 2,714.0 million. Net current transfers are estimated at USD 1,409.3 million compared to USD 1,194.5 million in FY 2014/15, largely driven by higher private sector receipts by both households and non-government organisations.
The surplus on the financial account declined to USD 1,270.7 million from of USD 1,911.8 million during FY 2013/14 mainly on account of the decline in FDI inflows, which fell from USD 1,224.8 million in FY 2013/14to USD1,028.4 million. Portfolio investment recorded a net outflow of USD
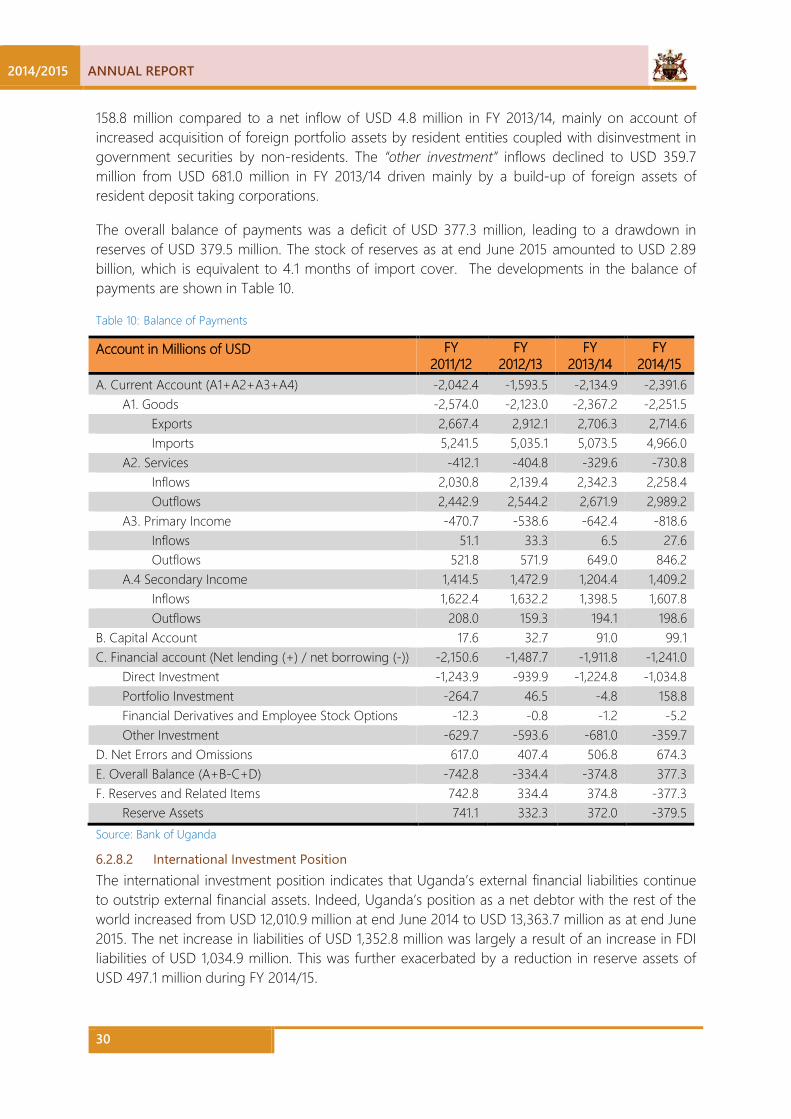
2014/2015 ANNUAL REPORT
30
158.8 million compared to a net inflow of USD 4.8 million in FY 2013/14, mainly on account of increased acquisition of foreign portfolio assets by resident entities coupled with disinvestment in government securities by non-residents. The “other investment” inflows declined to USD 359.7 million from USD 681.0 million in FY 2013/14 driven mainly by a build-up of foreign assets of resident deposit taking corporations.
The overall balance of payments was a deficit of USD 377.3 million, leading to a drawdown in reserves of USD 379.5 million. The stock of reserves as at end June 2015 amounted to USD 2.89 billion, which is equivalent to 4.1 months of import cover. The developments in the balance of payments are shown in Table 10.
Table 10: Balance of Payments
Account in Millions of USD FY 2011/12
FY 2012/13
FY 2013/14
FY 2014/15
A. Current Account (A1+A2+A3+A4) -2,042.4 -1,593.5 -2,134.9 -2,391.6 A1. Goods -2,574.0 -2,123.0 -2,367.2 -2,251.5 Exports 2,667.4 2,912.1 2,706.3 2,714.6 Imports 5,241.5 5,035.1 5,073.5 4,966.0 A2. Services -412.1 -404.8 -329.6 -730.8 Inflows 2,030.8 2,139.4 2,342.3 2,258.4 Outflows 2,442.9 2,544.2 2,671.9 2,989.2 A3. Primary Income -470.7 -538.6 -642.4 -818.6 Inflows 51.1 33.3 6.5 27.6 Outflows 521.8 571.9 649.0 846.2 A.4 Secondary Income 1,414.5 1,472.9 1,204.4 1,409.2 Inflows 1,622.4 1,632.2 1,398.5 1,607.8 Outflows 208.0 159.3 194.1 198.6
B. Capital Account 17.6 32.7 91.0 99.1 C. Financial account (Net lending (+) / net borrowing (-)) -2,150.6 -1,487.7 -1,911.8 -1,241.0
Direct Investment -1,243.9 -939.9 -1,224.8 -1,034.8 Portfolio Investment -264.7 46.5 -4.8 158.8 Financial Derivatives and Employee Stock Options -12.3 -0.8 -1.2 -5.2 Other Investment -629.7 -593.6 -681.0 -359.7
D. Net Errors and Omissions 617.0 407.4 506.8 674.3 E. Overall Balance (A+B-C+D) -742.8 -334.4 -374.8 377.3 F. Reserves and Related Items 742.8 334.4 374.8 -377.3
Reserve Assets 741.1 332.3 372.0 -379.5 Source: Bank of Uganda
6.2.8.2 International Investment Position The international investment position indicates that Uganda’s external financial liabilities continue to outstrip external financial assets. Indeed, Uganda’s position as a net debtor with the rest of the world increased from USD 12,010.9 million at end June 2014 to USD 13,363.7 million as at end June 2015. The net increase in liabilities of USD 1,352.8 million was largely a result of an increase in FDI liabilities of USD 1,034.9 million. This was further exacerbated by a reduction in reserve assets of USD 497.1 million during FY 2014/15.

ANNUAL REPORT 2014/2015
31
On a gross basis, Uganda’s stock of foreign liabilities amounted to USD 18,289.0 million, up from USD 16,894.3 million at end June 2014. The stock of FDI amounted to USD 10,459.3 million, accounting for 57.2 percent of the country’s total foreign liabilities. The bulk of the FDI stock, about 80.3 percent, was in the form of equity capital and reinvested earnings. Portfolio investment liabilities to non-residents amounted to USD 663.9 million, an increase of USD 31.4 million when compared to the end June 2014 position. “Other investment” liabilities amounted to USD 7,165.4 million as at end June 2015, the bulk of which were loans owed by government and the private sector to non-residents.
The stock of foreign assets amounted to USD 4,925.3 million, up from USD 4,883.5 million at end June 2014. Reserve assets estimated at USD 2.9 million dominated the foreign assets contributing 58.4 percent of the total. The “other investment” assets comprising mainly currencies and deposits abroad and loans to non- residents, amounted to USD 1,495.1 million, out of which currency and deposit assets accounted for 97.5 percent. Portfolio investment assets amounted to USD 500.1 million, with debt securities assets as the major category, accounting for 64.9 percent of the total portfolio investment assets. There was tremendous growth in the equity and investment fund share category over FY 2014/15, driven largely by acquisition of equity assets in non-resident entities by residents.
6.2.9 EXCHANGE RATES The depreciation pressures which started in early 2014 continued through June 2015, with the Shilling depreciating by 18.8 percent year-on-year on a trade weighted basis and by 29.1 percent against the USD to an average mid-rate of UGX. 3,398.49 per USD. The depreciation pressures were largely driven by the continued global strengthening of the USD; continued weakening of the current account deficit; reduction in FDI inflows on account of deferred investments in the oil sector because of low global oil prices; net portfolio outflows; elevated demand for foreign exchange from the key sectors of the economy including energy, manufacturing and offshore players; and bearish sentiments in the foreign exchange market.
Indeed, the USD had strengthened globally against major international currencies, in part driven by strong performance of the US economy and expectations of eminent interest rate hike, which has seen capital flow back to the US. As at end June 2015, the USD index, which measures the relative strength of the USD against a basket of seven major international currencies, appreciated by 17.4 percent year-on-year. All regional currencies have also depreciated in line with the global strengthening of the USD. Kenya shilling (KES) and the Tanzanian shilling (TZS) depreciated by 11.6 percent and 25.7 percent, respectively, year-on-year against the USD. The Rwandese franc (RWF) also depreciated by 5.2 percent, year-on-year against the USD.
In line with the heightened depreciation pressures, the exchange rate remained relatively volatile in FY 2014/15. Nonetheless, this volatility was not unique to Uganda, as bilateral USD exchange rates of most regional and global currencies also remained relatively volatile as shown in Figure 9.
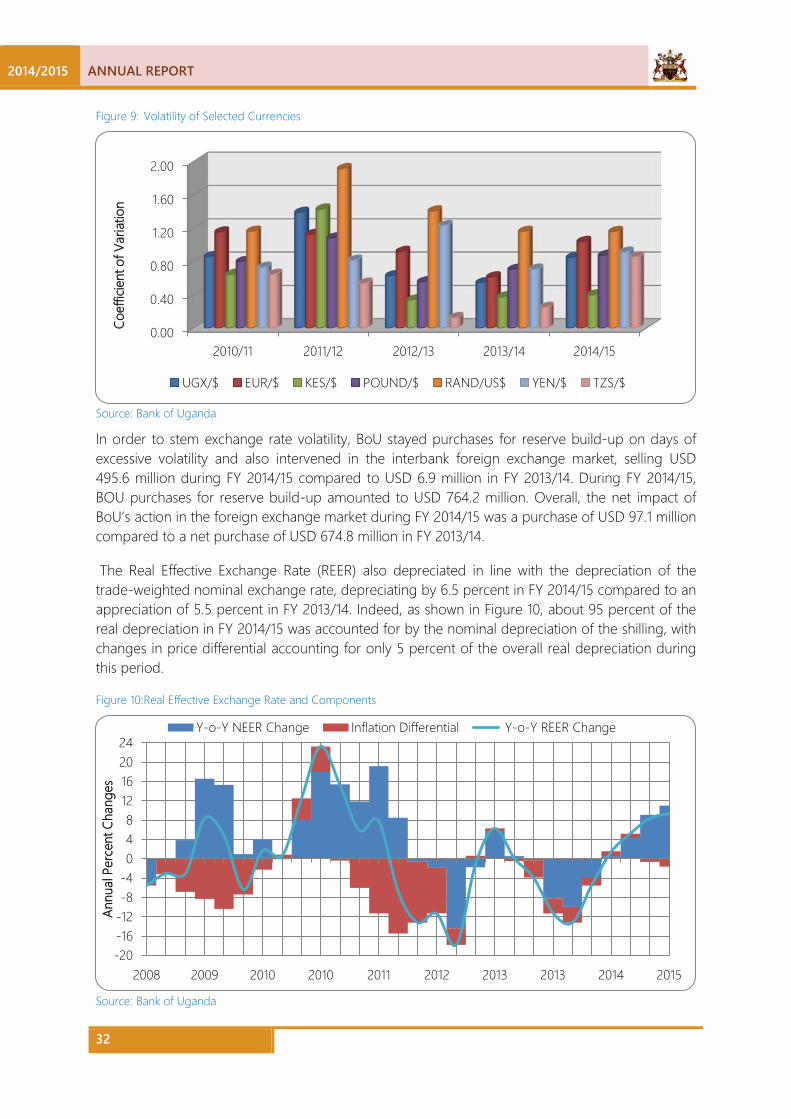
2014/2015 ANNUAL REPORT
32
Figure 9: Volatility of Selected Currencies
Source: Bank of Uganda
In order to stem exchange rate volatility, BoU stayed purchases for reserve build-up on days of excessive volatility and also intervened in the interbank foreign exchange market, selling USD 495.6 million during FY 2014/15 compared to USD 6.9 million in FY 2013/14. During FY 2014/15, BOU purchases for reserve build-up amounted to USD 764.2 million. Overall, the net impact of BoU’s action in the foreign exchange market during FY 2014/15 was a purchase of USD 97.1 million compared to a net purchase of USD 674.8 million in FY 2013/14.
The Real Effective Exchange Rate (REER) also depreciated in line with the depreciation of the trade-weighted nominal exchange rate, depreciating by 6.5 percent in FY 2014/15 compared to an appreciation of 5.5 percent in FY 2013/14. Indeed, as shown in Figure 10, about 95 percent of the real depreciation in FY 2014/15 was accounted for by the nominal depreciation of the shilling, with changes in price differential accounting for only 5 percent of the overall real depreciation during this period.
Figure 10: Real Effective Exchange Rate and Components
Source: Bank of Uganda
0.00
0.40
0.80
1.20
1.60
2.00
2010/11 2011/12 2012/13 2013/14 2014/15
Coef
ficie
nt o
f Var
iatio
n
UGX/$ EUR/$ KES/$ POUND/$ RAND/US$ YEN/$ TZS/$
-20-16-12-8-4048
12162024
2008 2009 2010 2010 2011 2012 2013 2013 2014 2015
Annu
al P
erce
nt C
hang
es
Y-o-Y NEER Change Inflation Differential Y-o-Y REER Change

ANNUAL REPORT 2014/2015
33
RESERVES AND INVESTMENT MANAGEMENT OPERATIONS 7.1
7.1.1 GLOBAL ECONOMY Global growth has slowed progressively over the last four years, with both the advanced and developing economies losing momentum. In the period under review, the risks to global growth still appeared skewed to the downside, but less so than before. The largest risks reflected drops in commodity prices along with geopolitical uncertainties. In Europe in particular, the Ukrainian situation slowed the Euro zone recovery, there were conflicts raging in Syria and Iraq, tensions between China and Japan, slowdown in China along with its banking system remaining fragile, and uncertainty over the Iranian nuclear deal. Despite the long list of headwinds, the global economy was seen growing by 3.5 percent (y/y) on the back of a strong recovery in the US, traction gaining in Western Europe and increasing production in emerging markets.
7.1.2 UNITED STATES OF AMERICA During the third quarter of calendar year 2014, GDP grew by 2.7 percent (y/y) then fell to 2.4 percent in the fourth quarter mainly due to harsh winter weather. The U.S. Federal Reserve Quantitative Easing program (QE), which injected liquidity in a bid prevent the economy from prolonged recession and stimulate growth, came to an end in October 2014 after adding more than $3.5 trillion to the Fed’s balance sheet. The Fed noted that after its (QE) ended, it would start rising its policy rate. Fed Chair Janet Yellen commented at a press conference earlier in 2014 that the “considerable time” between the ending of QE and the first hike in the Fed funds rate meant “something on the order of around six months,” suggesting that the move would come about mid-2015. Chair Yellen subsequently backed-off that statement noting that ultimately the timing would be data dependent and by June 2015, the Fed still had not raised its policy rate with market players anticipating a first rate hike in September 2015.
7.1.3 EUROZONE Greece continued to dominate headlines in Europe. It failed to meet the 30 June 2015 deadline and defaulted on its loan repayment to the IMF. In order to access more funding and avert more defaults, Greece had no choice but to accept further austerity measures by its creditors. Although market reaction to the recent reform packages passed in Greece at the end of the period under review was broadly positive, further episodes of significant uncertainty and volatility still loom. The Euro zone was not without successes, with Portugal exiting its bailout on schedule amid encouraging signs that it and its much larger Iberian neighbour, Spain, had turned the corner. The broadly successful stress tests on the banks were followed by a seemingly smooth transition of regulatory powers to the European Central Bank. Furthermore, the economic recovery in the euro area was given credence following the European Central Bank cutting its deposit rate into negative territory and stressing its intention to continue with the asset purchase program along with willingness to take further action should financial conditions tighten or the outlook for price stability deteriorate.
7.1.4 UNITED KINGDOM The United Kingdom averted a Scottish secession vote with 55 percent of voters declining to split Scotland from the U.K. versus 45 percent who voted for autonomy. Although there had been
7 FINANCIAL MARKETS
2014/2015 ANNUAL REPORT
34
some signs of a rate rise by the Bank of England during the period, inflation fell drastically from near 2.00 percent in June 2014 to -0.1 percent in June 2015 but some of this deceleration reflected the downward pull from plummeting energy prices. On the upside though, at the end of the period, GDP had averaged a strong 2.6 percent (y/y), consumer confidence rebounded 6.0 points to 7.0 in June 2015, the highest in over 15 years and the unemployment rate fell to 5.5 percent, the lowest in nearly 7 years, at the top of the 5.0-5.5 percent range that the Bank of England suggested may be consistent with full employment in the medium to longer term. However, absent a clear turn and indeed meaningful pickup in underlying inflation, the chances of a BoE rate hike were pushed forward to 2016 even as Governor Carney signalled that the time for lift-off was getting closer.
7.1.5 AUSTRALIA The Reserve Bank of Australia cut its policy rate by a total of 50 basis points in the period under review, to 2 percent. The Bank continues to believe that accommodative monetary policy is necessary to help the economy battle severe headwinds that are keeping growth below potential. In particular, the RBA hopes that its policy accommodation will drive further depreciation of the Australian dollar, which it sees as both likely and necessary to support growth and rebalance the economy. Annual GDP growth averaged 2.47 percent in the period under review and the unemployment rate was 6.0 percent at the end of the period, while inflation fell to 1.5 percent from 3.0 percent recorded in June 2014.
7.1.6 CANADA In Canada, the GDP growth rate fell to 0.5 percent (y/y) in May 2015 from 2.7 percent in July 2014; Bank of Canada cut its policy rate to 0.5 percent from 1 percent, annual inflation rate in Canada fell to 1 percent from 2.4 percent whereas the annual unemployment rate also fell to 6.8 percent from 7.1 percent during the period under review. The Canadian dollar (CAD) continued to decline owing to falls in commodity prices, falling from CAD 1.07 against the dollar in June 2014 to CAD 1.25 at the end of June 2015, a depreciation of 17 percent for the period.
7.1.7 JAPAN The Japanese government's efforts to pull the country out of a multi-decade pattern of deflation and stagnating economic growth appeared to work. Latest available GDP data came in higher at 1. percent (q/q), from minus 1.7 percent in June 2014, indicating that the economy had at last escaped the drag from the consumption tax rise. The weak YEN also provided a boost to Japan's large export sector, spurring sales for automakers and other industries.
7.1.8 CHINA In China, risks to economic activity remained high as the economy continued to slow and volatility of the stock market increased significantly. Chinese policy makers announced several measures designed to avoid a greater than anticipated economic slowdown in 2015. In June 2015, the People’s Bank of China eased policy for the fourth time since November 2014 by reducing the required reserve ratio allowing banks to lend more money in order to give the economy a boost and lowering the 1 year benchmark lending rates by 25 basis points to 4.85 percent. Outlook is for at least two more interest rate cuts and one required reserve ratio cut in the second half of 2015.

ANNUAL REPORT 2014/2015
35
DEVELOPMENTS IN THE RESERVES AND INVESTMENT 7.2MANAGEMENT OPERATIONS
During the period under review, the Bank of Uganda continued to manage the foreign exchange reserves in line with the objectives of capital preservation, liquidity, and reasonable and consistent returns as stipulated in the foreign exchange reserves management policy framework the Bank.
Bank of Uganda reserves are divided into two portions: the internally managed and externally managed portfolios. The internally managed portfolio is mainly invested in short term (0-1 year) treasury securities and money market instruments, while the externally managed portfolio is mainly invested in longer term (1-5 years) fixed income instruments. As at June 30, 2015, the total reserve position amounted to USD 2.88 billion compared to USD 3.37 billion as at 30 June 2014.
7.2.1 ACHIEVEMENTS The global markets continued to have low interest rate regimes which required BOU to continuously explore ways of enhancing returns and diversifying the portfolio. The Investment Policy was amended to expand the country eligibility profile from G7 to G10 with a 10 percent limit for investment in non G10 countries. BOU approved investing US dollar denominated funds with commercial bank counterparties outside of the US to increase flexibility and avail more competitive interest rates.
A decision was taken to establish an internally managed fixed income portfolio with an initial amount of US$ 200 million in order to diversify the portfolio and reduce counterparty credit risk and re-investment risk.
The Portfolio Analytics Tool 2 (PAT 2), a tool designed to automate fixed income investment operations was implemented successfully under the World Bank Treasury’s RAMP program. The tool which replaced the previous manual practice of using excel spreadsheets, has improved the accuracy, quality and reliability of reports, significantly reduced the time taken to carry out performance measurement, daily portfolio valuation and month-end processes and also reduced operational errors. The tool has also improved data storage as well as facilitated the standardization of reports.
In the externally managed portfolio, a new fund manager known as Pramerica Fixed Income Inc. was appointed to take over from Strategic Fixed Income. The performance of the fund managers were in line with the approved guidelines for investment of foreign reserve assets.
7.2.2 CHALLENGES Low interest rates continue to prevail in global markets mainly underpinned by low oil prices that have continued to put downward pressure on inflation, volatility caused by the Greek financial woes and the threat of leaving the Euro zone, high unemployment in the Euro zone slowdown in China and Australia and these factors have adversely impacted fixed income and money market returns. Further to the low interest rates, the uncertainty caused by the possibility of Greece’s exit from the euro zone increased sovereign default risk of some of BOU’s investment markets.
The expectation of the Fed raising interest rates resulted into strategies that did not pay off, given that the decision did not materialize in 2014/2015.
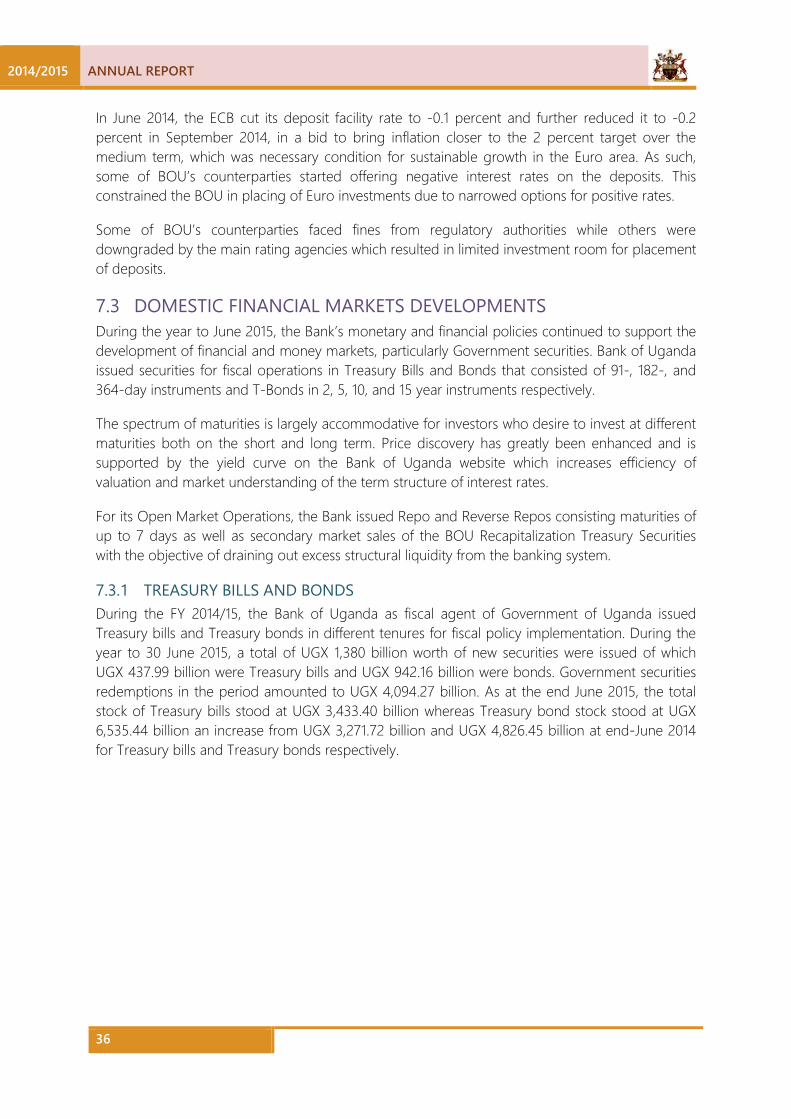
2014/2015 ANNUAL REPORT
36
In June 2014, the ECB cut its deposit facility rate to -0.1 percent and further reduced it to -0.2 percent in September 2014, in a bid to bring inflation closer to the 2 percent target over the medium term, which was necessary condition for sustainable growth in the Euro area. As such, some of BOU’s counterparties started offering negative interest rates on the deposits. This constrained the BOU in placing of Euro investments due to narrowed options for positive rates.
Some of BOU’s counterparties faced fines from regulatory authorities while others were downgraded by the main rating agencies which resulted in limited investment room for placement of deposits.
DOMESTIC FINANCIAL MARKETS DEVELOPMENTS 7.3During the year to June 2015, the Bank’s monetary and financial policies continued to support the development of financial and money markets, particularly Government securities. Bank of Uganda issued securities for fiscal operations in Treasury Bills and Bonds that consisted of 91-, 182-, and 364-day instruments and T-Bonds in 2, 5, 10, and 15 year instruments respectively.
The spectrum of maturities is largely accommodative for investors who desire to invest at different maturities both on the short and long term. Price discovery has greatly been enhanced and is supported by the yield curve on the Bank of Uganda website which increases efficiency of valuation and market understanding of the term structure of interest rates.
For its Open Market Operations, the Bank issued Repo and Reverse Repos consisting maturities of up to 7 days as well as secondary market sales of the BOU Recapitalization Treasury Securities with the objective of draining out excess structural liquidity from the banking system.
7.3.1 TREASURY BILLS AND BONDS During the FY 2014/15, the Bank of Uganda as fiscal agent of Government of Uganda issued Treasury bills and Treasury bonds in different tenures for fiscal policy implementation. During the year to 30 June 2015, a total of UGX 1,380 billion worth of new securities were issued of which UGX 437.99 billion were Treasury bills and UGX 942.16 billion were bonds. Government securities redemptions in the period amounted to UGX 4,094.27 billion. As at the end June 2015, the total stock of Treasury bills stood at UGX 3,433.40 billion whereas Treasury bond stock stood at UGX 6,535.44 billion an increase from UGX 3,271.72 billion and UGX 4,826.45 billion at end-June 2014 for Treasury bills and Treasury bonds respectively.

ANNUAL REPORT 2014/2015
37
Figure 11 Treasury Securities Outstanding Stock by Holder Category as at June 30, 2015
Source: Bank of Uganda
As at 30 June 2015, commercial banks held the largest portfolio of government securities at 45.0 percent of the total stock, 34.0 percent was held by Pension and provident funds, 11.0 percent was held by offshore players. Bank of Uganda and other financial institutions held 4.0 percent each while insurance companies and retail investors held 1.0 percent each.
7.3.2 SECURITIES RATES The Bank adopted a tight monetary policy stance through the increase of the Central Bank Rate (CBR) in order to forestall the inflation pressures driven in part by pass-through effects of the exchange rate depreciation on the prices of imported goods. The CBR was gradually raised by 2 percent to 13 percent in June 2015 from 11 percent in July 2014. Consequently, by end-June 2015, the effective yields on the 91-, 182-, and 364-day Treasury bills stood at 14.071, 15.249 and 16.440 percent, respectively, which was a significant rise compared to the corresponding rates of 9.517, 11.156 and 11.832 percent by end-June 2014. Similarly, the discount rates on the 91-, 182-, and 364-day Treasury bills rose from 8.989, 10.302 and 10.582 percent at end-June 2014 to 12.951, 13.702 and 14.122 percent, respectively by end-June 2015.
4.32%
44.50%
1.32%
11.26%
0.27%
3.48%
34.29%
0.57%
BANK OF UGANDA
COMMERCIAL BANK
INSURANCE COMPANY ANDDEPOSIT PROTECTION FUNDS
OFFSHORE PLAYERS
OTHER
OTHER FINANCIAL INSTITUTION
PENSION & PROVIDENT FUNDS
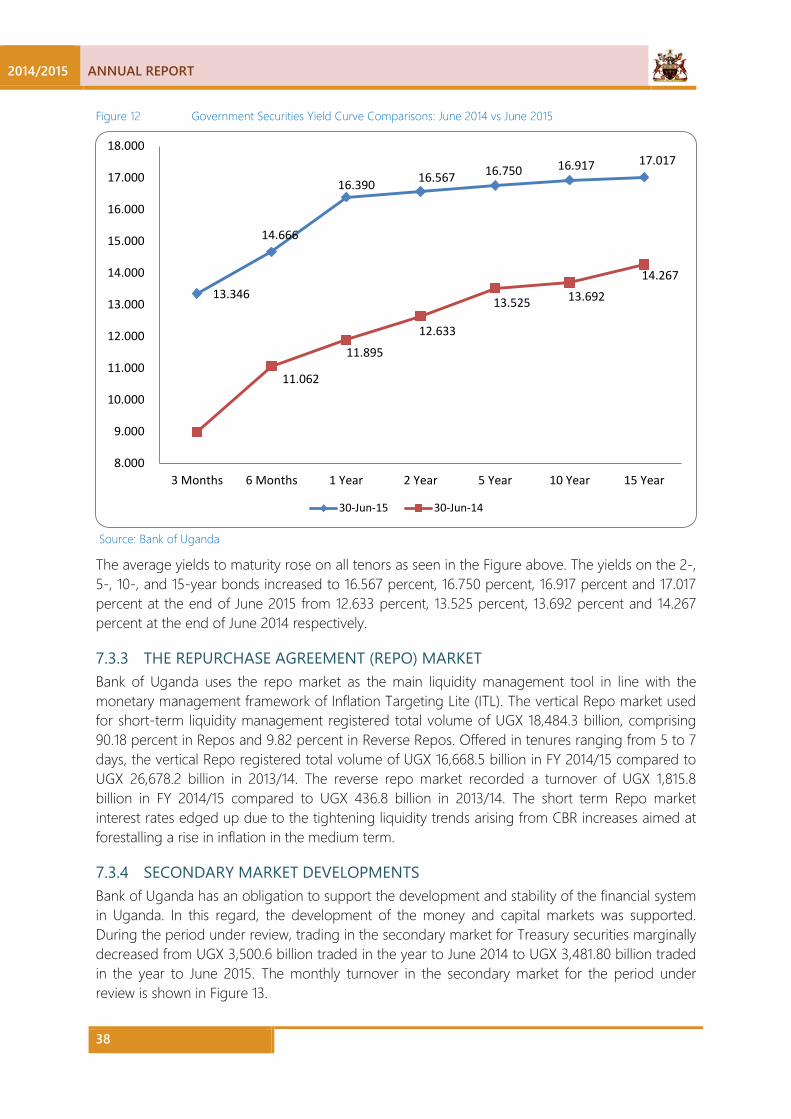
2014/2015 ANNUAL REPORT
38
Figure 12 Government Securities Yield Curve Comparisons: June 2014 vs June 2015
Source: Bank of Uganda
The average yields to maturity rose on all tenors as seen in the Figure above. The yields on the 2-, 5-, 10-, and 15-year bonds increased to 16.567 percent, 16.750 percent, 16.917 percent and 17.017 percent at the end of June 2015 from 12.633 percent, 13.525 percent, 13.692 percent and 14.267 percent at the end of June 2014 respectively.
7.3.3 THE REPURCHASE AGREEMENT (REPO) MARKET Bank of Uganda uses the repo market as the main liquidity management tool in line with the monetary management framework of Inflation Targeting Lite (ITL). The vertical Repo market used for short-term liquidity management registered total volume of UGX 18,484.3 billion, comprising 90.18 percent in Repos and 9.82 percent in Reverse Repos. Offered in tenures ranging from 5 to 7 days, the vertical Repo registered total volume of UGX 16,668.5 billion in FY 2014/15 compared to UGX 26,678.2 billion in 2013/14. The reverse repo market recorded a turnover of UGX 1,815.8 billion in FY 2014/15 compared to UGX 436.8 billion in 2013/14. The short term Repo market interest rates edged up due to the tightening liquidity trends arising from CBR increases aimed at forestalling a rise in inflation in the medium term.
7.3.4 SECONDARY MARKET DEVELOPMENTS Bank of Uganda has an obligation to support the development and stability of the financial system in Uganda. In this regard, the development of the money and capital markets was supported. During the period under review, trading in the secondary market for Treasury securities marginally decreased from UGX 3,500.6 billion traded in the year to June 2014 to UGX 3,481.80 billion traded in the year to June 2015. The monthly turnover in the secondary market for the period under review is shown in Figure 13.
13.346
14.666
16.390 16.567 16.750 16.917 17.017
11.062
11.895
12.633
13.525 13.692
14.267
8.000
9.000
10.000
11.000
12.000
13.000
14.000
15.000
16.000
17.000
18.000
3 Months 6 Months 1 Year 2 Year 5 Year 10 Year 15 Year
30-Jun-15 30-Jun-14
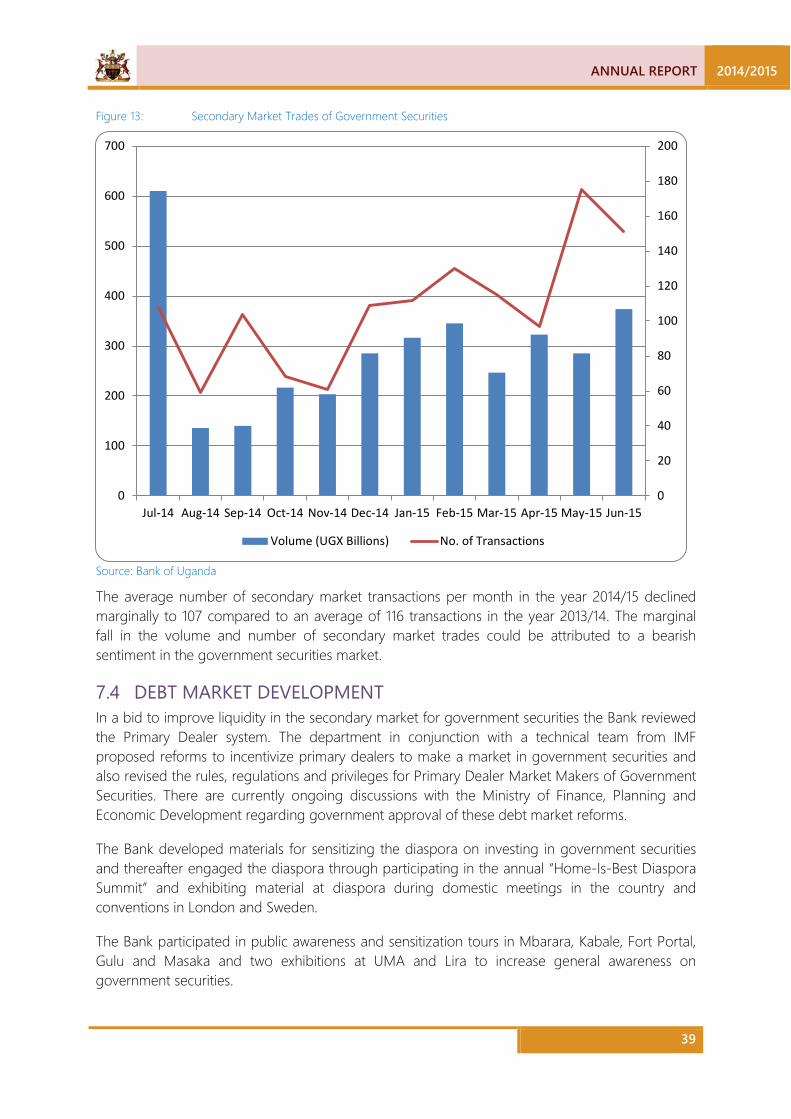
ANNUAL REPORT 2014/2015
39
Figure 13: Secondary Market Trades of Government Securities
Source: Bank of Uganda
The average number of secondary market transactions per month in the year 2014/15 declined marginally to 107 compared to an average of 116 transactions in the year 2013/14. The marginal fall in the volume and number of secondary market trades could be attributed to a bearish sentiment in the government securities market.
DEBT MARKET DEVELOPMENT 7.4In a bid to improve liquidity in the secondary market for government securities the Bank reviewed the Primary Dealer system. The department in conjunction with a technical team from IMF proposed reforms to incentivize primary dealers to make a market in government securities and also revised the rules, regulations and privileges for Primary Dealer Market Makers of Government Securities. There are currently ongoing discussions with the Ministry of Finance, Planning and Economic Development regarding government approval of these debt market reforms.
The Bank developed materials for sensitizing the diaspora on investing in government securities and thereafter engaged the diaspora through participating in the annual “Home-Is-Best Diaspora Summit” and exhibiting material at diaspora during domestic meetings in the country and conventions in London and Sweden.
The Bank participated in public awareness and sensitization tours in Mbarara, Kabale, Fort Portal, Gulu and Masaka and two exhibitions at UMA and Lira to increase general awareness on government securities.
0
20
40
60
80
100
120
140
160
180
200
0
100
200
300
400
500
600
700
Jul-14 Aug-14 Sep-14 Oct-14 Nov-14 Dec-14 Jan-15 Feb-15 Mar-15 Apr-15 May-15 Jun-15
Volume (UGX Billions) No. of Transactions

2014/2015 ANNUAL REPORT
40
The Bank of Uganda in conjunction with the Macroeconomic and Financial Management Institute of Eastern and Southern Africa (MEFMI) held an in-country workshop on Money and Capital Markets for the financial market players in Uganda. This training aimed at building capacity in money and capital markets by equipping participants with quantitative skills on pricing money market instruments and bonds.
CAPITAL MARKETS INFRASTRUCTURE DEVELOPMENT 7.5The Bank participates in the Capital Markets Infrastructure Technical Working Group which is on course to deliver integrated Capital Markets Infrastructure for the EAC region. This infrastructure will connect the various stock exchanges within the region as well as their depositories to realize a common market for financial instruments.
Bank of Uganda is in discussions with the Uganda Securities Exchange (USE) to explore ways to enable the trading of government securities on the stock exchange. Preliminary discussions are aimed at exploring the technical possibility of linking the USE Securities Depository to the Bank of Uganda Central Securities Depository (CSD) to enable more retail access and the efficient transaction and settlement of government securities.
The Bank is engaged in the testing of the Primary Dealership Shared Gateway (PDSG) which will allow retail investors to place online bids in the primary and secondary markets and also view their account statements.
EAST AFRICAN COMMUNITY REGIONAL ACTIVITIES 7.6Bank of Uganda was tasked by the Monetary Affairs Committee of the East African Community to develop a harmonized framework for Standing Facilities and Collateral Management within the EAC region. To this end, the Bank prepared Terms of Reference and engaged consultants from the IMF for provision of technical assistance towards the harmonization of the Standing Facilities and Collateral Management. The IMF mission visited Uganda and submitted a draft report.
The Bank has been able to meet all the East African Community, Monetary Affairs Committee (MAC) harmonization criteria for market operations by the set deadlines.
7.6.1 STRATEGIC PARTNERSHIPS The Bank has enhanced relationships with strategic partners through coordinated workshops and meetings in order to enable future engagements in financial market development. These partners include UNDP, World Bank, GIZ et-cetera.
In order to improve co-ordination of the various financial market development initiatives among the financial market stakeholders (e.g. Capital Markets Authority, fund managers, broker/dealers et-cetera), the Bank of Uganda co-ordinated meetings with market participants geared towards the formation of the Financial Markets Stakeholders Forum. This forum once established would advance the interests of the different market participants and regulators in Uganda’s financial markets and also provide guidance and regularly access the progress of various strategies and initiatives to develop and deepen the financial markets.
7.6.2 CHALLENGES The financial markets are still narrow and shallow, that is, with limited products and investors.
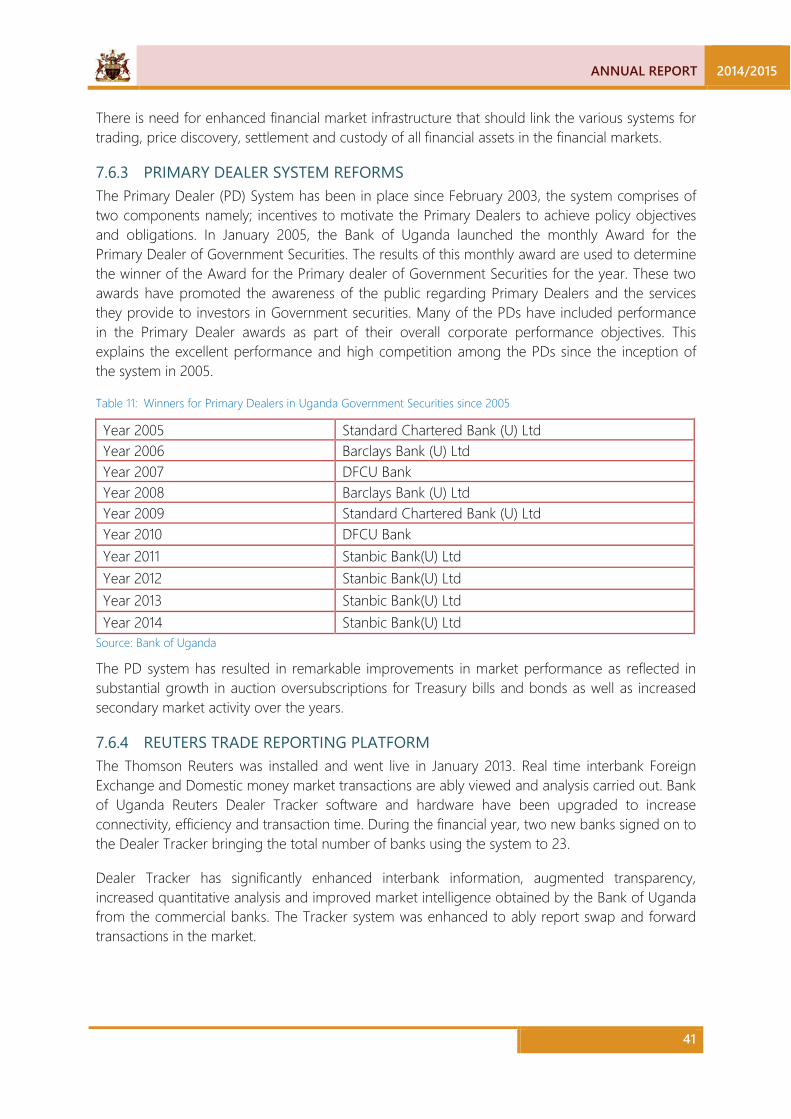
ANNUAL REPORT 2014/2015
41
There is need for enhanced financial market infrastructure that should link the various systems for trading, price discovery, settlement and custody of all financial assets in the financial markets.
7.6.3 PRIMARY DEALER SYSTEM REFORMS The Primary Dealer (PD) System has been in place since February 2003, the system comprises of two components namely; incentives to motivate the Primary Dealers to achieve policy objectives and obligations. In January 2005, the Bank of Uganda launched the monthly Award for the Primary Dealer of Government Securities. The results of this monthly award are used to determine the winner of the Award for the Primary dealer of Government Securities for the year. These two awards have promoted the awareness of the public regarding Primary Dealers and the services they provide to investors in Government securities. Many of the PDs have included performance in the Primary Dealer awards as part of their overall corporate performance objectives. This explains the excellent performance and high competition among the PDs since the inception of the system in 2005.
Table 11: Winners for Primary Dealers in Uganda Government Securities since 2005
Year 2005 Standard Chartered Bank (U) Ltd Year 2006 Barclays Bank (U) Ltd Year 2007 DFCU Bank Year 2008 Barclays Bank (U) Ltd Year 2009 Standard Chartered Bank (U) Ltd Year 2010 DFCU Bank Year 2011 Stanbic Bank(U) Ltd Year 2012 Stanbic Bank(U) Ltd Year 2013 Stanbic Bank(U) Ltd Year 2014 Stanbic Bank(U) Ltd
Source: Bank of Uganda
The PD system has resulted in remarkable improvements in market performance as reflected in substantial growth in auction oversubscriptions for Treasury bills and bonds as well as increased secondary market activity over the years.
7.6.4 REUTERS TRADE REPORTING PLATFORM The Thomson Reuters was installed and went live in January 2013. Real time interbank Foreign Exchange and Domestic money market transactions are ably viewed and analysis carried out. Bank of Uganda Reuters Dealer Tracker software and hardware have been upgraded to increase connectivity, efficiency and transaction time. During the financial year, two new banks signed on to the Dealer Tracker bringing the total number of banks using the system to 23.
Dealer Tracker has significantly enhanced interbank information, augmented transparency, increased quantitative analysis and improved market intelligence obtained by the Bank of Uganda from the commercial banks. The Tracker system was enhanced to ably report swap and forward transactions in the market.

2014/2015 ANNUAL REPORT
42
THE MASTER REPURCHASE AGREEMENT (MRA) 7.7The Master Repurchase Agreement is a legal framework under which interbank Horizontal REPO transactions are conducted. During the FY year 2014/2015, the Bank of Uganda and Commercial banks had various discussions regarding the Master Repurchase Agreement. Components of the MRA were modified and others curved out and subsequently a new MRA was completed towards the end of the financial year. The new MRA adopts the methodology of a Sale and Buy Back Agreement. The MRA has been signed by all Commercial banks and is currently in effect.
This should enhance and increase activity in the horizontal market and therefore play as a mechanism for the deepening and development of the interbank money market.
ANNUAL REPORT 2014/2015
43
COMMERCIAL BANKING 8.1The banking system remained safe and sound. The banks’ total assets grew by 15.9 percent from UGX 18.6 trillion in June 2014 to UGX 21.6 trillion as at June 2015. Total gross loans increased by 19.7 percent from UGX 8.8 trillion to UGX 10.5 trillion during the same period while the non-performing advances to total advances ratio improved from 5.8 percent in June 2014 to 4.0 percent in June 2015. Customer deposits grew by 16.48 percent during the year from UGX 12.4 trillion to UGX 14.5 trillion while net after-tax profits increased by 54.74 percent from UGX 357.9 billion during the year to June 2014 to UGX 553.8 billion in the year to June 2015. The banks’ core capital increased by 12.1 percent from UGX 2.5 trillion in June 2014 to UGX 2.7 trillion in June 2015. All the banks complied with the minimum on-going core capital requirement of UGX 25 billion as at June 30, 2015. In addition, all the banks maintained satisfactory liquidity levels.
CREDIT INSTITUTIONS 8.2Credit institutions also performed very well during the year with total assets increasing by 22.8 percent from UGX 298.0 billion at end June 2014 to UGX 365.8 billion at end June 2015 driven mainly by increase in loans and advances. Total loans increased by 19.6 percent from UGX .166.6 billion to UGX 199.3 billion over the same period. Total deposits increased by 29.4 percent from UGX 188.3 billion to UGX 243.7 billion during the year. All the credit institutions maintained unimpaired paid-up capital above the statutory requirements of UGX 1 billion and complied with the minimum core capital to risk weighted assets ratio requirement of 8 percent. Total capital grew by UGX 3.0 billion only from UGX 58.8 billion as end June 2014 to UGX 61.8 billion at end June 2015. However, the sector incurred a total loss of UGX 0.7 billion in June 2015 from a profit of UGX 1.5 billion at end June 2014.
MICROFINANCE DEPOSIT TAKING INSTITUTIONS 8.3The overall performance of Microfinance Deposit-taking Institutions (MDIs) was satisfactory. The number of licensed MDIs increased from 3 to 4 following the licensing of EFC Uganda Limited in November 2014. Total assets held by the sub-sector grew by 23.2 percent from UGX 292.6 billion in June 2014 to UGX 360.6 billion as at June 2015. Similarly, total loans grew by 26.5 percent from UGX 180.2 billion to UGX 227.9 billion during the same period. The sub-sector’s non-performing advances to total advances remained unchanged at 2.3 percent. Total customer deposits grew from UGX 113.7 billion to UGX 159.1 billion reflecting the public ever growing confidence in the sub-sector. Net after-tax profit declined slightly by 8.7 percent from UGX 9.3 billion in June 2014 to UGX 8.5 billion in June 2015. However, all MDIs maintained unimpaired paid-up capital above the statutory requirement of UGX 500million and complied with the minimum core capital to risk-weighted assets requirement of 15 percent. The paid-up capital held by the sub-sector increased by 131.7 percent; from UGX 13.6 billion in June 2014 to UGX 31.6 billion in June 2015. All MDIs complied with the minimum liquidity requirement during the FY 2014/2015.
SURVEILLANCE ACTIVITIES 8.4During 2014/15 on-site examinations of Bank of Uganda Supervised Financial Institutions (SFIs) namely; Commercial Banks, Credit Institutions and MDIs were conducted to ensure the safety and soundness of the individual institutions and the financial system as a whole. The examinations
8 FINANCIAL SECTOR SUPERVISION
2014/2015 ANNUAL REPORT
44
were complemented by a robust off-site surveillance and analysis framework. The surveillance activities enabled the regulator gain insight into risks faced by the SFIs and the emerging risks that require close monitoring.
Annual tripartite meetings were held with senior management of SFIs, external auditors and BoU to discuss audited annual financial accounts prior to their publication. The final audited financial accounts were duly published in the print media as required by law. Additionally, charges and fees were published on a quarterly basis during the FY 2014/15 with a view to promote transparency and enhance competition and fairness in the provision of financial services.
FINANCIAL PRODUCT INNOVATION AND ROLLOUT 8.5During FY 2014/15, some SFIs continued to build on the mobile banking platform. BoU approval was granted to some banks to offer products such as Mobile Money Bulk Payments Solutions, Cross Border Mobile Money transfers and derivative instruments. One MDI commenced offering ‘Save for a Target’ product over the mobile banking platform to enhance saving among its customers.
BRANCH EXPANSION 8.6The commercial banking sector continued to witness growth in banking outlets in 2014/15. As at June 30, 2015, the total number of bank branches stood at 570 compared to 560 branches as at June 30, 2014 while the number of Automatic Teller Machines stood at 834 as at June 30, 2015 compared to 817 as at June 30, 2014.
REGULATORY FRAMEWORK AND LICENSING 8.7The Financial Institution (Amendment) Bill 2015 was published and is ready for debate by Parliament. The Amendments will enable Islamic banking, Bancassurance and Agency Banking to be conducted in Uganda. Progress continued to be made in the efforts to amend the MDI Act, 2003 so as to provide for developments and innovation in the financial system. The draft bill prepared by BoU and MoFPED for regulation of Tier 4 was reviewed by Government agencies and will be presented to Parliament in the course of FY2015/16. The Anti-Terrorism Regulations 2015 were finalised. The Draft Anti-Money Laundering Regulations 2013 were finalised and forwarded to the office of the First Parliamentary Counsel. The Capital Market Authority Bill 2015 was approved by Cabinet and was scheduled to be tabled in Parliament for debate. The Insurance Regulatory Authority (Amendment) Bill 2015 was finalised and tabled before Cabinet.
MOBILE MONEY 8.8Mobile money transfer services have registered exponential growth over the years. As at 30 June 2015, registered users of mobile money services stood at 19.5 million, compared to 17.6 million as at 30 June 2014. . Transaction volumes also continue to be impressive, averaging at UGX 2,480.9 billion in the FY 2014/15 compared to UGX 1,853 billion during FY 2013/14. This growth is reflective of increased adoption of the service owing to its depth and convenience. Mobile money has also become complimentary to the banking sector, offering options for transfer and withdrawal of funds, without the physical intermediation of the banking agent.

ANNUAL REPORT 2014/2015
45
The Public Finance Management Act, 2015 (PFMA), was enacted into law and gazetted on 6th March 2015. The Act in Part VIII (Sections 55-75) provides for the management of revenues accruing from petroleum resources.
The Act establishes a Petroleum Fund (PF), where oil revenues shall be paid and withdrawals to be effected only under authority granted by an Appropriation Act and a warrant of the Auditor General to the Consolidated Fund, to support the annual budget; and the Petroleum Revenue Investment Reserve (PRIR) for investments. The Minister is responsible for the overall management of the PF.
In June 2015, the Government opened two accounts (UGX and USD) in order to operationalize the PF. These accounts are to receive all oil related revenues. In June 2015, USD 36 million was received as part payment of the USD 250 million capital gains tax (CGT) liability from Tullow. This sum includes USD 142 million received in 2012 and USD 108 million to be paid in three equal installments of USD 36 million in 2015, 2016 and 2017.
PETROLEUM REVENUE INVESTMENT RESERVE 9.1The Act mandates BoU with the operational management of the PRIR, which is to be managed within a framework of a written agreement to be entered into between the Minister and the Governor based on the principles of transparency, accountability, intergenerational fairness and equity. The PRIR shall not form part of the Central Bank reserves and shall be managed separately from the other reserves of the BoU. For every financial year, the Parliament shall appropriate money to be paid from the PF to the PRIR and shall be invested in accordance with the investment policy issued by the Minister in a manner that does not jeopardise the macroeconomic stability of Uganda.
9.1.1 PREPARATIONS FOR THE PRIR MANDATE During the year, the Bank continued to make progress in responding to demands of asset management operations seeking to set standards for greater transparency and accountability in ensuring that there is no undue risk caused to the PRIR and avoiding prejudicing the reputation of Uganda as a responsible member of the world community. Consultation and benchmarking missions were undertaken in the evolution of sovereign asset management increasingly focusing on; a) Developing and clarifying mission, policies, and objectives of the agency, b) Establishing formal and informal organizational structures as a means of delegating authority
and sharing responsibilities, c) Setting priorities and reviewing and revising objectives in terms of changing demands, d) Executing Strategies, their refinements and rationale, e) Support from external asset managers and the significant resources invested into this space,
and f) Selecting, motivating, training, and appraising staff.
The benchmarking missions involved oversight management, accounting, investment, risk, auditing, and research. Fund managers visited included the Strategic Investment Group, Nigeria Sovereign Investment Authority, Trinidad and Tobago Heritage and Stabilisation Fund. These
9 PETROLEUM REVENUE INVESTMENT FUND

2014/2015 ANNUAL REPORT
46
missions continue to provide insights into the ongoing designing of the necessary infrastructure, policies, tools and procedures but also enhance the quality and ownership of the outcome of the frameworks by the respective stakeholders.
On the capacity building side the bank reaffirmed its commitment to make every effort to enhance capacity in sovereign wealth related activities. This included construction of dummy portfolios and post trade analysis sessions were organized via Bloomberg and Reuter’s terminals. Principles of Portfolio management, trade simulations, risk analytics, valuation, performance and reporting were also considered.
In anticipation of the oil revenue, the Bank looks forward for the appointment of members of the Investment Advisory Committee by the Minister. This will complement progress made so far and bridge the gaps in the preparation of the operational management of the PRIR mandate.
The Bank will continue to be guided by the purposes and principles of the PFMA, with full respect for international law and its principles.
An oil and gas facility

ANNUAL REPORT 2014/2015
47
BUSINESS AUTOMATION 10.1During the year, the Bank went live with the following applications:
1. Enhancements to the Bank’s core banking system, to support the full implementation of the Treasury Single Account (TSA) by the Ministry of Finance, Economic Planning and Development.
2. The automation of operations under the Reserves Advisory and Management Program (RAMP), which will improve the management of foreign reserves.
3. Enhancements to the Bank’s Electronic Funds Transfer (EFT) processing to improve system performance, availability and controls.
4. Extension of the functionality of the Bank Supervision Application (BSA), an application sponsored and developed by the central banks of several East, Central and Southern African countries, to facilitate the online submission of returns by forex bureaux.
During the year, the Bank initiated projects funded by the African Development Bank to overhaul the Automated Clearing House system, and to upgrade the Real Time Gross Settlement System. The Bank commenced with the implementation of projects to automate its corporate performance management and pension administration operations, as well as enhancements to the Central Securities Depository (CSD) to improve performance and to extend access to other external stakeholders.
IT INFRASTRUCTURE 10.2The Bank successfully upgraded its core data storage systems, one of a series of projects intended to improve its business continuity arrangements. Projects were also initiated to upgrade the Bank’s security systems, and to improve information security controls. The Bank continues to effect improvements to other aspects of its IT infrastructure, in response to business requirements, and performance, capacity, security and maintenance imperatives.
IT GOVERNANCE 10.3Under the regional initiative to improve IT Governance at the central banks in the East African Community (EAC), the Bank continued with IT process improvements based on the Control Objectives for IT and related Technologies (COBIT) framework.
10 INFORMATION TECHNOLOGY DEVELOPMENTS

2014/2015 ANNUAL REPORT
48
BANKING OPERATIONS 11.1The Bank of Uganda Act, under Section 4(2(d)) and 2(h) mandates BoU to be banker to the Government of Uganda and the Banker to financial institutions respectively. In this role, the Bank maintains accounts for these customers.
The achievements registered during the FY 2014/15 include:-
i) All Government Ministries, Departments and Agencies (MDAs) were connected to the Bank of Uganda Banking System (BBS). The connectivity of the MDAs facilitated the speed at which government payments are processed and enhanced the efficiency with which customers’ payments are made.
ii) There was roll out of cash processing on the Bank of Uganda Banking System (BBS) connect. Customers (project accounts) are no longer allowed to use Security Papers to withdraw cash from the Banking Hall. This in turn reduced the risk of exposure to loss, due to forged signatures. Funds are sent from project accounts to the Treasury Single Account (TSA) cash account. Any funds not withdrawn on the same day are reversed back to the source account. However, the system has not yet been streamlined to incorporate the GBP and EUR cash withdrawals.
iii) Government cash withdrawal vouchers were replaced with soft (online) instructions through Integrated Financial Management System (IFMS). The Accountant General issued new guidelines, which require the votes to send money through IFMS to the TSA cash account. As mentioned in (ii) above, this has reduced the risk of exposure to loss.
iv) The first phase of implementation of the Treasury Single Account (TSA) was successfully completed. The Second phase of TSA implementation, which involves the local governments, is scheduled to commence in FY 2015/16 to extend the benefits of TSA to local government authorities.
v) The Secure File Transfer System (SFTS) under the Business Continuity Plan (BCP) of the Bank of Uganda Banking System (BBS) Connect was rolled out. The roll out of the SFTS guarantees that provision of banking services to government MDAs can be reinstated at a different location should a risk materialize to disrupt business at the Bank headquarters.
vi) A customer response system (SPICE WORKS) was installed. This has greatly reduced the turnaround or response time to online customer inquiries and needs.
vii) The File Transfer Protocol (FTP) was successfully installed. The FTP is targeted at ameliorating challenges certain MDAs were having with formatting files in preparation for the automated clearing process.
11 BANKING, CURRENCY AND PAYMENT SYSTEMS
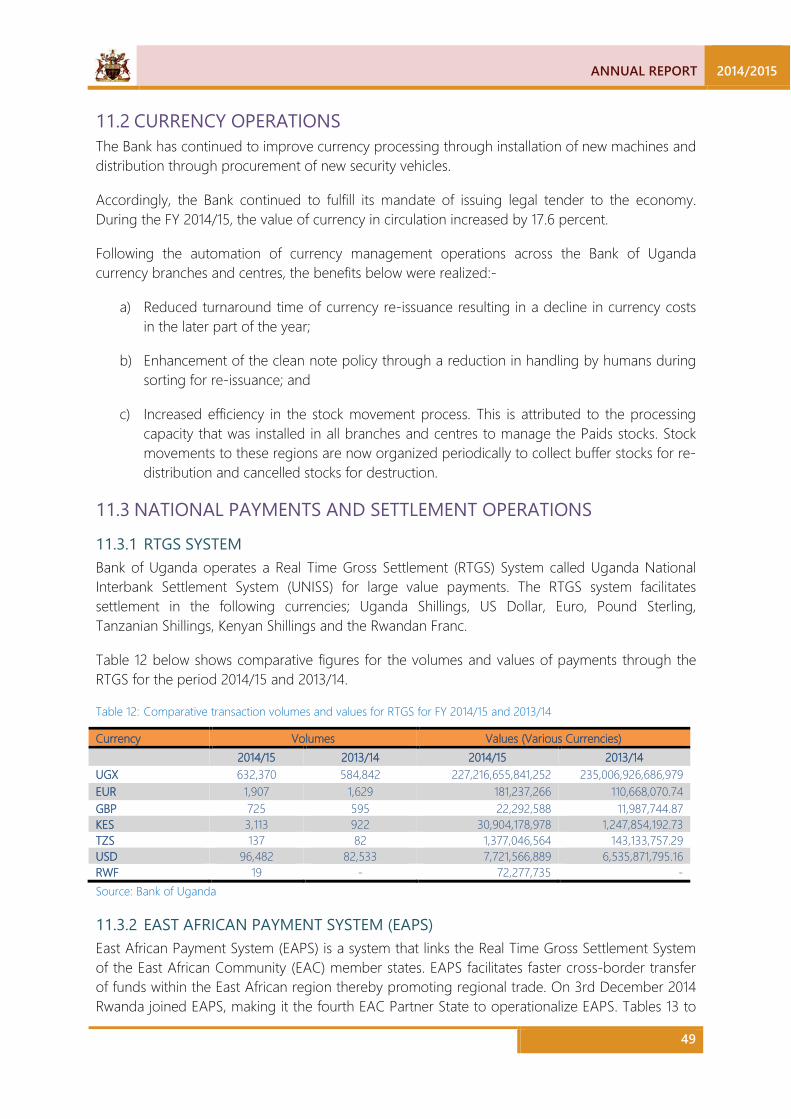
ANNUAL REPORT 2014/2015
49
CURRENCY OPERATIONS 11.2The Bank has continued to improve currency processing through installation of new machines and distribution through procurement of new security vehicles.
Accordingly, the Bank continued to fulfill its mandate of issuing legal tender to the economy. During the FY 2014/15, the value of currency in circulation increased by 17.6 percent.
Following the automation of currency management operations across the Bank of Uganda currency branches and centres, the benefits below were realized:-
a) Reduced turnaround time of currency re-issuance resulting in a decline in currency costs in the later part of the year;
b) Enhancement of the clean note policy through a reduction in handling by humans during sorting for re-issuance; and
c) Increased efficiency in the stock movement process. This is attributed to the processing capacity that was installed in all branches and centres to manage the Paids stocks. Stock movements to these regions are now organized periodically to collect buffer stocks for re-distribution and cancelled stocks for destruction.
NATIONAL PAYMENTS AND SETTLEMENT OPERATIONS 11.3
11.3.1 RTGS SYSTEM Bank of Uganda operates a Real Time Gross Settlement (RTGS) System called Uganda National Interbank Settlement System (UNISS) for large value payments. The RTGS system facilitates settlement in the following currencies; Uganda Shillings, US Dollar, Euro, Pound Sterling, Tanzanian Shillings, Kenyan Shillings and the Rwandan Franc.
Table 12 below shows comparative figures for the volumes and values of payments through the RTGS for the period 2014/15 and 2013/14.
Table 12: Comparative transaction volumes and values for RTGS for FY 2014/15 and 2013/14
Currency Volumes Values (Various Currencies) 2014/15 2013/14 2014/15 2013/14 UGX 632,370 584,842 227,216,655,841,252 235,006,926,686,979 EUR 1,907 1,629 181,237,266 110,668,070.74 GBP 725 595 22,292,588 11,987,744.87 KES 3,113 922 30,904,178,978 1,247,854,192.73 TZS 137 82 1,377,046,564 143,133,757.29 USD 96,482 82,533 7,721,566,889 6,535,871,795.16 RWF 19 - 72,277,735 - Source: Bank of Uganda
11.3.2 EAST AFRICAN PAYMENT SYSTEM (EAPS) East African Payment System (EAPS) is a system that links the Real Time Gross Settlement System of the East African Community (EAC) member states. EAPS facilitates faster cross-border transfer of funds within the East African region thereby promoting regional trade. On 3rd December 2014 Rwanda joined EAPS, making it the fourth EAC Partner State to operationalize EAPS. Tables 13 to

2014/2015 ANNUAL REPORT
50
16 show the volumes and values of EAPS transactions per currency, per country for the Financial Year 2014/15:
11.3.2.1 EAPS – Uganda shilling transactions Table 13: Ugandan shilling transaction volumes and values for FY 2014/15
Source Volume Value (UGX)
Sent from Kenya 1,322 43,050,204,893 Received by Kenya 1,162 40,889,284,988
Sent from Tanzania 62 1,138,218,844 Received by Tanzania 35 1,134,470,326 Sent from Rwanda 18 221,401,776 Received by Rwanda 18 400,619,897
Total 2,617 86,834,200,724
Source: Bank of Uganda
11.3.2.2 EAPS – Kenya shilling transactions Table 14: Kenyan shilling transaction volumes and values for FY 2014/15
Source Volume Value (KES)
Sent from Kenya 567 12,298,064,865 Received by Kenya 2,211 12,351,022,922
Total 2,778 24,649,087,787
Source: Bank of Uganda
11.3.2.3 EAPS – Tanzanian shilling transactions Table 15: Tanzanian shilling transaction volumes and values for FY 2014/15
Source Volume Value (TZS)
Sent from Kenya 1 100 Sent from Tanzania 15 737,861,602
Received by Tanzania 118 631,184,862 Total 134 1,369,046,564
Source: Bank of Uganda
11.3.2.4 EAPS – Rwandan Franc transactions Table 16: Rwandan franc transaction volumes and values for FY 2014/15
Source Volume Value (RWF)
Sent from Rwanda 6 2,383,704 Received by Rwanda 9 32,894,129
Total 15 35,277,833
Source: Bank of Uganda
COMESA - REGIONAL PAYMENT AND SETTLEMENT SYSTEM (REPSS) 11.4The COMESA Regional Payment and Settlement System (REPSS) is an electronic platform that facilitates cross-border payments within the Common Market of Eastern and Southern Africa (COMESA). The system settles payments denominated in US Dollars and Euros. The COMESA
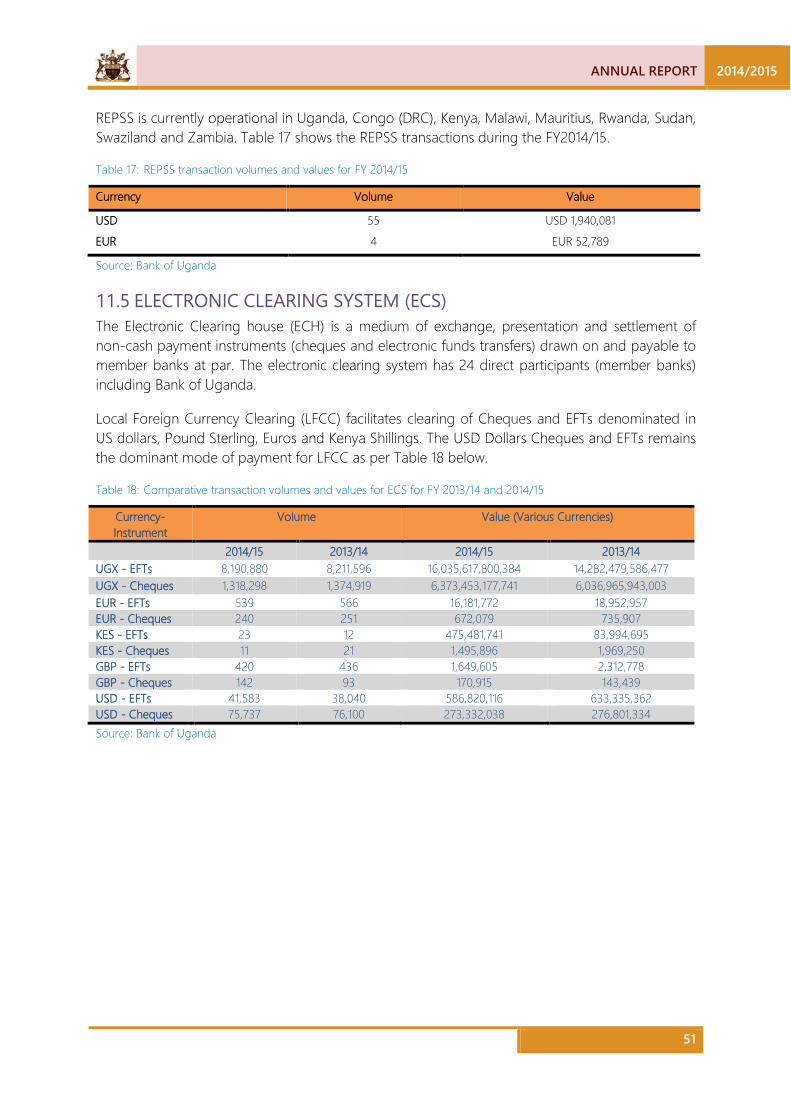
ANNUAL REPORT 2014/2015
51
REPSS is currently operational in Uganda, Congo (DRC), Kenya, Malawi, Mauritius, Rwanda, Sudan, Swaziland and Zambia. Table 17 shows the REPSS transactions during the FY2014/15.
Table 17: REPSS transaction volumes and values for FY 2014/15
Currency Volume Value
USD 55 USD 1,940,081 EUR 4 EUR 52,789
Source: Bank of Uganda
ELECTRONIC CLEARING SYSTEM (ECS) 11.5The Electronic Clearing house (ECH) is a medium of exchange, presentation and settlement of non-cash payment instruments (cheques and electronic funds transfers) drawn on and payable to member banks at par. The electronic clearing system has 24 direct participants (member banks) including Bank of Uganda.
Local Foreign Currency Clearing (LFCC) facilitates clearing of Cheques and EFTs denominated in US dollars, Pound Sterling, Euros and Kenya Shillings. The USD Dollars Cheques and EFTs remains the dominant mode of payment for LFCC as per Table 18 below.
Table 18: Comparative transaction volumes and values for ECS for FY 2013/14 and 2014/15
Currency-Instrument
Volume Value (Various Currencies)
2014/15 2013/14 2014/15 2013/14 UGX - EFTs 8,190,880 8,211,596 16,035,617,800,384 14,282,479,586,477 UGX - Cheques 1,318,298 1,374,919 6,373,453,177,741 6,036,965,943,003 EUR - EFTs 539 566 16,181,772 18,952,957 EUR - Cheques 240 251 672,079 735,907 KES - EFTs 23 12 475,481,741 83,994,695 KES - Cheques 11 21 1,495,896 1,969,250 GBP - EFTs 420 436 1,649,605 2,312,778 GBP - Cheques 142 93 170,915 143,439 USD - EFTs 41,583 38,040 586,820,116 633,335,362 USD - Cheques 75,737 76,100 273,332,038 276,801,334 Source: Bank of Uganda
2014/2015 ANNUAL REPORT
52
INTRODUCTION 12.1Agriculture plays a vital role in economic growth & sustainable development of the country. Empirical evidence reveals that Gross Domestic Product (GDP) growth originating from agriculture is twice as effective in reducing poverty as that linked to the non-agricultural sectors.” (FAO 2014). Investment in the sector has been shown to be an effective instrument to alleviate poverty & enhance food security. It is a critical sector in industrial activity, household incomes & food security among others. Uganda is endowed with favourable climate, water resources and fertile soils, all of which provide high leverage for high performance of the agricultural sector.
Notwithstanding these attributes, however, the sector remains riddled with rudimentary technology and is comprised of small holder farmers culminating into low productivity hence affecting GDP contribution.
It is under this background that the Government of Uganda (GoU) in the year 2009, established an Agricultural Credit Facility (ACF) in partnership with Commercial Banks, Credit Institutions, Micro Deposit-Taking Institutions (MDIs) and Uganda Development Bank Ltd (UDBL) all referred to as Participating Financial Institutions (PFIs). The ACF is a refinance scheme administered under the Memorandum of Understanding (MoU) signed between the GoU represented by the Ministry of Finance Planning and Economic Development, the PFIs and Bank of Uganda as the Fund administrator.
OBJECTIVES OF ACF 12.2The main objective of ACF is to promote commercialization of Agriculture through provision of medium and long term financing to projects engaged in agriculture, agro processing, modernization and mechanization.
FUNDING OF THE SCHEME 12.3The Scheme is funded by both the PFIs and GoU. As at 30th June 2015, the GoU remittance to the ACF Escrow account totalled UGX 119.07 billion to cover disbursements since inception and commitments made, as well as the applications in the pipeline currently amounting to UGX 18.07 billion. The PFIs in turn made a commitment to match the GoU contribution in equal proportion in accordance with the MoU.
PERFORMANCE OF THE SCHEME 12.4The performance of the Agricultural credit facility (ACF) has steadily improved since it was established in 2009 and this is attributed to a number of factors that include: continued Government effort to promote agriculture and agro-processing in the country, enhanced public awareness as well as increased involvement of the PFIs from eleven in December 2010 to sixteen in 2015, the confidence gained by PFIs after venturing into agriculture finance under the ACF guarantee. In addition, BoU has also done considerable sensitization to the public using means such as public exhibitions, dissemination of information via radio and other media platforms.
12 AGRICULTURAL CREDIT FACILITY
ANNUAL REPORT 2014/2015
53
The disbursements increased to UGX 179.02 billion in June 2015, from UGX 150.2 billion in June 2014 and UGX 118.5billion in June 2013. Consequently, the GoU contribution had reached UGX 88.22 billion by 30 June 2015, with UGX 73.9 billion and UGX 58 billion recorded` in the years 2014 and 2013, respectively. Funds amounting to UGX 12.57 billion have also been earmarked for a number of projects pending disbursement. To date, a total of 303 projects across the country have benefitted under the Scheme.
PROCEDURE OF ACCESSING THE FUND 12.5All ACF loan applications are channelled through the PFIs that are fully responsible for appraisal of the loan requests in line with their credit policy to ensure that only eligible projects are financed. If satisfied, the PFIs disburse their own funds upfront. Subsequently, the PFIs, request for re-imbursement of the GoU contribution from BoU.
LOAN TERMS AND CONDITIONS 12.6The terms and conditions under the scheme are stated in the MoU and the subsequent addenda. Sub-loan amounts are determined on the basis of appraisal of project viability and genuine credit needs of the clients in accordance with the lending policy of the respective PFIs. The loans under the ACF are denominated in Uganda shillings.
12.6.1 LOAN AMOUNT The maximum loan amount to a single borrower is UGX 2.1 billion. However, this amount can be increased up to UGX 5 billion on a case by case basis (for eligible projects that add significant value to the Agriculture sector and the economy as a whole).
12.6.2 LOAN TERM The maximum loan period should not exceed eight years and the minimum should be six months. The grace period is up to a maximum of three years.
12.6.3 INTEREST RATE The interest rate charged by the PFI to the final borrower is capped at 12 percent per annum.
7 AREAS FUNDED UNDER THE ACF 12.7A wide range of activities have been financed under the ACF with funding going to key investment areas such as ; Agro-processing machinery, Tractors, farm equipment, Irrigation equipment, green house facilities, farm expansion and modernisation, poultry brooders and related activities, piggery and storage facilities. Figure 14 shows the percentages of the areas funded under the scheme as at 30 June 2015.
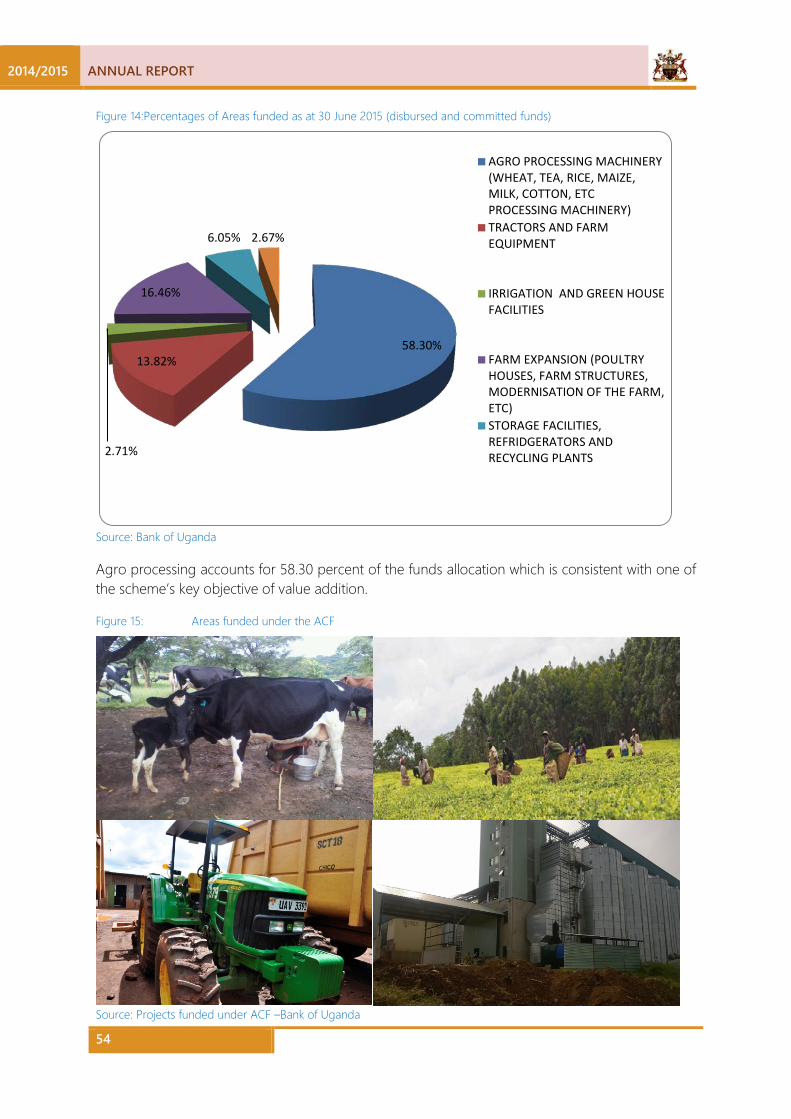
2014/2015 ANNUAL REPORT
54
Figure 14: Percentages of Areas funded as at 30 June 2015 (disbursed and committed funds)
Source: Bank of Uganda
Agro processing accounts for 58.30 percent of the funds allocation which is consistent with one of the scheme’s key objective of value addition.
Figure 15: Areas funded under the ACF
Source: Projects funded under ACF –Bank of Uganda
58.30% 13.82%
2.71%
16.46%
6.05% 2.67%
AGRO PROCESSING MACHINERY(WHEAT, TEA, RICE, MAIZE,MILK, COTTON, ETCPROCESSING MACHINERY)TRACTORS AND FARMEQUIPMENT
IRRIGATION AND GREEN HOUSEFACILITIES
FARM EXPANSION (POULTRYHOUSES, FARM STRUCTURES,MODERNISATION OF THE FARM,ETC)STORAGE FACILITIES,REFRIDGERATORS ANDRECYCLING PLANTS

ANNUAL REPORT 2014/2015
55
INTRODUCTION 13.1The Financial Statements of the Bank include the Statement of Profit or Loss and Other Comprehensive Income, Statement of Financial Position, Statement of Changes in Equity and Statement of Cash flows and accompanying notes.
The performance of the Bank is analysed on the basis of achievements in line with its Core Functions as spelt out in the BOU Act, Section 4 and outlined below:
a) Maintain monetary stability, b) Maintain an external assets reserve, c) Issue currency notes and coins, d) Banker and advisor to Government, e) Regulation and supervision of financial institutions, f) Banker to financial institutions and clearing house for cheques and other financial
instruments and g) Where appropriate, act as agent in financial matters for the Government.
STATEMENT OF PROFIT OR LOSS AND OTHER COMPREHENSIVE 13.2INCOME
13.2.1 INCOME The Bank realized total operating income of UGX 130,350 million in FY 2014/15 compared to UGX 129,883 million of FY 2013/14. A detailed discussion of income is presented below:-
13.2.1.1 INTEREST INCOME During the year ended 30 June 2015, the Bank recorded interest income of UGX 133,808 million, a 14.5 percent growth from UGX 116,833 million of the prior year. Total interest income for the year had been projected at UGX 190,928 million.
Interest income from externally managed funds accounted for 31 percent of total interest income while income from internally managed funds and local sources contributed 34 percent and 35 percent respectively. Figure 16 shows the distribution of total interest income.
13 FINANCIAL RESULTS FOR THE YEAR ENDED 30 JUNE 2015
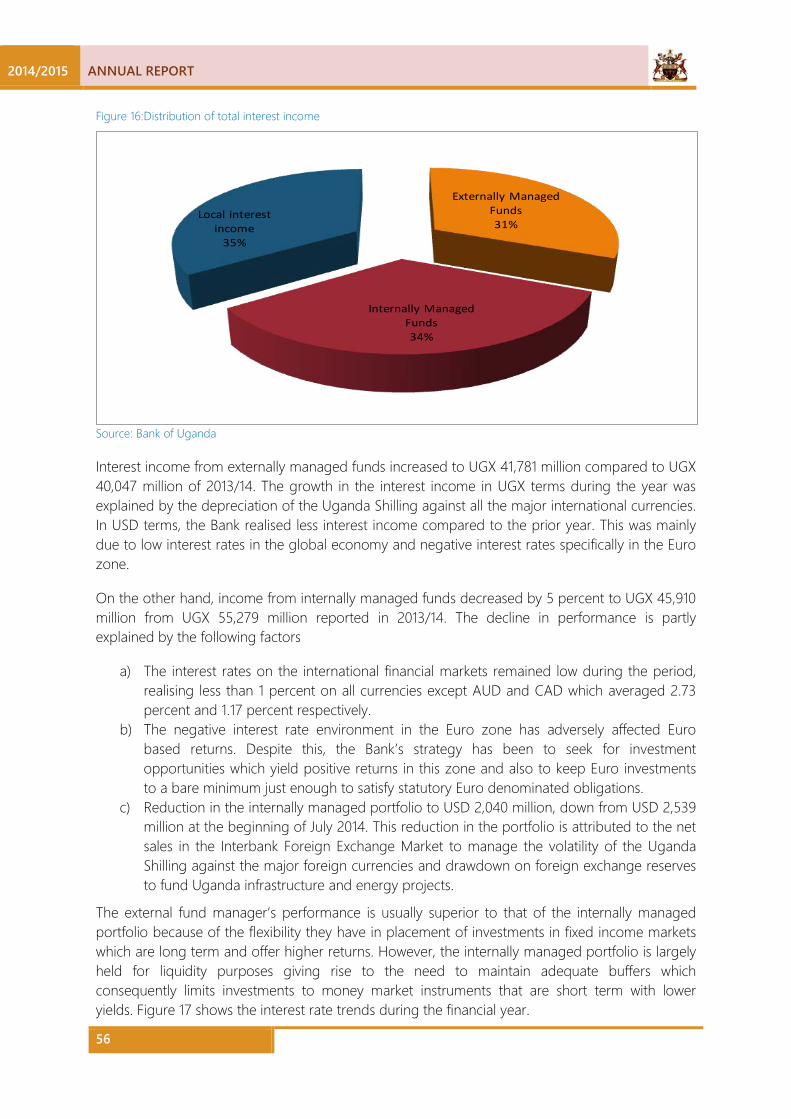
2014/2015 ANNUAL REPORT
56
Figure 16: Distribution of total interest income
Externally Managed Funds31%
Internally Managed Funds34%
Local interest income
35%
Source: Bank of Uganda
Interest income from externally managed funds increased to UGX 41,781 million compared to UGX 40,047 million of 2013/14. The growth in the interest income in UGX terms during the year was explained by the depreciation of the Uganda Shilling against all the major international currencies. In USD terms, the Bank realised less interest income compared to the prior year. This was mainly due to low interest rates in the global economy and negative interest rates specifically in the Euro zone.
On the other hand, income from internally managed funds decreased by 5 percent to UGX 45,910 million from UGX 55,279 million reported in 2013/14. The decline in performance is partly explained by the following factors
a) The interest rates on the international financial markets remained low during the period, realising less than 1 percent on all currencies except AUD and CAD which averaged 2.73 percent and 1.17 percent respectively.
b) The negative interest rate environment in the Euro zone has adversely affected Euro based returns. Despite this, the Bank’s strategy has been to seek for investment opportunities which yield positive returns in this zone and also to keep Euro investments to a bare minimum just enough to satisfy statutory Euro denominated obligations.
c) Reduction in the internally managed portfolio to USD 2,040 million, down from USD 2,539 million at the beginning of July 2014. This reduction in the portfolio is attributed to the net sales in the Interbank Foreign Exchange Market to manage the volatility of the Uganda Shilling against the major foreign currencies and drawdown on foreign exchange reserves to fund Uganda infrastructure and energy projects.
The external fund manager’s performance is usually superior to that of the internally managed portfolio because of the flexibility they have in placement of investments in fixed income markets which are long term and offer higher returns. However, the internally managed portfolio is largely held for liquidity purposes giving rise to the need to maintain adequate buffers which consequently limits investments to money market instruments that are short term with lower yields. Figure 17 shows the interest rate trends during the financial year.
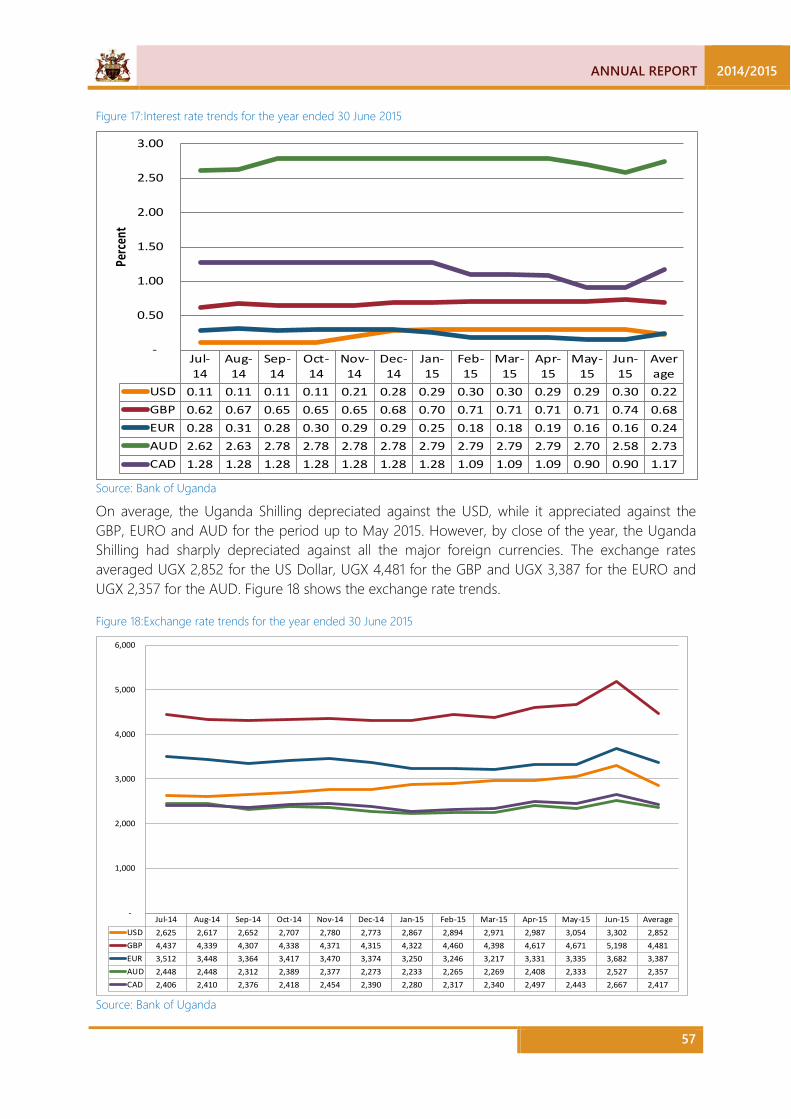
ANNUAL REPORT 2014/2015
57
Figure 17: Interest rate trends for the year ended 30 June 2015
Jul-14
Aug-14
Sep-14
Oct-14
Nov-14
Dec-14
Jan-15
Feb-15
Mar-15
Apr-15
May-15
Jun-15
Average
USD 0.11 0.11 0.11 0.11 0.21 0.28 0.29 0.30 0.30 0.29 0.29 0.30 0.22GBP 0.62 0.67 0.65 0.65 0.65 0.68 0.70 0.71 0.71 0.71 0.71 0.74 0.68EUR 0.28 0.31 0.28 0.30 0.29 0.29 0.25 0.18 0.18 0.19 0.16 0.16 0.24AUD 2.62 2.63 2.78 2.78 2.78 2.78 2.79 2.79 2.79 2.79 2.70 2.58 2.73CAD 1.28 1.28 1.28 1.28 1.28 1.28 1.28 1.09 1.09 1.09 0.90 0.90 1.17
-
0.50
1.00
1.50
2.00
2.50
3.00
Perc
ent
Source: Bank of Uganda
On average, the Uganda Shilling depreciated against the USD, while it appreciated against the GBP, EURO and AUD for the period up to May 2015. However, by close of the year, the Uganda Shilling had sharply depreciated against all the major foreign currencies. The exchange rates averaged UGX 2,852 for the US Dollar, UGX 4,481 for the GBP and UGX 3,387 for the EURO and UGX 2,357 for the AUD. Figure 18 shows the exchange rate trends.
Figure 18: Exchange rate trends for the year ended 30 June 2015
Jul-14 Aug-14 Sep-14 Oct-14 Nov-14 Dec-14 Jan-15 Feb-15 Mar-15 Apr-15 May-15 Jun-15 AverageUSD 2,625 2,617 2,652 2,707 2,780 2,773 2,867 2,894 2,971 2,987 3,054 3,302 2,852GBP 4,437 4,339 4,307 4,338 4,371 4,315 4,322 4,460 4,398 4,617 4,671 5,198 4,481EUR 3,512 3,448 3,364 3,417 3,470 3,374 3,250 3,246 3,217 3,331 3,335 3,682 3,387AUD 2,448 2,448 2,312 2,389 2,377 2,273 2,233 2,265 2,269 2,408 2,333 2,527 2,357CAD 2,406 2,410 2,376 2,418 2,454 2,390 2,280 2,317 2,340 2,497 2,443 2,667 2,417
-
1,000
2,000
3,000
4,000
5,000
6,000
Source: Bank of Uganda
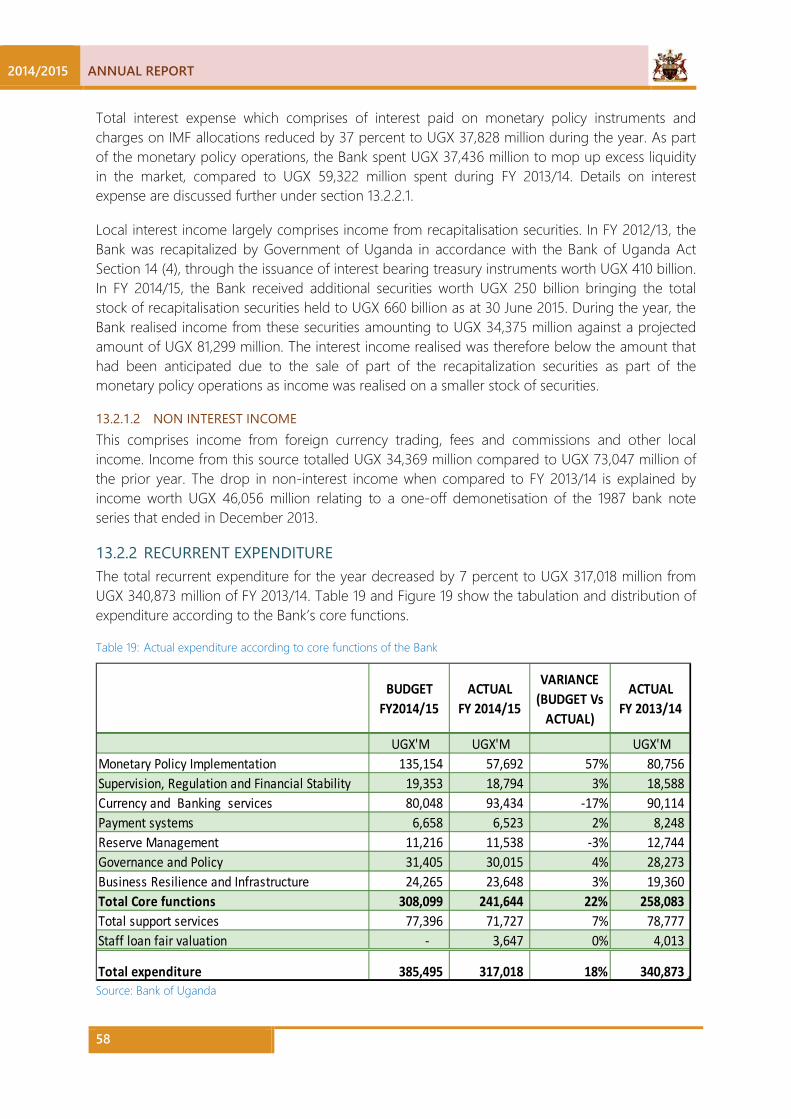
2014/2015 ANNUAL REPORT
58
Total interest expense which comprises of interest paid on monetary policy instruments and charges on IMF allocations reduced by 37 percent to UGX 37,828 million during the year. As part of the monetary policy operations, the Bank spent UGX 37,436 million to mop up excess liquidity in the market, compared to UGX 59,322 million spent during FY 2013/14. Details on interest expense are discussed further under section 13.2.2.1.
Local interest income largely comprises income from recapitalisation securities. In FY 2012/13, the Bank was recapitalized by Government of Uganda in accordance with the Bank of Uganda Act Section 14 (4), through the issuance of interest bearing treasury instruments worth UGX 410 billion. In FY 2014/15, the Bank received additional securities worth UGX 250 billion bringing the total stock of recapitalisation securities held to UGX 660 billion as at 30 June 2015. During the year, the Bank realised income from these securities amounting to UGX 34,375 million against a projected amount of UGX 81,299 million. The interest income realised was therefore below the amount that had been anticipated due to the sale of part of the recapitalization securities as part of the monetary policy operations as income was realised on a smaller stock of securities.
13.2.1.2 NON INTEREST INCOME This comprises income from foreign currency trading, fees and commissions and other local income. Income from this source totalled UGX 34,369 million compared to UGX 73,047 million of the prior year. The drop in non-interest income when compared to FY 2013/14 is explained by income worth UGX 46,056 million relating to a one-off demonetisation of the 1987 bank note series that ended in December 2013.
13.2.2 RECURRENT EXPENDITURE The total recurrent expenditure for the year decreased by 7 percent to UGX 317,018 million from UGX 340,873 million of FY 2013/14. Table 19 and Figure 19 show the tabulation and distribution of expenditure according to the Bank’s core functions.
Table 19: Actual expenditure according to core functions of the Bank
BUDGET FY2014/15
ACTUAL FY 2014/15
VARIANCE (BUDGET Vs
ACTUAL)
ACTUAL FY 2013/14
UGX'M UGX'M UGX'M Monetary Policy Implementation 135,154 57,692 57% 80,756 Supervision, Regulation and Financial Stability 19,353 18,794 3% 18,588 Currency and Banking services 80,048 93,434 -17% 90,114 Payment systems 6,658 6,523 2% 8,248 Reserve Management 11,216 11,538 -3% 12,744 Governance and Policy 31,405 30,015 4% 28,273 Business Resilience and Infrastructure 24,265 23,648 3% 19,360 Total Core functions 308,099 241,644 22% 258,083 Total support services 77,396 71,727 7% 78,777 Staff loan fair valuation - 3,647 0% 4,013
Total expenditure 385,495 317,018 18% 340,873 Source: Bank of Uganda
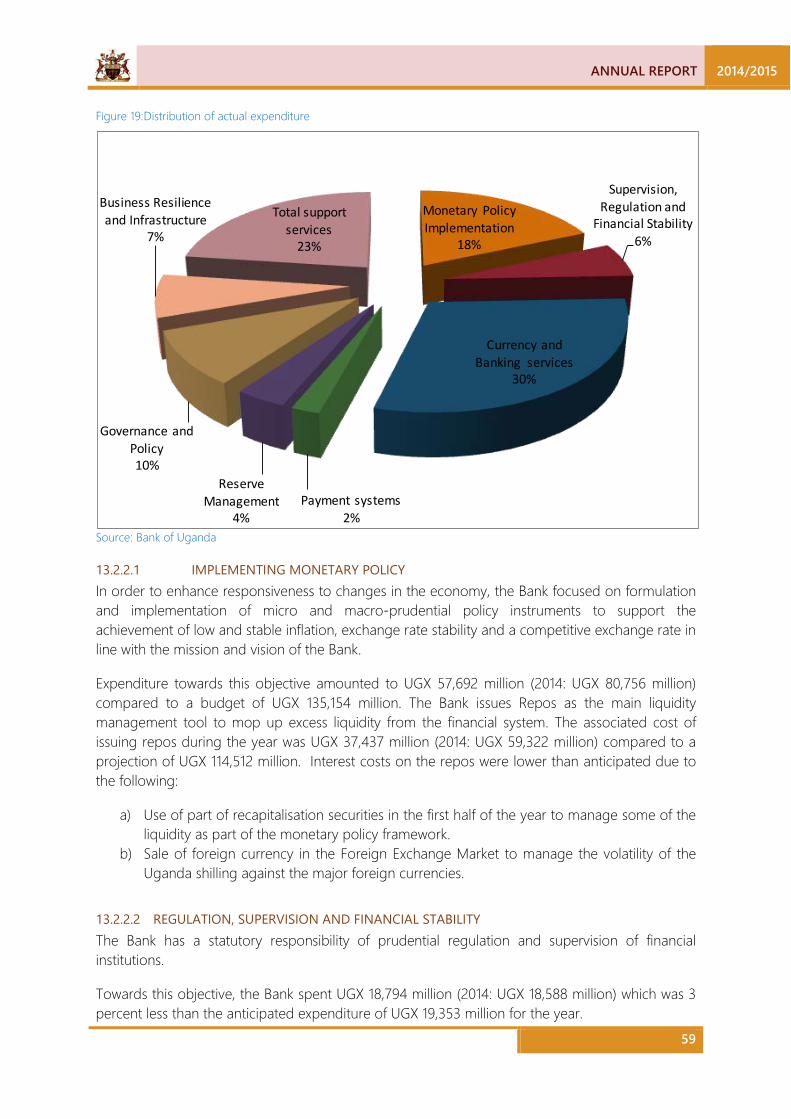
ANNUAL REPORT 2014/2015
59
Figure 19: Distribution of actual expenditure
Monetary Policy Implementation
18%
Supervision, Regulation and
Financial Stability6%
Currency and Banking services
30%
Payment systems2%
Reserve Management
4%
Governance and Policy10%
Business Resilience and Infrastructure
7%
Total support services
23%
Source: Bank of Uganda
13.2.2.1 IMPLEMENTING MONETARY POLICY In order to enhance responsiveness to changes in the economy, the Bank focused on formulation and implementation of micro and macro-prudential policy instruments to support the achievement of low and stable inflation, exchange rate stability and a competitive exchange rate in line with the mission and vision of the Bank.
Expenditure towards this objective amounted to UGX 57,692 million (2014: UGX 80,756 million) compared to a budget of UGX 135,154 million. The Bank issues Repos as the main liquidity management tool to mop up excess liquidity from the financial system. The associated cost of issuing repos during the year was UGX 37,437 million (2014: UGX 59,322 million) compared to a projection of UGX 114,512 million. Interest costs on the repos were lower than anticipated due to the following:
a) Use of part of recapitalisation securities in the first half of the year to manage some of the liquidity as part of the monetary policy framework.
b) Sale of foreign currency in the Foreign Exchange Market to manage the volatility of the Uganda shilling against the major foreign currencies.
13.2.2.2 REGULATION, SUPERVISION AND FINANCIAL STABILITY The Bank has a statutory responsibility of prudential regulation and supervision of financial institutions.
Towards this objective, the Bank spent UGX 18,794 million (2014: UGX 18,588 million) which was 3 percent less than the anticipated expenditure of UGX 19,353 million for the year.

2014/2015 ANNUAL REPORT
60
13.2.2.3 CURRENCY AND BANKING SERVICES One of the key responsibilities of the Bank is to ensure availability of currency notes in the right quality and quantity; and to promote public awareness on the currency handling and security features. In addition, the Bank facilitates payments, settlements and clearing of payment instruments for the government and financial institutions.
Total expenditure towards this objective amounted to UGX 93,434 million (2014: UGX 90,114 million) compared to a budget of UGX 80,048 million for the year under review. The higher than anticipated expenditure was due to increase in currency costs which were above the budget by 20.7 percent. This was largely attributed to higher note issuance costs for the first six months of the financial year as the Bank’s processing capacity had been impaired. Following the repair and installation of the note processing machines, notes issuance costs subsequently declined from UGX 36,519 million in the first half to UGX 17,385 million in the second half of the financial year.
13.2.2.4 FACILITATING EFFICIENT AND SAFE PAYMENT SYSTEMS The Bank’s key functions include ensuring the smooth operation of payment systems and securities settlement with focus largely on automation of business processes to ensure efficiency and safety in payment systems. During the year, the Bank completed the user acceptance testing of Central Securities Depository and Primary Dealer Shared Gateway. This is expected to allow investors to submit bids online for treasury securities during auctions. Consequently, the Bank spent UGX 6,523 million in FY 2014/15 (2014: UGX 8,248 million) compared to a budget of UGX 6,658 million.
13.2.2.5 RESERVE MANAGEMENT AND FINANCIAL MARKETS OPERATIONS The Bank of Uganda Act 2000 under Section 31 vests the maintenance of the country’s foreign exchange reserves in Bank of Uganda. The foreign reserves are managed in line with the objectives of capital preservation, liquidity and reasonable and consistent returns as stipulated in the Foreign Exchange Reserves Management Policy Framework.
The Bank provided UGX 11,216 million to cater for reserve management fees and related services and UGX 11,538 million was utilized compared to UGX 12,744 million of FY 2013/14.
13.2.2.6 GOVERNANCE AND POLICY The Bank has in place a strong governance framework that steers the strategic direction in line with its mission and vision. This covers the Board function in exercising oversight over the operations of the Bank including any other activities that fall within the strategic direction of the Bank.
During the year, the Bank incurred a cost of UGX 30,015 million (2014: UGX 28,273 million) against a budget of UGX 31,405 million.
13.2.2.7 BUSINESS RESILIENCE AND INFRASTRUCTURE In order to build and enhance a resilient IT environment that adequately supports efficient service delivery to the key stakeholders, the Bank ensures the efficient provision of IT infrastructure to support the payment systems, reserve management operations, financial system oversight banking services, monetary policy frameworks, currency operations and support services.
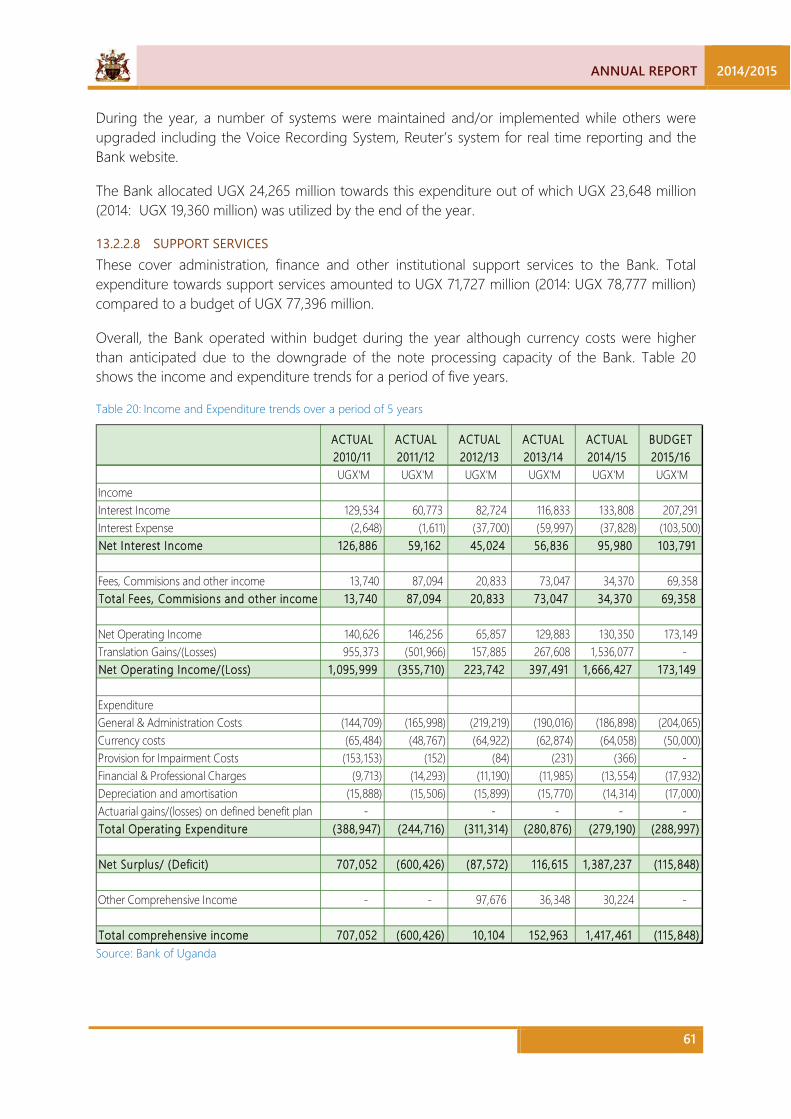
ANNUAL REPORT 2014/2015
61
During the year, a number of systems were maintained and/or implemented while others were upgraded including the Voice Recording System, Reuter’s system for real time reporting and the Bank website.
The Bank allocated UGX 24,265 million towards this expenditure out of which UGX 23,648 million (2014: UGX 19,360 million) was utilized by the end of the year.
13.2.2.8 SUPPORT SERVICES These cover administration, finance and other institutional support services to the Bank. Total expenditure towards support services amounted to UGX 71,727 million (2014: UGX 78,777 million) compared to a budget of UGX 77,396 million.
Overall, the Bank operated within budget during the year although currency costs were higher than anticipated due to the downgrade of the note processing capacity of the Bank. Table 20 shows the income and expenditure trends for a period of five years.
Table 20: Income and Expenditure trends over a period of 5 years
ACTUAL 2010/11
ACTUAL 2011/12
ACTUAL 2012/13
ACTUAL 2013/14
ACTUAL 2014/15
BUDGET 2015/16
UGX'M UGX'M UGX'M UGX'M UGX'M UGX'M IncomeInterest Income 129,534 60,773 82,724 116,833 133,808 207,291 Interest Expense (2,648) (1,611) (37,700) (59,997) (37,828) (103,500) Net Interest Income 126,886 59,162 45,024 56,836 95,980 103,791
Fees, Commisions and other income 13,740 87,094 20,833 73,047 34,370 69,358 Total Fees, Commisions and other income 13,740 87,094 20,833 73,047 34,370 69,358
Net Operating Income 140,626 146,256 65,857 129,883 130,350 173,149 Translation Gains/(Losses) 955,373 (501,966) 157,885 267,608 1,536,077 - Net Operating Income/(Loss) 1,095,999 (355,710) 223,742 397,491 1 ,666,427 173,149
ExpenditureGeneral & Administration Costs (144,709) (165,998) (219,219) (190,016) (186,898) (204,065) Currency costs (65,484) (48,767) (64,922) (62,874) (64,058) (50,000) Provision for Impairment Costs (153,153) (152) (84) (231) (366) - Financial & Professional Charges (9,713) (14,293) (11,190) (11,985) (13,554) (17,932) Depreciation and amortisation (15,888) (15,506) (15,899) (15,770) (14,314) (17,000) Actuarial gains/(losses) on defined benefit plan - - - - - Total Operating Expenditure (388,947) (244,716) (311,314) (280,876) (279,190) (288,997)
Net Surplus/ (Deficit) 707,052 (600,426) (87,572) 116,615 1 ,387,237 (115,848)
Other Comprehensive Income - - 97,676 36,348 30,224 -
Total comprehensive income 707,052 (600,426) 10,104 152,963 1,417,461 (115,848) Source: Bank of Uganda
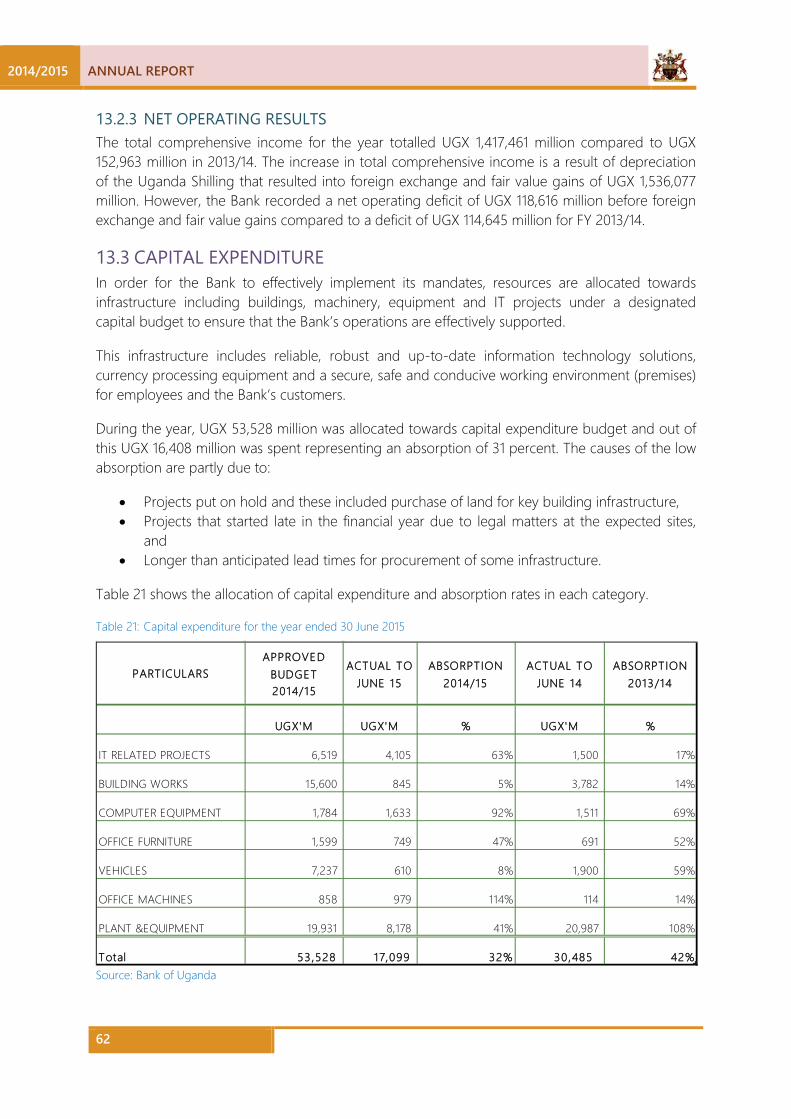
2014/2015 ANNUAL REPORT
62
13.2.3 NET OPERATING RESULTS The total comprehensive income for the year totalled UGX 1,417,461 million compared to UGX 152,963 million in 2013/14. The increase in total comprehensive income is a result of depreciation of the Uganda Shilling that resulted into foreign exchange and fair value gains of UGX 1,536,077 million. However, the Bank recorded a net operating deficit of UGX 118,616 million before foreign exchange and fair value gains compared to a deficit of UGX 114,645 million for FY 2013/14.
CAPITAL EXPENDITURE 13.3In order for the Bank to effectively implement its mandates, resources are allocated towards infrastructure including buildings, machinery, equipment and IT projects under a designated capital budget to ensure that the Bank’s operations are effectively supported.
This infrastructure includes reliable, robust and up-to-date information technology solutions, currency processing equipment and a secure, safe and conducive working environment (premises) for employees and the Bank’s customers.
During the year, UGX 53,528 million was allocated towards capital expenditure budget and out of this UGX 16,408 million was spent representing an absorption of 31 percent. The causes of the low absorption are partly due to:
• Projects put on hold and these included purchase of land for key building infrastructure, • Projects that started late in the financial year due to legal matters at the expected sites,
and • Longer than anticipated lead times for procurement of some infrastructure.
Table 21 shows the allocation of capital expenditure and absorption rates in each category.
Table 21: Capital expenditure for the year ended 30 June 2015
PARTICULARSAPPROVED
BUDGET 2014/15
ACTUAL TO JUNE 15
ABSORPTION 2014/15
ACTUAL TO JUNE 14
ABSORPTION 2013/14
UGX'M UGX'M % UGX'M %
IT RELATED PROJECTS 6,519 4,105 63% 1,500 17%
BUILDING WORKS 15,600 845 5% 3,782 14%
COMPUTER EQUIPMENT 1,784 1,633 92% 1,511 69%
OFFICE FURNITURE 1,599 749 47% 691 52%
VEHICLES 7,237 610 8% 1,900 59%
OFFICE MACHINES 858 979 114% 114 14%
PLANT &EQUIPMENT 19,931 8,178 41% 20,987 108%
Total 53,528 17,099 32% 30,485 42%Source: Bank of Uganda
ANNUAL REPORT 2014/2015
63
STATEMENT OF FINANCIAL POSITION 13.4The Statement of Financial Position shows the stock of the Bank’s assets and liabilities as well as the shareholder’s funds as at 30 June 2015. The analysis of the position is presented below.
13.4.1 ASSETS Total assets decreased by 6.7 percent to UGX 12,750,043 million from the prior year’s figure of UGX 13,677,887 million, with foreign assets accounting for 84 percent of the total assets at end June 2015.
13.4.1.1 FOREIGN ASSETS In USD terms, foreign assets decreased by 15.2 percent to USD 3,316 million mainly on account of Government forex expenditure on energy projects, sale of foreign currency to manage volatility of the exchange rate, and appreciation of the USD against other major currencies which resulted into unrealised foreign exchange losses on the investment positions of the Bank.
In UGX terms, the foreign assets increased by 7.7 percent to UGX 10,948,116 million during the year from UGX 10,165,482 million of the prior year due to the depreciation of the Uganda Shilling by 27.1 percent, 3.8 percent, 17.5 percent, 15.4 percent, 3.2 percent and 9.6 percent against the USD, EUR, GBP, SDR, AUD and CAD respectively when compared to 30 June 2014.
13.4.1.2 DOMESTIC ASSETS The domestic assets decreased by 48.7 percent to UGX 1,801,927 million as at 30 June 2015 from UGX 3,512,405 million of the prior year. The decrease was partly attributed to the settlement of the outstanding residual balance of the Ministry of Defence drawdown, in addition to other tax revenue transfers credited to the Uganda Consolidated Fund.
13.4.2 LIABILITIES Total liabilities decreased by 21.9 percent to UGX 9,316,811 million as at 30 June 2015 from the UGX 11,912,115 million of 30 June 2014, with the biggest portion of this amount being domestic liabilities accounting for 91.3 percent.
13.4.2.1 FOREIGN LIABILITIES Foreign liabilities comprise obligations to IMF which include SDR allocations SDR 173 million. The change in these liabilities is solely attributed to the depreciation of the Uganda Shillings against the SDR by 15.4 percent during the year.
13.4.2.2 DOMESTIC LIABILITIES Domestic liabilities decreased by 24.1 percent to UGX 8,503,957 million compared to the prior year mainly due to change in public debt management where proceeds of auctions of treasury bills and bonds are now directly credited onto the UCF.
13.4.3 SHAREHOLDERS’ FUNDS The Bank’s net worth increased by 94.4 percent to UGX 3,433,232 million (2014: UGX 1,765,772 million) including unrealised foreign exchange and fair value gains of UGX 3,029,498 million. The movement in the net worth is mainly explained by surplus for the year of UGX 1,417,461 million, and recapitalisation securities of UGX 250,000 million received from GoU during the year.
2014/2015 ANNUAL REPORT
64
INTRODUCTION 14.1The Directors are pleased to present their report for the year ended 30 June 2015. The report on the performance of the Bank fulfils the provisions of the Bank of Uganda Act (Cap. 51) Laws of Uganda, which require the Bank to make a report on its activities and operations during the preceding year, within three months after the end of each financial year.
NATURE OF BUSINESS 14.2As a Central Bank, the primary function of Bank of Uganda is to formulate and implement monetary policy aimed at achieving and maintaining price stability and ensuring a sound financial sector. The financial sector is a mechanism through which the monetary policy is transmitted. The Central Bank also fosters a stable and efficient payment system, is a banker and adviser to government and issuer of currency notes and coins as dictated by economic requirements.
OPERATING FINANCIAL RESULTS 14.3The Directors present the financial statements for the year ended 30 June 2015 as set out on pages 69 to 140 of this report. The Bank registered total comprehensive income of UGX 1,417,461 million compared to UGX 152,963 million in 2013/14. The surplus is largely explained by foreign exchange gains as a result of the depreciation of the Uganda Shilling against major international currencies.
DIVIDEND 14.4Due to the slow recovery in the global financial markets and continued uncertainty of the future income, the Directors do not recommend payment of a dividend to government for the year ended 30 June 2015 (30 June 2014: Nil).
DIRECTORS 14.5The Executive Directors who held office during the year and to the date of this report were:
Emmanuel Tumusiime-Mutebile (Prof.) Chairman Louis Kasekende (PhD) Member and Alternate Chairman
The Non-Executive Directors who held office during the year and to the date of this report were:
Christopher Manyindo Kassami Member James Kahoza Member Ibrahim K. Kabanda Member William S. Kalema Member Judy Obitre-Gama Member
None of the Directors had any financial interests in the Bank during the year, except for each of the executive directors of the Board who had a loan with the Bank. This loans were granted as
14 DIRECTORS’ REPORT
ANNUAL REPORT 2014/2015
65
part of the entitlements of the Directors as outlined in the terms and conditions of service. The loans were therefore recovered from emoluments in accordance with the Bank’s policy.
AUDITORS 14.6In accordance with Section 43 of the Bank of Uganda Act (Cap. 51) Laws of Uganda, the financial statements shall be audited once every year by the Auditor General or an auditor appointed by him to act on his behalf. For the year ended 30 June 2015, M/s Ernst & Young, Certified Public Accountants, were appointed to act on behalf of the Auditor General.
APPROVAL OF THE FINANCIAL STATEMENTS 14.7The financial statements were approved at a meeting of the Board of Directors held on 25 September 2015.
Susan Kanyemibwa
Bank Secretary
25 September 2015

2014/2015 ANNUAL REPORT
66
According to the Bank of Uganda Act, the Directors are responsible for the general management of the affairs of the Bank, among other duties. They are therefore required to prepare financial statements for each financial year, which give a true and fair view of the state of affairs of the Bank as at the end of the financial year and its operating results for that year. The Directors should also ensure that the Bank keeps proper accounting records, which disclose with reasonable accuracy, at any time, the financial position of the Bank. They are also responsible for safeguarding the assets of the Bank.
The Directors accept responsibility for the annual financial statements set out on pages 69 to 140, which have been prepared using appropriate accounting policies supported by reasonable and prudent judgements and estimates, in conformity with International Financial Reporting Standards and the requirements of the Bank of Uganda Act. The Directors are of the opinion that the financial statements give a true and fair view of the state of the financial affairs of the Bank as at 30 June 2015 and of its net deficit for the year then ended. The Directors further accept responsibility for the maintenance of accounting records, which may be relied upon in the preparation of financial statements, as well as adequate systems of internal financial control.
The Directors have made an assessment of the Bank’s ability to continue as a going concern and have no reason to believe that the business will not be a going concern for the next twelve months from the date of this statement.
The Auditor is responsible for reporting on whether the annual financial statements are fairly presented in accordance with International Financial Reporting Standards and the Bank of Uganda Act.
The financial statements were approved by the Board of Directors on 25 September 2015 and were signed on its behalf by:
Chairman Director Director
25 September 2015 25 September 2015 25 September 2015
15 STATEMENT OF THE DIRECTORS’ RESPONSIBILITIES
ANNUAL REPORT 2014/2015
67
Under the terms of Section 43 of the Bank of Uganda Act (Cap 51) and the National Audit Act 2008, I am required to audit the financial statements of Bank of Uganda. In accordance with the provisions of the same section, I appointed Ernst & Young, Certified Public Accountants to audit the financial statements of the Bank on my behalf and report to me so as to enable me report to Parliament in accordance with Article 163 (4) of the Constitution of the Republic of Uganda.
REPORT ON THE FINANCIAL STATEMENTS OF BANK OF UGANDA 16.1The financial statements of Bank of Uganda set out on pages 69 to 140 which comprise the statement of financial position as at 30 June 2015, the statement of profit or loss and other comprehensive income, statement of changes in equity and statement of cash flows for the year then ended, and a summary of significant accounting policies and other explanatory notes, have been audited.
DIRECTORS’ RESPONSIBILITY FOR THE FINANCIAL STATEMENTS 16.2The Directors of the Bank are responsible for the preparation and fair presentation of these financial statements in accordance with International Financial Reporting Standards and in the manner required by the Bank of Uganda Act, and for such internal controls as the directors determine is necessary to enable the preparation of financial statements that are free from material misstatement, whether due to fraud or error.
AUDITOR’S RESPONSIBILITY 16.3My responsibility is to express an opinion on the financial statements based on the audit. The audit was conducted in accordance with International Standards on Auditing. Those standards require that I comply with the ethical requirements and plan and perform the audit to obtain reasonable assurance as to whether the financial statements are free from material misstatement.
An audit involves performing procedures to obtain audit evidence about the amounts and disclosures in the financial statements. The procedures selected depend on the Auditor’s judgment, including the assessment of the risks of material misstatement of the financial statements, whether due to fraud or error. In making those risk assessments, the Auditor considers the internal control relevant to the entity’s preparation and fair presentation of the financial statements in order to design audit procedures that are appropriate in the circumstances, but not for the purpose of expressing an opinion on the effectiveness of the entity’s internal control. An audit also includes evaluating the appropriateness of accounting policies used and the reasonableness of accounting estimates made by the directors, as well as evaluating the overall presentation of the financial statements.
I believe that the audit evidence obtained is sufficient and appropriate to provide a basis for my audit opinion.
16 REPORT OF THE AUDITOR GENERAL TO PARLIAMENT

2014/2015 ANNUAL REPORT
68
OPINION 16.4In my opinion, the accompanying financial statements present fairly, in all material respects, the financial position of Bank of Uganda at 30 June 2015, and its financial performance and its cash flows for the year then ended in accordance with International Financial Reporting Standards and the requirements of the Bank of Uganda Act.
John F.S. Muwanga
AUDITOR GENERAL
KAMPALA
25 September 2015
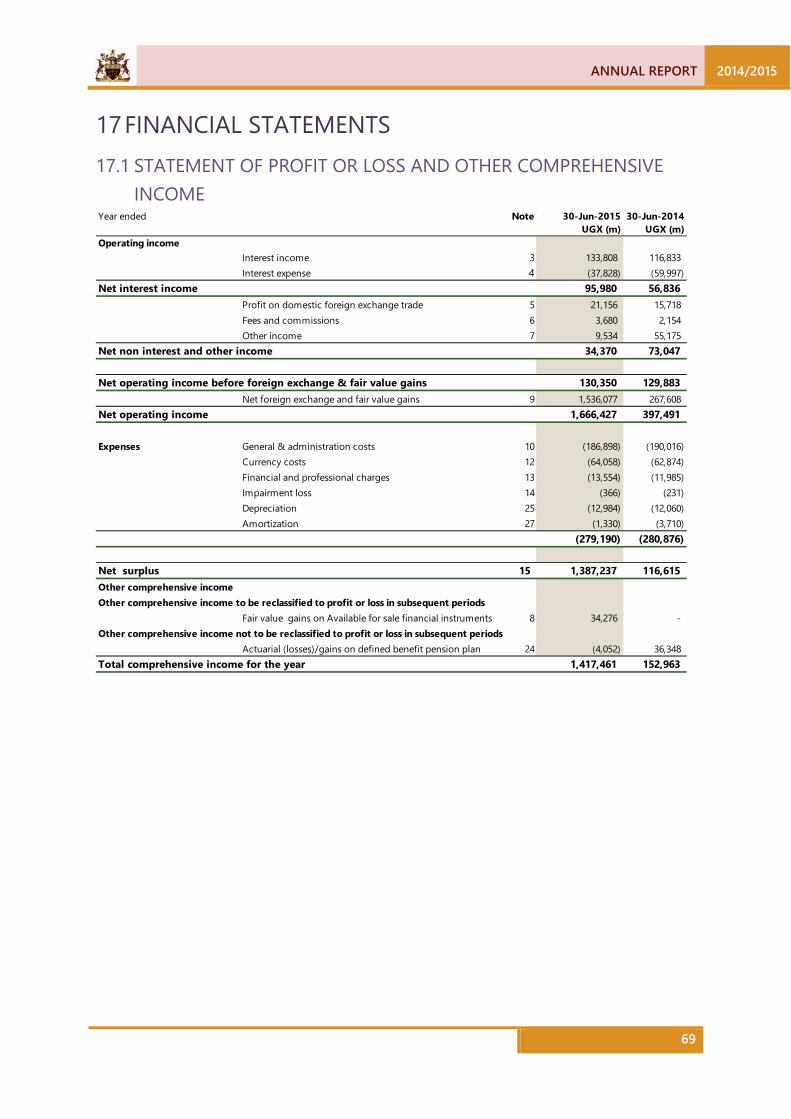
ANNUAL REPORT 2014/2015
69
STATEMENT OF PROFIT OR LOSS AND OTHER COMPREHENSIVE 17.1INCOME
Year ended Note 30-Jun-2015 30-Jun-2014UGX (m) UGX (m)
Operating incomeInterest income 3 133,808 116,833 Interest expense 4 (37,828) (59,997)
Net interest income 95,980 56,836 Profit on domestic foreign exchange trade 5 21,156 15,718 Fees and commissions 6 3,680 2,154 Other income 7 9,534 55,175
Net non interest and other income 34,370 73,047
Net operating income before foreign exchange & fair value gains 130,350 129,883 Net foreign exchange and fair value gains 9 1,536,077 267,608
Net operating income 1,666,427 397,491
Expenses General & administration costs 10 (186,898) (190,016) Currency costs 12 (64,058) (62,874) Financial and professional charges 13 (13,554) (11,985) Impairment loss 14 (366) (231) Depreciation 25 (12,984) (12,060) Amortization 27 (1,330) (3,710)
(279,190) (280,876)
Net surplus 15 1,387,237 116,615 Other comprehensive incomeOther comprehensive income to be reclassified to profit or loss in subsequent periods
Fair value gains on Available for sale financial instruments 8 34,276 - Other comprehensive income not to be reclassified to profit or loss in subsequent periods
Actuarial (losses)/gains on defined benefit pension plan 24 (4,052) 36,348 Total comprehensive income for the year 1,417,461 152,963
17 FINANCIAL STATEMENTS

2014/2015 ANNUAL REPORT
70
STATEMENT OF FINANCIAL POSITION 17.2As at 30-Jun-15 30-Jun-14
UGX (m) UGX (m)
Assets Foreign assets Cash and cash equivalents 16 824,162 311,860
Investments at fair value through profit or loss 17 (a) 6,317,150 6,565,381
Investments held-for-trading 17 (b) 3,504,206 2,724,923
Investments available-for-sale 17 (c) 73,549 1,804
Derivative financial instruments 18 7,098 2,916
Assets held with IMF 19 221,951 558,598 Total foreign assets 10,948,116 10,165,482 Domestic assets Investments in government securities 20 441,625 233,182
Loans, advances and drawdowns to government 21 760,589 2,761,663 Loans and advances to commercial banks 22 26,136 6,009
Staff loans 23 62,816 53,830
Employee benefits 24 27,943 25,906 Property, plant and equipment 25 199,198 197,815 Finance lease on leasehold land 26 50,754 50,754 Intangible assets 27 4,543 3,832 Other assets 28 228,323 179,414
Total domestic assets 1,801,927 3,512,405 Total assets 12,750,043 13,677,887
Liabilities Foreign liabilities IMF obligations 19 801,843 694,728 Other foreign liabilities 29 322 353 Derivative financial instruments 18 10,689 12,675
Total foreign liabilities 812,854 707,756 Domestic liabilities Currency in circulation 30 3,231,556 2,746,092
Government deposits 31 3,146,645 6,007,624 Commercial banks' deposits 32 1,864,591 1,371,783 Repos 33 187,400 910,854 Other liabilities 34 73,765 168,006
Total domestic liabilities 8,503,957 11,204,359 Total liabilities 9,316,811 11,912,115
Equity Issued capital 35 20,000 20,000
BoU recapitalisation funds 36 660,017 410,017 Reserves 37 2,753,215 1,335,755
Total Equity 3,433,232 1,765,772 Total liabilities & equity 12,750,043 13,677,887
The financial statements on pages 69 to 140 were approved by the Board of Directors on 25 September 2015 and signed on its behalf by:
Chairman Director Director

ANNUAL REPORT 2014/2015
71
STATEMENT OF CHANGES IN EQUITY 17.3
Issued capital
BoU recapitalisat
ion funds
Translation reserve
Asset revaluation
reserve
Fair value on
Available for sale financial
instruments
Revenue reserve
General reserve
Total
UGX (m) UGX (m) UGX (m) UGX (m) UGX (m) UGX (m) UGX (m) UGX (m)
At 1 July 2013 20,000 410,017 1,311,303 143,875 - (530,357) 257,971 1,612,809 Surplus for the year - - - - - 116,615 - 116,615 Other comprehensive income - - - - - 36,348 - 36,348
Total comprehensive income - - - - - 152,963 - 152,963 Revaluation surplus release - - - (1,470) - 1,470 - - Foreign exchange and fair value gains - - 267,608 - - (267,608) - - Transfer of realised foreign exchange gains - - (11,254) - - - 11,254 - At 30 June 2014 20,000 410,017 1,567,657 142,405 - (643,532) 269,225 1,765,772
At 1 July 2014 20,000 410,017 1,567,657 142,405 - (643,532) 269,225 1,765,772 Surplus for the year - - - - - 1,387,237 - 1,387,237 Other comprehensive income - - - - 34,276 (4,052) - 30,224
Total comprehensive income - - - - 34,276 1,383,185 - 1,417,461 Revaluation surplus release - - - (1,469) - 1,469 - - BoU recapitalisation securities - 250,000 - - - - - 250,000 Foreign Exchange and fair value gains - - 1,536,077 - - (1,536,077) - - Transfer of realised foreign exchange gains - - (74,236) - - - 74,236 - At 30 June 2015 20,000 660,017 3,029,498 140,936 34,276 (794,956) 343,461 3,433,232

2014/2015 ANNUAL REPORT
72
STATEMENT OF CASH FLOWS 17.4For the purpose of this statement, cash refers to foreign currency assets defined as cash and cash equivalents.
Year ended 30-Jun-15 30-Jun-14Note UGX (m) UGX (m)
Cash flows from operating activitiesNet surplus for the year 1,387,237 116,615 Amortisation 27 1,330 3,710 Depreciation 25 12,984 12,060 Profit on sale of fixed assets 7 (676) (30) Defined benefit plan costs charged to profit or loss 24 4,540 30,439
1,405,415 162,794 Foreign Assets
Decrease/(increase) in investments at fair value through profit or loss 248,231 (1,029,680) Increase in investments held-for-trading (779,283) (42,111) Increase in investments available-for-sale (37,469) (194) (Increase)/decrease in derivative financial instruments (4,182) 7,999 Decrease/(increase) in assets held with IMF 336,647 (11,123)
Increase in total foreign assets (236,056) (1,075,109) (Increase)/decrease in investments in government securities (208,443) 182,006 Decrease in loans, advances and drawdowns to government 2,001,074 4,032,875 (Increase)/decrease in loans and advances to commercial banks (20,127) 5,230 Increase in staff loans (8,986) (8,354) Increase in other assets (48,909) (66,054)
Decrease in total domestic assets 1,714,609 4,145,703 Decrease in total assets 1,478,553 3,070,594 Foreign liabilities
Increase in IMF obligations 107,115 19,812 Decrease in other foreign liabilities (31) - (Decrease)/increase in derivative financial instruments (1,986) 6,488
Increase in total foreign liabilities 105,098 26,300 Domestic Liabilities
Increase in currency in circulation 485,464 293,235 Decrease in government deposits (2,860,979) (4,017,621) Increase in commercial banks' deposits 492,808 255,397 (Decrease)/increase in repos (723,454) 367,753 (Decrease)/increase in other liabilities (94,241) 68,205
Decrease in total domestic liabilities (2,700,402) (3,033,031) Decrease in total liabilities (2,595,304) (3,006,731)
Net Cash from Operations 288,664 226,657 Bank contribution to BoU defined benefit plan 24 (10,629) (100,954)
Net Cash from Operating Activities 278,035 125,703 Cash flows from investing activities:
Proceeds from sale of property, plant and equipment 675 210 Purchase of property, plant and equipment 25 (14,367) (26,593) Purchase of software 27 (2,041) (1,160) Purchase of leasehold land 26 - (2,732)
Net Cash used in investing Activities (15,733) (30,275) Cash flows from financing activities:
BoU recapitalisation 36 250,000 - Net Cash used in Financing Activities 250,000 -
Increase in cash and cash equivalents 512,302 95,428 Add: Cash and Cash Equivalents at the beginning of the year 311,860 216,432
Cash and Cash Equivalents at 30 June 16 824,162 311,860
ANNUAL REPORT 2014/2015
73
1 REPORTING ENTITY Bank of Uganda is the Central Bank of Uganda as established under the Bank of Uganda Act 1966 as amended by the Bank of Uganda Act (Cap.51) Laws of Uganda 2000. Also the Constitution of the Republic of Uganda, 1995, Article 161, provides that the Bank of Uganda shall be the Central Bank of Uganda and therefore the Reporting Entity.
2 PRINCIPAL ACCOUNTING POLICIES The principal accounting policies adopted in preparation of these financial statements are set out in the following subsections. These policies have been consistently applied to all years presented unless otherwise stated.
2.1 BASIS OF PREPARATION The financial statements have been prepared on a historical cost basis, except for certain financial assets and liabilities that are measured at fair value and the revaluation of certain property, plant and equipment.
2.2 STATEMENT OF COMPLIANCE The financial statements have been prepared in accordance with and comply with International Financial Reporting Standards (IFRS) and in accordance with the requirements of the Bank of Uganda Act.
2.3 SIGNIFICANT ACCOUNTING ESTIMATES AND JUDGEMENTS The preparation of financial statements in conformity with IFRS requires the use of estimates and assumptions that affect the reported amounts of assets and liabilities and disclosure of contingent assets and liabilities at the date of the financial statements and the reported amounts of revenues and expenses during the reporting period. Although these estimates are based on the directors’ best knowledge of current events and actions, actual results ultimately may differ from those estimates.
The estimates and underlying assumptions are reviewed on an on-going basis. Revisions to accounting estimates are recognised in the period in which the estimate is revised if the revision affects only that period or in the period of the revision and future periods if the revision affects both current and future periods.
In particular, information about significant areas of estimations and critical judgements in applying accounting policies that have the most significant effect on the amount recognised in the financial statements are described in Note 44 – Use of estimates and judgements.
18 NOTES TO THE FINANCIAL STATEMENTS FOR THE YEAR ENDED 30 JUNE 2015
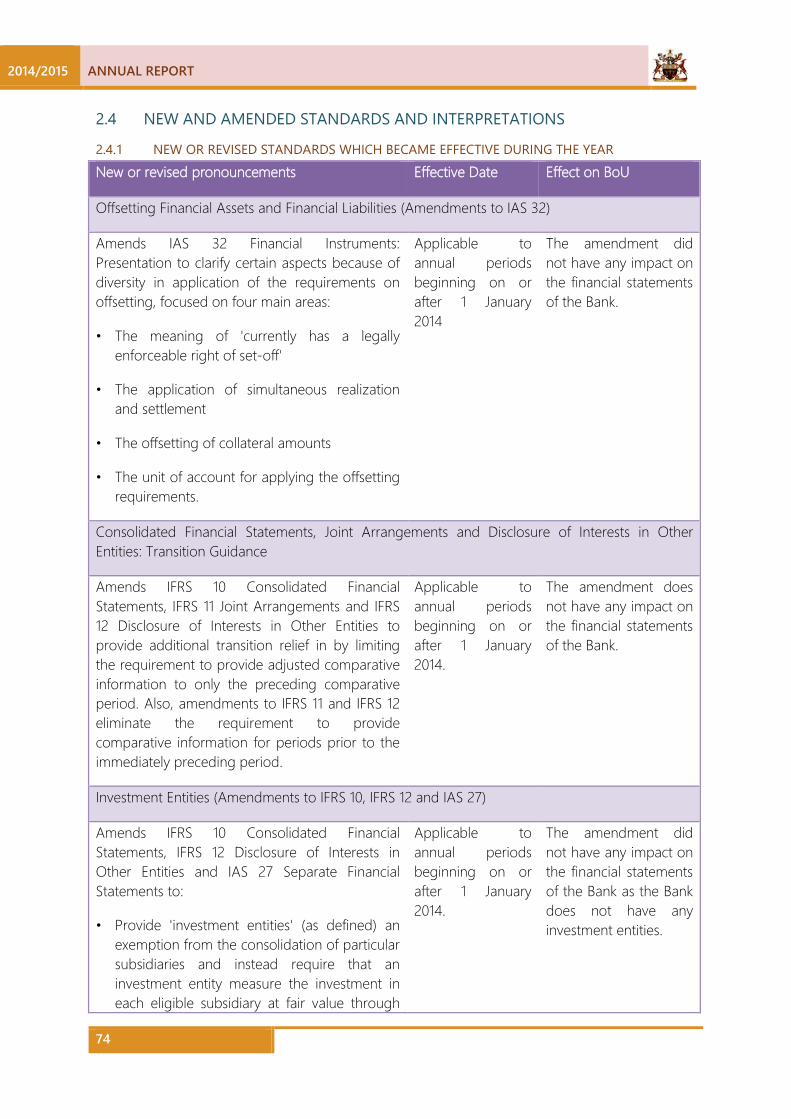
2014/2015 ANNUAL REPORT
74
2.4 NEW AND AMENDED STANDARDS AND INTERPRETATIONS
2.4.1 NEW OR REVISED STANDARDS WHICH BECAME EFFECTIVE DURING THE YEAR New or revised pronouncements Effective Date Effect on BoU
Offsetting Financial Assets and Financial Liabilities (Amendments to IAS 32)
Amends IAS 32 Financial Instruments: Presentation to clarify certain aspects because of diversity in application of the requirements on offsetting, focused on four main areas:
• The meaning of 'currently has a legally enforceable right of set-off'
• The application of simultaneous realization and settlement
• The offsetting of collateral amounts
• The unit of account for applying the offsetting requirements.
Applicable to annual periods beginning on or after 1 January 2014
The amendment did not have any impact on the financial statements of the Bank.
Consolidated Financial Statements, Joint Arrangements and Disclosure of Interests in Other Entities: Transition Guidance
Amends IFRS 10 Consolidated Financial Statements, IFRS 11 Joint Arrangements and IFRS 12 Disclosure of Interests in Other Entities to provide additional transition relief in by limiting the requirement to provide adjusted comparative information to only the preceding comparative period. Also, amendments to IFRS 11 and IFRS 12 eliminate the requirement to provide comparative information for periods prior to the immediately preceding period.
Applicable to annual periods beginning on or after 1 January 2014.
The amendment does not have any impact on the financial statements of the Bank.
Investment Entities (Amendments to IFRS 10, IFRS 12 and IAS 27)
Amends IFRS 10 Consolidated Financial Statements, IFRS 12 Disclosure of Interests in Other Entities and IAS 27 Separate Financial Statements to:
• Provide 'investment entities' (as defined) an exemption from the consolidation of particular subsidiaries and instead require that an investment entity measure the investment in each eligible subsidiary at fair value through
Applicable to annual periods beginning on or after 1 January 2014.
The amendment did not have any impact on the financial statements of the Bank as the Bank does not have any investment entities.
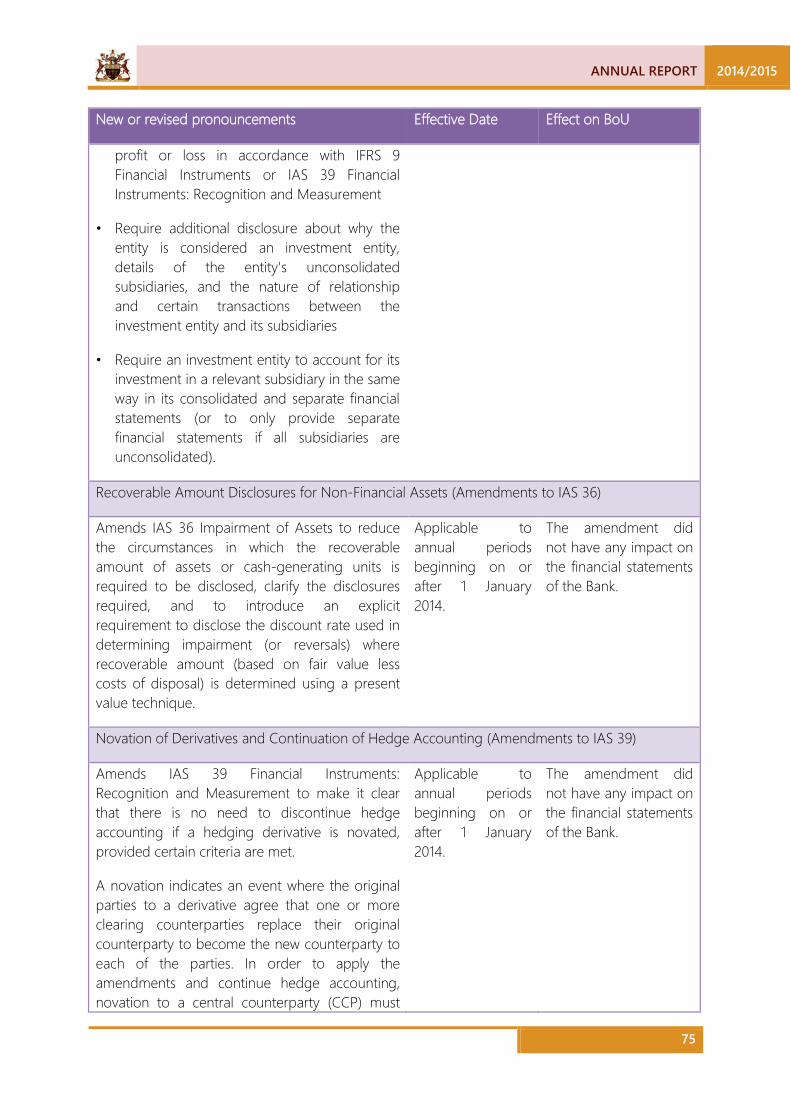
ANNUAL REPORT 2014/2015
75
New or revised pronouncements Effective Date Effect on BoU
profit or loss in accordance with IFRS 9 Financial Instruments or IAS 39 Financial Instruments: Recognition and Measurement
• Require additional disclosure about why the entity is considered an investment entity, details of the entity's unconsolidated subsidiaries, and the nature of relationship and certain transactions between the investment entity and its subsidiaries
• Require an investment entity to account for its investment in a relevant subsidiary in the same way in its consolidated and separate financial statements (or to only provide separate financial statements if all subsidiaries are unconsolidated).
Recoverable Amount Disclosures for Non-Financial Assets (Amendments to IAS 36)
Amends IAS 36 Impairment of Assets to reduce the circumstances in which the recoverable amount of assets or cash-generating units is required to be disclosed, clarify the disclosures required, and to introduce an explicit requirement to disclose the discount rate used in determining impairment (or reversals) where recoverable amount (based on fair value less costs of disposal) is determined using a present value technique.
Applicable to annual periods beginning on or after 1 January 2014.
The amendment did not have any impact on the financial statements of the Bank.
Novation of Derivatives and Continuation of Hedge Accounting (Amendments to IAS 39)
Amends IAS 39 Financial Instruments: Recognition and Measurement to make it clear that there is no need to discontinue hedge accounting if a hedging derivative is novated, provided certain criteria are met.
A novation indicates an event where the original parties to a derivative agree that one or more clearing counterparties replace their original counterparty to become the new counterparty to each of the parties. In order to apply the amendments and continue hedge accounting, novation to a central counterparty (CCP) must
Applicable to annual periods beginning on or after 1 January 2014.
The amendment did not have any impact on the financial statements of the Bank.
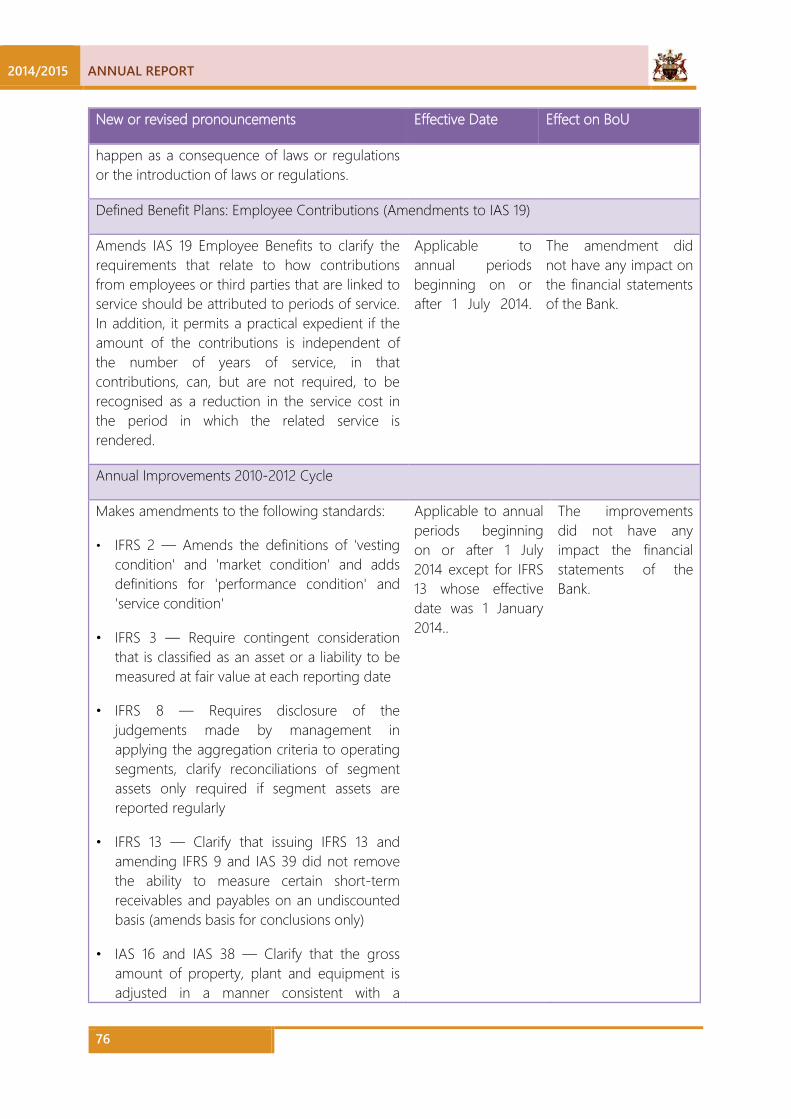
2014/2015 ANNUAL REPORT
76
New or revised pronouncements Effective Date Effect on BoU
happen as a consequence of laws or regulations or the introduction of laws or regulations.
Defined Benefit Plans: Employee Contributions (Amendments to IAS 19)
Amends IAS 19 Employee Benefits to clarify the requirements that relate to how contributions from employees or third parties that are linked to service should be attributed to periods of service. In addition, it permits a practical expedient if the amount of the contributions is independent of the number of years of service, in that contributions, can, but are not required, to be recognised as a reduction in the service cost in the period in which the related service is rendered.
Applicable to annual periods beginning on or after 1 July 2014.
The amendment did not have any impact on the financial statements of the Bank.
Annual Improvements 2010-2012 Cycle
Makes amendments to the following standards:
• IFRS 2 — Amends the definitions of 'vesting condition' and 'market condition' and adds definitions for 'performance condition' and 'service condition'
• IFRS 3 — Require contingent consideration that is classified as an asset or a liability to be measured at fair value at each reporting date
• IFRS 8 — Requires disclosure of the judgements made by management in applying the aggregation criteria to operating segments, clarify reconciliations of segment assets only required if segment assets are reported regularly
• IFRS 13 — Clarify that issuing IFRS 13 and amending IFRS 9 and IAS 39 did not remove the ability to measure certain short-term receivables and payables on an undiscounted basis (amends basis for conclusions only)
• IAS 16 and IAS 38 — Clarify that the gross amount of property, plant and equipment is adjusted in a manner consistent with a
Applicable to annual periods beginning on or after 1 July 2014 except for IFRS 13 whose effective date was 1 January 2014..
The improvements did not have any impact the financial statements of the Bank.

ANNUAL REPORT 2014/2015
77
New or revised pronouncements Effective Date Effect on BoU
revaluation of the carrying amount
• IAS 24 — Clarify how payments to entities providing management services are to be disclosed
Annual Improvements 2011-2013 Cycle
Makes amendments to the following standards:
• IFRS 1 — Clarify which versions of IFRSs can be used on initial adoption (amends basis for conclusions only)
• IFRS 3 — Clarify that IFRS 3 excludes from its scope the accounting for the formation of a joint arrangement in the financial statements of the joint arrangement itself
• IFRS 13 — Clarify the scope of the portfolio exception in paragraph 52
• IAS 40 — Clarifying the interrelationship of IFRS 3 and IAS 40 when classifying property as investment property or owner-occupied property
Applicable to annual periods beginning on or after 1 July 2014.
The improvements did not have any impact on the financial statements of the Bank.
IFRIC 21 Levies
Provides guidance on when to recognise a liability for a levy imposed by a government, both for levies that are accounted for in accordance with IAS 37 Provisions, Contingent Liabilities and Contingent Assets and those where the timing and amount of the levy is certain.
The Interpretation identifies the obligating event for the recognition of a liability as the activity that triggers the payment of the levy in accordance with the relevant legislation. It provides the following guidance on recognition of a liability to pay levies:
• The liability is recognised progressively if the obligating event occurs over a period of time
• If an obligation is triggered on reaching a
Applicable to annual periods beginning on or after 1 January 2014 with retrospective application.
The revised interpretation does not have any impact on the financial statements of the Bank as there are no levies imposed by Government.
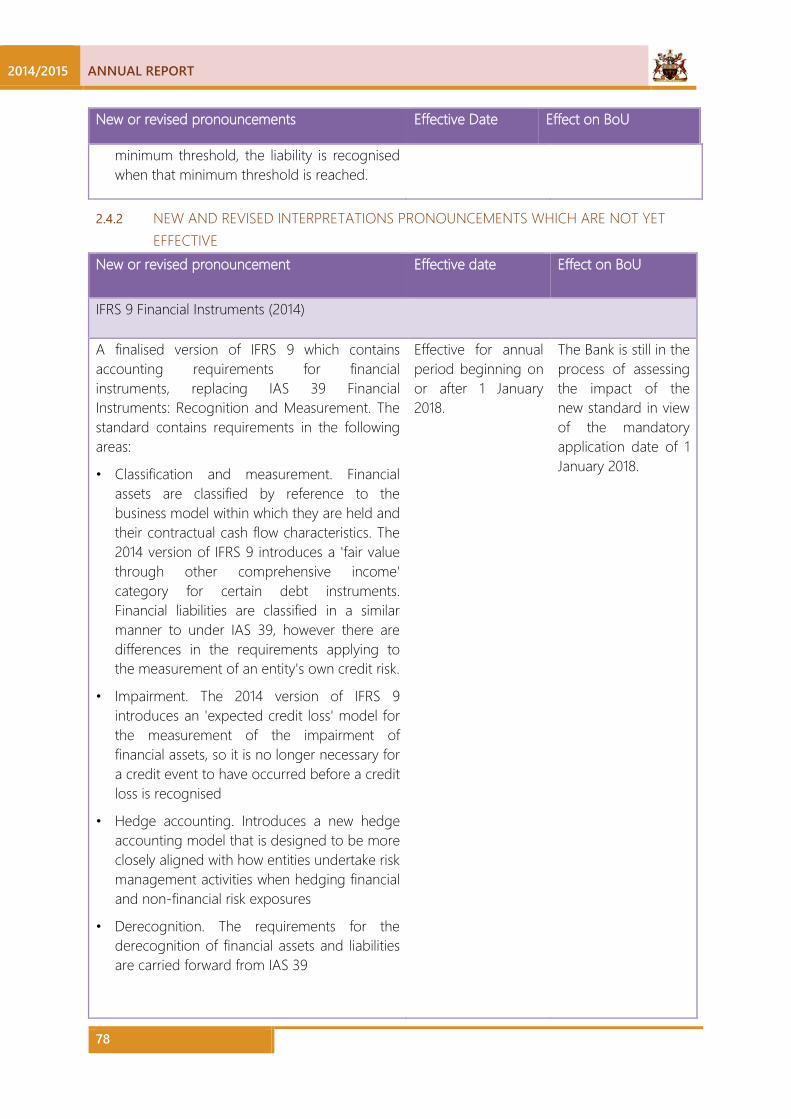
2014/2015 ANNUAL REPORT
78
New or revised pronouncements Effective Date Effect on BoU
minimum threshold, the liability is recognised when that minimum threshold is reached.
2.4.2 NEW AND REVISED INTERPRETATIONS PRONOUNCEMENTS WHICH ARE NOT YET EFFECTIVE
New or revised pronouncement Effective date Effect on BoU
IFRS 9 Financial Instruments (2014)
A finalised version of IFRS 9 which contains accounting requirements for financial instruments, replacing IAS 39 Financial Instruments: Recognition and Measurement. The standard contains requirements in the following areas:
• Classification and measurement. Financial assets are classified by reference to the business model within which they are held and their contractual cash flow characteristics. The 2014 version of IFRS 9 introduces a 'fair value through other comprehensive income' category for certain debt instruments. Financial liabilities are classified in a similar manner to under IAS 39, however there are differences in the requirements applying to the measurement of an entity's own credit risk.
• Impairment. The 2014 version of IFRS 9 introduces an 'expected credit loss' model for the measurement of the impairment of financial assets, so it is no longer necessary for a credit event to have occurred before a credit loss is recognised
• Hedge accounting. Introduces a new hedge accounting model that is designed to be more closely aligned with how entities undertake risk management activities when hedging financial and non-financial risk exposures
• Derecognition. The requirements for the derecognition of financial assets and liabilities are carried forward from IAS 39
Effective for annual period beginning on or after 1 January 2018.
The Bank is still in the process of assessing the impact of the new standard in view of the mandatory application date of 1 January 2018.

ANNUAL REPORT 2014/2015
79
New or revised pronouncement Effective date Effect on BoU
IFRS 14 Regulatory Deferral Accounts
IFRS 14 permits an entity which is a first-time adopter of International Financial Reporting Standards to continue to account, with some limited changes, for 'regulatory deferral account balances' in accordance with its previous GAAP, both on initial adoption of IFRS and in subsequent financial statements.
Applicable to an entity's first annual IFRS financial statements for a period beginning on or after 1 January 2016.
IFRS 14 does not have any impact on the financial statements of the Bank.
IFRS 15 Revenue from Contracts with Customers
IFRS 15 provides a single, principles based five-step model to be applied to all contracts with customers.
The five steps in the model are as follows:
• Identify the contract with the customer
• Identify the performance obligations in the contract
• Determine the transaction price
• Allocate the transaction price to the performance obligations in the contracts
• Recognise revenue when (or as) the entity satisfies a performance obligation.
Guidance is provided on topics such as the point in which revenue is recognised, accounting for variable consideration, costs of fulfilling and obtaining a contract and various related matters. New disclosures about revenue are also introduced.
Applicable to an entity's first annual IFRS financial statements for a period beginning on or after 1 January 2018.
IFRS 15 does not have any impact on the financial statements of the Bank.
Annual Improvements 2012-2014 Cycle
Makes amendments to the following standards:
• IFRS 5 — Adds specific guidance in IFRS 5 for cases in which an entity reclassifies an asset from held for sale to held for distribution or vice versa and cases in which held-for-
Applicable to annual periods beginning on or after 1 January 2016.
The Bank is assessing the impact of the amendments on the financial statements where applicable.
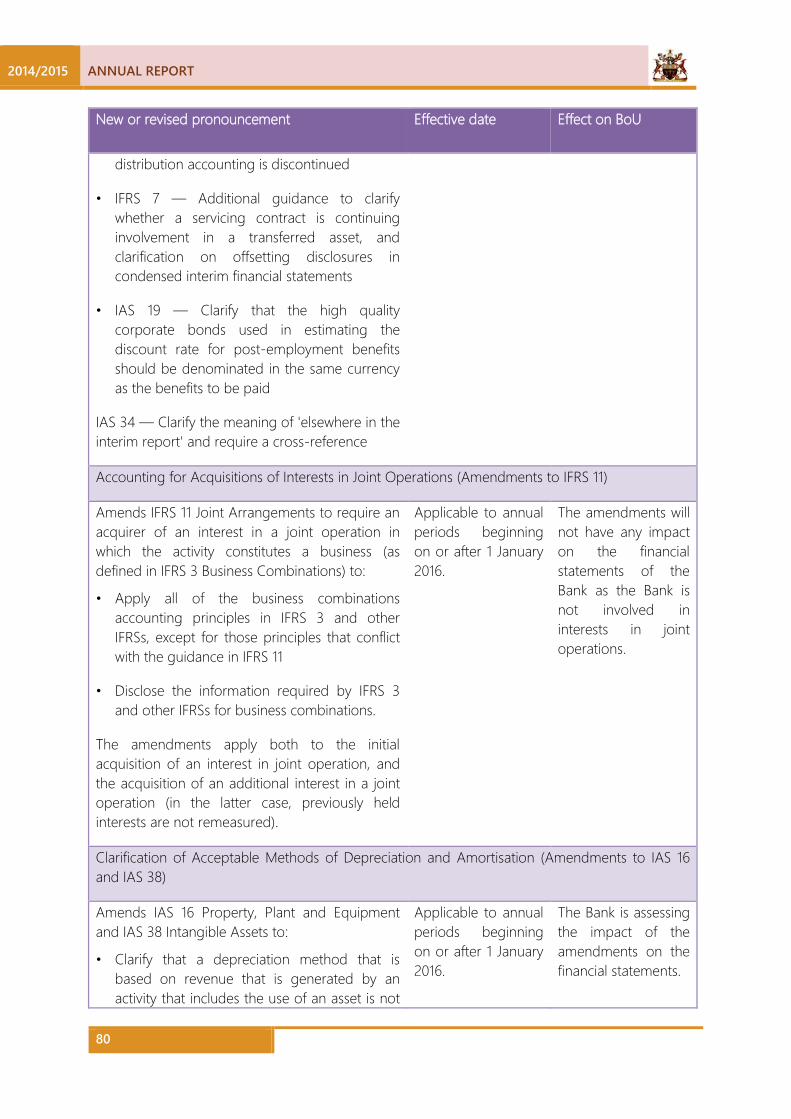
2014/2015 ANNUAL REPORT
80
New or revised pronouncement Effective date Effect on BoU
distribution accounting is discontinued
• IFRS 7 — Additional guidance to clarify whether a servicing contract is continuing involvement in a transferred asset, and clarification on offsetting disclosures in condensed interim financial statements
• IAS 19 — Clarify that the high quality corporate bonds used in estimating the discount rate for post-employment benefits should be denominated in the same currency as the benefits to be paid
IAS 34 — Clarify the meaning of 'elsewhere in the interim report' and require a cross-reference
Accounting for Acquisitions of Interests in Joint Operations (Amendments to IFRS 11)
Amends IFRS 11 Joint Arrangements to require an acquirer of an interest in a joint operation in which the activity constitutes a business (as defined in IFRS 3 Business Combinations) to:
• Apply all of the business combinations accounting principles in IFRS 3 and other IFRSs, except for those principles that conflict with the guidance in IFRS 11
• Disclose the information required by IFRS 3 and other IFRSs for business combinations.
The amendments apply both to the initial acquisition of an interest in joint operation, and the acquisition of an additional interest in a joint operation (in the latter case, previously held interests are not remeasured).
Applicable to annual periods beginning on or after 1 January 2016.
The amendments will not have any impact on the financial statements of the Bank as the Bank is not involved in interests in joint operations.
Clarification of Acceptable Methods of Depreciation and Amortisation (Amendments to IAS 16 and IAS 38)
Amends IAS 16 Property, Plant and Equipment and IAS 38 Intangible Assets to:
• Clarify that a depreciation method that is based on revenue that is generated by an activity that includes the use of an asset is not
Applicable to annual periods beginning on or after 1 January 2016.
The Bank is assessing the impact of the amendments on the financial statements.

ANNUAL REPORT 2014/2015
81
New or revised pronouncement Effective date Effect on BoU
appropriate for property, plant and equipment
• Introduce a rebuttable presumption that an amortisation method that is based on the revenue generated by an activity that includes the use of an intangible asset is inappropriate, which can only be overcome in limited circumstances where the intangible asset is expressed as a measure of revenue, or when it can be demonstrated that revenue and the consumption of the economic benefits of the intangible asset are highly correlated
• Add guidance that expected future reductions in the selling price of an item that was produced using an asset could indicate the expectation of technological or commercial obsolescence of the asset, which, in turn, might reflect a reduction of the future economic benefits embodied in the asset.
Agriculture: Bearer Plants (Amendments to IAS 16 and IAS 41)
The amendments bring bearer plants, which no longer undergo significant biological transformation, into the scope of IAS 16 so that they are accounted for in the same way as property, plant and equipment.
For the purpose of bringing bearer plants from the scope of IAS 41 into the scope of IAS 16 and therefore enabling entities to measure them at cost subsequent to initial recognition or at revaluation, a definition of a 'bearer plant' is introduced into both standards. A bearer plant is defined as "a living plant that:
a) Is used in the production or supply of agricultural produce;
b) Is expected to bear produce for more than one period; and
c) Has a remote likelihood of being sold as agricultural produce, except for incidental scrap sales."
The scope sections of both standards are then amended to clarify that biological assets except
The amendments are effective for annual periods beginning on or after 1 January 2016.
The amendments will not have any impact on the financial statements of the Bank as the Bank is not involved in agriculture.
2014/2015 ANNUAL REPORT
82
New or revised pronouncement Effective date Effect on BoU
for bearer plants are accounted for under IAS 41 while bearer plants are accounted for under IAS 16.
The amendments also clarify that produce growing on bearer plants continues to be accounted for under IAS 41 and that government grants related to bearer plants no longer fall into the scope of IAS 41 but need to be accounted for under IAS 20 Accounting for Government Grants and Disclosure of Government Assistance.
Equity Method in Separate Financial Statements (Amendments to IAS 27)
Amends IAS 27 Separate Financial Statements to permit investments in subsidiaries, joint ventures and associates to be optionally accounted for using the equity method in separate financial statements.
Applicable to annual periods beginning on or after 1 January 2016.
The amendments will not have any impact on the financial statements of the Bank as the Bank does not prepare separate financial statements.
Sale or Contribution of Assets between an Investor and its Associate or Joint Venture (Amendments to IFRS 10 and IAS 28)
Amends IFRS 10 Consolidated Financial Statements and IAS 28 Investments in Associates and Joint Ventures (2011) to clarify the treatment of the sale or contribution of assets from an investor to its associate or joint venture, as follows:
• Require full recognition in the investor's financial statements of gains and losses arising on the sale or contribution of assets that constitute a business (as defined in IFRS 3 Business Combinations)
• Require the partial recognition of gains and losses where the assets do not constitute a business, i.e. a gain or loss is recognised only to the extent of the unrelated investors’ interests in that associate or joint venture.
These requirements apply regardless of the legal form of the transaction, e.g. whether the sale or
Applicable on a prospective basis to a sale or contribution of assets occurring in annual periods beginning on or after 1 January 2016.
The amendments will not have any impact on the financial statements of the Bank as the Bank is not involved in interests in joint ventures or associates.

ANNUAL REPORT 2014/2015
83
New or revised pronouncement Effective date Effect on BoU
contribution of assets occurs by an investor transferring shares in a subsidiary that holds the assets (resulting in loss of control of the subsidiary), or by the direct sale of the assets themselves.
Disclosure Initiative (Amendments to IAS 1)
Amends IAS 1 Presentation of Financial Statements to address perceived impediments to preparers exercising their judgement in presenting their financial reports by making the following changes:
• Clarification that information should not be obscured by aggregating or by providing immaterial information, materiality considerations apply to the all parts of the financial statements, and even when a standard requires a specific disclosure, materiality considerations do apply;
• Clarification that the list of line items to be presented in these statements can be disaggregated and aggregated as relevant and additional guidance on subtotals in these statements and clarification that an entity's share of OCI of equity-accounted associates and joint ventures should be presented in aggregate as single line items based on whether or not it will subsequently be reclassified to profit or loss;
Additional examples of possible ways of ordering the notes to clarify that understandability and comparability should be considered when determining the order of the notes and to demonstrate that the notes need not be presented in the order so far listed in paragraph 114 of IAS 1.
Effective for annual periods beginning on or after 1 January 2016.
The Bank is assessing the impact of the amendments on the financial statements.

2014/2015 ANNUAL REPORT
84
New or revised pronouncement Effective date Effect on BoU
Investment Entities: Applying the Consolidation Exception (Amendments to IFRS 10, IFRS 12 and IAS 28)
Amends IFRS 10 Consolidated Financial Statements, IFRS 12 Disclosure of Interests in Other Entities and IAS 28 Investments in Associates and Joint Ventures (2011) to address issues that have arisen in the context of applying the consolidation exception for investment entities by clarifying the following points:
• The exemption from preparing consolidated financial statements for an intermediate parent entity is available to a parent entity that is a subsidiary of an investment entity, even if the investment entity measures all of its subsidiaries at fair value.
• A subsidiary that provides services related to the parent's investment activities should not be consolidated if the subsidiary itself is an investment entity.
• When applying the equity method to an associate or a joint venture, a non-investment entity investor in an investment entity may retain the fair value measurement applied by the associate or joint venture to its interests in subsidiaries.
• An investment entity measuring all of its subsidiaries at fair value provides the disclosures relating to investment entities required by IFRS 12.
Effective for annual periods beginning on or after 1 January 2016.
The amendments will not have any impact on the financial statements of the Bank as the Bank does not have any interests in other entities.
2.5 FUNCTIONAL AND PRESENTATION CURRENCY The financial statements are presented in Uganda Shillings, in accordance with section 18 of the Bank of Uganda Act (Cap.51) Laws of Uganda 2000, which is the Bank’s functional currency. Except where indicated, financial information presented in Uganda shillings has been rounded to the nearest million.
2.6 REVENUE RECOGNITION Income is recognised in the period in which it is earned. Income is recognised to the extent that it is probable that economic benefits will flow to the Bank and the revenue can be reliably
ANNUAL REPORT 2014/2015
85
measured. The following specific recognition criteria must also be met before revenue is recognised:
2.6.1 INTEREST Interest income and expense are recognised in profit or loss for all interest bearing instruments on an accrual basis using the effective interest method based on the actual purchase price. Interest income includes coupons earned from fixed income investments, trading securities and accrued discount and premium on treasury bills and other discounted securities.
2.6.2 NON-INTEREST AND OTHER INCOME Non-interest income, which consists of income from foreign currency trade, commissions from foreign currency operations, realised translation and fair value gains, is recognised on accrual basis.
Other income comprises net gains related to trading assets and liabilities and gains from disposal of Bank assets.
2.7 TAXES According to the Bank of Uganda Act and the Finance Act 2003, the Bank is exempt from payment of income tax in respect of its functions as defined by the Act.
2.8 RECOGNITION AND MEASUREMENT OF FINANCIAL INSTRUMENTS A financial instrument is a contract that gives rise to both a financial asset of one entity and a financial liability or equity instrument of another entity.
Management determines the appropriate classification of its financial instruments at the time of purchase and re-evaluates its portfolio on a regular basis to ensure that all financial instruments are appropriately classified.
2.8.1 FINANCIAL ASSETS
2.8.1.1 INITIAL RECOGNITION Purchases or sales of financial assets that require delivery of assets within the time frame generally established by regulation or convention in the marketplace are recognised on the trade date, which is the date that the Bank becomes a party to the contractual provisions of the instrument.
The classification of financial instruments on initial recognition depends on the purpose for which the financial instruments were acquired and their characteristics. All financial instruments are measured initially at their fair value plus, in the case of financial assets and financial liabilities not at fair value through profit or loss, any directly attributable incremental costs of acquisition or issue.
The five different types of financial instruments held by the Bank are;
i) Financial instruments held-to-maturity Investments classified as held to maturity are non-derivative financial assets with fixed or determinable payments and fixed maturities that the Bank has the intention and ability to hold to maturity. After initial measurement, held-to-maturity financial investments are measured at amortised cost using the effective interest method, less allowance for impairment. Amortised cost is calculated by taking into account any discount or premium on acquisition and fees that are an

2014/2015 ANNUAL REPORT
86
integral part of the effective interest rate. The amortisation is included in ‘Interest income’ in profit or loss. The losses arising from impairment of such investments are recognised in the profit or loss line ‘Impairment losses on financial investments’. Were the Bank to sell other than an insignificant amount of such assets, the entire category would be reclassified as available for sale. The Bank currently classifies investments in government securities as held to maturity.
ii) Held-for-trading financial assets The Bank recognises financial assets as held-for-trading assets on the date it commits to purchase the assets. Trading assets and liabilities are those assets and liabilities that the Bank acquires or incurs principally for the purpose of selling or repurchasing in the near term, or holds as part of a portfolio that is managed together for short-term profit or position taking. Financial instruments which are classified as held for trading are held principally for purposes of generating a profit from short-term fluctuations in price or dealers margin, and are measured at fair value. Gains and losses resulting from changes in fair values are recognised in operating income in profit or loss.
iii) Available-for-sale financial instruments These are unlisted equity financial instruments which are not loans and receivables originated by the Bank; or those held-to-maturity; or financial assets held-for-trading, and are measured at fair value. Gains are recognised in other comprehensive income and accumulated in the available for sale reserve. Losses that offset previous increases are recognised in other comprehensive income.
Unlisted equity instruments whose fair value cannot be reliably measured are measured at cost less provision for impairment losses.
iv) Loans and receivables Loans, advances and receivables are non-derivative financial assets with fixed or determinable payments that are not quoted in an active market. They arise when the Bank provides money or services directly to counterparty with no intention of trading the receivable. The Bank has classified the following financial assets as loans and receivables originated by the entity:
a) Loans and advances and drawdowns to Government, b) Loans and advances to commercial banks, c) Staff loans, d) Assets held with International Monetary Fund (IMF) and, e) Cash and cash equivalents.
After initial measurement, loans and receivables are measured at amortised cost using effective interest method less any allowance for impairment.
As the lender of last resort, the Bank may grant loans or advances for short term periods to commercial banks that pledge Government securities specified by the Bank. In its capacity as the fiscal agent and banker to the Government of Uganda, the Bank may make direct advances to the Government for the purpose of offsetting fluctuations between receipts from the budgeted revenue and the payments of the Government.
The Bank also operates a staff loans scheme for its employees for the provision of facilities such as house, house improvements, car loans and other advances at concessionary rates of interest. The Bank determines the terms and conditions for granting of the above loans.
ANNUAL REPORT 2014/2015
87
Loans granted at a lower than market interest rates are measured at present value of anticipated future cash flows discounted using market interest rates. The difference between the fair value of the loans and the carrying amount is treated as a long term employee benefit and is accounted for as a prepayment/deferred staff costs. The long term benefit is recognised as interest income while prepayment is expensed to staff costs as the services are rendered to the bank over the period of the loan.
v) Derivatives and financial instrument through profit or loss The Bank uses derivatives such as forward currency and futures contracts. Derivatives are recorded at fair value and carried as assets when their fair value is positive and liabilities when the fair value is negative. Changes in the fair value of derivatives are recognised immediately in profit or loss. The Bank has no derivatives which qualify for hedge accounting.
A financial asset or liability at fair value through profit or loss is a financial asset or liability that meets either of the following conditions. It is classified as held for trading, if:
• acquired or incurred principally for purpose of selling or repurchasing in the near term; • part of a portfolio of identified financial instruments that are managed together and for
which there is evidence of a recent actual pattern of short-term profit taking; or • a derivative (except for a derivative that is a financial guarantee contract or a designated
and effective hedging instrument) • Upon initial recognition, it is designated by the Bank as at fair value through profit or loss.
2.8.1.2 SUBSEQUENT MEASUREMENT Subsequent to initial recognition all trading instruments and all available-for-sale assets are measured at fair value, except that any instrument that does not have a quoted market price in an active market and whose fair value cannot be reliably measured is stated at cost, including transaction costs, less impairment losses.
The determination of fair values of financial assets and financial liabilities is based on quoted market prices or dealer price quotations for financial instruments traded in active markets.
For all other financial instruments, fair value is determined by using valuation techniques. Valuation techniques include net present value, the discounted cash flow method, comparison to similar instruments for which market observable prices exist, and valuation models. The Bank uses widely recognised valuation models for determining the fair value of common and simpler financial instruments like currency swaps. For these financial instruments, inputs into models are market observable.
Loans and receivables and held-to-maturity assets are measured at amortised cost less impairment losses. Amortised cost of a financial asset or liability is the amount at which the financial asset or liability is measured at initial recognition, minus principal repayments, plus or minus the cumulative amortisation using the effective interest rate method of any difference between the initial amount recognised and the maturity amount, minus any reduction for impairment. Premiums and discounts, including initial transaction costs, are included in the carrying amount of the related instrument and amortised based on the effective interest rate of the instrument.

2014/2015 ANNUAL REPORT
88
Gains and losses arising from change in the fair value of available-for-sale assets and trading instruments are recognised in other comprehensive income and profit or loss respectively.
2.8.1.3 DERECOGNITION A financial asset (or, where applicable, a part of a financial asset or part of a group of similar financial assets) is primarily derecognised (i.e., removed from the Bank’s statement of financial position) when:
The rights to receive cash flows from the asset have expired,
Or
The Bank has transferred its rights to receive cash flows from the asset or has assumed an obligation to pay the received cash flows in full without material delay to a third party under a ‘pass-through’ arrangement; and either (a) the Bank has transferred substantially all the risks and rewards of the asset, or (b) the Bank has neither transferred nor retained substantially all the risks and rewards of the asset, but has transferred control of the asset.
When the Bank has transferred its rights to receive cash flows from an asset or has entered into a pass-through arrangement, it evaluates if and to what extent it has retained the risks and rewards of ownership. When it has neither transferred nor retained substantially all of the risks and rewards of the asset, nor transferred control of the asset, the Bank continues to recognise the transferred asset to the extent of the Bank’s continuing involvement. In that case, the Bank also recognises an associated liability. The transferred asset and the associated liability are measured on a basis that reflects the rights and obligations that the Bank has retained.
The gains and losses on financial instruments are recognised in profit or loss when the financial instruments are derecognised.
2.8.2 FINANCIAL LIABILITIES
2.8.2.1 INITIAL RECOGNITION AND MEASUREMENT Financial liabilities are classified, at initial recognition, as financial liabilities at fair value through profit or loss, loans and borrowings, payables, or as derivatives designated as hedging instruments in an effective hedge, as appropriate.
All financial liabilities are recognised initially at fair value and, in the case of loans and borrowings and payables, net of directly attributable transaction costs.
The Bank’s financial liabilities include IMF obligations, derivative financial instruments, Government deposits, commercial banks’ deposits, repos and other liabilities.
2.8.2.2 SUBSEQUENT MEASUREMENT The measurement of financial liabilities depends on their classification, as described below:.
i) Financial liabilities at fair value through profit or loss Financial liabilities at fair value through profit or loss include financial liabilities held for trading and financial liabilities designated upon initial recognition as at fair value through profit or loss.

ANNUAL REPORT 2014/2015
89
Financial liabilities are classified as held for trading if they are incurred for the purpose of repurchasing in the near term. This category also includes derivative financial instruments entered into by the Bank that are not designated as hedging instruments in hedge relationships as defined by IAS 39.
Gains or losses on liabilities held for trading are recognised in profit or loss.
Financial liabilities designated upon initial recognition at fair value through profit or loss are designated at the initial date of recognition, and only if the criteria in IAS 39 are satisfied. The Bank has not designated any financial liability as at fair value through profit or loss.
ii) Loans and borrowings This is the category most relevant to the Bank. After initial recognition, the financial liabilities are subsequently measured at amortised cost using the EIR method. Gains and losses are recognised in profit or loss when the liabilities are derecognised as well as through the EIR amortisation process.
Amortised cost is calculated by taking into account any discount or premium on acquisition and fees or costs that are an integral part of the EIR. The EIR amortisation is included as finance costs in profit or loss.
2.8.2.3 DERECOGNITION A financial liability is derecognised when the obligation under the liability is discharged or cancelled or expires. When an existing financial liability is replaced by another from the same lender on substantially different terms, or the terms of an existing liability are substantially modified, such an exchange or modification is treated as the derecognition of the original liability and the recognition of a new liability. The difference in the respective carrying amounts is recognised in profit or loss.
2.8.3 OFFSETTING Financial assets and financial liabilities are offset and the net amount is reported in the consolidated statement of financial position if there is a currently enforceable legal right to offset the recognised amounts and there is an intention to settle on a net basis, to realise the assets and settle the liabilities simultaneously.
2.8.4 SECURITIES LENDING Securities lending transactions are usually collateralised by cash. The transfer of the securities to counterparties is only reflected on the statement of financial position if the risks and rewards of ownership are also transferred. Cash received or advanced as collateral is recorded as an asset or liability.
2.9 IMPAIRMENT
2.9.1 IMPAIRMENT OF FINANCIAL ASSETS The Bank assesses, at each reporting date, whether there is objective evidence that a financial asset or a group of financial assets is impaired. An impairment exists if one or more events that has occurred since the initial recognition of the asset (an incurred ‘loss event’), has an impact on the estimated future cash flows of the financial asset or the group of financial assets that can be reliably estimated. Evidence of impairment may include indications that the debtors or a group of
2014/2015 ANNUAL REPORT
90
debtors is experiencing significant financial difficulty, default or delinquency in interest or principal payments, the probability that they will enter bankruptcy or other financial reorganisation and observable data indicating that there is a measurable decrease in the estimated future cash flows, such as changes in arrears or economic conditions that correlate with defaults.
2.9.1.1 Financial Assets Carried At Amortised Cost For financial assets carried at amortised cost, the Bank first assesses whether impairment exists individually for financial assets that are individually significant, or collectively for financial assets that are not individually significant. If the Bank determines that no objective evidence of impairment exists for an individually assessed financial asset, whether significant or not, it includes the asset in a group of financial assets with similar credit risk characteristics and collectively assesses them for impairment. Assets that are individually assessed for impairment and for which an impairment loss is, or continues to be, recognised are not included in a collective assessment of impairment.
The amount of any impairment loss identified is measured as the difference between the asset’s carrying amount and the present value of estimated future cash flows (excluding future expected credit losses that have not yet been incurred). The present value of the estimated future cash flows is discounted at the financial asset’s original effective interest rate.
The carrying amount of the asset is reduced through the use of an allowance account and the loss is recognised in profit or loss. Interest income (recorded as finance income in profit or loss) continues to be accrued on the reduced carrying amount and is accrued using the rate of interest used to discount the future cash flows for the purpose of measuring the impairment loss. Loans together with the associated allowance are written off when there is no realistic prospect of future recovery and all collateral has been realised or has been transferred to the Bank. If, in a subsequent year, the amount of the estimated impairment loss increases or decreases because of an event occurring after the impairment was recognised, the previously recognised impairment loss is increased or reduced by adjusting the allowance account. If a write-off is later recovered, the recovery is credited to finance costs in profit or loss.
2.9.1.2 Available for sale investments For AFS financial assets, the Bank assesses at each reporting date whether there is objective evidence that an investment or a group of investments is impaired.
In the case of equity investments classified as AFS, objective evidence would include a significant or prolonged decline in the fair value of the investment below its cost. ‘Significant’ is evaluated against the original cost of the investment and ‘prolonged’ against the period in which the fair value has been below its original cost. When there is evidence of impairment, the cumulative loss – measured as the difference between the acquisition cost and the current fair value, less any impairment loss on that investment previously recognised in profit or loss – is removed from OCI and recognised in profit or loss. Impairment losses on equity investments are not reversed through profit or loss; increases in their fair value after impairment are recognised in OCI.
The determination of what is ‘significant’ or ‘prolonged’ requires judgement. In making this judgement, the Bank evaluates, among other factors, the duration or extent to which the fair value of an investment is less than its cost.
ANNUAL REPORT 2014/2015
91
In the case of debt instruments classified as AFS, the impairment is assessed based on the same criteria as financial assets carried at amortised cost. However, the amount recorded for impairment is the cumulative loss measured as the difference between the amortised cost and the current fair value, less any impairment loss on that investment previously recognised in profit or loss.
Future interest income continues to be accrued based on the reduced carrying amount of the asset, using the rate of interest used to discount the future cash flows for the purpose of measuring the impairment loss. The interest income is recorded as part of finance income. If, in a subsequent year, the fair value of a debt instrument increases and the increase can be objectively related to an event occurring after the impairment loss was recognised in profit or loss, the impairment loss is reversed through profit or loss.
2.9.2 IMPAIRMENT OF NON-FINANCIAL ASSETS The carrying amounts of the Bank’s non-financial assets are reviewed at each reporting date to determine whether there is any indication of impairment. If any such indication exists then the asset’s recoverable amount is estimated.
The recoverable amount of other assets is the greater of the fair value less costs of disposal and value in use. In assessing value in use, the estimated future cash flows are discounted to their present value using a pre-tax discount rate that reflects current market assessments of the time value of money and the risks specific to the assets. For an asset that does not generate independent cash flows, the recoverable amount is determined for the cash generated unit to which the asset belongs. A cash-generating unit is the smallest identifiable asset group that generates cash flows that largely are independent from other assets and groups. Impairment losses are recognised in profit or loss except for properties previously revalued with the revaluation surplus taken to OCI. For such properties, the impairment is recognised in OCI up to the amount of any previous revaluation.
An impairment loss is reversed only to the extent that the assets’ carrying amounts do not exceed the carrying amounts that would have been determined net of depreciation or amortisation, if no impairment loss has been recognised.
2.10 PROPERTY, PLANT AND EQUIPMENT Property, plant and equipment are initially recorded at cost. Cost includes expenditures that are directly attributable to the acquisition of the asset. The cost of self-constructed assets includes the cost of materials and direct labour, any other costs directly attributable to bringing the asset to a working condition for its intended use, and the costs of dismantling and removing the items and restoring the site on which they are located. Purchased software that is integral to the functionality of the related equipment is capitalised as part of that equipment.
Freehold land and buildings are subsequently shown at their market values, based on valuations by external independent valuers. The Bank revalues land (freehold and leasehold) and buildings after every five years. Increases in the carrying amounts arising on revaluation are recognised in other comprehensive income and accumulated in the asset revaluation reserve. Decreases that offset previous increases of the same asset are charged against revaluation reserve while all other decreases are charged to profit or loss. Gains and losses on disposal of property, plant and equipment are determined by reference to their carrying amounts and are taken into account in
2014/2015 ANNUAL REPORT
92
determining operating surplus. All assets are carried at cost or revalued amount less accumulated depreciation and impairment losses.
The release of the revaluation surplus to the revenue reserve is set to coincide with the useful life of the asset.
Freehold land is not depreciated. Depreciation on other assets is calculated on a straight-line basis to write off their cost or revalued amount of such assets to their residual values over the estimated useful lives.
The Bank is in the process of converting leasehold land to freehold in accordance with the Uganda Land Act 1998. On this basis, the risks and rewards of ownership of the leasehold land are hence considered to substantially be with the Bank, and the leasehold land is carried at revalued amounts and not amortised. Buildings on leasehold land are depreciated on a straight line basis over the shorter of 50 years or the lease period. The directors and management review the residual value and useful life of an asset at the year end and any change in accounting estimate is recorded through profit or loss. Other assets are depreciated over the term of their estimated useful lives at the following principal annual rates:
Buildings 2 percent Computers, plant and machinery 25 percent Vehicles 20 percent Bullion vans 10 percent Furniture and equipment 20 percent Notes processing machines 10 percent
Property that is being constructed or developed for future use to support operations is classified as Work–in–Progress (WIP) and stated at cost until construction or development is complete, at which time the asset is reclassified as property and equipment in use.
Subsequent expenditures are capitalized only when it is probable that the future economic benefits will flow to the Bank. Expenditure incurred to replace a component of item of property and equipment is accounted for separately and capitalized while the major replaced component is derecognised.
All other expenditure items which do not meet the recognition criteria are recognised in profit or loss as expenses as they are incurred.
An item of property and equipment is derecognised upon disposal or when no future economic benefits are expected from its use or disposal. Any loss or gain on derecognition of the asset (calculated as the difference between the net disposal proceeds and the carrying amount of the asset) is recognised in other operating income in profit or loss in the year the asset is derecognised
The assets’ residual values, useful lives and methods of depreciation are reviewed at each financial year end and adjusted prospectively if appropriate.
ANNUAL REPORT 2014/2015
93
2.11 FINANCE LEASE ON LEASEHOLD LAND The determination of whether an arrangement is (contains) a lease is based on the substance of the arrangement at the inception of the lease. The arrangement is, or contains, a lease of fulfilment of the arrangement is dependent on the use of a specific asset or assets and the arrangement conveys a right to use the asset or assets, even if that right is not explicitly specified in an arrangement.
Leases, where a significant portion of the risks and rewards of ownership are retained by the lessor, are classified as operating leases. Payments made under operating leases are charged to profit or loss on a straight line basis over the period of the lease.
Over the years management has noted that all risks and rewards from use of leasehold land accrued to Bank of Uganda. Considering the substance over form principle, the Bank has classified these leases as finance leases. The Bank has also embarked on the process of converting leasehold properties to freehold and ceased the amortisation of leasehold properties from 1 July 2008.
2.12 INTANGIBLE ASSETS The Bank’s intangible assets include the value of computer software.
An intangible asset is recognised only when its cost can be measured reliably and it is probable that the expected future economic benefits that are attributable to it will flow to the Bank.
Intangible assets acquired separately are measured on initial recognition at cost. Following initial recognition, intangible assets are carried at cost less any accumulated amortisation and any accumulated impairment losses.
The useful lives of intangible assets are assessed to be either finite or indefinite. Intangible assets with finite lives are amortised over the useful economic life. The amortisation period and the amortisation method for an intangible asset with a finite useful life are reviewed at least at each financial yearend. Changes in the expected useful life or the expected pattern of consumption of future economic benefits embodied in the asset are accounted for by changing the amortisation period or method, as appropriate, and they are treated as changes in accounting estimates. The amortisation expense on intangible assets with finite lives is presented as a separate line item in the profit or loss and other comprehensive income.
Amortisation of computer software is calculated over 4 years using the straight–line method to write down the cost of intangible assets to their residual values over their estimated useful lives.
2.13 CONSUMABLE STORES STOCKS Consumable stores stocks are valued at the lower of cost and net realisable value. Cost is determined using the weighted average cost method. Net realisable value is the estimated disposal price in line with the Bank’s procurement and disposal policies. Provisions are made for all obsolete stock.
2014/2015 ANNUAL REPORT
94
2.14 CURRENCY PRINTING AND MINTING COSTS Currency note printing and coin minting costs incurred are deferred and only charged to profit or loss in the year the currency is issued. The deferred amount is recognised in the statement of financial position as deferred currency costs and represents un-issued currency stocks.
2.15 CURRENCY IN CIRCULATION The exclusive rights of national currency issue are vested with the Bank of Uganda. Currency-in-circulation comprises Bank notes and coins issued by the Bank of Uganda.
2.16 DEMONETISATION OF CURRENCY Demonetisation is the process of revoking the legality of designated issues of notes or coins. The Bank may demonetise any of its Bank notes and coins on payment of the face value under section 24 (3) of the Bank of Uganda Act provided that a notice of not less than fifteen days is given in the official gazette. The value of demonetised currency notes and coins that is not returned to the Central Bank is recognised as income in profit or loss and the liability to the public is extinguished.
2.17 PROVISIONS A provision is recognised when the Bank has a present legal or constructive obligation as a result of a past event, it is probable that an outflow of resources embodying economic benefits and a reliable estimate can be made of the amount of the obligation. Provisions are determined by discounting the expected future cash flows at a pre-tax rate that reflects current market assessments of the time value of money and, where appropriate, the risks specific to that liability.
2.18 CASH AND CASH EQUIVALENTS Cash comprises foreign currency held in banking office and demand deposits held with foreign banks. Cash equivalents comprise short term highly liquid investments and term deposits that are readily convertible into known amounts of cash and which are subject to an insignificant risk in changes in value. The short-term highly liquid investments include balances with maturities of three months or less from the date of acquisition.
2.19 REPURCHASE AND SALE AGREEMENT REPO is an arrangement involving the sale for cash, of security at a specified price with a commitment to repurchase the same or similar securities at a fixed price either at a specific future date or at maturity.
For monetary purposes (liquidity management), the Bank from time to time mops up money from the financial market (REPO) or injects money into the market (Reverse REPO). The Bank engages in the above with commercial banks only.
When the Bank mops money from commercial banks, it creates a liability in its financial statements and secures this borrowing (liability) by assigning part of the securitised debt owing from Government to the Bank to the commercial banks it has mopped from. The Bank freezes the money mopped and pays interest at market rates on the money. The money mopped stays until maturity (7 to 14 days).
Similarly, the Bank also lends money to commercial banks (reverse repo). In this process, the Bank creates an asset in its financial statements and takes a security from the borrowing bank usually in
ANNUAL REPORT 2014/2015
95
form of Treasury Bills or Bonds. The Bank earns interest on this lending. The injected money stays with the borrowing bank until maturity (7 to 14 days).
The Bank treats reverse REPOs as collateralized loans for accounting purposes. In this case, a reverse REPO is recognised as a secured advance and is shown separately as Advance to Banks while repurchase agreements are shown as a Government liability in the books of the Bank.
Effective 1 July 2012, both REPO and Reverse REPO as instruments of monetary policy are owned and issued by the Bank as opposed to prior years where the Bank issued them as an agent of Government and both interest expense on REPOs and interest income on reverse REPOs are recognised in profit or loss
2.20 DIVIDENDS The Bank of Uganda Act (Cap 51) allows the Bank to retain 25 percent of realised income after taking into account expenses. In addition to this, the Board of Directors, in line with the requirements of Bank of Uganda Act, set a policy that all dividends shall be paid after reclassifying all unrealised exchange gains and other revaluations gains to translation reserve.
Dividends are recognised as a liability in the period in which they are declared. Proposed dividends are disclosed as a separate component of equity until they are declared.
2.21 DEPOSITS Deposits are non-derivative financial liabilities with fixed or determinable receipts that are not quoted in an active market. They arise when the Bank receives money or services directly from counterparty with no intention of trading the payable. Deposits held are measured at amortised cost with interest expense accruing on an effective interest rate basis.
Cash Ratio Deposits are taken from commercial banks for liquidity management (monetary policy purposes) of the Bank in accordance with the Banking Act and are interest free. Cash Ratio Reserves is a monetary policy instrument used to manage liquidity. The deposits earn no interest to commercial banks and the Bank does not trade on these deposits in any way. The deposits are currently computed at 8 percent of each commercial bank’s deposits it has taken from the public. Each commercial bank is required to deposit the applicable amount at the Bank and the computation is done on monthly basis.
2.22 FOREIGN CURRENCY TRANSLATION Financial assets and liabilities denominated in foreign currencies are translated into Uganda Shillings at the exchange rate ruling as at the reporting date. Transactions in foreign currencies during the year are converted into Uganda Shillings at rates ruling at the transaction dates. Monetary assets and liabilities at the reporting date which are expressed in foreign currencies are translated into Uganda Shillings at rates ruling at that date. The resulting differences from conversion and translation are recognised in profit or loss in the year in which they arise.
Non-monetary items that are measured in terms of historical cost in a foreign currency are translated using the exchange rates as at the dates of the initial transactions.
Non-monetary items measured at fair value in a foreign currency are translated using the exchange rates at the date when the fair value was determined.
2014/2015 ANNUAL REPORT
96
2.23 EMPLOYEE BENEFITS Wages, salaries, employer’s National Social Security Fund (NSSF) contributions and gratuity are accrued in the year in which the associated services are rendered by employees and recognised in profit or loss. Short term compensated absences such as paid annual leave are recognised when services are rendered by employees that increase their entitlement to future compensated absences. The Bank contributes 10 percent to NSSF in respect of all eligible employees, while staff contribute 5 percent of their total wages.
2.23.1 BANK OF UGANDA DEFINED BENEFITS SCHEME The Bank of Uganda Defined Benefits Scheme was established under an irrevocable trust in 1995 and is governed by the appointed Trustees. Employees on permanent and pensionable terms of service contribute 4 percent of their pensionable pay to the Scheme, while the employer (Sponsor) contributes 17.1 percent of each member’s pensionable pay. The Scheme was closed to new entrants effective 1 January 2014.
The defined benefit obligation is calculated annually by an independent actuary using the projected unit credit method. The present value of the defined benefit obligation is determined by discounting the estimated cash outflows using the discount rate that is based on the 10-year government bond yield in line with the general requirements of IAS 19: Employee Benefits.
The Bank’s net asset in respect of the plan is calculated by estimating the amount of future benefits that employees have earned in return for their service in the current and prior periods. The benefits are discounted to determine the present value and the fair value of the plan assets is deducted. Actuarial gains and losses comprise experience adjustments (the effects of differences between the previous actuarial assumptions and what actually occurred), as well as the effects of changes in actuarial assumptions. Actuarial gains or losses are recognised in other comprehensive income as per the requirements of IAS 19 Revised: Employee benefits. Re measurements are not reclassified to profit or loss in subsequent periods.
Past service cost is recognised as an expense at the earlier of: the date when a plan amendment or curtailment occurs and the date when an entity recognises any termination benefits, or related restructuring costs.
Net interest is calculated by applying the discount rate to the net defined benefit liability or asset. The Bank recognises the following changes in the net defined benefit obligation under ‘general and administration expenses’ in profit or loss:
• Service costs comprising current service costs, past-service costs, gains and losses on curtailments and non-routine settlements
• Net interest expense or income.
2.23.2 BANK OF UGANDA DEFINED CONTRIBUTION SCHEME The Bank started operating a defined contributions (DC) pension scheme for contract staff and any other staff recruited in the Bank effective 1 January 2014. The scheme is administered by the Defined Contribution Scheme Board of Trustees. The Scheme is funded by contributions from both the Bank and employees (17.1 percent and 4 percent of gross salary respectively).

ANNUAL REPORT 2014/2015
97
For defined contribution plans, the cost to be recognised in the period is the contribution payable in exchange for service rendered by employees during the period.
2.23.3 GRATUITY The Bank pays gratuity for a number of staff on contracts who are not under the Defined Contribution Scheme. The rates range from 20 percent to 22 percent. Gratuity is treated as an expense in profit or loss and the amount outstanding at year end is recognised as a liability to the Bank.
2.23.4 OTHER EMPLOYEE BENEFITS The estimated monetary liability for employees’ accrued leave entitlement at the reporting date is recognised as accrued expense.
2.24 FAIR VALUE MEASUREMENTS The Bank measures its financial instruments such as derivatives, and non-financial assets such as properties, at fair value at each reporting date. Fair value related disclosures for financial instruments and non-financial assets that are measured at fair value are summarised in the following notes:
• Disclosures for valuation methods, significant estimates and assumptions Notes 41 & 44 • Quantitative disclosures of fair value measurement hierarchy Note 41 • Derivative financial instruments Note 18 & 41 • Investments in unquoted equity shares Note 17 • Property under revaluation model Note 25 & 26 • Financial instruments at fair value through profit or loss Notes 17 & 41
2.25 FINANCIAL ASSETS AND FINANCIAL LIABILITIES
2.25.1 FINANCIAL ASSETS 30-Jun-2015 30-Jun-2014
UGX (m) UGX (m)Financial instruments at fair value through profit or loss:Investments at fair value through profit or loss 6,317,150 6,565,381 Investments held for trading 3,504,206 2,724,923 Derivative financial instruments 7,098 2,916 Financial instruments at fair value through OCI:Investments available for sale 73,549 1,804 Financial instruments held to maturity:Investments in government securities 441,625 233,182 Loans and receivables:Loans, advances and drawdowns to government 760,589 2,761,663 Loans and advances to commercial banks 26,136 6,009 Staff loans 62,816 53,830
2014/2015 ANNUAL REPORT
98
2.25.2 FINANCIAL LIABILITIES 30-Jun-2015 30-Jun-2014
UGX (m) UGX (m)Financial instruments at fair value through profit or loss:Derivative financial instruments 10,689 12,675 Other liabilities at amortised cost:IMF obligations 801,843 694,728 Government deposits 3,146,645 6,007,624 Commericial bank deposits 1,864,591 1,371,783 Repos 187,400 910,854
3 INTEREST INCOME 30-Jun-2015 30-Jun-2014
UGX (m) UGX (m)Interest income on term deposits with external institutions 43,885 35,142 Interest income on treasury bills investments 560 359 Interest income on repurchase agreements 158 90 Interest income on World Bank one year deposit 100 100 Interest income on Bank of Uganda managed funds 1,046 3,048 Interest income-externally managed funds 41,781 40,047 Interest income on assets held with IMF 161 449 Interest income on investments in government securities* 34,375 32,600 Interest income on loans, advances and drawdowns to government ** 86 207 Interest income on loans and advances to commercial banks 7,129 430 Interest income on staff loans*** 4,527 4,361
133,808 116,833
* This relates to income earned on BoU recapitalisation securities as at 30 June 2015 (see note 20).
**This relates to interest income earned on the special loan to Government relating to the procurement of the presidential jet (see note 21).
*** Included in interest income on staff loans is UGX 3,647 million (30 June 2014: UGX 3,896 million) relating to notional interest arising out of staff loans fair valuation in accordance with IAS 39.
4 INTEREST EXPENSE The expense below represents interest expense/charges on SDR allocation to the Bank as regularly advised by IMF and monetary policy costs.
30-Jun-2015 30-Jun-2014UGX (m) UGX (m)
Interest paid to IMF ( SDR allocation charges) 391 675 Vertical repo interest 37,437 59,322 Deposit auction interest - -
37,828 59,997
Effective 1 July 2012, the costs of monetary policy that were previously borne by the Government of Uganda, became a full responsibility of the Bank of Uganda when the Inflation Targeting Lite (ITL) was introduced.
ANNUAL REPORT 2014/2015
99
5 PROFIT ON DOMESTIC FOREIGN EXCHANGE TRADE 30-Jun-2015 30-Jun-2014
UGX (m) UGX (m)Income from foreign currency trade 21,156 15,718
21,156 15,718
The above represents income earned on sale or purchase of foreign exchange to or from GoU.
6 FEES AND COMMISSIONS 30-Jun-2015 30-Jun-2014
UGX (m) UGX (m)Commissions- foreign currency operations 3,680 2,154
3,680 2,154
Fees and commissions relate to charges on GoU foreign transactions and letters of credit.
7 OTHER INCOME
30-Jun-2015 30-Jun-2014UGX (m) UGX (m)
Gain on disposal of vehicles 676 8 Gain on disposal of property, plant and equipment - 22 Licence and cheque fees 1,051 978 Sale of receipt books 519 706 Sale of currency 5 7 Rental income 65 29 Real time gross & national interbank settlement systems 3,431 2,932 Fines, penalties & hire of bullion vans - 31 Write back of staff loans previously written off/provisions 4 58 Write back of amounts previously written off/provisions 448 947 Other income 1,028 1,147 Currency de-monetisation * - 46,056 Currency processing fees 2,307 2,254
9,534 55,175
* The Bank completed the recall exercise of the 1987 currency series as at 31 December 2013. An amount of UGX 46,056 million represented de-monetised currency that were not returned to the Bank by the deadline date and as such written back as income to the Bank in FY 2013/14.
8 OTHER COMPREHENSIVE INCOME 30-Jun-2015 30-Jun-2014
UGX (m) UGX (m)Actuarial gains/(losses) on defined benefit plan (see note 24) (4,052) 36,348 Fair value gains on available for sale financial instruments* 34,276 -
30,224 36,348
* This relates to fair value gains as a result of valuation of the AFREXIM (UGX 34,170 million) and SWIFT shares (UGX 106 million) held by the Bank based on available share price information as at 30 June 2015 (see note 17).
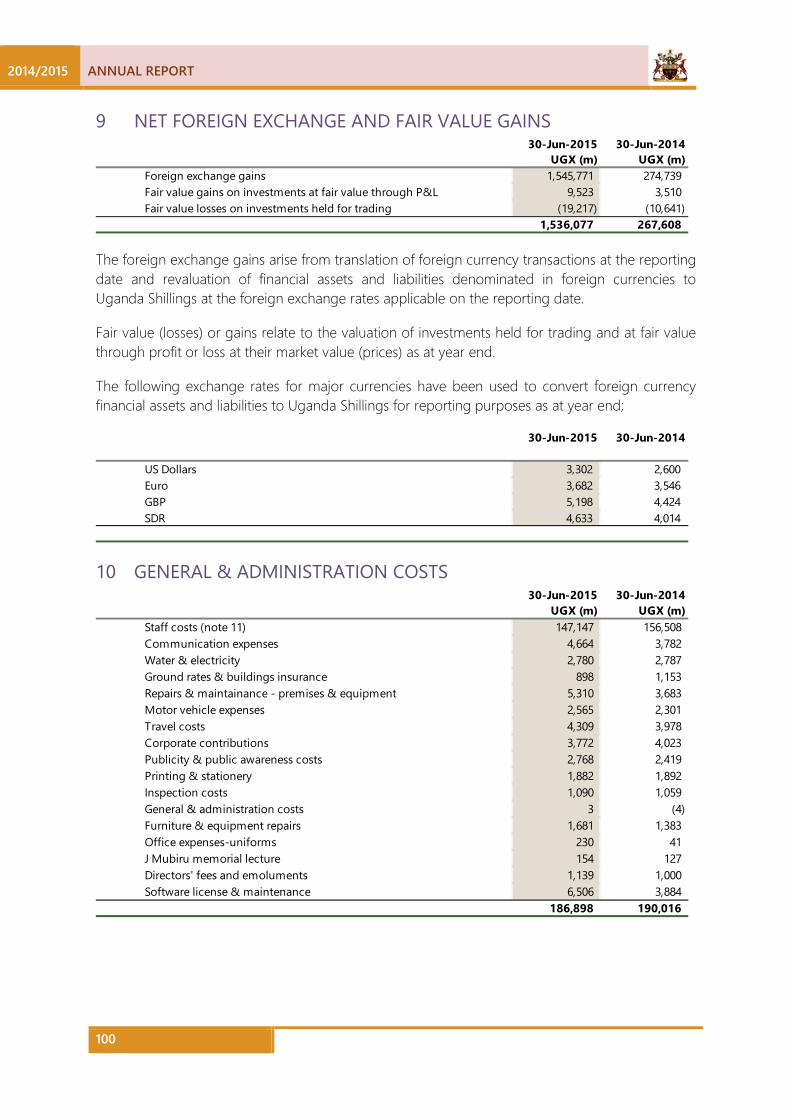
2014/2015 ANNUAL REPORT
100
9 NET FOREIGN EXCHANGE AND FAIR VALUE GAINS 30-Jun-2015 30-Jun-2014
UGX (m) UGX (m)Foreign exchange gains 1,545,771 274,739 Fair value gains on investments at fair value through P&L 9,523 3,510 Fair value losses on investments held for trading (19,217) (10,641)
1,536,077 267,608
The foreign exchange gains arise from translation of foreign currency transactions at the reporting date and revaluation of financial assets and liabilities denominated in foreign currencies to Uganda Shillings at the foreign exchange rates applicable on the reporting date.
Fair value (losses) or gains relate to the valuation of investments held for trading and at fair value through profit or loss at their market value (prices) as at year end.
The following exchange rates for major currencies have been used to convert foreign currency financial assets and liabilities to Uganda Shillings for reporting purposes as at year end;
30-Jun-2015 30-Jun-2014
US Dollars 3,302 2,600 Euro 3,682 3,546 GBP 5,198 4,424 SDR 4,633 4,014
10 GENERAL & ADMINISTRATION COSTS 30-Jun-2015 30-Jun-2014
UGX (m) UGX (m)Staff costs (note 11) 147,147 156,508 Communication expenses 4,664 3,782 Water & electricity 2,780 2,787 Ground rates & buildings insurance 898 1,153 Repairs & maintainance - premises & equipment 5,310 3,683 Motor vehicle expenses 2,565 2,301 Travel costs 4,309 3,978 Corporate contributions 3,772 4,023 Publicity & public awareness costs 2,768 2,419 Printing & stationery 1,882 1,892 Inspection costs 1,090 1,059 General & administration costs 3 (4) Furniture & equipment repairs 1,681 1,383 Office expenses-uniforms 230 41 J Mubiru memorial lecture 154 127 Directors' fees and emoluments 1,139 1,000 Software license & maintenance 6,506 3,884
186,898 190,016
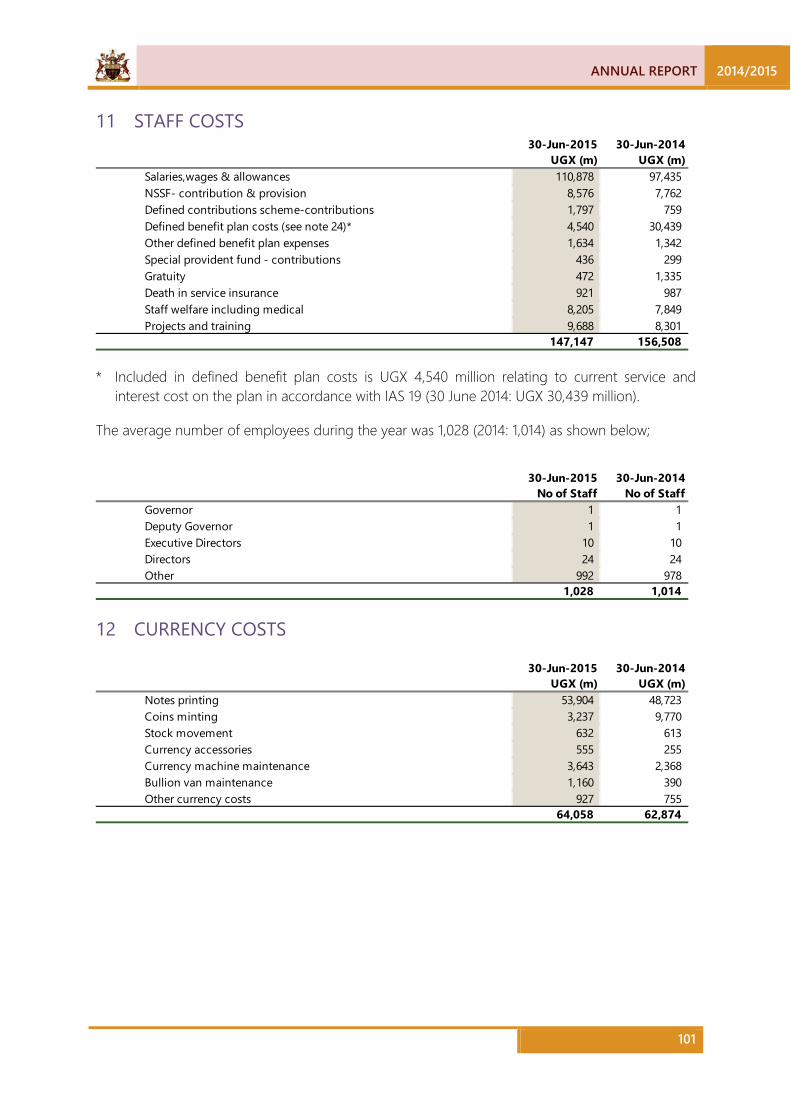
ANNUAL REPORT 2014/2015
101
11 STAFF COSTS 30-Jun-2015 30-Jun-2014
UGX (m) UGX (m)Salaries,wages & allowances 110,878 97,435 NSSF- contribution & provision 8,576 7,762 Defined contributions scheme-contributions 1,797 759 Defined benefit plan costs (see note 24)* 4,540 30,439 Other defined benefit plan expenses 1,634 1,342 Special provident fund - contributions 436 299 Gratuity 472 1,335 Death in service insurance 921 987 Staff welfare including medical 8,205 7,849 Projects and training 9,688 8,301
147,147 156,508
* Included in defined benefit plan costs is UGX 4,540 million relating to current service and interest cost on the plan in accordance with IAS 19 (30 June 2014: UGX 30,439 million).
The average number of employees during the year was 1,028 (2014: 1,014) as shown below;
30-Jun-2015 30-Jun-2014No of Staff No of Staff
Governor 1 1 Deputy Governor 1 1 Executive Directors 10 10 Directors 24 24 Other 992 978
1,028 1,014
12 CURRENCY COSTS
30-Jun-2015 30-Jun-2014UGX (m) UGX (m)
Notes printing 53,904 48,723 Coins minting 3,237 9,770 Stock movement 632 613 Currency accessories 555 255 Currency machine maintenance 3,643 2,368 Bullion van maintenance 1,160 390 Other currency costs 927 755
64,058 62,874

2014/2015 ANNUAL REPORT
102
13 FINANCIAL AND PROFESSIONAL CHARGES 30-Jun-2015 30-Jun-2014
UGX (m) UGX (m)Consultancy costs 1,987 1,035 Litigation fees & legal damages 695 611 Staff loans fair valuation* 3,647 3,896 Reserve management fees and other charges 7,028 6,244 Valuers' fees 7 - Retainer fees 18 15 Audit fees 120 120 Other professional fees 52 64
13,554 11,985
* This relates to notional interest arising out of staff loans fair valuation in accordance with IAS 39.
14 IMPAIRMENT LOSS
30-Jun-2015 30-Jun-2014UGX (m) UGX (m)
Provision for impairment loss on other assets (Note 28) 35 57 Provision for impairment loss on staff loans (Note 23) 331 174
366 231
15 NET SURPLUS FOR THE YEAR The net surplus for the year has been stated after charging/ (crediting):
30-Jun-2015 30-Jun-2014UGX (m) UGX (m)
Audit fees 120 120 Other proffessional fees 52 64 Directors' emoluments 391 236 Directors' fees 748 764 Depreciation 12,984 12,060 Amortisation 1,330 3,710 Litigation fees & legal damages 695 611 Other income (1,028) (1,147)
16 CASH AND CASH EQUIVALENTS 30-Jun-2015 30-Jun-2014
UGX (m) UGX (m)Foreign currency held in banking 10,567 5,109 Cash with foreign financial institutions 306,444 250,515 Repurchase agreements 507,151 56,145 Cash with local financial institutions - 91
824,162 311,860
Foreign cash held in banking relates to foreign cash balances that were held in the banking hall as at yearend. Cash with foreign financial institutions relates to cash balances held with external financial institutions. Repurchase agreements relate to overnight lending to the New York Federal Reserve Bank.
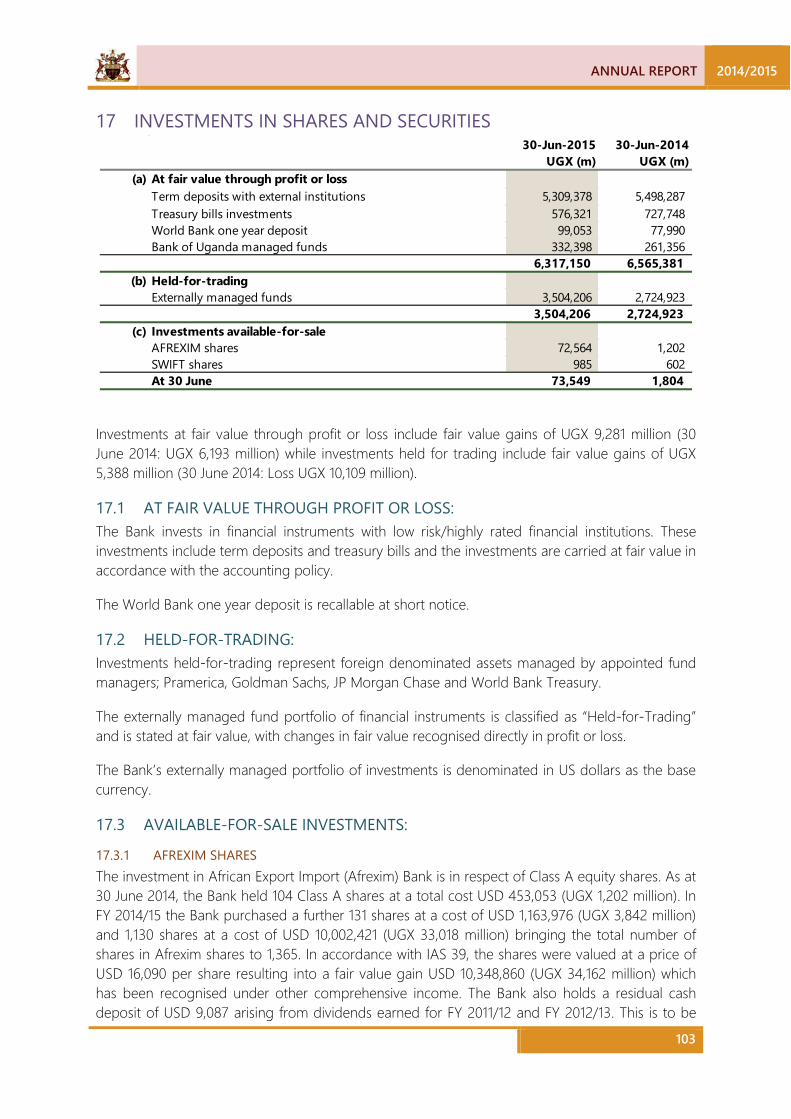
ANNUAL REPORT 2014/2015
103
17 INVESTMENTS IN SHARES AND SECURITIES
30-Jun-2015 30-Jun-2014UGX (m) UGX (m)
(a) At fair value through profit or lossTerm deposits with external institutions 5,309,378 5,498,287 Treasury bills investments 576,321 727,748 World Bank one year deposit 99,053 77,990 Bank of Uganda managed funds 332,398 261,356
6,317,150 6,565,381 (b) Held-for-trading
Externally managed funds 3,504,206 2,724,923 3,504,206 2,724,923
(c) Investments available-for-saleAFREXIM shares 72,564 1,202 SWIFT shares 985 602 At 30 June 73,549 1,804
Investments at fair value through profit or loss include fair value gains of UGX 9,281 million (30 June 2014: UGX 6,193 million) while investments held for trading include fair value gains of UGX 5,388 million (30 June 2014: Loss UGX 10,109 million).
17.1 AT FAIR VALUE THROUGH PROFIT OR LOSS: The Bank invests in financial instruments with low risk/highly rated financial institutions. These investments include term deposits and treasury bills and the investments are carried at fair value in accordance with the accounting policy.
The World Bank one year deposit is recallable at short notice.
17.2 HELD-FOR-TRADING: Investments held-for-trading represent foreign denominated assets managed by appointed fund managers; Pramerica, Goldman Sachs, JP Morgan Chase and World Bank Treasury.
The externally managed fund portfolio of financial instruments is classified as “Held-for-Trading” and is stated at fair value, with changes in fair value recognised directly in profit or loss.
The Bank’s externally managed portfolio of investments is denominated in US dollars as the base currency.
17.3 AVAILABLE-FOR-SALE INVESTMENTS:
17.3.1 AFREXIM SHARES The investment in African Export Import (Afrexim) Bank is in respect of Class A equity shares. As at 30 June 2014, the Bank held 104 Class A shares at a total cost USD 453,053 (UGX 1,202 million). In FY 2014/15 the Bank purchased a further 131 shares at a cost of USD 1,163,976 (UGX 3,842 million) and 1,130 shares at a cost of USD 10,002,421 (UGX 33,018 million) bringing the total number of shares in Afrexim shares to 1,365. In accordance with IAS 39, the shares were valued at a price of USD 16,090 per share resulting into a fair value gain USD 10,348,860 (UGX 34,162 million) which has been recognised under other comprehensive income. The Bank also holds a residual cash deposit of USD 9,087 arising from dividends earned for FY 2011/12 and FY 2012/13. This is to be

2014/2015 ANNUAL REPORT
104
used in funding future share calls. The performance trends in Afrexim’s financial statements reflect a profitability position and dividends being declared hence in the opinion of the Board there is no indication of impairment.
17.3.2 SWIFT SHARES The Bank held 58 shares in the Society for Worldwide Interbank Financial Telecommunication (SWIFT) at a total cost of Euro 169,900 as at 30 June 2014. During the year, the Bank was allotted a further 20 shares at cost of Euro 68,600 bringing the total number of shares to 78 shares as at 30 June 2015. The SWIFT is a cooperative society owned by its member financial institutions.
The fair value of the investments has been measured at cost of the new shares purchased during the year, adjusted for currency revaluation and there has been no indication of any impairment in line with the accounting policy on impairment. The Bank has no intention of disposing of the shares in the foreseeable future.
There were no shares derecognised during the year.
18 DERIVATIVE FINANCIAL INSTRUMENTS The table below shows the fair values of derivative financial instruments recorded as assets or liabilities together with their notional amounts. The notional amount, recorded gross, is the amount of a derivative’s underlying asset, reference rate or index and is the basis upon which changes in the value of derivatives are measured. The notional amounts indicate the value of transactions outstanding at the year end and are indicative of neither the market risk nor the credit risk.
30-Jun-2015 30-Jun-2014UGX (m) UGX (m)
Forward foreign exchange contractsAssets 7,098 2,916 Liabilities 10,689 12,675 Notional amount 2,448,984 2,227,232 Futures Notional amount 332,943 57,196
At their inception, derivatives often involve only a mutual exchange of promises with little or no transfer of consideration. However, these instruments frequently involve a high degree of leverage and are very volatile. A relatively small movement in the value of the asset, rate or index underlying a derivative contract may have a significant impact on the profit or loss of the Bank. Over–the–counter derivatives may expose the Bank to the risks associated with the absence of an exchange market on which to close out an open position.
18.1 FORWARDS AND FUTURES Forward and futures contracts are contractual agreements to buy or sell a specified financial instrument at a specific price and date in the future. Forwards are customised contracts transacted in the over–the–counter market. Futures contracts are transacted in standardised amounts on regulated exchanges and are subject to daily cash margin requirements. The main differences in the risks associated with forward and futures contracts are credit risk and liquidity risk. The Bank has credit exposure to the counterparties of forward contracts. The credit risk related to

ANNUAL REPORT 2014/2015
105
future contracts is considered minimal because the cash margin requirements of the exchange help ensure that these contracts are always honoured. Forward contracts are settled gross and are, therefore, considered to bear a higher liquidity risk than the futures contracts that are settled on a net basis. Both types of contracts result in market risk exposure.
19 ASSETS HELD AND OBLIGATIONS WITH INTERNATIONAL MONETARY FUND (IMF)
30-Jun-2015 30-Jun-2015 30-Jun-2014 30-Jun-2014Assets UGX (m) SDR (m) UGX (m) SDR (m)IMF SDR holdings 221,951 48 558,598 140
221,951 48 558,598 140 LiabilitiesIMF account no. 2 29 1 26 1 IMF SDR allocation 801,814 173 694,702 173
801,843 174 694,728 174
The assets represent IMF SDR Holdings held on behalf of Government of Uganda of SDR 48 million. The liabilities relate to SDR Allocations of SDR 173 million that funded the SDR holdings from IMF. The IMF Holdings and Allocations attract interest rates determined by the Fund as advised from time to time. Interest charged on the IMF holdings is the responsibility of Bank of Uganda. The liabilities and assets are not secured by collateral and the repayment terms are not fixed. The IMF assets and liabilities above are reported in Uganda Shillings at the year-end exchange rates. Translation gains/losses are recognised in profit or loss.
19.1 OTHER IMF ACCOUNTS NOT RECOGNISED 30-Jun-2015 30-Jun-2015 30-Jun-2014 30-Jun-2014
Assets UGX (m) SDR (m) UGX (m) SDR (m)IMF Quota 725,397 181 703,996 181
725,397 181 703,996 181 LiabilitiesIMF account no. 1 642,156 160 623,211 160 IMF Securities 83,241 21 80,785 21
725,397 181 703,996 181
The Other International Monetary Fund accounts not recognised consist of the Uganda Government total membership capital subscription Quota of SDR 181 million and the corresponding IMF I and securities accounts which are the responsibility of Government of Uganda as a fiscal agent and as such are not accounted for in the financial statements of the Bank.
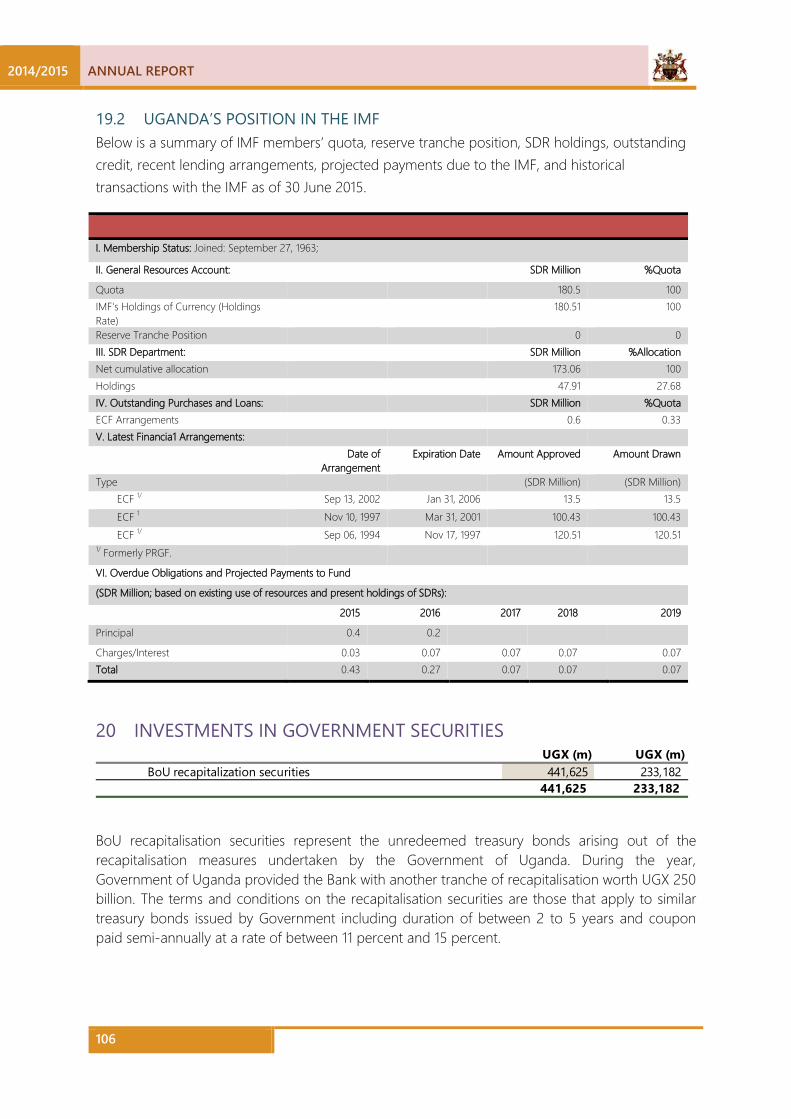
2014/2015 ANNUAL REPORT
106
19.2 UGANDA’S POSITION IN THE IMF Below is a summary of IMF members’ quota, reserve tranche position, SDR holdings, outstanding credit, recent lending arrangements, projected payments due to the IMF, and historical transactions with the IMF as of 30 June 2015.
I. Membership Status: Joined: September 27, 1963;
II. General Resources Account: SDR Million %Quota
Quota 180.5 100 IMF's Holdings of Currency (Holdings Rate)
180.51 100
Reserve Tranche Position 0 0 III. SDR Department: SDR Million %Allocation Net cumulative allocation 173.06 100 Holdings 47.91 27.68 IV. Outstanding Purchases and Loans: SDR Million %Quota ECF Arrangements 0.6 0.33 V. Latest Financia1 Arrangements: Date of
Arrangement Expiration Date Amount Approved Amount Drawn
Type (SDR Million) (SDR Million) ECF 1/ Sep 13, 2002 Jan 31, 2006 13.5 13.5 ECF 1 Nov 10, 1997 Mar 31, 2001 100.43 100.43 ECF 1/ Sep 06, 1994 Nov 17, 1997 120.51 120.51
1/ Formerly PRGF.
VI. Overdue Obligations and Projected Payments to Fund
(SDR Million; based on existing use of resources and present holdings of SDRs):
2015 2016 2017 2018 2019
Principal 0.4 0.2
Charges/Interest 0.03 0.07 0.07 0.07 0.07 Total 0.43 0.27 0.07 0.07 0.07
20 INVESTMENTS IN GOVERNMENT SECURITIES UGX (m) UGX (m)
BoU recapitalization securities 441,625 233,182 441,625 233,182
BoU recapitalisation securities represent the unredeemed treasury bonds arising out of the recapitalisation measures undertaken by the Government of Uganda. During the year, Government of Uganda provided the Bank with another tranche of recapitalisation worth UGX 250 billion. The terms and conditions on the recapitalisation securities are those that apply to similar treasury bonds issued by Government including duration of between 2 to 5 years and coupon paid semi-annually at a rate of between 11 percent and 15 percent.
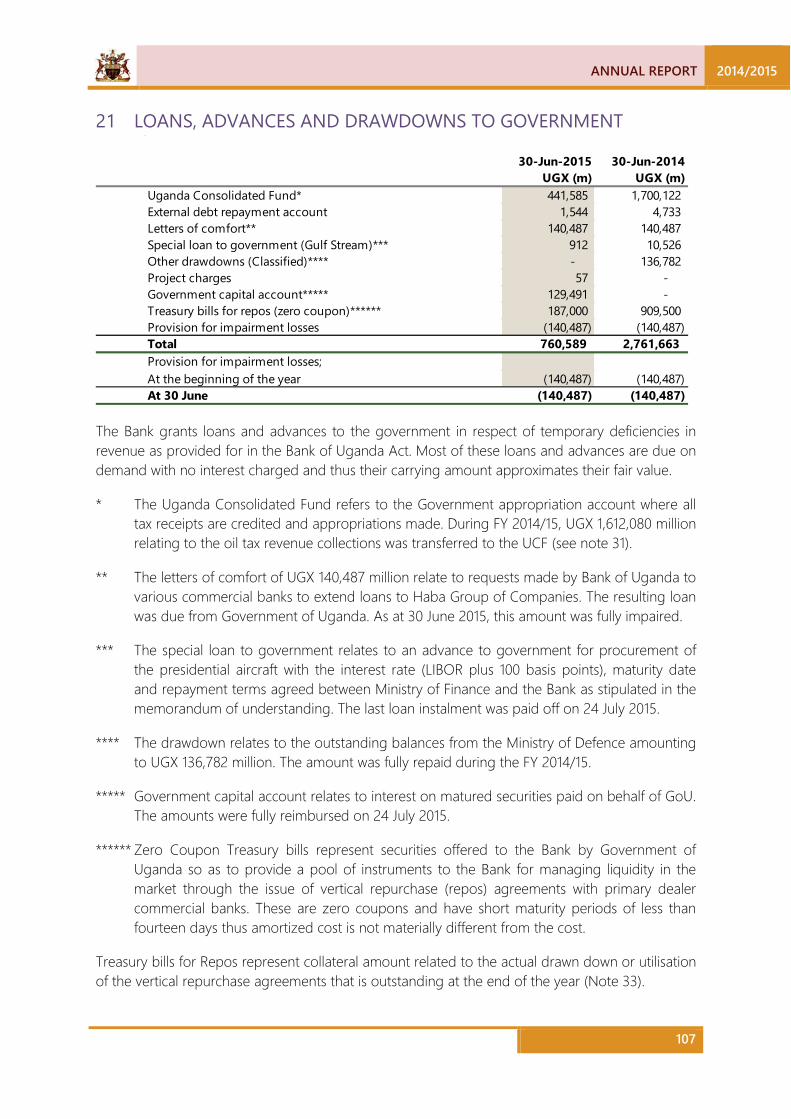
ANNUAL REPORT 2014/2015
107
21 LOANS, ADVANCES AND DRAWDOWNS TO GOVERNMENT
30-Jun-2015 30-Jun-2014UGX (m) UGX (m)
Uganda Consolidated Fund* 441,585 1,700,122 External debt repayment account 1,544 4,733 Letters of comfort** 140,487 140,487 Special loan to government (Gulf Stream)*** 912 10,526 Other drawdowns (Classified)**** - 136,782 Project charges 57 - Government capital account***** 129,491 - Treasury bills for repos (zero coupon)****** 187,000 909,500 Provision for impairment losses (140,487) (140,487) Total 760,589 2,761,663 Provision for impairment losses;At the beginning of the year (140,487) (140,487) At 30 June (140,487) (140,487)
The Bank grants loans and advances to the government in respect of temporary deficiencies in revenue as provided for in the Bank of Uganda Act. Most of these loans and advances are due on demand with no interest charged and thus their carrying amount approximates their fair value.
* The Uganda Consolidated Fund refers to the Government appropriation account where all tax receipts are credited and appropriations made. During FY 2014/15, UGX 1,612,080 million relating to the oil tax revenue collections was transferred to the UCF (see note 31).
** The letters of comfort of UGX 140,487 million relate to requests made by Bank of Uganda to various commercial banks to extend loans to Haba Group of Companies. The resulting loan was due from Government of Uganda. As at 30 June 2015, this amount was fully impaired.
*** The special loan to government relates to an advance to government for procurement of the presidential aircraft with the interest rate (LIBOR plus 100 basis points), maturity date and repayment terms agreed between Ministry of Finance and the Bank as stipulated in the memorandum of understanding. The last loan instalment was paid off on 24 July 2015.
**** The drawdown relates to the outstanding balances from the Ministry of Defence amounting to UGX 136,782 million. The amount was fully repaid during the FY 2014/15.
***** Government capital account relates to interest on matured securities paid on behalf of GoU. The amounts were fully reimbursed on 24 July 2015.
****** Zero Coupon Treasury bills represent securities offered to the Bank by Government of Uganda so as to provide a pool of instruments to the Bank for managing liquidity in the market through the issue of vertical repurchase (repos) agreements with primary dealer commercial banks. These are zero coupons and have short maturity periods of less than fourteen days thus amortized cost is not materially different from the cost.
Treasury bills for Repos represent collateral amount related to the actual drawn down or utilisation of the vertical repurchase agreements that is outstanding at the end of the year (Note 33).
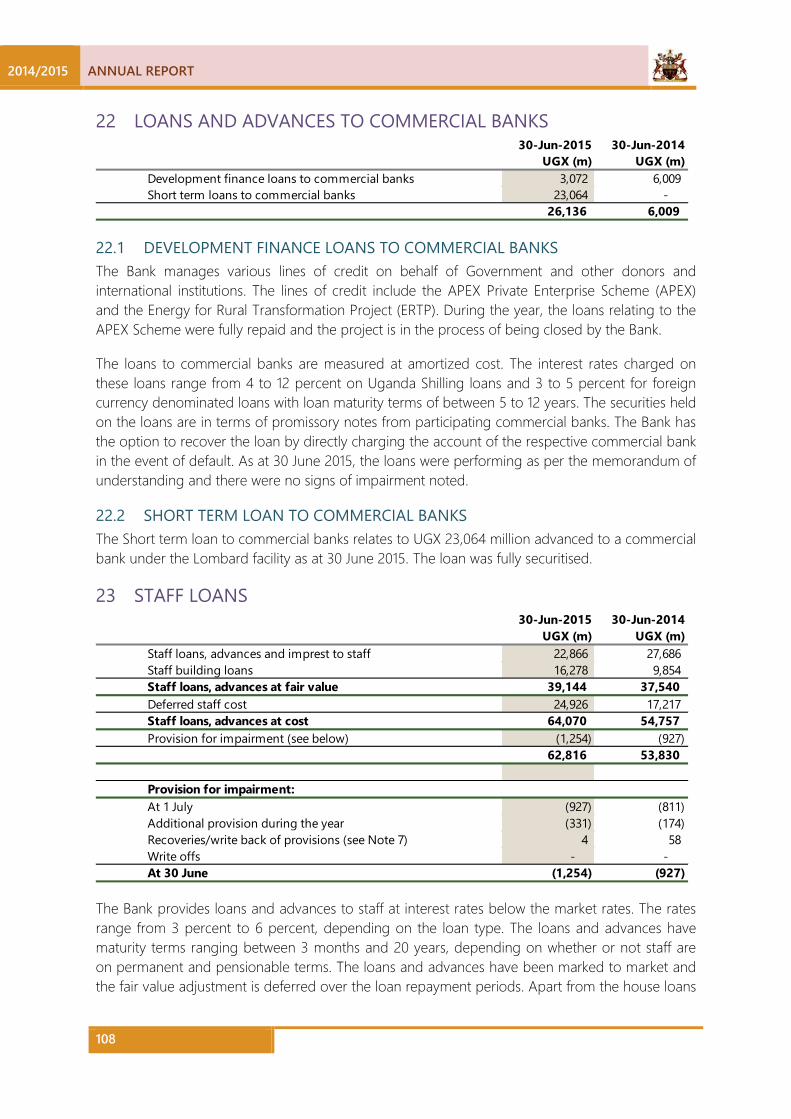
2014/2015 ANNUAL REPORT
108
22 LOANS AND ADVANCES TO COMMERCIAL BANKS 30-Jun-2015 30-Jun-2014
UGX (m) UGX (m)Development finance loans to commercial banks 3,072 6,009 Short term loans to commercial banks 23,064 -
26,136 6,009
22.1 DEVELOPMENT FINANCE LOANS TO COMMERCIAL BANKS The Bank manages various lines of credit on behalf of Government and other donors and international institutions. The lines of credit include the APEX Private Enterprise Scheme (APEX) and the Energy for Rural Transformation Project (ERTP). During the year, the loans relating to the APEX Scheme were fully repaid and the project is in the process of being closed by the Bank.
The loans to commercial banks are measured at amortized cost. The interest rates charged on these loans range from 4 to 12 percent on Uganda Shilling loans and 3 to 5 percent for foreign currency denominated loans with loan maturity terms of between 5 to 12 years. The securities held on the loans are in terms of promissory notes from participating commercial banks. The Bank has the option to recover the loan by directly charging the account of the respective commercial bank in the event of default. As at 30 June 2015, the loans were performing as per the memorandum of understanding and there were no signs of impairment noted.
22.2 SHORT TERM LOAN TO COMMERCIAL BANKS The Short term loan to commercial banks relates to UGX 23,064 million advanced to a commercial bank under the Lombard facility as at 30 June 2015. The loan was fully securitised.
23 STAFF LOANS 30-Jun-2015 30-Jun-2014
UGX (m) UGX (m)Staff loans, advances and imprest to staff 22,866 27,686 Staff building loans 16,278 9,854 Staff loans, advances at fair value 39,144 37,540 Deferred staff cost 24,926 17,217 Staff loans, advances at cost 64,070 54,757 Provision for impairment (see below) (1,254) (927)
62,816 53,830
Provision for impairment: At 1 July (927) (811) Additional provision during the year (331) (174) Recoveries/write back of provisions (see Note 7) 4 58 Write offs - - At 30 June (1,254) (927)
The Bank provides loans and advances to staff at interest rates below the market rates. The rates range from 3 percent to 6 percent, depending on the loan type. The loans and advances have maturity terms ranging between 3 months and 20 years, depending on whether or not staff are on permanent and pensionable terms. The loans and advances have been marked to market and the fair value adjustment is deferred over the loan repayment periods. Apart from the house loans
ANNUAL REPORT 2014/2015
109
which are secured by mortgages, salary advances are not secured. All mortgages are covered by an insurance policy of an amount that is twice the outstanding loan balances.
24 RECOGNISED RETIREMENT BENEFITS PLAN The Bank’s permanent and pensionable employees are eligible for retirement benefits under a defined benefit plan provided through a legally separate entity – The Bank of Uganda Defined Benefits Scheme.
The Scheme is licensed by the Uganda Retirements Benefits Authority and governed by a Trust Deed and Rules with a duly appointed Board of Trustees. The Trustees comprise six (6) Sponsor nominated representatives and three (3) member nominated representatives; two (2) of whom are nominated by active service members and one (1) nominated by pensioners. The Board of the Trustees is required by the law to act in the best interests of the plan participants and is responsible for setting certain policies –e.g. investment, contribution and indexation policies of the fund.
The benefits to members on retirement are determined as 1/60 x average salary for service prior to 30 June 2013 x Service Period less the value of NSSF Contribution balances. For service after 30 June 2013, the benefit is determined as 1/65 x average salary for service after 30 June 2013 x Service Period. This Amendment took effect from 1 July 2013.
Employees not participating in the Defined Benefit Scheme are eligible to join a Defined Contribution Scheme.
The net defined benefit asset in respect of the defined benefit pension plan is the fair value of the plan assets at the reporting date minus the present value of the defined benefit obligation. The defined benefit obligation is calculated by independent actuaries using the projected unit credit method. The current actuarial certification was carried out by Actuarial Services (E.A) Limited as at 30 June 2015.
The actuarial certification only includes the funded pension arrangements; the Bank of Uganda Defined Benefits Scheme (DBS).
The key risks associated with the Scheme are as follows:
i. Salary risk: The benefits are linked to salary and consequently have an associated risk to increases in salary.
ii. Investment risk: The Scheme is funded with separate assets. Investment risk would therefore arise in the Scheme.
iii. Interest rate risk: Decreases/ increases in the discount rate used (high quality corporate bonds) will increase/ decrease the defined benefit obligation.
iv. Benefits in the Scheme are payable on retirement, resignation, death or ill-health retirement. The actual cost to the Bank of the benefits is therefore subject to the demographic movements of employees.
The pension fund is fully funded by Bank of Uganda. The funding requirements are based on the pension fund’s actuarial measurement framework set out in the funding policies of the plan. The
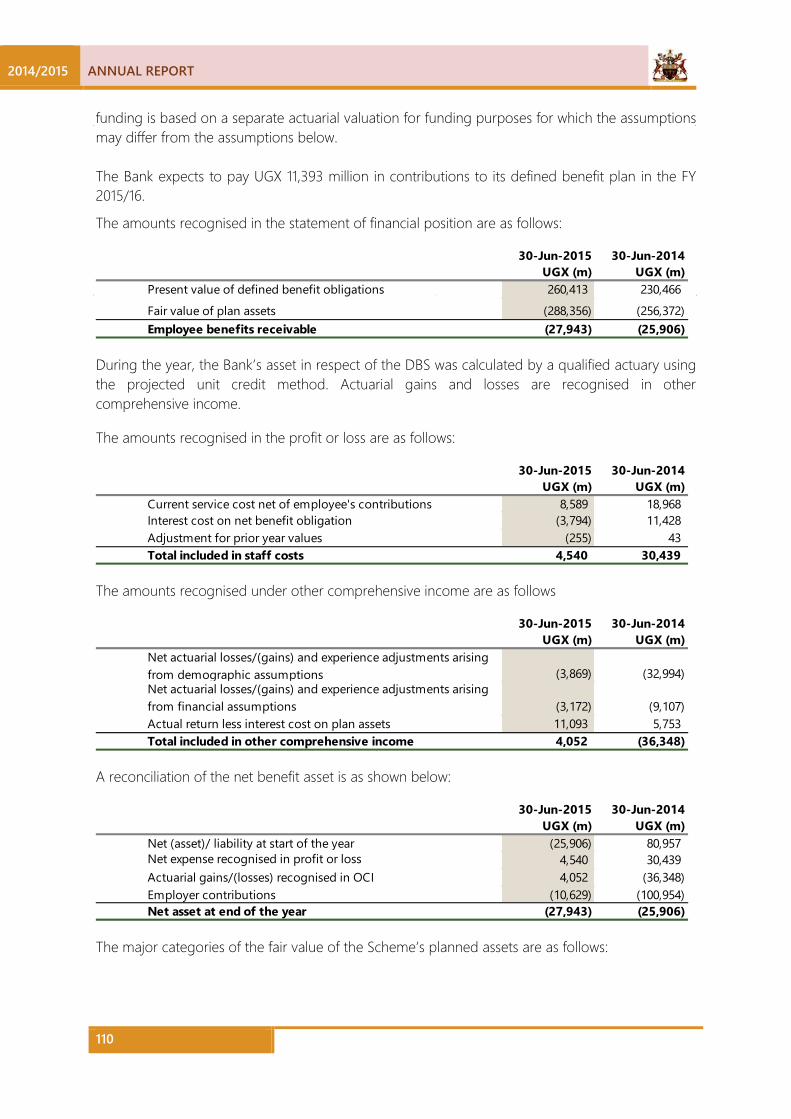
2014/2015 ANNUAL REPORT
110
funding is based on a separate actuarial valuation for funding purposes for which the assumptions may differ from the assumptions below. The Bank expects to pay UGX 11,393 million in contributions to its defined benefit plan in the FY 2015/16.
The amounts recognised in the statement of financial position are as follows:
30-Jun-2015 30-Jun-2014UGX (m) UGX (m)
Present value of defined benefit obligations 260,413 230,466
Fair value of plan assets (288,356) (256,372) Employee benefits receivable (27,943) (25,906)
During the year, the Bank’s asset in respect of the DBS was calculated by a qualified actuary using the projected unit credit method. Actuarial gains and losses are recognised in other comprehensive income.
The amounts recognised in the profit or loss are as follows:
30-Jun-2015 30-Jun-2014UGX (m) UGX (m)
Current service cost net of employee's contributions 8,589 18,968 Interest cost on net benefit obligation (3,794) 11,428 Adjustment for prior year values (255) 43 Total included in staff costs 4,540 30,439
The amounts recognised under other comprehensive income are as follows
30-Jun-2015 30-Jun-2014UGX (m) UGX (m)
Net actuarial losses/(gains) and experience adjustments arising from demographic assumptions (3,869) (32,994) Net actuarial losses/(gains) and experience adjustments arising from financial assumptions (3,172) (9,107) Actual return less interest cost on plan assets 11,093 5,753 Total included in other comprehensive income 4,052 (36,348)
A reconciliation of the net benefit asset is as shown below:
30-Jun-2015 30-Jun-2014UGX (m) UGX (m)
Net (asset)/ liability at start of the year (25,906) 80,957 Net expense recognised in profit or loss 4,540 30,439 Actuarial gains/(losses) recognised in OCI 4,052 (36,348) Employer contributions (10,629) (100,954) Net asset at end of the year (27,943) (25,906)
The major categories of the fair value of the Scheme’s planned assets are as follows:
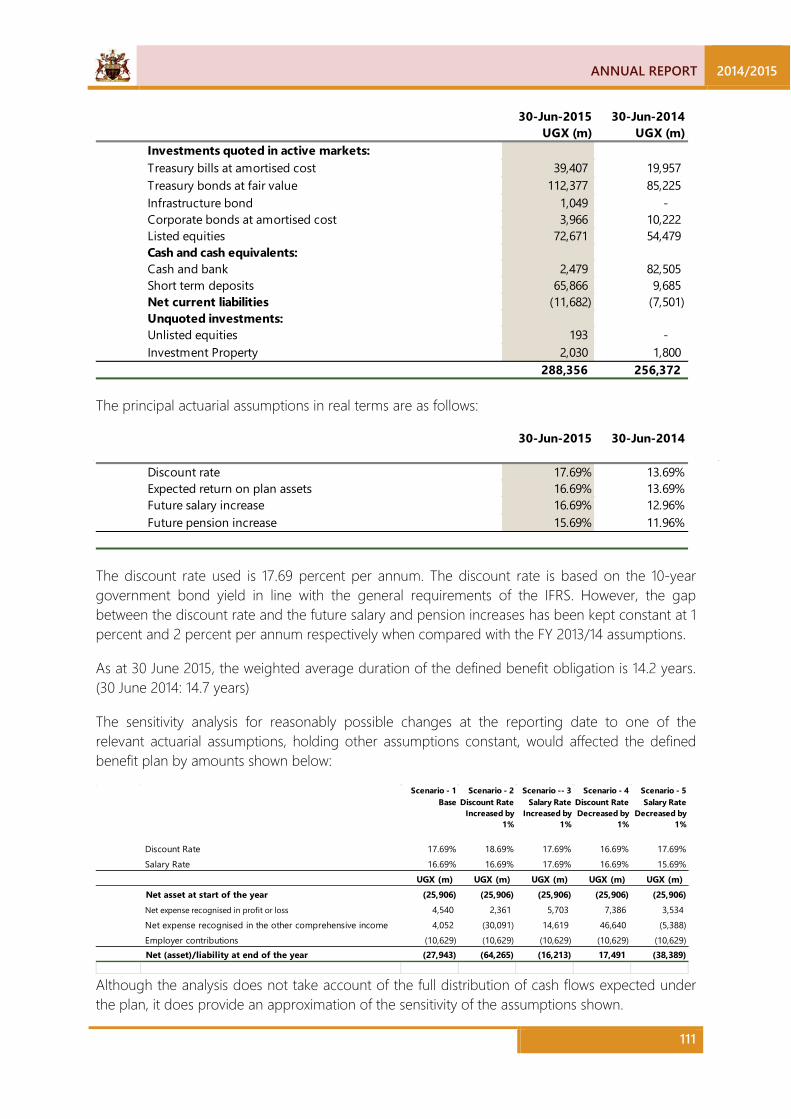
ANNUAL REPORT 2014/2015
111
30-Jun-2015 30-Jun-2014UGX (m) UGX (m)
Investments quoted in active markets:Treasury bills at amortised cost 39,407 19,957 Treasury bonds at fair value 112,377 85,225 Infrastructure bond 1,049 - Corporate bonds at amortised cost 3,966 10,222 Listed equities 72,671 54,479 Cash and cash equivalents:Cash and bank 2,479 82,505 Short term deposits 65,866 9,685 Net current liabilities (11,682) (7,501) Unquoted investments:Unlisted equities 193 - Investment Property 2,030 1,800
288,356 256,372
The principal actuarial assumptions in real terms are as follows:
30-Jun-2015 30-Jun-2014
Discount rate 17.69% 13.69%Expected return on plan assets 16.69% 13.69%Future salary increase 16.69% 12.96%Future pension increase 15.69% 11.96%
The discount rate used is 17.69 percent per annum. The discount rate is based on the 10-year government bond yield in line with the general requirements of the IFRS. However, the gap between the discount rate and the future salary and pension increases has been kept constant at 1 percent and 2 percent per annum respectively when compared with the FY 2013/14 assumptions.
As at 30 June 2015, the weighted average duration of the defined benefit obligation is 14.2 years. (30 June 2014: 14.7 years)
The sensitivity analysis for reasonably possible changes at the reporting date to one of the relevant actuarial assumptions, holding other assumptions constant, would affected the defined benefit plan by amounts shown below:
Scenario - 1 Base
Scenario - 2 Discount Rate
Increased by 1%
Scenario -- 3 Salary Rate
Increased by 1%
Scenario - 4 Discount Rate Decreased by
1%
Scenario - 5 Salary Rate
Decreased by 1%
Discount Rate 17.69% 18.69% 17.69% 16.69% 17.69%Salary Rate 16.69% 16.69% 17.69% 16.69% 15.69%
UGX (m) UGX (m) UGX (m) UGX (m) UGX (m)Net asset at start of the year (25,906) (25,906) (25,906) (25,906) (25,906) Net expense recognised in profit or loss 4,540 2,361 5,703 7,386 3,534 Net expense recognised in the other comprehensive income 4,052 (30,091) 14,619 46,640 (5,388) Employer contributions (10,629) (10,629) (10,629) (10,629) (10,629) Net (asset)/liability at end of the year (27,943) (64,265) (16,213) 17,491 (38,389)
Although the analysis does not take account of the full distribution of cash flows expected under the plan, it does provide an approximation of the sensitivity of the assumptions shown.
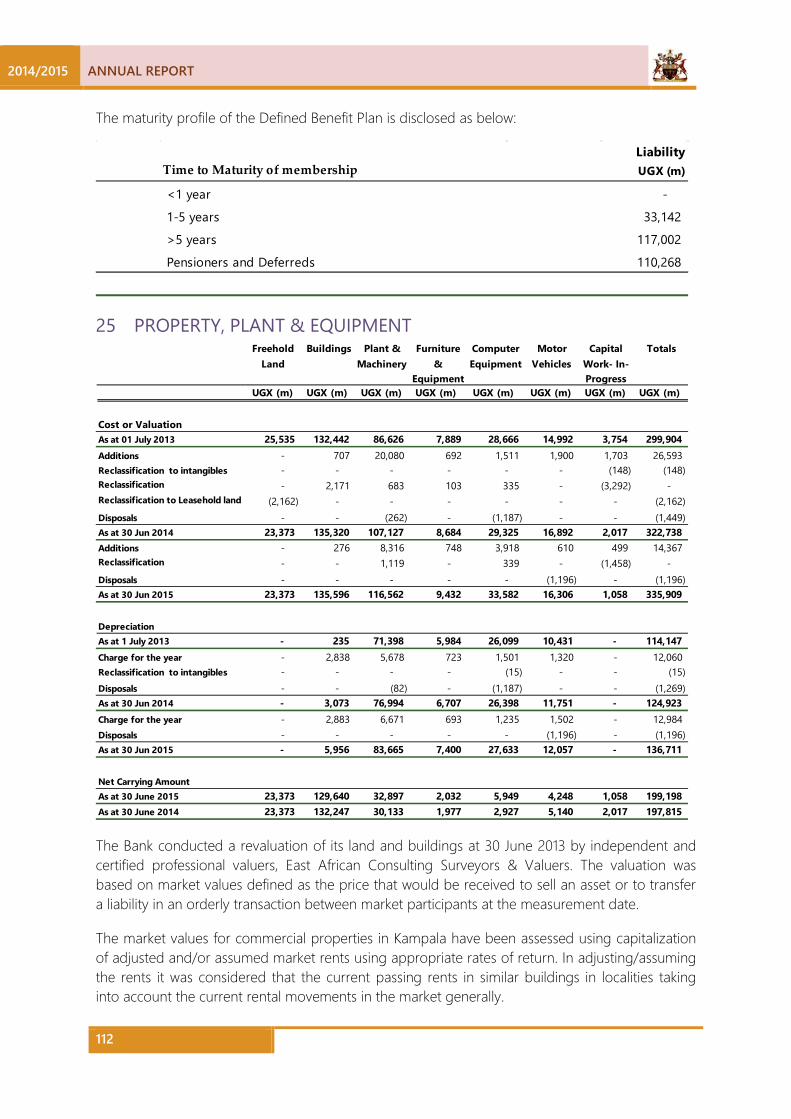
2014/2015 ANNUAL REPORT
112
The maturity profile of the Defined Benefit Plan is disclosed as below:
LiabilityTime to Maturity of membership UGX (m)
<1 year -
1-5 years 33,142
>5 years 117,002
Pensioners and Deferreds 110,268
25 PROPERTY, PLANT & EQUIPMENT
Freehold Land
Buildings Plant & Machinery
Furniture &
Equipment
Computer Equipment
Motor Vehicles
Capital Work- In-Progress
Totals
UGX (m) UGX (m) UGX (m) UGX (m) UGX (m) UGX (m) UGX (m) UGX (m)
Cost or ValuationAs at 01 July 2013 25,535 132,442 86,626 7,889 28,666 14,992 3,754 299,904 Additions - 707 20,080 692 1,511 1,900 1,703 26,593 Reclassification to intangibles - - - - - - (148) (148) Reclassification - 2,171 683 103 335 - (3,292) - Reclassification to Leasehold land (2,162) - - - - - - (2,162) Disposals - - (262) - (1,187) - - (1,449) As at 30 Jun 2014 23,373 135,320 107,127 8,684 29,325 16,892 2,017 322,738 Additions - 276 8,316 748 3,918 610 499 14,367 Reclassification - - 1,119 - 339 - (1,458) - Disposals - - - - - (1,196) - (1,196) As at 30 Jun 2015 23,373 135,596 116,562 9,432 33,582 16,306 1,058 335,909
DepreciationAs at 1 July 2013 - 235 71,398 5,984 26,099 10,431 - 114,147 Charge for the year - 2,838 5,678 723 1,501 1,320 - 12,060 Reclassification to intangibles - - - - (15) - - (15) Disposals - - (82) - (1,187) - - (1,269) As at 30 Jun 2014 - 3,073 76,994 6,707 26,398 11,751 - 124,923 Charge for the year - 2,883 6,671 693 1,235 1,502 - 12,984 Disposals - - - - - (1,196) - (1,196) As at 30 Jun 2015 - 5,956 83,665 7,400 27,633 12,057 - 136,711
Net Carrying AmountAs at 30 June 2015 23,373 129,640 32,897 2,032 5,949 4,248 1,058 199,198 As at 30 June 2014 23,373 132,247 30,133 1,977 2,927 5,140 2,017 197,815
The Bank conducted a revaluation of its land and buildings at 30 June 2013 by independent and certified professional valuers, East African Consulting Surveyors & Valuers. The valuation was based on market values defined as the price that would be received to sell an asset or to transfer a liability in an orderly transaction between market participants at the measurement date.
The market values for commercial properties in Kampala have been assessed using capitalization of adjusted and/or assumed market rents using appropriate rates of return. In adjusting/assuming the rents it was considered that the current passing rents in similar buildings in localities taking into account the current rental movements in the market generally.

ANNUAL REPORT 2014/2015
113
The market values in the rest of the buildings in upcountry towns and all residential properties have been arrived at either by direct comparison of sales of similar or near similar properties and locations or by depreciated replacement cost. The revaluation surplus of UGX 68,149 million was been recognised in the Asset Revaluation Reserve.
Capital work in progress relates to fixed assets that are still in construction or yet to be put in use.
Fair value measurement disclosures for revalued land and buildings are provided in note 41.
If land and buildings were measured using the cost model, the carrying amounts would be as follows:
30-Jun-2015 30-Jun-2014UGX (m) UGX (m)
Land (cost) 31,554 31,554 Net Carrying Amount 31,554 31,554
30-Jun-2015 30-Jun-2014UGX (m) UGX (m)
Buildings (cost) 116,094 115,818 Accumulated depreciation and impairment (10,060) (7,055) Net Carrying Amount 106,034 108,763
The Bank revalues its land and buildings after every 5 years.
Items disposed comprised a bullion van and a double cabin had a nil book value. All gains/ (losses) on disposal of assets are credited directly to the profit or loss.
26 FINANCE LEASE ON LEASEHOLD LAND 30-Jun-2015 30-Jun-2014
UGX (m) UGX (m)At 1 July 50,754 45,860 Additions - 2,732 Reclassification from property, plant and equipment** - 2,162 At 30 June 50,754 50,754
Finance lease on leasehold land relates to all land for office space and residential premises under the current lease agreements. At inception of the lease, the obligation associated with the acquisition was paid upfront and as such, the would-be minimum lease payments were expunged at the beginning of the lease in a single payment.
Given the substance of this transaction, the risks and rewards are borne by the Bank with automatic renewal at the end of the lease. This in effect gives the Bank the right to own the land in perpetuity.
The Bank has commenced conversion of all leasehold land into freehold and accordingly ceased amortisation of the leasehold land on 1 July 2008.
The leasehold land was revalued on 30 June 2013.
** Plot 2 High Street Mbarara was reclassified from freehold to leasehold during FY 2013/14

2014/2015 ANNUAL REPORT
114
27 INTANGIBLE ASSETS
SoftwareWork- In-Progress Totals
UGX (m) UGX (m) UGX (m)
Cost or Valuation As at 1 July 2013 18,467 2,934 21,401 Reclassification 3,580 (3,580) - Reclassification from Property Plant & Equipment* - 148 148 Additions - 1,160 1,160 As at 30 Jun 2014 22,047 662 22,709 Reclassification 662 (662) - Additions 1,257 784 2,041 As at 30 Jun 2015 23,966 784 24,750
Amortisation As at 1 July 2013 15,152 - 15,152 Reclassification from Property Plant & Equipment 15 - 15 Charge for the year 3,710 - 3,710 As at 30 Jun 2014 18,877 - 18,877 Charge for the year 1,330 - 1,330 As at 30 Jun 2015 20,207 - 20,207
Net Carrying Amount As at 30 June 2015 3,759 784 4,543 Net Carrying Amount As at 30 June 2014 3,170 662 3,832
* The reclassification relates to Oracle IFS upgrade costs from Property, Plant and Equipment to intangible assets.
Work in progress relates to IT systems that are under development and yet to be put in use
28 OTHER ASSETS 30-Jun-2015 30-Jun-2014
UGX (m) UGX (m)Consumable store stock 2,362 2,889 Prepayments & accrued income 58 24 Deferred currency costs * 224,825 174,373 Sundry debtors 1,171 2,185 Provisions for impairment losses (93) (57)
228,323 179,414 Provisions for impairment losses:At beginning of the year (57) (12) Additional provisions (35) (57) Write offs during the year - 12 At 30 June (93) (57)
* Deferred currency costs relate to currency printing and minting costs for notes and coins not yet issued into circulation in accordance with the Bank’s accounting policy. The policy of the Bank is to expense currency costs upon issue of the notes and coins into circulation.
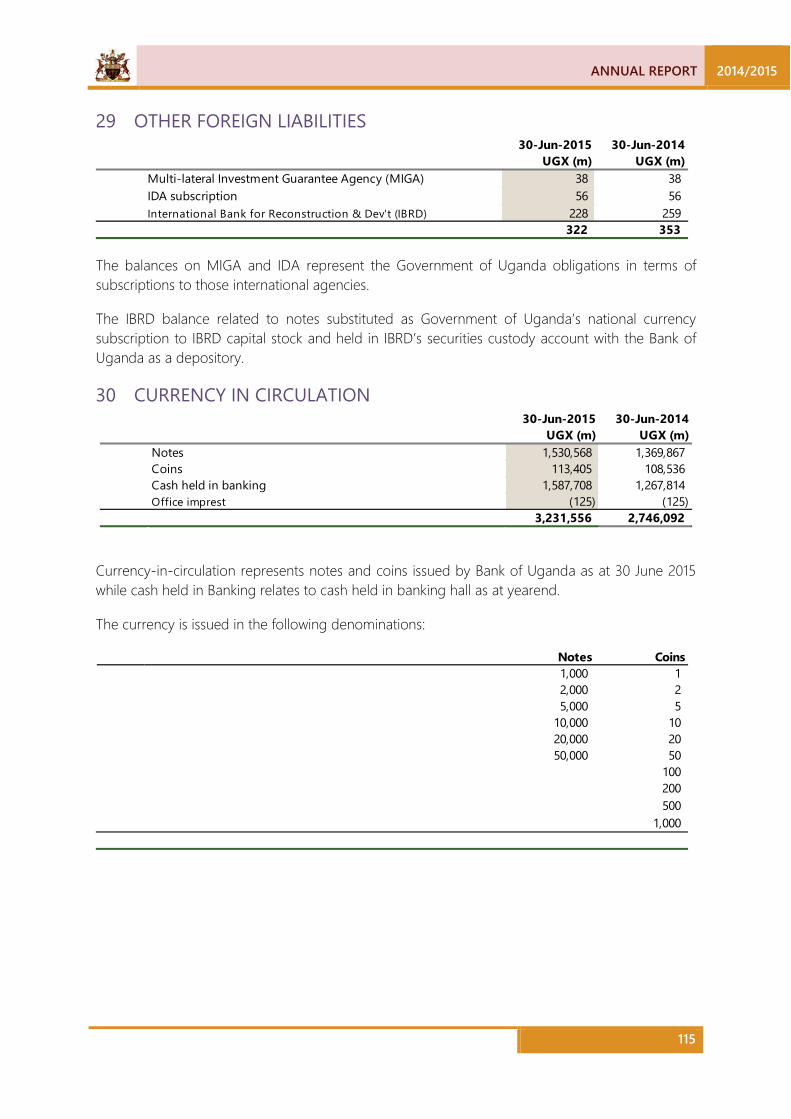
ANNUAL REPORT 2014/2015
115
29 OTHER FOREIGN LIABILITIES 30-Jun-2015 30-Jun-2014
UGX (m) UGX (m)Multi-lateral Investment Guarantee Agency (MIGA) 38 38 IDA subscription 56 56 International Bank for Reconstruction & Dev't (IBRD) 228 259
322 353
The balances on MIGA and IDA represent the Government of Uganda obligations in terms of subscriptions to those international agencies.
The IBRD balance related to notes substituted as Government of Uganda’s national currency subscription to IBRD capital stock and held in IBRD’s securities custody account with the Bank of Uganda as a depository.
30 CURRENCY IN CIRCULATION
30-Jun-2015 30-Jun-2014UGX (m) UGX (m)
Notes 1,530,568 1,369,867 Coins 113,405 108,536 Cash held in banking 1,587,708 1,267,814 Office imprest (125) (125)
3,231,556 2,746,092
Currency-in-circulation represents notes and coins issued by Bank of Uganda as at 30 June 2015 while cash held in Banking relates to cash held in banking hall as at yearend.
The currency is issued in the following denominations:
Notes Coins1,000 1 2,000 2 5,000 5
10,000 10 20,000 20 50,000 50
100 200 500
1,000
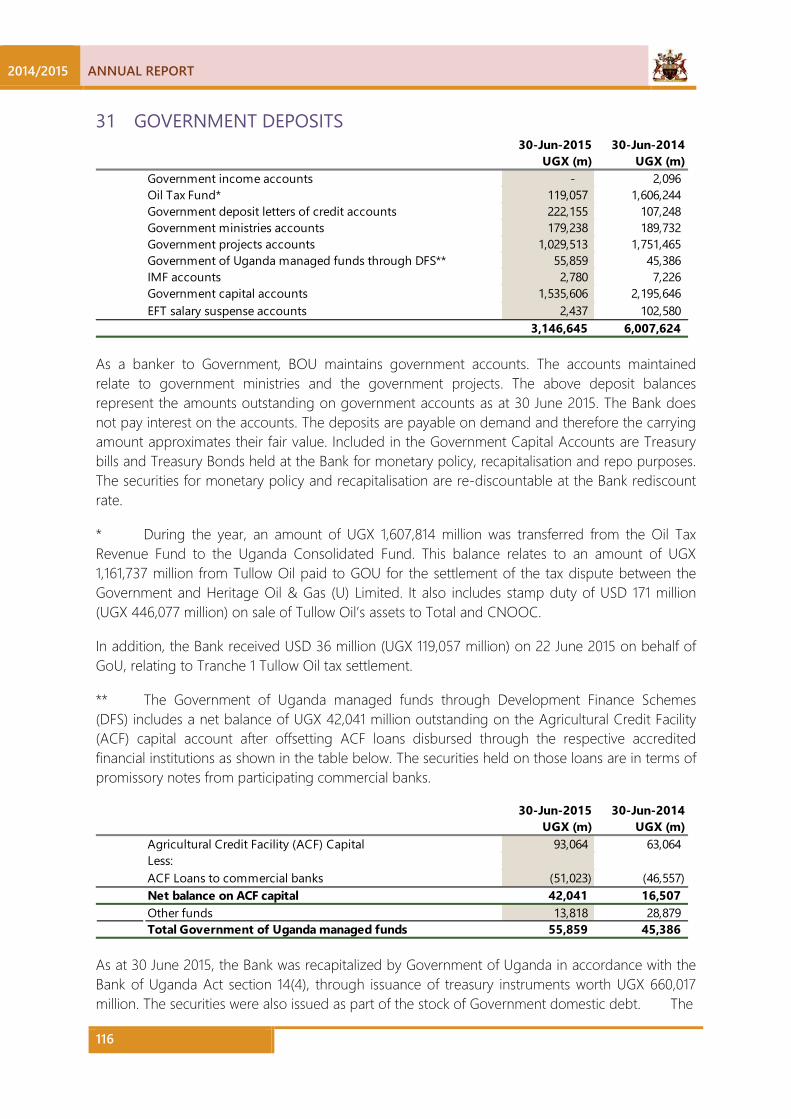
2014/2015 ANNUAL REPORT
116
31 GOVERNMENT DEPOSITS 30-Jun-2015 30-Jun-2014
UGX (m) UGX (m)Government income accounts - 2,096 Oil Tax Fund* 119,057 1,606,244 Government deposit letters of credit accounts 222,155 107,248 Government ministries accounts 179,238 189,732 Government projects accounts 1,029,513 1,751,465 Government of Uganda managed funds through DFS** 55,859 45,386 IMF accounts 2,780 7,226 Government capital accounts 1,535,606 2,195,646 EFT salary suspense accounts 2,437 102,580
3,146,645 6,007,624
As a banker to Government, BOU maintains government accounts. The accounts maintained relate to government ministries and the government projects. The above deposit balances represent the amounts outstanding on government accounts as at 30 June 2015. The Bank does not pay interest on the accounts. The deposits are payable on demand and therefore the carrying amount approximates their fair value. Included in the Government Capital Accounts are Treasury bills and Treasury Bonds held at the Bank for monetary policy, recapitalisation and repo purposes. The securities for monetary policy and recapitalisation are re-discountable at the Bank rediscount rate.
* During the year, an amount of UGX 1,607,814 million was transferred from the Oil Tax Revenue Fund to the Uganda Consolidated Fund. This balance relates to an amount of UGX 1,161,737 million from Tullow Oil paid to GOU for the settlement of the tax dispute between the Government and Heritage Oil & Gas (U) Limited. It also includes stamp duty of USD 171 million (UGX 446,077 million) on sale of Tullow Oil’s assets to Total and CNOOC.
In addition, the Bank received USD 36 million (UGX 119,057 million) on 22 June 2015 on behalf of GoU, relating to Tranche 1 Tullow Oil tax settlement.
** The Government of Uganda managed funds through Development Finance Schemes (DFS) includes a net balance of UGX 42,041 million outstanding on the Agricultural Credit Facility (ACF) capital account after offsetting ACF loans disbursed through the respective accredited financial institutions as shown in the table below. The securities held on those loans are in terms of promissory notes from participating commercial banks.
30-Jun-2015 30-Jun-2014UGX (m) UGX (m)
Agricultural Credit Facility (ACF) Capital 93,064 63,064 Less:ACF Loans to commercial banks (51,023) (46,557) Net balance on ACF capital 42,041 16,507 Other funds 13,818 28,879 Total Government of Uganda managed funds 55,859 45,386
As at 30 June 2015, the Bank was recapitalized by Government of Uganda in accordance with the Bank of Uganda Act section 14(4), through issuance of treasury instruments worth UGX 660,017 million. The securities were also issued as part of the stock of Government domestic debt. The
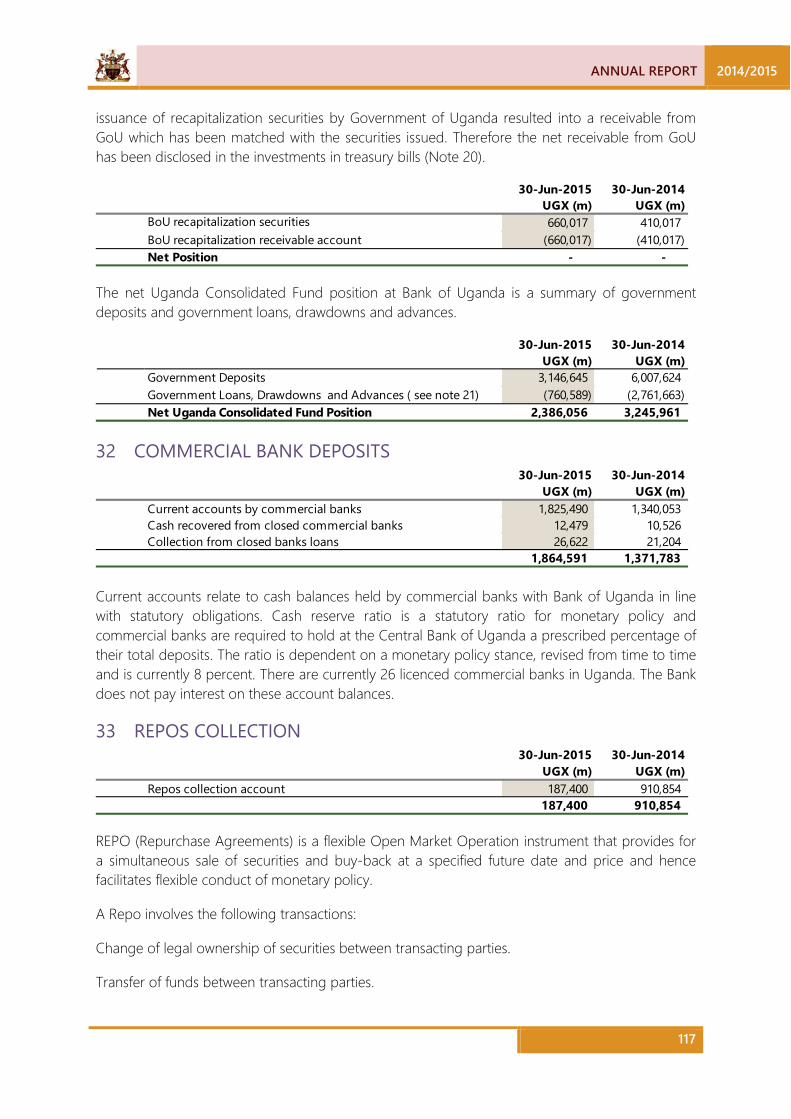
ANNUAL REPORT 2014/2015
117
issuance of recapitalization securities by Government of Uganda resulted into a receivable from GoU which has been matched with the securities issued. Therefore the net receivable from GoU has been disclosed in the investments in treasury bills (Note 20).
30-Jun-2015 30-Jun-2014UGX (m) UGX (m)
BoU recapitalization securities 660,017 410,017 BoU recapitalization receivable account (660,017) (410,017) Net Position - -
The net Uganda Consolidated Fund position at Bank of Uganda is a summary of government deposits and government loans, drawdowns and advances.
30-Jun-2015 30-Jun-2014UGX (m) UGX (m)
Government Deposits 3,146,645 6,007,624 Government Loans, Drawdowns and Advances ( see note 21) (760,589) (2,761,663) Net Uganda Consolidated Fund Position 2,386,056 3,245,961
32 COMMERCIAL BANK DEPOSITS 30-Jun-2015 30-Jun-2014
UGX (m) UGX (m)Current accounts by commercial banks 1,825,490 1,340,053 Cash recovered from closed commercial banks 12,479 10,526 Collection from closed banks loans 26,622 21,204
1,864,591 1,371,783
Current accounts relate to cash balances held by commercial banks with Bank of Uganda in line with statutory obligations. Cash reserve ratio is a statutory ratio for monetary policy and commercial banks are required to hold at the Central Bank of Uganda a prescribed percentage of their total deposits. The ratio is dependent on a monetary policy stance, revised from time to time and is currently 8 percent. There are currently 26 licenced commercial banks in Uganda. The Bank does not pay interest on these account balances.
33 REPOS COLLECTION 30-Jun-2015 30-Jun-2014
UGX (m) UGX (m)Repos collection account 187,400 910,854
187,400 910,854
REPO (Repurchase Agreements) is a flexible Open Market Operation instrument that provides for a simultaneous sale of securities and buy-back at a specified future date and price and hence facilitates flexible conduct of monetary policy.
A Repo involves the following transactions:
Change of legal ownership of securities between transacting parties.
Transfer of funds between transacting parties.

2014/2015 ANNUAL REPORT
118
Vertical REPO
Where a Repo is used as a monetary policy instrument, one of the parties to the agreement is the Central Bank, while a Primary Dealer (PD) constitutes the other party. The Vertical Repo transaction allows the Central Bank to mop up short-term liquidity by selling securities to PDs with an agreement to repurchase them at a specified future date – where the PD receives back full amount of principal and interest.
34 OTHER LIABILITIES 30-Jun-2015 30-Jun-2014
UGX (m) UGX (m)Uninvested pension fund cash 1,411 82,939 Deposit Protection Fund* 20,822 22,939 Accounts payable 12,767 46,409 Other creditors 33,917 10,357 IMF debt relief** - 525 UCBL sales proceeds 3,412 3,412 Provision for UCBL excluded liabilities*** 1,359 1,359 Money remittance institutions 77 66
73,765 168,006
* The Bank manages and controls the Deposit Protection Fund (DPF) in accordance with section 108-111 of the Financial Institutions Act 2004 (FIA). The DPF is a self-accounting fund and is audited separately by an independent firm of Auditors. The balance on the account represents cash at hand for the DPF.
** During the financial year 2005/06, Government benefited from IMF debt relief of SDR 87.7million (UGX 231 billion) under the Multilateral Debt Relief Initiative (MDRI). The relief is being gradually released to the Uganda Consolidated Fund (UCF) account according to the earlier agreed amortisation schedule between government and IMF. The relief was not reflected within government deposits as per agreed monetary programmes between Government of Uganda and IMF.
*** The Bank completed the dissolution of Uganda Commercial Bank Ltd (UCBL) on 21 February 2003 with the sale of the majority shares (80 percent) to Standard Bank Investment Corporation (Stanbic) through its subsidiary Stanbic (U) Ltd. Under the sale agreement, the Bank, on behalf of the shareholders, undertook to fulfil certain warranties, such as the payment of retrenchment costs for up to five hundred staff. The provision for excluded liabilities of UGX 1,359 million was set aside to cover other incidentals.
35 AUTHORISED AND ISSUED SHARE CAPITAL 30-Jun-2015 30-Jun-2014
UGX (m) UGX (m)Authorised30,000,000,000 of UGX 1.00 each 30,000 30,000
Issued and fully paid20,000,000,000 of UGX 1.00 each 20,000 20,000

ANNUAL REPORT 2014/2015
119
The Bank of Uganda Act (Cap. 51), Laws of Uganda 2000 is the law that establishes the Bank with the authorised capital of UGX 30 billion. As at 30 June 2015, UGX 20 billion was issued and fully paid.
36 BOU RECAPITALIZATION FUNDS 30-Jun-2015 30-Jun-2014
UGX (m) UGX (m)BoU recapitalisation securities 660,017 410,017
660,017 410,017 During the FY 2014/15, the Bank was further recapitalized by Government of Uganda with treasury securities worth UGX 250,000 million bringing the total stock of recapitalisation securities to UGX 660,017 million as at 30 June 2015 in accordance with the Bank of Uganda Act section 14 (4).
37 RESERVES 30-Jun-2015 30-Jun-2014
UGX (m) UGX (m)Asset revaluation reserve* 140,936 142,405 Revenue reserve** (794,956) (643,532) General reserve*** 343,461 269,225 Fair value on Available for sale financial instruments**** 34,276 - Unrealised translation reserve***** 3,029,498 1,567,657
2,753,215 1,335,755
*Assets revaluation reserve relates to surplus on revalued property and is not distributable. **Revenue reserve relates to accumulated losses on operations. ***General reserve includes realised foreign exchange gains and other special reserves. ****Relates to gains on fair value of AFS financial instruments. *****This relates to unrealised foreign exchange gains and losses on foreign assets and liabilities. The distributable deficit is arrived at as follows:
30-Jun-2015 30-Jun-2014UGX (m) UGX (m)
Total comprehensive surplus for the year 1,417,461 152,963 Foreign exchange and fair value gains (1,536,077) (267,608) Deficit sharing with Government (118,616) (114,645)
The distributable deficit refers to the net surplus for the Bank excluding foreign exchange and fair value gains.
38 CONTINGENT LIABILITIES AND COMMITMENTS Contingent liabilities and commitments, some of which are offset by corresponding obligations of third parties, arise in the normal course of business, including contingent liabilities in respect of letters of comfort and indemnities in connection with liquidity support operations.
38.1 LEGAL PROCEEDINGS The Bank is a litigant in various cases for breach of contract arising in the normal course of business amounting to UGX 3,205 million (2014: UGX 959 million). The directors are of the view
2014/2015 ANNUAL REPORT
120
that the Bank has a high chance of success against the plaintiffs and none of the cases individually or in aggregate would have a significant impact on the Bank’s operations.
38.2 CAPITAL COMMITMENTS As at 30 June 2015, the Bank’s capital commitments in respect of plant and equipment, office machine and equipment and building works amounted to UGX 976 million compared to UGX 13,614 million as at 30 June 2014.
38.3 COMMITMENTS ON BEHALF OF TREASURY The Bank issues treasury bills and bonds on behalf of Treasury. The commitments (interest) unless claimable from Treasury are not included in these financial statements as the Bank is involved in such transactions only as an agent.
38.4 LETTERS OF CREDIT Letters of credit commit the Bank to make payments on behalf of Government to third parties, and reimbursement by the customer is normally immediate. As at 30 June 2015, the total outstanding letters of credit on behalf of Government amounted to UGX 221,439 million (2014: UGX 79,975 million).
39 FINANCIAL RISK MANAGEMENT The Bank is involved in policy-orientated activities. Therefore, the Bank’s risk management framework differs from the risk management frameworks for most other financial institutions. The main financial risks to which the Bank is exposed include credit risk, foreign exchange risk, liquidity risk, price risk and interest rate risk. In the management of foreign reserves, minimizing liquidity risk is the prime consideration in order to maintain an effective foreign exchange intervention capability. Profiles for managing interest rate, credit, foreign currency, and liquidity are noted. Like most other central banks, the nature of the Bank’s operations creates exposures to a range of operational risks and reputational risks.
The Board seeks to ensure that strong and effective risk management and control systems are in place for assessing, monitoring, and managing risk exposure. The Foreign Exchange Reserve Management Policy Committee (FERMPC), comprising the Governor and senior management, is responsible for advising on the monitoring and management of the business strategy, risks, and performance of all statement of financial position-related activities. This review includes the appropriateness of risk-return trade-offs underlying the business strategy and portfolio structure. Specialist staff conduct the Bank’s foreign currency reserves management, and foreign exchange dealing operations in accordance with a clearly defined Reserves Management Policy/Framework, including limits and delegated authorities set by the Governor. The policy is subject to regular review by FERMPC.
The majority of the Bank’s financial risks arise from the foreign reserves management and financial market operations of the Bank. Within this department, a Risk Unit is responsible for maintaining the Bank’s financial risk management framework. A separate department of the Bank (Financial Services Group) operates independent risk reporting system that monitor and report compliance with various risk limits and policies.
ANNUAL REPORT 2014/2015
121
The Internal Audit function reports to the Governor and the Audit and Governance Committee of the Board of Directors on internal audit and related issues. A risk-based framework, which evaluates key business risks and internal controls, is used to determine the extent and frequency of internal audits conducted. All Bank departments are subject to periodic internal audit review.
The Bank insures all property, plant and equipment. Auditing arrangements are overseen by an Audit and Governance Committee comprising three of the Bank’s non-executive directors, which meets regularly to monitor the financial reporting and audit function within the Bank. The Committee reviews the internal audit function and has direct access to the external auditor. The Committee reports to the Board of Directors on its activities.
The overall risk management framework is designed to strongly encourage the sound and prudent management of the Banks’ risks. The Bank seeks to ensure the risk management framework is consistent with financial market best practice.
The Bank has exposure to the following risks:
• Operational Risk • Credit risk • Liquidity risk • Interest Rate Risk • Currency risks Below is a summary of information about the Bank’s exposure to each of the above risks, the Bank’s objectives, policies and processes for measuring and managing risk, and the Bank’s management of capital.
39.1 OPERATIONAL RISK Operational risk is the risk of loss in both financial and non-financial terms resulting from human error and the failure of internal processes and systems.
39.1.1 MANAGEMENT OF OPERATIONAL RISK Managing operational risk in the Bank is seen as an integral part of the day-today operations and management, which include explicit consideration of both the opportunities and the risks of all business activities.
Operational risk management includes Bank-wide corporate policies that describe the standard of conduct required of staff, a number of mandated generic requirements (e.g. A project management template), and specific internal control system designed around the particular characteristics of various Bank activities.
Compliance with corporate policies, generic requirements, and departmental internal control systems are managed by:
• An induction programme for new employees that makes them aware of the requirements; • A quarterly management affirmation by each Head of Department that corporate policies
and departmental internal control systems have been complied with; • Requirements for regular reconciliations and monitoring of transactions; • Requirements for appropriate segregation of duties; • Risk mitigation including insurance where this is effective;

2014/2015 ANNUAL REPORT
122
• Training and professional development; and • An active internal audit function.
The above policies and procedures for managing operational risk are reinforced by the requirement to promptly report all important unexpected issues, and to provide management with an opportunity to give immediate advice.
39.2 CREDIT RISK Credit risk is the risk of financial loss to the Bank if a customer or counterparty to a financial instrument fails to meet its contractual obligations, and arises principally from the Bank’s loans and advances to customers and other banks and investment securities.
39.2.1 MANAGEMENT OF CREDIT RISK The Board of Directors has delegated responsibility for management of credit risk to the senior management. Senior management oversight over credit risk includes;
• Establishing authorization structure for the approval and renewal of credit facilities. Authorization limits are allocated to the respective members of senior management. Large facilities require approval by the Board, Governor, Deputy Governor and Executive Directors as appropriate.
• Limiting concentrations of exposure to counterparties, geographies and by issuer, credit rating band, market liquidity and country.
• Using advice, guidance and specialist skills to promote best practice. • For risk management reporting purposes, the Bank considers and consolidates all elements
of credit risk exposure (such as individual obligor default risk, country and sector risk). • For risk management purposes, credit risk arising on trading securities is managed
independently, but reported as a component of market risk exposure.
39.2.2 IMPAIRED LOANS AND SECURITIES Impaired loans and securities are loans and securities for which the Bank determines that it is probable that it will be unable to collect all principal and interest due according to the contractual terms of the loan/securities agreement(s).
39.2.3 PAST DUE BUT NOT IMPAIRED LOANS Loans and securities where contractual interest or principal payments are past due but the Bank believes that impairment is not appropriate on the basis of the level of security/collateral available and/or the state of collection of amounts owed to the Bank.
39.2.4 ALLOWANCE FOR IMPAIRMENT The Bank establishes an allowance for impairment losses that represents its estimate of incurred losses in its loan portfolio. The main components of this allowance are a specific loss component that relates to individually significant exposures. The allowance for impairment is determined if there is objective evidence of impairment.
39.2.5 WRITE-OFF POLICY The Bank writes off a loan/security balance (and any related allowances for impairment losses) when the Bank determines that the loans/securities are uncollectible. This determination is reached after considering information such as the occurrence of significant changes in the
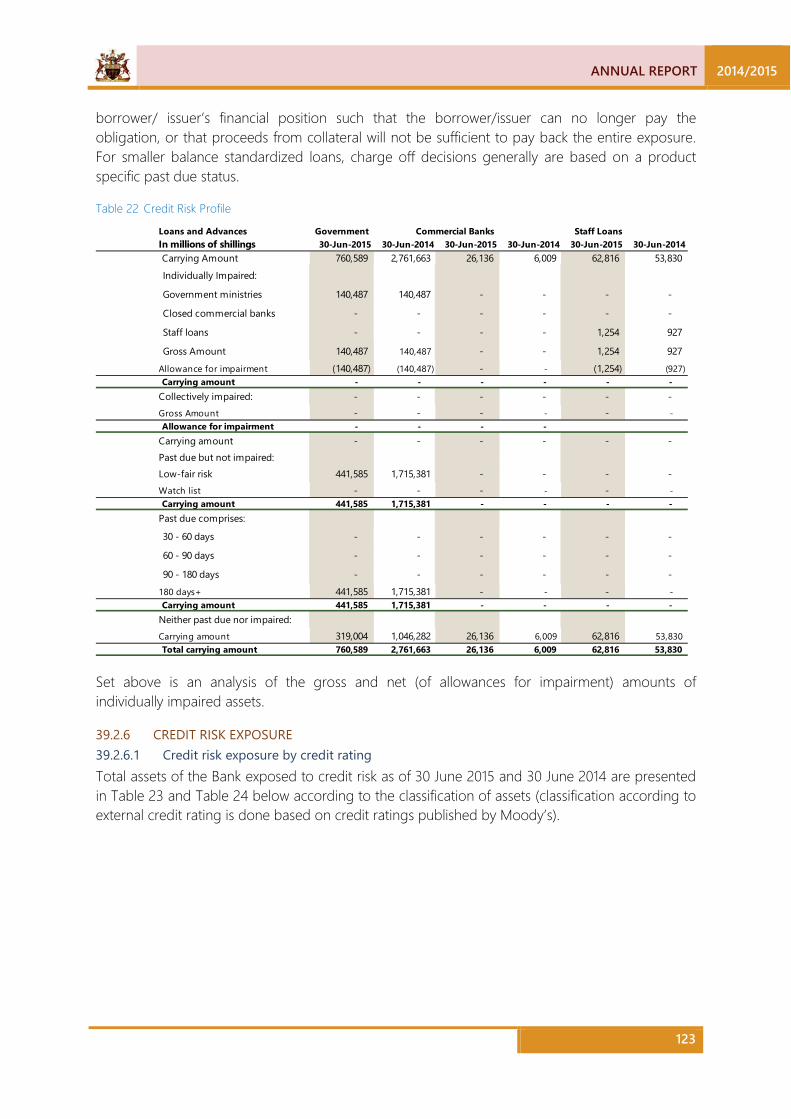
ANNUAL REPORT 2014/2015
123
borrower/ issuer’s financial position such that the borrower/issuer can no longer pay the obligation, or that proceeds from collateral will not be sufficient to pay back the entire exposure. For smaller balance standardized loans, charge off decisions generally are based on a product specific past due status.
Table 22 Credit Risk Profile
Loans and Advances Government Commercial Banks Staff LoansIn millions of shillings 30-Jun-2015 30-Jun-2014 30-Jun-2015 30-Jun-2014 30-Jun-2015 30-Jun-2014Carrying Amount 760,589 2,761,663 26,136 6,009 62,816 53,830 Individually Impaired:
Government ministries 140,487 140,487 - - - -
Closed commercial banks - - - - - -
Staff loans - - - - 1,254 927
Gross Amount 140,487 140,487 - - 1,254 927 Allowance for impairment (140,487) (140,487) - - (1,254) (927) Carrying amount - - - - - -
Collectively impaired: - - - - - - Gross Amount - - - - - - Allowance for impairment - - - -
Carrying amount - - - - - - Past due but not impaired:Low-fair risk 441,585 1,715,381 - - - - Watch list - - - - - - Carrying amount 441,585 1,715,381 - - - -
Past due comprises:
30 - 60 days - - - - - -
60 - 90 days - - - - - -
90 - 180 days - - - - - - 180 days+ 441,585 1,715,381 - - - - Carrying amount 441,585 1,715,381 - - - -
Neither past due nor impaired: Carrying amount 319,004 1,046,282 26,136 6,009 62,816 53,830 Total carrying amount 760,589 2,761,663 26,136 6,009 62,816 53,830
Set above is an analysis of the gross and net (of allowances for impairment) amounts of individually impaired assets.
39.2.6 CREDIT RISK EXPOSURE 39.2.6.1 Credit risk exposure by credit rating Total assets of the Bank exposed to credit risk as of 30 June 2015 and 30 June 2014 are presented in Table 23 and Table 24 below according to the classification of assets (classification according to external credit rating is done based on credit ratings published by Moody’s).
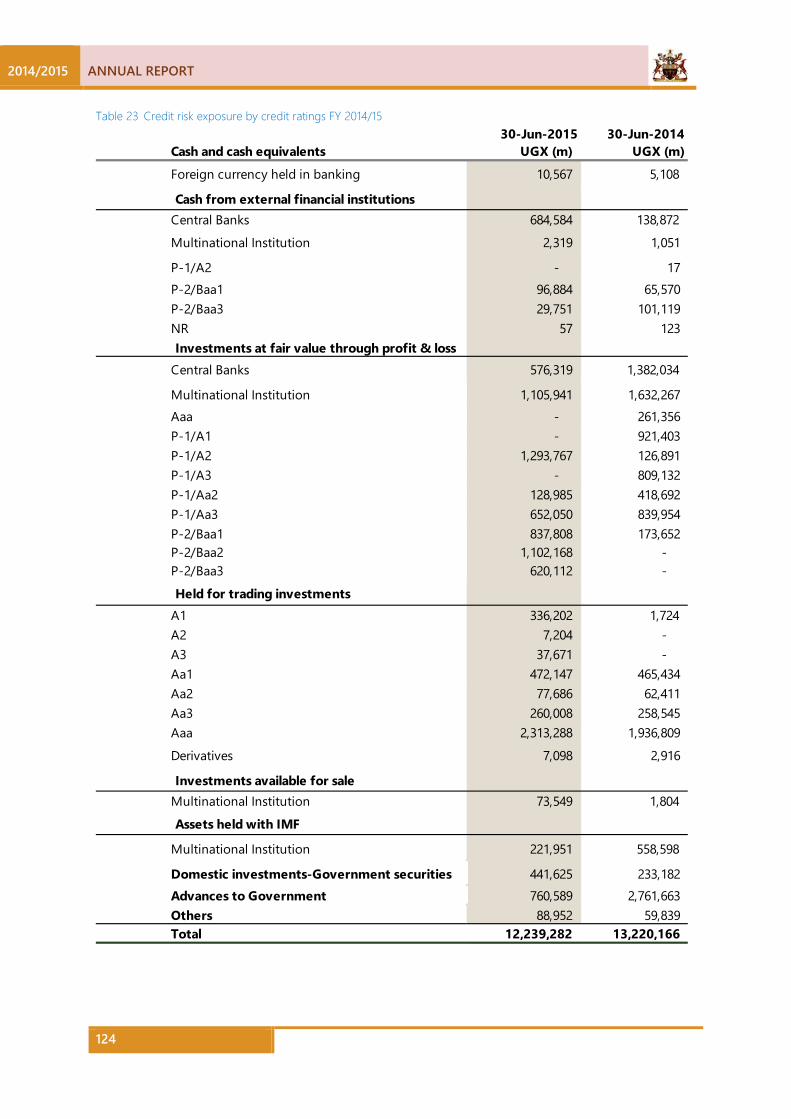
2014/2015 ANNUAL REPORT
124
Table 23 Credit risk exposure by credit ratings FY 2014/15 30-Jun-2015 30-Jun-2014
Cash and cash equivalents UGX (m) UGX (m)Foreign currency held in banking 10,567 5,108
Cash from external financial institutionsCentral Banks 684,584 138,872 Multinational Institution 2,319 1,051
P-1/A2 - 17 P-2/Baa1 96,884 65,570 P-2/Baa3 29,751 101,119 NR 57 123 Investments at fair value through profit & loss
Central Banks 576,319 1,382,034
Multinational Institution 1,105,941 1,632,267 Aaa - 261,356 P-1/A1 - 921,403 P-1/A2 1,293,767 126,891 P-1/A3 - 809,132 P-1/Aa2 128,985 418,692 P-1/Aa3 652,050 839,954 P-2/Baa1 837,808 173,652 P-2/Baa2 1,102,168 - P-2/Baa3 620,112 - Held for trading investments
A1 336,202 1,724 A2 7,204 - A3 37,671 - Aa1 472,147 465,434 Aa2 77,686 62,411 Aa3 260,008 258,545 Aaa 2,313,288 1,936,809 Derivatives 7,098 2,916
Investments available for saleMultinational Institution 73,549 1,804 Assets held with IMF
Multinational Institution 221,951 558,598
Domestic investments-Government securities 441,625 233,182 Advances to Government 760,589 2,761,663 Others 88,952 59,839 Total 12,239,282 13,220,166
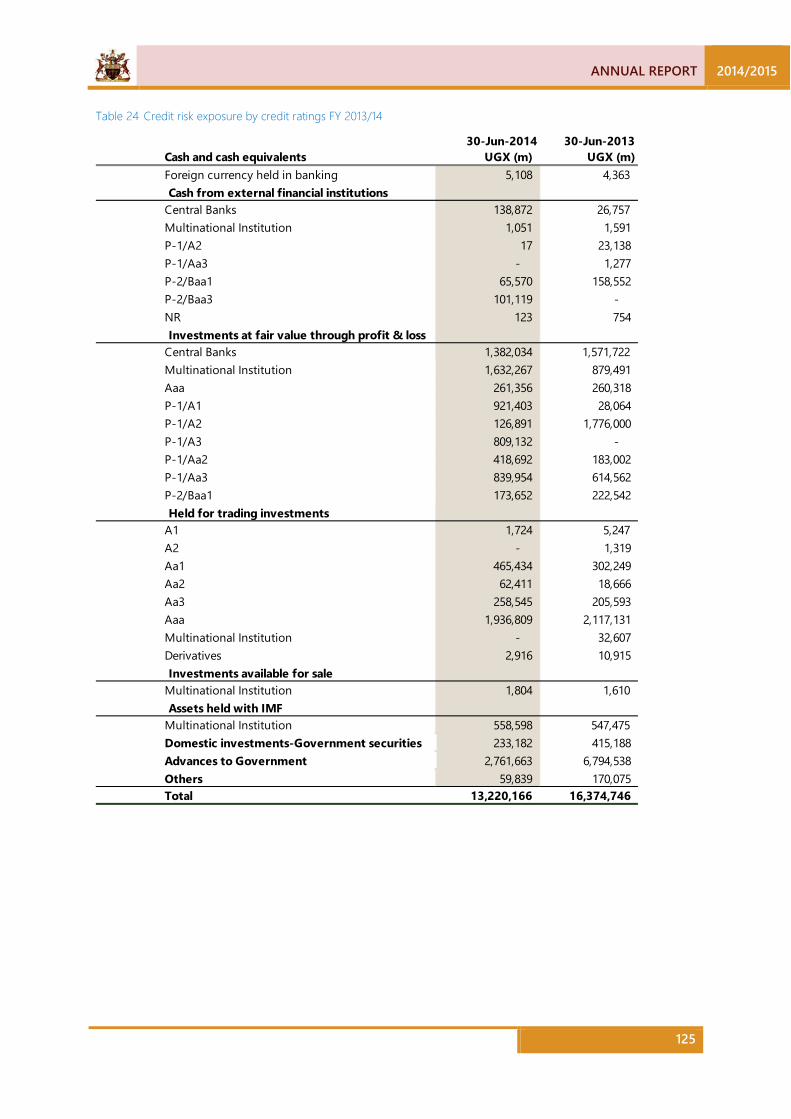
ANNUAL REPORT 2014/2015
125
Table 24 Credit risk exposure by credit ratings FY 2013/14
30-Jun-2014 30-Jun-2013Cash and cash equivalents UGX (m) UGX (m)Foreign currency held in banking 5,108 4,363 Cash from external financial institutions
Central Banks 138,872 26,757 Multinational Institution 1,051 1,591 P-1/A2 17 23,138 P-1/Aa3 - 1,277 P-2/Baa1 65,570 158,552 P-2/Baa3 101,119 - NR 123 754 Investments at fair value through profit & loss
Central Banks 1,382,034 1,571,722 Multinational Institution 1,632,267 879,491 Aaa 261,356 260,318 P-1/A1 921,403 28,064 P-1/A2 126,891 1,776,000 P-1/A3 809,132 - P-1/Aa2 418,692 183,002 P-1/Aa3 839,954 614,562 P-2/Baa1 173,652 222,542 Held for trading investments
A1 1,724 5,247 A2 - 1,319 Aa1 465,434 302,249 Aa2 62,411 18,666 Aa3 258,545 205,593 Aaa 1,936,809 2,117,131 Multinational Institution - 32,607 Derivatives 2,916 10,915 Investments available for sale
Multinational Institution 1,804 1,610 Assets held with IMF
Multinational Institution 558,598 547,475 Domestic investments-Government securities 233,182 415,188 Advances to Government 2,761,663 6,794,538 Others 59,839 170,075 Total 13,220,166 16,374,746
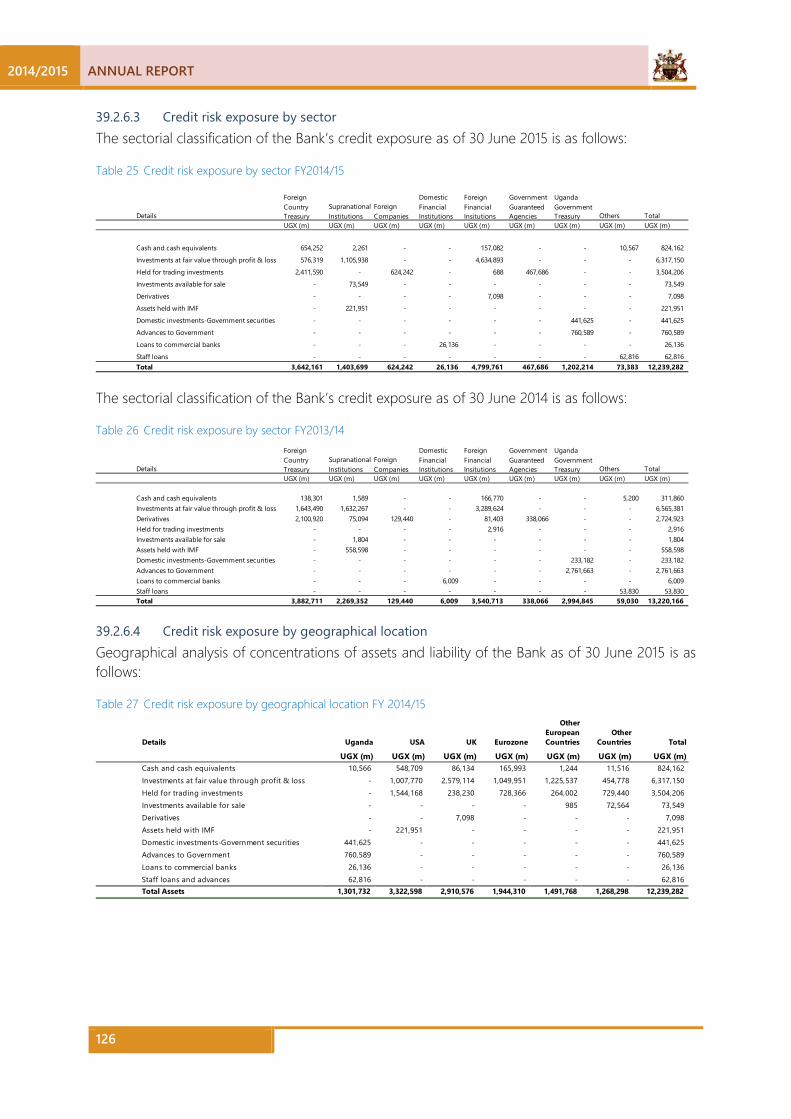
2014/2015 ANNUAL REPORT
126
39.2.6.3 Credit risk exposure by sector The sectorial classification of the Bank’s credit exposure as of 30 June 2015 is as follows:
Table 25 Credit risk exposure by sector FY2014/15
Details
Foreign Country Treasury
Supranational Institutions
Foreign Companies
Domestic Financial Institutions
Foreign Financial Insitutions
Government Guaranteed Agencies
Uganda Government Treasury Others Total
UGX (m) UGX (m) UGX (m) UGX (m) UGX (m) UGX (m) UGX (m) UGX (m) UGX (m)
Cash and cash equivalents 654,252 2,261 - - 157,082 - - 10,567 824,162
Investments at fair value through profit & loss 576,319 1,105,938 - - 4,634,893 - - - 6,317,150
Held for trading investments 2,411,590 - 624,242 - 688 467,686 - - 3,504,206
Investments available for sale - 73,549 - - - - - - 73,549
Derivatives - - - - 7,098 - - - 7,098
Assets held with IMF - 221,951 - - - - - - 221,951
Domestic investments-Government securities - - - - - - 441,625 - 441,625
Advances to Government - - - - - - 760,589 - 760,589
Loans to commercial banks - - - 26,136 - - - - 26,136
Staff loans - - - - - - - 62,816 62,816 Total 3,642,161 1,403,699 624,242 26,136 4,799,761 467,686 1,202,214 73,383 12,239,282
The sectorial classification of the Bank’s credit exposure as of 30 June 2014 is as follows:
Table 26 Credit risk exposure by sector FY2013/14
Details
Foreign Country Treasury
Supranational Institutions
Foreign Companies
Domestic Financial Institutions
Foreign Financial Insitutions
Government Guaranteed Agencies
Uganda Government Treasury Others Total
UGX (m) UGX (m) UGX (m) UGX (m) UGX (m) UGX (m) UGX (m) UGX (m) UGX (m)
Cash and cash equivalents 138,301 1,589 - - 166,770 - - 5,200 311,860 Investments at fair value through profit & loss 1,643,490 1,632,267 - - 3,289,624 - - - 6,565,381 Derivatives 2,100,920 75,094 129,440 - 81,403 338,066 - - 2,724,923 Held for trading investments - - - - 2,916 - - - 2,916 Investments available for sale - 1,804 - - - - - - 1,804 Assets held with IMF - 558,598 - - - - - - 558,598 Domestic investments-Government securities - - - - - - 233,182 - 233,182 Advances to Government - - - - - - 2,761,663 - 2,761,663 Loans to commercial banks - - - 6,009 - - - - 6,009 Staff loans - - - - - - - 53,830 53,830 Total 3,882,711 2,269,352 129,440 6,009 3,540,713 338,066 2,994,845 59,030 13,220,166
39.2.6.4 Credit risk exposure by geographical location Geographical analysis of concentrations of assets and liability of the Bank as of 30 June 2015 is as follows:
Table 27 Credit risk exposure by geographical location FY 2014/15
Details Uganda USA UK Eurozone
Other European Countries
Other Countries Total
UGX (m) UGX (m) UGX (m) UGX (m) UGX (m) UGX (m) UGX (m)Cash and cash equivalents 10,566 548,709 86,134 165,993 1,244 11,516 824,162 Investments at fair value through profit & loss - 1,007,770 2,579,114 1,049,951 1,225,537 454,778 6,317,150 Held for trading investments - 1,544,168 238,230 728,366 264,002 729,440 3,504,206 Investments available for sale - - - - 985 72,564 73,549 Derivatives - - 7,098 - - - 7,098 Assets held with IMF - 221,951 - - - - 221,951 Domestic investments-Government securities 441,625 - - - - - 441,625 Advances to Government 760,589 - - - - - 760,589 Loans to commercial banks 26,136 - - - - - 26,136 Staff loans and advances 62,816 - - - - - 62,816 Total Assets 1,301,732 3,322,598 2,910,576 1,944,310 1,491,768 1,268,298 12,239,282
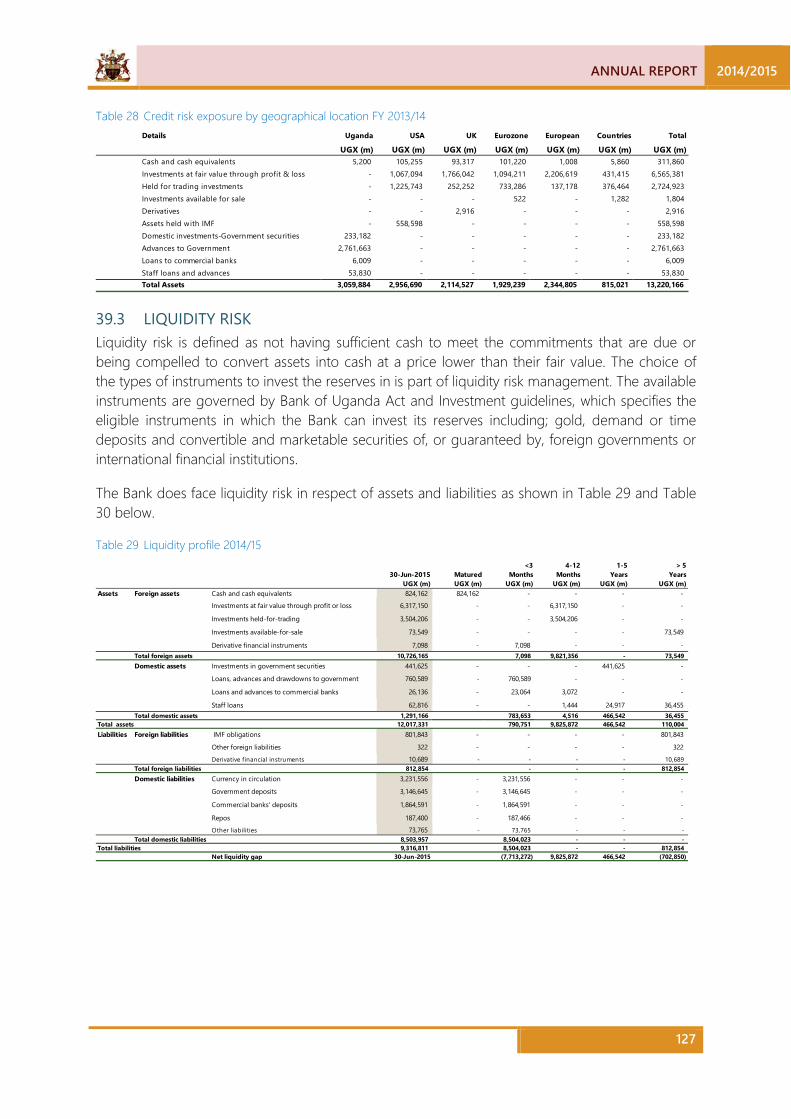
ANNUAL REPORT 2014/2015
127
Table 28 Credit risk exposure by geographical location FY 2013/14 Details Uganda USA UK Eurozone
European
Countries Total
UGX (m) UGX (m) UGX (m) UGX (m) UGX (m) UGX (m) UGX (m)Cash and cash equivalents 5,200 105,255 93,317 101,220 1,008 5,860 311,860 Investments at fair value through profit & loss - 1,067,094 1,766,042 1,094,211 2,206,619 431,415 6,565,381 Held for trading investments - 1,225,743 252,252 733,286 137,178 376,464 2,724,923 Investments available for sale - - - 522 - 1,282 1,804 Derivatives - - 2,916 - - - 2,916 Assets held with IMF - 558,598 - - - - 558,598 Domestic investments-Government securities 233,182 - - - - - 233,182 Advances to Government 2,761,663 - - - - - 2,761,663 Loans to commercial banks 6,009 - - - - - 6,009 Staff loans and advances 53,830 - - - - - 53,830 Total Assets 3,059,884 2,956,690 2,114,527 1,929,239 2,344,805 815,021 13,220,166
39.3 LIQUIDITY RISK Liquidity risk is defined as not having sufficient cash to meet the commitments that are due or being compelled to convert assets into cash at a price lower than their fair value. The choice of the types of instruments to invest the reserves in is part of liquidity risk management. The available instruments are governed by Bank of Uganda Act and Investment guidelines, which specifies the eligible instruments in which the Bank can invest its reserves including; gold, demand or time deposits and convertible and marketable securities of, or guaranteed by, foreign governments or international financial institutions.
The Bank does face liquidity risk in respect of assets and liabilities as shown in Table 29 and Table 30 below.
Table 29 Liquidity profile 2014/15 <3 4-12 1-5 > 5
30-Jun-2015 Matured Months Months Years YearsUGX (m) UGX (m) UGX (m) UGX (m) UGX (m) UGX (m)
Assets Foreign assets Cash and cash equivalents 824,162 824,162 - - - -
Investments at fair value through profit or loss 6,317,150 - - 6,317,150 - -
Investments held-for-trading 3,504,206 - - 3,504,206 - -
Investments available-for-sale 73,549 - - - - 73,549
Derivative financial instruments 7,098 - 7,098 - - - Total foreign assets 10,726,165 7,098 9,821,356 - 73,549 Domestic assets Investments in government securities 441,625 - - - 441,625 -
Loans, advances and drawdowns to government 760,589 - 760,589 - - -
Loans and advances to commercial banks 26,136 - 23,064 3,072 - -
Staff loans 62,816 - - 1,444 24,917 36,455 Total domestic assets 1,291,166 783,653 4,516 466,542 36,455
Total assets 12,017,331 790,751 9,825,872 466,542 110,004 Liabilities Foreign liabilities IMF obligations 801,843 - - - - 801,843
Other foreign liabilities 322 - - - - 322
Derivative financial instruments 10,689 - - - - 10,689 Total foreign liabilities 812,854 - - - 812,854 Domestic liabilities Currency in circulation 3,231,556 - 3,231,556 - - -
Government deposits 3,146,645 - 3,146,645 - - -
Commercial banks' deposits 1,864,591 - 1,864,591 - - -
Repos 187,400 - 187,466 - - - Other liabilities 73,765 - 73,765 - - -
Total domestic liabilities 8,503,957 8,504,023 - - - Total liabilities 9,316,811 8,504,023 - - 812,854
Net liquidity gap 30-Jun-2015 (7,713,272) 9,825,872 466,542 (702,850)

2014/2015 ANNUAL REPORT
128
Table 30 Liquidity profile 2013/14
<3 4-12 1-5 > 530-Jun-2014 Matured Months Months Years Years
UGX (m) UGX (m) UGX (m) UGX (m) UGX (m) UGX (m)Assets Foreign assets Cash and cash equivalents 311,860 311,860 - - - -
Investments at fair value through profit or loss 6,565,381 - - 6,565,381 - -
Investments held-for-trading 2,724,923 - - 2,724,923 - -
Investments available-for-sale 1,804 - - - - 1,804
Derivative financial instruments 2,916 - 2,916 - - - Total foreign assets 9,606,884 2,916 9,290,304 - 1,804 Domestic assets Investments in government securities 233,182 - 233,182 - - -
Loans, advances and drawdowns to government 2,761,663 - 2,761,663 - - -
Loans and advances to commercial banks 6,009 - 6,009 - - -
Staff loans 53,830 - 734 988 31,128 20,980 Total domestic assets 3,054,684 3,001,588 988 31,128 20,980
Total assets 13,677,887 3,004,504 9,291,292 31,128 22,784 Liabilities Foreign liabilities IMF obligations 694,728 - - - 694,728
Other foreign liabilities 353 - - - 353
Derivative financial instruments 12,675 - - - 12,675 Total foreign liabilities 707,756 - - - 707,756 Domestic liabilities Currency in circulation 2,746,092 2,746,092 - - -
Government deposits 6,007,624 4,422,573 - - 1,585,051
Commercial banks' deposits 1,371,783 1,371,783 - - -
Repos 910,854 910,854 - - -
Other liabilities 168,006 168,006 - - -
Total domestic liabilities 11,204,359 9,619,308 - - 1,585,051 Total liabilities 11,912,115 9,619,308 - - 2,292,807
Net liquidity gap 30-Jun-2014 (6,614,804) 9,291,292 31,128 (2,270,023)
39.4 MANAGEMENT OF LIQUIDITY RISK The Bank’s approach of managing liquidity is to ensure that as far as possible, that it will always have sufficient liquidity to meet its liabilities when due under both normal and stressed conditions without incurring unacceptable losses or risking damage to the Bank’s reputation.
In order to manage liquidity risk, the Bank invests its surplus reserves in time deposits with maturities concentrated in short-term maturity span of one to three months. The portfolio is structured in such a manner that a mix of deposits matures on timely manner to ensure availability of funds to meet scheduled government and the Bank’s obligations.
39.5 INTEREST RATE RISK Interest rate risk is a risk that changes in interest rates and credit spreads will affect the Bank’s income or the value of its holding of financial instruments.
Changes in market interest rates have a direct effect on the contractually determined cash flows associated with specific financial assets and financial liabilities, whose interest rates are periodically reset to market, as well as the fair value of other instruments on which the interest rates are fixed throughout the period of the contract.
39.6 MANAGEMENT OF INTEREST RATE RISK The objective of interest rate risk management is to manage and control interest rate risk exposures within acceptable parameters while optimizing the return on risk.
The Bank separates its exposure to interest rate risk between the internally managed portfolio and the externally managed portfolio. The externally managed portfolio is held by fund managers.
The table below summarizes the Bank’s exposure to interest rates risk. Included in the table are the Bank’s assets and liabilities at carrying amounts categorized by the earlier of contractual repricing or maturity dates
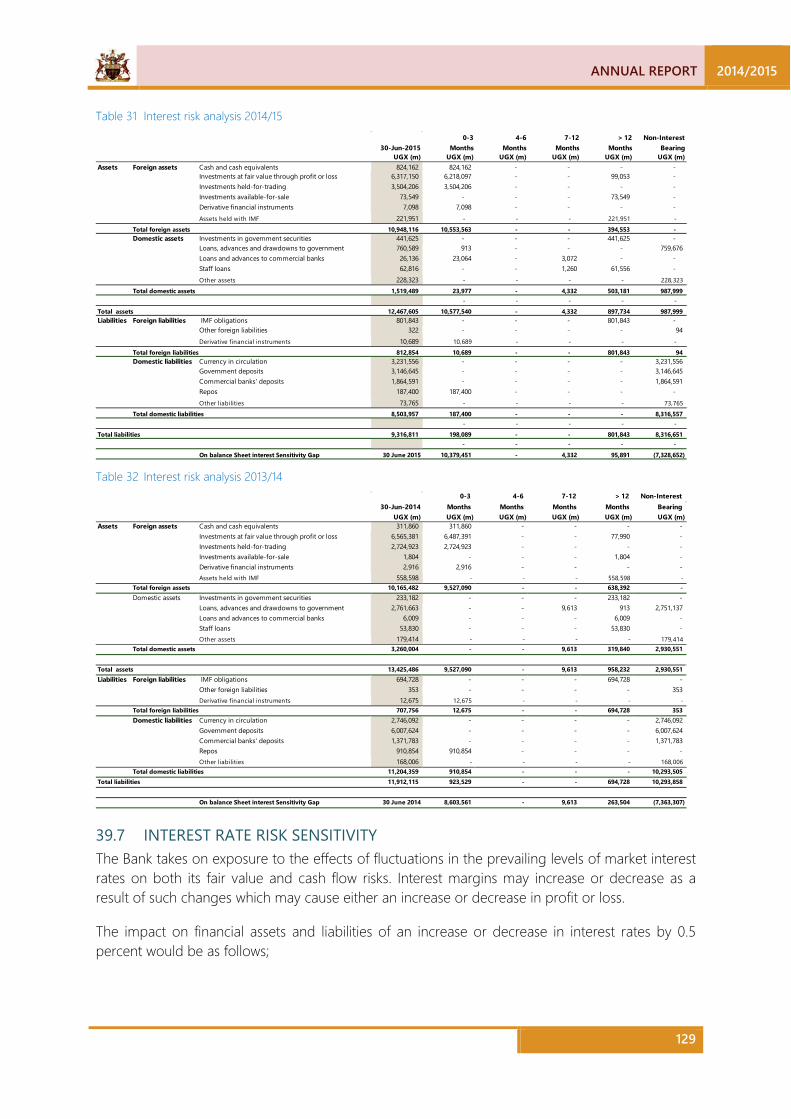
ANNUAL REPORT 2014/2015
129
Table 31 Interest risk analysis 2014/15 0-3 4-6 7-12 > 12 Non-Interest
30-Jun-2015 Months Months Months Months BearingUGX (m) UGX (m) UGX (m) UGX (m) UGX (m) UGX (m)
Assets Foreign assets Cash and cash equivalents 824,162 824,162 - - - - Investments at fair value through profit or loss 6,317,150 6,218,097 - - 99,053 - Investments held-for-trading 3,504,206 3,504,206 - - - - Investments available-for-sale 73,549 - - - 73,549 - Derivative financial instruments 7,098 7,098 - - - - Assets held with IMF 221,951 - - - 221,951 -
Total foreign assets 10,948,116 10,553,563 - - 394,553 - Domestic assets Investments in government securities 441,625 - - - 441,625 -
Loans, advances and drawdowns to government 760,589 913 - - - 759,676 Loans and advances to commercial banks 26,136 23,064 - 3,072 - - Staff loans 62,816 - - 1,260 61,556 - Other assets 228,323 - - - - 228,323
Total domestic assets 1,519,489 23,977 - 4,332 503,181 987,999 - - - - -
Total assets 12,467,605 10,577,540 - 4,332 897,734 987,999 Liabilities Foreign liabilities IMF obligations 801,843 - - - 801,843 -
Other foreign liabilities 322 - - - - 94 Derivative financial instruments 10,689 10,689 - - - -
Total foreign liabilities 812,854 10,689 - - 801,843 94 Domestic liabilities Currency in circulation 3,231,556 - - - - 3,231,556
Government deposits 3,146,645 - - - - 3,146,645 Commercial banks' deposits 1,864,591 - - - - 1,864,591 Repos 187,400 187,400 - - - - Other liabilities 73,765 - - - - 73,765
Total domestic liabilities 8,503,957 187,400 - - - 8,316,557 - - - - -
Total liabilities 9,316,811 198,089 - - 801,843 8,316,651 - - - - -
On balance Sheet interest Sensitivity Gap 30 June 2015 10,379,451 - 4,332 95,891 (7,328,652) Table 32 Interest risk analysis 2013/14
0-3 4-6 7-12 > 12 Non-Interest30-Jun-2014 Months Months Months Months Bearing
UGX (m) UGX (m) UGX (m) UGX (m) UGX (m) UGX (m)Assets Foreign assets Cash and cash equivalents 311,860 311,860 - - - -
Investments at fair value through profit or loss 6,565,381 6,487,391 - - 77,990 - Investments held-for-trading 2,724,923 2,724,923 - - - - Investments available-for-sale 1,804 - - - 1,804 - Derivative financial instruments 2,916 2,916 - - - - Assets held with IMF 558,598 - - - 558,598 -
Total foreign assets 10,165,482 9,527,090 - - 638,392 - Domestic assets Investments in government securities 233,182 - - - 233,182 -
Loans, advances and drawdowns to government 2,761,663 - - 9,613 913 2,751,137 Loans and advances to commercial banks 6,009 - - - 6,009 - Staff loans 53,830 - - - 53,830 - Other assets 179,414 - - - - 179,414
Total domestic assets 3,260,004 - - 9,613 319,840 2,930,551
Total assets 13,425,486 9,527,090 - 9,613 958,232 2,930,551 Liabilities Foreign liabilities IMF obligations 694,728 - - - 694,728 -
Other foreign liabilities 353 - - - - 353 Derivative financial instruments 12,675 12,675 - - - -
Total foreign liabilities 707,756 12,675 - - 694,728 353 Domestic liabilities Currency in circulation 2,746,092 - - - - 2,746,092
Government deposits 6,007,624 - - - - 6,007,624 Commercial banks' deposits 1,371,783 - - - - 1,371,783 Repos 910,854 910,854 - - - - Other liabilities 168,006 - - - - 168,006
Total domestic liabilities 11,204,359 910,854 - - - 10,293,505 Total liabilities 11,912,115 923,529 - - 694,728 10,293,858
On balance Sheet interest Sensitivity Gap 30 June 2014 8,603,561 - 9,613 263,504 (7,363,307)
39.7 INTEREST RATE RISK SENSITIVITY The Bank takes on exposure to the effects of fluctuations in the prevailing levels of market interest rates on both its fair value and cash flow risks. Interest margins may increase or decrease as a result of such changes which may cause either an increase or decrease in profit or loss.
The impact on financial assets and liabilities of an increase or decrease in interest rates by 0.5 percent would be as follows;
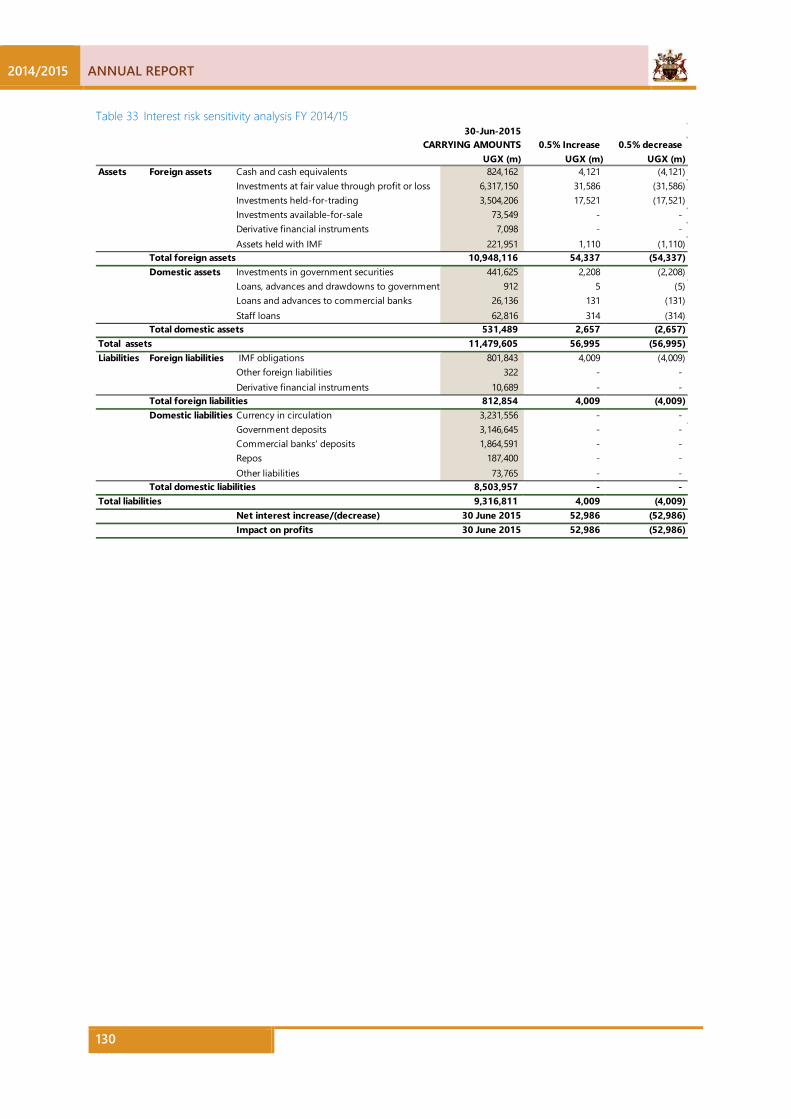
2014/2015 ANNUAL REPORT
130
Table 33 Interest risk sensitivity analysis FY 2014/15 30-Jun-2015
CARRYING AMOUNTS 0.5% Increase 0.5% decreaseUGX (m) UGX (m) UGX (m)
Assets Foreign assets Cash and cash equivalents 824,162 4,121 (4,121) Investments at fair value through profit or loss 6,317,150 31,586 (31,586) Investments held-for-trading 3,504,206 17,521 (17,521) Investments available-for-sale 73,549 - - Derivative financial instruments 7,098 - - Assets held with IMF 221,951 1,110 (1,110)
Total foreign assets 10,948,116 54,337 (54,337) Domestic assets Investments in government securities 441,625 2,208 (2,208)
Loans, advances and drawdowns to government 912 5 (5) Loans and advances to commercial banks 26,136 131 (131) Staff loans 62,816 314 (314)
Total domestic assets 531,489 2,657 (2,657) Total assets 11,479,605 56,995 (56,995) Liabilities Foreign liabilities IMF obligations 801,843 4,009 (4,009)
Other foreign liabilities 322 - - Derivative financial instruments 10,689 - -
Total foreign liabilities 812,854 4,009 (4,009) Domestic liabilities Currency in circulation 3,231,556 - -
Government deposits 3,146,645 - - Commercial banks' deposits 1,864,591 - - Repos 187,400 - - Other liabilities 73,765 - -
Total domestic liabilities 8,503,957 - - Total liabilities 9,316,811 4,009 (4,009)
Net interest increase/(decrease) 30 June 2015 52,986 (52,986) Impact on profits 30 June 2015 52,986 (52,986)
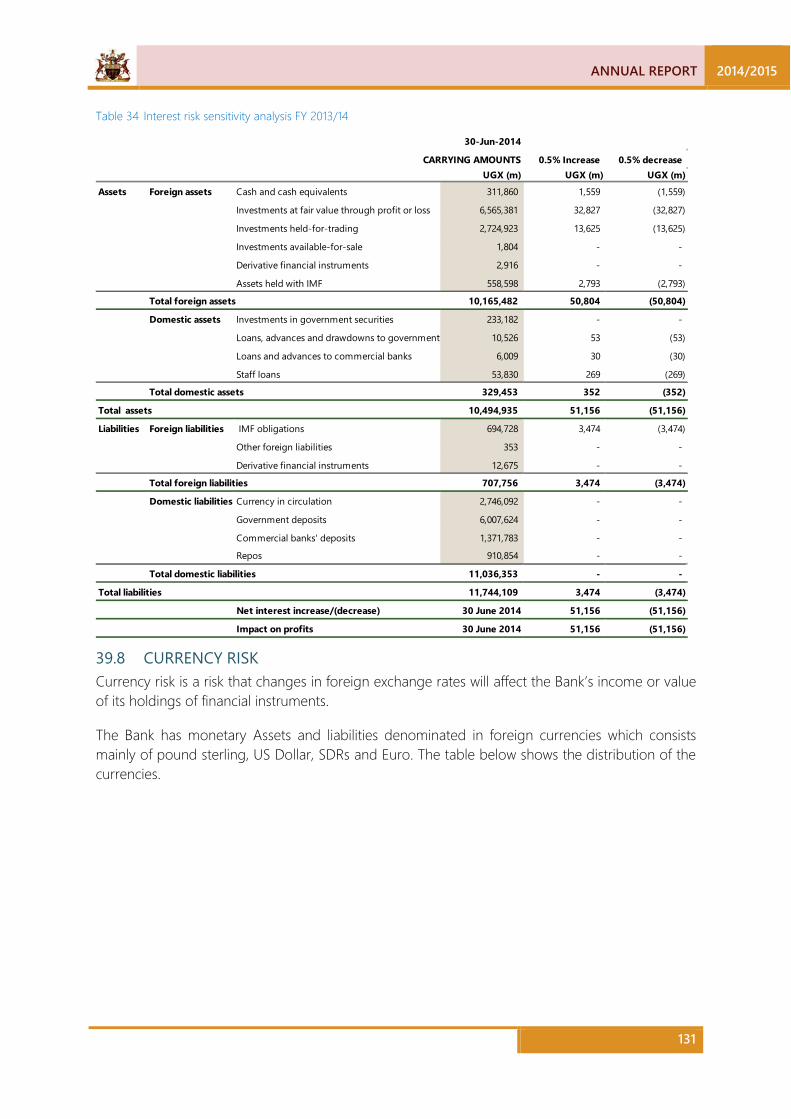
ANNUAL REPORT 2014/2015
131
Table 34 Interest risk sensitivity analysis FY 2013/14
30-Jun-2014
CARRYING AMOUNTS 0.5% Increase 0.5% decreaseUGX (m) UGX (m) UGX (m)
Assets Foreign assets Cash and cash equivalents 311,860 1,559 (1,559)
Investments at fair value through profit or loss 6,565,381 32,827 (32,827)
Investments held-for-trading 2,724,923 13,625 (13,625)
Investments available-for-sale 1,804 - -
Derivative financial instruments 2,916 - -
Assets held with IMF 558,598 2,793 (2,793)
Total foreign assets 10,165,482 50,804 (50,804)
Domestic assets Investments in government securities 233,182 - -
Loans, advances and drawdowns to government 10,526 53 (53)
Loans and advances to commercial banks 6,009 30 (30)
Staff loans 53,830 269 (269)
Total domestic assets 329,453 352 (352)
Total assets 10,494,935 51,156 (51,156)
Liabilities Foreign liabilities IMF obligations 694,728 3,474 (3,474)
Other foreign liabilities 353 - -
Derivative financial instruments 12,675 - -
Total foreign liabilities 707,756 3,474 (3,474)
Domestic liabilities Currency in circulation 2,746,092 - -
Government deposits 6,007,624 - -
Commercial banks' deposits 1,371,783 - -
Repos 910,854 - -
Total domestic liabilities 11,036,353 - -
Total liabilities 11,744,109 3,474 (3,474)
Net interest increase/(decrease) 30 June 2014 51,156 (51,156)
Impact on profits 30 June 2014 51,156 (51,156)
39.8 CURRENCY RISK Currency risk is a risk that changes in foreign exchange rates will affect the Bank’s income or value of its holdings of financial instruments.
The Bank has monetary Assets and liabilities denominated in foreign currencies which consists mainly of pound sterling, US Dollar, SDRs and Euro. The table below shows the distribution of the currencies.
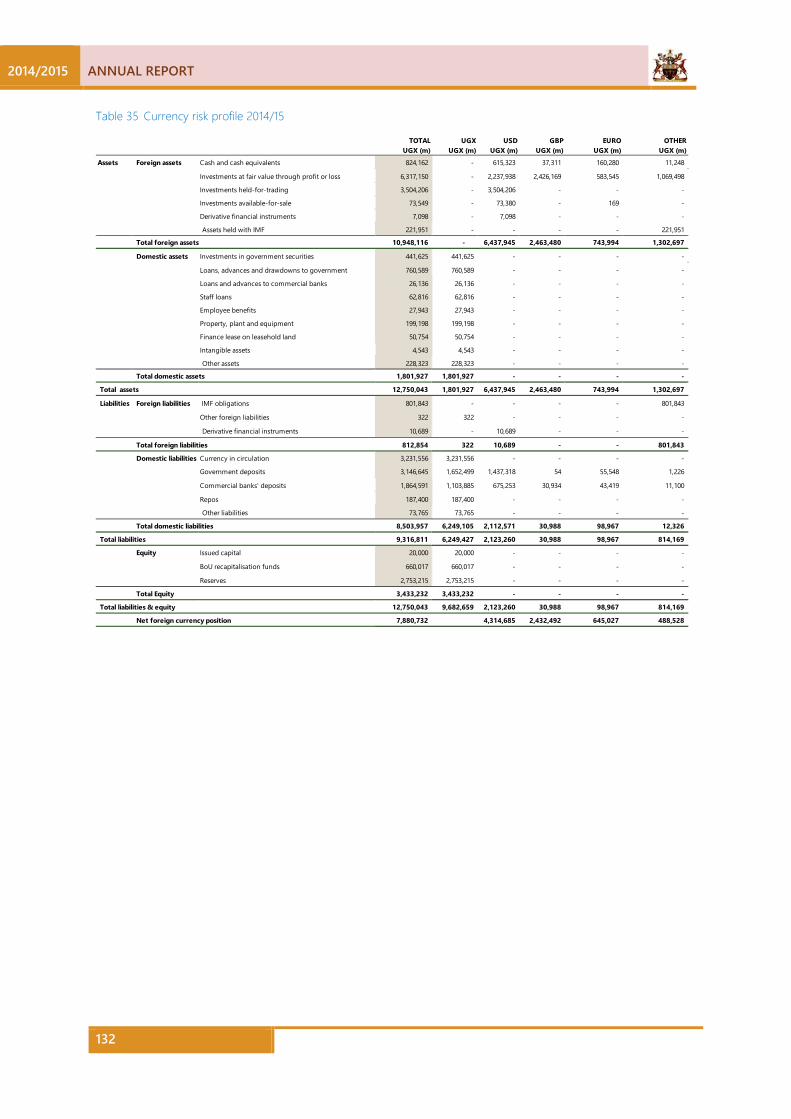
2014/2015 ANNUAL REPORT
132
Table 35 Currency risk profile 2014/15
TOTAL UGX USD GBP EURO OTHERUGX (m) UGX (m) UGX (m) UGX (m) UGX (m) UGX (m)
Assets Foreign assets Cash and cash equivalents 824,162 - 615,323 37,311 160,280 11,248
Investments at fair value through profit or loss 6,317,150 - 2,237,938 2,426,169 583,545 1,069,498
Investments held-for-trading 3,504,206 - 3,504,206 - - -
Investments available-for-sale 73,549 - 73,380 - 169 -
Derivative financial instruments 7,098 - 7,098 - - -
Assets held with IMF 221,951 - - - - 221,951
Total foreign assets 10,948,116 - 6,437,945 2,463,480 743,994 1,302,697
Domestic assets Investments in government securities 441,625 441,625 - - - -
Loans, advances and drawdowns to government 760,589 760,589 - - - -
Loans and advances to commercial banks 26,136 26,136 - - - -
Staff loans 62,816 62,816 - - - -
Employee benefits 27,943 27,943 - - - -
Property, plant and equipment 199,198 199,198 - - - -
Finance lease on leasehold land 50,754 50,754 - - - -
Intangible assets 4,543 4,543 - - - -
Other assets 228,323 228,323 - - - -
Total domestic assets 1,801,927 1,801,927 - - - -
Total assets 12,750,043 1,801,927 6,437,945 2,463,480 743,994 1,302,697
Liabilities Foreign liabilities IMF obligations 801,843 - - - - 801,843
Other foreign liabilities 322 322 - - - -
Derivative financial instruments 10,689 - 10,689 - - -
Total foreign liabilities 812,854 322 10,689 - - 801,843
Domestic liabilities Currency in circulation 3,231,556 3,231,556 - - - -
Government deposits 3,146,645 1,652,499 1,437,318 54 55,548 1,226
Commercial banks' deposits 1,864,591 1,103,885 675,253 30,934 43,419 11,100
Repos 187,400 187,400 - - - -
Other liabilities 73,765 73,765 - - - -
Total domestic liabilities 8,503,957 6,249,105 2,112,571 30,988 98,967 12,326
Total liabilities 9,316,811 6,249,427 2,123,260 30,988 98,967 814,169
Equity Issued capital 20,000 20,000 - - - -
BoU recapitalisation funds 660,017 660,017 - - - -
Reserves 2,753,215 2,753,215 - - - -
Total Equity 3,433,232 3,433,232 - - - -
Total liabilities & equity 12,750,043 9,682,659 2,123,260 30,988 98,967 814,169
Net foreign currency position 7,880,732 4,314,685 2,432,492 645,027 488,528

ANNUAL REPORT 2014/2015
133
Table 36 Currency risk profile 2013/14
TOTAL UGX USD GBP EURO OTHERUGX (m) UGX (m) UGX (m) UGX (m) UGX (m) UGX (m)
Assets Foreign assets Cash and cash equivalents 311,860 - 211,880 31,440 63,313 5,227
Investments at fair value through profit or loss 6,565,381 - 2,995,681 2,060,021 510,027 999,652
Investments held-for-trading 2,724,923 - 2,724,923 - - -
Investments available-for-sale 1,804 - 1,635 - 169 -
Derivative financial instruments 2,916 - 2,916 - - -
Assets held with IMF 558,598 - - - - 558,598
Total foreign assets 10,165,482 - 5,937,035 2,091,461 573,509 1,563,477
Domestic assets Investments in government securities 233,182 233,182 - - - -
Loans, advances and drawdowns to government 2,761,663 2,761,663 - - - -
Loans and advances to commercial banks 6,009 6,009 - - - -
Staff loans 53,830 53,830 - - - -
Employee benefits 25,906 25,906 - - - -
Property, plant and equipment 197,815 197,815 - - - -
Finance lease on leasehold land 50,754 50,754 - - - -
Intangible assets 3,832 3,832 - - - -
Other assets 179,414 179,414 - - - -
Total domestic assets 3,512,405 3,512,405 - - - -
Total assets 13,677,887 3,512,405 5,937,035 2,091,461 573,509 1,563,477
Liabilities Foreign liabilities IMF obligations 694,728 - - - - 694,728
Other foreign liabilities 353 353 - - - -
Derivative financial instruments 12,675 - 12,675 - - -
Total foreign liabilities 707,756 353 12,675 - - 694,728
Domestic liabilities Currency in circulation 2,746,092 2,746,092
Government deposits 6,007,624 4,498,932 1,437,318 54 64,090 7,230
Commercial banks' deposits 1,371,783 1,050,614 283,339 13,300 19,984 4,546
Repos 910,854 910,854 - - - -
Other liabilities 168,006 168,006 - - - -
Total domestic liabilities 11,204,359 9,374,498 1,720,657 13,354 84,074 11,776
Total liabilities 11,912,115 9,374,851 1,733,332 13,354 84,074 706,504
Equity Issued capital 20,000 20,000 - - - -
BoU recapitalisation funds 410,017 410,017 - - - -
Reserves 1,335,755 1,335,755 - - - -
Total Equity 1,765,772 1,765,772 - - - -
Total liabilities & equity 13,677,887 11,140,623 1,733,332 13,354 84,074 706,504
Net foreign currency position 7,628,218 4,203,703 2,078,107 489,435 856,973
39.9 MANAGEMENT OF CURRENCY RISK The Bank has an investment committee that offers oversight over this risk that regularly meets to review and monitor developments in the respective currency markets.
39.10 CURRENCY RISK SENSITIVITY ANALYSIS The impact on financial assets and liabilities of 15 percent appreciation or depreciation of the Uganda Shilling would be as follows:
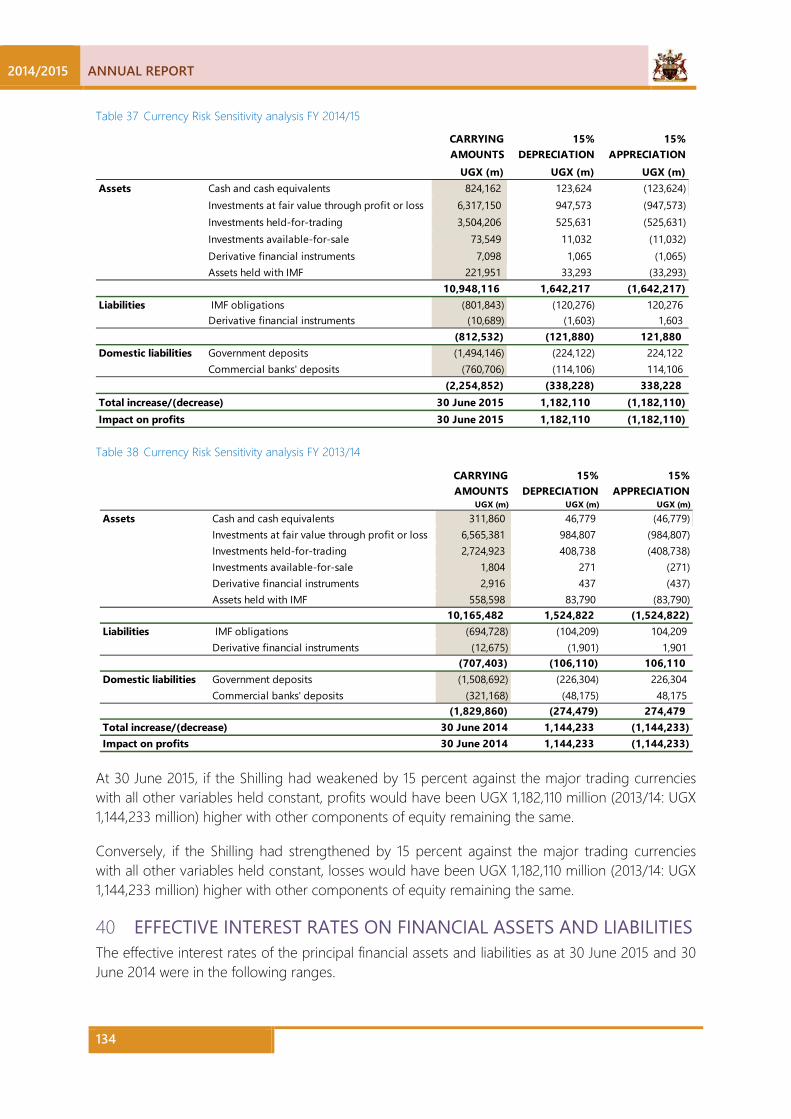
2014/2015 ANNUAL REPORT
134
Table 37 Currency Risk Sensitivity analysis FY 2014/15
CARRYING AMOUNTS
15% DEPRECIATION
15% APPRECIATION
UGX (m) UGX (m) UGX (m)Assets Cash and cash equivalents 824,162 123,624 (123,624)
Investments at fair value through profit or loss 6,317,150 947,573 (947,573) Investments held-for-trading 3,504,206 525,631 (525,631) Investments available-for-sale 73,549 11,032 (11,032) Derivative financial instruments 7,098 1,065 (1,065) Assets held with IMF 221,951 33,293 (33,293)
10,948,116 1,642,217 (1,642,217) Liabilities IMF obligations (801,843) (120,276) 120,276
Derivative financial instruments (10,689) (1,603) 1,603 (812,532) (121,880) 121,880
Domestic liabilities Government deposits (1,494,146) (224,122) 224,122 Commercial banks' deposits (760,706) (114,106) 114,106
(2,254,852) (338,228) 338,228 Total increase/(decrease) 30 June 2015 1,182,110 (1,182,110) Impact on profits 30 June 2015 1,182,110 (1,182,110)
Table 38 Currency Risk Sensitivity analysis FY 2013/14
CARRYING AMOUNTS
15% DEPRECIATION
15% APPRECIATION
UGX (m) UGX (m) UGX (m)Assets Cash and cash equivalents 311,860 46,779 (46,779)
Investments at fair value through profit or loss 6,565,381 984,807 (984,807) Investments held-for-trading 2,724,923 408,738 (408,738) Investments available-for-sale 1,804 271 (271) Derivative financial instruments 2,916 437 (437) Assets held with IMF 558,598 83,790 (83,790)
10,165,482 1,524,822 (1,524,822) Liabilities IMF obligations (694,728) (104,209) 104,209
Derivative financial instruments (12,675) (1,901) 1,901 (707,403) (106,110) 106,110
Domestic liabilities Government deposits (1,508,692) (226,304) 226,304 Commercial banks' deposits (321,168) (48,175) 48,175
(1,829,860) (274,479) 274,479 Total increase/(decrease) 30 June 2014 1,144,233 (1,144,233) Impact on profits 30 June 2014 1,144,233 (1,144,233)
At 30 June 2015, if the Shilling had weakened by 15 percent against the major trading currencies with all other variables held constant, profits would have been UGX 1,182,110 million (2013/14: UGX 1,144,233 million) higher with other components of equity remaining the same.
Conversely, if the Shilling had strengthened by 15 percent against the major trading currencies with all other variables held constant, losses would have been UGX 1,182,110 million (2013/14: UGX 1,144,233 million) higher with other components of equity remaining the same.
40 EFFECTIVE INTEREST RATES ON FINANCIAL ASSETS AND LIABILITIES The effective interest rates of the principal financial assets and liabilities as at 30 June 2015 and 30 June 2014 were in the following ranges.

ANNUAL REPORT 2014/2015
135
30-Jun-2015 30-Jun-2014% %
Assets Investments at fairvalue through profit or loss 0.72 0.59 Investments held-for-trading 1.19 1.47 Assets held for IMF 0.07 0.08 Investments in treasury bills 7.78 13.98 Staff loans 11.56 11.62 Loans and advances to commercial banks 27.28 7.16
Liabilities IMF Obligations 0.05 0.10
41 FAIR VALUE OF ASSETS AND LIABILITIES The following is a description of how fair values are determined for financial instruments that are recorded at fair value using valuation techniques. These incorporate the Bank’s estimate of assumptions that a market participant would make when valuing the instruments.
The fair values of financial assets and financial liabilities with standard terms and conditions and traded on active liquid markets are determined with reference to quoted market prices.
The fair values of other financial assets and financial liabilities are determined using valuation techniques. The fair values are based on net present value, discounted cash flow models and comparison with prices from observable current market transactions and dealer quotes for similar instruments.
The objective of valuation techniques is to arrive at a fair value measurement that reflects the price of that would be received to sell the asset or paid to transfer the liability in an orderly transaction between market participants at the measurement date. The Bank uses widely recognised valuation models for determining the fair value of financial instruments such as interest rates yields that use only observable market data and require little management judgment and estimation.
Foreign currency forward contracts are measured using quoted forward exchange rates and yield curves derived from quoted interest rates matching maturities of contracts.
The fair values of the Available-for-sale investments have been estimated using the last available prices for FY 2014/15.
The assumptions applied for revalued property are included in Note 25 and Note 26.
The Bank uses the following hierarchy for determining and disclosing the fair value of financial instruments by valuation technique:
Level 1: quoted (unadjusted) prices in active markets for identical assets and liabilities.
Level 2: other techniques for which all inputs which have a significant effect on the recorded fair value are observable, either directly or indirectly.
Level 3: techniques which use inputs that have a significant effect on the recorded fair value that are not based on observable market data
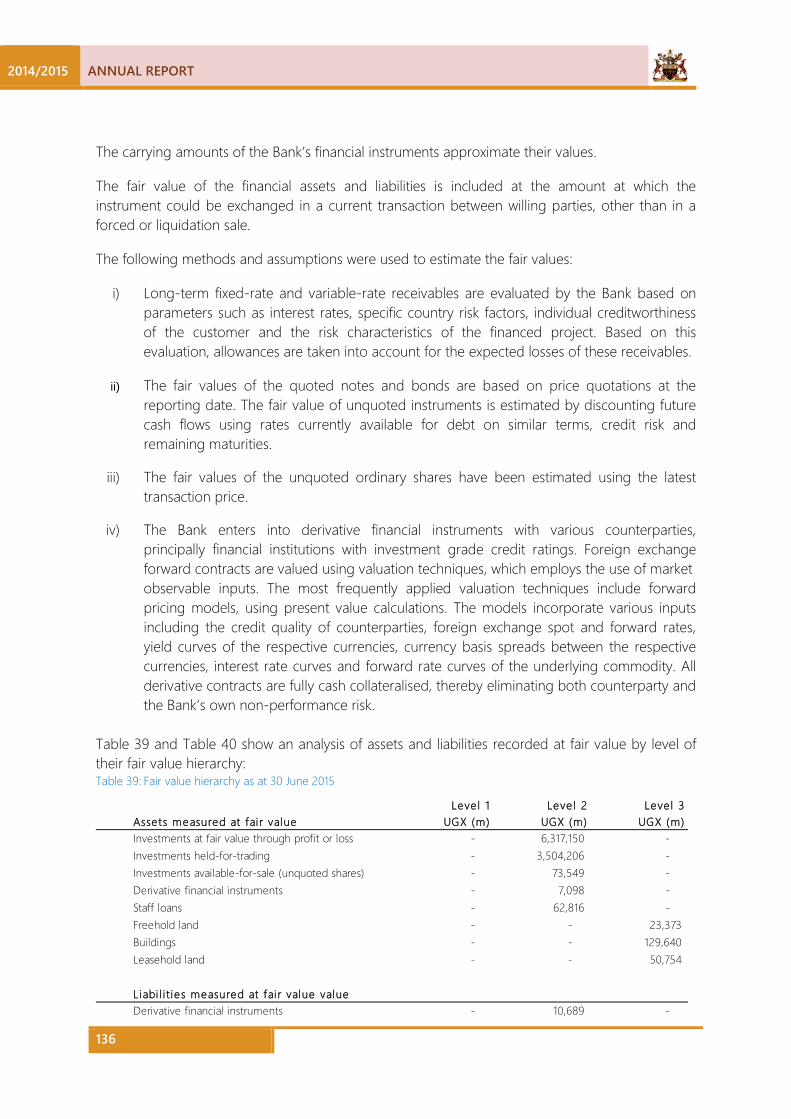
2014/2015 ANNUAL REPORT
136
The carrying amounts of the Bank’s financial instruments approximate their values.
The fair value of the financial assets and liabilities is included at the amount at which the instrument could be exchanged in a current transaction between willing parties, other than in a forced or liquidation sale.
The following methods and assumptions were used to estimate the fair values:
i) Long-term fixed-rate and variable-rate receivables are evaluated by the Bank based on parameters such as interest rates, specific country risk factors, individual creditworthiness of the customer and the risk characteristics of the financed project. Based on this evaluation, allowances are taken into account for the expected losses of these receivables.
ii) The fair values of the quoted notes and bonds are based on price quotations at the reporting date. The fair value of unquoted instruments is estimated by discounting future cash flows using rates currently available for debt on similar terms, credit risk and remaining maturities.
iii) The fair values of the unquoted ordinary shares have been estimated using the latest transaction price.
iv) The Bank enters into derivative financial instruments with various counterparties,
principally financial institutions with investment grade credit ratings. Foreign exchange forward contracts are valued using valuation techniques, which employs the use of market observable inputs. The most frequently applied valuation techniques include forward pricing models, using present value calculations. The models incorporate various inputs including the credit quality of counterparties, foreign exchange spot and forward rates, yield curves of the respective currencies, currency basis spreads between the respective currencies, interest rate curves and forward rate curves of the underlying commodity. All derivative contracts are fully cash collateralised, thereby eliminating both counterparty and the Bank’s own non-performance risk.
Table 39 and Table 40 show an analysis of assets and liabilities recorded at fair value by level of their fair value hierarchy: Table 39: Fair value hierarchy as at 30 June 2015
Leve l 1 Leve l 2 Leve l 3Assets measured at fai r value UGX (m) UGX (m) UGX (m)Investments at fair value through profit or loss - 6,317,150 - Investments held-for-trading - 3,504,206 - Investments available-for-sale (unquoted shares) - 73,549 - Derivative financial instruments - 7,098 - Staff loans - 62,816 - Freehold land - - 23,373 Buildings - - 129,640 Leasehold land - - 50,754
Liabi l i t ies measured at fai r value valueDerivative financial instruments - 10,689 -

ANNUAL REPORT 2014/2015
137
Table 40: Fair value hierarchy as at 30 June 2014
Leve l 1 Leve l 2 Leve l 3Assets measured at fai r value UGX (m) UGX (m) UGX (m)Investments at fair value through profit or loss - 6,565,381 - Investments held-for-trading - 2,724,923 - Investments available-for-sale (unquoted shares) - 1,804 - Derivative financial instruments - 2,916 - Staff loans - 53,830 - Freehold land - - 23,373 Buildings - - 132,247 Leasehold land - - 50,754
Liabi l i t ies measured at fai r value valueDerivative financial instruments - 12,675 -
The significant unobservable inputs used in the fair value measurement categorized within Level 3 of the fair value hierarchy are shown below:
Range
Signif icant unobse rvable valuation input USD
Price per acre (land) 1,500,000 - 4,500,000
Price per square metre (buildings) 80 - 120 Significant increases (decreases) in estimated price per square meter in isolation would result in a significantly (lower) fair value. The last valuation was done in FY 2012/13. There were no transfers between levels during the year.
42 CAPITAL MANAGEMENT The primary objectives of the Bank’s capital management are to ensure that the Bank complies with capital requirements of the Bank of Uganda, Act (Cap 51), Laws of Uganda, 2000.
In implementing capital requirements, the Bank maintains a General Reserve Fund which is determined by the Board from time to time. The Bank may, in consultation with the Minister of Finance, transfer funds from the General Reserve Fund to the capital of the Bank. However, the Bank has not considered it necessary to transfer funds from the General Reserve Fund to the capital of the Bank. The total capital of the Bank is shown in the table below.
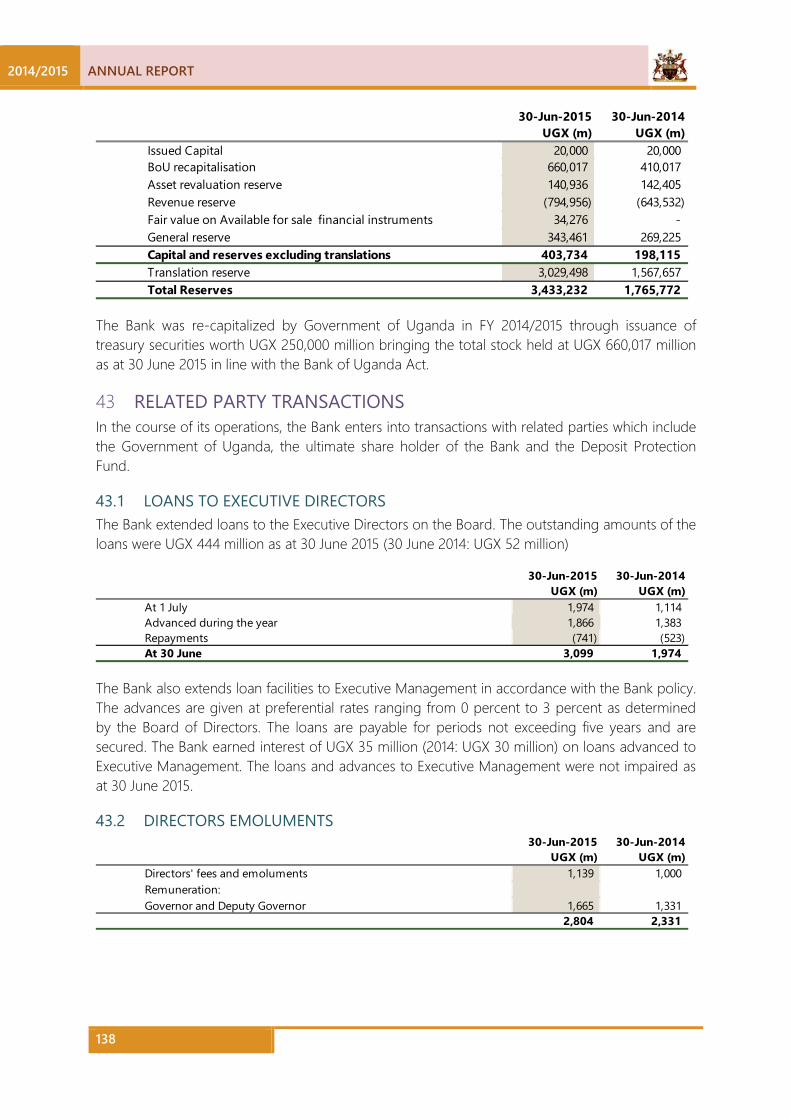
2014/2015 ANNUAL REPORT
138
30-Jun-2015 30-Jun-2014UGX (m) UGX (m)
Issued Capital 20,000 20,000 BoU recapitalisation 660,017 410,017 Asset revaluation reserve 140,936 142,405 Revenue reserve (794,956) (643,532) Fair value on Available for sale financial instruments 34,276 - General reserve 343,461 269,225 Capital and reserves excluding translations 403,734 198,115 Translation reserve 3,029,498 1,567,657 Total Reserves 3,433,232 1,765,772
The Bank was re-capitalized by Government of Uganda in FY 2014/2015 through issuance of treasury securities worth UGX 250,000 million bringing the total stock held at UGX 660,017 million as at 30 June 2015 in line with the Bank of Uganda Act.
43 RELATED PARTY TRANSACTIONS In the course of its operations, the Bank enters into transactions with related parties which include the Government of Uganda, the ultimate share holder of the Bank and the Deposit Protection Fund.
43.1 LOANS TO EXECUTIVE DIRECTORS The Bank extended loans to the Executive Directors on the Board. The outstanding amounts of the loans were UGX 444 million as at 30 June 2015 (30 June 2014: UGX 52 million)
30-Jun-2015 30-Jun-2014UGX (m) UGX (m)
At 1 July 1,974 1,114 Advanced during the year 1,866 1,383 Repayments (741) (523) At 30 June 3,099 1,974
The Bank also extends loan facilities to Executive Management in accordance with the Bank policy. The advances are given at preferential rates ranging from 0 percent to 3 percent as determined by the Board of Directors. The loans are payable for periods not exceeding five years and are secured. The Bank earned interest of UGX 35 million (2014: UGX 30 million) on loans advanced to Executive Management. The loans and advances to Executive Management were not impaired as at 30 June 2015.
43.2 DIRECTORS EMOLUMENTS 30-Jun-2015 30-Jun-2014
UGX (m) UGX (m)Directors' fees and emoluments 1,139 1,000 Remuneration:Governor and Deputy Governor 1,665 1,331
2,804 2,331
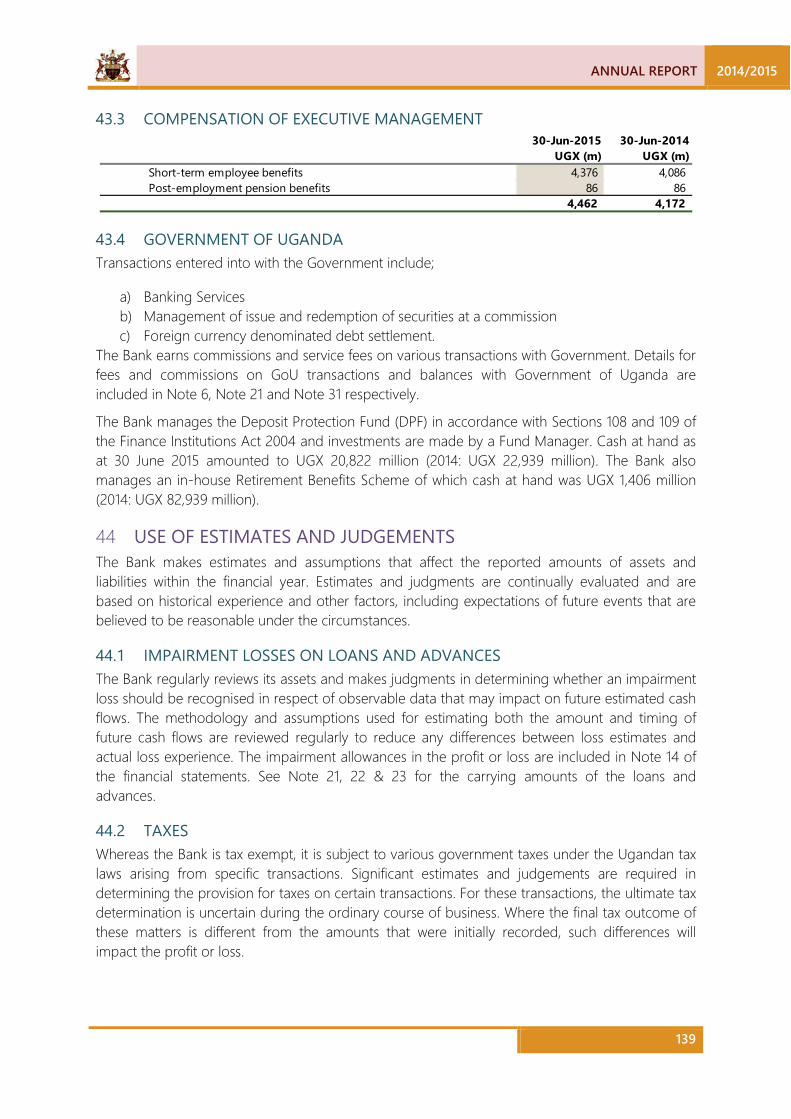
ANNUAL REPORT 2014/2015
139
43.3 COMPENSATION OF EXECUTIVE MANAGEMENT
30-Jun-2015 30-Jun-2014UGX (m) UGX (m)
Short-term employee benefits 4,376 4,086 Post-employment pension benefits 86 86
4,462 4,172
43.4 GOVERNMENT OF UGANDA Transactions entered into with the Government include;
a) Banking Services b) Management of issue and redemption of securities at a commission c) Foreign currency denominated debt settlement.
The Bank earns commissions and service fees on various transactions with Government. Details for fees and commissions on GoU transactions and balances with Government of Uganda are included in Note 6, Note 21 and Note 31 respectively.
The Bank manages the Deposit Protection Fund (DPF) in accordance with Sections 108 and 109 of the Finance Institutions Act 2004 and investments are made by a Fund Manager. Cash at hand as at 30 June 2015 amounted to UGX 20,822 million (2014: UGX 22,939 million). The Bank also manages an in-house Retirement Benefits Scheme of which cash at hand was UGX 1,406 million (2014: UGX 82,939 million).
44 USE OF ESTIMATES AND JUDGEMENTS The Bank makes estimates and assumptions that affect the reported amounts of assets and liabilities within the financial year. Estimates and judgments are continually evaluated and are based on historical experience and other factors, including expectations of future events that are believed to be reasonable under the circumstances.
44.1 IMPAIRMENT LOSSES ON LOANS AND ADVANCES The Bank regularly reviews its assets and makes judgments in determining whether an impairment loss should be recognised in respect of observable data that may impact on future estimated cash flows. The methodology and assumptions used for estimating both the amount and timing of future cash flows are reviewed regularly to reduce any differences between loss estimates and actual loss experience. The impairment allowances in the profit or loss are included in Note 14 of the financial statements. See Note 21, 22 & 23 for the carrying amounts of the loans and advances.
44.2 TAXES Whereas the Bank is tax exempt, it is subject to various government taxes under the Ugandan tax laws arising from specific transactions. Significant estimates and judgements are required in determining the provision for taxes on certain transactions. For these transactions, the ultimate tax determination is uncertain during the ordinary course of business. Where the final tax outcome of these matters is different from the amounts that were initially recorded, such differences will impact the profit or loss.
2014/2015 ANNUAL REPORT
140
44.3 FAIR VALUE OF FINANCIAL INSTRUMENTS Where the fair value of the financial assets and financial liabilities recorded in the statement of financial position cannot be determined from active markets, they are determined using valuation techniques including discounted cash flows models. The inputs to these models are taken from observable markets where possible, but where this is not feasible, a degree of judgment is required in establishing fair values. The judgments include considerations of inputs such as liquidity risk, credit risk and volatility. Changes in assumptions about these factors could affect the reported fair value of financial instruments. See Note 17 for the carrying amounts of financial instruments.
44.4 PENSION OBLIGATION The cost of the defined benefit employee benefit plan is determined using an actuarial valuation. The actuarial valuation involves making assumptions about discount rates, expected rates of return on assets, future salary increases, mortality rates and future pension increases. Due to the long term nature of this plan, such estimates are subject to significant uncertainty. See Note 24 for the assumptions used.
44.5 HELD-TO-MATURITY FINANCIAL ASSETS The Bank follows the guidance of IAS 39 on classifying non-derivative financial assets with fixed or determinable payments and fixed maturity as held-to-maturity. This classification requires significant judgment. In making this judgment, the Bank evaluates its intention and ability to hold such assets to maturity. If the Bank fails to keep these assets to maturity other than for the specific circumstances – for example, selling an insignificant amount close to maturity – it will be required to classify the entire class as available-for-sale. Details are included in Note 17 of the financial statements.
45 EVENTS AFTER THE REPORTING PERIOD There are no reportable events after the reporting period.
ANNUAL REPORT 2014/2015
141
APPENDIX 1: MACROECONOMIC INDICATORS ............................................................................................................................................. 142 APPENDIX 2: VALUE ADDED BY ECONOMIC ACTIVITY AT CURRENT PRICES ( UGX BILLION) ....................................................... 143 APPENDIX 3: BALANCE OF PAYMENTS (MILLION US$) ............................................................................................................................... 144 APPENDIX 4: COMPOSITION OF EXPORTS (VALUE IN MILLION US$) .................................................................................................... 145 APPENDIX 5: DIRECTION OF FORMAL TRADE (EXPORTS, MILLION US$) .............................................................................................. 146 APPENDIX 6: DIRECTION OF FORMAL TRADE (IMPORTS, MILLION US$).............................................................................................. 147 APPENDIX 7: MONETARY SURVEY ( UGX BILLION) ....................................................................................................................................... 148 APPENDIX 8: MONETARY AUTHORITY BALANCE SHEET (UGX BILLION.) .............................................................................................. 149 APPENDIX 9: COMMERCIAL BANK BALANCE SHEET (UGX BILLION) ...................................................................................................... 150 APPENDIX 10: COMMERCIAL BANK'S SHILLING DENOMINATED LOANS AND ADVANCES TO THE PRIVATE SECTOR .......... 151 APPENDIX 11: COMMERCIAL BANKS' FOREX DENOMINATED LOANS AND ADVANCES TO THE PRIVATE SECTOR ................ 152 APPENDIX 12: STRUCTURE OF INTEREST RATES (ANNUAL PERCENTAGE) ............................................................................................. 153 APPENDIX 13: FOREIGN EXCHANGE RATES (UGX. PER US$) ....................................................................................................................... 154 APPENDIX 14: COMPOSITE CONSUMER PRICE INDEX, UGANDA (2005/06 = 100) ............................................................................. 155 APPENDIX 15: INTERNATIONAL INVESTMENT POSITION: EXTERNAL ASSETS AND LIABILITIES ..................................................... 156
19 LIST OF APPENDICES
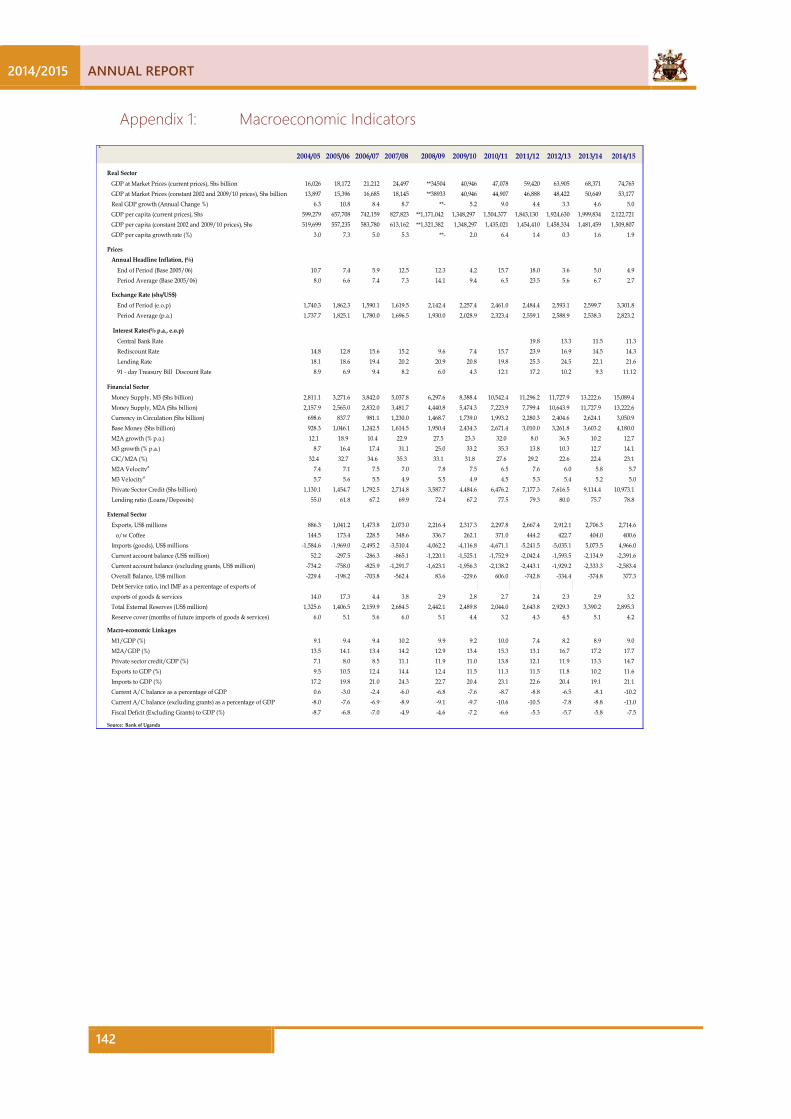
2014/2015 ANNUAL REPORT
142
Appendix 1: Macroeconomic Indicators 1
2004/05 2005/06 2006/07 2007/08 2008/09 2009/10 2010/11 2011/12 2012/13 2013/14 2014/15
Real Sector GDP at Market Prices (current prices), Shs billion 16,026 18,172 21,212 24,497 **34504 40,946 47,078 59,420 63,905 68,371 74,765 GDP at Market Prices (constant 2002 and 2009/10 prices), Shs billion 13,897 15,396 16,685 18,145 **38933 40,946 44,907 46,888 48,422 50,649 53,177 Real GDP growth (Annual Change %) 6.3 10.8 8.4 8.7 **- 5.2 9.0 4.4 3.3 4.6 5.0 GDP per capita (current prices), Shs 599,279 657,708 742,159 827,823 **1,171,042 1,348,297 1,504,377 1,843,130 1,924,630 1,999,834 2,122,721 GDP per capita (constant 2002 and 2009/10 prices), Shs 519,699 557,235 583,780 613,162 **1,321,382 1,348,297 1,435,021 1,454,410 1,458,334 1,481,459 1,509,807 GDP per capita growth rate (%) 3.0 7.3 5.0 5.3 **- 2.0 6.4 1.4 0.3 1.6 1.9
Prices Annual Headline Inflation, (%) End of Period (Base 2005/06) 10.7 7.4 5.9 12.5 12.3 4.2 15.7 18.0 3.6 5.0 4.9 Period Average (Base 2005/06) 8.0 6.6 7.4 7.3 14.1 9.4 6.5 23.5 5.6 6.7 2.7
Exchange Rate (shs/US$) End of Period (e.o.p) 1,740.3 1,862.3 1,590.1 1,619.5 2,142.4 2,257.4 2,461.0 2,484.4 2,593.1 2,599.7 3,301.8 Period Average (p.a.) 1,737.7 1,825.1 1,780.0 1,696.5 1,930.0 2,028.9 2,323.4 2,559.1 2,588.9 2,538.3 2,823.2
Interest Rates(% p.a., e.o.p) Central Bank Rate 19.8 13.3 11.5 11.3 Rediscount Rate 14.8 12.8 15.6 15.2 9.6 7.4 15.7 23.9 16.9 14.5 14.3 Lending Rate 18.1 18.6 19.4 20.2 20.9 20.8 19.8 25.3 24.5 22.1 21.6 91 - day Treasury Bill Discount Rate 8.9 6.9 9.4 8.2 6.0 4.3 12.1 17.2 10.2 9.3 11.12
Financial Sector Money Supply, M3 (Shs billion) 2,811.1 3,271.6 3,842.0 5,037.8 6,297.6 8,388.4 10,542.4 11,296.2 11,727.9 13,222.6 15,089.4 Money Supply, M2A (Shs billion) 2,157.9 2,565.0 2,832.0 3,481.7 4,440.8 5,474.3 7,223.9 7,799.4 10,643.9 11,727.9 13,222.6 Currency in Circulation (Shs billion) 698.6 837.7 981.1 1,230.0 1,468.7 1,739.0 1,993.2 2,280.3 2,404.6 2,624.1 3,050.9 Base Money (Shs billion) 928.3 1,046.1 1,242.5 1,614.5 1,950.4 2,434.3 2,671.4 3,010.0 3,261.8 3,603.2 4,180.0 M2A growth (% p.a.) 12.1 18.9 10.4 22.9 27.5 23.3 32.0 8.0 36.5 10.2 12.7 M3 growth (% p.a.) 8.7 16.4 17.4 31.1 25.0 33.2 35.3 13.8 10.3 12.7 14.1 CIC/M2A (%) 32.4 32.7 34.6 35.3 33.1 31.8 27.6 29.2 22.6 22.4 23.1 M2A Velocitya 7.4 7.1 7.5 7.0 7.8 7.5 6.5 7.6 6.0 5.8 5.7 M3 Velocitya 5.7 5.6 5.5 4.9 5.5 4.9 4.5 5.3 5.4 5.2 5.0 Private Sector Credit (Shs billion) 1,130.1 1,454.7 1,792.5 2,714.8 3,587.7 4,484.6 6,476.2 7,177.3 7,616.5 9,114.4 10,973.1 Lending ratio (Loans/Deposits) 55.0 61.8 67.2 69.9 72.4 67.2 77.5 79.3 80.0 75.7 78.8
External Sector Exports, US$ millions 886.3 1,041.2 1,473.8 2,073.0 2,216.4 2,317.3 2,297.8 2,667.4 2,912.1 2,706.3 2,714.6 o/w Coffee 144.5 173.4 228.5 348.6 336.7 262.1 371.0 444.2 422.7 404.0 400.6 Imports (goods), US$ millions -1,584.6 -1,969.0 -2,495.2 -3,510.4 -4,062.2 -4,116.8 -4,671.1 -5,241.5 -5,035.1 5,073.5 4,966.0 Current account balance (US$ million) 52.2 -297.5 -286.3 -865.1 -1,220.1 -1,525.1 -1,752.9 -2,042.4 -1,593.5 -2,134.9 -2,391.6 Current account balance (excluding grants, US$ million) -734.2 -758.0 -825.9 -1,291.7 -1,623.1 -1,956.3 -2,138.2 -2,443.1 -1,929.2 -2,333.3 -2,583.4 Overall Balance, US$ million -229.4 -198.2 -703.8 -562.4 83.6 -229.6 606.0 -742.8 -334.4 -374.8 377.3 Debt Service ratio, incl IMF as a percentage of exports of exports of goods & services 14.0 17.3 4.4 3.8 2.9 2.8 2.7 2.4 2.3 2.9 3.2 Total External Reserves (US$ million) 1,325.6 1,406.5 2,159.9 2,684.5 2,442.1 2,489.8 2,044.0 2,643.8 2,929.3 3,390.2 2,895.3 Reserve cover (months of future imports of goods & services) 6.0 5.1 5.6 6.0 5.1 4.4 3.2 4.3 4.5 5.1 4.2 Macro-economic Linkages M1/GDP (%) 9.1 9.4 9.4 10.2 9.9 9.2 10.0 7.4 8.2 8.9 9.0 M2A/GDP (%) 13.5 14.1 13.4 14.2 12.9 13.4 15.3 13.1 16.7 17.2 17.7 Private sector credit/GDP (%) 7.1 8.0 8.5 11.1 11.9 11.0 13.8 12.1 11.9 13.3 14.7 Exports to GDP (%) 9.5 10.5 12.4 14.4 12.4 11.5 11.3 11.5 11.8 10.2 11.6 Imports to GDP (%) 17.2 19.8 21.0 24.3 22.7 20.4 23.1 22.6 20.4 19.1 21.1 Current A/C balance as a percentage of GDP 0.6 -3.0 -2.4 -6.0 -6.8 -7.6 -8.7 -8.8 -6.5 -8.1 -10.2 Current A/C balance (excluding grants) as a percentage of GDP -8.0 -7.6 -6.9 -8.9 -9.1 -9.7 -10.6 -10.5 -7.8 -8.8 -11.0 Fiscal Deficit (Excluding Grants) to GDP (%) -8.7 -6.8 -7.0 -4.9 -4.6 -7.2 -6.6 -5.3 -5.7 -5.8 -7.5
Source: Bank of Uganda
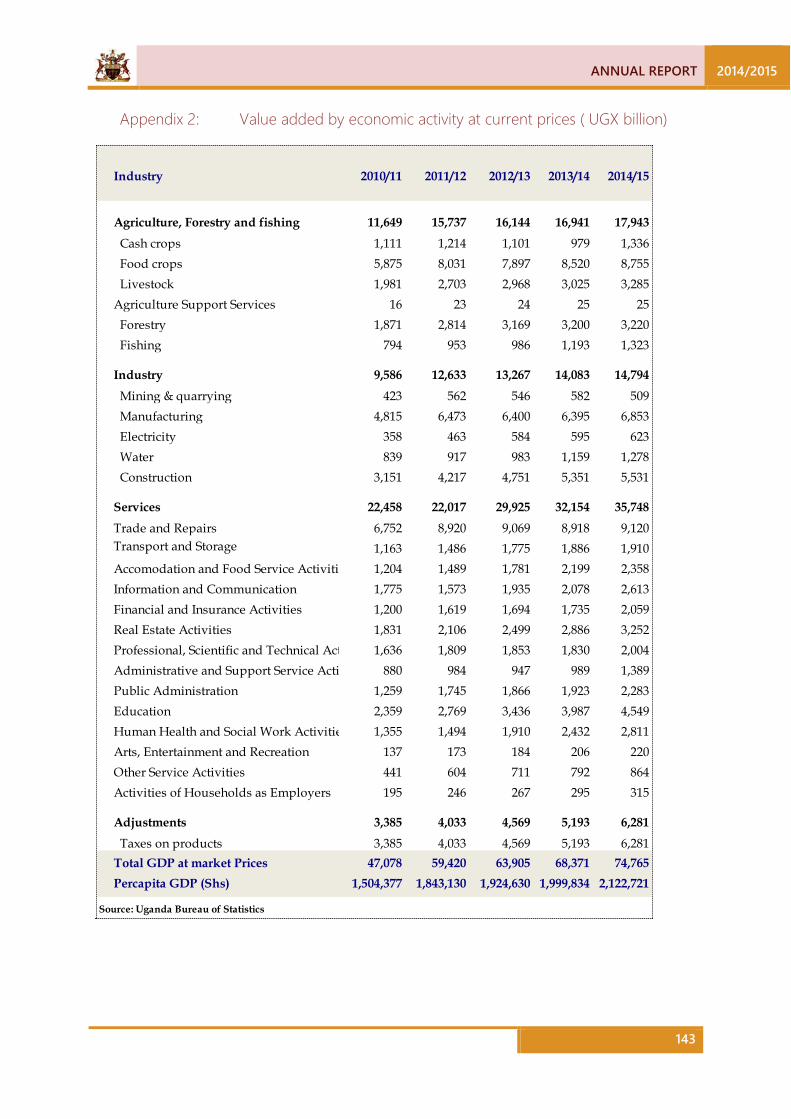
ANNUAL REPORT 2014/2015
143
Appendix 2: Value added by economic activity at current prices ( UGX billion)
Industry 2010/11 2011/12 2012/13 2013/14 2014/15
Agriculture, Forestry and fishing 11,649 15,737 16,144 16,941 17,943 Cash crops 1,111 1,214 1,101 979 1,336 Food crops 5,875 8,031 7,897 8,520 8,755 Livestock 1,981 2,703 2,968 3,025 3,285Agriculture Support Services 16 23 24 25 25 Forestry 1,871 2,814 3,169 3,200 3,220 Fishing 794 953 986 1,193 1,323
Industry 9,586 12,633 13,267 14,083 14,794 Mining & quarrying 423 562 546 582 509 Manufacturing 4,815 6,473 6,400 6,395 6,853 Electricity 358 463 584 595 623 Water 839 917 983 1,159 1,278 Construction 3,151 4,217 4,751 5,351 5,531
Services 22,458 22,017 29,925 32,154 35,748Trade and Repairs 6,752 8,920 9,069 8,918 9,120Transport and Storage 1,163 1,486 1,775 1,886 1,910Accomodation and Food Service Activitie 1,204 1,489 1,781 2,199 2,358Information and Communication 1,775 1,573 1,935 2,078 2,613Financial and Insurance Activities 1,200 1,619 1,694 1,735 2,059Real Estate Activities 1,831 2,106 2,499 2,886 3,252Professional, Scientific and Technical Act 1,636 1,809 1,853 1,830 2,004Administrative and Support Service Activ 880 984 947 989 1,389Public Administration 1,259 1,745 1,866 1,923 2,283Education 2,359 2,769 3,436 3,987 4,549Human Health and Social Work Activitie 1,355 1,494 1,910 2,432 2,811Arts, Entertainment and Recreation 137 173 184 206 220Other Service Activities 441 604 711 792 864Activities of Households as Employers 195 246 267 295 315
Adjustments 3,385 4,033 4,569 5,193 6,281 Taxes on products 3,385 4,033 4,569 5,193 6,281Total GDP at market Prices 47,078 59,420 63,905 68,371 74,765Percapita GDP (Shs) 1,504,377 1,843,130 1,924,630 1,999,834 2,122,721
Source: Uganda Bureau of Statistics
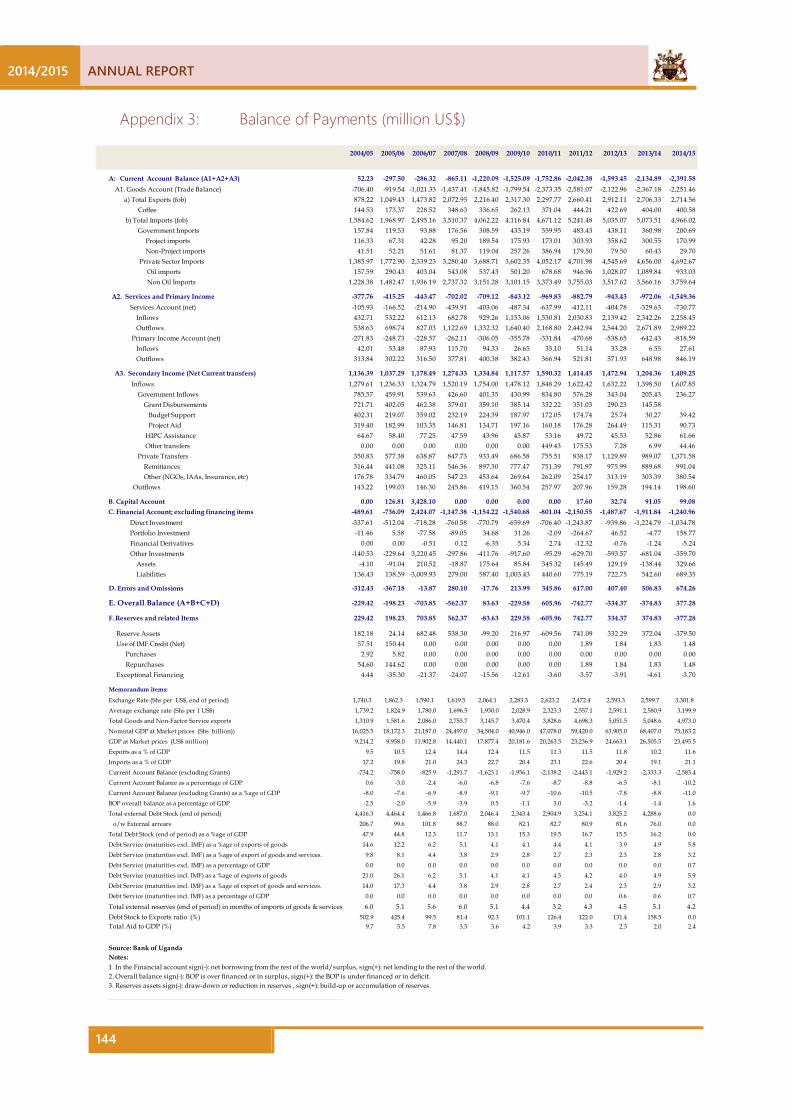
2014/2015 ANNUAL REPORT
144
Appendix 3: Balance of Payments (million US$)
2004/05 2005/06 2006/07 2007/08 2008/09 2009/10 2010/11 2011/12 2012/13 2013/14 2014/15
A: Current Account Balance (A1+A2+A3) 52.23 -297.50 -286.32 -865.11 -1,220.09 -1,525.09 -1,752.86 -2,042.38 -1,593.45 -2,134.89 -2,391.58 A1. Goods Account (Trade Balance) -706.40 -919.54 -1,021.33 -1,437.41 -1,845.82 -1,799.54 -2,373.35 -2,581.07 -2,122.96 -2,367.18 -2,251.46 a) Total Exports (fob) 878.22 1,049.43 1,473.82 2,072.95 2,216.40 2,317.30 2,297.77 2,660.41 2,912.11 2,706.33 2,714.56 Coffee 144.53 173.37 228.52 348.63 336.65 262.13 371.04 444.21 422.69 404.00 400.58 b) Total Imports (fob) 1,584.62 1,968.97 2,495.16 3,510.37 4,062.22 4,116.84 4,671.12 5,241.48 5,035.07 5,073.51 4,966.02 Government Imports 157.84 119.53 93.88 176.56 308.59 433.19 559.95 483.43 438.11 360.98 200.69 Project imports 116.33 67.31 42.28 95.20 189.54 175.93 173.01 303.93 358.62 300.55 170.99 Non-Project imports 41.51 52.21 51.61 81.37 119.04 257.26 386.94 179.50 79.50 60.43 29.70 Private Sector Imports 1,385.97 1,772.90 2,339.23 3,280.40 3,688.71 3,602.35 4,052.17 4,701.98 4,545.69 4,656.00 4,692.67 Oil imports 157.59 290.43 403.04 543.08 537.43 501.20 678.68 946.96 1,028.07 1,089.84 933.03 Non Oil Imports 1,228.38 1,482.47 1,936.19 2,737.32 3,151.28 3,101.15 3,373.49 3,755.03 3,517.62 3,566.16 3,759.64
A2. Services and Primary Income -377.76 -415.25 -443.47 -702.02 -709.12 -843.12 -969.83 -882.79 -943.43 -972.06 -1,549.36 Services Account (net) -105.93 -166.52 -214.90 -439.91 -403.06 -487.34 -637.99 -412.11 -404.78 -329.63 -730.77 Inflows 432.71 532.22 612.13 682.78 929.26 1,153.06 1,530.81 2,030.83 2,139.42 2,342.26 2,258.45 Outflows 538.63 698.74 827.03 1,122.69 1,332.32 1,640.40 2,168.80 2,442.94 2,544.20 2,671.89 2,989.22 Primary Income Account (net) -271.83 -248.73 -228.57 -262.11 -306.05 -355.78 -331.84 -470.68 -538.65 -642.43 -818.59 Inflows 42.01 53.48 87.93 115.70 94.33 26.65 35.10 51.14 33.28 6.55 27.61 Outflows 313.84 302.22 316.50 377.81 400.38 382.43 366.94 521.81 571.93 648.98 846.19
A3. Secondary Income (Net Current transfers) 1,136.39 1,037.29 1,178.49 1,274.33 1,334.84 1,117.57 1,590.32 1,414.45 1,472.94 1,204.36 1,409.25 Inflows 1,279.61 1,236.33 1,324.79 1,520.19 1,754.00 1,478.12 1,848.29 1,622.42 1,632.22 1,398.50 1,607.85 Government Inflows 785.57 459.91 539.63 426.60 401.35 430.99 834.80 576.28 343.04 205.43 236.27 Grant Disbursements 721.71 402.05 462.38 379.01 359.10 385.14 332.22 351.03 290.23 145.58 Budget Support 402.31 219.07 359.02 232.19 224.39 187.97 172.05 174.74 25.74 30.27 39.42 Project Aid 319.40 182.99 103.35 146.81 134.71 197.16 160.18 176.28 264.49 115.31 90.73 HIPC Assistance 64.67 58.40 77.25 47.59 43.96 45.87 53.16 49.72 45.53 52.86 61.66 Other transfers 0.00 0.00 0.00 0.00 0.00 0.00 449.43 175.53 7.28 6.99 44.46 Private Transfers 350.83 577.38 638.87 847.73 933.49 686.58 755.51 838.17 1,129.89 989.07 1,371.58 Remittances 316.44 441.08 325.11 546.36 897.30 777.47 751.39 791.97 975.99 889.68 991.04 Other (NGOs, IAAs, Insurance, etc) 176.78 334.79 460.05 547.23 453.64 269.64 262.09 254.17 313.19 303.39 380.54 Outflows 143.22 199.03 146.30 245.86 419.15 360.54 257.97 207.96 159.28 194.14 198.60
B. Capital Account 0.00 126.81 3,428.10 0.00 0.00 0.00 0.00 17.60 32.74 91.05 99.08C. Financial Account; excluding financing items -489.61 -736.09 2,424.07 -1,147.38 -1,154.22 -1,540.68 -801.04 -2,150.55 -1,487.67 -1,911.84 -1,240.96 Direct Investment -337.61 -512.04 -718.28 -760.58 -770.79 -659.69 -706.40 -1,243.87 -939.86 -1,224.79 -1,034.78 Portfolio Investment -11.46 5.58 -77.58 -89.05 34.68 31.26 -2.09 -264.67 46.52 -4.77 158.77 Financial Derivatives 0.00 0.00 -0.51 0.12 -6.35 5.34 2.74 -12.32 -0.76 -1.24 -5.24 Other Investments -140.53 -229.64 3,220.45 -297.86 -411.76 -917.60 -95.29 -629.70 -593.57 -681.04 -359.70 Assets -4.10 -91.04 210.52 -18.87 175.64 85.84 345.32 145.49 129.19 -138.44 329.66 Liabilities 136.43 138.59 -3,009.93 279.00 587.40 1,003.43 440.60 775.19 722.75 542.60 689.35
D. Errors and Omissions -312.43 -367.18 -13.87 280.10 -17.76 213.99 345.86 617.00 407.40 506.83 674.26
E. Overall Balance (A+B+C+D) -229.42 -198.23 -703.85 -562.37 83.63 -229.58 605.96 -742.77 -334.37 -374.83 377.28
F. Reserves and related Items 229.42 198.23 703.85 562.37 -83.63 229.58 -605.96 742.77 334.37 374.83 -377.28
Reserve Assets 182.18 24.14 682.48 538.30 -99.20 216.97 -609.56 741.09 332.29 372.04 -379.50 Use of IMF Credit (Net) 57.51 150.44 0.00 0.00 0.00 0.00 0.00 1.89 1.84 1.83 1.48 Purchases 2.92 5.82 0.00 0.00 0.00 0.00 0.00 0.00 0.00 0.00 0.00 Repurchases 54.60 144.62 0.00 0.00 0.00 0.00 0.00 1.89 1.84 1.83 1.48 Exceptional Financing 4.44 -35.30 -21.37 -24.07 -15.56 -12.61 -3.60 -3.57 -3.91 -4.61 -3.70
Memorandum items:
Exchange Rate (Shs per US$, end of period) 1,740.3 1,862.3 1,590.1 1,619.5 2,064.1 2,283.3 2,623.2 2,472.4 2,593.3 2,599.7 3,301.8 Average exchange rate (Shs per 1 US$) 1,739.2 1,824.9 1,780.0 1,696.5 1,930.0 2,028.9 2,323.3 2,557.1 2,591.1 2,580.9 3,199.9Total Goods and Non-Factor Service exports 1,310.9 1,581.6 2,086.0 2,755.7 3,145.7 3,470.4 3,828.6 4,698.3 5,051.5 5,048.6 4,973.0Nominal GDP at Market prices (Shs billion)) 16,025.5 18,172.3 21,187.0 24,497.0 34,504.0 40,946.0 47,078.0 59,420.0 63,905.0 68,407.0 75,183.2GDP at Market prices (US$ million) 9,214.2 9,958.0 11,902.8 14,440.1 17,877.4 20,181.6 20,263.5 23,236.9 24,663.1 26,505.5 23,495.5Exports as a % of GDP 9.5 10.5 12.4 14.4 12.4 11.5 11.3 11.5 11.8 10.2 11.6Imports as a % of GDP 17.2 19.8 21.0 24.3 22.7 20.4 23.1 22.6 20.4 19.1 21.1Current Account Balance (excluding Grants) -734.2 -758.0 -825.9 -1,291.7 -1,623.1 -1,956.1 -2,138.2 -2,443.1 -1,929.2 -2,333.3 -2,583.4Current Account Balance as a percentage of GDP 0.6 -3.0 -2.4 -6.0 -6.8 -7.6 -8.7 -8.8 -6.5 -8.1 -10.2Current Account Balance (excluding Grants) as a %age of GDP -8.0 -7.6 -6.9 -8.9 -9.1 -9.7 -10.6 -10.5 -7.8 -8.8 -11.0BOP overall balance as a percentage of GDP -2.5 -2.0 -5.9 -3.9 0.5 -1.1 3.0 -3.2 -1.4 -1.4 1.6Total external Debt Stock (end of period) 4,416.3 4,464.4 1,466.8 1,687.0 2,046.4 2,343.4 2,904.9 3,254.1 3,825.2 4,288.6 0.0 o/w External arrears 206.7 99.6 101.8 88.7 88.0 82.1 82.7 80.9 81.6 76.0 0.0Total Debt Stock (end of period) as a %age of GDP 47.9 44.8 12.3 11.7 13.1 15.3 19.5 16.7 15.5 16.2 0.0Debt Service (maturities excl. IMF) as a %age of exports of goods 14.6 12.2 6.2 5.1 4.1 4.1 4.4 4.1 3.9 4.9 5.8Debt Service (maturities excl. IMF) as a %age of export of goods and services. 9.8 8.1 4.4 3.8 2.9 2.8 2.7 2.3 2.3 2.8 3.2Debt Service (maturities excl. IMF) as a percentage of GDP 0.0 0.0 0.0 0.0 0.0 0.0 0.0 0.0 0.0 0.0 0.7Debt Service (maturities incl. IMF) as a %age of exports of goods 21.0 26.1 6.2 5.1 4.1 4.1 4.5 4.2 4.0 4.9 5.9Debt Service (maturities incl. IMF) as a %age of export of goods and services. 14.0 17.3 4.4 3.8 2.9 2.8 2.7 2.4 2.3 2.9 3.2Debt Service (maturities incl. IMF) as a percentage of GDP 0.0 0.0 0.0 0.0 0.0 0.0 0.0 0.0 0.6 0.6 0.7
Total external reserves (end of period) in months of imports of goods & services 6.0 5.1 5.6 6.0 5.1 4.4 3.2 4.3 4.5 5.1 4.2Debt Stock to Exports ratio (%) 502.9 425.4 99.5 81.4 92.3 101.1 126.4 122.0 131.4 158.5 0.0Total Aid to GDP (%) 9.7 5.5 7.8 3.5 3.6 4.2 3.9 3.3 2.3 2.0 2.4
Source: Bank of UgandaNotes:1. In the Financial account sign(-): net borrowing from the rest of the world/surplus, sign(+): net lending to the rest of the world.2. Overall balance sign(-): BOP is over financed or in surplus, sign(+): the BOP is under financed or in deficit.3. Reserves assets sign(-): draw-down or reduction in reserves , sign(+): build-up or accumulation of reserves.

ANNUAL REPORT 2014/2015
145
Appendix 4: Composition of Exports (Value in million US$)
2004/05 2005/06 2006/07 2007/08 2008/09 2009/10 2010/11 2011/12 2012/13 2013/14 2014/15
1. Coffee Value 144.527 173.373 228.518 348.629 336.653 262.131 371.044 444.211 422.689 404.004 400.577Volume, 60-Kg bags 2.520 2.102 2.536 3.028 3.198 2.744 2.779 3.038 3.374 3.653 3.260Unit Value 0.956 1.375 1.502 1.919 1.751 1.599 2.225 2.437 2.105 1.846 2.059
2. Non-Coffee Value 608.475 666.122 972.780 1,101.331 1,229.031 1,350.034 1,508.368 1,832.863 2,020.868 1,906.648 1,880.421 Electricity Value 8.252 4.684 6.312 11.190 11.108 14.384 13.928 17.277 15.571 27.159 24.426 Gold Value 71.326 101.554 116.142 44.852 27.836 38.476 6.848 11.473 4.942 0.254 0.234 Cotton Value 41.343 12.857 19.673 19.904 20.110 17.034 82.951 77.591 36.455 21.751 17.945 Tea Value 33.130 25.605 45.944 46.757 50.165 70.932 63.603 71.586 86.195 83.136 73.406 Tobacco Value 36.205 30.632 46.737 64.488 62.635 76.615 58.120 57.801 72.723 93.499 62.452 Fish & its Products Value 121.220 147.043 140.667 126.589 111.467 130.563 143.187 137.807 108.609 97.892 136.868 Hides & Skins Value 6.377 7.333 14.694 13.829 8.372 11.279 25.796 39.007 47.077 74.823 67.546 Simsim Value 3.067 5.515 3.950 13.869 13.242 9.621 17.724 13.151 23.540 46.099 50.692 Maize Value 13.293 23.728 27.938 17.961 27.513 27.815 25.594 47.026 54.431 31.258 72.388 Beans Value 4.327 8.280 5.778 5.709 13.775 9.596 11.136 15.223 16.121 20.665 34.161 Flowers Value 31.705 32.668 32.609 38.983 48.537 49.180 47.838 55.549 52.992 58.959 55.393 Oil re-exports Value 33.051 29.613 40.966 23.697 81.984 103.072 104.622 117.590 137.336 141.547 143.793 Cobalt Value 13.703 19.423 16.575 18.944 17.029 16.539 17.151 13.699 15.821 3.781 0.000 Others Exports Value 191.476 217.187 454.795 654.559 735.258 774.928 889.872 1158.084 1349.055 1184.085 1141.116
3. ICBT Exports Value 133.336 201.747 269.225 585.196 650.713 705.133 418.358 383.334 468.549 395.676 433.559
Total Value Exports 886.339 1,041.242 1,470.523 2,035.155 2,216.397 2,317.298 2,297.770 2,660.408 2,912.106 2,706.328 2,714.557
Source: Bank of Uganda
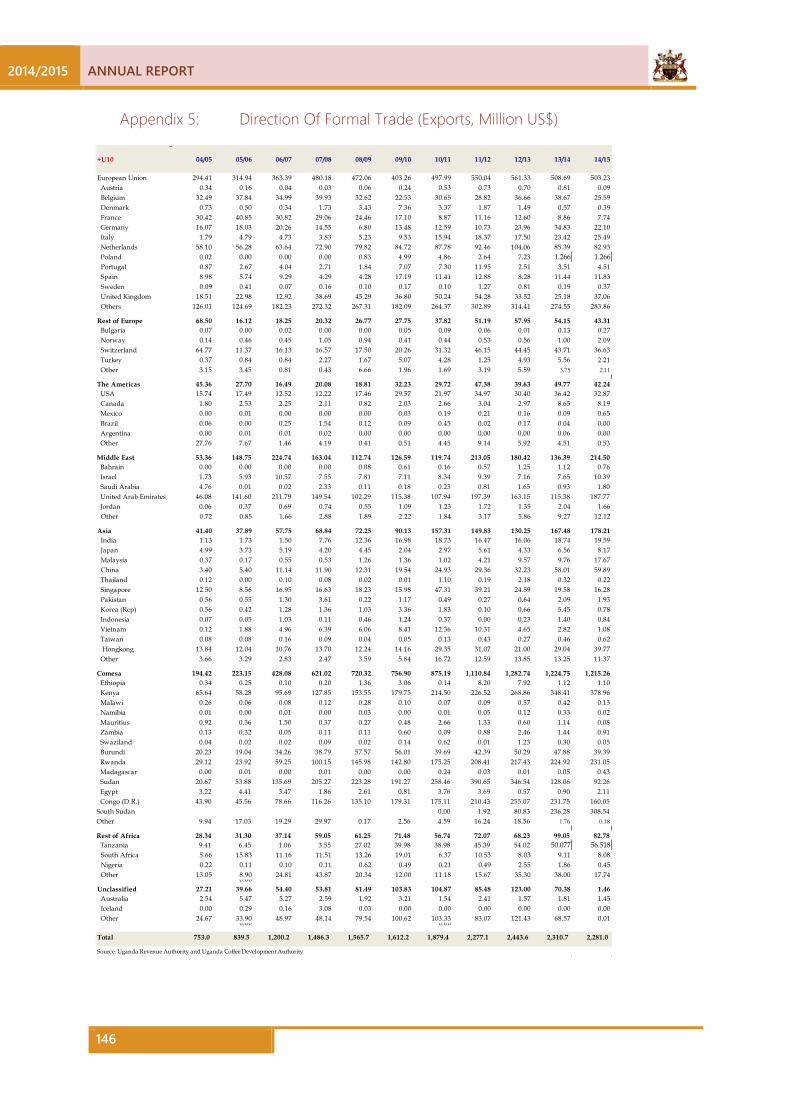
2014/2015 ANNUAL REPORT
146
Appendix 5: Direction Of Formal Trade (Exports, Million US$) 8
+U10 04/05 05/06 06/07 07/08 08/09 09/10 10/11 11/12 12/13 13/14 14/15
European Union 294.41 314.94 363.39 480.18 472.06 403.26 497.99 550.04 561.33 508.69 503.23 Austria 0.34 0.16 0.04 0.03 0.06 0.24 0.53 0.73 0.70 0.81 0.09 Belgium 32.49 37.84 34.99 39.93 32.62 22.53 30.65 28.82 36.66 38.67 25.59 Denmark 0.73 0.50 0.34 1.73 3.43 7.36 3.37 1.87 1.49 0.57 0.39 France 30.42 40.85 30.82 29.06 24.46 17.10 8.87 11.16 12.60 8.86 7.74 Germany 16.07 18.03 20.26 14.55 6.80 13.48 12.59 10.73 23.96 34.83 22.10 Italy 1.79 4.79 4.73 3.83 5.23 9.53 15.94 18.37 17.50 23.42 25.49 Netherlands 58.10 56.28 63.64 72.90 79.82 84.72 87.78 92.46 104.06 85.39 82.93 Poland 0.02 0.00 0.00 0.00 0.83 4.99 4.86 2.64 7.23 1.266 1.266 Portugal 0.87 2.67 4.04 2.71 1.84 7.07 7.30 11.95 2.51 3.51 4.51 Spain 8.98 5.74 9.29 4.29 4.28 17.19 11.41 12.88 8.28 11.44 11.83 Sweden 0.09 0.41 0.07 0.16 0.10 0.17 0.10 1.27 0.81 0.19 0.37 United Kingdom 18.51 22.98 12.92 38.69 45.29 36.80 50.24 54.28 33.52 25.18 37.06 Others 126.01 124.69 182.23 272.32 267.31 182.09 264.37 302.89 314.41 274.55 283.86
Rest of Europe 68.50 16.12 18.25 20.32 26.77 27.75 37.82 51.19 57.95 54.15 43.31 Bulgaria 0.07 0.00 0.02 0.00 0.00 0.05 0.09 0.06 0.01 0.13 0.27 Norway 0.14 0.46 0.45 1.05 0.94 0.41 0.44 0.53 0.56 1.00 2.09 Switzerland 64.77 11.37 16.13 16.57 17.50 20.26 31.32 46.15 44.45 43.71 36.63 Turkey 0.37 0.84 0.84 2.27 1.67 5.07 4.28 1.25 4.93 5.56 2.21 Other 3.15 3.45 0.81 0.43 6.66 1.96 1.69 3.19 5.59 3.75 2.11
The Americas 45.36 27.70 16.49 20.08 18.81 32.23 29.72 47.38 39.63 49.77 42.24 USA 15.74 17.49 12.52 12.22 17.46 29.57 21.97 34.97 30.40 36.42 32.87 Canada 1.80 2.53 2.25 2.11 0.82 2.03 2.66 3.04 2.97 8.65 8.19 Mexico 0.00 0.01 0.00 0.00 0.00 0.03 0.19 0.21 0.16 0.09 0.65 Brazil 0.06 0.00 0.25 1.54 0.12 0.09 0.45 0.02 0.17 0.04 0.00 Argentina 0.00 0.01 0.01 0.02 0.00 0.00 0.00 0.00 0.00 0.06 0.00 Other 27.76 7.67 1.46 4.19 0.41 0.51 4.45 9.14 5.92 4.51 0.53
Middle East 53.36 148.75 224.74 163.04 112.74 126.59 119.74 213.05 180.42 136.39 214.50 Bahrain 0.00 0.00 0.00 0.00 0.08 0.61 0.16 0.57 1.25 1.12 0.76 Israel 1.73 5.93 10.57 7.55 7.81 7.11 8.34 9.39 7.16 7.65 10.39 Saudi Arabia 4.76 0.01 0.02 2.33 0.11 0.18 0.23 0.81 1.65 0.93 1.80 United Arab Emirates 46.08 141.60 211.79 149.54 102.29 115.38 107.94 197.39 163.15 115.38 187.77 Jordan 0.06 0.37 0.69 0.74 0.55 1.09 1.23 1.72 1.35 2.04 1.66 Other 0.72 0.85 1.66 2.88 1.89 2.22 1.84 3.17 5.86 9.27 12.12
Asia 41.40 37.89 57.75 68.84 72.25 90.13 157.31 149.83 130.25 167.48 178.21 India 1.13 1.73 1.50 7.76 12.36 16.98 18.73 16.47 16.06 18.74 19.59 Japan 4.99 3.73 5.19 4.20 4.45 2.04 2.97 5.61 4.33 6.56 8.17 Malaysia 0.37 0.17 0.55 0.53 1.26 1.36 1.02 4.21 9.57 9.76 17.67 China 3.40 5.40 11.14 11.90 12.31 19.54 24.93 29.36 32.23 58.01 59.89 Thailand 0.12 0.00 0.10 0.08 0.02 0.01 1.10 0.19 2.18 0.32 0.22 Singapore 12.50 8.56 16.95 16.63 18.23 15.98 47.31 39.21 24.59 19.58 16.28 Pakistan 0.56 0.55 1.30 3.61 0.22 1.17 0.49 0.27 0.64 2.09 1.93 Korea (Rep) 0.56 0.42 1.28 1.36 1.03 3.36 1.83 0.10 0.66 5.45 0.78 Indonesia 0.07 0.05 1.03 0.11 0.46 1.24 0.37 0.00 0.23 1.40 0.84 Vietnam 0.12 1.88 4.96 6.39 6.06 8.41 12.36 10.31 4.65 2.82 1.08 Taiwan 0.08 0.08 0.16 0.09 0.04 0.05 0.13 0.43 0.27 0.46 0.62 Hongkong 13.84 12.04 10.76 13.70 12.24 14.16 29.35 31.07 21.00 29.04 39.77 Other 3.66 3.29 2.83 2.47 3.59 5.84 16.72 12.59 13.85 13.25 11.37
Comesa 194.42 223.15 428.08 621.02 720.32 756.90 875.19 1,110.84 1,282.74 1,224.75 1,215.26 Ethiopia 0.34 0.25 0.10 0.20 1.36 3.06 0.14 8.20 7.92 1.12 1.10 Kenya 65.64 58.28 95.69 127.85 153.55 179.75 214.50 226.52 268.86 348.41 378.96 Malawi 0.26 0.06 0.08 0.12 0.28 0.10 0.07 0.09 0.57 0.42 0.13 Namibia 0.01 0.00 0.01 0.00 0.03 0.00 0.01 0.05 0.12 0.33 0.02 Mauritius 0.92 0.36 1.50 0.37 0.27 0.48 2.66 1.33 0.60 1.14 0.08 Zambia 0.13 0.32 0.05 0.11 0.11 0.60 0.09 0.88 2.46 1.44 0.91 Swaziland 0.04 0.02 0.02 0.09 0.02 0.14 0.62 0.01 1.23 0.30 0.05 Burundi 20.23 19.04 34.26 38.79 57.57 56.01 39.69 42.39 50.29 47.88 39.39 Rwanda 29.12 23.92 59.25 100.15 145.98 142.80 175.25 208.41 217.43 224.92 231.05 Madagascar 0.00 0.01 0.00 0.01 0.00 0.00 0.24 0.03 0.01 0.05 0.43 Sudan 20.67 53.88 135.69 205.27 223.28 191.27 258.46 390.65 346.54 128.06 92.26 Egypt 3.22 4.41 3.47 1.86 2.61 0.81 3.76 3.69 0.57 0.90 2.11 Congo (D.R.) 43.90 45.56 78.66 116.26 135.10 179.31 175.11 210.43 255.07 231.75 160.05South Sudan 0.00 1.92 80.83 236.28 308.54Other 9.94 17.03 19.29 29.97 0.17 2.56 4.59 16.24 18.56 1.76 0.18
Rest of Africa 28.34 31.30 37.14 59.05 61.25 71.48 56.74 72.07 68.23 99.05 82.78 Tanzania 9.41 6.45 1.06 3.55 27.02 39.98 38.98 45.39 54.02 50.077 56.518 South Africa 5.66 15.83 11.16 11.51 13.26 19.01 6.37 10.53 8.03 9.11 8.08 Nigeria 0.22 0.11 0.10 0.11 0.62 0.49 0.21 0.49 2.55 1.86 0.45 Other 13.05 8.90 24.81 43.87 20.34 12.00 11.18 15.67 35.30 38.00 17.740.00Unclassified 27.21 39.66 54.40 53.81 81.49 103.83 104.87 85.48 123.00 70.38 1.46 Australia 2.54 5.47 5.27 2.59 1.92 3.21 1.54 2.41 1.57 1.81 1.45 Iceland 0.00 0.29 0.16 3.08 0.03 0.00 0.00 0.00 0.00 0.00 0.00 Other 24.67 33.90 48.97 48.14 79.54 100.62 103.33 83.07 121.43 68.57 0.010.00 0.00
Total 753.0 839.5 1,200.2 1,486.3 1,565.7 1,612.2 1,879.4 2,277.1 2,443.6 2,310.7 2,281.0
Source: Uganda Revenue Authority and Uganda Coffee Development Authority

ANNUAL REPORT 2014/2015
147
Appendix 6: Direction Of Formal Trade (Imports, Million US$)
04/05 05/06 06/07 07/08 08/09 09/10 10/11 11/12 12/13 13/14 14/15
Comesa 487.53 472.68 410.21 473.75 544.80 517.95 628.34 796.55 731.82 729.78 750.25 Kenya 440.36 422.76 360.69 410.54 468.34 446.81 535.07 680.67 611.57 602.86 610.25 Egypt 12.49 13.29 17.31 26.62 36.92 33.04 44.29 44.20 47.85 52.18 51.32 Swaziland 16.92 19.19 23.06 22.97 20.08 17.31 16.85 16.62 16.53 18.39 20.40 Congo (D.R.C) 2.71 2.41 0.13 0.38 2.23 4.96 6.72 25.58 31.01 25.03 31.40 Mauritius 0.00 0.36 2.10 2.47 6.92 3.42 9.85 7.98 7.83 6.23 9.41 Rwanda 0.56 0.54 0.61 2.52 2.56 5.32 6.12 8.94 7.68 12.10 9.60 Malawi 0.00 0.03 1.61 1.15 1.76 1.55 0.84 3.61 0.22 0.35 0.32 Sudan 0.00 0.05 0.16 0.18 0.24 0.96 3.89 4.82 6.17 5.28 2.62 Burundi 0.19 0.01 0.47 0.77 0.55 0.54 1.32 1.76 0.57 1.41 2.28 Zimbabwe 0.96 0.39 0.67 0.34 1.47 0.36 0.18 0.23 0.51 0.30 6.56 Ethiopia 0.35 0.08 0.21 0.20 0.63 0.93 0.60 0.37 0.24 0.14 0.25 Namibia 0.00 0.00 0.08 0.06 0.04 0.10 0.04 0.31 0.15 0.27 0.15 Zambia 0.64 0.88 1.29 0.63 0.76 0.90 1.61 1.27 1.16 4.40 3.17 Eritrea 0.00 0.00 0.00 0.00 0.00 0.00 0.00 0.00 0.08 0.02 0.05 Other 12.35 12.71 1.80 4.90 2.29 1.73 0.97 0.19 0.24 0.81 1.75
Rest of Africa 162.48 164.94 176.88 267.11 304.96 263.93 290.28 340.57 293.34 302.57 300.26 South Africa 148.73 141.98 151.35 219.08 258.87 207.40 245.96 232.27 233.51 233.08 235.23 Tanzania 11.60 19.06 22.37 44.75 33.29 52.84 32.47 54.81 49.34 55.00 54.98 Cote D'Ivoire 0.00 0.21 0.53 0.91 1.12 0.49 0.70 0.82 0.84 0.90 1.01 Ghana 0.00 0.02 0.09 0.26 0.59 1.72 8.37 2.07 4.48 4.72 2.59 Liberia 0.00 0.00 0.00 0.07 0.76 0.01 0.47 0.24 0.24 2.08 1.04 Nigeria 0.00 0.11 0.37 1.34 0.91 0.44 0.63 1.05 0.54 2.73 0.96 Benin 0.00 0.00 0.00 0.00 0.01 0.02 0.01 0.06 0.01 0.03 0.01 Gabon 0.00 0.00 0.00 0.07 0.06 0.17 0.15 0.22 0.36 0.24 0.12 Botswana 0.00 0.01 0.34 0.06 0.16 0.11 0.09 0.14 0.07 0.05 0.05 Mali 0.00 0.01 0.01 0.01 0.01 0.10 0.05 0.03 0.04 0.01 0.00 Cameroon 0.00 0.01 0.06 0.19 0.09 0.11 0.32 0.27 0.24 0.16 0.12 Burkina Faso 0.00 0.02 0.00 0.00 7.94 0.07 0.05 17.37 0.03 0.00 0.03 Senegal 0.00 0.05 0.04 0.03 0.01 0.02 0.03 0.12 0.05 0.07 0.13 Niger 0.00 0.00 0.10 0.02 0.22 0.19 0.35 0.20 0.12 0.13 0.03 Sierra Leone 0.00 0.00 0.00 0.01 0.02 0.03 0.00 0.00 0.04 0.01 0.03 Togo 0.00 0.00 0.00 0.00 0.71 0.10 0.07 0.12 0.16 0.25 0.22 Tunisia 0.00 0.03 0.05 0.03 0.04 0.12 0.56 30.79 0.78 0.53 0.34 Other 2.15 2.59 0.00 0.00 0.00 0.00 0.00 0.51 2.46 2.57 3.37
Rest of Europe 23.66 44.46 55.74 115.70 118.19 98.42 72.56 91.66 81.61 64.87 75.16 Ukraine 0.00 3.86 16.89 13.43 34.45 45.31 24.04 11.35 20.71 18.89 20.03 Turkey 0.00 5.89 12.32 22.82 62.13 21.58 25.29 54.12 24.14 16.94 19.59 Switzerland 12.11 19.27 24.88 22.01 15.66 18.55 19.58 23.86 33.51 24.04 31.19 Norway 2.44 1.41 1.13 48.35 4.75 3.22 2.02 1.40 2.71 4.20 3.46 Serbia 0.00 0.00 0.00 8.59 1.03 0.47 1.21 0.00 0.03 0.01 0.00 Croatia 0.00 0.00 0.00 0.16 0.00 8.47 0.09 0.00 0.05 0.03 0.04 Moldova Rep. 0.00 0.00 0.00 0.00 0.00 0.01 0.01 0.00 0.00 0.00 0.00 Other 9.11 14.03 0.52 0.35 0.16 0.82 0.31 0.92 0.46 0.75 0.85
Unclassified 183.03 145.34 120.78 174.56 205.36 201.88 291.34 278.02 224.34 146.58 133.12 USA 95.15 90.72 76.80 110.66 113.66 101.97 167.50 114.78 126.07 77.42 73.83 Brazil 5.39 7.73 8.49 4.90 15.59 52.36 46.66 55.66 29.23 12.70 11.55 Canada 30.12 9.38 10.97 27.67 27.63 17.94 22.43 19.49 18.42 16.19 18.96 Australia 18.69 27.46 3.88 4.32 3.89 4.56 14.78 27.64 18.85 16.55 6.04 Chile 0.00 0.00 0.00 0.00 0.00 0.20 0.59 0.08 0.35 0.07 0.09 Peru 0.00 0.00 0.01 0.00 0.02 0.01 0.13 0.00 0.00 0.03 0.02 Jamaica 0.00 0.00 0.07 0.00 0.03 0.00 0.07 0.12 0.07 0.08 0.03 Colombia 0.00 0.01 0.09 0.06 0.04 4.89 2.96 0.50 0.79 1.27 0.52 Mexico 0.07 0.13 0.02 0.12 0.25 0.17 1.08 5.22 0.62 2.95 1.72 Panama 0.00 0.00 0.20 0.01 0.05 0.10 0.43 0.00 0.14 0.05 0.14 British Virgin Islands 0.00 0.31 0.10 0.00 0.61 11.92 0.49 0.00 0.03 0.00 0.06 Argentina 31.88 8.48 14.53 23.58 35.45 1.79 11.77 31.16 19.40 12.99 14.59 Dominican Rep. 0.00 0.00 0.00 0.00 0.00 0.05 0.01 0.16 0.11 0.10 0.15 New Zealand 0.00 0.06 0.37 0.20 0.47 0.43 0.37 1.10 0.48 0.37 0.55 Uruguay 0.00 0.00 2.52 1.09 1.23 0.00 5.00 0.07 1.39 0.02 0.06 Cuba 0.00 0.00 0.00 0.00 0.00 0.18 0.00 0.00 0.00 0.27 0.00 Liechtenstein 0.00 0.00 0.00 0.00 0.00 0.03 0.00 0.04 0.02 0.02 0.01 Other 1.73 1.06 2.74 1.93 6.45 5.29 17.05 21.99 8.39 5.48 4.78
Total 1,889.9 2,135.8 2,494.8 3,508.7 4,060.3 4,114.4 4,668.9 5,241.5 5,035.1 5,073.5 4,966.0
Source: Bank of Uganda

2014/2015 ANNUAL REPORT
148
Appendix 7: Monetary Survey ( UGX billion)
Jun-03 Jun-04 Jun-05 Jun-06 Jun-07 Jun-08 Jun-09 Jun-10 Jun-11 Jun-12 Jun-13 Jun-14 Jun-15
Net Foreign Assets 2,056.35 2,315.00 2,606.04 3,061.60 3,804.25 5,068.44 5,639.02 5,779.48 6,668.50 7,900.90 8,426.82 8,851.10 9,655.83 Central Bank(net) 1,439.56 1,624.60 1,995.58 2,593.15 3,311.08 4,319.49 5,031.81 5,200.29 6,177.35 6,845.22 8,304.94 9,454.93 10,092.03 Of Which: Official Foreign Assets 1,913.18 2,007.42 2,274.55 2,602.42 3,341.98 4,379.68 5,042.40 5,445.01 5,361.71 6,536.36 7,552.66 8,822.05 9,559.52
Other Depository Corporations(net) 616.80 690.40 610.45 468.45 493.17 748.94 607.21 579.19 491.15 1,055.68 121.88 603.83- 436.20-
Net Domestic Assets (NDA) 332.09 272.26 205.08 210.00 37.77 -30.59 658.57 2,608.91 3,873.89 3,395.28 3,620.51 5,290.93 6,733.36 Domestic Claims 1,282.44 1,204.86 1,120.86 1,561.33 1,359.11 1,923.63 3,157.44 4,884.22 7,528.13 7,036.33 7,993.90 9,746.69 12,896.86
Claims on Central Government(net) 290.20 22.71 -172.74 -104.33 -715.79 -915.82 -543.94 92.48 692.17 -568.82 -104.59 538.53 1,826.66 Claims on Central Government 2,437.90 2,280.69 2,279.23 2,635.93 2,825.15 3,633.55 4,577.18 5,595.25 7,729.61 9,291.05 11,261.55 7,451.38 6,176.97 Less Liabilities to Central Government 2,147.70 2,257.98 2,451.97 2,740.26 3,540.94 4,549.36 5,121.12 5,502.77 7,037.45 9,859.86 11,366.14 6,912.86 4,350.31
Claims on Other Sectors 992.24 1,182.15 1,293.60 1,665.65 2,074.90 2,839.45 3,701.38 4,791.74 6,835.96 7,605.15 8,098.49 9,208.16 11,070.20 Other Financial Corporations 52.65 45.95 33.25 53.74 97.08 66.09 60.67 32.85 39.89 34.16 31.27 37.14 45.74 State and Local Government 0.79 0.36 0.03 0.60 0.85 0.09 0.04 0.87 0.91 0.31 0.70 0.67 1.21 Public Non Financial Corporations 8.24 17.26 11.84 23.19 34.64 29.63 37.27 52.57 38.81 38.63 55.95 46.82 37.69 Private Sector 930.56 1,118.57 1,248.48 1,588.11 1,942.34 2,743.64 3,603.40 4,705.45 6,756.36 7,532.05 8,010.57 9,123.54 10,985.56
Of which: Loans 928.68 1,114.45 1,247.11 1,587.49 1,941.96 2,743.64 3,603.40 4,677.63 6,739.72 7,524.29 7,989.83 9,114.19 10,973.08
Other Items(Net) -950.35 -932.60 -915.78 -1,351.32 -1,321.34 -1,954.22 -2,498.87 -2,261.46 -3,637.75 -3,624.69 -4,352.71 4,455.75- 6,163.50- Shares and Other Equity 745.26 669.38 563.61 848.19 790.64 1,183.43 2,289.37 2,513.08 3,552.23 3,475.92 4,408.05 4,774.71 6,841.92 Consolidation Adjustments -73.67 -108.79 -101.77 -71.55 -83.08 -103.34 45.72 193.76 -73.82 10.85 15.39 24.36- 32.17 Other Items(net) -131.41 -154.43 -250.41 -431.59 -447.62 -667.45 -255.21 57.87 -11.69 -159.62 39.95 343.31 646.26
Broad Money-M3 2,388.44 2,587.26 2,811.11 3,271.60 3,842.02 5,037.85 6,297.59 8,388.39 10,542.39 11,296.18 12,047.32 14,142.03 16,389.19 Foreign Currency Deposits 639.26 662.38 653.25 706.64 848.07 1,142.49 1,376.91 1,885.88 2,485.97 3,575.39 3,114.98 3,946.79 5,293.86
Broad Money-M2 1,749.19 1,924.88 2,157.86 2,564.96 2,993.95 3,895.35 4,920.68 6,502.52 8,056.42 7,720.79 8,932.34 10,195.25 11,095.33 Other Deposits-Local Currency 562.66 591.61 692.65 858.54 1,002.38 1,394.61 1,942.51 2,737.56 3,365.42 3,295.04 3,687.47 4,141.83 4,370.27
Narrow Money-M1 1,186.52 1,333.27 1,465.21 1,706.43 1,991.57 2,500.74 2,978.17 3,764.95 4,691.00 4,425.75 5,244.87 6,053.41 6,725.06 Transferable Deposits-Local Currency 725.14 803.98 860.15 961.53 1,127.96 1,426.26 1,732.74 2,331.04 2,802.92 2,486.41 3,103.72 3,718.29 3,962.95 Currency Outside Depository Corporations 461.38 529.29 605.06 744.89 863.62 1,074.48 1,245.43 1,433.92 1,888.08 1,939.34 2,141.16 2,335.12 2,762.10
Notes:(i) From Feb 2010, the Depository Corporations Survey include data for Credit Institutions and Micro Finance Deposit Taking Institutions.(ii) From Feb 2010, deposits excluded from broad money comprises Loan Insurance fund/ Compulsory Savings held by individuals at Credit Institutions and MDIs(iii) From Janaury 2011, NFA of ODCs was revised to correct misreporting of nonresident borrowing wrongly classified as borrowing from residents by ODCs.
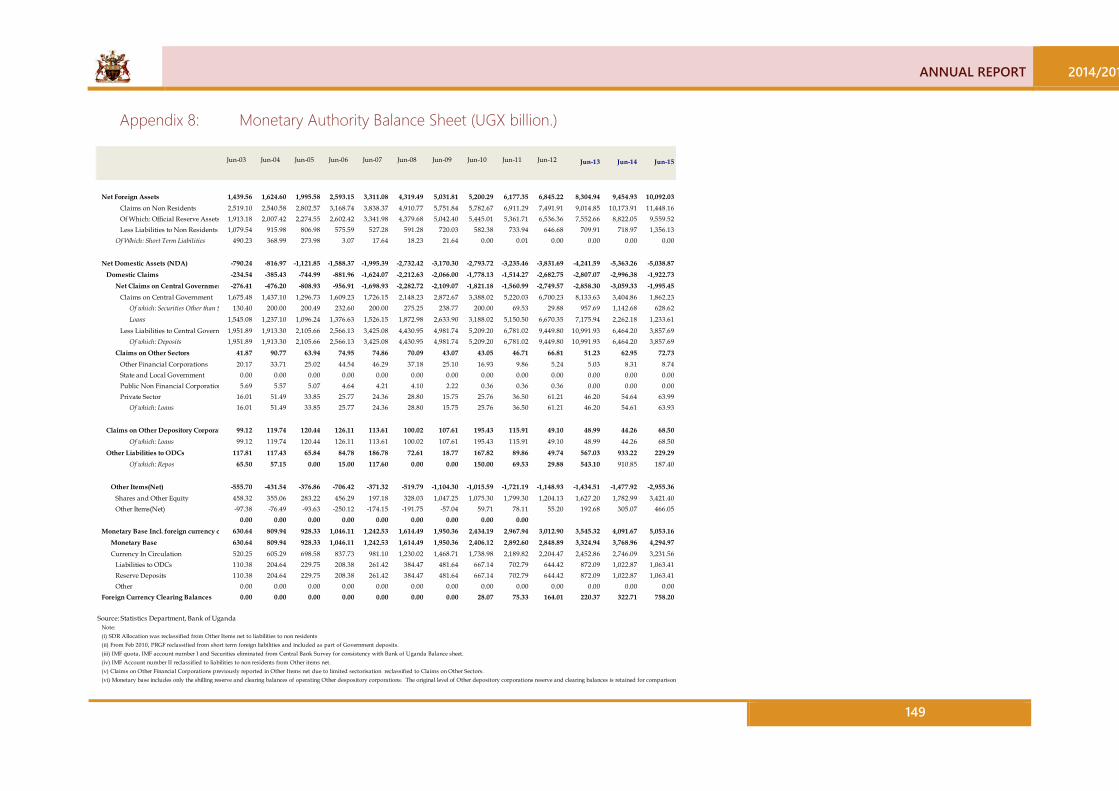
ANNUAL REPORT 2014/201
149
Appendix 8: Monetary Authority Balance Sheet (UGX billion.)
Jun-03 Jun-04 Jun-05 Jun-06 Jun-07 Jun-08 Jun-09 Jun-10 Jun-11 Jun-12 Jun-13 Jun-14 Jun-15
Net Foreign Assets 1,439.56 1,624.60 1,995.58 2,593.15 3,311.08 4,319.49 5,031.81 5,200.29 6,177.35 6,845.22 8,304.94 9,454.93 10,092.03Claims on Non Residents 2,519.10 2,540.58 2,802.57 3,168.74 3,838.37 4,910.77 5,751.84 5,782.67 6,911.29 7,491.91 9,014.85 10,173.91 11,448.16Of Which: Official Reserve Assets 1,913.18 2,007.42 2,274.55 2,602.42 3,341.98 4,379.68 5,042.40 5,445.01 5,361.71 6,536.36 7,552.66 8,822.05 9,559.52Less Liabilities to Non Residents 1,079.54 915.98 806.98 575.59 527.28 591.28 720.03 582.38 733.94 646.68 709.91 718.97 1,356.13
Of Which: Short Term Liabilities 490.23 368.99 273.98 3.07 17.64 18.23 21.64 0.00 0.01 0.00 0.00 0.00 0.00
Net Domestic Assets (NDA) -790.24 -816.97 -1,121.85 -1,588.37 -1,995.39 -2,732.42 -3,170.30 -2,793.72 -3,235.46 -3,831.69 -4,241.59 -5,363.26 -5,038.87Domestic Claims -234.54 -385.43 -744.99 -881.96 -1,624.07 -2,212.63 -2,066.00 -1,778.13 -1,514.27 -2,682.75 -2,807.07 -2,996.38 -1,922.73
Net Claims on Central Governmen -276.41 -476.20 -808.93 -956.91 -1,698.93 -2,282.72 -2,109.07 -1,821.18 -1,560.99 -2,749.57 -2,858.30 -3,059.33 -1,995.45Claims on Central Government 1,675.48 1,437.10 1,296.73 1,609.23 1,726.15 2,148.23 2,872.67 3,388.02 5,220.03 6,700.23 8,133.63 3,404.86 1,862.23
Of which: Securities Other than S 130.40 200.00 200.49 232.60 200.00 275.25 238.77 200.00 69.53 29.88 957.69 1,142.68 628.62
Loans 1,545.08 1,237.10 1,096.24 1,376.63 1,526.15 1,872.98 2,633.90 3,188.02 5,150.50 6,670.35 7,175.94 2,262.18 1,233.61
Less Liabilities to Central Govern 1,951.89 1,913.30 2,105.66 2,566.13 3,425.08 4,430.95 4,981.74 5,209.20 6,781.02 9,449.80 10,991.93 6,464.20 3,857.69Of which: Deposits 1,951.89 1,913.30 2,105.66 2,566.13 3,425.08 4,430.95 4,981.74 5,209.20 6,781.02 9,449.80 10,991.93 6,464.20 3,857.69
Claims on Other Sectors 41.87 90.77 63.94 74.95 74.86 70.09 43.07 43.05 46.71 66.81 51.23 62.95 72.73Other Financial Corporations 20.17 33.71 25.02 44.54 46.29 37.18 25.10 16.93 9.86 5.24 5.03 8.31 8.74State and Local Government 0.00 0.00 0.00 0.00 0.00 0.00 0.00 0.00 0.00 0.00 0.00 0.00 0.00Public Non Financial Corporation 5.69 5.57 5.07 4.64 4.21 4.10 2.22 0.36 0.36 0.36 0.00 0.00 0.00Private Sector 16.01 51.49 33.85 25.77 24.36 28.80 15.75 25.76 36.50 61.21 46.20 54.64 63.99
Of which: Loans 16.01 51.49 33.85 25.77 24.36 28.80 15.75 25.76 36.50 61.21 46.20 54.61 63.93
Claims on Other Depository Corporat 99.12 119.74 120.44 126.11 113.61 100.02 107.61 195.43 115.91 49.10 48.99 44.26 68.50Of which: Loans 99.12 119.74 120.44 126.11 113.61 100.02 107.61 195.43 115.91 49.10 48.99 44.26 68.50
Other Liabilities to ODCs 117.81 117.43 65.84 84.78 186.78 72.61 18.77 167.82 89.86 49.74 567.03 933.22 229.29Of which: Repos 65.50 57.15 0.00 15.00 117.60 0.00 0.00 150.00 69.53 29.88 543.10 910.85 187.40
Other Items(Net) -555.70 -431.54 -376.86 -706.42 -371.32 -519.79 -1,104.30 -1,015.59 -1,721.19 -1,148.93 -1,434.51 -1,477.92 -2,955.36Shares and Other Equity 458.32 355.06 283.22 456.29 197.18 328.03 1,047.25 1,075.30 1,799.30 1,204.13 1,627.20 1,782.99 3,421.40Other Items(Net) -97.38 -76.49 -93.63 -250.12 -174.15 -191.75 -57.04 59.71 78.11 55.20 192.68 305.07 466.05
0.00 0.00 0.00 0.00 0.00 0.00 0.00 0.00 0.00Monetary Base Incl. foreign currency c 630.64 809.94 928.33 1,046.11 1,242.53 1,614.49 1,950.36 2,434.19 2,967.94 3,012.90 3,545.32 4,091.67 5,053.16
Monetary Base 630.64 809.94 928.33 1,046.11 1,242.53 1,614.49 1,950.36 2,406.12 2,892.60 2,848.89 3,324.94 3,768.96 4,294.97Currency In Circulation 520.25 605.29 698.58 837.73 981.10 1,230.02 1,468.71 1,738.98 2,189.82 2,204.47 2,452.86 2,746.09 3,231.56
Liabilities to ODCs 110.38 204.64 229.75 208.38 261.42 384.47 481.64 667.14 702.79 644.42 872.09 1,022.87 1,063.41Reserve Deposits 110.38 204.64 229.75 208.38 261.42 384.47 481.64 667.14 702.79 644.42 872.09 1,022.87 1,063.41Other 0.00 0.00 0.00 0.00 0.00 0.00 0.00 0.00 0.00 0.00 0.00 0.00 0.00
Foreign Currency Clearing Balances 0.00 0.00 0.00 0.00 0.00 0.00 0.00 28.07 75.33 164.01 220.37 322.71 758.20
Source: Statistics Department, Bank of UgandaNote:(i) SDR Allocation was reclassified from Other Items net to liabilities to non residents(ii) From Feb 2010, PRGF reclassified from short term foreign liabilities and included as part of Government deposits.(iii) IMF quota, IMF account number I and Securities eliminated from Central Bank Survey for consistency with Bank of Uganda Balance sheet. (iv) IMF Account number II reclassified to liabilities to non residents from Other items net. (v) Claims on Other Financial Corporations previously reported in Other Items net due to limited sectorisation reclassified to Claims on Other Sectors.(vi) Monetary base includes only the shilling reserve and clearing balances of operating Other despository corporations. The original level of Other depository corporations reserve and clearing balances is retained for comparison

2014/2015 ANNUAL REPORT
150
Appendix 9: Commercial Bank Balance Sheet (UGX billion)
Jun-93 Jun-94 Jun-95 Jun-96 Jun-97 Jun-98 Jun-99 Jun-00 Mar-01 Jun-02 Jun-03 Jun-04 Jun-05 Jun-06 Jun-07 Jun-08 Jun-09 Jun-10 Jun-11 Jun-12 Jun-13 Jun-14 Jun-15
Net Foreign Assets 50.85 50.96 79.82 75.13 120.78 166.52 197.22 291.49 373.83 472.4 616.8 690.4 610.5 468.5 493.2 748.9 607.2 601.2 513.5 1,095.9 166.2 560.2- 408.6- Claims on Non Residents 100.38 108.46 122.47 134.76 165.73 254.05 271.99 364.68 449.75 551.1 702.2 789.8 725.6 632.3 688.8 980.4 1,141.6 1,339.9 1,187.2 2,038.0 1,551.3 1,270.3 2,192.7 Of Which: Foreign Currency 49.53 57.50 42.65 59.63 44.95 87.53 74.76 73.19 75.93 13.4 21.2 24.9 30.6 41.2 40.6 64.1 133.6 157.5 186.5 132.8 225.0 196.0 290.2 Deposits 10.33 14.92 9.16 12.91 11.00 15.77 12.78 10.98 16.95 537.7 680.0 763.0 687.3 578.3 640.1 910.4 1,006.2 376.6 734.2 1,536.5 1,165.7 892.9 1,728.1
Loans 0.00 0.00 0.00 0.00 0.00 0.00 0.74 2.72 2.83 0.0 1.0 1.8 7.7 12.8 8.2 5.8 1.9 801.6 254.2 362.4 129.6 136.7 121.8 Less Liabilities to Non Residents 78.7 85.4 99.4 115.1 163.9 195.7 231.4 534.4 738.7 673.7 942.1 1,385.1 1,830.5 2,601.3
Of Which: Deposits 175.86 214.49 230.33 356.46 462.51 582.74 697.23 792.01 875.90 24.3 41.5 53.9 67.6 107.0 81.8 86.3 49.8 206.8 249.8 136.7 130.9 298.3 591.7 Loans -6.55 -10.12 -44.87 -7.25 84.39 120.59 97.08 169.36 215.44 54.4 43.9 45.4 47.5 56.9 113.9 145.1 484.7 528.2 415.0 803.4 1,224.8 1,530.2 1,998.9
1.53 0.01 0.28 0.83 1.06 2.41 0.42 0.02 0.00Net Domestic Assets (NDA) 12.31 31.71 39.58 66.33 150.61 185.69 209.34 320.27 410.20 990.7 1,254.9 1,274.0 1,522.2 1,962.8 2,233.7 2,960.7 4,006.4 5,358.1 7,276.0 7,234.0 7,853.8 12,069.6 13,704.7
Domestic Claims 20.40 41.84 84.73 74.42 67.28 67.51 112.68 150.93 194.76 1,204.1 1,517.0 1,590.3 1,865.9 2,443.3 2,983.2 4,136.3 5,223.4 6,484.0 8,803.9 9,421.8 10,462.0 12,387.7 14,353.8 Net Claims on Central Government 0.00 0.00 0.00 0.00 0.00 0.00 20.20 12.39 18.90 454.3 566.6 498.9 636.2 852.6 983.1 1,366.9 1,565.1 1,902.7 2,241.8 2,169.3 2,742.0 3,589.3 3,791.0
Claims on Central Government 0.00 0.00 0.00 0.00 0.00 0.00 1.09 1.02 0.91 723.9 762.4 843.6 982.5 1,026.7 1,099.0 1,485.3 1,704.5 2,196.2 2,498.2 2,579.3 3,116.2 4,037.9 4,283.6 Less Liabilities to Central Government 173.36 212.17 257.74 344.82 353.06 431.83 546.34 580.41 609.79 269.6 195.8 344.7 346.3 174.1 115.9 118.4 139.4 293.6 256.4 410.1 374.2 448.7 492.6
Claims on Other Sectors 35.82 40.89 50.09 57.10 62.59 58.53 0.00 0.00 609.79 749.8 950.4 1,091.4 1,229.7 1,590.7 2,000.0 2,769.4 3,658.3 4,581.3 6,562.2 7,252.5 7,720.0 8,798.4 10,562.8 Other Financial Corporations 137.54 171.27 207.65 287.72 290.47 373.30 484.80 493.20 488.04 27.1 32.5 12.2 8.2 9.2 50.8 28.9 35.6 15.8 29.9 28.9 26.1 28.8 36.9 State and Local Government 0.00 0.00 0.00 0.00 0.00 0.00 61.54 87.22 121.75 1.2 0.8 0.4 0.0 0.6 0.8 0.1 0.0 0.9 0.9 0.3 0.7 0.7 1.2 Public Non Financial Corporations 9.05 12.44 17.47 18.90 25.07 30.33 32.53 28.83 30.85 2.9 2.6 11.7 6.8 18.6 30.4 25.5 35.1 52.2 38.4 38.3 55.9 46.8 32.6 Private Sector 718.7 914.6 1,067.1 1,214.6 1,562.3 1,918.0 2,714.8 3,587.7 4,512.4 6,492.9 7,185.1 7,637.2 8,722.2 10,492.0
Of which: Loans 37.20 54.28 90.96 51.26 88.25 111.17 105.44 163.31 157.96 716.1 912.7 1,063.0 1,213.3 1,561.7 1,917.6 2,714.8 3,587.7 4,484.6 6,476.2 7,177.3 7,616.5 8,712.8 10,479.6 45.65 60.42 98.85 58.98 93.19 116.19 117.20 112.38 174.75
Claims on the Central Bank 8.45 6.14 7.89 7.71 4.94 10.49 26.64 24.57 21.79 260.9 306.4 402.8 387.6 405.8 584.0 567.6 708.7 1,213.4 1,121.8 1,126.8 1,975.0 2,656.6 2,512.0 Currency 0.00 0.00 0.00 0.00 0.00 0.00 0.00 0.00 ... 40.7 58.9 76.0 93.5 92.8 117.5 155.5 223.3 295.8 290.2 252.1 294.5 393.2 448.3 Reserve Deposits 0.00 0.00 0.00 0.00 0.00 5.47 14.89 32.23 5.00 188.5 181.9 269.7 294.1 297.9 348.9 412.1 485.4 767.6 759.1 845.8 1,137.7 1,353.0 1,876.2 Other Claims 0.00 0.00 0.00 0.00 0.00 0.00 0.00 43.27 ... 31.7 65.6 57.2 0.0 15.1 117.6 0.0 0.0 150.0 72.5 28.9 542.9 910.5 187.4
Labilities to the Central Bank 155.0 192.1 233.3 220.7 217.5 215.0 158.3 46.9 55.4 152.6 54.2 54.1 52.9 48.8 -25.81 -6.32 0.93 -9.05 -83.29 -79.97 -124.01 -206.30 -229.90
Other Items(Net) 127.88 160.51 159.31 159.61 135.71 177.02 188.32 242.95 274.37 -254.1 -321.0 -392.3 -437.2 -573.4 -866.9 -1,331.1 -1,440.3 -1,421.7 -1,818.1 -2,439.8 -2,902.6 2,921.8- 3,112.2- Shares and Other Equity 152.16 166.81 158.10 167.83 217.94 254.58 312.33 449.25 504.26 266.4 286.9 314.3 280.4 391.9 593.5 855.4 1,242.1 1,383.1 1,676.3 2,169.5 2,660.6 2,850.0 3,236.1 Other Items(Net) 3.75 1.95 -3.85 -10.63 -16.10 -24.03 -18.82 -26.67 93.37 12.3 -34.0 -77.9 -156.8 -181.5 -273.5 -475.7 -198.2 -38.6 -141.8 -270.4 -242.0 71.9- 123.8
9.83 4.36 4.36 5.48 5.43 9.34 11.33 8.42 2.34Deposits Liabilities to the Public -1.53 -0.02 -0.29 -0.83 -1.06 -2.41 0.00 0.00 -0.01 1,528.3 1,927.1 2,058.0 2,206.1 2,526.7 2,978.4 3,963.4 5,052.2 6,821.5 8,468.5 9,150.5 9,646.4 11,509.4 13,296.1
Deposits Included in Broad Money 1,528.3 1,927.1 2,058.0 2,206.1 2,526.7 2,978.4 3,963.4 5,052.2 6,821.5 8,468.5 9,150.5 9,646.4 11,509.4 13,262.2 Foreign Currency Deposits 146.28 191.48 204.22 321.62 435.77 562.08 685.90 783.58 873.56 444.9 639.3 662.4 653.3 706.6 848.1 1,142.5 1,376.9 1,879.7 2,476.5 3,565.2 3,104.1 3,933.6 5,277.0
Transferable Deposits 326.5 489.9 522.2 526.3 541.8 651.6 874.2 1,076.8 1,455.2 1,726.5 2,431.1 1,785.3 2,343.2 3,324.8 Other Deposits 238.10 313.42 402.04 473.80 588.26 780.46 875.89 1,040.51 1,177.79 118.4 149.3 140.2 127.0 164.9 196.5 268.3 300.1 424.5 750.1 1,134.2 1,318.8 1,590.4 1,952.2
Local Currency Deposits 36.13 46.16 67.11 75.02 103.53 146.91 207.82 310.84 367.00 1,083.4 1,287.8 1,395.6 1,552.8 1,820.1 2,130.3 2,820.9 3,675.2 4,941.8 5,991.9 5,585.2 6,542.3 7,575.8 7,985.2 Transferable Deposits 201.97 267.25 334.93 398.78 484.73 633.55 668.07 729.67 810.79 617.5 725.1 804.0 860.1 961.5 1,128.0 1,426.3 1,732.7 2,331.0 2,802.9 2,486.4 3,103.7 3,718.3 3,963.0 Other Deposits 122.02 157.22 206.28 220.74 263.92 324.91 360.09 413.05 462.09 465.9 562.7 591.6 692.7 858.5 1,002.4 1,394.6 1,942.5 2,610.7 3,189.0 3,098.8 3,438.6 3,857.5 4,022.3
Deposits Excluded from Broad Money 79.95 110.03 128.64 178.04 220.81 308.64 296.90 305.80 339.00 0.0 0.0 0.0 0.0 0.0 0.0 0.0 0.0 0.0 0.0 0.0 0.0 - 33.8
Source: Bank of Uganda
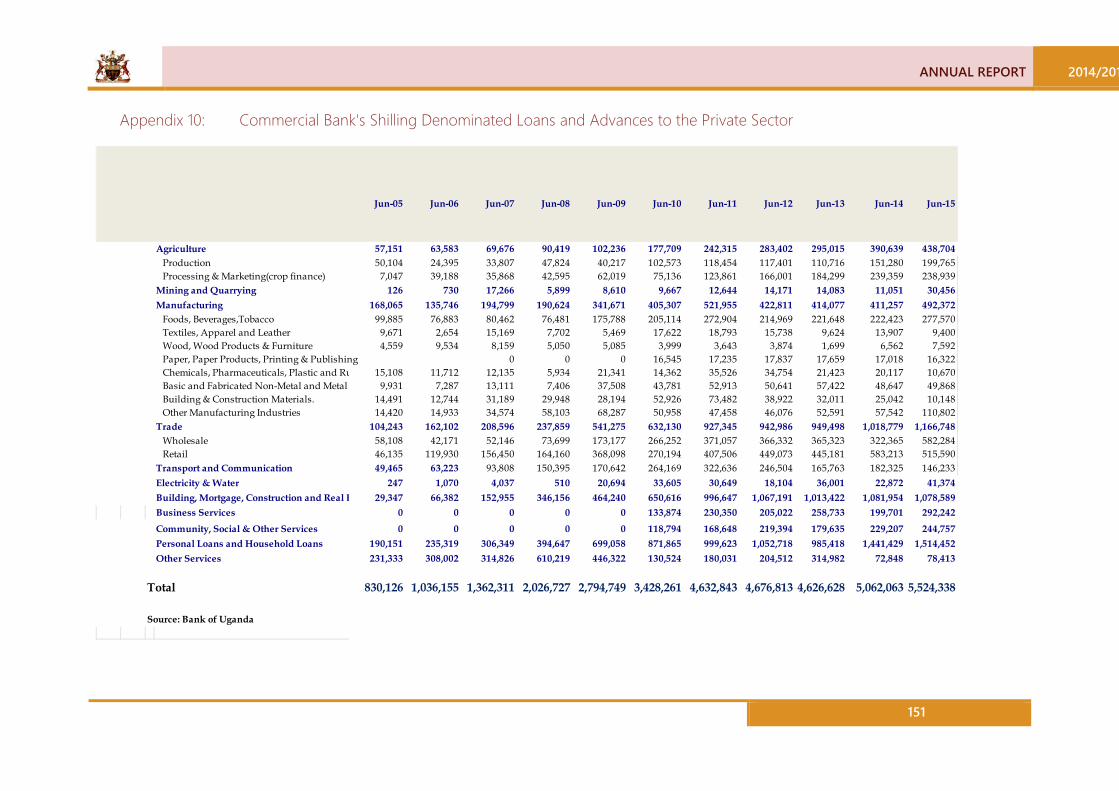
ANNUAL REPORT 2014/201
151
Appendix 10: Commercial Bank's Shilling Denominated Loans and Advances to the Private Sector
Jun-05 Jun-06 Jun-07 Jun-08 Jun-09 Jun-10 Jun-11 Jun-12 Jun-13 Jun-14 Jun-15
Agriculture 57,151 63,583 69,676 90,419 102,236 177,709 242,315 283,402 295,015 390,639 438,704 Production 50,104 24,395 33,807 47,824 40,217 102,573 118,454 117,401 110,716 151,280 199,765 Processing & Marketing(crop finance) 7,047 39,188 35,868 42,595 62,019 75,136 123,861 166,001 184,299 239,359 238,939Mining and Quarrying 126 730 17,266 5,899 8,610 9,667 12,644 14,171 14,083 11,051 30,456Manufacturing 168,065 135,746 194,799 190,624 341,671 405,307 521,955 422,811 414,077 411,257 492,372 Foods, Beverages,Tobacco 99,885 76,883 80,462 76,481 175,788 205,114 272,904 214,969 221,648 222,423 277,570 Textiles, Apparel and Leather 9,671 2,654 15,169 7,702 5,469 17,622 18,793 15,738 9,624 13,907 9,400 Wood, Wood Products & Furniture 4,559 9,534 8,159 5,050 5,085 3,999 3,643 3,874 1,699 6,562 7,592 Paper, Paper Products, Printing & Publishing 0 0 0 16,545 17,235 17,837 17,659 17,018 16,322 Chemicals, Pharmaceuticals, Plastic and Ru 15,108 11,712 12,135 5,934 21,341 14,362 35,526 34,754 21,423 20,117 10,670 Basic and Fabricated Non-Metal and Metal 9,931 7,287 13,111 7,406 37,508 43,781 52,913 50,641 57,422 48,647 49,868 Building & Construction Materials. 14,491 12,744 31,189 29,948 28,194 52,926 73,482 38,922 32,011 25,042 10,148 Other Manufacturing Industries 14,420 14,933 34,574 58,103 68,287 50,958 47,458 46,076 52,591 57,542 110,802Trade 104,243 162,102 208,596 237,859 541,275 632,130 927,345 942,986 949,498 1,018,779 1,166,748 Wholesale 58,108 42,171 52,146 73,699 173,177 266,252 371,057 366,332 365,323 322,365 582,284 Retail 46,135 119,930 156,450 164,160 368,098 270,194 407,506 449,073 445,181 583,213 515,590Transport and Communication 49,465 63,223 93,808 150,395 170,642 264,169 322,636 246,504 165,763 182,325 146,233Electricity & Water 247 1,070 4,037 510 20,694 33,605 30,649 18,104 36,001 22,872 41,374Building, Mortgage, Construction and Real E 29,347 66,382 152,955 346,156 464,240 650,616 996,647 1,067,191 1,013,422 1,081,954 1,078,589Business Services 0 0 0 0 0 133,874 230,350 205,022 258,733 199,701 292,242Community, Social & Other Services 0 0 0 0 0 118,794 168,648 219,394 179,635 229,207 244,757Personal Loans and Household Loans 190,151 235,319 306,349 394,647 699,058 871,865 999,623 1,052,718 985,418 1,441,429 1,514,452Other Services 231,333 308,002 314,826 610,219 446,322 130,524 180,031 204,512 314,982 72,848 78,413
Total 830,126 1,036,155 1,362,311 2,026,727 2,794,749 3,428,261 4,632,843 4,676,813 4,626,628 5,062,063 5,524,338
Source: Bank of Uganda

2014/2015 ANNUAL REPORT
152
Appendix 11: Commercial Banks' Forex Denominated Loans and Advances to the Private Sector
Jun-05 Jun-06 Jun-07 Jun-08 Jun-09 Jun-10 Jun-11 Jun-12 Jun-13 Jun-14 Jun-15
Agriculture 56,900 72,012 52,135 75,155 60,876 114,888 181,126 162,194 266,933 413,303 546,173 Production 19,236 29,872 14,229 14,928 12,045 55,297 104,376 103,775 125,722 136,146 218,097 Processing & Marketing(crop finance) 37,664 42,141 37,906 60,227 48,831 59,591 76,751 58,418 141,211 277,157 328,076Mining and Quarrying 537 20 26,742 3,798 2,094 27,866 6,703 16,918 13,393 11,001 18,659Manufacturing 60,505 104,579 62,606 149,087 207,627 213,150 398,161 580,177 689,079 790,179 1,149,527 Foods, Beverages,Tobacco 28,454 50,385 26,890 40,701 72,254 88,114 150,565 265,091 202,914 212,972 329,967 Textiles, Apparel and Leather 4,666 7,537 0 1,599 3,314 7,400 10,172 19,211 26,273 25,404 56,400 Wood, Wood Products & Furniture 805 1,901 1,184 1,494 166 7,854 15,034 8,929 11,158 14,031 18,757 Paper, Paper Products, Printing & Publishing 0 0 0 0 0 15,685 38,540 37,229 71,182 78,340 110,823 Chemicals, Pharmaceuticals, Plastic and Rubber Produ 2,121 1,020 5,593 841 44,913 28,209 44,819 72,668 69,493 103,650 110,671 Basic and Fabricated Non-Metal and Metal Products 1,288 405 262 9,747 8,341 23,361 24,398 43,120 76,786 103,937 178,240 Building & Construction Materials. 3,385 21,832 13,135 17,071 4,494 6,527 74,307 101,140 150,626 139,878 168,350 Other Manufacturing Industries 19,786 21,499 15,542 77,634 74,144 35,999 40,326 32,789 80,647 111,967 176,319
Trade 55,121 76,073 75,905 98,311 205,370 237,827 470,829 622,842 609,192 803,909 890,909 Wholesale 45,882 46,378 51,242 37,463 55,767 89,886 124,448 158,527 143,185 267,440 462,244 Retail 9,238 29,696 24,663 60,847 149,603 47,462 97,492 94,017 104,134 167,596 196,622Transport and Communication 16,269 29,649 18,326 38,787 39,854 89,533 183,819 227,892 278,885 287,650 357,419Electricity & Water 1,849 500 2,538 22,921 2,092 18,884 30,261 56,274 76,373 84,710 131,814Building, Mortgage, Construction and Real Estate 9,356 16,649 51,374 68,909 131,159 194,667 339,937 614,316 771,884 958,784 1,309,671Business Services 0 0 0 0 0 12,917 55,909 56,689 128,702 182,684 204,513Community, Social & Other Services 0 0 0 0 0 12,622 49,353 36,638 64,112 67,930 110,967Personal Loans and Household Loans 6,014 9,566 19,895 28,156 95,180 90,013 32,750 59,278 70,729 82,503 85,101Other Services 101,670 140,614 155,251 234,350 82,693 98,341 134,532 107,005 80,517 38,953 60,127
Total 308,222 449,663 464,772 719,473 826,944 1,110,708 1,883,380 2,540,221 3,049,799 3,721,606 4,864,880
Source: Bank of Uganda

ANNUAL REPORT 2014/201
153
Appendix 12: Structure of Interest Rates (annual percentage)
Jun-11 Sep-11 Dec-11 Mar-12 Jun-12 Sep-12 Dec-12 Mar-13 Apr-13 May-13 Jun-13 Sep-13 Dec-13 Mar-14 Jun-14 Sep-14 Dec-14 Mar-15 Jun-15
Bank of Uganda Ways and Means 12.10 15.59 20.09 15.66 16.68 10.71 9.36 8.84 9.49 9.39 9.52 9.39 8.78 9.35 8.94 9.96 10.56 12.27 12.76 Rediscount rate 13.26 18.00 27.00 26.00 24.00 21.00 17.13 15.00 15.00 15.00 14.00 15.00 14.50 14.50 14.00 14.00 14.00 14.00 16.00 Central Bank Rate 14.33 22.00 22.00 20.67 17.00 13.13 12.00 12.00 12.00 11.00 12.00 11.50 11.50 11.00 11.00 11.00 11.00 13.00
Treasury Bills 91 Days 12.10 15.59 20.09 15.66 16.68 10.71 9.36 8.84 9.49 9.39 9.52 9.39 8.78 9.35 8.94 9.96 10.56 12.27 12.76 182 Days 12.41 16.00 20.06 16.77 17.11 10.81 13.18 11.23 10.27 10.28 11.01 10.89 11.65 11.33 10.42 11.29 12.31 13.53 13.55 273 Days … … … … … … … … … … … … … … … … … … … 364 Days 12.55 16.77 18.31 16.25 16.14 10.20 13.17 10.88 10.37 10.80 11.65 11.02 11.55 11.50 10.64 11.42 12.09 13.79 14.02
Commercial Banks (Weighted Average)Local Currency Deposit Rates 2.26 3.22 2.90 3.36 3.57 3.44 2.89 2.82 2.78 2.92 2.60 3.03 3.43 3.10 2.42 2.54 3.01 2.66 2.69
Demand deposits 1.19 1.20 1.22 1.34 1.46 1.56 1.65 1.58 1.58 1.59 1.51 1.74 2.28 1.88 1.79 1.77 1.65 1.43 1.50 Savings deposits 2.34 2.33 2.35 3.22 3.28 3.16 3.13 3.24 3.23 3.06 3.12 3.29 2.47 2.51 2.31 2.41 3.23 3.29 3.26
Time Deposits 10.74 13.87 18.88 20.32 19.83 14.95 12.03 12.10 10.82 12.17 12.26 12.00 12.62 12.40 9.82 10.03 10.49 9.76 10.39
Lending Rates 19.93 22.12 25.41 27.24 26.61 26.32 24.48 24.03 24.69 23.45 22.72 22.52 22.44 21.87 21.55 21.18 20.68 20.08 22.34
Foreign Currency Deposit Rates 1.29 1.27 1.42 1.28 1.28 1.23 1.21 1.36 1.50 1.45 1.37 1.33 1.54 1.34 1.49 1.33 1.44 1.47 1.32
Demand deposits 1.08 0.99 0.95 0.95 0.97 0.96 0.97 0.96 0.99 0.98 1.01 1.06 1.15 0.96 0.96 0.96 0.96 0.96 0.96 Savings deposits 1.49 1.54 1.69 1.80 1.69 1.66 1.73 1.69 1.69 1.68 1.66 1.65 1.74 1.72 1.52 1.53 1.52 1.52 1.51
Time Deposits 3.06 2.81 4.12 5.14 4.42 4.13 3.70 4.70 4.95 4.97 4.52 4.01 4.70 4.21 4.31 3.80 4.18 4.25 3.97
Lending Rates 9.69 9.72 9.95 10.25 8.66 8.97 9.74 9.91 10.28 9.73 10.11 9.65 9.88 9.39 9.03 9.84 10.79 10.44 9.87
rce: Bank of Uganda
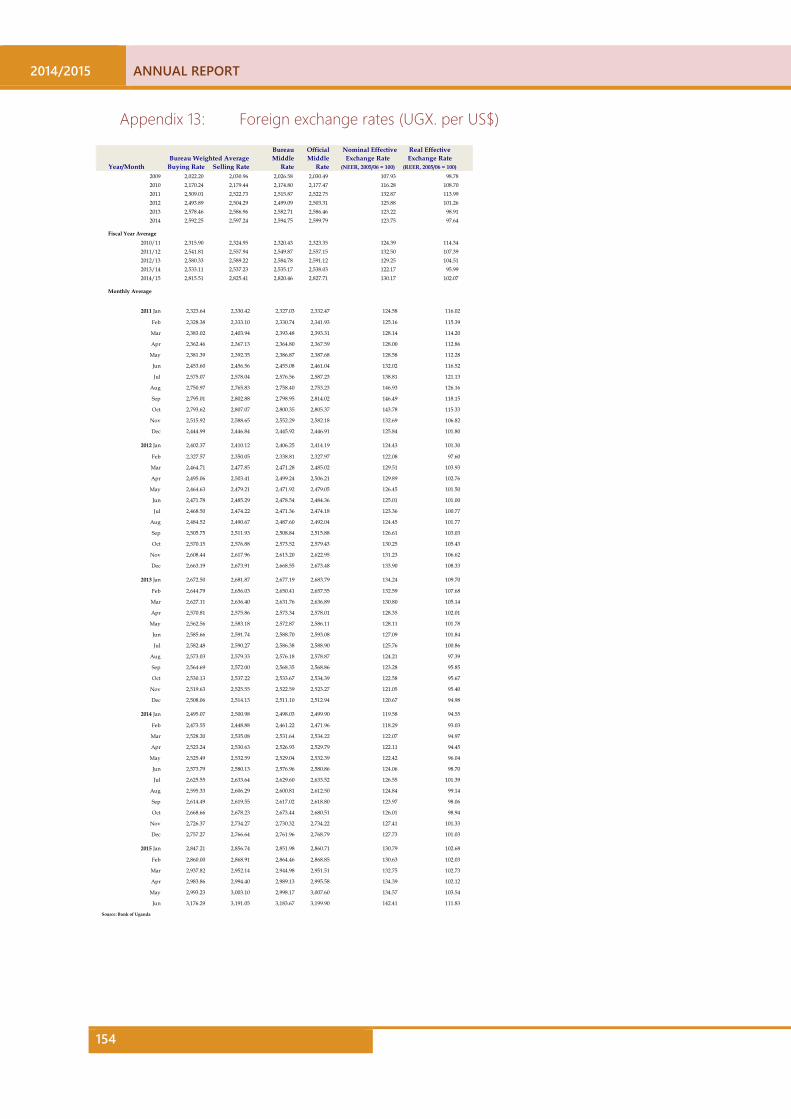
2014/2015 ANNUAL REPORT
154
Appendix 13: Foreign exchange rates (UGX. per US$) Bureau Official Nominal Effective Real Effective
Bureau Weighted Average Middle Middle Exchange Rate Exchange RateYear/Month Buying Rate Selling Rate Rate Rate (NEER, 2005/06 = 100) (REER, 2005/06 = 100)
2009 2,022.20 2,030.96 2,026.58 2,030.49 107.93 98.782010 2,170.24 2,179.44 2,174.80 2,177.47 116.28 108.702011 2,509.01 2,522.73 2,515.87 2,522.75 132.87 113.992012 2,493.89 2,504.29 2,499.09 2,503.31 125.88 101.262013 2,578.46 2,586.96 2,582.71 2,586.46 123.22 98.912014 2,592.25 2,597.24 2,594.75 2,599.79 123.75 97.64
Fiscal Year Average 2010/11 2,315.90 2,324.95 2,320.43 2,323.35 124.39 114.34 2011/12 2,541.81 2,557.94 2,549.87 2,557.15 132.50 107.392012/13 2,580.33 2,589.22 2,584.78 2,591.12 129.25 104.512013/14 2,533.11 2,537.23 2,535.17 2,538.03 122.17 95.992014/15 2,815.51 2,825.41 2,820.46 2,827.71 130.17 102.07
Monthly Average
2011 Jan 2,323.64 2,330.42 2,327.03 2,332.47 124.58 116.02
Feb 2,328.38 2,333.10 2,330.74 2,341.93 125.16 115.39
Mar 2,383.02 2,403.94 2,393.48 2,393.31 128.14 114.20
Apr 2,362.46 2,367.13 2,364.80 2,367.59 128.00 112.86
May 2,381.39 2,392.35 2,386.87 2,387.68 128.58 112.28
Jun 2,453.60 2,456.56 2,455.08 2,461.04 132.02 116.52
Jul 2,575.07 2,578.04 2,576.56 2,587.23 138.81 121.13
Aug 2,750.97 2,765.83 2,758.40 2,753.23 146.93 126.16
Sep 2,795.01 2,802.88 2,798.95 2,814.02 146.49 118.15
Oct 2,793.62 2,807.07 2,800.35 2,805.37 143.78 115.33
Nov 2,515.92 2,588.65 2,552.29 2,582.18 132.69 106.82
Dec 2,444.99 2,446.84 2,445.92 2,446.91 125.84 101.80
2012 Jan 2,402.37 2,410.12 2,406.25 2,414.19 124.43 101.30
Feb 2,327.57 2,350.05 2,338.81 2,327.97 122.08 97.60
Mar 2,464.71 2,477.85 2,471.28 2,485.02 129.51 103.93
Apr 2,495.06 2,503.41 2,499.24 2,506.21 129.89 102.76
May 2,464.63 2,479.21 2,471.92 2,479.05 126.45 101.50
Jun 2,471.78 2,485.29 2,478.54 2,484.36 125.01 101.00
Jul 2,468.50 2,474.22 2,471.36 2,474.18 123.36 100.77
Aug 2,484.52 2,490.67 2,487.60 2,492.04 124.45 101.77
Sep 2,505.75 2,511.93 2,508.84 2,515.88 126.61 103.03
Oct 2,570.15 2,576.88 2,573.52 2,579.43 130.25 105.43
Nov 2,608.44 2,617.96 2,613.20 2,622.95 131.23 106.62
Dec 2,663.19 2,673.91 2,668.55 2,673.48 133.90 108.33
2013 Jan 2,672.50 2,681.87 2,677.19 2,683.79 134.24 109.70
Feb 2,644.79 2,656.03 2,650.41 2,657.55 132.59 107.68
Mar 2,627.11 2,636.40 2,631.76 2,636.89 130.80 105.14
Apr 2,570.81 2,575.86 2,573.34 2,578.01 128.35 102.01
May 2,562.56 2,583.18 2,572.87 2,586.11 128.11 101.78
Jun 2,585.66 2,591.74 2,588.70 2,593.08 127.09 101.84
Jul 2,582.48 2,590.27 2,586.38 2,588.90 125.76 100.86
Aug 2,573.03 2,579.33 2,576.18 2,578.87 124.21 97.39
Sep 2,564.69 2,572.00 2,568.35 2,568.86 123.28 95.85
Oct 2,530.13 2,537.22 2,533.67 2,534.39 122.58 95.67
Nov 2,519.63 2,525.55 2,522.59 2,523.27 121.05 95.40
Dec 2,508.06 2,514.13 2,511.10 2,512.94 120.67 94.98
2014 Jan 2,495.07 2,500.98 2,498.03 2,499.90 119.58 94.55
Feb 2,473.55 2,448.88 2,461.22 2,471.96 118.29 93.03
Mar 2,528.20 2,535.08 2,531.64 2,534.22 122.07 94.97
Apr 2,523.24 2,530.63 2,526.93 2,529.79 122.11 94.45
May 2,525.49 2,532.59 2,529.04 2,532.39 122.42 96.04
Jun 2,573.79 2,580.13 2,576.96 2,580.86 124.06 98.70
Jul 2,625.55 2,633.64 2,629.60 2,633.52 126.55 101.39
Aug 2,595.33 2,606.29 2,600.81 2,612.50 124.84 99.14
Sep 2,614.49 2,619.55 2,617.02 2,618.80 123.97 98.06
Oct 2,668.66 2,678.23 2,673.44 2,680.51 126.01 98.94
Nov 2,726.37 2,734.27 2,730.32 2,734.22 127.41 101.33
Dec 2,757.27 2,766.64 2,761.96 2,768.79 127.73 101.03
2015 Jan 2,847.21 2,856.74 2,851.98 2,860.71 130.79 102.68
Feb 2,860.00 2,868.91 2,864.46 2,868.85 130.63 102.03
Mar 2,937.82 2,952.14 2,944.98 2,951.51 132.75 102.73
Apr 2,983.86 2,994.40 2,989.13 2,995.58 134.39 102.12
May 2,993.23 3,003.10 2,998.17 3,007.60 134.57 103.54
Jun 3,176.29 3,191.05 3,183.67 3,199.90 142.41 111.83
Source: Bank of Uganda
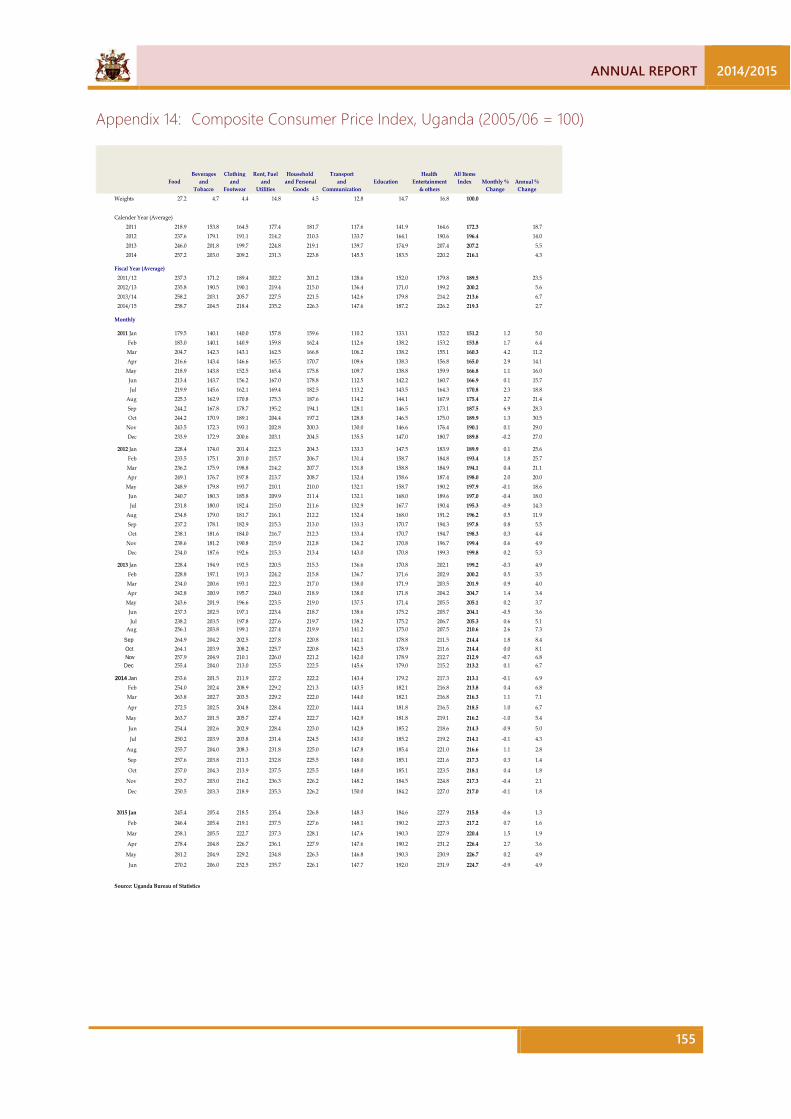
ANNUAL REPORT 2014/2015
155
Appendix 14: Composite Consumer Price Index, Uganda (2005/06 = 100)
Beverages Clothing Rent, Fuel Household Transport Health All ItemsFood and and and and Personal and Education Entertainment Index Monthly % Annual %
Tobacco Footwear Utilities Goods Communication & others Change ChangeWeights 27.2 4.7 4.4 14.8 4.5 12.8 14.7 16.8 100.0
Calender Year (Average)2011 218.9 153.8 164.5 177.4 181.7 117.6 141.9 164.6 172.3 18.72012 237.6 179.1 191.1 214.2 210.3 133.7 164.1 190.6 196.4 14.02013 246.0 201.8 199.7 224.8 219.1 139.7 174.9 207.4 207.2 5.52014 257.2 203.0 209.2 231.3 223.8 145.5 183.5 220.2 216.1 4.3
Fiscal Year (Average) 2011/12 237.3 171.2 189.4 202.2 201.2 128.6 152.0 179.8 189.5 23.5 2012/13 235.8 190.5 190.1 219.4 215.0 136.4 171.0 199.2 200.2 5.6 2013/14 258.2 203.1 205.7 227.5 221.5 142.6 179.8 214.2 213.6 6.7 2014/15 258.7 204.5 218.4 235.2 226.3 147.6 187.2 226.2 219.3 2.7
Monthly
2011 Jan 179.5 140.1 140.0 157.8 159.6 110.2 133.1 152.2 151.2 1.2 5.0 Feb 183.0 140.1 140.9 159.8 162.4 112.6 138.2 153.2 153.8 1.7 6.4Mar 204.7 142.3 143.1 162.5 166.8 106.2 138.2 155.1 160.3 4.2 11.2Apr 216.6 143.4 146.6 165.5 170.7 109.6 138.3 156.8 165.0 2.9 14.1May 218.9 143.8 152.5 165.4 175.8 109.7 138.8 159.9 166.8 1.1 16.0Jun 213.4 143.7 156.2 167.0 178.8 112.5 142.2 160.7 166.9 0.1 15.7Jul 219.9 145.6 162.1 169.4 182.5 113.2 143.5 164.3 170.8 2.3 18.8
Aug 225.3 162.9 170.8 175.3 187.6 114.2 144.1 167.9 175.4 2.7 21.4Sep 244.2 167.8 178.7 195.2 194.1 128.1 146.5 173.1 187.5 6.9 28.3Oct 244.2 170.9 189.1 204.4 197.2 128.8 146.5 175.0 189.9 1.3 30.5
Nov 243.5 172.3 193.1 202.8 200.3 130.0 146.6 176.4 190.1 0.1 29.0Dec 233.9 172.9 200.6 203.1 204.5 135.5 147.0 180.7 189.8 -0.2 27.0
2012 Jan 228.4 174.0 201.4 212.3 204.3 133.3 147.5 183.9 189.9 0.1 25.6 Feb 233.5 175.1 201.0 215.7 206.7 131.4 158.7 184.8 193.4 1.8 25.7Mar 236.2 175.9 198.8 214.2 207.7 131.8 158.8 184.9 194.1 0.4 21.1Apr 249.1 176.7 197.8 213.7 208.7 132.4 158.6 187.4 198.0 2.0 20.0
May 248.9 179.8 193.7 210.1 210.0 132.1 158.7 190.2 197.9 -0.1 18.6Jun 240.7 180.3 185.8 209.9 211.4 132.1 168.0 189.6 197.0 -0.4 18.0Jul 231.8 180.0 182.4 215.0 211.6 132.9 167.7 190.4 195.3 -0.9 14.3
Aug 234.8 179.0 181.7 216.1 212.2 132.4 168.0 191.2 196.2 0.5 11.9Sep 237.2 178.1 182.9 215.3 213.0 133.3 170.7 194.3 197.8 0.8 5.5Oct 238.1 181.6 184.0 216.7 212.3 133.4 170.7 194.7 198.3 0.3 4.4
Nov 238.6 181.2 190.8 215.9 212.8 136.2 170.8 196.7 199.4 0.6 4.9Dec 234.0 187.6 192.6 215.3 213.4 143.0 170.8 199.3 199.8 0.2 5.3
2013 Jan 228.4 194.9 192.5 220.5 215.3 136.6 170.8 202.1 199.2 -0.3 4.9Feb 228.8 197.1 191.3 224.2 215.8 136.7 171.6 202.9 200.2 0.5 3.5Mar 234.0 200.6 193.1 222.3 217.0 138.0 171.9 203.5 201.9 0.9 4.0Apr 242.8 200.9 195.7 224.0 218.9 138.0 171.8 204.2 204.7 1.4 3.4May 243.6 201.9 196.6 223.5 219.0 137.5 171.4 205.5 205.1 0.2 3.7Jun 237.3 202.5 197.1 223.4 218.7 138.6 175.2 205.7 204.1 -0.5 3.6
Jul 238.2 203.5 197.8 227.6 219.7 138.2 175.2 206.7 205.3 0.6 5.1 Aug 256.1 203.8 199.1 227.4 219.9 141.2 175.0 207.5 210.6 2.6 7.3
Sep 264.9 204.2 202.5 227.8 220.8 141.1 178.8 211.5 214.4 1.8 8.4 Oct 264.1 203.9 208.2 225.7 220.8 142.5 178.9 211.6 214.4 0.0 8.1 Nov 257.9 204.9 210.1 226.0 221.2 142.0 178.9 212.7 212.9 -0.7 6.8 Dec 255.4 204.0 213.0 225.5 222.5 145.6 179.0 215.2 213.2 0.1 6.7
2014 Jan 253.6 201.5 211.9 227.2 222.2 143.4 179.2 217.3 213.1 -0.1 6.9 Feb 254.0 202.4 208.9 229.2 221.3 143.5 182.1 216.8 213.8 0.4 6.8Mar 263.8 202.7 203.5 229.2 222.0 144.0 182.1 216.8 216.3 1.1 7.1
Apr 272.5 202.5 204.8 228.4 222.0 144.4 181.8 216.5 218.5 1.0 6.7
May 263.7 201.5 205.7 227.4 222.7 142.9 181.8 219.1 216.2 -1.0 5.4
Jun 254.4 202.6 202.9 228.4 223.0 142.8 185.2 218.6 214.3 -0.9 5.0
Jul 250.2 203.9 203.8 231.4 224.5 143.0 185.2 219.2 214.1 -0.1 4.3
Aug 255.7 204.0 208.3 231.8 225.0 147.8 185.4 221.0 216.6 1.1 2.8
Sep 257.6 203.8 211.3 232.8 225.5 148.0 185.1 221.6 217.3 0.3 1.4
Oct 257.0 204.3 213.9 237.5 225.5 148.0 185.1 223.5 218.1 0.4 1.8
Nov 253.7 203.0 216.2 236.3 226.2 148.2 184.5 224.8 217.3 -0.4 2.1
Dec 250.5 203.3 218.9 235.3 226.2 150.0 184.2 227.0 217.0 -0.1 1.8
2015 Jan 245.4 205.4 218.5 235.4 226.8 148.3 184.6 227.9 215.8 -0.6 1.3
Feb 246.4 205.4 219.1 237.5 227.6 148.1 190.2 227.3 217.2 0.7 1.6
Mar 258.1 205.5 222.7 237.3 228.1 147.6 190.3 227.9 220.4 1.5 1.9
Apr 278.4 204.8 226.7 236.1 227.9 147.6 190.2 231.2 226.4 2.7 3.6
May 281.2 204.9 229.2 234.8 226.3 146.8 190.3 230.9 226.7 0.2 4.9
Jun 270.2 206.0 232.5 235.7 226.1 147.7 192.0 231.9 224.7 -0.9 4.9
Source: Uganda Bureau of Statistics

2014/2015 ANNUAL REPORT
156
Appendix 15: International Investment Position: External Assets and Liabilities End of period (million US$) 2005 2006 2007 2008 2009 2010 2011 Mar-12 Jun-12 Sep-12 Dec-12 Mar-13 Jun-13 Sep-13 Dec-13 Mar-14 Jun-14 Sep-14 Dec-14 Mar-15 Jun-15
Assets 2,013.66 2,617.05 3,398.53 3,084.97 3,665.64 3,569.25 3,450.47 3,840.63 4,145.17 4,360.28 4,321.56 4,517.03 4,538.47 4,592.27 5,055.09 5,130.36 4,883.47 4,775.54 4,817.87 4,847.08 4,925.25
Direct investment abroad 0.00 0.00 0.00 0.00 28.85 62.92 50.67 62.25 73.84 85.42 97.01 85.20 73.40 61.60 49.80 49.96 50.11 50.17 50.23 50.23 50.23
Equity capital and reinvested earnings 0.00 0.00 0.00 0.00 25.71 62.52 51.98 63.74 75.49 87.24 98.99 87.54 76.10 64.65 53.20 53.36 53.51 53.57 53.63 53.63 53.63
Other capital 0.00 0.00 0.00 0.00 3.14 0.41 -1.32 -1.48 -1.65 -1.82 -1.99 -2.34 -2.69 -3.05 -3.40 -3.40 -3.40 -3.40 -3.40 -3.40 -3.40
Financial derivatives, net 0.00 0.00 0.00 0.00 0.00 0.04 0.04 0.01 0.04 0.33 0.09 0.01 0.00 0.01 0.10 0.01 1.71 1.34 0.61 0.01 2.58
Portfolio investment 0.00 0.00 0.00 12.06 12.05 12.06 9.51 8.46 11.02 16.18 18.42 50.27 86.70 172.21 212.68 248.04 296.43 328.75 360.63 402.19 500.10
Equity securities 0.00 0.00 0.00 12.06 12.05 12.06 9.51 8.46 11.02 12.76 15.19 18.57 20.28 26.53 33.45 38.32 38.70 41.95 59.74 87.90 175.47
Debt securities 0.00 0.00 0.00 0.00 0.00 0.00 0.00 0.00 0.00 3.42 3.23 31.70 66.42 145.68 179.24 209.73 257.72 286.79 300.90 314.29 324.63
Bonds and notes
Money-market instruments
Financial derivatives 0.00 0.00 0.00 0.00 0.00 0.04 0.04 0.01 0.04 0.33 0.09 0.01 0.00 0.01 0.10 0.01 1.71 1.34 0.61 0.01 2.58
Other investment 669.42 806.14 967.67 872.17 1,118.36 1,077.69 1,028.44 1,280.53 1,484.17 1,389.59 1,295.94 1,414.03 1,474.69 1,407.94 1,689.52 1,526.33 1,160.91 1,379.16 1,187.78 1,598.00 1,495.12
Trade credits
Loans 9.97 5.99 6.78 1.28 0.53 263.25 176.61 205.94 146.58 81.34 30.75 84.56 49.99 46.62 56.10 85.82 52.59 31.54 40.02 75.74 36.89
Currency and deposits 658.38 799.08 960.89 870.89 1,117.83 814.44 851.83 1,074.59 1,337.59 1,308.25 1,265.18 1,329.47 1,424.70 1,361.32 1,633.41 1,440.51 1,108.32 1,347.62 1,147.76 1,522.25 1,458.23
Other assets 1.07 1.07 0.00 0.00 0.00 0.00 0.00 0.00 0.00 0.00 0.00 0.00 0.00 0.00 0.00 0.00 0.00 0.00 0.00 0.00 0.00
Reserve assets 1,344.24 1,810.91 2,430.86 2,200.73 2,506.38 2,416.54 2,361.80 2,489.38 2,576.10 2,868.75 2,910.11 2,967.51 2,903.68 2,950.51 3,102.98 3,306.02 3,374.31 3,016.13 3,218.62 2,796.65 2,877.23
Liabilities 6,893.93 4,325.97 5,832.90 6,914.42 8,845.36 10,191.02 11,724.25 12,492.07 13,138.65 13,596.35 13,824.33 14,174.32 14,698.41 15,293.82 15,888.80 16,787.97 16,894.35 17,079.50 17,445.54 17,900.45 18,288.97
Direct investment in reporting economy 2,024.37 2,668.63 3,460.93 4,189.79 5,031.37 5,575.24 6,469.53 6,837.50 7,283.50 7,589.78 7,674.92 7,948.92 8,222.92 8,496.92 8,770.92 9,059.26 9,424.42 9,638.41 9,917.48 10,212.79 10,459.32
Equity capital and reinvested earnings 1,683.12 2,322.88 3,065.02 3,642.66 4,413.23 4,661.20 5,234.25 5,499.35 5,874.01 6,094.66 6,156.00 6,368.05 6,580.10 6,792.15 7,004.20 7,318.35 7,571.98 7,732.25 7,974.08 8,193.27 8,394.33
Other capital 341.24 345.74 395.91 547.13 618.13 914.03 1,235.28 1,338.16 1,409.49 1,495.12 1,518.92 1,580.87 1,642.82 1,704.77 1,766.72 1,740.90 1,852.44 1,906.16 1,943.40 2,019.51 2,064.99
Financial derivatives 0.00 0.00 0.00 0.00 0.00 0.00 0.00 0.00 0.00 0.00 0.00 0.00 0.00 0.00 0.00 0.00 0.00 0.00 0.00 0.00 0.00
Portfolio investment 32.77 51.61 148.29 128.90 194.91 119.59 356.02 419.06 439.48 364.29 335.38 384.02 393.60 441.28 508.35 1,050.75 632.46 722.12 679.95 665.03 663.88
Equity securities 24.64 43.77 69.98 37.58 153.09 103.34 179.16 221.65 208.41 205.19 205.84 194.85 235.23 245.77 274.65 792.08 320.32 368.92 334.05 323.17 304.94
Debt securities 8.12 7.84 78.32 91.32 41.82 16.25 176.86 197.41 231.07 159.10 129.54 189.16 158.37 195.51 233.69 258.66 312.14 353.21 345.90 341.86 358.95
Bonds and notes 0.00 0.00 0.00 0.00 0.00 0.00 0.00 0.00 0.00 0.00 0.00 0.00 0.00 0.00 0.00 0.00 0.00 0.00 0.00 0.00 0.00
Money-market instruments 0.00 0.00 0.00 0.00 0.00 0.00 0.00 0.00 0.00 0.00 0.00 0.00 0.00 0.00 0.00 0.00 0.00 0.00 0.00 0.00 0.00
Financial derivatives 0.00 0.00 0.00 0.00 0.00 0.54 0.51 0.45 0.23 0.00 0.00 0.59 0.12 0.38 0.19 0.02 0.32 0.47 1.00 1.25 0.41
Other investment 4,836.80 1,605.73 2,223.67 2,595.72 3,619.08 4,495.65 4,898.19 5,235.06 5,415.45 5,642.28 5,814.03 5,840.79 6,081.78 6,355.24 6,609.34 6,677.95 6,837.15 6,718.49 6,847.11 7,021.39 7,165.36
Trade credits 43.53 61.39 83.74 108.89 135.97 138.48 143.08 140.14 136.40 132.94 129.28 125.41 120.95 116.07 110.19 104.03 97.11 90.01 133.92 145.59 137.80
Loans 4,751.87 1,497.53 2,072.00 2,438.39 3,130.88 3,881.27 4,229.09 4,550.07 4,738.16 4,969.15 5,112.21 5,164.38 5,395.70 5,674.36 5,854.23 5,851.90 6,059.82 5,954.60 5,974.79 6,091.03 6,209.43
Currency and deposits 38.57 44.92 66.29 33.90 25.77 74.85 120.25 127.77 119.13 106.06 136.89 121.38 133.19 126.87 204.69 274.92 231.29 234.78 306.04 363.65 393.58
Other liabilities 2.83 1.88 1.64 14.55 326.47 401.05 405.76 417.08 421.76 434.13 435.66 429.61 431.94 437.94 440.22 447.11 448.93 439.10 432.36 421.13 424.55
International Investment Position, net -4,880.27 -1,708.92 -2,434.37 -3,829.45 -5,179.72 -6,621.77 -8,273.79 -8,651.44 -8,993.48 -9,236.07 -9,502.77 -9,657.29 -10,159.94 -10,701.55 -10,833.72 -11,657.61 -12,010.88 -12,303.96 -12,627.67 -13,053.38 -13,363.72
Source: Bank of Uganda