annual report - bts group ab
TRANSCRIPT

Annual Report2018

Business overviewBTS focuses on the people side of strategy, working with leaders at all levels to help them make better decisions, convert those decisions to actions and deliver results. At our core, we believe people learn best by doing. For more than 30 years, we’ve been designing powerful experiences that have profound and lasting impact on people and their careers. We inspire new ways of thinking, build critical capabilities and unleash business success. It’s strategy made personal.
The following are some of our service offerings:
Strategy ExecutionAt our core, we are focused on helping our clients with their strategy implementation needs by harnessing the power of their people. We use business simulations, experiential learning and digital tools to make strategy personal, so that each manager and employee translates it into activities and behaviors they will do and care about – turning it into action.
Leadership Development ProgramsLeadership development is essential to the success of any organization, yet it is a well-known fact that most corporate leadership training programs are in effective. We have been disrupting the leadership training industry through our Define, Assess, Experience and Execute Great Approach to developing leaders.
AssessmentFocused and relevant talent selection and development is critical, yet challenging when faced with a limited resource pool and a highly competitive labor market. BTS Assessment centers and services provide targeted approaches to precisely identify talent and capability gaps, enabling clients to define high performance for critical roles, select the right people and develop their capabilities at all levels.
Developing Business AcumenBusiness acumen is the intuitive understanding of how a company makes money, and includes strategic perspective, market orientation and profit acumen. It is an essential skill set that all employees need for an organization to be effective.
Transforming Sales OrganizationsOur research shows that senior-level buyers are looking for consultative sales people who will help accelerate their business results. We provide buyer- centric consulting, sales transformation (planning, change management and sales training), assessment, selection and on-the-job execution tools.
CoachingCoaching help leaders, at all levels, improve and change. We are using an approach that is virtual, affordable, scalable and fast. This approach changes coaching from being a service for senior leaders into a practical tool to turn strategy into action across the organization. The research and data driven approach allows for mindset shifts at scale in clients.
Digital Solutions, Events and ServicesWe are the leader in customized cloud-based business simulations and other immersive experiences and tools that can be delivered in a classroom, virtually, or for self-paced applications. We design and implement large leader ship and sales conferences using our PulseTM technology platform, which engages people, gathers their input and ensures outcomes and application back on the job.

BTS is a global professional services firm headquartered in Stockholm, Sweden, with approximately 700 professionals in 33 offices located on six continents.
Operating profit (EBITA) per operating unit
Net sales per operating unit
Helping the world’s leading companies turn strategy into results
Sao Paulo
Phoenix
Austin
Buenos Aires
Mexico City
Chicago
San José
New York
Stockholm
Amsterdam
Mumbai
Dubai
Bilbao
Madrid
Milan (2)
Paris
LondonPortsmouth
Johannesburg
Singapore
Seoul
Tokyo
Shanghai
Taipei
Bangkok
Melbourne
Sydney
Cologne
Bangalore
San Francisco (2)
20182017MSEK
0
100
200
300
400
500
600
700
800
BTS
Nor
th A
mer
ica
BTS
Eur
ope
BTS
Oth
er m
ark
ets
AP
G
20182017MSEK
0
20
40
60
80
100
BTS
Nor
th A
mer
ica
BTS
Eur
ope
BTS
Oth
er m
ark
ets
AP
G
Philadelphia

We work with our clients to build commitment and capability to accelerate strategy execution and improve business results. Our vision is to be the global leader in turning strategy into action.
Some of our clients
Profit after taxNet sales
Helping the world’s leading companies turn strategy into results
MSEK
0
500
1,000
1,500
2,000
2018201720162015201420132012201120102009
MSEK
0
30
60
90
120
150
2018201720162015201420132012201120102009
ABB
ANZ
Autodesk
Bancomer
Chevron
Coca-Cola
EY
DBS
Gas Natural
Honda
HP
Mercado Libre
Merck
Microsoft
National Australia Bank
Nike
Salesforce.com
SAP
Standard Bank
Telstra
Tencent
Uber
Wärtsilä

BTS ANNUAL REPORT 2018 1
2018 in brief
• Net turnover amounted to MSEK 1,598.4 (1,242.6).
• Revenue growth was 26 percent, adjusted for changes in foreign exchange rates.
• EBITA increased by 43 percent to MSEK 202.1 (140.9).
• Profit before tax increased by 37 percent to MSEK 179.8 (131.4).
• Profit after tax increased by 29 percent to MSEK 126.1 (98.1).
• Earnings per share increased by 28 percent to SEK 6.67 (5.20).
Earnings and dividends per shareNet sales by source of revenue 2018 (2017)
Key ratios 2018 2017Net sales, MSEK 1,598.4 1,242.6
Operating profit (EBITA), MSEK 202.1 140.9
Operating margin (EBITA margin), % 13 11
Operating profit (EBIT), MSEK 183.4 132.3
Operating margin (EBIT margin), % 11 11
Profit before tax, MSEK 179.8 131.4
Profit after tax, MSEK 126.1 98.1
Profit margin, % 8 8
Operating capital, MSEK 544.7 506.2
Key ratios 2018 2017Return on operating capital, % 35 28
Return on equity, % 20 17
Equity ratio at the end of the year, % 46 47
Cash flow from operating activities, MSEK 158.2 98.2
Cash flow, MSEK 50.3 72.6
Cash and cash equivalents at the end of the year, MSEK
262.4 199.9
Average number of employees 645 548
Number of employees at the end of the year 701 596
Net turnover per employee, MSEK 2.5 2.3
Development 22% (24%)
Licenses 9% (6%)
Other revenues 6% (6%)Programs 63% (64%)
Dividend per shareEarnings per share
SEK
0
1
2
3
4
5
6
7
8
2018*201720162015201420132012201120102009
*Proposed dividend

BTS ANNUAL REPORT 20182

Contents
Words from the CEO .................................................................... 4–5Vision, Purpose, Value Proposition and Goals ...................6Strategic Principles .............................................................................. 7
Practice AreasStrategic Alignment and Business Acumen ...............10–11Leadership and Management..............................................12–13Sales and Marketing .................................................................. 14–15Innovation ..........................................................................................16–17Assessment ...................................................................................... 18–19Coaching ........................................................................................... 20–21
Business Model and ClientsBusiness Model .............................................................................24–25Digital Services ............................................................................. 26–27Our Clients and Industries ....................................................28–29Growth, Profitability and Acquisitions .........................30–31
Organization and CultureOrganization .......................................................................................... 34Core Values ............................................................................................. 35Our People and Culture ..........................................................36–37
Advantage Performance GroupAdvantage Performance Group .......................................40–41
Financial InformationFive-Year Summary..................................................... 43–45BTS Share information .............................................. 46–47Management Report ...................................................48–51Consolidated Income Statement ................................... 52Consolidated Statement of Comprehensive Income ..................................................... 52Consolidated Balance Sheet ........................................... 53Changes in Consolidated Equity .................................... 54Consolidated Cash Flow Statement ............................. 55Parent Company’s Income Statement ......................... 56Parent Company’s Statement of Comprehensive Income ..................................................... 56Parent Company’s Balance Sheet ................................. 57Parent Company’s Cash Flow Statement ...................58Changes in Parent Company’s Equity ........................... 59Notes to the Annual Report ...................................... 60–75Audit Report ..................................................................76–78
Governance and ManagementSustainability Report ...............................................................82–87Corporate Governance Report .........................................88–91The Board of Directors and Auditor .............................92–93Senior Executives and Global Partners ......................94–95Shareholder Information .............................................................. 96
BTS ANNUAL REPORT 2018 3

Is it possible to have an organization and a culture, which are at the same time high performing and big hearted?
Can a hardworking and highly productive organization be full of happy employees?
And – should business executives care about if their people and other stake holders are happy?
Should businesses care?The classic theory of economics states that if businesses focus on the one sole objective of optimizing shareholder returns, then resource allocation will work well and the society will benefit.
While optimizing return on capital and equity is still key for how the economy allocates its resources; the world has also moved on.
We have moved from survival mode to self-fulfillment. Values have evolved during the last decades, and today’s customers demand that the businesses they buy from are doing good; and today’s employees demand to work for an organization with a purpose they find inspiring, and a culture that frees them to delight customers and do their best work.
Sure, there are still many companies stuck in past times – with unhappy people and negative cultures – but if they don’t change; with time they will more and more exist only in the history books.
Two inspiring LeadersTwo business leaders with breakthrough leadership ideas over the last forty years were both CEO’s of airlines; a business which touches huge amounts of people – customers and employees.
Many other business leaders were the flavor of the year and were high on charts, but just like the vast majority of hit songs, their ideas faded over the years.
Jan Carlzon successfully turned around three troubled companies, the last one SAS (Scandinavian Airlines), and then wrote “Moments of Truth”, 35 years later still a big seller, and one of the best business books written by a CEO.
His leadership idea is based on the two fundamental drivers of motivation for people – fear and love. Both work as principles for how to organize. However, love as a driver will lead to motivated, independent, innovative, productive workers. And this is released through “customer-driven, loving, strategic leadership.”
Herb Kelleher democratized flying, making it affordable for the average American, by building Southwest Airlines from nothing to a business worth more than all other US airlines combined, and the no 1 shareholder returning on the S&P 500 for the past thirty years.
He stated that “The business of business is not business; the business of business is people – yesterday, today, forever”. And that the no. 1 characteristic of a leader is “to be genuinely interested in, and like, people. Show them tolerance, patience, respect and empathy. Show them that you admire, value and love them as individuals, rather than just as producers”.
Herb Kelleher was aware that organizations can grow in a way where people leave their soul at the door; and he fought everyday so people could be their best selves and proud. For every manual, process, or playbook that he ever wrote, he would start each with the same bullet, “These are our guidelines, feel free to break them in service of the customer.”
A better worldThe Leadership ideas of Jan Carlzon and Herb Kelleher are more relevant today than ever; in the fastmoving world where creativity and speed are key to winning, and where the war for talent is primarily won based on culture and purpose.
What constitutes effectiveness and happiness in an organization; in addition to the ideas of Herb Kelleher and Jan Carlzon?
Clarity – in defining reality of the unique problems the company has to solve and the way forward. Hope – realistic intent and inspiring ambition. Open transparent communication – to say things as they are in a respectful way. Constructive disagreements while maintaining a positive spirit. A culture where people truly care for each other.
Better businesses can have a huge impact in building a better world! I know that it is possible to create long-term, top-tier competitive returns and a culture in which people feel cared for and believed in to do their best work. The majority of the world’s working population work in businesses. If they are effective and happy at work, they will also bring this to their families and their communities.
BTS culture …… is our main competitive advantage. BTS people are more engaged and happier than in other comparable firms. External and internal data verify this.
And many clients share that they chose BTS because of our culture – they tell us, “BTS you care more than others.” What they are referring to – they feel that our people go deep and really understand their unique business model, strategy, culture; are easy and enjoyable to work with; and free to bring their most creative ideas to address their unique needs.
We have combined high performance and a big-hearted culture in BTS; and our people, clients and business thrive from this.
Words from the CEO
Leadership, happiness and performance
BTS ANNUAL REPORT 20184

A dying model – the cost cuttersIn my words of the CEO two years ago, I wrote about the “losers” – companies who focus on pure cost cutting and zero based budgeting to improve their fortunes – and I wrote about the winning formula; finding real efficiencies and investing the freed up resources to reach a vision of future success.
Kraft Heinz was a stock market favorite two years ago; cutting costs and increasing margins, but lack of growth has reversed their fortunes totally and the stock price has tumbled. We can compare this with PepsiCo, which in its 2019 plan announced more investments in growth and no profit growth during 2019 – this plan sent the stock price up.
Over one million leaders…… have been developed through BTS’s services. We continuously meet CEO’s, heads of divisions, mid-level leaders, leaders at all levels – who we helped develop ten or twenty or thirty years ago; and they testify about the significant impact on their businesses and careers from their BTS experiences.
It is true that many companies are wasting money on leadership development and corporate programs without impact. But companies need to invest more – not less – and apply the success formula:
All leadership expectations, development, and people processes should be business useful and practical, and in lock-step with the future direction of the firm. They must be aimed to ensure that culture and strategy are mutually reinforcing instead of – what sometimes is the case – simultaneously defeating.
People form beliefs and habits from experiences. Breakthrough, unforgettable experiences are powerful ways to practice a desired future state, a new way of thinking and working. When these experience are used as part of a scaled, organizational-wide initiative, combined with practice in the flow of work, support, accountability and process shifts, companies achieve significant results.
Leadership and culture – Results for Our Customers More and more customers see us as their leadership partner supporting their culture shifts and broader transformation.
I would like to share a case where we have worked with all leaders in an organization – the global software leader SAP.
BTS is proud to be SAP’s partner in driving the people side of their business and culture transformation over the past five years. To shift a 90,000+ people global organization, SAP and BTS created roadmaps to enable all leaders, from top executives to front line, to drive the strategy, live new leadership expectations, and adapt the culture – and we engaged all 9,000 leaders in several learning and development journeys.
We have seen phenomenal results: Average Leadership Trust scores have increased from 28 to 61 (measured on an NPS scale), and Employee Engagement has increased from 77 percent to 85 percent. At the same time, SAP’s revenue and profit growth, as well as the stock price, have all accelerated.
Another record year!During 2018, our revenues grew 26 percent. Our earnings grew 37 percent; with continued significant R&D investments in digital solutions.
Of our total growth of 26 percent, 16 percent was organic and 10 percent was acquired. Our rate of organic growth expanded during the second half of the year.
We grew in all regions; 47 percent in Europe, 22 percent in North America, and 29 percent in Other Markets.
We grew in all practice areas; with the most rapid growth in our Coaching Practice and our Innovation & Digital Transformation Practice.
Outlook for 2019Our growth and investments during 2018 put us in a position for a very positive development in 2019 and the years to follow. In 2019, we expect continued healthy growth and profit before tax that is better than in the preceding year.
Stockholm, April, 2019
Henrik EkelundFounder and CEO of BTS Group AB
Words from the CEO
Leadership, happiness and performance
BTS ANNUAL REPORT 2018 5

Vision, Purpose, Value Proposition and Goals
The global leader in turning strategy into action
BTS focuses on the people side of strategy, working with leaders at all levels to help them make better decisions, convert those decisions to actions and deliver results. At our core, we believe people learn best by doing. For more than 30 years, we’ve been designing fun, powerful experiences that have a profound and lasting impact on people and their careers. We inspire new ways of thinking, build critical capabilities and unleash business success. It’s strategy made personal.
VISIONThe global leader
in turning strategy into action.
PURPOSE We inspire and equip people to do the best
work of their lives, creating better businesses and
a better planet.
VALUE PROPOSITION We make strategy
personal and drive great execution. Our unforgettable
experiences create levels of alignment,mindset,
and capability that deliver better results,
faster.
FINANCIAL GOALS BTS’s financial
goals over time are:• A revenue growth, adjusted for
changes in exchange rates, of 20 percent, primarily organic.
• An EBITA margin of 15 percent.• An equity ratio that does not
fall below 50 percent over extended periods.
BTS ANNUAL REPORT 20186

Strategic Principles
The BTS Group’s 11 Strategic Principles
Focus We focus on our world-class capability to customize and deliver discovery-based solutions that give our clients superior business results and ROI. Every new solution/service we develop shall build on the core competencies of BTS.
InternationalizationBTS is a global organization, providing services around the world to a client base of mainly international organizations.
Organic growth complemented by acquisitionsBTS grows organically, building on its core competencies and customer base. Acquisitions must provide major synergies and complement new markets, new customer bases, and new areas of expertise/solutions.
BTS enters new geographic markets and new sectors through a customer- driven approach – revenues and customers first, cost second.
Top clients and long-term partnershipsBTS’s clients shall be predominantly high-image/large clients – and the most demanding and professional clients.
BTS establishes long-term partner ships with clients, built on delivery of top-quality and highly visible results and strong customer relations.
By leveraging our portfolio of solutions and capabilities, we build suites of solutions used throughout our clients’ organizations, resulting in a recurring and growing flow of revenues over a long period of time.
Differentiation – higher value and premium positionBTS’s services are differentiated through superior business results and ROI. Some differentiation factors for BTS are:|| Discovery-based learning|| Customization|| Results process|| Customer intimacy and focus|| Great people driven by excellence and quality|| Global coverage|| Broad range of solutions|| Innovation
Offer solutions and IP – not sell timeBTS’s prices are generally fixed and are not set per unit of time.
BTS capitalizes on its IP (Intellectual Property), creating recurring revenues while striving to increase the share of total sales attributable to license revenues.
Network-oriented sales and marketingBTS continuously increases the quantity of, and improves the quality of, resources dedicated to client contacts and sales. These are key drivers of growth for BTS. Our priorities:|| Existing clients and account management|| New targets generated through the network of existing clients|| Qualified new targets that can profit from our competitive advantages
Value chain – focus on strategic assets and high valueBTS owns and sources internally:|| Intellectual Property|| Customization|| Client contacts|| High level/critical delivery
BTS uses independent resources and contractors – to gain access to expertise and for optimal resource planning – in order to maximize quality and productivity.
BTS builds partnerships in order to gain access to customers and to combine capabilities.
One company – one best practiceBTS has detailed processes and best practice exchanges to ensure compatible methods throughout the Group – leveraging the company’s knowledge and increasing productivity. We deliver well-coordinated and integrated services across the globe.
Innovate – and develop close to the customerBTS invests in development to cover the key needs of our clients and to provide the best solutions. BTS adapts existing solutions and develops new solutions in joint projects with clients to secure effective and client-needs-driven innovation.
The people and the company spiritBTS’s professionals are all very visible to the client, and the company spirit is a main driver of client and employee satisfaction. BTS emphasizes a positive and professional company culture expressed in six core values.
Recruitment, development, and motivation of our people – creating business-focused high performers throughout the organization – are key drivers of our growth.
BTS ANNUAL REPORT 2018 7

BTS ANNUAL REPORT 20188

Practice Areas
Strategic Alignment and Business Acumen 10–11
Leadership and Management 12–13
Sales and Marketing 14–15
Innovation 16–17
Assessment 18–19
Coaching 20–21
BTS ANNUAL REPORT 2018 9

Strategic Alignment and Business Acumen
Business Acumen Skills and Capabilities are Critical in Navigating Today’s Changing Business Environment
Today’s rapidly changing business climate pressures leaders and their employees to better understand their company’s business model, how they impact value creation, and the critical levers they can pull to make their business successful. While strategy alignment and business acumen are essential to effective strategy execution, people often lack these skills. This inhibits speed in decision-making and the ability to achieve strategic priorities. BTS designs and facilitates business simulation-based experiences that help leaders develop today’s necessary business skills.
BTS works with all levels of employees from individual contributor-level to c-suite executives. Strategy Alignment and Business Acumen programs allow participants to run their company, practice executing their strategy, and engage in teamwork in a fun and risk-free environment. This builds alignment, ownership, and a deep sense of confidence in applying new business skills and tools back on the job. Business acumen programs use a combination of pre- and post-work; live, classroom-based, and virtual workshops; as well as on-the-job application and coaching. This approach inspires new ways of thinking, builds critical capabilities, and drives business success.
Our Framework for turning strategy into action: Execution = Alignment x Mindset x Capability || Alignment: We enable people to truly understand the business strategy. This means knowing the “what” of the strategy, the “why” behind the strategy, and the person’s role in leading their teams to execute it.|| Mindset: By instilling new beliefs and mindsets about how the business works at multiple levels of the organization, people work in more effective ways.|| Capability: We increase knowledge and develop the skills required to execute new behaviors and form new habits.
Key Differences|| Custom-Built Using Business Context and Strategy: Our strategic alignment and business acumen experiences are built on flexible platforms that allow for rapid and cost-effective customization. || Experiential Learning: Experiences are drawn on the benefits of neuroscience that explains the best way to change behaviors is through learned experiences.|| Focus on Business Results: We begin with the end in mind and design the learning experience based on the desired business outcomes. || Global Partner: Our worldwide reach enables seamless and efficient implementation.
BTS ANNUAL REPORT 201810

CLIENT STORY
Sustaining Hypergrowth: Strategy Alignment for Billions and BeyondIn today’s tech sector, rapid growth is everything. A leading tech organization that hosts platforms for searching, monitoring, and analyzing machine-generated data has grown at an impressive rate to USD 1 billion in revenue. As it grows to the USD 4 billion, USD 5 billion, USD 10 billion mark and beyond, mindset overhauls and a clear focus on the company’s overall strategy are essential. Looking ahead to its future, the organization wanted to ensure that its top leaders were aligned as the company strategy shifted to a cloud-first world. To achieve this goal, the organization
partnered with BTS to create their first ever senior leadership strategy alignment summit, bringing together the top 100 leaders at the company for a two-day retreat.
On-site, the leaders aligned around the company’s 2018 priorities and initiatives using a sophisticated customized business simulation. The simulation allowed leaders to take the helm of the business, unifying the top leadership around the organization’s goals and priorities, while demonstrating the business approaches necessary to maintain the company’s 50 percent year-over-year growth trajectory.
Ultimately the program exceeded expectations and provided great results. Net Promoter Score (NPS) data showed that 9.2 out of 10 participants would recommend the program to a friend and 9.4 out of 10 liked the way that the program was organized and executed.
BTS ANNUAL REPORT 2018 11

Leadership and Management Development
A New Value System for Future Leaders
Today’s business environment is defined by speed, adaptability, constant innovation and evolving people values; a climate where the traditional leadership archetypes do not apply. An entirely new value system for the leaders of the future is emerging.
While leaders of the past were often tasked with executing predetermined strategies, increasing efficiency, and improving processes, one of the most important characteristics of future leaders is their desire and ability to be a perpetual rookie – in launching new business models, leaving conventional wisdom behind and leading in new ways.
BTS transforms leaders so that they can transform organizations over and over again.
Through years of experience and research, we have found the essential elements of what make up effective leaders. Today’s high-performing leaders are purpose driven, multipliers, agile, and they use enterprise thinking when they make decisions.
We develop leaders at all levels of the organization, in the context of the company. To begin, we uncover the critical leadership behaviors, mindsets, and capabilities that maximize the execution of a company’s strategy. Then, we scale them through experiential leadership development programs in the form of learning journeys. These include a variety of tools and techniques including assessments, simulations, deep skill practice, coaching, and ‘Go Do’ activities. Our learning journeys
are delivered virtually, in live classroom workshop experiences, or through a combination of both.
BTS Leadership and Management’s offerings fall into four broad areas:|| Leadership Curriculum: Leaders at each level are developed—first line, mid-level, and senior leaders—to effectively execute the company’s strategy.|| Purpose-Driven Leadership: We tap into the personal purpose of the next generation leader and align this to the future direction of the organization.|| Agile Leadership: Leaders are prepared for new ways of working to align with today’s and tomorrow’s challenges.|| Leadership Capabilities: Core capabilities are developed that are necessary for leaders to transition into their new roles.
PURPOSE DRIVENConnect their strengths, values, and experiences
to the organization to ignite purpose
MULTIPLIERSMultiply the intelligence and contribution
of the people around them
AGILELead in an environment that is volatile,
uncertain, complex and ambiguous
ENTERPRISE THINKING
Lead with an enterprise perspective, foster collaboration
and drive organization-wide results
BTS ANNUAL REPORT 201812

Key Differences|| World-Leading Point-of-View on What Leaders Need Today: Leadership is relentlessly contextual and immensely personal. We identify and create the new desired behaviors specific to each organization.|| Integrating Different Capabilities: We combine leadership, business acumen, and innovation leadership capabilities in our programs. This allows leaders to learn new behaviors in an environment close to their daily life and more natural form the new desired habits that drive business results.
|| Hands-On Practice and Focus to Increase Self-Insight: We enable learning by doing and use a questioning approach that facilitates self-insight, rather than giving advice.|| Global Partner: Our worldwide reach enables seamless and efficient implementation.
CLIENT STORY
Successful Culture TransformationThe senior leaders of a Global Fortune 500 company realized that the company’s culture needed to change for them to succeed in the new external environment. Specifically, they identified six areas required in the new culture including collaboration, accountability, pro-activeness and feedback. To effectively drive this change, the company partnered with BTS to develop a world-class learning journey for the company’s middle managers. The journey was customized to the organization’s strategic priorities, business context, and future ambitions. The highly personalized simulations reflected the actual business and people challenges that managers faced back on the job. Also, digital tools and gamification significantly raised engagement and put the accountability for change back in the hands of the middle managers. The learning journey was not only recognized with four prominent international industry awards but more importantly, the results from the change were visible to the senior leaders. There was a significant application of the learnings back on-the-job with 96% of the participants reporting a positive impact linked to the new culture.
BTS ANNUAL REPORT 2018 13

Sales and Marketing
The Buyer’s Paradox Puts a Different Pressure on Sales and Marketing
Businesses today want and need to move at a higher speed, but complexity and uncertainty slows down their decision-making processes. This paradox makes sales cycles more unpredictable and life increasingly difficult for sales organizations. To under-stand why some are still able to succeed in this environment, the BTS Sales and Marketing Practice studied what the best salespeople do differently. The results show how top-performers deploy business and people dynamics. We call them Accelerator Sellers and have codified their approach to make it easy for our clients to implement it across their team.
We focus on the salesperson and the sales manager. We also have world-class content for sales leaders, marketing teams, specialized sales resources, and channel partners. We weave our content into training and transformation experiences. These range from deeply customized programs and learning journeys that are tied to the business and strategy to short and robust plug-and-play training modules that are quick to implement.
Through our solutions, salespeople and sales managers develop a mastery of business acumen and people dynamics that help to inspire better decisions and drive results. This allows salespeople to more effectively:|| Engage buyers to accelerate stakeholder alignment and customer decision-making.|| Prioritize their sales activity to fast-track their pipeline and improve forecast accuracy.
We train sales managers to have the skills they need to lead and develop people and execute their sales plan.
CLIENT STORY
Driving Revenue Growth through Customer Centricity Although there has been tremendous growth in the Asian wealth management industry over the past years, many wealth managers still take a product-focused approach when consulting with their customers. As the industry matured and customer needs evolved, one of the largest banks in Eastern Asia knew they needed to change how they engaged with their wealth management customers. Therefore, the retail division of the bank launched a new customer centric sales strategy. This was supported by a comprehensive training program designed by BTS to equip wealth managers with a deeper understanding of targeted client segments, the underlying needs driving client’s wealth management decisions, and how to take a consultative approach in meeting those needs. Three months after the program, 91.3% of the participants had completed their action plans and their overall business results had increased by 25.5% compared to the last quarter. Amongst the initial results were an increase in new assets of USD 3.8 million, more than 30 new VIP Accounts, and over 100 new customer cases, totaling to new asset creation of USD 17 million.
Key Differences|| World-Leading Point-of-View on What Sellers Need Today: Our strong focus on results and practical approach help our clients achieve their desired outcomes faster.|| Integrating Business Acumen and People Dynamics: Some firms specializes in either business acumen or people dynamics while our strength lies in integrating the two.|| Research-Based Content Deployed in Experiential Learning Experiences: As a thought-leader, we drive the latest thinking on sales and marketing, which is the foundation of our solutions. Our content takes multiple forms including innovative plug-and-play moments and world-leading simulations.|| Global Partner: Our worldwide reach enables seamless and efficient implementation.
BTS ANNUAL REPORT 201814

BTS ANNUAL REPORT 2018 15

Innovation
Succeeding in the New Global Business Ecosystem
Creating cultures and environments that are conducive to innovation and managing through digital disruption are two of the most critical areas that companies around the globe are struggling to address. At BTS, we help firms to capture the benefits of digital technology, speed, innovation, and smart risk-taking. We do this through consulting services and ‘designed experiences’ to help people bridge the gap from the current state to the desired future state.
We work with leaders at every level of an organization. Our approach allows leaders to practice and internalize the shifts required to create a culture in which innovation and digital transformation can thrive. We combine a sequence of short, mini-lecture sessions, hands-on “tabletop” workshop exercises where learning and tools can be applied. Customized business simulations compress the months and years of high-risk innovation projects into a few hours. Through our designed learning experiences, ranging from one to five days long, participants learn the essential principles, techniques, and tools needed to:|| Help leaders develop the mindset, alignment, and capability to create a culture of innovation in their organizations.|| Focus on the people side of digital transformation; technology means nothing without people putting winning ideas, strategies, and skills into practice.|| Teach practical innovation skills around strategy, empathy, ideation, and experimentation.|| Make innovation fun.
Key Differences|| Start with Business Outcomes: Innovation begins with user insights and ends with executable concepts that drive business results. We start with business outcomes, and reverse engineer our solutions, not vice-versa.|| Focus on Creating a Culture of Innovation: Innovation tools are ubiquitous and commonplace; what matters is creating a culture in which they are used. Our approach helps leaders practice and internalize the shifts required to create a culture in which their people feel confident and encouraged to innovate.|| Practice Key Leadership Moments: Creating a culture of innovation requires leaders to keep their feet in two places at once; scaling today’s business model in one while creating the space for their people to discover tomorrow’s in the other. Our approach helps leaders recognize the daily work moments that matter for innovation and what great action looks like in each moment.|| Global Partner: Our worldwide reach enables seamless and efficient implementation.
CLIENT STORY
Building an Innovation Culture A Global Fortune 100 Media Company found itself in a period of rapid transition. The CEO knew that future success required a strong culture of innovation that revolves around the consumer. Thus, the company put its senior leaders through an innovation journey designed in partnership with BTS. The goal was to help them understand the role of innovation in meeting consumer needs, and to convert the insights into tangible projects that would help the company to accelerate growth. One year after its completion, eleven innovation projects were being further developed and implemented.
BTS ANNUAL REPORT 201816

BTS ANNUAL REPORT 2018 17

Assessment
It Is More Critical Than Ever to Identify and Develop the Right Talent
BTS ANNUAL REPORT 201818

Companies are faced with limited talent pools and a highly competitive market, making hiring and promoting the right people extremely difficult. BTS Assessment helps companies gain an accurate understanding of their employees’ capabilities and designs talent selection and development initiatives that align with the strategic needs of the business.
We work across the organization, from first-time hires to high potentials, to those who prepare for the C-Suite. Our solutions make identifying, selecting, and developing the right talent more accurate and efficient as people are assessed on the high-impact behaviors critical to business success. We also develop and deliver custom and tailored-to-fit initiatives that are behavior-focused, high-impact, and drives execution. Applying a contextually-rich approach and an in-depth data-focused methodology, we help clients define what differentiates great performers, identify great talent, and understand the strengths and development needs of their existing talent.
Key Differences|| Using the Context of the Organization: Our customized solutions mirror the business and culture dynamics.|| Data-Driven Talent Decisions: Our methodology allows for more precise talent decisions using better data.|| Actionable Results: We provide quick and easy-to-interpret results without psychology jargon.|| Real Impact: Our solutions enable measurable ROI that illustrates the impact of selection decisions.|| Global, Virtual Delivery: Our assessments are conducted virtually on any device, from anywhere in the world.|| Cost-Effective Approach: We reduce cost by administering efficient and scalable solutions.
CLIENT STORY
Developing and Selecting Leaders in the Moments that Matter Following a change in CEO and the introduction of a new strategy, a leading retail company turned to BTS Assessment to help define their new leadership expectations at all levels of the company. Rather than utilizing standard competency models, we created Great Profiles and Playbooks for each level in the organization, making their new leadership expectations clear and actionable. Based on the Great Profiles, we created a series of customized, Moment-based Leadership Simulations that introduced leaders to the new leader expectations and allowed them to practice as if they were acting on them in real life. The simulation experience reached over 120,000 people. This approach ensured that every level of leadership would understand the new leader expectations and have the skills necessary to drive their culture and own their new strategy. Next, the BTS Assessment practice developed a Moments-based Assessment that identified whether a candidate would be a good fit for the organization’s culture and values. The assessment was level and role agnostic and allowed the candidates to understand better the company culture and values which they could use in their job selection. Additionally, the assessment produced a selection report that allowed for a stronger hiring decision, as well as a development report that was used to help with onboarding and development.
BTS ANNUAL REPORT 2018 19

Coaching
The World’s Most Innovative Approach to Leadership CoachingTraditional coaching is often seen as very personal, focused on the individual’s strategies or goals rather than the company’s. It’s a ‘black box’ because no one knows what happens after it is paid for, and seen as too expensive. BTS Coach has eliminated all of these constraints and invented global scalable leadership coaching over a decade ago. Today, we are the world leader in size, service, and science.
BTS ANNUAL REPORT 201820

We work with leaders at every level of an organization. Based on our coaching framework and robust technology, we offer high-quality leadership coaching at scale. Our programs and journeys are tailored to the business context and delivered through different means. One-to-one coaching is carried out either face-to-face or virtually. PODs are our solution to small group coaching and maximize the 70/20/10 principle of effective learning and can also be facilitated face-to-face or virtually.
Key Differences|| Aligned to Business Strategy and Context: Based on our use of pre-work and aligned coaching content, we target coaching to drive the business agenda. We also provide actionable data back to the organization.|| A Global Coaching Team and One Standard: Our coaches make up a dedicated team who are not only highly qualified and experienced, but also engage in 160 hours of certification to reach our unique standards (257 coaches, 37 countries, 33 languages, 97% Net Promoter Score).
|| The World’s Foremost Mindset Research: We believe great coaching doesn’t just focus on behavior but the mindset behind it. Tapping into a unique database of over 100,000 coaching conversations, our research centers around the mindset shifts that make the most significant difference. || A Scalable Solution: With our digital platform and coaching methodology, we can offer affordable and accessible coaching to all leaders in an organization. This means coaching is no longer only affordable to a few executives, but a scalable lever for change.
CLIENT STORY
Preparing for Future Success During Times of Prosperity Despite facing a shrinking market, a global premium spirits producer operating in a large, developed market continues to outperform its competitors, delivering industry-leading results and achieving double-digit growth. This success was due to a recent business transformation that shifted the organization’s focus on innovation, developing a performance culture and managing costs. To build a sustainable approach to this success, and reach their goal of becoming the best performing, most trusted and respected consumer packaged goods company locally, the organization identified the need to develop a leadership coaching culture. Creating a coaching culture would help the organization improve feedback, increase employee engagement, and decrease attrition—while preserving their existing culture. To bring this transformation to life, the company partnered
with BTS Coach to develop a coaching effectiveness program, as a new way of leading both people and business performance. Ultimately, the program proved to be very successful and made a lasting impact on the business, receiving high levels of participation and positive responses from participants. The results showed that participants’ teams had significantly more effective relationships, increased collaboration, improved engagement, higher levels of trust, and more efficient operations as a result of the program. Furthermore, employee engagement increased, and attrition was cut by nearly half.
BTS ANNUAL REPORT 2018 21

BTS ANNUAL REPORT 201822

Business Model and ClientsBusiness Model 24–25
Digital Services 26–27
Our Clients and Industries 28–29
Growth, Profitability and Acquisitions 30–31
BTS ANNUAL REPORT 2018 23

Business Model
World-leading capabilities are shaped in partnership with our clients
BTS values its customer relations. Participants in the company’s business programs are important future customers. New assignments come mostly from former buyers and program participants changing jobs or companies – and calling on BTS from their new positions.
BTS builds relationships at different levels in the clients’ organizations. Through these relationships, new projects are continuously generated.
BTSCUSTOMER
POTENTIALCUSTOMER
POTENTIALCUSTOMER
POTENTIALCUSTOMER
4.A larger group ofthe employees need tounderstand and learnhow to apply the new strategy.
3.A subsidiary in adifferent countryimplements thestrategy.
2.A business unitimplements a newstrategy.
1.The initial project typicallyinvolves high-level executives.
Outstanding results, well over the client’s expectations in an initial project, lead to customized solutions for managers and employees at different levels throughout the organization.
Network-based marketingBTS employs a network-based marketing approach covering a number of selected industries.
The network, composed of both those executives who make strategic decisions about change and learning initiatives and those who actually purchase solutions, helps generate opportunities for new assignments and customers. When BTS approaches a new industry, it initially focuses on a few leading companies. Once these assignments are completed, they will serve as reputation-building reference projects for new sales to other organizations in the same industry.
Multi-market expansion with limited riskBTS continuously expands its business operations to new markets around the world. BTS works with multinational clients and implements projects in a large number of countries without necessarily having an established local office in every market.
Existing customer relationships make up the base when BTS starts up operations in a new market – a fact that reduces the expansion risk. In addition, BTS works hard to nurture relationships with other large corporations active in the targeted markets.
Once business has grown to sufficient volume in a new market and the future potential appears attractive, BTS can take the logical step and establish a new, local office.
The foundation for growth lies in BTS’s ability to create long-lasting customer relationships at different levels in the customer organization. An initial BTS assignment is often designed for, and implemented with, the client’s senior executives and managers. This customization process is carried out in close cooperation with the client.
BTS ANNUAL REPORT 201824

Net turnover by source of revenue 2018 (2017)
Development 22% (24%)
Licenses 9% (6%)Other revenues 6% (6%) Programs 63% (64%)
Acquisition strategyBTS’s growth strategy is primarily built on organic growth. Over the past few years, the company has made a number of acquisitions in different countries.
BTS’s strategy for acquisitions is built on creating a broader base for future organic growth while at the same time finding complementary acquisitions. The goal is to offer more services to both existing and new customers. All acquisitions have resulted in cross-selling. This is a result of conscious efforts to identify new business opportunities based on needs within the extended customer base. The training of account managers and the needs-focused discussions with individual clients have played an important role in this process.
DevelopmentDeveloping the revenue mixBTS’s revenues originate from three areas:|| Development|| Programs|| Licenses
BTS works continuously to develop and combine different methods of training delivery to ensure optimal, value-added customer benefits, and at the same time strengthen its own revenue streams and profitability.
Development efficient customizationsIn collaboration with customers, BTS customizes both the content and the form of its business programs. The company has successfully improved its profitability by increasing the efficiency of the customization process. This improvement is a result of advancements and fine-tuning of development methods as well as increased reuse of previous development work.
When BTS develops solutions for corporations in new industries, the cost of customization is initially high. With the later reuse of experience and skills, however, these costs subsequently fall.
Programs – the majority of revenuesInstructor-led live and virtual seminar programs comprise the greatest source of revenue for BTS, and they are the predominant form of business delivery. BTS consultants are very much involved throughout the whole customization process, and, during delivery, facilitate these solutions in programs.
Increased licensing revenueBTS also delivers its solutions via e-Learning and CD-ROM formats, and as manual board solutions. The long-term goal is to increase license revenues. License-based business simulations are very efficient learning tools for customers; they make it possible to reach larger groups of employees in organizations, all over the world and at all levels. At the same time, they are a profitable line for BTS.
BTS ANNUAL REPORT 2018 25

Digital Services
Powerful digital-enabled journeys, experiences and tools drive action and result
Turning strategy into action requires alignment, mindset shifts, learning, reinforcement, and follow up. This means it’s a journey. We believe that digital-enabled learning journeys achieve far more than workshops alone. As an enabler of these journeys, we provide online resources and every day tools to be accessed in the moment of need. In addition, digital tools facilitate workshops, assessments, coaching and practice. Our digital journey platforms bring together formal, informal and social learning to drive action and results.
Our clients demand digital-enabled journeys and experiences for three main reasons:|| Results: Clients want to see business results and they want to see their people do the best work of their lives. Digital puts learning and application in the flow of work and supports reinforcement and go-dos so that learning sticks and drives results.|| Scale and speed: Clients want to reach large audiences to quickly and effectively build alignment, mindset and capability. Digital platforms enable this through virtual learning, client-facilitated experiences and ad hoc team learning in the context of normal work.
|| Data: Journeys, experiences and tools should get better with usage and generate data to demonstrate impact. Digital tools enable better collection and data use to personalize experiences, target and adapt learning, and tie behaviors directly to business results.
To meet these needs, BTS’s digital offerings have expanded significantly in recent years, reflecting the increasingly digital world. Core BTS offerings are now digitized, leveraging an upgraded set of capabilities and platforms compatible across modern devices in iOS, Android and Windows. We currently offer: || Digital-enabled learning journeys: a series of carefully crafted touch points that combine facilitated and self-paced experiences with go-do activities that are completed in people’s work cadence|| Scalable business simulations: immersive and engaging discovery-based solutions that can be BTS-facilitated, client-facilitated or self-paced|| Performance support micro-learning: easy access interactive tools and resources that enable better decision-making and enhance performance in the moment of need
|| Digital events: conference events transformed into engaging, interactive experiences that are transformational not just informational|| Ad hoc team experiences: on-demand digital-enabled experiences for cascading strategy or learning, led by executives and managers in the flow of work without the formal scheduling|| Coaching, practice and assessments: individual or team-based sessions that shift mindsets, enhance skills and predict performance – scheduled and delivered on BTS’ digital platforms
BTS’s digital platforms aggregate tools for learning, reinforcement, action and follow up. This allows for greater ease of access as well as robust data collection to provide insights on learning and strategy execution outcomes. Our platforms make it possible for thousands of people to interact, engage and learn at the same time, making deployment of strategy highly scalable and efficient.
BTS Digital is a specialist team and capability that uses modern technology as an enabler to accelerate learning, spark change and drive business results. This group inside BTS creates digital learning journeys, simulations for in-person and virtual workshops, immersive digital events, and online and mobile solutions. BTS Digital supports the design, production and deployment of these digital-enabled offerings, as well as the development of the technology and product platforms on which they run.
BTS ANNUAL REPORT 201826

CLIENT STORY
Rapid Leadership Alignment at Global Technology Company A leading technology company wanted to align its 8,000 manages on leadership behaviors in the context of their business. And they wanted to get it all done in a single 24-hour period.
Using our Strategy Simulation platform, a “choose your own adventure” tool where each choice a participant makes triggers new information, we created a customized business leadership simulation. The two-hour experience was deployed in five sessions: starting in APAC and then on to India and Europe, and then finally to the East and West Coasts of the US. Each session combined an in-person event with an equal or larger number of people joining the same session virtually via streaming video and web collaboration platforms. The client facilitated the simulation itself with onsite and remote support from BTS. Ultimately the program was successful and delivered the new strategy to 8,000 leaders in a 24-hour period.
BTS ANNUAL REPORT 2018 27

Our Clients and Industries
Delivering better results, faster BTS builds long-term customer relationships, on average six to eight years, and has deep expertise in a number of industries.
Driving Future Growth: Doubling Down on General ManagersOver the past 50 years, the world has changed dramatically. Global economic growth has accelerated, the world economy has expanded, and per capita income has nearly tripled. A high-tech manufacturing company recognized the need for dramatic change to support real growth in the future. The company wanted to focus on what these shifts meant for their GMs, and which specific skills GMs needed to be successful and drive growth on the job. The organization identified commercial acumen as the most critical. As such, the company oriented their existing GM program around developing this skill. Ultimately the program would help GMs recognize how to best apply their commercial acumen in the pivotal
moments they face on the job. The company partnered with BTS to design and deliver a capstone solution, which was primarily comprised of a moments-based sales simulation. This brought to life the scenarios and situations general managers face related to commercial (product launches, managing customers, driving sales, coordinating marketing initiatives, and leading sales leaders) within the real-world, highlighting the greatest and most pivotal behaviors GMs can make in each moment. Equipped with the commercial acumen and sales leadership skills they needed, this general manager population is now prepared to drive growth and lead the company into the future.
Fostering a Culture of Innovation through High-Potential C-Suite LeadersFaced with declining business results and lagging behind their competitors, a multinational conglomerate decided that it was time for a leadership overhaul among their topmost level of leaders. The chairman identified that the leaders in line to become CEOs in each business unit needed to make the shift from “slow-moving” and “familial” to “entrepreneurial” and “innovative” leadership, but without losing the best of the company’s culture. The company had long fostered a strong employee-first culture, where the environment was warm and welcoming, focused on talent growth and development, but not necessarily geared towards driving innovation. This resulted in less-than-optimal business results when compared to their hyper-innovative competitors in fields like electronics and technology. The company created a
During the 1990s, BTS grew rapidly in the Manufacturing, Telecom, and Information Technology Industries, with major global companies such as Phillips, Ericsson, and HP as valued customers. During the early 2000s, BTS expanded its positions by entering four new industries: Financial Services,
Pharmaceuticals & Healthcare, Retail & Logistics, and Energy. In recent years, BTS has continued to grow across industries, especially within the rapidly expanding areas of Technology and Software.
Financial Services17% (16%)
Energy 15% (9%)
IT 14% (18%)
Manufacturing12% (15%)
Pharmaceuticals and Biotech 11% (12%)
Professional Services 11% (11%)
Retail and Logistics 3% (3%)Telecommunications 4% (4%)
FMCG (Fast Moving Consumer Goods) 7% (4%)
Other7% (8%)
Revenue source per sector
New customers 20% Existing customers 80%
Revenue generation
CLIENT STORIES
BTS ANNUAL REPORT 201828

Professional Services
Pharmaceuticals & BiotechFinancial Services
FMCG (Fast Moving Consumer Goods)
IT Equipment & Software
Energy
Retail
|| Gap|| Nike|| Unicomer
|| Accenture|| Schlumberger|| Sodexo
|| Merck|| Novartis|| UCB
|| Bancomer|| Standard Bank|| ANZ
|| Coca-Cola|| Mondelez|| Unilever
|| SAP|| Intuit|| Microsoft
|| Chevron|| Iberdrola|| Repsol
Telecommunications
|| Ericsson|| Telefónica || Verizon
Manufacturing
|| Atlas Copco|| Eaton|| Honeywell
high-potential leadership development program for its Heads of Business Units who were all leaders on the cusp of moving to the CEO position, to foster a more “entrepreneurial” mindset. BTS partnered with LG to create an experience that was a part of this leadership program. The experience included a customized business simulation that would align leaders to the new leadership model and way of doing business. To make innovation a reality, leaders needed to shift their mindset and really see and experience how they could run the company differently. The high-potential leadership program is viewed as the spark that helped ignite innovation, pushed leaders out of their comfort zones, and challenged them to think differently. Together, the journey has truly revolutionized the mindsets of leaders.
Leveraging Leadership Development for High Growth in First-Level LeadersThe largest online commerce and payment ecosystem in Latin America is growing at an unprecedented rate, and the organization expects to double its workforce in the next five years. To support this growth, the organization needed to accelerate leadership development among frontline leaders, team leaders and supervisors, some of the most quickly growing and pivotal groups of leaders at the company. The company partnered with BTS to create a leadership development program designed to provide clarity about what great leadership looks like within the organization. This meant creating awareness around the need for people development to support business growth, developing and training managers’ abilities to make decisions involving people, and developing specific tools and models to improve
day-to-day interactions, including communication, best practices for delegation, feedback, and high impact questions. The leadership development program was delivered in a two-day workshop featuring a customized business simulation, which allowed leaders to practice the critical leadership behaviors necessary for success on-the-job. The workshop also used pre and post-program assessments to measure the participants’ growth as well as six “go-do” follow-up activities to help leaders apply the learning back in the field. Ultimately the company was able to transform their behaviors and performance. The organization demonstrated how high the return can be for investing in your organization’s leadership – and how critical it is for maintaining impressive growth into the future.
Where we work – Industries
BTS ANNUAL REPORT 2018 29

Growth, Profitability and Acquisitions
Growth and profit year after year
BTS has a strong position in a large, growing and fragmented market. The value of the total market is estimated to over USD 30 billion and to grow by 4–5 percent a year. It’s a highly fragmented market and BTS’s market share is estimated to be under 1 percent. BTS financial goals are 20 percent revenue growth per year, and 15 percent operating margin (EBITA).
Continuous growth and profitBTS has delivered profit every year, and profit growth almost every year, irrespective of market conditions and despite substantial costs for acquisitions and investments in product development and market establishment around the world.
This development is a result of BTS’s growth strategy, dynamic business model, and the entrepreneurial organization.
The strategy to generate growth focuses on growing revenue and share of wallet per customer account; offering innovative digital solutions and content in our programs. Furthermore, BTS aims to expand to new geographies organically or by acquisitions.
In the 1990s, BTS successfully managed to achieve continuous profitable growth. Good market conditions and new product initiatives, as well as new offices in the US, UK, Finland, and South Africa, played a major role in the company’s growth during this period. When the market conditions worsened between 2001 and 2003, BTS managed to maintain a healthy level of revenues, despite the unfavorable business climate (particularly in the IT, Telecom, and Manufacturing industries, where BTS was predominantly active) through adhering to its successful long-term strategy.
New initiativesIn the difficult market conditions of 2001–2003, BTS successfully managed to reinforce the business for future growth and profitability by implementing a range of new initiatives, such as expanding into new industries and geographical markets.
Increasing profitsBTS constantly strives to improve profitability. The changes and initiatives implemented during the period of consolidation between 2001 and 2003 have, in combination with a focus on raising the proportion of revenues from licensing, led to improvements in margins.
BTS will reach its EBITA margin goal of 15 percent by constant improvements of billability, project execution, better systems and processes to reduce overhead, optimized pricing, increased licensing and adding recurring revenue services. The digital investments are expected to decline as share of revenue over time.
Organic growthBTS’s expansion strategy is primarily built on organic growth. During 2002 and 2003, BTS opened businesses in Australia and Spain. These initiatives have grown substantially and served as starting points for our offices in Asia and Latin America.
Acquisitions in 2005 and 2006BTS’s strategy for acquisitions aims to create a broader base for future organic growth by adding new markets, new value-adding products and services, and new talent.
BTS acquired The Strategic Management Group Learning Solutions in 2005 and The Advantage Performance Group and The Real Learning Company in 2006. The new companies have added new technologies and delivery methods, a broader customer base, and a wealth of new talent.
The 2008–2009 recessionThe recession during 2008–2009 had a significant negative impact on our industry. Most companies saw their revenues decline 20–40 percent in 2009.
Our recession strategy was based on two key factors: our low market share and our highly competitive offerings. By focusing our resources on highly prioritized accounts, we were able to maintain our revenue and profit levels.
At the same time, BTS made strategic investments and progress during the recession, creating a strong foundation for growth as of 2010 and onward.
BTS ANNUAL REPORT 201830

Growth 2010–2018During the years 2010–2018 BTS’s revenues grew by an average of 11 percent annually (currency adjusted) with growth in all regions, and at high speed in Asia and Latin America.
We grow the average size of our projects by offering global services and more complete solutions delivering increased results for our customers.
During 2013, BTS acquired all the business operations in the Danish company Wizerize A/S. The acquisition created new opportunities to offer digital-enabled solutions that are built on current and future social and mobile IT platforms. These solutions supplement and strengthen BTS’s existing offerings very well.
In 2014 BTS acquired all the businesses of the American companies Sandra Hartog Associates, Inc. and Fenestra, Inc., which will strengthen BTS’s position in the fast-growing market for services and technology within assessment services.
In 2015 BTS acquired the South African company AVO Vision, which provides BTS and AVO with major opportunities in the fast-growing and important African market with an enormous need for talent development. All the business operations in the Australian company Synergy Group Pty Ltd were also acquired in 2015. This represents a significant strengthening of BTS’s operations in Australia and will increase BTS’s delivery capacity and create a considerably stronger and broader offering in Australia.
In 2016 BTS acquired all business operations in the Italian companies Cesim Italia and Design Innovation, which significantly strengthen BTS’s position in southern Europe,
through the addition of several major Italian customers, and also reinforce BTS’s Italian operation by supplementing it with further expertise and innovative solutions. Furthermore, the acquisitions also provide a good opportunity to help many of the major Italian companies globally.
In 2017 BTS acquired all the businesses of the English company Coach in a Box Holdings Ltd. and its subsidiaries and the German company MTAC GmbH.
Coach in a Box assists leaders at all levels improve and change using a coaching approach that is virtual, affordable, scalable and fast. BTS and Coach in a Box’s combined services strengthen the customer offering and make the companies a stronger partner on the market, thus creating synergies and significant growth opportunities.
MTAC works with some of the largest organizations in the German-speaking part of Europe with innovative education and simulation-based services for strategy implementation, business acumen, leadership and marketing. The acquisition provides BTS with a base in German-speaking countries, which easily makes it the largest market in Europe. It also allows BTS to serve existing global clients better, and it creates significant growth potential. In addition, MTAC adds top knowledge in the area of marketing expertise, which is a potentially new practice area for BTS.
BTS ANNUAL REPORT 2018 31

BTS ANNUAL REPORT 201832

Organization and Culture Organization 34
Core Values 35
Our People and Culture 36–37
BTS ANNUAL REPORT 2018 33

Organization
A truly global organization
BTS Group’s four operational unitsBTS Group’s operative activities are run through four units, and the executive management has full business and P&L responsibility for their respective geographical markets.
BTS North AmericaAustin, Chicago, Los Angeles, New York, Philadelphia, Phoenix and, San Francisco.
BTS EuropeAmsterdam, Cologne, London, Paris, and Stockholm.
BTS Other marketsBangalore, Bangkok, Bilbao, Buenos Aires, Costa Rica, Dubai, Johannesburg, Madrid, Melbourne, Mexico City, Milan, Mumbai, Portsmouth, Sao Paolo, Seoul, Shanghai, Singapore, Sydney, Taipei, and Tokyo.
Advantage Performance Group (APG)APG operates in the US market and delivers performance improvement through sales and leadership training that results in meaningful business impact using its Advantage WaySM implementation process.
Product-specific unitsBTS has two product-specific units that work with new concepts and the production of solutions, as well as provide active sales support to the customers of the operational units.
BTS Digital ServicesBTS Digital Services is responsible for connected learning and online and virtual solutions.
BTS Board SimulationsBTS Board Simulations is responsible for manual board business simulations.
Practice areasBTS has six practice areas. Specialists and thought leaders have been gathered within each practice area and are responsible for developing new concepts and solutions as well as ensuring the use of best practices across the BTS Group:|| Strategic Alignment & Business Acumen|| Leadership and Management|| Sales and Marketing || Innovation || Assessment|| Coaching
Group-internal functionsGroup-internal functions cover Group Finance, Investor Relations, Corporate Communications, and Global Operations Development.
BTS North America BTS Europe
Practice areas
BTS Digital Services
BTS Board Simulations
Strategic Alignment & Business Acumen
Leadership and Management Sales and Marketing Innovation Assessment Coaching
Group Management
Group-internal functions
BTS Other markets APG
BTS ANNUAL REPORT 201834

Core Values
We live and embrace: P E O P LE
Positive spirit and fun|| We believe that a “can do” attitude and humor enhance a successful business.|| We believe in looking at problems openly and view them as opportunities.|| We strive to maintain a good spirit.
Honesty and integrity|| We believe in being loyal to those who are not present.|| We believe in giving and receiving feedback constructively.|| We believe in treating people as equals and in respecting others’ differences.
Opportunities based on merit|| We reward and provide people with opportunities based on results and competencies.|| We make decisions and evaluate ideas based on their facts and merits.|| We achieve success through hard and effective work.
Putting the team first|| We believe that BTS's success depends on teamwork and if the team needs support we do our very best to provide it. || We believe in putting the team first in individual decisions and in thinking of the individual in team decisions.
Lasting value for clients and people|| We strive to build up long-term relationships with our clients to create a legacy for the client and his or her staff.|| We focus on driving results forward – in learning, improved behavior and business performance.|| We encourage the learning, development and rewarding of BTS and its staff.|| We create our growth through our clients’ success and our active business generation.
Excellence through professionalism|| We strive to deliver top-quality solutions and services, within deadlines, to exceed client expectations.|| We balance clients’ and BTS's competencies, best practices and methods to achieve optimal results.
P
E
O
P
L
E
“I feel strongly encouraged to succeed at BTS, by my team and colleagues from around the world. The support I get during busy times at work is outstanding. BTS is more than a great place to work, it’s a place to grow as a person and develop as a professional. I truly enjoy the journey and are doing my best to share this wonderful culture with new-hires and the next generation.“
CLIENT TESTIMONIAL
BTS ANNUAL REPORT 2018 35

Our People and Culture
Great place to work
Fun & AdventureThe very nature of our work is fun. We engage in sophisticated, bottom-line-oriented business simulations with some of the smartest people in the business world; our clients are managers and executives of leading companies across the globe. Leading 25 top executives through a two-to-three day simulation experience is an adventure that BTS’ers liken to being a tour guide on an “intellectual white water rafting trip.”
Achievement & ExcellenceWe believe that if you find the right people, and give them freedom and responsibility, they will achieve great things. Our consultants work with the top talent of world-class corporations. Whether we are on stage in front of senior executives, engaged in a client development meeting with a C-level executive or creating an innovation new simulation application, we believe in delivering excellence. With very little direction or mandate, our unique culture nurtures consultants who are highly motivated to pursue high levels of achievement and excellence.
Freedom & ResponsibilityBTS gives high levels of autonomy to our consultants. They have the independence to manage their own time when they are on the road, at client sites and in the office. The flip side of this freedom is an enormous amount of client-facing responsibility. Within weeks of beginning at BTS, new consultants lead managers and executives at world- class companies through BTS simulations and experiential learning solutions.
Fun & Adventure
Achievement &
Excellence
Freedom & Responsibility
Teamwork
Lear
ning
Coaching
During the year, we expanded our employee base to approximately 700 professionals. We work hard to develop, engage and retain our employees. Our culture is the key reason why world-leading companies do business with us and it is why our employees consider BTS a great place to work. Our success is built upon teams of highly talented and diverse professionals who develop and deliver innovative solutions to our global client base.
BTS ANNUAL REPORT 201836

“The number one reason I love BTS is, of course, the people. I feel so lucky to be a part of such a truly amazing group of fun, caring, and talented people working together across the world to make a difference in the lives our clients. The number two reason I love BTS is how we continue to maintain a strong entrepreneurial culture no matter how big we grow. Experimenting, innovating, reinventing… Our freedom to be creative and take risks at BTS keeps us agile, relevant, and makes work exciting.”
“Reflecting on more than a decade as a member of the BTS family (which says a lot in itself), I appreciate that each day is a new adventure; our work is ever-evolving and regularly pushes us to explore new approaches and reach beyond boundaries. My gravitation is towards the entrepreneurial and innovative nature of our day-to-day work and I love feeling that I am a part of something bigger than myself, and take pride in what we do as a collective team. I feel lucky that our work helps shape a path for others to reach meaningful outcomes, unique to their needs. It feels powerful to be a part of something like that. I value the many friendships gained through my time here and colleagues easily become extended family. What I also genuinely appreciate is that BTS allows the flexibility to deal with the needs of family and daily life, which in turn helps me to be a more present and productive employee.”
“The reason I enjoy working at BTS (and have been for the past 15 years) is that we share the same culture around the world. I feel at home no matter which of our offices I’m working in. With so many local cultures around the world, it is the strong BTS culture that unites us all. And, the corporate value clichés are not clichés here, they’re lived and breathed every day. It’s difficult to find a company that allows you freedom to manage your own time and be held responsible for results rather than how and where the work gets done. That is the foundation of how BTS operates.
BTS is also a place to develop as an individual, both as a person and as a professional. This would not be possible without business growth. Being in an organization that conquers new countries, adds new practice areas, and develops new methodologies opens up amazing opportunities for every employee and for our clients. I always like it when Henrik says “My wish is to see all of you as global partners,” because I know that it’s true.”
CLIENT TESTIMONIALS
KEY FIGURES, EMPLOYEES 2018 2017 2016 2015 2014
Number of employees at the end of the year 701 596 523 463 405
Of whom women, %1 51 50 48 44 40
Net turnover per employee, KSEK 2,478 2,268 2,224 2,394 2,035
1 Yearly average number
BTS ANNUAL REPORT 2018 37

BTS ANNUAL REPORT 201838

Advantage Performance Group Advantage Performance Group 40–41
BTS ANNUAL REPORT 2018 39

Advantage Performance Group
Helping leaders lead, sellers sell, and businesses flourish
APG uses their Advantage WaySM methodology to both define and measure the impact of various solutions. Developed in partnership with Dr. Robert Brinkerhoff, it leverages his groundbreaking work on High Impact Learning and Success Case Methodologies to help organizations achieve documented business results and improved job performance.
APG works with several leading solution providers, including BTS, who provide assessments, coaching and learning and development programs. Additionally, APG has a network of facilitators who deliver programs around the US and in some cases internationally. Looking ahead to the future, APG will continue to collaborate with BTS to meet client needs. This includes a renewed focus on high potential development, culture shifts within organizations, and solutions that are scalable and highly efficient at implementing strategy to develop emerging leaders at all levels.
Key Differences || Insightful: Our organization serves as a source of world-class thought leadership. We orchestrate expertise and provide integration services to deliver business results.|| Creative: Our approach brings inspired ideas to life through imaginative yet practical solutions.|| Accountable: We are relentless in our pursuit of becoming our clients’ most accountable partner. For 28 years, we have delivered on our promises and are the first call our clients make when they have a need.
Advantage Performance Group (APG) is a fully owned, North American- based BTS subsidiary that serves clients in complimentary ways to traditional BTS consultants, helping organizations accelerate business results. They do this through behavioral change and competency development, work-for-hire content development, turn-key assessment programs, and curriculum-based training via standard or tailored solutions, providing a flexible, cost-effective approach to support initiatives.
BTS ANNUAL REPORT 201840

“APG guided my team toward the right solutions and made sure all the content was relevant and completely customized to our audience. I am very glad I made the decision to work with them for this project; it made all the difference!” Associate Director, Global Leadership Development, Global Pharmaceutical Organization
“Being a not-for-profit organization, we need to look very carefully at our return on people development when making investments. APG has proven to be a true partner, providing both flexibility and, most importantly, organizational impact.” CFO, North American Retail Marketing Association
“We consider APG to be a partner, not a vendor. It never feels like they are trying to sell us something. We talk about what we need and their design team works with us to develop it. Even when they work with competing vendors for a project with us, it’s always collaborative. There’s a huge level of trust in our relationship.” Senior Director, Learning and Organizational Effectiveness, Global Medical Device Firm
“We sought a partner who would be hands-on, seek to know the causes of our pain, bring discernment and understanding into resolving our problem, and suggest complementary resources to meet our challenges with measurable ideas. APG delivered on all of this and more.” Director of Learning and Development, North American Food Distributer
CLIENT TESTIMONIALS
BTS ANNUAL REPORT 2018 41

Five-Year Summary..................................................... 43–45
BTS Share information .............................................. 46–47
Management Report ...................................................48–51
Consolidated Income Statement ................................... 52
Consolidated Statement of
Comprehensive Income ..................................................... 52
Consolidated Balance Sheet ........................................... 53
Changes in Consolidated Equity .................................... 54
Consolidated Cash Flow Statement ............................. 55
Parent Company’s Income Statement ......................... 56
Parent Company’s Statement of
Comprehensive Income ..................................................... 56
Parent Company’s Balance Sheet ................................. 57
Parent Company’s Cash Flow Statement ...................58
Changes in Parent Company’s Equity ........................... 59
Notes to the Annual Report ...................................... 60–77
Audit Report .................................................................. 76–79
Financial information

BTS ANNUAL REPORT 2018 43
Five-Year Summary
Income statementConsolidated income statements in summary
SEK millions 2018 2017 2016 2015 2014
Net sales 1,598.4 1,242.6 1,107.6 1,043.9 781.5
Operating expenses –1,384.5 –1,091.8 –982.1 –922.5 –690.0
Depreciation of property, plant, and equipment –11.8 –9.9 –8.0 –7.7 –6.5
Amortization of intangible assets –18.7 –8.6 –5.8 –4.3 –2.6
Operating profit (EBIT) 183.4 132.3 111.7 109.5 82.4
Net sales per operating unit
SEK millions 2018 2017 2016 2015 2014
BTS North America 714.2 573.7 534.7 528.6 362.2
BTS Europe 315.7 204.0 191.6 178.9 153.8
BTS Other markets 459.9 350.9 270.7 222.7 168.4
APG 108.6 114.1 110.7 113.7 97.1
Total 1,598.4 1,242.6 1,107.6 1,043.9 781.5
Operating profit (EBITA) per operating unit
SEK millions 2018 2017 2016 2015 2014
BTS North America 93.4 73.7 58.9 60.6 42.5
BTS Europe 44.9 17.9 25.0 23.3 19.8
BTS Other markets 62.8 47.6 32.9 27.3 20.1
APG 0.9 1.7 0.7 2.6 2.6
Total 202.1 140.9 117.5 113.8 85.0
Operating Units
BTS North America consists of BTS’s operations in North America excluding APG.
BTS Europe consists of operations in France, Germany, the Netherlands, Sweden, and the UK.
BTS Other markets consists of operations in Argentina, Australia, Brazil, China, Costa Rica, India, Italy, Japan, Mexico, Singapore, South Africa, South Korea, Spain, Taiwan, Thailand, and United Arab Emirates.
APG consists of operations in Advantage Performance Group.
Fin
an
cia
l in
form
ati
on

BTS ANNUAL REPORT 201844
Balance sheetConsolidated balance sheets in summary
SEK millions 2018 2017 2016 2015 2014
Assets
Non-current assets 581.2 549.1 346.1 278.9 261.4
Accounts receivable 512.5 335.1 361.0 276.8 239.0
Other current assets 172.0 141.4 101.1 115.8 67.2
Cash and cash equivalents 262.4 199.9 135.4 139.5 114.3
Total assets 1,528.0 1,225.6 943.7 811.0 681.9
Equity and liabilities
Equity 704.2 580.6 543.1 483.3 434.5
Interest-bearing liabilities 102.8 125.6 25.3 16.7 –
Non-interest-bearing liabilities 721.0 519.5 375.3 311.0 247.4
Total equity and liabilities 1,528.0 1,225.6 943.7 811.0 681.9
Cash flowConsolidated cash flow in summary
SEK millions 2018 2017 2016 2015 2014
Cash flow from operating activities 158.2 98.2 47.5 57.9 44.8
Cash flow from investing activities –37.3 –80.2 –26.5 –19.0 –21.0
Cash flow from financing activities –70.6 54.7 –36.5 –16.3 –32.9
Cash flow for the year 50.3 72.6 –15.5 22.6 –9.1
Cash and cash equivalents, start of year 199.9 135.4 139.5 114.3 108.8
Translation differences in cash and cash equivalents 12.2 –8.2 11.4 2.6 14.6
Cash and cash equivalents, end of year 262.4 199.9 135.4 139.5 114.3

BTS ANNUAL REPORT 2018 45
Financial ratios for the Group
SEK millions 2018 2017 2016 2015 2014
Net sales 1,598.4 1,242.6 1,107.6 1043.9 781.5
Operating profit (EBITA) 202.1 140.9 117.5 113.7 85.0
Operating margin (EBITA margin), % 12.6 11.3 10.6 10.9 10.9
Operating profit (EBIT) 183.4 132.3 111.7 109.5 82.4
Operating margin (EBIT margin), % 11.5 10.6 10.1 10.5 10.5
Profit margin, % 7.9 7.9 6.7 7.0 7.2
Earnings per share, SEK 6.67 5.20 3.96 3.89 3.01
Operating capital 544.7 506.2 432.9 360.4 320.2
Return on operating capital, % 34.9 28.2 28.2 32.2 29.1
Equity 704.2 580.6 543.1 483.3 434.5
Return on equity, % 19.6 17.5 14.4 15.8 14.2
Equity per share, SEK 37.04 30.74 29.13 25.92 23.30
Equity/assets ratio, % 46.1 47.4 57.6 59.6 63.7
Dividend per share, SEK 3.601 2.80 2.50 2.35 1.75
Cash flow 50.3 72.6 –15.5 22.6 –9.1
Cash and cash equivalents 262.4 199.9 135.4 139.5 114.3
Number of employees at year-end 701 596 523 463 405
Average number of employees 645 548 498 436 384
Annual net turnover per employee 2.5 2.3 2.2 2.4 2.01 Proposed dividend.
Definitions
Operating margin (EBITA margin)Operating profit before amortization of intangible assets as a percentage of net sales.
Operating margin (EBIT margin)Operating profit after amortization/ depreciation as a percentage of net sales.
Profit marginProfit for the period as a percentage of net sales.
Earnings per shareEarnings attributable to the Parent Company’s shareholders divided by the number of shares before delution.
Operating capitalBalance sheet total less cash and cash equivalents, other interest- bearing assets, and non-interest- bearing liabilities.
Return on operating capital Operating profit as a percentage of average operating capital.
Return on equityProfit after tax on an annual basis as a percentage of average equity.
Equity per share Equity excluding non-controlling interests divided by the number of shares at the end of the year.
Equity/assets ratioEquity as a percentage of the balance sheet total.
Dividend per share Dividends proposed or adopted, divided by the number of shares at year-end.
Annual net sales per employeeNet sales for the whole year, divided by the average number of employees.
Price/earnings ratioPrice per share divided by earnings per share.
Fin
an
cia
l in
form
ati
on

BTS ANNUAL REPORT 201846
BTS share information
SEK 2018 2017 2016 2015 2014
Share price at December 31 127.00 93.50 72.00 77.50 59.50
Earnings per share 6.67 5.20 3.96 3.89 3.01
Price/earnings ratio, December 31 19.0 18.0 18.2 19.9 19.8
Cash and cash equivalents per share, December 31 13.80 10.58 7.26 7.48 6.13
Equity per share, December 31 37.04 30.74 29.13 25.92 23.30
Dividend per share 3.601 2.80 2.50 2.35 1.75 1 Proposed dividend.
On June 6, 2001, the BTS share was floated on Nasdaq Stock-holm in connection with the issue of new stock, raising capital for the Company of SEK 78.1 million after issue expenses.
The share capital totals SEK 6,337,972, distributed among 853,800 Class A shares and 18,160,116 Class B shares, each with a quotient value of SEK 0.33. Each Class A share entitles the holder to ten votes, each Class B share one vote. All shares carry equal rights to participate in the Company’s assets and profits.
At December 31, 2018, there were 2,512 (1,412) shareholders in the company, an increase by 78 percent. In the past few years BTS has increased its investor relations activities including webcasted interim report presentations in Sweden and road shows to financial centres in Europe.
Dividend policy
The Company’s goal is to distribute 40–65 percent of profit after tax in the long run.
0
200
400
600
800
B share OMX Stockholm PI Traded volume (thousands)
0
50
100
150
200
20182017201620152014
BTS Group AB share price 2014–2018
Share price quotes cover opening price first day of trading 2014 to closing price last day of trading 2018.
Sources: SIX Trust and Fidessa

BTS ANNUAL REPORT 2018 47
Share capital Change in capital
Year Transaction Increase in share
capital, SEK Share capital,
SEK Class A shares Class B sharesTotal no. of
sharesPar value per
share, SEK
1999Formation of the Company 100,000 100,000 439,900 560,100 1,000,000 00:10
1999 New issue 8,200 108,200 82,000 1,082,000 00:10
2001Stock dividend issue 4,219,800 4,328,000 1,082,000 04:00
2001 4:1 split 4,328,000 1,319,700 1,926,300 4,328,000 01:00
2001
Conversion of Class A to Class B shares –1,475,000 1,475,000 4,328,000 01:00
2001 New issue 1,500,000 5,828,000 1,500,000 5,828,000 01:00
2002 New issue 69,300 5,897,300 69,300 5,897,300 01:00
2006 3:1 split 5,897,300 569,200 11,225,400 17,691,900 00:33
2006 New issue 118,800 6,016,100 356,400 18,048,300 00:33
2012 New issue 5,922 6,022,022 17,765 18,066,065 00:33
2013 New issue 174,601 6,196,623 523,805 18,589,870 00:33
2014 New issue 18,834 6,215,457 56,500 18,646,370 00:33
2017 New issue 80,227 6,295,684 240,681 18,887,051 00:33
2018 New issue 42,288 6,337,972 126,865 19,013,916 00:33
10 largest shareholders
NameNo. of
Class A shares No. of
Class B shares Holding Pctg. holding Pctg. votes
Henrik Ekelund incl. companies 816,000 3,189,034 4,005,034 21.1 42.5
Nordea funds 2,953,280 2,953,280 15.5 11.1
Stefan af Petersens incl. companies 37,800 2,292,095 2,329,895 12.3 10.0
Lannebo funds 2,150,207 2,150,207 11.3 8.1
Swedbank Robur funds 1,371,230 1,371,230 7.2 5.1
Third Swedish National Pension Fund (AP3) 947,803 947,803 5.0 3.5
Stefan Hellberg incl. companies 614,791 614,791 3.2 2.3
AMF funds 384,007 384,007 2.0 1.4
Elementa 336,247 336,247 1.8 1.3
Canaccord (HSBC trustee) 265,500 265,500 1.4 1.0
Total for 10 largerst shareholders 853,800 14,504,194 15,357,994 80.8 86.3
Other shareholders – 3,655,922 3,655,922 19.2 13.7
Total 853,800 18,160,116 19,013,916 100.0 100.0
Fin
an
cia
l in
form
ati
on

BTS ANNUAL REPORT 201848
Management report
The Board of Directors and CEO of BTS Group AB (publ), corporate identity number 556566-7119, hereby submit their annual accounts and consolidated financial statements for the fiscal year 2018. The consolidated income statement and bal-ance sheet as well as the Parent Company’s income statement and balance sheet will be submitted to the Annual General Meeting for adoption.
Operations
BTS Group AB is an international consulting and education firm which focuses on the individuals when organizations are executing strategic changes and works with leaders at all levels to help them make better decisions, progress from decision to action and deliver results. For more than 30 years, BTS has been creating motivational and effective programs which make a profound and lasting impact on the participants and their careers by inspiring new ways of thinking and enhancing the critical capabilities that employees and leaders need to achieve improved corporate performance.
BTS has a broad range of services which meet needs within strategy execution and talent development with services that monitor the employee from evaluation for selection and devel-opment, to strategic consensus and strategy implementation. This is achieved through programs in business acumen, leader-ship and sales and include the aid of business simulations and other forms of experiential learning and implementation tools. Most BTS clients are major corporations.
Revenue and profit
BTS’s net sales increased by 29% during the year, to SEK 1,598.4 million (1,242.6). Adjusted for changes in exchange rates, revenues increased by 26%.
Operating profit (EBITA) increased by 43% during the year, to SEK 202.1 million (140.9). Operating profit was charged with SEK 18.7 million (8.6) for amortization of intangible assets attributable to acquisitions. Operating profit (EBIT) increased by 39% to SEK 183.4 million (132.3).
The operating margin (EBITA margin) was 12.6% (11.3). The operating margin (EBIT margin) was 11.5% (10.6). Consoli-dated profit before tax for the year increased by 37%, to SEK 179.8 million (131.4).
Net sales for BTS’s operations in North America totaled SEK 714.2 million (573.7) in 2018. Adjusted for changes in exchange rates, revenues increased by 22%. Operating profit (EBITA) totaled SEK 93.4 million (73.7) for the year. The operating margin (EBITA margin) was 13.1% (12.8).
Net sales for BTS Europe totaled SEK 315.7 million (204.0) in 2018. Adjusted for changes in exchange rates, revenues increased by 47%. Operating profit (EBITA) totaled SEK 44.9
million (17.9) for the year. The operating margin (EBITA margin) was 14.2% (8.8).
Net sales for BTS Other markets totaled SEK 459.9 million (350.9) in 2018. Adjusted for changes in exchange rates, rev enues increased by 29%. Operating profit (EBITA) totaled SEK 62.8 million (47.6) for the year. The operating margin (EBITA margin) was 13.7% (13.6).
Net sales for APG reached SEK 108.6 million (114.1) in 2018. Adjusted for changes in exchange rates, revenues decreased by 6%. Operating profit (EBITA) totaled SEK 0.9 million (1.7) for the year. The operating margin (EBITA margin) was 1.6% (–1.3).
Financial position
At the end of the period, cash and cash equivalents were SEK 262.4 million (199.9). The Group’s interest-bearing loans, attrib-utable to previously completed acquisitions, totaled SEK 102.8 million (125.6) at the end of the period. Equity totaled SEK 704.2 million (580.6) at year-end, and the equity/assets ratio was 46% (47). BTS’s cash flow from operating activities for the year was SEK 158.2 million (98.2).
Determination of acquisition analyses
The preliminary acquisition analyses for the acquisitions of Coach in a Box Holdings Ltd and MTAC GmbH that took place in the fourth quarter of 2017 have been adopted. The effect was an increase in goodwill and a provision for deferred tax liabilities of MSEK 10.2.
The Board’s proposed guidelines for determining salaries and other compensation to senior executives
The Board of Directors proposes that the 2019 Annual General Meeting does not change the guidelines for deciding on sal aries and other compensation to the CEO and other senior execu-tives. For the guidelines decided by the 2018 AGM, see Note 6.
Employees
The number of employees in BTS Group AB at December 31, 2018 was 701 (596). The average number of employees during the year was 645 (548).
Shareholders
The total number of shares outstanding at December 31, 2018 is 19,013,916, consisting of 853,800 Class A and 18,160,116 Class B shares. Each Class A share entitles the holder to 10 votes per share, each Class B one vote per share.
In 2018, 56,390 Series B shares were newly issued as partial payment of additional purchase price for acquisitions com-pleted in 2016 at a price of SEK 91.20 per share. Also in 2018, 70,475 Series B shares were newly issued as a result of holders

BTS ANNUAL REPORT 2018 49
of employee stock options, according to BTS Group’s employee stock option program 2015/2019, utilized them to acquire shares.
The Company’s articles of association contain no restric-tions on the transfer of shares. The Company has three share-holders, Henrik Ekelund, Nordea Fonder and Stefan af Peter-sens, whose holdings each exceeded 10% of votes at year-end 2018. Some employees own shares in the Company, but the employees as a whole have no investment through any pension fund or the like. The Company is not aware of any agreements between shareholders that would restrict the right to transfer shares. Neither is there any agreement to which the Company is a party that would take effect, be changed, or cease to apply if control of the Company changed as a result of a public take-over bid.
Parent Company
The activities of the Parent Company, BTS Group AB, consist exclusively of tasks internal to the Group. The assets of the Parent Company consist primarily of shares in subsidiaries and cash and cash equivalents. The Company’s net sales totaled SEK 3.0 million (2.3), and profit after financial items SEK 68.9 million (47.9). Cash and cash equivalents were SEK 4.5 million (0.2).
Reduction of the statutory reserve of the parent company
The Swedish Companies Registration Office (Sw. Bolagsverket) approved in December 2018 the resolution by the Annual General Meeting 2018 to reduce the statutory reserve (Sw. reservfond) of the parent company in a total amount of approximately MSEK 41.4. The reduction amount has been transferred to unresticted equity.
Outlook for 2019
Profit before tax is expected to be better than last year.
Market development
The market for BTS services continued to trend positively during the year. The share of licensing revenue grew, with rapidly increasing sales of digital licenses.
Sustainability report and corporate governance report
In accordance with the Swedish Annual Accounts Act, BTS has chosen to prepare the statutory Sustainability Report (Chap-ter 6, paragraph 11, of the Swedish Annual Accounts Act)) and the statutory Corporate Governance Report (Chapter 6, para-graph 8, of the Swedish Annual Accounts Act) as two reports separated from the Annual Report. The Sustainability Report and the Corporate Governance Report have been submitted
to the auditor at the same time as the Annual Report. The description of the sustainability work and corporate govern-ance can be found on pages 82-91 of the Annual Report for 2018, which is published on the BTS website.
Information about risk and uncertainty Market risksSensitivity to economic conditions
Demand for training is sensitive to economic fluctuations. Slower growth and costcutting programs affect corporate training budgets negatively. Similarly, economic recovery increases willingness to invest in training.
Dependence on individual customers
BTS’s ten largest customers accounted for 23% (25) of its sales in 2018. By striving for a broad customer base, BTS limits its dependence on individual customers.
No sector dominates
BTS customers are mainly active in nine business sectors: IT Equipment & Software, Financial Services, Manufacturing, Pharmaceuticals & Biotech, Fast-Moving Consumer Goods (FMCG), Energy, Telecommunications, Professional Services, and Retail. The global distribution of its customers’ operations helps reduce BTS’s exposure to cyclical fluctuations in specific industries.
Geographical spread
44% (46) of BTS’s sales in 2018 were in the operating unit BTS North America, BTS Other markets represented 29% (28), BTS Europe accounted for 20% (17) and APG 7% (9).
Fragmented competitive situation
The market for corporate training and management is frag-mented. BTS encounters different competitors in different markets and has no global competitor.
Operational risksQuality and brands
BTS builds its marketing on network-based sales developed over the years by good customer relationships, which are brought about by high demands on the quality of BTS deliver-ies. BTS minimizes the risk of dissatisfied customers by recruit-ing and cultivating qualified consultants and by ensuring that all development and all deliveries adhere to established pro-cesses. BTS also follows up on quality in every project.
Fin
an
cia
l in
form
ati
on

BTS ANNUAL REPORT 201850
Intellectual property
BTS owns all rights to the business simulations it develops for clients, thus retaining the right to reuse general intellectual property, such as software and adaptations, when developing new simulations. For license-based products and solutions, the client purchases the number of licenses needed for the employees participating.
Securing human resources
Rapid growth requires intensive recruiting and training of employees. At the same time, it is essential to retain com-petent personnel. To meet these requirements, BTS follows an established model for recruiting and skills development.
Dependence on key personnel
To reduce dependence on individual employees and to insure the long-term quality of BTS training courses, methods, technologies, and business simulations are well documented.
Financial risks
Effective and systematic assessments of financial and commercial risks are vital to BTS. The Group’s financial policy specifies guidelines and objectives for managing financial risks within the Group.
Financing and risk management have been gathered under the Group finance function. The subsidiaries manage all foreign exchange dealings and credit to clients within the framework of the policy. For details, see Note 2, Significant accounting policies, and Note 18, Financial instruments and financial risk management.
Foreign exchange risks
The currencies with the greatest impact on BTS’s earnings are the U.S. dollar (USD), the euro (EUR), and the pound Sterling (GBP). The day-to-day exposure to fluctuations in exchange rates is limited, as revenues and expenses are primarily in the same currency in each market. BTS does not normally hedge its foreign exchange exposure. The sensitivity analysis below shows the effects on operating profits of changes in the value of USD, EUR, and GBP in relation to the Swedish krona (SEK).
Percentage change
Change* KSEK
SEK/USD +/–10% 13,121
SEK/EUR +/–10% 4,080
SEK/GBP +/–10% 3,626* Based on 2018 figures
Credit risks
BTS only accepts creditworthy counterparties. BTS’s accounts receivable are distributed among a large number of compa-nies operating in different sectors. The maximum credit risk at year-end was SEK 13,648 thousand (15,504), which corre-sponds to the largest credit exposure to any single group.
Liquidity risk and interest rate risk
BTS manages liquidity risk by maintaining sufficient cash and cash equivalents and a reserve in the form of an approved overdraft facility. BTS may borrow funds only with the approval of the Board of Directors. Any excess liquidity in subsidiaries is initially to be used to repay loans. Interest rates on the Group’s financial assets and liabilities are usually fixed for short periods. Interest rate risk refers to changes in market rates that could adversely affect BTS, either through increased costs of borrowing for the Company or through fluctuations in returns on the funds invested at variable interest rates.
Multiple-year review
Performance for the past five fiscal years is presented below.
SEK thousands 2018 2017 2016 2015 2014
Sales 1,598,399 1,242,591 1,107,644 1,043,900 781,454
Operating expenses –1,384,450 –1,091,837 –982,121 –922,473 –690,035
Depreciation of property, plant, and equipment –11,835 –9,887 –8,016 –7,688 –6,464
Amortization of intangible assets –18,713 –8,574 –5,808 –4,286 –2,568
Operating profit (EBIT) 183,401 132,292 111,699 109,452 82,387
Operating margin (EBIT margin) % 11 11 10 10 11
Number of employees at year-end 701 596 523 463 405
Average number of employees 645 548 498 436 384
Net sales per employee 2,478 2,268 2,224 2,394 2,035

BTS ANNUAL REPORT 2018 51
Research and development
The development that BTS has conducted during the year is essentially related to customer-specific product development, which has been expensed directly. Any research has not occurred. For a more detailed description, see Note 2 Account-ing principles.
Proposed appropriation of earnings Parent Company
The following funds are at the disposal of the Annual General Meeting:
SEK
Profit brought forward 82,430,750
Profit for the year 68,112,132
Total 150,542,882
The Board of Directors proposes that earnings be appropriated as follows:
To be distributed to shareholders: SEK 3.60 per share totaling1 68,916,380
To be carried forward 81,626,502
Total 150,542,882
1 The total amount of the proposed dividend is based on the number of outstanding shares as of April 18, 2019.
The Board proposes a dividend of SEK 3.60 per share, to be paid in an amount of SEK 1.80 on two occasions. The dividend is proposed to be paid on May 22, 2019 and November 20, 2019 respectively.
Statement from the Board of Directors on the proposed dividend
The proposed dividend to shareholders will reduce the Parent Company’s equity/assets ratio to 32%, and the Group’s equity/assets ratio to 44%. The equity/assets ratio as well as the cash situation is considered satisfactory.
The Board of Directors is of the opinion that the proposed dividend will not prevent the Company from fulfilling its obliga-tions in the short or long run nor from making the requisite investments. Thus the proposed dividend is justifiable in terms of the provisions of Chapter 17, section 3, paragraphs 2–3 of the Swedish Companies Act (prudence rule).
Regarding the operations of the Group and the Parent Company in other respects, please see the following income statements and balance sheets and to the cash flow state-ments and accompanying notes.
Fin
an
cia
l in
form
ati
on

BTS ANNUAL REPORT 201852
Consolidated Income Statement
SEK thousands NOTE 2018 2017
Net sales 9 1,598,399 1,242,591Operating expensesOther external expenses 3, 4, 5 –625,030 –498,007
Employee benefit expenses 6 –759,420 –593,831
Depreciation of property, plant, and equipment and amortization of intangible assets 7, 8 –30,548 –18,461
Total operating expenses –1,414,998 –1,110,299OPERATING PROFIT 9 183,401 132,292Financial items 10
Financial income 684 479
Financial expenses –3,814 –1,478
Total gain/loss on financial items –3,130 –999
Affiliated companies, profit after tax –477 135
PROFIT BEFORE TAX 179,794 131,429Tax on profit for the year 11 –53,660 –33,295
PROFIT FOR THE YEAR 126,134 98,134Profit for the year attributable to: Parent Company’s shareholders 126,134 98,134
Earnings per share (profit for the year attributable to Parent Company shareholders) 12
Earnings per share, before dilution, SEK 6.67 5.20
No. of shares at year-end 19,013,916 18,887,051
Dividend per share, SEK 13 3.601 2.80
1 Proposed dividend
Consolidated statement of comprehensive income
SEK thousands NOTE 2018 2017
PROFIT FOR THE YEAR 126,134 98,134Other comprehensive incomeItems that later could be reclassified to profit or lossTranslation differences in equity 17 39,747 –38,154
Other comprehensive income for the year, net after tax 39,747 –38,154
TOTAL COMPREHENSIVE INCOME FOR THE YEAR 165,881 59,980
portion attributable to Parent Company shareholders 165,881 59,980

BTS ANNUAL REPORT 2018 53
Consolidated Balance Sheet
SEK thousands NOTE 12-31-18 12-31-17
ASSETSNon-current assetsIntangible assetsGoodwill 7 455,268 421,374
Other intangible assets 7 72,026 86,899
Total intangible assets 527,294 508,273
Property, plant, and equipmentEquipment 8 38,803 29,638
Financial assetsDeferred tax assets 15 4,496 3,694
Other non-current receivables 18 10,586 7,512
Total financial assets 15,082 11,206Total non-current assets 581,179 549,117
Current assetsCurrent receivablesAccounts receivable 18 512,468 335,132
Other receivables 18 11,569 6,892
Prepaid expenses and accrued income 16 160,438 134,550
Total current receivables 684,474 476,573
Cash and cash equivalents 262,357 199,876
Total current assets 946,831 676,449
TOTAL ASSETS 1,528,010 1,225,566
EQUITY AND LIABILITIES
Equity 17
Share capital 6,338 6,296
Other paid-in capital 4,908 46,102
Reserves 32,681 –6,870
Retained earnings, including profit for the year 660,276 535,028
Total equity 704,203 580,555
ProvisionsAccrued tax liabilities 15, 18 47,945 32,860
Other provisions 18 172,663 186,859
Total provisions 220,608 219,719
Non-current liabilities 18, 19 62,893 84,839
Current liabilitiesAccounts payable 18 35,555 31,058
Tax liabilities 8,098 4,971
Other current liabilities 18, 20 97,742 68,845
Accrued expenses and prepaid income 21 398,912 235,579
Total current liabilities 540,307 340,453
TOTAL EQUITY AND LIABILITIES 1,528,010 1,225,566
Information on pledged assets and contingent liabilities in notes 23 and 24.
Fin
an
cia
l in
form
ati
on

BTS ANNUAL REPORT 201854
Changes in Consolidated Equity
Attributable to Parent Company
SEK thousands NOTE 17Share
capital
Other paid-in capital Reserves
Retained earnings
including profit for the year
Total equity
Opening balance at January 1, 2017 6,215 46,812 30,573 459,494 543,094
Comprehensive incomeProfit for the year 98,134 98,134
Other comprehensive incomeTranslation differences –710 –37,443 –38,154
Total comprehensive income 0 –710 –37,443 98,134 59,980
Transactions with shareholdersNew issue 80 21,165 21,245
Share-based payment according to IFRS 2 974 974
Dividends to shareholders –46,616 –46,616
Other 1,878 1,878
Total transactions with shareholders 80 0 0 –22,600 –22,520
Closing balance at December 31, 2017 6,296 46,102 –6,870 535,028 580,555
Opening balance at January 1, 2018 6,296 46,102 –6,870 535,028 580,555
Comprehensive incomeProfit for the year 126,134 126,134
Reduction of the statutory reserve –41,390 41,390
Other comprehensive incomeTranslation differences 196 39,551 39,747
Total comprehensive income 0 –41,194 39,551 167,524 165,881
Transactions with shareholdersNew issue 42 10,901 10,943
Share-based payment according to IFRS 2 311 311
Dividends to shareholders –53,010 –53,010
Other –477 –477
Total transactions with shareholders 42 0 0 –42,275 –42,233
Closing balance at December 31, 2018 6,338 4,908 32,681 660,276 704,203

BTS ANNUAL REPORT 2018 55
Consolidated Cash Flow Statement
SEK thousands NOTE 2018 2017
Operating activities Operating profit 183,401 132,292
Adjustments for non-cash items
Depreciation and amortization 30,548 18,461
Financial items 10 –3,572 –810
Tax paid for the year –50,280 –50,563
Cash flow from operating activities before changes in working capital 160,097 99,380
Cash flow from changes in working capital
Change in accounts receivable –154,188 10,285
Change in other operating receivables –26,357 –13,838
Change in accounts payables and other operating liabilities 178,611 2,370
Cash flow from changes in working capital –1,934 –1,182
Cash flow from operating activities 158,163 98,198
Investing activitiesAcquisition of property, plant, and equipment 8 –19,233 –17,720
Acquisition of intangible assets 7 – 98
Acquisitions of companies after deduction of cash and cash equivalents –15,055 –64,724
Change in other financial assets –3,033 2,129
Cash flow from investing activities –37,321 –80,217
Financing activitiesRepayment of loan –24,394 –4,419
Borrowings 1,028 105,696
Dividends to shareholders 13 –53,010 –46,616
New issue 5,800 –
Cash flow from financing activities –70,576 54,661
Cash flow for the year 50,266 72,642Cash and cash equivalents, start of year 199,876 135,433
Translation differences in cash and cash equivalents 12,215 –8,200
Cash and cash equivalents, end of year 262,357 199,876
Fin
an
cia
l in
form
ati
on
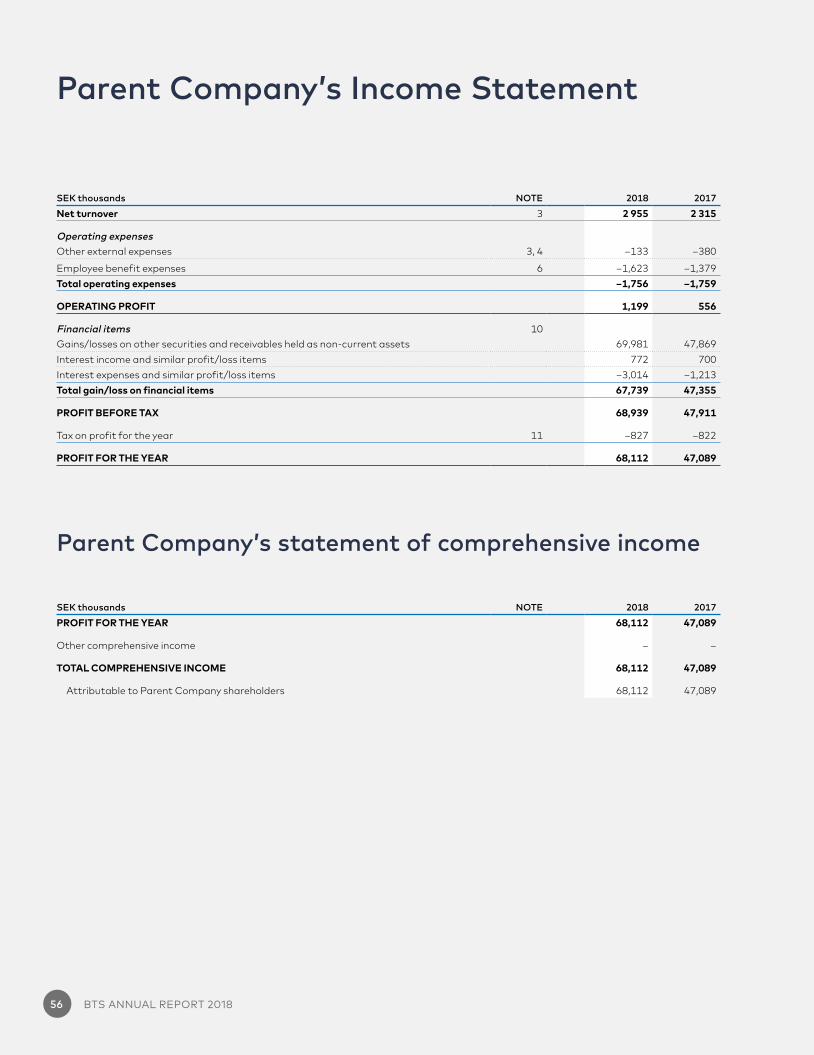
BTS ANNUAL REPORT 201856
Parent Company’s Income Statement
SEK thousands NOTE 2018 2017
Net turnover 3 2 955 2 315
Operating expensesOther external expenses 3, 4 –133 –380
Employee benefit expenses 6 –1,623 –1,379
Total operating expenses –1,756 –1,759
OPERATING PROFIT 1,199 556
Financial items 10
Gains/losses on other securities and receivables held as non-current assets 69,981 47,869
Interest income and similar profit/loss items 772 700
Interest expenses and similar profit/loss items –3,014 –1,213
Total gain/loss on financial items 67,739 47,355
PROFIT BEFORE TAX 68,939 47,911
Tax on profit for the year 11 –827 –822
PROFIT FOR THE YEAR 68,112 47,089
Parent Company’s statement of comprehensive income
SEK thousands NOTE 2018 2017
PROFIT FOR THE YEAR 68,112 47,089
Other comprehensive income – –
TOTAL COMPREHENSIVE INCOME 68,112 47,089
Attributable to Parent Company shareholders 68,112 47,089

BTS ANNUAL REPORT 2018 57
Parent Company’s Balance Sheet
SEK thousands NOTE 12-31-18 12-31-17
ASSETS
Non-current assetsFinancial assetsParticipations in Group companies 14 279,378 279,378
Receivables from Group companies 22,606 21,670
Total non-current assets 301,983 301,048
Current assetsCurrent receivablesReceivables from Group companies 40,300 52,789
Other receivables 1 –
Prepaid expenses and accrued income 1,216 454
Total current receivables 41,517 53,243
Cash and cash equivalents 4,509 246
Total current assets 46,027 53,489
TOTAL ASSETS 348,010 354,537
EQUITY AND LIABILITIES
Equity 17
Restricted equityShare capital 6,338 6,296
Statutory reserve – 41,390
Total restricted equity 6,338 47,685
Non-restricted equityRetained earnings 82,431 36,061
Profit for the year 68,112 47,089
Total non-restricted equity 150,543 83,150
Total equity 156,881 130,836
Provisions 18 87,802 88,836
Non-current liabilities 18, 19 60,000 84,116
Current liabilitiesAccounts payable 94 13
Tax liabilities 74 71
Other current liabilities 18, 20 42,844 50,332
Accrued expenses and prepaid income 21 316 333
Total current liabilities 43,327 50,749
TOTAL EQUITY AND LIABILITIES 348,010 354,537
Information on pledged assets and contingent liabilities in notes 23 and 24.
Fin
an
cia
l in
form
ati
on

BTS ANNUAL REPORT 201858
Parent Company’s Cash Flow Statement
SEK thousands NOTE 2018 2017
Operating activitiesOperating profit 1,199 556
Financial income and expense 10 –2,206 –513
Tax paid for the year –824 –817
Cash flow from operating activities before changes in working capital –1,830 –775
Cash flow from changes in working capitalChange in operating receivables 8,547 –31,998
Change in accounts payables and other operating liabilities 8,058 –4,968
Cash flow from changes in working capital 16,605 –36,966
Cash flow from operating activities 14,775 –37,740
Investing activitiesDividends received from subsidiaries 65,181 44,174
Acquisition of companies after deduction of cash and cash equivalents –9,918 –64,724
Cash flow from investing activities 55,264 –20,551
Financing activitiesGroup contributions 4,800 3,695
Repayment of loan –24,394 –4,419
Borrowings 1,028 105,696
Dividends to shareholders 13 –53,010 –46,616
New issue 5,800 –
Cash flow from financing activities –65,776 58,356
Cash flow for the year 4,263 64Cash and cash equivalents, start of year 246 182
Cash and cash equivalents, end of year 4,509 246

BTS ANNUAL REPORT 2018 59
Changes in Parent Company’s Equity
SEK thousands NOTE 17Share
capitalStatutory
reserveRetained earnings
Profit for the year
Total equity
Opening balance at January 1, 2017 6,215 41,390 19,710 41,803 109,118
By AGM proposed appropriation:
Transfer to retained earnings 41,803 –41,803 –
Comprehensive income for the period 47,089 47,089
Transactions with shareholders Dividends to shareholders –46,616 –46,616
New issue 80 21,165 21,245
Closing balance at December 31, 2017 6,296 41,390 36,061 47,089 130,836
Opening balance at January 1, 2018 6,296 41,390 36,061 47,089 130,836By AGM proposed appropriation:
Transfer to retained earnings 47,089 –47,089 –Reduction of the statutory reserve –41,390 41,390 –Comprehensive income for the period 68,112 68,112Transactions with shareholders Dividends to shareholders –53,010 –53,010New issue 42 10,901 10,943Closing balance at December 31, 2018 6,338 – 82,431 68,112 156,881
Fin
an
cia
l in
form
ati
on

BTS ANNUAL REPORT 201860
Notes to the Annual Report
NOTE 1 | General information
The Parent Company is a public limited liability company registered and headquartered in Stockholm, Sweden, at Grevgatan 34, SE-114 53 Stockholm. The Parent Company is listed on Nasdaq Stockholm. BTS is an international consulting and education firm which focuses on individuals when organizations are executing strategic changes and works with leaders at all levels to help them make better decisions, progress from decision to action and deliver results. BTS has a broad range of services which meet needs within both strategy execution and talent development with services that monitor the employee from evaluation for selection and develop-ment, to strategic consensus and strategy implementation. This is achieved through programs in business acumen, leadership and sales with the aid of business simulations and other forms of experi ential learning and implementation tools. Most BTS clients are major corporations.
The annual report and consolidated financial statements were approved for publication by the Board of Directors on April 20, 2018.
NOTE 2 | Significant accounting policies
Amounts are stated in SEK thousands unless otherwise stated.BTS prepares its consolidated financial statements in compli-
ance with the Annual Accounts Act (ÅRL), the Swedish Financial Reporting Board’s recommendation RFR 1, Supplementary Accounting Regulations for Groups, and the International Financial Reporting Standards (IFRS) and interpretations issued by the International Financial Reporting Interpretations Committee (IFRIC) as approved by the European Union. Unless otherwise stated, these principles were also applied for the multiple year reviews presented.
The Parent Company has followed the provisions of the Annual Accounts Act (ÅRL) and RFR 2, Accounting for Legal Entities. The Parent Company’s shareholdings in subsidiaries are reported using the cost method.
The Parent Company recognizes group contributions in the income statement which deviates from the accounting policies applied in the Group.
The most important accounting principles applied in the pre-paration of the consolidated financial statements are described below. These policies were applied consistently for all years presented, unless otherwise stated.
New and amended accounting principles applied by the GroupThe following standards are applied by the Group for the first time for the fiscal year beginning January 1, 2018:
IFRS 9 Financial instrumentsIFRS 9 deals with classification, measurement and recognition of financial assets and liabilities and new rules for hedge accounting. The full version of IFRS 9 was issued in July 2014. It replaces the parts of IAS 39, which deals with the classification and measure-ment of financial instruments and introduce a new impairment model.The rules for derecognition have been transferred from IAS 39
Financial Instruments, but accounting and valuation have not been changed.
BTS applies IFRS 9 for the first time for the financial year 2018 with the transition date on January 1, 2018. BTS has analyzed IFRS 9 and found that it will not have any significant effects on the Group’s results, valuation or accounting of Group financial assets and liabilities. The Group applies the new recommendation retro-actively and without any recalculation of any comparative figures. The transition to IFRS 9 does not entail any change in earnings, financial position or cash flow for the Group.
IFRS 15 Revenue from Contracts with CustomersIFRS 15 is the new standard for revenue recognition. IFRS 15 supersedes IAS 18 Revenue and IAS 11 Construction Contracts.
IFRS 15 is based on the principle that revenue is recognized when the customer obtains control over the sold goods or services – a principle which replaces the previous principle that revenue is recognized when the risks and benefits have been transferred to the buyer.
BTS applies IFRS 15 for the first time for the financial year 2018 with the transition date on January 1, 2018. The transition to IFRS 15 does not entail any change in earnings, financial position or cash flow for the Group.
New standards, changes and interpretations of existing standards that were not applied early by the GroupA number of new standards and interpretations come into force for fiscal years beginning after January 1, 2018 and have not been applied in the preparation of this financial report. None of these are expected to have any significant impact on the Group’s finan-cial reports, with the exception of the following:
IFRS 16 LeasesFRS 16, Leases applies from January 1, 2019, and is applied by BTS from this date.
The new standard means that all leases are recognized in the balance sheet. An asset (the right to use a leased asset) and a financial liability corresponding to the commitment the company has to pay leasing fees must be reported for virtually all leasing commitments. There is an exception for short contracts and agree-ments of lesser value. The income statement will also be affected as previously reported leasing costs will be replaced by depreciation on the right of use and interest expenses for the leasing debt. The cost is normally higher during the first years of a lease to later decrease. The discount rate is assessed by country and asset class with respect to the length of the lease aggreements. The average discount rate is 4%.
When first applying IFRS 16, companies can choose full retro-active application or a variant with relief rules. The transitional rule chosen is the relief rule for simplified calculation at the transition date January 1, 2019. Furthermore, the exceptions for short-term leases and leasing of low-value assets are applied, where these will be expensed linearly over the contract period. Based on the infor-mation available, the Group estimates that the total assets will increase by SEK 189 million. Most of the Group’s leasing agree-ments relate to premises and office and IT equipment.
No other IFRS or IFRIC interpretations that have not yet entered into force are expected to have any significant impact on the Group.

BTS ANNUAL REPORT 2018 61
Consolidated financial statementsSubsidiaries are all companies (including structured entities) over which the Group has control. The Group controls a company when it is exposed to or entitled to variable returns from its holding in the company and is able to influence returns through its influence in the company. Subsidiaries are included in the consolidated financial statements from and including the date control was transferred to the Group. They are excluded from the consolidated financial statements from and including the date control ceases.
The Group’s annual accounts have been prepared according to the acquisition method. A subsidiary’s purchase price consists of the fair value of the transferred assets, liabilities and the shares issued by the Group. The purchase price also includes the fair value of all the assets or liabilities that result from a contingent purchase price agreement. Acquisition-related costs are expensed as they occur. Identifiable acquired assets and assumed liabilities in a business combination are initially valued at fair value on the acqui-sition date, based on a market evaluation performed at the time of the acquisition. The acquired subsidiaries’ equity is completely eliminated, which means that only the portion of the subsidiary’s equity that was gained after the acquisition is included in Group equity.
If the consolidated acquisition value of the subsidiary’s shares exceed the net value of identified acquired assets and assumed liabilities recorded in an acquisition analysis, the difference is recognized as goodwill.
Companies acquired during the fiscal year are included in the consolidated financial statements beginning on the date the Group began to exercise control over the company, with the amounts referring to the period after this date.
When the Group no longer has control each remaining holding is measured at fair value on the date control no longer applies. Change in carrying amount is recognized in profit or loss. Fair value is used as the initial recognized value and provides the basis for continued recognition of the remaining holding as an associ-ate, joint venture or financial asset. All amounts relating to the dis-posed unit previously recognized in other comprehensive income are recognized as if the Group had directly disposed of the attrib-utable assets or liabilities. This can result in amounts previously recognized in other comprehensive income being reclassified to profit or loss.
Intra-group transactions and balance sheet items, as well as intra-group profits or intra-group losses are eliminated in full.
All transactions with non-controlling interests are recognized in equity as long as they do not cause any change in control. These transactions do not create goodwill or gains or losses.The accounting principles for subsidiaries have been amended where appropriate in order to guarantee the consistent applica-tion of the Group’s principles.
Exchange rates for currencies most relevant to the Group:
Average 2018
December 31, 2018
Average 2017
December 31, 2017
USD 8.69 8.97 8.55 8.23
EUR 10.26 10.28 9.64 9.85
GBP 11.59 11.35 11.00 11.10
AUD 6.49 6.32 6.55 6.42
SGD 6.44 6.56 6.19 6.16
ZAR 0.66 0.62 0.64 0.67
MXN 0.45 0.46 0.45 0.42
Other currencies have not had a material impact on the consolid-ated balance sheets or income statements.
Revenue/Assignments in progressRevenue is recognized on delivery of services to clients based on agreements signed.
Income from completed customization/development assignments and the expenses attributable to the assignment are recognized as revenue and expenses, respectively, in proportion to the degree of completion of the assignment at the end of the reporting period (percentage of completion method). The degree of completion of an assignment is determined by comparing the expenses paid up to the end of the reporting period with estimated total expenditure for the assignment. If the outcome of a service assignment cannot be reli-ably calculated, the revenue from that assignment is recognized only to the extent corresponding to the assignment expenses incurred that are likely to be covered by the client. Anticipated losses on assignments are recognized directly as expenses.
When educational services, “programs”, are delivered to a client, they are recognized as revenue immediately after the implement a tion.
Revenues for licenses, i.e. the customer’s right to independently use the materials and solutions for a certain period and/or a cer-tain number of occasions, are recognized when a binding agree-ment has been reached and BTS has fulfilled its obligations to the client, and the amount of the revenue is known.
Research and developmentExpenditure for customer-specific product development is expensed directly. Expenditure related to development projects (attributable to the development and testing of new or improved products) is capitalized as an intangible asset to the extent such expenditure can be expected to generate future economic bene-fits. The company has not conducted any research. The develop-ment normally conducted by BTS is customer-specific.
Employee benefitsPensionsThe Group has different pension plans in different countries. All are defined-contribution plans, and the assets are managed by external parties. The Company pays fixed fees and has thereby fulfilled its obligations. The costs are charged to consolidated earnings as pension rights are vested.
Share-based paymentsBTS Group AB issued employee stock options to the Group’s employees in 2015. The program enables employees to acquire stock in the company. The fair value of the allocated stock options is recognized as an employee benefit expense with a correspond-ing increase in equity. The fair value of the allocated stock options is calculated using the Black-Scholes model and taking into con-sideration the conditions prevailing at the time of allocation. The cost recognized corresponds to the fair value of the estimated number of stock options and shares expected to be vested. Social security contributions attributable to share-based payments to employees as compensation for purchased services are expensed and distributed over the periods during which the services are per-formed. Provisions for social security contributions are based on the stock options’ fair value at the time of the report. The fair value is calculated using the same valuation model and parameter values used when the stock options were issued.
During the first quarter of 2017, some of the major shareholders of BTS issued a total of 50,000 call options on market terms to Jessica Parisi, CEO of BTS North America. Utilization of the options requires employment and may occur after the options have been exercised January 1, 2020 through January 31, 2020 at an exercise price of SEK 80.00 per share. The accounting fair value of these is reported over the term up to the first quarter of 2020
Fin
an
cia
l in
form
ati
on
BTS ANNUAL REPORT 201862
according to IRFS2, and has been calculated using the Black-Scholes model taking into account the conditions prevailing at the time of the issue. The accounting cost according to IFRS2 has amounted to SEK 128 thousand in 2018.
BorrowingBorrowing expenses are charged to earnings for the period to which they refer.
Borrowings are recognized initially at the amount received less transaction costs. After the date of acquisition, the loan is meas-ured at amortized cost as per the effective interest method. The effective interest method distributes interest income and expenses over the relevant period. The effective interest is the interest rate that exactly discounts the estimated future disbursements to the financial liability’s net carrying amount.
Non-current liabilities are liabilities with an anticipated duration longer than 12 months. All others are current liabilities.
Income taxesIncome taxes recognized comprise taxes for the current year that are to be paid or received as well as changes in deferred tax. All tax liabilities and claims are measured at their nominal amounts according to the tax rules and tax rates that have been decided or announced and that most probably will be adopted. Tax effects associated with items recognized in the income statement are also recognized in the income statement. Tax effects associated with items recognized in equity are also recognized in equity.
Current tax is the tax to be paid or received for the current year. This includes adjustments of current tax attributable to prior periods.
According to the balance sheet method, deferred tax is ca lcu-lated on all temporary differences between the carrying amount and tax base of assets and liabilities. Deferred tax assets relating to loss carryforwards or other future tax-effective deductions are recognized to the extent that it is likely they can be used to offset profits for future taxation.
Segment reportingOperating segments are reported in a manner that agrees with internal reporting that is provided to the chief operating decision maker. The chief operating decision maker is the function respons-ible for allocation of resources and assessment of operating seg-ments’ earnings. In the Group it is the Parent Company’s CEO who makes strategic decisions. BTS’s operating segments consist of the Group’s operating units BTS North America, BTS Europe, BTS Other markets and APG. Each subsidiary’s share of con solidated sales is used as a weight for allocation of Group wide overhead.
Leases and rental agreementsWhen a lease entitles the Company as lessee to all financial benefits and risks attributable to the leased asset, the asset is recognized as a non-current asset in the balance sheet. The corre-sponding obligation to pay lease charges in the future is recog-nized as a liability. Assets are depreciated at a rate corresponding to their expected useful life.
A lease in which a significant portion of the risks and benefits associated with ownership are retained by the lessor is classified as an operating lease. Payments made during the term of the lease are expensed in the income statement on a straight-line basis over the period of the lease.
Property, plant and equipmentProperty, plant and equipment are recognized at acquisition cost less accumulated depreciation and impairment losses, if any. The acquisition cost includes expenses directly attributable to the
acquisition of the asset. Planned depreciation is charged on a straight-line basis based on the acquisition cost and the estimated useful life. The following depreciation periods apply for existing assets: • Equipment and installations, 3–6 years
The residual value and useful life are tested annually and adjusted as necessary.
Intangible assetsGoodwillGoodwill is initially valued as the amount by which a total pur-chase price of the acquired net assets exceed the fair value of the identifiable acquired assets and assumed liabilities. If the purchase price is lower than the fair value of acquired net assets, the difference is recorded directly in the income statement. Impairment tests are conducted annually or more frequently if there are indications of a decline in value.
Products, technology and softwareAcquired products, technology, and software have a limited use-ful life and are recognized at acquisition cost less accumulated amort ization and any impairment losses. Amortization is charged on a straight-line basis during the estimated useful life (2–9 years).
Franchise contractsAcquired franchise contracts have a limited useful life and are recognized at acquisition cost less accumulated amortization and any impairment losses. Amortization is charged on a straight-line basis during the estimated period of use (15 years).
Customer contractsAcquired customer contracts have a limited useful life and are recognized at acquisition cost less accumulated amortization and any impairment losses. Amortization is charged on a straight-line basis during the estimated useful life (2–15 years).
BrandsAcquired brands with an indefinite useful life are recognized at acquisition cost less accumulated impairment losses as required. Impairment tests are performed annually or more frequently if impairment is indicated.
Acquired brands with a limited useful life are recognized at acquisition cost less accumulated amortization and any impair-ment losses. Amortization is charged on a straight-line basis during the estimated useful life (10 years).
ImpairmentWhen there are indications that the carrying amount of any prop-erty, plant, equipment, or intangible asset, exceeds its recoverable amount, an impairment test is performed. The recoverable amount is the higher of an asset’s net realizable value and value in use. If it cannot be determined for an individual asset, the recoverable amount of the smallest cash-generating unit to which the asset belongs is calculated.
Each year the Group performs impairment tests on goodwill according to the following principle:
The recoverable amounts are based on value in use, calculated as the present value of future growth and earnings forecasts during multiple years, taking into account extrapolated cash flows beyond this multiyear period. Impairment tests are carried out on the operating segment level, which is the lowest level in the com-pany at which goodwill is monitored.
Any impairment is recognized immediately as an expense and not reversed.

BTS ANNUAL REPORT 2018 63
Critical estimates and judgmentsTo prepare the financial statements in accordance with IFRS, executive management must make judgments, estimates, and assumptions that affect the application of the accounting policies and the amounts recognized as assets, liabilities, income, and expenses. The estimates and assumptions are based on historical experience and various other factors that appear reasonable in the prevailing circumstances. The results of these estimates and assumptions are then used to judge the carrying amounts of assets and liabilities that would not be evident from other sources. Actual outcomes may deviate from these estimates and judgments. Estimates and judgments are periodically reviewed. Changes in estimates are recognized in the period in which the change is made if the change affected only that period.
Impairment tests on goodwill and intangible assets with indefinite useful lifeEach year the Group performs impairment tests on goodwill and intangible assets with indefinite useful life in accordance with the principle described above. Recoverable amounts for cash- generating units have been determined by calculating the value in use. Certain estimates must be made for these calculations; please see Note 7.
Determination of additional considerationTo determine anticipated additional consideration, the Group makes realistic estimates of future growth and earnings for multiple years, separately for each subsidiary acquired.
Financial instruments after 01-01-18ClassificationThe Group classifies its financial assets and liabilities in the follow-ing categories: financial assets measured at fair value through profit or loss, financial assets measured at amortized cost, finan-cial liabilities at fair value through profit or loss and financial liabil-ities valued at amortized cost. The classification is dependent on for what purpose and under which business model the financial asset or liability was acquired.
BTS has no financial assets that are valued at fair value through profit or loss as of the closing date.
Financial assets valued at amortized costFinancial assets valued at amortized cost are financial instru-ments that are held within the framework of a business model whose purpose is to collect contractual cash flows. The contrac-tual cash flows consist solely of principal amounts and interest and are valued at amortized cost in accordance with the effective interest method.
An example of BTS financial assets that are valued at amortized cost are accounts receivable.
Financial liabilities at fair value through profit or lossFinancial liabilities measured at fair value through profit or loss are limited to additional purchase prices attributable to company acquisitions.
Financial liabilities valued at amortized costFinancial liabilities valued at amortized cost are all other financial instruments, such as liabilities to credit institutions and accounts payable.
Accounting and valuationFinancial assets are initially recognized at fair value plus transac-tion costs for all financial assets that are not reported at fair value through profit or loss. Financial assets recognized at fair value through profit or loss are initially recognized at fair value and transaction costs are expensed in the income statement. Financial assets are recognized in the balance sheet when the Group becomes a party to the contractual terms of the instrument. Usual purchases and sales of financial assets are reported on the settlement date. Financial assets are removed from the balance sheet when the right to receive cash flows from the instrument has expired or been transferred and the Group has transferred vir-tually all risks and benefits associated with ownership. Financial liabilities are recognized when the Group becomes bound by the contractual obligations attributable to the instrument. Financial liabilities are removed from the balance sheet when the obligation in the agreement has been fulfilled or otherwise extinguished. Loan receivables and accounts receivable as well as other financial liabilities are reported after the acquisition date at amortized cost using the effective interest method.
Offset of financial instrumentsFinancial assets and liabilities are offset and reported with a net amount in the balance sheet, only when there is a legal right to offset the reported amounts and an intention to settle them with a net amount or to simultaneously realize the asset and settle the debt.
Impairment of financial instrumentsAt each financial year-end, the financial assets valued at impair-ment tests are valued at amortized cost according to the model for expected loan losses. Expected credit losses represent the dif-ference between all contractual cash flows that fall due in accord-ance with the contract and all cash flows that the Group expects to receive are valued at present value using the original effective interest rate. Write-downs of accounts receivable are always the same as the expected credit loss for the entire term.
Financial instruments before 01-01-18Financial assets and liabilities are recognized in the balance sheets whenever there is a contractual right or obligation to receive or remit cash or other financial assets from or to another party, or to exchange one financial instrument for another.
The Group classifies and measures financial instruments in the following categories:
Loans and accounts receivableRefers to non-derivative financial assets that are not listed on an active market but have payments that can be determined. These items are included in current assets unless due more than 12 months after the end of the reporting period, in which case they are recognized as non-current assets. BTS’s loan and trade receiv-ables are recognized at amortized cost using the effective interest method, less any provisions for impairment. Current receivables such as accounts receivable are deemed as nominal value and as reasonably approximate to their fair value, so they are not discounted to present value.
A provision is made for impairment of an account receivable when objective evidence indicates that BTS will not be able to secure payment of the entire amount due as per the original terms of the receivable. Significant financial difficulties of a debtor – for example the probability of the debtor declaring bankruptcy or undergoing a financial reconstruction – are regarded as indica-tions of the possible impairment of an account receivable. The size of the provision is based on the difference between the carrying
Fin
an
cia
l in
form
ati
on

BTS ANNUAL REPORT 201864
amount of the asset and the estimated future cash flows. Pro visions are made for doubtful accounts receivable after tests in each individual case.
Cash and cash equivalentsCash and cash equivalents are cash and demand deposits at banks and similar institutions, plus current liquid investments with a duration less than three months from the date of acquisition.
Financial liabilities Financial liabilities held during the year are measured at amort-ized cost using the effective interest method. Current liabilities such as trade payables are deemed reasonably approximate to their fair value, so they are not discounted to present value.
Translation of foreign currencyFunctional currency and presentation currencyItems in the financial statements for the various units in the Group are measured in the currency used in the economic environment in which the company conducts its main business activities (functional currency). Swedish krona (SEK), which is the Group’s presentation currency, is used in the consolidated financial statements.
Transactions and balance sheet itemsTransactions in foreign currency are translated into the functional currency at the exchange rate prevailing on the transaction date or the date the items are remeasured. Currency gains and currency losses that arise from payment of such transactions or translation of assets and liabilities in foreign currency at the exchange rate at the end of the reporting period, are recognized in profit or loss.
Group companiesProfit or loss and financial position for all Group companies whose functional currency is different from the presentation currency are translated to the Group’s presentation currency as follows:• assets and liabilities for each of the balance sheets are trans-
lated at the exchange rate at the end of the reporting period,• income and expenses for each of the income statements are
translated at the average exchange rate for the year, • all exchange differences that arise are recognized in other
comprehensive income.
Goodwill and fair value adjustments arising at acquisition of foreign operations are treated as assets and liabilities of those operations and translated at the exchange rate at the end of the reporting period. Exchange differences are recognized in other comprehensive income.
Cash flow statementThe cash flow statement is prepared according to the indirect method. The reported cash flow comprises only transactions that entail incoming and outgoing payments. Cash flow is reported divided into continuing operations, investing activities and financing activities.
Cash and cash equivalents are cash and demand deposits at banks and similar institutions, plus current liquid investments with a duration less than three months from the date of acquisition.
NOTE 3 | Transactions with related parties
The Parent Company has a close relationship with its subsidiaries, see Note 14. Except for transactions between Group companies, related-party (the Board, the CEO and other senior executives) transactions took place as shown in Note 6.
The subsidiary in the UK has also acquired services from a related party with a value of SEK 19.8 (16.9) million on market terms and conditions.
Purchases and sales between Group companiesGroupMarket terms and conditions apply to the supply of services between subsidiaries. The value of these are shown in Note 9.
Receivables and liabilities between Group companies are attrib-utable exclusively to selling and purchasing transactions between the companies. The value of these is specified in Note 9. The liabili-ties are interest-free.
Parent CompanyOf the Parent Company’s total purchasing expenses and sales income, 0% (0) of purchases and 100% (100) of sales refer to other Group companies.
NOTE 4 | Information about auditors’ fees
Fees and remunerationGroup Parent Company
SEK thousands 2018 2017 2018 2017
PwCAudit assignments 825 622 775 407
Other assignments – 3,099 – –
Other auditorsAudit assignments 2,272 1,414 – –
Other assignments 934 680 – –
4,031 5,815 775 407
Of audit assignments, 825 refers to PwC Sweden. Of the fees relating to other assignments in 2017, 415 refers to PwC Sweden. Other assignments concern assistance with Due Diligence services in the acquisition of Coach in a Box Holding Ltd and its subsidiaries in the UK, Australia, India, Singapore and the United States.
NOTE 5 | Leases and rental agreements
GroupThe Group has no financial leases. Expenses for operating leases totaled till 39,545 (34,091) for the year. Future leasing and rental fees for operating leases are as follows.
SEK thousands
2019 39,658
2020 32,564
2021 30,219
2022 22,293
2023 16,457
Later 47,432
Total 188,622
The majority of the Group’s lease agreements concern premises and office and IT equipment. The Group’s operating lease agreements do not contain any variable fees of material value. The agreements do not contain any restrictions.

BTS ANNUAL REPORT 2018 65
NOTE 6 | Average number of employees, salaries, other compensation, social security contributions, etc.
Average number of employees Group 2018 2017
Number of employees
Of whichmen
Number of employees
Of whichmen
SubsidiariesArgentina 2 1 – –
Australia 29 11 24 12
Belgium – – 2 1
Brazil 10 5 9 4
China 12 6 11 5
Costa Rica 4 – 1 –
Denmark – – 1 1
France 5 2 5 2
Germany 21 12 7 5
India 51 26 34 16
Italy 38 20 40 18
Japan 7 4 6 4
Mexico 13 7 11 4
Singapore 31 16 24 14
South Africa 25 9 33 11
South Korea 7 3 5 2
Spain 42 22 40 22
Sweden 26 16 25 14
Switzerland 2 1 2 1
Taiwan 3 1 3 1
Thailand 3 1 1 1
The Netherlands 5 3 5 4
United Arab Emirates 5 4 – –
United Kingdom 86 38 52 24
United States 218 109 210 111
Total for the Group 645 318 548 276
Distribution of senior executives by gender, %
2018 2017
Women Men Women Men
CEO and other senior executives (excl. the Board) 20 80 20 80
Board Parent Company 33 67 33 67
Board Group 10 90 10 90
In this context, “other senior executives” refers to the person (the two persons) who, together with the CEO, have constituted the Group management team.
Parent CompanyThe Parent Company had no employees in 2018.
Salaries, other compensation, and social security contributions Group 2018 2017
SEK thousands
Salaries and compensation
Social security contributions
of which pension
expensesSalaries and
compensation
Social security contributions
of which pension
expenses
Subsidiaries 636,447 88,494 498,255 80,534
20,058 18,982
Pension expenses for employees who are president of or a mem-ber of the board of a Group company totaled 3,339 (3,213). All pension plans are defined-contribution plans.
Parent CompanyThe CEO is a member of the Board but receives no Board fee. Other members of the Board in the Parent Company have received compensation only in the form of Board fees.
SEK thousands 2018 2017
Reinhold Geijer Chairman of the Board 425 350
Mariana Burenstam Linder Member 194 175
Stefan Gardefjord Member 254* 220*
Dag Sehlin Member 254* 220*
Anna Söderblom Member 194 109
Total 1,320 1,074* of which committee fee 60 (45)
For the CEO, see the figures for compensation to senior executives below.
Salaries and other compensation by country and divided between Board members and others Group 2018 2017
SEK thousandsBoard
and CEOOther
employeesBoard
and CEOOther
employees
In SwedenParent Company 1,320 – 1,074 –
Subsidiaries 2,834 20,367 2,309 19,428
Total Sweden 4,154 20,367 3,384 19,428
Outside SwedenUnited States 12,273 320,367 12,119 287,460
Europe 20,811 75,088 11,178 43,227
Other 18,374 165,014 16,567 104,892
Total outside Sweden 51,458 560,468 39,864 435,580
Total for the Group 55,612 580,835 43,248 455,007
Terms of employment and compensation for senior executivesGuidelines for compensation and other terms of employment for senior executivesThe Company shall employ persons under conditions and at salaries commensurate with the market to be able to recruit and retain employees with excellent skills and of a high caliber to reach the Company’s objectives. When employing persons outside Swe-den, the Company shall comply with each country’s generally accepted terms of employment and good practice.
Forms of compensation are intended to achieve a consensus on the long-term view of operations by rewarding performance that benefits the Company and thus the shareholders. Compensation
Fin
an
cia
l in
form
ati
on

BTS ANNUAL REPORT 201866
paid to individual employees will be based on their position and tasks, performance, skills, and experience. Compensation will normally consist of a fixed basic salary and defined-contribution pension benefits, the latter no more than 35% of the fixed basic salary for the CEO of the Parent Company and no more than 30% of the fixed basic salary for other senior executives. When deemed appropriate, the basic salary and pension benefit can be augmented by variable compensation, other benefits, and participation in incentive programs.
The Board is entitled to deviate from the above policies in individ-ual cases under special circumstances. The Board intends to propose to the AGM that the policies remain unchanged in 2019.
Compensation and benefits of the senior executivesCompensation includes basic salary, other benefits, variable compensation, and pension expenses.
Other benefits consist exclusively of company cars. The total sum of compensation paid to senior executives was 11,428 (9,567), of which pension expenses were 2,263 (2,188). All pension plans are defined-contribution plans.
The CEO Henrik Ekelund was paid salary and other benefits total-ing 6,250 (4,990), including 1,582 (539) in variable compensation. Variable compensation is calculated using a model that triggers payment when Group earnings exceed predefined profitability targets. The CEO has a defined-contribution pension entitlement equal to 35% (35) of his fixed salary, paid in the form of pension insurance entitling the CEO to a pension from the age of 65.
The CEO’s employment contract states a mutual period of notice of six months. In addition, if the Company terminates the CEO’s employment contract, the CEO is entitled to a severance package corresponding to 12 months’ salary. None of the other senior executives is entitled to a severance package.
Other senior executives have been paid salaries and other benefits totaling 2,916 (2,389), of which variable remuneration was 791 (269). Variable compensation is based on targets achieved by the Company and the individual. Provisions to pensions are made with 30% of the fixed salary and paid in the form of pension insurance entitling the executive to a pension from the age of 65.
Share-based paymentEmployee stock option program 2015/2019The 2015 Annual General Meeting resolved on an employee stock option program 2015/2019. Allocation to be a maximum of 40,000 stock options per employee. A maximum total of 150 people could be allocated stock options. Board members elected by the Annual General Meeting and who are not also employees of the company or another group company or the Parent Company’s CEO, are not allocated any stock options.
The 2015/2019 employee stock option program comprises a maximum total of 840,000 stock options, entitling to acquisition of a corresponding number of Class B shares in BTS Group AB.
Each stock option allocated to an employee entitles the holder to acquire one Class B share in BTS at an exercise price of SEK 82.30. Each stock option is valid for four years. The options have vesting conditions such that they can be exercised successively for three years after the allocation, with normally 1/3 of the total number of allocated stock options per year, provided certain financial targets set by the Board are attained. The Company’s Board has set as a target that the operating margin before amort ization of intangi-ble assets (EBITA margin) for each year shall amount to at least 12% for all the stock options for each year to be exercised. If the EBITA margin is less than 12%, the number of options available for exercise is reduced. If the EBITA margin is less than 10%, no exer-cise of the options will be allowed. Stock options that cannot be exercised are forfeited.
Exercise of stock options is contingent on continued employment on the exercise date and can take place after the options are exer-cisable between September 1, 2016 and June 30, 2019, both dates inclusive.
2018 2017
Average exercise
price per share
Stock options
(thousands)
Average exercise
price per share
Stock options
(thousands)
Per January 1 82.30 398 82.30 491
Allocated – – – –
Excercised 82.30 –37 – –
Forfeited – – 82.30 –93
Per December 31 82.30 361 82.30 398
The value of employee stock options has been calculated using the Black-Scholes valuation model based on the share price and other market conditions on July 6, 2015, without taking vesting limitations into account. Considering performance conditions and assuming an annual employee turnover of 5%, the compensation expense is estimated to total SEK 2.9 million which according to IFRS 2 is recognized in installments over the vesting period. The expense for the fiscal year amounted to SEK 183 (851) thousands. Other key parameters in the model were the volume- weighted average price paid during the 10 trading days prior to allocation of SEK 64.12, the above exercise price, volatility of 30%, anticipated dividend of SEK 2.0, as well as a risk-free interest of –0.35% for maturities of 2.5 years, –0.25% for 3.0 years and –0.15% for 3.5 years.
Social security contributions are recognized as an expense during the vesting period and a provision for these is accumulated as necessary during the vesting period. The value of this provision and thus the expense recognized are remeasured continuously based on changes in the value of the employee stock options. Employee stock options allocated to American employees may be ISO options, which means that this, according to current legislation, do not incur social security contributions.
To be able to carry out the employee stock option plan in a cost-effective and flexible manner and to cover future expenses, mainly social security contributions, the Annual General Meeting held on May 7, 2015, also resolved on a private placement of war-rants with the wholly owned Swedish subsidiary BTS Sverige AB, reg. no. 556566-7127, carrying entitlement to subscribe for a maxi-mum total of 966,000 Class B shares with a right and obligation for BTS Sverige AB to transfer or otherwise dispose of the warrants in order to fulfill the commitments of the Company or another employer company in the Group and to cover future costs resulting from the employee stock option plan.
Assuming that all warrants as above are exercised for subscrip-tion of new shares, the Company’s share capital will increased by SEK 322,000 and result in a dilution equivalent to approximately 5% of the share capital and a maximum of approximately 4% of the voting rights for all shares.

BTS ANNUAL REPORT 2018 67
NOTE 7 | Intangible assets
GroupSEK thousands 12-31-18 12-31-17
GoodwillAccumulated acquisition cost, opening balance 425,100 276,214
Purchases 10,2381) 169,736
Translation difference 23,656 –20,850
Accumulated acquisition cost, closing balance 458,994 425,100
Accumulated impairments, opening balance –3,726 –3,726
Accumulated impairments, closing balance –3,726 –3,726
Carrying amount, closing balance 455,268 421,3741) Effect of established acquisition analyses.
Other intangible assetsSEK thousands 12-31-18 12-31-17
Franchise contractsAccumulated acquisition cost, opening balance 10,179 11,248
Translation difference 913 –1,069
Accumulated acquisition cost, closing balance 11,092 10,179
Accumulated amortization, opening balance 7,648 7,701
Amortization for the year 716 704
Translation difference 709 –758
Accumulated amortization, closing balance 9,073 7,648
Carrying amount, closing balance 2,019 2,531
SEK thousands 12-31-18 12-31-17
Technology, products & softwareAccumulated acquisition cost, opening balance 87,348 65,397
Purchases – 27,482
Translation difference 5,735 –5,530
Accumulated acquisition cost, closing balance 93,082 87,348
Accumulated amortization, opening balance 44,644 45,403
Amortization for the year 8,228 3,543
Translation difference 3,862 –4,302
Accumulated amortization, closing balance 56,733 44,644
Carrying amount, closing balance 36,349 42,704
SEK thousands 12-31-18 12-31-17
Customer contractsAccumulated acquisition cost, opening balance 33,532 14,961
Purchases – 19,312
Translation difference 1,528 –741
Accumulated acquisition cost, closing balance 35,060 33,532
Accumulated amortization, opening balance 7,757 5,894
Amortization for the year 6,188 2,376
Translation difference 510 –512
Accumulated amortization, closing balance 14,455 7,757
Carrying amount, closing balance 20,604 25,775
SEK thousands 12-31-18 12-31-17
BrandsAccumulated acquisition cost, opening balance 27,933 19,998
Purchases – 9,493
Translation difference 1,773 –1,557
Accumulated acquisition cost, closing balance 29,707 27,933
Accumulated amortization, opening balance 12,044 11,159
Amortization for the year 3,582 1,951
Translation difference 1,028 –1,065
Accumulated amortization, closing balance 16,654 12,044
Carrying amount, closing balance 13,053 15,889
Total closing balance, carrying amount of other intangible assets 72,026 86,899
Impairment testsThe value of goodwill is tested through an impairment test annually and more often if there are indications of impairment. Goodwill is distributed among the cash-generating units that are expected to benefit from the synergies in acquisitions and are consistent with the Group’s operating units / operating segments, which is the lowest level in the company on which goodwill is moni-tored. Impairment tests therefore occur for each operating entity and are BTS North America, BTS Europe, BTS Other Markets and APG.
Recovery values for the units are determined by calculating the value in use. These calculations are based on estimated future cash flows based on the present values of future growth and profit forecasts over a four-year period and extrapolated cash flows beyond the four-year period. Significant assumptions used to calculate values in use:– Forecast of operating margin– Growth rate for periods beyond the budget period – Selected discount rate after tax
The forecast operating margin has been determined based on past performance and expectations of future market developments. In order to extrapolate cash flows beyond the budget period, a growth rate of 1.5–3 (1.5–3) percent has been used, which is consid-ered a conservative estimate. In addition, a discount rate in local currency before tax has been used in the calculations for each operating unit. The discount rate – the weighted average capital cost (WACC) – consists of risk-free interest, the market risk pre-mium and a company-specific risk premium, as well as for each unit, a market capital structure. The discount rates used are for BTS North America 10.0 (10.0) percent, BTS Europe 10.8 (10.8) percent, BTS Other markets 10.5 (10.5) percent and APG 9.2 (9.2) percent.After impairment tests, it has been established that no impairment loss exists on 12-31-18.
At the impairment tests, sensitivity analyzes have also been made for each operating unit:– Where the estimated operating margin was 10 percent lower
than the basic assumption– If the estimated growth rate to extrapolate cash flows beyond
the budget period would have been 10 percent lower than the basic assumption
– If the estimated weighted capital cost applied to discounted cash flows had been 10 percent higher than the basic assumption.
Fin
an
cia
l in
form
ati
on

BTS ANNUAL REPORT 201868
NOTE 8 | Property, plant, and equipment
Group Equipment SEK thousands 12-31-18 12-31-17
Accumulated acquisition cost, opening balance 91,220 81,468
Acquired accumulated acquisition cost – 4,481
Purchases 19,233 17,720
Disposals –34,006 –6,376
Translation difference 5,880 –6,073
Accumulated acquisition cost, closing balance 82,326 91,220
Accumulated depreciation, opening balance 61,582 59,460
Acquired accumulated acquisition cost – 3,466
Depreciation for the year 11,835 9,887
Disposals –33,112 –6,567
Translation difference 3,218 –4,664
Accumulated depreciation, closing balance 43,523 61,582
Carrying amount, closing balance 38,803 29,638
Distribution of goodwill and other intangible assets by segment
Group
12-31-18 SEK thousands
BTS North
AmericaBTS
EuropeBTS Other
markets APG Total
Goodwill 226,150 183,518 45,600 – 455,268
Franchise contracts – – – 2,019 2,019
Customer contracts 2,001 15,237 3,367 – 20,604
Technology, Products & Software 10,892 21,515 3,943 – 36,349
Brands 3,633 7,471 1,951 – 13,053
Total 242,675 227,740 54,860 2,019 527,294
Reduction of the value in use as a percentage of each sensitivity analysis
BTS North America BTS Europe BTS Other markets APG
10% lower operating margin –10.6 (–9.7) –10.5 (–9.6) –10.3 (–9.4) –12.4 (–11.4)
10% lower long term growth –3.0 (–2.9) –2.7 (–2.6) –1.4 (–1.6) –2.1 (–1.9)
10% higher discount rate –13.0 (–13.0) –12.7 (–12.9) –8.2 (–11.3) –13.4 (–12.4)
None of the cases above should lead to an impairment in a single operational unit. The calculations are hypothetical and should not be seen as an indication that these factors are more or less likely to change. The sensitivity analysis should therefore be interpreted with caution.
12-31-17 SEK thousands
BTS North
AmericaBTS
EuropeBTS Other
markets APG Total
Goodwill 207,506 169,736 44,132 – 421,374
Franchise contracts – – – 2,531 2,531
Customer contracts 2,549 18,636 4,591 – 25,775
Technology, Products & Software 11,574 26,539 4,591 – 42,704
Brands 4,432 9,162 2,295 – 15,889
Total 226,061 224,073 55,608 2,531 508,273

BTS ANNUAL REPORT 2018 69
North America Europe Other markets APGEliminations
& unallocated GroupSEK thousands 2018 2017 2018 2017 2018 2017 2018 2017 2018 2017 2018 2017
IncomeExternal sales 714,176 573,670 315,673 203,978 459,925 350,887 108,624 114,057 1,598,399 1,242,591
Internal sales 67,692 57,624 61,892 48,090 26,793 13,335 1,018 1,243 –157,394 –120,292 – –
Total income 781,869 631,293 377,565 252,067 486,718 364,222 109,641 115,300 –157,394 –120,292 1,598,399 1,242,591
Operating profit 88,193 70,186 37,394 16,034 57,602 45,069 212 1,003 183,401 132,292
Financial income 684 479 684 479
Financial expenses –3,814 –1,478 –3,814 –1,478
Affiliated companies, profit after tax –477 135 –477 135
Tax on profit for the year –53,660 –33,295 –53,660 –33,295
Profit for the year 126,134 98,134
Other informationAssets 676,070 519,431 569,517 425,219 316,315 299,382 31,235 36,901 –65,127 –55,367 1,528,010 1,225,566
Liabilities 284,530 187,921 456,909 359,432 121,796 132,078 25,700 20,948 –65,127 –55,367 823,807 645,012
Investments 13,538 4,184 1,838 74,435 6,868 1,598 22 – 22,266 80,217
Depreciation of property, plant, and equipment –6,332 –5,852 –2,467 –1,790 –2,990 –2,197 –45 –48 –11,835 –9,887
Amortization of intangible assets –3,580 –3,520 –11,804 –1,850 –2,613 –2,500 –716 –704 –18,713 –8,574
Total sales according to business model
2018 2017
BTS North America BTS Europe
BTS Other markets APG TOTAL
BTS North America BTS Europe
BTS Other markets APG TOTAL
Programs 397.8 190.4 333.0 86.8 1,008.1 332.7 122.8 235.8 92.6 783.8
Development 190.5 79.1 74.8 – 344.4 158.5 54.8 87.9 – 301.1
Licenses 78.1 23.5 26.9 21.8 150.3 43.7 8.9 6.1 21.4 80.1
Other revenues 47.8 22.6 25.3 – 95.7 38.8 17.5 21.2 – 77.5
TOTAL 714.2 315.7 459.9 108.6 1,598.4 573.7 204.0 350.9 114.1 1,242.6
NOTE 9 | Segment reporting
GroupThe Group’s operations are managed and reported by the operat-ing units BTS North America, BTS Europe, BTS Other markets, and APG, who are the Group’s segments. BTS North America consists of BTS’s operations in North America excluding APG. BTS Europe consists of operations in France, Germany, the Netherlands, Sweden, and the UK.
BTS Other markets consists of operations in in Argentina, Australia, Brazil, China, Costa Rica, India, Italy, Japan, Mexico, Singapore, South Africa, South Korea, Spain, Taiwan, Thailand, and United Arab Emirates. APG has operations in North America.
Operating units invoice one another for services based on time expended and on market terms.
BTS has begun to apply IFRS 15 revenues from agreements with customers as of January 1, 2018. The new standard has not had any significant impact on the financial statements in addition to increased disclosure requirements. No adjustment of the opening balance on January 1, 2018 is made.
The BTS business model is divided into four categories of revenue; Development, Programs, Licenses and Other Revenue.
For performed Development, the income and expenses attribut-able to the assignment are reported as revenue or cost in relation to the degree of completion of the assignment on the balance sheet date (progressive profit calculation). The degree of completion of an assignment is determined by comparing expenses incurred on the balance sheet date with estimated total expenses for the assignment. Normally invoicing takes place as the work proceeds in accordance with agreed terms.
Upon delivery of Programs, training services, these are recognized and invoiced directly after implementation.
Revenue for Licenses, that is, the customer’s right to use BTS’s material and solutions for a certain time and / or number of
occasions, is reported when binding agreement has been reached and BTS has fulfilled its obligations towards the customer and when the revenue size is known. Invoicing takes place in accord-ance with agreed terms.
Other income mainly relates to invoiced expenses in connection with Development and Programs. These are invoiced and recog-nized as revenue simultaneously with each project.
The payment terms are usually between 45 and 75 days and do not exceed one year in any case. The compensation is usually set at a fixed price. In the rare case of a complaint, individual compensa-tion can be agreed.
Of the Group’s total revenue, 37,776 (34,186) refers to the country of residence Sweden. The value of the Group’s fixed assets in Sweden amounted to 1,026 (8).
The Group’s reported contract assets and contract liabilities are shown in notes 16 and 21.
Fin
an
cia
l in
form
ati
on

BTS ANNUAL REPORT 201870
NOTE 10 | Financial items
Group’s financial itemsSEK thousands 2018 2017
Interest income 684 479
Total financial income 684 479
Foreign exchange losses –10 –212
Interest expenses –3,804 –1,266
Total financial expenses –3,814 –1,478
Total gain/loss on financial items –3,130 –999
Group’s financial items cash flow statementSEK thousands 12-31-18 12-31-17
Total gain/loss on finacial items –3,130 –999
Accrued interest 36 53
Affiliated companies, profit after tax –477 135
Total –3,572 –810
Parent Company’s financial itemsSEK thousands 2018 2017
Gains/Losses on other securities and receivables held as non-current assetsDividends from subsidiaries 65,181 44,174
Group contributions 4,800 3,695
Total 69,981 47,869
Interest income 772 700
Interest expenses –3,014 –1,213
Total gain/loss on financial items 67,739 47,355
NOTE 11 | Tax on profit for the year
GroupSEK thousands 2018 2017
Income tax as recognized in the income statement –53,660 –33,295
Current tax expense –53,918 –44,812
Current tax attributable to previous years –1,080 –192
Postponed tax income/expense (+/–) 1,338 11,709
Tax for the year –53,660 –33,295
Parent CompanySEK thousands 2018 2017
Current tax for the year –827 –822
Reconciliation of effective taxGroupSEK thousands 2018 2017
Profit before tax 179,794 131,429
Tax expense based on Swedish income tax rates, 22% –39,555 –28,914
Effects of different tax rates –2,232 –3,692
Non-deductible expenses –11,533 –2,793
Non-taxable income 739 2,297
Tax attributable to previous years –1,080 –192
Effective tax recognized –53,660 –33,295
Effective tax rate 29.8% 25.3%
Parent CompanySEK thousands 2018 2017
Profit before tax 68,939 47,911
Tax expense based on Swedish income tax rates, 22% –15,167 –10,540
Dividends from subsidiaries 14,340 9,718
Effective tax recognized –827 –822
Effective tax rate 1.2% 1.7%
NOTE 12 | Earnings per share
GroupEarnings per share are calculated by dividing the profit attribut-able to Parent Company shareholders with the weighted average number of common stock on issue during the period.
2018 2017
Profit for the year attributable to Parent Company shareholders, SEK thousands 126,134 98,134
Earnings per share, before dilution, SEK 6.67 5.20
Total no. of shares, before dilution, (thousands) 18,905 18,887
Earnings per share, after dilution, SEK 6.56 5.09
Total no. of shares, after dilution, (thousands) 19,232 19,285
NOTE 13 | Dividend per share
Dividends paid in 2018 totaled SEK 53,010 thousand (SEK 2.80 per share). Dividends paid 2017 totaled SEK 46,616 thousand (SEK 2.50 per share). At the AGM to be held May 15, 2019, a dividend for fiscal year 2018 of SEK 3.60 per share, to be paid on two occasions in the amount of SEK 1.80 per payment, totaling SEK 68,916 thou-sand, will be proposed. The total amount of the proposed dividend is based on the number of outstanding shares as of April 18, 2019, and is not recognized as a liability in these financial statements.

BTS ANNUAL REPORT 2018 71
NOTE 14 | Financial assets
Parent Company Participations in Group companies
SEK thousands No. of shares Pctg. equity
Carrying amount
12-31-18
Carrying amount
12-31-17
Parent Company holdingsBTS Sverige AB 5,000 100 7,456 7,456
Corp. id. no. 556566-7127
Domicile: Stockholm
BTS USA, Inc. 1,000 100 77,430 77,430
Corp. id. no. 06-1356708
Domicile: Connecticut
BTS in London Ltd. 5,000 100 6,833 6,833
Corp. id. no. 577 1376 13
Domicile: London
Business Training Systems AS 100 100 94 94
Corp. id. no. 957 694 187
Domicile: Oslo
Catalysts for profitability and growth Ltd 1,000 100 1 1
Corp. id. no. 1998/010779/07
Domicile: Centurion
BTS Finland AB 1,000 100 100 100
Corp. id. no. 556583-1673
Domicile: Stockholm
BTS Asia Pacific PTE Ltd 50,000 100 237 237
Corp. id. no. 200811464Z
Domicile: Singapore
Business Training Solutions S.L. 1,031 100 7,911 7,911
Corp. id. no. B95138160
Domicile: Bilbao
BTS Management SA 1,000 100 673 673
Corp. id. no. 01 73.802 11
Domicile: Geneva
Business Game Factory Oy 90,750 100 654 654
Corp. id. no. 1807788-2
Domicile: Helsinki
BTS Brussels NV 620,000 100 587 587
Corp. id. no. 878.155.648
Domicile: Brussels
BTS Coach in a box Holdings Ltd 56,000 100 177,402 177,402
Corp. id. no. 5379864
Domicile: Portsmouth
Total shares in subsidiaries 279,378 279,378
Fin
an
cia
l in
form
ati
on

BTS ANNUAL REPORT 201872
NOTE 15 | Deferred tax
Deferred tax assets
GroupSEK thousands 12-31-18 12-31-17
Opening balance, net 3,694 1,953
Recognized change in profit for the year 799 803
Acquisitions of Group companies – 978
Translation differences 3 –40
Closing balance, net 4,496 3,694
The amount concerns unused loss carry-forwards in subsidiaries which are expected to be utilized during upcoming years.
Deferred tax liabilities
GroupSEK thousands 12-31-18 12-31-17
Opening balance, net 32,860 47,512
Recognized change in profit for the year 12,136 –11,709
Translation differences 2,949 –2,943
Closing balance, net 47,945 32,860
The preliminary acquisition analyses for the acquisitions of Coach in a Box Holdings Ltd and MTAC GmbH that took place in the fourth quarter of 2017 have been adopted. The effect was an increase in goodwill and a provision for deferred tax liabilities of MSEK 10.2.
NOTE 16 | Prepaid expenses and accrued income
GroupSEK thousands 12-31-18 12-31-17
Accrued income (current contract assets attributable to consulting services) 103,619 95,391
Prepaid rent 2,620 3,864
Other items 54,200 35,295
Total 160,438 134,550
NOTE 17 | Equity and appropriation of earnings
GroupAs of December 31, 2018, the share capital consists of 853,800 Class A shares and 18,160,116 Class B shares, totaling 19,013,916 shares with a total value of SEK 6,337,972. Each share has a quotient value of SEK 0.33. Each Class A share entitles the holder to ten votes per share, each Class B one vote per share.
The equity in all Group companies that have a functional currency different from the reporting currency is translated into the reporting currency (SEK). Translation differences arise if the SEK exchange rate for a functional currency at the end of the period is different from its rate at the start of the period. These translation differences have no effect on taxes. Closing accumu-lated translation differences recognized directly in equity totaled 32,440. Opening accumulated differences totaled –7,309.
Proposed appropriation of earningsThe Board of Directors proposes that earnings be appropriated as follows:
To be distributed to shareholders: SEK 3.60 per share totaling1) 68,916,380
To be carried forward 81,626,502
Total 150,542,882
1) The total amount of the proposed dividend is based on the number of outstanding shares as of April 18, 2019.
The Board proposes a dividend of SEK 3.60 per share, to be paid in an amount of SEK 1.80 on two occasions. The dividend is proposed to be paid on May 22, 2019 and November 20, 2019 respectively.
NOTE 18 | Financial instruments and financial risk management
Policies for financing and financial risk managementThe Board directs and monitors BTS’s financing activities and finan-cial risks. Financing and risk management are gathered under the Group finance function and conducted in compliance with a financial policy adopted by the Board of Directors that stresses low risk. The aim of the Company’s risk management is to optimize the Group’s cost of capital and, in a deliberate manner, to manage and control the Group’s financial risks. Hedging instruments may be used within given parameters. Future payments are not normally hedged. Cash and cash equivalents may be invested in interest- bearing accounts or in interest- bearing securities carrying low credit risk. The duration of the investment portfolio must not exceed nine months.
During the year, BTS’s holdings of financial instruments were limited to primary instruments such as accounts receivable, trade payables, and the like. Customer contracts contain no currency clauses or anything that could be considered embedded deriv atives. No hedging instruments are held or have been purchased or sold during the year, the same applies for the previous year.
Fair value of financial assets and liabilities
GroupSEK thousands 12-31-18 12-31-17
Other non-current receivables 10,586 7,512
Accounts receivable 512,468 335,132
Other current receivables 11,569 6,892
Cash and cash equivalents 262,357 199,876
Total financial assets 796,979 549,411
Non-current liabilities 62,893 84,839
Other provisions 172,663 186,859
Accounts payable 35,555 31,058
Other current liabilities 97,742 68,845
Total financial liabilities 368,852 371,602
Financial assetsFinancial assets valued at amortized costOther non-current receivables chiefly consist of rental deposits and interest-bearing financial claims on various counterparts.
Rental deposits have a maturity corresponding to their respective leases.
Reported value is deemed equivalent to the fair value.Accounts receivable denominated in foreign currencies are
measured at the closing rate. Accounts receivable in the BTS North America operating unit constitute 39% (35) of the Group’s total accounts receivable. The table below shows the distribution of accounts receivable by currency.

BTS ANNUAL REPORT 2018 73
GroupSEK thousands 12-31-18 12-31-17
SEK 21,546 15,229
USD 225,718 136,661
GBP 74,152 62,726
EUR 75,909 59,134
Other currencies 115,143 61,382
Total accounts receivable 512,468 335,132
Historically the Group has had very low credit losses on accounts receivable. The spread of risk is good among companies, sectors and geographic markets. Fair value agrees with carrying amount and no significant impairment of accounts receivable has been recognized during the year, same principle as in the previous year. The Group applies the simplified method for calculating expected loan losses. The method means that expected losses during the entire term of the loan are used as a basis for accounts receivable and contract assets. Expected credit loss is based on the customers’ payment and loss history.
At December 31, 2018, accounts receivable totaling 80,740 (60,599) were more than 30 days past due.
GroupSEK thousands 12-31-18 12-31-17
Total accounts receivable 512,468 335,132
1–30 days overdue 82,206 57,586
more than 30 days overdue 32,554 23,476
more than 60 days overdue 48,186 37,123
Cash and cash equivalentsAt the end of the reporting period, there was only cash in hand and bank balances.
Financial liabilitiesFinancial liabilities valued at amortized costFinancial liabilities held during the year are measured at the amortized cost using the effective interest method. At year-end 2018 the financial liabilities consisted of accounts payable and non-current liabilities.
Accounts payable are deemed reasonably approximate to their fair value. All accounts payable fall due within 12 months, of which most are due within a month, why they are not discounted to present value.
Financial liabilities at fair value through profit or lossBTS only has contingent purchase consideration attributable to business combinations that are measured at fair value through profit or loss.
Calculation of fair valueWhen the fair value of an asset or liability is to be determined, the Group uses observable data to the greatest extent possible. Real values are categorized at different levels in a real value hierarchy based on input data used in the valuation technique as follows:
Level 1: according to prices quoted on an active market for identical instruments
Level 2: based on directly or indirectly observable market data that is not included in level 1
Level 3: based on input data that are not observable on the market. The fair value corresponds to the carrying amount, with the exception of the bond loan. The following summarizes the methods and assumptions that were mainly used to determine fair value of the Group’s financial instruments.
Conditional additional purchase priceContingent consideration is valued at market value according to level 3, ie fair value based on input data that is not observable on the market. The calculation of contingent consideration depends on the parameters in each agreement. These parameters are mainly linked to expected results for the acquired companies over the next three years. An increase in the expected results means a higher liability for contingent consideration. However, usually there is a ceiling for each conditional purchase price that limits how large the debt can be. The maximum payment for contingent consider-ation was SEK 224.9 (227.2) million at the balance sheet date.
Reported items regarding conditional additional purchases (level 3) is as follows:
KSEK 12-31-18 12-31-17
Opening balance 186,859 33,484
Paid price –20,193 –9,559
Translation differences 5,996 699
Value change – 162,235
Closing balance 172,663 186,859
Foreign exchange riskThe Group is exposed to foreign exchange risks associated with the translation of foreign subsidiaries, thus influencing profit and equity in the Group. The currencies that have the greatest influence are USD, EUR, and GBP. Transaction exposure is limited, because revenues and expenses are primarily denominated in the same currency in each market. BTS does not normally hedge its foreign exchange exposure. The sensitivity analysis below shows the effects on operating profits based on BTS’s 2018 income statement and should only be seen as an indication of the significance of the different currencies.
Percentagechange
Change in profit, 2018
Change in profit, 2017
Change in equity, 2018
Change in equity, 2017
SEK/USD +/–10% 13,121 10,411 40,954 33,110
SEK/EUR +/–10% 4,080 1,832 7,854 6,814
SEK/GBP +/–10% 3,626 1,271 5,426 5,341
Credit riskCredit risk refers to companies not getting paid, fully or partly, for their accounts receivable from customers. BTS only accepts creditworthy counterparties in financial transactions, and the limit is determined individually for each customer. Creditworthy refers to companies that have undergone customary credit checks with satisfactory results. The intention is for credit limits to reflect the solvency of each customer. BTS has sufficiently diversified risk. BTS’s accounts receivable and sales are spread among a large number of companies operating in a variety of sectors.
The maximum credit risk exposure on accounts receivable at year end was 512,468 (335,132). Fair value agrees with book value.
Liquidity risk and interest rate riskBTS manages liquidity risk by maintaining sufficient cash and cash equivalents including unutilized part of approved overdraft facility. Interest rates on the Group’s financial assets and liabilities are usually fixed for short periods. Interest rate risk refers to changes in the market interest rate that affect BTS’s results negatively.
Percentage change in market interest rate
Change in interest expense,
SEK thousands, 2018
Interest bearing liabilities +/–10% 380
Fin
an
cia
l in
form
ati
on

BTS ANNUAL REPORT 201874
BTS’s policy is to allow borrowing with the Board’s approval. Any surplus cash in subsidiaries should first of all be used to repay loans, which was done during the year. Interest risk for interest income is limited to the fluctuating return on cash and cash equivalents invested at variable rates.
GroupSEK thousands 12-31-18 12-31-17
Cash and cash equivalents 262,357 199,876
Unutilized portion of bank overdraft facility 38,373 38,848
Cash and cash equivalents available 300,731 238,723
Capital riskBTS’s goal for its capital structure is to safeguard the Group’s ability to continue and expand its operations, so that they continue to gen-erate a return for shareholders and benefit other stakeholders, at the same time as the cost of capital is kept at a reasonable level.
To maintain or change the capital structure, the dividends can be raised or lowered, shares can be issued or repurchased, and assets can be bought or sold.
BTS’s financial objective – and a measure of its capital risk – is that its equity/assets ratio never remains less than 50% over extended periods. At year-end, the Group’s equity/assets ratio was 46 (47) .
Reconcilation net liabilitiesSEK thousands 12-31-18 12-31-17
Cash and cash equivalents 262,357 199,876
Non-current loans –62,893 –84,839
Current loans –49,154 –47,996
Net liabilities 150,311 67,041
SEK thousandsCash and cash
equivalents Current
loans Non-current
loans Total
Net liabilities 01-01-17 135,433 25,649 26,813 82,971
Through acquisitions 38,432 – – 38,432
Translation differencies –8,200 –432 –1,107 –6,660
Cash flow 34,211 21,277 80,000 –67,066
Non cash flow impact – 1,503 –20,867 19,364
Net liabilities 12-31-17 199,876 47,996 84,839 67,041
SEK thousandsCash and cash
equivalents Current
loans Non-current
loans Total
Net liabilities 01-01-18 199,876 47,996 84,839 67,041
Through acquisitions – – – –
Translation differencies 12,215 39 202 11,975
Cash flow 50,266 –23,366 – 73,632
Non cash flow impact – 24,486 –22,148 –2,337
Net liabilities 12-31-18 262,357 49,154 62,893 150,311
Not 19 | Non-current liabilities
Non-current liabilities refer to interest-bearing loans from credit institutions which will be repaid as follows. The amounts include the agreed interest rate.
SEK thousands
2020 21,559
2021 21,085
2022 20,612
Total 63,256
NOTE 20 | Bank overdraft facility
GroupSEK thousands 12-31-18 12-31-17
Approved credit limit 56,728 56,174
Unutilized portion –38,373 –38,848
Credit utilized 18,355 17,326
Parent CompanySEK thousands 12-31-18 12-31-17
Approved credit limit 40,000 40,000
Unutilized portion –21,645 –22,674
Credit utilized 18,355 17,326
NOTE 21 | Accrued expenses and prepaid income
GroupSEK thousands 12-31-18 12-31-17
Accrued salaries incl. social security contributions 159,727 115,375
Accrued income (current contract assets attributable to consulting services) 188,478* 80,270
Other items 50,707 39,934
Total 398,912 235,579* The increase in contract liabilities is attributable to the fact that the Group has
provided a higher volume of services during the year.
Parent CompanySEK thousands 12-31-18 12-31-17
Other items 316 333
NOT 22 | Business acquisitions
Determination of acquisition analysesThe preliminary acquisition analyses for the acquisitions of Coach in a Box Holdings Ltd and MTAC GmbH that took place in the fourth quarter of 2017 have been adopted. The effect was an increase in goodwill and a provision for deferred tax liabilities of MSEK 10.2.
NOTE 23 | Pledged assets
GroupSEK thousands 12-31-18 12-31-17
Assets pledged for debts to credit institutionsCompany mortgages 10,000 10,000
NOTE 24 | Contingent liabilities on behalf of Group companies
Parent CompanySEK thousands 12-31-18 12-31-17
Guarantee commitments on behalf of subsidiaries 5,046 4,631
NOTE 25 | Events after the close of the fiscal year
No material events occurred after the close of the fiscal year up until the Board’s signing of the annual report, thus none have affected the preparation of the balance sheets and income statements.

BTS ANNUAL REPORT 2018 75
The Board of Directors and Chief Executive Officer affirm that the consolidated financial statements were prepared in accordance with International Financial Reporting Standards (IFRS) and that the annual report was prepared in accord-ance with generally accepted accounting principles in Sweden. The annual report and consolidated financial statements, respectively, provide a true and fair view of the Parent Company’s and the Group’s financial positions and earnings.
The management report for the Parent Company and the Group provides a fair review of developments in the Parent Company’s and the Group’s operations, financial position, and earnings and describes the material risks and uncertainties facing the Parent Company and the companies that are part of the Group.
The consolidated income statement and balance sheet as well as the Parent Company’s income statement and balance sheet will be submitted for adoption to the Annual General Meeting of May 15, 2019.
Reinhold GeijerChairman of the Board
Mariana Burenstam LinderMember of the Board
Our audit report was submitted on April 23, 2019. Öhrlings PricewaterhouseCoopers AB
Magnus ThorlingAuthorized Public Accountant
Stockholm, Sweden, April 18, 2019
Stefan GardefjordMember of the Board
Dag SehlinMember of the Board
Anna SöderblomMember of the Board
Henrik EkelundChief Executive Officer
and Member of the Board
Fin
an
cia
l in
form
ati
on

Auditor’s reportUnofficial translation
To the general meeting of the shareholders of BTS Group AB, corporate identity number 556566-7119
Report on the annual accounts and consolidated accountsOpinions
We have audited the annual accounts and consolidated accounts of BTS Group AB for the year 2018. The annual accounts and consolidated accounts of the company are included on pages 48–75 in this document.
In our opinion, the annual accounts have been prepared in accordance with the Annual Accounts Act and present fairly, in all material respects, the financial position of parent company as of 31 December 2018 and its financial performance and cash flow for the year then ended in accordance with the Annual Accounts Act. The consolidated accounts have been prepared in accordance with the Annual Accounts Act and present fairly, in all material respects, the financial position of the group as of 31 December 2018 and their financial per-formance and cash flow for the year then ended in accordance with International Financial Reporting Standards (IFRS), as adopted by the EU, and the Annual Accounts Act. The statu-tory administration report is consistent with the other parts of the annual accounts and consolidated accounts.
We therefore recommend that the general meeting of shareholders adopts the income statement and balance sheet for the parent company and the group.
Our opinions in this report on the annual accounts and consolidated accounts are consistent with the content of the additional report that has been submitted to the parent company’s Board of Directors in accordance with the Audit Regulation (537/2014) Article 11.
Basis for Opinions
We conducted our audit in accordance with International Standards on Auditing (ISA) and generally accepted auditing standards in Sweden. Our responsibilities under those stan-dards are further described in the Auditor’s Responsibilities section. We are independent of the parent company and the group in accordance with professional ethics for accountants in Sweden and have otherwise fulfilled our ethical responsibili-ties in accordance with these requirements. This includes that, based on the best of our knowledge and belief, no prohibited services referred to in the Audit Regulation (537/2014) Article 5.1 have been provided to the audited company or, where applicable, its parent company or its controlled companies within the EU.
We believe that the audit evidence we have obtained is sufficient and appropriate to provide a basis for our opinions.
Audit scope
We designed our audit by determining materiality and assess-ing the risks of material misstatement in the consolidated financial statements. In particular, we considered where man-agement made subjective judgements; for example, in respect of significant accounting estimates that involved making assumptions and considering future events that are inherently uncertain. As in all of our audits, we also addressed the risk of management override of internal controls, including among other matters consideration of whether there was evidence of bias that represented a risk of material misstatement due to fraud.
We tailored the scope of our audit in order to perform suffi-cient work to enable us to provide an opinion on the consolidated financial statements as a whole, taking into account the struc-ture of the Group, the accounting processes and controls, and the industry in which the group operates.
The BTS group is comprised of approximately 35 units whereof a number of these are limited in size. All of the units in Sweden and both of the units in the US, two of the units in England, and all of the units in Australia, Singapore and Spain have been audited. The audit of the units in Sweden and of the largest unit in the US has been performed by the central team. Where work has been executed by unit auditors, the central team in Sweden has determined the level of our required involvement in their audit work. We have done this to be able to conclude as to whether sufficient and appropriate audit evidence has been obtained in order to provide an opinion on the group’s financial reports in their entirety. As a part of our work, we have obtained written reports from the subsidiaries’ auditors. During the year, we also visited the subsidiary, APG, in the US and discussed significant accounting issues and observations from the audit with company management and with the local auditors.
Materiality
The scope of our audit was influenced by our application of materiality. An audit is designed to obtain reasonable assur-ance whether the financial statements are free from material misstatement. Misstatements may arise due to fraud or error.
BTS ANNUAL REPORT 201876

They are considered material if individually or in aggregate, they could reasonably be expected to influence the economic decisions of users taken on the basis of the consolidated finan-cial statements.
Based on our professional judgement, we determined certain quantitative thresholds for materiality, including the
overall group materiality for the consolidated financial state-ments as a whole. These, together with qualitative consider-ations, helped us to determine the scope of our audit and the nature, timing and extent of our audit procedures and to evaluate the effect of misstatements, both individually and in aggregate on the financial statements as a whole.
Key audit matters
Key audit matters of the audit are those matters that, in our professional judgment, were of most significance in our audit of the annual accounts and consolidated accounts of the current period. These matters were addressed in the context of our audit of, and in forming our opinion thereon, the annual accounts and consolidated accounts as a whole, but we do not provide a separate opinion on these matters.
Key audit matter How our audit addressed the Key audit matter
Revenues and work in progress
See also Note 2 (Accounting principles) and Note 16, respective Note 21.
We decided to focus on revenues as the group’s revenues are primarily generated through various projects based on client agreements and these agreements can have either short or longer tenors. In order to secure a correct view of the group’s results for the year, the reporting of work in progress must be be reliable. Revenue recognition is also dependent on management’s assessments as to the progress of the respective projects at point of reporting, that is, in conjunction with bookclosing. The group’s balance sheet includes accrued revenue of KSEK 103,619 and deferred income of KSEK 188,478.
In our audit, we have performed a number of audit measures to assess the reporting of revenue in the income statement and of work in progress in the balance sheet. Our audit has included a review of the routines and processes for revenue recognition, of selected controls, of selected projects against agreements, of internal delivery evidence supporting the reported degree of completion, and of invoices and payments received.
We examined a selection of items in the bookkeeping against client invoices in order to verify that these items were reported in the correct year. With the aim of verifying the reasonability of the company’s model for calculating degree of completion and in order to ensure that shorter assignments have been invoiced at the right time, we executed a trend analysis of the allocation of revenue over the year to identify any possible unexplained peaks and dips in the revenue flow during the year.
BTS ANNUAL REPORT 2018 77

Key audit matter How our audit addressed the Key audit matter
Impairment testing of goodwill
See also Note 2 (Accounting principles) and Note 7.
The group’s balance sheet includes goodwill totalling KSEK 455,268.
We focused our audit on goodwill related to the North American operations, KSEK 226,150, as this amount comprises a significant portion of total goodwill and of the group’s balance sheet total. Goodwill is not amortized but is subject to an annual impairment test. The valuation of goodwill is based on company management’s subjective assessments regarding future cash flows and on assumptions regarding the yield requirement, etc. which implies that the valuation is, in its nature, characterized by uncertainty, since it might be affected by unexpected future events.
The company’s impairment testing has not resulted in a writedown.
Our audit of goodwill related to the American operations has taken place through our examination of company management’s impairment testing and we verified that that the testing is documented and executed in accordance with the applicable accounting principles and generally accepted valuation models.
We have examined the manner in which the valuation model has been determined and have studied the budgets and forecasts for future cash flows. We have verified that these agree with company management’s plans and intentions.
We studied company management’s significant assumptions in determining, for example, sales growth in the forecasts and the yield requirement applied in discounting the cash flows (WACC). We also examined the prepared sensitivity analyses.
We compared the values produced according to the above with the operating capital for the segment.
Other information than the annual accounts and consolidated accounts
This document also contains other information than the annual accounts and consolidated accounts and is found on pages 1–47 and 92–96. The Board of Directors and the Managing Director are responsible for this other information.
Our opinion on the annual accounts and consolidated accounts does not cover this other information and we do not express any form of assurance conclusion regarding this other information.
In connection with our audit of the annual accounts and consolidated accounts, our responsibility is to read the information identified above and consider whether the information is materially inconsistent with the annual accounts and consolidated accounts. In this procedure we also take into account our knowledge otherwise obtained in the audit and assess whether the information otherwise appears to be materially misstated.
If we, based on the work performed concerning this information, conclude that there is a material misstatement of this other information, we are required to report that fact. We have nothing to report in this regard.
Responsibilities of the Board of Directors and the Managing Director
The Board of Directors and the Managing Director are responsible for the preparation of the annual accounts and consolidated accounts and that they give a fair presentation in accordance with the Annual Accounts Act and, concerning the consolidated accounts, in accordance with IFRS as adopted by the EU. The Board of Directors and the Managing Director are also responsible for such internal control as they determine is necessary to enable the preparation of annual accounts and consolidated accounts that are free from material misstatement, whether due to fraud or error.
In preparing the annual accounts and consolidated accounts, The Board of Directors and the Managing Director are responsible for the assessment of the company’s and the group’s ability to continue as a going concern. They disclose, as applicable, matters related to going concern and using the going concern basis of accounting. The going concern basis of accounting is however not applied if the Board of Directors and the Managing Director intend to liquidate the company, to cease operations, or has no realistic alternative but to do so.
Auditor’s responsibility
Our objectives are to obtain reasonable assurance about whether the annual accounts and consolidated accounts as a whole are free from material misstatement, whether due to fraud or error, and to issue an auditor’s report that includes our opinions. Reasonable assurance is a high level of assurance, but is not a guarantee that an audit conducted in accordance with ISAs and generally accepted auditing standards in Sweden will always detect a material misstatement when it exists. Misstatements can arise from fraud or error and are considered material if, individually or in the aggregate, they could reasonably be expected to influence the economic decisions of users taken on the basis of these annual accounts and consolidated accounts.
A further description of our responsibility for the audit of the annual accounts and consolidated accounts is available on Revisorsinspektionen’s website: www.revisorsinspektionen.se/revisornsansvar. This description is part of the auditor’s report.
Report on other legal and regulatory requirementsOpinions
In addition to our audit of the annual accounts and consolidated accounts, we have also audited the administration of the Board of Directors and the Managing Director of BTS Group
BTS ANNUAL REPORT 201878

AB for the year 2018 and the proposed appropriations of the company’s profit or loss.
We recommend to the general meeting of shareholders that the profit be appropriated in accordance with the proposal in the statutory administration report and that the members of the Board of Directors and the Managing Director be dis-charged from liability for the financial year.
Basis for Opinions
We conducted the audit in accordance with generally accepted auditing standards in Sweden. Our responsibilities under those standards are further described in the Auditor’s Responsibili-ties section. We are independent of the parent company and the group in accordance with professional ethics for account-ants in Sweden and have otherwise fulfilled our ethical respons ibilities in accordance with these requirements.
We believe that the audit evidence we have obtained is sufficient and appropriate to provide a basis for our opinions.
Responsibilities of the Board of Directors and the Managing Director
The Board of Directors is responsible for the proposal for appropriations of the company’s profit or loss. At the proposal of a dividend, this includes an assessment of whether the dividend is justifiable considering the requirements which the company’s and the group’s type of operations, size and risks place on the size of the parent company’s and the group’s equity, consolidation requirements, liquidity and position in general.
The Board of Directors is responsible for the company’s organization and the administration of the company’s affairs. This includes among other things continuous assessment of the company’s and the group’s financial situation and ensuring that the company’s organization is designed so that the accounting, management of assets and the company’s financial affairs otherwise are controlled in a reassuring manner. The Managing Director shall manage the ongoing administration according to the Board of Directors’ guidelines and instructions and among other matters take measures that are necessary to fulfill the company’s accounting in accord ance with law and handle the management of assets in a reassuring manner.
Auditor’s responsibility
Our objective concerning the audit of the administration, and thereby our opinion about discharge from liability, is to obtain audit evidence to assess with a reasonable degree of assur-ance whether any member of the Board of Directors or the Managing Director in any material respect:• has undertaken any action or been guilty of any omission
which can give rise to liability to the company, or• in any other way has acted in contravention of the
Companies Act, the Annual Accounts Act or the Articles of Association.
Our objective concerning the audit of the proposed appropriations of the company’s profit or loss, and thereby our opinion about this, is to assess with reasonable degree of assurance whether the proposal is in accordance with the Companies Act.
Reasonable assurance is a high level of assurance, but is not a guarantee that an audit conducted in accordance with gener-ally accepted auditing standards in Sweden will always detect actions or omissions that can give rise to liability to the com-pany, or that the proposed appropriations of the company’s profit or loss are not in accordance with the Companies Act.
A further description of our responsibility for the audit of the administration is available on Revisorsinspektionen’s website: www.revisorsinspektionen.se/revisornsansvar. This description is part of the auditor’s report.
Öhrlings PricewaterhouseCoopers AB, Stockholm, was appointed auditor of BTS Group AB by the general meeting of the shareholders on May 16, 2018, and has been the company’s auditor since the February 22, 1999.
Stockholm April 23, 2019
Öhrlings PricewaterhouseCoopers AB
Magnus ThorlingAuthorized Public Accountant
BTS ANNUAL REPORT 2018 79


Governance and ManagementSustainability Report 82–87
Corporate Governance Report 88–91
The Board of Directors and Auditor 92–93
Senior Executives and Global Partners 94–95
Shareholder Information 96

Sustainability Report 2018
The Sustainability Report has been prepared in accordance with the provisions of Chapters 6 and 7 of the Swedish Annual Accounts Act and encompasses the BTS Group in its entirety.
BTS Board of Directors is responsible for this Sustainability report.
General information about BTS
BTS is a global professional services firm headquartered in Stockholm, Sweden, with over 700 professionals in 33 offices located on six continents.
We focus on the people side of strategy, working during strategy implementation with the leaders at all levels to help them make better decisions, convert those decisions to actions and deliver results. At our core, we believe people learn best by doing. For over 30 years, we’ve been designing fun, powerful experiences that have a profound and lasting impact on people and their careers. We inspire new ways of thinking, to build critical capabilities and unleash business success. It is strategy made personal.
In addition to helping clients and employees achieve success, we aim to contribute to a better society. Our sustainability work comprises efforts to improve environmental, economic, and social responsibility. Sustainability efforts extend beyond social impact to include employees, clients, owners and mem-bers of the Board, suppliers and other stakeholders. “Employ-ees” in this context includes cooperating partners and subcon-tractors.
Our vision, business, and values form the basis for our sus-tainability work, and our Sustainability Policy governs all social impact and sustainability efforts.
Building a sustainable business in five areas
1. Anti-corruption 2. Employees 3. Human rights4. Environmental Impact5. Social responsibility
1. Anti-corruption Strong business ethics
BTS’ employees are characterized by strong business ethics, observing generally accepted business customs and practices. Every assignment that we undertake aligns to these stan-dards. If we believe that we cannot implement an assignment or fulfill a customer requirement, the assignment will not be accepted.
We do not offer benefits or the equivalent, which differ from law or other regulations, nor anything incompatible with generally accepted business practices.
Employees cannot accept payments from third parties who might influence, or be perceived to influence, objectivity when making business decisions.
Potential risks include partnerships that require the pur-chase of material or services from vendors, clients’ expecta-tion to be compensated for attending BTS client events, and the benefits our sales organization offers when a client is evalu ating suppliers. The processes followed by local leader-ship and management ensure that these risks are eliminated.
We have not had any reported cases of corruption this year.
Societal impact from our engagements
Linking decisions to outcomes is a prerequisite for long-term, sustainable success for our clients. Our customized programs expose our clients’ people to various situations where they explore the trade-offs between short- and long-term gains, which include environmental and safety impact.
These engaging and effective programs create a lasting impact by inspiring new ways of thinking and strengthening critical capabilities. Leaders and employees also gain a better understanding of the importance of developing sustainable business practices to ensure long-term success.
2. Our peopleA sustainable workplace
People make the difference: Within all enterprises, people create value. Attracting talent, as well as developing and retaining skilled employees is critical for us to deliver favorable results and achieve long-term success. This is especially important in the professional services industry where the quality of employees has a direct positive correlation with customer satisfaction and profitability. As a result, we offer many benefits and maintain a sound company culture to ensure that we remain an attractive employer.
Today’s labor market is significantly more mobile than ever before. Employees are more focused on individual develop-ment, demanding better support, training, and a good work environment. As a result, employers must make a strong effort to attract and retain the right people.
Since the early 1990s, we have established a global recruit-ment process that helps match our business expectations with people expectations, so that potential new hires understand how we work as a company and how we support our clients.
One of the greatest risks in any business today is overwork-ing employees, when people push themselves over the limit. Through our global planning teams and local leadership, we mitigate this risk by acting early when we see patterns of excess working begin to develop.
BTS ANNUAL REPORT 201882

The nature of our work at BTS can be strenuous to the work-life balance as many assignments require travel, some-times to other regions. To reduce the risk strain, we plan projects so that more resources can be used locally, rather than flying people from one continent to the other, and schedule projects more care-fully for each individual and office.
To be an attractive employer, BTS’ leaders listen to their employees. Man-agement conducts an employee survey every year to analyze the current status of employees, the culture, and workplace, as well as development opportunities available. From this information, leaders formulate action plans to ensure that BTS maintains engaged employees.
Equal treatment
It is fundamental that all employees – to the extent possible – and without discrimination based on age, geographic origin, education and professional background – have the same opportunities for personal development and job satisfaction, enjoyment at work, and understanding of their role in the organization. BTS does not discriminate and offers a workplace with a safe and healthy work environment charac-terized by equality, diversity and respect for the individual employee.
We seek continuous improvement and compliance with relevant legislation based on the following principles:}} Everyone has the right to be treated with dignity and respect.}} We do not tolerate discrimination or harassment on the grounds of race, gender, disability, nationality, religion, philosophical belief, political belief, age, sexual orientation, family status, trade union activity or any other factor.}} We adopt fair and inclusive practices throughout our operations and seek to eliminate all prejudice, discrimination, bullying and harassment.
All employees have a personal responsibility for the practical application of these principles in their day-to-day activities and must report if they have an experience that contradicts these principles. Non-compliance with policy will not be tolerated and is acted on accordingly by local and senior management.
We have not had any reported cases of violation this year.
Diversity
For BTS’ long-term sustainability and dynamic operations the balance between of women and men is a question with high-priority for BTS and is considered in the recruitment and selection process.
It is therefore gratifying that we since the year 2013, when the percentage of women was 40% have increased the share of female employees to 51% for 2018.Women 51%Men 49%
Over the last several years we analyzed the gender mix among consultants. We realized that the gender balance was equal at lower and mid-levels, but that there were very few women among the higher levels of consultants. This issue is something that we have begun to address by offering more flexible working solutions. More flexible vacation and work from home policies allow people at BTS to have lives outside of work, whether it is pursuing personal interests or having children. Ultimately this allows women to advance their careers in the long-term.
Personal development
BTS has mandatory development programs for people at pivotal levels of leadership, which aid in personal development and keep the organizational culture intact. These programs have been designed to make sure that leaders lead in accord-ance with BTS values and ensure that our culture is continuously evolving sustainably.
BTS ANNUAL REPORT 2018 83

During our onboarding program, a two-week program, new employees are introduced to our vision, mission, and ways of working. They gain a better understanding of our responsi-bilities to our clients, other employees, and the environment. Senior leaders deliver this onboarding program, allowing them to connect with the new hires by listening and talking to the new employees.
At the director level, consultants’ responsibilities increase, and they are tasked with leading and managing individuals and teams. Directors learn the new personal and leadership skills they need to be successful in developing a sound and sus-tainable business at a one-week director boot camp. Working with their peers, the new directors learn how coaching and employee development will help them to achieve this goal.
Our core values
BTS’ core values are designed to maintain our unique culture of respect and trust. They play a critical role in employee development, evaluating the yearly performance of leaders and employees, as well as in appraisal discussions at the end of the year.
Positive spirit and fun
• We believe that a “can do” attitude and sense of humor enable successful business.
• We believe in looking at problems openly, and view them as opportunities.
• We strive to be in good spirits at all times.
Honesty and integrity
• We believe in loyalty.• We believe in giving and receiving constructive feedback.• We believe in treating people as equals and respecting
differences.
Opportunities based on merits
• We provide opportunities and rewards based on results.• We make decisions and evaluate ideas based on facts
and merit.• We achieve success through effective hard work.
Putting the team first
• We believe that BTS’ success depends on teamwork, and we support our colleagues.
• We believe in putting the team first when making individual decisions and thinking of the individual when making team decisions.
BTS ANNUAL REPORT 201884

Creating lasting value for clients and people
• We strive to build long-term relationships with our clients and create a legacy for our clients and their people.
• We focus on driving results through learning, improved behavior, and business performance.
• We encourage all BTS:ers to learn, develop and be rewarded for their hard work.
• We grow through our clients’ successes and actively generating business
Excellence through professionalism
• We strive to deliver top quality solutions and services, within deadlines, exceeding client expectations.
• We balance client expectations, using BTS best practices and methods to achieve results.
Key performance indicators
We do not have key performance indicators to show at pres-ently. They will be included in the 2019 Sustainability report.
3. Human rights
We do not see any risks violating human rights in our opera-tions, and always follow the United Nation’s declaration of human rights.
4. Environmental Impact
BTS supports the environment in two ways – by thinking about how we can impact the environment through our work, and how we can support organizations working to improve the environment.
Reduce and recycle
As a professional services organization without production or manufacturing functions, BTS’ environmental impact is mainly limited to keeping offices and doing business travel. Nevertheless, we work to actively minimize our environmental impact and contribute to a more sustainable society by optim-izing energy consumption and using environmentally friendly products and services. .
In service of this, BTS uses video-conferencing and other technology to connect virtually rather than physically travel, whenever possible. This together with using regional and local resources reduces travelling whenever possible.
We also focus on recycling consumable supplies used in the business. In addition, operations at BTS comply with the principles of efficient resource usage (optimized use of non- renewable resources) and adopt an eco-cycle approach (recycling of resources).
BTS ANNUAL REPORT 2018 85
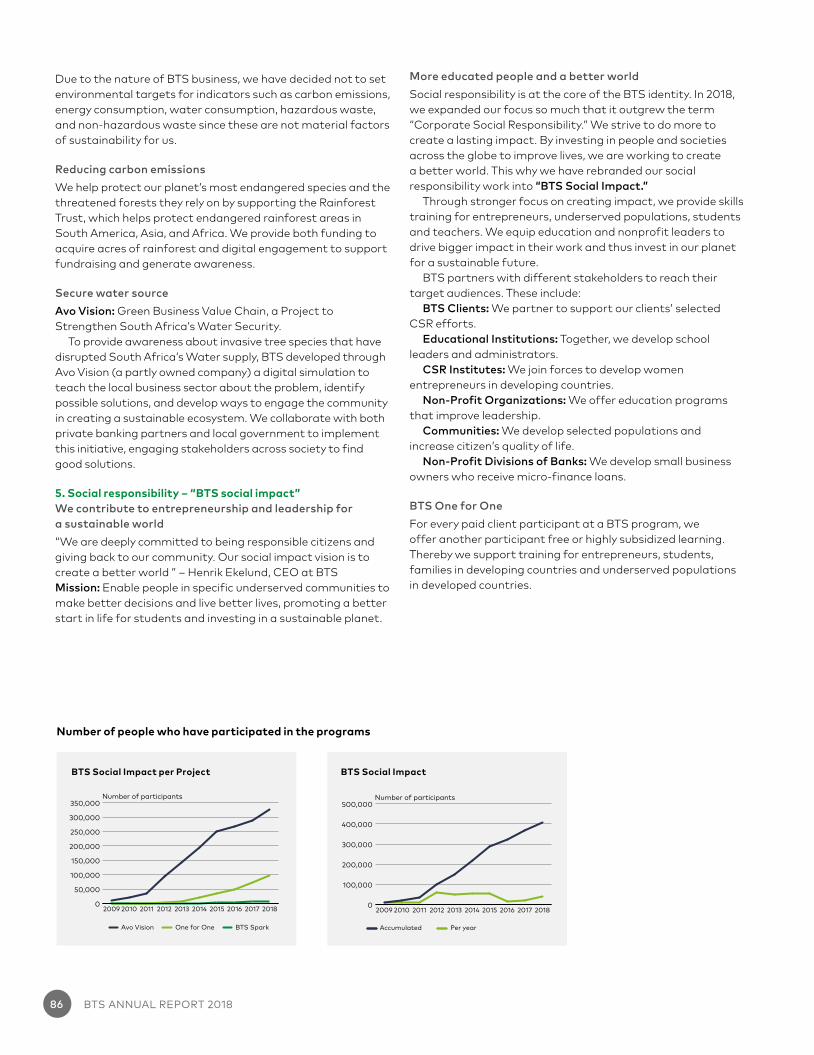
Due to the nature of BTS business, we have decided not to set environmental targets for indicators such as carbon emissions, energy consumption, water consumption, hazardous waste, and non-hazardous waste since these are not material factors of sustainability for us.
Reducing carbon emissions
We help protect our planet’s most endangered species and the threatened forests they rely on by supporting the Rainforest Trust, which helps protect endangered rainforest areas in South America, Asia, and Africa. We provide both funding to acquire acres of rainforest and digital engagement to support fundraising and generate awareness.
Secure water source
Avo Vision: Green Business Value Chain, a Project to Strengthen South Africa’s Water Security.
To provide awareness about invasive tree species that have disrupted South Africa’s Water supply, BTS developed through Avo Vision (a partly owned company) a digital simulation to teach the local business sector about the problem, identify possible solutions, and develop ways to engage the community in creating a sustainable ecosystem. We collaborate with both private banking partners and local government to implement this initiative, engaging stakeholders across society to find good solutions.
5. Social responsibility – “BTS social impact”We contribute to entrepreneurship and leadership for a sustainable world
“We are deeply committed to being responsible citizens and giving back to our community. Our social impact vision is to create a better world ” – Henrik Ekelund, CEO at BTSMission: Enable people in specific underserved communities to make better decisions and live better lives, promoting a better start in life for students and investing in a sustainable planet.
More educated people and a better world
Social responsibility is at the core of the BTS identity. In 2018, we expanded our focus so much that it outgrew the term “Corporate Social Responsibility.” We strive to do more to create a lasting impact. By investing in people and societies across the globe to improve lives, we are working to create a better world. This why we have rebranded our social responsibility work into “BTS Social Impact.”
Through stronger focus on creating impact, we provide skills training for entrepreneurs, underserved populations, students and teachers. We equip education and nonprofit leaders to drive bigger impact in their work and thus invest in our planet for a sustainable future.
BTS partners with different stakeholders to reach their target audiences. These include:
BTS Clients: We partner to support our clients’ selected CSR efforts.
Educational Institutions: Together, we develop school leaders and administrators.
CSR Institutes: We join forces to develop women entrepreneurs in developing countries.
Non-Profit Organizations: We offer education programs that improve leadership.
Communities: We develop selected populations and increase citizen’s quality of life.
Non-Profit Divisions of Banks: We develop small business owners who receive micro-finance loans.
BTS One for One
For every paid client participant at a BTS program, we offer another participant free or highly subsidized learning. Thereby we support training for entrepreneurs, students, families in developing countries and underserved populations in developed countries.
Number of participants
0
50,000
100,000
150,000
200,000
250,000
300,000
350,000
2018201720162015201420132012201120102009
Avo Vision One for One BTS Spark
Number of participants
0
100,000
200,000
300,000
400,000
500,000
2018201720162015201420132012201120102009
Per yearAccumulated
Number of people who have participated in the programs
BTS Social Impact per Project BTS Social Impact
BTS ANNUAL REPORT 201886

Auditor’s report on the statutory Sustainability Report
To the annual meeting of the shareholders of BTS Group AB, Corp. Reg. No.: 556566-7119
Engagement and responsibilities
The board of directors is responsible for the Sustainability Report for 2018 on pages 82–87 and that it has been prepared in accordance with the Swedish Annual Accounts Act.
The scope and extent of review
Our examination of the statutory Sustainability Report has been conducted in accordance with FAR’s auditing standard RevR 12 – Auditor’s report on statutory Sustainability Report. This means that our examination of the statutory Sustainabil-ity Report is different and substantially less in scope than an audit conducted in accordance with International Standards on Auditing (ISA) and generally accepted auditing in Sweden. We believe that the examination provides us with a sufficient basis for our opinion.
Opinion
A Sustainability Report has been prepared.
Stockholm, April 23, 2019 Öhrlings PricewaterhouseCoopers AB
Magnus ThorlingAuthorized Public Accountant
BTS Spark
BTS Spark – a non-profit organization – that leverages our strong coaching capabilities to offer personalized leader-ship development for education leaders. We work to unlock natural leadership learning in schools and education sys-tems to give students the best start in life. We offer flexible learning opportunities at a low cost, including one-to-one coaching, group coaching, webinars, online learning, and workshops. The three main areas we work with are:}} Preparing people to lead at their best}} Helping leaders be great coaches}} Developing resilience and wellbeing
BTS Communities: Avo Vision
Through a joint-venture with Avo Vision, we provide sub-sidized training for local communities through education programs for entrepreneurs, families, students, immi-grants or other disadvantaged groups, primarily in South Africa. Our programs are directed towards citizens, addressing various development initiatives such as housing, financial literacy, water sourcing, and energy.
BTS Social Impact – Success StoriesMultipliers for Non-Profits
In 2018, BTS delivered our first pro-bono, open-enrollment Multipliers program. This one-day program helps non-profit and education leaders understand how to leverage peoples’ natural intelligence to bring out their best performance. We hosted two face-to-face sessions for over 40 non-profit and education leaders in the San Francisco Bay Area. These programs were very successful and opened doors to several opportunities for our Social Impact team. BTS plans to expand these sessions to other offices globally in 2019.
Savings Banks Foundation
BTS partners with the Savings Bank Foundation for Inter-national Cooperation (SBFIC) on the Easter Caribbean Currency Union (EECU) development project. This project, led by the SBFIC, targets leaders from small and medium- sized enterprises as well as local financial institutions, pro-viding them with the opportunity to enhance their business acumen and entrepreneurial know-how. Using two board simulations co-created with BTS, the Micro-Business Game and The Savings Game, participants learn how to work better together and improve their financial acumen. The 2018 sessions were highly successful. SBFIC representa-tives and participants were able to identify several oppor-tunities that they could leverage for a greater impact in the region. Due to this success, BTS plans to offer these programs through local education institutions such as The First National Bank of Saint Lucia, as well as through sim-ilar institutions in Saint Vincent. BTS will also work with SBFIC to add a Train-the-Trainer aspect to these sessions, which will allow for even greater reach and impact.
BTS ANNUAL REPORT 2018 87

Corporate Governance Report 2018
BTS Group AB is a public limited liability company based in Stockholm, Sweden, and listed on NASDAQ Stockholm AB. Consequently the BTS Group’s corporate governance is based on Swedish legislation and regulations such as the Companies Act, the set of rules for issuers on NASDAQ Stockholm, the Swedish Code of Corporate Governance (the Code) and the Company’s own articles of association.
Since 2008, BTS Group follows the Code in all essential parts, although some adjustments to the Company’s smaller size has been assessed appropriately.
Corporate governance structure
The corporate bodies of BTS Group AB comprise the following:Annual General Meeting (AGM) – highest decision-making
bodyBoard of Directors – has ultimate responsibility
for the Company’s organi-zation and management
Chief Executive Officer (CEO) – has responsibility for day-to-day management
Auditors – audit the Board of Directors’ and CEO’s management at the request of the share-holders/Annual General Meeting.
Shareholders
The total number of shares outstanding is 19,013,916, consist-ing of 853,800 Class A and 18,160,116 Class B shares. Each Class A share entitles the holder to ten votes per share, each Class B one vote per share.
At December 31, 2018, BTS Group AB had 2,512 sharehold-ers. The ten largest shareholders had total shareholdings cor-responding to 80.8% of shares and 86.3% of votes. A list of the largest shareholders is found on page 47 in the Annual Report.
Annual General Meeting
BTS’s highest decision-making body is the Annual General Meeting (AGM). Notice of the AGM shall be published no earlier than six weeks and no later than four weeks before the AGM and shall appear in Post- och Inrikestidningar and Svenska Dagbladet. All shareholders entered in the share register on the record date who have notified the Company in time of their intention to participate in the AGM may do so. Shareholders unable to attend can be represented by proxy.
The AGM elects the Company’s Board and the Chairman of the Board. The business of the AGM includes}} adopting the income statement and balance sheet,}} determining the appropriation of the Company’s earnings,
}} determining whether to discharge the members of the Board and the CEO from liability to the Company,}} electing auditors,}} determining fees to be paid to the Board and auditors, and}} adopting guidelines for renumeration to senior executives.
2018 Annual General Meeting
The 2018 AGM was held on Wednesday, May 16, 2018, at the Company’s offices in Stockholm. 28 shareholders attended, representing 75.3% of the number of shares outstanding and 82.4% of the votes. Decisions made included the following:}} The income statement and balance sheet and the consolidated income statement and balance sheet for the fiscal year 2017 were adopted.}} The proposed dividend of SEK 2.80 per share was approved, to be paid in an amount of SEK 1.40 on two occasions.}} The Board of Directors and CEO were discharged from liability for management during the fiscal year as recommended by the auditors.}} A total of SEK 1,370,000 in fees was approved to be paid to members of the Board who receive no salary from the Company or any subsidiary, of which SEK 450,000 shall be paid to the Chairman and SEK 200,000 each to other members. For work on Board committees, fees totaling SEK 120,000 shall be paid.}} Auditors’ fees were approved to be paid based on approved invoices.}} Mariana Burenstam Linder, Henrik Ekelund, Stefan Gardefjord, Reinhold Geijer, Dag Sehlin and Anna Söderblom were re-elected to the Board for the period until the next AGM. Reinhold Geijer subsequently was appointed Chairman of the Board.}} For the period until the next Annual General Meeting the accounting firm Öhrlings PricewaterhouseCoopers was re-elected as auditor with Magnus Thorling as chief auditor for the audit.}} Instructions for the nominating committee were assumed, such that the committee be made up of representatives from the three shareholders controlling the most votes, based on Euroclear Sweden AB’s data at September 30 respective year, and the Chairman of the Board, and is valid until the AGM decides otherwise.}} Guidelines for remuneration and other terms of employment for senior executives were determined.}} The Board of Directors was authorized to decide, during the period until the next AGM, whether to issue shares or convertible instruments that would result in a maximum of 1,200,000 Class B shares being issued for capital contributed in kind or as offsets. This authorization refers to corporate acquisitions.
BTS ANNUAL REPORT 201888

Nominating committee
The nominating committee has the task of preparing and submitting proposals to the AGM concerning the following, when relevant.}} Election of a president for the AGM}} Election of the Chairman of the Board and other members of the Board }} Board fees: in total and divided among the Chairman and other members of the Board as well as compensation for work on committees, when relevant }} Audit fees}} Election of auditor and deputy auditor, when relevant}} Adoption of a policy for appointing the nominating committee.
A nominating committee for BTS Group AB was appointed on October 23, 2018. BTS’s three largest shareholders in consultation with Reinhold Geijer, Chairman of the Board, appointed Anders Dahl (representing Henrik Ekelund), Erik Durhan (appointed by Nordea Funds), Stefan af Petersens (own holdings) and Reinhold Geijer to the committee. Anders Dahl was appointed chairman of the nominating committee.
Shareholders in BTS Group AB have been able to contact the nominating committee to propose candidates to the Board.
All of the nominating committee’s candidates based on the above will be announced in the notice for the 2019 AGM. The nominating committee’s statement supporting its proposal for the Board of Directors of BTS Group AB as well as the information about the candidates recruited by the committee will be published on BTS’s web site when the proposal is announced.
Board of Directors
The Board of Directors has ultimate responsibility for the Company’s organization and management and is appointed by the shareholders at each AGM for the period from that AGM until the end of the next. BTS’s Board decides on issues such as strategic direction, acquisitions, investments, financ-ing, and Group-wide policies. BTS’s Board shall also insure proper disclosure to BTS’s various stakeholders.
The articles of association specify that BTS’s Board shall consist of no fewer than three and no more than eight mem-bers. The AGM held on May 16, 2018, decided that for the period until the next AGM the Board would consist of six mem-bers and no deputy members.
Once each fiscal year, the work of the Board is assessed, either by the Board alone or with external assistance, providing a basis for the Board’s procedures in the future.
The Board is deemed to comply with the NASDAQ Stock-holm marketplace rules and the Swedish Code of Corporate Governance regarding requirements on independence of members of the Board in relation to the Company, Company management and large shareholders.
Information about the Board of Directors is to be found on pages 92–93 in the Annual Report.
The work of the Board of Directors
In addition to legislation and recommendations, a written set of procedures adopted annually governs the work of the Board. The Board’s set of procedures is intended to clarify and regu-late the Board’s tasks and how it works as well as the division of responsibilities among the Chairman, other Board members, and the CEO. According to these procedures, the Board shall normally hold a minimum of four ordinary meetings. At each of these meetings, the Board deals with issues of material signific ance to the Company. In addition, the Board receives reports from senior management about current business con-ditions in the Group’s market segments.
Board meetings are held periodically in connection with the Company’s financial reports, and otherwise as required. The Board deals with the year-end report and proposed appropria-tion of earnings in February, interim reports in April, August, and October–November, and the budget for the coming year in December. Occasionally, an issue is delegated to the Chairman of the Board and the CEO for joint deliberation. The Company’s CFO serves as Board secretary. During the past year, seven meetings were held.
Evaluation of the Board and the CEO
Every year the Board makes an evaluation of the work of the Board. The purpose of the evaluation is to get an opinion on the Board members’ views on how the board work is conducted, and what measures can be taken to streamline the board work. The Nomination Committee has been informed of the content of the 2018 evaluation.
The Board evaluates the ongoing CEO’s work by following the development of the business towards set goals as well as through an annual CEO’s evaluation.
Compensation to the BoardThe AGM held on May 16, 2018, approved a total of SEK
1,370,000 in fees to be paid to those Board members who
Composition and independence of the 2018 Board
Member Position Elected Committee work IndependentBoard meeting attendence
Reinhold Geijer Chairman of the Board 2016 Yes 7/7
Mariana Burenstam Linder Member 2004 Yes 7/7
Henrik Ekelund Member 1986 No1 7/7
Stefan Gardefjord Member 2003 Audit committe Yes 7/7
Dag Sehlin Member 2003 Audit committe Yes 7/7
Anna Söderblom Member 2017 Yes 7/71 Henrik Ekelund is the largest shareholder and is President and CEO of BTS Group.
BTS ANNUAL REPORT 2018 89

BTS ANNUAL REPORT 201890
receive no salary from the Company or any of its subsidiaries, such that SEK 450,000 be paid to the Chairman and SEK 200,000 each to the members. The AGM also approved a total of SEK 120,000 in fees for work on Board committees.
The AGM also determined that auditors’ fees will be paid based on approved invoices.
Members of the Board in the Parent Company have received compensation only in the form of Board fees and Committee fees, with the exception of the CEO who is not renumerated for the Board work. The Members of the Board are not included in any incentive programs for Group employees that are based on shares or share prices.
Compensation committee
The compensation committee has the task of reviewing and recommending to the Board policies for compensation for the Company’s senior executives, including performance-based pay-ments and pension benefits. Issues concerning the CEO’s terms of employment, compensation, and benefits are prepared by the compensation committee and decided by the Board. The duties of the compensation committee were performed during the year by the Board as a whole excluding the CEO.
The Board will propose policies for compensation and other terms of employment for the Company’s senior executives for the approval of the AGM on May 15, 2019.
More information about compensation to senior executives is found in Note 6 of the annual report.
Audit committee
The Board has appointed an audit committee. The task of the audit committee is to prepare the Board’s work assuring the quality of the Company’s financial reports. The audit commit-tee also adopts guidelines on services other than auditing that the Company may purchase from the Company’s auditors. The committee is also tasked with providing the nominating com-mittee with an assessment of the audit work and of assisting the nominating committee in preparing the nominating com-mittee’s proposal to the AGM regarding the election of aud-itors as well as the size of the audit fee. The Company’s CFO, also the Board secretary, prepared the business for the meet-ings. The audit committee has had two meetings in 2018.
Auditors
The auditors examine the management of the Company by the Board and CEO and the quality of the Company’s accounts and they report the results of their audit to the shareholders through the audit report, which is submitted at the AGM. In addition, the auditor participates in the Board meeting when the financial accounts are presented and sub-mits a report on the audit of the Company’s earnings, financial position, and internal control. The Company’s auditor may also submit a statement of his findings directly to the Chairman of the Board, if deemed necessary. The Board shall at least once a year, without the presence of the CEO or other members of management, meet the Company’s auditor. During the year, the auditor participated in one board meeting, and on this occasion also reported the audit in writing.
The auditor is elected by the AGM for a period of one year. The 2018 AGM re-elected the registered public accounting firm Öhrlings PricewaterhouseCoopers with Magnus Thorling as managing auditor for the period until the end of 2019 AGM.
More information about compensation to auditors is found in Note 4 of the annual report.
For 2018, the Company’s auditors did not review BTS’s semi-annual report or the nine-month interim report, which deviates from the Code. The Board has determined to date that the additional costs of such reviews have not been justifiable.
Senior executives
BTS’s senior executives include: Henrik Ekelund, President & CEO of BTS Group AB, and Stefan Brown, CFO and Vice President of BTS Group AB.
More information about senior executives is found on page 94 of the annual report.
Guidelines for compensation and other terms of employment for senior executives
The AGM held on May 16, 2018, adopted policies for compensa-tion to senior executives. These mean that BTS shall employ persons on terms and at salaries commensurate with the mar-ket to be able to recruit and retain employees with excellent skills and of a high caliber to reach the Company’s goals. When employing persons in different countries, the Company shall comply with each country’s generally accepted forms of employment and good practice.
Forms of compensation are intended to achieve a consensus on the long-term view of operations by rewarding perfor-mance that benefits the Company and thus the shareholders. Compensation paid to individual employees will be based on their position and tasks, performance, skills, and experience. Compensation will normally consist of a fixed basic salary and defined-contribution pension benefits, the latter no more than 35% of the fixed basic salary for the CEO of the Parent Com-pany and no more than 30% of the fixed basic salary for other senior executives. When deemed appropriate, the basic salary and pension benefit can be augmented by variable compensa-tion, other benefits, and participation in incentive programs. Only the CEO in the Parent Company is entitled to a severance package, corresponding to 12 months’ salary if the Company terminates his employment contract.
The Board is entitled to deviate from the principles above in individual cases under special circumstances.
Information and communication
The overall goal of BTS’s communication is to provide share-holders and employees, actors in the market, and other stake-holders with an up-to-date, true, and fair view of the Company and its business operations. Communication shall be correct, credible, characterized by good relevance to the Company’s stakeholders, and based on on-going contacts, clarity, and good ethics. BTS believes that high-quality communication efforts actively help bolster confidence in the Company and the management, making it easier to achieve business objectives.

BTS publishes up-to-date information about the Company on its web site. Interim reports and annual reports are published in Swedish and English. Events that could be expected to affect the share price are announced in press releases. In addition, the Company communicates with mass media, capital markets, and shareholders when interim reports are published and also participates in other activities on an ongoing basis.
The Board of Directors’ description of internal control concerning financial reports
Good corporate governance is about organization and routine in a good control environment, the proper handling of financial information, and minimizing risk. A good control environment is also based on an organizational structure with explicit and documented delegation of decision-making authority, straightforward policies and guidelines, and a corporate culture with good common values.
Control environment
Internal control at BTS is based on a control environment embracing the organization, lines of decision-making, author-ity, and responsibility. The Board of Directors has a written set of procedures that clarifies the Board’s responsibility and regu-lates how Board tasks are delegated. The set of procedures also specifies which issues are submitted to the Board for a decision. How roles are divided between the Board and the CEO is established in the Board’s set of procedures and its instructions to the CEO. The Board and the CEO also manage the business with reference to the Companies Act, other laws and regulations, rules and regulations for stock market companies, and the Code, etc.
The Company has established policies in areas such as finan-cial reporting, IT and IT security, human resources (compensa-tion to senior executives), sustainability etc. The Board’s instruc-tions to the CEO specify financial responsibilities and authority, as do procedures adopted for signing off. To limit and control financial risk, the Board has adopted a financial policy.
The Company’s operating organization is adopted and com-municated through an organization chart augmented by the assignment of roles and responsibilities.
The Board of Directors follows up to insure that policies adopted for financial reporting and internal control are adhered to and maintains appropriate relationships with the Company’s auditors. Company management is responsible for the system of internal controls required for managing significant risks in operating activities.
Risk assessment and control activities
The Board of Directors has ultimate responsibility for risk management. A well-defined organization and decision-making procedure are intended to foster prudent risk taking and good awareness of risk among employees. To insure that internal rou-tines and controls have worked adequately and uniformly, the most important processes have procedural descriptions. Built-in checkpoints also minimize the risk of errors in accounting. Like-wise, procedures for the Company’s accounting and consolidation systems have been documented. Ongoing activities aim at main-taining good internal control, thus avoiding and detecting risks.
Information and communication
Significant guidelines, manuals, and such that govern financial reporting are updated and communicated on an ongoing basis to personnel affected in the Group. Formal as well as informal channels to Company management and the Board exist to transmit significant information from employees. For external communication, the Company follows the governing regula-tions discussed above.
Follow-up
The Board of Directors continuously evaluates the information provided by Company management. The work of the Board includes insuring that actions are taken concerning any deficien-cies or proposals for corrective action arising from external audits.
BTS has no internal audit unit of its own, based on the assessment that there are no special circumstances in operat-ing activities according to Group size, organization and report-ing structure or other conditions to justify such a unit. The follow- up performed by the Board and management is considered to meet the need.
Auditor’s report on the corporate governance statememt
To the general meeting of shareholders in BTS Group AB (publ), corporate identity number 556566-7119
Engagement and responsibility
It is the Board of Directors who is responsible for the corporategovernance statement for the financial year 2018 found onpages 88–91 and that it has been prepared in accordance withthe Annual Accounts Act.
The scope of the audit
Our examination has been conducted in accordance with FAR’s auditing standard RevU 16 The auditor’s examination of the corporate governance statement. This means that our examina-tion of the corporate governance statement is different and sub-stantially less in scope than an audit conducted in accord ance with International Standards on Auditing and generally accepted auditing standards in Sweden. We believe that the examination has provided us with a sufficient basis for our opinions.
Opinions
A corporate governance statement has been prepared.Disclosures in accordance with chapter 6, section 6, secondparagraph, points 2–6 of the Annual Accounts Act and chapter 7, section 31, second paragraph of the same law are consistentwith the annual accounts and the consolidated accounts andare in accordance with the Annual Accounts Act.
Stockholm, April 23, 2019Öhrlings PricewaterhouseCoopers AB
Magnus ThorlingAuthorized Public Accountant
BTS ANNUAL REPORT 2018 91

The Board of Directors and Auditor
Reinhold GeijerBorn 1953.
Chairman of the Board of directors of BTS Group AB since 2016.
Other assignments: Board member of Skandia, The Swedish Export Credit Cor-poration, Eterna Invest, Zacco A/S and Edsbyn Senab AB.
Shareholdings in BTS Group AB: 10 000 class B shares.
Reinhold Geijer was CEO of The Royal Bank of Scotland´s Nordic branch 2003-2015, and also CEO of Nordisk Renting AB 2001-2015. He has also served as CFO of Telia, CEO of Foreningssparbanken (now Swed-bank), worked within Ericsson, SSAB Swedish Steel and Weyerhaeuser Com-pany in the United States. Reinhold Geijer graduated in business administration at the Stockholm School of Economics.
Independent of the Company and its major shareholders.
Mariana Burenstam LinderBorn 1957.
Member of the Board of BTS Group AB since 2004.
Other assignments: Member of the board of Latour AB and Resurs Holding AB.
Shareholdings in BTS Group AB: 22,100 Class B shares.
Mariana Burenstam Linder has extensive experience from management positions in several Swedish companies. Former posi-tions include founder and CEO of Buren-stam & Partners, CEO of Ainax, Head of Enskilda Banken with global responsibility for Private Banking, deputy CEO of SEB, CIO of Trygg-Hansa and later the SEB group, CEO of ABB Financial Consulting and CEO of Nordic Management AB. Mariana Burenstam Linder graduated in business administration at the Stockholm School of Economics.
Independent of the Company and its major shareholders.
Stefan GardefjordBorn 1958.
Member of the Board of BTS Group AB since 2003.
President and CEO of Swedish Space Corporation.
Other assignments: Member of the board of Knowit AB.
Shareholdings in BTS Group AB: 20,000 Class B shares.
Stefan Gardefjord has been CEO of Logica Sverige AB and member of the executive management of Logica. He has since 1987 held several senior positions in the WM-data group, including CEO of differ-ent subsidiaries, business area head, and group director of marketing, sales, and information. Stefan Gardefjord graduated upper secondary school in business.
Independent of the Company and its major shareholders.
REINHOLD GEIJER MARIANA BURENSTAM LINDER STEFAN GARDEFJORD
BTS ANNUAL REPORT 201892

The above information on share holdings was correct at December 31, 2018.
HENRIK EKELUNDDAG SEHLIN ANNA SÖDERBLOM
Dag SehlinBorn 1945.
Member of the Board of BTS Group AB since 2003, Chairman of the Board 2003–2008.
Shareholdings in BTS Group AB (including related parties): 16,000 Class B shares.
Dag Sehlin has long-term experience in senior positions in the Swedish financial sector. Previous positions include CFO and deputy CEO of Posten AB, deputy CEO of the OM Group, and prior to that various positions in accounting and finance at several Swedish companies. He also has long-term experience from work as an independ ent consultant and member of the board of various listed companies and other enterprises. Dag Sehlin graduated in business administration at the Stockholm School of Economics.
Independent of the Company and its major shareholders.
Anna Söderblom Born 1963.
Member of the Board of BTS Group AB since 2017.
Teacher and researcher at the Stockholm School of Economics.
Other assignments: Chairwoman of Advenica AB and member of the board of directors of Poolia AB, Almi Företagspart-ner AB, Länsförsäkringar Liv Försäkring-saktiebolag, Midway Holding AB and Cabonline Holding AB.
Shareholdings in BTS Group AB: 500 class B shares.
Anna Söderblom has earlier among other things been operational as the head of technical support and marketing director at Microsoft Nordic, marketing director at Sweden Post, Letter Division, and invest-ment manager at Industrifonden. Anna Söderblom has a university degree in mathematics from Lund University and a PhD in business administration from Stockholm School of Economics.
Independent of the Company and its major shareholders.
Henrik EkelundBorn 1955.
President and CEO of BTS Group AB.
Shareholdings in BTS Group AB (including companies): 816,000 Class A shares, 3,189,034 Class B shares, totally 4,005,034 shares.
Henrik Ekelund is the founder of BTS and has been its CEO since its inception in 1986. Henrik Ekelund has comprehensive experi-ence as a board member and owner of high-growth enterprises. Henrik Ekelund graduated in business administration at the Stockholm School of Economics.
Not independent of the Company or its major shareholders.
AUDITORÖhrlings PricewaterhouseCoopers AB.Managing Auditor: Magnus Thorling, Authorized Public Accountant.
BTS ANNUAL REPORT 2018 93

Senior Executives and Global Partners
Henrik EkelundBorn 1955. Global Partner. Founder, President and CEO of BTS Group AB. See Board of Directors on the preceding page for more information.
Stefan BrownBorn 1963. CFO and Executive Vice President of BTS Group AB. Employee of BTS since 1990.
Philios AndreouBorn 1967. Global Partner. Executive Vice President, President and CEO of BTS Other markets. Employee of BTS since 2003.
Joel SigristBorn 1972. Global Partner. Executive Vice President, President and CEO of BTS Europe. Employee of BTS since 2003.
Jessica ParisiBorn 1977. Global Partner.Executive Vice President, President and CEO of BTS North America. Employee of BTS since 1999.
Todd EhrlichBorn 1968. Global Partner. Executive Vice President, Global Head of Development Process and COO BTS North America. Employee of BTS since 1995.
Rommin AdlBorn 1964. Global Partner.Executive Vice President. Employee of BTS since 1994.
David AckleyBorn 1969. Global Partner.Executive Vice President, Global Head of BTS Digital Services.Employee of BTS since 1996.
BTS ANNUAL REPORT 201894

Fredrik SchullerBorn 1978. Global Partner.Executive Vice President.Employee of BTS since 2004.
Marta ZaragozaBorn 1971. Global Partner.Executive Vice President.Employee of BTS since 2006.
Patrick FeiBorn 1974. Global Partner.Executive Vice President.Employee of BTS since 2000.
Stefan HellbergBorn 1957. Global Partner. Executive Vice President. Employee of BTS since 1986.
Lou SchachterBorn 1964. Global Partner. Executive Vice President and Global Head of the BTS Sales Practice. Employee of BTS since 2006.
Advantage Performance Group Inc.
Jonathan HodgeBorn 1972. President and CEO of APG.Employee of BTS since 2006.
Steve ToomeyBorn 1963. Global Partner. Executive Vice President Employee of BTS since 1995.
Dan ParisiBorn 1968. Global Partner. Executive Vice President. Employee of BTS since 1995.
Peter MulfordBorn 1968. Global Partner. Executive Vice President, Head of Innovation Practice. Employee of BTS since 1997.
BTS ANNUAL REPORT 2018 95

Annual General Meeting 2018
Shareholders in BTS Group AB (publ) are invited to the AGM on Wednesday, May 15, 2019, at 14.00 p.m. at the Company’s premises, Grevgatan 34, 5th floor, Stockholm.
Shareholders wishing to participate must be entered in the share register maintained by Euroclear Sweden AB no later than Thursday May 9, 2018, and must have notified BTS Group AB no later than Thursday May 9, 2019.
Shareholders may notify the Company by phone at +46 8 58 70 70 00, fax +46 8 58 70 70 01, or e-mail at [email protected].
The notification should include the shareholder’s name, personal identification number or corporate identification number, address, phone number, and the number of shares held.
To participate in the AGM, shareholders who have registered their shares under the name of a trustee must temporarily re- gister them with Euroclear Sweden AB under their own name. Any such re-registration request should be made well in advance of Thursday May 9, 2019.
Dividend
The Board of Directors proposes a dividend of SEK 3.60 per share to be paid on two occasions in the amount of SEK 1.80 per payment.
2018 reporting dates and financial information
Interim reports:January–March May 15, 2019April–June August 23, 2019July–September November 13, 2019Year-end report February 2020
The above reports can be ordered from BTS Group AB, Grevgatan 34, SE-114 53 Stockholm, phone +46 8 58 70 70 00 or e-mail [email protected]. Financial information from BTS Group AB is also published on www.bts.com.
Definitions
BTS Group AB, BTS Group AB (publ), BTS, the Company BTS Group AB with or without the Group’s subsidiaries (unless otherwise indicated by the context).
Shareholder Information
Every care has been taken in the translation of this Annual Report. In the event of discrepancies, however, the Swedish original will supersede the English translation.
BTS ANNUAL REPORT 201896

Production: BTS Group AB. Images used under license from Shutterstock, Adobe Stock and employees of BTS Group. Printer: Strokirk-Landströms, Lidköping, Sweden, April 2018.
3041 0126

Strategy made personalWe create powerful experiences that help leaders build the future of their business
SWEDENHead OfficeGrevgatan 34114 53 StockholmSWEDENTel. 08 58 70 70 00
ARGENTINAReconquista 657PB D.0003 C1003 CABA.Buenos Aires, ArgentinaTel. +54 1157955721
AUSTRALIA198 Harbour Esplanade,Suite 404Docklands VIC 3008Tel. +61 3 9670 9850
Level 610 Barrack StSydney NSW 2000Tel. +61 02 8243 0900
BRAZILRua Geraldo Flausino Gomes, 85, cj 4204575-060 São Paulo – SPTel. +55 (11) 5505 2070
CHINA1376 West Nanjing RoadSuite 531, East Office TowerShanghai CentreShanghai 200040Tel. +86 21 6289 8688
COSTA RICAOffice 203Prisma Business CenterSan JoseTel: +506 22 88 48 19
FRANCE57, rue de Seine75006 ParisTel. +33 1 40 15 07 43
GERMANYRitterstraße 12D-50668 CologneTel +49 221 270 70 763
INDIAVatika Business CenterDivyashree Chambers, 2nd Floor, Wing AO’Shaugnessy Road,Langford TownBangalore 560025 Tel. +91 80 4291 1111 Ext 116
801, 8th Floor, DHL ParkOpposite MTNL, Staff quarters,S.V. Road, Goregaon (West).Mumbai - 400062Maharashtra,Tel. +91 22 6196 6800
ITALYViale Fulvio Testi 22320162 MilanTel. +39 02 6611 6364
BTS Design InnovationViale Abruzzi, 1320131 MilanTel. +39 02 69015719
JAPANTS Kojimachi Bldg. 3F6-4-6 Kojimachi Chiyoda-kuTokyo 102-0083, JapanTel. +81 (3) 6272 9973
MEXICOEdificio Torre MoliereCalle Moliere 13 – PHCol Chapultepec PolancoC.P. 11560 México, D.F.Tel. +52 (55) 52 81 69 72
THE NETHERLANDSBarbara Strozzilaan 201 1083 HN AmsterdamThe NetherlandsTel: + 31 (0)20 615 15 14
SINGAPORE1 Finlayson Green#07-02Singapore 049246Tel. +65 6221 2870
SPAINSimon Bolivar 27-1,Office No. 4Bilbao 48013Tel. +34 94 423 5594
Calle José Abascal 55,piso 3ºDcha28003 MadridTel. +34 91 417 5327
SOUTH AFRICA267 West Avenue, 1st FloorCenturion 0046, GautengTel. +27 12 663 6909
SOUTH KOREARoom 103, 1st FloorWonseo Building13, Changdeokgung 1-gilJongo-guSeoul 03058Tel. +82 2 539 7676
TAIWAN7 F., No. 307,Dun-Hua, North RoadTaipei 105Tel. +886 2 8712 3665
THAILAND128/27 Phyathai PlazaBuilding (4th Floor)Phyathai Rd. Kwaeng ThungPhyathaiKhet Ratchathewi Bangkok 10400 Tel. +66 2 216 5974
UK 1 Queen Caroline StreetLondon W6 9YNTel: +44 20 7368 4180
Holbrook Court, Cumberland Business Centre,Hampshire, PO5 1DSPortsmouthTel: +44 2393 162686
UNITED ARAB EMIRATES10th Floor, Swiss TowerJumeirah Lakes TowersDubai Tel. +971 4 279 8341
USAFrost Bank Building401 Congress AvenueSuite 2740Austin, Texas 78701Tel. +1 512 474 1416
200 South Wacker DriveSuite 925Chicago, IL 60606Tel. +1 312 509 4750
101 West Elm StSuite 310Conshohocken, PA 19428Tel. (toll free) +1 800 445 7089Tel. +1 484 391 2900
350 Fifth Ave, Suite 5020 New York, NY 10118Tel. +1 646 378 3730
4742 N. 24th St., Suite 120Phoenix, AZ 85016Tel. +1 480 948 2777
222 Kearny Street, Ste 1000San Francisco, CA 94108Tel. +1 415 362 4200
ADVANTAGEPERFORMANCE GROUP100 Smith Ranch Road,Suite 306San Rafael, CA 94903USATel. +1 800 494 6646