annual report c financial statements - capgemini … · capgemini 2016 annual report 3 statutory...
TRANSCRIPT
CAPGEMINI 2016 ANNUAL REPORT 1
December 31, 2016
ANNUAL REPORT
CONSOLIDATED FINANCIAL STATEMENTS

CAPGEMINI 2016 ANNUAL REPORT 2
CONTENTS STATUTORY AUDITORS’ REPORT ON THE CONSOLIDATED FINANCIAL ST ATEMENTS ................................................. 3
CONSOLIDATED INCOME STATEMENT .......................... ........................................................................................................ 4
STATEMENT OF INCOME AND EXPENSE RECOGNIZED IN EQUITY ........... ........................................................................ 5
CONSOLIDATED STATEMENT OF FINANCIAL POSITION ............. ........................................................................................ 6
CONSOLIDATED STATEMENT OF CASH FLOWS .................... .............................................................................................. 7
CONSOLIDATED STATEMENT OF CHANGES IN EQUITY ............... ...................................................................................... 8
NOTES TO THE CONSOLIDATED FINANCIAL STATEMENTS FOR THE YEAR ENDE D DECEMBER 31, 2016 .................. 9
NOTE 1 ACCOUNTING BASIS .................................. .......................................................................................................... 9
NOTE 2 CONSOLIDATION PRINCIPLES AND GROUP STRUCTURE ............ ................................................................ 10
NOTE 3 ALTERNATIVE PERFORMANCE MEASURES .......................... ......................................................................... 13
NOTE 4 OPERATING SEGMENTS .................................................................................................................................... 14
NOTE 5 CONSOLIDATED INCOME STATEMENT ......................... ................................................................................... 18
NOTE 6 REVENUES ........................................................................................................................................................... 18
NOTE 7 OPERATING EXPENSES BY NATURE .............................. ................................................................................. 19
NOTE 8 OTHER OPERATING INCOME AND EXPENSE ........................ .......................................................................... 19
NOTE 9 NET FINANCIAL EXPENSE ................................. ................................................................................................ 20
NOTE 10 INCOME TAX EXPENSE ................................................................................................................................. 21
NOTE 11 EARNINGS PER SHARE .................................... ............................................................................................. 22
NOTE 12 EQUITY ............................................................................................................................................................. 23
NOTE 13 GOODWILL AND INTANGIBLE ASSETS ........................ ................................................................................ 33
NOTE 14 PROPERTY, PLANT AND EQUIPMENT ............................. ............................................................................. 35
NOTE 15 CASH-GENERATING UNITS AND ASSET IMPAIRMENT TESTS ........... ....................................................... 37
NOTE 16 DEFERRED TAXES .......................................................................................................................................... 39
NOTE 17 FINANCIAL INSTRUMENTS .............................. .............................................................................................. 42
NOTE 18 OTHER NON-CURRENT ASSETS ................................................................................................................... 43
NOTE 19 ACCOUNTS AND NOTES RECEIVABLE .......................... .............................................................................. 44
NOTE 20 OTHER CURRENT RECEIVABLES .............................. ................................................................................... 45
NOTE 21 NET DEBT / NET CASH AND CASH EQUIVALENTS ................ ..................................................................... 45
NOTE 22 CASH FLOWS ........................................ ........................................................................................................... 52
NOTE 23 CURRENCY, INTEREST RATE AND COUNTERPARTY RISK MANAGEMENT .... ........................................ 54
NOTE 24 PROVISIONS FOR PENSIONS AND OTHER POST-EMPLOYMENT BENEFITS.......... ................................. 57
NOTE 25 CURRENT AND NON-CURRENT PROVISIONS .............................................................................................. 63
NOTE 26 OTHER NON-CURRENT AND CURRENTLIABILITIES .............. ..................................................................... 63
NOTE 27 ACCOUNTS AND NOTES PAYABLE ............................ .................................................................................. 63
NOTE 28 NUMBER OF EMPLOYEES ..................................... ......................................................................................... 64
NOTE 29 OFF-BALANCE SHEET COMMITMENTS .......................... .............................................................................. 65
NOTE 30 RELATED-PARTY TRANSACTIONS ........................... .................................................................................... 66
NOTE 31 SUBSEQUENT EVENTS ................................................................................................................................... 67
NOTE 32 LIST OF THE MAIN CONSOLIDATED COMPANIES BY COUNTRY ........ ...................................................... 68
NOTE 33 AUDIT FEES ..................................................................................................................................................... 71
CAPGEMINI 2016 ANNUAL REPORT 3
STATUTORY AUDITORS’ REPORT ON THE CONSOLIDATED FINA NCIAL STATEMENTS
FOR THE YEAR ENDED DECEMBER 31, 2016 This is a free translation into English of the statutory auditors’ report issued in French and is provided solely for the convenience of English speaking users. The statutory auditors’ report includes information specifically required by French law in such reports, whether modified or not. This information is presented below the opinion on the consolidated financial statements and includes an explanatory paragraph discussing the auditors’ assessments of certain significant accounting and auditing matters. These assessments were considered for the purpose of issuing an audit opinion on the consolidated financial statements taken as a whole and not to provide separate assurance on individual account captions or on information taken outside of the consolidated financial statements. This report should be read in conjunction with, and construed in accordance with, French law and professional auditing standards applicable in France.
To the Shareholders,
In compliance with the assignment entrusted to us by your Annual General Meeting we hereby report to you, for the year ended 31 December
2016, on:
• the audit of the accompanying consolidated financial statements of Cap Gemini S.A. ;
• the justification of our assessments;
• the specific verification required by law.
These consolidated financial statements have been approved by the Board of Directors. Our role is to express an opinion on these consolidated
financial statements based on our audit.
I - Opinion on the consolidated financial statement s
We conducted our audit in accordance with professional standards applicable in France; those standards require that we plan and perform the
audit to obtain reasonable assurance about whether the consolidated financial statements are free of material misstatement. An audit involves
performing procedures, using sampling techniques or other methods of selection, to obtain audit evidence about the amounts and disclosures in
the consolidated financial statements. An audit also includes evaluating the appropriateness of accounting policies used and the reasonableness
of accounting estimates made, as well as the overall presentation of the consolidated financial statements. We believe that the audit evidence we
have obtained is sufficient and appropriate to provide a basis for our audit opinion.
In our opinion, the consolidated financial statements give a true and fair view of the assets and liabilities and of the financial position of the Group
as at 31 December 2016 and of the results of its operations for the year then ended in accordance with International Financial Reporting Standards
as adopted by the European Union.
II - Justification of our assessments
In accordance with the requirements of article L.823-9 of the French Commercial Code (code de commerce) relating to the justification of our assessments, we bring to your attention the following matters:
• Note 6 to the consolidated financial statements sets out the methods used to account for revenues and costs related to long-term contracts. As part of our assessments, we ensured that the above-mentioned accounting rules and principles adopted by your Group were properly applied and verified that the information provided in the note above was appropriate. We also obtained assurance that the estimates used were reasonable.
• Goodwill of €7,176 million is recorded in the consolidated balance sheet. The approach adopted by the Group as well as the accounting principles and methods applied to determine the value in use of these assets are described in Note 15 to the consolidated financial statements. As part of our assessments, we verified whether the approach applied was correct and that the assumptions used and resulting valuations were consistent overall.
• Deferred tax assets amounting to €1,473 million are recorded in the consolidated balance sheet. Note 16 to the consolidated financial statements describes the methods used to calculate the value of these assets. As part of our assessments, we verified the overall consistency of the information and assumptions used to perform these calculations.
These assessments were made in the context of our audit of the consolidated financial statements taken as a whole, and therefore contributed to the opinion we formed which is expressed in the first part of this report.
III - Specific verification
As required by law, we have also verified in accordance with professional standards applicable in France the information presented in the Group’s
management report.
We have no matters to report as to its fair presentation and its consistency with the consolidated financial statements.
The statutory auditors
Neuilly-sur-Seine, 24 February 2017
PricewaterhouseCoopers Audit
Paris La Défense, 24 February 2017
KPMG Audit Division of KPMG S.A.
Françoise Garnier
Partner
Richard Béjot
Partner
Frédéric Quélin
Partner

CAPGEMINI 2016 ANNUAL REPORT 4
CONSOLIDATED INCOME STATEMENT
2015 2016
in millions of euros Notes Amount % Amount %
Revenues 4 - 6 11,915 100 12,539 100
Cost of services rendered (8,838) (74.2) (9,183) (73.3)
Selling expenses (955) (8.0) (1,032) (8.2)
General and administrative expenses (860) (7.2) (884) (7.0)
Operating expenses 7 (10,653) (89.4) (11,099) (88.5)
Operating margin * 1,262 10.6 1,440 11.5
Other operating income and expense 8 (240) (2.0) (292) (2.3)
Operating profit 1,022 8.6 1,148 9.2
Net finance costs 9 (55) (0.5) (104) (0.8)
Other financial income and expense 9 (63) (0.5) (42) (0.4)
Net financial expense (118) (1.0) (146) (1.2)
Income tax income (expense) 10 (1) 203 1.7 (2) (94) (0.8)
PROFIT FOR THE YEAR
1,107 9.3 908 7.2
Attributable to:
Owners of the Company 1,124 9.4 921 7.3
Non-controlling interests (17) (0.1) (13) (0.1)
EARNINGS PER SHARE
Average number of shares outstanding during the year 168,452,917 169,450,721
Basic earnings per share (in euros) 11 6.67 5.44
Diluted average number of shares outstanding 178,581,519 179,080,780
Diluted earnings per share (in euros) 11 6.33 5.25 (1) Including the remeasurement of deferred tax assets on US tax loss carry-forwards in the amount of €476 million,
(2) Including tax income (net) of €180 million in respect of goodwill arising on legal restructurings.
* Operating margin, an alternative performance measure monitored by the Group, is defined in Note 3, Alternative performance measures.

CAPGEMINI 2016 ANNUAL REPORT 5
STATEMENT OF INCOME AND EXPENSE RECOGNIZED IN EQUITY in millions of euros 2015 2016
Actuarial gains and losses on defined benefit pension plans, net of tax (1) 97 (257)
Remeasurement of hedging derivatives, net of tax (2) 35 53
Translation adjustments (2) 255 173
TOTAL INCOME AND EXPENSE RECOGNIZED IN EQUITY 387 (31)
Profit for the year (reminder) 1,107 908
If this income and expense recognized in equity had been recognized in profit or loss, profit for the year would have been as follows: 1,494 877
Attributable to:
Owners of the Company 1,514 886
Non-controlling interests (20) (9) (1) Items that will not be reclassified subsequently to profit or loss,
(2) Items that may be reclassified subsequently to profit or loss.

CAPGEMINI 2016 ANNUAL REPORT 6
CONSOLIDATED STATEMENT OF FINANCIAL POSITION
in millions of euros Notes December 31,
2015 December 31,
2016
Goodwill 13 - 15 7,055 7,176
Intangible assets 13 848 813
Property, plant and equipment 14 763 754
Deferred taxes 16 1,412 1,473
Other non-current assets 18 457 374
Total non-current assets 10,535 10,590
Accounts and notes receivable 19 3,055 3,074
Current tax receivables 64 132
Other current receivables 20 543 627
Cash management assets 21 116 157
Cash and cash equivalents 21 1,950 1,879
Total current assets
5,728 5,869
TOTAL ASSETS
16,263 16,459
in millions of euros Notes December 31,
2015 December 31,
2016
Share capital 1,377 1,373
Additional paid-in capital 3,499 3,453
Retained earnings and other reserves 887 1,525
Profit for the year 1,124 921
Equity (attributable to owners of the Company) 6,887 7,272
Non-controlling interests 26 13
Total equity 6,913 7,285
Long-term borrowings 21 3,161 3,287
Deferred taxes 16 221 227
Provisions for pensions and other post-employment benefits 24 1,216 1,374
Non-current provisions 25 28 26
Other non-current liabilities 26 367 292
Total non-current liabilities 4,993 5,206
Short-term borrowings and bank overdrafts 21 652 125
Accounts and notes payable 27 2,724 2,818
Advances from customers and billed in advance 19 739 737
Current provisions 25 90 104
Current tax liabilities 61 109
Other current payables 26 91 75
Total current liabilities 4,357 3,968
TOTAL EQUITY AND LIABILITIES
16,263 16,459

CAPGEMINI 2016 ANNUAL REPORT 7
CONSOLIDATED STATEMENT OF CASH FLOWS Cash flows for the period are discussed in Note 22, Cash flows.
2015 2016
in millions of euros Notes Amount Amount
Profit for the year attributable to owners of the C ompany 1,124 921
Non-controlling interests (17) (13)
Impairment of goodwill 13 - 15 40 -
Depreciation, amortization and impairment of fixed assets 264 299
Change in provisions 8 (5)
Losses on disposals of assets 17 6
Expenses relating to share grants 32 54
Net finance costs 9 55 104
Income tax expense / (income) 10 (203) 94
Unrealized gains on changes in fair value and other (19) (11)
Cash flows from operations before net finance costs and income tax (A) 1,301 1,449
Income tax paid (B) (137) (167)
Change in accounts and notes receivable and advances from customers and amounts billed in advance (22) (45)
Change in capitalized costs on projects (10) 13
Change in accounts and notes payable (80) 128
Change in other receivables/payables (48) (59)
Change in operating working capital (C) (160) 37
NET CASH FROM OPERATING ACTIVITIES (D=A+B+C) 1,004 1,319
Acquisitions of property, plant and equipment and intangible assets 13 - 14 (198) (197)
Proceeds from disposals of property, plant and equipment and intangible assets 19 21
(179) (176)
Cash inflows (outflows) on business combinations net of cash and cash equivalents acquired (3,392) (23)
Cash outflows in respect of cash management assets (2) (36)
Other cash (outflows) inflows, net (13) (16)
(3,407) (75)
NET CASH USED IN INVESTING ACTIVITIES (E) (3,586) (251)
Proceeds from issues of share capital 564 -
Proceeds from issues of share capital subscribed by non-controlling interests 5 -
Dividends paid (198) (229)
Net payments relating to transactions in Cap Gemini S.A. shares (81) (315)
Proceeds from borrowings 2,775 505
Repayments of borrowings (691) (1,004)
Interest paid (38) (115)
Interest received 28 43
NET CASH (USED IN) / FROM FINANCING ACTIVITIES (F) 2,364 (1,115)
NET DECREASE IN CASH AND CASH EQUIVALENTS (G=D+E+F) (218) (47)
Effect of exchange rate movements on cash and cash equivalents (H) 26 (31)
CASH AND CASH EQUIVALENTS AT BEGINNING OF YEAR (I) 21 2,140 1,948
CASH AND CASH EQUIVALENTS AT END OF YEAR (G+H+I) 21 1,948 1,870

CAPGEMINI 2016 ANNUAL REPORT 8
CONSOLIDATED STATEMENT OF CHANGES IN EQUITY
Translation adjustments Other
At January 1, 2015 163 592 949 1 309 3 010 (60) 1 688 (10 ) (880) 5 057 26 5 083
Dividends paid out for 2014 - - - - (198) - - (198) - (198)Incentive instruments and employee share ow nership 1 888 551 15 49 92 (18) - - 138 - 138Adjustments to the put option granted to minority shareholders - - - - (32) - - (32) - (32)Tax impact of the derivative instrument on Cap Gemini S.A. shares - - - - 22 - - 22 - 22
Elimination of treasury shares - - - (107) 2 - - (105) - (105)
Share capital increase 6 700 000 53 440 - 7 - - 500 5 505
Transactions w ith minority shareholders - - - - (9) - - (9) 15 6
Transactions w ith shareholders 8 588 551 68 489 (15) (22 6) - - 316 20 336Income and expense recognized in equity - - - - - 258 132 390 (3) 387
Profit for the year - - - - 1 124 - - 1 124 (17) 1 107
At December 31, 2015 172 181 500 1 377 3 499 (75) 2 586 2 48 (748) 6 887 26 6 913
Dividends paid out for 2015 - - - - (229) - - (229) - (229)
Incentive instruments and employee share ow nership - - - 62 15 - - 77 - 77
Derivatives on Cap Gemini S.A. shares, net of tax - - - - (32) - - (32) - (32)
Early redemption of ORNANE 2013 - - - 56 (37) - - 19 - 19
Elimination of treasury shares - - - (340) - - - (340) - (340)
Share capital reduction by cancellation of treasury shares (617 235) (4) (46) 50 - - - - - -
Transactions w ith minority shareholders - - - - 4 - - 4 (4) -
Transactions w ith shareholders (617 235) (4) (46) (172) (279) - - (501) (4) (505)Income and expense recognized in equity - - - - - 169 (204) (35) 4 (31)
Profit for the year - - - - 921 - - 921 (13) 908
At December 31, 2016 171 564 265 1 373 3 453 (247) 3 228 417 (952) 7 272 13 7 285
in millions of eurosNumber of
sharesShare capital
Additional paid-in capital
Treasury shares
Total income and expense recognized
in equity
Equity (attributable
to owners of the
Company)
Non-controlling
interestsTotal
equity
Consolidated retained
earnings and other
reserves

CAPGEMINI 2016 ANNUAL REPORT 9
NOTES TO THE CONSOLIDATED FINANCIAL STATEMENTS FOR THE YEAR ENDED DECEMBER 31, 2016
NOTE 1 ACCOUNTING BASIS The consolidated financial statements for the year ended December 31, 2016 and the notes thereto were adopted by the Board of Directors on February 15, 2017. The consolidated financial statements will be approved by the Combined Shareholders’ Meeting, scheduled for May 10, 2017.
A) IFRS standards-base
Pursuant to European Commission Regulation no. 1606/2002 of July 19, 2002, the 2016 consolidated financial statements have been prepared in accordance with international accounting standards (IFRS, International Financial Reporting Standards) as issued by the International Accounting Standards Board (IASB) and endorsed by the European Union (EU). The Group also takes account of the positions adopted by Syntec Numérique, an organization representing major consulting and computer services companies in France, regarding the application of certain IFRSs.
The main accounting policies are presented at the beginning of each note to the consolidated financial statements.
B) New standards and interpretations applicable in 2016
a) New standards, amendments and interpretations of mandatory application (published by the IASB, endorsed by the EU, entered into effect on January 1, 2016)
The accounting policies applied by the Group are unchanged on those applied for the preparation of the 2015 consolidated financial statements, with the exception of new standards, amendments and interpretations which entered into effect on January 1, 2016 and which had no material impact on the Group financial statements.
b) New standards, amendments and interpretations no t adopted early (published by the IASB, endorsed by the EU, not yet in effect at January 1, 2016)
The potential impacts of the application of new standards, amendments and interpretations on the Group consolidated financial statements will not be material. The Group worked together with international sector players and within Syntec Numérique in France on identifying application issues relating to IFRS 15, Revenue from contracts with customers. At the same time, the Group launched a project to analyze, for a sample of contracts, any differences between accounting policies currently applied and IFRS 15. The conclusions of this analysis and the potential impacts are currently being finalized.
c) New standards, amendments and interpretations no t yet endorsed (published by the IASB, not yet endorsed by the EU, not yet in effect at January 1, 2016)
The Group did not elect to adopt early the standards, amendments, and interpretations published by the IASB but not yet endorsed by the European Union at December 31, 2016 or in effect at January 1, 2016.
C) Use of estimates
The preparation of consolidated financial statements involves the use of estimates and assumptions which may have an impact on the reported values of assets and liabilities at the period end or on certain items of either net profit or the income and expenses recognized directly in equity for the year. Estimates are based on economic data and assumptions which are likely to vary over time and are subject to a degree of uncertainty. They mainly concern revenue recognition on fixed-price contracts accounted for on a percentage-of-completion basis, recognition of deferred tax assets, measurement of the recoverable amount of assets, provisions for pensions and other post-employment benefits, the fair value of derivatives, and provisions.

CAPGEMINI 2016 ANNUAL REPORT 10
NOTE 2 CONSOLIDATION PRINCIPLES AND GROUP STRUCTURE Consolidation methods
The accounts of companies directly or indirectly controlled by the parent company are fully consolidated. The parent company is deemed to exercise control over an entity when it has the power to govern the financial and operating policies of the entity so as to obtain benefits from its activities.
Investments in associates over whose management the parent company directly or indirectly exercises significant influence, without however exercising full or joint control, are accounted for by the equity method. This method consists of recording the Group’s share in profit for the year of the associate in the Income Statement. The Group’s share in net assets of the associate is recorded under “Other non-current assets” in the Consolidated Statement of Financial Position.
Details of the scope of consolidation are provided in Note 32, List of the main consolidated companies by country. All consolidated companies prepared their accounts to December 31, 2016 in accordance with the accounting policies adopted by the Group.
Inter-company transactions are eliminated on consolidation, as well as inter-company profits.
The Group does not control any special purpose entities that have not been consolidated.
Foreign currency translation
The consolidated accounts presented in these consolidated financial statements have been prepared in euros.
The Consolidated Statements of Financial Position of subsidiaries denominated in foreign currencies are translated into euros at year-end rates of exchange with the exception of equity accounts, which are carried at their historical values. Income statements denominated in foreign currencies are translated into euros at the average rates of exchange for the year. However, for certain material transactions, it may be relevant to use a specific rate of exchange. Differences arising from translation at these different rates are recognized directly in equity under “Translation reserves” and have no impact on the Income Statement.
Exchange differences arising on monetary items which form an integral part of the net investment in foreign subsidiaries are recognized in equity under “Translation reserves”. Exchange differences on receivables and payables denominated in a foreign currency are recorded in operating income or expense or financial income or expense, depending on the type of transaction concerned. The exchange rates used to translate the financial statements of the Group’s main subsidiaries into euros are as follows:
Average rate Closing rate
2015 2016 2015 2016
Australian dollar 0.67838 0.67230 0.67128 0.68512
Brazilian real 0.27480 0.26057 0.23193 0.29150
Canadian dollar 0.70630 0.68234 0.66155 0.70482
Chinese renminbi yuan 0.14349 0.13609 0.14163 0.13661
Indian rupee 0.01406 0.01345 0.01389 0.01397
Norwegian krona 0.11200 0.10765 0.10413 0.11006
Polish zloty 0.23916 0.22920 0.23453 0.22674
Pound sterling 1.37806 1.22455 1.36249 1.16798
Swedish krona 0.10691 0.10567 0.10882 0.10469
US dollar 0.90166 0.90404 0.91853 0.94868
N.B. the income statement of IGATE, purchased on July 1, 2015, was consolidated at average exchange rates for the second-half of 2015.
Business combinations
Business combinations are accounted for using the acquisition method. Under this method, the identifiable assets acquired and liabilities assumed are recognized at fair value at the acquisition date and may be adjusted during the 12 months following this date.
Exchange gains and losses on inter-company transact ions The results and financial position of a foreign subsidiary are included in the Group’s consolidated financial statements after the elimination of inter-company balances and transactions. However, a foreign exchange gain or loss arising on an inter-company monetary asset or liability (e.g. an inter-company receivable denominated in a currency different from the functional currency of the subsidiary) cannot be eliminated. Such foreign exchange gains and losses are recognized in the Income statement or in Income and expense recognized directly in equity, if the underlying forms an integral part of the net investment in the foreign operation (e.g. a loan with no fixed maturity). The fair values of hedging instruments relating to inter-company operating transactions performed as part of the centralized management of currency risk in the parent company are eliminated.

CAPGEMINI 2016 ANNUAL REPORT 11
Acquisitions in 2016
In the first-half of 2016, the Group acquired Oinio in Germany (100 employees), strengthening Capgemini’s digital transformation offering around the Salesforce solution and platform.
The Group also acquired Fahrenheit 212 in the United States (70 employees), an innovation strategy and design firm, to develop new digital offerings in North America. The acquisition price for these two acquisitions was €22 million, in addition to which earn-outs comprising conditions of presence are recorded in “Other operating income and expense”.
These acquisitions did not have a material impact on the Group financial statements for the year ended December 31, 2016.
Recap of the acquisition of IGATE in 2015 IGATE is a technology and services group based in the United States and headquartered in New Jersey. In 2014, it reported US GAAP revenues of US$ 1.3 billion and operating income of US$ 220 million, and had 33,484 employees at December 31, 2014. North America is IGATE’s main market generating 79% of revenues in 2014, followed by Europe (14%) and the Asia-Pacific region (7%). Pursuant to the terms of the merger agreement announced on April 27, 2015, Capgemini completed the acquisition of IGATE Corporation on July 1, 2015, which became a wholly-owned subsidiary of the Capgemini Group at that date. On July 1, 2015, all issued and outstanding IGATE Corporation ordinary shares (other than IGATE Corporation ordinary shares held by the company) and vested rights under stock option plans were converted into a right to receive cash of US$ 48 per security. The resulting purchase price was US$ 3,961 million. IGATE Corporation shares are no longer traded and have been delisted from the NASDAQ Global Select Market. IGATE is fully consolidated from July 1, 2015. Since its acquisition on July 1, 2015, IGATE has contributed €609 million to Group revenues, €88 million to Group operating profit and €68 million to Group profit for the year. Had the acquisition been performed on January 1, 2015 and based on information provided by IGATE in respect of the first-half of 2015, the Group estimates that IGATE’s contribution to its revenues, operating profit and profit for the year would have been €1,194 million, €160 million and €109 million, respectively for 2015. The goodwill balance recognized on initial consolidation was not materially restated at the end of the allocation period.

CAPGEMINI 2016 ANNUAL REPORT 12
Financing transactions To finance this acquisition, the Group performed the following transactions to supplement available cash:
► negotiation of a bridge loan of US$ 3,800 billion (available for draw-down in US dollars and/or euro) with a group of 15 banks following a round of syndication completed on June 2, 2015 (the bridge loan having been subscribed by a restricted group of banks on April 24, 2015). This loan was drawn twice on June 29, 2015, in the amount of €2,200 million and US$ 1,000 million (representing a total euro-equivalent of €3,094 million) for the partial financing of the acquisition of IGATE on July 1, 2015 and the refinancing of a portion of its borrowings (see below);
► a €500 million share capital increase (net of post-tax share issue costs) launched on June 9, 2015 by private placement and concerning 6,700,000 new shares. The subscription price was €75.50 per share, representing a discount of 2.4% on the volume-weighted average price of June 9, 2015;
► a “triple tranche” bond issue for a total nominal amount of €2,750 million, placed on June 24, 2015 and with a settlement/delivery date of July 1, 2015. The three tranches of this bond issue present the following characteristics (see Note 21, Net debt / Net cash and cash equivalents):
• €500 million of notes due July 2, 2018, paying a floating coupon of 3 month Euribor + 85pb (issue price 100%),
• €1,250 million of notes due July 1, 2020, paying an annual coupon of 1.75% (issue price 99.853%),
• €1,000 million of notes due July 1, 2023, paying an annual coupon of 2.50% (issue price 99.857%).
On July 7, 2015, the proceeds from this bond placement were allocated to the repayment of the €3,094 million drawdown on the bridge loan. The bridge loan was cancelled in full on July 9, 2015.
Furthermore, Capgemini entered into the following transactions to manage the interest rate and foreign currency risk associated with this acquisition:
► purchase of euro interest rate swaptions: all these options were unwound before the acquisition of IGATE and were recognized in full in net financial expense at December 31, 2015;
► purchase of US dollar/euro call options: all these instruments were unwound before the acquisition of IGATE and were recognized in full in net financial expense at December 31, 2015;
► set-up, for a total notional amount of US$ 1,000 million and with a 5-year maturity, of EUR/USD fix-to-fix cross currency swaps, classified as cash flow hedges for the interest rate component and as fair value hedges for the exchange rate component. In respect of these financial instruments, Capgemini will receive from the relevant banking counterparties a rate of 1.75% on a notional amount of €894 million, in exchange for payment of an average rate of 3.51% on a notional amount of US$ 1,000 million (see Note 9, Net financial expense).
Following its acquisition by Capgemini, IGATE repaid its main borrowings in July 2015:
► a bond issue of a principal amount of US$ 325 million, maturing in 2019,
► a bank loan with an outstanding balance of US$ 234 million.
Employee incentive instruments In the context of the acquisition of IGATE on July 1, 2015, the Capgemini Group decided to maintain the vesting conditions of capital instruments (share subscription options, reserved shares and performance shares) granted by IGATE prior to the acquisition and to fix the price thereof based on the transaction price. A cash amount will therefore be granted at the initial vesting dates calculated based on a price of US$ 48. The cash payment for share subscription options and reserved shares not vested at July 1, 2015 will be made primarily in 2015 (post acquisition), 2016 and 2017 subject to compliance with the presence condition associated with these instruments at the vesting date. The payment in respect of vested capital instruments is US$ 42 million. The US$ 75.5 million expense in respect of instruments in the course of vesting is spread over the period between the different grant and vesting dates. Accordingly, a provision of US$ 54 million was recognized in the opening balance sheet in respect of services rendered between the grant dates and the date of acquisition of IGATE. The expense in respect of the period after the acquisition date is estimated at US$ 21.5 million and will be recognized progressively in the Income Statement over the period from the acquisition date to the relevant vesting dates. An expense of €7.7 million was recognized in respect of 2016 (€9.9 million in 2015).
CAPGEMINI 2016 ANNUAL REPORT 13
NOTE 3 ALTERNATIVE PERFORMANCE MEASURES The alternative performance measures monitored by the Group are defined as follows:
► Operating margin is equal to revenues less operating expenses. It is calculated before “Other operating income and expenses” which include amortization of intangible assets recognized in business combinations, the charge resulting from the deferred recognition of the fair value of shares granted to employees (including social security contributions and employer contributions), and non-recurring revenues and expenses, notably impairment of goodwill, negative goodwill, capital gains or losses on disposals of consolidated companies or businesses, restructuring costs incurred under a detailed formal plan approved by the Group’s management, the cost of acquiring and integrating companies acquired by the Group, including earn-outs comprising conditions of presence in companies acquired, and the effects of curtailments, settlements and transfers of defined benefit pension plans,
► Normalized earnings per share are calculated by dividing normalized profit or loss attributable to owners of the Company by the weighted average number of ordinary shares outstanding during the period, excluding treasury shares. Normalized net profit or loss is equal to profit for the period attributable to owners of the Company corrected for the impact of items recognized in other operating income and expense (see Note 8, Other operating income and expense), net of tax calculated using the effective tax rate,
► Net debt (or net cash and cash equivalents) comprises (i) cash and cash equivalents, as presented in the Consolidated Statement of Cash Flows (consisting of short-term investments and cash at bank) less bank overdrafts, and also including (ii) cash management assets (assets presented separately in the Consolidated Statement of Financial Position due to their characteristics), less (iii) short- and long-term borrowings. Account is also taken of (iv) the impact of hedging instruments when these relate to borrowings and own shares
► Organic free cash flow calculated based on items in the Statement of Cash Flows is equal to cash flow from operations less acquisitions of property, plant, equipment and intangible assets (net of disposals) and adjusted for flows relating to the net interest cost.

CAPGEMINI 2016 ANNUAL REPORT 14
NOTE 4 OPERATING SEGMENTS Group Management analyzes and measures activity performance:
► in the geographic areas where the Group is present,
► in the different businesses (consulting services, technology and engineering services, application services, and other managed services).
The geographic analysis enables management to monitor the performance:
► of commercial development: it focuses on trends in major contracts and clients in Group markets across all its businesses. This monitoring seeks to coordinate the service offering of the different businesses in the countries, given their considerable interaction and to measure the services rendered. These analyses are performed by Group Management within the Coordination Committee of the geographic area, which brings together the business managers operating in a given area;
► at operational and financial level: management of treasury and support services, the operating investment and financing policies and the acquisition policy are decided and implemented by geographic area.
The business analysis enables the transversal management and monitoring of resources and service production during the fiscal year in the strategic units, primarily business-focused and therefore the roll-out of uniform expertise and know-how in all countries and regions.
Accordingly, the Group presents segment reporting for the five geographic areas where it is located.
Costs relating to operations and incurred by Group holding companies on behalf of geographic areas and businesses are allocated to the relevant segments either directly or on the basis of an allocation key. Items not allocated correspond to headquarter expenses.
Inter-segment transactions are carried out on an arm’s length basis.
The performance of operating segments is measured based on the operating margin*. This indicator enables the measurement and comparison of the operating performance of operating segments, irrespective of whether their business results from internal or external growth. The operating margin* realized by the main offshore production centers (India and Poland) is reallocated to the geographic areas managing the contracts to enable a better understanding of the performance of these areas. * Operating margin, an alternative performance measure monitored by the Group, is defined in Note 3, Alternative performance measures and Note 5, Consolidated Income Statement. SEGMENT REPORTING BY GEOGRAPHIC AREA
The Group now communicates segment information for five geographic areas: North America, France, United Kingdom and Ireland, the Rest of Europe and Asia-Pacific and Latin America. The Rest of Europe area now includes Benelux, the weight of which is constantly decreasing due to the geographic diversification of the Group outside Europe.
Segment reporting is complemented by information on revenues and operating margin for each of the Group’s four businesses.
These areas are presented in detail below:
Geographic area Main countries
North America Canada, United States
France France
United Kingdom and Ireland Ireland, United Kingdom
Rest of Europe Belgium, Denmark, Finland, Germany, Italy, Luxembourg, Netherlands, Norway, Poland, Portugal, Spain, Sweden, Switzerland
Asia-Pacific and Latin America Argentina, Australia, Brazil, China, India, Japan, Mexico, Singapore

CAPGEMINI 2016 ANNUAL REPORT 15
ANALYSIS OF THE INCOME STATEMENT BY GEOGRAPHIC AREA
2016 (in millions of euros)
North America France
United Kingdom
and Ireland
Rest of Europe
Asia-Pacific
and Latin America
HQ expenses
Elimina- tions Total
Revenues
►external 3,800 2,567 1,993 3,214 965 - - 12,539
►inter-geographic area 151 200 155 273 1,251 (2,030) -
TOTAL REVENUES 3,951 2,767 2,148 3,487 2,216 - (2,030) 12,539
OPERATING MARGIN * 587 234 290 339 64 (74) - 1,440
% of revenues 15.4 9.1 14.6 10.5 6.6 - - 11.5
OPERATING PROFIT 487 167 259 288 23 (76) - 1,148
2015 (in millions of euros)
North America France
United Kingdom
and Ireland
Rest of Europe
Asia-Pacific
and Latin America
HQ expenses
Elimina- tions Total
Revenues
►external 3,325 2,444 2,150 3,066 930 - - 11,915
►inter-geographic area 151 185 162 239 1,051 - (1,788) -
TOTAL REVENUES 3,476 2,629 2,312 3,305 1,981 - (1,788) 11,915
OPERATING MARGIN * 494 199 289 313 39 (72) - 1,262
% of revenues 14.9 8.1 13.4 10.2 4.2 - - 10.6
OPERATING PROFIT 408 152 291 255 (24) (60) - 1,022 * Operating margin, an alternative performance measure monitored by the Group, is defined in Note 3, Alternative performance measures.

CAPGEMINI 2016 ANNUAL REPORT 16
ANALYSIS OF ASSETS AND LIABILITIES BY GEOGRAPHIC AREA
At December 31, 2016 (in millions of euros)
North America France
United Kingdom
and Ireland
Rest of Europe
Asia-Pacific and Latin America
Not allocated
Elimina- tions
Total
Assets by geographic area
► external 3,507 2,611 1,620 2,835 1,910 39 - 12,522
► inter-geographic area 84 83 61 88 176 28 (520) -
TOTAL ASSETS 3,591 2,694 1,681 2,923 2,096 67 (520) 12,522 o/w acquisitions of intangible assets and property,
plant and equipment (1) 26 46 29 64 91 1 - 257
Deferred tax assets 1,473
Income tax assets 159
Cash management assets 157
Cash and cash equivalents 1,879
Derivative instruments 269
TOTAL ASSETS 16,459
Liabilities by geographic area
► external 907 1,197 1,405 1,070 732 10 - 5,321
► inter-geographic area 150 100 80 127 61 - (518) -
TOTAL LIABILITIES 1,057 1,297 1,485 1,197 793 10 (518) 5,321
Equity 7,285
Deferred tax liabilities 227
Income tax liabilities 125
Borrowings and bank overdrafts 3,412
Derivative instruments 89
TOTAL LIABILITIES AND EQUITY 16,459
At December 31, 2015 (in millions of euros)
North America France
United Kingdom
and Ireland
Rest of Europe
Asia-Pacific and Latin America
Not allocated
Elimina- tions
Total
Assets by geographic area
► external 3,385 2,603 1,757 2,772 1,796 36 - 12,349
► inter-geographic area 69 77 56 88 137 39 (466) -
TOTAL ASSETS 3,454 2,680 1,813 2,860 1,933 75 (466) 12,349 o/w acquisitions of intangible assets and property,
plant and equipment (1) 28 51 40 49 74 1 - 243
Deferred tax assets 1,412
Income tax assets 94
Cash management assets 116
Cash and cash equivalents 1,950
Derivative instruments 342
TOTAL ASSETS 16,263
Liabilities by geographic area
► external 814 1,192 1,378 983 645 8 - 5,020
► inter-geographic area 110 103 73 109 72 - (467) -
TOTAL LIABILITIES 924 1,295 1,451 1,092 717 8 (467) 5,020
Equity 6,913
Deferred tax liabilities 221
Income tax liabilities 79
Borrowings and bank overdrafts 3,813
Derivative instruments 217
TOTAL LIABILITIES AND EQUITY 16,263 (1) Total acquisitions of intangible assets and property, plant and equipment is different from the figure reported in the Statement of Cash Flows (€197 million in 2016 and €198 million in 2015), which excludes acquisitions of assets held under finance leases (€60 million in 2016 and €45 million in 2015).

CAPGEMINI 2016 ANNUAL REPORT 17
SEGMENT REPORTING BY BUSINESS
Segment reporting by business is presented according to the following classification:
► Consulting Services, which help to enhance the performance of organizations based on in-depth knowledge of client industries and processes;
► Technology & Engineering Services, which provide assistance and support to internal IT teams within client companies;
► Application Services, which devise, develop, implement and maintain IT applications covering the Group’s system integration and application maintenance activities;
► Other Managed Services, which integrate, manage and/or develop either fully or partially, client IT Infrastructure systems (or those of a group of clients), transaction services, on-demand services and/or business activities (Business Process Outsourcing, BPO).
BREAKDOWN OF REVENUES BY BUSINESS
2015 2016
in millions of euros Amount % Amount %
Consulting services 480 4 506 4
Technology & Engineering Services 1,744 15 1,873 15
Application services 6,997 59 7,557 60
Other managed services 2,694 22 2,603 21
REVENUES 11,915 100 12,539 100 BREAKDOWN OF OPERATING MARGIN BY BUSINESS
2015 2016
in millions of euros Amount % Amount %
Consulting services 44 9.1 54 10.7
Technology & Engineering Services 202 11.6 240 12.8
Application services 830 11.9 960 12.7
Other managed services 258 9.6 260 10.0
Headquarter expenses (72) - (74) -
OPERATING MARGIN * 1,262 10.6 1,440 11.5 * Operating margin, an alternative performance measure monitored by the Group, is defined in Note 3, Alternative performance measures.

CAPGEMINI 2016 ANNUAL REPORT 18
NOTE 5 CONSOLIDATED INCOME STATEMENT
Income and expenses are presented in the Consolidated Income Statement by function. Operating expenses are broken down into the cost of services rendered (corresponding to costs incurred for the execution of client projects), selling expenses, and general and administrative expenses.
These three captions represent ordinary operating expenses which are deducted from revenues to obtain operating margin*, one of the main Group business performance indicators.
Operating profit is obtained by deducting other operating income and expenses from operating margin.
Other operating income and expenses include amortization of intangible assets recognized in business combinations, the charge resulting from the deferred recognition of the fair value of shares granted to employees (including social security contributions and employer contributions), and non-recurring revenues and expenses, notably impairment of goodwill, negative goodwill, capital gains or losses on disposals of consolidated companies or businesses, restructuring costs incurred under a detailed formal plan approved by the Group’s management, the cost of acquiring and integrating companies acquired by the Group, including earn-outs relating to conditions of presence in companies acquired and the effects of curtailments, settlements and transfers of defined benefit pension plans.
Profit for the year attributable to owners of the Company is then obtained by taking into account the following items:
► net finance costs, including net interest on borrowings calculated using the effective interest rate, less income from cash, cash equivalents and cash management assets;
► other financial income and expense, which primarily correspond to the impact of remeasuring financial instruments to fair value when these relate to items of a financial nature, disposal gains and losses and the impairment of investments in non-consolidated companies, net interest costs on defined benefit pension plans, exchange gains and losses on financial items, and other financial income and expense on miscellaneous financial assets and liabilities calculated using the effective interest rate;
► current and deferred income tax expense;
► share of profit of associates;
► share of non-controlling interests.
* Operating margin, an alternative performance measure monitored by the Group, is defined in Note 3, Alternative performance measures.
NOTE 6 REVENUES The method for recognizing revenues and costs depends on the nature of the services rendered:
a. Time and materials contracts
Revenues and cost of services are recognized as services are rendered.
b. Long-term fixed-price contracts
Revenues, including systems development and integration contracts, are recognized using the “percentage-of-completion” method. Costs are recognized as they are incurred.
c. Outsourcing contracts
Revenues from outsourcing agreements are recognized over the term of the contract as the services are rendered.
The related costs are recognized as they are incurred. However, a portion of costs incurred in the initial phase of outsourcing contracts (transition and/or transformation costs) may be deferred when they are specific to a given contract, relate to future activity on the contract and/or will generate future economic benefits, and are recoverable. These costs are allocated to work-in-progress and any reimbursement by the client is recorded as a deduction from the costs incurred. When the projected cost of the contract exceeds contract revenues, a loss to completion is recognized in the amount of the difference.
Revenues receivable from these contracts are recognized in the Consolidated Statement of Financial Position under “Accounts and notes receivable” when invoiced to customers and “Accrued income” when they are not yet invoiced. Advances from customers and billed in advance are included in current liabilities. Group revenues total €12,539 million (€11,915 million in 2015), representing a year-on-year increase of 5.2%, based on the year-end Group scope and exchange rates and 7.9% at constant exchange rates.

CAPGEMINI 2016 ANNUAL REPORT 19
NOTE 7 OPERATING EXPENSES BY NATURE
2015 2016
in millions of euros Amount % of revenues Amount % of revenues
Personnel expenses 7,260 60.9% 7,611 60.7%
Travel expenses 499 4.2% 521 4.2%
7,759 65.1% 8,132 64.9%
Purchases and sub-contracting expenses 2,207 18.5% 2,254 18.0%
Rent and local taxes 372 3.1% 380 3.0%
Other charges to depreciation, amortization and provisions and proceeds from asset disposals 315 2.7% 333 2.6%
OPERATING EXPENSES 10,653 89.4% 11,099 88.5%
BREAKDOWN OF PERSONNEL COSTS
in millions of euros Note 2015 2016
Wages and salaries 5,845 6,151
Payroll taxes 1,344 1,401
Pension costs related to defined benefit pension plans and other post-employment benefit expenses 24 71 59
PERSONNEL EXPENSES 7,260 7,611
NOTE 8 OTHER OPERATING INCOME AND EXPENSE
in millions of euros Notes 2015 2016 Amortization of intangible assets recognized in business combinations (45) (68)
Impairment of goodwill 13 - 15 (40) -
Expense relating to share grants 12 (42) (58)
Restructuring costs (81) (103)
Integration costs for purchased companies (39) (68)
Acquisition costs (16) (1)
Other operating expenses (29) (5)
Total operating expenses (292) (303)
Other operating income 52 11
Total operating income 52 11
OTHER OPERATING INCOME AND EXPENSE (240) (292)
RESTRUCTURING COSTS
Fiscal year 2016 restructuring costs primarily concern workforce reduction measures in the amount of €91 million (€67 million in 2015) and the streamlining of real estate and production assets in the amount of €7 million (€11 million in 2015).
INTEGRATION COSTS FOR PURCHASED COMPANIES
Integration costs for purchased companies total €68 million and mainly concern the integration of the IGATE group and primarily the cost of consultants involved in the integration and expenses relating to incentive instruments granted to IGATE employees. Integration costs also include earn-outs associated with conditions of presence for companies purchased in 2016.
In 2015, Other operating income included income of €35 million relating to the decrease in the present value of the benefit obligation for the main Capgemini UK Plc. pension plan, following an agreement with certain members regarding a reduction in their defined benefits.

CAPGEMINI 2016 ANNUAL REPORT 20
NOTE 9 NET FINANCIAL EXPENSE
in millions of euros Note 2015 2016
Income from cash, cash equivalents and cash management assets 28 25
Net interest on borrowings (71) (95)
Net finance costs at the nominal interest rate (43) (70)
Impact of amortized cost on borrowings (12) (34)
Net finance costs at the effective interest rate (55) (104)
Net interest cost on defined benefit pension plans 24 (45) (37)
Exchange gains (losses) on financial transactions 21 28
Gains (losses) on derivative instruments (20) (30)
Other (19) (3)
Other financial income and expense (63) (42)
o/w financial income 143 219
o/w financial expenses (206) (261)
NET FINANCIAL EXPENSE (118) (146) Net interest on borrowings (€95 million) and the impact of amortized cost on borrowings (€34 million) total €129 million and mainly comprise:
► coupons on the 2011 bond issue of €24 million (compared with €26 million in 2015), plus an amortized cost accounting impact of €1 million (stable on 2015);
► the expense relating to the “ORNANE 2013” bonds redeemable in cash and/or in new and/or existing shares of €30 million (compared with €10 million in 2015), including €22 million in respect of the difference between the market value of the bond component of the ORNANE 2013 bonds (€400 million) and the accounting value of the bond component at the redemption date (see Note 21, Net debt / Net cash and cash equivalents);
► coupons on the bond issues maturing in July 2018, July 2020 and July 2023 of €50 million, plus an amortized cost accounting impact of €3 million in respect of these bonds: floating coupon of €4 million on the July 2018 tranche, coupon of €23 million on the July 2020 tranche and coupon of €26 million on the July 2023 tranche, respectively (compared with total coupons of €26 million plus an amortized cost accounting impact of €1 million in 2015 for these three bond issues performed on July 1, 2015) (see Note 2, Consolidation principles and Group structure);
► the net cost of EUR/USD fix-to-fix cross currency swaps of €16 million.
Exchange gains on financial transactions and losses on derivative instruments primarily concern inter-company loans denominated in foreign currencies and their related hedging arrangements.
Fair value gains and losses on the conversion option embedded in the “ORNANE 2013” bonds and the call option on own shares purchased in October 2013 are included in “Gains (losses) on derivative instruments” (see Note 21, Net debt / Net cash and cash equivalents). Given the “matching” nature of the main characteristics of these two derivative instruments, their respective fair value gains and losses fully offset each other, resulting in a nil impact on the Group net financial expense.

CAPGEMINI 2016 ANNUAL REPORT 21
NOTE 10 INCOME TAX EXPENSE The income tax expense is the sum of the current tax expense and the deferred tax expense. It is recognized in net profit, except where it relates to a business combination or items recognized in equity or in income and expense recognized in equity.
Current income taxes
The current income tax expense is the estimated amount of tax payable (or receivable) in respect of the taxable profit (or loss) for a period and any adjustment to the current tax amount in respect of prior periods. The tax payable (or receivable) is calculated using tax rates that have been enacted or substantively enacted at the year-end.
Deferred taxes
See note 16, Deferred tax.
The income tax expense for fiscal year 2016 breaks down as follows:
in millions of euros Note 2015 2016
Current income taxes (226) (131)
Deferred taxes 16 429 37
INCOME TAX (EXPENSE) / INCOME 203 (94) The difference between the French standard rate of income tax and the effective Group tax rate can be analyzed as follows:
2015 2016
in millions of euros Amount % Amount %
Profit before tax 904 1,002
Standard tax rate in France (%) 38.00 34.43
Tax expense at the standard rate (343) 38.0 (345) 34.43
Difference in tax rates between countries (1) 53 (5.9) 16 (1.6)
Impact of:
Deferred tax assets not recognized on temporary differences and tax loss carry-forwards arising in the period (31) 3.4 (26) 2.6
Net recognition of deferred tax assets on temporary differences and tax loss carry-forwards arising prior to January 1 192 (21.3) 116 (11.6)
Utilization of previously unrecognized tax loss carry-forwards 4 (0.4) 3 (0.3)
Prior year adjustments (8) 0.8 8 (0.8)
Taxes not based on taxable profit (43) 4.8 (45) 4.5
Permanent differences and other items (97) 10.7 (1) 0.1 Income Tax expense and effective tax rate before tax income (net) in r espect of goodwills arising on legal restructuring and remeas urement of deferred tax assets on US tax loss carry-forwards (273) 30.1 (274) 27.3
Tax income (net) in respect goodwills arising on legal restructuring 180 (18.0)
Remeasurement of deferred tax assets on US tax loss carry-forwards 476 (52.6) Income Tax (Expense) / Income and effective tax rate after tax income (net) in respect of goodwills arising on legal restructuring and remeasurement of deferred tax assets on US tax loss carry-forwards 203 (22.5) (94) 9.3
(1) In 2016, includes the impact of the change in tax rate in France from 2020. The heading “Taxes not based on taxable profit” primarily consists of the Corporate Value-Added Contribution (Cotisation sur la Valeur Ajoutée des Enterprises, CVAE) and the additional 3% contribution on dividends paid in France, certain State taxes in the United States and the regional tax on productive activities (IRAP) in Italy.

CAPGEMINI 2016 ANNUAL REPORT 22
NOTE 11 EARNINGS PER SHARE Earnings per share, diluted earnings per share and normalized earnings per share are measured as follows:
► basic earnings per share are calculated by dividing profit or loss attributable to owners of the Company by the weighted average number of ordinary shares outstanding during the period, excluding treasury shares. The weighted average number of ordinary shares outstanding is adjusted by the number of ordinary shares bought back or issued during the period and is calculated by reference to the date of redemption or issue of shares during the year;
► diluted earnings per share are calculated by dividing profit or loss attributable to owners of the Company by the weighted average number of ordinary shares outstanding during the year as used to calculate basic earnings per share, both items being adjusted for the effects of all potential dilutive financial instruments corresponding to (i) bonds redeemable in cash and/or in new and/or existing shares, (ii) performance shares (iii) free share grants and (iv) redeemable share subscription or purchase warrants.
► normalized earnings per shar e are calculated by dividing normalized profit or loss attributable to owners of the Company by the weighted average number of ordinary shares outstanding during the period, excluding treasury shares held during the period. Normalized net profit or loss is equal to profit for the year attributable to owners of the Company corrected for the impact of items recognized in other operating income and expense (see Note 8, Other operating income and expense), net of tax calculated using the effective tax rate.
BASIC EARNINGS PER SHARE
2015 2016
Profit for the year attributable to owners of the Company (in millions of euros) 1,124 921
Weighted average number of ordinary shares 168,452,917 169,450,721
BASIC EARNINGS PER SHARE (in euros) 6.67 5.44
DILUTED EARNINGS PER SHARE
Diluted earnings per share are calculated by assuming conversion into ordinary shares of all dilutive instruments outstanding during the year. The average share price in 2016 was €80.91. In 2016, instruments considered dilutive for the purpose of calculating diluted earnings per share include:
► the “ORNANE 2013” convertible bonds issued on October 25, 2013, i.e. a weighted average of 5,305,591 bonds, as the €20 million interest expense recorded (net of taxes) on the bonds is lower per bond than basic earnings per share. These bonds were redeemed early in the last quarter of 2016 (see Note 21 – Net debt / Net cash and cash equivalents);
► shares to be delivered to French and non-French employees under the 2012, 2013 and 2014 performance share grant plans, representing a weighted average of 2,236,137 shares. At December 31, 2016, the only remaining condition applicable to these shares is the presence of the beneficiaries in the Group at the delivery dates, scheduled for January and March 2017 and August 2018, respectively;
► all the shares available for grant under the performance share grant plan, the terms of which were approved by the Board of Directors on July 29, 2015, representing a weighted average of 1,053,800 shares. The related performance conditions will be assessed in March 2018;
► the shares available for grant under the performance share grant plan, the terms of which were approved by the Board of Directors on July 26, 2016, representing a weighted average of 689,492 shares. The related performance conditions will be assessed in August 2019;
► the shares available for grant under the performance share grant plan, the terms of which were approved by the Board of Directors on February 17, 2016, representing a weighted average of 155,050 shares. The related presence conditions will be assessed in March 2018 and March 2020.
► the shares falling within the scope of the free share grant plan open to all French employees, the terms of which were approved by the Board of Directors on October 8, 2014, representing a weighted average of 67,429 shares;
► the weighted average number of Redeemable Share Subscription or Purchase Warrants (BSAAR), i.e. 122,560 warrants, as the average price of the Cap Gemini S.A. share in 2016 is higher than the aggregate of the €34 strike price and the €3.22 issue premium.
CAPGEMINI 2016 ANNUAL REPORT 23
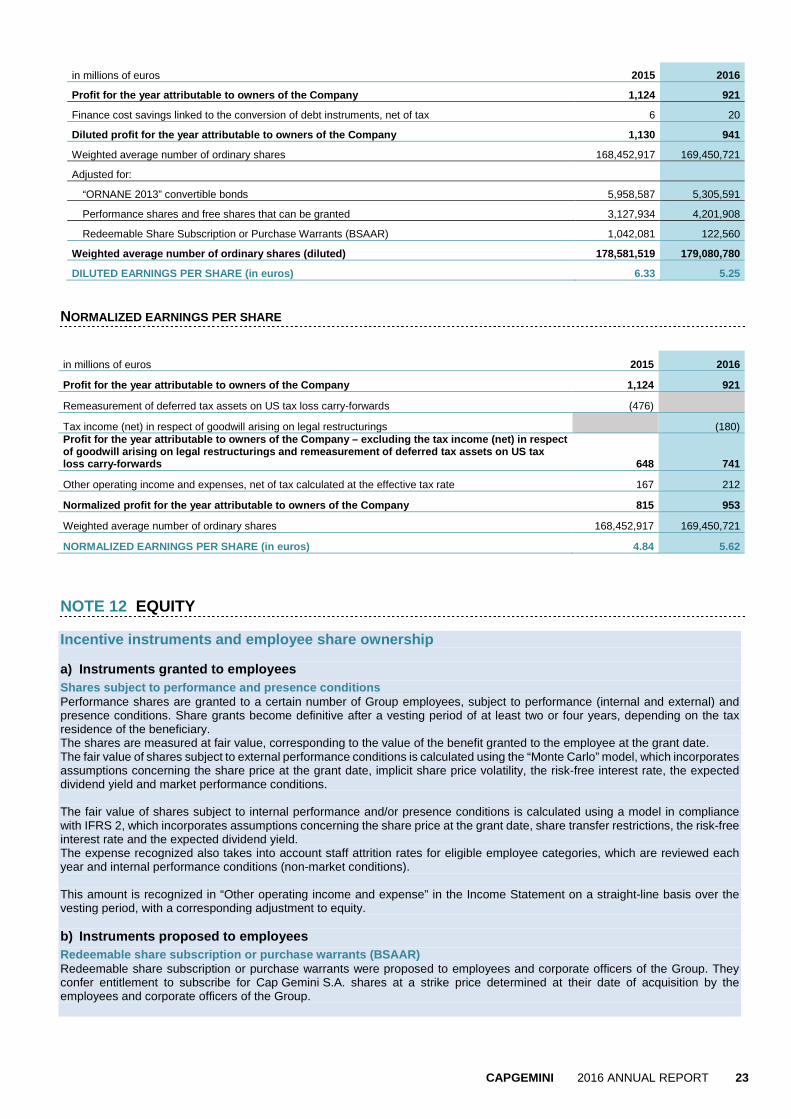
in millions of euros 2015 2016
Profit for the year attributable to owners of the C ompany 1,124 921
Finance cost savings linked to the conversion of debt instruments, net of tax 6 20
Diluted profit for the year attributable to owners of the Company 1,130 941
Weighted average number of ordinary shares 168,452,917 169,450,721
Adjusted for:
“ORNANE 2013” convertible bonds 5,958,587 5,305,591
Performance shares and free shares that can be granted 3,127,934 4,201,908
Redeemable Share Subscription or Purchase Warrants (BSAAR) 1,042,081 122,560
Weighted average number of ordinary shares (diluted ) 178,581,519 179,080,780
DILUTED EARNINGS PER SHARE (in euros) 6.33 5.25 NORMALIZED EARNINGS PER SHARE
in millions of euros 2015 2016
Profit for the year attributable to owners of the C ompany 1,124 921
Remeasurement of deferred tax assets on US tax loss carry-forwards (476)
Tax income (net) in respect of goodwill arising on legal restructurings (180) Profit for the year attributable to owners of the C ompany – excluding the tax income (net) in respect of goodwill arising on legal restructurings and rem easurement of deferred tax assets on US tax loss carry-forwards 648 741
Other operating income and expenses, net of tax calculated at the effective tax rate 167 212
Normalized profit for the year attributable to owne rs of the Company 815 953
Weighted average number of ordinary shares 168,452,917 169,450,721
NORMALIZED EARNINGS PER SHARE (in euros) 4.84 5.62
NOTE 12 EQUITY Incentive instruments and employee share ownership a) Instruments granted to employees Shares subject to performance and presence condition s Performance shares are granted to a certain number of Group employees, subject to performance (internal and external) and presence conditions. Share grants become definitive after a vesting period of at least two or four years, depending on the tax residence of the beneficiary. The shares are measured at fair value, corresponding to the value of the benefit granted to the employee at the grant date. The fair value of shares subject to external performance conditions is calculated using the “Monte Carlo” model, which incorporates assumptions concerning the share price at the grant date, implicit share price volatility, the risk-free interest rate, the expected dividend yield and market performance conditions. The fair value of shares subject to internal performance and/or presence conditions is calculated using a model in compliance with IFRS 2, which incorporates assumptions concerning the share price at the grant date, share transfer restrictions, the risk-free interest rate and the expected dividend yield. The expense recognized also takes into account staff attrition rates for eligible employee categories, which are reviewed each year and internal performance conditions (non-market conditions). This amount is recognized in “Other operating income and expense” in the Income Statement on a straight-line basis over the vesting period, with a corresponding adjustment to equity. b) Instruments proposed to employees Redeemable share subscription or purchase warrants (BSAAR) Redeemable share subscription or purchase warrants were proposed to employees and corporate officers of the Group. They confer entitlement to subscribe for Cap Gemini S.A. shares at a strike price determined at their date of acquisition by the employees and corporate officers of the Group.

CAPGEMINI 2016 ANNUAL REPORT 24
Employee savings plan Leveraged employee share ownership plans offering the possibility to subscribe for shares at a discounted preferential rate have been set up by the Group. When determining the IFRS 2 expense measuring the benefit granted to employees, the Group adjusts the amount of the discount granted by the Group to employees on the subscription price based on the following two items: ► the cost of the non-transferability of shares granted to employees during a period of five years. This cost is measured taking
account of the five-year lock-in period. It corresponds to the cost of a two-stage strategy under which the market participant enters into a forward sale effective at the end of the five-year lock-in period and simultaneously borrows the amount necessary to buy a share available for immediate transfer. This borrowing is financed with the proceeds from the forward sale of the share and the dividends received during the lock-in period. This cost is calculated based on the following assumptions:
• the subscription price is set by the Chairman and Chief Executive Officer pursuant to the powers delegated by the Board of Directors. This subscription price is equal to the average Cap Gemini S.A. share price, adjusted for volume, during the twenty trading days preceding the decision of the Chairman and Chief Executive Officer, to which a discount is applied,
• the grant date is the date at which employees are fully informed of the specific characteristics and terms and conditions of the offer and particularly the subscription price,
• the loan rate granted to employees and used to determine the cost of the non-transferability of shares, is the rate at which a bank would grant a consumer loan repayable on maturity without allocation, to a private individual with an average risk profile, for a term corresponding to the term of the plan;
► the opportunity gain reflecting the possibility granted to employees to benefit from market terms and conditions identical to those of the Group.
In certain countries where the set-up of a leveraged plan through an Employee Savings Mutual Fund (Fonds Commun de Placement Entreprise) or directly in the name of the employee is not possible, the employee share ownership plan (ESOP) includes a Stock Appreciation Rights (SAR) mechanism. The benefit offered by the Group corresponds to the amount of the discount on the share subscription price. Treasury shares Cap Gemini S.A. shares held by the Company or by any consolidated companies are shown as a deduction from equity, at cost. Any proceeds from sales of treasury shares are taken directly to equity, net of the tax effect, so that the post-tax gain or loss on the sale has no impact on the Income Statement for the period. Derivative instruments on own shares When derivative instruments on own shares satisfy IAS 32 classification criteria for recognition in equity, they are initially recognized in equity in the amount of the consideration received or paid. Subsequent changes in fair value are not recognized in the financial statements, other than the related tax effect. Where these instruments do not satisfy the aforementioned criteria, the derivative instruments on own shares are recognized in assets or liabilities at fair value. Changes in fair value are recognized in profit or loss. The fair value remeasurement of these instruments at the year-end is recognized based on external valuations. INCENTIVE INSTRUMENTS AND EMPLOYEE SHARE OWNERSHIP
A) Stock option plans The Group no longer grants stock options since the plan authorized in 2005. The last grant under this plan was performed in June 2008. B) Performance share plans The Combined Shareholders’ Meetings of May 24, 2012, May 23, 2013, May 6, 2015 and then May 18, 2016, authorized the Board of Directors to grant shares to a certain number of Group employees, on one or several occasions and within a maximum period of 18 months, subject to performance and/or presence conditions. On December 12, 2012, February 20, 2013, July 30, 2014, July 29, 2015, February 17, 2016 and July 26, 2016, the Board of Directors approved the terms and conditions and the list of beneficiaries of these six plans.

CAPGEMINI 2016 ANNUAL REPORT 25
The main features of these plans are set out in the table below: 2012
International Plan 2013
International Plan
Maximum number of shares that may be granted 2,426,555 shares 2,426,555 shares
% of share capital at the date of the Board of Directors' decision 1.5% 1.5%
Total number of shares granted 1,003,500 (1) 1,209,100 (1)
Date of Board of Directors' decision December 12, 2012 February 20, 2013
Performance assessment dates At the end of the first and second calendar years following the grant
date
At the end of the first and second years following the grant date
Vesting period 2 years and ½ month as from the grant date (France) or 4 years
and ½ month as from the grant date (other countries)
2 years and 1 week as from the grant date (France) or 4 years and 1 week as
from the grant date (other countries)
Mandatory lock-in period effective as from the vesting date (France only)
4 years
Main market conditions at the grant date
Volatility 25.80% 38.70%
Risk-free interest rate 0.35% - 0.98% 0.59% - 1.28%
Expected dividend rate 3.00% 3.00%
Other conditions
Performance conditions Yes (see below)
Employee presence within the Group at the vesting date Yes
Pricing model used to calculate the fair value of shares Monte Carlo for performance shares with external (market) conditions
Range of fair values (in euros)
Free shares (per share and in euros) n/a n/a
Performance shares (per share and in euros) 14.35 – 28.67 16.18 – 32.14
Of which corporate officers 16.18 18.12
Number of shares at December 31, 2015
that may vest under the plan in respect of shares previously granted, subject to conditions (performance and presence)
521,500 713,500
o/w to corporate officers
- -
Change during the period
Number of shares subject to performance and/or presence conditions granted during the year
- -
o/w to corporate officers
- -
Number of shares forfeited or canceled during the year
22,000 49,600
Number of shares vested during the year
Number of shares at December 31, 2016
that may vest under the plan in respect of shares previously granted, subject to conditions (presence only)
499,500 (2) 663,900 (2)
Weighted average number of shares 510,550 688,700
Share price at the grant date (in euros) 33.15 36.53

CAPGEMINI 2016 ANNUAL REPORT 26
2014 International Plan
2015 International Plan
Maximum number of shares that may be granted 1,590,639 shares 1,721,759 shares
% of share capital at the date of the Board of Directors' decision
1% 1%
Total number of shares granted 1,290,500 (1) 1,068,550 (1)
Date of Board of Directors' decision July 30, 2014 July 29, 2015
Performance assessment dates Three years for the internal performance condition and two years
for the external performance condition
Three years for the two performance conditions
Vesting period 2 years as from the grant date (France) or four years as from the
grant date (other countries)
2 years and 7 months as from the grant date (France) or 4 years as from the
grant date (other countries) Mandatory lock-in period effective as from the vesting date (France only)
4 years 3 years
Main market conditions at the grant date
Volatility 26.33% 24.54%
Risk-free interest rate 0.34% - 0.81% 0.10% - 0.55%
Expected dividend rate 2.31% 1.60%
Other conditions
Performance conditions Yes (see below)
Employee presence within the Group at the vesting date Yes
Pricing model used to calculate the fair value of shares Monte Carlo for performance shares with external (market) conditions
Range of fair values (in euros)
Free shares (per share and in euros) n/a n/a
Performance shares (per share and in euros) 26.46 – 48.26 61.73 – 82.18
Of which corporate officers 29.32 56.66
Number of shares at December 31, 2015
that may vest under the plan in respect of shares previously granted, subject to conditions (performance and presence)
1,232,500 1,064,650
o/w to corporate officers
50,000 (1) 40,000 (1)
Change during the period
Number of shares subject to performance and/or presence conditions granted during the year
- -
o/w to corporate officers
- -
Number of shares forfeited or canceled during the year
66,500 21,700
Number of shares vested during the year
390,750 (3) -
Number of shares at December 31, 2016
that may vest under the plan in respect of shares previously granted, subject to conditions (presence only)
that may vest under the plan in respect of shares previously granted, subject to conditions (performance and presence)
776,250 (2) 1,042,950 (4)
Weighted average number of shares 1,036,937 1,053,800
Share price at the grant date (in euros) 53.35 87.60

CAPGEMINI 2016 ANNUAL REPORT 27
2016 International Plans
Maximum number of shares that may be granted 1,721,815 shares 1,721,815 shares
% of share capital at the date of the Board of Directors' decision
1% 1%
Total number of shares granted 180,500 (5) 1,663,500 (1)
Date of Board of Directors' decision February 17, 2016 July 26, 2016
Performance assessment dates Presence condition only Three years for the two performance conditions
Vesting period 2 years as from the grant date (France) or four years as from the
grant date (other countries)
3 years and 1 week as from the grant date (France) or 4 years as from the
grant date (other countries) Mandatory lock-in period effective as from the vesting date (France only)
2 years 2 years
Main market conditions at the grant date
Volatility n/a 26.35%
Risk-free interest rate 0.15% - 0.03% 0.2% - 0.17%
Expected dividend rate 1.60% 1.60%
Other conditions
Performance conditions Yes (see below)
Employee presence within the Group at the vesting date Yes
Pricing model used to calculate the fair value of shares Monte Carlo for performance shares with external (market) conditions
Range of fair values (in euros)
Free shares (per share and in euros) n/a n/a
Performance shares (per share and in euros) 55.45 – 57.59 54.02 – 77.1
Of which corporate officers - 52,68
Number of shares at December 31, 2015
that may vest under the plan in respect of shares previously granted, subject to conditions (performance and presence)
o/w to corporate officers
- -
Change during the period
Number of shares subject to performance and/or presence conditions granted during the year
180,500 1,663,500
o/w to corporate officers
- 42,000(1)
Number of shares forfeited or canceled during the year
6,600 10,900
Number of shares vested during the year
Number of shares at December 31, 2016
that may vest under the plan in respect of shares previously granted, subject to conditions (performance and presence)
173,900 (6) 1,652,600 (7)
Weighted average number of shares 155,050 689,492
Share price at the grant date (in euros) 71.61 83.78
(1) Grant subject to performance conditions only; (2) In respect of the “foreign” plan only; (3) Balance on the “French” plan granted in August 2016 subject to performance and presence conditions at this date; (4) Of which 354,750 shares in respect of the “French” plan and 688,200 shares in respect of the “foreign” plan; (5) Grant subject to presence conditions only for beneficiaries employed by IGATE, acquired on July 1, 2015; (6) Of which 7,500 shares in respect of the “French” plan and 166,400 shares in respect of the “foreign” plan; (7) Of which 453,350 shares in respect of the “French” plan and 1,119,250 shares in respect of the “foreign” plan.

CAPGEMINI 2016 ANNUAL REPORT 28
a) Shares vested under the 2014 plan Based on an assessment of the performance conditions of the 2014 plan for shares granted to beneficiaries tax-resident in France, 100% of the initial allocation vested to those beneficiaries still present in the Group at the vesting date at the beginning of August 2016. With regards to the external performance condition, due to the good performance of the share over the calculation period, the relative performance of the Cap Gemini S.A. share compared to that of the basket of comparable companies exceeded 110%, the threshold above which 100% of the initial allocation vests in respect of the external performance condition. With regards to the internal performance condition, cumulative organic free cash flow* generation for fiscal years 2013 to 2015 exceeded the €1.1 billion threshold, enabling the vesting of the maximum number of shares in respect of the internal performance condition. As both conditions exceeded the maximum vesting thresholds, 100% of shares initially allocated vested to beneficiaries tax-resident in France still present in the Group at the vesting date, subject however to a lock-in period of four years in accordance with plan rules. A total of 390,750 shares vested under the 2014 plan, representing 94.3% of the maximum possible amount. The performance conditions are assessed at the same dates and under the same conditions for non-French beneficiaries, however the shares vest at the end of a four-year period, subject to their presence in the Group at this date. Vested shares are not, however subject to a lock-in period. * Organic free cash flow, an alternative performance measure monitored by the Group, is defined in Note 3, Alternative performance measures and Note 22, Cash flows. b) Performance conditions of the 2012, 2013 2014, 2 015 and 2016 plans In accordance with the AMF recommendation of December 8, 2009 regarding the inclusion of an internal and external performance condition when granting performance shares, the Board of Directors decided from the 2010 plan to add an internal condition to the external condition initially planned. The following internal and external performance conditions apply: The external performance condition accounts for 50% of the grant calculation as does the internal performance condition. External performance condition The external performance condition is applied in an identical manner across the 2012 to 2015 plans and in line with the conditions applied to the first two plans, as follows: ► No shares are granted if the performance of the Cap Gemini S.A. share during the period in question is less than 90% of the
performance of the basket of securities over the same period.
► The number of shares ultimately granted:
• is equal to 40% of the number of shares initially allocated if the performance of the Cap Gemini S.A. share is at least equal to 90% of the basket,
• is equal to 60% of the number of shares initially allocated if the performance of the Cap Gemini S.A. share is equal to 100% of the basket,
• is equal to 100% of the number of shares initially allocated if the relative performance of the Cap Gemini S.A. share is higher than or equal to 110% of the basket,
• varies on a straight-line basis between 40% and 60% and between 60% and 100% of the initial allocation, based on a pre-defined schedule, where the performance of the Cap Gemini S.A. share is between 90% and 100% of the basket in the first case and 100% and 110% of the basket in the second case.
Under these conditions, if the performance of the Cap Gemini S.A. share is in line with that of the basket of comparable shares, only 60% of the initial allocation will be granted in respect of the external performance condition (i.e. 30% of the initial allocation). The terms of the external performance condition were tightened for the 2016 plan and accordingly: ► No shares are granted if the performance of the Cap Gemini share during the period in question is less than the performance
of the basket of securities over the same period.
► The number of shares ultimately granted:
• is equal to 50% of the number of shares initially allocated if the performance of the Cap Gemini share is at least equal to 100% of the basket,
• is equal to 100% of the number of shares initially allocated if the relative performance of the Cap Gemini share is higher than or equal to 110% of the basket,
• varies on a straight-line basis between 50% and 100% of the initial allocation, based on a pre-defined schedule, where the performance of the Cap Gemini share is between 100% and 110% of the basket.

CAPGEMINI 2016 ANNUAL REPORT 29
The benchmark basket comprises the following securities, with each security equally weighted: ► 2012 and 2013 Plans: Accenture / CSC / Atos / Tieto / Steria / CGI Group / Infosys / Sopra / Cognizant ► 2014, 2015 and 2016 Plans: Accenture / CSC / Atos / Tieto / CAC 40 index / CGI Group / Infosys / Sopra / Cognizant The fair value of shares subject to external performance conditions is adjusted for a discount calculated in accordance with the Monte Carlo model, together with a discount for non-transferability for the shares granted in France. Internal performance condition The internal performance condition is based on the generation of Organic Free Cash Flow* (OFCF) over a three-year period encompassing fiscal years 2012 to 2014 for the 2012 and 2013 plans, fiscal years 2013 to 2015 for the 2014 plan, fiscal years 2015 to 2017 for the 2015 plan and fiscal years 2016 to 2018 for the 2016 plan. Accordingly: ► no shares will be granted in respect of the internal performance condition if the cumulative increase in Organic Free Cash Flow
over the reference period is less than €750 million for the 2012 and 2013 plans, €850 million for the 2014 plan, €1,750 million for the 2015 plan and €2,400 million for the 2016 plan;
► 100% of the initial internal allocation will be granted if Organic Free Cash Flow is equal to or exceeds €1 billion for the 2012 and 2013 plans, €1.1 billion for the 2014 plan, €2 billion for the 2015 plan and €2.7 billion for the 2016 plan.
The fair value of shares subject to internal performance conditions is calculated assuming 100% realization and will be adjusted where necessary in line with effective realization of this condition. A discount for non-transferability is also applied for the shares granted in France. * Organic free cash flow, an alternative performance measure monitored by the Group, is defined in Note 3, Alternative performance measures and Note 22, Cash flows. C) Free share plans Following the grant performed in 2012, the Combined Shareholders’ Meeting of May 23, 2013 gave the Board of Directors an 18-month authorization to grant shares to certain Group employees, on one or several occasions subject only to a condition of presence. This authorization was partially used and the terms and conditions of the grant and the list of beneficiaries were set by the Board of Directors meeting of October 8, 2014. The main features of these plans are set out in the table below:
2014 France Plan
Date of the Combined Shareholders’ Meeting May 23, 2013
Maximum number of shares that may be granted
1% of the share capital on the date of the Board of Directors' decision i.e. a maximum of 1,595,495
shares, of which a maximum of 15% granted without performance conditions
Total number of shares granted 104,379 (1)
Date of the Board of Directors' decision October 8, 2014
Grant condition assessment date Presence condition only (employee presence within
the Group at the vesting date)
Vesting period 2 years as from the grant date
(Democratic plan)
Mandatory lock-in period effective as from the vesting date 2 years
Number of shares at December 31, 2015 that may vest under this plan in respect of shares previously granted, subject to presence conditions 96,120
Number of shares subject to presence conditions granted during the year -
Number of shares forfeited or canceled during the year 18,594
Number of shares vested during the year 77,526
Number of shares at December 31, 2016 that may vest under this plan in respect of shares previously granted, subject to presence conditions -
Weighted average number of shares 67,429
Share price at the grant date (in euros) €52.69
Main market conditions at the grant date
Risk-free interest rate 0.34%
Expected dividend rate 2.31%
Fair value in euros (per share)
€43.91 (1) i.e. 6.5% of the total authorized maximum granted without performance conditions, pursuant to the resolution (authorization capped at 15% of the total). These transactions aim to develop employee share ownership by enabling all employees of French companies with at least three months seniority at the grant date to receive shares and thereby become Cap Gemini S.A. shareholders at the end of the vesting

CAPGEMINI 2016 ANNUAL REPORT 30
period. More than 20,000 employees were concerned by each share grant, with a differentiated share allocation based on annual salary (four categories), the lowest paid employees receiving more shares than the highest paid employees. The Board of Director decisions were preceded each time by the signature of a company-wide agreement, in respect of payment of the profit-sharing bonus. At the end of the vesting period, nearly 77,500 shares vested to 15,200 beneficiaries at the beginning of October 2016. D) Redeemable share subscription or purchase warran ts (BSAAR) During 2009, 2,999,000 warrants were subscribed by employees and corporate officers of the Group (at a price of €3.22 per warrant). The exercise period commenced the date of listing of the BSAAR warrants on the Euronext Paris market on July 23, 2013 and terminates on the seventh anniversary of the issue date. Between July 23, 2009 and the date the warrants were admitted to trading on Euronext Paris, they could not be exercised or transferred except under the conditions specified in the issue agreement. The issue was disclosed in a prospectus approved by the AMF on May 14, 2009 under reference number no.09-140. Between the date of admission of the BSAAR warrants to trading on the Euronext Paris market and July 23, 2016, the expiry date of the BSAAR warrants, 2,990,760 BSAAR warrants were exercised resulting in delivery of the same number of shares (344,392 BSAAR warrants were exercised in 2016). The remaining 8,240 BSAAR warrants were delisted from the Euronext Paris market. This program expired at the end of July 2016. E) International Employee Share Ownership Plan – E SOP 2012 The Group set up an employee share ownership plan (ESOP 2012) in the second half of 2012. On September 27, 2012, the Group issued 6,000,000 new shares reserved for employees with a par value of €8, representing a share capital increase of €153 million net of issue costs. The total cost of this employee share ownership plan in 2012 was €0.8 million, attributable to the Stock Appreciation Rights (SAR) mechanism for employees in countries where the set-up of an Employee Savings Mutual Fund (Fonds Commun de Placement Entreprise, FCPE) was not possible or relevant. F) International Employee Share Ownership Plan – E SOP 2014 The Group set up an employee share ownership plan (ESOP 2014) in the second half of 2014. On December 18, 2014, the Group issued 5,000,000 new shares reserved for employees with a par value of €8, representing a share capital increase of €229 million net of issue costs. The total cost of this employee share ownership plan in 2014 was €1.1 million, attributable to the Stock Appreciation Rights (SAR) mechanism for employees in countries where the set-up of an Employee Savings Mutual Fund (Fonds Commun de Placement Entreprise, FCPE) was not possible or relevant.
IMPACT OF INCENTIVE INSTRUMENTS AND EMPLOYEE SHARE OWNERSHIP PLANS
The following table breaks down by type of incentive and employee share ownership instrument, the expense recognized in “Other operating income and expense” (including payroll taxes and employer contributions) and the residual amount to be amortized in future periods.
2015 2016
in millions of euros Note Expense of the period
Residual amount to be amortized in
future periods Expense of the period
Residual amount to be amortized in
future periods
Performance share plans 40 99 55 153
Other 2 1 3 8
TOTAL 7 42 100 58 161

CAPGEMINI 2016 ANNUAL REPORT 31
G) Employee incentive instruments - IGATE The main features of this plan are set out in the table below: 2015 Plan
Vesting period One, two or three years for the market condition and three years for the internal condition
Number of units at December 31, 2015 that may vest under the plan in respect of units previously granted subject to performance and presence conditions
114,073
Number of units subject to performance and presence conditions granted during the year
-
Number of units forfeited or cancelled during the year 13,118
Number of units vested during the year 15,400
Number of units at December 31, 2016 that may vest under the plan in respect of units previously granted subject to performance and presence conditions
85,555
Main market conditions at the grant date
Risk-free interest rate 0.35%
Expected dividend rate 1.60%
Fair value in euros (per unit) €56.30
On July 1, 2015, in the context of the IGATE acquisition, Capgemini exchanged IGATE Performance Share Awards (PSA) held by beneficiaries for Capgemini Performance Units (PUs):
► The number of PUs granted was calculated by multiplying the number of IGATE PSAs outstanding by the following ratio:
US$ 48 (unit purchase price of IGATE shares paid by Capgemini) €78.37 (closing price of the Cap Gemini S.A. on April 24, 2015) x 1.0824 (€/US$ exchange rate on April 24, 2015))
► This calculation is equivalent to adjusting the number of PSAs by the exchange parity of the IGATE and Cap Gemini S.A. shares in US$ on April 24, 2015.
► The vesting of PUs is subject to the attainment of internal and market performance conditions and the presence of the beneficiary in the Group at the vesting date:
• The internal performance condition consists of a cumulative organic free cash flow (OFCF)* objective for the period 2015 to 2017, as presented in the audited, published Statements of Cash Flows for fiscal years 2015, 2016 and 2017, with the maximum number of units vesting for an aggregate amount of €2 billion.
• The market performance condition is based on the ability of the Cap Gemini share to outperform a reference basket comprising the CAC40 index and the following companies in equal weighting: Accenture, CSC, Atos, Tieti, CGI Group, Infosys, Sopra, and Cognizant.
► The vesting schedule is as follows:
• 25% of PUs on July 1, 2016, subject to presence and market performance conditions,
• 25% of PUs on July 1, 2017, subject to presence and market performance conditions,
• 25% of PUs on July 1, 2018, subject to presence and market performance conditions,
• 25% of PUs on July 1, 2019, subject to presence and internal performance conditions.
► In addition, PUs vesting in the first three years are subject to a final adjustment clause tied to the change in the Cap Gemini S.A. share price between the vesting dates and July 1, 2019.
The internal condition was only satisfied 54% at the first vesting date, resulting in the vesting of 15,400 PUs and the cancellation of 13,118 PUs for this first tranche.
* Organic free cash flow, an alternative performance measure monitored by the Group, is defined in Note 3, Alternative performance measures and Note 22, Cash flows.

CAPGEMINI 2016 ANNUAL REPORT 32
TREASURY SHARES AND MANAGEMENT OF SHARE CAPITAL AND MARKET RISK S
The Group does not hold any shares for financial investment purposes and does not have any interests in listed companies. At December 31, 2016, treasury shares were deducted from consolidated equity in the amount of €247 million. These consist of (i) 2,879,357 shares purchased under the share buyback program and (ii) 270,910 shares in respect of the implementation of the liquidity agreement (the associated liquidity line is €9 million) and the contractual holding system for key employees of American activities. In view of the small number of treasury shares held, the Group is not therefore exposed to significant equity risk. Finally, as the value of treasury shares is deducted from equity, changes in the share price do not impact the Consolidated Income Statement. The Group’s capital management strategy is designed to maintain a strong capital base in view of supporting the continued development of its business activities and delivering a return to shareholders, while adopting a prudent approach to debt as evidenced by the use of the debt-to-equity ratio as a key performance indicator (see Note 29, Off-balance sheet commitments). At December 31, 2016, and following the acquisition of IGATE, the Group had net debt* of €1,413 million (compared with €1,767 million at December 31, 2015). In order to best manage the structure of its capital, the Group can issue new shares, buy back its own shares, adjust the dividend paid to shareholders or enter into derivative instruments on its own shares. It is recalled that in October 2013, the Group sold a call option on Cap Gemini S.A. shares to a bank counterparty. Following the early redemption of the ORNANE bonds outstanding at November 21, 2016 (see Note 21 – Net debt / Net cash and cash equivalents), Cap Gemini S.A. exercised in full the call option on its own shares purchased on October 18, 2013. The call option sold by the Company was also exercised in full. Cap Gemini S.A. recognized an amount of €14 million in equity at December 31, 2016 in respect of the unwinding of these transactions. * Net debt, an alternative performance measure monitored by the Group, is defined in Note 21, Net debt / net cash and cash equivalents. CURRENCY RISK AND TRANSLATION GAINS AND LOSSES ON THE ACCOUNTS OF SUBSIDIARIES WITH A FUNCTIONAL CURRENCY OTHER THAN THE EURO
Regarding risks arising on the translation of the foreign currency accounts of consolidated subsidiaries, the consolidated financial statements are particularly impacted by fluctuations in the US dollar and the pound sterling against the euro, generating a positive impact on translation reserves, mainly due to the appreciation of the US dollar partially offset by the depreciation of the pound sterling against the euro in 2016. The Group does not hedge risks arising on the translation of the foreign currency accounts of consolidated subsidiaries whose functional currency is not the euro. The main exchange rates used for the preparation of the financial statements are presented in Note 2, Consolidation principles and Group Structure.

CAPGEMINI 2016 ANNUAL REPORT 33
NOTE 13 GOODWILL AND INTANGIBLE ASSETS
Goodwill
Goodwill is equal to the excess of the acquisition price (plus, where applicable, non-controlling interests) over the net amount recognized in respect of identifiable assets acquired and liabilities assumed. Where an acquisition confers control with remaining non-controlling interests (acquisition of less than 100%), the Group elects either to recognize goodwill on the full amount of revalued net assets, including the share attributable to non-controlling interests (full goodwill method) or on the share in revalued net assets effectively acquired only (partial goodwill method). This choice is made on an individual transaction basis.
Goodwill balances are allocated to the different cash-generating units (as defined in Note 15, Cash-generating units and asset impairment tests) based on the value in use contributed to each unit.
When a business combination with non-controlling interests provides for the grant of a put option to these non-controlling interests, an operating liability is recognized in the Consolidated Statement of Financial Position in the amount of the estimated exercise price of the put option granted to non-controlling interests, through a reduction in reserves. Changes in this put option resulting from any changes in estimates or the unwinding of the discount are also recognized through reserves. Any additional acquisitions of non-controlling interests are considered a transaction with shareholders and, as such, identifiable assets are not remeasured and no additional goodwill is recognized.
When the cost of a business combination is less than the fair value of the assets acquired and liabilities assumed, the negative goodwill is recognized immediately in the Income Statement in “Other operating income and expense”.
Acquisition-related costs are expensed in the Income Statement in “Other operating income and expense” in the year incurred.
Goodwill is not amortized but tested for impairment at least annually, or more frequently when events or changes in circumstances indicate that it may be impaired. Customer relationships On certain business combinations, where the nature of the customer portfolio held by the acquired entity and the nature of the business performed should enable the acquired entity to continue commercial relations with its customers as a result of efforts to build customer loyalty, customer relationships are valued in intangible assets and amortized over the estimated term of contracts held in portfolio at the acquisition date. Licenses and software Computer software and user rights acquired on an unrestricted ownership basis, as well as software and solutions developed internally and which have a positive, lasting and quantifiable effect on future results, are capitalized and amortized over three to five years. The capitalized costs of software and solutions developed internally are costs that relate directly to their production, i.e. the salary costs of the staff that developed the relevant software.
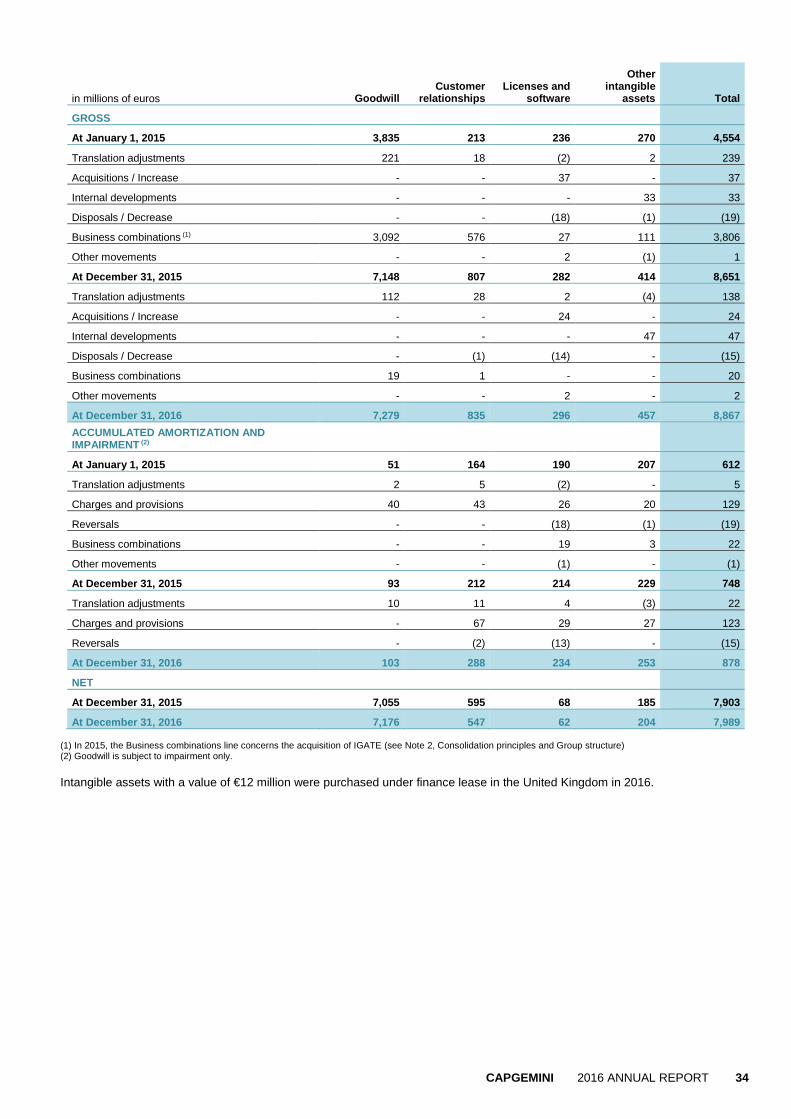
CAPGEMINI 2016 ANNUAL REPORT 34
in millions of euros Goodwill Customer
relationships Licenses and
software
Other intangible
assets Total
GROSS
At January 1, 2015 3,835 213 236 270 4,554
Translation adjustments 221 18 (2) 2 239
Acquisitions / Increase - - 37 - 37
Internal developments - - - 33 33
Disposals / Decrease - - (18) (1) (19)
Business combinations (1) 3,092 576 27 111 3,806
Other movements - - 2 (1) 1
At December 31, 2015 7,148 807 282 414 8,651
Translation adjustments 112 28 2 (4) 138
Acquisitions / Increase - - 24 - 24
Internal developments - - - 47 47
Disposals / Decrease - (1) (14) - (15)
Business combinations 19 1 - - 20
Other movements - - 2 - 2
At December 31, 2016 7,279 835 296 457 8,867
ACCUMULATED AMORTIZATION AND IMPAIRMENT (2)
At January 1, 2015 51 164 190 207 612
Translation adjustments 2 5 (2) - 5
Charges and provisions 40 43 26 20 129
Reversals - - (18) (1) (19)
Business combinations - - 19 3 22
Other movements - - (1) - (1)
At December 31, 2015 93 212 214 229 748
Translation adjustments 10 11 4 (3) 22
Charges and provisions - 67 29 27 123
Reversals - (2) (13) - (15)
At December 31, 2016 103 288 234 253 878
NET
At December 31, 2015 7,055 595 68 185 7,903
At December 31, 2016 7,176 547 62 204 7,989 (1) In 2015, the Business combinations line concerns the acquisition of IGATE (see Note 2, Consolidation principles and Group structure) (2) Goodwill is subject to impairment only. Intangible assets with a value of €12 million were purchased under finance lease in the United Kingdom in 2016.

CAPGEMINI 2016 ANNUAL REPORT 35
NOTE 14 PROPERTY, PLANT AND EQUIPMENT A) Property, plant and equipment The carrying amount of property, plant and equipment is recorded in assets in the Consolidated Statement of Financial Position and corresponds to the historical cost of these items, less accumulated depreciation and any impairment. No items of property, plant and equipment have been revalued. Buildings owned by the Group are measured based on the components approach. Subsequent expenditure increasing the future economic benefits associated with assets (costs of replacing and/or bringing assets into compliance) is capitalized and depreciated over the remaining useful lives of the relevant assets. Ongoing maintenance costs are expensed as incurred. Depreciation is calculated on a straight-line basis over the estimated useful lives of the relevant assets. It is calculated based on acquisition cost less any residual value. Property, plant and equipment are depreciated over the following estimated useful lives:
Buildings 20 to 40 years
Fixtures and f ittings 10 years
Computer equipment 3 to 5 years
Off ice furniture and equipment 5 to 10 years
Vehicles 5 years
Other equipment 5 years
Residual values and estimated useful lives are reviewed at each period end. The sale of property, plant and equipment gives rise to disposal gains and losses corresponding to the difference between the selling price and the net carrying amount of the relevant asset. B) Leases Leases that do not transfer to the Group substantially all the risks and rewards incidental to ownership are classified as operating leases, and give rise to lease payments expensed as incurred over the lease term. However, when the Group assumes substantially all of the risks and rewards incidental to ownership, the lease is classified as a finance lease and is recognized as an asset at the lower of the fair value of the leased asset and the present value of future minimum lease payments, with the related obligation recorded in liabilities within borrowings. The asset is depreciated over the period during which it is expected to be used by the Group and the obligation is amortized over the lease term. Deferred tax is recognized as appropriate.
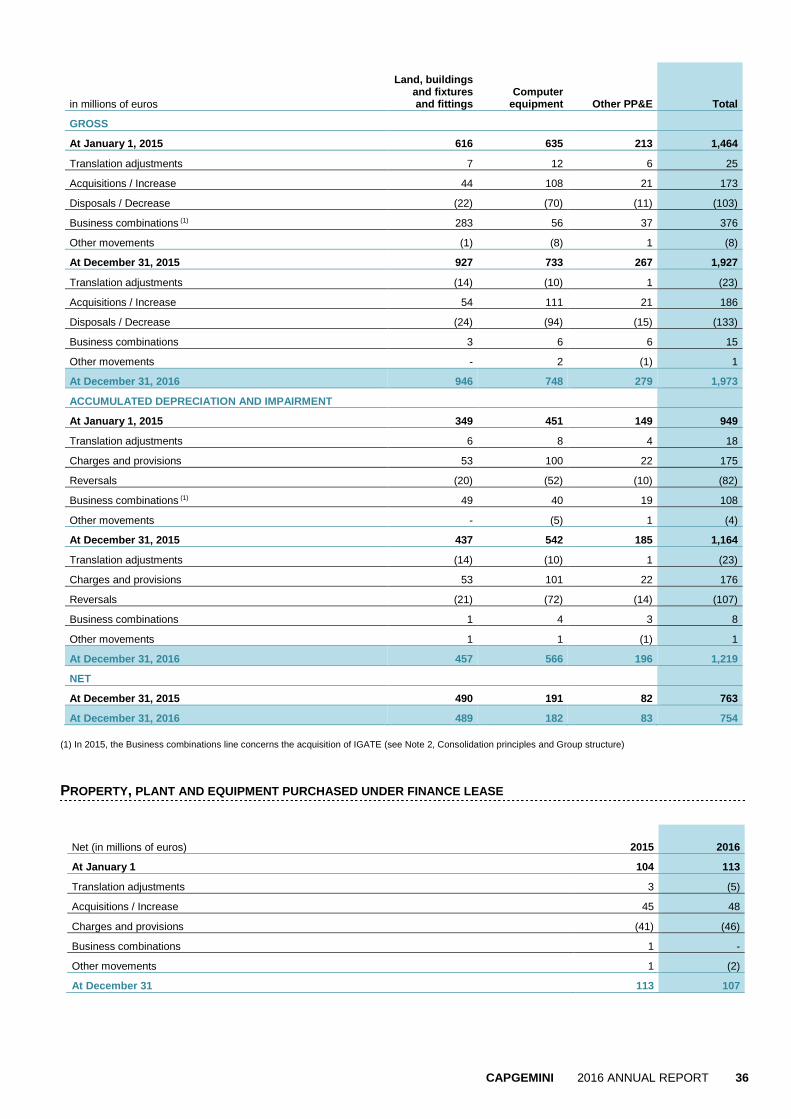
CAPGEMINI 2016 ANNUAL REPORT 36
in millions of euros
Land, buildings and fixtures and fittings
Computer equipment Other PP&E Total
GROSS
At January 1, 2015 616 635 213 1,464
Translation adjustments 7 12 6 25
Acquisitions / Increase 44 108 21 173
Disposals / Decrease (22) (70) (11) (103)
Business combinations (1) 283 56 37 376
Other movements (1) (8) 1 (8)
At December 31, 2015 927 733 267 1,927
Translation adjustments (14) (10) 1 (23)
Acquisitions / Increase 54 111 21 186
Disposals / Decrease (24) (94) (15) (133)
Business combinations 3 6 6 15
Other movements - 2 (1) 1
At December 31, 2016 946 748 279 1,973
ACCUMULATED DEPRECIATION AND IMPAIRMENT
At January 1, 2015 349 451 149 949
Translation adjustments 6 8 4 18
Charges and provisions 53 100 22 175
Reversals (20) (52) (10) (82)
Business combinations (1) 49 40 19 108
Other movements - (5) 1 (4)
At December 31, 2015 437 542 185 1,164
Translation adjustments (14) (10) 1 (23)
Charges and provisions 53 101 22 176
Reversals (21) (72) (14) (107)
Business combinations 1 4 3 8
Other movements 1 1 (1) 1
At December 31, 2016 457 566 196 1,219
NET
At December 31, 2015 490 191 82 763
At December 31, 2016 489 182 83 754 (1) In 2015, the Business combinations line concerns the acquisition of IGATE (see Note 2, Consolidation principles and Group structure) PROPERTY, PLANT AND EQUIPMENT PURCHASED UNDER FINANCE LEASE
Net (in millions of euros) 2015 2016
At January 1 104 113
Translation adjustments 3 (5)
Acquisitions / Increase 45 48
Charges and provisions (41) (46)
Business combinations 1 -
Other movements 1 (2)
At December 31 113 107
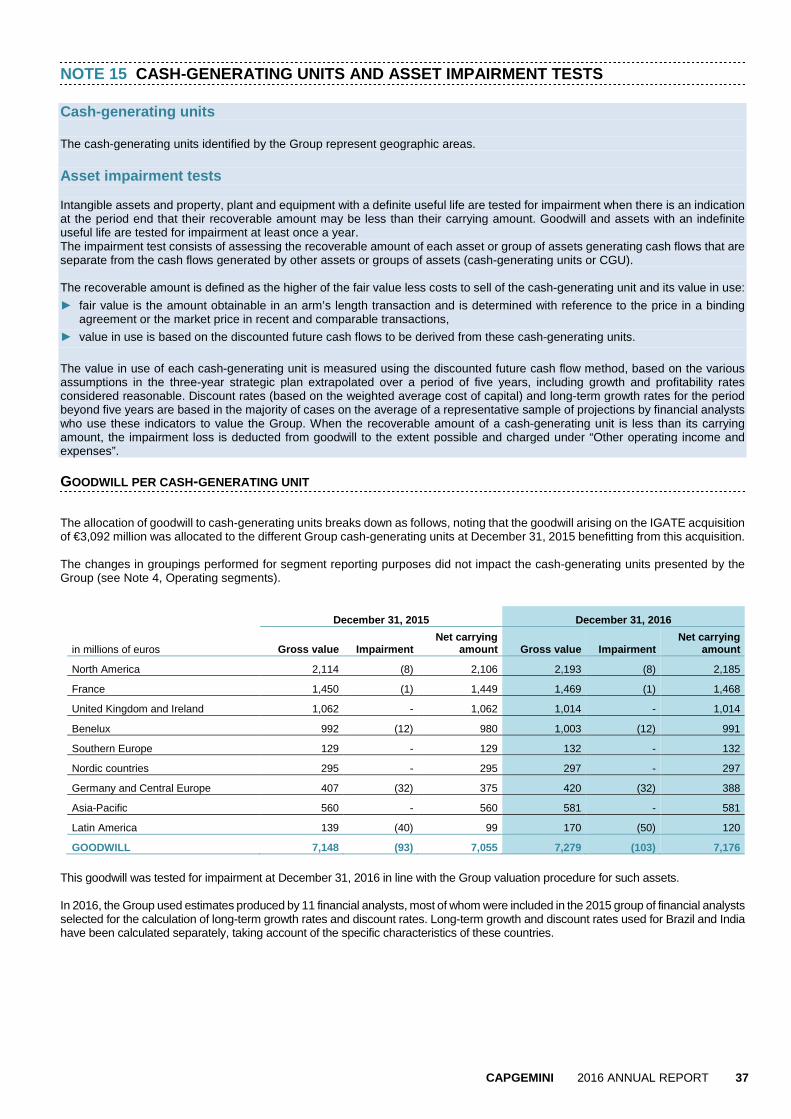
CAPGEMINI 2016 ANNUAL REPORT 37
NOTE 15 CASH-GENERATING UNITS AND ASSET IMPAIRMENT TESTS Cash-generating units The cash-generating units identified by the Group represent geographic areas. Asset impairment tests Intangible assets and property, plant and equipment with a definite useful life are tested for impairment when there is an indication at the period end that their recoverable amount may be less than their carrying amount. Goodwill and assets with an indefinite useful life are tested for impairment at least once a year. The impairment test consists of assessing the recoverable amount of each asset or group of assets generating cash flows that are separate from the cash flows generated by other assets or groups of assets (cash-generating units or CGU). The recoverable amount is defined as the higher of the fair value less costs to sell of the cash-generating unit and its value in use:
► fair value is the amount obtainable in an arm’s length transaction and is determined with reference to the price in a binding agreement or the market price in recent and comparable transactions,
► value in use is based on the discounted future cash flows to be derived from these cash-generating units.
The value in use of each cash-generating unit is measured using the discounted future cash flow method, based on the various assumptions in the three-year strategic plan extrapolated over a period of five years, including growth and profitability rates considered reasonable. Discount rates (based on the weighted average cost of capital) and long-term growth rates for the period beyond five years are based in the majority of cases on the average of a representative sample of projections by financial analysts who use these indicators to value the Group. When the recoverable amount of a cash-generating unit is less than its carrying amount, the impairment loss is deducted from goodwill to the extent possible and charged under “Other operating income and expenses”. GOODWILL PER CASH -GENERATING UNIT
The allocation of goodwill to cash-generating units breaks down as follows, noting that the goodwill arising on the IGATE acquisition of €3,092 million was allocated to the different Group cash-generating units at December 31, 2015 benefitting from this acquisition. The changes in groupings performed for segment reporting purposes did not impact the cash-generating units presented by the Group (see Note 4, Operating segments).
December 31, 2015 December 31, 2016
in millions of euros Gross value Impairment Net carrying
amount Gross value Impairment Net carrying
amount
North America 2,114 (8) 2,106 2,193 (8) 2,185
France 1,450 (1) 1,449 1,469 (1) 1,468
United Kingdom and Ireland 1,062 - 1,062 1,014 - 1,014
Benelux 992 (12) 980 1,003 (12) 991
Southern Europe 129 - 129 132 - 132
Nordic countries 295 - 295 297 - 297
Germany and Central Europe 407 (32) 375 420 (32) 388
Asia-Pacific 560 - 560 581 - 581
Latin America 139 (40) 99 170 (50) 120
GOODWILL 7,148 (93) 7,055 7,279 (103) 7,176
This goodwill was tested for impairment at December 31, 2016 in line with the Group valuation procedure for such assets. In 2016, the Group used estimates produced by 11 financial analysts, most of whom were included in the 2015 group of financial analysts selected for the calculation of long-term growth rates and discount rates. Long-term growth and discount rates used for Brazil and India have been calculated separately, taking account of the specific characteristics of these countries.

CAPGEMINI 2016 ANNUAL REPORT 38
Value in use is measured using the discounted future cash flow method and based on the following main assumptions:
► number of years over which cash flows are estimated: five years, based on data taken from the three-year strategic plan process, with extrapolation of this data for the remaining period,
► long-term growth rate used to extrapolate to perpetuity final year estimated cash flows: 7.0% for Brazil (8% in 2015), 4% for India (3.8% in 2015) and 2.4% for the rest of the Group (stable on 2015),
► discount rate: 8.4% for North America (9.0% in 2015), 14.2% for Brazil (14.7% in 2015), 14.9% for India (13.4% in 2015), 7.9% for the United Kingdom (8.7% in 2015) and 8.4% for the rest of the Group (8.5% in 2015).
No impairment losses were recognized at December 31, 2016 as a result of these impairment tests. Furthermore, an analysis of the calculation’s sensitivity to a combined change in the following key assumptions:
► +/- 2 points in the revenue growth rate for the first five years;
► +/- 1 point in the operating margin rate* for the first five years;
► +/- 0.5 points in the discount rate;
► +/- 0.5 points in the long-term growth rate;
did not identify any recoverable amounts below the carrying amount for any cash-generating units, with the exception of the Latin America cash-generating unit, where the difference between the recoverable amount resulting from this test and the net carrying amount is considered immaterial. This cash-generating unit remains sensitive to the environment and economic climate in Brazil. * Operating margin, an alternative performance measure monitored by the Group, is defined in Note 3, Alternative performance measures.

CAPGEMINI 2016 ANNUAL REPORT 39
NOTE 16 DEFERRED TAXES
Deferred taxes are:
► recorded to take account of temporary differences between the carrying amounts of certain assets and liabilities and their tax basis;
► recognized in income or expenses in the Income Statement, in income and expense recognized in equity, or directly in equity in the period, depending on the underlying to which they relate;
► measured taking account of known changes in tax rates (and tax regulations) enacted or substantively enacted at the year-end. Adjustments for changes in tax rates to deferred taxes previously recognized in the Income Statement, in income and expense recognized in equity or directly in equity are recognized in the Income Statement, in income and expense recognized in equity or directly in equity, respectively, in the period in which these changes become effective.
Deferred tax assets are recognized when it is probable that taxable profits will be available against which the recognized tax asset can be utilized. The carrying amount of deferred tax assets is reviewed at each period end. This amount is reduced to the extent that it is no longer probable that additional taxable profit will be available against which to offset all or part of the deferred tax assets to be utilized. Conversely, the carrying amount of deferred tax assets will be increased when it becomes probable that future taxable profit will be available in the long-term against which to offset tax losses not yet recognized. The probability of recovering deferred tax assets is primarily assessed based on a 10-year plan, taking account of the probability of realization of future taxable profits.
The main deferred tax assets and liabilities are offset if, and only if, the subsidiaries have a legally enforceable right to offset current tax assets against current tax liabilities, and when the deferred taxes relate to income taxes levied by the same taxation authority. RECOGNIZED DEFERRED TAX ASSETS
Deferred tax assets and movements therein break down as follows:
in millions of euros Note
Tax loss carry-
forwards
Temporary differences
on amortizable
goodwill
Provisions for pensions and
other post-employment
benefits
Other deductible temporary
differences
Total deferred
tax assets
At January 1, 2015 562 90 315 98 1,065
Business combinations 13 - 4 (66) (49)
Translation adjustments 28 (2) 7 (9) 24
Deferred tax recognized in the Income Statement 10 440 (48) (13) 43 422
Deferred tax recorded in income and expense recognized in equity (1) - 7 11 17 Other movements, including offset with deferred tax liabilities (98) - (24) 55 (68)
At December 31, 2015 944 40 296 132 1,412
Business combinations - - - 2 2
Translation adjustments 20 9 (17) (1) 11
Deferred tax recognized in the Income Statement 10 (46) 120 (15) (24) 35
Deferred tax recorded in income and expense recognized in equity (27) - 22 12 7
Other movements 1 - (5) 10 6
At December 31, 2016 892 169 281 131 1,473 Recognized tax loss carry-forwards total €895 million at December 31, 2016 and primarily concern the United States in the amount of €638 million (US$ 672 million) and France in the amount of €237 million.
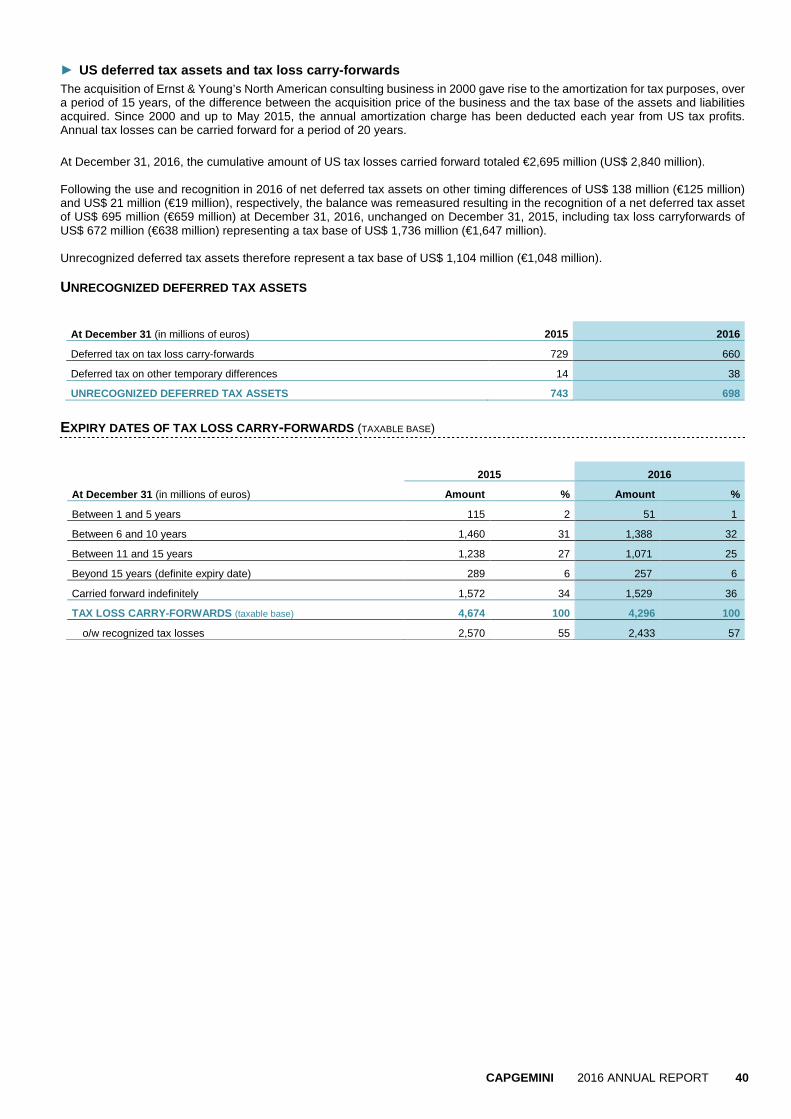
CAPGEMINI 2016 ANNUAL REPORT 40
► US deferred tax assets and tax loss carry-forwards The acquisition of Ernst & Young’s North American consulting business in 2000 gave rise to the amortization for tax purposes, over a period of 15 years, of the difference between the acquisition price of the business and the tax base of the assets and liabilities acquired. Since 2000 and up to May 2015, the annual amortization charge has been deducted each year from US tax profits. Annual tax losses can be carried forward for a period of 20 years. At December 31, 2016, the cumulative amount of US tax losses carried forward totaled €2,695 million (US$ 2,840 million). Following the use and recognition in 2016 of net deferred tax assets on other timing differences of US$ 138 million (€125 million) and US$ 21 million (€19 million), respectively, the balance was remeasured resulting in the recognition of a net deferred tax asset of US$ 695 million (€659 million) at December 31, 2016, unchanged on December 31, 2015, including tax loss carryforwards of US$ 672 million (€638 million) representing a tax base of US$ 1,736 million (€1,647 million). Unrecognized deferred tax assets therefore represent a tax base of US$ 1,104 million (€1,048 million). UNRECOGNIZED DEFERRED TAX ASSETS
At December 31 (in millions of euros) 2015 2016
Deferred tax on tax loss carry-forwards 729 660
Deferred tax on other temporary differences 14 38
UNRECOGNIZED DEFERRED TAX ASSETS 743 698
EXPIRY DATES OF TAX LOSS CARRY -FORWARDS (TAXABLE BASE)
2015 2016
At December 31 (in millions of euros) Amount % Amount %
Between 1 and 5 years 115 2 51 1
Between 6 and 10 years 1,460 31 1,388 32
Between 11 and 15 years 1,238 27 1,071 25
Beyond 15 years (definite expiry date) 289 6 257 6
Carried forward indefinitely 1,572 34 1,529 36
TAX LOSS CARRY-FORWARDS (taxable base) 4,674 100 4,296 100
o/w recognized tax losses 2,570 55 2,433 57

CAPGEMINI 2016 ANNUAL REPORT 41
DEFERRED TAX LIABILITIES
Deferred tax liabilities and movements therein break down as follows:
in millions of euros Note
Tax-deductible goodwill
amortization Customer
relationships
Other taxable temporary
differences Total deferred
tax liabilities
At January 1, 2015 59 21 78 158
Business combinations - 78 56 134
Translation adjustments 4 (9) - (5) Deferred tax recognized in the Income Statement 10 1 (12) 4 (7) Other movements, including offset with deferred tax assets - (7) (52) (59)
At December 31, 2015 64 71 86 221
Business combinations - - - -
Translation adjustments 2 2 - 4 Deferred tax recognized in the Income Statement 10 1 (8) 5 (2) Deferred tax recorded in income and expense recognized in equity - - 1 1
Other movements - (7) 10 3
At December 31, 2016 67 58 102 227

CAPGEMINI 2016 ANNUAL REPORT 42
NOTE 17 FINANCIAL INSTRUMENTS Financial instruments consist of:
► financial assets, including other non-current assets, accounts receivable, other current assets, cash management assets and cash and cash equivalents;
► financial liabilities, including long- and short-term borrowings and bank overdrafts, accounts payable, and other current payables and non-current liabilities;
► derivative instruments
a) Recognition of financial instruments
Financial instruments (assets and liabilities) are initially recognized in the Consolidated Statement of Financial Position at their initial fair value. The subsequent measurement of financial assets and liabilities is based on either fair value or amortized costs depending on their classification in the Consolidated Statement of Financial Position. The fair value of a financial instrument is the amount for which an asset could be exchanged, or a liability settled, between knowledgeable, willing parties in an arm’s length transaction. Amortized cost corresponds to the initial carrying amount (net of transaction costs), plus interest calculated using the effective interest rate, less cash outflows (coupon interest payments and repayments of principal and redemption premiums where applicable). Accrued interest (income and expense) is not recorded on the basis of the financial instrument’s nominal interest rate, but on the basis of its effective interest rate. Financial assets measured at amortized cost are subject to impairment tests as soon as there are indicators of a loss in value. Any loss in value is recognized in the Income Statement. Financial instruments are recognized at inception and on subsequent dates in accordance with the methods described below. These methods draw on the following interest rate definitions:
► the coupon interest rate or coupon, which is the nominal interest rate on borrowings;
► the effective interest rate, which is the rate that exactly discounts the estimated cash flows through the expected term of the instrument, or, where appropriate, a shorter period to the net carrying amount of the financial asset or liability at initial recognition. The effective interest rate takes into account all fees paid or received, transaction costs, and, where applicable, premiums to be paid and received;
► the market interest rate, which reflects the effective interest rate recalculated at the measurement date based on current market parameters.
Financial instruments (assets and liabilities) are derecognized when the related risks and rewards of ownership have been transferred, and when the Group no longer exercises control over the instruments.
b) Derivative instruments
Derivative instruments mainly comprise forward foreign exchange purchase and sale contracts (in the form of tunnels, where applicable), interest rate swaps and call options on own shares.
Other derivative instruments
Other derivative instruments are initially recognized at fair value. Except as described below in the case of instruments designated as cash flow hedges, changes in the fair value of derivative instruments, estimated based on market rates or data provided by bank counterparties, are recognized in the Income Statement at the period end. When operating or financial cash flow hedges are eligible for hedge accounting, the fair value of the hedging instruments are recognized firstly in “Income and expense recognized in equity” and subsequently taken to operating profit when the hedged item itself impacts the Income Statement.
c) Fair value measurement
Fair value measurement methods for financial and non-financial assets and liabilities as defined above are classified according to the following three fair value levels:
► Level 1: fair value measured based on quoted prices (unadjusted) observed in active markets for identical assets or liabilities;
► Level 2: fair value measured using inputs other than quoted prices in active markets, that are observable either directly (i.e. as prices) or indirectly (i.e. derived from prices);
► Level 3: fair value of assets or liabilities measured using inputs that are not based on observable market data (unobservable inputs).
As far as possible, the Group applies Level 1 measurement methods.

CAPGEMINI 2016 ANNUAL REPORT 43
FINANCIAL INSTRUMENT CLASSIFICATION AND FAIR VALUE HIERARCH Y
The following table presents the net carrying amount of financial assets and liabilities and the fair value of financial instruments broken down according to the three classification levels defined above (except for financial instruments where the net carrying amount represents a reasonable approximation of fair value).
Notes Fair valueAmortized
cost Level 1 Level 2 Level 3
Financial assets
Shares in non-consolidated companies and in associates 18 4 4
Long-term deposits, receivables and other investments 18 119
Other non-current assets 18 131
Asset derivative instruments non-current and current 18 - 20 269 269
Accounts and notes receivables 19 3 074
Other current rassets 20 478
Cash management assets 21 157 157
Cash and cash equivalents 21 1 879 1 879
Financial l iabilities
Bonds 21 3 260
Obligations under f inance leases 21 100
Draw -dow ns on bank and similar facilities and other borrow ings, net 21 43
Other non-current and current liabilities 26 278
Liability derivative instruments non-current and current 26 89 89
Accounts and notes payable 27 2 818
Bank overdrafts 21 9 9
December 31, 2016 (in millions of euros)
Fair valueNet carrying amount
NOTE 18 OTHER NON-CURRENT ASSETS
At December 31 (in millions of euros) Notes 2015 (1) 2016
Long-term deposits, receivables and other investments 96 119
Derivative instruments 23 228 120
Non-current tax receivables 88 83
Other 45 52
OTHER NON-CURRENT ASSETS 22 457 374 (1) Certain reclassifications have been made to 2015 amounts to conform to current year presentation. These reclassifications had no impact on net income nor on net cash flows. Long-term deposits, receivables and other investments consist mainly of “aides à la construction” (building aid program) loans and security deposits and guarantees relating to leases. Derivative instruments consist of the fair value of derivative instruments contracted as part of the centralized management of currency risk in the amount of €120 million (current portion of €145 million, see Note 20, Other current assets”). At December 31, 2015, derivative instruments also included the call option on own shares purchased by Cap Gemini S.A. on October 18, 2013, valued at €162 million. This option was exercised in 2016 on the early redemption of the ORNANE 2013 bonds (see Note 21 – Net debt / Net cash and cash equivalents). At December 31, 2016, non-current tax receivables include research tax credit receivables and competitiveness and employment tax credit receivables in France in the amount of €56 million (€58 million at December 31, 2015).

CAPGEMINI 2016 ANNUAL REPORT 44
NOTE 19 ACCOUNTS AND NOTES RECEIVABLE
At December 31 (in millions of euros) Note 2015 2016
Accounts receivable 1,924 1,996
Provisions for doubtful accounts (15) (27)
Accrued income 1,037 1,012
Accounts and notes receivable, excluding capitalize d costs on projects 22 2,946 2,981
Capitalized costs on projects 22 109 93
ACCOUNTS AND NOTES RECEIVABLE 3,055 3,074 Total accounts receivable and accrued income net of advances from customers and billed in advance, can be analyzed as follows in number of days revenue:
At December 31 (in millions of euros) Note 2015 2016
Accounts and notes receivable, excluding capitalized costs on projects 22 2,946 2,981
Advances from customers and billed in advance 22 (739) (737) TOTAL ACCOUNTS RECEIVABLE NET OF ADVANC ES FROM CUSTOMERS AND BILLED IN ADVANCE 2,207 2,244
In number of days’ annual revenue (1) 64 64
(1) This ratio is adjusted to take account of the impact of entries into the scope of consolidation.
In 2016, receivables totaling €66 million were assigned with transfer of credit risk as defined by IAS 39 to a financial institution (€43 million in 2015) and were therefore derecognized in the Statement of Financial Position at December 31, 2016. AGED ANALYSIS OF ACCOUNTS RECEIVABLE
The low bad debt ratio reflects the fact that most invoices are only issued after the client has validated the services provided. At end-2016, past due balances totaled €341 million, representing 17.3% of accounts and notes receivable less provisions for doubtful accounts. The breakdown is as follows:
in millions of euros < 30 days > 30 days and
< 90 days > 90 days
Net accounts receivable 206 88 47
As a % of accounts and notes receivable, net of provisions for doubtful accounts 10,4% 4,5% 2.4% Past due balances concern accounts receivable from clients which are individually analyzed and monitored. CREDIT RISK
The Group’s 5 largest clients contribute around 11% of Group revenues (stable on 2015). The top 10 clients collectively account for 16% of Group revenues. The solvency of these major clients and the sheer diversity of the other smaller clients help limit credit risk. The economic environment could impact the business activities of the Group’s clients, as well as the amounts receivable from these clients. However, the Group does not consider that any of its clients, business sectors or geographic areas present a significant credit risk that could materially impact the financial position of the Group as a whole.

CAPGEMINI 2016 ANNUAL REPORT 45
NOTE 20 OTHER CURRENT RECEIVABLES
At December 31 (in millions of euros) Notes 2015 (1) 2016
Social security and tax-related receivables, other than income tax 167 216
Prepaid expenses 205 209
Derivative instruments 23 114 149
Other 57 53
OTHER CURRENT RECEIVABLES 22 543 627
(1) Certain reclassifications have been made to 2015 amounts to conform to current year presentation. These reclassifications had no impact on net income nor on net cash flows. At December 31, 2016, Social security and tax-related receivables, other than income tax include research tax credit receivables and competitiveness and employment tax credit receivables in France in the amount of €88 million (€77 million at December 31, 2015), after recognition of research tax credit income and competitiveness and employment tax credit in France deducted from operating expenses of €54 million (€56 million in 2015).
NOTE 21 NET DEBT / NET CASH AND CASH EQUIVALENTS Cash and cash equivalents presented in the Consolidated Statement of Cash Flows consist of short-term investments and cash at bank less bank overdrafts.
Net cash and cash equivalents or net debt comprise cash and cash equivalents as defined above, and cash management assets (assets presented separately in the Consolidated Statement of Financial Position due to their characteristics), less short- and long-term borrowings. Account is also taken of the impact of hedging instruments when these relate to borrowings and own shares.
in millions of euros Note 2015 2016
Short-term investments 1,107 1,449
Cash at bank 843 430
Bank overdrafts (2) (9)
Cash and cash equivalents 22 1,948 1,870
Cash management assets 116 157
Bonds (3,107) (3,236)
Obligations under finance leases (54) (51)
Long-term borrowings (3,161) (3,287)
Bonds (526) (24)
Obligations under finance leases (43) (49)
Draw-downs on bank and similar facilities and other borrowings, net (81) (43)
Short-term borrowings (650) (116)
Borrowings (3,811) (3,403)
Derivative instruments (1) (20) (37)
NET DEBT (1,767) (1,413) (1) At December 31, 2015 and December 31, 2016 including the fair value of the 5-year EUR/USD fix-to-fix cross currency swaps set-up in June 2015 in respect of the IGATE acquisition financing. At December 31, 2015, this heading also included the fair value of the conversion option embedded in the “ORNANE 2013” bonds, and of the call option on own shares purchased by Cap Gemini S.A. on October 18, 2013. These options were exercised in 2016 on the early redemption of the ORNANE 2013 bonds (see Note 21, Net debt / Net cash and cash equivalents).
SHORT-TERM INVESTMENTS
At December 31, 2016, short-term investments mainly consist of UCITS, certificates of deposit and term bank deposits, paying interest at standard market rates.
CAPGEMINI 2016 ANNUAL REPORT 46
CASH MANAGEMENT ASSETS
Cash management assets consist of capitalization contracts with insurance companies which may be cancelled by Cap Gemini S.A. at any time without penalty, as well as marketable securities held by certain IGATE group companies in India which do not meet all the monetary UCITS classification criteria defined by ESMA (European Securities and Markets Authority) for money market mutual funds, particularly with regards to the average maturity of the portfolio. These funds may, however, be redeemed at any time without penalty. BORROWINGS
A) Bonds a) 2016 Bond issue On November 3, 2016, Cap Gemini S.A. placed a €500 million bond issue comprising 5,000 bonds with a unit value of €100,000 each and with a settlement/delivery date of November 9, 2016.
The bonds mature on November 9, 2021 and pay an annual coupon of 0.50% (issue price 99.769%). The bond issue is callable before this date by Cap Gemini S.A., subject to certain conditions set out in the issue prospectus and particularly concerning the minimum redemption price.
The bond issue is also subject to standard early redemption, early repayment and pari passu clauses.
The terms and conditions of the bond issue were set out in the prospectus approved by the AMF on November 7, 2016 under reference number no.16-518. b) July 1, 2015 Bond issue On June 24, 2015, Cap Gemini S.A. performed a “triple tranche” bond issue for a total nominal amount of €2,750 million and with a settlement/delivery date of July 1, 2015:
► 2015 Bond issue (July 2018):
The nominal amount of this tranche is €500 million, comprising 5,000 bonds with a unit value of €100,000 each. The bonds mature on July 2, 2018 and pay a floating coupon of 3 month Euribor + 85pb, revised quarterly (issue price 100%).
► 2015 Bond issue (July 2020):
The nominal amount of this tranche is €1,250 million, comprising 12,500 bonds with a unit value of €100,000 each. The bonds mature on July 1, 2020 and pay an annual coupon of 1.75% (issue price 99.853%).
► 2015 Bond issue (July 2023):
The nominal amount of this tranche is €1,000 million, comprising 10,000 bonds with a unit value of €100,000 each. The bonds mature on July 1, 2023 and pay an annual coupon of 2.50% (issue price 99.857%).
The July 2020 and July 2023 tranches are callable by Cap Gemini S.A., subject to certain conditions set out in the issue prospectus and particularly concerning the minimum redemption price.
These three bond issues are also subject to standard early redemption, early repayment and pari passu clauses.
The terms and conditions of these three tranches were set out in the prospectus approved by the AMF on June 29, 2015 under reference number no.15-318. c) “ORNANE 2013” Bond issue On October 18, 2013, Cap Gemini S.A. launched an offering of bonds redeemable in cash and/or in new and/or existing shares (Obligations à option de Remboursement en Numéraire et/ou en Actions Nouvelles et/ou Existantes, ORNANE), maturing on January 1, 2019. Bondholders enjoyed all rights from October 25, 2013.
The total nominal amount of the issue was €400 million, comprising 5,958,587 bonds with a nominal value of €67.13 each, representing an issue premium of 42.5% compared with the Company benchmark share price during the relevant period.
On October 18, 2013, the Company purchased a call option on its own shares aimed at neutralizing the potential dilution related to the ORNANE 2013 bond issue. In addition, and in order to optimize the cost of the Group’s financial resources, the Company sold a call option also on its own shares but with a higher strike price. Together, these two transactions synthetically enhanced the effective dilution threshold of the ORNANEs by approximately 5%.
The bonds did not bear any interest (zero coupon bonds).
During the period from October 25, 2013 to December 31, 2016 (inclusive), bondholders could only exercise their share conversion rights in the limited circumstances listed in the prospectus.
From January 1, 2017 (inclusive), bondholders could exercise their share conversion rights at any time up to the eighteenth trading day (exclusive) preceding January 1, 2019.
On the exercise by bondholders of their share conversion rights, Cap Gemini S.A. could present, at its initiative, either: (i) a cash amount up to the nominal value of the bonds and new and/or existing shares thereafter, where applicable; or (ii) only new and/or existing shares.

CAPGEMINI 2016 ANNUAL REPORT 47
The bonds were redeemable at par on January 1, 2019 if share conversion rights has not been exercised by bondholders.
The bond issue was also subject to standard early redemption, early repayment and pari passu clauses.
Given the settlement terms of the “ORNANE 2013” bonds, an embedded conversion option was recognized in “Other non-current liabilities”, with fair value movements taken to profit or loss.
In parallel and given its terms and conditions, the call option on own shares purchased on October 18, 2013 was recognized in assets. Fair value movements were taken to profit and loss and offset those on the embedded conversion option.
The terms and conditions of this issue were set out in the prospectus approved by the AMF on October 18, 2013 under reference number no.13-557.
On October 5, 2016, Cap Gemini S.A. announced its decision to redeem all of the ORNANE bonds outstanding on November 21, 2016 at par and based on a conversion ratio of 1.00 Cap Gemini share per ORNANE bond.
In this context, holders of 5,934,131 ORNANE bonds exercised their share allotment rights resulting in the presentation of €398 million and 640,184 existing shares. On November 21, 2016, Cap Gemini S.A. redeemed all outstanding ORNANE bonds, i.e. 24,456 bonds for a total of €2 million.
The conversion option embedded in the ORNANE bonds and the call option on own shares recognized in “Other non-current liabilities” and “Other non-current assets”, respectively, of similar amount, were released without any net impact on the Income Statement.
In this context, Cap Gemini S.A. exercised in full the call option on its own shares purchased on October 18, 2013. The call option sold by the Company was also exercised in full. Cap Gemini S.A. received an amount of €14 million on the exercise of these two calls.
d) 2011 Bond issue On November 18, 2011, Cap Gemini S.A. performed a bond issue maturing on November 29, 2016. Bondholders enjoyed all rights from November 29, 2011. The total nominal amount of the issue was €500 million, comprising 5,000 bonds with a nominal value of €100,000 each. The bonds bore interest at 5.25% per year, potentially increasing to 6.50% in the event of a down-grading of Cap Gemini S.A.’s credit rating. The bonds were redeemable in full on November 29, 2016. They could be called before this date by the Company, subject to certain conditions set out in the issue prospectus and particularly concerning the minimum redemption price. Bondholders could request the early redemption of all or part of their bonds in the event of a change in control of the Company, provided this change in control was accompanied by a downgrading of the Company’s financial rating. Early repayment could also be requested by any bondholder, subject to the occurrence of certain events and particularly failure to pay sums due in respect of the bond issue or to comply with other obligations set out in the documentation (beyond any “grace” periods, if applicable), cross default (in excess of a minimum threshold), liquidation or dissolution. An upgrade or downgrade in Cap Gemini S.A.’s credit rating did not constitute an early repayment event. Furthermore, Cap Gemini S.A. undertook that the bonds would rank pari passu with all other marketable bonds issued by the Company. The terms and conditions of this issue were set out in the prospectus approved by the AMF on November 25, 2011 under reference number no.11-546. The 2011 bond issue was redeemed in full on November 29, 2016.

CAPGEMINI 2016 ANNUAL REPORT 48
IMPACT OF BONDS ON THE FINANCIAL STATEMENTS
2016
2015 Bond issue
At December 31 (in millions of euros)
2011 Bond issue
“ORNANE 2013” bonds July 2018 July 2020 July 2023
2016 Bond issue
Equity component n/a n/a n/a n/a n/a n/a
Option component in respect of the embedded conversion option n/a n/a n/a n/a n/a n/a Debt component at amortized cost, including accrued interest - - 500 1,256 1,007 497
Effective interest rate 5.5% 2.7% 1.0% 1.9% 2.6% 0.6% Interest expense recognized in the Income Statement for the period 25 30 4 23 26 -
Nominal interest rate 5.3% 0.0% 0.8% 1.8% 2.5% 0.5%
Nominal interest expense (coupon) 24 - 3 22 25 -
2015
2015 Bond issue
At December 31 (in millions of euros)
2011 Bond issue
“ORNANE 2013” bonds July 2018 July 2020 July 2023
2016 Bond issue
Equity component n/a n/a n/a n/a n/a
Option component in respect of the embedded conversion option n/a 162 n/a n/a n/a Debt component at amortized cost, including accrued interest 501 370 500 1,255 1,007
Effective interest rate 5.5% 2.7% 1.0% 1.9% 2.6% Interest expense recognized in the Income Statement for the period 27 10 2 12 13
Nominal interest rate 5.3% 0.0% 0.8% 1.8% 2.5%
Nominal interest expense (coupon) 26 - 2 11 13
FAIR VALUE OF BONDS
2016
2015 Bond issue
At December 31 (in millions of euros)
2011 Bond issue
“ORNANE 2013” bonds July 2018 July 2020 July 2023
2016 Bond issue
Fair value 505 1,320 1,116 502
Market rate 0.1% 0.4% 0.9% 0.4%
2015
2015 Bond issue
At December 31 (in millions of euros)
2011 Bond issue
“ORNANE 2013” bonds
July 2018 July 2020
July 2023
2016 Bond issue
Fair value 525 391 506 1,293 1,053
Market rate 0.2% 0.8% 0.4% 1.2% 1.9%

CAPGEMINI 2016 ANNUAL REPORT 49
B) Obligations under finance leases
in millions of euros Earliest date of
leases Latest
expiry date Effective interest
rate December 31,
2016 OBLIGATIONS UNDER FINANCE LEASES Computer equipment and other fixed assets 2010 2021 4,0% 100
o/w long-term obligations 51
o/w short-term obligations 49
C) Breakdown of borrowings by currency
At December 31, 2015 At December 31, 2016
in millions of euros Euro Other
currencies Total Euro Other
currencies Total
2011 Bond issue 501 - 501
“ORNANE 2013” bonds 370 - 370
2015 Bond issue – July 2018 500 - 500 500 - 500
2015 Bond issue – July 2020 1,255 - 1,255 1,256 - 1,256
2015 Bond issue – July 2023 1,007 - 1,007 1,007 - 1,007
2016 Bond issue 497 - 497 Draw-downs on bank and similar facilities and other borrowings, net - 81 81 - 43 43
Obligations under finance leases 52 45 97 65 35 100
Bank overdrafts 2 - 2 3 6 9
BORROWINGS 3,687 126 3,813 3,328 84 3,412 Obligations under finance leases are mainly denominated in pound sterling in the amount of €20 million (€25 million at December 31, 2015) and in US dollars in the amount of €11 million (€15 million at December 31, 2015). D) Effective Interest Rate (EIR) In 2016, the effective interest rate on the Group’s average outstanding borrowings was 3.0% (2.6% in 2015). At December 31, 2016, 85% of the Group’s borrowings are at fixed rates (86% in 2015) and the remainder is at floating rates. E) Syndicated credit facility negotiated by Cap Gem ini S.A. On January 30, 2014, the Group signed with a syndicate of 18 banks a €750 million multi-currency credit facility, maturing on July 30, 2019. In the event of exercise (subject to the approval of the banks) of two one-year extension options, exercisable at the end of the first and second years, respectively, the maturity of the new facility will be extended by a maximum of two additional years. Following the exercise of the second one-year extension option, the maturity of this credit facility was extended to July 27, 2021. The initial margin on this credit facility was 0.45% (excluding the fee on drawn amounts which varies according to the portion of the facility drawn). This margin may be adjusted upwards or downwards according to the credit rating of Cap Gemini S.A. The facility is also subject to a fee on undrawn amounts equal to 35% of the margin. The margin currently applicable is 0.45% and the fee on undrawn amounts is 0.1575%. An upgrade or downgrade in Cap Gemini S.A.’s credit rating would have no impact on the availability of this credit facility. The other main terms and conditions of the credit facility, in particular with respect to certain financial ratios, are detailed in Note 29, Off-balance sheet commitments. This credit facility had not been drawn at December 31, 2016.

CAPGEMINI 2016 ANNUAL REPORT 50
NET DEBT BY MATURITY AT REDEMPTION VALUE
The amounts indicated below correspond to the undiscounted value of future contractual cash flows. Future cash flows relating to the 2015 and 2016 bond issues were estimated based on contractual nominal interest rates and assuming the bonds would be redeemed in full at maturity. The contractual cash flows associated with “Obligations under finance leases” represent contractual repayments of the liability.
in millions of euros Contractual
maturity Carrying amount
Contractual cash flows
Less than 1
year 1 to 2 years
2 to 5 years
Beyond 5 years
At December 31, 2016
Cash and cash equivalents 2017 1,870 1,870 1,870 - - -
Cash management assets 2017 157 157 157 - - -
2015 Bond issue – July 2018 2018 (500) (505) (3) (502) - -
2015 Bond issue – July 2020 2020 (1,256) (1,338) (22) (22) (1,294) -
2015 Bond issue – July 2023 2023 (1,008) (1,175) (25) (25) (75) (1,050)
2016 Bond issue 2021 (497) (513) (3) (3) (507) -
Obligations under finance leases 2017 à 2020 (100) (105) (53) (34) (18) - Draw-downs on bank and similar facilities and other borrowings, net 2017 à 2020 (42) (105) (52) (18) (35) -
Borrowings (3,403) (3,741) (158) (604) (1,929) (1,050)
Derivative instruments on borrowings (37)
NET DEBT (1,413) (1,714) 1,869 (604) (1,929) (1,050)
At December 31, 2015
Cash and cash equivalents 2016 1,948 1,948 1,948 - - -
Cash management assets 2016 116 116 116 - - -
2011 Bond issue 2016 (501) (526) (526) - - -
“ORNANE 2013” bonds 2019 (370) (400) - - (400) -
2015 Bond issue – July 2018 2018 (500) (511) (4) (4) (503) -
2015 Bond issue – July 2020 2020 (1,255) (1,360) (22) (22) (1,316) -
2015 Bond issue – July 2023 2023 (1,007) (1,200) (25) (25) (75) (1,075)
Obligations under finance leases 2016 to 2020 (97) (103) (47) (33) (23) - Draw-downs on bank and similar facilities and other borrowings 2016 to 2020 (81) (158) (91) (17) (50) -
Borrowings (3,811) (4,258) (715) (101) (2,367) (1,075)
Derivative instruments on borrowings (20)
NET DEBT (1,767) (2,194) 1,349 (101) (2,367) (1,075)
CAPGEMINI 2016 ANNUAL REPORT 51
NET DEBT / NET CASH AND CASH EQUIVALENTS AND LIQUIDITY RISK
The financial liabilities whose repayment could expose the Group to liquidity risk are mainly the bond issues performed in 2015 and the bond issue performed in 2016. To manage the liquidity risk that may result from financial liabilities becoming due and payable, at the contractual due date or early, the Group has implemented a conservative financing policy mainly based on:
► prudent use of debt leveraging, coupled with limited use of any clauses that could lead to early repayment of borrowings;
► maintaining a high level of available funds at all times;
► actively managing the due dates of financial liabilities in order to limit the concentration of borrowings’ maturities;
► using diverse sources of financing, allowing the Group to reduce its reliance on certain categories of lenders.
NET DEBT / NET CASH AND CASH EQUIVALENTS AND CREDIT RISK
Financial assets which could expose the Group to a credit or counterparty risk mainly consist of financial investments: in accordance with Group policy, cash balances are not invested in equity-linked products, but in (i) negotiable debt securities (certificates of deposit), (ii) term deposits, (iii) capitalization contracts or (iv) short-term money market mutual funds, subject to minimum credit rating and diversification rules. At December 31, 2016, short-term investments totaled €1,449 million and comprise mainly (i) money market mutual funds meeting the criteria defined by ESMA (European Securities and Markets Authority) for classification in the “monetary category”; and (ii) negotiable debt securities and term deposits maturing within three months or immediately available, issued by highly rated companies or financial institutions (minimum rating of A2/P2 or equivalent). Consequently, these short-term investments do not expose the Group to any material credit risk.

CAPGEMINI 2016 ANNUAL REPORT 52
NOTE 22 CASH FLOWS The Consolidated Statement of Cash Flows analyzes the year-on-year change in cash flows from operating, investing and financing activities. Foreign currency cash flows are translated into euros at the average exchange rate for the year. Exchange gains or losses resulting from the translation of cash flows relating to foreign currency assets and liabilities at the year-end exchange rate are shown in “Effect of exchange rate movements on cash and cash equivalents” in the Statement of Cash Flows. At December 31, 2016, cash and cash equivalents totaled €1,870 million (see Note 21, Net debt / Net cash and cash equivalents), down €78 million on December 31, 2015 (€1,948 million). Excluding the impact of exchange rate fluctuations on cash and cash equivalents of negative €31 million, this decrease is €47 million. Cash flow impacts are shown in the Consolidated Statement of Cash Flows. NET CASH FROM OPERATING ACTIVITIES
In 2016, net cash from operating activities totaled €1,319 million (compared with €1,004 million in 2015) and resulted from:
► cash flows from operations before net finance costs and income tax in the amount of €1,449 million;
► payment of current income taxes in the amount of €167 million,
► a decrease in working capital requirements, generating a positive cash impact of €37 million.
Changes in working capital requirements (WCR) and the reconciliation with the Consolidated Statement of Financial Position are as follows:
Statement of Cash Flows
items
in millions of euros NotesDecember 31,
2015December 31,
2016Net
impact
Non working
capital items (1)
Impact of WCR items
Net profit impact
Foreign exchange
impact
Reclas-sifications (2)
and changes in
Group structure Amount
Accounts and notes receivable, excl. capitalized costs on projects 19 2 946 2 981 (35) (18) (53) - (5) (7) (65)
Capitalized costs on projects 19 109 93 16 - 16 - (3) - 13
Advances from customers and billed in advance 19 (739) (737) (2) - (2) - 22 - 20
Change in accounts and notes receivable and advances from customers and amounts billed in advance (21) (18) (39) - 14 (7) (32)Accounts and notes payable (accounts payable) 27 (1 015) (1 105) 90 8 98 - 20 10 128
Changes in accounts and notes payable 90 8 98 - 20 10 128
Other non-current assets 18 457 374 83 (91) (8) - - (16) (24)
Other current receivables 20 543 627 (84) 30 (54) (2) (9) 15 (50)
Accounts and notes payable (excluding accounts payable) 27 (1 709) (1 713) 4 1 5 - 7 4 16
Other non-current & current liabilities 26 (458) (367) (91) 127 36 (1) (34) (2) (1)
Change in other receivables/payables (88) 67 (21) (3) (36) 1 (59)CHANGE IN OPERATING WORKING CAPITAL 38 (3) (2) 4 37
Working capital requirement components (Consolidated Statement of Financial Position)
Neutralization of items w ith no cash impact
(1) Non-working capital items comprise cash flows relating to investing and financing activities, payment of the income tax expense and non-cash items;
(2) The Reclassifications heading mainly includes changes relating to the current and non-current reclassification of certain accounts and notes receivable and payable and changes in the position of certain tax and employee-related receivables and payables in assets or liabilities.

CAPGEMINI 2016 ANNUAL REPORT 53
NET CASH USED IN INVESTING ACTIVITIES
The main components of net cash used in investing activities of €251 million (compared with €3,586 million in 2015) reflect:
► cash outflows of €117 million relating to acquisitions of property, plant and equipment, net of disposals, primarily due to purchases of computer hardware for client projects or the partial renewal of IT installations and the renovation, extension and refurbishment of office space;
► cash outflows of €59 million relating to acquisitions of intangible assets, net of disposals, mainly involving software for customer projects or for internal use and internally generated intangible assets (see Note 13, Goodwill and intangible assets);
NET CASH FROM FINANCING ACTIVITIES
Net cash outflows as a result of financing activities totaled €1,115 million (compared with cash inflows of €2,364 million in 2015) and mainly comprised:
► the redemption of the 2011 bond issue in the amount of €500 million;
► the early redemption of ORNANE 2013 bonds outstanding at November 21, 2016 in the amount of €400 million;
► cash outflows of €340 million for the buyback of own shares mainly under the share buyback program and in respect of the implementation of the liquidity agreement;
► payment of the 2015 dividend of €229 million;
► cash outflows of €72 million in respect of interest payments net of interest received;
► cash outflows of €56 million to repay obligations under finance leases.
Compensated by:
► cash inflows of €497 million following the 2016 bond issue.
ORGANIC FREE CASH FLOW
Organic free cash flow calculated based on items in the Statement of Cash Flows is equal to cash flow from operations less acquisitions of property, plant, equipment and intangible assets (net of disposals) and adjusted for flows relating to the net interest cost.
At December 31 (in millions of euros) 2015 2016
Cash flows from operations 1,004 1,319
Acquisitions of property, plant and equipment and intangible assets (198) (197)
Proceeds from disposals of property, plant and equipment and intangible assets 19 21
Acquisitions of property, plant, equipment and inta ngible assets (net of disposals) (179) (176)
Interest paid (38) (115)
Interest received 28 43
Net interest cost (10) (72)
ORGANIC FREE CASH FLOW 815 1,071

CAPGEMINI 2016 ANNUAL REPORT 54
NOTE 23 CURRENCY, INTEREST RATE AND COUNTERPARTY RISK MANAG EMENT CURRENCY RISK MANAGEMENT
A) Exposure to currency risk and currency risk mana gement policy a) Currency risk and hedging operating transactions The growing use of offshore production centers located in India, Poland and Latin America, exposes the Group to currency risk with respect to some of its production costs. The Group implements a policy aimed at minimizing and managing these currency risks, due in the majority to internal flows with India. The definition of the hedging policy and the management of operational currency risk is centralized at parent company level. Currency risk is managed primarily based on periodic reporting by subsidiaries of their exposure to currency risk over the coming 1 to 3 years. On this basis, the parent company acting as an internal bank, grants internal currency guarantees to subsidiaries and enters into currency hedges with its bank counterparties, primarily through forward purchase and sale foreign exchange contracts. These hedging transactions are generally recorded in accordance with cash flow hedge accounting rules. b) Currency risk and hedging financial transactions The Group is exposed to the risk of exchange rate fluctuations in respect of:
► inter-company financing transactions, mainly within the parent company, these flows generally being hedged (in particular using forward purchase and sale foreign exchange contracts);
► fees paid to the parent company by subsidiaries whose functional currency is not the euro.
c) Sensitivity of revenues and the operating margin * to fluctuations in the main currencies A 10% fluctuation in the US dollar-euro exchange rate would trigger a corresponding 2.7% change in revenues and a 3.2% change in the operating margin* amount. Similarly, a 10% fluctuation in the pound sterling-euro exchange rate would trigger a corresponding 1.6% change in revenues and a 1.9% change in the operating margin* amount. * Operating margin, an alternative performance measure monitored by the Group, is defined in Note 3, Alternative performance measures. B) Hedging derivatives Amounts hedged at December 31, 2016 using forward purchase and sale foreign exchange contracts, mainly concern the parent company with respect to the centralized management of currency risk on operating transactions and inter-company financing transactions. At December 31, 2016, the euro-equivalent value of forward purchase and sale foreign exchange contracts breaks down by transaction type and maturity as follows:
in millions of euros < 6 months
> 6 months and < 12 months > 12 months TOTAL
Operating transactions 1,344 1,027 1,793 4,164
o/w ► fair value hedge 388 - - 388
► cash flow hedge 956 1,027 1,793 3,776
Financial transactions 258 47 949 1,254
o/w ► fair value hedge 258 47 - 305
► cash flow hedge for the interest rate component and fair value hedge for the exchange rate component
- - 949 949
TOTAL 1,602 1,074 2,742 5,418 Hedges contracted in respect of operating transactions mainly comprise forward purchase and sale foreign exchange contracts maturing between 2017 and 2020 with an aggregate euro-equivalent value at closing exchange rates of €4,164 million (€3,072 million at December 31, 2015). The hedges were chiefly taken out in respect of transactions in Indian rupee (INR 182,000 million), US dollars (USD 1,084 million) and Polish zloty (PLN 1,124 million). The maturities of the hedges range from 1 to 37 months and the main counterparty is Cap Gemini S.A. (for a euro-equivalent value of €4,129 million).

CAPGEMINI 2016 ANNUAL REPORT 55
Hedges contracted in respect of financial transactions concern Cap Gemini S.A. in the amount of €1,254 million at December 31, 2016. They mainly comprise hedged inter-company loans for €1,241 million (€1,356 million at December 31, 2015), including €949 million in respect of EUR/USD fix-to-fix cross-currency swaps (see Note 2, Consolidation principles and Group structure). The residual balance primarily corresponds to loans denominated in US dollars and Swedish krona. The Group’s overall exposure to currency risk on assets/liabilities primarily concerns the Group’s internal financing activity.
December 31, 2016
in millions of euros
US dollar
Swedish krona
Indian rupee
Other currencies TOTAL
Assets 245 8 - 247 500
Liabilities (1,098) (130) (151) (226) (1,605)
Net exposure in the Consolidated Statement of Finan cial Position (1,105)
Hedging derivatives 946
NET EXPOSURE (159)
December 31, 2015
in millions of euros
US dollar
Swedish krona
Indian rupee
Other currencies TOTAL
Assets 377 8 1 228 614
Liabilities (1,062) (135) (96) (183) (1,476)
Net exposure in the Consolidated Statement of Finan cial Position (862)
Hedging derivatives 766
NET EXPOSURE (96) C) Fair value of hedging derivatives Hedging derivatives are recorded in the following accounts:
At December 31 (in millions of euros) Note 2015 (1) 2016
Other non-current assets 18 228 107
Other current assets 20 114 149
Other non-current and current liabilities 26 (217) (89)
Fair value of hedging derivatives, net 125 180
Relating to: ► operating transactions 145 217
► financial transactions (20) (37)
(1) Certain reclassifications have been made to 2015 amounts to conform to current year presentation. These reclassifications had no impact on net income nor on net cash flows.
The main hedging derivatives comprise mainly: ► the fair value of derivative instruments contracted as part of the centralized management of currency risk recorded in “Other
non-current assets” in the amount of €120 million, in “Other current assets” in the amount of €145 million, in “Other non current liabilities” in the amount of €13 million and in “Other current liabilities” in the amount of €35 million.
► EUR/USD fix-to-fix cross currency swaps recorded in “Other non-current liabilities” valued at €35 million at December 31, 2016.

CAPGEMINI 2016 ANNUAL REPORT 56
The change in the period in derivative instruments hedging operating and financing transactions recorded in income and expense recognized in equity breaks down as follows
in millions of euros 2016
Hedging derivatives recorded in income and expense recognized in equity at January 1 124
Amounts reclassified to profit in respect of transactions performed (12)
Fair value of derivative instruments hedging future transactions 91
Hedging derivatives recorded in income and expense recognized in equity at December 31 203
INTEREST RATE RISK MANAGEMENT
A) Interest rate risk management policy The Group’s exposure to interest rate risk should be analyzed in light of its cash position: at December 31, 2016, the Group had €2,036 million in cash and cash equivalents, with short-term investments mainly at floating rates (or failing this, at fixed rates for periods of less than or equal to 3 months), and €3,412 million in gross indebtedness principally at fixed rates (85%) (see Note 21, Net debt / Net cash and cash equivalents). The high proportion of fixed-rate borrowings is due to the weight of bond issues in gross indebtedness. B) Exposure to Interest rate risk: sensitivity anal ysis As 85% of Group borrowings were at fixed rates in 2016, any increase or decrease in interest rates would have had a negligible impact on the Group’s net finance costs. Based on average levels of floating-rate short-term investments and cash management assets, a 100-basis point rise in interest rates would have had a positive impact of around €5 million on the Group’s net finance costs in 2016. Conversely, a 100-basis point fall in interest rates would have had an estimated €5 million negative impact on the Group’s net finance costs.
COUNTERPARTY RISK MANAGEMENT
In addition, in line with its policies for managing currency and interest rate risks as described above, the Group also enters into hedging agreements with leading financial institutions. Accordingly, counterparty risk can be deemed not material. At December 31, 2016, the Group’s main counterparties for managing currency and interest rate risk are Barclays, BNP Paribas, CA CIB, Citibank, Commerzbank, HSBC, ING, JP Morgan, Morgan Stanley, Natixis, Royal Bank of Scotland, Santander, and Société Générale.

CAPGEMINI 2016 ANNUAL REPORT 57
NOTE 24 PROVISIONS FOR PENSIONS AND OTHER POST-EMPLOYMENT B ENEFITS A) Defined contribution plans Defined contribution plans are funded by contributions paid by employees and Group companies to the organizations responsible for managing the plans. The Group’s obligations are limited to the payment of such contributions which are expensed as incurred. The Group’s obligation under these plans is recorded in “Accounts and notes payable”. Defined contribution plans are operated in most European countries (France, the United Kingdom, the Netherlands, Germany and Central Europe, Nordic countries, Italy and Spain), in the United States and in the Asia-Pacific area. B) Defined benefit pension plans Defined benefit pension plans consist of either:
► unfunded plans, where benefits are paid directly by the Group and the related obligation is covered by a provision corresponding to the present value of future benefit payments. Estimates are based on regularly reviewed internal and external assumptions. These unfunded plans correspond mainly to retirement termination payments and healthcare assistance plans,
► funded plans, where the benefit obligation is covered by external funds. Group contributions to these external funds are made in accordance with the specific regulations in force in each country.
Obligations under these plans are determined by independent actuaries using the projected unit credit method. Under this method, each period of service gives rise to an additional unit of benefit entitlement and each of these units is valued separately in order to obtain the amount of the Group’s final obligation. The resulting obligation is discounted by reference to market yields on high quality corporate bonds, of a currency and term consistent with the currency and term of the post-employment benefit obligation. For funded plans, only the estimated funding deficit is covered by a provision. Current and past service costs - corresponding to an increase in the obligation - are recorded within “Operating expenses” of the period. Gains or losses on the curtailment, settlement or transfer of defined benefit pension plans are recognized in “Other operating income” or “Other operating expenses.” The impact of discounting defined benefit obligations as well as the expected return on plan assets is recorded net in “Other financial expense” or “Other financial income”. Actuarial gains and losses correspond to the effect of changes in actuarial assumptions and experience adjustments (i.e. differences between projected actuarial assumptions and actual data) on the amount of the benefit obligation or the value of plan assets. They are recognized in full in “Income and expense recognized directly in equity” in the year in which they arise (with the related tax effect).

CAPGEMINI 2016 ANNUAL REPORT 58
BREAKDOWN OF PROVISIONS FOR PENSIONS AND OTHER POST -EMPLOYMENT BENEFITS
Provisions for pensions and other post-employment benefits comprise obligations under funded defined benefit plans (particularly in the United Kingdom and Canada) and obligations primarily relating to retirement termination payments (particularly in France, Germany, Sweden and India). Provision for pensions and other post-employment ben efits by main countries
Obligation Plan assets
Net provision in the Consolidated
Statement of Financial Position
in millions of euros 2015 2016 2015 2016 2015 2016
United Kingdom 3,330 3,633 (2,633) (2,787) 697 846
Canada 624 674 (448) (484) 176 190
France 237 237 (16) (22) 221 215
Germany 88 101 (47) (57) 41 44
Sweden 34 34 (9) (9) 25 25
India 39 45 (21) (27) 18 18
Other 146 145 (10) (109) 38 36 PROVISIONS FOR PENSIONS AND OTHER POST-EMPLOYMENT BENEFITS AT DECEMBER 31 4,498 4,869 (3,282) (3,495) 1,216 1,374 Movements in provisions for pensions and other post -employment benefits during the last two fiscal yea rs were as follows:
Obligation Plan assets
Net provision in the Consolidated
Statement of Financial Position
in millions of euros Note
s 2015 2016 2015 2016 2015 2016
PRESENT VALUE OF THE BENEFIT OBLIGATION AT JANUARY 1 4,432 4,498 (3,138) (3,282) 1,294 1,216
Expense for the period recognized in the Income Sta tement 204 209 (120) (113) 84 96
Service cost 7 71 59 - - 71 59
Curtailments, settlements and plan transfers (32) - - - (32) -
Interest cost 9 165 150 (120) (113) 45 37
Impact on income and expense recognized in equity (177) 772 83 (496) (94) 276
Change in actuarial gains and losses (177) 772 - - (177) 772
Impact of changes in financial assumptions (101) 858 - - (101) 858
Impact of changes in demographic assumptions - (11) - - - (11)
Experience adjustments (76) (75) - - (76) (75)
Return on plan assets (1) - - 83 (496) 83 (496)
Other 39 (610) (107) 396 (68) (214)
Contributions paid by employees 7 7 (7) (7) - -
Benefits paid to employees (141) (152) 130 124 (11) (28)
Contributions paid - - (99) (89) (99) (89)
Translation adjustments 170 (469) (130) 369 40 (100)
Business combinations 3 - (1) - 2 -
Other movements - 4 - (1) - 3
PRESENT VALUE OF THE BENEFIT OBLIGATION AT DECEMBER 31 4,498 4,869 (3,282) (3,495) 1,216 1,374
(1) After deduction of financial income on plan assets recognized in the Income Statement and calculated using the discount rate.
CAPGEMINI 2016 ANNUAL REPORT 59
ANALYSIS OF THE CHANGE IN PROVISIONS FOR PENSIONS AND OTHER POST -EMPLOYMENT BENEFITS
A) United Kingdom In the United Kingdom, post-employment benefits primarily consist of defined contribution pension plans with some employees accruing pensionable service within a defined benefit pension plan. In addition there are former and current employees accruing deferred benefits in defined benefit pension plans. The plans are administered within trusts which are legally separate from the employer and are governed by a trustee board comprising of independent trustees and representatives of the employer. The defined benefit plans provide pensions and lump sums to members on retirement and to their dependents on death. Members who leave service before retirement are entitled to a deferred pension. The main plan is closed to the accrual of pensionable service benefit for all current employees since March 31, 2015. Employees covered by defined benefit pension plans break down as follows: ► 700 current employees accruing pensionable service (964 at December 31, 2015), ► 7,690 former and current employees not accruing pensionable service (7,889 at December 31, 2015), ► 2,868 retirees (2,491 at December 31, 2015). The plans are subject to the supervision of the UK Pension Regulator; the funding schedules for these plans are determined by an independent actuary as part of actuarial valuations usually carried out every three years. Capgemini UK Plc., the employer, gives firm commitments to the trustees regarding the funding of any deficits identified, over an agreed period. The responsibility to fund these plans lies with the employer. The defined benefit pension plans expose the Group to the increase in liabilities that could result from changes in the life expectancy of members, fluctuations in interest and inflation rates and, more generally, a downturn in financial markets. The average maturity of pension plans in the United Kingdom is 22 years. In accordance with local regulations, the non-renewal of certain client contracts in full or in part could require Capgemini UK Plc. to bring forward the funding of any deficits in respect of the employees concerned.

CAPGEMINI 2016 ANNUAL REPORT 60
Obligation Plan assets
Net provision in the Consolidated
Statement of Financial Position
in millions of euros 2015 2016 2015 2016 2015 2016
PRESENT VALUE OF THE BENEFIT OBLIGATION AT JANUARY 1 3,252 3,330 (2,480) (2,633) 772 697
Expense for the period recognized in the Income Sta tement 105 121 (95) (88) 10 33
Service cost 15 10 - 15 10
Curtailments, settlements and plan transfers (35) - - (35) -
Interest cost 125 111 (95) (88) 30 23
Impact on income and expense recognized in equity ( 156) 765 84 (481) (72) 284
Change in actuarial gains and losses (156) 765 - - (156) 765
Impact of changes in financial assumptions (89) 830 - (89) 830
Experience adjustments (67) (65) - (67) (65)
Return on plan assets (1) - 84 (481) 84 (481)
Other 129 (583) (142) 415 (13) (168)
Contributions paid by employees 1 1 (1) (1) - -
Benefits paid to employees (73) (72) 73 72 - -
Contributions paid - - (62) (58) (62) (58)
Translation adjustments 201 (512) (152) 402 49 (110)
PRESENT VALUE OF THE BENEFIT OBLIGATION AT DECEMBER 31 3,330 3,633 (2) (2,633) (2,787) 697 846
(1) After deduction of financial income on plan assets recognized in the Income Statement and calculated using the discount rate;
(2) The year-on-year increase in the present value of the obligation is mainly due to the impact of a decrease in the benchmark discount rate (3.8% to 2.6%-2.8%). In 2015, the curtailment following a plan change represents income of €35 million due to the decrease in the present value of the benefit obligation for the main Capgemini UK Plc. pension plan after an agreement was reached with certain members regarding a reduction in their defined benefits.
a) Main actuarial assumptions Discount rate, salary inflation rate and inflation rate
in % At December 31, 2015 At December 31, 2016
Discount rate 3.8 2.6-2.8
Salary inflation rate 2.4-3.2 2.3-3.1
Inflation rate 3.2 3.1
At the 2016 year end, the Group moved to a calculation method for the discount rate and inflation, based on a full yield curve valuation method, compared to a single discount rate method used at the 2015 year end. This change in method led to a decrease in the present value of the pension obligation of approximately €200 million at December 31, 2016. Mortality tables used are those commonly used in the United Kingdom. b) Plan assets in millions of euros 2015 2016
Shares 1,421 54% 1,377 49%
Bonds and hedging assets 1,168 44% 1,336 48%
Other 44 2% 74 3%
TOTAL 2,633 100% 2,787 100% Shares correspond to investments in equities or diversified growth investments, the majority of which in developed markets. Bonds and hedging assets consist of bonds invested in liquid markets. A portion of these investments seeks to hedge interest rate risk on the plan liabilities; this matching portfolio consists of UK government bonds (GILT), owned directly or borrowed via sale and repurchase agreements.

CAPGEMINI 2016 ANNUAL REPORT 61
c) Sensitivity analysis
Impact on the obligation at December 31,
2016
in millions of euros Increase Decrease
Increase/decrease of 50 basis points in the discount rate (367) 427
Increase/decrease of 50 basis points in the inflation rate 282 (270)
Increase/decrease of 50 basis points in the mortality rate (60) 56 d) Contributions
Future contributions
Contributions to defined benefit pension funds in the United Kingdom in respect of 2017 are estimated at €60 million, including the funding of pension plan deficits over the period defined with the trustees as part of the regular actuarial valuations. B) Canada In Canada, defined post-employment benefits consist of defined benefit pension plans and other pension and similar plans. The plan assets are held in trust separately from the employer’s assets. Nonetheless, the responsibility to fund the plans lies with the employer. The plans expose the Group to the increase in liabilities that could result from changes in the life expectancy of members, fluctuations in interest and inflation rates and, more generally, a downturn in financial markets. The average maturity of pension plans in Canada is 20 years. The plans are subject to regular actuarial valuations performed at least every three years. In accordance with local regulations, the non-renewal of certain client contracts in full or in part could require the Canadian entities to bring forward the funding of any deficits in respect of the employees concerned. In Canada, employees covered by defined benefit pension plans break down as follows:
► 1,000 current employees accruing pensionable service (782 at December 31, 2015),
► 80 former and current employees not accruing pensionable service (79 at December 31, 2015),
► 303 retirees (275 at December 31, 2015).
Obligation Plan assets
Net provision in the Consolidated
Statement of Financial Position
in millions of euros 2015 2016 2015 2016 2015 2016
PRESENT VALUE OF THE BENEFIT OBLIGATION AT JANUARY 1 647 624 (470) (448) 177 176
Expense for the period recognized in the Income Sta tement 65 50 (19) (19) 46 31
Service cost 23 25 - 23 25
Curtailments, settlements and plan transfers 15 - 15 -
Interest cost 27 25 (19) (19) 8 6
Impact on income and expense recognized in equity ( 9) (6) (4) (9) (13) (15)
Change in actuarial gains and losses (9) (6) - - (9) (6)
Impact of changes in financial assumptions (10) 14 - (10) 14
Impact of changes in demographic assumptions - (14) - - (14)
Experience adjustments 1 (6) - 1 (6)
Return on plan assets (1) - (4) (9) (4) (9)
Other (79) 6 45 (8) (34) (2)
Contributions paid by employees 4 4 (4) (4) - -
Benefits paid to employees (36) (45) 35 43 (1) (2)
Contributions paid - (19) (14) (19) (14)
Translation adjustments (47) 42 33 (30) (14) 12
Other movements - 5 - (3) - 2
PRESENT VALUE OF THE BENEFIT OBLIGATION AT DECEMBER 31 624 674 (448) (484) 176 190
(1) After deduction of financial income on plan assets recognized in the Income Statement and calculated using the discount rate.
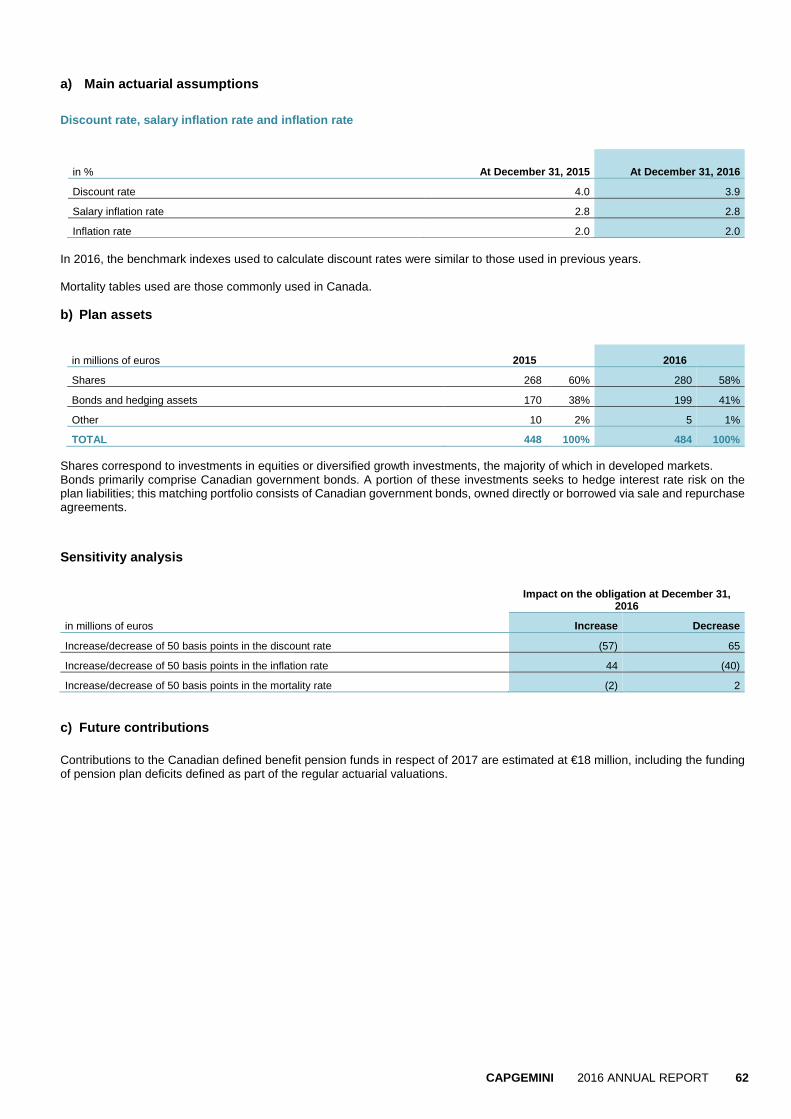
CAPGEMINI 2016 ANNUAL REPORT 62
a) Main actuarial assumptions
Discount rate, salary inflation rate and inflation rate
in % At December 31, 2015 At December 31, 2016
Discount rate 4.0 3.9
Salary inflation rate 2.8 2.8
Inflation rate 2.0 2.0 In 2016, the benchmark indexes used to calculate discount rates were similar to those used in previous years. Mortality tables used are those commonly used in Canada. b) Plan assets
in millions of euros 2015 2016
Shares 268 60% 280 58%
Bonds and hedging assets 170 38% 199 41%
Other 10 2% 5 1%
TOTAL 448 100% 484 100% Shares correspond to investments in equities or diversified growth investments, the majority of which in developed markets. Bonds primarily comprise Canadian government bonds. A portion of these investments seeks to hedge interest rate risk on the plan liabilities; this matching portfolio consists of Canadian government bonds, owned directly or borrowed via sale and repurchase agreements.
Sensitivity analysis
Impact on the obligation at December 31,
2016
in millions of euros Increase Decrease
Increase/decrease of 50 basis points in the discount rate (57) 65
Increase/decrease of 50 basis points in the inflation rate 44 (40)
Increase/decrease of 50 basis points in the mortality rate (2) 2 c) Future contributions Contributions to the Canadian defined benefit pension funds in respect of 2017 are estimated at €18 million, including the funding of pension plan deficits defined as part of the regular actuarial valuations.

CAPGEMINI 2016 ANNUAL REPORT 63
NOTE 25 CURRENT AND NON-CURRENT PROVISIONS A provision is recognized in the Consolidated Statement of Financial Position at the year-end if, and only if, (i) the Group has a present obligation (legal or constructive) as a result of a past event; (ii) it is probable that an outflow of resources embodying economic benefits will be required to settle the obligation; and (iii) a reliable estimate can be made of the amount of the obligation. Provisions are discounted when the impact of the time value of money is material. Movements in current and non-current provisions break down as follows:
in millions of euros 2015 2016
At January 1 72 118
Charge 64 46
Reversals (utilization of provisions) (12) (14)
Reversals (surplus provisions) (18) (16)
Other 12 (4)
At December 31 118 130 At December 31, 2016, current provisions (€104 million) and non-current provisions (€26 million) mainly concern risks relating to projects and contracts amounting to €110 million (€99 million at December 31, 2015) and risks relating to tax and labor disputes amounting to €20 million (€19 million at December 31, 2015).
NOTE 26 OTHER NON-CURRENT AND CURRENTLIABILITIES
At December 31 (in millions of euros) Notes 2015 (1) 2016
Special employee profit-sharing reserve 32 28
Derivative instruments 23 217 89
Liabilities related to acquisitions of consolidated companies 116 147
Non-current tax liabilities 18 16
Other 75 87
OTHER NON-CURRENT LIABILITIES 22 458 367
(1) Certain reclassifications have been made to 2015 amounts to conform to current year presentation. These reclassifications had no impact on net income nor on net cash flows. Liabilities related to acquisitions of consolidated companies consist for €135 million of put options granted to Caixa Participacões and EMC in 2012 and 2013 on their investments in CPM Braxis and earn-outs granted at the time of certain acquisitions. Derivative instruments primarily consist of EUR/USD fix-to-fix cross currency swaps valued at €35 million at December 31, 2016 (€20 million at December 31, 2015). At December 31, 2015, derivative instruments also included the conversion option embedded in the “ORNANE 2013” bonds, valued at €162 million. This option was exercised in 2016 on the early redemption of the ORNANE 2013 bonds (see Note 21 – Net debt / Net cash and cash equivalents).
NOTE 27 ACCOUNTS AND NOTES PAYABLE
At December 31 (in millions of euros) Note 2015 2016
Accounts payable 1,015 1,105
Accrued taxes other than income tax 390 392
Personnel costs 1,303 1,311
Other 16 10
ACCOUNTS AND NOTES PAYABLE 22 2,724 2,818

CAPGEMINI 2016 ANNUAL REPORT 64
NOTE 28 NUMBER OF EMPLOYEES AVERAGE NUMBER OF EMPLOYEES BY GEOGRAPHIC AREA
2015 2016
Employees % Employees %
North America 12,627 8 16,846 9
France 23,558 15 23,690 13
United Kingdom and Ireland 8,759 5 9,075 5
Benelux 8,385 5 8,200 4
Southern Europe 7,414 5 7,713 4
Nordic countries 4,053 2 4,041 2
Germany and Central Europe 10,817 7 11,897 7
Asia-Pacific and Latin America 85,495 53 103,944 56
Not allocated 160 - 187 -
AVERAGE NUMBER OF EMPLOYEES 161,268 100 185,593 100 NUMBER OF EMPLOYEES AT DECEMBER 31 BY GEOGRAPHIC AREA
2015 2016
Employees % Employees %
North America 16,034 9 16,895 9
France 23,832 13 24,226 12
United Kingdom and Ireland 8,656 5 9,025 5
Benelux 8,307 5 8,037 4
Southern Europe 7,434 4 8,074 4
Nordic countries 4,007 2 4,067 2
Germany and Central Europe 11,233 6 12,464 7
Asia-Pacific and Latin America 100,977 56 110,011 57
Not allocated 159 - 278 -
NUMBER OF EMPLOYEES AT DECEMBER 31 180,639 100 193,077 100

CAPGEMINI 2016 ANNUAL REPORT 65
NOTE 29 OFF-BALANCE SHEET COMMITMENTS OFF-BALANCE SHEET COMMITMENTS RELATING TO GROUP OPERATING ACTIVITI ES
A) Commitments given on client contracts The Group has provided performance and/or financial guarantees for a number of major contracts. These include the contracts signed with HM Revenue & Customs, Euroclear, the Metropolitan Police, Ontario Power Generation Inc., Environment Agency, Johnson & Johnson Services, Inc., the Department of Work and Pensions, EMC, Monsanto, Becton Dickinson & Company, Carnival Corporation and Michelin. In addition, certain clients enjoy:
► limited financial guarantees issued by the Group and totaling €1,601 million at December 31, 2016 (stable vs December 31, 2015);
► bank guarantees borne by the Group and totaling €197 million at December 31, 2016 (€172 million at December 31, 2015).
B) Commitments given on non-cancellable leases Commitments given on non-cancellable leases break down by maturity as follows:
in millions of euros Computer equipment Offices
Vehicles and other non-cancellable
leases Total
Y+1 6 198 55 259
Y+2 4 158 39 201
Y+3 3 101 23 127
Y+4 2 62 7 71
Y+5 1 48 - 49
Y+6 and beyond - 68 - 68
At December 31, 2016 16 635 124 775
At December 31, 2015 19 671 137 827 Lease payments recognized in the Income Statement in 2016 totaled €362 million (€350 million in 2015). C) Other commitments given Other commitments given total €37 million at December 31, 2016 (€29 million at December 31, 2015) and mainly comprise firm purchase commitments relating to goods or services in the United Kingdom and France. D) Other commitments received Other commitments received total €130 million at December 31, 2016 (€112 million at December 31, 2015) and primarily comprise:
► commitments received on client contracts: in the context of a contract signed in 2010, the Group received a limited financial guarantee of €50 million from the client;
► commitments received following the purchase of shares held by certain minority shareholders of CPM Braxis for an amount of €63 million.

CAPGEMINI 2016 ANNUAL REPORT 66
OFF-BALANCE SHEET COMMITMENTS RELATING TO GROUP FINANCING
A) Bonds Cap Gemini S.A. has committed to standard obligations in respect of the 2015 bond issues and the 2016 bond issue detailed in Note 21, Net debt / Net cash and cash equivalents, and particularly to maintain pari passu status with all other marketable bonds that may be issued by the Company. B) Syndicated credit facility obtained by Cap Gemin i S.A. and not drawn to date Cap Gemini S.A. has agreed to comply with the following financial ratios (as defined in IFRS) in respect of the credit facility disclosed in Note 21, Net debt / Net cash and cash equivalents:
► the consolidated net debt* to consolidated equity ratio must be less than 1 at all times;
► the interest coverage ratio (the extent to which consolidated net finance costs are covered by consolidated operating margin) must be equal to or greater than 3 at December 31 and June 30 of each year (based on the 12 months then ended).
At December 31, 2015 and 2016, the Group complied with these financial ratios. The credit facility agreement also includes covenants restricting Cap Gemini S.A.’s ability to carry out certain operations. These covenants also apply to Group subsidiaries. They include restrictions primarily relating to pledging assets as collateral, asset sales, mergers and similar transactions. Cap Gemini S.A. also committed to standard obligations, including an agreement to maintain pari passu status. * The alternative performance measures monitored by the Group (operating margin and net debt) are defined in Note 3, Alternative performance measures, and broken down in Note 21, Net debt / Net cash and cash equivalents. C) Borrowings secured by assets Some borrowings are secured by assets recorded in the Consolidated Statement of Financial Position. At December 31, 2016, these related to finance leases for an amount of €100 million and other borrowings in the amount of €7 million. CONTINGENT LIABILITIES
During 2016 and in previous fiscal years, certain Group companies underwent tax audits leading in some cases to tax reassessments. A number of proposed adjustments have been challenged and litigation and pre-litigation proceedings were in progress at the period end. In general, no provisions have been set aside for these disputes in the consolidated financial statements in so far as Capgemini can justify its positions and considers the likelihood of winning the disputes to be high. This is particularly the case, in France, for research tax credits for the period 2008 to 2013, in respect of which the tax authorities have rejected the portion concerning private clients in certain companies registered for the research tax credit.
NOTE 30 RELATED-PARTY TRANSACTIONS ASSOCIATES
Associates are equity-accounted companies over which the Group exercises significant influence. At December 31, 2016, O2C Pro LLC is the only company equity-accounted by the Group since its acquisition in 2011. Transactions with this equity associate in 2016 were performed at arm’s length and were of immaterial volume. OTHER RELATED-PARTIES
In 2016, no material transactions were carried out with:
► shareholders holding significant voting rights in the share capital of Cap Gemini S.A.;
► members of management, including Directors;
► entities controlled or jointly controlled by a member of key management personnel, or over which he/she has significant influence or holds significant voting rights.
Moreover, it is worth noting that Caixa Participacões, a minority shareholder, is also one of the main clients of CPM Braxis, accounting for approximately 14% of its revenues.

CAPGEMINI 2016 ANNUAL REPORT 67
Finally, MM Consulting, whose Chairman and Chief Executive Officer is Yann Delabrière (a director of Cap Gemini S.A.), signed a one-year agreement with Capgemini Consulting to provide this entity with assistance in the Digital Manufacturing market, by contributing its knowledge of the automobile sector. Fees of €87,000 were invoiced to the consulting entity for work performed in 2016 under the terms of the agreement which entered into effect in October 2016. GROUP MANAGEMENT COMPENSATION
The table below provides a breakdown of the 2015 and 2016 compensation of members of management bodies, encompassing the Group operating management structure at each year-end, comprising 25 members in 2016 (24 members in 2015) and Directors (compensation, fees and attendance fees).
in thousands of euros 2015 2016
Short-term benefits excluding employer payroll taxes (1) 23,185 24,166
o/w attendance fees to salaried Directors 65 80
o/w attendance fees to non-salaried Directors (2) (3) 779 719
Short-term benefits: employer payroll taxes 6,328 4,573
Post-employment benefits (4) 1,184 1,695
Share-based payment (5) 6,035 9,781 (1) Including gross wages and salaries, bonuses, profit-sharing, attendance fees and benefits in kind; (2) Note that Paul Hermelin has waived receipt of his attendance fees since 2011 (as did Serge Kampf from 2011 until his death); (3) 15 directors in 2016 and 12 directors in 2015; (4) Primarily the annualized expense in respect of retirement termination payments pursuant to contract and/or a collective bargaining agreement; (5) Deferred recognition of the annual expense relating to the grant of performance shares.
NOTE 31 SUBSEQUENT EVENTS At the Combined Shareholders’ Meeting, the Board of Directors will recommend a dividend payout to Cap Gemini S.A. shareholders of €1.55 per share in respect of 2016. A dividend of €1.35 per share was paid in respect of fiscal year 2015.

CAPGEMINI 2016 ANNUAL REPORT 68
NOTE 32 LIST OF THE MAIN CONSOLIDATED COMPANIES BY COUNTRY Cap Gemini S.A. is the parent company of what is generally known as “the Capgemini Group” comprising 134 companies. The main consolidated companies at December 31, 2016 are listed below.
Country List of the main companies consolidated at December 31, 2016 % interest Consolidation
Method (1)
ARGENTINA Capgemini Argentina S.A. 100.00% FC
AUSTRALIA Capgemini Australia Pty Ltd. 100.00% FC
AUSTRIA Capgemini Consulting Österreich AG 100.00% FC
BELGIUM Capgemini Belgium N.V./S.A. 100.00% FC
Sogeti Belgium S.A. 100.00% FC
BRAZIL Capgemini Business Services Brasil - Assessoria Empresarial Ltda. 100.00% FC
Consultoria de Gestao Gemini Ltda. 100.00% FC
CPM Braxis S.A. 78.61% FC
CPM Braxis Tecnologia, Ltda. 78.61% FC
CANADA Capgemini Canada Inc. 100.00% FC
Capgemini Financial Services Canada Inc. 100.00% FC
Gestion Capgemini Québec Inc. 100.00% FC
IGATE Technologies (Canada), Inc. 100.00% FC
Inergi LP 100.00% FC
New Horizon System Solutions LP 100.00% FC
Société en Commandite Capgemini Québec 100.00% FC
CHILE Capgemini Business Services Chile Ltda. 100.00% FC
CHINA Capgemini (China) Co., Ltd. 100.00% FC
Capgemini (Hangzhou) Co., Ltd. 100.00% FC
Capgemini (Kun Shan) Co., Ltd. 100.00% FC
Capgemini Business Services (China) Ltd. 100.00% FC
IGATE Computer Systems (Suzhou) Co., Ltd. 99.77% FC
ITBconsult Shanghai Ltd. 100.00% FC
Praxis Beijing Technology Co. Ltd. 100.00% FC
Capgemini Hong Kong Ltd. 100.00% FC
ITBconsult Hong Kong Ltd. 100.00% FC
COLOMBIA Capgemini Colombia S.A.S. 100.00% FC
CZECH REPUBLIC Capgemini Czech Republic s.r.o. 100.00% FC
DENMARK Capgemini Sogeti Danmark A/S 100.00% FC
FINLAND Capgemini Finland Oy 100.00% FC
Sogeti Finland Oy 100.00% FC
FRANCE Backélite S.A.S. 100.00% FC
Cap Gemini S.A. Parent company
Capgemini Consulting S.A.S. 100.00% FC
Capgemini France S.A.S. 100.00% FC
Capgemini Gouvieux S.A.S. 100.00% FC
Capgemini Outsourcing Services S.A.S. 100.00% FC
Capgemini Service S.A.S. 100.00% FC
Capgemini Technology Services S.A.S. 100.00% FC
Cloud ERP Solutions S.A.S. 100.00% FC
Immobilière Les Fontaines S.A.R.L. 100.00% FC
Open Cascade S.A.S. 100.00% FC
Prosodie S.A.S. 100.00% FC (1) FC = Full consolidation EM = Equity method

CAPGEMINI 2016 ANNUAL REPORT 69
Country List of the main companies consolidated at December 31, 2016 % interest Consolidation
Method (1)
SCI Paris Etoile 100.00% FC
Silgem S.A.S. 50.00% FC
Sogeti Corporate Services S.A.S. 100.00% FC
Sogeti France S.A.S. 100.00% FC
Sogeti High Tech S.A.S. 100.00% FC
Sogeti S.A.S. 100.00% FC
GERMANY Capgemini Deutschland GmbH 100.00% FC
Capgemini Deutschland Holding GmbH 100.00% FC
Capgemini Outsourcing Services Gmbh 100.00% FC
IT & Business Services GmbH 100.00% FC
Sogeti Deutschland GmbH 100.00% FC
GUATEMALA Capgemini Business Services Guatemala S.A. 100.00% FC
HUNGARY Capgemini Magyarorszag Kft. 100.00% FC
INDIA AXA Technologies Services India Pvt Ltd. 99.77% FC
Capgemini Technology Services India Limited 99.77% FC
IGATE Infrastructure Management Services Limited 99.77% FC
INDONESIA Patni Computer Systems Indonesia 99.77% FC
IRELAND Capgemini Sogeti Ireland Ltd. 100.00% FC
ITALY Capgemini BS S.r.l. 100.00% FC
Capgemini Italia S.p.A. 100.00% FC
JAPAN Capgemini Japan K.K. 100.00% FC
LUXEMBOURG Capgemini Reinsurance International S.A. 100.00% FC
IGATE Technologies Luxembourg S.A.R.L. 100.00% FC
Sogeti Luxembourg S.A. 100.00% FC
MALAYSIA Capgemini Services Malaysia Sdn. Bhd. 100.00% FC
MEXICO Capgemini Mexico S. de R.L. de C.V. 100.00% FC
MOROCCO Capgemini Technology Services Maroc SA 100.00% FC
NETHERLANDS Capgemini Educational Services B.V. 100.00% FC
Capgemini N.V. 100.00% FC
Capgemini Nederland B.V. 100.00% FC
Dunit B.V. 100.00% FC
Sogeti Nederland B.V. 100.00% FC
NORWAY Capgemini Norge AS 100.00% FC
IBX Norge AS 100.00% FC
Sogeti Norge AS 100.00% FC
PHILIPPINES Capgemini Philippines Corp. 100.00% FC
POLAND Capgemini Polska Sp. z.o.o. 100.00% FC
PORTUGAL Capgemini Portugal, Serviços de Consultoria e Informatica S.A. 100.00% FC
ROMANIA Capgemini Services Romania s.r.l. 100.00% FC
RUSSIA Datavision NN 100.00% FC
SAUDI ARABIA Capgemini Saudi Ltd. 100.00% FC
SINGAPORE Capgemini Asia Pacific Pte Ltd. 100.00% FC
Capgemini Singapore Pte Ltd. 100.00% FC
IGATE Singapore Pte. Ltd. 99.77% FC
SLOVAKIA Capgemini Slovensko s.r.o. 100.00% FC (1) FC = Full consolidation EM = Equity method

CAPGEMINI 2016 ANNUAL REPORT 70
Country List of the main companies consolidated at December 31, 2016 % interest Consolidation
Method (1)
SPAIN Capgemini España S.L. 100.00% FC
Prosodie Ibérica 100.00% FC
Sogeti España S.L. 100.00% FC
SWEDEN Capgemini AB 100.00% FC
Capgemini Sverige AB 100.00% FC
IBX Group AB 100.00% FC
Sogeti Sverige AB 100.00% FC
Sogeti Sverige Mitt AB 100.00% FC
SWITZERLAND Capgemini Suisse S.A. 100.00% FC
Sogeti Suisse S.A. 100.00% FC
UNITED ARAB EMIRATES Capgemini Middle East FZ LLC 100.00% FC
Thesys Technologies LLC 49.00% FC
UNITED KINGDOM Capgemini Financial Services UK Ltd. 100.00% FC
Capgemini UK plc 100.00% FC
CGS Holdings Ltd. 100.00% FC
F212 UK Ltd. 100.00% FC
IGATE Computer Systems (UK) Limited 100.00% FC
IGATE Information Services (UK) Limited 100.00% FC
Sogeti UK Ltd. 100.00% FC
UNITED STATES Capgemini America, Inc. 100.00% FC
Capgemini Business Services USA LLC 100.00% FC
Capgemini Government Solutions LLC 100.00% FC
Capgemini North America, Inc. 100.00% FC
Capgemini Technologies LLC 100.00% FC
CHCS Services, Inc. 100.00% FC
O2C Pro, LLC 49.00% EM
Sogeti USA LLC 100.00% FC
VIETNAM Capgemini Vietnam Co., Ltd. 100.00% FC (1) FC = Full consolidation EM = Equity method

CAPGEMINI 2016 ANNUAL REPORT 71
NOTE 33 AUDIT FEES Statutory audit fees for fiscal year 2016 break down as follows:
in million euros (excluding VAT) 2016 2015 2016 2015
Certification of the accounts 3.3 4.0 3.1 2.8
• Cap Gemini S.A. 0.5 0.5 0.5 0.6
• Fully-consolidated subsidiaries 2.8 3.5 2.6 2.2
Other services (1) 1.8 3.2 1.5 1.9
TOTAL 5.1 7.2 4.6 4.7
KPMG PwC
(1) The majority of these fees concern assignments performed at the request of our customers pursuant to the standard ISA 34-02 and concern the audit of applications and/or processes outsourced to the Group.