annual report - cdpq
TRANSCRIPT

2013ANNUAL REPORT
EXPERTISE AND LONG-TERM VIEW

22013 HIGHLIGHTS
4FIRMLY ROOTED IN QUÉBEC, ACTIVE IN THE WORLD
6OUR 2013 ACHIEVEMENTS
10MESSAGE FROM THE CHAIRMAN OF THE BOARD
12MESSAGE FROM THE PRESIDENT AND CHIEF EXECUTIVE OFFICER
15OUR CLIENTS, THE DEPOSITORS
23MANAGEMENT REPORT 24 Macroeconomic Environment 29 Analysis of Overall Performance 32 Analysis of Performance by Asset Class 43 Risk Management 49 Compliance
51LA CAISSE IN QUÉBEC 56 La Caisse’s Achievements in Québec
71RESPONSIBLE INVESTMENT 72 Responsible Investment Report 76 Sustainable Development Report
79REPORTS OF THE BOARD OF DIRECTORS AND BOARD COMMITTEES
107BOARD OF DIRECTORS AND EXECUTIVE COMMITTEE 108 Organizational Structure 110 Board of Directors 111 Executive Committee
113FINANCIAL REPORT
121COMBINED FINANCIAL STATEMENTS

AR 2013 1CAISSE DE DÉPÔT ET PLACEMENT DU QUÉBEC
BUILDING FOR THE LONG TERM IN QUÉBEC AND AROUND THE WORLD
OUR CONVICTIONS
• Firmly rooted in Québec, we invest in high-quality businesses and projects.
• We have a deep understanding of our assets and the markets in which we invest.
• With our partners, we play an influential role in global markets.
• Our performance is the result of our expertise and operational know-how.
• The quality of our service and our returns reinforces the trust of our clients.

AR 2013 2CAISSE DE DÉPÔT ET PLACEMENT DU QUÉBEC
2013 highlights
10.0%FOUR-YEAR ANNUALIZED RETURN
$61.2 BNET INVESTMENT RESULTS OVER FOUR YEARS
$200.1 BNET ASSETS AS AT DECEMBER 31, 2013
AAAHIGHEST CREDIT RATINGS RE-AFFIRMEDDBRS, Moody’s and Standard & Poor’s re-affirm credit ratings – with a stable outlook – for La Caisse and CDP Financial
13.1%OVERALL RETURN IN 2013
$22.8 BNET INVESTMENT RESULTS IN 2013
17.0¢PER $100 OF AVERAGE NET ASSETS IN 2013An operating expense ratio that positions La Caisse among the leaders in its category
3740
01_T
able
aux
RA
-AN
V7
7/0
4/20
14
P
AG
E 2
CAISSE NET ASSETS FROM 2009 TO 2013(in billions of dollars)
2010
151.7
2011
159.0
2012
176.2
2013
200.1
2009
131.6

CAISSE DE DÉPÔT ET PLACEMENT DU QUÉBEC AR 2013 3
LA CAISSE IN QUÉBEC
$11.9 BSINCE 2009New investments and commitments in Québec
$3.6 BNEW INVESTMENTS AND COMMITMENTS IN QUÉBEC IN 2013For a total of $10.3 B over the past four years
550QUÉBEC COMPANIES IN THE PORTFOLIO
OUR CLIENTS, THE DEPOSITORS
31 DEPOSITORS ENTRUST THEIR FUNDS TO LA CAISSE
8 OF THESE ACCOUNT FOR 97.4% OF NET ASSETS
9.1% to 10.6%RETURNS OF THE EIGHT MAIN DEPOSITORS’ FUNDS OVER FOUR YEARSThe difference in returns is attributable to depositors’ asset-allocation decisions
3740
01_T
able
aux
RA
-AN
V7
7/0
4/20
14
P
AG
E 11
2
Weighted average return on depositors’ funds
Highest return
Lowest return
0
5
10
15
20
2013
6.6%di�erence
1.5%di�erence
10.0%
13.1%
4 years
1 Government and Public Employees Retirement Plan
2 Retirement Plans Sinking Fund
3 Régie des rentes du Québec
4 Supplemental Pension Plan for Employees of the Québec Construction Industry
5 Commission de la santé et de la sécurité du travail
6 Société de l’assurance automobile du Québec
7 Pension Plan of Management Personnel
8 Generations Fund
CAISSE DE DÉPÔT ET PLACEMENT DU QUÉBEC AR 2013 4
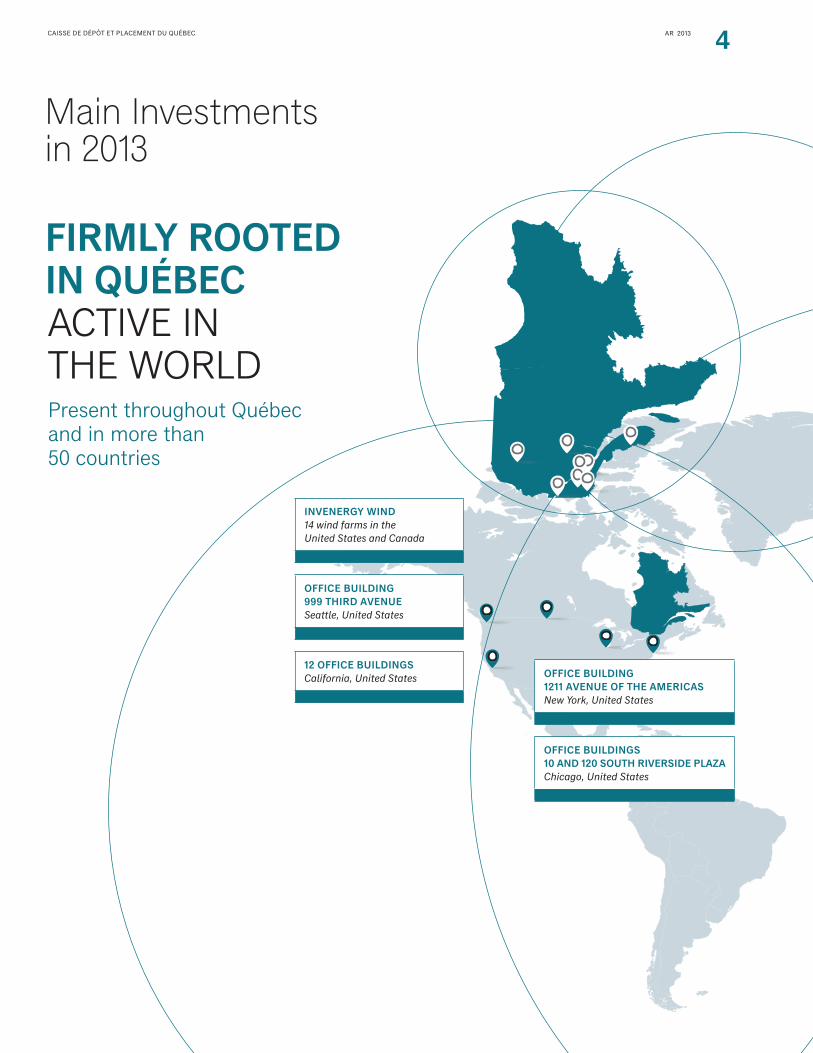
FIRMLY ROOTED IN QUÉBEC ACTIVE IN THE WORLDPresent throughout Québec and in more than 50 countries
Main Investments in 2013
INVENERGY WIND14 wind farms in the United States and Canada
OFFICE BUILDING 999 THIRD AVENUESeattle, United States
12 OFFICE BUILDINGSCalifornia, United States OFFICE BUILDING
1211 AVENUE OF THE AMERICASNew York, United States
OFFICE BUILDINGS 10 AND 120 SOUTH RIVERSIDE PLAZAChicago, United States
CAISSE DE DÉPÔT ET PLACEMENT DU QUÉBEC AR 2013 5
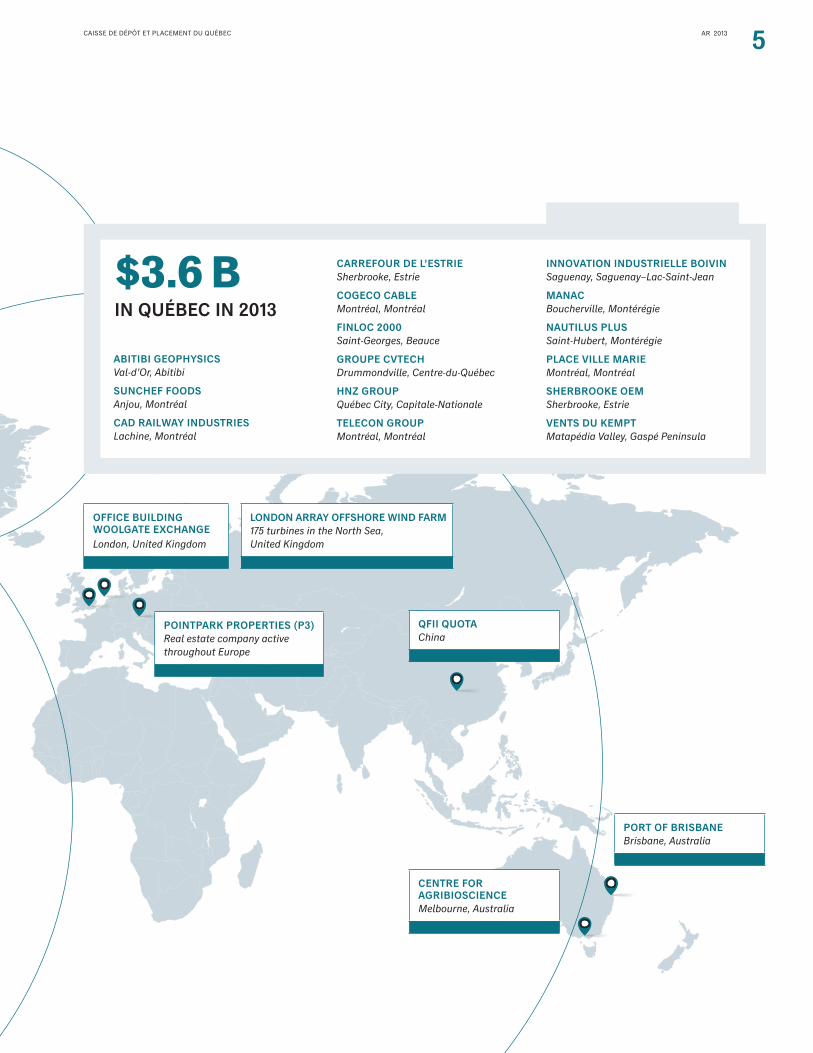
$3.6 BIN QUÉBEC IN 2013
ABITIBI GEOPHYSICSVal-d’Or, Abitibi
SUNCHEF FOODSAnjou, Montréal
CAD RAILWAY INDUSTRIESLachine, Montréal
CARREFOUR DE L’ESTRIESherbrooke, Estrie
COGECO CABLEMontréal, Montréal
FINLOC 2000Saint-Georges, Beauce
GROUPE CVTECHDrummondville, Centre-du-Québec
HNZ GROUPQuébec City, Capitale-Nationale
TELECON GROUPMontréal, Montréal
INNOVATION INDUSTRIELLE BOIVINSaguenay, Saguenay–Lac-Saint-Jean
MANACBoucherville, Montérégie
NAUTILUS PLUSSaint-Hubert, Montérégie
PLACE VILLE MARIEMontréal, Montréal
SHERBROOKE OEMSherbrooke, Estrie
VENTS DU KEMPTMatapédia Valley, Gaspé Peninsula
OFFICE BUILDING WOOLGATE EXCHANGELondon, United Kingdom
LONDON ARRAY OFFSHORE WIND FARM175 turbines in the North Sea, United Kingdom
POINTPARK PROPERTIES (P3)Real estate company active throughout Europe
QFII QUOTAChina
PORT OF BRISBANEBrisbane, Australia
CENTRE FOR AGRIBIOSCIENCEMelbourne, Australia

CAISSE DE DÉPÔT ET PLACEMENT DU QUÉBEC AR 2013 6
OUR STRATEGIC DIRECTIONS 2013 ACHIEVEMENTS
ABSOLUTE-RETURN MANAGEMENTFocus on quality
• Invest on the basis of strong convictions rather than major stock market indexes
• Invest in high-quality assets whose value is directly linked to the real economy
• Develop long-term relationships with promising companies
• Launched the Global Quality Equity portfolio, which had $17.2 billion in assets as at December 31, 2013
• Continued to gradually wind down the Global Equity portfolio
• Made relationship-based investments to develop long-term partnerships with companies in our portfolio
LESS-LIQUID ASSETSTarget tangible assets
• Increase investments in private equity, infrastructure and real estate
• Invest by prioritizing long-term strategic and financial partnerships
• Increased weighting of less-liquid assets in depositors’ asset allocation
• Repositioned Private Equity, Infrastructure and Real Estate portfolios by region and by sector, and made further investments totalling $9.6 billion
QUÉBECInvest in the market we know best
• Seek out and act on the best business and investment opportunities
• Serve as a bridge between Québec companies and global markets
• Strengthen entrepreneurship at all stages of its progression
• Made $3.6 billion of new investments and commitments in Québec companies, including $600 million in Québec SMEs
• Increased our involvement with entrepreneurs throughout Québec
• With Finance Montréal, held the inaugural edition of the International Pension Conference of Montréal
EMERGING MARKETSCapitalize on growth in these markets
• Gain a better understanding of emerging markets by drawing on the in-depth knowledge and expertise of local partners
• Increase direct and indirect investments in these regions
• Established a team to develop an active investment strategy for emerging markets
• Gradually introduced active management into the Emerging Markets Equity portfolio
• Obtained an additional US$300 million quota, for a total quota of US$500 million, to invest in companies on the Shanghai and Shenzhen stock exchanges
DEPTH OF EXPERTISE AND PROCESSESDeepen our understanding of assets and sectors
• Emphasize in-house portfolio management
• Develop multidisciplinary research
• Strengthen operational and sector expertise
• Continue to integrate investment and risk management decisions
• Simplify our approach by improving systems and processes for greater operational efficiency
• Created a transversal proprietary research program
• Recruited several operational and sector experts
• Adjusted investment processes to strengthen integration of risk management
• Simplified processes and systems, and migrated to new technology solutions to support investment operations
Our 2013 achievements

CAISSE DE DÉPÔT ET PLACEMENT DU QUÉBEC AR 2013 7
OUR STRATEGIC DIRECTIONS 2013 ACHIEVEMENTS
ABSOLUTE-RETURN MANAGEMENTFocus on quality
• Invest on the basis of strong convictions rather than major stock market indexes
• Invest in high-quality assets whose value is directly linked to the real economy
• Develop long-term relationships with promising companies
• Launched the Global Quality Equity portfolio, which had $17.2 billion in assets as at December 31, 2013
• Continued to gradually wind down the Global Equity portfolio
• Made relationship-based investments to develop long-term partnerships with companies in our portfolio
LESS-LIQUID ASSETSTarget tangible assets
• Increase investments in private equity, infrastructure and real estate
• Invest by prioritizing long-term strategic and financial partnerships
• Increased weighting of less-liquid assets in depositors’ asset allocation
• Repositioned Private Equity, Infrastructure and Real Estate portfolios by region and by sector, and made further investments totalling $9.6 billion
QUÉBECInvest in the market we know best
• Seek out and act on the best business and investment opportunities
• Serve as a bridge between Québec companies and global markets
• Strengthen entrepreneurship at all stages of its progression
• Made $3.6 billion of new investments and commitments in Québec companies, including $600 million in Québec SMEs
• Increased our involvement with entrepreneurs throughout Québec
• With Finance Montréal, held the inaugural edition of the International Pension Conference of Montréal
EMERGING MARKETSCapitalize on growth in these markets
• Gain a better understanding of emerging markets by drawing on the in-depth knowledge and expertise of local partners
• Increase direct and indirect investments in these regions
• Established a team to develop an active investment strategy for emerging markets
• Gradually introduced active management into the Emerging Markets Equity portfolio
• Obtained an additional US$300 million quota, for a total quota of US$500 million, to invest in companies on the Shanghai and Shenzhen stock exchanges
DEPTH OF EXPERTISE AND PROCESSESDeepen our understanding of assets and sectors
• Emphasize in-house portfolio management
• Develop multidisciplinary research
• Strengthen operational and sector expertise
• Continue to integrate investment and risk management decisions
• Simplify our approach by improving systems and processes for greater operational efficiency
• Created a transversal proprietary research program
• Recruited several operational and sector experts
• Adjusted investment processes to strengthen integration of risk management
• Simplified processes and systems, and migrated to new technology solutions to support investment operations

AR 2013 8CAISSE DE DÉPÔT ET PLACEMENT DU QUÉBEC

AR 2013 9CAISSE DE DÉPÔT ET PLACEMENT DU QUÉBEC
Messages from the Chairman of the Board and the President and Chief Executive Officer

AR 2013 10CAISSE DE DÉPÔT ET PLACEMENT DU QUÉBEC
In 2013, the Board of Directors noted with satisfaction that La Caisse’s senior management and its teams were implementing the main strategic orientations developed from 2011 on. The objective is to position La Caisse more effectively in Québec and in the world to fulfill its mission with a view to achieving consistent, long-term returns.
The Board provided a positive assessment of a year in which key initiatives were deployed, such as absolute-return manage-ment for publicly traded equities, further investments in less-liquid assets and commitments to develop and grow Québec companies. This year’s achievements also include the appointment, in the fall of 2013, of an Executive Vice-President responsible for implementing La Caisse’s strategy to capitalize on growth in emerging markets.
While monitoring the deployment of these initiatives, the Board paid close attention to risk management – a key pillar of La Caisse’s investment strategies. With the support of its Investment and Risk Management Committee, it focused particularly on the investment policies of the new portfolios offered to depositors and on risk-return evaluations of La Caisse’s overall portfolio and specialized portfolios. It also approved and monitored the major investments made during the year.
RENEWED MANDATE FOR THE PRESIDENT AND CHIEF EXECUTIVE OFFICER
The Board also noted that the strategies put in place in 2013 were solidly anchored in the foundations built by the manage-ment team since 2009, under the leadership of Michael Sabia. These include:
• stronger collaboration with depositors, with a commitment to serve them in a fiduciary spirit;
• development of clear strategic priorities, as well as an action plan to implement them;
• a new focus on fundamental expertise and core investment operations;
• stronger risk management to support consistent returns over the long term; and
• a firm commitment to Québec and its companies.
Since his appointment in March 2009, the Board has conducted an annual evaluation of Mr. Sabia’s performance based on highly ambitious objectives. Each year, in light of the results delivered, the Board found that his performance far exceeded the objectives set.
On the strength of all the achievements of the past five years, the Board of Directors unanimously appointed Mr. Sabia to the position of President and Chief Executive Officer of La Caisse for a second mandate, with the approval of the Government of Québec.
GOVERNANCE ROLE IN SUPPORT OF CAISSE SENIOR MANAGEMENT
During the same period, the Board was able to play its governance role fully to support La Caisse’s senior management, drawing since 2009 on best practices to review its own composition, structure and activities, as well as those of its committees.
The Board has benefited from the expertise of seasoned directors with experience in such areas as strategic planning, financial management, investment and risk management, governance and ethics, and human resources. The Board members all gave generously of their time and shared their knowledge graciously. As Chairman of the Board, I am most grateful to them.
Message from theChairman of the Board

AR 2013 11CAISSE DE DÉPÔT ET PLACEMENT DU QUÉBEC
ACKNOWLEDGMENTS
I would like to thank Jean Pierre Ouellet, Michel A. Lavigne, Réal Raymond and André Legault, who stepped down from the Board in 2013, for their dedication throughout their mandates.
I would also like to welcome Rita Dionne-Marsolais and Patricia Curadeau-Grou, as well as Jean La Couture, François Joly and Gilles Godbout, who were appointed to the Board during the year. It is worth noting that the Board almost reached parity in 2013, with women accounting for six of its 13 members.
In conclusion, on behalf of the Board, I would like to thank the employees of La Caisse for the excellent work they did in 2013. I acknowledge their outstanding expertise and applaud their professionalism and commitment; such strengths will enable La Caisse to continue serving the depositors well in the years to come.
ROBERT TESSIERChairman of the Board

AR 2013 12CAISSE DE DÉPÔT ET PLACEMENT DU QUÉBEC
Message from the Presidentand Chief Executive Officer
In October 2013, La Caisse’s Board of Directors and the Government of Québec did me the honour of renewing my mandate for another five years. And I thank them for their trust. Trust in our strategic direction, in the choices we have made in navigating the world’s markets over the long term.
For five years, our people have worked hard to put La Caisse back on track and improve its perfor-mance. We have come a long way. We have simplified our investment strategies to emphasize absolute returns and quality assets rooted in the real economy. We have taken a more active approach in developing the talent of our people. We have substantially improved the way we manage risk. And we have made our internal operations more efficient. With sound investments and visible leadership, we have enhanced our presence in Québec. We have delivered solid results. And, with all the changes we have made and the work accomplished by all our employees, I think we have restored the trust placed in La Caisse by our clients and, I hope, all Quebecers.
TODAY, LA CAISSE IS SOLID AND FINANCIALLY SOUND
That’s good. But it’s not enough. Our institution can go further and do better. I joined La Caisse five years ago because I was convinced of its immense potential. Today I have a much deeper under-standing of the institution and I am even more convinced of its potential. That is why we have given ourselves one simple goal for the next five years: to build an investment institution that is among the very best in the world.

AR 2013 13CAISSE DE DÉPÔT ET PLACEMENT DU QUÉBEC
WHAT DOES THAT MEAN?
INVESTED GLOBALLY. An institution that will have a global presence, with investments in the most promising markets.
STRONG IN QUÉBEC. An institution with a strong role in Québec – where we will work to globalize the Québec economy and make entrepreneurship more dynamic than ever.
TALENTED. An institution that attracts and mobilizes top talent, because of its corporate culture, its way of doing business, in short, its “brand.”
PERFORMANCE-DRIVEN. An institution focused on the long term, with investments in high-quality assets and performance that goes beyond simply meeting our clients’ needs.
Achieving our goal of being one of the best in the world will take time, energy and effort as we work to achieve solid results over the long term.
And we will achieve this goal because our strategy focuses on quality. It relies on rigorous processes leveraged by research and thorough understanding. But, above all, our strategy is driven by talented people and their commitment.
MICHAEL SABIAPresident and Chief Executive Officer

CAISSE DE DÉPÔT ET PLACEMENT DU QUÉBEC AR 2013 14

AR 2013 15CAISSE DE DÉPÔT ET PLACEMENT DU QUÉBEC
Our Clients, the Depositors

AR 2013 16CAISSE DE DÉPÔT ET PLACEMENT DU QUÉBEC
STRATEGIC DECISIONS WITH LEVERAGE FOR THE LONG TERM
La Caisse’s client-centric approach is based on listening and collaborating so that it can propose solutions designed to meet the needs of its depositors. In 2013, La Caisse therefore implemented, in co-operation with the depositors, major decisions made the previous year concerning its investment directions and strategy. The main changes made during the year focused on two key pillars: La Caisse’s specialized portfolio offering and the strategic allocation of depositors’ assets.
PORTFOLIO OFFERING
Several Caisse teams mobilized to complete the implementation of changes made in 2013 to the portfolio offering, in particular:
• Creating the Global Quality Equity portfolio, focused on high-quality securities with more stable returns over the long term. Its benchmark index consists of 85% MSCI ACWI, unhedged, and 15% DEX 91 Day T-Bills;
• Gradually winding down the Global Equity portfolio;
• Gradually applying an active management approach to the Emerging Markets Equity portfolio. The benchmark index now consists of MSCI EM, unhedged, and adjusted to include the MSCI China A index;
• Integrating a management mandate based on long-term relationships with growth-driven companies into the Private Equity portfolio. The hedged index now consists of 50% MSCI World and 50% State Street Private Equity, adjusted;
• Finalizing the repositioning of the Hedge Fund portfolio and adjusting its benchmark index. At the end of 2013, this portfolio’s activities were integrated into Active Overlay Strategies, a new non-capitalized specialized portfolio intro-duced on January 1, 2014.
The specialized portfolio offering and the portfolios’ benchmark indexes as at December 31, 2013, are provided in Table 2 on page 18, and in Table 3 on page 19, respectively.
STRATEGIC ALLOCATION OF DEPOSITORS’ ASSETS
Constantly aiming to satisfy the needs of its clients, La Caisse continued to strengthen its ability to analyze their long-term financial obligations. In 2013, this expertise enabled it to enhance its advisory services related to asset allocation.
Orientations for strategic asset allocation were the focus of several working sessions between Caisse teams and depositors during the year. As a result of the sessions, most depositors adjusted their asset allocations in light of their specific needs and Caisse orientations, concerning mainly:
• The level of weighting to be given to the new Global Quality Equity portfolio;
• The increased weighting of less-liquid assets; and
• The increased weighting of investments in emerging markets.
Certain depositors also scaled back their allocation to the fixed-income portfolios and shortened the duration of their bond positions to reduce their exposure to rising interest rates. They also adjusted their allocation to the various equity portfolios, such as indexed portfolios.
To offset the underweighting of less-liquid portfolios, resulting from disciplined deployment of capital in real estate, infra-structure and private equity, La Caisse offered depositors a strategy to invest available cash in financial markets. The strategy is designed to generate a return exceeding that of short-term investments while respecting the risk-return profile of each portfolio concerned.
Our Clients,the Depositors

AR 2013 17CAISSE DE DÉPÔT ET PLACEMENT DU QUÉBEC
DEPOSITORS’ INDIVIDUAL RETURNS
The equity markets made strong gains in 2013, returning an average of 22.4%, while the bond markets returned -1.2%. Because of this disparity, asset allocation decisions had a substantial impact on each depositor’s return. Such decisions depend on factors that include a depositor’s target returns, risk tolerance and investment horizon. In 2013, the returns for the eight main depositors ranged from 8.9% to 15.5%. Over four years, the differences between these depositors’ returns are much smaller, ranging from 9.1% to 10.6% (see Figure 1).
CLIENT SATISFACTION
In 2013, La Caisse obtained feedback from all its clients on their overall satisfaction and on the following topics: strategic orien-tations, investment policies, risk management, reporting, collaboration and communication. This exercise is part of the initiative to enhance the services offered and analyze clients’ needs more effectively. It found high levels of satisfaction with most aspects of the services, particularly collaborative forums, portfolio offering and reporting practices.
3740
01_T
able
aux
RA
-AN
V7
7/0
4/20
14
P
AG
E 10
0
FIGURE 1
DIFFERENCES IN RETURNS ON THE EIGHT MAIN DEPOSITORS’ FUNDS(as a percentage)
Weighted average return on depositors’ funds
Highest return
Lowest return
0
5
10
15
20
2013
6.6%di�erence
1.5%di�erence
10.0%
13.1%
4 years
WE ARE IMPROVING OUR PORTFOLIO OFFERING AND ADVISORY SERVICES TO BETTER MEET OUR CLIENTS’ NEEDS

CAISSE DE DÉPÔT ET PLACEMENT DU QUÉBEC AR 2013 18
Our Clients, the Depositors
A PORTFOLIO OFFERING ADAPTED TO DEPOSITORS’ NEEDSLa Caisse provides its depositors with the ability to allocate their funds to specialized portfolios that hold securities from the same asset class. Each portfolio is managed according to a set of rules contained in an investment policy. This document specifies:
• The portfolio’s management approach;
• Its investment universe and benchmark index;
• Its target returns; and
• Its risk monitoring.
In addition to its specialized portfolios, La Caisse offers custo-mized overlay strategies so that each depositor can tailor its exposure to foreign currencies and interest rates.
CUSTOMIZED ADVISORY SERVICESLa Caisse offers depositors advisory services to assist them with their investment decisions. The services include:
• Analyses of financial markets and economic outlooks;
• Risk and return forecasts for the main asset classes and specialized portfolios; and
• Simulated allocation of depositors’ funds to various specialized portfolios in order to determine the optimal composition of their benchmark portfolio, in line with their needs and risk tolerance.
3740
01_T
able
aux
RA
-AN
V8
14/
04/2
014
PAG
E 9
TABLE 2
SPECIALIZED PORTFOLIO OFFERING(as at December 31, 2013)
ACTIVELY MANAGED INDEXED OBJECTIVES
FIXED INCOME BondsReal Estate Debt
Short Term InvestmentsLong Term Bonds
Reduce the portfolio’s overall risk levelMatch depositors’ assets and liabilities
INFLATION- SENSITIVE INVESTMENTS
Real EstateInfrastructure
Real Return Bonds Have exposure to markets whose investment income is indexed to inflationPartially hedge the inflation risk associated with the liabilities of several depositors
EQUITY Canadian EquityGlobal Quality EquityGlobal EquityEmerging Markets Equity Private Equity
U.S. EquityEAFE Equity
Increase depositors’ long-term target returns
OTHER INVESTMENTS
Hedge FundsAsset AllocationABTN
Achieve diversification and complementarity of La Caisse’s overall portfolio

CAISSE DE DÉPÔT ET PLACEMENT DU QUÉBEC AR 2013 19
3740
01_T
able
aux
RA
-AN
V8
8/0
4/20
14
P
AG
E 10
TABLE 3
BENCHMARK INDEXES OF THE SPECIALIZED PORTFOLIOS1
(as at December 31, 2013)
SPECIALIZED PORTFOLIO BENCHMARK INDEX
BONDS(Created October 1, 1996)
DEX Universe Bond, adjusted to increase the proportion of Québec bonds in the index
REAL ESTATE DEBT(Created April 1, 1995)
DEX Universe Bond
SHORT TERM INVESTMENTS(Created July 1, 1998)
DEX 91 Day T-Bill
LONG TERM BONDS(Created April 1, 2005)
DEX Long Term Government Bond, adjusted to increase the proportion of provincial bonds in the index
REAL ESTATE(Created October 1, 1985)
Aon Hewitt – Real Estate, adjusted
INFRASTRUCTURE(Created July 1, 2010)
Infrastructure (index consisting of a basket of infrastructure-related public securities, partially hedged)
REAL RETURN BONDS(Created January 1, 2004)
DEX Real Return Bond
CANADIAN EQUITY(Created July 1, 1995)
Canadian Equity (index consisting of 90% S&P/TSX Capped and 10% Morningstar National Bank Québec)
GLOBAL QUALITY EQUITY(Created January 1, 2013)
Global Quality Equity (index consisting of 85% MSCI ACWI, unhedged, and 15% DEX 91 Day T-Bill)
GLOBAL EQUITY(Created April 1, 2010)
MSCI ACWI, unhedged
EMERGING MARKETS EQUITY(Created January 1, 1995)
Emerging Markets Equity (index consisting of MSCI EM, unhedged and adjusted to include MSCI China A Index)
U.S. EQUITY(Created April 1, 2010)
S&P 500, unhedged
EAFE EQUITY(Created April 1, 2010)
MSCI EAFE, unhedged
PRIVATE EQUITY(Created July 1, 2003)
Private Equity (hedged index consisting of 50% MSCI World and 50% State Street Private Equity, adjusted to reflect the investment sectors in the specialized portfolio)
HEDGE FUNDS(Created April 1, 2003)
Dow Jones Credit Suisse Hedge Fund, hedged and adjusted to include only Macro Trends, Managed Futures and Market Neutral strategies
1. For the detailed changes in benchmark indexes of the specialized portfolios from the past 10 years, refer to the 2013 Annual Report Additional Information, Section 1, Tables of Returns.

CAISSE DE DÉPÔT ET PLACEMENT DU QUÉBEC AR 2013 20
Our Clients, the DepositorsOur Clients, the Depositors
BEHIND OUR CLIENTS ARE QUEBECERS La Caisse’s clients are mainly public and parapublic pension and insurance plans. And behind our clients are the majority of Quebecers.
Together, they pay out each year:
• More than $19 B in pension and insurance benefits
• To almost 2 MILLION Quebecers
3740
01_T
able
aux
RA
-AN
V8
14/
04/2
014
PAG
E 2
TABLE 4
THE EIGHT MAIN DEPOSITORS’ FUNDS, representing 97.4% of net assets as at December 31, 2013
1 GOVERNMENT AND PUBLIC EMPLOYEES RETIREMENT PLAN
$50.4 BNET ASSETS
530,000 contributors210,000 retirees and 14,000 surviving spouses and orphans$4 billion in retirement benefits paid annually
2 RETIREMENT PLANS SINKING FUND
$46.9 BNET ASSETS
Fund used by the Government of Québec to capitalize the employer’s portion of retirement benefits of employees in the public and parapublic sectors
3 RÉGIE DES RENTES DU QUÉBEC (RRQ)
$45.9 BNET ASSETS
4 million contributors1.7 million beneficiaries$11 billion in benefits paid annually
4 SUPPLEMENTAL PENSION PLAN FOR EMPLOYEES OF THE QUÉBEC CONSTRUCTION INDUSTRY
$15.9 BNET ASSETS
160,000 contributors85,000 retirees or surviving spouses$650 million in benefits paid annually
5 COMMISSION DE LA SANTÉ ET DE LA SÉCURITÉ DU TRAVAIL
$12.2 BNET ASSETS
220,000 contributing employers3.7 million workers covered$1.8 billion in benefits paid annually
6 SOCIÉTÉ DE L’ASSURANCE AUTOMOBILE DU QUÉBEC
$8.9 BNET ASSETS
5 million driver’s licence holders6 million registered vehicles$1 billion paid in compensation annually
7 PENSION PLAN OF MANAGEMENT PERSONNEL
$8.7 BNET ASSETS
29,000 contributors24,500 retirees and 2,000 surviving spouses and orphans$1 billion in benefits paid annually
8 GENERATIONS FUND $5.9 BNET ASSETS
Fund used to repay Québec’s debt

CAISSE DE DÉPÔT ET PLACEMENT DU QUÉBEC AR 2013 21
3740
01_T
able
aux
RA
-AN
V8
14/
04/2
014
PAG
E 3
TABLE 5
LA CAISSE’S 31 DEPOSITORS – Comparison of net assets as at December 31, 2012, and as at December 31, 2013(fair value as at December 31 – in millions of dollars)
Depositors’ net assets
First deposit
2013 2012
$ % $ %
PENSION PLANSRégie des rentes du Québec 1966 45,871 22.9 39,070 22.2
Supplemental Pension Plan for Employees of the Québec Construction Industry 1970 15,943 8.0 14,476 8.2
Government and Public Employees Retirement Plan 1973 50,442 25.2 45,141 25.6
Pension Plan of Management Personnel 1973 8,689 4.3 7,798 4.4
Individual Plans 1977 208 0.1 190 0.1
Pension Plan of Elected Municipal Officers 1989 196 0.1 173 0.1
Régime complémentaire de rentes des techniciens ambulanciers/paramédics et des services préhospitaliers d’urgence 1990 389 0.2 340 0.2
Ministère des Finances et de l’Économie, Government of Québec1
Retirement Plans Sinking Fund 1994 46,863 23.4 40,722 23.1 Superannuation Plan for the Members of the Sûreté du Québec –
Caisse employeurs 2009 338 0.2 303 0.2
Régime de retraite de l’Université du Québec 2004 297 0.2 253 0.2
Régime de retraite du personnel des CPE et des garderies privées conventionnées du Québec 2005 182 0.1 124 0.1
Régime de retraite pour certains employés de la Commission scolaire de la Capitale 2006 36 – 36 –
Régime de rentes pour le personnel non enseignant de la Commission des écoles catholiques de Montréal 2007 216 0.1 219 0.1
Superannuation Plan for the Members of the Sûreté du Québec – Caisse participants 2007 229 0.1 173 0.1
Régime de retraite des employés de la Ville de Laval 2007 143 0.1 114 0.1
Retirement Plan for Active Members of the Centre hospitalier Côte-des-Neiges 2010 72 – 68 –
Fonds commun de placement des régimes de retraite de l’Université Laval 2012 134 0.1 114 0.1
Fiducie globale Ville de Magog 2012 48 – 41 –
Régime de retraite des employées et employés de la Ville de Sherbrooke 2012 26 – 13 –
Régime de retraite des agents de la paix en services correctionnels2 2013 145 0.1 – –
Régime complémentaire de retraite des employés réguliers de la Société de transport de Sherbrooke2 2013 56 – – –
INSURANCE PLANSRégie des marchés agricoles et alimentaires du Québec 1967 8 – 8 –
La Financière agricole du Québec 1968 345 0.2 271 0.2
Autorité des marchés financiers 1969 631 0.3 622 0.4
Commission de la santé et de la sécurité du travail 1973 12,181 6.1 10,882 6.2
Société de l'assurance automobile du Québec 1978 8,948 4.5 8,132 4.6
Fédération des producteurs de bovins du Québec 1989 5 – 4 –
Survivor’s Pension Plan 1997 387 0.2 361 0.2
Conseil de gestion de l'assurance parentale 2005 3 – 3 –
OTHER DEPOSITORSOffice de la protection du consommateur 1992 105 0.1 87 –
Société des alcools du Québec 1994 87 – 118 0.1
Ministère des Finances et de l’Économie, Government of Québec1
Generations Fund 2007 5,908 3.0 5,170 2.9 Accumulated Sick Leave Fund 2008 843 0.4 750 0.4 Fonds d’information sur le territoire 2011 83 – 352 0.2
Agence du revenu du Québec 2012 92 – 82 –
Total 200,149 100.0 176,210 100.0
1. The Ministère des Finances et de l’Économie entrusts La Caisse with a total of five funds.
2. New depositor in 2013.

AR 2013 22CAISSE DE DÉPÔT ET PLACEMENT DU QUÉBEC

AR 2013 23CAISSE DE DÉPÔT ET PLACEMENT DU QUÉBEC
Management Report
AR 2013 24CAISSE DE DÉPÔT ET PLACEMENT DU QUÉBEC
MacroeconomicEnvironment
HIGHLIGHTS
1United StatesThe renewed vigour of the U.S. economy since 2010 is positive for the economies of Québec and Canada.
2Euro zoneThe German economy is the main reason that the euro zone returned to growth in 2013, but the recovery continues to be weak.
3Emerging marketsTo achieve their full potential, emerging markets must implement structural reforms.
THE GLOBAL ECONOMY: PROGRESS, BUT CHALLENGES REMAIN
The past four years have been particularly eventful for the global economy. During much of that time, the United States and Europe focused on correcting the imbalances that had developed in their economies before and during the financial crisis of 2008, mainly the excessive levels of debt that were limiting their growth. In addition to lowering its key interest rate to almost 0%, the U.S. Federal Reserve (Fed) also relied on a series of unpreced-ented asset purchases referred to as quantitative easing. These policy actions took the 10-year interest rate to a historic low, increased the level of liquidity and spurred gains on equity markets in the United States and elsewhere in the world. This strategy worked well and enabled the United States to make significant progress in solving its problems. In December 2013, the Fed was able to begin tapering its stimulus program. Europe, in contrast, favoured an approach based on fiscal austerity; far
from having the desired effect however, it caused the euro zone’s most severe recession since its inception, followed by only a negligible improvement in the economic situation.
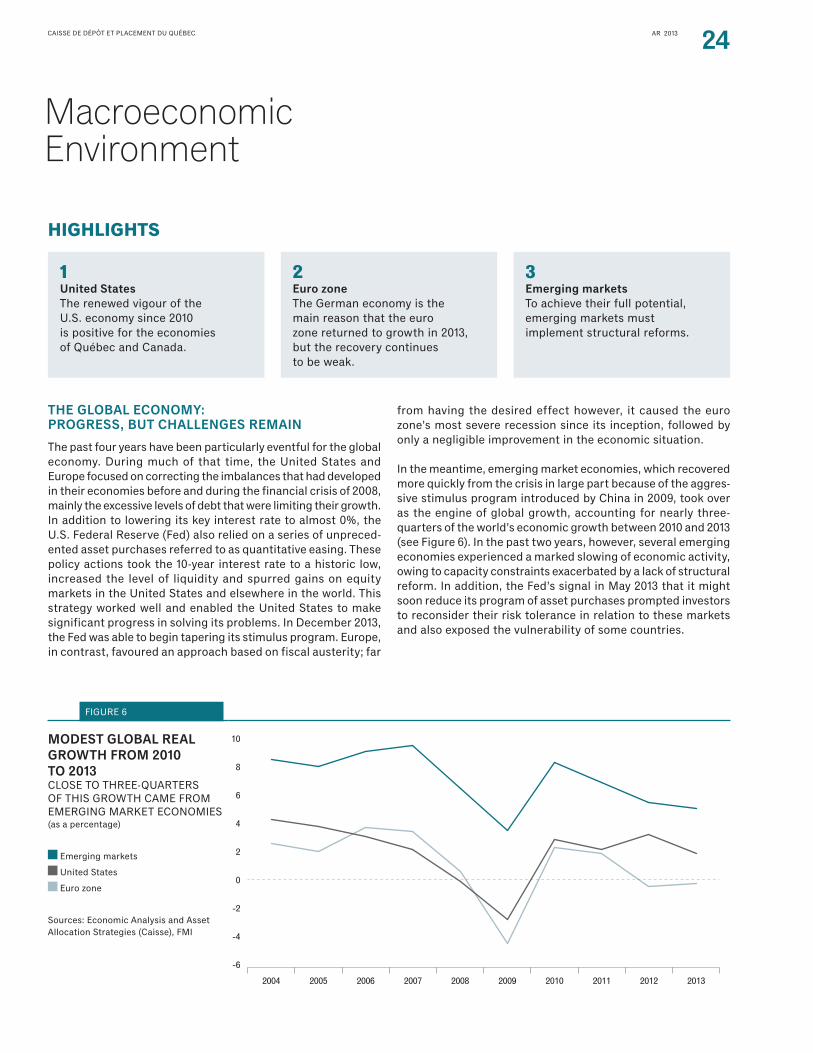
In the meantime, emerging market economies, which recovered more quickly from the crisis in large part because of the aggres-sive stimulus program introduced by China in 2009, took over as the engine of global growth, accounting for nearly three-quarters of the world’s economic growth between 2010 and 2013 (see Figure 6). In the past two years, however, several emerging economies experienced a marked slowing of economic activity, owing to capacity constraints exacerbated by a lack of structural reform. In addition, the Fed’s signal in May 2013 that it might soon reduce its program of asset purchases prompted investors to reconsider their risk tolerance in relation to these markets and also exposed the vulnerability of some countries.
3740
01_T
able
aux
RA
-AN
V7
7/0
4/20
14
P
AG
E 10
4
FIGURE 6
MODEST GLOBAL REAL GROWTH FROM 2010 TO 2013 CLOSE TO THREE-QUARTERS OF THIS GROWTH CAME FROM EMERGING MARKET ECONOMIES(as a percentage)
Emerging markets
United States
Euro zone
Sources: Economic Analysis and Asset Allocation Strategies (Caisse), FMI
-6
-4
-2
0
2
4
6
8
10
2013201220112010200920082007200620052004

AR 2013 25CAISSE DE DÉPÔT ET PLACEMENT DU QUÉBEC
Overall, a global economic recovery is under way, but its strength varies widely by geographic region and country.
In this context, La Caisse is monitoring three themes that will shape the global economy in the coming years:
1. Normalization of U.S. monetary policy
2. Evolution of Europe’s economic situation
3. Policies in emerging markets
1. Normalization of U.S. monetary policyAfter the steep recession of 2008-2009, the U.S. economy grew at an average annual rate of 2.3% from 2010 to 2013, a reasonable performance given the severity of the financial crisis it experienced. This outcome illustrates the appropriateness of the bold stimulative measures that were adopted. The govern-ment also took the right approach to fiscal policy, waiting until the economy was more firmly on the path to growth before starting to reverse the easing of fiscal policy implemented in 2009-2010.
This approach helped revitalize the economy, pushing up housing prices and generating strong gains on the stock markets. As a result, U.S. households improved their balance sheets, with net wealth now exceeding the pre-crisis level by 17% (see Figure 7), which has recently led to an increase in spending.
3740
01_T
able
aux
RA
-AN
V7
7/0
4/20
14
P
AG
E 10
5
FIGURE 7
U.S. HOUSEHOLD NET WEALTH REACHES NEW HEIGHTS(in US$B)
QE: Quantitative easing programs
TALF: Term Asset-Backed Securities Loan Facility
TARP: Troubled Asset Relief Program
TWIST: Program to lengthen the maturities of assets held by the Fed
Sources: Economic Analysis and Asset Allocation Strategies (Caisse), Datastream
48,000
52,000
56,000
60,000
64,000
68,000
72,000
76,000
80,000
QE1
TALF
TAR
P
QE2
Twis
t 1
Twis
t 2
QE3
17%
2013201220112010200920082007200620052004

CAISSE DE DÉPÔT ET PLACEMENT DU QUÉBEC AR 2013 26
Macroeconomic Environment
The United States also benefited from increased domestic energy production as a result of technological innovations, as well as from the lower electricity and natural gas prices that ensued. The strengthening of private domestic demand enabled private sector output to grow by an average of 3.1% over the past two years, despite the tightening of fiscal policy in 2013, which subtracted about 1.75 percentage points from real GDP. Consequently, the federal deficit fell from 8.5% of nominal GDP in 2010 to 3.3% in 2013. The improvement in the U.S. economy convinced the Fed to start normalizing monetary policy in December.
This process, which is taking place after several years of unprecedented stimulus, could lead to surprises around the world, including in the United States, its stronger growth dynamic notwithstanding.
The strengthening of the world’s largest economy is good news for Québec and Canada as it becomes increasingly clear that their economies must be reoriented toward exports (see Figure 8). Between 2010 and 2013, Canada’s economy expanded at an annual rate of 2.4%, a pace close to that of the United States. In Québec, growth was a little weaker at 1.7%. It is worth noting, however, that Québec weathered the recession better,
mainly because of public investments in infrastructure and lower exposure to some sectors hit hard by the U.S. crisis, such as the automotive industry. Accordingly, compared with 2007, the growth of Québec’s economic activity was similar to Canada’s, albeit a little less volatile.
Québec and Canada emerged from the recession faster than most other developed countries. In the past two years, however, they have entered a phase of slower economic growth, as a result of weak-trend productivity growth and the development of imbalances that have limited the increase in domestic demand. In particular, the high level of household debt has forced consumers to slow the increase in their spending.
In addition, private non-residential investment in Canada has stagnated since 2012 largely due to weak commodity prices. At the same time, the high Canadian dollar weighed on exports of Canadian manufactured goods, which created a large current account deficit averaging 3.2% of GDP from 2010 to 2013. Of course, Québec was not spared from these competitiveness issues, but some progress has been made since the end of 2012 as a result of improved U.S. demand and the appeal of certain Québec exports, particularly forest products.
3740
01_T
able
aux
RA
-AN
V7
7/0
4/20
14
P
AG
E 10
7
FIGURE 8
CANADA – EXPORT GROWTH NEEDED(January 1, 2002 = 100)
Real final domestic demand
Real GDP
Real exports
Sources: Economic Analysis and Asset Allocation Strategies (Caisse), Statistics Canada
85
90
95
100
105
110
115
120
125
130
135
140
2002 2003 2004 2005 2006 2007 2008 2009 2010 2011 2012 2013

CAISSE DE DÉPÔT ET PLACEMENT DU QUÉBEC AR 2013 27
2. Evolution of Europe’s economic situationIn response to a series of crises in the euro zone between 2010 and 2013, EU leaders adopted an approach based on fiscal austerity, which weakened the euro zone’s economy without solving most of the fundamental problems afflicting it (see Figure 9). They did not introduce the institutional reforms required to make their monetary union function well. Nor did they introduce structural reforms that, along with aggressive easing of monetary policy, could have helped the countries in difficulty perform better economically and control their debt levels more effectively. The European Central Bank (ECB) flooded the banking system with liquidity but did not cut interest rates to a minimum and refused to take additional risks onto its balance sheet. Instead, the authorities relied on a process of internal devaluation to compensate for the lack of competitiveness of the countries with significant current account deficits. As a result, the euro zone entered a severe recession.
The recession ended in the spring of 2013, after the European leaders agreed to reduce austerity measures and after the uncertainty stemming from the debt crisis had abated. The decisive moment was undoubtedly the ECB President’s statement in the summer of 2012 that he would do “whatever it takes” to preserve the euro zone. Thus far, the strong perfor-mance of the German economy is the main reason that the euro zone has returned to growth, although some indicators have recently pointed to a strengthening of economic activity in other euro zone countries. Nonetheless, the recovery remains weak, with the spectre of deflation looming on the horizon.
In this context, La Caisse believes the ECB will eventually have to ease monetary policy further. Member countries also need to strengthen their institutions and move forward with struc-tural reforms to eliminate the dysfunctions undermining the euro zone’s potential. In this regard, the impending elections in Europe may manifest a rejection of European integration by many citizens, which would make it more difficult to adopt the needed reforms.
3740
01_T
able
aux
RA
-AN
V7
7/0
4/20
14
P
AG
E 10
6
FIGURE 9
A SERIES OF CRISES IN THE EURO ZONE1 10-YEAR BOND YIELDS(as a percentage)
Portugal
Spain
Italy
Ireland
France
Germany
Sources: Economic Analysis and Asset Allocation Strategies (Caisse), Datastream
0
2
4
6
8
10
12
14
16
18
2010 2011 2012 2013
ECB President: “Whatever it takes”
Unlimited long-term
refinancingto banks (LTROs)
Irish bailout
Portuguese bailoutGreek
bailoutEFSFbailoutfund
ESMbailoutfund
1. Greece has been omitted so that the scale better reflects the other countries. Its 10-year yields grew to 33% at the end of 2011 and the beginning of 2012.

CAISSE DE DÉPÔT ET PLACEMENT DU QUÉBEC AR 2013 28
Macroeconomic Environment
3. Policies in emerging marketsThe turbulence in emerging markets in the wake of the Fed’s signal in May 2013 that it would most likely reduce its program of asset purchases shows that these countries are anything but a homogeneous group and have to be considered indivi-dually. After the recession of 2008-2009, emerging economies rebounded strongly as a result of highly expansionary policies at the global level, a large influx of foreign capital and the absence of serious imbalances. In 2011, however, several countries, including China, Brazil and India, began to encounter capacity constraints and inflationary pressures became evident. They responded by tightening monetary policy, which, together with the slow growth of productive capacity owing to a lack of structural reforms in recent years, detracted from their eco- nomic growth (see Figure 10). The weak demand in developed markets for their exports further complicated the situation.
Countries with large current account deficits financed by foreign investments in the financial markets were particularly affected by the Fed’s announcement, and their currencies depreciated significantly. To contain inflation, their central banks generally responded by raising interest rates, which will slow growth further. The fact that emerging markets have strong trading relationships with one another will most likely exacerbate the situation.
While the long-term potential of these countries remains intact, their performance will depend on their leaders’ willingness to undertake the reforms necessary to improve the functioning of their economies. Moreover, the Chinese economy’s shift toward domestic demand will affect other emerging countries, as well as countries producing raw materials, such as Canada.
3740
01_T
able
aux
RA
-AN
V7
7/0
4/20
14
P
AG
E 10
8
FIGURE 10
SLOWING ECONOMIC GROWTH IN EMERGING MARKETS ANNUAL REAL GDP GROWTH(as a percentage)
China
India
Brazil
Sources: Economic Analysis and Asset Allocation Strategies (Caisse), Oxford Economics
201320122011201020092008
-2
0
2
4
6
8
10
12
14
16

AR 2013 29CAISSE DE DÉPÔT ET PLACEMENT DU QUÉBEC
Analysis ofOverall Performance
Since 2010, the Caisse team continued to pursue its strategy based on in-depth knowledge of companies and markets, with emphasis on absolute-return management and by investing in high-quality assets anchored in the real economy. In an environment characterized by high volatility, managers positioned their portfolios well and generated solid results throughout the period.
FOUR-YEAR RETURN
La Caisse’s overall portfolio had a 10.0% weighted average return on depositors’ funds for the four-year period ended December 31, 2013 (see Table 12, p. 30). The overall return exceeds the 8.8% return on La Caisse’s benchmark portfolio, for value added of $6.0 billion. Each asset class contributed significantly to the four-year return.
The Fixed Income asset class generated a 5.9% return, outper-forming the 4.5% return of its benchmark index. All the portfolios in this asset class added value by surpassing their benchmarks, with the exception of the Long Term Bond portfolio, which is indexed. The Bond portfolio had a return of 5.7% and generated $8.9 billion of net investment results on a stand- alone basis.
In the Inflation-Sensitive Investments asset class, the Real Estate and Infrastructure portfolios had returns of 13.0% and 16.8%, respectively, and generated $11.9 billion of net investment results (see Table 22, p. 42).
All the specialized portfolios in the Equity asset class contri-buted positively to the $32.8 billion of net investment results over four years. The Private Equity portfolio returned 16.5%, significantly outperforming the 11.3% return on its benchmark index, and generated $10.0 billion of net investment results.
2013 RETURN
Over one year, the 13.1% weighted average return on depositors’ funds exceeded the 12.6% return on La Caisse’s benchmark portfolio (see Table 11).
In 2013, La Caisse’s investment teams capitalized on robust equity market returns and acted on strong convictions to generate value added. They also succeeded in preserving depositors’ capital invested in fixed income during a year when interest rates resumed their rise. Moreover, they continued to generate high returns by holding less-liquid assets, such as real estate, infrastructure and private equity.
3740
01_T
able
aux
RA
-AN
V7
7/0
4/20
14
P
AG
E 14
TABLE 11
NET ASSETS AND RETURNS IN RELATION TO BENCHMARK INDEXES(for periods ended December 31, 2013)
4 years 1 year
Asset classNet assets
$B
Net investment results
$MReturn
%Index
%
Net investment results
$MReturn
%Index
%
Fixed Income 69.2 12,865 5.9 4.5 (41) 0.0 (1.2)
Inflation-Sensitive Investments 31.8 12,058 13.4 13.7 3,367 12.5 15.6
Equity 93.8 32,831 10.9 10.0 18,161 22.9 22.6
Other Investments Hedge Funds 3.7 419 3.6 3.1 85 2.9 2.9
Asset Allocation 1.2 (197) N/A N/A 182 N/A N/A
ABTN1 (0.1) 2,985 N/A N/A 728 N/A N/A
Total2,3 200.1 61,182 10.0 8.8 22,768 13.1 12.6
1. The financing of the ABTN portfolio slightly exceeds the fair market value of the investments and is the reason for the negative net assets.
2. The total includes customized Overlay Strategies and cash activities.
3. See Note 3 of the General Notes, at the end of the Annual Report.
CAISSE DE DÉPÔT ET PLACEMENT DU QUÉBEC AR 2013 30
Analysis of Overall Performance
During the year, the institution’s asset allocation was adjusted to increase its exposure to equities and reduce its exposure to bonds. Moreover, disciplined deployment of capital in a context of high prices for quality assets resulted in the underweight position of the less-liquid asset portfolios being maintained.
GEOGRAPHIC DIVERSIFICATION
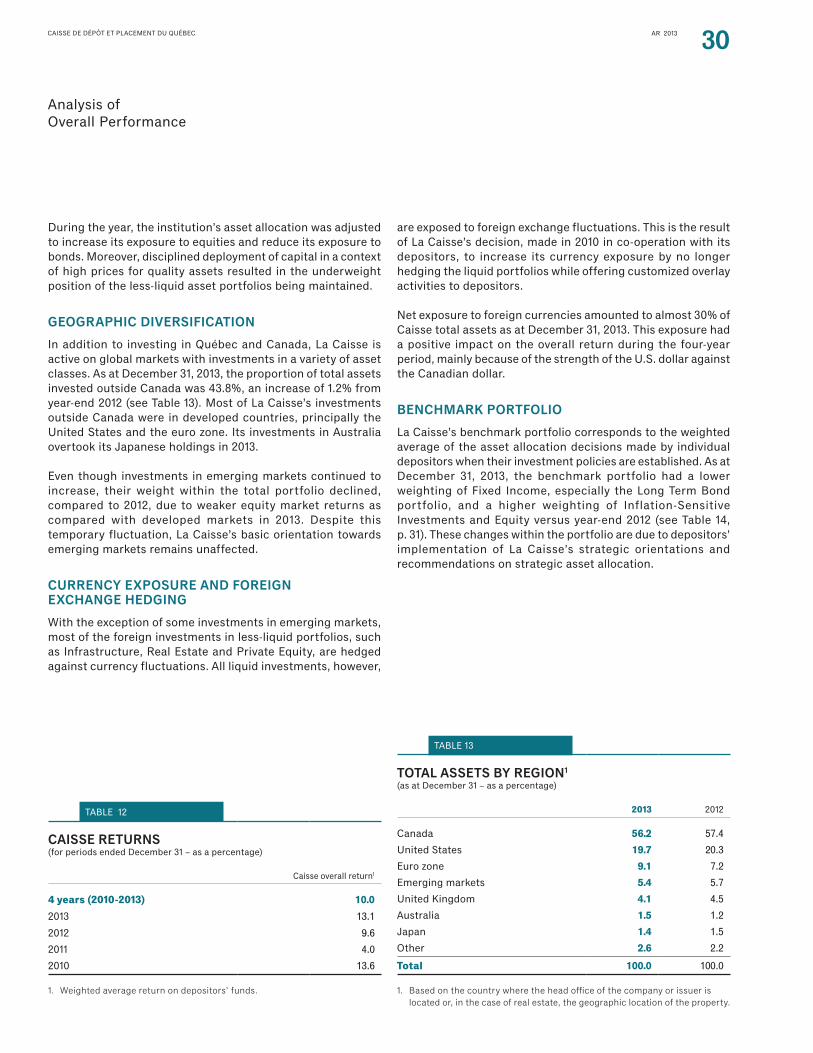
In addition to investing in Québec and Canada, La Caisse is active on global markets with investments in a variety of asset classes. As at December 31, 2013, the proportion of total assets invested outside Canada was 43.8%, an increase of 1.2% from year-end 2012 (see Table 13). Most of La Caisse’s investments outside Canada were in developed countries, principally the United States and the euro zone. Its investments in Australia overtook its Japanese holdings in 2013.
Even though investments in emerging markets continued to increase, their weight within the total portfolio declined, compared to 2012, due to weaker equity market returns as compared with developed markets in 2013. Despite this temporary fluctuation, La Caisse’s basic orientation towards emerging markets remains unaffected.
CURRENCY EXPOSURE AND FOREIGN EXCHANGE HEDGING
With the exception of some investments in emerging markets, most of the foreign investments in less-liquid portfolios, such as Infrastructure, Real Estate and Private Equity, are hedged against currency fluctuations. All liquid investments, however,
are exposed to foreign exchange fluctuations. This is the result of La Caisse’s decision, made in 2010 in co-operation with its depositors, to increase its currency exposure by no longer hedging the liquid portfolios while offering customized overlay activities to depositors.
Net exposure to foreign currencies amounted to almost 30% of Caisse total assets as at December 31, 2013. This exposure had a positive impact on the overall return during the four-year period, mainly because of the strength of the U.S. dollar against the Canadian dollar.
BENCHMARK PORTFOLIO
La Caisse’s benchmark portfolio corresponds to the weighted average of the asset allocation decisions made by individual depositors when their investment policies are established. As at December 31, 2013, the benchmark portfolio had a lower weighting of Fixed Income, especially the Long Term Bond portfolio, and a higher weighting of Inflation-Sensitive Investments and Equity versus year-end 2012 (see Table 14, p. 31). These changes within the portfolio are due to depositors’ implementation of La Caisse’s strategic orientations and recommendations on strategic asset allocation.
3740
01_T
able
aux
RA
-AN
V7
7/0
4/20
14
P
AG
E 13
TABLE 12
CAISSE RETURNS (for periods ended December 31 – as a percentage)
Caisse overall return1
4 years (2010-2013) 10.0
2013 13.1
2012 9.6
2011 4.0
2010 13.6
1. Weighted average return on depositors’ funds.
3740
01_T
able
aux
RA
-AN
V8
11/
04/2
014
PAG
E 15
TABLE 13
TOTAL ASSETS BY REGION1
(as at December 31 – as a percentage)
2013 2012
Canada 56.2 57.4
United States 19.7 20.3
Euro zone 9.1 7.2
Emerging markets 5.4 5.7
United Kingdom 4.1 4.5
Australia 1.5 1.2
Japan 1.4 1.5
Other 2.6 2.2
Total 100.0 100.0
1. Based on the country where the head office of the company or issuer is located or, in the case of real estate, the geographic location of the property.

CAISSE DE DÉPÔT ET PLACEMENT DU QUÉBEC AR 2013 31
OVERALL PORTFOLIO
The composition of the overall portfolio is the result of decisions made by La Caisse to deviate from the benchmark portfolio so as to generate value added. As at December 31, 2013, the overall portfolio had a lower weighting of the fixed-income portfolios and a higher weighting of the Real Estate and Infrastructure portfolios versus year-end 2012. As for the Equity asset class,
the weighting of the Global Equity portfolio, which is being wound down, was significantly reduced as a large portion of its assets was transferred to the Global Quality Equity portfolio, created in 2013. The weightings of the Canadian Equity portfolio and of the indexed U.S. Equity and EAFE Equity portfolios were also down.
3740
01_T
able
aux
RA
-AN
V7
7/0
4/20
14
P
AG
E 11
TABLE 14
COMPOSITION OF THE BENCHMARK PORTFOLIO AND CHANGES IN THE OVERALL PORTFOLIO(percentage of depositors’ net assets)
Benchmark portfolio
as at December 31, 20131
as at December 31, 20121 Overall portfolio
Lower limit
%
Benchmark portfolio
%
Upper limit
%
Benchmark portfolio
%
as at December 31, 2013
%
as at December 31, 2012
%
Fixed Income Bonds 22.0 27.0 33.8 26.1 27.6 25.0
Real Estate Debt 2.6 5.5 8.2 5.8 4.4 4.3
Short Term Investments 0.2 1.1 8.9 1.1 1.8 5.1
Long Term Bonds 0.7 1.0 2.8 2.3 0.9 2.1
Total 34.6 35.3 34.7 36.5
Inflation-Sensitive Investments Real Estate 7.7 11.4 14.7 11.4 11.3 10.3
Infrastructure 2.0 4.9 8.0 4.5 4.0 3.6
Real Return Bonds 0.1 0.6 2.5 0.8 0.6 0.7
Total 16.9 16.7 15.9 14.6
EquityCanadian Equity 6.9 11.4 15.9 12.4 11.6 12.6
Global Quality Equity 1.7 6.6 10.4 N/A 8.6 N/A
Global Equity 0.0 2.0 6.7 7.2 1.8 7.8
Québec International N/A N/A N/A 0.1 N/A 0.0
Emerging Markets Equity 1.8 5.0 8.0 4.4 5.1 5.0
U.S. Equity 1.4 5.5 9.8 5.9 4.9 5.8
EAFE Equity 1.3 5.3 9.5 6.1 4.9 5.6
Private Equity 7.3 10.7 14.1 9.9 10.1 10.2
Total 46.5 46.0 47.0 47.0
Other InvestmentsHedge Funds 0.1 2.0 3.2 2.0 1.8 1.8
Asset Allocation 0.0 0.0 1.0 0.0 0.7 0.6
ABTN N/A N/A N/A N/A (0.1) (0.5)
Total 100.0 100.0 100.0 100.0
1. The benchmark portfolio and its upper and lower limits are the result of the weighted average of the depositors’ respective benchmark portfolios.

AR 2013 32CAISSE DE DÉPÔT ET PLACEMENT DU QUÉBEC
Analysis of Performanceby Asset Class
For the four-year period, each asset class had positive returns. Returns by asset class varied significantly in 2013. All the portfolios recorded positive returns with the exception of Long Term Bonds and Real Return Bonds.
FIXED INCOME
PORTFOLIOS
• Bonds
• Real Estate Debt
• Short Term Investments
• Long Term Bonds
$69.2 BNet assets
34.7%of La Caisse’s overall portfolio
5.9%Four-year return on the asset class
BONDS
Four-year returnFor the four-year period ended December 31, 2013, the Bond portfolio returned 5.7%, outperforming its benchmark by 1.0% (see Table 22, p. 42). This result is due to strategies put in place during this period based on two main themes: improvement of economic conditions and, more recently, normalization of interest rates. Various types of strategies contributed to the portfolio’s value added, such as:
• taking positions to mitigate the impact of rising rates in developed countries;
• overweighting provincial securities, especially Québec bonds, focusing on narrower spreads; and
• overweighting bonds issued by public and private corporations, combined with the higher return on the portfolio’s holdings.
2013 returnThe portfolio returned 0.2% in 2013, outperforming its benchmark index (see Table 22, p. 42). Even though bond yields increased, the managers preserved the portfolio’s capital and outperformed the index, which recorded a negative return for the first time since 1999.
Table 15 gives the DEX bond index returns by maturity and issuer. The DEX Universe Bond Index returned -1.2% in 2013 because of an across-the-board increase in Canadian govern-ment bond yields, especially for long-term maturities. However, the improved economic environment helped narrow the credit spreads of corporate bonds, giving them a positive return of 0.8%.
3740
01_T
able
aux
RA
-AN
V7
7/0
4/20
14
P
AG
E 17
TABLE 15
DEX BOND INDEX RETURNS(as a percentage)
2013 2012
DEX Bond Indexes Short Term Medium Term Long Term Total Short Term Medium Term Long Term Total
Federal 1.3 (2.2) (8.9) (1.5) 1.1 2.9 4.5 2.1
Provincial 1.8 (0.4) (6.0) (2.7) 1.6 3.9 3.7 3.4
Québec 1.7 (0.1) (6.2) (2.6) 1.6 3.9 3.5 3.3
Corporate 2.4 1.1 (3.2) 0.8 3.9 8.1 9.5 6.2
Universe 1.7 (0.6) (6.2) (1.2) 2.0 4.6 5.2 3.6

CAISSE DE DÉPÔT ET PLACEMENT DU QUÉBEC AR 2013 33
REAL ESTATE DEBT
Four-year returnOver the four-year period, the portfolio returned 9.1%, outper-forming its benchmark index by 4.4% (see Table 22, p. 42). The value added is due partially to the portfolio’s higher current return, as mortgage rates exceeded the interest rates on the bonds in the index. It is also attributable to the narrowing of mortgage credit spreads and gains on the sale of foreign assets. The portfolio’s credit risk has been reduced significantly since 2010 with a strategy that emphasizes high-quality Canadian assets.
2013 returnThe portfolio returned 0.1% in 2013, outperforming the benchmark index, which had a negative return (see Table 22, p. 42). The value added is due mainly to the portfolio’s current return, which exceeded that of the index. This was partially offset by a more significant impact of the narrowing of credit spreads for the index than for the portfolio.
As in 2012, portfolio managers maintained their leading position in Québec and continued their operations in Ontario and Western Canada. Transaction volume was in line with objectives while the credit quality of the underwritten assets was maintained, in accordance with a strategy designed to protect returns over the long term. Credit performance continued to be excellent, with none of the portfolio’s loans in default on interest payments (90 days or more).
SHORT TERM INVESTMENTS
This indexed portfolio returned 1.0% over four years and 1.1% in 2013 (see Table 22, p. 42). The results reflect a context of very low short-term interest rates.
LONG TERM BONDS
This portfolio, which is also indexed, returned 6.5% over four years, taking advantage of falling interest rates during the period (see Table 22, p. 42). The -6.5% return recorded in 2013 is essentially due to higher interest rates, which caused the price of the portfolio’s long-term bonds to decline.
OVER FOUR YEARS, THE RETURN ON THE FIXED INCOME ASSET CLASS IS 5.9%, OR 1.4% MORE THAN THE INDEX
BOND PORTFOLIO
Composition
• Bonds: – Government of Canada and other countries – Governments of Canadian provinces – Public and private corporations
Advantages
• Source of current return and liquidity• Low level of risk• Diversification• Capital preservation• Matching of depositors’ assets with
their long-term financial commitments
REAL ESTATE DEBT PORTFOLIO
Composition
• Canadian commercial mortgage loans, primarily senior, on office buildings, shopping centres, industrial buildings and multiresidential properties
Advantages
• Return exceeding that of bonds• High and relatively stable current return• Low credit risk as a result of prudent underwriting
and high asset quality• Matching of depositors’ assets with their long-term
financial commitments

CAISSE DE DÉPÔT ET PLACEMENT DU QUÉBEC AR 2013 34
Analysis of Performance by Asset Class
INFLATION-SENSITIVE INVESTMENTS
PORTFOLIOS
• Real Estate
• Infrastructure
• Real Return Bonds
$31.8 BNet assets
15.9%of La Caisse’s overall portfolio
13.4%Four-year return on the asset class
REAL ESTATE
Four-year returnFor the four-year period ended December 31, 2013, the portfolio returned 13.0%, underperforming its benchmark index by 1.0% (see Table 22, p. 42). The absolute return is due mainly to the rise in value of shopping centres and office buildings in North America, as well as the current income generated by properties. The difference vis-à-vis the index is due mainly to the weak performance of the hotel sector, which is being reduced in the portfolio. Since the 2011 launch of the program to sell the portfolio’s hotels, almost 50% of these non-strategic assets have been divested in an orderly fashion.
In the past four years, managers made significant progress with the implementation and growth of platforms and strategic partnerships outside the country. They also carried out a repositioning of the portfolio by geography and sector, which gave rise to $23.1 billion of transactions, including $11.6 billion of sales and $11.5 billion of acquisitions.
Figures 16 and 17 illustrate the result of the strategy used to reposition the Real Estate portfolio. The first shows that invest-ments in Québec and the United States are up, whereas those in Europe are down. The second shows that multiresidential properties and shopping centres are up, but hotels and funds in the portfolio are down.
3740
01_T
able
aux
RA
-AN
V13
24/
04/2
014
PAG
E 23
FIGURE 16
REAL ESTATE BY REGION(as a percentage of fair value)1
December 31, 2009
December 31, 2013
Québec Canada United Europe, Asia Emerging ex Québec States and other markets
30.627.4
25.3
19.3
7.2 5.8
30.4
24.6
16.9
12.5
1. Percentages do not include cash in the portfolio.
3740
01_T
able
aux
RA
-AN
V8
7/0
4/20
14
P
AG
E 24
FIGURE 17
REAL ESTATE BY SECTOR1
(as a percentage of fair value)2
December 31, 2009
December 31, 2013
Shopping O�ces Multi- Hotels Funds Securities centres residential and financings
31.7
6.910.5
4.4
11.3 10.0
4.63.1
31.4
4.5
39.237.5
1. Other investments, particularly in land and the industrial sector, represent approximately 3% of the portfolio (not shown).
2. Percentages do not include cash in the portfolio.

CAISSE DE DÉPÔT ET PLACEMENT DU QUÉBEC AR 2013 35
2013 returnThe portfolio returned 15.1% in 2013, slightly underperforming its benchmark index (see Table 22, p. 42). The managers continued to reposition the portfolio during the year, with sales and acquisitions totalling $9.0 billion. Here are some notable examples:
• The position in the United States was strengthened in 2013 with transactions such as a stake in 1211 Avenue of the Americas in New York City, the acquisition of the office towers at 10 and 120 South Riverside Plaza in Chicago, the purchase of 999 Third Avenue (Wells Fargo Center) in Seattle and additions to the multiresidential portfolio.
• In Europe, the reduced weighting of the portfolio and its positioning in the large, high-quality markets of London and Paris continued. The sales involved several office buildings in Paris, London and Munich, a shopping centre in Scotland and four hotels in Paris, for a total of approximately $1.5 billion. Acquisitions included interests in London’s Woolgate Exchange as well as in PointPark Properties, a logistics and warehouse company that provides exposure to a growth sector related directly to the thriving e-commerce trade.
REAL RETURN BONDS
This indexed portfolio has a four-year return of 4.1% (see Table 22, p. 42). The -13.1% return recorded in 2013 is due to the impact of rising real interest rates on the portfolio’s long-term bonds.
REAL ESTATE PORTFOLIO
Composition
• Direct investments in shopping centres, office buildings and multiresidential properties, held within various geographic and sector-specific platforms
• Quality buildings located mainly in large, growth-oriented markets
Advantages
• Higher current return than that of fixed income• Diversification• Protection against inflation as a result of indexed leases
INFRASTRUCTURE PORTFOLIO
Composition
• Interests in companies that operate ports, airports, wind farms, oil, gas and electricity transmission and distribution systems, water distribution systems, and passenger transportation systems
• Quality companies that have low risk profiles and are less sensitive to economic fluctuations
Advantages
• Stable and predictable returns over the long term• Protection against inflation over the long term

CAISSE DE DÉPÔT ET PLACEMENT DU QUÉBEC AR 2013 36
Analysis of Performance by Asset Class
INFRASTRUCTURE
Four-year returnSince 2010, managers have been building this portfolio, which reached $8.0 billion in 2013, by emphasizing quality assets in growth-driven sectors and strategic and financial long- term partnerships.
Over four years, the portfolio’s 16.8% return outperformed the index (see Table 22, p. 42). The return is due mainly to portfolio companies’ solid operating results as well as falling interest rates.
2013 returnThe portfolio returned 10.6% in 2013, mainly because of its high-quality assets and the strong operating results of all the companies in the portfolio (see Table 22, p. 42). Even so, sharply rising equity markets contributed to the variance between the portfolio’s return and that of its benchmark index. The benchmark, consisting of publicly traded equities, rose considerably in 2013.
During the year, managers repositioned the portfolio to improve its geographic and sector diversification (see Figures 18 and 19). They sold assets totalling $0.3 billion, including the stake in Enbridge Energy Partners, and made new investments totalling $2.1 billion, including interests in Invenergy’s windpower projects in the United States, Canada and Québec, and in the Port of Brisbane in Australia.
3740
01_T
able
aux
RA
-AN
V8
8/0
4/20
14
P
AG
E 21
FIGURE 18
INFRASTRUCTURE BY REGION(as a percentage of fair value)1
July 1, 20102
December 31, 2013
1. Percentages do not include cash in the portfolio.
2. The portfolio was created on July 1, 2010.
Québec Canada United Europe Asia, ex Québec States Australasia and other markets
17.7
8.93.1 1.6
15.2
24.7
64.0
46.1
0.0
18.7
3740
01_T
able
aux
RA
-AN
V8
8/0
4/20
14
P
AG
E 22
FIGURE 19
INFRASTRUCTURE BY SECTOR(as a percentage of fair value)1
July 1, 20102
December 31, 2013
Energy Industrials Utilities Other
48.445.845.1 44.8
3.15.7 3.4 3.7
1. Percentages do not include cash in the portfolio.
2. The portfolio was created on July 1, 2010.
THIS ASSET CLASS PLACES PRIORITY ON HIGH-QUALITY ASSETS AND LONG-TERM STRATEGIC PARTNERSHIPS

CAISSE DE DÉPÔT ET PLACEMENT DU QUÉBEC AR 2013 37
EQUITY
PORTFOLIOS
• Canadian Equity
• Global Quality Equity
• Global Equity
• Emerging Markets Equity
• U.S. Equity
• EAFE Equity
• Private Equity
$93.8 BNet assets
47.0%of La Caisse’s overall portfolio
10,9 %Four-year return on the asset class
CANADIAN EQUITY
Four-year returnFor the four-year period ended December 31, 2013, the portfolio returned 6.4%, underperforming its benchmark index by 1.1% (see Table 22, p. 42). The difference is due mainly to security selection in the materials and industrials sectors, as well as an underweight position in the health care and telecommunications sectors. In 2013, the restructuring of the portfolio initiated two years ago paid off.
2013 returnThe portfolio returned 16.3% in 2013, outperforming its benchmark index (see Table 22, p. 42). The return is due to the portfolio’s exposure to companies in cyclical sectors that are not related to resources and have significant exposure to the U.S. market, as well as an underweight position in materials, specifically gold stocks.
The portfolio’s positioning arises from changes made to its management approach over the past two years. The security- selection strategy was enhanced with stronger research capabilities and the development of major investment themes to guide managers in their decision-making. The main thrusts underlying the portfolio’s positioning are relatively weak economic growth in Canada, a more favourable outlook in the United States and a gradual increase in interest rates.
The significant weighting of Québec companies in the portfolio also made a positive contribution to the 2013 results. As at December 31, 2013, such companies accounted for 32.0% of the portfolio, versus 23.5% of its benchmark index, which consists of the S&P/TSX Index and the Morningstar National Bank Québec Index in proportions of 90% and 10%, respectively. Québec companies account for 15.1% of the S&P/TSX Index.
CANADIAN EQUITY PORTFOLIO
Composition
• Securities of publicly traded companies in all sectors of the economy
Advantages
• Long-term return exceeding that of fixed-income securities• Protection against inflation over the long term
THE EQUITY CLASS ACCOUNTS FOR THE LARGEST CONTRIBUTION TO THE NET INVESTMENT RESULTS OVER FOUR YEARS

CAISSE DE DÉPÔT ET PLACEMENT DU QUÉBEC AR 2013 38
Analysis of Performance by Asset Class
GLOBAL QUALITY EQUITY
The Global Quality Equity portfolio was created on January 1, 2013, with the transfer of a portion of the holdings of the Global Equity portfolio, followed by gradual deployment of capital during the year. The portfolio is index-agnostic and absolute-return oriented and built upon in-depth fundamental analysis. It focuses on securities of large, established companies with considerable exposure to global growth and stable earnings over the long term.
This portfolio returned 32.4% in 2013, mainly because of managers’ decision to invest in major international companies established in United States and Europe, many of them active in the health care and consumer products sectors (see Table 22, p. 42). The one-year result exceeded expectations, especially in the context of strong equity market returns. With a level of risk lower than that of equity markets as a whole, this portfolio is designed to offer some protection in down markets but benefits less from strong equity market returns.
GLOBAL EQUITY
As a result of the creation of the Global Quality Equity portfolio on January 1, 2013, the portfolio’s operations were gradually transferred to other portfolios during the year. In 2013, this actively managed portfolio returned 32.2%, outperforming its benchmark index (see Table 22, p. 42). The portfolio is expected to be fully wound down in the first half of 2014.
EMERGING MARKETS EQUITY
Four-year returnOver four years, the portfolio returned 3.1% (see Table 22, p. 42). Emerging markets underperformed developed markets during the period (see Figure 21, p. 40) because of slowing growth, as well as currency devaluations in several countries.
2013 returnOver one year, the portfolio returned 4.0%, surpassing its benchmark index (see Table 22, p. 42). The factors that contri-buted to its outperformance include the results of the active management mandates introduced into the portfolio as of July 1, 2013. These mandates were awarded to external managers and essentially cover China, Brazil and India. The deployment of active management operations in the portfolio will continue in the years to come in order to take advantage of growth in the main emerging markets.
For the Chinese market, La Caisse obtained an additional US$300 million quota as a Qualified Foreign Institutional Investor (QFII). This amount is in addition to the US$200 million quota that it already had for investments in securities listed on the Shanghai and Shenzhen stock exchanges.
GLOBAL QUALITY EQUITY PORTFOLIO
Composition
• Securities of large companies traded on the stock exchanges of countries in the MSCI ACWI Index (United States, Canada, Europe, Australasia, Far East and emerging markets)
Advantages
• Risk-adjusted return exceeding that of the equity markets on a long-term horizon
• Geographic diversification• Protection against inflation over the long term
EMERGING MARKETS EQUITY PORTFOLIO
Composition
• Securities listed on the stock exchanges of countries in the MSCI EM Index
• A-shares listed on the Shanghai and Shenzhen stock exchanges
Advantages
• Return exceeding that of equity markets in developed countries over the long term
• Geographic diversification

CAISSE DE DÉPÔT ET PLACEMENT DU QUÉBEC AR 2013 39
PRIVATE EQUITY
Four-year returnOver four years, the 16.5% return on the Private Equity portfolio outperformed its benchmark index by 5.3% (see Table 22, p. 42) and generated net investment results of $10 billion. Its excellent performance is due to solid earnings by portfolio companies as a result of their improved operational performance and reduced debt levels. Direct investments and investments made through funds both contributed positively to the portfolio’s absolute return for the period.
The portfolio’s investment strategy is based on a rigorous, disci-plined approach that achieves its objectives over long periods.
2013 returnOver one year, the portfolio returned 19.7%, underperforming its benchmark index (see Table 22, p. 42). Private investments in publicly traded companies provided a large portion of the portfolio’s absolute return. CGI Group in particular contributed to the return as its share price rose significantly with the successful integration of Logica. The portfolio underperformed
because 50% of its benchmark is based on an equity index that recorded strong gains in 2013. For its part, the portfolio holds interests in public and private companies, aiming to generate a long-term return that outperforms the stock markets.
During the year, managers rebalanced the portfolio’s direct investments. They took substantial positions in growth-driven companies with a view to long-term business partnerships. They also took advantage of the stock market rally to realize gains on various investments that had been held for several years. Investments in funds were also repositioned to limit exposure to leveraged buyouts, to take advantage of opportunities on the distressed-debt market and to put in place a strategy for the secondary market.
As shown by Figure 20, the portfolio’s weighting of investments in Québec rose substantially, going from 21.0% to 27.5%, between July 1, 2010 and December 31, 2013. This rise reflects the strategy to increase La Caisse’s direct investments in Québec companies.
3740
01_T
able
aux
RA
-AN
V7
7/0
4/20
14
P
AG
E 27
FIGURE 20
PRIVATE EQUITY BY REGION(as a percentage of fair value)1
July 1, 20102
December 31, 2013
27.5
21.0
9.8
4.4
38.542.9
18.8
24.1
1.73.3 3.74.3
Québec Canada United Europe Asia, Emerging ex Québec States Australasia markets and other markets 1. Percentages do not include cash in the portfolio.
2. The portfolio was adjusted significantly on July 1, 2010.
PRIVATE EQUITY PORTFOLIO
Composition
• Direct investments in companies in all sectors of the economy, especially defensive sectors with stable, predictable earnings
• Stakes in high-performing investment funds
Advantages
• Return exceeding that of the equity markets over the long term

CAISSE DE DÉPÔT ET PLACEMENT DU QUÉBEC AR 2013 40
Analysis of Performance by Asset Class
U.S. EQUITY
This indexed portfolio returned 16.5% over four years and 41.3% in 2013 (see Table 22, p. 42).
EAFE EQUITY
This indexed portfolio returned 9.3% over four years and 31.5% over one year (see Table 22, p. 42). Its outperformance over both periods is due to the difference between the tax rate for the dividends La Caisse receives as an investor in the securities in the index, and the rate used by MSCI to calculate the return on the index.
OTHER INVESTMENTSHEDGE FUNDS
Four-year returnOver four years, the portfolio returned 3.6%, outperforming the 3.1% return on its benchmark index (see Table 22, p. 42).
2013 returnThe portfolio’s one-year return of 2.9% is almost identical to that of its benchmark index (see Table 22, p. 42). The return is attributable mainly to the results of the Market Neutral strategy. As for the Managed Futures strategy, it did not produce the expected results in the context of government intervention and trend reversal that prevailed in 2013. During the year, managers completed the portfolio’s repositioning to concentrate on stra -tegies with a risk-return profile that is neutral in relation to La Caisse’s overall portfolio.
HEDGE FUND PORTFOLIO
Composition
• Interests in external hedge funds emphasizing three stra - tegies: Global Macro, Managed Futures and Market Neutral
Advantages
• Possibility to generate a return that outperforms bonds but with less risk than with equities
• Diversification
3740
01_T
able
aux
RA
-AN
V7
7/0
4/20
14
P
AG
E 26
FIGURE 21
EQUITY MARKET PERFORMANCE IN 2013(as at December 31, 2012 = 100, in Canadian dollars)
S&P 500
MSCI EAFE
S&P/TSX
MSCI EM
Source: Rimes
Dec.2012
Jan.2013
Feb.2013
March2013
April2013
May2013
June2013
July2013
Aug.2013
Sept.2013
Oct.2013
Nov.2013
Dec.2013
80
90
100
110
120
130
140
150

CAISSE DE DÉPÔT ET PLACEMENT DU QUÉBEC AR 2013 41
ASSET ALLOCATION
Four-year returnOver four years, the portfolio’s net investment results are -$197 million (see Table 22, p. 42), mainly because of the results reported in 2012 when the equity positioning subtracted value.
2013 returnThe portfolio’s net investment results for 2013 total $182 million (see Table 22, p. 42). Generally speaking, positions on liquid markets contributed to these results, in particular:
• overweighting equities when these markets recorded outstanding returns;
• underweighting bonds in anticipation of an interest rate increase that occurred in May; and
• taking positions on the U.S. dollar, which appreciated against the Canadian dollar in the fourth quarter.
ASSET ALLOCATION PORTFOLIO
Composition
• Positions on financial markets, mainly in the form of financial instruments
Advantages
• Calibration of the portfolio’s risk-return profile• Protection against risks of extreme fluctuations• Enhancement of the overall portfolio’s return
ABTN
Four-year returnOver four years, this portfolio contributed $3.0 billion to net investment results (see Table 22, p. 42), mainly because the market value of the positions rose with the shorter average maturities of the securities in the portfolio and improved market conditions. These results made it possible to reduce the provision for unrealized losses on ABTNs from $5.1 billion to $1.5 billion.
2013 returnThe portfolio’s 2013 contribution to the net investment results is $728 million (see Table 22, p. 42). These results are attributable to the same factors that prevailed in the three preceding years and reduced the provision for ABTNs from $2.2 billion to $1.5 billion.
The ABTN portfolio’s operations are gradually winding down. Reducing risks is therefore an important aspect of the manage-ment strategy. Since 2012, the strategy has focused on transactions making it possible to close out certain positions. The end of the portfolio’s operations is expected in 2016 or 2017.
RETURNS BY SPECIALIZED PORTFOLIO
Table 22 on page 42 gives the returns on the specialized portfolios in relation to their benchmark indexes for four-year and one-year periods ending December 31, 2013.

CAISSE DE DÉPÔT ET PLACEMENT DU QUÉBEC AR 2013 42
3740
01_T
able
aux
RA
-AN
V13
23/
04/2
014
PAG
E 29
TABLE 22
SPECIALIZED PORTFOLIO RETURNS IN RELATION TO BENCHMARK INDEXES(for periods ended December 31, 2013)
4 years 1 year
Specialized portfolio 2013 Index1 Net assets$B
Net investment
results $M
Return%
Index%
Net investment
results $M
Return%
Index%
Fixed IncomeBonds DEX Universe Bond, adjusted 55.0 8,920 5.7 4.7 33 0.2 (1.2)
Real Estate Debt DEX Universe Bond 8.8 2,741 9.1 4.7 8 0.1 (1.2)
Short Term Investments2 DEX 91 Day T-Bill 3.5 218 1.0 0.9 61 1.1 1.0
Long Term Bonds2 DEX Long Term Government Bond, adjusted 1.9 986 6.5 6.6 (143) (6.5) (6.4)
Total 69.2 12,865 5.9 4.5 (41) 0.0 (1.2)
Inflation-Sensitive Investments
Real Estate Aon Hewitt – Real Estate, adjusted 22.6 8,660 13.0 14.0 2,896 15.1 15.6
Infrastructure3 Infrastructure 8.0 3,250 16.8 15.3 641 10.6 22.6
Real Return Bonds2 DEX Real Return Bond 1.2 148 4.1 4.1 (170) (13.1) (13.1)
Total 31.8 12,058 13.4 13.7 3,367 12.5 15.6
EquityCanadian Equity Canadian Equity 23.1 5,071 6.4 7.5 3,368 16.3 14.8
Global Quality Equity Global Quality Equity 17.2 2,587 N/A N/A 2,587 32.4 26.1
Global Equity MSCI ACWI, unhedged 3.5 3,422 N/A N/A 2,024 32.2 31.0
Emerging Markets Equity4
MSCI EM, unhedged and adjusted 10.3 976 3.1 3.1 384 4.0 3.7
U.S. Equity2,5 S&P 500, unhedged 9.7 5,538 16.5 16.4 3,639 41.3 41.3
EAFE Equity2,6 MSCI EAFE, unhedged 9.8 3,547 9.3 8.9 2,733 31.5 31.0
Equity Markets7 73.6 22,853 9.5 9.7 14,735 23.7 22.4
Private Equity Private Equity 20.2 9,978 16.5 11.3 3,426 19.7 22.7
Total7 93.8 32,831 10.9 10.0 18,161 22.9 22.6
Other InvestmentsHedge Funds Dow Jones Credit Suisse
Hedge Fund, adjusted and hedged 3.7 419 3.6 3.1 85 2.9 2.9
Asset Allocation 1.2 (197) N/A N/A 182 N/A N/A
ABTN8 (0.1) 2,985 N/A N/A 728 N/A N/A
Total9 200.1 61,182 10.0 8.8 22,768 13.1 12.6
1. The description of the indexes is given in Table 3, p. 19.
2. These portfolios have been indexed since April 1, 2010. The Long Term Bond and Real Return Bond portfolios are indexed over the entire period.
3. This line includes the Investments and Infrastructures portfolio until June 30, 2010, and the Infrastructure portfolio since July 1, 2010.
4. This portfolio was indexed from April 1, 2010, to June 30, 2013.
5. This line includes the U.S. Equity, hedged and U.S. Equity, unhedged portfolios until March 31, 2010, and the U.S. Equity portfolio since April 1, 2010.
6. This line includes the Foreign Equity, hedged and Foreign Equity, unhedged portfolios until March 31, 2010, and the Europe, Australasia and Far East (EAFE) Equity portfolio since April 1, 2010.
7. For the four-year period, the contribution of the Québec International portfolio is included in this line.
8. The financing of the ABTN portfolio slightly exceeds the market value of the investments and is the reason for the negative net assets.
9. The total includes customized Overlay Strategies and cash activities.

AR 2013 43CAISSE DE DÉPÔT ET PLACEMENT DU QUÉBEC
Risk Management
HIGHLIGHTS
1Overall, in 2013, La Caisse reduced or maintained its financial-risk levels relative to the previous year, as needed. The reduced market risk is primarily a result of its shift to absolute-return management.
2During the year, La Caisse replaced its active risk limit with an absolute risk limit based on the ratio of the absolute risk of the overall portfolio to that of the benchmark portfolio.
3Analytical tools were broadened to allow for better risk monitoring and in-depth analyses.
RISK MANAGEMENT AT LA CAISSE
Over the past four years, La Caisse has made many changes to enhance its risk management practices. In particular, it has increased its specialized resources in this area, reviewed its oversight and processes, and improved its methodologies and management tools. These efforts have increased the Risk group’s level of initiative and influence and have therefore strengthened the support it provides for investment decision making. In this way, La Caisse has achieved its goal of establishing a stronger risk management culture.
In 2013, development of various financial risk measures and further work on oversight, processes, methodologies and management tools demonstrated the priority La Caisse places on continued improvement of its risk management.
EVOLUTION OF RISK MEASURES
Throughout the year, La Caisse managed its risks proactively, taking into account the global economic and financial context, expected changes to it, market assessments and the sectoral and geographic concentrations of its portfolio. In response, it lowered or maintained the level of financial risk in relation to that of the previous year.
Market riskDuring the year, stock markets in Canada, the United States and Europe were further sustained by higher earnings multiples that serve as a basis for equity valuations, and the actions of central banks rather than growth in corporate earnings. This situation influenced La Caisse’s decision to position its overall portfolio prudently in the context of a global economic recovery and rising interest rates. In addition, the asset allocation portfolio was positioned for higher stock markets.
This positioning is reflected by the absolute market risk of the overall portfolio as at December 31, 2013, which was down from year-end 2012 and continues to be moderate (see Table 25, p. 45).
The changes in the level of absolute risk of La Caisse’s overall portfolio and of the benchmark portfolio are shown in Figure 23 on page 44. The lower absolute risk of the overall portfolio in 2013 is attributable mainly to the deployment of the Global Quality Equity portfolio, better diversification of the Infrastructure portfolio and the reduced risk of the ABTNs. The decline in the absolute risk of La Caisse’s benchmark portfolio is due mainly to the substantial weighting in its index of the new Global Quality Equity portfolio.

CAISSE DE DÉPÔT ET PLACEMENT DU QUÉBEC AR 2013 44
Risk Management
3740
01_T
able
aux
RA
-AN
V8
11/
04/2
014
PAG
E 11
1
FIGURE 24
IMPACT OF THE GLOBAL QUALITY EQUITY PORTFOLIO’S WEIGHTING ON CHANGES IN ABSOLUTE RISK(as a percentage)
Caisse absolute risk
Weighting of the Global Quality Equity portfolio in Caisse net assets
Absolute risk of the Caisse equity portfolios
Dec.2012
Jan.2013
Feb.2013
March2013
April2013
May2013
June2013
July2013
Aug.2013
Sept.2013
Oct.2013
Nov.2013
Dec.2013
0.0
1.0
2.0
3.0
4.0
5.0
6.0
7.0
8.0
9.0
10.0
Wei
ghti
ng o
f the
Glo
bal Q
ualit
y Eq
uity
por
tfol
io
25
30
35
40
45
Absolute Risk
3740
01_T
able
aux
RA
-AN
V7
7/0
4/20
14
P
AG
E 10
2
FIGURE 23
CHANGES IN CAISSE ABSOLUTE RISK AND BENCHMARK PORTFOLIO RISK(as a percentage)
Absolute risk
Benchmark portfolio risk
Dec.2009
June2010
Dec.2010
June2011
Dec.2011
June2012
Dec.2012
June2013
Dec.2013
26
28
30
32
34
36
38
40
The strategic decision to reduce the size of the Global Equity portfolio gradually in favour of the Global Quality Equity portfolio therefore had a dominant effect on La Caisse’s absolute risk and that of its equity portfolios (see Figure 24). This change is based on the conviction that the Global Quality Equity portfolio has a better risk-return relationship than that of the other equity portfolios and that the securities in the portfolio are more resilient to adverse market events.
To substantiate this conviction, which responds to the uncertain and volatile environment of the prevailing financial markets, La Caisse conducted in-depth analyses. For example, it observed the historical volatility of such a portfolio, it studied how such securities perform in extreme scenarios and it dissected the portfolio’s predominant style features. Relative to the broad equity markets, this type of portfolio generates a higher return per risk unit, and its losses are less substantial in extreme

CAISSE DE DÉPÔT ET PLACEMENT DU QUÉBEC AR 2013 45
market movements. The Global Quality Equity portfolio is comprised of high-quality, low-volatility securities whose funda-mentals over the long term are favourable, stable and more certain, particularly with respect to return on assets, cash flows, leverage and barriers to entry. In-depth analysis and the invest-ment selection process support La Caisse’s conviction that the risk-return relationship of such a strategy is favourable.
The strategic decision to reduce the size of the Global Equity portfolio gradually in favour of the Global Quality Equity portfolio is the main reason for the lower absolute risk of the Equity asset class (see Table 25).
New investments and the reduced size of the largest exposures in the Infrastructure portfolio increased the diversification of this evolving portfolio and reduced its absolute risk. This lower risk is the main reason for the decreased risk of the Inflation-Sensitive Investments asset class (see Table 25).
The risk of the ABTN portfolio was also lower in 2013. This decrease is due to the underlying investments’ reduced sensi-tivity to rate spreads, owing to their approaching maturities. Furthermore, a large portion of the underlying investments matured in 2013. Most of the remainder will mature in 2015 and 2016.
As a result, the ratio of the absolute risk of the overall portfolio to the absolute risk of the benchmark portfolio went from 1.07% to 1.05% from December 31, 2012, to December 31, 2013 (see Figure 26).
Asset allocation decisions contributed to the change in the market risk profile of the overall portfolio during the year but had no significant impact on the year.
3740
01_T
able
aux
RA
-AN
V8
7/0
4/20
14
P
AG
E 10
3
FIGURE 26
CHANGES IN THE ABSOLUTE RISK RATIO
Absolute risk ratio
Dec.2009
June2010
Dec.2010
June2011
Dec.2011
June2012
Dec.2012
June2013
Dec.2013
0.90
0.95
1.00
1.05
1.10
1.15
1.20
1.25
1.30
3740
01_T
able
aux
RA
-AN
V7
7/0
4/20
14
P
AG
E 33
TABLE 25
ABSOLUTE MARKET RISK1
(as a percentage of total net value of the asset class as at December 31)
Asset class 2013 2012
Fixed Income 9.2 9.1
Inflation-Sensitive Investments 38.7 39.8
Equity 44.6 46.8
Other Investments2 1.2 1.2
Overall 29.4 30.6
1. The VaR figures are for a 1,500-day horizon at a 99% level of confidence.
2. The risk of the Other Investments asset class is given as a percentage of Caisse net assets. This asset class contains the Hedge Fund, Asset Allocation and ABTN portfolios.

CAISSE DE DÉPÔT ET PLACEMENT DU QUÉBEC AR 2013 46
Risk Management
Credit riskIn a context of rising sovereign bond yields and reduced compensation for corporate credit risk, steps were taken to adjust the portfolios’ exposure to credit risk. La Caisse used mainly credit VaR (value at risk) to measure and monitor this risk.
In the first half of 2013, La Caisse increased its exposure to corporate credit risk to take advantage of a potential contraction of credit spreads. After rates rose and credit spreads narrowed, the portfolio was repositioned to a level similar to that at the start of the year.
La Caisse’s dynamic management of credit risks was a defining aspect of the Bond portfolio’s exposure.
Concentration riskBroader diversification of the Infrastructure portfolio and realized gains on certain positions in the portfolio helped lower the concentration risk. This reduction was partially offset by the gradual capitalization of the Global Quality Equity portfolio, which comprises a limited number of quality securities.
Counterparty riskDuring the year, the credit quality of several counterparties with which La Caisse negotiates and conducts financial trans-actions continued to require special attention. Uncertainty over the situation in Europe prompted La Caisse to maintain low exposure to this risk and to monitor it actively.
Each day, La Caisse tracks a series of financial indicators for each of its counterparties. The counterparties’ financial health is also reviewed periodically by a group whose members are drawn from its risk teams and the investment teams that specialize in the financial sector. Throughout the year, La Caisse actively managed changes in the credit quality of its counter-parties while keeping this risk at a low level (see Table 27).
New regulations on derivatives encourage clearing transactions and shift counterparty risk to clearing houses. The regulatory authorities are also aiming to reduce systemic risk. La Caisse implemented oversight of these risks vis-à-vis its clearing brokers and clearing houses.
Liquidity riskIn a market context in which uncertainty and volatility continued to be high, La Caisse maintained an adequate level of liquidity. As at December 31, 2013, the Caisse portfolios had close to $44 billion in liquidity, which allowed La Caisse to fully respect its potential commitments, even in the event of a major market correction.
3740
01_T
able
aux
RA
-AN
V8
11/
04/2
014
PAG
E 36
TABLE 27
CHANGE IN EXPOSURE TO COUNTERPARTY RISK1
(as at December 31 – in millions of dollars)
2013 2012 2011 2010
Gross exposure without offsetting effect 2,054 2,570 4,252 4,391
Net exposure under ISDA agreements2 110 58 435 301
1. Cleared over-the-counter derivatives are not included.
2. Net exposure under ISDA agreements and gross exposure less offsetting of amounts at risk and exchange of collateral.

CAISSE DE DÉPÔT ET PLACEMENT DU QUÉBEC AR 2013 47
REVIEW OF OVERSIGHT AND PROCESSES
In 2013, the risk teams carried out various types of work to further strengthen their risk management oversight and processes, as well as fundamental risk analysis capabilities.
Adoption of a framework based on La Caisse’s overall absolute riskAfter a one-year transition period, La Caisse decided to replace its active risk limit with an absolute risk limit based on the ratio of the overall portfolio’s absolute risk to that of its benchmark portfolio. This change is consistent with the shift in recent years toward managing a larger portion of the portfolio on an absolute-return basis.
This absolute-return management approach generates the largest proportion of the absolute risk used by La Caisse to achieve its returns. To support this decision, analysis of the history of the absolute risk ratio made it possible to confirm the acceptable level for La Caisse and to establish its tolerance for loss in extreme markets. The risk framework applied to the specialized portfolios was also taken into consideration. This framework, based on the absolute risk ratio, ensures better management of the procyclical nature of La Caisse’s overall portfolio by limiting below-index returns during major market corrections.
Other frameworksLa Caisse established a framework and an investment policy for the Emerging Markets Equity portfolio, whose approach is gradually shifting from index management to active manage-ment. The shift involves selecting external managers, primarily local or regional, who invest in public companies in emerging markets.
An investment policy was also developed and implemented for the new Active Overlay Strategies portfolio, created in January 2014. This portfolio, essentially non-capitalized, brings together various activities that target an absolute return without substantially increasing the measured absolute risk of the overall portfolio.
Internal credit ratingsManagement of issuer credit risk is based on best practices in the industry. A new governance approach to internal credit ratings was introduced and a review committee was formed. In 2013, the committee reviewed the largest issuers in the Bond portfolio.
Development of fundamental risk analysis capabilitiesIn 2013, La Caisse developed methods to analyze fundamental aspects of risk. These prospective and qualitative methods are designed to complement quantitative methods. They generally aim to measure the risks associated with sectoral or regional concentrations.
For example, in-depth analyses were conducted on the energy sector holdings in the overall portfolio, in light of disruption in the North American energy landscape.
Similar analyses were carried out for the concentration risk of the portfolio’s holdings in Brazil. Exposure to the country was measured, macroeconomic and geopolitical scenarios were developed and their impacts on the overall portfolio were assessed.
These analyses were based on a transversal approach used by investment teams and in-house and external experts.
Operational risksIn 2013, La Caisse continued its efforts to improve operational risk management so as to better anticipate issues related to a constantly changing environment and adequately monitor how its strategic plan is implemented:
• The process used to identify operational issues and incidents was reviewed; and
• The Operational Risk Committee continued to co-ordinate La Caisse’s efforts to monitor and reduce its operational risks.

CAISSE DE DÉPÔT ET PLACEMENT DU QUÉBEC AR 2013 48
Risk Management
IMPROVED RISK MANAGEMENT METHODOLOGIES AND TOOLS
Improved modelling of the market risk of less-liquid investmentsIn 2012, to obtain a better estimate of the market risk of portfolios holding less-liquid assets, La Caisse began to review the methodology used for the Infrastructure portfolio. In 2013, this innovative approach was extended to all direct investments in the portfolio. The specifics of each investment are now taken into account in risk modelling, with the result that market risk measurements are more precise and relevant. Through this approach, analytical and simulation tools were implemented for each investment, as well as for the portfolio as a whole.
In co-operation with Ivanhoé Cambridge, a similar approach was undertaken for investments in the Real Estate portfolio.
Improvements in quantitative risk analysisDuring the year, the quantitative analysis tools were broadened to offer better risk monitoring and more in-depth analysis.
For the equity markets, oversight of risks and concentrations in the Global Quality Equity portfolio was implemented. This oversight includes several risk measures from different sources, such as VaR and risk factors. From a quantitative standpoint, customized simulations and prospective analyses were carried out for certain activities to better understand the risk and to optimize the use of risk budgets. La Caisse also used a new way of analyzing correlation by combining securities that react similarly to market events.
Furthermore, the ability to analyze the fixed-income portfolios advanced substantially in 2013. La Caisse reviewed, improved and implemented the reports and dashboards used for risk oversight, and also performed several analyses to support the fund managers, including analysis of emerging market debt risk and of the Bond portfolio’s sensitivity to changes in interest rates and credit spreads.
Oversight of derivatives improved with the introduction of a calculation method to subject different groups of products to specific stress tests. A uniform nomenclature to better categorize the use of derivatives was also introduced.
Efforts were also made to create quantitative tools in order to further analyze the potential impact of asset allocation decisions on risk and return. The approach used allows for a better under-standing of sensitivities to various market shocks and the impact on risk of different asset allocation decisions.
Several initiatives were carried out to deepen the analyses of the portfolios’ concentrations. Geographic classification of securities according to revenue source country, breakdown of exposure with information on the investments’ underlying assets and improved interest rate curves for risk calculation improved the quality and granularity of the data La Caisse uses in its analyses. At the same time, a tool used for temporal analysis of concentrations was improved to cover all Caisse assets and to review additional aspects.
These initiatives improved the accuracy and reliability of the risk measures and the risk analysis capability.
For more information on La Caisse’s risk management practices, please consult its website at www.lacaisse.com.

AR 2013 49CAISSE DE DÉPÔT ET PLACEMENT DU QUÉBEC
Compliance
La Caisse’s compliance activities include oversight to ensure adherence to the depositors’ investment policies and the investment policies of the specialized portfolios, the Code of Ethics and Professional Conduct, the Language Policy and the Information Disclosure Policy.
HIGHLIGHTS
1Various activities continued to raise employee awareness of the Code of Ethics and Professional Conduct.
2La Caisse’s revised Language Policy was approved by the Office québécois de la langue française.
INVESTMENT POLICIES
Compliance programs are in place to certify compliance with the depositors’ investment policies and the investment policies of La Caisse’s specialized portfolios. Certificates of compliance with these policies were issued to depositors twice in 2013, as of June 30 and December 31.
CODE OF ETHICS AND PROFESSIONAL CONDUCT
It is vital that Caisse employees and officers comply with its Code of Ethics and Professional Conduct. The Code stresses the importance of appropriate conduct, taking into account the organization’s practices, respect for individuals and groups, and compliance with Caisse-applicable laws, regulations and policies. It also specifies a pre-approval process for employees’ personal transactions.
At the beginning of each year, all employees must complete declarations on compliance with the Code and the holdings in their personal portfolios. They are also required to report any situation they believe could constitute a breach of the Code or any Caisse policy. In 2013, La Caisse put in place activities to make employees aware of the various aspects of the Code, as well as the Ethics Line, and asked them to sign their annual declarations. In addition, articles on ethics were published in the employees’ internal newsletter throughout the year to remind them of appropriate behaviour in situations involving ethics and professional conduct.
The Code of Ethics and Professional Conduct for Officers and Employees is available on the institution’s website ( www.lacaisse.com ) under the Governance tab.

CAISSE DE DÉPÔT ET PLACEMENT DU QUÉBEC AR 2013 50
Compliance
ACCESS TO INFORMATION
La Caisse processes requests for access to documents under the Act respecting access to documents held by public bodies and the protection of personal information (Access Act). In 2013, La Caisse processed nine requests for document access. All requests were handled within the legally prescribed time limit. Of these nine requests, four were accepted and one was accepted in part. Those accepted involved Caisse policies, salaries and benefits of the members of the Board of Directors, the list of access requests since January 1, 2011, and the list of contracts since January 1, 2010. Four requests were refused, either because they involved strategic information or informa-tion concerning a third party. None of the requests were subject to an application for review by the Commission d’accès à l’information (Access to Information Commission).
LANGUAGE POLICY
La Caisse complies with the requirements of the Charter of the French Language and its Language Policy, which stipulates French as the daily language of work for all employees. It considers the quality and use of French in its oral and written communication to be of paramount importance.
To that end, it provides its employees with various tools that contribute to correct French usage, as well as a number of reference works, including a lexicon that it compiled to define terms specific to its own operations.
In 2013, the employee newsletter published articles every two weeks on the proper use of expressions and idioms. The articles also encouraged employees to use the tools and references available on the website of the Office québécois de la langue française, as well as the other language tools available to them.
During the year, La Caisse again took part in the Francofête festivities held by the Office québécois de la langue française from March 16 to 24. The event featured initiatives such as daily quizzes and articles on the quality and use of French. La Caisse also continued to disseminate its quarterly electronic bulletin La pause linguistique to all administrative assistants.
With the adoption of a new government policy on the use and quality of French in the public service, La Caisse reviewed its Language Policy to align it with government policy. The policy was submitted to the Office québécois de la langue française, which approved it in December 2013.
La Caisse’s standing committee on language, consisting of key persons from various units of the institution, met regularly during the year. The committee’s work focused on changes to the Language Policy and a related awareness campaign.
COMPLAINT MANAGEMENT
La Caisse has designated Ginette Depelteau, Senior Vice-President, Compliance and Responsible Investment, to receive complaints and analyze them with all due attention. Complaints can be conveyed to her by phone (514 847-5901), fax (514 281-9334) or e-mail ([email protected]).

AR 2013 51CAISSE DE DÉPÔT ET PLACEMENT DU QUÉBEC
La Caisse in Québec

AR 2013 52CAISSE DE DÉPÔT ET PLACEMENT DU QUÉBEC
400QUÉBEC SMEs INVESTED IN OVER THE PAST 4 YEARS
550QUÉBEC COMPANIES IN THE PORTFOLIO
440BUILDINGS OWNED OR FINANCED IN QUÉBEC
$350 MOFFERING STRENGTHENED IN TWO KEY SECTORS OF THE ECONOMY
$600 MTOTAL NEW SME COMMITMENTS IN 2013
$3.6 BNEW INVESTMENTS AND COMMITMENTS IN 2013
$11.9 BNEW INVESTMENTS AND COMMITMENTS SINCE 2009
A LEADING ROLE IN QUÉBEC

Rouyn-Noranda
Val-d'Or
Matane
Murdochville
Matapédia
Baie-Comeau
Lévis
Montmagny
DrummondvilleKingsey Falls
SherbrookeValcourt
Laval
Gatineau
Trois-RivièresJoliette
Mont-TremblantSainte-Adèle
L'Assomption
Montréal Longueuil
Saint-Jean-sur-RichelieuChâteauguay
Thetford MinesSaint-Georges
Rimouski
Rivière-du-Loup
Saguenay
Kuujjuaq
Alma
Québec
Shawinigan
AR 2013 53CAISSE DE DÉPÔT ET PLACEMENT DU QUÉBEC
ACTIVE IN ALL REGIONS
INVESTMENTS
NETWORK
EXPERTISE
DISCUSSION FORUMS
PARTNERSHIPS
CONNECTIONS

AR 2013 54CAISSE DE DÉPÔT ET PLACEMENT DU QUÉBEC
INVESTING IN QUÉBEC:
A FIRM COMMITMENTWITH TANGIBLE RESULTSQuébec is the market that La Caisse knows best. It has developed a unique offering that leads to productive partnerships with Québec’s businesses and various other economic stakeholders. This solid expertise, acquired here in Québec, also serves the institution well in other markets. And all this benefits our clients, businesses and the Québec economy.
La Caisse has a strong presence throughout Québec, providing financing and operational know-how to promising businesses in all regions, at every stage of their development. It also plays a leading role in Québec’s real estate and bond markets. La Caisse has a dual mandate: to generate returns for its clients while contributing to Québec’s economic development. At La Caisse, these two objectives naturally go hand in hand.
Over the past four years, La Caisse has continued to strengthen its presence in Québec. In particular, it has made $10.3 billion in new investments and commitments, including $3.6 billion in 2013. Since 2009, new investments and commitments totalled $11.9 billion.
La Caisse’s strong commitment towards Québec has also taken the form of many initiatives and partnerships to strengthen and promote entrepreneurship, develop expertise and new financial leadership, and foster the expansion of local businesses in international markets.
In 2013, La Caisse’s total assets in Québec grew by $6.7 billion, with more than 73% of this amount coming from the private sector. For a better understanding of its investments in Québec, see Table 28 on page 56, which presents total assets by invest-ment type: bonds, real estate, publicly traded equities and investments by the Private Equity group (including infra-structure). Over the past four years, La Caisse’s total assets in Québec grew by $20.3 billion.

AR 2013 55CAISSE DE DÉPÔT ET PLACEMENT DU QUÉBEC
LOCAL MARKET EXPERTISE
CRITICAL MASS
LONG-TERM INVESTOR ROLE
GLOBAL REACH
SEEK OUT AND SEIZE THE BEST BUSINESS AND INVESTMENT OPPORTUNITIES
SERVE AS A BRIDGE BETWEEN QUÉBEC COMPANIES AND GLOBAL MARKETS
STRENGTHEN THE VITALITY OF ENTREPRENEURSHIP AND THE NEXT GENERATION OF FINANCIAL LEADERS
FOUR COMPARATIVE ADVANTAGES
THREE ACTION PRIORITIES

AR 2013 56CAISSE DE DÉPÔT ET PLACEMENT DU QUÉBEC
BUILDING STRONG QUÉBEC COMPANIESLa Caisse proposes a distinctive offering with financial and operational expertise to businesses with the potential to grow in local and global markets. It strives to act on the best business and investment opportunities by reaching out to promising small, medium-sized and large companies.
In this way, La Caisse helps drive the growth behind today’s and tomorrow’s success stories. As at December 31, 2013, La Caisse had partnerships with more than 550 Québec companies. Its investment portfolio in Québec’s private sector, which has grown by $13.8 billion over the past four years, reached $32.5 billion at year end.
A UNIQUE OFFERING FOR MEDIUM-SIZED AND LARGE COMPANIES
La Caisse’s involvement with medium-sized and large companies takes the form of financing as well as equity and private equity investments. La Caisse is known for the vast expertise it has acquired in more than 30 years of private equity investing. It makes these negotiated investments with a long-term view. La Caisse develops true partnerships with its portfolio companies and brings value added to their growth, notably by giving them access to its extensive network of directors, operational experts and entrepreneurs, in Québec and globally. As at December 31, 2013, La Caisse had $6.3 billion in private equity assets in Québec (see Table 31, p. 58). In 2013, La Caisse authorized many new investments (a few examples are provided on page 60) for a total of $880 million. Table 29, on page 57, presents the top 10 private equity investments in Québec.
3740
01_T
able
aux
RA
-AN
V7
7/0
4/20
14
P
AG
E 39
TABLE 28
CAISSE TOTAL ASSETS IN QUÉBEC BY INVESTMENT TYPE(as at December 31 – in billions of dollars)
2013 2012
Bonds 30.1 27.7
Real Estate 10.4 9.0
Equity Markets 7.0 4.7
Private Equity group 6.3 5.7
Total 53.8 47.1
Private sector 32.5 27.6
Public sector 21.3 19.5
Total 53.8 47.1
La Caisse’s achievementsin Québec

CAISSE DE DÉPÔT ET PLACEMENT DU QUÉBEC AR 2013 57
3740
01_T
able
aux
RA
-AN
V7
7/0
4/20
14
P
AG
E 45
TABLE 29
TOP 10 QUÉBEC INVESTMENTS – PRIVATE EQUITY GROUP (as at December 31, 2013)
BRP (Bombardier Recreational Products)Camoplast SolidealCGI GroupGENIVAR (today WSP Global)Industrial Alliance, Insurance and Financial ServicesNoverco (Gaz Métro)QuebecorQuebecor MediaSNC-Lavalin GroupTAD Canco (Kruger)
Furthermore, as at December 31, 2013 more than $7.0 billion of the Canadian Equity portfolio was invested in Québec equities, up $2.3 billion from 2012. Table 30 presents the top 10 positions in this portfolio.
The weight of Québec companies in the portfolio also grew, rising 8.7% to 32.0%. This weighting, which far exceeds the 15.1% weighting of Québec companies in the S&P/TSX Index, made a positive contribution to the portfolio’s results. The 2013 return on the Morningstar National Bank Québec Index signifi-cantly outpaced the S&P/TSX (32.0% versus 13.0%).
La Caisse also provides loans and purchases corporate bonds. Many such transactions were authorized in 2013, for a total of more than $550 million. A few examples of investments authorized in 2013 are given on page 60.
A UNIQUE OFFERING THAT GOES BEYOND INVESTMENT
3740
01_T
able
aux
RA
-AN
V7
7/0
4/20
14
P
AG
E 43
TABLE 30
TOP 10 QUÉBEC POSITIONS – EQUITY MARKETS(as at December 31, 2013)
Alimentation Couche-TardCanadian National Railway CompanyCGI GroupDollaramaGildan ActivewearIndustrial Alliance, Insurance and Financial ServicesNational Bank of CanadaPower Corporation of CanadaSNC-Lavalin GroupValeant Pharmaceuticals International

CAISSE DE DÉPÔT ET PLACEMENT DU QUÉBEC AR 2013 58
La Caisse’s achievements in Québec
CUSTOMIZED OFFERING FOR SMEs
SMEs are at the core of Québec’s economy. In addition to providing financing, La Caisse fosters their growth by giving them access to expertise and partnerships with other key actors in the financial sector. In the past four years, La Caisse has worked with almost 400 SMEs in every region of Québec. In 2013 alone, its commitments to Québec SMEs totalled close to $600 million.
SMALL CAPS
La Caisse also invests in publicly traded Québec companies with market capitalizations of less than $400 million. Its $200-million commitment contributes to the development of Québec’s equity market and the growth of well-managed, promising businesses poised to become world-class players. Investments totalling $31 million were authorized in 2013. A few examples are presented on page 61.
CAPITAL CROISSANCE PME FUND
Stemming from a partnership reached in 2010 with Desjardins Group, the Capital Croissance PME fund is instrumental in the development and expansion of Québec’s small businesses by offering funding and strategic guidance. With initial funding of $200 million, the first phase of Capital Croissance PME invested $190 million in 186 promising companies in every region of Québec. Given the success of this initiative, La Caisse and Desjardins Group launched phase two of the Fund in April 2013. The second phase involves an additional commitment of $230 million to help fast-growing SMEs expand their operations and undertake research and development projects.
In 2013 alone, the fund authorized more than $53 million of investments in 56 businesses. A few examples can be found on page 61.
VENTURE CAPITAL
La Caisse also contributes to the vitality of the development of the venture capital sector, and has served as a catalyst for the development of strong Québec technology companies. The Teralys Capital Fund, the largest fund of funds in Canada, is a fine example. It was created in 2009 with $700 million in initial funding, including $250 million provided by La Caisse. Teralys invests in and develops specialized venture capital funds in three sectors: information technology, life sciences and green technology. In 2013, the Fund authorized investments totalling $215 million in five venture capital funds.
3740
01_T
able
aux
RA
-AN
V7
7/0
4/20
14
P
AG
E 44
TABLE 31
PRIVATE EQUITY GROUP ASSETS AND COMMITMENTS IN QUÉBEC(as at December 31 – in millions of dollars)
2013 2012
AssetsUndisbursed
commitments
Assets and undisbursed
commitments AssetsUndisbursed
commitments
Assets and undisbursed
commitments
Venture capital 89 306 395 91 293 384
Small and medium-sized businesses 729 387 1,116 596 168 764
Large businesses 5,506 370 5,876 4,988 106 5,094
Total 6,324 1,063 7,387 5,675 567 6,242

CAISSE DE DÉPÔT ET PLACEMENT DU QUÉBEC AR 2013 59
INVESTMENTS AND OPERATIONAL EXPERTISE FOR PROMISING SECTORS
La Caisse combines investment and expertise to help develop sectors of the Québec economy that present opportunities for growth, such as manufacturing and natural resources. It is one of the few investors that can offer this kind of value added.
QUÉBEC MANUFACTURING FUND
The Québec Manufacturing Fund (QMF), a Caisse initiative created in 2006, contributes to the growth of Québec manufac-turers by providing much more than financing. QMF managers work alongside the management teams of their investee companies to define and prioritize strategies and coordinate their implementation so as to improve profitability.
Since the QMF’s inception, its managers have carried out promising projects involving five Québec manufacturing companies. Working closely with management, they have contributed to business development, operational optimization and various mergers and acquisitions. In the past four years, the QMF has worked with Liberty Spring, Ezeflow and Hason Steel.
Seeing the value of this initiative, La Caisse injected another $100 million into the QMF in 2013, bringing its total commitment to $200 million. With this new financial commitment, the QMF will be able to invest in additional manufacturers that have developed technically superior niche products.
SODÉMEX
Since 1997, La Caisse has been the sole investor in the Sodémex Exploration fund, which comprises Québec small caps active in natural resource exploration. To counter the scarcity of capital available to companies in the development phase, La Caisse launched Sodémex Développement in June 2013. This new $250-million fund makes investments of $5 to $20 million, over and above the $75 million of funding available from Sodémex Exploration.
La Caisse’s offering in this sector now covers all the growth stages of Québec’s natural resources companies.
As at December 31, 2013, Sodémex Exploration had interests in more than 70 companies, including Midland Exploration (gold and base metals). Early in 2014, Sodémex Développement announced an investment in Virginia Mines to finance its Coulon project located at a James Bay site holding Québec’s largest undeveloped copper-zinc-silver deposit.
VALUE-ADDED EXPERTISE THAT AIMS FOR GROWTH

CAISSE DE DÉPÔT ET PLACEMENT DU QUÉBEC AR 2013 60
La Caisse’s achievements in Québec
MEDIUM-SIZED AND LARGEBUSINESSES
SUNCHEF FOODSPoultry processingMontréal• $10 million stake as part
of a $17.5 million investment with BDC
• Project: expansion of the Anjou plant to introduce new product lines
CAD RAILWAY INDUSTRIESRepair and refurbishment of railway vehiclesMontréal• $4 million investment• Project: modernization of
equipment and facilities to diversify the service offering
FINLOC 2000Financing for rolling equipmentSaint-Georges• $3.3 million investment
and $10 million renewal• Project: continued expansion
TELECON GROUPConstruction, installation and maintenance of cable and wireless networksMontréal• $8.3 million financial project• Project: optimization and
share buyback
NAUTILUS PLUSChain of fitness centresSaint-Hubert• $10 million investment• Project: implementation
of a long-term expansion plan
DISTECH CONTROLSIndustry leader in energy management solutionsBrossard• $8.0 million investment• Project: accelerated
growth and international development plan
GARDA WORLDGlobal business solutions and security servicesMontréal• $72 million commitment• Project: continued expansion
COGECO CABLEResidential and commercial cable servicesMontréal• $50 million in financing• Project: acquisition
VENTS DU KEMPTWind-power projectMatapedia Valley• $50 million commitment• Project: construction
of a 43-turbine wind farm
A FEW INVESTMENTS MADE IN 2013La Caisse made many investments during the year, in companies of all sizes and at different stages of their growth.

CAISSE DE DÉPÔT ET PLACEMENT DU QUÉBEC AR 2013 61
SMALL AND MEDIUM-SIZED BUSINESSES
5N PLUSManufacturer of products for pharmaceutical, electronic and industrial applicationsMontréal• Share purchase for a total value
of $6.2 million• Contribution to the company’s
growth and development
CVTECH GROUPManagement and maintenance of power distribution and transmission lines, generating stations and substationsDrummondville• Share purchase for a total value
of $3.1 million• Contribution to the company’s
growth and development
HNZ GROUPProvider of helicopter transportation services to several industriesLes Cèdres• Share purchase for a total value
of $3.6 million• Contribution to the company’s
growth and development
H2O INNOVATIONDesign and manufacture of water-treatment systemsQuébec City• Share purchase for a total value
of $2.7 million• Contribution to the company’s
growth and development
MANACDesign, manufacture and distribution of trailers and semi-trailersSaint-Georges• Share purchase for a total value
of $4.8 million• Contribution to the company’s
growth and development
ABITIBI GEOPHYSICSGround and borehole geophysical servicesVal-d’Or• $725,000 investment• Project: growth
FROMAGERIE DE L’ANCÊTREOrganic butter and cheese manufacturerBécancour• $750,000 investment• Project: improved productivity
SHERBROOKE OEMDesign, manufacture and integration of customized recycling equipmentSherbrooke• $1.7 million investment• Project: shareholder buyout
ROGERS GROUPManufacture of directional, merchandising and crowd management signsLongueuil• $225,000 investment• Project: acquisitions
INNOVATION INDUSTRIELLE BOIVINFerrous and non-ferrous metal recovery and industrial equipment reclamationSaguenay• $295,000 investment• Project: growth

CAISSE DE DÉPÔT ET PLACEMENT DU QUÉBEC AR 2013 62
La Caisse’s achievements in Québec
A LEADER IN QUÉBEC REAL ESTATE INVESTMENTWell established in Québec’s real estate market through its two subsidiaries, Ivanhoé Cambridge and Otéra Capital, La Caisse is one of the largest real estate investors in the province.
As at December 31, 2013, La Caisse’s real estate assets totalled $10.4 billion, as detailed in Table 32. In the past four years, its real estate subsidiaries completed more than $3.7 billion of investments and financings in Québec. Table 33 on page 63 presents the top 10 investments.
IVANHOÉ CAMBRIDGE
Ivanhoé Cambridge owns more than 40 properties in Québec, including 25 shopping centres and 12 office buildings, valued at $6.9 billion. It is a leading property owner in 14 Québec cities, where it generates important economic activity. Ivanhoé Cambridge has a particularly strong presence in downtown Montréal, where it owns high-quality office and commercial properties totalling more than seven million square feet of space.
In 2013, Ivanhoé Cambridge carried out transactions in Québec totalling more than $650 million. It consolidated its position in the Montréal market, investing more than $400 million to buy its partner’s 50% interest in Place Ville Marie and thereby becoming the sole owner of this downtown landmark. Ivanhoé Cambridge also acquired a 50% interest in Carrefour de l’Estrie, in Sherbrooke, the largest shopping centre in the Eastern Townships.
Ivanhoé Cambridge also invested in the expansion and renova-tion of some of its buildings in Québec. It launched a project to modernize Montréal’s Rockhill residential complex, at a cost of $20 million, and completed the expansion and renovation of Galeries d’Anjou, a project valued at $86 million.
OTÉRA CAPITAL
Otéra Capital is a leading commercial mortgage lender whose Québec assets total $3.5 billion. It finances almost 400 commer-cial buildings. In 2013, the company provided about 50 loans in several regions of Québec, for a total of $1.1 billion.
3740
01_T
able
aux
RA
-AN
V7
7/0
4/20
14
P
AG
E 41
TABLE 32
REAL ESTATE ASSETS AND COMMITMENTS IN QUÉBEC(as at December 31 - in millions of dollars)
2013 2012
AssetsUndisbursed
commitments
Assets and undisbursed
commitments AssetsUndisbursed
commitments
Assets and undisbursed
commitments
Shopping centres 4,438 19 4,457 3,871 51 3,922
Offices 4,216 456 4,672 3,603 245 3,848
Other 1,731 263 1,994 1,533 181 1,714
Total 10,385 738 11,123 9,007 477 9,484

CAISSE DE DÉPÔT ET PLACEMENT DU QUÉBEC AR 2013 63
3740
01_T
able
aux
RA
-AN
V7
7/0
4/20
14
P
AG
E 42
TABLE 33
TOP 10 QUÉBEC INVESTMENTS – REAL ESTATE(as at December 31, 2013)
Centre CDP Capital, MontréalCentre Eaton de Montréal, MontréalFairview Pointe-Claire, Pointe-ClaireGaleries d’Anjou, MontréalGaleries Rive Nord, RepentignyLaurier Québec, QuébecLe 1000 De La Gauchetière, MontréalPlace Ste-Foy, QuébecPlace Ville Marie, MontréalRockland, Mont-Royal
BONDS: A KEY ROLE IN PUBLIC AND PRIVATE FINANCINGLa Caisse is one of the largest buyers of Québec bond securities. It is active in both the public sector (bonds issued by the Government of Québec, publicly owned corporations, municipalities and para-governmental corporations) and the private sector (loans to and bonds issued by Québec companies).
La Caisse actively helps finance public entities in Québec, injecting liquidity into this market and generating economic activity.
It also plays a key role in the financing of private-sector businesses. As a long-standing partner of many companies, La Caisse has participated in the financing of many growth projects over the years.
As at December 31, 2013, La Caisse’s total assets in bond secur-ities issued by Québec’s public and private sectors stood at $30.1 billion, up $2.4 billion from the year-earlier figure (see Table 34).
3740
01_T
able
aux
RA
-AN
V8
8/0
4/20
14
P
AG
E 40
TABLE 34
ASSETS IN QUÉBEC – BONDS(as at December 31 – in billions of dollars)
2013 2012
Québec public sector
Government of Québec 14.1 10.5
Hydro-Québec 4.0 5.6
Other crown corporations 2.1 2.3
Municipalities and para-governmental corporations 1.1 1.1
Subtotal 21.3 19.5
Private sector: corporate securities 8.8 8.2
Total 30.1 27.7

CAISSE DE DÉPÔT ET PLACEMENT DU QUÉBEC AR 2013 64
La Caisse’s achievements in Québec
FROM QUÉBEC SMEs TO WORLD LEADERSAs a long-term investor, La Caisse does more than simply offer capital. It provides expertise to promising Québec businesses, developing true partnerships with them, and plays an active role in their expansion over time.
FINANCIAL PARTNER OF CAMOPLAST SOLIDEAL FOR 13 YEARSManufacture of tires and tracks for off-road vehicles, Sherbrooke
World leader in its sectorFacilities: Canada, United States, Belgium, China, Sri Lanka and South Korea
Employees: 8,200
GROWTH IN SALES FROM $135 MILLION TO $1 BILLION
CAISSE INVESTMENTS SINCE 20001 For the buyout of the
company by a group of investors
2 For the acquisition of a division of CAT in the U.S.
3 For the purchase of BRP’s industrial division
4 For a partial shareholder buyout
20132009200620032000
135
1,005
1 23
4

CAISSE DE DÉPÔT ET PLACEMENT DU QUÉBEC AR 2013 65
CAISSE INVESTMENTS SINCE 19871 To foster growth 2 For a shareholder buyout 3 For recapitalization 4 For the acquisition
of Progressive in the U.S. 5 To foster growth
* Sale of a division (2012)
*
1
2 3
4
5
201320092002199819911987
26
257
CAISSE INVESTMENTS SINCE 19991 For the acquisition of
Garda Security Group
2 For acquisitions in the U.S. 3 For an acquisition in
the U.S. 4 For the privatization
of the company 5 For the acquisition
of G4S Canada
FINANCIAL PARTNER OF GARDA WORLD FOR 14 YEARSGlobal business solutions and security services, Montréal
Largest private security company in the worldMarkets: North America, Latin America, Europe, Africa, Asia and the Middle East
Employees: 45,000
GROWTH IN SALES FROM $7 MILLION TO $1.3 BILLION
20132009200520021999
7
1,354
1
2
3
45
FINANCIAL PARTNER OF HÉROUX-DEVTEK FOR 26 YEARSDesign and manufacture of landing gear, Longueuil
World’s third largest landing-gear companyFacilities: Québec, Ontario, United States and United Kingdom
Employees: 1,400
GROWTH IN SALES FROM $26 MILLION TO $257 MILLION

CAISSE DE DÉPÔT ET PLACEMENT DU QUÉBEC AR 2013 66
La Caisse’s achievements in Québec
BRIDGE TO THE WORLD: LONG-TERM PARTNER IN GROWTHIn an era when competition and business opportunities can come from any part of the world, it is imperative that Québec companies carve out a place in global markets and step up their exports.
La Caisse can play an important role with Québec companies that want to strengthen their international positioning by giving them access to its networks, experts and investment capacity.
In recent years, it has invested in international expansion projects of many companies, including CAE, Cogeco Cable, Cascades, CGI and GENIVAR (today WSP Global).
La Caisse can also serve as an intermediary, introducing Québec companies to established entrepreneurs or financial actors in a target country or to major international contractors.
La Caisse is also involved in various initiatives designed to foster international expansion.
SME PASSPORT
SME Passport is a training and advisory program for SMEs with strong potential for international development. It was created through a partnership between the Board of Trade of Metropolitan Montréal, Québec International, La Caisse, National Bank, the Ministère des Finances et de l’Économie and its Export Québec unit.
The program was launched in 2012, and has already yielded compelling results. The first cohort of 22 businesses from the greater Québec City and Montréal areas participated in 22 trade missions to a dozen countries. These missions have given rise to six projects to create foreign subsidiaries, five industrial agreements, signed or pending, and the identification of approximately 10 sales intermediaries in various parts of the world. A second cohort of 23 entrepreneurs was launched in October.
MISSIONS COMMERCIALES DE L’UNIVERSITÉ LAVAL
In 2013, La Caisse partnered with Missions commerciales de l’Université Laval, a trade-mission initiative that assists Québec companies with their international growth projects.
For the past 18 years, Missions commerciales de l’Université Laval has provided customized services in areas such as in-depth market research, technical representation, partner relations, recruiting and import/export logistics. More than 450 businesses have taken advantage of these services so far, which have resulted in many distribution, sales and procure - ment contracts.
QUÉBEC MANUFACTURERS AND EXPORTERS
La Caisse is a long-standing partner of Québec Manufacturers and Exporters (QME), an association whose mission is to improve business environment and help manufacturers and exporters become more competitive in local and international markets.
In 2013, La Caisse became associated with the Café series of private sessions, providing a forum for QME members to discuss important issues with major players in Québec’s economy. It is also associated with the Export-Experts initiative, which provides alliance building and discussion opportunities for gatherings of about 15 business leaders.

CAISSE DE DÉPÔT ET PLACEMENT DU QUÉBEC AR 2013 67
FOSTERING ENTREPRENEURSHIPDeveloping entrepreneurship in Québec is one of La Caisse’s top priorities.
La Caisse reviewed its entrepreneurship-related activities in 2013 with a view to maximizing their impact. An in-depth analytical and brainstorming process was initiated to address such matters as entrepreneurial culture, business transfer and SME growth. A series of meetings bringing together stake-holders from the business community will be used to define and implement practical and innovative actions to stimulate the entrepreneurial ecosystem.
La Caisse also collaborates with organizations and groups that promote entrepreneurship or are involved in developing the next generation of entrepreneurs.
ÉCOLE D’ENTREPRENEURSHIP DE BEAUCE
The École d’Entrepreneurship de Beauce (EEB) was founded in 2008 and is still Canada’s only school for business leaders. Since its inception, the EEB has trained three groups of entrepreneurs who can already attest to the positive outcomes of time spent at the institution, such as an average $2.5 million increase in sales since their training.
La Caisse is a founding partner of the EEB and in 2013 it strength-ened this partnership. Its role includes contributions to the school’s development activities.
FONDATION DE L’ENTREPRENEURSHIP
La Caisse has been a partner of the Fondation de l’entrepre-neurship for more than 20 years. It is now a leading partner of the organization, which plays a key role for Québec’s entrepre-neurs. For more than four years, La Caisse has been associated with the publication of the Indice entrepreneurial québécois, an extensive annual entrepreneurship survey, and with the presentation of the survey results during a tour that enables it to meet entrepreneurs in every region of Québec.
La Caisse also participates in the annual meeting of Réseau M, which provides mentoring for entrepreneurs, with the presenta-tion of an award to recognize the excellent practices of a mentor engaged in fostering entrepreneurship in Québec.
PRÊT À ENTREPRENDRE
During the year, La Caisse continued to work with Prêt à entre-prendre, a program designed to stimulate a new wave of Québec entrepreneurs. The program was launched in 2012 with five other actors: the Government of Québec; Desjardins Group and Capital régional et coopératif Desjardins; the Fédération des chambres de commerce du Québec; the Fondation de l’entre-preneurship; and Quebecor.
In 2013, the program enabled 56 new entrepreneurs from all regions of Québec to receive financing as well as advice from a team of mentors and experts.
RÉSEAU DES FEMMES D’AFFAIRES DU QUÉBEC
In 2013, La Caisse established a partnership with the Réseau des femmes d’affaires du Québec, an organization that has identified, advised and promoted women leaders in business, the community, political and economic sectors for more than 30 years. The Réseau provides opportunities for women of every generation to develop networks, for example, through referrals, both regionally and internationally, and reinforce their role in the business community.
Through its partnership, La Caisse participates in an award program for Québec businesswomen, which honour Québec women who excel in business, as well as for its economic development project for women, which promotes and encou-rages the growth of businesses owned by women.
CAISSE DE DÉPÔT ET PLACEMENT DU QUÉBEC AR 2013 68
La Caisse’s achievements in Québec
A LEADER IN QUÉBEC’S FINANCIAL INDUSTRY La Caisse is actively involved in developing Québec’s pool of financial expertise because talent is essential for a dynamic financial industry.
During the year, Le Caisse continued to foster its relationships with several Québec universities and played a very active role in Finance Montréal.
FOSTERING THE NEXT GENERATION OF FINANCIAL LEADERS
La Caisse works together with several Québec universities. Over the years, it has participated in implementing and funding research chairs and creating programs that meet specific needs in Québec’s financial industry:
• The Caisse de dépôt-UQAM (Université du Québec à Montréal) Research Chair in Portfolio Management;
• The Caisse de dépôt et placement du Québec Leadership Chair in Actuarial Management of Asset Risks at Université Laval;
• A partnership with UQAM’s markets room;
• A contribution to the Short Master’s Program in Financial Engineering at the École de technologie supérieure (ÉTS) for holders of technical degrees;
• Funding for a Université Laval study on entrepreneurship;
• Funding for a Université de Sherbrooke study on responsible investment;
• Funding for a Concordia University research project on responsible investment; and
• Funding for the Fonds Guynemer Giguère of the Fondation HEC (École des hautes études commerciales) Montréal.
La Caisse also plays a very active role in Finance Montréal, which seeks to strengthen Québec’s financial sector. Its partici-pation in Finance Montréal’s retirement project led to the establishment in 2013 of the first International Pension Conference of Montréal, an annual event that will enhance Montréal’s international stature as a centre of pension manage-ment expertise. La Caisse is also involved in Finance Montréal’s human resources project, which has implemented Carrefour de stages, in which a program of structured, managed internships was established for finance students. It provides practical training that meets market needs and facilitates collaboration between businesses and universities. In 2013, La Caisse hired 12 interns as part of the pilot project in connection with this new initiative.
To attract and retain more women in investment and manage-ment positions, La Caisse also continued the work of its committee to foster the next generation of women in finance. Several measures were adopted in 2013, including a mentoring program run in co-operation with the Association des femmes en finance du Québec (AFFQ), the posting of management openings at La Caisse and systematic interviewing of all female candidates qualified for management positions. These measures boosted the representation of potential women candidates for management positions at La Caisse from 10% in 2012 to 33% in 2013.
STRENGTHENING THE VITALITY OF MANY SECTORS
La Caisse contributes to the vitality of Québec’s financial industry as well as other sectors of economic activity. Almost two-thirds of La Caisse’s $2.8 billion in daily banking trans-actions are handled by banks and brokers in Québec. Furthermore, the operations of La Caisse and its real estate subsidiaries require almost 2,000 Québec suppliers, for a total of more than $640 million spent in Québec in 2013. La Caisse’s Policy on Contracts for the Acquisition or Leasing of Goods and Services also favours Québec suppliers, provided that they satisfy its cost and quality criteria.

CAISSE DE DÉPÔT ET PLACEMENT DU QUÉBEC AR 2013 69
STATEMENT ON LA CAISSE’S CONTRIBUTION TO QUÉBEC’S ECONOMIC DEVELOPMENTThe mission of La Caisse de dépôt et placement du Québec is to receive moneys on deposit as provided by law and to manage them with a view to achieving an optimal return on depositors’ capital within the framework of their investment policies while contributing to Québec’s economic development.
Returns and economic development go hand in hand. La Caisse intends to use all its abilities to advance Québec’s economic development. It seeks to play a leadership role by making investments in well-managed companies that can generate attractive returns for its depositors. It also aims to foster the growth of promising companies, in Québec and internationally. It wants to play an active role in successful entrepreneurship and to ensure business succession. La Caisse also wants to help strengthen Québec’s financial markets and to continue optimizing its operating expenses in Québec.
La Caisse’s proximity to and deep knowledge of the Québec business environment and market, its view as a long-term investor, its critical mass and its global reach are comparative advantages. Today, this enables La Caisse to renew its commitment to Québec’s economy by focusing on the following priorities:
1 SEEK OUT AND SEIZE THE BEST BUSINESS AND INVESTMENT OPPORTUNITIES
2 SERVE AS A BRIDGE BETWEEN QUÉBEC COMPANIES AND GLOBAL MARKETS
3 STRENGTHEN THE VITALITY OF ENTREPRENEURSHIP AND THE NEXT GENERATION OF FINANCIAL LEADERS
Invest funds and foster the growth of well- managed companies with a view to long-term economic development, while generating a return that allows its depo - sitors to fulfill their obligations.
• Make profitable, long-term investments in areas that La Caisse knows well, such as natural resources and infrastructure.
• Invest in medium-sized Québec firms that have the potential to become larger corporations.
• Build institutional partnerships to offer companies throughout Québec varied expertise and the best financial services and tools.
Offer diverse expertise, networks and investments to Québec companies capable of seizing international business opportunities, to heighten their presence and accelerate their growth.
• Maximize its presence, networks and expertise in all major markets.
• Invest in Québec companies and further their efforts to develop new products, expand their international operations and accelerate their growth.
• Strengthen strategic partnerships with globally active institutional investors, while integrating their financial expertise into that of La Caisse.
Foster the creation and expansion of Québec businesses while facilitating business succession. Strengthen the vitality of entrepreneurship and develop Québec’s financial expertise.
• Encourage the emergence and growth of entrepreneurs in all regions of Québec.
• Participate in development initiatives to enhance financial expertise, in concert with universities and other partners.

AR 2013 70CAISSE DE DÉPÔT ET PLACEMENT DU QUÉBEC

AR 2013 71CAISSE DE DÉPÔT ET PLACEMENT DU QUÉBEC
Responsible Investment

AR 2013 72CAISSE DE DÉPÔT ET PLACEMENT DU QUÉBEC
Responsible InvestmentReport
HIGHLIGHTS
1In 2013, La Caisse voted on 40,601 proposals in connection with 3,972 shareholder meetings.
2La Caisse’s shareholder engagement involving Canadian businesses focused on themes such as compensation programs, environmental and social issues, and governance.
3La Caisse organized a conference on water that brought together various specialists to discuss the issue and related risks that must be taken into account.
RESPONSIBLE INVESTMENT APPROACH
In its investment activities, La Caisse is guided by its mission, its depositors’ investment policies, the investment policies of its specialized portfolios and its depositors’ challenges, particu-larly risk factors and responsible investment.
The institution invests in shares of publicly traded and privately held companies, debt securities, real estate, infrastructure and other assets. Its holdings include actively managed and indexed investments.
La Caisse is a long-term investor. Its actively managed invest-ments are therefore generally made with a view to the long term, giving it the flexibility it needs to foster responsible invest-ment practices. La Caisse believes that, if businesses manage environmental, social and governance criteria (ESG criteria)
proactively and effectively, they are more likely to achieve sustainability and create value over the long term.
The decision to invest in a security or to exclude it from the portfolio is based on rigorous analysis of a set of elements that go beyond financial criteria to include ESG criteria. La Caisse occasionally invests in sectors that could be considered contro-versial. In such cases, it applies the approach set forth in its Policy on Responsible Investment. The policy is available on the institution’s website ( www.lacaisse.com ) under the Investments tab in the Responsible Investment section.
La Caisse takes a three-pronged approach: it includes ESG criteria in its analysis of actively managed investments, it practices shareholder engagement and on occasion it excludes specific securities (see Table 35).
3740
01_T
able
aux
RA
-AN
V8
8/0
4/20
14
P
AG
E 46
TABLE 35
LA CAISSE’S RESPONSIBLE INVESTMENT APPROACH
VISION La Caisse is a responsible shareholder and acts in a fiduciary spirit to provide risk-adjusted, long-term returns.
POLICIES Policy on Responsible Investment Policy on Principles Governing the Exercise of Voting Rights of Public Companies
APPROACH Integration of ESG criteria Shareholder engagement Exclusion
ACTIVITIES Exercise of voting rights Direct dialogue Collaborative initiatives Dialogue between stakeholders and industry Risk analysis Research Review of individual cases

AR 2013 73CAISSE DE DÉPÔT ET PLACEMENT DU QUÉBEC
2013 RESPONSIBLE INVESTMENT REPORT
La Caisse’s three-pronged Policy on Responsible Investment involved various initiatives in 2013. The following is a brief overview of these activities.
1. INTEGRATION OF ESG CRITERIA
Consideration of ESG criteria for the various asset classes is important because La Caisse is a long-term investor that emphasizes active management. When La Caisse makes an active-management decision, these factors are reviewed as part of a comprehensive analysis of the investment. Table 36 provides an explanation of ESG criteria.
Examples of action taken by La Caisse in 2013:
• Developed an analysis of the compensation programs of the 100 largest companies in terms of the market capitalization of the S&P/TSX Index, for purposes of comparison.
• Developed sector ratings for each ESG risk for the securities in the S&P/TSX Index.
• Held a conference on water on September 18, 2013, to bring together various specialists who discussed water-related issues and the risks that must be taken into account.
2. SHAREHOLDER ENGAGEMENT
La Caisse’s shareholder engagement takes different forms, such as advocacy involving businesses, alone or in collaboration with other investors, and exercising voting rights at shareholder meetings. La Caisse routinely comments on the consultations of Canadian securities authorities and legislation concerning governance issues and investment activities.
In applying its responsible investment approach, La Caisse contacts companies to obtain information that may be of benefit to all shareholders or to discuss specific issues and ways to improve practices. Such communications with companies are generally private. Barring exceptional circumstances, La Caisse does not disclose the names of companies it contacts in this way.
Shareholder engagement with Canadian companies
Shareholder engagement – Compensation programs
Objectives under this theme:
La Caisse believes executive compensation should be aligned with corporate results, so it reviews compensation programs, paying special attention to the link between compensation and corporate performance.
Examples of action taken by La Caisse in 2013:
• Participated in meetings organized by the Canadian Coalition for Good Governance with board members of various Canadian companies.
3740
01_T
able
aux
RA
-AN
V8
7/0
4/20
14
P
AG
E 47
TABLE 36
WHAT ARE ESG CRITERIA?
The degree to which La Caisse takes environmental, social and governance criteria into account depends on the company, the type of industry and the investment vehicle selected. These criteria are reviewed during the analysis that precedes an investment decision and at meetings with company executives as issues arise.
Environmental criteriainclude, for example, the impact of company activities on climate and greenhouse gas emissions, pollution, scarcity of resources and site rehabilitation.
Social criteriainclude, for example, human rights, consent of local communities, working conditions, and health and safety.
Governance criteriainclude, for example, executive compensation, election and mandate of directors.

CAISSE DE DÉPÔT ET PLACEMENT DU QUÉBEC AR 2013 74
Responsible Investment Report
• Conducted meetings with officers and directors to discuss compensation programs, comparisons of such programs with those of peers in the same industry, advisory votes and special bonuses.
• Publicly took an important position concerning the advisory vote of Barrick Gold Corporation on certain issues related to compensation practices, including an excessive signing bonus that was completely unrelated to performance.
Shareholder engagement – Environmental and social issues
Objectives under this theme:
Environmental and social issues are important because they may have financial consequences for a company and its share-holders and may also affect its reputation. Furthermore, such issues routinely create social-acceptability risks for the company’s stakeholders, including employees, shareholders, local citizens and non-governmental organizations (NGOs).
Examples of action taken by La Caisse in 2013:
• Took part in several field visits to meet with various stake-holders, observe and verify the status of certain projects, review various operating activities and discuss specific issues.
• Supported the Carbon Disclosure Project (CDP), which sends companies a questionnaire so that they can disclose infor-mation on their approach to managing climate change and greenhouse gas emissions.
• Participated in CDP Water Disclosure, an initiative that under-scores the importance of water and addresses the issue through dialogue with companies.
• Supported several shareholder proposals designed to obtain more information on environmental risks and the measures that companies have taken to address them.
• Supported the Extractive Industries Transparency Initiative (EITI), an organization that fights corruption by encouraging countries at risk to implement measures that ensure open- ness and accountable management of revenues from natural resources.
Shareholder engagement – Governance
Objectives under this theme:
La Caisse carefully examines governance issues so that it can take action when companies fail to adopt the best governance practices, whether such practices involve the composition of the board of directors and its committees, diversity, annual election of directors or the share capital structure. The institu-tion also works to improve Canada’s proxy voting system.
Examples of action taken by La Caisse in 2013:
• Collaborated with other Canadian institutional investors to send comments to the regulatory authorities after hearings on the Canadian proxy voting system.
• Participated in a committee of the Canadian Coalition for Good Governance that adopted the organization’s public positions.
• Appointed a Caisse representative to the governance committee of the Pension Investment Association of Canada (PIAC), which reviews governance issues important to such investors.
• Submitted comments to the regulatory authorities for hearings on takeovers, diversity and disclosure thresholds for holdings.
Shareholder engagement – Emerging marketsShareholder engagement in emerging markets presents challenges, especially because of geography and cultural dif fer-ences. La Caisse has therefore given a mandate to a specialized firm to help it carry out shareholder engagement activities. In 2013, dialogue was established with more than 75 companies in emerging markets. Even though environmental and social issues were regularly raised with the companies, governance matters stood out as the most important, given the noticeable discre pancy vis-à-vis internationally recognized best gover- nance practices.

CAISSE DE DÉPÔT ET PLACEMENT DU QUÉBEC AR 2013 75
Proxy votingThe exercise of voting rights at shareholder meetings of La Caisse’s portfolio companies is an important activity. The institution exercises this right in respect of all investee companies, whether they are held in an actively managed or indexed portfolio.
An internal team exercises voting rights for the shareholder meetings of Canadian and U.S. companies. For companies outside North America, voting rights are exercised with assis-tance from an external firm, according to Caisse policies and directives. In such cases, La Caisse reviews the firm’s voting recommendations and takes any action it deems necessary.
Other engagement activitiesLa Caisse also conducts engagement activities of greater scope than those involving specific themes or dialogue with companies. It collaborates on responsible-investment matters with various stakeholders and, in this way, promotes and advances responsible investment.
Examples of action taken by La Caisse in 2013:
• Took part in work performed by investors involved in the UN Principles for Responsible Investment (PRI), to which La Caisse has been a signatory since its inception in 2006.
• Was a member in a group of Québec PRI signatories that meets informally on a regular basis to discuss responsible investment issues and PRI implementation at various organizations.
• Participation in several meetings with various stakeholders interested in understanding La Caisse’s approach to responsible investing.
• Participation in many discussions with Canadian peers on various matters involving issuing companies.
3. EXCLUSION
Excluding securities from its portfolio is an exceptional measure that La Caisse takes in certain circumstances. If the circum-stances so justify, it may exclude securities of companies that are in violation of local or international law. An internal committee composed of managers from various units, including investment teams, reviews such matters.
La Caisse excludes from its portfolio companies that manufac-ture weapons banned by the Ottawa Convention Banning Landmines and the Oslo Convention on Cluster Munitions. Such securities could be reinstated in the portfolio if the companies in question stopped manufacturing such weapons.
RESPONSIBLE INVESTMENT COMMITTEE
The role of the Responsible Investment Committee is to examine key issues associated with this subject, in particular shareholder- engagement issues, to determine whether specific securities should be excluded from or brought back into the portfolio. The Committee met twice in 2013.
For more information on La Caisse’s responsible investment actions, refer to its website at www.lacaisse.com .
La Caisse voted on 40,601 proposals in 2013 in connection with 3,972 shareholder meetings:
Canada: 155 meetings United States: 733 meetings International: 3,084 meetings
Out of all votes, 12.8% were against management proposals:1
Canada: 6.3% United States: 11.7% International: 13.5%
1. Votes against management tended to concern compensation programs that did not meet Caisse criteria and the election of directors to boards of which the majority of the members were not independent.

AR 2013 76CAISSE DE DÉPÔT ET PLACEMENT DU QUÉBEC
SustainableDevelopment Report
The Sustainable Development Action Plan presented in this section shows the emphasis La Caisse places on the sustainability and continuity of its operations. It also reflects its commitment to the strategy implemented by the Government of Québec since the Sustainable Development Act came into force. La Caisse adopted its Sustainable Development Action Plan in 2009. Since then, it has undertaken many practical activities and initiatives to reduce its ecological footprint, to raise awareness of sustainable development, to preserve and promote Québec’s cultural heritage and to share its sustainable development knowledge with its peers as well as its clients, the depositors.
NEW 2012-2015 ACTION PLAN
The Plan sets out 11 actions for the years 2012 to March 2015. This section presents a progress report on the actions taken in 2013 and serves as a formal accounting of the institution’s achievements.
OBJECTIVE
PROMOTE THE CONCEPT AND PRINCIPLES OF SUSTAINABLE DEVELOPMENT
ACTION 1
Provide Caisse employees with sustainable development information and training
• Interactive online training on sustainable development princi-ples was provided for 200 Caisse employees and more than 150 Ivanhoé Cambridge employees covered by the training criteria of the Ministère du Développement durable, de l’Environnement, de la Faune et des Parcs. The 50% employee participation target was surpassed by a wide margin.
• Close to 60 articles and columns on various aspects of sustainable development appeared in La Caisse’s internal publication. Posters were used to publicize various environ-mental topics, including initiatives at the Centre CDP Capital.
• Two well-attended conferences on sustainable development were held: one concerned water-related issues of investment and attracted more than 80 participants, including 11 speakers; and the other examined how government corporations can address the issue of sustainable development.
• A working committee comprising employees from various units developed and initiated activities directly aligned with the objectives of the Government Sustainable Development Strategy. These activities are an integral part of La Caisse’s action plan, which aims to have a total of eight activities in place by year-end 2014.
• In 2013, Ivanhoé Cambridge added a corporate social respon- sibility (CSR) section to its website and introduced a CSR section on its employee portal.
OBJECTIVE
DEVELOP A PREVENTION CULTURE AND CONDITIONS FAVOURABLE TO HEALTH, SAFETY AND THE ENVIRONMENT
ACTION 2
Continue to improve working conditions that foster employee health and safety
• La Caisse adopted a comprehensive health strategy and updated its employee group insurance plan.
• Measures were taken to ensure employees travelling on business can be located and contacted quickly.
• Ivanhoé Cambridge adopted an occupational health and safety policy.
• Employees received information on security at the Centre CDP Capital and on emergency and disaster measures.

AR 2013 77CAISSE DE DÉPÔT ET PLACEMENT DU QUÉBEC
ACTION 3
Take measures to encourage employees to use green transport
• Employees were surveyed on their transportation behaviour, and the findings were analyzed. In 2014, La Caisse will consider ways to make it easier for employees to switch to public transit and active commuting.
OBJECTIVE
ENCOURAGE RESPONSIBLE PROCUREMENT AND SOUND ENVIRONMENTAL MANAGEMENT
ACTION 4
Strengthen practices and activities designed to encourage responsible consumption
• After reviewing its procurement policy, La Caisse added new clauses on sustainable development to the policy as well as to its tender documents. These requirements are taken into account in all new contracts awarded through competitive bidding.
• Under this policy, La Caisse continued its strategy of placing priority on suppliers of goods and services with a place of business in Québec.
• Ivanhoé Cambridge developed a responsible procurement policy that will be adopted in 2014.
ACTION 5
Continue environmental management
• Two new electric vehicle charging stations were installed at Carrefour Rimouski shopping centre, bringing the number of such stations at Ivanhoé Cambridge’s Québec properties to 64.
• A greenhouse gas emissions inventory was carried out as part of an initiative to develop a program to measure and monitor such emissions at Canadian properties managed by Ivanhoé Cambridge.
• In 2013, Ivanhoé Cambridge continued its composting initia-tives at 13 properties in Québec.
• In 2013, Ivanhoé Cambridge maintained the BOMA BESt certifications obtained in recent years for 26 properties in Québec.
OBJECTIVE
PROTECT AND PROMOTE QUÉBEC’S HERITAGE
ACTION 6
Continue to promote cultural heritage
• An exhibition open to the public was held in the summer of 2013 to showcase a portion of La Caisse’s art collection.
• Four guided tours of the collection were given to employees and external groups.
• A meeting was held at La Caisse between employees and an artist represented in the collection.
ACTION 7
Continue to enhance architectural heritage
• In 2013, Ivanhoé Cambridge pursued its program to enhance historic Québec buildings. It continued to revitalize Place Ville Marie, a landmark property in downtown Montréal, with a view to obtaining LEED certification. Ivanhoé Cambridge also began renovating the Rockhill residential complex in Montréal to restore the vitality and appeal that are central to its reputation.
• As co-owner of the Sun Life Building in Montréal, Ivanhoé Cambridge also received the Commercial Heritage Award as part of the Montréal Architectural Heritage Campaign. The award underscores the owners’ constant concern for the exceptional architectural character of the building and their use of professionals who provide meticulous property man age ment services.

CAISSE DE DÉPÔT ET PLACEMENT DU QUÉBEC AR 2013 78
Sustainable Development Report
OBJECTIVE
FIGHT SOCIAL INEQUALITY
ACTION 8
Encourage employees to support philanthropic causes
• A program designed to encourage employees to engage in community action was deployed successfully. The program has three components: encourage involvement in community organizations; get involved in Bénévoles d’affaires, whose mission is to facilitate the sharing of professional skills and expertise; and support the organization’s causes.
• Volunteer activities took place through the year. For example, employees collected winter clothes, sorted donated food and school supplies, installed computers for an organization that helps children with their homework.
• In collaboration with Bénévoles d’affaires, 12 twinning arrangements were put in place for employees willing to serve on boards of directors or working committees.
• In the fall, almost 250 employees took part in the Ride for Juvenile Diabetes Research, raising $175,000 for the Juvenile Diabetes Research Foundation.
OBJECTIVE
RESPOND TO CHANGING DEMOGRAPHICS AND FOSTER WORK-LIFE BALANCE
ACTION 9
Optimize the work environment
• A pilot project was carried out to implement a framework for close management of teleworking. The initiative is expected to be deployed fully in 2014. It is designed to enhance effec-tiveness and flexibility, and offers benefits to both La Caisse and its employees.
OBJECTIVE
NURTURE A NEW GENERATION OF FINANCE PROFESSIONALS
ACTION 10
Develop the next generation of financial leaders
• La Caisse was actively involved in defining the objectives of and implementing Finance Montréal’s Carrefour de stages, a structured program of finance internships aligned with market needs.
• La Caisse hired 12 interns as part of the Carrefour de stages pilot project.
• Three meetings involving Caisse investment professionals and university students were held.
• La Caisse arranged for Concordia University to carry out a responsible investment research project.
ACTION 11
Promote the visibility and representation of women in finance
• Several measures were taken by La Caisse’s committee to foster the next generation of women in finance, including a mentoring program in collaboration with the Association des femmes en finance du Québec (AFFQ), systematic posting with the AFFQ of management positions at La Caisse and systematic interviews for each woman candidate qualified for a management position.
• The number of women on the lists of potential candidates for management positions at La Caisse rose from 10% in 2012 to 33% in 2013.

AR 2013 79CAISSE DE DÉPÔT ET PLACEMENT DU QUÉBEC
Reports of the Board of Directors and Board Committees

AR 2013 80CAISSE DE DÉPÔT ET PLACEMENT DU QUÉBEC
Board ofDirectors’ Report
HIGHLIGHTS
1Renewed the mandate of the President and Chief Executive Officer.
2Followed up on La Caisse’s strategic orientations involving primarily absolute-return management, less-liquid assets and investments in Québec and investments in emerging markets.
3Implemented an absolute risk framework for the overall portfolio.
THE BOARD OF DIRECTORS
MANDATE
The mandate of the Board of Directors includes ensuring that La Caisse is managed in compliance with the provisions of its incorporating Act and regulations and that it takes the necessary steps to attain the objectives stated in its mission.
For a full description of the Board of Directors’ mandate, please consult the Governance section of the Caisse website at www.lacaisse.com.
COMPOSITION
As at December 31, 2013, the Board consisted of 13 members out of a maximum of 15. During the year, after consulting the Board, the Government of Québec renewed the mandate of Michèle Desjardins as an independent director and appointed six members to the Board of Directors. Rita Dionne-Marsolais and Patricia Curadeau-Grou, as well as Jean La Couture, François Joly and Gilles Godbout, were appointed independent members, while André Legault, who was then President and Chief Executive Officer of the Commission administrative des régimes de retraite et d’assurances (CARRA), was appointed as a non-independent member. Mr. Legault stepped down from his position at CARRA at the end of 2013 and also resigned from La Caisse’s Board.
Table 37 on page 81 provides information on the directors’ attendance at Board and Committee meetings in 2013.
DIRECTOR COMPENSATION
The compensation of La Caisse’s directors, other than the Chairman and the President and Chief Executive Officer, is determined by an order-in-council of the Government of Québec. Their compensation for 2013 is provided in Table 38 on page 81. The directors are also entitled to be reimbursed for their travel and living expenses, where applicable.
COMPENSATION OF THE CHAIRMAN OF THE BOARD
The annual compensation of the Chairman of the Board is set at $195,000 by an order-in-council of the Government of Québec. The Chairman is also entitled to be reimbursed for representa-tion expenses related to the duties of his position, to a maximum of $15,000 a year.

AR 2013 81CAISSE DE DÉPÔT ET PLACEMENT DU QUÉBEC
3740
01_T
able
aux
RA
-AN
V7
7/0
4/20
14
P
AG
E 51
TABLE 37
DIRECTOR ATTENDANCE AT BOARD AND COMMITTEE MEETINGS IN 20131
Directors Board of Directors Audit Committee
Investment and Risk Management
CommitteeHuman Resources
CommitteeGovernance and Ethics
Committee
6 reg. 5 spec. 6 reg. 1 spec. 6 reg. 4 spec. 7 reg. 6 reg.
Elisabetta Bigsby 6 4 – – 5/5 3 7 –
Louise Charette 6 5 6 1 – – – 6
Patricia Curadeau-Grou 2/2 1/1 – – 1/1 1/1 – –
Michèle Desjardins 6 3 – – – – 1/1 6
Rita Dionne-Marsolais 6 4 0/1 – – – – 4/5
Gilles Godbout 6 4 1/1 – 5/5 3 – –
Denys Jean 4 2 – – – – – –
François Joly 5/5 4 4/4 1 5/5 4 5/5 –
Jean La Couture 6 5 – – 5/5 4 – –
A. Michel Lavigne 1/1 – 2/2 – 1/1 – – –
André Legault 4/5 5 – – – – – –
Jean Pierre Ouellet 1/1 – – – – – – –
Réal Raymond 0/1 – – – 0/1 – – –
François R. Roy 6 5 6 1 6 4 – –
Michael Sabia 6 4 – – – – – –
Ouma Sananikone 5 5 – – 4/5 3/3 6 1/1
Robert Tessier 6 5 – – – – 7 6
1. Directors justify their absences from regular meetings of a Committee or the Board to La Caisse’s Secretariat. During 2013, directors were not able to attend certain meetings, due mainly to health reasons or to obligations related to family or work commitments.
3740
01_T
able
aux
RA
-AN
V7
7/0
4/20
14
P
AG
E 52
TABLE 38
COMPENSATION PAID TO INDEPENDENT DIRECTORS UNDER ORDER-IN-COUNCIL1
(in dollars)
DirectorsAnnual
compensationCompensation as Committee Chair
Attendance fees
Total compensation
Elisabetta Bigsby 17,603 5,500 19,194 42,297
Louise Charette2 17,603 – 19,142 36,745
Jean La Couture 17,603 4,137 15,048 36,788
Patricia Curadeau-Grou 4,439 – 3,744 8,183
Michèle Desjardins 17,603 – 12,528 30,131
Rita Dionne-Marsolais 17,603 – 8,854 26,457
Gilles Godbout 17,603 – 9,223 26,826
François Joly2 13,240 4,137 21,316 38,693
A. Michel Lavigne 4,363 1,363 3,272 8,998
Jean Pierre Ouellet 4,363 – 818 5,181
Réal Raymond 4,363 1,363 – 5,726
François R. Roy2 17,603 – 21,638 39,241
Ouma Sananikone 17,603 925 17,492 36,020
Total 341,286
1. In accordance with the terms of the Order-in-Council:
a. 1.75% increase was applied on April 1, 2013, to the annual compensation, the Committee Chairs’ compensation and the attendance fees.
b. The attendance fee for each special or short Board or Committee meeting, held by conference call, is half of the attendance fee allowed for a regular meeting.
c. Members who have retired from the public sector receive total reduced compensation.
2. These directors received attendance fees for attending an Audit Committee meeting of La Caisse’s real estate subsidiaries.

CAISSE DE DÉPÔT ET PLACEMENT DU QUÉBEC AR 2013 82
Board of Directors’ Report
ACTIVITY REPORT
Renewal of the President and Chief Executive Officer’s mandateEach year since 2009, the Board of Directors, assisted by the Human Resources Committee, has concluded that Mr. Sabia’s performance significantly exceeded the objectives set for him at the start of the year. The Board is extremely pleased with Mr. Sabia’s work during his initial mandate, in terms of La Caisse’s performance, depositor satisfaction, employee mobilization and even the institution’s commitment to Québec.
With government approval, the Board of Directors therefore unanimously renewed Mr. Sabia’s mandate as President and Chief Executive Officer for another five-year term.
Strategic directionsLa Caisse’s strategic orientations, approved by the Board, aim to generate returns that are more stable and less volatile by placing greater emphasis on absolute-return management, investing in assets directly linked to the real economy, investing in Québec, and capitalizing on growth in emerging markets. The year 2013 provided the opportunity to introduce many of the required changes. Accordingly, the Board did the following:
• Reviewed the strategy for each of the investment groups. The Board also regularly oversaw and contributed construc-tively to the development of strategic priorities.
• Reviewed the implementation of the Global Quality Equity portfolio, which was created on January 1, 2013, and con - sidered the long-term approach used by the managers.
• Approved the proposal to combine the various non-capitalized absolute-return strategies into a new specialized portfolio, Active Overlay Strategies.
• Approved the implementation of absolute-risk oversight for the overall portfolio.
• Regularly monitored activities conducive to Québec’s economic development. For more information on the acti- vities conducted by La Caisse, refer to “La Caisse in Québec” on page 51.
• Monitored implementation of the overall portfolio’s increased weighting of less-liquid assets, as agreed to in 2012.
• Approved the hiring of Rashad Kaldany, Executive Vice- President, Emerging Markets, and reviewed the strategy to improve the overall portfolio’s risk-return profile though geographic diversification. At mid-year, the Board also monitored the gradual introduction of active management in the Emerging Markets Equity portfolio.
The Board ensured that these priorities were discussed with and approved by the depositors before they were implemented. Furthermore, the Board reviewed and discussed with senior management the comments gathered from depositors regarding their overall satisfaction and ways of maintaining a high level of satisfaction with the services rendered.
Finally, to follow up on the strategic priorities and to diversify La Caisse’s financing sources, the Board gave the subsidiary CDP Financial Inc. approval for a financing program on the U.S. market. This program is used to finance investment activities on liquid markets as opportunities arise.
Business plansThe Board received from various Caisse units their annual business plans incorporating objectives related not only to strategic priorities and day-to-day management but also to initiatives fostering optimal use of resources. The Board also adopted La Caisse’s business plan and annual budget and received regular reports from senior management on the development of the business plan.

CAISSE DE DÉPÔT ET PLACEMENT DU QUÉBEC AR 2013 83
Financial results, internal controls and management systemsWith assistance from the Audit Committee, the Board fulfilled its responsibilities with respect to financial results and internal controls, notably by reviewing the quarterly financial statements, approving interim and annual combined financial statements, evaluating the integrity of controls applied to data used to prepare the financial statements and related notes, and monitoring internal audits. The Board also reviewed the returns of the investment units and approved the press release announ-cing the annual and interim financial results, as well as the Annual Report.
See the Report of the Audit Committee on page 84 for more information on the responsibilities discharged by the Committee and the Board.
Investment and Risk ManagementWith assistance from the Investment and Risk Management Committee, the Board ensured that an effective and rigorous risk management framework and processes were applied throughout the year. It also monitored and assessed the work designed to adapt the framework and processes to the changes stemming from strategic priorities. Furthermore, it approved investment proposals under its authority and recommended by the Committee, taking into account the impact of each one on the level and concentration of risk of the specialized portfolio in question and of La Caisse’s overall portfolio.
For more information on the activities of the Board and the Investment and Risk Management Committee, see the Report of the Investment and Risk Management Committee on page 105.
Corporate governanceAt each meeting of the Board, its committees reported on their activities so that it could review and express an opinion on their recommendations. Committee members and Board members alike, also met regularly without the presence of senior manage-ment. The Board also held discussions with the President and Chief Executive Officer in the absence of other members of senior management.
See the Report of the Governance and Ethics Committee on page 87 for more information on the responsibilities discharged by this Committee and the Board regarding governance and ethics.
Supervision of senior management and human resources managementWith assistance from the Human Resources Committee, the Board approved the President and Chief Executive Officer’s detailed objectives for 2013. The Board also reviewed the performance of the President and Chief Executive Officer on the basis of the objectives set at the beginning of the year.
The Board also reviewed the President and Chief Executive Officer’s performance evaluations of senior management. It reviewed the succession plans for them and for the President and Chief Executive Officer. It approved the 2013 salary condi-tions and the level of incentive compensation to be paid to senior management. It also authorized the appointment of Mr. Kaldany to the position of Executive Vice-President as well as his compensation.
See the Report of the Human Resources Committee on page 89 for more information on the responsibilities discharged by the Committee and the Board.

AR 2013 84CAISSE DE DÉPÔT ET PLACEMENT DU QUÉBEC
Report of theAudit Committee
HIGHLIGHTS
1Reviewed and monitored preparation of the financial statements.
2Reviewed the implementation of IFRS.
3Monitored financial certification and resource optimization programs.
THE AUDIT COMMITTEE
MANDATE
The Audit Committee sees that the financial statements accu- rately reflect La Caisse’s financial position. It also ensures that adequate and effective internal control mechanisms and a risk management process are in place.
For a full description of the Audit Committee’s mandate, see the Governance section of the Caisse website ( www.lacaisse.com ).
COMPOSITION (as at December 31, 2013)
The Committee consisted of five independent members, including professionals with accounting or finance expertise and the experience and knowledge required to read and under-stand financial statements and properly fulfill their roles.
• Chair: François Joly (guest member at meetings of the Investment and Risk Management Committee)
• Members: Louise Charette, Rita Dionne-Marsolais, Gilles Godbout and François R. Roy
The Chairman of the Board attends the Committee’s meetings.
ACTIVITY REPORT
Number of meetings held in 2013: 7
The following report was approved by the members of the Committee.
Financial reportingIn 2013, the Committee fulfilled its financial reporting respon-sibilities as follows:
• Reviewed the 2012 combined financial statements with the Finance group and the co-auditors, namely the Auditor General of Québec and Ernst & Young, and reviewed such matters as:
– the process used to prepare the financial statements;
– the valuation of over-the-counter liquid investments, less- liquid investments and ABTNs;
– the validation of the notional amount of derivative financial instruments by an external firm; and
– the audit of returns by an external firm to ensure their calculation and presentation complied with industry standards.
• Strengthened the process used to measure the fair value of investments and recommended that the Board combine the policies specific to each type of investment in a new overall policy applicable to future years.
• Reviewed the report on the financial certification process that enables the President and Chief Executive Officer and the Chief Financial Officer to certify publicly that the disclo-sure controls and procedures and the internal financial reporting controls are adequate and effective.

AR 2013 85CAISSE DE DÉPÔT ET PLACEMENT DU QUÉBEC
• Recommended that the Board adopt the annual financial statements.
• Reviewed the press releases announcing La Caisse’s financial results and preparatory work on the Annual Report.
• Arranged for members of the Audit Committee to attend meetings of the real estate subsidiaries’ audit committees and reviewed the committees’ annual activity reports.
• Received the co-auditors’ report submitted to Caisse senior management after their year-end audit.
• Reviewed the quarterly financial statements, budget monitoring reports, operating expenses and year-end budget estimates.
• Discussed with the co-auditors their plan for auditing La Caisse’s financial statements.
• Discussed with Ernst & Young its internal quality-control procedures.
• Monitored the External Co-Auditor Independence Policy and submitted a recommendation to the Board regarding Ernst & Young’s audit fees.
• Reviewed the main accounting positions and elections recommended by the Finance group that have an impact on La Caisse’s financial statements in anticipation of the implementation of International Financial Reporting Standards (IFRS) and monitored the preparatory work for such implementation.
• Held regular discussions with Finance personnel without the presence of senior management.
• Met regularly with the co-auditors to discuss various aspects of their mandate without the presence of senior management.
Internal AuditIn 2013, the Committee carried out the following activities with Internal Audit:
• Adopted the 2013-2014 internal audit plan and reviewed Internal Audit’s 2013 business plan.
• Reviewed Internal Audit’s progress reports prepared under the internal audit plan to address such matters as internal control mechanisms, risk management processes and optimal use of resources.
• Monitored the implementation of Internal Audit’s recommen-dations by Caisse senior management.
• Reviewed status reports on internal audit of the real estate subsidiaries.
• Reviewed reports under the institution’s continuous audit program.
• Discussed the results of an external expert’s assessment of Internal Audit’s service quality and reviewed the resulting changes.
• Ensured that the Internal Audit team was able to act indepen- dently from Caisse senior management.
• Held regular discussions with the Vice-President, Internal Audit, without the presence of senior management.

CAISSE DE DÉPÔT ET PLACEMENT DU QUÉBEC AR 2013 86
Report of the Audit Committee
Internal controls and plan for the optimal use of resourcesThe Committee reviewed many aspects of internal controls and optimal use of resources in 2013. Its activities included the following:
• Discussed senior management’s overall evaluation of the design and effectiveness of the general control environment.
• Reviewed the findings of senior management and Internal Audit on processes and controls related to the general control environment and information technology, and regularly monitored the outsourcer’s implementation of the controls.
• Tracked progress on the redesign of the financial certification program, an initiative aimed in part at improving the efficiency of Caisse oversight functions.
• Reviewed and approved the Treasury group’s mandate.
• Monitored and analyzed the effects of activities to promote optimal use of resources.
• Monitored investments made under the last paragraph of section 37.1 of the Act respecting the Caisse.
• Reviewed delegations of authority for approval by the Board.
Risk managementThe Board of Directors established the Investment and Risk Management Committee to help the Audit Committee fulfill its duty to implement a risk management process. The Committee therefore carried out the following activities to monitor all risk management work:
• It received copies of the Investment and Risk Management Committee minutes of meetings.
• It received copies of the certificates of compliance with the depositors’ investment policies and with the investment policies of La Caisse’s specialized portfolios.
• The Chair of the Audit Committee attended the meetings of the Investment and Risk Management Committee.
USE OF EXTERNAL EXPERTS
The Audit Committee did not use the services of external experts in 2013. It did, however, endorse senior management’s use of external firms for an independent review of the fair value of private equity, certain liquid securities, real estate, real estate debt and ABTNs.

AR 2013 87CAISSE DE DÉPÔT ET PLACEMENT DU QUÉBEC
HIGHLIGHTS
1Recommended the composition and chairmanship of the Board’s committees.
2Reviewed the Code of Ethics and Professional Conduct for Directors and the Code of Ethics and Professional Conduct for Officers and Employees.
3Reviewed La Caisse’s activities in connection with the Policy on Responsible Investment.
GOVERNANCE AND ETHICS COMMITTEE
MANDATE
The Governance and Ethics Committee ensures that La Caisse adheres to the highest standards of governance and ethics. For a full description of the Governance and Ethics Committee’s mandate, please consult the Governance section of the Caisse website ( www.lacaisse.com ).
COMPOSITION (as at December 31, 2013)
Five independent members:
• Chair: Ouma Sananikone
• Members: Louise Charette, Michèle Desjardins, Rita Dionne-Marsolais and Robert Tessier
ACTIVITY REPORT
Number of meetings in 2013: 6
The following report was approved by the Committee members.
Composition of the Board and its committeesThe Committee reviewed the composition of the Board and its committees to ensure that it is optimal. To that end, the Committee:
• Analyzed the Board’s composition, each director’s term of office and the Board’s overall skills and expertise, in accordance with the skills and experience profile of independent directors.
• Recommended the appointment to the Board of independent members.
• Recommended to the Board the composition and chairman-ship of its committees.
The Board and its committees• Reviewed the responsibilities described in the mandates of
the Board and of each of its committees, and in the mandates of their chairs and of the President and Chief Executive Officer.
• Discussed governance practices affecting evaluations of the Board and senior management.
Report of the Governanceand Ethics Committee

CAISSE DE DÉPÔT ET PLACEMENT DU QUÉBEC AR 2013 88
Report of the Governance and Ethics Committee
• Ensured that key individuals – whether members of Caisse senior management or external specialists – were available to explain various items on the agendas of Board meetings, and that there was sufficient time for a full discussion.
• Ensured that the Board had all the information and time required to analyze issues affecting La Caisse.
• Verified throughout the year that discussions were held without the presence of senior management and ensured that there was adequate time for full discussion by the directors.
• Discussed a program involving presentations at Board meetings and outside this formal framework to allow directors to discuss, among themselves and with senior management, matters relevant to their duties.
Rules of ethics and professional conductRegarding rules of ethics and professional conduct, the Committee:
• Reviewed the rules on declarations of interests, obtained assurance, on behalf of the Board, that the declarations of interests submitted by the directors complied with the provi-sions in effect and transmitted the declarations to the authorities designated under the Act respecting the Caisse.
• Revised the Code of Ethics and Professional Conduct for Directors and the Code of Ethics and Professional Conduct for Officers and Employees, and reviewed the report on the implementation of rules of ethics and professional conduct.
• Revised the directive on transactions involving securities of companies having ties with Caisse directors and reviewed such transactions, as required.
Policy on Responsible InvestmentIn line with the institution’s Policy on Responsible Investment, the Committee:
• Reviewed the report on the exercise of the institution’s right to vote the shares of portfolio companies.
• Reviewed and discussed a report on La Caisse’s shareholder engagement, namely its exercise of voting rights and dialogue with portfolio companies, particularly in emerging markets.
La Caisse• Reviewed the Policy on Donations and Sponsorships, reviewed
the report on donations and sponsorships provided by La Caisse during the year and reviewed the annual budget for such activities.
• Reviewed the process for verifying that the institution’s external managers apply rules of ethics and professional conduct.
• Reviewed the process for appointing members to the boards of privately held companies in which La Caisse invests.
Evaluation of committee and Board operationsThe program to evaluate the institution’s Board, committees and directors enhances its governance by establishing areas requiring improvement. Because the Board included several new members, the Committee recommended that this evalua-tion process be deferred by one year.
USE OF EXTERNAL EXPERTS
The Governance and Ethics Committee did not use the services of external experts in 2013.

AR 2013 89CAISSE DE DÉPÔT ET PLACEMENT DU QUÉBEC
HIGHLIGHTS
1Recommendation by the Board of Directors that the mandate of the President and Chief Executive Officer be renewed
2Monitoring of market compensation practices
3Review of strategic orientations on organizational health
HUMAN RESOURCES COMMITTEE
MANDATE
The mandate of the Human Resources Committee is to review the orientations and strategies used by La Caisse to manage its human resources, including performance evaluation, succes-sion planning and executive compensation as well as its general human resources practices.
For a full description of the mandate of the Human Resources Committee, please consult the Governance section of La Caisse’s website ( www.lacaisse.com ).
COMPOSITION (as at December 31, 2013)
The Committee is composed of five independent members:
• Chair: Elisabetta Bigsby
• Members: Michèle Desjardins, François Joly, Ouma Sananikone and Robert Tessier
ACTIVITY REPORT
Number of meetings held in 2013: 7
The following report has been approved by Committee members.
President and Chief Executive OfficerThe Committee reviewed Mr. Sabia’s objectives for 2013 as President and Chief Executive Officer and recommended that the Board of Directors approve them. Furthermore, the Committee reviewed the performance evaluation and total compensation conditions for the President and Chief Executive Officer and recommended them to the Board of Directors for approval.
The Committee also reviewed and evaluated Mr. Sabia’s achieve-ments in terms of developing and repositioning La Caisse and its investment strategy for Québec and elsewhere in the world during his first mandate as President and Chief Executive Officer. The Committee concluded that Mr. Sabia’s performance was exceptional, and recommended that the Board renew his mandate for another five years.
Senior managementThe Committee reviewed and recommended the following items to the Board for approval:
• The performance evaluations of members of senior manage-ment and the determination of their total compensation;
• The succession plan for senior management positions and the position of President and Chief Executive Officer; and
• The appointment of the Executive Vice-President, Emerging Markets.
Report of the HumanResources Committee

CAISSE DE DÉPÔT ET PLACEMENT DU QUÉBEC AR 2013 90
Report of the Human Resources Committee
Key strategies and policies for integrated talent managementIn 2013, the Committee discussed several key strategies and policies for integrated talent management. To that end, the Committee:
• reviewed the employee compensation structure, including base salary and incentive compensation, and recommended it to the Board of Directors for approval;
• reviewed strategic orientations on organizational health and reviewed and discussed employee-engagement initiatives; and
• analyzed various management indicators, including indi -cators of operational risks related to human resources management and those affecting succession plans.
Use of external expertsIn exercising their functions, the Board of Directors and its committees may use external experts. In implementing the incentive compensation program, the Committee and the Board used the services of Hugessen Consulting, an independent consulting firm recognized for its expertise in the compensation of pension fund personnel. The Committee takes Hugessen Consulting’s recommendations into account but makes its own decisions, which may be based on information other than the firm’s recommendations.
COMPENSATION POLICY
Committee’s work on compensationDuring 2013, with advice from Hugessen Consulting, the Committee ensured that the compensation policy adopted in 2010 would meet its strategic objectives of paying for long-term performance, offering competitive compensation and linking the interests of officers and depositors. The Committee reviewed how La Caisse’s compensation policy was applied; it analyzed the proposed incentive compensation and proposals for imple-mentation of co-investment and ensured that the proposals were aligned with the compensation policy and market practices.
Accordingly, the Committee analyzed and recommended to the Board for approval the amount of incentive compensation to be paid under the incentive compensation program.
The Committee also received an update on compensation market trends with regard to salary reviews. It discussed the salary conditions of La Caisse’s employees in 2013 and recom-mended them to the Board for approval.
FrameworkLa Caisse’s compensation policy was adopted in accordance with Schedule A of the regulation governing the internal management of La Caisse (the Internal Bylaw). This schedule was revised by an order in council in 1996 and:
• defines the maximum levels of employee total compensation and the reference markets;
• states that the data reflecting the reference-market profile must be compiled by a recognized independent firm through an annual survey and must be administered and analyzed according to a methodology and rules generally accepted in the field; and
• stipulates that La Caisse’s payroll must not exceed 100% of the midpoint of the salary scales.
Reference markets and compensation levels1
For the position of President and Chief Executive Officer, the reference market consists of a sample of eight large Canadian pension funds, as listed in Table 45 (p. 100). For this position, total compensation must be between the median and third quartile (75th percentile) of the reference market, depending on whether La Caisse’s performance is average or superior.
For investment-related positions, the Canadian institutional investment market serves as the reference. A representative sample must include institutions, insurance companies, trust companies, pension funds, investment advisers, brokerage firms and fund managers or their counterparts in similar indus-tries. The current sample comprises the 42 organizations listed in Table 43 (p. 99). For these positions, total compensation must fall within the upper decile of the reference market.
1. For compensation purposes, the first quartile ranges from the 1st to the 25th percentile, the second quartile ranges from the 26th to the 50th percentile, the third quartile ranges from the 51st to the 75th percentile and the fourth quartile ranges from the 76th to the 100th percentile.

CAISSE DE DÉPÔT ET PLACEMENT DU QUÉBEC AR 2013 91
For non-investment positions, the Québec market serves as the reference, which must include public-sector jobs. It therefore contains a representative sample of large public- and private-sector Québec firms and financial-sector companies. The current sample comprises the 55 organizations listed in Table 44 (p. 100). For these positions, total compensation must be within the third quartile of the reference market.
In 2013, La Caisse retained the services of Towers Watson for benchmarking of its reference markets. The selection criteria used to determine the companies in the reference markets include size, industry and companies that recruit talent similar to the profiles sought by La Caisse, that offer innovative and diverse investment products, that are recognized for best practices in human resources, that have a performance-driven culture and that are included in the Towers Watson database.
Strategic objectives of the compensation policyLa Caisse relies on highly skilled employees to fulfill its mission, which is to receive moneys on deposit as provided by law and manage them with a view to achieving an optimal return on capital within the framework of its depositors’ investment policies while contributing to Québec’s economic development.
The total compensation policy therefore has the following three objectives:
1. Pay for performance: Incentive compensation proportional to the returns delivered to depositors. This goal has four key components:
• Long-term focus: compensate consistent performance over many years;
• Risk-return balance: encourage measured risk-taking conducive to sustainable, long-term returns for depositors, taking into account their risk tolerance;
• Overall evaluation: strike a balance between individual contribution, portfolio returns and Caisse performance;
• Emphasis on La Caisse’s overall perspective: place greater emphasis on employees’ contributions to La Caisse’s strategic priorities and overall performance, with more focus on leadership and desired behaviours.
2. Offer competitive compensation: Attract, motivate and retain employees with experience and expertise that will allow La Caisse to attain its strategic objectives, within the guide-lines in the Internal Bylaw, as described above.
3. Link the interests of officers and depositors: Ensure that their individual and team efforts are conducive to La Caisse’s long-term success.
La Caisse’s incentive compensation policies comply with the Principles for Sound Compensation Practices issued by the Financial Stability Forum (FSF) and endorsed by the G20 nations: effective compensation governance; alignment of compensa-tion with long-term, measured risk-taking; and regular review of compensation practices.
Components of total compensationLa Caisse’s employees receive total compensation based on four components:
1. Base salary2. Incentive compensation3. Pension plan4. Benefits

CAISSE DE DÉPÔT ET PLACEMENT DU QUÉBEC AR 2013 92
Report of the Human Resources Committee
Base salaryUnder the Internal Bylaw, the average base salary must not exceed the midpoint of the salary scales. Within these para- meters, annual base salaries are set according to the salary conditions prevailing on the reference markets.
Each year, the Human Resources Committee submits the payroll budget to the Board for approval.
For 2013, the Board of Directors approved the following recom-mendations made by Caisse senior management so as to:
• maintain salary scales near the median of the benchmark markets, as measured by recognized external firms; and
• provide a budget for merit pay increases that is below the median of the forecast market increases.
Incentive compensationIn the investment industry, incentive compensation is an essential part of the total compensation package for employees because it aligns their financial incentives with clients’ target returns.
Incentive compensation at La Caisse serves to recognize performance, attainment of objectives and contribution to the achievement of strategic orientations. Incentive compensation is an important part of total compensation, so it directly influ-ences the total compensation level and its position relative to the reference market.
The incentive compensation program, introduced in 2010, recog-nizes consistent performance over a four-year period with incentive compensation and allows a portion of this incentive compensation to be deferred into a co-investment account over a three-year period (see page 95). This mechanism links the interests of officers and depositors by varying these amounts according to the absolute return generated for depositors.
Components of performance incentive compensationPerformance incentive compensation is never guaranteed; it depends on evaluations of performance criteria as established by the incentive compensation program. Accordingly, employees receive performance incentive compensation based on the three components outlined in Figure 39.
3740
01_T
able
aux
RA
-AN
V8
14/
04/2
014
PAG
E 53
FIGURE 39
PERFORMANCE INCENTIVE COMPONENTS
BASED ON ACHIEVEMENT OF INDIVIDUAL OBJECTIVES Individual contribution
BASED ON ACHIEVEMENT OF BUSINESS OBJECTIVES OR RETURNS ON THE SPECIALIZED PORTFOLIOS OF EACH UNIT
Portfolio return or business plan achievement
BASED ON ACHIEVEMENT OFLA CAISSE’S TARGET RETURNS Caisse overall return

CAISSE DE DÉPÔT ET PLACEMENT DU QUÉBEC AR 2013 93
Achievements since 2010In the four-year period from 2010 to 2013, La Caisse achieved a 10.0% annualized net return, generating $61.2 billion in net investment results despite an uncertain and volatile economic environment.
• This return exceeded that of its benchmark portfolio, which was 8.8%. The difference represents $6.0 billion of value added.
• Over four years, each asset class contributed significantly to La Caisse’s overall return.
• In this period, La Caisse surpassed its depositors’ long-term objectives by a wide margin.
In 2013, La Caisse generated a 13.1% return, representing $22.8 billion in net investment results:
• This return exceeded that of its benchmark portfolio, which was 12.6%, and represents $851.0 million of value added.
• Depositors’ net assets stood at $200.1 billion at year-end.
• Fifteen of the 17 specialized portfolios posted positive results.
In 2013, La Caisse continued to implement the key strategic objectives of its business plan, including:
Increased presence of La Caisse in QuébecIn the past four years, La Caisse increased its assets in Québec through new investments and commitments and undertook several initiatives to strengthen its involvement with entrepreneurs.
– La Caisse’s assets in Québec rose by $20.3 billion, to $53.8 billion as at December 31, 2013, with $32.5 billion invested in the private sector.
– La Caisse’s new investments and commitments for Québec companies totalled $10.3 billion.
– La Caisse implemented a three-pronged development strategy for Québec:
1. Seek out and seize the best business and investment opportunities;
2. Serve as a bridge between Québec companies and global markets;
3. Strengthen the vitality of entrepreneurship and the next generation of financial leaders.
To implement its development strategy for Québec, in 2013 La Caisse:
– made new investments and commitments totalling $3.6 billion, including $600 million of new commitments to Québec SMEs;
– took part in more than 125 activities to develop relation-ships with the business community and Québec companies; and
– provided commercial mortgage loans totalling $1.1 billion.
Implementation of its investment strategyAbsolute-return management
– Launch of the Global Quality Equity portfolio early in 2013. This absolute-return management portfolio focuses on quality equities with more stable returns over the long term and with less risk, in line with the depositors’ risk- return profiles.
– At the end of 2013, the portfolio had $17.2 billion in assets under management, representing 8.6% of La Caisse’s overall portfolio.
– In 2013, the Global Quality Equity portfolio had a one-year return of 32.4%.
Less-liquid assets
– Continued application of the private equity, infrastructure and real estate investment strategy. A total of $9.6 billion was invested in these less-liquid assets in 2013.
– Infrastructure investment in the Port of Brisbane, Australia.
– Energy investment in around 15 wind farms in Québec, elsewhere in Canada, the United States and the North Sea.

CAISSE DE DÉPÔT ET PLACEMENT DU QUÉBEC AR 2013 94
Report of the Human Resources Committee
– Acquisition of AIMCo’s 50% interest in Place Ville Marie, enabling Ivanhoé Cambridge to become the sole owner of the landmark building in downtown Montréal.
– Stronger presence of Ivanhoé Cambridge in the United States with the acquisition of an interest in a building in New York, the acquisition of office towers in Chicago and the launch of that city’s largest real estate project of the past five years.
– Strategic repositioning of the real estate portfolio in Europe with a focus on certain markets, in particular London and Paris.
Emerging markets and in-depth expertise
– During the year, La Caisse strengthened its research teams and significantly enhanced its emerging markets expertise.
o Appointment of the Executive Vice-President, Emerging Markets.
o Creation of a team to develop an investment strategy for these markets, to be implemented gradually between 2013 and 2018.
– Beginning in July 2013, active external management was introduced for the Emerging Markets Equity portfolio to capitalize on the growth potential in these countries.
Deepening our knowledge to manage risk more effectively
– Maintained a fine balance between risk and return, particularly by:
o reducing the overall portfolio’s absolute risk and active risk; and
o maintaining a robust level of liquidity.
– Implemented an absolute risk management framework, consistent with changes in the overall portfolio.
Ability to research and analyze economic and financial trends
– In recent years, particular attention has been paid to bolstering research capacities: recruiting employees with operational and sectoral expertise (geology, health care, mechanical engineering, etc.) and creating a research program to develop comprehensive expertise and enhance investment decision making.
Management of the overall portfolio and changes in the offering to depositors
In recent years, La Caisse has refocused its investment stra- tegies on core activities and made extensive changes to the portfolio offering to make it more flexible and better adapted to depositors’ needs. It has also strengthened its advisory services and reporting to depositors, and implemented new collaborative mechanisms.
The comments collected from depositors in 2013 demonstrate a high level of satisfaction with La Caisse’s management of the overall portfolio and the changes in its offering.
Simplification and optimizationIn recent years, La Caisse has implemented a new operational business model focused on the client and on efficiency.
In 2013, La Caisse:
– continued its efforts to improve efficiency, with the ratio of expenses to average net assets falling to 17.0 cents per $100 of average net assets, versus 17.9 cents in 2012, and again placing La Caisse among the leaders in its category;
– deployed strategic initiatives to improve operational agility, data management, portfolio rebalancing and the procure-ment cycle, particularly by:
o simplifying operations, processes and systems by upgrading the operational chain and migrating to new technological solutions;
o developing data management by implementing governance that ensures data access, integrity and completeness; and
o implementing a new application that rebalances portfolios; and
– introduced an internal organizational health measure and launched strategic initiatives to improve it.

CAISSE DE DÉPÔT ET PLACEMENT DU QUÉBEC AR 2013 95
2013 performance incentive compensationTaking into account incentive compensation paid and deferred, employees’ total compensation in 2013 was below the median of the reference markets, for an annualized net return of 10.0% over the four-year period from 2010 to 2013. This return represents $6.0 billion in value added, over and above the benchmark portfolio, for superior performance over four years.
More specifically, a study by Towers Watson showed that employees’ total compensation ranked between the 24th and 78th percentiles (where the 100th percentile represents the highest compensation in the market) in the reference markets, depending on the position type, the specific performance of the portfolios and the compensation paid for these posi- tions (see Table 40). In comparison with 2010, the amount of incentive compensation in relation to La Caisse’s net assets has decreased slightly.
The opinion presented by Hugessen Consulting to La Caisse’s Board of Directors stated:
“We reviewed La Caisse’s returns and benchmark indexes for 2013, as well as the factors that contributed to its return, and we are satisfied with them. We can confirm, among other things, that the value-added calculations, the 2013 return multiples, the 2010-2013 average return multiples and the 2013 incentive compensation multiples are consistent with La Caisse’s incentive compensation program. In our opinion, the total amount of incentive compensation awarded under the program in 2013 is reasonable in the prevailing market conditions and given La Caisse’s performance in 2010, 2011, 2012 and 2013.”
Co-investment: deferred performance incentive compensationThe purpose of co-investment is to better align the interests of those employees with the most influence on La Caisse’s organizational and financial performance with the interests of depositors over the long term. The value of the deferred and co-invested performance incentive amounts will vary – upward or downward – along with La Caisse’s average absolute overall return during the incentive deferral period.
At the end of each three-year period, the deferred amount, plus or minus the average return credited for the period, will be paid to each participant as a deferred incentive payment with restric-tions. Figure 41, on page 96, illustrates this mechanism.
Members of the Executive Committee have three years to contribute at least the equivalent of their base salary to the co-invest ment account.
3740
01_T
able
aux
RA
-AN
V7
7/0
4/20
14
P
AG
E 54
TABLE 40
POSITIONING OF TOTAL COMPENSATION BY POSITION TYPE
Position typeMaximum total compensation under the Bylaw1
Average positioning of the total compensation paid in 2013 relative to reference markets under the Bylaw
Investment positions 90th percentile Between the 24th and 78th percentile On average, 39th percentileNon-investment positions 75th percentile
1. Maximum total compensation refers to percentile positions found in Schedule A of the Internal Bylaw, revised by government decree in 1996.

CAISSE DE DÉPÔT ET PLACEMENT DU QUÉBEC AR 2013 96
Report of the Human Resources Committee
Changes made in 2013In line with best practices for incentive compensation in the financial sector, to achieve a better alignment with absolute- return objectives over time, an increase was applied to the minimum co-investment threshold, beginning in 2013.
For the President and Chief Executive Officer, as well as members of senior management, the minimum threshold of the total incentive compensation that must be deferred in a co-investment account was raised from 40% to 55%. For all the vice-presidents and senior vice-presidents as well as for inter-mediate and senior investment employees, the minimum threshold was increased from 25% to 35%.
Since 2011, La Caisse has offered such employees the option of deferring and co-investing an additional portion of their incen- tive compensation into a co-investment account. In relation to 2012, the new mandatory minimums and voluntary participation increased the deferred and co-invested amounts by almost 30%.
Pension planDepending on their positions, all employees are members of and contribute to one of two defined-benefit pension plans: the Government and Public Employees Retirement Plan or the Pension Plan of Management Personnel (PPMP). In addition, managers and professionals in strategic positions participate in the Régime additionnel de retraite (RAR) and members of senior management participate in the Supplemental Pension Plan for Designated Officers (RSRCD). Under both plans, they
are entitled, after the normal age of retirement, to receive a total annual pension equal to 2% of their eligible earnings for each year or fractional year of plan membership, taking into account the annual tax limits imposed by the Canada Revenue Agency for each year they were not RAR or RSRCD members.
Some executives will have additional years of service recognized under the RSRCD, depending on the circumstances of their hiring or promotion.
BenefitsEmployees enjoy a range of competitive benefits, including group insurance (such as medical, dental and life insurance). Moreover, senior executives benefit from perquisites that mainly cover the costs associated with car allowances. La Caisse also requires members of senior management to undergo annual health checkups.
Review of the President and Chief Executive Officer’s performance and total compensation
Performance reviewEarly in 2013, the Committee recommended to the Board for review and approval a series of non-financial individual obje ctives proposed by the President and Chief Executive Officer. This series of major business objectives was aimed at achieving targets aligned with La Caisse’s strategy and business plan.
3740
01_T
able
aux
RA
-AN
V8
9/0
4/20
14
P
AG
E 55
FIGURE 41
DEFERRED AND CO-INVESTED PERFORMANCE INCENTIVES
YEAR 1 YEAR 2 YEAR 3 YEAR 4 YEAR 5 YEAR 6
Deferred amount
Payment+/- performance
Deferred amount
Payment+/- performance
Deferred amount
Payment+/- performance

CAISSE DE DÉPÔT ET PLACEMENT DU QUÉBEC AR 2013 97
The Human Resources Committee evaluated the implemen-tation of the investment strategies, La Caisse’s increased presence in Québec, its management of the overall portfolio, its changes to the offering to depositors and its simplification and optimization of operations.
The Committee also received a summary of feedback provided by the members of the Executive Committee to the Chairman of the Board.
At the end of this process, a report was submitted to the Board of Directors stating that the Committee was fully satisfied with the performance of the President and Chief Executive Officer, who had not only attained the objectives he had been given but had also exceeded them by a wide margin. The Board deemed his performance remarkable.
Review of total compensationThe compensation and the other employment conditions of the President and Chief Executive Officer are based on parameters set by the government after consultation with the Board of Directors.
In accordance with his request, Mr. Sabia has received no salary increase since he was appointed in 2009. In 2013, Mr. Sabia’s base salary was unchanged at $500,000.
In 2013, no deferred incentive compensation was paid to Mr. Sabia for 2010, because he had voluntarily waived any incentive compensation for 2009 and 2010.
The President and Chief Executive Officer’s annual incentive compensation was determined on the basis of the three components presented in Figure 42.
This year, the component linked to La Caisse’s overall return corresponds to the return over the four-year period from 2010 to 2013. The net annualized return for this period is 10.0%, with $6.0 billion of value added over and above the benchmark portfolio. This return represents a superior performance over four years.
As for the component based on the organization’s objectives, in the past four years under Mr. Sabia’s leadership, La Caisse:
• completely repositioned its investment strategy to generate solid returns in line with depositors’ needs;
• re-established with its depositors a relationship based on constructive collaboration and trust;
• significantly enhanced its risk management, in terms of expertise, methodologies and tools;
• strengthened its presence in Québec through a strategy that led to $10.3 billion in new investments and commitments over four years, and $11.9 billion since 2009; and
• simplified and greatly improved its operational efficiency.
3740
01_T
able
aux
RA
-AN
V7
7/0
4/20
14
P
AG
E 56
FIGURE 42
PERFORMANCE INCENTIVE COMPONENTS OF THE PRESIDENT AND CHIEF EXECUTIVE OFFICER
CAISSE OVERALL RETURN Based on the level of attainment of La Caisse’s return objectives
ACHIEVEMENT OF THE ORGANIZATION’S OBJECTIVES Based on the level of attainment of the organization’s objectives
INDIVIDUAL CONTRIBUTION Based on the level of attainment of individual objectives

CAISSE DE DÉPÔT ET PLACEMENT DU QUÉBEC AR 2013 98
Report of the Human Resources Committee
In terms of his individual contribution, Mr. Sabia’s strong leadership engaged and mobilized La Caisse’s teams around a shared vision and objectives so as to strengthen the organizational culture.
The Committee and the Board of Directors are of the opinion that Mr. Sabia performed exceptionally well in the past four years, exceeding his objectives by a wide margin.
Like all other members of senior management covered by the incentive compensation program, the President and Chief Executive Officer is required to defer a minimum of 55% of his incentive compensation in a co-investment account. For his having achieved the annual objectives, the Board of Directors granted Mr. Sabia $600,000 of incentive compensation, and he elected to defer an amount of $800,000 to the co-investment account. In 2016, Mr. Sabia will be eligible to receive the deferred incentive compensation related to this amount, increased or decreased according to La Caisse’s average absolute return over the three-year period, between 2014 and 2016.
The other employment conditions to which Mr. Sabia is entitled are aligned with La Caisse’s policies and comply with the para meters set out in the Internal Bylaw. He receives $40,000 in annual perquisites and is a member of La Caisse’s Employee Group Insurance Plan.
When he was appointed in 2009, Mr. Sabia waived membership in any pension plan. He also waived any severance pay, regard-less of cause. Even so, given that membership in the basic pension plan is mandatory under the provisions of the Pension Plan of Management Personnel (under CARRA rules), Mr. Sabia is obliged to be a member despite his waiver. In 2013, contribu-tions to the mandatory basic plan represented an annual cost of $16,585 to La Caisse.
In 2013, the direct compensation paid to the President and Chief Executive Officer was 69% lower than the maximum direct compensation paid for a superior performance by the reference market, which is made up of his peers at eight large Canadian pension funds. For a superior performance, there is a difference of about $2.6 million between the direct compensation paid to the President and Chief Executive Officer and the direct compensation paid in the reference market (see Table 49, p. 104).
There are three reasons for this difference. First, at the begin-ning of his first mandate, Mr. Sabia proposed that his potential incentive compensation be reduced. Second, the incentive compensation program provides for the application of limits on La Caisse’s return recognized for the purposes of deter-mining incentive compensation. Third, in 2013 no deferred incentive compensation was paid to Mr. Sabia for 2010, because he had voluntarily waived any incentive compensation for 2009 and 2010.
Compensation of the President and Chief Executive Officer and the five most highly compensated executives for 2011-2013La Caisse’s Board of Directors recognizes the importance of quality leadership and firmly believes that the policies and programs it has endorsed make it possible to:
• offer competitive compensation in a market where competi-tion for talent is intense and where La Caisse must compete in globally to generate the expected returns; and
• achieve the strategic objectives that enable La Caisse to fulfill its mission.
Pursuant to the Act respecting the Caisse de dépôt et placement du Québec, La Caisse discloses below, for itself and its wholly owned subsidiaries, the compensation of the President and Chief Executive Officer as well as that of the five most highly compensated executives reporting directly to him (see Table 46, p. 101).

AR 2013 99CAISSE DE DÉPÔT ET PLACEMENT DU QUÉBEC
3740
01_T
able
aux
RA
-AN
V7
7/0
4/20
14
P
AG
E 57
TABLE 43
REFERENCE MARKET – INVESTMENT POSITIONS
• Addenda Capital• AEGON Fund Management• Air Canada• Alberta Investment Management
Corporation• Alberta Teacher’s Retirement
Fund Board• ATB Financial• BIMCOR• British Columbia Investment
Management Corporation• Canadian Broadcasting
Corporation• CN Investment Division• Connor, Clark & Lunn
Financial Group• CPP Investment Board• Desjardins Asset Management• Greystone Managed Investments• Halifax Regional Municipality
Pension Plan
• Healthcare of Ontario Pension Plan (HOOPP)
• Hydro-Québec• HSBC Global Asset
Management Canada• Industrial Alliance Insurance
and Financial Services• Insurance Corporation
of British Columbia• Intact Investment Management• Lucie and André Chagnon
Foundation• Matrix Asset Management• Mawer Investment Management• MD Physician Services• Montreal Police Benevolent
& Pension Association• Montrusco Bolton Investments• New Brunswick Investment
Management Corporation• Nova Scotia, Department
of Finance (LMTS)
• Ontario Teachers’ Pension Plan (OTPP)
• Ontario Pension Board• OPSEU Pension Trust• Pembroke Management• Sun Life Financial• Telus Communication• The CAAT Pension Plan• The Canadian Medical
Protective Association• The Civil Service
Superannuation Board• The Great-West Life
Assurance Company• The Public Sector Pension
Investments Board (PSP Investments)
• Worker’s Compensation Board of Alberta
• Workplace Safety and Insurance Board (Ontario)

CAISSE DE DÉPÔT ET PLACEMENT DU QUÉBEC AR 2013 100
Report of the Human Resources Committee
3740
01_T
able
aux
RA
-AN
V8
14/
04/2
014
PAG
E 58
TABLE 44
REFERENCE MARKET – NON-INVESTMENT POSITIONS
• Addenda Capital• Agropur Cooperative• Aimia• Air Canada• Alcoa Canada• AstraZeneca Canada• Bank of Montreal• BCE• Bell Aliant
Regional Communications• BIMCOR• Bombardier• Bombardier Aerospace• Canadian Broadcasting Corporation• Canadian National Railway Company• Cirque du soleil• CN Investment Division• COGECO• Desjardins Group• Ericsson Canada• Gaz Métro
• General Electric Canada• GLV Group• Hydro-Québec• IBM Canada• Intact Financial Corporation • Intact Investment Management• Kruger• La Coop fédérée• Lassonde Industries• L’Oréal Canada• Loto-Québec• McKesson Canada• Microsoft Canada• Molson Coors Canada• Montrusco Bolton Investments• Northbridge Financial Corporation• Power Corporation of Canada• Quebecor• Resolute Forest Products• RGA Canada Reinsurance Group
of America
• Rio Tinto Alcan• SGI Canada• SNC-Lavalin Group• Square Victoria
Communications Group• Telus Communication• Tembec• The Cadillac Fairview Corporation• The CSL Group• The Great-West Life
Assurance Company• The Public Sector
Pension Investment Board (PSP Investments)
• TMX Group• Valero Energy• VIA Rail Canada• Videotron• Yellow Media
3740
01_T
able
aux
RA
-AN
V7
7/0
4/20
14
P
AG
E 59
TABLE 45
REFERENCE MARKET – PRESIDENT AND CHIEF EXECUTIVE OFFICER
• Alberta Investment Management Corporation
• BIMCOR• British Columbia Investment
Management Corporation
• CPP Investment Board• Healthcare of Ontario Pension
Plan (HOOPP)• Ontario Municipal Employees
Retirement System (OMERS)
• Ontario Teachers’ Pension Plan (OTPP)
• The Public Sector Pension Investment Board (PSP Investments)
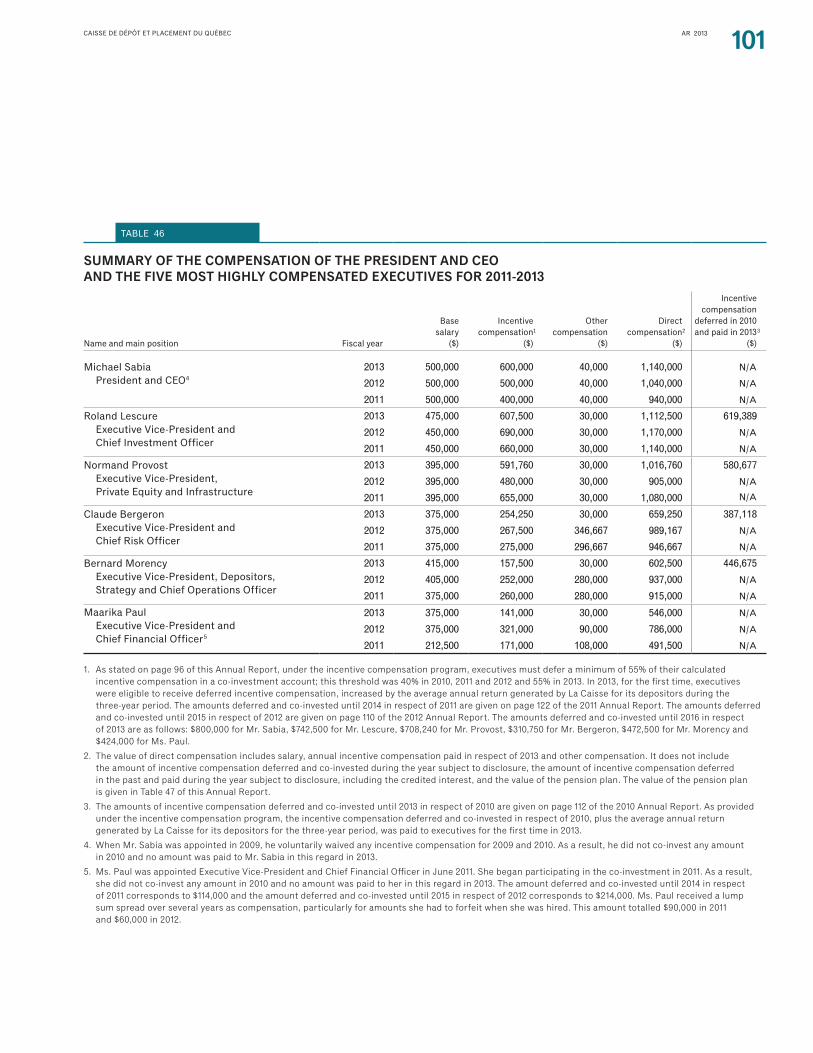
AR 2013 101CAISSE DE DÉPÔT ET PLACEMENT DU QUÉBEC
3740
01_T
able
aux
RA
-AN
V8
14/
04/2
014
PAG
E 60
TABLE 46
SUMMARY OF THE COMPENSATION OF THE PRESIDENT AND CEO AND THE FIVE MOST HIGHLY COMPENSATED EXECUTIVES FOR 2011-2013
Name and main position Fiscal year
Basesalary
($)
Incentive compensation
($)
Other compensation
($)
Direct compensation
($)
Incentive compensation
deferred in 2010 and paid in 2013
($)
Michael Sabia President and CEO4
2013 500,000 600,000 40,000 1,140,000 N/A
2012 500,000 500,000 40,000 1,040,000 N/A
2011 500,000 400,000 40,000 940,000 N/A
Roland Lescure Executive Vice-President and Chief Investment Officer
2013 475,000 607,500 30,000 1,112,500 619,389
2012 450,000 690,000 30,000 1,170,000 N/A
2011 450,000 660,000 30,000 1,140,000 N/A
Normand Provost Executive Vice-President, Private Equity and Infrastructure
2013 395,000 591,760 30,000 1,016,760 580,677
2012 395,000 480,000 30,000 905,000 N/A
2011 395,000 655,000 30,000 1,080,000 N/A
Claude Bergeron Executive Vice-President and Chief Risk Officer
2013 375,000 254,250 30,000 659,250 387,118
2012 375,000 267,500 346,667 989,167 N/A
2011 375,000 275,000 296,667 946,667 N/A
Bernard Morency Executive Vice-President, Depositors,
Strategy and Chief Operations Officer
2013 415,000 157,500 30,000 602,500 446,675
2012 405,000 252,000 280,000 937,000 N/A
2011 375,000 260,000 280,000 915,000 N/A
Maarika Paul Executive Vice-President and Chief Financial Officer5
2013 375,000 141,000 30,000 546,000 N/A
2012 375,000 321,000 90,000 786,000 N/A
2011 212,500 171,000 108,000 491,500 N/A
1. As stated on page 96 of this Annual Report, under the incentive compensation program, executives must defer a minimum of 55% of their calculated incentive compensation in a co-investment account; this threshold was 40% in 2010, 2011 and 2012 and 55% in 2013. In 2013, for the first time, executives were eligible to receive deferred incentive compensation, increased by the average annual return generated by La Caisse for its depositors during the three-year period. The amounts deferred and co-invested until 2014 in respect of 2011 are given on page 122 of the 2011 Annual Report. The amounts deferred and co-invested until 2015 in respect of 2012 are given on page 110 of the 2012 Annual Report. The amounts deferred and co-invested until 2016 in respect of 2013 are as follows: $800,000 for Mr. Sabia, $742,500 for Mr. Lescure, $708,240 for Mr. Provost, $310,750 for Mr. Bergeron, $472,500 for Mr. Morency and $424,000 for Ms. Paul.
2. The value of direct compensation includes salary, annual incentive compensation paid in respect of 2013 and other compensation. It does not include the amount of incentive compensation deferred and co-invested during the year subject to disclosure, the amount of incentive compensation deferred in the past and paid during the year subject to disclosure, including the credited interest, and the value of the pension plan. The value of the pension plan is given in Table 47 of this Annual Report.
3. The amounts of incentive compensation deferred and co-invested until 2013 in respect of 2010 are given on page 112 of the 2010 Annual Report. As provided under the incentive compensation program, the incentive compensation deferred and co-invested in respect of 2010, plus the average annual return generated by La Caisse for its depositors for the three-year period, was paid to executives for the first time in 2013.
4. When Mr. Sabia was appointed in 2009, he voluntarily waived any incentive compensation for 2009 and 2010. As a result, he did not co-invest any amount in 2010 and no amount was paid to Mr. Sabia in this regard in 2013.
5. Ms. Paul was appointed Executive Vice-President and Chief Financial Officer in June 2011. She began participating in the co-investment in 2011. As a result, she did not co-invest any amount in 2010 and no amount was paid to her in this regard in 2013. The amount deferred and co-invested until 2014 in respect of 2011 corresponds to $114,000 and the amount deferred and co-invested until 2015 in respect of 2012 corresponds to $214,000. Ms. Paul received a lump sum spread over several years as compensation, particularly for amounts she had to forfeit when she was hired. This amount totalled $90,000 in 2011 and $60,000 in 2012.
1 2 3

CAISSE DE DÉPÔT ET PLACEMENT DU QUÉBEC AR 2013 102
Report of the Human Resources Committee
3740
01_T
able
aux
RA
-AN
V8
14/
04/2
014
PAG
E 61
TABLE 47
PENSION SUMMARY OF THE PRESIDENT AND CEO AND THE FIVE MOST HIGHLY COMPENSATED EXECUTIVES
Name and main position
Years of credited service
Accrued obligation at start of year
($)
Change due to
compensatory items
($)
Change due to non-
compensatory items
($)
Accrued obligation at
year-end($)
Annual benefits($)
At year-end At age 65
Michael Sabia President and CEO6 4.8 12,900 25,800 0 0 0 0
Roland Lescure Executive Vice-President and Chief Investment Officer 4.2 161,000 515,900 1,216,400 413,000 (175,200) 1,454,200
Normand Provost Executive Vice-President, Private Equity and Infrastructure 33.6 308,200 404,100 3,102,100 381,600 (443,800) 3,039,900
Claude Bergeron Executive Vice-President and Chief Risk Officer 33.2 223,400 321,200 1,624,500 70,000 (78,500) 1,616,000
Bernard Morency Executive Vice-President, Depositors, Strategy and Chief Operations Officer 4.4 95,000 161,500 1,139,300 322,300 (94,400) 1,367,200
Maarika Paul Executive Vice-President and Chief Financial Officer 2.6 56,500 211,000 372,100 211,300 (39,000) 544,400
1. This is the number of years of credited service in the basic plan.
2. Annual benefits equal the amount of the pension payable under the basic plan and the supplemental plan at year-end or at age 65.
3. The obligations do not include those of the basic plan because employer and employee contributions are remitted to CARRA, which assumes the liability for the benefits. La Caisse’s contribution was $16,585 per executive in 2013.
4. The change due to compensatory items includes the annual cost of pension benefits, base salary changes according to the salary increase assumption used, plan changes and the award of additional years of service.
5. The change due to non-compensatory items includes amounts attributable to interest accrued on the obligation at the beginning of the year, actuarial gains and losses associated with non-compensatory items and changes in actuarial assumptions.
6. When Mr. Sabia was appointed in 2009, he waived membership in any pension plan. Membership in the Pension Plan of Management Personnel is mandatory, however, under CARRA rules, as described on its website at http://www.carra.gouv.qc.ca/ang/regime/rrpe/rrpe_s00.htm.
1
3 4 5 3
2
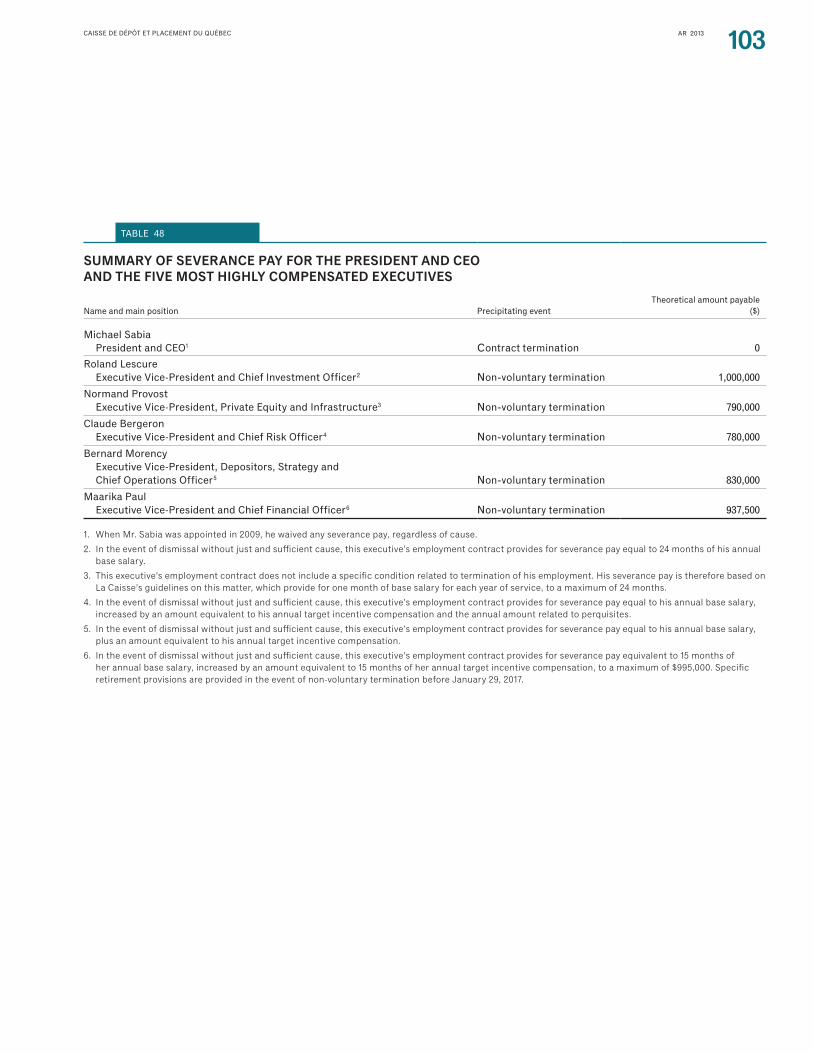
AR 2013 103CAISSE DE DÉPÔT ET PLACEMENT DU QUÉBEC
3740
01_T
able
aux
RA
-AN
V8
14/
04/2
014
PAG
E 62
TABLE 48
SUMMARY OF SEVERANCE PAY FOR THE PRESIDENT AND CEO AND THE FIVE MOST HIGHLY COMPENSATED EXECUTIVES
Name and main position Precipitating eventTheoretical amount payable
($)
Michael Sabia President and CEO1 Contract termination 0
Roland Lescure Executive Vice-President and Chief Investment Officer2 Non-voluntary termination 1,000,000
Normand Provost Executive Vice-President, Private Equity and Infrastructure3 Non-voluntary termination 790,000
Claude Bergeron Executive Vice-President and Chief Risk Officer4 Non-voluntary termination 780,000
Bernard Morency Executive Vice-President, Depositors, Strategy and Chief Operations Officer5 Non-voluntary termination 830,000
Maarika Paul Executive Vice-President and Chief Financial Officer6 Non-voluntary termination 937,500
1. When Mr. Sabia was appointed in 2009, he waived any severance pay, regardless of cause.
2. In the event of dismissal without just and sufficient cause, this executive’s employment contract provides for severance pay equal to 24 months of his annual base salary.
3. This executive’s employment contract does not include a specific condition related to termination of his employment. His severance pay is therefore based on La Caisse’s guidelines on this matter, which provide for one month of base salary for each year of service, to a maximum of 24 months.
4. In the event of dismissal without just and sufficient cause, this executive’s employment contract provides for severance pay equal to his annual base salary, increased by an amount equivalent to his annual target incentive compensation and the annual amount related to perquisites.
5. In the event of dismissal without just and sufficient cause, this executive’s employment contract provides for severance pay equal to his annual base salary, plus an amount equivalent to his annual target incentive compensation.
6. In the event of dismissal without just and sufficient cause, this executive’s employment contract provides for severance pay equivalent to 15 months of her annual base salary, increased by an amount equivalent to 15 months of her annual target incentive compensation, to a maximum of $995,000. Specific retirement provisions are provided in the event of non-voluntary termination before January 29, 2017.

CAISSE DE DÉPÔT ET PLACEMENT DU QUÉBEC AR 2013 104
Report of the Human Resources Committee
3740
01_T
able
aux
RA
-AN
V8
14/
04/2
014
PAG
E 63
TABLE 49
BENCHMARKING OF POTENTIAL MAXIMUM DIRECT COMPENSATION AND CAISSE DIRECT COMPENSATION IN 2013 FOR THE PRESIDENT AND CEO AND THE FIVE MOST HIGHLY COMPENSATED EXECUTIVES1,7
Reference marketsDirect compensation paid Caisse
Position
Maximum compensation
under the Bylaw ($)
For a superior performance
($)
Direct compensation
paid in 2013 ($)
President and CEO5 4,970,200 3,727,650 1,140,000
Executive Vice-President and Chief Investment Officer 4,081,000 3,060,750 1,731,889
Executive Vice-President, Private Equity and Infrastructure 3,131,000 2,348,250 1,597,437
Executive Vice-President and Chief Risk Officer 1,712,000 1,284,000 1,046,368
Executive Vice-President, Depositors, Strategy and Chief Operations Officer N/A N/A 1,049,175
Executive Vice-President and Chief Financial Officer6 1,228,000 921,000 546,000
1. The direct compensation paid in 2013 is aligned with the principle of “earned” compensation, as defined under the Income Tax Act as compensation that is “paid in cash and taxable.”
2. As stipulated in the Internal Bylaw, potential direct compensation at the 75th percentile of the appropriate reference markets was used for the President and Chief Executive Officer and non-investment positions. The 90th percentile of the reference market was used for investment positions. These theoretical amounts exclude the value of pension plans but include the value of perquisites and long-term compensation granted in the past and payable during the year.
3. Direct compensation paid by the reference markets for a superior performance corresponds to about 75% of the maximum direct compensation under the Internal Bylaw.
4. These amounts reflect direct compensation paid in 2013, which does not include deferred and co-invested incentive compensation (see Note 1 in Table 46) and the value of the pension plan, but includes the value of the amounts of incentive compensation deferred in 2010 and paid for the first time in 2013 and the value of perquisites. This compensation was paid for a 10.0% four-year net annualized return (2010, 2011, 2012 and 2013), equivalent to a superior performance.
5. When Mr. Sabia was appointed in 2009, he voluntarily waived any incentive compensation for 2009 and 2010. As a result, he did not co-invest any amount in 2010 and no amount was paid to him in this regard in 2013.
6. Ms. Paul was appointed Executive Vice-President and Chief Financial Officer in June 2011. She began participating in co-investment in 2011. As a result, she did not co-invest any amount in 2010 and no amount was paid to her in this regard in 2013.
7. Towers Watson, Compensation of the President and Chief Executive Officer Study and Compensation of Executive Committee Members Study, Caisse de dépôt et placement du Québec, 2013.
2 3 4

AR 2013 105CAISSE DE DÉPÔT ET PLACEMENT DU QUÉBEC
HIGHLIGHTS
1Recommended the investment policy for the new Active Overlay Strategies portfolio.
2Analyzed and recommended the implementation of a new framework to monitor the market risk of financial instruments and contracts.
3Reviewed the risk-return reports on each specialized portfolio and on La Caisse as a whole.
THE INVESTMENT AND RISK MANAGEMENT COMMITTEE
The Board of Directors established the Investment and Risk Management Committee to help the Audit Committee fulfill its duty to implement a risk management process.
MANDATE
The Committee’s mandate is to establish guidelines and policies for risk management in order to attain an optimal risk-return relationship. For a complete description of the Committee’s mandate, consult the Governance section of the Caisse website ( www.lacaisse.com ).
COMPOSITION (as at December 31, 2013)
• Chair: Jean La Couture
• Members: Elisabetta Bigsby, Patricia Curadeau-Grou, Gilles Godbout and François R. Roy
• Guest member: François Joly, Chair of the Audit Committee
The Chairman of the Board attends the Committee’s meetings.
ACTIVITY REPORT
Number of meetings held in 2013: 9
The Committee used various mechanisms to provide the Audit Committee and the Board with the necessary assurance regarding implementation of a risk management process. The Committee:
• provided oral and written reports on its activities to the Board of Directors after each meeting;
• made copies of the records of its deliberations available to the Audit Committee and the Board; and
• invited the Chair of the Audit Committee to attend each meeting.
The members of the Committee approved the following report.
Report of the Investment andRisk Management Committee

CAISSE DE DÉPÔT ET PLACEMENT DU QUÉBEC AR 2013 106
Report of the Investment and Risk Management Committee
Risk management guidelines and policiesIn 2013, the Committee fulfilled its responsibilities in ways that included the following:
• Examined, at each Committee meeting, risk-return reports for the specialized portfolios of the investment units or for the institution as a whole.
• Analyzed the investment policy for the new Active Overlay Strategies portfolio and recommended that the Board approve it.
• Reviewed the specialized portfolios’ investment policies to ensure optimal management of investment and risk activities, such as those involving securities borrowing and lending, and recommended the related changes to the Board of Directors.
• Reviewed the target returns and value-added objectives for the actively managed portfolios and recommended that the Board approve them.
• Analyzed the implementation of a new framework to monitor the market risk of financial instruments and contracts, and recommended that the Board approve it.
• Reviewed the method used to establish a market-risk tolerance threshold for the overall portfolio, as well as for the Infrastructure portfolio, and recommended that the Board approve it.
• Reviewed and monitored La Caisse’s overall strategy for the energy sector and the criteria used to assess investment opportunities in the sector.
• Discussed the process used to manage credit and counterparty risk.
• Reviewed and discussed the report of the internal Operational Risk Committee.
• Analyzed amendments to the Integrated Risk Management Policy and recommended that the Board approve them.
• Reviewed and monitored the Risk group’s business plan.
• Received accountability reports on compliance and internal control.
Investment proposals• Reviewed and recommended investment proposals under
the Board’s authority, considering the analysis submitted by the team responsible for the transaction, the project’s risk analysis and, more specifically, its impact on the risk level and concentration of the specialized portfolio concerned and the institution’s overall portfolio, as well as the investment’s compliance with risk oversight policies and guidelines.
• Discussed the risk-return relationship for each investment proposal submitted to the Committee.
• Received follow-up reports on the investment proposals authorized by the Board as well as investments author - ized by senior management but not falling under the Board’s purview.
• Regularly monitored major investments with a particular impact on the risk level and concentration of the specialized portfolio concerned as well as the overall portfolio.
Depositors• Discussed depositors’ endorsement of La Caisse’s priorities
and strategies for implementing them.
• Analyzed the certificates of compliance with the depositors’ investment policies and the specialized portfolios’ investment policies.
USE OF EXTERNAL EXPERTS
The Investment and Risk Management Committee did not use the services of external experts in 2013.

AR 2013 107CAISSE DE DÉPÔT ET PLACEMENT DU QUÉBEC
Board of Directors and Executive Committee

AR 2013 108CAISSE DE DÉPÔT ET PLACEMENT DU QUÉBEC
Organizational Structure
La Caisse’s Board of Directors consists of the Chairman, President and Chief Executive Officer, depositors’ representa-tives and independent members. The Act respecting the Caisse stipulates that at least two-thirds of the directors, including the Chairman, must be independent.
The Executive Committee is composed of the President and Chief Executive Officer and senior officers from La Caisse’s various sectors. As at December 31, 2013, La Caisse had a total of 838 employees. At this same time, the real estate subsi-diaries, Ivanhoé Cambridge and Otéra Capital, had a total of 1,934 employees.
These subsidiaries operate independently of La Caisse, that is, they are overseen by their own board of directors and managed by separate presidents (see Figure 51, p. 109).
3740
01_T
able
aux
RA
-AN
V8
8/0
4/20
14
P
AG
E 64
Emerging MarketsPrivate Equity and Infrastructure
Investment Management
Fixed Income
Equity Markets
Active Overlay Strategies
Economic Analysis and Asset Allocation Strategies
Depositors and Strategic Initiatives
Risk
Finance
Operations and Information Technology
Talent Management and Organizational Development
Legal Affairs and Secretariat
Public Affairs
Real estate subsidiaries
Ivanhoé Cambridge
Otéra Capital
FIGURE 50
ORGANIZATIONAL STRUCTURE – CAISSE(as at December 31, 2013)
Executive Committee
CHAIRMAN
PRESIDENT AND CHIEF EXECUTIVE OFFICER
BOARD OF DIRECTORS
Internal Audit
Human Resources Committee
Governance and Ethics Committee
Audit Committee
Investment and Risk Management Committee

CAISSE DE DÉPÔT ET PLACEMENT DU QUÉBEC AR 2013 109
REAL ESTATE
Real estate investments, which take the form of equity and debt, involve primarily shopping centres, office buildings and multiresidential properties in Canada, the United States, Europe, Brazil and Asia. The holdings are divided into two specialized portfolios: Real Estate and Real Estate Debt.
The Real Estate portfolio consists of the assets of Ivanhoé Cambridge, a world-class real estate company that leverages its high-level expertise in all areas of real estate, including investment, development, leasing, asset management and operations. Ivanhoé Cambridge’s real estate portfolio holds mainly shopping centres, office buildings and multiresidential properties.
The Real Estate Debt portfolio consists of the holdings of Otéra Capital, one of the largest commercial real estate financing companies in Canada. Otéra Capital manages a portfolio comprised mainly of senior Canadian commercial mortgages.
Figure 51 presents the organizational structure of the real estate operations and La Caisse’s percentage of interests in the subsidiaries Ivanhoé Cambridge and Otéra Capital.
For more information on the real estate subsidiaries, visit www.ivanhoecambridge.com and www.oteracapital.com.
3740
01_T
able
aux
RA
-AN
V7
7/0
4/20
14
P
AG
E 65
FIGURE 51
ORGANIZATIONAL STRUCTURE – REAL ESTATE SUBSIDIARIES(as at December 31, 2013)
REAL ESTATE
BOARD OF DIRECTORSIvanhoé Cambridge
BOARD OF DIRECTORS Otéra Capital
IVANHOÉ CAMBRIDGE 1
(subsidiary – 93.3%)OTÉRA CAPITAL2
(subsidiary – 97.5%)
ANCAR IVANHOEBrazil
MCAP
1. Daniel Fournier, Chairman and Chief Executive Officer, Ivanhoé Cambridge
2. Alfonso Graceffa, President and Chief Executive Officer, Otéra Capital Raymond McManus, Chairman, Otéra Capital

AR 2013 110CAISSE DE DÉPÔT ET PLACEMENT DU QUÉBEC
ROBERT TESSIERChairman of the Board of Directors
Committees: Governance and Ethics / Human Resources Board member since March 2009
ELISABETTA BIGSBYCorporate Director
Committees: Human Resources / Investment and Risk Management Board member since November 2009
LOUISE CHARETTECorporate Director
Committees: Governance and Ethics / Audit Board member since May 2005
PATRICIA CURADEAU-GROUStrategic Adviser to the President and Chief Executive Officer National Bank of Canada
Committee: Investment and Risk Management Board member since October 2013
MICHÈLE DESJARDINSPresident Koby Consulting and Senior Associate Lansberg Gersick & Associates LLC
Committees: Governance and Ethics / Human Resources Board member since December 2009
RITA DIONNE-MARSOLAISEconomist and Corporate Director
Committees: Governance and Ethics / Audit Board member since January 2013
GILLES GODBOUTCorporate Director
Committees: Investment and Risk Management / Audit Board member since January 2013
DENYS JEANPresident and Chief Executive Officer Régie des rentes du Québec
Board member since September 2011
FRANÇOIS JOLYCorporate Director
Committees: Audit / Human Resources / Investment and Risk Management Board member since March 2013
JEAN LA COUTURECorporate Director President, Huis Clos Ltée, Gestion et médiation
Committee: Investment and Risk Management Board member since January 2013
FRANÇOIS R. ROYCorporate Director
Committees: Investment and Risk Management / Audit Board member since December 2009
MICHAEL SABIAPresident and Chief Executive Officer Caisse de dépôt et placement du Québec
Board member since March 2009
OUMA SANANIKONECorporate Director
Committees: Governance and Ethics / Human Resources Board member since August 2007
Board of Directors
To consult the biographies of the members of the Board of Directors, please visit the Governance section of the Caisse website at www.lacaisse.com.

CAISSE DE DÉPÔT ET PLACEMENT DU QUÉBEC AR 2013 111
CLAUDE BERGERONExecutive Vice-President and Chief Risk Officer
MICHÈLE BOISVERTExecutive Vice-President Public Affairs
FRÉDÉRICK CHARETTEExecutive Vice-President Talent Management and Organizational Development
MARC CORMIERExecutive Vice-President Fixed Income and Active Overlay Strategies
DANIEL FOURNIERChairman and Chief Executive Officer Ivanhoé Cambridge
MARIE GIGUÈREExecutive Vice-President Legal Affairs and Secretariat
JEAN-LUC GRAVELExecutive Vice-President Equity Markets
ROLAND LESCUREExecutive Vice-President and Chief Investment Officer
PIERRE MIRONExecutive Vice-President Operations and Information Technology
BERNARD MORENCYExecutive Vice-President Depositors, Strategy and Chief Operations Officer
MAARIKA PAULExecutive Vice-President and Chief Financial Officer
NORMAND PROVOSTExecutive Vice-President Private Equity and Infrastructure
MICHAEL SABIAPresident and Chief Executive Officer
Executive Committee
To consult the biographies of the members of the Executive Committee, please visit the Governance section of the Caisse website at www.lacaisse.com.

CAISSE DE DÉPÔT ET PLACEMENT DU QUÉBEC AR 2013 112

AR 2013 113CAISSE DE DÉPÔT ET PLACEMENT DU QUÉBEC
Financial Report

AR 2013 114CAISSE DE DÉPÔT ET PLACEMENT DU QUÉBEC
Changes in Assets
HIGHLIGHTS
1Depositors’ net assets reached $200.1 billion, up $68.5 billion since December 31, 2009.
2Over four years, net investment results totalled $61.2 billion, 54% of which came from the Equity asset class.
3Depositors’ total net deposits over four years amounted to $7.3 billion.
DEPOSITORS’ NET ASSETS
Net assets grew from $131.6 billion as at December 31, 2009, to $200.1 billion as at December 31, 2013, increasing $68.5 billion over four years. This growth came essentially from net invest-ment results of $61.2 billion and depositors’ net contributions of $7.3 billion.
During 2013, depositors’ net assets were up $24.0 billion to $200.1 billion, versus $176.2 billion as at December 31, 2012. The $24.0 billion increase was due to $22.8 billion of net invest-ment results, which came mainly from the Equity asset class, and $1.2 billion of depositors’ deposits (see Table 52, p. 115).
Net assets include a consolidation adjustment of $702 million ($637 million in 2012) stemming from the early adoption of International Financial Reporting Standards (IFRS) as at December 31, 2012, for the Real Estate portfolio, which includes the subsidiary Ivanhoé Cambridge. This subsidiary is valued and presented as an investment, and its valuation reflects the fair value of the business, including the fair value of its real estate assets, the quality of the portfolio and integrated management of the platform.
TOTAL ASSETS
Total assets reached $245.7 billion as at December 31, 2013, versus $213.8 billion at the end of 2012. The $31.9 billion increase is due to reinvestment of investment income, unrealized increases in value and depositors’ deposits. La Caisse, which has a strong financial position, continued to manage its liabil-ities carefully while holding them steady at 19% of total assets. The liabilities consist primarily of short selling of securities, securities sold under repurchase agreements, derivative financial instruments and the financing programs of the subsidiary CDP Financial, which are used mainly to finance real estate investments.
ASSETS UNDER MANAGEMENT AND ASSETS UNDER ADMINISTRATION
As at December 31, 2013, La Caisse’s assets under management and administration totalled $48.8 billion, up $3.5 billion from one year earlier.
This growth came mainly from the portfolio administered by MCAP Commercial LP, a subsidiary of Otéra Capital. This com- pany administers more than $39 billion of Canadian residential and commercial mortgages, and construction loans.
NET INVESTMENT RESULTS
Over four years, net investment results amounted to $61.2 billion, with the Equity asset class contributing the most to the overall return; it generated $32.8 billion of net investment results, including almost $10 billion from the Private Equity portfolio.
In 2013, La Caisse recorded net investment results of $22.8 billion, versus $14.9 billion the previous year (see Table 53, p. 115). This increase is directly attributable to high returns on the stock markets and private equity, which produced $18.2 billion of total results for the Equity asset class. The favourable results for 2013 were also due to the Inflation-Sensitive Investments asset class, whose largest contribution came from the Real Estate portfolio, with $2.9 billion.
DEPOSITORS’ NET DEPOSITS
Depositors’ total net deposits as at December 31, 2013, were $1.2 billion, mainly because of the contributions made by the Retirement Plans Sinking Fund, the Régie des rentes du Québec and two new depositors.
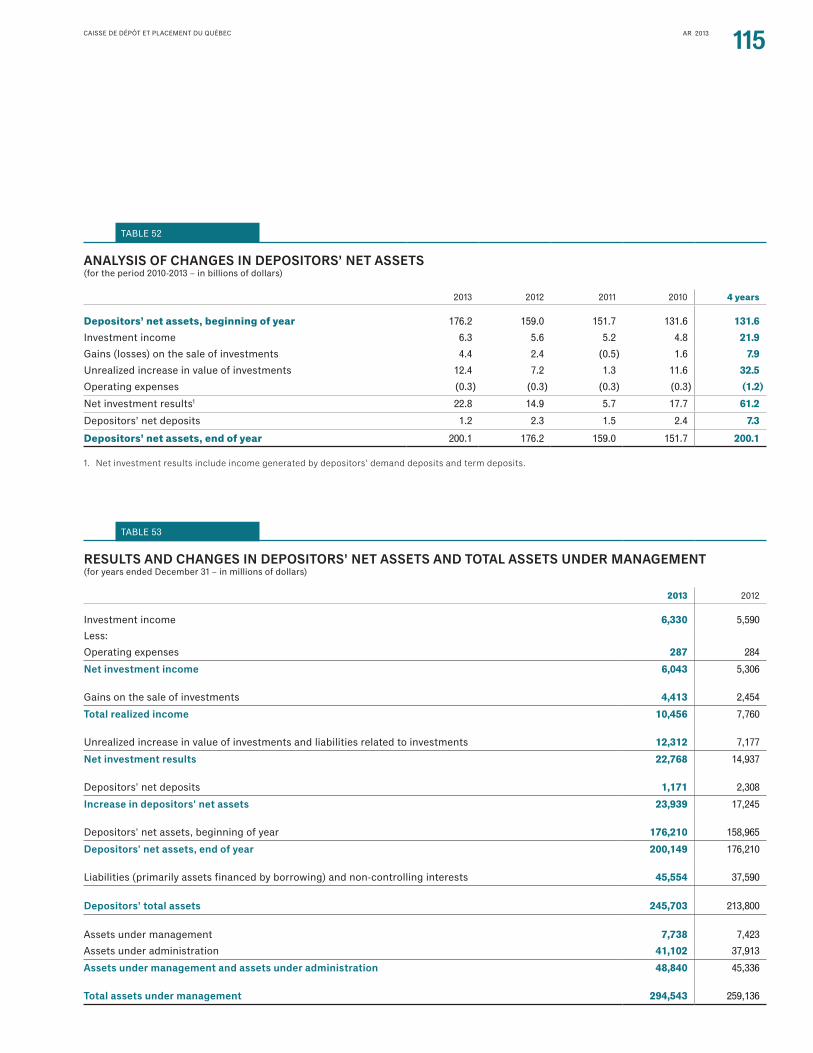
AR 2013 115CAISSE DE DÉPÔT ET PLACEMENT DU QUÉBEC
3740
01_T
able
aux
RA
-AN
V7
7/0
4/20
14
P
AG
E 30
TABLE 52
ANALYSIS OF CHANGES IN DEPOSITORS’ NET ASSETS(for the period 2010-2013 – in billions of dollars)
2013 2012 2011 2010 4 years
Depositors’ net assets, beginning of year 176.2 159.0 151.7 131.6 131.6
Investment income 6.3 5.6 5.2 4.8 21.9
Gains (losses) on the sale of investments 4.4 2.4 (0.5) 1.6 7.9
Unrealized increase in value of investments 12.4 7.2 1.3 11.6 32.5
Operating expenses (0.3) (0.3) (0.3) (0.3) (1.2)
Net investment results1 22.8 14.9 5.7 17.7 61.2
Depositors’ net deposits 1.2 2.3 1.5 2.4 7.3
Depositors’ net assets, end of year 200.1 176.2 159.0 151.7 200.1
1. Net investment results include income generated by depositors’ demand deposits and term deposits.
3740
01_T
able
aux
RA
-AN
V8
9/0
4/20
14
P
AG
E 31
TABLE 53
RESULTS AND CHANGES IN DEPOSITORS’ NET ASSETS AND TOTAL ASSETS UNDER MANAGEMENT (for years ended December 31 – in millions of dollars)
2013 2012
Investment income 6,330 5,590
Less:Operating expenses 287 284
Net investment income 6,043 5,306
Gains on the sale of investments 4,413 2,454
Total realized income 10,456 7,760
Unrealized increase in value of investments and liabilities related to investments 12,312 7,177
Net investment results 22,768 14,937
Depositors' net deposits 1,171 2,308
Increase in depositors' net assets 23,939 17,245
Depositors' net assets, beginning of year 176,210 158,965
Depositors' net assets, end of year 200,149 176,210
Liabilities (primarily assets financed by borrowing) and non-controlling interests 45,554 37,590
Depositors’ total assets 245,703 213,800
Assets under management 7,738 7,423
Assets under administration 41,102 37,913
Assets under management and assets under administration 48,840 45,336
Total assets under management 294,543 259,136

AR 2013 116CAISSE DE DÉPÔT ET PLACEMENT DU QUÉBEC
Operating expenses represent La Caisse’s total portfolio management and administration costs. External management fees are amounts paid to external financial institutions to manage funds on La Caisse’s behalf. Operating expenses include expenditures for the management of the Real Estate and Real Estate Debt portfolios. Operating expenses related to the management and administration of real estate assets and mortgages are deducted from real estate investment income and mortgage income, respectively.
For fiscal year 2013, operating expenses totalled $287 million, compared to $284 million in 2012. External management fees totalled $11 million, an amount equivalent to that of 2012. In the combined financial statements, external management fees are netted from investment income.
Operating expenses and external management fees amounted to $298 million in 2013, compared to $295 million in 2012. This amount represents 17.0 cents per $100 of average net assets, placing La Caisse among the leaders in its management category (see Figure 54).
Over four years, operating expenses and external management fees went from 22.0 cents to 17.0 cents per $100 of average net assets, a decrease of five basis points.
OPERATIONAL EFFICIENCY
La Caisse periodically reviews its procedures to maintain strict control over its operating expenses. It aims to keep operating expenses at a level that, given the composition of its invest-ments, is favourably comparable to that of same-size institutional fund managers with similar operations. For many years, La Caisse has been benchmarking its costs by asset class.
Analysis of Operating Expensesand External Management Fees
3740
01_T
able
aux
RA
-AN
V7
7/0
4/20
14
P
AG
E 66
FIGURE 54
OPERATING EXPENSES AND EXTERNAL MANAGEMENT FEES EXPRESSED IN CENTS PER $100 OF DEPOSITORS’ AVERAGE NET ASSETS (for periods ended December 31)
2009 2010 2011 2012 2013
19.4
22.0
18.0 17.9 17.0

CAISSE DE DÉPÔT ET PLACEMENT DU QUÉBEC AR 2013 117
CDP Financial
CDP Financial is a wholly owned subsidiary of La Caisse. Its transactions are designed to optimize the cost of financing the operations of La Caisse and its subsidiaries, diversify their sources of financing and match financed assets in terms of currencies and interest rates. To achieve its objectives, it has two financing programs on the local and international institutional markets: short-term borrowing and term borrowing.
SHORT-TERM BORROWING
As at December 31, 2013, short-term financing totalled $1.5 billion, with $1 billion on the Canadian market and US$500 million on the U.S. market. The average maturity of the borrowings on the Canadian market was 81 days, and transactions totalled $5 billion during the year, while the average maturity of the borrowings on the U.S. market was 118 days, and transactions totalled US$500 million in 2013.
TERM BORROWING
As at December 31, 2013, the fair value of CDP Financial’s outstanding term notes totalled $9 billion, versus $8.9 billion at the end of 2012 (see Figure 55). The change from 2012 is due to interest rate fluctuations and the effect of depreciation of the Canadian dollar. Because there was no specific need for additional term financing, no new notes were issued in 2013.
CREDIT RATING AGENCIES AFFIRM LA CAISSE’S FINANCIAL STRENGTH
Dominion Bond Rating Services (DBRS), Moody’s Investors Service (Moody’s) and Standard & Poor’s (S&P) affirmed their investment-grade credit ratings with a stable outlook (see Table 56). In addition, the agencies issued the highest rating to the new U.S. short-term financing program. Updates confirming CDP Financial’s and La Caisse’s credit ratings were published on November 15, 2013.
3740
01_T
able
aux
RA
-AN
V11
16/
04/2
014
PAG
E 68
FIGURE 55
BREAKDOWN OF LIABILITIES – CDP FINANCIAL(fair market value as at December 31 – in billions of dollars)
Short-term notes
Term notes
2010 2011 2012 2013
8.1
1.0 1.0 1.01.5
8.8 8.9 9.0
3740
01_T
able
aux
RA
-AN
V11
16/
04/2
014
PAG
E 67
TABLE 56
CREDIT RATINGS
Short-term Long-term
DBRS R-1 high AAA
Moody’s Prime-1 (Aaa) Aaa
S&P A-1 + A-1 HIGH
AAA

AR 2013 118CAISSE DE DÉPÔT ET PLACEMENT DU QUÉBEC
The financial statements of La Caisse de dépôt et placement du Québec are combined: they comprise the accounts of its subsidiaries, the General Fund, the individual funds and the specialized portfolios. Depositors’ holdings presented in the Combined statement of net assets include the net account value of each Caisse depositor. Note 2 to the audited combined financial statements as at December 31, 2013 describes the significant accounting policies used by La Caisse.
EXTERNAL AUDIT
La Caisse’s financial statements are prepared in accordance with the prevailing accounting standards, namely Canadian generally accepted accounting principles (GAAP), as stipulated in the Act respecting the Caisse de dépôt et placement du Québec.
In accordance with the Act, the co-auditors audited all of La Caisse’s accounting records and issued an unqualified auditors’ report for each of the 59 financial statements.
CHANGEOVER TO INTERNATIONAL FINANCIAL REPORTING STANDARDS (IFRS)
In October 2012, the IASB published Investment Entities, applic-able to a company such as La Caisse. In December 2012, Part I of the CPA Canada Handbook was updated to reflect the recent amendments, whose effective date and transition date are January 1, 2014, and January 1, 2013, respectively. Accordingly, the date for La Caisse’s first combined financial statements prepared according to IFRS is December 31, 2014.
Implementation of IFRSOnce Investment Entities was published, La Caisse initiated its IFRS conversion program. In accordance with its timetable, in fiscal 2013 the institution completed several key steps of its detailed plan, including changes to accounting and business processes, operating systems and internal controls. La Caisse also validated its accounting positions completed to date with the co-auditors, prepared an opening balance sheet and prelim-inary comparative figures and started to prepare draft annual IFRS financial statements.
Main IFRS accounting standards applicable to La Caisse’s financial statementsAdoption of IFRS will result in changes affecting reporting, valuation, presentation and disclosure in financial statements. The preliminary analyses conducted to date could vary as a result of new facts likely to arise before the first annual IFRS financial statements are published, given that the new standards will evolve. The main standards that have an impact on La Caisse are discussed below.
Investment entitiesUnder Canadian GAAP, La Caisse consolidates its subsidiaries whereas, according to IFRS, these subsidiaries must be presented and measured at fair value as investments. The fair value of the assets and liabilities of subsidiaries that are consoli-dated according to Canadian GAAP could differ significantly from the measurement of an investment based on an enterprise value method according to IFRS. When the first annual combined financial statements according to IFRS are prepared, the adjust-ment of $702 million from the early adoption of IFRS by the Real Estate portfolio will be recorded in depositors’ combined net holdings as at January 1, 2014. In addition to this adjustment, La Caisse is analyzing the other impacts that application of this standard will have, including a decrease in its total assets and liabilities.
Fair value measurementIFRS 13 Fair Value Measurement provides a single source of guide-lines for all fair value measurements. Fair value is the price that is received on the sale of an asset or is paid to transfer a liability in an orderly transaction between market participants at the measurement date. According to analyses completed to date, adoption of IFRS 13 should not have a significant impact at the IFRS transition date.
Reporting and disclosureGiven that information is reported in accordance with several IFRS standards, additional information will have to be included in the notes to the financial statements.
During fiscal 2014, La Caisse will finalize its analysis of the accounting and information requirements for the first IFRS-compliant annual financial statements and will finish upgrading the systems, processes and controls required for such disclosure.
SignificantAccounting Policies

AR 2013 119CAISSE DE DÉPÔT ET PLACEMENT DU QUÉBEC
Investment valuation is a process whereby a fair value is assigned to each of La Caisse’s investments with a view to preparation of its financial statements. Measurement of invest-ments at fair value is performed periodically according to policies and procedures specific to each type of investment. These procedures comply with the standards and practices of Canadian and international organizations and involve the use of stock market prices as well as reports of independent valuators, appraisers and experts. The co-auditors have access to all major valuation files in performing their audit of the year-end financial statements.
CONCEPTUAL FRAMEWORK
According to the provisions of CPA Canada Handbook Accounting Guideline AcG-18, La Caisse must measure its invest-ments at fair value. Fair value is the amount of consideration that would be agreed upon in an arm’s-length transaction between knowledgeable, willing parties who are under no compulsion to act. Fair value must be established on the assumption that the investments are available for sale on the preparation date of the financial statements. The purpose of the accounting standards is to define a conceptual framework for all situations that require fair value measurement.
IMPACT ON LA CAISSE’S INVESTMENTS
La Caisse believes that these fair value standards provide a coherent framework. However, these highly restrictive standards ignore the fact that, given the very long investment horizon of its main depositors, La Caisse has the resources and the intention to hold certain investments until their optimal value is reached.
As a result, the fair value determined as at December 31, 2013, for less liquid investments, such as real estate, private equity, infrastructure, commercial debt and commercial mortgages, reflects the overall volatility of the financial markets and there-fore may differ from the economic value of such investments over the long term.
ESTABLISHING FAIR VALUE AT LA CAISSE
The fair value of investments is established first as a function of real transactions involving identical or comparable assets in active markets. However, if there are no observable data or the markets are inactive, that is, no purchases or sales are taking place, La Caisse must establish fair value using valuation methods. The main valuation methods currently used are discounting of cash flows and the earnings multiples of compar-able companies. The main variables used by these methods are cash flows, discount rates, financing and illiquidity premiums, EBITDA multiples and price-earnings multiples. These methods require the use of estimates and assumptions. They are carried out with all the rigour required in such a process.
Liquid investmentsThe fair value of liquid investments is established from prices quoted on major stock exchanges and prices or data provided by securities dealers or other recognized specialized organiza-tions, and from valuation methods used on capital markets, such as discounting of cash flows, which is based on directly or indirectly observable data. Twice a year, the fair value of all portfolios of unlisted liquid products is reviewed by independent external firms. Valuation of these products, which include bonds and over-the-counter derivative financial instruments, is based on valuation models and input data.
Less liquid investments
Private equity and infrastructureThe fair value of private equity and infrastructure investments is determined semi-annually, at June 30 and December 31, unless significant circumstances require a change in the value of an investment at another time during the year.
Fair value is established by an internal valuation team, independent of the investment units. Investments whose fair value exceeds a predetermined materiality threshold must be submitted to an independent valuation committee or an external valuator. The committee, which reports to La Caisse’s Audit Committee, is composed of independent valuation profes-sionals. The co-auditors attend the committee’s meetings as observers. The process is complemented internally by regular and one-time valuations, as events occur.
Fair ValueMeasurement

CAISSE DE DÉPÔT ET PLACEMENT DU QUÉBEC AR 2013 120
Fair Value Measurement
Real estate investmentsThe fair value of real estate investments is determined semi- annually, at June 30 and December 31, unless significant known circumstances require a one-time investment valuation adjust-ment. External chartered appraisers certify the fair value of the real estate assets. In addition, the real estate subsidiaries’ external auditors audit fair values during preparation of the audited financial statements.
Furthermore, IFRS were early adopted in 2012 for the Real Estate portfolio. According to IFRS, this portfolio is considered an investment entity and the new accounting standard requires that the subsidiary Ivanhoé Cambridge be valued and presented as an investment that reflects the fair value of the business. This value was determined by independent external appraisers and reflects, among other things, the fair value of the real estate assets, the quality of the portfolio and the integrated manage-ment of the platform.
The fair value of mortgage loans and securities is established monthly from the discounted value of future contractual cash flows at the market interest rate. The rate is that which could be obtained for loans or securities with similar terms and matur-ities. In cases where the timing of cash flows cannot be estimated with reasonable reliability, fair value is either the fair value of any asset given as collateral, net of expected costs of realization and any amount legally owed to borrowers, or the mortgages’ observable market price. The fair value of these investments is reviewed semi-annually by independent external firms.
ABTNsAsset-backed term notes (ABTNs) are financial instruments with an average maturity of three years. To provide an economic hedge so as to reduce the risk of loss inherent in changes in the ABTNs’ fair value and of possible collateral calls, La Caisse uses derivative financial instruments, such as credit default swaps and interest rate swaps.
The Master Asset Vehicle 1 (MAV1) ABTNs and some ABTNs excluded from the restructuring agreement are essentially composed of credit default swaps and pledged assets. The fair value of the credit default swaps is established with valuation techniques that are based as much as possible on observable market data, such as credit spreads, correlation factors and an illiquidity premium, which is calculated from the spread between the bid and ask prices of similar financial instruments traded on the market. For the other ABTNs, La Caisse established fair values using a valuation technique based on a financial model whose assumptions use observable market data, such as interest rates and credit quality, as much as possible.
All the data and methodologies used to establish the fair value of the ABTNs as at December 31, 2013 were reviewed by an independent external firm.

AR 2013 121CAISSE DE DÉPÔT ET PLACEMENT DU QUÉBEC
Combined Financial Statements

AR 2013 122CAISSE DE DÉPÔT ET PLACEMENT DU QUÉBEC
Management’s responsibility for combined financial reporting
Preparation and presentation of the combined financial statements of the Caisse de dépôt et placement du Québec (the “Caisse”) are the responsibility of management. The combined financial statements were prepared in accordance with Canadian generally accepted accounting principles (GAAP). We ensure that the financial data in the Annual Report are consistent with those in the combined financial statements.
The combined financial statements include amounts based on management’s best estimates and judgment, with due regard for their relative importance. Moreover, in the preparation of the financial data, management has made decisions regarding the information to be presented, has made estimates and has made assumptions that affect the information presented. Future results may differ considerably from our current estimates, because of changes in the financial markets or other events that may have an impact on the fair value of the investments established as at December 31, 2013.
In our responsibility for the reliability of financial information, we use a sophisticated internal control mechanism applied systematically on all levels of the organization. This mechanism consists of organizational and operational controls, financial information disclosure controls and procedures, and internal control over financial information. The Caisse’s internal control mechanism is based, among other things, on a clear definition of responsibilities, effective allocation of duties, delegation of powers, competent resources, appropriate procedures, information systems, tools and practices, relevant and reliable information whose adequacy enables all employees to fulfill their responsibilities, control, compliance and integrated risk management measures that are proportional to the issues specific to each process and designed to reduce risks likely to affect achievement of the Caisse’s objects, and oversight of compliance with an extensive body of internal policies.
This control mechanism makes it possible to ensure that appropriate internal controls are in place with regards to operations, assets and records. Moreover, the Caisse’s internal audit group reviews the internal controls on a regular basis. These controls and audits are designed to provide reasonable assurance regarding the reliability of the accounting records used to prepare the combined financial statements and to ensure that assets are not used or disposed of in any unauthorized manner, that liabilities are recorded, and that we meet all the legal requirements to which the Caisse is subject, including the Act respecting the Caisse de dépôt et placement du Québec.
Each year, we certify that the design of the internal control regarding financial information is sufficient and that the design and functioning of the financial information disclosure controls and procedures are effective. We report any significant irregularity to the Audit Committee of the Board of Directors of the Caisse, as necessary.
The Auditor General of Québec and Ernst & Young LLP (the “co-auditors”) have audited the combined financial statements of the Caisse, and their report covers the nature and scope of the audit and expresses their opinion. The co-auditors have unrestricted access to the Audit Committee to discuss any matter relating to their audit.
The Board of Directors and its committees supervise the manner in which management fulfills its responsibility for the establishment and presentation of financial information, maintenance of appropriate internal controls, compliance with the requirements of laws and regulations, management of and control over the main risks and evaluation of major transactions. Moreover, it approves the combined financial statements and the Annual Report.
The Board of Directors has approved the combined financial statements as at December 31, 2013. It is assisted in its responsibilities by the Audit Committee, of which all members are outside directors. This Committee meets with management and the co-auditors, examines the combined financial statements and recommends their approval to the Board of Directors.
MICHAEL SABIAPresident and Chief Executive Officer
Montréal, February 25, 2014
MAARIKA PAUL, FCPA, FCA, CBVExecutive Vice-President and Chief Financial Officer
AR 2013 123CAISSE DE DÉPÔT ET PLACEMENT DU QUÉBEC
To the National Assembly
Report on the combined financial statements
We have audited the accompanying combined financial statements of the Caisse de dépôt et placement du Québec, which comprise the combined statement of net assets as at December 31, 2013, and the combined statement of income and changes in net assets for the year then ended, and a summary of significant accounting policies and other explanatory information included in the notes to the combined financial statements.
Management’s responsibility for the combined financial statementsManagement is responsible for the preparation and fair presentation of these combined financial statements in accordance with Canadian generally accepted accounting principles (GAAP) and for such internal control as management determines is necessary to enable the preparation of combined financial statements that are free from material misstatement, whether due to fraud or error.
Auditors’ responsibilityOur responsibility is to express an opinion on the combined financial statements on the basis of our audit. We conducted our audit in accordance with Canadian generally accepted auditing standards. Those standards require that we comply with ethical requirements and that we plan and perform the audit to obtain reasonable assurance that the combined financial statements are free from material misstatement.
An audit involves performing procedures to obtain audit evidence about the amounts and disclosures in the combined financial statements. The procedures selected depend on the auditor’s judgment, including the assessment of the risks of material misstatement of the combined financial statements, whether due to fraud or error. In making such risk assessments, the auditor considers internal control relevant to the entity’s preparation and fair presentation of the combined financial statements in order to design audit procedures that are appropriate to the circumstances, but not for the purpose of expressing an opinion on the effectiveness of the entity’s internal control. An audit also includes evaluating the appropriateness of accounting policies used and the reasonableness of accounting estimates made by management, as well as evaluating the overall presentation of the combined financial statements.
We believe that the audit evidence we have obtained is sufficient and appropriate to provide a basis for our audit opinion.
OpinionIn our opinion, the combined financial statements present fairly, in all material respects, the financial position of the Caisse de dépôt et placement du Québec as at December 31, 2013, and the results of its operations and its cash flows for the year then ended in accordance with Canadian generally accepted accounting principles.
Report on other legal and regulatory requirements
As required by the Auditor General Act (CQLR, chapter V-5.01), we report that, in our opinion these principles have been applied on a basis consistent with that of the preceding year.
Acting Auditor General of Québec
Michel Samson, CPA auditor, CA
Montréal, February 25, 2014
Ernst & Young LLP
CPA auditor, CA, permit no. A112431
Montréal, February 25, 2014
Independent auditors’ report

AR 2013 124CAISSE DE DÉPÔT ET PLACEMENT DU QUÉBEC
(in millions of dollars) 2013 2012
AssetsInvestments (note 3A) 240,940 210,460
Advances to depositors 996 797
Investment income, accrued and receivable 851 751
Transactions being settled 1,368 153
Other assets (note 4) 846 1,002
245,001 213,163
LiabilitiesLiabilities related to investments (note 3B) 39,998 34,129
Transactions being settled 1,969 155
Other liabilities (note 5) 1,386 1,300
43,353 35,584
Combined net assets 201,648 177,579
Less:Non-controlling interests (note 6C) 2,201 2,006
Depositors’ net holdings in accordance with Canadian GAAP (note 6A) 199,447 175,573
Commitments and contingencies (note 11)
The accompanying notes are an integral part of the combined financial statements
Supplemental information (note 6B)Depositors’ net holdings in accordance with Canadian GAAP 199,447 175,573
Consolidation adjustment arising from early adoption of IFRS by a specialized portfolio 702 637
Depositors’ net holdings before consolidation adjustment 200,149 176,210
For the Board of Directors,
MICHAEL SABIA FRANÇOIS JOLY
Combined statement of net assetsAs at December 31

AR 2013 125CAISSE DE DÉPÔT ET PLACEMENT DU QUÉBEC
(in millions of dollars) 2013 2012
Investment income (note 7A) 6,587 5,904
Less:Operating expenses (note 8) 287 284
Net investment income 6,300 5,620
Gains on the sale of investments (note 7C) 4,433 2,127
Total realized income 10,733 7,747
Unrealized increases in value of investments and liabilities related to investments (note 7D) 12,303 6,644
Net investment results 23,036 14,391
Depositors’ net deposits 1,171 2,308
Other changes in non-controlling interests (note 6C) (138) (582)
Increase in combined net assets 24,069 16,117
Combined net assets, beginning of year 177,579 161,462
Combined net assets, end of year 201,648 177,579
Attributable to depositors
Net investment results (note 7E) 23,036 14,391
Less:Net investment results attributable to non-controlling interests (note 7E) 333 91
Net investment results attributable to depositors (note 7E) 22,703 14,300
Depositors’ net deposits 1,171 2,308
Increase in depositors’ net holdings 23,874 16,608
Depositors’ net holdings, beginning of year 175,573 158,965
Depositors’ net holdings in accordance with Canadian GAAP 199,447 175,573
The accompanying notes are an integral part of the combined financial statements
Combined statement of income and changes in net assets For years ended December 31

AR 2013 126CAISSE DE DÉPÔT ET PLACEMENT DU QUÉBEC
Combined fundscomplementary notesas at December 31, 2013
01CONSTITUTION AND OPERATIONS
The Caisse de dépôt et placement du Québec (the “Caisse”), a legal person established in the public interest within the meaning of the Civil Code, is governed by the Act respecting the Caisse de dépôt et placement du Québec (CQLR, chapter C-2) (the “Act”). It receives all funds whose deposit is provided under the Act. Pursuant to the federal and provincial income tax acts, the Caisse is not subject to income taxes.
COMBINED FINANCIAL STATEMENTS
The combined financial statements comprise the accounts of the subsidiaries controlled by the Caisse, the General Fund, the individual funds and the specialized portfolios.
GENERAL FUND (CONSOLIDATED STATEMENTS)
The General Fund comprises all treasury operations (management of demand and term deposits, and corporate financing of the Caisse).
INDIVIDUAL FUNDS
The individual funds are comprised of diversified investments, and each fund has only one depositor that exclusively makes participation deposits therein. The individual funds are for the use of the following depositors:
Fund 300 : Québec Pension Plan Fund, administered by the Régie des rentes du Québec;
Fund 301 : Government and Public Employees Retirement Plan, administered by the Commission administrative des régimes de retraite et d’assurances;
Fund 302 : Pension Plan of Management Personnel, administered by the Commission administrative des régimes de retraite et d’assurances;
Fund 303 : Special Plans Fund, administered by the Commission administrative des régimes de retraite et d’assurances;
Fund 305 : Pension Plan of Elected Municipal Officers, administered by the Commission administrative des régimes de retraite et d’assurances;
Fund 306 : Régime complémentaire de rentes des techniciens ambulanciers/paramédics et des services préhospitaliers d’urgence, administered by Aon Hewitt;
Fund 307 : Fonds de l’assurance automobile du Québec, administered by the Société de l’assurance automobile du Québec;
Fund 3 1 1 : Supplemental Pension Plan for Employees in the Québec Construction Industry – General Account, administered by the Commission de la construction du Québec;
Fund 312 : Supplemental Pension Plan for Employees in the Québec Construction Industry – Retirees Account, administered by the Commission de la construction du Québec;
Fund 313 : Supplemental Pension Plan for Employees in the Québec Construction Industry – Supplementary Account, administered by the Commission de la construction du Québec;
Fund 314 : Deposit Insurance Fund, administered by the Autorité des marchés financiers;
Fund 315 : Compte dédié, administered by La Financière agricole du Québec;
Fund 316 : Retirement Plans Sinking Fund – RREGOP, administered by the ministère des Finances et de l’Économie, Government of Québec;
Fund 317 : Retirement Plans Sinking Fund – PPMP, administered by the ministère des Finances et de l’Économie, Government of Québec;
Fund 318 : Retirement Plans Sinking Fund, administered by the ministère des Finances et de l’Économie, Government of Québec;
Fund 326 : Crop Insurance Fund, administered by La Financière agricole du Québec;
Fund 328 : Survivor’s Pension Plan, administered by the Secrétariat du Conseil du trésor, Government of Québec;
Fund 329 : Fonds d’assurance-garantie, administered by the Régie des marchés agricoles et alimentaires du Québec;
Fund 330 : Fonds de la santé et de la sécurité du travail, administered by the Commission de la santé et de la sécurité du travail;
Fund 332 : Fonds des cautionnements des agents de voyages – cautionnements individuels, administered by the Office de la protection du consommateur;

AR 2013 127CAISSE DE DÉPÔT ET PLACEMENT DU QUÉBEC
CONSTITUTION AND OPERATIONS (cont.)
Fund 333 : Compensation Fund for Customers of Travel Agents, administered by the Office de la protection du consommateur;
Fund 341 : Education and Good Governance Fund – Treasury Fund, administered by the Autorité des marchés financiers;
Fund 342 : Régime de retraite de l’Université du Québec, administered by the Comité de retraite du Régime de retraite de l’Université du Québec;
Fund 343 : Parental Insurance Fund, administered by the Conseil de gestion de l’assurance parentale;
Fund 347 : Régime de retraite du personnel des CPE et des garderies privées conventionnées du Québec, administered by Aon Hewitt;
Fund 351 : Generations Fund, administered by the ministère des Finances et de l’Économie, Government of Québec;
Fund 353 : Superannuation Plan for the Members of the Sûreté du Québec – caisse participants, administered by the Commission administrative des régimes de retraite et d’assurances;
Fund 354 : Superannuation Plan for the Members of the Sûreté du Québec – caisse employeurs, administered by the ministère des Finances et de l’Économie, Government of Québec;
Fund 361 : Pension Plan of the Non-Teaching Staff of the Commission des écoles catholiques de Montréal, administered by the Commission administrative des régimes de retraite et d’assurances;
Fund 362 : Régime de retraite pour certains employés de la Commission scolaire de la Capitale, administered by the Commission administrative des régimes de retraite et d’assurances;
Fund 363 : Régime de retraite des employés de la Ville de Laval, administered by the Comité du Régime de retraite des employés de la Ville de Laval;
Fund 367 : Fund Management System, administered by the ministère des Finances et de l’Économie, Government of Québec;
Fund 368 : Education and Good Governance Fund – Capitalized Fund, administered by the Autorité des marchés financiers;
Fund 369 : Accumulated Sick Leave Fund, administered by the ministère des Finances et de l’Économie, Government of Québec;
Fund 371 : Fonds des congés de maladie accumulés – ARQ, administered by the Agence du revenu du Québec (created April 1, 2012);
Fund 372 : Fonds commun de placement des régimes de retraite de l’Université Laval, administered by the Comités de retraite (created July 1, 2012);
Fund 373 : Retirement Plan for Active Members of the Centre hospitalier Côte-des-Neiges, administered by the Commission administrative des régimes de retraite et d’assurances;
Fund 374 : Fiducie globale Ville de Magog, administered by the Comité de retraite mixte (created October 1, 2012);
Fund 376 : Régime de retraite des employées et employés de la Ville de Sherbrooke, administered by the Comité de retraite des employées et employés de la Ville de Sherbrooke (created January 1, 2013); and
Fund 378 : Pension Plan of Peace Officers in Correctionnal Services – Fonds des cotisations des employés, administered by the Commission administrative des régimes de retraite et d’assurances (created July 1, 2013).
SPECIALIZED PORTFOLIOS
The specialized portfolios are pooled funds for participation deposits of the various funds. The specialized portfolios are the following:
• Real Estate (710) (IFRS)• Canadian Equity (720)• EAFE Equity (Europe, Australasia and Far East) (730)• U.S. Equity (731)• Emerging Markets Equity (732)• Global Equity (735) (being dissolved)• Global Quality Equity (736) (created January 1, 2013)• Short Term Investments (740)• Real Estate Debt (750) (consolidated statements)
• Bonds (760)• Real Return Bonds (762)• Long Term Bonds (764) • Hedge Funds (770) (consolidated statements)• Asset Allocation (771)• ABTN (772)• Private Equity (780) (consolidated statements)• Infrastructure (782) (consolidated statements)
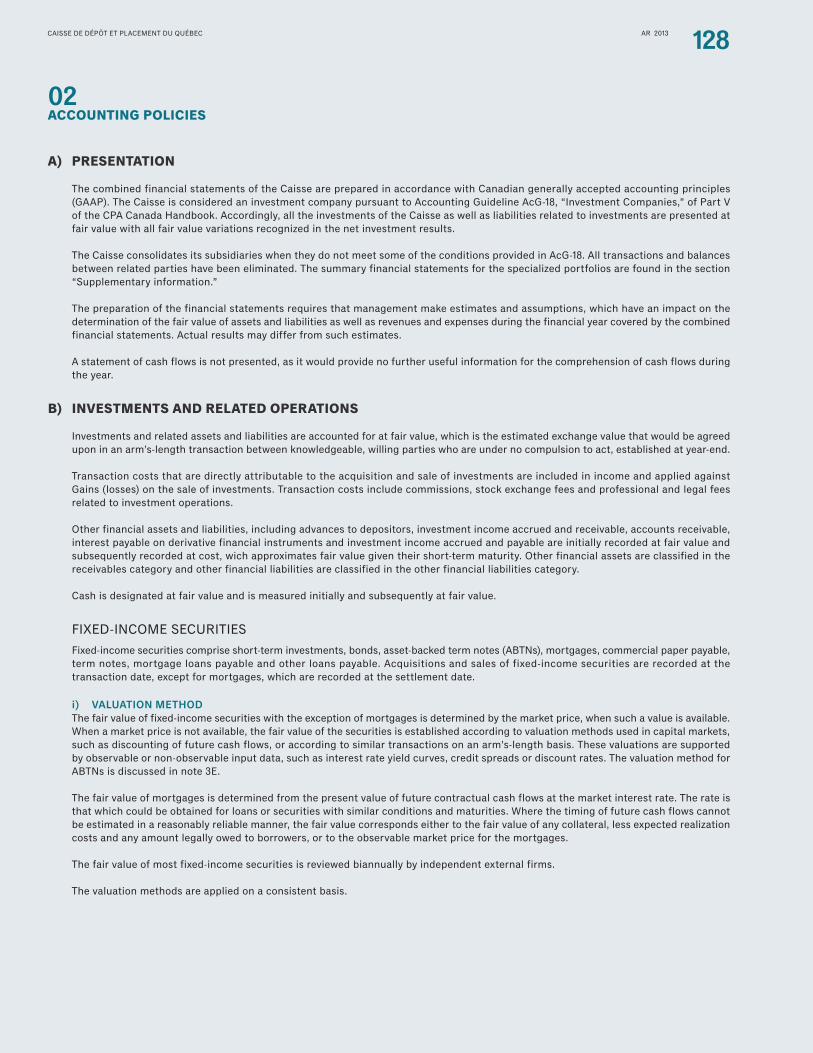
AR 2013 128CAISSE DE DÉPÔT ET PLACEMENT DU QUÉBEC
02ACCOUNTING POLICIES
A) PRESENTATION
The combined financial statements of the Caisse are prepared in accordance with Canadian generally accepted accounting principles (GAAP). The Caisse is considered an investment company pursuant to Accounting Guideline AcG-18, “Investment Companies,” of Part V of the CPA Canada Handbook. Accordingly, all the investments of the Caisse as well as liabilities related to investments are presented at fair value with all fair value variations recognized in the net investment results.
The Caisse consolidates its subsidiaries when they do not meet some of the conditions provided in AcG-18. All transactions and balances between related parties have been eliminated. The summary financial statements for the specialized portfolios are found in the section “Supplementary information.”
The preparation of the financial statements requires that management make estimates and assumptions, which have an impact on the determination of the fair value of assets and liabilities as well as revenues and expenses during the financial year covered by the combined financial statements. Actual results may differ from such estimates.
A statement of cash flows is not presented, as it would provide no further useful information for the comprehension of cash flows during the year.
B) INVESTMENTS AND RELATED OPERATIONS
Investments and related assets and liabilities are accounted for at fair value, which is the estimated exchange value that would be agreed upon in an arm’s-length transaction between knowledgeable, willing parties who are under no compulsion to act, established at year-end.
Transaction costs that are directly attributable to the acquisition and sale of investments are included in income and applied against Gains (losses) on the sale of investments. Transaction costs include commissions, stock exchange fees and professional and legal fees related to investment operations.
Other financial assets and liabilities, including advances to depositors, investment income accrued and receivable, accounts receivable, interest payable on derivative financial instruments and investment income accrued and payable are initially recorded at fair value and subsequently recorded at cost, wich approximates fair value given their short-term maturity. Other financial assets are classified in the receivables category and other financial liabilities are classified in the other financial liabilities category.
Cash is designated at fair value and is measured initially and subsequently at fair value.
FIXED-INCOME SECURITIESFixed-income securities comprise short-term investments, bonds, asset-backed term notes (ABTNs), mortgages, commercial paper payable, term notes, mortgage loans payable and other loans payable. Acquisitions and sales of fixed-income securities are recorded at the transaction date, except for mortgages, which are recorded at the settlement date.
i) VALUATION METHODThe fair value of fixed-income securities with the exception of mortgages is determined by the market price, when such a value is available. When a market price is not available, the fair value of the securities is established according to valuation methods used in capital markets, such as discounting of future cash flows, or according to similar transactions on an arm’s-length basis. These valuations are supported by observable or non-observable input data, such as interest rate yield curves, credit spreads or discount rates. The valuation method for ABTNs is discussed in note 3E.
The fair value of mortgages is determined from the present value of future contractual cash flows at the market interest rate. The rate is that which could be obtained for loans or securities with similar conditions and maturities. Where the timing of future cash flows cannot be estimated in a reasonably reliable manner, the fair value corresponds either to the fair value of any collateral, less expected realization costs and any amount legally owed to borrowers, or to the observable market price for the mortgages.
The fair value of most fixed-income securities is reviewed biannually by independent external firms.
The valuation methods are applied on a consistent basis.

AR 2013 129CAISSE DE DÉPÔT ET PLACEMENT DU QUÉBEC
ACCOUNTING POLICIES (cont.)
ii) INVESTMENT INCOME AND GAINS (LOSSES) ON THE SALE OF INVESTMENTSInvestment income from fixed-income securities includes amortization of the premium or the discount, which makes it possible to maintain a constant effective yield until maturity. Income from mortgages is reduced by operating expenses and is recorded under the item Investment income – Fixed-income securities.
Gains (losses) on the sale of investments represent the difference between the amortized cost and the net realizable value on the sale of investments. The amortized cost corresponds to the acquisition cost adjusted to reflect amortization of the premium or the discount.
VARIABLE-INCOME SECURITIESVariable-income securities comprise equities and convertible securities, investment funds as well as real estate holdings. Acquisitions and sales of equities and convertible securities are recorded at the transaction date, whereas acquisitions and sales of real estate holdings and investment funds are recorded at the settlement date.
i) VALUATION METHODThe fair value of listed equities and convertible securities is determined from prices on major stock exchanges. For unlisted equities and convertible securities, prices are provided by recognized financial institutions or valuations are made according to commonly used valuation methods, such as the earnings multiples of comparable listed companies or discounting of cash flows, or on the basis of similar transactions on an arm’s-length basis. These valuations are supported by observable or non-observable input data, such as EBITDA multiples, price/earnings ratios, price/book value ratios, discount rates and future cash flows. The valuations of unlisted equities and convertible securities are reviewed biannually by a valuation committee made up of independent experts or by independent external firms.
The fair value of investment funds is recorded under the item Equities and convertible securities is determined from the fair value provided by the general partner or the administrator, in accordance with commonly used valuation methods.
Real estate holdings include partial or full ownership of income properties through interests in a company or a partnership. The fair value of income properties included in real estate holdings is determined and certified biannually by external, recognized and independent chartered real estate appraisers. The valuation techniques used for income properties are based mainly on three recognized methodologies: discounting of cash flows at the market rate, comparison with recent similar market transactions and capitalization of earnings. These valuations are supported by observable or non-observable input data, such as leases, operating expenses, rates of return and discount rates. The valuations are established in accordance with commonly used professional valuation standards.
The valuation methods are applied on a consistent basis.
ii) INVESTMENT INCOME AND GAINS (LOSSES) ON THE SALE OF INVESTMENTSDividend income is recognized when the Caisse obtains the right to the dividend, generally on the ex-dividend date. Income from real estate holdings is reduced by operating expenses related to real estate holdings, operating expenses and loan financial expenses, and is recorded under the item Investment income – Variable-income securities.
Gains (losses) on the sale of investments represent the difference between the cost and the net realizable value on the sale of investments. The cost of investments corresponds to the acquisition cost, with the exception of the cost of investments in joint ventures, which are recorded on the basis of the equity method.
DERIVATIVE FINANCIAL INSTRUMENTSIn managing its investments, the Caisse conducts transactions involving various derivative financial instruments to manage the risks associated with exchange rate, interest rate and market fluctuations.
Derivative financial instruments whose fair value is favourable are recorded under the item Investments, whereas those whose fair value is unfavourable are recorded under the item Liabilities related to investments.
i) VALUATION METHODFor over-the-counter derivative financial instruments, prices are provided by recognized financial institutions or valuations are made from similar transactions on an arm’s-length basis or with recognized, commonly used models. The models used include discounting of future cash flows at the current rate of return and the Black-Scholes model. These models require the use of assumptions regarding the amount and timing of future cash flows and the current rate of return. The assumptions are prepared with observable and non-observable input data, such as interest rate yield curves, credit spreads and foreign exchange rates as well as the volatility and correlation of equity prices, commodity prices and interest rates. The fair value estimates of most over-the-counter derivative financial instruments are reviewed biannually by independent external firms. The fair value of listed derivative financial instruments, if any, is determined from prices on major stock exchanges.
The valuation methods are applied on a consistent basis.

AR 2013 130CAISSE DE DÉPÔT ET PLACEMENT DU QUÉBEC
ACCOUNTING POLICIES (cont.)
ii) INVESTMENT INCOME AND GAINS (LOSSES) ON THE SALE OF INVESTMENTSInvestment income as well as gains (losses) on the sale of investments on derivative financial instruments is included with investment income and gains (losses) on the sale of investments, depending on the underlying investments.
SECURITIES ACQUIRED UNDER REVERSE REPURCHASE AGREEMENTSThe Caisse conducts securities-borrowing operations involving short-term investments and bonds to cover short sales or to generate additional income. These securities-borrowing operations are recorded in Securities acquired under reverse repurchase agreements under the item Investments. Interest earned on reverse repurchase agreements is recorded as interest income under the item Investment income – Fixed-income securities.
SECURITIES SOLD UNDER REPURCHASE AGREEMENTSThe Caisse conducts securities-lending operations involving short-term investments and bonds to generate cash flow liquidity or additional income. These securities-lending operations are recorded in Securities sold under repurchase agreements under the item Liabilities related to investments. Interest paid on repurchase agreements is applied against Investment income – Fixed-income securities.
SHORT SELLING OF SECURITIESShort selling of securities represents the commitment by the Caisse to purchase securities from third parties to cover its positions. Interest expenses related to commitments involving short selling of short-term investments and bonds are recorded under Investment income – Fixed-income securities, whereas expenses related to commitments involving short selling of equities are recorded under Investment income – Variable-income securities.
Gains (losses) on commitments related to short selling of short-term investments and bonds are recorded under the item Gains (losses) on the sale of investments – Fixed-income securities, whereas those related to short selling of equities are recorded under the item Gains (losses) on the sale investments – Variable-income securities.
LENDING AND BORROWING OF SECURITIESThe Caisse conducts securities lending and borrowing operations involving equities to cover short selling or to generate additional income. Such transactions are not derecognized or recorded in net assets because the transferor retains a right to the transferred shares. Investment income from lending of securities is included under the item Investment income – Variable-income securities.
HIERARCHY OF FAIR VALUEThe Caisse’s financial instruments are classified according to the following hierarchy:
• Level 1: Calculation of the fair value of the instrument is based on prices (not adjusted) quoted on active markets for identical assets or liabilities.
• Level 2: Calculation of the fair value of the instrument is based on data other than the quoted prices contemplated in level 1, which are observable directly (in the form of prices) or indirectly (determined from prices). This level includes instruments whose valuation is based on prices quoted on markets that are not active for identical instruments and instruments whose valuation is based on prices observed for similar instruments as well as valuation techniques based on assumptions that take into account observable market data.
• Level 3: Calculation of the fair value of the instrument uses data that are not based on observable market data (non-observable data). This level includes instruments whose valuation is based on prices observed for similar instruments, adjusted to reflect the differences between the instruments being valued and the available market data. This level also includes instruments whose valuation is based on valuation techniques using assumptions that take into account market data that are observable but are adjusted significantly to reflect the specific characteristics of the instrument being valued.
The classification of financial instruments in the levels of the hierarchy is established at the time of the initial valuation of the instrument and reviewed on each subsequent valuation date. Transfers between the hierarchical levels are measured at fair value at the start of each year.
Quantitative information on the hierarchy of fair value is given in note 3F.
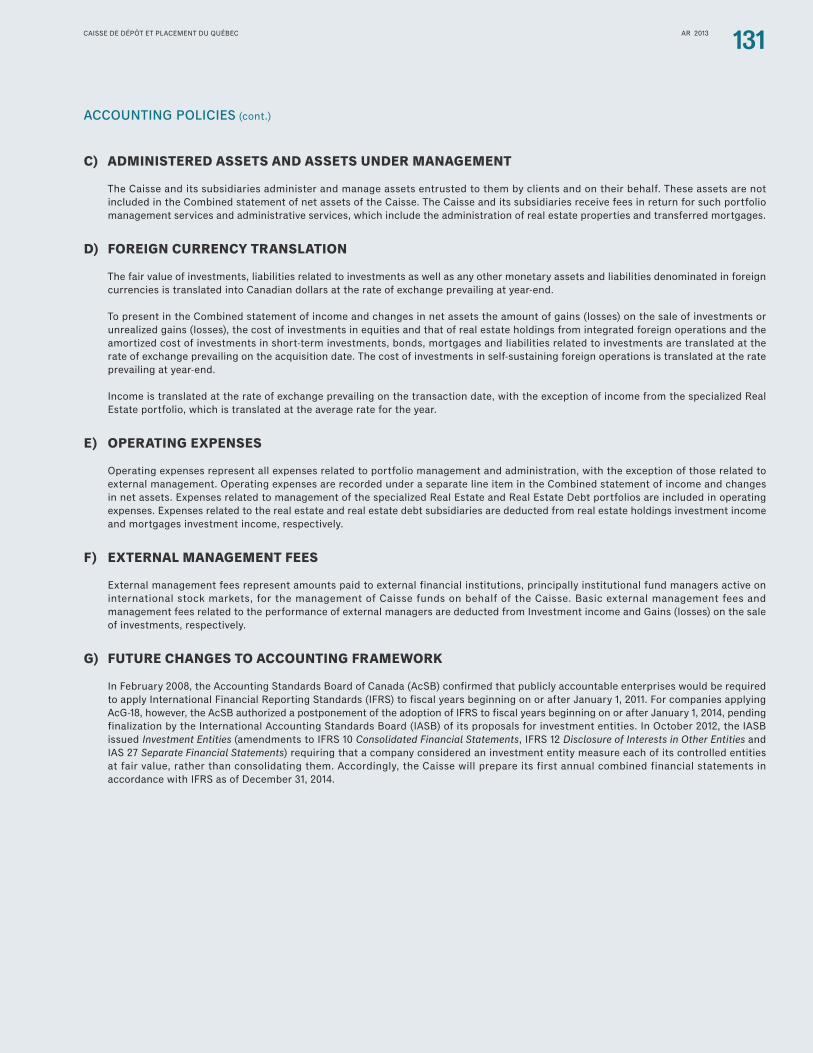
AR 2013 131CAISSE DE DÉPÔT ET PLACEMENT DU QUÉBEC
ACCOUNTING POLICIES (cont.)
C) ADMINISTERED ASSETS AND ASSETS UNDER MANAGEMENT
The Caisse and its subsidiaries administer and manage assets entrusted to them by clients and on their behalf. These assets are not included in the Combined statement of net assets of the Caisse. The Caisse and its subsidiaries receive fees in return for such portfolio management services and administrative services, which include the administration of real estate properties and transferred mortgages.
D) FOREIGN CURRENCY TRANSLATION
The fair value of investments, liabilities related to investments as well as any other monetary assets and liabilities denominated in foreign currencies is translated into Canadian dollars at the rate of exchange prevailing at year-end.
To present in the Combined statement of income and changes in net assets the amount of gains (losses) on the sale of investments or unrealized gains (losses), the cost of investments in equities and that of real estate holdings from integrated foreign operations and the amortized cost of investments in short-term investments, bonds, mortgages and liabilities related to investments are translated at the rate of exchange prevailing on the acquisition date. The cost of investments in self-sustaining foreign operations is translated at the rate prevailing at year-end.
Income is translated at the rate of exchange prevailing on the transaction date, with the exception of income from the specialized Real Estate portfolio, which is translated at the average rate for the year.
E) OPERATING EXPENSES
Operating expenses represent all expenses related to portfolio management and administration, with the exception of those related to external management. Operating expenses are recorded under a separate line item in the Combined statement of income and changes in net assets. Expenses related to management of the specialized Real Estate and Real Estate Debt portfolios are included in operating expenses. Expenses related to the real estate and real estate debt subsidiaries are deducted from real estate holdings investment income and mortgages investment income, respectively.
F) EXTERNAL MANAGEMENT FEES
External management fees represent amounts paid to external financial institutions, principally institutional fund managers active on international stock markets, for the management of Caisse funds on behalf of the Caisse. Basic external management fees and management fees related to the performance of external managers are deducted from Investment income and Gains (losses) on the sale of investments, respectively.
G) FUTURE CHANGES TO ACCOUNTING FRAMEWORK
In February 2008, the Accounting Standards Board of Canada (AcSB) confirmed that publicly accountable enterprises would be required to apply International Financial Reporting Standards (IFRS) to fiscal years beginning on or after January 1, 2011. For companies applying AcG-18, however, the AcSB authorized a postponement of the adoption of IFRS to fiscal years beginning on or after January 1, 2014, pending finalization by the International Accounting Standards Board (IASB) of its proposals for investment entities. In October 2012, the IASB issued Investment Entities (amendments to IFRS 10 Consolidated Financial Statements, IFRS 12 Disclosure of Interests in Other Entities and IAS 27 Separate Financial Statements) requiring that a company considered an investment entity measure each of its controlled entities at fair value, rather than consolidating them. Accordingly, the Caisse will prepare its first annual combined financial statements in accordance with IFRS as of December 31, 2014.

AR 2013 132CAISSE DE DÉPÔT ET PLACEMENT DU QUÉBEC
03INVESTMENTS AND LIABILITIES RELATED TO INVESTMENTS
A) INVESTMENTS
(in millions of dollars) 2013 2012Fair
value CostFair
value Cost
Fixed-income securities Short-term investments Canadian 1,083 1,093 391 407
Foreign 733 832 941 1,178
1,816 1,925 1,332 1,585
Bonds Issued or guaranteed by: Government of Canada 15,692 15,748 16,212 15,816
Province of Québec 13,977 14,486 10,419 9,797
Other Canadian provinces 2,490 2,497 1,090 1,021
Municipalities and other Canadian agencies 1,325 1,296 1,374 1,303
Canadian government corporations 12,159 12,159 13,207 12,610
U.S. government 712 847 924 945
Other foreign governments 2,037 1,936 – –
Mortgage securities Canadian 12 13 122 117
Foreign – 109 – 109
Canadian corporations 13,191 12,866 8,791 8,134
Foreign corporations 6,490 6,761 4,948 5,213
Inflation-indexed securities Canadian 979 1,032 1,252 1,123
Foreign 473 462 65 59
69,537 70,212 58,404 56,247
ABTNs (note 3E) 9,752 10,093 9,894 11,203
Mortgages Canadian 8,583 8,499 7,411 7,126
Foreign 1,946 1,801 1,647 1,733
10,529 10,300 9,058 8,859
Total fixed-income securities 91,634 92,530 78,688 77,894
Variable-income securities Equities and convertible securities Canadian 24,035 19,468 22,650 21,023
U.S. 35,039 27,734 31,509 30,235
Foreign and emerging markets 39,347 34,394 34,648 33,815
Hedge funds 3,843 3,702 3,228 3,252
102,264 85,298 92,035 88,325
Real estate holdings Canadian 18,050 11,411 15,857 11,041
Foreign 11,451 12,438 9,904 11,115
29,501 23,849 25,761 22,156
Total variable-income securities 131,765 109,147 117,796 110,481

AR 2013 133CAISSE DE DÉPÔT ET PLACEMENT DU QUÉBEC
INVESTMENTS AND LIABILITIES RELATED TO INVESTMENTS (cont.)
(in millions of dollars) 2013 2012Fair
value CostFair
value Cost
Amounts receivable with respect to investmentsSecurities acquired under reverse repurchase agreements Canadian 10,958 10,958 8,629 8,629
Foreign 4,582 4,575 2,754 2,737
Amount pertaining to derivative financial instruments (note 10) Canadian 1,329 1,141 1,905 1,160
Foreign 672 194 688 101
17,541 16,868 13,976 12,627
Total investments 240,940 218,545 210,460 201,002
B) LIABILITIES RELATED TO INVESTMENTS
(in millions of dollars) 2013 2012Fair
value CostFair
value Cost
Securities sold under repurchase agreements Canadian 8,571 8,571 3,762 3,762
Foreign 3,679 3,674 862 861
Commercial paper payable Canadian 1,529 1,527 1,017 1,018
Term notes Canadian 9,020 8,289 8,879 8,287
Short selling of securities Canadian 6,605 5,170 7,792 7,020
Foreign 5,087 4,825 4,427 4,270
Mortgage loans payable Canadian 282 270 502 478
Foreign 1,797 1,596 1,722 1,750
Other loans payable Canadian 1,264 1,280 2,613 2,641
Foreign 453 446 398 398
Amount pertaining to derivative financial instruments (note 10) Canadian 435 – 915 –
Foreign 1,276 160 1,240 88
Total liabilities related to investments 39,998 35,808 34,129 30,573
Term notes are redeemable at maturity and are guaranteed by the assets of the Caisse. Fixed-rate term notes denominated in U.S. dollars and in Canadian dollars have an optional prepayment clause at the option of the issuer.
Mortgage loans are repayable half-yearly, monthly or at maturity and are guaranteed by real estate holdings. Some mortgage loans may also be guaranteed by cash.
Most of the other loans payable are repayable at maturity. Those related to investments in ABTNs have a prepayment clause prorated to net cash flows received on investments in ABTNs and are guaranteed by them.
The fair value of the real estate holdings that guarantee the mortgage loans and some other loans payable is $5,815 million ($6,661 million in 2012).

AR 2013 134CAISSE DE DÉPÔT ET PLACEMENT DU QUÉBEC
INVESTMENTS AND LIABILITIES RELATED TO INVESTMENTS (cont.)
C) JOINT VENTURES AND NON-CONSOLIDATED INTERESTS
As at December 31, the item Investments – Real estate holdings includes assets and liabilities of joint ventures and non-consolidated interests, recorded at fair value. The details of these investments are as follows:
(in millions of dollars) 2013 2012
Investments in joint ventures and non-consolidated interests 12,210 11,073
Real estate holdings 16,731 15,195
Short-term investments 32 10
Mortgages 47 –
Derivative financial instruments 17 –
Investment income, accrued and receivable 66 54
Other assets 629 555
17,522 15,814
Mortgage loans payable 4,451 3,923
Other liabilities 768 741
Non-controlling interests 93 77
5,312 4,741
D) BREAKDOWN OF NET HOLDINGS
The following table gives a summary of the Caisse’s net holdings as at December 31:
(in millions of dollars) 2013 2012
Investments (note 3A) 240,940 210,460
Other assets 4,061 2,703
Total assets 245,001 213,163
Liabilities related to investments (note 3B) 39,998 34,129
Other liabilities 3,355 1,455
Non-controlling interests (note 6C) 2,201 2,006
Depositors’ net holdings in accordance with Canadian GAAP (note 6A) 199,447 175,573
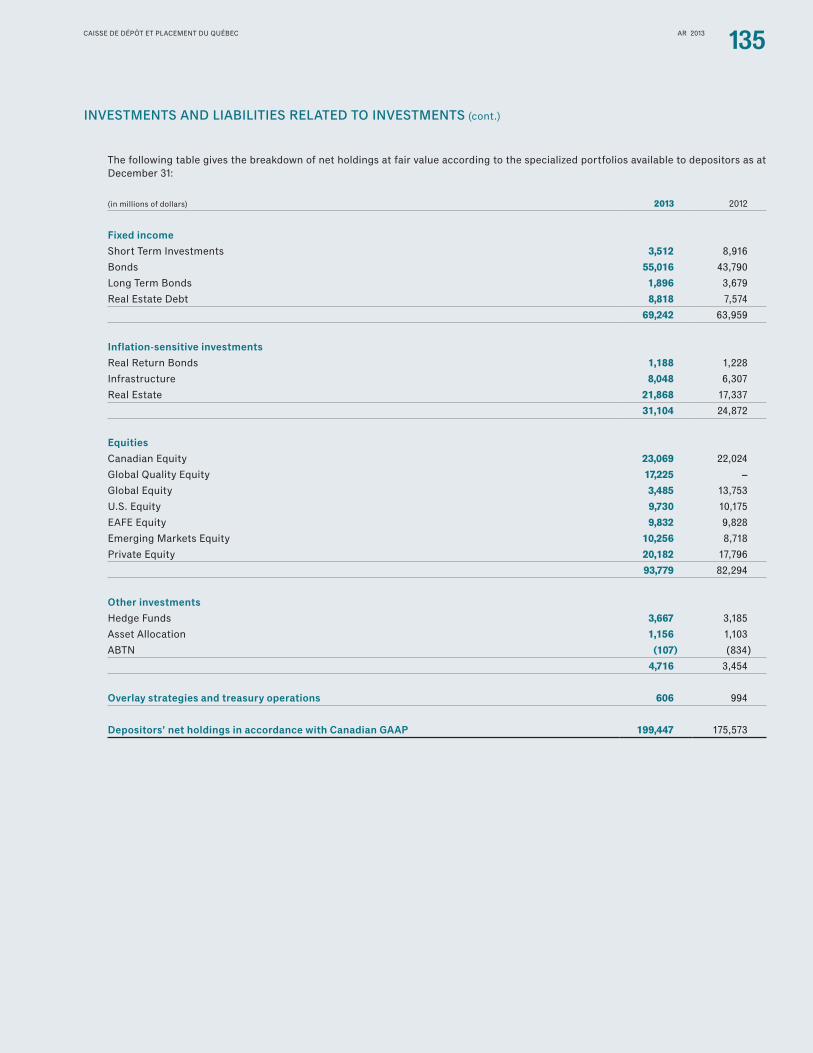
AR 2013 135CAISSE DE DÉPÔT ET PLACEMENT DU QUÉBEC
INVESTMENTS AND LIABILITIES RELATED TO INVESTMENTS (cont.)
The following table gives the breakdown of net holdings at fair value according to the specialized portfolios available to depositors as at December 31:
(in millions of dollars) 2013 2012
Fixed incomeShort Term Investments 3,512 8,916
Bonds 55,016 43,790
Long Term Bonds 1,896 3,679
Real Estate Debt 8,818 7,574
69,242 63,959
Inflation-sensitive investmentsReal Return Bonds 1,188 1,228
Infrastructure 8,048 6,307
Real Estate 21,868 17,337
31,104 24,872
EquitiesCanadian Equity 23,069 22,024
Global Quality Equity 17,225 –
Global Equity 3,485 13,753
U.S. Equity 9,730 10,175
EAFE Equity 9,832 9,828
Emerging Markets Equity 10,256 8,718
Private Equity 20,182 17,796
93,779 82,294
Other investmentsHedge Funds 3,667 3,185
Asset Allocation 1,156 1,103
ABTN (107) (834)
4,716 3,454
Overlay strategies and treasury operations 606 994
Depositors’ net holdings in accordance with Canadian GAAP 199,447 175,573

AR 2013 136CAISSE DE DÉPÔT ET PLACEMENT DU QUÉBEC
INVESTMENTS AND LIABILITIES RELATED TO INVESTMENTS (cont.)
E) ABTNs AND RELATED FINANCIAL INSTRUMENTS
ABTNs represent debt backed by a variety of financial instruments. The underlying instruments are essentially credit default swaps as well as assets given as collateral for MAV 1 and MAV 2, whereas MAV 3 contains traditional assets, such as residential and commercial mortgage debt. In addition, the Caisse uses derivative financial instruments, such as interest rate swaps and credit default swaps, to obtain an economic hedge in order to reduce the risk of loss inherent in a fluctuation of the fair value of the ABTNs as well as eventual collateral calls.
The ABTNs as well as other related financial instruments consist of the following as at December 31:
(in millions of dollars) 2013 2012
Fair value
Unrealized increases
(decreases) in value Cost Fair value
Unrealized increases
(decreases) in value Cost
Investments
MAV 11 8,251 (170) 8,421 8,684 (705) 9,389
MAV 21 157 38 119 143 24 119
MAV 31 114 (125) 239 134 (144) 278
Funding facility (21) (21) – (210) (210) –
Subtotal 8,501 (278) 8,779 8,751 (1,035) 9,786
ABTNs excluded from the restructuring agreement 1,251 (63) 1,314 1,143 (274) 1,417
Total ABTNs 9,752 (341) 10,093 9,894 (1,309) 11,203
Amount pertaining to derivative financial instruments2 24 (1,116) 1,140 259 (881) 1,140
Total investments 9,776 (1,457) 11,233 10,153 (2,190) 12,343
Liabilities related to investments2 842 3 839 1,411 (1) 1,412
8,934 (1,460) 10,394 8,742 (2,189) 10,931
1. Master Asset Vehicles, or MAVs.
2. Included under the items in notes 3A and B.
MAV 1 ABTNs and certain ABTNs excluded from the restructuring agreement consist essentially of credit default swaps. The fair value of the credit default swaps is established with valuation techniques based as much as possible on observable market data, such as credit spreads, correlation factors and an illiquidity premium, which is calculated from the spread between the bid and ask prices for similar financial instruments in the market. For the other ABTNs, the Caisse has established fair values using a valuation technique based on a financial model whose assumptions use as much as possible observable market data, such as interest rates and credit quality. Moreover, a favourable court judgment was rendered in the summer of 2013 in respect of litigation involving an ABTN excluded from the restructuring agreement. After an analysis of the conclusions of the judgment, the Caisse considered this development favourable in determining the fair value of the related investment.
As at December 31, 2013, the funding facility, which represents commitments in respect of MAV 1, totals $6,167 million ($6,167 million in 2012) and matures in July 2017. The Caisse establishes the fair value of this funding facility by applying a valuation technique based on CDX.IG index tranches plus a financing premium. The funding facility represents indemnification agreements that may eventually oblige the Caisse to make payments to the beneficiaries of the guarantee.
A 1% downward variation of credit spreads would involve an increase in the fair value of the ABTNs net of the economic hedge of approximately $2 million ($6 million in 2012). A 1% upward variation, however, would result in a decrease of approximately $2 million in the fair value ($5 million in 2012).

AR 2013 137CAISSE DE DÉPÔT ET PLACEMENT DU QUÉBEC
INVESTMENTS AND LIABILITIES RELATED TO INVESTMENTS (cont.)
F) HIERARCHY OF FAIR VALUE
The following tables summarize the allocation of the fair value of the investments and the liabilities related to investments among the three levels of the hierarchy as at December 31:
(in millions of dollars) 2013
Level 1 Level 2 Level 3 Total
Investments
Fixed-income securitiesShort-term investments – 1,784 32 1,816
Bonds – 65,043 4,494 69,537
ABTNs – – 9,752 9,752
Mortgages – 8,366 2,163 10,529
Total fixed-income securities – 75,193 16,441 91,634
Variable-income securitiesEquities and convertible securities 73,577 3,065 25,622 102,264
Real estate holdings1 – – 29,501 29,501
Total variable-income securities 73,577 3,065 55,123 131,765
Amounts receivable with respect to investments Securities acquired under reverse repurchase agreements – 15,540 – 15,540
Amount pertaining to derivative financial instruments 25 1,941 35 2,001
73,602 95,739 71,599 240,940
Liabilities related to investmentsSecurities sold under repurchase agreements – 12,250 – 12,250
Commercial paper payable – 1,529 – 1,529
Term notes – 9,020 – 9,020
Short selling of securities 7,483 4,166 43 11,692
Mortgage loans payable – 282 1,797 2,079
Other loans payable – 1,717 – 1,717
Amount pertaining to derivative financial instruments 11 1,653 47 1,711
7,494 30,617 1,887 39,998
1. Investments in real estate holdings include partial or full ownership of income properties through interests in a company or a partnership.

AR 2013 138CAISSE DE DÉPÔT ET PLACEMENT DU QUÉBEC
INVESTMENTS AND LIABILITIES RELATED TO INVESTMENTS (cont.)
(in millions of dollars) 2012
Level 1 Level 2 Level 3 Total
Investments
Fixed-income securitiesShort-term investments – 1,182 150 1,332
Bonds – 54,948 3,456 58,404
ABTNs – – 9,894 9,894
Mortgages – 7,395 1,663 9,058
Total fixed-income securities – 63,525 15,163 78,688
Variable-income securitiesEquities and convertible securities 64,080 3,904 24,051 92,035
Real estate holdings1 – – 25,761 25,761
Total variable-income securities 64,080 3,904 49,812 117,796
Amounts receivable with respect to investments Securities acquired under reverse repurchase agreements – 11,383 – 11,383
Amount pertaining to derivative financial instruments 23 2,290 280 2,593
64,103 81,102 65,255 210,460
Liabilities related to investmentsSecurities sold under repurchase agreements – 4,624 – 4,624
Commercial paper payable – 1,017 – 1,017
Term notes – 8,879 – 8,879
Short selling of securities 8,231 3,938 50 12,219
Mortgage loans payable – 503 1,721 2,224
Other loans payable – 3,011 – 3,011
Amount pertaining to derivative financial instruments 14 2,043 98 2,155
8,245 24,015 1,869 34,129
1. Investments in real estate holdings include partial or full ownership of income properties through interests in a company or a partnership.

AR 2013 139CAISSE DE DÉPÔT ET PLACEMENT DU QUÉBEC
INVESTMENTS AND LIABILITIES RELATED TO INVESTMENTS (cont.)
LEVEL 3: RECONCILIATION BETWEEN OPENING AND CLOSING BALANCESFor the financial instruments classified in level 3 of the hierarchy, the details of the reconciliation between the opening and closing balances are as follows:
(in millions of dollars) 2013
Opening balance
Total gains (losses)
recorded in results Purchases Sales Issuance Settlement
Net transfers to and from
level 3Closing balance
Total gains (losses)
attributable to
investments held at
year-end, recorded in
results
Short-term investments 150 108 756 (227) – (755) – 32 (15)
Bonds 3,456 42 6 (135) 1,377 (280) 28 4,494 26
ABTNs 9,894 960 – – – (1,102) – 9,752 967
Mortgages 1,663 212 – – 812 (551) 27 2,163 218 Equities and
convertible securities 24,051 3,545 3,388 (4,692) – – (670) 25,622 2,310
Real estate holdings 25,761 1,919 3,888 (2,067) – – – 29,501 1,642
Net amount pertaining to derivative financial instruments3 182 (199) – – – 2 3 (12) (190)
Short selling of securities (50) (6) 13 – – – – (43) 6
Mortgage loans payable (1,721) (198) – – (488) 610 – (1,797) (185)
1. Recorded under the items Gains on the sale of investments and Unrealized increases in value of investments and liabilities related to investments.
2. Recorded under the item Unrealized increases in value of investments and liabilities related to investments.
3. Derivative assets and derivative liabilities are recorded on a net basis in the reconciliation between opening and closing balances.
TRANSFERS BETWEEN LEVELS 1, 2 AND 3 OF THE HIERARCHY OF FAIR VALUEDuring fiscal 2013, financial instruments with a fair value of $588 million and $82 million were transferred out of level 3 and added to the level 2 and level 1 financial instruments, respectively, as a result of additional observable data taken into account in the valuation method.
1 2

AR 2013 140CAISSE DE DÉPÔT ET PLACEMENT DU QUÉBEC
INVESTMENTS AND LIABILITIES RELATED TO INVESTMENTS (cont.)
(in millions of dollars) 2012
Opening balance
Total gains (losses)
recorded in results Purchases Sales Issuance Settlement
Net transfers to and from
level 3Closing balance
Total gains (losses)
attributable to
investments held at
year-end, recorded in results
Short-term investments 211 (44) 1,504 (70) 3 (1,454) – 150 (42)
Bonds 3,209 (36) – (97) 852 (457) (15) 3,456 (32)
ABTNs 7,901 2,424 – (310) – (121) – 9,894 2,575
Mortgages 1,363 28 – – 979 (633) (74) 1,663 35 Equities and
convertible securities 25,527 1,439 3,400 (6,291) – (23) (1) 24,051 660
Real estate holdings 22,033 652 3,742 (666) – – – 25,761 648
Net amount pertaining to derivative financial instruments3 974 (801) – – – 9 – 182 (796)
Short selling of securities (60) (17) 27 – – – – (50) (16)
Mortgage loans payable (1,720) (10) – – 9 – – (1,721) (10)
Other loans payable (9) – – – – 9 – – –
1. Recorded under the items Gains on the sale of investments and Unrealized increases in value of investments and liabilities related to investments.
2. Recorded under the item Unrealized increases in value of investments and liabilities related to investments.
3. Derivative assets and derivative liabilities are recorded on a net basis in the reconciliation between opening and closing balances.
TRANSFERS BETWEEN LEVELS 2 AND 3 OF THE HIERARCHY OF FAIR VALUEDuring fiscal 2012, financial instruments were transferred out of level 3 and added to the level 2 financial instruments as a result of additional observable data taken into account in the valuation method.
LEVEL 3: FAIR VALUE MEASUREMENT BASED ON REASONABLE ALTERNATIVE ASSUMPTIONSIn certain cases, the assumptions used in the valuation techniques are based on non-observable data or observable market data adjusted significantly to reflect the specific characteristics of the instrument being valued. Although the Caisse considers that its fair value measurements are appropriate, the use of reasonably possible alternative assumptions could result in different fair values. It is possible that different entities will arrive at different valuations of the fair value of the same financial instrument on the same measurement date. Even so, the valuation techniques and input data used by such entities can meet the objective of fair value measurement. The fact that different valuations of fair value exist reflects the judgment and assumptions applied, as well as the uncertainty surrounding fair value measurement of instruments.
1 2

AR 2013 141CAISSE DE DÉPÔT ET PLACEMENT DU QUÉBEC
INVESTMENTS AND LIABILITIES RELATED TO INVESTMENTS (cont.)
The analysis that follows shows the sensitivity of the valuations to reasonable alternative assumptions of the non-observable data. Equities and convertible securities, bonds and the net amount pertaining to derivative financial instruments are sensitive mainly to the EBITDA multiple and the discount rate used in the valuation, which may reasonably range from 5.0 to 12.9 and from 7.8% to 13.7%, respectively, in 2013 (from 5.5 to 11.0 and from 8.0% to 12.0%, respectively, in 2012). Mortgage loans payable are sensitive mainly to the credit spread, which may reasonably vary by about 1.0% in 2013 (1.0% in 2012). The fair value of real estate holdings is sensitive mainly to the capitalization rate or the discount rate used in the valuation of the property, which may reasonably vary by about 0.3% in 2013 (0.3% in 2012). The fair value of the investment funds for which the Caisse does not have access to information on the underlying investments is based on the fair value provided by the general partner or the external manager. Accordingly, given that no additional information indicates that it is necessary to adjust such fair value, no other reasonably possible assumptions can be used.
Substitution of reasonable alternative assumptions for the main assumptions would result in an increase of approximately $1,147 million ($881 million in 2012) or a decrease of approximately $1,092 million ($966 million in 2012) in the total fair value of the level 3 instruments, excluding ABTNs, real estate investments and investment funds. The impact of such substitution on the fair value of the ABTNs is described in note 3E.
04OTHER ASSETS
(in millions of dollars) 2013 2012
Cash 448 646
Accounts receivable 243 213
Fixed assets 155 143 846 1,002
05OTHER LIABILITIES
(in millions of dollars) 2013 2012
Interest payable on derivative financial instruments 85 84
Investment income, accrued and payable 217 165
Income tax liabilities, payable and future 423 390
Other liabilities 661 661
1,386 1,300
06DEPOSITORS’ NET HOLDINGS AND NON-CONTROLLING INTERESTS
A) DEPOSITORS’ NET HOLDINGS
Demand deposits and term deposits bear interest at variable and fixed rates, respectively, and constitute indebtedness on the part of the Caisse toward the depositors. The average annual rates paid on demand and term deposits are 1.0% and 1.5%, respectively (1.0% and 1.5% in 2012).
During the year, the Caisse paid $4 million ($5 million in 2012) of interest on both demand and term deposits.
Participation deposits are expressed in units. Each unit gives its holder a proportionate share in the net holdings and the net income of a particular fund. At the end of each monthly period for the General Fund and the individual funds, the net investment income and the gains (losses) on the sale of investments are allocated to participation deposit holders. At the opening of the following period, the amounts allocated are paid out to the depositors’ demand deposit accounts. Generally, the balance of demand deposits is reinvested in participation deposits at the opening of each monthly period based on the depositors’ investment policies. The number of issued units of participation deposits depends on the fair value determined at the end of the previous monthly period.
During the year, the Caisse paid $11,382 million ($7,552 million in 2012) in net income to participation deposit holders.

AR 2013 142CAISSE DE DÉPÔT ET PLACEMENT DU QUÉBEC
DEPOSITORS’ NET HOLDINGS AND NON-CONTROLLING INTERESTS (cont.)
(in millions of dollars) 2013 2012
Caisse’s indebtedness toward depositors Demand deposits 371 887
Term deposits 92 134
Net income to be paid out to participation deposit holders 1,328 1,612
1,791 2,633
Participation deposit holders’ holdings Participation deposits Balance, beginning of year 159,017 149,861
Units issued 13,647 9,725
Units cancelled (497) (569)
Balance, end of year 172,167 159,017
Unallocated gains on the sale of investments of specialized portfolios 8,282 8,898
Unrealized increases in value of investments and liabilities related to investments net of non-controlling interests 17,909 5,662
Consolidation adjustment arising from early adoption of IFRS by a specialized portfolio (note 6B) (702) (637)
197,656 172,940
Depositors’ net holdings in accordance with Canadian GAAP 199,447 175,573
The Caisse defines its capital as the net holdings of the holders of participation deposits, demand deposits and term deposits. The Caisse is not subject to external capital requirements.
The mission of the Caisse is to receive moneys on deposit as provided by law and to manage them with a view to achieving an optimal return on depositors’ capital within the framework of their investment policies. Through its wholly owned subsidiary CDP Financial Inc., the Caisse issues capital securities to optimize financing costs and to fund certain investments.
B) CONSOLIDATION ADJUSTMENT ARISING FROM EARLY ADOPTION OF IFRS BY A SPECIALIZED PORTFOLIO
The document Investment Entities, published in October 2012 by the IASB, requires that a company considered an investment entity value each of its controlled entities at fair value instead of consolidating them. The AcSB has incorporated this document into Part I of the CPA Canada Handbook. The standard for investment entities is applicable to fiscal years beginning on or after January 1, 2014, but early application is allowed. The Caisse elected to early adopt IFRS for the financial statements of the specialized Real Estate portfolio as of the year ended December 31, 2012.
IFRS for investment entities differ from the provisions of AcG-18 mainly in their accounting treatment of certain subsidiaries. In accordance with Canadian GAAP, the specialized Real Estate portfolio consolidated its subsidiaries whereas, according to IFRS, an investment entity must not consolidate its subsidiaries but instead measure and present them at fair value, as an investment. Measurement of the fair value of the investments held by the specialized Real Estate portfolio is henceforth based on an enterprise value technique. This change in the valuation method increased the fair value of the investments in the specialized Real Estate portfolio.
The combined financial statements of the Caisse for the years ended December 31, 2013 and 2012, have been prepared in accordance with Canadian GAAP and, pursuant to AcG-18, the subsidiaries of the specialized Real Estate portfolio have been consolidated. Accordingly, a consolidation adjustment was required to exclude from depositors’ net holdings established in accordance with Canadian GAAP an amount of $702 million as at December 31, 2013, and $637 million as at December 31, 2012, arising from early adoption of IFRS by the specialized Real Estate portfolio. As supplemental information, these amounts are presented separately from depositors’ net holdings under the item Consolidation adjustment arising from early adoption of IFRS by a specialized portfolio in the Combined statement of net assets as well as in note 6A. When the first annual combined financial statements according to IFRS are published as at December 31, 2014, the adjustment of $637 million will be recorded in depositors’ net holdings as at January 1, 2013, the date of the transition to IFRS. Moreover, an amount of $65 million, corresponding to the increase in the enterprise fair value of the investments of the specialized Real Estate portfolio, will be recorded for the year ended December 31, 2013, namely the comparative year established according to IFRS.

AR 2013 143CAISSE DE DÉPÔT ET PLACEMENT DU QUÉBEC
DEPOSITORS’ NET HOLDINGS AND NON-CONTROLLING INTERESTS (cont.)
In addition to the adjustment arising from non-consolidation of the subsidiaries of the specialized Real Estate portfolio, the Caisse is continuing its analysis of the other impacts of adopting IFRS on the combined financial statements, the individual funds, the General Fund and the other specialized portfolios. The Caisse is therefore not yet in a position to determine the complete impact of the transition on its first annual combined financial statements that will be prepared in accordance with IFRS as of December 31, 2014.
C) NON-CONTROLLING INTERESTS
Non-controlling interests represent interests of non-controlling shareholders in consolidated subsidiaries that are not directly or indirectly attributable to the Caisse. Non-controlling interests are recorded at their share of the fair value of the investment and are allocated a proportional share of combined net assets and net investment results. Changes in the Caisse’s interest in a subsidiary that do not result in a loss of control thereof are recorded as transactions on combined net assets.
As at December 31, the details of non-controlling interests are as follows:
(in millions of dollars) 2013 2012
Balance, beginning of year 2,006 2,497
Net investment results attributable to non-controlling interests (note 7E) 333 91
Other changes in non-controlling interests1 (138) (582)
Balance, end of year 2,201 2,006
1. In 2013, the other changes are due mainly to distributions as well as to an increase in non-controlling interests in consolidated subsidiairies. In 2012, the other changes are due mainly to the dissolution of a subsidiary, distributions and the buyback by the Caisse of non-controlling interests in consolidated subsidiaries.
As at December 31, the details of the cost and the fair value of non-controlling interests are as follows:
(in millions of dollars) 2013 2012Fair
value CostFair
value Cost
Canadian 2,071 1,780 1,901 1,654
Foreign 130 125 105 112
2,201 1,905 2,006 1,766

AR 2013 144CAISSE DE DÉPÔT ET PLACEMENT DU QUÉBEC
A) INVESTMENT INCOME
(in millions of dollars) 2013 2012
Fixed-income securities Short-term investments 171 241
Bonds 1,575 1,611
Mortgages 365 354
2,111 2,206
Variable-income securities Equities and convertible securities 3,474 2,828
Real estate holdings (note 7B) 1,016 850
4,490 3,678
Other income (5) 30
Less:External management fees 9 10
6,587 5,904
Investment income – Fixed-income securities were increased by $33 million ($74 million in 2012) as net income (net expenses) related to securities acquired (sold) under reverse repurchase (repurchase) agreements. In addition, those related to short-term investments were reduced by $11 million ($11 million in 2012) as interest expense on commercial paper, and those related to bonds were reduced by $320 million ($307 million in 2012) as interest expense on term notes.
B) NET INCOME FROM REAL ESTATE HOLDINGS
(in millions of dollars) 2013 2012
Income from real estate holdings 2,795 2,614
Less:Expenses related to real estate subsidiaries Operating expenses related to real estate holdings 1,389 1,351
Operation expenses 69 58
Loan financial expenses 321 355
1,779 1,764
1,016 850
07INVESTMENT INCOME, GAINS (LOSSES) ON THE SALE OF INVESTMENTS AND UNREALIZED INCREASES (DECREASES) IN VALUE OF INVESTMENTS AND LIABILITIES RELATED TO INVESTMENTS

AR 2013 145CAISSE DE DÉPÔT ET PLACEMENT DU QUÉBEC
INVESTMENT INCOME, GAINS (LOSSES) ON THE SALE OF INVESTMENTS AND UNREALIZED INCREASES (DECREASES) IN VALUE OF INVESTMENTS AND LIABILITIES RELATED TO INVESTMENTS (cont.)
C) GAINS (LOSSES) ON THE SALE OF INVESTMENTS
(in millions of dollars) 2013 2012
Fixed-income securities Short-term investments 175 (88)
Bonds 840 1,312
ABTNs (7) (151)
Mortgages 7 (2)
1,015 1,071
Variable-income securities Equities and convertible securities 3,711 923
Real estate holdings (178) 203
3,533 1,126
Less:Transaction costs of investments 113 69
External management fees 2 1
4,433 2,127
The amount of $4,433 million of gains on the sale of investments ($2,127 million in 2012) recorded in the Combined statement of income and changes in net assets includes $985 million of foreign exchange losses ($292 million in 2012).

AR 2013 146CAISSE DE DÉPÔT ET PLACEMENT DU QUÉBEC
INVESTMENT INCOME, GAINS (LOSSES) ON THE SALE OF INVESTMENTS AND UNREALIZED INCREASES (DECREASES) IN VALUE OF INVESTMENTS AND LIABILITIES RELATED TO INVESTMENTS (cont.)
D) UNREALIZED INCREASES (DECREASES) IN VALUE OF INVESTMENTS AND LIABILITIES RELATED TO INVESTMENTS
(in millions of dollars) 2013 2012
Fixed-income securities Short-term investments 177 (320)
Bonds (3,313) (1,639)
ABTNs 734 1,802
Mortgages 13 (24)
Securities acquired under reverse repurchase agreements (10) 24
(2,399) (157)
Variable-income securities Equities and convertible securities 13,308 6,235
Real estate holdings 2,028 539
15,336 6,774
12,937 6,617
Less:Liabilities related to investments Securities sold under repurchase agreements 4 1
Commercial paper payable 3 (1)
Term notes 139 106
Short selling of securities 768 511
Mortgage loans payable 217 (5)
Other loans payable 19 1
Derivative financial instruments (516) (640)
634 (27)
12,303 6,644
The unrealized increases in value in the amount of $12,303 million ($6,644 million in 2012) recorded in the Combined statement of income and changes in net assets include unrealized increases in value of $3,481 million related to foreign exchange (decreases in value of $641 million in 2012).

AR 2013 147CAISSE DE DÉPÔT ET PLACEMENT DU QUÉBEC
INVESTMENT INCOME, GAINS (LOSSES) ON THE SALE OF INVESTMENTS AND UNREALIZED INCREASES (DECREASES) IN VALUE OF INVESTMENTS AND LIABILITIES RELATED TO INVESTMENTS (cont.)
E) NET INVESTMENT RESULTS ATTRIBUTABLE TO DEPOSITORS AND NON-CONTROLLING INTERESTS
(in millions of dollars) 2013 2012
Depositors
Non- controlling
interests Total Depositors
Non- controlling
interests Total
Investment income 6,330 257 6,587 5,590 314 5,904
Less:Operating expenses 287 – 287 284 – 284
Net investment income 6,043 257 6,300 5,306 314 5,620
Gains (losses) on the sale of investments 4,413 20 4,433 2,454 (327) 2,127
Total realized income 10,456 277 10,733 7,760 (13) 7,747
Unrealized increases in value of investments and liabilities related to investments 12,247 56 12,303 6,540 104 6,644
Net investment results 22,703 333 23,036 14,300 91 14,391
08OPERATING EXPENSES
(in millions of dollars) 2013 2012
Salaries and employee benefits 153 149
Information technology and professional services 47 50
Data services and subscriptions 13 13
Premises and equipment 16 18
Depreciation of fixed assets 28 27
Other 17 15
274 272
Safekeeping of securities 13 12
287 284

AR 2013 148CAISSE DE DÉPÔT ET PLACEMENT DU QUÉBEC
09IDENTIFICATION AND MANAGEMENT OF RISKS RELATED TO INVESTMENT OPERATIONS
The Caisse has implemented a number of policies, directives and procedures to oversee its operations.
Risk management is based on an integrated risk management policy adopted by the Board of Directors. This policy, which is revised on a regular basis, is intended to promote a risk management culture and ensure stringent risk management practices to help the Caisse carry out its mission on behalf of its depositors. More specifically, the policy defines risk management governance, establishes the acceptable level of risk so as to avoid excessive loss, links the level of risk to the target value added and aims for an efficient allocation of risk.
Governance of risk management is based on three levels of control:
1. Portfolio managers, who are primarily responsible for managing the risks related to operations under their purview;2. The Investment-Risk Committee, a subcommittee of the Executive Committee, with assistance from the Risk Department and the Policies
and Compliance Senior Vice-Presidency; and3. The Board of Directors, its Audit Committee and its Investment and Risk Management Committee, as well as Internal Audit.
The policy includes reporting mechanisms for each of these levels. It also includes a framework for outsourcing management of investments, management of operational risks and management of derivative financial instruments.
To ensure the objectivity and rigour required to manage risks, teams that are independent of the portfolio managers are responsible for defining and monitoring the integrated risk management policy as well as the investment policies applying to the specialized portfolios.
The financial risks defined in the integrated risk management policy include the following:
a) Market risk;b) Credit risk;c) Counterparty risk related to derivative financial instruments; andd) Financing-liquidity risk.
Investment policies are designed to oversee the activities performed by the portfolio managers. For each specialized portfolio, an investment policy establishes the philosophy, management type, investment universe, benchmark index, value-added target and risk oversight, including concentration and risk limits. The managers must abide by the limits in their investment activities.
A) MARKET RISK
Market risk represents the risk of financial loss arising from changes in the value of financial instruments. Such value is affected by changes in certain market variables, such as interest rates, exchange rates, share prices and commodity prices. The risk derives from the volatility in the price of a financial instrument, which itself results from the volatility of such market variables.
The Caisse manages all market risks according to an integrated approach. The major factors contributing to risk, such as sectors, countries and issuers, are taken into account.
The Caisse may use derivative financial instruments traded on exchanges or negotiated directly with banks and securities dealers, to manage market risks.
The Caisse measures its market risk using the method known as Value at Risk (VaR), which is based on a statistical estimate of the volatility of the fair value of each position and its correlations. VaR is a statistical estimate of a portfolio’s potential loss according to a predetermined confidence level during a given exposure period. The VaR of the market is estimated with a 99% confidence level over an exposure period of one year. The VaR calculated by the Caisse therefore presents the level of loss that a portfolio should reach or exceed in 1% of cases. The Caisse estimates VaR for each instrument in its specialized portfolios and aggregates the information for the overall portfolio.
The Caisse uses the historical-simulation method to estimate VaR. This method is based essentially on the assumption that the future will be similar to the past. It requires that historical data series on all the risk factors needed to estimate the returns on instruments be available. In the absence of historical data, alternative methods are used. A history of 1,500 days of observation of risk factors, such as variations in exchange rates, interest rates and financial asset prices, is used to estimate the volatility of returns and the correlation between asset returns.

AR 2013 149CAISSE DE DÉPÔT ET PLACEMENT DU QUÉBEC
IDENTIFICATION AND MANAGEMENT OF RISKS RELATED TO INVESTMENT OPERATIONS (cont.)
The Caisse calculates two types of risk: absolute risk and active risk. The absolute risk, or absolute VaR, of the Caisse’s benchmark portfolio (target portfolio of the depositors as a whole) is the result of the risk of the benchmark indexes of the asset classes in the portfolio. For example, should the depositors elect to increase the weight of equities in their respective benchmark portfolios, such risk would increase automatically because of the higher level of volatility of this asset class. Consequently, the expected absolute return would also increase. The absolute risk of the overall portfolio (consisting of the actual investments) corresponds to the risk (volatility) of the positions in the Caisse’s overall portfolio. The absolute risk of the overall portfolio and that of the benchmark portfolio are calculated with the same method but they relate to different portfolios, namely the overall portfolio actually invested by the Caisse and the benchmark portfolio targeted by the depositors.
Active risk, or VaR related to active management, represents the possibility that the Caisse will record a return different from that of its benchmark portfolio as a result of active management of its overall portfolio. The higher the active risk, the more the absolute return expected from the overall portfolio will stand out from the benchmark portfolio return.
The absolute risk of the Caisse’s benchmark portfolio and the active risk and absolute risk of the overall portfolio are measured on a regular basis and are subject to various limits.
As at December 31, the overall portfolio’s absolute risk and active risk, according to a 99% confidence level and a 1,500-day history, are as follows:
ABSOLUTE RISK OF THE OVERALL PORTFOLIO
(as a %) 2013 2012
Fixed income 9.2 9.1
Inflation-sensitive investments 38.7 39.8
Equities 44.6 46.8
Other investments1 1.2 1.2
Overall risk 29.4 30.6
ACTIVE RISK OF THE OVERALL PORTFOLIO
(as a %) 2013 2012
Fixed income 2.0 1.4
Inflation-sensitive investments 9.2 12.9
Equities 4.9 5.4
Other investments1 1.3 1.1
Overall risk 3.7 4.4
1. The VaR for the Other investments category is presented as a percentage of the net assets of the Caisse.
FOREIGN EXCHANGE RISKForeign exchange risk represents the risk that the fair value or future cash flows of a financial instrument will fluctuate because of variations in foreign currency exchange rates. This risk is integrated into the overall measurement of VaR.
To manage foreign exchange risk, the Caisse also uses instruments negotiated with banks. The maturities of these instruments generally range from one to 12 months for forward contracts and options, and from one to two years for foreign currency swaps. On maturity, new derivative financial instruments are negotiated to maintain effective long-term management of the foreign exchange risks associated with investments and liabilities related to investments in foreign currencies.

AR 2013 150CAISSE DE DÉPÔT ET PLACEMENT DU QUÉBEC
IDENTIFICATION AND MANAGEMENT OF RISKS RELATED TO INVESTMENT OPERATIONS (cont.)
The allocation of investments, liabilities related to investments and non-controlling interests denominated in foreign currencies is as follows as at December 31:
(in millions of dollars) 2013
Currency1
Canadian dollar
U.S.dollar Euro
Pound sterling Other Subtotal Total
InvestmentsFixed-income securities 81,417 4,388 3,526 544 1,759 10,217 91,634
Variable-income securities Equities and convertible securities 23,929 42,005 10,255 6,576 19,499 78,335 102,264
Real estate holdings 18,050 5,389 4,095 265 1,702 11,451 29,501 Amounts receivable with
respect to investments Securities acquired under
reverse repurchase agreements 10,958 1,519 3,063 – – 4,582 15,540 Amount pertaining to
derivative financial instruments 1,329 547 46 46 33 672 2,001
135,683 53,848 20,985 7,431 22,993 105,257 240,940
Liabilities related to investmentsConventional products2 19,819 10,759 7,576 17 116 18,468 38,287 Amount pertaining to derivative
financial instruments 435 896 280 77 23 1,276 1,711
20,254 11,655 7,856 94 139 19,744 39,998
Non-controlling interests 2,071 14 18 92 6 130 2,201
113,358 42,179 13,111 7,245 22,848 85,383 198,741
(in millions of dollars) 2012
Currency1
Canadian dollar
U.S.dollar Euro
Pound sterling Other Subtotal Total
InvestmentsFixed-income securities 72,711 3,400 1,045 498 1,034 5,977 78,688
Variable-income securities Equities and convertible securities 22,364 37,910 8,984 5,277 17,500 69,671 92,035
Real estate holdings 15,857 4,114 3,846 613 1,331 9,904 25,761 Amounts receivable with
respect to investments Securities acquired under
reverse repurchase agreements 8,629 2,328 426 – – 2,754 11,383 Amount pertaining to
derivative financial instruments 1,905 433 86 29 140 688 2,593
121,466 48,185 14,387 6,417 20,005 88,994 210,460
Liabilities related to investmentsConventional products2 17,822 10,553 3,240 188 171 14,152 31,974 Amount pertaining to derivative
financial instruments 915 826 115 177 122 1,240 2,155
18,737 11,379 3,355 365 293 15,392 34,129
Non-controlling interests 1,901 9 14 82 – 105 2,006
100,828 36,797 11,018 5,970 19,712 73,497 174,325
1. Investments are recorded under the currency they are denominated in and are translated into Canadian dollars.
2. Conventional products include liabilities related to investments with the exception of the amount pertaining to derivative financial instruments.

AR 2013 151CAISSE DE DÉPÔT ET PLACEMENT DU QUÉBEC
IDENTIFICATION AND MANAGEMENT OF RISKS RELATED TO INVESTMENT OPERATIONS (cont.)
The impact of translation of the fair value of foreign currency investments into Canadian dollars included under the item Gains on the sale of investments and under Unrealized increases in value of investments and liabilities related to investments is favourable by $4,226 million (unfavourable by $1,273 million in 2012). The impact of exchange rate hedging related to a portion of such investments is unfavourable by $1,730 million (favourable by $340 million in 2012). The net impact on net investment results is favourable by $2,496 million (unfavourable by $933 million in 2012).
INTEREST RATE RISKInterest rate risk is the risk that the fair value or future cash flows of a financial instrument will fluctuate because of changes in market interest rates. All interest-bearing assets and liabilities as well as their effective rates are shown in note 9D in the table presenting the exposure to liquidity risk. This risk is integrated into the overall measurement of VaR.
PRICE RISKPrice risk is the risk that the fair value or future cash flows of a financial instrument will fluctuate because of changes in market prices (other than changes arising from interest rate risk or foreign exchange risk), whether such changes derive from the characteristics of the instrument itself or of its issuer, or from elements affecting all similar financial instruments traded on the market. This risk is integrated into the overall measurement of VaR.
B) CREDIT RISK
Credit risk is the possibility of a loss of fair value in the event that a borrower, endorser, guarantor or counterparty does not honour its obligation to repay a loan or to fulfill any other financial commitment, or sees its financial position deteriorate. Sources of credit risk include fixed-income securities, derivative financial instruments, provision of financial collateral and lending commitments.
Analysis of credit risk includes the probability of default and the recovery rate on debt securities held by the Caisse, as well as monitoring of changes in the credit quality of issuers or groups of issuers whose securities are held in all the portfolios of the Caisse.
Analysis of concentration measures the fair value of a group of financial instruments, particularly fixed-income and variable-income securities, related to a single issuer or to a group of issuers controlled by a parent company, with similar characteristics (region, sector and credit rating).
The concentration limit by group of issuers is 3% of the Caisse’s total assets, with the exception of securities issued by the Government of Canada, of Québec or another Canadian province or territory, as well as by their departments and agencies, which are not subject to concentration limits. Sovereign issuers rated AAA are also excluded from this concentration limit. Specific concentration limits also apply to investments in emerging markets. Concentration by issuer is monitored on a monthly basis or on initiation of a transaction requiring approval from the Investment-Risk Committee.

AR 2013 152CAISSE DE DÉPÔT ET PLACEMENT DU QUÉBEC
IDENTIFICATION AND MANAGEMENT OF RISKS RELATED TO INVESTMENT OPERATIONS (cont.)
The concentration by credit rating of the Caisse’s groups of issuers is as follows as at December 31:
2013 2012
Value as a % of investments1
Credit rating:2
AAA – AA 19.2 17.8
A 23.6 23.4
BBB 13.8 13.4
BB or lower 2.8 3.4
No credit rating:Real estate assets 16.4 16.3
ABTNs 0.6 0.7
Private equity 7.2 5.4
Private investment funds and hedge funds 6.5 6.8
Mortgages and mortgage securities 5.3 5.1
Other 4.6 7.7
100.0 100.0
1. The percentage of investments represents net positions by group of issuers.
2. Credit ratings are obtained from the main recognized credit rating agencies and are aggregated according to an algorithm developed in house. For the purposes of this concentration, only long-term credit ratings from the main agencies are used.
In the table above, the groups of issuers for which no credit rating is available are categorized. For most of these groups, the absence of a credit rating from the main recognized credit rating agencies is due to the private nature of the investments, the absence of any debt, restructuring of the investments or a combination of these elements. Most of the issuers, however, are evaluated with an internal rating system that is used to closely monitor changes in the credit cycle. The system includes exposure limits by sector and country (or region) and by external credit rating (no limit for internal credit ratings).
As at December 31, 2013, 149 groups of issuers (146 in 2012) whose securities are held by the Caisse received a credit upgrade from the main credit rating agencies, while 131 others received a downgrade (176 in 2012). The Caisse frequently monitors changes in credit ratings by the agencies and compares them with the internal credit ratings when they are available.
In the case of mortgages with no assigned credit rating, the analysis of credit risk is based in part on the loan-to-value ratio. In this ratio, the amount of the loan is divided by the fair value of any asset received as collateral on the subscription date or the date funds were granted, or at any other time during the term of the loan.
The table below shows the breakdown of mortgages as at December 31:
2013 2012
Value as a % of mortgages
Loan-to-value ratio0 to 55% 27.1 31.7
55 to 65% 34.4 32.1
65 to 75% 38.0 35.8
75 to 85% 0.3 0.4
More than 85% 0.2 0.0
100.0 100.0
Credit risk is measured by the fair value of investments before collateral or other credit upgrades are taken into account. For off-balance- sheet items, the value taken into account to determine maximum exposure to credit risk corresponds to the amount guaranteed or incurred.

AR 2013 153CAISSE DE DÉPÔT ET PLACEMENT DU QUÉBEC
IDENTIFICATION AND MANAGEMENT OF RISKS RELATED TO INVESTMENT OPERATIONS (cont.)
The maximum exposure to credit risk is as follows as at December 31:
(in millions of dollars) 2013 2012
Investments Fixed-income securities 91,634 78,688
Amounts receivable with respect to investments 17,541 13,976
109,175 92,664
Off-balance-sheet Collateral pledged (note 12) 17,230 11,894
Guarantees and loan guarantees (note 11) 649 906
Funding facility (note 11) 6,167 6,167
24,046 18,967
Total maximum exposure 133,221 111,631
In reality, this exposure is less because the Caisse takes various measures to mitigate credit risk, such as the taking of guarantees (refer to note 12).
C) COUNTERPARTY RISK RELATED TO DERIVATIVE FINANCIAL INSTRUMENTS
Some over-the-counter derivative financial instruments give rise to counterparty risk, because they are negotiated by private contract without being traded through a clearing house. Counterparty risk corresponds to the credit risk from current or potential exposures arising from transactions involving this type of instrument in the event that the counterparty becomes unable to respect the terms of the contracts.
To limit its exposure to counterparty risk arising from transactions involving over-the-counter derivative financial instruments, the Caisse carries out transactions with financial institutions whose credit ratings are established by recognized credit rating agencies and according to operational limits set by management. Moreover, the Caisse enters into legal agreements based on the standards of the International Swaps and Derivatives Association (ISDA), which allows it to benefit from the offset between the amounts at risk and the exchange of collateral to limit its net exposure to this risk.
This risk is measured by counterparty, pursuant to the applicable legal agreement, from which it is possible to calculate the net exposure resulting from all over-the-counter derivative financial instruments and collateral exchanged. Actual exposure to counterparty risk is measured on a daily basis, pursuant to the applicable legal agreement. Potential exposure to counterparty risk is measured on a monthly basis.
As at December 31, 2013, the legal agreements and the collateral received helped reduce exposure to the counterparty risk of over-the-counter derivative financial instruments. The maximum exposure to this risk is $110 million ($58 million in 2012), in respect of 60 active counterparties (59 in 2012).
D) FINANCING-LIQUIDITY RISK
Financing-liquidity risk corresponds to the possibility that the Caisse may not always be able to fulfill the commitments related to its financial liabilities without having to obtain funds at abnormally high prices or having to sell assets. It also corresponds to the risk that the Caisse may not be able to sell investments quickly or to purchase investments without having a significant unfavourable effect on the price of the investment in question.
Analysis of compliance with established rules is monitored on a monthly basis, and the liquidity status is determined daily. The Caisse uses various scenario simulations to estimate the potential impact of various market events on its liquidity. Managers evaluate the liquidity of the markets on which the Caisse obtains financing for its operations. They also ensure that the Caisse is active on various financial markets and maintains relationships with the recognized credit rating agencies that rate the Caisse as well as with capital providers.

AR 2013 154CAISSE DE DÉPÔT ET PLACEMENT DU QUÉBEC
IDENTIFICATION AND MANAGEMENT OF RISKS RELATED TO INVESTMENT OPERATIONS (cont.)
The summary of maturities at par value of investments and liabilities related to investments as at December 31 is as follows:
(in millions of dollars) 2013 2012
Less than 1 year
1 year to5 years
More than 5 years Total
Effectiveinterest
rate% Total
Effectiveinterest
rate%
Fixed-income securities Short-term investments Canadian 671 158 297 1,126 3.9 608 2.4
Foreign 223 526 66 815 2.8 926 2.9
894 684 363 1,941 3.4 1,534 2.7
Bonds Issued or guaranteed by: Government of Canada 2,300 9,849 4,561 16,710 1.5 14,709 1.5
Province of Québec 8 867 12,877 13,752 3.5 8,529 3.4
Other Canadian provinces – 196 2,310 2,506 3.4 906 3.7
Municipalities and other Canadian agencies 110 829 368 1,307 2.6 1,302 4.1 Canadian government
corporations 17 5,487 5,577 11,081 2.6 11,080 2.8
U.S. government – – 673 673 3.8 721 3.8
Other foreign governments – 2,039 – 2,039 0.3 – –
Mortgage securities Canadian – 5 8 13 6.1 117 4.6
Foreign – 109 – 109 – 109 –
Canadian corporations 342 5,213 7,050 12,605 5.4 8,685 5.0
Foreign corporations 1,102 2,500 3,238 6,840 4.9 4,722 5.9
Inflation-indexed securities Canadian – 2 616 618 0.9 679 0.9
Foreign 292 101 – 393 0.3 50 0.7
4,171 27,197 37,278 68,646 3.2 51,609 3.2
ABTNs 387 9,654 112 10,153 – 11,260 –
Mortgages Canadian 136 3,013 5,538 8,687 4.0 7,317 3.6
Foreign 1,011 713 77 1,801 3.5 1,732 2.5
1,147 3,726 5,615 10,488 3.9 9,049 3.4
6,599 41,261 43,368 91,228 3.4 73,452 3.3
Amounts receivable with respect to investments
Securities acquired under reverse repurchase agreements
Canadian 10,960 – – 10,960 1.0 8,632 1.0
Foreign 4,582 – – 4,582 0.1 2,754 0.1
15,542 – – 15,542 0.7 11,386 0.8

AR 2013 155CAISSE DE DÉPÔT ET PLACEMENT DU QUÉBEC
IDENTIFICATION AND MANAGEMENT OF RISKS RELATED TO INVESTMENT OPERATIONS (cont.)
(in millions of dollars) 2013 2012
Less than 1 year
1 year to5 years
More than 5 years Total
Effectiveinterest
rate% Total
Effectiveinterest
rate%
Liabilities related to investments
Securities sold under repurchase agreements 12,250 – – 12,250 0.7 4,625 0.8
Commercial paper payable 1,531 – – 1,531 0.8 1,019 1.1
Term notes 2,125 1,000 5,286 8,411 3.9 7,963 3.8
Short selling of securities 5 2,054 1,739 3,798 1.7 3,543 1.9
Mortgage loans payable 351 1,649 54 2,054 3.0 2,421 4.1
Other loans payable 895 839 – 1,734 1.2 3,038 1.2
17,157 5,542 7,079 29,778 1.9 22,609 2.4
The Caisse is a party to various commitments and issues financial guarantees that may have an impact on its liquidity (refer to notes 3E, 11 and 12).
10DERIVATIVE FINANCIAL INSTRUMENTS
Derivative financial instruments are financial contracts whose value fluctuates as a function of the underlying asset, and which do not require holding or delivering the underlying asset itself. The underlying may be of a financial nature (interest rate, foreign currency or stock market security or index) or may be a commodity (precious metal, good or crude oil). Some derivative financial instruments are settled through clearing houses.
The notional amount of a derivative financial instrument represents the value of the notional principal to which a rate or a price applies to determine the exchange of future cash flows, and does not reflect the credit risk pertaining to the instrument.
The Caisse uses derivative financial instruments that include the following:
• Forward contracts and futures contracts are undertakings that enable the purchase or sale of an underlying, the quantity and price of which are determined in the contract, which includes a predetermined maturity date. A forward contract involves customized terms and conditions negotiated directly between the parties on the over-the-counter market. A futures contract has terms and conditions determined by an organized market.
• A swap is a transaction whereby two parties agree to exchange cash flows on predetermined conditions that include a notional amount and a term to maturiry.
• An option is a contract that is negotiated by mutual agreement or traded on an organized market and that gives the purchaser the right, but not the obligation, to buy or sell a given amount of an underlying security, index or commodity at a strike price stipulated in advance, either at a determined date or at any time before a specified maturity date.
• A warrant is a contract that enables the purchase of an underlying at a price established by the contract and according to the maturity stated therein.
Foreign exchange risk arises from investments and liabilities related to investments denominated in foreign currencies, as well as from related derivative financial instruments.
Derivative financial instruments that are traded on exchanges or negotiated with banks and securities dealers are used to manage the interest rate and market risks of the overall investment portfolio.

AR 2013 156CAISSE DE DÉPÔT ET PLACEMENT DU QUÉBEC
DERIVATIVE FINANCIAL INSTRUMENTS (cont.)
A) SUMMARY OF DERIVATIVE FINANCIAL INSTRUMENTS
(in millions of dollars) 2013 2012
Fair value
Notional amount Assets Liabilities
Net amount
Net amount
Foreign exchange risk management1
Foreign currency swaps Purchases 333 – 14 (14) (12)
Forward contracts Purchases 2,881 11 9 2 (10)
Sales 21,890 36 572 (536) (193)
25,104 47 595 (548) (215)
Interest rate and market risk managementInterest rate and foreign currency swaps 45,416 1,226 834 392 93
Interest rate swaps settled through a clearing house 17,041 – – – –
Credit default swaps 32,063 27 2 25 256
Equity and convertible securities swaps 16,670 467 46 421 294
Futures contracts 11,026 1 – 1 1
Forward contracts 7,174 11 69 (58) (7)
Over-the-counter options Purchases 11,558 185 – 185 63
Sales 9,461 – 154 (154) (69)
Exchange-traded options Purchases 1,395 25 – 25 12
Sales 2,003 – 11 (11) (3)
Warrants 84 12 – 12 13
153,891 1,954 1,116 838 653
Total derivative financial instrument contracts 178,995 2,001 1,711 290 438
1. When foreign exchange risk management transactions involve simultaneous use of the U.S. dollar and other currencies, the notional amount presented above represents only the final value denominated in Canadian dollars.

AR 2013 157CAISSE DE DÉPÔT ET PLACEMENT DU QUÉBEC
DERIVATIVE FINANCIAL INSTRUMENTS (cont.)
B) SUMMARY OF DERIVATIVE FINANCIAL INSTRUMENT MATURITIES
(in millions of dollars) 2013 2012
Notional amount – Maturity
Less than 1 year
1 year 5 years
More than 5 years Total
Notional amount
Foreign exchange risk management Foreign currency swaps Purchases 186 147 – 333 1,169
Forward contracts Purchases 2,881 – – 2,881 1,988
Sales 21,409 481 – 21,890 24,736
24,476 628 – 25,104 27,893
Interest rate and market risk managementInterest rate and foreign currency swaps 9,916 21,384 14,116 45,416 52,307
Interest rate swaps settled through a clearing house – 8,346 8,695 17,041 –
Credit default swaps 395 31,668 – 32,063 32,829
Equity and convertible securities swaps 14,099 2,571 – 16,670 21,399
Commodity swaps – – – – 21
Futures contracts 11,026 – – 11,026 6,737
Forward contracts 7,118 56 – 7,174 3,146
Over-the-counter options Purchases 8,108 3,450 – 11,558 3,035
Sales 6,512 2,949 – 9,461 3,005
Exchange-traded options Purchases 1,395 – – 1,395 1,434
Sales 2,003 – – 2,003 1,682
Warrants 51 30 3 84 82
60,623 70,454 22,814 153,891 125,677
Total derivative financial instrument contracts 85,099 71,082 22,814 178,995 153,570
(in millions of dollars) 2013 2012
Fair value – Maturity
Less than 1 year
1 year 5 years
More than 5 years Total
Fair value
Derivative financial instrumentsAssets 660 417 924 2,001 2,593
Liabilities 925 434 352 1,711 2,155
Net amount (265) (17) 572 290 438

AR 2013 158CAISSE DE DÉPÔT ET PLACEMENT DU QUÉBEC
11COMMITMENTS AND CONTINGENCIES
Given the nature of its operations, the Caisse has a number of commitments.
Commitments to buy investments mean the Caisse is committed to buying investments that will be settled in the coming financial years, in accordance with the terms and conditions in each agreement.
For the Caisse, guarantees and loan guarantees consist in providing guarantees to financial institutions and corporations regarding future income deriving from the sale of investments and transactions on derivative financial instruments as well as repayment of borrowings by investee companies. Guarantees related to the repayment of loans have no specific maturity date, except in some cases where the terms range from one to nine years.
(in millions of dollars) 2013 2012
Commitments to buy investments 14,622 8,142
Guarantees and loan guarantees 649 906
ABTNs (funding facility)1 6,167 6,167
21,438 15,215
1. For a description of the commitments related to ABTNs, see note 3E.
12COLLATERALS
In the normal course of business, the Caisse pledges financial assets as collateral for securities borrowed, securities sold under repurchase agreements and transactions involving derivative financial instruments. The counterparty is authorized to sell or pledge as collateral certain securities in the absence of default by the Caisse. On certain conditions, the Caisse may have to pledge additional collateral if collateral already pledged loses value.
The following table presents the fair value of the collateral pledged by the Caisse as at December 31:
(in millions of dollars) 2013 2012
Collateral pledged for Securities borrowed 4,902 6,781
Securities sold under repurchase agreements 11,697 4,648
Over-the-counter derivative financial instruments 522 306
Exchange-traded derivative financial instruments 109 159
17,230 11,894
The Caisse receives financial assets as collateral for securities lent, securities acquired under reverse repurchase agreements and transactions involving derivative financial instruments. The Caisse is authorized to sell or pledge certain securities in the absence of default by the counterparty. The Caisse is obliged to return such securities to the counterparties. If the value of the collateral received decreases, the Caisse may in certain cases request additional collateral.
The following table presents the fair value of the collateral received by the Caisse as at December 31:
(in millions of dollars) 2013 2012
Collateral received for Securities lent 2,079 2,159
Securities acquired under reverse repurchase agreements 13,920 11,408
Over-the-counter derivative financial instruments 1,180 1,386
17,179 14,953
13COMPARATIVE FIGURES
Certain figures from the 2012 financial statements have been reclassified to conform to the presentation adopted in 2013.

AR 2013 159CAISSE DE DÉPÔT ET PLACEMENT DU QUÉBEC
SUPPLEMENTARY INFORMATIONSummary financial statements for the specialized portfolios
(in millions of dollars) SHORT TERMINVESTMENTS (740) BONDS (760)
LONG TERMBONDS (764)
REAL ESTATEDEBT (750)
Consolidated net assets as at December 31 2013 2012 2013 2012 2013 2012 2013 2012AssetsInvestments Real estate holdings – – – – – – – – Equities and convertible securities – – – – – – 287.5 123.1 Bonds – – 64,297.2 53,246.2 1,873.2 3,940.4 – – Mortgages – – – – – – 8,651.7 7,445.4 Mortgage securities – – – – – – 12.5 121.9 Short-term investments – – 2,002.6 1,420.0 – – 0.1 – Notes receivable from entities under common control – – – – 300.0 721.0 – – Securities acquired under reverse repurchase agreements 6,167.8 8,916.3 9,600.0 8,487.2 – – – – ABTNs – – – – – – – –
6,167.8 8,916.3 75,899.8 63,153.4 2,173.2 4,661.4 8,951.8 7,690.4Demand deposits in the General Fund 0.2 – – – 4.0 2.9 1.7 2.7Other assets – 0.3 3,912.0 884.6 18.4 39.5 104.3 222.2
6,168.0 8,916.6 79,811.8 64,038.0 2,195.6 4,703.8 9,057.8 7,915.3LiabilitiesLiabilities related to investments Securities sold under repurchase agreements – – 17,941.9 13,605.2 299.6 720.8 – – Notes payable to entities under common control – – 300.0 721.0 – – – – Loans payable – – – – – – – – Loans payable to entities under common control – – – – – – – 84.0 Mortgage loans payable – – – – – – – – Short selling of securities – – 4,216.5 4,344.4 – – – – Derivative financial instruments – – 901.4 1,215.0 – – 47.8 46.3
– – 23,359.8 19,885.6 299.6 720.8 47.8 130.3Advances from the General Fund – 0.4 46.4 124.1 – – – –Other liabilities 2,659.5 8.4 1,554.4 375.5 6.5 314.4 170.6 176.4
2,659.5 8.8 24,960.6 20,385.2 306.1 1,035.2 218.4 306.7Consolidated net assets 3,508.5 8,907.8 54,851.2 43,652.8 1,889.5 3,668.6 8,839.4 7,608.6Less:Non-controlling interests – – – – – – 47.5 35.8Net holdings of funds 3,508.5 8,907.8 54,851.2 43,652.8 1,889.5 3,668.6 8,791.9 7,572.8
Consolidated statement of income and changes in net assetsfor years ended December 31IncomeInvestment income 62.5 92.8 1,712.2 1,449.5 81.2 127.3 159.6 356.2Other income – – 3.0 2.3 – – – –
62.5 92.8 1,715.2 1,451.8 81.2 127.3 159.6 356.2Operating expenses 1.0 1.2 51.8 48.0 1.4 2.6 4.1 4.6Income before the following items 61.5 91.6 1,663.4 1,403.8 79.8 124.7 155.5 351.6Interest on notes payable to entities under common control – – 0.3 5.3 – – – –Interest on loans payable – – – – – – – –Net investment income (loss) 61.5 91.6 1,663.1 1,398.5 79.8 124.7 155.5 351.6Gains (losses) on sale of investments – – 320.4 1,015.7 33.4 172.4 7.4 (6.2)Unrealized increase (decrease) in value of investments and
liabilities related to investments (0.4) 0.8 (1,950.1) (669.1) (256.1) (185.6) (150.6) 0.8Net investment results 61.1 92.4 33.4 1,745.1 (142.9) 111.5 12.3 346.2Participation units issued (cancelled) (5,398.9) 2,151.3 12,828.1 1,783.9 (1,556.4) (65.2) 1,361.3 969.0Net investment loss (net income) recovered from (allocated to)
participation unit holders (61.5) (91.6) (1,663.1) (1,398.5) (79.8) (124.7) (150.1) (346.1)Other changes in non-controlling interests – – – – – – 7.3 (1.0)Increase (decrease) in consolidated net assets (5,399.3) 2,152.1 11,198.4 2,130.5 (1,779.1) (78.4) 1,230.8 968.1Consolidated net assets, beginning of year 8,907.8 6,755.7 43,652.8 41,522.3 3,668.6 3,747.0 7,608.6 6,640.5Consolidated net assets, end of year 3,508.5 8,907.8 54,851.2 43,652.8 1,889.5 3,668.6 8,839.4 7,608.6
Attributable to participation unit holdersNet investment results 61.1 92.4 33.4 1,745.1 (142.9) 111.5 12.3 346.2Less:Net investment results attributable to non-controlling interests – – – – – – 4.4 3.8Net investment results attributable to participation unit holders 61.1 92.4 33.4 1,745.1 (142.9) 111.5 7.9 342.4Participation units issued (cancelled) (5,398.9) 2,151.3 12,828.1 1,783.9 (1,556.4) (65.2) 1,361.3 969.0Net investment loss (net income) recovered from (allocated to) participation unit holders (61.5) (91.6) (1,663.1) (1,398.5) (79.8) (124.7) (150.1) (346.1)Increase (decrease) in net holdings of funds (5,399.3) 2,152.1 11,198.4 2,130.5 (1,779.1) (78.4) 1,219.1 965.3Net holdings of funds, beginning of year 8,907.8 6,755.7 43,652.8 41,522.3 3,668.6 3,747.0 7,572.8 6,607.5Net holdings of funds, end of year 3,508.5 8,907.8 54,851.2 43,652.8 1,889.5 3,668.6 8,791.9 7,572.8
Investments and liabilities related to investments at costas at December 31Investments Real estate holdings – – – – – – – – Equities and convertible securities – – – – – – 209.1 106.3 Bonds – – 63,554.4 50,050.2 1,944.8 3,755.9 – – Mortgages – – – – – – 8,618.8 7,207.3 Mortgage securities – – – – – – 121.4 225.3 Short-term investments – – 1,937.7 1,432.5 – – 0.1 – Notes receivable from entities under common control – – – – 300.0 721.0 – – Securities acquired under reverse repurchase agreements 6,168.0 8,916.3 9,593.1 8,474.2 – – – – ABTNs – – – – – – – –
6,168.0 8,916.3 75,085.2 59,956.9 2,244.8 4,476.9 8,949.4 7,538.9Liabilities related to investments Securities sold under repurchase agreements – – 17,935.8 13,603.3 299.7 720.9 – – Notes payable to entities under common control – – 300.0 721.0 – – – – Loans payable – – – – – – – – Loans payable to entities under common control – – – – – – – 84.0 Mortgage loans payable – – – – – – – – Short selling of securities – – 4,100.9 4,187.8 – – – – Derivative financial instruments – – 118.9 37.4 – – – –
– – 22,455.6 18,549.5 299.7 720.9 – 84.0

AR 2013 160SUPPLEMENTARY INFORMATIONSummary financial statements for the specialized portfolios (cont.)
CAISSE DE DÉPÔT ET PLACEMENT DU QUÉBEC
(in millions of dollars) REAL RETURN BONDS (762) INFRASTRUCTURE (782) REAL ESTATE (710) 1
CANADIAN EQUITY (720)
Consolidated net assets as at December 31 2013 2012 2013 2012 2013 2012 2013 2012AssetsInvestments Real estate holdings – – – – 29,607.3 25,835.8 – – Equities and convertible securities – – 6,191.9 5,436.4 4,378.9 3,449.5 16,323.8 15,097.6 Bonds 1,085.3 1,233.4 2,873.4 1,210.7 – – – – Mortgages – – – – 2,120.7 1,867.4 – – Mortgage securities – – – – – – – – Short-term investments – – 8.2 – 33.4 52.7 – – Notes receivable from entities under common control – – – – – – 12,854.2 13,412.2 Securities acquired under reverse repurchase agreements – – 479.8 495.6 – – – – ABTNs – – – – – – – –
1,085.3 1,233.4 9,553.3 7,142.7 36,140.3 31,205.4 29,178.0 28,509.8Demand deposits in the General Fund 62.9 125.7 201.5 451.3 – 8.8 – 51.4Other assets 107.4 2.5 37.8 24.2 493.2 522.4 25.6 45.8
1,255.6 1,361.6 9,792.6 7,618.2 36,633.5 31,736.6 29,203.6 28,607.0LiabilitiesLiabilities related to investments Securities sold under repurchase agreements 66.3 133.8 475.4 – – – – – Notes payable to entities under common control – – – – – – – – Loans payable – – – – 451.8 330.0 – – Loans payable to entities under common control – – – – 9,205.3 9,316.0 – – Mortgage loans payable – – – – 2,275.5 2,427.5 – – Short selling of securities – – 478.1 494.9 – – 5,897.6 6,549.1 Derivative financial instruments – – 243.4 162.6 388.1 316.7 1.3 3.5
66.3 133.8 1,196.9 657.5 12,320.7 12,390.2 5,898.9 6,552.6Advances from the General Fund – – – – 19.6 – 227.3 –Other liabilities – 2.6 56.7 50.6 850.4 1,799.3 78.4 108.9
66.3 136.4 1,253.6 708.1 13,190.7 14,189.5 6,204.6 6,661.5Consolidated net assets 1,189.3 1,225.2 8,539.0 6,910.1 23,442.8 17,547.1 22,999.0 21,945.5Less:Non-controlling interests – – 543.0 644.6 1,610.1 1,325.4 – –Net holdings of funds 1,189.3 1,225.2 7,996.0 6,265.5 21,832.7 16,221.7 22,999.0 21,945.5
Consolidated statement of income and changes in net assetsfor years ended December 31IncomeInvestment income 18.7 25.5 1,008.8 862.3 726.5 605.4 709.3 671.2Other income – – 1.9 3.2 – – – 3.8
18.7 25.5 1,010.7 865.5 726.5 605.4 709.3 675.0Operating expenses 0.8 2.1 28.2 22.1 8.5 9.6 42.6 47.8Income before the following items 17.9 23.4 982.5 843.4 718.0 595.8 666.7 627.2Interest on notes payable to entities under common control – – – – – – – –Interest on loans payable – – – – – – – –Net investment income (loss) 17.9 23.4 982.5 843.4 718.0 595.8 666.7 627.2Gains (losses) on sale of investments (30.6) 51.2 (297.1) 466.7 116.8 515.4 1,152.5 824.7Unrealized increase (decrease) in value of investments and
liabilities related to investments (157.4) (40.5) 45.3 (837.0) 2,234.7 345.4 1,549.0 (173.0)Net investment results (170.1) 34.1 730.7 473.1 3,069.5 1,456.6 3,368.2 1,278.9Participation units issued (cancelled) 152.1 (71.2) 1,880.1 621.1 3,164.5 (1,595.8) (1,648.0) 2,802.4Net investment loss (net income) recovered from (allocated to) participation unit holders (17.9) (23.4) (790.8) (591.9) (384.6) (1,512.6) (666.7) (627.2)Other changes in non-controlling interests – – (191.1) (478.5) 46.3 (102.8) – –Increase (decrease) in consolidated net assets (35.9) (60.5) 1,628.9 23.8 5,895.7 (1,754.6) 1,053.5 3,454.1Consolidated net assets, beginning of year 1,225.2 1,285.7 6,910.1 6,886.3 17,547.1 19,301.7 21,945.5 18,491.4Consolidated net assets, end of year 1,189.3 1,225.2 8,539.0 6,910.1 23,442.8 17,547.1 22,999.0 21,945.5
Attributable to participation unit holdersNet investment results (170.1) 34.1 730.7 473.1 3,069.5 1,456.6 3,368.2 1,278.9Less:Net investment results attributable to non-controlling interests – – 89.5 (37.7) 238.4 124.5 – –Net investment results attributable to participation unit holders (170.1) 34.1 641.2 510.8 2,831.1 1,332.1 3,368.2 1,278.9Participation units issued (cancelled) 152.1 (71.2) 1,880.1 621.1 3,164.5 (1,595.8) (1,648.0) 2,802.4Net investment loss (net income) recovered from (allocated to) participation unit holders (17.9) (23.4) (790.8) (591.9) (384.6) (1,512.6) (666.7) (627.2)Increase (decrease) in net holdings of funds (35.9) (60.5) 1,730.5 540.0 5,611.0 (1,776.3) 1,053.5 3,454.1Net holdings of funds, beginning of year 1,225.2 1,285.7 6,265.5 5,725.5 16,221.7 17,998.0 21,945.5 18,491.4Net holdings of funds, end of year 1,189.3 1,225.2 7,996.0 6,265.5 21,832.7 16,221.7 22,999.0 21,945.5
Investments and liabilities related to investments at costas at December 31Investments Real estate holdings – – – – 23,703.8 22,010.9 – – Equities and convertible securities – – 5,145.4 4,508.4 4,031.7 3,473.1 12,464.9 13,455.7 Bonds 1,137.2 1,127.8 2,864.1 1,203.5 – – – – Mortgages – – – – 1,869.1 1,844.1 – – Mortgage securities – – – – – – – – Short-term investments – – 6.2 – 33.9 53.1 – – Notes receivable from entities under common control – – – – – – 12,854.1 13,412.2 Securities acquired under reverse repurchase agreements – – 479.9 492.1 – – – – ABTNs – – – – – – – –
1,137.2 1,127.8 8,495.6 6,204.0 29,638.5 27,381.2 25,319.0 26,867.9Liabilities related to investments Securities sold under repurchase agreements 66.3 133.8 477.5 – – – – – Notes payable to entities under common control – – – – – – – – Loans payable – – – – 454.0 331.3 – – Loans payable to entities under common control – – – – 8,492.8 8,761.6 – – Mortgage loans payable – – – – 2,053.8 2,420.6 – – Short selling of securities – – 484.3 491.8 – – 4,458.4 5,780.1 Derivative financial instruments – – 37.5 41.9 20.8 20.3 – –
66.3 133.8 999.3 533.7 11,021.4 11,533.8 4,458.4 5,780.1
1. The financial statements of the specialized Real Estate portfolio have been prepared in accordance with IFRS, and a separate report has been produced for them by the independent auditors.

SUPPLEMENTARY INFORMATIONSummary financial statements for the specialized portfolios (cont.)
AR 2013 161CAISSE DE DÉPÔT ET PLACEMENT DU QUÉBEC
(in millions of dollars)
GLOBAL EQUITY (735)
GLOBAL QUALITY
EQUITY (736) U.S. EQUITY (731) EAFE EQUITY (730)EMERGING MARKETS
EQUITY (732)
Consolidated net assets as at December 31 2013 2012(Created
January 1, 2013) 2013 2012 2013 2012 2013 2012AssetsInvestments Real estate holdings – – – – – – – – – Equities and convertible securities 5,095.9 19,148.7 16,454.8 9,723.9 10,159.9 9,832.1 9,825.9 10,306.3 8,723.6 Bonds 0.3 – – – – – – – – Mortgages – – – – – – – – – Mortgage securities – – – – – – – – – Short-term investments 0.4 1.0 – – – – – – – Notes receivable from entities under common control – – – – – – – – – Securities acquired under reverse repurchase
agreements – – – – – – – – – ABTNs – – – – – – – – –
5,096.6 19,149.7 16,454.8 9,723.9 10,159.9 9,832.1 9,825.9 10,306.3 8,723.6Demand deposits in the General Fund – – 720.6 – 3.4 – – – –Other assets 62.9 213.7 52.1 13.8 12.3 26.3 22.1 313.4 9.9
5,159.5 19,363.4 17,227.5 9,737.7 10,175.6 9,858.4 9,848.0 10,619.7 8,733.5LiabilitiesLiabilities related to investments Securities sold under repurchase agreements – – – – – – – – – Notes payable to entities under common control – 2,529.0 – – – – – – – Loans payable – – – – – – – – – Loans payable to entities under common control – – – – – – – – – Mortgage loans payable – – – – – – – – – Short selling of securities 1,462.0 2,447.6 – – – 3.6 – 64.0 5.4 Derivative financial instruments 37.4 140.3 – – – 0.1 – 15.8 0.1
1,499.4 5,116.9 – – – 3.7 – 79.8 5.5Advances from the General Fund 135.3 396.9 – 7.2 – 17.4 19.4 282.7 7.9Other liabilities 41.9 116.7 30.2 16.2 25.9 13.2 9.0 8.3 9.4 1,676.6 5,630.5 30.2 23.4 25.9 34.3 28.4 370.8 22.8Consolidated net assets 3,482.9 13,732.9 17,197.3 9,714.3 10,149.7 9,824.1 9,819.6 10,248.9 8,710.7Less:Non-controlling interests – – – – – – – – –Net holdings of funds 3,482.9 13,732.9 17,197.3 9,714.3 10,149.7 9,824.1 9,819.6 10,248.9 8,710.7
Consolidated statement of income and changes in net assetsfor years ended December 31IncomeInvestment income 242.6 354.1 247.5 230.0 216.0 305.5 336.2 229.5 205.1Other income – – – – – – – – –
242.6 354.1 247.5 230.0 216.0 305.5 336.2 229.5 205.1Operating expenses 34.9 40.5 18.1 5.9 7.2 7.9 9.9 17.4 13.1Income before the following items 207.7 313.6 229.4 224.1 208.8 297.6 326.3 212.1 192.0Interest on notes payable to entities under common control 36.9 17.6 – – – – – – –Interest on loans payable – – – – – – – – –Net investment income (loss) 170.8 296.0 229.4 224.1 208.8 297.6 326.3 212.1 192.0Gains (losses) on sale of investments 2,173.6 15.1 62.5 1,088.8 166.1 406.9 (380.2) (81.4) (89.6)Unrealized increase (decrease) in value of investments
and liabilities related to investments (320.6) 1,264.2 2,295.0 2,325.7 699.9 2,028.7 1,300.0 253.2 921.2Net investment results 2,023.8 1,575.3 2,586.9 3,638.6 1,074.8 2,733.2 1,246.1 383.9 1,023.6Participation units issued (cancelled) (12,103.0) 1,611.4 14,839.8 (3,849.9) 1,177.8 (2,431.1) (194.4) 1,366.4 1,998.0Net investment loss (net income) recovered from
(allocated to) participation unit holders (170.8) (296.0) (229.4) (224.1) (208.8) (297.6) (326.3) (212.1) (192.0)Other changes in non-controlling interests – – – – – – – – –Increase (decrease) in consolidated net assets (10,250.0) 2,890.7 17,197.3 (435.4) 2,043.8 4.5 725.4 1,538.2 2,829.6Consolidated net assets, beginning of year 13,732.9 10,842.2 – 10,149.7 8,105.9 9,819.6 9,094.2 8,710.7 5,881.1Consolidated net assets, end of year 3,482.9 13,732.9 17,197.3 9,714.3 10,149.7 9,824.1 9,819.6 10,248.9 8,710.7
Attributable to participation unit holdersNet investment results 2,023.8 1,575.3 2,586.9 3,638.6 1,074.8 2,733.2 1,246.1 383.9 1,023.6Less:Net investment results attributable to
non-controlling interests – – – – – – – – –Net investment results attributable to participation
unit holders 2,023.8 1,575.3 2,586.9 3,638.6 1,074.8 2,733.2 1,246.1 383.9 1,023.6Participation units issued (cancelled) (12,103.0) 1,611.4 14,839.8 (3,849.9) 1,177.8 (2,431.1) (194.4) 1,366.4 1,998.0Net investment loss (net income) recovered from
(allocated to) participation unit holders (170.8) (296.0) (229.4) (224.1) (208.8) (297.6) (326.3) (212.1) (192.0)Increase (decrease) in net holdings of funds (10,250.0) 2,890.7 17,197.3 (435.4) 2,043.8 4.5 725.4 1,538.2 2,829.6Net holdings of funds, beginning of year 13,732.9 10,842.2 – 10,149.7 8,105.9 9,819.6 9,094.2 8,710.7 5,881.1Net holdings of funds, end of year 3,482.9 13,732.9 17,197.3 9,714.3 10,149.7 9,824.1 9,819.6 10,248.9 8,710.7
Investments and liabilities related to investments at costas at December 31Investments Real estate holdings – – – – – – – – – Equities and convertible securities 4,488.3 18,261.3 14,159.7 6,605.9 9,367.5 7,333.4 9,356.4 9,161.8 7,841.2 Bonds 0.2 0.2 – – – – – – – Mortgages – – – – – – – – – Mortgage securities – – – – – – – – – Short-term investments – – – – – – – – – Notes receivable from entities under common control – – – – – – – – – Securities acquired under reverse repurchase
agreements – – – – – – – – – ABTNs – – – – – – – – –
4,488.5 18,261.5 14,159.7 6,605.9 9,367.5 7,333.4 9,356.4 9,161.8 7,841.2Liabilities related to investments Securities sold under repurchase agreements – – – – – – – – – Notes payable to entities under common control – 2,529.0 – – – – – – – Loans payable – – – – – – – – – Loans payable to entities under common control – – – – – – – – – Mortgage loans payable – – – – – – – – – Short selling of securities 1,308.6 2,441.6 – – – 3.2 – 70.7 5.3 Derivative financial instruments 7.0 3.0 – – – – – – –
1,315.6 4,973.6 – – – 3.2 – 70.7 5.3

AR 2013 162SUPPLEMENTARY INFORMATIONSummary financial statements for the specialized portfolios (cont.)
CAISSE DE DÉPÔT ET PLACEMENT DU QUÉBEC
(in millions of dollars)
PRIVATE EQUITY (780) HEDGE FUNDS (770) ASSET ALLOCATION (771) ABTN (772)Consolidated net assets as at December 31 2013 2012 2013 2012 2013 2012 2013 2012AssetsInvestments Real estate holdings – – – – – – – – Equities and convertible securities 18,830.1 17,087.1 3,808.3 3,283.0 1,757.5 1,020.4 – – Bonds 1,006.1 999.4 – – 0.9 97.3 – – Mortgages – – – – – – – – Mortgage securities – – – – – – – – Short-term investments – – – – 570.9 269.5 – – Notes receivable from entities under common control – – – – – – – – Securities acquired under reverse repurchase agreements – – – – – – – – ABTNs – – – – – – 9,775.8 10,152.3
19,836.2 18,086.5 3,808.3 3,283.0 2,329.3 1,387.2 9,775.8 10,152.3Demand deposits in the General Fund 508.3 – – – 451.0 197.9 – –Other assets 332.1 36.0 1.7 9.3 8.1 2.6 31.0 34.8
20,676.6 18,122.5 3,810.0 3,292.3 2,788.4 1,587.7 9,806.8 10,187.1LiabilitiesLiabilities related to investments Securities sold under repurchase agreements – – – – – – – – Notes payable to entities under common control – – – – 1,013.2 – 9,018.6 9,556.5 Loans payable – – – – – – 824.5 1,385.8 Loans payable to entities under common control – – – – – – – – Mortgage loans payable – – – – – – – – Short selling of securities 256.8 49.6 – – 64.5 41.2 – – Derivative financial instruments 227.3 96.3 11.2 5.1 452.5 442.9 17.1 25.0
484.1 145.9 11.2 5.1 1,530.2 484.1 9,860.2 10,967.3Advances from the General Fund – 179.7 124.5 94.4 – – 12.5 8.0Other liabilities 103.8 105.1 6.2 5.7 111.3 4.5 41.5 46.2
587.9 430.7 141.9 105.2 1,641.5 488.6 9,914.2 11,021.5Consolidated net assets 20,088.7 17,691.8 3,668.1 3,187.1 1,146.9 1,099.1 (107.4) (834.4)Less:Non-controlling interests – – – – – – – –Net holdings of funds 20,088.7 17,691.8 3,668.1 3,187.1 1,146.9 1,099.1 (107.4) (834.4)
Consolidated statement of income and changes in net assetsfor years ended December 31IncomeInvestment income 827.3 458.4 (0.3) 0.4 27.6 24.5 140.4 146.6Other income 5.6 19.0 – – – – – –
832.9 477.4 (0.3) 0.4 27.6 24.5 140.4 146.6Operating expenses 42.5 39.3 11.2 13.0 15.9 15.1 4.3 5.5Income before the following items 790.4 438.1 (11.5) (12.6) 11.7 9.4 136.1 141.1Interest on notes payable to entities under common control – – – – 1.2 – 116.2 119.9Interest on loans payable – – – – – – 11.6 16.3Net investment income (loss) 790.4 438.1 (11.5) (12.6) 10.5 9.4 8.3 4.9Gains (losses) on sale of investments 126.5 449.3 (81.3) 134.6 (166.8) (417.4) (7.4) (134.3)Unrealized increase (decrease) in value of investments and
liabilities related to investments 2,509.0 1,245.8 177.7 8.0 239.9 (14.5) 726.7 1,815.5Net investment results 3,425.9 2,133.2 84.9 130.0 83.6 (422.5) 727.6 1,686.1Participation units issued (cancelled) (238.6) 272.2 384.6 (227.2) (25.3) 309.3 7.7 4.2Net investment loss (net income) recovered from (allocated to) participation unit holders (790.4) (438.1) 11.5 12.6 (10.5) (9.4) (8.3) (4.9)Other changes in non-controlling interests – – – – – – – –Increase (decrease) in consolidated net assets 2,396.9 1,967.3 481.0 (84.6) 47.8 (122.6) 727.0 1,685.4Consolidated net assets, beginning of year 17,691.8 15,724.5 3,187.1 3,271.7 1,099.1 1,221.7 (834.4) (2,519.8)Consolidated net assets, end of year 20,088.7 17,691.8 3,668.1 3,187.1 1,146.9 1,099.1 (107.4) (834.4)
Attributable to participation unit holdersNet investment results 3,425.9 2,133.2 84.9 130.0 83.6 (422.5) 727.6 1,686.1Less:Net investment results attributable to non-controlling interests – – – – – – – –Net investment results attributable to participation unit holders 3,425.9 2,133.2 84.9 130.0 83.6 (422.5) 727.6 1,686.1Participation units issued (cancelled) (238.6) 272.2 384.6 (227.2) (25.3) 309.3 7.7 4.2Net investment loss (net income) recovered from (allocated to) participation unit holders (790.4) (438.1) 11.5 12.6 (10.5) (9.4) (8.3) (4.9)Increase (decrease) in net holdings of funds 2,396.9 1,967.3 481.0 (84.6) 47.8 (122.6) 727.0 1,685.4Net holdings of funds, beginning of year 17,691.8 15,724.5 3,187.1 3,271.7 1,099.1 1,221.7 (834.4) (2,519.8)Net holdings of funds, end of year 20,088.7 17,691.8 3,668.1 3,187.1 1,146.9 1,099.1 (107.4) (834.4)
Investments and liabilities related to investments at costas at December 31Investments Real estate holdings – – – – – – – – Equities and convertible securities 16,869.8 17,672.4 3,642.3 3,300.7 1,655.1 983.6 – – Bonds 1,156.5 1,171.0 – – – – – – Mortgages – – – – – – – – Mortgage securities – – – – – – – – Short-term investments – 65.0 – – 18.7 26.7 – – Notes receivable from entities under common control – – – – – – – – Securities acquired under reverse repurchase agreements – – – – – – – – ABTNs – – – – – – 11,233.3 12,342.8
18,026.3 18,908.4 3,642.3 3,300.7 1,673.8 1,010.3 11,233.3 12,342.8Liabilities related to investments Securities sold under repurchase agreements – – – – – – – – Notes payable to entities under common control – – – – 1,011.3 – 9,016.6 9,556.9 Loans payable – – – – – – 839.0 1,412.0 Loans payable to entities under common control – – – – – – – – Mortgage loans payable – – – – – – – – Short selling of securities 239.3 23.9 – – 56.2 40.1 – – Derivative financial instruments – – – – 7.1 26.9 – –
239.3 23.9 – – 1,074.6 67.0 9,855.6 10,968.9

AR 2013 163CAISSE DE DÉPÔT ET PLACEMENT DU QUÉBEC
FINANCIAL CERTIFICATE OF THE PRESIDENT AND CHIEF EXECUTIVE OFFICER
I, Michael Sabia, President and Chief Executive Officer of La Caisse de dépôt et placement du Québec, certify that:
1. Review: I have reviewed the Combined financial state-ments, the tables of returns, the press release announcing the annual results and the Annual Report (hereafter referred to as the “Annual Filings”) of La Caisse de dépôt et placement du Québec (“La Caisse”) for the year ended December 31, 2013.
2. No false or misleading information: To the best of my knowledge, having exercised reasonable diligence, the Annual Filings do not contain any untrue statement of a material fact or omit to state any material fact that is required to be stated or necessary to make a statement that is not misleading in light of the circumstances in which it was made, with respect to the period covered by the Annual Filings.
3. Fair presentation: To the best of my knowledge, having exercised reasonable diligence, the Combined financial statements and the other financial information included in the Annual Filings present fairly, in all material respects, the financial position of La Caisse as at the closing dates of the periods presented in the Annual Filings, as well as the results of its operations for those years.
4. Responsibility: I am responsible for the establishment and maintenance of disclosure controls and procedures (DC&P) and internal control over financial reporting (ICFR) for La Caisse.
5. Design: Subject to the limitations, if any, described in paragraphs 5.2 and 5.3, at fiscal year-end, I have:
a) Designed, or caused to be designed under my super-vision, DC&P to provide reasonable assurance that:
i) Material information relating to La Caisse is made known to me by others, particularly during the period in which the Annual Filings are prepared.
ii) lnformation required to be disclosed by La Caisse in its Annual Filings filed or submitted by it under the legislation is recorded, processed, summarized and reported within the time periods prescribed by the legislation.
b) Designed, or caused to be designed under my super-vision, ICFR to provide reasonable assurance that financial information is reliable and that the Combined financial statements have been prepared, with a view to publication of financial information, in accordance with Canadian generally accepted accounting principles.
5.1. Control framework: The control framework that I have used to design the ICFR is that proposed by the Committee of Sponsoring Organizations of the Treadway Commission (COSO 1992).
5.2. ICFR material weakness relating to design: Not applicable.
5.3. Limitation of scope and design: Not applicable.
6. Evaluation: I have:
a) Evaluated or caused to be evaluated under my super-vision, the effectiveness of the DC&P of La Caisse at fiscal year-end and La Caisse disclosed in its Annual Report my conclusions based on this evaluation.
b) Evaluated or caused to be evaluated under my super-vision, the effectiveness of the ICFR of La Caisse at fiscal year-end and La Caisse disclosed in its Annual Report the following information:
i) My conclusions about the effectiveness of the ICFR at fiscal year-end based on that evaluation.
ii) Description of any material weaknesses relating to current operation at fiscal year-end: Not applicable.
7. Reporting changes to the ICFR: La Caisse disclosed in its Annual Report any change made to the ICFR that occurred during the accounting period beginning on January 1, 2013 and ending on December 31, 2013 that has had, or is likely to have, a material impact on the ICFR.
8. Reporting to co-auditors and the Board of Directors or Audit Committee of La Caisse: I have disclosed, based on our most recent valuation of the ICFR, to the co-auditors and the Board of Directors of La Caisse or its Audit Committee, any fraud that involves management or other employees who have a significant role in the ICFR.
President and Chief Executive Officer
MICHAEL SABIAApril 4, 2014

CAISSE DE DÉPÔT ET PLACEMENT DU QUÉBEC AR 2013 164
FINANCIAL CERTIFICATE OF THE EXECUTIVE VICE-PRESIDENT AND CHIEF FINANCIAL OFFICER
I, Maarika Paul, Executive Vice-President and Chief Financial Officer of La Caisse de dépôt et placement du Québec, certify that:
1. Review: I have reviewed the Combined financial state-ments, the tables of returns, the press release announcing the annual results and the Annual Report (hereafter referred to as the “Annual Filings”) of La Caisse de dépôt et placement du Québec (“La Caisse”) for the year ended December 31, 2013.
2. No false or misleading information: To the best of my knowledge, having exercised reasonable diligence, the Annual Filings do not contain any untrue statement of a material fact or omit to state any material fact that is required to be stated or necessary to make a statement that is not misleading in light of the circumstances in which it was made, with respect to the period covered by the Annual Filings.
3. Fair presentation: To the best of my knowledge, having exercised reasonable diligence, the Combined financial statements and the other financial information included in the Annual Filings present fairly, in all material respects, the financial position of La Caisse as at the closing dates of the periods presented in the Annual Filings, as well as the results of its operations for those years.
4. Responsibility: I am responsible for the establishment and maintenance of disclosure controls and procedures (DC&P) and internal control over financial reporting (ICFR) for La Caisse.
5. Design: Subject to the limitations, if any, described in paragraphs 5.2 and 5.3, at fiscal year-end, I have:
a) Designed, or caused to be designed under my super-vision, DC&P to provide reasonable assurance that:
i) Material information relating to La Caisse is made known to me by others, particularly during the period in which the Annual Filings are prepared.
ii) lnformation required to be disclosed by La Caisse in its Annual Filings filed or submitted by it under the legislation is recorded, processed, summarized and reported within the time periods prescribed by the legislation.
b) Designed, or caused to be designed under my super-vision, ICFR to provide reasonable assurance that financial information is reliable and that the Combined financial statements have been prepared, with a view to publication of financial information, in accordance with Canadian generally accepted accounting principles.
5.1. Control framework: The control framework that I have used to design the ICFR is that proposed by the Committee of Sponsoring Organizations of the Treadway Commission (COSO 1992).
5.2. ICFR material weakness relating to design: Not applicable.
5.3. Limitation of scope and design: Not applicable.
6. Evaluation: I have:
a) Evaluated or caused to be evaluated under my super-vision, the effectiveness of the DC&P of La Caisse at fiscal year-end and La Caisse disclosed in its Annual Report my conclusions based on this evaluation.
b) Evaluated or caused to be evaluated under my super-vision, the effectiveness of the ICFR of La Caisse at fiscal year-end and La Caisse disclosed in its Annual Report the following information:
i) My conclusions about the effectiveness of the ICFR at fiscal year-end based on that evaluation.
ii) Description of any material weaknesses relating to current operation at fiscal year-end: Not applicable.
7. Reporting changes to the ICFR: La Caisse disclosed in its Annual Report any change made to the ICFR that occurred during the accounting period beginning on January 1, 2013 and ending on December 31, 2013 that has had, or is likely to have, a material impact on the ICFR.
8. Reporting to co-auditors and the Board of Directors or Audit Committee of La Caisse: I have disclosed, based on our most recent valuation of the ICFR, to the co-auditors and the Board of Directors of La Caisse or its Audit Committee, any fraud that involves management or other employees who have a significant role in the ICFR.
Executive Vice-President and Chief Financial Officer
MAARIKA PAULApril 4, 2014

CAISSE DE DÉPÔT ET PLACEMENT DU QUÉBEC AR 2013 165
CONCLUSIONS ABOUT THE DESIGN AND EFFECTIVENESS OF INTERNAL CONTROL OVER FINANCIAL REPORTING
In 2013, the Chief Financial Officer oversaw work to update existing documentation and to evaluate the design and effec-tiveness of internal control over financial reporting, and the Executive Committee approved the methodology for evaluating key controls. The purpose of this evaluation of internal control over the main financial processes was to ensure that La Caisse could meet its quality objectives related to financial reporting, in all material respects.
The evaluation of the design and effectiveness of internal control over financial reporting was carried out with the framework usually adopted by North American companies, namely that of the Committee of Sponsoring Organizations of the Treadway Commission (COSO). This work enabled the Disclosure Committee to conclude that the design of control over financial reporting is adequate and effective, and that it provides reasonable assurance that the financial information presented in the Annual Filings, as defined in La Caisse’s Financial Certification Policy, is reliable, and that La Caisse’s combined financial statements were prepared in accordance with Canadian generally accepted accounting principles.
CONCLUSIONS ABOUT THE DESIGN AND EFFECTIVENESS OF FINANCIAL REPORTING CONTROLS AND PROCEDURES
Under La Caisse’s Financial Certification Policy, the design and effectiveness of disclosure controls and procedures pertaining to the Annual Filings, namely the combined financial state-ments, the tables of returns, the press release announcing the annual results and the Annual Report, must be evaluated.
As with the evaluation of internal control over financial reporting, the Chief Financial Officer also oversaw efforts to update existing documentation and to evaluate the design and effec-tiveness of disclosure controls and procedures, and the Executive Committee also approved the methodology for evalu-ating key controls.
As at December 31, 2013, the evaluation confirmed that the disclosure controls and procedures are adequate and effective, and provide reasonable assurance that all relevant information is gathered and submitted in a timely fashion to senior manage-ment, in particular to the President and Chief Executive Officer, so as to ensure that appropriate decisions concerning disclosure can be made.
The Board of Directors also approved the 2013 Annual Filings before their public disclosure.


• The 2013 Annual Report and the 2013 Annual Report Additional Information are available on our Caisse website at www.lacaisse.com.• For information: 514 842-3261, [email protected]• Le Rapport annuel 2013 et le document Renseignements additionnels au rapport annuel 2013 sont aussi accessibles en français sur notre site Web: www.lacaisse.com.• Legal Deposit – Bibliothèque et Archives nationales du Québec, 2014• ISSN 1705-6462• ISSN online 1705-6470
1. La Caisse’s operations comply with the requirements of the Act respecting the Caisse de dépôt et placement du Québec1 and investment industry practices. Its financial statements are prepared in accordance with Canadian generally accepted accounting principles. Each year, La Caisse’s co- auditors, the Auditor General of Québec and Ernst & Young LLP, audit the financial statements, the compliance of operations with laws, regulations, policies and guidelines, to the extent they deem appropriate.
2. The 2013 Annual Report Additional Information is an integral part of the 2013 Annual Report and presents, in the first section, the Tables of Returns as at December 31, 2013, for the composites of La Caisse’s depositors’ accounts. The tables and calculations have been audited as at December 31, 2013, by Deloitte LLP for compliance with the Global Investment Performance Standards (GIPS®).
3. In this Annual Report, depositors’ net assets are defined as depositors’ net holdings. Depositors’ net assets and net investment results are presented before the consolidation adjustment in the Combined financial statements of La Caisse de dépôt et placement du Québec.
4. The returns of the specialized portfolios represent the time-weighted rate of return.
5. The benchmark indexes for the asset classes and overall portfolio are based on the weighted average of the benchmark indexes for the specialized portfolios that comprise them.
6. Unless otherwise stated, returns, which are expressed as a percentage, are presented before operating expenses and other fees, but net of transaction fees, external management fees of investment funds and expenses of the real estate subsidiaries, and are annualized for periods of more than one year. They include the return on cash and cash
equivalents and they take into account any foreign exchange hedging. The return spreads related to operating expenses of each specialized portfolio are presented in the tables of returns in the 2013 Annual Report Additional Information.
7. Unless otherwise stated, net investment results and net assets are presented net of operating expenses and other fees.
8. Some returns are expressed in basis points (b.p.). One hundred basis points equal 1.00% and one basis point equals 0.01%.
9. Unless otherwise stated, all figures are in Canadian dollars. The letters M and B used with dollar amounts designate millions and billions, respectively.
10. Totals (figures or percentages) may vary because of rounding of figures.
11. Unless otherwise stated, all data in the tables and figures are from studies carried out by La Caisse.
12. The tables listing the top 10 investments present, in alpha-betical order, the main cash positions based on information shown in Tables 8, 9, 10 and 11 of the 2013 Annual Report Additional Information.
13. To determine whether an asset is classified as a Québec investment, La Caisse uses the location of the head office of the company or of the issuer or, in the case of real estate, the location of the property.
This classification system is widely used in the fund manage-ment industry but involves biases. Some companies are included even though their core operations are outside Québec. Similarly, companies with extensive operations in Québec are excluded if their head office is outside the province.
1. The Act respecting the Caisse de dépôt et placement du Québec is available on the Caisse website at www.lacaisse.com.
General Notes

BUSINESS OFFICECentre CDP Capital 1000, place Jean-Paul-Riopelle Montréal (Québec) H2Z 2B3 Tel: 514 842-3261 Fax: 514 842-4833
HEAD OFFICEÉdifice Price 65, rue Sainte-Anne, 14e étage Québec (Québec) G1R 3X5 Tel: 418 684-2334 Fax: 418 684-2335
CDP CAPITAL US1540 Broadway, Suite 1600 New York, NY 10036 United States Tel: 212 596-6300 Fax: 212 730-2356
Hearing impaired514 847-2190
www.lacaisse.com