annual report - chemco · galanz supreme (9,000 - 24,000 btu) midea (9,000 - 60,000 btu) ammonia...
TRANSCRIPT

ANNUALREPORT
CH
EM
CO
L
IM
IT
ED
A
NN
UA
L
RE
PO
RT
2
01
4
ANNUAL REPORT 2014 1
Dear Shareholder
The Board of Directors is pleased to present the Annual Report of Chemco Limited for the year ended 31 December 2014, the contents of which are listed below.
This report was approved by the Board of Directors at its meeting held on 11 May 2015.
Antoine L Harel Beas CheekhooreeChairman Managing Director
What’s inside02
03
04
05
06
07
08
09
10
16
25
24
26
Vision, Mission and Values
Statutory Disclosures
Statement of Cash Flows
Statement of Changes in Equity
Notes to the Financial Statements
18
19
21
22
23
20
17
Statement of Compliance
Certificate by Secretary
Statement of Financial Position
Statement of Profit or Loss
Statement of Profit or Loss and Other Comprehensive Income
Independent Auditors’ Report to the Members
Statement of Directors’ Responsibilities
Corporate Information
Board of Directors
Senior Management Profile
Chairman’s Statement
Managing Director’s Report
Corporate Governance Report
Company Profile
Business Segments

CHEMCO LIMITED2
• Passion Generate desire for success
• Relationship Build a strong bond with our partners and
with the community
• Integrity Be honest and ethical in our dealings
• Development Promote a learning culture and embrace
change
• Excellence Nurture creativity, share best practices and deliver on promises
Vision
Mission
Values
To be the leader in the chemical business in the regionand to diversify through new ventures
• To foster a quality culture and sustainable development
• To satisfy the requirements of all our stakeholders
• To create an environment conducive to maximising the wealth of our Company
• To promote the development and welfare of our staff while applying best practices and high ethical standards

ANNUAL REPORT 2014 3
Company profile
Operating since
PROFIT AFTER TAXATION (Rs’M)
DIVIDEND PER SHARE (Rs)
Sectors of activity Number of employees
1984 7 89
8.8
1.10
OPERATING RESULTS 2014
Chemco Limited was incorporated in 1984. It is a public company listed on the Development and Enterprise Market (DEM) since 2007 and is a subsidiary of Harel Mallac & Co. Ltd. The Company is involved in the distribution of industrial chemicals as well as a range of consumer goods in the local and regional markets.
324.3TURNOVER (Rs’M)

CHEMCO LIMITED4
Business Segments
9%Sugar Chemicals
ProductsCoagulants FlocculantsBiocides Lime Phosphoric AcidSulphur
End UsesComplete range of process chemicals for the sugar industry
8%Tyres
ProductsGT Radial CEAT Superhawk Ketter
End UsesVariety of radial tyres for passenger cars to fit 12 to 15 inch rims and tyres for light trucks, lorries and buses
5%Water Treatment Chemicals
ProductsCoagulants Flocculants PolymersLime Calcium HypochloriteChlorine Dioxide
End UsesBoiler water treatment Cooling tower/chillerProcess water treatment
Water Treatment:Demineralised System Softeners PlantReverse Osmosis Membrane System
16%Refrigeration
ProductsAir ConditionersGalanz Supreme (9,000 - 24,000 btu)Midea (9,000 - 60,000 btu)Ammonia Gas and Freon Gases R22, R407C and R410
End UsesAir conditioners suitable for domestic and industrial purposes
2%Laboratory Services*
ProductsWater & Wastewater AnalysisMicrobiological TestingSoil and Sand Analytical Services
End UsesEnvironmental monitoring services provided with high tech laboratory equipment
Technical support to Customers
55%Industrial Chemicals
ProductsCaustic Soda Hydrochloric Acid Hydrogen Peroxide Calcium Carbonate Sodium Sulphate Sodium Chloride Sulphuric AcidFood Chemicals
End UsesRange of chemicals for textile, food and beverages and detergents industry
5%Swimming Pool Chemicals and Equipments
ProductsCyanuric Acid Calcium Hypochlorite Chempool Acid & Alkali Pool Accessories Pumps & Filters Desalination Equipment Reverse Osmosis SystemsWater Purifiers
End UsesWide range of chemicals and equipments to keep swimming pool water crystal clear
* The Laboratory is ISO 17025 certified

ANNUAL REPORT 2014 5
Corporate Information
COMPANY SECRETARYHM Secretaries Ltd.18 Edith Cavell StreetPort Louis
AUDITORSBDO & Co
BANKERSThe Mauritius Commercial Bank Ltd.Bramer Banking Corporation Ltd.
LEGAL ADVISERSIvan Collendavelloo ChambersEtude Georges Robert
NOTARYMr Didier Maigrot Notary Public
REGISTERED OFFICEChaussée TromelinFort GeorgePort Louis
REGISTRYMauritius Computing Services Ltd.18 Edith Cavell StreetPort Louis
BUSINESS REGISTRATION NUMBERC07004261

CHEMCO LIMITED6
Board of Directors
ANTOINE L HAREL (57) Chairman (Non-Executive)
Antoine L Harel is a Fellow Member of the Institute of Chartered Accountants in England and Wales and holds a BA (Hons) degree in Accounting and Computing. He joined Harel Mallac & Co. Ltd. in 1987. In 1997, he was appointed Group CEO and is Chairman of the Board since April 2005. He was President of the Mauritius Chamber of Commerce and Industry in 1992/1993. He was appointed to the Board of Directors of Chemco Limited on 30 November 1999.
Other Directorships (listed Companies): Harel Mallac & Co. Ltd. (Chairman), Compagnie des Magasins Populaires Limitée (Chairman), The Mauritius Chemical and Fertilizer Industry Limited (Chairman), Bychemex Limited (Chairman) and Les Gaz Industriels Ltd (Chairman).
VINCENT LABAT (52)Independent Director
Vincent Labat graduated as a Chemical Engineer. From 1996 to 2009, he was the Managing Director of Les Gaz Industriels Ltd, a listed Company. In 2010, he joined Medine Limited as Project Development Executive. In July 2011, he was appointed as Managing Director of the Agriculture Cluster. He was appointed to the Board of Directors of Chemco Limited on 12 August 2010.
Other Directorships (listed Companies): Bychemex Limited and The Mauritius Chemical and Fertilizer Industry Limited.
CHARLES HAREL (47) Non-Executive Director
Charles Harel holds an MBA from the University of Birmingham, UK, as well as a National Diploma in Management and Finance from Cape Technikon, South Africa. He joined the Harel Mallac Group in 1993 and was nominated CEO of the Group effective January 2014. He was appointed to the Board of Directors of Chemco Limited on 29 May 2013.
Other Directorships (listed Companies): Harel Mallac & Co. Ltd., Compagnie des Magasins Populaires Limitée, The Mauritius Chemical and Fertilizer Industry Limited and Bychemex Limited.
GUY HAREL (66) Non-Executive Director
Aged 66, Guy Harel joined Harel Mallac Group in 1981 as Managing Director of Fapcom Ltd. In 1983, he created Henkel Chemicals (Mauritius) Limited and became its Managing Director in 1996. He was, since the acquisition of the former by the Harel Mallac Group in 2007, the Managing Director of Archemics Ltd. up to 31 December 2012. He was appointed to the Board of Chemco Limited on 29 May 2013.
Other Directorships (listed Companies): Bychemex Limited and The Mauritius Chemical and Fertilizer Industry Limited.
MICHEL RIVALLAND G.O.S.K. (61) Non-Executive Director
Michel Rivalland G.O.S.K. is a Fellow Member of the Chartered Association of Certified Accountants. He joined the Board of Directors of The Mauritius Chemical and Fertilizer Industry Limited on 1 June 2006 and served as Managing Director from October 2006 to 30 June 2009. He is currently an Executive Director of Harel Mallac & Co. Ltd. He was appointed to the Board of Directors of Chemco Limited on 21 December 2006.
Other Directorships (listed Companies): Compagnie des Magasins Populaires Limitée, Harel Mallac & Co. Ltd., Bychemex Limited and The Mauritius Chemical and Fertilizer Industry Limited.
JEAN YVES CORSON (55) Independent DirectorIn office up to 21 July 2014
Jean Yves Corson holder of a Maîtrise d’Economie d’Entreprise from Université de Paris I, Panthéon, Sorbonne held various senior management positions in France from 1986 to 1990 before returning to Mauritius where he joined Noblesse Cie Ltée. He joined the Groupe Union in 1992 as Financial Manager and was appointed Corporate Planning and Development Manager in 1999. He was appointed to the Board of Directors of Chemco Limited on 14 December 2010.Jean Yves Corson passed away on 21 July 2014.
BEAS CHEEKHOOREE Executive Director In office as from 31 October 2014
Beas Cheekhooree holds a Bachelor’s degree in Chemical Engineering from the North East London Polytechnic, United Kingdom. He has over 25 years experience in textile and apparel sector and occupied various senior management positions during the last 15 years in the textile industry, in Mauritius and in India before joining the Harel Mallac Group in 2012 as Managing Director of Harel Mallac Export Ltd, a company forming part of the Chemical Arm of Harel Mallac and has occupied this position up to now. In October 2013, he was appointed General Manager of MCFI Ltd. Group of Companies. Since October 2014 he is the Managing Director of Harel Mallac Export Ltd., Harel Mallac (Tanzania) Limited and MCFI Group of companies.
Other Directorships (listed Companies): Bychemex Limited and The Mauritius Chemical and Fertilizer Industry Limited.

ANNUAL REPORT 2014 7
Senior Management Profile
BEAS CHEEKHOOREEManaging Director
Beas Cheekhooree holds a Bachelor’s degree in Chemical Engineering from the North East London Polytechnic, United Kingdom. He has over 25 years experience in textile and apparel sector and occupied various senior management positions during the last 15 years in the textile industry, in Mauritius and in India before joining the Harel Mallac Group in 2012 as Managing Director of Harel Mallac Export Ltd, a company forming part of the Chemical Arm of Harel Mallac and has occupied this position up to now. In October 2013, he was appointed General Manager of MCFI Ltd. Group of Companies. Since October 2014 he is the Managing Director of Harel Mallac Export Ltd., Harel Mallac (Tanzania) Limited and MCFI Group of companies.
RAVI VENKATASAMIOperations Manager
Ravi Venkatasami holds a BEng (Hons) degree in Chemical and Environmental Engineering and a Master’s degree in Project Management. He joined the Group in October 2001 where he has assumed various positions as Sales Executive (2003) and Export Manager (2007). He has been the Operations Manager of Chemco Limited and Bychemex Limited since February 2010.
ROMESH RAJA RAIFinance Manager
Romesh Raja Rai is an Associate Member of the Institute of Chartered Accountants in England and Wales (ACA) and completed his articles with Coopers and Lybrand (London). He joined the MCFI Group in 1988 as Finance Manager.

CHEMCO LIMITED8
Dear Shareholder
The business environment was again marked by subdued economic growth, with a GDP growth rate of 3.5% for the year ending 2014 and a contraction of the sugar sector by 1.7%. Against the backdrop of this sluggish economic environment as well as flaring competition, Chemco achieved a satisfactory performance in 2014.
Turnover increased by 6% over last year to Rs324M while Basic Earnings per Share grew by 12%. These notable positive financial results can be attributed to more stringent cost control measures and improved operational efficiency. The Company also increased its Return on Net Capital Employed to 10%.
During the year, Chemco further consolidated its position in the domestic market as a leading supplier of chemicals, household air conditioning units and water management services. The water treatment division has shown remarkable progression, with an average growth rate of 20% per annum. The Company’s efforts to tap into the household water purifiers segment as well as build its credentials in sea water desalination and brackish water treatment plants in the hospitality sector, have been heftily rewarded. In the same vein, the company has been leveraging new business opportunities by successfully launching the Total Water Management (TWM) services in 2014. It is currently servicing leading hotel resorts such as Oberoi and Shanti Maurice.
As the Company pursues its growth strategy, it will strengthen its customer base through value-added technical expertise and enhanced customer proximity. In tune with the worldwide sustainability movement and as a prolific innovator, the company is intent on bringing more and more sustainable technologies in water purification and effluent treatment processes to the local market.
Acknowledgements
The Board would like to extend its gratitude to the Management and staff of Chemco for their commitment, professionalism and hard work. We are confident that the Company’s strategic orientation, dedicated talent pool and customer-centric approach will continue to deliver sustainable growth in the years ahead.
Jean Yves Corson, a member of the Board since 2010, passed away in July 2014. Since his appointment to the Board, he has put his financial and business acumen at the service of the Company. We are grateful for his valued contribution.
Antoine L HarelChairman
Chairman’s Statement

ANNUAL REPORT 2014 9
Managing Director’s Report
The Industrial Chemicals Division, one of the major contributor to the Company’s turnover, accounts for 55% of the Company’s revenue during the year ending December 2014. Despite operating in an extremely competitive business segment, Chemco managed to remain at the forefront of the local chemicals business. Turnover of the division grew by 6% in comparison to 2013. With a strong market presence and an efficient inventory management system, the division consistently met customers’ expectations, be it in terms of product quality or timely delivery.
The Refrigeration Division maintained its market share in spite of the growing number of players in the household air conditioning business in Mauritius. The Company remained one of the leading importers of air conditioning units across the island. Two new eco-friendly brands namely, Eco-Air and AUX, were introduced during the year as part of its sustainable range of products.
The Tyre Division sustained a loss in market share. Sales were curtailed as a result of rising competition from local importers of tyres from China and increased competitive pricing. However, the division managed to mitigate further market share erosion by expanding its distribution channels and appointing selected resellers in strategic locations around the island.
The Detergent Division performed well and turnover grew by 10% over the previous year despite a proliferation of small players entering the market. Increased imports from countries such as Egypt and South Africa also led to cut-throat competition in this particular market. The Company introduced a range of eco-friendly detergents during the year in view of moving out of the ‘generic’ detergent segment.
The Total Water Management Services Division delivered a noteworthy performance in 2014. Thanks to renewed sales and marketing strategies and the introduction of enhanced customer value propositions, turnover grew by a substantial 36% compared to the previous year. The shift from the traditional business model of selling water treatment chemicals to a complete water management package yielded positive results. The comprehensive suite of services now includes purification systems for incoming raw water supply, management of effluent treatment plants, management and operation of swimming pools, related consultancy services in water management and water purification units for domestic households.
The Sugar Chemicals Division improved its turnover by 26% in spite of unfavourable factors. Indeed, the sugar sector faced many challenges in 2014, notably adverse climatic conditions, labour strikes and the general economic slowdown due to the General Elections at the end of the year. The falling sugar prices on the world market further compounded the difficulties of the sector. That said, the Company will pursue its strategy to supply first class and high quality chemicals cost effectively to the sector.
The Laboratory Division made remarkable progress in 2014. Turnover grew by 15%. The chemical and microbiological labs performed satisfactorily thanks to a dedicated and qualified pool of technicians. This unit is also consolidating its reputation on the market by focusing on its sampling protocol, testing services and integrity of results. The Company aims at capitalising on these strengths to enhance its brand image whilst looking for international affiliation to further build its expertise.
The Way Forward
Chemco will continue to invest in eco-friendly products while pursuing its sustainable development initiatives in 2015. The Company intends to grow its customer base by focusing on innovation and value-added services including providing technical advice on sustainability to the manufacturing sector at large. With a newly invigorated growth plan and strengthened marketing strategies, the Company will launch several initiatives to increase its brand awareness whilst promoting a more judicious use of chemicals.
Beas CheekhooreeManaging Director

CHEMCO LIMITED10
Corporate Governance Report
Chemco Limited (the ‘Company’) is committed to the highest standards of business integrity, transparency and professionalism in all its activities to ensure that the activities within the Company are managed ethically and responsibly to enhance business value for all stakeholders.
THE BOARD OF DIRECTORS
The Board endeavours to exercise leadership, entrepreneurship, integrity and judgment in directing the Company, so as to achieve continuing prosperity for the organisation whilst ensuring both performance and compliance.
The Board also ensures that the activities of the Company comply with all legal and regulatory requirements as well as with its constitution from which the Board derives its authority to act.
The Board inter alia oversees the development and implementation of the Company’s corporate strategy and reviews performance objectives. It provides for succession plans for key individuals, ensures effective communication with the Company’s stakeholders, promotes the Company’s Code of Ethics, and oversees financial and capital management. As such, it reviews and approves quarterly and annual financial reports, monitors financial results and approves major capital expenditure, acquisitions, divestitures and material commitments. The Board finally oversees compliance and risk management.
The Board was aggrieved in July 2014 by the demise of Mr Jean Yves Corson, an independent director, who loyally served the Company for the past four years.
At 31 December 2014, the Board of Directors consisted of six members, of whom one is an independent director and one an executive director. The Board concluded that in view of its size, having one executive director and the Finance Manager attending board meetings whenever required is in accordance with the spirit of the Code of Corporate Governance for Mauritius with regard to executive presence on the Board. The Board will consider the appointment of an additional independent director to bring the number of such directors on the Board to two.
Non-executive Directors have free access to members of the senior management team. All Directors have access to the Company Secretary. The Directors are elected as per the provisions of the Company’s constitution that do not provide for a definite term of office.
With a view to enhancing the Board’s effectiveness, a Board performance review is carried out yearly to assess the directors’ appreciation of the Board’s performance, its procedures and practices. The results of the assessment are examined by the Corporate Governance Committee. This Committee makes its recommendations to the Board on any required remedial action.
Since the Company has a management contract with The Mauritius Chemical and Fertilizer Industry Limited (MCFI), the Board has delegated authority to MCFI’s Audit Committee and Corporate Governance Committee to provide it with assistance in discharging its duties and responsibilities. This is done through a more comprehensive evaluation of specific issues that are the remit of such committees. The Board regularly receives the reports and recommendations of these committees and takes appropriate action.
The Board entrusts the day-to-day management of the Company to MCFI through its Managing Director who ensures the smooth running of the organisation. The composition of the Board of Directors and other directorships held by the Directors in other listed companies are given on page 6.
BOARD MEETINGS
The Board meets regularly during the year. For the period under review the Board met six times. Board meetings are conducted in accordance with the Company’s constitution and the Companies Act. Board meetings are organised in such a way as to allow Directors to receive all relevant information critical to their understanding of the business to be conducted at the Board meeting, and therefore to participate fully in the decision-making process. The Board may invite management or external consultants to attend Board meetings whenever required.
RESPONSIBILITIES ENTRUSTED TO MCFI’S CORPORATE GOVERNANCE COMMITTEE
The Board has entrusted to MCFI’s Corporate Governance Committee the key areas that are the remit of a nomination and remuneration committee. The Committee’s main responsibilities include establishing a formal and transparent procedure for developing policy on senior management remuneration. The Committee also fixes the fees of the Company’s non-executive and independent non-executive Directors. It oversees the process regarding recommendation of potential candidates as Directors, ensures that proposed Directors are not disqualified from holding that position, and monitors the balance and effectiveness of the Board. The Committee met four times in 2014.
RESPONSIBILITIES ENTRUSTED TO MCFI’S AUDIT COMMITTEE
The Board has entrusted to MCFI’s Audit Committee the key areas that are the remit of an Audit Committee as detailed in the formal terms of reference approved by the Board. The Committee thus assists the Board in discharging its duties relating to the safeguarding of assets, the operation of adequate systems and control processes, and the preparation of accurate financial reports and statements, in compliance with all applicable legal requirements and accounting standards. The Committee also addresses issues relating to risk management and provides a forum for discussing business risks and control issues, and for formulating relevant recommendations for consideration by the Board. During the period under review the Committee met four times.

ANNUAL REPORT 2014 11
Corporate Governance Report
ATTENDANCE AT BOARD MEETINGS HELD IN 2014
Directors Attendance
Antoine L Harel 6/6Charles Harel 6/6Guy Harel 5/6Jean Yves Corson 3/3Vincent Labat 3/6Michel Rivalland G.O.S.K 6/6Beas Cheekhooree 2/2
RISK MANAGEMENT
The Board regularly addresses and evaluates physical, human resources, IT, business, financial, reputational as well as regulatory and compliance risks. In the course of 2014, the internal audit function examined and evaluated the adequacy and effectiveness of control systems in place within the Company. Reports were subsequently produced and submitted to the Audit Committee. The Audit Committee reviewed the reports and, when applicable, made relevant recommendations to the Board. Since 2010 a risk management framework for the Company was adopted followed by implementation of a continuous and dynamic system of risk assessment through compliance checks and discussions with the management for enhanced risk mitigation strategies. Some of the risk areas and relevant control procedures have been identified as follows:
Physical Risks
Among the physical risks identified are unavoidable events such as riots, cyclones and other natural calamities. Mitigating actions such as the adoption of cyclone and fire procedures, the subscription to a relevant insurance cover, and the identification of a business continuity plan and disaster recovery plan have been taken.
To limit the occurrence of on-site accidents, health and safety as well as security procedures have been implemented. The Company also draws upon the expertise of both an Occupational Physician Consultant and a full-time Health and Safety Officer.
The Company’s control procedures ensure mitigation of risks relating to fraud and theft.
Human Resources Risks
Loss of key personnel has been identified as a major risk factor. In view of mitigating this risk, retention policies have been adopted as well as a formal performance assessment and reward system implemented within the Company. Furthermore, a Code of Ethics has been adopted, so as to limit reputational risks. Health surveillance is performed at regular intervals on employees in high risk jobs in line with the Company’s Health and Safety policy.
Technology Risks
In order to mitigate the risk of an IT crash or major breakdown, back-up and restriction procedures have been set up within the Company.
Internal Control
Internal control is a process designed to provide reasonable assurance regarding the achievement of organisational objectives with respect to:• Effectiveness and efficiency of operations• Safeguarding of assets and data of the organisation• Reliability of financial and other reporting• Prevention of fraud and irregularities• Acceptance and management of risk• Conformity with the codes of practice and ethics adopted by the organisation• Compliance with applicable laws and regulations• Supporting business sustainability under normal as well as adverse operating conditions.
Internal Control is applicable to and is built into various business processes so as to cover all significant enterprise areas.
During the year, one review of internal control was performed by the Internal Audit.
The Board has set appropriate policies to ensure that the above control measures are implemented.

CHEMCO LIMITED12
Internal Audit
Internal audit is an objective assurance function reporting to the Board of Directors and Management. The Internal Audit function is performed by the Harel Mallac Group Internal Auditor.
Internal audit provides assurance as to the adequacy and effectiveness of the risk management and internal control framework of an organisation. Internal audit assists the Board and management to maintain and improve the process by which risks are identified and managed, and helps the Board discharge its responsibilities to maintain and strengthen the internal control framework.
The Internal Auditor has examined the current control systems to check their suitability and to ensure that they are being adhered to. The Internal Auditor conducts its assignments based on a yearly plan which is validated by the Audit Committee and has unrestricted access to the Company’s records, management and employees. Systems reviewed in 2014 at Company levels include the sales, debtors’ and cash cycle as well as the stock cycle and cover all significant areas of the Company’s internal control.
In 2014, the Internal Auditor has regularly submitted to the Audit Committee reports for discussion and follow-up of the implementation of recommended actions.
GROUP STRUCTURE
The Directors recognise that the parent entity is Harel Mallac & Co. Ltd. and that the ultimate parent entity is Société Pronema. The Directors common to the aforesaid entities are Mr Antoine L Harel who is gérant of Société Pronema and Director of Harel Mallac & Co. Ltd. and Messrs Charles Harel and Michel Rivalland G.O.S.K. who sit on the Board of Directors of Harel Mallac & Co. Ltd.
SHAREHOLDERS HOLDING MORE THAN 5 PER CENT OF THE COMPANY
Shareholders directly or indirectly interested in 5 per cent or more of the ordinary share capital of the Company are detailed on page 16.
DIVIDEND POLICY
Dividends are distributed after considering the Company’s performance and profitability, gearing, investment needs, capital expenditure requirements and growth opportunities.
Year Dividend per share
(Rs) Dividend Cover
(Times)Dividend Yield
(%)
2010 1.1 3.2 4.72011 1.0 4.1 3.12012 1.0 1.8 4.02013 1.0 1.3 4.42014 1.1 1.3 4.8
SHARE PRICE INDEX FROM JANUARY 2012 TO FEBRUARY 2015
130
135
140
145
150
155
160
165
170
175
180
185
190
295
200
205
210
12
25
35
45
55
65
75
85
Jan
- 12
Feb
- 12
Mar
- 1
2
Apr
- 1
2
May
- 1
2
Jun
- 12
Jul -
12
Aug
- 1
2
Sep
- 12
Oct
- 1
2
Nov
- 1
2
Dec
- 1
2
Jan
- 13
Feb
- 13
Mar
- 1
3
Apr
- 1
3
May
- 1
3
Jun
- 13
Jul -
13
Aug
- 1
3
Sep
- 13
Oct
- 1
3
Nov
- 1
3
Dec
- 1
3
Jan
- 14
Feb
- 14
Jan
- 15
Feb
- 15
Mar
- 1
4
Apr
- 1
4
May
- 1
4
Jun
- 14
Jul -
14
Aug
- 1
4
Sep
- 14
Oct
- 1
4
Nov
- 1
4
Dec
- 1
4
De
me
x
Chemco Share Price v/s Demex from January 2012 to February 2015 C
he
mco
De
me
x
Months
Ch
em
co S
har
e P
rice
(R
s)Corporate Governance Report

ANNUAL REPORT 2014 13
DIRECTORS’ INTEREST IN SHARES
The direct and indirect interests of Directors in the ordinary shares of the Company are to be found on page 16.
DIRECTORS’ DEALING IN SHARES OF THE COMPANY
The direct and indirect interests of Directors in the ordinary shares of the Company are to be found on page 16. The Directors are aware of Appendix 6 of the Listing Rules of the Stock Exchange of Mauritius Ltd. which provides for restrictions on dealings during a close period as well as the provisions of the Companies Act 2001 on disclosure and restrictions on share dealings by Directors. All the disclosures made by the Directors are entered into an Interest Register.
During the year under review none of the Directors bought or sold any of the Company’s shares.
RELATED PARTY TRANSACTIONS
Related party transactions are detailed on page 46.
SENIOR MANAGEMENT PROFILE
The profile of the senior management members is given on page 7.
COMPANY’S CONSTITUTION
The constitution of the Company does not provide any ownership restrictions or pre-emption rights. It is in agreement with the Companies Act 2001 and the DEM rules, and does not contain any material clause that needs to be disclosed.
SHAREHOLDERS AGREEMENT AFFECTING THE GOVERNANCE OF THE COMPANY BY THE BOARD
The Company is not aware of any such agreement during the period under review.
THIRD PARTY MANAGEMENT AGREEMENT
The Company has a management agreement with The Mauritius Chemical and Fertilizer Industry Limited for management support services including but not limited to financial, accounting, legal, internal audit and human resources fields. The agreement is renewable on a yearly basis.
DIRECTORS’ FEES
Directors are paid directors’ fees with the Exception of the executive Director and two of the non-executive directors.
DIRECTORS’ REMUNERATION
Directors’ remuneration is given on page 16. It has been disclosed globally due to sensitivity of the information.
REMUNERATION POLICY
The Company’s remuneration policy recommends that the Company provides competitive rewards for its senior management staff, taking into account the Company’s performance and external market data from independent sources, in particular, where available salary levels for similar positions in comparable companies. The remuneration package consists of base salary, fringe benefits and an annual individual performance bonus. The remuneration package is determined by the Board of Directors upon recommendations of the Corporate Governance Committee.
EMPLOYEE SHARE OPTION PLAN
No employee share option plan is available within the Company.
CODE OF ETHICS
The Board has adopted a Code of Ethics reflecting the Company’s values and corporate culture.
Corporate Governance Report

CHEMCO LIMITED14
PROFILE OF COMPANY’S SHAREHOLDERS AS AT 28 FEBRUARY 2015
SUMMARY OF SHAREHOLDING CATEGORY AS AT 28 FEBRUARY 2015
Size of shareholding Number of Shareholders Number of shares Owned % Holding1-500 881 76,088 1.23501-1,000 158 105,687 1.701,001-5,000 108 216,629 3.495,001-10,000 21 156,267 2.5210,001-50,000 20 393,140 6.3350,001-100,000 4 273,804 4.41100,001-250,000 3 418,260 6.74250,001-500,000 3 1,174,140 18.91Over 500,000 1 3,394,707 54.67Total 1,199 6,208,722 100.00
Category of Shareholders Number of Shareholders Number of Shares Owned % HoldingIndividual 1,130 702,023 11.30Insurance and assurance companies 3 94,698 1.53Investment and trust companies 1 1 0.00Other corporate bodies 65 5,412,000 87.17Total 1,199 6,208,722 100.00
SHAREHOLDER INFORMATION
Forthcoming Annual Meeting
A proxy form is enclosed for those shareholders unable to attend. Shareholders are requested to bring their identity cards or passports to the meeting, as these are required for registration.
Schedule of EventsPublication of condensed audited results for previous year March 2015 Annual Meeting May/June 2015Publication of condensed results for the 1st quarter May 2015Publication of condensed results for the 2nd quarter August 2015Publication of condensed results for the 3rd quarter November 2015Dividend declaration & payment December 2015/January 2016
Shareholders’ Practical Guide
Issues ActionChange of address Contact the Company’s secretariatIf shares are deposited with CDS Contact personal broker Change of name Contact the Company’s secretariatAcquisition or disposal of shares Contact personal broker Share transfers Contact the Company’s secretariatLost share certificate Contact the Company’s secretariatDirect dividend credit Forward the relevant form to the Company’s secretariat
Corporate Governance Report

ANNUAL REPORT 2014 15
SOCIAL, HEALTH AND SAFETY
The Company is fully committed to protect and enhance the health and safety of all its employees in the workplace through its on-going hazard and risk assessment processes, control systems and preventive measures against any occupational diseases in compliance with OSHA 2005.
In line with the philosophy of the Harel Mallac Group, Occupational Health and Safety is a foremost priority across all business operations. The objectives of the Company are to continuously improve the workplace environment; drive injuries, occupational illnesses and operational incidents as close to zero as possible and to strive for a work environment where ‘Nobody gets injured’.
Business operations involve inherent risks but these risks can be substantially reduced if managed properly. Therefore, a considerable amount of time, effort and money have been expended in identifying and eliminating potential hazards before they led to incidents - and our investment has been rewarded.
The Group’s approach to Occupational Health and Safety in 2015 will further enhance the work environment while instigating a sustainable change in workplace by focusing on employees’ safety-oriented behaviours.
The Company also ensures that its recruitment and promotion policies are fair and that procedures adopted are both transparent and merit-based. We also promote conscientious business practices whereby we ensure that there is honesty and transparency in all our practices, and the provision of a healthy and safe environment for all employees.
CORPORATE, SOCIAL AND ENVIRONMENTAL RESPONSIBILITY
As a member of the Harel Mallac Group, Chemco is actively involved in the various corporate social responsibility (CSR) activities funded by the ‘Fondation Harel Mallac’ as well as actively supports the causes it endorses.
The key focal points of the ‘Fondation Harel Mallac’ were reviewed in 2014 in order to ensure that it optimises the reach of its CSR initiatives. Sustainability was at the core of this realignment and the foundation would henceforth support projects that further create and nurture lasting relationships with the Group’s stakeholders.
For the year elapsed, 80% of the foundation fund was split among three main initiatives, namely the CSR Group Project, CSR to Employees and CSR to Community, while the remaining 20% of the fund has been carried forward to enable the foundation to strengthen its support capacity to the community in 2015.
Furthermore, and in line with the philosophy of the Harel Mallac Group, it was decided that all employees willing to, would benefit from a solidarity release of one workday during the year to assist an NGO supported by the foundation.
The Company also strives to improve the environmental impact of its activities by encouraging responsible use of resources in order to ensure the quality of life for future generations. The Company has embarked on significant programmes in the use of more environment-friendly products and services, as well as the reduction of electricity and other resources in the conduct of its business.
Corporate Governance Report

CHEMCO LIMITED16
Statutory DisclosuresPRINCIPAL ACTIVITIES
The principal activities of the Company during the year have remained unchanged and consist of the trading of specialised chemical products for the textile industry and general goods.
DIRECTORS
The Directors of the Company as at 31 December 2014 are listed on page 6.
DIRECTORS’ SERVICE CONTRACTS
There are no service contracts between the Company and its Directors.
DIRECTORS’ REMUNERATION AND BENEFITS
Remuneration and benefits received, or due from the Company were:
2014 2013Rs’000 Rs’000
Executive Director - -Non-executive Directors 477 499Total 477 499
DIRECTORS’ INTERESTS IN SHARES
The interests of the Directors in the shares of the Company as at 31 December 2014 were:
Directors Direct Interest Indirect Interest
Antoine L Harel - 196,085Charles Harel - 194,920
The other Directors have no shares either directly or indirectly in the Company.
CONTRACTS OF SIGNIFICANCE
There was no contract of significance to which the Company has been a party and in which a Director of the Company was materially interested, be it directly or indirectly.
THIRD PARTY MANAGEMENT AGREEMENT
The Company has a management contract with The Mauritius Chemical and Fertilizer Industry Limited.
SHAREHOLDERS
At 28 February 2015, the following shareholders were directly or indirectly interested in more than 5 per cent of the Company’s share capital.
2014 2013Donations Rs’000 Rs’000
Political - -Others - -Corporate Social Responsibility 219 307
Shareholders Interest %
Harel Mallac & Co.Ltd. 54.67Alteo Limited 7.42The Mauritius Chemical & Fertilizer Industry Ltd 6.52
CORPORATE SOCIAL RESPONSIBILITY
AUDITORS’ FEES
The fees payable to the auditors, for the audit and other services were:
Other services provided by the auditors of the Company relate to the issue of certificate for stock items in the bonded warehouse.
2014 2013Rs’000 Rs’000
Audit fees payable: -BDO & Co 130 130Fees paid for other services provided by:-BDO & Co - 10
ANNUAL REPORT 2014 17
Statement of Directors’ Responsibilities
The Directors acknowledge their responsibilities for:
1. Adequate accounting records and maintenance of effective internal control systems.
2. The preparation of financial statements which fairly present the state of affairs of the Company as at the end of the financial year, the results of its operations, and cash flow for that year and comply with International Financial Reporting Standard (IFRS).
3. The selection of appropriate accounting policies supported by reasonable and prudent judgements.
The External Auditors are responsible for reporting on whether the Company’s financial statements are fairly presented.
The Directors report that:
1. Adequate accounting records and an effective system of internal controls and risk management have been maintained.
2. Appropriate accounting policies supported by reasonable and prudent judgements and estimates have been used consistently.
3. International Financial Reporting Standards have been adhered to. Any departure in the fair presentation has been disclosed, explained and quantified.
4. The Code of Corporate Governance has been adhered to. Reasons have been provided where there has not been compliance.
Signed on behalf of the Board of Directors on 9 March 2015.
Antoine L Harel Beas CheekhooreeChairman Managing Director

CHEMCO LIMITED18
Name of PIE: CHEMCO LIMITED
Reporting Period: Year ended 31 December 2014
We, the Directors of Chemco Limited, confirm to the best of our knowledge that the PIE has not complied with Section 2.2.2, 2.2.3 and 2.8.2 of the Code of Corporate Governance. The reason for non-compliance is detailed on page 10 of the Corporate Governance Report.
Antoine L Harel Beas CheekhooreeChairman Managing Director
9 March 2015
Statement of Compliance(Section 75 (3) of the Financial Reporting Act)

ANNUAL REPORT 2014 19
Certificate by Secretary
We certify to the best of our knowledge and belief that the Company has filed with the Registrar of Companies all such returns as are required of the Company under the Companies Act 2001.
For HM Secretaries Ltd.Secretary
9 March 2015
CHEMCO LIMITED20
This report is made solely to the members of Chemco Limited (the “Company”), as a body, in accordance with Section 205 of the Companies Act 2001. Our audit work has been undertaken so that we might state to the Company’s members those matters we are required to state to them in an auditors’ report and for no other purpose. To the fullest extent permitted by law, we do not accept or assume responsibility to anyone other than the Company and the Company’s members as a body, for our audit work, for this report, or for the opinions we have formed.
Report on the Financial Statements
We have audited the financial statements of Chemco Limited on pages 21 to 48 which comprise the statement of financial position as at 31 December 2014 and the statement of profit or loss, statement of profit or loss and other comprehensive income, statement of changes in equity and statement of cash flows for the year then ended, and a summary of significant accounting policies and other explanatory notes. Directors’ Responsibility for the Financial Statements
The directors are responsible for the preparation and fair presentation of these financial statements in accordance with International Financial Reporting Standards and in compliance with the requirements of the Companies Act 2001, and for such internal control as the directors determine is necessary to enable the preparation of the financial statements that are free from material misstatement, whether due to fraud or error.
Auditors’ Responsibility
Our responsibility is to express an opinion on these financial statements based on our audit. We conducted our audit in accordance with International Standards on Auditing. Those Standards require that we comply with ethical requirements and plan and perform the audit to obtain reasonable assurance whether the financial statements are free from material misstatement.
An audit involves performing procedures to obtain audit evidence about the amounts and disclosures in the financial statements. The procedures selected depend on the auditors’ judgement, including the assessment of the risks of material misstatement of the financial statements, whether due to fraud or error. In making those risk assessments, the auditors consider internal control relevant to the Company’s preparation and fair presentation of the financial statements in order to design audit procedures that are appropriate in the circumstances, but not for the purpose of expressing an opinion on the effectiveness of the Company’s internal control. An audit also includes evaluating the appropriateness of accounting policies used and the reasonableness of accounting estimates made by the directors, as well as evaluating the overall presentation of the financial statements.
Report on the Financial Statements
We believe that the audit evidence we have obtained is sufficient and appropriate to provide a basis for our audit opinion.
Opinion
In our opinion, the financial statements on pages 21 to 48 give a true and fair view of the financial position of the Company as at 31 December 2014 and of its financial performance and its cash flows for the year then ended in accordance with International Financial Reporting Standards and comply with the Companies Act 2001.
Report on Other Legal and Regulatory Requirements
Companies Act 2001
We have no relationship with, or interests in, the Company, other than in our capacity as auditors, business advisers and dealings in the ordinary course of business.
We have obtained all information and explanations we have required.
In our opinion, proper accounting records have been kept by the Company as far as it appears from our examination of those records.
Financial Reporting Act 2004
The Directors are responsible for preparing the corporate governance report. Our responsibility is to report the extent of compliance with the Code of Corporate Governance as disclosed in the annual report and on whether the disclosure is consistent with the requirements of the Code.
In our opinion, the disclosure in the annual report is consistent with the requirements of the Code.
BDO & Co Rookaya Ghanty, F.C.C.A.Chartered Accountants Licensed by FRC
Port Louis, Mauritius.
9 March 2015
Independent Auditors’ Report to the Members
ANNUAL REPORT 2014 21
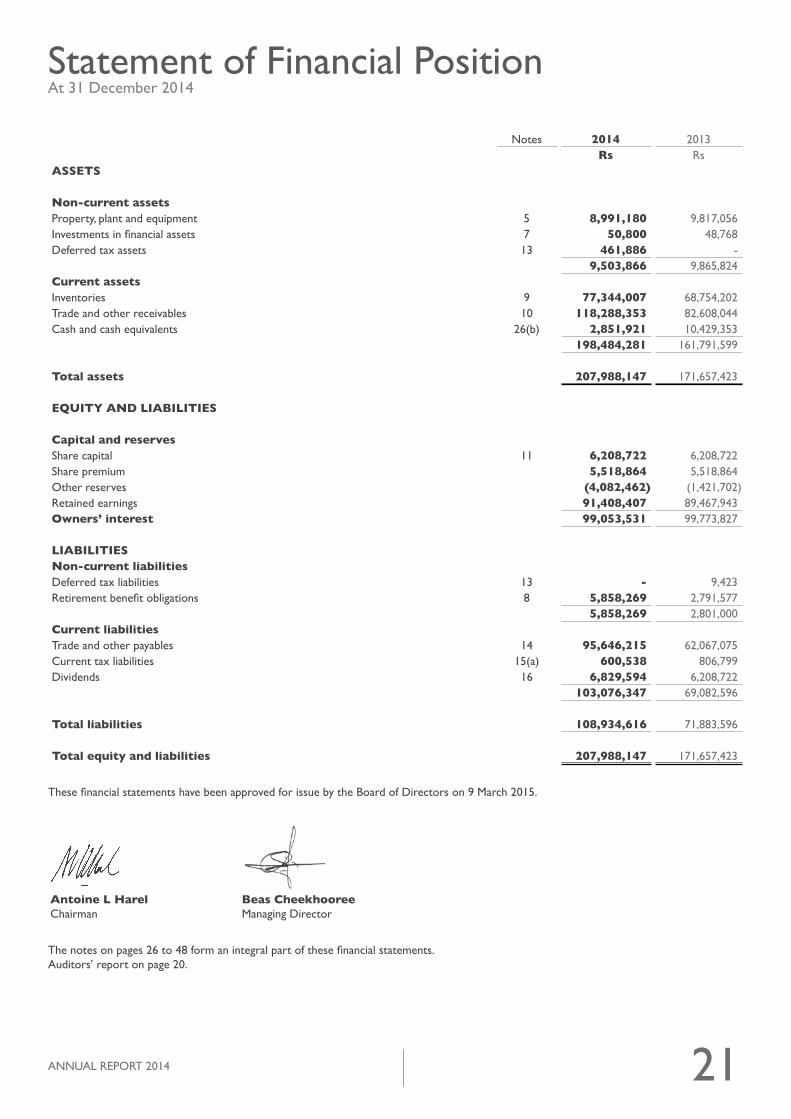
Statement of Financial PositionAt 31 December 2014
Notes 2014 2013Rs Rs
ASSETS
Non-current assetsProperty, plant and equipment 5 8,991,180 9,817,056 Investments in financial assets 7 50,800 48,768 Deferred tax assets 13 461,886 -
9,503,866 9,865,824 Current assetsInventories 9 77,344,007 68,754,202 Trade and other receivables 10 118,288,353 82,608,044 Cash and cash equivalents 26(b) 2,851,921 10,429,353
198,484,281 161,791,599
Total assets 207,988,147 171,657,423
EQUITY AND LIABILITIES
Capital and reservesShare capital 11 6,208,722 6,208,722 Share premium 5,518,864 5,518,864 Other reserves (4,082,462) (1,421,702)Retained earnings 91,408,407 89,467,943 Owners’ interest 99,053,531 99,773,827
LIABILITIESNon-current liabilitiesDeferred tax liabilities 13 - 9,423 Retirement benefit obligations 8 5,858,269 2,791,577
5,858,269 2,801,000 Current liabilitiesTrade and other payables 14 95,646,215 62,067,075 Current tax liabilities 15(a) 600,538 806,799 Dividends 16 6,829,594 6,208,722
103,076,347 69,082,596
Total liabilities 108,934,616 71,883,596
Total equity and liabilities 207,988,147 171,657,423
These financial statements have been approved for issue by the Board of Directors on 9 March 2015.
The notes on pages 26 to 48 form an integral part of these financial statements. Auditors’ report on page 20.
Antoine L Harel Beas CheekhooreeChairman Managing Director

CHEMCO LIMITED22
Notes 2014 2013Rs Rs
Revenue 2.14, 17 324,326,860 306,263,328 Cost of sales 23 (254,315,057) (241,613,002)Gross profit 70,011,803 64,650,326 Other income 18 1,456,510 1,216,842
Other gains/(losses) - net 19 955,142 (225,761)Operating expenses 23 (63,435,281) (56,968,634)
8,988,174 8,672,773 Finance income 20 1,442,651 695,978
Profit before taxation 22 10,430,825 9,368,751 Income tax expense 15(b) (1,660,767) (1,546,931)Profit for the year 8,770,058 7,821,820
Profit attributable to owners of the parent 8,770,058 7,821,820
Earnings per share (Rs/share) 25 1.41 1.26
Statement of Profit or LossFor the year ended 31 December 2014
The notes on pages 26 to 48 form an integral part of these financial statements. Auditors’ report on page 20.

ANNUAL REPORT 2014 23
The notes on pages 26 to 48 form an integral part of these financial statements. Auditors’ report on page 20.
Note 2014 2013Rs Rs
Profit for the year 8,770,058 7,821,820
Other comprehensive income for the year:
Items that will not be reclassified to profit or loss:Remeasurement of defined benefit obligations 12 (2,662,792) 389,414
Items that may be reclassified subsequently to profit or loss:Increase/(decrease) in fair value of available-for-sale financial assets 12 2,032 (8,128)
Other comprehensive income for the year, net of tax (2,660,760) 381,286
Total comprehensive income for the year 6,109,298 8,203,106
Total comprehensive income attributable to owners of the parent 6,109,298 8,203,106
Statement of Profit or Loss and Other Comprehensive IncomeFor the year ended 31 December 2014

CHEMCO LIMITED24
ActuarialShare Share Fair value (losses)/ Retained
Notes capital premium reserve gains earnings TotalRs Rs Rs Rs Rs Rs
At 1 January 2014 6,208,722 5,518,864 28,448 (1,450,150) 89,467,943 99,773,827
Profit for the year - - - - 8,770,058 8,770,058 Other comprehensive income for the year 12 - - 2,032 (2,662,792) - (2,660,760)Total comprehensive income for the year - - 2,032 (2,662,792) 8,770,058 6,109,298
Dividends 16 - - - - (6,829,594) (6,829,594)Total transactions with owners of the parent - - - - (6,829,594) (6,829,594)
Balance at 31 December 2014 6,208,722 5,518,864 30,480 (4,112,942) 91,408,407 99,053,531
At 1 January 2013- as restated 6,208,722 5,518,864 36,576 (1,839,564) 87,854,845 97,779,443
Profit for the year - - - - 7,821,820 7,821,820 Other comprehensive income for the year 12 - - (8,128) 389,414 - 381,286 Total comprehensive income for the year - - (8,128) 389,414 7,821,820 8,203,106
Dividends 16 - - - - (6,208,722) (6,208,722)Total transactions with owners of the parent - - - - (6,208,722) (6,208,722)
Balance at 31 December 2013 6,208,722 5,518,864 28,448 (1,450,150) 89,467,943 99,773,827
Statement of Changes in EquityFor the year ended 31 December 2014
The notes on pages 26 to 48 form an integral part of these financial statements. Auditors’ report on page 20.

ANNUAL REPORT 2014 25
Statement of Cash FlowsFor the year ended 31 December 2014
Notes 2014 2013Rs Rs
Cash flow from operating activitiesCash generated from operations 26(a) 2,751,609 42,847,145 Interest paid (450,115) (984,029)Tax paid (1,868,432) (1,877,490)Net cash generated from operating activities 433,062 39,985,626
Cash flows from investing activitiesPurchase of property, plant and equipment 5 (2,230,803) (2,180,053)Proceeds from sale of property, plant and equipment 248,913 - Dividend received 1,829 2,032 Net cash used in investing activities (1,980,061) (2,178,021)
Cash flows from financing activitiesDividends paid 16 (6,208,722) (6,208,722)Net cash used in financing activities (6,208,722) (6,208,722)
Net (decrease)/increase in cash and cash equivalents (7,755,721) 31,598,883
Movement in cash and cash equivalentsAt 1 January 10,429,353 (21,363,145)(Decrease)/increase (7,755,721) 31,598,883 Effect of foreign exchange rate changes 178,289 193,615 At 31 December 26(b) 2,851,921 10,429,353
The notes on pages 26 to 48 form an integral part of these financial statements. Auditors’ report on page 20.

Notes to the Financial StatementsFor the year ended 31 December 2014
CHEMCO LIMITED26
1. GENERAL INFORMATION Chemco Limited is a public company incorporated and domiciled in Mauritius. The address of its registered office is Chaussée Tromelin, Fort George, Port Louis. Its main activity is the trading of chemicals and general goods.
The Company is listed on the Development & Enterprise Market (DEM) of the Stock Exchange of Mauritius. The directors consider Harel Mallac & Co. Ltd., incorporated in the Republic of Mauritius as the holding company and Société Pronema, an entity registered in the Republic of Mauritius as the ultimate parent entity. These financial statements will be submitted for consideration and approval at the forthcoming Annual Meeting of Shareholders of the Company. 2. SIGNIFICANT ACCOUNTING POLICIES The principal accounting policies adopted in the preparation of these financial statements are set out below. These policies have been consistently applied to all the years presented, unless otherwise stated. 2.1 Basis of preparation The financial statements of Chemco Limited comply with the Companies Act 2001 and have been prepared in accordance with International Financial Reporting Standards (IFRS). Where necessary, comparative figures have been amended to conform with changes in presentation in the current year. The financial statements are prepared under the historical cost convention, except that available-for-sale investments are stated at their fair value. These financial statements are that of an individual entity. The financial statements are presented in Mauritian Rupees. (a) Standards, Amendments to published Standards and Interpretations effective in the reporting period Amendments to IAS 32, ‘Offsetting Financial Assets and Financial Liabilities’, clarify the requirements relating to the offset of financial assets and financial liabilities. The amendment is not expected to have any impact on the Company’s financial statements. Amendments to IFRS 10, IFRS 12 and IAS 27, ‘Investment Entities’, define an investment entity and exempt a reporting entity that meets the definition of an investment entity from consolidating its subsidiaries but instead to measure its subsidiaries at fair value through profit or loss in its consolidated and separate financial statements. Consequential amendments have been made to IFRS 12 and IAS 27 to introduce new disclosure requirements for investment entities. The amendment has no impact on the Company’s financial statements. IFRIC 21, ‘Levies’, sets out the accounting for an obligation to pay a levy that is not income tax. The interpretation addresses what the obligating event is that gives rise to pay a levy and when should a liability be recognised. The Company is not subject to levies so the interpretation has no impact on the Company’s financial statements. Amendments to IAS 36, ‘Recoverable Amount Disclosures for Non-financial Assets’, remove the requirement to disclose the recoverable amount of a cash-generating unit (CGU) to which goodwill or other intangible assets with indefinite useful lives had been allocated. The amendment has no impact on the Company’s financial statements. Amendments to IAS 39, ‘Novation of Derivatives and Continuation of Hedge Accounting’, provide relief from the requirement to discontinue hedge accounting when a derivative designated as a hedging instrument is novated under certain circumstances. The amendments also clarify that any change to the fair value of the derivative designated as a hedging instrument arising from the novation should be included in the assessment and measurement of hedge effectiveness. The amendment has no impact on the Company’s financial statements. Annual Improvements 2010-2012 Cycle IFRS 13 (Amendment), ‘Fair Value Measurement’ clarifies in the Basis for Conclusions that short-term receivables and payables with no stated interest rates can be measured at invoice amounts when the effect of discounting is immaterial. The amendment has no impact on the Company’s financial statements. Annual Improvements 2011-2013 Cycle IFRS 1 (Amendment), ‘First-time Adoption of International Financial Reporting Standards’ clarifies in the Basis for Conclusions that an entity may choose to apply either a current standard or a new standard that is not yet mandatory, but permits early application, provided either standard is applied consistently throughout the periods presented in the entity’s first IFRS financial statements. The amendment has no impact on the Company’s financial statements, since the Company is an existing IFRS preparer.

Notes to the Financial StatementsFor the year ended 31 December 2014
ANNUAL REPORT 2014 27
2. SIGNIFICANT ACCOUNTING POLICIES (CONT’D) 2.1 Basis of preparation (Cont’d) (b) Standards, Amendments to published Standards and Interpretations issued but not yet effective
Certain standards, amendments to published standards and interpretations have been issued that are mandatory for accounting periods beginning on or after January 1, 2015 or later periods, but which the Company has not early adopted. At the reporting date of these financial statements, the following were in issue but not yet effective: IFRS 9 Financial Instruments Defined Benefit Plans: Employee Contributions (Amendments to IAS 19) Annual Improvements to IFRSs 2010-2012 cycle Annual Improvements to IFRSs 2011-2013 cycle IFRS 14 Regulatory Deferral Accounts Accounting for Acquisitions of Interests in Joint Operations (Amendments to IFRS 11) Clarification of Acceptable Methods of Depreciation and Amortisation (Amendments to IAS 16 and IAS 38) IFRS 15 Revenue from Contract with Customers Agriculture: Bearer Plants (Amendments to IAS 16 and IAS 41) Equity Method in Separate Financial Statements (Amendments to IAS 27) Sale or Contribution of Assets between an Investor and its Associate or Joint Venture (Amendments to IFRS 10 and IAS 28) Annual Improvements to IFRSs 2012-2014 Cycle Investment Entities: Applying the Consolidation Exception (Amendments to IFRS 10, IFRS 12 and IAS 28) Disclosure Initiative (Amendments to IAS 1)
Where relevant, the Company is still evaluating the effect of these Standards, amendments to published Standards and Interpretations issued but not yet effective, on the presentation of its financial statements. The preparation of financial statements in conformity with IFRS requires the use of certain critical accounting estimates. It also requires management to exercise its judgement in the process of applying the Company’s accounting policies. The areas involving a higher degree of judgement or complexity, or areas where assumptions and estimates are significant to the financial statements, are disclosed in Note 4. 2.2 Property, plant and equipment Property, plant and equipment are stated at historical cost less depreciation. Historical cost includes expenditure that is directly attributable to the acquisition of the items. Subsequent costs are included in the assets carrying amount or recognised as a separate asset as appropriate, only when it is probable that the future economic benefits associated with the item will flow to the Company and the cost of the item can be measured reliably. Depreciation is calculated on a straight line method to write off the cost or revalued amounts of the assets to their residual values over their estimated useful lives as follows:
The assets’ residual values and useful lives are reviewed, and adjusted if appropriate, at the end of each reporting period. Where the carrying amount of an asset is greater than its estimated recoverable amount, it is written down immediately to its recoverable amount. Gains and losses on disposals of property, plant and equipment are determined by comparing proceeds with carrying amount and are included in profit or loss. 2.3 Inventories Inventories are stated at the lower of cost and net realisable value. Cost is determined on a weighted average basis. The cost of finished goods comprises purchase cost and other direct costs. Net realisable value is the estimated selling price in the ordinary course of business less the costs of completion and applicable variable selling expenses.
YearsPlant and machinery 10Furniture, fittings and office equipment 3 - 10Motor vehicles 5Forklift 5

Notes to the Financial StatementsFor the year ended 31 December 2014
CHEMCO LIMITED28
2. SIGNIFICANT ACCOUNTING POLICIES (CONT’D)
2.4 Foreign currencies (i) Functional and presentation currency Items included in the financial statements are measured using Mauritian rupees, the currency of the primary economic environment in which the entity operates (“functional currency”). The financial statements are presented in Mauritian rupees, which is the Company’s functional and presentation currency. (ii) Transactions and balances Foreign currency transactions are translated into the functional currency using the exchange rates prevailing on the dates of the transactions. Foreign exchange gains and losses resulting from the settlement of such transactions and from the translation at year-end exchange rates of monetary assets and liabilities denominated in foreign currencies are recognised in profit or loss. Foreign exchange gains and losses that relate to borrowings and cash and cash equivalents are presented in profit or loss within ‘finance income/(costs)’. Foreign exchange gains and losses that relate to trade payables and purchases are presented in profit or loss within ‘cost of sales’. All other foreign exchange gains and losses are presented in profit or loss within ‘other gains/(losses) - net’. Non-monetary items that are measured at historical cost in a foreign currency are translated using the exchange rate at the date of the transaction.
Non-monetary items that are measured at fair value in a foreign currency are translated using the exchange rates at the date the fair value was determined. 2.5 Current and deferred income tax The tax expense for the period comprises of current and deferred tax. Tax is recognised in profit or loss, except to the extent that it relates to items recognised in other comprehensive income or directly in equity. Current tax The current income tax charge is based on taxable income for the year calculated on the basis of tax laws enacted or substantively enacted by the end of the reporting period. Deferred tax Deferred income tax is provided in full, using the liability method, on temporary differences arising between the tax bases of assets and liabilities and their carrying amounts in the financial statements. However, if the deferred income tax arises from initial recognition of an asset or liability in a transaction, other than a business combination, that at the time of the transaction affects neither accounting nor taxable profit or loss, it is not accounted for. Deferred income tax is determined using tax rates that have been enacted or substantively enacted at the reporting date and are expected to apply in the period when the related deferred income tax asset is realised or the deferred income tax liability is settled. Deferred tax assets are recognised to the extent that it is probable that future taxable profit will be available against which deductible temporary differences can be utilised. 2.6 Alternative Minimum Tax (AMT) Alternative Minimum Tax (AMT) is provided for, where the Company, which has a tax liability of less than 7.5% of its book profit, pays a dividend. AMT is calculated as the lower of 10% of the dividend paid and 7.5% of book profit. 2.7 Retirement benefit obligations
(i) Defined contribution plans A defined contribution plan is a pension plan under which the Company pays fixed contributions into a separate entity. The Company has no legal or constructive obligations to pay further contributions if the fund does not hold sufficient assets to pay all employees the benefits relating to employee service in the current and prior periods. The Company operates a defined contribution retirement benefit plan for all qualifying employees. Payments to defined contribution retirement plans are charged as an expense as they fall due.

Notes to the Financial StatementsFor the year ended 31 December 2014
ANNUAL REPORT 2014 29
2. SIGNIFICANT ACCOUNTING POLICIES (CONT’D)
2.7 Retirement benefit obligations (Cont’d) (ii) Defined benefit plans A defined benefit plan is a pension plan that is not a defined contribution plan. Typically defined benefit plans define an amount of pension benefit that an employee will receive on retirement, usually dependent on one or more factors such as age, years of service and compensation. The liability recognised in the statement of financial position in respect of defined benefit pension plans is the present value of the defined benefit obligation at the end of the reporting period less the fair value of plan assets. The defined benefit obligation is calculated annually by independent actuaries using the projected unit credit method. Remeasurement of the net defined benefit liability, which comprise actuarial gains and losses arising from experience adjustments and changes in actuarial assumptions, the return on plan assets (excluding interest) and the effect of the asset ceiling (if any, excluding interest), is recognised immediately in other comprehensive income in the period in which they occur. Remeasurements recognised in other comprehensive income shall not be reclassified to profit or loss in subsequent period. The Company determines the net interest expense/(income) on the net defined benefit liability/(asset) for the period by applying the discount rate used to measure the defined benefit obligation at the beginning of the annual period to the net defined benefit liability/(asset), taking into account any changes in the net defined liability/(asset) during the period as a result of contributions and benefit payments. Net interest expense/(income) is recognised in profit or loss. Service costs comprising current service cost, past service cost, as well as gains and losses on curtailments and settlements are recognised immediately in profit or loss. (iii) Gratuity on retirement For those employees who are not covered (or who are insufficiently covered) by the above pension plans, the net present value of gratuity on retirement payable under the Employment Rights Act 2008 is calculated by a qualified actuary and provided for. The obligations arising under this item are not funded. (iv) Profit sharing and bonus plans The Company recognises a liability and an expense for bonuses and profit sharing, based on a formula that takes into consideration the profit attributable to the Company’s shareholders after certain adjustments. The Company recognises a provision where contractually obliged or where there is a past practice that has created a constructive obligation. 2.8 Financial assets (a) Categories of financial assets The Company classifies its financial assets in the following categories: available-for-sale financial assets and loans and receivables. The classification depends on the purpose for which the investments were acquired. Management determines the classification of its financial assets at initial recognition. (i) Available-for-sale financial assets Available-for-sale financial assets are non-derivatives that are either designated in this category or not classified in any of the other categories. They are included in non-current assets unless management intends to dispose of the investment within twelve months of the end of the reporting period. (ii) Loans and receivables Loans and receivables are non-derivative financial assets with fixed or determinable payments that are not quoted in an active market. They are recognised initially at fair value plus any directly attributable transaction costs. Subsequent to initial recognition, loans and receivables are measured at amortised cost less any impairment. They are included in current assets when maturity is within twelve months after the end of the reporting period or non-current assets for maturities greater than twelve months. The Company’s loans and receivables comprise of cash and cash equivalents, and trade and other receivables. (b) Recognition and measurement Purchases and sales of financial assets are recognised on trade-date (or settlement date), the date on which the Company commits to purchase or sell the asset. Investments are initially measured at fair value plus transaction costs.
Unrealised gains and losses arising from changes in the fair value of financial assets classified as available-for-sale are recognised in other comprehensive income.
Notes to the Financial StatementsFor the year ended 31 December 2014
CHEMCO LIMITED30
2. SIGNIFICANT ACCOUNTING POLICIES (CONT’D)
2.8 Financial assets (Cont’d)
(b) Recognition and measurement (Cont’d)
When financial assets classified as available-for-sale are sold or impaired, the accumulated fair value adjustments are included in profit or loss as gains and losses on financial assets. The fair values of quoted investments are based on current bid prices. If the market for a financial asset is not active (and for unlisted securities), the Company establishes fair value by using valuation techniques. These include the use of recent arm’s length transactions, reference to other instruments that are substantially the same and capitalised earnings method. (c) Impairment of financial assets
(i) Financial assets classified as available-for-sale The Company assesses at the end of each reporting period whether there is objective evidence that a financial asset or a group of financial assets is impaired. In the case of equity investments classified as available-for-sale, a significant or prolonged decline in the fair value of the security below its cost is considered in determining whether the securities are impaired. If any such evidence exists for available-for-sale financial assets, the cumulative loss, measured as the difference between acquisition cost and the current fair value, less any impairment loss on that financial asset previously recognised in profit or loss - is removed from equity and recognised in profit or loss. Impairment losses recognised in profit or loss for an investment in an equity instrument classified as available-for-sale are not reversed through profit or loss. (ii) Financial assets carried at amortised cost For loans and receivables category, the amount of the loss is measured as the difference between the asset’s carrying amount and the present value of estimated future cash flows (excluding future credit losses that have not been incurred) discounted at the financial asset’s original effective interest rate. The carrying amount of the asset is reduced and, the amount of the loss is recognised in profit or loss. If a loan has a variable interest rate, the discount rate for measuring any impairment loss is the current effective interest rate determined under the contract. If in a subsequent period, the amount of the impairment loss decreases and the decrease can be related objectively to an event occurring after the impairment was recognised (such as an improvement in the debtor’s credit rating), the previously recognised impairment loss is reversed through profit or loss to the extent that the carrying amount of the financial asset at the date the impairment is reversed does not exceed what the amortised cost would have been had the impairment not been recognised. 2.9 Trade receivables Trade receivables are recognised initially at fair value and subsequently measured at amortised cost using the effective interest method, less provision for impairment. A provision for impairment of trade receivables is established when there is objective evidence that the Company will not be able to collect all amounts due according to the original terms of receivables. The amount of the provision is the difference between the asset’s carrying amount and the present value of estimated future cash flows, discounted at the effective interest rate. The amount of provision is recognised in profit or loss. 2.10 Borrowings Borrowings are recognised initially at fair value being their issue proceeds net of transaction costs incurred. Borrowings are subsequently stated at amortised cost; any difference between the proceeds (net of transaction costs) and the redemption value is recognised in profit or loss over the period of the borrowings using the effective interest method. Borrowings are classified as current liabilities unless the Company has an unconditional right to defer settlement of the liability for at least twelve months after the end of the reporting period. 2.11 Trade and other payables Trade and other payables are stated at fair value and subsequently measured at amortised cost using the effective interest method. 2.12 Cash and cash equivalents Cash and cash equivalents include cash in hand, deposits held at call with banks, other short-term highly liquid investments with original maturities of 3 months or less and bank overdrafts. Bank overdrafts are shown within borrowings in current liabilities in the statement of financial position.

Notes to the Financial StatementsFor the year ended 31 December 2014
ANNUAL REPORT 2014 31
2.SIGNIFICANT ACCOUNTING POLICIES (CONT’D)
2.13 Share capital Ordinary shares Ordinary shares are classified as equity. Incremental costs directly attributable to the issue of new shares are shown in equity as deduction, net of tax, from proceeds. 2.14 Revenue recognition Revenue is measured at the fair value of the consideration received or receivable, and represents amounts receivable for goods supplied, stated net of discounts, returns, value added taxes, rebates and other similar allowances. (a) Sale of goods Sales of goods are recognised when the goods are delivered and titles have passed, at which time all of the following conditions are satisfied: - the Company has transferred to the buyer the significant risks and rewards of ownership of the goods;- the Company retains neither continuing managerial involvement to the degree usually associated with ownership nor effective control over
the goods sold;- the amount of revenue can be measured reliably; - it is probable that the economic benefits associated with the transaction will flow to the Company; and - the costs incurred or to be incurred in respect of the transaction can be measured reliably. (b) Rendering of services Revenue from rendering of services are recognised in the accounting year in which the services are rendered (by reference to completion of the specific transaction assessed on the basis of the actual service provided as a proportion of total services to be provided). (c) Other revenues earned by the Company are recognised on the following bases: - Interest income - on a time-proportion basis using the effective interest method. - Dividend income - when the shareholder’s right to receive payment is established. 2.15 Dividend distribution Dividend distribution to the Company’s shareholders is recognised as a liability in the Company’s financial statements in the period in which the dividends are declared. 2.16 Provisions Provisions are recognised when the Company has a present or constructive obligation as a result of past events; it is probable that an outflow of resources that can be reliably estimated will be required to settle the obligation. The amount recognised as a provision is the best estimate of the consideration required to settle the present obligation at the end of the reporting period, taking into account the risks and uncertainties surrounding the obligation. When a provision is measured using the cash flows estimated to settle the present obligation, its carrying amount is the present value of those cash flows (when the effect of the time value of money is material). 2.17 Impairment of non-financial assets Assets that have an indefinite useful life are not subject to amortisation and are tested annually for impairment. Assets that are subject to amortisation are reviewed for impairment whenever events or changes in circumstances indicate that the carrying amount may not be recoverable. Any impairment loss is recognised for the amount by which the carrying amount of the asset exceeds its recoverable amount. The recoverable amount is the higher of an asset’s fair value less costs to sell and value in use. For the purposes of assessing impairment, assets are grouped at the lowest levels for which there are separately identifiable cash flows (cash-generating units). 2.18 Related parties Parties are considered to be related if one party has the ability to control the other party or exercise significant influence over the party making financial or operating decisions.

Notes to the Financial StatementsFor the year ended 31 December 2014
CHEMCO LIMITED32
The table above excludes prepayments and accruals. At 31 December 2014, if the rupee had weakened/strengthened by 5% against the following currencies with all other variables held constant, post tax profit would have been as shown in the table, mainly as a result of foreign exchange gains/losses on translation of foreign currency denominated financial assets and liabilities.
(ii) Price risk
The market prices of the Company’s available-for-sale quoted investment securities are susceptible to future fluctuations.
Sensitivity analysis The table below summarises the impact of increases/decreases in the fair value of the investments on the Company’s equity. The analysis is based on the assumption that the fair value has increased/decreased by 5%.
2014 2013Financial Financial Financial Financial assets liabilities assets liabilities
Rs Rs Rs Rs
Mauritian rupee 78,436,818 18,252,693 63,712,596 17,410,382 US Dollar 32,198,752 71,504,266 16,855,137 40,430,148 Euro 450,146 - - - South African Rand - 2,003,829 - -
111,085,716 91,760,788 80,567,733 57,840,530
2014 2013Financial Financial Financial Financial assets liabilities assets liabilities
Rs Rs Rs Rs
Impact on post-tax results: +/- +/- +/- +/-US Dollar 1,368,447 3,038,931 716,343 1,718,281 Euro 19,131 - - - South African Rand - 85,163 - -
1,387,578 3,124,094 716,343 1,718,281
Impact on equity2014 2013Rs Rs
Available-for-sale financial assets 2,540 2,438
(a) Market risk (i) Currency risk The Company operates internationally and is exposed to foreign exchange risk arising from various currency exposures primarily with respect to US dollar, Euro and South African Rand. Foreign exchange risk arises from future commercial transactions and recognised assets and liabilities. Management has set up a policy to require the Company to manage its foreign exchange risk exposure with treasury. Currency profile The currency profile of the Company’s financial assets and liabilities is summarised below:
3. FINANCIAL RISK MANAGEMENT 3.1 Financial Risk Factors The Company’s activities expose it to a variety of financial risks, namely market risk (including currency risk, fair value interest risk, cash flow interest risk and price risk), credit risk and liquidity risk. The Company’s overall risk management programme focuses on the unpredictability of financial markets and seeks to minimise potential adverse effects on the Company’s financial performance.

Notes to the Financial StatementsFor the year ended 31 December 2014
ANNUAL REPORT 2014 33
Less than1 year
RsAt 31 December 2014Trade and other payables 95,646,215
At 31 December 2013Trade and other payables 62,067,075
3.2 Capital risk management The Company’s objectives when managing capital are: - to safeguard the Company’s ability to continue as a going concern, so that it can continue to provide returns for shareholders and benefits for
other stakeholders, - to provide an adequate return to shareholders by pricing products and services commensurately with the level of risk. The Company manages the capital structure and makes adjustments to it in the light of changes in economic conditions and the risk characteristics of the underlying assets. In order to maintain or adjust the capital structure, the Company may adjust the amount of dividends paid to shareholders, or sell assets to reduce debt. There were no changes in the Company’s approach to capital risks management during the year.
3. FINANCIAL RISK MANAGEMENT (CONT’D)
(a) Market risk (Cont’d) 3.1 Financial Risk Factors (Cont’d)
(iii) Cash flow and fair value interest rate risk The Company’s interest rate risk arises from short-term borrowings. Borrowings issued at variable rates expose the Company to cash flow interest-rate risk. Borrowings issued at fixed rates expose the Company to fair value interest-rate risk. The Company is not exposed to cash flow and fair value interest rate risk. (b) Credit risk Credit risk is the risk of financial loss to the Company if a customer or counterparty to a financial instrument fails to meet its contractual obligations, and arises principally from the Company’s trade receivables. The amounts presented in the statement of financial position are net of allowances for doubtful receivables, estimated by the Company’s management based on prior experience and the current economic environment. The Company has policies in place to ensure that sales of products and services are made to customers with an appropriate credit history.
The Company has no significant concentration of credit risk, with exposure spread over a large number of counterparties and customers. The Company has policies that limit the amount of credit exposure to any company. (c) Liquidity risk Liquidity risk is the risk that the Company will encounter difficulty in meeting the obligations associated with its financial liabilities that are settled by delivery of cash or another financial asset. Prudent liquidity risk management implies maintaining sufficient cash, the availability of funding through an adequate amount of committed credit facilities. The Company aims at maintaining flexibility in funding by keeping committed credit lines available. Management monitors rolling forecasts of the Company’s liquidity reserve on the basis of expected cash flows and does not foresee any major liquidity risk over the next two years. The table below analyses the Company’s non-derivative financial liabilities based on the remaining period at the end of the reporting period:
Forecasted liquidity reserve is as follows: 2015Rs’000
Net cash flows from operating activities 24,240 Net cash flows from investing activities (12,620)Net cash flows from financing activities (6,209)Increase 5,411 Opening balance 2,852 Closing balance 8,263

Notes to the Financial StatementsFor the year ended 31 December 2014
CHEMCO LIMITED34
3. FINANCIAL RISK MANAGEMENT (CONT’D)
3.3 Fair value estimation The fair value of financial instruments traded in active markets is based on quoted market prices at the end of the reporting period. A market is regarded as active if quoted prices are readily and regularly available from an exchange, dealer, broker, industry group, pricing service, or regulatory agency, and those prices represent actual and regularly occurring market transactions on an arm’s length basis. The quoted market price used for financial assets held by the Company is the current bid price. These instruments are included in level 1. Instruments included in level 1 comprise primarily of quoted equity investments classified as trading securities or available-for-sale. The fair value of financial instruments that are not traded in an active market is determined by using valuation techniques. These valuation techniques maximise the use of observable market data where it is available and rely as little as possible on specific estimates. If all significant inputs required to fair value an instrument are observable, the instrument is included in level 2. If one or more of the significant inputs is not based on observable market data, the instrument is included in level 3. Specific valuation techniques used to value financial instruments include: - Quoted market prices or dealer quotes for similar instruments. - The fair value of interest rate swaps is calculated as the present value of the estimated future cash flows based on observable yield curves. - The fair value of forward foreign exchange contracts is determined using forward exchange rates at the end of the reporting period, with the resulting value discounted back to present value.
- Other techniques, such as discounted cash flow analysis, are used to determine fair value for the remaining financial instruments. The nominal value less estimated credit adjustments of trade receivables and payables are assumed to approximate their fair values. The fair value of financial liabilities for disclosure purposes is estimated by discounting the future contractual cashflows at the current market interest rate that is available to the Company for similar financial instruments. 4. CRITICAL ACCOUNTING ESTIMATES AND JUDGEMENTS Estimates and judgements are continuously evaluated and are based on historical experience and other factors, including expectations of future events that are believed to be reasonable under the circumstances. 4.1 Critical accounting estimates and assumptions The Company makes estimates and assumptions concerning the future. The resulting accounting estimates will, by definition, seldom equal the related actual results. The estimates and assumptions that have a significant risk of causing a material adjustment to the carrying amounts of assets and liabilities within the next financial year are disclosed below. (a) Depreciation policies Property, plant and equipment are depreciated to their residual values over their estimated useful lives. The residual value of an asset is the estimated net amount that the Company would currently obtain from disposal of the asset, if the asset were already of the age and in condition expected at the end of its useful life. The directors therefore make estimates based on historical experience and use best judgement to assess the useful lives of assets at the end of their expected useful lives. (b) Limitation of sensitivity analysis Sensitivity analysis in respect of market risk demonstrates the effect of a change in a key assumption while other assumptions remain unchanged. In reality, there is a correlation between the assumptions and other factors. It should also be noted that these sensitivities are non-linear and larger or smaller impacts should not be interpolated or extrapolated from these results. Sensitivity analysis does not take into consideration that the Company’s assets and liabilities are managed. Other limitations include the use of hypothetical market movements to demonstrate potential risk that only represent the Company’s view of possible near-term market changes that cannot be predicted with any certainty.
(c) Asset lives and residual values Property, plant and equipment are depreciated over its useful life taking into account residual values, where appropriate. The actual lives of the assets and residual values are assessed annually and may vary depending on a number of factors. In reassessing asset lives, factors such as technological innovation and maintenance programmes are taken into account. Residual value assessments consider issues such as future market conditions, the remaining life of the asset and projected disposal values. Consideration is also given to the extent of current profits and losses on the disposal of similar assets.

Notes to the Financial StatementsFor the year ended 31 December 2014
ANNUAL REPORT 2014 35
4. CRITICAL ACCOUNTING ESTIMATES AND JUDGEMENTS (CONT’D) 4.1 Critical accounting estimates and assumptions (Cont’d)
(d) Pension benefits The present value of the pension obligations depends on a number of factors that are determined on an actuarial basis using a number of assumptions. The assumptions used in determining the net costs for pensions include the discount rate. Any changes in these assumptions will impact the carrying amount of pension obligations. The Company determines the appropriate discount rate at the end of each year. This is the interest rate that should be used to determine the present value of estimated future cash outflows expected to be required to settle the pension obligations. In determining the appropriate discount rate, the Company considers the interest rates of long-term government bonds that are denominated in the currency in which the benefits will be paid, and that have terms to maturity approximating the terms of the related pension obligation. Other key assumptions for pension obligations are based in part on current market conditions. Additional information is disclosed in note 8. (e) Impairment of available-for-sale financial assets The Company follows the guidance of IAS 39 on determining when an investment is other-than-temporarily impaired. This determination requires significant judgement. In making this judgement, the Company evaluates, among other factors, the duration and extent to which the fair value of an investment is less than its cost, and the financial health of and near-term business outlook for the investee, including factors such as industry and sector performance, changes in technology and operational and financing cash flow.
5. PROPERTY, PLANT AND EQUIPMENT
Furniture,Fittings
Plant and and Office MotorMachinery equipment vehicles Forklift Total
Rs Rs Rs Rs Rs(a) COST At 1 January 2014 8,691,322 8,444,509 17,046,322 1,300,000 35,482,153 Additions 1,114,183 262,094 854,526 - 2,230,803 Disposals - - (1,444,210) - (1,444,210)At 31 December 2014 9,805,505 8,706,603 16,456,638 1,300,000 36,268,746
DEPRECIATION At 1 January 2014 6,429,553 5,242,658 12,735,219 1,257,667 25,665,097 Charge for the year 425,515 566,902 2,021,929 42,333 3,056,679 Disposal adjustment - - (1,444,210) - (1,444,210)At 31 December 2014 6,855,068 5,809,560 13,312,938 1,300,000 27,277,566
NET BOOK VALUES At 31 December 2014 2,950,437 2,897,043 3,143,700 - 8,991,180

Notes to the Financial StatementsFor the year ended 31 December 2014
CHEMCO LIMITED36
5. PROPERTY, PLANT AND EQUIPMENT (CONT’D)
Furniture,Fittings
Plant and and Office MotorMachinery equipment vehicles Forklift Total
Rs Rs Rs Rs Rs(b) COST At 1 January 2013 8,629,322 7,611,239 15,761,539 1,300,000 33,302,100 Additions 62,000 833,270 1,284,783 - 2,180,053 At 31 December 2013 8,691,322 8,444,509 17,046,322 1,300,000 35,482,153
DEPRECIATION At 1 January 2013 6,029,281 4,692,038 10,359,468 1,130,667 22,211,454 Charge for the year 400,272 550,620 2,375,751 127,000 3,453,643 At 31 December 2013 6,429,553 5,242,658 12,735,219 1,257,667 25,665,097
NET BOOK VALUES At 31 December 2013 2,261,769 3,201,851 4,311,103 42,333 9,817,056
(c) Depreciation expense of Rs3,056,679 (2013: Rs3,453,643) has been charged to operating expenses.
Class of Holding Denominated Stated Country ofoperation & Main
Name of companies shares held Year ended Direct % currency capital incorporation business
31 December 2014Chemco SARL Ordinary 31 December 2014 100 MGA 600,000 Madagascar Trading
31 December 2013Asian Buying House Ltd Ordinary 31 December 2013 100 MUR 100,000 Mauritius Trading Chemco SARL Ordinary 31 December 2013 100 MGA 600,000 Madagascar Trading
6. INVESTMENTS IN SUBSIDIARY COMPANIES
The board has decided to wind up the subsidiaries, hence they have not been consolidated in the financial statements.
7. INVESTMENTS IN FINANCIAL ASSETS
2014 2013Rs Rs
Available-for-sale financial assetsAt 1 January 48,768 56,896 Increase/(decrease) in fair value 2,032 (8,128)At 31 December 50,800 48,768
(a)The movement in investments in financial assets may be summarised as follows:
Rs At 31 December 2014
Available-for-sale financial assets 50,800
Level 1 Rs
At 31 December 2013Available-for-sale financial assets 48,768
Available-for-sale financial assets are denominated in Mauritian rupees.

Notes to the Financial StatementsFor the year ended 31 December 2014
ANNUAL REPORT 2014 37
2014 2013Rs Rs
Amounts recognised in the statement of financial position:- Defined pension benefits (note 8(a)(i)) 2,671,549 938,534 - Other post-retirement benefits (note 8(b)(ii)) 3,186,720 1,853,043
5,858,269 2,791,577
Analysed as follows:Non-current liabilities 5,858,269 2,791,577
Amount charged to profit or loss:- Defined pension benefits (note 8(a)(v)) 557,107 882,695 - Other post-retirement benefits (note 8(b)(v)) 227,731 624,225
784,838 1,506,920
Amount charged/(credited) to other comprehensive income:- Defined pension benefits (note 8(a)(vi)) 2,026,751 (461,145)- Other post-retirement benefits (note 8(b)(vi)) 1,105,946 3,011
3,132,697 (458,134)
8. RETIREMENT BENEFIT OBLIGATIONS
(a) Defined pension benefits The Company contributes to a defined benefit pension. The plan is a final salary plan, which provides benefits to members in the form of a guaranteed level of pension payable for life and a benefit on death or disablement in service before retirement. The level of benefits provided depends on members’ length of service and their salary in the final years leading up to retirement. The assets of the plan are independently administered by The Anglo Mauritius Assurance Society Ltd. The most recent actuarial valuation of the plan assets and the present value of the defined benefit obligations were carried out at December 31, 2014 by The Anglo Mauritius Assurance Society Ltd. The present value of the defined benefit obligations, and the related current service cost and past service cost, were measured using the Projected Unit Credit Method. The assets of the plan in respect of staff members are invested in Anglo Mauritius’ deposit administration fund. The latter is expected to produce a smooth progression of returns from one year to the next without regular fluctuations associated with asset-linked investments such as Equity Funds.

Notes to the Financial StatementsFor the year ended 31 December 2014
CHEMCO LIMITED38
8. RETIREMENT BENEFIT OBLIGATIONS (CONT’D)
(i) The amounts recognised in the statement of financial position are as follows:
2014 2013Rs Rs
Present value of funded obligations 13,016,584 10,288,175 Fair value of plan assets (10,345,035) (9,349,641)Liability in the statement of financial position 2,671,549 938,534
(ii) The reconciliation of the opening balances to the closing balances for the net defined benefit liability is as follows:
2014 2013Rs Rs
At 1 January- as restated 938,534 941,984 Charged to profit or loss (note 8(a)(v)) 557,107 882,695 Charged/(credited) to other comprehensive income (note 8(a)(vi)) 2,026,751 (461,145)Contributions paid (850,843) (425,000)At 31 December 2,671,549 938,534
(iii) The movement in the defined benefit obligation over the year is as follows:2014 2013Rs Rs
At 1 January 10,288,175 9,461,244 Current service cost 353,518 509,570 Interest cost 743,242 846,211 Past service cost - 160,410 Actuarial losses/(gains) 1,818,790 (689,260)Benefits paid (187,141) - At 31 December 13,016,584 10,288,175
(iv) The movement in the fair value of plan assets of the year is as follows:2014 2013Rs Rs
At 1 January 9,349,641 8,519,260 Expected return on plan assets 672,949 737,768 Actuarial losses (207,961) (228,115)Employer contributions 850,843 425,000 Scheme expenses (28,000) (11,488)Cost of insuring risk benefits (105,296) (92,784)Benefits paid (187,141) - At 31 December 10,345,035 9,349,641
(a) Defined pension benefits (Cont’d)
(v) The amounts recognised in profit or loss are as follows:
2014 2013Rs Rs
Current service cost 353,518 509,570 Interest cost 743,242 846,211 Expected return on plan assets (672,949) (737,768)Scheme expenses 28,000 11,488 Cost of insuring risks benefits 105,296 92,784 Past service cost - 160,410 Total included in employee benefit expense (note 24) 557,107 882,695

Notes to the Financial StatementsFor the year ended 31 December 2014
ANNUAL REPORT 2014 39
8. RETIREMENT BENEFIT OBLIGATIONS (CONT’D)
(a) Defined pension benefits (Cont’d)
The total included in employee benefit expense is included in operating expenses in the statement of profit or loss.
2014 2013Rs Rs
Actual return on plan assets 467,550 509,653
(vi) The amounts recognised in other comprehensive income are as follows:2014 2013Rs Rs
Remeasurement on the net defined benefit liability: Liability experience (losses)/gains (1,818,700) 1,047,662 Losses on pension scheme assets (208,051) (228,115)Actuarial losses arising from changes in financial assumptions - (358,402)Actuarial (losses)/gains recognised (2,026,751) 461,145
(vii) The principal actuarial assumptions used for the purposes of the actuarial valuations were:2014 2013
% %Discount rate 7.00 7.00 Future salary increases 5.00 5.00
(viii) Sensitivity analysis on defined benefit obligations at the end of the reporting period: Increase Decrease
Rs Rs
Discount rate (1% increase) - 1,018,707 Future salary growth (1% increase) 963,134 -
An increase/decrease of 1% in other principal actuarial assumptions would not have a material impact on defined benefit obligations at the end of the reporting period. The sensitivity above have been determined based on a method that extrapolates the impact on net defined benefit obligation as a result of reasonable changes in key assumptions occurring at the end of the reporting period. The present value of the defined benefit obligation has been calculated using the projected unit credit method. The sensitivity analysis may not be representative of the actual change in the defined benefit obligation as it is unlikely that the change in assumptions would occur in isolation of one another as some of the assumptions may be correlated. There was no change in the methods and assumptions used in preparing the sensitivity analysis from prior years. (ix) The defined benefit pension plan exposes the Company to actuarial risks, such as longevity risk, currency risk, interest rate risk and market (investment) risk.
(x) The funding requirements are based on the pension fund’s actuarial measurement framework set out in the funding policies of the plan. (xi) The Company expects to pay Rs766,841 in contributions to its post-employment benefit plans for the year ending December 31, 2015. (xii) The weighted average duration of the defined benefit obligations as at 31 December 2014 is 8 years.

Notes to the Financial StatementsFor the year ended 31 December 2014
CHEMCO LIMITED40
8. RETIREMENT BENEFIT OBLIGATIONS (CONT’D)
(ii) The amounts recognised in the statement of financial position are as follows:2014 2013Rs Rs
Liability in the statement of financial position 3,186,720 1,853,043
(iii) The reconciliation of the opening balances to the closing balances for the net defined benefit liability is as follows:
2014 2013Rs Rs
At 1 January- as restated 1,853,043 1,225,807 Charged to profit or loss (note 8(b)(v)) 227,731 624,225 Charged to other comprehensive income (note 8(b)(vi)) 1,105,946 3,011 At 31 December 3,186,720 1,853,043
(iv) The movement in the defined benefit obligation over the year is as follows:2014 2013Rs Rs
At 1 January 1,853,043 1,225,807 Current service cost 91,606 74,249 Interest cost 136,125 110,505 Past service cost - 439,471 Actuarial losses 1,105,946 3,011 At 31 December, 3,186,720 1,853,043
(v) The amounts recognised in profit or loss are as follows: 2014 2013Rs Rs
Current service cost 91,606 74,249 Past service cost - 439,471 Interest cost 136,125 110,505 Total included in employee benefit expense (note 24) 227,731 624,225
The total included in employee benefit expense is included in operating expenses in the statement of profit or loss.
(vi) The amounts recognised in other comprehensive income are as follows:2014 2013Rs Rs
Remeasurement on the net defined benefit liability: Liability experience losses (1,105,946) (11,274)Actuarial gains arising from changes in financial assumptions - 8,263 Actuarial losses recognised (1,105,946) (3,011)
(b) Other post-retirement benefits (i) Other post-retirement benefits comprise of retirement gratuity payable under the Employment Rights Act 2008.

Notes to the Financial StatementsFor the year ended 31 December 2014
ANNUAL REPORT 2014 41
8. RETIREMENT BENEFIT OBLIGATIONS (CONT’D)
(b) Other post-retirement benefits (Cont’d)
(vii) Sensitivity analysis on defined benefit obligations at the end of the reporting period: Increase Decrease
Rs Rs
Discount rate (1% increase) - 503,993 Future salary growth (1% increase) 647,222 -
An increase/decrease of 1% in other principal actuarial assumptions would not have a material impact on defined benefit obligations at the end of the reporting period.
9. INVENTORIES 2014 2013Rs Rs
Finished goods 73,372,781 63,859,237 Containers and tools 1,306,493 1,222,459 Goods in transit 2,664,733 3,672,506
77,344,007 68,754,202
(a) The cost of inventories recognised as expense and included in cost of sales amounted to Rs254,315,057 (2013: Rs241,613,002).
10. TRADE AND OTHER RECEIVABLES 2014 2013Rs Rs
Trade receivables 89,505,042 76,304,136 Less: provision for impairment (939,624) (220,868)
88,565,418 76,083,268 Receivables from related companies 19,007,564 4,173,390 Prepayments 7,202,637 2,040,311 Other receivables 3,512,734 311,075
118,288,353 82,608,044
The carrying amount of trade and other receivables approximate their fair value.
At 31 December 2014, trade receivables of Rs939,624 were impaired (2013: Rs220,868). The amount of provision was Rs939,624 as at 31 December 2014 (2013: Rs220,868). These relate to three customers for whom there is no recent history of default. The ageing analysis is as follows:
2014 2013Rs Rs
Over 6 months 939,624 220,868
At 31 December 2014, trade receivables of Rs8.3 million (2013: Rs5.9 million) were past due but not impaired. These relate to independent customers for whom there is no recent history of default. The ageing analysis of these trade receivables is as follows:
2014 2013Rs Rs
3 to 6 months 8,293,318 4,502,172 Over 6 months - 1,475,058
8,293,318 5,977,230
The carrying amount of trade and other receivables are denominated in the following currencies:2014 2013Rs Rs
Rupee 86,943,499 68,508,992 US Dollar 31,344,854 14,099,052
118,288,353 82,608,044

Notes to the Financial StatementsFor the year ended 31 December 2014
CHEMCO LIMITED42
10. TRADE AND OTHER RECEIVABLES (CONT’D)
Movements on the provision for impairment of trade receivables are as follows:2014 2013Rs Rs
(b) At 1 January 220,868 - Provision for receivable impairment 835,624 222,559 Receivables written off during the year as uncollectible (116,868) (1,691)At 31 December 939,624 220,868
The other classes within trade and other receivables do not contain impaired assets.
The maximum exposure to credit risk at the reporting date is the fair value of each class of receivable mentioned above. The Company does not hold any collateral as security.
11. SHARE CAPITAL 2014 2013Rs Rs
Authorised12,417,444 ordinary shares of Re1 each 12,417,444 12,417,444
Issued and fully paid6,208,722 ordinary shares of Re1 each 6,208,722 6,208,722
12. OTHER COMPREHENSIVE INCOMEActuarial gains/ Fair value
Notes (losses) reserveRs Rs
2014Items that may be reclassified subsequently to profit or loss:Increase in fair value of available-for-sale financial assets 7 - 2,032
Items that will not be reclassified to profit or loss:Remeasurement of defined benefit obligations 8 (3,132,697) - Deferred tax relating to components of other comprehensive income 13 469,905 -
Other comprehensive income for the year 2014 (2,662,792) 2,032
2013Items that may be reclassified subsequently to profit or loss:Decrease in fair value of available-for-sale financial assets 7 - (8,128)
Items that will not be reclassified to profit or loss:Remeasurement of defined benefit obligations 8 458,134 - Deferred tax relating to components of other comprehensive income 13 (68,720) -
Other comprehensive income for the year 2013 389,414 (8,128)
Actuarial (losses)/gainsThe actuarial (losses)/gains reserve represents the cumulative remeasurement of defined benefit obligation recognised.
Fair value reserveThe fair value reserve comprises of the cumulative net change in the fair value of available-for-sale financial assets that has been recognised in other comprehensive income until the investments are derecognised or impaired.

Notes to the Financial StatementsFor the year ended 31 December 2014
ANNUAL REPORT 2014 43
2014 2013Rs Rs
Deferred tax (assets)/liabilities (461,886) 9,423
The movement on the deferred tax account is as follows: 2014 2013Rs Rs
At 1 January - as restated 9,423 105,906 Credited to profit or loss (note 15) (1,404) (165,203)(Credited)/charged to other comprehensive income (469,905) 68,720 At 31 December (461,886) 9,423
The movement in deferred tax assets and liabilities during the year, without taking into consideration the offsetting of balances within the same fiscal authority on the same entity, is as follows:
Deferred tax Deferredliabilities tax assets
Accelerated Retirement tax benefit
depreciation obligations TotalRs Rs Rs
At 1 January 2013 431,076 (325,170) 105,906 Credited to statement of profit or loss (2,916) (162,287) (165,203)Charged to other comprehensive income - 68,720 68,720 At 31 December 2013 428,160 (418,737) 9,423 (Credited)/charged to statement of profit or loss (11,304) 9,900 (1,404)Credited to other comprehensive income - (469,905) (469,905)At 31 December 2014 Rs 416,856 (878,742) (461,886)
14. TRADE AND OTHER PAYABLES 2014 2013Rs Rs
Trade payables 86,048,257 46,018,895 Payable to related parties (note 28) 3,162,661 10,800,350 Other payables and accruals 6,435,297 5,247,830
95,646,215 62,067,075
The carrying amounts of trade and other payables approximate their fair value.
13. DEFERRED INCOME TAX Deferred income tax is calculated on all temporary differences under the liability method at 15% (2013: 15%). There is a legally enforceable right to offset current tax assets against current tax liabilities and deferred income tax assets and liabilities when the deferred income taxes relate to the same fiscal authority on the same entity. The following amounts are shown in the statement of financial position:
15. CURRENT TAX LIABILITIES2014 2013Rs Rs
(a) Current tax liabilitiesAt 1 January 806,799 972,155 Current tax on adjusted profit for the year at 15% (2013: 15%) 1,669,202 1,693,895 Tax paid during the year (799,768) (990,396)Payment under Advance Payment System (1,068,664) (887,094)(Over)/under provision in previous year (7,031) 18,239 At 31 December 600,538 806,799

Notes to the Financial StatementsFor the year ended 31 December 2014
CHEMCO LIMITED44
15. CURRENT TAX LIABILITIES (CONT’D)
(b) Income tax expense 2014 2013Rs Rs
Current tax on the adjusted profit for the year at 15% (2013: 15%) 1,669,202 1,693,895 Deferred tax (note 13) (1,404) (165,203)(Over)/under provision in respect of last year (7,031) 18,239 Tax charge 1,660,767 1,546,931
The tax on the Company’s profit before tax differs from the theoretical amount that would arise using the basic tax rate of the Company as follows: 2014 2013
Rs Rs
Profit before taxation 10,430,825 9,368,751
Tax calculated at 15% 1,564,624 1,405,313 Expenses not deductible for tax purposes 203,622 123,682 Income not subject to tax (100,448) (303)(Over)/Under provision in previous year (7,031) 18,239 Tax charge 1,660,767 1,546,931
16. DIVIDENDS PER SHARE 2014 2013Rs Rs
At 1 January 6,208,722 6,208,722 Proposed dividend per share Rs1.10 (2013: Rs1 per share) 6,829,594 6,208,722 Dividend paid (6,208,722) (6,208,722)At 31 December 6,829,594 6,208,722
17. REVENUE 2014 2013Rs Rs
Revenue from the sale of goods 324,326,860 305,103,170 Revenue from the rendering of services - 1,160,158
324,326,860 306,263,328
18. OTHER INCOME 2014 2013Rs Rs
Investment income 1,829 2,032 Profit on disposal of property, plant and equipment 248,913 - Management fees receivable 1,080,000 1,080,000 Sundry income 125,768 134,810
1,456,510 1,216,842
19. OTHER GAINS/(LOSSES) - NET 2014 2013Rs Rs
Net foreign exchange gains/(losses) (note 21) 955,142 (225,761)
20. FINANCE INCOME2014 2013Rs Rs
Interest expense- Bank overdraft (273,761) (662,693)- Current accounts (176,354) (321,336)Total interest expense (450,115) (984,029)Net foreign exchange gains (note 21) 1,892,766 1,680,007
1,442,651 695,978

Notes to the Financial StatementsFor the year ended 31 December 2014
ANNUAL REPORT 2014 45
21. NET FOREIGN EXCHANGE GAINS/(LOSSES)2014 2013Rs Rs
The exchange differences (charged)/credited to profit or loss are included as follows:
Cost of sales (50,029) 668,675 Other gains/(losses) - net (note 19) 955,142 (225,761)Finance income (note 20) 1,892,766 1,680,007
22. PROFIT BEFORE TAXATION2014 2013Rs Rs
Profit before taxation is arrived at after:Crediting:Profit on disposal of property, plant and equipment 248,913 - and charging:Depreciation on property, plant and equipment (note 5) 3,056,679 3,453,643 Employee benefit expense (note 24) 32,665,196 29,312,133
23. EXPENSES BY NATURE2014 2013Rs Rs
Depreciation on property, plant and equipment 3,056,679 3,453,643 Employee benefit expense (note 24) 32,665,196 29,312,133 Repairs and maintenance 4,979,267 4,437,546 Rent and rates 5,068,520 5,150,520 Management fees 4,780,000 4,863,597 Changes in inventories of finished goods (9,513,544) 4,107,030 Raw materials and consumables used 263,828,601 237,505,972 Other expenses 12,885,619 9,751,195 Total cost of sales and operating expenses 317,750,338 298,581,636
24. EMPLOYEE BENEFIT EXPENSE2014 2013Rs Rs
Wages and salaries 29,801,014 25,612,928 Social security costs 1,332,911 1,157,402 Pension costs - defined contribution plans 746,433 1,034,883 Pension costs - defined benefit plans (note 8(a)(v)) 557,107 882,695 Other post-retirement benefits (note 8(b)(v)) 227,731 624,225
32,665,196 29,312,133
25. EARNINGS PER SHARE2014 2013
Profit for the year Rs 8,770,058 7,821,820
Number of ordinary shares in issue 6,208,722 6,208,722
Earnings per share Rs 1.41 1.26

Notes to the Financial StatementsFor the year ended 31 December 2014
CHEMCO LIMITED46
26. NOTES TO THE STATEMENT OF CASH FLOWS2014 2013Rs Rs
(a) Cash generated from operationsProfit before taxation 10,430,825 9,368,751 Adjustments for:Depreciation of property, plant and equipment 3,056,679 3,453,643 Retirement benefit obligations (66,005) 1,081,920 Interest expense 450,115 984,029 Profit on disposal of property, plant and equipment (248,913) - Investment income (1,829) (2,032)Net foreign exchange losses/(gains) 386,548 (66,659)Changes in working capital:- inventories (8,589,805) 2,277,366 - trade and other receivables (35,921,278) 16,897,174 - trade and other payables 33,255,272 8,852,953 Cash generated from operations 2,751,609 42,847,145
(b) Cash and cash equivalents
Cash and cash equivalents and bank overdrafts include the following for the purpose of the statement of cash flows.
Cash and cash equivalents 2,851,921 10,429,353
27. CONTINGENT LIABILITIES At 31 December 2014, the Company had contingent liabilities in respect of bank and other guarantees and other matters arising in the ordinary course of business from which it is anticipated that no material liabilities would arise.
28. RELATED PARTY TRANSACTIONS Transactions Balances
(i) 2014Remuneration and benefits
Interest
paid
Purchase of goods andservices
Sales of goods and services
Management services and
fees paidManagement fees received
Amount owed by related
party
Amount owed to related
partyRs Rs Rs Rs Rs Rs Rs Rs
Fellow subsidiaries - 176,354 3,816,132 3,216,778 4,780,000 1,080,000 19,007,564 3,162,661 Directors and key management personnel 477,565 - - - - - - -
(ii) 2013
Fellow subsidiaries - 321,336 2,734,408 25,406,602 4,863,597 1,080,000 4,173,390 10,800,350 Directors and key management personnel 499,000 - - - - - - -
The sales to and purchases from related parties are made in the normal course of business. Outstanding trade balances at the year-end are unsecured, interest free (with the exception of loans) and settlement occurs in cash.
There has been no guarantees provided or received for any related party receivables or payables. For the year ended 31 December 2014, the Company has not recorded any impairment of receivables relating to amounts owed by related parties (2013: Rsnil). This assessment is undertaken each financial year through examining the financial position of the related party and the market in which the related party operates. Remuneration and benefits for directors and key management personnel relates to director fees.

Notes to the Financial StatementsFor the year ended 31 December 2014
ANNUAL REPORT 2014 47
31. CAPITAL COMMITMENTS2014 2013Rs Rs
Capital expenditure contracted for at the end of the reporting period but not yet incurred is as follows: Plant and machinery 7,000,000 -
32. THREE-YEAR SUMMARY OF PUBLISHED RESULTS AND ASSETS AND LIABILITIES2012
(a) Statement of profit or loss 2014 2013 RestatedRs Rs Rs
Continuing operationsRevenue 324,326,860 306,263,328 324,134,974
Profit before taxation 10,430,825 9,368,751 13,435,917 Income tax expense (1,660,767) (1,546,931) (2,256,758)Profit for the year from continuing operations 8,770,058 7,821,820 11,179,159
Profit attributable to:- Owners of the parent 8,770,058 7,821,820 11,179,159
29. SEGMENTAL INFORMATION Due to the type of products, the risks and rewards for the range of products cannot be separately identified. No separate reporting segment is therefore identifiable. 30. EVENTS AFTER THE REPORTING DATE There are no event after the end of the reporting period which the directors consider may materially affect the financial statements for the year ended 31 December 2014.

Notes to the Financial StatementsFor the year ended 31 December 2014
CHEMCO LIMITED48
(b) Statement of profit or loss and other comprehensive income2012
2014 2013 RestatedRs Rs Rs
Profit for the year from continuing operations 8,770,058 7,821,820 11,179,159 Other comprehensive income for the year (2,660,760) 381,286 (124,383)Total comprehensive income for the year 6,109,298 8,203,106 11,054,776
Total comprehensive income attributable to:- Owners of the parent 6,109,298 8,203,106 11,054,776
Dividend per share (Rs) 1.10 1.00 1.00 Earnings per share from continuing operations (Rs/share) 1.41 1.26 1.80
(c) Statement of financial position 2012
2014 2013 RestatedASSETS Rs Rs RsNon-current assets 9,503,866 9,865,824 11,147,542 Current assets 198,484,281 161,791,599 172,142,937 Total assets 207,988,147 171,657,423 183,290,479
EQUITY AND LIABILITIESCapital and reserves 99,053,531 99,773,827 97,779,442
LIABILITIESNon-current liabilities 5,858,269 2,801,000 2,273,697 Current liabilities 103,076,347 69,082,596 83,237,340 Total equity and liabilities 108,934,616 71,883,596 85,511,037
Total equity and liabilities 207,988,147 171,657,423 183,290,479
32. THREE-YEAR SUMMARY OF PUBLISHED RESULTS AND ASSETS AND LIABILITIES (CONT’D)

Chemco LimitedChaussée Tromelin, Fort George Port LouisMauritiusTel: (230) 216 3990 Fax: (230) 242 5321
Member of the Harel Mallac Group
CH
EM
CO
L
IM
IT
ED
A
NN
UA
L
RE
PO
RT
2
01
4