annual report - crater gold
TRANSCRIPT

ANNUAL REPORT
For the year ended 30 June 2018
Crater Gold Mining Limited (ASX: CGN) ABN 75 067 519 779

Contents Page
Corporate Directory 2
Directors' Report 3
Auditor's Independence Declaration 23
Consolidated Statement of Profit or Loss and Other Comprehensive Income 24
Consolidated Statement of Financial Position 25
Consolidated Statement of Changes in Equity 26
Consolidated Statement of Cash Flows 27
Notes to the Consolidated Financial Statements 28
Directors' Declaration 50
Independent Auditor's Report 51
ASX Additional Information 55

Corporate Directory
Crater Gold Mining Limited 2
Directors: S W S Chan (Non-executive Chairman) R D Parker (Managing Director) T M Fermanis (Deputy Chairman) L K K Lee (Non-executive Director) D T Y Sun (Non-executive Director) Company Secretary: A S Betti ABN: 75 067 519 779 Registered Office and Level 2, Principal place of business: 22 Mount Street, Perth WA 6000 Australia Telephone: +61 8 6188 8181 Email: [email protected] Postal Address: PO Box 7054 Cloisters Square PERTH WA 6850 Australia Share Registry: Link Market Services Limited 178 St Georges Terrace Perth WA 6000 Australia Telephone: 1300 554 474 Auditors: RSM Australia Partners Level 32 2 The Esplanade Perth WA 6000 Australia Telephone: +61 3 9261 9100 Bankers National Australia Bank Ltd 100 St Georges Terrace
PERTH WA 6000 ASX Listing: Crater Gold Mining Limited shares are quoted on the Australian Securities Exchange under
the code “CGN”. Website address: www.cratergold.com.au

Directors’ Report
Crater Gold Mining Limited 3
The Directors present their report, together with the financial statements, on the Group (referred to hereafter as the 'the Group') consisting of Crater Gold Mining Limited (referred to hereafter as the 'Company' or 'Parent Entity') and the entities it controlled at the end of, or during, the year ended 30 June 2018.
Directors
The following persons were Directors of Crater Gold Mining Limited during the whole of the financial year and up to the date of this report, unless otherwise stated:
S W S Chan (Non-executive Chairman) R D Parker (Managing Director) T M Fermanis (Deputy Chairman) L K K Lee (Non-executive Director) D T Y Sun (Non-executive Director) R Johnson (Technical Director, resigned 6 December 2017)
Principal Activities
The principal activities of the Group consist of the exploration, evaluation and exploitation of potential world-class gold and other base metal projects at the Group’s mining tenements predominately situated in Goroka, Papua New Guinea and Queensland, Australia.
Dividends
No dividends of the Company or any entity of the Group have been paid, declared or recommended since the end of the preceding year. The Directors do not recommend the payment of any dividend for the year ended 30 June 2018.
Review of Operations and Results
The Group incurred a loss of $5,739,906 for the year ended 30 June 2018 (2017: loss of $25,284,741).
Operations Report
Company Focus – High Grade Zone project at Crater Mountain, Papua New Guinea
The year ended 30 June 2018 was one of continued progress working towards gold mining at the High Grade Zone (HGZ), Crater Mountain. The Company carried out a number of technical reviews of the HGZ Gold Mine, including reviews by Mr. Robert Usher, mining engineer and former Executive General Manager of PanAust Asia along with a high-level geological review by experienced geologist Mr. Dorian L. (Dusty) Nicol.
Mining Associates Limited (MA) were retained to assist in the preparation of various mine plan parameters, in particular in identifying stoping blocks with gold grades in excess of 10g/t between the 1930 level up to the 1960 level. MA also assisted with confirmation of the Company’s intended mining method to efficiently extract the targeted gold-bearing ore.
Minmet Services Pty Ltd (Minmet) were engaged to carry out a review of the processing plant and to recommend upgrades for implementation before the recommencement of operations to improve gold recovery. Minmet’s scope of work also included metallurgical test work and analysis to confirm operating plans with early batch plant run representative ore data being collected to ensure laboratory test works were aligned with actual plant operating conditions.
The primary focus for management during the year was on developing plans from the results of the aforementioned studies in readiness for the restart of gold mining and exploration activities at Crater Mountain.
While working towards the resumption of mining, a thorough repair and maintenance program of the site and all equipment was carried out and a comprehensive preventative maintenance schedule produced.
As previously reported, in line with the Company’s strategy to restart exploration, an Atlas Copco Diamec 252 drill rig was purchased along with additional ancillary equipment. The rig is a very compact drill rig, estimated to be able to drill diamond core holes of up to approximately 300m in length.
Personnel appointments were made to strengthen the on-site management team including the appointment of Brett Collins as General Manager, PNG. Mr. Collins’ background is primarily in ore processing, security and safety. He brings a wealth of experience and will contribute to further improving the processing plant functionality and the overall recovery of gold. Amongst these appointments was a specialist Community Relations Officer which has led to improved relationships with the community at large. The Company has also made significant progress on development of the Memorandum Of Agreement between the Company, the community and the local and national government. We expect to finalise this agreement in the coming months.
A high-level 12 months mining plan for a longhole stope mining scenario was also completed and presented to the MRA, and approved, as part of the process of working towards the re-commencement of mining operations.
Directors’ Report
Crater Gold Mining Limited 4
In March 2018, the Company received approval from the MRA for a conditional restart of mining operations at the HGZ.
The near-term objective is to establish the Company as a profitable gold producer. We anticipate that the HGZ mine will generate sufficient cash flow to fund further expansion of the HGZ mine and importantly, to fund the resumption of exploration activities at Crater Mountain. If sufficient cash flow from the HGZ mine is generated it can potentially eliminate the need for further external capital to fund exploration activities in the future.
The HGZ is a high-grade, high-sulphidation, epithermal quartz-pyrite-gold mineralised zone, extending from surface to possibly several hundred metres depth (possibly in excess of 500m); local artisanal miners produced an estimated 15,000 ounces of gold from a small area of shallow workings (maximum 50m depth as encountered by the Company) in the base of a mineralised spur in the period from 2005 to 2011.
While the immediate focus remains on generating positive cash flows from the HGZ mine, our goal is also to increase the current JORC compliant resource of 24Mt at 1.0 g/t Au for 790,000 ounces at the nearby Mixing Zone project at Crater Mountain through further exploration work (refer ASX Release of 24 November 2011: “Crater Mt – Initial Resource Estimate”). This information was prepared and first disclosed under the JORC Code 2004. It has not been updated since to comply with the JORC Code 2012 on the basis that the information has not materially changed since it was last reported. The Company is not aware of any new information or data that materially affects the information contained in that ASX release. All material assumptions and technical parameters underpinning that resource estimate continue to apply and have not materially changed.
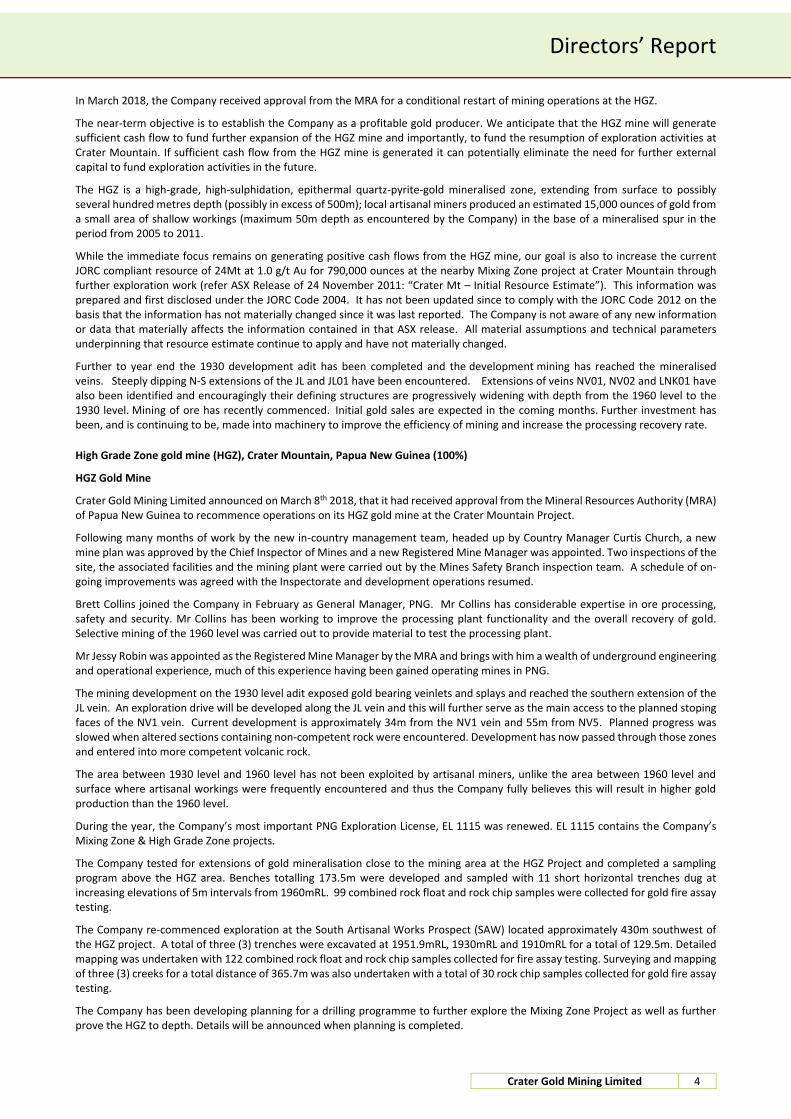
Further to year end the 1930 development adit has been completed and the development mining has reached the mineralised veins. Steeply dipping N-S extensions of the JL and JL01 have been encountered. Extensions of veins NV01, NV02 and LNK01 have also been identified and encouragingly their defining structures are progressively widening with depth from the 1960 level to the 1930 level. Mining of ore has recently commenced. Initial gold sales are expected in the coming months. Further investment has been, and is continuing to be, made into machinery to improve the efficiency of mining and increase the processing recovery rate.
High Grade Zone gold mine (HGZ), Crater Mountain, Papua New Guinea (100%)
HGZ Gold Mine
Crater Gold Mining Limited announced on March 8th 2018, that it had received approval from the Mineral Resources Authority (MRA) of Papua New Guinea to recommence operations on its HGZ gold mine at the Crater Mountain Project.
Following many months of work by the new in-country management team, headed up by Country Manager Curtis Church, a new mine plan was approved by the Chief Inspector of Mines and a new Registered Mine Manager was appointed. Two inspections of the site, the associated facilities and the mining plant were carried out by the Mines Safety Branch inspection team. A schedule of on-going improvements was agreed with the Inspectorate and development operations resumed.
Brett Collins joined the Company in February as General Manager, PNG. Mr Collins has considerable expertise in ore processing, safety and security. Mr Collins has been working to improve the processing plant functionality and the overall recovery of gold. Selective mining of the 1960 level was carried out to provide material to test the processing plant.
Mr Jessy Robin was appointed as the Registered Mine Manager by the MRA and brings with him a wealth of underground engineering and operational experience, much of this experience having been gained operating mines in PNG.
The mining development on the 1930 level adit exposed gold bearing veinlets and splays and reached the southern extension of the JL vein. An exploration drive will be developed along the JL vein and this will further serve as the main access to the planned stoping faces of the NV1 vein. Current development is approximately 34m from the NV1 vein and 55m from NV5. Planned progress was slowed when altered sections containing non-competent rock were encountered. Development has now passed through those zones and entered into more competent volcanic rock.
The area between 1930 level and 1960 level has not been exploited by artisanal miners, unlike the area between 1960 level and surface where artisanal workings were frequently encountered and thus the Company fully believes this will result in higher gold production than the 1960 level.
During the year, the Company’s most important PNG Exploration License, EL 1115 was renewed. EL 1115 contains the Company’s Mixing Zone & High Grade Zone projects.
The Company tested for extensions of gold mineralisation close to the mining area at the HGZ Project and completed a sampling program above the HGZ area. Benches totalling 173.5m were developed and sampled with 11 short horizontal trenches dug at increasing elevations of 5m intervals from 1960mRL. 99 combined rock float and rock chip samples were collected for gold fire assay testing.
The Company re-commenced exploration at the South Artisanal Works Prospect (SAW) located approximately 430m southwest of the HGZ project. A total of three (3) trenches were excavated at 1951.9mRL, 1930mRL and 1910mRL for a total of 129.5m. Detailed mapping was undertaken with 122 combined rock float and rock chip samples collected for fire assay testing. Surveying and mapping of three (3) creeks for a total distance of 365.7m was also undertaken with a total of 30 rock chip samples collected for gold fire assay testing.
The Company has been developing planning for a drilling programme to further explore the Mixing Zone Project as well as further prove the HGZ to depth. Details will be announced when planning is completed.
Directors’ Report
Crater Gold Mining Limited 5
Figure 1- 1930 Adit level development CROYDON PROJECTS: QLD, AUSTRALIA
High priority polymetallic, silver and copper targets identified for drill testing
Based on the encouraging results, the Company has applied for EPMA 26749, which will cover possible extensions outside of the current EPM 13775 tenement area.
A2 Polymetallic Project SGH Soil Sampling Program
The Company completed a grid based SGH soil sampling program at the A2 Polymetallic project. The program involved the collection
of B-Horizon soil samples from 361 sites together with 16 selected duplicates for a total of 377 samples.
The SGH sampling technique is a cost effective, deep penetrating geochemical technique, which has been successful at other
prospects worldwide in being able to detect geochemical anomalism for metals from depths of up to 900 metres.
The grid-based sampling program covered the previously drilled mineralised holes at the A2 Polymetallic project site (a zone 1,250m
long by 600m wide) and the entire aeromagnetic anomaly, most of which was untested. It was anticipated that the SGH technique
would collaborate the previously intersected mineralisation identified by the drilling, and further identify extensions of the known
mineralisation
Priority targets identified will be tested by drilling later this year.
The SGH analysis and interpretation has led to the identification of the following high priority targets;
Polymetallic Anomalies
Three (3) identified polymetallic anomalies (P1, P2 and P3 – Figure 2) associated with Redox-cell are high priority drill targets to which Actlabs has allocated a high confidence rating of 5.5. Actlabs use a maximum rating score of 6.0, with a rating in excess of 4.0 considered to be significant.
Anomaly P1: This anomaly provides important credibility for the SGH technique in that it has detected the broad polymetallic stock-work vein mineralisation previously intersected in drilling by the Company. Eight of the previous nine drill holes tested the 500m western half of this anomaly, with only one hole drilled in the 500m eastern half. Further drill testing in the eastern half is warranted.
Anomaly P2: This much larger polymetallic anomaly is located along the margin of the R1 Redox-cell to the north of the A2 project drilled area and persists for at least 500m N-S and 2,800m E-W. High priority targets have been identified for drill testing.
Anomaly P3: This small anomaly is located along the southern boundary of the R1 Redox-cell, just inside the southern tenement boundary. A high priority target has been identified for drill testing.

Directors’ Report
Crater Gold Mining Limited 6
Figure 2- Polymetallic targets P1, P2, P3
Copper and Silver Anomalies
These large high priority anomalies are located in the NW corner of the EPM (Figures 3 & 4). While they have actually been identified as separate silver (500m wide E-W and 1,600m N-S) and copper (250m wide E-W and 1,800m N-S) anomalies, they may also indicate the presence of combined copper-silver anomalism. Actlabs interpret that mineralisation is likely to be located vertically beneath the anomalies and these offer high priority drill targets. Actlabs has allocated a high confidence rating of 5.0 out of a maximum 6.0 for these anomalies.
Figure 3- Silver target area

Directors’ Report
Crater Gold Mining Limited 7
Figure 4- Copper target area
Actlab’s interpretation of Redox-cells is that the centre of the cell halo is expected to be the original location of the upwelling of mineralising fluids from depth and that the outer segments along the rims of the cells may represent the lateral extent of mineralisation. Their interpretation of the A2 SGH soil sample results has identified a number of nested-segmented Redox-cells in the survey area.
New License Extension Applied for
Based on the encouraging results, the Company applied for EPMA 26749, which will cover possible extensions outside of the current tenement area. The extension area is shown in Figure 5 below.
Figure 5- EPMA 26749

Directors’ Report
Crater Gold Mining Limited 8
A5 Anomaly Prospect, QLD
Encouraging co-incident gold and silver-copper-polymetallic anomalism obtained from SGH soil sampling at the A5 Anomaly Prospect.
The A5 Anomaly Prospect area has similar aeromagnetic features to the A2 Project area located 16 km to the SE.
The Company announced that it received Actlab’s interpretation report on the analytical results of a trial Spatiotemporal Geochemical Hydrocarbon (SGH) soil sampling program undertaken in the A5 Anomaly Prospect area at Croydon in North Queensland within EPM 16002.
The A5 Anomaly Prospect area bears broad similarities to the A2 Polymetallic Project. A total of 74 B-horizon soil samples were collected at the end of 2017 at 100m spacings along three, 2.4km long, 100m spaced, N-S lines (Figure 6). Samples were placed in storage with the intention of submitting them for SGH analysis if the results of the A2 Anomaly Project sampling program provided encouragement. Upon confirmation of positive results from the testing of samples submitted from the A2 Polymetallic Project, the samples for the A5 prospect were submitted for assay in early 2018.
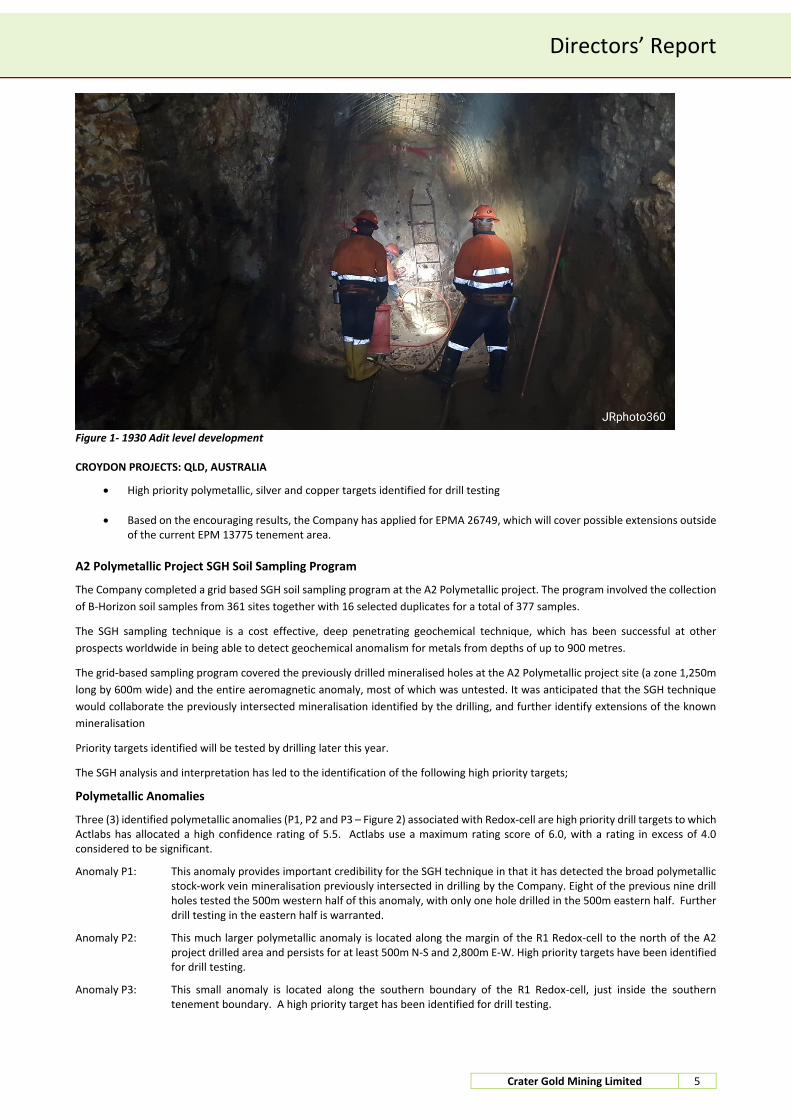
The SGH testing of samples from the A5 prospect detected anomalies associated with gold, silver, copper and polymetallic mineralisation (Figures 7). The copper, silver and polymetallic anomalism is essentially co-incident (Figure 7). Gold anomalism partly overlaps the co-incident anomalism as shown on Figure 7. All of the anomalism defined by the soil sampling undertaken to date closely overlies the central zone of the aeromagnetic anomaly low as shown on Figure 7.
Although the trial SGH soil sampling program for the A5 prospect only covered a narrow area 2,400m long by 200m wide, Actlabs were able to identify the presence of a Redox Cell defined by a “rabbit ear” feature they consider to be part of a halo anomaly that would become more evident if the survey area was wider (identified circular Redox Cell shown on Figure 7).
Figure 6- Soil sampling grid – A5 anomaly prospect, EPM 16002
Directors’ Report
Crater Gold Mining Limited 9
Figure 7- Co-incident Cu-Ag-Polymetallic SGH soil anomaly and partly overlaping Au anomaly draped over an aeromagnetic base
Although acknowledging that expansion of the sampled area needs to be undertaken to formerly confirm this, Actlabs allocated their interpretation of the SGH test results for A5 a high confidence rating of 4.0 out of a possible maximum 6.0 for the silver-copper-polymetallic anomalies indicated. Actlabs gave a higher confidence rating of 4.5 out a maximum 6.0 for the gold anomaly indicated. Anomalism associated with gold, silver, copper and polymetallic has been identified by Actlabs around the margin of the Redox Cell.
Based on the encouraging trial results, extension of the area sampled will be undertaken to define extensions and any further anomalous zones to prioritise targets for drill testing.
Golden Gate Graphite Project
Thick Intervals of Graphite Mineralisation Intersected o GGDDH 1701: 62.7m @ 6.79% GC* from 29.3m (cut-off 3.4% GC*)
o GGDDH 1702: 53.9m @ 6.79%GC* from 69.1m (cut-off 3.1% GC*)
GC* = Graphitic Carbon
The Company announced that it intersected thick graphite mineralisation in two diamond core holes (GGDDH 1701 and GGDDH 1702) drilled in the Golden Gate Project area at Croydon. Hole GGDDH 1701 confirmed the intersection (in terms of both intersected interval and grade) reported from near-by historical holes GGRC 2005 and GGDH2 (25m to the NE) drilled by previous exploration Company Central Coast Exploration (CCE). Hole GGDDH 1702 confirms the down-dip extrapolated extension of GGRC 2003 (95m to the SW) drilled by CCE.
The thick graphite mineralisation intersected in both of the holes is of similar grade and is hosted in intensely hydrothermally altered (sericitic) granite. Graphite occurs in narrow veins, “clots” and commonly forms rims around xenolithic fragments. While some previous interpretations have considered the graphite to have formed from the assimilation of carbonaceous sediments within the granite during its emplacement, little evidence for this was noted in the core and a hydrothermal origin is favoured. No graphite mineralisation was observed within the Croydon Volcanics (overlying the granite) as historically reported from some previous exploration Company activities.
Samples were selected for petrological and mineralogical examination, QEMSCANS (Quantitative Evaluation of Minerals via Scanning Electron Microscope by SGS) and MLA (Mineral Liberation Analysis scans by ALS Laboratory Services), designed to determine if deleterious minerals are associated with the graphite and to determine the graphite grain size characteristics. Based on the results of these procedures, a composite sample was selected for detailed metallurgical test work to determine graphite quality and potential recoveries.

Directors’ Report
Crater Gold Mining Limited 10
Previous Graphite Evaluation Work
Metallurgical test work by previous explorers at Golden Gate has not been conclusive. Test work that was previously undertaken by the Company on drill core and surface grab chip samples provided contrary results that indicated that some of the graphite samples may have been of amorphous quality. However, mineralogical examination of the drill core test samples suggested that the material may well have been flake graphite that had been pulverised by the action of the RC drilling bit used. Also, the surface grab chip samples were oxidised and not ideal for metallurgical testing.
Figure 8- Graphite mineralisation from approximately 29.3m from the 1st drill hole
JUMBO AND LARGE FLAKE GRAPHITE IDENTIFIED
Petrological examination of graphite mineralisation from the Golden Gate Project identified jumbo graphite flake (0.30-0.50 mm), large graphite flake (0.18-0.30 mm) and fine graphite flake (<0.18 mm).
Average size of graphite flakes is large at around 0.25 mm.
The Company announced that it received the final report for the petrological examination undertaken on eight (8) polished sections of graphite mineralised core samples from the Golden Gate Graphite Project undertaken by Pterosaur Petrology, Townsville, Queensland. These core samples were from the two diamond core holes drilled by the Company late last year.
This work identified the presence of significant graphite flake sizes of 0.05 to 0.50mm, with an average of around 0.25mm. Most of the large graphite flakes (0.18 to 0.30mm) and jumbo graphite flakes (0.30 to 0.50mm) appear to be largely independent from other mineral grains, which may render them relatively easy to liberate during processing (see polished section photographs). It should be noted, however, that the relative percentages of the flake sizes present cannot be determined at this stage as the petrological work has been undertaken on small samples which have been selected to investigate specific textural features and minerals present and as such are unlikely to be representative of the graphite mineralisation overall. More detailed investigation will be undertaken by the metallurgical scoping test work that is currently in progress on a representative composited sample.

Directors’ Report
Crater Gold Mining Limited 11
Figure 9 -Polished Section 2- Reflected light [25x Mag. F.O.V. 4.8 mm] - Coarse graphite flake - (Brown in colour) Corporate
Cancelled Rights Issues
On 24th July 2017, the Company announced an 11:2 renounceable rights issue (rights issue) to raise approximately $15million as part of a broader corporate transformation that would see the Company recapitalised, cleared of debt and funded for an active programme to develop its operations in PNG. The transformation also included a significant re-structure of the Company’s management and a proposed renaming to Paradise Gold Mining Ltd.
The rights issue, which was partially and conditionally underwritten by Patersons Securities Limited (Patersons) launched on 26th July 2017 and was twice extended. At the close of the issue there had been insufficient take-up of rights by existing shareholders to trigger Patersons’ underwriting obligations and, as a result, the rights issue was terminated. The Company at that time also advised that some of the proposed new management would not eventuate and the Company name would also not change. All application funds received were refunded to applicants.
Subsequent to the terminated rights issue the Company announced that a fresh rights Issue (the ‘fresh rights issue’) would be launched. Since that announcement it has been determined that it is not possible to launch the Fresh Rights issue in the time frame expected given the structure that was proposed.
Loan Facilities
In order to meet the Company’s creditor obligations whilst a longer-term financing solution was put in place, Freefire agreed to advance an unsecured, arms-length-terms loan to the Company in the amount of $A2.0 million (the ‘Freefire Interim Loan’).
The Company later arranged a $A4.0 million unsecured loan facility, enabling it to continue to advance its flagship Crater Mountain gold project and it’s Queensland Polymetallic and Graphite projects. This was made by way of an unsecured loan facility from the Company’s major shareholder, Freefire Technology Ltd (“Freefire”). The first $A1 million in funding is available at the option of the Company, with the balance of $A3 million requiring the consent of Freefire prior to a draw down request being executed.
Convertible Notes Redemption
During the year the Company’s 138,190 listed convertible notes, trading under the ASX code CGNG expired and were fully redeemed to note holders.
Share Issue
On 29 December 2017, the Company issued 3,500,000 shares at a deemed issued price of $0.01 to two Directors in lieu of Directors fees as per shareholders’ approval obtained at the Company’s AGM on 29 November 2017.
Directors’ Report
Crater Gold Mining Limited 12
Performance Rights Issue
On 29 December 2017, the Company issued 19,033,080 performance rights to Directors and a consultant as per shareholders’ approval obtained at the Company’s AGM on 29 November 2017. At this time, the Company also issued 12,111,960 performance rights to employees and consultants under the Company’s employee equity incentive plan. The terms and conditions for the Performance Rights are detailed in Appendix 3B lodged with ASX on 29 December 2017.
On 16 April 2018, the Company issued 6,055,980 performance rights to an employee under the Company’s employee equity incentive plan. The terms and conditions for the Performance Rights are detailed in Appendix 3B lodged with ASX on 16 April 2018.
Purchase of Drill Rig for Crater Mountain Gold project:
In line with its strategy to restart drilling at its flagship Crater Mountain Gold Project, the Company entered into an agreement to acquire a drill rig to facilitate recommencement of drilling in the near term.
The Company purchased an Atlas Copco Diamec 252 drill rig (“Diamec 252 Drill Rig”) together with additional ancillary equipment, including: (a) a 415 volt 45 kilowatt electric over hydraulic power pack; (b) a 1,000 volt 45 kilowatt electric over hydraulic power pack; (c) an air over 22 kilowatt hydraulic power pack; (d) Bob Cat mounting accessories; (e) and feed frames and positioners, skid mounted and (f) hydraulic motors and pumps.
Company Secretary Resignation/Appointment and Resignation of Director Richard Johnson
The Company announced that Ms Andrea Betti joined Crater Gold Mining Ltd as Company Secretary, effective Monday 9th October 2017. Ms Betti is an accounting and corporate governance professional with over 20 years’ experience in accounting, corporate governance, finance and corporate banking. She has a Bachelor of Commerce, Graduate Diploma in Corporate Governance, Graduate Diploma in Applied Finance and Investment and a Masters of Business Administration. Ms Betti has acted as Chief Financial Officer and Company Secretary for companies in the private and public sector, as well as senior executive roles in the banking and finance industry. Mr Heath Roberts has resigned as Company Secretary, effective 9th October 2017, and the Company thanks him for his many years of service and dedication.
Mr Richard Johnson resigned as a Director of the Company on the 6th of December 2017.
Change of Address:
On 9 October 2017, the Company changed its Registered Office address and Principal Place of Business address to:
Level 3 216 St Georges Terrace PERTH WA 6000
Its postal address was changed to:
P.O. Box 7054 CLOISTERS SQUARE PERTH WA 6850
Subsequent to year end, on 15 August 2018, the Company advised it had further changed its Registered Office address and Principal Place of Business address to:
Level 2 22 Mount Street PERTH WA 6000
Its postal address remained the same.
Matters Subsequent to the End of the Financial Year
On 2 August 2018, the Company announced it had arranged a New Loan Facility for $1.5M, with an interest rate of 8% p.a. with the funding to be provided by way of an unsecured loan facility from Company’s major shareholder, Freefire Technology Ltd.
On 31 August 2018, the Company announced a proposal for the conversion of $12.0 million of debt due to Freefire Technology Limited (“Freefire”) (a Company associated with the CGN’s Chairman, Mr Sam Chan) into 12.0 million non – voting redeemable convertible preference shares issued at $1.00 each. The shares will not be listed.
No other matter or circumstance has arisen since 30 June 2018 that has significantly affected, or may significantly affect the Group's operations, the results of those operations, or the Group's state of affairs in future financial years.
Likely Developments, Expected Results of Operations and Future Strategy
The Group intends to continue its exploration, development and production activities on its existing projects with the Group’s strategy is to become a profitable gold producer at the HGZ mine, whilst at the same time restarting further exploration drilling work in both the HGZ and the Mixing Zone. Gold production at the HGZ mine is anticipated to generate a positive cash flow for the Company, enabling it to potentially reduce or eliminate the need for further external funding in the future, and to enable it to further develop the flagship Crater Mountain project and its other prospects in Queensland, Australia.

Directors’ Report
Crater Gold Mining Limited 13
Environmental Regulation and Performance
The Group is subject to environmental regulation in relation to its former mining activities in North Queensland by the Environmental Protection Agency of Queensland. The Company complies with the Mineral Resources Act (1989) and Environmental Protection Act (1994). It is also subject to the Environmental Act (2000) (Papua New Guinea) on its activities in PNG.
Schedule of Tenements
Set out below is the schedule of tenements that the Company and its subsidiaries hold as at 30 June 2018.
Schedule of Crater Gold Mining Limited tenements:
Particulars Project Name Registered Holder % Owned Status Expiry Area (Km2)
EPM 8795 Croydon CGN 100 Renewal Lodged 6/09/2018 9.6
EPM 13775 Wallabadah CGN 100 Granted 5/03/2020 16
EPM 16002 Foote Creek CGN 100 Granted
30/01/2021 28.8
EPM 18616 Black Mountain CGN 100 Granted 18/06/2013 57.6
EL 1115 Crater Mountain Anomaly Ltd 1 100 Renewal Lodged 25/09/2018 41
EL 2203 Ubaigubi Anomaly Ltd 1 100 Renewal lodged 10/09/2017 88
EL 2249 Crater Mountain Anomaly Ltd 1 100 Renewal lodged 10/11/2017 10
EL 2318 South Crater Anomaly Ltd 1 100 Renewal lodged 10/09/2017 20
EL 2334 Crater Mountain Anomaly Ltd 1 100 Renewal lodged 21/05/2017 68
EL 2335 Crater Mountain Anomaly Ltd 1 100 Renewal lodged 22/05/2017 78
ML 510 Crater Mountain Anomaly Ltd 1 100 Granted 4/11/2019 1.58
1 Anomaly Limited is CGN’s 100% owned PNG subsidiary COMPETENT PERSONS STATEMENTS
The information contained in this report relating to exploration activities at the Crater Mountain Gold Project is based on and fairly represents information and supporting documentation prepared by appropriately qualified Company personnel and reviewed by Ken Chapple, who is an Associate Member of The Australasian Institute of Mining and Metallurgy and a Fellow of the Australian Institute of Geoscientists. Mr Chapple has sufficient experience relevant to the style of mineralisation and type of deposit involved to qualify as a Competent Person as defined in the 2012 JORC Code. Mr Chapple is an independent principal geological consultant with KCICD Pty Ltd and consents to the inclusion in the report of matters based on his information in the form and context in which it appears.
The information contained in this report that relates to Exploration Results at the Golden Gate Graphite and the A2 Polymetallic Projects near Croydon, Queensland, is based on information compiled by Ken Chapple, or prepared by appropriately qualified external technical experts and reviewed by him. Mr Chapple is an Associate Member of The Australasian Institute of Mining and Metallurgy and a Fellow of the Australian Institute of Geoscientists. Mr Chapple has been assisting the Company as a technical consultant relating to his areas of expertise. Mr Chapple has sufficient experience relevant to the style of mineralisation and type of deposit involved to qualify as a Competent Person as defined in the 2012 JORC Code. Mr Chapple is an independent principal geological consultant with KCICD Pty Ltd and consents to the inclusion in the report of matters based on his information in the form and context in which it appears.
Forward Looking Statements
This Announcement may contain forward looking statements. The words 'anticipate', 'believe', 'expect', 'project', 'forecast', 'estimate', 'likely', 'intend', 'should', 'could', 'may', 'target', 'plan‘ and other similar expressions are intended to identify forward- looking statements. Forward-looking statements are subject to risk factors associated with the Company’s business, many of which are beyond the control of the Company. It is believed that the expectations reflected in these statements are reasonable at the time made but they may be affected by a variety of variables and changes in underlying assumptions which could cause actual results or trends to differ materially from those expressed or implied in such statements. You should therefore not place undue reliance on forward-looking statements.

Directors’ Report
Crater Gold Mining Limited 14
Presentation of technical data and Competent Persons review
Resource estimates contained in this report were previously announced in the Company’s ASX news releases of:
• 21 December 2011 Initial Resource Estimate (This information was prepared and first disclosed under the JORC Code 2004. It has not been updated since to comply with the JORC Code 2012). The Company confirms that it is not aware of any new information or data that materially affects the information included in that announcement, and that all material assumptions and technical parameters underpinning the estimates continue to apply and have not materially changed.
• 14 November 2016 titled ‘Maiden JORC Gold Resource at HGZ Project, Crater Mountain, PNG’.
Such resource estimates are subject to the relevant assumptions, qualifications and procedures described in the relevant ASX news releases.
To date, the Company has only announced estimates of Inferred Mineral Resources. Nothing in this report or prior announcements by the Company constitutes presentation of Mineral Reserves. As such, economic analysis cannot be applied based on the date contained.
The Company has an ’exploration target’ of ‘multi-million ounces’ for the epithermal gold resources at the Nevera Prospect at Crater Mountain Project. A targeting exercise was carried out by Mining Associates (“MA”) for the Nevera prospect using a simple 10x10x10m block model informed by 5 m bench channel samples (not including rock chips) and a Nearest Neighbour (“NN”) estimation technique with a limited search range. The NN method was chosen so that no averaging of the grades occurred although there is a risk that estimates can be over selective. As the initial target is highly selective narrow underground mining, this is an acceptable approach. An initial examination of the composited data shows two natural breaks in Au grade distribution. One at about 0.4 g/t Au and a second at about 10 g/t Au. MA suggests that these represent low grade and high mineralisation events respectively. The block model was informed using a 100m spherical search so that no assumption was made of the direction and trend of mineralisation. Informing samples consisted of 2,766 5 m downhole composites and 1,479 5 m bench samples. No domain selection was used, but no blocks above the topography were estimated. Volume covered is about 700 m long, 700 m wide and 100 m to 350 m deep (variable with topography). This is certainly suitable for both selective mining and a bulk open pit. A bulk density of 2.5 t/m3 was used for reporting, the grade tonnage plot using cut-off grades from 1 to 20 g/t Au was reported. The target for Nevera prospect bulk open pit mining using a cut-off grade 1 g/t Au is 24 Mt @ 2.7 g/t Au for 2Moz of contained Au. The target for the HGZ only for selective underground mining using a cut-off grade 10g/t is 60-100koz @ 13-30 g/t. The exploration targets are conceptual in nature as there has been insufficient exploration to define them as Mineral Resources. It is uncertain if further exploration will result in the determination of a Mineral Resource under the JORC Code 2012. The exploration targets are not being reported as part of any Mineral Resource.
No New Information or Data
This report contains references to exploration results and Mineral Resource estimates, all of which have been cross-referenced to previous announcements made by the Company. The Company confirms that it is not aware of any new information or data that materially affects the information included in the relevant announcements and in the case of estimates of Mineral Resources, that all material assumptions and technical parameters underpinning the estimates in the relevant market announcement continue to apply and have not materially changed.

Directors’ Report
Crater Gold Mining Limited 15
Information on Directors and Secretary
The Directors and Secretary of the Company in office at the date of this report, unless otherwise stated, and their qualifications, experience and special responsibilities are as follows:
S W S Chan BA (Non-Executive Chairman), age 69
Mr Chan has been a Director of the Company since 29 January 2013 and was appointed as Non-Executive Chairman on 11 March 2013.
Mr Chan is a director and the controller of Freefire Technology Limited (“Freefire”), the major shareholder in the Company.
Mr Chan received a Bachelor’s degree from the University of Manchester, UK in 1970 and qualified as a chartered accountant in 1973. He was the Company secretary of Yangtzekiang Garment Limited from 1974 to 1988 and has been a Director of Yangtzekiang Garment Limited since 1977. Mr Chan was appointed the Managing Director of YGM Trading Limited from 1987 to 2006 and the Chief Executive Officer of YGM Trading Limited from 2006 to 2010. He has been the Vice Chairman of the board of YGM Trading Limited since 2010. Mr Chan is also on the board of Yangtzekiang Garment Limited.
Mr Chan was formerly a Director of Hang Ten Group Holdings Limited (listed in Hong Kong) from January 2003 to March 2012.
As at the date of this report, Mr Chan has a beneficial interest of 160,649,929 ordinary shares in the Company and 2,300,000 options over ordinary shares in the Company.
R D Parker B Eng (Managing Director), age 47
Mr Parker has been a Director of the Company since 12 March 2013 and was appointed Managing Director on 1 April 2015.
Mr Parker lives in Hong Kong. He is a qualified Marine Engineer and Marine Industries Manager having graduated from Southampton Institute of Higher Education, Marine Division, in Warsash, United Kingdom. Mr Parker is a professional Company Director.
As at the date of this report, Mr Parker has an interest in 96,036 ordinary shares, 2,300,000 options and 6,055,980 Performance Rights in the Company.
T M Fermanis F Fin, MSAA (Deputy Chairman), age 54
Mr Fermanis has been a Director of the Company since 2 November 2009 and was appointed Deputy Chairman on 1 April 2015.
Mr Fermanis has extensive experience in stockbroking and has been an advisor since 1985 with extensive experience in the resource sector. He has been involved in gold exploration in PNG for a number of years.
Mr Fermanis is a member of the Remuneration and Nomination Committee.
As at the date of this report, Mr Fermanis has an interest in 602,311 ordinary shares, 2,300,000 options and 6,055,980 Performance Rights in the Company.
L K K Lee MCom, MAppFin, CPA (Non-executive Director), age 57
Mr Lee has been a Director of the Company since 6 June 2014 and was appointed Finance Director on 1 April 2015. Mr Lee transitioned to Non-executive Director during the year.
Mr Lee received a Bachelor of Commerce degree and a Master of Commerce degree from the University of New South Wales, Australia. He also holds a Master of Applied Finance degree from the Macquarie University, Australia. He has over 25 years of experience in finance, corporate finance, management, auditing and accounting. He worked in an international accounting firm for several years and has worked as group financial controller, chief financial officer and Director of listed companies on the Hong Kong Stock Exchange for over 10 years.
Mr Lee is a member of the Hong Kong Institute of Certified Public Accountants and a member of CPA Australia.
Mr Lee is a member of the Audit Committee.
As at the date of this report, Mr Lee has an interest in 1,750,000 ordinary shares, 2,300,000 options and 2,595,420 Performance Rights in the Company.

Directors’ Report
Crater Gold Mining Limited 16
D T Y Sun (Non-executive Director), age 70
Mr Sun has been a Director of the Company since 29 January 2013.
Mr Sun obtained a Bachelor of Economics from the University of Tasmania and held management positions with the Ford Motor Company in Melbourne and in Brisbane, as well as with Citibank NA and Lloyds Bank Plc in Hong Kong. He has been an executive Director of several listed companies in Hong Kong and has been engaged in advisory services on strategic planning and corporate development, mainly in corporate finance, since 1991.
Mr Sun is Chairman of the Audit Committee and of the Remuneration and Nomination Committee.
As at the date of this report, Mr Sun has an interest in 1,750,000 ordinary shares, 2,300,000 options and 2,595,420 Performance Rights in the Company.
R L Johnson BSc Eng Mining, FAusIMM (Technical Director), age 66
Mr Johnson was appointed as Technical Director on 19 July 2016 and resigned on 6 December 2017.
Andrea Betti AGIA ACIS BCom, MBA, GDipAppFin(SecInst), GDipACG
Ms Andrea Betti was appointed Company Secretary on 9 October 2017.
Heath Roberts Dip Law (SAB), Grad. Dip Legal Practice (UTS) (Company Secretary)
Mr Heath Roberts was appointed Company Secretary on 14 August 2015 and resigned on 9 October 2017.
Directors’ Meetings
The Company held 3 Board meeting during the year. In addition to formal Board meetings during the year a number of issues were dealt with by means of circular resolutions of the Board. The number of formal meetings attended by each Director was:
Name
Board Audit Committee Remuneration and Nomination
Committee
Eligible to Attend
Attended Eligible to
Attend Attended
Eligible to Attend
Attended
S W S Chan 3 3 - - - -
T M Fermanis 3 3 - - 1 1
L K K Lee 3 3 2 2 1 1
R D Parker 3 3 - - - -
D T Y Sun 3 3 2 2 1 1
R L Johnson 1 0 - - - -
The Eligible to Attend column represents the number of meetings held during the time the Director held office or was a member of the Committee during the year.
Remuneration Report (Audited)
The information provided under headings (a) - (d) is provided in accordance with section 300A of the Corporations Act 2001. These disclosures have been audited.
a) Principles used to determine the nature and amount of remuneration
The Company has a Remuneration and Nomination Committee. The Board has adopted a Remuneration and Nomination Policy which provides advice on remuneration and incentive policies and practices and specific recommendations on remuneration packages and other terms of employment for executive Directors, other senior executives and Non-Executive Directors. The performance of the Company is taken into consideration when the remuneration policies of the Company are assessed by the Committee. The Corporate Governance Statement provides further information on the role of this Committee.
Executive Remuneration
The remuneration policy ensures that contracts for services are reviewed on a regular basis and properly reflect the duties and responsibilities of the individuals concerned. The executive remuneration structure is based on a number of factors including relevant market conditions, knowledge and experience with the industry, organisational experience, performance of the Company and that the remuneration is competitive in retaining and attracting motivated people. There are no guaranteed pay increases included in the senior executives' contracts.

Directors’ Report
Crater Gold Mining Limited 17
Non-Executive Directors
Fees and payments to Non-Executive Directors reflect the demands which are made on, and the responsibilities of, the Directors. Non-executive Directors’ fees and payments are reviewed annually by the Board.
Additional information
The earnings of the Group for the five years to 30 June 2018 are summarised below:
2018 2017 2016 2015 2014
$‘000 $‘000 $‘000 $‘000 $‘000
Sales revenue - 225 385 53 Nil
EBITDA (4,660) (17,417) (10,061) (1,865) (2,249)
EBIT (4,879) (24,561) (10,259) (1,871) (2,236)
Loss after income tax (5,740) (25,285) (10,887) (2,517) (2,236)
The factors that are considered to affect Total Shareholders Return ('TSR') are summarised below:
2018 2017 2016 2015 2014
Share price at financial year end ($) 0.017 0.01 0.07 0.09 0.08
Total dividends per share (cents per share) Nil Nil Nil Nil Nil
Basic earnings per share (cents per share) (2.075) (9.503) (5.143) (1.792) (1.806)
Directors' fees
The current base remuneration was last reviewed with effect from 26 March 2009.
Non-Executive Director’s fees are determined within an aggregate Directors’ fee pool limit, which is periodically recommended for approval by shareholders. The maximum currently stands at $200,000 per annum and was approved by shareholders at the Annual General Meeting on 23 November 2010.
The following fees have applied for the year ended 30 June 2018:
Non-Executive Director’s base fee - $35,000 per annum;
The Managing Director and Deputy Chairman are paid a salary separate to the above;
Audit Committee and the Remuneration and Nomination Committee – no additional fees payable. Except for retirement benefits provided by the superannuation guarantee legislation, there are no retirement benefits for the Non-Executive Directors.
Voting and comments made at the company's 2017 Annual General Meeting ('AGM')
At the 2017 AGM, 92% of the votes received supported the adoption of the remuneration report for the year ended 30 June 2017. The company did not receive any specific feedback at the AGM regarding its remuneration practices.
b) Details of remuneration
Directors and the key management personnel (as defined in section 300A Corporations Act 2001) of the Company and the Group are set out in the following tables. The key management personnel of the Company and the Group includes the Directors as per page 15 and the following executive officers who have authority and responsibility for the planning, directing and controlling the activities of the Group.
Director / key management person Short-term Short-term Post-employment Share based payments Total
Base Fees/salary
Other 5 Superannuation Performance
Rights 7/Options % of total
2018
Non-executive Directors
S W S Chan 35,000 - - - - 35,000
D T Y Sun 35,000 6 - - 8,996 20.45% 43,996
L K K Lee 35,000 6 7,083 - 8,996 17.61% 51,079
Subtotal 105,000 7,083 - 17,992 130,075
Executive Directors
R D Parker, Managing Director 161,583 - - 20,994 11.50% 182,577
T M Fermanis, Deputy Chair 138,736 - 14,597 20,994 12.04% 174,327
R L Johnson, Technical Director 14,583 - - - - 14,583
Other key management personnel - -
M G O’Kane 1 147,336 - - 20,994 12.47% 168,330
C Church 2 299,297 - - 20,994 6.55% 320,291
Total 866,535 7,083 14,597 101,968 990,183
Directors’ Report
Crater Gold Mining Limited 18
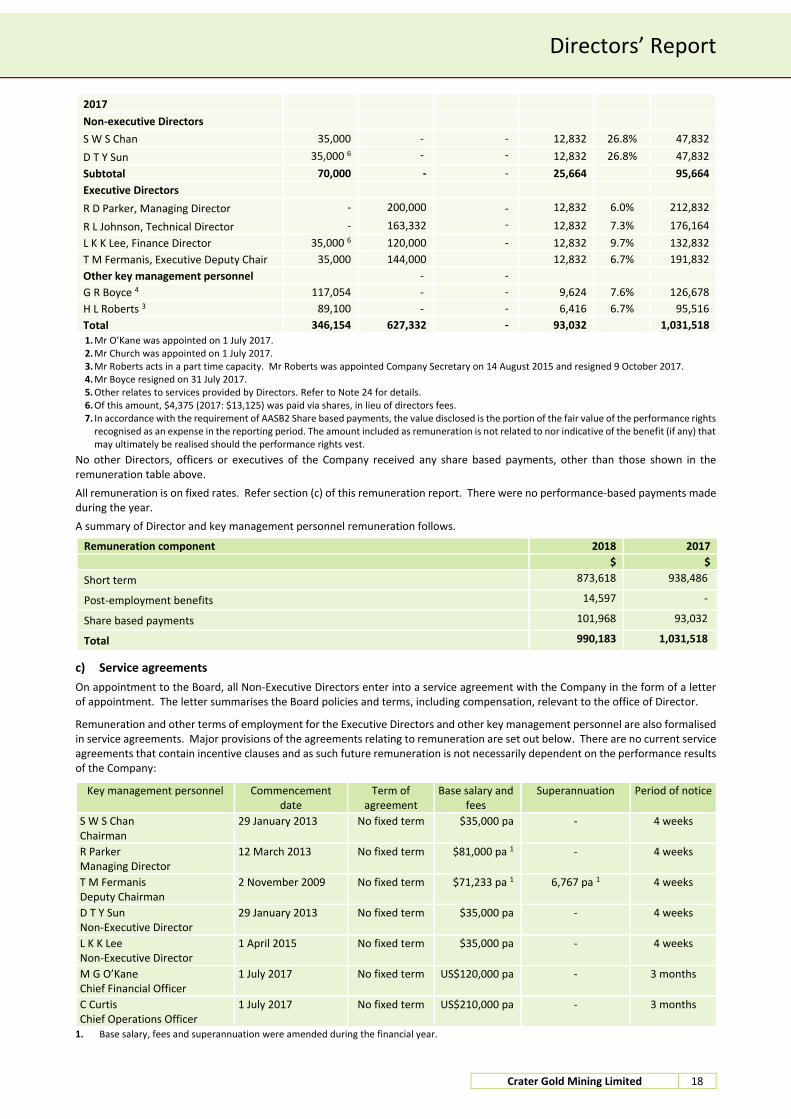
2017
Non-executive Directors
S W S Chan 35,000 - - 12,832 26.8% 47,832
D T Y Sun 35,000 6 - - 12,832 26.8% 47,832
Subtotal 70,000 - - 25,664 95,664
Executive Directors
R D Parker, Managing Director - 200,000 - 12,832 6.0% 212,832
R L Johnson, Technical Director - 163,332 - 12,832 7.3% 176,164
L K K Lee, Finance Director 35,000 6 120,000 - 12,832 9.7% 132,832
T M Fermanis, Executive Deputy Chair 35,000 144,000 12,832 6.7% 191,832
Other key management personnel - -
G R Boyce 4 117,054 - - 9,624 7.6% 126,678
H L Roberts 3 89,100 - - 6,416 6.7% 95,516
Total 346,154 627,332 - 93,032 1,031,518 1. Mr O’Kane was appointed on 1 July 2017. 2. Mr Church was appointed on 1 July 2017. 3. Mr Roberts acts in a part time capacity. Mr Roberts was appointed Company Secretary on 14 August 2015 and resigned 9 October 2017. 4. Mr Boyce resigned on 31 July 2017. 5. Other relates to services provided by Directors. Refer to Note 24 for details. 6. Of this amount, $4,375 (2017: $13,125) was paid via shares, in lieu of directors fees. 7. In accordance with the requirement of AASB2 Share based payments, the value disclosed is the portion of the fair value of the performance rights
recognised as an expense in the reporting period. The amount included as remuneration is not related to nor indicative of the benefit (if any) that may ultimately be realised should the performance rights vest.
No other Directors, officers or executives of the Company received any share based payments, other than those shown in the remuneration table above.
All remuneration is on fixed rates. Refer section (c) of this remuneration report. There were no performance-based payments made during the year.
A summary of Director and key management personnel remuneration follows.
Remuneration component 2018 2017
$ $
Short term 873,618 938,486
Post-employment benefits 14,597 -
Share based payments 101,968 93,032
Total 990,183 1,031,518
c) Service agreements
On appointment to the Board, all Non-Executive Directors enter into a service agreement with the Company in the form of a letter of appointment. The letter summarises the Board policies and terms, including compensation, relevant to the office of Director.
Remuneration and other terms of employment for the Executive Directors and other key management personnel are also formalised in service agreements. Major provisions of the agreements relating to remuneration are set out below. There are no current service agreements that contain incentive clauses and as such future remuneration is not necessarily dependent on the performance results of the Company:
Key management personnel Commencement date
Term of agreement
Base salary and fees
Superannuation Period of notice
S W S Chan Chairman
29 January 2013 No fixed term $35,000 pa - 4 weeks
R Parker Managing Director
12 March 2013 No fixed term $81,000 pa 1 - 4 weeks
T M Fermanis Deputy Chairman
2 November 2009 No fixed term $71,233 pa 1 6,767 pa 1 4 weeks
D T Y Sun Non-Executive Director
29 January 2013 No fixed term $35,000 pa - 4 weeks
L K K Lee Non-Executive Director
1 April 2015 No fixed term $35,000 pa - 4 weeks
M G O’Kane Chief Financial Officer
1 July 2017 No fixed term US$120,000 pa - 3 months
C Curtis Chief Operations Officer
1 July 2017 No fixed term US$210,000 pa - 3 months
1. Base salary, fees and superannuation were amended during the financial year.

Directors’ Report
Crater Gold Mining Limited 19
d) Equity based compensation
Securities granted as part of remuneration for the year ended 30 June 2018
The Employee Equity Incentive Plan (“Plan”) is designed to provide long-term incentives for executives to deliver long-term shareholder returns. Participation in the plan is at the Board’s discretion.
Share based compensation for the year ended 30 June 2018
No shares were issued to Directors and other key management personnel as part of compensation during the year ended 30 June 2018 (2017: nil). No options were issued to Directors and other key management personnel as part of compensation during the year ended 30 June 2018 (2017: NIL). 29,414,760 Performance Rights were issued to Directors and other key management personnel as part of compensation during the year ended 30 June 2018 (2017: nil).
Options and rights over equity instruments
The number of options over ordinary shares in the Company held during the financial year by each Director and key management personnel of the Group, including their personally related parties are set out below. Options granted carry no dividend or voting rights.
Name Balance at the start of the
year
Granted during the year as
compensation
Exercised during the year
Other changes during the year
Balance at the end of the year
2018
Directors
S W S Chan 2,800,000 - - (500,000) 2,300,000
T M Fermanis 2,800,000 - - (500,000) 2,300,000
L K K Lee 2,800,000 - - (500,000) 2,300,000
R D Parker 2,800,000 - - (500,000) 2,300,000
D T Y Sun 2,800,000 - - (500,000) 2,300,000
Key management personnel
M G O’Kane - - - - -
C Church - - - - -
Performance Rights
Performance Rights convert into fully paid ordinary share in the Company upon the achievement of specific hurdles within a specific time frame. For full details on the terms and conditions of the Performance Rights granted during the financial period, refer to ASX announcement dated 29 December 2018. Performance Rights granted carry no dividend or voting rights. The number of Performance Rights in the Company held during the financial year by each Director and key management personnel of the Group, including their personally related parties are set out below:
Name Balance at the start of the
year
Granted during the year as
compensation
Exercised during the year
Other changes during the year
Balance at the end of the year
2018
Directors
S W S Chan - - - - -
T M Fermanis - 6,055,980 - - 6,055,980
L K K Lee - 2,595,420 - - 2,595,420
R D Parker - 6,055,980 - - 6,055,980
D T Y Sun - 2,595,420 - - 2,595,420
Key management personnel
M G O’Kane - 6,055,980 - - 6,055,980
C Church - 6,055,980 - - 6,055,980
Directors’ Report
Crater Gold Mining Limited 20
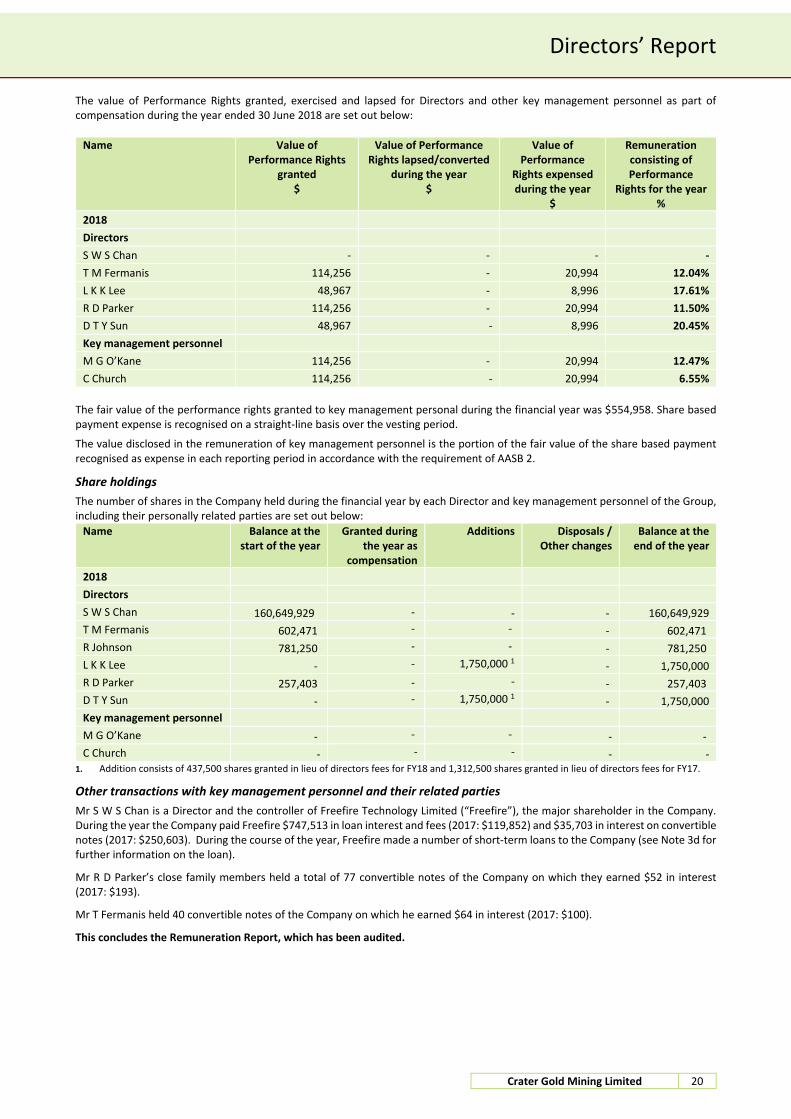
The value of Performance Rights granted, exercised and lapsed for Directors and other key management personnel as part of compensation during the year ended 30 June 2018 are set out below:
Name Value of Performance Rights
granted $
Value of Performance Rights lapsed/converted
during the year $
Value of Performance
Rights expensed during the year
$
Remuneration consisting of Performance
Rights for the year %
2018
Directors
S W S Chan - - - -
T M Fermanis 114,256 - 20,994 12.04%
L K K Lee 48,967 - 8,996 17.61%
R D Parker 114,256 - 20,994 11.50%
D T Y Sun 48,967 - 8,996 20.45%
Key management personnel
M G O’Kane 114,256 - 20,994 12.47%
C Church 114,256 - 20,994 6.55%
The fair value of the performance rights granted to key management personal during the financial year was $554,958. Share based payment expense is recognised on a straight-line basis over the vesting period.
The value disclosed in the remuneration of key management personnel is the portion of the fair value of the share based payment recognised as expense in each reporting period in accordance with the requirement of AASB 2.
Share holdings
The number of shares in the Company held during the financial year by each Director and key management personnel of the Group, including their personally related parties are set out below:
Name Balance at the start of the year
Granted during the year as
compensation
Additions Disposals / Other changes
Balance at the end of the year
2018
Directors
S W S Chan 160,649,929 - - - 160,649,929
T M Fermanis 602,471 - - - 602,471
R Johnson 781,250 - - - 781,250
L K K Lee - - 1,750,000 1 - 1,750,000
R D Parker 257,403 - - - 257,403
D T Y Sun - - 1,750,000 1 - 1,750,000
Key management personnel
M G O’Kane - - - - -
C Church - - - - - 1. Addition consists of 437,500 shares granted in lieu of directors fees for FY18 and 1,312,500 shares granted in lieu of directors fees for FY17.
Other transactions with key management personnel and their related parties
Mr S W S Chan is a Director and the controller of Freefire Technology Limited (“Freefire”), the major shareholder in the Company. During the year the Company paid Freefire $747,513 in loan interest and fees (2017: $119,852) and $35,703 in interest on convertible notes (2017: $250,603). During the course of the year, Freefire made a number of short-term loans to the Company (see Note 3d for further information on the loan).
Mr R D Parker’s close family members held a total of 77 convertible notes of the Company on which they earned $52 in interest (2017: $193).
Mr T Fermanis held 40 convertible notes of the Company on which he earned $64 in interest (2017: $100).
This concludes the Remuneration Report, which has been audited.

Directors’ Report
Crater Gold Mining Limited 21
Shares under Option
Unissued ordinary shares of the Company under option at the date of this report are as follows:
Grant date Expiry date Exercise price ($) Number of shares
under option Type
28 July 2015 27 July 2019 $0.25 7,800,000 Unlisted
9 September 2015 27 July 2019 $0.25 5,800,000 Unlisted
12 July 2016 12 July 2020 $0.125 9,000,000 Unlisted
Option holders do not have any rights under the options to participate in any share issue of the Company.
Shares Issued on the Exercise of Options
No shares have been issued on the exercise of options during the course of the year (2017: Nil) or subsequent to year end.
Indemnification and Insurance of Directors
During the year, the Company paid premiums of $9,630 (2017: $20,127) to insure the Directors and Officers of the Company in relation to all liabilities and expenses arising as a result of the performance of their duties in their respective capacities to the extent permitted by the Corporations Act 2001.
Indemnity and insurance of auditor
The Company has not, during or since the end of the financial year, indemnified or agreed to indemnify the auditor of the Company or any related entity against a liability incurred by the auditor. During the financial year, the Company has not paid a premium in respect of a contract to insure the auditor of the Company or any related entity.
Proceedings on behalf of the Company
No person has applied to the Court under section 237 of the Corporations Act 2001 for leave to bring proceedings on behalf of the Company, or to intervene in any proceedings to which the Company is a party for the purpose of taking responsibility on behalf of the Company for all or part of those proceedings.
Non-Audit Services
The Group paid $12,000 to RSM for non-audit services, relating to an independent expert report, during the year. The Directors are satisfied that the provision of non-audit services during the financial year, by the auditor (or by another person or firm on the auditor's behalf), is compatible with the general standard of independence for auditors imposed by the Corporations Act 2001. The Directors are of the opinion that the services as disclosed above do not compromise the external auditor's independence requirements of the Corporations Act 2001 for the following reasons: - all non-audit services have been reviewed and approved to ensure that they do not impact the integrity and objectivity of the
auditor; and - none of the services undermine the general principles relating to auditor independence as set out in APES 110 Code of Ethics
for Professional Accountants issued by the Accounting Professional and Ethical Standards Board, including reviewing or auditing the auditor's own work, acting in a management or decision-making capacity for the Company, acting as advocate for the Company or jointly sharing economic risks and rewards.
Annual General Meeting All resolutions at the Company’s 2017 Annual General Meeting on 29 November 2017 were passed.
Directors’ Report
Crater Gold Mining Limited 22
Auditor’s Independence Declaration
A copy of the auditors’ independence declaration as required under section 307C of the Corporations Act 2001 is set out on page 23.
Corporate Governance
The Board is committed to achieving and demonstrating the highest standards of corporate governance. As such, Crater Gold Mining Limited and its Controlled Entities (‘the Group’) have adopted a corporate governance framework and practices to ensure they meet the interests of shareholders. The Australian Securities Exchange Corporate Governance Council’s Corporate Governance Principles and Recommendations – 3rd edition (‘the ASX Principles’) are applicable for financial years commencing on or after 1 July 2015, consequently for the Group’s 30 June 2018 year end. As a result, the Group has chosen to publish its Corporate Governance Statement on its website rather than in this Annual Report. The Corporate Governance Statement and governance policies and practices can be found in the corporate governance section of the Company’s website at http://www.cratergold.com.au. This report is made in accordance with a resolution of Directors, pursuant to section 298(2)(a) of the Corporations Act 2001. On behalf of the Directors R D Parker T M Fermanis Managing Director Deputy Chairman 30 September 2018
THE POWER OF BEING UNDERSTOODAUDIT | TAX | CONSULTING
RSM Australia Partners is a member of the RSM network and trades as RSM. RSM is the trading name used by the members of the RSM network. Each member of the RSM network is an independent accounting and consulting firm which practices in its own right. The RSM network is not itself a separate legal entity in any jurisdiction.
RSM Australia Partners ABN 36 965 185 036
Liability limited by a scheme approved under Professional Standards Legislation
RSM Australia Partners
Level 32, Exchange Tower 2 The Esplanade Perth WA 6000GPO Box R1253 Perth WA 6844
T +61 (0) 8 9261 9100 F +61 (0) 8 9261 9111
www.rsm.com.au
AUDITOR’S INDEPENDENCE DECLARATION
As lead auditor for the audit of the financial report of Crater Gold Mining Limited for the year ended 30 June 2018, I declare that, to the best of my knowledge and belief, there have been no contraventions of:
(i) the auditor independence requirements of the Corporations Act 2001 in relation to the audit; and
(ii) any applicable code of professional conduct in relation to the audit.
RSM AUSTRALIA PARTNERS
Perth, WA TUTU PHONG Dated: 30 September 2018 Partner

Consolidated Statement of Profit or Loss and Other Comprehensive Income
For the Financial Year ended 30 June 2018
Crater Gold Mining Limited 24
June June
2018 2017
Notes $ $
Continuing Operations
Revenue 5 - 225,288
Cost of sales - (823,178)
Gross (loss) from gold production - (597,890)
(Loss) on disposal of fixed assets 5 - 7,273
Interest income 5 205 826
Reversal of bad debt 5 88,543 -
Gross profit / (loss) from continuing activities 88,748 (589,791)
Expenses
Administration expense 6 (2,596,830) (1,559,307)
Corporate compliance expense 6 (180,975) (104,018)
Depreciation expense 6 (218,616) (191,139)
Exploration and evaluation costs 6 (1,848,903) -
Exploration and evaluation costs impaired 6, 13 - (15,049,107)
Share based payments 6 (122,310) (115,488)
Financing expense (861,020) (722,501)
Impairment of mining asset 6, 14 - (6,953,390)
Loss before income tax expenses from continuing operations (5,739,906) (25,284,741)
Income tax expense 7 - -
Loss for the year after income tax expense (5,739,906) (25,284,741)
Other comprehensive income Items that will be reclassified subsequently to profit or loss when specific conditions are met:
Exchange differences on translating foreign operations (net of tax) 20 (80,870) (616,932)
Total comprehensive income for the year (5,820,776) (25,901,673)
Loss per share from continuing operations attributable to the ordinary equity holders of Crater Gold Mining Limited:
Basic loss - cents per share 8 (2.075) (9.503)
Diluted loss - cents per share 8 (2.075) (9.503)
The above Consolidated Statement of Profit or Loss and Other Comprehensive Income should be read in conjunction with the accompanying notes.

Consolidated Statement of Financial Position As at 30 June 2018
Crater Gold Mining Limited 25
June June
2018 2017
Notes $ $
ASSETS
Current assets
Cash and cash equivalents 10 265,155 296,185
Trade and other receivables 11 102,341 137,307
Total current assets 367,496 433,492
Non-current assets
Other financial assets 12 65,796 66,967
Exploration and evaluation 13 9,014,465 8,953,712
Plant and equipment 15 687,384 641,347
Total non-current assets 9,767,645 9,662,026
Total Assets 10,135,141 10,095,518
LIABILITIES
Current liabilities
Trade and other payables 16 1,685,558 2,269,452
Related party payables 17 873,587 1,203,078
Interest-bearing liabilities 18 13,679,324 7,109,173
Total current liabilities 16,238,469 10,581,703
Non-current liabilities
Total non-current liabilities - -
Total liabilities 16,238,469 10,581,703
Net Liabilities (6,103,328) (486,185)
EQUITY
Contributed equity 19 61,015,655 60,934,332
Convertible note reserve - 340,507
Reserves 20 (2,001,161) (226,644)
Accumulated losses 20 (65,117,822) (61,534,380)
Total Equity (6,103,328) (486,185)
The above Consolidated Statement of Financial Position should be read in conjunction with the accompanying notes.
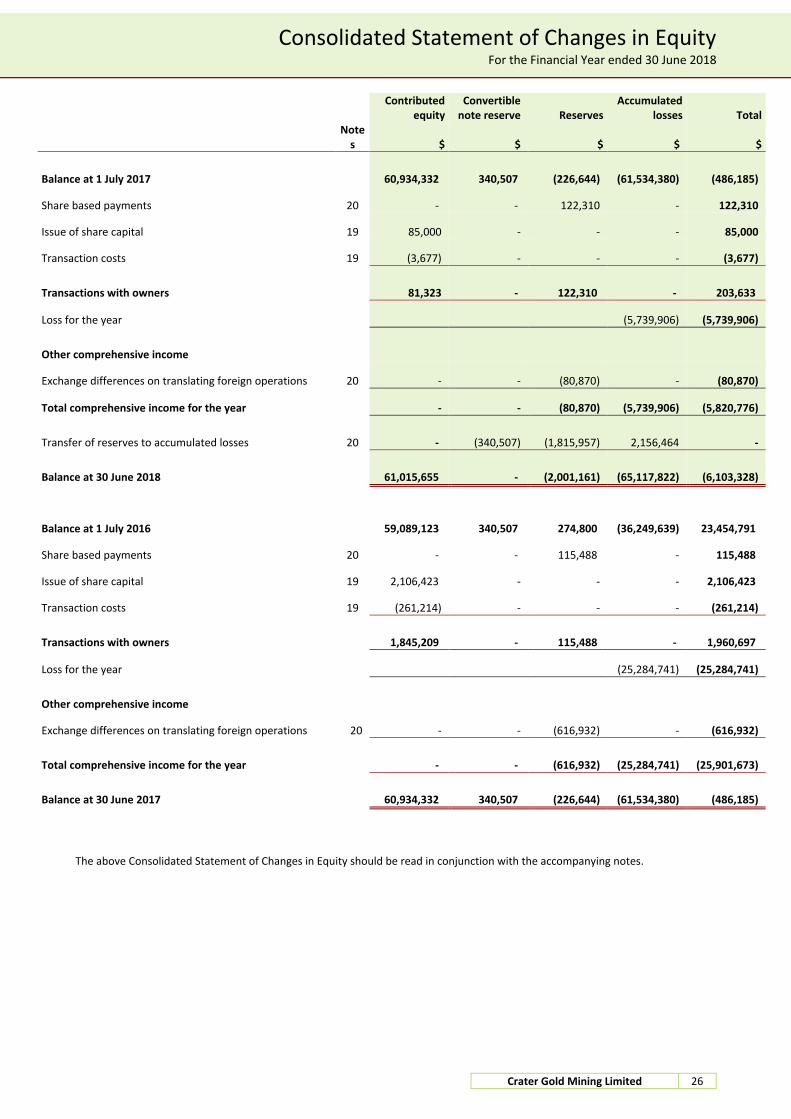
Consolidated Statement of Changes in Equity For the Financial Year ended 30 June 2018
Crater Gold Mining Limited 26
Contributed
equity Convertible
note reserve Reserves Accumulated
losses Total
Note
s $ $ $ $ $
Balance at 1 July 2017 60,934,332 340,507 (226,644) (61,534,380) (486,185)
Share based payments 20 - - 122,310 - 122,310
Issue of share capital 19 85,000 - - - 85,000
Transaction costs 19 (3,677) - - - (3,677)
Transactions with owners 81,323 - 122,310 - 203,633
Loss for the year (5,739,906) (5,739,906)
Other comprehensive income
Exchange differences on translating foreign operations 20 - - (80,870) - (80,870)
Total comprehensive income for the year - - (80,870) (5,739,906) (5,820,776)
Transfer of reserves to accumulated losses 20 - (340,507) (1,815,957) 2,156,464 -
Balance at 30 June 2018 61,015,655 - (2,001,161) (65,117,822) (6,103,328)
Balance at 1 July 2016 59,089,123 340,507 274,800 (36,249,639) 23,454,791
Share based payments 20 - - 115,488 - 115,488
Issue of share capital 19 2,106,423 - - - 2,106,423
Transaction costs 19 (261,214) - - - (261,214)
Transactions with owners 1,845,209 - 115,488 - 1,960,697
Loss for the year (25,284,741) (25,284,741)
Other comprehensive income
Exchange differences on translating foreign operations 20 - - (616,932) - (616,932)
Total comprehensive income for the year - - (616,932) (25,284,741) (25,901,673)
Balance at 30 June 2017 60,934,332 340,507 (226,644) (61,534,380) (486,185)
The above Consolidated Statement of Changes in Equity should be read in conjunction with the accompanying notes.

Consolidated Statement of Cash Flows For the Financial Year ended 30 June 2018
Crater Gold Mining Limited 27
June June
2018 2017
Notes $ $
Cash flows from operating activities
Receipts from customers - 225,288
Payments to suppliers and employees (2,036,105) (2,174,822)
Interest received 261 826
Interest paid (109,228) (108,681)
Net cash used in operating activities 28 (2,145,072) (2,057,389)
Cash flows from investing activities
Purchases of property, plant and equipment (146,099) (28,333)
Payments for exploration and evaluation (3,219,967) (1,743,041)
(Payments for)/proceeds from security deposits (1,000) 1,614
Net cash used in investing activities (3,367,066) (1,769,760)
Cash flows from financing activities
Proceeds from issue of ordinary shares and options - 2,076,423
Share issue costs (3,677) (261,214)
Proceeds from borrowings 6,362,481 3,780,000
Repayment of borrowings (920,466) (1,618,878)
Net cash provided by financing activities 5,438,338 3,976,331
Net (decrease)/increase in cash held (73,800) 149,182
Cash at the beginning of the period 10 296,185 95,239
Effects of foreign exchange movements on cash transactions and balances 42,770 51,764
Cash and cash equivalents at the end of the period 10 265,155 296,185
The above Consolidated Statement of Cash Flows should be read in conjunction with the accompanying notes.
Notes to the Consolidated Financial Statements
Crater Gold Mining Limited 28
1 Summary of Significant Accounting Policies
Crater Gold Mining Limited (the “Company”) and its legal subsidiaries together are referred to in this financial report as the Group.
Details of the principal accounting policies adopted in the preparation of the financial report are set out below. These policies have been consistently applied to all years presented, unless otherwise stated.
Crater Gold Mining Limited is a for profit public Company, limited by shares and domiciled in Australia.
The financial statements were authorised for issue, in accordance with a resolution of the Directors, on 30 September 2018. The Directors have the power to amend and reissue the financial statements.
Basis of preparation
This general purpose financial report has been prepared in accordance with Australian Accounting Standards, Australian Accounting Interpretations, and other authoritative pronouncements of the Australian Accounting Standards Board and the Corporations Act 2001. These Financial Statements also comply with International Reporting Standards as issued by the International Accounting Standards Board (IASB).
Change in Accounting Policy
Effective 1 July 2017, the Group has revised its accounting policy to expense all costs incurred in respect to the treatment of exploration and evaluation expenditure. In prior periods, the Group would capitalise all exploration and evaluation expenditure and recognise this as an exploration and evaluation asset in the Statement of Financial Position pursuant to AASB 6. The Group has determined that it is now more appropriate to treat these items as expenditure in the Statement of Profit or Loss and Other Comprehensive Income. An independent valuation of the exploration and evaluation assets was undertaken in the previous period and the Group has determined it is best to hold the value of the assets at the level of the valuation until such time that new information is available which would indicate a material change to the independent valuation.
New, revised or amending Accounting Standards and Interpretations adopted
The Group has adopted all of the new, revised or amending Accounting Standards and Interpretations issued by the Australian Accounting Standards Board (AASB) that are mandatory for the current reporting period.
Historical cost convention
The financial statements have been prepared under the historical cost convention, except for, where applicable, the revaluation of available-for-sale financial assets, financial assets and liabilities at fair value through profit or loss, investment properties, certain classes of property, plant and equipment and derivative financial instruments.
Critical accounting estimates
The preparation of the financial statements requires the use of certain critical accounting estimates. It also requires management to exercise its judgement in the process of applying the Group's accounting policies. The areas involving a higher degree of judgement or complexity, or areas where assumptions and estimates are significant to the financial statements, are disclosed in Note 2.
Parent entity information
In accordance with the Corporations Act 2001, these financial statements present the results of the Group only. Supplementary information about the parent entity is disclosed in Note 27.
Principles of consolidation
The consolidated financial statements incorporate the assets and liabilities of all subsidiaries of Crater Gold Mining Limited (‘Company' or 'Parent Entity') as at 30 June 2018 and the results of all subsidiaries for the year then ended. Crater Gold Mining Limited and its subsidiaries together are referred to in these financial statements as the 'Group'.
Subsidiaries are all those entities over which the Group has control. The Group controls an entity when the Group is exposed to, or has rights to, variable returns from its involvement with the entity and has the ability to affect those returns through its power to direct the activities of the entity. Subsidiaries are fully consolidated from the date on which control is transferred to the Group. They are de-consolidated from the date that control ceases.
Intercompany transactions, balances and unrealised gains on transactions between entities in the Group are eliminated. Unrealised losses are also eliminated unless the transaction provides evidence of the impairment of the asset transferred. Accounting policies of subsidiaries have been changed where necessary to ensure consistency with the policies adopted by the Group.
The acquisition of subsidiaries is accounted for using the acquisition method of accounting. A change in ownership interest, without the loss of control, is accounted for as an equity transaction, where the difference between the consideration transferred and the book value of the share of the non-controlling interest acquired is recognised directly in equity attributable to the parent.
Non-controlling interest in the results and equity of subsidiaries are shown separately in the statement of profit or loss and other comprehensive income, statement of financial position and statement of changes in equity of the Group. Losses incurred by the Group are attributed to the non-controlling interest in full, even if that results in a deficit balance.

Notes to the Financial Statements
Crater Gold Mining Limited 29
Where the Group loses control over a subsidiary, it derecognises the assets including goodwill, liabilities and non-controlling interest in the subsidiary together with any cumulative translation differences recognised in equity. The Group recognises the fair value of the consideration received and the fair value of any investment retained together with any gain or loss in profit or loss.
Operating Segments
Operating segments are presented using the 'management approach', where the information presented is on the same basis as the internal reports provided to the Chief Operating Decision Makers ('CODM'). The CODM is responsible for the allocation of resources to operating segments and assessing their performance.
Foreign currency translation
The financial statements are presented in Australian dollars, which is Crater Gold Mining Limited's functional and presentation currency.
Foreign currency transactions
Foreign currency transactions are translated into Australian dollars using the exchange rates prevailing at the dates of the transactions. Foreign exchange gains and losses resulting from the settlement of such transactions and from the translation at financial year-end exchange rates of monetary assets and liabilities denominated in foreign currencies are recognised in profit or loss.
Foreign operations
The assets and liabilities of foreign operations are translated into Australian dollars using the exchange rates at the reporting date. The revenues and expenses of foreign operations are translated into Australian dollars using the average exchange rates, which approximate the rates at the dates of the transactions, for the period. All resulting foreign exchange differences are recognised in other comprehensive income through the foreign currency reserve in equity.
The foreign currency reserve is recognised in profit or loss when the foreign operation or net investment is disposed of.
Revenue recognition
Revenue is recognised when it is probable that the economic benefit will flow to the Group and the revenue can be reliably measured. Revenue is measured at the fair value of the consideration received or receivable.
Income Tax
The income tax expense or benefit for the period is the tax payable on that period's taxable income based on the applicable income tax rate for each jurisdiction, adjusted by the changes in deferred tax assets and liabilities attributable to temporary differences, unused tax losses and the adjustment recognised for prior periods, where applicable.
Deferred tax assets and liabilities are recognised for temporary differences at the tax rates expected to be applied when the assets are recovered, or liabilities are settled, based on those tax rates that are enacted or substantively enacted, except for:
When the deferred income tax asset or liability arises from the initial recognition of goodwill or an asset or liability in a transaction that is not a business combination and that, at the time of the transaction, affects neither the accounting nor taxable profits; or
When the taxable temporary difference is associated with interests in subsidiaries, associates or joint ventures, and the timing of the reversal can be controlled, and it is probable that the temporary difference will not reverse in the foreseeable future.
Deferred tax assets are recognised for deductible temporary differences and unused tax losses only if it is probable that future taxable amounts will be available to utilise those temporary differences and losses.
The carrying amount of recognised and unrecognised deferred tax assets are reviewed at each reporting date. Deferred tax assets recognised are reduced to the extent that it is no longer probable that future taxable profits will be available for the carrying amount to be recovered. Previously unrecognised deferred tax assets are recognised to the extent that it is probable that there are future taxable profits available to recover the asset.
Deferred tax assets and liabilities are offset only where there is a legally enforceable right to offset current tax assets against current tax liabilities and deferred tax assets against deferred tax liabilities; and they relate to the same taxable authority on either the same taxable entity or different taxable entities which intend to settle simultaneously.
Crater Gold Mining Limited (the 'Parent Entity') and its wholly-owned Australian subsidiaries have formed an income tax consolidated group under the tax consolidation regime. The head entity and each subsidiary in the tax consolidated group continue to account for their own current and deferred tax amounts. The tax consolidated group has applied the 'separate taxpayer within group' approach in determining the appropriate amount of taxes to allocate to members of the tax consolidated group.
In addition to its own current and deferred tax amounts, the head entity also recognises the current tax liabilities (or assets) and the deferred tax assets arising from unused tax losses and unused tax credits assumed from each subsidiary in the tax consolidated group.
Assets or liabilities arising under tax funding agreements with the tax consolidated entities are recognised as amounts receivable from or payable to other entities in the tax consolidated group. The tax funding arrangement ensures that the intercompany charge equals the current tax liability or benefit of each tax consolidated group member, resulting in neither a contribution by the head entity to the subsidiaries nor a distribution by the subsidiaries to the Parent Entity.

Notes to the Financial Statements
Crater Gold Mining Limited 30
Current and non-current classification
Assets and liabilities are presented in the statement of financial position based on current and non-current classification.
An asset is classified as current when: it is either expected to be realised or intended to be sold or consumed in the Group’s normal operating cycle; it is held primarily for the purpose of trading; it is expected to be realised within 12 months after the reporting period; or the asset is cash or cash equivalent unless restricted from being exchanged or used to settle a liability for at least 12 months after the reporting period. All other assets are classified as non-current.
A liability is classified as current when: it is either expected to be settled in the Group's normal operating cycle; it is held primarily for the purpose of trading; it is due to be settled within 12 months after the reporting period; or there is no unconditional right to defer the settlement of the liability for at least 12 months after the reporting period. All other liabilities are classified as non-current.
Deferred tax assets and liabilities are always classified as non-current.
Cash and cash equivalents
Cash and cash equivalents includes cash on hand, deposits held at call with financial institutions, other short-term, highly liquid investments with original maturities of three months or less that are readily convertible to known amounts of cash and which are subject to an insignificant risk of changes in value. For the statement of cash flows presentation purposes, cash and cash equivalents also includes bank overdrafts, which are shown within borrowings in current liabilities on the statement of financial position.
Trade and other receivables
Trade receivables are initially recognised at fair value and subsequently measured at amortised cost using the effective interest method, less any provision for impairment. Trade receivables are generally due for settlement within 30 days.
Collectability of trade receivables is reviewed on an ongoing basis. Debts which are known to be uncollectable are written off by reducing the carrying amount directly. A provision for impairment of trade receivables is raised when there is objective evidence that the Group will not be able to collect all amounts due according to the original terms of the receivables. Significant financial difficulties of the debtor, probability that the debtor will enter bankruptcy or financial reorganisation and default or delinquency in payments (more than 60 days overdue) are considered indicators that the trade receivable may be impaired. The amount of the impairment allowance is the difference between the asset's carrying amount and the present value of estimated future cash flows, discounted at the original effective interest rate. Cash flows relating to short-term receivables are not discounted if the effect of discounting is immaterial.
Other receivables are recognised at amortised cost, less any provision for impairment.
Investments and other financial assets
Investments and other financial assets are initially measured at fair value. Transaction costs are included as part of the initial measurement, except for financial assets at fair value through profit or loss. They are subsequently measured at either amortised cost or fair value depending on their classification. Classification is determined based on the purpose of the acquisition and subsequent reclassification to other categories is restricted.
Financial assets are derecognised when the rights to receive cash flows from the financial assets have expired or have been transferred and the Group has transferred substantially all the risks and rewards of ownership.
Financial assets at fair value through profit or loss
Financial assets at fair value through profit or loss are either: (i) held for trading, where they are acquired for the purpose of selling in the short-term with an intention of making a profit; or (ii) designated as such upon initial recognition, where they are managed on a fair value basis or to eliminate or significantly reduce an accounting mismatch. Except for effective hedging instruments, derivatives are also categorised as fair value through profit or loss. Fair value movements are recognised in profit or loss.
Available-for-sale financial assets
Available-for-sale financial assets are non-derivative financial assets, principally equity securities, that are either designated as available-for-sale or not classified as any other category. After initial recognition, fair value movements are recognised in other comprehensive income through the available-for-sale reserve in equity. Cumulative gain or loss previously reported in the available-for-sale reserve is recognised in profit or loss when the asset is derecognised or impaired.
Impairment of financial assets
The Group assesses at the end of each reporting period whether there is any objective evidence that a financial asset or group of financial assets is impaired. Objective evidence includes significant financial difficulty of the issuer or obligor; a breach of contract such as default or delinquency in payments; the lender granting to a borrower concessions due to economic or legal reasons that the lender would not otherwise do; it becomes probable that the borrower will enter bankruptcy or other financial reorganisation; the disappearance of an active market for the financial asset; or observable data indicating that there is a measurable decrease in estimated future cash flows.
The amount of the impairment allowance for financial assets carried at cost is the difference between the asset's carrying amount and the present value of estimated future cash flows, discounted at the current market rate of return for similar financial assets.
Available-for-sale financial assets are considered impaired when there has been a significant or prolonged decline in value below initial cost. Subsequent increments in value are recognised in other comprehensive income through the available-for-sale reserve.

Notes to the Financial Statements
Crater Gold Mining Limited 31
Property, plant and equipment
Land and buildings are shown at fair value, based on periodic, at least every 3 years, valuations by external independent valuers, less subsequent depreciation and impairment for buildings. The valuations are undertaken more frequently if there is a material change in the fair value relative to the carrying amount. Any accumulated depreciation at the date of revaluation is eliminated against the gross carrying amount of the asset and the net amount is restated to the revalued amount of the asset. Increases in the carrying amounts arising on revaluation of land and buildings are credited in other comprehensive income through to the revaluation surplus reserve in equity. Any revaluation decrements are initially taken in other comprehensive income through to the revaluation surplus reserve to the extent of any previous revaluation surplus of the same asset. Thereafter the decrements are taken to profit or loss.
Plant and equipment is stated at historical cost less accumulated depreciation and impairment. Historical cost includes expenditure that is directly attributable to the acquisition of the items.
Depreciation is calculated on a straight-line basis to write off the net cost of each item of property, plant and equipment (excluding land) over their expected useful lives as follows:
Plant and equipment 3-7 years
The residual values, useful lives and depreciation methods are reviewed, and adjusted if appropriate, at each reporting date.
Leasehold improvements and plant and equipment under lease are depreciated over the unexpired period of the lease or the estimated useful life of the assets, whichever is shorter.
An item of property, plant and equipment is derecognised upon disposal or when there is no future economic benefit to the Group. Gains and losses between the carrying amount and the disposal proceeds are taken to profit or loss. Any revaluation surplus reserve relating to the item disposed of is transferred directly to retained profits.
Leases
The determination of whether an arrangement is or contains a lease is based on the substance of the arrangement and requires an assessment of whether the fulfilment of the arrangement is dependent on the use of a specific asset or assets and the arrangement conveys a right to use the asset.
A distinction is made between finance leases, which effectively transfer from the lessor to the lessee substantially all the risks and benefits incidental to the ownership of leased assets, and operating leases, under which the lessor effectively retains substantially all such risks and benefits.
Finance leases are capitalised. A lease asset and liability are established at the fair value of the leased assets, or if lower, the present value of minimum lease payments. Lease payments are allocated between the principal component of the lease liability and the finance costs, so as to achieve a constant rate of interest on the remaining balance of the liability.
Leased assets acquired under a finance lease are depreciated over the asset's useful life or over the shorter of the asset's useful life and the lease term if there is no reasonable certainty that the Group will obtain ownership at the end of the lease term.
Operating lease payments, net of any incentives received from the lessor, are charged to profit or loss on a straight-line basis over the term of the lease.
Exploration and evaluation assets
Exploration and evaluation expenditure in relation to separate areas of interest for which rights of tenure are current have previously been carried forward as an asset in the statement of financial position where it is expected that the expenditure will be recovered through the successful development and exploitation of an area of interest, or by its sale. As disclosed above under “changes to accounting policies” from 1 July 2017, the Group has revised its accounting policy to expense all costs incurred in respect to the treatment of exploration and evaluation expenditure. In prior periods the Group would capitalise all exploration and evaluation expenditure and recognise this as an exploration and evaluation asset in the Statement of Financial Position pursuant to AASB 6. The Group has determined that it is now more appropriate to treat these items as expenditure in the Statement of Profit or Loss and Other Comprehensive Income. An independent valuation of the exploration and evaluation assets was undertaken in the previous period and the Group has determined it is best to hold the value of the assets at the level of the valuation until such time that new information is available which would indicate a material change to the independent valuation.
Mining assets
Capitalised mining development costs include expenditures incurred to develop new ore bodies to define further mineralisation in existing ore bodies, to expand the capacity of a mine and to maintain production. Mining development also includes costs transferred from exploration and evaluation phase once production commences in the area of interest.
Amortisation of mining development is computed by the units of production basis over the estimated proved and probable reserves. Proved and probable mineral reserves reflect estimated quantities of economically recoverable reserves which can be recovered in the future from known mineral deposits. These reserves are amortised from the date on which production commences. The amortisation is calculated from recoverable proven and probable reserves and a predetermined percentage of the recoverable measured, indicated and inferred resource. This percentage is reviewed annually.
Restoration costs expected to be incurred are provided for as part of development phase that give rise to the need for restoration.

Notes to the Financial Statements
Crater Gold Mining Limited 32
Impairment of non-financial assets
Non-financial assets are reviewed for impairment whenever events or changes in circumstances indicate that the carrying amount may not be recoverable. An impairment loss is recognised for the amount by which the asset's carrying amount exceeds its recoverable amount.
Recoverable amount is the higher of an asset's fair value less costs of disposal and value-in-use. The value-in-use is the present value of the estimated future cash flows relating to the asset using a pre-tax discount rate specific to the asset or cash-generating unit to which the asset belongs. Assets that do not have independent cash flows are grouped together to form a cash-generating unit.
Trade and other payables
These amounts represent liabilities for goods and services provided to the Group prior to the end of the financial year and which are unpaid. Due to their short-term nature they are measured at amortised cost and are not discounted. The amounts are unsecured and are usually paid within 30 days of recognition.
Borrowings
Loans and borrowings are initially recognised at the fair value of the consideration received, net of transaction costs. They are subsequently measured at amortised cost using the effective interest method.
The component of the convertible notes that exhibits characteristics of a liability is recognised as a liability in the statement of financial position, net of transaction costs.
On the issue of the convertible notes, the fair value of the liability component is determined using a market rate for an equivalent non-convertible bond and this amount is carried as a non-current liability on the amortised cost basis until extinguished on conversion or redemption. The increase in the liability due to the passage of time is recognised as a finance cost. The remainder of the proceeds are allocated to the conversion option that is recognised and included in shareholders equity as a convertible note reserve, net of transaction costs. The carrying amount of the conversion option is not remeasured in the subsequent years. The corresponding interest on convertible notes is expensed to profit or loss.
Finance costs
Finance costs attributable to qualifying assets are capitalised as part of the asset. All other finance costs are expensed in the period in which they are incurred.
Provisions
Provisions are recognised when the Group has a present (legal or constructive) obligation as a result of a past event, it is probable the Group will be required to settle the obligation, and a reliable estimate can be made of the amount of the obligation. The amount recognised as a provision is the best estimate of the consideration required to settle the present obligation at the reporting date, taking into account the risks and uncertainties surrounding the obligation. If the time value of money is material, provisions are discounted using a current pre-tax rate specific to the liability. The increase in the provision resulting from the passage of time is recognised as a finance cost
Employee benefits
Share based payments
Equity-settled and cash-settled share based compensation benefits are provided to Directors and employees.
Equity-settled transactions are awards of shares, performance rights or options over shares, that are provided to employees in exchange for the rendering of services. Cash-settled transactions are awards of cash for the exchange of services, where the amount of cash is determined by reference to the share price.
The cost of equity-settled transactions are measured at fair value on grant date. Fair value is independently determined using an appropriate valuation model that takes into account the exercise price, the term of the option, the impact of dilution, the share price at grant date and expected price volatility of the underlying share, the expected dividend yield and the risk free interest rate for the term of the option, together with non-vesting conditions that do not determine whether the Group receives the services that entitle the employees to receive payment. No account is taken of any other vesting conditions.
The cost of equity-settled transactions are recognised as an expense with a corresponding increase in equity over the vesting period. The cumulative charge to profit or loss is calculated based on the grant date fair value of the award, the best estimate of the number of awards that are likely to vest and the expired portion of the vesting period. The amount recognised in profit or loss for the period is the cumulative amount calculated at each reporting date less amounts already recognised in previous periods.
The cost of cash-settled transactions is initially, and at each reporting date until vested, determined using an appropriate valuation model, taking into consideration the terms and conditions on which the award was granted. The cumulative charge to profit or loss until settlement of the liability is calculated as follows:
during the vesting period, the liability at each reporting date is the fair value of the award at that date multiplied by the expired portion of the vesting period.
from the end of the vesting period until settlement of the award, the liability is the full fair value of the liability at the reporting date.
Notes to the Financial Statements
Crater Gold Mining Limited 33
All changes in the liability are recognised in profit or loss. The ultimate cost of cash-settled transactions is the cash paid to settle the liability.
Market conditions are taken into consideration in determining fair value. Therefore, any awards subject to market conditions are considered to vest irrespective of whether or not that market condition has been met, provided all other conditions are satisfied.
If equity-settled awards are modified, as a minimum an expense is recognised as if the modification has not been made. An additional expense is recognised, over the remaining vesting period, for any modification that increases the total fair value of the share based compensation benefit as at the date of modification.
If the non-vesting condition is within the control of the Group or employee, the failure to satisfy the condition is treated as a cancellation. If the condition is not within the control of the Group or employee and is not satisfied during the vesting period, any remaining expense for the award is recognised over the remaining vesting period, unless the award is forfeited.
If equity-settled awards are cancelled, it is treated as if it has vested on the date of cancellation, and any remaining expense is recognised immediately. If a new replacement award is substituted for the cancelled award, the cancelled and new award is treated as if they were a modification.
Fair value measurement
When an asset or liability, financial or non-financial, is measured at fair value for recognition or disclosure purposes, the fair value is based on the price that would be received to sell an asset or paid to transfer a liability in an orderly transaction between market participants at the measurement date; and assumes that the transaction will take place either: in the principal market; or in the absence of a principal market, in the most advantageous market.
Fair value is measured using the assumptions that market participants would use when pricing the asset or liability, assuming they act in their economic best interests. For non-financial assets, the fair value measurement is based on its highest and best use. Valuation techniques that are appropriate in the circumstances and for which sufficient data are available to measure fair value, are used, maximising the use of relevant observable inputs and minimising the use of unobservable inputs.
Assets and liabilities measured at fair value are classified, into three levels, using a fair value hierarchy that reflects the significance of the inputs used in making the measurements. Classifications are reviewed at each reporting date and transfers between levels are determined based on a reassessment of the lowest level of input that is significant to the fair value measurement.
For recurring and non-recurring fair value measurements, external valuers may be used when internal expertise is either not available or when the valuation is deemed to be significant. External valuers are selected based on market knowledge and reputation. Where there is a significant change in fair value of an asset or liability from one period to another, an analysis is undertaken, which includes a verification of the major inputs applied in the latest valuation and a comparison, where applicable, with external sources of data.
Issued capital
Ordinary shares are classified as equity.
Incremental costs directly attributable to the issue of new shares or options are shown in equity as a deduction, net of tax, from the proceeds.
Dividends
Dividends are recognised when declared during the financial year and no longer at the discretion of the Company.
Earnings per share
Basic earnings per share
Basic earnings per share is calculated by dividing the profit attributable to the owners of Crater Gold Mining Limited, excluding any costs of servicing equity other than ordinary shares, by the weighted average number of ordinary shares outstanding during the financial year, adjusted for bonus elements in ordinary shares issued during the financial year.
Diluted earnings per share
Diluted earnings per share adjusts the figures used in the determination of basic earnings per share to take into account the after-income tax effect of interest and other financing costs associated with dilutive potential ordinary shares and the weighted average number of shares assumed to have been issued for no consideration in relation to dilutive potential ordinary shares.
Goods and Services Tax ('GST') and other similar taxes
Revenues, expenses and assets are recognised net of the amount of associated GST, unless the GST incurred is not recoverable from the tax authority. In this case it is recognised as part of the cost of the acquisition of the asset or as part of the expense.
Receivables and payables are stated inclusive of the amount of GST receivable or payable. The net amount of GST recoverable from, or payable to, the tax authority is included in other receivables or other payables in the statement of financial position.
Cash flows are presented on a gross basis. The GST components of cash flows arising from investing or financing activities which are recoverable from, or payable to the tax authority, are presented as operating cash flows.
Commitments and contingencies are disclosed net of the amount of GST recoverable from, or payable to, the tax authority.
Notes to the Financial Statements
Crater Gold Mining Limited 34
New Accounting Standards and Interpretations not yet mandatory or early adopted
Australian Accounting Standards and Interpretations that have recently been issued or amended but are not yet mandatory, have not been early adopted by the Group for the annual reporting period ended 30 June 2018. The Group's assessment of the impact of these new or amended Accounting Standards and Interpretations, most relevant to the Group, are set out below.
AASB 9 Financial Instruments
This standard is applicable to annual reporting periods beginning on or after 1 January 2018. The standard replaces all previous versions of AASB 9 and completes the project to replace IAS 39 'Financial Instruments: Recognition and Measurement'. AASB 9 introduces new classification and measurement models for financial assets. A financial asset shall be measured at amortised cost, if it is held within a business model whose objective is to hold assets in order to collect contractual cash flows, which arise on specified dates and solely principal and interest. All other financial instrument assets are to be classified and measured at fair value through profit or loss unless the entity makes an irrevocable election on initial recognition to present gains and losses on equity instruments (that are not held-for-trading) in other comprehensive income ('OCI'). For financial liabilities, the standard requires the portion of the change in fair value that relates to the entity's own credit risk to be presented in OCI (unless it would create an accounting mismatch). New simpler hedge accounting requirements are intended to more closely align the accounting treatment with the risk management activities of the entity. New impairment requirements will use an 'expected credit loss' ('ECL') model to recognise an allowance. Impairment will be measured under a 12-month ECL method unless the credit risk on a financial instrument has increased significantly since initial recognition in which case the lifetime ECL method is adopted. The standard introduces additional new disclosures. The Group will adopt this standard from 1 July 2018 and the impact of its adoption is expected to be not material on the Group.
AASB 16 Leases
This standard is applicable to annual reporting periods beginning on or after 1 January 2019. The standard replaces AASB 117 'Leases' and for lessees will eliminate the classifications of operating leases and finance leases. Subject to exceptions, a 'right-of-use' asset will be capitalised in the statement of financial position, measured at the present value of the unavoidable future lease payments to be made over the lease term. The exceptions relate to short-term leases of 12 months or less and leases of low-value assets (such as personal computers and small office furniture) where an accounting policy choice exists whereby either a 'right-of-use' asset is recognised or lease payments are expensed to profit or loss as incurred. A liability corresponding to the capitalised lease will also be recognised, adjusted for lease prepayments, lease incentives received, initial direct costs incurred and an estimate of any future restoration, removal or dismantling costs. Straight-line operating lease expense recognition will be replaced with a depreciation charge for the leased asset (included in operating costs) and an interest expense on the recognised lease liability (included in finance costs). In the earlier periods of the lease, the expenses associated with the lease under AASB 16 will be higher when compared to lease expenses under AASB 117. However, EBITDA (Earnings Before Interest, Tax, Depreciation and Amortisation) results will be improved as the operating expense is replaced by interest expense and depreciation in profit or loss under AASB 16. For classification within the statement of cash flows, the lease payments will be separated into both a principal (financing activities) and interest (either operating or financing activities) component. For lessor accounting, the standard does not substantially change how a lessor accounts for leases. The Group will adopt this standard from 1 July 2019 and the impact of its adoption is expected to be not material on the Group.
2 Critical accounting judgements, estimates and assumptions
The preparation of the financial statements requires management to make judgements, estimates and assumptions that affect the reported amounts in the financial statements. Management continually evaluates its judgements and estimates in relation to assets, liabilities, contingent liabilities, revenue and expenses. Management bases its judgements, estimates and assumptions on historical experience and on other various factors, including expectations of future events, management believes to be reasonable under the circumstances. The resulting accounting judgements and estimates will seldom equal the related actual results. The judgements, estimates and assumptions that have a significant risk of causing a material adjustment to the carrying amounts of assets and liabilities (refer to the respective notes) within the next financial year are discussed below.
Share based payment transactions
The Group measures the cost of equity-settled transactions with employees by reference to the fair value of the equity instruments at the date at which they are granted. The fair value is determined by using the ESO5 Barrier model taking into account the terms and conditions upon which the instruments were granted. The accounting estimates and assumptions relating to equity-settled share based payments would have no impact on the carrying amounts of assets and liabilities within the next annual reporting period but may impact profit or loss and equity.
Impairment of non-financial assets other than goodwill and other indefinite life intangible assets
The Group assesses impairment of non-financial assets other than goodwill and other indefinite life intangible assets at each reporting date by evaluating conditions specific to the Group and to the particular asset that may lead to impairment. If an impairment trigger exists, the recoverable amount of the asset is determined. This involves fair value less costs of disposal or value-in-use calculations, which incorporate a number of key estimates and assumptions. It is reasonably possible that the underlying metal price assumption may change which may then impact the estimated life of mine determinant and may then require a material adjustment to the carrying value of mining plant and equipment, mining infrastructure and mining development assets. Furthermore, the expected future cash flows used to determine the value-in-use of these assets are inherently uncertain and could materially change over time.
They are significantly affected by a number of factors including reserves and production estimates, together with economic factors such as metal spot prices, discount rates, estimates of costs to produce reserves and future capital expenditure.
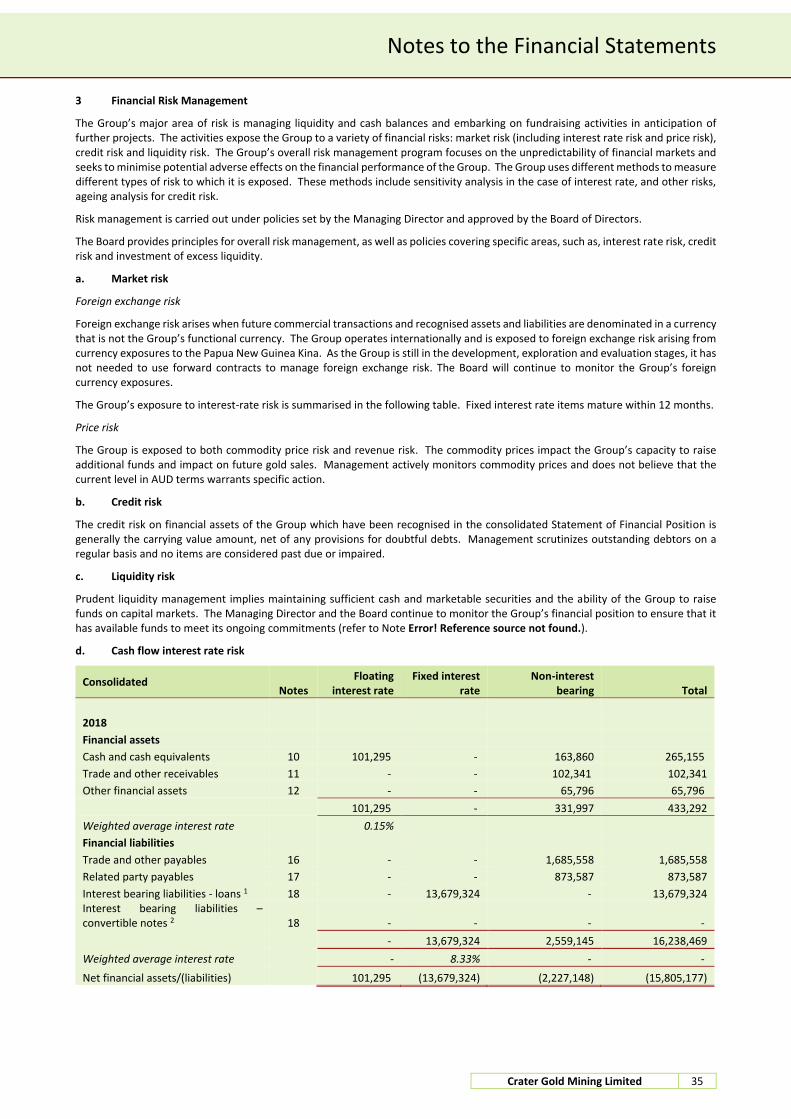
Notes to the Financial Statements
Crater Gold Mining Limited 35
3 Financial Risk Management
The Group’s major area of risk is managing liquidity and cash balances and embarking on fundraising activities in anticipation of further projects. The activities expose the Group to a variety of financial risks: market risk (including interest rate risk and price risk), credit risk and liquidity risk. The Group’s overall risk management program focuses on the unpredictability of financial markets and seeks to minimise potential adverse effects on the financial performance of the Group. The Group uses different methods to measure different types of risk to which it is exposed. These methods include sensitivity analysis in the case of interest rate, and other risks, ageing analysis for credit risk.
Risk management is carried out under policies set by the Managing Director and approved by the Board of Directors.
The Board provides principles for overall risk management, as well as policies covering specific areas, such as, interest rate risk, credit risk and investment of excess liquidity.
a. Market risk
Foreign exchange risk
Foreign exchange risk arises when future commercial transactions and recognised assets and liabilities are denominated in a currency that is not the Group’s functional currency. The Group operates internationally and is exposed to foreign exchange risk arising from currency exposures to the Papua New Guinea Kina. As the Group is still in the development, exploration and evaluation stages, it has not needed to use forward contracts to manage foreign exchange risk. The Board will continue to monitor the Group’s foreign currency exposures.
The Group’s exposure to interest-rate risk is summarised in the following table. Fixed interest rate items mature within 12 months.
Price risk
The Group is exposed to both commodity price risk and revenue risk. The commodity prices impact the Group’s capacity to raise additional funds and impact on future gold sales. Management actively monitors commodity prices and does not believe that the current level in AUD terms warrants specific action.
b. Credit risk
The credit risk on financial assets of the Group which have been recognised in the consolidated Statement of Financial Position is generally the carrying value amount, net of any provisions for doubtful debts. Management scrutinizes outstanding debtors on a regular basis and no items are considered past due or impaired.
c. Liquidity risk
Prudent liquidity management implies maintaining sufficient cash and marketable securities and the ability of the Group to raise funds on capital markets. The Managing Director and the Board continue to monitor the Group’s financial position to ensure that it has available funds to meet its ongoing commitments (refer to Note Error! Reference source not found.).
d. Cash flow interest rate risk
Consolidated Notes
Floating interest rate
Fixed interest rate
Non-interest bearing Total
2018
Financial assets
Cash and cash equivalents 10 101,295 - 163,860 265,155
Trade and other receivables 11 - - 102,341 102,341
Other financial assets 12 - - 65,796 65,796
101,295 - 331,997 433,292
Weighted average interest rate 0.15%
Financial liabilities
Trade and other payables 16 - - 1,685,558 1,685,558
Related party payables 17 - - 873,587 873,587
Interest bearing liabilities - loans 1 18 - 13,679,324 - 13,679,324 Interest bearing liabilities – convertible notes 2 18 - - - -
- 13,679,324 2,559,145 16,238,469
Weighted average interest rate - 8.33% - -
Net financial assets/(liabilities) 101,295 (13,679,324) (2,227,148) (15,805,177)
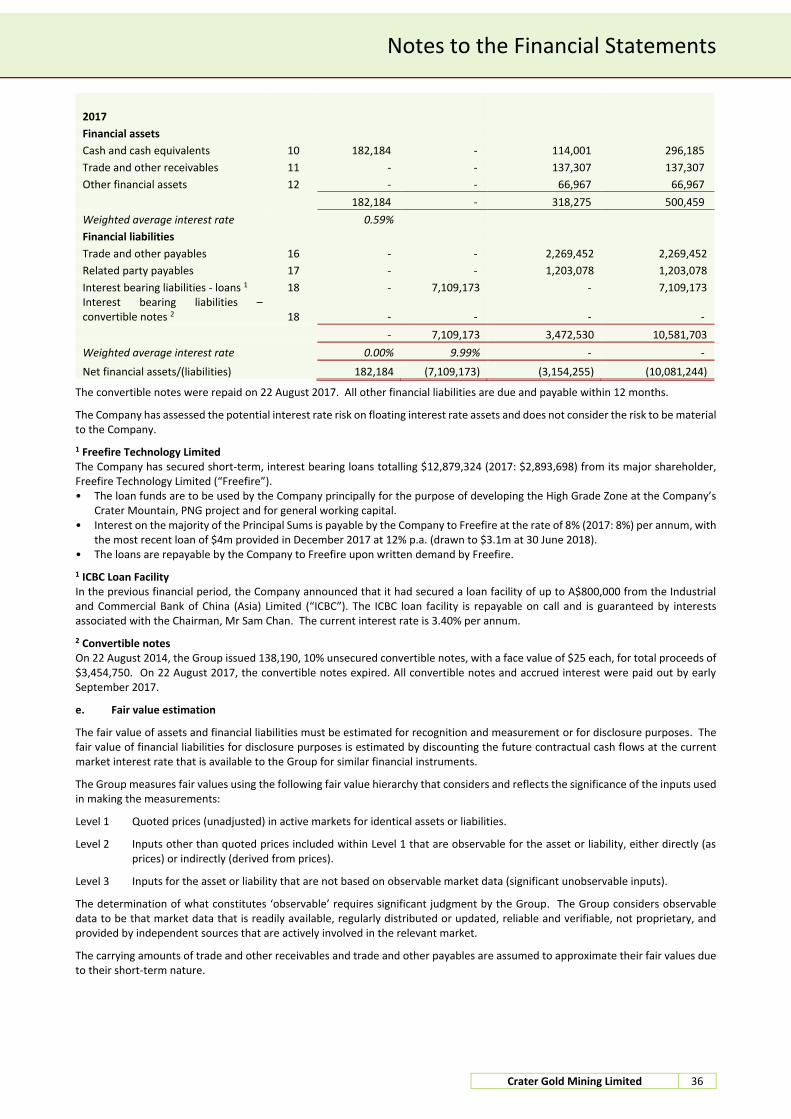
Notes to the Financial Statements
Crater Gold Mining Limited 36
2017
Financial assets
Cash and cash equivalents 10 182,184 - 114,001 296,185
Trade and other receivables 11 - - 137,307 137,307
Other financial assets 12 - - 66,967 66,967
182,184 - 318,275 500,459
Weighted average interest rate 0.59%
Financial liabilities
Trade and other payables 16 - - 2,269,452 2,269,452
Related party payables 17 - - 1,203,078 1,203,078
Interest bearing liabilities - loans 1 18 - 7,109,173 - 7,109,173 Interest bearing liabilities – convertible notes 2 18 - - - -
- 7,109,173 3,472,530 10,581,703
Weighted average interest rate 0.00% 9.99% - -
Net financial assets/(liabilities) 182,184 (7,109,173) (3,154,255) (10,081,244)
The convertible notes were repaid on 22 August 2017. All other financial liabilities are due and payable within 12 months.
The Company has assessed the potential interest rate risk on floating interest rate assets and does not consider the risk to be material to the Company.
1 Freefire Technology Limited The Company has secured short-term, interest bearing loans totalling $12,879,324 (2017: $2,893,698) from its major shareholder, Freefire Technology Limited (“Freefire”). • The loan funds are to be used by the Company principally for the purpose of developing the High Grade Zone at the Company’s
Crater Mountain, PNG project and for general working capital. • Interest on the majority of the Principal Sums is payable by the Company to Freefire at the rate of 8% (2017: 8%) per annum, with
the most recent loan of $4m provided in December 2017 at 12% p.a. (drawn to $3.1m at 30 June 2018). • The loans are repayable by the Company to Freefire upon written demand by Freefire.
1 ICBC Loan Facility In the previous financial period, the Company announced that it had secured a loan facility of up to A$800,000 from the Industrial and Commercial Bank of China (Asia) Limited (“ICBC”). The ICBC loan facility is repayable on call and is guaranteed by interests associated with the Chairman, Mr Sam Chan. The current interest rate is 3.40% per annum.
2 Convertible notes On 22 August 2014, the Group issued 138,190, 10% unsecured convertible notes, with a face value of $25 each, for total proceeds of $3,454,750. On 22 August 2017, the convertible notes expired. All convertible notes and accrued interest were paid out by early September 2017.
e. Fair value estimation
The fair value of assets and financial liabilities must be estimated for recognition and measurement or for disclosure purposes. The fair value of financial liabilities for disclosure purposes is estimated by discounting the future contractual cash flows at the current market interest rate that is available to the Group for similar financial instruments.
The Group measures fair values using the following fair value hierarchy that considers and reflects the significance of the inputs used in making the measurements:
Level 1 Quoted prices (unadjusted) in active markets for identical assets or liabilities.
Level 2 Inputs other than quoted prices included within Level 1 that are observable for the asset or liability, either directly (as prices) or indirectly (derived from prices).
Level 3 Inputs for the asset or liability that are not based on observable market data (significant unobservable inputs).
The determination of what constitutes ‘observable’ requires significant judgment by the Group. The Group considers observable data to be that market data that is readily available, regularly distributed or updated, reliable and verifiable, not proprietary, and provided by independent sources that are actively involved in the relevant market.
The carrying amounts of trade and other receivables and trade and other payables are assumed to approximate their fair values due to their short-term nature.
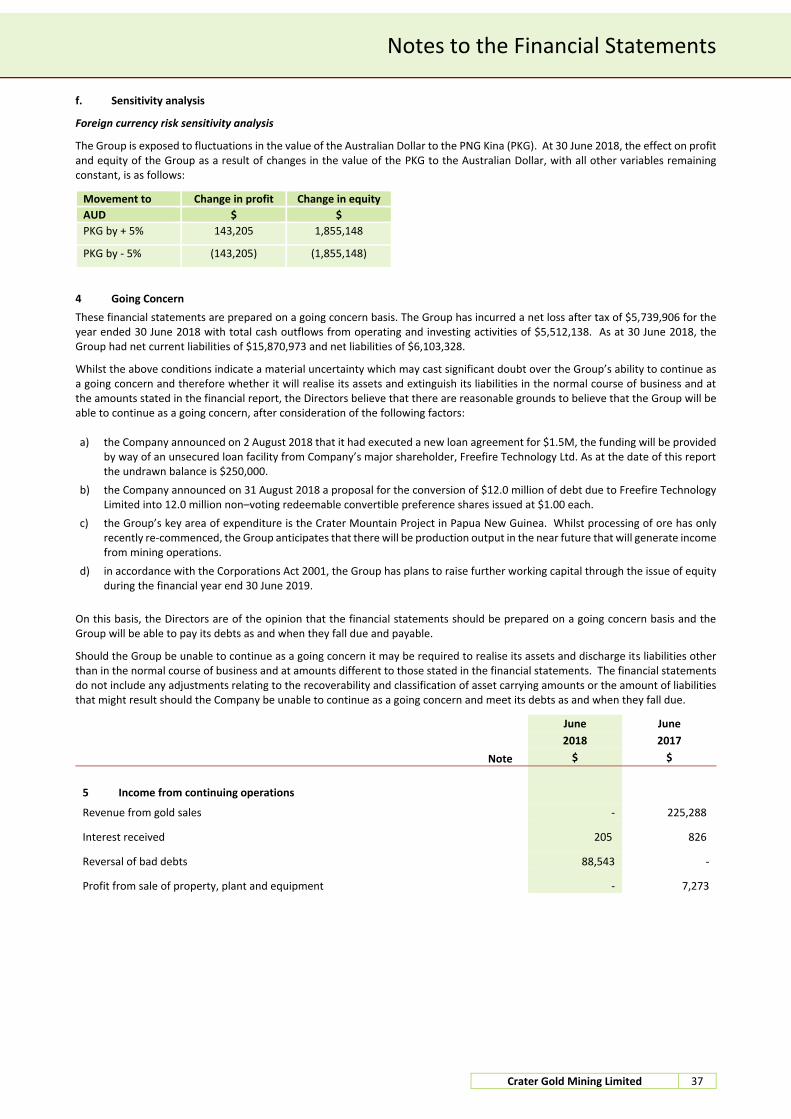
Notes to the Financial Statements
Crater Gold Mining Limited 37
f. Sensitivity analysis
Foreign currency risk sensitivity analysis
The Group is exposed to fluctuations in the value of the Australian Dollar to the PNG Kina (PKG). At 30 June 2018, the effect on profit and equity of the Group as a result of changes in the value of the PKG to the Australian Dollar, with all other variables remaining constant, is as follows:
Movement to Change in profit Change in equity
AUD $ $
PKG by + 5% 143,205 1,855,148
PKG by - 5% (143,205) (1,855,148)
4 Going Concern
These financial statements are prepared on a going concern basis. The Group has incurred a net loss after tax of $5,739,906 for the year ended 30 June 2018 with total cash outflows from operating and investing activities of $5,512,138. As at 30 June 2018, the Group had net current liabilities of $15,870,973 and net liabilities of $6,103,328.
Whilst the above conditions indicate a material uncertainty which may cast significant doubt over the Group’s ability to continue as a going concern and therefore whether it will realise its assets and extinguish its liabilities in the normal course of business and at the amounts stated in the financial report, the Directors believe that there are reasonable grounds to believe that the Group will be able to continue as a going concern, after consideration of the following factors: a) the Company announced on 2 August 2018 that it had executed a new loan agreement for $1.5M, the funding will be provided
by way of an unsecured loan facility from Company’s major shareholder, Freefire Technology Ltd. As at the date of this report the undrawn balance is $250,000.
b) the Company announced on 31 August 2018 a proposal for the conversion of $12.0 million of debt due to Freefire Technology Limited into 12.0 million non–voting redeemable convertible preference shares issued at $1.00 each.
c) the Group’s key area of expenditure is the Crater Mountain Project in Papua New Guinea. Whilst processing of ore has only recently re-commenced, the Group anticipates that there will be production output in the near future that will generate income from mining operations.
d) in accordance with the Corporations Act 2001, the Group has plans to raise further working capital through the issue of equity during the financial year end 30 June 2019.
On this basis, the Directors are of the opinion that the financial statements should be prepared on a going concern basis and the Group will be able to pay its debts as and when they fall due and payable.
Should the Group be unable to continue as a going concern it may be required to realise its assets and discharge its liabilities other than in the normal course of business and at amounts different to those stated in the financial statements. The financial statements do not include any adjustments relating to the recoverability and classification of asset carrying amounts or the amount of liabilities that might result should the Company be unable to continue as a going concern and meet its debts as and when they fall due.
June June
2018 2017
Note $ $
5 Income from continuing operations
Revenue from gold sales - 225,288
Interest received 205 826
Reversal of bad debts 88,543 - Profit from sale of property, plant and equipment - 7,273

Notes to the Financial Statements
Crater Gold Mining Limited 38
June June
2018 2017
Note $ $
6 Expenses
Expenses, excluding finance costs, included in the Statement of Profit or Loss and Other Comprehensive Income classified by nature
Audit fees 69,847 129,277
Accounting fees 120,346 11,558
Consulting fees 1,264,894 717,943
Directors’ fees 373,108 133,664 Depreciation and amortisation expense 218,616 191,139
Employee benefits expense 41,243 34,831
Exploration and evaluation costs 1,848,903 -
Exploration costs written off or impaired 13 - 15,049,107
General administration expenses 163,238 397,024
- Insurance - Directors & officers indemnity insurance 7,343 21,060
- Insurance - Other 2,287 1,101
Total insurance 9,630 22,161
Legal Fees 206,058 37,912
Marketing and promotion expenses 161 17,905
Minimum lease payments 80,474 21,732
Mining asset impairment 14 - 6,953,390
Share based payments 24 122,310 115,488
Share registry, meeting costs and other compliance costs 180,975 104,018
Telephone/internet 54,777 605
Travel 213,054 34,695
7 Income Tax
a. Numerical reconciliation of income tax revenue to prima facie tax receivable
Loss before income tax (5,739,906) (25,284,741)
Tax at the Australian tax rate of 30% (1,721,972) (7,585,422)
Tax effect of amounts which are not deductible (taxable) in calculating taxable income:
Non-deductible share based payments 36,693 34,646
Non-deductible expenses 111,127 6,966,016
Deferred tax asset not brought to account 1,574,152 575,603
Other - 9,157
- - Net adjustment to deferred tax assets and liabilities for tax losses and temporary differences not recognised - -
Income tax expense - -
b. Tax losses
Unused tax losses for which no deferred tax asset has been recognised
Opening balance 46,673,952 44,356,102
Taxable loss for the year 1,795,020 2,317,850
Closing balance 48,468,972 46,673,952
Potential tax benefits @ 30% 14,540,692 14,002,186
8 Earnings per Share
a. Basic loss per share
Loss from continuing operations attributable to the ordinary equity holders of Crater Gold Mining Limited (cents per share) (2.075) (9.503)
b. Diluted loss per share
Loss from continuing operations attributable to the ordinary equity holders of Crater Gold Mining Limited (cents per share) (2.075) (9.503)

Notes to the Financial Statements
Crater Gold Mining Limited 39
The calculation of basic earnings per share at 30 June 2018 was based on the loss from continuing operations attributable to ordinary shareholders of $5,739,906 (2017 loss: $25,284,741) and a weighted average number of ordinary shares outstanding during the financial year ended 30 June 2018 of 276,655,291 (2017: 266,080,056), calculated as follows:
c. Weighted average number of shares used as a denominator 2018 2017
Shares Shares
Basic loss per share 276,655,291 266,080,056
Diluted loss per share 276,655,291 266,080,056
At the year end, the Group had 22,600,000 options on issue (2017: 30,100,000), representing:
22,600,000 unlisted options with weighted average exercise price of $0.20 (2017: 30,100,000 at average $0.21)
9 Operating Segments
Croydon
$
Crater Mountain
$
Australian Head Office
$
Intersegment eliminations
$ Consolidated
$
Full-year to 30 June 2018
Gold sales revenue - - - - -
Cost of sales - - - - -
Other revenue - 88,543 205 - 88,748
Profit on disposal of assets - - - - -
Assets written down/impaired - - - - -
Other expenses (210,772) (2,788,658) (2,829,224) - (5,828,654)
Segment loss (210,772) (2,700,115) (2,829,019) - (5,739,906)
Segment assets 987,819 8,861,020 14,189,307 (13,903,005) 10,135,141
Segment liabilities - 46,012,109 15,216,160 (44,989,800) 16,238,469
Full-year to 30 June 2017
Gold sales revenue - 225,288 - - 225,288
Other revenue - (823,178) - - (823,178)
Loss on disposal of assets - - 826 - 826
Assets written down/impaired - - 7,273 - 7,273
Assets impaired - (22,002,497) - - (22,002,497)
Other expenses - (549,934) (2,142,519) - (2,692,453)
Segment loss - (23,150,321) (2,134,420) - (25,284,741)
Segment assets 987,819 8,880,556 9,998,285 (9,771,142) 10,095,518
Segment liabilities - 42,774,282 8,674,687 (40,867,266) 10,581,703
Segment information is presented using a “management approach”, that is segment information is provided on the same basis as information used for internal reporting purposes by the chief executive and the Board. In identifying its operating segments, management generally follows the Group's project activities. Each of these activities is managed separately.
The Chief Operating Decision Makers (“CODM”) review EBITDA (earnings before interest, tax, depreciation and amortisation). The accounting policies adopted for internal reporting to the CODM are consistent with those adopted in the financial statements.
Description of segments
Accounting policies adopted
Unless stated otherwise, all amounts reported to the Board of Directors, being the chief operating decision makers with respect to operating segments, are determined in accordance with accounting policies that are consistent with those adopted in the annual financial statements of the Group.
Segment Assets
Where an asset is used across multiple segments, the asset is allocated to the segment that received the majority of the economic value form the asset. In most instances, segment assets are clearly identifiable on the basis of their nature and physical condition.

Notes to the Financial Statements
Crater Gold Mining Limited 40
Segment Liabilities
Liabilities are allocated to segments where there is a direct nexus between the incurrence of the liability and the operations of the segment. Borrowings are generally considered to relate to the Group as a whole and are not allocated. Segment liabilities include trade and other payables and certain direct borrowings.
Croydon
This project consists of two sub-projects in far North West Queensland, the Croydon Polymetallic Project and the Croydon Gold Project.
Head Office Perth
These are the overhead and administrative costs for the parent entity.
Crater Mountain
This is an advanced exploration and production project located in the PNG Highlands approximately 50kms southwest of Goroka.
Geographical information
Sales to external customers Geographical non-current assets
2018 2017 2018 2017 $ $ $ $
Australia - - 1,141,470 1,015,319 Papua New Guinea - 225,288 8,626,175 8,646,707
- 225,288
9,767,645 9,662,026
The geographical non-current assets above are exclusive of, where applicable, financial instruments, deferred tax assets, post-employment benefits assets and rights under insurance contracts.
Types of products and services
The principal products and services of this operating segment are the mining and exploration operations in Australia and Papua New Guinea.
June June
2018 2017
Note $ $
10 Current Assets - Cash and Equivalents
Cash at bank and on hand 265,155 296,185
The effective (weighted average) interest rate on short term bank deposit was 0.15% (2017: 0.41%).
11 Current Assets - Trade and Other Receivables
GST receivable 49,528 17,458
Other 52,813 119,849
102,341 137,307
12 Non-Current Assets - Other Financial Assets
Security deposits 65,796 66,967
65,796 66,967
13 Non-Current Assets - Exploration and Evaluation
Opening net book value 8,953,712 22,664,481
Expenditure capitalised - 1,843,909
Exploration costs written off/impairment - (15,049,107)
Effect of movement in exchange rates 60,753 (505,571)
Closing net book value 9,014,465 8,953,712
The above impairments/write downs were recognised in the previous period.
The ultimate recoupment of costs carried forward for exploration and evaluation assets is dependent on the successful development and commercial exploitation or sale of the respective areas.
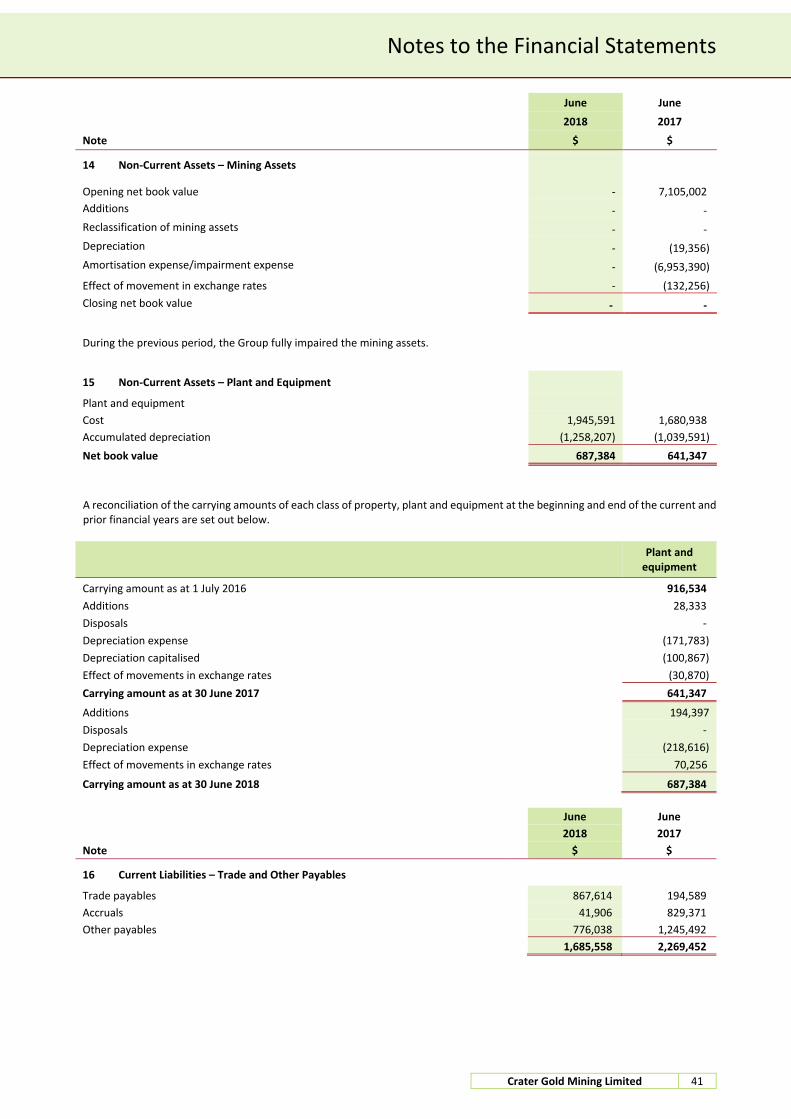
Notes to the Financial Statements
Crater Gold Mining Limited 41
June June
2018 2017
Note $ $
14 Non-Current Assets – Mining Assets
Opening net book value - 7,105,002
Additions - -
Reclassification of mining assets - -
Depreciation - (19,356)
Amortisation expense/impairment expense - (6,953,390)
Effect of movement in exchange rates - (132,256)
Closing net book value - -
During the previous period, the Group fully impaired the mining assets.
15 Non-Current Assets – Plant and Equipment
Plant and equipment
Cost 1,945,591 1,680,938
Accumulated depreciation (1,258,207) (1,039,591)
Net book value 687,384 641,347
A reconciliation of the carrying amounts of each class of property, plant and equipment at the beginning and end of the current and prior financial years are set out below.
Plant and equipment
Carrying amount as at 1 July 2016 916,534
Additions 28,333
Disposals -
Depreciation expense (171,783)
Depreciation capitalised (100,867)
Effect of movements in exchange rates (30,870)
Carrying amount as at 30 June 2017 641,347
Additions 194,397
Disposals -
Depreciation expense (218,616)
Effect of movements in exchange rates 70,256
Carrying amount as at 30 June 2018 687,384
June June
2018 2017
Note $ $
16 Current Liabilities – Trade and Other Payables
Trade payables 867,614 194,589
Accruals 41,906 829,371
Other payables 776,038 1,245,492
1,685,558 2,269,452

Notes to the Financial Statements
Crater Gold Mining Limited 42
June June
2018 2017
Note $ $
17 Related Party Payables
G R Boyce (CFO, resigned 31st July 2017) - 13,613
S W S Chan 66,485 40,235
T M Fermanis 200,201 215,000
Freefire Technology Ltd (accrued interest) - 225,524
R Johnson (Technical Director, resigned 6th December 2017) - 179,998
L K K Lee 152,289 157,706
R D Parker 261,814 271,180
D T Y Sun 43,750 35,000
J S Spence (Director for Anomaly Ltd – PNG subsidiary) 93,106 58,057
H Roberts (Company Secretary, resigned 9th October 2017) - 6,765
C Church 55,942 -
873,587 1,203,078
18 Current Liabilities Interest-Bearing Liabilities
Convertible notes - 3,415,475
ICBC loan 800,000 800,000
Freefire Technology Limited loan 12,879,324 2,893,698
13,679,324 7,109,173
Refer to Note 3(d) for detailed information on financial instruments.
19 Contributed Equity
a. Share Capital
Equity Securities Issued
No. of ordinary shares
Total $
For the financial year ended 30 June 2018
As at 1 July 2017 272,118,621 60,934,332
Shares issued 7,346,154 81,323
As at 30 June 2018 279,464,775 61,015,655
For the financial year ended 30 June 2017
As at 1 July 2016 242,026,860 59,089,123
Shares issued 30,091,761 1,845,209
As at 30 June 2017 272,118,621 60,934,332
b. Ordinary Shares
Ordinary shares entitle the holder to participate in dividends and the proceeds on winding up of the Company in proportion to the number of shares and the amounts paid on those shares held. The fully paid ordinary share have no par value and the Company does not have a limited amount of authorised capital.
On a show of hands every member present at a meeting in person or by proxy shall have one vote and upon a poll each share shall have one vote.
Capital risk management
The Group’s objectives when managing capital is to safeguard its ability to continue as a going concern, so that it can provide returns for shareholders and benefits for other stakeholders and to maintain an optimum capital structure to reduce the cost of capital.
In order to maintain or adjust the capital structure, the Group may adjust the amount of dividends paid to shareholders, return capital to shareholders, issue new shares or sell assets to reduce debt.
The Group would look to raise capital when an opportunity to invest in a business or Company was seen as value adding relative to the current Company's share price at the time of the investment. The Group is not actively pursuing additional investments in the short term as it continues to integrate and grow its existing businesses in order to maximise synergies.
The capital risk management policy remains unchanged from the 30 June 2017 Annual Report.
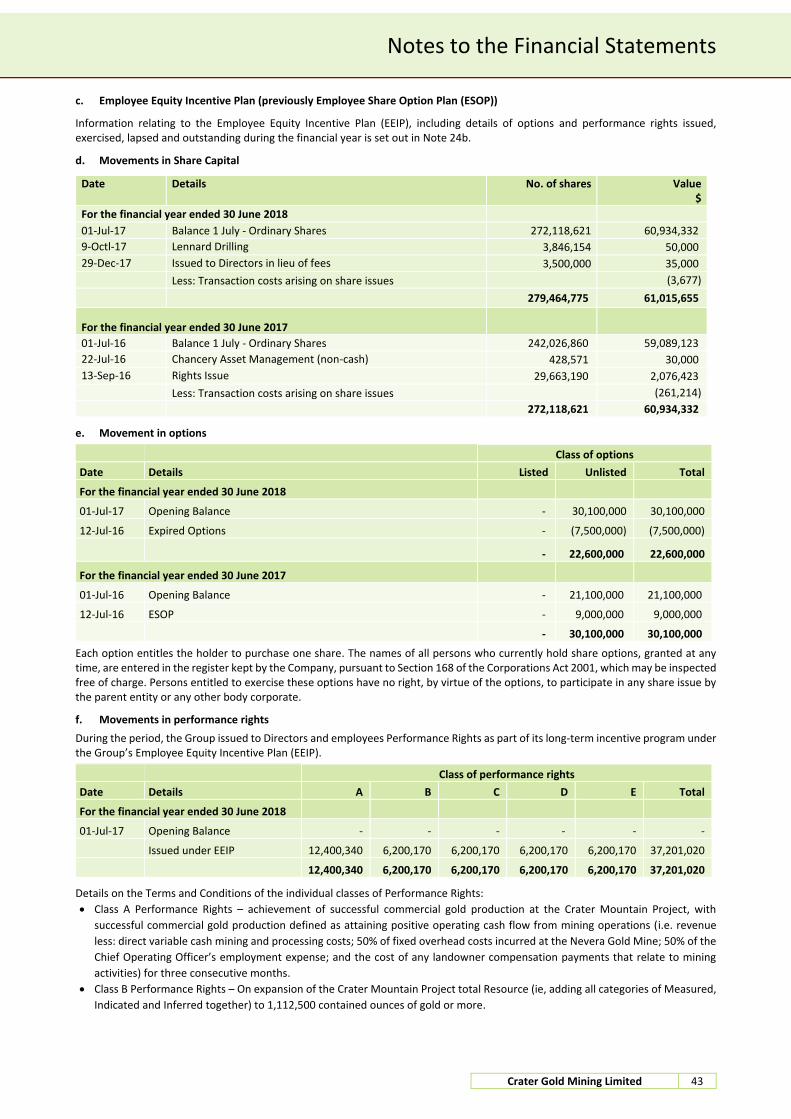
Notes to the Financial Statements
Crater Gold Mining Limited 43
c. Employee Equity Incentive Plan (previously Employee Share Option Plan (ESOP))
Information relating to the Employee Equity Incentive Plan (EEIP), including details of options and performance rights issued, exercised, lapsed and outstanding during the financial year is set out in Note 24b.
d. Movements in Share Capital
Date Details No. of shares Value $
For the financial year ended 30 June 2018
01-Jul-17 Balance 1 July - Ordinary Shares 272,118,621 60,934,332
9-Octl-17 Lennard Drilling 3,846,154 50,000
29-Dec-17 Issued to Directors in lieu of fees 3,500,000 35,000
Less: Transaction costs arising on share issues (3,677)
279,464,775 61,015,655
For the financial year ended 30 June 2017
01-Jul-16 Balance 1 July - Ordinary Shares 242,026,860 59,089,123
22-Jul-16 Chancery Asset Management (non-cash) 428,571 30,000
13-Sep-16 Rights Issue 29,663,190 2,076,423
Less: Transaction costs arising on share issues (261,214)
272,118,621 60,934,332
e. Movement in options
Class of options
Date Details Listed Unlisted Total
For the financial year ended 30 June 2018
01-Jul-17 Opening Balance - 30,100,000 30,100,000
12-Jul-16 Expired Options - (7,500,000) (7,500,000)
- 22,600,000 22,600,000
For the financial year ended 30 June 2017
01-Jul-16 Opening Balance - 21,100,000 21,100,000
12-Jul-16 ESOP - 9,000,000 9,000,000
- 30,100,000 30,100,000
Each option entitles the holder to purchase one share. The names of all persons who currently hold share options, granted at any time, are entered in the register kept by the Company, pursuant to Section 168 of the Corporations Act 2001, which may be inspected free of charge. Persons entitled to exercise these options have no right, by virtue of the options, to participate in any share issue by the parent entity or any other body corporate.
f. Movements in performance rights
During the period, the Group issued to Directors and employees Performance Rights as part of its long-term incentive program under the Group’s Employee Equity Incentive Plan (EEIP).
Class of performance rights
Date Details A B C D E Total
For the financial year ended 30 June 2018
01-Jul-17 Opening Balance - - - - - -
Issued under EEIP 12,400,340 6,200,170 6,200,170 6,200,170 6,200,170 37,201,020
12,400,340 6,200,170 6,200,170 6,200,170 6,200,170 37,201,020
Details on the Terms and Conditions of the individual classes of Performance Rights:
Class A Performance Rights – achievement of successful commercial gold production at the Crater Mountain Project, with
successful commercial gold production defined as attaining positive operating cash flow from mining operations (i.e. revenue
less: direct variable cash mining and processing costs; 50% of fixed overhead costs incurred at the Nevera Gold Mine; 50% of the
Chief Operating Officer’s employment expense; and the cost of any landowner compensation payments that relate to mining
activities) for three consecutive months.
Class B Performance Rights – On expansion of the Crater Mountain Project total Resource (ie, adding all categories of Measured,
Indicated and Inferred together) to 1,112,500 contained ounces of gold or more.

Notes to the Financial Statements
Crater Gold Mining Limited 44
Class C Performance Rights – if at any time the share price remains at or above A$0.020 per share for 20 consecutive trading days
with an average daily trading liquidity for those trading days at or above A$20,000.
Class D Performance Rights – if at any time the share price remains at or above A$0.030 per share for 20 consecutive trading days
with an average daily trading liquidity for those trading days at or above A$20,000.
Class E Performance Rights – if at any time the share price remains at or above A$0.040 per share for 20 consecutive trading days
with an average daily trading liquidity for those trading days at or above A$20,000.
June June
2018 2017
Note $ $
20 Reserves and Accumulated Losses
Reserves
Share based payment reserve 344,759 2,008,406
Share cancellation reserve - 30,000
Foreign currency translation reserve (2,345,920) (2,265,050)
(2,001,161) (226,644)
Movements
Share based payments reserve
Balance 1 July 2017 2,008,406 1,892,918
Transfer to accumulated losses (options expired) (1,785,957) -
Share based payments expense for year 122,310 115,488
Balance 30 June 2018 344,759 2,008,406
Share cancellation reserve
Balance 1 July 2017 30,000 30,000
Transfer to accumulated losses (30,000) -
Balance 30 June 2018 - 30,000
Foreign currency translation reserve
Balance 1 July 2017 (2,265,050) (1,648,118)
Currency translation differences (80,870) (616,932)
Balance 30 June 2018 (2,345,920) (2,265,050)
Convertible note equity reserve
Balance 1 July 2017 340,507 340,507
Transfer to accumulated losses (340,507) -
Balance 30 June 2018 - 340,507
Accumulated losses
Movements in accumulated losses were as follows:
Balance 1 July 2017 (61,534,380) (36,249,639)
Loss for the year (5,739,906) (25,284,741)
Transfer from reserves 2,156,464 -
Balance 30 June 2018 (65,117,822) (61,534,380)
Nature and purpose of reserves
Share based payments reserve
The share based payments reserve is used to recognise:
The fair value of options and performance rights issued to employees and Directors; and
The fair value of options and performance rights issued as consideration for goods or services rendered.
Share cancellation reserve
The cancellation of shares in 2010 was realised within the share cancellation reserve, transferred to accumulated losses in current year.
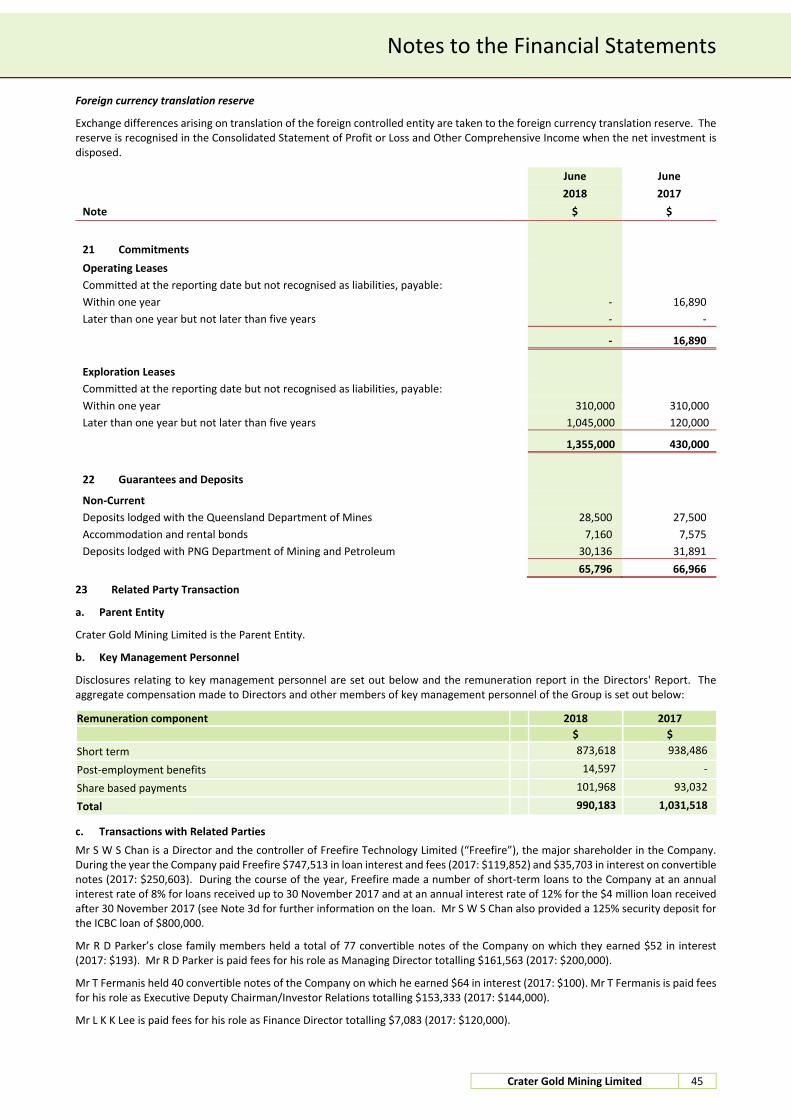
Notes to the Financial Statements
Crater Gold Mining Limited 45
Foreign currency translation reserve
Exchange differences arising on translation of the foreign controlled entity are taken to the foreign currency translation reserve. The reserve is recognised in the Consolidated Statement of Profit or Loss and Other Comprehensive Income when the net investment is disposed.
June June
2018 2017
Note $ $
21 Commitments Operating Leases
Committed at the reporting date but not recognised as liabilities, payable:
Within one year - 16,890
Later than one year but not later than five years - -
- 16,890
Exploration Leases
Committed at the reporting date but not recognised as liabilities, payable:
Within one year 310,000 310,000
Later than one year but not later than five years 1,045,000 120,000
1,355,000 430,000
22 Guarantees and Deposits
Non-Current
Deposits lodged with the Queensland Department of Mines 28,500 27,500
Accommodation and rental bonds 7,160 7,575
Deposits lodged with PNG Department of Mining and Petroleum 30,136 31,891
65,796 66,966
23 Related Party Transaction
a. Parent Entity
Crater Gold Mining Limited is the Parent Entity.
b. Key Management Personnel
Disclosures relating to key management personnel are set out below and the remuneration report in the Directors' Report. The aggregate compensation made to Directors and other members of key management personnel of the Group is set out below:
Remuneration component 2018 2017
$ $
Short term 873,618 938,486
Post-employment benefits 14,597 -
Share based payments 101,968 93,032
Total 990,183 1,031,518
c. Transactions with Related Parties
Mr S W S Chan is a Director and the controller of Freefire Technology Limited (“Freefire”), the major shareholder in the Company. During the year the Company paid Freefire $747,513 in loan interest and fees (2017: $119,852) and $35,703 in interest on convertible notes (2017: $250,603). During the course of the year, Freefire made a number of short-term loans to the Company at an annual interest rate of 8% for loans received up to 30 November 2017 and at an annual interest rate of 12% for the $4 million loan received after 30 November 2017 (see Note 3d for further information on the loan. Mr S W S Chan also provided a 125% security deposit for the ICBC loan of $800,000.
Mr R D Parker’s close family members held a total of 77 convertible notes of the Company on which they earned $52 in interest (2017: $193). Mr R D Parker is paid fees for his role as Managing Director totalling $161,563 (2017: $200,000).
Mr T Fermanis held 40 convertible notes of the Company on which he earned $64 in interest (2017: $100). Mr T Fermanis is paid fees for his role as Executive Deputy Chairman/Investor Relations totalling $153,333 (2017: $144,000).
Mr L K K Lee is paid fees for his role as Finance Director totalling $7,083 (2017: $120,000).
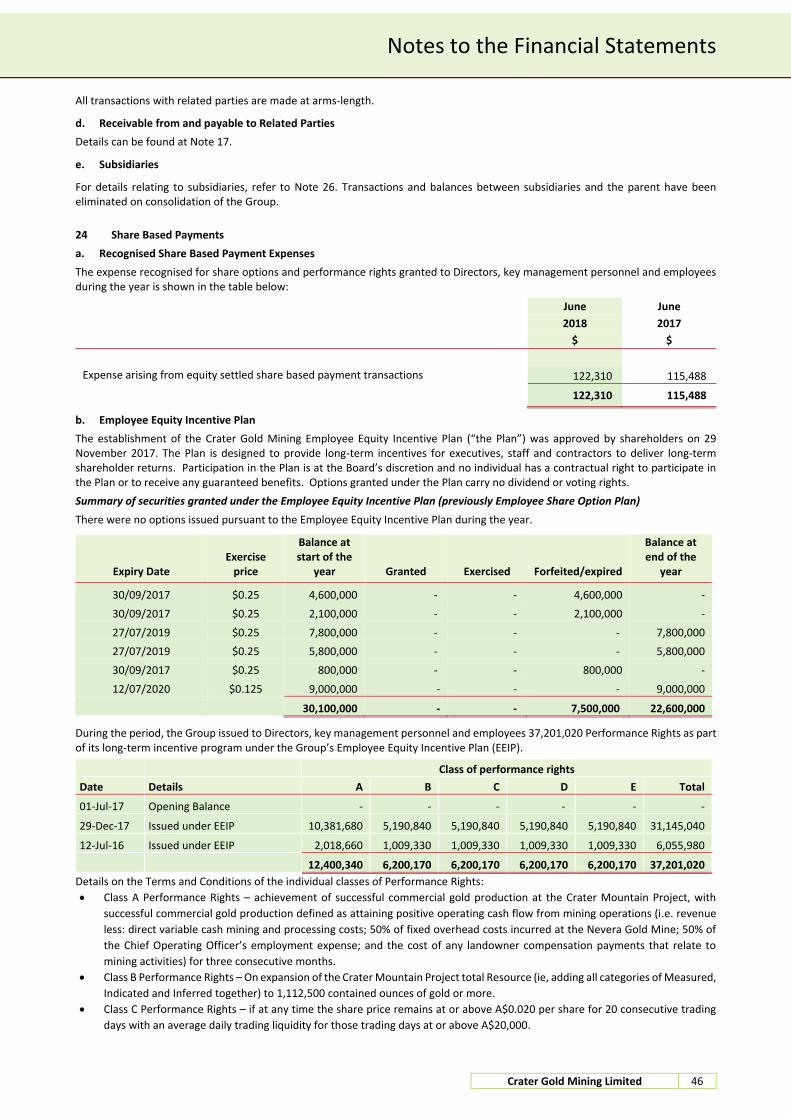
Notes to the Financial Statements
Crater Gold Mining Limited 46
All transactions with related parties are made at arms-length.
d. Receivable from and payable to Related Parties
Details can be found at Note 17.
e. Subsidiaries
For details relating to subsidiaries, refer to Note 26. Transactions and balances between subsidiaries and the parent have been eliminated on consolidation of the Group.
24 Share Based Payments
a. Recognised Share Based Payment Expenses
The expense recognised for share options and performance rights granted to Directors, key management personnel and employees during the year is shown in the table below:
June June
2018 2017
$ $
Expense arising from equity settled share based payment transactions 122,310 115,488
122,310 115,488
b. Employee Equity Incentive Plan
The establishment of the Crater Gold Mining Employee Equity Incentive Plan (“the Plan”) was approved by shareholders on 29 November 2017. The Plan is designed to provide long-term incentives for executives, staff and contractors to deliver long-term shareholder returns. Participation in the Plan is at the Board’s discretion and no individual has a contractual right to participate in the Plan or to receive any guaranteed benefits. Options granted under the Plan carry no dividend or voting rights.
Summary of securities granted under the Employee Equity Incentive Plan (previously Employee Share Option Plan)
There were no options issued pursuant to the Employee Equity Incentive Plan during the year.
Expiry Date Exercise
price
Balance at start of the
year Granted Exercised Forfeited/expired
Balance at end of the
year
30/09/2017 $0.25 4,600,000 - - 4,600,000 -
30/09/2017 $0.25 2,100,000 - - 2,100,000 -
27/07/2019 $0.25 7,800,000 - - - 7,800,000
27/07/2019 $0.25 5,800,000 - - - 5,800,000
30/09/2017 $0.25 800,000 - - 800,000 -
12/07/2020 $0.125 9,000,000 - - - 9,000,000
30,100,000 - - 7,500,000 22,600,000
During the period, the Group issued to Directors, key management personnel and employees 37,201,020 Performance Rights as part of its long-term incentive program under the Group’s Employee Equity Incentive Plan (EEIP).
Class of performance rights
Date Details A B C D E Total
01-Jul-17 Opening Balance - - - - - -
29-Dec-17 Issued under EEIP 10,381,680 5,190,840 5,190,840 5,190,840 5,190,840 31,145,040
12-Jul-16 Issued under EEIP 2,018,660 1,009,330 1,009,330 1,009,330 1,009,330 6,055,980
12,400,340 6,200,170 6,200,170 6,200,170 6,200,170 37,201,020
Details on the Terms and Conditions of the individual classes of Performance Rights:
Class A Performance Rights – achievement of successful commercial gold production at the Crater Mountain Project, with
successful commercial gold production defined as attaining positive operating cash flow from mining operations (i.e. revenue
less: direct variable cash mining and processing costs; 50% of fixed overhead costs incurred at the Nevera Gold Mine; 50% of
the Chief Operating Officer’s employment expense; and the cost of any landowner compensation payments that relate to
mining activities) for three consecutive months.
Class B Performance Rights – On expansion of the Crater Mountain Project total Resource (ie, adding all categories of Measured,
Indicated and Inferred together) to 1,112,500 contained ounces of gold or more.
Class C Performance Rights – if at any time the share price remains at or above A$0.020 per share for 20 consecutive trading
days with an average daily trading liquidity for those trading days at or above A$20,000.

Notes to the Financial Statements
Crater Gold Mining Limited 47
Class D Performance Rights – if at any time the share price remains at or above A$0.030 per share for 20 consecutive trading
days with an average daily trading liquidity for those trading days at or above A$20,000.
Class E Performance Rights – if at any time the share price remains at or above A$0.040 per share for 20 consecutive trading
days with an average daily trading liquidity for those trading days at or above A$20,000.
The fair value of the performance rights granted during the financial year was $694,262. The value of performance rights expensed during the year was $122,310 with the remaining amount to be expensed over the vesting period. Total amount expensed was split between key management personnel ($101,968) and employees ($20,342).
Performance rights are valued using the ESO5 Barrier model where performance rights have market-based vesting conditions. The expected life is based on management’s best estimate at the time of valuation of vesting criteria being achieved, (Group used the expiry date). The weighted average fair value of performance rights granted during the year was $0.02.
Where performance rights have do not have market-based vesting conditions the values were calculated using the share price at the grant date, multiplied by the amount performance rights granted (Class A and B Performance Rights) and ESO5 Barrier model (for market vesting conditions – Class C, D and E Performance Rights) applying the following inputs:
Grant Date Expiry Date Share Price at
Grant Date Exercise
Price Expected volatility
Dividend Yield
Risk Free Rate
Fair value at grant date
27-Nov-2017 31-Dec-2020 $0.02 n/a 73.78% n/a 2.05% 587,603
15-Mar-2018 31-Dec 2020 $0.019 n/a 73.78% n/a 2.05% 106,659
c. Share Option Based Payments made to Unrelated Party
The Company did not issue any options over ordinary shares to extinguish its liabilities (2017: Nil).
d. Option Based Payments
The Company did not issue any options over ordinary shares to extinguish its liabilities (2017: Nil).
June June
2018 2017
Note $ $
25 Remuneration of Auditors
During the year, the following fees were paid or payable for services provided by RSM Australia (2017: BDO), the auditor of the parent entity, its related practices and unrelated firms.
RSM - Audit and review of financial reports 50,000 -
Non-audit services – RSM 12,000 -
BDO - Audit and review of financial reports - 114,250
62,000 114,250
BDO Papua New Guinea (Auditors of Anomaly Limited)
Audit and review of financial reports 19,847 15,027
19,847 15,027
26 Subsidiaries
a. Ultimate Controlling Entity
Crater Gold Mining Limited is the ultimate controlling entity for the Group.
b. Subsidiaries
The consolidated financial statements incorporate the assets, liabilities and results of the following wholly-owned subsidiaries in accordance with the accounting policy described in Note 1.
Name of entity Principal place of business / Country of Incorporation
Class of shares Percentage ownership
2018 %
2017 %
Anomaly Resources Limited Australia Ordinary 100 100
Anomaly Limited Papua New Guinea Ordinary 100 100
The proportion of ownership interest is equal to the proportion of voting power held.
There are no significant restrictions over the Group’s ability to access or use assets and settle liabilities.

Notes to the Financial Statements
Crater Gold Mining Limited 48
June June
2018 2017
Note $ $
27 Parent Entity information
Statement of Profit or Loss
Loss after income tax (2,553,202) (48,581,386)
Total Comprehensive Loss (2,553,202) (48,581,386)
Statement of Financial Position
Total current assets 133,560 182,184
Total assets 1,275,029 1,197,503
Total current liabilities 15,216,160 5,241,753
Total liabilities 15,216,160 8,657,228
Equity
Contributed equity 83,303,739 83,222,415
Convertible note equity - 340,507
Reserves 1,551,963 3,215,611
Accumulated losses (98,796,833) (94,238,258)
Total Equity (13,941,131) (7,459,725)
Contingent liabilities
The Parent Entity had no contingent liabilities as at 30 June 2018 (2017: nil).
Capital commitments - Property, plant and equipment
The Parent Entity had no capital commitments for property, plant and equipment as at 30 June 2018 (2017: nil).
Significant accounting policies
The accounting policies of the parent entity are consistent with those of the Group, as disclosed in Note 1, except for the following:
Investments in subsidiaries are accounted for at cost, less any impairment, in the Parent Entity.
June June
2018 2017
Note $ $
28 Reconciliation of loss for the period from continuing operations to net cash outflow from operating activities
Loss for the period from continuing operations (5,739,906) (25,284,741)
Adjustments for non-cash income and expense items:
Depreciation and amortisation/impairment 218,616 7,144,529
Non-cash interest transactions 751,791 464,003
Exploration expenses/impairment 1,848,903 15,049,107
Reversal of bad debt (88,543) -
Share based payment expenses 122,310 -
Payables settled by equity payments - 145,488
Change in operating assets and liabilities:
Movements in trade and other receivables 34,966 66,359
Movements in trade creditors and accruals 706,791 357,865
Net cash outflow from operating activities (2,145,072) (2,057,389)

Notes to the Financial Statements
Crater Gold Mining Limited 49
29 Post Reporting Date Events
On 2 August 2018, the Company announced it had arranged a New Loan Facility for $1.5 million, with an interest rate of 8% p.a. with the funding to be provided by way of an unsecured loan facility from Company’s major shareholder, Freefire Technology Ltd.
On 31 August 2018, the Company announced a proposal for the conversion of $12.0 million of debt due to Freefire Technology Limited (“Freefire”) (a Company associated with the CGN’s Chairman, Mr Sam Chan) into 12.0 million non – voting redeemable convertible preference shares issued at $1.00 each. The shares will not be listed.
No other matter or circumstance has arisen since 30 June 2018 that has significantly affected, or may significantly affect the Group's operations, the results of those operations, or the Group's state of affairs in future financial years.
30 Contingent Liabilities
The Group does not have any contingent liabilities (2017: nil).

Directors’ Declaration
Crater Gold Mining Limited 50
In the Directors' opinion:
the attached financial statements and notes comply with the Corporations Act 2001, the Accounting Standards, the Corporations Regulations 2001 and other mandatory professional reporting requirements;
the attached financial statements and notes comply with International Financial Reporting Standards as issued by the International Accounting Standards Board as described in Note 1 to the financial statements;
the attached financial statements and notes give a true and fair view of the Group's financial position as at 30 June 2018 and of its performance for the financial year ended on that date; and
there are reasonable grounds to believe that the Company will be able to pay its debts as and when they become due and payable.
The Directors have been given the declarations required by section 295A of the Corporations Act 2001. Signed in accordance with a resolution of Directors made pursuant to section 295(5)(a) of the Corporations Act 2001. On behalf of the Directors R D Parker Managing Director 30 September 2018

THE POWER OF BEING UNDERSTOODAUDIT | TAX | CONSULTING
RSM Australia Partners is a member of the RSM network and trades as RSM. RSM is the trading name used by the members of the RSM network. Each member of the RSM network is an independent accounting and consulting firm which practices in its own right. The RSM network is not itself a separate legal entity in any jurisdiction.
RSM Australia Partners ABN 36 965 185 036
Liability limited by a scheme approved under Professional Standards Legislation
RSM Australia Partners
Level 32, Exchange Tower 2 The Esplanade Perth WA 6000GPO Box R1253 Perth WA 6844
T +61 (0) 8 9261 9100 F +61 (0) 8 9261 9111
www.rsm.com.au
INDEPENDENT AUDITOR’S REPORT TO THE MEMBERS OF
CRATER GOLD MINING LIMITED
Opinion
We have audited the financial report of Crater Gold Mining Limited (the Company) and its subsidiaries (the Group), which comprises the consolidated statement of financial position as at 30 June 2018, the consolidated statement of profit or loss and other comprehensive income, the consolidated statement of changes in equity and the consolidated statement of cash flows for the year then ended, and notes to the financial statements, including a summary of significant accounting policies, and the directors' declaration.
In our opinion, the accompanying financial report of the Group is in accordance with the Corporations Act 2001, including:
(i) Giving a true and fair view of the Group's financial position as at 30 June 2018 and of its financial performance for the year then ended; and
(ii) Complying with Australian Accounting Standards and the Corporations Regulations 2001.
Basis for Opinion
We conducted our audit in accordance with Australian Auditing Standards. Our responsibilities under those standards are further described in the Auditor's Responsibilities for the Audit of the Financial Report section of our report. We are independent of the Group in accordance with the auditor independence requirements of the Corporations Act 2001 and the ethical requirements of the Accounting Professional and Ethical Standards Board's APES 110 Code of Ethics for Professional Accountants (the Code) that are relevant to our audit of the financial report in Australia. We have also fulfilled our other ethical responsibilities in accordance with the Code.
We confirm that the independence declaration required by the Corporations Act 2001, which has been given to the directors of the Company, would be in the same terms if given to the directors as at the time of this auditor's report.
We believe that the audit evidence we have obtained is sufficient and appropriate to provide a basis for our opinion.
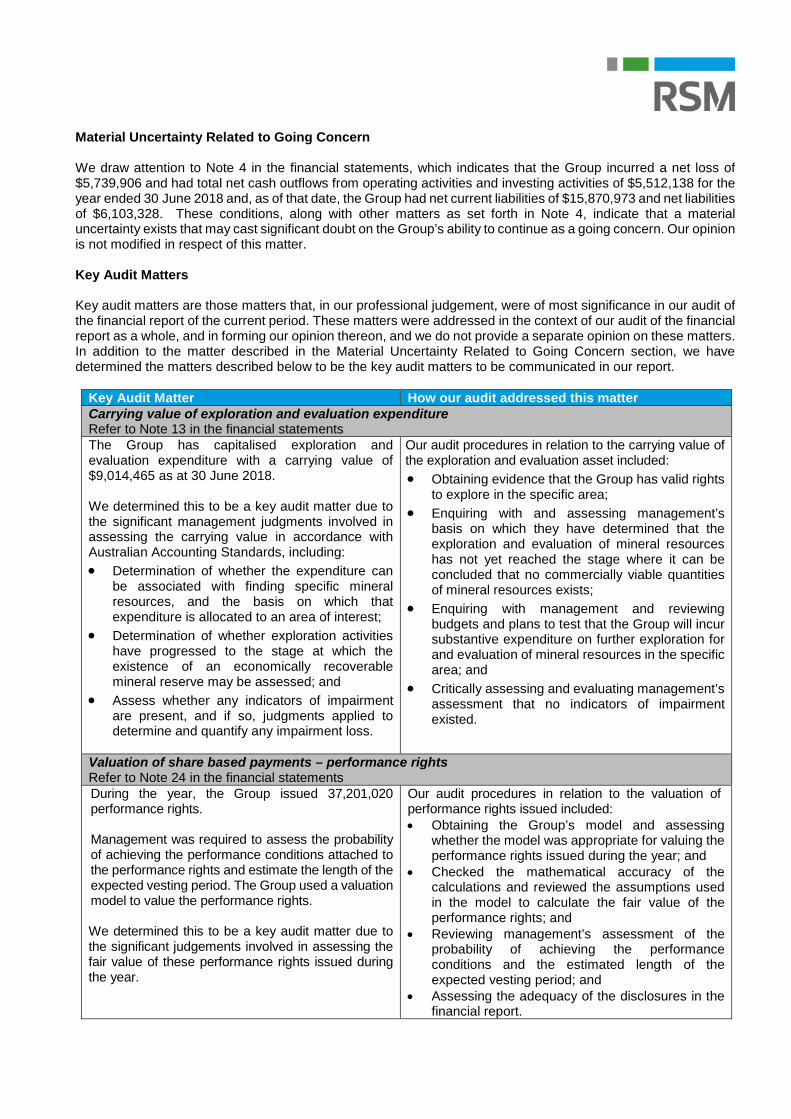
Material Uncertainty Related to Going Concern
We draw attention to Note 4 in the financial statements, which indicates that the Group incurred a net loss of $5,739,906 and had total net cash outflows from operating activities and investing activities of $5,512,138 for the year ended 30 June 2018 and, as of that date, the Group had net current liabilities of $15,870,973 and net liabilities of $6,103,328. These conditions, along with other matters as set forth in Note 4, indicate that a material uncertainty exists that may cast significant doubt on the Group’s ability to continue as a going concern. Our opinion is not modified in respect of this matter.
Key Audit Matters
Key audit matters are those matters that, in our professional judgement, were of most significance in our audit of the financial report of the current period. These matters were addressed in the context of our audit of the financial report as a whole, and in forming our opinion thereon, and we do not provide a separate opinion on these matters. In addition to the matter described in the Material Uncertainty Related to Going Concern section, we have determined the matters described below to be the key audit matters to be communicated in our report.
Key Audit Matter How our audit addressed this matterCarrying value of exploration and evaluation expenditure Refer to Note 13 in the financial statementsThe Group has capitalised exploration and evaluation expenditure with a carrying value of $9,014,465 as at 30 June 2018.
We determined this to be a key audit matter due to the significant management judgments involved in assessing the carrying value in accordance with Australian Accounting Standards, including:
Determination of whether the expenditure can be associated with finding specific mineral resources, and the basis on which that expenditure is allocated to an area of interest;
Determination of whether exploration activities have progressed to the stage at which the existence of an economically recoverable mineral reserve may be assessed; and
Assess whether any indicators of impairment are present, and if so, judgments applied to determine and quantify any impairment loss.
Our audit procedures in relation to the carrying value of the exploration and evaluation asset included:
Obtaining evidence that the Group has valid rights to explore in the specific area;
Enquiring with and assessing management’s basis on which they have determined that the exploration and evaluation of mineral resources has not yet reached the stage where it can be concluded that no commercially viable quantities of mineral resources exists;
Enquiring with management and reviewing budgets and plans to test that the Group will incur substantive expenditure on further exploration for and evaluation of mineral resources in the specific area; and
Critically assessing and evaluating management’s assessment that no indicators of impairment existed.
Valuation of share based payments – performance rights Refer to Note 24 in the financial statementsDuring the year, the Group issued 37,201,020 performance rights.
Management was required to assess the probability of achieving the performance conditions attached to the performance rights and estimate the length of the expected vesting period. The Group used a valuation model to value the performance rights.
We determined this to be a key audit matter due to the significant judgements involved in assessing the fair value of these performance rights issued during the year.
Our audit procedures in relation to the valuation of performance rights issued included: Obtaining the Group’s model and assessing
whether the model was appropriate for valuing the performance rights issued during the year; and
Checked the mathematical accuracy of the calculations and reviewed the assumptions used in the model to calculate the fair value of the performance rights; and
Reviewing management’s assessment of the probability of achieving the performance conditions and the estimated length of the expected vesting period; and
Assessing the adequacy of the disclosures in the financial report.

Other Information
The directors are responsible for the other information. The other information comprises the information included in the Group's annual report for the year ended 30 June 2018, but does not include the financial report and the auditor's report thereon.
Our opinion on the financial report does not cover the other information and accordingly we do not express any form of assurance conclusion thereon.
In connection with our audit of the financial report, our responsibility is to read the other information and, in doing so, consider whether the other information is materially inconsistent with the financial report or our knowledge obtained in the audit or otherwise appears to be materially misstated.
If, based on the work we have performed, we conclude that there is a material misstatement of this other information, we are required to report that fact. We have nothing to report in this regard.
Responsibilities of the Directors for the Financial Report
The directors of the Company are responsible for the preparation of the financial report that gives a true and fair view in accordance with Australian Accounting Standards and the Corporations Act 2001 and for such internal control as the directors determine is necessary to enable the preparation of the financial report that gives a true and fair view and is free from material misstatement, whether due to fraud or error.
In preparing the financial report, the directors are responsible for assessing the ability of the Group to continue as a going concern, disclosing, as applicable, matters related to going concern and using the going concern basis of accounting unless the directors either intend to liquidate the Group or to cease operations, or have no realistic alternative but to do so.
Auditor's Responsibilities for the Audit of the Financial Report
Our objectives are to obtain reasonable assurance about whether the financial report as a whole is free from material misstatement, whether due to fraud or error, and to issue an auditor's report that includes our opinion. Reasonable assurance is a high level of assurance, but is not a guarantee that an audit conducted in accordance with the Australian Auditing Standards will always detect a material misstatement when it exists. Misstatements can arise from fraud or error and are considered material if, individually or in the aggregate, they could reasonably be expected to influence the economic decisions of users taken on the basis of this financial report.
A further description of our responsibilities for the audit of the financial report is located at the Auditing and Assurance Standards Board website at: www.auasb.gov.au/auditors_responsibilities/ar1.pdf. This description forms part of our auditor's report.
Report on the Remuneration Report
Opinion on the Remuneration Report
We have audited the Remuneration Report included within the directors' report for the year ended 30 June 2018.
In our opinion, the Remuneration Report of Crater Gold Mining Limited, for the year ended 30 June 2018, complies with section 300A of the Corporations Act 2001.
Responsibilities
The directors of the Company are responsible for the preparation and presentation of the Remuneration Report in accordance with section 300A of the Corporations Act 2001. Our responsibility is to express an opinion on the Remuneration Report, based on our audit conducted in accordance with Australian Auditing Standards.
RSM AUSTRALIA PARTNERS
Perth, WA TUTU PHONG Dated: 30 September 2018 Partner

Shareholder Information
Crater Gold Mining Limited 55
The following information is required to be disclosed under ASX Listing Rule 4:10 and is not disclosed elsewhere in this Report. This information is correct as at 21 September 2018.
Substantial Shareholders
The following substantial shareholders are recorded in the Company’s register of substantial shareholders.
Name Number of shares % holding
Freefire Technology Ltd 160,085,929 58.83%
Voting Rights
Ordinary shares – on a show of hands, are one vote for every registered holder and on a poll, are one vote for each share held by registered holders. Options holders have no voting rights.
Holders of Each Class of Equity Security
Name Code Number of holders
Fully paid ordinary Shares CGN 3,126
Unlisted Options (exercisable at $0.25 per option on or before 27 July 2019) CGNO39 6
Unlisted Options (exercisable at $0.25 per option on or before 27 July 2019) CGNO41 6
Unlisted Options (exercisable at $0.125 per option on or before 12 July 2020) CGNO42 10
Top 20 Holders of Ordinary Shares
Name Number of shares % holding
Freefire Technology Ltd 160,085,929 57.28%
HSBC Custody Nominees (Australia) Limited 8,107,901 2.90%
Mr Paul Thomas McGreal 5,800,000 2.08%
BNP Paribas Nominees Pty Ltd <IB AU Noms Retail client DRP> 4,703,528 1.68%
Mr Graham John Bailey & Mrs Annette Maree Bailey <Bailey Super Fund A/C> 4,375,000 1.57%
Mr Norman Colburn Mayne <N C Mayne Family Fund A/C> 4,200,000 1.50%
Lennard Drilling Pty Ltd 3,846,154 1.38%
Graham Bailey Earthmoving Pty Ltd 3,125,000 1.12%
Mr Fouad Abdo 2,937,941 1.05%
Mr Joe Holloway 2,643,524 0.95%
J P Morgan Nominees Australia Limited 2,177,833 0.78%
One Managed Investment Funds Limited <Technical Investing Absolute Return A/C> 2,160,637 0.77%
Bloom Star Investment Limited 1,775,649 0.64%
Desmond Tak Yan Sun 1,750,000 0.63%
Kin Keung Lee 1,750,000 0.63%
Mr David Mingorance 1,220,000 0.44%
Mr Barry Rowland Butler & Mrs Julie Butler 1,162,107 0.42%
IAE Study In Australia Pty Ltd <IAE Superannuation Fund A/C> 1,000,000 0.36%
Mr Colin Frank West 1,000,000 0.36%
Mr Carlo Battisti 1,000,000 0.36%
Richard Lewis Johnson 781,250 0.28%
James Sinton Spence 767,100 0.27%
J & C Brennan Superannuation Fund Pty Ltd <The Brennan Super Funds A/C> 750,000 0.27%
Grand Total 217,119,553 77.69%

Shareholder Information
Crater Gold Mining Limited 56
Distribution of Equity Securities
Class of Security Security Code 1 to 1,000 1,001 to 5,000
5,001 to 10,000
10,001 to 100,000
100,001 and Over
Total
Fully paid ordinary Shares CGN 1,349 767 298 543 169 3,278
Unlisted Options CGNO39 - - - - 6 6
Unlisted Options CGNO41 - - - - 6 6
Unlisted Options CGNO42 - - - - 10 10
Number of Holders Holding Less than a Marketable Parcel of Shares
A marketable parcel is defined by the Market Rule Procedures of the ASX as a parcel of securities with a value of not less than $500.
The number of ordinary shareholders holding less than a marketable parcel of shares is 2,686.
On Market Buy-back
There is no current on market buy-back.
Stock Exchange Listing
Quotation has been granted for all the ordinary shares of the Company on all Member Exchanges of the Australian Securities Exchange Limited.
Unquoted Securities
Options over unissued shares:
A total number of 22,600,000 options are on issue. 13,300,000 are on issue to 16 holders of ordinary securities. 9,300,000 options are on issue to six Directors.