annual report dated december 31, 2005 %%transmsg
TRANSCRIPT
The Fund seeks long-term capital appreciation throughinvestments and advocacy that promote the American system
of free enterprise.
Annual ReportDated December 31, 2005


FREE ENTERPRISE ACTION FUND
TABLE OF CONTENTS
Page
Letter to Shareholders***************************************************************** 3Schedule of Portfolio Investments******************************************************* 8Statement of Assets and Liabilities ****************************************************** 16Statement of Operations *************************************************************** 17Statement of Changes in Net Assets***************************************************** 18Financial Highlights ******************************************************************* 19Notes to Financial Statements ********************************************************** 20Report of Independent Registered Public Accounting Firm ********************************* 23Supplemental Information ************************************************************* 24
This report must be preceded or accompanied by a prospectus of the Fund. The prospectus contains more complete information,including investment objective, risks, fees and expenses and should be read carefully before investing or sending any money.
A description of the policies and procedures that the Fund uses to determine how to vote proxies relating to the portfolio securitiesand information regarding how the Fund voted proxies relating to the portfolio securities during the most recent 12-month periodended June 30 is available without charge, upon request, by calling 1-800-766-3960 or on the Securities and ExchangeCommission’s (‘‘SEC’’) website at http://www.sec.gov.
The Fund files a Form N-Q with the SEC no more than sixty days after the Fund’s first and third quarters of its fiscal year. Form N-Qincludes a schedule of the Fund’s portfolio holdings as of the end of those fiscal quarters. The Fund’s N-Q filings can be found on theSEC’s website at http://www.sec.gov. The Fund’s N-Q filings may also be reviewed and copied at the SEC’s Public Reference Roomin Washington, D.C. Call 800-SEC-0330 for information on the operation of the Public Reference Room.
Free Enterprise Action Fund, like all mutual funds:) Is NOT FDIC insured) Has no bank guarantee) May lose value
1

(This Page Intentionally Left Blank)
2
FREE ENTERPRISE ACTION FUNDLetter to Shareholders
Launched on March 1, 2005, the Free Enterprise Action Fund (FEAF) achieved its investment and advocacy goals for 2005, layingthe groundwork for an even more successful 2006.
FUND PERFORMANCE AND PORTFOLIO
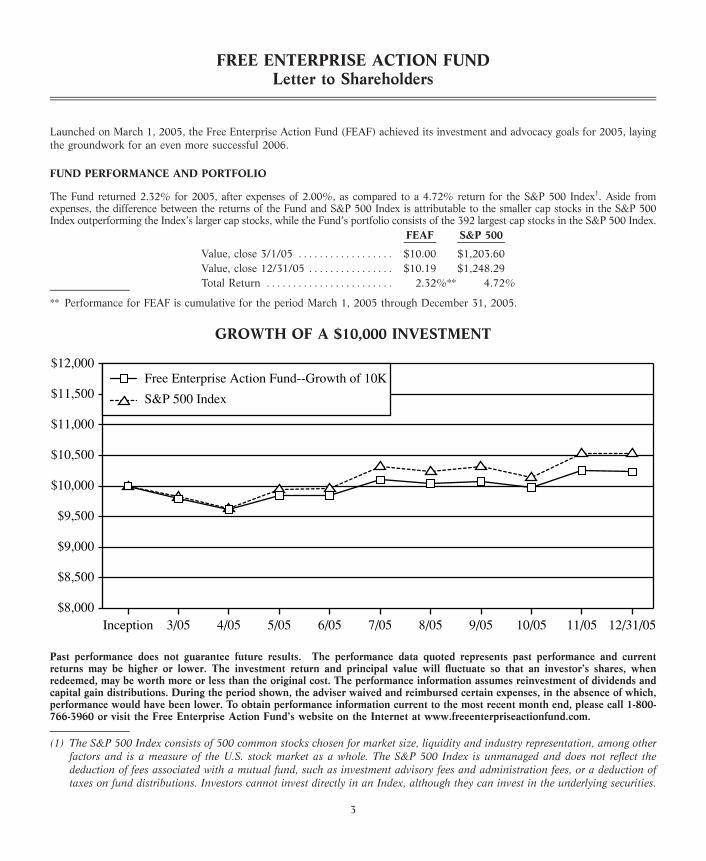
The Fund returned 2.32% for 2005, after expenses of 2.00%, as compared to a 4.72% return for the S&P 500 Index1. Aside fromexpenses, the difference between the returns of the Fund and S&P 500 Index is attributable to the smaller cap stocks in the S&P 500Index outperforming the Index’s larger cap stocks, while the Fund’s portfolio consists of the 392 largest cap stocks in the S&P 500 Index.
FEAF S&P 500
Value, close 3/1/05 ****************** $10.00 $1,203.60Value, close 12/31/05 **************** $10.19 $1,248.29Total Return ************************ 2.32%** 4.72%
** Performance for FEAF is cumulative for the period March 1, 2005 through December 31, 2005.
GROWTH OF A $10,000 INVESTMENT
12/31/0511/0510/059/058/057/056/055/054/053/05Inception$8,000
$8,500
$9,000
$9,500
$10,000
$10,500
$11,000
$11,500
$12,000
S&P 500 Index
Free Enterprise Action Fund--Growth of 10K
Past performance does not guarantee future results. The performance data quoted represents past performance and currentreturns may be higher or lower. The investment return and principal value will fluctuate so that an investor’s shares, whenredeemed, may be worth more or less than the original cost. The performance information assumes reinvestment of dividends andcapital gain distributions. During the period shown, the adviser waived and reimbursed certain expenses, in the absence of which,performance would have been lower. To obtain performance information current to the most recent month end, please call 1-800-766-3960 or visit the Free Enterprise Action Fund’s website on the Internet at www.freeenterpriseactionfund.com.
(1) The S&P 500 Index consists of 500 common stocks chosen for market size, liquidity and industry representation, among otherfactors and is a measure of the U.S. stock market as a whole. The S&P 500 Index is unmanaged and does not reflect thededuction of fees associated with a mutual fund, such as investment advisory fees and administration fees, or a deduction oftaxes on fund distributions. Investors cannot invest directly in an Index, although they can invest in the underlying securities.
3

FREE ENTERPRISE ACTION FUNDLetter to Shareholders, continued
The Fund owns common stock in 392 of the companies in the S&P 500. As of December 31, the net assets of the Fund wasapproximately $4.79 million. The Fund’s ‘‘Top Ten’’ holdings as of December 31, 2005 appear in the table below. A sector-by-sectorlisting of our holdings follows.
General Electric ************************** 2.91% Procter & Gamble ************************ 1.52%
ExxonMobil ****************************** 2.39% Bank of America ************************** 1.45%
Microsoft Corp. ************************** 2.30% American Int’l Group********************** 1.41%
Citigroup ******************************** 2.01% Johnson & Johnson************************ 1.35%
Wal-Mart Stores ************************** 1.53% Pfizer, Inc. ******************************* 1.21%
*** The Fund’s composition is subject to change.
Sector Diversification (as a percentage of total investments)***As of December 31, 2005
Financial Services ************************ 20.0% Short-Term Investments******************* 5.4%
Healthcare ****************************** 12.0% Software******************************** 3.9%
Industrial Materials ********************** 11.3% Business Services ************************ 3.7%
Hardware ******************************* 9.5% Media ********************************** 3.6%
Consumer Services *********************** 8.8% Utilities********************************* 3.0%
Consumer Goods ************************ 8.5% Telecommunications********************** 2.7%
Energy********************************** 7.5% Options********************************* 0.1%
100.0%
*** The Fund’s composition is subject to change.
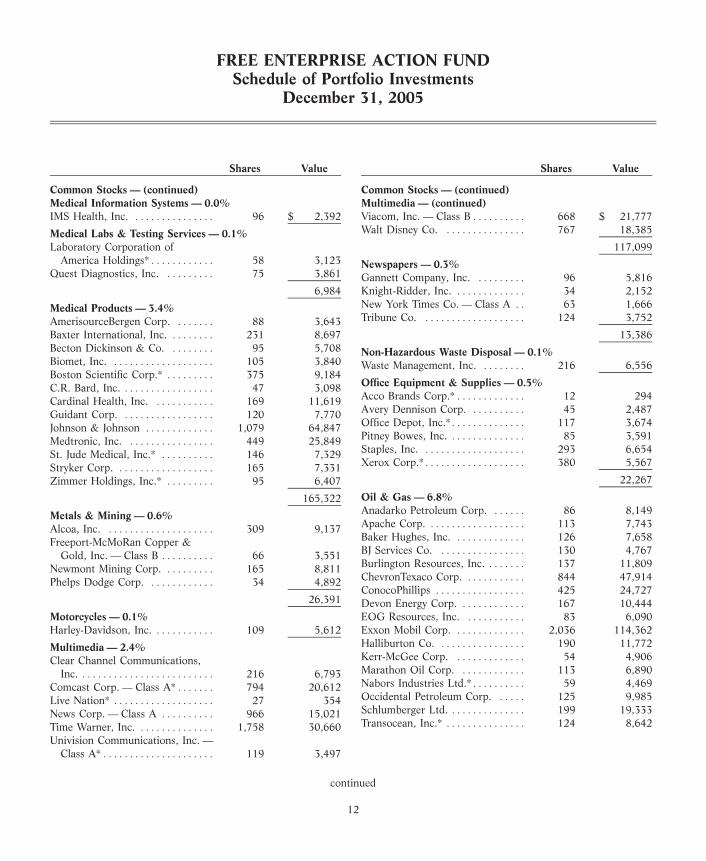
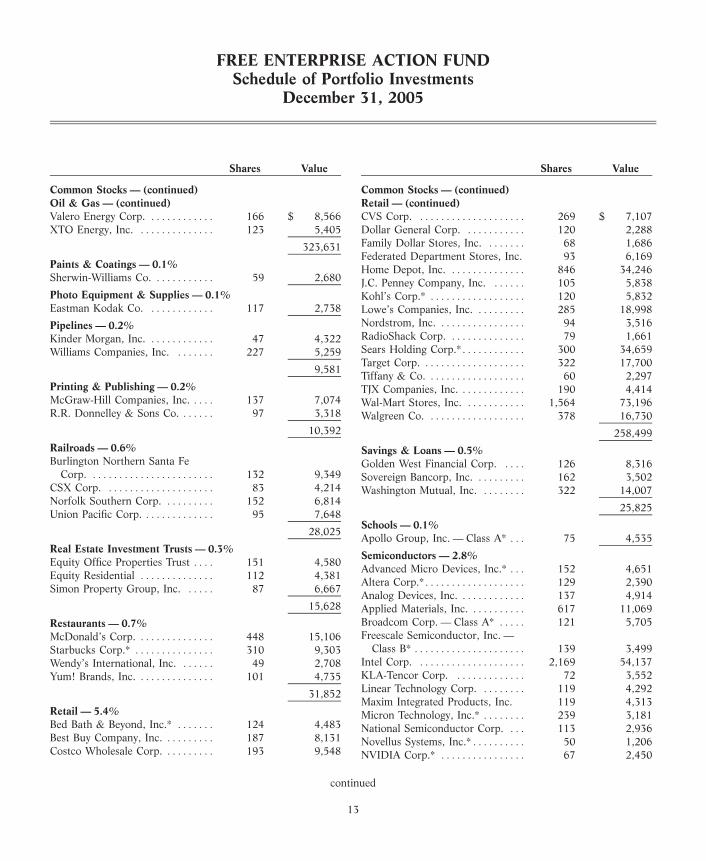
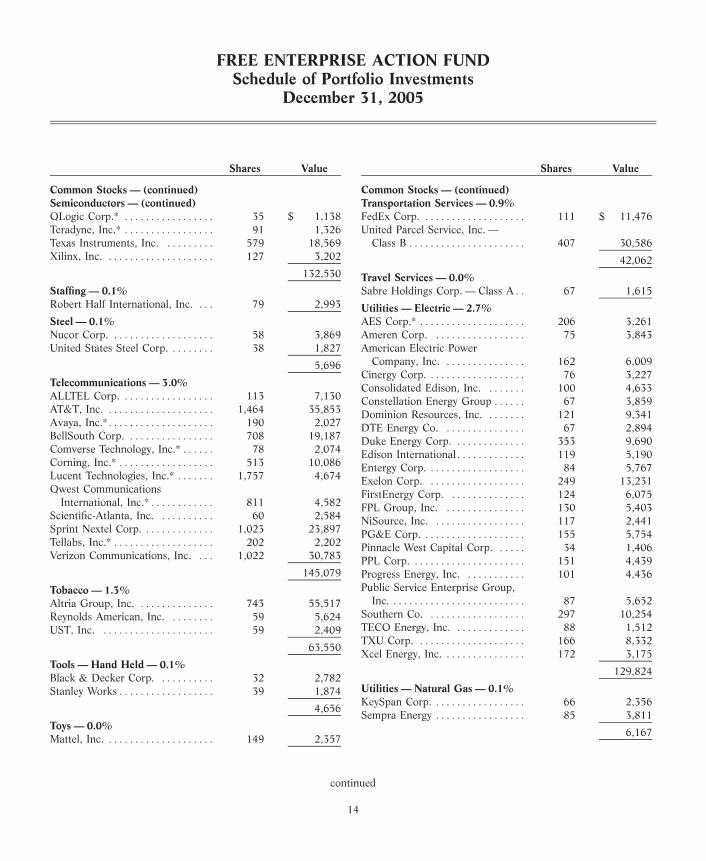
Our portfolio as of December 31, 2005 is attached.
FUND ADVOCACY
The Fund’s advocacy efforts are directed at promoting shareholder value over the long-term and defending the American system offree enterprise. Beginning with the fund’s commencement of operations on March 1, 2005, the Fund’s notable accomplishments for2005 include:
) Convinced JPMorgan Chase to reverse its decision to lobby for global warming regulations. Based on pressure from theRainforest Action Network, banking giant JP Morgan Chase announced in April that it would assemble a coalition of financialservices companies to lobby state and federal governments for restrictive global warming regulation. Thanks to action by theFEAF’s managers at JPM’s annual shareholder meeting in May, the CEO announced that the bank would not be lobbying onglobal warming – a position that was reiterated to the Fund in follow-up correspondence.
) Helped defeat shareholder resolutions concerning global warming. In response to an activist campaign to pressure mutualfund managers to vote in favor of global warming resolutions offered at the ExxonMobil annual meeting, the FEAF’smanagers worked to develop institutional investor opposition to the resolutions. All global warming resolutions weredefeated.
) Opened up the Citigroup ‘‘Environmental Partners’’ program to pro-free enterprise input. Citigroup announced an‘‘Environmental Partners’’ program that only included environmental groups as advisers to the bank. The FEAF’s managersconvinced Citigroup to include the FEAF as one of its ‘‘partners.’’ The FEAF will continue working with Citigroup to ensurethat the bank receives accurate and balanced advice from its ‘‘partners’’ on environmental issues.
4

FREE ENTERPRISE ACTION FUNDLetter to Shareholders, continued
The FEAF helped file a number of shareholder resolutions for the 2005 annual meeting season, including:
) Charitable Contributions. Corporate support for pro-free enterprise think tanks has declined over the last few years whilesupport for Left-wing activist groups appears to have increased. The FEAF helped file shareholder resolutions requestingdisclosure of the business purposes of corporate charitable contributions in hopes of exposing contributions to Left-wingactivist groups as efforts to appease these groups. Resolutions were filed with Coca-Cola, PepsiCo and Citigroup.
) Corporate Governance. Goldman Sachs has a policy banning personal conflicts of interest with firm business. In 2004,Goldman Sachs donated 680,000 acres in Chile to an environmental group, admittedly for no business purpose. An official ofthe group is the daughter of the Goldman Sachs’ CEO. In 2005, Goldman Sachs announced it would lobby governments forrestrictive global warming regulation, a policy also advocated by the Nature Conservancy. The Goldman Sachs CEO is alsochairman of the Nature Conservancy. The FEAF helped file a shareholder resolution requesting Goldman Sachs’s corporategovernance committees to investigate the CEO’s potential personal conflicts of interest.
) Flat Tax Report. Significant reform of the tax code is not likely to occur without the participation of corporations. TheFEAF supported the filing of shareholder resolutions requesting reports on the impacts to the companies and shareholders ofthe flat tax as discussed in ‘‘Flat Tax Revolution: Using a Postcard to Abolish the IRS’’ by Steve Forbes (Regnery 2005).Resolutions were filed with General Electric, Citigroup, Johnson & Johnson and Verizon.
) Global Warming Report. In 2005, General Electric announced that it would be supporting restrictive global warmingregulation. The FEAF supported the filing of a shareholder resolution with GE requesting a report justifying GE’s position onglobal warming in terms of the costs and benefits to shareholders.
) Lobbying Priorities Report. Over the past several years, JPMorgan Chase & Co. agreed to settle various lawsuits, includingEnron and WorldCom litigation, for billions of dollars, despite claiming that it had meritorious defenses to the lawsuits. TheCompany spent at least $500 million in attorney’s fees during 2004. Rather than launching a lobbying effort to focus onlawsuit reform that might reduce unmeritorious litigation that harms shareholder value, JPMorgan Chase announced in April2005 that it would lobby governments for restrictive global warming regulation. The FEAF is supporting a shareholderresolution filed with JPMorgan Chase that requests a report to shareholders on the Company’s process for identifying andprioritizing legislative and regulatory public policy advocacy activities.
The FEAF has also commenced a number of other advocacy activities during 2005 addressing a variety of free enterprise-relatedissues including:
) Financial services companies intimidated by external activists from participating in the public policy debate over socialsecurity reform;
) The CEO-member Business Roundtable’s failure to defend businesses in the face of congressional attacks on oil companyprofits and pharmaceutical company patent rights;
) Utility holding companies harming shareholders by supporting regional initiatives for restricting greenhouse gas emissions;
) New York Stock Exchange succumbing to pressure from animal rights extremists and not listing Life Sciences Research, Inc.;
) An effort by the New York Times to investigate the adoption of children by Supreme Court Justice John Roberts;
) Property and casualty insurers being pressured by environmental activist efforts to support claims that natural disasters, suchas Hurricane Katrina, are linked with global warming; and
) Microsoft capitulation to anti-chemical activists concerning the use of PVC plastic packaging.
The FEAF has attracted interest from the media during 2005 including:
) CNBC (Kudlow & Company), March 28, ‘‘Steven Milloy of the Free Enterprise Action Fund discusses his organization’s workagainst corporate social responsibility’’
) New York Sun, April 1, ‘‘Big Labor Targets Wall Street’’
5

FREE ENTERPRISE ACTION FUNDLetter to Shareholders, continued
) Wall Street Journal, April 25, ‘‘JP Morgan Adopts ‘‘Green’’ Lending Policies’’
) American Banker, May 20, ‘‘JPM Enviro Pact Leaves Complexity In Its Wake’’
) Financial Post (Canada), May 26, ‘‘A Fund for Profit Activists’’
) ‘‘Human Events, June 13, ‘‘Free Enterprise Action Fund’’
) National Review, July 4, ‘‘Birkenstocks and Stocks’’
) Fox News Channel, August 2, ‘‘Your World With Neil Cavuto’’
) Washington Post, October 5, ‘‘A New Worry for Insurers: Firms Looking at Whether Climate Change Could Affect TheirBottom Lines’’
) Human Events, November 8, 2005, ‘‘Corporate Social Responsibility: Another Cover for the Leftist Political Agenda’’
) American Spectator, November 10, ‘‘The Permanent Shakedown Left’’
) Inside EPA, December 2, 2005, ‘‘Goldman Sachs’ Novel Climate Plan Is Latest Target Of Free-Market Fire’’
The FEAF issued the following media releases during 2005:
) Microsoft Called on to Reverse Phase-out of PVC Plastic; Mutual Fund Sees Move as Unwarranted and Harmful, PR Web,December 13, 2005
) Free Enterprise Action Fund Requests Review of Goldman Sachs’ Environmental Policy, PR Web, November 30, 2005
) Free Enterprise Action Fund Urges Business Roundtable to Defend Capitalism Against Congressional Overreaching, PR Web,November 10, 2005
) Free Enterprise Action Fund Urges Insurers to Conduct Independent Analyses of Alleged Link Between Global Warming andWeather-Related Losses, PR Web, November 1, 2005
) Free Enterprise Action Fund Asks ‘‘Why are the leaders of the socially responsible investment industry stonewalling target ofviolent hate speech?’’, PR Web, October 20, 2005
) Free Enterprise Action Fund Calls on Calvert Investments and KLD Research to Withdraw Sponsorship of ‘‘SociallyResponsible’’ Conference Featuring Speaker Who Advocated Violence Against Fund Managers, PR Web, October 10, 2005
) Free Enterprise Action Fund Warns Business Roundtable Member Companies To Focus On Real Business Growth Strategies,Not ‘‘Feel-Good’’ Public Relations Stunts, PR Web, September 28, 2005
) Free Enterprise Action Fund Calls on Citigroup to Diversify the Bank’s ‘‘Environment Partners’’ Program, PR Web,September 22, 2005
) Free Enterprise Action Fund Questions GE Decision To Side With Global Warming Activists, PR Web, September 14, 2005
) Free Enterprise Action Fund asks ConEd, PG&E to disclose involvement with state global warming initiatives, PR Web,September 7, 2005
) Free Enterprise Action Fund Asks Financial Service Companies Whether Their Support For Social Security Reform Has BeenImpacted By Activist-Investor Pressure, PR Web, August 17, 2005
) A Pioneering Mutual Fund for Pro-Free-Market Investors, State Policy Network News, July/August 2005
) Free Enterprise Action Fund, Human Events, June 13, 2005
) Free Enterprise Action Fund Requests Audit Committee Review of JPMorgan Chase Capitulation to Social Activist Demands,Business Wire, April 26, 2005
6

FREE ENTERPRISE ACTION FUNDLetter to Shareholders, continued
LOOKING AHEAD TO 2006
The Free Enterprise Action Fund is looking forward to a productive 2006. In items of investment performance, we intend tocontinue holding our diversified portfolio of large-cap companies and managing the portfolio so as to produce a market-based return.
In terms of advocacy, we intend to support the shareholder resolutions that have been filed, participate in annual shareholdermeetings and to continue and expand upon the Fund’s advocacy efforts so as to promote shareholder value and defend our system offree enterprise.
Sincerely,
Thomas J. Borelli Steven J. MilloyAction Fund Management, LLC Action Fund Management, LLC
7
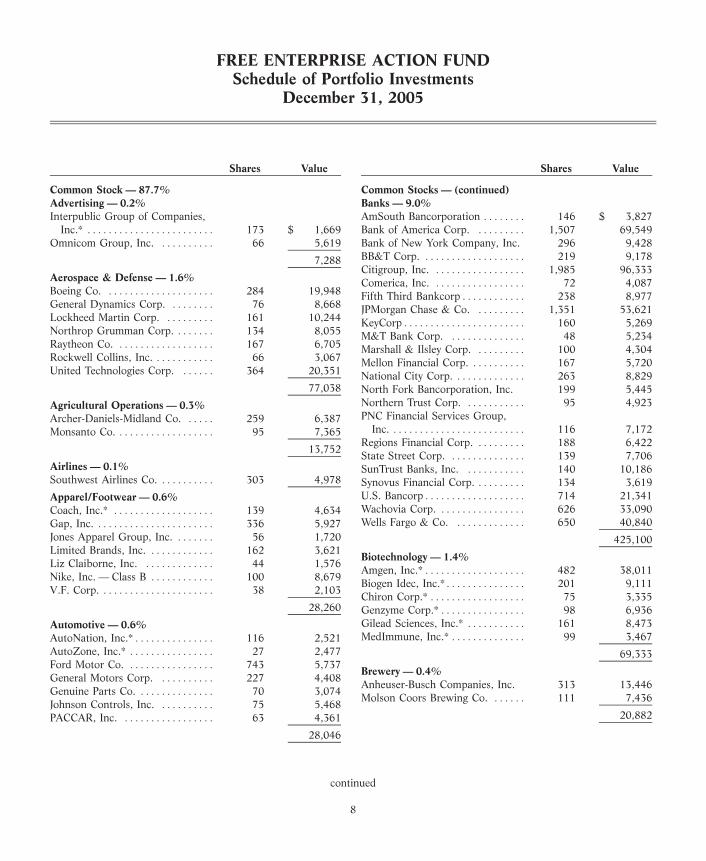
FREE ENTERPRISE ACTION FUNDSchedule of Portfolio Investments
December 31, 2005
Shares Value Shares Value
Common Stock — 87.7% Common Stocks — (continued)Advertising — 0.2% Banks — 9.0%Interpublic Group of Companies, AmSouth Bancorporation ******** 146 $ 3,827
Inc.* ************************ 173 $ 1,669 Bank of America Corp. ********* 1,507 69,549Omnicom Group, Inc. ********** 66 5,619 Bank of New York Company, Inc. 296 9,428
BB&T Corp. ******************* 219 9,1787,288Citigroup, Inc. ***************** 1,985 96,333
Aerospace & Defense — 1.6% Comerica, Inc. ***************** 72 4,087Boeing Co. ******************** 284 19,948 Fifth Third Bankcorp************ 238 8,977General Dynamics Corp. ******** 76 8,668 JPMorgan Chase & Co. ********* 1,351 53,621Lockheed Martin Corp. ********* 161 10,244 KeyCorp*********************** 160 5,269Northrop Grumman Corp. ******* 134 8,055 M&T Bank Corp. ************** 48 5,234Raytheon Co. ****************** 167 6,705 Marshall & Ilsley Corp. ********* 100 4,304Rockwell Collins, Inc. *********** 66 3,067 Mellon Financial Corp. ********** 167 5,720United Technologies Corp. ****** 364 20,351 National City Corp. ************* 263 8,829
77,038 North Fork Bancorporation, Inc. 199 5,445Northern Trust Corp. *********** 95 4,923Agricultural Operations — 0.3%PNC Financial Services Group,Archer-Daniels-Midland Co. ***** 259 6,387
Inc. ************************* 116 7,172Monsanto Co. ****************** 95 7,365Regions Financial Corp. ********* 188 6,422
13,752State Street Corp. ************** 139 7,706
Airlines — 0.1% SunTrust Banks, Inc. *********** 140 10,186Southwest Airlines Co. ********** 303 4,978 Synovus Financial Corp. ********* 134 3,619
U.S. Bancorp******************* 714 21,341Apparel/Footwear — 0.6%Wachovia Corp. **************** 626 33,090Coach, Inc.* ******************* 139 4,634Wells Fargo & Co. ************* 650 40,840Gap, Inc. ********************** 336 5,927
Jones Apparel Group, Inc. ******* 56 1,720 425,100Limited Brands, Inc. ************ 162 3,621
Biotechnology — 1.4%Liz Claiborne, Inc. ************* 44 1,576
Amgen, Inc.******************** 482 38,011Nike, Inc. — Class B ************ 100 8,679
Biogen Idec, Inc.**************** 201 9,111V.F. Corp. ********************* 38 2,103
Chiron Corp.* ****************** 75 3,33528,260 Genzyme Corp.***************** 98 6,936
Gilead Sciences, Inc.* *********** 161 8,473Automotive — 0.6%MedImmune, Inc.* ************** 99 3,467AutoNation, Inc.**************** 116 2,521
AutoZone, Inc.* **************** 27 2,477 69,333Ford Motor Co. **************** 743 5,737
Brewery — 0.4%General Motors Corp. ********** 227 4,408
Anheuser-Busch Companies, Inc. 313 13,446Genuine Parts Co. ************** 70 3,074
Molson Coors Brewing Co. ****** 111 7,436Johnson Controls, Inc. ********** 75 5,468
20,882PACCAR, Inc. ***************** 63 4,361
28,046
continued
8

FREE ENTERPRISE ACTION FUNDSchedule of Portfolio Investments
December 31, 2005
Shares Value Shares Value
Common Stocks — (continued) Common Stocks — (continued)Brokerage Services — 2.0% Computer Software & Services — (continued)Bear Stearns Companies, Inc. **** 44 $ 5,083 Automatic Data Processing, Inc. 224 $ 10,279Charles Schwab Corp. ********** 562 8,245 Computer AssociatesGoldman Sachs Group, Inc. ***** 178 22,732 International, Inc. ************ 231 6,512Lehman Brothers Holdings, Inc. ** 103 13,202 Electronic Arts, Inc.************* 115 6,016Merrill Lynch & Company, Inc. ** 355 24,044 First Data Corp. *************** 304 13,075Morgan Stanley***************** 415 23,547 Fiserv, Inc.********************* 79 3,418
Intuit, Inc.* ******************** 70 3,73196,853Mercury Interactive Corp.******** 36 1,000
Building Materials — 0.2% Microsoft Corp. **************** 4,220 110,354American Standard Companies, Oracle Corp.* ****************** 1,990 24,298
Inc. ************************* 75 2,996 Siebel Systems, Inc. ************ 218 2,306Masco Corp. ******************* 187 5,645
193,755Vulcan Materials Co. *********** 38 2,575Computers & Peripherals — 4.4%11,216Apple Computer, Inc.* ********** 272 19,554
Casino Services — 0.1% Cisco Systems, Inc.* ************ 2,487 42,577Harrah’s Entertainment, Inc. ***** 39 2,780 Computer Sciences Corp.* ******* 84 4,254International Game Technology, Dell, Inc.* ********************* 954 28,610
Inc. ************************* 142 4,371 Electronic Data Systems Corp. *** 203 4,8807,151 EMC Corp.* ******************* 904 12,312
Hewlett-Packard Co. ************ 1,082 30,978Chemicals — 0.9%IBM Corp. ******************** 626 51,458Dow Chemical Co. ************* 326 14,285Lexmark International, Inc. —E.I. du Pont de Nemours & Co. ** 334 14,195
Class A********************** 54 2,421Eastman Chemical Co. ********** 32 1,651NCR Corp.********************* 68 2,308Ecolab, Inc. ******************* 109 3,953Network Appliance, Inc.* ******** 145 3,915International Flavors &Sun Microsystems, Inc.* ********* 1,307 5,476Fragrances, Inc. ************** 46 1,541Symbol Technologies, Inc. ******* 116 1,487PPG Industries, Inc. ************ 66 3,821
Rohm & Haas Co. ************** 80 3,874 210,230Sigma-Aldrich Corp. ************ 30 1,899 Consumer Products — 2.2%
45,219 Avon Products, Inc. ************ 191 5,453Colgate-Palmolive Co. *********** 202 11,080Commercial Services — 0.5%Fortune Brands, Inc. ************ 58 4,525Cendant Corp. ***************** 417 7,193Kimberly-Clark Corp. *********** 187 11,155Cintas Corp. ******************* 71 2,924Newell Rubbermaid, Inc. ******** 103 2,449Moody’s Corp. ***************** 109 6,695Procter & Gamble Co. ********** 1,260 72,929Paychex, Inc. ****************** 133 5,070
107,59121,882
Computer Software & Services — 4.0%Adobe Systems, Inc. ************ 158 5,840Affiliated Computer Services, Inc.* 51 3,018Autodesk, Inc. ***************** 91 3,908
continued
9
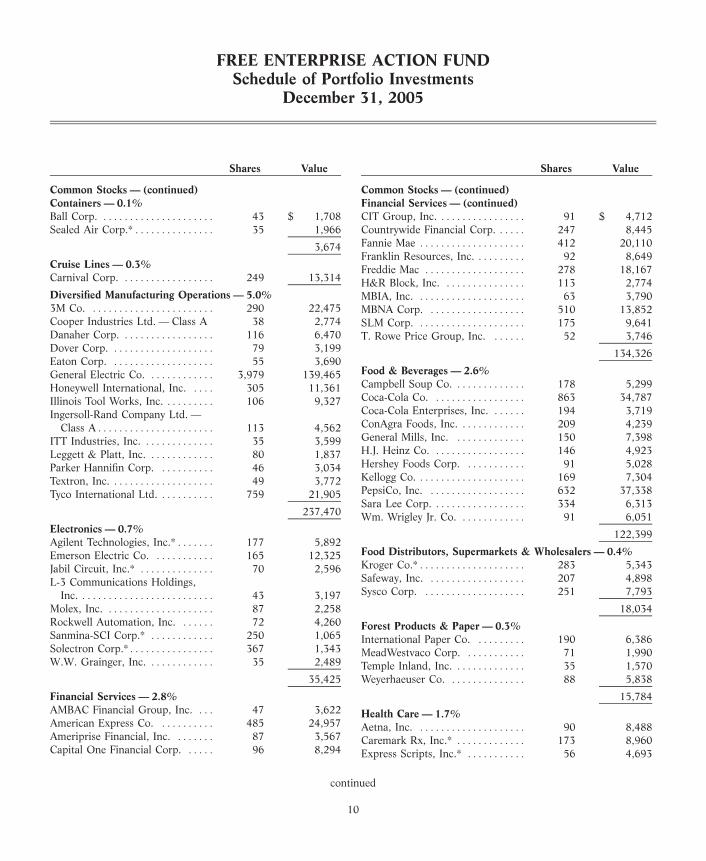
FREE ENTERPRISE ACTION FUNDSchedule of Portfolio Investments
December 31, 2005
Shares Value Shares Value
Common Stocks — (continued) Common Stocks — (continued)Containers — 0.1% Financial Services — (continued)Ball Corp. ********************* 43 $ 1,708 CIT Group, Inc. **************** 91 $ 4,712Sealed Air Corp.**************** 35 1,966 Countrywide Financial Corp. ***** 247 8,445
Fannie Mae ******************** 412 20,1103,674Franklin Resources, Inc. ********* 92 8,649
Cruise Lines — 0.3% Freddie Mac ******************* 278 18,167Carnival Corp. ***************** 249 13,314 H&R Block, Inc. *************** 113 2,774Diversified Manufacturing Operations — 5.0% MBIA, Inc. ******************** 63 3,7903M Co. *********************** 290 22,475 MBNA Corp. ****************** 510 13,852Cooper Industries Ltd. — Class A 38 2,774 SLM Corp. ******************** 175 9,641Danaher Corp. ***************** 116 6,470 T. Rowe Price Group, Inc. ****** 52 3,746Dover Corp. ******************* 79 3,199 134,326Eaton Corp. ******************* 55 3,690
Food & Beverages — 2.6%General Electric Co. ************ 3,979 139,465Campbell Soup Co. ************* 178 5,299Honeywell International, Inc. **** 305 11,361Coca-Cola Co. ***************** 863 34,787Illinois Tool Works, Inc. ********* 106 9,327Coca-Cola Enterprises, Inc. ****** 194 3,719Ingersoll-Rand Company Ltd. —ConAgra Foods, Inc. ************ 209 4,239Class A********************** 113 4,562General Mills, Inc. ************* 150 7,398ITT Industries, Inc. ************* 35 3,599H.J. Heinz Co. ***************** 146 4,923Leggett & Platt, Inc. ************ 80 1,837Hershey Foods Corp. *********** 91 5,028Parker Hannifin Corp. ********** 46 3,034Kellogg Co. ******************** 169 7,304Textron, Inc. ******************* 49 3,772PepsiCo, Inc. ****************** 632 37,338Tyco International Ltd. ********** 759 21,905Sara Lee Corp. ***************** 334 6,313
237,470 Wm. Wrigley Jr. Co. ************ 91 6,051Electronics — 0.7% 122,399Agilent Technologies, Inc.******** 177 5,892
Food Distributors, Supermarkets & Wholesalers — 0.4%Emerson Electric Co. *********** 165 12,325Kroger Co.********************* 283 5,343Jabil Circuit, Inc.* ************** 70 2,596Safeway, Inc. ****************** 207 4,898L-3 Communications Holdings,Sysco Corp. ******************* 251 7,793Inc. ************************* 43 3,197
Molex, Inc. ******************** 87 2,258 18,034Rockwell Automation, Inc. ****** 72 4,260 Forest Products & Paper — 0.3%Sanmina-SCI Corp.* ************ 250 1,065 International Paper Co. ********* 190 6,386Solectron Corp.***************** 367 1,343 MeadWestvaco Corp. *********** 71 1,990W.W. Grainger, Inc. ************ 35 2,489 Temple Inland, Inc. ************* 35 1,570
35,425 Weyerhaeuser Co. ************** 88 5,838
Financial Services — 2.8% 15,784AMBAC Financial Group, Inc. *** 47 3,622 Health Care — 1.7%American Express Co. ********** 485 24,957 Aetna, Inc. ******************** 90 8,488Ameriprise Financial, Inc. ******* 87 3,567 Caremark Rx, Inc.* ************* 173 8,960Capital One Financial Corp. ***** 96 8,294 Express Scripts, Inc.* *********** 56 4,693
continued
10

FREE ENTERPRISE ACTION FUNDSchedule of Portfolio Investments
December 31, 2005
Shares Value Shares Value
Common Stocks — (continued) Common Stocks — (continued)Health Care — (continued) Insurance — (continued)Humana, Inc.* ***************** 70 $ 3,803 American International Group,McKesson Corp. *************** 108 5,572 Inc. ************************* 990 $ 67,547Medco Health Solutions, Inc.***** 105 5,859 Aon Corp. ********************* 137 4,925UnitedHealth Group, Inc. ******* 457 28,397 Chubb Corp. ****************** 72 7,031WellPoint, Inc.* **************** 215 17,155 CIGNA Corp. ****************** 48 5,362
Cincinnati Financial Corp. ******* 75 3,35182,927Hartford Financial Services
Homebuilders — 0.2% Group, Inc. ****************** 107 9,190Centex Corp. ****************** 48 3,432 Lincoln National Corp. ********** 70 3,712KB Home********************** 35 2,543 Loews Corp. ******************* 67 6,355Pulte Homes, Inc. ************** 86 3,385 Marsh & McLennan Companies,
9,360 Inc. ************************* 219 6,955MetLife, Inc. ****************** 281 13,768Hospitals — 0.2%Principal Financial Group, Inc. *** 127 6,024HCA, Inc. ********************* 150 7,575Progressive Corp. ************** 75 8,759Health Management Associates,Prudential Financial, Inc. ******** 186 13,613Inc. — Class A *************** 103 2,262St. Paul Travelers Companies, Inc. 259 11,570
9,837XL Capital Ltd. — Class A******* 55 3,706
Hotels & Motels — 0.3%200,635
Hilton Hotels Corp. ************ 161 3,882Internet Business Services — 0.6%Marriott International, Inc. —eBay, Inc.* ********************* 465 20,111Class A********************** 84 5,625Symantec Corp.***************** 432 7,560Starwood Hotels & Resorts
Worldwide, Inc. ************** 80 5,109 27,67114,616 Machinery — 0.4%
Caterpillar, Inc. **************** 229 13,229Household Appliances — 0.1%Deere & Co. ******************* 96 6,539Whirlpool Corp. *************** 29 2,429
19,768Industrial Gases — 0.2%Air Products & Chemicals, Inc. ** 80 4,735 Medical — Drugs — 3.9%Praxair, Inc. ******************* 121 6,408 Abbott Laboratories************* 578 22,791
Allergan, Inc. ****************** 54 5,83011,143Bristol-Myers Squibb Co. ******** 703 16,155
Instruments — Scientific — 0.1%Eli Lilly & Co. ***************** 415 23,485
Fisher Scientific International,Forest Laboratories, Inc.* ******** 138 5,614
Inc.* ************************ 52 3,217Merck & Company, Inc. ********* 741 23,571
Waters Corp.* ****************** 48 1,814Pfizer, Inc. ******************** 2,491 58,089
5,031 Schering-Plough Corp. ********** 556 11,593Wyeth************************* 482 22,206Insurance — 4.2%
ACE Ltd. ********************* 108 5,772 189,334AFLAC, Inc. ******************* 203 9,423Allstate Corp. ****************** 251 13,572
continued
11
FREE ENTERPRISE ACTION FUNDSchedule of Portfolio Investments
December 31, 2005
Shares Value Shares Value
Common Stocks — (continued) Common Stocks — (continued)Medical Information Systems — 0.0% Multimedia — (continued)IMS Health, Inc. *************** 96 $ 2,392 Viacom, Inc. — Class B********** 668 $ 21,777
Walt Disney Co. *************** 767 18,385Medical Labs & Testing Services — 0.1%Laboratory Corporation of 117,099
America Holdings************* 58 3,123 Newspapers — 0.3%Quest Diagnostics, Inc. ********* 75 3,861 Gannett Company, Inc. ********* 96 5,816
6,984 Knight-Ridder, Inc. ************* 34 2,152New York Times Co. — Class A ** 63 1,666Medical Products — 3.4%Tribune Co. ******************* 124 3,752AmerisourceBergen Corp. ******* 88 3,643
Baxter International, Inc. ******** 231 8,697 13,386Becton Dickinson & Co. ******** 95 5,708 Non-Hazardous Waste Disposal — 0.1%Biomet, Inc. ******************* 105 3,840 Waste Management, Inc. ******** 216 6,556Boston Scientific Corp.* ********* 375 9,184
Office Equipment & Supplies — 0.5%C.R. Bard, Inc. ***************** 47 3,098Acco Brands Corp.************** 12 294Cardinal Health, Inc. *********** 169 11,619Avery Dennison Corp. ********** 45 2,487Guidant Corp. ***************** 120 7,770Office Depot, Inc.*************** 117 3,674Johnson & Johnson ************* 1,079 64,847Pitney Bowes, Inc. ************** 85 3,591Medtronic, Inc. **************** 449 25,849Staples, Inc. ******************* 293 6,654St. Jude Medical, Inc.* ********** 146 7,329Xerox Corp.******************** 380 5,567Stryker Corp. ****************** 165 7,331
22,267Zimmer Holdings, Inc.* ********* 95 6,407Oil & Gas — 6.8%165,322Anadarko Petroleum Corp. ****** 86 8,149Metals & Mining — 0.6%Apache Corp. ****************** 113 7,743Alcoa, Inc. ******************** 309 9,137Baker Hughes, Inc. ************* 126 7,658Freeport-McMoRan Copper &BJ Services Co. **************** 130 4,767Gold, Inc. — Class B ********** 66 3,551Burlington Resources, Inc. ******* 137 11,809Newmont Mining Corp. ********* 165 8,811ChevronTexaco Corp. *********** 844 47,914Phelps Dodge Corp. ************ 34 4,892ConocoPhillips ***************** 425 24,727
26,391 Devon Energy Corp. ************ 167 10,444Motorcycles — 0.1% EOG Resources, Inc. *********** 83 6,090Harley-Davidson, Inc. *********** 109 5,612 Exxon Mobil Corp. ************* 2,036 114,362
Halliburton Co. **************** 190 11,772Multimedia — 2.4%Kerr-McGee Corp. ************* 54 4,906Clear Channel Communications,Marathon Oil Corp. ************ 113 6,890Inc. ************************* 216 6,793Nabors Industries Ltd.*********** 59 4,469Comcast Corp. — Class A******** 794 20,612Occidental Petroleum Corp. ***** 125 9,985Live Nation* ******************* 27 354Schlumberger Ltd. ************** 199 19,333News Corp. — Class A ********** 966 15,021Transocean, Inc.* *************** 124 8,642Time Warner, Inc. ************** 1,758 30,660
Univision Communications, Inc. —Class A********************** 119 3,497
continued
12
FREE ENTERPRISE ACTION FUNDSchedule of Portfolio Investments
December 31, 2005
Shares Value Shares Value
Common Stocks — (continued) Common Stocks — (continued)Oil & Gas — (continued) Retail — (continued)Valero Energy Corp. ************ 166 $ 8,566 CVS Corp. ******************** 269 $ 7,107XTO Energy, Inc. ************** 123 5,405 Dollar General Corp. *********** 120 2,288
Family Dollar Stores, Inc. ******* 68 1,686323,631Federated Department Stores, Inc. 93 6,169
Paints & Coatings — 0.1% Home Depot, Inc. ************** 846 34,246Sherwin-Williams Co. *********** 59 2,680 J.C. Penney Company, Inc. ****** 105 5,838Photo Equipment & Supplies — 0.1% Kohl’s Corp.* ****************** 120 5,832Eastman Kodak Co. ************ 117 2,738 Lowe’s Companies, Inc. ********* 285 18,998
Nordstrom, Inc. **************** 94 3,516Pipelines — 0.2%RadioShack Corp. ************** 79 1,661Kinder Morgan, Inc. ************ 47 4,322Sears Holding Corp.************* 300 34,659Williams Companies, Inc. ******* 227 5,259Target Corp. ******************* 322 17,700
9,581Tiffany & Co. ****************** 60 2,297
Printing & Publishing — 0.2% TJX Companies, Inc. ************ 190 4,414McGraw-Hill Companies, Inc. **** 137 7,074 Wal-Mart Stores, Inc. *********** 1,564 73,196R.R. Donnelley & Sons Co. ****** 97 3,318 Walgreen Co. ****************** 378 16,730
10,392 258,499Railroads — 0.6% Savings & Loans — 0.5%Burlington Northern Santa Fe Golden West Financial Corp. **** 126 8,316
Corp. *********************** 132 9,349 Sovereign Bancorp, Inc. ********* 162 3,502CSX Corp. ******************** 83 4,214 Washington Mutual, Inc. ******** 322 14,007Norfolk Southern Corp. ********* 152 6,814
25,825Union Pacific Corp. ************* 95 7,648
Schools — 0.1%28,025
Apollo Group, Inc. — Class A* *** 75 4,535Real Estate Investment Trusts — 0.3%
Semiconductors — 2.8%Equity Office Properties Trust **** 151 4,580
Advanced Micro Devices, Inc.* *** 152 4,651Equity Residential ************** 112 4,381
Altera Corp.******************** 129 2,390Simon Property Group, Inc. ***** 87 6,667
Analog Devices, Inc. ************ 137 4,91415,628 Applied Materials, Inc. ********** 617 11,069
Broadcom Corp. — Class A* ***** 121 5,705Restaurants — 0.7%Freescale Semiconductor, Inc. —McDonald’s Corp. ************** 448 15,106
Class B* ********************* 139 3,499Starbucks Corp.* *************** 310 9,303Intel Corp. ******************** 2,169 54,137Wendy’s International, Inc. ****** 49 2,708KLA-Tencor Corp. ************* 72 3,552Yum! Brands, Inc. ************** 101 4,735Linear Technology Corp. ******** 119 4,29231,852Maxim Integrated Products, Inc. 119 4,313
Retail — 5.4% Micron Technology, Inc.* ******** 239 3,181Bed Bath & Beyond, Inc.* ******* 124 4,483 National Semiconductor Corp. *** 113 2,936Best Buy Company, Inc. ********* 187 8,131 Novellus Systems, Inc.*********** 50 1,206Costco Wholesale Corp. ********* 193 9,548 NVIDIA Corp.* **************** 67 2,450
continued
13
FREE ENTERPRISE ACTION FUNDSchedule of Portfolio Investments
December 31, 2005
Shares Value Shares Value
Common Stocks — (continued) Common Stocks — (continued)Semiconductors — (continued) Transportation Services — 0.9%QLogic Corp.* ***************** 35 $ 1,138 FedEx Corp. ******************* 111 $ 11,476Teradyne, Inc.* ***************** 91 1,326 United Parcel Service, Inc. —Texas Instruments, Inc. ********* 579 18,569 Class B ********************** 407 30,586Xilinx, Inc. ******************** 127 3,202 42,062
132,530 Travel Services — 0.0%Staffing — 0.1% Sabre Holdings Corp. — Class A** 67 1,615Robert Half International, Inc. *** 79 2,993 Utilities — Electric — 2.7%Steel — 0.1% AES Corp.* ******************** 206 3,261Nucor Corp. ******************* 58 3,869 Ameren Corp. ***************** 75 3,843United States Steel Corp. ******** 38 1,827 American Electric Power
Company, Inc. *************** 162 6,0095,696Cinergy Corp. ****************** 76 3,227
Telecommunications — 3.0% Consolidated Edison, Inc. ******* 100 4,633ALLTEL Corp. ***************** 113 7,130 Constellation Energy Group ****** 67 3,859AT&T, Inc. ******************** 1,464 35,853 Dominion Resources, Inc. ******* 121 9,341Avaya, Inc.********************* 190 2,027 DTE Energy Co. *************** 67 2,894BellSouth Corp. **************** 708 19,187 Duke Energy Corp. ************* 353 9,690Comverse Technology, Inc.* ****** 78 2,074 Edison International************* 119 5,190Corning, Inc.* ****************** 513 10,086 Entergy Corp. ****************** 84 5,767Lucent Technologies, Inc.* ******* 1,757 4,674 Exelon Corp. ****************** 249 13,231Qwest Communications FirstEnergy Corp. ************** 124 6,075
International, Inc.************* 811 4,582 FPL Group, Inc. *************** 130 5,403Scientific-Atlanta, Inc. ********** 60 2,584 NiSource, Inc. ***************** 117 2,441Sprint Nextel Corp. ************* 1,023 23,897 PG&E Corp. ******************* 155 5,754Tellabs, Inc.* ******************* 202 2,202 Pinnacle West Capital Corp. ***** 34 1,406Verizon Communications, Inc. *** 1,022 30,783 PPL Corp. ********************* 151 4,439
145,079 Progress Energy, Inc. *********** 101 4,436Public Service Enterprise Group,Tobacco — 1.3%
Inc. ************************* 87 5,652Altria Group, Inc. ************** 743 55,517Southern Co. ****************** 297 10,254Reynolds American, Inc. ******** 59 5,624TECO Energy, Inc. ************* 88 1,512UST, Inc. ********************* 59 2,409TXU Corp. ******************** 166 8,332
63,550Xcel Energy, Inc. *************** 172 3,175
Tools — Hand Held — 0.1%129,824
Black & Decker Corp. ********** 32 2,782Utilities — Natural Gas — 0.1%Stanley Works****************** 39 1,874KeySpan Corp. ***************** 66 2,356
4,656Sempra Energy ***************** 85 3,811
Toys — 0.0%6,167
Mattel, Inc. ******************** 149 2,357
continued
14

FREE ENTERPRISE ACTION FUNDSchedule of Portfolio Investments
December 31, 2005
Shares Value Contracts Value
Options — 0.1%Common Stocks — (continued)SPDR Trust Series 1 January CallWeb Portals/ISP — 0.5%
Option expiring January 21,Yahoo!, Inc.******************** 555 $ 21,7452006 @ $129 **************** 350 $ 2,625
Wireless Communications — 1.0%Total Options Motorola, Inc. ***************** 941 21,257
(Cost $31,150) ************************ 2,625QUALCOMM, Inc. ************* 624 26,882Total Investments 48,139
(Cost $4,363,625)(a) — 92.8% ********** 4,450,948Total Common Stocks Other Assets in Excess of Liabilities — 7.2% 343,735
(Cost $4,091,711)********************** 4,207,559Net Assets — 100.0% ******************** $4,794,683
Short-Term Investments — 5.0%Money Market Mutual Fund — 5.0%Huntington Money Market Fund** 240,764 240,764
Total Short-Term Investments (Cost $240,764) *********************** 240,764
Percentages indicated are based on net assets.
(a) Represents cost for financial reporting and for federal income tax purposes and differs from value by net unrealized appreciationof securities as follows:
Unrealized appreciation ************************************************* $ 281,381Unrealized depreciation ************************************************* (194,058)Net unrealized appreciation********************************************** $ 87,323
* Represents non-income producing securities.
Call Options WrittenContracts Value
SPDR Trust Series 1 Call Option expiring January 21, 2006 @ $128 ******************************* 350 $7,000
Total Call Options Written (premiums received $44,975) ***************************************** $7,000
See notes to financial statements.
15

FREE ENTERPRISE ACTION FUNDStatement of Assets and Liabilities
December 31, 2005
Assets:Investments in securities, at value (cost $4,363,625)****************************************** $4,450,948Cash************************************************************************************ 230,991Accrued income************************************************************************** 6,298Receivable for investments tendered ******************************************************** 4,654Receivable from Adviser ****************************************************************** 103,338Deposits with broker for call options written ************************************************ 42,919Prepaid expenses ************************************************************************* 8,893
Total Assets *************************************************************************** 4,848,041
Liabilities:Call options written (premiums received $44,975)******************************************** 7,000Administration fees*********************************************************************** 4,192Chief Compliance Officer fees ************************************************************* 872Accounting fees ************************************************************************** 4,856Transfer Agent fees*********************************************************************** 5,177Trustee fees ***************************************************************************** 625Other accrued expenses ******************************************************************* 30,636
Total Liabilities ************************************************************************ 53,358
Net Assets ****************************************************************************** $4,794,683
Net Assets Consist of:Capital********************************************************************************** $4,706,537Accumulated net investment loss *********************************************************** (4,360)Accumulated net realized gain/(loss) on investments ****************************************** (32,792)Net unrealized appreciation of written call options ******************************************* 37,975Net unrealized appreciation/(depreciation) on investments and purchased option contracts ******** 87,323
Net Assets ****************************************************************************** $4,794,683
Shares Outstanding*********************************************************************** 470,499
Net Asset Value — Offering and Redemption Price per Share ********************************** $ 10.19
See notes to financial statements.
16

FREE ENTERPRISE ACTION FUNDStatement of Operations
Period Ended December 31, 2005(a)
Investment Income:Dividends ********************************************************************************* $ 62,059
Total Investment Income ****************************************************************** 62,059
Expenses:Investment advisory fees ******************************************************************** 44,727Administration fees************************************************************************* 35,237Chief Compliance Officer fees *************************************************************** 4,167Accounting fees **************************************************************************** 41,219Audit fees ********************************************************************************* 15,550Insurance fees ***************************************************************************** 9,544Legal fees ********************************************************************************* 52,639Registration and filing fees ****************************************************************** 20,473Printing fees ******************************************************************************* 26,147Transfer agent fees ************************************************************************* 36,042Trustees’ fees ****************************************************************************** 8,125Other fees********************************************************************************* 8,247
Total Expenses*************************************************************************** 302,117
Expenses waived by the Adviser************************************************************ (44,727)Expenses reimbursed by the Adviser ******************************************************** (185,616)
Net Expenses ************************************************************************** 71,774
Net Investment Loss *********************************************************************** (9,715)
Realized and Unrealized Gain/(Loss) on Investments:Net realized losses on written call options transactions ****************************************** (13,834)Net realized gain on investment transactions and purchased option contracts ********************** 2,771Change in unrealized appreciation of written call options**************************************** 37,975Change in unrealized appreciation/(depreciation) on investments and purchased option contracts***** 87,323
Net Realized and Unrealized Gain/(Loss) on Investments**************************************** 114,235
Change in Net Assets Resulting from Operations ********************************************* $104,520
(a) From the commencement of operations on March 1, 2005 to December 31, 2005.
See notes to financial statements.
17
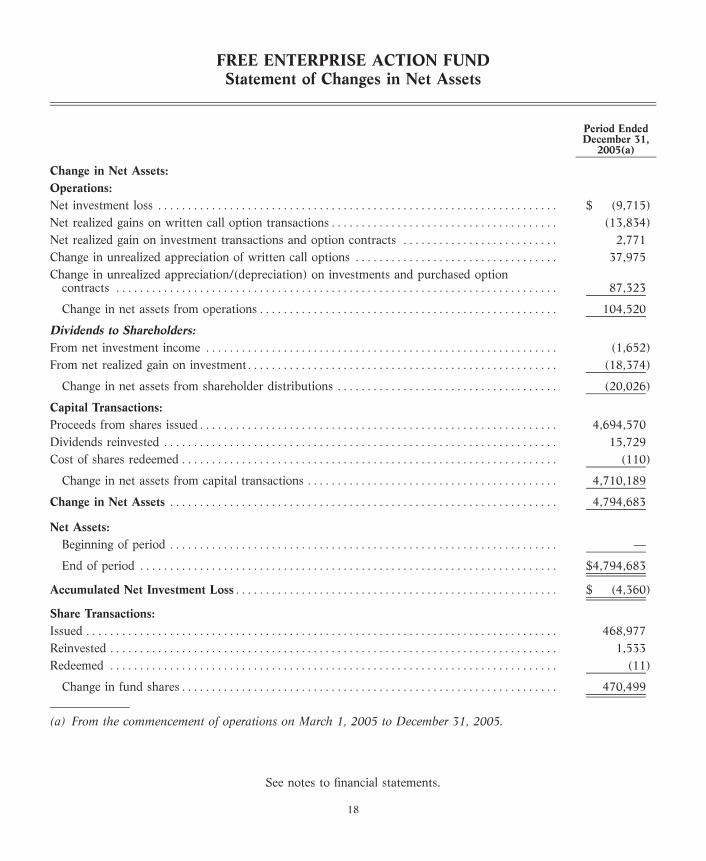
FREE ENTERPRISE ACTION FUNDStatement of Changes in Net Assets
Period EndedDecember 31,
2005(a)
Change in Net Assets:Operations:Net investment loss ******************************************************************* $ (9,715)Net realized gains on written call option transactions************************************** (13,834)Net realized gain on investment transactions and option contracts ************************** 2,771Change in unrealized appreciation of written call options ********************************** 37,975Change in unrealized appreciation/(depreciation) on investments and purchased option
contracts ************************************************************************** 87,323
Change in net assets from operations************************************************** 104,520
Dividends to Shareholders:From net investment income *********************************************************** (1,652)From net realized gain on investment**************************************************** (18,374)
Change in net assets from shareholder distributions ************************************* (20,026)
Capital Transactions:Proceeds from shares issued************************************************************ 4,694,570Dividends reinvested ****************************************************************** 15,729Cost of shares redeemed*************************************************************** (110)
Change in net assets from capital transactions ****************************************** 4,710,189
Change in Net Assets ***************************************************************** 4,794,683
Net Assets:Beginning of period ***************************************************************** —
End of period ********************************************************************** $4,794,683
Accumulated Net Investment Loss****************************************************** $ (4,360)
Share Transactions:Issued ******************************************************************************* 468,977Reinvested *************************************************************************** 1,533Redeemed *************************************************************************** (11)
Change in fund shares*************************************************************** 470,499
(a) From the commencement of operations on March 1, 2005 to December 31, 2005.
See notes to financial statements.
18
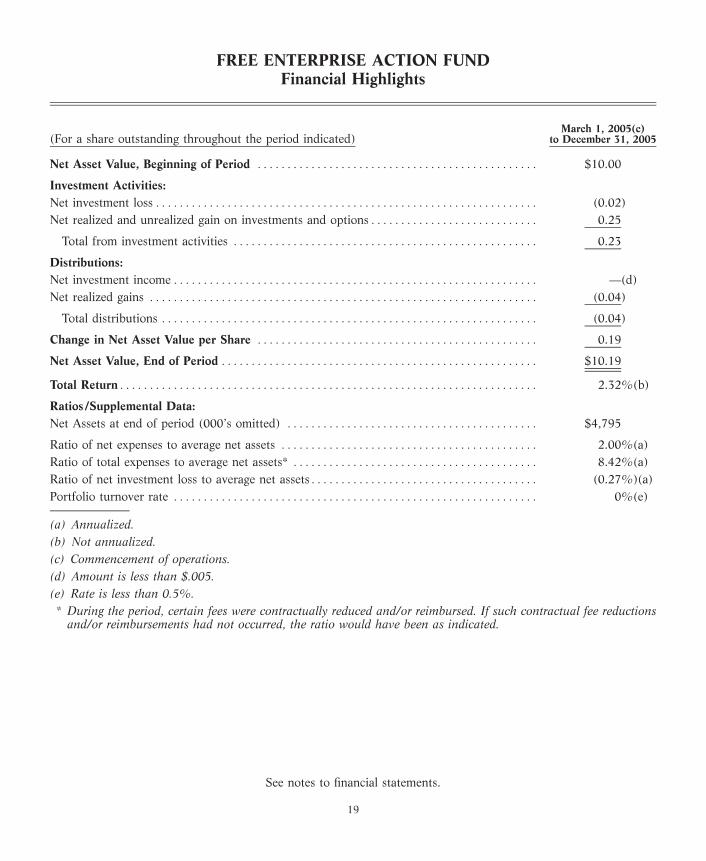
FREE ENTERPRISE ACTION FUNDFinancial Highlights
March 1, 2005(c)(For a share outstanding throughout the period indicated) to December 31, 2005
Net Asset Value, Beginning of Period *********************************************** $10.00
Investment Activities:Net investment loss**************************************************************** (0.02)Net realized and unrealized gain on investments and options**************************** 0.25
Total from investment activities *************************************************** 0.23
Distributions:Net investment income************************************************************* —(d)Net realized gains ***************************************************************** (0.04)
Total distributions *************************************************************** (0.04)
Change in Net Asset Value per Share *********************************************** 0.19
Net Asset Value, End of Period ***************************************************** $10.19
Total Return********************************************************************** 2.32%(b)
Ratios/Supplemental Data:Net Assets at end of period (000’s omitted) ****************************************** $4,795
Ratio of net expenses to average net assets ******************************************* 2.00%(a)Ratio of total expenses to average net assets* ***************************************** 8.42%(a)Ratio of net investment loss to average net assets************************************** (0.27%)(a)Portfolio turnover rate ************************************************************* 0%(e)
(a) Annualized.(b) Not annualized.(c) Commencement of operations.(d) Amount is less than $.005.(e) Rate is less than 0.5%.* During the period, certain fees were contractually reduced and/or reimbursed. If such contractual fee reductions
and/or reimbursements had not occurred, the ratio would have been as indicated.
See notes to financial statements.
19
FREE ENTERPRISE ACTION FUNDNotes to Financial Statements
1. Organization:
The Variable Insurance Funds (the ‘‘Trust’’) was organized on July 20, 1994, and is registered under the Investment Company Act of1940, as amended (the ‘‘Act’’), as an open-end management investment company established as a Massachusetts business trust.
The Trust is authorized to issue an unlimited number of shares without par value. As of the date of this report, the Trust offeredmultiple separate series, each with its own investment objective. The accompanying financial statements are for the Free EnterpriseAction Fund (the ‘‘Fund’’).
The Free Enterprise Action Fund commenced operations on March 1, 2005.
Under the Trust’s organizational documents, its officers and trustees are indemnified against certain liabilities arising out of theperformance of their duties to the Trust. In addition, in the normal course of business, the Trust enters into contracts with theirvendors and others that provide for general indemnifications. The Trust’s maximum exposure under these arrangements is unknown,as this would involve future claims that may be made against the Trust. However, based on experience, the Trust expects that risk ofloss is remote.
2. Significant Accounting Policies:
The following is a summary of significant accounting policies followed by the Fund in the preparation of its financial statements. Thepolicies are in conformity with Generally Accepted Accounting Principles of the United States of America (‘‘GAAP’’). Thepreparation of financial statements in conformity with GAAP requires management to make estimates and assumptions that affectthe reported amounts of assets and liabilities and disclosure of contingent assets and liabilities at the date of the financial statementsand the reported amounts of income and expenses for the period. Actual results could differ from those estimates.
Securities Valuation: Portfolio securities, the principal market for which is a securities exchange, generally will be valued at theclosing price on that exchange on the day of computation, or, if there have been no sales during such day, at the last sales price onany other exchange or trading system. Portfolio securities, the principal market for which is not a securities exchange, generally willbe valued on the basis of the mean between the last bid and ask quotes furnished by primary market makers for those securities. ForNASDAQ/NMS traded securities, market value may also be determined on the basis of the Nasdaq Official Closing Price instead ofthe closing price. Foreign securities generally are valued based on quotations from the primary market in which they are traded andare translated from the local currency into U.S. dollars using current exchange rates. The value of foreign securities may be affectedsignificantly on a day that the New York Stock Exchange is closed and an investor is unable to purchase or redeem shares. Shares ofinvestment companies are valued on the basis of their net asset values, subject to any applicable sales charge. Portfolio securitieswith a remaining maturity of 60 days or less will be valued either at amortized cost or original cost plus accrued interest, whichapproximates current value.
All other assets and securities, including securities for which market quotations are not readily available, will be valued at their fairmarket value as determined in good faith under the general supervision of the Board of Trustees. If a significant market eventimpacting the value of a portfolio security occurs subsequent to the close of trading in the security, but prior to the calculation of theFund’s net asset value per share, market quotations for that security may not be readily available. If the impact of such a significantmarket event materially affects the net asset value per share of the Fund, an affected portfolio security will be valued at fair marketvalue as determined in good faith under the general supervision of the Board of Trustees.
Securities Transactions and Related Income: Security transactions are accounted for no later than one business day after tradedate. However, for financial reporting purposes, security transactions are accounted for on trade date. Dividend income is recordedon the ex-dividend date. Interest income, which includes amortization of premium and accretion of discounts, is accrued as earned.Realized gains and losses from security transactions and unrealized appreciation and depreciation of investments are determined onthe basis of identified cost.
Expenses: Expenses that are directly related to the Fund are charged directly to the Fund, while general Trust expenses areallocated to the Fund and other series of the Trust based on their relative net assets or another appropriate method.
20
FREE ENTERPRISE ACTION FUNDNotes to Financial Statements, continued
Distributions to Shareholders: The Fund intends to declare and pay applicable dividends from net investment income and to makedistributions of applicable net realized capital gains, if any, on an annual basis. Dividends from net investment income anddistributions from net realized gains are determined in accordance with federal income tax regulations, which may differ fromGAAP. These ’’book/tax’’ differences are considered to be either temporary or permanent in nature. To the extent these differencesare permanent in nature, such amounts are reclassified within the composition of net assets based on their federal tax-basistreatment; temporary differences do not require reclassifications.
Options: The Fund may purchase put and call options on securities. The Fund may write only covered call options. This means thatthe Fund will only write a call option on a security which it already owns. Such options must be listed on recognized U.S. exchangesand issued by the Options Clearing Corporation. The purpose of writing covered call options is to generate additional premiumincome for the Fund. This premium income will serve to enhance the Fund’s total return and will reduce the effect of any pricedecline of the security involved in the option. Covered call options will generally be written on securities which are not expected tomake any major price moves in the near future but which, over the long term, are deemed to be attractive investments for the Fund.
A call option gives the purchaser the right to buy, and the writer the obligation to sell the underlying security at the stated exerciseprice at any time prior to the expiration of the option, regardless of the market price of the security. A put option gives the purchaserthe right to sell, and the writer the obligation to buy the underlying security at the stated exercise price at any time prior to theexpiration of the option, regardless of the market price of the security.
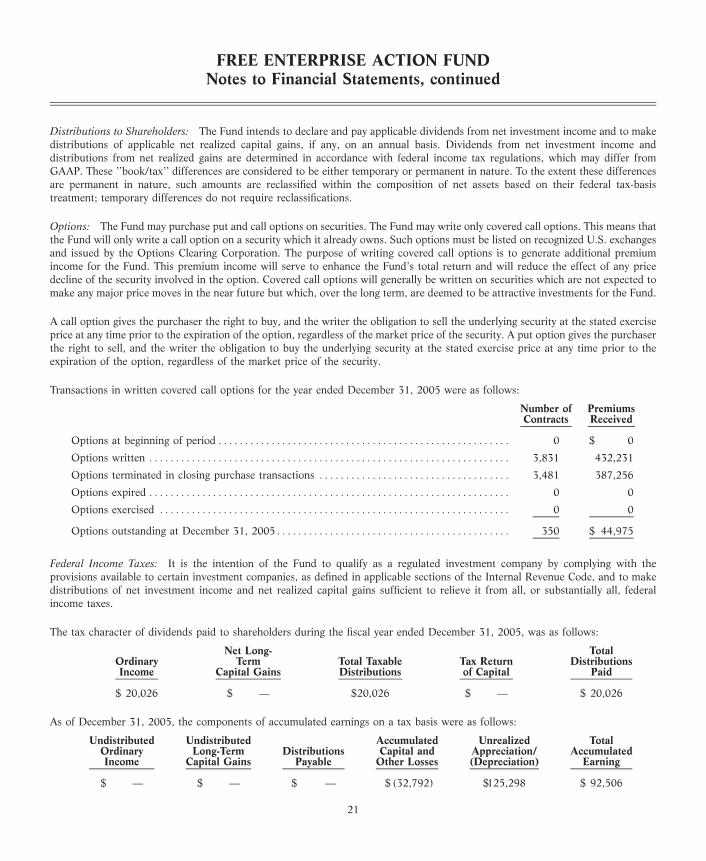
Transactions in written covered call options for the year ended December 31, 2005 were as follows:
Number of PremiumsContracts Received
Options at beginning of period******************************************************* 0 $ 0
Options written ******************************************************************** 3,831 432,231
Options terminated in closing purchase transactions ************************************ 3,481 387,256
Options expired ******************************************************************** 0 0
Options exercised ****************************************************************** 0 0
Options outstanding at December 31, 2005******************************************** 350 $ 44,975
Federal Income Taxes: It is the intention of the Fund to qualify as a regulated investment company by complying with theprovisions available to certain investment companies, as defined in applicable sections of the Internal Revenue Code, and to makedistributions of net investment income and net realized capital gains sufficient to relieve it from all, or substantially all, federalincome taxes.
The tax character of dividends paid to shareholders during the fiscal year ended December 31, 2005, was as follows:
Net Long- TotalOrdinary Term Total Taxable Tax Return DistributionsIncome Capital Gains Distributions of Capital Paid
$ 20,026 $ — $20,026 $ — $ 20,026
As of December 31, 2005, the components of accumulated earnings on a tax basis were as follows:
Undistributed Undistributed Accumulated Unrealized TotalOrdinary Long-Term Distributions Capital and Appreciation/ AccumulatedIncome Capital Gains Payable Other Losses (Depreciation) Earning
$ — $ — $ — $ (32,792) $125,298 $ 92,506
21
FREE ENTERPRISE ACTION FUNDNotes to Financial Statements, continued
Capital losses after October 31 (‘‘post-October losses’’) within the taxable year are deemed to arise on the first business day of theFund’s next taxable year. After October 31, 2005, Free Enterprise Action Fund incurred and will elect to defer net capital losses inthe approximate amount of $32,792.
3. Purchases and Sales of Securities:
The aggregate purchases and sales of portfolio securities (excluding short-term securities) for the period ended December 31, 2005,were as follows:
Purchases Sales
$4,107,256 $18,316
4. Related Party Transactions:
Action Fund Management, LLC (‘‘AFM’’ or the ‘‘Adviser’’) provides investment advisory services to the Fund. Under the terms ofthe investment advisory agreement, the Adviser is entitled to receive a fee computed daily and paid monthly at the annual rate of1.25% of the average daily net assets of the Fund.
The Adviser has contractually agreed to waive all or a portion of its fees and reimburse certain expenses for the Fund throughApril 30, 2006 to the extent that expenses exceed 2.00% of the average daily net assets of the Fund. Under the terms of thisagreement, the Adviser may request and receive reimbursement of the investment advisory fees waived and other expensesreimbursed by it at a later date not to exceed three years from the period ending April 30 in which they were taken. Suchreimbursement shall be made monthly, but only if the operating expenses of the Fund are at an annualized rate less than the expenselimit for the payments made through the period ended December 31. As of the period ended December 31, 2005, the reimbursementthat may potentially be made by the Fund is as follows:
Expires 2008
$230,343
Thinkorswim Advisors, Inc. (‘‘TOS’’ or the ‘‘Sub-adviser’’) serves as the investment sub-adviser to the Fund pursuant to anInvestment Subadvisory Agreement entered into between the Sub-adviser and the Adviser. The Sub-adviser assists the Adviser inmaking day-to-day investment decisions for the Fund, subject to the general supervision of the Adviser, the Fund’s Board of Trustees,and in accordance with the investment objective, policies, and restrictions of the Fund. The Sub-adviser conducts all researchrelating to potential options positions for the Fund, makes recommendations to the Adviser, and assists the Adviser in makinginvestment decisions with respect to all options trading.
BISYS Fund Services Ohio, Inc. (‘‘BISYS Ohio’’) with which certain officers and trustees (with the exception of the ChiefCompliance Officer) of the Trust are affiliated, serves the Trust as Fund Accountant, Administrator and Transfer Agent. Such officersand trustees are paid no fees directly by the Trust for serving as officers and trustees of the Trust. Under the Fund AccountingAgreement, BISYS Ohio receives a fee from the Trust based upon a tiered fee structure, subject to a minimum fee of $37,500 perannum, plus applicable reimbursement of certain expenses. Under the Administration Agreement, BISYS Ohio receives a fee fromthe Trust based upon a tiered fee structure, subject to a minimum fee of $45,000 per annum. Under the Transfer Agent Agreement,BISYS Ohio receives $17,000 per annum, plus applicable reimbursement of certain expenses.
BISYS Fund Services Limited Partnership (‘‘BISYS’’) serves, without compensation, as principal underwriter and distributor of theFund’s shares.
BISYS Ohio also provides an employee to serve the Trust as Chief Compliance Officer for which BISYS Ohio receives compensationand reimbursement from the Trust for certain expenses as approved by the Trust’s Board of Trustees. BISYS, an Ohio limitedpartnership, and BISYS Ohio are subsidiaries of The BISYS Group, Inc.
22

FREE ENTERPRISE ACTION FUNDReport of Independent Registered Public Accounting Firm
To the Board of Trustees and Shareholdersof the Free Enterprise Action Fund of the Variable Insurance Funds (the ‘‘Trust’’)
We have audited the accompanying statement of assets and liabilities, including the schedule of portfolio investments, of the FreeEnterprise Action Fund (the ‘‘Fund’’) of the Variable Insurance Funds (the ‘‘Trust’’) as of December 31, 2005, and the relatedstatements of operations, changes in net assets and financial highlights for the period from March 1, 2005 (commencement ofoperations) through December 31, 2005. These financial statements and financial highlights are the responsibility of the Fund’smanagement. Our responsibility is to express an opinion on these financial statements and financial highlights based on our audit.
We conducted our audit in accordance with the standards of the Public Company Accounting Oversight Board (United States).Those standards require that we plan and perform the audit to obtain reasonable assurance about whether the financial statementsand financial highlights are free of material misstatement. We were not engaged to perform an audit of the Fund’s internal controlover financial reporting. Our audit included consideration of internal control over financial reporting as a basis of designing auditprocedures that are appropriate in the circumstances, but not for the purpose of expressing an opinion on the effectiveness of theFund’s internal control over financial reporting. According, we express no such opinion. An audit also includes examining, of a testbasis, evidence supporting the amounts and disclosures in the financial statements and financial highlights, assessing the accountingprinciples used and significant estimates made by management, and evaluating the overall financial statement presentation. Ouraudit procedures included confirmation of securities owned as of December 31, 2005, by correspondence with the custodians. Webelieve that our audit provides a reasonable basis for our opinion.
In our opinion, the financial statements and financial highlights referred to above present fairly, in all material respects, the financialposition of the Free Enterprise Action Fund of the Variable Insurance Funds at December 31, 2005, the results of its operations, thechanges in its net assets, and the financial highlights for the period from March 1, 2005 through December 31, 2005 in conformitywith U.S. generally accepted accounting principles.
Columbus, OhioFebruary 10, 2006
23
FREE ENTERPRISE ACTION FUNDSupplemental Information (unaudited)
FREE ENTERPRISE ACTION FUND MANAGEMENT
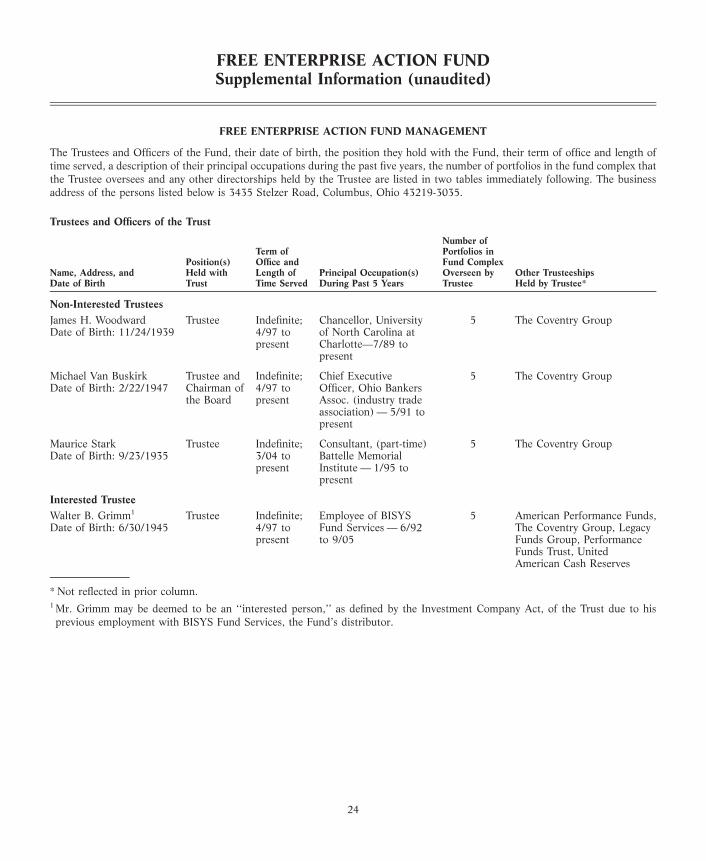
The Trustees and Officers of the Fund, their date of birth, the position they hold with the Fund, their term of office and length oftime served, a description of their principal occupations during the past five years, the number of portfolios in the fund complex thatthe Trustee oversees and any other directorships held by the Trustee are listed in two tables immediately following. The businessaddress of the persons listed below is 3435 Stelzer Road, Columbus, Ohio 43219-3035.
Trustees and Officers of the Trust
Number ofTerm of Portfolios in
Position(s) Office and Fund ComplexName, Address, and Held with Length of Principal Occupation(s) Overseen by Other TrusteeshipsDate of Birth Trust Time Served During Past 5 Years Trustee Held by Trustee*
Non-Interested TrusteesJames H. Woodward Trustee Indefinite; Chancellor, University 5 The Coventry GroupDate of Birth: 11/24/1939 4/97 to of North Carolina at
present Charlotte—7/89 topresent
Michael Van Buskirk Trustee and Indefinite; Chief Executive 5 The Coventry GroupDate of Birth: 2/22/1947 Chairman of 4/97 to Officer, Ohio Bankers
the Board present Assoc. (industry tradeassociation) — 5/91 topresent
Maurice Stark Trustee Indefinite; Consultant, (part-time) 5 The Coventry GroupDate of Birth: 9/23/1935 3/04 to Battelle Memorial
present Institute — 1/95 topresent
Interested TrusteeWalter B. Grimm1 Trustee Indefinite; Employee of BISYS 5 American Performance Funds,Date of Birth: 6/30/1945 4/97 to Fund Services — 6/92 The Coventry Group, Legacy
present to 9/05 Funds Group, PerformanceFunds Trust, UnitedAmerican Cash Reserves
* Not reflected in prior column.1 Mr. Grimm may be deemed to be an ‘‘interested person,’’ as defined by the Investment Company Act, of the Trust due to hisprevious employment with BISYS Fund Services, the Fund’s distributor.
24
FREE ENTERPRISE ACTION FUNDSupplemental Information (unaudited)
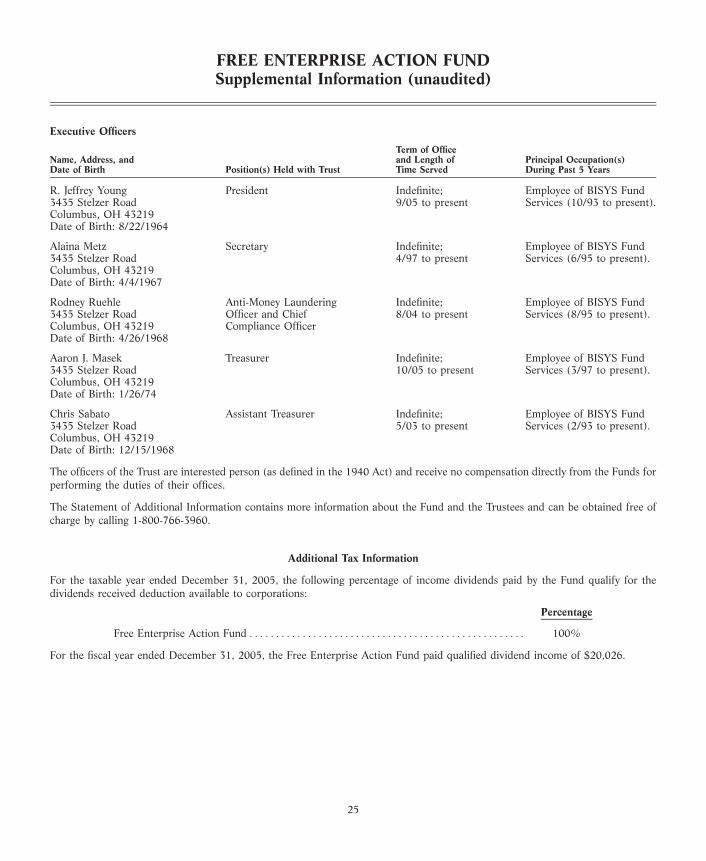
Executive Officers
Term of OfficeName, Address, and and Length of Principal Occupation(s)Date of Birth Position(s) Held with Trust Time Served During Past 5 Years
R. Jeffrey Young President Indefinite; Employee of BISYS Fund3435 Stelzer Road 9/05 to present Services (10/93 to present).Columbus, OH 43219Date of Birth: 8/22/1964
Alaina Metz Secretary Indefinite; Employee of BISYS Fund3435 Stelzer Road 4/97 to present Services (6/95 to present).Columbus, OH 43219Date of Birth: 4/4/1967
Rodney Ruehle Anti-Money Laundering Indefinite; Employee of BISYS Fund3435 Stelzer Road Officer and Chief 8/04 to present Services (8/95 to present).Columbus, OH 43219 Compliance OfficerDate of Birth: 4/26/1968
Aaron J. Masek Treasurer Indefinite; Employee of BISYS Fund3435 Stelzer Road 10/05 to present Services (3/97 to present).Columbus, OH 43219Date of Birth: 1/26/74
Chris Sabato Assistant Treasurer Indefinite; Employee of BISYS Fund3435 Stelzer Road 5/03 to present Services (2/93 to present).Columbus, OH 43219Date of Birth: 12/15/1968
The officers of the Trust are interested person (as defined in the 1940 Act) and receive no compensation directly from the Funds forperforming the duties of their offices.
The Statement of Additional Information contains more information about the Fund and the Trustees and can be obtained free ofcharge by calling 1-800-766-3960.
Additional Tax Information
For the taxable year ended December 31, 2005, the following percentage of income dividends paid by the Fund qualify for thedividends received deduction available to corporations:
Percentage
Free Enterprise Action Fund **************************************************** 100%
For the fiscal year ended December 31, 2005, the Free Enterprise Action Fund paid qualified dividend income of $20,026.
25
FREE ENTERPRISE ACTION FUNDSupplemental Information (unaudited)
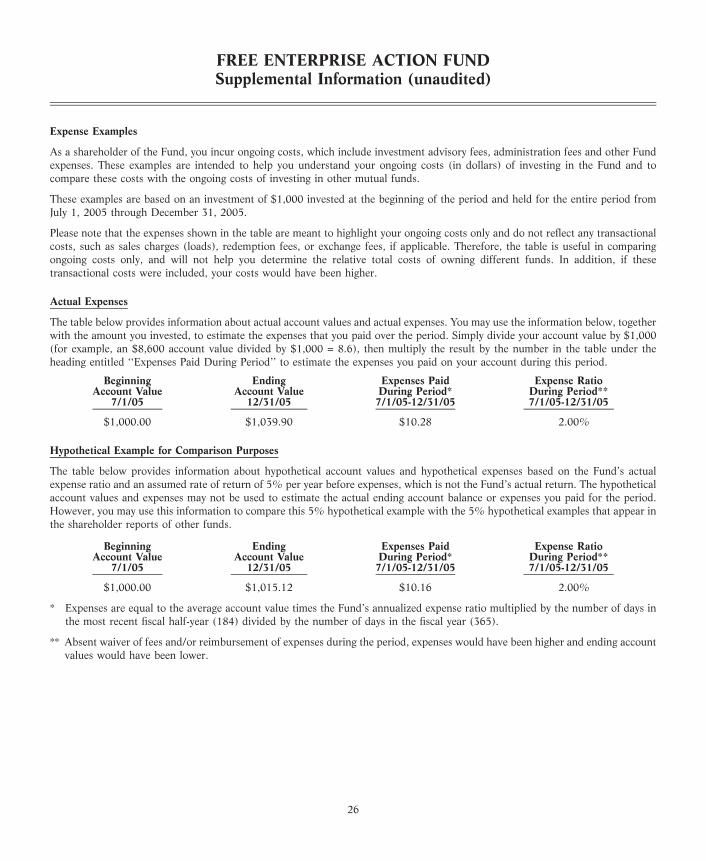
Expense Examples
As a shareholder of the Fund, you incur ongoing costs, which include investment advisory fees, administration fees and other Fundexpenses. These examples are intended to help you understand your ongoing costs (in dollars) of investing in the Fund and tocompare these costs with the ongoing costs of investing in other mutual funds.
These examples are based on an investment of $1,000 invested at the beginning of the period and held for the entire period fromJuly 1, 2005 through December 31, 2005.
Please note that the expenses shown in the table are meant to highlight your ongoing costs only and do not reflect any transactionalcosts, such as sales charges (loads), redemption fees, or exchange fees, if applicable. Therefore, the table is useful in comparingongoing costs only, and will not help you determine the relative total costs of owning different funds. In addition, if thesetransactional costs were included, your costs would have been higher.
Actual Expenses
The table below provides information about actual account values and actual expenses. You may use the information below, togetherwith the amount you invested, to estimate the expenses that you paid over the period. Simply divide your account value by $1,000(for example, an $8,600 account value divided by $1,000 = 8.6), then multiply the result by the number in the table under theheading entitled ‘‘Expenses Paid During Period’’ to estimate the expenses you paid on your account during this period.
Beginning Ending Expenses Paid Expense RatioAccount Value Account Value During Period* During Period**
7/1/05 12/31/05 7/1/05-12/31/05 7/1/05-12/31/05
$1,000.00 $1,039.90 $10.28 2.00%
Hypothetical Example for Comparison Purposes
The table below provides information about hypothetical account values and hypothetical expenses based on the Fund’s actualexpense ratio and an assumed rate of return of 5% per year before expenses, which is not the Fund’s actual return. The hypotheticalaccount values and expenses may not be used to estimate the actual ending account balance or expenses you paid for the period.However, you may use this information to compare this 5% hypothetical example with the 5% hypothetical examples that appear inthe shareholder reports of other funds.
Beginning Ending Expenses Paid Expense RatioAccount Value Account Value During Period* During Period**
7/1/05 12/31/05 7/1/05-12/31/05 7/1/05-12/31/05
$1,000.00 $1,015.12 $10.16 2.00%
* Expenses are equal to the average account value times the Fund’s annualized expense ratio multiplied by the number of days inthe most recent fiscal half-year (184) divided by the number of days in the fiscal year (365).
** Absent waiver of fees and/or reimbursement of expenses during the period, expenses would have been higher and ending accountvalues would have been lower.
26
FREE ENTERPRISE ACTION FUNDSupplemental Information (unaudited)
INVESTMENT ADVISORY AND SUB-ADVISORY AGREEMENTS — REVIEW AND APPROVAL
At a meeting of the Board of Trustees on June 3, 2004, the Board reviewed and considered the Investment Advisory Agreementbetween the Trust, on behalf of the Fund, and Action Fund Management, LLC (‘‘Action’’), as well as the Investment Sub-AdvisoryAgreement with respect to the Fund between Action and Thinkorswim Advisors, Inc. (the ‘‘Sub-Adviser’’), to determine whether theagreements should be approved for an initial two-year period. Following their review and consideration, the Trustees determinedthat the Investment Advisory Agreement and the Investment Sub-Advisory Agreement will enable shareholders of the Fund to obtainhigh quality services at a cost that is appropriate, reasonable, and in the best interests of its shareholders. The Board, including theindependent members of the Board, unanimously approved the Investment Advisory Agreement and the Investment Sub-AdvisoryAgreement. In reaching their decision, the Trustees requested and obtained from Action and the Sub-Adviser such information asthey deemed reasonably necessary to evaluate the proposed agreements. In considering the proposed Investment AdvisoryAgreement and Investment Sub-Advisory Agreement, the Trustees evaluated a number of considerations that they believed, in lightof the legal advice furnished to them by Fund counsel and their own business judgment, to be relevant. They based their decisions onthe following considerations, among others, although they did not identify any consideration or particular information that wascontrolling of their decisions:
The nature, extent and quality of the advisory service to be provided. The Board considered the nature and quality of the servicesanticipated to be provided by Action and the Sub-Adviser. The Board concluded that Action and the Sub-Adviser are capable ofproviding high quality services to the Fund, as indicated by the unique package of advisory and advocacy services to be provided byAction and the innovative investment product to be offered to investors, the financial resources of Action and the Sub-Adviser,Action’s management capabilities and retention of personnel with significant public policy experience, and the professionalqualifications and experience of the Sub-Adviser’s portfolio management team. The Trustees also concluded that Action and theSub-Adviser proposed to provide investment and related services that are appropriate in scope and extent in light of the Fund’soperations, the competitive landscape of the investment company business and investor needs.
The investment performance of the Fund. The Board noted that, as a new mutual fund, the Fund had no performance trackrecord. On the basis of the Trustees’ assessment of the nature, extent and quality of advisory and other services to be provided orprocured by Action and the Sub-Adviser, the Trustees concluded that Action and the Sub-Adviser should be capable of generating alevel of investment performance and shareholder advocacy that is appropriate in light of the Fund’s investment objective, policiesand strategies and competitive with the investment performance of many other investment companies.
The cost of advisory services provided and the level of profitability. The Board reviewed information regarding Action’s costs ofprocuring portfolio management services, as well as the costs of provision of management and advocacy services. The Trusteesreviewed data regarding the Fund’s management fees and projected operating expenses (gross and net of expense limitationarrangements) at projected asset levels. Based on such information, the Trustees determined that the management fees and projectedoverall expense ratio of the Fund generally were competitive with other mutual funds, although such a comparison was of limitedutility in light of the unique package of advisory and advocacy services to be provided or procured by Action. In addition, on thebasis of the Board’s review of the management fees to be charged by Action for investment advisory and advocacy services, Action’sestimated management income resulting from its management of the Fund, and the estimated income to the Sub-Adviser to bederived from the relationship with the Fund, the Board concluded that the level of investment management fees are appropriate inlight of the services to be provided or procured and the management fees and overall expense ratios of other investment companies.The Trustees also concluded that Action and the Sub-Adviser were unlikely to derive any significant profit from their services to theFund in the near-term future.
Whether fee levels reflect economies of scale and the extent to which economies of scale would be realized as the Fund grows.The Board concluded that the inclusion of asset-based breakpoints in the Fund’s advisory fee schedule appropriately benefitsinvestors by eventually realizing economies of scale in the form of lower management fees as the level of assets grows. However, theTrustees concluded that the Fund was unlikely to achieve economies of scale in the reasonably foreseeable future. In addition, theBoard concluded that the Fund’s management fees appropriately reflect the Fund’s anticipated size, the current economicenvironment for Action, and the competitive nature of the investment company market. The Trustees also concluded that they willhave the opportunity to periodically re-examine whether the Fund has achieved economies of scale, and the appropriateness ofmanagement fees payable to Action and fees payable by Action to the Sub-Adviser, in the future.
27

FREE ENTERPRISE ACTION FUNDSupplemental Information (unaudited)
Benefits (such as soft dollars) to Action, its affiliates, or the Sub-Adviser from their relationship with the Fund. The Boardconcluded that any other benefits that may be derived by Action, its affiliates, and the Sub-Adviser from their relationship with theFund are reasonable and fair, and are consistent with industry practice and the best interests of the Fund and its shareholders. In thisregard, the Board noted that neither Action nor the Sub-Adviser is expected to realize ‘‘soft dollar’’ benefits from its relationshipwith the Fund.
Other considerations. The Board determined that Action had made a substantial commitment to the recruitment of high qualitypersonnel, and maintained the financial and operational resources reasonably necessary to manage the Fund in a professional mannerthat is consistent with the best interests of the Fund and its shareholders. The Trustees also determined that Action had made asignificant entrepreneurial commitment to the management and success of the Fund, reflected by Action’s expense limitation and feewaiver arrangement with the Fund, which was expected to result in Action waiving a substantial amount of advisory fees and/orreimbursing Fund expenses for the benefit of shareholders while the Fund was in its start-up phase.
28

