annual report for the maple ridge wind power project …batsandwind.org/pdf/jain_2009b.pdfannual...
TRANSCRIPT

MAPLE RIDGE WIND POWER AVIAN AND BAT FATALITY STUDY REPORT – 2008
Curry & Kerlinger, LLC – May 2009 ©
Annual Report for the Maple Ridge Wind Power Project Post-construction Bird and Bat Fatality Study - 2008 May 14, 2009 Prepared for: Iberdrola Renewables, Inc. and Horizon Energy and Technical Advisory Committee (TAC) for the Maple Ridge Project Study Prepared by: Aaftab Jain Paul Kerlinger Richard Curry Linda Slobodnik and Mark Lehman Curry and Kerlinger, LLC Aaftab Jain 174 Fayette Blvd. Syracuse, NY 13224 Office: 315-445-0111 Cell: 315-560-8650 [email protected]

MAPLE RIDGE WIND POWER AVIAN AND BAT FATALITY STUDY REPORT – 2008
Curry & Kerlinger, LLC – May 2009 © ii
ACKNOWLEDGEMENTS Members of the TAC provided valuable oversight and comments on this manuscript. USDA-APHIS, New York City Audubon, New York State Department of Environmental Conservation and the Wadsworth Rabies Laboratory in Albany, NY provided technical assistance. We are grateful to Horizon members: Tod Nash, Robert Burke, Caron Martin, William Burke and Tom Zehr, as well as to all Vestas America employees who notified us of incidental findings of birds/bats. We are grateful to landowners for their continued cooperation in granting us site access/crop clearing rights. We thank EDR-PC for assistance with GIS/GPS work. Finally, we would like to thank Robert Carnie, John Kirch, Naomi Gill, Alex Lyndaker, Stephanie Lehman, Adam Lyndaker and Sean O’Connor, members of the field crew, for their hard work, motivation and attention to detail, without which this study would not have been possible.

MAPLE RIDGE WIND POWER AVIAN AND BAT FATALITY STUDY REPORT – 2008
Curry & Kerlinger, LLC – May 2009 © iii
EXECUTIVE SUMMARY .......................................................................................................................... 1
1.0 INTRODUCTION:................................................................................................................................. 5
1.1 Project Description ............................................................................................................................. 6 1.2 Study Area......................................................................................................................................... 10
2.0 METHODS........................................................................................................................................... 10
2.1 Carcass Surveys ................................................................................................................................ 10 2.1.1 Site Selection ............................................................................................................................... 10 2.1.2 Standardized Surveys ................................................................................................................. 14 2.1.3 Adjustment Factors applied to Raw Data ................................................................................... 16
3.0 RESULTS............................................................................................................................................. 20
3.1 Search Effort..................................................................................................................................... 20 3.1.1 Summary of Search Effort (64 Turbines, 7-Day search sites) .................................................... 20 3.1.2 Meteorological Towers............................................................................................................... 22
3.2 Incidents Recorded During Standardized Surveys and Incidentally .............................................. 23 3.2.1 Birds ........................................................................................................................................... 23 3.2.2 Bats............................................................................................................................................. 29 3.2.3 Seasonal Distribution of Fatalities (Birds and Bats)................................................................... 32 3.2.4 Distance from Turbine Bases...................................................................................................... 34 3.2.5 Multiple Regression Model ........................................................................................................ 36 3.2.6 Extraordinary Maintenance Activities ........................................................................................ 38 3.2.7 Lit versus Un-Lit Turbine Sites .................................................................................................. 39
3.3 Adjusting Fatality Estimates ............................................................................................................. 40 3.3.1 Estimates from 7-day Search Sites ............................................................................................. 40 3.3.2 Estimated Fatalities by Species .................................................................................................. 43
4.0 DISCUSSION....................................................................................................................................... 47 4.1 Project Duration and Search Interval............................................................................................. 47 4.2 Seasonal Distribution of Fatalities................................................................................................. 48 4.3 Species Composition and Fatality Rates at Maple Ridge and Other Wind Power Facilities in the U.S........................................................................................................................................................ 48 4.4 Night Migrant Fatalities................................................................................................................. 50 4.5 Bird Population Trends and Significance of Fatalities at Maple Ridge......................................... 50 4.6 Bat Fatalities.................................................................................................................................. 53
5.0 REFERENCES .................................................................................................................................... 56

MAPLE RIDGE WIND POWER AVIAN AND BAT FATALITY STUDY REPORT – 2008
Curry & Kerlinger, LLC – May 2009 © iv
APPENDICES APPENDIX A: Maple Ridge Wind Resource Area Project Site Information Datasheet. APPENDIX B: Maple Ridge Wind Resource Area Project Incident (Mortality) Datasheet APPENDIX C: Maple Ridge Wind Resource Area Project Incident Location (GPS) Datasheet APPENDIX D: Distribution of carcasses for scavenge rate tests (Sc) APPENDIX E: Number of 7-Day searches completed per site by November 14, 2007 APPENDIX F: Tests of the Efficacy of Brown House Mice (Mus Musculus) As Surrogates for Bats during Scavenge Rate and Search Efficiency Testing APPENDIX G: Comparing Sc and Se Estimated Over 2006, 2007 and 2008 APPENDIX H: Incidental Birds and Bats Reported By Paul Cryan and Crew During an Independent Study At The Maple Ridge WRA In 2008

MAPLE RIDGE WIND POWER AVIAN AND BAT FATALITY STUDY REPORT – 2008
Curry & Kerlinger, LLC – May 2009 © v
LIST OF TABLES
Table 1. 2008 Phase I site selection indicating sites retained from 2006 and 2007................................12
Table 2. 2008 Phase II and IA site selection including proximity to Northwest edge of the MRWRA (NW-edge hypothesis). ....................................................................................................13
Table 3. Number of surveys completed at all 64 survey towers from April 15 to November 9, 2008. ...................................................................................................................................................21
Table 4. Number of surveys completed at both meteorological towers from April 15 to November 5, 2008. ............................................................................................................................22
Table 5. Number of avian incidents at each wind turbine by species group found during standardized surveys and “incidentally” from April 15 to November 9, 2008............................24
Table 6. Numbers of bat incidents by species found at wind turbine locations during standardized surveys and “incidentally” from April 15 to November 9, 2008............................30
Table 7. Number of birds and bats found per month, from April 15 to November 9, 2008.................32
Table 8. Species Size Groupings used in Analyses. ..................................................................................35
Table 9. Number of Incidents (Birds and Bats) versus total area searched per 10m distance annulus at 64 searched sites, April 15 to November 9, 2008. ........................................................35
Table 10. Results from bird and bat regression models, from surveys conducted from April 15 to November 9, 2008. ...................................................................................................................37
Table 11. Contingency table showing the proportion of night migrant birds comparing lit vs. unlit 7-day search sites .....................................................................................................................39
Table 12. Contingency table showing the proportion of bats comparing lit vs. unlit 7-day search sites.........................................................................................................................................39
Table 13. Area Adjustment Factor (bird and bat incidents from standardized surveys conducted from April 30 to November 9, 2008 (not including ‘added incidentals’). ..................41
Table 14. Maple Ridge scavenger removal study data (2008).................................................................42
Table 15. Maple Ridge searcher efficiency study data (2008).................................................................42
Table 16. First full season estimates (April 15 to November 9, 2008) for bird and bat collision mortality under 195 towers of the Maple Ridge WRA, (without incidental finds) adjusted for Search Efficiency, Scavenge Rate, Proportion of Towers Searched, Search Intensity and Proportion of completed surveys per week, from 64 7-day Sites..............43
Table 17. Incidents per species found during both standardized surveys and incidentally, April 15 to November 9, 2008. Estimate of total mortality is an approximation with adjustments for Search Efficiency, Scavenge Rate, Proportion of Towers Searched, Area Adjustment and Proportion of completed surveys per week. Results are reported

MAPLE RIDGE WIND POWER AVIAN AND BAT FATALITY STUDY REPORT – 2008
Curry & Kerlinger, LLC – May 2009 © vi
in incidents per turbine and per total installed megawatt capacity per turbine at the Maple Ridge WRA............................................................................................................................44
Table 18. Bird mortality reported at U.S. wind-energy projects (from NRC 2007)* ...........................49
Table 19. BBS population trends and geographical distribution of bird species found at the Maple Ridge WRA during standardized surveys and incidentally (April 15 to November 14, 2008) Sauer et al. 2005. ...........................................................................................52
Table 20. Population trends and geographical distribution of bat species found at the Maple Ridge WRA during standardized surveys and incidentally (April 15 to November 14, 2008)...................................................................................................................................................53
Table 21. Estimates of bat fatalities per turbine and per megawatt at different wind facilities in Eastern and Midwestern U.S. modified from Arnett et al. (2008)............................................54
Table 22. Percent species composition of bat fatalities at wind facilities in Eastern and Midwestern U.S. (modified from Arnett et al. 2008)......................................................................55

MAPLE RIDGE WIND POWER AVIAN AND BAT FATALITY STUDY REPORT – 2008
Curry & Kerlinger, LLC – May 2009 © vii
LIST OF FIGURES
Figure 1. High resolution project map for the Northern section of the Maple Ridge Wind Resource Area. ....................................................................................................................................8
Figure 2. High Resolution Project map for the Southern section of the Maple Ridge Wind Resource Area. ....................................................................................................................................9
Figure 3. Representation of carcass survey search pattern centered on a wind turbine tower (not to scale). .....................................................................................................................................15
Figure 4. Locations of bird incidents at the Maple Ridge WRA found during standardized surveys (April 15 to November 9, 2008)..........................................................................................27
Figure 5. Locations of bat incidents at the Maple Ridge WRA found during standardized surveys, (April 15 to November 9, 2008).........................................................................................28
Figure 6. Distribution of bat incidents by species, from standardized surveys conducted from (April 15 to November 9, 2008). .............................................................................................29
Figure 7. Number of birds found per month from April 15 to November 9, 2008................................33
Figure 8. Number of bats found per month from April 15 to November 9, 2008. ................................33
Figure 9. Number of birds and bats found per day from April 15 to November 9, 2008. ....................34
Figure 10. Density of bird incidents at 64 searched sites, from surveys conducted from April 15 to November 9, 2008, in relation to distance from towers. .......................................................36
Figure 11. Density of bat incidents at 64 searched sites, from surveys conducted from April 15 to November 9, 2008, in relation to distance from towers. .......................................................36
Figure 12. Examples of searched towers showing searchable area divided into concentric annuli. ................................................................................................................................................41

MAPLE RIDGE WIND POWER AVIAN AND BAT FATALITY STUDY REPORT – 2008
Curry & Kerlinger, LLC – May 2009 © 1
EXECUTIVE SUMMARY
The Maple Ridge Wind Power Project consists of 195 wind turbines and three permanent meteorology towers on the Tug Hill Plateau of Lewis County, just west of Lowville, New York. In 2005, a total of 120 Vestas wind turbines were constructed within the Phase I project area; the remaining 75 turbines in Phase IA and II of the project were constructed in May to December 2006. Each 1.65 MW turbine consists of an 80m (262 feet) tall tubular steel tower; a maximum 82m (269 feet) diameter rotor; and a nacelle which houses the generator, transformer and power train. The towers have a base diameter of approximately 4.5m (15 feet) and a top diameter of 2.5m (8 feet). The tower is topped by the nacelle, which is approximately 2.8m (9 feet) high and 7.6m (25 feet) long, and connects with the rotor hub. The rotor consists of three 41m (134 feet) long composite blades. Nearly one-third (57 out of 195; 29.2%) of the nacelles are equipped with L-864 FAA aviation obstruction beacons (lights) consisting of flashing red strobes (for night) and no illumination during the day. With a rotor blade oriented in the 12 o’clock position, each turbine has a maximum height of approximately 122 m (400 feet). All components of the turbine are painted white. The current report reflects data collected between April 15 and November 9, 2008, and follows two annual reports covering the periods: summer-fall 2006 and April 30-November 14, 2007. As such, the current report is the second complete 3-season of study (Spring-Summer-Fall, winter studies precluded by heavy snowfall and limited site accessibility). Weekly carcass searches were conducted at 64 of 195 (32.8%) turbine sites. We completed 1,882 individual turbine searches, equivalent to about 30 rounds of searches at the 64 turbines. Two out of the three meteorological towers were also searched weekly for a total of 60 searches, from April 15, 2008 to November 5, 2008 (30 rounds). A total of 74 avian incidents were recorded by searchers during standardized surveys under wind turbines, representing 53 incidents identified to 32 species, 6 incidents that were attributable to family but not species, and 15 incidents that could not be identified to a taxonomic group because they were partially scavenged or decayed prior to being found. Of the 53 identified incidents, there were 22 songbird species, 3 game bird species (Ruffed Grouse, American Woodcock and Wild Turkey), 3 raptor species (American Kestrel, Cooper's Hawk and Sharp-shinned Hawk), 2 water bird/shorebird species (Mallard and Killdeer) and two ‘songbird-like’ species (Belted Kingfisher, Mourning Dove). Thirty-nine out of the 74 (52.70%) incidents identified to species were night migrants or belonged to species that showed some evidence of night migration. Of all 42 identified songbirds, (excluding incidental finds), 32 (76.19 %) were night migrants. While these birds are classified as ‘night migrants’ we are not certain that all were migrating at the time of collision. The greatest number of bird incidents occurred during October, but numbers of fatalities did not vary greatly between months. A total of 23 avian incidents were recorded by searchers or reported by WRA employees at times or locations other than during standardized weekly surveys. These incidental bird carcass finds consisted of 1 raptor species (one Sharp-shinned Hawk), 9 songbird species

MAPLE RIDGE WIND POWER AVIAN AND BAT FATALITY STUDY REPORT – 2008
Curry & Kerlinger, LLC – May 2009 © 2
(one each of Black-capped Chickadee, Eastern Kingbird, European Starling, Grey Catbird, Pine Warbler, Red-eyed Vireo, Rose-breasted Grosbeak, and Yellow-rumped Warbler, as well as two Bobolinks. Two additional songbirds were identified only as a kinglet sp. and a passerine sp. In addition, we found a woodpecker species (one Yellow-bellied Sapsucker), two waterbird/shorebird species (three Killdeer, one Gull spp.) and five unidentified bird incidents. The term “incident” is used here to refer to either a fatality or injury of a bird or bat found within the wind project area and does not necessarily indicate that the cause of death or injury was wind turbine related. This term is not to be confused with the term defined earlier, “incidental find”, which refers to incidents found at times other than during standardized surveys and at sites outside the 64 turbines searched. Remains of 140 bats were found by searchers during standardized surveys (April 15, 2008 to November 9, 2008), representing five species (61 Hoary Bats, 29 Silver-haired Bats, 16 Eastern Red Bats, 24 Little Brown Bats and 7 Big Brown Bats, along with two identified only as myotis spp. and one unknown species). The greatest number of bat incidents occurred during the fall dispersal and migration period, with 114 (81.4%) bat carcasses found between July 1, 2008 and September 30, 2008. A total of 76 bat incidents were recorded by searchers or reported by WRA employees at times or locations other than during standardized surveys on weekly searched sites. Of these fatalities, 32 were Hoary Bats, 5 were Eastern Red Bats, 17 were Silver-haired Bats, 11 were Little Brown Bats, 8 were Big Brown Bats, and 3 were unidentified species. Bat carcasses were found closer to turbine tower bases than bird carcasses (bats – 25.9m ± 2.70 95% CI; birds – 39.01m ± 4.29 95% CI). Unlike in 2007, there was no evidence that bat fatalities were different at turbines close to wetland areas vs. turbines located farther from wetlands. There was also no evidence that bat or bird fatalities were different between wooded vs. non-wooded turbine sites. Fatality rates of night migrant birds and bats were not statistically different between lit (FAA L-864 obstruction lights) and unlit turbines, as was found in 2006 and 2007. Neither bird nor bat fatality rates were significantly greater at the northwest-edge of the Wind Resource Area (hypothesized as the source of initial contact of bats with the Wind Resource Area during the fall). The amount of area searchable under each tower and the numbers of towers searched per round were adjusted when calculating final fatality estimates. In addition, carcass removal (scavenging) and searcher efficiency studies were conducted to estimate the proportion of carcasses missed by the searchers and the proportion removed by scavengers within the 7-day search cycles. These rates, along with the proportion of towers searched and the average number of towers searched per survey round were used to estimate the total number of fatalities likely to have occurred during the study period at all 195 turbines at the Maple Ridge Wind Resource Area (WRA). The project was scheduled to start on April 15, 2008 (Late season snowfall in March, precludes clearing and searching of turbine areas prior to early-April). In the first week of searching (April 15-21, 2008), 58 out of the total of 64 turbine sites (~91%) were “set up”

MAPLE RIDGE WIND POWER AVIAN AND BAT FATALITY STUDY REPORT – 2008
Curry & Kerlinger, LLC – May 2009 © 3
and searches immediately began on those towers. Four more turbine sites were added by April 23, 2008 (these were earlier inaccessible due to snow) and the last two sites were established and being searched by May 10, 2008 (these two were replacements for sites for which landowner permission had been withdrawn). Also, search areas under meteorological towers 1 and 2 were established and searches began on April 15 and 16, 2008, respectively. By dividing the estimated number of incidents by the number of turbines and by 1.65 MW per turbine searched in each period, a rate of incidents/turbine and incidents/Megawatt was calculated for the study duration. In addition, by dividing the number of incidents/turbine by the rotor swept area (m2) and multiplying that figure by 2000, we are able to calculate the number of incidents/2000m2 rotor swept area. A typical 1.65 MW wind turbine tower in New York State will produce approximately 4,400 MWh per year (William Moore, PPM-Atlantic Renewable, pers. comm.). The metric “incidents/MWh produced” is calculated for the duration of the project period. It is presumed that some of the carcasses noticed during non-survey activities (site maintenance and scavenger checks, etc.) could have been discovered during regular surveys. Contrary to standard practice, since a number of incidental findings occurred during these non-survey activities, we did an additional calculation of mortality rates using incidental finds that met the criteria mentioned above. The actual estimate of mortality is likely between these two estimates. See Results for 95% CI. The estimates for birds are:
• 7-Day standardized surveys (Total period 208 days): 667 incidents/period, 2.07 incidents/Mw/period, 3.42 incidents/turbine/period, 0.0014 incidents/MWh produced and 1.30 incidents per 2000m2 rotor swept area/period.
• 7-Day standardized surveys + added incidentals (Total period 208 days): 733 incidents/period, 2.28 incidents/Mw/period, 3.76 incidents/turbine/period, 0.0015 incidents/MWh produced and 1.42 incidents per 2000m2 rotor swept area/period.

MAPLE RIDGE WIND POWER AVIAN AND BAT FATALITY STUDY REPORT – 2008
Curry & Kerlinger, LLC – May 2009 © 4
The absence of bat fatalities in the first and last few weeks of our searches indicated that the 2008 study period spanned the entire duration of bat activity (outside caves) in the vicinity of the WRA. Thus, we are confident that our extrapolated results of bat (but not bird) mortality are ‘per year’ and directly comparable with full year studies in other regions where searching is possible throughout the year. With respect to bird fatalities, annual fatality rates should be slightly greater. The rationale for this statement is that migrants accounted for a large proportion of bird fatalities and the study included the peak migration period for most birds and relatively little migration occurs during the months not searched (December-March). The estimates for bats are:
• 7-Day standardized surveys: 1595 incidents/year, 4.96 incidents/Mw/year, 8.18 incidents/turbine/year, 0.0019 incidents/MWh produced and 3.10 incidents per 2000m2 rotor swept area/year.
• 7-Day standardized surveys + added incidentals: 1739 incidents/year, 5.41 incidents/Mw/year, 8.92 incidents/turbine/year, 0.0020 incidents/MWh produced and 3.38 incidents per 2000m2 rotor swept area/year.
The fatality rates and species composition of both birds and bats for the 2008 study were somewhat lower than results found at Maple Ridge in 2006 and 2007, indicating that minimal variation occurs between years. However, a full comparison should await a standardization of methods of calculation for the different years. Specifically, we improved our estimate of search efficiency and area adjustment in 2008. The application of these changes to the 2006 and 2007 reports would allow us to make a detailed comparison between the two full project years (2007, 2008) as well as an improved estimate for the 2006 (pilot) season. Fatality rates and species composition of birds and bats were similar to what has been found at other eastern and mid-western wind power project sites. For birds, fatalities are not likely to be biologically significant. For bats, the species composition is similar to that found at other eastern and Midwestern sites. The numbers of bat fatalities per turbine or per megawatt of power generated are somewhat lower than those reported from studies at Appalachian ridges, but greater than those reported from Midwestern states, in most cases. It is not known whether the fatality rate of bats is biologically significant because so little is known about bat populations and their dynamics.

MAPLE RIDGE WIND POWER AVIAN AND BAT FATALITY STUDY REPORT – 2008
Curry & Kerlinger, LLC – May 2009 © 5
1.0 INTRODUCTION:
The following report describes the research design, initiation and completion of the third year of post-construction study of avian and bat collision fatalities at the 195-turbine Maple Ridge Wind Power Project in Lewis County, New York (Figures 1, 2). During the period June-November 2006, a post-construction bird and bat fatality study was conducted at the Maple Ridge Wind Power Project in Lewis County, NY. That study was designated as a pilot study conducted to establish a protocol that could be used to conduct three additional years of study (2007, 2008 and 2011). The current protocol is slightly different from that used in 2006 (P. Kerlinger. “Proposed Scope of Work for a Postconstruction Avian and Bat Fatality Study at the Maple Ridge Wind Power Project, Lewis County, New York” dated March 14, 2006). People/agencies who reviewed the proposed scope of work included staffers from the U. S. Fish and Wildlife Service (USFWS), U.S. Army Corps of Engineers (ACE), Environmental Design and Research (EDR), New York State Department of Environmental Conservation, developers (Iberdrola Renewables and Horizon) and others. Changes/additions were made for the 2007 and 2008 studies based upon results of the 2006 study, input from the TAC and upon a statistical analysis conducted by Dr. James Gibbs, Dept. of Environmental and Forest Biology, SUNY-ESF, Syracuse, NY. The study protocol remains in compliance with the Army Corps of Engineers (ACOE) permit for the Maple Ridge Wind Resource Area (MRWRA). In addition, the methods used for calculating overall fatality rates have been refined for 2008 based on methods developed after the 2007 field season, including the use of a sub-meter accuracy GPS unit to adjust for area searched under each tower and a modification in the Search Efficiency testing protocol to better reflect conditions on the ground (see Methods). The Technical Advisory Committee (TAC), which has the responsibility of reviewing and commenting on progress reports, annual reports, and other updates from this project, is comprised of representatives from some or all of these groups. TAC members: Patrick Doyle, Horizon Wind Energy William Moore, PPM Energy Paul Kerlinger, Curry and Kerlinger Aaftab Jain, Curry and Kerlinger Alan Hicks, NYSDEC* Brianna Gary, NYSDEC* Tim Sullivan, USFWS* Mark Watson, NYSERDA* Mike Burger, Audubon New York* Diane Sullivan Enders, moderator (EDR)

MAPLE RIDGE WIND POWER AVIAN AND BAT FATALITY STUDY REPORT – 2008
Curry & Kerlinger, LLC – May 2009 © 6
* Members of the TAC reviewed the 2007 annual report and requested changes that are reflected in the current 2008 report as well as a revised version of the 2007 report. The 2008 report was presented to the TAC on February 24, 2009. However, due to other obligations, the USFWS, NYSDEC, NYSERDA and Audubon New York were unable to participate in the review of the 2008 report. The objectives of the 2008 fatality study, the third year of post-construction study, are to provide a quantitative estimate of the number of bird and bat fatalities that occur at the Maple Ridge WRA during the study period. Specifically, estimates of numbers of fatalities will be determined for: Birds (collective fatalities of all species), Bats (collective fatalities of all species), Bird species (species by species), Bat species (species by species), Raptors (all species collectively), Waterfowl (all species collectively), Songbirds (all species collectively) and Night migrants (all species collectively and individual species).
The methods used include searches under turbines in concert with studies of carcass removal rates (scavenging) and searcher efficiency rates. The study was conducted at a subset of turbines and will be done for a period of 3 years post-construction (2006, 2007, 2008 and 2011) totaling 4 years including the pilot study. If it is determined that modifications of the current protocol and methods are needed, revisions will be evaluated by the TAC.
1.1 Project Description The Maple Ridge Wind Power Project consists of 195 wind turbines and three permanent meteorology towers on the Tug Hill Plateau of Lewis County, just west of Lowville, New York. In 2005, a total of 120 Vestas wind turbines were constructed within the Phase I project area; the remaining 75 turbines in Phase IA and II of the project were constructed in May to December 2006. Each 1.65 MW turbine consists of an 80m (262 feet) tall tubular steel tower; a maximum 82m (269 feet) diameter rotor; and a nacelle which houses the generator, transformer and power train. The towers have a base diameter of approximately 4.5m (15 feet) and a top diameter of 2.5m (8 feet). The tower is topped by the nacelle, which is approximately 2.8m (9 feet) high and 7.6m (25 feet) long, and connects with the rotor hub. The rotor consists of three 41m (134 feet) long composite blades. Nearly one-third (57 out of 195; 29.2%) of the nacelles are equipped with L-864 FAA aviation obstruction beacons (lights) consisting of flashing red strobes (for night) and no illumination during the day. With a rotor blade oriented in the 12 o’clock position, each turbine has a maximum height of approximately 122 m (400 feet). All components of the turbine are painted white. Two 80-meter-(262-foot) tall meteorological towers were also constructed in 2005 to collect wind data and support performance testing of the project. The towers are free-

MAPLE RIDGE WIND POWER AVIAN AND BAT FATALITY STUDY REPORT – 2008
Curry & Kerlinger, LLC – May 2009 © 7
standing galvanized lattice steel structures with FAA obstruction lighting. One additional meteorological tower of the same description was constructed as a part of Phase II (2006 construction). Other project components include a series of buried electrical interconnect lines, a system of gravel service roads to each wind turbine, an approximately 6.44 km (4-mile) aerial 34.5kV electrical distribution line and a substation.

MAPLE RIDGE WIND POWER AVIAN AND BAT FATALITY STUDY REPORT – 2008
Curry & Kerlinger, LLC – May 2009 © 8
Figure 1. High resolution project map for the Northern section of the Maple Ridge Wind Resource Area.

MAPLE RIDGE WIND POWER AVIAN AND BAT FATALITY STUDY REPORT – 2008
Curry & Kerlinger, LLC – May 2009 © 9
Figure 2. High Resolution Project map for the Southern section of the Maple Ridge Wind Resource Area.

MAPLE RIDGE WIND POWER AVIAN AND BAT FATALITY STUDY REPORT – 2008
Curry & Kerlinger, LLC – May 2009 © 10
1.2 Study Area The project is located on the eastern edge of the Tug Hill Plateau in the Towns of Martinsburg, Harrisburg and Lowville. The total project area totals approximately 21,100 acres. The project area lies approximately 1 mile west of NYS Route 12 (north of West Lowville) and County Route 29 (south of West Lowville). Phase I includes approximately 15,570 acres of land (on 84 separate parcels) under lease from 52 different landowners in the Towns of Harrisburg, Martinsburg, and Lowville. This boundary has a north-northwest orientation, and extends from the intersection of Graves Road and Corrigan Hill Road, in the south, to Cobb Road, Snyder Road and State Highway 177, in the north. Phase II includes approximately 5,575 acres of land (on 31 separate parcels), under lease from 17 different landowners, in the Towns of Harrisburg and Lowville. This boundary has a north-northwest orientation, spanning from Cobb Road, Snyder Road, and State Highway 177, in the south, to O’Brien Road, in the north. The project site is located in a rural and agricultural area with elevations ranging from about 1,300 to 1,980 feet above mean sea level. The majority of the area consists of open crop fields (primarily hay, alfalfa and corn) and pastures, with forested areas generally confined to woodlots, wooded wetlands and ravines/stream corridors. Larger areas of contiguous forest occur in the western portion of the project area. The site also includes successional old field, hedgerow, successional shrubland, yards, farms, streams and ponds. Existing built features within the site boundaries include various communication towers, single-family homes, barns, silos, small industrial facilities and other agricultural buildings. Roads on site include a two lane highway (Hwy 177) as well as several local paved and gravel roads present before the construction of the wind project. Narrower gravel access roads were created over farmland and through forested areas to service the towers (Figures 1, 2). 2.0 METHODS
2.1 Carcass Surveys
2.1.1 Site Selection Sixty-four turbine sites were chosen to be searched in 2007. 2 meteorological towers were also searched. Site selection was through a process of randomization and stratification. All turbine locations were surveyed, and classified broadly as bare ground, agricultural (crop), agricultural (grassland), brush and wooded. Most sites belonged to two or more classes (e.g. agricultural crop field with woodlot and some brush). Tables 1 and 2 show the primary ground cover at the various sites under which searches occurred. The project was scheduled to start on April 15, 2008 (Late season snowfall in March, precludes clearing and searching of turbine areas prior to early-April). In the first week of searching (April

MAPLE RIDGE WIND POWER AVIAN AND BAT FATALITY STUDY REPORT – 2008
Curry & Kerlinger, LLC – May 2009 © 11
15-21), 58 out of the total of 64 turbine sites (~91%) were “set up” and searches immediately began on those towers. Four more turbine sites were rapidly added by April 23, 2008 (these were earlier inaccessible due to snow) and the last two sites were established and being searched by May 10, 2008 (these two were replacements for sites for which landowner permission had been withdrawn). Also, search areas under meteorological towers 1 and 2 were established and searches began on April 15 and 16, 2008, respectively. We transitioned from searching 50 out of 120 (41.7%) Phase I turbine sites in 2006 (and two meteorological towers) to searching 64 out of 195 (32.8%) sites from Phases I, II and IA (and two meteorological towers) in 2007 and 2008.
a) We chose ~33% of the turbines of each phase, in a randomized stratification process, as sixty-four turbine sites represented ~33% of the total 195 turbine sites at the Maple Ridge Wind Resource Area (MRWRA). Thus, we chose ~1/3 of the: 120 Phase I turbines (39 sites); 20 Phase IA turbines (7 sites); and 55 Phase II turbines (18 sites). Phase I sites were chosen through a randomized process in 2006. Sites that were eliminated from the Phase I sites included 2 turbine sites for which landowner permission was withdrawn. The remaining eliminated sites had sites of similar ground cover in close proximity. This process retained adequate distribution of sites over Phase I. Both Phase IA and Phase II sites were chosen at random out of all suitable sites. Some sites were not considered due to electric fencing and presence of cattle. Also, 7 sites from the original randomization in Phase II were replaced by re-randomization, due to concerns of landowner participation.
b) Adequate coverage of the north-west region of the MRWRA Phases IA and II are located in the North-West portion of the MRWRA. The North-west Edge hypothesis could be examined by comparing levels of fatalities between turbines near the North-west Edge (a subset of Phase IA and II) versus the remaining turbines. North-West Edge turbines were defined as turbines within 1.25 km of a virtual line (connecting turbines 120, 135, 114, 142, 149 and 150) on the Northern and Western boundaries of the MRWRA.
c) Adequate numbers of both sites surrounded by forest (wooded) vs. non-wooded sites will ensure statistical validity to account for the reduced search area in wooded sites. (Tables 1, 2) Also, while ground cover differs from year to year as a result of management practices, the large number of sites covered by the study ensures that the breadth of site types and conditions observed at the MRWRA were adequately represented (grass, crop, wooded and brush).
d) Sites searched daily in 2006 (Phase I) were included in the study, except for Sites 97 and 98, because the landowner withdrew access.
e) In 2008, landowner permission for access to two sites (17 and 195) was withdrawn. These were replaced with sites 86 and 192 (both former sites from 2006).

MAPLE RIDGE WIND POWER AVIAN AND BAT FATALITY STUDY REPORT – 2008
Curry & Kerlinger, LLC – May 2009 © 12
Table 1. 2008 Phase I site selection indicating sites retained from 2006 and 2007.
Phase Turbine Number Wooded Ring1 Primary Ground
Cover
Retained from 2006
Retained from 2007
Met Met Tower #1 n/a Grass/Wooded Retained Retained Met Met Tower #2 n/a Grass/Wooded Retained Retained
1 12 No Grass Retained Retained 1 16 No Grass Retained Retained 1 17 Yes Grass/Wooded Retained Dropped2 1 23 No Grass Retained Retained 1 24 No Grass Retained Retained 1 26 No Grass Retained Retained 1 27 No Grass Retained Retained 1 34 Yes Grass/Wooded Retained Retained 1 37 Yes Grass/Wooded Retained Retained 1 39 No Grass Retained Retained 1 40 No Grass Retained Retained 1 50 No Grass/Wooded Retained Retained 1 52 No Grass Retained Retained 1 53 Yes Grass/Wooded Retained Retained 1 56 No Crop Retained Retained 1 57 No Grass/Crop Retained Retained 1 59 No Crop Retained Retained 1 64 Yes Grass/Wooded Retained Retained 1 75 No Grass Retained Retained 1 76 No Grass/Wooded Retained Retained 1 77 No Grass/Crop/Brush Retained Retained 1 82 Yes Wooded Retained Retained 1 83 Yes Wooded Retained Retained 1 89 No Grass/Crop Retained Retained 1 101 Yes Grass/Wooded Retained Retained 1 102 Yes Grass/Wooded Retained Retained 1 103 Yes Grass/Wooded Retained Retained 1 104 No Grass/Wooded Retained Retained 1 108 No Grass Retained Retained 1 109 No Grass Retained Retained 1 110 No Grass Retained Retained 1 179 Yes Grass/Wooded Retained Retained 1 180 No Grass/Wooded Retained Retained 1 183 Yes Wooded Retained Retained 1 189 No Grass Retained Retained 1 195 No Grass/Wooded Retained Dropped2 1 197 Yes Grass/Wooded/Brush Retained Retained 1 22a No Grass Retained Retained 1 54A Yes Grass/Wooded Retained Retained 1 32 No Grass/Wooded Dropped Dropped 1 35 No Grass Dropped Dropped 1 45 Yes Grass/Wooded Dropped Dropped

MAPLE RIDGE WIND POWER AVIAN AND BAT FATALITY STUDY REPORT – 2008
Curry & Kerlinger, LLC – May 2009 © 13
Phase Turbine Number Wooded Ring1 Primary Ground
Cover
Retained from 2006
Retained from 2007
1 86 No Grass Dropped Retained in 2008
1 90 No Grass Dropped Dropped 1 97 No Grass/Crop Dropped Dropped 1 98 No Grass/Crop Dropped Dropped 1 181 No Grass Dropped Dropped 1 185 Yes Wooded Dropped Dropped
1 192 Yes Grass/Wooded Dropped Retained in 2008
1 193 Yes Wooded Dropped Dropped 1. Wooded Ring indicates that turbine was constructed in a forest clearing with less area than the 120m by 130m search area. 2. Sites dropped as landowner withdrew permission Table 2. 2008 Phase II and IA site selection including proximity to Northwest edge of the MRWRA (NW-edge hypothesis).
Phase Turbine Number Wooded Ring Primary Ground
Cover N-W Edge
Retained from 2007
2 36 No Grass/Crop No Retained 2 79A No Crop Yes Retained 2 114 No Grass/Crop Yes Retained 2 116 No Grass/Crop/Wooded Yes Retained 2 118 No Grass Yes Retained 2 121 No Grass/Crop/Wooded Yes Retained 2 122 No Grass/Crop Yes Retained 2 124 No Grass/Crop Yes Retained 2 125 Yes Grass/Wooded Yes Retained 2 126 Yes Grass/Wooded Yes Retained 2 127 No Grass/Crop Yes Retained 2 129 No Grass/Crop Yes Retained 2 130 No Grass/Crop Yes Retained 2 133 No Crop Yes Retained 2 134 Yes Grass/Wooded Yes Retained 2 136 Yes Grass/Wooded Yes Retained 2 167 No Grass No Retained 2 168 No Grass No Retained
1A 61A Yes Grass/Wooded Yes Retained 1A 149 No Grass Yes Retained 1A 153 No Grass No Retained 1A 154 No Grass No Retained 1A 184 Yes Grass/Wooded Yes Retained 1A 187 Yes Grass/Wooded No Retained 1A 198 Yes Grass/Wooded Yes Retained

MAPLE RIDGE WIND POWER AVIAN AND BAT FATALITY STUDY REPORT – 2008
Curry & Kerlinger, LLC – May 2009 © 14
2.1.2 Standardized Surveys Carcass surveys were conducted every 7 days at 64 wind turbine towers. Searchers and search times were continuously switched over the course of the project to reduce the chance of towers being continually surveyed at the same time of day, or by the same searcher. Search teams were also switched on a daily basis. Searches were conducted when weather and other conditions permitted. Work was not done during lightning but was conducted during light rain. The survey consisted of searchers walking in parallel transects within an overall search area of 130m by 120m, centered on the tower. While walking in each 5m wide transect, the searcher used the unaided eye, alternately scanning an area that extended for 2.5m (compares favorably to Johnson et al. 2003) on either side of his/her track (Figure 3). The surveyors used range finders to initially establish and flag the beginning, midpoint and end of each transect. Site by site differences did remain. Towers that were constructed by clearing wooded areas had heavily wooded areas approximately 35-45m from the tower base. These wooded sites could only be cleared and searched out to the tree line. Non-wooded sites were searched out to the overall search area, also subject to local site conditions (un-cleared brush, wetlands etc). A sub-meter accurate backpack GPS Trimble XRS unit was used to measure the searchable area under each turbine. Data recorded at the beginning of the surveys included meteorological data (cloud cover, temperature and wind velocity) and ground cover information (crop type and height). In addition, the start and finish times were recorded for each tower searched (Appendix A). With respect to birds, any feathers or clumps of feathers with flesh attached were recorded as a fatality. Loose feathers were not considered fatalities unless there were several primary or tail feathers indicating more than could be lost during molting. When unattached single loose feathers were found their location was recorded and the feathers were removed and retained but not recorded as a fatality. Small feathers such as down feathers were also not recorded, since these most likely were lost as a result of normal preening. In any event, this type of remains was too scant to assign cause of death.

MAPLE RIDGE WIND POWER AVIAN AND BAT FATALITY STUDY REPORT – 2008
Curry & Kerlinger, LLC – May 2009 © 15
Figure 3. Representation of carcass survey search pattern centered on a wind turbine tower (not to scale).
When a carcass or injured bird or bat was found, the searchers performed a thorough investigation and documentation of the incident using the protocols listed in the ‘Proposed Scope of Work for a Postconstruction Avian and Bat Fatality Study at the Maple Ridge Wind Power Project’. An incident report number was assigned and an incident report filled out for each find (Appendix B). A handheld Global Positioning System (GPS) unit was used to determine geographic coordinates and a range finder and compass were used to determine distance and bearing from the tower. Distance of the carcass from the centerline of the transect (the line the searcher walked) was also measured. The carcass was photographed in the position in which it was found, using a digital camera, and a preliminary identification was made. After identifying the animal by species (including age and sex when possible), an examination was performed to determine the nature and extent of any injuries and whether any scavenging or insect infestation had occurred. In case of dismemberment, the surveyors searched the vicinity to locate all body parts. In case of avian incidents, all loose feathers were collected in order to avoid identifying the feathers as an additional kill during the next survey of the tower. The bird or bat carcass was then placed in a plastic bag labeled with date, species, tower number, and incident report number, and taken to a freezer to be stored in accordance with the U.S. Fish and Wildlife Service (USFWS) permit requirements. When carcasses were found at times and locations outside of one of the standardized surveys conducted as part of this study, the carcass was processed as above but it
130m
5m-wide Search Transects
Turbine Tower
Wetland (Cannot be searched)
120m
Wooded Area (Cannot be searched)

MAPLE RIDGE WIND POWER AVIAN AND BAT FATALITY STUDY REPORT – 2008
Curry & Kerlinger, LLC – May 2009 © 16
was classified as an “incidental” find. With the approval of the NYSDEC, qualified project technicians (Andy Fuerst, Jeremy Histed, Chris Hansen and Josh Meacham) identified bird carcasses. Bat carcasses were identified by Alan Hicks (NYSDEC). When an injured animal was found, the protocol required that the searchers recorded the same data collected for a carcass, noting that it was an injury and not a fatality. The searchers then captured and restrained the animal in a manner to avoid either further injury to the animal or injury to the survey crew. Once the animal was secured, it was transported to a wildlife rehabilitator or veterinarian. One such avian incident occurred in 2008. The severely injured bird in question was euthanized by a local veterinarian. Rabies related precautions precluded the handling and rehabilitation of injured bats in New York State. Two injured bats (in 2008) were euthanized using cervical dislocation. All injuries were not discounted from final mortality estimates due to the severity of the wounds. Only in those cases where the animal was in proximity to a specific turbine was a turbine number recorded as the location in the report. When no corroborating information that the injury was linked to a tower was available, the animal was simply recorded as an “incidental” find. The protocol dictated that if the carcass or injured animal found was listed as a threatened or endangered species, or a species of concern, the FWS was to be notified immediately by telephone and collection of the dead/injured animal was to be delayed until specific direction for proceeding was received from the FWS. As described in the protocol, the first carcass survey at each site was considered a “clean sweep” conducted at all newly installed and operational wind turbine towers. All carcass remains noted in the first search were removed and treated as incidental finds to increase the likelihood that all carcasses found during the subsequent surveys would be associated with incidents that occurred during the course of the standardized surveys. Clean sweeps were conducted using the same protocol as used in the standardized carcass surveys. 2.1.3 Adjustment Factors applied to Raw Data: 2.1.3.1 Area Adjustment Search Intensity (Search Sites Limited by Mowing Obstacles) (Si): Because the areas searched under turbines in the Maple Ridge WRA were limited by habitat conditions such as trees, shrubs and wetlands that could not be cleared, we applied an area adjustment factor to the number of incidents found at partially searched sites. We used a sub-meter accuracy GPS Trimble XRS unit to measure the cleared search area within each search site. We analyzed the extent of searchable area within the 120m by 130m area with ESRI ArcGIS software. The total number of incidents (separately for all four size classes: small, medium and large birds and bats) was separated into 10m incremental annuli (0-10m, 10.1-20m, etc.) that fell within the 120m by 130m search area for all turbines (Table 13, Figure 12). Then, the fatality numbers for each annulus were divided by the percent area searched in that annulus. For example, if 20 bat fatalities were found in the 40.1-50 meter annulus (at all turbine sites) and if 50% of the available area in that annulus was searched (at all turbine sites), then 20 would be only half of the total number of bats in that interval. Therefore, (20/0.50) = 40 area-adjusted bat

MAPLE RIDGE WIND POWER AVIAN AND BAT FATALITY STUDY REPORT – 2008
Curry & Kerlinger, LLC – May 2009 © 17
fatalities for that annulus. We based our adjustment factor on prior work in Fiedler et al. (2008). Se, Sc and Ws adjustments were applied after this area adjustment process. 2.1.3.2 Adjustment for proportion of complete surveys per week (Ws) We began searches concurrently with site set-up. However, unlike the previous year where we adjusted for missed searches during the first few weeks of searching (Project set-up period adjustment), the first round of searches in 2008 (April 15 – 21) covered almost all the towers (~91%) to be searched. In all subsequent weeks until the last week of the project, at least 97% of the 64 towers were searched. (Each week, 0-2 towers were missed due to weather, site maintenance, site access permission or other reasons beyond our control). Rather than make a week by week adjustment for the proportion of towers searched, we divided the numbers of birds and bats found during standardized searches over the entire study period by the average proportion of the 64 sites searched to obtain adjusted figures. See Section 3.3.1.1 and 3.3.1.3 for the effect of these adjustment factors. 2.1.3.3 Searcher Efficiency, Scavenger Removal, Proportion of Operational Towers Searched In addition to the earlier adjustments made, it is generally recognized that the number of carcasses found under the towers is lower than the total number of birds and bats likely to have been killed due to three additional adjustment factors. The first is the possibility that the searchers will miss carcasses due to the amount of ground cover or the size and camouflage of the species. A second possibility is that the carcasses are removed prior to the time the searchers arrive on location after the collision event occurred. Finally, the estimate of incidents must be adjusted by the ratio of the number of towers searched to the number of operational towers in the WRA. Applying these adjustment factors to the actual number of carcasses found during standardized surveys reduces underestimation of mortality due to these factors. Several scavenger removal and searcher efficiency studies conducted throughout the study duration in 2008 estimated the proportion of carcasses missed by the searchers and the proportion removed by scavengers within 7-day search cycles. We made the following adjustments to extrapolate the mortality counts to estimated mortality for the entire wind farm. We adjusted the number of incidents found, previously adjusted for Proportion of towers searched per week (Ts) and Proportion of Annuli searched (Pa), for Scavenger efficiency (Sc), Search efficiency (Se) and Proportion of towers searched to the total of 195 operational towers in the WRA (Ps). a) Proportion of test carcasses left by scavengers within the search period (Sc).
Scavenge rate (Sc) was measured over 9 tests (18-May, 7-Jun, 9-July, 26-Aug, 1-Sep, 25-Sep, 26-Sep, 5-Oct, 18-Oct) by placing 51 bat carcasses, 34 house mice (Mus musculus) and 36 small bird (sparrow sized) carcasses, 18 medium bird (American Woodcock sized) carcasses and 6 large bird (American Crow sized) carcasses on mortality transects at various searched sites in the MRWRA. Carcasses were distributed among searched sites during the late afternoon-early evening before Day 1 of the test (Appendix D). Latex gloves and plastic bags were used to ensure that carcasses did not come into direct contact with the person placing them on site (Linda Slobodnik, Director or Field Operations (DFO). Placement bias prevention measures included dropping carcasses at varied distances to tower base and at all

MAPLE RIDGE WIND POWER AVIAN AND BAT FATALITY STUDY REPORT – 2008
Curry & Kerlinger, LLC – May 2009 © 18
types of searched ground cover (gravel, grass/hay and corn stubble). Also, carcasses were thrown over the DFO’s shoulder to add a random element to the eventual location. Thus carcasses landed in locations independent to the center line of the transect in which it fell. Carcasses were dry and partially thawed when placed. Field technicians monitored carcasses daily for evidence of scavenging until all carcasses were scavenged or deemed too decomposed/picked clean by insects, typically from 10 days to 4 weeks. The status of each carcass was reported as completely intact (CI), partially scavenged with carcass or large group of feathers remaining (PSC/PSF) or no remains (NR). Movement of carcasses was noted, although this could not always be distinguished from weather related events. The probability of a collision event is equally distributed over all days of the search cycle (7 days). Thus, the overall duration between carcass fall and discovery is approximately half the actual search cycle (3.5 days). For example, if a carcass was discovered at a 7-day search site, it had an equal probability of having hit the tower on each of the previous 7 nights. The average time between impact and discovery is (1 + 2 + 3 + 4 + 5 + 6)/6 = 3.5 days (rounded to 4 days). Thus, the scavenge rate was calculated for the number of test carcasses that remained visible (body of carcass not removed or severely scavenged) after 4 days.
b) Proportion of carcasses not missed by observers in the search efficiency trials (Se). The carcasses used to test for Search Efficiency were a subset of the ones used to test for Scavenge Rate i.e. the carcasses that were not scavenged before the technicians arrived onsite. See Tables 14, 15. The dates of search efficiency trials coincided with the start dates of scavenging trials. Search efficiency trials were conducted for each observer by having the DFO, place bat carcasses, tail-less brown house mouse (Mus musculus) carcasses as well as bird carcasses of three sizes, small, medium and large, under towers in the MRWRA, without the knowledge of the searchers. Carcasses were placed during the late afternoon-early evening before Day 1 of the test. The DFO did not walk directly from the gravel access area to the carcass location, and took care not to leave obvious tracks in grass/mud. The searchers recorded all carcasses that they discovered, including planted carcasses (which were identifiable by a small tag attached to and hidden below the carcass). Some test carcasses that were not found during the initial search were found in subsequent searches. Technicians were not informed as to their location during subsequent searches. Counting these “late finds” allowed us to more accurately model actual search conditions, where carcasses were found that showed evidence of decomposition and weathering from lying on the ground for over a week. Thus, we were able to incorporate into our model those carcasses that were not found in the first search after collision mortality occurred, but were found during subsequent searches prior to a scavenging event. This marks an improvement over the Se rate used in the adjustment model in Jain et al 2006, 2007, which likely overestimated the total number of carcasses missed by searchers at daily and three day searches. The effect of this change on the results from adjustments to 7-day searches is small, as most carcasses were scavenged before a second round of searches, a week later. Planted evidence of collisions was later removed from the database and a mean search efficiency rate (Se) was calculated as the ratio of test carcasses found prior to scavenging to test carcasses not scavenged. Carcasses that were missed were checked immediately after searches to ascertain whether they had been scavenged.

MAPLE RIDGE WIND POWER AVIAN AND BAT FATALITY STUDY REPORT – 2008
Curry & Kerlinger, LLC – May 2009 © 19
c) Proportion of towers searched to the total of 195 operational towers in the windfarm (Ps). Ps for the 64 7-day sites was 64:195.
Thus, PsSeSc
CC××
=)
Where C
) = Adjusted total number of kills estimated at the windfarm.
The variance of the number of kills found was first calculated per tower using standard
methods (Ramsey and Schafer, 2002). Then, we calculated the variance due to the adjustment factors Sc and Se, using the variance of a product formula (Goodman, 1960). The variance of the product of Sc and Se is:
( ) ⎥⎦
⎤⎢⎣
⎡
××
+×= 222 )var(
CCvar )Var(
SeScSeScCC
))
We used this procedure for the 7-day search frequencies to get an estimate of mortality for birds and bats.

MAPLE RIDGE WIND POWER AVIAN AND BAT FATALITY STUDY REPORT – 2008
Curry & Kerlinger, LLC – May 2009 © 20
3.0 RESULTS
3.1 Search Effort
3.1.1 Summary of Search Effort (64 Turbines, 7-Day search sites) As described in the study protocol and methods, the first carcass survey at each site was considered a “clean sweep” conducted at all newly installed and operational wind turbine towers. All carcass remains noted in the first search at a wind turbine site were removed to increase the likelihood that all carcasses found during the subsequent surveys would be associated with incidents that occurred during the course of the standardized surveys. Clean sweeps were conducted using the same protocol as used in the standardized carcass surveys (see below). 6 birds and no bats were found during initial “clean sweeps,” and designated as incidental finds. All 6 bird “clean sweep” finds were either feather spots or small carcass remnants, or, in one case, a considerably decomposed sharp-shinned hawk. Approximately 30 rounds (1882 turbine searches) of standardized searching were conducted between April 15, 2008 and November 9, 2008 (Table 3). In the first week of searching (April 15-21, 2008, 58 out of the total of 64 turbine sites (~91%) were “set up” and searches immediately began on those towers. Four more turbine sites were added by April 23, 2008 (these were earlier inaccessible due to snow) and the last two sites were established and being searched by May 10, 2008 (these two were replacements for sites for which landowner permission had been withdrawn). Thus, in contrast to the previous year, the initial numbers of towers searched per week did not significantly differ from the numbers of towers searched per week in the duration of the project. The first 3 rounds consisted of 58, 62 and 62 turbines each, as site access permissions were received and more turbines were set up during the first days of the project. After this project set-up period, 26 rounds of standardized searches were conducted (97% or more complete search rounds). One incomplete round comprising 52 turbines was also conducted at the end of the study, when winter weather began to prevent regular search activities. The total search period was 208 days. Two out of the three meteorological towers were also searched weekly for a total of 60 searches, from April 15, 2008 to November 5, 2008 (30 rounds, 204 day search period). All turbines were searched as frequently as the protocol described, although minor weather and human related disruptions occurred. If a scheduled search could not be conducted, field technicians accessed the sites at the earliest available date before the next search round was due to occur. While weather and tower maintenance work did cause search postponements, by the end of the season, 61 out of 64 towers were searched at an average number of days between successive searches of between 6.5 days and 7.0 days. The remaining three towers were searched at an average number of days between successive searches of between 7.0 days and 7.25 days. The average number of days between searches for all 64 turbines was 6.80 and the median was 6.77. Appendix E has greater details on number of searches and search frequency per tower.

MAPLE RIDGE WIND POWER AVIAN AND BAT FATALITY STUDY REPORT – 2008
Curry & Kerlinger, LLC – May 2009 © 21
3.1.1.1 Extraordinary Maintenance activities: During the 2008 project year, MRWRA turbines were occasionally shut down to make repairs and refitting. Searches were adjusted so that towers were revisited when no work was ongoing, and searched at the earliest possible time. Besides the maintenance activities described above, searches had to be modified at a few towers as the wind developer instructed technicians to avoid a 15m (~50 foot) radius around the transformer at the base of the Phase I towers. Unlike 2007 (Jain et al. 2008), where the exclusion zone affected all Phase I searched towers simultaneously for a significant period of time, this exclusion zone only affected a total of 25 out of 1882 searches (~1%) over the entire course of the project and would have had a negligible effect on our results. Table 3. Number of surveys completed at all 64 survey towers from April 15 to November 9, 2008.
64 Wind Turbine Towers (7-Day Search Period)
Carcass Surveys: Start Date End Date Round 11 (58 Turbines) 15-Apr 21-Apr Round 21 (62 Turbines) 22-Apr 30-Apr Round 31 (62 Turbines) 29-Apr 5-May
Round 4 6-May 12-May
Round 5 12-May 20-May
Round 6 20-May 26-May
Round 7 26-May 2-Jun
Round 8 2-Jun 9-Jun
Round 9 9-Jun 16-Jun
Round 10 16-Jun 23-Jun
Round 11 23-Jun 30-Jun
Round 12 30-Jun 7-Jul
Round 13 7-Jul 14-Jul
Round 14 14-Jul 21-Jul
Round 15 21-Jul 28-Jul
Round 16 28-Jul 4-Aug
Round 17 4-Aug 11-Aug
Round 18 11-Aug 18-Aug
Round 19 17-Aug 25-Aug
Round 20 24-Aug 1-Sep
Round 21 31-Aug 8-Sep
Round 22 7-Sep 15-Sep
Round 23 14-Sep 22-Sep
Round 24 22-Sep 29-Sep
Round 25 28-Sep 6-Oct
Round 26 5-Oct 14-Oct
Round 27 11-Oct 20-Oct
Round 28 19-Oct 27-Oct
Round 29 26-Oct 3-Nov

MAPLE RIDGE WIND POWER AVIAN AND BAT FATALITY STUDY REPORT – 2008
Curry & Kerlinger, LLC – May 2009 © 22
64 Wind Turbine Towers (7-Day Search Period)
Carcass Surveys: Start Date End Date Round 302 2-Nov 9-Nov
1. Indicates project setup period. 2. Indicates incomplete 7-Day survey due to winter weather.
3.1.2 Meteorological Towers Both meteorological towers were searched weekly, for a total of 60 searches, from April 15, 2008 to November 5, 2008. The total search period was 204 days. Meteorological towers 1 and 2 were both searched at an average number of days between successive searches of 7 days respectively. See Table 4 for a complete list of search dates. Table 4. Number of surveys completed at both meteorological towers from April 15 to November 5, 2008.
Meteorological Tower 1
Meteorological Tower 2
Date Date
Round 1 15-Apr 16-Apr
Round 2 22-Apr 23-Apr
Round 3 29-Apr 30-Apr
Round 4 6-May 7-May
Round 5 13-May 14-May
Round 6 20-May 21-May
Round 7 27-May 28-May
Round 8 3-Jun 4-Jun
Round 9 10-Jun 11-Jun
Round 10 17-Jun 18-Jun
Round 11 24-Jun 25-Jun
Round 12 1-Jul 2-Jul
Round 13 8-Jul 9-Jul
Round 14 15-Jul 16-Jul
Round 15 22-Jul 23-Jul
Round 16 29-Jul 30-Jul
Round 17 5-Aug 6-Aug
Round 18 12-Aug 14-Aug
Round 19 19-Aug 20-Aug
Round 20 26-Aug 27-Aug
Round 21 2-Sep 3-Sep
Round 22 9-Sep 10-Sep
Round 23 16-Sep 17-Sep
Round 24 23-Sep 24-Sep
Round 25 30-Sep 1-Oct
Round 26 7-Oct 8-Oct
Round 27 14-Oct 15-Oct
Round 28 22-Oct 22-Oct
Round 29 1-Nov 1-Nov
Round 30 3-Nov 5-Nov

MAPLE RIDGE WIND POWER AVIAN AND BAT FATALITY STUDY REPORT – 2008
Curry & Kerlinger, LLC – May 2009 © 23
3.2 Incidents Recorded During Standardized Surveys and Incidentally During this study, a total of 97 avian fatalities/injuries (incidents) and 216 bat fatalities/injuries (incidents) were recorded during standardized surveys at turbine towers as well as incidentally reported. Two (birds) were also reported during standardized surveys at the meteorological towers. Incidentally reported carcasses included finds by wind developer employees at any of the 195 turbine sites and finds by field technicians not in standardized search plots or not during standardized searches. Of these 97 bird carcasses, 23 (23.71%) were found incidentally and of the 216 total bat carcasses, 76 (35.19%) were found incidentally. 51 of the 76 incidental carcasses were found by alternate researchers at non-survey sites (Appendix G). Normally, incidental finds are not included in any extrapolation of total incidents/tower, as they are outside the study design framework. However, a number of incidents were noted, at survey sites, by field technicians visiting sites for scavenge tests and maintenance. Site maintenance techniques required frequent visits to sites before and after mowing activity to remove/replace boundary and transect markers. Further, some sites required daily checking during scavenger tests. We deemed it possible that field technicians could have noted some of these incidents during standardized searches if they had not already noticed them. We classified these incidental findings as “added incidentals.” We performed an additional calculation to estimate mortality using both incidents from standardized searches and “added incidentals” (See Section 3.3.) There were 7 (~8.64%) “added incidentals” for birds and 13 (~ 8.50%) “added incidentals” for bats.
3.2.1 Birds: A total of 74 avian incidents were recorded by searchers during standardized surveys under wind turbines, representing 53 incidents identified to 32 species, 6 incidents that were attributable to class but not species, and 15 incidents that could not be identified to a taxonomic group because they were partially scavenged or decayed prior to being found (Table 5). Of the 53 identified incidents, there were 22 songbird species, 3 game bird species (Ruffed Grouse, Woodcock and Wild Turkey), 3 raptor species (American Kestrel, Cooper's Hawk and Sharp-shinned Hawk), 2 water bird/shorebird species (Mallard and Killdeer) and two ‘songbird-like’ species (Belted Kingfisher, Mourning Dove). 39 out of the 53 (73.58%) incidents identified to species were night migrants or belonged to species that showed some evidence of night migration (Paul Kerlinger, Pers. Obs.). Of all 42 identified songbirds, (excluding incidental finds), 32 (76.19 %) were night migrants. While these birds are classified as ‘night migrants’ we could not ascertain that they were in the process of migration at the time of collision. Golden-crowned Kinglets (n = 5; 6.76% of 74 avian incidents) and European Starlings (n = 4; 5.41% of 74 avian incidents) were the most common species found. The greatest number of bird incidents occurred during the month of October, but did not vary greatly between months. One Red-eyed Vireo (night-migrating songbird) and one Wood Duck (water bird) was found at Meteorological Tower 1 and 2, respectively.
MAPLE RIDGE WIND POWER AVIAN AND BAT FATALITY STUDY REPORT – 2008
Curry & Kerlinger, LLC – May 2009 © 24
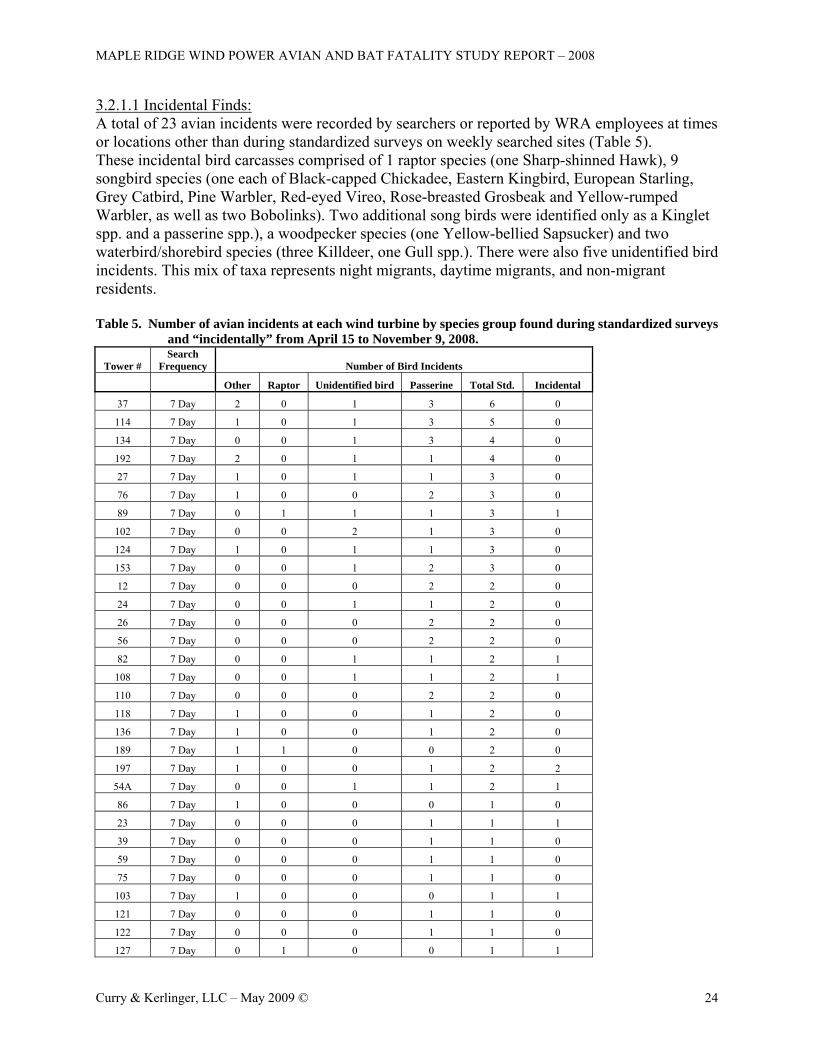
3.2.1.1 Incidental Finds: A total of 23 avian incidents were recorded by searchers or reported by WRA employees at times or locations other than during standardized surveys on weekly searched sites (Table 5). These incidental bird carcasses comprised of 1 raptor species (one Sharp-shinned Hawk), 9 songbird species (one each of Black-capped Chickadee, Eastern Kingbird, European Starling, Grey Catbird, Pine Warbler, Red-eyed Vireo, Rose-breasted Grosbeak and Yellow-rumped Warbler, as well as two Bobolinks). Two additional song birds were identified only as a Kinglet spp. and a passerine spp.), a woodpecker species (one Yellow-bellied Sapsucker) and two waterbird/shorebird species (three Killdeer, one Gull spp.). There were also five unidentified bird incidents. This mix of taxa represents night migrants, daytime migrants, and non-migrant residents. Table 5. Number of avian incidents at each wind turbine by species group found during standardized surveys
and “incidentally” from April 15 to November 9, 2008.
Tower # Search
Frequency Number of Bird Incidents
Other Raptor Unidentified bird Passerine Total Std. Incidental
37 7 Day 2 0 1 3 6 0
114 7 Day 1 0 1 3 5 0
134 7 Day 0 0 1 3 4 0
192 7 Day 2 0 1 1 4 0
27 7 Day 1 0 1 1 3 0
76 7 Day 1 0 0 2 3 0
89 7 Day 0 1 1 1 3 1
102 7 Day 0 0 2 1 3 0
124 7 Day 1 0 1 1 3 0
153 7 Day 0 0 1 2 3 0
12 7 Day 0 0 0 2 2 0
24 7 Day 0 0 1 1 2 0
26 7 Day 0 0 0 2 2 0
56 7 Day 0 0 0 2 2 0
82 7 Day 0 0 1 1 2 1
108 7 Day 0 0 1 1 2 1
110 7 Day 0 0 0 2 2 0
118 7 Day 1 0 0 1 2 0
136 7 Day 1 0 0 1 2 0
189 7 Day 1 1 0 0 2 0
197 7 Day 1 0 0 1 2 2
54A 7 Day 0 0 1 1 2 1
86 7 Day 1 0 0 0 1 0
23 7 Day 0 0 0 1 1 1
39 7 Day 0 0 0 1 1 0
59 7 Day 0 0 0 1 1 0
75 7 Day 0 0 0 1 1 0
103 7 Day 1 0 0 0 1 1
121 7 Day 0 0 0 1 1 0
122 7 Day 0 0 0 1 1 0
127 7 Day 0 1 0 0 1 1

MAPLE RIDGE WIND POWER AVIAN AND BAT FATALITY STUDY REPORT – 2008
Curry & Kerlinger, LLC – May 2009 © 25
Tower # Search
Frequency Number of Bird Incidents
Other Raptor Unidentified bird Passerine Total Std. Incidental
168 7 Day 0 0 0 1 1 0
179 7 Day 0 0 0 1 1 0
183 7 Day 0 0 0 1 1 0
22a 7 Day 0 0 1 0 1 0
16 7 Day 0 0 0 0 0 0
34 7 Day 0 0 0 0 0 0
36 7 Day 0 0 0 0 0 0
40 7 Day 0 0 0 0 0 0
50 7 Day 0 0 0 0 0 0
52 7 Day 0 0 0 0 0 1
53 7 Day 0 0 0 0 0 0
57 7 Day 0 0 0 0 0 0
64 7 Day 0 0 0 0 0 0
77 7 Day 0 0 0 0 0 0
83 7 Day 0 0 0 0 0 0
101 7 Day 0 0 0 0 0 0
104 7 Day 0 0 0 0 0 0
109 7 Day 0 0 0 0 0 0
116 7 Day 0 0 0 0 0 0
125 7 Day 0 0 0 0 0 0
126 7 Day 0 0 0 0 0 0
129 7 Day 0 0 0 0 0 1
130 7 Day 0 0 0 0 0 0
133 7 Day 0 0 0 0 0 1
149 7 Day 0 0 0 0 0 0
154 7 Day 0 0 0 0 0 1
167 7 Day 0 0 0 0 0 0
180 7 Day 0 0 0 0 0 0
184 7 Day 0 0 0 0 0 1
187 7 Day 0 0 0 0 0 0
198 7 Day 0 0 0 0 0 0
61A 7 Day 0 0 0 0 0 0
79A 7 Day 0 0 0 0 0 0
MET 1 7 Day 0 0 0 1 1 0
MET 2 7 Day 1 0 0 0 1 0
6 Non-
Survey -- -- -- -- -- 2
32 Non-
Survey -- -- -- -- -- 1
95 Non-
Survey -- -- -- -- -- 1
107 Non-
Survey -- -- -- -- -- 1
141 Non-
Survey -- -- -- -- -- 2
162 Non-
Survey -- -- -- -- -- 1
165 Non-
Survey -- -- -- -- -- 1

MAPLE RIDGE WIND POWER AVIAN AND BAT FATALITY STUDY REPORT – 2008
Curry & Kerlinger, LLC – May 2009 © 26
Tower # Search
Frequency Number of Bird Incidents
Other Raptor Unidentified bird Passerine Total Std. Incidental
Survey Tower Totals 14 3 15 42 74 23
Sorted by grand total number of avian fatalities (Total Std.). Includes incidents associated with wind turbines found during standardized surveys and “incidentally” (April 15, 2008 to November 9, 2008). Incidental finds are listed in a separate column by species but are not included in either the totals or calculations.

MAPLE RIDGE WIND POWER AVIAN AND BAT FATALITY STUDY REPORT – 2008
Curry & Kerlinger, LLC – May 2009 © 27
Figure 4. Locations of bird incidents at the Maple Ridge WRA found during standardized surveys (April 15 to November 9, 2008). Note: Maps include incidents considered to be associated with a wind turbine only, and not those found incidentally.

MAPLE RIDGE WIND POWER AVIAN AND BAT FATALITY STUDY REPORT – 2008
Curry & Kerlinger, LLC – May 2009 © 28
Figure 5. Locations of bat incidents at the Maple Ridge WRA found during standardized surveys, (April 15 to November 9, 2008). Note: Maps include incidents considered to be associated with a wind turbine only, and not those found incidentally

MAPLE RIDGE WIND POWER AVIAN AND BAT FATALITY STUDY REPORT – 2008
Curry & Kerlinger, LLC – May 2009 © 29
3.2.2 Bats Remains of 140 bats were found by searchers during standardized surveys (April 15, 2008 to November 9, 2008), representing five species (Hoary Bat, Silver-haired Bat, Eastern Red Bat, Little Brown Bat and Big Brown Bat). Out of the 140 bats found during standardized surveys, Hoary Bats comprised 43.6% (n = 61), Silver-Haired Bats comprised 20.7% (n = 29), Little Brown Bats comprised 17.1% (n = 24), Red Bats comprised 11.4% (n = 16) and Big Brown Bats comprised 5.0% (n = 7). Further, 1.4% (n = 2) were identified as Myotis species (probably Little Brown Bat) and 0.7% (n = 1) could not be identified because of the advanced state of decomposition (Figure 6). Figure 6. Distribution of bat incidents by species, from standardized surveys conducted from (April 15 to November 9, 2008).
Bat Incidents by Species
29 24
712
16
61
01020304050607080
Hoary
Silver-h
aired
Little
Brow
nRed
Big Brown
Myotis
spp.
Unknow
n Spp.
Bat Species
# In
cide
nts
HoarySilver-hairedLittle BrownRedBig BrownMyotis spp.Unknown Spp.
3.2.2.1 Incidental Finds: A total of 76 bat incidents were recorded by searchers or reported by WRA employees at times or locations other than during standardized surveys on weekly searched sites. An additional source of incidental ‘finds’ this year was from other researchers who visited the MRWRA occasionally to study independently learn about tower collision mortality. Some of the carcasses collected by these researchers were given to our technicians for use or disposal. As explained previously (Section 3.2), some incidental finds were classified as “added incidentals.” There were 13 added incidentals, (6 Silver-Haired Bats, 3 Hoary Bats, 1 Eastern Red Bat, 1 Little Brown Bat, 1 Big Brown Bat and 1 unidentified bat). Of the remaining 63 bats that were not added incidentals, there were 29 Hoary Bats, four Eastern Red Bats, 11 Silver-Haired Bats, 10 Little Brown Bats and seven Big Brown Bats. There were also two unidentified bat incidents.

MAPLE RIDGE WIND POWER AVIAN AND BAT FATALITY STUDY REPORT – 2008
Curry & Kerlinger, LLC – May 2009 © 30
Table 6 shows the number of bat incidents associated with specific wind turbines found during standardized surveys as well as incidental finds. Table 6. Numbers of bat incidents by species found at wind turbine locations during standardized surveys and “incidentally” from April 15 to November 9, 2008.
Turbine # Hoary Silver Little Brown Red
Big Brown
Myotis spp.
Unknown Spp. Total Incidental
134 3 3 1 2 0 0 0 9 0
56 4 1 2 0 0 0 0 7 0
114 3 0 1 1 1 0 0 6 0
125 2 1 3 0 0 0 0 6 0
130 2 2 1 0 0 0 1 6 1
82 1 2 1 1 0 0 0 5 0
167 2 2 0 0 1 0 0 5 1
37 1 0 3 0 0 0 0 4 0
103 2 1 0 1 0 0 0 4 0
126 2 0 0 1 1 0 0 4 0
149 3 0 1 0 0 0 0 4 1
179 1 2 0 1 0 0 0 4 0
183 3 0 0 0 1 0 0 4 1
198 2 1 1 0 0 0 0 4 0
26 0 2 1 0 0 0 0 3 0
89 1 1 1 0 0 0 0 3 0
102 2 0 0 0 1 0 0 3 0
108 1 1 0 1 0 0 0 3 0
110 1 1 0 1 0 0 0 3 0
187 0 3 0 0 0 0 0 3 0
192 2 0 0 1 0 0 0 3 0
22a 1 0 1 0 0 1 0 3 0
79A 2 1 0 0 0 0 0 3 0
34 1 1 0 0 0 0 0 2 0
36 1 0 0 0 1 0 0 2 0
40 1 0 1 0 0 0 0 2 0
57 1 0 0 0 0 1 0 2 0
59 1 0 1 0 0 0 0 2 0
64 0 0 2 0 0 0 0 2 0
76 1 1 0 0 0 0 0 2 0
83 2 0 0 0 0 0 0 2 1
118 1 0 0 1 0 0 0 2 0
122 2 0 0 0 0 0 0 2 0
127 0 0 0 2 0 0 0 2 0
129 0 2 0 0 0 0 0 2 0
153 1 0 1 0 0 0 0 2 1
168 2 0 0 0 0 0 0 2 0
197 0 0 1 1 0 0 0 2 0
16 0 0 0 1 0 0 0 1 0

MAPLE RIDGE WIND POWER AVIAN AND BAT FATALITY STUDY REPORT – 2008
Curry & Kerlinger, LLC – May 2009 © 31
Turbine # Hoary Silver Little Brown Red
Big Brown
Myotis spp.
Unknown Spp. Total Incidental
27 1 0 0 0 0 0 0 1 0
50 0 1 0 0 0 0 0 1 0
52 0 0 0 0 1 0 0 1 0
77 1 0 0 0 0 0 0 1 0
104 1 0 0 0 0 0 0 1 2
121 1 0 0 0 0 0 0 1 0
124 1 0 0 0 0 0 0 1 0
180 1 0 0 0 0 0 0 1 0
184 0 0 1 0 0 0 0 1 0
189 0 0 0 1 0 0 0 1 1
12 0 0 0 0 0 0 0 0 0
23 0 0 0 0 0 0 0 0 0
24 0 0 0 0 0 0 0 0 0
39 0 0 0 0 0 0 0 0 0
53 0 0 0 0 0 0 0 0 0
75 0 0 0 0 0 0 0 0 2
86 0 0 0 0 0 0 0 0 0
101 0 0 0 0 0 0 0 0 0
109 0 0 0 0 0 0 0 0 0
116 0 0 0 0 0 0 0 0 1
133 0 0 0 0 0 0 0 0 3
136 0 0 0 0 0 0 0 0 0
154 0 0 0 0 0 0 0 0 0
54A 0 0 0 0 0 0 0 0 1
61A 0 0 0 0 0 0 0 0 2
5 ….. ….. ….. ….. ….. ….. ….. ….. 1
10 ….. ….. ….. ….. ….. ….. ….. ….. 1
25 ….. ….. ….. ….. ….. ….. ….. ….. 2
29 ….. ….. ….. ….. ….. ….. ….. ….. 2
31 ….. ….. ….. ….. ….. ….. ….. ….. 1
45 ….. ….. ….. ….. ….. ….. ….. ….. 2
47 ….. ….. ….. ….. ….. ….. ….. ….. 6
49 ….. ….. ….. ….. ….. ….. ….. ….. 3
60 ….. ….. ….. ….. ….. ….. ….. ….. 1
68 ….. ….. ….. ….. ….. ….. ….. ….. 2
69 ….. ….. ….. ….. ….. ….. ….. ….. 4
90 ….. ….. ….. ….. ….. ….. ….. ….. 4
91 ….. ….. ….. ….. ….. ….. ….. ….. 1
93 ….. ….. ….. ….. ….. ….. ….. ….. 2
94 ….. ….. ….. ….. ….. ….. ….. ….. 1
95 ….. ….. ….. ….. ….. ….. ….. ….. 1
97 ….. ….. ….. ….. ….. ….. ….. ….. 1
107 ….. ….. ….. ….. ….. ….. ….. ….. 1
111 ….. ….. ….. ….. ….. ….. ….. ….. 1
113 ….. ….. ….. ….. ….. ….. ….. ….. 1

MAPLE RIDGE WIND POWER AVIAN AND BAT FATALITY STUDY REPORT – 2008
Curry & Kerlinger, LLC – May 2009 © 32
Turbine # Hoary Silver Little Brown Red
Big Brown
Myotis spp.
Unknown Spp. Total Incidental
117 ….. ….. ….. ….. ….. ….. ….. ….. 1
120 ….. ….. ….. ….. ….. ….. ….. ….. 2
137 ….. ….. ….. ….. ….. ….. ….. ….. 1
139 ….. ….. ….. ….. ….. ….. ….. ….. 1
141 ….. ….. ….. ….. ….. ….. ….. ….. 1
159 ….. ….. ….. ….. ….. ….. ….. ….. 1
165 ….. ….. ….. ….. ….. ….. ….. ….. 1
170 ….. ….. ….. ….. ….. ….. ….. ….. 2
175 ….. ….. ….. ….. ….. ….. ….. ….. 2
176 ….. ….. ….. ….. ….. ….. ….. ….. 1
178 ….. ….. ….. ….. ….. ….. ….. ….. 2
182 ….. ….. ….. ….. ….. ….. ….. ….. 1
186 ….. ….. ….. ….. ….. ….. ….. ….. 1
193 ….. ….. ….. ….. ….. ….. ….. ….. 2
81-A1 ….. ….. ….. ….. ….. ….. ….. ….. 1
Totals 61 29 24 16 7 2 1 140 76
Sorted by grand total number of bat fatalities per turbine
3.2.3 Seasonal Distribution of Fatalities (Birds and Bats) The duration of this project extended across 3 seasons (from 1 week after snow cleared in early-April) until snow once again made searching impossible in early-November). As a result, we are able to discern patterns in seasonal mortalities. The greatest number of bat incidents occurred during the fall dispersal migration period, with 114 (81.4%) bat carcasses found between July 1, 2008 and September 30, 2008 (Table 7, Figures 8 and 9). The number of incidents declined sharply in subsequent months, as fall migration concluded and temperatures became colder. No bat incidents were noted in the first half of November or in the second half of April. This indicated that our study fully encompassed the period of bat activity (outside hibernacula) in 2008. The greatest number of bird incidents occurred during October, but no clear seasonal change in fatalities was noted. While only three raptor fatalities were noted, these occurred in April, July and November, spanning the entire study duration. (Table 7, Figures 7 and 9). Table 7. Number of birds and bats found per month, from April 15 to November 9, 2008.
Species Group 15-Apr May June July August September October 9-Nov Raptor 1 0 0 1 0 0 0 1 Passerine 6 7 2 5 4 8 8 2 Other Bird1 2 2 2 2 1 3 2 0 Unknown 0 1 1 4 2 1 6 0 Total Birds 9 10 5 12 7 12 16 3 Total Bats 0 4 14 50 38 26 8 0
1‘Other Bird’ comprised of Water/Shorebirds, Song-bird like birds such as kingfisher and woodpecker spp.

MAPLE RIDGE WIND POWER AVIAN AND BAT FATALITY STUDY REPORT – 2008
Curry & Kerlinger, LLC – May 2009 © 33
Figure 7. Number of birds found per month from April 15 to November 9, 2008.
Bird Incidents by Month
0
5
10
15
20
15-A
pr MayJu
ne July
Augus
t
Septem
ber
Octobe
r9-N
ov
Date
# B
ird In
cide
nts
Bird Incidents byMonth
Figure 8. Number of bats found per month from April 15 to November 9, 2008.
Bat Incidents by Month
0
10
20
30
40
50
60
15-A
pr MayJu
ne July
Augus
t
Septem
ber
Octobe
r9-N
ov
Date
# B
at In
cide
nts
Bat Incidents byMonth

MAPLE RIDGE WIND POWER AVIAN AND BAT FATALITY STUDY REPORT – 2008
Curry & Kerlinger, LLC – May 2009 © 34
Figure 9. Number of birds and bats found per day from April 15 to November 9, 2008. Note: Trend lines indicating a 14 day moving average.
0
1
2
3
4
5
6
4/15/08 5/15/08 6/14/08 7/14/08 8/13/08 9/12/08 10/12/08 11/11/08
Date
# In
cide
nts
0
1
2
3
4
5
Bat Incidents Bird Incidents14 per. Mov. Avg. (Bat Incidents) 14 per. Mov. Avg. (Bird Incidents)
3.2.4 Distance from Turbine Bases There were primarily two classes of animals involved with tower collisions: small birds and bats. These two unrelated groups of species are similar in size and general shape. The small sample size of larger birds was not considered in the following analyses because of the paucity of data available. We included unidentified birds along with small birds for the purposes of this analysis. 140 bat incidents and 60 bird incidents were used to evaluate “fall” distance from tower base. While the weight and size of small birds and bats can be similar, there are differences in the flight speed of these groups (in general, bats tend to be more maneuverable in small areas and birds tend to be stronger, swifter fliers). Turbine incidents were divided into small bird and bat events to determine if surveying a 120m by 130m area is an effective method for finding the majority of carcasses for both size classes. The number of incidents of species (found during standardized surveys only) falling into each size group (Table 8) were then tabulated based on distance (range) from the base of wind turbines (Table 9). Of the 60 bird incidents found during standardized surveys, the mean distance to the turbine tower base was 39.01m ± 4.29 95% CI and the median distance was 42.5m. Of the 140 bat incidents found during standardized surveys, the mean distance to the turbine tower base was 25.9m ± 2.70 95% CI and the median distance was 22.5m. Thus, bat incidents were concentrated closer to the tower than birds. The annuli (Table 9) with a radius greater than 60m were only partially within the 4 sides of the 120 by 130m search area. Thus distance from the turbines alone was not adequate to evaluate the spread of bird and bat carcasses at searched sites. Instead, we looked at bird and bat incident density in the following manner. As searchable area varied between sites, we used data from GPS Trimble XRS measurements and analysis in ArcView GIS 3.3 to calculate the area searched per 10m concentric annulus around each of the 64 searched turbines. Distances were recorded for all bird and bat carcasses found during standardized surveys. We divided the number of birds and bats found within each

MAPLE RIDGE WIND POWER AVIAN AND BAT FATALITY STUDY REPORT – 2008
Curry & Kerlinger, LLC – May 2009 © 35
10m annulus (at 64 annulus) by the total searched area that fell within that annulus (at 64 turbines) to arrive at an incident density. Table 8. Species Size Groupings used in Analyses.
Category Description Small Bird < 8” length (most smaller passerines) Bats < 6” length (some bats may be as small as 2”)
Table 9. Number of Incidents (Birds and Bats) versus total area searched per 10m distance annulus at 64
searched sites, April 15 to November 9, 2008.
Buffer Area
Searched Bird
Incidents
Bird Incident Density
Bat Incidents
Bat Incident Density
0-10 20004 5 0.00025 27 0.00135 10-20 60010 5 0.00008 31 0.00052 20-30 98736 8 0.00008 33 0.00033 30-40 132649 11 0.00008 19 0.00014 40-50 143775 9 0.00006 18 0.00013 50-60 150252 14 0.00009 8 0.00005 60-70 120222 7 0.00006 4 0.00003 70-80 51130 1 0.00002 0 0.00000 80-90 5130 0 0.00000 0 0.00000
These densities were plotted (Figure 10, 11) along with the best fitting trend line (The most appropriately shaped trend-line with the highest R2 value) to approximate the distance at which density drops to zero, indicating no more incidents would be found at that distance. The R2 (goodness-of-fit) value for both trend lines are shown (R2= 1 indicates perfect fit). The R2 for both bird and bat incidents was 0.88. The trend-line derived from that data was in accordance with our expectation that bird incidents approximate zero at a point farther out than bat incidents (densities of bat incidents approximate zero at ~70m from the turbine base and bird incidents approximate zero at ~90m from the turbine base. The current available data indicate that the current maximum search area of 120m by 130m was adequate to detect most bird and bat collision fatalities, but a small number of bat fatalities and a potentially higher number of bird fatalities may be missed.

MAPLE RIDGE WIND POWER AVIAN AND BAT FATALITY STUDY REPORT – 2008
Curry & Kerlinger, LLC – May 2009 © 36
Figure 10. Density of bird incidents at 64 searched sites, from surveys conducted from April 15 to November 9, 2008, in relation to distance from towers. Note: Polynomial trend line approximates distance at which density crosses zero.
Bird Fall Distribution
R2 = 0.88
0.00000
0.00005
0.00010
0.00015
0.00020
0.00025
0.00030
0 - 10
m
10.1
- 20m
20.1
- 30m
30.1
- 40m
40.1
- 50m
50.1
- 60m
60.1
- 70m
70.1
- 80m
80.1
- 90m
Buffer
Den
sity
(Inc
iden
ts/s
q. m
)
Bird DensityPoly. (Bird Density)
Figure 11. Density of bat incidents at 64 searched sites, from surveys conducted from April 15 to November 9, 2008, in relation to distance from towers. Note: Logarithmic trend line approximates distance at which density crosses zero.
Bat Fall Distribution
R2 = 0.88
0.000000.000200.000400.000600.000800.001000.001200.001400.00160
0 - 10
m
10.1
- 20m
20.1
- 30m
30.1
- 40m
40.1
- 50m
50.1
- 60m
60.1
- 70m
70.1
- 80m
80.1
- 90m
Buffer
Den
sity
(Inc
iden
ts/s
q. m
)
Bat DensityLog. (Bat Density)
3.2.5 Multiple Regression Model We collected data on several site conditions (factors) at turbines in order to determine their correlation with bird and bat fatalities. Factors included the presence of wooded areas on sites

MAPLE RIDGE WIND POWER AVIAN AND BAT FATALITY STUDY REPORT – 2008
Curry & Kerlinger, LLC – May 2009 © 37
(Wooded), sites that were on the North-West Edge vs. the remaining sites (N-W_Edge), and, for bats only, the distance to nearest wetland (Dist_Wetland). N-W-Edge: Models testing the N-W_Edge factor only used data from the fall, as TAC members hypothesized that if fall migrating birds and bats encounter the turbines at the Northwest boundary of the MRWRA before encountering the remaining turbines, the number of fatalities may be significantly higher at the former. Out of 64 towers searched on a 7-day basis, 18 were classified as N-W_Edge and 46 were classified as non-N-W_Edge sites. Wooded: The area within the MRWRA wind farm includes a mix of agricultural/grassland (non-wooded) and wooded land. Out of the 64 towers searched, 30 were classified as wooded and 34 were classified as non-wooded sites. Dist_wetland: All of the 5 bat species found at the MRWRA are known to forage over water bodies to some extent (Erickson 2002, Furlonger et al. 1987, Genter and Jurist 1995, Zinn and Baker 1979) and to use wetlands for some of their daily water intake needs (Kurta 2000). We determined the distance of each searched turbine site to the nearest wetland, using wetland delineation by Environmental Research and Design (EDR). Dist_Wetland was not a factor in bird models. We weighted the number of incidents per site by the square of the total area searched under each site (Area_searched) as this varied between sites. Numbers of both bird and bat incidents noted were sufficiently high to use a standard linear regression for models Bird 1 and Bat 1, 2. However, numbers of fall bird incidents were low, so we used a logistic regression for the Bird 2 (Fall) model. We ran four regression models in total, including two models each for birds and bats (Table 10). Table 10. Results from bird and bat regression models, from surveys conducted from April 15 to November 9, 2008.
Model Factors Response Variable Weight Variable
Model Name Wooded N-W_Edge Log (Dist_Wetland)
Bird 1 ns1 ---2 --- # Bird Incidents Area Searched
Bird 2 (Fall) ns ns --- # Fall Bird Incidents Area Searched
Bat 1 ns --- ns # Bat Incidents Area Searched
Bat 2 (Fall) ns ns ns # Fall Bat Incidents Area Searched
1. ns: Not Significant, 2. ---: Factor not used in model Model Bird 1:
There was no evidence that the number of bird incidents differed between Wooded and Non-wooded sites (F test, F = 0.31, p = 0.58, df = 1, 62).

MAPLE RIDGE WIND POWER AVIAN AND BAT FATALITY STUDY REPORT – 2008
Curry & Kerlinger, LLC – May 2009 © 38
Model Bird 2 (Fall): There was no evidence that the number of bird incidents differed between Wooded and Non-wooded sites (Chi-Squared Test, χ = 0.36, p = 0.55, df = 2). There was no evidence that the number of bird incidents differed between N-W-Edge and non-N-W-Edge sites (Chi-Squared Test, χ = 2.18, p = 0.14, df = 2).
Model Bat 1:
There was no evidence that the number of bat incidents was higher at Wooded compared to Non-wooded sites (T-test, t = -0.54, p = 0.59, df = 1, 60). There was no evidence that the number of bat incidents decreased with the greater distance to the nearest wetland (T-test, t = -0.71, p = 0.48, df = 1, 60).
Model Bat 2 (Fall):
There was no evidence that the number of bat incidents was higher at Wooded compared to Non-wooded sites (T-test, t = -1.25, p = 0.22, df = 1, 58). There was no evidence that the number of bat incidents decreased with the greater distance to the nearest wetland (T-test, t = 0.13, p = 0.89, df = 1, 58). There was no evidence that sites on the N-W edge had greater bat incidents than non-N-W_Edge sites (T-test, t = -0.99, p = 0.33, df = 1, 58).
3.2.6 Extraordinary Maintenance Activities: During the 2007 project year, the MRWRA experienced unusually high levels of turbine maintenance. Turbines were made inactive for major repairs and refitting, for significant amounts of time, although searches continued on schedule and results presented from 2007 data (Jain et al. 2008) accurately reflect the numbers of fatalities estimated for that year. However, in 2008, there was no widespread shutdown of towers. Rather, maintenance occurred at varying intervals, and did not unduly impinge upon our survey activity. Besides the maintenance activities described above, some of the searched turbines had exclusion zones of 50 feet placed around the transformer at the base of the tower, (~4.5% of a fully searched site). Unlike 2007, this exclusion zone affected very few searches (approximately 25 searches out of a total of 1882 (~1%) completed over the course of the study period). This zone of exclusion affected very few towers in the initial month of the project, not during the peak periods of bat fatalities. Most of this area constituted the gravel pad at the base of the turbine, and every effort was made to continue to search these areas to the best of our ability. Searchers modified their survey pattern by carefully scanning these areas from outside the 15m circle, noting any evidence of bird or bat incidents. However, a negligible number of incidents may have been missed due to increased distance. Two towers (Sites 39 and 197) were affected by maintenance activities that did not affect searches. From 12 September until the end of the year, these two towers were ‘feathered’ i.e. they were non-operational. No birds or bats were found at these two towers after they were removed from operation. However, very few birds/bats were found in the period before 12 September, at these towers, so no statistical conclusions about the effect of feathering on bird/bat mortality can be made from this small sample size.

MAPLE RIDGE WIND POWER AVIAN AND BAT FATALITY STUDY REPORT – 2008
Curry & Kerlinger, LLC – May 2009 © 39
3.2.7 Lit versus Un-Lit Turbine Sites We examined the numbers of bird and bat fatalities at turbines with FAA lights vs. turbines without such lights. Seventeen of the 64 searched towers (26.6%) were lit with L-864 red flashing FAA beacons as opposed to 47 non-lit turbines (73.4%). Fourteen of 39 (35.9%) bird fatalities of night migrants were found at turbines with FAA beacons and 25 (64.1%) fatalities were found at turbines without such lights. With respect to bat fatalities 40 of 140 (28.6%) were found at turbines with FAA beacons, whereas 100 (61.4%) were found at turbines without beacons. Chi-square tests were performed contrasting the number of incidents noted at lit vs. unlit turbine sites to test whether the actual proportion of incidents at lit versus unlit towers differed significantly from the expected proportion. No significant differences were found. If the FAA lights did not attract birds/bats, the proportion of incidents should be the same as the proportion of lit to unlit towers. As the mean searched area at lit ( x = 12197 m2) versus unlit turbines ( x = 12382m2) did not differ significantly, (T-test, t = 0.18. p = 0.86, df = 62) we were able to use data from all 64 sites. There was no significant deviation (Table 11) from the expected number of night-migrant bird incidents at turbines with L-864 red flashing FAA beacons as opposed to non-lit turbines (Chi-Squared Test, χ2 = 1.00, df = 1, P = 0.32, ns). Further, there was no significant deviation (Table 12) from the expected number of bat incidents at turbines with L-864 red flashing FAA beacons as opposed to non-lit turbines (Chi-Squared Test, χ2 = 0.09, df = 1, P = 0.77, ns). Table 11. Contingency table showing the proportion of night migrant birds comparing lit vs. unlit 7-day search sites
# 7-Day
Turbines
# Night Migrant
Birds Sum Lit 17 14 31 Unlit 47 25 72
Sum 64 39 103 Table 12. Contingency table showing the proportion of bats comparing lit vs. unlit 7-day search sites
# 7-Day
Turbines # Bats Sum Lit 17 40 57 Unlit 47 100 147
Sum 64 140 204

MAPLE RIDGE WIND POWER AVIAN AND BAT FATALITY STUDY REPORT – 2008
Curry & Kerlinger, LLC – May 2009 © 40
3.3 Adjusting Fatality Estimates
3.3.1 Estimates from 7-day Search Sites Our search protocols were designed to search a subset (n = 64) of the 195 turbines in all three phases (I, II and IA) of the MRWRA. Results presented here include 95% confidence intervals. 3.3.1.1 Proportion of complete surveys per week (Ws) / Project Set-up Adjustment Unlike the previous year, site set-up was largely complete in the first week of searching. Thus, rather than adjust for individual set-up search rounds, we adjusted our raw numbers by dividing the numbers of birds and bats found over all search rounds by the proportion of the 64 sites searched, averaged over all rounds to obtain proportion of complete surveys per week (Table 16). Over the entire course of the project, the mean proportion of the 64 towers searched per week (Ws) was 0.98 and the median proportion was 1 i.e. we missed only 2% of scheduled searches per week, on average, over the study period. Please see Table 18 for the effect of this adjustment factor on raw numbers of birds and bats found. 3.3.1.2 Area Searched (Search Sites Limited by Mowing Obstacles) After dividing the area searched under the 64 turbines into 8 concentric buffers (annuli) of 10m increments in size (i.e. 0–10m, 10.1m–20m etc.) (Table 13, Figure 12), we examined the fall distribution of the 140 bat incidents and 74 bird incidents in these annuli. The total number of incidents (separately for all four size classes: small, medium and large birds and bats) in each 10m increment search annulus and the percent area searched in that annulus are reported below (Table 13).

MAPLE RIDGE WIND POWER AVIAN AND BAT FATALITY STUDY REPORT – 2008
Curry & Kerlinger, LLC – May 2009 © 41
Figure 12. Examples of searched towers showing searchable area divided into concentric annuli.
Table 13. Area Adjustment Factor (bird and bat incidents from standardized surveys conducted from April 30 to November 9, 2008 (not including ‘added incidentals’).
Pre-Area Adjusted Area Adjusted
Annulus
Total Area
Searched at 64 towers
Total Searchable
area/ annulus
Search Intensity
(Proportion) of
annulus searched
(Si) Small birds
Med. birds
Large birds
Unid. birds
Bats
Small birds
Med. birds
Large birds
Unid. birds2 Bats
0-10 20004 20108.8 0.9948 5 1 0 0 27 5. 1.01 0.00 0.00 27.14 10-20 60010 60326.4 0.9948 4 1 0 1 31 4.02 1.01 0.00 1.01 31.16 20-30 98736 100544 0.9820 5 3 1 2 33 5.09 3.05 1.02 2.04 33.60 30-40 132649 140762 0.9424 9 3 1 3 19 9.55 3.18 1.06 3.18 20.16 40-50 143775 180979 0.7944 9 1 0 0 18 11.33 1.26 0.00 0.00 22.66 50-60 150252 221197 0.6793 9 2 1 5 8 13.25 2.94 1.47 7.36 11.78 60-70 120222 176119 0.6826 3 0 0 3 4 4. 0.00 0.00 4.39 5.86 70-80 51130 80289.6 0.6368 1 0 0 1 0 1.57 0.00 0.00 1.57 0.00
45 11 3 15 140 54.23 12.45 3.55 19.55 152.37
As evident from the column entitled “Search intensity…”, the innermost annuli required negligible adjustment as they were generally fully searched (out to 40m from the tower base).

MAPLE RIDGE WIND POWER AVIAN AND BAT FATALITY STUDY REPORT – 2008
Curry & Kerlinger, LLC – May 2009 © 42
Incidents found in outer annuli (lower in number) were adjusted more robustly. Thus, the number of bat incidents found from standardized surveys (140) was adjusted for area to 152.37. The number of birds found (74) has been corrected for area to 89.78. 3.3.1.3 Scavenger Removal and Search Efficiency. Table 14 provides the results of the scavenger study as described in the Methods section. The proportion of small, medium and large birds not scavenged (Sc) within four days was used to adjust the number of small, medium and large size bird incidents, respectively, that were discovered by our searchers during standardized surveys. Similarly, the proportion of bats not scavenged (Sc) within four days was used to adjust the number of bat incidents that were discovered by our searchers. Table 14. Maple Ridge scavenger removal study data (2008).
Size Class # Carcasses # Scavenged. Prop. not scavenged1 (Sc) Small Birds – 7 day 36 15 0.58 Medium Birds – 7 day 18 3 0.83 Large Birds – 7 day 6 1 0.83 Bats and mice– 7 day 85 41 0.52
1. Over 4 days, see methods. Table 15 shows the results of the search efficiency study as described in the Methods. The proportion of carcasses found (Se) was used to adjust the number of incidents that were discovered by our searchers, in each size class (Small, Medium, Large and Bats). Table 15. Maple Ridge searcher efficiency study data (2008).
Size Class # Carcasses # Carcasses not found Prop found (Se ) Small Birds 32 11 0.66 Medium Birds 18 2 0.89 Large Birds3 6 1 0.83 Bats 61 26 0.57
Table 16 shows estimates of the number of bird and bat fatalities attributed to collisions with the wind turbines at the Maple Ridge project in the 2008 study period. The table reflects search and scavenging rates as determined in tables 15 and 16 and adjustments for Si and Ws, the number of birds/bats found during standardized searches, the number of birds/bats, and the subsequent estimate adjustment made using the formula described in the Methods. The first row contains the number of incidents noted (# Found). The second and third rows contain those numbers after Search intensity (Si) and Proportion of completed surveys per week (Ws) as described in Section 3.3.1.1 and 3.3.1.2. Finally, the numbers are adjusted by the adjustment factors Se, Sc and Ps to get the adjusted total. The 95% confidence intervals are calculated as mentioned in the Methods, and included here.

MAPLE RIDGE WIND POWER AVIAN AND BAT FATALITY STUDY REPORT – 2008
Curry & Kerlinger, LLC – May 2009 © 43
Table 16. First full season estimates (April 15 to November 9, 2008) for bird and bat collision mortality under 195 towers of the Maple Ridge WRA, (without incidental finds) adjusted for Search Efficiency, Scavenge Rate, Proportion of Towers Searched, Search Intensity and Proportion of completed surveys per week, from 64 7-day Sites.
Adjustment Factors Birds Bats Total Carcasses
Small Medium Large Bats # Found 60 11 3 140
# After Area Adjustment Search Intensity (Si)
73.78 12.45 3.55 152.37 242.15
After proportion of completed surveys/week
(Ws)
98% 98% 98% 98%
% Not Scavenged (Sc) 58% 83% 83% 52%
Search Efficiency (Se) 66% 89% 83% 57%
Proportion of Towers Searched (Ps)
32.82% 32.82% 32.82% 32.82%
Adjusted Total 599 52 16 1595 2262
95% CI (±) 24 1 1 153 Per Tower 3.07 0.27 0.08 8.18 Per MW 1.86 0.16 0.05 4.96 Per MW Produced 0.0012 0.0001 0.00003 0.0033
Per 2000m2 Rotor Swept Area 1.16 0.10 0.03 3.10
As stated in the methods, incidental finds are not normally included in any extrapolation of total incidents/tower, as they are outside the regular study design framework. We deemed it possible that field technicians could have noted some incidents during standardized searches if they had not already noticed them during frequent maintenance and scavenge test visits. We classified these incidental findings as “added incidentals.” The number of “added incidentals” for birds was 7. The number of “added incidentals” for bats was 13. If all added incidentals were treated as survey finds, the final fatality tally would have included an additional 66 small birds fatalities and 144 bat fatalities, bringing total numbers to 665 small birds, 52 medium birds, 16 large birds and 1739 bats (see Executive Summary for fatality estimates per tower, MW, MWh and 2000m2 rotor swept area.).
3.3.2 Estimated Fatalities by Species We adjusted the number of incidents of birds and bats per species, in Table 17, by the same extrapolation factors described in the methods. Estimate of total mortality includes adjustment for Search Efficiency, Scavenge Rate, Proportion of Towers Searched, Area Adjustment Search

MAPLE RIDGE WIND POWER AVIAN AND BAT FATALITY STUDY REPORT – 2008
Curry & Kerlinger, LLC – May 2009 © 44
intensity and Proportion of completed surveys per week. These adjustment factors were estimated by size class, and not by species. Thus, by applying them to ‘per species’ numbers, the resulting estimate of 20 American Goldfinch fatalities should serve only as a general indicator of impact per species. The table rows are classified by bird size (large, medium and small) and by bats. The species within the rows are in alphabetical order. The first numerical column shows the number of incidents recorded at the 64 7-day search sites. The next three columns show the number of incidents per megawatt, number of incidents per turbine and the estimate of mortality over the entire 195 turbines of the MWRWA calculated for that species. Finally, the incidental species are also reported in the final column, but not used in any extrapolations. Table 17. Incidents per species found during both standardized surveys and incidentally, April 15 to November 9, 2008. Estimate of total mortality is an approximation with adjustments for Search Efficiency, Scavenge Rate, Proportion of Towers Searched, Area Adjustment and Proportion of completed surveys per week. Results are reported in incidents per turbine and per total installed megawatt capacity per turbine at the Maple Ridge WRA.
Avian Class (Raptor, Song Bird,
Water Bird/ Shorebird or Other)
Avian Migrant Status 2008 Estimated #
Estimate of
mortality (195
towers) Incidental Finds
Species Name
64 7-Day Sites
Inc/ Mw
Inc/ Turbine 7-Day Sites
Birds (Large)
Wild Turkey Game Bird Non migrant 2 0.03 0.05 11 .
Gull Species Water Bird Day
Migrant 1 0.02 0.03 5 1
Total Large 3 0.05 0.08
Total Estd. Large 16 1
Birds (Medium)
American Kestrel Water Bird Day
Migrant 1 0.01 0.02 5 .
Cooper's Hawk Water Bird Day
Migrant 1 0.01 0.02 5 .
Mallard Water Bird
Night /Day
Migrant 1 0.01 0.02 5 .
Northern Mockingbird Song Bird Non
migrant 1 0.01 0.02 5 .
Ruffed Grouse Game Bird Non
migrant 3 0.04 0.07 14 .
Sharp-shinned Hawk Water Bird Day
Migrant 1 0.01 0.02 5 1
Woodcock Game Bird Night Migrant 2 0.03 0.05 10 .
Woodpecker Species Other Unknown 1 0.01 0.02 5 .
Total Medium 11 0.16 0.27
Total Estd. Med. 52 1
Birds (Small)
American Goldfinch Song Bird Day Migrant 2 0.06 0.10 20 .
American Redstart Song Bird Night
Migrant 1 0.03 0.05 10 .
American Robin Song Bird Night Migrant 1 0.03 0.05 10 .
Belted Kingfisher Other Night Migrant 1 0.03 0.05 10 .
Black-polled Warbler Song Bird Night Migrant 1 0.03 0.05 10 .
Black-throated Blue Song Bird Night 2 0.06 0.10 20 .

MAPLE RIDGE WIND POWER AVIAN AND BAT FATALITY STUDY REPORT – 2008
Curry & Kerlinger, LLC – May 2009 © 45
Avian Class (Raptor, Song Bird,
Water Bird/ Shorebird or Other)
Avian Migrant Status 2008 Estimated #
Estimate of
mortality (195
towers) Incidental Finds
Species Name
64 7-Day Sites
Inc/ Mw
Inc/ Turbine 7-Day Sites
Warbler Migrant
Dark-eyed Junco Song Bird Night Migrant 1 0.03 0.05 10 .
Eastern Kingbird Song Bird Night Migrant 1 0.03 0.05 10 1
Eastern Towhee Song Bird Night Migrant 1 0.03 0.05 10 .
European Starling Song Bird Crepuscular 4 0.12 0.20 40 1
Golden-crowned Kinglet Song Bird Night
Migrant 5 0.16 0.26 50 .
Indigo Bunting Song Bird Night Migrant 1 0.03 0.05 10 .
Killdeer Water Bird Night
Migrant 2 0.06 0.10 20 3
Magnolia Warbler Song Bird Night
Migrant 3 0.09 0.15 30 .
Mourning Dove Other
Night /Day
Migrant 1 0.03 0.05 10 .
Nashville Warbler Song Bird Night Migrant 1 0.03 0.05 10 .
Nuthatch spp. Song Bird Night Migrant 1 0.03 0.05 10 .
Purple Finch Song Bird Night Migrant 2 0.06 0.10 20 .
Red-breasted Nuthatch Song Bird Night Migrant 1 0.03 0.05 10 .
Red-eyed Vireo Song Bird Night Migrant 1 0.03 0.05 10 1
Rose-breasted Grosbeak Song Bird Night Migrant 1 0.03 0.05 10 1
Ruby-crowned Kinglet Song Bird Night Migrant 3 0.09 0.15 30 .
Tree Swallow Song Bird Day Migrant 3 0.09 0.15 30 .
Warbler spp. Song Bird Night Migrant 2 0.06 0.10 20 .
White-breasted Nuthatch Song Bird Night
Migrant 1 0.03 0.05 10 .
White-winged Crossbill Song Bird Night Migrant 1 0.03 0.05 10 .
Wren Spp. Song Bird Night Migrant 1 0.03 0.05 10 .
Unidentified Bird Unknown Unknown 15 0.47 0.77 150 5 Black-capped Chickadee . . . . . . 1 Bobolink . . . . . . 2 Grey Catbird . . . . . . 1 Kinglet spp. . . . . . . 1 Passerine spp. . . . . . . 1 Pine Warbler . . . . . . 1 Yellow-bellied Sapsucker . . . . . . 1 Yellow-rumped Warbler . . . . . . 1
Total Small Birds 60 1.86 3.07
Total Estd. Small 599 21
Total Birds 74 2.07 3.42 Total 667 23

MAPLE RIDGE WIND POWER AVIAN AND BAT FATALITY STUDY REPORT – 2008
Curry & Kerlinger, LLC – May 2009 © 46
Avian Class (Raptor, Song Bird,
Water Bird/ Shorebird or Other)
Avian Migrant Status 2008 Estimated #
Estimate of
mortality (195
towers) Incidental Finds
Species Name
64 7-Day Sites
Inc/ Mw
Inc/ Turbine 7-Day Sites
Estd. Birds
Bats . . Hoary Bat . . 61 2.16 3.56 695 32 Eastern Red Bat . . 16 0.57 0.93 182 5 Silver-haired Bat . . 29 1.03 1.69 330 17 Little Brown Bat . . 24 0.85 1.40 273 11 Big Brown Bat . . 7 0.25 0.41 80 8 Myotis Species . . 2 0.07 0.12 23 . Unknown Species . . 1 0.04 0.06 11 3
Total Bats 140 4.96 8.18
Total Estd. Bats 1595 76
Total (Birds & Bats) 214
Total Estd. (Birds & Bats) 2262 99

MAPLE RIDGE WIND POWER AVIAN AND BAT FATALITY STUDY REPORT – 2008
Curry & Kerlinger, LLC – May 2009 © 47
4.0 DISCUSSION
4.1 Project Duration and Search Interval The 2008 study at the Maple Ridge WRA included the entire period in which conditions were adequate for regular study site maintenance and searches. Within one week of site accessibility after winter, a majority of search sites were set up and searched. As was agreed to by the TAC for the 2007 field work, 64 turbines were to be searched at 7-day search intervals. This sample constitutes about one-third (32.8%) of turbines at the Project site and is the largest sample size, in terms of absolute numbers of turbines, searched at any project in the eastern United States. This, along with the fact that there were two previous years of searches and the number of sites cleared for searching was so large, constitutes the most thorough search effort to date of bird and bat fatalities at wind turbines in the United States. The protocols for conducting fatality searches were similar to practices employed elsewhere (Kerns and Kerlinger 2004), although our methods were more intensive than at many other sites. Most fatality studies at wind turbines have used a 14 to 30 day search cycle (Erickson et al. 2001), although at sites in the Midwest (Howe et al. 2002, Jain 2005,) and at sites in the east (Arnett et al. 2005, Nicholson 2002, Kerns and Kerlinger 2004) search intensity was similar or more frequent than our study. Those studies, with the exception of Kerns and Kerlinger (2004) were conducted during limited periods during spring, summer and fall, and did not include as large a sample size of turbines searched. Arnett et al. (2005) searched at one and 7-day frequencies in West Virginia and Pennsylvania, although they searched only during August and part of September to cover the primary season of bat migration and mortality. Nicholson (2005) searched every day during spring and fall because he was primarily interested in migrating birds, but that study included only three turbines so daily searches were relatively easy to accomplish. In Iowa, Jain (2005) searched every two days, from late spring to early winter over a two year period, but cleared less area under each tower as compared to this study. The 2006 Annual report called for various changes in research protocols in 2007 and 2008. Those changes included: taking care to insure that search efficiency was not overestimated. Tests were scheduled without the knowledge of searchers, using appropriately sized carcasses. Small birds were primarily kinglets, sparrows and juncos, ranging from ~ 3.5 inches, (10 cm) to ~ 6.5 inches (17 cm) in length. For bats, we used Little Brown Bats, which are smaller and less conspicuous than the majority of bat specimens (Red Bats) found during the study. Limitations on the use of bats carcasses were a direct result of concern regarding White-nose Syndrome, which has infected and presumably killed large numbers of bats in the North-East US. After discussions with Alan Hicks (NYSDEC) we used fewer bats for search efficiency and scavenger tests. To increase our sample sizes, we procured and used brown house mice (Mus musculus) with body length of 60-65 mm (without tails) and width of 20-23 mm. We removed the tails of the mice so that the total body shape more closely resembled bats. These acted as surrogates for bats and increased our total test numbers (follows NYSDEC adopted Guidelines for Conducting Bird and Bat Studies at Commercial Wind Energy Projects, Jan 2009).

MAPLE RIDGE WIND POWER AVIAN AND BAT FATALITY STUDY REPORT – 2008
Curry & Kerlinger, LLC – May 2009 © 48
Our comparison of search efficiency and scavenging rates between bats and mice was addressed in Appendix F and will help in project management decisions at other WRA study sites. Large and medium birds remained difficult to procure. We were able to conduct tests using only 6 large birds and 18 medium sized birds over 3 different test dates, covering the full duration of the project, the search efficiency and scavenge rates remained fairly consistent over the entire duration of the project (2006, 2007 and 2008) and we are confident of our results. Please see Appendix G for a detailed comparison. We also used GPS to measure the actual searchable area at each turbine site, to weight the number of incidents found at a site with the proportion of searchable area. This permitted comparisons between site types (e.g. wooded vs. non-wooded sites, N-W edge vs. non-N-W edge sites, etc) via a multiple regression model, as well as adjustment for unsearched areas.
4.2 Seasonal Distribution of Fatalities Similar to other Midwestern and eastern WRA sites, the greatest mortality for both birds and bats was expected to occur during the dispersal and migration seasons. An increase in fatalities (Figure 8) over a three month period for bats (July to September) indicated that temporal mortality patterns at Maple Ridge WRA were not unusual, and mirrored findings at Mountaineer in West Virginia and Meyersdale in Pennsylvania (Arnett et al. 2005, Kerns and Kerlinger 2004), as well as studies in the Midwestern and western United States (Jain 2005, Johnson 2003, Howe et al. 2002). Fall bat mortalities are hypothesized to be primarily due to migration activity, although migration related activity such as staging or pre-migration flocking/foraging may also play a role. No bat fatalities were noted in the first 15 days (May) or last 20 days (October-November) of searching during the 2008 study. Our data demonstrate that the duration of our study encompasses the entire period of bat activity (outside of hibernacula) in upstate New York, and that few to no additional fatalities would have been noted if searches had begun sooner or ended later in the year. Thus, for bats, we consider the adjusted fatality rates to be ‘per year’ and not limited to the study duration. Bird fatalities in November 2008 continued at low levels, suggesting that, had the search season been extended, some additional incidents would likely have been noted. This is similar to the end of season results in 2006, where a number of additional bird fatalities could have occurred after searches ended, as bird fatalities continued into November 2006. November 2007 did not show this trend. However, it is unlikely that large numbers of birds are killed after mid-November and before mid-April because there are far fewer birds migrating during this time period. It is also important to note that the Maple Ridge WRA is largely unsearchable during winter because of frequent heavy snowfall that makes sites inaccessible and covers search areas.
4.3 Species Composition and Fatality Rates at Maple Ridge and Other Wind
Power Facilities in the U.S. In an effort to determine whether fatalities at the Maple Ridge WRA are similar, both in numbers and species composition to other wind power facilities in the United States, we refer to results

MAPLE RIDGE WIND POWER AVIAN AND BAT FATALITY STUDY REPORT – 2008
Curry & Kerlinger, LLC – May 2009 © 49
presented by the National Research Council (NRC 2007) recent review (Table 18). For the most part, the types of fatalities at wind plants reviewed by NRC as being thorough studies, suggests that night migrating songbirds are the species most often killed at wind plants in the eastern United States. The studies also agree that there are very few waterbirds or shorebirds killed and that raptors are also rare among the fatality lists. There appears to be a slightly greater proportion of night migrant fatalities in the Midwest and east as opposed to the west. Overall, there appear to be fewer fatalities at western facilities than at eastern facilities. The numbers of birds killed per turbine and per megawatt, at the Maple Ridge WRA during all three years of study, fall within the range of studies listed in Table 18. While the methods differ on a study-by-study basis and the reader is cautioned to keep these differences in mind, results presented by these studies reflect the best data collected to date on fatalities at North American WRA’s. Table 18. Bird mortality reported at U.S. wind-energy projects (from NRC 2007)*
All Bird Mortality
Wind Project
Study Period #
Turbines Turbine
MW Project
MW Turbine
per period MW
per period Reference
Pacific Northwest
Stateline, OR/WA1 July 2001 – Dec 2003 454 0.66 300 1.93 2.92
Erickson et al. 2004
Vansycle, OR1 Jan 1999 – Dec 1999 38 0.66 25 0.63 0.95
Erickson et al. 2004
Combine Hills, OR1 Not Available 41 1.00 41 2.56 2.56 Young et al. 2005
Klondike, OR1 Feb 2002 – Feb 2003 16 1.50 24 1.42 0.95
Johnson et al. 2003
Nine Canyon, WA1 Sep 2002 –
August 2003 37 1.30 62 3.59 2.76 Erickson et al. 2003
Rocky Mountain
Foote Creek Rim, WY, Phase I2 Nov 1998 – Dec 2000 72 0.60 43 1.50 2.50 Young et al. 2001
Foote Creek Rim, WY, Phase II2 June 2001 – June 2002 33 0.75 25 1.49 1.99 Young et al. 2003
Upper Midwest
Wisconsin3 Late July 1999
–May 2001 31 0.66 20 1.30 1.97 Howe et al. 2002
Buffalo Ridge, MN, Phase I3
Apr 1994–Dec 1995; 15 Mar–15 Nov 1996–
1999 73 0.30 33 0.98 3.27 Johnson et al. 2002
Buffalo Ridge, MN, Phase I3
15 Mar 1998 –15 Nov 1999; 15 Jun 2001– 15 Sep 2002 143 0.75 107 2.27 3.03
Johnson et al. 2002
Buffalo Ridge, MN, Phase II3
15 Mar 1999 –15 Sep 1999; 15 Jun 2001 –15 Sep 2002 139 0.75 104 4.45 5.93
Johnson et al. 2002
Top of Iowa3 15 Mar 2003 –15 Dec 2004 89 0.90 80 1.29 1.44 Koford et al. 2005
East
Buffalo Mountain, TN4 1 Sep 2000 – 30 Sep 2003 3 0.66 2 7.70 11.67
Nicholson 2001, 2002
Mountaineer, WV4 4 Apr 2003 – 22
Nov 2003 44 1.50 66 4.04 2.69 Kerns and Kerlinger 2004
Maple Ridge, NY3,4 30 Apr 2007 -14 Nov 2007 195 1.65 322 5.67-6.31 3.44-3.82
Jain et al. 2007 – this study
Maple Ridge, NY3,4 15 Apr 2008 - 9 Nov 2008 195 1.65 322 3.42-3.76 2.07-2.28
Jain et al. 2008 – this study
1 Agricultural/grassland/Conservation Reserve Program (CRP) lands 2 Short-grass prairie 3 Agricultural 4 Forest * Note: Where studies include more than one year, final estimates were reported on a per year basis.

MAPLE RIDGE WIND POWER AVIAN AND BAT FATALITY STUDY REPORT – 2008
Curry & Kerlinger, LLC – May 2009 © 50
4.4 Night Migrant Fatalities Determining the exact number of night migrants amongst the bird mortalities at the MRWRA is difficult, as some of the birds involved may be resident breeders or individuals dispersing during the post-breeding season. It should be noted that a species that typically migrates at night may also breed on site, and could collide with a turbine during the breeding season, perhaps during daylight hours. However, two years of monitoring daytime flight patterns at the Top of Iowa windfarm showed that only 0.043% of observed daytime flight occurred at rotor height in proximity to the rotors (Jain 2005). During daylight, and in good visible conditions, birds can see turbines and appear to avoid colliding with them (Jain 2005). The numbers of fatalities of night migrating birds were small in comparison with fatality rates of these birds at tall, guyed communication towers in the Midwestern and eastern United States where fatalities sometimes involve hundreds or even thousands of birds in a single night or migration season at a single tower (Gehring et al. 2009). Those towers have two types of Federal Aviation Administration lighting (steady burning red L-810 and flashing red incandescent beacons – L-864), multiple sets of guy wires, and are almost always in excess of 500 feet (152m). We conducted tests of night migrant incidents found at lit and unlit turbines for the 64 7-day search sites. We found no relationship between the numbers of night migrant fatalities and the presence of L-864 red flashing beacons on turbines. These results correspond to results from 2006 and 2007 at Maple Ridge and results from all other wind power sites where such tests could be conducted (Kerlinger et al. 2006). The results also corroborate results at tests conducted at communication towers (Gehring et al. 2009) that did not indicate that red flashing L-864 beacons attract night migrating birds. We also observed no significant evidence of a higher proportion of bird or bat fatalities at FAA lit turbines in 2008, as was the case in 2006 and 2007. Thus, there is no evidence for bats or birds that FAA lighting in the form of flashing red beacons attracts or disorients these animals resulting in greater numbers of fatalities than at unlit turbines. The fact that the Maple Ridge turbines are about 397 feet (121m) in height, do not have guy wires, and have only flashing red strobe-like lights may also help to explain the smaller numbers of night migrant fatalities at those turbines as compared to fatalities at tall communication towers (>500 feet, 152 m) that have more lights and guy wires.
4.5 Bird Population Trends and Significance of Fatalities at Maple Ridge Four European Starlings were amongst the incidents noted during standardized surveys in 2008, accounting for 6% of fatalities found. These birds are alien, invasive species that are not protected by the Migratory Bird Treaty Act (MBTA). They are often considered pests and targeted for population reduction. While the estimates of birds/MW and birds/turbine include extrapolations from these incidents (including starlings), when considering the significance of the annual mortality at the MRWRA, it should be noted that 6% of birds found are derived from non-MBTA species. In terms of extrapolated figures, approximately 40 out of 667 estimated birds were non-MBTA species. By including European Starlings in our calculations, we have
MAPLE RIDGE WIND POWER AVIAN AND BAT FATALITY STUDY REPORT – 2008
Curry & Kerlinger, LLC – May 2009 © 51
been conservative regarding our estimates of the significance of bird deaths at Maple Ridge turbines. None of the bird carcasses, that were found and identified during standardized or incidental surveys, are state or federally listed species. Virtually all birds killed by the turbines are relatively common species whose populations are not likely to be impacted by wind turbine impacts like those at Maple Ridge. Two incidents involving state species of special concern were noted: one Sharp-shinned Hawk (April 4, 2008) and one Cooper’s Hawk (November 3, 2008). The North American populations of these species (Table 19) are large enough that small numbers of fatalities will not destabilize these species populations. Table 19 describes the geographic range (source area) and estimated North American population of the species identified. Those populations come from large geographic ranges to the north of Maple Ridge, including far upstate New York, Quebec, and Ontario, as well as the Northwest Territories. It is also possible that some birds originate as far west as Manitoba or even Saskatchewan, but those likely account for a small portion of the migrants that fly over Maple Ridge. Most of the species listed in Table 19 are not listed in the National Audubon Society 2007 watch list which includes data from the North American Breeding Bird Survey (BBS) trends from 1966-2005 (Sauer et al. 2005), nor are they on lists published by other agencies or organizations. While it is difficult to estimate the effect of local sources of mortality (such as wind turbine collision) on entire populations, the estimated total numbers of incidents at the Maple Ridge WRA are very small compared to the overall populations of the species involved. The eastern population of the Golden-crowned Kinglet, which was also found more often than other species during searches in 2006, 2007 and 2008 (n = 5 incidents identified in 2008), is estimated to be decreasing across the U.S. but stable or increasing in the Eastern U.S. (Sauer et al. 2005). Given the overall population of this species (estimated 34 million birds), it is unlikely that the level of collision mortality at the Maple Ridge WRA (Table 18) could have a significant adverse effect on population levels, even with respect to cumulative impacts of fatalities from many wind plants. It is important here to note that regulated harvests of declining waterfowl and shorebird species occur on an annual basis, without significant negative impacts to populations. For example, about 400,000 American Woodcock – ~8-10% of the North American population are harvested annually by hunters in the eastern United States and Canada. Two American Woodcock fatalities were found during regular surveys at the Maple Ridge site (estimated fatality of 10 incidents per project period at the MRWRA). The average hunting harvest for woodcock in New York State is roughly 10,000 per year, although there is uncertainty associated with this number that could be more than 1,000 birds. Another relevant comparison would be with the New York State waterfowl harvest. During the 2002 and 2003 hunting seasons more about one-third of one million ducks and geese were shot in the State without significant impact to their populations. Most relevant is the sport harvest of more than 3,000 Northern Pintails, 23,000 American Black Duck, and about 6,000 Greater Scaup, all of which are declining species according to the North American Waterfowl Management Plan. The fact that the harvest of declining species of this magnitude does not impact populations is important for evaluating whether impacts to birds at the Maple Ridge site is biologically significant. Note that the harvests of these animals is subject to a 10-15% margin

MAPLE RIDGE WIND POWER AVIAN AND BAT FATALITY STUDY REPORT – 2008
Curry & Kerlinger, LLC – May 2009 © 52
of error, which means that the overall annual harvest of waterfowl for New York, as determined by the USFWS and the NYS DEC may 30,000+ birds greater than reported above. Table 19. BBS population trends and geographical distribution of bird species found at the Maple Ridge WRA during standardized surveys and incidentally (April 15 to November 14, 2008) Sauer et al. 2005.
Species North America Population
National Audubon Society 2007 Watch List Geographic Range
American Goldfinch 24 million No Temp. North America
American Kestrel 5.8 million No Temperate and Boreal North America
American Redstart 25 million No Temperate and Boreal Forests North America
American Robin 320 million No North America
Belted Kingfisher 2.2 million No Temperate North America
Blackpoll Warbler 21 million No Boreal Forest Black-throated Blue Warbler 2 million No N. Temp. and Boreal Forest North America
Cooper's Hawk 570,000 No Temp. North America
Dark-eyed Junco 260 million No N. Temperate and Boreal Forest
Eastern Kingbird 13 million No Central and Eastern North America
Eastern Towhee 11 million Stewardship Temperate Forests North America
European Starling Non-MBTA species N/A ----
Golden-crowned Kinglet 34 million No Boreal Forest North America
Indigo Bunting 28 million Stewardship Eastern North America
Killdeer 1.3 million No Temperate and Boreal North America
Magnolia Warbler 32 million Stewardship Boreal and North Temp. Forest (Mostly E of Rockies)
Mallard 8.6 million No North America
Mourning Dove 130 million No Temp. North America
Nashville Warbler 34 million Stewardship N. Temp. and Boreal Forest
Northern Mockingbird 45 million No Temperate North America
Purple Finch 3 million No N. Temp. and Boreal Forest North America
Red-breasted Nuthatch 18 million No N. Temp. and Boreal Forest North America
Red-eyed Vireo 140 million No Temp. and Boreal Forests
Red-tailed Hawk 2.2 million No North America
Rose-breasted Grosbeak 4.6 million No N. Temp and Boreal Forests
Ruby-crowned Kinglet 72 million No Boreal Forest North America
Ruffed Grouse 8.3 million No N Temp. and Boreal Forests
Sharp-shinned Hawk 1.1 million No North America
White-breasted Nuthatch 10 million No Temperate Forests North America White-winged Crossbill 41 million Stewardship Boreal Forest
Wild Turkey 1.3 million No Temp. Forests (E North America)
American Woodcock 5 million No Eastern North America Stewardship” is an undefined term used by Partners in Flight (Rich et al. 2004), presumably to focus on species for which population changes need to be carefully examined.

MAPLE RIDGE WIND POWER AVIAN AND BAT FATALITY STUDY REPORT – 2008
Curry & Kerlinger, LLC – May 2009 © 53
4.6 Bat Fatalities The few population estimates for bats in North America are limited mostly to cave-dwelling bat species that live in large colonies. Due to the nocturnal habits of this group of these mammals, it is extremely difficult to study populations and geographic distribution. Consequently, it is even more difficult to assess the impact of collision mortality on the populations of these species (Arnett et al 2008). All bat species found during searches at the Maple Ridge WRA are widely distributed, and, while possibly uncommon in New York State, are not listed as state or federally endangered. However, Kunz et al. 2007 stated that the eastern red bat (Lasiurus borealis) may be in decline throughout much of its range, making it more susceptible to cumulative fatalities associated with projected wind energy development. Recent reviews of bat fatalities at wind resource areas (Arnett et al. 2008, Johnson 2005, Kunz et al 2007) have stated that the potential for significant cumulative population impacts, especially for migrating, tree-roosting bat species is an important concern, while acknowledging that the dearth of information of baseline population estimates and demographics remains a key challenge. O’Shea and Bogan (2003) speculate that changes in forest management (i.e. roost availability) may be a limiting factor for some species of tree-roosting bat species (hoary and red bats) in the U.S. A recent collapse in numbers of cave-dwelling little brown and big brown bats (Alan Hicks, personal communication) has been connected to a fungal infection (White-nose Syndrome) of the respiratory system (though the cause of this collapse is unknown). Thus, while the significance of bat fatalities at the Maple Ridge WRA cannot be determined, bat fatalities should remain a source of concern. The period during which the peak of fatalities occurred, in the 2006 pilot season and in 2007 and 2008, corresponds to the peak periods reported in studies in the eastern, Midwestern, and western United States (Kerns and Kerlinger 2004, Gruver 2002, Jain 2005, Jain et al. 2007, Johnson et al 2003a, Young et al. 2003), suggesting that some of the mechanics of these fatalities are independent of geography. Whereas in 2006 and 2007 there was some evidence to support the idea that bat fatalities may increase in proximity to wetlands and moderate evidence pointing towards increased fatalities in the presence of wooded sites in 2007, we did not see this in 2008. Multiple full year analyses should continue to test for and more fully understand the relationship between bat fatalities, proximity to wetlands and wooded areas. Table 20. Population trends and geographical distribution of bat species found at the Maple Ridge WRA during standardized surveys and incidentally (April 15 to November 14, 2008). Species Tree-Roosting Population Trends Geographic Range Hoary Bat Yes Unknown North America
Eastern Red Bat Yes Poss. Decreasing Central and Eastern North America
Silver-Haired Bat Yes Unknown North America (Except Mexico)
Little Brown Bat No
Poss. Increasing in North America. Possibly Decreasing in NE-US. North America
Big Brown Bat No
Poss. Increasing in North America. Possibly Decreasing in NY. North America

MAPLE RIDGE WIND POWER AVIAN AND BAT FATALITY STUDY REPORT – 2008
Curry & Kerlinger, LLC – May 2009 © 54
Tables 21 and 22 show the comparison of the fatalities per turbine, per MW and per 2000 m2 rotor Swept Area at the MRWRA and other WRA’s in the Eastern and Midwestern U.S. Bat fatality rates at Maple Ridge are higher than those reported in the western and Midwestern U.S., and generally lower than those rates reported from the Appalachian mountains in the eastern U.S. Table 21. Estimates of bat fatalities per turbine and per megawatt at different wind facilities in Eastern and Midwestern U.S. modified from Arnett et al. (2008).
Study Area Location Study Period
Est. Mean Fatality/ Turbine
Estimated
Mean Fatality/MW
Estimated Mean Fatality/ 2000m2 rotor Swept Area
Reference
Eastern U.S.
Buffalo Mountain, TN (phase 1) a 1 Sep 2000–30 Sep 2003 20.8 31.5 24.0 Nicholson
2001, 2002 Buffalo Mountain, TN
(phase 2) a 1 Apr–31 Dec 2005 35.2 53.3 40.6 Nicholson 2001, 2002
Buffalo Mountain, TN (phase 2 b 1 Apr–31 Dec 2005 69.6 38.7 27.7 Nicholson
2001, 2002
Meyersdale, PA c 2 Aug–13 Sep 2004 23 15.3 11.3 Arnett et al. 2008
Mountaineer, WV (2003)1 4 Apr–11 Nov 2003 48 32 23.6 Arnett et al. 2008
Mountaineer, WV (2004) c 31 Jul–11 Sep 2004 38 25.3 18.7 Arnett et al. 2008
MRNY 2007 (This study) 30 Apr-14 Nov 2007 15.54-18.53 9.42-11.23 5.88-7.02 This Study
MRNY 2008 (This study) 15 Apr-9 Nov 2008 8.18-8.92 4.96-5.41 3.10-3.38 This Study
Midwestern U.S.
Buffalo Ridge, MN 1 d Apr - Dec 1994–1995; 15 Mar–15 Nov 1996–1999 0.1 0.2 0.2 Johnson et
al. 2002
Buffalo Ridge, MN 2 e 15 Mar–15 Nov 1998–1999; 15 Jun–15 Sep 2001–2002
2.0 2.7 2.4 Johnson et al. 2002
Buffalo Ridge, MN 3 f 15 Mar–15 Sep 1999; 15 Jun–15 Sep 2001–2002 2.1 2.7 2.3 Johnson et
al. 2002
Lincoln, WI Jul 1999–Jul 2001 4.3 6.5 5.0 Howe et al. 2002
Top of Iowa, IA 15 Mar–15 Dec 2003, 2004 7.8 8.7 7.4 Koford et al. 2005
a - Estimated bats killed by 3 Vestas V47 0.66 megawatt turbines. b - Estimated bats killed by 15 Vestas V80, 1.8 megawatt turbines. c - Estimated bats killed from daily searches conducted at these facilities. d - Estimated bats killed by 73 Kenetech 33 0.33 megawatt turbines based on 4 years of data. e - Estimated bats killed by 143 Zond 0.75 megawatt turbines based on 4 years of data. f - Estimated bats killed by 138 Zond 0.75 megawatt turbines based on 3 years of data.

MAPLE RIDGE WIND POWER AVIAN AND BAT FATALITY STUDY REPORT – 2008
Curry & Kerlinger, LLC – May 2009 © 55
Table 22. Percent species composition of bat fatalities at wind facilities in Eastern and Midwestern U.S. (modified from Arnett et al. 2008).
STUDY LOCATION
EPFUa
LABO
LACI
LANO
MYLU
MYSE
PISU
Other
Total No. Bats Found
Eastern U.S.
Buffalo Mountain, TN (phase 1) 0.9 60.5 9.6 1.8 - - 25.4 1.8 b 114
Buffalo Mountain, TN (phase 2) 0.4 60.9 13.0 7.6 - - 17.2 0.8 b 238
Meyersdale, PA 6.9 27.5 45.4 5.7 2.7 0.7 8.0 0.5 262 Mountaineer, WV (2003) 0.4 42.1 18.5 5.9 12.6 1.3 18.3 0.8 475 Mountaineer, WV (2004) 2.5 24.1 33.7 4.8 9.8 - 24.6 0.5 398
MRNY (2007) 8.4 9.9 49.5 15.84 15.3 - - 1.0 202 MRNY (2008) 5.0 11.4 43.6 20.7 17.1 - - 2.1 140
Midwestern U.S.
Buffalo Ridge, MN 1-3 3.6 17.4 65.0 4.8 1.9 - 1.7 5.7 420 Lincoln, WI 1.4 38.9 34.7 16.7 - - - 8.3 72
Top of Iowa, IA 10.7 24.0 28.0 12.0 24.0 - 1.3 - 75
a - EPFU = big brown bat; LABO = eastern red bat; LACI = hoary bat; LANO = silver-haired bat; MYLU = little brown bat; MYSE = northern long-eared bat; PISU = eastern pipistrelle; b - Unidentified species

MAPLE RIDGE WIND POWER AVIAN AND BAT FATALITY STUDY REPORT – 2008
Curry & Kerlinger, LLC – May 2009 © 56
5.0 REFERENCES
Arnett, E. B., W. K. Brown, W. P. Erickson, J. K. Fiedler, B. L. Hamilton, T. H. Henry, A. Jain, G. D. Johnson, J. Kerns, R. R. Koford, C. P. Nicholson, T. J. O'Connell, M. D. Piorkowski, R. D. Tankersley, Jr. 2008. Patterns of Bat Fatalities at Wind Energy Facilities in North America. The Journal of Wildlife Management 72 (1): 61-78. Arnett, E.B., technical editor. 2005. Relationships between bats and wind turbines in Pennsylvania and West Virginia: an assessment of bat fatality search protocols, patters of fatality, and behavioral interactions with wind turbines. A final report submitted to the Bats and Wind Energy Cooperative. Bat Conservation International. Austin, Texas, USA. Bat Conservation International © 2008. Species Profiles. <http://www.batcon.org/SPprofiles/index.asp> Erickson, W.P., G.D. Johnson, M.D. Strickland, and K. Kronner. 2000. Avian and bat mortality associated with the Vansycle Wind Project, Umatilla County, Oregon: 1999 study year. Tech. Report to Umatilla County Dept. of Resource Services and Development, Pendleton, OR. Erickson, W., G.D. Johnson, M.D. Strickland, K.J. Sernka, and R. Good. 2001. Avian collisions with wind turbines: a summary of existing studies and comparisons to other sources of collision mortality in the United States. White paper prepared for the National Wind Coordinating Committee, Avian Subcommittee, Washington, DC. Erickson, W.P., G.D. Johnson, D.P. Young, M.D. Strickland, R.E. Good, M. Bourassa, K., Bay, and K. Sernka. 2002. Synthesis and comparison of baseline avian and bat use, raptor nesting and mortality information from proposed and existing wind developments. Prepared for Bonneville Power Administration, PO Box 3621, Portland, Oregon 97208 Erickson, W., J. Jeffrey, K. Kronner, and K. Bay. 2004. Stateline wind project wildlife monitoring annual report, results for the period July 2001 – December 2003. Prepared for to FPL Energy, Stateline Technical Advisory Committee, Oregon Department of Energy, by Western EcoSystems Technology, Pendleton, OR. December 2004. Erickson, W., K. Kronner, and B. Gritski. 2003. Nine Canyon Wind Power Project avian and bat monitoring report. September 2002-August 2003. Prepared for Nine Canyon Technical Advisory Committee and Energy Northwest. ESRI, 380 New York Street, Redlands, California, 92373-8100, USA <http:// www.esri.com> Fiedler, J.K., T. H. Henry, R. D. Tankersley, and C. P. Nicholson. 2007

MAPLE RIDGE WIND POWER AVIAN AND BAT FATALITY STUDY REPORT – 2008
Curry & Kerlinger, LLC – May 2009 © 57
Results of Bat and Bird Mortality Monitoring at the Expanded Buffalo Mountain Windfarm, 2005. Tennessee Valley Authority, Knoxville. <http://www.tva.gov/environment/bmw_report> Furlonger, C.L., H.J. Dewar, and M.B. Fenton. 1987. Habitat use by foraging insectivorous bats. Canadian Journal of Zoology 65:284-288. Gehring, J., P. Kerlinger, and A. Manville. 2009. Communication towers, lights, and birds: successful methods of reducing the frequency of avian collisions. Ecological Applications, in press. Genter, D.L., and K.A. Jurist. 1995. Bats of Montana. Montana Natural Heritage. Program. Helena, USA. Goodman, L.A. 1960. On the exact variance of products. Journal of the American Statistical Association 55:708-713. Gruver, J.C. 2002. Assessment of bat community structure and roosting habitat preferences for the hoary bat (Lasiurus cinereus) near Foote Creek Rim, Wyoming. M.S. Thesis, University of Wyoming, Laramie. 149pp. Howe, R.W., W. Evans, and A.T. Wolf. 2002. Effects of wind turbines on birds and bats in northeastern Wisconsin. Report to Wisconsin Public Service Corporation and Madison Gas and Electric Company. Jain, A.A. 2005. Bird and bat behavior and mortality at a northern Iowa windfarm. M.S. Thesis. Iowa State University, Ames, IA. (submitted for publication). Johnson, G.D., D.P. Young, Jr., W.P. Erickson, M.D. Strickland, R.E. Good, and P. Becker. 2000. Avian and bat mortality associated with the initial phase of the Foote Creek Rim Windpower Project, Carbon County, Wyoming: November 3, 1998-October 31, 1999. Report to SeaWest Energy Corp. and Bureau of Land Management. Johnson, G.D., W.P. Erickson, M.D. Strickland, M.F. Shepherd, D.A. Shepherd, and S.A. Sarappo. 2002. Collision mortality of local and migrant birds at the large-scale wind power development on Buffalo Ridge, Minnesota. Wildlife Society Bulletin 30:879-887. Johnson, G.D., W.P. Erickson, M.D. Strickland, M.F. Shepherd, D.A. Shepherd, and S.A. Sarappo. 2003. Mortality of bats at a large-scale wind power development at Buffalo Ridge, Minnesota. American Midland Naturalist 150:332–342. Johnson, G., W. Erickson, J. White, and R. McKinney. 2003. Avian and bat mortality during the first year of operation at the Klondike Phase I Wind Project, Sherman County, Oregon. Draft report to Northwestern Wind Power. Kerlinger, P. 2004a. Wind turbines and avian risk: lessons from communication towers. Presented at the American Bird Conservancy-American Wind Energy Association

MAPLE RIDGE WIND POWER AVIAN AND BAT FATALITY STUDY REPORT – 2008
Curry & Kerlinger, LLC – May 2009 © 58
Meeting, May 18-19, 2004, Washington, DC. Kerlinger, P. 2004b. Attraction of night migrating birds to FAA and other types of lights. National Wind Coordinating Committee – Wildlife Working Group Meeting, November 3-4, 2004, Lansdowne, VA. Kerlinger, P., J. Gehring, W. Erickson, and R. Curry. In prep. Federal Aviation Administration obstruction lighting and night migrant fatalities at wind turbines in North America: A review of data from existing studies. In review at Journal of the Wilson Ornithological Society (Wilson Bulletin). Kerns, J., and P. Kerlinger. 2004. A study of bird and bat collision fatalities at the Mountaineer Wind Energy Center, Tucker County, West Virginia: Annual report for 2003. Report to FPL Energy and the MWEC Technical Review Committee. Koford, R., A. Jain, G. Zenner, and A. Hancock. 2005. Avian mortality associated with the Top of Iowa Wind Power Project. Report to Iowa Department of Natural Resources. Kunz, T. H., E. B. Arnett, W. P. Erickson, A. R. Hoar, G. D. Johnson, R. P. Larkin, M. D. Strickland, R. W. Thresher, and M. D. Tuttle. 2007. Ecological impacts of wind energy development on bats: questions, research needs, and hypotheses. Frontiers in Ecology and the Environment. 5(6): 315-324. Kurta, A. 2000. The Need for Shelter, Food, and Water, pg. 197. Bat Conservation and Mining: A Technical Interactive Forum (2000: St. Louis, Missouri) Eds. Kimery C. Vories, Dianne Throgmorton; U.S. Dept. of the Interior, Office of Surface Mining, Environmental Impacts of Wind-Energy Projects Committee on Environmental Impacts of Wind Energy Projects, Committee on Environmental Impacts of Wind Energy Projects, National Research Council, 2007. ISBN: 978-0-309-10830-0, 394 p. Nicholson, C. P. 2001, 2002. Buffalo Mountain Windfarm bird and bat mortality monitoring report: October 2000 – September 2002. Preliminary report. Tennessee Valley Authority, Knoxville, TN. Ramsey, F.L. and D.W. Schafer, 2002. The Statistical Sleuth. Second Edition. Duxbury, Pacific Grove, CA, USA. O’Shea, T.J. and Bogan, M.A., eds., 2003, Monitoring trends in bat populations of the United States and territories: problems and prospects: U.S. Geological Survey, Biological Resources Discipline, Information and Technology Report, USGS/BRD/ITR--2003–0003, 274 p. Sauer, J. R., J. E. Hines, and J. Fallon. 2005. The North American Breeding Bird Survey, Results and Analysis 1966 - 2005. Version 6.2.2006. USGS Patuxent Wildlife Research Center, Laurel, MD. <http://www.mbr-pwrc.usgs.gov/bbs/>

MAPLE RIDGE WIND POWER AVIAN AND BAT FATALITY STUDY REPORT – 2008
Curry & Kerlinger, LLC – May 2009 © 59
Shire, G.G., K. Brown, and G. Winegrad. 2000. Communication towers: a deadly hazard to birds. American Bird Conservancy, Washington, DC. Smallwood, J. A., and D. M. Bird. 2002. American Kestrel (Falco sparverius). In The Birds of North America, No. 602 (A. Poole and F. Gill, Eds.). The Birds of North America, Inc., Philadelphia, PA. Trapp, J. L. 1998. Bird kills at towers and other man-made structures: an annotated partial bibliography (1960-1998). U. S. Fish and Wildlife Service web report: www.fws.gov/r9mbmo. Young, D.P., G.D. Johnson, W.P. Erickson, M.D. Strickland, R.E. Good, and P. Becker. 2001. Avian and bat mortality associated with the Initial Phase of the Foote Creek Rim Windpower Project, Carbon County, Wyoming: November 1998-October 31, 2000. Prepared for SeaWest Windpower, Inc., San Diego, CA, and Bureau of Land Management, Rawlins, WY, by Western Ecosystems Technology, Inc., Cheyenne, WY. 32 pp. Young, D.P., W.P. Erickson, R.E. good, M.D. Strickland, and G.D. Johnson. 2003. Avian and bat mortality associated with the initial phase of the Foote Creek Rim Windpower Project, Carbon County, Wyoming. Report to Pacificorp, Inc., Sea West Windpower, Inc., and Bureau of Land Management. Young, D.P., J.D. Jeffrey, W.P. Erickson, K. Bay, K. Kronner, B. Gritski, and J. Baker. 2005. Combine Hills Turbine Ranch wildlife monitoring first annual report: March 2004-March 2005. Prepared for Eurus Energy America Corporation, Umatilla County, and the Combine Hills Technical Advisory Committee.

MAPLE RIDGE WIND POWER AVIAN AND BAT FATALITY STUDY REPORT – 2008
Curry & Kerlinger, LLC – May 2009 © 60
APPENDICES

MAPLE RIDGE WIND POWER AVIAN AND BAT FATALITY STUDY REPORT – 2008
Curry & Kerlinger, LLC – May 2009 © 61
APPENDIX A: MAPLE RIDGE WIND RESOURCE AREA PROJECT SITE INFORMATION DATASHEET. A similar log was kept for each site as well as the two meteorological towers) detailing site conditions at each search and the number of incidents noted.
Date Time Surveyed
Temp °F
% Cloud Cover
Survey Weather
Conditions
Wind Direction Wind
Prior Evening
Conditions
Bird Carcasses
Bat Carcasses Observer
Habitat Conditions
and Site Repairs Needed

MAPLE RIDGE WIND POWER AVIAN AND BAT FATALITY STUDY REPORT – 2008
Curry & Kerlinger, LLC – May 2009 © 62
APPENDIX B: MAPLE RIDGE WIND RESOURCE AREA PROJECT INCIDENT (MORTALITY) DATASHEET Details for each incident (bird or bat) were recorded by observers in an individual row of this datasheet. Additional information such as presence of predator sign, evidence of mowing damage, additional carcass condition information etc. was recorded in the last column. Turbine
# Date Time Bird / Bat # Habitat Vegetation
Length Species/Age/Sex Carcass Condition
Time on Ground
Dir-Dist Transect Observer Picture
Number Additional
Information

MAPLE RIDGE WIND POWER AVIAN AND BAT FATALITY STUDY REPORT – 2008
Curry & Kerlinger, LLC – May 2009 © 63
APPENDIX C: MAPLE RIDGE WIND RESOURCE AREA PROJECT INCIDENT LOCATION (GPS) DATASHEET In addition to Incident (Mortality) sheet, observers noted GPS coordinates to the towers for future use in GIS analyses. However, Distance and Bearing to the turbine base were also recorded for increased accuracy. Bird/Bat # Location (Longitude) Location (Latitude) Elevation Distance Bearing
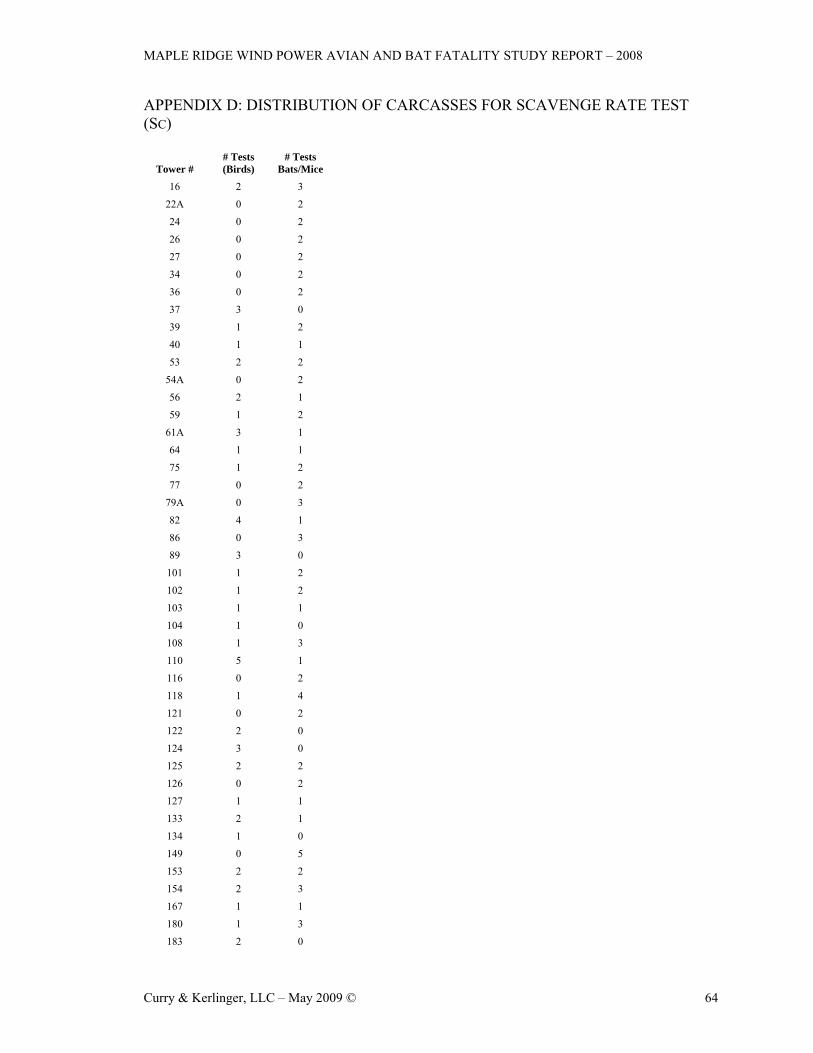
MAPLE RIDGE WIND POWER AVIAN AND BAT FATALITY STUDY REPORT – 2008
Curry & Kerlinger, LLC – May 2009 © 64
APPENDIX D: DISTRIBUTION OF CARCASSES FOR SCAVENGE RATE TEST (SC)
Tower # # Tests (Birds)
# Tests Bats/Mice
16 2 3
22A 0 2
24 0 2
26 0 2
27 0 2
34 0 2
36 0 2
37 3 0
39 1 2
40 1 1
53 2 2
54A 0 2
56 2 1
59 1 2
61A 3 1
64 1 1
75 1 2
77 0 2
79A 0 3
82 4 1
86 0 3
89 3 0
101 1 2
102 1 2
103 1 1
104 1 0
108 1 3
110 5 1
116 0 2
118 1 4
121 0 2
122 2 0
124 3 0
125 2 2
126 0 2
127 1 1
133 2 1
134 1 0
149 0 5
153 2 2
154 2 3
167 1 1
180 1 3
183 2 0

MAPLE RIDGE WIND POWER AVIAN AND BAT FATALITY STUDY REPORT – 2008
Curry & Kerlinger, LLC – May 2009 © 65
Tower # # Tests (Birds)
# Tests Bats/Mice
184 0 2
185 1 0
187 1 0
189 0 1
192 0 3
197 2 0
Met #2 0 2

MAPLE RIDGE WIND POWER AVIAN AND BAT FATALITY STUDY REPORT – 2008
Curry & Kerlinger, LLC – May 2009 © 66
APPENDIX E: NUMBER OF 7-DAY SEARCHES COMPLETED PER SITE BY NOVEMBER 9, 2008
Turbine Number Phase
First Search
Most Recent Search # Searches
# Days Since First Search
Average Search Period
12 1 4/19/08 11/9/08 29 204 7.03 16 1 4/17/08 11/6/08 30 203 6.77
22A 1 4/15/08 11/4/08 29 203 7.00 23 1 4/18/08 11/7/08 30 203 6.77 24 1 4/19/08 11/9/08 30 204 6.80 26 1 4/18/08 11/7/08 29 203 7.00 27 1 4/15/08 11/4/08 30 203 6.77 34 1 4/18/08 11/7/08 30 203 6.77 37 1 4/17/08 11/6/08 30 203 6.77 39 1 4/21/08 11/3/08 30 196 6.53 40 1 4/21/08 11/3/08 30 196 6.53 50 1 4/15/08 11/3/08 30 202 6.73 52 1 4/18/08 11/7/08 29 203 7.00 53 1 4/20/08 11/2/08 29 196 6.76
54A 1 4/19/08 11/9/08 30 204 6.80 56 1 4/21/08 11/3/08 29 196 6.76 57 1 4/15/08 11/3/08 30 202 6.73 59 1 4/20/08 11/2/08 29 196 6.76 64 1 4/21/08 11/3/08 28 196 7.00 75 1 4/16/08 11/5/08 30 203 6.77 76 1 4/18/08 11/7/08 28 203 7.25 77 1 4/18/08 11/7/08 30 203 6.77 82 1 4/18/08 11/6/08 30 202 6.73 83 1 4/23/08 11/3/08 29 194 6.69 86 1 5/10/08 11/9/08 27 183 6.78 89 1 4/24/08 11/6/08 29 196 6.76
101 1 4/16/08 11/05/08 28 203 7.25 102 1 4/20/08 11/2/08 29 196 6.76 103 1 4/21/08 11/3/08 29 196 6.76 104 1 4/17/08 11/6/08 30 203 6.77 108 1 4/20/08 11/2/08 28 196 7.00 109 1 4/21/08 11/3/08 29 196 6.76 110 1 4/16/08 11/5/08 30 203 6.77 179 1 4/19/08 11/9/08 30 204 6.80 180 1 4/16/08 11/5/08 30 203 6.77 183 1 4/17/08 11/6/08 30 203 6.77 189 1 4/21/08 11/3/08 30 196 6.53 192 1 5/11/08 11/2/08 26 175 6.73 197 1 4/17/08 11/6/08 30 203 6.77 36 2 4/15/08 11/4/08 30 203 6.77
79A 2 4/25/08 11/7/08 29 196 6.76 114 2 4/15/08 11/4/08 30 203 6.77 116 2 4/18/08 11/7/08 30 203 6.77

MAPLE RIDGE WIND POWER AVIAN AND BAT FATALITY STUDY REPORT – 2008
Curry & Kerlinger, LLC – May 2009 © 67
Turbine Number Phase
First Search
Most Recent Search # Searches
# Days Since First Search
Average Search Period
118 2 4/20/08 11/2/08 29 196 6.76 121 2 4/18/08 11/7/08 30 203 6.77 122 2 4/17/08 11/6/08 30 203 6.77 124 2 4/21/08 11/3/08 29 196 6.76 125 2 4/20/08 11/2/08 29 196 6.76 126 2 4/15/08 11/4/08 30 203 6.77 127 2 4/21/08 11/3/08 29 196 6.76 129 2 4/19/08 11/9/08 30 204 6.80 130 2 4/23/08 11/5/08 29 196 6.76 133 2 4/16/08 11/5/08 30 203 6.77 134 2 4/17/08 11/6/08 30 203 6.77 136 2 4/19/08 11/9/08 30 204 6.80 167 2 4/21/08 11/3/08 29 196 6.76 168 2 4/18/08 11/7/08 30 203 6.77 61A 1A 4/16/08 11/5/08 30 203 6.77 149 1A 4/19/08 11/9/08 30 204 6.80 153 1A 4/16/08 11/5/08 29 203 7.00 154 1A 4/20/08 11/2/08 29 196 6.76 184 1A 4/21/08 11/3/08 28 196 7.00 187 1A 4/17/08 11/6/08 30 203 6.77 198 1A 4/15/08 11/4/08 30 203 6.77
Met 1 Met 4/15/08 11/3/08 30 202 6.73 Met 2 Met 4/16/08 11/5/08 30 203 6.77

MAPLE RIDGE WIND POWER AVIAN AND BAT FATALITY STUDY REPORT – 2008
Curry & Kerlinger, LLC – May 2009 © 68
APPENDIX F: TEST OF THE EFFICACY OF BROWN HOUSE MICE (MUS MUSCULUS) AS SURROGATES FOR BATS DURING SCAVENGE RATE AND SEARCH EFFICIENCY TESTING Scavenge Rate (Sc): We conducted a paired test of scavenge rates for bats and mice at the Maple Ridge Wind Resource Area. Habitat conditions under towers were as described in Jain et al. 2006, 2007 (mowed ground and gravel under wind turbine towers in a mixed agricultural and wooded setting). For the test, several pairs, consisting of one bat and one tail-less brown house mouse (Mus musculus), were placed in mowed ground under several turbines in the same afternoon. Care was taken to place the carcasses apart from each other. Carcasses were examined daily for signs of scavenging for up to 4.5 weeks. The response variable was average number of days until carcasses were no longer visible due to scavenging. The results are presented below. Maple Ridge WRA Paired Sc Test We found no significant evidence for a difference in mean days until scavenge event between bat and mouse carcasses (Paired t-test, t = 1.42, df = 9, p = 0.19) Search Efficiency (Se): The search efficiency test was performed concurrently with the scavenge rate test. Maple Ridge WRA Paired Se Test (n = 61): There was no significant difference between the odds of finding a bat over a mouse (Chi-Square Test, χ2 = 0.08, df = 1, p = 0.78 Results: Scavenge Rate (Sc): The paired test showed no significant difference between the average number of days before scavenging occurred for mice and bats. Similar tests were performed at other WRA’s in the region but results are yet to be released by the developer. However, the results of those tests do not differ from results presented here. We tentatively conclude that, given the scarcity of bats available for testing due to White-nose Syndrome, Brown house mouse carcasses are an acceptable substitute for scavenger studies. Search Efficiency (Se): The paired test showed no significant difference in the odds of finding a bat over a mouse. Similar tests were performed at 3 other WRA’s in the region but results are yet to be released by the developer. However, with one exception, the results of those tests do not differ from results presented here. Though there is no strong evidence to contraindicate the use of mice as surrogates for search efficiency tests, more study is advised.

MAPLE RIDGE WIND POWER AVIAN AND BAT FATALITY STUDY REPORT – 2008
Curry & Kerlinger, LLC – May 2009 © 69
APPENDIX G: COMPARING SC AND SE ESTIMATED OVER 2006, 2007 AND 2008 The following data tables are excerpted from Jain et al. 2006, 2007 and this document (2008). Also included are graphical representations of the Sc and Se rates, comparing small birds and bats between years. Please note that the number of small birds used for scavenge rate in 2006 was restricted to one test, late in the season, due to difficulties in procuring birds and permits. This lead to an unusually high proportion of birds not scavenged. Medium and large birds are not represented graphically, due to small sample sizes. However, examining the tables shows low variation between these rates as well. Finally, bat Se and Sc rates include rates estimated with both bats and mice. However, no major change in either rate is noted between years. Table 15. Maple Ridge Scavenger Removal Study Data (2006).
# Carcasses # Scavenged Prop. not Scavenged (Sc) Small Birds – 1 day1 16 1 0.94 Small Birds – 3 day 16 1 0.94 Small Birds – 7 day 16 1 0.94 Bats – 1 day 51 10 0.80 Bats – 3 day 51 14 0.73 Bats – 7 day 51 20 0.61
1Sc for small birds was also used to estimate the proportion of medium sized birds scavenged. Table 16. Maple Ridge Searcher Efficiency Study Data (2006).
# Carcasses # Carcasses not found Prop found (Se )
Small Birds1,2 16 7 0.56 Medium Birds 16 7 0.56 Large Birds3 4 0 1.00
Bats 41 20 0.51 1The search efficiency rate is unaffected by the three search periods therefore the same rate was applied to all three search frequencies. 2Se for small birds was also used to estimate Se for medium sized birds 3Only 4 carcasses were used to test for Se for large sized bird. However, large bird carcasses were very prominent at mowed sites, giving us confidence in this statistic. Table 21. Maple Ridge scavenger removal study data (2007).
Size Class # Carcasses # Scavenged. Prop. not scavenged1 (Sc) Small Birds 70 38 0.46 Medium Birds 16 7 0.56 Large Birds 23 8 0.65 Bats 70 31 0.55
1. Over 4 days, see methods.

MAPLE RIDGE WIND POWER AVIAN AND BAT FATALITY STUDY REPORT – 2008
Curry & Kerlinger, LLC – May 2009 © 70
Table 22. Maple Ridge searcher efficiency study data (2007).
# Carcasses # Carcasses not found Prop found (Se )
Small Birds 61 23 0.62 Medium Birds 16 2 0.88 Large Birds3 15 1 0.93
Bats 61 25 0.59 Table 16. Maple Ridge scavenger removal study data (2008).
Size Class # Carcasses # Scavenged. Prop. not scavenged1 (Sc)
Small Birds – 7 day 36 15 0.58 Med. Birds – 7 day 18 3 0.83 Large Birds – 7 day 6 1 0.83 Bats and mice– 7 day 85 41 0.52
Table 17. Maple Ridge searcher efficiency study data (2008).
Size Class # Carcasses # Carcasses not found Prop found (Se )
Small Birds 32 11 0.66 Medium Birds 18 2 0.89 Large Birds3 6 1 0.83 Bats 61 26 0.57
Figure A. Comparison of Scavenge rates (Sc) estimated over three different years of the project.
Scavenge Rates between years
0
0.2
0.4
0.6
0.8
1
2006 2007 2008
Year
Sc (P
rop.
not
sca
veng
ed)
BatsSmall Birds

MAPLE RIDGE WIND POWER AVIAN AND BAT FATALITY STUDY REPORT – 2008
Curry & Kerlinger, LLC – May 2009 © 71
Figure B. Comparison of Search Efficiency rates (Se) estimated over three different years of the project
Search Efficiency Rates between years
0
0.2
0.4
0.6
0.8
1
2006 2007 2008
Year
Sc (P
rop.
foun
d)
BatsSmall Birds

MAPLE RIDGE WIND POWER AVIAN AND BAT FATALITY STUDY REPORT – 2008
Curry & Kerlinger, LLC – May 2009 © 72
APPENDIX H: INCIDENTAL BIRDS AND BATS REPORTED BY PAUL CRYAN AND CREW DURING AN INDEPENDENT STUDY AT THE MAPLE RIDGE WRA IN 2008
Bat Species Turbine #
Hoary Eastern
Red Big
Brown Little
Brown Silver-haired Bat
Total Bats Total Birds
5 1 0 0 0 0 0 1 0
6 0 0 0 0 0 0 0 European Starling;
Rose-breasted Grosbeak
10 0 0 1 0 0 0 1 0
25 2 0 0 0 0 0 2 0
29 0 1 1 0 0 0 2 0
31 1 0 0 0 0 0 1 0
45 2 0 0 0 0 0 2 0
47 4 1 0 0 0 1 6 0
49 1 0 0 0 1 1 3 0
60 0 0 0 0 1 0 1 0
68 1 0 0 1 0 0 2 0
69 2 1 0 1 0 0 4 0
81A-1 0 0 1 0 0 0 1 0
90 0 0 1 2 1 0 4 0
91 0 0 0 1 0 0 1 0
93 1 0 0 0 1 0 2 0
94 0 0 0 1 0 0 1 0
95 0 0 0 0 1 0 1 Killdeer
97 1 0 0 0 0 0 1 0
107 1 0 0 0 0 0 1 Red-eyed Vireo
111 0 0 1 0 0 0 1 0
113 1 0 0 0 0 0 1 0
117 1 0 0 0 0 0 1 0
120 0 0 0 0 2 0 2 0
137 0 0 0 1 0 0 1 0
139 1 0 0 0 0 0 1 0
141 1 0 0 0 0 0 1 2 Bobolinks
159 1 0 0 0 0 0 1 0

MAPLE RIDGE WIND POWER AVIAN AND BAT FATALITY STUDY REPORT – 2008
Curry & Kerlinger, LLC – May 2009 © 73
Bat Species Turbine #
Hoary Eastern
Red Big
Brown Little
Brown Silver-haired Bat
Total Bats Total Birds
162 0 0 0 0 0 0 0 Gull
165 0 0 0 0 1 0 1 Passerine
170 1 0 1 0 0 0 2 0
175 2 0 0 0 0 0 2 0
176 1 0 0 0 0 0 1 0
178 0 1 0 1 0 0 2 0
182 1 0 0 0 0 0 1 0
186 0 0 1 0 0 0 1 0
193 0 0 0 2 0 0 2 0