annual report fy2012 - chiyoda corp
TRANSCRIPT

CORPORATE PHILOSOPHY
Enhance our business in aiming for harmonybetween energy and the environment, and contribute to the sustainable development of a society as an integrated engineering companythrough the use of our collective wisdom andpainstakingly developed technology.
Minato Mirai Grand Central Tower4-6-2, Minatomirai, Nishi-ku, Yokohama 220-8765, JapanTel: (81)45-225-7777 (voice guidance)http://www.chiyoda-corp.com/en/
For the year ended March 31, 2013
ANNUAL REPORT FY2012
(As of August 2013)
Selected in FTSE Group’s responsibleinvestment index

1CHIYODA CORPORATION ANNUAL REPORT FY2012
Note: Yen amounts are rounded down to the nearest million. U.S. dollar amounts and percentages are rounded to the nearest unit.
Financial HighlightsYears Ended March 31, 2013, 2012, 2011, 2010 and 2009
2013 2012 2011 2010 2009
For the Year (Millions of Yen)
Revenues ¥398,918 ¥254,675 ¥247,082 ¥312,985 ¥446,438
Cost of revenue 356,402 215,783 215,563 298,766 427,461
Operating income 25,113 24,197 17,544 1,702 7,227
Income before income taxesand minority interests 26,747 23,543 11,476 4,714 9,651
Net income 16,077 14,364 7,979 2,953 6,498
At Year-End (Millions of Yen)
Total assets ¥435,379 ¥365,795 ¥353,392 ¥328,174 ¥357,816
Total equity 189,356 168,737 155,758 149,253 145,917
Current ratio (%) 166.3 165.5 173.8 175.2 161.1
Per Common Share (Yen )
Earnings per share (EPS) ¥62.06 ¥55.44 ¥30.79 ¥11.39 ¥25.58
Book value per share (BPS) 727.24 648.95 599.15 573.61 561.12
Dividend per share 19.0 17.0 11.0 3.5 7.5
Ratios (%)
Return on assets (ROA) 6.4 6.6 4.6 1.4 3.1
Return on equity (ROE) 9.0 8.9 5.3 2.0 5.7
Forward-Looking Statements: This annual report contains forward-looking statements about Chiyoda Corporation’s outlooks, plans, forecasts, results and other items that may take place in the future. Such statements are based on data available as of July 1, 2013. Unknown risks and other uncertainties that happen in the future may cause our actual results to be different from the forward-looking statements contained in this report. The risks and uncertainties include business and economic conditions, competitive pressure, changes in laws and regulations, addition or elimination of products, and exchange rate fluctuation, among others.
Revenues Operating Income Net Income
Contents01 Financial Highlights
02 At a Glance
03 To Our Shareholders
04 Management’s Discussion and Analysis
06 The Medium-Term Management Plan
08 Topics
12 Corporate Governance
14 Corporate Information
16 Directors and Officers
17 Stock Information
Profile Since its establishment in 1948, Chiyoda Corporation has engaged
in engineering and construction work and services at innumerable
industrial plants both in Japan and overseas in the fields of oil,
natural gas and other energy sources; petrochemicals and chemicals;
pharmaceuticals; and general industrial machinery.
More than forty years ago in 1972, Chiyoda’s founder was already
emphasizing in a booklet entitled Legacy for the Twenty-first Century
that sustainable social development should progress by harmonizing
nature and industrial development.
We were one of the first companies to state our intention to
contribute to sustainable social development through our engineering
and technology by providing appropriate solutions to the various
energy and environmental issues we currently face, and have been
putting those words into action ever since. This booklet is available on
our website.
With over 60 years of technological experience, Chiyoda is working
to build on its position as the “Reliability No. 1” project company
with a high level of customer and investor trust, not only in terms of
technology but also in terms of our people and management. At the
same time, we will continue to improve our financial strength and to
raise our corporate value.
Courtesy of Mizushima LNG Co., Ltd.
0
100
200
300
400
500
600
700
800
Billions of yen Billions of yenBillions of yen
446.4
247.1
2009 2010 2012
313.0
20110
10
20
30
6.58.0
2009 2010 2012
3.0
20110
5
10
15
20
25
30
7.2
17.5
2009 2010 2012
1.7
254.7
14.4
24.2
20112013 20132013
398.9 16.1
25.1
0
100
200
300
400
500
600
700
800
Billions of yen Billions of yenBillions of yen
446.4
247.1
2009 2010 2012
313.0
20110
10
20
30
6.58.0
2009 2010 2012
3.0
20110
5
10
15
20
25
30
7.2
17.5
2009 2010 2012
1.7
254.7
14.4
24.2
20112013 20132013
398.9 16.1
25.1
0
100
200
300
400
500
600
700
800
Billions of yen Billions of yenBillions of yen
446.4
247.1
2009 2010 2012
313.0
20110
10
20
30
6.58.0
2009 2010 2012
3.0
20110
5
10
15
20
25
30
7.2
17.5
2009 2010 2012
1.7
254.7
14.4
24.2
20112013 20132013
398.9 16.1
25.1

2 CHIYODA CORPORATION ANNUAL REPORT FY2012 3CHIYODA CORPORATION ANNUAL REPORT FY2012
32
1833
116 12
50
6
2958
811
23
At a Glance To Our Shareholders(Billions of yen)
*1: Classified as “Gas and power utilities” in “Consolidated Financial Results” *2: Classified as “Industrial machinery” and “General chemicals” in “Consolidated Financial Results” *3: Courtesy of Qatargas Operating Company Limited *4: Courtesy of Shell *5: Courtesy of Solar Frontier K.K. *6: Courtesy of Kashima Aromatics Co., Ltd. *7: Water Treatment Plant
Revenues New Orders Backlog of Contracts
Overseas Projects under Execution (As of June 30, 2013)EPC* / EPCm** / EPsCm*** ExecutionFEED**** / Feasibility Study
ArzewAlgeria / LNG
New Ulaanbaatar International AirportMongolia / Infrastructure
Plateau Maintenance ProjectQatar / LNG
Long Term Service Agreement (RasGas / Qatargas / Shell)
Qatar / LNG, GTLLa�an Re�nery Phase 2 Project
Qatar / Condensate Re�nery
Al Jubail Export Re�nery Saudi Arabia / Oil Re�neryIndustrial Wastewater TreatmentSaudi Arabia / Water Recycling
Puerto La CruzVenezuela / Oil Re�nery
Arrow LNGAustralia / LNG
Abadi LNGIndonesia / FLNG
Ichthys LNGAustralia / LNG
PNG LNGPapua New Guinea / LNG
*EPC : Engineering, Procurement and Construction**EPCm : Engineering, Procurement and Construction management***EPsCm : Engineering, Procurement support and Construction management****FEED : Front-end Engineering and Design
Map Ta Phut Industrial ComplexThailand / Energy Saving
Mozambique LNGArea 1&4
Mozambique / LNG
Nickel Re�ning PlantPhilippines / Material
Nghi Son Re�neryVietnam / Re�nery & Petrochemical
Tokuyama Phase-2Malaysia / Renewable Energy Material
StolthavenSingapore / Tank terminal
Shell BukomSingapore / Re�nery
InfeniumSingapore / Chemical
LNG
Gas Processing*1
Fine Industries*2
Petroleum and Petrochemicals
Others
398.9Billion yen
128.4 (32%)
73.0 (18%)
130.4 (33%)
42.7 (11%)
24.5 (6%)
402.9Billion yen
47.2 (12%)
24.9 (6%)
115.9 (29%)
200.6 (50%)
14.2 (3%)
900.6Billion yen
521.2 (58%)
69.9 (8%)
94.7 (11%)
203.9 (23%)
10.9 (0%)
Thank you for your continued support over
this past 12 months.
We would like to present the Chiyoda
Group’s annual report for the fiscal year ended
March 31, 2013.
Revenues and earnings rose year-on-year
on the back of new contracts for refineries in
Southeast Asia and the Middle East, as well as
steady progress made in executing backlog
projects such as LNG plants in Papua New
Guinea and Australia. In the 12 months before
the year under review, the final year of our
Medium-Term Management Plan entitled
“Engineering Excellence, Value Creation 2012”,
we implemented key strategies aimed at
creating a firm basis for future growth.
This is a time of major change both in
Japan and overseas, with increased demand
for energy due to economic growth in
emerging countries, the momentum of
development from the shale revolution,
the continuing global shift from oil to gas,
the growing trend of renewable energies,
as well as rapid urbanization. Under the
new Medium-Term Management Plan titled
“Seize the moment, Open up new frontiers”
launched by the new management team in
fiscal 2013, we will further implement key
strategies of the previous plan. By executing
Engineering, Procurement, and Construction
(EPC) projects as usual, expanding our
business through accelerated investment
in fields related to our core business, and
strengthening health, safety and environment
(HSE) and risk management policies, the
entire Chiyoda Group management team and
staff will work eagerly to create new value
and raise corporate value.
We paid a dividend of ¥19 per share, in
line with our earnings for fiscal 2012. We ask
all of our shareholders for their continued
support in our ongoing efforts.
*3
*4
*5
*6
*7
Takashi Kubota (Left)
Executive ChairmanChiyoda Corporation
Shogo Shibuya (Right)
President & CEOChiyoda Corporation
4 CHIYODA CORPORATION ANNUAL REPORT FY2012 5CHIYODA CORPORATION ANNUAL REPORT FY2012
Management’s Discussion and Analysis
Analysis of Results
Results by Business Segment
for the EPC for refinery project in the Middle East. Our subsidiary in Singapore signed an Enterprise Framework
Agreement for downstream projects within Asia and started the related study works. EPC works are progressing
favorably, including a heavy oil cracking unit in Saudi Arabia and petrochemical plant in Singapore, and EPsCm
(Engineering, Procurement support and Construction management) services for heavy crude oil upgrading
facilities in Venezuela and for a petroleum refinery in Singapore are progressing as well.
In Japan, we continued to perform the EPC work for a TransAlkylation Unit, the diagnosis of existing
facilities, maintenance and upgrading works, studies and construction works aimed at improving the
competitiveness of and energy saving in the facilities.
Results of Operations
LNG Plants/Gas and Power Utilities
Petroleum, Petrochemicals and Gas Chemicals
Industrial Machinery/Environment/ Chemicals and Other Fields
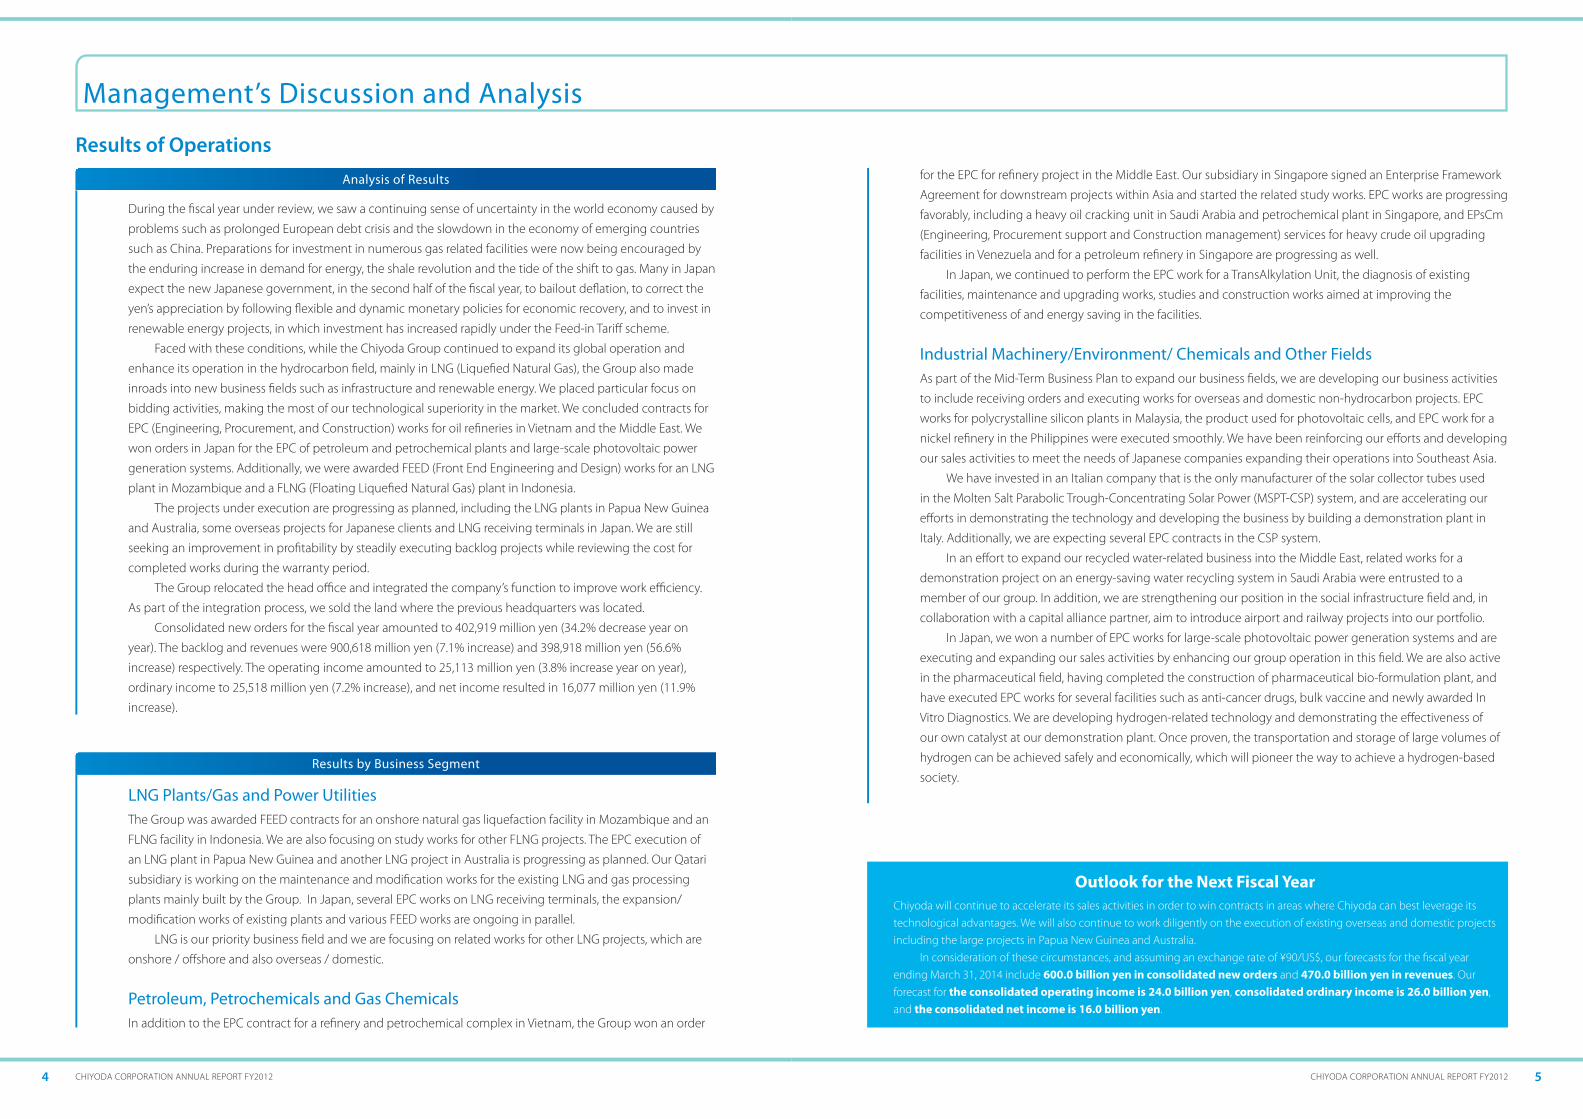
During the fiscal year under review, we saw a continuing sense of uncertainty in the world economy caused by
problems such as prolonged European debt crisis and the slowdown in the economy of emerging countries
such as China. Preparations for investment in numerous gas related facilities were now being encouraged by
the enduring increase in demand for energy, the shale revolution and the tide of the shift to gas. Many in Japan
expect the new Japanese government, in the second half of the fiscal year, to bailout deflation, to correct the
yen’s appreciation by following flexible and dynamic monetary policies for economic recovery, and to invest in
renewable energy projects, in which investment has increased rapidly under the Feed-in Tariff scheme.
Faced with these conditions, while the Chiyoda Group continued to expand its global operation and
enhance its operation in the hydrocarbon field, mainly in LNG (Liquefied Natural Gas), the Group also made
inroads into new business fields such as infrastructure and renewable energy. We placed particular focus on
bidding activities, making the most of our technological superiority in the market. We concluded contracts for
EPC (Engineering, Procurement, and Construction) works for oil refineries in Vietnam and the Middle East. We
won orders in Japan for the EPC of petroleum and petrochemical plants and large-scale photovoltaic power
generation systems. Additionally, we were awarded FEED (Front End Engineering and Design) works for an LNG
plant in Mozambique and a FLNG (Floating Liquefied Natural Gas) plant in Indonesia.
The projects under execution are progressing as planned, including the LNG plants in Papua New Guinea
and Australia, some overseas projects for Japanese clients and LNG receiving terminals in Japan. We are still
seeking an improvement in profitability by steadily executing backlog projects while reviewing the cost for
completed works during the warranty period.
The Group relocated the head office and integrated the company’s function to improve work efficiency.
As part of the integration process, we sold the land where the previous headquarters was located.
Consolidated new orders for the fiscal year amounted to 402,919 million yen (34.2% decrease year on
year). The backlog and revenues were 900,618 million yen (7.1% increase) and 398,918 million yen (56.6%
increase) respectively. The operating income amounted to 25,113 million yen (3.8% increase year on year),
ordinary income to 25,518 million yen (7.2% increase), and net income resulted in 16,077 million yen (11.9%
increase).
The Group was awarded FEED contracts for an onshore natural gas liquefaction facility in Mozambique and an
FLNG facility in Indonesia. We are also focusing on study works for other FLNG projects. The EPC execution of
an LNG plant in Papua New Guinea and another LNG project in Australia is progressing as planned. Our Qatari
subsidiary is working on the maintenance and modification works for the existing LNG and gas processing
plants mainly built by the Group. In Japan, several EPC works on LNG receiving terminals, the expansion/
modification works of existing plants and various FEED works are ongoing in parallel.
LNG is our priority business field and we are focusing on related works for other LNG projects, which are
onshore / offshore and also overseas / domestic.
In addition to the EPC contract for a refinery and petrochemical complex in Vietnam, the Group won an order
As part of the Mid-Term Business Plan to expand our business fields, we are developing our business activities
to include receiving orders and executing works for overseas and domestic non-hydrocarbon projects. EPC
works for polycrystalline silicon plants in Malaysia, the product used for photovoltaic cells, and EPC work for a
nickel refinery in the Philippines were executed smoothly. We have been reinforcing our efforts and developing
our sales activities to meet the needs of Japanese companies expanding their operations into Southeast Asia.
We have invested in an Italian company that is the only manufacturer of the solar collector tubes used
in the Molten Salt Parabolic Trough-Concentrating Solar Power (MSPT-CSP) system, and are accelerating our
efforts in demonstrating the technology and developing the business by building a demonstration plant in
Italy. Additionally, we are expecting several EPC contracts in the CSP system.
In an effort to expand our recycled water-related business into the Middle East, related works for a
demonstration project on an energy-saving water recycling system in Saudi Arabia were entrusted to a
member of our group. In addition, we are strengthening our position in the social infrastructure field and, in
collaboration with a capital alliance partner, aim to introduce airport and railway projects into our portfolio.
In Japan, we won a number of EPC works for large-scale photovoltaic power generation systems and are
executing and expanding our sales activities by enhancing our group operation in this field. We are also active
in the pharmaceutical field, having completed the construction of pharmaceutical bio-formulation plant, and
have executed EPC works for several facilities such as anti-cancer drugs, bulk vaccine and newly awarded In
Vitro Diagnostics. We are developing hydrogen-related technology and demonstrating the effectiveness of
our own catalyst at our demonstration plant. Once proven, the transportation and storage of large volumes of
hydrogen can be achieved safely and economically, which will pioneer the way to achieve a hydrogen-based
society.
Outlook for the Next Fiscal YearChiyoda will continue to accelerate its sales activities in order to win contracts in areas where Chiyoda can best leverage its technological advantages. We will also continue to work diligently on the execution of existing overseas and domestic projects including the large projects in Papua New Guinea and Australia.
In consideration of these circumstances, and assuming an exchange rate of ¥90/US$, our forecasts for the fiscal year ending March 31, 2014 include 600.0 billion yen in consolidated new orders and 470.0 billion yen in revenues. Our forecast for the consolidated operating income is 24.0 billion yen, consolidated ordinary income is 26.0 billion yen, and the consolidated net income is 16.0 billion yen.

6 CHIYODA CORPORATION ANNUAL REPORT FY2012 7CHIYODA CORPORATION ANNUAL REPORT FY2012
The Medium-Term Management Plan
(1) Changes and trends of the external environment
(4) Quantitative Target (Profit Plan)
(6) Personnel Plan
(5) Capital Plan / Investment Strategy
(3) Key Strategies under The MT-Plan
(2) Chiyoda Group 10 years on
“Seize the moment, Open up new frontiers”Chiyoda has established 5 key growth strategies and 5 key operating foundation strategies as the key strategies under The MT-Plan for Fiscal Years 2013 – 2016.
Growth Strategies The growth strategies aim to improve the base level of profit by expanding the business to take account of any prevailing external environmental trends (a shift to gas and a following wind of increasing demand for LNG) considered to be favorable for Chiyoda business based on: • expansion of Chiyoda group core business in the fields of gas and LNG projects, • expansion of business into offshore and upstream projects, • increase in the number of domestic and overseas small/medium size projects to be undertaken, • energy/social infrastructure The main points of growth strategies are:
1 Strengthening of core business • Pursuit of LNG project business opportunities to the maximum extent possible • Challenges for unconventional projects (FLNG, projects in cold / deep sea area & under harsh environment)
2 Expansion into new business fields, establishing new business models and new sources of revenue
• Expansion of business field to offshore / upstream • Expansion of business fields to new energy and renewable energies
3 Upgrading of services to address clients’ need for commercialization
• Assistance to Japanese companies in their overseas expansion of business • Acceleration in establishing professional service business and provision of front-end services to international oil companies (IOC) at overseas bases adjacent IOC offices
4 Use of the economic vigor of emerging countries for the growth of the Chiyoda Group
• Execution of medium and small size local projects • Shift to EPC project execution based on consolidated global operation
5 Acceleration of investment • Acceleration of investment in the fields related to Chiyoda's core business and strongholds
Operating Foundation Strategy Consolidation of Chiyoda’s “base” (global infrastructure) and ”resources” (secure, develop and reinforce the pool of human resources) will be continued as the operating foundation for growth strategy. The main points the of operation foundation strategy are:
6 Strengthening of competitiveness and execution capability
• Improve competitiveness against competitors and continue to improve execution capability
7 Establishment and operation of data management infrastructure
• Enhance utilization of data management (ERP) for efficient management and control of operation / Establish global platform for operation
8 Promotion of consolidated operation base and global operation
• Establish framework of global human resource management for utilization of global resource
9Securing / development of human resources, optimization of allocation, and creation of a lively and energetic working environment
• Establish framework for human resource development / increase and exchange of project key personnel within the group companies
• Evolve into a company with a lively and energetic working environment regardless of nationality, sex, age and so on
10Strengthening of safety and risk management / establishment of culture prioritizing the health of employees
• Proactively strengthen the risk management framework to respond to changes in the external environment and the times
• Promote culture prioritizing the safety and health of employees
The results of the previous Medium-Term Management Plan “Engineering Excellence, Value Creation 2012” were
comprehensively reviewed and, in consideration of such, The Medium-Term Management Plan (The MT-Plan) was
established with the slogan “Seize the moment, Open up new frontiers” with the objective of pursuing further growth of
the Chiyoda Group for the period covering Fiscal Years 2013 – 2016.
In order to establish The MT-Plan, the trend of influences and changes occurring in the external environment were
first analyzed. We then set the direction in which we would like to see the Group develop.
The analysis of the changes occurring and trend of influences in the external environment showed that: World energy demand is projected to further increase and changes are occurring in the structure of energy demand (shift to gas and renewable energy).
The developments in shale oil exploration have brought about a revitalization of the US market. Competition between contractors is escalating, including those from Europe, the US and, particularly, Korea. Chiyoda Group envisages that the number of projects being developed in harsh areas of the world, such as in severely cold climates and in deep seas will increase. Chiyoda has also observed that developing countries are emerging, national oil companies (NOC) are growing presence, and Japanese companies are accelerating expansion of overseas business.
With the key measures in place, based on the key strategies, Chiyoda will be able to pursue diversification of its source of profit for stable growth. The target management index is set at a consolidated net income of J. Yen 30 billion.
The MT-Plan envisages that the Chiyoda group will have approximately 10,000 personnel in the expanded domestic and overseas operation base as of Fiscal Year 2016. With the centre of gravity of part of the work shifting from CGH to the group companies, and with the progress of sharing the work among group companies in Japan and abroad, enhancement of the capability of the personnel at CGH will also be required.
Chiyoda will provide a stable capital plan based on business performance. A high return of equity (ROE) of over 12% will be sought and a dividend ratio of over 30% will be set.
In order to sustain further growth of the Chiyoda Group, the company will invest in areas that will contribute to Chiyoda’s growth, areas to consolidate the operating foundation and areas to expand and stabilize profit.
In order to continue Chiyoda’s sustainable development, we plan to budget J. Yen 80 billion for our investment strategy. Such capital will be distributed and invested prudently, flexibly and efficiently in accordance with the actual progress of The MT-Plan and changes in the business environment.
The MT-Plan has been developed by 1) establishing a vision of how we want the Chiyoda Group to be “10 years on”, and 2) establishing what Chiyoda needs to do in the first 4 years for that vision to become a reality.
This led us to consider the future direction we need to take in order to expand our business based on three axes, 1) Operation, 2) Business Model and 3) Business Field/Area.
1) Axis: Operation Chiyoda will pursue a “group style” operation for execution of regional medium / small size projects. We will establish several offices as Chiyoda Regional Headquarters (CRH), the main overseas bases of operation, as well as setting up subsidiary offices operating under CRH, to encourage sharing the work among Chiyoda Group companies on a worldwide basis.
2) Axis: Business Model This axis designates the style of business that the Chiyoda Group should pursue. It is important that we secure a new sources of revenue from providing professional services on a reimbursable basis, developing and licensing our advanced technology, etc, as well as continuing with our core business of undertaking lump sum turnkey / engineering, procurement and construction (LSTK/EPC) contracts. We will, in addition, look to invest in the fields related to Chiyoda’s core business and strongholds.
3) Axis: Business Field/Area Chiyoda Group has long specialized in EPC contracts for onshore hydrocarbon projects. We will seek to expand our business under this axis into offshore and upstream projects (related to exploration and treatment of oil and gas fields). Chiyoda Group perceives that energy / social infrastructure will provide new sources of profit and will also allow us to further explore business opportunities in our existing main market of Asia / the Middle East / Oceania as well as in Continental North America and Africa.
Direction of evolution
OperationOperation
BusinessModel
BusinessModel
BusinessField / Area
BusinessField / Area
CurrentBusinessDomain
・Operation by Japanese nationals in Japan
・Operation to execute medium and small size project on the basis of local production for local consumption
・Division of work on a worldwide basis by strategic regional operation centers
・EPC (LSTK + CR)
・Promotion of monetization of technology &・Investment based on Project Management know-how and technology
・Pillar of existing business: Gas value chain projects (from LNG to receiving terminals), hydrocarbon downstream and non-hydrocarbon projects
・O�shore ・upstream &・Energy infrastructure, social infrastructure &・Expansion of business area (Australia, North America, East Africa)
Growth of business through 3 axes of operation, business and business �eld / area
Further evolution aimed at Chiyoda Group 10 years on

8 CHIYODA CORPORATION ANNUAL REPORT FY2012 9CHIYODA CORPORATION ANNUAL REPORT FY2012
SPERA Hydrogen is easy to useOnce considered a distant dream, hydrogen, as a source of conventional energy, has
become a reality, and Chiyoda Corporation has made it remarkably easy to use. Our
innovative technologies enable hydrogen, the lightest of gases and difficult to store
or transport under normal conditions, to be liquefied and consequently transported
at ambient temperature and pressure. We named this liquid “SPERA Hydrogen.”
Almost unthinkable before, this “hydrogen of hope” is highly safe and stable, is able
to survive transportation over long distances and can be stored over long periods of
time. It will overturn the conventional wisdom regarding hydrogen.
Two technologies have made SPERA Hydrogen possible1. HydrogenationBy applying Organic Chemical Hydride (OCH) Technology, the
hydrogen is fixed to toluene, a major component of gasoline, and
produces a liquid called methylcyclohexane (MCH), which is easy
to handle at ambient temperature and pressure. This is SPERA
Hydrogen. Our technology facilitates storage of hydrogen in large quantities and transportation over long distances in
a safe and stable manner, and at a low cost, because it eliminates the need for hydrogen to be liquefied at cryogenic
temperatures or pressurized in cylinders.
2. DehydrogenationThe extraction of hydrogen from methylcyclohexane (MCH)
had, for some time, been considered impossible. However, in
2004 Chiyoda Corporation succeeded in developing the world’s
first dehydrogenation catalyst through the use of platinum
nanoparticles. We named this catalyst “SPERA Catalyst”. SPERA Catalyst not only makes it possible to easily extract
hydrogen from SPERA Hydrogen (MCH), but it has a long lifespan and can be mass produced.
Demonstration plant verifies “Large-Scale Hydrogen Storage and Transportation System”In March 2013, Chiyoda completed a demonstration plant at its Koyasu
Office and Research Park to verify its “Large-Scale Hydrogen Storage and
Transportation System” and, thereafter, successfully achieved its expected
performance including 1) hydrogenation to fix hydrogen to toluene
producing SPERA Hydrogen, 2) storage and transportation of SPERA
Hydrogen, and 3) dehydrogenation to
extract hydrogen from SPERA Hydrogen
by using SPERA Catalyst. This system can
utilize existing infrastructures, including
oil tanks and tankers for storage and transportation, and proves that it is possible to
supply and deliver hydrogen on a commercial basis.
Topics
Group Companies Awarded Long Term Contracts
EFA with Shell (Chiyoda Singapore) Chiyoda Singapore (Pte) Limited* signed an Enterprise Framework Agreement (EFA) with
Shell for Onshore Engineering and Project Management Services-Downstream covering
downstream projects within Asia. Under this EFA, Chiyoda Singapore will provide
a full range of services for Front End Engineering Design (FEED) and Engineering,
Procurement, and Construction Management (EPCm) by utilizing Chiyoda Group’s
regional capacity located in each country. Chiyoda Group places great importance on
the continuation of its valuable relationship with Shell.
Long Term Engineering Services Contracts in Qatar (Chiyoda Almana)Chiyoda Almana Engineering LLC (“Chiyoda Almana”)*1 was awarded long term engineering services contracts by the
three companies; Qatar Chemical Company Limited (“Q-Chem”), Qatar Chemical Company II Limited (“Q-Chem II”) and
Ras Laffan Olefins Company Limited (“RLOC“).
Chiyoda and Chiyoda Almana are aiming to contribute further to Qatari sustainable development through the
engineering services of these contracts and through those contracts awarded previously. Chiyoda group intends
to expand its “Project Life Cycle Engineering”*2 services to other countries in the Middle East, and elsewhere, while
strengthening its regional business development through its global operation network.
* Chiyoda Singapore (Pte) Limited was established in 1971 and is a 100% subsidiary company of Chiyoda Corporation
* SPERA derives from the Latin for “hope”.
*1: Chiyoda Almana was established by Chiyoda in March, 2008, in collaboration with a local company (Al-Mana Group), as a local company providing full engineering services in Qatar.*2: A business model, involving both Chiyoda and the client, to provide feasibility studies, front-end engineering design (FEED), detailed engineering, procurement and construction (EPC),
operation, maintenance, expansion, modification, upgrading and revamping throughout the lifecycle of a project.
Dr. Geok Yong, Vice President of Shell Project & Technology with CSL’s President
Morita at the signing ceremony
On 27 January 2013, the signing ceremony for the Nghi Son Refinery and Petrochemical Complex took place in the Thanh
Hoa Province in Vietnam.
Almost 800 people attended the magnificent ceremony including Vietnamese Prime Minister Nguyen Tan Dung,
the Japanese Ambassador to Vietnam, Yasuaki Tanizaki, and representatives of Nghi Son Refinery and Petrochemical LLC
and investors from Idemitsu Kosan Co., Ltd., Kuwait Petroleum International, Vietnam Oil and Gas Corporation and Mitsui
Chemicas,Inc. A number of senior managements of the contractors forming a joint venture also joined the ceremony
including our then President Takashi Kubota as well as local entities concerned.
This project is a grassroots oil refinery and petrochemical complex, which will be the second refinery in Vietnam
and will have a daily processing capacity of 200,000 barrels of crude oil (atmospheric distillation basis). The completion is
scheduled for the second half of 2016.
Signing Ceremony for Refinery and Petrochemical Complex in Vietnam
SPERA* Hydrogen
Demonstration plant

10 CHIYODA CORPORATION ANNUAL REPORT FY2012 11CHIYODA CORPORATION ANNUAL REPORT FY2012
Topics
Challenge to Continue in Our LNG Business
In December 2012, CC JV, a joint venture comprising of Chiyoda and CB&I, was awarded a contract by Anadarko
Moçambique Area 1, Limitada, for the Front End Engineering and Design (FEED) for an onshore natural gas liquefaction
facility project in the Republic of Mozambique. Additionally, PT Chiyoda International Indonesia was awarded a FEED
contract in January 2013 for Abadi Floating LNG (FLNG) Project in collaboration with PT Saipem Indonesia (Leader), PT
Tripatra Engineers & Constructors , PT Tripatra Engineering and PT Rekayasa Industri. The Clients are INPEX Masela, Ltd.
(Operator: 60%),Shell Upstream Overseas Services (I) Limited (30%) and PT EMP Energi Indonesia (10%).
Such achievements reflect the high regard in which we are held based on our peerless technological capabilities
accumulated through successful completion of large-scale LNG plants, which has enabled problem-free operation in
Qatar in the Middle East, and our first tier project management capabilities now being showcased at LNG plants under
construction in Papua New Guinea and Australia. We will continue to seek new frontiers, address the challenges of
satisfying customers and meeting the needs of the times, regardless of location or technology.
Seven companies won the Japan Institute of Energy Award 2012 in Technical
Division for the establishment of a JAPAN-GTL (Gas to Liquids) Process. The seven
companies include Japan Oil, Gas and Metals National Corporation (JOGMEC),
INPEX CORPORATION, COSMO OIL CO., LTD, Japan Petroleum Exploration Co., Ltd, JX
Nippon Oil & Energy Corporation, NIPPON STEEL & SUMIKIN ENGINEERING CO., LTD
and Chiyoda Corporation.
Gas-To-Liquids (GTL) is a technology that uses natural gas as the raw material
and produces petroleum products such as naphtha, diesel oil and kerosene through
chemical reactions. JAPAN-GTL features the utilization of carbon dioxide as raw
material, which is a groundbreaking technology that would for the first time ever
allow for natural gas containing carbon dioxide to be used directly for conversion.
Through series of demonstration tests, the seven companies established the Japan-GTL Process as a technology
applicable to commercial plants. The seven companies will further continue studies of the Japan-GTL process for future
commercialization.
In March 2013 Chiyoda Corporation and Consolidated Contractors
Company (CCC, Head Office: Athens, Greece) established a joint
venture company in Singapore, “Chiyoda-CCC Engineering (PTE.)
Limited (CCEL), having its regional headquarters in Abu Dhabi, United
Arab Emirates.
The inauguration ceremony was held with about 200 people in
attendance, including our then President Kubota and representatives
of CCC.
The purpose of this establishment is to operate an engineering
company targeting certain hydrocarbon processing industries within
the Middle East. Taking advantage of regional presence and resources,
CCEL will provide total project lifecycle services in energy, oil, gas,
petrochemicals and utilities sectors.
Mr. Madoka Koda, President of CCEL at the inauguration ceremony
“JAPAN-GTL Process” won the Japan Institute of Energy Award 2012
Chiyoda and CCC Establish Joint Venture Company
JAPAN-GTL Process
CH4-CO2+
Steam
SyngasProduction
FTSynthesis*
Upgrading(Hydrotreating)
PetroleumProductsNatural Gas
Products
FT
H2CO
Syngas
NaphthaKerosensGas Oil
*FT Synthesis : Fischer- Tropsch Synthesis
The winning companies of JAPAN-GTL joint research receive their award
Chiyoda Licenses its Own Process Technology on Acetic Acid
Chiyoda Corporation was awarded a Licensing and Engineering contract for the use of its technology, the Acetica®
process, to produce acetic acid.
This technology was sub-licensed for a gas-to-chemicals complex in Linhares, Espirito Santo State, southeast Brazil,
called Complexo Gás-Químico UFN-IV*.
Chiyoda developed the Acetica® process, a methanol-carbonylation process that use methanol and carbon
monoxide as feedstock, which employs a heterogeneous catalyst for the
efficient production of acetic acid.
The process has tangible advantages including 1) an easy-to-handle catalyst
2) limited loss of precious rhodium
3) efficient reactor
4) low content of by-products
5) relatively low corrosiveness and less utility consumption effected by the
use of a loop-typed bubbling reactor system.
Chiyoda aims to license its own technology and provide associated
engineering services which will contribute to the growing needs for
materialization or expansion to produce acetic acid.
* This complex is planned to produce ammonia and urea fertilizers, methanol, acetic acid, formic acid and melamine.
Linhares, Estado do Espírito Santo
Main process facilities: Syngas Producing Section FT (Fischer-Tropsch) Synthesis Section Upgrading (hydrotreating) Section

12 CHIYODA CORPORATION ANNUAL REPORT FY2012 13CHIYODA CORPORATION ANNUAL REPORT FY2012
Corporate GovernanceThe Chiyoda Group recognizes that its management needs to focus on corporate social responsibility that inspires the
support and trust of shareholders, customers, employees, and other stakeholders. We believe that this is a foundation of
our corporate activities. As such, we continue working toward sustainable long-term qualitative growth, improving our
management basics, and ensuring management soundness and transparency. We have identified improved corporate
governance and a stronger internal controls structure as important issues for our company and we strive to further
enhance these areas.
Corporate Governance System
External Directors and Outside Corporate Auditors
Director Compensation, Etc
The Chiyoda Group operates under an executive officer system and its efficiency in executing its business is based on the
establishment of a corporate auditor system. The Board of Directors has adopted this system of performing management
supervisory functions with the participation of one external director and three outside audit & supervisory board members,
which ensures that there is oversight from an objective and neutral standpoint.
The Board of DirectorsThe Board of Directors meets once a month. The Board is made up of nine directors, one of whom is an external director, and
three audit & supervisory board members, all of whom are outside audit & supervisory board members. The Board of Directors
decides on important business matters and oversees the execution of business operations. Appropriate decisions are made
and management oversight is conducted under the objective views of the external director and outside audit & supervisory
board members. In addition, an Executive Officer Meeting is held once a month, with Board members present, and its business
reports are presented at the monthly Board Meeting, thereby fulfilling its reporting function. The Company efficiently executes
business operations under an executive officer system.
The Executive CommitteeThe Company has established an Executive Committee as a decision-making body on matters concerning the execution of
business operations. The Executive Committee, composed of representative directors excluding the Chairman, makes prompt
decisions concerning the execution of business operations as stipulated by the Board of Directors’ resolutions. It also conducts
preliminary deliberations regarding matters to be brought before the Board of Directors for resolution.
Auditing by Audit & Supervisory Board MembersThe Company has three audit & supervisory board members, all of whom are outside audit & supervisory board members;
two of the audit & supervisory members serve on a full-time basis. They are responsible for auditing the state of execution of
director duties. Two of the outside audit & supervisory board members are independent auditors and the other is exceptionally
well-versed in finance and accounting.
Status of Internal Controls SystemThe Company has structured and is operating a system of internal controls, in line with the unique nature and characteristics
of our business, which optimizes operational effectiveness and efficiency, financial reporting reliability, legal compliance, and
asset preservation.
The Company has established an Internal Controls Management Committee (ICMC) to improve our systems of internal
controls. The Director of the Risk Management & CSR Division chairs the committee and the heads of departments related to
internal controls serve as committee members.
The ICMC receives referrals from the Executive Committee to exchange information and coordinate with each
department to determine whether operations are being appropriately and efficiently carried out under an adequate system of
internal controls. At the end of the fiscal period, or as and when deemed necessary, the ICMC will offer advice to the Executive
Committee on improvements in internal controls .
The Executive Committee takes the advice received from the ICMC under consideration and submits proposed internal
controls improvements, if any, to the Board of Directors for decision.
The Company employs one external director and three outside audit & supervisory board members. The names of external
director and outside audit & supervisory board members, and the Company’s rationale for selecting them (including the
rationale for designation as independent directors of Hiroshi Ida and Yukihiro Imadegawa, both of whom are on file with the
Tokyo Stock Exchange as independent directors) are as follows.
Name Rationale for Election as External Director and Outside Audit & Supervisory Board Member
Masaji Santo The individual is able to suitably perform his duties as an external director by putting to use his experience as the former President of Mitsubishi Chile Ltda. and as a Senior Vice President of Mitsubishi Corporation.
Hiroshi Ida
The individual is able to contribute to the sound management of the Company through neutral and objective audits based on his experience as a former executive officer with Mitsubishi UFJ Trust and Banking Corporation.<Rationale for Designation as an Independent Director>The individual is not involved in any matters that conflict with the interests of general Company shareholders, and is recognized as an outside audit & supervisory board member having no conflict of interest with general Company shareholders.
Munehiko Nakano The individual is able to contribute to the sound management of the Company through neutral and objective audits based on his experience as a former corporate auditor with Lawson, Inc. and a finance and accounting executive with Mitsubishi Corporation
Yukihiro Imadegawa
The individual is able to contribute to the sound management of the Company through neutral and objective audits based on his expertise in corporate law as an attorney.<Rationale for Designation as an Independent Director>The individual is not involved in any matters that conflict with the interests of general Company shareholders, and is recognized as an outside audit & supervisory board member having no conflict of interest with general Company shareholder.
There are no particular relationships of interest between Company and the external director and outside audit &
supervisory board members.
Number Base Compensation
Incentive Compensation
Stock-Based Compensation
Directors 10 ¥192million ¥79million ¥52million
Audit & Supervisory Board Members 5 ¥ 61million - -
Rationale for Adoption of Current System
Corporate Governance and Internal Controls
Overview and Rationale for Adoption of Corporate Governance System
External Directors and Outside Audit & Supervisory Board Members
Total Compensation for Each Director Category; Total Compensation by Director Type, and Number of Directors in Question
Based on its establishment of a corporate auditor system, the Chiyoda Group efficiently executes business operations under
an executive officer system. The Board of Directors has adopted an existing system of corporate governance that is capable of
sufficiently performing management supervisory functions from an objective and neutral standpoint with the participation of
one external director and three outside audit & supervisory board members.
Notes:1. Total director compensation is ¥325 million. Total audit &
supervisory board member compensation is ¥61 million. Total outside audit & supervisory board member (four individuals) compensation is ¥55 million.
2. The number of directors above discloses the number of directors and audit & supervisory board members receiving compensation during the fiscal period, including two directors and two audit & supervisory board members who retired as of the General Shareholders’ Meeting held on June 26, 2012.
Global Operation Unit
Corporate Planning Unit Corporate Services Unit, HRM* UnitFinance & Project Audit Unit
Crisis Management Unit
CSR Unit
SQE Unit
Operational Auditing Unit
General Shareholders’ Meeting
Internal Controls Management Committee(ICMC)
Risk Management & CSR Division
Executive O�cersExecutive O�cer Meeting
4 Representative Directors
Department Internal Controls
Business Execution Departments(Risk Manager)
Self-Assessment
(departments w
ith internal control functions)
Financial Audit
Executive Committee
Election
ElectionElection
Election ReportReport
Report
ReportSubmit/Report
Submit/Report
Submit/Report
Organization Sta�ngScheduled Reports (deliverables, etc.)
(advice)
Audit Referral
AuditSupervision
Survey, Report Request
Election
DirectorsBoard of Directors Corporate Auditors
Audit & Supervisory Board
Accounting Auditor
GroupCompanies
*HRM: Human Resource Management

14 CHIYODA CORPORATION ANNUAL REPORT FY2012 15CHIYODA CORPORATION ANNUAL REPORT FY2012
Corporate Information (As of March 31, 2013)
Corporate Data Global Network
Chiyoda Global HeadquartersMinatomirai Grand Central Tower4-6-2, Minatomirai, Nishi-ku, Yokohama 220-8765, JapanTel: (81)45-225-7777 (voice guidance)
EstablishedJanuary 20, 1948
Paid-in Capital¥ 43,396 million
Number of Employees1,519 (Non-Consolidated)4,915 (Consolidated)
Annual Fiscal CloseMarch 31
Shareholders’ MeetingJune
Chiyoda’s global network enables Project Lifecycle Engineering to be offered all over the world. Chiyoda has expanded
its network in order to provide prompt support for customers’ business activities on a global scale. Our services cover
the entire life cycles of projects – from planning, engineering, procurement and construction through to operation and
maintenance. With a view to meeting the ever-changing needs of our customers, we offer services by utilizing local
offices and group companies with thorough knowledge of the latest local and global circumstances in countries around
the world.
Audit & Supervisory BoardBoard of Directors
Executive Committee
President
Executive O�ce UnitCorporate-service Review Team
SQE UnitCSR UnitOperational Auditing UnitCrisis Management Unit
Risk Management & CSR Division
Project Administration UnitProject Management UnitIT Management UnitGlobal Operation Unit
Business Planning UnitBusiness Operation Unit
O�shore & Upstream Project OperationsGlobal Project Management Division
Global Human Resource Planning UnitBPM* TeamWork Process Innovation Task TeamGlobal Operation Platform Task TeamChiyoda Globalization Task Force Team change the Mindset
Corporate Planning UnitIR & Public Relations Sec.
Corporate Services UnitHRM* UnitFinance & Project Audit Unit
Corporate Planning management & Finance Division
Engineering Operation UnitGas & LNG Process Engineering UnitRe�nery, Petrochemical & New Energy Process Engineering UnitIntegrity Management Unit
International Gas & LNG Project Unit
Project Team
Gas & LNG Project Operations
Technology & Engineering Division
Strategic Project Development Unit
Oil & Petrochemical Project UnitGas & Storage Project UnitInternational Downstream & Non-hydrocarbon Project Unit
Downstream & Non Hydrocarbon Project Operations
Project Team
Engineering Solution UnitProject Lifecycle Engineering UnitProgram Management Consulting Unit
ChAS Project Operations
Space Solution UnitChAS Business Strategy Unit
Mechanical Engineering UnitControl System Engineering UnitElectrical System & Smart Grid Engineering Unit Piping Engineering UnitCivil Engineering Unit
PLC* Planning & Administration UnitProcurement & Logistics Management UnitConstruction UnitCommissioning Unit
Project Logistics & Construction Division
Investment Promotion TeamLegal Sec.
Strategic Business Planning & Administration Unit
Corporate Relations Sec.Business Development Unit 1Business Development Unit 2Business Development Unit 3
Business Development Division
IP* Planning & Administration UnitStrategic Business & Investment Management UnitGreen Infrastructure Project Unit
Infrastructure Project Operations
Technology Development Unit
Pharmaceutical & Environmental Project Unit
Green Materials Project Unit
Research & Development Center
HRM: Human Resource Management BPM: Business Process Management PLC: Project Logistics & Construction IP: Infrastructure Project
Sales Base Engineering Center
Procurement Center Project Execution Base
Abu Dhabi O�ce
Chiyoda-CCC Engineering (Pte) Limited
Bangalore O�ce
Chiyoda Oceania Pty Limited
Chiyoda Philippines Corporation
Chiyoda Corporation Netherlands B.V.
Milan Representative O�ce
Beijing O�ce
Chiyoda & Public Works Co., Ltd.
Chiyoda Corporation (Shanghai)
Korea Representative O�ce
Chiyoda International Corporation
Middle East Headquarters Doha O�ce
Chiyoda Almana Engineering LLC
Chiyoda Petrostar Ltd.
L&T-Chiyoda Limited
Jakarta O�ce
PT. Chiyoda International Indonesia
Chiyoda do Brasil Representações Ltda.
Singapore Human Resources O�ce
Chiyoda Singapore (Pte) Limited
Chiyoda Malaysia Sdn. Bhd.
Chiyoda Sarawak Sdn. Bhd.
Chiyoda (Thailand) Limited
USA
Brazil
Japan<Chiyoda Global Headquarters>
Korea
China
MyanmarThailandMalaysia
Singapore
Indonesia
Australia
IndiaUAE
QatarSaudi Arabia
Italy
The Netherlands
Philippines
Organization Chart
Chiyoda's Global Network
(As of July 1, 2013)

16 CHIYODA CORPORATION ANNUAL REPORT FY2012 17CHIYODA CORPORATION ANNUAL REPORT FY2012
Directors and Officers (As of July 1, 2013) Stock Information
Representative Directors Directors
Board of Directors
Audit & Supervisory Board Members
Monthly Stock Price Range on the Tokyo Stock Exchange
Executive Officers
Executive Chairman Takashi Kubota*1
President & CEO Shogo Shibuya*1
Senior Executive Vice President Keiichi Nakagaki*1
Senior Executive Vice President Hiroshi Ogawa*1
Executive Vice President & CFO Masahito Kawashima
Executive Vice President Satoru Yokoi
Senior Vice President Tadashi Izawa*1
Senior Vice President Katsutoshi Kimura
Senior Vice President Kenjiro Miura
Senior Vice President Mamoru Nakano*1
Senior Vice President Takao Kamiji
Senior Vice President Hiromi Koshizuka
Senior Vice President Sumio Nakashima
Senior Vice President Koichi Shirakawa
Vice President Noriyuki Kasuya
Hiroshi Ida*3 Munehiko Nakano*3 Yukihiro Imadegawa*3
Executive Vice President Katsuo Nagasaka*1
Senior Vice President Ryosuke Shimizu
Senior Vice President Masahiko Kojima*1
Director Masaji Santo*1/*2
Vice President Eisuke Oki*1
Vice President Masao Ishikawa*1
Vice President Toshiyuki Kariya*1
Vice President Yasumitsu Abe*1
Vice President Nobuyuki Uchida
Vice President Yasuo Hosono*1
Vice President Mitsuya Ogawa
Vice President Seiichiro Ikeda
Vice President Akira Fujisawa*1
*1 : New Assignments*2 : External*3 : Outside Corporate Auditor
(Yen) (Yen)
Share Price (left)Volume (right)Nikkei Stock Average (right)
(Thousandsof shares)
20081 2 34 5 6 7 8 9 101112 4 5 6 7 8 9 1011121 2 3 4 5 6 7 8 9 1011121 2 3 5 6 7 8 9 10111241 2 3 1 2 34 5 6 7 8 9 101112
2009 2010 2011 2012 2013
0
2,400
1,600
800
160,000
80,000
0
45,000
30,000
15,000
Breakdown by shareholder
Financial Institutions Securities CompaniesOther CorporationsForeign Investors and OthersIndividuals and Others
Total Number of Shares Issued:
260,325 thousand
4.06
22.63
38.10
23.58
11.63
Authorized Shares570,000,000
Capital Stock Issued 260,324,529
Number of Shareholders14,503
Number of Share per Unit1,000
Stock CodeISIN: JP3528600004SEDOL1: 6191704 JPTSE: 6366
Transfer Agent of Common StockMitsubishi UFJ Trust and Banking Corporation1-4-5 Marunouchi, Chiyoda-ku, Tokyo
Number of Shares Owned
(Thousands of Shares)
Ratio Shares Owned
(%)
Mitsubishi Corporation 86,931 33.39
The Master Trust Bank of Japan, Ltd. (Trust Account) 11,777 4.52
Japan Trustee Services Bank, Ltd. (Trust Account) 9,250 3.55
The Bank of Tokyo-Mitsubishi UFJ, Ltd. 9,033 3.47
The Mitsubishi UFJ Trust and Banking Corporation 7,496 2.87
Bank of New York GCM Client Account JPRD ISG (FE-AC) 3,153 1.21
State Street Bank and Trust Company 2,883 1.10
State Street Bank and Trust Company 505225 2,806 1.07
Tokio Marine & Nichido Fire Insurance Co., Ltd. 2,759 1.06
Mellon Bank N.A. as Agent for its Client Mellon Omnibus US Pension 2,319 0.89
Major Shareholders (as of March 31,2013)

CORPORATE PHILOSOPHY
Enhance our business in aiming for harmonybetween energy and the environment, and contribute to the sustainable development of a society as an integrated engineering companythrough the use of our collective wisdom andpainstakingly developed technology.
Minato Mirai Grand Central Tower4-6-2, Minatomirai, Nishi-ku, Yokohama 220-8765, JapanTel: (81)45-225-7777 (voice guidance)http://www.chiyoda-corp.com/en/
For the year ended March 31, 2013
ANNUAL REPORT FY2012
(As of August 2013)
Selected in FTSE Group’s responsibleinvestment index

CORPORATE PHILOSOPHY
Enhance our business in aiming for harmonybetween energy and the environment, and contribute to the sustainable development of a society as an integrated engineering companythrough the use of our collective wisdom andpainstakingly developed technology.
Minato Mirai Grand Central Tower4-6-2, Minatomirai, Nishi-ku, Yokohama 220-8765, JapanTel: (81)45-225-7777 (voice guidance)http://www.chiyoda-corp.com/en/
For the Year Ended March 31, 2013, and Independent Auditor's Report
Consolidated Financial Statements
(As of August 2013)
Selected in FTSE Group’s responsibleinvestment index

1 Consolidated Financial Statements 2Consolidated Financial Statements
Consolidated Balance Sheet (March 31, 2013)
- 2 -
Chiyoda Corporation and Consolidated Subsidiaries Consolidated Balance Sheet March 31, 2013
Millions of Yen
Thousands of U.S. Dollars
(Note 1) ASSETS 2013 2012 2013 CURRENT ASSETS: Cash and cash equivalents (Note 13) ¥ 180,229 ¥ 173,769 $1,917,333 Held-to-maturity securities—current (Notes 5 and 13) 2,400 25,531 Short-term investments (Note 13) 226 307 2,407 Notes and accounts receivable—trade (Note 13) 37,917 30,051 403,376 Allowance for doubtful accounts (3 ) (6) (36) Costs and estimated earnings on long-term construction contracts (Notes 4 and 13) 27,477 13,788 292,309 Costs of construction contracts in process 15,295 13,419 162,713 Accounts receivable—other 8,476 7,282 90,174 Jointly controlled assets of joint venture (Note 13) 94,696 65,794 1,007,408 Deferred tax assets (Note 10) 13,162 12,987 140,029 Prepaid expenses and other 3,329 3,083 35,421 Total current assets 383,206 320,478 4,076,670 PROPERTY, PLANT, AND EQUIPMENT: Land 5,375 12,736 57,191 Buildings and structures 11,711 16,072 124,594 Machinery and equipment 1,124 1,220 11,960 Tools, furniture, and fixtures 5,450 5,201 57,983 Construction in progress 494 109 5,258 Total 24,156 35,340 256,987 Accumulated depreciation (9,609 ) (16,339) (102,226) Net property, plant, and equipment 14,547 19,001 154,761 INVESTMENTS AND OTHER ASSETS: Investment securities (Notes 5 and 13) 23,740 15,527 252,558 Investments in and advances to unconsolidated subsidiaries and associated companies (Note 6) 5,164 2,668 54,936 Goodwill 675 716 7,182 Software 5,987 3,215 63,700 Other assets (Note 10) 2,138 4,277 22,745 Allowance for doubtful accounts (80 ) (88) (859) Total investments and other assets 37,624 26,316 400,263 TOTAL ¥ 435,379 ¥ 365,795 $4,631,695 See notes to consolidated financial statements.
Millions of Yen
Thousands of U.S. Dollars
(Note 1) LIABILITIES AND EQUITY 2013 2012 2013 CURRENT LIABILITIES:
Current portion of long-term debt (Notes 7, 12 and 13) ¥ 91 ¥ 10,006 $ 977Notes and accounts payable—trade (Note 13) 117,769 86,211 1,252,863Advance receipts on construction contracts 79,210 76,533 842,660Income taxes payable (Note 13) 8,500 1,162 90,429Deposits received 6,822 6,179 72,583Allowance for warranty costs for completed works 480 289 5,113Allowance for losses on construction contracts 1,291 568 13,739Asset retirement obligations 5 165 54Accrued expenses and other 16,259 12,572 172,976
Total current liabilities 230,431 193,687 2,451,398
NONCURRENT LIABILITIES:Long-term debt (Notes 7, 12 and 13) 10,135 204 107,819Liability for retirement benefits (Note 8) 2,310 2,486 24,584Provision for treatment of PCB waste 364 123 3,882Asset retirement obligations 957 59 10,190Other liabilities (Note 10) 1,822 496 19,392
Total noncurrent liabilities 15,591 3,369 165,869
COMMITMENTS AND CONTINGENT LIABILITIES (Notes 7, 12, 14 and 15)
EQUITY (Notes 9 and 18):Common stock—authorized, 570,000 thousand shares;
issued, 260,324 thousand shares in 2013 and 2012 43,396 43,396 461,663 Preferred stock—authorized, 80,000 thousand shares in 2013 and 2012Capital surplus 37,112 37,112 394,815Retained earnings 100,988 89,346 1,074,343Treasury stock—at cost, 1,279 thousand shares in 2013 and
1,260 thousand shares in 2012 (1,349) (1,328) (14,358) Accumulated other comprehensive income (loss):
Unrealized gain on available-for-sale securities 6,584 1,509 70,044Deferred gain on derivatives under hedge accounting 2,890 442 30,746Foreign currency translation adjustments (1,235) (2,358) (13,140)
Total 188,386 168,120 2,004,116Minority interests 969 617 10,310
Total equity 189,356 168,737 2,014,427
TOTAL ¥435,379 ¥365,795 $4,631,695
3 Consolidated Financial Statements 4Consolidated Financial Statements
Consolidated Statement of Comprehensive Income(Year Ended March 31, 2013)
Consolidated Statement of Income(Year Ended March 31, 2013)
- 3 - (Continued)
Chiyoda Corporation and Consolidated Subsidiaries Consolidated Statement of Income Year Ended March 31, 2013
Millions of Yen
Thousands of U.S. Dollars
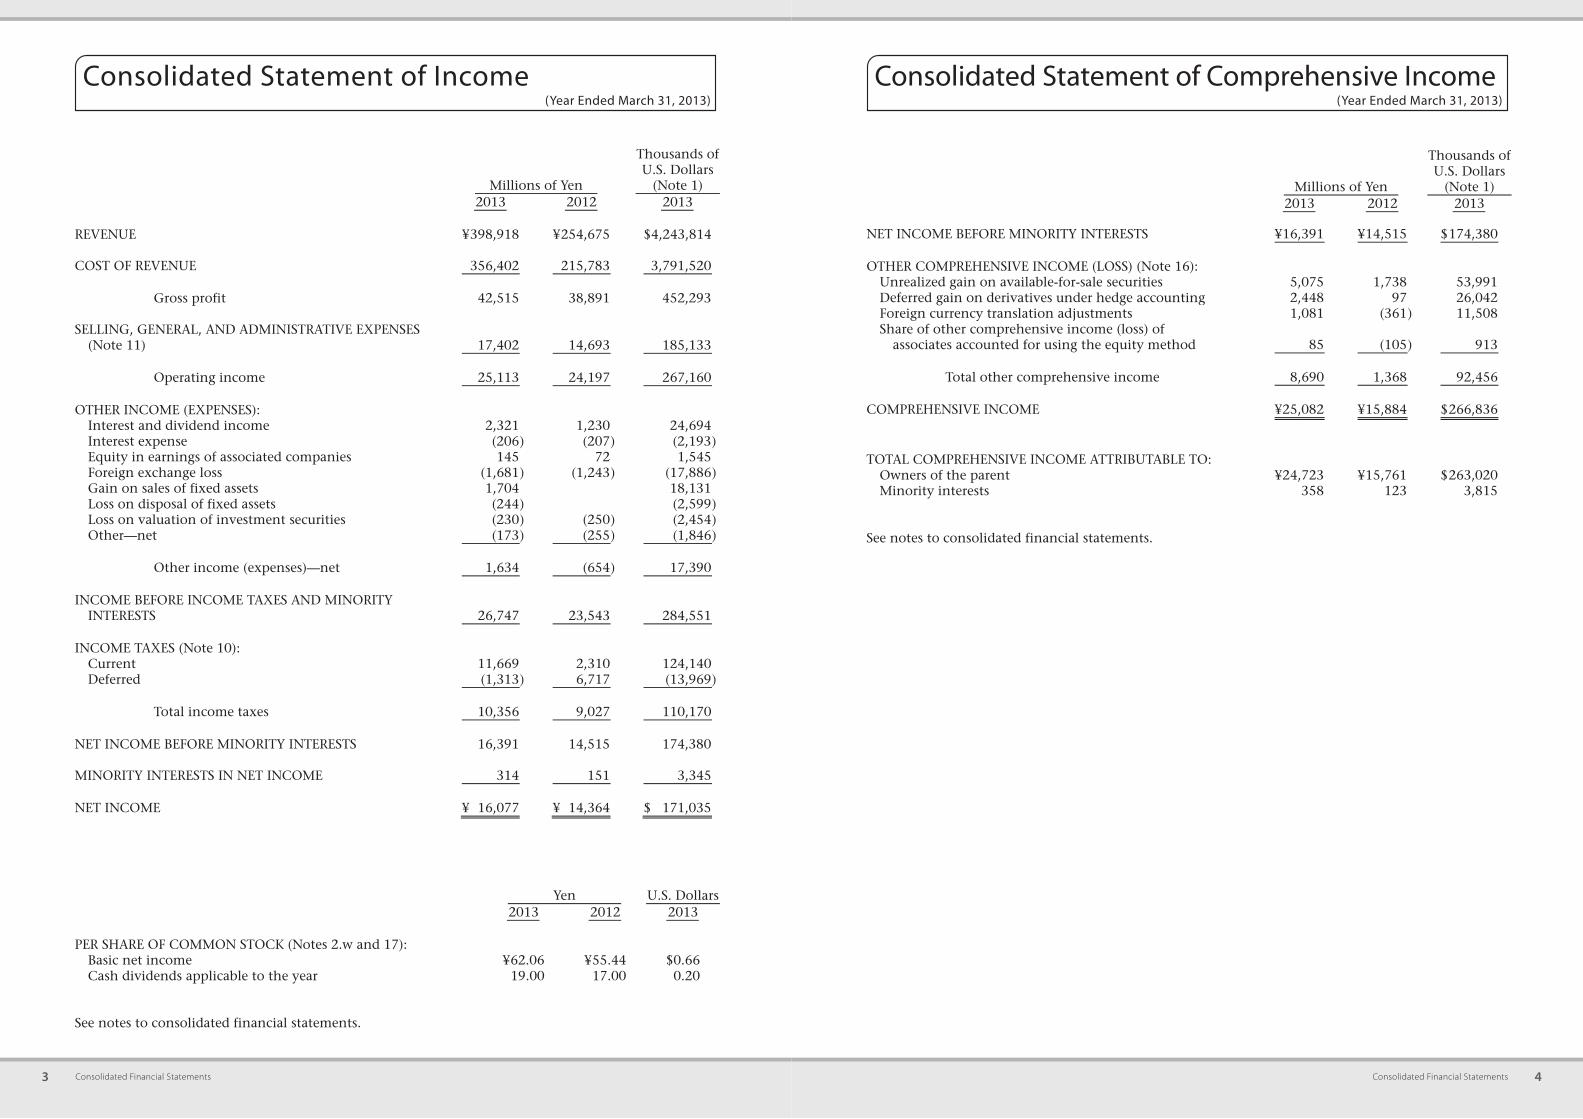
(Note 1) 2013 2012 2013 REVENUE ¥398,918 ¥ 254,675 $4,243,814 COST OF REVENUE 356,402 215,783 3,791,520 Gross profit 42,515 38,891 452,293 SELLING, GENERAL, AND ADMINISTRATIVE EXPENSES (Note 11) 17,402 14,693 185,133 Operating income 25,113 24,197 267,160 OTHER INCOME (EXPENSES): Interest and dividend income 2,321 1,230 24,694 Interest expense (206) (207 ) (2,193) Equity in earnings of associated companies 145 72 1,545 Foreign exchange loss (1,681) (1,243 ) (17,886) Gain on sales of fixed assets 1,704 18,131 Loss on disposal of fixed assets (244) (2,599) Loss on valuation of investment securities (230) (250 ) (2,454) Other—net (173) (255 ) (1,846) Other income (expenses)—net 1,634 (654 ) 17,390 INCOME BEFORE INCOME TAXES AND MINORITY INTERESTS 26,747 23,543 284,551 INCOME TAXES (Note 10): Current 11,669 2,310 124,140 Deferred (1,313) 6,717 (13,969) Total income taxes 10,356 9,027 110,170 NET INCOME BEFORE MINORITY INTERESTS 16,391 14,515 174,380 MINORITY INTERESTS IN NET INCOME 314 151 3,345 NET INCOME ¥ 16,077 ¥ 14,364 $ 171,035
- 4 - (Concluded)
Chiyoda Corporation and Consolidated Subsidiaries Consolidated Statement of Income Year Ended March 31, 2013 Yen U.S. Dollars 2013 2012 2013 PER SHARE OF COMMON STOCK (Notes 2.w and 17): Basic net income ¥62.06 ¥ 55.44 $0.66 Cash dividends applicable to the year 19.00 17.00 0.20 See notes to consolidated financial statements.
- 5 -
Chiyoda Corporation and Consolidated Subsidiaries Consolidated Statement of Comprehensive Income Year Ended March 31, 2013
Millions of Yen
Thousands of U.S. Dollars
(Note 1) 2013 2012 2013 NET INCOME BEFORE MINORITY INTERESTS ¥16,391 ¥ 14,515 $174,380 OTHER COMPREHENSIVE INCOME (LOSS) (Note 16): Unrealized gain on available-for-sale securities 5,075 1,738 53,991 Deferred gain on derivatives under hedge accounting 2,448 97 26,042 Foreign currency translation adjustments 1,081 (361 ) 11,508 Share of other comprehensive income (loss) of associates accounted for using the equity method 85 (105 ) 913 Total other comprehensive income 8,690 1,368 92,456 COMPREHENSIVE INCOME ¥25,082 ¥ 15,884 $266,836 TOTAL COMPREHENSIVE INCOME ATTRIBUTABLE TO: Owners of the parent ¥24,723 ¥ 15,761 $263,020 Minority interests 358 123 3,815 See notes to consolidated financial statements.

5 Consolidated Financial Statements 6Consolidated Financial Statements
Consolidated Statement of Changes in Equity (Year Ended March 31, 2013)
- 6 -
Chiyoda Corporation and Consolidated Subsidiaries Consolidated Statement of Changes in Equity Year Ended March 31, 2013 Thousands Millions of Yen
Accumulated Other
Comprehensive Income (Loss)
Outstanding Number of Shares of Common
Stock Common
Stock Capital Surplus
Retained Earnings
Treasury Stock
Unrealized (Loss) Gain
on Available-for-Sale
Securities
Deferred Gain on
Derivatives under Hedge Accounting
Foreign Currency
Translation Adjustments Total
Minority Interests
Total Equity
BALANCE, APRIL 1, 2011 259,102 ¥ 43,396 ¥ 37,112 ¥ 77,832 ¥(1,295) ¥ (229) ¥ 345 ¥ (1,919 ) ¥ 155,242 ¥516 ¥155,758 Net income 14,364 14,364 14,364 Cash dividends, ¥11.00 per share (2,850) (2,850) (2,850) Purchase of treasury stock (37 ) (32) (32) (32) Net change in the year 1,738 97 (438 ) 1,396 100 1,497 BALANCE, MARCH 31, 2012 259,065 43,396 37,112 89,346 (1,328) 1,509 442 (2,358 ) 168,120 617 168,737 Net income 16,077 16,077 16,077 Cash dividends, ¥17.00 per share (4,404) (4,404) (4,404) Change of scope of consolidation (31) (31) (31) Purchase of treasury stock (19 ) (21) (21) (21) Net change in the year 5,075 2,448 1,123 8,646 351 8,998 BALANCE, MARCH 31, 2013 259,045 ¥ 43,396 ¥ 37,112 ¥100,988 ¥(1,349) ¥6,584 ¥2,890 ¥ (1,235 ) ¥ 188,386 ¥969 ¥189,356 Thousands of U.S. Dollars (Note 1)
Accumulated Other
Comprehensive Income (Loss)
Common
Stock Capital Surplus
Retained Earnings
TreasuryStock
Unrealized Gain on
Available-for-Sale
Securities
Deferred Gain on
Derivatives under Hedge Accounting
Foreign Currency
Translation Adjustments Total
Minority Interests
Total Equity
BALANCE, MARCH 31, 2012 $ 461,663 $ 394,815 $ 950,499 $(14,131) $16,053 $ 4,703 $ (25,091 ) $1,788,513 $ 6,569 $1,795,083 Net income 171,035 171,035 171,035 Cash dividends, $0.18 per share (46,852) (46,852) (46,852) Change of scope of consolidation (338) (338) (338) Purchase of treasury stock (227) (227) (227) Net change in the year 53,991 26,042 11,951 91,985 3,741 95,726 BALANCE, MARCH 31, 2013 $ 461,663 $ 394,815 $1,074,343 $(14,358) $70,044 $30,746 $ (13,140 ) $2,004,116 $10,310 $2,014,427 See notes to consolidated financial statements.

7 Consolidated Financial Statements 8Consolidated Financial Statements
Consolidated Statement of Cash Flows (Year Ended March 31, 2013)
- 7 - (Continued)
Chiyoda Corporation and Consolidated Subsidiaries Consolidated Statement of Cash Flows Year Ended March 31, 2013
Millions of Yen
Thousands of U.S. Dollars
(Note 1) 2013 2012 2013 OPERATING ACTIVITIES: Income before income taxes and minority interests ¥26,747 ¥ 23,543 $284,551 Adjustments for: Income taxes paid (130 ) (10,820 ) (1,389) Depreciation and amortization 2,580 2,637 27,450 (Reversal of) allowance for doubtful accounts—net (11 ) 4 (118) Allowance for (reversal of) warranty costs for completed works 187 (894 ) 1,998 Allowance for (reversal of) loss on construction contracts 723 (489 ) 7,695 Liability for retirement benefits—net (185 ) (320 ) (1,968) Gain on sales and disposals of fixed assets (1,460 ) (15,532) Foreign exchange (gain) loss—net (125 ) 22 (1,334) Equity in earnings of associated companies (145 ) (72 ) (1,545) Changes in operating assets and liabilities: (Increase) decrease in trade notes and accounts receivable, and costs and estimated earnings on long-term construction contracts (20,453 ) 11,946 (217,595) Increase in costs of construction contracts in process (1,714 ) (796 ) (18,243) Increase (decrease) in trade notes and accounts payable 30,130 (11,102 ) 320,537 Increase in advance receipts on construction contracts 992 14,236 10,561 (Increase) decrease in accounts receivable—other (3,170 ) 3,678 (33,730) (Increase) decrease in jointly controlled assets of joint venture (28,603 ) 22,776 (304,290) Increase in deposits received 619 1,640 6,589 Increase in interest and dividend receivable (674 ) (544 ) (7,177) Other—net 8,840 169 94,051 Total adjustments (12,599 ) 32,071 (134,042) Net cash provided by operating activities— (Forward) ¥ 14,147 ¥ 55,615 $ 150,509
- 8 - (Concluded)
Chiyoda Corporation and Consolidated Subsidiaries Consolidated Statement of Cash Flows Year Ended March 31, 2013
Millions of Yen
Thousands of U.S. Dollars
(Note 1) 2013 2012 2013 Net cash provided by operating activities—(Forward) ¥ 14,147 ¥ 55,615 $ 150,509 INVESTING ACTIVITIES: Net decrease (increase) in time deposits 127 (234 ) 1,354 Purchases of marketable securities (2,400) (25,531) Purchases of property, plant, and equipment (3,620) (1,618 ) (38,518) Proceeds from sales of property, plant, and equipment 7,020 1,725 74,682 Purchases of intangible assets (3,502) (1,380 ) (37,260) Payments for asset retirement obligations (66) (705) Payments for purchases of investment securities (2,450) (7,561 ) (26,070) Purchases of investments in subsidiaries (57 ) Payments of short-term loans receivable (85 ) Proceeds from collections of short-term loans receivable 81 871 Payments of long-term loans receivable (514) (5,473) Proceeds from collections of long-term loans 35 71 374 Other—net 32 350 Net cash used in investing activities (5,257) (9,140 ) (55,926) FINANCING ACTIVITIES: Proceeds from long-term debt 10,000 106,382 Repayments of long-term debt (10,000) (106,382) Payments of cash dividends (4,397) (2,844 ) (46,784) Payments of cash dividends to minority shareholders (7) (7 ) (74) Other—net (27) (47 ) (293) Net cash used in financing activities (4,432) (2,899 ) (47,152) FOREIGN CURRENCY TRANSLATION ADJUSTMENTS ON CASH AND CASH EQUIVALENTS 2,024 (424 ) 21,532 NET INCREASE IN CASH AND CASH EQUIVALENTS 6,482 43,151 68,962 DECREASE IN CASH AND CASH EQUIVALENTS RESULTING FROM EXCLUSION OF SUBSIDIARIES FROM CONSOLIDATION (22) (237) CASH AND CASH EQUIVALENTS, BEGINNING OF YEAR 173,769 130,618 1,848,609 CASH AND CASH EQUIVALENTS, END OF YEAR ¥180,229 ¥ 173,769 $1,917,333 See notes to consolidated financial statements.

9 Consolidated Financial Statements 10Consolidated Financial Statements
(Year Ended March 31, 2013)Notes to Consolidated Financial Statements
- 9 -
Chiyoda Corporation and Consolidated Subsidiaries Notes to Consolidated Financial Statements Year Ended March 31, 2013 1. BASIS OF PRESENTATION OF CONSOLIDATED FINANCIAL STATEMENTS
The accompanying consolidated financial statements have been prepared in accordance with the provisions set forth in the Japanese Financial Instruments and Exchange Act and its related accounting regulations and in accordance with accounting principles generally accepted in Japan, which are different in certain respects as to the application and disclosure requirements of International Financial Reporting Standards. In preparing these consolidated financial statements, certain reclassifications and rearrangements have been made to the consolidated financial statements issued domestically in order to present them in a form which is more familiar to readers outside Japan. In addition, certain reclassifications and rearrangements have been made in the 2012 consolidated financial statements to conform to the classifications used in 2013. The consolidated financial statements are stated in Japanese yen, the currency of the country in which Chiyoda Corporation (the "Company") is incorporated and principally operates. The translations of Japanese yen amounts into U.S. dollar amounts are included solely for the convenience of readers outside Japan and have been made at the rate of ¥94 to $1, the approximate rate of exchange at March 31, 2013. Such translations should not be construed as representations that the Japanese yen amounts could be converted into U.S. dollars at that or any other rate. Japanese yen figures less than a million yen are rounded down to the nearest million yen, except for per-share data. U.S. dollar figures less than a thousand U.S. dollars are rounded down to the nearest thousand U.S. dollars, except for per-share data.
2. SUMMARY OF SIGNIFICANT ACCOUNTING POLICIES
a. Consolidation—The consolidated financial statements as of March 31, 2013, include the accounts of the Company and its 18 significant (21 in 2012) subsidiaries (together, the "Group"). Under the control or influence concept, those companies in which the Company, directly or indirectly, is able to exercise control over operations are fully consolidated, and those companies over which the Group has the ability to exercise significant influence are accounted for by the equity method. Investments in two associated companies are accounted for by the equity method in 2013 and 2012. Investments in the remaining unconsolidated subsidiaries and associated companies are stated at cost. If the equity method of accounting had been applied to the investments in these companies, the effect on the accompanying consolidated financial statements would not be material. The excess of the cost of acquisition over the fair value of the net assets of an acquired subsidiary at the date of acquisition is being amortized over a period of 20 years.
- 10 -
All significant intercompany balances and transactions have been eliminated in consolidation. All material unrealized profit included in assets resulting from transactions within the Group is eliminated.
b. Construction Contracts—In December 2007, the Accounting Standards Board of Japan (the
"ASBJ") issued ASBJ Statement No. 15, "Accounting Standard for Construction Contracts" and ASBJ Guidance No. 18, "Guidance on Accounting Standard for Construction Contracts." Under this accounting standard, construction revenue and construction costs should be recognized by the percentage-of-completion method if the outcome of a construction contract can be estimated reliably. When total construction revenue, total construction costs, and the stage of completion of the contract at the balance sheet date can be reliably measured, the outcome of a construction contract is deemed to be estimated reliably. If the outcome of a construction contract cannot be reliably estimated, the completed-contract method should be applied. When it is probable that the total construction costs will exceed total construction revenue, an estimated loss on the contract should be immediately recognized by providing for a loss on construction contracts. Concerning the construction contracts, the Group applies the accounting methods below:
Unbilled costs on contracts, which are accounted for by the completed-contract method, are stated as costs of construction contracts in process. Payments received in excess of costs and estimated earnings on contracts, which are accounted for by the percentage-of-completion method and payments received on the other contracts, are presented as current liabilities. Costs of preparation work for unsuccessful proposals and other projects that are not realized are charged to income, as incurred, and are included in costs of revenue.
c. Cash Equivalents—Cash equivalents are short-term investments that are readily convertible into cash and that are exposed to insignificant risk of changes in value. Cash equivalents include time deposits, certificate of deposits, and commercial paper, all of which mature or become due within three months of the date of acquisition.
d. Held-to-Maturity Securities and Investment Securities—Held-to-maturity securities and
investment securities are classified and accounted for, depending on management's intent, as follows: (1) held-to-maturity debt securities, for which there is the positive intent and ability to hold to maturity are reported at cost; and (2) available-for-sale securities are reported at fair value, with unrealized gains and losses, net of applicable taxes, reported in a separate component of equity. Nonmarketable available-for-sale securities are stated at cost determined by the moving-average method. For other-than-temporary declines in fair value, investment securities are reduced to net realizable value by a charge to income.
e. Short-Term Investments—Short-term investments are time deposits, which will mature three
months after the date of acquisition. Short-term investments are exposed to insignificant risk of changes in value.
f. Jointly Controlled Assets of Joint Venture—Jointly controlled assets of a joint venture are the
equity amount equivalent of the Company and consolidated subsidiaries related to the cash deposits of the joint venture.

11 Consolidated Financial Statements 12Consolidated Financial Statements
Notes to Consolidated Financial Statements
- 11 -
g. Allowance for Doubtful Accounts—The allowance for doubtful accounts is stated in amounts considered to be appropriate based on the Group's past credit loss experience and an evaluation of potential losses in the receivables outstanding.
h. Property, Plant, and Equipment—Property, plant, and equipment are stated at cost.
Depreciation is computed by the declining-balance method, except for buildings owned by the Company that are depreciated using the straight-line method, at rates based on the estimated useful lives of the assets. The range of useful lives is from 8 to 57 years for buildings and structures, from 4 to 17 years for machinery and equipment, and from 4 to 15 years for tools, furniture, and fixtures. Equipment held for leases is depreciated by the straight-line method over the respective lease periods.
i. Long-Lived Assets—The Group reviews its long-lived assets for impairment whenever events or
changes in circumstances indicate the carrying amount of an asset or asset group may not be recoverable. An impairment loss is recognized if the carrying amount of an asset or asset group exceeds the sum of the undiscounted future cash flows expected to result from the continued use and eventual disposition of the asset or asset group. The impairment loss would be measured as the amount by which the carrying amount of the asset exceeds its recoverable amount, which is the higher of the discounted cash flows from the continued use and eventual disposition of the asset or the net selling price at disposition.
j. Software—Software for internal use is amortized on a straight-line basis over its estimated
useful life (five years at the maximum). k. Other Assets—Intangible assets are carried at cost less accumulated amortization, which is
calculated by the straight-line method over their estimated useful lives. l. Allowance for Warranty Costs for Completed Work—The allowance for warranty costs for
completed work is provided based on past rate experience. m. Allowance for Losses on Construction Contracts—The allowance for losses on construction
contracts is provided for an estimated amount of probable losses to be incurred in future years in respect of construction projects in progress. When there are losses on completed-contract method applied contracts, the allowance for losses on construction contracts is offset against the costs of construction contracts in process on the balance sheet.
n. Provision for Treatment of PCB Waste—A provision for treatment of PCB (Poly Chlorinated
Biphenyl) waste is provided based on estimated costs of the treatment for PCB products and equipment as well as their collection and transportation fees.
o. Retirement and Pension Plans—Employees of the Company are, under most circumstances,
entitled to payments from the defined contribution pension plan and the defined benefit corporate pension plan. Employees of certain of the Company's consolidated subsidiaries are, under most circumstances, entitled to certain lump-sum severance payments and pension payments. Effective April 1, 2000, the Company and its domestic consolidated subsidiaries adopted a new accounting standard for employees' retirement benefits and accounted for the liability for retirement benefits based on the projected benefit obligations and plan assets at the balance sheet date.
- 12 -
The transitional obligation of ¥5,696 million ($60,599 thousand) is being amortized and charged to income over 15 years using the straight-line amortization method and presented as an operating expense in the consolidated statements of income for the years ended March 31, 2013 and 2012. Certain of the Company's consolidated subsidiaries terminated their unfunded retirement benefit allowance for all directors and officers under the resolution of the shareholders' meeting and the board meeting during the year ended March 31, 2012. The outstanding balance was reclassified to noncurrent liabilities—other liabilities in the years ended March 31, 2013 and 2012.
p. Asset Retirement Obligations—In March 2008, the ASBJ published ASBJ Statement No. 18,
"Accounting Standard for Asset Retirement Obligations" and ASBJ Guidance No. 21, "Guidance on Accounting Standard for Asset Retirement Obligations." Under this accounting standard, an asset retirement obligation is defined as a legal obligation imposed either by law or contract that results from the acquisition, construction, development, and normal operation of a tangible fixed asset and is associated with the retirement of such tangible fixed asset. The asset retirement obligation is recognized as the sum of the discounted cash flows required for the future asset retirement and is recorded in the period in which the obligation is incurred if a reasonable estimate can be made. If a reasonable estimate of the asset retirement obligation cannot be made in the period the asset retirement obligation is incurred, the liability should be recognized when a reasonable estimate of the asset retirement obligation can be made. Upon initial recognition of a liability for an asset retirement obligation, an asset retirement cost is capitalized by increasing the carrying amount of the related fixed asset by the amount of the liability. The asset retirement cost is subsequently allocated to expense through depreciation over the remaining useful life of the asset. Over time, the liability is accreted to its present value each period. Any subsequent revisions to the timing or the amount of the original estimate of undiscounted cash flows are reflected as an adjustment to the carrying amount of the liability and the capitalized amount of the related asset retirement cost.
q. Research and Development Costs—Research and development costs are charged to income as
incurred. r. Leases—In March 2007, the ASBJ issued ASBJ Statement No. 13, "Accounting Standard for Lease
Transactions," which revised the previous accounting standard for lease transactions. Under the previous accounting standard, finance leases that were deemed to transfer ownership of the leased property to the lessee were capitalized. However, other finance leases were permitted to be accounted for as operating lease transactions if certain "as if capitalized" information was disclosed in the note to the lessee's financial statements. The revised accounting standard requires that all finance lease transactions be capitalized by recognizing lease assets and lease obligations in the balance sheet. The Company applied the revised accounting standard effective April 1, 2008. In addition, the Company continues to account for leases which existed at the transition date and do not transfer ownership of the leased property to the lessee as operating lease transactions. All other leases are accounted for as operating leases.

13 Consolidated Financial Statements 14Consolidated Financial Statements
Notes to Consolidated Financial Statements
- 13 -
s. Income Taxes—The provision for income taxes is computed based on the pretax income included in the consolidated statement of income. The asset and liability approach is used to recognize deferred tax assets and liabilities for the expected future tax consequences of temporary differences between the carrying amounts and the tax bases of assets and liabilities. Deferred taxes are measured by applying currently enacted tax laws to the temporary differences. The Company files a tax return under the consolidated corporate-tax system, which allows companies to base tax payments on the combined profits or losses of the parent company and its wholly-owned domestic subsidiaries.
t. Foreign Currency Transactions—All short-term and long-term monetary receivables and
payables denominated in foreign currencies are translated into Japanese yen at the exchange rates at the balance sheet date. Foreign exchange gains and losses from translation are recognized in the consolidated statement of income to the extent that they are not hedged by foreign currency forward contracts.
u. Foreign Currency Financial Statements—Balance sheet accounts of consolidated foreign
subsidiaries are translated into Japanese yen at the current exchange rate as of the balance sheet date except for equity, which is translated at the historical rate. Differences arising from such translation are shown as "Foreign currency translation adjustments" under accumulated other comprehensive income in a separate component of equity. Revenue and expense accounts of consolidated foreign subsidiaries are translated into Japanese yen at the current exchange rate as of the balance sheet date.
v. Derivatives and Hedging Activities—The Company uses derivative financial instruments,
including foreign currency forward contracts and interest swap contracts, as a means of hedging exposure to foreign currency risks and interest rate risks. The Company does not enter into derivatives for trading or speculative purposes. Derivative financial instruments are classified and accounted for as follows:
(1) All derivatives are recognized as either assets or liabilities and measured at fair value, with
gains or losses recognized in the consolidated statement of income. (2) For derivatives used for hedging purposes, if such derivatives qualify for hedge accounting
because of high correlation and effectiveness between the hedging instruments and the hedged items, gains or losses on derivatives are deferred until maturity of the hedged transactions.
Foreign currency forward contracts are utilized to hedge foreign exchange risks. Certain assets
and liabilities on construction contracts denominated in foreign currencies are translated at the contracted rates if the forward contracts qualify for hedge accounting. Foreign currency deposits are held to hedge foreign exchange risks derived from forecasted purchases of fixed assets denominated in foreign currency. Interest rate swaps which qualify for hedge accounting and meet specific matching criteria are not remeasured at market value but the differential paid or received under the swap agreements is recognized and included in interest expense.
- 14 -
w. Per-Share Information—Basic net income per share is computed by dividing net income available to common shareholders by the weighted-average number of common shares outstanding for the period, retroactively adjusted for stock splits. Diluted net income per share reflects the potential dilution that could occur if securities were exercised or converted into common stock. Diluted net income per share of common stock assumes full conversion of the outstanding convertible notes and bonds at the beginning of the year (or at the time of issuance) with an applicable adjustment for related interest expense, net of tax, and full exercise of outstanding warrants. Cash dividends per share presented in the accompanying consolidated statement of income are dividends applicable to the respective years including dividends to be paid after the end of the year. Diluted net income per share is not disclosed because there is no potential stock, which has a dilutive effect for the fiscal years ended March 31, 2013 and 2012.
x. Accounting Changes and Error Corrections—In December 2009, the ASBJ issued ASBJ Statement
No. 24, "Accounting Standard for Accounting Changes and Error Corrections" and ASBJ Guidance No. 24, "Guidance on Accounting Standard for Accounting Changes and Error Corrections." Accounting treatments under this standard and guidance are as follows: (1) Changes in Accounting Policies—When a new accounting policy is applied following revision of an accounting standard, the new policy is applied retrospectively unless the revised accounting standard includes specific transitional provisions in which case the entity shall comply with the specific transitional provisions. (2) Changes in Presentation—When the presentation of financial statements is changed, prior-period financial statements are reclassified in accordance with the new presentation. (3) Changes in Accounting Estimates—A change in an accounting estimate is accounted for in the period of the change if the change affects that period only, and is accounted for prospectively if the change affects both the period of the change and future periods. (4) Corrections of Prior-Period Errors—When an error in prior-period financial statements is discovered, those statements are restated.
y. New Accounting Pronouncements
Accounting Standard for Retirement Benefits—On May 17, 2012, the ASBJ issued ASBJ Statement No. 26, "Accounting Standard for Retirement Benefits" and ASBJ Guidance No. 25, "Guidance on Accounting Standard for Retirement Benefits," which replaced the Accounting Standard for Retirement Benefits that had been issued by the Business Accounting Council in 1998 with an effective date of April 1, 2000, and the other related practical guidance, and followed by partial amendments from time to time through 2009. Major changes are as follows:
(a) Treatment in the balance sheet
Under the current requirements, actuarial gains and losses and past service costs that are yet to be recognized in profit or loss are not recognized in the balance sheet, and the difference between retirement benefit obligations and plan assets (hereinafter, "deficit or surplus"), adjusted by such unrecognized amounts, is recognized as a liability or asset.

15 Consolidated Financial Statements 16Consolidated Financial Statements
Notes to Consolidated Financial Statements
- 15 -
Under the revised accounting standard, actuarial gains and losses and past service costs that are yet to be recognized in profit or loss shall be recognized within equity (accumulated other comprehensive income), after adjusting for tax effects, and the deficit or surplus shall be recognized as a liability (liability for retirement benefits) or asset (asset for retirement benefits).
(b) Treatment in the statement of income and the statement of comprehensive income
The revised accounting standard does not change how to recognize actuarial gains and losses and past service costs in profit or loss. Those amounts would be recognized in profit or loss over a certain period no longer than the expected average remaining working lives of the employees. However, actuarial gains and losses and past service costs that arose in the current period and have not yet been recognized in profit or loss shall be included in other comprehensive income and actuarial gains and losses and past service costs that were recognized in other comprehensive income in prior periods and then recognized in profit or loss in the current period shall be treated as reclassification adjustments.
This accounting standard and the guidance are effective for the end of annual periods
beginning on or after April 1, 2013, with earlier application being permitted from the beginning of annual periods beginning on or after April 1, 2013. However, no retrospective application of this accounting standard to consolidated financial statements in prior periods is required. The Company expects to apply the revised accounting standard from the end of the annual period beginning on April 1, 2013, and is in the process of measuring the effects of applying the revised accounting standard for the year ending March 31, 2014.
3. ACCOUNTING CHANGES
Changes in Accounting Policies That Are Difficult to Distinguish from Changes in Accounting Estimates—In conjunction with the revision of the Corporation Tax Act, the Company and its domestic consolidated subsidiaries have changed the depreciation method for property, plant, and equipment acquired on or after April 1, 2012, to the depreciation method based on the revised Corporation Tax Act. The impact of this change on income (loss) is minimal.
4. CONSTRUCTION CONTRACTS
Costs and estimated earnings recognized with respect to construction contracts which are accounted for by the percentage-of-completion method at March 31, 2013 and 2012, were as follows:
Millions of Yen Thousands of U.S. Dollars
2013 2012 2013
Costs and estimated earnings ¥329,290 ¥282,492 $3,503,090Amounts billed (301,813) (268,703 ) (3,210,781) Net ¥ 27,477 ¥ 13,788 $ 292,309
- 16 -
5. HELD-TO-MATURITY SECURITIES AND INVESTMENT SECURITIES Held-to-maturity securities and investment securities at March 31, 2013 and 2012, consisted of the following:
Millions of Yen Thousands of U.S. Dollars
2013 2012 2013
Current—Held-to-maturity securities ¥ 2,400 $ 25,531Noncurrent—Equity securities 23,740 ¥15,527 252,558
The costs and aggregate fair values of marketable and investment securities at March 31, 2013 and
2012, were as follows:
March 31, 2013 Millions of Yen
Cost Unrealized
Gains Unrealized
Losses Fair
Value
Securities classified as: Available-for-sale—equity securities ¥11,455 ¥9,991 ¥ 112 ¥21,334 Held-to-maturity 2,400 2,400
March 31, 2012 Millions of Yen
Cost Unrealized
Gains Unrealized
Losses Fair
Value
Securities classified as— Available-for-sale—equity securities ¥ 11,682 ¥2,570 ¥ 367 ¥ 13,885 March 31, 2013 Thousands of U.S. Dollars
Cost Unrealized
Gains Unrealized
Losses Fair
Value
Securities classified as: Available-for-sale—equity securities $121,866 $106,290 $1,196 $226,960 Held-to-maturity 25,531 25,531
Available-for-sale securities whose fair value was not readily determinable at March 31, 2012, were
as follows. Similar information for 2013 is disclosed in Note 13.
Carrying AmountMarch 31, 2012 Millions of Yen
Available-for-sale—Equity securities ¥1,642

17 Consolidated Financial Statements 18Consolidated Financial Statements
Notes to Consolidated Financial Statements
- 17 -
6. INVESTMENTS IN AND ADVANCES TO UNCONSOLIDATED SUBSIDIARIES AND ASSOCIATED COMPANIES Investments in and advances to unconsolidated subsidiaries and associated companies at March 31, 2013 and 2012, were as follows:
Millions of Yen Thousands ofU.S. Dollars
2013 2012 2013
Investments ¥4,686 ¥2,662 $49,858Long-term receivables 477 5 5,078 Total ¥5,164 ¥2,668 $54,936
7. LONG-TERM DEBT
Long-term debt at March 31, 2013 and 2012, consisted of the following:
Millions of Yen Thousands of U.S. Dollars
2013 2012 2013
Long-term loans principally from banks, due serially through 2018, with interest rates ranging from 1.9% to 2.0% at 2013 and 2012—Unsecured ¥ 10,221 ¥ 10,198 $ 108,736 Obligations under finance lease 5 12 61 Total 10,226 10,210 108,797Less current portion (91) (10,006 ) (977) Long-term debt, less current portion ¥10,135 ¥ 204 $107,819
Annual maturities of long-term debt, excluding finance leases (see Note 12), at March 31, 2013,
were as follows:
Year Ending March 31 Millions of Yen
Thousands ofU.S. Dollars
2014 ¥ 88 $ 941 2015 132 1,411 2018 10,000 106,382 Total ¥10,221 $108,736
Commitment-line contracts at March 31, 2013, were as follows:
Millions of Yen Thousands of U.S. Dollars
Commitment-line contracts ¥15,000 $159,574 Unused commitments ¥15,000 $159,574
- 18 -
8. RETIREMENT AND PENSION PLANS Employees of the Company are, under most circumstances, entitled to payments from the defined contribution pension plan and the defined benefit corporate pension plan upon retirement or termination. Employees of certain of the Company's consolidated subsidiaries are, under most circumstances, entitled to certain lump-sum severance payments and pension payments upon retirement or termination. The liability for employees' retirement benefits at March 31, 2013 and 2012, consisted of the following:
Millions of Yen Thousands ofU.S. Dollars
2013 2012 2013
Projected benefit obligation ¥23,727 ¥ 24,492 $252,418Fair value of plan assets (19,858) (18,429 ) (211,259)Unrecognized transitional obligation (1,217) (1,826 ) (12,954)Unrecognized actuarial loss (839) (2,432 ) (8,933)Unrecognized prior service cost 499 675 5,312Net amount booked in the consolidated balance sheet 2,310 2,479 24,584Prepaid pension expenses (6 ) Net liability for employees' retirement benefits ¥ 2,310 ¥ 2,486 $ 24,584
The components of net periodic benefit costs for the years ended March 31, 2013 and 2012, were as
follows:
Millions of Yen Thousands ofU.S. Dollars
2013 2012 2013
Service cost ¥ 721 ¥ 829 $ 7,672Interest cost 326 341 3,476Expected return on plan assets (275) (264 ) (2,930)Amortization of transitional obligation 608 608 6,477Recognized actuarial loss 591 748 6,287Amortization of prior service cost (176) (176 ) (1,875) Subtotal 1,796 2,086 19,108Payment to defined contribution pension trust 372 294 3,958 Net periodic benefit costs ¥2,168 ¥2,381 $23,066
Assumptions used for the years ended March 31, 2013 and 2012, are set forth as follows:
2013 2012
Discount rate 1.5% 1.5%Expected rate of return on plan assets 1.6% 1.6%Recognition period of actuarial gain/loss 10 years 10 yearsAmortization period of transitional obligation 15 years 15 yearsAmortization period of prior service cost 10 years 10 years

19 Consolidated Financial Statements 20Consolidated Financial Statements
Notes to Consolidated Financial Statements
- 19 -
9. EQUITY Japanese companies are subject to the Companies Act of Japan (the "Companies Act"). The significant provisions in the Companies Act that affect financial and accounting matters are summarized below:
a. Dividends
Under the Companies Act, companies can pay dividends at any time during the fiscal year in addition to the year-end dividend upon resolution at the shareholders' meeting. For companies that meet certain criteria, the Board of Directors may declare dividends (except for dividends in kind) at any time during the fiscal year if the company has prescribed so in its articles of incorporation. However, the Company cannot do so because it does not meet all the above criteria. The Company is organized as a company with board committees. The Companies Act permits companies to distribute dividends in kind (noncash assets) to shareholders subject to a certain limitation and additional requirements. Semiannual interim dividends may also be paid once a year upon resolution by the Board of Directors if the articles of incorporation of the company so stipulate. The Companies Act provides certain limitations on the amounts available for dividends or the purchase of treasury stock. The limitation is defined as the amount available for distribution to the shareholders, but the amount of net assets after dividends must be maintained at no less than ¥3 million.
b. Increases/Decreases and Transfer of Common Stock, Reserve, and Surplus
The Companies Act requires that an amount equal to 10% of dividends must be appropriated as a legal reserve (a component of retained earnings) or as additional paid-in capital (a component of capital surplus), depending on the equity account charged upon the payment of such dividends, until the aggregate amount of legal reserve and additional paid-in capital equals 25% of the common stock. Under the Companies Act, the total amount of additional paid-in capital and legal reserve may be reversed without limitation. The Companies Act also provides that common stock, legal reserve, additional paid-in capital, other capital surplus, and retained earnings can be transferred among the accounts under certain conditions upon resolution of the shareholders.
c. Treasury Stock and Treasury Stock Acquisition Rights
The Companies Act also provides for companies to purchase treasury stock and dispose of such treasury stock by resolution of the Board of Directors. The amount of treasury stock purchased cannot exceed the amount available for distribution to the shareholders, which is determined by a specific formula. Under the Companies Act, stock acquisition rights are presented as a separate component of equity. The Companies Act also provides that companies can purchase both treasury stock acquisition rights and treasury stock. Such treasury stock acquisition rights are presented as a separate component of equity or deducted directly from stock acquisition rights.
- 20 -
10. INCOME TAXES The Company and its domestic subsidiaries are subject to Japanese national and local income taxes which, in the aggregate, resulted in normal effective statutory tax rates of approximately 38% for the year ended March 31, 2013, and 41% for the year ended March 31, 2012. The tax effects of significant temporary differences which resulted in deferred tax assets and liabilities at March 31, 2013 and 2012, were as follows:
Millions of Yen Thousands ofU.S. Dollars
2013 2012 2013
Deferred tax assets: Cost of revenue ¥11,438 ¥ 10,712 $121,690 Allowance for employees' bonus 1,641 1,475 17,460 Retirement benefits 792 859 8,428 Future deductible depreciation 636 1,876 6,766 Enterprise tax 511 160 5,436 Loss on valuation of investment securities 424 342 4,520 Other 3,955 2,695 42,075 Less valuation allowance (1,082) (594 ) (11,513) Total 18,317 17,527 194,866 Deferred tax liabilities: Unrealized gain on available-for-sale securities 3,414 695 36,329 Deferred gain on derivatives under hedge accounting 1,852 304 19,703 Profit/loss in joint venture 402 797 4,282 Other 380 562 4,045 Total 6,050 2,359 64,365 Net deferred tax assets ¥12,267 ¥ 15,168 $130,500
Prior to April 1, 2012, "Deferred gain on derivatives under hedge accounting" was included in
"Other" among the deferred tax liabilities section. Since this fiscal year ended March 31, 2013, the amount is disclosed separately due to the increase in materiality. Net deferred tax assets as of March 31, 2013 and 2012, were recorded in the accompanying consolidated balance sheet as follows:
Millions of Yen Thousands of U.S. Dollars
2013 2012 2013
Current assets—Deferred tax assets ¥13,162 ¥ 12,987 $140,029Investments and other assets—Other assets 570 2,204 6,065Noncurrent liabilities—Other liabilities (1,465) (23 ) (15,594)

21 Consolidated Financial Statements 22Consolidated Financial Statements
Notes to Consolidated Financial Statements
- 21 -
A reconciliation between the normal effective statutory tax rate and the actual effective tax rate reflected in the accompanying consolidated statement of income for the year ended March 31, 2012, is as follows:
2012
Normal effective statutory tax rate 41%Expenses not deductible for income tax purposes 1Nontaxable dividend income (1)Profit/loss in joint venture (6)Tax credit (1)Lower income tax rates applicable to subsidiaries (2)Tax rate changes due to tax reform 5 Actual effective tax rate 38%
For the year ended March 31, 2013, a reconciliation is not disclosed because the difference is less
than 5% of the normal effective statutory tax rate. On December 2, 2011, new tax reform laws were enacted in Japan, which changed the normal effective statutory tax rate from approximately 41% to 38% effective for the fiscal years beginning on or after April 1, 2012 through March 31, 2015, and to 36% thereafter.
11. RESEARCH AND DEVELOPMENT COSTS
Research and development costs charged to income were ¥2,323 million ($23,007 thousand) and ¥1,848 million for the years ended March 31, 2013 and 2012, respectively.
12. LEASES
The Group leases certain machinery, computer equipment, and other assets. Obligations under finance leases and future minimum payments under noncancelable operating leases were as follows:
Year Ended March 31, 2013 Millions of Yen Thousands of U.S. Dollars Finance Leases Finance Leases
On
BalanceOff
BalanceOperating
Leases On
Balance Off
Balance Operating
Leases
Due within one year ¥3 ¥ 9 ¥188 $36 $ 99 $2,001Due after one year 2 13 494 24 147 5,256 Total ¥5 ¥23 ¥682 $61 $ 246 $7,257
- 22 -
Pro forma Information of Leased Property Whose Lease Inception Was before March 31, 2008 ASBJ Statement No. 13, "Accounting Standard for Lease Transactions" requires that all finance lease transactions be capitalized to recognize lease assets and lease obligations in the balance sheet. However, ASBJ Statement No. 13 permits leases without ownership transfer of the leased property to the lessee and whose lease inception was before March 31, 2008, to continue to be accounted for as operating lease transactions if certain "as if capitalized" information is disclosed in the note to the financial statements. The Company applied ASBJ Statement No. 13 effective April 1, 2008, and accounted for such leases as operating lease transactions. Pro forma information of leased property whose lease inception was before March 31, 2008, on an "as if capitalized" basis was as follows:
Year Ended March 31, 2013 Millions of Yen
Buildings and
Structures
Tools, Furniture,
and Fixtures Other Total
Acquisition cost ¥16 ¥51 ¥ 26 ¥93Accumulated depreciation 9 42 18 70 Net leased property ¥ 6 ¥ 8 ¥ 8 ¥23
Year Ended March 31, 2012 Millions of Yen
Buildings and
Structures
Tools, Furniture,
and Fixtures Other Total
Acquisition cost ¥67 ¥79 ¥ 26 ¥173Accumulated depreciation 32 61 15 109 Net leased property ¥34 ¥17 ¥ 10 ¥ 63
Year Ended March 31, 2013 Thousands of U.S. Dollars
Buildings and
Structures
Tools, Furniture,
and Fixtures Other Total
Acquisition cost $172 $543 $ 276 $992Accumulated depreciation 100 454 191 746 Net leased property $ 71 $ 89 $ 85 $246

23 Consolidated Financial Statements 24Consolidated Financial Statements
Notes to Consolidated Financial Statements
- 23 -
Obligations under finance leases for the years ended March 31, 2013 and 2012, were as follows:
Millions of Yen Thousands of U.S. Dollars
2013 2012 2013
Due within one year ¥ 9 ¥ 47 $ 99Due after one year 13 16 147 Total ¥23 ¥ 63 $246
Depreciation expense as lessee, which is not reflected in the accompanying consolidated statement
of income, computed by the straight-line method was ¥13 million ($142 thousand) and ¥53 million for the years ended March 31, 2013 and 2012, respectively. Lease payments were approximately equal to the depreciation expense. The amounts of obligations, acquisition cost, and depreciation under finance leases include the imputed interest income portion and interest expense portion.
13. FINANCIAL INSTRUMENTS AND RELATED DISCLOSURES
(1) Group Policy for Financial Instruments The Group uses financial instruments for cash surpluses, if any, invested in low-risk financial assets, such as certificates of deposit and deposits at call. For operating capital, the Group uses bank loans. Derivatives are used, not for speculative purposes, but to manage exposure to the market risk of fluctuation in foreign currency exchange rates and interest rates.
(2) Nature and Extent of Risks Arising from Financial Instruments
Receivables, such as trade notes and trade accounts, are exposed to customer credit risk. Although receivables in foreign currencies are exposed to the market risk of fluctuation in foreign currency exchange rates, the position, net of payables in foreign currencies, is hedged by using foreign currency forward contracts. Cash equivalents include certificates of deposit, which mature shortly and are used for cash surpluses. Short-term investments include deposits at call, which will mature three months after the date of acquisition. Both certificates of deposit and deposits at call are exposed to default risk of the issuing financial institution. Investment securities are equity securities related to the business, which the Group operates. Marketable securities are exposed to the risk of fluctuations in stock prices. Payment terms of payables, such as trade notes and trade accounts, are generally less than one year. Although payables in foreign currencies are exposed to the market risk of fluctuation in foreign currency exchange rates, those risks are netted against the balance of receivables denominated in the same foreign currency as noted above. Bank loans are used for operating capital. Although they are exposed to the market risks from changes in interest rates, the risk is hedged by using interest rate swap contracts.
- 24 -
Derivatives are foreign currency forward contracts and interest rate swap contracts, which are used to manage exposure to market risks from changes in foreign currency exchange rates of receivables and payables, and from changes in interest rates, respectively. Please see Notes 2.v and 14 for more detail about derivatives.
(3) Risk Management for Financial Instruments
Credit risk management Credit risk is the risk of economic loss arising from a counterparty's failure to repay or service debt according to the contractual terms. The Group manages its credit risk from receivables on the basis of internal guidelines, which include monitoring of payment terms and balances of major customers to identify the default risk of customers at an early stage. Certificates of deposit and deposits at call are exposed to insignificant default risk because transactions are limited to major financial institutions. With respect to foreign currency forward contracts, the Group limits the counterparty to those derivatives to major financial institutions that can bear losses arising from credit risk. Market risk management (risk of foreign exchange and interest rates) Foreign currency trade receivables and payables are exposed to market risk resulting from fluctuations in foreign currency exchange rates. Such foreign exchange risk is hedged principally with foreign currency forward contracts. Interest expense associated with long-term debts is exposed to market risk resulting from changes in interest rates. Such risk is hedged by interest rate swap contracts. Foreign currency forward contracts are controlled under internal guidelines. The position related to particular construction contracts is identified and is reviewed monthly. Reconciliation of the transaction and balances with customers' confirmation replies is made, and the transactions related to foreign currency forward contracts are executed and accounted for under internal guidelines. Marketable and investment securities are managed by monitoring the market values and financial position of issuers on a regular basis. The Group assesses the stock price risk quantitatively so as to account for significant declines in market value as impairment losses. Liquidity risk management Liquidity risk comprises the risk that the Group cannot meet its contractual obligations in full on their maturity dates. The Group manages its liquidity risk by holding adequate volumes of liquid assets along with timely adequate financial planning.
(4) Fair Values of Financial Instruments
Fair values of financial instruments are based on quoted prices in active markets. If a quoted price is not available, another rational valuation technique is used instead. Also, please see Note 14 for the detail of fair value for derivatives.

25 Consolidated Financial Statements 26Consolidated Financial Statements
Notes to Consolidated Financial Statements
- 25 -
(a) Fair values of financial instruments March 31, 2013
Millions of Yen
Carrying Amount Fair Value
Unrealized Gain (Loss)
Cash and cash equivalents ¥180,229 ¥ 180,229 Held-to-maturity securities—current 2,400 2,400 Short-term investments 226 226 Notes and accounts receivable 37,917 37,917 Costs and estimated earnings on long-term construction contracts 27,477 27,477 Jointly controlled assets of joint venture 94,696 94,696 Investment securities 21,334 21,334 Total ¥364,280 ¥ 364,280 Current portion of long-term debt ¥ 88 ¥ 88 Notes and accounts payable—trade 117,769 117,769 Income taxes payable 8,500 8,500 Long-term debt 10,132 10,132 Total ¥136,490 ¥ 136,490
March 31, 2012
Millions of Yen
Carrying Amount Fair Value
Unrealized Gain (Loss)
Cash and cash equivalents ¥173,769 ¥ 173,769 Short-term investments 307 307 Notes and accounts receivable 30,051 30,051 Costs and estimated earnings on long-term construction contracts 13,788 13,788 Jointly controlled assets of joint venture 65,794 65,794 Investment securities 13,885 13,885 Total ¥297,597 ¥ 297,597 Current portion of long-term debt ¥ 10,000 ¥ 10,000 Notes and accounts payable—trade 86,211 86,211 Income taxes payable 1,162 1,162 Long-term debt 198 198 Total ¥ 97,572 ¥ 97,572
- 26 -
March 31, 2013
Thousands of U.S. Dollars
Carrying Amount Fair Value
Unrealized Gain (Loss)
Cash and cash equivalents $1,917,333 $1,917,333 Held-to-maturity securities—current 25,531 25,531 Short-term investments 2,407 2,407 Notes and accounts receivable 403,376 403,376 Costs and estimated earnings on long-term construction contracts 292,309 292,309 Jointly controlled assets of joint venture 1,007,408 1,007,408 Investment securities 226,960 226,960 Total $3,875,327 $3,875,327 Current portion of long-term debt $ 941 $ 941 Notes and accounts payable—trade 1,252,863 1,252,863 Income taxes payable 90,429 90,429 Long-term debt 107,794 107,794 Total $1,452,028 $1,452,028
Cash and Cash Equivalents, Held-to-Maturity Securities—Current, Short-Term
Investments, Notes and Accounts Receivable, and Costs and Estimated Earnings on Long-Term Construction Contracts The carrying values of accounts mentioned above approximate fair value because of their short maturities. Jointly Controlled Assets of Joint Venture The jointly controlled assets of the joint venture are jointly controlled cash recognized based on the Company's share of the venture. The carrying values of jointly controlled assets of the joint venture approximate fair value because of their short maturities. Investment Securities The fair values of investment securities are measured at the quoted market price of the stock exchange for the equity instruments. The information of the fair value for investment securities by classification is included in Note 5. The above schedules do not include investment securities whose fair value cannot be reliably determined. Notes and Accounts Payable—Trade and Income Taxes Payable The carrying values of accounts mentioned above approximate fair value because of their short maturities.

27 Consolidated Financial Statements 28Consolidated Financial Statements
Notes to Consolidated Financial Statements
- 27 -
Current Portion of Long-Term Debt (Bank Loans)/Long-Term Debt (Bank Loans) The fair value of fixed rate loans is calculated by discounting total principal and interest payments to present value using a discount rate equal to the rate that would be charged if the loan was newly borrowed. The fair value of floating rate loans, which are subject to a specific method for interest rate swaps, is calculated by discounting total principal and interest payments, which are handled together with interest rate swaps, to present value using a discount rate equal to the rate that would be charged if the loan was newly borrowed. Derivatives The information of the fair value for derivatives is included in Note 14.
(b) Carrying amount of financial instruments whose fair values cannot be reliably determined
Millions of Yen Thousands of U.S. Dollars
2013 2012 2013
Investment securities that do not have a quoted market price in an active market ¥2,403 ¥1,639 $ 25,565 Investments in equity instruments that do not have a quoted market price in an active market 2 2 31 Investments in unconsolidated subsidiaries and associated companies that do not have a quoted market price in an active market 4,686 2,662 49,858
(5) Maturity Analysis for Financial Assets and Securities with Contractual Maturities
March 31, 2013
Millions of Yen
Due in 1 Year or Less
Due after 1 Year
through 5 Years
Due after 5 Years
through 10 Years
Due after 10 Years
Cash and cash equivalents ¥180,194 Held-to-maturity securities—current 2,400 Short-term investments 226 Notes and accounts receivable, and costs and estimated earnings on long-term construction contracts 64,861 ¥ 532 Jointly controlled assets of joint venture 94,696 Total ¥342,378 ¥532
- 28 -
March 31, 2012
Millions of Yen
Due in 1 Year or Less
Due after 1 Year
through 5 Years
Due after 5 Years
through 10 Years
Due after 10 Years
Cash and cash equivalents ¥173,684 Short-term investments 307 Notes and accounts receivable, and costs and estimated earnings on long-term construction contracts 43,731 ¥ 109 Jointly controlled assets of joint venture 65,794 Total ¥283,517 ¥109
March 31, 2013
Thousands of U.S. Dollars
Due in 1 Year or Less
Due after 1 Year
through 5 Years
Due after 5 Years
through 10 Years
Due after 10 Years
Cash and cash equivalents $1,916,958 Held-to-maturity securities—current 25,531 Short-term investments 2,407 Notes and accounts receivable, and costs and estimated earnings on long-term construction contracts 690,018 $5,667 Jointly controlled assets of joint venture 1,007,408 Total $3,642,324 $5,667
Please see Note 7 for annual maturities of long-term debt and Note 12 for obligations under
finance leases.

29 Consolidated Financial Statements 30Consolidated Financial Statements
Notes to Consolidated Financial Statements
- 29 -
14. DERIVATIVES Derivative Transactions to Which Hedge Accounting Is Not Applied March 31, 2013
Millions of Yen
Contract Amount
Contract Amount Due after One Year
Fair Value (Loss)
Unrealized Gain (Loss)
Foreign currency forward contracts: Selling U.S.$/buying yen ¥14,267 ¥ (15 ) ¥(15) Selling Euro/buying yen 11,243 Selling GBP/buying yen 284 Selling AUD/buying yen 1,933 (4 ) (4) Buying U.S.$/selling yen 276 ¥36 52 52 Buying Euro/selling yen 79 51 12 12 Total ¥28,085 ¥87 ¥ 45 ¥ 45
March 31, 2012
Millions of Yen
Contract Amount
Contract Amount Due after One Year
Fair Value(Loss)
Unrealized Gain (Loss)
Foreign currency forward contracts: Selling U.S.$/buying yen ¥18,468 ¥ (34 ) ¥(34) Selling Euro/buying yen 4,492 7 7 Selling GBP/buying yen 182 Selling AUD/buying yen 81 (6 ) (6) Buying U.S.$/selling yen 119 3 3 Buying Euro/selling yen 42 Buying SGD/selling yen 3 Buying Euro/selling U.S.$ 391 (5 ) (5) Total ¥23,781 ¥ (34 ) ¥(34)
- 30 -
March 31, 2013
Thousands of U.S. Dollars
Contract Amount
Contract Amount Due after One Year
Fair Value (Loss)
Unrealized Gain (Loss)
Foreign currency forward contracts: Selling U.S.$/buying yen $151,781 $ (162 ) $(162) Selling Euro/buying yen 119,609 (2 ) (2) Selling GBP/buying yen 3,026 (1 ) (1) Selling AUD/buying yen 20,571 (46 ) (46) Buying U.S.$/selling yen 2,945 $387 561 561 Buying Euro/selling yen 844 548 135 135 Total $298,778 $935 $ 483 $ 483
Derivative Transactions to Which Hedge Accounting Is Applied
March 31, 2013
Millions of Yen
Hedged Item Contract Amount
Contract Amount Due after One Year
Fair Value(Loss)
Foreign currency forward contracts— Accounted for under deferred hedge accounting method:
Selling U.S.$/buying yen Foreign currency ¥ 1,863 ¥ 513 ¥(220) Buying U.S.$/selling yen forecasted 4,489 1,056 851 Buying Euro/selling yen transaction 584 461 116 Buying SGD/selling yen 221 3 Total ¥ 7,158 ¥ 2,031 ¥ 752 Other*1: Selling U.S.$/buying yen Receivables ¥ 693 Buying U.S.$/selling yen Payables 948 ¥ 101 Buying Euro/selling yen 372 Buying SGD/selling yen 18 Total ¥ 2,032 ¥ 101 Interest rate swaps*2 (fixed rate payment, floating rate receipt)
Long-term debt ¥10,000 ¥ 10,000
Total ¥10,000 ¥ 10,000

31 Consolidated Financial Statements 32Consolidated Financial Statements
Notes to Consolidated Financial Statements
- 31 -
March 31, 2012
Millions of Yen
Hedged Item Contract Amount
Contract Amount Due after One Year
Fair Value(Loss)
Foreign currency forward contracts— Accounted for under deferred hedge accounting method:
Selling U.S.$/buying yen Foreign currency ¥ 1,785 ¥ 581 ¥ (39) Selling GBP/buying yen forecasted 25 (1) Buying U.S.$/selling yen transaction 6,492 2,995 242 Buying Euro/selling yen 1,041 100 14 Buying SGD/selling yen 46 2 Total ¥ 9,391 ¥ 3,677 ¥218 Other*1: Selling U.S.$/buying yen Receivables ¥ 43 Buying U.S.$/selling yen Payables 267 ¥ 60 Buying Euro/selling yen 6 Total ¥ 317 ¥ 60 Interest rate swaps*2 (fixed rate payment, floating rate receipt)
Current portion of long-term debt
¥10,000 ¥ 10,000
Total ¥10,000 ¥ 10,000
- 32 -
March 31, 2013
Thousands of U.S. Dollars
Hedged Item Contract Amount
Contract Amount Due after One Year
Fair Value(Loss)
Foreign currency forward contracts— Accounted for under deferred hedge accounting method:
Selling U.S.$/buying yen Foreign currency $ 19,823 $ 5,466 $(2,343) Buying U.S.$/selling yen forecasted 47,759 11,234 9,058 Buying Euro/selling yen transaction 6,217 4,907 1,244 Buying SGD/selling yen 2,357 42 Total $ 76,158 $ 21,608 $ 8,001 Other*1: Selling U.S.$/buying yen Receivables $ 7,375 Buying U.S.$/selling yen Payables 10,092 $ 1,077 Buying Euro/selling yen 3,959 Buying SGD/selling yen 195 Total $ 21,622 $ 1,077 Interest rate swaps*2 (fixed rate payment, floating rate receipt)
Long-term debt $106,382 $ 106,382
Total $106,382 $ 106,382
*1 Foreign currency forward contracts, which are applied to the foreign currency translation at the
contract rate of the assets and liabilities on construction contracts denominated in foreign currencies.
*2 Interest rate swap contracts accounted under a specific method, are treated as part of the hedged
long-term debt, thus their fair values are integrally computed with those of the hedged long-term debt. See Note 13 for the fair value of long-term debt.
15. CONTINGENT LIABILITIES
At March 31, 2013, the Group had the following contingent liabilities:
Millions of Yen Thousands ofU.S. Dollars
Guarantees on employees' housing loans ¥ 130 $ 1,387Performance bond for an unconsolidated subsidiary 1,743 18,544

33 Consolidated Financial Statements 34Consolidated Financial Statements
Notes to Consolidated Financial Statements
- 33 -
16. COMPREHENSIVE INCOME The components of other comprehensive income for the years ended March 31, 2013 and 2012, were as follows:
Millions of Yen Thousands ofU.S. Dollars
2013 2012 2013
Unrealized gain on available-for-sale securities: Gains arising during the year ¥7,564 ¥2,156 $80,478 Reclassification adjustments to profit or loss 231 250 2,460 Amount before income tax effect 7,796 2,406 82,938 Income tax effect (2,721) (668 ) (28,947) Total ¥5,075 ¥1,738 $53,991 Deferred gain on derivatives under hedge accounting: Gains (losses) arising during the year ¥6,362 ¥ (424 ) $67,690 Adjustment to acquisition cost of assets (2,299) 549 (24,464) Reclassification adjustments to profit or loss (117) 6 (1,248) Amount before income tax effect 3,945 131 41,977 Income tax effect (1,497) (34 ) (15,934) Total ¥2,448 ¥ 97 $26,042 Foreign currency translation adjustments— Adjustments arising during the year ¥1,081 ¥ (361 ) $ 11,508 Total ¥1,081 ¥ (361 ) $11,508 Share of other comprehensive income (loss) in associates—Gains (losses) arising during the year ¥ 85 ¥ (105 ) $ 913 Total ¥ 85 ¥ (105 ) $ 913 Total other comprehensive income ¥8,690 ¥1,368 $92,456
17. NET INCOME PER SHARE
A reconciliation of the differences between basic and diluted net income per share ("EPS") for the years ended March 31, 2013 and 2012, is as follows:
Year Ended March 31, 2013
Millions of Yen
Thousands of Shares Yen U.S. Dollars
Net
IncomeWeighted-Average
Shares EPS
Basic EPS—Net income available to common shareholders ¥ 16,077 259,053 ¥ 62.06 $0.66
- 34 -
There is no dilutive effect for the year ended March 31, 2013. Year Ended March 31, 2012
Millions of Yen
Thousands of Shares Yen
Net
IncomeWeighted-Average
Shares EPS
Basic EPS—Net income available to common shareholders ¥ 14,364 259,086 ¥ 55.44
There is no dilutive effect for the year ended March 31, 2012.
18. SUBSEQUENT EVENT The following appropriation of retained earnings at March 31, 2013, was approved at the Company's shareholders' meeting on June 25, 2013:
Millions of Yen Thousands ofU.S. Dollars
Year-end cash dividends, ¥19.00 ($0.20) per share ¥4,921 $52,360
19. SEGMENT INFORMATION
Under ASBJ Statement No. 17, "Accounting Standard for Segment Information Disclosures" and ASBJ Guidance No. 20, "Guidance on Accounting Standard for Segment Information Disclosures," an entity is required to report financial and descriptive information about its reportable segments. Reportable segments are operating segments or aggregations of operating segments that meet specified criteria. Operating segments are components of an entity about which separate financial information is available and such information is evaluated regularly by the chief operating decision maker in deciding how to allocate resources and in assessing performance. Generally, segment information is required to be reported on the same basis as is used internally for evaluating operating segment performance and deciding how to allocate resources to operating segments.
(1) Description of Reportable Segments
The Group's reportable segments are those for which separate financial information is available and regular evaluation by the Company's management is being performed in order to decide how resources are allocated within the Group. The Group globally provides "Engineering" services, including planning, engineering, construction, procurement, commissioning, and maintenance, adapting the most appropriate functions of each related company.
(2) Methods of Measurement for the Amounts of Sales, Profit (Loss), Assets, Liabilities, and Other
Items for Each Reportable Segment The accounting policies of each reportable segment are consistent with those disclosed in Note 2, "Summary of Significant Accounting Policies." The profit in reporting segments is based on the operating income. Intersegment income and transfer are measured at the quoted market price.

35 Consolidated Financial Statements 36Consolidated Financial Statements
Notes to Consolidated Financial Statements
- 35 -
(3) Information about Sales, Profit (Loss), Assets, Liabilities, and Other Items Year Ended March 31, 2013
Millions of Yen
Reportable Segment Reconcili- Consoli-
Engineering Other*1 Total ations*2 dated*3
Sales: Sales to external customers ¥392,037 ¥ 6,881 ¥398,918 ¥398,918 Intersegment sales or transfers 9 8,504 8,513 ¥ (8,513) Total ¥392,046 ¥15,385 ¥407,432 ¥ (8,513) ¥398,918 Segment profit ¥ 24,499 ¥ 848 ¥ 25,348 ¥ (235) ¥ 25,113Segment assets 429,400 4,874 434,274 1,104 435,379Segment liabilities 236,130 1,943 238,073 7,949 246,023Other: Depreciation 2,593 22 2,616 (36) 2,580 Amortization of goodwill 5 35 41 41 Investment in associated companies 1,151 1,151 1,151 Increase in property, plant, and equipment and intangible assets 9,215 43 9,259 (300) 8,958
Year Ended March 31, 2012
Millions of Yen
Reportable Segment Reconcili- Consoli-
Engineering Other*1 Total ations*2 dated*3
Sales: Sales to external customers ¥247,849 ¥ 6,826 ¥254,675 ¥254,675 Intersegment sales or transfers 2 8,508 8,510 ¥ (8,510) Total ¥247,851 ¥15,334 ¥263,186 ¥ (8,510) ¥254,675 Segment profit ¥ 23,755 ¥ 531 ¥ 24,287 ¥ (89) ¥ 24,197Segment assets 358,155 8,165 366,321 (525) 365,795Segment liabilities 185,832 3,671 189,503 7,553 197,057Other: Depreciation 2,664 21 2,685 (48) 2,637 Amortization of goodwill 84 84 84 Investment in associated companies 945 945 945 Increase in property, plant, and equipment and intangible assets 3,631 4 3,635 (180) 3,455
- 36 -
Year Ended March 31, 2013
Thousands of U.S. Dollars
Reportable Segment Reconcili- Consoli-
Engineering Other*1 Total ations*2 dated*3
Sales: Sales to external customers $4,170,609 $ 73,205 $4,243,814 $4,243,814 Intersegment sales or transfers 97 90,472 90,570 $ (90,570) Total $4,170,707 $163,677 $4,334,384 $ (90,570) $4,243,814 Segment profit $ 260,636 $ 9,025 $ 269,662 $ (2,501) $ 267,160Segment assets 4,568,088 51,858 4,619,946 11,748 4,631,695Segment liabilities 2,512,023 20,675 2,532,698 84,568 2,617,267Other: Depreciation 27,591 244 27,836 (386) 27,450 Amortization of goodwill 59 378 438 438 Investment in associated companies 12,250 12,250 12,250 Increase in property, plant, and equipment and intangible assets 98,038 463 98,501 (3,195) 95,306
Notes for the year ended March 31, 2013: *1 "Other" represents industry segments, which are not included in the reportable segment,
consisting of temporary staffing services, IT services, and travel services. *2 The detail of the reconciliations is as follows:
(1) The reconciliation in segment profit of ¥(235) million ($(2,501) thousand) is the elimination of intersegment trades.
(2) The reconciliation in segment assets of ¥1,104 million ($11,748 thousand) is the result
of the elimination of intersegment trades of ¥(2,066) million ($(21,985) thousand) and the Group's assets of ¥3,170 million ($33,733 thousand), which are not included in the reportable segment.
(3) The reconciliation in segment liabilities of ¥7,949 million ($84,568 thousand) is the
result of the elimination of intersegment trades of ¥(2,050) million ($(21,814) thousand) and the Group's liabilities of ¥10,000 million ($106,382 thousand), which are not included in the reportable segment.
(4) The reconciliation in depreciation of ¥(36) million ($(386) thousand) is the elimination
of intersegment trades. (5) The reconciliation in increase in property, plant, and equipment and intangible assets
of ¥(300) million ($(3,195) thousand) is the elimination of intersegment trades.
*3 The calculation of the segment profit is based on the operating income on the consolidated statement of income.

37 Consolidated Financial Statements 38Consolidated Financial Statements
Notes to Consolidated Financial Statements
- 37 -
Notes for the year ended March 31, 2012: *1 "Other" represents industry segments, which are not included in the reportable segment,
consisting of temporary staffing services, IT services, and travel services. *2 The detail of the reconciliations is as follows:
(1) The reconciliation in segment profit of ¥(89) million is the elimination of intersegment trades.
(2) The reconciliation in segment assets of ¥(525) million is the result of the elimination of
intersegment trades of ¥(2,740) million and the Group's assets of ¥2,214 million, which are not included in the reportable segment.
(3) The reconciliation in segment liabilities of ¥7,553 million is the result of the
elimination of intersegment trades of ¥(2,446) million and the Group's liabilities of ¥10,000 million, which are not included in the reportable segment.
(4) The reconciliation in depreciation of ¥(48) million is the elimination of intersegment
trades. (5) The reconciliation in increase in property, plant, and equipment and intangible assets
of ¥(180) million is the elimination of intersegment trades.
*3 The calculation of the segment profit is based on the operating income on the consolidated statement of income.
Related Information
(1) Information about Products and Services The proportion of engineering business is more than 90% of the total sales of the Group. Accordingly, the presentation of the information about each service is not required under Japanese accounting standards.
(2) Information about Geographical Areas
(a) Revenue Year Ended March 31, 2013
Millions of Yen Thousands of U.S. Dollars
Japan ¥150,800 $1,604,255Malaysia 83,685 890,274Papua New Guinea 66,143 703,655Australia 44,559 474,040Others 53,729 571,589 Total ¥398,918 $4,243,814
- 38 -
Year Ended March 31, 2012
Millions of Yen
Japan ¥ 94,925Papua New Guinea 70,508Malaysia 30,575Middle East 30,398Others 28,267 Total ¥254,675
Note: Revenue is classified in countries or regions based on location of construction site.
(b) Property, plant, and equipment Year Ended March 31, 2013
Millions of Yen Thousands of U.S. Dollars
Japan ¥12,935 $137,611Asia 1,377 14,653Others 234 2,496 Total ¥14,547 $154,761
Year Ended March 31, 2012
The proportion of fixed assets placed in Japan is more than 90% of the total fixed assets of the Group. Accordingly, presentation of the information about fixed assets is not required under Japanese accounting standards.
(3) Information about Major Customers
Year Ended March 31, 2013
Name Related Segment Millions of Yen Thousands of U.S. Dollars
Tokuyama Malaysia Sdn. Bhd Engineering ¥82,921 $882,146Esso Highlands Ltd. Engineering 65,159 693,190Ichthys Lng Pty Ltd. Engineering 42,185 448,783
Year Ended March 31, 2012
Name Related Segment Millions of Yen
Esso Highlands Ltd. Engineering ¥69,856Tokuyama Malaysia Sdn. Bhd Engineering 28,815

39 Consolidated Financial Statements 40Consolidated Financial Statements
Notes to Consolidated Financial Statements
- 39 -
(4) Information about Goodwill by Segments Ending balance of goodwill as of March 31, 2013 and 2012, was as follows:
Millions of Yen Thousands ofU.S. Dollars
2013 2012 2013
Engineering ¥180 $1,917Other* 494 ¥ 716 5,265 Total ¥675 ¥ 716 $7,182
* Other involves temporary staffing services and IT services.
* * * * * *
INDEPENDENT AUDITOR’S REPORT
CORPORATE PHILOSOPHY
Enhance our business in aiming for harmonybetween energy and the environment, and contribute to the sustainable development of a society as an integrated engineering companythrough the use of our collective wisdom andpainstakingly developed technology.
Minato Mirai Grand Central Tower4-6-2, Minatomirai, Nishi-ku, Yokohama 220-8765, JapanTel: (81)45-225-7777 (voice guidance)http://www.chiyoda-corp.com/en/
For the Year Ended March 31, 2013, and Independent Auditor's Report
Consolidated Financial Statements
(As of August 2013)
Selected in FTSE Group’s responsibleinvestment index