annual report - j. lauritzen a/sstatic.j-l.com/imce/jlar2014_lowres.pdf · this annual report...
TRANSCRIPT

www.j-lauritzen.com
2014Annual Report

CONTENT · ANNUAL REPORT 20142
OVERVIEWIntroduction by Chairman and CEO 3About Us 4Highlights 2014 6Group Key Figures 8Outlook 2015 10
BUSINESSLauritzen Bulkers 11Lauritzen Kosan 16Other Businesses 21People, Relations and Systems 22Finance 24
GOVERNANCECorporate Governance 26Risk Management 27Corporate Responsibility 29Board of Directors 30Management 32
FINANCIALS Financial review 34Consolidated financial statements 36Parent company financial statements 67Management statement 89Independent Auditors’ Report 90List of Group Companies 91
Table of Contents
DISCLAIMERThis Annual Report contains forward-looking statements about J. Lauritzen’s future financial position. Such statements are subject to risks and uncertainties as various factors, many of which are beyond the control of J. Lauritzen, may cause actual developments and actual results to differ materially from expectations contained in the Annual Report. Accordingly, forward-looking statements should not be relied upon as a prediction of actual results.

OVERVIEW · ANNUAL REPORT 2014 3
Early 2014, an undercurrent of optimism existed in the shipping markets in general and amongst members of the dry-cargo community in particu-lar. The reality of the past year has proved this op-timism misplaced, and 2014 turned out to be con-siderably more difficult and challenging for us than expected.
The net results for 2014 were USD (166)m com-pared to USD (285)m in 2013. The results were in line with our most recent expectations but consi-derably below our expectations at the beginning of the year. The results were heavily impacted by impairment and provisions totalling USD (161)m. While the results were unsatisfactory in financial terms, we regard them as an outcome consistent with a very difficult year.
It is part of our strategy to diversify the revenue base and value creation opportunities by spread-ing business activities and investment interests across different market segments. The exit from the product tanker segment in 2013-14, the sales of our shuttle tankers and two of our capesize bulk carriers in 2014 have changed the risk profile of our revenue base. We maintain some diversifica-tion by operating two distinctly different business activities while our investment in Axis Offshore provides a further diversification to our value cre-ation opportunities.
In our view, our value creation will to an increasing extent have to be driven by our ability to combine
acumen, operational excellence and talent to transform relations, insight and knowledge into shared value to our owner and to our clients.
The global shipping industry faces cost-intensive challenges imposed on our industry by regulators and authorities. We support well considered en-vironmental regulation and call for their effective enforcement when economic incentives for non-compliance are obvious.
We have little doubt that we are facing a 2015 where it is very difficult indeed to find any credit-able reasons for our markets to improve conside-rably. The gas carrier earnings will continue to be impacted by slow global economic growth, dry bulk suffers from severe oversupply and offshore activities are hampered by low oil prices.
Low energy prices may provide the beginning of an upturn as households all over the world feel the increased spending power and start consuming. It is, however, unlikely for this to have an impact short-term, and we believe that our three business areas will be faced with a year of hard work and little financial reward.
Bent ØstergaardChairman of the Board Jan Kastrup-NielsenPresident and CEO
Introduction by Chairman and CEO

OVERVIEW · ANNUAL REPORT 20144
About Us J. Lauritzen has served the maritime trade world-wide for more than 130 years and has been en-gaged in a range of different segments of the shipping industry. Today, we are a global provider of marine transportation of dry bulk cargoes, pe-trochemicals and liquefied petroleum gases. In addition we have investments in the offshore ser-vice sector.
Our businessLauritzen Bulkers controls a modern fleet of more than 100 primarily handysize and supramax dry bulk carriers. The handysize operation is our main business activity and is based on a large homoge-neous fleet of owned, part-owned and long-term time-chartered vessels, vessels committed by partners as well as a substantial number of short-term time-chartered vessels.
Lauritzen Kosan specialises in carriage of petro-chemicals and liquefied petroleum gases - a seg-ment of the shipping industry characterised by technically complex requirements from regulators and clients. Lauritzen Kosan controls a fleet of 39 semi-refrigerated, fully-pressurized and ethylene gas carriers.
In addition to our two main business areas, we have business interests in the offshore service sector through our part-ownership of Axis Off-shore Ltd., provider of high specification accom-modation units servicing the offshore oil and gas industry.
Lauritzen Bulkers
Lauritzen Kosan
Invested capital per business unit, year-end 2014
Lauritzen Bulkers
Lauritzen Kosan
Revenue per business unit, 2014
J. Lauritzen at a glance
• Founded in 1884, Denmark• Owned by the Lauritzen Foundation. The
Lauritzen Foundation is a self-governing in-stitution regulated by the Danish Act on Commercial Foundations. Through its char-ter, the Foundation is committed to promote and develop the Danish shipping industry in general and support humanitarian work.
• Operating world-wide with headquarters in Copenhagen, Denmark
• Overseas offices in Singapore, China, the Philippines, the United States, Switzerland and Spain
• 5,759 port calls in 104 countries during 2014• 213 employees ashore• 20 nationalities with a gender distribution of
37% female and 63% male• 798 seafarers on board owned vessels

OVERVIEW · ANNUAL REPORT 2014 5
Who we areWe consider ourselves a value-driven organisa-tion with Accountability, Respect, Competence, Enthusiasm, Entrepreneurship and Team Spirit representing the essence of who and what we are. Our attitudes, decisions and actions always reflect our values.
Our value creation is anchored in the ability of our people to build and manage relations with our clients and hereby understand and fulfil effi-ciently many different types of transportation re-quirements.
Our aim is to be considered always approach-able, always accountable and always looking to-wards shared value creation.
We can only achieve this by attracting and devel-oping high-calibre talented people, who anchor themselves in our tradition for open communica-tion, in combination with our organisational structure and tools, and who are empowered to develop our business.
We believe that part of a quality service is to con-duct business in a responsible manner creating benefits broadly while being open, fair and hon-est in all our activities.
Lauritzen Kosan
Lauritzen Bulkers
0% 20% 40% 60% 80% 100%
Africa Asia Oceania Europe North America South America
Business strategyDuring 2013-14 we made wide-ranging adjust-ments to our business portfolio, and this has al-lowed us to devote our full attention to the devel-opment of Lauritzen Bulkers and Lauritzen Kosan. The strategies of Lauritzen Bulkers and Lauritzen Kosan share the objective of creating value to our owner and clients by being reliable and trustwor-thy providers of marine transportation services on a global scale. Our two business units operate in two distinctly different segments of the shipping industry, and their respective business models dif-fer, yet, they share the following strategic attri-butes:
• Build and manage long-term relations with clients and stakeholders
• Create insight via building critical mass in selected segments
• Embrace complexity, leverage skills and competencies
• Select and invest in talent
Geographic distribution of imports, 2014
OVERVIEW · ANNUAL REPORT 20146
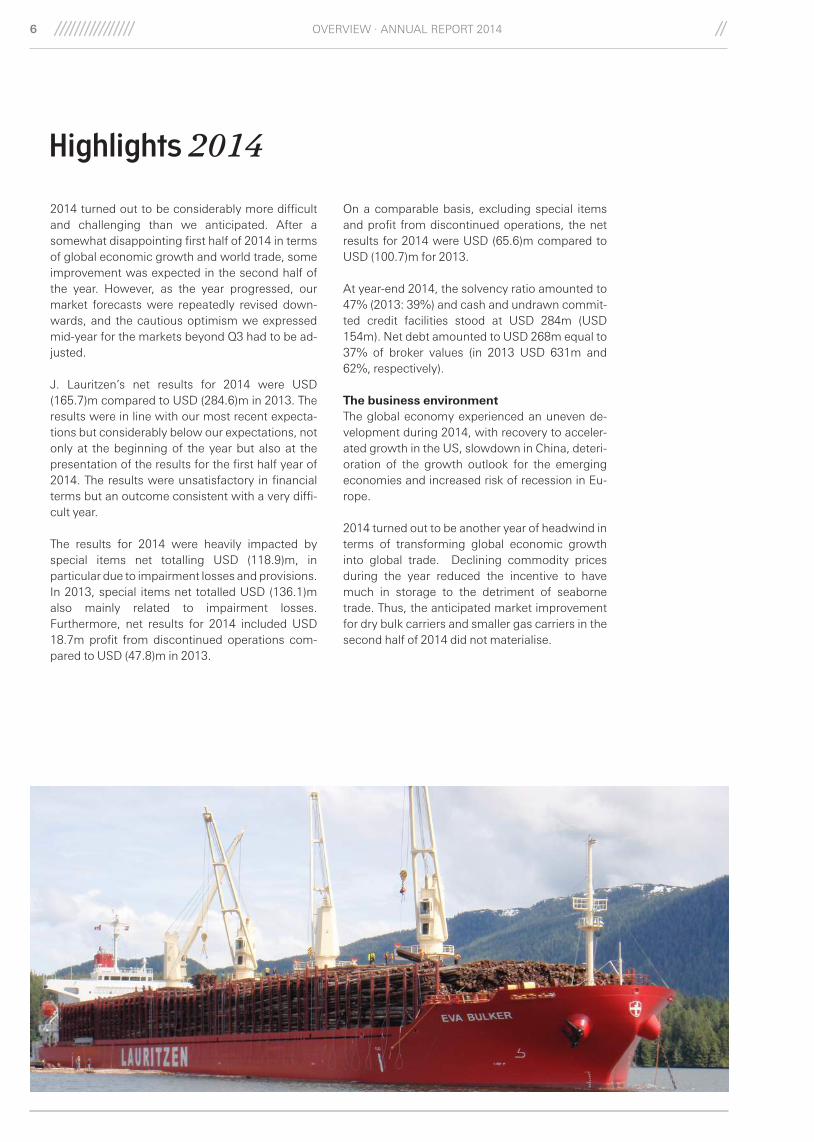
Highlights 2014
2014 turned out to be considerably more difficult and challenging than we anticipated. After a somewhat disappointing first half of 2014 in terms of global economic growth and world trade, some improvement was expected in the second half of the year. However, as the year progressed, our market forecasts were repeatedly revised down-wards, and the cautious optimism we expressed mid-year for the markets beyond Q3 had to be ad-justed.
J. Lauritzen’s net results for 2014 were USD (165.7)m compared to USD (284.6)m in 2013. The results were in line with our most recent expecta-tions but considerably below our expectations, not only at the beginning of the year but also at the presentation of the results for the first half year of 2014. The results were unsatisfactory in financial terms but an outcome consistent with a very diffi-cult year.
The results for 2014 were heavily impacted by special items net totalling USD (118.9)m, in particular due to impairment losses and provisions. In 2013, special items net totalled USD (136.1)m also mainly related to impairment losses. Furthermore, net results for 2014 included USD 18.7m profit from discontinued operations com-pared to USD (47.8)m in 2013.
On a comparable basis, excluding special items and profit from discontinued operations, the net results for 2014 were USD (65.6)m compared to USD (100.7)m for 2013.
At year-end 2014, the solvency ratio amounted to 47% (2013: 39%) and cash and undrawn commit-ted credit facilities stood at USD 284m (USD 154m). Net debt amounted to USD 268m equal to 37% of broker values (in 2013 USD 631m and 62%, respectively).
The business environmentThe global economy experienced an uneven de-velopment during 2014, with recovery to acceler-ated growth in the US, slowdown in China, deteri-oration of the growth outlook for the emerging economies and increased risk of recession in Eu-rope.
2014 turned out to be another year of headwind in terms of transforming global economic growth into global trade. Declining commodity prices during the year reduced the incentive to have much in storage to the detriment of seaborne trade. Thus, the anticipated market improvement for dry bulk carriers and smaller gas carriers in the second half of 2014 did not materialise.

OVERVIEW · ANNUAL REPORT 2014 7
Falling crude oil prices in the second half of the year led to reduced bunker prices and reduced the incentive to slowsteam, effectively increasing the supply of carrying capacity.
Main events in 2014During 2014, we succeeded in executing signifi-cant adjustments to our business portfolio, in-cluding the exit from the product tanker and shut-tle tanker segments.
The completion of these adjustments allowed us to devote our full attention to the development of Lauritzen Bulkers and Lauritzen Kosan.
A range of initiatives and adjustments were initi-ated in Lauritzen Bulkers with a view to increasing the value creation from transforming a significant number of shipping transactions into knowledge and market insight that enable Lauritzen Bulkers to take additional but time-limited shipping risk and hereby generate additional earnings from spot trading activities.
At Lauritzen Kosan, efforts were made to strength-en the business model, which is rooted in the abil-ity to, repeatedly, deliver reliable performance in a niche market surrounded by complex require-ments.
In order to simplify the legal structure of the J. Lauritzen Group, the decision was taken to merge subsidiary group companies with the parent com-pany in Denmark and Singapore, respectively. Lauritzen Bulkers and Lauritzen Kosan remain the trading names of our business activities.
During 2014, Lauritzen Bulkers and Lauritzen Ko-san controlled a combined average fleet of 147 vessels compared to 155 vessels in 2013. At year-end 2014, we owned 19 bulk carriers (average age of 4.6 years) and 22 gas carriers (average age of 9.8 years).
Our newbuilding programme consists of four su-pramax and two handysize dry bulk carriers. Two additional handysize dry bulk carriers have been ordered in a joint venture. The newbuildings are expected to be delivered through 2016-18.
Axis Offshore, our joint venture in the Accommo-dation and Support Vessel (ASV) segment, has two high-specification semi-submersible ASVs under construction with expected delivery in 2015 and 2016.
Assets and solvencyTotal invested capital was USD 836m at year-end 2014, down from USD 1,225m at year-end 2013.
The total book value of vessels amounted to USD 773.0m, down USD 248.1m on 2013 due to the sale of assets, impairment losses and deprecia-tion. Brokers’ valuations of vessels were on aver-age down 9% on 2013.

OVERVIEW · ANNUAL REPORT 20148
USDm 2014 2013 2012 2011 2010
Income statementRevenue 443 501 558 587 665Time-charter equivalent income (TCE) 351 352 388 520 588Operating income before depreciation (EBITDA) and special items 15 7 17 126 192EBITDA accounted for as discontinued operations 16 48 55 N/A N/AProfit/(loss) on sale of vessels and other assets 14 (8) 2 8 (12)Depreciation (56) (63) (75) (91) (75)Share of profit in joint ventures (1) (6) (8) 5 11Operating income (EBIT) before special items (28) (70) (64) 48 115Special items, net (119) (136) (200) (25) 82Financial items, net (40) (31) (41) (69) (56)Profit/(loss) from continuing operations before tax (187) (237) (305) (46) 141Profit/(loss) from discontinued operations 19 (48) (43) N/A N/AThe J. Lauritzen Group's share of profit/(loss) (166) (285) (350) (46) 131
Balance sheetNon current assets 952 1,185 1,931 2,361 2,062Total assets 1,208 1,877 2,315 2,682 2,411J. Lauritzen's share of equity 573 740 852 1,199 1,239Non-current liabilities 424 754 1,297 1,311 967Invested capital * 836 1,225 1,469 2,344 2,049Net interest bearing debt (NIBD) * 268 631 685 1,160 840
Cash flows and financial ressourcesCash flow from operating activities 60 (20) 34 86 164Cash flow from investment activities 553 28 (108) (330) (325)- hereof investments in vessels, machinery and equipm. (43) (118) (190) (438) (538)Cash flow from financing activities (572) (126) 107 323 142Changes for the year in cash and cash equivalents 41 (118) 33 79 (19)Financial ressources at the end of the year 284 154 268 292 202
Key figures and financial ratios Average number of employees * 1,064 1,125 1,167 1,300 1,148 Total number of ship days * 53,515 56,736 59,156 55,115 54,385 DKK exchange rate year-end 612 541 566 575 561 Average DKK exchange rate 562 562 580 536 563
Profit margin (6.1)% (12.7)% (10.0)% 7.4% 15.6%NIBD/EBITDA * 17.5 86.2 39.4 9.2 4.4Solvency ratio 47% 39% 37% 45% 52%Return on equity (ROE) (25.3)% (35.8)% (34.1)% (3.8)% 11.1%Return on invested capital (ROIC) * (14.3)% (15.3)% (17.1)% 1.1% 10.2%
* Continuing operations only in 2012-2014
Group Key Figures
In 2013, J. Lauritzen decided to discontinue its operations in Lauritzen Offshore - Shuttle tankers and Lauritzen Tankers and thus these activities
have been accounted for as discontinued operations for the periods 2012-2014. Comparison figures for 2010-2011 have not been represented.
The key figures have been calculated as follows:
Profit margin: Operating income before special items excl. Share of profit in joint ventures x 100 / Revenue
Solvency ratio: Total equity, year-end x 100 / Total equity and liabilities, year-end
Return on equity: J. Lauritzen’s share of profit/(loss) x 100 / J. Lauritzen’s average share of equity
Invested capital: Total assets less cash, securities, non operational assets and non interest-bearing current liabilities
Return on invested capital: Operating income after special items x 100 / Average invested capital
Net interest bearing debt (NIBD): Interest-bearing liabilities, less subordinated loan, interest-bearing assets and cash
NIBD/EBITDA: NIBD / Operating income before depreciation and special items

OVERVIEW · ANNUAL REPORT 2014 9
Capital structure USDm
Revenue USDm
Selected key figures USDm
Cash flow from operations and financial resources USDm
-400
-300
-200
-100
0
100
200
2010 2011 2012 2013 2014
EBITDA EBIT
Result for the year Special items, net
0
200
400
600
800
2010 2011 2012 2013 2014
Lauritzen Bulkers Lauritzen Kosan Other Discontinued oper.
0
500
1,000
1,500
2,000
2,500
3,000
2010 2011 2012 2013 2014
Total equity Non-current liab. Current liab.
-50
0
50
100
150
200
250
300
2010 2011 2012 2013 2014
Cash flow from operating activities Financial resources

OVERVIEW · ANNUAL REPORT 201410
Outlook 2015Global economic activity is expected to increase slightly in 2015 primarily due to solid growth in the US, whereas the European area is struggling to avoid recession. The contribution to global growth from China and from emerging economies is ex-pected to decrease. China’s economy is gradually changing from investment driven growth towards consumption driven growth. We see this as a risk for further decrease of Chinese import growth of raw materials to the detriment of demand for dry bulk shipping.
The current low oil prices are, however, expected to turn out to be a stimulus to global growth, and the availability of low priced LPG in combination with the US recovery is e.g. expected to support demand for gas carriers.
Increases in protectionist measures and sanctions that reflect ongoing geopolitical conflicts repre-sent a threat to global trade and marine transpor-tation. The existing Indonesian mineral export ban and the Chinese coal import restrictions are ex-pected to continue to have a negative impact on demand for dry bulk shipping.
Tonnage supply is expected to grow slightly stronger than demand growth in 2015, and net fleet growth is expected to further increase in the coming years due to significant ordering in 2013 and 2014. The incentive to slowsteam has been reduced with the current low bunker oil prices ef-fectively causing an additional increase in carry-ing capacity.
Based on the above, we expect market conditions and the overall business environment in 2015 to remain as challenging as in 2014.
EBITDA before special items for 2015 is expected to be within the range USD (20)m-30m, compared to USD 15m in 2014.
Net results are expected to be USD (70)m-(20)m, up compared to USD (166)m in 2014 where spe-cial items net had an impact of USD (119)m on the net results.
Currency and interest rate fluctuations as well as effects from the sale of assets, if any, may impact the result.

BUSINESS · ANNUAL REPORT 2014 11
Lauritzen Bulkers
2014 2013
Revenue 311.5 319.5
Time-charter equivalent income 248.8 238.6
EBITDA before special items 6.4 (12.1)
Depreciation (29.5) (36.9)
Profit/(loss) on sale of vessels etc. 13.4 (10.7)
Share of profits in joint ventures (3.9) (11.9)
Operating income before special items (13.6) (71.6)
Special items, net (118.9) (136.1)
Operating income after special items (132.5) (207.7)
Ship-days 39,118 40,895
Key figures USDm
0
20
40
60
80
100
120
0
20
40
60
80
100
2010 2011 2012 2013 2014 Handysize Supramax
Capesize Total (RHS)
Agricultural products
Construction materials
Metals
Energy
Minerals
Activity (average no. of ships)
Cargo mix, 2014
Operating income from our dry bulk activities be-fore depreciation (EBITDA) and special items amounted to USD 6.4m in 2014 which was up compared to USD (12.1)m in 2013. The activity level, measured by performed ship-days, declined by 4% compared to 2013.
The results for 2014 were negatively impacted by special items net totalling USD (118.9)m which comprised impairment losses and provisions to-talling USD (161.0)m, revenue from the sale of a counterparty claim relating to STX Pan Ocean and other settlements totalling USD 31.7m as well as a profit of USD 10.4m from sale of vessels also as a consequence of the STX Pan Ocean default. For comparison, the results for 2013 were impacted by special items net totalling USD (136.1)m main-ly related to impairment losses.
Operating income after special items amounted to USD (132.5)m compared to USD (207.7)m in 2013.
Measured by time-charter equivalent income, the total income in 2014 amounted to USD 248.8m, with USD 9,012/day in the handysize segment, USD 9,958/day in the supramax segment and USD 29,518/day in the capesize segment. The spot trading activity contributed with USD 8.4m, net.
During 2014, we worked on a range of initiatives and organisational adjustments to focus our busi-ness activities and to improve our ability to gener-ate value in fluctuating markets, in particular from spot trading activities.
Market conditions turned out to be considerably more difficult in 2014 than expected, and we ex-pect the business environment to remain chal-lenging throughout 2015.
ACTIVITY IN 2014In 2014, the total number of ship-days performed reached 39,118 corresponding to 107 vessels on average, compared to 40,895 ship-days with 112 vessels on average in 2013. Spot ship-days amounted to 10,311 compared to 8,897 in 2013 due to increased focus on the spot trading activi-ty.
Measured by the number of fixtures, which amounted to 1,098 in 2014, the activity in 2014 was on par with 2013. Our client base totalled more than 250 clients.

0
10,000
20,000
30,000
40,000
0
10,000
20,000
30,000
40,000
50,000
60,000
70,000
2010-01 2011-01 2012-01 2013-01 2014-01 2015-01
Average of the 4 T/C Routes for Baltic Capesize Index - LHS Average of the 6 T/C Routes for Baltic Supramax Index - RHS Average of the 6 T/C Routes for the Baltic Handysize Index - RHS
Spot market rates since 2010 in time-charter equivalent USD/day
Source: Own analysis based on data from clarkson research services
BUSINESS · ANNUAL REPORT 201412
GLOBAL MARKET DEVELOPMENTSThe dry bulk markets started 2014 with expect-ation of a recovery in the second part of 2014. Fol-lowing the trough related to the Chinese New Year, the expected seasonal uptick in Q2 did, how-ever, not materialise due to a combination of ne-gative events, including the effects of the mineral export ban imposed by Indonesia. This and the slowdown in Chinese coal imports dented the ex-pected rate improvements in the latter part of Q3 and into Q4. Despite overall robust demand growth (approximately 6%) that actually exceed-ed nominal supply growth (approximately 5%) freight rates were disappointing. The decreasing bunker prices in H2 reduced the incentive to slow-steam, and this effectively increased the supply of carrying capacity in addition to the nominal sup-ply growth.
The annual spot market average (on time-charter equivalent basis, as reported by Clarkson Re-search Services) was down 6% in the handysize segment, down 4% in the supramax segment and down 2% in the capesize segment compared to 2013.
STRATEGY AND BUSINESS MODELA strong presence in the handysize bulk carrier segment is the hallmark of Lauritzen Bulkers’ strategy.
The objective is to deliver competitive and reliable transportation services to our clients while gener-ating earnings to our owner exceeding market lev-els.
The dry bulk market is generally characterised by solid demand, fragmentation among carriers, strong price competition and fluctuating capacity
utilisation. This allows us ample possibilities to provide dry bulk shipping services on the basis of a large homogeneous fleet consisting of a core of owned, part-owned and long-term time-chartered vessels, vessels committed by partners and a sub-stantial volume of shorter term time-chartered vessels.
Our business model in handysize is rooted in our ability to transform a significant number of ship-ping transactions into knowledge and market in-sight. We have a strategic goal to employ a similar approach in the neighbouring supramax segment as this will allow us more opportunity to leverage our business model.
To achieve this we pay special attention to:• Positioning: Remain a preferred carrier by
having strong client focus and providing first-class dry bulk shipping services
• Performance: Optimise fleet utilisation in order to minimise ballasting days
• Processes: Always look to improve and trim processes to reduce costs and ensure scalability
• Spot trading: Leverage our knowledge and take additional time-limited shipping risk, i.e. additional positions in cargo, periods or ship-days, and thereby generating additional earnings
In addition to our presence in the handysize and supramax bulk carrier segments, we have a limit-ed presence in the capesize segment with two owned vessels long-term employed to a reliable counterparty. We do not wish to take new active shipping risk in this segment and our focus is strictly to act as shipowners under existing long-term charters.

BUSINESS · ANNUAL REPORT 2014 13
0% 10% 20% 30% 40% 50% 60% 70% 80% 90%
100%
Capesize Supramax Handysize
2015 2014
Business risk managementFluctuations in freight rates is the primary risk fac-tor associated with our business model. With a business strategy focusing on the handysize and supramax segments, the majority of our business is concluded in the spot and shorter term period market and market volatility is thus reflected in our earnings. The existence of market volatility is, however, also supportive for our strategy to earn margins from our spot trading activities.
Based on our outlook for handysize and supramax dry bulk carriers, the contract coverage for 2015 in relation to our committed fleet in handysize is approximately at the same level as early 2014, whereas coverage for our committed supramax fleet has increased, to some extent due to a de-crease in the fleet size. In the capesize segment, the relatively high coverage reflects our aim only to have vessels employed on longer term con-tracts.
Other important risk factors associated with our business model are access to tonnage, credit risk related to counterparties and fleet portfolio man-agement. We manage risk in relation to these fac-tors in the following way:• Tonnage: Securing and rejuvenating the
controlled fleet with focus on size and fuel efficiency. Obtaining flexibility in charter parties in terms of trading, period and purchase options
• Counterparties: Careful scrutiny of counter-parties, including i.a. their trading history, prior to concluding longer term contracts within predefined limits
• Fleet portfolio management: Balancing the needs for control, flexibility and commitment by having a core fleet of owned, part-owned and longer-term time-chartered vessels, vessels committed by partners as well as short-term chartered vessels enabling our spot trading activity
Coverage at the beginning of the year

BUSINESS · ANNUAL REPORT 201414
Core fleet and vessels committed by poolpartners at year-end 2014
2015 2016 2017 2018
Owned
Handysize 2
Supramax 2 1 1
Part-owned
Handysize 2
Supramax
Chartered
Handysize 3 6 3
Supramax 1 1
Total 4 9 8 1
Handysize 3 6 7
Supramax 1 3 1 1
Deliveries of newbuildings
Handy-size
Supra-max
Cape-size
Total New-buildings
Owned 17 0 2 19 6
Part-owned 10 0 0 10 2
T/C in 25 10 2 37 14
Pool, etc. 11 0 0 11 0
Total 63 10 4 77 22
FLEETIn 2014, our core fleet averaged 57 vessels (un-changed from 2013). Vessels committed by pool partners averaged 22 (down from 30 in 2013). At year-end 2014, our core fleet and vessels commit-ted by pool partners comprised 63 handysize, ten supramax and four capesize bulk carriers.
Two supramax vessels, sold in 2013, were deli-vered to new owners, and a further two were sold and delivered during 2014. Two capesize vessels were also sold and delivered to their new owners in 2014, reflecting our strategy to exit this seg-ment as an active player. A total of 16 long-term time-chartered vessels were delivered to the core fleet while ten vessels were redelivered to owners during 2014.
Four scheduled dry dockings were completed in 2014. Unscheduled off-hire for our owned fleet came to 0.47% of available ship-days in 2014 (0.57% in 2013).
At year-end 2014, the average age of the owned fleet was 4.6 years (3.3 years at year-end 2013).
The newbuilding programme includes six owned vessels and a further two vessels ordered by a joint-venture formed together with Sincere Indus-trial Corporation with scheduled delivery in 2016-18. Various tonnage providers are expected to de-liver a further 14 newbuildings on long-term time-charter to us.
PERFORMANCEWe work with our processes and organisation to ensure our competitiveness in a cost-focused market, where we see reliability, quality and glo-bal presence as a way to deliver value.
Increasing vessel performanceOur technical department implemented Vessel Energy Renovation Plans (VERP) on four vessels during 2014 (three vessels in 2013). VERP is a fleet performance catalogue that covers the opti-misation of auxiliary machine consumption, in-cluding pumps, fans and air conditioning, plus ad-ditional initiatives for technical and operational optimisation.
Vessel Energy Renovation Plans have been implemented on seven vessels over the last
two years realising fuel-savings of approximately 7%
A performance desk was established during 2014 to strengthen our efforts within energy-efficiency and increasing fleet performance. This new func-tion is establishing a Key Performance Indicator system for all performance-related data as a tool to streamline efficiency and at the same time stimulate a performance-oriented culture.
Operational excellenceDuring 2014, our operations department began utilising the Optimum Ship Routing (OSR) plat-form provided by WNI Weathernews Internation-al, enabling us to work in an even more structured way with day-to-day performance analysis, pro-jected fuel consumption and routing recommen-dations.
Note: Not including vessels with a charter duration of less than 12 months
BUSINESS · ANNUAL REPORT 2014 15
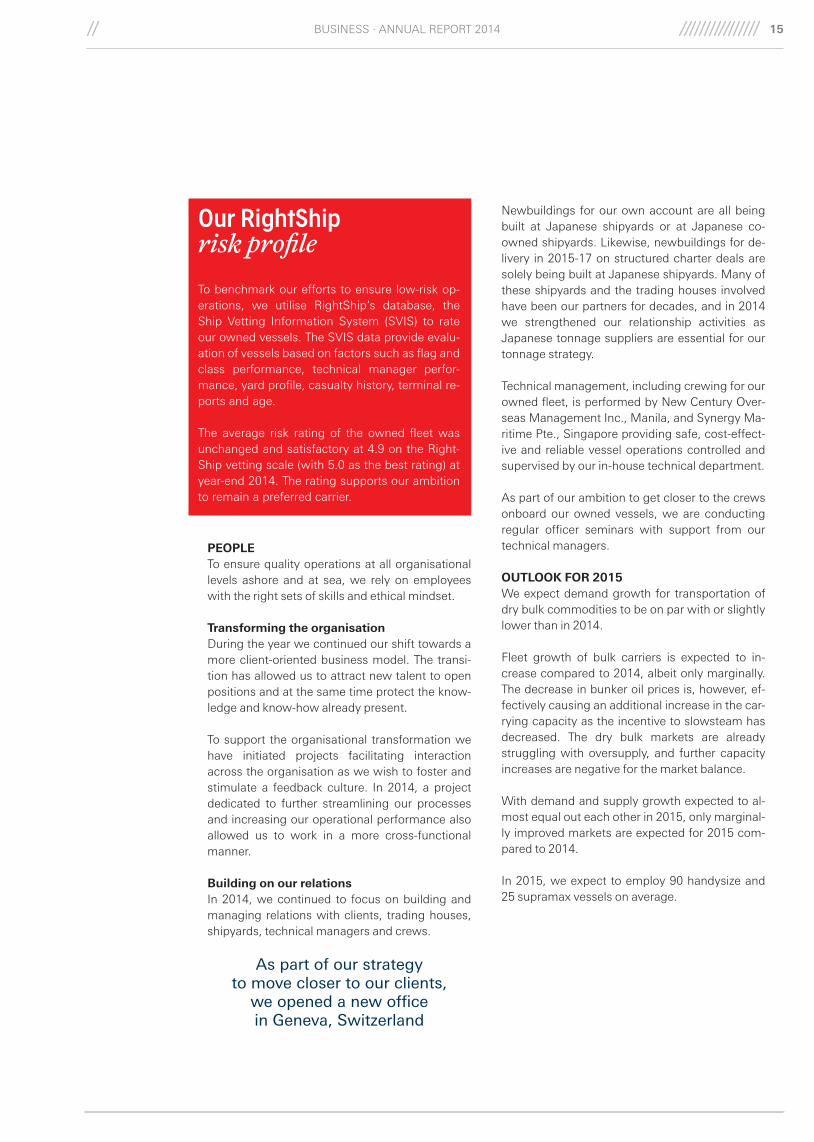
Our RightShip risk profile To benchmark our efforts to ensure low-risk op-erations, we utilise RightShip’s database, the Ship Vetting Information System (SVIS) to rate our owned vessels. The SVIS data provide evalu-ation of vessels based on factors such as flag and class performance, technical manager perfor-mance, yard profile, casualty history, terminal re-ports and age.
The average risk rating of the owned fleet was unchanged and satisfactory at 4.9 on the Right-Ship vetting scale (with 5.0 as the best rating) at year-end 2014. The rating supports our ambition to remain a preferred carrier.
PEOPLETo ensure quality operations at all organisational levels ashore and at sea, we rely on employees with the right sets of skills and ethical mindset.
Transforming the organisationDuring the year we continued our shift towards a more client-oriented business model. The transi-tion has allowed us to attract new talent to open positions and at the same time protect the know-ledge and know-how already present. To support the organisational transformation we have initiated projects facilitating interaction across the organisation as we wish to foster and stimulate a feedback culture. In 2014, a project dedicated to further streamlining our processes and increasing our operational performance also allowed us to work in a more cross-functional manner.
Building on our relationsIn 2014, we continued to focus on building and managing relations with clients, trading houses, shipyards, technical managers and crews.
As part of our strategy to move closer to our clients,
we opened a new office in Geneva, Switzerland
Newbuildings for our own account are all being built at Japanese shipyards or at Japanese co-owned shipyards. Likewise, newbuildings for de-livery in 2015-17 on structured charter deals are solely being built at Japanese shipyards. Many of these shipyards and the trading houses involved have been our partners for decades, and in 2014 we strengthened our relationship activities as Japanese tonnage suppliers are essential for our tonnage strategy.
Technical management, including crewing for our owned fleet, is performed by New Century Over-seas Management Inc., Manila, and Synergy Ma-ritime Pte., Singapore providing safe, cost-effect-ive and reliable vessel operations controlled and supervised by our in-house technical department.
As part of our ambition to get closer to the crews onboard our owned vessels, we are conducting regular officer seminars with support from our technical managers.
OUTLOOK FOR 2015We expect demand growth for transportation of dry bulk commodities to be on par with or slightly lower than in 2014.
Fleet growth of bulk carriers is expected to in-crease compared to 2014, albeit only marginally. The decrease in bunker oil prices is, however, ef-fectively causing an additional increase in the car-rying capacity as the incentive to slowsteam has decreased. The dry bulk markets are already struggling with oversupply, and further capacity increases are negative for the market balance.
With demand and supply growth expected to al-most equal out each other in 2015, only marginal-ly improved markets are expected for 2015 com-pared to 2014.
In 2015, we expect to employ 90 handysize and 25 supramax vessels on average.
Note: Not including vessels with a charter duration of less than 12 months

BUSINESS · ANNUAL REPORT 201416
Lauritzen Kosan
0
10
20
30
40
50
0
5
10
15
20
25
2010 2011 2012 2013 2014
Semi-refrigerated Ethylene Fully-pressurised (F/P) Total (RHS)
LPG
Propylene
Butadiene
Ethylene Other
Activity (average no. of ships)
2014 2013
Revenue 131.8 180.8
Time-charter equivalent income 102.3 112.5
EBITDA before special items 17.9 28.1Depreciation (26.5) (26.5)
Profit/(loss) on sale of vessels etc. - 1.3
Share of profits in joint ventures 1.3 0.8
Operating income before special items (7.3) 3.6Special items, net - -
Operating income after special items (7.3) 3.6Ship-days 14,397 15,841
Cargo mix, 2014 Key figures USDm
EBITDA before special items from our gas carrier activities amounted to USD 17.9m in 2014 com-pared to USD 28.1m in 2013. Challenging market conditions for smaller semi-refrigerated gas carri-ers and a decrease in activity level, measured by ship-days down 9% compared to 2013, were the main contributing factors.
Operating income amounted to USD (7.3)m com-pared to USD 3.6m in 2013.
Measured as time-charter equivalent income, the total income in 2014 amounted to USD 102.3m, with notable differences between vessel types and sizes, ranging from USD 6,971/day for the fully-pressurised carriers, USD 9,883/day for the semi-refrigerated carriers to USD 14.436/day for the ethylene carriers.
During 2014, we made efforts to strengthen our business with focus on improving performance while building closer relations to existing clients and potential new business partners. One out-come from the activities was the agreement with Odfjell Gas to have two of their ethylene gas carri-ers join our ethylene gas carrier pool.
Market conditions turned out to be considerably more difficult in 2014 than anticipated, and we ex-pect the business environment to remain chal-lenging in 2015.
ACTIVITY IN 2014In 2014, the total number of ship-days performed reached 14,397 corresponding to 39 vessels on average, compared to 15,841 ship-days with 43 vessels on average in 2013. We maintained a strong presence in the Atlantic basin with transat-lantic cargo contracts as well as an increasing number of LPG exports from the US.
Our client base, representing some of the world’s largest oil majors and energy traders, totals some 90 clients, and the top 10 clients accounted for half of the 2014 revenues. The vast majority are repeating clients.

BUSINESS · ANNUAL REPORT 2014 17
0
100
200
300
400
500
600
700
2010-01 2011-01 2012-01 2013-01 2014-01
F/P (3,500 cbm., trading east of Suez) F/P (3,500 cbm., trading west of Suez)
Semi-refrigerated (6,500 cbm) Ethylene (10,000 cbm)
Spot market rates since 2010 in time-charter equivalent 1,000 USD/month
Source: Own analysis based on data from Fearnley’s
GLOBAL MARKET DEVELOPMENTSAfter some improvement in the market balance during the first part of 2014, a set-back was seen during the second half. Economic and geopolitical factors contributed to disappointing overall de-mand growth for smaller gas carriers in 2014. An-other factor that put a strain on the market was a number of unscheduled turnarounds in the petro-chemical industry which reduced availability of products for exports.
STRATEGY AND BUSINESS MODELLauritzen Kosan specialises in safe and efficient carriage of petrochemicals and liquefied petroleum gases on a global basis - a segment of the shipping industry characterised by technically complex re-quirements from regulators and clients.
The strategy is based on our brand and rooted in years of solid operational performance. We strive to remain a leading, reliable, high quality provider of safe and flexible transportation to our clients and in this way generate value to our owner.
We control and operate smaller semi-refrigerated, ethylene and fully-pressurised gas carriers in the 3-10,000 cbm segment serving the petrochemical companies, oil majors and traders. The underlying
long-term drivers of demand for smaller gas carri-ers are the global consumption of plastics and li-quefied petroleum gases (for fuel and heating pur-poses as well as petrochemical feedstock). In the shorter term, the demand for transportation is fluc-tuating with production cycles in the refinery and petrochemical industry.
The reliability of our performance has earned us the trust of our
many repeating clients
Our business model is based on our ability to main-tain reliability and embrace complexity:
• Maintain reliability: Continuous focus on im-provements through education and training, innovation and careful implementation of pro-cedures to ensure our reliability as service pro-vider to our clients
• Embrace complexity: Strong collaboration be-tween the commercial departments and our in-house technical department to ensure that we meet the strictest health, safety and envi-ronmental standards and stringent require-ments from clients and authorities

BUSINESS · ANNUAL REPORT 201418
0% 10% 20% 30% 40% 50% 60% 70% 80% 90%
100%
Fully-pressurised Semi-refrigerated Ethylene
2015 2014
Business risk managementVessel employment and fluctuating freight rates are key risk factors associated with our business model. Cargo contracts that are renewed annually form the majority of our business. The contract coverage at the beginning of 2015 is slightly lower for our fully-pressurised gas carriers but slightly higher for our semi-refrigerated gas carriers and ethylene carriers compared to last year. The changes reflect market conditions as well as a change in committed days.
Compliance, utilisation and fleet portfolio man-agement are other important risk factors associ-ated with our business model. We manage risk in relation to these risk factors in the following way:
• Compliance: In a business with complex re-quirements from regulators and clients, lack of compliance can have detrimental impact on our daily business and on our long-term business relations. In all aspects of our business we thus have strict focus on complying with requirements to be able to trade for any client anywhere
• Utilisation: A significant part of our business is concluded as cargo contracts (COAs) and we strive to balance the need to provide ton-nage to meet contract requirements with additional employment from time-char-ter and spot contracts in order to maximise fleet utilisation
• Fleet portfolio management: Tonnage char-tering, part-ownership (joint ventures), pool- partnership and sale and purchase of vessels are core elements of our fleet portfo-lio management. The limited size of the market for smaller gas carriers, however, restricts the availability of tonnage for char-tering and likewise limits sales & purchase turnover
Coverage at the beginning of the year

BUSINESS · ANNUAL REPORT 2014 19
Semi-refrigerated Ethylene Fully-pressurised Total New-buildings
Owned 6 6 10 22 0
Part-owned 0 3 0 3 0
B/B in 6 0 0 6 0
T/C in 0 0 2 2 0
Pool, etc. 6 4 0 10 0
Total 18 13 12 43 0
Vetting PerformanceThe 27 gas carriers that are technically managed in-house were inspected 124 times by oil majors during 2014. During the year, we focussed par-ticularly on improving performance under the Oil Companies International Marine Forum’s (OCIMF) Ship Inspection Report Programme (SIRE).
Our target for SIRE inspections in 2014 (4.5 observations per vetting inspection) was met with an average of 4.1 observations per vetting inspection. Crew-related observations accounted for an average of 1.5 of the total observations. The last 2.6 observations related to office and vessel construction and design observations. Vetting performance is a reflection of the safety performance of our company. Our focus continues to be on strengthening the safety culture of our people onboard the vessels and in the offices. A reduction in the number of vetting observations will not only reduce the commercial implications originating from the vetting regime, but it will also contribute to creating safer operations of our vessels.
FLEETThe total operated fleet consists of owned, part-owned and chartered tonnage as well as vessels in commercial management (pool). In total, the com-bined average carrying capacity was 220,004 cbm in 2014 (224,737 cbm in 2013). At the end of 2014, the average age of the owned fleet was 9.8 years (9.3 years at year-end 2013).
On average, we operated a total fleet of 39 vessels in 2014. The average operated fleet of semi-refrig-erated gas carriers totalled 17 vessels (down one from 2013). We extended the bareboat charter on four vessels and now operate a modern fleet of smaller semi-refrigerated vessels following our sale of older tonnage and redelivery of older bare-boat-chartered vessels. The operated fleet of fully-pressurised gas carriers decreased to 12 vessels in 2014. The fleet of ethylene gas carriers decreased in 2014 to 11 vessels.
In 2014, we conducted eight scheduled drydock-ings (14 in 2013). Unscheduled off-hire came to 1.6% of available vessel days in 2014 (1.9% in 2013).
PERFORMANCEThe ever-changing regulatory agenda is setting an increasingly demanding scene for ship manage-ment in terms of both complexity and costs. How-ever, we see increased complexity as an opportun-ity. Working proactively with regulators and increased demands are embedded in our business model. We continuously monitor new demands and we prepare and invest to meet future demands from regulators and clients always focusing on competitive ship management and pushing the boundaries of best practice.
Improving energy-efficiencyOur performance management department moni-tors, develops and implements energy-efficiency initiatives as part of our REJUICE programme, a systematic approach to assessing and achieving fuel-savings.
Since 2012, our energy-efficiency related to trans-port work has improved by more than 15% across our owned fleet. Our initial focus has been to de-velop a solid data platform for ongoing monitoring and evaluation of performance. Enhanced data collection through auto-logging and KPI tracking has been added to the traditional daily reports to form the basis for an automated reporting system that provides us with a reliable and current over-view of the performance of our fleet.
In 2014, focus on optimising trim and ballasting, as well as limiting hull and propeller fouling, contrib-uted with approximately 6% fuel savings. Looking into 2015, further improvements are expected as we introduce enhanced weather routing and initia-tives to increase crew awareness on energy-effi-ciency. The implementation of an enhanced KPI structure will support and motivate energy-effi-ciency efforts onboard our owned vessels.
Core fleet and vessels committed by pool partners at year-end 2014

BUSINESS · ANNUAL REPORT 201420
PEOPLETo ensure quality operations at all organisational levels ashore and at sea, we rely on employees with the right sets of skills and ethical mindset.
Strengthening the organisationWe continued the organisational changes initiated in 2013 resulting in closer collaboration between our commercial, operational and technical depart-ments. These changes provided us with the ability to better understand and meet clients’ expecta-tions.
Supporting the organisational transformation, ad-ditional focus was on facilitating knowledge shar-ing and empowerment of our employees with the objective of ensuring competitive ship manage-ment.
During the year, our technical organisation was ex-panded in Manila, the Phillipines.
Focus on our safety cultureSafeguarding our people, the environment and our clients’ cargoes is the crux of our health and safety efforts and improving the safety culture for all em-ployees is always on top of our agenda.
All crew members are introduced to Lauritzen Ko-san at a Safety Culture Awareness course and on the basis of this our senior officers are enrolled in the Lauritzen Kosan Leadership and Management course, empowering leaders on board our vessels with our management culture and tools.
Lost Time Injury Frequency was 0.5 in 2014
While the human element is one of many factors we work with, we also include IT and business in-telligence as part of our efforts. In 2014, we contin-ued to work with identifying trends and patterns to improve our performance. Combining our experi-enced seafarers, our company culture and IT tools form the basis of our strategic work to create value and increase safety performance.
Long-term relationsAn open dialogue and face-to-face meetings are an important part of the way we build trust and devel-op our business relationships. Identification and insight of our clients’ priorities enable us to im-prove our services as well as create a solid basis for future investments and new tonnage.
Our competitiveness and service are demonstrated by the fact that many clients have had their con-tracts with us for more than 15 years.
OUTLOOK FOR 2015In 2015, we will continue to pursue our strategy of leveraging both our brand and technical manage-ment platform to build long-term relations with our existing as well as potential new clients. In addi-tion, we will continue to work to optimise the com-position of our fleet, both through pool arrange-ments as well as through the evaluation of existing time charters.
In 2015, we anticipate a slight improvement of the market balance. Supply is projected to grow by ap-proximately 6% with especially fully-pressurised as well as larger semi-refrigerated tonnage continu-ing to flow into the market. Demand growth is ex-pected to grow slightly faster, assuming a stabilisa-tion of energy and petrochemical prices, and a reduction of maintenance and outage of refining and petrochemical plants.
Rate improvements are only expected to a limited extent in 2015 and any case, it will be a recovery from low levels, particularly for the smallest size gas carriers.
We expect to employ 36 vessels on average in 2015. The decrease of the operated fleet is a result of redelivery of the bareboat-chartered vessels and fewer pool vessels.

BUSINESS · ANNUAL REPORT 2014 21
Other BusinessesIn addition to our main business activities in the dry bulk and gas segments, we have investments in the offshore service sector and a minor sharehold-ing in the product tanker segment. These invest-ments have originated as part of our own business activities.
Axis OffshoreWe hold 34% of the shares (50% of the voting rights) in Axis Offshore Pte. Ltd.
Axis Offshore was formed in 2012 as a joint ven-ture together with the Norwegian equity fund HitecVision, based on our existing business in the Accommodation and Support Vessel (ASV) seg-ment and our monohull ASV, the Dan Swift. In ad-dition to the Dan Swift, Axis Offshore has two high-specification semi-submersible ASVs under construction at the Cosco Qidong Offshore ship-yard in China. The newbuildings are expected to be delivered in 2015-16.
Our outstanding capital commitment to Axis Off-shore amounts to up to USD 67m to be injected in connection with the delivery of the two newbuild-ings. The actual amount to be injected depends on the financing structure of Axis Offshore.
Hafnia TankersWe hold 5.6% of the shares in Hafnia Tankers Ltd. The shares were acquired in connection with the sale of our fleet of product tankers to Hafnia Tank-
ers during 2013-14. Hafnia Tankers is a shipping company focused on ownership and chartering of tonnage in the product tanker segment.
Discontinued activitiesIn August 2013, the strategic decision was taken to exit the product tanker segment, cf. above and in October 2013 we sold our fleet of ten owned MR product tankers to Hafnia Tankers. The last of our owned product tankers was delivered to the new owner in Q1 of 2014.
Lauritzen Tankers contributed USD 2.8m to the 2014 results included as profit from discontinued operations.
In early January 2014, we announced that we had accepted an offer to sell Lauritzen Offshore’s fleet of three shuttletankers to Knutsen NYK Off-shore Tankers (KNOT). The vessels were deli-vered during Q2 and Q3 of 2014. The operational activities in Lauritzen Offshore Services were ter-minated simultaneously with the delivery of the vessels.
Lauritzen Offshore contributed USD 15.9m to the 2014 results included as profit from discontinued operations.

BUSINESS · ANNUAL REPORT 201422
People, Relations and Systems Our people, tools and systems enable us to build and manage our relations with stakeholders effi-ciently. Attracting and developing talented em-ployees is essential to us, as competent and moti-vated employees are an important foundation towards fulfilling our goals.
Ensuring employee developmentIn 2014, we amended our appraisal system by launching the Employee Development Dialogue (EDD). EDD is a tool assisting us in the implemen-tation of our business strategies by setting ambi-tious goals for each employee and linking individ-ual goals with individual development activities and business strategy. The new system supports our focus on stimulating a performance-oriented feedback culture. The system is aimed at our en-tire land-based organisation. As part of the imple-mentation of EDD, we have conducted mandato-ry workshop sessions both at the Copenhagen office and the Singapore office covering 95% of management being trained in the new approach. Almost all our land-based employees have attend-ed sessions introducing the EDD.
A new IT-platform for all human resource (HR) matters was introduced in 2014 to streamline and ensure more accurate and accessible HR data across the organisation.
Internal talent pipelineIt is important that we develop relationships with talents early in their careers and that we recognise our responsibility to develop these new talents.
In line with our recruitment strategy, we have tak-en steps to develop our internal talent pipeline by increasing the number of trainees. In 2014, new trainees joined us in Copenhagen, Singapore and Stamford, USA. At year-end, 6% of our land-based workforce was trainees.
In addition to trainees, we also welcome young talents conducting shorter internships in our of-fices. In Singapore, two interns were taken on-board as part of our commitment to the Global In-ternship Award, an initiative taken by the Maritime and Port Authority of Singapore as part of their ongoing efforts to promote maritime careers amongst the young talent pool in Singapore.
DiversityWe define diversity in terms of cultural width, ex-tensive experience, new inspiration and gender. Diversity is an important and natural prerequisite for innovation and development of our business.
We employ 20 different nationalities across our offices.
2014 was a year with influx of new graduates from universities as well as experienced shipping employees bringing experience from other parts of the industry.
In 2013, a policy for diversity management, in-cluding equal gender composition of all manage-ment levels, was approved by the Board of Direc-tors. Our target is that the overall gender distribution of employees shall be matched at management levels. The distribution of females and males in managerial positions of our shore-based organisation was 26% and 74% in 2014. We aim to reach the goal of 31% and 69% by De-cember 2015. The corresponding distribution be-tween females and males within the organisation as a whole remained stable at 37% and 63%.
Our aim to increase the number of females in managerial positions has led us to put further em-phasis on initiatives focusing on recruitment, staff development, measurement and benchmarking that may strengthen a more equal gender distri-bution amongst managers in 2015.
Executive Management has an equal gender dis-tribution.
At year-end 2014, the Board of Directors consist-ed of nine members, six elected by the general meeting and three by the employees.
With six board members elected by the annual general meeting, the diversity profile of the Board of Directors was 17% female with 34% coming from outside Denmark compared to 20% female and 40% coming from outside Denmark at year-end 2013. Our objective is to have two female board members by 2017 elected at the annual general meeting.
Employee developmentThe retention rate for shore-based personnel was 83% and remained at the same level as last year. Retirements, organisational changes, including the termination of our product and shuttle tanker operations affected the turnover of staff in 2014.
At year-end our total headcount was 1,011 com-pared to 1,108 in 2013.

BUSINESS · ANNUAL REPORT 2014 23
0
200
400
600
800
1,000
2013 2014
Seafarers Head office Overseas offices
2013 2014
Total workforce 2013-2014
The average age of shore-based personnel in-creased to 42.3 years (40.6 in 2013). The average length of service with J. Lauritzen increased slightly to 8.8 years (8.4 in 2013).
SeafarersAt Lauritzen Bulkers, ship management and crew-ing is outsourced to external service providers. Our in-house technical department controls and supervises the external managers to ensure safe, efficient operations and alignment of expecta-tions.
An essential part of Lauritzen Kosan’s services de-pends on crew performance, and all officers are selected carefully together with external crew managers. Technical management of the owned fleet is conducted in-house or by associated com-panies.
Irrespective of the technical management set-up, both business units conduct officer seminars to communicate specific topics and provide dia-logue and discussions between the shore and sea sides of our operations.
Strengthened global presenceThrough our offices in Singapore, China, USA, Spain, the Philippines, Switzerland and our head-quarters in Copenhagen, we are in close contact with our clients, brokers, tonnage providers and other stakeholders.
In 2014, our Singapore and Manila offices grew in terms of number of staff. The increased number of employees serving our clients in the Eastern Hem-isphere implied that both offices moved to new and larger facilities during the year.
A new office opened in Geneva in January 2015 providing proximity to our growing number of Swiss-based clients.
Networks for solutions and new insightsWe see network participation as a way of engag-ing and building leverage related to issues and challenges relevant to us and our industry. We participate in the following networks and commit-tees:
• The Danish Shipowners’ Association • The Danish Committee on Corporate
Governance• International Chamber of Shipping• BIMCO• The Baltic Exchange• Danish Society for Education and Business• The Trident Alliance• The Maritime Anti-Corruption Network• IMPA ACT• UN Global Compact
Our systemsInformation Technology (IT) systems are critical for the conduct of our business. Our IT infrastruc-ture and application management is outsourced to a third party provider, while our internal IT or-ganisation has the authority, capabilities and ca-pacity to manage the relationship in order to en-sure the desired quality and availability of the IT services.
Following a review of the existing set-up, a tender for renewal of the operation and maintenance of our systems was conducted during 2014, and to-wards the end of 2014 the transition to a new ser-vice provider was completed. During the year, we launched a new IT strategy plan with the objective of securing compliance with our business strate-gy based on a stable platform.
Building business intelligence
We regard superior knowledge as key to in-creasing performance and decided to establish a central Business Intelligence (BI) unit in 2014.
The BI function will help us transform internal and external data into meaningful and useful information for business analysis and thereby support improved decision making and provide basis for the development of new service offer-ings to our clients.

BUSINESS · ANNUAL REPORT 201424
Finance and Investor RelationsIt is a key objective for us to have access to diver-sified financial resources to finance our fleet of owned and part-owned vessels.
The owned fleet is financed with a mix of debt in-struments (bank facilities and issued bonds) and own funds. At year-end 2014, bank facilities ac-counted for 75% of the long-term debt with the remainder sourced from corporate bonds (net of own holdings).
Bank facilitiesThe bank facilities are provided by Scandinavian and international banks, financial institutions and in some cases supported by export credit agen-cies (ECAs).
The bank facilities are composed of amortising loan facilities (term loans) and revolving credit fa-cilities (long-term rights to draw liquidity on-de-mand). ECA-backed term loans are fully amortis-ing whereas other term loans typically are repaid as bullet loans at maturity which usually requires refinancing. Revolving credit facilities reduce the need to hold excess liquidity and are used to opti-mise our funding position and lower the net fi-nancing costs.
Facilities are obtained by J. Lauritzen A/S (the pa-rent company) or our subsidiary J. Lauritzen Sin-gapore Pte. Ltd., depending on vessel ownership, and are provided on the basis of collateral security including a mortgage on the vessels.
Corporate bondsWe currently have two corporate bonds outstand-ing. The first bond was issued in 2010 and the sec-ond in 2012. Both were issued with a five-year tenor and are listed on the Oslo Stock Exchange. To reduce the amount of relatively expensive debt, a nominal NOK 29m in the 2017-maturing bond and a nominal NOK 37.5m in the 2015-maturing bond were repurchased in 2014. In 2013, a nomi-nal NOK 259m was repurchased in the 2015-ma-turing bond.
Refinancing of maturing debtDuring 2014 we refinanced USD 226m (corres-ponding to 73%) of bank facilities originally scheduled to mature in 2015-17. This refinancing was provided by banks from the existing group of lenders after a tender process. The refinancing in-creased the share of revolving credit facilities. The remaining refinancing of bank facilities amounts to a total USD 83m during 2016-17.
A total of USD 71m, net (NOK 441m, net) of the bond debt will mature in May 2015.
Financing of newbuilding programmeOur newbuilding programme, comprising six owned dry bulk carriers, is scheduled to be deli-vered between 2016 and 2018. A committed post-delivery bank facility for up to USD 109m (65% loan to market value at delivery) covering all six vessels has been secured.
Financing of newbuildings to be part-owned via joint ventures will be raised directly in the joint venture entities.
Outstanding debt and commitment at year-end in USDm
Repayment profile of outstanding debt in USDm
Note: Existing facilities and commitments. Bond debt at hedged value less holdings of own bonds. Numbers may change subsequently
0
50
100
150
200
250
2015 2016 2017 2018 2019 > 2019
Repayment Bullet bank loans Bullet bonds Undrawn revolving credits
0
100
200
300
400
500
600
2014 2015 2016 2017 2018 2019Term loans Term loans ECA backedRevolving credits (drawn) Bonds unsecuredUndrawn revolving credits
Note: Existing facilities and commitments. Bond debt at hedged value less holdings of own bonds. Numbers may change subsequently

BUSINESS · ANNUAL REPORT 2014 25
CovenantsOur bank facilities include customary covenants: • Security maintenance: A requirement to
maintain a minimum value of the collateral security (e.g. a ratio between the fair value of the security and the outstanding debt in the particular facility) of typically 125%
• Financial covenants: A value-adjusted con-solidated solvency ratio of minimum 30%, consolidated liquidity of minimum USD 50m and consolidated working capital ratio (ratio between current assets and current liabilities) to be higher than 1
The corporate bonds have financial covenants re-quiring a consolidated solvency ratio of minimum 30% and a consolidated liquidity of minimum USD 50m. Prospectuses for the bonds are avail-able on http://www.j-l.com/about/investor-rela-tions
Throughout 2014, we complied with all coven-ants.
INVESTOR RELATIONSDue to the listing of corporate bonds on the Oslo Stock Exchange, we have since 2010 kept an on-going dialogue with current and potential inves-tors, analysts and other market professionals, providing them with easy and equal access to in-formation. Maintaining close relations with the investor community is important to us.
We want to provide timely, precise and relevant information about our business, results and ex-pectations and other matters that affect the per-ception and assessment of the securities we is-sue. It is our objective that the market price of the securities we issue fairly reflects our expected fi-nancial performance and our ability to repay our debt obligations as they fall due.
Stock Exchange Announcements 2014 The following Stock Exchange announcements were released in calendar 2014 via Oslo Stock Ex-change.
Announcement No. 1:Sale of three shuttle tankers
Announcement No. 2:Financial report for 2013
Announcement No. 3:New member of the Board of Directors
Announcement No. 4: Sale of counterparty claim
Announcement No. 5 :Interim financial report - first quarter 2014
Announcement No. 6:J. Lauritzen contemplates intra-group merger
Announcement No. 7:J. Lauritzen contemplates intra-group merger - update
Announcement No. 8:Interim financial report for the first half of 2014
Announcement No. 9:Interim financial report - third quarter 2014 Announcement No. 10:Write-downs and provisions

GOVERNANCE · ANNUAL REPORT 201426
Our corporate governance efforts are conducted in accordance with the “Recommendations for Corporate Governance” made by the Danish Committee on Corporate Governance and Section 107b of the Danish Financial Statements Act.
MANAGEMENT STRUCTUREIn accordance with the Danish Companies Act, we have a two-tier management structure con-sisting of two separate bodies: the Board of Direc-tors and the Executive Management. The Board of Directors is the central, supreme governing body. Day-to-day management is conducted by the Ex-ecutive Management in line with the rules and procedures laid down by the Board of Directors.
Board of DirectorsThe core task of the Board of Directors is to ensure that J. Lauritzen has a business strategy and ap-propriate capital structure, just as the Board must ensure the sound organisation of the activities of the company. In addition, focus is on risk manage-ment and internal control as well as ensuring that budgets and estimates are drawn up and ap-proved and that monthly and quarterly reports are submitted.
In 2014, the Board met six times, including a strat-egy seminar. Between meetings, recommenda-tions were submitted to the Board for written re-solution seven times.
The Board of Directors is supported by two per-manent committees: The Audit Committee and the Nomination and Remuneration Committee. The Audit Committee held five meetings and the Nomination and Remuneration Committee held two meetings in 2014.
At the general meeting in April 2014, five mem-bers were re-elected and Mr. Jesper Lok, (CEO, Falck Emergency as of January 2015) was elected as new member of the Board of Directors. At year-end 2014, the Board of Directors consisted of nine members, six elected by the general meeting and three by the employees.
With six board members elected at the annual general meeting, the diversity profile of the Board of Directors was 17% female with 34% coming from outside Denmark compared to 20% female and 40% coming from outside Denmark at year-end 2013. Our objective is to have two female board members by 2017.
The average length of board members’ service was eight years.
Corporate Governance
Lauritzen Foundation J. Lauritzen A/S was founded in 1884 and has been engaged in ocean transport for more than 130 years. The Lauritzen Foundation was estab-lished in 1945, and since then, it has been in full control of J. Lauritzen. The Lauritzen Foundation is a commercial foundation and is as such a self-governing institution under Danish law and is re-gulated by the Danish Act on Commercial Founda-tions. The Foundation is also subject to supervision by the Danish Ministry of Justice and the Danish Ministry of Business and Growth.
Through its charter, the Foundation is committed to promoting and developing the Danish shipping industry in general and supporting humanitarian work. Its policy is also to ensure flexible capital structures of the companies it owns.
In addition to its ownership of J. Lauritzen and its controlling interest in DFDS A/S (42.8% holding), the Lauritzen Foundation has holdings via wholly-owned LF Investment ApS in oil analysis, measu-ring equipment, software, healthcare products, biotechnology and real estate sectors.
The Lauritzen Foundation supports our goal of having a well-balanced financial structure, taking into consideration J. Lauritzen’s continued exist-ence and development.
Executive ManagementThe Executive Management is appointed by the Board of Directors and consists of Jan Kastrup-Nielsen, President & CEO and Birgit Aagaard-Svendsen, Executive Vice President & CFO. Day-to-day management is conducted by the Executive Management. An Executive Group functions as the coordinating forum for the day-to-day management and includes the Executive Management, Business Unit presidents and the heads of Corporate Control, Treasury and Corpo-rate Human Resources.
Additional informationPlease visit our corporate website for additional information on our Board Committees’ Terms of Reference, competence profiles of Board mem-bers and Principles of Remuneration at http://www.j-l.com/about/corporate-governance
Our statutory report on Corporate Governance 2014 is available at http://static.j-l.com/imce/jl_answer_cguk_2014.pdf

GOVERNANCE · ANNUAL REPORT 2014 27
Risk ManagementRisk Management is an integral part of our cor-porate governance and our policies on handling risk are approved by the Board of Directors.
RISK APPETITE AND TOLERANCESJ. Lauritzen enjoys strong brand recognition and it is vital to protect our reputation as an accountable quality shipowner and operator with high stand-ards in all aspects of safety and corporate gover-nance.
We create value by taking calculated business risk. We want to minimise our exposure to finan-cial risk and aim to keep a certain credit risk pro-file, defined by e.g. key financial indicators, sup-porting J. Lauritzen as being a solid and trustworthy business partner. Our risk tolerance related to operational issues such as fleet man-agement and safety is in principle zero.
BUSINESS RISKBusiness risk relates primarily to volatility in freight rates and asset values.
Our earnings generation benefits from the diversi-fication of our business portfolio which spans across distinctively different areas of maritime transportation as well as the presence in different vessel segments within the business units. Volati-lity in our earnings is further reduced via a delibe-rate combination of open and covered ship-days (including use of Forward Freight Agreements, FFAs).
The business strategies for the individual business units, including policies for contract coverage by vessel segments and overall limits for off-balance sheet exposure (such as chartered tonnage), are approved by the Board of Directors and reporting on these are an integral part of our internal report-ing routines. Please see the chapters about our business units for detailed information on their re-spective business models, contract coverage and management of their specific business risk.
Fluctuations in asset values affect our balance sheet, financial covenants and the minimum val-ue clauses in our loan agreements. Risk relating to fleet and asset values is managed by having a di-versified fleet comprising owned, part-owned as well as pool and time-chartered vessels with dif-ferent durations, optional periods and purchase options. Cash generation and profitability is mon-itored vessel-by-vessel.
2014 saw vessel values decline, and USD 1.2m in cash has been provided as additional security af-
ter year-end 2014 in one loan facility to comply with security covenants due to the decrease in vessel values. Should vessel values decrease by 10% during 2015 compared to the December 2014 valuations, nil would be required by year-end 2015 as additional security for the existing bank facilities.
FINANCIAL RISKCredit riskContracts for longer term business entail a poten-tial counterparty credit risk. To minimise the risk of entering into agreements with anyone who does not have the ability or willingness to honour their part of agreed terms, we perform a thorough credit assessment prior to concluding longer term contracts. This assessment includes i.a. the cli-ent’s credit rating and financial statements as well as recent trading history, payment performance and reputation. Larger contracts are approved by the Board of Directors. Please see note 4.5 in the accounts for further details.
Liquidity riskManaging liquidity risk is essential in a volatile in-dustry like shipping. Liquidity is continuously monitored and assessed based on forecasts for the current year and projections for the subse-quent years. Sensitivity analyses and stress tests are performed regularly. Please see note 4.5 in the accounts for further details. Currency and interest riskCurrency and interest risk relate to currency ex-change rates and interest rates as well as to risk connected with the use of derivative financial in-struments.
Our policy is to use derivative financial instru-ments to hedge currency and interest rate risk. When using derivative financial instruments, our exposure relates to movements in the market val-ue of the derivatives which could cause margin calls affecting our liquidity. To reduce the risk of margin calls we have established credit lines with a number of financial counterparties based on second priority mortgages in our vessels.
For an overview of derivative financial instru-ments, risk related to changes in market values of derivatives, currency exchange rates and interest rates, please refer to notes 4.1 and 4.5 in the ac-counts.
Currency RiskOur operating and reporting currency is USD and thus all amounts are recorded and reported in

GOVERNANCE · ANNUAL REPORT 201428
Ebola outbreakIn March 2014, a serious outbreak of Ebola was seen in West Africa, which turned out to become the largest and most complex outbreak of Ebola in history. No seafarers are yet known to have been infected with Ebola during a call to one of the Ebola-affected countries.
Conducting port calls in West Africa, we have en-sured that all necessary information and precau-tionary instructions have been provided to vessels calling at ports in the affected areas. Recommen-dations from both the International Maritime Or-ganization (IMO) and the World Health Organiza-tion (WHO) advocate that the movement of ships, including the handling of cargo and goods, to and from affected areas, should continue as normal in order to reduce the isolation and economic hard-ship of the affected countries. We fully support these recommendations.
We recognise how vital it is for West Africa’s economy that ship operations are maintained in the area. Lauritzen Bulkers’ primary activities in the region mainly relate to discharge of food products, including grain and wheat.
USD. Currency exposure relates to operational and financial cash flows in other currencies than USD. The most important non-USD operating cost currency is DKK arising mainly from head of-fice costs. Currency risk related to debt in JPY is partially hedged and is fully hedged with regards to debt in NOK.
Interest RiskPart of our loan portfolio is subject to floating in-terest rates. At year-end 2014, all debt was hedged into fixed interest rates. The hedge ratio was 176% when measured by total debt less our cash in hand and deposits at year-end.
BUNKER OIL PRICE RISKBunker oil is a significant cost element but in prin-ciple only a risk in relation to contracted cargo vol-umes not covered by BAF (Bunker Adjustment Factor). Most of the operated fleet is either em-ployed in the spot market, re-let, on time-charter or employed under a Contract of Affreightment (COA) with BAF, and the bunker oil price risk is thus considered limited.
OPERATIONAL RISKOperational risk refers to potential losses resulting from non-compliance, human error and inade-quate systems, accidents, piracy, insufficient in-surance and IT systems. Operational risk is gener-ally managed via detailed operating procedures and ongoing training. The chapters about our business units have specific discussions on topics relating to their operations.
SafetyCasualties from ship operations can have serious consequences and the shipping industry has widely implemented international safety stand-ards. Several clients have additional requirements relating to safety, environmental protection, etc. At J. Lauritzen, we have safety standards in place, complying not only with general safety standards, but also above and beyond client demands.
Operation in high-risk areasRisk related to our crews and clients’ cargo due to piracy or violent crime-related activity in certain parts of the world has our strictest attention. We adhere to recommendations and best manage-ment practices (BMP4) from relevant national and international bodies. The necessity for engaging armed security teams on vessels operating in high-risk regions is assessed on the basis of voy-age-specific risk assessments. This is supported by industry anti-piracy measures aboard, close
monitoring by technical management and by mili-tary sources providing intelligence relevant to our vessels and military escorts. In 2014, Lauritzen Bulkers had 50 transits in high-risk areas whereas Lauritzen Kosan had 32. There were no incidents related to these transits.
InsuranceAn insurance policy is adopted with the aim of re-ducing the financial implications of incidents and casualties. The insurances cover our assets, our chartered and operated fleet, our liabilities and non-marine risk. As a general rule, insurances are always taken out with first class international in-surance companies and are always taken out with a certain financial safety margin to avoid any seri-ous consequential impact of an incident or casua-lty on our financial status.
IT systemsIT is critical, and it is imperative that our IT sys-tems are available round-the-clock and are ac-cessible worldwide. Redundant systems and du-plicate infrastructure are in place, and systems are tested to ensure that they can be restored within pre-defined time limits.

GOVERNANCE · ANNUAL REPORT 2014 29
Corporate ResponsibilityOur corporate responsibility efforts are based on our core values and aligned with internationally recognised principles, such as the voluntary UN Global Compact initiative and the UN Guiding Prin-ciples on Business and Human Rights.
Policy commitmentOur corporate responsibility policy includes com-mitments in relation to human rights, labour rights, protection of the environment, anti-corruption and responsible supply chain management. In 2014, we formalised an overarching policy that sum-marises our global commitments and existing poli-cies.
Focus areasIn 2014, our main corporate responsibility activities were focused on human rights assessment in rela-tion to our offices, the continued implementation of energy-efficiency projects, compliance sessions as part of the implementation of our anti-corrup-tion programme and dialogue with selected suppli-ers as part of the implementation of our supplier code of conduct. Our main achievements and results in 2014 can be summarised as follows:
• Assessment of our potential and actual human rights impacts in relation to our offices
• Continuous implementation of our Energy Efficiency Project enabling a cut in our CO2 emissions
• Founding member of Trident Alliance• Anti-corruption training of approximately
75% of our shore-based personnel in Copenhagen, Singapore, Shanghai and Manila
• Launch of anti-corruption training sessions for our senior officers starting in Lauritzen Kosan with approximately 50% trained at year-end
• Engagement with selected suppliers with regard to the implementation of the IMPA ACT programme
In 2015, we plan to take our corporate responsibili-ty efforts to a new phase of integration with our business model and strategy and thus our overall value creation.
Additional informationPlease visit our corporate website for additional in-formation on our corporate responsibility and download our Corporate Responsibility report 2014, http://static.j-l.com/imce/jlcr2014.pdf
Global CommitmentsWe are signatory to and support the UN Global Compact. The initiative is a voluntary commit-ment to include and integrate ten principles on human rights including labour rights, protection of the environment as well as anti-corruption into our business practices. This work has been struc-tured and conducted since we signed the Global Compact in 2011 and has resulted in the imple-mentation of e.g. our Anti-Corruption Programme, our responsible supply chain management pro-gramme (IMPA ACT) and our energy-efficiency programme.
Game changing principlesIn 2011, the UN Human Rights Council unani-mously endorsed the Guiding Principles on Busi-ness and Human Rights. The Guiding Principles and their ‘spirit’ have been accepted and embed-ded in guidelines (e.g. the OECD guidelines for multinational enterprises) and legislation (e.g. the Danish Financial Statements Act, S.99a) making them the first universally accepted reference points for managing adverse impacts on human rights including labour rights.
For us, the Guiding Principles provide tools and a description of a process assisting us in our com-mitment to respect human rights, and thus the translation into practice of the first six principles of our voluntary commitment to the UN Global Compact. Consequently, we have developed an overall corporate responsibility policy commit-ment that is aligned with the requirements set forth by the UN Guiding Principles.

GOVERNANCE · ANNUAL REPORT 201430
Board of Directors
ChairmanBent ØstergaardMember since 2003 // Remuneration: DKK 850,000Chairman of the Nomination and Remuneration Committee
PresidentLF Investment ApS & Lauritzen Fonden
Chairman of the Board:Cantion A/SDFDS A/SFrederikshavn Maritime Erhvervspark A/SNanoNord A/S
Board member:Comenxa A/S Desmi A/SDurisol UK LtdMama Mia Holding A/SMeabco Holding A/SMeabco A/SWith Fonden
Vice ChairmanIngar SkaugMember since 1998 // Remuneration: DKK 500,000Member of the Audit CommitteeMember of the Nomination and Remuneration Committee
Chairman of the Board:Center for Creative LeadershipRagni Invest ASVectura AS Environor AS
Board member:Berg-Hansen Reisebureau ASDFDS A/SMiros AS Bery Maritime ASPetroleum Geo-Services ASA (Remuneration and CSR Committee)PURE ASABV/AGL (Adjaristqali Netherlands BV/ Adjaristqali Georgia LLG)
Board MemberNiels HeeringMember since 2001 // Remuneration: DKK 450,000Chairman of the Audit CommitteeMember of the Nomination and Remuneration Committee
Chairman of the Board, partnerGorrissen Federspiel
Chairman of the Board:NTR Holding A/S Civ. Ing. N.T. Rasmussens FondEllos A/SHelgstrand Dressage A/SNesdu A/SHenning Stæhr A/S
Deputy Chairman of the Board:15. Juni Fonden
Board member:Scandinavian Private Equity Partners A/SOle Mathiesen A/SLise og Valdemar Kählers Familiefond
Board MemberPeter Poul Lauritzen BayMember since 2003 // Remuneration: DKK 250,000
Management Consultant, Head of Operations, Strategy Department Accenture
Board member: J. Krebs & Co, A/S

GOVERNANCE · ANNUAL REPORT 2014 31
Board MemberMarianne WiinholtMember since 2011 // Remuneration: DKK 300,000Member of the Audit Committee
Executive Vice President and CFODONG Energy A/S
Board MemberJesper LokMember since March 2014 // Remuneration: DKK 190,278
CEOFalck Emergency - as of January 2015
Board member:Danish Crown
Board MemberSøren Berg*Member since 2005 // Remuneration: DKK 250,000
Project Manager Lauritzen Kosan
Board member:De Forenede Sejlskibe I/S
Board MemberUlrik Danstrøm*Member since 2009 // Remuneration: DKK 250,000
Senior Chartering Manager Lauritzen Bulkers
Board MemberSøren Roschmann**Member since August 2014 // Remuneration: DKK 94,429
Senior Technical Manager, Head of Technical Department Lauritzen Bulkers
* Re-elected in 2013 by the employees** Elected in 2013 by the employees
NOMINATION &REMUNERATION COMMITTEEBent Østergaard (Chairman)Ingar Skaug (Member)Niels Heering (Member)
AUDIT COMMITTEENiels Heering (Chairman)Ingar Skaug (Member)Marianne Wiinholt (Member)

GOVERNANCE · ANNUAL REPORT 201432
Management
President & CEOJan Kastrup-NielsenJoined J. Lauritzen in 2000 // CEO since February 2013
Board member:The Danish Shipowners’ Association Avance Gas Holding Limited
Executive Vice President & CFOBirgit Aagaard-SvendsenJoined J. Lauritzen in 1998 // In current position since 1998
Chairman of the Board:Komitéen for god Selskabsledelse (Danish Committee on Corporate Governance)DSEB (Danish Society for Education and Business)
Board member:The West of England Ship Owners Mutual Insurance Association (Luxembourg) Otto Mønsted A/S
Executive Management and Executive Committee

GOVERNANCE · ANNUAL REPORT 2014 33
Vice President, J. Lauritzen A/SCorporate Human ResourcesJan Ulrik Nielsen*Joined J. Lauritzen in 2011 // In current position since 2015
*As from 1 January 2015
Senior Vice President, J. Lauritzen A/S Group TreasuryJohn JørgensenJoined J. Lauritzen in 2001 // In current position since 2008
Senior Vice President, J. Lauritzen A/S Corporate ControlErik BierreJoined J. Lauritzen in 2000 // In current position since 2000
President - Lauritzen BulkersPeter BorupJoined J. Lauritzen in February 2013 // In current position since February 2013
President - Lauritzen Kosan Thomas WøidemannJoined J. Lauritzen in 2002 // In current position since 2011
Other Executive Committee members

34
Financial Review
J. Lauritzen’s results were USD (165.7)m in 2014 compared to USD (284.6)m in 2013.
The results for 2014 were heavily impacted by special items net totalling USD (118.9)m which comprised impairment losses and provisions totalling USD (161.0)m, revenue from the sale of a counterparty claim and other settlements totalling USD 31.7m and profit of USD 10.4m from sale of vessels also as a consequence of a counterparty default.
For comparison, the results for 2013 were impacted by special items net totalling USD (136.1)m mainly related to impairment losses. Fur-thermore, net results for 2014 included a USD 18.7m profit from dis-continued operations compared to USD (47.8)m in 2013.
Revenue declined from USD 500.9m in 2013 to USD 443.3m in 2014.
The time-charter equivalent income amounted to USD 351.1m based on total number of ship-days of 53,515 compared to USD 351.7m in 2013, which was based on 56,736 ship-days.
Hire of chartered vessels declined from USD (213.6)m in 2013 to USD (201.4)m in 2014 mainly due to the redelivery of time-chartered bulk carriers. Operating costs for owned and bareboat-chartered vessels totalled USD (94.6)m, down from USD (96.4)m in 2013.
Administrative costs totalled USD (48.3)m compared to USD (45.3)m in 2013.
Operating income before depreciation (EBITDA) and special items amounted to USD 15.3m, up USD 8.0m on 2013 of which USD 18.5m was related to Lauritzen Bulkers and USD (10.2)m to Lauritzen Kosan.
In 2014, profit from the sale of vessels and other assets totalled USD 13.6m. The profit related to the sale of four supramax bulk carriers and one gas carrier. For comparison, 2013 saw a net loss of USD (7.6)m mainly related to the sale of one handysize bulk carrier partly off-set by profit from the sale of one gas carrier and the sale of 16% of our shareholding in Axis Offshore.
Depreciation totalled USD (56.0)m compared to USD (63.4)m in 2013. The decline was due to vessel disposals and the impact from impair-ment losses in 2013 on depreciation going forward.
Share of profit in joint ventures totalled USD (0.9)m, up from USD (6.0)m in 2013. The increase was mainly due to losses incurred in 2013 on bulk carriers owned by joint ventures and not repeated in 2014 partly off-set by a decrease in our share of profit in Axis Offshore.
Operating income before special items amounted to USD (28.1)m compared to USD (69.7)m in 2013.
Net financial costs of USD (40.4)m increased from USD (30.7)m in 2013, mainly due to lower currency exchange rate gains on long-term debt.
Income tax amounted to USD 2.9m, up from USD 0.1m in 2013 due to recognition of deferred tax assets.
Results from continuing operations were USD (184.5)m up from USD (236.5)m in 2013.
Results from discontinued operations totalled USD 18.7m compared to USD (47.8)m in 2013, which included impairment losses of USD (50.3)m.
Results for the year were USD (165.7)m, up from USD (284.3)m in 2013.
INCOME STATEMENT
At year-end 2014, total assets amounted to USD 1,208.0m, down USD 668.7m on 2013 due to the sale of vessels, depreciation and impairment losses.
The carrying amount of vessels, property and equipment totalled USD 808.2m compared to USD 1,030.3m in 2013. The carrying amount of vessels in operation amounted to USD 773.0m (2013: USD 1,021.1m), whereas brokers’ valuations totalled USD 722.0m.
The carrying amount of six bulk carriers under construction amounted to USD 29.0m (2013: USD nil).
Investments in joint ventures totalled USD 89.2m (2013: USD 101.1m). This included our 34% shareholding in Axis Offshore Pte. Ltd. which amounted to USD 47.0m (2013: USD 45.4m).
Investments classified as shares available for sale, including our investment in Hafnia Tankers Ltd. totalled USD 40.8m (2013: USD 43.4m).
Current receivables including fair value adjustments on FFAs and other financial derivatives amounted to a total of USD 52.6m, down USD 11.4m on 2013. The decline in receivables was mainly due to the exit from the product tanker and shuttle tanker segments.
Assets held for sale amounted to USD nil compared to USD 451.4m in 2013.
Shareholders’ equity was down by USD 167.9m at USD 572.8m. Solvency was 47%, up from 39% at the end of 2013.
At year-end 2014, total liabilities amounted to USD 635.3m, down USD 500.9m on 2013.
Provisions for onerous time charter contracts amounted to USD 60.1m (2013: USD nil).
Total interest bearing debt decreased to USD 461.9m from USD 794.7m in 2013 due to repayment of mortgage debt and repurchase of own corporate bonds.
BALANCE SHEET STATEMENT
FINANCIALS · ANNUAL REPORT 2014

35
Other payables including fair value adjustments on Forward Freight Agreements (FFAs) and other financial derivatives, amounted to USD 113.4m (2013: USD 74.7m). The increase was mainly due to fair value adjustments on financial derivatives.
Liabilities associated with assets held for sale amounted to USD nil compared to USD 266.7m in 2013.
CASH FLOW STATEMENT
Cash flow from operating activities totalled USD 60.4m, up from USD (19.9)m in 2013 mainly reflecting a decrease in working capital for the discontinued operations and a decrease in outgoing financial pay-ments due to sale of vessels.
In 2014 cash flow from investment activities amounted to USD 552.7m, up from USD 28.2m in 2013 mainly due to the sale of vessels and less investments in newbuildings.
Cash flow from financing activities amounted to USD (572.3)m com-pared to USD (126.1)m in 2013. The change was mainly due to repay-ment of debt related to vessels sold and repurchase of issued corpo-rate bonds.
Cash and cash equivalents at year-end amounted to USD 184.4m compared to USD 154.1m at year-end 2013. At year-end 2014, financial resources, including undrawn committed facilities and committed facilities available upon delivery of vessels, totalled USD 393.1m compared to USD 154.1m at year-end 2013.
In addition to the financial resources noted above, J. Lauritzen has an unsecured overdraft facility of DKK 100m for multi-currency short-term financing needs.
FINANCIALS · ANNUAL REPORT 2014

36
Income statementStatement of Comprehensive IncomeBalance Sheet StatementCash Flow Statement Equity Statement
NotesSection 1 - Basis of Reporting
1.1 General information 1.2 Change in accounting policies and new financial reporting standards 1.3 General accounting policies 1.4 Significant accounting estimates & judgments 1.5 New accounting regulations for future implementation
Section 2 - Operating Activities2.1 Segment information 2.2 Special items2.3 Operating leasing income2.4 Staff costs, office & fleet
Section 3 - Operating Assets and Liabilities3.1 Vessels, property & equipment 3.2 Operating leasing of vessels3.3 Investment in joint ventures3.4 Contractual commitments3.5 Working capital3.6 Other receivables3.7 Provisions
Section 4 - Capital Structure and Financing4.1 Long-term borrowings 4.2 Mortgages4.3 Financial income4.4 Financial expenses4.5 Financial instruments & financial risk4.6 Equity
Section 5 - Other Notes5.1 Assets held for sale and discontinued operations5.2 Other operating leases5.3 Contingent liabilities5.4 Tax5.5 Fees to auditors5.6 Related parties5.7 Events after balance sheet date
Consolidated Financial Statements
43464748
4141414242
3737383940
49515253535353
545555555661
62646465666666
FINANCIALS · ANNUAL REPORT 2014

37
Income Statement
Statement of Comprehensive Income
USD '000 Note 2014 2013
Revenue 2.1, 2.2 443,295 500,904
Voyage related costs (92,222) (149,228)
Time-charter equivalent income 351,073 351,676
Other operating income 8,550 10,961
Hire of chartered vessels 2.2 (201,434) (213,589)
Operating costs of vessels 2.4 (94,587) (96,439)
Administrative costs 2.4 (48,292) (45,293)
Operating income before depreciation (EBITDA) and special items 15,310 7,316
Profit/(loss) on sale of vessels and other assets 13,594 (7,622)
Depreciation (56,018) (63,438)
Share of profit in joint ventures 2.2, 3.3 (949) (5,998)
Operating income (EBIT) before special items (28,063) (69,742)
Special items, net 2.2 (118,908) (136,127)
Financial income 4.3 7,944 11,671
Financial expenses 4.4 (48,377) (42,420)
Profit/(loss) from continuing operations before tax (187,404) (236,618)
Income tax 5.4 2,919 137
Profit/(loss) from continuing operations (184,485) (236,481)
Profit/(loss) from discontinued operations 5.1 18,743 (47,835)
Profit/(loss) for the year (165,742) (284,317)
Profit attributable to:
The J. Lauritzen Group (165,742) (284,613)
Non-controlling interests 0 297
(165,742) (284,317)
USD '000 2014 2013
Profit/(loss) for the year (165,742) (284,317)
Items that can be reclassified subsequently to income statement:
Other comprehensive income:
Exchange differences on translating foreign operations (1,466) 1,892
Fair value adjustment of hedging instruments during the year (7,172) 1,248
Gain/(loss) on hedging instruments transferred to financial expenses 9,760 12,397
Fair value adjustment of shares available for sale (2,587) 1,444
Other comprehensive income net of tax (1,465) 16,981
Total comprehensive income for the year (167,207) (267,336)
Total comprehensive income attributable to:
The J. Lauritzen Group (167,207) (267,632)
Non-controlling interests 0 297
(167,207) (267,336)
FINANCIALS · ANNUAL REPORT 2014

38
Balance Sheet StatementUSD '000 Note 2014 2013
ASSETS
Vessels, property and equipment 3.1 808,215 1,030,333
Investments in joint ventures 3.3 89,158 101,086
Deferred tax assets 5.4 3,600 297
Shares available for sale 4.5 40,840 43,427
Receivables from joint ventures 9,343 9,821
Other receivables 541 0
Non-current assets 951,697 1,184,964
Bunkers 9,683 12,264
Trade receivables 4.5 16,817 24,925
Other receivables 3.6 16,668 26,334
Prepayments 7,641 9,772
Derivative financial instruments 4.5 11,435 3,015
Securities 9,711 10,000
Cash at hand and in bank 184,388 154,145
256,343 240,455
Assets held for sale 5.1 - 451,368
Current assets 256,343 691,823
Total assets 1,208,040 1,876,787
LIABILITIES
Share capital 62,356 62,356
Retained earnings 510,139 675,881
Reserves 281 1,747
J. Lauritzen's share of equity 572,776 739,983
Non-controlling interests - 668
Equity 4.6 572,776 740,651
Long-term provisions 3.7 33,343 -
Non-current derivative financial instruments 4.5 31,782 23,126
Long-term borrowings 4.1 359,209 731,291
Non-current liabilities 424,334 754,418
Current portion of long-term borrowings 4.1 102,648 63,447
Trade payables 10,969 12,849
Other payables 23,065 21,463
Provisions 3.7 26,713 -
Prepayments 200 191
Derivative financial instruments 4.5 46,105 15,097
Current tax payables 5.4 1,229 1,952
210,930 114,998
Liabilities related to assets held for sale 5.1 - 266,719
Current liabilities 210,930 381,718
Total liabilities 635,264 1,136,135
Total equity and liabilities 1,208,040 1,876,787
FINANCIALS · ANNUAL REPORT 2014

39
Cash Flow StatementUSD '000 - Inclusive discontinued operations Note 2014 2013
Operating income (109,347) (213,734)
Depreciation and impairment losses carried back 141,150 264,484
Change in provisions carried back 60,057 (18)
(Profit)/loss on sale of vessels and other assets (29,162) 6,184
Change in bunkers 2,581 4,491
Change in receivables 22,285 (2,979)
Change in payables 3,528 (14,604)
Cash flow from operations before financial items 91,092 43,823
Ingoing financial payments 2,075 1,370
Outgoing financial payments (32,274) (68,536)
Cash flow from ordinary operations 60,893 (23,343)
Paid corporate tax 5.4 (447) 3,410
Cash flow from operating activities 60,446 (19,932)
Investments in vessels 3.1 (13,711) (11,125)
Payments on vessels under construction 3.1 (28,976) (98,042)
Payments on vessels under construction, classified as held for sale 5.1 (535) (8,502)
Investments in machinery and equipment 3.1 (10) (17)
Investments in joint ventures 3.3 (4,322) (1,720)
Sale of vessels 601,835 116,105
Sale of other non current assets 1,850 -
Disposal of joint ventures 3.3 - 22,530
Dividend received from joint ventures 3.3 10 554
Dividend to minority interest (668) -
Purchase and sale of securities and shares available for sale (433) (25,798)
Bank deposits pledged as security for debt (2,354) 34,180
Cash flow from investment activities 552,686 28,165
Financial receivables (1,178) 7,254
Instalment on long-term debt (750,567) (182,256)
Proceeds from loans 179,411 48,877
Cash flow from financing activities (572,334) (126,125)
Changes for the year in cash and cash equivalents 40,798 (117,892)
Cash and cash equivalents at beginning of year 154,145 267,000
Currency adjustments on cash and cash equivalents (10,555) 5,037
Cash and cash equivalents at the end of the year 184,388 154,145
Undrawn committed credit facilities at end of year *) 99,701 -
Financial resources at the end of the year 284,089 154,145
Committed facilities available upon delivery of vessels 109,000 -
Financial resources incl. committed facilities available upon delivery of vessels 393,089 154,145
*) In addition J. Lauritzen has an unsecured overdraft facility of DKK 100m for multi-currency short-term financing needs.
FINANCIALS · ANNUAL REPORT 2014

40
Equity Statement
USD '000
Equity 1/1 2013 60,633 (31,668) 22,063 (5,630) (15,235) 806,670 852,068 371 852,440
Profit/(loss) for the year - - - - - (284,613) (284,613) 297 (284,317)
Other comprehensive income:
Exchange differences on translating foreign
operations - - - 1,892 1,892 - 1,892 - 1,892
(Gain)/loss on hedging instruments
transferred to financial expenses - 12,397 - - 12,397 - 12,397 - 12,397 Fair value adjustment of hedging instruments during the period - 1,248 - 1,248 - 1,248 - 1,248
Fair value adjustment of shares available for sale - - 1,444 - 1,444 - 1,444 - 1,444 Total other comprehensive income - 13,645 1,444 1,892 16,981 - 16,981 - 16,981 Total comprehensive income - 13,645 1,444 1,892 16,981 (284,613) (267,632) 297 (267,336) Transactions with owners:
Capital increase 1,722 - - - - 153,825 155,547 - 155,547 Paid dividend - - - - - - - - - Total transactions with owners 1,722 - - - - 153,825 155,547 - 155,547 Equity 31/12 2013 62,356 (18,022) 23,507 (3,738) 1,747 675,881 739,983 668 740,651
Profit/(loss) for the year - - - - - (165,742) (165,742) 0 (165,742)
Other comprehensive income:
Exchange differences on translating foreign
operations - - - (1,466) (1,466) - (1,466) - (1,466)
Deferred (gain)/loss on hedging instruments
transferred to financial expenses - 9,760 - - 9,760 - 9,760 - 9,760
Fair value adjustment of hedging instruments during the period - (7,172) - (7,172) - (7,172) - (7,172) Fair value adjustment of shares available for sale - - (2,587) - (2,587) - (2,587) - (2,587) Other comprehensive income - 2,588 (2,587) (1,466) (1,465) - (1,465) - (1,465) Total comprehensive income - 2,588 (2,587) (1,466) (1,465) (165,742) (167,207) 0 (167,207)
Hedging instrument
Shares available
for saleTranslation
gain/lossRetained earnings
Hedging instrument
Sharecapital
Shares available
for saleTranslation
gain/lossRetained earnings Total Total
Non-controlling
interestsReserves
p 2,588 (2,587) (1,466) (1,465) (165,742) (167,207) 0 (167,207) Transactions with owners:
Capital increase - - - - - - - - - Paid dividend - - - - - - - (668) (668) Total transactions with owners - - - - - - - (668) (668)
Equity 31/12 2014 62,356 (15,434) 20,919 (5,204) 281 510,139 572,776 - 572,776
FINANCIALS · ANNUAL REPORT 2014

41
Section 1Basis for reportingIn order to improve presentation and relevance of the contents of the financial report we have changed the structure of the explanatory notes to gather information of key areas, and by presenting the ac-counting policies and critical accounting estimates and judgments in the notes to which they relate.
The general accounting policies that apply to the consolidated finan-cial statement as a whole are described below.
NOTE 1.1 GENERAL INFORMATION
J. Lauritzen A/S is a private limited company with domicile in Den-mark. The consolidated financial statements for the period 1 January – 31 December 2014 comprise J. Lauritzen A/S and its subsidiaries (The Group).
The consolidated financial statements have been prepared in ac-cordance with International Financial Reporting Standards (IFRS) as adopted by the EU and additional Danish disclosure requirements for annual reports of reporting class D.
NOTE 1.2 CHANGE IN ACCOUNTING POLICIES AND NEW FI-NANCIAL REPORTING STANDARDS
With effective date 1 January 2014, we have adopted:
• IFRS 10 Consolidated financial statement• IFRS 11 Joint arrangements• IFRS 12 Disclosure of interest in other entities• Amendment to IAS 27 Separate financial statements• Amendment to IAS 28 Investment in associates and
joint ventures• Amendment to IAS 32 Financial instruments: Presentation• Amendment to IAS 36 Recoverable amount disclosures
for non-financial assets• Amendment to IAS 39 Financial instruments: Recognition
and Measurement• IFRIC 21 Levies
None of these new IFRS’s and IFRIC’s has affected recognition or measurement in 2014, but they have led to further disclosures in the notes.
To increase the transparency and comparability of the operating activities, it has been decided to introduce a separate line in the income statement “Special items”. “Special items” will include significant one-off income and expenses, such as revenue from sale of claims and claim settlements, sale of assets as a consequence of counterparty default or strategic initiatives, impairment losses on vessels and on investments in joint ventures as well as provisions for onerous contracts and the use and reversals hereof.
Comparative figures have been adjusted.
NOTE 1.3 GENERAL ACCOUNTING POLICIES
Basis of preparation The financial statements are presented in US dollars, which is J. Lau-ritzen’s functional currency. All amounts have been rounded to the nearest thousand.
The accounting policies set out below have been applied consistently by all Group entities and to all periods presented in these consolidated financial statements.
Certain reclassifications have been made in the comparative figures compared to previously published financial information.
Materiality in financial reportingIn preparation of the Annual Report Management considers the pre-sentation of financial statements to ensure content is relevant and material for the user. A judgment is made of whether more detailed specifications are necessary in the presentation of the Groups finan-cial position and result or whether an aggregation of less material amounts is preferred. The notes to the financial statement are pre-pared with focus on ensuring that the content is relevant and the pre-sentation clear. All judgments are made with due consideration of legislation.
Basis of consolidation The Annual Report comprises the Parent Company, J. Lauritzen A/S, and subsidiaries controlled by the Parent Company. The Group con-trols an entity when it is exposed to, or has rights to, variable returns from its involvement with the entity and has the ability to affect those returns through its power over the entity. The existence and effect of potential voting rights that in substance are exercisable or convert-ible are considered when assessing whether the Group has control or significant influence over another entity.
Enterprises in which the Group has a significant influence, but not control over the financial and operating policies are classified as as-sociates. A joint venture is a joint arrangement in which the Group has joint control, whereby the Group has rights to the net assets of the ar-rangement.
Joint ventures and associates are recognised using the equity method.
The Consolidated Financial Statements are prepared on the basis of the financial statements of the Parent Company and its subsidiaries, by combining items of a uniform nature and eliminating inter-compa-ny transactions and balances, and are based on financial statements prepared in compliance with the Group’s accounting policies.
Acquisitions, disposals and entities formed during the year are in-cluded in the Consolidated Financial Statements during the period of the Group’s control or significant influence. Comparative figures are not adjusted for acquisitions.
FINANCIALS · ANNUAL REPORT 2014
42
Translation of foreign currencies Items included in the Consolidated Financial Statements of each of the Group’s entities are measured using the currency of the primary economic environment in which the entity operates (the functional currency).
Foreign currency transactions are translated into the functional cur-rency at the exchange rate of the date when initially recognised. Gains and losses arising between the exchange rate of the transaction date and that of the settlement date are recognised in the income state-ment under financial items.
Receivables, payables and other monetary items in foreign currencies that have not been settled at the balance sheet date are translated at the exchange rates then prevailing. Any differences between the exchange rates at the balance sheet date and the transaction date rates are recognised in the income statement under financial items.
The results and financial position of any Group entity that has a functional currency different from J. Lauritzen’s presentation currency are translated into the presentation currency as follows:
Assets and liabilities, including goodwill and fair value adjustments arising on consolidation are translated at the closing rates at the date of the balance sheet.
Income and expenses for each income statement are translated at exchange rates approximating the exchange rate of the date of trans-action date, and all resulting exchange differences are recognised as a separate component of equity.
Exchange differences arising from the translation of the net invest-ment in foreign subsidiaries, associates, joint ventures and of bor-rowings or other currency instruments relating to hedging such investments are recognised in other comprehensive income in the translation reserve of equity. Exchange differences are released to the income statement upon disposal of the net investment.
Cash flow statement The cash flow statement has been prepared according to the indirect method and shows the cash flows from operating, investing and financing activities for the year.
NOTE 1.4 SIGNIFICANT ACCOUNTING ESTIMATES AND JUDG-MENTS
The preparation of the financial statements includes management estimates and judgments that affect the recognition and carrying amounts of assets, liabilities and disclosure of contingent assets and liabilities at the date of the financial statements and the reported per-formance. Estimates and judgments are based on historical data and other assumptions and sources that are considered reasonable. Ac-tual results could differ from those estimates and judgments.
The following items has been identified as significant accounting es-timates and judgments used in the preparation of its consolidated financial statements, they are presented in the related notes:
Critical accounting estimates and judgments:• Estimated useful life and residual value of vessels – note 3.1• Impairment test of non current assets and charter commit-
ments – note 3.1Critical accounting judgments:• Special items - note 2.2• Leases – note 2.3 and 3.2• Joint ventures – note 3.3• Assets held for sale – note 5.1• Tax – note 5.4
Methods for determination of fair valueA number of assets and liabilities are measured at fair value. Fair value is defined as the price that would be received to sell an asset or paid to transfer a liability in an orderly transaction between market participants at the measurement date. The methods for determina-tion of fair value for measurement and/or disclosure purposes are de-scribed in the relevant notes.
NOTE 1.5 NEW ACCOUNTING REGULATIONS FOR FUTURE IMPLEMENTATION
The IASB has issued a number of new or revised accounting standards (IAS and IFRS) and interpretations (IFRICs), that are not compulsory for the Group in the preparation of the financial statements for 2014. None of these are expected to have significant influence on the financial reporting for the Group.
We expect to implement the standards and interpretations on effect-ive date as issued by the IASB subject to their endorsement by the EU. None of the new standards and interpretations is expected to have material effect going forward.
FINANCIALS · ANNUAL REPORT 2014

43
Section 2Operating ActivitiesNOTE 2.1 SEGMENT INFORMATION
USDm
2014
Revenue 311.5 131.8 18.9 14.4 476.6 0.0 476.6 443.3
Voyage related costs (62.7) (29.5) (2.3) (0.3) (94.7) (0.0) (94.8) (92.2)
T/C equivalent income 248.8 102.3 16.6 14.2 381.9 (0.0) 381.9 351.1
Other operating income 5.2 2.6 0.5 0.1 8.3 0.8 9.2 8.5
Hire of chartered vessels (186.0) (15.4) 0.0 (8.1) (209.5) 0.0 (209.5) (201.4)
Operating costs of vessels (40.2) (54.1) (2.9) (2.7) (99.9) (0.3) (100.2) (94.6)
Contribution II before special items 27.8 35.3 14.2 3.5 80.8 0.5 81.3 63.6
Administration costs (21.4) (17.4) (1.8) (0.2) (40.8) (9.4) (50.2) (48.3)
Operating income before depreciation (EBITDA) and special items 6.4 17.9 12.4 3.3 40.0 (8.9) 31.1 15.3
Depreciation (29.5) (26.5) 0.0 0.0 (56.0) (0.0) (56.0) (56.0)
Profit/(loss) on sale of vessels 13.4 0.0 0.0 0.0 13.5 0.0 13.5 13.5
Share of profit in joint ventures (3.9) 1.3 0.0 0.0 (2.6) 1.6 (0.9) (0.9)
Operating income before special items (13.6) (7.3) 12.4 3.3 (5.1) (7.3) (12.4) (28.1)
Special items (118.9) 0.0 5.2 0.0 (113.7) 0.0 (113.7) (118.9)
Operating income after special items (132.5) (7.3) 17.6 3.3 (118.9) (7.3) (126.2) (147.0)
Non current assets 511.1 347.1 0.0 0.0 858.3 93.4 951.7 951.7
Investments in joint ventures 22.2 20.0 0.0 0.0 42.2 47.0 89.2 89.2
Current assets 30.1 15.4 0.0 2.4 47.9 208.4 256.3 253.9
Total assets 541.2 362.6 0.0 2.4 906.2 301.8 1,208.0 1,205.6
Liabilities 275.9 81.8 0.4 1.4 359.5 275.7 635.3 633.4
Net assets 265.4 280.8 (0.4) 1.0 546.7 26.1 572.8 572.2
Onshore employees, average 74 63 3 0 140 69 209 205
Crew on vessels, average 450 408 8 19 886 0 886 858
Total employees, average 524 471 11 20 1,026 69 1,095 1,064
P fi i (3 1)% (6 5)% 65 8% 22 8% (0 5)% N/A (2 4)% (6 1)%
Discontinued operations:
LauritzenBulkers
LauritzenKosan
LauritzenOffshore
LauritzenTankers
Total reportablesegments
Total Group
continuing Other/Un-allocated
TotalGroup
Profit margin (3.1)% (6.5)% 65.8% 22.8% (0.5)% N/A (2.4)% (6.1)%
Return on invested capital (20.9)% (2.0)% 20.1% 2.8% (9.9)% N/A (10.2)% (14.3)%
Investments in vessels etc. (CAPEX) 34.8 8.4 0.0 0.0 43.2 0.0 43.2 43.2
Invested capital - Year end 461.3 356.6 (0.4) 1.0 818.4 18.0 836.4 835.9
Invested capital - Average 634.9 364.6 87.7 118.7 1,205.9 31.2 1,237.1 1,030.7
The reportable segments in the Group consist of the business units Lauritzen Bulkers (bulk carriers), Lauritzen Kosan (gas carriers), and the discontinued operations Lauritzen Offshore (shuttle tankers) and Lauritzen Tankers (product tankers). The reportable segments are identical with how we have organized our business. Each business unit is operated independently as each business unit services differ-ent customers and employs different types of vessels.
The accounting policies of the reportable segments are consistent with the Group’s accounting policies.
The revenue reported represents revenue from external customers. There were no inter-segment sales in 2014 or 2013.
Unallocated items include finance costs and corporate services not allocated to the business units as well as financial assets and financialliabilities not allocated to business units including the investment in Axis Offshore and Hafnia Tankers.
None of our businesses are limited to a specific geographical area and thus geographical information is irrelevant. As the Group is not reliant on any single major customer, no customer information is given.
FINANCIALS · ANNUAL REPORT 2014

44
NOTE 2.1 SEGMENT INFORMATION (continued)
USDm
2013
Revenue 319.5 180.8 36.3 81.3 617.8 0.6 618.5 500.9
Voyage related costs (80.9) (68.2) (0.6) (2.3) (152.1) (0.1) (152.2) (149.2)
T/C equivalent income 238.6 112.5 35.6 79.0 465.8 0.5 466.3 351.7
Other operating income 7.1 2.6 0.6 0.7 11.0 1.2 12.3 11.0
Hire of chartered vessels (196.6) (17.0) 0.0 (36.2) (249.8) 0.0 (249.8) (213.6)
Operating costs of vessels (42.2) (53.6) (6.0) (20.1) (122.0) (0.6) (122.5) (96.4)
Contribution II before special items 6.9 44.5 30.2 23.3 105.0 1.2 106.2 52.6
Administration costs (19.0) (16.4) (3.3) (2.3) (40.9) (9.9) (50.8) (45.3)
Operating income before depreciation (EBITDA) and special items (12.1) 28.1 27.0 21.1 64.1 (8.7) 55.4 7.3
Depreciation (36.9) (26.5) (10.6) (7.2) (81.2) (0.0) (81.2) (63.4)
Profit/(loss) on sale of vessels etc. (10.7) 1.3 0.0 0.0 (9.5) 1.8 (7.7) (7.7)
Share of profit in joint ventures (11.9) 0.8 0.0 0.0 (11.1) 5.2 (6.0) (6.0)
Operating income before special items (71.6) 3.6 16.3 13.9 (37.8) (1.8) (39.5) (69.8)
Special items (136.1) 0.0 (28.2) (20.7) (185.0) 0.0 (185.0) (136.1)
Operating income after special items (207.7) 3.6 (11.8) (6.8) (222.7) (1.8) (224.5) (205.9)
Non current assets 728.3 366.1 0.0 0.0 1,094.4 90.6 1,185.0 1,185.0
Investments in joint ventures 37.5 18.2 0.0 0.0 55.7 45.4 101.1 101.1
Current assets 107.6 46.4 175.1 245.4 574.6 117.2 691.8 271.3
Total assets 835.9 412.5 175.1 245.4 1,669.0 207.8 1,876.8 1,456.2
Liabilities 345.3 97.2 130.9 144.5 718.0 418.2 1,136.1 860.7
Net assets 490.6 315.3 44.2 101.0 951.0 (210.4) 740.7 595.5
Onshore employees, average 69 64 7 5 145 68 213 201
Crew on vessels, average 504 420 22 188 1,134 0 1,134 924
Total employees, average 573 484 29 193 1,279 68 1,347 1,125
Profit margin (18.7)% 1.6% 45.0% 17.1% (4.3)% N/A (5.4)% (12.7)%
R i d i l (23 0)% 0 9% (6 1)% (2 6)% (12 8)% N/A (12 5)% (15 3)%
Discontinued operations:
LauritzenBulkers
LauritzenKosan
Total reportablesegments
Other/Un-allocated
TotalGroup
LauritzenTankers
Total Group
continuing LauritzenOffshore
Return on invested capital (23.0)% 0.9% (6.1)% (2.6)% (12.8)% N/A (12.5)% (15.3)%
Investments in vessels etc. (CAPEX) 34.9 8.4 0.1 74.4 117.7 0.0 117.7 43.3
Invested capital - Year end 808.5 372.6 175.8 236.4 1,593.3 44.4 1,637.7 1,225.5
Invested capital - Average 901.8 384.5 194.1 257.5 1,737.9 60.8 1,798.8 1,347.2
FINANCIALS · ANNUAL REPORT 2014

45
NOTE 2.1 SEGMENT INFORMATION (continued)
ACCOUNTING POLICIES
Segment information Segment information on key business areas is disclosed in line with the internal financial management, risks and accounting policies.
Assets in a segment comprise those that are directly attributable to the segment’s operations, including intangible assets, vessels, property, equipment, investments in associated companies and joint ventures, inventories, trade and other receivables, prepayments and cash.
Liabilities in a segment comprise those that are directly related to the segment’s operation, including trade payables, accruals and other liabilities.
Revenues Revenues include charter income, freight and demurrage revenues from the vessels. Revenues are recognised in the income statement as services are delivered. Uncompleted voyages are recognised with the share related to the financial year. Earnings from vessels which are engaged in pools are recognised in revenue on a net distribution basis.
In addition revenue comprises changes in fair value on forward freight agreements (FFA) used as hedging of the freight income. Hedge accounting is not applied on FFA’s.
Other operating incomeOther operating income includes commercial and technical man-agement fee.
Voyage related costsVoyage related costs include bunker oil, port costs, agent’s com-missions and other voyage related costs. Furthermore, voyage re-lated costs include fair value changes on financial bunkers contracts which are entered into for the purpose of hedging bunkers costs as hedge accounting is not applied for these transactions.
Operating cost of vessels Operating cost of vessels includes maintenance and repairs, crew staff costs, insurance of hulls and machinery, consumption of lubri-cants and supplies etc.
FINANCIALS · ANNUAL REPORT 2014

46
NOTE 2.2 SPECIAL ITEMS
To better illustrate the underlying development a number of one-off items have been recognised as special items:
USD '000 2014 2013
A) One-off revenue from sale of claims and claim settlements 31,680 1,580
B) Sale of vessels as a consequence of counterparty defaults or strategic initiatives 10,391 -
C) Impairment losses on vessels and vessels under construction (85,132) (132,965)
D) Provisions for onerous contracts (60,057) -
E) Impairment losses on vessels owned by joint ventures (15,790) (4,742)
Special items, net (118,908) (136,127)
INCOME STATEMENT - CONDENSED
USD '000 Ref. 2014 2013
Revenue A) 474,974 502,484
Other operating income 8,550 10,961
Costs D) (496,591) (504,549)
Operating income before depreciation (EBITDA) (13,067) 8,896
Profit/(loss) on sale of assets B) 23,985 (7,622)
Depreciation and impairment losses C) (141,150) (196,402)
Share of profit in joint ventures E) (16,739) (10,740)
Operating income (146,971) (205,868)
Net financial items (40,433) (30,749)
Profit/(loss) before tax (187,404) (236,618)
Income tax 2,919 137
Profit/(loss) from continuing operations (184,485) (236,481)
If special items had been included in the operating profit before special items, they would have been included in the Income Statement as follows:
ACCOUNTING POLICIES
To increase the transparency and comparability of the operating activities, it has been decided to introduce a separate line in the income statement “Special items”.
“Special items” will include significant one-off income and ex-penses, such as revenue from sale of claims and claim settle-ments, sale of assets as a consequence of counterparty default or strategic initiatives, impairment losses on vessels and on invest-ments in joint ventures as well as provisions for onerous contracts and the use and reversals hereof.
CRITICAL ACCOUNTING ESTIMATES & JUDGMENTS
The use of special items entails management judgment in the sep-aration from other items in the income statement. Management carefully considers such changes in order to ensure the correct distinction between the operating activities and one-off items.
FINANCIALS · ANNUAL REPORT 2014

47
NOTE 2.3 OPERATING LEASING INCOME
At the balance sheet date the Group has the following contractually committed leasing income from time-charter and bareboat contracts:
CRITICAL ACCOUNTING ESTIMATES & JUDGMENTS
The Group enters into different contracts regarding chartering vessels out. The majority of these contacts can easily be cate-gorized as either operational or financial leases.
However, some contracts may require judgment as to the sub-stance of the agreement in order to recognise and measure them in accordance with the Group’s accounting policies.
2014
USDm committed
income
No. of vessels, full
year equivalents
USDm committed
income
No. of vessels, full
year equivalents
USDm committed
income
No. of vessels, full
year equivalents
USDm committed
income
No. of vessels, full
year equivalents
USDm committed
income
No. of vessels, full
year equivalents
< 1 Year 39.0 3.5 15.6 4.3 54.6 7.8 - - 54.6 7.8 1 - 2 Year 32.3 3.0 6.3 2.0 38.6 5.0 - - 38.6 5.0 2 - 3 Year 31.3 3.0 3.3 1.0 34.6 4.0 - - 34.6 4.0 3 - 4 Year 28.1 2.4 0.1 - 28.2 2.4 - - 28.2 2.4 4 - 5 Year 25.7 2.0 - - 25.7 2.0 - - 25.7 2.0 > 5 Year 147.7 12.6 - - 147.7 12.6 - - 147.7 12.6 Total 304.1 - 25.4 - 329.5 - - - 329.5 -
2013< 1 Year 41.1 4.6 29.8 7.8 70.9 12.4 36.1 3.8 107.0 16.2 1 - 2 Year 34.0 3.0 3.4 1.0 37.4 4.0 25.9 3.0 63.3 7.0 2 - 3 Year 32.2 3.0 3.3 1.0 35.5 4.0 26.0 3.0 61.5 7.0 3 - 4 Year 31.2 3.0 3.3 1.0 34.5 4.0 20.5 2.1 55.0 6.1 4 - 5 Year 28.0 2.4 0.1 0.0 28.1 2.5 20.1 2.0 48.3 4.5 > 5 Year 172.9 14.6 - - 172.9 14.6 95.7 9.5 268.6 24.1 Total 339.4 - 39.9 - 379.3 - 224.4 - 603.7 -
Lauritzen Bulkers Lauritzen KosanTotal continuing
business Discontinued operation Total
FINANCIALS · ANNUAL REPORT 2014
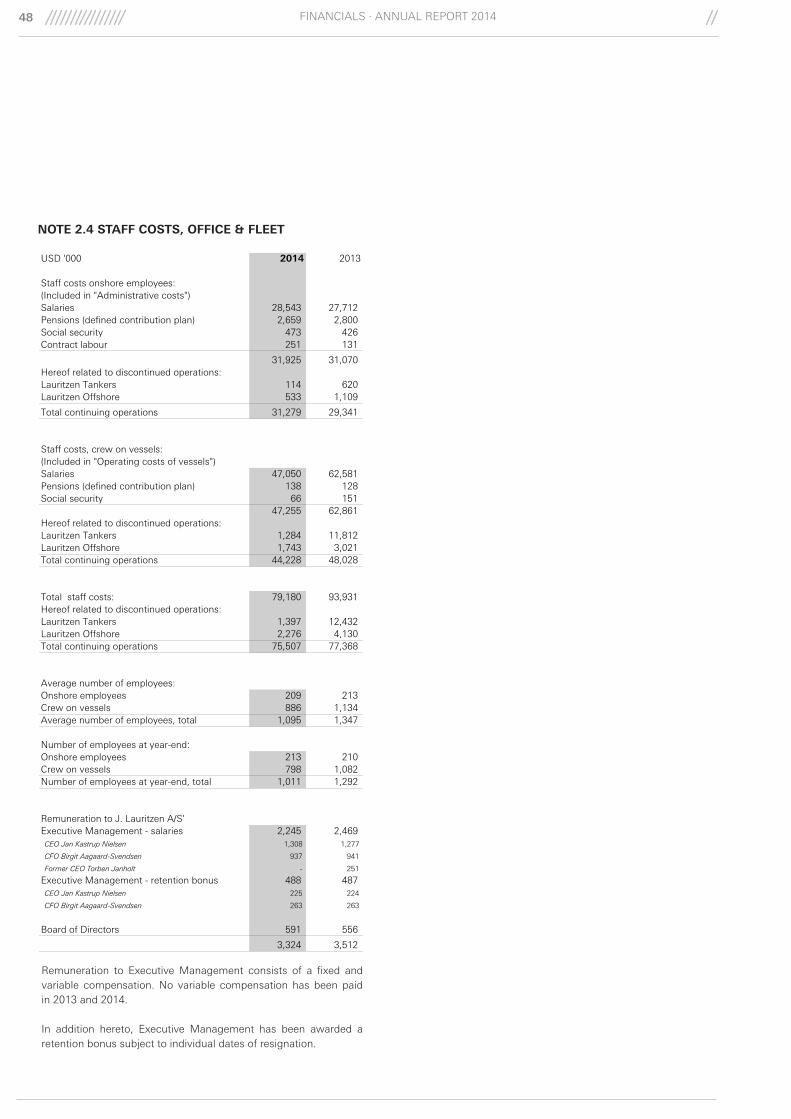
48
NOTE 2.4 STAFF COSTS, OFFICE & FLEET
Remuneration to Executive Management consists of a fixed and variable compensation. No variable compensation has been paid in 2013 and 2014.
In addition hereto, Executive Management has been awarded a retention bonus subject to individual dates of resignation.
USD '000 2014 2013
Staff costs onshore employees:(Included in "Administrative costs")Salaries 28,543 27,712 Pensions (defined contribution plan) 2,659 2,800 Social security 473 426 Contract labour 251 131
31,925 31,070 Hereof related to discontinued operations:Lauritzen Tankers 114 620 Lauritzen Offshore 533 1,109
Total continuing operations 31,279 29,341
Staff costs, crew on vessels:(Included in "Operating costs of vessels")Salaries 47,050 62,581 Pensions (defined contribution plan) 138 128 Social security 66 151
47,255 62,861 Hereof related to discontinued operations:Lauritzen Tankers 1,284 11,812 Lauritzen Offshore 1,743 3,021 Total continuing operations 44,228 48,028
Total staff costs: 79,180 93,931 Hereof related to discontinued operations:Lauritzen Tankers 1,397 12,432 Lauritzen Offshore 2,276 4,130 Total continuing operations 75,507 77,368
Average number of employees:Onshore employees 209 213 Crew on vessels 886 1,134 Average number of employees, total 1,095 1,347
Number of employees at year-end:Onshore employees 213 210 Crew on vessels 798 1,082 Number of employees at year-end, total 1,011 1,292
Remuneration to J. Lauritzen A/S'Executive Management - salaries 2,245 2,469 CEO Jan Kastrup Nielsen 1,308 1,277
CFO Birgit Aagaard-Svendsen 937 941
Former CEO Torben Janholt - 251
Executive Management - retention bonus 488 487 CEO Jan Kastrup Nielsen 225 224
CFO Birgit Aagaard-Svendsen 263 263
Board of Directors 591 556
3,324 3,512
FINANCIALS · ANNUAL REPORT 2014

49
NOTE 3.1 VESSELS, PROPERTY & EQUIPMENT
Section 3Operating Assets and Liabilities
USD '000
2014
Cost as at 1 January 1,513,895 0 3,074 17,970 1,534,939
Exchange rate adjustments (1,112) - (146) (34) (1,293)
Additions 13,711 28,976 - 10 42,697
Disposals (192,365) (16) - (7,807) (200,188)
Transferred to assets held for sale (note 5.1) (72,123) - - - (72,123)
Cost as at 31 December 1,262,006 28,961 2,928 10,138 1,304,032
Depreciation and impairment losses as at 1 January (492,769) 0 (570) (11,267) (504,606)
Exchange rate adjustments 195 - 29 34 258
Depreciation (54,895) - (88) (1,036) (56,018)
Impairment losses (85,132) - - - (85,132)
Disposals 120,422 - - 6,106 126,528
Transferred to assets held for sale (note 5.1) 23,153 - - - 23,153
Depreciation and impairment losses as at 31 December (489,027) 0 (628) (6,162) (495,817)
Balance as at 31 December 772,979 28,961 2,300 3,976 808,215
2013
Cost as at 1 January 2,180,658 73,894 3,053 19,052 2,276,657
Exchange rate adjustments in foreign companies 274 - 20 (21) 273
Additions 11,125 98,042 - 17 109,185
Transferred from vessels under construction 87,757 (87,757) - - 0
Disposals (24,960) (45,356) - (1,078) (71,394)
Transferred to assets held for sale (note 5.1) (740,959) (38,823) - - (779,782)
Cost as at 31 December 1,513,895 0 3,074 17,970 1,534,939
Vessels
Vessels under
constructionLand &
buildings
Machinery,tools and
equipment Total
Depreciation and impairment losses as at 1 January (478,745) (34,829) (491) (10,142) (524,208)
Exchange rate adjustments in foreign companies (96) - 9 19 (68)
Transferred from vessels under construction (20,796) 20,796 - - -
Depreciation (78,939) - (87) (2,193) (81,219)
Impairment losses (188,668) (13,579) - - (202,247)
Reversal of impairment losses 15,893 3,088 - - 18,981
Disposals 19,929 10,820 - 1,049 31,798
Transferred to assets held for sale (note 5.1) 238,651 13,704 - - 252,355
Depreciation and impairment losses as at 31 December (492,769) 0 (570) (11,267) (504,606)
Balance as at 31 December 1,021,126 - 2,504 6,703 1,030,333
Impairment test 2014The impairment test at the end of 2014 resulted in impairment losses of USD 100.9m related to the CGU Small bulk carriers, and provisions for onerous long-term charters of USD 60.1m. The impairment losses of own vessels amounts to USD 85.1m while vessels partly owned through investments in joint ventures were impaired by USD 15.8m.
The further deterioration of the dry bulk shipping market has led to a reduction of our freight rate forecasts. In line with the market develop-ment, dry bulk asset values have also declined.
The impairment test is based on freight rate estimates, current con-tract cover and risk assessment of longer-term charter parties. Based on the factors above and the impairment test management conclud-ed that the carrying amount exceeded the recoverable amount for the CGU Small Bulk Carriers, in the Operating segment Lauritzen Bulkers.
The recoverable amount of the vessels in the CGU Small Bulk Carriers is the fair value less costs of disposal estimated by use of two independent broker valuations.
FINANCIALS · ANNUAL REPORT 2014

50
ACCOUNTING POLICIES
Vessels Vessels are measured at cost less accumulated depreciation and accumulated impairment losses. Vessels are depreciated on a straight line basis to an estimated scrap value. Expected useful life of vessels is 25 years.
Cost of vessels acquired by way of finance leases are stated at the lower of fair value, and the present value of the minimum lease payments at the inception of the lease.
Rebuilding of vessels is capitalised if the rebuilding is intended to extend the service life and/or improve the earning potential. Re-building is depreciated over the expected service life of the invest-ment.
Costs relating to dry dockings are capitalised and depreciated on a straight line basis. The expected useful life of dry dockings range from 30 to 60 months.
Vessels under construction are measured at cost incurred until the time the vessel is taken into service less accumulated impairment losses.
LandLand is measured at cost. Land is not depreciated.
Buildings Buildings are measured at cost less accumulated depreciation and accumulated impairment losses. Buildings are depreciated on a straight line basis. Expected useful life of buildings is 50 years.
Machinery, tools and equipment Machinery, tools and equipment are measured at cost less accumulated depreciation and accumulated impairment losses. Machinery, tools and equipment are depreciated on a straight line basis. Expected useful life of machinery, tools and equipment is 5-10 years.
Impairment The carrying amount of fully owned and chartered vessels and vessels under construction together with part owned vessels through investments in joint ventures and associates are tested annually for impairment.
An impairment loss is recognised whenever the carrying amount of an asset or its cash-generating unit exceeds its recoverable amount. Impairment losses are recognised in the income state-ment.
Impairment losses of assets within a CGU are allocated to the carrying amount of the assets in the CGU on a pro rata basis to the higher of fair value less cost to sell and value in use. If the total carrying amount of the assets in the CGU still exceeds the value in use of the CGU, provisions are made for onerous contracts. Provisions are made to individual contracts, if net present value from an individual contract is negative.
CRITICAL ACCOUNTING ESTIMATES & JUDGMENTS
Estimated useful life and residual value of vessels: The estimated useful life and residual value of vessels are assessed annually and adjusted if appropriate. The residual value is based on estimates on steel value less costs to scrap. Estimated useful life of vessels is 25 years and the useful life of dry dockings range from 30 to 60 months.
There has been no significant impact on profit/loss arising from changes in estimated useful life or residual value in 2013 or 2014.
Impairment test of non-current assets and charter commit-ments:The impairment test is carried out at the lowest level for which there are separately identifiable cash inflows (cash generating units, CGU). The CGUs applied in the impairment test for 2014 are identical to those applied for 2013:
Fair value less costs of disposal is estimated by use of at least two independent broker valuations and value in use is calculated as present value of future cash flows to be derived from the vessels and other non-current assets during their useful life.
The key assumptions used in the impairment test include estimated future earnings (including charter income, COAs and estimated spot rates for open ship days), operating costs, counterparty risk, the composition of CGUs and the rate used to discount future cash flows. We use a risk adjusted weighted average cost of capital (real) of 6.5% (2013: 6.5%) as the discount rate.
Lauritzen BulkersSmall bulk carriersLarge bulk carriers
Lauritzen Kosan All gas carriers
FINANCIALS · ANNUAL REPORT 2014

51
NOTE 3.2 OPERATING LEASING OF VESSELS
At the balance sheet date the Group has the following operational lease obligations from time-charter and bareboat contracts:
2014
USDm committed obligation
No. of vessels, full
year equivalents
USDm committed obligation
No. of vessels, full
year equivalents
USDm committed obligation
No. of vessels, full
year equivalents
USDm committed obligation
No. of vessels, full
year equivalents
USDm committed obligation
No. of vessels, full
year equivalents
< 1 Year 152.2 33.7 12.0 6.0 164.2 39.7 - - 164.2 39.7 1 - 2 Year 119.7 26.2 7.7 4.3 127.4 30.5 - - 127.4 30.5 2 - 3 Year 99.8 22.6 3.7 2.1 103.5 24.7 - - 103.5 24.7 3 - 4 Year 93.4 21.4 - - 93.4 21.4 - - 93.4 21.4 4 - 5 Year 69.0 16.0 - - 69.0 16.0 - - 69.0 16.0 > 5 Year 221.1 50.1 - - 221.1 50.1 - - 221.1 50.1 Total 755.3 - 23.4 - 778.6 - - - 778.6 -
2013< 1 Year 147.8 30.4 14.3 7.6 162.1 38.0 7.9 1.4 170.0 39.5 1 - 2 Year 104.2 22.4 9.6 5.0 113.8 27.4 5.8 1.0 119.6 28.4 2 - 3 Year 96.8 21.8 7.1 4.1 103.9 25.8 5.8 1.0 109.7 26.8 3 - 4 Year 73.2 17.5 4.0 2.3 77.2 19.8 0.3 0.1 77.5 19.8 4 - 5 Year 66.6 16.0 - - 66.6 16.0 - - 66.6 16.0 > 5 Year 186.4 49.3 - - 186.4 49.3 - - 186.4 49.3
Total 675.0 - 35.0 - 710.0 - 19.7 - 729.8 -
Total
Discontinued operation Lauritzen Bulkers Lauritzen Kosan Total continuing
business
At year end 2014, the Group had purchase option on 21 bulk carriers (2013: 18 bulk carriers).
CRITICAL ACCOUNTING ESTIMATES & JUDGMENTS
The Group enters into different contracts regarding chartering vessels in. The majority of these contacts can easily be categorized as either operational or financial leases. However, some contracts may require judgment as to the substance of the agreement in order to recognize and measure them in accordance with the Group’s accounting policies.
FINANCIALS · ANNUAL REPORT 2014

52
NOTE 3.3 INVESTMENT IN JOINT VENTURES
ACCOUNTING POLICIES
Share of profit in associated companies and joint ventures The proportionate share of the net profit after tax in associated companies and joint ventures, after the elimination of proportional share of internal profit/loss is recognised in the income statement.
Investments in associates and joint ventures Investments in associates and joint ventures are recognised according to the equity method of accounting.
Any goodwill resulting from the acquisition is included in the car-rying value of the investment. The investments in associates and joint ventures are tested annually for impairment.
Associates and joint ventures with negative equity are measured at USD 0 (nil), unless the Group has a legal or constructive obliga-tion to cover the negative balance of the associate.
CRITICAL ACCOUNTING ESTIMATES & JUDGMENT
The assessment of the level of control in an investment and there-by the classification of an investment as subsidiaries, associates or joint ventures is based on managerial judgment.
USD '000 2014 2013
Cost as at 1 January 104,206 130,579 Additions during the year 4,322 1,720 Disposal during the year (1,500) (28,093)
Cost as at 31 December 107,028 104,206
Revaluation as at 1 January 18,124 20,911 Exchange rate adjustments (45) (24) Dividends received (10) (554) Revaluations during the year (16,739) (10,740) Share of equity movements 543 - Disposal during the year 1,500 8,531
Revaluation as at 31 December 3,373 18,124
Impairment losses as at 1 January (21,243) (21,243)
Impairment losses as at 31 December (21,243) (21,243)
Balance as at 31 December 89,158 101,087
Key figures for joint ventures (100%):
USD '000 2014 2013
Revenue 134,858 194,224 Net profit (3,594) (29,289) Assets 647,508 749,040 Liabilities 395,679 413,858
Group's share of net profit (13,593) (10,234) Internal profit/loss (3,146) (506) Net profit in joint ventures (16,739) (10,740)
Hereof related to discontinued operations:Lauritzen Tankers - - Lauritzen Offshore - - Total continuing operations (16,739) (10,740)
Group's share of equity 95,256 104,039 Internal profit/loss (6,098) (2,952)
89,158 101,087
Key figures for material investments in joint ventures (100%):
Name Country OwnershipAxis Offshore Pte. Ltd. Singapore 33.6%
USD '000 2014 2013
Revenue 45,624 46,127 Operating expenses (19,463) (17,431) Depreciation and amortization (12,081) (12,097) Finance, net (9,266) (5,140) Tax (119) (85) Net profit 4,694 11,375
Non-current assets 254,908 256,233 Current assets 46,698 58,614 - hereof cash at hand and in bank 32,397 51,314 Total assets 301,606 314,848
Non-current liabilites 142,908 160,307 Current liabilities 17,600 17,800 Total liabilities 160,508 178,107
Guarantees and payment obligations relating to joint ventures:
USDm 2014 2013
Guarantees undertaken for debt in joint ventures 121 137 Max. obligations to pay in capital into joint ventures 102 96
FINANCIALS · ANNUAL REPORT 2014

53
NOTE 3.4 CONTRACTUAL COMMITMENTS
The Group has entered into newbuilding contracts with a remaining contractual commitment of USD 139.3 million. These contracts cover the construction of 6 bulk carriers due for delivery in 2016-2018.
NOTE 3.5 WORKING CAPITAL
NOTE 3.6 OTHER RECEIVABLES
USD '000 2014 2013
Bank deposits pledged as security for debt 2,354 - Pool receivables 7,782 17,439 Receivable from Export Credit Agency 1,656 4,606 Other short-term receivables 4,876 4,288 Total other receivables 16,668 26,334
NOTE 3.7 PROVISIONS
USD '000 2014 2013
Provisions as at 1 January - 18 Additions 60,057 - Used during the year - (18)
Provisions as at 31 December 60,057 - Hereof:Non-current liabilities 33,343 - Current liabilities 26,713 -
Provisions as at 31 December 60,057 -
The provisions in 2014 refer to onerous long-term time-charters.
USD '000 2014 2013
Bunkers 9,683 12,264 Trade receivables 16,817 24,925 Other receivables 14,314 26,334 Prepayments 7,641 9,772 Total working capital assets 48,455 73,295
Trade payables 10,969 12,849 Other payables 16,853 11,457 Prepayments 200 191 Total working capital liabilities 28,022 24,497
Net working capital 20,432 48,799
FINANCIALS · ANNUAL REPORT 2014

54
NOTE 4.1 LONG-TERM BORROWINGS
Section 4Capital Structure and Finances
USD '000 <1 year 1 - 2 year 2 - 3 year 3 - 4 year 4 - 5 year > 5 year Total
Issued bonds, net *) (54,168) - (62,232) - - - (116,400)
Mortgage on vessels *) (47,918) (65,659) (96,324) (33,099) (35,807) (66,088) (344,894) Other debt (562) - - - - - (562)
Total long-term borrowings (102,648) (65,659) (158,556) (33,099) (35,807) (66,088) (461,857)
USD '000 <1 year 1 - 2 year 2 - 3 year 3 - 4 year 4 - 5 year > 5 year Total
Issued bonds *) - (71,739) - (80,193) - - (151,932)
Mortgage on vessels *) (62,455) (180,259) (237,094) (78,958) (15,733) (66,679) (641,178)
Other debt (993) (636) - - - - (1,629)
Total long-term borrowings (63,447) (252,634) (237,094) (159,151) (15,733) (66,679) (794,739)
(266,719) - - - - - (266,719)
Total, incl. liabilities ass. with assets held for sale (330,167) (252,634) (237,094) (159,151) (15,733) (66,679) (1,061,458)
*) Please refer to page 25 for description of financial covenants.
USD '000 CurrencyFixed/
VariableInterest rate
fixation
Average effective
interest rate, excl.
hedging
Average effective
interest rate incl. hedging Book value
2014Mortgage on vessels USD Variable 3-6 month 2.10% 4.59% (295,178)
Mortgage on vessels JPY Variable 6 month 2.26% 2.69% (49,716)
Issued bonds NOK Fix./Var. 1-3 years 10.23% 10.12% (116,400)
Other debt DKK Fixed 1 year 4.00% 4.00% (562)
Total 4.96% 6.68% (461,857)
2013
Mortgage on vessels USD Variable 3-6 month 2.02% 3.56% (577,709)
Mortgage on vessels JPY Variable 6 month 2.31% 2.71% (63,469)
Issued bonds NOK Fix./Var. 2-4 years 10.20% 9.04% (151,932)
Other debt DKK Fixed 1-2 years 4.61% 4.61% (1,629)
Total 3.60% 4.55% (794,739)
2014
2013
Mortgage on vessels classified as "Liabilities associated with assets held for sale", ref note 5.1.
FINANCIALS · ANNUAL REPORT 2014

55
NOTE 4.1 LONG-TERM BORROWINGS (continued)
NOTE 4.2 MORTGAGES
NOTE 4.4 FINANCIAL EXPENSES
NOTE 4.3 FINANCIAL INCOME
USD '000 2014 2013
Debt for a total of 344,894 641,178 is secured by mortgage in assetsat the following book values:Vessels 758,512 1,011,943
Debt classified as liabilities associated withassets held for sale for a total of - 266,719 is secured by mortgage in assets at the following book values:Vessels classified as held for sale - 451,368
USD '000 2014 2013
Interest income, bank deposits 180 511 Other interest income 119 201 Currency exchange gains and losses, net 5,869 10,301 Dividends received on shares available for sale 1,015 632 Interest on financial instr. at FV through P&L 760 26 Firm commitments under FV hedge accounting - 3,988 Derivatives, FV hedge of firm commitments - (3,988)
Financial income 7,944 11,671
USD '000 2014 2013
Interest expenses on loans (45,065) (61,031) Other financial expenses (1,181) (7,411) Financial instruments at FV through P&L, net (4,938) (2,983) Financial expenses (51,184) (71,425)
Hereof related to discontinued operations:Lauritzen Tankers (471) (16,278) Lauritzen Offshore (2,335) (12,727) Total continuing operations (48,377) (42,420)
ACCOUNTING POLICIES
Mortgage debt and other interest bearing debt are initially rec-ognised at fair value less any transaction costs incurred. Subse-quently, financial liabilities are measured at amortised cost using the effective interest rate method, such that the difference between the proceeds and the redemption value is recognised in the income statement over the lifetime of the loan.
ACCOUNTING POLICIES
Financial items include interest income and expenses, realised and unrealised exchange gains and losses, adjustments to the value of securities and certain financial instruments and other financial income and expenses.
Borrowing costs directly attributable to the acquisition or construc-tion of assets are capitalised as part of the cost of the asset.
Currency exposure on non-USD long-term borrowings, net of hedging:
USD '000 Book value
Currency hedging
derivatives
Net currency
exposure on loan
JPY (49,716) 18,300 (31,416)
DKK (562) - (562)
NOK (116,400) 116,400 -
Total (166,679) 134,700 (31,978)
USD '000 Book value
Currency hedging
derivatives and deposits
Net currency
exposure on loan
JPY (63,469) 14,000 (49,469)
DKK (1,629) - (1,629)
NOK (151,932) 151,932 -
Total (217,030) 165,932 (51,098)
Interest exposure on long-term borrowings to floating interest rates:
USD '000 2014 2013
Total long-term borrowings (461,857) (794,739)
Hereof amortized formation costs 13,368 16,245
Hereof fixed to maturity (54,730) (73,368)
Floating interest borrowings (420,495) (737,616)
Interest rate swaps floating to fixed, nominal 493,504 390,483
Exposure to floating interest rates at year end 73,009 (347,132)
2014
2013
FINANCIALS · ANNUAL REPORT 2014

56
NOTE 4.5 FINANCIAL INSTRUMENTS AND FINAN-CIAL RISK
*) Contractual cash flows include undiscounted interest payments based on interest levels at year-end.
The risk of losses in financial positions arising from movements in market prices to which J. Lauritzen is exposed
The risk that J. Lauritzen is not able to meet its future cash flow needs
The risk of incurring a financial loss if a customer or counterparty fails to fulfill its contractual obligations
Credit risk
Market risk
Liquidity risk
The Group is through its operation, investment and financing exposed to certain financial risk. The financial risk relates to and is defined as such:
Financial risk is regularly assessed and prioritized based on how likely it is to occur and its potential impact. As defined by the Board of Directors, overall policies and objectives for financial risk were generally unchanged from 2013.
LIQUIDITY RISKThe purpose of managing liquidity risk is to ensure sufficient capital for day-to-day operations and financial commitments also in distressed situations. Cash requirements are regularly assessed in various scenarios and stress tested. The general guidelines on liquidity including a minimum liquidity requirement is approved by the Board of Directors.
Liquidity is continuously monitored and assessed based on forecasts for the current year and years to come including outstanding capital expenditure, proceeds from committed and expected credit facilities and future liabilities from existing and expected future credit facilities. This is done to ensure that liquidity is adequate at any times.
At year-end 2014, cash and cash equivalents amounted to USD 184m. In addition hereto, the Group had undrawn committed credit facilities of USD 100m and an unsecured overdraft facility of DKK 100m for multi-currency short-term financing needs. The Group has no refinancing needs until 2016, and funding of our newbuilding pro-gram consisting of six vessels is secured.
The Group’s loan portfolio consists of traditional mortgage-backed ship finance (approximately 53% of total facilities), ECA (Export Credit Agency) backed agreements (approximately 22% of total facilities) as well as unsecured (non-mortgage) corporate bonds (approximately 25% of total facilities). According to our Financial Strategy, no finan-cial counterparty may account for more than 25% of total loan facili-ties.
The loan agreements include a minimum value clause (MVC) where cash security has to be pledged if outstanding loan to market value reaches a certain limit. At year-end 2014, the Group had placed no pledged cash related to MVC in loan agreements (2013: USD nil). There were no breaches of credit facilities in 2014 and 2013.
Below is a maturity analysis of the financial liabilities at year-end 2014. A maturity analysis of operational lease obligations is included in note 3.2.
USD '000
2014Carrying amount
Contractual cash flow <1 year 1 - 2 year 2 - 3 year 3 - 4 year 4 - 5 year > 5 year
Interest-bearing debt *) (461,857) (516,089) (120,763) (79,540) (168,398) (37,204) (39,426) (70,759) Trade and other payables (34,033) (34,033) (34,033) - - - - - Derivatives, liabilities at fair value (77,887) (77,887) (46,105) (15,864) (9,356) (3,304) (2,340) (919) Total at 31 December 2014 (573,778) (628,010) (200,901) (95,404) (177,754) (40,507) (41,765) (71,678)
2013
Interest bearing debt *) (794,739) (884,693) (94,397) (277,762) (253,186) (168,676) (18,511) (72,162) Debt associated with assets held for sale (266,719) (266,719) (266,719) - - - - - Trade payable and other payables (34,312) (34,312) (34,312) - - - - - Derivatives, liabilities at fair value (38,223) (38,223) (15,097) (11,342) (7,223) (3,421) (786) (353) Total at 31 December 2013 (1,133,993) (1,223,947) (410,525) (289,104) (260,409) (172,097) (19,297) (72,515)
FINANCIALS · ANNUAL REPORT 2014
57
MARKET RISKMarket risk is the risk of losses in financial positions arising from movements in market prices to which the Group is exposed through financial instruments. Market risk is regularly assessed and prioritized based on how likely it is to occur and its potential impact. Based on this assessment, the following market risk factors are considered sig-nificant for the Group:
To a minor extent the Group is exposed to other market risk factors that are considered less significant. These include risk on financial instruments related to share prices, oil prices and freight rates (FFA). We use derivatives to hedge oil and freight rates on a small scale. The fair value of these instruments is disclosed in the table “Derivative financial instruments”.
Below is a description of how we manage the significant market risk factors and perform sensitivity analysis of the exposure. Sensitivity information is calculated at balance sheet date and comprises only sensitivity relating to financial instruments, so the amounts disclosed do not necessarily give a complete picture of the Group’s risk relating to changes in currency rates and interest rates.
Currency riskThe operating and reporting currency is USD and thus all amounts are recorded and reported in USD. Matching income and expenses and assets and liabilities minimizes the net currency risk, leaving net positions to be focused on.
Our policy is to use derivative instruments to hedge the currency risk relating to net non-USD cash flows from operating activities, invest-ments and financing. The general hedging policy is approved by the Board of Directors.
The hedging strategy for operating costs is based on estimated annual net non-USD cash flows, i.e. 12 months rolling cash flow.
Hedge accounting is not applied to forward contracts relating to future costs in non-USD currencies.
Please refer to note 4.1 for further disclosure of the currency exposure of long-term borrowings and hedging hereof.
Sensitivity of currency riskTo measure currency risk in accordance with IFRS 7, sensitivity is cal-culated as the change in fair value of future cash flows from financial instruments as a result of fluctuations in exchange rates on the bal-ance sheet date. Sensitivity to fluctuations in non-USD currencies at balance sheet date based (other things being equal and after tax) on a 10% decrease in currency translation rates against USD (assuming 100% effectiveness) would result in a net profit/(loss) of USD 1.0m (2013: 2.1m) and affect equity by USD (-1.4)m (2013: 0.5m). The ef-fect of a 10% increase in the currency translation rates against USD would have a corresponding inverse effect.
Interest rate riskOur policy is to hedge risk associated with changes in interest rates to limit the negative financial effects of adverse changes in interest rates by converting variable interest rates to fixed interest rates. Net interest rate risk may be hedged via forward rate agreements, interest rate swaps and related instruments if assessed as advantageous. The general hedging policy is approved by the Board of Directors.
Cash flow hedge accounting is used in respect of interest rate deriva-tives. These are recycled in the income statement over the term of the hedged loans. Please refer to note 4.1 for disclosure of the exposure to floating interest rates at balance sheet date.
Changes in market values on derivatives could cause margin calls. To reduce this risk we have established credit lines with financial coun-terparties. At year-end 2014, the Group had pledged cash for cover of margin calls amounting to USD 2.4m (2013: USD nil).
Sensitivity of interest rate riskSensitivity of interest fluctuations is calculated as the hypothetic ef-fect on net profit and equity as a result of fluctuations in interest rates at balance sheet date.
The sensitivity analysis includes financial instruments recognised at fair value for which the calculated effect on equity represents an im-mediate fair value change from a thought change in interest rates and financial instruments with variable interest recognised at amortized costs for which the calculated effect represents a one year effect on net profit and equity based on balances at year end.
Assumptions for the sensitivity analysis:
•Allhedginginstrumentsassumed100%effective.• Changesininterestratesareglobalandthustheimpactonthe
fair value of forward currency contracts and similar derivatives is not considered.
• Sharesavailable forsaleandsharesat fairvalue throughprofitor loss are not included in sensitivity calculations due to inability to reliably measure the sensitivity of share prices to interest rate changes.
The long-term floating rate borrowings are all fixed using interest
rate swaps.
Relates to the risk of contractual commitments in non-USD. At
year-end 2014 the Group had no non-USD commitments on
newbuildings.
Currency risk from operations is related to non-USD costs where
DKK expenses are the largest contributor.
Liquidity risk - Operational cash flow
Currency risk - Investments
Interest rates risk - Long-term borrowing
Relates to long-term borrowing in non-USD. At year-end, the
Group had long-term borrowings denominated in NOK, DKK and
JPY, ref. note 4.1.
Currency risk - Financing
FINANCIALS · ANNUAL REPORT 2014
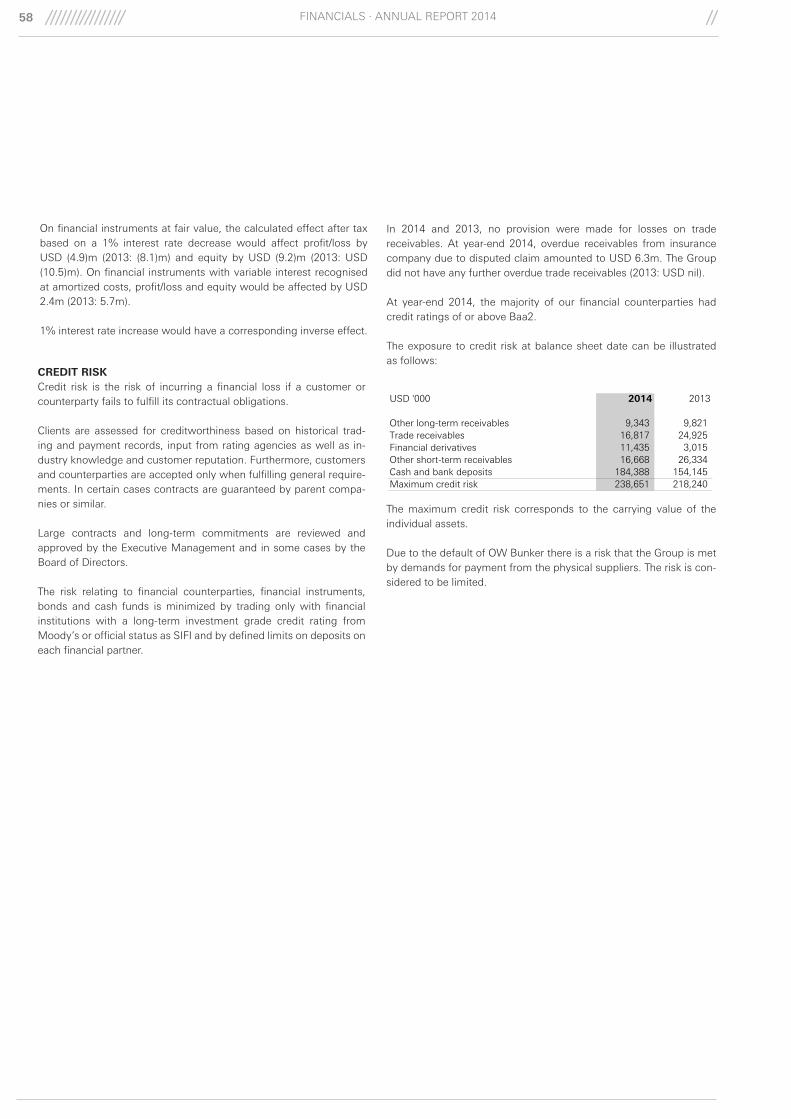
58
USD '000 2014 2013
Other long-term receivables 9,343 9,821 Trade receivables 16,817 24,925 Financial derivatives 11,435 3,015 Other short-term receivables 16,668 26,334 Cash and bank deposits 184,388 154,145 Maximum credit risk 238,651 218,240
The maximum credit risk corresponds to the carrying value of the individual assets.
Due to the default of OW Bunker there is a risk that the Group is met by demands for payment from the physical suppliers. The risk is con-sidered to be limited.
On financial instruments at fair value, the calculated effect after tax based on a 1% interest rate decrease would affect profit/loss by USD (4.9)m (2013: (8.1)m) and equity by USD (9.2)m (2013: USD (10.5)m). On financial instruments with variable interest recognised at amortized costs, profit/loss and equity would be affected by USD 2.4m (2013: 5.7m).
1% interest rate increase would have a corresponding inverse effect.
CREDIT RISKCredit risk is the risk of incurring a financial loss if a customer or counterparty fails to fulfill its contractual obligations.
Clients are assessed for creditworthiness based on historical trad-ing and payment records, input from rating agencies as well as in-dustry knowledge and customer reputation. Furthermore, customers and counterparties are accepted only when fulfilling general require-ments. In certain cases contracts are guaranteed by parent compa-nies or similar.
Large contracts and long-term commitments are reviewed and approved by the Executive Management and in some cases by the Board of Directors.
The risk relating to financial counterparties, financial instruments, bonds and cash funds is minimized by trading only with financial institutions with a long-term investment grade credit rating from Moody’s or official status as SIFI and by defined limits on deposits on each financial partner.
In 2014 and 2013, no provision were made for losses on trade receivables. At year-end 2014, overdue receivables from insurance company due to disputed claim amounted to USD 6.3m. The Group did not have any further overdue trade receivables (2013: USD nil).
At year-end 2014, the majority of our financial counterparties had credit ratings of or above Baa2.
The exposure to credit risk at balance sheet date can be illustrated as follows:
FINANCIALS · ANNUAL REPORT 2014

59
DERIVATIVE FINANCIAL INSTRUMENTS
ACCOUNTING POLICIES
Derivatives are recognised at fair value. Positive and negative fair values of derivatives are presented in the statement of financial position in separate line items, and offsetting is made only when the Group has the right and intention to settle several derivatives net.
Fair value hedgeChanges in the fair value of derivatives designated as and qualifying for recognition as a hedge of the fair value of a recognised asset or liability are recognised in the income statement together with changes in the fair value of the hedged asset or liability. Hedging of future cash flows relating to firm commitments are treated as fair value hedges.
Cash flow hedgeWhere a derivative financial instrument is designated as a hedge of a highly probable forecasted transaction, the effective part of any gain or loss on it is recognised in other comprehensive income in the hedging reserve of equity. When the forecasted transaction subse-quently is realised, the associated cumulative gain or loss is reclas-sified from other comprehensive income in the hedging reserve of equity to the income statement in the same period or periods during which the hedged forecasted transaction affects profit or loss. The ineffective part of any gain or loss is recognised in the income state-ment immediately.
When a hedging instrument expires or is sold, terminated or exercised, or the entity revokes designation of the hedge relationship but the hedged forecast transaction still is expected to occur, the cumulative gain or loss at that point remains in other comprehensive income in the hedging reserve of equity and is recognised in accordance with the above policy when the transaction occurs. If the hedged transaction is no longer expected to take place, the cumulative unrealised gain or loss recognised in equity is recognised in the income statement immediately.
Net investment hedgeDerivatives used to hedge net investments in foreign subsidiaries, associates or joint ventures are accounted for similarly to cash flow hedges. Any gain or loss on the hedging instrument relating to the effective portion of the hedge is recognised in equity; the gain and loss relating to the ineffective portion is recognised immediately in the income statement.
Derivatives that do not qualify for hedge accounting For derivatives that do not qualify for hedge accounting, changes in fair value are recognised in the income statement as they occur.
Methods for determination of fair value – derivativesThe fair values of derivative instruments are based on their listed market price, if available, or estimated using appropriate market rates prevailing at the balance sheet date.
USDmCash flow /Fair value hedge
Nominal, USDm
Duration, month
Recognised on equity Fair value
Nominal, USDm
Duration, month
Recognised on equity Fair value
Hedge accounting applied:Currency: USD/NOK Cash flow 206.0 5-34 (5.1) (51.6) 206.0 17-46 (2.4) (12.1) Interest rate swaps Cash flow 448.7 1-107 (10.6) (12.7) 390.5 9-119 (16.1) (17.3) Terminated interest rate swap Cash flow N/A N/A 0.3 N/A N/A N/A 0.4 N/ATotal (15.4) (64.3) (18.0) (29.3)
Hedge accounting not applied:Currency: USD/NOK N/A (47.0) 0-4 - 8.1 (47.6) 0-2 - (0.5) Currency: USD/EUR N/A 2.7 0-1 - (0.2) - N/A - - Currency: USD/DKK N/A 18.0 0-1 - (0.7) 29.0 0-2 - 0.8 Currency: USD/JPY N/A (81.7) 0-6 - (1.0) 14.0 0-2 - (1.1) Interest rate swaps N/A 44.8 40 - (0.2) 124.5 52-75 - (1.8) FFA's and oil contracts N/A N/A 0-24 - (3.9) N/A N/A - 0.9 Interest indexswap N/A 30.8 15 - (4.2) 34.5 27 - (4.4) Total - (2.1) - (5.9)
Total derivative financial instruments (66.4) (35.2)
Presented in the financial statement as:Derivative financial instruments, assets 11.4 3.0 Non-current derivative financial instr., liabilities (31.8) (23.1) Derivative financial instruments, liabilities (46.1) (15.1)
2014 2013
Our policy is to use derivative financial instruments to hedge financial risk. At year-end, the Group held the following derivatives:
FINANCIALS · ANNUAL REPORT 2014

60
CATEGORIES OF FINANCIAL ASSETS AND LIABILITIES
USD '000 2014 2013
Fin. assets at FV through P/L *) 21,146 13,015 Loans and receivables**) 227,216 215,225 Fin. assets available for sale **) 40,840 43,427 Fin. liabilities - at FV through P/L *) (77,887) (38,223) Fin. liabilities - at amortised cost**) (495,812) (829,050)
ACCOUNTING POLICIES
Financial assetsInvestments are classified in the following categories:
• Financial assets at fair value through profit or loss (financial derivatives)
• Loans and receivables and• Available-for-sale financial assets
The classification depends on the purpose for which the invest-ments were acquired. Management determines the classification of its investments on initial recognition and re-evaluates this des-ignation at every reporting date to the extent that such a designa-tion is permitted and required. Financial assets classified at fair value through profit or loss is investments that are measured and reported at fair value in the internal management reporting.
*) Figure includes financial derivatives designated for hedge accounting **) Amounts recognised for financial asset and liabilities at amortised cost do not differ materially from their fair value with the exception of issued bonds. Fair value of issued bonds amount to USD 118.8m whereas the carrying amount totalled USD 116.4m.
Fair value hierarchy With the exception of listed bonds and shares of USD 9.7m (2013: USD 10.0m) (level 1) and shares available for sale of USD 40.8m (2013: USD 43.4m) (level 3), all financial instruments are stated at fair value on the basis of observable market prices (level 2), directly as prices or indirectly derived from prices.
In 2014, fair value adjustment of Level 3 financial instruments amounted to USD (2.6)m recognised in other comprehensive income (2013: 1.4m). The fair value adjustment relate to unlisted shares for which a valuation technique has been used to determine fair value. Material inputs in the valuation comprise equity value and expected ROE compared to our return requirements. Financial instruments categorized at Level 3 have developed as follows:
USD ‘000 2014 2013
Book value at 1 January 43,427 26,010 Purchase during the year - 15,973 Fair value adjustment (2,587) 1,444 Book value at 31 December 40,840 43,427
Financial assets at fair value through profit or loss Comprise financial derivatives on which hedge accounting is not applied and securities which is classified as such on initial recogni-tion.
Loans and receivablesLoans and receivables are non-derivative financial assets with fixed or determinable payments that are not quoted in an active market. Loans and receivables are included in Trade receivables and Other receivables in the statement of financial position. Trade receivables and Other receivables are stated at amortised cost less allowances for doubtful trade receivables. The allowances are based on an individual assessment of each receivable.
Available-for-sale financial assetsAvailable-for-sale financial assets are non-derivatives that are not classified held for trading. They are included in non-current assets unless management intends to dispose of the investment within 12 months of the balance sheet date.
Recognition and measurement of financial assetsPurchases and sales of investments are recognised on the settle-ment date. Investments are initially recognised at fair value plus transaction costs for all financial assets not classified as fair value through profit or loss.
Available-for-sale financial assets and financial assets at fair value through profit or loss are subsequently carried at fair value. Loans and receivables are carried at amortised cost using the effective interest method.
Unrealised gains and losses arising from changes in the fair value of financial assets classified as available-for-sale are recognised in equity. When financial assets classified as available-for-sale are sold or impaired, the accumulated fair value adjustments are included in the Income statement as gains and losses from available-for-sale financial assets.
Methods for determination of fair valueListed shares: For listed shares the fair value is determined as the stock exchange closing price at the balance sheet date.
Bonds: The fair value of investments in bonds is based on the closing price at the balance sheet date obtained directly from the market or from third parties. The fair value of bond related products where an active and liquid market does not exist, is obtained by using discounted cash flow techniques and observable market data prevailing at the balance sheet date.
Shares available for sale: Include unlisted shares for which valu-ation techniques are used to measure fair value. Changes in fair value are recognised in equity.
The following categories of financial assets and liabilities are recog-nised in the balance sheet:
FINANCIALS · ANNUAL REPORT 2014

61
4.6 EQUITY
ACCOUNTING POLICIES
Proposed dividend is recognised as a separate item under equity until approved at the Annual General Meeting, where after it is rec-ognised as a liability.
The authorized and issued share capital of J. Lauritzen A/S amount to DKK 440m (2013: 440m) with 1 share (2013: 1 share) of DKK 50,000 or multiples of this.
Capital managementThe general guidelines on capital approved by the Board of Directors include minimum T/C adjusted solvency ratio of 40% for the Group.
J. Lauritzen A/S pursues a prudent dividend policy that secures the necessary liquidity and supports our ability to grow the business or-ganically.
At the end of 2013 and 2014 no proposed dividends were included in retained earnings.
FINANCIALS · ANNUAL REPORT 2014

62
Section 5Other NotesNOTE 5.1 ASSETS HELD FOR SALE AND DISCONTINUED OPERATIONS
USD '000 2014 2013
Assets held for sale:
Assets held for sale that do not qualify for discontinued operation:Two bulk carriers - 53,148
Assets held for sale that qualify for discontinued operation:Lauritzen Tankers - 219,000 Lauritzen Offshore Shuttle tankers - 179,220 Total assets held for sale - 451,368
Liabilities associated with assets held for sale, qualifying for discontinued operations:
Lauritzen Tankers - 142,259 Lauritzen Offshore Shuttle tankers - 124,460 Total liabilities associated with assets held for sale - 266,719
Assets held for sale that do not qualify for discontinued operations
Assets held for sale that qualify for discontinued operations
Profit/(loss) from discontinued operations:
Lauritzen Tankers 2,815 (22,776) Lauritzen Offshore Shuttle tankers 15,928 (25,059) Total profit/(loss) from discontinued operations 18,743 (47,835)
I) Lauritzen Tankers
As stated in announcement to Oslo Børs no. 6/2013 dated 15 August 2013, a strategic decision had been taken to trim the balance sheet bygradual exit of the product tanker segment. The conditions for classifying Lauritzen Tankers "as held for sale" and "discontinued operation"were fulfilled in the end of 3rd quarter 2013 as the wholly-owned fleet, cf. announcement to Olso Børs no. 7/2013 dated 22 October 2013was reported sold with delivery before the end of February 2014.
The results of Lauritzen Tankers are presented as discontinued operations for all periods presented. The Income statement for thediscontinued operations can be presented as follows:
USD '000 2014 2013
Revenue 14,431 81,046 Other operating income 121 274 Costs (11,281) (60,242) EBITDA 3,271 21,078 Depreciations 0 (7,168) Impairment losses - (22,147) Finance net (456) (16,278) Profit/(loss) on the remeasurement to fair value less costs to sell - 1,438 Pretax profit/(loss) from discontinued operations 2,815 (23,077) Income taxes - 301 Profit/(loss) on discontinued operations, net of taxes 2,815 (22,776)
Attributable to:The J. Lauritzen Group 2,815 (23,073) Non-controlling interests 0 297
2,815 (22,776)
At year-end 2013 the consolidated statement of financial position included assets held for sale of USD 53m that do not qualify for discontinued operation. The assets held for sale relate to two bulk carriers sold with delivery in 2014. The two vessels were measured at the lower of their previously carrying amount (USD 53m) and net sales price (USD 59m). Delivery of the vessels have therefore affected profit/(loss) in 2014 by USD 6m.
At year-end 2013 the consolidated statement of financial position included assets held for sale of USD 398m that qualify for discontinued operation. The assets held for sale related to Lauritzen Tankers (USD 219m) and Lauritzen Offshore shuttle tankers (USD 179m). Liabilities associated with the assets held for sale amounted to USD 267m of which USD 142m relates to Lauritzen Tankers and USD 124m relates to Lauritzen Offshore shuttle tankers. The assets has been delivered to new owners in 2014 and the corresponding liabilities settled.
FINANCIALS · ANNUAL REPORT 2014

63
NOTE 5.1 ASSETS HELD FOR SALE AND DISCONTINUED OPERATIONS (CONTINUED)
II) Lauritzen Offshore Shuttle tankers
USD '000 2014 2013
Revenue 18,897 36,188 Other operating income 489 606 Costs (6,949) (9,834) EBITDA 12,437 26,960 Depreciation - (10,614) Impairment losses - (28,153) Profit/(loss) on sale of vessels 5,162 - Finance, net (2,335) (12,727) Pretax profit/(loss) from discontinued operations 15,263 (24,533) Income taxes 665 (525) Profit/(loss) on discontinued operations, net of taxes 15,928 (25,059)
Attributable to:The J. Lauritzen Group 15,928 (25,059) Non-controlling interests 0 0
15,928 (25,059)
Cash flow from discontinued operations:
The Cash flow from Lauritzen Tankers and Lauritzen Offshore Shuttle tankers is included in the Cash Flow Statement for all periodspresented.
USD '000 2014 2013
Cash flow from operating activities 60,446 (19,932) Hereof cash flow from operating activities - discontinued operations:Lauritzen Tankers 17,864 (857) Lauritzen Offshore Shuttle tankers (28,836) 21,744 Cash flow from operating activities, continuing operations 71,417 (40,819)
Cash flow from investment activities 552,686 28,165 Hereof cash flow from investment activities - discontinued operations:Lauritzen Tankers 219,031 11,601 Lauritzen Offshore Shuttle tankers 184,382 121 Cash flow from investing activities, continuing operations 149,273 16,443
Cash flow from financing activities (572,333) (126,125) Hereof cash flow from financing activities - discontinued operations:Lauritzen Tankers (142,259) 20,439 Lauritzen Offshore Shuttle tankers (124,460) (13,040) Cash flow from financing activities, continuing operations (305,614) (133,524)
Towards the end of 2013 the Group received and an offer to sell its fleet of three shuttle tankers, and the three vessels were classified as held for sale as per 31 Dec 2013. The agreement to sell was lifted on January 15 2014 and reported to Oslo Bors cf. announcement no 1/2014. The vessels were delivered to new owners during 2nd and 3rd quarter 2014 and affected profit/(loss) by USD 5m in 3rd quarter 2014.
The sale of the shuttle tankers caused a closing of the operating segment, and Lauritzen Offshore Shuttle tankers is presented as discontinued operations for all periods presented. The Income statement for the discontinued operations can be presented as follows:
FINANCIALS · ANNUAL REPORT 2014
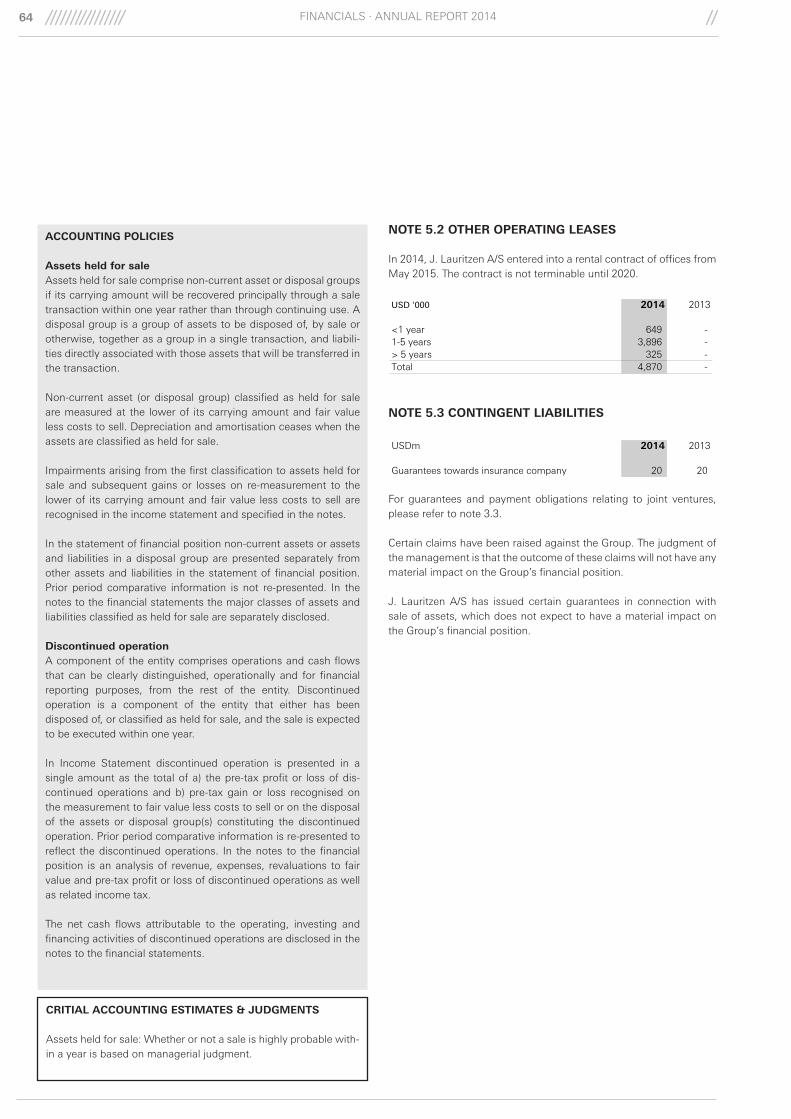
64
NOTE 5.2 OTHER OPERATING LEASES
NOTE 5.3 CONTINGENT LIABILITIES
USD '000 2014 2013
<1 year 649 - 1-5 years 3,896 - > 5 years 325 - Total 4,870 -
USDm 2014 2013
Guarantees towards insurance company 20 20
For guarantees and payment obligations relating to joint ventures, please refer to note 3.3. Certain claims have been raised against the Group. The judgment of the management is that the outcome of these claims will not have any material impact on the Group’s financial position. J. Lauritzen A/S has issued certain guarantees in connection with sale of assets, which does not expect to have a material impact on the Group’s financial position.
In 2014, J. Lauritzen A/S entered into a rental contract of offices from May 2015. The contract is not terminable until 2020.
ACCOUNTING POLICIES
Assets held for saleAssets held for sale comprise non-current asset or disposal groups if its carrying amount will be recovered principally through a sale transaction within one year rather than through continuing use. A disposal group is a group of assets to be disposed of, by sale or otherwise, together as a group in a single transaction, and liabili-ties directly associated with those assets that will be transferred in the transaction.
Non-current asset (or disposal group) classified as held for sale are measured at the lower of its carrying amount and fair value less costs to sell. Depreciation and amortisation ceases when the assets are classified as held for sale.
Impairments arising from the first classification to assets held for sale and subsequent gains or losses on re-measurement to the lower of its carrying amount and fair value less costs to sell are recognised in the income statement and specified in the notes.
In the statement of financial position non-current assets or assets and liabilities in a disposal group are presented separately from other assets and liabilities in the statement of financial position. Prior period comparative information is not re-presented. In the notes to the financial statements the major classes of assets and liabilities classified as held for sale are separately disclosed.
Discontinued operationA component of the entity comprises operations and cash flows that can be clearly distinguished, operationally and for financial reporting purposes, from the rest of the entity. Discontinued operation is a component of the entity that either has been disposed of, or classified as held for sale, and the sale is expected to be executed within one year.
In Income Statement discontinued operation is presented in a single amount as the total of a) the pre-tax profit or loss of dis-continued operations and b) pre-tax gain or loss recognised on the measurement to fair value less costs to sell or on the disposal of the assets or disposal group(s) constituting the discontinued operation. Prior period comparative information is re-presented to reflect the discontinued operations. In the notes to the financial position is an analysis of revenue, expenses, revaluations to fair value and pre-tax profit or loss of discontinued operations as well as related income tax.
The net cash flows attributable to the operating, investing and financing activities of discontinued operations are disclosed in the notes to the financial statements.
CRITIAL ACCOUNTING ESTIMATES & JUDGMENTS
Assets held for sale: Whether or not a sale is highly probable with-in a year is based on managerial judgment.
FINANCIALS · ANNUAL REPORT 2014

65
NOTE 5.4 TAX
USD '000 2014 2013
Tax in the Income Statement consist of:Current tax 281 270 Deferred tax 3,303 (357)
Income tax 3,584 (88)
Hereof related to discontinued operations:
Lauritzen Tankers - 301 Lauritzen Offshore 665 (525)
Total continuing operations 2,919 137
Tax on the profit is specified as follows:Calculated 24.5% (2013: 25%) of result before tax 45,914 71,057 Adjustment in foreign companies deviating from 24.5%/25% tax 63 217 Tax effect of:Tonnage tax (35,772) (72,522) Non-taxable items (6,651) 3,148 Adjustments previous year 267 697 Share of profit joint ventures (237) (2,685)
3,584 (88)
Effective tax percent (2)% 0%
Deferred tax on the Balance Sheet:Deferred tax 1 January 297 655 Translation adj. in foreign operations - - Tax on profit 3,303 (357)
Deferred tax 31 December 3,600 297
Deferred tax concerns:Taxable losses carried forward 3,600 297
3,600 297
Unrecognised share of taxable losses carried forward 4,300 9,000
Corporate tax (receivable)/payable can be specified as follows:Balance 1 January 1,952 (1,117) Exchange rate adjustments (7) (72) Paid during the year (434) 3,410 Provision for the year (14) 427 Adjustment to prior years (267) (697)
1,229 1,952
ACCOUNTING POLICIES
Income taxIncome tax consists of tax calculated according to the regulations of the Danish Tonnage Tax Act for Danish based shipping activities and according to foreign tax regulations for foreign activities, as well as adjustments related to deferred tax. Income tax is recog-nised in the income statement except to the extent that it relates to items recognised directly to equity, in which case it is recognised in equity.
Corporate and deferred taxCorporate tax is the expected tax payable on the taxable income for the year, using tax rates enacted or substantially enacted at the balance sheet date, and any adjustment to tax payable in respect of previous years.
Deferred tax is provided using the balance sheet liability method, providing for temporary differences between the carrying amounts of assets and liabilities for financial reporting purposes and the amounts used for taxation purposes. The following temporary differences are not provided for: goodwill not deductible for tax purposes, the initial recognition of assets or liabilities that affect neither accounting nor taxable profit, nor differences relating to investments in subsidiaries to the extent that they will probably not reverse in the foreseeable future. The amount of deferred tax pro-vided is based on the expected manner of realisation or settlement of the carrying amount of assets and liabilities, using tax rates en-acted or substantively enacted at the balance sheet date.
A deferred tax asset is recognised only to the extent that it is prob-able that future taxable profits will be available against which the asset can be utilised. Deferred tax assets are reduced to the extent that it is no longer probable that the related tax benefit will be realised.
Certain group companies are jointly taxed with subsidiaries of the Lauritzen Foundation, the sole owner of J. Laurtizen A/S.
Provision for income tax for the year includes estimates of non-deductible finance expenses under the interest ceiling rules as well as estimates on the effect of joint taxation contribution.
In 2005, the Danish based companies of the Group entered the Danish tonnage taxation system, the adoption of which is binding until at least 2014. We do not expect to exit the tonnage taxation and thus no deferred tax provision has been made on the assets or liabilities effected by the Danish tonnage taxation system. If, however, the Danish Group companies should leave the Danish tonnage taxation system there could be a deferred tax liability of up to a maximum of USD 7m.
CRITIAL ACCOUNTING ESTIMATES & JUDGMENTS
The Group recognises deferred tax assets, including the expected tax value of tax loss carryforwards, if management assesses that these tax assets can be offset against positive taxable income in the foreseeable future. This judgment is made annually and based on budgets and business plans for the coming years, including planned initiatives.
FINANCIALS · ANNUAL REPORT 2014
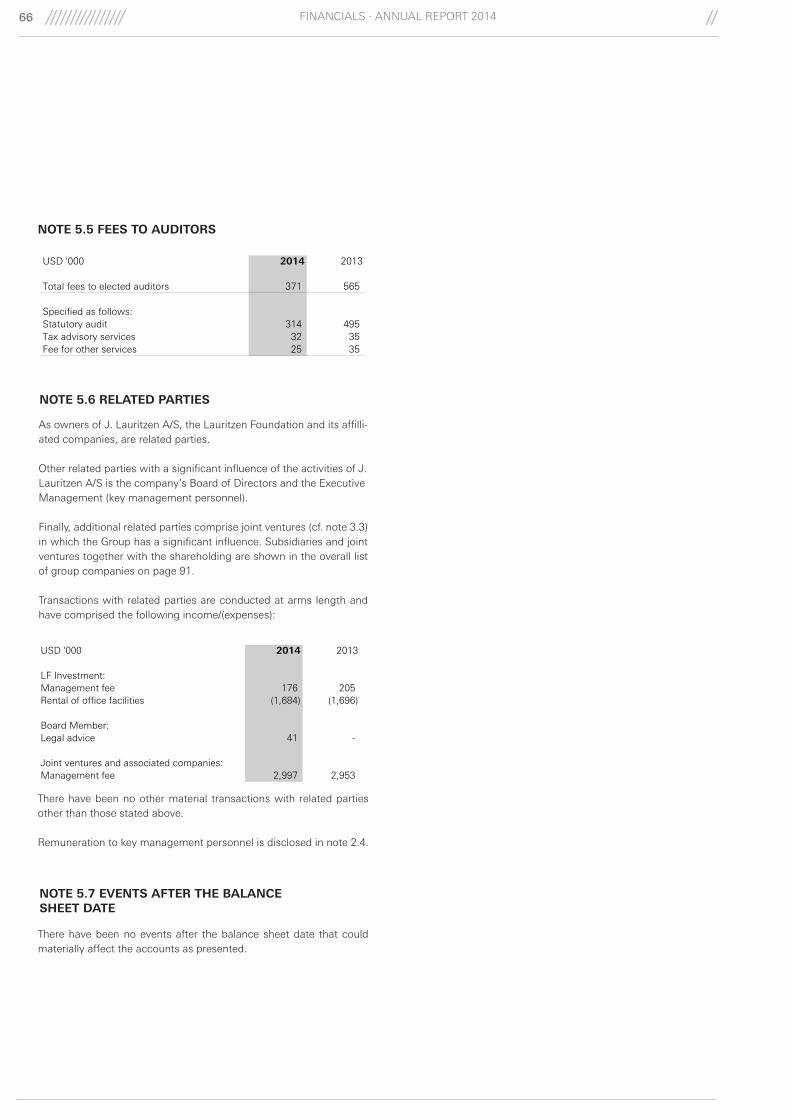
66
USD '000 2014 2013
LF Investment:Management fee 176 205 Rental of office facilities (1,684) (1,696)
Board Member:Legal advice 41 -
Joint ventures and associated companies:Management fee 2,997 2,953
NOTE 5.5 FEES TO AUDITORS
NOTE 5.6 RELATED PARTIES
As owners of J. Lauritzen A/S, the Lauritzen Foundation and its affilli-ated companies, are related parties.
Other related parties with a significant influence of the activities of J.Lauritzen A/S is the company’s Board of Directors and the ExecutiveManagement (key management personnel).
Finally, additional related parties comprise joint ventures (cf. note 3.3) in which the Group has a significant influence. Subsidiaries and joint ventures together with the shareholding are shown in the overall list of group companies on page 91.
Transactions with related parties are conducted at arms length and have comprised the following income/(expenses):
NOTE 5.7 EVENTS AFTER THE BALANCE SHEET DATE
There have been no events after the balance sheet date that could materially affect the accounts as presented.
USD '000 2014 2013
Total fees to elected auditors 371 565
Specified as follows:Statutory audit 314 495 Tax advisory services 32 35 Fee for other services 25 35
There have been no other material transactions with related parties other than those stated above.
Remuneration to key management personnel is disclosed in note 2.4.
FINANCIALS · ANNUAL REPORT 2014

67
Income StatementStatement of Comprehensive IncomeBalance Sheet StatementCash Flow Statement Equity Statement
NotesSection 1 - Basis of Reporting
1.1 General information 1.2 Accounting policies 1.3 Significant accounting estimates & judgments 1.4 New accounting regulations for future implementation
Section 2 - Operating Activities2.1 Special items2.2 Operating leasing income2.3 Staff costs, office & fleet
Section 3 - Operating Assets and Liabilities3.1 Vessels, property & equipment 3.2 Operating leasing of vessels3.3 Investment in subsidiaries3.4 Investment in joint ventures3.5 Contractual commitments3.6 Working capital3.7 Provisions
Section 4 - Capital Structure and Financing4.1 Long-term borrowings 4.2 Mortgages4.3 Financial income4.4 Financial expenses4.5 Financial instruments & financial risk4.6 Equity
Section 5 - Other Notes5.1 Assets held for sale and discontinued operations5.2 Other operating leases5.3 Contingent liabilities5.4 Tax5.5 Fees to auditors5.6 Related parties5.7 Events after balance sheet date
Parent Company Financial Statements
73
74
75
72
72
72
72
68
68
69
70
71
76
77
77
77
77
78
78
79
80
80
80
81
84
85
87
87
87
88
88
88
FINANCIALS · ANNUAL REPORT 2014

68 FINANCIALS · ANNUAL REPORT 2014
Income Statement
Statement of Comprehensive Income
USD '000 Note 2014 2013
Revenue 2.1 388,060 434,533
Voyage related costs (76,245) (137,008)
T/C equivalent income 311,815 297,525
Other operating income 9,395 13,462
Hire of chartered vessels 2.1 (202,651) (200,896)
Operating costs of vessels 2.3 (67,416) (69,839)
Administrative costs 2.3 (39,585) (40,074)
Operating income before depreciation (EBITDA) and special items 11,558 177
Profit/(loss) on sale of vessels and other assets 12,526 (6,841)
Depreciation (40,094) (48,243)
Operating income (EBIT) before special items (16,010) (54,907)
Special items, net 2.1 (70,812) (113,935)
Financial income 4.3 111,670 29,469
Financial expenses 4.4 (44,521) (44,583)
Profit/(loss) from continuing operations before tax (19,673) (183,956)
Income tax 5.4 923 567
Profit/(loss) from continuing operations (18,750) (183,390)
Profit/(loss) from discontinued operations 5.1 2,700 (23,452)
Profit/(loss) for the year (16,050) (206,842)
USD '000 2014 2013
Profit/(loss) for the year (16,050) (206,842)
Items that can be reclassified subsequently to profit or loss:
Other comprehensive income:
Exchange differences on translating foreign operations (1,499) 1,834
Fair value adjustment of hedging instruments during the year (7,172) 17,767
Deferred gains/(loss) on hedging instruments transferred to financial expenses 9,760 (8,888)
Fair value adjustment of shares available for sale (2,587) 1,444
Other comprehensive income net of tax (1,499) 12,157
Total comprehensive income for the year (17,549) (194,685)

69FINANCIALS · ANNUAL REPORT 2014
Balance Sheet StatementUSD '000 Note 2014 2013
ASSETS
Vessels, property and equipment 3.1 581,045 760,197
Investments in subsidiaries 3.3 312,084 312,055
Investments in joint ventures 3.4 52,492 49,670
Deferred tax assets 5.4 3,600 297
Shares available for sale 4.5 40,840 43,427
Other receivables 541 -
Non-current assets 990,602 1,165,647
Bunkers 9,031 11,858
Trade receivables 4.5 13,953 20,393
Other receivables 15,929 25,192
Prepayments 7,402 7,661
Receivables from affiliated companies 4,362 20,514
Current tax receivables 5.4 - 256
Derivative financial instruments 4.5 11,435 3,015
Securities 9,711 10,000
Cash at hand and in bank 171,507 132,877
243,329 231,766
Assets held for sale 5.1 - 272,148
Current assets 243,329 503,914
Total assets 1,233,931 1,669,561
LIABILITIES
Share capital 62,356 62,356
Retained earnings 497,633 513,683
Reserves 5,819 7,318
JL's share of equity 565,808 583,357
Non-controlling interests - -
Equity 4.6 565,808 583,357
Long-term provisions 3.7 33,344 -
Non-current derivative financial instruments 4.5 31,782 23,126
Long-term borrowings 4.1 297,594 662,867
Non-current liabilities 362,720 685,993
Current portion of long-term borrowings 4.1 91,681 50,841
Trade payables 9,857 10,700
Other payables 21,377 16,704
Provisions 3.7 26,714 -
Debt to affiliated companies 107,537 166,730
Derivative financial instruments 4.5 46,105 12,976
Current tax payables 5.3 2,132 -
305,403 257,951
Liabilities associated with assets held for sale 5.1 - 142,259
Current liabilities 305,403 400,211
Total liabilities 668,123 1,086,204
Total equity and liabilities 1,233,931 1,669,561

70 FINANCIALS · ANNUAL REPORT 2014
Cash Flow StatementUSD '000 - Inclusive discontinued operations Note 2014 2013
Operating income (83,549) (176,165)
Depreciation and impairment losses carried back 92,979 193,074
Change in provisions carried back 60,057 -
(Profit)/loss on sale of vessels and other assets (22,932) 5,403
Change in bunkers (2,827) 11,858
Change in receivables 34,485 (112,034)
Change in payables (52,154) 87,139
Cash flow from operations before financial items 26,059 9,275
Ingoing financial payments 1,673 301
Outgoing financial payments (21,903) (43,636)
Cash flow from ordinary operations 5,829 (34,060)
Paid corporate tax 5.4 (50) 3,571
Cash flow from operating activities 5,779 (30,489)
Investments in vessels 3.1 (8,568) (7,357)
Payments on vessels under construction 3.1 (28,960) (98,043)
Payments on vessels under construction, classified as held for sale 5.1 (535) (8,502)
Purchase of company 3.3 (104) (544)
Investments in joint ventures 3.4 (4,322) (1,720)
Sale of vessels 420,079 107,391
Sale of other non current assets 1,850 (77)
Disposal of joint ventures 3.4 - 23
Dividend received from subsidiaries 4.3 103,053 15,018
Dividend received from joint ventures 4.3 10 554
Purchase and sales of securities and shares available for sale - (28,147)
Repurchase of issued bonds (433) -
Bank deposits pledged as security for debt (2,354) 33,040
Sale of controlling interest in subsidiaries - 16,835
Cash flow from investment activities 479,715 28,471
Financial receivables (558) 8,067
Instalment on long-term debt (484,293) (154,895)
Proceeds from loans 46,843 45,011
Cash flow from financing activities (438,007) (101,817)
Changes for the year in cash and cash equivalents 47,487 (103,836)
Cash and cash equivalents at beginning of year 132,877 230,336
Currency adjustments on cash and cash equivalents (8,857) 6,377
Cash and cash equivalents at the end of the year 171,507 132,877

71FINANCIALS · ANNUAL REPORT 2014
Equity Statement
USD '000
Equity 1/1 2013 60,633 (26,902) 22,063 - (4,839) 349,109 - 404,903
Additions from merger - - - - 217,592 - 217,592
Profit/(loss) for the year - - - - - (206,842) - (206,842)
Other comprehensive income:Exchange differences on translating foreign
operations - - - 1,834 1,834 - - 1,834
Deferred (gain)/loss on hedging instruments
transferred to financial expenses - (8,888) - - (8,888) - - (8,888) Fair value adjustment of hedging instruments during the period - 17,767 - 17,767 - - 17,767
Fair value adjustment of shares available for sale - - 1,444 - 1,444 - - 1,444 Total other comprehensive income - 8,879 1,444 1,834 12,157 - - 12,157 Total comprehensive income - 8,879 1,444 1,834 12,157 (206,842) - (194,685) Transactions with owners:
Capital increase 1,722 - - - - 153,825 - 155,547 Paid dividend - - - - - - - - Total transactions with owners 1,722 - - - - 153,825 - 155,547 Equity 31/12 2013 62,356 (18,023) 23,507 1,834 7,318 513,683 - 583,357
Profit/(loss) for the year - - - - - (16,050) - (16,050)
Other comprehensive income:
Exchange differences on translating foreign
operations - - - (1,499) (1,499) - - (1,499)
Deferred (gain)/loss on hedging instruments
transferred to financial expenses 9 760 9 760 9 760
Hedging instrument
Shares available
for saleRetained earnings
Hedging instrument
Sharecapital
Shares available
for saleRetained earnings TotalReserves
Proposed dividens
Translation gain/loss
transferred to financial expenses - 9,760 - - 9,760 - - 9,760
Fair value adjustment of hedging instruments during the period - (7,172) - (7,172) - - (7,172) Fair value adjustment of shares available for sale - - (2,587) - (2,587) - - (2,587) Other comprehensive income - 2,588 (2,587) (1,499) (1,499) - - (1,499) Total comprehensive income - 2,588 (2,587) (1,499) (1,499) (16,050) - (17,549) Transactions with owners:
Paid dividend - - - - - - - - Total transactions with owners - - - - - - - -
Equity 31/12 2014 62,356 (15,435) 20,919 335 5,819 497,633 - 565,808

72 FINANCIALS · ANNUAL REPORT 2014
Section 1Basis for reportingNOTE 1.1 GENERAL INFORMATION
The separate financial statements for the parent company form part of the Annual Report as required by the Danish Financial Statement Act.
In order to improve presentation and relevance of the contents of the financial report the Group has changed the structure of the explana-tory notes to gather information of key areas.
With effect from January 1 2014 J. Lauritzen A/S as continuing com-pany merged with the subsidiaries Lauritzen Bulkers A/S, Lauritzen Kosan A/S, Lauritzen Tankers A/S and LB Ship Owner II A/S. The merger has been made using the book value method and the com-parative figures has been changed accordingly.
NOTE 1.2 ACCOUNTING POLICIES
The accounting policies for the financial statements of the parent company are the same as for the Group consolidated financial statements with the following additions. For a description of the accounting policies of the Group, please refer to the notes of the Group consolidated financial statements.
SUPPLEMENTARY ACCOUNTING POLICIES FOR THE PARENT COMPANY
Financial assetsInvestments in subsidiaries, associates and joint ventures are recog-nized in the financial statement of the parent company at cost less accumulated impairment losses. Cost includes fair value of consider-ation paid plus directly attributable acquisition costs.
If there are indications of impairment, impairment test is performed as described in accounting policies to the consolidated financial statements.
In the income statement dividends received during the year from sub-sidiaries are shown under financial income. If the distribution from subsidiaries exceeds retained earnings, the distribution reduces the cost of the investment in subsidiaries when the distribution is charac-terized as repayment of the parent company’s investment.
TaxJ. Lauritzen A/S is subject to the Danish tax regulations included in the compulsory joint taxation with its parent company, the Lauritzen Foundation and all Danish subsidiaries under the Lauritzen Founda-tion.
J. Lauritzen A/S is the managing company in the joint taxation and consequently settles all payment of company tax with the authorities. Tax receivables and tax payables are recognized as current assets and current liabilities respectively. Outstanding tax contributions from other companies included in the joint taxation are recognized as receivable/debt from affiliated companies.
NOTE 1.3 SIGNIFICANT ACCOUNTING ESTIMATES AND JUDG-MENTS
The preparation of the financial statements in conformity with IFRS requires management to make estimates and judgments that affect the reported carrying amounts of assets and liabilities and disclosure of contingent assets and liabilities at the date of the financial statements and the reported performance. Management bases its estimates on historical experience and various other assumptions and sources that are believed to be reasonable. Actual results could differ from those estimates.
The critical accounting estimates and judgments described in the notes of the Group consolidated financial statement also apply for the financial statement of the parent company. In addition hereto material accounting estimates for the parent company comprise estimates included in impairment testing of investments and receivables in affiliated companies.
NOTE 1.4 NEW ACCOUNTING REGULATIONS FOR FUTURE IMPLEMENTATION
Reference is made to note 1.5 of the Group consolidated financial statements for disclosure of new accounting regulation. None of the new standards and interpretations is expected to have material effect on the financial statement of the parent company.

73FINANCIALS · ANNUAL REPORT 2014
Section 2Operating ActivitiesNOTE 2.1 SPECIAL ITEMS
To better illustrate the underlying development a number of one-off items have been recognized as special items:
USD '000 2014 2013
A) One-off revenue from sale of claims and claim settlements 31,680 1,580
B) Sale of vessels as a consequence of counterparty defaults or strategic initiatives 10,391 -
C) Impairment losses on vessels and vessels under construction (52,826) (115,515)
D) Provisions for onerous contracts (60,057) -
Special items, net (70,812) (113,935)
INCOME STATEMENT - CONDENSED
USD '000 Ref. 2014 2013
Revenue A) 419,740 436,113
Other operating income 9,395 13,462
Costs D) (445,952) (447,818)
Operating income before depreciation (EBITDA) (16,818) 1,757
Profit/(loss) on sale of assets B) 22,917 (6,841)
Depreciation and impairment losses C) (92,920) (163,759)
Operating income (86,822) (168,843)
Financial items, net 67,148 (15,114)
Profit/(loss) before tax (19,673) (183,956)
Income tax 923 567
Profit/(loss) from continuing operations (18,750) (183,390)
If special items had been included in the operating profit before special items, they would have been included in the Income Statement as follows:

74 FINANCIALS · ANNUAL REPORT 2014
NOTE 2.2 OPERATING LEASING INCOME
At the balance sheet date, J. Lauritzen A/S has the following contractually committed leasing income from time-charter contracts:
2014
USDm committed
income
No. of vessels, full year
equivalents
USDm committed
income
No. of vessels, full year
equivalents
USDm committed
income
No. of vessels, full year
equivalents
USDm committed
income
No. of vessels, full year
equivalents < 1 Year 39.0 3.5 5.9 1.2 - - 44.9 4.6 1 - 2 Year 32.3 3.0 - - - - 32.3 3.0 2 - 3 Year 31.3 3.0 - - - - 31.3 3.0 3 - 4 Year 28.1 2.4 - - - - 28.1 2.4 4 - 5 Year 25.7 2.0 - - - - 25.7 2.0 > 5 Year 147.7 12.6 - - - - 147.7 12.6 Total 304.1 - 5.9 - - - 310.0 -
2013< 1 Year 35.4 3.6 17.9 3.9 6.6 1.2 59.9 8.7 1 - 2 Year 28.4 2.0 - - 5.8 1.0 34.2 3.0 2 - 3 Year 26.6 2.0 - - 5.8 1.0 32.4 3.0 3 - 4 Year 25.6 2.0 - - 0.3 0.1 25.9 2.1 4 - 5 Year 25.6 2.0 - - - - 25.6 2.0 > 5 Year 172.9 14.6 - - - - 172.9 14.6 Total 314.6 - 17.9 - 18.4 - 350.9 -
Lauritzen Bulkers Lauritzen KosanTankers
(discontinued operation) Total

75FINANCIALS · ANNUAL REPORT 2014
NOTE 2.3 STAFF COSTS, OFFICE & FLEET
Remuneration to Executive Management consists of a fixed and variable compensation. No variable compensation has been paid in 2014 and 2013. In addition hereto Executive Management has been awarded a retention bonus subject to individual dates of resignation.
USD '000 2014 2013
Staff costs onshore employees:(Included in "Administrative costs")Salaries 21,813 21,052 Pensions (defined contribution plan) 2,427 2,430 Social security 79 80 Contract labour 251 131
24,571 23,692 Hereof related to discontinued operations:Lauritzen Tankers 114 620
Total continuing operations 24,458 23,072
Staff costs, crew on vessels:(Included in "Operating costs of vessels")Salaries 33,894 47,107 Pensions (defined contribution plan) - - Social security 2 0
33,896 47,108 Hereof related to discontinued operations:Lauritzen Tankers 1,284 11,812 Total continuing operations 32,613 35,296
Total staff costs: 58,467 70,800 Hereof related to discontinued operations:Lauritzen Tankers 1,397 12,432 Total continuing operations 57,070 58,368
Average number of employees:Onshore employees 156 157 Crew on vessels 639 1,112 Average number of employees, total 795 1,269
Number of employees at year-end:Onshore employees 161 155 Crew on vessels 559 1,062 Number of employees at year-end, total 720 1,217
Remuneration to J. Lauritzen A/S'Executive Management - salaries 2,245 2,469 CEO Jan Kastrup Nielsen 1,308 1,277
CFO Birgit Aagaard-Svendsen 937 941
Former CEO Torben Janholt - 251
Executive Management - retention bonus 488 487 CEO Jan Kastrup Nielsen 225 224
CFO Birgit Aagaard-Svendsen 263 263
Board of Directors 591 556
3,324 3,512

76 FINANCIALS · ANNUAL REPORT 2014
NOTE 3.1 VESSELS, PROPERTY & EQUIPMENT
Section 3Operating Assets and Liabilities
USD '000
2014
Cost as at 1 January 1,150,474 - 17,305 1,167,778
Additions 8,568 28,960 - 37,529
Disposals (180,116) - (7,807) (187,923)
Transferred to assets held for sale (note 5.1) (70,923) - - (70,923)
Cost as at 31 December 908,003 28,960 9,497 946,460
Depreciation and impairment losses as at 1 January (396,886) - (10,696) (407,582)
Depreciation (39,075) - (1,019) (40,094)
Impairment losses (52,826) - - (52,826)
Disposals 106,455 - 6,106 112,561
Transferred to assets held for sale (note 5.1) 22,526 - - 22,526
Depreciation and impairment losses as at 31 December (359,806) - (5,609) (365,415)
Balance as at 31 December 548,197 28,960 3,888 581,045
2013
Cost as at 1 January - - 1,604 1,604 Additions from merger 1,564,439 73,893 16,535 1,654,867
Additions 7,357 98,043 - 105,400
Transferred from vessels under construction 87,757 (87,757) - 0
Disposals (12,980) (45,356) (835) (59,170)
Transferred to assets held for sale (note 5.1) (496,100) (38,823) - (534,923)
Cost as at 31 December 1,150,474 0 17,304 1,167,778
Depreciation and impairment losses as at 1 January - - (206) (206)
Additions from merger (381,679) (34,828) (9,157) (425,664)
Transferred from vessels under construction (20,796) 20,796 - -
Depreciation (53,244) - (2,168) (55,411)
Vessels
Vessels under
construction
Machinery,tools and
equipment Total
Depreciation (53,244) (2,168) (55,411)
Impairment losses (139,887) (16,667) - (156,553)
Reversal of impairment losses 15,803 3,088 - 18,891
Disposals 12,993 10,819 835 24,647
Transferred to assets held for sale (note 5.1) 169,923 16,792 - 186,715
Depreciation and impairment losses as at 31 December (396,885) - (10,696) (407,582)
Balance as at 31 December 753,588 0 6,608 760,196
Impairment test 2014The impairment test at the end of 2014 resulted in impairment losses of USD 52.8m related to the CGU Small bulk carriers, and provisions for onerous long-term charters of USD 60.1m.
The further deterioration of the dry bulk shipping market has led to a reduction of our freight rate forecasts. In line with the market develop-ment, dry bulk asset values have also declined. The impairment test is based on freight rate estimates, current contract cover and risk as-sessment of longer-term charter parties. Based on the factors above
and the impairment test management concluded that the carrying amount exceeded the recoverable amount for the CGU Small bulk carriers, in the Operating segment Lauritzen Bulkers. The recoverable amount of the vessels in the GCU Small bulk carriers is the fair value less costs of disposal estimated by use of two independent broker valuations.

77FINANCIALS · ANNUAL REPORT 2014
NOTE 3.2 OPERATING LEASING OF VESSELS
At the balance sheet date, J. Lauritzen A/S has the following operational lease obligations from time-charter and bareboat contracts:
At year-end 2014, J. Lauritzen A/S had purchase option on 21 bulk carriers (2013: 17 bulk carriers).
NOTE 3.3 INVESTMENT IN SUBSIDIARIES
USD '000 2014 2013
Lauritzen Reefers A/S, Denmark 100% 100%Lauritzen Ship Owner A/S, Denmark 100% 100%J. Lauritzen Singapore Pte., Singapore 100% 100%KRK 4 ApS, Denmark 100% 100%Segetrans Argentina S.A., Argentina 100% 100%J. Lauritzen Shanghai Co. Ltd., China 100% 100%Greden Limited, Bahamas - 100%Labas (Bahamas) Ltd., Bahamas - 100%Shoreoff Invest Bermuda Ltd., Bermuda - 100%Quantum Tankers A/S, Denmark - 50%Gasnaval S.A., Spain 100% 100%J. Lauritzen (USA) Inc., USA 100% 100%J. Lauritzen S.A., Switzerland 100% -
USD '000 2014 2013
Cost as at 1 January 448,881 813,728 Subsidiaries merged into parent - (391,942) Additions from merger - 43,385 Additions during the year 104 544 Disposal during the year (76) (16,835)
Cost as at 31 December 448,909 448,881
Accumulated impairment losses at 1 Jan (136,826) (380,276) Subsidiaries merged into parent - 243,450 Revaluations during the year - -
Revaluation as at 31 December (136,826) (136,826)
Balance as at 31 December 312,084 312,055
Ownership
2014
USDm committed obligation
No. of vessels, full year
equivalents
USDm committed obligation
No. of vessels, full year
equivalents
USDm committed obligation
No. of vessels, full year
equivalents
USDm committed obligation
No. of vessels, full year
equivalents < 1 Year 152.2 33.7 7.0 4.0 - - 159.2 37.7 1 - 2 Year 119.7 26.2 7.0 4.0 - - 126.7 30.2 2 - 3 Year 99.8 22.6 3.7 2.1 - - 103.5 24.7 3 - 4 Year 93.4 21.4 - - - - 93.4 21.4 4 - 5 Year 69.0 16.0 - - - - 69.0 16.0 > 5 Year 221.1 50.1 - - - - 221.1 50.1 Total 755.2 - 17.6 - - - 772.8 -
2013< 1 Year 144.3 28.4 8.1 5.0 7.9 1.4 160.4 34.9 1 - 2 Year 104.2 21.4 5.2 3.0 5.8 1.0 115.2 25.4 2 - 3 Year 96.8 20.8 5.2 3.0 5.8 1.0 107.8 24.8 3 - 4 Year 73.3 16.5 3.7 2.1 0.3 0.1 77.3 18.7 4 - 5 Year 66.6 15.0 - - - - 66.6 15.0 > 5 Year 186.4 41.3 - - 186.4 41.3
Total 671.6 - 22.3 - 19.8 - 713.6 -
Lauritzen Bulkers Lauritzen Kosan Tankers
(discontinued operation) Total
NOTE 3.4 INVESTMENT IN JOINT VENTURES
NOTE 3.5 CONTRACTUAL COMMITMENTS
USD '000 2014 2013
Cost as at 1 January 49,670 - Addition from merger - 57,839 Additions during the year 4,322 1,720 Disposal during the year (1,500) (9,888)
Cost as at 31 December 52,492 49,670
Balance as at 31 December 52,492 49,670
Key figures for joint ventures, in total:
USD '000 2014 2013
Revenue 58,634 69,956 Net profit (9,227) (40,539) Assets 211,482 246,877 Liabilities 125,283 112,354
Guarantees and payment obligations relating to joint ventures:
USDm 2014 2013
Guarantees undertaken for debt in joint ventures 17 18 Max. obligations to pay in capital into joint ventures 35 29
J. Lauritzen A/S has entered into newbuilding contracts with a remain-ing contractual commitment of USD 139.3 million. These contracts cover the construction of 6 bulk carriers due for delivery in 2016-2018.

78 FINANCIALS · ANNUAL REPORT 2014
NOTE 3.6 WORKING CAPITAL
NOTE 3.7 PROVISIONS
USD '000 2014 2013
Bunkers 9,031 11,858 Trade receivables 13,953 20,393 Other receivables 13,575 25,192 Prepayments 7,402 7,661 Total working capital assets 43,960 65,103
Trade payables 9,857 10,700 Other payables 15,603 7,722 Prepayments - - Total working capital liabilities 25,461 18,422
Net working capital 18,499 46,681
USD '000 2014 2013
Provisions as at 1 January - - Additions 60,057 - Used during the year - -
Provisions as at 31 December 60,057 - Hereof:Non-current liabilities 33,343 - Current liabilities 26,713 -
Provisions as at 31 December 60,057 -
The provisions in 2014 refer to onerous long-term time-charters.

79FINANCIALS · ANNUAL REPORT 2014
NOTE 4.1 LONG-TERM BORROWINGS
Section 4Capital Structure and Financing
USD '000 <1 year 1-5 year > 5 year Total
Mortgage on vessels *) (36,951) (187,019) (48,342) (272,312)
Issued bonds, net *) (54,168) (62,232) - (116,400) Other debt (562) - - (562)
Total long-term borrowings (91,681) (249,252) (48,342) (389,275)
USD '000 <1 year 1-5 year > 5 year Total
Mortgage on vessels *) (49,848) (443,620) (66,679) (560,147)
Issued bonds *) - (151,932) - (151,932)
Other debt (993) (636) - (1,629)
Total long-term borrowings - - - (50,841) (596,188) (66,679) (713,708)
(142,259) (142,259)
Total, incl. liabilities ass. with assets held for sale (193,101) (596,188) (66,679) (855,968)
*) Please refer to page 25 for description of financial covenants.
USD '000 CurrencyFixed/
VariableInterest rate
fixation
Average effective
interest rate, excl.
hedging
Average effective
interest rate incl. hedging Book value
2014Mortgage on vessels USD Variable 3-6 month 1.89% 4.52% (222,596)
Mortgage on vessels JPY Variable 6 month 2.26% 2.69% (49,716)
Issued bonds NOK Fix./Var. 1-3 years 10.23% 10.12% (116,400)
Other debt DKK Fixed 1 year 4.00% 4.00% (562)
Total 4.96% 6.68% (389,275)
Mortgage on vessels USD Variable 3-6 months 2.03% 3.82% (496,678)
Mortgage on vessels JPY Variable 6 months 2.31% 2.71% (63,469)
Issued bonds NOK Fix./Var. 2-4 years 10.20% 9.04% (151,932)
Other debt DKK Fixed 1-2 years 4.61% 4.61% (1,629)
Total 3.20% 4.38% (713,708)
Currency exposure on non-USD long-term borrowings, net of hedging:
USD '000 Book value
Currency hedging
derivatives
Net currency
exposure on loan Book value
Currency hedging
derivatives
Net currency
exposure on loan
JPY (49,716) 18,300 (31,416) (63,469) 14,000 (49,469)
DKK (562) - (562) (1,629) - (1,629)
NOK (116,400) 116,400 - (151,932) 151,932 -
Total (166,679) 134,700 (31,978) (217,030) 165,932 (51,098)
Interest exposure on long-term borrowings to floating interest rates:
USD '000 2014 2013
Total long-term borrowings (389,275) (713,708)
Hereof amortized formation costs 12,174 15,560
Hereof fixed to maturity (54,730) (73,368)
Floating interest borrowings (346,719) (655,901)
Interest rate swaps floating to fixed at year end, nominal 493,504 390,483
Exposure to floating interest rates at year end 146,785 (265,417)
2013
2014
20132014
2013
Mortgage on vessels classified as "Liabilities related to assets held for sale", ref note 5.1.

80 FINANCIALS · ANNUAL REPORT 2014
NOTE 4.2 MORTGAGES
USD '000 2014 2013
Debt for a total of 272,312 (560,147) is secured by mortgage in assetsat the following book values:Vessels 546,047 747,862
Debt classified as liabilities related toassets held for sale for a total of - 142,259 is secured by mortgage in assets at the following book values:Vessels classified as held for sale - 219,000
NOTE 4.3 FINANCIAL INCOME
USD '000 2014 2013
Interest income, bank deposits 179 502 Interest on receivables from subsidiaries (282) 589 Currency exchange gains and losses, net 6,934 8,854 Dividends on shares available for sale 1,015 632 Dividends received from subsidiaries 103,053 15,018 Dividends received from joint ventures 10 554 Interest on financial instr. at FV through P&L 760 26 Firm commitments under FV hedge accounting - 3,988 Derivatives, FV hedge of firm commitments - (3,988)
Financial income 111,670 26,175
Hereof related to discontinued operations:Lauritzen Tankers 0 (3,294)
Total continuing operations 111,670 29,469
NOTE 4.4 FINANCIAL EXPENSES
USD '000 2014 2013
Interest expenses on loans (39,697) (47,876) Interest on debt to subsidiaries 0 (1,448) Other financial expenses (415) (5,443) Financial instruments at FV through P&L, net (4,938) (2,983) Financial expenses (45,050) (57,750)
Hereof related to discontinued operations:Lauritzen Tankers (529) (13,168) Total continuing operations (44,521) (44,583)
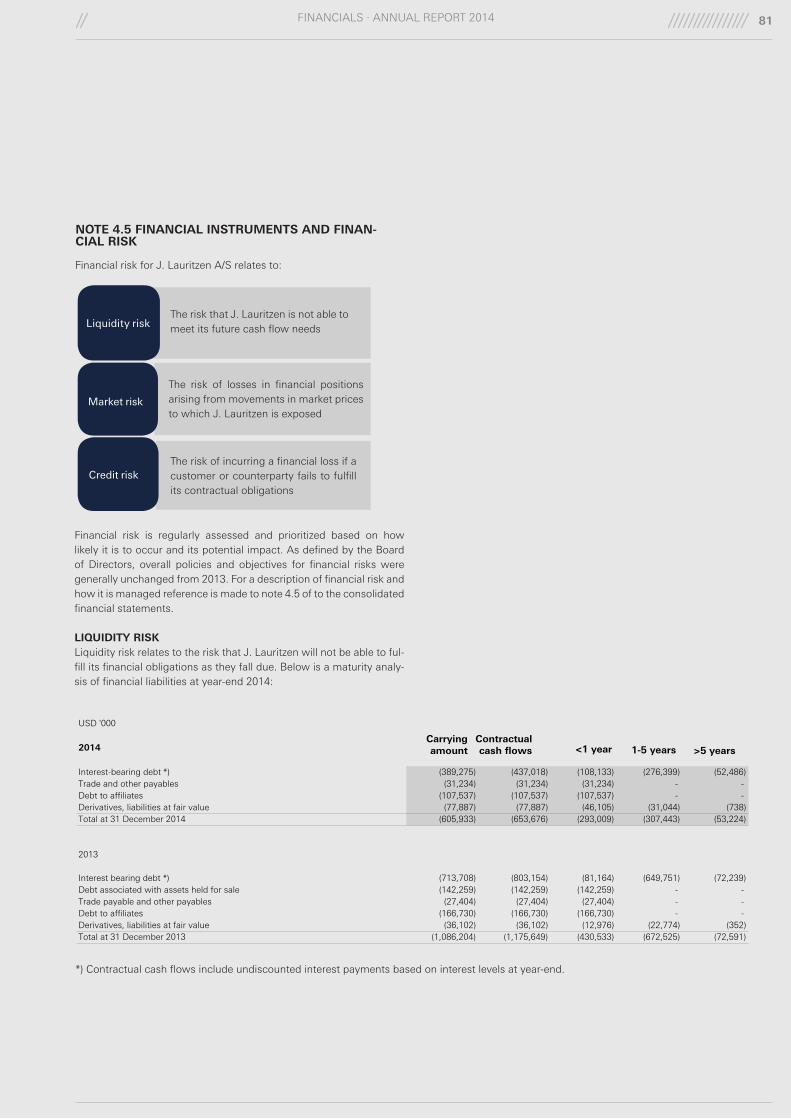
81FINANCIALS · ANNUAL REPORT 2014
USD '000
2014
Interest-bearing debt *) (389,275) (437,018) (108,133) (276,399) (52,486) Trade and other payables (31,234) (31,234) (31,234) - - Debt to affiliates (107,537) (107,537) (107,537) - - Derivatives, liabilities at fair value (77,887) (77,887) (46,105) (31,044) (738) Total at 31 December 2014 (605,933) (653,676) (293,009) (307,443) (53,224)
2013
Interest bearing debt *) (713,708) (803,154) (81,164) (649,751) (72,239) Debt associated with assets held for sale (142,259) (142,259) (142,259) - - Trade payable and other payables (27,404) (27,404) (27,404) - - Debt to affiliates (166,730) (166,730) (166,730) - - Derivatives, liabilities at fair value (36,102) (36,102) (12,976) (22,774) (352) Total at 31 December 2013 (1,086,204) (1,175,649) (430,533) (672,525) (72,591)
Carrying amount
Contractual cash flows <1 year >5 years1-5 years
NOTE 4.5 FINANCIAL INSTRUMENTS AND FINAN-CIAL RISK
Financial risk for J. Lauritzen A/S relates to:
Financial risk is regularly assessed and prioritized based on how likely it is to occur and its potential impact. As defined by the Board of Directors, overall policies and objectives for financial risks were generally unchanged from 2013. For a description of financial risk and how it is managed reference is made to note 4.5 of to the consolidated financial statements.
LIQUIDITY RISKLiquidity risk relates to the risk that J. Lauritzen will not be able to ful-fill its financial obligations as they fall due. Below is a maturity analy-sis of financial liabilities at year-end 2014:
The risk of losses in financial positions arising from movements in market prices to which J. Lauritzen is exposed
The risk that J. Lauritzen is not able to meet its future cash flow needs
The risk of incurring a financial loss if a customer or counterparty fails to fulfill its contractual obligations
Credit risk
Market risk
Liquidity risk
*) Contractual cash flows include undiscounted interest payments based on interest levels at year-end.

82 FINANCIALS · ANNUAL REPORT 2014
MARKET RISKMarket risk is risk of losses in financial positions arising from movements in market prices to which J. Lauritzen A/S is exposed through financial instruments. The sensitivity analysis of J. Lauritzen A/S’s exposure to the market risk is disclosed below.
Sensitivity information is calculated at balance sheet date and com-prises only sensitivity relating to financial instruments, therefore the amounts disclosed do not necessarily give a complete picture of the Parent Company’s risk relating to changes in currency rates and inter-est rates.
Currency riskTo measure currency risk in accordance with IFRS 7, sensitivity is calculated as the change in fair value of future cash flows from financial instruments as a result of fluctuations in exchange rates on balance sheet date. Sensitivity to fluctuations in non-USD currencies at balance sheet date based (other things being equal and after tax) on a 10% decrease in currency translation rates against USD (assuming 100% effectiveness) would result in a net profit/loss of USD 1.0m (2013: 2.1m) and affect equity by USD (1.4)m (2013: (0.5)m). The effect of a 10% increase in the currency translation rates against USD would have a corresponding inverse effect.
Interest rate riskSensitivity of interest fluctuations is calculated as the hypothetic effect on net profit and equity as a result of fluctuations in interest rates at balance sheet date.
The sensitivity analysis includes financial instruments recognised at fair value for which the calculated effect on equity represents an immediate fair value change from a thought change in interest rates and financial instruments with variable interest recognized at amortized costs for which the calculated effect represents a one year effect on net profit and equity based on balances at year-end.
Assumptions for the sensitivity analysis:
• All hedging instruments assumed 100% effective.• Changes in interest rates are global and thus the impact on the
fair value of forward currency contracts and similar derivatives is not considered.• Shares available for sale and shares at fair value through profit or
loss are not included in sensitivity calculations due to inability to reliably measure the sensitivity of share prices to interest rate changes.
On financial instruments at fair value, the calculated effect after tax based on a 1% interest rate decrease would affect profit/loss by USD (4.9)m (2013: (3.9)m) and equity by USD (9.2)m (2013: USD (6.3)m). On financial instruments with variable interest recognised at amor-tized costs, profit/loss and equity would be affected by USD 1.6m (2013: USD nil).
A 1% interest rate increase would have a corresponding inverse effect.
CREDIT RISKCredit risk is the risk of incurring a financial loss if a customer or coun-terparty fails to fulfill its contractual obligations.
In 2014 and 2013 no provisions were made for losses on trade receiv-ables. At year-end 2014 overdue receivables from insurance company due to disputed claim amounted to USD 6.3m. The Parent Company did not have any further overdue trade receivables (2013: USD nil).
At year-end 2014, the majority of our financial counterparties had credit ratings of or above Baa2.
J. Lauritzen A/S’s exposure to credit risks at balance sheet date can be illustrated as follows:
USD '000 2014 2013
Trade receivables 13,953 20,393 Financial derivatives 11,435 3,015 Other short-term receivables 15,929 25,192 Cash and bank deposits 171,507 132,877 Maximum credit risk 212,823 181,477
The maximum credit risk corresponds to the carrying value of the individual assets.
Due to the default of OW Bunker there is a risk that the J. Lauritzen A/S is met by demands for payment from the physical suppliers. The risk is considered to be limited.

83FINANCIALS · ANNUAL REPORT 2014
DERIVATIVE FINANCIAL INSTRUMENTS
USDmCash flow /Fair value hedge
Nominal, USDm
Duration, month
Recognised on equity Fair value
Nominal, USDm
Duration, month
Recognised on equity Fair value
Hedge accounting applied:Currency: USD/JPY Fair value - - - - 0 - - Currency: USD/NOK Cash flow 206.0 5-34 (5.1) (51.6) 206.0 17-46 (2.4) (12.1) Interest rate swaps Cash flow 448.7 1-107 (10.6) (12.7) 390.5 9-119 (16.1) (17.3) Terminated interest rate swap Cash flow N/A N/A 0.3 N/A N/A N/A 0.4 N/ATotal (15.4) (64.3) (18.0) (29.3)
Hedge accounting not applied:Currency: USD/NOK N/A (47.0) 0-4 - 8.1 (47.6) 0-2 - (0.5) Currency: USD/EUR N/A 2.7 0-1 - (0.2) - N/A - - Currency: USD/DKK N/A 18.0 0-1 - (0.7) 29.0 0-2 - 0.8 Currency: USD/JPY N/A (81.7) 0-6 - (1.0) 14.0 0-2 - (1.1) Interest rate swaps N/A 44.8 40 - (0.2) - 75 - 0.4 FFA's and oil contracts N/A N/A 0-24 - (3.9) N/A N/A - 0.9 Interest indexswap N/A 30.8 15 - (4.2) 34.5 27 - (4.4) Total - (2.1) - (3.8)
Total derivative financial instruments (66.4) (33.1)
Presented in the financial statement as:Derivative financial instruments, assets 11.4 3.0 Non-current derivative financial instr., liabilities (31.8) (23.1) Derivative financial instruments, liabilities (46.1) (13.0)
2014 2013
Our policy is to use derivative financial instruments to hedge financial risks. At year end the Company held the following derivatives:

84 FINANCIALS · ANNUAL REPORT 2014
CATEGORIES OF FINANCIAL ASSETS AND LIABILITIES
The following categories of financial assets and liabilities are recog-nised in the balance sheet:
USD ‘000 2014 2013
Book value at 1 January 43,427 26,010 Purchase during the year 15,973 Fair value adjustment (2,587) 1,444 Book value at 31 December 40,840 43,427
USD '000 2014 2013
Fin. assets at FV through P/L *) 21,146 13,015 Loans and receivables**) 201,389 178,462 Fin. assets available for sale **) 40,840 43,427 Fin. liabilities - at FV through P/L *) (77,887) (36,102) Fin. liabilities - at amortised cost**) (420,509) (741,112)
Fair value hierarchy With the exception of listed bonds and shares of USD 9.7m (2013: USD 10.0m) (level 1) and shares available for sale of USD 40.8m (2013: USD 43.4m) (level 3), all financial instruments are stated at fair value on the basis of observable market prices (level 2), directly as prices or indirectly derived from prices.
In 2014, fair value adjustment of Level 3 financial instruments amounted to USD (2.6)m recognised in other comprehensive income (2013: 1.4m). The fair value adjustment relate to unlisted shares for which a valuation technique has been used to determine fair value. Material inputs in the valuation comprise equity value and expected ROE compared to our return requirements. Financial instruments categorized at Level 3 have developed as follows:
4.6 EQUITY
Composition of share capital and dividends are disclosed in note 4.6 in the consolidated statements.
*) Figure includes financial derivatives designated for hedge accounting **) Amounts recognised for financial asset and liabilities at amortised cost do not differ materially from their fair value with the exception of issued bonds. Fair value of issued bonds amount to USD 118.8m whereas the carrying amount totalled USD 116.4m.

85FINANCIALS · ANNUAL REPORT 2014
Section 5Other NotesNOTE 5.1 ASSETS HELD FOR SALE AND DISCONTINUED OPERATIONS
USD '000 2014 2013
Assets held for sale:
Assets held for sale that do not qualify for discontinued operation: - Two bulk carriers - 53,148
Assets held for sale that qualify for discontinued operation:Lauritzen Tankers - 219,000 Total assets held for sale - 272,148
Labilities associated with assets held for sale, qualifying for discontinued operations:
Lauritzen Tankers - 142,259 Total liabilities associated with assets held for sale - 142,259
Assets held for sale that do not qualify for discontinued operations
Assets held for sale that qualify for discontinued operations
Profit/(loss) from discontinued operations:
Lauritzen Tankers 2,700 (23,452) Total profit/(loss) from discontinued operations 2,700 (23,452)
At year-end 2013 the statement of financial position included assets held for sale of USD 53m that do not qualify for discontinued operation. The assets held for sale relate to two bulk carriers sold with delivery in 2014. The two vessels were measured at the lower of their previously carrying amount (USD 53m) and net sales price (USD 59m). Delivery of the vessels have therefore affected profit/(loss) in 2014 by USD 6m.
At year-end 2013 the consolidated statement of financial position included assets held for sale of USD 219m related to Lauritzen Tankers that qualify for discontinued operation. Liabilities related to the assets held for sale amounted to USD 142m. The assets has been delivered to new owners in 2014 and the corresponding liabilities settled.

86 FINANCIALS · ANNUAL REPORT 2014
NOTE 5.1 ASSETS HELD FOR SALE AND DISCONTINUED OPERATIONS (CONTINUED)
I) Lauritzen TankersAs stated in announcement to Oslo Børs no. 6/2013 dated 15 August 2013, a strategic decision had been taken to trim the balance sheet bygradual exit of the product tanker segment. The conditions for classifying Lauritzen Tankers "as held for sale" and "discontinued operation"were fulfilled in the end of 3rd quarter 2013 as the wholly-owned fleet, cf. announcement to Olso Børs no. 7/2013 dated 22 October 2013was reported sold with delivery before the end of February 2014.
The results of Lauritzen Tankers are presented as discontinued operations in the Income Statement for all periods presented. The Incomestatement for the discontinued operations can be presented as follows:
USD '000 2014 2013
Revenue 14,431 80,638 Other operating income 121 274 Costs (11,279) (60,357) EBITDA 3,273 20,555 Depreciation (58) (7,168) Impairment losses - (22,147) Finance net (530) (16,462) Profit/(loss) on the remeasurement to fair value less costs to sell 15 1,438 Pretax profit/(loss) from discontinued operations 2,700 (23,784) Income taxes - 331 Profit/(loss) on discontinued operations, net of taxes 2,700 (23,452)
Attributable to:The J. Lauritzen Group 2,700 (23,452) Non-controlling interests - -
2,700 (23,452)

87FINANCIALS · ANNUAL REPORT 2014
NOTE 5.2 OTHER OPERATING LEASES
NOTE 5.3 CONTINGENT LIABILITIES
In 2014, J. Lauritzen has entered into a rental contract of offices from May 2015. The contract is not terminable until 2020.
USD '000 2014 2013
<1 year 649 - 1-5 years 3,896 - > 5 years 325 - Total 4,870 -
For guarantees and payment obligations relating to joint ventures, please refer to note 3.4.
Certain claims have been raised against J. Lauritzen A/S. The judg-ment of the management is that the outcome of these claims will not have any material impact on the financial position.
J. Lauritzen A/S has issued certain guarantees in connection with sale of assets, which does not expect to have a material impact on the financial position.
USDm 2014 2013
Guarantees undertaken for debt in subsidiaries 132 175Guarantees towards insurance company 20 20
NOTE 5.4 TAX
Certain group companies are jointly taxed with subsidiaries of the Lau-ritzen Foundation, the sole owner of J. Lauritzen A/S.
Provision for income tax for the year includes estimates of non-de-ductible finance expenses under the interest ceiling rules as well as estimates on the effect of joint taxation contribution.
In 2005, the Danish based companies of the Group entered the Dan-ish tonnage taxation system, the adoption of which is binding until at least 2014. J. Lauritzen does not expect to exit the tonnage taxation and thus no deferred tax provision has been made on the assets or liabilities effected by the Danish tonnage taxation system. If, however, J. Lauritzen should leave the Danish tonnage taxation system there could be a deferred tax liability of up to a maximum of USD 7m.
USD '000 2014 2013
Tax in the Income Statement consist of:Current tax (2,380) 1,255 Deferred tax 3,303 (357)
Income tax 923 898
Hereof related to discontinued operations:
Lauritzen Tankers - 331
Total continuing operations 923 567
Tax on the profit is specified as follows:Calculated 24,5% (2013: 25%) of result before tax 4,158 51,852 Tax effect of: - Tonnage tax (25,932) (55,930) Non-taxable items 25,250 3,815 Adjustments previous year (2,554) 1,161
923 898
Effective tax percent (5)% 0%
Deferred tax on the Balance Sheet:Deferred tax 1 January 297 655 Tax on profit 3,303 (357)
Deferred tax 31 December 3,600 297
Deferred tax concerns:Taxable losses carried forward 3,600 297
3,600 297 Unrecognised share of taxable losses carried forward 1,700 6,000
Corporate tax (receivable)/payable can be specified as follows:Balance 1 January (256) (1,713) Additions from merger - (792) Exchange rate adjustments 59 (67) Paid during the year (50) 3,571 Provision for the year (174) (95) Adjustment to prior years 2,554 (1,161)
2,132 (256)

88 FINANCIALS · ANNUAL REPORT 2014
NOTE 5.5 FEES TO AUDITORS
NOTE 5.6 RELATED PARTIES
NOTE 5.7 EVENTS AFTER BALANCE SHEET DATE
As owners of J. Lauritzen A/S, the Lauritzen Foundation and its affilli-ated companies, are related parties.
Other related parties with a significant influence of the activities of J.Lauritzen A/S is the company’s Board of Directors and the ExecutiveManagement (key management personnel).
Finally, additional related parties comprise joint ventures (cf. note 10)in which J. Lauritzen has a significant influence. Subsidiaries and joint ventures together with J. Lauritzen’s shareholding are shown in the overall list of group companies on page 91.
Transactions with related parties are conducted at arms length and have comprised the following income/(expenses):
USD '000 2014 2013
LF Investment:Management fee 176 205 Rental of office facilities (1,684) (1,696)
Group companies:Management fee, income/(expenses) (1,349) 205 Rental and lease income/(expenses) 52 56 Currency hedging income/(expenses) - (89) Guarantee commission income/(expenses) 1,292 633
Joint ventures and associated companies:Management fee 2,997 2,953
There have been no events after the balance sheet date that could materially affect the accounts as presented.
USD '000 2014 2013
Total fees to elected auditors 272 370
Specified as follows:Statutory audit 215 300 Tax advisory services 32 35 Fee for other services 25 35
There have been no other material transactions with related parties other than those stated above.
Consideration to key management personnel is disclosed in note 2.3.

89
Jan Kastrup-NielsenPresident & CEO
The Board of Directors and Executive Manage-ment have today discussed and approved the an-nual report of J. Lauritzen A/S for the financial year 2014.
The annual report has been prepared in accord-ance with International Financial Reporting Stand-ards as adopted by the EU and additional dis-closure requirements in the Danish Financial Statements Act. It is our opinion that the consoli-dated financial statements and parent company fi-nancial statements give a true and fair view of the Group’s and the parent company’s financial posi-tion at 31 December 2014 and of the results of the Group’s and the parent company’s operations and cash flows for the financial year 1 January – 31 De-cember 2014.
Management Statement
Birgit Aagaard-SvendsenExecutive Vice President & CFO
* Elected by the employees
Bent Østergaard, Chairman
Niels Heering
Marianne Wiinholt
Søren Berg*
Søren Roschmann*
BOARD OF DIRECTORS
EXECUTIVE MANAGEMENT
Ingar Skaug, Vice Chairman
Peter Poul Lauritzen Bay
Jesper T. Lok
Ulrik Danstrøm*
Further, in our opinion, the Management’s re-view gives a fair review of the development in the Group’s and the parent company’s operations and financial matters, the results of the Group’s and the parent company’s operations and financial po-sition and describes the material risks and uncer-tainties affecting the Group and the parent com-pany.
We recommend that the annual report be approved at the Annual General Meeting.
Copenhagen, 25 February 2015
FINANCIALS · ANNUAL REPORT 2014

90
Independent Auditors’ ReportTO THE SHAREHOLDER OF J. LAURITZEN A/S
INDEPENDENT AUDITORS’ REPORT ON THE CON-SOLIDATED FINANCIAL STATEMENTS AND THE PARENT COMPANY FINANCIAL STATEMENTS
We have audited the consolidated financial statements and the parent company financial statements of J. Lau-ritzen A/S for the financial year 1 January – 31 Decem-ber 2014, which comprise income statement, statement of comprehensive income, balance sheet statement, cash flow statement, equity statement and notes, in-cluding a summary of significant accounting policies, for the Group as well as for the parent company. The consolidated financial statements and the parent com-pany financial statements are prepared in accordance with International Financial Reporting Standards as ad-opted by the EU and Danish disclosure requirements for listed companies.
Executive Management’s responsibility for the consolidated financial statements and the parent company financial statementsExecutive Management is responsible for the prepara-tion of consolidated financial statements and parent company financial statements that give a true and fair view in accordance with International Financial Report-ing Standards as adopted by the EU and Danish dis-closure requirements for listed companies and for such internal control that Executive Management determines is necessary to enable the preparation of consolidated financial statements and parent company financial statements that are free from material misstatement, whether due to fraud or error.
Auditors’ responsibilityOur responsibility is to express an opinion on the con-solidated financial statements and the parent company financial statements based on our audit. We conducted our audit in accordance with International Standards on Auditing and additional requirements under Danish au-dit regulation. This requires that we comply with ethical requirements and plan and perform the audit to obtain reasonable assurance as to whether the consolidated financial statements and the parent company financial statements are free from material misstatement.
An audit involves performing procedures to obtain audit evidence about the amounts and disclosures in the con-solidated financial statements and the parent company financial statements. The procedures selected depend on the auditors’ judgement, including the assessment of the risks of material misstatement of the consoli-dated financial statements and the parent company financial statements, whether due to fraud or error. In making those risk assessments, the auditors consider internal control relevant to the Company’s preparation of consolidated financial statements and parent compa-ny financial statements that give a true and fair view in
order to design audit procedures that are appropriate in the circumstances, but not for the purpose of express-ing an opinion on the effectiveness of the Company’s internal control.
An audit also includes evaluating the appropriateness of accounting policies used and the reasonableness of accounting estimates made by Executive Management, as well as evaluating the overall presentation of the con-solidated financial statements and the parent company financial statements.
We believe that the audit evidence we have obtained is sufficient and appropriate to provide a basis for our opinion.
Our audit has not resulted in any qualification.
OpinionIn our opinion, the consolidated financial statements and the parent company financial statements give a true and fair view of the Group’s and the parent compa-ny’s financial position at 31 December 2014 and of the results of the Group’s and the parent company’s opera-tions and cash flows for the financial year 1 January – 31 December 2014 in accordance with International Fi-nancial Reporting Standards as adopted by the EU and Danish disclosure requirements for listed companies.
STATEMENT ON THE BOARD OF DIRECTORS & EXECUTIVE MANAGEMENT’S REVIEWPursuant to the Danish Financial Statements Act, we have read the Board of Directors & Executive Man-agement’s review. We have not performed any further procedures in addition to the audit of the consolidated financial statements and the parent company financial statements. On this basis, it is our opinion that the in-formation provided in the Board of Directors & Execu-tive Management’s review is consistent with the con-solidated financial statements and the parent company financial statements.
Copenhagen, 25 February 2015
Ernst & YoungGodkendt Revisionspartnerselskab
Henrik Kronborg IversenState Authorized Public Accountant
Carsten KjærState Authorized Public Accountant
FINANCIALS · ANNUAL REPORT 2014

91
List of Group CompaniesCompany name Country Ownership %
Group operating entities (ship owning)J. Lauritzen A/S Denmark -J. Lauritzen Singapore Pte. Ltd. Singapore 100 Gasnaval S.A. Spain 100
Other group operating entitiesJ. Lauritzen Shanghai Co. Ltd China 100 J. Lauritzen S.A. Switzerland 100 J. Lauritzen (USA) Inc. USA 100
Joint-ventures (ship owning)K/S Bulkinvest 30 Denmark 18 K/S Danred I Denmark 44 K/S Danred II Denmark 40 K/S Danred III Denmark 35 K/S Danred V Denmark 50 K/S Danskib 34 Denmark 20 K/S Danskib 63 Denmark 14 K/S Handybulk Denmark 26 Admiral Glory Shipping Corporation Panama 50 Admiral Logistics Corporation Panama 50 Axis Offshore Pte. Ltd. Singapore 34 Handyventure Singapore Pte. Ltd. Singapore 50 LKT Gas Carriers Pte. Ltd. Singapore 50 Milau Pte. Ltd. Singapore 50
Other operating interestsDe Forenede Sejlskibe I/S Denmark 43 Star Management Associates Japan 30
Liquidation pendingSegetrans Argentina S.A. Argentina 100 Lauritzen Offshore Services A/S Denmark 100 Lauritzen Offshore Pte. Ltd. Singapore 100 Lauritzen Shuttletankers Singapore Pte. Ltd. Singapore 100
DormantKRK 4 ApS Denmark 100 Lauritzen Reefers A/S Denmark 100 Lauritzen Ship Owner A/S Denmark 100
FINANCIALS · ANNUAL REPORT 2014
CHINAJ. Lauritzen Shanghai Co. Ltd.Unit 2306, Chong Hing Finance CenterNo. 288 Nanjing Road WestHuangpu District, ShanghaiChina 200003Phone: +86 21 6358 0066Fax: +86 21 6358 0077
PHILIPPINESLauritzen Kosan Manila ROHQ Unit-B 6th Floor Glass Tower BuildingNo. 115 Don Carlos Palanca Jr. StreetLegaspi Village, Makati City 1229 PHILIPPINES Tlf: +63 2 856 7929
SINGAPOREJ. Lauritzen Singapore Pte. Ltd.1 Harbourfront Avenue#16-18 Keppel Bay TowerSingapore 098632Phone: +65 6275 8000Fax: +65 6275 7208
SPAINGasnaval S.A.PAE IbarrabarriEdificio A-1C/Iturriondo 18E-48940 Leioa, VizcayaSpainPhone: +34 94 479 5600Fax: +34 94 416 7316
SWITZERLAND J. Lauritzen S.A.6, Place de Eaux-vives 1207 Geneva SwitzerlandPhone: + 41 79 595 1424
USAJ. Lauritzen (USA) Inc.4 Landmark Square, Suite 150Stamford, CT 06901USAPhone: +1 203 961 8661Fax: +1 203 964 0350
HEAD OFFICEJ. Lauritzen A/S28 Sankt Annae PladsDK-1291 Copenhagen KPhone: +45 3396 8000Fax: +45 3396 8001Website: www.j-lauritzen.comCVR: 55 70 01 17
OWNERLauritzen Fonden28 Sankt Annae PladsDK-1291 Copenhagen KPhone: +45 3396 8425Fax: +45 3396 8434Email: [email protected]: www.lauritzenfonden.com
FINANCIAL YEAR: 1 January – 31 December
AUDITORSErnst & Young P/SOsvald Helmuths Vej 4, DK-2000 Frederiksberg, Denmark Phone: +45 7323 3000Fax: +45 7229 3377