annual report june 30, 2020 - halal mutual funds
TRANSCRIPT

Beginning on January 1, 2021, as permitted by regulations adopted by the Securities and Exchange
Commission, paper copies of the Funds’ shareholder reports like this one will no longer be sent by
mail, unless you specifically request paper copies of the reports. Instead, the reports will be made
available on the Funds’ website https://www.azzadfunds.com/mutual-funds/, and you will be
notified by mail each time a report is posted and provided with a website link to access the report.
If you already elected to receive shareholder reports electronically, you will not be affected by this
change and you need not take any action. You may elect to receive shareholder reports and other
communications from the Funds electronically by contacting your financial intermediary (such as
a broker-dealer or bank) or, if you are a direct investor, by following the instructions included with
paper Fund documents that have been mailed to you.
You may elect to receive all future reports in paper free of charge. You can inform the Fund that
you wish to continue receiving paper copies of your shareholder reports by contacting the Fund at
888-350-3369. If you own shares through a financial intermediary, you may contact your financial
intermediary or follow instructions included with this disclosure to elect to continue to receive
paper copies of your shareholder reports. Your election to receive reports in paper will apply to all
funds held with the Fund complex or at your financial intermediary.
ANNUAL REPORT JUNE 30, 2020

TABLE OF CONTENTS
PAGE
SHAREHOLDER LETTER 1
PERFORMANCE ILLUSTRATION 4
PORTFOLIO ANALYSIS 6
SCHEDULE OF INVESTMENTS 8
STATEMENTS OF ASSETS AND LIABILITIES 21
STATEMENTS OF OPERATIONS 22
STATEMENTS OF CHANGES IN NET ASSETS 23
STATEMENT OF CASH FLOWS 25
FINANCIAL HIGHLIGHTS 26
NOTES TO FINANCIAL STATEMENTS 28
REPORT OF INDEPENDENT REGISTERED PUBLIC ACCOUNTING FIRM 43
EXPENSE ILLUSTRATION 44
TRUSTEES & OFFICERS 45
ADDITIONAL INFORMATION 47

AZZAD FUNDS
SHAREHOLDER LETTER
JUNE 30, 2020 (UNAUDITED)
1
Dear Azzad Funds Shareholder,
Enclosed please find your copy of the Azzad Funds annual report, in which you can read
a review of your investments for the 12-month period ended June 30, 2020.
The first nine months of the Funds’ fiscal year were relatively tame compared to the
cataclysm that befell markets in early March 2020. The emergence of COVID-19 in the
United States, as well as the subsequent lockdown to stem the spread of the virus,
sparked a rapid deterioration that has no clear parallel in history.
The depth and pace of the equity market decline, which culminated on March 23, 2020,
were historic. The S&P 500 fell 34 percent from its February high in just 22 days. The
shift from a bull market to a bear market was the fastest ever, and the month of March
proved to be the most volatile, up-and-down month for the S&P 500 in history.
Then came the recovery. The second quarter of 2020 posted the best quarterly
performance for stocks since 1998, with major benchmark indexes making sizeable gains
over their historically poor first-quarter tallies. Much of the second-quarter growth in the
stock market and economy was a bounce back from a dismal March and April when
pandemic-related lockdowns and restrictions virtually shut down the economy.
Nevertheless, stocks rose as investors focused on favorable economic data and the
possibility of further government stimulus, despite rising virus cases and tepid trade
relations with China. As an illustration of how dramatic the turnaround was, The Azzad
Ethical Fund posted double-digit losses over the first nine months of the fiscal year; three
months later, it ended the fiscal year with a positive double-digit return.
If you would like to discuss your financial goals, please contact an Azzad investment
advisor at 888.86.AZZAD. Thank you for your continued trust and investment.
Sincerely,
Joshua Brockwell, CSRICTM
Investment Communications Director

AZZAD FUNDS
SHAREHOLDER LETTER (CONTINUED)
JUNE 30, 2020 (UNAUDITED)
2
Azzad Wise Capital Fund (WISEX)
The Azzad Wise Capital Fund (“Wise Fund”) returned 2.41% for the 12-month period
from 7/1/2019 to 6/30/2020, underperforming its benchmark, the BofAML U.S. Corp. &
Govt. 1-3 Yr. Index, which returned 4.18%.
According to the Wise Fund’s sub-advisor Federated Investment Management Company
(“Federated”), the Wise Fund’s fiscal year started where the previous one left off:
rallying short-dated global bonds driven by a flight-to-quality in response to rising U.S.-
China trade tensions and impeachment proceedings in the U.S.
Wavering economic data in the U.S. and European manufacturing sectors stoked
recession fears, further compressing government yields and resulting in a U.S. 10- to 2-
year yield curve inversion, highlighting bond investors’ recession concerns.
Despite escalating geopolitical tensions in the Middle East, sovereign and corporate sukuk
markets finished the first six months of the Wise Fund’s fiscal year with a strong
performance. The threat of possible conflict between the U.S. and Iran was more than offset
by the market’s appetite for risk. The market for investment grade one- to three-year sukuk
returned close to 70 basis points for the final quarter of calendar 2019, topping off a strong
year in terms of total return. Saudi Arabia remained in the spotlight for much of the first
half, specifically related to its initial public offering of Saudi Aramco shares.
The second half of the Wise Fund’s fiscal year, which started out on relatively solid,
albeit deteriorating, macroeconomic footing, rapidly transformed into a coronavirus-
fueled freefall that would drive economies into recession. Global GDP was revised
sharply lower, with estimates of the U.S. economy dropping by an unimaginable 25-50%.
With this bleak realization at hand, financial markets plunged on a global level. By the
middle of March, the financial meltdown had rapidly morphed into a global liquidity
crisis, leaving no asset class untouched.
With global financial dislocations rising precipitously, the major global central banks
began aggressively easing monetary policies with rate cuts and quantitative easing. The
Federal Reserve and ECB tore up their traditional rule books, expanding their balance
sheets by trillions of dollars to provide unlimited liquidity to the banking sector, and set
up myriad programs to backstop stressed parts of the financial markets.
This unlimited liquidity, Federated reports, was not enough by itself. Governments were
expected to contribute on the fiscal side, as well. Country after country announced large
amounts of stimulus, dwarfing anything seen in 2008. This led to a broad-based rally in global
fixed income, which continued through the end of the fiscal year. Almost all fixed income
asset classes saw sharp price appreciation, including Islamic fixed income securities.
The rally spurred strong demand for conventional fixed income new issuance, which both
cash-strapped corporates and sovereigns have been eager to meet. However, the large
pricing concessions on new issues seen in Spring 2020 have largely dissipated, according
to Federated.
AZZAD FUNDS
SHAREHOLDER LETTER (CONTINUED)
JUNE 30, 2020 (UNAUDITED)
3
While conventional primary issuance remained elevated through year-end for both
corporates and sovereigns, sukuk issuance is off 35-40% from last year’s levels despite
the strong performance of the asset class and investor appetite for new sukuk issuance.
Given the complexity of global sukuk issuance, most government issuers of sukuk have
turned to conventional bond markets as they grapple with the impact of low oil prices and
tight budgets, while corporate issuers have been able to take advantage of measures
implemented by monetary authorities to unlock banking sector liquidity to help
corporations cope with adverse impacts. Ultimately, this lack of new supply coupled with
investor demand, has created a positive market dynamic, according to Federated. It
continues to drive spreads tighter, which is a plus for sukuk holders.
While the portfolio returned positive net performance for the period despite the volatility
seen in the third quarter, it was unable to maintain pace with the strong, record
setting performance of the benchmark on the back of collapsing government yields in the
second half of the period.
This affected the Wise Fund’s performance in two ways. First, neither the sukuk nor the
equity allocations could maintain pace with the index in the second half, despite positive
net returns. Second, the collapse in government yields contributed to a compression in
LIBOR, reducing the return on floating rate assets such as Islamic trade finance and
Islamic bank deposits.
Looking forward toward the upcoming fiscal year, Federated sees an unclear future for
Islamic financial securities. While many analysts are expecting the sukuk market to
continue to recover through Fall and Winter 2020-2021, deteriorating credit quality is
their major concern. Given the shocks to the economic environment and rapid change in
market conditions over the last six months, they expect credit risk to increase. Although
they note that positive market technicals, ample central bank liquidity, and fiscal stimulus
currently provide support for higher beta issuers, their experience has shown how quickly
these dynamics can change, reversing market momentum and sentiment literally
overnight. Thus, Federated remains cautious going into the new fiscal year.
The performance quoted represents past performance, which does not guarantee future results. This summary represents the views of the Azzad Funds portfolio managers and sub-advisors as
of June 30, 2020. Those views may change, and the Funds disclaim any obligation to advise
investors of such changes. The Azzad Funds are self-distributed and available by prospectus
only. A free copy of the prospectus, which contains information about the Funds’ risks, fees,
and objectives, and other important information, is available at www.azzadfunds.com or by
calling 888.350.3369. The Bank of America Merrill Lynch U.S. Corporate & Government 1-3
Year Index tracks the performance of U.S. dollar-denominated investment grade corporate
and government public debt issued in the U.S. Domestic bond market, excluding collateralized
products. The Russell MidCap® Growth Index measures the performance of the mid-cap
growth segment of the U.S. equity universe. It includes those Russell MidCap® Index
companies with higher price to book ratios and higher forecasted growth values. The index is
unmanaged and an investment cannot be made directly in this or any other index.

AZZAD ETHICAL FUND
PERFORMANCE ILLUSTRATION
JUNE 30, 2020 (UNAUDITED)
4
Average Annual Total Return
For the Periods Ended June 30, 2020
Azzad Ethical Fund Russell MidCap Growth Index
Six Months 5.13% 4.16%
1 Year 11.63% 11.91%
3 Year 13.38% 14.76%
5 Year 8.69% 11.60%
10 Year 12.50% 15.09%
Since Inception (1) 6.15% 8.21%
(1) December 22, 2000.
The performance quoted represents past performance, which does not guarantee future results. The
investment return and principal value of an investment will fluctuate so that an investor’s shares, when redeemed,
may be worth more or less than their original cost. The returns shown do not reflect a deduction of taxes that a
shareholder would pay on Fund distributions or the redemption of Fund shares. Current performance of the Fund
may be lower or higher than the performance quoted. The Fund’s investment objectives, risks, charges and
expenses must be considered carefully before investing. The total annual operating expenses, before any fees
waived, are 1.14% for the Ethical Fund per the November 1, 2019 prospectus. Performance data current to the
most recent month end may be obtained by calling 1-888-350-3369.
The Russell Midcap Growth Index measures the performance of the mid-cap growth segment of the U.S. equity
universe. It includes those Russell Midcap Index companies with higher price-to-book ratios and higher forecasted
growth values. The Russell Midcap Growth Index is constructed to provide a comprehensive and unbiased
barometer of the mid-cap growth market. The Index is completely reconstituted annually to ensure larger stocks do
not distort the performance and characteristics of the true mid-cap growth market.
Return figures reflect any change in price per share and assume the reinvestment of all distributions.
Cumulative Performance Comparison $10,000 Investment Since Inception
This chart assumes an initial investment of $10,000 made on 12/22/2000 (commencement of operations). Total
return is based on the net change in net asset value (“NAV”) and assuming reinvestment of all dividends and other
distributions. Performance figures represent past performance which is not predictive of future performance.
Investment return and principal value will fluctuate so that your shares, when redeemed, may be worth more or less
than their original cost.

AZZAD WISE CAPITAL FUND
PERFORMANCE ILLUSTRATION
JUNE 30, 2020 (UNAUDITED)
5
Average Annual Total Return
For the Periods Ended June 30, 2020
Azzad Wise Capital Fund ICE BofAML US Corp&Govt 1-3 Yr Index
Six Months 0.42% 2.83%
1 Year 2.41% 4.18%
3 Year 2.31% 2.89%
5 Year 1.85% 2.11%
10 Year 2.24% 1.67%
Since Inception (1) 2.02% 1.73%
(1) April 6, 2010
The performance quoted represents past performance, which does not guarantee future results. The
investment return and principal value of an investment will fluctuate so that an investor’s shares, when redeemed,
may be worth more or less than their original cost. The returns shown do not reflect a deduction of taxes that a
shareholder would pay on Fund distributions or the redemption of Fund shares. Current performance of the Fund
may be lower or higher than the performance quoted. The Fund’s investment objectives, risks, charges and
expenses must be considered carefully before investing. The total annual operating expenses, before any fees
waived, are 1.43% for the Wise Fund per the November 1, 2019 prospectus. Performance data current to the most
recent month end may be obtained by calling 1-888-350-3369.
The ICE BofAML US Corp&Gov’t 1-3 Yr Index is comprised of short-term bond funds having durations between
one and three and half years, thus making them attractive to fairly conservative investors. These funds invest in a
variety of bonds, from the most creditworthy, such as Treasury bonds, to mortgages and corporations. On rare
occasions, they may even invest in more speculative high-yield and emerging-markets debt.
Return figures reflect any change in price per share and assume the reinvestment of all distributions.
Cumulative Performance Comparison $10,000 Investment Since Inception
This chart assumes an initial investment of $10,000 made on 4/6/2010 (commencement of operations). Total
return is based on the net change in net asset value (“NAV”) and assuming reinvestment of all dividends and other
distributions. Performance figures represent past performance which is not predictive of future performance.
Investment return and principal value will fluctuate so that your shares, when redeemed, may be worth more or less
than their original cost.

AZZAD ETHICAL FUND
PORTFOLIO ANALYSIS
JUNE 30, 2020 (UNAUDITED)
6
The following chart gives a visual breakdown of the Ethical Fund by the industry sectors the
underlying securities represent as a percentage of the portfolio of investments.
The following chart gives a visual breakdown of the Ethical Fund by the industry sectors the
underlying securities represent as a percentage of the net assets.
Sectors are based on Morningstar® classifications.
Portfolio allocations are subject to change.

AZZAD WISE CAPITAL FUND
PORTFOLIO ANALYSIS
JUNE 30, 2020 (UNAUDITED)
7
The following chart gives a visual breakdown of the Wise Fund by the security types the underlying
securities represent as a percentage of the portfolio of investments.
The following chart gives a visual breakdown of the Wise Fund by the security types the underlying
securities represent as a percentage of net assets.
Sectors are based on Morningstar® classifications.
Portfolio allocations are subject to change.

AZZAD ETHICAL FUND
SCHEDULE OF INVESTMENTS
JUNE 30, 2020
8
Shares Value
COMMON STOCKS - 86.18%
Aircraft Engines & Engine Parts - 0.32% 3,927 Heico Corp. Class A $ 319,029
Apparel & Other Finished Products of Fabrics & Similar Material - 1.55%
2,405 Carter's, Inc. 194,084
7,103 Columbia Sportswear Co. 572,360
2,555 Lululemon Athletica, Inc. (Canada) * 797,186
1,563,630
Arrangement of Transportation of Freight & Cargo - 0.55% 7,036 C.H. Robinson Worldwide, Inc. 556,266
Auto Controls for Regulating Residential & Commercial Environment - 0.06%
644 Trane Technologies PLC (Ireland) 57,303
Biological Products (No Diagnostic Substances) - 0.12% 458 Bio-Techne Corp. 120,944
Computer Communications Equipment - 1.17%
3,135 Arista Networks, Inc. * 658,444
3,768 F5 Networks, Inc. * 525,561
1,184,005
Computer Peripheral Equipment - 1.50% 1,370 Fortinet, Inc. * 188,060
5,769 Palo Alto Networks, Inc. * 1,324,966
1,513,026
Converted Paper & Paperboard Products (No Containers/Boxes) - 0.27% 2,419 Avery Dennison Corp. 275,984
Electrical Work - 1.21%
31,200 Quanta Services, Inc. 1,223,976 Electronic Components & Accessories - 0.27%
1,234 Hubbell, Inc. 154,694
797 Universal Display Corp. 119,247
273,941
Electronic Connectors - 1.46% 15,391 Amphenol Corp. Class A 1,474,612
Footwear (No Rubber) - 0.24%
7,800 Skechers USA, Inc. Class A * 244,764
General Industrial Machinery & Equipment - 0.94% 568 Ingersoll Rand, Inc. 15,972
3,652 Zebra Technologies Corp. Class A * 934,730
950,702
Hotels & Motels - 0.54% 6,953 Choice Hotels International, Inc. 548,592
The accompanying notes are an integral part of these financial statements.
AZZAD ETHICAL FUND
SCHEDULE OF INVESTMENTS (CONTINUED)
JUNE 30, 2020
9
Shares Value
Household Appliances - 0.36%
7,721 Smith A O Corp. $ 363,814
In Vitro & In Vivo Diagnostic Substances - 0.09% 284 Idexx Laboratories, Inc. * 93,765
Industrial & Commercial Fans & Blowers & Air Purifying Equipment - 0.76%
16,527 Donaldson Co. 768,836
Industrial Instruments for Measurement, Display & Control - 0.52% 7,232 Cognex Corp. 431,895
914 Keysight Technologies, Inc. * 92,113
524,008
Instruments for Measuring & Testing of Electricity & Electric Signals - 0.66% 7,900 Teradyne, Inc. 667,629
Laboratory Analytical Instruments - 2.13%
12,266 Agilent Technologies, Inc. 1,083,946
1,804 Bruker Corp. 73,387
298 Mettler Toledo International, Inc. * 240,054
4,169 Waters Corp. * 752,088
2,149,475
Measuring & Controlling Devices - 0.11% 504 Rockwell Automation, Inc. 107,352
Men's & Boys' Furnishings, Work Clothing, & Allied Garments - 0.46%
1,753 Cintas Corp. 466,929 Metal Cans - 0.08%
1,176 Ball Corp. 81,720 Metalworking Machinery & Equipment - 0.15%
1,792 Lincoln Electric Holdings, Inc. 150,958 Miscellaneous Food Preparations & Kindred Products - 0.16%
905 McCormick & Company, Inc. 162,366 Motor Vehicle Parts & Accessories - 0.41%
5,261 Aptiv Plc. (United Kingdom) 409,937 Newspapers, Publishing or Publishing & Printing - 0.63%
15,065 New York Times Co. Class A 633,182
Optical Instruments & Lenses - 2.15% 11,187 KLA Tencor Corp. 2,175,648
Paints, Varnishes, Lacquers, Enamels & Allied Products - 1.05%
14,150 RPM International, Inc. 1,062,099
The accompanying notes are an integral part of these financial statements.
AZZAD ETHICAL FUND
SCHEDULE OF INVESTMENTS (CONTINUED)
JUNE 30, 2020
10
Shares Value
Pharmaceutical Preparations - 1.86%
7,026 BioMarin Pharmaceutical, Inc. * $ 866,587
6,241 Jazz Pharmaceuticals PLC (Ireland) * 688,632
2,123 Sage Therapeutics, Inc. * 88,274
1,464 Sarepta Therapeutics, Inc. * 234,738
1,878,231
Plastic Material, Synth Resins & Nonvulcan Elastomers - 0.55% 12,213 Hexcel Corp. 552,272
Plastic Products - 0.07%
887 Armstrong World Industries, Inc. 69,151
Pumps & Pumping Equipment - 0.45% 15,857 Flowserve Corp. 452,242
Radio & TV Broadcasting & Communications Equipment - 0.40%
2,328 Ubiquiti, Inc. 406,376
Railroad Equipment - 0.06% 1,139 Westinghouse Air Brake Technologies Corp. 65,572
Retail-Auto & Home Supply Stores - 2.47%
1,100 AutoZone, Inc. * 1,240,932
2,973 O'Reilly Automotive, Inc. * 1,253,625
2,494,557
Retail-Auto Dealers & Gasoline Stations - 1.11% 13,497 Copart, Inc. * 1,123,895
Retail-Building Materials, Hardware, Garden Supply - 2.55%
47,515 Fastenal Co. 2,035,543
4,129 Tractor Supply Co. 544,161
2,579,704
Retail-Catalog & Mail-Order Houses - 0.10% 850 CDW Corp. 98,753
Retail-Radio TV & Consumer Electronics Stores - 0.64%
7,457 Best Buy Co., Inc. 650,772
Retail-Retail Stores - 0.88% 4,366 Ulta Beauty, Inc. * 888,132
Retail-Variety Stores - 2.85%
10,775 Dollar General Corp. 2,052,745
1,422 Dollar Tree, Inc. * 131,791
2,715 Five Below, Inc. * 290,261
4,126 Ollie's Bargain Outlet Holdings, Inc. * 402,904
2,877,701
The accompanying notes are an integral part of these financial statements.
AZZAD ETHICAL FUND
SCHEDULE OF INVESTMENTS (CONTINUED)
JUNE 30, 2020
11
Shares Value
Semiconductors & Related Devices - 3.05%
4,172 IPG Photonics Corp. * $ 669,147
3,000 Maxim Integrated Products, Inc. 181,830
12,343 Skyworks Solution, Inc. 1,578,176
6,637 Xilinx, Inc. 653,014
3,082,167
Services-Business Services - 1.34% 2,123 Akamai Technologies, Inc. * 227,352
674 Broadridge Financial Solutions, Inc. 85,052
138 Costar Group, Inc. * 98,072
7,494 Etsy, Inc. * 796,088
349 Fair Isaac Corp. * 145,896
1,352,460
Services-Child Day Care Services - 0.67% 5,813 Bright Horizons Family Solutions, Inc. * 681,284
Services-Commercial Physical & Biological Research - 1.99%
5,286 Charles River Laboratories International, Inc. * 921,614
2,157 Exact Science Corp. * 187,530
6,460 Exelixis, Inc. * 153,360
7,162 Incyte Corp. * 744,633
2,007,137
Services-Computer Integrated Systems - 2.75% 21,002 Cerner Corp. 1,439,687
18,267 GoDaddy, Inc. Class A * 1,339,519
2,779,206
Services-Computer Processing & Data Preparation - 1.69% 766 Proofpoint, Inc. * 85,118
1,258 RingCentral, Inc. Class A * 358,543
3,275 Zendesk, Inc. * 289,936
101,560 Zynga, Inc. Class A * 968,882
1,702,479
Services-Computer Programming, Data Processing, Etc. - 2.96% 3,371 Factset Research Systems, Inc. 1,107,272
1,233 IHS Markit Ltd. (United Kingdom) 93,092
23,752 Switch, Inc. Class A 423,261
832 The Trade Desk, Inc. Class A * 338,208
34,585 Twitter, Inc. * 1,030,287
2,992,120
Services-Computer Programming Services - 3.55% 7,445 Epam Systems, Inc. * 1,876,214
8,253 VeriSign, Inc. * 1,706,968
3,583,182
Services-Consumer Credit Reporting, Collection Agencies - 2.02% 592 Equifax, Inc. 101,753
22,293 TransUnion 1,940,383
2,042,136
The accompanying notes are an integral part of these financial statements.

AZZAD ETHICAL FUND
SCHEDULE OF INVESTMENTS (CONTINUED)
JUNE 30, 2020
12
Shares Value
Services-Detective, Guard & Armored Car Services - 0.56%
5,560 Allegion Plc. (Ireland) $ 568,343 Services-Help Supply Services - 0.70%
13,366 Robert Half International, Inc. 706,126
Services-Home Health Care Services - 0.75% 1,678 Chemed Corp. 756,895
Services-Management Services - 0.27%
2,261 Gartner, Inc. * 274,327
Services-Medical Laboratories - 0.70% 4,274 Laboratory Corp. Of America Holdings * 709,954
Services-Membership Sports & Recreation Clubs - 0.59%
9,797 Planet Fitness, Inc. Class A * 593,404
Services-Prepackaged Software - 16.27% 906 Alteryx, Inc. Class A * 148,838
4,739 Atlassian Corp. PLC Class A (United Kingdom) * 854,300
22,116 Cadence Design Systems, Inc. * 2,122,251
2,782 Ceridain HCM Holding, Inc. * 220,529
15,528 Citrix Systems, Inc. 2,296,746
1,024 Coupa Software, Inc. * 283,689
3,040 Docusign, Inc. * 523,518
447 HubSpot, Inc. * 100,284
588 MongoDB, Inc. Class A * 133,088
3,416 New Relic, Inc. * 235,362
6,030 Nutanix, Inc. Class A * 142,941
2,741 Okta, Inc. * 548,830
3,463 Paycom Software, Inc. * 1,072,595
8,757 Paylocity Holding Corp. * 1,277,559
5,165 PTC, Inc. * 401,785
6,463 Realpage, Inc. * 420,160
20,984 SolarWinds, Inc. * 370,787
5,174 Splunk, Inc. * 1,028,074
18,418 Square, Inc. Class A * 1,932,785
594 Synopsys, Inc. * 115,830
5,413 Twilio, Inc. Class A * 1,187,720
4,350 Veeva Systems, Inc. Class A * 1,019,727
16,437,398
Services-To Dwellings & Other Buildings - 0.37% 8,800 Rollins, Inc. 373,032
Special Industry Machinery - 1.52%
4,733 Lam Research Corp. 1,530,936
Specialty Cleaning, Polishing & Sanitation Preparations - 1.37% 6,330 Clorox Co. 1,388,612
The accompanying notes are an integral part of these financial statements.

AZZAD ETHICAL FUND
SCHEDULE OF INVESTMENTS (CONTINUED)
JUNE 30, 2020
13
Shares Value
Sugar & Confectionery Products - 0.44%
3,439 Hershey Co. $ 445,763
Surgical & Medical Instruments & Apparatus - 3.35% 4,530 Dexcom, Inc. * 1,836,462
8,366 Hill-Rom Holdings, Inc. 918,419
471 ICU Medical, Inc. * 86,810
858 Insulet Corp. * 166,675
536 Penumbra, Inc. * 95,848
1,033 Resmed, Inc. 198,336
231 Teleflex, Inc. 84,079
3,386,629
Trucking (No Local) - 1.53% 3,672 Hunt J.B. Transport Services, Inc. 441,888
6,507 Old Dominion Freight Line, Inc. 1,103,522
1,545,410
Wholesale-Durable Goods - 0.75% 2,424 W.W. Grainger, Inc. 761,524
Wholesale-Groceries & Related Products - 0.69%
1,900 Dominos Pizza, Inc. 701,936
Wholesale-Medical, Dental & Hospital Equipment & Supplies - 0.85% 14,630 Henry Schein, Inc. * 854,246
X-Ray Apparatus & Tubes & Related Irradiation Apparatus - 1.54%
27,333 Hologic, Inc. * 1,557,981
TOTAL FOR COMMON STOCKS (Cost $61,473,582) - 86.18% 87,076,537
REAL ESTATE INVESTMENT TRUSTS - 4.06%
18,674 American Homes 4 Rent Class A 502,331
28,508 Equity Lifestyle Properties, Inc. 1,781,180
2,924 Extra Space Storage, Inc. 270,090
11,443 Sun Communities, Inc. 1,552,586
TOTAL FOR REAL ESTATE INVESTMENT TRUSTS (Cost $3,558,454) - 4.06% 4,106,187
TOTAL FOR INVESTMENTS (Cost $65,032,036) ** - 90.24% 91,182,724
OTHER ASSETS LESS LIABILITIES, NET - 9.76% 9,863,771
NET ASSETS - 100.00% $ 101,046,495
* Non-income producing securities during the period.
** Refer to Note 8 for Tax Cost.
The accompanying notes are an integral part of these financial statements.
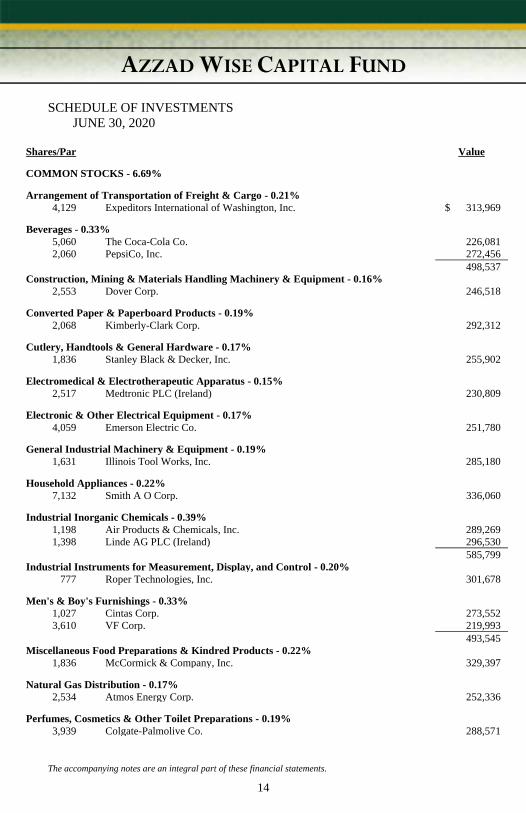
AZZAD WISE CAPITAL FUND
SCHEDULE OF INVESTMENTS
JUNE 30, 2020
14
Shares/Par Value
COMMON STOCKS - 6.69%
Arrangement of Transportation of Freight & Cargo - 0.21%
4,129 Expeditors International of Washington, Inc. $ 313,969
Beverages - 0.33% 5,060 The Coca-Cola Co. 226,081
2,060 PepsiCo, Inc. 272,456
498,537
Construction, Mining & Materials Handling Machinery & Equipment - 0.16% 2,553 Dover Corp. 246,518
Converted Paper & Paperboard Products - 0.19%
2,068 Kimberly-Clark Corp. 292,312
Cutlery, Handtools & General Hardware - 0.17% 1,836 Stanley Black & Decker, Inc. 255,902
Electromedical & Electrotherapeutic Apparatus - 0.15%
2,517 Medtronic PLC (Ireland) 230,809
Electronic & Other Electrical Equipment - 0.17% 4,059 Emerson Electric Co. 251,780
General Industrial Machinery & Equipment - 0.19%
1,631 Illinois Tool Works, Inc. 285,180
Household Appliances - 0.22% 7,132 Smith A O Corp. 336,060
Industrial Inorganic Chemicals - 0.39%
1,198 Air Products & Chemicals, Inc. 289,269
1,398 Linde AG PLC (Ireland) 296,530
585,799
Industrial Instruments for Measurement, Display, and Control - 0.20% 777 Roper Technologies, Inc. 301,678
Men's & Boy's Furnishings - 0.33%
1,027 Cintas Corp. 273,552
3,610 VF Corp. 219,993
493,545
Miscellaneous Food Preparations & Kindred Products - 0.22% 1,836 McCormick & Company, Inc. 329,397
Natural Gas Distribution - 0.17%
2,534 Atmos Energy Corp. 252,336
Perfumes, Cosmetics & Other Toilet Preparations - 0.19% 3,939 Colgate-Palmolive Co. 288,571
The accompanying notes are an integral part of these financial statements.
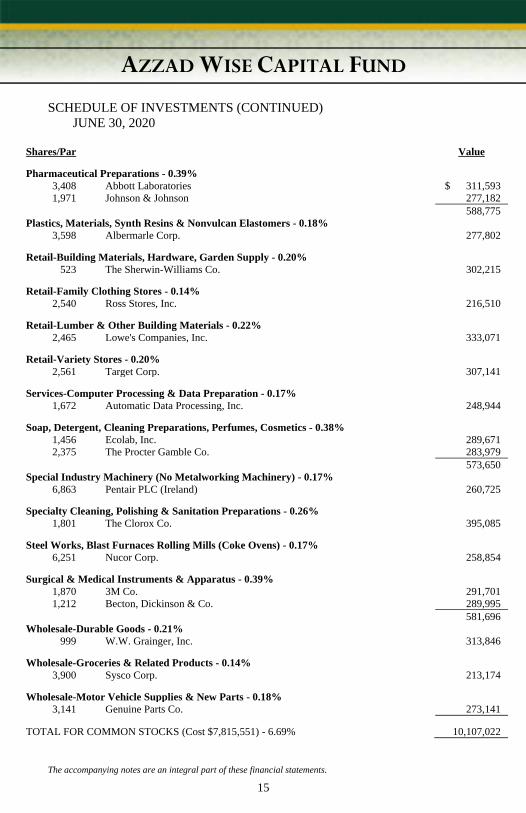
AZZAD WISE CAPITAL FUND
SCHEDULE OF INVESTMENTS (CONTINUED)
JUNE 30, 2020
15
Shares/Par Value
Pharmaceutical Preparations - 0.39%
3,408 Abbott Laboratories $ 311,593
1,971 Johnson & Johnson 277,182
588,775
Plastics, Materials, Synth Resins & Nonvulcan Elastomers - 0.18% 3,598 Albermarle Corp. 277,802
Retail-Building Materials, Hardware, Garden Supply - 0.20%
523 The Sherwin-Williams Co. 302,215
Retail-Family Clothing Stores - 0.14% 2,540 Ross Stores, Inc. 216,510
Retail-Lumber & Other Building Materials - 0.22%
2,465 Lowe's Companies, Inc. 333,071
Retail-Variety Stores - 0.20% 2,561 Target Corp. 307,141
Services-Computer Processing & Data Preparation - 0.17%
1,672 Automatic Data Processing, Inc. 248,944
Soap, Detergent, Cleaning Preparations, Perfumes, Cosmetics - 0.38% 1,456 Ecolab, Inc. 289,671
2,375 The Procter Gamble Co. 283,979
573,650
Special Industry Machinery (No Metalworking Machinery) - 0.17% 6,863 Pentair PLC (Ireland) 260,725
Specialty Cleaning, Polishing & Sanitation Preparations - 0.26%
1,801 The Clorox Co. 395,085
Steel Works, Blast Furnaces Rolling Mills (Coke Ovens) - 0.17% 6,251 Nucor Corp. 258,854
Surgical & Medical Instruments & Apparatus - 0.39%
1,870 3M Co. 291,701
1,212 Becton, Dickinson & Co. 289,995
581,696
Wholesale-Durable Goods - 0.21% 999 W.W. Grainger, Inc. 313,846
Wholesale-Groceries & Related Products - 0.14%
3,900 Sysco Corp. 213,174
Wholesale-Motor Vehicle Supplies & New Parts - 0.18% 3,141 Genuine Parts Co. 273,141
TOTAL FOR COMMON STOCKS (Cost $7,815,551) - 6.69% 10,107,022
The accompanying notes are an integral part of these financial statements.

AZZAD WISE CAPITAL FUND
SCHEDULE OF INVESTMENTS (CONTINUED)
JUNE 30, 2020
16
Shares/Par Value
SUKUKS - 63.81%
Banks - 15.02%
3,000,000 AHB Sukuk, Ltd., 4.375%, 09/19/2023 (Cayman Islands) $ 3,198,924
4,200,000 DIB Sukuk, Ltd., 3.600%, 03/30/2021 (Cayman Islands) 4,259,304
2,000,000 DIB Sukuk, Ltd., 3.664%, 02/14/2022 (Cayman Islands) 2,049,052
4,000,000 QIB Sukuk, Ltd., REGS, 2.754%, 10/27/2020 (Cayman Islands) 4,020,128
4,504,000 QIB Sukuk, Ltd., REGS, 3.251%, 05/23/2022 (Cayman Islands) 4,601,467
4,500,000 SIB Sukuk Co. III Ltd. REGS, 3.084%, 09/08/2021 (Cayman Islands) 4,559,503
22,688,378
Basic Materials - 1.78% 2,585,000 Equate Sukuk Spc Ltd. REGS, 3.944%, 02/21/2024 (Kuwait) 2,682,152
Communications Equipment - 3.76%
5,645,000 Axiata Spv2 Bhd, Series REGS, 3.466%, 11/19/2020 (Malaysia) 5,674,128
Financial Services - 1.35% 1,940,000 FAB Sukuk Co. Ltd., REGS, 3.625%, 03/05/2023 (Cayman Islands) 2,041,850
Food and Beverage - 0.70%
1,000,000 Almarai Sukuk, Ltd., 4.311%, 03/05/2024 (Cayman Islands) 1,060,786
Real Estate - 1.91% 1,400,000 Dar Al-Arkan International Sukuk Co., REGS, 6.875%, 03/21/2023 (Cayman Islands) 1,332,814
1,500,000 DIFC Investments LLC, Note, Series REGS, 4.325% 11/12/2024 (United Arab Emirates) 1,556,430
2,889,244
Sovereigns - 25.54% 1,250,000 CBB International Sukuk Six, REGS, 5.250%, 03/20/2025 (Bahrain) 1,302,644
1,000,000 CBB International Sukuk Progr. Co., REGS, 6.250%, 11/14/2024 (Bahrain) 1,064,210
1,000,000 Hazine Mustesarligi, Series 144A, 5.004%, 04/06/2023 (Turkey) (1) 990,132
1,000,000 Hazine Mustesarligi, Series 144A, 4.251%, 06/08/2021 (Turkey) (1) 999,500
1,000,000 Hazine Mustesarligi, Series 144A, 5.800%, 02/21/2022 (Turkey) (1) 1,011,500
2,100,000 KSA Sukuk, Ltd., Series 144A, 2.894%, 04/20/2022 (Saudi Arabia) (1) 2,158,687
2,500,000 KSA Sukuk, Ltd., Series 144A, 4.303%, 01/19/2029 (Saudi Arabia) (1) 2,876,500
1,500,000 KSA Sukuk, Ltd., Series 144A, 2.969%, 10/29/2029 (Saudi Arabia) (1) 1,573,896
500,000 Oman, Government, Series 144A, 4.397%, 06/01/2024 (Oman) (1) 488,230
2,500,000 Oman, Government, Series 144A, 5.932%, 10/31/2025 (Oman) (1) 2,568,610
1,500,000 Perusahaan Pener Indois Sukuk, Series 144A, 2.300%, 06/23/2025 (Indonesia) (1) 1,501,875
2,600,000 Perusahaan Pener Indois Sukuk, Series REGS, 3.300%, 11/21/2022 (Indonesia) 2,685,020
2,000,000 Perusahaan Penerbit SBSN Indois Sukuk, Series 144A, 3.400%, 03/29/2022 (Indonesia) (1) 2,059,840
2,300,000 Perusahaan Penerbit SBSN Indois Sukuk, Series 144A, 3.900%, 08/20/2024 (Indonesia) (1) 2,453,157
1,685,000 Perusahaan Penerbit SBSN Indois Sukuk, Series 144A, 4.150%, 03/29/2027 (Indonesia) (1) 1,831,123
517,000 Perusahaan Penerbit SBSN Indois Sukuk, REGS, 3.400%, 03/29/2022 (Indonesia) 532,469
2,500,000 Ras al-Khaimah, 3.094%, 03/31/2025 (Cayman Islands) 2,605,555
6,250,000 Sharjah Sukuk 2, Ltd., 3.839%, 01/27/2021 (Cayman Islands) 6,350,087
3,400,000 Wakala Global Sukuk BHD, REGS, 4.646%, 07/06/2021 (Malaysia) 3,522,325
38,575,360
The accompanying notes are an integral part of these financial statements.

AZZAD WISE CAPITAL FUND
SCHEDULE OF INVESTMENTS (CONTINUED)
JUNE 30, 2020
17
Shares/Par Value
Supranationals - 6.58% 2,000,000 Apicorp Sukuk, Ltd. REGS, 2.383%, 10/28/2020 (Cayman Islands) $ 2,012,514
4,070,000 Apicorp Sukuk, Ltd., 3.141%, 11/01/2022 (Cayman Islands) 4,248,014
2,500,000 IDB Trust Services, Ltd. REGS, 1.957%, 10/02/2024 (Jersey) 2,592,397
1,000,000 IDB Trust Services, Ltd. REGS, 3.389%, 09/26/2023 (Jersey) 1,078,384
9,931,309
Transportation & Logistics - 1.38% 2,000,000 DP World Cresent, Ltd, Sr. Unsecd. Note, Series REGS, 3.908%, 05/31/2023 (Cayman Islands) 2,082,800
Utilities - 5.06%
1,500,000 Tabreed Sukuk SPC, Ltd, Sr. Unsecd. Note REGS, 5.500%, 10/31/2025 (United Arab Emirates) 1,675,408
5,700,000 Saudi Electricity Global Sukuk, Series REGS, 4.211%, 04/03/2022 (Cayman Islands) 5,970,100
7,645,508
Wireline Telecommunications Services - 0.73% 1,000,000 Saudi Telecom Co., Series 144A, 3.890%, 05/13/2029 (Saudi Arabia) (1) 1,105,620
TOTAL FOR SUKUKS (Cost $94,832,463) - 63.81% 96,377,135
TRADE FINANCE AGREEMENTS - 3.70% (2)
Shares/Par
Acquisition
Date (2) Cost (2) Value
Consumer Banking - 0.77% 54,525
Government of Djibouti, 3.620%, 07/15/2020
(12-month US LIBOR +3.800%) (Djibouti) (3) 06/10/2020
54,525
54,525
54,525
Government of Djibouti, 3.620%, 08/14/2020
(12-month US LIBOR +3.800%) (Djibouti) (3) 06/10/2020
54,525
54,525
54,526
Government of Djibouti, 3.620%, 09/14/2020
(12-month US LIBOR +3.800%) (Djibouti) (3) 06/10/2020
54,526
54,526
1,000,000
Turk Eximbank, 2.812%, (Interpolated
LIBOR +1.100%) 11/16/2020 (Turkey) 02/18/2020
1,000,000
999,700
1,163,576
1,163,276
Consumer Non-Cyclical/Food-Wholesale - 0.51% 64,745
Government of the Gambia, 5.752%, (12-month
US LIBOR +3.500%), 07/02/2020 (Gambia) (3) 07/05/2019
64,745
64,486
6,013
Government of the Gambia, 5.120%, (12-month
US LIBOR +3.500%), 07/09/2020 (Gambia) (3) 07/12/2019
6,013
5,989
69,882
Government of the Gambia, 5.140%, (12-month
US LIBOR +3.500%), 07/13/2020 (Gambia) (3) 07/17/2019
69,882
69,602
77,057
Government of the Gambia, 5.140%, (12-month
US LIBOR +3.500%), 08/21/2020 (Gambia) (3) 08/26/2019
77,057
76,749
55,368
Government of the Gambia, 5.140%, (12-month
US LIBOR +3.500%), 08/31/2020 (Gambia) (3) 09/05/2020
55,368
55,146
25,392
PT Pacific Indopalm Industries, 2.523%, (3-month
US LIBOR +2.500%) 07/07/2020 (Indonesia) 03/10/2020
25,392
25,392
35,160
PT Pacific Indopalm Industries, 2.412%, (3-month
US LIBOR +2.500%) 07/14/2020 (Indonesia) 03/16/2020
35,160
35,160
The accompanying notes are an integral part of these financial statements.
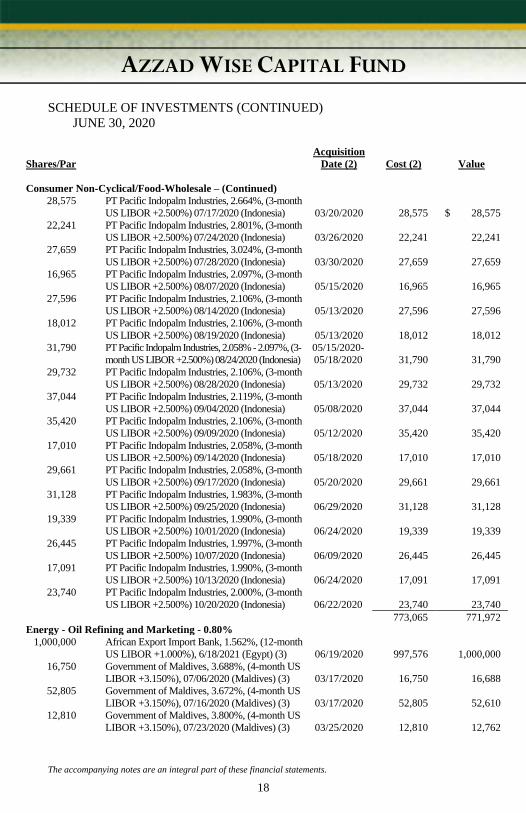
AZZAD WISE CAPITAL FUND
SCHEDULE OF INVESTMENTS (CONTINUED)
JUNE 30, 2020
18
Shares/Par
Acquisition
Date (2) Cost (2) Value
Consumer Non-Cyclical/Food-Wholesale – (Continued) 28,575
PT Pacific Indopalm Industries, 2.664%, (3-month
US LIBOR +2.500%) 07/17/2020 (Indonesia) 03/20/2020
28,575 $ 28,575
22,241
PT Pacific Indopalm Industries, 2.801%, (3-month
US LIBOR +2.500%) 07/24/2020 (Indonesia) 03/26/2020
22,241
22,241
27,659
PT Pacific Indopalm Industries, 3.024%, (3-month
US LIBOR +2.500%) 07/28/2020 (Indonesia) 03/30/2020
27,659
27,659
16,965
PT Pacific Indopalm Industries, 2.097%, (3-month
US LIBOR +2.500%) 08/07/2020 (Indonesia) 05/15/2020
16,965
16,965
27,596
PT Pacific Indopalm Industries, 2.106%, (3-month
US LIBOR +2.500%) 08/14/2020 (Indonesia) 05/13/2020
27,596
27,596
18,012
PT Pacific Indopalm Industries, 2.106%, (3-month
US LIBOR +2.500%) 08/19/2020 (Indonesia) 05/13/2020
18,012
18,012
31,790
PT Pacific Indopalm Industries, 2.058% - 2.097%, (3-
month US LIBOR +2.500%) 08/24/2020 (Indonesia)
05/15/2020-
05/18/2020
31,790
31,790
29,732
PT Pacific Indopalm Industries, 2.106%, (3-month
US LIBOR +2.500%) 08/28/2020 (Indonesia) 05/13/2020
29,732
29,732
37,044
PT Pacific Indopalm Industries, 2.119%, (3-month
US LIBOR +2.500%) 09/04/2020 (Indonesia) 05/08/2020
37,044
37,044
35,420
PT Pacific Indopalm Industries, 2.106%, (3-month
US LIBOR +2.500%) 09/09/2020 (Indonesia) 05/12/2020
35,420
35,420
17,010
PT Pacific Indopalm Industries, 2.058%, (3-month
US LIBOR +2.500%) 09/14/2020 (Indonesia) 05/18/2020
17,010
17,010
29,661
PT Pacific Indopalm Industries, 2.058%, (3-month
US LIBOR +2.500%) 09/17/2020 (Indonesia) 05/20/2020
29,661
29,661
31,128
PT Pacific Indopalm Industries, 1.983%, (3-month
US LIBOR +2.500%) 09/25/2020 (Indonesia) 06/29/2020
31,128
31,128
19,339
PT Pacific Indopalm Industries, 1.990%, (3-month
US LIBOR +2.500%) 10/01/2020 (Indonesia) 06/24/2020
19,339
19,339
26,445
PT Pacific Indopalm Industries, 1.997%, (3-month
US LIBOR +2.500%) 10/07/2020 (Indonesia) 06/09/2020
26,445
26,445
17,091
PT Pacific Indopalm Industries, 1.990%, (3-month
US LIBOR +2.500%) 10/13/2020 (Indonesia) 06/24/2020
17,091
17,091
23,740
PT Pacific Indopalm Industries, 2.000%, (3-month
US LIBOR +2.500%) 10/20/2020 (Indonesia) 06/22/2020
23,740
23,740
773,065 771,972
Energy - Oil Refining and Marketing - 0.80% 1,000,000
African Export Import Bank, 1.562%, (12-month
US LIBOR +1.000%), 6/18/2021 (Egypt) (3) 06/19/2020
997,576
1,000,000
16,750
Government of Maldives, 3.688%, (4-month US
LIBOR +3.150%), 07/06/2020 (Maldives) (3) 03/17/2020
16,750
16,688
52,805
Government of Maldives, 3.672%, (4-month US
LIBOR +3.150%), 07/16/2020 (Maldives) (3) 03/17/2020
52,805
52,610
12,810
Government of Maldives, 3.800%, (4-month US
LIBOR +3.150%), 07/23/2020 (Maldives) (3) 03/25/2020
12,810
12,762
The accompanying notes are an integral part of these financial statements.

AZZAD WISE CAPITAL FUND
SCHEDULE OF INVESTMENTS (CONTINUED)
JUNE 30, 2020
19
Shares/Par
Acquisition
Date (2) Cost (2) Value
Energy - Oil Refining and Marketing – (Continued) 12,000
Government of Maldives, 3.864%, (4-month US
LIBOR +3.150%), 08/06/2020 (Maldives) (3) 04/08/2020
12,000 $ 11,955
28,687
Government of Maldives, 3.858%, (4-month US
LIBOR +3.150%), 08/12/2020 (Maldives) (3) 04/08/2020
28,687
28,581
26,250
Government of Maldives, 3.595%, (4-month US
LIBOR +3.150%), 08/19/2020 (Maldives) (3) 04/24/2020
26,250
26,153
26,794
Government of Maldives, 3.593% - 3.640%, (4-month
US LIBOR +3.150%), 08/26/2020 (Maldives) (3)
04/21/2020-
04/24/2020
26,794
26,695
10,651
Government of Maldives, 3.706%, (4-month US
LIBOR +3.150%), 09/07/2020 (Maldives) (3) 03/25/2020
10,651
10,612
4,993
Government of Maldives, 3.636%, (4-month US
LIBOR +3.150%), 09/14/2020 (Maldives) (3) 04/21/2020
4,993
4,975
15,965
Government of Maldives, 3.806%, (4-month US
LIBOR +3.150%), 10/06/2020 (Maldives) (3) 04/08/2020
15,965
15,906
1,205,281 1,206,937
Foreign Sovereign - 1.62% 90,943
Government of Pakistan, 4.590%, (12-month US
LIBOR +2.500%), 07/02/2020 (Pakistan) (3) 07/05/2019
90,943
90,943
52,632
Government of Pakistan, 4.690%, (12-month US
LIBOR +2.500%), 07/06/2020 (Pakistan) (3) 07/11/2019
52,632
52,632
63,019
Government of Pakistan, 4.600%, (12-month US
LIBOR +2.500%), 07/09/2020 (Pakistan) (3) 07/12/2019
63,019
63,019
57,254
Government of Pakistan, 4.620%, (12-month US
LIBOR +2.500%), 07/13/2020 (Pakistan) (3) 07/18/2019
57,254
57,254
51,168
Government of Pakistan, 4.600%, (12-month US
LIBOR +2.500%), 07/20/2020 (Pakistan) (3) 07/24/2019
51,168
51,168
48,032
Government of Pakistan, 4.450%, (12-month US
LIBOR +2.500%), 08/03/2020 (Pakistan) (3) 08/06/2019
48,032
48,032
49,371
Government of Pakistan, 4.450%, (12-month US
LIBOR +2.500%), 08/14/2020 (Pakistan) (3) 08/19/2019
49,371
49,371
33,532
Government of Pakistan, 4.450%, (12-month US
LIBOR +2.500%), 09/08/2020 (Pakistan) (3) 09/10/2019
33,532
33,532
1,000,000
The Tunisian Company of Electricity and Gas, 2.969%
- 3.720%, (US LIBOR +2.100%), 08/31/2020 (Tunisia)
03/02/2020-
03/03/2020
1,000,000
999,800
94,501
Tunisian Refining Industries Company DD1, 2.636%,
(12-month US LIBOR +2.100%), 12/02/2020 (Tunisia) 05/06/2020
94,501
94,492
103,621
Tunisian Refining Industries Company DD1, 2.636%,
(12-month US LIBOR +2.100%), 01/04/2021 (Tunisia) 05/06/2020
103,621
103,611
104,069
Tunisian Refining Industries Company DD1, 2.636%,
(12-month US LIBOR +2.100%), 02/01/2021 (Tunisia) 05/06/2020
104,069
104,059
104,306
Tunisian Refining Industries Company DD1, 2.636%,
(12-month US LIBOR +2.100%), 03/01/2021 (Tunisia) 05/06/2020
104,306
104,296
104,493
Tunisian Refining Industries Company DD1, 2.636%,
(12-month US LIBOR +2.100%), 04/01/2021 (Tunisia) 05/06/2020
104,493
104,482
104,739
Tunisian Refining Industries Company DD1, 2.636%,
(12-month US LIBOR +2.100%), 05/04/2021 (Tunisia) 05/06/2020
104,739
104,729
The accompanying notes are an integral part of these financial statements.

AZZAD WISE CAPITAL FUND
SCHEDULE OF INVESTMENTS (CONTINUED)
JUNE 30, 2020
20
Shares/Par
Acquisition
Date (2) Cost (2) Value
Foreign Sovereign – (Continued) 59,166
Tunisian Refining Industries Company DD1, 2.818%,
(12-month US LIBOR +2.100%), 12/16/2020 (Tunisia) 05/20/2020
59,166 $ 59,160
64,720
Tunisian Refining Industries Company DD1, 2.818%,
(12-month US LIBOR +2.100%), 01/15/2021 (Tunisia) 05/20/2020
64,720
64,713
64,831
Tunisian Refining Industries Company DD1, 2.818%,
(12-month US LIBOR +2.100%), 02/16/2021 (Tunisia) 05/20/2020
64,831
64,824
65,070
Tunisian Refining Industries Company DD1, 2.818%,
(12-month US LIBOR +2.100%), 03/15/2021 (Tunisia) 05/20/2020
65,070
65,063
65,166
Tunisian Refining Industries Company DD1, 2.818%,
(12-month US LIBOR +2.100%), 04/15/2021 (Tunisia) 05/20/2020
65,166
65,160
65,319
Tunisian Refining Industries Company DD1, 2.818%,
(12-month US LIBOR +2.100%), 05/17/2021 (Tunisia) 05/20/2020
65,319
65,313
2,445,951 2,445,651
TOTAL FOR TRADE FINANCE AGREEMENTS (Cost $5,587,873) - 3.70% $5,587,873 $ 5,587,836
BANK TIME DEPOSITS - 19.85% (4)
6,162,809 Arab Banking Corp., NY Branch, 0.600% - 2.150%, 07/17/2020 - 09/24/2020 (Bahrain) 6,162,809
5,139,243 Gulf International Bank (UK), 0.080% - 1.650%,07/06/2020 - 08/26/2020 (Bahrain) 5,139,243
9,372,740 Maybank Islamic Bank, 0.450% - 1.850%, 08/03/2020 - 12/07/2020 (Malaysia) 9,372,740
9,300,698 Qatar National Bank, 0.650% -2.100%, 07/31/2020 - 03/19/2021 (Qatar) 9,300,698
TOTAL FOR BANK TIME DEPOSITS (Cost $29,975,491) - 19.85% 29,975,490
TOTAL FOR INVESTMENTS (Cost $138,211,378) ** - 94.05% 142,047,483
OTHER ASSETS LESS LIABILITIES, NET - 5.95% 8,986,749
NET ASSETS - 100.00% $ 151,034,232
* Non-income producing securities during the period.
** Refer to Note 8 for Tax Cost.
(1) Denotes a restricted security that may be sold without restriction to "qualified institutional buyers" as defined in
Rule 144A under the Securities Act of 1933 and that the Fund has determined to be liquid under criteria established
by the Fund's Board of Trustees. At June 30, 2020 these liquid restricted securities amount to $21,618,670, which
represented 14.31% of total net assets.
(2) Denotes a restricted and/or an illiquid security that either: (a) cannot be offered for public sale without first
being registered, or availing of an exemption from registration, under the Securities Act of 1933; or (b) is subject to
a contractual restriction on public sales; or (c) is considered an illiquid security as defined by the Investment
Company Act of 1940. At June 30, 2020, these restricted and/or illiquid securities amounted to $5,587,836, which
represented 3.70% of total net assets and level 3 securities.
(3) Floating/variable note with current rate and current maturity or next reset date shown.
(4) Variable rate instrument, varying maturity dates ranging from one month to twelve months; 7 day demand
redemption clause per deposit.
LIBOR – London Interbank Offered Rate.
The accompanying notes are an integral part of these financial statements.

AZZAD FUNDS
STATEMENTS OF ASSETS AND LIABILITIES
JUNE 30, 2020
21
Azzad Ethical Azzad Wise
Fund Capital Fund
Assets: Investment Securities at Value (Cost $65,032,036 and
$138,211,378, respectively) $ 91,182,724 $ 142,047,483
Cash 5,815,904 8,664,064
Receivables: Shareholder Subscriptions 41,587 464,826
Securities Sold 4,321,003 1,041,279
Dividends 50,464 20,357
Sukuk and Other Income - 1,036,652
Prepaid Expenses 15,134 15,404
Total Assets 101,426,816 153,290,065
Liabilities: Shareholder Redemptions 294,192 483,715
Securities Purchased - 1,505,250
Distributions Payable - 110,189
Due to Adviser 52,457 119,010
Distribution Fees 7,757 3,310
Trustee Fees 1,864 1,864
Accrued Expenses 24,051 32,495
Total Liabilities 380,321 2,255,833
Net Assets $ 101,046,495 $ 151,034,232
Net Assets Consist of: Paid In Capital $ 74,767,174 $ 146,934,231
Distributable Earnings 26,279,321 4,100,001
Net Assets, for 6,491,420 and 14,185,415 Shares Outstanding, respectively $ 101,046,495 $ 151,034,232
Net Asset Value Per Share $ 15.57 $ 10.65
Redemption Price Per Share ($15.57*0.98; $10.65*0.98) Note 5* $ 15.26 $ 10.44
* The Funds will charge a 2.00% redemption fee on shares redeemed within 90 days of purchase for the Azzad
Ethical Fund and for the Azzad Wise Capital Fund.
The accompanying notes are an integral part of these financial statements.

AZZAD FUNDS
STATEMENTS OF OPERATIONS
For the year ended June 30, 2020
22
Azzad Ethical Azzad Wise
Fund Capital Fund
Investment Income: Dividends $ 661,837 $ 279,548
Sukuk Income - 2,848,340
Other Income from Underlying Investments - 1,181,191
Total Investment Income 661,837 4,309,079
Expenses: Advisory 729,710 1,747,462
Distribution 136,821 73,423
Legal 8,068 8,612
Transfer Agent 65,600 88,282
Audit 13,797 16,276
Registration and Filing Fees 30,266 31,106
Administrative 9,022 9,022
Custody 23,227 85,992
Printing 8,243 5,200
Trustee 4,273 5,664
Miscellaneous 19,868 11,883
Insurance 790 790
Total Expenses 1,049,685 2,083,712
Fees Waived by the Adviser (146,669) (189,404)
Net Expenses 903,016 1,894,308
Net Investment Income (Loss) (241,179) 2,414,771
Realized and Unrealized Gain on Investments and Foreign Currency Transactions: Realized Gain on Investments and Foreign Currency Transactions 3,970,359 439,625
Net Change in Unrealized Appreciation on Investments and Foreign
Currency Transactions
7,207,161
266,431
Net Realized and Unrealized Gain on Investments and Foreign Currency Transactions 11,177,520 706,056
Net Increase in Net Assets Resulting from Operations $ 10,936,341 $ 3,120,827
The accompanying notes are an integral part of these financial statements.

AZZAD ETHICAL FUND
STATEMENTS OF CHANGES IN NET ASSETS
23
Years Ended
6/30/2020 6/30/2019
Increase (Decrease) in Net Assets From Operations: Net Investment Loss $ (241,179) $ (1,010)
Net Realized Gain on Investments 3,970,359 4,211,010
Unrealized Appreciation on Investments 7,207,161 5,261,298
Net Increase in Net Assets Resulting from Operations 10,936,341 9,471,298
Distributions to Shareholders (5,674,344) (4,507,877)
Capital Share Transactions 7,271,735 2,850,917
Total Increase in Net Assets 12,533,732 7,814,338 Net Assets: Beginning of Year 88,512,763 80,698,425
End of Year $ 101,046,495 $ 88,512,763
The accompanying notes are an integral part of these financial statements.

AZZAD WISE CAPITAL FUND
STATEMENTS OF CHANGES IN NET ASSETS
24
Years Ended
6/30/2020 6/30/2019
Increase (Decrease) in Net Assets From Operations: Net Investment Income $ 2,414,771 $ 2,082,586
Net Realized Gain (Loss) on Investments 439,625 (191,490)
Unrealized Appreciation on Investments 266,431 2,483,668
Net Increase in Net Assets Resulting from Operations 3,120,827 4,374,764
Distributions to Shareholders (2,404,247) (2,725,267)
Capital Share Transactions 10,679,481 27,494,275
Total Increase in Net Assets 11,396,061 29,143,772 Net Assets: Beginning of Year 139,638,171 110,494,399
End of Year $ 151,034,232 $ 139,638,171
The accompanying notes are an integral part of these financial statements.
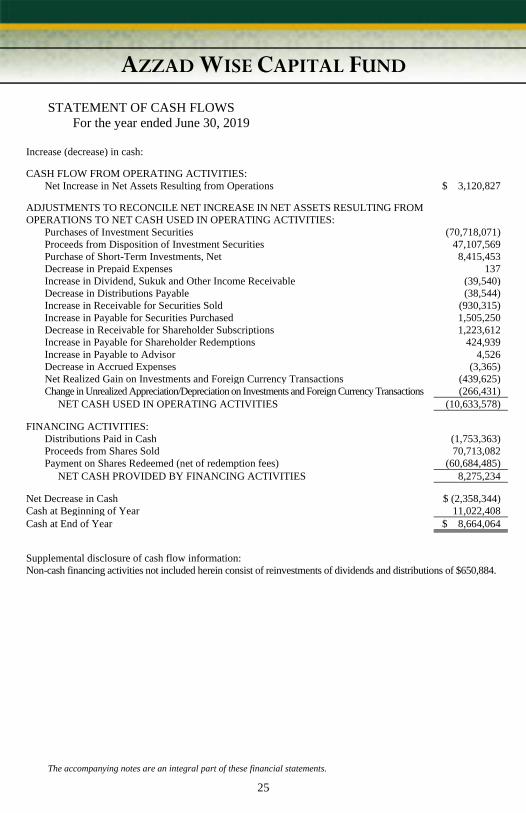
AZZAD WISE CAPITAL FUND
STATEMENT OF CASH FLOWS
For the year ended June 30, 2019
25
Increase (decrease) in cash:
CASH FLOW FROM OPERATING ACTIVITIES: Net Increase in Net Assets Resulting from Operations $ 3,120,827 ADJUSTMENTS TO RECONCILE NET INCREASE IN NET ASSETS RESULTING FROM OPERATIONS TO NET CASH USED IN OPERATING ACTIVITIES: Purchases of Investment Securities (70,718,071)
Proceeds from Disposition of Investment Securities 47,107,569
Purchase of Short-Term Investments, Net 8,415,453
Decrease in Prepaid Expenses 137
Increase in Dividend, Sukuk and Other Income Receivable (39,540)
Decrease in Distributions Payable (38,544)
Increase in Receivable for Securities Sold (930,315)
Increase in Payable for Securities Purchased 1,505,250
Decrease in Receivable for Shareholder Subscriptions 1,223,612
Increase in Payable for Shareholder Redemptions 424,939
Increase in Payable to Advisor 4,526
Decrease in Accrued Expenses (3,365)
Net Realized Gain on Investments and Foreign Currency Transactions (439,625)
Change in Unrealized Appreciation/Depreciation on Investments and Foreign Currency Transactions (266,431)
NET CASH USED IN OPERATING ACTIVITIES (10,633,578)
FINANCING ACTIVITIES: Distributions Paid in Cash (1,753,363)
Proceeds from Shares Sold 70,713,082
Payment on Shares Redeemed (net of redemption fees) (60,684,485)
NET CASH PROVIDED BY FINANCING ACTIVITIES 8,275,234
Net Decrease in Cash $ (2,358,344)
Cash at Beginning of Year 11,022,408
Cash at End of Year $ 8,664,064
Supplemental disclosure of cash flow information: Non-cash financing activities not included herein consist of reinvestments of dividends and distributions of $650,884.
The accompanying notes are an integral part of these financial statements.

AZZAD ETHICAL FUND
FINANCIAL HIGHLIGHTS
Selected data for a share outstanding throughout each year.
26
For the Years Ended
6/30/2020 6/30/2019 6/30/2018 6/30/2017 6/30/2016
Net Asset Value, at Beginning of Year $ 14.84 $ 14.18 $ 13.88 $ 12.06 $ 13.44
Income From Investment Operations: Net Investment Income (Loss) * (0.04) 0.00*** (0.01) (0.01) 0.01
Net Gain (Loss) on Securities
(Realized and Unrealized)
1.71 1.43
2.31
1.84
(1.31)
Total from Investment Operations 1.67 1.43 2.30 1.83 (1.30) Distributions: Net Investment Income 0.00 0.00 0.00 (0.01) 0.00
Realized Gains (0.94) (0.77) (2.00) 0.00 (0.08)
Total Distributions (0.94) (0.77) (2.00) (0.01) (0.08) Redemption Fees (a) *** 0.00 0.00 0.00 0.00 0.00
Net Asset Value, at End of Year $ 15.57 $ 14.84 $ 14.18 $ 13.88 $ 12.06
Total Return ** 11.63% 11.24% 17.37% 15.20% (9.66)% Ratios/Supplemental Data: Net Assets at End of Year (Thousands) $101,046 $ 88,513 $ 80,698 $ 68,945 $65,408
Before Waivers Ratio of Expenses to Average Net Assets 1.15% 1.14% 1.15% 1.17% 1.16%
Ratio of Net Investment Loss to Average Net Assets (0.42)% (0.15)% (0.25)% (0.23)% (0.12)%
After Waivers Ratio of Expenses to Average Net Assets 0.99% 0.99% 0.99% 0.99% 0.99%
Ratio of Net Investment Income (Loss) to
Average Net Assets
(0.26)% 0.00%
(0.09)%
(0.06)%
(0.05)%
Portfolio Turnover 34.77% 49.29% 28.83% 107.97% 33.70%
(a) The Fund will charge a 2.00% redemption fee on shares redeemed within 90 days of purchase.
* Per share net investment income (loss) has been determined on the basis of average shares outstanding during the period.
** Assumes reinvestment of dividends.
*** Amount calculated is less than $0.005 per share.
The accompanying notes are an integral part of these financial statements.

AZZAD WISE CAPITAL FUND
FINANCIAL HIGHLIGHTS
Selected data for a share outstanding throughout each year.
27
For the Years Ended
6/30/2020 6/30/2019 6/30/2018 6/30/2017 6/30/2016
Net Asset Value, at Beginning of Year $ 10.57 $ 10.43 $ 10.45 $ 10.44 $ 10.39
Income From Investment Operations: Net Investment Income * 0.17 0.18 0.13 0.11 0.07
Net Gain (Loss) on Securities
(Realized and Unrealized)
0.08 0.19 (0.04) 0.01 0.05
Total from Investment Operations 0.25 0.37 0.09 0.12 0.12 Distributions: Net Investment Income (0.17) (0.19) (0.11) (0.11) (0.07)
Realized Gains 0.00 (0.04) 0.00 0.00 0.00
Total Distributions (0.17) (0.23) (0.11) (0.11) (0.07) Redemption Fees (a) *** 0.00 0.00 0.00 0.00 0.00
Net Asset Value, at End of Year $ 10.65 $ 10.57 $ 10.43 $ 10.45 $ 10.44
Total Return ** 2.41% 3.63% 0.90% 1.19% 1.15% Ratios/Supplemental Data: Net Assets at End of Year (Thousands) $151,034 $ 139,638 $ 110,494 $ 104,154 $ 93,297
Before Waivers/Recoupment Ratio of Expenses to Average Net Assets 1.42% 1.43% 1.44% 1.42% 1.42%
Ratio of Net Investment Income to Average
Net Assets 1.52% 1.58% 1.05% 0.95% 0.60%
After Waivers/Recoupment Ratio of Expenses to Average Net Assets 1.29% 1.29% 1.29% 1.29% 1.36%
Ratio of Net Investment Income to Average
Net Assets 1.64% 1.72% 1.20% 1.07% 0.66%
Portfolio Turnover 50.14% 39.40% 40.14% 43.01% 19.10%
(a) The Fund will charge a 2.00% redemption fee on shares redeemed within 90 days of purchase.
* Per share net investment income has been determined on the basis of average shares outstanding during the period.
** Assumes reinvestment of dividends.
*** Amount calculated is less than $0.005 per share.
The accompanying notes are an integral part of these financial statements.

AZZAD FUNDS
NOTES TO FINANCIAL STATEMENTS
JUNE 30, 2020
28
Note 1. Organization
The Azzad Funds (the "Trust") is an open-end management investment company under
the Investment Company Act of 1940, as amended, (the “1940 Act"). The Trust was
organized as a Massachusetts business trust on December 16, 1996. The Trust is
comprised of the following Funds: The Azzad Ethical Fund (the “Ethical Fund”), which
commenced operations on December 22, 2000 and is a registered, diversified fund, and
the Azzad Wise Capital Fund (the “Wise Fund”), which commenced operations on April
6, 2010 and is a registered, diversified fund, (collectively the "Funds"). Azzad Asset
Management, Inc. (“Adviser”) is the investment adviser to both Funds (see Note 4).
The Ethical Fund’s primary investment objective is to provide shareholders with long-
term total returns using means that are consistent with the Adviser’s ethical principles.
The Wise Fund’s primary investment objective is to provide shareholders with capital
preservation and income.
The Funds should be considered long-term investments and are not appropriate for short-
term goals. The Funds may also be used in all types of retirement and college savings
plans including separately managed (wrap) programs.
Each of Ethical Fund’s and Azzad Wise Fund’s classifications have changed from “non-
diversified” to “diversified” for purposes of the Investment Company Act of 1940, as
amended. This means that each Fund, with respect to 75% of its total assets, may not
purchase the securities of any issuer (except securities issued or guaranteed by the U.S.
government or any of its agencies or instrumentalities or securities issued by other
investment companies) if, as a result (i) more than 5% of the Fund’s total assets would be
invested in securities of that issuer, or (ii) the Fund would hold more than 10% of the
outstanding voting securities of that issuer.
Note 2. Summary of Significant Accounting Policies
The following is a summary of the significant accounting policies followed by the Funds
in the preparation of its financial statements. The Funds follow the accounting and
reporting guidance of Financial Accounting Standards Board (“FASB”) Accounting
Standard Codification 946 and Accounting Standards Update (“ASU”) 2013-08
applicable to investment companies.
Security Valuation – All investments in securities are recorded at their estimated fair
value, as described in Note 3.
Foreign Currency – Investment securities and other assets and liabilities denominated in
foreign currencies are translated into U.S. dollar amounts at the date of valuation.
Purchases and sales of investment securities and income and expense items denominated
in foreign currencies are translated into U.S. dollar amounts on the respective dates of
such transactions.

AZZAD FUNDS
NOTES TO FINANCIAL STATEMENTS (CONTINUED)
JUNE 30, 2020
29
The Wise Fund does not isolate that portion of the results of operations resulting from
changes in foreign exchange rates on investments from the fluctuations arising from
changes in market prices of securities held. Such fluctuations are included with the net
realized and unrealized gain or loss from investments.
Reported net realized foreign exchange gains or losses arise from sales of foreign
currencies, currency gains or losses realized between the trade and settlement dates on
securities transactions, and the difference between the amounts of dividends, income, and
foreign withholding taxes recorded on the Wise Fund’s books and the U.S. dollar
equivalent of the amounts actually received or paid. Net unrealized foreign exchange
gains and losses arise from changes in the fair values of assets and liabilities, other than
investments in securities at fiscal period-end, resulting from changes in exchange rates.
Security Transactions and Related Investment Income- Investment transactions are
accounted for on the trade date. Realized gains and losses from security transactions are
determined on the identified cost basis. Dividend income is recorded on the ex-dividend
date. Withholding taxes on foreign dividends have been provided for in accordance with
the Funds’ understanding of the applicable country’s tax rules and rates. Net realized
gain/(loss) on the statement of operations also includes realized gain distributions
received from Real Estate Investment Trusts (“REITS”). Distributions of net realized
gains are recorded on the REIT’s ex-dividend date. Sukuk income and income from
other investments in the Wise Fund are recorded on an accrual basis. Discounts and
premiums on securities purchased are amortized over the life of the respective security.
Federal Income Taxes- The Funds make no provision for federal income or excise tax.
The Funds intend to qualify each year as regulated investment companies (“RICs”) under
subchapter M of the Internal Revenue Code of 1986, as amended, by complying with the
requirements applicable to RICs and by distributing substantially all of their taxable
income. The Funds also intend to distribute sufficient net investment income and net
capital gains, if any, so that they will not be subject to excise tax on undistributed income
and gains. If the required amount of net investment income or gains is not distributed,
the Funds could incur a tax expense. Therefore, no federal income tax or excise provision
is required.
The Funds recognize the tax benefits of uncertain tax positions only when the position is
more likely than not to be sustained, assuming examination by tax authorities.
Management has analyzed the Funds’ tax positions and concluded that no liability for
unrecognized tax benefits should be recorded related to uncertain tax positions taken on
returns filed for open tax years (2017-2019) or expected to be taken in the Funds’ 2020
tax returns. The Funds identify their major tax jurisdiction as U.S. Federal, however the
Funds are not aware of any tax positions for which it is reasonably possible that the total
amounts of unrecognized tax benefits will change materially in the next 12 months.
The Funds recognize interest and penalties, if any, related to unrecognized tax benefits as
income tax expense in the Statement of Operations. During the year ended June 30, 2020,
the Funds did not incur any interest or penalties.
AZZAD FUNDS
NOTES TO FINANCIAL STATEMENTS (CONTINUED)
JUNE 30, 2020
30
Cash and cash equivalents – The Funds consider all highly liquid debt instruments
having original maturities of three months or less at the date of purchase to be cash
equivalents. The Funds may, during the ordinary course of business, maintain account
balances with banks in excess of federally insured limits. The Funds have not
experienced losses on these accounts, and management believes that the Funds are not
exposed to significant risks on such accounts.
Restricted and Illiquid Securities - Each Fund may invest up to 15% of its net assets in
securities that are considered to be illiquid. A security is considered to be illiquid if it
cannot be sold or disposed of in the ordinary course of business within seven days at
approximately the value at which the Fund has valued the security. Examples of illiquid
securities include securities that have a limited trading market, securities that are sold in
private placements without being registered for public sale under the Securities Act of
1933, as amended (the “1933 Act”), and are therefore subject to restrictions on resale,
and other securities that are subject to restrictions on resale. Certain restricted securities
such as commercial paper issued under Section 4(a)(2) of the 1933 Act and domestically
traded securities that are not registered under the 1933 Act, but are regularly traded
among qualified institutional buyers because they are exempt from registration under
1933 Act Rule 144A, may be treated as liquid securities by the Adviser, for purposes of
the 15% limitation, pursuant to procedures adopted by the Board of Trustees of the Trust
(the “Board”), which require consideration of factors such as trading activity, availability
of market quotations and number of dealers willing to purchase the security.
Redemption Fees- The Ethical Fund and the Wise Fund each charge a 2.00% redemption
fee for shares redeemed within 90 days of investment. These fees are deducted from the
redemption proceeds otherwise payable to the shareholder. The Funds will retain the fees
charged as an increase in paid-in capital and such fees become part of each Fund’s daily
NAV calculation. See Note 5.
Dividends and Distributions to Shareholders- The Ethical Fund intends to distribute
substantially all of its net investment income as dividends to their shareholders on at least
an annual basis. Net investment income in Wise Fund, if any, is declared as dividends
and paid monthly. The Funds intend to distribute their net realized long-term capital gains
and their net realized short-term capital gains at least once a year. Distributions to
shareholders, which are determined in accordance with income tax regulations, are
recorded on the ex-dividend date. The treatment for financial reporting purposes of
distributions made to shareholders during the year from net investment income or net
realized capital gains may differ from their ultimate treatment for federal income tax
purposes. These differences are caused primarily by differences in the timing of the
recognition of certain components of income, expenses or realized capital gain for federal
income tax purposes. Where such differences are permanent in nature, they are
reclassified in the components of the net assets based on their ultimate characterization
for federal income tax purposes. Any such reclassifications will have no effect on net
assets, results of operations or net asset value per share of the Funds. Please see Note 8
for additional information on dividends paid.

AZZAD FUNDS
NOTES TO FINANCIAL STATEMENTS (CONTINUED)
JUNE 30, 2020
31
Estimates- The preparation of financial statements in conformity with GAAP requires
management to make estimates and assumptions that affect the reported amounts of
assets and liabilities and disclosure of contingent assets and liabilities at the date of the
financial statements and the reported amounts of increases and decreases in net assets
from operations during the reporting period. Actual results could differ from those
estimates.
Note 3. Securities Valuations
Processes and Structure
The Board has adopted guidelines for valuing securities including in circumstances in
which market quotes are not readily available and has delegated to the Adviser the
responsibility for determining fair value prices, subject to review by the Board.
The Board has adopted written Pricing and Valuation Procedures (the “Procedures”)
governing the fair valuation of securities, and has delegated authority to the Adviser to
apply those methods in making fair value determinations, subject to Board oversight. The
Adviser has established a Valuation Committee to oversee the implementation of these
Procedures. The Valuation Committee has the responsibility of determining the fair value
of each of the Fund’s securities or other assets in the absence of readily available market
quotations. The Valuation Committee also reviews the Funds’ Procedures to make sure
they continue to be appropriate for the Funds. The Valuation Committee meets annually
and on an as needed basis. The Valuation Committee reviews its own fair value decisions
and reports to the Board on all fair valuation decisions that are made. The Board reviews
all valuation decisions made by the Valuation Committee and evaluates whether the
Valuation Committee is adhering to the Funds’ Procedures and whether the Procedures
continue to be appropriate for the Funds.
Hierarchy of Fair Value Inputs
The Funds utilize various methods to measure the fair value of most of their investments
on a recurring basis. GAAP establishes a hierarchy that prioritizes inputs to valuation
techniques used to measure fair value. The three levels of inputs are as follows:
• Level 1. Unadjusted quoted prices in active markets for identical assets or liabilities
that the Funds have the ability to access.
• Level 2. Observable inputs other than quoted prices included in level 1 that are
observable for the asset or liability either directly or indirectly. These inputs may
include quoted prices for the identical instrument on an inactive market, prices for
similar instruments, interest rates, prepayment speeds, credit risk, yield curves,
default rates, and similar data.
• Level 3. Unobservable inputs for the asset or liability to the extent that relevant
observable inputs are not available, representing the Funds’ own assumptions about

AZZAD FUNDS
NOTES TO FINANCIAL STATEMENTS (CONTINUED)
JUNE 30, 2020
32
the assumptions that a market participant would use in valuing the asset or liability,
and that would be based on the best information available.
The availability of observable inputs can vary from security to security and is affected by
a wide variety of factors, including, for example, the type of security, whether the
security is new and not yet established in the marketplace, the liquidity of markets, and
other characteristics particular to the security. To the extent that valuation is based on
models or inputs that are less observable or unobservable in the market, the determination
of fair value requires more judgment. Accordingly, the degree of judgment exercised in
determining fair value is greatest for instruments categorized in level 3.
The inputs used to measure fair value may fall into different levels of the fair value
hierarchy. In such cases, for disclosure purposes, the level in the fair value hierarchy
within which the fair value measurement falls in its entirety is determined based on the
lowest level input that is significant to the fair value measurement in its entirety.
Fair Value Measurements
A description of the valuation techniques applied to each Fund's major categories of
assets and liabilities measured at fair value on a recurring basis follows.
Equity securities (common stock and real estate investment trusts). Securities traded on a
national securities exchange (or reported on the NASDAQ national market) are stated at
the last reported sales price on the day of valuation. To the extent these securities are
actively traded, and valuation adjustments are not applied, they are categorized in level 1
of the fair value hierarchy. Certain foreign securities may be fair valued using a pricing
service that considers the correlation of the trading patterns of the foreign security to the
intraday trading in the U.S. markets for investments such as American Depositary
Receipts, financial futures, Exchange Traded Funds, and the movement of the certain
indexes of securities based on a statistical analysis of the historical relationship and that
are categorized in level 2. Preferred stock and other equities traded on inactive markets or
valued by reference to similar instruments are also categorized in level 2.
Sukuks. The Wise Fund invests in Sukuks. Sukuks are used to finance projects and asset
acquisitions while avoiding the Islamic prohibition on interest. Whereas bonds represent
a debt ownership, a sukuk certificate represents ownership or interest in a tangible asset,
or the usufruct of an asset. They are therefore considered to be asset-based securities.
Sukuks grant investors a proportionate beneficial ownership of the underlying asset,
along with its associated risks and potential cash flows. Underlying assets may include,
without limitation, real estate (developed and undeveloped), infrastructure projects, lease
contracts and machinery and equipment. While the certificate is linked to the returns
generated by certain assets of the issuer, the underlying assets are not pledged as security
for the certificates, and the Wise Fund (as the investor) is relying on the creditworthiness
of the issuer for all payments required by the Sukuk. Sukuk certificate holders share the
risk of the underlying asset. If the assets on which sukuk are issued do not perform as
well as expected, the sukuk investor will bear a share of the loss. Unlike conventional
bonds, sukuks do not earn interest payments.

AZZAD FUNDS
NOTES TO FINANCIAL STATEMENTS (CONTINUED)
JUNE 30, 2020
33
Sukuks may be issued by international financial institutions, foreign governments and
agencies of foreign governments and even global corporations. Like conventional bonds,
rating agencies rate Sukuks based on their credit quality and the issuer’s ability to pay
investors. Sukuks receive ratings that look exactly like conventional bonds. At June 30,
2020, 63.81% of the Wise Fund’s net assets were invested in Sukuks. These instruments
will be categorized as level 2 investments in the fair value hierarchy.
Trade Finance Agreements. Trade finance agreements in which the Wise Fund may
invest consist primarily of loans or similar instruments used to finance international trade
and related infrastructure projects, such as, for example, facilities for pre-export finance,
process and commodities finance, receivables financing, factoring or forfeiting, trade
credit insurance, letters of credit and other documentary credits, documentary collection,
promissory notes, bills of exchange and other negotiable instruments. The Wise Fund
may invest in such investments by way of purchase, assignment, participation, guarantee,
insurance or another financial instrument. Trade finance agreement transactions may
include both domestic and international transactions, and may include sellers of goods or
services, buyers of such goods or services, intermediaries such as banks and other
financial institutions as lenders, insurers, and other parties. A trade finance agreement
transaction can involve various structures. For example, while a seller (or exporter) can
require a purchaser (an importer) to prepay for goods shipped, the purchaser (importer)
may wish to reduce risk by requiring the seller to document the goods that have been
shipped. Banks, financial institutions or other lenders may assist by providing various
forms of support, such as a letter of credit provided by the importer’s bank to the exporter
(or the exporter's bank) providing for payment upon presentation of certain documents
(for example, a bill of lading). The exporter's bank also may make a loan (by advancing
funds) to the exporter on the basis of the export contract.
Trade Finance agreements are located primarily in or have exposure to global emerging
markets. As such, the Wise Fund is subject to all of the risks typical to investments
generally made in emerging markets. In addition, the Wise Fund is subject to risks
specific to the trade finance agreements asset class such as liquidity risk, credit rating
risk, and counter-party risk. The Wise Fund will only invest in trade finance agreements
related securities if it is determined that this investment is in accordance with the Wise
Fund’s ethical investment philosophy. Trade finance agreements will be categorized as
level 3 investments in the fair value hierarchy. Trade finance agreements are considered
illiquid securities as defined by the 1940 Act. The Wise Fund’s investments in trade
finance agreements at June 30, 2020 represented 3.70% of the Wise Fund’s net assets.
Bank Time Deposits. In a typical bank deposit, a bank raises funds to invest in various
commercial activities from its investors. The bank and its investors both share in the
profit and risk of loss of investment in such activities. The bank is responsible for
monitoring the underlying investments to make sure that they will achieve the anticipated
profit rate agreed upon in the contract on the maturity date. If the bank makes any profit
by the maturity date, the profits are shared with investors according to a pre-agreed ratio.
Conversely, if a loss is made, it is borne by the investors in the absence of gross
negligence, fraud or willful default by the bank. The bank provides investors with
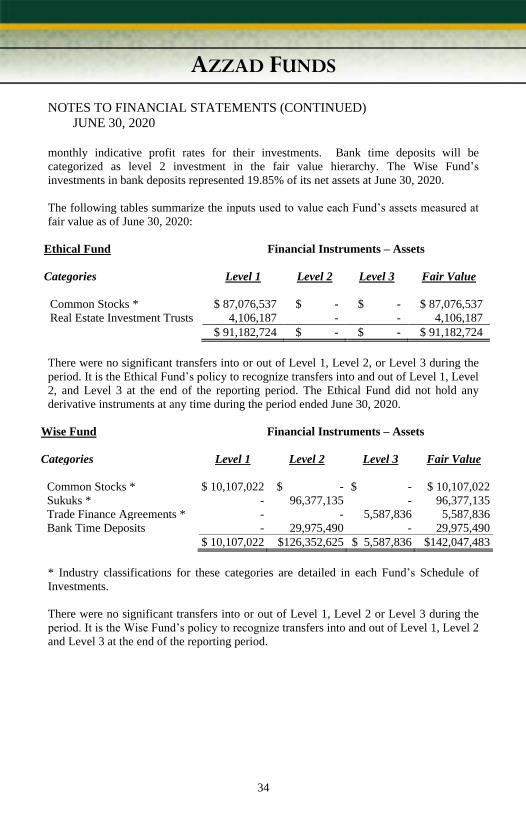
AZZAD FUNDS
NOTES TO FINANCIAL STATEMENTS (CONTINUED)
JUNE 30, 2020
34
monthly indicative profit rates for their investments. Bank time deposits will be
categorized as level 2 investment in the fair value hierarchy. The Wise Fund’s
investments in bank deposits represented 19.85% of its net assets at June 30, 2020.
The following tables summarize the inputs used to value each Fund’s assets measured at
fair value as of June 30, 2020:
Ethical Fund Financial Instruments – Assets
Categories Level 1 Level 2 Level 3 Fair Value
Common Stocks * $ 87,076,537 $ - $ - $ 87,076,537
Real Estate Investment Trusts 4,106,187 - - 4,106,187
$ 91,182,724 $ - $ - $ 91,182,724
There were no significant transfers into or out of Level 1, Level 2, or Level 3 during the
period. It is the Ethical Fund’s policy to recognize transfers into and out of Level 1, Level
2, and Level 3 at the end of the reporting period. The Ethical Fund did not hold any
derivative instruments at any time during the period ended June 30, 2020.
Wise Fund Financial Instruments – Assets
Categories Level 1 Level 2 Level 3 Fair Value
Common Stocks * $ 10,107,022 $ - $ - $ 10,107,022
Sukuks * - 96,377,135 - 96,377,135
Trade Finance Agreements * - - 5,587,836 5,587,836
Bank Time Deposits - 29,975,490 - 29,975,490
$ 10,107,022 $126,352,625 $ 5,587,836 $142,047,483
* Industry classifications for these categories are detailed in each Fund’s Schedule of
Investments.
There were no significant transfers into or out of Level 1, Level 2 or Level 3 during the
period. It is the Wise Fund’s policy to recognize transfers into and out of Level 1, Level 2
and Level 3 at the end of the reporting period.

AZZAD FUNDS
NOTES TO FINANCIAL STATEMENTS (CONTINUED)
JUNE 30, 2020
35
Following is a reconciliation of Level 3 assets for which significant unobservable inputs
were used to determine fair value:
Investments in
Trade Finance
Agreements
Balance as of 6/30/2019 $ 10,967,560
Accrued Accretion/(Amortization) -
Change in Unrealized Appreciation/(Depreciation) (5,358)
Realized Gain/(Loss) -
Purchases 13,487,535
Sales (18,861,901)
Transfers In/(Out) of Level 3 -
Balance as of 6/30/2020 $ 5,587,836
The Wise Fund uses a pricing service to provide price evaluations for Level 3 Trade
Finance Agreements. The values supplied by the pricing service under this agreement are
determined by market quotations where such quotations are available, fair value where
market quotations are not available. Unless otherwise stated the valuations are marked
Mid-Market for each transaction and are derived from proprietary models. The
quantitative unobservable inputs used by the pricing service are proprietary and not
provided to the Wise Fund and therefore the disclosure that would address these inputs is
not included above.
Note 4. Transactions with the Adviser and Affiliates
Advisory Agreement - Azzad Asset Management, Inc. (the "Adviser") under an advisory
agreement with the Trust, furnishes management and investment advisory services and,
subject to the supervision of the Board, directs the investments of the Trust in accordance
with the Funds’ investment objectives, policies and limitations. For this service, the
Adviser receives a monthly management fee at the annual rate of 0.80% and 1.19% of the
average daily net assets for the Ethical Fund and Wise Fund, respectively.
For the year ended June 30, 2020, the Adviser earned $729,710 and $1,747,462 in
advisory fees for the Ethical Fund and Wise Fund, respectively. At June 30, 2020, the
Adviser was owed $51,718 and $118,271 in advisory fees for the Ethical Fund and Wise
Fund, respectively.
The Funds’ Adviser has agreed to contractually waive all or a portion of its fees or
reimburse the Funds for certain operating expenses, to the extent necessary to limit each
Fund’s net annual operating expenses (excluding brokerage costs; borrowing costs,
including without limitation dividends on securities sold short; taxes; indirect expenses,
such as expenses incurred by other investment companies in which the Funds invest; and
litigation and other extraordinary expenses) to 0.99% and 1.29%, for Ethical Fund and
Wise Fund, respectively, of average daily net assets for a five year period ending
December 1, 2023. Any waiver or reimbursement of operating expenses by the Adviser is

AZZAD FUNDS
NOTES TO FINANCIAL STATEMENTS (CONTINUED)
JUNE 30, 2020
36
subject to repayment by the respective Fund within three years after such reimbursement
or waiver occurred, if the Board approves such reimbursement and the Fund is able to
make the repayment without exceeding the expense limitations in place at the time of the
waiver or reimbursement occurred and any expense limitation is in place. For the year
ended June 30, 2020, the Adviser waived fees of $146,669 for the Ethical Fund and
$189,404 for the Wise Fund.
The Adviser will be entitled to reimbursement of fees waived or reimbursed by the
Adviser to the Funds. Fees waived or expenses reimbursed during a given year may be
paid to the Adviser during the following three-year period to the extent that payment of
such expenses does not cause the Funds to exceed the expense limitation. As of June 30,
2020, the unreimbursed amounts paid or waived by the Adviser on behalf of the Ethical
Fund and Wise Fund are $400,103 and $522,992, respectively. As of June 30, 2020,
amounts subject to future recoupment are as follows:
Fiscal Year Ended
Recoverable in
Fiscal Year Ending Ethical Fund Wise Fund
June 30, 2018 June 30, 2021 $ 122,831 $ 163,096
June 30, 2019 June 30, 2022 $ 130,603 $ 170,492
June 30, 2020 June 30, 2023 $ 146,669 $ 189,404
Sub-advisory Agreement – Effective as of March 30, 2020, Ziegler Capital Management
(“Sub-Adviser”, “Ziegler”) no longer served as sub-adviser to Ethical Fund. The Adviser
assumed all day-to-day investment management responsibilities upon the termination of
the sub-advisory relationship with Ziegler. The Adviser had entered into a Sub-Advisory
Agreement with Ziegler on August 16, 2012, on behalf of the Ethical Fund. The sub-
advisory fee paid to Ziegler was paid by the Adviser, not the Ethical Fund and therefore
did not impact the fees paid by the Ethical Fund. The Ethical Fund received additional
research services and investment management expertise, from a reputable firm, without
additional expense to the Ethical Fund. For the year ended June 30, 2020, Ziegler earned
$222,163 in sub-advisory fees for the Ethical Fund.
The Adviser entered into a Sub-Advisory Agreement with Federated Investors, Inc.
(“Sub-Adviser”, “Federated”) on March 10, 2014, on behalf of the Wise Fund. The sub-
advisory fee paid to Federated is paid by the Adviser, not the Wise Fund and therefore
does not impact the fees paid by the Wise Fund. The Wise Fund receives additional
research services and investment management expertise, from a reputable investment
manager without any additional expense to the Wise Fund. For the year ended June 30,
2020 Federated earned $470,369 in sub-advisory fees for the Wise Capital Fund.
Administrative Agreement - The Funds have an Administrative Agreement with the
Adviser. Pursuant to the Administrative Agreement, the Adviser, subject to the overall
supervision and review of the Board, provides administrative services to the Funds,
provides the Funds with office space, facilities and business equipment, and provides the
services and clerical personnel for administering the affairs of the Funds. As such, each
of the Funds pays the Adviser $750 per month, per Fund. For the year ended June 30,
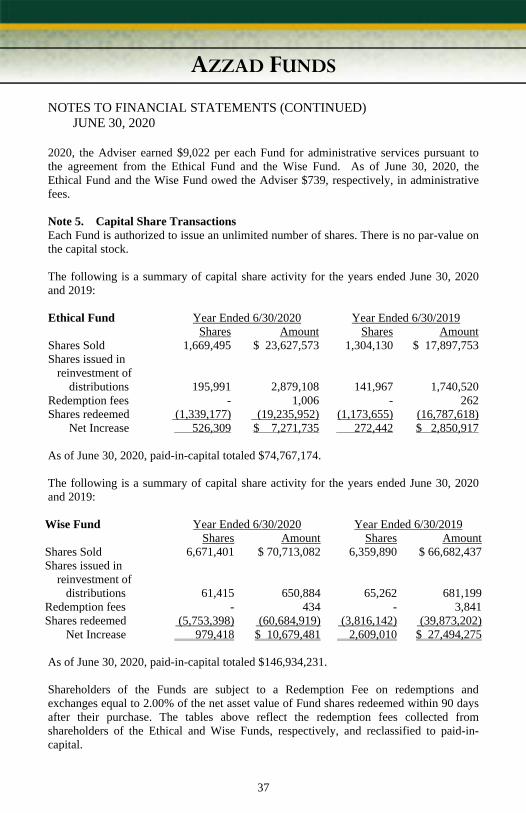
AZZAD FUNDS
NOTES TO FINANCIAL STATEMENTS (CONTINUED)
JUNE 30, 2020
37
2020, the Adviser earned $9,022 per each Fund for administrative services pursuant to
the agreement from the Ethical Fund and the Wise Fund. As of June 30, 2020, the
Ethical Fund and the Wise Fund owed the Adviser $739, respectively, in administrative
fees.
Note 5. Capital Share Transactions
Each Fund is authorized to issue an unlimited number of shares. There is no par-value on
the capital stock.
The following is a summary of capital share activity for the years ended June 30, 2020
and 2019:
Ethical Fund Year Ended 6/30/2020 Year Ended 6/30/2019
Shares Amount Shares Amount
Shares Sold 1,669,495 $ 23,627,573 1,304,130 $ 17,897,753
Shares issued in
reinvestment of
distributions 195,991 2,879,108 141,967 1,740,520
Redemption fees - 1,006 - 262
Shares redeemed (1,339,177) (19,235,952) (1,173,655) (16,787,618)
Net Increase 526,309 $ 7,271,735 272,442 $ 2,850,917
As of June 30, 2020, paid-in-capital totaled $74,767,174.
The following is a summary of capital share activity for the years ended June 30, 2020
and 2019:
Wise Fund Year Ended 6/30/2020 Year Ended 6/30/2019
Shares Amount Shares Amount
Shares Sold 6,671,401 $ 70,713,082 6,359,890 $ 66,682,437
Shares issued in
reinvestment of
distributions 61,415 650,884 65,262 681,199
Redemption fees - 434 - 3,841
Shares redeemed (5,753,398) (60,684,919) (3,816,142) (39,873,202)
Net Increase 979,418 $ 10,679,481 2,609,010 $ 27,494,275
As of June 30, 2020, paid-in-capital totaled $146,934,231.
Shareholders of the Funds are subject to a Redemption Fee on redemptions and
exchanges equal to 2.00% of the net asset value of Fund shares redeemed within 90 days
after their purchase. The tables above reflect the redemption fees collected from
shareholders of the Ethical and Wise Funds, respectively, and reclassified to paid-in-
capital.

AZZAD FUNDS
NOTES TO FINANCIAL STATEMENTS (CONTINUED)
JUNE 30, 2020
38
Note 6. Investment Transactions
For the year ended June 30, 2020, purchases and sales of investment securities other than
short-term investments aggregated $30,697,697 and $38,014,578, respectively, for the
Ethical Fund. For the year ended June 30, 2020, the totals were $70,484,731 and
$46,636,861, respectively, for the Wise Fund.
Note 7. Concentration of Risk
The Wise Fund invests in securities of non-U.S. and U.S. issuers. Political or economic
developments may have an effect on the liquidity and volatility of portfolio securities and
currency holdings. As of June 30, 2020, the diversification of countries was as follows:
Country Percentage of Net Assets
Cayman Islands 33.36%
Malaysia 12.30%
Bahrain 9.05%
Indonesia 7.65%
United States 6.17%
Qatar 6.16%
Saudi Arabia 5.11%
Turkey 2.65%
Jersey 2.43%
United Arab Emirates 2.14%
Oman 2.02%
Kuwait 1.78%
Tunisia 1.32%
Egypt 0.66%
Ireland 0.52%
Pakistan 0.30%
Gambia 0.18%
Maldives 0.14%
Djibouti 0.11%
Investing in foreign securities involves risks not typically associated with U.S.
investments, including, among others, adverse fluctuations in foreign currency values as
well as adverse political, social, and economic developments affecting a foreign country,
less publicly available information, more volatile or less liquid securities markets,
restrictions on receiving the investment proceeds from a foreign country, foreign tax
laws, potential difficulties in enforcing contractual obligations, less revealing accounting
practices, inadequate or irregular regulation, and more volatile performance. Foreign
financial markets may also have fewer investor protections. Foreign companies may also
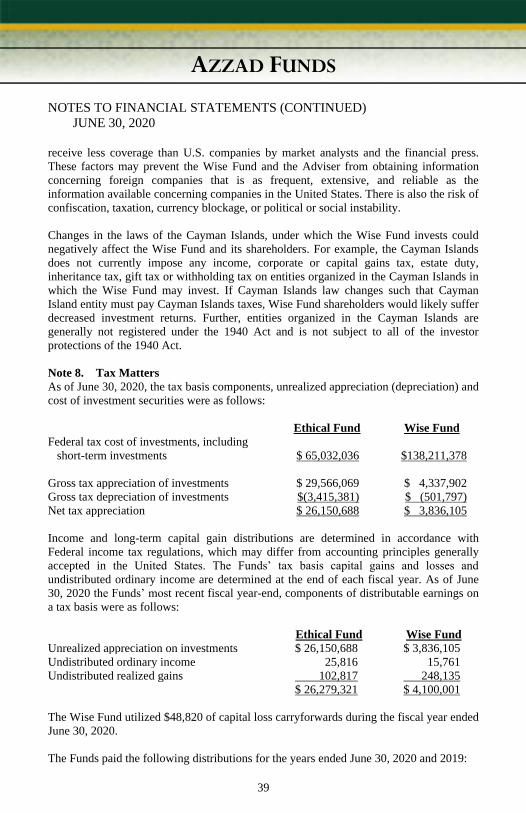
AZZAD FUNDS
NOTES TO FINANCIAL STATEMENTS (CONTINUED)
JUNE 30, 2020
39
receive less coverage than U.S. companies by market analysts and the financial press.
These factors may prevent the Wise Fund and the Adviser from obtaining information
concerning foreign companies that is as frequent, extensive, and reliable as the
information available concerning companies in the United States. There is also the risk of
confiscation, taxation, currency blockage, or political or social instability.
Changes in the laws of the Cayman Islands, under which the Wise Fund invests could
negatively affect the Wise Fund and its shareholders. For example, the Cayman Islands
does not currently impose any income, corporate or capital gains tax, estate duty,
inheritance tax, gift tax or withholding tax on entities organized in the Cayman Islands in
which the Wise Fund may invest. If Cayman Islands law changes such that Cayman
Island entity must pay Cayman Islands taxes, Wise Fund shareholders would likely suffer
decreased investment returns. Further, entities organized in the Cayman Islands are
generally not registered under the 1940 Act and is not subject to all of the investor
protections of the 1940 Act.
Note 8. Tax Matters
As of June 30, 2020, the tax basis components, unrealized appreciation (depreciation) and
cost of investment securities were as follows:
Ethical Fund Wise Fund
Federal tax cost of investments, including
short-term investments
$ 65,032,036
$138,211,378
Gross tax appreciation of investments $ 29,566,069 $ 4,337,902
Gross tax depreciation of investments $(3,415,381) $ (501,797)
Net tax appreciation $ 26,150,688 $ 3,836,105
Income and long-term capital gain distributions are determined in accordance with
Federal income tax regulations, which may differ from accounting principles generally
accepted in the United States. The Funds’ tax basis capital gains and losses and
undistributed ordinary income are determined at the end of each fiscal year. As of June
30, 2020 the Funds’ most recent fiscal year-end, components of distributable earnings on
a tax basis were as follows:
Ethical Fund Wise Fund
Unrealized appreciation on investments $ 26,150,688 $ 3,836,105
Undistributed ordinary income 25,816 15,761
Undistributed realized gains 102,817 248,135
$ 26,279,321 $ 4,100,001
The Wise Fund utilized $48,820 of capital loss carryforwards during the fiscal year ended
June 30, 2020.
The Funds paid the following distributions for the years ended June 30, 2020 and 2019:

AZZAD FUNDS
NOTES TO FINANCIAL STATEMENTS (CONTINUED)
JUNE 30, 2020
40
Ethical Fund
Year Ended $ Amount Tax Character
6/30/2020 $ 417,110 Ordinary Income
6/30/2020 $ 5,257,234 Long-Term Capital Gain
Year Ended $ Amount Tax Character
6/30/2019 $ 1,668,397 Ordinary Income
6/30/2019 $ 2,839,480 Long-Term Capital Gain
Wise Fund
Year Ended $ Amount Tax Character
6/30/2020 $ 2,404,247 Ordinary Income
Year Ended $ Amount Tax Character
6/30/2019 $ 2,211,621 Ordinary Income
6/30/2019 $ 513,646 Long-Term Capital Gain
Note 9. Distribution Plan
The Funds maintain that certain Amended and Restated Distribution Plan (the “Plan”)
pursuant to Rule 12b-1 under the 1940 Act, that allows each Fund to pay distribution
expenditures incurred in connection with the sale and promotion of such Fund and the
furnishing of services to shareholders of the Fund. The Plan provides that the Fund may
pay up to a maximum on an annual basis of 0.15% and 0.05% of the average daily value
of the net assets of Ethical Fund and Wise Fund, respectively. Under the Plan, permitted
expenditures include: (a) payments, including incentive compensation, to securities
dealers or other financial intermediaries, financial institutions, investment advisers and
others that are engaged in the sale of Shares, or that may be advising shareholders of the
Fund regarding the purchase, sale or retention of Shares; (b) payments, including
incentive compensation, to securities dealers or other financial intermediaries, financial
institutions, investment advisers and others that hold Shares for shareholders in omnibus
accounts or as shareholders of record or provide shareholder support or administrative
services to the Fund’s shares and their shareholders; (c) expenses of maintaining
personnel (including personnel of organizations with which the Trust has entered into
agreements related to the Plan) who engage in or support distribution of Shares or who
render shareholder support services, including, but not limited to, allocated overhead,
office space and equipment, telephone facilities and expenses, answering routine
inquiries regarding the Trust, processing shareholder transactions, and providing such
other shareholder services as the Trust may reasonably request; (d) costs of preparing,
printing and distributing prospectuses and statements of additional information and
reports for each Fund’s shares for recipients other than existing shareholders; (e) costs of
formulating and implementing marketing and promotional activities, including, but not
limited to, sales seminars, direct mail promotions and television, radio, newspaper,
magazine and other mass media advertising; (f) costs of preparing, printing and
distributing sales literature; (g) costs of obtaining such information, analyses and reports
with respect to marketing and promotional activities as the Trust may, from time to time,
deem advisable; and (h) costs of implementing and operating the Plan. The Trust is

AZZAD FUNDS
NOTES TO FINANCIAL STATEMENTS (CONTINUED)
JUNE 30, 2020
41
authorized to engage in the activities listed above, and in any other activities related to
the distribution of Shares, either directly or through other persons with which the Trust
has entered into agreements related to the Plan. Because these expenses are paid out of
each Fund’s respective assets on an ongoing basis, over time these expenses may increase
the cost of a shareholder’s investment and may cost a shareholder more than paying other
types of sales charges. For the year ended June 30, 2020, the Ethical Fund incurred
$136,821 in distribution fees and the Wise Fund incurred $73,423 in distribution fees.
Note 10. Control and Ownership
The beneficial ownership, either directly or indirectly, of more than 25% of the voting
securities of a Fund creates a presumption of control of the funds under Section 2(a)(9) of
the 1940 Act. As of June 30, 2020, Folio Investments, Inc. (“Folio”), in aggregate,
owned approximately 44% and 71% of the shares of the Ethical Fund and the Wise Fund,
respectively, for the benefit of others. As a result, Folio may be deemed to control both
Funds.
Note 11. Indemnifications
In the normal course of business, each Fund enters into contracts that contain general
indemnification to other parties. A Fund’s maximum exposure under these contracts is
unknown as this would involve future claims that may be made against the Fund that
have not yet occurred. The Funds expect the risk of loss to be remote.
Note 12. Subsequent Events
On August 18, 2020 the Board, including all Independent Trustees, approved a new Sub-
Advisory Agreement between the Adviser and Ivy Investments, subject to shareholder
approval. In addition, the Board, including all Independent Trustees, approved the
elimination of the 2% early redemption fee for each of Wise Fund and Ethical Fund.
On July 31, 2020, the Wise Fund paid shareholders of record at July 30, 2020, a net
investment income distribution of $130,362, equivalent to $0.009151 per share.
Management has evaluated the impact of all subsequent events through the date the
financial statements were available to be issued and has determined that there were no
additional subsequent events requiring disclosure in the financial statements for the
Funds.
Note 13. Market Risk
Overall market risks may also affect the value of the Funds. Factors such as domestic
economic growth and market conditions, interest rate levels and political events affect the
securities markets. Local, regional or global events such as war, acts of terrorism, the
spread of infectious illness or other public health issue, recessions and depressions, or
other events could have a significant impact on the Fund and its investments and could
result in increased premiums or discounts to the Fund’s net asset value, and may impair
market liquidity, thereby increasing liquidity risk. The Funds could lose money over short
periods due to short-term market movements and over longer periods during more
prolonged market downturns. During a general market downturn, multiple asset classes

AZZAD FUNDS
NOTES TO FINANCIAL STATEMENTS (CONTINUED)
JUNE 30, 2020
42
may be negatively affected. Changes in market conditions and interest rates can have the
same impact on all types of securities and instruments.
Impact of COVID-19 – An outbreak of infectious respiratory illness caused by a novel
coronavirus known as COVID-19 was first detected in China in December 2019 and has
now been detected globally. This coronavirus has resulted in travel restrictions, closed
international borders, enhanced health screenings at ports of entry and elsewhere,
disruption of and delays in healthcare service preparation and delivery, prolonged
quarantines, cancellations, supply chain disruptions, and lower consumer demand, as well
as general concern and uncertainty. The impact of COVID-19, and other infectious illness
outbreaks that may arise in the future, could adversely affect the economies of many
nations or the entire global economy, individual issuers and capital markets in ways that
cannot necessarily be foreseen. In addition, the impact of infectious illnesses in emerging
market countries may be greater due to generally less established healthcare systems.
Public health crises caused by the COVID-19 outbreak may exacerbate other pre-existing
political, social and economic risks in certain countries or globally. The duration of the
COVID-19 outbreak and its effects cannot be determined with certainty.
AZZAD FUNDS REPORT OF INDEPENDENT REGISTERED PUBLIC ACCOUNTING FIRM
43
To the Shareholders and
Board of Trustees
The Azzad Ethical Fund and Azzad Wise Capital Fund,
each a Series of the Azzad Funds
Opinion on the Financial Statements
We have audited the accompanying statements of assets and liabilities of the Azzad Ethical Fund (the
“Ethical Fund”) and Azzad Wise Capital Fund (the “Wise Fund”), each a series of The Azzad Funds,
(the “Funds”) including the schedules of investments, as of June 30, 2020, the related statements of
operations for the year then ended, the statement of cash flows for the Wise Fund for the year then
ended, the statements of changes in net assets for each of the two years in the period then ended and the
related notes (collectively referred to as the “financial statements”), and the financial highlights for each
of the five years in the period then ended. In our opinion, the financial statements and financial
highlights present fairly, in all material respects, the financial position of the Funds as of June 30, 2020,
the results of their operations and cash flows for the Wise Fund for the year then ended, the changes in
their net assets for each of the two years in the period then ended, and their financial highlights for each
of the five years in the period then ended, in conformity with accounting principles generally accepted
in the United States of America.
Basis for Opinion
These financial statements are the responsibility of the Funds’ management. Our responsibility is to
express an opinion on these financial statements and financial highlights based on our audits. We are a
public accounting firm registered with the Public Company Accounting Oversight Board (United
States) (“PCAOB”) and are required to be independent with respect to the Funds in accordance with the
U.S. federal securities laws and the applicable rules and regulations of the Securities and Exchange
Commission and the PCAOB.
We conducted our audits in accordance with the standards of the PCAOB. Those standards require that
we plan and perform the audits to obtain reasonable assurance about whether the financial statements
and financial highlights are free of material misstatement, whether due to error or fraud. The Funds are
not required to have, nor were we engaged to perform, an audit of their internal control over financial
reporting. As part of our audits, we are required to obtain an understanding of internal control over
financial reporting but not for the purpose of expressing an opinion on the effectiveness of the Funds’
internal control over financial reporting. Accordingly, we express no such opinion.
Our audits included performing procedures to assess the risk of material misstatement of those financial
statements and financial highlights, whether due to error or fraud, and performing procedures that
respond to those risks. Such procedures included examining, on a test basis, evidence regarding the
amounts and disclosures in the financial statements and financial highlights. Our procedures included
confirmation of securities and cash owned as of June 30, 2020, by correspondence with the custodian
and brokers; when replies were not received from brokers, we performed other auditing procedures. Our
audits also included evaluating the accounting principles used and significant estimates made by
management, as well as evaluating the overall presentation of the financial statements and financial
highlights. We believe that our audits provide a reasonable basis for our opinion.
We have served as the Funds’ auditors since 2005
Abington, Pennsylvania
August 27, 2020

AZZAD FUNDS
EXPENSE ILLUSTRATION
JUNE 30, 2020 (UNAUDITED)
44
Expense Example
As a shareholder of the Funds, you incur two types of costs: (1) transaction costs, including
redemption fees and exchange fees; and (2) ongoing costs, including management fees; distribution
(12b-1) fees; and other Fund expenses. This example is intended to help you understand your
ongoing costs (in dollars) of investing in the Fund and to compare these costs with the ongoing costs
of investing in other mutual funds.
The Examples are based on an investment of $1,000 invested at the beginning of the period and held
for the entire period, January 1, 2020 through June 30, 2020.
Actual Expenses
The first line of the table below provides information about actual account values and actual
expenses. You may use the information in this line, together with the amount you invested, to
estimate the expenses that you paid over the period. Simply divide your account value by $1,000 (for
example, an $8,600 account value divided by $1,000 = 8.6), then multiply the result by the number
in the first line under the heading entitled "Expenses Paid During the Period" to estimate the
expenses you paid on your account during this period.
Hypothetical Example for Comparison Purposes
The second line of the table below provides information about hypothetical account values and
hypothetical expenses based on the Funds' actual expense ratio and an assumed rate of return of 5%
per year before expenses, which is not the Funds' actual return. The hypothetical account values and
expenses may not be used to estimate the actual ending account balance or expenses you paid for the
period. You may use this information to compare the ongoing costs of investing in these Funds and
other funds. To do so, compare this 5% hypothetical example with the 5% hypothetical examples
that appear in the shareholder reports of the other funds.
Ethical Fund
Beginning
Account Value
Ending
Account Value
Expenses Paid
During the Period*
January 1, 2020 June 30, 2020
January 1, 2020 to
June 30, 2020
Actual $1,000.00 $1,051.32 $5.05
Hypothetical
(5% Annual Return before expenses) $1,000.00 $1,019.94 $4.97
* Expenses are equal to the Fund's annualized expense ratio of 0.99%, multiplied by the average account value
over the period, multiplied by 182/366 (to reflect the one-half year period).
Wise Fund
Beginning
Account Value
Ending
Account Value
Expenses Paid
During the Period*
January 1,
2020 June 30, 2020
January 1, 2020
to June 30, 2020
Actual $1,000.00 $1,004.22 $6.43
Hypothetical
(5% Annual Return before expenses) $1,000.00 $1,018.45 $6.47
* Expenses are equal to the Fund's annualized expense ratio of 1.29%, multiplied by the average account value
over the period, multiplied by 182/366 (to reflect the one-half year period).
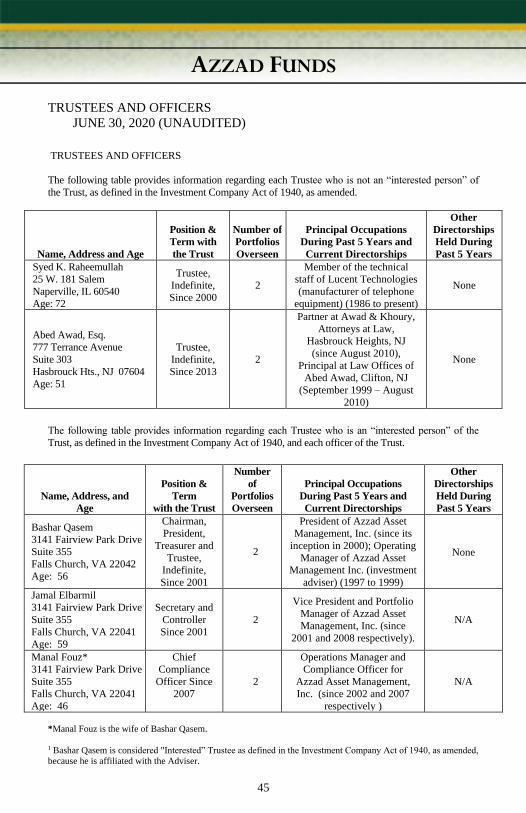
AZZAD FUNDS
TRUSTEES AND OFFICERS
JUNE 30, 2020 (UNAUDITED)
45
TRUSTEES AND OFFICERS
The following table provides information regarding each Trustee who is not an “interested person” of
the Trust, as defined in the Investment Company Act of 1940, as amended.
Name, Address and Age
Position &
Term with
the Trust
Number of
Portfolios
Overseen
Principal Occupations
During Past 5 Years and
Current Directorships
Other
Directorships
Held During
Past 5 Years
Syed K. Raheemullah
25 W. 181 Salem
Naperville, IL 60540
Age: 72
Trustee,
Indefinite,
Since 2000
2
Member of the technical
staff of Lucent Technologies
(manufacturer of telephone
equipment) (1986 to present)
None
Abed Awad, Esq.
777 Terrance Avenue
Suite 303
Hasbrouck Hts., NJ 07604
Age: 51
Trustee,
Indefinite,
Since 2013
2
Partner at Awad & Khoury,
Attorneys at Law,
Hasbrouck Heights, NJ
(since August 2010),
Principal at Law Offices of
Abed Awad, Clifton, NJ
(September 1999 – August
2010)
None
The following table provides information regarding each Trustee who is an “interested person” of the
Trust, as defined in the Investment Company Act of 1940, and each officer of the Trust.
Name, Address, and
Age
Position &
Term
with the Trust
Number
of
Portfolios
Overseen
Principal Occupations
During Past 5 Years and
Current Directorships
Other
Directorships
Held During
Past 5 Years
Bashar Qasem
3141 Fairview Park Drive
Suite 355
Falls Church, VA 22042
Age: 56
Chairman,
President,
Treasurer and
Trustee,
Indefinite,
Since 2001
2
President of Azzad Asset
Management, Inc. (since its
inception in 2000); Operating
Manager of Azzad Asset
Management Inc. (investment
adviser) (1997 to 1999)
None
Jamal Elbarmil
3141 Fairview Park Drive
Suite 355
Falls Church, VA 22041
Age: 59
Secretary and
Controller
Since 2001
2
Vice President and Portfolio
Manager of Azzad Asset
Management, Inc. (since
2001 and 2008 respectively).
N/A
Manal Fouz*
3141 Fairview Park Drive
Suite 355
Falls Church, VA 22041
Age: 46
Chief
Compliance
Officer Since
2007
2
Operations Manager and
Compliance Officer for
Azzad Asset Management,
Inc. (since 2002 and 2007
respectively )
N/A
*Manal Fouz is the wife of Bashar Qasem.
1 Bashar Qasem is considered "Interested” Trustee as defined in the Investment Company Act of 1940, as amended,
because he is affiliated with the Adviser.

AZZAD FUNDS
TRUSTEES AND OFFICERS (CONTINUED)
JUNE 30, 2020 (UNAUDITED)
46
LIQUIDITY RISK MANAGEMENT PROGRAM
The Funds have adopted and implemented a written liquidity risk management program
as required by Rule 22e-4 (the “Liquidity Rule”) under the Investment Company Act.
The program is reasonably designed to assess and manage the Funds’ liquidity risk,
taking into consideration, among other factors, the Funds’ investment strategy and the
liquidity of its portfolio investments during normal and reasonably foreseeable stressed
conditions; its short and long-term cash flow projections; and its cash holdings and access
to other funding sources.
During the fiscal year ended June 30, 2020, the Trust’s Liquidity Risk Management
Program Committee (the “Committee”) reviewed the Funds’ investments and determined
that the Funds held adequate levels of cash and highly liquid investments to meet
shareholder redemption activities in accordance with applicable requirements.
Accordingly, the Committee concluded that (i) the Funds’ liquidity risk management
program is reasonably designed to prevent violations of the Liquidity Rule and (ii) the
Funds’ liquidity risk management program has been effectively implemented.

AZZAD FUNDS
ADDITIONAL INFORMATION
JUNE 30, 2020 (UNAUDITED)
47
PROXY VOTING POLICY
A description of the policies and procedures that the Funds use to determine how to vote
proxies relating to portfolio securities and information regarding how the Funds voted
those proxies during the most recent twelve month period ended June 30, are available
without charge upon request by calling the Funds at 1-888-350-3369 and from Fund
documents filed with the Securities and Exchange Commission (“SEC”) on the SEC’s
website at www.sec.gov.
PORTFOLIO HOLDINGS
The Funds file their complete schedule of portfolio holdings with the Securities and
Exchange Commission ("SEC") for the first and third quarters of each fiscal year on
Form N-PORT. The Funds’ Form N-PORT is available on the SEC's web site at
http://www.sec.gov. The Funds’ Form N-PORT may also be reviewed and copied at the
SEC's Public Reference Room in Washington, DC. Information on the operation of the
Public Reference Room may be obtained by calling 1-800-732-0330. The information on
Form N-PORT is available without charge, upon requests, by calling (888) 350-3369.
STATEMENT OF ADDITIONAL INFORMATION
The Funds’ Statement of Additional Information ("SAI") includes additional information
about the Trustees and is available, without charge, upon request. You may call toll-free
(888) 350-3369 to request a copy of the SAI or to make shareholder inquiries.
ADVISORY AND SUB-ADVISORY AGREEMENTS RENEWAL
In connection with a meeting held on May 14, 2020, the Board of Trustees (the “Board”
or the “Trustees”) of the Azzad Funds (the “Trust”), including a majority of the Trustees
who are not “interested persons” as that term is defined by the Investment Company Act
of 1940, as amended, discussed the renewal of the investment advisory agreements (the
“Advisory Agreements”) between Azzad Asset Management (the “Adviser”) and the
Trust, with respect to the Azzad Ethical Fund and the Azzad Wise Capital Fund (the
“Funds”). The Trustees also considered the renewal of the sub-advisory agreement (the
‘Sub-Advisory Agreement”) between the Adviser and Federated Investment Management
(“Federated”) with respect to Azzad Wise Capital Fund. In considering the renewal of the
Sub-Advisory Agreement, the Trustees requested and received materials specific to the
Sub-Advisory contract, as well as, the services provided to Azzad Wise Capital Fund
under the contract.
The Board also requested and received various informational materials including, without
limitation: (i) documents containing information about the Adviser and Federated,
including financial information, a description of personnel and the services provided to
the Funds, information on investment advice and performance; (ii) comparative expense
and performance information for other mutual funds with strategies similar to the Funds;

AZZAD FUNDS
ADDITIONAL INFORMATION (CONTINUED)
JUNE 30, 2020 (UNAUDITED)
48
and (iii) benefits to be realized by the Adviser and Federated from its relationship with
the Funds.
In considering the Agreements, the Board, including the Independent Trustees, did not
identify any single factor as all-important or controlling in their decision. In reaching
their decision to renew the Agreements, the Board considered the factors enumerated
below.
ADVISORY AGREEMENTS WITH AZZAD ASSET MANAGEMENT AND
EACH OF THE AZZAD ETHICAL FUND AND AZZAD WISE CAPITAL FUND
1) Nature, Extent and Quality of the Services Provided to the Funds
The Board considered the nature, extent and quality of services provided by the
Adviser to the Funds. They noted their experience in working with Adviser and expressed
satisfaction in the long-standing working relationship. The Trustees considered the
employees, resources, time and money that the Adviser has continued to commit in
managing the Funds. They considered the unique investment philosophies and strategies
of the Funds and the Adviser’s experience overseeing Federated, with respect to Wise
Fund. They considered the Adviser’s risk management processes and systems that were
designed to stay within each Fund’s stated investment restrictions and guidelines. The
Trustees reviewed the service provided under the Investment Advisory Agreements,
including providing Trust officers, voting and recording proxies, coordinating with
service providers, overseeing the Funds’ investment strategies and Wise Fund’s Sub-
Adviser, and in the case of the Wise Fund, portfolio management with respect to the
equity portion of the Wise Fund. The Trustees considered the Adviser’s employees,
including the chief compliance officer’s, allocation of time to the Funds, compensation,
and experience. They noted that the Adviser has a separate Administration Agreement
pursuant to which the Adviser handles the administrative functions of the Funds, at a cost
benefit to the Funds and their shareholders. The Board discussed such services and
expressed their satisfaction. They reviewed the Form ADV, financial data and the
compliance policies and procedures provided by the Adviser. The Board expressed
satisfaction with the nature, extent and quality of the services provided and noted that the
Adviser was expected to continue to provide a benefit to the Funds.
2) Investment Performance of the Funds and the Adviser
The Trustees reviewed each Fund’s performance for prior periods and noted
that performance is also reviewed at each quarterly Board meeting. The Trustees
observed that the reviews included a comparison of each Fund’s performance to that of
the relevant benchmark and other funds in the relevant Morningstar category. The
Trustees noted that the Wise Fund had outperformed its peer group average and its
benchmark, the ICE BofAML US Corp & Govt 1-3 Yr Index over the 1-year, 3-year and
inception-to-date periods through December 31, 2019. The Trustees noted that the Wise
Fund had underperformed its peer group average and the ICE BofAML US Corp & Govt
1-3 Yr Index for the quarter ended March 31, 2020. The Trustees noted that the Adviser

AZZAD FUNDS
ADDITIONAL INFORMATION (CONTINUED)
JUNE 30, 2020 (UNAUDITED)
49
explained such underperformance was primarily due to Wise Fund’s overweight in equity
securities, relative to its peers and the benchmark. The Trustees noted that the Wise
Fund’s Morningstar ranking was 76.
The Trustees noted that, for the period ended December 31, 2019, the Ethical
Fund had underperformed its peer group average and its benchmark, the Russell Mid Cap
Growth Index, over the 1-year, 3-year, 5-year, 10-year and inception-to-date, except that
the Ethical Fund had slightly outperformed its peer group average over the 3-year period.
The Trustees further discussed the Ethical Fund’s performance for the quarter, 1-year, 3-
year, 5-year and inception-to-date performance through March 31, 2020 and noted that
Ethical Fund outperformed the benchmark and peer group average through the quarter.
The Trustees noted that Ethical Fund’s Morningstar ranking was 32.
The Trustees acknowledged receiving the attribution information, portfolio
characteristics and asset under management information for each Fund and compared
such information to the composition of each benchmark and each peer group. The
Trustees noted that that relative underperformance over the short-term period was a result
of each Fund’s investment restrictions and overweighting to equities, relative to the
benchmarks and peer groups. After further discussion, the Trustees concluded that each
Fund’s performance was not unreasonable.
3) Fees and Expenses
The Trustees considered whether the Adviser’s compensation was fair and
reasonable considering the services it provides to the Funds. In doing so, the Trustees
considered the resources the Adviser spends on overseeing and managing the Funds. The
Trustees noted the Ethical Fund’s advisory fee was 0.80%, relative to the peer group
average of 0.73%. The Trustees observed that Ziegler no longer served as a sub-adviser
to the Ethical Fund and that the Adviser had assumed Ziegler’s former responsibilities as
sub-adviser, and further, would now receive the full advisory fee from the Ethical Fund.
The Trustees further noted that Ethical Fund’s expense ratio of 0.99% was lower than the
peer group average and the Morningstar category average expense ratios of 1.13% and
1.17%, respectively. The Trustees noted that the Wise Fund’s advisory fee of 1.19%,
was significantly higher that the peer group average of 0.34%. The Trustees observed that
Wise Fund’s expense ratio of 1.29% was also higher than both the peer group average
and the Morningstar category average expense ratios of 0.71% and 0.74%, respectively.
The Trustees considered the Adviser’s explanation regarding the differences between the
Wise Fund and its peer group and Morningstar category and concluded that the increased
challenges and complexities with the Wise Fund that justified such higher expense ratio
and fee.
With respect to the expense ratio for both Funds, the Trustees considered that
the Funds use a considerable amount of the Adviser’s internal resources, both financial
and human capital in servicing the Funds. The Trustees noted that the Adviser
compensates the sub-adviser to the Wise Fund out of its investment advisory fee and the
Adviser utilizes its proprietary screening software in managing the Funds, in accordance

AZZAD FUNDS
ADDITIONAL INFORMATION (CONTINUED)
JUNE 30, 2020 (UNAUDITED)
50
with each Fund’s investment mandate. The Trustees also noted that the Funds’ have an
expense cap agreement in effect until December 1, 2023, which was renewed by the
Adviser and that, in addition to such contractual fee waivers or expense reimbursements,
the Adviser offsets various Fund costs, including providing chief compliance officer.
The Trustees agreed that the fees and expenses for both Funds are acceptable, given each
Fund’s unique investment strategy and increased challenges relative to the peers.
4.) Profitability
The Trustees reviewed the profitability analysis provided by the Adviser and
noted that the Adviser realized profits in connection with its relationship with both Funds
but agreed that such profits were modest in terms of actual dollars and in light of the time
and effort necessary to manage the Funds. The Trustees considered that the Adviser had
waived $136,085.46 and $175,654.89 in advisory fees over the past twelve months for
Ethical Fund and Wise Fund, respectively. The Trustees also considered ancillary
benefits that the Adviser may be receiving from its association with the Funds. They
noted that the Adviser had no soft dollar arrangements in the previous year. They
considered the Administration Agreement and compensation paid to the Adviser, noting
the Adviser’s costs in administering the Funds exceeds the amount paid by the Funds
under this Agreement. The Trustees concluded that excessive profitability or ancillary
benefits were not a concern at this time.
5) Economies of Scale
The Trustees discussed economies of scale for each Fund. The Trustees noted
that the Funds were both still relatively small and that the Adviser was unsure when
economies of scale would be reached and did not have immediate plans to change the fee
structure of either Fund. The Trustees determined to revisit the matter of economies of
scale at the next renewal of the Investment Advisory Agreement.
Conclusion Based on their evaluation of the preceding factors, the Trustees concluded
that the Funds’ shareholders would benefit from continuing the Advisory Agreements
with Azzad Asset Management, Inc. with respect to each Fund. Therefore, the Trustees
voted unanimously in favor of the renewal of the Agreements for an additional term of
one year.
SUB-ADVISORY AGREEMENT WITH FEDERATED WITH RESPECT TO
AZZAD WISE CAPITAL FUND
1.) Nature, Quality and Extent of the Services Provided by Federated
The Board considered that Federated provides the Wise Fund with portfolio
management services for the majority of the assets of the Wise Fund, excluding the
equity positions. The Trustees reviewed the nature of services that Federated provides the
Wise Fund under the terms of the Sub-Advisory Agreement and reviewed in detail
Federated’s 15c questionnaire responses. The Board considered the portfolio

AZZAD FUNDS
ADDITIONAL INFORMATION (CONTINUED)
JUNE 30, 2020 (UNAUDITED)
51
management team’s strong credit analysis background and experience in the emerging
markets, where most of the Wise Fund’s holdings are sourced. The Trustees also noted
the portfolio management team’s familiarity and experience with Islamic bank deposits,
sukuk and trade finance and recent increased commitments to responsible investing
philosophies. They acknowledged Federated’s strong culture of compliance and its use of
top tier compliance systems, noting no recent exams or litigation and no material
compliance violations. The Trustees noted that Federated’s $60 million insurance
coverage was sufficient. The Trustees concluded that it was satisfied with the nature,
extent and quality of sub-advisory services provided to the Wise Fund by Federated.
2.) Investment Performance of Azzad Wise Capital Fund and Federated
The Trustees observed that the Wise Fund had outperformed its peer group
average and its benchmark, the ICE BofAML US Corp & Govt 1-3 Yr Index over the 1-
year, 3-year and inception-to-date periods through December 31, 2019. The Trustees
noted that the Wise Fund had underperformed its peer group average and the ICE
BofAML US Corp & Govt 1-3 Yr Index for the quarter ended March 31, 2020, primarily
due to increased market volatility due to the pandemic and Wise Fund’s overweight in
equity securities relative to its peers and the benchmark. The Trustees noted that the
Wise Fund’s Morningstar ranking was 76. The Trustees noted that Federated’s
investment approach has remained consistent. The Trustees concluded that Federated’s
performance over the prior periods has been satisfactory and consistent with the long-
term investment strategy being pursued by the Wise Fund.
3.) Fees and Expenses
The Trustees acknowledged that Federated’s sub-advisory fee is paid by the
Adviser, from the advisory fee and not directly by the Wise Fund. The Trustees
considered the fees that the Sub-Adviser charges with respect to the Wise Fund and
considered that the Sub-Adviser had granted the Fund a reduction from its standard fee.
The Board noted that the Sub-Adviser does not benefit from soft dollar arrangements
from its trades for the Wise Fund. The Trustees noted that the fees Federated charges, in
relation to its profit from the Wise Fund, were reasonable.
4.) Profitability
The Board also considered the profitability of Federated. The Board reviewed
Federated’s expenses with respect to the Wise Fund and noted Federated’s fees earned
during the period. The Board concluded that excessive profitability was not an issue with
Federated at current asset and allocation levels and the Board would further evaluate
profitability in the future.

AZZAD FUNDS
ADDITIONAL INFORMATION (CONTINUED)
JUNE 30, 2020 (UNAUDITED)
52
5.) Economies of Scale
The Board considered whether economies of scale are present with respect to
Federated’s role as sub-adviser to the Wise Fund. The Board acknowledged that
Federated had agreed to breakpoints in its fee above certain asset levels and concluded
that while such breakpoints appeared reasonable, any such economies of scale would be
best evaluated at the Adviser-level, rather than Sub-Adviser-level.
Conclusion Based on their evaluation of all material factors, the Board, including the
Independent Trustees, concluded that the Sub-Advisory Agreement with Federated was
fair and reasonable to shareholders, that the Sub-Adviser’s services provided substantial
benefits to shareholders, and that the renewal of the Sub-Advisory Agreement was in the
best interests of the Wise Fund and its shareholders. Therefore, the Board, including the
Independent Trustees, voted unanimously in favor of renewal of the Subadvisory
Agreement for an additional term of one year.

53
This Page Was Left Blank Intentionally

54
BOARD OF TRUSTEES
Syed K. Raheemullah
Bashar Qasem
Abed Awad, Esq.
INVESTMENT ADVISER
Azzad Asset Management, Inc.
SUB-ADVISER
Federated Investors, Inc.
DIVIDEND PAYING AGENT,
SHAREHOLDERS’ SERVICING AGENT,
TRANSFER AGENT
Mutual Shareholder Services, LLC
CUSTODIAN
Huntington National Bank, NA
INDEPENDENT REGISTERED PUBLIC ACCOUNTING FIRM
Sanville & Company
LEGAL COUNSEL
Thompson Hine LLP
This report is provided for the general information of the shareholders of the Azzad Funds.
This report is not intended for distribution to prospective investors in the Funds, unless
preceded or accompanied by an effective prospectus.