annual report on the vermont blueprint for health · the blueprint in 2018 focused on strengthening...
TRANSCRIPT
Report to
The Vermont Legislature
Annual Report on
The Vermont Blueprint for Health
In Accordance with
18 V.S.A. §709: Blueprint for Health, Annual Report
Submitted to: House Committee on Health Care; Senate Committee on Health and Welfare; and Health Reform Oversight Committee
Submitted by: Cory Gustafson
Commissioner
Prepared by: Beth Tanzman
Executive Director
Report Date: January 31, 2019
Department of Vermont Health Access
2
1 CONTENTS 2 About the Blueprint ................................................................................................................ 3
3 Executive Summary ................................................................................................................ 4
4 The Blueprint in 2018 ............................................................................................................. 8
4.1 Aligning The Blueprint and OneCare ............................................................................... 8
4.2 Strengthening Our Network ............................................................................................. 8
4.3 Innovation ........................................................................................................................ 9
5 Blueprint Programs ............................................................................................................... 11
5.1 Patient-Centered Medical Homes ................................................................................... 11
5.2 Community Health Teams .............................................................................................. 13
5.3 Women’s Health Initiative .............................................................................................. 14
5.4 Hub & Spoke ................................................................................................................... 16
5.5 Self-Management Programs ........................................................................................... 19
5.6 Data Collection, Analysis, and Reporting ...................................................................... 20
6 Blueprint Evaluation – From a Program to System Perspective .......................................... 24
6.1 Context ........................................................................................................................... 24
6.2 Limitations of VHCURES and Impact of Gobeille vs. Liberty Mutual .......................... 25
6.3 Evaluation Populations .................................................................................................. 26
6.4 Expenditures .................................................................................................................. 32
6.5 Utilization: Opportunities for Improved Care Quality and Management ..................... 38
6.6 Quality Measures – Substance Use Disorder and Mental Health ................................. 45
6.7 Quality Measures: Asthma ............................................................................................. 47
6.8 Patient Experience ......................................................................................................... 48
6.9 Women’s Health ............................................................................................................. 50
6.10 Conclusion ....................................................................................................................... 51
7 Blueprint Partner Programs ................................................................................................. 52
7.1 Support and Services at Home (SASH) .......................................................................... 52
7.2 Vermont Chronic Care Initiative (VCCI) ....................................................................... 55
8 Health Service Area Highlights for 2018 ............................................................................... 57
3
2 ABOUT THE BLUEPRINT
The Vermont Blueprint for Health designs community-led strategies for improving health and well-being.
Current Blueprint programs include Patient-Centered Medical Homes, Community Health Teams, the Hub & Spoke system of opioid use disorder treatment, the Women’s Health Initiative, Support and Services at Home (SASH), Self-Management and Healthier Living Workshops, full population data and analytics for policy makers, communities, and practices, and a series of learning labs for providers and community teams.
The Blueprint’s design work responds to the emerging needs of Vermonters and the latest opportunities in health and human services reform, creating change in the delivery system. This work began with patient-centered primary care and community health, then a system of treatment for opioid use disorder, and is now addressing the social determinants of health. The Blueprint Transformation Network of locally hired Program Managers, Community Health Team Leaders, and Quality Improvement Facilitators work with ACO and community-based partners to lead the implementation of these innovations in practices and communities across Vermont.
The state-level Blueprint team is a unit within the Department of Vermont Health Access and collaborates with the Department’s payment reform, quality, and clinical units. As part of the Agency of Human Service’s leadership group, the Blueprint is positioned to contribute to both health and human services reforms. The program has consistently benefitted from strong support from the Vermont Legislature and the Governor.
Blueprint programs are continuously informed by comprehensive evaluations of health care quality and outcomes at the practice, community, and state levels. These evaluations have demonstrated that Blueprint programs slow the growth in health care costs while maintaining or improving outcomes.
As the care delivery system and payment model evolve, the Blueprint’s aim is constant: connecting Vermonters with whole-person care that is evidence-based, patient- and family-centered, and cost-effective.
4
3 EXECUTIVE SUMMARY 18 V.S.A. § 709. requires the Blueprint to make an annual report to the legislature: (a) The director of the Blueprint shall report annually, no later than January 31, on the status of implementation of the Vermont Blueprint for Health for the prior calendar year and shall provide the report to the House Committee on Health Care, the Senate Committee on Health and Welfare, and the Health Care Oversight Committee. (b) The report required by subsection (a) of this section shall include the number of participating insurers, health care professionals, and patients; the progress made in achieving statewide participation in the chronic care management plan, including the measures established under this subchapter; the expenditures and savings for the period; the results of health care professional and patient satisfaction surveys; the progress made toward creation and implementation of privacy and security protocols; information on the progress made toward the requirements in this subchapter; and other information as requested by the committees. The provisions of 2 V.S.A. § 20(d) (expiration of required reports) shall not apply to the report to be made under subsection (a) of this section.
Report contents This report will provide information about the status of the Blueprint today. The program has evolved beyond the original “chronic care management plan” described in legislation but remains true to the original vision of all-payer supported, community-directed health reform that promotes the wellbeing of all Vermonters while slowing growth in cost. This report also provides a new quantitative evaluation that uses full population data to assess progress the goals established in the All Payer ACO Model for population health, quality of care, and cost containment.
Summary of Blueprint 2018 focus areas The Blueprint in 2018 focused on strengthening the Transformation Network of Program Managers, Quality Improvement Facilitators, and Community Health Team Leaders. The state team participated in hiring and training many new local members and on enhancing the ongoing supports that help them lead health reform in Vermont communities.
The Blueprint primary care practices and community health teams continue to provide a foundation for health reforms in Vermont. Program leaders collaborate with OneCare Vermont to improve care and control costs without duplicating efforts or investments. For example, rather than hire new field staff, the OneCare Vermont ACO relies on Blueprint Community Health staff to implement the care model in primary care. And recent national publications (see section 4.2) have demonstrated ACOs that include advanced primary care, like the Blueprint’s Patient-Centered Medical Homes, achieve greater savings and higher quality care.
The Blueprint is uniquely positioned to act as an innovation engine to further the State’s health care reform priorities, connecting departments within the Agency of Human Service (AHS) and collaborating with health care and human service providers inside and outside of the ACO network. One example of innovation in 2018 is the design of the SBINS (Screening, Brief Intervention, and Navigation to Services) approach of universal screening and navigation to services for mental health, suicidality, substance use disorder, and social determinants of health. Another example is the plan to pilot local systems of treatment for chronic pain. These programs are now part of Vermont’s innovation ecosystem, available for potential adoption by payers and providers.
5
Summary of Blueprint programs in 2018
• Almost all of Vermont’s primary care practices participate in the Blueprint for Health, including 137 of Vermont’s estimated 149 primary care practices. These Patient-Centered Medical Homes provide evidence-based care consistent with national standards focused on care access, team-based care, patient/population health management, care management and support, care coordination and care transitions, and performance measurement and quality improvement.
• The Blueprint Community Health Teams supplement the care that is available in Patient-Centered Medical Homes play an important role in patient/population health management and link patients with the social and economic services that can help support healthy living.
• In 2018 The Blueprint for Health worked with Community Health Team Leaders and staff to implement a common community-based care model adopted by both The Blueprint and OneCare Vermont.
• Participation in the Women’s Health Initiative continued to grow adding three new women’s health specialty practices and four new Patient-Centered Medical Homes between the third quarter of 2017 and the third quarter of 2018.
• The Hub & Spoke program continued to add new medication-assisted treatment (MAT) prescribers in Spokes, expanding local capacity for opioid use disorder treatment.
• The Self-Management Programs now includes a workplace-based Chronic Disease Self-Management Program and the Center for Diseases Control’s (CDC) Diabetes Self-Management Program. New offerings planned for next year include a youth tobacco cessation program that addresses vaping, a youth mental health and emotional wellness program, and online delivery of the CDC’s Diabetes Prevention Program.
• In 2018 The Blueprint expanded the scope of its data and analytics products from program evaluation / reporting on Vermonters seen in Blueprint practices, to reporting on the larger population of all insured Vermonters. This change supports better understanding of the health of Vermonters and the care they access.
• The Blueprint, in alignment with the State’s HIE plan, is planning advancements to the Vermont Clinical Registry, a database of clinical measures about the health of Vermonters and the screenings and care they receive. These advancements seek to create a more complete dataset including clinical outcomes that cannot be determined from claims data alone, pulling from the electronic health record systems of all Blueprint participating practices and including data about social determinants of health, women’s health, and substance use disorder.
• The Support and Services at Home (SASH) program is slowing growth in Medicare expenditures for a portion of their participants. The program is piloting enhancements to their model that target home-based diabetes and mental health care.
• The Vermont Chronic Care Initiative (VCCI) shifted its approach in 2019 to better align with current Blueprint and OneCare Vermont work and to be inclusive of not only the sickest Medicaid beneficiaries but also those with rising risk of health problems or who are referred based on clinical judgement.
6
Summary of the quantitative evaluation of health care in Vermont
In 2018 the Blueprint identified a gap in analytic products available to state health reform policy makers and local leaders: the need to systematically review health service utilization, expenditures, and outcomes for the whole population across payers and programs to understand trends and identify actionable opportunities to improve care. In response, the Blueprint broadened its focus beyond Blueprint program evaluation and now uses its data and analytics resources to better understand the health and well-being of all Vermonters, the variation in care, outcomes, and expenditures across regions and sub-populations, and the progress the state is making towards the goals of the All Payer ACO Model. Broadly these goals are:
• Limiting the annual growth in health care costs to 3.5% or less for included services; • Increasing access to primary care; • Decreasing deaths due to suicide and drug overdoses; and • Reducing morbidity and limiting the increase in prevalence of three chronic illnesses
(COPD, diabetes). The first year of the All-Payer ACO Model Agreement was 2018. The quantitative evaluation included in this report examines health care service utilization, expenditures, and quality outcomes for the full population represented in Vermont’s all-payer claims database over the previous 7-years (2011 – 2017) with the goals of:
1. Understanding trends in expenditures and utilization of health services during the implementation of health care reform initiatives, with a specific focus on the Blueprint for Health reforms;
2. Identifying areas that would benefit from improved care coordination and preventive care; and
3. Establishing baselines for evaluating progress against the All-Payer ACO Model Agreement population health goals moving forward.
The key findings are:
• Annual growth in person-level health care expenditures between 2011 and 2017 was 3.01% for the full population and 2.39% for patients attributed to Blueprint Patient-Centered Medical Homes.
• Vermont residents receiving primary care in Blueprint PCMHs show significantly lower growth in inpatient expenditures and about half the growth in pharmacy costs of Vermont residents receiving primary care in other settings. Well-coordinated advanced primary care is an important element for containing health care costs.
• Rates of chronic conditions are growing in Vermont. The annual growth rates of COPD, diabetes, and hypertension are a little less than 2% each. With these annual growth rates, the full population’s prevalence is projected to stay under the Agreement’s one percentage point increase target for 2022 for diabetes and COPD but not hypertension. Patients of Blueprint PCMHs have a higher prevalence in each of the three conditions, but slower annual growth rates than the full population.
• Care is moving out of inpatient settings; a greater proportion of health care is happening in outpatient settings.
7
• The care provided to people with a substance use disorder or mental health condition is not well coordinated across settings. Measures of initiation and engagement in treatment after a new diagnosis and rates of follow-up after emergency department or inpatient treatment indicate a need for substantial improvement.
• Naturally the focus of most health reform and quality improvement projects is on the sickest members of the population, whose care represents a large proportion of health care spending. This evaluation finds additional opportunity for reducing unnecessary healthcare utilization amongst healthier people.
• 90.4% of Vermonters with any health care claim visited a primary care provider within the past two years (as of 2017). Of respondents to the Behavior Risk Factor Surveillance Survey (BRFSS), 88% of adult Vermonters reported that they had a personal health care provider, indicating concordance between self-reported survey data and claims and indicating that the All-Payer ACO Model Agreement target of 89% is within reach.
8
4 THE BLUEPRINT IN 2018 In 2018, the Blueprint focused its efforts in three areas: collaborating with OneCare Vermont on population health and primary care reforms, strengthening its Transformation Network, and designing new multi-sector responses to Agency of Human Service priorities.
4.1 ALIGNING THE BLUEPRINT AND ONECARE The focus of health reform in Vermont has shifted to the All-Payer ACO Model Agreement in which an integrated network of health providers assumes responsibility and risk for the health of the population and the cost of care. This Accountable Care Organization (ACO) approach builds on the foundation of the Blueprint for Health’s primary care reforms. The 2018 publication by Patient Centered Primary Care Collaborative, Advanced Primary Care, a Key Contributor to Successful ACOs found that ACOs achieved higher savings and better-quality care when their network included primary care providers working in Patient-Centered Medical Home settings. Yet primary care reform alone is not enough. Controlling the growth in health care costs and shifting investments upstream (towards social determinants and prevention) require alignment across payers and with on inpatient and specialist care, which is supported through the ACO structure. In this framework, the Blueprint for Health and OneCare Vermont collaborate rather than compete.
The Blueprint and OneCare Vermont purposefully avoid duplication of efforts and investments, but rather leverage each other’s networks where they will be most effective. One example appears in a case study by the Commonwealth Fund, Vermont’s Bold Experiment in Community-Driven Health Care Reform, featuring OneCare’s inclusive approach to care coordination, bringing together health care and human service providers to care for people at risk of poor health because of complex medical or social conditions. The Commonwealth Fund’s report reminds us that “rather than hiring its own staff to organize this effort, OneCare is relying on care coordinators already in the field as a result of Vermont’s Blueprint for Health.” In addition to sharing this infrastructure of direct service providers, the Blueprint and OneCare are beginning to make shared investments in local population health leadership. For the first time in 2018, OneCare invested in the work of the Blueprint Program Managers – providing $25,000 to the administrative entities in each of the state’s four risk-bearing communities to support the Program Managers’ leadership of care model implementation.
4.2 STRENGTHENING OUR NETWORK National evaluations of medical home initiatives have shown that the Blueprint reduces the cost of medical care. Not every medical home initiative demonstrated that same success. The most notable difference in the Blueprint’s approach was the funding of staff dedicated exclusively to supporting practices and communities in transforming their approach to health care delivery. These Transformation Network staff include Program Managers and Quality Improvement Facilitators. They are hired by the Blueprint administrative entity in each Health Service Area – usually, but not always the area hospital – using State grant funding. This funding is distinct from the payments payers make directly to practices and Community Health Team staff.
In 2018, the Blueprint dedicated time and effort to strengthening the Transformation Network. Always a part of the work on the state-based Blueprint team, this year hiring, training, and
9
supporting the Network was a central focus. This was necessitated by turnover of many Network positions – a little less than half of the Program Managers and Quality Improvement Facilitators were new within the year. The support included recruiting and interviewing help for administrative entities, onboarding for new network members, individual training, one-on-one coaching, and extensive group trainings. Group trainings included sessions to develop role-specific skills and knowledge and monthly convening of all Transformation Network members together with other AHS staff and OneCare Vermont staff to align priorities and work.
4.3 INNOVATION The Blueprint has historically served as an innovation engine for State of Vermont priorities that require the participation of health and human service providers inside and outside of the ACO network.
Past examples of successful design projects include the Patient-Centered Medical Home and Community Health Team model, SASH, Hub & Spoke, and the Women’s Health Initiative. In 2018, the Blueprint accepted two new design challenges. One led to SBINS, an approach of universal screening and navigation to services for mental health, suicidality, substance use disorder, and social determinants of health. The other resulted in a plan to pilot local systems of treatment for chronic pain. Both demonstrate the Blueprint’s current approach to innovation, which values evidence-based practice, systematic statewide reach, responsiveness to local conditions, sensitivity to provider and patient experience, fiscal responsibility, and speed.
The SBINS model is an evolution of the evidence-based screening, brief intervention, and referral to treatment program SBIRT. Despite the success of that model, the federal grant supporting it ended. In collaboration with the Department of Health, the Blueprint network developed an enhanced model that identifies a broader range of risk factors, goes beyond referral to ensure patients connect with necessary services, and would be implemented in all hospital emergency departments and Blueprint primary care practices (154 settings). To design an implementation strategy, the Blueprint convened workgroups including clinical staff, practice and organization staff, and community leaders. They brought personal experience of providing care and managing resources that informed realistic approaches to universal screening and active navigation to services for all patients. The Blueprint then issued a comprehensive planning guidance document and hosted change leadership sessions. Preparations are underway to make SBINS a turn key program for interested payers and providers.
Also in 2018, Blueprint leadership worked collaboratively with a group of experts on the treatment of chronic pain with the aim of developing and testing new systems of care for chronic pain that could help patients improve their function, pain management, and quality of life while avoiding high risk treatments including opioids. As many as 10,000 Vermont Medicaid members have been treated for pain-related conditions for two consecutive years (using 2015/2016 data), suggesting a new systematic approach could benefit numerous people living with pain, their families, and their communities. The advisory group convened by the Blueprint created a vision for what such systems of care might include, building towards a request for proposals for pilot programs that could be active in 2019. Each community or regional pilot program would include an interdisciplinary team of pain specialists who would provide a comprehensive assessment and service plan for patients and will be available to consult with primary care teams on complex cases. At participating primary care sites, enhanced services would include ongoing medical, psychological, and complementary and alternative treatment
10
modalities such as chiropractic, acupuncture, yoga, massage, Tai Chai, Feldenkrais, mindfulness, and meditation. Some pilots may choose to include a “pain clinic” in their model, offering intensive, short-term services to people with especially severe chronic pain and/or complex needs. Within this framework, each community can propose models that meet desired objectives and work with local infrastructure and resources. The variation in the accepted pilot programs will provide an opportunity to test and compare different approaches. The learning from these pilots may lead to guidance for statewide scaling of systematic approaches to chronic pain management in 2020 or thereafter. The pilots are now ready to be tested. DVHA continues to scrutinize current expenditures and federal funding opportunities in pursuit of a budget neutral approach to test these pilots.
11
5 BLUEPRINT PROGRAMS
5.1 PATIENT-CENTERED MEDICAL HOMES
5.1.1 About Patient-Centered Medical Homes The Blueprint supports Vermont primary care practices in becoming Patient-Centered Medical Homes, recognized by the National Committee for Quality Assurance (NCQA), which provides the most widely-used standards for advanced primary care. NCQA requires practices to demonstrate annually that they provide care that meets a set of criteria organized under the following six concepts:
• Team-Based Care and Practice Organization • Knowing and Managing Your Patients • Patient-Centered Access and Continuity • Care Management and Support • Care Coordination and Care Transitions • Performance Measurement and Quality Improvement
The Blueprint’s Quality Improvement Facilitators support practices in understanding the Patient-Centered Medical Home model and NCQA’s standards, developing systems that meet or exceed them, and achieving and maintaining Patient-Centered Medical Home recognition. Between annual NCQA reporting periods, Facilitators work with practices on ongoing quality improvement activities, which may focus on ongoing practice transformation, health and payment reform goals and efforts, or quality improvement opportunities identified by the practice, organization, or community.
The payments that have supported Patient-Centered Medical Homes since 2008 represent an early example of payment for quality instead of service volume, and of all-payer alignment of payments in support of shared goals. Insurers (Medicaid, Medicare, Vermont’s major commercial insurers, and some self-insured businesses) support practice transformation and ongoing quality improvement activities with a per member per month payment to each Blueprint-participating Patient-Centered Medical Home. An additional performance-based payment promotes improvements in rates of preventative care and management of chronic conditions.
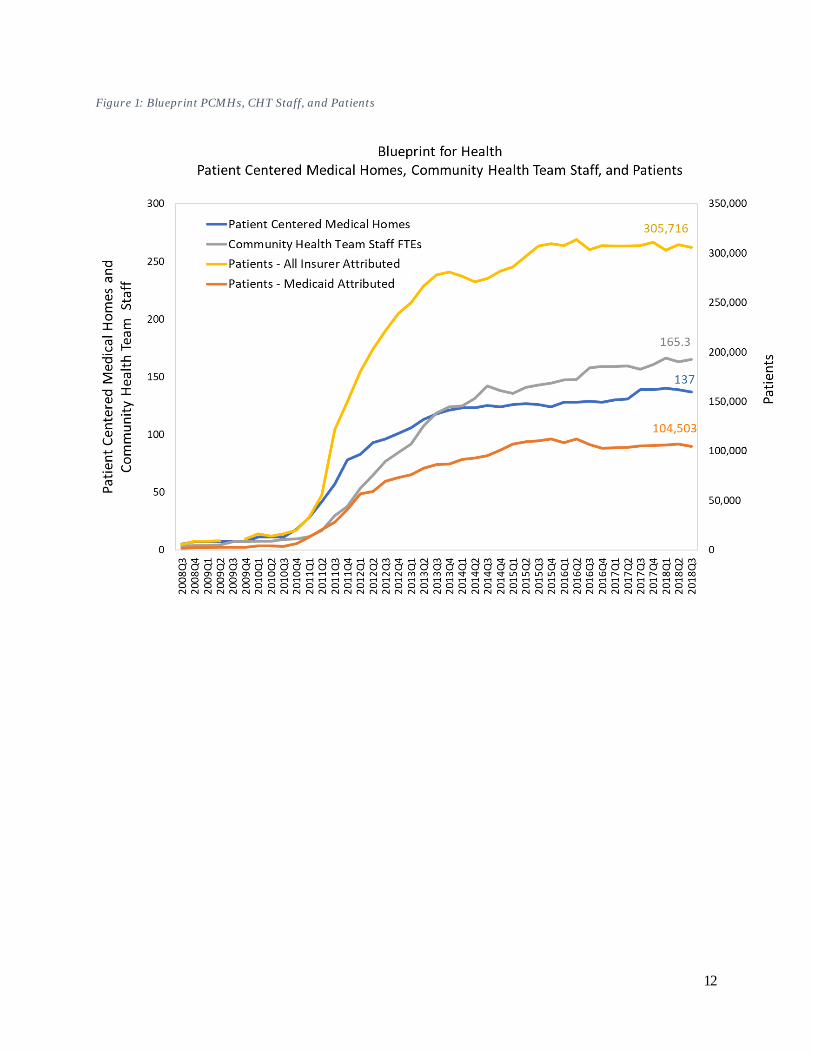
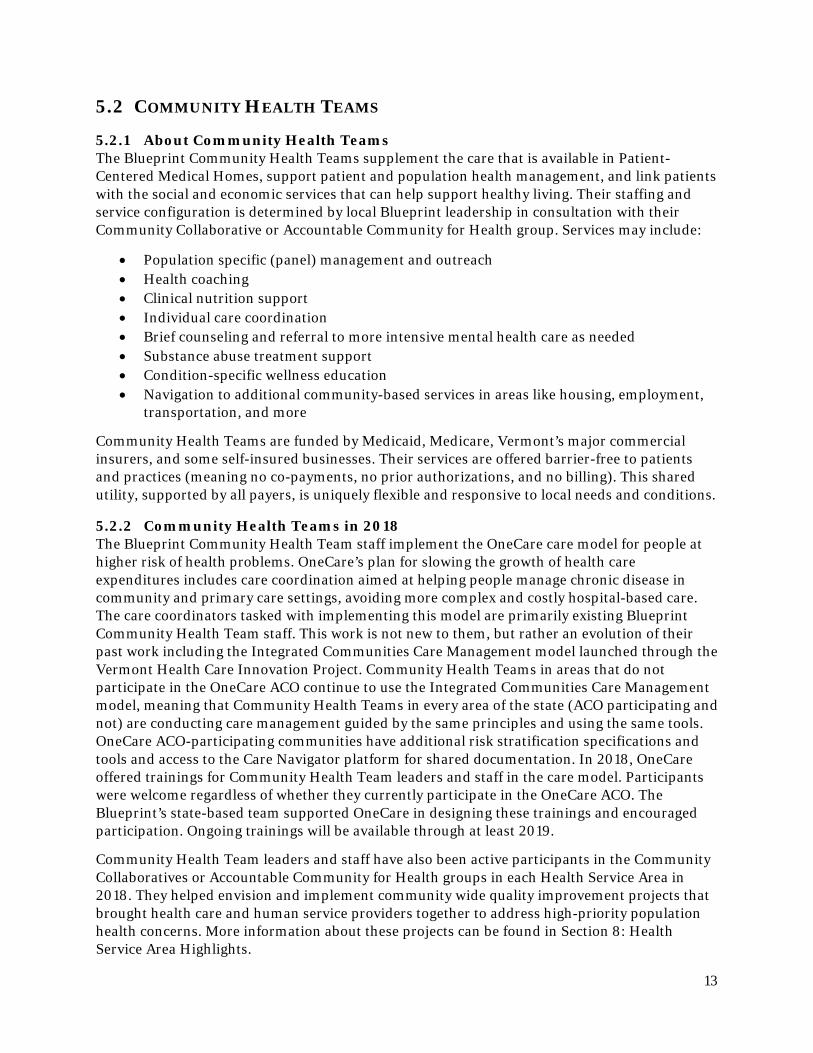
5.1.2 Patient-Centered Medical Homes in 2018 Almost all of Vermont’s primary care practices participate in the Blueprint for Health, including 137 of Vermont’s estimated 149 primary care practices. In 2018, two practices chose to join the Blueprint and were recognized as Patient-Centered Medical Homes. There was one practice consolidation and three practice closures (primarily due to provider retirement, although one practice cited financial reasons).
The following chart shows the growth of the Blueprint program over time, including the number of participating Patient-Centered Medical Homes, the number of Community Health Team staff active (counted by full time equivalent (FTE) positions), and the number of Medicaid and all-insurer patients attributed to Patient-Centered Medical Homes (based on having received more of their primary care services in those practices than in any other over a two year period).
12
Figure 1: Blueprint PCMHs, CHT Staff, and Patients
13
5.2 COMMUNITY HEALTH TEAMS
5.2.1 About Community Health Teams The Blueprint Community Health Teams supplement the care that is available in Patient-Centered Medical Homes, support patient and population health management, and link patients with the social and economic services that can help support healthy living. Their staffing and service configuration is determined by local Blueprint leadership in consultation with their Community Collaborative or Accountable Community for Health group. Services may include:
• Population specific (panel) management and outreach • Health coaching • Clinical nutrition support • Individual care coordination • Brief counseling and referral to more intensive mental health care as needed • Substance abuse treatment support • Condition-specific wellness education • Navigation to additional community-based services in areas like housing, employment,
transportation, and more
Community Health Teams are funded by Medicaid, Medicare, Vermont’s major commercial insurers, and some self-insured businesses. Their services are offered barrier-free to patients and practices (meaning no co-payments, no prior authorizations, and no billing). This shared utility, supported by all payers, is uniquely flexible and responsive to local needs and conditions.
5.2.2 Community Health Teams in 2018 The Blueprint Community Health Team staff implement the OneCare care model for people at higher risk of health problems. OneCare’s plan for slowing the growth of health care expenditures includes care coordination aimed at helping people manage chronic disease in community and primary care settings, avoiding more complex and costly hospital-based care. The care coordinators tasked with implementing this model are primarily existing Blueprint Community Health Team staff. This work is not new to them, but rather an evolution of their past work including the Integrated Communities Care Management model launched through the Vermont Health Care Innovation Project. Community Health Teams in areas that do not participate in the OneCare ACO continue to use the Integrated Communities Care Management model, meaning that Community Health Teams in every area of the state (ACO participating and not) are conducting care management guided by the same principles and using the same tools. OneCare ACO-participating communities have additional risk stratification specifications and tools and access to the Care Navigator platform for shared documentation. In 2018, OneCare offered trainings for Community Health Team leaders and staff in the care model. Participants were welcome regardless of whether they currently participate in the OneCare ACO. The Blueprint’s state-based team supported OneCare in designing these trainings and encouraged participation. Ongoing trainings will be available through at least 2019.
Community Health Team leaders and staff have also been active participants in the Community Collaboratives or Accountable Community for Health groups in each Health Service Area in 2018. They helped envision and implement community wide quality improvement projects that brought health care and human service providers together to address high-priority population health concerns. More information about these projects can be found in Section 8: Health Service Area Highlights.
14
5.3 WOMEN’S HEALTH INITIATIVE
5.3.1 About the Women’s Health Initiative Women receive primary care and preventative care services in both Patient-Centered Medical Homes and obstetrics and gynecology practices. Through the Women’s Health Initiative, both types of practices are offering the women they serve enhanced health and psychosocial screening, comprehensive family planning counseling, and timely access to long acting reversible contraception (LARC). The aim is to help women be well, avoid unintended pregnancies, and build thriving families.
Women who visit participating practices are screened for mental health and substance use conditions, interpersonal violence, and access to housing and food. If they are identified as at-risk, they have immediate access to a licensed mental health provider for brief intervention, counseling, and navigation to community-based services and treatment as needed.
Participating practices also commit to offering comprehensive family planning counseling for their current patients and for women newly referred by partnering community-based organizations. Women who wish to become pregnant receive services to support healthy pregnancy. Women who wish to delay or avoid becoming pregnant have access to the full spectrum of contraception options, including same-day access to LARC.
Additional information about the Women’s Health Initiative, including the payments that support the work, can be found on the Blueprint for Health website.
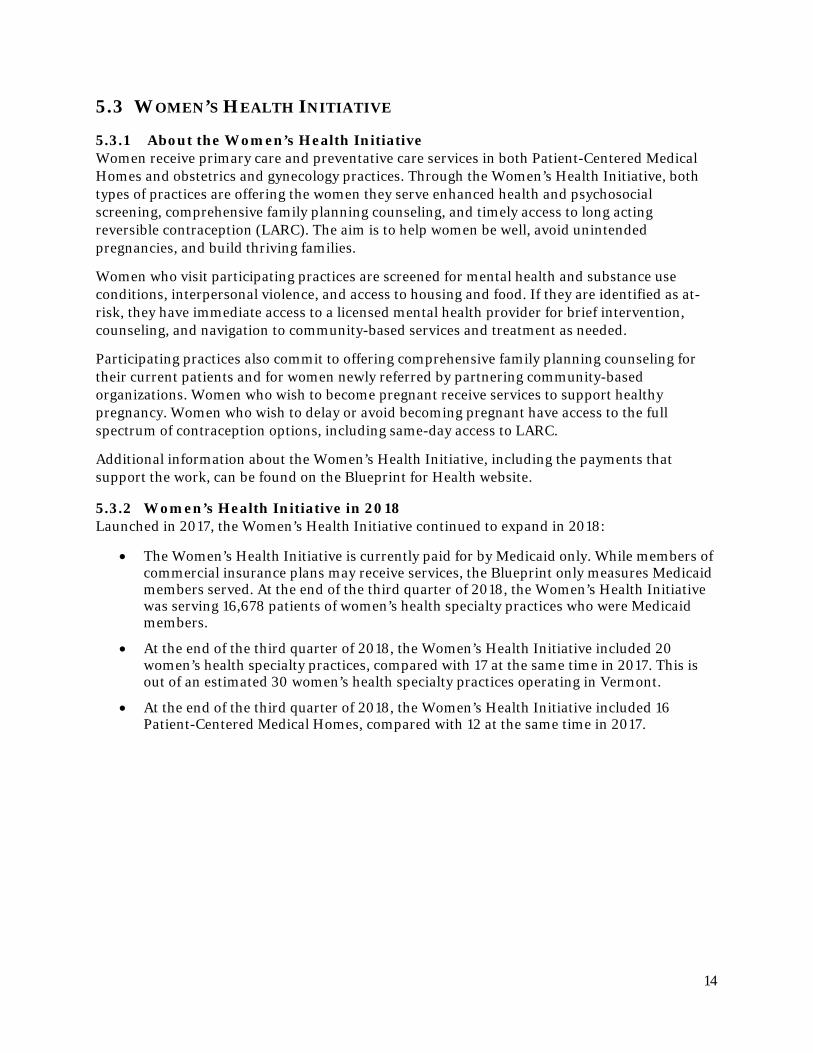
5.3.2 Women’s Health Initiative in 2018 Launched in 2017, the Women’s Health Initiative continued to expand in 2018:
• The Women’s Health Initiative is currently paid for by Medicaid only. While members of commercial insurance plans may receive services, the Blueprint only measures Medicaid members served. At the end of the third quarter of 2018, the Women’s Health Initiative was serving 16,678 patients of women’s health specialty practices who were Medicaid members.
• At the end of the third quarter of 2018, the Women’s Health Initiative included 20 women’s health specialty practices, compared with 17 at the same time in 2017. This is out of an estimated 30 women’s health specialty practices operating in Vermont.
• At the end of the third quarter of 2018, the Women’s Health Initiative included 16 Patient-Centered Medical Homes, compared with 12 at the same time in 2017.
15
Figure 2: Women's Health Initiative
16
5.4 HUB & SPOKE
5.4.1 About Hub & Spoke Hub & Spoke is Vermont’s system of medication-assisted treatment (MAT), supporting people in recovery from opioid use disorder. Nine regional Hubs (or opioid treatment programs) offer daily support for patients with complex addictions. At over 86 local Spokes (or office-based opioid treatment), doctors, nurses, and counselors offer ongoing opioid use disorder treatment fully integrated with general health care and wellness services. The Blueprint administers the Spoke part of the Hub & Spoke system.
Spokes are settings where opioid use disorder treatment is integrated into general medical care, like treatment for other chronic diseases. These are mostly primary care or family medicine practices and include obstetrics and gynecology practices, specialty outpatient addictions treatment programs, and practices specializing in chronic pain. Prescribers in Spoke practices are physicians, nurse practitioners, and physician assistants who are federally waivered to prescribe buprenorphine. They may also provide oral naltrexone or injectable Vivitrol. Spokes receive specialized staff – one nurse and one licensed mental health / addictions counselor for every 100 Medicaid patients receiving medication-assisted treatment (MAT). The new staffing helps expand access to treatment by providing prescribers with multi-disciplinary teams to see patients more frequently, proactively monitor care, and coordinate patient care across health and human services systems. For patients, specialized Spoke staff are essential members of their care team; they work together towards long-term recovery and improved health and well-being. The Blueprint and the Vermont Department of Health’s Division of Alcohol and Drug Abuse Programs (ADAP) offer ongoing training to Spoke prescribers and teams. More detail about the structure and impact of the Hub & Spoke System can be found on the Blueprint website.
5.4.2 Hub & Spoke in 2018 In 2018 the Blueprint helped expand access to treatment and improve quality of care for opioid use disorder:
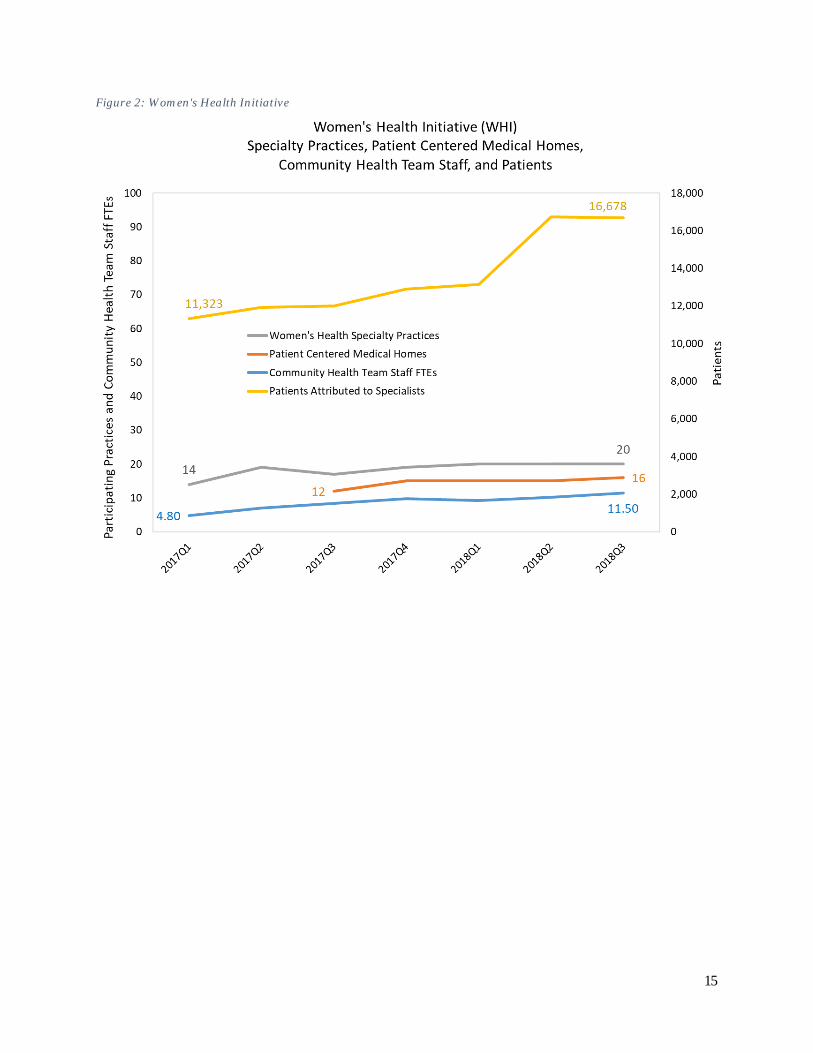
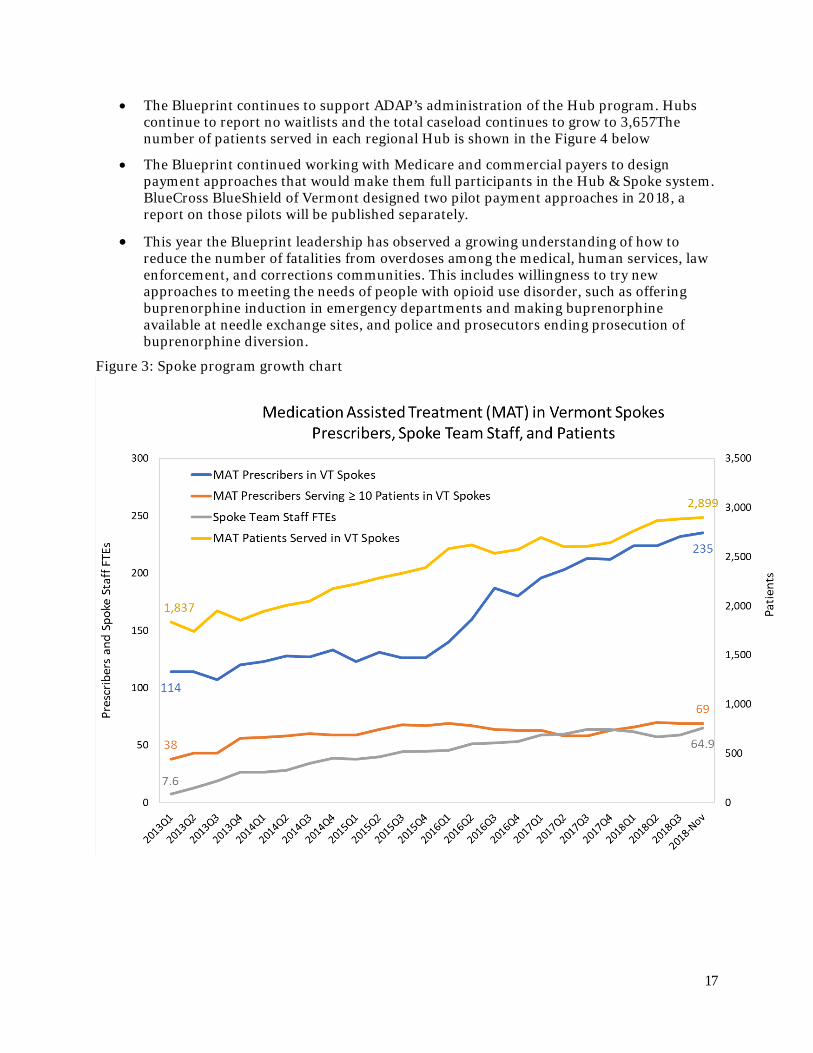
• Figure 3 below shows the growth of the Spoke program, including the number of providers, spoke staff, and patients. The number of Medicaid beneficiaries receiving treatment in Spoke settings grew from 2,606 in the third quarter of 2017 to 2,899 in November 2018.
• 235 prescribers offered MAT in Spoke settings in November 2018, up from 213 in the third quarter of 2017. 69 of these prescribers treated ten or more individuals with opioid use disorder, up from 58 at the same time last year.
• Specialized Spoke staff – the nurses and licensed mental health professionals working with medication assisted treatment patients in Spoke settings – included 64.9 full time equivalent positions in November 2018 compared to 63.8 at the end of the third quarter of 2017.
• A team including Blueprint and VDH-ADAP staff designed learning sessions for Spoke providers and practice teams. They held two sessions in the fourth quarter of 2018 and more are scheduled for 2019. Sessions feature research and clinical experts, including peer Spoke prescribers. The focus of the current series is improving transitions between Hubs and Spokes, use of harm reduction strategies, use of Vivitrol, and supporting more comprehensive services for wellness and recovery strategies.
17
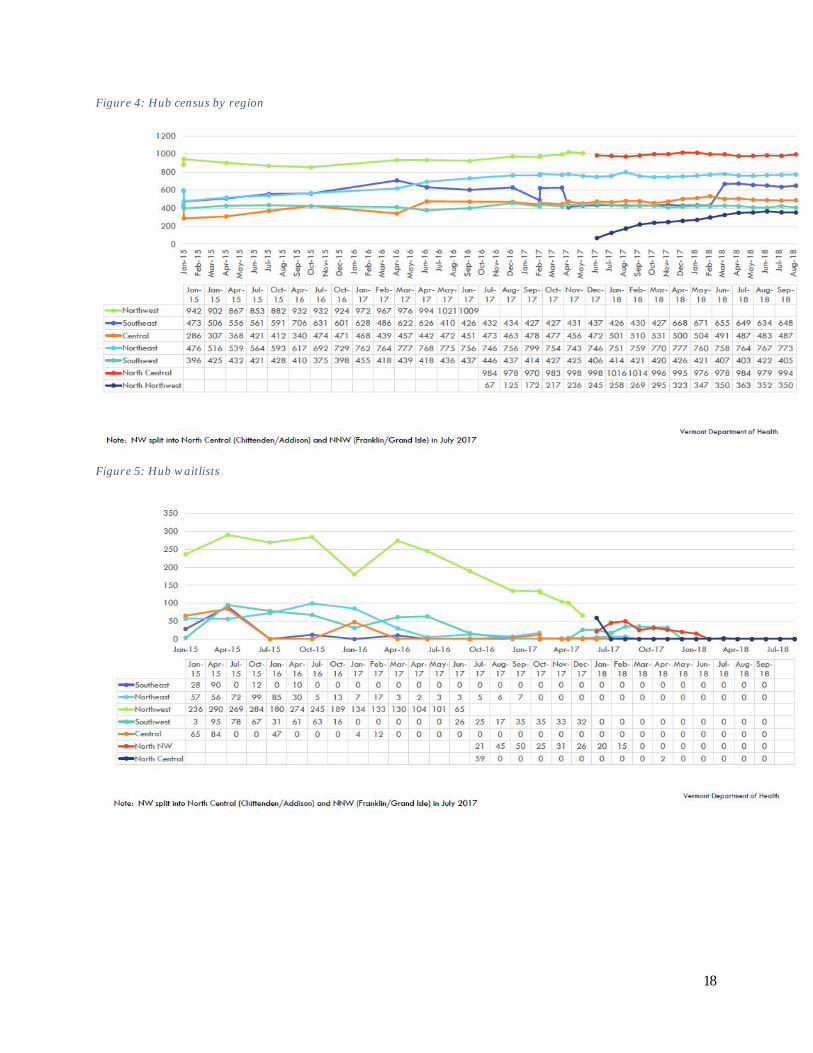
• The Blueprint continues to support ADAP’s administration of the Hub program. Hubs continue to report no waitlists and the total caseload continues to grow to 3,657The number of patients served in each regional Hub is shown in the Figure 4 below
• The Blueprint continued working with Medicare and commercial payers to design payment approaches that would make them full participants in the Hub & Spoke system. BlueCross BlueShield of Vermont designed two pilot payment approaches in 2018, a report on those pilots will be published separately.
• This year the Blueprint leadership has observed a growing understanding of how to reduce the number of fatalities from overdoses among the medical, human services, law enforcement, and corrections communities. This includes willingness to try new approaches to meeting the needs of people with opioid use disorder, such as offering buprenorphine induction in emergency departments and making buprenorphine available at needle exchange sites, and police and prosecutors ending prosecution of buprenorphine diversion.
Figure 3: Spoke program growth chart
18
Figure 4: Hub census by region
Figure 5: Hub waitlists
19
5.5 SELF-MANAGEMENT PROGRAMS
5.5.1 About the Self-Management Programs The Blueprint offers workshops that help people learn skills to better manage chronic conditions. Topics include healthy living with diabetes, diabetes prevention, tobacco cessation, mental health and emotional well-being, and living with chronic pain. Participants gain a better understanding of their health condition, explore their motivations, identify their strengths, and develop plans for achieving their health goals. They begin putting those plans into action with support from coaches and peers. The workshops last from four weeks to 12 months.
Blueprint Program Managers and Self-Management Program Coordinators organize local workshops, Community Health Improvement at the University of Vermont Medical Center offers statewide technical assistance and data collection, and the Vermont Department of Health supports training of program leaders and marketing to potential participants.
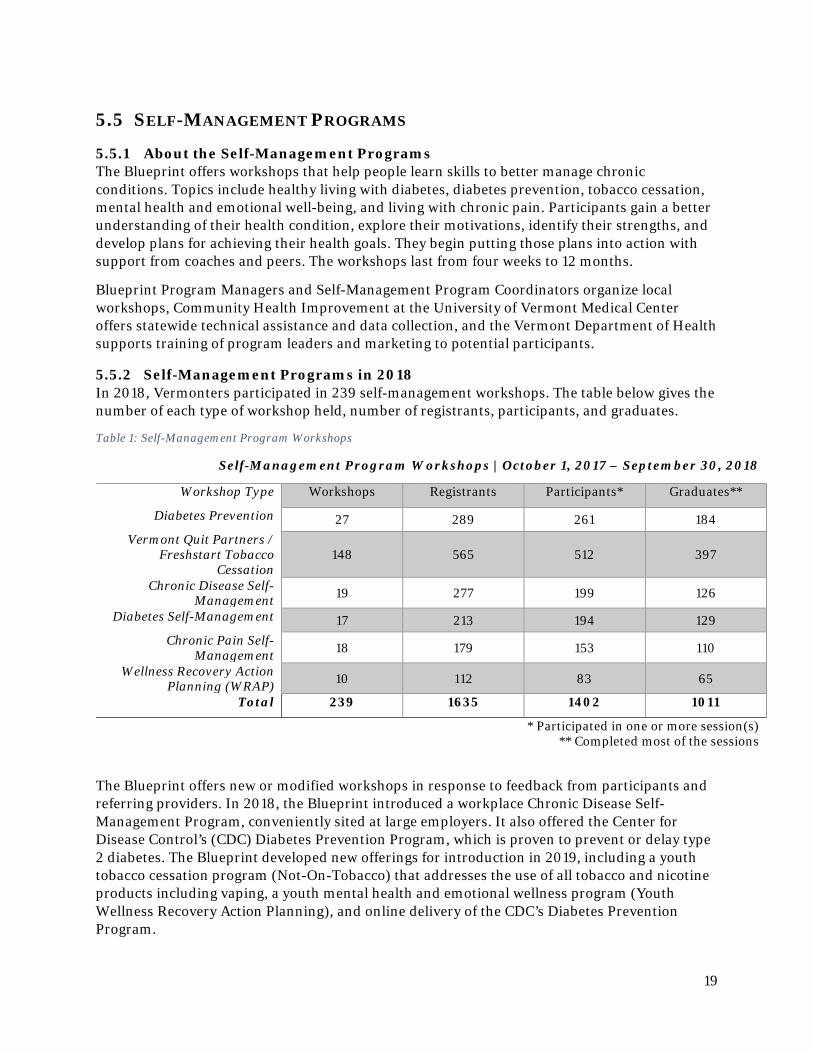
5.5.2 Self-Management Programs in 2018 In 2018, Vermonters participated in 239 self-management workshops. The table below gives the number of each type of workshop held, number of registrants, participants, and graduates.
Table 1: Self-Management Program Workshops
Self-Management Program Workshops | October 1, 2017 – September 30, 2018
Workshop Type Workshops Registrants Participants* Graduates**
Diabetes Prevention 27 289 261 184 Vermont Quit Partners /
Freshstart Tobacco Cessation
148 565 512 397
Chronic Disease Self-Management 19 277 199 126
Diabetes Self-Management 17 213 194 129 Chronic Pain Self-
Management 18 179 153 110
Wellness Recovery Action Planning (WRAP) 10 112 83 65
Total 239 1635 1402 1011
* Participated in one or more session(s) ** Completed most of the sessions
The Blueprint offers new or modified workshops in response to feedback from participants and referring providers. In 2018, the Blueprint introduced a workplace Chronic Disease Self-Management Program, conveniently sited at large employers. It also offered the Center for Disease Control’s (CDC) Diabetes Prevention Program, which is proven to prevent or delay type 2 diabetes. The Blueprint developed new offerings for introduction in 2019, including a youth tobacco cessation program (Not-On-Tobacco) that addresses the use of all tobacco and nicotine products including vaping, a youth mental health and emotional wellness program (Youth Wellness Recovery Action Planning), and online delivery of the CDC’s Diabetes Prevention Program.
20
5.6 DATA COLLECTION, ANALYSIS, AND REPORTING As OneCare Vermont focused on the population attributed to the ACO, the Blueprint is shifting its analytic work to focus on the health and health care of the full population.
5.6.1 Finding the Blueprint’s data niche in 2018 In 2018, the Blueprint researched the user experience of its data profiles (practice and hospital service area profiles of health care expenditures, utilization, and quality). The team also interviewed leadership and analytics teams from OneCare Vermont and Bi-State Primary Care Association to understand their current data capabilities and plans. This research illuminated major advances in the electronic health record (EHR) systems in Patient-Centered Medical Homes and advancing capabilities of the OneCare and Bi-State networks. EHRs and the OneCare and Bi-State platforms can produce timely patient- and panel-level health information to support continuous quality improvement for identified priority areas. However, these data sources are limited to a practice’s patient population, or in the case of the ACO, to their attributed lives. The Blueprint uses data from Vermont’s all-payer claims database the Vermont Health Care Uniform Reporting and Evaluation System (VHCURES), and the Vermont Clinical Registry, which continue to serve as the only sources for multi-payer, full population (or nearly full population) data. This breadth of this data allows for better understanding of variation between practices in a community and between communities in the state. This information can help practices and communities identify priorities for change and is important for state policy-makers evaluating the effectiveness of health reforms.
5.6.2 Full population data reporting in the Blueprint’s latest practice and community health profiles
The Blueprint is gradually shifting its data products to better support this unique full population view. The community health profiles now report on the population seen in Blueprint Patient-Centered Medical Homes, the population accessing primary care in other settings including non-Blueprint participating primary care practices and specialty practices (in Vermont and out-of-state), and patients with insurance but no primary care claims. Together, this is the closest approximation of the whole population possible using VCHURES. This advance will help community groups (Community Collaboratives / Accountable Community for Health Groups) and state policy makers better understand the health status and health care utilization patterns of Vermonters.
5.6.3 About the Vermont Clinical Registry The Blueprint uses clinical data to understand the health of Vermonters using a tool to aggregate clinical data called the Vermont Clinical Registry (the Registry). The Registry is built from information primary care providers and practice teams record in their EHR during patient visits. The data is organized in groups of measures related to common conditions and age- and gender-appropriate well-care. It includes health information like height, weight, and blood pressure along with information about the care provided in the visit, like screening, immunizations, and counseling.
21
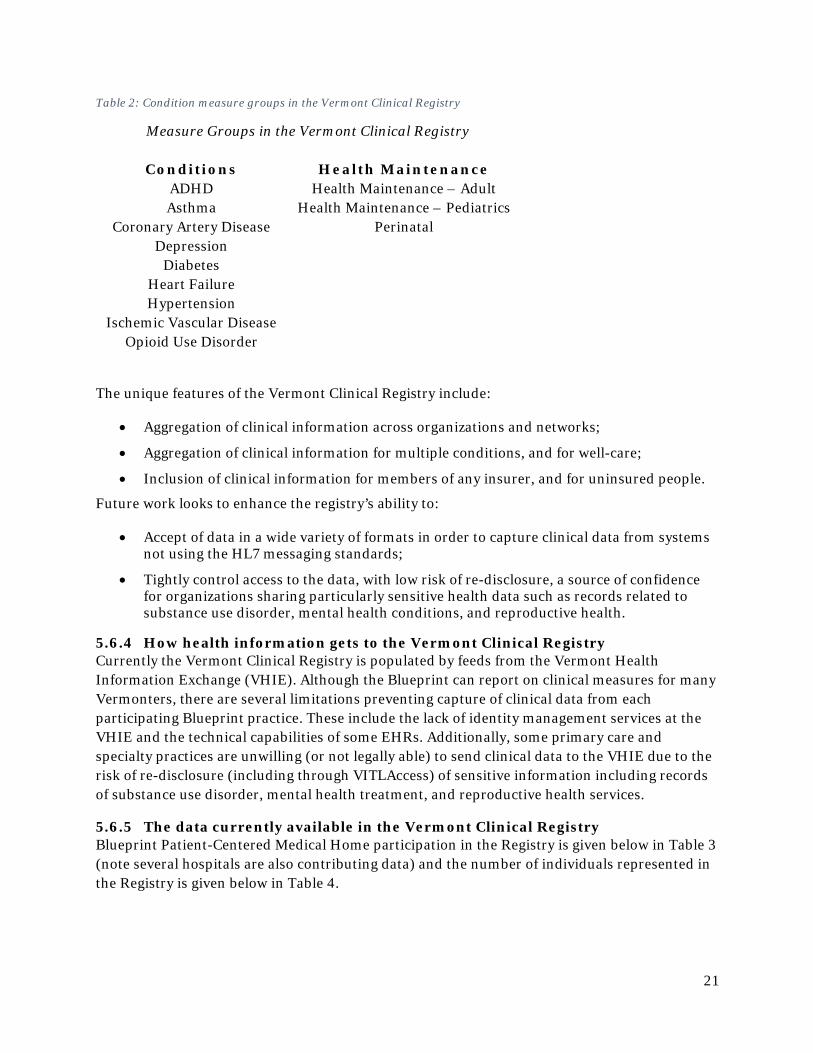
Table 2: Condition measure groups in the Vermont Clinical Registry
Measure Groups in the Vermont Clinical Registry
Conditions Health Maintenance ADHD Health Maintenance – Adult Asthma Health Maintenance – Pediatrics
Coronary Artery Disease Perinatal Depression
Diabetes Heart Failure Hypertension
Ischemic Vascular Disease Opioid Use Disorder
The unique features of the Vermont Clinical Registry include:
• Aggregation of clinical information across organizations and networks;
• Aggregation of clinical information for multiple conditions, and for well-care;
• Inclusion of clinical information for members of any insurer, and for uninsured people.
Future work looks to enhance the registry’s ability to:
• Accept of data in a wide variety of formats in order to capture clinical data from systems not using the HL7 messaging standards;
• Tightly control access to the data, with low risk of re-disclosure, a source of confidence for organizations sharing particularly sensitive health data such as records related to substance use disorder, mental health conditions, and reproductive health.
5.6.4 How health information gets to the Vermont Clinical Registry Currently the Vermont Clinical Registry is populated by feeds from the Vermont Health Information Exchange (VHIE). Although the Blueprint can report on clinical measures for many Vermonters, there are several limitations preventing capture of clinical data from each participating Blueprint practice. These include the lack of identity management services at the VHIE and the technical capabilities of some EHRs. Additionally, some primary care and specialty practices are unwilling (or not legally able) to send clinical data to the VHIE due to the risk of re-disclosure (including through VITLAccess) of sensitive information including records of substance use disorder, mental health treatment, and reproductive health services.
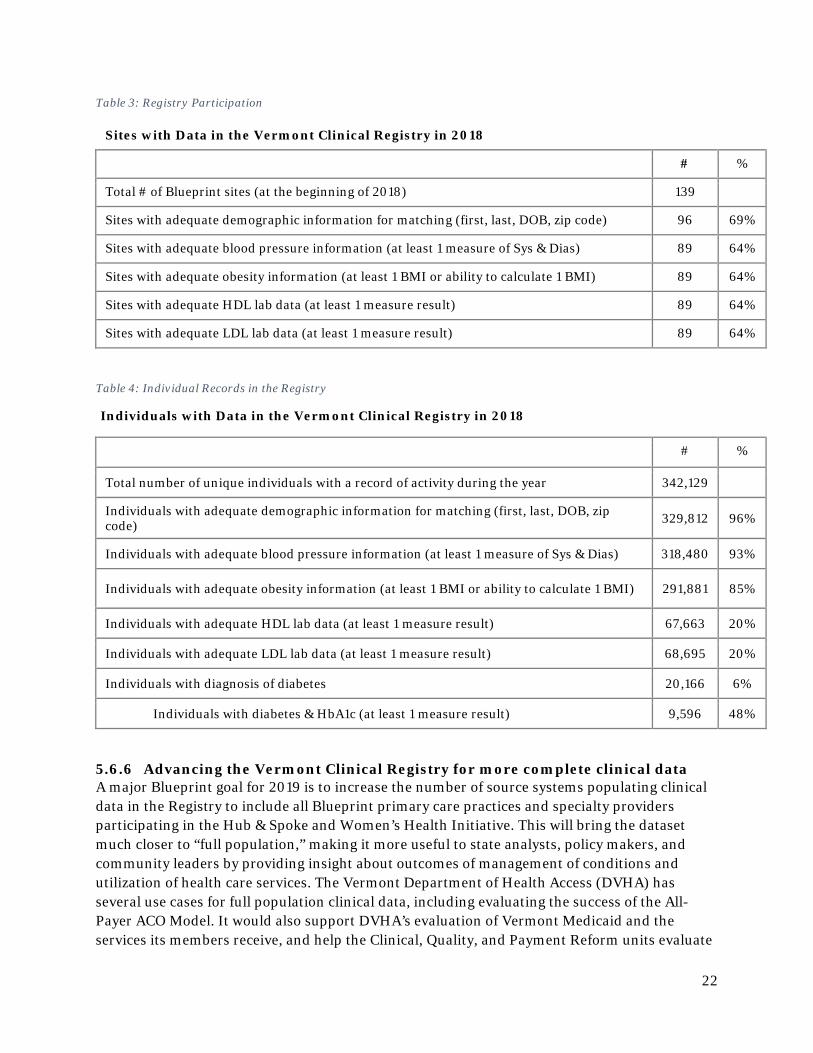
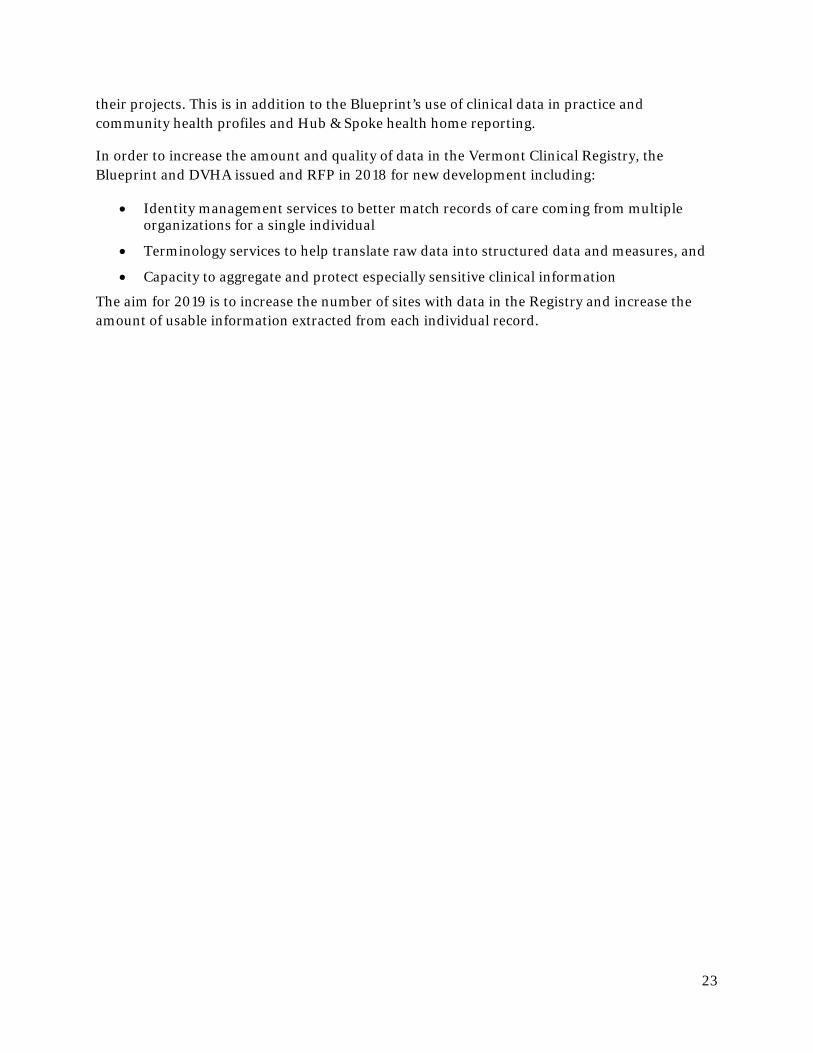
5.6.5 The data currently available in the Vermont Clinical Registry Blueprint Patient-Centered Medical Home participation in the Registry is given below in Table 3 (note several hospitals are also contributing data) and the number of individuals represented in the Registry is given below in Table 4.
22
Table 3: Registry Participation
Sites with Data in the Vermont Clinical Registry in 2018
# %
Total # of Blueprint sites (at the beginning of 2018) 139
Sites with adequate demographic information for matching (first, last, DOB, zip code) 96 69%
Sites with adequate blood pressure information (at least 1 measure of Sys & Dias) 89 64%
Sites with adequate obesity information (at least 1 BMI or ability to calculate 1 BMI) 89 64%
Sites with adequate HDL lab data (at least 1 measure result) 89 64%
Sites with adequate LDL lab data (at least 1 measure result) 89 64%
Table 4: Individual Records in the Registry
Individuals with Data in the Vermont Clinical Registry in 2018
# %
Total number of unique individuals with a record of activity during the year 342,129
Individuals with adequate demographic information for matching (first, last, DOB, zip code) 329,812 96%
Individuals with adequate blood pressure information (at least 1 measure of Sys & Dias) 318,480 93%
Individuals with adequate obesity information (at least 1 BMI or ability to calculate 1 BMI) 291,881 85%
Individuals with adequate HDL lab data (at least 1 measure result) 67,663 20%
Individuals with adequate LDL lab data (at least 1 measure result) 68,695 20%
Individuals with diagnosis of diabetes 20,166 6%
Individuals with diabetes & HbA1c (at least 1 measure result) 9,596 48%
5.6.6 Advancing the Vermont Clinical Registry for more complete clinical data A major Blueprint goal for 2019 is to increase the number of source systems populating clinical data in the Registry to include all Blueprint primary care practices and specialty providers participating in the Hub & Spoke and Women’s Health Initiative. This will bring the dataset much closer to “full population,” making it more useful to state analysts, policy makers, and community leaders by providing insight about outcomes of management of conditions and utilization of health care services. The Vermont Department of Health Access (DVHA) has several use cases for full population clinical data, including evaluating the success of the All-Payer ACO Model. It would also support DVHA’s evaluation of Vermont Medicaid and the services its members receive, and help the Clinical, Quality, and Payment Reform units evaluate
23
their projects. This is in addition to the Blueprint’s use of clinical data in practice and community health profiles and Hub & Spoke health home reporting.
In order to increase the amount and quality of data in the Vermont Clinical Registry, the Blueprint and DVHA issued and RFP in 2018 for new development including:
• Identity management services to better match records of care coming from multiple organizations for a single individual
• Terminology services to help translate raw data into structured data and measures, and
• Capacity to aggregate and protect especially sensitive clinical information
The aim for 2019 is to increase the number of sites with data in the Registry and increase the amount of usable information extracted from each individual record.
24
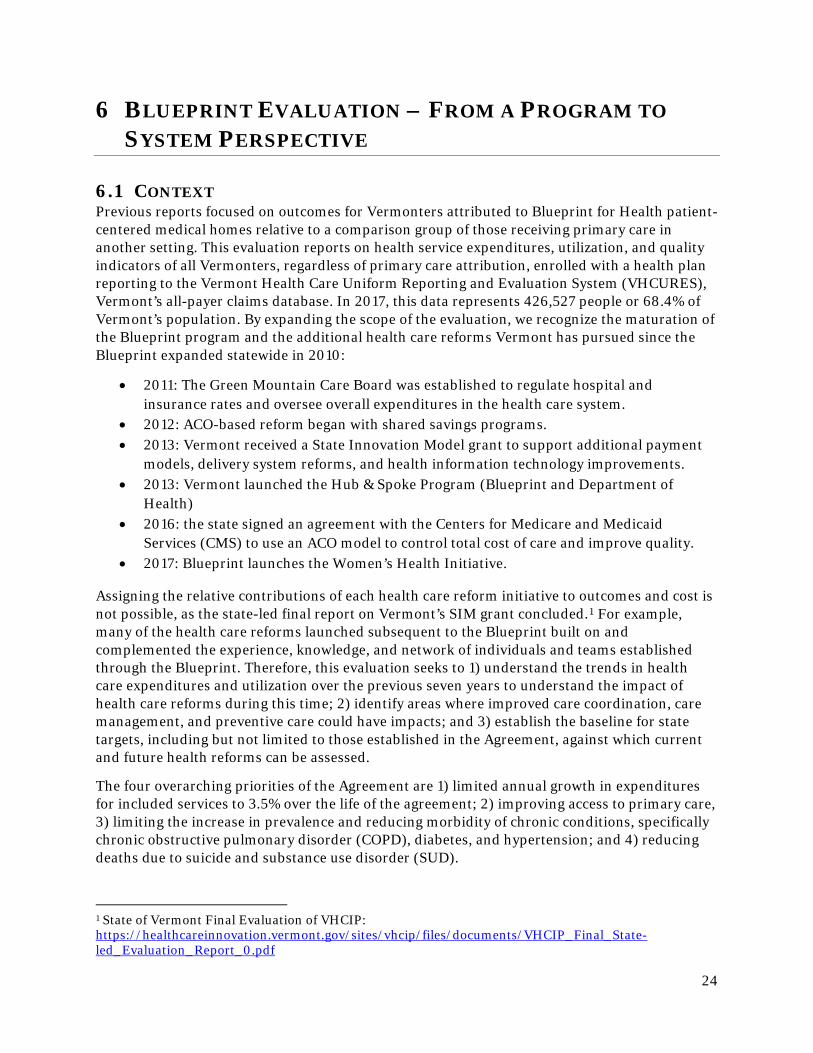
6 BLUEPRINT EVALUATION – FROM A PROGRAM TO SYSTEM PERSPECTIVE
6.1 CONTEXT Previous reports focused on outcomes for Vermonters attributed to Blueprint for Health patient-centered medical homes relative to a comparison group of those receiving primary care in another setting. This evaluation reports on health service expenditures, utilization, and quality indicators of all Vermonters, regardless of primary care attribution, enrolled with a health plan reporting to the Vermont Health Care Uniform Reporting and Evaluation System (VHCURES), Vermont’s all-payer claims database. In 2017, this data represents 426,527 people or 68.4% of Vermont’s population. By expanding the scope of the evaluation, we recognize the maturation of the Blueprint program and the additional health care reforms Vermont has pursued since the Blueprint expanded statewide in 2010:
• 2011: The Green Mountain Care Board was established to regulate hospital and insurance rates and oversee overall expenditures in the health care system.
• 2012: ACO-based reform began with shared savings programs. • 2013: Vermont received a State Innovation Model grant to support additional payment
models, delivery system reforms, and health information technology improvements. • 2013: Vermont launched the Hub & Spoke Program (Blueprint and Department of
Health) • 2016: the state signed an agreement with the Centers for Medicare and Medicaid
Services (CMS) to use an ACO model to control total cost of care and improve quality. • 2017: Blueprint launches the Women’s Health Initiative.
Assigning the relative contributions of each health care reform initiative to outcomes and cost is not possible, as the state-led final report on Vermont’s SIM grant concluded.1 For example, many of the health care reforms launched subsequent to the Blueprint built on and complemented the experience, knowledge, and network of individuals and teams established through the Blueprint. Therefore, this evaluation seeks to 1) understand the trends in health care expenditures and utilization over the previous seven years to understand the impact of health care reforms during this time; 2) identify areas where improved care coordination, care management, and preventive care could have impacts; and 3) establish the baseline for state targets, including but not limited to those established in the Agreement, against which current and future health reforms can be assessed.
The four overarching priorities of the Agreement are 1) limited annual growth in expenditures for included services to 3.5% over the life of the agreement; 2) improving access to primary care, 3) limiting the increase in prevalence and reducing morbidity of chronic conditions, specifically chronic obstructive pulmonary disorder (COPD), diabetes, and hypertension; and 4) reducing deaths due to suicide and substance use disorder (SUD).
1 State of Vermont Final Evaluation of VHCIP: https://healthcareinnovation.vermont.gov/sites/vhcip/files/documents/VHCIP_Final_State-led_Evaluation_Report_0.pdf
25
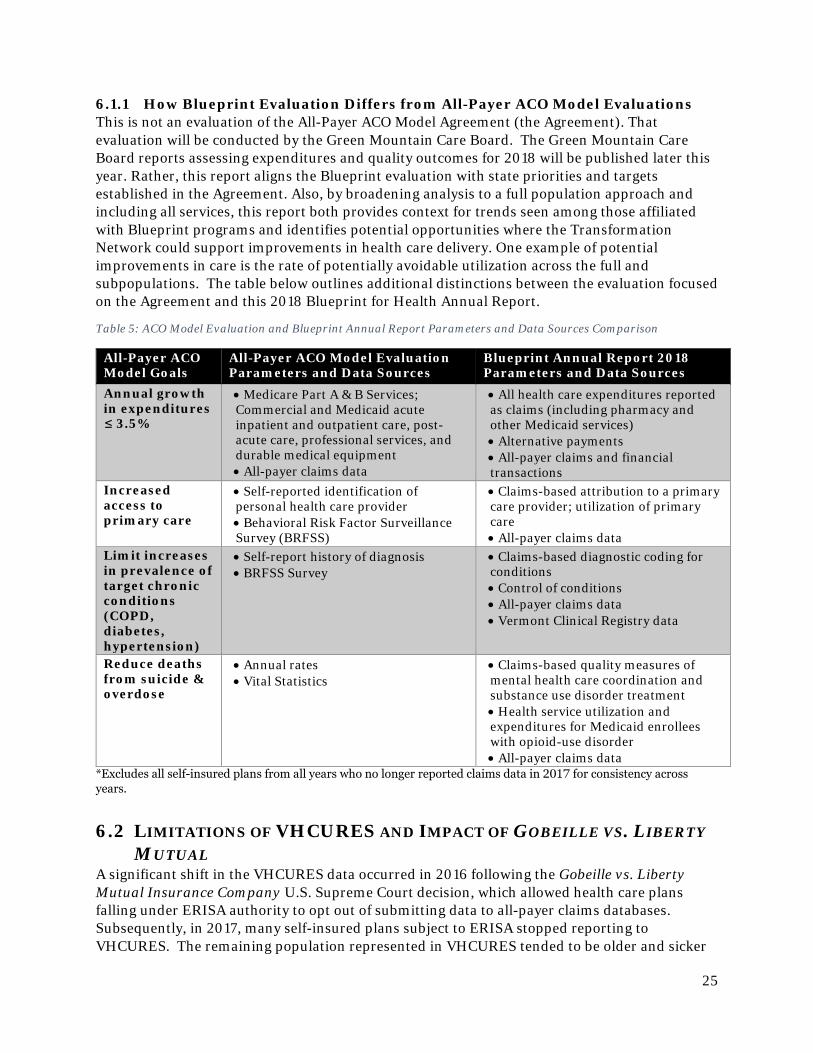
6.1.1 How Blueprint Evaluation Differs from All-Payer ACO Model Evaluations This is not an evaluation of the All-Payer ACO Model Agreement (the Agreement). That evaluation will be conducted by the Green Mountain Care Board. The Green Mountain Care Board reports assessing expenditures and quality outcomes for 2018 will be published later this year. Rather, this report aligns the Blueprint evaluation with state priorities and targets established in the Agreement. Also, by broadening analysis to a full population approach and including all services, this report both provides context for trends seen among those affiliated with Blueprint programs and identifies potential opportunities where the Transformation Network could support improvements in health care delivery. One example of potential improvements in care is the rate of potentially avoidable utilization across the full and subpopulations. The table below outlines additional distinctions between the evaluation focused on the Agreement and this 2018 Blueprint for Health Annual Report.
Table 5: ACO Model Evaluation and Blueprint Annual Report Parameters and Data Sources Comparison
All-Payer ACO Model Goals
All-Payer ACO Model Evaluation Parameters and Data Sources
Blueprint Annual Report 2018 Parameters and Data Sources
Annual growth in expenditures ≤ 3.5%
• Medicare Part A & B Services; Commercial and Medicaid acute inpatient and outpatient care, post-acute care, professional services, and durable medical equipment • All-payer claims data
• All health care expenditures reported as claims (including pharmacy and other Medicaid services) • Alternative payments • All-payer claims and financial transactions
Increased access to primary care
• Self-reported identification of personal health care provider • Behavioral Risk Factor Surveillance Survey (BRFSS)
• Claims-based attribution to a primary care provider; utilization of primary care • All-payer claims data
Limit increases in prevalence of target chronic conditions (COPD, diabetes, hypertension)
• Self-report history of diagnosis • BRFSS Survey
• Claims-based diagnostic coding for conditions • Control of conditions • All-payer claims data • Vermont Clinical Registry data
Reduce deaths from suicide & overdose
• Annual rates • Vital Statistics
• Claims-based quality measures of mental health care coordination and substance use disorder treatment • Health service utilization and expenditures for Medicaid enrollees with opioid-use disorder • All-payer claims data
*Excludes all self-insured plans from all years who no longer reported claims data in 2017 for consistency across years.
6.2 LIMITATIONS OF VHCURES AND IMPACT OF GOBEILLE VS. LIBERTY MUTUAL
A significant shift in the VHCURES data occurred in 2016 following the Gobeille vs. Liberty Mutual Insurance Company U.S. Supreme Court decision, which allowed health care plans falling under ERISA authority to opt out of submitting data to all-payer claims databases. Subsequently, in 2017, many self-insured plans subject to ERISA stopped reporting to VHCURES. The remaining population represented in VHCURES tended to be older and sicker
26
resulting in higher average per member per year (PMPY) costs and utilization rates relative to previous years. To address this change and allow comparability with earlier years the Blueprint removed the claims associated with self-insured plans no longer submitting in 2017 from all previous years. The number of people whose data was removed from each year ranged from 109,709 Vermonters in 2011 to 82,798 in 2017. Analysis indicated that this step achieved greater consistency in age, payer mix, health status, and gender across all years. It is also an approach that has been explored by other states.
In addition to those self-insured we removed, this analysis excludes ages less than one year of age due to frequent challenges in separating their claims from their parents’ claims during this period, and ages 65 and older for whom commercial or Medicaid is the primary payer, due to difficulties in identifying total cost of care across multiple payers given VHCURES is currently deidentified. VHCURES data also does not include federal employees, veterans, and people who are uninsured.
Even with these limitations in the data, the following analysis represents the majority of Vermont residents, from 391,658 (62.5%) in 2011 and 426,527 (68.4%) in 2017; thereby providing the best available data on health care trends across the state.
6.3 EVALUATION POPULATIONS This evaluation includes all individuals represented in the VHCURES claims data after removal of people in self-insured plans no longer reporting in 2017. Trends on key measures are reported for the following populations:
1. Full Population: all individuals age one and older enrolled in a health plan in VHCURES; 2. Primary care attributed2 groups
a. Blueprint PCMH: Vermonters receiving most of their care in a patient-centered medical home (PCMH);
b. Other Primary Care: Vermonters receiving most of their primary care in a setting other than a Blueprint PCMH;
c. No Primary Care: Vermonters who did not have a primary care visit; 3. Vermonters with opioid use disorder (OUD);
a. OUD MAT: Those receiving medication-assisted treatment (MAT) and participating in the Hub & Spoke program after 2013;
b. Other OUD Tx: Those receiving non-MAT forms of treatment (Tx) for opioid use disorder; and
4. Vermont women ages 15-44.
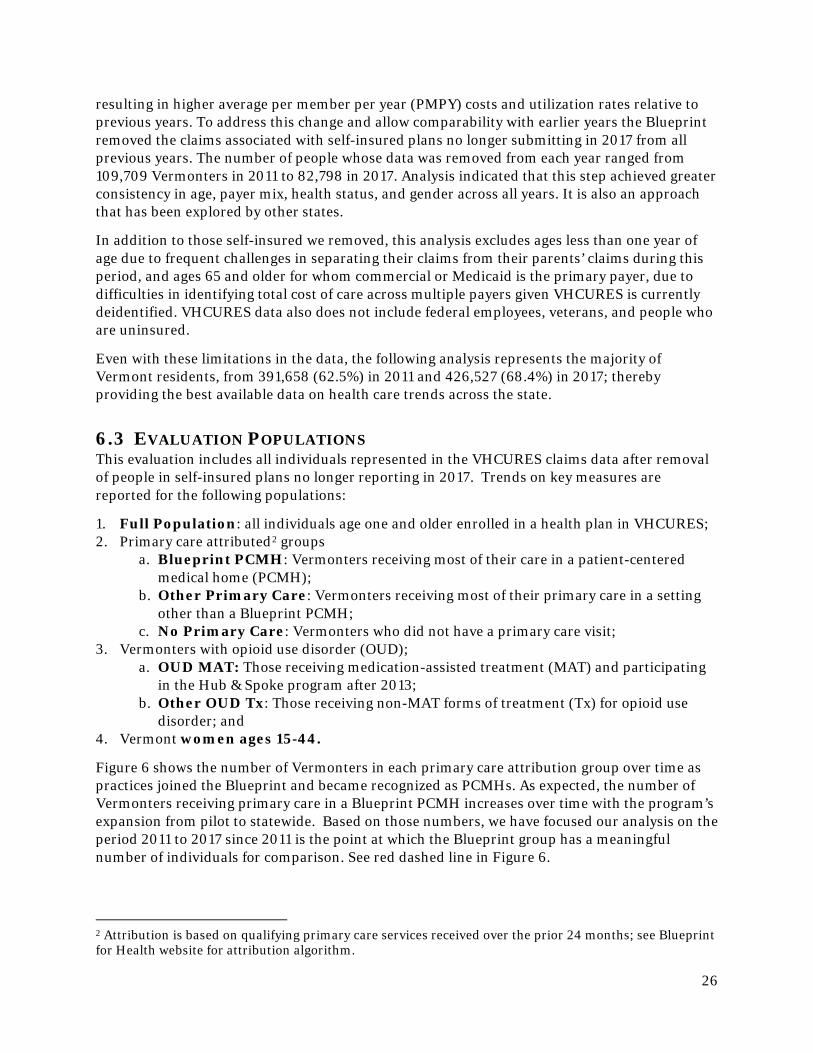
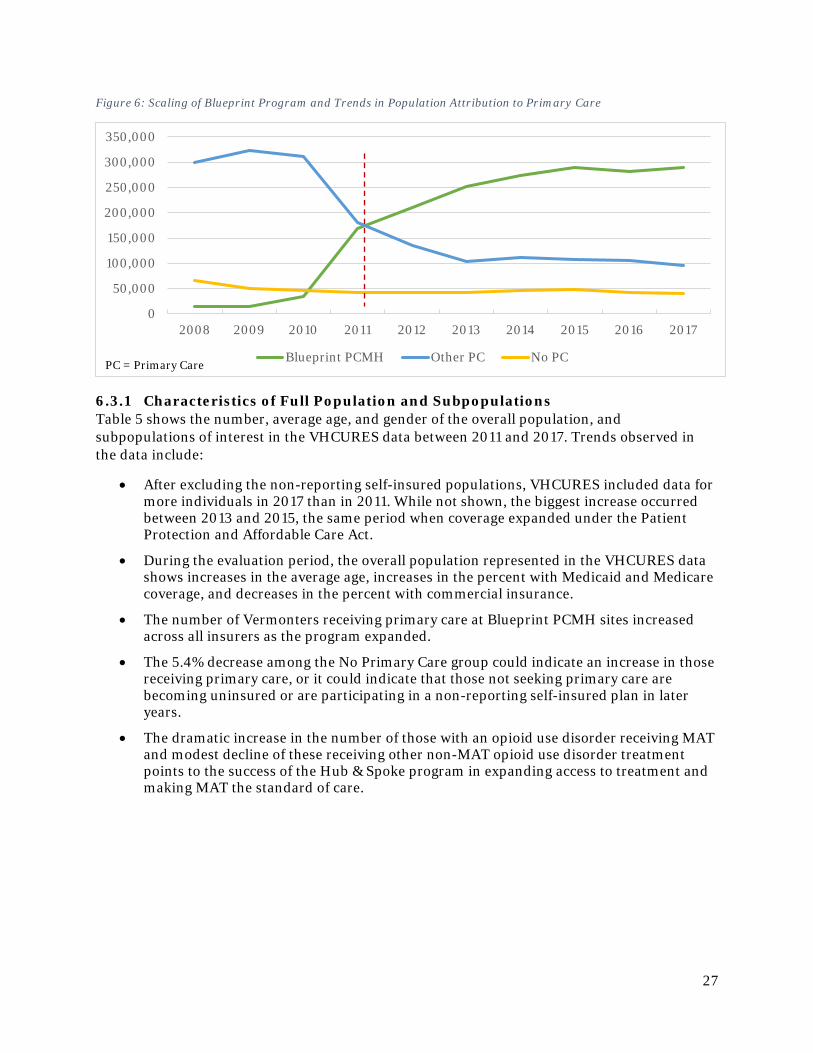
Figure 6 shows the number of Vermonters in each primary care attribution group over time as practices joined the Blueprint and became recognized as PCMHs. As expected, the number of Vermonters receiving primary care in a Blueprint PCMH increases over time with the program’s expansion from pilot to statewide. Based on those numbers, we have focused our analysis on the period 2011 to 2017 since 2011 is the point at which the Blueprint group has a meaningful number of individuals for comparison. See red dashed line in Figure 6.
2 Attribution is based on qualifying primary care services received over the prior 24 months; see Blueprint for Health website for attribution algorithm.
27
Figure 6: Scaling of Blueprint Program and Trends in Population Attribution to Primary Care
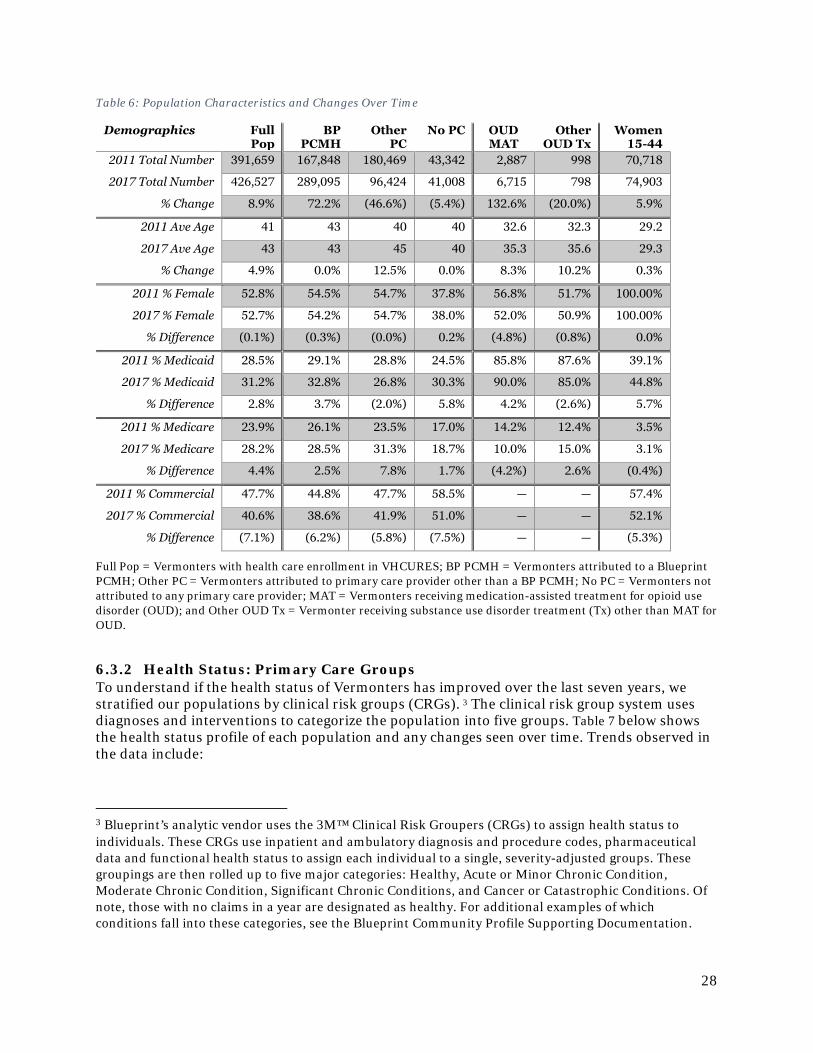
6.3.1 Characteristics of Full Population and Subpopulations Table 5 shows the number, average age, and gender of the overall population, and subpopulations of interest in the VHCURES data between 2011 and 2017. Trends observed in the data include:
• After excluding the non-reporting self-insured populations, VHCURES included data for more individuals in 2017 than in 2011. While not shown, the biggest increase occurred between 2013 and 2015, the same period when coverage expanded under the Patient Protection and Affordable Care Act.
• During the evaluation period, the overall population represented in the VHCURES data shows increases in the average age, increases in the percent with Medicaid and Medicare coverage, and decreases in the percent with commercial insurance.
• The number of Vermonters receiving primary care at Blueprint PCMH sites increased across all insurers as the program expanded.
• The 5.4% decrease among the No Primary Care group could indicate an increase in those receiving primary care, or it could indicate that those not seeking primary care are becoming uninsured or are participating in a non-reporting self-insured plan in later years.
• The dramatic increase in the number of those with an opioid use disorder receiving MAT and modest decline of these receiving other non-MAT opioid use disorder treatment points to the success of the Hub & Spoke program in expanding access to treatment and making MAT the standard of care.
0
50,000
100,000
150,000
200,000
250,000
300,000
350,000
2008 2009 2010 2011 2012 2013 2014 2015 2016 2017
Blueprint PCMH Other PC No PCPC = Primary Care
28
Table 6: Population Characteristics and Changes Over Time
Demographics Full Pop
BP PCMH
Other PC
No PC OUD MAT
Other OUD Tx
Women 15-44
2011 Total Number 391,659 167,848 180,469 43,342 2,887 998 70,718
2017 Total Number 426,527 289,095 96,424 41,008 6,715 798 74,903
% Change 8.9% 72.2% (46.6%) (5.4%) 132.6% (20.0%) 5.9%
2011 Ave Age 41 43 40 40 32.6 32.3 29.2
2017 Ave Age 43 43 45 40 35.3 35.6 29.3
% Change 4.9% 0.0% 12.5% 0.0% 8.3% 10.2% 0.3%
2011 % Female 52.8% 54.5% 54.7% 37.8% 56.8% 51.7% 100.00%
2017 % Female 52.7% 54.2% 54.7% 38.0% 52.0% 50.9% 100.00%
% Difference (0.1%) (0.3%) (0.0%) 0.2% (4.8%) (0.8%) 0.0%
2011 % Medicaid 28.5% 29.1% 28.8% 24.5% 85.8% 87.6% 39.1%
2017 % Medicaid 31.2% 32.8% 26.8% 30.3% 90.0% 85.0% 44.8%
% Difference 2.8% 3.7% (2.0%) 5.8% 4.2% (2.6%) 5.7%
2011 % Medicare 23.9% 26.1% 23.5% 17.0% 14.2% 12.4% 3.5%
2017 % Medicare 28.2% 28.5% 31.3% 18.7% 10.0% 15.0% 3.1%
% Difference 4.4% 2.5% 7.8% 1.7% (4.2%) 2.6% (0.4%)
2011 % Commercial 47.7% 44.8% 47.7% 58.5% — — 57.4%
2017 % Commercial 40.6% 38.6% 41.9% 51.0% — — 52.1%
% Difference (7.1%) (6.2%) (5.8%) (7.5%) — — (5.3%)
Full Pop = Vermonters with health care enrollment in VHCURES; BP PCMH = Vermonters attributed to a Blueprint PCMH; Other PC = Vermonters attributed to primary care provider other than a BP PCMH; No PC = Vermonters not attributed to any primary care provider; MAT = Vermonters receiving medication-assisted treatment for opioid use disorder (OUD); and Other OUD Tx = Vermonter receiving substance use disorder treatment (Tx) other than MAT for OUD.
6.3.2 Health Status: Primary Care Groups To understand if the health status of Vermonters has improved over the last seven years, we stratified our populations by clinical risk groups (CRGs). 3 The clinical risk group system uses diagnoses and interventions to categorize the population into five groups. Table 7 below shows the health status profile of each population and any changes seen over time. Trends observed in the data include:
3 Blueprint’s analytic vendor uses the 3M™ Clinical Risk Groupers (CRGs) to assign health status to individuals. These CRGs use inpatient and ambulatory diagnosis and procedure codes, pharmaceutical data and functional health status to assign each individual to a single, severity-adjusted groups. These groupings are then rolled up to five major categories: Healthy, Acute or Minor Chronic Condition, Moderate Chronic Condition, Significant Chronic Conditions, and Cancer or Catastrophic Conditions. Of note, those with no claims in a year are designated as healthy. For additional examples of which conditions fall into these categories, see the Blueprint Community Profile Supporting Documentation.
29
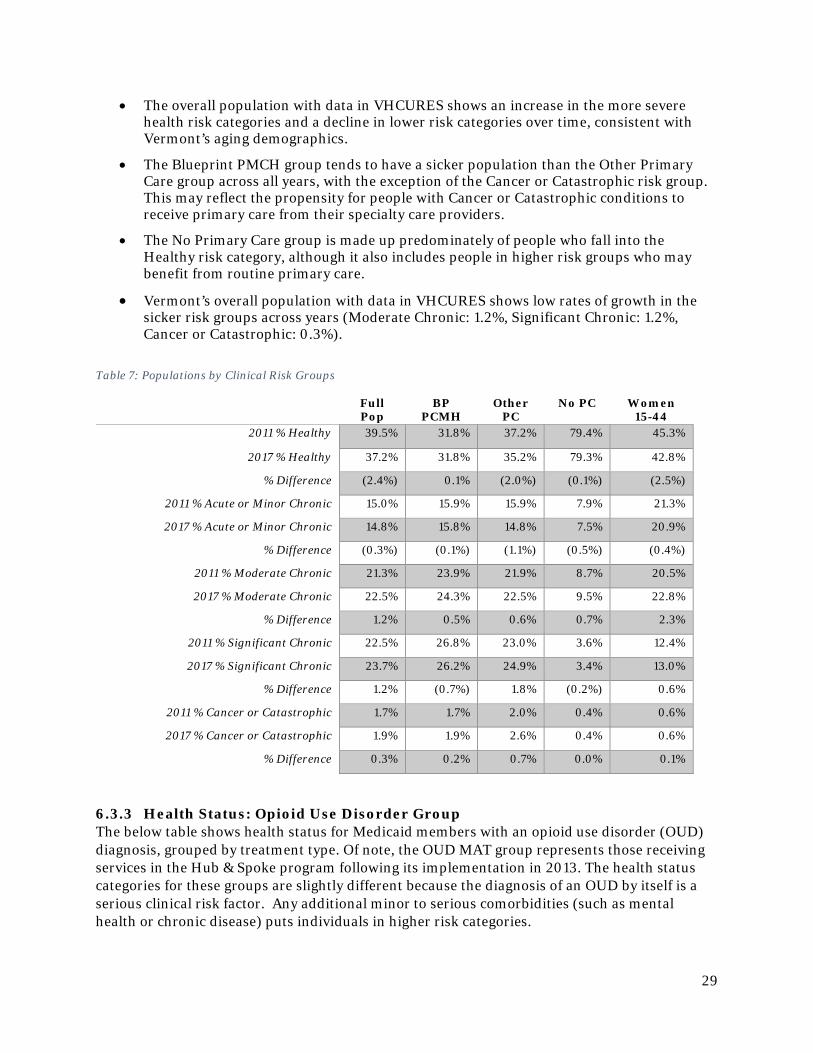
• The overall population with data in VHCURES shows an increase in the more severe health risk categories and a decline in lower risk categories over time, consistent with Vermont’s aging demographics.
• The Blueprint PMCH group tends to have a sicker population than the Other Primary Care group across all years, with the exception of the Cancer or Catastrophic risk group. This may reflect the propensity for people with Cancer or Catastrophic conditions to receive primary care from their specialty care providers.
• The No Primary Care group is made up predominately of people who fall into the Healthy risk category, although it also includes people in higher risk groups who may benefit from routine primary care.
• Vermont’s overall population with data in VHCURES shows low rates of growth in the sicker risk groups across years (Moderate Chronic: 1.2%, Significant Chronic: 1.2%, Cancer or Catastrophic: 0.3%).
Table 7: Populations by Clinical Risk Groups
Full Pop
BP PCMH
Other PC
No PC Women 15-44
2011 % Healthy 39.5% 31.8% 37.2% 79.4% 45.3%
2017 % Healthy 37.2% 31.8% 35.2% 79.3% 42.8%
% Difference (2.4%) 0.1% (2.0%) (0.1%) (2.5%)
2011 % Acute or Minor Chronic 15.0% 15.9% 15.9% 7.9% 21.3%
2017 % Acute or Minor Chronic 14.8% 15.8% 14.8% 7.5% 20.9%
% Difference (0.3%) (0.1%) (1.1%) (0.5%) (0.4%)
2011 % Moderate Chronic 21.3% 23.9% 21.9% 8.7% 20.5%
2017 % Moderate Chronic 22.5% 24.3% 22.5% 9.5% 22.8%
% Difference 1.2% 0.5% 0.6% 0.7% 2.3%
2011 % Significant Chronic 22.5% 26.8% 23.0% 3.6% 12.4%
2017 % Significant Chronic 23.7% 26.2% 24.9% 3.4% 13.0%
% Difference 1.2% (0.7%) 1.8% (0.2%) 0.6%
2011 % Cancer or Catastrophic 1.7% 1.7% 2.0% 0.4% 0.6%
2017 % Cancer or Catastrophic 1.9% 1.9% 2.6% 0.4% 0.6%
% Difference 0.3% 0.2% 0.7% 0.0% 0.1%
6.3.3 Health Status: Opioid Use Disorder Group The below table shows health status for Medicaid members with an opioid use disorder (OUD) diagnosis, grouped by treatment type. Of note, the OUD MAT group represents those receiving services in the Hub & Spoke program following its implementation in 2013. The health status categories for these groups are slightly different because the diagnosis of an OUD by itself is a serious clinical risk factor. Any additional minor to serious comorbidities (such as mental health or chronic disease) puts individuals in higher risk categories.
30
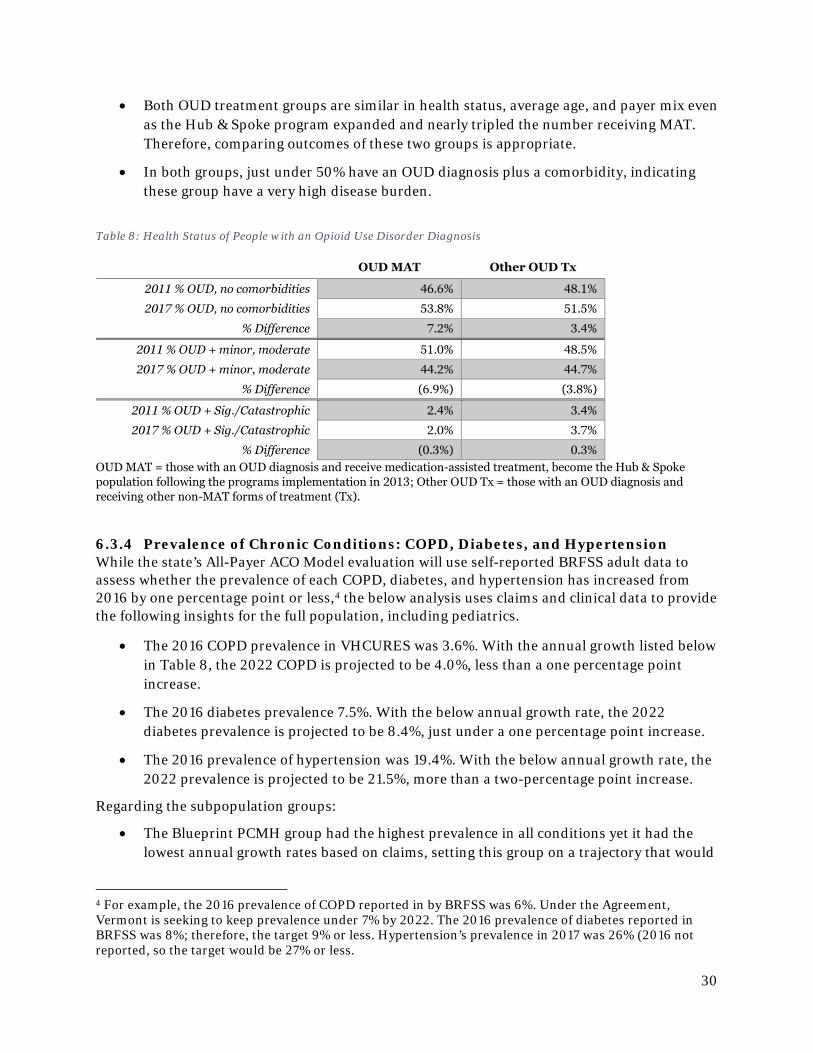
• Both OUD treatment groups are similar in health status, average age, and payer mix even as the Hub & Spoke program expanded and nearly tripled the number receiving MAT. Therefore, comparing outcomes of these two groups is appropriate.
• In both groups, just under 50% have an OUD diagnosis plus a comorbidity, indicating these group have a very high disease burden.
Table 8: Health Status of People with an Opioid Use Disorder Diagnosis
OUD MAT Other OUD Tx
2011 % OUD, no comorbidities 46.6% 48.1%
2017 % OUD, no comorbidities 53.8% 51.5%
% Difference 7.2% 3.4%
2011 % OUD + minor, moderate 51.0% 48.5%
2017 % OUD + minor, moderate 44.2% 44.7%
% Difference (6.9%) (3.8%)
2011 % OUD + Sig./Catastrophic 2.4% 3.4%
2017 % OUD + Sig./Catastrophic 2.0% 3.7%
% Difference (0.3%) 0.3% OUD MAT = those with an OUD diagnosis and receive medication-assisted treatment, become the Hub & Spoke population following the programs implementation in 2013; Other OUD Tx = those with an OUD diagnosis and receiving other non-MAT forms of treatment (Tx).
6.3.4 Prevalence of Chronic Conditions: COPD, Diabetes, and Hypertension While the state’s All-Payer ACO Model evaluation will use self-reported BRFSS adult data to assess whether the prevalence of each COPD, diabetes, and hypertension has increased from 2016 by one percentage point or less,4 the below analysis uses claims and clinical data to provide the following insights for the full population, including pediatrics.
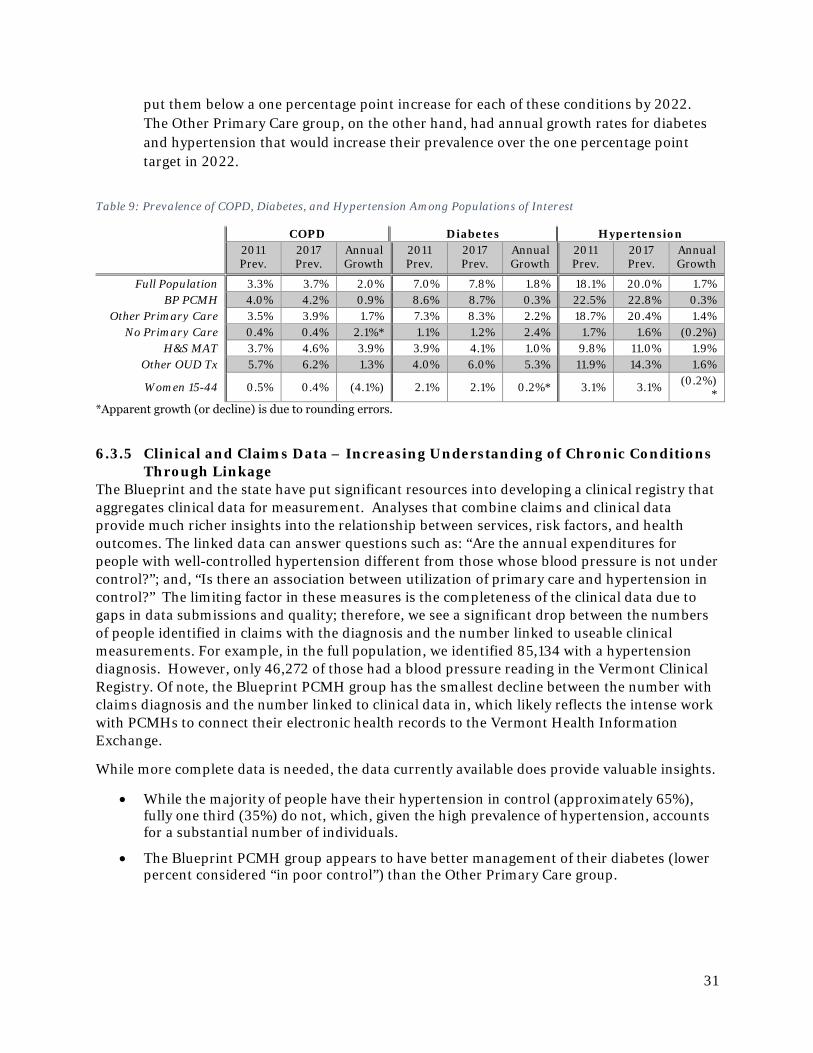
• The 2016 COPD prevalence in VHCURES was 3.6%. With the annual growth listed below in Table 8, the 2022 COPD is projected to be 4.0%, less than a one percentage point increase.
• The 2016 diabetes prevalence 7.5%. With the below annual growth rate, the 2022 diabetes prevalence is projected to be 8.4%, just under a one percentage point increase.
• The 2016 prevalence of hypertension was 19.4%. With the below annual growth rate, the 2022 prevalence is projected to be 21.5%, more than a two-percentage point increase.
Regarding the subpopulation groups:
• The Blueprint PCMH group had the highest prevalence in all conditions yet it had the lowest annual growth rates based on claims, setting this group on a trajectory that would
4 For example, the 2016 prevalence of COPD reported in by BRFSS was 6%. Under the Agreement, Vermont is seeking to keep prevalence under 7% by 2022. The 2016 prevalence of diabetes reported in BRFSS was 8%; therefore, the target 9% or less. Hypertension’s prevalence in 2017 was 26% (2016 not reported, so the target would be 27% or less.
31
put them below a one percentage point increase for each of these conditions by 2022. The Other Primary Care group, on the other hand, had annual growth rates for diabetes and hypertension that would increase their prevalence over the one percentage point target in 2022.
Table 9: Prevalence of COPD, Diabetes, and Hypertension Among Populations of Interest
COPD Diabetes Hypertension 2011 Prev.
2017 Prev.
Annual Growth
2011 Prev.
2017 Prev.
Annual Growth
2011 Prev.
2017 Prev.
Annual Growth
Full Population 3.3% 3.7% 2.0% 7.0% 7.8% 1.8% 18.1% 20.0% 1.7% BP PCMH 4.0% 4.2% 0.9% 8.6% 8.7% 0.3% 22.5% 22.8% 0.3%
Other Primary Care 3.5% 3.9% 1.7% 7.3% 8.3% 2.2% 18.7% 20.4% 1.4% No Primary Care 0.4% 0.4% 2.1%* 1.1% 1.2% 2.4% 1.7% 1.6% (0.2%)
H&S MAT 3.7% 4.6% 3.9% 3.9% 4.1% 1.0% 9.8% 11.0% 1.9% Other OUD Tx 5.7% 6.2% 1.3% 4.0% 6.0% 5.3% 11.9% 14.3% 1.6%
Women 15-44 0.5% 0.4% (4.1%) 2.1% 2.1% 0.2%* 3.1% 3.1% (0.2%)*
*Apparent growth (or decline) is due to rounding errors.
6.3.5 Clinical and Claims Data – Increasing Understanding of Chronic Conditions Through Linkage
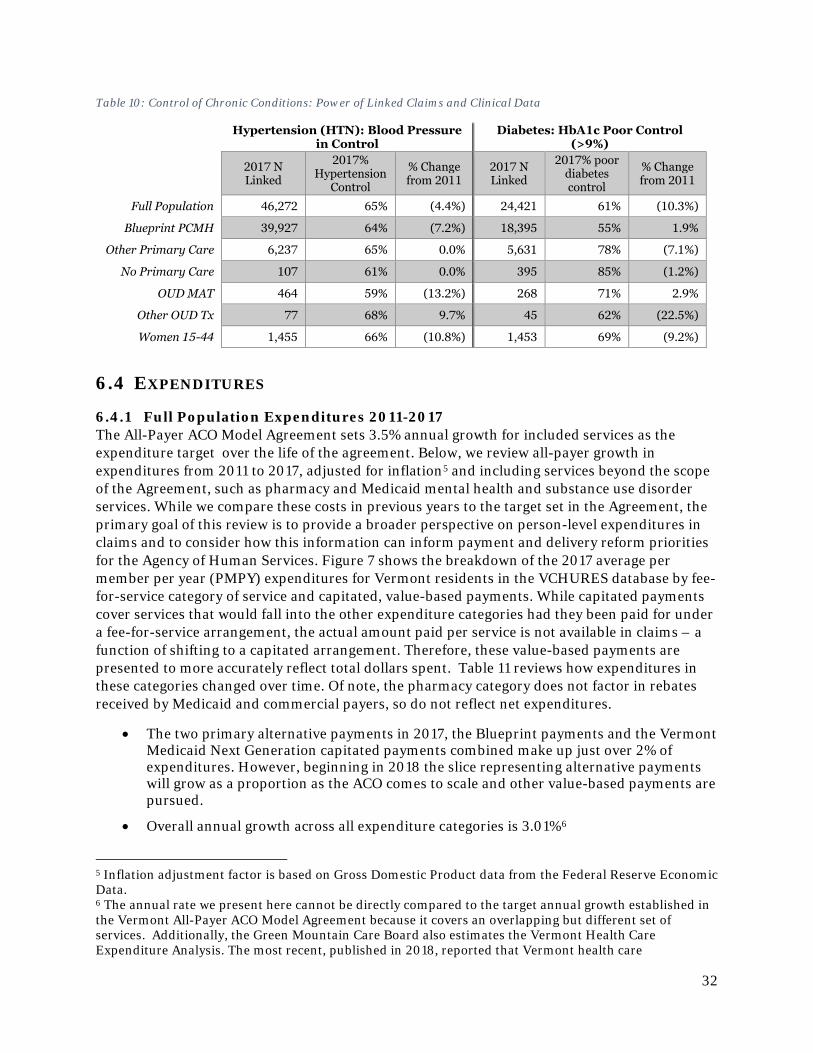
The Blueprint and the state have put significant resources into developing a clinical registry that aggregates clinical data for measurement. Analyses that combine claims and clinical data provide much richer insights into the relationship between services, risk factors, and health outcomes. The linked data can answer questions such as: “Are the annual expenditures for people with well-controlled hypertension different from those whose blood pressure is not under control?”; and, “Is there an association between utilization of primary care and hypertension in control?” The limiting factor in these measures is the completeness of the clinical data due to gaps in data submissions and quality; therefore, we see a significant drop between the numbers of people identified in claims with the diagnosis and the number linked to useable clinical measurements. For example, in the full population, we identified 85,134 with a hypertension diagnosis. However, only 46,272 of those had a blood pressure reading in the Vermont Clinical Registry. Of note, the Blueprint PCMH group has the smallest decline between the number with claims diagnosis and the number linked to clinical data in, which likely reflects the intense work with PCMHs to connect their electronic health records to the Vermont Health Information Exchange.
While more complete data is needed, the data currently available does provide valuable insights.
• While the majority of people have their hypertension in control (approximately 65%), fully one third (35%) do not, which, given the high prevalence of hypertension, accounts for a substantial number of individuals.
• The Blueprint PCMH group appears to have better management of their diabetes (lower percent considered “in poor control”) than the Other Primary Care group.
32
Table 10: Control of Chronic Conditions: Power of Linked Claims and Clinical Data
Hypertension (HTN): Blood Pressure in Control
Diabetes: HbA1c Poor Control (>9%)
2017 N Linked
2017% Hypertension
Control
% Change from 2011
2017 N Linked
2017% poor diabetes control
% Change from 2011
Full Population 46,272 65% (4.4%) 24,421 61% (10.3%)
Blueprint PCMH 39,927 64% (7.2%) 18,395 55% 1.9%
Other Primary Care 6,237 65% 0.0% 5,631 78% (7.1%)
No Primary Care 107 61% 0.0% 395 85% (1.2%)
OUD MAT 464 59% (13.2%) 268 71% 2.9%
Other OUD Tx 77 68% 9.7% 45 62% (22.5%)
Women 15-44 1,455 66% (10.8%) 1,453 69% (9.2%)
6.4 EXPENDITURES
6.4.1 Full Population Expenditures 2011-2017 The All-Payer ACO Model Agreement sets 3.5% annual growth for included services as the expenditure target over the life of the agreement. Below, we review all-payer growth in expenditures from 2011 to 2017, adjusted for inflation5 and including services beyond the scope of the Agreement, such as pharmacy and Medicaid mental health and substance use disorder services. While we compare these costs in previous years to the target set in the Agreement, the primary goal of this review is to provide a broader perspective on person-level expenditures in claims and to consider how this information can inform payment and delivery reform priorities for the Agency of Human Services. Figure 7 shows the breakdown of the 2017 average per member per year (PMPY) expenditures for Vermont residents in the VCHURES database by fee-for-service category of service and capitated, value-based payments. While capitated payments cover services that would fall into the other expenditure categories had they been paid for under a fee-for-service arrangement, the actual amount paid per service is not available in claims – a function of shifting to a capitated arrangement. Therefore, these value-based payments are presented to more accurately reflect total dollars spent. Table 11 reviews how expenditures in these categories changed over time. Of note, the pharmacy category does not factor in rebates received by Medicaid and commercial payers, so do not reflect net expenditures.
• The two primary alternative payments in 2017, the Blueprint payments and the Vermont Medicaid Next Generation capitated payments combined make up just over 2% of expenditures. However, beginning in 2018 the slice representing alternative payments will grow as a proportion as the ACO comes to scale and other value-based payments are pursued.
• Overall annual growth across all expenditure categories is 3.01%6
5 Inflation adjustment factor is based on Gross Domestic Product data from the Federal Reserve Economic Data. 6 The annual rate we present here cannot be directly compared to the target annual growth established in the Vermont All-Payer ACO Model Agreement because it covers an overlapping but different set of services. Additionally, the Green Mountain Care Board also estimates the Vermont Health Care Expenditure Analysis. The most recent, published in 2018, reported that Vermont health care
33
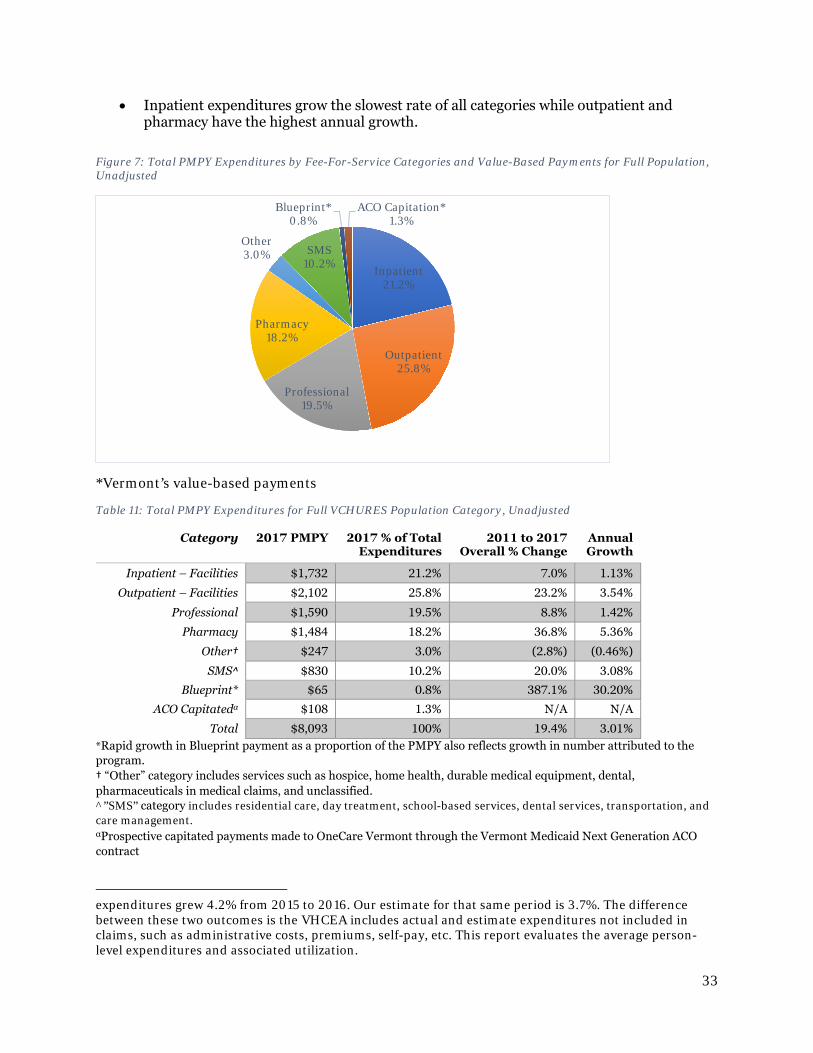
• Inpatient expenditures grow the slowest rate of all categories while outpatient and pharmacy have the highest annual growth.
Figure 7: Total PMPY Expenditures by Fee-For-Service Categories and Value-Based Payments for Full Population, Unadjusted
*Vermont’s value-based payments
Table 11: Total PMPY Expenditures for Full VCHURES Population Category, Unadjusted
Category 2017 PMPY 2017 % of Total Expenditures
2011 to 2017 Overall % Change
Annual Growth
Inpatient – Facilities $1,732 21.2% 7.0% 1.13%
Outpatient – Facilities $2,102 25.8% 23.2% 3.54%
Professional $1,590 19.5% 8.8% 1.42%
Pharmacy $1,484 18.2% 36.8% 5.36%
Other† $247 3.0% (2.8%) (0.46%)
SMS^ $830 10.2% 20.0% 3.08%
Blueprint* $65 0.8% 387.1% 30.20%
ACO Capitatedα $108 1.3% N/A N/A
Total $8,093 100% 19.4% 3.01% *Rapid growth in Blueprint payment as a proportion of the PMPY also reflects growth in number attributed to the program. † “Other” category includes services such as hospice, home health, durable medical equipment, dental, pharmaceuticals in medical claims, and unclassified. ^”SMS” category includes residential care, day treatment, school-based services, dental services, transportation, and care management. αProspective capitated payments made to OneCare Vermont through the Vermont Medicaid Next Generation ACO contract
expenditures grew 4.2% from 2015 to 2016. Our estimate for that same period is 3.7%. The difference between these two outcomes is the VHCEA includes actual and estimate expenditures not included in claims, such as administrative costs, premiums, self-pay, etc. This report evaluates the average person-level expenditures and associated utilization.
Inpatient21.2%
Outpatient25.8%
Professional19.5%
Pharmacy18.2%
Other3.0% SMS
10.2%
Blueprint*0.8%
ACO Capitation*1.3%
34
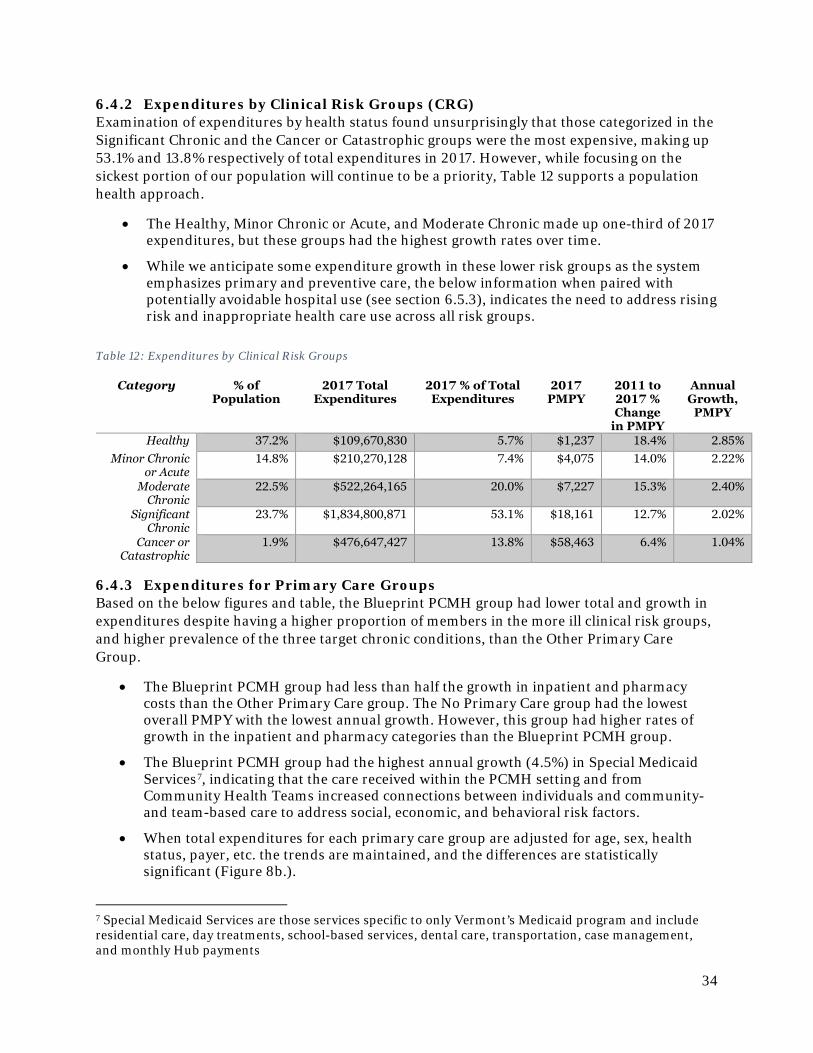
6.4.2 Expenditures by Clinical Risk Groups (CRG) Examination of expenditures by health status found unsurprisingly that those categorized in the Significant Chronic and the Cancer or Catastrophic groups were the most expensive, making up 53.1% and 13.8% respectively of total expenditures in 2017. However, while focusing on the sickest portion of our population will continue to be a priority, Table 12 supports a population health approach.
• The Healthy, Minor Chronic or Acute, and Moderate Chronic made up one-third of 2017 expenditures, but these groups had the highest growth rates over time.
• While we anticipate some expenditure growth in these lower risk groups as the system emphasizes primary and preventive care, the below information when paired with potentially avoidable hospital use (see section 6.5.3), indicates the need to address rising risk and inappropriate health care use across all risk groups.
Table 12: Expenditures by Clinical Risk Groups
6.4.3 Expenditures for Primary Care Groups Based on the below figures and table, the Blueprint PCMH group had lower total and growth in expenditures despite having a higher proportion of members in the more ill clinical risk groups, and higher prevalence of the three target chronic conditions, than the Other Primary Care Group.
• The Blueprint PCMH group had less than half the growth in inpatient and pharmacy costs than the Other Primary Care group. The No Primary Care group had the lowest overall PMPY with the lowest annual growth. However, this group had higher rates of growth in the inpatient and pharmacy categories than the Blueprint PCMH group.
• The Blueprint PCMH group had the highest annual growth (4.5%) in Special Medicaid Services7, indicating that the care received within the PCMH setting and from Community Health Teams increased connections between individuals and community- and team-based care to address social, economic, and behavioral risk factors.
• When total expenditures for each primary care group are adjusted for age, sex, health status, payer, etc. the trends are maintained, and the differences are statistically significant (Figure 8b.).
7 Special Medicaid Services are those services specific to only Vermont’s Medicaid program and include residential care, day treatments, school-based services, dental care, transportation, case management, and monthly Hub payments
Category % of Population
2017 Total Expenditures
2017 % of Total Expenditures
2017 PMPY
2011 to 2017 % Change
in PMPY
Annual Growth,
PMPY
Healthy 37.2% $109,670,830 5.7% $1,237 18.4% 2.85% Minor Chronic
or Acute 14.8% $210,270,128 7.4% $4,075 14.0% 2.22%
Moderate Chronic
22.5% $522,264,165 20.0% $7,227 15.3% 2.40%
Significant Chronic
23.7% $1,834,800,871 53.1% $18,161 12.7% 2.02%
Cancer or Catastrophic
1.9% $476,647,427 13.8% $58,463 6.4% 1.04%
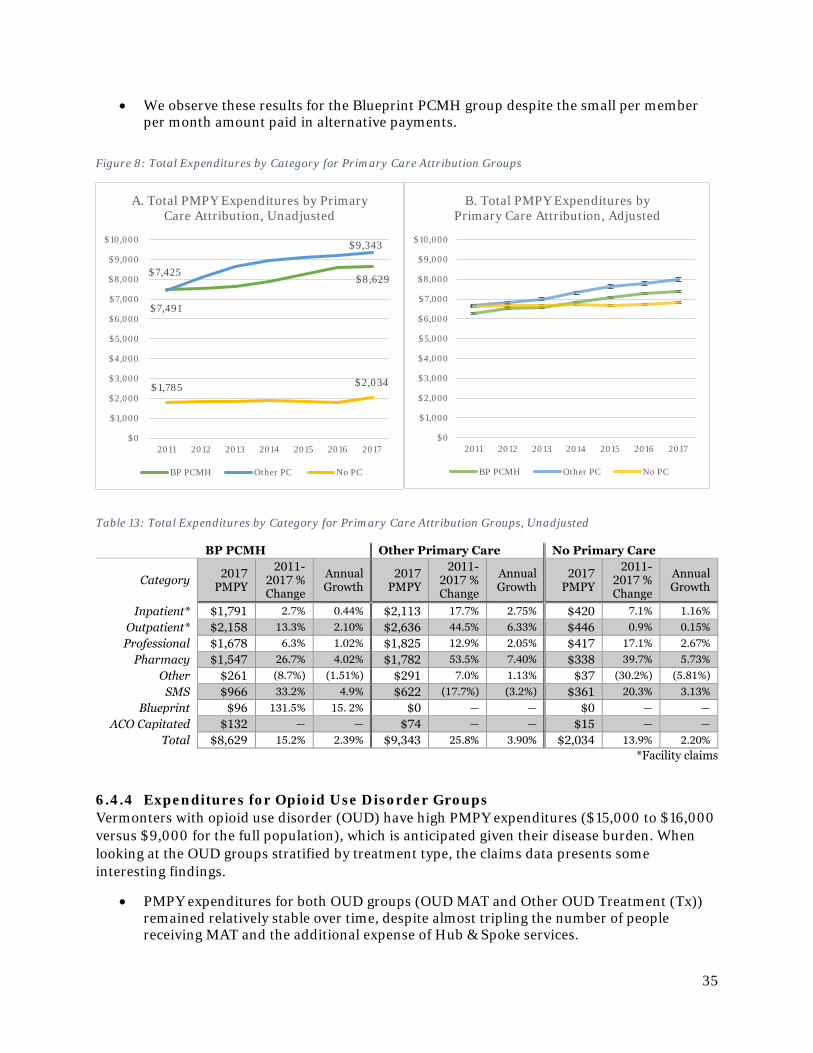
35
• We observe these results for the Blueprint PCMH group despite the small per member per month amount paid in alternative payments.
Figure 8: Total Expenditures by Category for Primary Care Attribution Groups
Table 13: Total Expenditures by Category for Primary Care Attribution Groups, Unadjusted
BP PCMH Other Primary Care No Primary Care
Category 2017 PMPY
2011-2017 % Change
Annual Growth
2017 PMPY
2011-2017 % Change
Annual Growth
2017 PMPY
2011-2017 % Change
Annual Growth
Inpatient* $1,791 2.7% 0.44% $2,113 17.7% 2.75% $420 7.1% 1.16% Outpatient* $2,158 13.3% 2.10% $2,636 44.5% 6.33% $446 0.9% 0.15% Professional $1,678 6.3% 1.02% $1,825 12.9% 2.05% $417 17.1% 2.67%
Pharmacy $1,547 26.7% 4.02% $1,782 53.5% 7.40% $338 39.7% 5.73% Other $261 (8.7%) (1.51%) $291 7.0% 1.13% $37 (30.2%) (5.81%)
SMS $966 33.2% 4.9% $622 (17.7%) (3.2%) $361 20.3% 3.13% Blueprint $96 131.5% 15. 2% $0 — — $0 — —
ACO Capitated $132 — — $74 — — $15 — — Total $8,629 15.2% 2.39% $9,343 25.8% 3.90% $2,034 13.9% 2.20%
*Facility claims
6.4.4 Expenditures for Opioid Use Disorder Groups Vermonters with opioid use disorder (OUD) have high PMPY expenditures ($15,000 to $16,000 versus $9,000 for the full population), which is anticipated given their disease burden. When looking at the OUD groups stratified by treatment type, the claims data presents some interesting findings.
• PMPY expenditures for both OUD groups (OUD MAT and Other OUD Treatment (Tx)) remained relatively stable over time, despite almost tripling the number of people receiving MAT and the additional expense of Hub & Spoke services.
$7,491
$8,629 $7,425
$9,343
$1,785 $2,034
$0
$1,000
$2,000
$3,000
$4,000
$5,000
$6,000
$7,000
$8,000
$9,000
$10,000
2011 2012 2013 2014 2015 2016 2017
A. Total PMPY Expenditures by Primary Care Attribution, Unadjusted
BP PCMH Other PC No PC
$0
$1,000
$2,000
$3,000
$4,000
$5,000
$6,000
$7,000
$8,000
$9,000
$10,000
2011 2012 2013 2014 2015 2016 2017
B. Total PMPY Expenditures by Primary Care Attribution, Adjusted
BP PCMH Other PC No PC
36
• Both OUD MAT and Other OUD Tx had similar total cost of care but different distributions across expenditure categories.
o OUD MAT had lower and declining inpatient and outpatient expenditures.
o OUD MAT had increasing amount spent on Spoke staff beginning in 2013 and in SMS, which includes Hub monthly payments.
o OUD MAT group has higher proportion of their total expenditures due to pharmacy costs, which include treatment medication such as buprenorphine. However, pharmacy expenditures for the OUD MAT group are decreasing over time while pharmacy expenditures for the Other OUD Treatment group are increasing over time.
• A greater proportion of expenditures for the OUD MAT group went toward appropriate OUD treatment costs and the group showed reduced expenditures for other medical services relative to the Other OUD Treatment group.
• The spike in 2015 expenditures in the OUD MAT group include a rapid increase in urinalysis or drug testing. This data does not reflect the impact of a settlement that the state reached with the testing laboratories for over $5 million in over-billing in 2015. While the cost of urinalysis does not appear to have returned to pre-2013 levels, it has come down significantly since 2015.
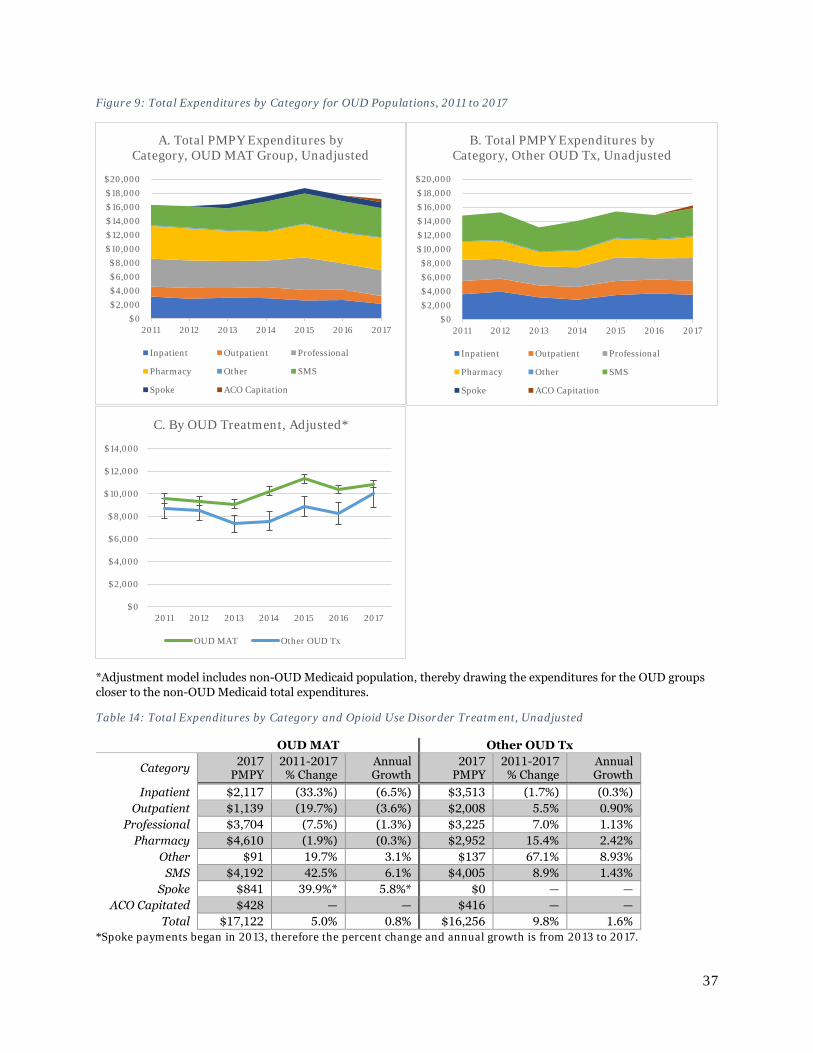
37
Figure 9: Total Expenditures by Category for OUD Populations, 2011 to 2017
*Adjustment model includes non-OUD Medicaid population, thereby drawing the expenditures for the OUD groups closer to the non-OUD Medicaid total expenditures.
Table 14: Total Expenditures by Category and Opioid Use Disorder Treatment, Unadjusted
OUD MAT Other OUD Tx
Category 2017 PMPY
2011-2017 % Change
Annual Growth
2017 PMPY
2011-2017 % Change
Annual Growth
Inpatient $2,117 (33.3%) (6.5%) $3,513 (1.7%) (0.3%) Outpatient $1,139 (19.7%) (3.6%) $2,008 5.5% 0.90%
Professional $3,704 (7.5%) (1.3%) $3,225 7.0% 1.13% Pharmacy $4,610 (1.9%) (0.3%) $2,952 15.4% 2.42%
Other $91 19.7% 3.1% $137 67.1% 8.93% SMS $4,192 42.5% 6.1% $4,005 8.9% 1.43%
Spoke $841 39.9%* 5.8%* $0 — — ACO Capitated $428 — — $416 — —
Total $17,122 5.0% 0.8% $16,256 9.8% 1.6% *Spoke payments began in 2013, therefore the percent change and annual growth is from 2013 to 2017.
$0$2,000$4,000$6,000$8,000
$10,000$12,000$14,000$16,000$18,000$20,000
2011 2012 2013 2014 2015 2016 2017
A. Total PMPY Expenditures by Category, OUD MAT Group, Unadjusted
Inpatient Outpatient Professional
Pharmacy Other SMS
Spoke ACO Capitation
$0$2,000$4,000$6,000$8,000
$10,000$12,000$14,000$16,000$18,000$20,000
2011 2012 2013 2014 2015 2016 2017
B. Total PMPY Expenditures by Category, Other OUD Tx, Unadjusted
Inpatient Outpatient Professional
Pharmacy Other SMS
Spoke ACO Capitation
$0
$2,000
$4,000
$6,000
$8,000
$10,000
$12,000
$14,000
2011 2012 2013 2014 2015 2016 2017
C. By OUD Treatment, Adjusted*
OUD MAT Other OUD Tx
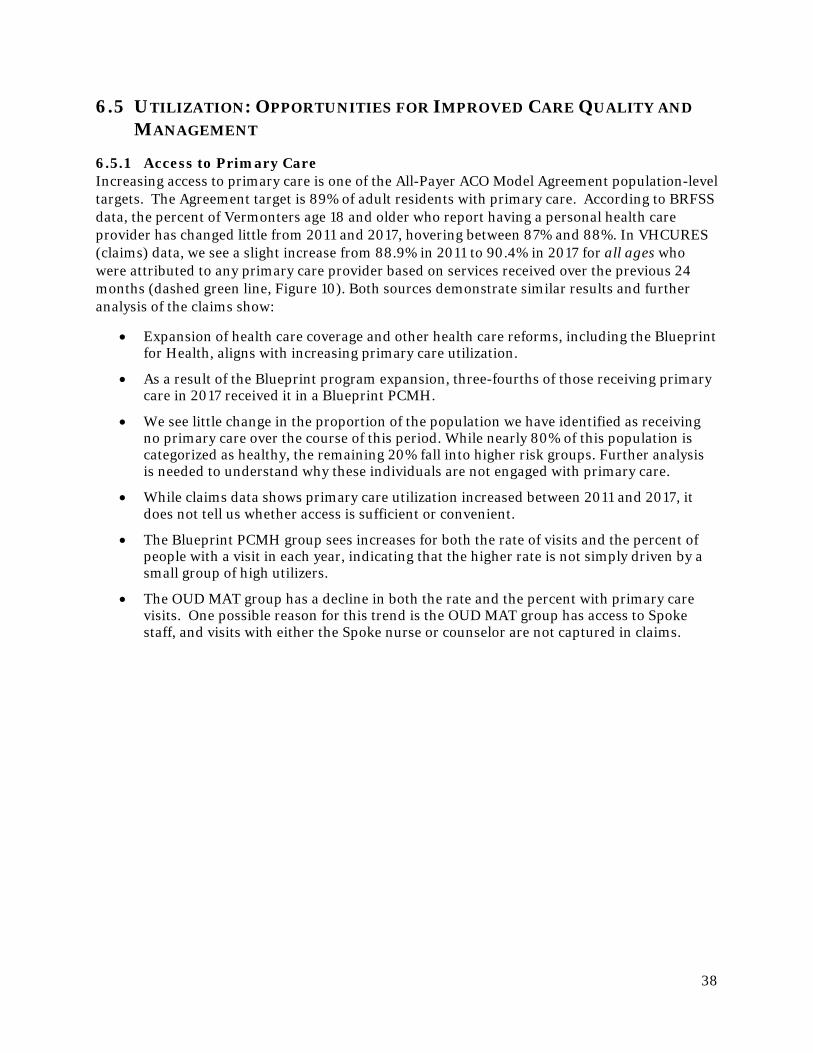
38
6.5 UTILIZATION: OPPORTUNITIES FOR IMPROVED CARE QUALITY AND MANAGEMENT
6.5.1 Access to Primary Care Increasing access to primary care is one of the All-Payer ACO Model Agreement population-level targets. The Agreement target is 89% of adult residents with primary care. According to BRFSS data, the percent of Vermonters age 18 and older who report having a personal health care provider has changed little from 2011 and 2017, hovering between 87% and 88%. In VHCURES (claims) data, we see a slight increase from 88.9% in 2011 to 90.4% in 2017 for all ages who were attributed to any primary care provider based on services received over the previous 24 months (dashed green line, Figure 10). Both sources demonstrate similar results and further analysis of the claims show:
• Expansion of health care coverage and other health care reforms, including the Blueprint for Health, aligns with increasing primary care utilization.
• As a result of the Blueprint program expansion, three-fourths of those receiving primary care in 2017 received it in a Blueprint PCMH.
• We see little change in the proportion of the population we have identified as receiving no primary care over the course of this period. While nearly 80% of this population is categorized as healthy, the remaining 20% fall into higher risk groups. Further analysis is needed to understand why these individuals are not engaged with primary care.
• While claims data shows primary care utilization increased between 2011 and 2017, it does not tell us whether access is sufficient or convenient.
• The Blueprint PCMH group sees increases for both the rate of visits and the percent of people with a visit in each year, indicating that the higher rate is not simply driven by a small group of high utilizers.
• The OUD MAT group has a decline in both the rate and the percent with primary care visits. One possible reason for this trend is the OUD MAT group has access to Spoke staff, and visits with either the Spoke nurse or counselor are not captured in claims.
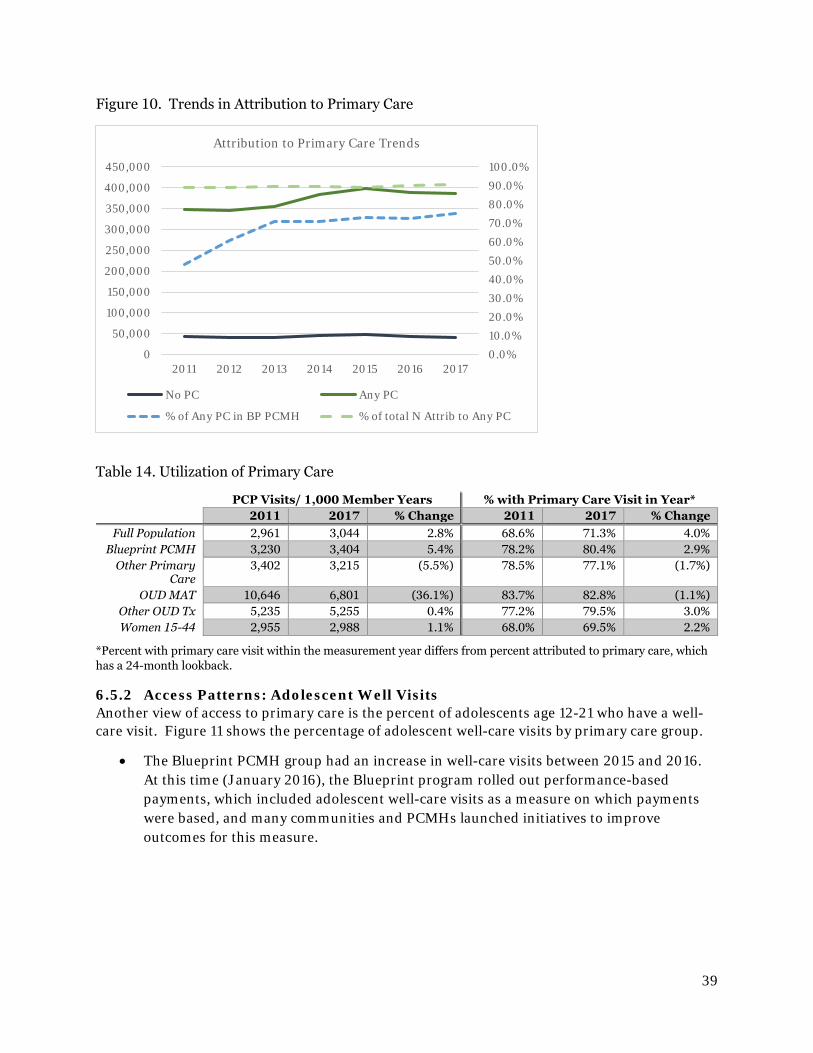
39
Figure 10. Trends in Attribution to Primary Care
Table 14. Utilization of Primary Care
PCP Visits/ 1,000 Member Years % with Primary Care Visit in Year* 2011 2017 % Change 2011 2017 % Change
Full Population 2,961 3,044 2.8% 68.6% 71.3% 4.0% Blueprint PCMH 3,230 3,404 5.4% 78.2% 80.4% 2.9%
Other Primary Care
3,402 3,215 (5.5%) 78.5% 77.1% (1.7%)
OUD MAT 10,646 6,801 (36.1%) 83.7% 82.8% (1.1%) Other OUD Tx 5,235 5,255 0.4% 77.2% 79.5% 3.0% Women 15-44 2,955 2,988 1.1% 68.0% 69.5% 2.2%
*Percent with primary care visit within the measurement year differs from percent attributed to primary care, which has a 24-month lookback.
6.5.2 Access Patterns: Adolescent Well Visits Another view of access to primary care is the percent of adolescents age 12-21 who have a well-care visit. Figure 11 shows the percentage of adolescent well-care visits by primary care group.
• The Blueprint PCMH group had an increase in well-care visits between 2015 and 2016. At this time (January 2016), the Blueprint program rolled out performance-based payments, which included adolescent well-care visits as a measure on which payments were based, and many communities and PCMHs launched initiatives to improve outcomes for this measure.
0.0%
10.0%
20.0%
30.0%
40.0%
50.0%
60.0%
70.0%
80.0%
90.0%
100.0%
0
50,000
100,000
150,000
200,000
250,000
300,000
350,000
400,000
450,000
2011 2012 2013 2014 2015 2016 2017
Attribution to Primary Care Trends
No PC Any PC
% of Any PC in BP PCMH % of total N Attrib to Any PC
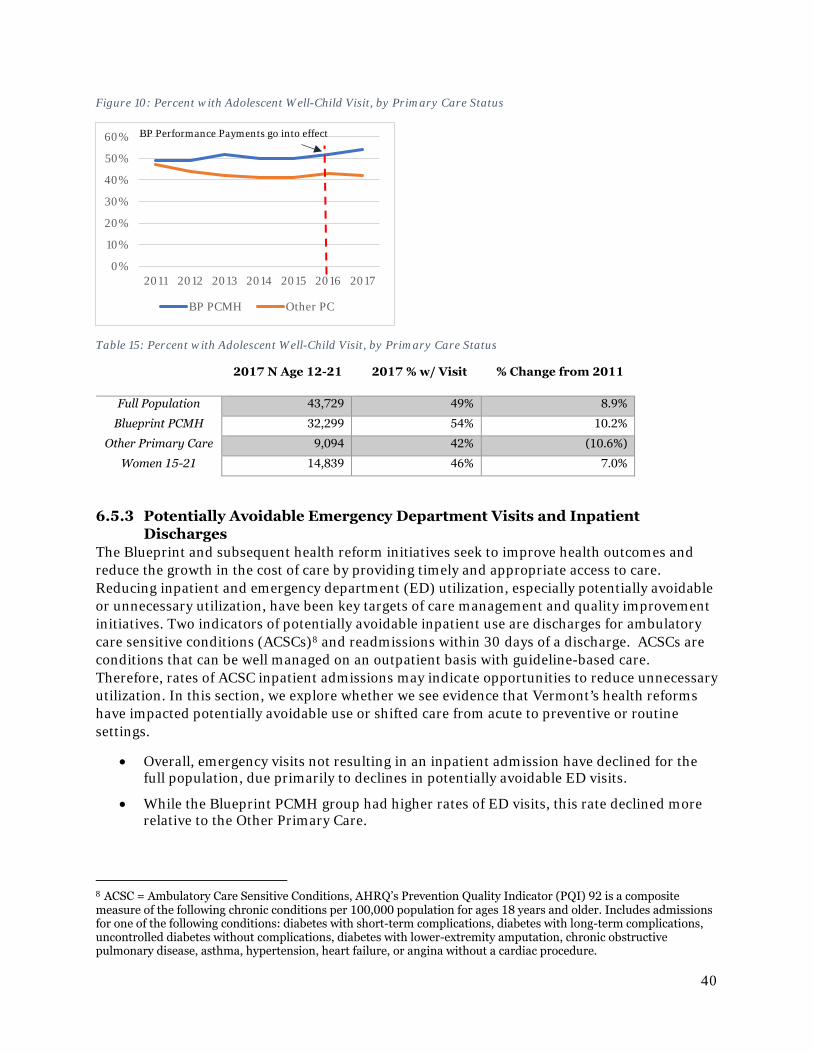
40
Figure 10: Percent with Adolescent Well-Child Visit, by Primary Care Status
Table 15: Percent with Adolescent Well-Child Visit, by Primary Care Status
2017 N Age 12-21 2017 % w/ Visit % Change from 2011
Full Population 43,729 49% 8.9%
Blueprint PCMH 32,299 54% 10.2%
Other Primary Care 9,094 42% (10.6%)
Women 15-21 14,839 46% 7.0%
6.5.3 Potentially Avoidable Emergency Department Visits and Inpatient Discharges
The Blueprint and subsequent health reform initiatives seek to improve health outcomes and reduce the growth in the cost of care by providing timely and appropriate access to care. Reducing inpatient and emergency department (ED) utilization, especially potentially avoidable or unnecessary utilization, have been key targets of care management and quality improvement initiatives. Two indicators of potentially avoidable inpatient use are discharges for ambulatory care sensitive conditions (ACSCs)8 and readmissions within 30 days of a discharge. ACSCs are conditions that can be well managed on an outpatient basis with guideline-based care. Therefore, rates of ACSC inpatient admissions may indicate opportunities to reduce unnecessary utilization. In this section, we explore whether we see evidence that Vermont’s health reforms have impacted potentially avoidable use or shifted care from acute to preventive or routine settings.
• Overall, emergency visits not resulting in an inpatient admission have declined for the full population, due primarily to declines in potentially avoidable ED visits.
• While the Blueprint PCMH group had higher rates of ED visits, this rate declined more relative to the Other Primary Care.
8 ACSC = Ambulatory Care Sensitive Conditions, AHRQ’s Prevention Quality Indicator (PQI) 92 is a composite measure of the following chronic conditions per 100,000 population for ages 18 years and older. Includes admissions for one of the following conditions: diabetes with short-term complications, diabetes with long-term complications, uncontrolled diabetes without complications, diabetes with lower-extremity amputation, chronic obstructive pulmonary disease, asthma, hypertension, heart failure, or angina without a cardiac procedure.
0%
10%
20%
30%
40%
50%
60%
2011 2012 2013 2014 2015 2016 2017
BP PCMH Other PC
BP Performance Payments go into effect
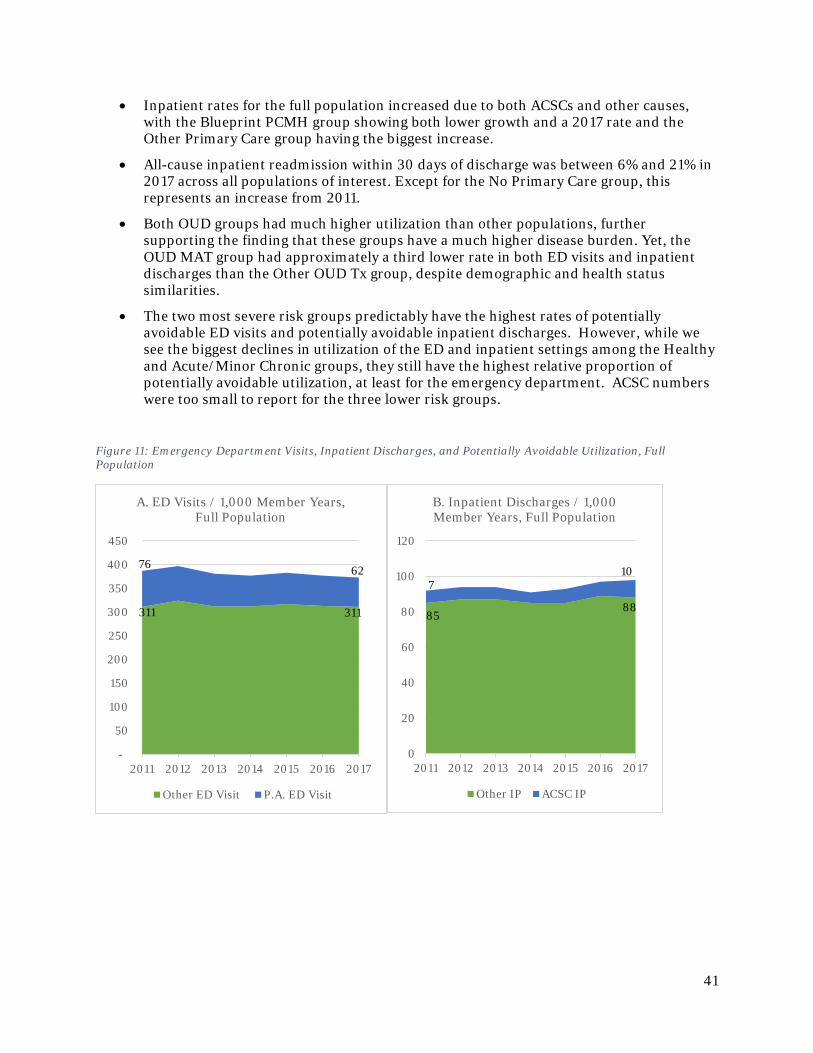
41
• Inpatient rates for the full population increased due to both ACSCs and other causes, with the Blueprint PCMH group showing both lower growth and a 2017 rate and the Other Primary Care group having the biggest increase.
• All-cause inpatient readmission within 30 days of discharge was between 6% and 21% in 2017 across all populations of interest. Except for the No Primary Care group, this represents an increase from 2011.
• Both OUD groups had much higher utilization than other populations, further supporting the finding that these groups have a much higher disease burden. Yet, the OUD MAT group had approximately a third lower rate in both ED visits and inpatient discharges than the Other OUD Tx group, despite demographic and health status similarities.
• The two most severe risk groups predictably have the highest rates of potentially avoidable ED visits and potentially avoidable inpatient discharges. However, while we see the biggest declines in utilization of the ED and inpatient settings among the Healthy and Acute/Minor Chronic groups, they still have the highest relative proportion of potentially avoidable utilization, at least for the emergency department. ACSC numbers were too small to report for the three lower risk groups.
Figure 11: Emergency Department Visits, Inpatient Discharges, and Potentially Avoidable Utilization, Full Population
-
50
100
150
200
250
300
350
400
450
2011 2012 2013 2014 2015 2016 2017
A. ED Visits / 1,000 Member Years, Full Population
Other ED Visit P.A. ED Visit
0
20
40
60
80
100
120
2011 2012 2013 2014 2015 2016 2017
B. Inpatient Discharges / 1,000 Member Years, Full Population
Other IP ACSC IP
710
8588
76 62
311 311
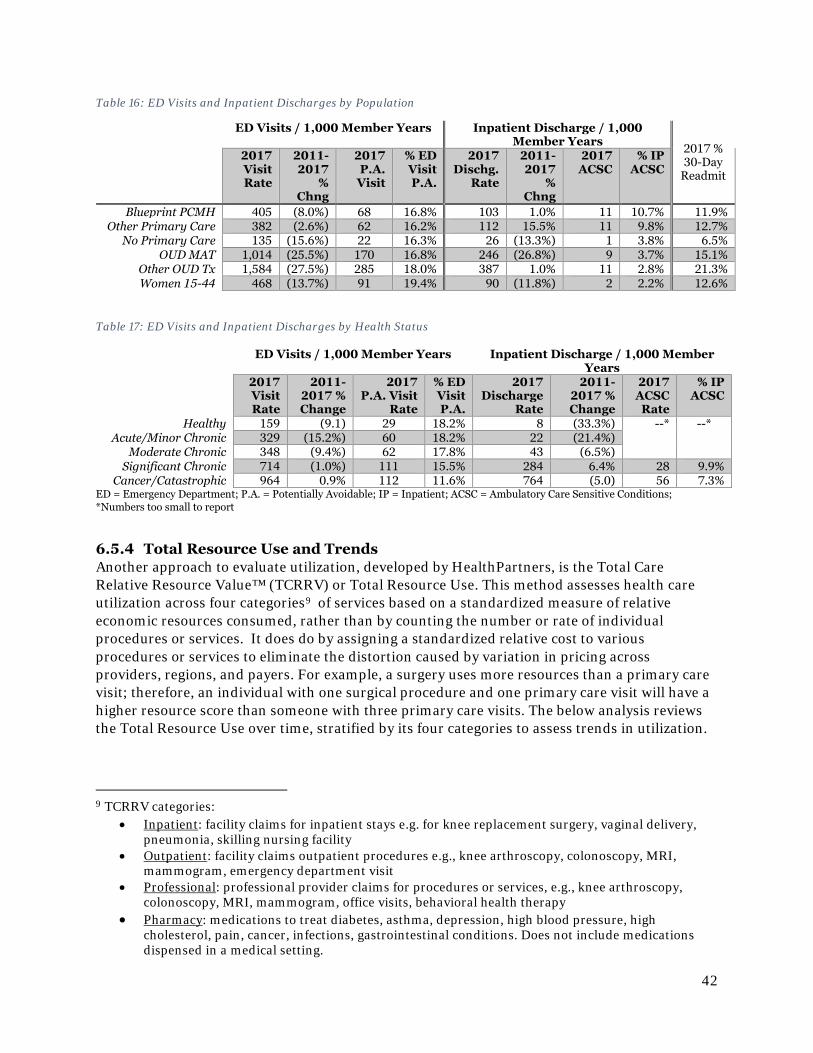
42
Table 16: ED Visits and Inpatient Discharges by Population
Table 17: ED Visits and Inpatient Discharges by Health Status
ED = Emergency Department; P.A. = Potentially Avoidable; IP = Inpatient; ACSC = Ambulatory Care Sensitive Conditions; *Numbers too small to report
6.5.4 Total Resource Use and Trends Another approach to evaluate utilization, developed by HealthPartners, is the Total Care Relative Resource Value™ (TCRRV) or Total Resource Use. This method assesses health care utilization across four categories9 of services based on a standardized measure of relative economic resources consumed, rather than by counting the number or rate of individual procedures or services. It does do by assigning a standardized relative cost to various procedures or services to eliminate the distortion caused by variation in pricing across providers, regions, and payers. For example, a surgery uses more resources than a primary care visit; therefore, an individual with one surgical procedure and one primary care visit will have a higher resource score than someone with three primary care visits. The below analysis reviews the Total Resource Use over time, stratified by its four categories to assess trends in utilization.
9 TCRRV categories:
• Inpatient: facility claims for inpatient stays e.g. for knee replacement surgery, vaginal delivery, pneumonia, skilling nursing facility
• Outpatient: facility claims outpatient procedures e.g., knee arthroscopy, colonoscopy, MRI, mammogram, emergency department visit
• Professional: professional provider claims for procedures or services, e.g., knee arthroscopy, colonoscopy, MRI, mammogram, office visits, behavioral health therapy
• Pharmacy: medications to treat diabetes, asthma, depression, high blood pressure, high cholesterol, pain, cancer, infections, gastrointestinal conditions. Does not include medications dispensed in a medical setting.
ED Visits / 1,000 Member Years Inpatient Discharge / 1,000 Member Years 2017 %
30-Day Readmit
2017 Visit Rate
2011-2017
% Chng
2017 P.A. Visit
% ED Visit P.A.
2017 Dischg.
Rate
2011-2017
% Chng
2017 ACSC
% IP ACSC
Blueprint PCMH 405 (8.0%) 68 16.8% 103 1.0% 11 10.7% 11.9% Other Primary Care 382 (2.6%) 62 16.2% 112 15.5% 11 9.8% 12.7%
No Primary Care 135 (15.6%) 22 16.3% 26 (13.3%) 1 3.8% 6.5% OUD MAT 1,014 (25.5%) 170 16.8% 246 (26.8%) 9 3.7% 15.1%
Other OUD Tx 1,584 (27.5%) 285 18.0% 387 1.0% 11 2.8% 21.3% Women 15-44 468 (13.7%) 91 19.4% 90 (11.8%) 2 2.2% 12.6%
ED Visits / 1,000 Member Years Inpatient Discharge / 1,000 Member Years
2017 Visit Rate
2011-2017 % Change
2017 P.A. Visit
Rate
% ED Visit P.A.
2017 Discharge
Rate
2011-2017 % Change
2017 ACSC Rate
% IP ACSC
Healthy 159 (9.1) 29 18.2% 8 (33.3%) --* --* Acute/Minor Chronic 329 (15.2%) 60 18.2% 22 (21.4%)
Moderate Chronic 348 (9.4%) 62 17.8% 43 (6.5%) Significant Chronic 714 (1.0%) 111 15.5% 284 6.4% 28 9.9%
Cancer/Catastrophic 964 0.9% 112 11.6% 764 (5.0) 56 7.3%
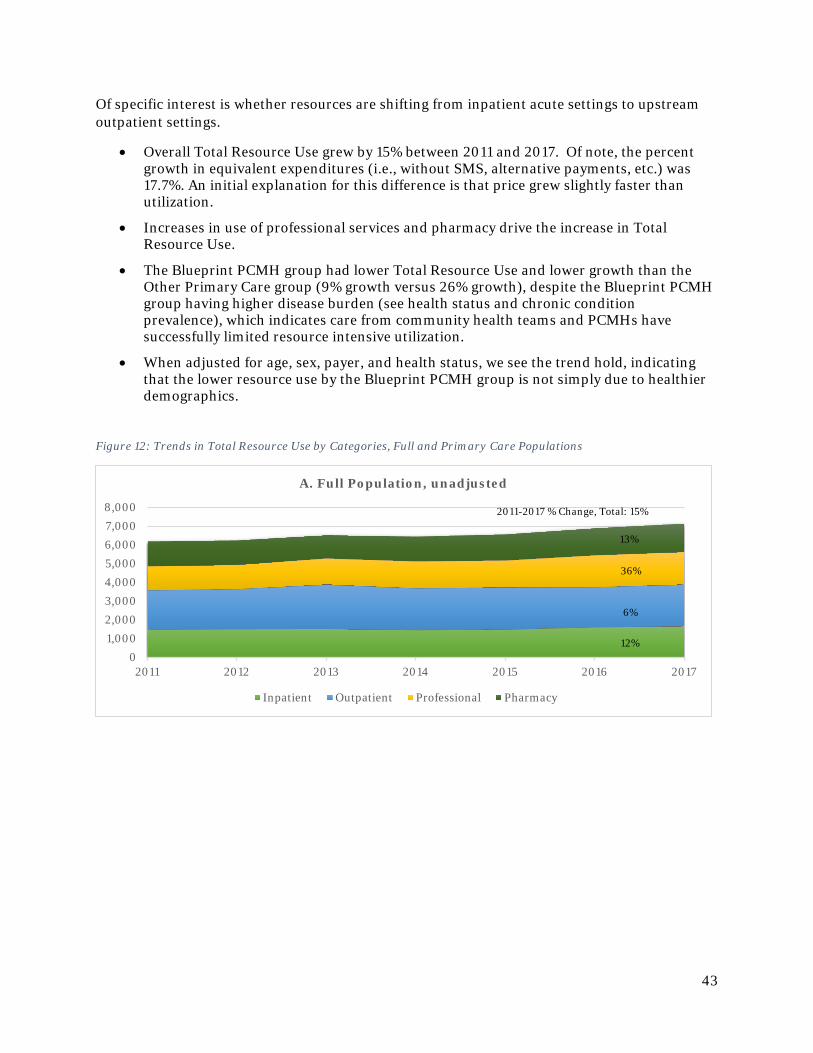
43
Of specific interest is whether resources are shifting from inpatient acute settings to upstream outpatient settings.
• Overall Total Resource Use grew by 15% between 2011 and 2017. Of note, the percent growth in equivalent expenditures (i.e., without SMS, alternative payments, etc.) was 17.7%. An initial explanation for this difference is that price grew slightly faster than utilization.
• Increases in use of professional services and pharmacy drive the increase in Total Resource Use.
• The Blueprint PCMH group had lower Total Resource Use and lower growth than the Other Primary Care group (9% growth versus 26% growth), despite the Blueprint PCMH group having higher disease burden (see health status and chronic condition prevalence), which indicates care from community health teams and PCMHs have successfully limited resource intensive utilization.
• When adjusted for age, sex, payer, and health status, we see the trend hold, indicating that the lower resource use by the Blueprint PCMH group is not simply due to healthier demographics.
Figure 12: Trends in Total Resource Use by Categories, Full and Primary Care Populations
01,0002,0003,0004,0005,0006,0007,0008,000
2011 2012 2013 2014 2015 2016 2017
A. Full Population, unadjusted
Inpatient Outpatient Professional Pharmacy
2011-2017 % Change, Total: 15%
13%
36%
6%
12%
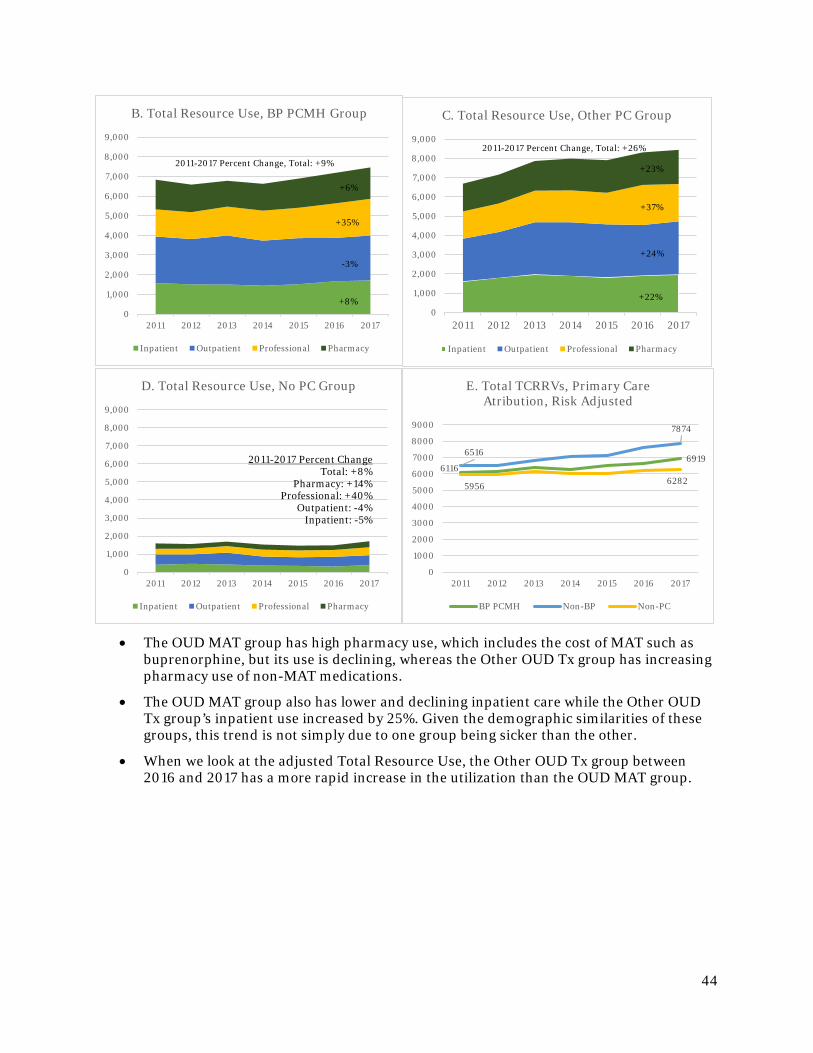
44
• The OUD MAT group has high pharmacy use, which includes the cost of MAT such as buprenorphine, but its use is declining, whereas the Other OUD Tx group has increasing pharmacy use of non-MAT medications.
• The OUD MAT group also has lower and declining inpatient care while the Other OUD Tx group’s inpatient use increased by 25%. Given the demographic similarities of these groups, this trend is not simply due to one group being sicker than the other.
• When we look at the adjusted Total Resource Use, the Other OUD Tx group between 2016 and 2017 has a more rapid increase in the utilization than the OUD MAT group.
0
1,000
2,000
3,000
4,000
5,000
6,000
7,000
8,000
9,000
2011 2012 2013 2014 2015 2016 2017
B. Total Resource Use, BP PCMH Group
Inpatient Outpatient Professional Pharmacy
2011-2017 Percent Change, Total: +9%
+6%
+35%
-3%
+8%0
1,000
2,000
3,000
4,000
5,000
6,000
7,000
8,000
9,000
2011 2012 2013 2014 2015 2016 2017
C. Total Resource Use, Other PC Group
Inpatient Outpatient Professional Pharmacy
2011-2017 Percent Change, Total: +26%
+23%
+37%
+24%
+22%
0
1,000
2,000
3,000
4,000
5,000
6,000
7,000
8,000
9,000
2011 2012 2013 2014 2015 2016 2017
D. Total Resource Use, No PC Group
Inpatient Outpatient Professional Pharmacy
2011-2017 Percent ChangeTotal: +8%
Pharmacy: +14%Professional: +40%
Outpatient: -4%Inpatient: -5%
61166919
6516
7874
5956 6282
0
1000
2000
3000
4000
5000
6000
7000
8000
9000
2011 2012 2013 2014 2015 2016 2017
E. Total TCRRVs, Primary Care Atribution, Risk Adjusted
BP PCMH Non-BP Non-PC
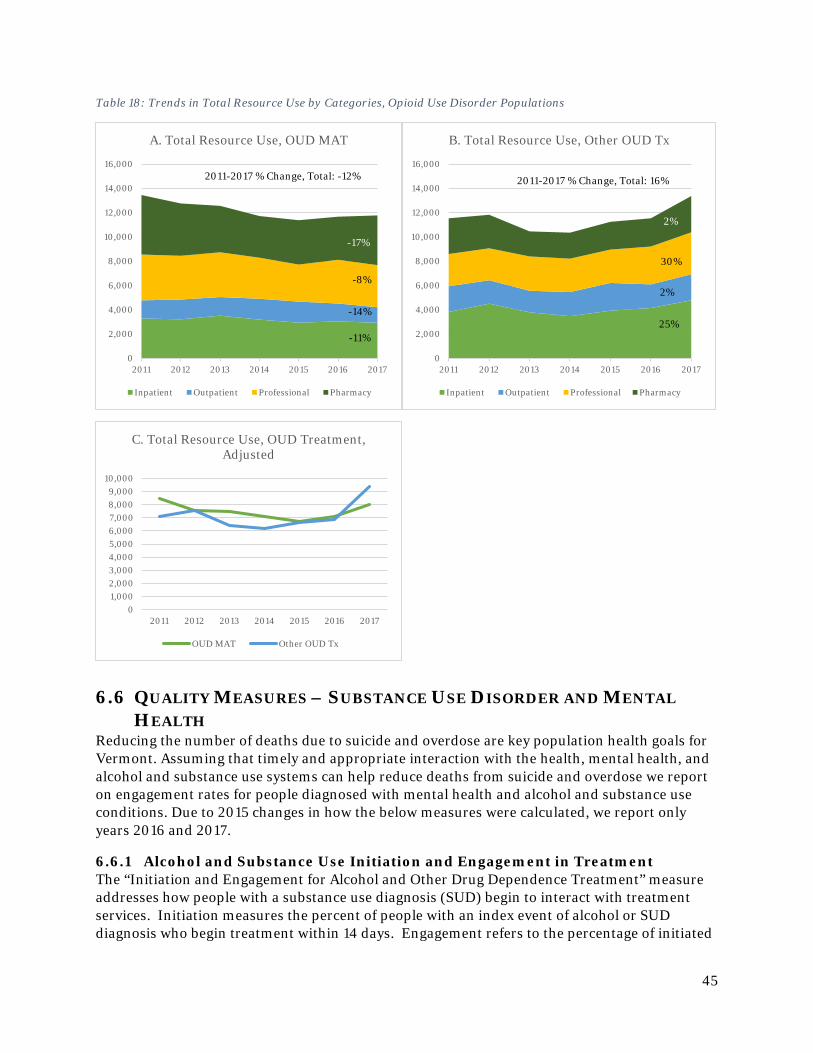
45
Table 18: Trends in Total Resource Use by Categories, Opioid Use Disorder Populations
6.6 QUALITY MEASURES – SUBSTANCE USE DISORDER AND MENTAL HEALTH
Reducing the number of deaths due to suicide and overdose are key population health goals for Vermont. Assuming that timely and appropriate interaction with the health, mental health, and alcohol and substance use systems can help reduce deaths from suicide and overdose we report on engagement rates for people diagnosed with mental health and alcohol and substance use conditions. Due to 2015 changes in how the below measures were calculated, we report only years 2016 and 2017.
6.6.1 Alcohol and Substance Use Initiation and Engagement in Treatment The “Initiation and Engagement for Alcohol and Other Drug Dependence Treatment” measure addresses how people with a substance use diagnosis (SUD) begin to interact with treatment services. Initiation measures the percent of people with an index event of alcohol or SUD diagnosis who begin treatment within 14 days. Engagement refers to the percentage of initiated
0
2,000
4,000
6,000
8,000
10,000
12,000
14,000
16,000
2011 2012 2013 2014 2015 2016 2017
A. Total Resource Use, OUD MAT
Inpatient Outpatient Professional Pharmacy
2011-2017 % Change, Total: -12%
-17%
-8%
-14%
-11%
0
2,000
4,000
6,000
8,000
10,000
12,000
14,000
16,000
2011 2012 2013 2014 2015 2016 2017
B. Total Resource Use, Other OUD Tx
Inpatient Outpatient Professional Pharmacy
2%
30%
2%
25%
2011-2017 % Change, Total: 16%
01,0002,0003,0004,0005,0006,0007,0008,0009,000
10,000
2011 2012 2013 2014 2015 2016 2017
C. Total Resource Use, OUD Treatment, Adjusted
OUD MAT Other OUD Tx
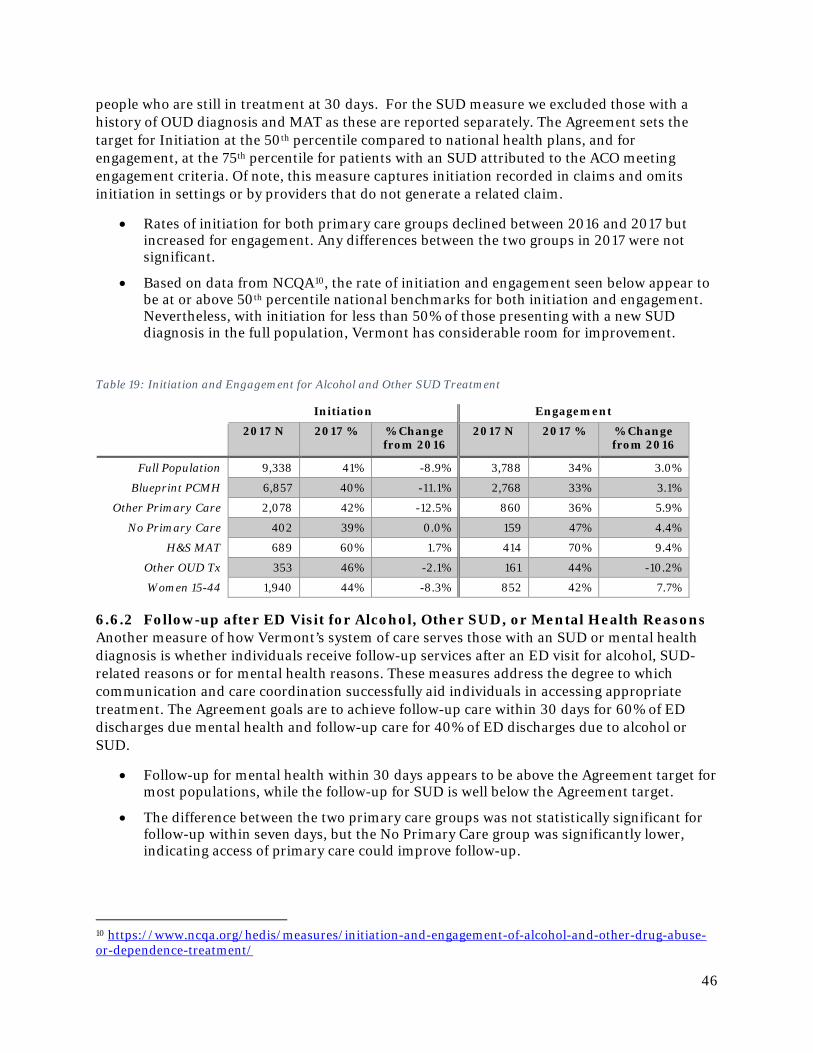
46
people who are still in treatment at 30 days. For the SUD measure we excluded those with a history of OUD diagnosis and MAT as these are reported separately. The Agreement sets the target for Initiation at the 50th percentile compared to national health plans, and for engagement, at the 75th percentile for patients with an SUD attributed to the ACO meeting engagement criteria. Of note, this measure captures initiation recorded in claims and omits initiation in settings or by providers that do not generate a related claim.
• Rates of initiation for both primary care groups declined between 2016 and 2017 but increased for engagement. Any differences between the two groups in 2017 were not significant.
• Based on data from NCQA10, the rate of initiation and engagement seen below appear to be at or above 50th percentile national benchmarks for both initiation and engagement. Nevertheless, with initiation for less than 50% of those presenting with a new SUD diagnosis in the full population, Vermont has considerable room for improvement.
Table 19: Initiation and Engagement for Alcohol and Other SUD Treatment
Initiation Engagement
2017 N 2017 % % Change from 2016
2017 N 2017 % % Change from 2016
Full Population 9,338 41% -8.9% 3,788 34% 3.0%
Blueprint PCMH 6,857 40% -11.1% 2,768 33% 3.1%
Other Primary Care 2,078 42% -12.5% 860 36% 5.9%
No Primary Care 402 39% 0.0% 159 47% 4.4%
H&S MAT 689 60% 1.7% 414 70% 9.4%
Other OUD Tx 353 46% -2.1% 161 44% -10.2%
Women 15-44 1,940 44% -8.3% 852 42% 7.7%
6.6.2 Follow-up after ED Visit for Alcohol, Other SUD, or Mental Health Reasons Another measure of how Vermont’s system of care serves those with an SUD or mental health diagnosis is whether individuals receive follow-up services after an ED visit for alcohol, SUD-related reasons or for mental health reasons. These measures address the degree to which communication and care coordination successfully aid individuals in accessing appropriate treatment. The Agreement goals are to achieve follow-up care within 30 days for 60% of ED discharges due mental health and follow-up care for 40% of ED discharges due to alcohol or SUD.
• Follow-up for mental health within 30 days appears to be above the Agreement target for most populations, while the follow-up for SUD is well below the Agreement target.
• The difference between the two primary care groups was not statistically significant for follow-up within seven days, but the No Primary Care group was significantly lower, indicating access of primary care could improve follow-up.
10 https://www.ncqa.org/hedis/measures/initiation-and-engagement-of-alcohol-and-other-drug-abuse-or-dependence-treatment/
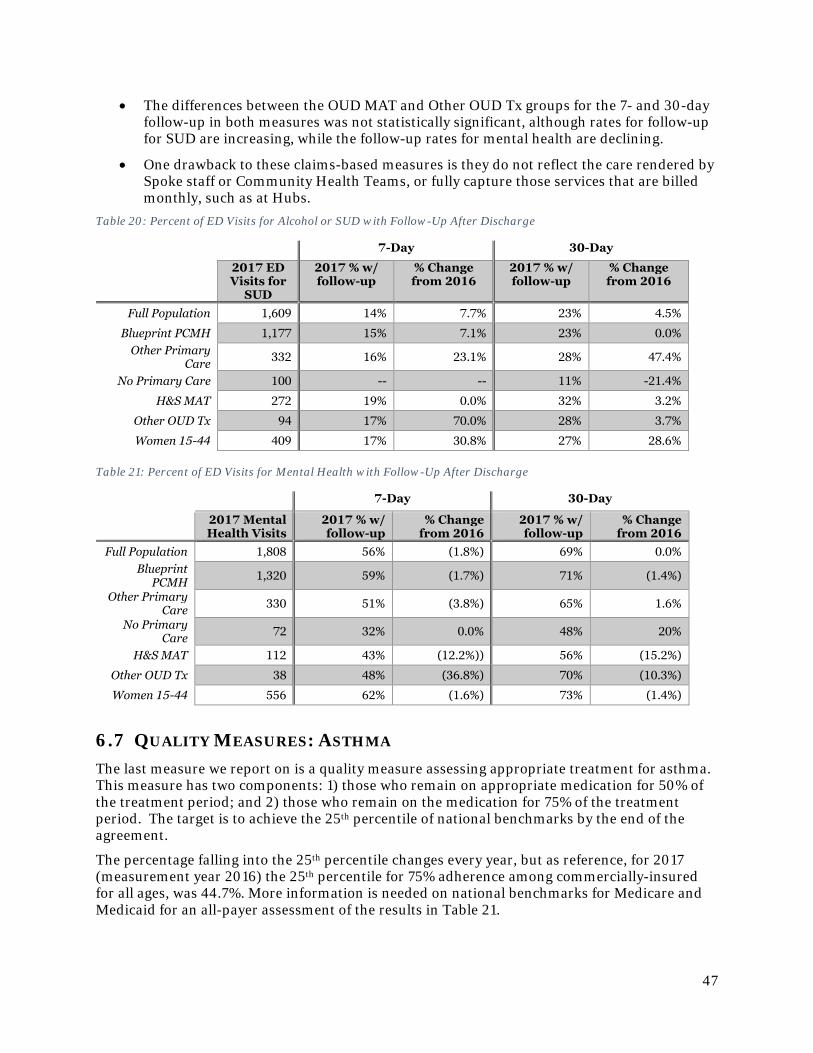
47
• The differences between the OUD MAT and Other OUD Tx groups for the 7- and 30-day follow-up in both measures was not statistically significant, although rates for follow-up for SUD are increasing, while the follow-up rates for mental health are declining.
• One drawback to these claims-based measures is they do not reflect the care rendered by Spoke staff or Community Health Teams, or fully capture those services that are billed monthly, such as at Hubs.
Table 20: Percent of ED Visits for Alcohol or SUD with Follow-Up After Discharge
7-Day 30-Day
2017 ED Visits for
SUD
2017 % w/ follow-up
% Change from 2016
2017 % w/ follow-up
% Change from 2016
Full Population 1,609 14% 7.7% 23% 4.5%
Blueprint PCMH 1,177 15% 7.1% 23% 0.0% Other Primary
Care 332 16% 23.1% 28% 47.4%
No Primary Care 100 -- -- 11% -21.4%
H&S MAT 272 19% 0.0% 32% 3.2%
Other OUD Tx 94 17% 70.0% 28% 3.7%
Women 15-44 409 17% 30.8% 27% 28.6% Table 21: Percent of ED Visits for Mental Health with Follow-Up After Discharge
7-Day 30-Day
2017 Mental Health Visits
2017 % w/ follow-up
% Change from 2016
2017 % w/ follow-up
% Change from 2016
Full Population 1,808 56% (1.8%) 69% 0.0% Blueprint
PCMH 1,320 59% (1.7%) 71% (1.4%)
Other Primary Care 330 51% (3.8%) 65% 1.6%
No Primary Care 72 32% 0.0% 48% 20%
H&S MAT 112 43% (12.2%)) 56% (15.2%)
Other OUD Tx 38 48% (36.8%) 70% (10.3%)
Women 15-44 556 62% (1.6%) 73% (1.4%)
6.7 QUALITY MEASURES: ASTHMA The last measure we report on is a quality measure assessing appropriate treatment for asthma. This measure has two components: 1) those who remain on appropriate medication for 50% of the treatment period; and 2) those who remain on the medication for 75% of the treatment period. The target is to achieve the 25th percentile of national benchmarks by the end of the agreement.
The percentage falling into the 25th percentile changes every year, but as reference, for 2017 (measurement year 2016) the 25th percentile for 75% adherence among commercially-insured for all ages, was 44.7%. More information is needed on national benchmarks for Medicare and Medicaid for an all-payer assessment of the results in Table 21.
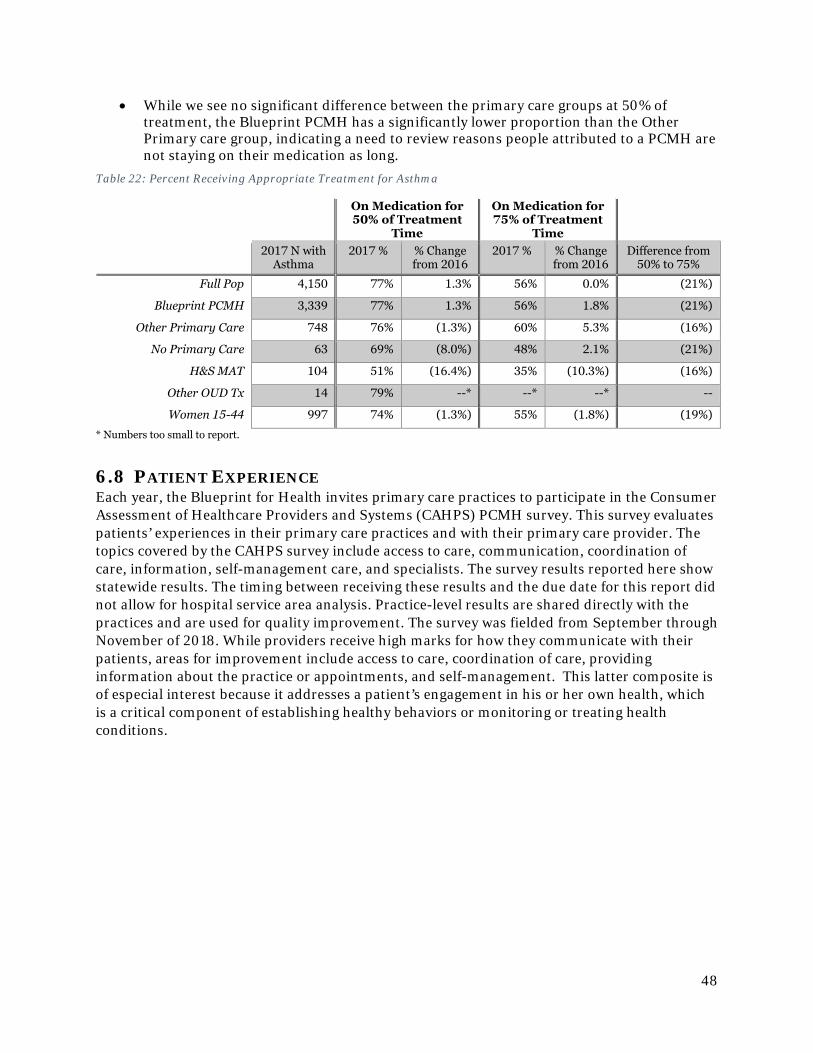
48
• While we see no significant difference between the primary care groups at 50% of treatment, the Blueprint PCMH has a significantly lower proportion than the Other Primary care group, indicating a need to review reasons people attributed to a PCMH are not staying on their medication as long.
Table 22: Percent Receiving Appropriate Treatment for Asthma
On Medication for 50% of Treatment
Time
On Medication for 75% of Treatment
Time
2017 N with
Asthma 2017 % % Change
from 2016 2017 % % Change
from 2016 Difference from
50% to 75%
Full Pop 4,150 77% 1.3% 56% 0.0% (21%)
Blueprint PCMH 3,339 77% 1.3% 56% 1.8% (21%)
Other Primary Care 748 76% (1.3%) 60% 5.3% (16%)
No Primary Care 63 69% (8.0%) 48% 2.1% (21%)
H&S MAT 104 51% (16.4%) 35% (10.3%) (16%)
Other OUD Tx 14 79% --* --* --* --
Women 15-44 997 74% (1.3%) 55% (1.8%) (19%)
* Numbers too small to report.
6.8 PATIENT EXPERIENCE Each year, the Blueprint for Health invites primary care practices to participate in the Consumer Assessment of Healthcare Providers and Systems (CAHPS) PCMH survey. This survey evaluates patients’ experiences in their primary care practices and with their primary care provider. The topics covered by the CAHPS survey include access to care, communication, coordination of care, information, self-management care, and specialists. The survey results reported here show statewide results. The timing between receiving these results and the due date for this report did not allow for hospital service area analysis. Practice-level results are shared directly with the practices and are used for quality improvement. The survey was fielded from September through November of 2018. While providers receive high marks for how they communicate with their patients, areas for improvement include access to care, coordination of care, providing information about the practice or appointments, and self-management. This latter composite is of especial interest because it addresses a patient’s engagement in his or her own health, which is a critical component of establishing healthy behaviors or monitoring or treating health conditions.
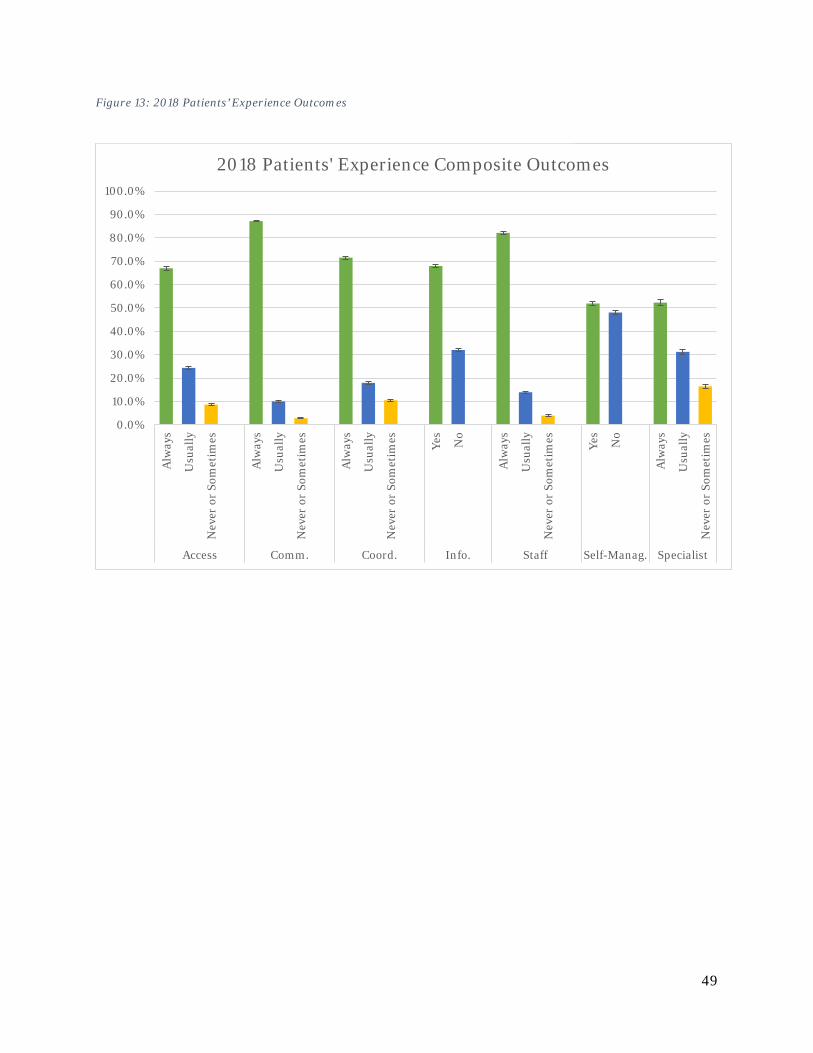
49
0.0%
10.0%
20.0%
30.0%
40.0%
50.0%
60.0%
70.0%
80.0%
90.0%
100.0%
Alw
ays
Usu
ally
Nev
er o
r So
met
imes
Alw
ays
Usu
ally
Nev
er o
r So
met
imes
Alw
ays
Usu
ally
Nev
er o
r So
met
imes Yes
No
Alw
ays
Usu
ally
Nev
er o
r So
met
imes Yes
No
Alw
ays
Usu
ally
Nev
er o
r So
met
imes
Access Comm. Coord. Info. Staff Self-Manag. Specialist
2018 Patients' Experience Composite Outcomes
Figure 13: 2018 Patients’ Experience Outcomes
50
Table 23: Questions Associated with Each Patients' Experience Composite
Access to Care Composite
In the last 6 months, when you contacted this provider's office to get an appointment for care you needed right away, how often did you get an appointment as soon as you needed? In the last 6 months, when you contacted this provider's office during regular office hours, how often did you get an answer to your medical question that same day? In the last 6 months, when you made an appointment for a check-up or routine care with this provider, how often did you get an appointment as soon as you needed?
Communication Composite
In the last 6 months, how often did this provider listen carefully to you? In the last 6 months, how often did this provider show respect for what you had to say? In the last 6 months, how often did this provider explain things in a way that was easy to understand? In the last 6 months, how often did this provider spend enough time with you?
Coordinated Care Composite
In the last 6 months, when this provider ordered a blood test, x-ray, or other test for you, how often did someone from this provider's office follow up to give you those results? In the last 6 months, how often did you and someone from this provider's office talk at each visit about all the prescription medicines you were taking? In the last 6 months, how often did this provider seem to know the important information about your medical history?
Information Composite
Did this provider's office give you information about what to do if you needed care during evenings, weekends, or holidays? Some offices remind patients between visits about tests, treatment or appointments. In the last 6 months, did you get any reminders from this provider's office between visits?
Office Staff Composite
In the last 6 months, how often were clerks and receptionists at this provider's office as helpful as you thought they should be? In the last 6 months, how often did clerks and receptionists at this provider's office treat you with courtesy and respect?
Self-Management Composite
In the last 6 months, did someone from this provider's office ask you if there are things that make it hard for you to take care of your health? In the last 6 months, did someone from this provider's office talk with you about specific goals for your health?
Specialist Composite
In the last 6 months, how often was it easy to get appointments with specialists? In the last 6 months, how often did the specialist you saw most seem to know the important information about your medical history?
6.9 WOMEN’S HEALTH Finally, while we have reported many of the health utilization, expenditures and outcomes for women age 15 to 44 throughout this report, we would also like to call special attention to this group as the constituency of the Blueprint’s Women’s Health Initiative. This program launched in 2017, so our last year of data presented in this report covers the implementation and expansion of this program. Therefore, the results we present in this report serve as assessing women’s health in the period leading up to the Women’s Health Initiative and as a baseline for evaluating the impact of this program on women’s health. Some key outcomes for this group include:
51
• Medicaid enrollment makes up a larger proportion of women 15 to 44 (44.8%) compared to the full population (31.2%). One reason for this difference could be the broader Medicaid eligibility for pregnant women.
• While there has been a slight shift from healthy to higher risk categories, this group remains relatively healthy with low prevalence of the three chronic conditions highlighted in this report. Of those with hypertension that could be linked to clinical data, women in this age group was similar to the full population for in hypertension control, but worse in diabetes.
• Women age 15 to 44 had lower total per member per year expenditures and annual growth was 2.6%.
• Women in this group had slightly lower primary care utilization, but this could also reflect many women relying on their obstetrician-gynecologist for their primary care needs.
• Area for potential improvement include potentially avoidable emergency department visits and readmission within 30 days of an inpatient discharge. Both rates were higher for women age 15-44 than the full population.
As the Blueprint continues its evaluation of the Women’s Health Initiative in 2018 and onward, we will continue to monitor changes in expenditures, settings in which is received care, and potentially avoidable utilization of health services as enhanced care coordination, family planning services, and screening are implemented through the program.
6.10 CONCLUSION The data presented here indicate areas where Vermont’s health system is performing well and where gaps remain. For example, those attributed to a patient-centered medical home in Vermont, despite having higher disease burden, have lower costs and utilization. This pattern holds true regardless of whether the results are crude or adjusted for age, gender, payer, health status, etc. For the population with an OUD diagnosis, despite having similar demographics and health status, those receiving MAT through the Hub & Spoke program have lower medical utilization. However, the rates of potentially avoidable utilization and the low rates of follow-up and engagement in treatment for those with an SUD or mental health condition indicate more work needs to be done.
The shift in how the Blueprint evaluates the services supported through its programs within the context of the broader health system provides valuable findings, but also identifies areas for additional analysis. Future areas for analysis include connecting claims data to other data sets to understand how different services intersect and identify the total per capita costs across sectors. For example, using Vital Statistics to identify women and their newborns, not always an easy or clear task in claims could allow us to see the connections between risk factors, adverse birth outcomes (such as low birthrate), and costs over the first year or two of life. Another type of study could provide a deeper understanding of the dynamics or factors driving the expenditure, utilization, and outcome results seen in this report. For example, a more detailed look at the population with diabetes could reveal comorbidities contributing to cost, impact of treatment adherence on control of diabetes and utilization of services, etc. Future evaluations of this type can inform program design within the Blueprint, such identifying priorities or strategies for improving care management, or support decision-making or allocation of resources across the broader health and human services landscape.
52
7 BLUEPRINT PARTNER PROGRAMS
7.1 SUPPORT AND SERVICES AT HOME (SASH)
7.1.1 About SASH: home-based services helping older Vermonters stay well The SASH model is a caring partnership of non-profit housing, primary care, human service agencies, and hospitals working to support participants’ efforts to remain healthy and safe at home. SASH is currently funded by Medicare through the Next Generation Risk program contract with OneCare Vermont under the All Payer Model agreement. Program participants are typically older Vermonters but also include younger disabled adults. They include Medicare beneficiaries and dually eligible Medicare/Medicaid beneficiaries. Participants may live either in subsidized housing or in residences in the community at large. Each panel of approximately 100 SASH participants is served by a team of one full-time housing-based SASH Care Coordinator and one quarter-time Wellness Nurse. SASH teams focus their efforts on three areas of intervention proven most effective in reducing unnecessary Medicare expenditures:
1. transition support after a hospital or rehabilitation facility stay, 2. self-management education and coaching for chronic conditions and health maintenance,
and 3. care coordination. SASH’s evidence-based practices also include a comprehensive health and wellness assessment for every participant, creation of an individualized care plan, on-site one-on-one coaching and care coordination, and group health and wellness programs.
SASH staff meet regularly with local partners, collectively referred to as SASH teams and typically including representatives from the Blueprint Community Health Team, local Home Health Agencies, Area Agencies on Aging, and mental health providers. A Memorandum of Understanding between all partner organizations formalizes the roles and responsibilities of the team members.
The State of Vermont’s Department of Aging and Independent Living supports Cathedral Square to act as the statewide administrator for SASH, responsible for training, data management and model fidelity. SASH is administered locally by six Designated Regional Housing Organizations (DRHOs) including Cathedral Square. SASH is primarily funded by Medicare – previously as part of the Multi-Payer Advanced Primary Care (MAPCP) demonstration and now through the All-Payer ACO Model agreement. More detail about the SASH program is available at the SASH website https://sashvt.org/.
7.1.2 New article shows slower growth in Medicare expenditures among SASH participants in Cathedral Square sites
In 2018, a study published in the U.S. Department of Housing and Urban Development’s Cityscape journal11 found that while the SASH program does not have a statistically significant 11 Kandilov, Amy, Vince Keyes, Martijn van Hasselt, Alisha Sanders, Noelle Siegfried, Robyn Stone, Patrick Edwards, Aubrey Collins, and Jenna Brophy. 2018. “The Impact of the Vermont Support and Services at Home Program on Healthcare Expenditures,” Cityscape 20 (2): 7-18.
53
impact on Medicare expenditures for all participants in the study’s sample, it does significantly slow the growth in total Medicare expenditures and expenditures for hospital care, emergency department visits, and specialist physician visits for participants in SASH panels in Chittenden County and those panels outside of Chittenden County that are also managed by the Cathedral Square Corporation. The article concluded that “a housing-plus-services model has the potential to slow the growth of healthcare costs.” With mounting evidence of the model’s effectiveness, SASH leadership is exploring ways to better serve its existing participants and opportunities to expand to reach more people.
SASH’s current participant numbers are about the same as they have been for the past several years due to level funding of the program. SASH is funded for 54 panels and each panel is limited to 100 participants in order to best serve each person. SASH would like to be able to expand to serve new affordable housing developments as they are built but would need additional funding to do so. SASH could also add participants through private senior housing, as demonstrated by its recent partnership with Fern Hill. This private non-profit senior housing building has contracted SASH to serve a half-panel (50 people). Prior to this partnership, some building residents were community participants through a neighboring SASH Hub. These residents had such positive experiences that Fern Hill leadership was inspired to approach SASH and become the first privately-funded SASH site.
7.1.3 Piloting enhanced services for SASH participants: home-based supports for diabetes and mental health
SASH continues to fine tune its model, piloting new services to support the health of all participants or specific panels of participants. In 2018 a Centers for Disease Control and Prevention (CDC)-funded pilot tested whether adding a pharmacist to a SASH team would help participants with diabetes or pre-diabetes manage their condition. Pilot activities included education and self-management programs, a public talk by the pharmacist about diabetes, pharmacist participation in SASH team meetings, review of medications and lab results, and select one-on-one meetings between SASH participants and the pharmacist. The pilot helped participants reduce their HbA1c levels (average change of 1%), weight (7.7 lbs.), and LDL cholesterol (35.5 mg/dl). It also helped SASH team members identify several opportunities to improve communication and care – lessons that will inform their ongoing work and will be useful to any broader implementation of this model.
A second 2018 pilot tested the effectiveness of locating mental health resources where people live. OneCare Vermont funded this pilot, which placed a Howard Center clinician at two Cathedral Square SASH housing sites in Chittenden County. The clinician offered flexible and home-based supports including one-on-one formal therapy, informal emotional wellness visits, support groups around such issues as anxiety and depression, and psycho-education programming to residents. Preliminary outcomes include:
1. Greater and faster access to mental health supports – 78% of pilot participants had their first encounter with the clinician within 0-1 days of a referral- with the majority seen the same day.
2. Increased self-management of mental health conditions – 80% of surveyed participants reported being “more able to cope with daily life” due to pilot services.
3. Reduced stigma to seeking mental health supports – 30% of referrals to clinician were self-referrals and almost 80% of surveyed participants felt there was less stigma associated with seeking support for emotional issues due to the pilot.
54
7.1.4 Envisioning home-based health and social supports for families in affordable housing
At the end of 2018 SASH is developing a vision for a new SASH model that would serve families in affordable housing residences to improve wellbeing across many domains – health, nutrition, finance, housing, and more. Initial ideas include adding housing-based staff who would work with residents and their existing community service providers to do the following (and more):
• Expand supplemental food shelf capacity and/or on-site food drops • Partner with summer meals programs to provide on-site meals to children • Support families with getting children to school/child care and end of the school
day transition • Provide nutrition and cooking classes • Provide and/or coordinate health and wellness screenings • Refer to community services.
The model is being designed with community partner and resident input by the staff of Downstreet, Housing Vermont, and Cathedral Square. The team is exploring funding sources for the pilot. Should the pilot be successful, a sustainable funding model will need to be developed to support an ongoing program.
55
7.2 VERMONT CHRONIC CARE INITIATIVE (VCCI)
7.2.1 Evaluating local Blueprint / VCCI alignment, seeking opportunities for budget reductions across both programs
In 2018, Department of Vermont Health Access leadership asked Medicaid Medical Director Scott Strenio and Blueprint leadership to evaluate the alignment of the Blueprint and the Vermont Chronic Care Initiative (VCCI), in order to find the efficiencies across both programs that should be expected with the emergence of the ACO. This work additionally created an opportunity to re-envision the role of VCCI in order to best utilize the skills of program staff to fill a gap in the current system of care for vulnerable individuals participating in Medicaid.
7.2.2 Providers and communities value VCCI’s intensive, flexible care management services
In the listening tour the team learned that providers and communities value the intensity, flexibility, and person-centeredness of VCCI services and appreciate that VCCI staff are highly skilled and highly trained. However, the historic eligibility requirements for people to receive VCCI services (strictly the top 5% of Medicaid utilizers, no dual-eligible members) were a barrier to the services reaching everyone who needed them. In 2018 VCCI adopted a more flexible approach to risk stratification, using data, clinical judgement, and screening to identify people in need of support for current health problems or with rising risk of future problems. This approach is closely aligned with how OneCare Vermont and Blueprint Community Health Teams risk stratify patients.
One notable observation is the intensity of the VCCI case management services. VCCI case management includes elements of care coordination but also includes skills building, intensive self-management support, education, assessment and in-depth planning and monitoring. VCCI case managers maintain smaller client caseloads compared to care coordinators. They work in home or community settings depending on client needs. One listening tour interviewee told VCCI and Blueprint leadership that “VCCI puts a safety net around patients with complex social needs that practice-based care coordinators can’t, providing a higher level of service.” Over time VCCI staff help each of their clients build a team of local providers who they will rely on for longer term health and social supports. Medicaid leadership is keenly interested in monitoring VCCI, Blueprint, and ACO work to determine what lessons may be learned to inform future approaches to care coordination and care coordination investments.
7.2.3 Re-envisioning VCCI services to immediately connect new Medicaid beneficiaries with the right level of care
Informed by these findings, DVHA and Blueprint leadership helped create a vision for VCCI services in the future. Over the course of 2018, the initiative has begun shifting to achieve this vision. Changes include:
7.2.3.1 Aligning with the ACO and Blueprint Model of Care • Using common processes including identifying participants’ goals and care needs,
working to assemble a local care team, and identifying a long-term lead care coordinator. • Adopting risk categories similar to those used by the ACO and screening all new
Medicaid enrollees to determine risk categorization. • Connecting people in risk categories “Level 1” (healthy/well) and “Level 2” (early onset
or stable chronic illness) to primary care (if no current provider) and helping the
56
schedule their first appointments. Additionally, offering people in these categories self-management classes like tobacco cessation or the Diabetes Prevention Program.
• Offering full VCCI services to people in categories “Level 3” (full onset chronic illness and rising risk) and “Level 4” (complex/high-cost with acute catastrophic conditions).
• Systematically adopting common tools introduced in the Integrated Communities Care Management training and used by Blueprint Community Health Teams and the ACO including eco-maps, backwards planning (Camden Cards), root cause analysis, and shared care plans.
• Investigating the possibility of using Care Navigator, the ACO’s tool, to document – aiming for more care team members across organizations to have access to a shared care plan and necessary information about the client.
7.2.3.2 Screening and outreach to New Medicaid Members including Social Determinants of Health
• Focusing on screening and providing services for new Medicaid beneficiaries, who will not be eligible for ACO services, for 6-18 months after Medicaid enrollment (depending on the month of the year when they enroll).
• Including social determinants of health in the screening (using a screening tool borrowed from the Women’s Health Initiative). Food insecurity, housing insecurity, or experience of partner violence immediately results in immediate categorization as Level 3.
• Allowing for re-categorization based on clinical judgement.
7.2.3.3 Implementing Needs Based Eligibility • Moving beyond the top 5% of utilizers and opening services to a broader population,
including dual-eligible beneficiaries. • Accepting referrals from providers for VCCI services for any non-ACO attributed
Medicaid beneficiary.
Each of these changes helps amplify VCCI’s existing strengths – the program’s people and the intensity and flexibility of the services they provide to vulnerable individuals. By screening all Medicaid beneficiaries as soon as they enroll, VCCI is helping people get connected to the appropriate level of care quickly, in a moment before any other service or program is aware of their needs or accountable for their care. The program’s role and services will continue to evolve based on the successes and learnings from the small tests of change it is conducting, always looking to use its team’s strengths to fill gaps in the current system of care.

57
8 HEALTH SERVICE AREA HIGHLIGHTS FOR 2018 The following section offers a by-the-numbers look at Blueprint activities in each health service area along with highlights of the year in the words of each Blueprint Program Manager.
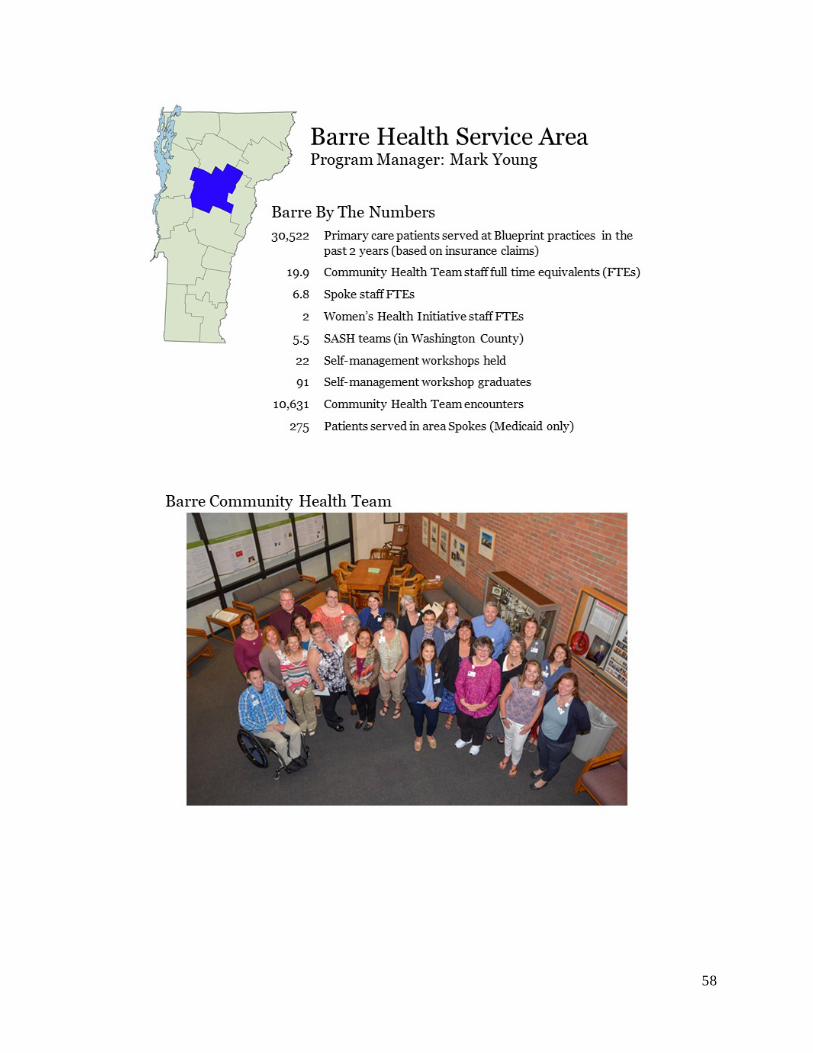
58
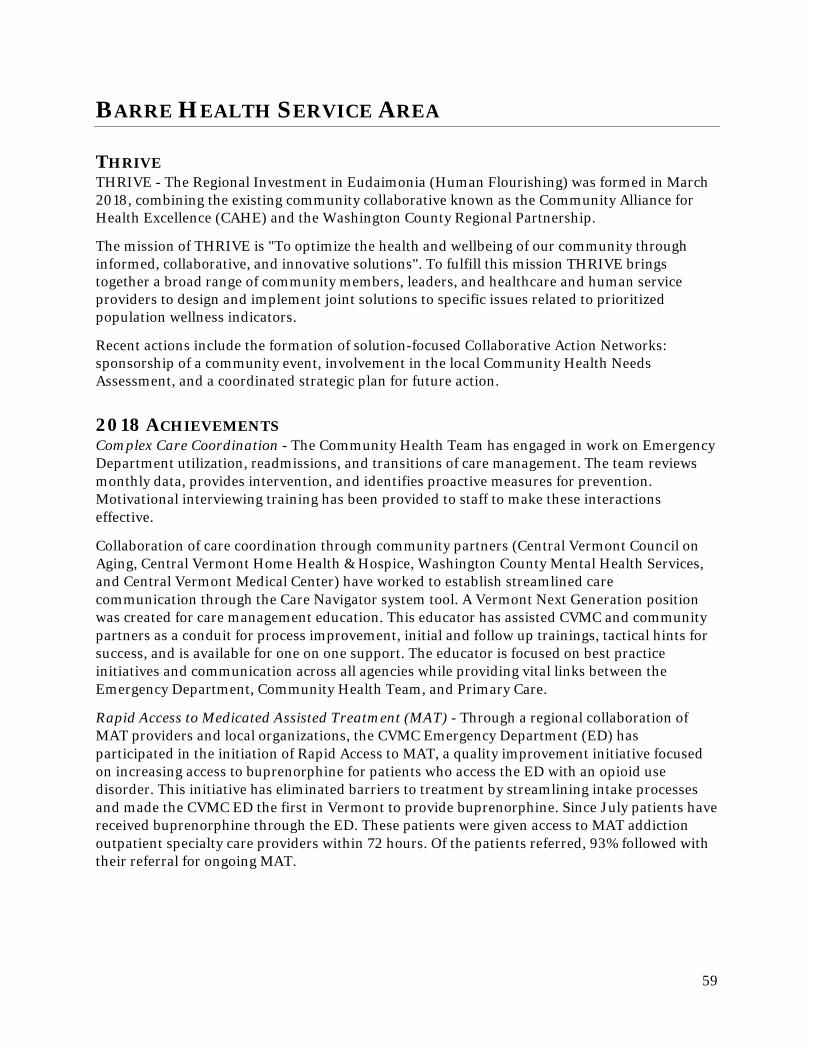
59
BARRE HEALTH SERVICE AREA
THRIVE THRIVE - The Regional Investment in Eudaimonia (Human Flourishing) was formed in March 2018, combining the existing community collaborative known as the Community Alliance for Health Excellence (CAHE) and the Washington County Regional Partnership.
The mission of THRIVE is "To optimize the health and wellbeing of our community through informed, collaborative, and innovative solutions". To fulfill this mission THRIVE brings together a broad range of community members, leaders, and healthcare and human service providers to design and implement joint solutions to specific issues related to prioritized population wellness indicators.
Recent actions include the formation of solution-focused Collaborative Action Networks: sponsorship of a community event, involvement in the local Community Health Needs Assessment, and a coordinated strategic plan for future action.
2018 ACHIEVEMENTS Complex Care Coordination - The Community Health Team has engaged in work on Emergency Department utilization, readmissions, and transitions of care management. The team reviews monthly data, provides intervention, and identifies proactive measures for prevention. Motivational interviewing training has been provided to staff to make these interactions effective.
Collaboration of care coordination through community partners (Central Vermont Council on Aging, Central Vermont Home Health & Hospice, Washington County Mental Health Services, and Central Vermont Medical Center) have worked to establish streamlined care communication through the Care Navigator system tool. A Vermont Next Generation position was created for care management education. This educator has assisted CVMC and community partners as a conduit for process improvement, initial and follow up trainings, tactical hints for success, and is available for one on one support. The educator is focused on best practice initiatives and communication across all agencies while providing vital links between the Emergency Department, Community Health Team, and Primary Care.
Rapid Access to Medicated Assisted Treatment (MAT) - Through a regional collaboration of MAT providers and local organizations, the CVMC Emergency Department (ED) has participated in the initiation of Rapid Access to MAT, a quality improvement initiative focused on increasing access to buprenorphine for patients who access the ED with an opioid use disorder. This initiative has eliminated barriers to treatment by streamlining intake processes and made the CVMC ED the first in Vermont to provide buprenorphine. Since July patients have received buprenorphine through the ED. These patients were given access to MAT addiction outpatient specialty care providers within 72 hours. Of the patients referred, 93% followed with their referral for ongoing MAT.
60
61
BENNINGTON HEALTH SERVICE AREA
BENNINGTON COMMUNITY COLLABORATIVE Goal: Build a high-performing system that supports measurable improvement in the health of the community Purpose: The Bennington Health Service Area (HSA) Community Collaborative (CC) will identify and develop systems to support population health management in the Bennington Health Service Area to improve community health, support appropriate use of resources, and improve personal experience. Definition of Health: (includes individual and community health) Health is a state of complete physical, mental and social well-being and not merely the absence of disease or infirmity. Scope: The scope of the Bennington Community Collaborative is to address population health in the Bennington HSA. The focus will be on quality outcomes, cost and value. The approach will be system-based change utilizing the structures of the Vermont Blueprint for Health, Vermont All Payer Model and the Bennington Accountable Community for Health.
2018 ACHIEVEMENTS
Major Achievements Seven Bennington Health Service Area practices underwent Patient Centered Medical Home Scoring under the 2017 NCQA Standards. All seven practices were awarded recognition.
Bennington RiseVT was implemented in the summer of 2018.
A Bennington Leadership – Opioid Response Plan was developed with a focus on four areas: prevention, treatment, recovery and criminal justice. Members of the Leadership Team include: Agency of Human Services, Alliance for Community Transformation, Bennington Blueprint, Bennington State’s Attorney, Center for Restorative Justice, Department of Children and Family Services, Department of Health – Bennington District Office, Hawthorn Recovery Center, Southwestern Vermont Healthcare, Office of the Public Defender, Bennington Sheriff, The Collaborative, The Town of Bennington, The Turning Point Center, and United Counseling Service. The leadership team has established a mission, vision, and goals, assessment, strategies and prioritized needs. The next step is to seek funding to meet critical community needs targeting prevention and recovery housing.
Additional Featured Projects Implementation of a syringe services program. Several community leaders and partners have identified the need for a Syringe Services Program in the Bennington HSA. This is a collaborative effort with town government, spoke practices, primary care, The Southern Vermont Aids Project, law enforcement and The Turning Point Center. The next step in this critical harm reduction strategy is the launch of the Advisory Council in November 2018, and the program opening in early 2019.
Lessons learned from the Women’s Health Initiative has resulted in an overwhelming positive response to screening for social determinates of health across practice settings. Primary Care practices are currently gearing up for Screening, Brief Intervention and Navigation to Services (SBINS). Practices are establishing workflows for implementation of screening for their panels
62
in anticipation of additional Community Health Team staffing to support the navigation to services. Screening tools are being matched to populations such as: pregnant women, children, adolescents and adults. Multiple community partners are engaged in this highly collaborative effort.
Peer coaches from the Turning Point Center are available 24/7 to see individuals in the SVMC Emergency Department with an overdose or a substance use disorder (SUD) related diagnosis. The peer coaches engage individuals for navigation to treatment. The goal is to admit persons into treatment within 48 hours. Bennington will have the capacity to admit to treatment within 48 hours with the opening of a new spoke practice: SaVida Health.
The Vermont Chronic Care Initiative (VCCI) recently changed its target population and referral process. This change has been positive and well received by the Blueprint Community Health Team and community partners. This can be best exemplified by a case study where VCCI, the Community Health Team, and The Turning Point Center worked together to address the complex needs of a very high-risk individual and were successful in resolving medical problems, homelessness, and provided navigation to treatment for substance use disorder.
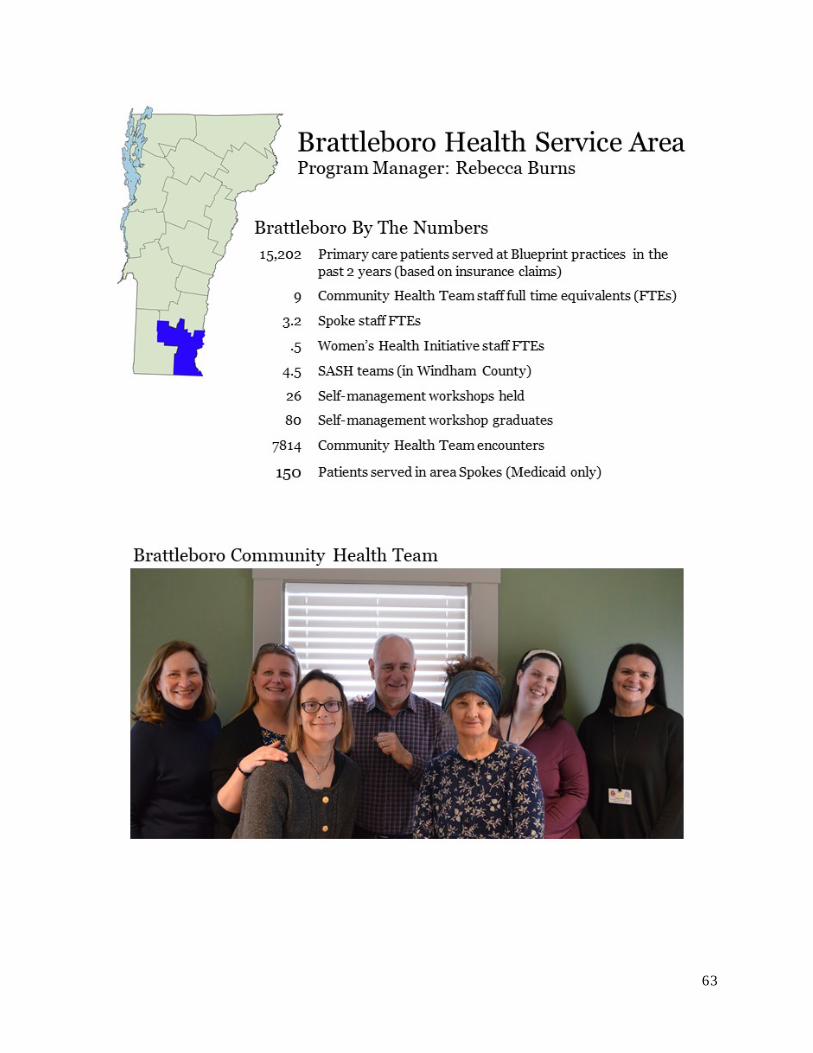
63
64
BRATTLEBORO HEALTH SERVICE AREA
SOUTHEASTERN VERMONT ACCOUNTABLE COMMUNITY FOR HEALTH The Southeastern VT ACH’s goal is to build an integrated, high-performing network of partners that supports measurable improvement in meeting the needs of families and individuals in the community. The Southeastern VT ACH will develop systems to improve community health and well-being, support appropriate use of resources, and improve access and individual experience of community services. The Southeastern VT ACH consists of an Organizing Committee and a Full Committee. The Organizing Committee meets monthly and the Full Committee meets quarterly.
The work of the Southeastern VT ACH encompasses the population in the Brattleboro Health Service Area. The focus will be on quality outcomes, cost and value. The approach will be systems-based change utilizing the structures and resources of the VT Blueprint for Health, OneCare Vermont, the Agency of Human Services, and other guiding organizations. The group is currently reviewing several data sources to assess community needs, including area hospitals’ Community Health Needs Assessments and Agency of Humans Services Community Profiles.
2018 ACHIEVEMENTS
Major Achievement Building a new community dental clinic: Medicaid beneficiaries in Brattleboro area have inadequate access to dental care. This gap in services has appeared in in the last two Community Health Needs Assessments. In 2018, community members joined together to change this. A multi-organization advisory group including Blueprint staff explored how they might collectively create a new clinic to expand access. Brattleboro Memorial Hospital and the United Way of Windham County committed resources: the hospital has hired a dentist and provided space, the United Way has provided a grant writer and is hiring clinic staff. Horizon Dental has also donated four operatories. The new clinic is slated to open in the spring of 2019.
Additional Featured Projects Community focus on care coordination: Care coordination was a community-wide focus in 2018. All Patient Centered Medical home patients in the Brattleboro area have needs-based access to care coordination. Interdisciplinary teams are implementing the OneCare Vermont care model but making services available regardless of ACO attribution. Teams are using OneCare Vermont’s Care Navigator platform to document care and share patient information. A monthly interagency care coordination meeting promotes communication and aligns efforts.
Pool program makes exercise accessible: The area Comfort Inn partnered with the Community Health Team in 2018 to offer free swimming pool access to any Patient Centered Medical Home patient referred by their provider. Free printed exercise guides help patients make the most of their time at the pool.
HRSA grant support opioid response planning: The Brattleboro community has received a $200,000, year-long planning grant to explore new strategies for combatting the opioid epidemic. Areas of interest include prevention, treatment, recovery, and peer support – all considered in the context of a rural county. The work will be led by a multi-agency group, including Blueprint staff.
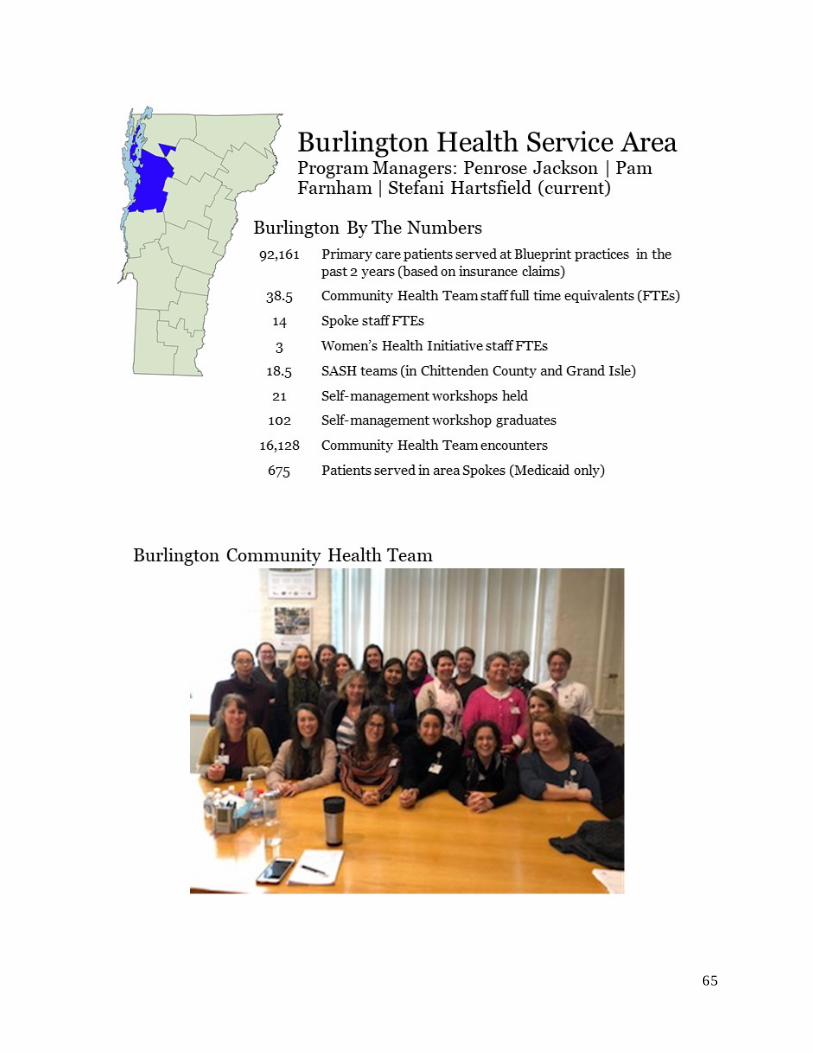
65
66
BURLINGTON HEALTH SERVICE AREA
CHITTENDEN COUNTY ACCOUNTABLE COMMUNITY FOR HEALTH (CACH) The mission of the Chittenden County Accountable Community for Health (CACH) is to be accountable for the health and well-being of all people in our county through mutually reinforcing clinical and community initiatives.
2018 ACHIEVEMENTS In 2018 the Burlington Health Service Area (HSA) began groundwork on an integrated system of care that will increase the efficiency of existing collaborative networks across all sectors. This new integration will promote better health and overall well-being for the people of Chittenden County while also reducing unnecessary expenditures. Some preliminary steps taken in 2018 towards our integrated system of care were:
• Successful launch of our first primary prevention community initiative through RiseVT in a rural section of our county which identifies itself as “transportation desert,” does not have any recreation department and has an extremely varied of socioeconomic composition.
• Expansion and alignment of the CACH group to move towards focused priorities in 2019 that align with the findings of the Community Health Needs Assessment, the State Health Improvement Plan, ECOS goals, and the ACO Quality Metrics.
• Launch of rapid cycle improvement projects involving hospital, emergency, and community partners to examine systems-based solutions to high frequency emergency department and inpatient customers.
• Multi-organization members of the Chittenden County Complex Care Coordination Leadership Team shared and reviewed each of their individual workflows for complex care coordination to better understand how to work together as a community. Their common strengths and challenges informed the “Community Complex Care Coordination Workflow” that the Burlington HSA has been working on in 2018. This shared workflow will continue to be finalized in early 2019 and will be an integral part of the HSA’s integrated care management approach.
• Ongoing Community Health Team support for individual patients leads to many personal success stories. The following are two recent examples:
PATIENT STORIES My best friend once told me that to ask for help is not a sign of weakness, but a sign of strength. That always stuck with me, so when I couldn’t quit on my own I decided to ask Vermont Quit Partners for help. Their people are informed and professional, and had nothing but compassionate, non-judgmental support and enthusiasm for all of us who needed help and structure on this journey to be tobacco free. I participated in large and small support groups, and then worked one-on-one with Amy. I have not smoked for over 2-1/2 years...and they are the reason. They saved my life.
67
– Quote from a patient referred through the Vermont Quit Line to Amy Hallett, CHT Tobacco Treatment Specialist
JA was referred to the CHT in spring of 2015 for weight loss, high blood pressure, and high cholesterol. Her weight was 253 lbs, she wasn’t exercising, and she needed some help to truly understand what it meant to eat a balanced diet. She had grown up in a family that loved to bake and cook delicious food. We discussed the benefits of eating balanced meals, portion size, meal planning, exercise, as well as the importance of mindfulness and moderation. JA started out at just 5 minutes on her exercise bike and slowly increased from there. She stopped drinking juice, started including healthy proteins at each meal and transitioned her diet to look more like a Mediterranean diet with lots of fruits and veggies, whole grains, and healthier fats. We meet monthly for about 6 months and then less frequently, eventually transitioning to occasional email check-ins. At one point she told me that she was able to mow her entire law at one time, which for years she had had to do over the course of two days due to getting too tired to finish. That was a big moment for her. JA continued to lose weight gradually and increased her exercise, eventually settling info 60 minutes of walking most days and 40 minutes on the bike daily. After FOUR years of consistent eating and exercise (still having her favorite treats of a little red wine and low-fat ice cream on most nights!) JA reached a weight loss of over 115 lbs, her labs were vastly improved, and her statin dose was cut in half. She reports that her body feels better and she doesn’t have the aches and pains she used to. She has maintained her weight loss and was officially graduated from the CHT in fall of 2018.
- Patient story by Bridget Shea, CHT Clinical Dietician
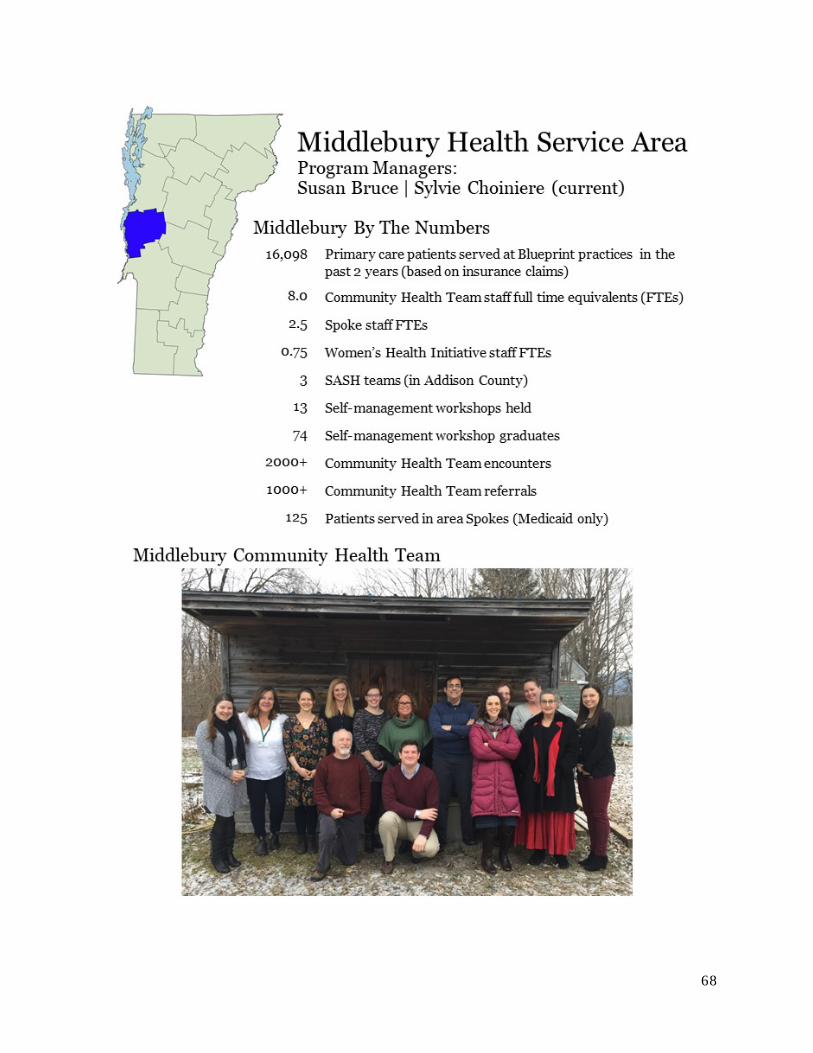
68
69
MIDDLEBURY HEALTH SERVICE AREA
COMMUNITY HEALTH ACTION TEAM (CHAT) The Community Health Action Team’s mission is to provide interventions, services, and programming to all children, adults and older Vermonters in order to receive the proper care to be healthy, vibrant members of community. This is a collaboration between 20 different agencies and organizations, which provide services across the life span. In 2018, the three identified priorities included care coordination, substance use and abuse, and housing.
2018 ACHIEVEMENTS
Major Achievement Access to Services: During the past year, the Community Health Team focused on increasing accessibility to residents in the area. As a result, the Registered Dieticians have expanded their services through Telemedicine. The registered dieticians as well as the UVM – Porter Medical Center providers have been trained to use the online system to make it easier for residents in the Middlebury Health Service Area to access their providers. This service is available in the UVM – Porter Medical Practices and expansion is likely to occur with our other Community Health Team members based on the needs of the community. Another priority was to reduce the barrier to prescriptions. The Community Health Team has collaborated with the Porter Hospital Pharmacy on the 340B Drug Discount Program. This collaboration has enhanced the ability of the CHT Care Coordinator to advocate for patients and support their medical needs in seeking prescriptions for diabetes and asthma.
Additional Featured Projects MAT Program: The MAT Program has expanded and there is no longer a waitlist for patients seeking treatment for substance use disorder. Mountain Health Center and the UVM-Porter Practices have eight MAT waivered providers to help meet the needs of patients. The providers in the different practices are continuing to expand.
CHAT: The CHAT priorities ignited significant changes. Through community conversations and the support of OneCareVT, two adult outpatient care coordinators were hired for the Porter practices to help patients navigate the health care system and provide additional support. The housing committee developed a Middlebury Shares Housing Model to address the housing issue while providing integrated services. Another major achievement was the OK. You’ve Got This campaign that focuses on resiliency as the Youth Risk Behavior Survey indicated a high prevalence of risk factors including depression, low resiliency, and anxiety among youth in Addison County.
Quality Improvement: All the practices in the health service area have spent time during the past year to review the 2017 NCQA standards and have begun developing virtual binders so they are prepared to attest in 2020 and could respond to an audit. The Porter Practices and Rainbow Pediatrics have reviewed and revised their quality improvement measures and both the adult and pediatric measures will be the same for all practices. The new measures align with the Blueprint and OneCare Vermont Quality measures for 2019.
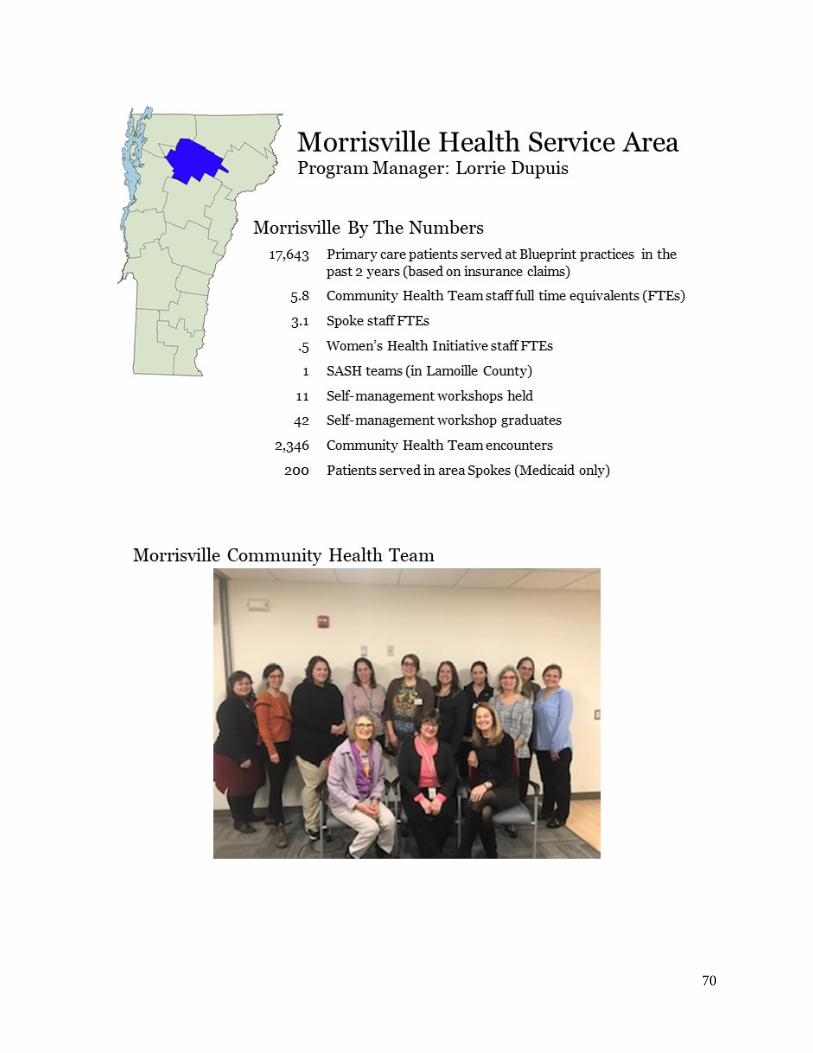
70
71
MORRISVILLE HEALTH SERVICE AREA
LAMOILLE UNIFIED COMMUNITY COLLABORATIVE Our Lamoille Unified Community Collaborative (UCC) involves 24 health care and human service organizations and programs. We have more than doubled the number of participating programs and organizations over our previous year. This increase is in part related to our growing efforts in becoming a sustainable Accountable Community for Health. In 2018 we created and passed a Mission Statement and Charter to establish operational protocols for focusing on collective impact and health care reform efforts through partnerships and multi-organizational initiatives across continuum of care settings. This group meets monthly.
2018 ACHIEVEMENTS
Major Achievement Multiple organizations within our UCC responded to the grassroots all-volunteer effort to open the first temporary warming shelter for homeless individuals and families at in our area. The shelter was initiated by Father Rick Swanson at St. John’s in the Mountain Episcopal Church in Stowe. As a result of having a place to stay, this formerly invisible group of individuals became visible. Their physical, mental, and social determinants of health needs could be identified and addressed in an integrated way. In addition, community volunteers kept the shelter operating day-to-day with food and overnight supervision. Organizations within the UCC responded and volunteered; doctors, social workers, and nurses provided evaluations, treatment, and care coordination. At the same time the shelter opened, the UCC was developing their mission statement and charter as an Accountable Community for Health and included “well-housed,” as an outcome for all, believing that our community is healthier when everyone has a home. Starting in December 2018 a temporary warming shelter was opened in the Northgate Shopping Center in Morrisville. A newly renovated and furnished community house is scheduled to open January 18, 2019 with the help of multiple organizations including churches, synagogues, government agencies, primary care medical homes, Community Health Team members, mental health agencies, community volunteers, and a committed hospital – a tangible step in working together to build a healthy community.
Additional Featured Projects A resource and referral specialist was hired in the Copley Emergency Department (ED) through a collaborative effort between the Community Health Services of Lamoille Valley (the Blueprint administrative entity) and Copley Hospital to reduce the number of frequent ED utilizers and connect patients with appropriate resources in the community. We are repeating the “Super Utilizer” ED project from 2017. Care coordination interventions will include both an assigned care coordinator and a shared care plan. The Lamoille Care Management team (LCMT), the group created to provide complex case management in our HSA, will provide the care coordination interventions.
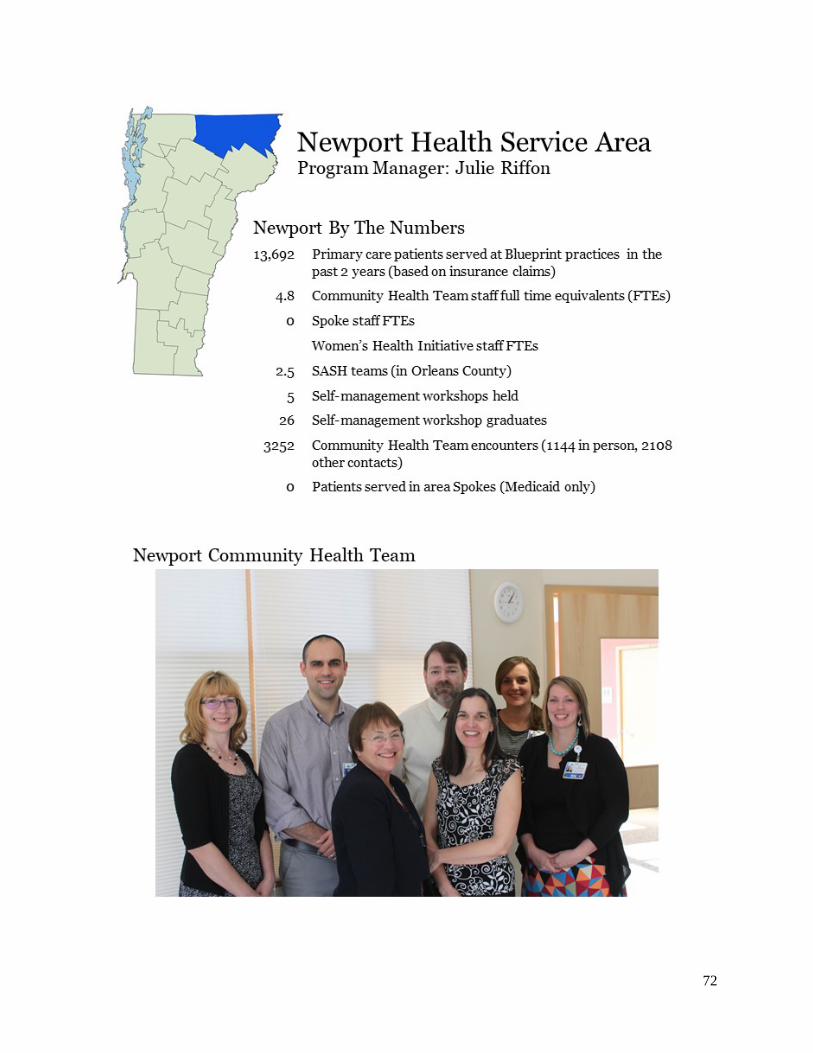
72
73
NEWPORT HEALTH SERVICE AREA
UPPER NORTHEAST KINGDOM COMMUNITY COUNCIL (UNEKCC) Mission: We are committed to significantly improve the health and well-being of the people in Orleans and northern Essex counties.”
Vision: through innovation and collaborative effort, we build strong communities supporting healthy and prosperous lives in Orleans and northern Essex counties
Membership: The Chief Executive Officers or their designees from North Country Hospital, NEK Community Action, NEK Human Services, Northern Counties Health Care, RuralEdge, Newport District VT Department of Health, Orleans Essex VNA & Hospice, Council on Aging and the supervisory unions serving the HSA
Common agenda: Our next generation, whose dreams are community supported, is VT’s healthiest and most successful generation
Measurable indicators of success: financial stability, educational outcomes, civic engagement, health (mental, dental and physical and community assets)
2018 UNEKCC accomplishments: adjusted to transitions in leadership among key member organizations; finalized measures for indicators for success using Results Based Accountability (RBA) methodology, began to determine joint funding to hire a part-time Program Coordinator and to decide on a common project and action steps to complete in 2019
2018 ACHIEVEMENTS
Major Achievement In 2018 North Country Hospital HealthCare Shares program expanded to include identified high risk and very high-risk OneCare Vermont ACO Next Generation Medicaid members. Orleans County has the lowest fruit and vegetables consumption in Vermont and this program encourages vegetable consumption among participants. The people served included 79 families who were referred by primary care and pediatric practices, including 243 individuals, 90 children, and 35 seniors. 42% of the participants were ACO-attributed Medicaid beneficiaries. All participated in the 11-week program which provided locally grown vegetables and recipes. North Country Hospital collaborated with community partners to expand this program which directly addressed the 2018 Community Health Needs Assessment priority health concern of “supporting healthy eating and physical activity.”
Additional Featured Projects All components of the Newport health service area’s Blueprint team (Patient Centered Medical Homes, Facilitator, Community Health Team members and Program Manager) played critical roles as North Country Hospital successfully transitioned from three separate electronic medical record systems to one shared by all departments and medical practices. This has decreased gaps in information and increased the continuity of the care our patients receive.
Also, North Country Hospital successfully expanded access to psychiatric services, already embedded five days a week in North Country Hospital’s Primary Care Newport Patient Centered Medical Home to meet the critical need of providing as-needed consults to patients in the Inpatient and/or Emergency Departments. Newport’s Community Health Team staff coordinate this process.
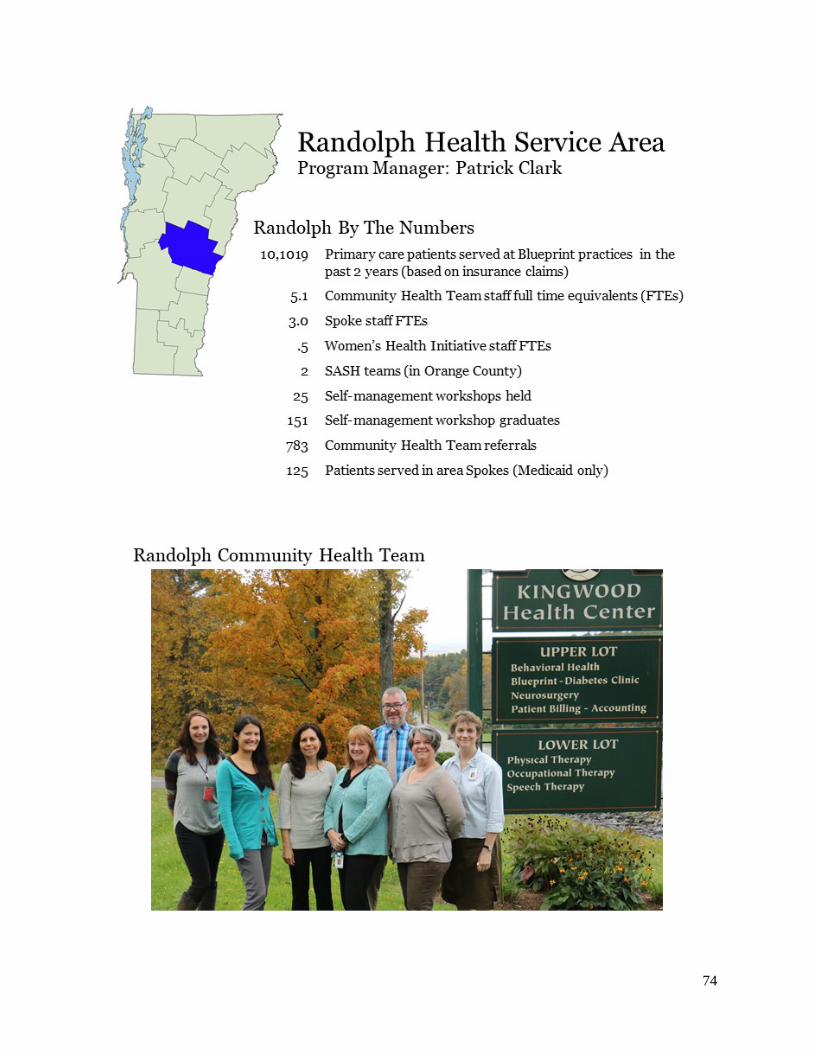
74
75
RANDOLPH HEALTH SERVICE AREA
RANDOLPH EXECUTIVE COMMUNITY COUNCIL (RECC) Using the Accountable Communities for Health framework, the RECC brings together integral community stakeholders to organize a coordinated effort towards improved community and individual health with an emphasis on prevention. We address population and public health in our area, through the identification of issues and measures which are most relevant, applicable, and challenging for our community members. We utilize qualitative and quantitative data to learn how we can best serve all segments of our population, through person-centric, wrap-around support that addresses the whole person and community. RECC members chose high emergency department utilization and nutrition as priority areas this year. Workgroups have formed around these priority areas, and the workgroup members have begun to discuss specific projects to address the priority areas.
2018 ACHIEVEMENTS
Major Achievement Emergency Department (ED) High Utilizers: We continue to actively monitor ED visits and are focused on reducing ED utilization for patients with four or more ED visits within a three-month period. We complete ED action plans for this patient cohort and we created a mechanism within our electronic health record that notifies ED staff members that an action plan is active for this patient cohort. In addition to the emergency department action plans, we are also completing shared care plans for these patients in the primary care setting. Our Community Health Team (CHT) works in conjunction with community partners to determine the root cause of the high utilization, which can usually be tied to a social determinant issue, a systems issue, or a complex chronic disease management issue. If the cause is a social determinant, the CHT Care Coordinators work with the patient to address it. If the cause is systems-related, we work with hospital administration to address it. If the cause is disease management, the CHT RN Care Manager works with the patient to address it. In addition to our Randolph Health Service Area High ED Utilizer Workgroup, our CHT also participates in the Barre Health Service Area ED High Utilizer Workgroup because a number of our attributed patients sometimes use the ED in that area.
Additional Featured Projects Medication Assisted Treatment (MAT) – Two of our MAT providers are now offering Vivitrol injections as an alternative to Suboxone to treat individuals with opioid use disorder. One of our Randolph MAT locations recently became a Narcan distribution site, and it is the only non-pharmacy location in Orange County to offer Narcan to the public free of charge. Our Berlin MAT location is now participating in the rapid access treatment initiative in Central Vermont, which is a collaboration with other community MAT providers to offer ongoing, uninterrupted MAT services to individuals presenting in the emergency department with untreated opioid use disorder.
Self-Management Programs (SMPs): Our Randolph SMP Regional Coordinator is now responsible for the coordination of SMPs in the Upper Valley area as well (the Upper Valley was formerly a separate health service area and is now part of the Windsor health service area for purposes other than the SMP). The addition of this territory has created the opportunity to build

76
relationships with new community partners and community facilitators to offer workshops to residents of the Upper Valley.
Caregiver Support Resources: Two of our CHT Care Coordinators completed caregiver support group facilitator training and are now offering a monthly free caregiver support group in Randolph. This group was requested by members of our community, and we were able to implement this with guidance from the Central Vermont Council on Aging.
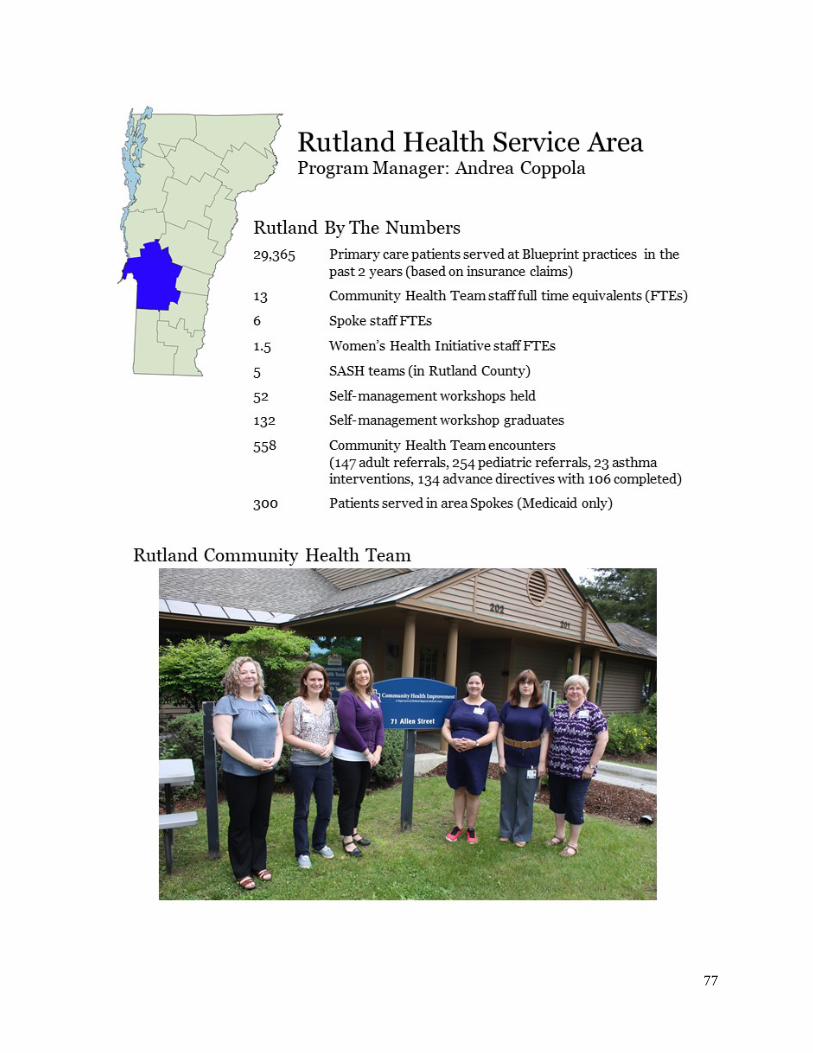
77
78
RUTLAND HEALTH SERVICE AREA
THE RUTLAND COMMUNITY COLLABORATIVE Mission: The Rutland Community Collaborative is committed to improving the overall health of the Rutland community through appropriate utilization of healthcare services.
The Rutland Community Collaborative has approximately 115 active members from over twenty different organizations. The collaborative has seen many successes and is in the beginning stages of developing a logo and a brand. In the past the collaborative has been very hospital centric, over the past year it opened up to more community members. The collaborative meetings have become more interactive and larger numbers of community members are now attending subcommittee meetings.
Members:
• Rutland Mental Health Services • Rutland Regional Medical Center • SASH • Home health agencies • Independent primary care practices • Community pharmacies and durable medical equipment supply vendors • Long term care facilities • Local non-profits & state agencies including:
o Homeless Prevention Center o Southern Vermont Council on Aging o Vermont Chronic Care Initiative o Vermont Department of Health – Alcohol and Drug Abuse Programs
2018 ACHIEVEMENTS
Major Achievement The Community Health Team has been striving to “work smarter.” In 2018, the Pediatric Referral Committee and the Maternal Child Health Committee merged into one dynamic group called The Maternal Child Health Coalition. This revitalized coalition streamlined processes and functions to educate and inform both local and state agencies and offers quarterly learning collaborative for the broader community.
The Community Health Team Adult Referral & Care Coordination Committee (RCC) has been expanding relationships with a wide variety of community partners. In 2018, the RCC has seen consistent participation from organizations including SASH, The Homeless Prevention Center, the VNA, primary care, community social service agencies, and state agencies.
Additional Featured Projects The Rutland Community Collaborative has seven subcommittees that meet on a monthly basis. Each subcommittee has a distinct purpose and has established annual goals that align with the mission to improve the overall health of the Rutland community. The subcommittees are:

79
Education & Patient Engagement, Transitions Committee, Data Analysis, Behavioral Health, Clinical Case Review, Palliative Care & Hospice, and a Serious Illness committee.
Project Vision has brought significant change to the Rutland area. With its vision to make “Rutland one of the healthiest, safest and happiest places to live in America”, Project Vision has proven to be a model for other communities. This collaborative effort works to address the global needs of the community, breaking down silos and creating new and different partnerships that address the underlying needs of the community.
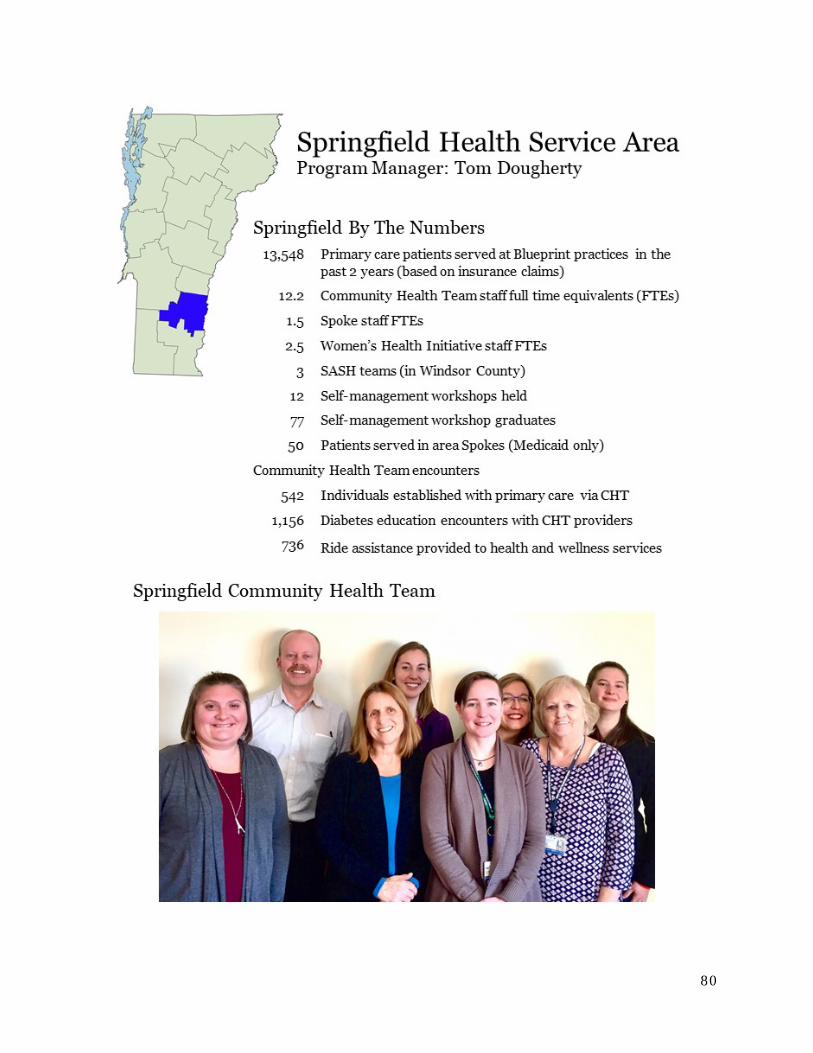
80
81
SPRINGFIELD HEALTH SERVICE AREA
SPRINGFIELD HSA COMMUNITY COLLABORATIVE The Springfield HSA Community Collaborative brings community providers of health, wellness, and social services together to discuss goals and to make decisions to work towards the goal of health and well-being for our community. Nine workgroups address priority issues identified in our community health needs assessment including improving access to key services such as substance use treatment, behavioral health services, oral health services, and women’s health services. They also work to improve coordination of care across organizations and sectors and prevent chronic conditions through the development of a more vibrant, resilient, and supportive community. In 2018 these efforts resulted in expanded and streamlined access to these services, greater awareness of resources in the community, and closer collaboration in meeting community needs.
2018 ACHIEVEMENTS
Major Achievement Care coordination: Our Blueprint team continued to evolve in 2018 to support care coordination, prevention and management of chronic conditions, quality improvement initiatives, and panel management – all while learning new tools and workflows to implement the ACO model of care along with our colleagues and community partners. One major accomplishment was the implementation of a new behavioral health/substance use care coordinator role with our Designated Agency partner, HCRS. Being embedded in the Community Health Team while also an employee of the Designated Agency enabled Lindsey Mack, the new care coordinator, to expedite key connections for patients served by both organizations and to coordinate interventions between primary care providers, behavioral health clinicians, and community workers. Dedicating a team member to these key areas also facilitated expansion of the Rapid Access program and streamlined referrals to substance use treatment at both organizations.
Additional Featured Projects Lifestyle Medicine: Our Community Health Team’s registered dieticians and certified diabetes educators were instrumental in the development and implementation of a Lifestyle Medicine program in our FQHC. Combining elements of self-management, behavioral health, physical therapy, primary care, and health education, the program engages patients with or at-risk for chronic conditions. Participants gain knowledge, skills, and support to achieve their personal health and wellness goals. 2018 efforts included the design and launch of an intensive 8-week program offered to FQHC employees, demonstrating the importance and value of employer engagement in community wellness initiatives and establishing a model to engage employees elsewhere in the community.
Medication assisted treatment (MAT) expansion: Our Community Health Team worked in concert with several of our community collaborative workgroups on expansion of MAT treatment for opioid use disorder to three new sites within our FQHC system. New care coordinators, counselors, and prescribers were trained and deployed. This expansion was made in concert with an awareness and education program for all staff in primary care practices providing them with a better understanding of addiction and the treatments available and how

82
to support patients’ recovery. This effort also engaged community members and partners at county-wide summits and forum events to mobilize an effective community response and reduce stigma and discrimination.
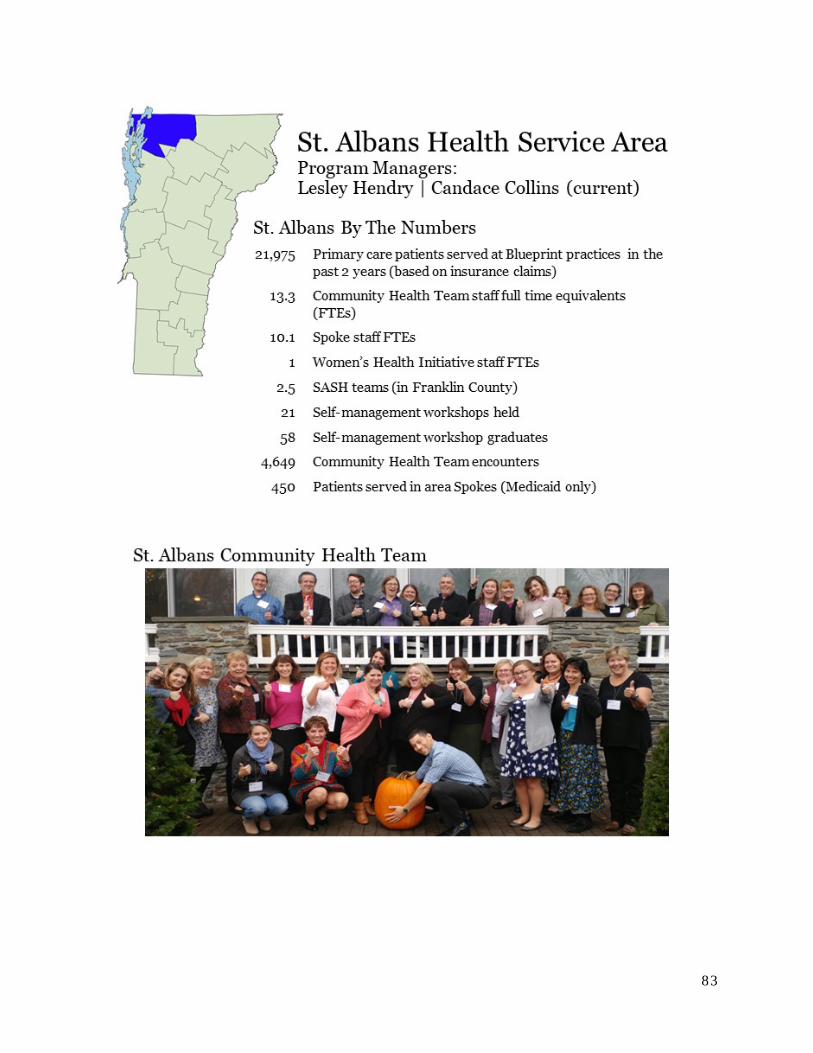
83
84
ST. ALBANS HEALTH SERVICE AREA
ST. ALBANS ACCOUNTABLE COMMUNITY FOR HEALTH The St. Albans Accountable Community (ACH) for Health ensures efforts to improve community health and advance prevention are inter-connected and aligned. The ACH is made up of the Franklin-Grand Isle Unified Community Collaborative (UCC), the Regional Clinical Performance Council (RCPC), and Community Partnerships. The UCC sets priorities and shepherds resources to promote a collaborative, integrated approach to population health. The RCPC brings leaders and health care providers together to plan, make decisions at the community level, and implement clinical strategies to improve the cost and quality of health care and the experience of care for those in our community. The St. Albans health service area has many formal partnerships that meet as workgroups to improve quality of services, the patient experience, and outcomes for individuals and the system.
2018 ACHIEVEMENTS
Major Achievement The 2018 St. Albans Learning Collaborative focused on transitions of care. Patient Centered Medical Homes partnered with inpatient, Emergency Department, skilled nursing facilities and other services to improve communication, coordination of care, and team-based approaches. The Community Health Team led efforts in each Patient Centered Medical Home to connect patients to SASH and Age Well programs and develop shared care plans. Northern Tier Center for Health (NOTCH) worked with Franklin County Home Health Agency (Home Health) to improve Medication Reconciliation during transitions. They coordinated calls between patient, CHT, and Home Health nurse to conduct a “live” medication reconciliation in the patient’s home. The team is working on allowing SASH nurses access to their electronic health record for all identified mutual patients. Northwestern Counseling and Support Services (NCSS) worked on creating consistency in the referral processes from Patient Centered Medical Homes to NCSS and closing the loop on the referrals. Northwestern Primary Care worked with connected patients to Palliative Care. St. Albans Primary Care partnered with NCSS and other community partners to attend care team meetings with patients. Cold Hollow Family Practice worked with NCSS CRT and Developmental Services to determine collaborative approaches to assist in education regarding medications for patients and connect with case managers and an NCSS nurse to share medication lists.
Additional Featured Projects The St. Albans ACH is taking on Social Determinants of Health. The UCC reviewed social determinants assets and opportunities in the community. Partners were invited to present their work with social determinants and present project proposals for funding. In partnership with Champlain Housing Trust, the UCC designated four apartments for homeless families. Through a coordinated entry process, housing will be offered to the most vulnerable people. NCSS and Samaritan House offer support services to establish a “landlord history” and linkages with community supports. NOTCH provides meals to school-age children and adolescents when school is not in session. The Resilient Communities Action Team (RCAT), a sub-group of RCPC, assessed screening of social determinants in primary care settings. The UCC will fund a project to integrate the Transition to Success model presented at the 2018 Blueprint for Health
85
Conference in Patient Centered Medical Homess. By leveraging and expanding existing care management relationships and resources and treating the social determinants of health as a medical condition, this model will improve patient experience, improve population health and reduce total cost of care. The St. Albans health service area brought in nationally renowned experts to design a patient-centered approach to delivering chronic pain management in a primary care setting. All Patient Centered Medical Homes implemented a patient-centered taper, so pain medications are prescribed according to CDC guidelines.
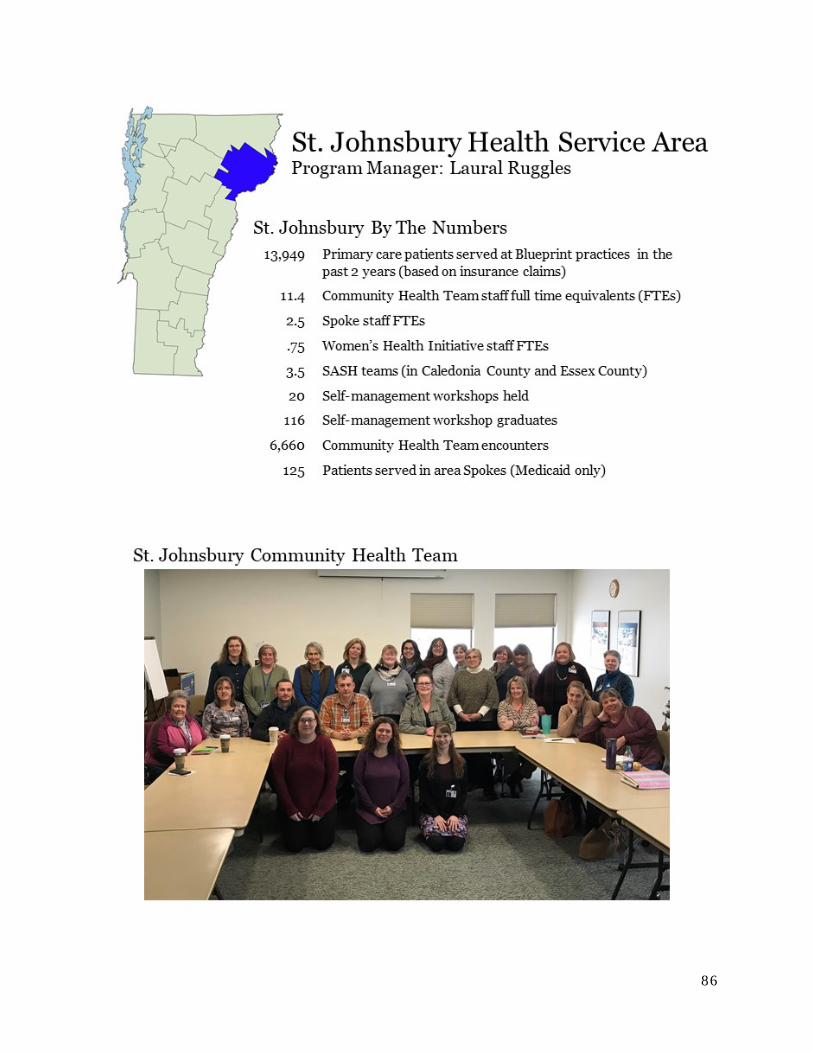
86
87
ST. JOHNSBURY HEALTH SERVICE AREA
NEK PROSPER! CALEDONIA – SOUTHERN ESSEX ACCOUNTABLE HEALTH COMMUNITY
NEK Prosper! is committed to our shared goal of improving the health and well-being of the people in Caledonia and southern Essex Counties by integrating our efforts and services, with an emphasis on reducing poverty in our region. We want everyone in our communities to be:
Well Nourished
Well Housed
Physically Healthy
Mentally Healthy
Financially Secure
2018 ACHIEVEMENTS
Major Achievement Regional Mental Health Campaign: Positive Balance – Creating Community Resilience for All: The Mentally Healthy Collaborative Action Network of NEK Prosper! launched a campaign focused on training, events, and media to reduce stigma and myths around mental health and suicide and increase positive messaging about belonging and seeking help and where to get it. Key partners were the Patient Center Medical Homes, hospital emergency department, local schools, and the designated mental health agency. Media messages through local radio stations reached about 20,000 listeners. Crisis Text Line posters were featured in the medical homes and hospital emergency department. The group attended the Colors of the Kingdom Festival this fall to promote the campaign and increase awareness of mental health issues in our community. Future projects include Zero Suicide gatekeeper training and UMatter Suicide Prevention “train the trainers.”
Additional Featured Projects Diabetes success! The St. Johnsbury Community Health Center reports that as a result of the work of their diabetes team (providers, nurses, care coordinator, behavioral health specialist, and a certified diabetic educator) they saw a reduction in the number of patients with an A1c over 9%. From 21% of diabetic patients with an A1c over 9% last year down to 10% this year – an 11% reduction! Kudos too to the community outreach staff who helped patients enroll in insurance to be sure they can afford their medical care and diabetic medications and supplies.
Convenient Care Clinic Pilot: Corner Medical and Kingdom Internal Medicine have collaborated with the hospital emergency department to pilot their own version of a walk-in clinic for their patients. A nurse practitioner from the hospital emergency department sees Corner Medical or Kingdom Internal Medicine patients at their respective medical homes one day a week. The first two hours of the clinic are reserved for follow up appointments for patients recently seen in the Emergency Department. The rest of the day is open for “walk-ins”. The nurse practitioners have been seeing nine – twelve patients per day. The plan is to expand the clinic to two days a week in the coming year.
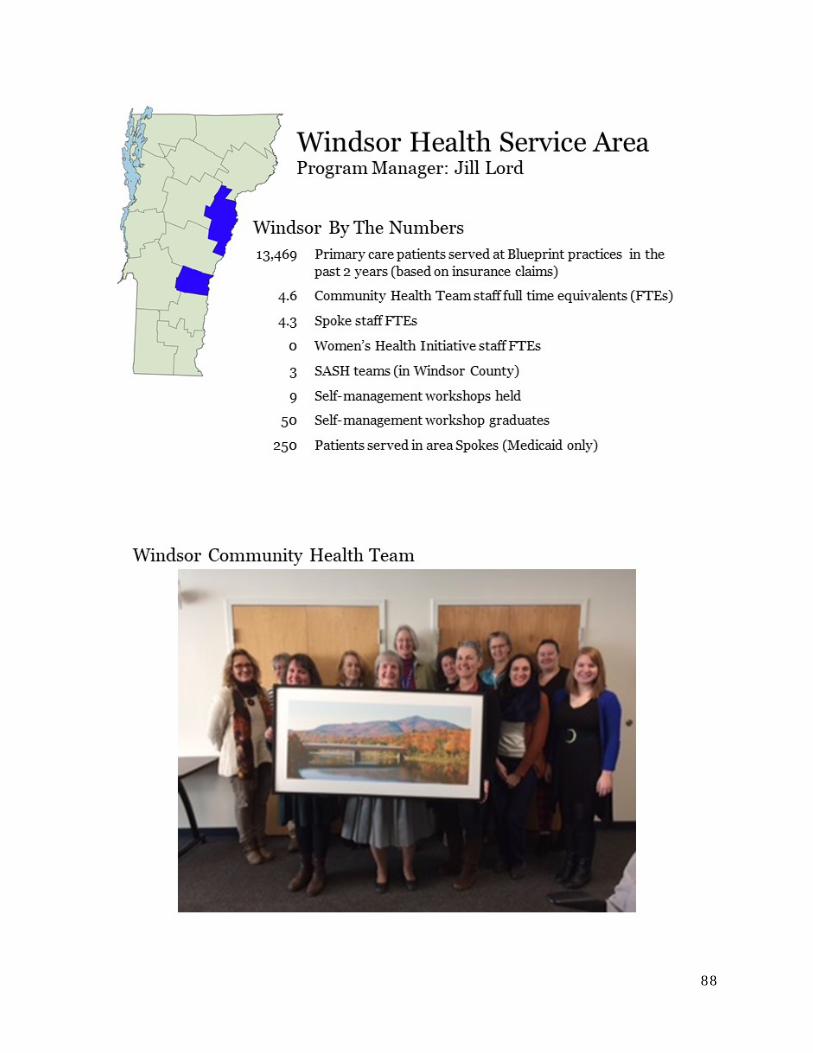
88
89
WINDSOR HEALTH SERVICE AREA
WINDSOR HEALTH SERVICE AREA COMMUNITY COLLABORATIVE AND THE UPPER VALLEY COMMUNITY COLLABORATIVE
Both Community Collaboratives bring together health and human service leaders and citizens who are committed to improve population health.
The mission of Upper Valley Community Collaborative is to improve the quality of life of the people in the communities we serve. Quality improvement projects have included dental access for adults on Medicaid, behavioral health in schools / trauma-informed schools, care coordination workflows & referrals between agencies, food insecurity, Interagency Care Team meetings, and health & nutrition education.
The Windsor HSA Community Collaborative is an Accountable Community for Health. Our Mission is to increase the quality of healthcare, improve the patient care experience, contain costs, and to promote health equity. Work includes improving blood pressure management, diabetes control, initiation and engagement and treatment for substance misuse, care coordination, nutrition, exercise and tobacco cessation, Regional Falls Prevention working with our community partners and OneCare Vermont, and completing an extensive Community Health Needs Assessment.
2018 ACHIEVEMENTS
Major Achievement Windsor Health Service Area through the leadership of Mt. Ascutney Hospital and Health Center has worked intentionally to create an Accountable Community for Health working with community partners and addressing 12 major community health needs including alcohol and drug misuse, access to mental health services, access to dental care, access to affordable health insurance, access to affordable healthy food, promotion of physical activity, addressing poverty and family stress through the Family Wellness Program, access to transportation, access to primary health care, health care for seniors, smoking and tobacco use. In this effort we worked with 44 community partners. There was an investment of $609,500 from Mt. Ascutney Hospital and Health Center with an additional $951,500 of grant-supported funds in over 78 unique programs. (Our annual report is available per your request.) We also completed an extensive update of our community health needs assessment this year.
White River Family Practice organized a summer snack Backpack Program that provided nutritious, kid-friendly food to 70 children over a 10-week period. Businesses, community groups, and the Vermont Department of Health have helped as partners in the process. They included value-added items such as dental supplies and enrichment items in the backpacks.
Little Rivers Health Care established a behavioral health service in Blue Mountain Union Pre-K to 12 serving over 450 students and in Oxbow Middle/High School serving over 350 students. They provided three social workers. Of the three, two qualified as LADAC’s. This group provided trauma-informed training across the whole community. They also conducted a survey to gauge the effectiveness of the effort.
90
Additional Featured Projects This year the Windsor HSA worked intensively in the face of staffing vacancies to expand our care coordination capacity working with major community partners. There was an intentional effort to build skills and capacity within our region working with OneCare Vermont. We completed a comprehensive and extensive Community Health Needs Assessment in 2018. We organized a series of region wide summits to mobilize community partners for the treatment and prevention of substance misuse among youth and to prevent opiate deaths. We created a Quality Dashboard and initiated quality projects in the area of hypertension management, diabetes management, initiation and engagement in treatment for substance use disorder, and wellness through 3 – 4 – 50 and RiseVT.
White River Family Practice participated in a Diabetes Blueprint for Health Learning Collaborative. This effort involved the entire office. Education was provided to patients. Follow-up and panel management was done which improved patient accountability and A1C outcomes.
Little Rivers Health Care initiated an oral health service. Working with the hygienists they completed an inventory of all dental resources in their region and have begun to focus on the dental needs of children. Their goal is to improve the oral health of their community.