annual report - parliament of victoria · 2018-12-18 · annual report 2017 – 2018 annual report...
TRANSCRIPT

A N N U A L R E P O R T
2 0 1 7 – 2 0 1 8
AN
NU
AL
RE
PO
RT
20
17 –
20
18
Authorised by Transport for Victoria, 1 Spring Street, Melbourne.
AccessibilityIf you would like to receive this publication in an accessible format, such as large print or audio, phone 03 9619 5958 or email [email protected]
Unless indicated otherwise, this work is made available under the terms of the Creative Commons Attribution 3.0 Australia licence.
To view a copy of this licence, visit creativecommons.org/licenses/by/3.0/auIt is a condition of this Creative Commons Attribution 3.0 Licence that you must give credit to the original author who is the State of Victoria.
V/L
INE
MSR01744 Annual Report 2017-18_4pp Cover.indd 1 3/12/2018 3:24 PM

V/Line CorporationABN 91 273 289 190GPO Box 5343Melbourne VIC 3001 Head Office / AdministrationLevel 9, 750 Collins StreetDocklands VIC 3008Telephone (03) 9619 5900Facsimile (03) 9619 5000vline.com.au Customer information, reservations, sales and feedback Freecall 1800 800 007
Project teamRebecca Northeast Scheree MularczykLes Lovell Denis Grigolato
Printed byFinsbury Green, Port Melbourne.
MSR01744 Annual Report 2017-18_4pp Cover.indd 2 3/12/2018 3:24 PM

Table of Contents
Responsible Body’s declaration 2
Section One: Year in review 3
Section Two: Governance and organisational structure 21
Section Three: Workforce data 31
Section Four: Other disclosures 39
Financial Statements 57
Disclosure Index 134
MSR01744 Annual Report 2017-18_2.indd 1 3/12/2018 3:40 PM
2 V/Line | Annual Report | 2017 – 2018
4 September 2018
The Hon Jacinta Allan MP Minister for Public Transport Level 20, 1 Spring Street Melbourne VIC 3000
The Hon Tim Pallas MP Treasurer Level 4, 1 Treasury Place East Melbourne VIC 3002
Dear Ministers
In accordance with the Financial Management Act 1994, I am pleased to present the Annual Report of V/Line Corporation (and its subsidiary V/Line Pty Ltd) for the year ending 30 June 2018.
Yours faithfully
Jeroen Weimar Chair
Responsible Body’s declaration
MSR01744 Annual Report 2017-18_2.indd 2 3/12/2018 3:40 PM

3
Section One
YEAR IN REVIEW
MSR01744 Annual Report 2017-18_2.indd 3 3/12/2018 3:40 PM

4 V/Line | Annual Report | 2017 – 2018
Purpose To provide a connected and bright future for Victorians
Vision A modern, high performing railway and coach service for all
Mission Connecting Victoria by empowering our people to be their best
Values Accountable We hold ourselves and others to account for the work that we do
Be bold We challenge, share ideas, and empower our people to speak up
Integrity We are honest, ethical, and transparent
Respectful We value others and accept their differences
Be our best We always strive for excellence and deliver this to our customers,
colleagues and community
Purpose, Vision, Mission, Values
MSR01744 Annual Report 2017-18_2.indd 4 3/12/2018 3:40 PM

5Section One – Year in Review
Chair’s Report
The 2017-18 financial year has been one of improved leadership and performance stability while V/Line continued to experience enormous patronage growth.
Under the stewardship of the previous Chair, Jennifer Dawson, the Board has overseen a strengthening in corporate governance processes, has fortified the financial rigour of the business and demanded executive accountability which has contributed considerably to improving the overall business confidence within V/Line.
On behalf of the Board of V/Line, I extend our gratitude to Jenny for her leadership.
It was also the first full financial year for our Chief Executive Officer, James Pinder, who has established clear business priorities including:
• improving performance
• focusing on modernisation and key projects
• empowering the people of V/Line.
The leadership team James has assembled has provided stability and focus for the business during 2017-18 which has translated into increased employee engagement. Significant steps have also been taken to modernise legacy operational systems and hold third-party maintenance providers to account for improved rolling stock reliability.
We are committed to providing V/Line with confidence for the future and have taken steps to ensure stability in its ownership structure. On 17 February 2018 all the employees, assets, liabilities, contracts and business operations were transferred from V/Line Pty Ltd to V/Line Corporation. This ensures the consolidation of V/Line’s legal and corporate structure and secures the ongoing public ownership of V/Line’s business.
The Regional Rail Revival investment by the Victorian and Commonwealth Governments is welcomed by the Board, but will see an even greater volume of works and disruption to passenger journeys over the coming years as these important upgrades are delivered.
With this increasing volume of improvement works being undertaken across the network, the Board has continued to focus on ensuring safety, service delivery and customer communication are at the forefront of business planning.
On behalf of the Board I would like to thank all the people across V/Line; our station staff, conductors and drivers, controllers and schedulers, service planners and administration teams, coach service planners and the engineers who work up and down our network. V/Line is able to provide regional rail and coach services to record numbers of passengers thanks to more than 1,900 dedicated and professional V/Line staff who work around the clock to run and improve our railway.
Jeroen Weimar Chair
MSR01744 Annual Report 2017-18_2.indd 5 3/12/2018 3:40 PM

6 V/Line | Annual Report | 2017 – 2018
The last financial year has seen a significant increase in momentum for V/Line as Victoria’s regional rail network continues our evolution towards becoming a high frequency commuter railway.
Significant government investment is helping us deliver the upgrades we need to our infrastructure and rolling stock and my role as leader of this organisation is to continue the drive towards modernising our culture and workforce in order to adapt to this ever-changing environment.
There are great challenges for V/Line in the coming years, but with these challenges come opportunities.
We need to refine our approach to recruitment and training to ensure we give our people the right skills to fill future roles as we take delivery of more trains and run more services.
We need to modernise our legacy systems for service planning, timetabling, rostering and performance.
And all of this needs to happen in conjunction with improved punctuality and reliability during a period of unprecedented patronage growth.
The commencement of the $1.75 billion Regional Rail Revival project – which will deliver improvements across all of V/Line’s rail corridors – is among the highlights of a busy 2017-18 year.
V/Line undertook significant work to prepare the Gippsland line for the running of its first VLocity train on 26 August and the August 2018 timetable which will see the life of the Avon River Bridge extended while works are undertaken to replace it.
Other highlights of the 2017-18 financial year include the re-opening of the Ararat to Maryborough freight line after 15 years as part of the Murray Basin Rail Project and the rollout of technology to improve mobile phone and data reception across the VLocity fleet.
V/Line delivered more than 20 million passenger journeys for the first time in 2017-18 and we put our 200th VLocity carriage into service as well as delivering 151 new train services per week.
I would like to extend a sincere thank you to the V/Line Board and Executive team and to all of our hardworking staff across Victoria. It is the people of V/Line who make this organisation such an important element of the social and economic fabric of regional Victoria.
In particular, I extend a personal thank you to Jenny Dawson, who finished her three-year term as Chair of the V/Line Board on 30 June 2018. It has been an absolute pleasure to work with and learn from Jenny. Her leadership during a challenging time has been critical to this organisation and she leaves a significant legacy.
I am pleased to welcome Jeroen Weimar as the new Chair of the V/Line Board. Jeroen’s expertise will provide invaluable support to the V/Line management team and he will no doubt help us foster stronger ongoing relationships with Victoria’s other key transport agencies.
James Pinder Chief Executive Officer
CEO’s Report
MSR01744 Annual Report 2017-18_2.indd 6 3/12/2018 3:40 PM
7Section One – Year in Review
Manner of Establishment and Responsible Ministers
This is the annual report of V/Line Corporation (V/Line) and its wholly owned subsidiary V/Line Pty Ltd.
V/Line is governed by the Transport Integration Act 2010, which sets out its objectives and functions, and the State-Owned Enterprises Act 1992. It operates as a not-for-profit corporation.
V/Line is responsible to the Victorian Minister for Public Transport and the Victorian Treasurer.
This report provides a summary of our key activities and financial performance for the period 1 July 2017 to 30 June 2018.
Transport for VictoriaV/Line is part of Victoria’s integrated transport portfolio, Transport for Victoria. Transport for Victoria leads a user-centred, outcomes focused and integrated approach that guides smart, long-term investments that support the state’s connectivity, prosperity and liveability.
Transport for Victoria has a strategic approach to designing and managing the network and is building a modern transport system.
The integrated transport portfolio is working to enable an optimised network where transport modes work in harmony to move people and freight in the most effective and efficient way, with each mode being used when and where it is best suited.
V/Line Corporation and V/Line Pty LtdV/Line Corporation was established as a statutory corporation in July 2003 and continues under the Transport Integration Act 2010. On 14 October 2008, V/Line Corporation was declared a state business corporation pursuant to the State-Owned Enterprises Act 1992.
V/Line Corporation has an independent Board appointed in accordance with the Transport Integration Act.
V/Line Corporation is the sole shareholder of V/Line Pty Ltd. In April 2017, Parliament passed the Transport Integration Amendment (Head, Transport for Victoria and Other Governance Reforms) Act 2017 that included facilitative provisions to transfer the employees, assets, rights and liabilities, from V/Line Pty Ltd to V/Line Corporation. The transfer supported the Government’s objective to strengthen the public ownership of V/Line for future generations of Victorians. The Minister for Public Transport approved the transfer in accordance with the relevant legislative requirements and the transfer successfully occurred on 17 February 2018. A liquidator will be appointed to undertake a member’s voluntary liquidation of V/Line Pty Ltd in due course.
No shares are held by a senior officer as nominee or held beneficially in a statutory authority or subsidiary.
MSR01744 Annual Report 2017-18_2.indd 7 3/12/2018 3:40 PM
8 V/Line | Annual Report | 2017 – 2018
Nature and Range of Services Provided
V/Line’s RoleV/Line is an operating agency as part of Transport for Victoria delivering services under a Partnership Agreement with Public Transport Victoria (PTV) (and other key contracts).
V/Line is:
• an operator of passenger rail and coach services
• a freight access provider
• a maintainer of railway infrastructure and rolling stock
• a project deliverer when engaged to do so.
About V/Line – Service ProvidedV/Line, as a brand, has provided public transport services to regional Victoria for over 30 years.
Each week, V/Line schedules more than 1,980 train services between Melbourne and:
• Geelong and Warrnambool
• Ballarat, Maryborough and Ararat
• Bendigo, Swan Hill and Echuca
• Seymour, Shepparton and Albury
• Traralgon, Sale and Bairnsdale.
More than 1,360 V/Line-branded coach services connect with the rail network and serve regional Victorian communities. Some of our coach services also link Victoria with South Australia, New South Wales and the Australian Capital Territory. Private sector operators provide all V/Line-branded coach services under the management of V/Line.
As well as being a public transport operator, V/Line also leases, provides access to and maintains over 3,520 kilometres of rail track used by passengers and freight rail operators.
V/Line is a major employer with a workforce of 1,964 including many who live and work in regional Victoria.
MSR01744 Annual Report 2017-18_2.indd 8 3/12/2018 3:40 PM

9Section One – Year in Review
Passenger Network Map
A B C D E F HG Î J K L M
A B C D E F HG Î J K L M
1
2
3
4
5
6
7
8
9
1
2
3
4
5
6
7
8
9
A B C D E F HG Î J K L M
A B C D E F HG Î J K L M
1
2
3
4
5
6
7
8
9
1
2
3
4
5
6
7
8
9
V/Line train – travel with mykiV/Line train – paper ticket requiredV/Line coach – paper ticket requiredRun by another operator
Effective January 2017 Not to scale, not all stops shown
SymbolsTrain and coach lines
© Public Transport Victoria 2017
* Limited services at Berwick Station
SkyBus services operate directly between Melbourne Airport and Southern Cross StationCustomer service hub For opening hours visit ptv.vic.gov.au
Interchange with Metro servicesInterchange with Metro servicesStations are drop off only to Melbourne and pick up only from Melbourne
Coaches at Melbourne Airport aredrop off only to Melbourne and pick up only from Melbourne
Train and coach interchangeCoach interchangeTrain Station and coach stop(without interchange)Train StationCoach stopEnd of line
State boundary
Melbourne Airport ✙ Bairnsdale
Cann River
Nathalia
Donald
Dunkeld
Bacchus Marsh ✙
Caroline Springs ✙
To Narooma &Batemans Bay
Cowes(Phillip Island)
Inverloch
Wonthaggi
Yarram
Korumburra
Lang Lang
Anderson
SOUTHERN CROSS Ringwood
MansfieldMount Buller
Yea
Whittlesea
Beechworth
Bright
Mount Beauty
Dandenong
Richmond
Clayton
Flinders Street
FootscraySunshine
AvenelEuroa
Violet TownBenalla ✙
ChilternSpringhurst Wodonga ✙
Albury Wangaratta ✙
To Canberra
To Sydney
Yarrawonga
Nagambie
Mooroopna
✙ Shepparton
Numurkah
Tocumwal
Finley
Griffith
Cobram
Lancefield
Heathcote
Kyabram
Stanhope
Barmah
Woodend ✙
Kyneton ✙
BENDIGO ✙
Castlemaine ✙
Epsom
Cohuna
Robinvale
Manangatang
Piangil
Ouyen
To Adelaide
To Adelaide
HorshamNhill
Dimboola
Pinnaroo Murrayville
Warracknabeal
Hopetoun
Stawell
Birchip
Rupanyup
Sea Lake
Mildura ✙
St Arnaud
ElmoreRochester
✙ Riddells Creek✙ Gisborne
Macedon
Malmsbury
Kangaroo Flat ✙
Deer Park
SunburyWatergardens
✙ Clarkefield
Rockbank
Ballan ✙ Melton ✙
Ardeer
Tarneit ✙Wyndham Vale ✙
Lara ✙Little River
North ShoreCorio
Eaglehawk
Dingee
Pyramid
Kerang
✙ Swan Hill
Berwick* GarfieldNar Nar
Goon
Pakenham Tynong Bunyip
Caulfield
North Melbourne
SEYMOUR ✙
Craigieburn
Broadmeadows
Wallan ✙
Wandong
Broadford ✙
Donnybrook
Tallarook
Heathcote Junction
Kilmore East ✙
Essendon
BALLARAT
Wendouree ✙BeaufortArarat ✙
✙ Maryborough
CreswickClunes
Talbot
Avoca
North Geelong ✙GEELONG ✙
Port Campbell Apollo BayLorne
Waurn Ponds ✙
South Geelong ✙
BirregurraCamperdown ✙Sherwood Park
Warrnambool ✙Port Fairy
Koroit
Heywood
Portland
Mount Gambier
Casterton
Glenthompson
Skipton
Terang
Mortlake
Hamilton
Anglesea
Marshall ✙
Trafalgar
Morwell ✙
Longwarry
Warragul ✙
Drouin ✙
Yarragon
Moe ✙
Maffra
TRARALGON ✙
RosedaleSale ✙
Stratford
Leongatha
Koo Wee Rup
Eildon
CapePaterson
Colac ✙ Winchelsea
Halls Gap
Murtoa
Dunolly
Wedderburn
Moama
Deniliquin
Barham
Orbost
Lakes Entrance
Paynesville
Marlo
Mallacoota
Echuca ✙
Daylesford
MurchisonEast
To Canberra
Murchison
Kilmore
RomseyGenoa
Rutherglen
Corowa
Mulwala
Derrinallum Lismore
✙
✙
Albury K3Anderson Î8Anglesea E7Apollo Bay D7Ararat D5Ardeer G5Avenel Î3Avoca D4Bacchus Marsh E5Bairnsdale L5Ballan E5Ballarat E5Barham F2Barmah G2Beaufort D5Beechworth J4Benalla Î3Bendigo F4Berwick Î7Birchip C3Birregurra D7Bright J4Broadford H4Broadmeadows H5Bunyip J7Camperdown C7Cann River L5Cape Paterson Î9Caroline Springs F5Casterton A6Castlemaine F4Caulfield H6Chiltern K3
Clarkefield G5Clayton Î6Clunes D5Cobram H2Cohuna E2Colac C6Corio F6Corowa J2Cowes (Phillip Island) Î8Craigieburn H5Creswick D5Dandenong Î7Daylesford E4Deer Park G5Deniliquin F2Derrinallum D6Dimboola B4Dingee E3Donald C3Donnybrook H5Drouin K7Dunkeld B6Dunolly D4Eaglehawk E3Echuca F2Eildon J6Elmore F3Epsom F3Essendon H5Euroa Î3Finley H2Flinders Street H6Footscray H6
Garfield J7Geelong E7Genoa L5Gisborne G5Glenthompson C6Halls Gap C5Hamilton B6Heathcote G4Heathcote Junction H5Heywood A7Hopetoun C2Horsham B4Inverloch J9Kangaroo Flat F4Kerang E2Kilmore H4Kilmore East H4Koo Wee Rup Î7Koroit B6Korumburra Î7Kyabram G3Kyneton F4Lakes Entrance L5Lancefield G4Lang Lang Î7Lara 4 F6Leongatha J8Lismore D6Little River F6Longwarry J7Lorne E7Macedon G4Maffra K5
Mallacoota M5Malmsbury F4Manangatang E2Mansfield J5Marlo M5Marshall D6Maryborough D5Melbourne Airport G5Melton F5Mildura D1Moama F2Moe K6Mooroopna H3Mortlake B6Morwell K6Mount Beauty J4Mount Buller J5Mount Gambier A7Mulwala J2Murchison H3Murchison East H3Murrayville B1Murtoa B4Nagambie H3Nar Nar Goon J7Nathalia G2Nhill A4North Geelong E6North Melbourne H6North Shore E6Numurkah H2Orbost L5Ouyen D1
Pakenham Î7Paynesville L5Piangil E2Pinnaroo A1Port Campbell C7Port Fairy B7Portland B7Pyramid E3Richmond H6Riddells Creek G5Ringwood Î6Robinvale D1Rochester F3Rockbank F5Romsey G5Rosedale L6Rupanyup C4Rutherglen J2Sale L6Sea Lake D2Seymour H4Shepparton H2Sherwood Park C7Skipton D6South Geelong E7Southern Cross H6Springhurst J3St Arnaud D4Stanhope G3Stawell C5Stratford L5Sunbury G5Sunshine H6
Swan Hill E2Talbot D5Tallarook H4Tarneit F6Terang C7Tocumwal H2Trafalgar K6Traralgon K6Tynong J7Violet Town Î3Wallan H5Wandong H4Wangaratta J3Warracknabeal C3Warragul K6Warrnambool B7Watergardens G5Waurn Ponds D7Wedderburn D4Wendouree D5Whittlesea Î6Winchelsea D6Wodonga K3Wonthaggi J8Woodend G4Wyndham Vale F6Yarragon K6Yarram J8Yarrawonga Î2Yea J5
MSR01744 Annual Report 2017-18_2.indd 9 3/12/2018 3:40 PM

10 V/Line | Annual Report | 2017 – 2018
Performance Overview
FACTS AND FIGURES FY 17-18 FY 16-17
Total passenger trips (rail and coach) 20,838,396 19,300,326
Rail passenger trips 19,513,458 17,925,413
Coach passenger trips 1,324,938 1,374,913
Paper tickets sold 2,056,525* 2,007,311*
EMPLOYEES
Full-time staff 1,720 1,573
Total staff 1,964 1,776
STATIONS
Total number of stations 91 91
CUSTOMERS
Overall customer satisfaction – trains 75.08 75.55†
Overall customer satisfaction – coaches 82.43 81.50†
Number of customer information enquiries 295,488 343,436
Number of feedback cases 17,754 15,713
Number of on-train consultation sessions with passengers 5 4
Compulsory compensation paid to passengers for V/Line not meeting on-time targets (complimentary ticket value) $156,921 $84,435
Farebox revenue $101.8 million $96.4 million
Farebox (per cent breakdown)
62 per cent full fare
67 per cent full fare
38 per cent concession
33 per cent concession
Subsidy per passenger $23.93 $23.33
FINANCE
Total income $1.1 billion $778.6 million
Total expenses $1.1 billion $777.6 million
Income tax benefits/(expenses) $2.1 million ($1.4) million
Net result $0.2 million ($0.4) million
* Does not include myki ticket sales. † Figure differs from previous years. For comparison reasons, figure has been recalculated to reflect the methodology
in V/Line’s new Partnership Agreement.
MSR01744 Annual Report 2017-18_2.indd 10 3/12/2018 3:40 PM

11Section One – Year in Review
FACTS AND FIGURES FY 17-18 FY 16-17
FLEET
VLocity carriages 225 198
Locomotives 31 41
Loco-hauled carriages 133 133
Sprinters (single unit) 21 21
SAFETY
SIFR (Serious Injury Frequency Rate) = LTI (Lost Time Injury) and MTI (Medically Treated Injury) per million hours worked 27.9 38.9
SPAD (Signals Passed at Danger) per million km (Human Factors + Technical) 3.61 2.99
SPAD (Signals Passed at Danger) per million km (Human Factors only) 1.76 1.41
FREIGHT
Total Gross Tonne Kilometres (GTK) 1,621,317 1,625,342
Total Freight Train Journeys 6,590 5,863
Freight Type (GTK ‘000) Grain 840,881 802,289
Container 718,703 749,799
Other 61,733 73,254
SERVICE DELIVERY
Reliability overall (commuter and long-distance services, average monthly performance) 97.0 97.8
Reliability – commuter 96.9 97.8
Reliability – long-distance 97.4 97.8
Punctuality – commuter (on time to five minutes) 84.3 86.5
Punctuality – long-distance (on time to 10 minutes) 81.9 80.0
Number of services – commuter 80,976 75,550
Number of services – long-distance 14,176 12,887
Number of services that left on time from originating station 80,604 76,657
MSR01744 Annual Report 2017-18_2.indd 11 3/12/2018 3:40 PM

12 V/Line | Annual Report | 2017 – 2018
V/Line train passenger trips – percentage change 2013-14 to 2017-18
Patronage
Rail patronage by line 2013-14 to 2017-18
115.8%GEELONG
21.1%BENDIGO
46.7%BALLARAT
5.6%SEYMOUR
-9.9%TRARALGON
GEELONG
BENDIGO
BALLARAT
TRARALGON
SEYMOUR
2015-2016
2014-2015
2013-2014
2016-2017
2017-2018
2017-2018
2017-2018
2017-2018
2017-2018
6.74 million
4.24 million
4.02 million
7.62 million
8.67 million
2.84 million
1.80 million
1.54 million
4.65 million
2015-2016
2014-2015
2013-2014
2016-2017
2.50 million
2.51 million
2.35 million
2.59 million
2015-2016
2014-2015
2013-2014
2016-2017
3.79 million
3.36 million
3.17 million
4.33 million
2015-2016
2014-2015
2013-2014
2016-2017
1.76 million
2.04 million
2.00 million
1.88 million
2015-2016
2014-2015
2013-2014
2016-2017
1.49 million
1.48 million
1.46 million
1.50 million
MSR01744 Annual Report 2017-18_2.indd 12 3/12/2018 3:40 PM

13Section One – Year in Review
Train and coach patronage
-1.6%DECREASE
2013-2014 (i)
3.9%INCREASE
2014-2015
9.2%INCREASE
2016-2017
8.0%INCREASE
2017-2018
17.5%INCREASE
2015-2016 (ii)
V/Line train and coach passenger trips over five years – percentage change
2013-2014
14.47 MILLION
2014-2015
15.04 MILLION
2015-2016
17.68 MILLION
2016-2017
19.30 MILLION
2017-2018
20.84 MILLION
(i) There was a drop in V/Line patronage during construction of the Regional Rail Link, with trains being replaced by coaches while some of the major works were underway.
(ii) In 2015-16, the Regional Rail Link opened significantly increasing services and patronage on the Ballarat and Geelong corridors.
MSR01744 Annual Report 2017-18_2.indd 13 3/12/2018 3:40 PM

14 V/Line | Annual Report | 2017 – 2018
Performance Reporting (Non-Financial) – achievements, operational performance and key initiatives
Service DeliveryAside from safety, improving performance is V/Line’s key priority. The Service Delivery team, from train drivers to network controllers, timetable planners and supporting functions have been continually challenged to improve the delivery and punctuality of our services.
In 2017-18, V/Line established a Performance Support team to develop short, medium and long term opportunities to improve punctuality and reliability with a view to sharpen our focus on lifting performance.
V/Line has developed specialised tools to assist in measuring performance and targeting new opportunities. A Performance Reporting and Visualisation Regime has been established with a Network Performance Visualisation Centre using a Business Intelligence Portal and Performance Dashboard to analyse daily, weekly and monthly performance.
In response to continuing increases in both patronage and services delivered, a number of new roles were introduced during 2017-18 with a restructure of V/Line’s Integrated Operations Centre. A series of newly-established network management and train control positions will help improve the day-to-day functioning of the control centre. Communications improvements, disruption management and facilities and system upgrades are also ongoing.
A project is also underway to replace the current manual, paper-based train orders process with an electronic platform.
In anticipation of continued service increases, 70 new trainee drivers have been recruited and an additional 21 practical driver trainers (PDTs) appointed, significantly increasing V/Line’s on-the-job training capabilities.
The Security and Resilience team relocated its Network Support Centre to Southern Cross Station in 2017-18 and Authorised Officers worked with Victoria Police to identify key hot spots for trespassing across the network and to educate communities about reducing risk-taking behaviour.
A targeted focus on anti-social behaviour in Eastern Victoria involved educational sessions at schools and attendance at community days to explain rail safety.
The first two V/Line incident response vehicles commenced operations on the network, allowing for better management of emergency incidents.
MSR01744 Annual Report 2017-18_2.indd 14 3/12/2018 3:40 PM

15Section One – Year in Review
Freight ServicesV/Line provides access to and maintains 3,520 kilometres of rail track used for passenger rail services and bulk freight rail services. V/Line provides a complete freight access service ensuring both scheduled and ad hoc freight access requests are accommodated and safely integrated with passenger rail services.
During the financial year ended 30 June 2018, the total number of freight train journeys across the V/Line network increased 12 per cent to 6,590. During this same period the total Gross Tonne Kilometres (GTK) recorded remained steady at 1,621 million.
Bulk grain transportation accounted for 840 million of total GTK which was up from 802 million in the previous year. Bulk container freight represented 718 million of total GTK down marginally from 749 million recorded in the 2016-17 financial year.
CustomerThe Customer group, which includes station staff, train conductors and customer communications staff, made a significant contribution to helping maintain performance during periods of increased service disruption, much of which was due to the significant volume of rail and road improvement works being carried out across the state.
Overall customer satisfaction with train services was 75.08 down marginally from 75.55 for the previous year. For coach services, the customer satisfaction measure was 82.42 which improved from 81.50.
Train station customer service teams assisted with on-time train departures through announcements and by increasing visibility on platforms prior to departures.
In a bid to entrench passenger understanding of the importance of on-time train departures, the Whistle Blows, Train Goes campaign was launched to provide tips on how to safely and efficiently board a train.
V/Line has maintained its certification against the International Customer Service Standard (ICSS) for another year.
The total number of customer information enquiries reduced 14 per cent this year to 295,488 and the number of feedback cases managed by V/Line increased by 13 per cent to 17,754. Total compulsory compensation paid to passengers for V/Line not meeting performance targets was $156,921.
V/Line saw patronage of 20.8 million train and coach trips in 2017-18, an increase of 8 per cent on the previous financial year.
The one-millionth passenger was celebrated at Tarneit station on 29 June 2018. This station was opened in June 2015 as part of the 47.5km Regional Rail Link Project and is located in one of the fastest growing patronage corridors on the V/Line network.
The largest patronage increases were seen in the South West and North with increases of 13.6 per cent and 8.5 per cent respectively. Increases were also seen in the West (+7.0 per cent) and the North East (0.8 per cent). Only the Eastern corridor showed a decline (-3.6 per cent).
MSR01744 Annual Report 2017-18_2.indd 15 3/12/2018 3:40 PM

16 V/Line | Annual Report | 2017 – 2018
Rail trips are forecast to increase significantly across existing V/Line corridors in the next decade. Patronage on the Ballarat line will increase by over 40 per cent and similar increases are expected for the Northern and Eastern corridors.
Patronage growth will be even more significant in the South West, with rail trips forecast to increase by over 60 per cent. The North East corridors are expected to double in patronage over the next decade.
Asset ManagementThe Asset Management team is responsible for ensuring that all of V/Line’s railway assets are maintained, accounted for, and put to their highest and best use. As well as focusing on performance improvement, the team is creating the foundation to achieve ISO55001 accreditation.
During the 2017-18 year, the Network Engineering team installed eight track-side lubricators, created new design standards across all assets, improved reliability with a point conditioning monitoring system and have made changes to V/Line’s level crossing predictor control system.
There has been a continuous focus throughout the year on the removal of periodic Temporary Speed Restrictions related to the condition of rail. Predictive geometry techniques are now being used as part of a proactive track repair program, which has delivered highly successful outcomes in maintaining the track condition.
The Network Maintenance team’s main highlight was the ongoing improvement in mud hole repairs to maintain line speed. Locations where mud holes had developed under Glued Insulated Rail Joints (GIRJs) were given special attention. As a result, only two joint breaks occurred in the lead-up to winter, considerably fewer than the 17 which occurred in 2016-17.
Recruitment commenced for 12 signal maintenance technician apprentices to join the Asset Management team. This was the largest recruitment program undertaken for many years for signal maintenance apprentices. Four of the apprentices will be based in regional Victoria.
A total of 27 new VLocity carriages were delivered into service during the year and the Fleet team improved the passenger experience with the rollout of the mobile repeater program which improved phone and internet connectivity on the VLocity train fleet. As at 30 June 2018, a total of 62 VLocity carriages have been upgraded with a further 13 to be completed before the end of December 2018. The team also upgraded the Classic Fleet with reliability improvements on the N-class locomotive HEP power systems and trialled enhanced N-set carriage heating and air-conditioning systems.
A Quality, Improvement, Compliance & Risk team was formed in 2018 to bolster Asset Management’s capability and culture around risk management and compliance.
Strategy and ProgramThe Strategy and Program team provides advice internally as well as to the wider transport industry on the development of the regional rail network and future operations.
Advice is underpinned by analysis and modelling to understand short, medium and long-term impacts, development of strategies and plans to deliver operational outcomes, and coordinating budget funding submissions.
The team is also responsible for project development and delivery ranging from construction and infrastructure projects to timetable change programs and performance-focused initiatives. Some of the highlights from 2017-18 including delivering $199 million of infrastructure works on time and to budget and the development and early works for the Regional Rail Revival package.
In August 2017, Strategy and Program oversaw the development and implementation of a new timetable which added 151 new services to the
MSR01744 Annual Report 2017-18_2.indd 16 3/12/2018 3:40 PM

17Section One – Year in Review
timetable each week. The Geelong corridor received 74 extra services each week with the remaining services being added to timetables on the Ballarat, Ararat, Bendigo, Seymour, Shepparton and Traralgon lines.
As part of the $50 million Safer Country Crossings Program, a total of 23 vehicle level crossings on priority roads were upgraded during the financial year with 13 pedestrian crossings also upgraded. The upgrades have been undertaken at critical locations which accommodate high speed passenger trains or a number of heavy vehicles.
Construction timeframes for the $1.75 billion Regional Rail Revival were announced with the Ballarat line upgrade scheduled for completion in late 2019. V/Line has been supporting the early works packages on the Ballarat line and relocating critical services in preparation for major construction works.
All lines on the V/Line network will receive upgrades with the Warrnambool line to be completed by late 2020, Geelong and Bendigo upgrades complete by late 2021 and the Gippsland line upgrade to be completed by late 2022. The Avon River Bridge on the Gippsland line is expected to be replaced by late 2021. Strategy and Program have been key advisors to Rail Projects Victoria in preparation of project scopes for each line upgrade.
The $440 million Murray Basin Rail Project will deliver standardising and upgrading of 1,055 kilometres of rail track which services the freight industry in Victoria’s north west.
The project is jointly funded by the Australian Federal Government and Victorian State Government and is essential to better connect key freight centres in north west Victoria with our ports and encourage competition and private investment in our rail freight network.
Stage Two of the Murray Basin Rail Project was largely completed during the year with the re-opening of the Ararat to Maryborough freight line after 15 years. Following completion of upgrade works on the Mildura line, the line was reopened with freight train returning to operating out of the Merbein intermodal terminal.
Business ServicesThe Business Services team further consolidated V/Line’s cost efficiency drive across the business by providing dedicated business partners to each division and practising strong financial governance. This ensured rigorous budget management during a period of significant growth in services, patronage and project activity.
The Procurement team ensured the network of suppliers selected to support delivery of V/Line’s business priorities were aligned to the Victorian Government’s Purchasing Board guidelines. A key element for risk management of suppliers is the widespread and ongoing application of supplier panel arrangements across the business.
A spending analysis program has also helped the business to better understand the value delivered from procurement activities. It provides critical business intelligence to understand spending and costs, allowing business units to leverage better outcomes in price, reliability and choice of suppliers.
A technology modernisation program has also been established to further align investment with better governance across the organisation. A software development team has been formed to help drive modernisation.
MSR01744 Annual Report 2017-18_2.indd 17 3/12/2018 3:40 PM
18 V/Line | Annual Report | 2017 – 2018
Enterprise Governance and RiskThe Enterprise Governance and Risk team continues to support the business by providing advice across corporate strategy and planning, risk, assurance, legal and integrity issues.
In 2017-18, the Corporate Planning and Reporting team worked closely with Transport for Victoria (TfV) to support the TfV establishment objectives. This team also led discussion on a new five-year partnership agreement with PTV and renegotiated key agreements with Metro Trains Melbourne as part of the metropolitan re-franchising process.
The Legal team continues to support business areas by delivering advice across a broad range of subjects. The team has helped deliver initiatives to support improvement of front-line performance, including working with TfV to introduce incident response vehicles.
Risk, Audit and Assurance staff continued to strengthen V/Line’s approach to risk. In the 2017-18 year, a revision of enterprise-wide risk management was undertaken to ensure that this area is effectively managed.
An integrity support service was launched which included internal training, induction education, an internal intranet page and an external and an internal “whistle-blower” phone line.
Community PartnershipsV/Line sponsors a range of partnerships and programs in regional Victoria, from youth sports and readiness-for-work programs to community volunteer programs for the beautification of regional railway stations. V/Line also provides support for regional arts initiatives such as the Castlemaine State Festival and helps to promote passenger accessibility through its ongoing support for Travellers Aid.
More than 500 young people from across regional Victoria participated in the V/Line Cup, which is an under-15 football partnership between AFL Victoria and V/Line. The V/Line Cup offers boys and girls from regional areas a stepping-stone towards a career pathway in AFL football with 22 V/Line Cup alumni being drafted in the AFL and AFLW leagues this year. The 2017 V/Line Cup generated $2.1 million in economic benefit to the Latrobe Valley region.
Through V/Line’s partnership with Doxa Youth Foundation, over 2000 students from 73 disadvantaged and low socio-economic schools were supported with free travel to attend Doxa camps to provide them with leadership and life skills. V/Line has also supported nine young people from socially and financially disadvantaged backgrounds to undertake a cadetship through Doxa’s program.
More than 300 young people from disadvantaged regional Victorian areas have participated in VCE / VCAL work-readiness mentoring sessions with V/Line leaders as part of the partnership with the Beacon Foundation.
The Stationeers Program is a partnership with Keep Victoria Beautiful. It supports community volunteering at 37 V/Line railway stations, which largely involves cleaning of facilities and maintenance of garden beds and nearby grounds.
V/Line is a long-term partner of Travellers Aid, which offers invaluable services at Southern Cross, Flinders Street and Seymour stations including buggy services as well as personal care and assistance to passengers in need of accessibility support.
MSR01744 Annual Report 2017-18_2.indd 18 3/12/2018 3:40 PM

19Section One – Year in Review
Hattah
Robinvale
ManangatangPiangil
Nyah West
Ultima
Swan Hill
Kerang
Pyramid
Dingee
MarongBendigo
Castlemaine
MalmsburyKyneton
Woodend
Sunbury
BacchusMarsh
Ballan Craigieburn
Drouin
Nar Nar Goon
Pakenham
Trafalgar Morwell
Moe Traralgon Sale
Bairnsdale
Wallan
Broadford
Seymour
Tallarook
Mangalore
EuroaNagambie
MurchisonEast
ToolambaShepparton
Strathmerton
Tocumwal Yard
Oaklands
Kyabram
Rochester
Echuca
DeniliquinWakool
Moulamein
Dookie
BenallaGlenrowan
Wangaratta
SpringhurstWodonga
Albury
Ouyen
Hopetoun Woomelang
Sea Lake
Wycheproof
Korong Vale
Inglewood
Yaapeet
BirchipJeparit
Dimboola
DiapurServiceton
Adelaide
Horsham
Warracknabeal
St ArnaudMurtoa
Glenorchy
Stawell
Ararat
Maryborough
Dunolly
Beaufort
Tatyoon
Westmere
Berrybank
Inverleigh
Gheringhap
Clunes
Ballarat
Heywood
Branxholme
Hamilton
Warrnambool
TerangCamperdown
GeelongNorth Geelong
ColacWinchelsea
Glenthompson
Maroona Yard
Portland
Mittyack
LingaPanitya
Red CliffsMildura
Yelta
WerribeeWyndham
Vale
Eaglehawk
Lara
DeerPark
Moolort
Standard gauge
Broad gauge
Dual gauge
V/Line Passenger
V/Line operations over lines managed by others
V/Line Freight
Suspended / managed by others
LEGEND
Bentleigh Huntingdale
Alamein
Kooyong
Clifton Hill
FlemingtonRacecourse
Caulfield
Elsternwick
Mount
Wav
erley
Glen W
averl
ey
Blackb
urn
Ringw
ood
Cambe
rwell
North D
ynon
South
Dyn
on
South
ern C
ross
Flind
ers St
reet
Glenfer
rie
Richm
ond
Lilydale Rosanna
Newmarket
Hurstbridge
VictoriaPark
Epping
Reservoir Fawkner
Upfield
Glenroy
St Albans
Sydenham
Bendigo
Broadmeadows
Sunshine Albion
DeerPark
Ardeer
TottenhamYard
Brooklyn
Seaholme
Werribee
Wyndham Vale
Tarneit Spotswood
Williamstown Pier
Newport
OakPark
Strathmore
Jewell Merri
Westall Yard
Boronia
Belgrave
Bayswater
Cheltenham Sandringham
Brighton Beach
Mordialloc
Dandenong
Lyndhurst
Cranbourne
Stony Point
Jacana
Traralgon
Geelong
Ballarat
Craigieburn
Darling
S. Yarra
NorthMelbourne
MELBOURNE METRO AREA
Victorian Rail Network Map
MSR01744 Annual Report 2017-18_2.indd 19 3/12/2018 3:40 PM

20 V/Line | Annual Report | 2017 – 2018
Performance Reporting – Financial
Current year financial reviewV/Line reported a $0.2 million profit after income tax for the year ended 30 June 2018 compared to a $0.4 million loss in 2016-17. The profit for the year was favourable against a budgeted loss after tax of $11.7 million.
The major contributing factors to the improvement against the budget were:
• lower fleet maintenance costs due to a re-negotiated wheel rate and a reprojection of whole of life maintenance costs
• reduced fuel costs due to the hedge strategy V/Line has in place, offset in part by higher bus replacements.
Total revenue increased by $291.3 million to $1.1 billion. The significant contributors to this increase include funding relating to the delivery of the Murray Basin Rail Project and additional operating subsidy to enable V/Line to manage increased weekday services which were introduced in August 2017.
V/Line’s diesel fuel hedge strategy successfully mitigated the impact of increasing fuel prices by not applying additional cash flow pressures.
The net cash flow from operating activities was $81.8 million, compared with $3.4 million in 2016-17, with a net increase in cash of $60.7 million, the increase resulting from the advanced funding received for the Murray Basin Rail Project.
V/Line Corporation five year financial summary ($’000)
Five year financial summary 2018 2017 2016 2015 2014
Income from government 898,880 624,880
521,584
467,568 436,099
Total Income from transactions 1,069,907 778,628 675,142 618,774 577,479
Total expenses from transactions 1,075,631 780,757 700,727 621,061 587,138
Net result from transactions (5,724) (2,129) (25,585) (2,287) (9,659)
Net cash flow from operating activities 81,762 3,397 11,270 27,266 374
Total assets 333,041 219,912 230,394 225,354 206,875
Total liabilities 265,465 157,478 164,448 137,435 126,245
MSR01744 Annual Report 2017-18_2.indd 20 3/12/2018 3:40 PM

21
Section Two
GOVERNANCE AND ORGANISATIONAL STRUCTURE
MSR01744 Annual Report 2017-18_2.indd 21 3/12/2018 3:40 PM

22 V/Line | Annual Report | 2017 – 2018
CFO Business Services
Albert Giorgini
Finance and Accounting
Procurement
Business Information Solutions (ICT)
EGM Enterprise Governance and Risk
Brendan Geary
Legal Services
Risk Assurance and Audit
Integrity
Information Security
Corporate Planning, Contracts and Reporting
Insurance
Company Secretary (Acting)
Rebecca Northeast
Board Governance
Secretariat to the Board
Director/Board liaison
EGM Strategy and Program
Colin Taylor
Strategy and Growth
Strategic Operatiions
Project Development, Management and Delivery
Operational Readiness
State Projects Interface
Major Works
EGM Corporate Affairs
Daniel Hoare
Corporate Affairs
Stakeholder Relations
Communications and Media
Chief Executive Officer
James Pinder
V/LINE BOARD
EGM People
Elaine Seckold
Workplace Relations
Learning and Capability
People Services
Talent and Recruitment
Culture Change and Leadership
EGM Asset Management
Alex Panayi
Network Maintenance
Network Engineering
Fleet
Asset Management Business and Performance (inc Freight)
Quality and Compliance
EGM Health, Safety and Environment
Dean Matthews
Compliance and Safeworking
Safety Risk and Assurance
People Safety, Health and Wellbeing
Environment & Sustainability
EGM Service Delivery
Paul D‘Alessio
Train Services
Network Services
Performance Support
Strategic Bus Planning
Security and Resilience
Chief Operating Officer
Carol-Anne Nelson
EGM Customer (Acting)
Jonathan McKeown
Customer Experience
Station Staff
Conductors
Catering
Southern Cross Station
Accessibility
Organisation structure and corporate governance arrangements
Leadership team as at 30 June 2018
MSR01744 Annual Report 2017-18_2.indd 22 3/12/2018 3:40 PM

23Section Two – Governance and Organisational Structure
Board roleThe Board has overall responsibility for the corporate governance of V/Line and V/Line Pty Ltd, respectively. The Board has established protocols and procedures to ensure that corporate governance is maintained at the highest levels and the strategic direction and overall performance of the respective business entities can be developed and monitored diligently.
The roles and responsibilities of the Board are set out in the V/Line Board Charter. In accordance with this charter, the Board conducts a regular review of its performance and identifies areas for improvement.
Board composition The Boards of V/Line Corporation (V/Line) and V/Line Pty Ltd consist of the same independent non-executive directors. The directors of V/Line are appointed by the Governor-in-Council on recommendation of the Minister for Public Transport, made after consultation with the Treasurer.
Board of Directors as at 30 June 2018Jennifer Dawson – Chair (1 July 2015 to 30 June 2018) Jenny is a Chartered Accountant who has served for many years on Victorian and Federal government regional development committees. She served for 15 years as a Director of the ASX listed Bendigo and Adelaide Bank Ltd. Jenny currently Chairs Sandhurst Trustees Ltd and Adelaide Managed Funds (subsidiaries of Bendigo and Adelaide Bank Ltd) and the Bendigo Art Gallery Foundation. She is a Victorian State Council member of the Australian Institute of Company Directors. Jenny holds a Bachelor of Accounting degree. She is a Fellow of the Institute of Chartered Accountants.
Craig Cook – Deputy Chair (Since 1 July 2015) Craig has expertise in governance and risk management and in regional development issues. Craig has over 15 years of experience in both government and publicly-listed boards including the boards of Goulburn-Murray Water, Rural Finance Corporation, VicSuper, VicSuper Ecosystem Services and the Port of Hastings Development Authority. He holds a Bachelor of Economics degree.
Gabrielle Bell – Director (Since 1 July 2015) Gabrielle is a corporate lawyer with broad experience working in Australia and South-East Asia. She is an experienced non-executive Director and is currently serving on the boards of South East Water, VicSuper Pty Ltd and InLife Independent Living Ltd. She holds a Bachelor of Laws and Bachelor of Engineering (Chemical) and is a graduate of the Australian Institute of Company Directors.
Kay Macaulay – Director (Since 1 July 2015) Kay worked for the Australian Industry Group for 28 years in various roles including Regional Manager. Kay is a former member of the Central Highlands Area Consultative Committee, the University of Ballarat (Federation University) Council and Grampians Regional Development Australia Committee. She has been a member of Rotary International for 17 years.
John Donovan – Director (Since 1 July 2015) John is the Managing Director of AFM Investment Partners, a director of a public hospital and a responsible manager of an Australian Financial Services Licence. He is a former director of Gippsland Water and Adminpartners. He is a graduate of the Australian Institute of Company Directors, a Senior Fellow of Finsia, a Fellow of the Australian Institute of Management, a Certified Practicing Marketer and Fellow of the Australian Marketing Institute and an associate member of the Australasian Investor Relations Association. He holds a Master of Public Relations.
Rachel Thomson – Director (Since 1 July 2017) Rachel has more than 20 years’ experience working in Australia and internationally in senior roles in risk management and insurance. Rachel is currently a Non-Executive Director of Central Highlands Water. She holds a Bachelor of Science degree from the University of Melbourne and is a graduate of the Australian Institute of Company Directors.
Independent Chair of Audit, Finance & Risk CommitteeJohn Gibbins(Since 1 November 2017) John has over 30 years’ experience as an audit and risk partner with KPMG and Deloitte. He is currently a consultant to MinterEllison and is a member of the audit committee for the Emergency Services Telecommunication Authority. John is a Fellow of the Institute of Company Directors and holds a Bachelor of Commerce degree.
MSR01744 Annual Report 2017-18_2.indd 23 3/12/2018 3:40 PM
24 V/Line | Annual Report | 2017 – 2018
Committee Membership and RolesDuring the period 1 July 2017 to 30 June 2018, the Board committees of V/Line comprised the Audit, Finance and Risk Committee; the Human Resources and Governance Committee; the Safety, Security, Health and Environment Committee; and the Customer and Brand Committee.
Each committee has a charter that sets out its roles and responsibilities.
Audit, Finance and Risk CommitteeAssists the Board to review and report independently on financial information published by V/Line; to review the effectiveness of V/Line’s internal control environment; to determine the scope of the internal audit function and ensure its resources are adequate and used effectively, including coordination with the external auditors; to maintain effective communication with external auditors, to consider recommendations made by internal and external auditors and review the implementation of actions to resolve issues raised; and to oversee the effective operation of the risk management framework.
Members from 1 July 2017 to 30 June 2018 were John Donovan, Jennifer Dawson and Rachel Thomson. John Donovan was Chair from 1 July 2017 to 31 October 2017. John Gibbins was appointed by the Board and has been the Independent Chair of the Committee from 1 November 2017 to 30 June 2018.
Number of meetings held during the year: Six
HR and Governance CommitteeAssists the Board in the appointment, review and succession of the Chief Executive Officer; reviewing the remuneration policy of staff; monitoring workforce performance; and culture and change initiatives.
Members as at 30 June 2018 were Craig Cook (Chair), Kay Macaulay and Gabrielle Bell.
Number of meetings held during the year: Two
Safety, Security, Health and Environment CommitteeAssists the Board in discharging its obligations in relation to its safety, security, health and environment practices and provides an overview mechanism for examining the related operational risk management in V/Line.
Members as at 30 June 2018 were Gabrielle Bell (Chair), Jennifer Dawson and Kay Macaulay.
Number of meetings held during the year: Four
Customer and Brand CommitteeAssists the Board in carrying out its oversight responsibilities in relation to customer and brand strategy.
Members as at 30 June 2018 were: John Donovan (Chair), Craig Cook and Rachel Thomson.
Number of meetings held during the year: Two
MSR01744 Annual Report 2017-18_2.indd 24 3/12/2018 3:40 PM

25
Other ReportingAccess to information
Directors of V/Line and V/Line Pty Ltd are entitled to full access to information required to discharge their responsibilities. Directors of both entities may obtain independent professional advice on matters arising from carrying out their Board duties. Directors also have access to senior managers and/or officers of the entity and, on request, to documents held by the entity.
Indemnification of officers
During the financial year, V/Line insured all directors and officers of V/Line and V/Line Pty Ltd against certain liabilities incurred by them in that capacity. In accordance with normal commercial practices, the terms of the
insurance contract prohibit disclosure of details of the nature of the liabilities covered by the insurance contract and the amount of the premium paid under the contract. V/Line has entered into deeds of indemnity and access with each current and former director and company secretary. These deeds provide for indemnification against liabilities arising from the conduct of the business or from the discharge of directors’ and officers’ duties (other than liability relation to a wilful breach of duty or trust) and the maintenance of directors’ and officers’ insurance.
Ministerial directionsV/Line received no ministerial directions for the period ending 30 June 2018.
V/Line Corporation Board Meetings Special Purpose Meetings
Director
Eligible to attend
Number attended
Eligible to attend
Number attended
Jennifer Dawson, Chair 6 6 2 2
Craig Cook 6 5 2 2
Gabrielle Bell 6 5 2 2
Kay Macaulay 6 6 2 2
John Donovan 6 6 2 2
Rachel Thomson 6 6 2 2
Board and committee meeting attendance
Section Two – Governance and Organisational Structure
MSR01744 Annual Report 2017-18_2.indd 25 3/12/2018 3:40 PM

26 V/Line | Annual Report | 2017 – 2018
V/Line Pty Ltd Board Meetings Special Purpose Meetings
Director
Eligible to attend
Number attended
Eligible to attend
Number attended
Jennifer Dawson, Chair 6 6 2 2
Craig Cook 6 5 2 2
Gabrielle Bell 6 5 2 2
Kay Macaulay 6 6 2 2
John Donovan 6 6 2 2
Rachel Thomson 6 6 2 2
Committees HR and Governance Audit, Finance and Risk
Director
Eligible to attend
Number attended
Eligible to attend
Number attended
Jennifer Dawson N/A N/A 6 6
Craig Cook 2 2 N/A N/A
Gabrielle Bell 2 2 N/A N/A
Kay Macaulay 2 2 N/A N/A
John Donovan N/A N/A 6 6
Rachel Thomson N/A N/A 6 6
Independent Chair Eligible to attend Number attended
John Gibbins 3 3
Committees Safety, Security, Health and Environment Customer and Brand
Director
Eligible to attend
Number attended
Eligible to attend
Number attended
Jennifer Dawson 4 4 N/A N/A
Craig Cook N/A N/A 2 2
Gabrielle Bell 4 4 N/A N/A
Kay Macaulay 4 4 N/A N/A
John Donovan N/A N/A 2 2
Rachel Thomson N/A N/A 1 1
MSR01744 Annual Report 2017-18_2.indd 26 3/12/2018 3:40 PM

27Section Two – Governance and Organisational Structure
Occupational Health and Safety
V/Line’s Destination Zero strategy provides the framework, initiatives and risk-based guidance to manage V/Line’s health, safety and environment (HSE) risks and improve V/Line’s safety culture. This year V/Line continued the journey towards the Destination Zero aspirational target of zero rail and coach incidents, zero harm to people and zero damage to the environment.
HSE engagement and communication activities continue to evolve. Safety Alerts warn of immediate identified risks while the internal publication Lessons Learnt share learning from incidents, near misses, and investigations with the broader workforce. Other publications include Talking Health, Safety or Environment and Destination Zero Updates. These can be sent to all employees or targeted to specific departments to make sure the message is relevant and gets to the right audiences.
There is extensive governance and oversight of V/Line’s HSE strategy through the Board’s Safety, Security, Health and Environment Committee, a management led HSE Council, HSE senior leadership team Assurance Review Committee, OHS committee meetings and frontline safety toolbox talks and pre-starts.
Focused Destination Zero initiatives in the 2017-18 financial year included:
• risk simplification framework and processes
• enhanced, targeted HSE communications
• reinvigoration of post injury welfare management
• key risk initiatives such as enhanced hazardous tree and vegetation management plans and manual handling committees.
V/Line also has a coordinated SPAD (Signal Passed at Danger) reduction and management strategy for this high railway risk, which includes:
• utilising a newly developed SPAD risk ranking assessment tool to prioritise signals in terms of SPAD risk to enable a risk-based approach to safety improvement
• investigating innovative solutions (such as on-track warning lights) to increase driver awareness on approach to multi-SPAD signals
• SPAD risk awareness activities such as SPAD alerts and one-to-one supervisor briefings on SPAD causes and prevention
• conducting investigations into each SPAD to determine and address contributing factors, including formalised competency assessment plans for drivers involved in SPAD (and other) events
• research into the factors contributing to SPADs occurring during Empty Car and Shunt moves (which contribute to a disproportionately high number of SPAD events), and addressing the identified contributing factors
• continued rolling out of the Professional Driving Guide, which incorporates SPAD reduction strategies
• continued rolling out of Operational Awareness Training to drivers, which provides strategies to manage SPAD precursors (33% of our drivers have completed this training as at 30 June 2018).
MSR01744 Annual Report 2017-18_2.indd 27 3/12/2018 3:40 PM

28 V/Line | Annual Report | 2017 – 2018
This year V/Line implemented a number of initiatives to decrease trespasser incidents, including:
• ongoing identification of trespass hot spots with targeted campaigns in collaboration with Victoria Police
• delivery of an educational program to schools in the Eastern region with attendance at community days to explain rail safety and associated risks.
V/Line also continues to work proactively with WorkSafe to ensure our obligations are met and to resolve all workplace matters efficiently and effectively in collaboration with the workforce.
V/Line’s Safety Management System was also extensively reviewed by the rail regulator (ONRSR) and re-accredited as ‘compliant’ to the Rail Safety National Law, as part of the transfer of the accreditation from V/Line Pty Ltd to V/Line Corporation.
Incident management The continuation of the Destination Zero program has resulted in improvements to incident numbers.
The key measure for significant staff injury, SIFR (Serious Injury Frequency Rate – incidents per million work hrs), reduced to 27.9, a 28.3 per cent reduction on the previous year (2016-17 = 38.9), and 7 per cent below the annual forecast of 30. The severity of injuries also reduced from the previous year with an average time off per injury at six days (down from eight).
Level crossing collisions reduced by over 50 per cent compared to the previous two years (three in 2017-18 and seven in each of the previous two years). An extensive program of upgrade works is now contributing to a reduction in collisions. However, ongoing vigilance and improvements will be required while level crossings remain.
The end of year SPAD frequency rate increased (from 2.99 to 3.61) with an increase in both Technical SPADs and Human Factors SPADs. The SPAD rate was inconsistent throughout the year with the highest monthly SPAD rate in four years occurring in September, and then a SPAD-free month in March (the first since June 2011). While the SPAD rate takes into account kms travelled, the frequency of services increased in 2017-18 increasing the exposure to signals and therefore SPADs. A SPAD Committee met regularly to review every SPAD to assess potential additional controls.
The ‘Human Factors’ SPAD rate increased to 1.8 incidents/million kms, up from 1.4 in 2016-17. Despite the increase, this rate continues to be one of the lowest in industry and is supported by additional engineering controls such as TPWS (V/Line’s emergency brake system), that minimises the consequence of a SPAD should they occur. More and more locations are being fitted with TPWS using the risk ranking tool to prioritise.
There was an increase in reported trespasser incidents from 589 in 2016-2017 to 908 in 2017-2018. The increase is mainly attributed to improved reporting to assist with focused campaigns.
MSR01744 Annual Report 2017-18_2.indd 28 3/12/2018 3:40 PM

29
Serious Injury Frequency Rate (SIFR) 2017-18 2016-17 2015-16
Measure Actual Actual Actual
SIFR 27.9 38.9 30.9
SIFR Forecast 30 33 35
SIFR Variance -2.1 5.9 -4.1
SIFR % Variance to Forecast -7% 17.9% -11.7%
Signals Passed at Danger (SPAD) (Human Factors + Technical) 2017-18 2016-17 2015-16
Measure Actual Actual Actual
SPAD 3.61 2.99 3.7
SPAD Forecast 3.00 3.50 4.0
SPAD Variance 0.61 -0.51 -0.3
SPAD % Variance to Forecast 20.33% -14.57% -7.5%
V/Line has continued to implement a risk and opportunity based Environmental Management System accredited to ISO 14001:2015. Energy consumption intensity continued to decrease at V/Line in 2017-18, falling to 0.839 MJ/passenger km. This is a 3.3 per cent decrease from the previous year’s consumption of 0.868 MJ/passenger km, further strengthening the environmental benefits of ‘rail over road’.
During the year V/Line successfully transitioned to the new Quality and Environmental management system standards ISO 9001/ISO 14001.
HSE Indicator PerformanceThe two safety lag performance indicators used at V/Line are:
• SIFR for personal injury (per million workhours)
• SPAD for rail safety (per million kilometres travelled) (Human Factors + Technical).
Section Two – Governance and Organisational Structure
MSR01744 Annual Report 2017-18_2.indd 29 3/12/2018 3:40 PM

30 V/Line | Annual Report | 2017 – 2018
WorkCover – Personal Injury Lost Time Claims
# time loss standard
claims
Full-time equivalent
(FTE)Per 100
staffAverage cost
per claim
2017-18 38 1915.5 1.98 $38,477
2016-17 30 1730.4 1.73 $42,490
2015-16 24 1610.7 1.49 $49,471
Year Per 100 FTE
2017-18 14.62
2016-17 14.45
2015-16 7.63
Year Per 100 FTE
2017-18 437
2016-17 440
2015-16 485
Hazards and Incidents per 100 FTEThe total number of hazards/100FTE reported has marginally increased over 2017-18. This can be seen as positive as staff continue to use the system. Continued training and awareness has ensured that logged hazards are tracked, reported to all relevant stakeholders (including employee elected health and safety representatives), and closed out once rectified.
The total number of incidents/100FTE reported has marginally decreased when compared to the previous year. As with hazards, training and awareness has continued to ensure that all reportable incidents are recorded, and appropriate management and investigation completed as required.
The total number of WorkCover standard claims lodged over the last reportable year has increased, however the average cost per claim and average time off has decreased. This indicates both a decrease in the severity of incidents and an improvement in claims management.
Hazards Reported
Incidents Reported
MSR01744 Annual Report 2017-18_2.indd 30 3/12/2018 3:40 PM

31
Section Three
WORKFORCE DATA
MSR01744 Annual Report 2017-18_2.indd 31 3/12/2018 3:40 PM

32 V/Line | Annual Report | 2017 – 2018
Our People
In order to adapt to changes in our industry, V/Line has embarked on a cultural journey with a belief that no business transformation can succeed without also incorporating a human transformation; the culture should clearly define who we are, what we stand for, how we behave and how we decide what is right. In August 2017, we launched our new purpose, vision, mission and values which support our desired culture. Our culture is guided by five values; accountable, be bold, integrity, respectful and be our best. These values underpin the work we do and guide us in our day-to-day activities.
To deliver our strategic objectives and enable our people to be the best they can be, we launched our people strategy ‘Putting our People First.’ It is based on three themes:
Recruit and retain the right peopleOur achievement highlights include:
• New employees Over the past 12 months, 305 new employees commenced with V/Line in various roles including drivers, customer-facing staff and infrastructure employees.
• Apprentices, cadets and graduates We recruited 37 apprentices, cadets and graduates, providing an opportunity for our employees to mentor and share their technical skills and rail knowledge. These programs are an important source of early career pathing for a sustainable workforce.
• Students V/Line continues to support opportunities for students through the Level Crossing Removal Authority’s (LXRA) Training for the Future initiatives.
V/Line continues its sponsorship of engineering, environmental, and communication undergraduates through the Doxa Cadetship Program and Beacon Foundations’ High Impact Program, where our leadership team members share their unique stories and career paths.
Develop and engage our peopleOur achievement highlights include:
• Be Your Best Launched new SharePoint site dedicated to being your best. This contains information and resources for staff to find out about V/Line’s key priorities, shared values and how we are tracking as part of Towards 92, new initiatives and ideas, professional development and training opportunities, as well as recognising the dedication and service of our people.
• Leadership capability A crucial factor in retaining key talent and driving culture. We continue to focus our emerging leaders and through our partnership with RMIT with 17 graduating from our Management Development Program with a Cert IV in Leadership and Management over the past 12 months. V/Line is currently refreshing its leadership approach to focus on accountability, values, constructive style, and inclusivity as part of our culture shift.
MSR01744 Annual Report 2017-18_2.indd 32 3/12/2018 3:40 PM

33Section 3 – Workforce Data
We have continued to run a series of senior leadership forums where external guest speakers attended to share their experience on topics such as diversity and inclusion, leadership, and culture. The aim of these forums is to foster diversity in thought and position us as a learning organisation.
• Supporting Engagement In May 2018 V/Line invited employees to have their say on their experience of working at V/Line to identify opportunities and strengths through our ‘Pulse’ employee engagement survey (EES). The results showed our top line engagement score increased to 61 per cent – up from the 2016 survey by 3 per cent. This is encouraging as it shows positive growth in our engagement during a time of considerable change and provides a platform for our action plans to strengthen our culture and performance.
• Enhancing our performance Our performance review process has been enhanced to assist our leadership teams deliver our vision. We incorporated an assessment on how we demonstrate our values as well as measure achievements. We encourage regular coaching conversations to identity development plans and career aspirations. We are on track to have this process automated for the 2018-19 review process.
• Positive Mental Health We continue to provide our people with resilience training skills to support their teams, colleagues or friends who are facing trauma. To address psychological injuries, V/Line continues to deliver ‘Coping with Trauma’ training to all drivers and other at-risk employees. This is designed to help our people feel more prepared should they be exposed to a stressful incident. We also run a ‘Supporting our people to cope with Trauma’ program for people leaders.
• Our People Capabilities Our people capabilities are the skills that support our people in their development, to help them to be the best they can be. Formal training and professional development programs supplement on-the-job development opportunities. Training is undertaken in technical, management and leadership skills, such as conversations for change, compliance training, including professional standards and governance, unconscious bias, appropriate workplace behaviour, and Living our Values. Track Principles Workshops take place and include practical and theoretical activities designed to address fundamental rail knowledge for those working in the industry. Seven employees graduated our Track Inspector Program.
• Diversity awareness V/Line raised employees’ awareness and involvement in diversity by supporting participation in hosting events including:
– Biggest Morning Tea
– RUOK? Day
– Harmony Day morning tea.
MSR01744 Annual Report 2017-18_2.indd 33 3/12/2018 3:40 PM

34 V/Line | Annual Report | 2017 – 2018
• Staff recognition V/Line recognises the achievements of staff who have gone above and beyond in their roles through monthly CEO Morning Teas (9 held to-date). Service Recognition events include:
– 193 employees recognised for 10, 15, and 20 years’ service
– 201 employees recognised for 25, 30, 40 and 50 years’ service.
• Registered Training Organisation (RTO) Successfully transitioned from V/Line Pty Ltd to V/Line Corporation, which included a two-year funding contract. The RTO is growing and has seen a 30 per cent increase in the number of classes delivered for several qualifications.
Create an environment that is diverse, inclusive and supportiveV/Line is committed to creating a workplace that reflects the communities it serves and creating a workplace that accepts and values the contributions of all employees, free from discrimination, harassment and bullying. In December, we launched our Equality, Inclusion and Respect Strategy 2018–2020. Over the past six months, measures have been set and many initiatives have commenced on this journey including Inclusive Workplace seminars and the continuation of our Appropriate Workplace Behaviour workshops. With the establishment of our Culture Council, implementation of activities and practices that support the V/Line Equality, Inclusion and Respect Plan are underway, contributing to an inclusive and flexible workplace environment for all employees.
Employment and conduct principlesV/Line applies merit and equity principles when appointing staff. The selection processes ensure that applicants are assessed and evaluated fairly and equitably based on the key selection criteria and other accountabilities without discrimination. Employees have been correctly classified in workforce data collections.
Industrial RelationsNo time has been lost through industrial action and disputes.
MSR01744 Annual Report 2017-18_2.indd 34 3/12/2018 3:40 PM

35Section 3 – Workforce Data
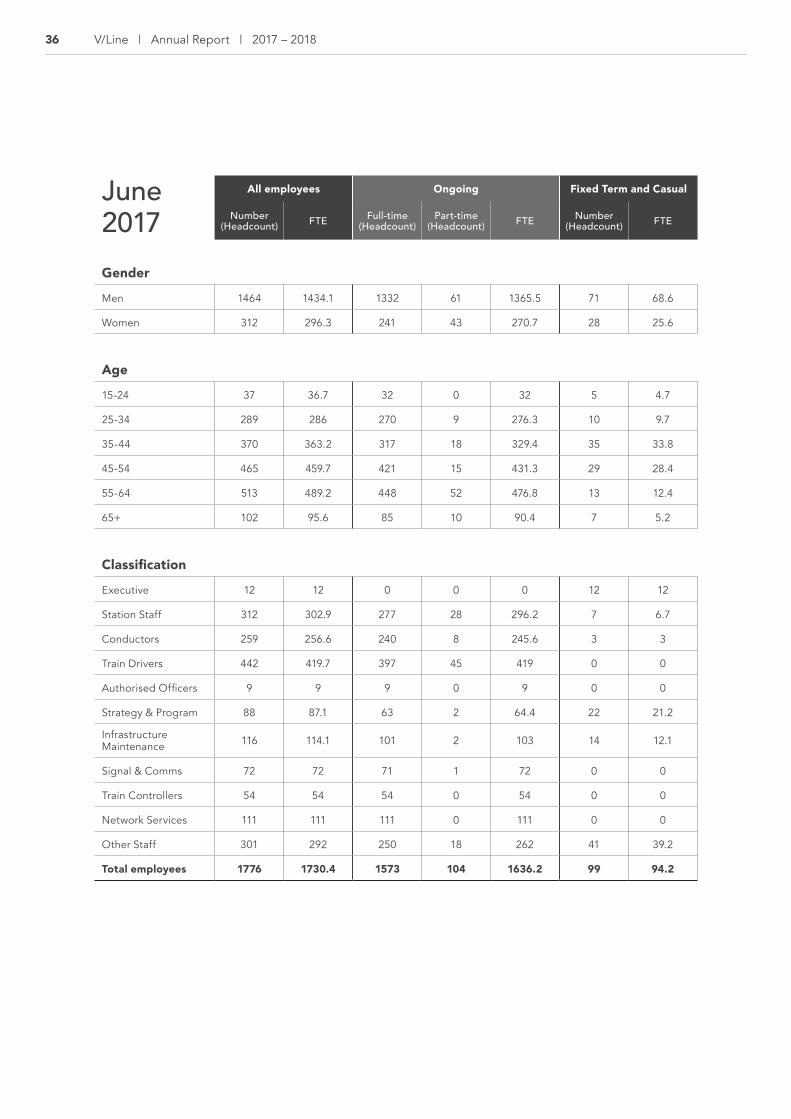
Comparative workforce dataThe following table discloses the head count and full-time staff equivalent (FTE) of all active employees of V/Line, employed in the last full pay period in June 2018 against the last full pay period in June 2017.
June 2018
All employees Ongoing Fixed Term and Casual
Number (Headcount) FTE Full-time
(Headcount)Part-time
(Headcount) FTE Number (Headcount) FTE
Gender
Men 1598 1565 1429 67 1466.50 102 99.10
Women 366 349 282 48 315.10 36 34.80
Age
15-24 39 38.70 33 1 33.70 5 5
25-34 376 373 339 10 346.30 27 27
35-44 431 423.90 371 17 382.70 43 42.10
45-54 498 490.70 435 21 449.30 42 41.40
55-64 502 479.60 438 49 465.70 15 14.20
65+ 118 108.10 95 17 103.90 6 4.20
Classification
Executive 12 12 0 0 0 12 12
Station Staff 311 300.60 261 32 282.90 18 17.70
Conductors 291 288.70 276 6 280 9 8.70
Train Drivers 400 378.60 356 43 378.10 1 .50
Authorised Officers 9 9 9 0 9 0 0
Strategy & Program 124 123.10 95 3 97.10 26 26
Infrastructure Maintenance 158 157.70 145 1 145.70 12 12
Signal & Comms 93 92.40 90 0 90 3 2.40
Train Controllers 57 57 57 0 57 0 0
Network Services 165 164.10 161 0 161 4 3.10
Other Staff 344 332 270 30 289.80 44 42.20
Total employees 1964 1915.50 1720 115 1790.90 129 124.60
MSR01744 Annual Report 2017-18_2.indd 35 3/12/2018 3:40 PM
36 V/Line | Annual Report | 2017 – 2018
June 2017
All employees Ongoing Fixed Term and Casual
Number (Headcount) FTE Full-time
(Headcount)Part-time
(Headcount) FTE Number (Headcount) FTE
Gender
Men 1464 1434.1 1332 61 1365.5 71 68.6
Women 312 296.3 241 43 270.7 28 25.6
Age
15-24 37 36.7 32 0 32 5 4.7
25-34 289 286 270 9 276.3 10 9.7
35-44 370 363.2 317 18 329.4 35 33.8
45-54 465 459.7 421 15 431.3 29 28.4
55-64 513 489.2 448 52 476.8 13 12.4
65+ 102 95.6 85 10 90.4 7 5.2
Classification
Executive 12 12 0 0 0 12 12
Station Staff 312 302.9 277 28 296.2 7 6.7
Conductors 259 256.6 240 8 245.6 3 3
Train Drivers 442 419.7 397 45 419 0 0
Authorised Officers 9 9 9 0 9 0 0
Strategy & Program 88 87.1 63 2 64.4 22 21.2
Infrastructure Maintenance 116 114.1 101 2 103 14 12.1
Signal & Comms 72 72 71 1 72 0 0
Train Controllers 54 54 54 0 54 0 0
Network Services 111 111 111 0 111 0 0
Other Staff 301 292 250 18 262 41 39.2
Total employees 1776 1730.4 1573 104 1636.2 99 94.2
MSR01744 Annual Report 2017-18_2.indd 36 3/12/2018 3:40 PM

37Section 3 – Workforce Data
Workforce inclusion policyAt V/Line our values are at the centre of everything we do, behaviours are constructive, and we accept and value the contributions of all employees regardless of gender, ethnicity, sexual orientation, religion, age or ability. We are committed to a diverse, inclusive and respectful workplace that reflects the communities we serve.
As part of V/Line’s Equality, Inclusion and Respect strategy we have a target of 25 per cent female participation in the workplace by 2020 and 50 per cent women on the executives’ gender profile by 2020.
Other areas of focus include generational diversity, lesbian, gay, bisexual, transgender and intersex, Aboriginal and Torres Strait Islander People and People with a Disability.
V/Line is active in the Transport for Victoria ‘Women in Transport’ program and the Level Crossing Removal Authority’s social inclusion and procurement programs.
The following table outlines V/Line’s actual progress against this target in 2017-18.
Executive officer dataFor V/Line an executive officer (EO) is defined as a person to whom the Victorian Government’s Policy on Executive Remuneration in Public Entities applies. All figures reflect employment levels at the last full pay period in June of the current and corresponding previous reporting year.
Workforce inclusion policy initiative
Target Actual progress in 2017-18
Actual progress in 2016-17
Executive Officers: Executive Officers: Executive Officers:
Gender profile at executive levels1
50 per cent women; 50 per cent men by 2020
19 per cent women; 81 per cent men
Comparable data is not available for 2016-17
* Comparable data is not available for 2016-17.
Total number of EOs for V/Line, broken down into gender
All Women Men Self-described
No. Var. No. Var. No. Var. No. Var.
Executive Leadership Team 12 0 3 0 9 0 0 0
Senior Leadership Team 35 * 10 * 25 * * *
Broader Leadership Team 32 * 2 * 30 * * *
1. Note that the self-described category is nil for this entity.
MSR01744 Annual Report 2017-18_2.indd 37 3/12/2018 3:40 PM

38 V/Line | Annual Report | 2017 – 2018
Notes
The salaries reported above are for the full financial year, at a 1-FTE rate, and includes superannuation (a) There are 2 employees employed on a part-time basis at 0.70 FTE rate respectively.(b) There are 9 employees employed on a part-time basis at 0.70 FTE rate respectively.
The following table discloses the annualised total salary for senior employees of V/Line, categorised by classification. The salary amount is reported as the full-time annualised salary.
Remuneration of Government Sector Executive Remuneration Panel (GSERP) and non-GSERP contract staff
Income band (salary)GSERP
contract staffNon – GSERP contract staff
< $160 000 5 123(b)
$160 000 – $179 999 18 15 (b)
$180 000 – $199 999 22 8
$200 000 – $219 999 13(a) 1
$220 000 – $239 999 8(a) 1
$240 000 – $259 999 2 0
$260 000 – $279 999 2 0
$280 000 – $299 999 4 0
$300 000 – $319 999 2 0
$320 000 – $339 999 1 0
$340 000 – $359 999 0 0
$360 000 – $379 999 0 0
$380 000 – $399 999 1 0
$400 000 – $419 999 0 0
$420 000 – $439 999 0 0
$440 000 – $459 999 1 0
$460 000 – $479 999 0 0
$480 000 – $499 999 0 0
Total 79 148
MSR01744 Annual Report 2017-18_2.indd 38 3/12/2018 3:40 PM

39
Section Four
OTHER DISCLOSURES
MSR01744 Annual Report 2017-18_2.indd 39 3/12/2018 3:40 PM

40 V/Line | Annual Report | 2017 – 2018
Local Jobs First – Victorian Industry Participation Policy (VIPP)The Victorian Industry Participation Policy Act 2003 requires departments and public-sector bodies to report on the implementation of the Local Jobs First – Victorian Industry Participation Policy (VIPP). Departments and public-sector bodies are required to apply Local Jobs First – VIPP in all procurement activities valued at $3 million or more in metropolitan Melbourne and for state-wide projects, or $1 million or more for procurement activities in regional Victoria.
During 2017-18, V/Line commenced eleven Local Jobs First – VIPP applicable procurements totalling $97 million. Of those projects, three were located in regional Victoria, two in metropolitan Melbourne and six state-wide. While all the applicable procurements underwent a VIPP Contestability Assessment, two required a VIPP Plan.
During 2017-18, V/Line did not complete any Local Jobs First – VIPP applicable projects.
The outcomes reported from the implementation of the VIPP where information was provided, were as follows:
• an average of 100 per cent of local content outcome was recorded
• a total of zero Annualised Employee Equivalent (AEE) positions were created
• zero new apprenticeships created and zero existing apprenticeships retained.
During 2017-18, zero small to medium sized or large businesses prepared a VIPP Plan for contracts.
During 2017-18, all projects, which commenced on or after 1 September, had 100 per cent local content as the projects were local by nature.
Government advertising expenditureV/Line did not undertake any advertising campaigns in the reporting period that involved a media spend of $100,000 or greater.
Consultancy expenditureDetails of consultancies valued at $10,000 or greater In 2017-18, there were 42 consultancies where the total fees payable to the consultants were $10,000 or greater. Total expenditure incurred in 2017-18 in relation to these consultancies was $18,148,000 (excluding GST). Details of individual consultancies are set out in the following tables.
Details of consultancies under $10,000 In 2017-18, there were 41 consultancies engaged during the year where the total fees payable to the consultants were less than $10,000. The total expenditure incurred in 2017-18 in relation to these consultancies was $117,000 (excluding GST). A full list of V/Line contractors and consultants engaged in 2017-18 are set out in the following tables.
MSR01744 Annual Report 2017-18_2.indd 40 3/12/2018 3:40 PM

41Section 4 – Other Disclosures
Non-Project Related Consultants Purpose of Consultancy
Total approved
project fee (excl. GST)
$'000
Expenditure 2017-18
(excl. GST) $'000
Future expenditure
(excl. GST) $'000
Deakin University Operational and technology improvement services designed for training and cultural change
671 648 23
Maddocks Pty Ltd Legal Services including transfer of V/Line Pty Ltd to V/Line Corporation (VLC Project)
648 633 15
RSM Australia Pty Ltd Internal audit & risk management services
419 392 28
Corsair Consulting Group Pty Ltd
Financial advisory and management services
393 393 –
Ernst & Young Financial due diligence and taxation services
274 274 –
DLA Piper Australia Legal Services 274 206 68
Barrington Centre Pty Ltd Employee assistance program and training
222 222 –
Ringgo Solutions Pty Ltd Financial modelling services 168 140 28
Monash University Track Measurement & Assessment Engineering services
115 115 –
C.C Kelly & J Yang Forensic Investigation and Efficiency services
71 71 –
Dale D'Rozario Fatigue Management framework 65 65 –
Mercer Consulting (Australia) Pty Ltd
HR remuneration review 63 63 –
Corrs Chambers Westgarth Legal Services 59 59 –
Fatigue Management and Sleep Solutions Australia
Fatigue risk management review 50 44 6
Votar Partners Pty Ltd Records Management 43 39 4
Lloyds Register Quality Assurance Ltd
ISO audit services 42 34 8
List A Barristers Legal Services 22 22 –
Dedale Asia Pacific Pty Ltd Professional safety services on CCTV camera trial project
20 20 –
Hall & Wilcox Legal Services 14 14 –
Human Synergistics Australia Pty Ltd
Frontline Leadership Program 13 13 –
Kathleen Townsend Executive Solutions
Professional services on transfer of business operations from V/Line Pty Ltd to V/Line Corporation
12 12 –
Greens List Barristers Legal Services 11 11 –
A.J. Dever Pty Ltd Legal Services 11 11 –
Office of the National Rail Safety Regulator
Rail Safety Regulator services for VLC Project
10 10 –
Total 3,690 3,511 179
Below $10K 117 117 Nil
Consultancies 2017-18 – Details of Consultants over $10,000
MSR01744 Annual Report 2017-18_2.indd 41 3/12/2018 3:40 PM

42 V/Line | Annual Report | 2017 – 2018
Project Related Consultants Purpose of Consultancy
Total approved
project fee (excl. GST)
$'000
Expenditure 2017-18
(excl. GST) $'000
Future expenditure
(excl. GST) $'000
Interface Rail Engineering Pty Ltd
Engineering Services for Murray Basin Rail Project, Avon River Bridge and Regional Rail Revival
5,325 4,578 748
Rail Control Systems Australia Pty Ltd
Engineering and Design Services for Level Crossing upgrade
4,668 4,585 83
Boleh Consulting Pty Ltd and (Australia) Pty Ltd
Engineering Services for Murray Basin Rail Project, Avon River Bridge and Regional Rail Revival
1,212 1,133 79
RPS Manidis Roberts Pty Ltd Consultancy and communication support for Murray Basin Rail Project
940 691 249
GHD Pty Ltd Engineering Services for Murray Basin Rail Project and Merebin Railway cutting
803 637 166
Kinsley Group Pty Ltd Concept Design, Survey & Geotech Investigation and Design Services
830 529 301
Advisian Pty Ltd Consultancy services for Operational readiness
625 470 156
Hatch Nuttall Engineering Pty Ltd
Engineering Services for bridge investigations
570 535 35
Sterling Group Consultants Pty Ltd
Infrastructure Inspection, Survey and Design services
448 429 20
Fanjord Solutions ICT advisory and project management 398 398 –
Opus International Consultants Pty Ltd (Australia)
Signalling box design and engineering services
280 204 76
ONTOIT Global Pty Ltd Project Advisory Services 288 18 270
SMEC Australia Pty Limited Investigative services for Geelong Tunnel and North Melbourne Flyover
228 136 92
Aecom Australia Pty Ltd Data analysis and documentation for Ballarat Line Upgrade project
148 33 115
Golder Associates Pty Ltd Geotechnical construction support services
101 101 –
Turner & Townsend Pty Ltd ISO services for Murray Basin Rail Project
81 81 –
Agonis Group Pty Ltd Condition assessment and specification documentation
38 38 –
Ecology and Heritage Partners Pty Ltd
Environmental & Biodiversity consultancy services
32 23 8
DLA Piper Australia Legal services 18 18 –
Total 17,034 14,637 2,397
Below $10K Nil Nil Nil
Consultancies 2017-18 – Details of Consultants over $10,000
MSR01744 Annual Report 2017-18_2.indd 42 3/12/2018 3:40 PM

43Section 4 – Other Disclosures
Information and communication technology expenditureFor the 2017-18 reporting period, V/Line had a total ICT expenditure of $12,395,534, with the details shown below.
All operational ICT expenditure
Business As Usual (BAU) ICT
expenditure
ICT expenditure related to projects to create or enhance ICT capabilities
Business as usual ICT
expenditure
Operational expenditure
Capital expenditure
$’000 $’000 $’000 $’000
11,273 1,123 163 960
MSR01744 Annual Report 2017-18_2.indd 43 3/12/2018 3:40 PM

44 V/Line | Annual Report | 2017 – 2018
Freedom of informationThe Freedom of Information Act 1982 allows the public a right of access to documents held by the Department. The purpose of the Act is to extend as far as possible the right of the community to access information held by government departments, local councils, Ministers and other bodies subject to the Act.
An applicant has a right to apply for access to documents held by V/Line. This comprises documents both created by V/Line or supplied to V/Line by an external organisation or individual, and may also include maps, films, microfiche, photographs, computer printouts, computer discs, tape recordings and videotapes. Information about the type of material produced by V/Line is available on V/Line’s website under its Part II Information Statement.
The Act allows V/Line to refuse access, either fully or partially, to certain documents or information. Examples of documents that may not be accessed include: cabinet documents; some internal working documents; law enforcement documents; documents covered by legal professional privilege, such as legal advice; personal information about other people; and information provided to V/Line in-confidence.
From 1 September 2017, the Act has been amended to reduce the Freedom of Information (FOI) processing time for requests received from 45 to 30 days. In some cases, this time may be extended.
If an applicant is not satisfied by a decision made by V/Line, under section 49A of the Act they have the right to seek a review by the Office of the Victorian Information Commissioner (OVIC) within 28 days of receiving a decision letter.
Making a requestFOI requests can be lodged online at www.foi.vic.gov.au. An application fee of $28.90 currently applies. Access charges may also be payable if the document pool is large, and the search for material is unreasonably time consuming.
Access to documents can also be obtained through a written request to V/Line’s Freedom of Information Officer, as detailed in s17 of the Freedom of Information Act 1982.
When making an FOI request, applicants should ensure requests are in writing, and clearly identify what types of material/documents are being sought.
Requests for documents in the possession of V/Line should be addressed to:
Freedom of Information Officer V/Line Corporation GPO Box 5343 Melbourne VIC 3001
FOI statistics/timelinessDuring 2017-18, V/Line received 12 applications. Of these requests, two were from Members of Parliament and the remainder from the general public.
V/Line made 12 FOI decisions during the 12 months ended 30 June 2018 and all decisions were made within the statutory 30 day time period.
The average time taken to finalise requests in 2017-18 was 25 days.
Two requests were subject to a complaint/internal review by OVIC.
Further informationFurther information regarding the operation and scope of FOI can be obtained from the Act, regulations made under the Act and at foi.vic.gov.au.
MSR01744 Annual Report 2017-18_2.indd 44 3/12/2018 3:40 PM

45Section 4 – Other Disclosures
Compliance with the Building Act 1993V/Line requires that all new buildings and works to existing buildings carried out for and on its behalf comply with the Building Act 1993.
Competitive Neutrality PolicyCompetitive neutrality requires government businesses to ensure where services compete, or potentially compete with the private sector, any advantage arising solely from their government ownership be removed if it is not in the public interest. Government businesses are required to cost and price these services as if they were privately owned. Competitive neutrality policy supports fair competition between public and private businesses and provides government businesses with a tool to enhance decisions on resource allocation.
This policy does not override other policy objectives of government and focuses on efficiency in the provision of service.
V/Line continues to comply with the requirements of the Competitive Neutrality Policy.
Compliance with the Protected Disclosure Act 2012 The Protected Disclosure Act 2012 encourages and assists people in making disclosures of improper conduct by public officers and public bodies. The Act provides protection to people who make disclosures in accordance with the Act and establishes a system for the matters disclosed to be investigated and rectifying action to be taken.
V/Line does not tolerate improper conduct by employees, nor the taking of reprisals against those who come forward to disclose such conduct. It is committed to ensuring transparency and accountability in its administrative and management practices and supports the making of disclosures that reveal corrupt conduct, conduct involving a substantial mismanagement of public resources, or conduct involving a substantial risk to public health and safety or the environment.
V/Line is committed to the aims and objectives of the Act. V/Line has procedures in place for protecting people against detrimental action that might be taken against them in reprisal for the making of protected disclosures. Our procedure can be found at vline.com.au.
V/Line cannot receive disclosures under the Act. Any disclosure of improper conduct by V/Line or its employees, which a discloser wishes to make under the Protected Disclosure Act may be made to:
Independent Broad-based Anti-Corruption Commission (IBAC)
Level 1, North Tower, 459 Collins Street Melbourne, VIC 3000
Phone: 1300 735 135 Internet: www.ibac.vic.gov.au
MSR01744 Annual Report 2017-18_2.indd 45 3/12/2018 3:40 PM

46 V/Line | Annual Report | 2017 – 2018
Compliance with the Disability Act 2006The Disability Act 2006 requires V/Line to prepare a disability action plan and report on its implementation in our annual report. V/Line’s 2015-2018 Accessibility Action Plan (the Plan) is a three-year plan that sets out our commitment to providing an inclusive and accessible service to all Victorians.
V/Line’s Plan is aligned with the Absolutely everyone: state disability plan for 2017-2020, which is the Victorian Government’s Framework for enabling people with a disability to participate and contribute to the social economic and civic life of their community.
This year our progress against the Plan has included the following achievements:
• working with V/Line’s Customer Accessibility Reference Group, we made a number of improvements, including:
– a new design for the accessible areas in Sprinter cars
– installation of a grab rail in the buffet car to increase stability for all passengers
– additional Boarding Assistance Zones at Footscray, Sunshine and Broadmeadows stations
– trial of veloSTRAIL flange gap technology to support safer access at the pedestrian crossing at North Shore Road
• the fifth Community Accessibility Forum was held with customers, advocates and industry partners. This forum discussed improvements across the whole customer journey for customers with accessibility needs, which will inform the development of V/Line’s next Accessibility Action Plan
• a quarterly accessibility update newsletter was produced V/Line customers and stakeholders
• a new, dedicated Accessibility Adviser commenced working with V/Line
• V/Line maintained certification under the Communication Access Symbol and began embedding ongoing learning and improvements
• regular consultation was completed with key external stakeholders on upcoming projects
• V/Line participated in state and national accessibility committees.
As the current Plan comes to an end, we are proud of the achievements that have occurred over the past three years. V/Line has commenced the process of developing our next accessibility action plan that will guide us into the future to continue to improve the experience for our customers.
MSR01744 Annual Report 2017-18_2.indd 46 3/12/2018 3:40 PM

47Section 4 – Other Disclosures
V/Line Corporation was established as a statutory rail corporation in July 2003 and was declared a State-Owned Business Corporation pursuant to the State-Owned Enterprises Act 1992 on 14 October 2008. It therefore reports to both the Minister for Public Transport and the Treasurer and is governed by both the Transport Integration Act 2010 and the State-Owned Enterprises Act 1992.
V/Line also leases and maintains the regional rail network and provides access to rail freight operators.
Key Performance Indicators include: Customer Satisfaction, Stakeholder Perception, Serious Injury Frequency Rate (SIFR), Signals Passed at Danger (SPADs), Asset Reliability, Service Delivery and Financial Performance.
V/Line prepares its accounts in accordance with generally accepted accounting principles incorporating the Australian Accounting Standards, the Financial Management Act 1994 and the requirements of Public Transport Victoria (PTV).
In accordance with the requirements of V/Line’s Services Agreement, regular reports are provided to PTV covering all aspects of V/Line’s delivery of its obligations under this agreement. As a State business corporation, V/Line also provides performance reports to the Department of Treasury and Finance, the Department of Economic Development, Job, Transport and Resources and Transport for Victoria.
Compliance with Transport Integration Act 2010Under section 164(1)(b) of the Transport Integration Act 2010, V/Line must include in its Annual Report a copy of its statement of corporate intent.
Statement of Corporate Intent
Purpose Vision Mission ValuesTo provide a connected and bright future for Victorians
A modern, high performing railway and coach service for all
Connecting Victoria by empowering our people to be their best
AccountableBe boldIntegrityRespectfulBe our best
Strategic Priorities and Objectives
Strategic Priorities and Objectives
Safety and care for the environment embedded as part of our everyday
Performance Deliver services that are punctual and reliable to connect regional Victoria and meet our Service Agreement obligations
Significant Projects Actively engage in the delivery of significant projects to benefit V/Line
People and Culture Build an engaged and accountable team in an environment where our people can be their best
Modernisation Create a modern, high performing Victorian regional rail network
MSR01744 Annual Report 2017-18_2.indd 47 3/12/2018 3:40 PM

48 V/Line | Annual Report | 2017 – 2018
Office based environmental impactsBuilding Energy UseV/Line consumes energy at a range of sites across the network, including office facilities, stations, maintenance facilities, infrastructure yards, and signalling and signage sites.
The data represented below was collected through energy retailer billing information, and comprehensively reflects known V/Line sites. V/Line is continually developing systems to more comprehensively and accurately collect and manage data for V/Line sites.
Actions undertaken
V/Line is currently assessing options for including renewable electricity in the energy profile and undertook an assessment of the solar capacity of the network in 2017-18. V/Line also upgraded lighting at a number of locations from metal halide or fluorescent systems to LED, as existing systems ended their lifespan.
Targets
V/Line sets targets for total energy intensity, not building energy consumption. The target for 2017-18 was for energy intensity to be at or below a 2015-16 baseline. When energy reductions due to wheel wear issues in 2015-16 were factored into calculations, energy consumption decreased by 3.8 per cent on 2015-16 intensity levels.
Building Energy Use 2017-18 2016-17 2015-16
Energy Use segmented by primary source (MJ)
Electricity 53,806,281 54,716,044 58,501,021
Natural Gas (ref *) 0 1,092,167 1,460,755
TOTAL 53,806,281 55,808,211 59,961,776
Energy Intensity (MJ / passenger kilometre) 0.0262 0.0293 0.0328
GHG 2017-18 2016-17 2015-16
Greenhouse Gas Emissions from energy consumption (tonnes CO2-e)
Electricity 16,291 16,567 17,713
Natural Gas (ref *) 0 56 75
TOTAL 16,291 16,623 17,788
Units of building energy used per FTE (MJ/FTE) 28089.94 32384.50 37227.15
MSR01744 Annual Report 2017-18_2.indd 48 3/12/2018 3:40 PM

49Section 4 – Other Disclosures
Explanatory notes
• Electricity data is sourced directly from government energy suppliers. This data did not include 2017-18 natural gas consumption, which is currently unavailable. Natural gas represents only a minor proportion of building energy consumption (ref *).
• Historical figures for energy consumption have been adjusted from previously reported figures due to improved data accuracy. Disruption due to VLocity wheel wear issues significantly reduced train fuel consumption in the latter half of 2015-16.
• V/Line purchases electricity as part of a government contract, which does not include Green Power.
Waste and recycling V/Line produces a variety of waste types, ranging from station and office waste to used sleepers, ballast, soil and train parts. This waste is collected primarily by V/Line’s principal waste contractor, who provides data for all sites to V/Line. This data includes only waste produced by V/Line staff and activities, as well as passenger waste deposited at stations. This data does not include waste sleepers and spoil.
Waste and Recycling 2017-18 2016-17
Waste disposed of by destination (kg)
Landfill 430,903 428,677
Commingled recycling 9,315 12,072
Paper and cardboard 12,345 10,955
Other recovered materials 49,734 0
TOTAL 502,297 451,704
Waste disposed of per FTE by destination (kg/FTE)
Landfill 224.96 248.75
Commingled recycling 4.86 7.01
Paper and cardboard 6.44 6.36
Other recovered materials 37.27 17.36
TOTAL 274 279
Emissions associated with waste disposal (tonnes CO2-e) 368 394
MSR01744 Annual Report 2017-18_2.indd 49 3/12/2018 3:40 PM

50 V/Line | Annual Report | 2017 – 2018
Actions undertaken
V/Line has undertaken the following actions to reduce the amount of waste sent to landfill:
• a rollout of waste minimisation communications was delivered in Autumn 2017
• staff members are encouraged to reduce the amount of waste produced and use correct recycling practices
• implementation of a four-stream recycling system at head office, including general waste, paper and cardboard recycling, green waste recycling, and general recycling
• introduction of an improved data management system for waste disposal
• services are available for the recycling of printer cartridges, batteries and other waste electrical equipment throughout the office.
Targets
V/Line’s waste management targets have primarily focused on paper reduction, however with the new waste data system in place, 2018-19 will include broader waste management targets.
Explanatory notes
• Waste data is broader than office waste and includes both waste produced by V/Line staff and activities as well as passenger waste.
• The current waste data collection system only commenced in August 2016.
MSR01744 Annual Report 2017-18_2.indd 50 3/12/2018 3:40 PM

51Section 4 – Other Disclosures
Actions undertaken
V/Line has taken the following actions to reduce the environmental effects associated with paper use:
• paper reduction was included in the Autumn 2018 waste communications campaign
• paper purchased by V/Line offices is 100 per cent recycled where possible
• a printer monitoring system has been implemented, to allow more accurate consumption data management
• a swipe card system has been implemented, which reduces unnecessary printing
• information regarding paper reduction is included in sustainability communications.
Targets
V/Line’s paper reduction target for 2017-18 was to maintain paper usage per FTE at or below a 2016-17 baseline. V/Line’s paper consumption per FTE for 2017-18 decreased by over 12 per cent, comfortably achieving this target.
Explanatory notes
• Paper data is now reported using a printer-based consumption data system maintained by the printer service provider. This has increased data accuracy, however does not have capability to provide the percentage of recycled paper used.
• 100 per cent recycled paper is ordered as a standard across the business, with coloured or paper with non-recycled content ordered as the exception.
Paper UseV/Line works continually to reduce paper consumption. To improve data accuracy, V/Line has collected and reported on paper consumption data monitored by printers, rather than from purchasing information, since 2014-15. The table below includes all data for printers on V/Line’s centralised printing system.
Paper Consumption 2017-18 2016-17 2015-16
Total units of A4 equivalent copy paper used (reams) 9,008 9,220 9,250
Reams of A4 equivalent copy paper used per FTE (reams/FTE) 4.70 5.35 5.74
MSR01744 Annual Report 2017-18_2.indd 51 3/12/2018 3:40 PM

52 V/Line | Annual Report | 2017 – 2018
Actions undertaken
V/Line head offices include waterless urinals, and V/Line installs water efficient appliances where practical in new facilities.
Targets
V/Line sets targets for total water consumption across the whole network, not specifically energy consumption in buildings. The target for 2017-18 was for water consumption per passenger kilometre to be at or below a 2015-16 baseline. While water consumption has increased since 2015-16 due to an increase in services and projects, it has decreased since the previous financial year.
Explanatory notes
V/Line obtains water data from billing information received from thirteen water companies. There is a significant lag between when this data is received, and accuracy increases following the end of the financial year. V/Line is currently exploring options for streamlining this process to increase data accuracy.
Water consumptionWater is consumed at V/Line sites for many purposes including maintenance works, the washing of trains, kitchens and bathrooms, train watering and cleaning. Mains supply is the most heavily-used water source at V/Line, however some locations are now using tank or recycled water.
Data on this consumption is obtained from invoices sent by the water corporations, and covers all V/Line sites.
Available water data has been used to extrapolate annual consumption for 2017-18.
Water Consumption 2017-18 2016-17 2015-16
Total water consumption (kL) 117,945 121,207 92,964
Units of water used per FTE (kL / FTE) 61.6 70.3 57.7
Water consumption per passenger kilometre (L / pass km) 0.0576 0.0637 0.0509
MSR01744 Annual Report 2017-18_2.indd 52 3/12/2018 3:40 PM
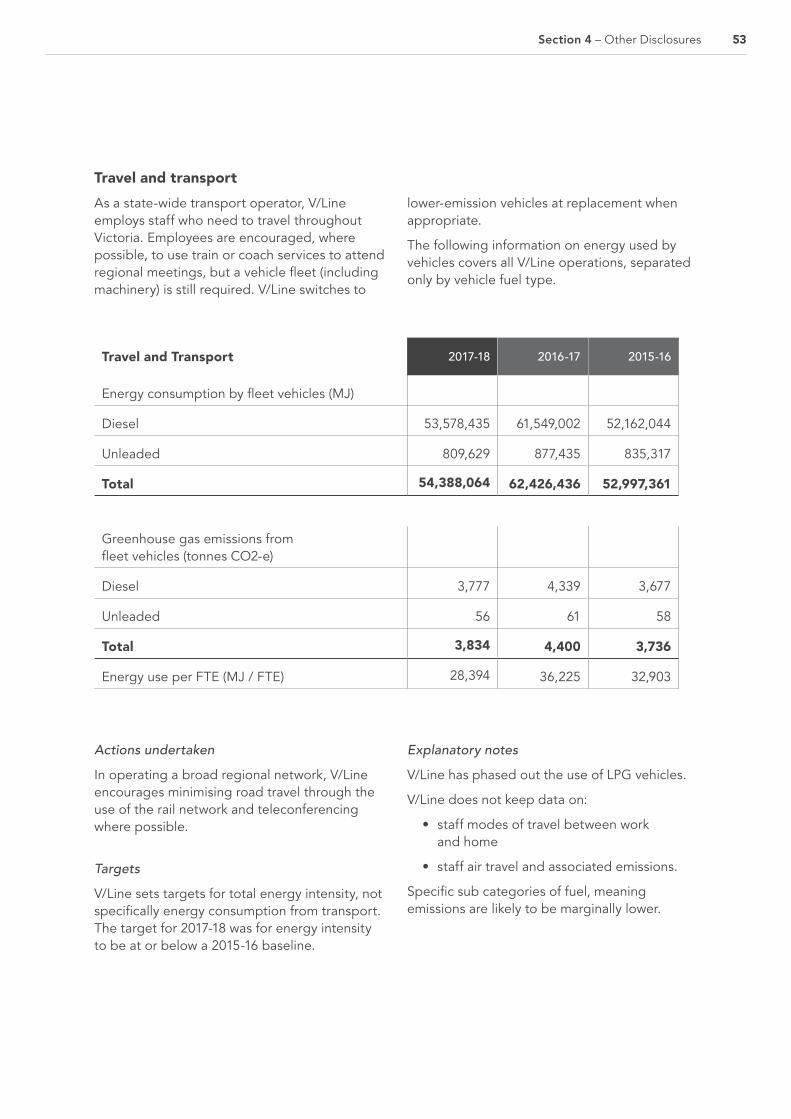
53Section 4 – Other Disclosures
Actions undertaken
In operating a broad regional network, V/Line encourages minimising road travel through the use of the rail network and teleconferencing where possible.
Targets
V/Line sets targets for total energy intensity, not specifically energy consumption from transport. The target for 2017-18 was for energy intensity to be at or below a 2015-16 baseline.
Explanatory notes
V/Line has phased out the use of LPG vehicles.
V/Line does not keep data on:
• staff modes of travel between work and home
• staff air travel and associated emissions.
Specific sub categories of fuel, meaning emissions are likely to be marginally lower.
Travel and transportAs a state-wide transport operator, V/Line employs staff who need to travel throughout Victoria. Employees are encouraged, where possible, to use train or coach services to attend regional meetings, but a vehicle fleet (including machinery) is still required. V/Line switches to
lower-emission vehicles at replacement when appropriate.
The following information on energy used by vehicles covers all V/Line operations, separated only by vehicle fuel type.
Travel and Transport 2017-18 2016-17 2015-16
Energy consumption by fleet vehicles (MJ)
Diesel 53,578,435 61,549,002 52,162,044
Unleaded 809,629 877,435 835,317
Total 54,388,064 62,426,436 52,997,361
Greenhouse gas emissions from fleet vehicles (tonnes CO2-e)
Diesel 3,777 4,339 3,677
Unleaded 56 61 58
Total 3,834 4,400 3,736
Energy use per FTE (MJ / FTE) 28,394 36,225 32,903
MSR01744 Annual Report 2017-18_2.indd 53 3/12/2018 3:40 PM
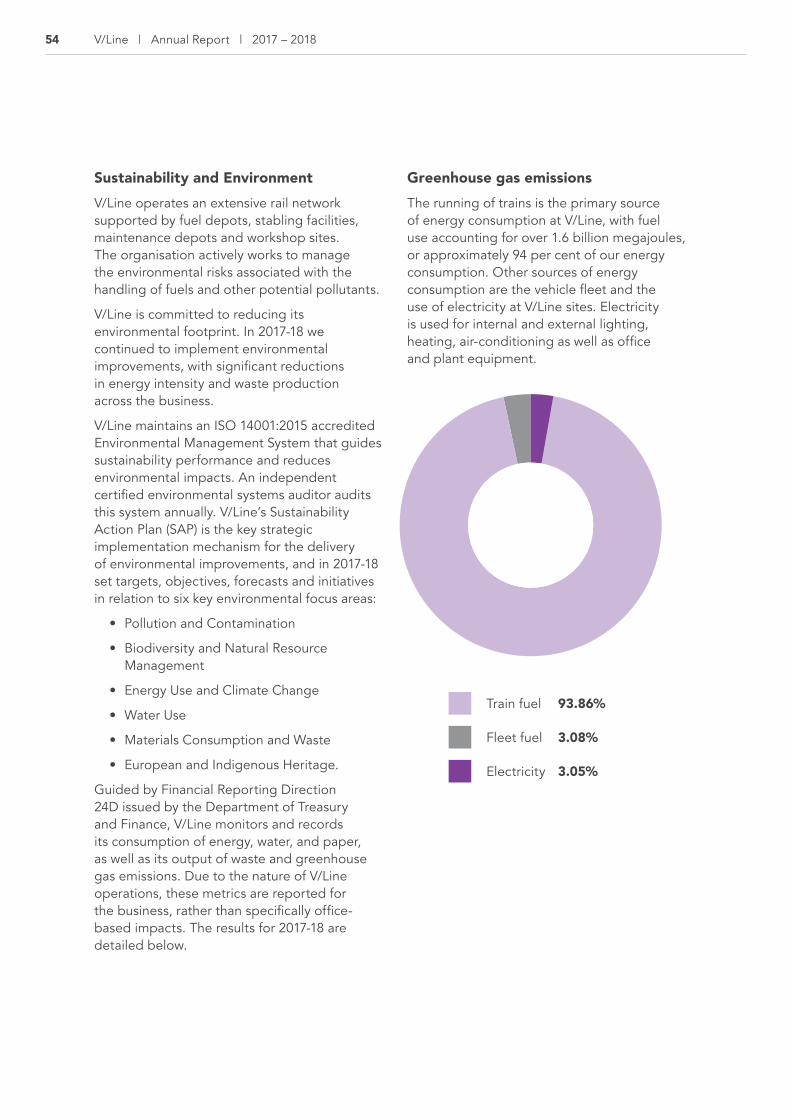
54 V/Line | Annual Report | 2017 – 2018
Sustainability and EnvironmentV/Line operates an extensive rail network supported by fuel depots, stabling facilities, maintenance depots and workshop sites. The organisation actively works to manage the environmental risks associated with the handling of fuels and other potential pollutants.
V/Line is committed to reducing its environmental footprint. In 2017-18 we continued to implement environmental improvements, with significant reductions in energy intensity and waste production across the business.
V/Line maintains an ISO 14001:2015 accredited Environmental Management System that guides sustainability performance and reduces environmental impacts. An independent certified environmental systems auditor audits this system annually. V/Line’s Sustainability Action Plan (SAP) is the key strategic implementation mechanism for the delivery of environmental improvements, and in 2017-18 set targets, objectives, forecasts and initiatives in relation to six key environmental focus areas:
• Pollution and Contamination
• Biodiversity and Natural Resource Management
• Energy Use and Climate Change
• Water Use
• Materials Consumption and Waste
• European and Indigenous Heritage.
Guided by Financial Reporting Direction 24D issued by the Department of Treasury and Finance, V/Line monitors and records its consumption of energy, water, and paper, as well as its output of waste and greenhouse gas emissions. Due to the nature of V/Line operations, these metrics are reported for the business, rather than specifically office-based impacts. The results for 2017-18 are detailed below.
Greenhouse gas emissionsThe running of trains is the primary source of energy consumption at V/Line, with fuel use accounting for over 1.6 billion megajoules, or approximately 94 per cent of our energy consumption. Other sources of energy consumption are the vehicle fleet and the use of electricity at V/Line sites. Electricity is used for internal and external lighting, heating, air-conditioning as well as office and plant equipment.
Train fuel 93.86%
Fleet fuel 3.08%
Electricity 3.05%
MSR01744 Annual Report 2017-18_2.indd 54 3/12/2018 3:40 PM

55Section 4 – Other Disclosures
Additional information available on requestIn compliance with the requirements of the Standing Directions of the Minister for Finance, details in respect of the items listed below have been retained by V/Line and are available on request, subject to the provisions of the Freedom of Information Act 1982:
(a) a statement that declarations of pecuniary interests have been duly completed by all relevant officers
(b) details of shares held by a senior officer as nominee or held beneficially in a statutory authority or subsidiary
(c) details of publications produced by the entity about itself, and how these can be obtained
(d) details of changes in prices, fees, charges, rates and levies charged by the entity
(e) details of any major external reviews carried out on the entity
(f) details of major research and development activities undertaken by the entity
(g) details of overseas visits undertaken including a summary of the objectives and outcomes of each visit
(h) details of major promotional, public relations and marketing activities undertaken by the entity to develop community awareness of the entity and its services
(i) details of assessments and measures undertaken to improve the occupational health and safety of employees
(j) a general statement on industrial relations within the entity and details of time lost through industrial accidents and disputes
(k) a list of major committees sponsored by the entity, the purposes of each committee and the extent to which the purposes have been achieved
(l) details of all consultancies and contractors including:
i. consultants/contractors engaged
ii. services provided
iii. expenditure committed to for each engagement.
The information is available on request from the Company Secretary.
MSR01744 Annual Report 2017-18_2.indd 55 3/12/2018 3:40 PM

56 V/Line | Annual Report | 2017 – 2018
Attestation for financial management compliance with Ministerial Standing Direction 5.1.4I Jeroen Weimar, on behalf of the Responsible Body, certify that V/Line Corporation has complied with the applicable Standing Directions of the Minister for Finance under the Financial Management Act 1994 and Instructions.
Jeroen Weimar Chair
MSR01744 Annual Report 2017-18_2.indd 56 3/12/2018 3:40 PM

FINANCIAL STATEMENTS
57
MSR01744 Annual Report 2017-18_2.indd 57 3/12/2018 3:40 PM
58 V/Line | Annual Report | 2017 – 2018
V/Line Corporation – Financial Statements
V/Line Corporation has presented its audited general purpose financial statements for the financial year ended 30 June 2018 in the following structure to provide users with the information about the Corporation’s stewardship of resources entrusted to it.
Financial statementsConsolidated comprehensive operating statement 64
Consolidated balance sheet 65
Consolidated cash flow statement 66
Consolidated statement of changes in equity 67
MSR01744 AR Financial Statements 2017-18_2.indd 58 3/12/2018 3:42 PM
59Financial Statements
Notes to the financial statements
1. About this report The basis on which the financial statements have been prepared
and compliance with reporting regulations
68
2. Funding delivery of our services Revenue recognised to fulfil its functions and provide outputs
73
2.1 Summary of income that funds the delivery of our services 73
2.2 Ticket sales / Fare-box 74
2.3 Contributions from Government 74
2.4 Value in kind 74
2.5 Project re-imbursement 75
3. The cost of delivering services Operating cost of the Group
76
3.1 Expenses incurred in delivery of our services (excl. Depreciation/Amortisation) 77
3.2 Operating costs (excluding labour) 77
3.3 Employee benefits 78
3.4 Superannuation 82
3.5 Administrative expenses 83
3.6 Project expenses 83
3.7 Infrastructure maintenance 83
3.8 Trains provided free of charge 83
3.9 Income tax benefit/(expense) 84
3.10 Leases 84
3.11 Other economic flows included in net result 84
MSR01744 AR Financial Statements 2017-18_2.indd 59 3/12/2018 3:42 PM

60 V/Line | Annual Report | 2017 – 2018
4. Key assets available to support output delivery Property, plant, equipment, and intangible assets utilised
in fulfilling the Group’s functions and conducting its activities
85
4.1 Property, plant, and equipment 86
4.2 Depreciation and impairment 90
4.3 Intangible assets 91
4.4 Investment in subsidiaries 91
5. Other assets and liabilities Other key assets and liabilities
92
5.1 Receivables 93
5.2 Payables 96
5.3 Inventories 97
5.4 Taxes 98
5.5 Other non-financial assets 99
5.6 Other financial assets 99
5.7 Other financial liabilities 99
6. Financing our operations Sources of finance utilised by the Group during its operations
100
6.1 Cash flow information and balances 101
6.2 Commitments for expenditure 102
7. Risks, contingencies, and valuation judgements Financial risk management, contingent assets and liabilities
as well as fair value determination
103
7.1 Financial instruments specific disclosures 103
7.2 Contingent assets and contingent liabilities 110
7.3 Fair value determination 111
8. Other disclosures 1168.1 Scope and presentation of financial statements 117
8.2 Not for profit 117
8.3 Going concern 117
8.4 Restructuring of administrative arrangements 118
8.5 Accounting for goods and services tax (GST) 119
8.6 Responsible persons 120
8.7 Remuneration of executives 120
8.8 Remuneration of auditors 121
8.9 Equity 121
8.10 Related parties 122
8.11 Subsequent events 125
8.12 Dividends 125
8.13 Australian Accounting Standards (AAS) issued that are not yet effected 125
MSR01744 AR Financial Statements 2017-18_2.indd 60 3/12/2018 3:42 PM

61Financial Statements
Declaration in the financial statements
The attached financial statements for V/Line Corporation and the Corporation’s subsidiary have been prepared in accordance with Direction 5.2 of the Standing Directions of the Minister for Finance under the Financial Management Act 1994, applicable Financial Reporting Directions (FRD), Australian Accounting Standards (AAS) including Interpretations, and other mandatory professional reporting requirements.
We further state that, in our opinion, the information set out in the consolidated comprehensive operating statement, consolidated balance sheet, consolidated statement of changes in equity, consolidated cash flow statement and accompanying notes, presents fairly the financial transactions during the year ended 30 June 2018 and financial position of the consolidated entity at 30 June 2018.
At the time of signing, we are not aware of any circumstance which would render any particulars included in the financial statements to be misleading or inaccurate.
We authorise the attached financial statements for issue on 24 August 2018.
Jeroen Weimar, Chair
James Pinder, Chief Executive Officer
Albert Giorgini, Chief Financial Officer
MSR01744 AR Financial Statements 2017-18_2.indd 61 3/12/2018 3:42 PM

62 V/Line | Annual Report | 2017 – 2018
Independent Auditor’s Report
MSR01744 AR Financial Statements 2017-18_2.indd 62 3/12/2018 3:42 PM

63Financial Statements
MSR01744 AR Financial Statements 2017-18_2.indd 63 3/12/2018 3:42 PM

64 V/Line | Annual Report | 2017 – 2018
Consolidated comprehensive operating statementFor the financial year ended 30 June 2018
Notes
2018 $’000
2017 $’000
Continuing Operations
Income from transactions
Revenue 2.1(a) 662,511 601,281
Other income 2.1(b) 407,396 177,347
Total income from transactions 1,069,907 778,628
Expenses from transactions
Operational expenses 3.2,3.3.1 544,374 479,782
Depreciation/Amortisation 4.2 19,161 25,270
Administrative expenses 3.5 61,725 61,446
Project expenses 3.6 301,436 81,300
Infrastructure maintenance 3.7 104,977 95,610
Trains provided free of charge – operating expenditure 3.8 43,958 37,349
Total expenses from transactions 1,075,631 780,757
Net result from transactions (net operating balance) (5,724) (2,129)
Other economic flows included in net result
Net gain on financial instruments(a) 3.11(a) 3,902 1,640
Other gains/(losses) from other economic flows 3.11(b) (48) 1,481
Total other economic flows included in net result 3,854 3,121
Net result from continuing operations before income tax (1,870) 992
Income tax benefit/(expense) 3.9 2,104 (1,351)
Net result for the period after income tax 8.1 234 (359)Other economic flows – other comprehensive income: Items that may be reclassified subsequently to net result Fair value gains/(losses) on hedging instruments, net of tax
4,908 (3,153)
Total other economic flows – other comprehensive income 4,908 (3,153)
Comprehensive result 5,142 (3,512)
The accompanying notes form part of these financial statements.(a) ‘Net gain/(loss) on financial instruments’ includes bad and doubtful debts from other economic flows,
unrealised and realised gains/(losses) from revaluations, impairments and reversals of impairment
MSR01744 AR Financial Statements 2017-18_2.indd 64 3/12/2018 3:42 PM

65Financial Statements
Consolidated balance sheetAs at 30 June 2018
Notes
2018 $’000
2017 $’000
Assets
Financial assets
Cash and cash equivalents 6.1 68,266 7,562
Receivables 5.1 88,613 59,597
Other financial assets 5.6 4,504 –
Total financial assets 161,383 67,159
Non-financial assets
Inventories 5.3 34,238 17,946
Property, plant, and equipment 4.1 124,456 118,262
Intangible assets 4.3 7,308 11,605
Other non-financial assets 5.5 5,656 4,940
Total non-financial assets 171,658 152,753
Total assets 333,041 219,912
Liabilities
Payables 5.2 181,047 75,842
Employee related provisions 3.3.2 84,418 79,128
Other financial liabilities 5.7 – 2,508
Total liabilities 265,465 157,478
Net assets 67,576 62,434
Equity
Accumulated deficit 8.9 (59,547) (59,781)
Physical asset revaluation surplus 8.9 123,971 123,971
Hedge reserve 8.9 3,152 (1,756)
Net worth 67,576 62,434
Commitments for expenditure 6.2
Contingent assets and contingent liabilities 7.2
The accompanying notes form part of these financial statements
MSR01744 AR Financial Statements 2017-18_2.indd 65 3/12/2018 3:42 PM

66 V/Line | Annual Report | 2017 – 2018
Consolidated cash flow statementFor the financial year ended 30 June 2018
Notes
2018 $’000
2017 $’000
Cash flows from Operating Activities
Receipts
Receipts from government 1,030,666 682,379
Receipts from tickets sales and other entities 106,681 112,122
Interest received 983 437
Total receipts 1,138,330 794,938
Payments
Payments to suppliers and employees (1,050,564) (790,777)
Goods and Services Tax paid to the Australian Taxation Office(a) (6,004) (764)
Total payments (1,056,568) (791,541)
Net cash flows from operating activities 6.1.1 81,762 3,397
Cash flows from Investing Activities
Purchases of non-financial assets (21,058) (16,010)
Net cash flows used in investing activities (21,058) (16,010)
Net increase/(decrease) in cash and cash equivalents 60,704 (12,613)
Cash and cash equivalents at the beginning of the financial year 7,562 20,175
Cash and cash equivalents at the end of the financial year 6.1 68,266 7,562
The accompanying notes form part of these financial statements. (a) GST paid to the Australian Taxation Office is presented on a net basis.
MSR01744 AR Financial Statements 2017-18_2.indd 66 3/12/2018 3:42 PM

67Financial Statements
Consolidated statement of changes in equityFor the financial year ended 30 June 2018
Notes
Physical Asset
Revaluation Surplus
$’000
Hedge Reserve
$’000
Accumulated Deficit
$’000
Total Equity
$’000
Balance at 1 July 2016 8.9 123,971 1,397 (59,422) 65,946
Net result for the year 8.9 – – (359) (359)
Other comprehensive income for the year – (3,153) – (3,153)
Balance at 30 June 2017 8.9 123,971 (1,756) (59,781) 62,434
Net result for the year 8.9 – – 234 234
Other comprehensive income for the year 8.9 – 4,908 – 4,908
Balance at 30 June 2018 8.9 123,971 3,152 (59,547) 67,576
The accompanying notes form part of these financial statements.
MSR01744 AR Financial Statements 2017-18_2.indd 67 3/12/2018 3:42 PM

68 V/Line | Annual Report | 2017 – 2018
1. About this Report
These annual consolidated financial statements represent the audited general purpose financial statements for V/Line Corporation (“the Corporation”) and its controlled entity V/Line Pty Ltd (together referred to as “the Group”) for the year ended 30 June 2018.
The Corporation is a Victorian statutory corporation established under the Rail Corporations Act 1996 and continued under the Transport Integration Act 2010. Its principal address is:
V/Line Corporation Level 9, 750 Collins Street Docklands VIC 3008
The functions of the Group are to:
• operate rail and coach passenger services;
• operate services ancillary or incidental to its rail passenger services, including any other transport services;
• operate and maintain rail infrastructure and related infrastructure, including for communications, to support rail passenger and rail freight services;
• manage access to the rail network operated by the Group;
• independently perform a function to meet requirements as set by the Public Transport Development Authority (PTV);
• develop and deliver projects, including by acquiring rolling stock, constructing rail infrastructure, roads, or road-related infrastructure, or provide assistance to the Department of Economic Development, Jobs, Transport and Resources (DEDJTR) or any other relevant body in making improvements to the transport system;
• provide advice to PTV to assist in operational policy development in relation to public transport system matters as requested by PTV;
• develop and implement effective environmental policies, strategies, and management systems under DEDJTR’s planning framework to support a sustainable transport system, including minimising any adverse environmental impacts from rail passenger and rail freight services; and
• provide, or arrange for the provision and dissemination of, information to Victorians about its rail passenger and rail freight services and report on the activities of any other person carrying out the above objectives on behalf of the Group.
MSR01744 AR Financial Statements 2017-18_2.indd 68 3/12/2018 3:42 PM

69Financial Statements
Basis of preparationThe accrual basis of accounting has been applied in the preparation of these financial statements whereby assets, liabilities, equity, income, and expenses are recognised in the reporting period to which they relate, regardless of when cash is received or paid.
On 17 February 2018 V/Line undertook a transfer of its entire business; employees, assets, rights, liabilities, and obligations from the operative subsidiary V/Line Pty Ltd to its parent entity, V/Line Corporation, in accordance with legislative amendments to the Transport Integration Act 2010. Transfers of net assets arising from administrative restructurings are treated as distributions to or contributions by owners. Transfers of net liabilities arising from administrative restructurings are treated as distributions to owners. Consistent with the requirements of FRD 119A Transfers through Contributed Capital, assets and liabilities are transferred at their carrying amounts.
Judgements, estimates and assumptions are required to be made about the carrying values of assets and liabilities that are not readily apparent from other sources. The estimates and associated assumptions are based on professional judgements derived from historical experience and various other factors that are believed to be reasonable under the circumstances. Actual results may differ from these estimates.
Revisions to accounting estimates are recognised in the period in which the estimate is revised and also in future periods that are affected by the revision. Judgements and assumptions made by management in the application of AAS that have significant effects on the financial statements and estimates relate to:
• the fair value of plant and equipment, leasehold improvements and rolling stock (refer Note 7.3);
• the fair value of financial instruments (refer note 7.3); and
• assumptions for employee benefit provisions based on likely tenure of existing staff, patterns of leave claims, future salary movements and future discount rates (refer to Note 3.3.1 & 3.3.2).
These financial statements are presented in Australian dollars and are prepared in accordance with the historical cost convention except for:
• certain non-financial physical assets which, subsequent to acquisition, are measured at a re-valued amount being their fair value at the date of the revaluation less any subsequent accumulated depreciation and subsequent impairment losses. Revaluations are conducted with sufficient regularity to ensure that carrying amounts do not materially differ from their fair value and are tested for impairment annually; and
• Derivative financial instruments after initial recognition, which are measured at fair value with changes reflected in the comprehensive operating statement.
Historical cost is based on the fair values of the consideration given in exchange for assets.
The financial statements of the subsidiary company have been prepared in compliance with AASs as they apply on a liquidation basis. However, there is no impact on comparatives as the business operations of the subsidiary company continue to be performed by the Corporation subsequent to the transfer date on 17 February 2018.
Amounts in the financial statements have been rounded to the nearest $1,000, unless otherwise stated.
Figures in the financial statements may not equate due to rounding.
MSR01744 AR Financial Statements 2017-18_2.indd 69 3/12/2018 3:42 PM
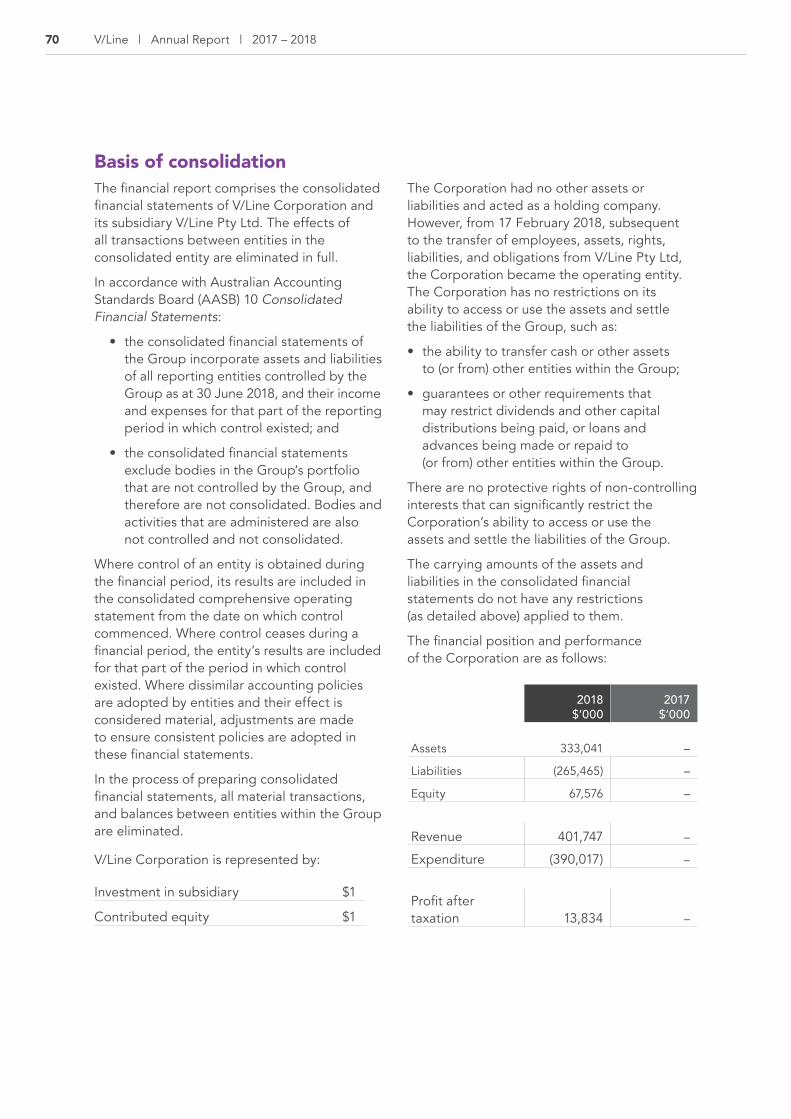
70 V/Line | Annual Report | 2017 – 2018
Basis of consolidationThe financial report comprises the consolidated financial statements of V/Line Corporation and its subsidiary V/Line Pty Ltd. The effects of all transactions between entities in the consolidated entity are eliminated in full.
In accordance with Australian Accounting Standards Board (AASB) 10 Consolidated Financial Statements:
• the consolidated financial statements of the Group incorporate assets and liabilities of all reporting entities controlled by the Group as at 30 June 2018, and their income and expenses for that part of the reporting period in which control existed; and
• the consolidated financial statements exclude bodies in the Group’s portfolio that are not controlled by the Group, and therefore are not consolidated. Bodies and activities that are administered are also not controlled and not consolidated.
Where control of an entity is obtained during the financial period, its results are included in the consolidated comprehensive operating statement from the date on which control commenced. Where control ceases during a financial period, the entity’s results are included for that part of the period in which control existed. Where dissimilar accounting policies are adopted by entities and their effect is considered material, adjustments are made to ensure consistent policies are adopted in these financial statements.
In the process of preparing consolidated financial statements, all material transactions, and balances between entities within the Group are eliminated.
V/Line Corporation is represented by:
Investment in subsidiary $1
Contributed equity $1
The Corporation had no other assets or liabilities and acted as a holding company. However, from 17 February 2018, subsequent to the transfer of employees, assets, rights, liabilities, and obligations from V/Line Pty Ltd, the Corporation became the operating entity. The Corporation has no restrictions on its ability to access or use the assets and settle the liabilities of the Group, such as:
• the ability to transfer cash or other assets to (or from) other entities within the Group;
• guarantees or other requirements that may restrict dividends and other capital distributions being paid, or loans and advances being made or repaid to (or from) other entities within the Group.
There are no protective rights of non-controlling interests that can significantly restrict the Corporation’s ability to access or use the assets and settle the liabilities of the Group.
The carrying amounts of the assets and liabilities in the consolidated financial statements do not have any restrictions (as detailed above) applied to them.
The financial position and performance of the Corporation are as follows:
2018 $’000
2017 $’000
Assets 333,041 –
Liabilities (265,465) –
Equity 67,576 –
Revenue 401,747 –
Expenditure (390,017) –
Profit after taxation 13,834 –
MSR01744 AR Financial Statements 2017-18_2.indd 70 3/12/2018 3:42 PM

71Financial Statements
Entities consolidated within the V/Line Corporation group are:
The income statement for V/Line Pty Ltd for the period to 17 February 2018 were as follows:
Transfer of Operations from V/Line Pty Ltd to V/Line CorporationIn accordance with legislative amendments to the Transport Integration Act 2010, V/Line undertook a transfer of its entire business; employees, assets, rights, liabilities, and obligations from the operative subsidiary V/Line Pty Ltd to its parent entity, V/Line Corporation. The transfer date was confirmed by the Minister for Public Transport and occurred on 17 February 2018. As at the transfer date, V/Line Corporation employs all staff, owns all assets, exercises all rights, and assumes all liabilities and obligations that formerly resided with
V/Line Pty Ltd. The members voluntary liquidation of V/Line Pty Ltd will commence in the 2018-19 financial year.
Assets, liabilities, and equity balances were transferred as at 17 February 2018 from V/Line Pty Ltd to V/Line Corporation. Total assets totalled $244.5 million, liabilities $193.0 million resulting in net assets of $51.5 million. Equity transferred totalled $51.5 million.
Amounts have been rounded to the nearest $1,000.
Name
Principal place of incorporation and business
Equity interest
2018 $’000
2017 $’000
V/Line Pty Ltd Australia 100% – –
Revenue $’000 Expenditure $’000
Contributions from government 312,352 Operational 344,821
Project re-imbursement 257,760 Project re-imbursement 257,760
Farebox 62,397 Depreciation/Amortisation 11,878
Trains provided free of charge 27,732 Trains provided free of charge 27,732
Other income 7,306 Administrative 39,569
Interest 613
Total Revenue 668,160 Total Expenditure 681,760Loss before tax (13,600)
MSR01744 AR Financial Statements 2017-18_2.indd 71 3/12/2018 3:42 PM

72 V/Line | Annual Report | 2017 – 2018
Compliance informationThese general purpose financial statements have been prepared in accordance with the Financial Management Act 1994 (FMA) and applicable AAS which include Interpretations, issued by the AASB. In particular, they are presented in a manner consistent with the requirements of the AASB 1049 Whole of Government and General Government Sector Financial Reporting.
Where appropriate, those AAS paragraphs applicable to not-for-profit entities have been applied. Accounting policies are selected and applied in a manner which ensures that the resulting financial information satisfies the concepts of relevance and reliability, thereby ensuring that the substance of the underlying transactions or other events is reported.
These annual general purpose financial statements were authorised for issue by the Board of Directors (“the Board”) on 24 August 2018.
The following assets, liabilities and equity were transferred from V/Line Pty Ltd to V/Line Corporation as at 17 February 2018:
Assets $’000 Liabilities $’000
Cash and cash equivalents 43,857 Payables 111,145
Receivables 47,725 Provision for employee benefits 80,226
Inventories 21,008 Other liabilities 1,595
PPE and Intangibles 126,103
Prepayments 4,472
Other financial assets 1,302 Total Liabilities 192,966Total Assets 244,467 Net Assets 51,501
Equity $’000
Accumulated deficit (73,381)
Reserves 124,882
Net Equity 51,501
MSR01744 AR Financial Statements 2017-18_2.indd 72 3/12/2018 3:42 PM

73Financial Statements
Income is recognised and measured at the fair value of the consideration received or receivable to the extent it is probable that the economic benefits will flow to the Group and that it can be reliably measured.
IntroductionTo enable the Group to fulfil its functions and provide outputs, it receives income from various sources.
Structure2.1 Summary of income that funds the
delivery of our services
2.2 Ticket sales / Fare-box
2.3 Contributions
2.4 Value in kind
2.5 Government project re-imbursement
2. Funding delivery of our services
2.1 Summary of income that funds the delivery of our services
Notes
2018 $’000
2017 $’000
(a) RevenueTicket sales / Fare-box revenue 2.2 101,843 96,402
Inter-operator income 800 778
Contributions from Government 2.3 505,618 454,963
Other income 10,292 11,789
Trains received free of charge (Value in Kind) 2.4 43,958 37,349
662,511 601,281
(b) Other incomeInterest 983 437
Project re-imbursement 2.5 406,413 176,910
407,396 177,347Total income from transactions 1,069,907 778,628
MSR01744 AR Financial Statements 2017-18_2.indd 73 3/12/2018 3:42 PM

74 V/Line | Annual Report | 2017 – 2018
Fare-box revenue is recognised as received when paid. The Group receives fare-box revenue from both the myki and V/Net ticketing systems. Myki revenues are subject to the allocation methodologies of the New Ticketing System Revenue Sharing Agreement. V/Net is the Group’s ticketing system for non-myki areas and this revenue is directly received.
The State Government of Victoria provides subsidies that are recognised as revenue when they are controlled by the Group, which is generally upon receipt of the Franchise subsidy. Contributions are of an operational nature.
Contributions of resources provided free of charge or for nominal consideration are recognised at their fair value when the recipient obtains control over the resources, irrespective of whether restrictions or conditions are imposed over the use of the contributions. Contributions in the form of services are only recognised when a fair value can be reliably determined, and the services would have been purchased if not donated.
Use of VLocity, diesel multiple unit trains which are leased or owned by Rolling Stock Holdings (Victoria) Pty Ltd are received free of charge (“Value in Kind”; “VIK”). The VIK measurement is based on the value of the lease payments made by PTV and the notional value based on the capital cost per unit of rolling stock purchased outright. An expense of the equal amount is also recognised in the Comprehensive Operating Statement. Therefore, the net impact on Comprehensive Income is zero arising from this recognition. Refer the related party disclosure in Note 8.10. where the amount is shown against PTV.
2.2 Ticket sales/Fare-box
2018 $’000
2017 $’000
Myki ticketing system 70,369 65,410
V/Net ticketing system 31,474 30,992
101,843 96,402
2.3 Contributions from Government
Franchise subsidy 498,567 450,263
Leave funding 7,051 4,700
505,618 454,963
2.4 Value in kind
Trains received free of charge 43,958 37,349
MSR01744 AR Financial Statements 2017-18_2.indd 74 3/12/2018 3:42 PM
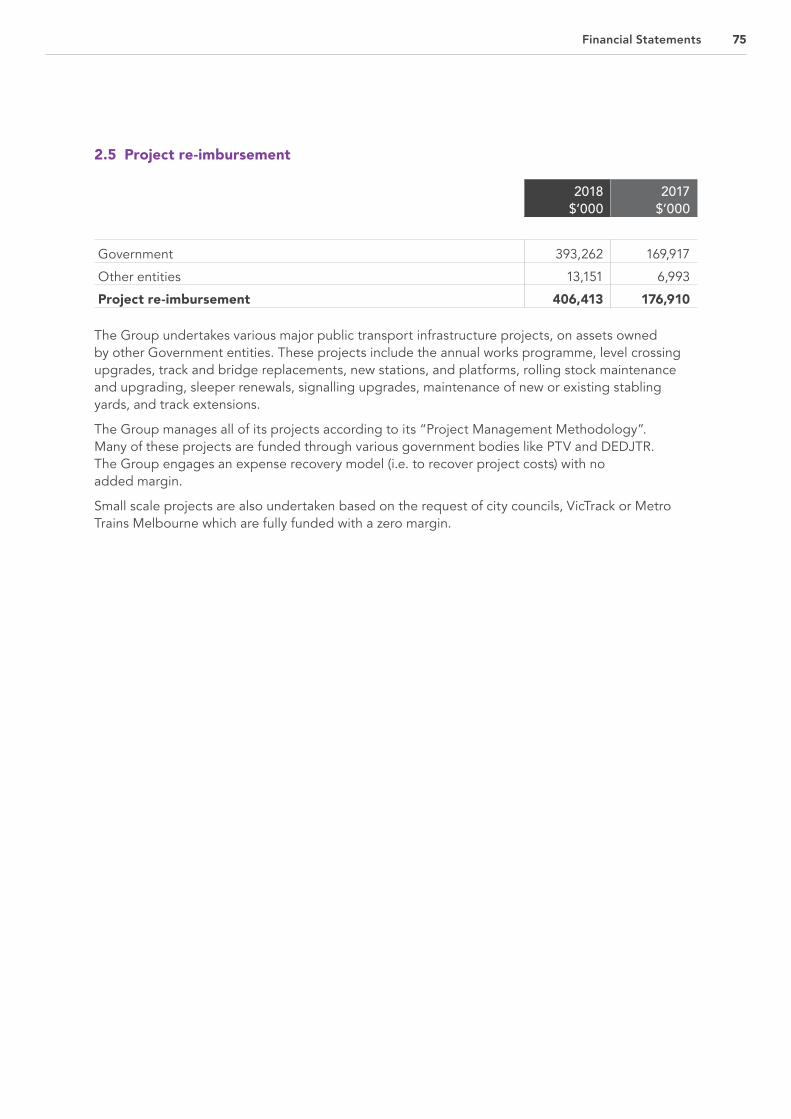
75Financial Statements
The Group undertakes various major public transport infrastructure projects, on assets owned by other Government entities. These projects include the annual works programme, level crossing upgrades, track and bridge replacements, new stations, and platforms, rolling stock maintenance and upgrading, sleeper renewals, signalling upgrades, maintenance of new or existing stabling yards, and track extensions.
The Group manages all of its projects according to its “Project Management Methodology”. Many of these projects are funded through various government bodies like PTV and DEDJTR. The Group engages an expense recovery model (i.e. to recover project costs) with no added margin.
Small scale projects are also undertaken based on the request of city councils, VicTrack or Metro Trains Melbourne which are fully funded with a zero margin.
2.5 Project re-imbursement
2018 $’000
2017 $’000
Government 393,262 169,917
Other entities 13,151 6,993
Project re-imbursement 406,413 176,910
MSR01744 AR Financial Statements 2017-18_2.indd 75 3/12/2018 3:42 PM

76 V/Line | Annual Report | 2017 – 2018
IntroductionThis section provides an account of the expenses incurred by the Group in delivering services and outputs.
In Section 2, the funds that enable the provision of services were disclosed and in this note the cost associated with the provision of services are recorded.
Structure3.1 Expenses incurred in delivery of services
3.2 Operating costs (excl. labour)
3.3 Employee benefits
3.4 Superannuation
3.5 Administrative expenses
3.6 Project expenses
3.7 Infrastructure maintenance
3.8 Trains provided free of charge
3.9 Income tax benefit/(expense)
3.10 Leases
3.11 Other economic flows included in net result
3. The cost of delivering our services
MSR01744 AR Financial Statements 2017-18_2.indd 76 3/12/2018 3:42 PM

77Financial Statements
3.1 Expenses incurred in delivery of services (excl. Depreciation/Amortisation)
Notes
2018 $’000
2017 $’000
Operating costs (excl. labour) 3.2 286,494 252,591
Employee benefit expenses 3.3.1 257,880 227,191
Operational expenses 544,374 479,782
Administrative expenses 3.5 61,725 61,446
Project expenses 3.6 301,436 81,300
Infrastructure maintenance 3.7 104,977 95,610
Trains provided free of charge (Value in Kind) 3.8 43,958 37,349
Total expenses incurred in delivery of services 1,056,470 755,487
3.2 Operating costs (excl. labour)
Fleet maintenance 127,943 120,650
Fuel costs 29,351 22,901
Access charges 16,233 15,876
V/Line branded coach contract costs 36,743 35,135
Road coach services 17,135 13,027
Other direct costs 20,555 14,885
Repairs & maintenance 38,534 30,117
286,494 252,591
Expenses from transactions are recognised as they are incurred and reported in the financial year to which they relate.
Supplies and servicesSupplies and services are recognised as an expense in the reporting period in which they are incurred. The carrying amounts of any inventories held for repairs and maintenance are expensed when used.
Value in kindContributions of resources provided free of charge or for nominal consideration are recognised at their fair value when the transferee obtains control over them, irrespective of whether restrictions or conditions are imposed over the use of the contributions.
These expenses represent the day to day running costs incurred in normal operations.
MSR01744 AR Financial Statements 2017-18_2.indd 77 3/12/2018 3:42 PM

78 V/Line | Annual Report | 2017 – 2018
3.3 Employee benefits
3.3.1 Employeebenefitexpensesinthecomprehensiveoperatingstatement
2018 $’000
2017 $’000
Salaries and wages 192,554 172,996
Superannuation 25,028 21,859
Annual leave and long service leave expense 26,091 19,530
Other on-costs (payroll tax and WorkCover levy) 14,207 12,806
257,880 227,191
Employee expenses include all costs related to employment including wages and salaries, fringe benefits tax, leave entitlements, termination payments and WorkCover premiums.
MSR01744 AR Financial Statements 2017-18_2.indd 78 3/12/2018 3:42 PM

79Financial Statements
3.3.2 Employeebenefitsinthebalancesheet
Current employee provisions
2018 $’000
2017 $’000
Employee benefits (Note 3.3.2 (a)): (i) Annual leave (Note 3.3.2(a)):
– unconditional and expected to be settled wholly within 12 months(iii)
– unconditional and expected to be settled wholly after 12 months(ii)
17,856 4,682
15,981 4,156
22,538 20,137
Other leave (Note 3.3.2(a)):
– unconditional and expected to be settled wholly within 12 months(iii) 2,791 2,233
2,791 2,233
Long service leave (Note 3.3.2(a)):
– unconditional and expected to be settled wholly within 12 months(iii) – unconditional and expected to be settled wholly after 12 months(ii)
8,786 33,387
8,529 32,400
42,173 40,929
Other provisions – employee related (Note 3.3.2(a)) 1,799 2,062
1,799 2,062
Total employee provisions 69,301 65,361
Provisions for on-costs (Note 3.3.2(a) and Note 3.3.2(b)):
– unconditional and expected to be settled wholly within 12 months(iii) – unconditional and expected to be settled wholly after 12 months(ii)
4,373 3,844
3,953 3,685
8,217 7,638
Total current provisions for employee benefits 77,518 72,999
Non-current provisions Employee benefits (Note 3.3.2(a)):(i) Long service leave (LSL) On-costs (Note 3.3.2(a) and Note 3.3.2(b))
6,324 576
5,615 514
Total non-current provisions for employee benefits 6,900 6,129Total Provisions for employee benefits 84,418 79,128
(i) Employee benefits consist of annual leave and long service leave accrued by employees. On-costs such as payroll tax and workers’ compensation insurance are not employee benefits and are reflected separately.
(ii) These amounts are recorded at present value. (iii) These amounts are recorded at nominal values.
MSR01744 AR Financial Statements 2017-18_2.indd 79 3/12/2018 3:42 PM

80 V/Line | Annual Report | 2017 – 2018
2018 $’000
2017 $’000
(a) Employee benefits and on-costs(i)
Current employee benefitsAnnual Leave 22,538 20,137
Long Service Leave 42,173 40,929
Other leave 2,791 2,233
Other provisions – employee related 1,799 2,062
69,301 65,361
Non-current employee benefitsLong service leave 6,324 5,615
6,324 5,615Total employee benefits 75,625 70,976Current on-costs 8,217 7,638
Non-current on-costs 576 514
Total on-costs 8,793 8,152Total employee benefits and on-costs 84,418 79,128
Employee Benefits
On-costs Total
2018 $’000
2018 $’000
2018 $’000
(b) Movement in ProvisionsOpening Balance 70,976 8,152 79,128Net additional provisions recognised and reductions arising from payments/other sacrifices of future economic benefits 4,605 637 5,242
Unwind of discount and effect of changes in the discount rate 44 4 48
Closing Balance 75,625 8,793 84,418Current 69,301 8,217 77,518
Non-current 6,324 576 6,900
Total 75,625 8,793 84,418
(i) Employee benefits consist of annual leave and long service leave accrued by employees. On-costs such as payroll tax and workers’ compensation insurance are not employee benefits and are reflected separately.
MSR01744 AR Financial Statements 2017-18_2.indd 80 3/12/2018 3:42 PM

81Financial Statements
Provision is made for benefits accruing to employees in respect of wages and salaries, annual leave, and LSL for services rendered to the reporting date.
Employee benefits are guaranteed by the State of Victoria. This guarantee does not satisfy the recognition criteria under the AAS for an offsetting receivable to be recognised in the accounts of the Group.
(i) Wages,salaries,andannualleave Liabilities for wages and salaries, including non-monetary benefits, annual leave and all other short-term employee benefits have been classified as current liabilities in the consolidated balance sheet, as the Group does not have an unconditional right to defer the settlement of these liabilities.
Depending on the expectation of the timing of settlement, liabilities for wages and salaries, annual leave and other short-term employee benefits are measured at:
• undiscounted value – if the Group expects to wholly settle the liability within 12 months; or
• present value – if the Group does not expect to wholly settle the liability within 12 months.
(ii) Longserviceleave A liability for LSL is recognised in the provision for employee benefits.
Unconditional LSL is disclosed in the notes to the financial statements as a current liability; even where the Group does not expect to settle the liability within 12 months because it will not have the unconditional right to defer the settlement of the entitlement should an employee take leave within 12 months.
The components of this current LSL are measured at:
• undiscounted value – component that the Group expects to wholly settle within 12 months; and
• present value – component that the Group does not expect to wholly settle within 12 months.
Conditional LSL is disclosed as a non-current liability as there is an unconditional right to defer the settlement of the entitlement until the employee has completed seven years of continuous service. This non-current LSL liability is measured at present value.
Any gain or loss following revaluation of the present value of the non-current LSL liability is recognised as a transaction, except to the extent that a gain or loss arises due to changes in bond interest rates, for which it is then recognised as an other economic flow.
(iii) TerminationbenefitsTermination benefits are payable when employment is terminated before the normal retirement date, or when an employee decides to accept an offer of benefits in exchange for the termination of employment. The Group recognises termination benefits when it is demonstrably committed to either terminating the employment of current employees according to a detailed formal plan without possibility of withdrawal or providing termination benefits as a result of an offer made to encourage voluntary redundancy. Benefits falling due more than 12 months after the end of the reporting period are discounted to present value.
(iv) Employeebenefitson-costsProvisions for on-costs comprising payroll tax, workers’ compensation and superannuation are recognised separately from the provision for employee benefits.
Superannuation on costs associated with the annual leave provision has been applied to ninety per cent of the provision before on-costs. The remaining ten per cent representing estimated terminations do not attract superannuation payment obligation.
MSR01744 AR Financial Statements 2017-18_2.indd 81 3/12/2018 3:42 PM

82 V/Line | Annual Report | 2017 – 2018
3.4 SuperannuationEmployees of the Group are entitled to receive superannuation benefits and the Group contributes to both defined benefit and defined contribution plans. The defined benefit plan(s) provides benefits based on years of service and final average salary.
The Group does not recognise any defined benefit liability in respect of the plans because it has no legal or constructive obligation to pay future benefits relating to its employees. Its only obligation is to pay superannuation contributions as they fall due. The Department of Treasury and Finance (“DTF”) discloses the State’s defined benefit liabilities in its disclosure for administered items.
However, superannuation contributions paid or payable for the reporting period are included as part of employee benefits in the consolidated comprehensive operating statement of the Group.
The name, details and amounts expensed in relation to the major employee superannuation funds and contributions made by the Group are as follows:
Paid contribution for the year
Contributions outstanding at year end
Fund 2018 $’000
2017 $’000
2018 $’000
2017 $’000
Defined benefit plans(i)
State Superannuation Fund – revised and new 6,480 5,486 563 1,174
Transport Superannuation Fund 2,414 1,871 211 412
Total defined benefit plans 8,894 7,356 774 1,586
Defined contribution plansVicSuper 8,695 7,303 780 985
Various other 6,933 5,093 529 92
Total defined contribution plans 15,628 12,396 1,309 1,077Total superannuation plans 24,522 19,752 2,083 2,663
(i) The basis for determining the level of contributions is determined by the various actuaries of the defined benefit superannuation plans.
MSR01744 AR Financial Statements 2017-18_2.indd 82 3/12/2018 3:42 PM
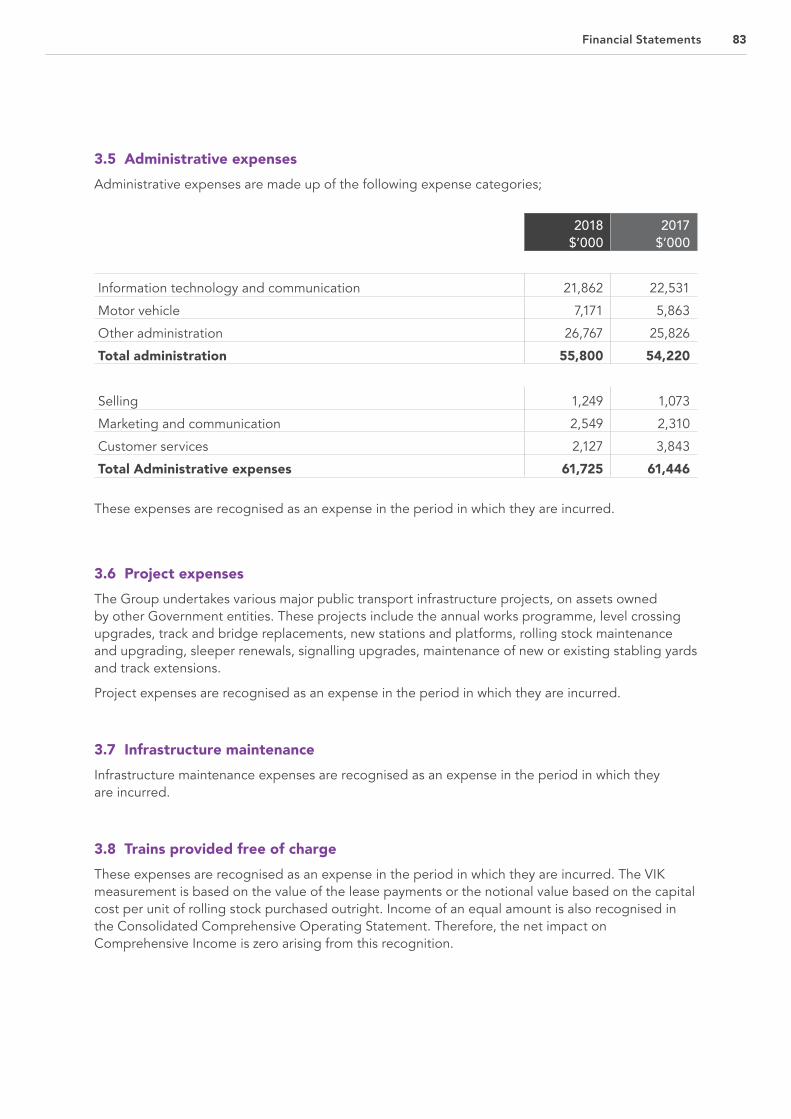
83Financial Statements
3.6 Project expensesThe Group undertakes various major public transport infrastructure projects, on assets owned by other Government entities. These projects include the annual works programme, level crossing upgrades, track and bridge replacements, new stations and platforms, rolling stock maintenance and upgrading, sleeper renewals, signalling upgrades, maintenance of new or existing stabling yards and track extensions.
Project expenses are recognised as an expense in the period in which they are incurred.
3.7 Infrastructure maintenance Infrastructure maintenance expenses are recognised as an expense in the period in which they are incurred.
3.8 Trains provided free of chargeThese expenses are recognised as an expense in the period in which they are incurred. The VIK measurement is based on the value of the lease payments or the notional value based on the capital cost per unit of rolling stock purchased outright. Income of an equal amount is also recognised in the Consolidated Comprehensive Operating Statement. Therefore, the net impact on Comprehensive Income is zero arising from this recognition.
These expenses are recognised as an expense in the period in which they are incurred.
3.5 Administrative expensesAdministrative expenses are made up of the following expense categories;
2018 $’000
2017 $’000
Information technology and communication 21,862 22,531
Motor vehicle 7,171 5,863
Other administration 26,767 25,826
Total administration 55,800 54,220
Selling 1,249 1,073
Marketing and communication 2,549 2,310
Customer services 2,127 3,843
Total Administrative expenses 61,725 61,446
MSR01744 AR Financial Statements 2017-18_2.indd 83 3/12/2018 3:42 PM

84 V/Line | Annual Report | 2017 – 2018
3.9 Income tax benefit/(expense)
2018 $’000
2017 $’000
Accounting (loss)/profit before income tax (1,870) 992
Prima facie tax payable on profit from ordinary activities before income tax at 30% (2017: 30%) 561 (298)
Tax expense relating to non-temporary differences – (2)
Deferred tax expense relating to reversal of temporary differences – (1,051)
Initial recognition of deferred tax asset on losses 1,543 –
Income tax benefit/(expense) 2,104 (1,351)
The component of tax benefit/(expense) comprises:
Current tax (2,099) (4,399)
Deferred tax 4,203 3,048
Balance 2,104 (1,351)
Weighted average tax rate 112.5% 136.1%
(a) Net gains/(losses) on financial instrumentsImpairment of contractual receivables (38) (26)
Net gain on hedge 3,940 1,666
Total net gains on financial instruments 3,902 1,640
(b) Other gains/(losses) from other economic flowsNet gain/(loss) arising from revaluation of long service leave liability (48) 1,481
Total other gains/(losses) from other economic flows (48) 1,481
3.10 LeasesLease payments for operating leases, where substantially all the risks and benefits of ownership remain with the lessor, are recognised as an expense in the consolidated comprehensive operating statement on a straight-line basis over the term of the lease, unless another systematic basis is more representative of the pattern of the benefits derived from the use of the leased assets.
3.11 Other economic flows included in net result Other economic flows are changes in the volume or value of an asset or liability that do not result from transactions.
MSR01744 AR Financial Statements 2017-18_2.indd 84 3/12/2018 3:42 PM

85Financial Statements
4. Key assets available to support output delivery
IntroductionThe Group controls infrastructure that is utilised in fulfilling its functions and conducting its activities. They represent the resources that have been entrusted to the Group to be utilised for delivery of those outputs.
FairvaluemeasurementWhere the assets included in this section are carried at fair value, additional information is disclosed in Note 7.3 in connection with how those fair values were determined.
Structure4.1 Property, plant, and equipment
4.2 Depreciation and impairment
4.3 Intangible assets
4.4 Investment in subsidiaries
MSR01744 AR Financial Statements 2017-18_2.indd 85 3/12/2018 3:42 PM

86 V/Line | Annual Report | 2017 – 2018
Total Transportation and Communications(ii)
2018 $’000
2017 $’000
Plant and equipmentAt fair value 35,378 38,845
Accumulated depreciation (29,969) (33,684)
Net carrying amount 5,409 5,161
Rolling stockAt fair value 128,354 128,754
Accumulated depreciation (43,559) (36,333)
Net carrying amount 84,795 92,421
Leasehold ImprovementsAt fair value 6,554 8,223
Accumulated depreciation (4,759) (5,943)
Net carrying amount 1,795 2,280
Rolling stock – capitalised improvementsAt fair value 31,264 19,676
Accumulated depreciation (10,857) (4,754)
Net carrying amount 20,407 14,922Capital works in progress 12,050 3,478Total property, plant, and equipment 124,456 118,262
4.1 Property, plant, and equipment
4.1.1 Classificationby‘purposegroups’–carryingamounts (i)
i. Property plant and equipment are classified primarily by the ‘purpose’ for which the assets are used, according to one of six purpose groups based upon government purpose classifications. All assets in a purpose group are further sub categorised according to the asset’s ‘nature’ (i.e. buildings, plant, and equipment, etc.), with each sub category being classified as a separate class of asset for financial reporting purposes.
ii. The Group classifies all its property, plant, and equipment into the purpose group of Transportation and Communications. This purpose is based upon the government’s purpose classifications, as per above.
All non-financial physical assets are measured initially at cost and subsequently re-valued at fair value less accumulated depreciation and impairment upon the revaluation of the entire asset class. Where an asset is acquired for no or nominal cost, the cost is its fair value at the date of acquisition. The cost of constructed assets includes the costs of all materials used in construction and direct labour costs of the project.
The Group’s non-financial physical assets are mostly specialised in nature. As a not-for-profit entity, the future economic benefits of the Group’s non-financial physical assets are not primarily dependent on their ability to generate net cash inflows. As a result, the fair value of the Group’s non-financial physical assets has been determined by reference to the asset’s current replacement cost, adjusting for the associated depreciation.
MSR01744 AR Financial Statements 2017-18_2.indd 86 3/12/2018 3:42 PM

87Financial Statements
Total Transportation and Communications
2018 $’000
2017 $’000
Rolling stock at fair valueCarrying amount at beginning of year 92,421 110,206
Depreciation expense (7,626) (17,785)
Carrying amount at end of year 84,795 92,421
Rolling stock at cost – capitalised improvementsCarrying amount at beginning of year 14,922 8,230
Additions 12,583 10,011
Disposals (995) –
Depreciation expense (6,103) (3,319)
Carrying amount at end of year 20,407 14,922
Plant and equipmentCarrying amount at beginning of year 5,161 4,768
Additions 1,754 1,133
Disposals (605) (19)
Depreciation expense (901) (721)
Carrying amount at end of year 5,409 5,161
Leasehold improvementsCarrying amount at beginning of year 2,280 2,543
Additions 259 159
Disposals (347) –
Depreciation expense (397) (422)
Carrying amount at end of year 1,795 2,280
Capital works in progressCarrying amount at beginning of year 3,478 4,545
Additions 9,587 4,727
Net movements to Intangible assets 163 (5,794)
Disposals (1,178) –
Carrying amount at end of year 12,050 3,478
For plant and equipment and leasehold improvements, existing depreciated cost is generally a reasonable proxy for current replacement cost because of the short lives of the assets concerned.
There were no changes in valuation techniques throughout the period to 30 June 2018.
For all assets measured at fair value, the current use is considered the highest and best use.
4.1.2 Classificationby‘purposegroups’–movementincarryingamounts
MSR01744 AR Financial Statements 2017-18_2.indd 87 3/12/2018 3:42 PM

88 V/Line | Annual Report | 2017 – 2018
Total Transportation and Communications
2018 $’000
2017 $’000
Total property, plant, and equipmentCarrying amount at beginning of year 118,262 130,292
Additions 24,183 16,030
Disposals (3,125) (19)
Depreciation expense (15,027) (22,247)
Net movements to Intangible assets 163 (5,794)
Carrying amount at end of year 124,456 118,262
4.1.3 RollingstockThe rolling stock fleet comprises diesel electric locomotives, carriages, diesel multiple units (known as Sprinters) and vans. Repairs and maintenance work on the rolling stock is scheduled in accordance with the Group’s rolling stock management plan and rail safety management standards. Scheduled maintenance examinations on rolling stock are determined at set intervals depending on the type of rolling stock.
The refurbishment program, as part of the rolling stock management plan, consists of major examinations and overhauls of rolling stock. The Group treats these examinations as significant upgrades, which extend the useful life of the rolling stock. The refurbishment program will allow for the fleet to operate to the current useful life profile as per the 2015 Valuer General Victoria (“VGV”) full valuation. The refurbishment program also includes the replacement of major units such as traction and locomotive motors, generators, wheel sets and bogies. These items are capitalised and depreciated over their useful life. All other maintenance examinations and minor work are treated as repairs and maintenance and expensed when incurred.
As the market for the rolling stock lacks sufficient depth due to the specialised nature of the assets and the small population and volume traded, other indirect methods of valuation have been used.
The current replacement cost method was used as the primary method of the last valuation and provided a fair value for the rolling stock fleet as at 30 June 2015 of $122.3 million.
The Group considers that the net carrying amount of the rolling stock as at 30 June 2018 is a reasonable approximation of its fair value.
Non-financial physical assets are measured at fair value in accordance with FRD 103G Non-financial physical assets issued by the Minister for Finance. The Group undertook an independent revaluation of its rolling stock as at 30 June 2015 in line with the 5-year revaluation cycle based on the asset’s government purpose classification. Revaluations may occur more frequently if fair value assessments indicate material changes in value. Independent valuers are generally used to conduct these scheduled revaluations.
MSR01744 AR Financial Statements 2017-18_2.indd 88 3/12/2018 3:42 PM

89Financial Statements
Any interim revaluations are determined in accordance with the requirements of the FRDs. The 2015 valuation was performed by the VGV. The Group has adopted current replacement cost as the valuation basis for its rolling stock. This approach is in accordance with the requirements of AASB 136 and FRD 106B, which states that the net recoverable test does not apply to a not-for-profit entity since there is no dependence on its assets’ abilities to generate net cash inflows.
Revaluation increments, or decrements arise from differences between an asset’s carrying amount and fair value.
Revaluation increments, or decrements are accounted for as follows;
• Net revaluation increases (where the carrying amount of a class of assets is increased as a result of a revaluation) are recognised in ‘Other economic flows – other comprehensive income’ and accumulated in equity under the asset revaluation surplus. However, the net revaluation increase is recognised in the net result to the extent that it reverses a net revaluation decrease in respect of the same class of property, plant and equipment previously recognised as an expense (other economic flows) in the net result; and
• Net revaluation decreases are recognised in ‘Other economic flows – other comprehensive income’ to the extent that a credit balance exists in the asset revaluation surplus in respect of the same class of property, plant, and equipment. Otherwise, net revaluation decreases are recognised immediately as other economic flows in the net result. The net revaluation decrease recognised in ‘Other economic flows – other comprehensive income’ reduces the amount accumulated in equity under the asset revaluation surplus.
Revaluation increases and revaluation decreases relating to individual assets within an asset class are offset against one another within that asset class and are not offset in respect of assets in different classes. The asset revaluation surplus is not transferred to accumulated funds on de-recognition of the relevant asset.
4.1.4 LeaseholdimprovementsThe cost of a leasehold improvement is capitalised as an asset and depreciated over the shorter of the remaining term of the lease or the estimated useful life of the improvement.
In general, the fair value of those assets is measured at the current replacement cost. There are limitations and restrictions imposed on those assets use and/or disposal which may impact the fair value of these assets and should be taken into account when the fair value is determined.
MSR01744 AR Financial Statements 2017-18_2.indd 89 3/12/2018 3:42 PM

90 V/Line | Annual Report | 2017 – 2018
2018 $’000
2017 $’000
Depreciation/Amortisation of non-financial assetsRolling stock 7,626 17,785
Rolling stock - capitalised improvements 6,103 3,319
Plant and equipment 901 721
Leasehold improvements 397 422
Intangible assets 4,134 3,023
Total depreciation/amortisation of non-financial assets 19,161 25,270
4.2 Depreciation and impairment
DepreciationAll infrastructure assets, buildings, plant and equipment and other non financial physical assets (excluding items under operating leases) that have finite useful lives are depreciated.
Depreciation is generally calculated on a straight line basis, at rates that allocate the asset’s value, less any estimated residual value, over its estimated useful life. The estimated useful lives, residual values and depreciation method are reviewed at the end of each annual reporting period, and adjustments made where appropriate.
ImpairmentAll non-financial assets, except for deferred tax assets, inventories, and prepayments, are assessed annually for indications of impairment. The impairment is then accounted for in line with the revaluation decrements as per Note 4.1.3.
If there is an indication that there has been a reversal in the estimate of an asset’s recoverable amount since the last impairment loss was recognised, the carrying amount shall be increased to its recoverable amount. This reversal of the impairment loss occurs only to the extent that the asset’s carrying amount does not exceed the carrying amount that would have been determined, net of depreciation, if no impairment loss had been recognised in prior years.
It is deemed that, in the event of the loss or destruction of an asset, the future economic benefits arising from the use of the asset will be replaced, unless a specific decision to the contrary has been made. The recoverable amount for most assets is measured at the higher of current replacement cost and fair value less costs to sell.
MSR01744 AR Financial Statements 2017-18_2.indd 90 3/12/2018 3:42 PM

91Financial Statements
Estimatedusefullivesofproperty,plant,andequipmentThe estimated useful lives for the different asset classes for both current and prior years are set out below:
Plant and equipment 3 to 10 years
Rolling stock 2 to 22 years
Leasehold improvements 3 to 10 years
Rolling stock – capitalised improvements 2 to 22 years
The assets’ residual values, useful lives and depreciation methods are reviewed, and adjusted if appropriate, at each financial year end.
4.3 Intangible assets Computer software Total2018
$’0002017
$’0002018
$’0002017
$’000Gross carrying amountOpening balance 16,919 11,125 16,919 11,125
Net movements (to)/from capital works in progress (163) 5,794 (163) 5,794
Closing balance 16,756 16,919 16,756 16,919
Accumulated amortisationOpening balance (5,314) (2,291) (5,314) (2,291)
Amortisation of intangible assets (4,134) (3,023) (4,134) (3,023)
Closing balance (9,448) (5,314) (9,448) (5,314)Net book value at end of financial year 7,308 11,605 7,308 11,605
Intangible assets are initially recognised at cost. Subsequently, intangible assets with finite useful lives are carried at cost less accumulated amortisation and accumulated impairment losses. Costs incurred subsequent to initial acquisition are capitalised when it is expected the additional future economic benefits will flow to the Group.
AmortisationIntangible assets with finite lives are amortised on a systematic (straight line) basis over the asset’s useful life. Amortisation begins when the asset is available for use, that is, when it is in the location and condition necessary for it to be capable of operating in the manner intended by management.
4.4 Investment in SubsidiariesInvestments in subsidiaries are carried at cost.
MSR01744 AR Financial Statements 2017-18_2.indd 91 3/12/2018 3:42 PM

92 V/Line | Annual Report | 2017 – 2018
IntroductionThis section sets out those assets and liabilities that arose from the Group’s controlled operations.
Structure5.1 Receivables
5.2 Payables
5.3 Inventories
5.4 Taxes
5.5 Other non-financial assets
5.6 Other financial assets
5.7 Other financial liabilities
5. Other assets and liabilities
MSR01744 AR Financial Statements 2017-18_2.indd 92 3/12/2018 3:42 PM

93Financial Statements
2018 $’000
2017 $’000
ContractualTrade receivables 43,805 34,184
Other receivables 40,500 24,202
Provision for doubtful contractual receivables (110) (187)
84,195 58,199
StatutoryFuel rebate receivable from the ATO 4,418 1,398
4,418 1,398Total receivables 88,613 59,597
Related party receivables (included in above)(a)
PTV and DEDJTR 66,576 50,628
Other related parties 1,157 76
67,733 50,704
5.1 Receivables
Receivables consist of:
• Contractual receivables, such as debtors in relation to sales of goods and services. They represent passenger, inter-operator and other revenues receivable and are carried at nominal amounts due less any allowance for impairment.
• Statutory receivables, such as amounts owing from the Australian Taxation Office (ATO) relating to fuel tax credits. They are recognised and measured similarly to contractual receivables (except for impairment) but are not classified as financial instruments because they do not arise from a contract.
Related party receivables, such as amounts owing from PTV and DEDJTR. They predominantly consist of amounts owing from PTV and DEDJTR and are carried at nominal value due to their short-term nature. There is no interest charged on related party receivables. They are initially recognised at fair value and are subsequently measured at amortised cost using the effective interest method, less any impairment.
(a) Refer Note 8.10 Related parties
MSR01744 AR Financial Statements 2017-18_2.indd 93 3/12/2018 3:42 PM

94 V/Line | Annual Report | 2017 – 2018
2018 $’000
2017 $’000
Balance at beginning of the year (187) (161)
Increase in provision recognised in the net result (38) (26)
Reversal of provision of receivables written off during the year as uncollectible 115 –
Balance at end of the year (110) (187)
Movement in the provision for doubtful contractual receivables
DoubtfuldebtsReceivables are assessed for bad and doubtful debts on a regular basis. A provision for doubtful debts is recognised when there is objective evidence that the debts may not be collected, and bad debts are written off when identified. In assessing impairment of statutory (non-contractual) financial assets, which are not financial instruments, professional judgement is applied in assessing materiality using estimates, averages, and other computational methods in accordance with AASB 136 Impairment of Assets.
A provision is made for estimated irrecoverable amounts from the sale of goods when there is objective evidence that an individual receivable is impaired. The increase in the provision for the year is recognised in the net result.
Bad debts considered as written off by mutual consent are classified as a transaction expense.
Bad debts not written off, but included in the provision for doubtful debts, are classified as other economic flows in the net result.
During the 2017-18 financial year, an additional $37,509 (2017: $25,637) was also provided for, increasing the provision for doubtful contractual receivables by this amount. In 2017-18 based on a detailed analysis of the recoverability of individual accounts, the Group wrote off $114,745 (2017: $1,081,901) as bad unrecoverable debt. This amount has been included as part of Administrative expenses as disclosed in Note 3.5.
MSR01744 AR Financial Statements 2017-18_2.indd 94 3/12/2018 3:42 PM

95Financial Statements
Carrying amount
Not past due and
not impaired
Past due but not impaired Impaired financial
assets Less than 1 month
1-3 months
3 months – 1 year
1-5 years
$’000 $’000 $’000 $’000 $’000 $’000 $’000
2018
Receivables:Trade receivables 43,805 – 41,566 1,254 875 – 110
Other receivables 40,500 40,500 – – – – –
Total 84,305 40,500 41,566 1,254 875 – 110
2017
Receivables:Trade receivables 34,184 – 30,082 3,742 173 – 187
Other receivables 24,202 24,202 – – – – –
Total 58,386 24,202 30,082 3,742 173 – 187
Ageing analysis of contractual financial assets
Receivables are due for settlement at no more than 30 days from the date of recognition. No interest is charged on receivables. No collateral is held as security or credit enhancement in relation to any of its financial assets. There are no financial assets that have had their terms renegotiated so as to prevent them from being past due or impaired.
MSR01744 AR Financial Statements 2017-18_2.indd 95 3/12/2018 3:42 PM

96 V/Line | Annual Report | 2017 – 2018
2018 $’000
2017 $’000
ContractualTrade payables – unsecured(i) 58,234 26,674
Superannuation payable 2,102 3,947
Accruals 46,630 23,174
Deferred income 64,560 8,112
Other payables 5,902 8,886
177,428 70,793
Related party payables(i)
Public Transport Victoria and VicTrack 1,225 1,870
StatutoryGST payable (490) 1,586
FBT payable 127 78
Other taxes payable 3,921 3,282
WorkCover payable 61 103
3,619 5,049Total payables 181,047 75,842
5.2 Payables
The average credit period for related party payables is 30 days. No interest is charged on outstanding payables. Terms and conditions of amounts payable to other government agencies vary according to a particular agreement with that agency.
Payables consist of:
• contractual payables, such as trade payables, and unearned income from tickets sold relating to trips that will be taken after the reporting date and deferred income. Trade payables represent liabilities for goods and services provided to the Group prior to the end of the financial year that are unpaid, and arise when the Group becomes obliged to make future payments in respect of the purchase of those goods and services; and
• statutory payables, such as goods and services tax, fringe benefits tax payables, and payroll related payables.
Contractual payables are classified as financial instruments and categorised as financial liabilities at amortised cost. Statutory payables are recognised and measured similarly to contractual payables but are not classified as financial instruments and are not included in the category of financial liabilities at amortised cost because they do not arise from a contract.
All payables are recognised at amortised cost and are not discounted due to their short-term nature.
(i) Note 8.10 Related parties
MSR01744 AR Financial Statements 2017-18_2.indd 96 3/12/2018 3:42 PM
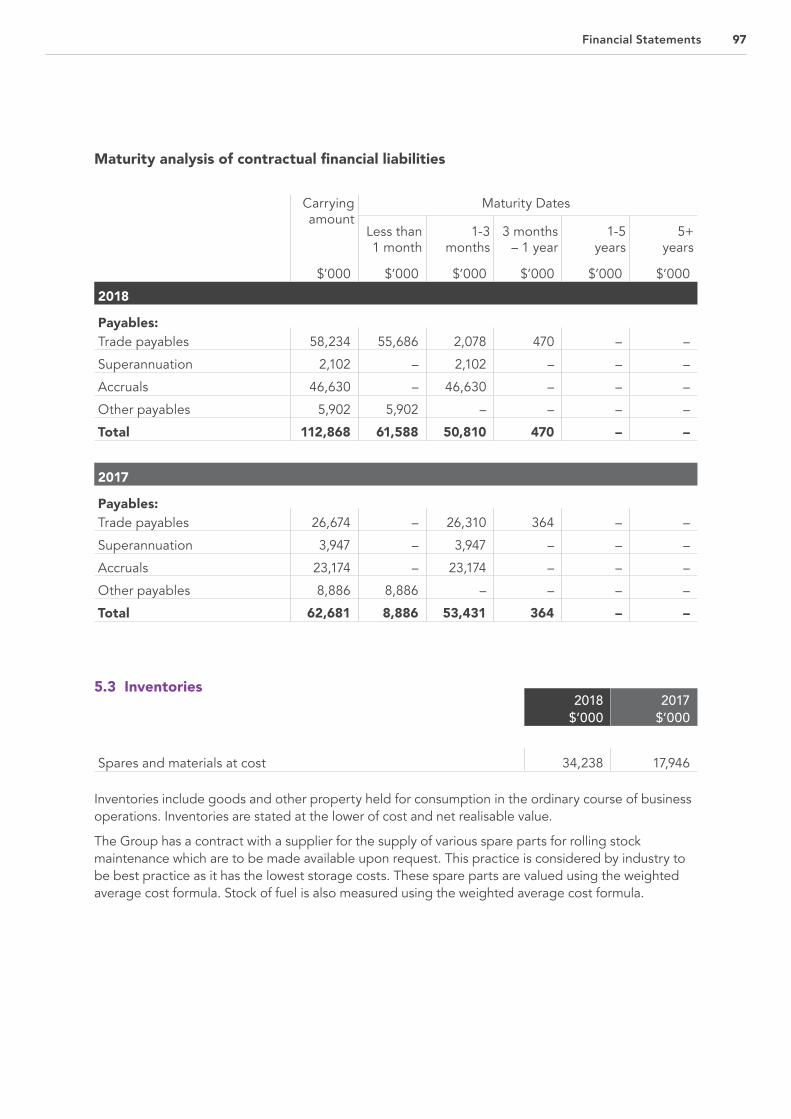
97Financial Statements
Carrying amount
Maturity Dates
Less than 1 month
1-3 months
3 months – 1 year
1-5 years
5+ years
$’000 $’000 $’000 $’000 $’000 $’000
2018
Payables:Trade payables 58,234 55,686 2,078 470 – –
Superannuation 2,102 – 2,102 – – –
Accruals 46,630 – 46,630 – – –
Other payables 5,902 5,902 – – – –
Total 112,868 61,588 50,810 470 – –
2017
Payables:Trade payables 26,674 – 26,310 364 – –
Superannuation 3,947 – 3,947 – – –
Accruals 23,174 – 23,174 – – –
Other payables 8,886 8,886 – – – –
Total 62,681 8,886 53,431 364 – –
Maturity analysis of contractual financial liabilities
5.3 Inventories
2018 $’000
2017 $’000
Spares and materials at cost 34,238 17,946
Inventories include goods and other property held for consumption in the ordinary course of business operations. Inventories are stated at the lower of cost and net realisable value.
The Group has a contract with a supplier for the supply of various spare parts for rolling stock maintenance which are to be made available upon request. This practice is considered by industry to be best practice as it has the lowest storage costs. These spare parts are valued using the weighted average cost formula. Stock of fuel is also measured using the weighted average cost formula.
MSR01744 AR Financial Statements 2017-18_2.indd 97 3/12/2018 3:42 PM

98 V/Line | Annual Report | 2017 – 2018
2018 $’000
2017 $’000
Deferred tax balances Gross deferred tax assets – temporary differencesRecognised losses available for offsetting against future taxable income 2,209 3,556
Accruals 684 1,197
Provision for employee entitlements 25,344 23,949
Other provisions 33 56
Equity – Fuel Hedge Reserve – 752
Total deferred tax assets 28,270 29,510
Deferred tax liabilityAccelerated depreciation for taxation purposes 26,919 29,510
Equity – Fuel Hedge Reserve 1,351 –
Total deferred tax liability 28,270 29,510
Net deferred tax asset/(liability) – –
Movement in deferred tax liability:Opening net deferred tax liability – –
Deferred tax movement through equity (2,104) 1,351
Utilisation of carry forward tax losses (2,099) (4,399)
Prior year deferred tax benefit/(expense) 452 –
De-recognition of excess carry forward tax losses – (1,051)
Recognition of prior year carry forward tax losses 1,543 –
Current year deferred tax benefit/(expense) 2,208 4,099
Aggregate deferred tax asset/(liability) – –
5.4 Taxes
The Group has no unrecognised deferred tax assets attributable to carry forward tax losses (2017: $1.1 million).
Amount charged directly to equityFuel hedge reserves 1,351 (752)
Total amount charged to equity 1,351 (752)
MSR01744 AR Financial Statements 2017-18_2.indd 98 3/12/2018 3:42 PM

99Financial Statements
By direction of the Treasurer of Victoria, under the State Owned Enterprise Act 1992, the Group entered into the National Tax Equivalent Regime (NTER) on 1 October 2003. Any NTER expense payable is calculated on operating profit or loss adjusted for temporary differences between NTER income and accounting income.
Deferred tax is accounted for using the balance sheet liability method in respect of temporary differences arising between the tax bases of assets and liabilities and their carrying amounts in the financial statements. No deferred income tax will be recognised from the initial recognition of an asset or liability, excluding a business combination, where there is no effect on accounting or taxable profit or loss.
Deferred tax is calculated at the tax rates that are expected to apply to the period when the asset is realised, or liability is settled. Deferred tax is credited in the consolidated comprehensive operating statement except where it relates to items that may be credited directly to equity, in which case the deferred tax is adjusted directly against equity.
Deferred income tax assets are recognised to the extent that it is probable that future tax profits will be available against which deductible temporary differences can be utilised. Deferred tax assets were not recognised for deductible temporary differences as management is uncertain that future taxable profits will be available to utilise these temporary differences.
The amount of benefits brought to account or which may be realised in the future is based on the assumption that no adverse change will occur in income taxation legislation and the anticipation that the Group will derive sufficient future assessable income to enable the benefit to be realised and comply with the conditions of deductibility imposed by the law.
Under existing arrangements with the Administrator of the NTER, V/Line Corporation and its subsidiary V/Line Pty Ltd are treated as separate entities for the purposes of their income tax compliance obligations. Each entity accounts for tax on a stand-alone basis not on a consolidated income tax basis. The tax obligations of V/Line Pty Ltd have been transferred to V/Line Corporation on 17 February 2018.
5.5 Other non-financial assets
2018 $’000
2017 $’000
Prepayments 5,656 4,940
Other non-financial assets include prepayments which represent payments in advance of receipt of goods or services or that part of expenditure made in one accounting period covering a term extending beyond that period such as software licenses.
5.6 Other financial assets
Current other financial assetsFuel hedge derivative 4,504 –
Total other financial assets 4,504 –
5.7 Other financial liabilities
Current other financial liabilitiesFuel hedge derivative – 2,508
Total other financial liabilities – 2,508
To reduce the volatility and provide increased certainty over its diesel fuel exposure the Group has entered into diesel fuel hedges with Treasury Corporation of Victoria (TCV). As at 30 June 2018, the Group has monthly diesel fuel hedges maturing until March 2019.
MSR01744 AR Financial Statements 2017-18_2.indd 99 3/12/2018 3:42 PM

100 V/Line | Annual Report | 2017 – 2018
IntroductionThis section provides information on the sources of finance utilised by the Group during its operations, along with interest expenses (the cost of borrowings) and other information related to financing activities of the Group.
This section includes disclosures of balances that are financial instruments (such as cash balances).
Structure6.1 Cash flow information and balances
6.2 Commitments for expenditure
6. How we financed our operations
MSR01744 AR Financial Statements 2017-18_2.indd 100 3/12/2018 3:42 PM

101Financial Statements
2018 $’000
2017 $’000
Cash at bank 68,110 7,407
Cash on hand 156 155
Total cash and cash equivalents 68,266 7,562
2018 $’000
2017 $’000
Net result for the period 234 (359)
Non-cash movementsDepreciation and amortisation of non-current assets 19,161 25,270
Tax (benefit)/expense (2,104) 1,351
Movements in assets and liabilitiesIncrease in trade and other receivables (29,015) (7,918)
Increase in inventories (16,293) (8,057)
(Increase)/decrease in prepayments (716) 80
Increase/(decrease) in trade and other payables 105,205 (9,994)
Increase in employee benefits 5,290 3,024
Net cash flows from operating activities 81,762 3,397
6.1 Cash flow information and balances
6.1.1 Reconciliationofnetresultforthereportingperiod tonetcashflowsfromoperatingactivities
Cash and cash equivalents comprise cash on hand and cash at bank, which is held for the purpose of meeting short term cash commitments rather than for investment purposes, and which are readily convertible to known amounts of cash and are subject to an insignificant risk of changes in value.
MSR01744 AR Financial Statements 2017-18_2.indd 101 3/12/2018 3:42 PM

102 V/Line | Annual Report | 2017 – 2018
Nominal values
2018 $’000
2017 $’000
Operating and lease commitments payableLess than 1 year 9,609 6,234
Longer than 1 year but not longer than 5 years 15,658 8,579
5 years or more 1,508 692
Total operating lease commitments 26,775 15,505
Other commitments payableLess than 1 year 162 3,895
Longer than 1 year but not longer than 5 years 2 3,245
5 years or more – –
Total other commitments 164 7,140Total commitments (inclusive of GST) 26,939 22,645Less GST recoverable from the ATO 2,449 2,059
Total commitments (exclusive of GST) 24,490 20,586
6.2 Commitments for expenditureCommitments for future expenditure include operating and capital commitments arising from contracts. These commitments are recorded below at their nominal value and inclusive of GST.
Where it is considered appropriate and provides additional relevant information to users, the net present values of significant individual projects are stated. These future expenditures cease to be disclosed as commitments once the related liabilities are recognised in the balance sheet.
Commitments for future expenditure primarily relate to the lease of tools of trade, vehicles and plant and equipment. There are also commercial lease agreements in relation to tenancy at 628 Bourke Street Melbourne, and 500, 707 and 750 Collins Street Docklands with various expiry dates respectively and include certain fixed percentage increases at the dates specified in the agreements. The total operating lease expense for the year was $9.7 million (2017: $3.1 million).
Under its fleet maintenance contract, the Group is required to pay a fixed management fee to the supplier which is indexed annually to CPI.
MSR01744 AR Financial Statements 2017-18_2.indd 102 3/12/2018 3:42 PM

103Financial Statements
7. Risks, contingencies, and valuation judgements
IntroductionThe Group is exposed to risk from its activities and outside factors. In addition, it is often necessary to make judgements and estimates associated with recognition and measurement of items in the financial statements. This section sets out financial instrument specific information, (including exposures to financial risks) as well as those items that are contingent in nature or require a higher level of judgement to be applied, which for the Group related mainly to fair value determination.
Structure7.1 Financial instruments specific disclosures
7.2 Contingent assets and contingent liabilities
7.3 Fair value determination
7.1 Financial instruments specific disclosures
IntroductionFinancial instruments arise out of contractual agreements that give rise to a financial asset of one entity and a financial liability or equity instrument of another entity. Due to the nature of the Group’s activities, certain financial assets and financial liabilities arise under statute rather than a contract. Such financial assets and financial liabilities do not meet the definition of financial instruments in AASB 132 Financial Instruments: Presentation. For example, statutory receivables arising from taxes, fines and penalties do not meet the definition of
financial instruments as they do not arise under contract.
Where relevant, for note disclosure purposes, a distinction is made between those financial assets and financial liabilities that meet the definition of financial instruments in accordance with AASB 132 and those that do not.
Categories of financial instruments
Loans and receivablesLoans and receivables are financial instrument assets with fixed and determinable payments that are not quoted on an active market. These assets are initially recognised at fair value plus any directly attributable transaction costs. Subsequent to initial measurement, loans and receivables are measured at amortised cost using the effective interest method, less any impairment.
Loans and receivables category includes cash and deposits, trade receivables and other receivables, but not statutory receivables.
AvailableforsalefinancialinstrumentassetsAvailable for sale financial instrument assets are those designated as available for sale or not classified in any other category of financial instrument asset. The Group does not hold any available for sale financial instrument assets.
Such assets are initially recognised at fair value. Subsequent to initial recognition, they are measured at fair value with gains and losses arising from changes in fair value recognised in equity until the investments are disposed. On disposal, the cumulative gain or loss previously recognised in equity is transferred to other economic flows in the net result.
MSR01744 AR Financial Statements 2017-18_2.indd 103 3/12/2018 3:42 PM

104 V/Line | Annual Report | 2017 – 2018
DerivativefinancialinstrumentsDerivative financial instruments are classified as held for trading financial assets and liabilities. They are initially recognised at fair value on the date on which a derivative contract is entered into. Derivatives are carried as assets when their fair value is positive and as liabilities when their fair value is negative. Any gains or losses arising from changes in the fair value of derivatives after initial recognition are recognised in the consolidated comprehensive operating statement as an ‘other economic flow’ included in the net result.
The Group designates certain derivatives as either:
• hedges of the fair value of recognised assets or liabilities, or a firm commitment (fair value hedge); or
• hedges of highly probable forecast transactions (cash flow hedge).
At the inception of the transaction the relationship between hedging instruments and hedged items, as well as the Group’s risk management objective and strategy for undertaking various hedge transactions, is documented.
Assessments, both at hedge inception and on an ongoing basis, of whether the derivatives that are used in hedging transactions have been and will continue to be highly effective in offsetting changes in fair values or cash flows of hedged items, are also documented.
In relation to fair value hedges, changes in the fair value of derivatives that are designated and qualify as fair value hedges are recognised in profit or loss, together with any changes in the fair value of hedged assets or liabilities that are attributable to the hedged risk. Whereas for cash flow hedges, the effective portion of changes in the fair value of derivatives that are designated and qualify as cash flow hedges is deferred to a hedge reserve in equity. The gain or loss relating to the ineffective portion is recognised immediately in profit or loss.
During the financial year, the Group entered into a diesel fuel swap hedge arrangement with TCV for a period of 12 months. The diesel fuel hedges are designated as cash flow hedges.
ReclassificationoffinancialinstrumentsFinancial instrument assets that meet the definition of loans and receivables may be reclassified out of the fair value through profit and loss category into the loans and receivables category, where they would have met the definition of loans and receivables had they not been required to be classified as fair value through profit and loss. In these cases, the financial instrument asset may be reclassified out of the fair value through profit and loss category, if there is the intention and ability to hold them for the foreseeable future or until maturity.
FinancialliabilitiesatamortisedcostFinancial instrument liabilities are initially recognised on the date they are originated. They are initially measured at fair value plus any directly attributable transaction costs. Subsequent to initial recognition, these financial instruments are measured at amortised cost with any difference between the initial recognised amount and the redemption value being recognised in profit and loss over the period of the interest bearing liability, using the effective interest rate method.
Financial instrument liabilities measured at amortised cost include the Group’s contractual payables, deposits held, and advances received, and interest bearing arrangements other than those designated at fair value through profit or loss.
Financial assets are derecognised when the rights to receive cash flows from the assets have expired or have been substantially transferred, or when control of the asset have been transferred. Financial liabilities are derecognised when the obligation under the liabilities are discharged, cancelled or expires.
At the end of each reporting period, the Group assesses whether there is objective evidence that a financial asset or a group of financial assets is impaired. All financial instrument assets are subject to annual review for impairment. The allowance is the difference between the financial asset’s carrying amount and the present value of estimated future cash flows, discounted at the effective interest rate.
MSR01744 AR Financial Statements 2017-18_2.indd 104 3/12/2018 3:42 PM

105Financial Statements
The Group’s financial instruments consist of cash and cash equivalents, deposits with banks, fuel hedges, accounts receivable and accounts payable.
The main purpose in holding derivative and non-derivative financial instruments is to prudentially manage the Group’s financial risks within the Government’s policy parameters.
The main risks the Group is exposed to through its financial instruments are interest rate risk, commodity risk, foreign currency risk, credit risk and liquidity risk. The Group manages these financial risks in accordance with its financial risk management policy.
7.1.1 Financialinstruments:Categorisation
Contractual financial assets/
liabilities designated at fair
value through profit/loss
Contractual financial assets –
loans and receivables
Contractual financial
liabilities at amortised cost
$’000 $’000 $’000
2018
Contractual financial assetsCash and cash equivalents – 68,266 –
Trade and other receivables – 84,195 –
Fuel hedge derivative 4,504 – –
Total contractual financial assets 4,504 152,461 –
Contractual financial liabilitiesTrade and other payables – – 112,868
Total contractual financial liabilities – – 112,868
2017
Contractual financial assetsCash and cash equivalents – 7,562 –
Trade and other receivables – 58,199 –
Total contractual financial assets – 65,761 –
Contractual financial liabilitiesTrade and other payables – – 62,681
Fuel hedge derivative 2,508 – –
Total contractual financial liabilities 2,508 – 62,681
MSR01744 AR Financial Statements 2017-18_2.indd 105 3/12/2018 3:42 PM

106 V/Line | Annual Report | 2017 – 2018
7.1.2 Financialinstruments:Netholdinggain/(loss)onfinancialinstrumentsbycategory
Interest Income
Gain/(loss) on hedge
Impairment loss
Total
$’000 $’000 $’000 $’000
2018
Contractual financial assetsFinancial assets – loans and receivables 983 – (38) 945
Fuel hedge derivative – 3,940 – 3,940
Total contractual financial assets 983 3,940 (38) 4,885
2017
Contractual financial assetsFinancial assets – loans and receivables 437 – (26) 411
Total contractual financial assets 437 – (26) 411
Contractual financial liabilitiesFuel hedge derivative – 1,666 – 1,666
Total contractual financial liabilities – 1,666 – 1,666
The net gain/ (loss) disclosed above has been determined as follows:
• for financial assets – loans and receivables (consisting of cash and cash equivalents and receivables), the net gain/ (loss) is calculated by taking the interest income earned during the year, minus any impairment recognised in the net result.
• for financial assets and liabilities that are designated at fair value through profit or loss including the fuel hedge derivative, the net gain or loss is calculated by taking the movement in fair value of the financial asset or liability.
7.1.3 Financialriskmanagementobjectivesand policies
As a whole, the Group’s financial risk management program seeks to manage these risks and the associated volatility of its financial performance.
Details of the significant accounting policies and methods adopted, including the criteria for recognition, the basis of measurement, and the basis on which income and expenses are recognised, with respect to each class of financial asset, financial liability, and equity instrument above are disclosed in Note 8.1 to the financial statements.
The main purpose in holding financial instruments is to prudently manage the Group’s financial risks within the government policy parameters.
The Group’s main financial risks include credit risk, liquidity risk, interest rate risk, foreign currency risk and commodity risk. The Group manages these financial risks in accordance with its financial risk management policy.
The Group uses different methods to measure and manage the different risks to which it is exposed. Primary responsibility for the identification and management of financial risks rests with the financial risk management committee of the Group.
MSR01744 AR Financial Statements 2017-18_2.indd 106 3/12/2018 3:42 PM
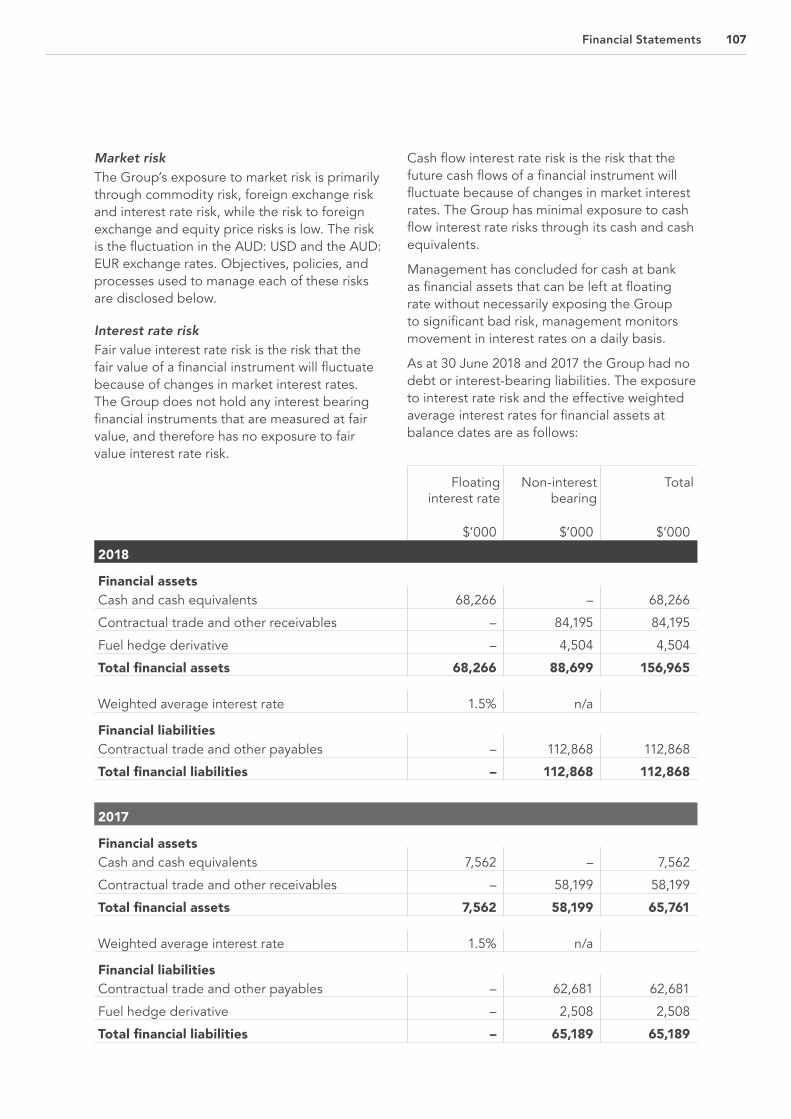
107Financial Statements
MarketriskThe Group’s exposure to market risk is primarily through commodity risk, foreign exchange risk and interest rate risk, while the risk to foreign exchange and equity price risks is low. The risk is the fluctuation in the AUD: USD and the AUD: EUR exchange rates. Objectives, policies, and processes used to manage each of these risks are disclosed below.
InterestrateriskFair value interest rate risk is the risk that the fair value of a financial instrument will fluctuate because of changes in market interest rates. The Group does not hold any interest bearing financial instruments that are measured at fair value, and therefore has no exposure to fair value interest rate risk.
Cash flow interest rate risk is the risk that the future cash flows of a financial instrument will fluctuate because of changes in market interest rates. The Group has minimal exposure to cash flow interest rate risks through its cash and cash equivalents.
Management has concluded for cash at bank as financial assets that can be left at floating rate without necessarily exposing the Group to significant bad risk, management monitors movement in interest rates on a daily basis.
As at 30 June 2018 and 2017 the Group had no debt or interest-bearing liabilities. The exposure to interest rate risk and the effective weighted average interest rates for financial assets at balance dates are as follows:
Floating interest rate
Non-interest bearing
Total
$’000 $’000 $’000
2018
Financial assetsCash and cash equivalents 68,266 – 68,266
Contractual trade and other receivables – 84,195 84,195
Fuel hedge derivative – 4,504 4,504
Total financial assets 68,266 88,699 156,965
Weighted average interest rate 1.5% n/a
Financial liabilitiesContractual trade and other payables – 112,868 112,868
Total financial liabilities – 112,868 112,868
2017
Financial assetsCash and cash equivalents 7,562 – 7,562
Contractual trade and other receivables – 58,199 58,199
Total financial assets 7,562 58,199 65,761
Weighted average interest rate 1.5% n/a
Financial liabilitiesContractual trade and other payables – 62,681 62,681
Fuel hedge derivative – 2,508 2,508
Total financial liabilities – 65,189 65,189
MSR01744 AR Financial Statements 2017-18_2.indd 107 3/12/2018 3:42 PM

108 V/Line | Annual Report | 2017 – 2018
CommodityriskCommodity risk relates to the risk that the fair value or future cash flows of a financial instrument will fluctuate because of changes in market prices largely due to demand and supply factors (other than those arising from interest rate risk or currency risk) for commodities.
The Group is exposed to commodity price risk in its operation. To reduce the volatility and provide increased certainty over its diesel fuel exposure, the Group has entered into diesel fuel hedges with TCV.
As at 30 June 2018, the Group has monthly diesel fuel hedges maturing until March 2019. The cash flow impact will be incurred in the month that the hedges mature.
At the end of the reporting period, the details of outstanding diesel hedging contracts are as follows:
As at 30 June 2018, the diesel fuel hedges were a financial asset and had a fair value of $4,503,816 (2017: $2,507,919 financial liability). Refer 5.6 and 5.7. This amount has been recognised in Other Comprehensive Income, net of tax.
There has been a restatement of the comparative notional principal amount from $27.4 million to $20.4 million due to volume reassessments by the third party provider of the information.
No amount was removed from equity during the period and included in the initial cost or other carrying amount of a non-financial asset or non-financial liability whose acquisition or incurrence was a hedged highly probable forecast transaction.
The Group did not reclassify any amount from equity to profit or loss during the period due to its diesel fuel hedges being effective.
Maturity of notional amounts
Fixed diesel fuel price Notional Principal
2018 Cents per litre
2017 Cents per litre
2018 $’000
2017 $’000
Less than 1 year 60.6 55.3 19,084 20,377
1 to 2 years – – – –
2 to 5 years – – – –
19,084 20,377
Reconciliation of Cash flow hedge reserve2018
$’0002017
$’000
Opening balance (1,756) 1,397
Revaluations to fair value, net of tax 968 (4,819)
Gain on settlement of hedge transferred to profit or loss 3,940 1,666
Closing balance, net of tax 3,152 (1,756)
MSR01744 AR Financial Statements 2017-18_2.indd 108 3/12/2018 3:42 PM

109Financial Statements
ForeigncurrencyriskThe Group is exposed to foreign currency risk arising from AUD/USD and AUD/EUR exchange rate fluctuations through its fleet maintenance program. The Group in conjunction with TCV and DTF is currently in the process of implementing a mitigation strategy to manage the foreign currency exposure. It is anticipated that this strategy will be operational in the 2018-19 financial year. The Group is also exposed to the AUD: USD exchange rate fluctuations through its exposure to diesel fuel. The exchange rate risk on the diesel fuel is mitigated through the diesel fuel hedge.
CreditriskCredit risk arises from the contractual financial assets of the Group, which comprise cash and deposits and non-statutory receivables.
The Group’s exposure to credit risk arises from the potential default of a counter party on their contractual obligations resulting in financial loss to the Group. Credit risk is monitored on a regular basis. The carrying amount of financial assets recorded in the consolidated balance sheet, net of any allowances for losses, represents the Group’s maximum exposure to credit risk without taking into account the value of any collateral, or other security obtained.
Credit risk associated with the Group’s financial assets is minimal as the main debtor is the Victorian Government. For debtors other than Government, the Group’s policy is to transact with entities that have high credit ratings and to obtain sufficient collateral or credit enhancements where appropriate. In addition, the Group does not engage in hedging for its contractual financial assets and mainly obtains contractual financial assets that are on fixed interest, except for cash assets, which are mainly cash at bank. As with the Group’s policy for debtors, it only deals with banks with high credit ratings.
Provision of impairment for contractual financial assets is calculated based on objective evidence that the Group will not be able to collect a receivable. Objective evidence includes financial difficulties of the debtor, default payments, debts which are more than 90 days overdue, and changes in debtor credit ratings.
Credit risk in trade receivables is also managed by enforcing disclosed payment terms and ensuring that debt collection policies and procedures are followed at all times.
Refer Section 5.1 for the maturity analysis of contractual financial assets.
Credit quality of contractual financial assets that are neither past due or impaired
AAA Credit Rating
Other Total
$’000 $’000 $’000
2018
Contractual financial assetsCash and cash equivalents 68,266 – 68,266
Trade and other receivables 67,733 16,462 84,195
Fuel hedge derivative 4,504 – 4,504
Total contractual financial assets 140,503 16,462 156,965
2017
Contractual financial assetsCash and cash equivalents 7,562 – 7,562
Trade and other receivables 55,764 2,435 58,199
Fuel hedge derivative – – –
Total contractual financial assets 63,326 2,435 65,761
MSR01744 AR Financial Statements 2017-18_2.indd 109 3/12/2018 3:42 PM

110 V/Line | Annual Report | 2017 – 2018
LiquidityriskLiquidity risk is the risk that the Group would be unable to meet its financial obligations as and when they fall due. The Group manages liquidity risk by closely monitoring forecast cash flows to ensure that adequate funding is maintained at all times.
DEDJTR has agreed to provide adequate cash flow support through PTV via a Letter of Support to enable the Group to meet its current and future operational obligations as and when they fall due for a period up to September 2019, should this be required. This assurance from DEDJTR for financial support only applies while the Group remains in full state ownership.
Refer Section 5.2 for the maturity analysis of contractual financial liabilities.
SensitivityanalysisThe Group’s sensitivity to market risk is determined based on the observed range of actual historical data for the preceding five-year period, with all variables other than the primary risk variable held constant. Sensitivity analyses shown are for illustrative purposes only. The following movements are ‘reasonably possible’ over the next 12 months:
In relation to cash and cash equivalents, the movement of 100 basis points up and down (2017: 100 basis points up and down) in market interest rates, would result in the net result increasing/(decreasing) by $682,660/ ($682,660) (2017: $75,620/ ($75,620)).
In relation to the diesel fuel swap hedges, the movement of 10% up and down in Gasoil 500PPM AUD per barrel would result in no change to the net result as the diesel fuel swap hedges will still be considered effective. Other financial assets and hedge reserve will be increased/(decreased) by $2,341,324/ ($2,341,324) (2017: $1,771,307/ ($1,771,307)).
7.2 Contingent assets and contingent liabilities
Contingent assets and contingent liabilities are not recognised in the consolidated balance sheet, and if quantifiable, are measured at nominal value. They are presented inclusive of GST receivable or payable respectively.
Contingent assetsContingent assets are possible assets that arise from past events, whose existence will be confirmed only by the occurrence or non-occurrence of one or more uncertain future events not wholly within the control of the entity.
These are classified as either quantifiable, where the potential economic benefit is known, or non-quantifiable.
There are no material contingent assets.
Contingent liabilitiesContingent liabilities are:
• possible obligations that arise from past events, whose existence will be confirmed only by the occurrence or non-occurrence of one or more uncertain future events not wholly within the control of the entity; or
• present obligations that arise from past events but are not recognised because:
– it is not probable that an outflow of resources embodying economic benefits will be required to settle the obligations; or
– the amount of the obligations cannot be measured with sufficient reliability.
The only quantifiable contingent liability relates to a bank guarantee ($0.5m) for the Group’s office at 500 Collins Street. The Group’s other contingent liabilities are classified as non-quantifiable and relate to:
A number of claims arising from freight derailments which have been referred to V/Line’s insurers who are dealing with the claims.
MSR01744 AR Financial Statements 2017-18_2.indd 110 3/12/2018 3:42 PM

111Financial Statements
V/Line is defending a number of claims relating to personal injuries. There have been minor claims made over time by customers arising out of incidents on V/Lines’ network. These claims are dealt with in the ordinary course of business and are referred to V/Line’s insurers as the matters arise.
V/Line’s operations are subject to various environmental regulations under both Commonwealth and State laws. V/Line takes active steps to improve environmental management systems and ongoing internal procedures, to help discharge obligations under these laws. In 2017-18 V/Line investigated all incidents of alleged vegetation disturbance associated with V/Line activities and where necessary worked with the Department of Environment, Land, Water, and Planning to put in place remediation plans.
A Clean Up Notice under section 62A of the Environment Protection Act 1970 (Vic) relating to the remediation of legacy contamination at Ararat was issued in July 2016. The contamination existed within a small section of rail land adjacent to the disused rail line between Ararat and Maryborough near the Grano Street level crossing and is the result of historical gasworks activities on the adjacent site. Remediation activities and verification have been completed, and the notice has been rescinded.
The EPA issued two further Clean Up Notices in May 2018 in relation to dumped rubbish and soil on the South Western line by third parties. Cleanup of rubbish has commenced and testing of soil is underway.
7.3 Fair value determination
Significant judgement: Fair value measurements of assets and liabilitiesFair value determination requires judgement and the use of assumptions. This section discloses the most significant assumptions used in determining fair values. Changes to assumptions could have a material impact on the results and financial position of the Group.
This section sets out information on how the Group determined fair value for financial reporting purposes. Fair value is the price that would be received to sell an asset or paid to transfer a liability in an orderly transaction between market participants at the measurement date.
The following assets and liabilities are carried at fair value:
• financial assets and liabilities at fair value through operating result; and
• non-financial physical assets.
In addition, the fair values of other assets and liabilities that are carried at amortised cost, also need to be determined for disclosure purposes.
Consistent with AASB 13 Fair Value Measurement, the Group determines the policies and procedures for both recurring fair value measurements such as property, plant and equipment and financial instruments and for non-recurring fair value measurements in accordance with the requirements of AASB 13 and the relevant Financial Reporting Directions.
MSR01744 AR Financial Statements 2017-18_2.indd 111 3/12/2018 3:42 PM

112 V/Line | Annual Report | 2017 – 2018
Fair value hierarchy All assets and liabilities for which fair value is measured or disclosed in the financial statements are categorised within the fair value hierarchy, described as follows, based on the lowest level input that is significant to the fair value measurement as a whole:
• Level 1 – Quoted (unadjusted) market prices in active markets for identical assets or liabilities;
• Level 2 – Valuation techniques for which the lowest level input that is significant to the fair value measurement is directly or indirectly observable; and
• Level 3 – Valuation techniques for which the lowest level input that is significant to the fair value measurement is unobservable.
For the purpose of fair value disclosures, the Group has determined classes of assets and liabilities on the basis of the nature, characteristics and risks of the asset or liability and the level of the fair value hierarchy as explained above.
In addition, the Group determines whether transfers have occurred between levels in the hierarchy by re-assessing categorisation (based on the lowest level input that is significant to the fair value measurement as a whole) at the end of each reporting period.
VGV is the Group’s independent valuation agency. The Group in conjunction with VGV, monitors changes in the fair value of each asset and liability through relevant data sources to determine whether revaluation is required.
7.3.1 Fairvaluedeterminationoffinancialassetsandliabilities
The fair values and net fair values of financial instrument assets and liabilities are determined as follows:
Level 1 – the fair value of financial instrument with standard terms and conditions and traded in active liquid markets are determined with reference to quoted market prices;
Level 2 – the fair value is determined using inputs other than quoted price that are observable for the financial asset or liability, either directly or indirectly; and
Level 3 – the fair value is determined in accordance with generally accepted pricing models based on discounted cash flow analysis using unobservable market inputs.
The Group’s derivative financial instruments are recorded at fair value at initial recognition and on a recurring basis after recognition. The Group’s fair values and net fair values of the derivative instruments are considered to be at Level 2. No other financial assets or liabilities are recorded at fair value.
MSR01744 AR Financial Statements 2017-18_2.indd 112 3/12/2018 3:42 PM

113Financial Statements
2018 $’000
2017 $’000
Financial assetsCash and cash equivalents 68,266 7,562
Trade and other receivables 84,195 58,199
Fuel hedge derivative 4,504 –
Total financial assets 156,965 65,761
Financial liabilitiesTrade and other payables 112,868 62,681
Fuel hedge derivative – 2,508
Total financial liabilities 112,868 65,189Net financial assets 44,097 572
Fair Value at 30 June 2018
($‘000)
Valuation technique
Inputs used
Diesel fuel swap hedges
4,504 Income approach using discounted cash flow
methodology
Commodity price AUD: USD exchange rates
The carrying amounts of financial assets and financial liabilities approximate their fair values and are shown below:
Valuation techniques and inputs used to measure level 2 fair values
MSR01744 AR Financial Statements 2017-18_2.indd 113 3/12/2018 3:42 PM

114 V/Line | Annual Report | 2017 – 2018
Fair value measurement hierarchy for assets
Carrying amount as at 30 June 2018
Fair value measurement at end of reporting period using:
$’000Level 1
$’000Level 2
$’000Level 3
$’0002018Plant and equipment at fair value 5,409 – – 5,409
Rolling stock at fair value 84,795 – – 84,795
Leasehold improvements at fair value 1,795 – – 1,795
Rolling stock – capitalised improvements at fair value 20,407 – – 20,407
Carrying amount as at 30 June 2017
Fair value measurement at end of reporting period using:
$’000Level 1
$’000Level 2
$’000Level 3
$’0002017Plant and equipment at fair value 5,161 – – 5,161
Rolling stock at fair value 92,421 – – 92,421
Leasehold improvements at fair value 2,280 – – 2,280
Rolling stock – capitalised improvements at fair value 14,922 – – 14,922
7.3.2 Fairvaluedeterminationofnon-financialphysicalassets
There have been no transfers between levels during the period.
The Group’s non-financial physical assets are mostly specialised in nature. As a not-for-profit entity, the future economic benefits of the Group’s non-financial physical assets are not primarily dependent on their ability to generate net cash inflows. As a result, the fair value of the Group’s non-financial physical assets has been determined by reference to the asset’s current replacement cost, adjusted for the associated depreciations.
For plant and equipment and leasehold improvements, existing depreciated cost is generally a reasonable proxy for current replacement cost because of the short lives of the assets concerned.
As depreciation adjustments are considered as significant, unobservable inputs in nature, it is considered that the Group’s non-financial physical assets would be categorised within level 3 of the fair value hierarchy.
There were no changes in valuation techniques throughout the period to 30 June 2018.
MSR01744 AR Financial Statements 2017-18_2.indd 114 3/12/2018 3:42 PM

115Financial Statements
For all assets measured at fair value, the current use is considered the highest and best use. For movement in carrying amount of assets please refer to section 4.1.
Description of significant unobservable inputs to Level 3 valuations
2018 and 2017 Valuation technique Significant Unobservable Inputs
Plant and equipment Current replacement cost Cost per unit Useful life of plant and equipment
Rolling stock Current replacement cost Cost per unit Useful life of rolling stock
Leasehold improvements Current replacement cost Cost of improvement Shorter of the remaining term of the lease or the useful life of the improvement
Rolling stock – capitalised improvements
Current replacement cost Cost per improvement Useful life of capitalised improvement
MSR01744 AR Financial Statements 2017-18_2.indd 115 3/12/2018 3:42 PM
116 V/Line | Annual Report | 2017 – 2018
IntroductionThis section includes additional material disclosures required by accounting standards or otherwise, for the understanding of this financial report.
Structure8.1 Scope and presentation of financial
statements
8.2 Not for profit
8.3 Going concern
8.4 Restructuring of administrative arrangements
8.5 Accounting for the goods and services tax (GST)
8.6 Responsible persons
8.7 Remuneration of executives
8.8 Remuneration of auditors
8.9 Equity
8.10 Related party disclosures
8.11 Subsequent events
8.12 Dividends
8.13 Australian Accounting Standards issued that are not yet effected
8. Other disclosures
MSR01744 AR Financial Statements 2017-18_2.indd 116 3/12/2018 3:42 PM

117Financial Statements
8.1 Scope and presentation of financial statements
ConsolidatedcomprehensiveoperatingstatementThe comprehensive operating statement comprises three components, being ‘net result from transactions’ (or termed as ‘net operating balance’), ‘other economic flows included in net result’, and ‘other economic flows – other comprehensive income’. The sum of the former two, together with the Income tax (expense) benefit, represents the net result.
The net result is equivalent to profit or loss derived in accordance with AAS.
‘Other economic flows’ are changes to asset values arising from market re-measurements. They include:
• gains and losses from disposals of non-financial assets;
• revaluations and impairments of non-financial physical and intangible assets; and
• fair value changes of financial instruments.
This classification is consistent with the whole of government reporting format and is allowed under AASB 101 Presentation of Financial Statements.
ConsolidatedbalancesheetAssets and liabilities are presented in liquidity order with assets aggregated into financial assets and non-financial assets.
Current and non-current assets and liabilities are disclosed in the notes to the financial statements, where relevant. In general, non-current assets or liabilities are expected to be recovered or settled more than 12 months after the reporting period, except for the provisions of employee benefits, which are classified as current liabilities due to the Group not having the unconditional right to defer the settlement of liabilities within 12 months after the end of the reporting period.
ConsolidatedcashflowstatementCash flows are classified according to whether or not they arise from operating, investing, or financing activities. This classification is consistent with the requirements under AASB 107 Statement of Cash Flows.
ConsolidatedstatementofchangesinequityThe consolidated statement of changes in equity presents reconciliations of non-owner and owner changes in equity from opening balances at the beginning of the reporting period to the closing balances at the end of the reporting period. It also shows separately changes due to amounts recognised in the ‘Comprehensive result’ and amounts related to ‘Transactions with owner in its capacity as owner’.
8.2 Not for profit The Board is of the view that the Group qualifies as a not-for-profit entity since the primary obligation of the Group is the delivery of subsidised public transportation services to regional Victoria which is consistent with FRD 108C Classification of entities as for-profit. The Group has a Partnership Agreement with PTV which determines the services that the Group provides, and the subsidy payments received for those services. Hence, the Group’s funding is based on achieving a small profit or loss before interest, depreciation, and tax. Neither the mission nor corporate strategies of the Group reflect achieving profit. The Group has been deemed to have a not-for-profit status and accordingly those accounting standards applicable to not-for-profit entities have been applied.
8.3 Going concernThe Group provides public transport services to rural and regional Victoria and is also responsible for the management and maintenance of the regional rail network it operates on. The provision of these services is subsidised by the State Government of Victoria. Without the provision of that subsidy the Group could not continue as a going concern.
MSR01744 AR Financial Statements 2017-18_2.indd 117 3/12/2018 3:42 PM
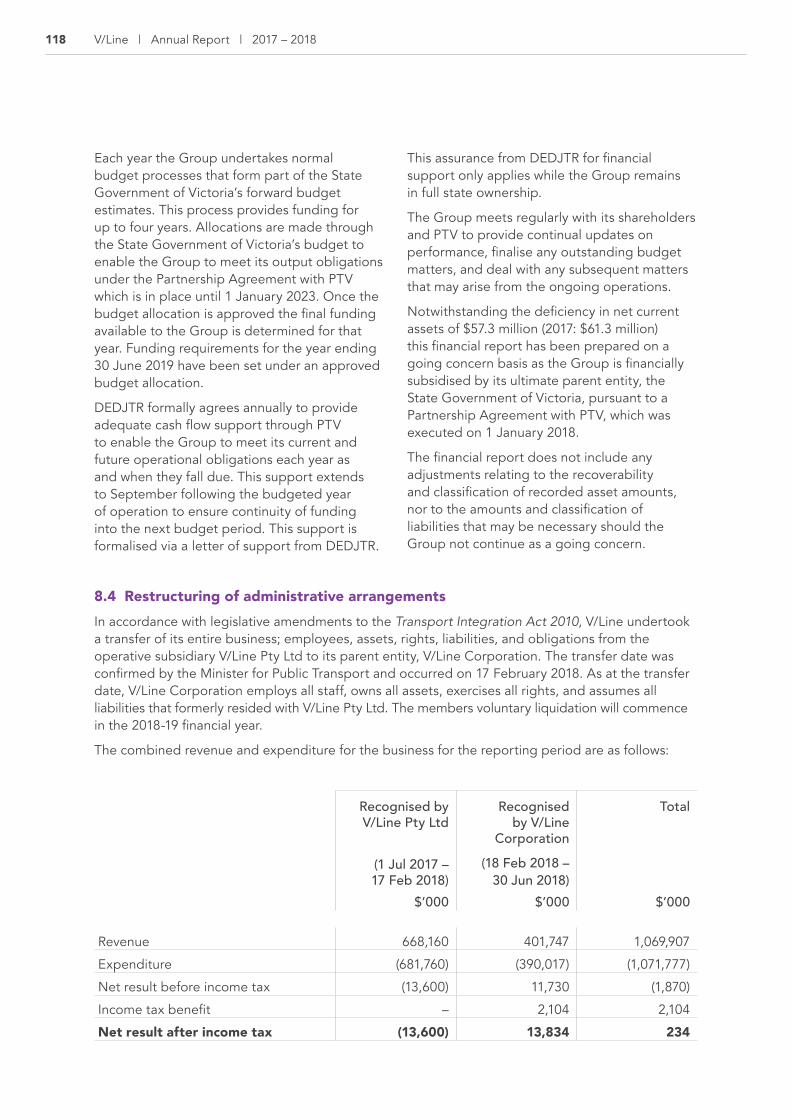
118 V/Line | Annual Report | 2017 – 2018
Each year the Group undertakes normal budget processes that form part of the State Government of Victoria’s forward budget estimates. This process provides funding for up to four years. Allocations are made through the State Government of Victoria’s budget to enable the Group to meet its output obligations under the Partnership Agreement with PTV which is in place until 1 January 2023. Once the budget allocation is approved the final funding available to the Group is determined for that year. Funding requirements for the year ending 30 June 2019 have been set under an approved budget allocation.
DEDJTR formally agrees annually to provide adequate cash flow support through PTV to enable the Group to meet its current and future operational obligations each year as and when they fall due. This support extends to September following the budgeted year of operation to ensure continuity of funding into the next budget period. This support is formalised via a letter of support from DEDJTR.
This assurance from DEDJTR for financial support only applies while the Group remains in full state ownership.
The Group meets regularly with its shareholders and PTV to provide continual updates on performance, finalise any outstanding budget matters, and deal with any subsequent matters that may arise from the ongoing operations.
Notwithstanding the deficiency in net current assets of $57.3 million (2017: $61.3 million) this financial report has been prepared on a going concern basis as the Group is financially subsidised by its ultimate parent entity, the State Government of Victoria, pursuant to a Partnership Agreement with PTV, which was executed on 1 January 2018.
The financial report does not include any adjustments relating to the recoverability and classification of recorded asset amounts, nor to the amounts and classification of liabilities that may be necessary should the Group not continue as a going concern.
Recognised by V/Line Pty Ltd
Recognised by V/Line
Corporation
Total
(1 Jul 2017 – 17 Feb 2018)
(18 Feb 2018 – 30 Jun 2018)
$’000 $’000 $’000
Revenue 668,160 401,747 1,069,907
Expenditure (681,760) (390,017) (1,071,777)
Net result before income tax (13,600) 11,730 (1,870)
Income tax benefit – 2,104 2,104
Net result after income tax (13,600) 13,834 234
8.4 Restructuring of administrative arrangementsIn accordance with legislative amendments to the Transport Integration Act 2010, V/Line undertook a transfer of its entire business; employees, assets, rights, liabilities, and obligations from the operative subsidiary V/Line Pty Ltd to its parent entity, V/Line Corporation. The transfer date was confirmed by the Minister for Public Transport and occurred on 17 February 2018. As at the transfer date, V/Line Corporation employs all staff, owns all assets, exercises all rights, and assumes all liabilities that formerly resided with V/Line Pty Ltd. The members voluntary liquidation will commence in the 2018-19 financial year.
The combined revenue and expenditure for the business for the reporting period are as follows:
MSR01744 AR Financial Statements 2017-18_2.indd 118 3/12/2018 3:42 PM

119Financial Statements
The net assets assumed by V/Line Corporation as a result of the administrative restructure is recognised in the balance sheet at the carrying amount of those assets in V/Line Pty Ltd’s balance sheet immediately before the transfer. There was no net impact of the assets transferred to the consolidated balance sheet of the Group as V/Line Pty Ltd is a wholly-owned subsidiary of V/Line Corporation.
The net asset transfers were treated as a contribution of capital by V/Line Corporation. No income has been recognised by V/Line Corporation in respect of the net assets transferred from V/Line Pty Ltd.
The net assets transferred from V/Line Pty Ltd to V/Line Corporation on 17 February 2018 are as follows:
8.5 Accounting for the goods and services tax (GST)
Income, expenses, and assets are recognised net of the amount of associated GST, except where GST incurred is not recoverable from the taxation authority. In this case, the GST payable is recognised as part of the cost of acquisition of the asset or as part of the expense.
Receivables and payables are stated inclusive of the amount of GST receivable or payable. The net amount of GST recoverable from or
payable to the taxation authority is included with other receivables or payables in the consolidated balance sheet.
Cash flows are presented on a gross basis. The GST components of cash flows arising from investing or financing activities which are recoverable from or payable to the taxation authority are presented as an operating cash flow.
Commitments and contingent assets and liabilities are also stated inclusive of GST.
$’000 $’000Assets LiabilitiesCash and cash equivalents 43,857 Payables 111,145
Receivables 47,725 Provision for employee benefits 80,226
Inventories 21,008 Other liabilities 1,595
PPE and Intangibles 126,103
Prepayments 4,472
Other assets 1,302 Total Liabilities 192,966Total Assets 244,467 Net Assets 51,501
EquityAccumulated deficit (73,381)
Reserves 124,882
Net Equity 51,501
MSR01744 AR Financial Statements 2017-18_2.indd 119 3/12/2018 3:42 PM
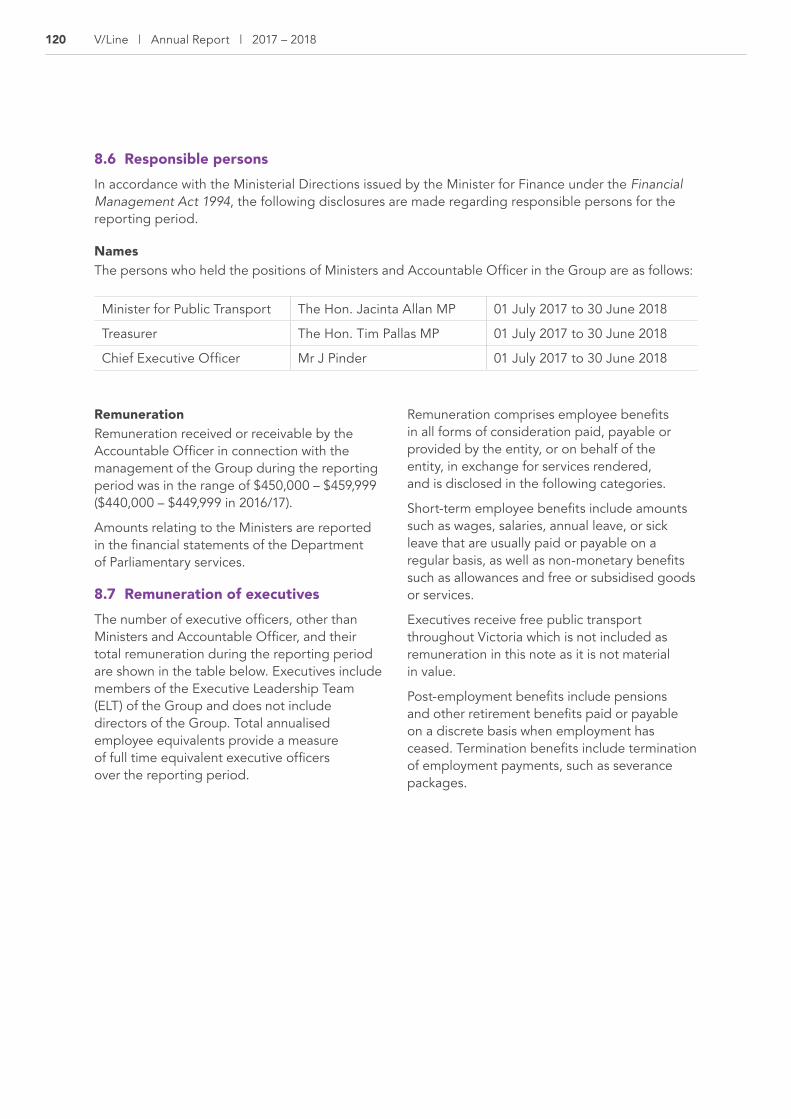
120 V/Line | Annual Report | 2017 – 2018
8.6 Responsible personsIn accordance with the Ministerial Directions issued by the Minister for Finance under the Financial Management Act 1994, the following disclosures are made regarding responsible persons for the reporting period.
NamesThe persons who held the positions of Ministers and Accountable Officer in the Group are as follows:
RemunerationRemuneration received or receivable by the Accountable Officer in connection with the management of the Group during the reporting period was in the range of $450,000 – $459,999 ($440,000 – $449,999 in 2016/17).
Amounts relating to the Ministers are reported in the financial statements of the Department of Parliamentary services.
8.7 Remuneration of executives The number of executive officers, other than Ministers and Accountable Officer, and their total remuneration during the reporting period are shown in the table below. Executives include members of the Executive Leadership Team (ELT) of the Group and does not include directors of the Group. Total annualised employee equivalents provide a measure of full time equivalent executive officers over the reporting period.
Remuneration comprises employee benefits in all forms of consideration paid, payable or provided by the entity, or on behalf of the entity, in exchange for services rendered, and is disclosed in the following categories.
Short-term employee benefits include amounts such as wages, salaries, annual leave, or sick leave that are usually paid or payable on a regular basis, as well as non-monetary benefits such as allowances and free or subsidised goods or services.
Executives receive free public transport throughout Victoria which is not included as remuneration in this note as it is not material in value.
Post-employment benefits include pensions and other retirement benefits paid or payable on a discrete basis when employment has ceased. Termination benefits include termination of employment payments, such as severance packages.
Minister for Public Transport The Hon. Jacinta Allan MP 01 July 2017 to 30 June 2018
Treasurer The Hon. Tim Pallas MP 01 July 2017 to 30 June 2018
Chief Executive Officer Mr J Pinder 01 July 2017 to 30 June 2018
MSR01744 AR Financial Statements 2017-18_2.indd 120 3/12/2018 3:42 PM

121Financial Statements
8.8 Remuneration of auditors
8.9 Equity
Remuneration of executive officers2018
$2017
$
Short-term employee benefits 3,196,289 2,455,445
Post-employment benefits 279,487 212,650
Termination benefits – 235,731
Total remuneration(a) 3,475,776 2,903,826Total number of executives(b) 13 15Total annualised employee equivalent (AEE)(c) 11 11
Amounts received or due and receivable by the auditors for auditing the Group:
– audit of the financial statements – Victorian Auditor-General’s Office 103 109
103 109
Accumulated deficitBalance at beginning of the year (59,781) (59,422)
Net result 234 (359)
Balance at end of the year (59,547) (59,781)
Physical asset revaluation surplusBalance at beginning of the year 123,971 123,971
Net increase/(decrease) in Asset revaluation reserve(d) – –
Balance at end of the year 123,971 123,971
Hedge reserveBalance at beginning of the year (1,756) 1,397
Net increase/(decrease) in Hedge reserve(e) 4,908 (3,153)
Balance at end of the year 3,152 (1,756)
(a) Remuneration represents the expenses incurred by the entity in the current reporting period for the employee, in accordance with AASB 119 Employee Benefits.
(b) The total number of executive officers includes persons who meet the definition of Key Management Personnel (KMP) under AASB 124 Related Party Disclosures and are also reported within the related parties note disclosure.
(c) Annualised employee equivalent is based on the time fraction worked during the reporting period. This is calculated as the total number of days the employee is engaged to work during the week by the total number of full-time working days per week (this is generally five full working days per week).
(d) The physical assets revaluation surplus arises on the revaluation of the “classic fleet” rolling stock.(e) The hedge reserve surplus arises from recording the valuation of the fuel hedge net of income tax effect.
MSR01744 AR Financial Statements 2017-18_2.indd 121 3/12/2018 3:42 PM

122 V/Line | Annual Report | 2017 – 2018
8.10 Related partiesThe Group is a Victorian statutory corporation and is a controlled entity of the State of Victoria.
Related parties of the Group include:
• all key management personnel and their close family members and personal business interests (controlled entities, joint ventures, and entities they have significant influence over);
• all cabinet ministers and their close family members; and
• all departments and public sector entities that are controlled and consolidated into the whole of state consolidated financial statements.
All related party transactions have been entered into on an arm’s length basis.
Significant transactions with government-related entitiesDuring the year, the Group had the following government-related entity transactions:
Related party Nature of transaction
Terms and conditions
2018 $
2017 $
ExpensesPublic Transport Victoria
Provision of network marketing and customer information services including operation of a call centre
In accordance with the Partnership Agreement
677,895 200,874
Victorian Rail Track Provision of communication services
In accordance with agreement between the parties
18,345,560 19,088,870
Department of Environment Land Water and Planning
Valuation of Non-Financial Assets
In accordance with agreement between the parties
7,110 15,575
Treasury Corporation Victoria
Diesel fuel hedges In accordance with agreement between the parties
336,564 187,428
MSR01744 AR Financial Statements 2017-18_2.indd 122 3/12/2018 3:42 PM

123Financial Statements
Related party Nature of transaction
Terms and conditions
2018 $
2017 $
RevenuePublic Transport Victoria
Provides funding to the Group
In accordance with the Partnership Agreement
505,617,857 454,962,984
Public Transport Victoria
myki/Ticket sales In accordance with the Revenue Sharing agreement
70,369,077 65,410,201
Public Transport Victoria
Reimbursement of project expenditure
In accordance with agreement between the parties
191,526,835 162,969,031
Public Transport Victoria
Free use of VLocity trains
In accordance with agreement between the parties
43,957,804 37,349,472
VicRoads Reimbursement of project expenditure
In accordance with agreement between the parties
35,404 122,565
VicRoads Network access charges
In accordance with agreement between the parties
11,257 –
Department of Economic Development, Jobs, Transport, and Resources
Reimbursement of project expenditure
In accordance with agreement between the parties
201,092,016 6,699,626
Victorian Rail Track Network access charges
In accordance with agreement between the parties
(8,032) 127,815
Victorian Rail Track Reimbursement of project expenditure
In accordance with agreement between the parties
607,393 125,933
MSR01744 AR Financial Statements 2017-18_2.indd 123 3/12/2018 3:42 PM

124 V/Line | Annual Report | 2017 – 2018
KMP of the Group include the Portfolio Minister, the Hon. Jacinta Allan MP and Treasurer, the Hon. Tim Pallas MP, Accountable Officer, Directors, and members of the Executive Leadership Team.
The names of the Directors during the financial year were:
• Ms Jennifer Dawson – Chair (term concluded on 30 June 2018)
• Mr Craig Cook – Deputy Chair
• Ms Rachel Thomson
• Mr John Donovan
• Ms Gabrielle Bell
• Ms Kay Macaulay
Mr Jeroen Weimar was appointed as the Chair of V/Line Corporation on 1 July 2018.
The names of the Executive Leadership Team members during the financial year were:
• Chief Executive Officer James Pinder Ongoing
• Chief Operating Officer Carol-Anne Nelson Ongoing
• Chief Financial Officer Albert Giorgini Ongoing
• EGM Enterprise Gov. & Risk Brendan Geary Ongoing
• EGM Health, Safety & Envirn. Dean Matthews Ongoing
• EGM Strategy & Program Colin Taylor Ongoing
• EGM Asset Management Alex Panayi Ongoing
• EGM Service Delivery Paul D’Alessio Ongoing
• EGM Corporate Affairs Daniel Hoare Ongoing
• EGM Customer Melinda Button Ongoing (maternity leave)
• Acting EGM Customer Jonathan McKeown Commenced 28/08/17
• EGM People Elaine Seckold Ongoing
• Company Secretary Rochelle Reynolds Ongoing (secondment from 14/05/18)
• Company Secretary Rebecca Northeast Commenced 14/05/18
The compensation detailed below excludes the salaries and benefits the Portfolio Minister and Treasurer receive. Their remuneration and allowances are set by the Parliamentary Salaries and Superannuation Act 1968 and is reported within the Department of Parliamentary Services’ Financial Report.
Remuneration of Key Management Personnel2018
$2017
$
Short-term employee benefits 3,873,728 3,107,691
Post-employment benefits 322,286 261,309
Termination benefits – 240,824
4,196,014 3,609,824
MSR01744 AR Financial Statements 2017-18_2.indd 124 3/12/2018 3:42 PM

125Financial Statements
Transactions and balances with key management personnel and other related partiesGiven the breadth and depth of State government activities, related parties transact with the Victorian public sector in a manner consistent with other members of the public e.g. stamp duty and other government fees and charges. Further employment of processes within the Victorian public sector occur on terms and conditions consistent with the Public Administration Act 2004 and the Group’s Codes of Conduct and Standards. Procurement processes occur on terms and conditions consistent with the Victorian Government Procurement Board requirements.
The previous Chair of the Group was appointed on 1 July 2015. The Chair’s husband was the sole director and shareholder of KFBL Pty Ltd trading as Bendigo Coachlines. Bendigo Coachlines provides standby coach services on an as needs basis to V/Line and has done so for a period in excess of ten years. The business was sold on 1 June 2016 and ceased to be a related party from that date.
The Chair declared this interest prior to her appointment and a protocol for any engagement of Bendigo Coachlines was established by the Board. The protocol confirms that decisions relating to the engagement of Bendigo Coachlines are undertaken by V/Line’s management and operational staff in the ordinary course of business, and as such is not a matter for Board approval.
Aside from this, and outside of normal citizen type transactions with V/Line, there were no related party transactions that involved key management personnel, their close family members, and their personal business interests. No provision has been required, nor any expense recognised, for impairment of receivables from related parties.
8.11 Subsequent eventsThe financial statements were authorised for issue on 24 August 2018.
There were two matters that have occurred after 30 June 2018 that are not reflected in the financial statements. During the 2018-19 financial year, V/Line Pty Ltd will commence voluntary members liquidation and two VLocity trains were damaged in a collision in July, it is expected that V/Line will be liable for the insurance deductible only.
There were no other matter or circumstance not otherwise dealt with in the financial statements, which has the potential to significantly affect the operations of V/Line, the results of those operations or the state of affairs of the Group in subsequent financial years.
8.12 DividendsNo dividends were paid, declared, or recommended during the year, or subsequent to the year end.
8.13 Australian Accounting Standards issued that are not yet effected
New accounting standards and interpretations have been published that are not mandatory for the reporting period ended 30 June 2018. The DTF assesses the impact of all these new standards and advises entities of their applicability and early adoption where applicable. As at 30 June 2018, the following standards and interpretations had been issued but were not mandatory for the financial year ended 30 June 2018.
MSR01744 AR Financial Statements 2017-18_2.indd 125 3/12/2018 3:42 PM

126 V/Line | Annual Report | 2017 – 2018
Standard/Interpretation
Summary Applicable for the annual reporting periods beginning
Impact on the Group’s financial statements
AASB 9 Financial Instruments
The key changes include the simplified requirements for the classification and measurement of financial assets, a new hedging accounting model and a revised impairment loss model to recognise impairment losses earlier, as opposed to the current approach that recognises impairment only when incurred.
1 January 2018 An assessment has indicated that there will be no significant impact.
Additional disclosure for financial instruments will be required.
AASB 2014-1 Amendments to Australian Accounting Standards [Part E Financial Instruments]
Amends various AASs to reflect the AASB’s decision to defer the mandatory application date of AASB 9 to annual reporting periods beginning on or after 1 January 2018, and to amend reduced disclosure requirements.
1 January 2018 An assessment has indicated that there is no significant impact, as this amending standard will defer the application period of AASB 9 to the 2018-19 reporting period.
AASB 2014-7 Amendments to Australian Accounting Standards arising from AASB 9
Amends various AASs to incorporate the consequential amendments arising from the issuance of AASB 9.
1 January 2018 An assessment has indicated that there is no significant impact.
AASB 15 Revenue from Contracts with Customers
The core principle of AASB 15 requires an entity to recognise revenue when the entity satisfies a performance obligation by transferring a promised good or service to a customer. Note that amending standard AASB 2015-8 Amendments to Australian Accounting Standards – Effective Date of AASB 15 has deferred the effective date of AASB 15 to annual reporting periods beginning on or after 1 January 2018, instead of 1 January 2017.
1 January 2018 The changes in revenue recognition requirements in AASB 15 may result in changes to the timing and amount of revenue recorded in the financial statements. The Standard will also require additional disclosures on service revenue and contract modifications.
MSR01744 AR Financial Statements 2017-18_2.indd 126 3/12/2018 3:42 PM

127Financial Statements
Standard/Interpretation
Summary Applicable for the annual reporting periods beginning
Impact on the Group’s financial statements
AASB 2014-5 Amendments to Australian Accounting Standards arising from AASB 15
Amends the measurement of trade receivables and the recognition of dividends as follows:
• Trade receivables that do not have a significant financing component, are to be measured at their transaction price, at initial recognition.
• Dividends are recognised in the profit and loss only when:
– the entity’s right to receive payment of the dividend is established;
– it is probable that the economic benefits associated with the dividend will flow to the entity; and
– the amount can be measured reliably.
1 January 2018, except amendments to AASB 9 (Dec 2009) and AASB 9 (Dec 2010) apply from 1 January 2018
An assessment has indicated that there is no significant impact
AASB 2015-8 Amendments to Australian Accounting Standards – Effective Date of AASB 15
This Standard defers the mandatory effective date of AASB 15 from 1 January 2017 to 1 January 2018.
1 January 2018 This amending standard will defer the application period of AASB 15 for for-profit entities to the 2018/19 reporting period in accordance with the transition requirements.
MSR01744 AR Financial Statements 2017-18_2.indd 127 3/12/2018 3:42 PM

128 V/Line | Annual Report | 2017 – 2018
Standard/Interpretation
Summary Applicable for the annual reporting periods beginning
Impact on the Group’s financial statements
AASB 2016-3 Amendments to Australian Accounting Standards – Clarifications to AASB 15
This Standard amends AASB 15 to clarify the requirements on identifying performance obligations, principal versus agent considerations and the timing of recognising revenue from granting a licence. The amendments require:
• A promise to transfer to a customer a good or service that is ‘distinct’ to be recognised as a separate performance obligation;
• For items purchased online, the entity is a principal if it obtains control of the good or service prior to transferring to the customer; and
• For licences identified as being distinct from other goods or services in a contract, entities need to determine whether the licence transfers to the customer over time (right to use) or at a point in time (right to access).
1 January 2018 An assessment has indicated that there is no significant impact
AASB 2016-7 Amendments to Australian Accounting Standards – Deferral of AASB 15 for Not-for-Profit Entities
This Standard defers the mandatory effective date of AASB 15 for not-for-profit entities from 1 January 2018 to 1 January 2019.
1 January 2019 This amending standard will defer the application period of AASB 15 for not-for-profit entities to the 2019-20 reporting period.
MSR01744 AR Financial Statements 2017-18_2.indd 128 3/12/2018 3:42 PM

129Financial Statements
Standard/Interpretation
Summary Applicable for the annual reporting periods beginning
Impact on the Group’s financial statements
AASB 2016-8 Amendments to Australian Accounting Standards – Australian Implementation Guidance for Not-for-Profit Entities
AASB 2016-8 inserts Australian requirements and authoritative implementation guidance for not-for-profit entities into AASB 9 and AASB 15.
This Standard amends AASB 9 and AASB 15 to include requirements to assist not-for-profit entities in applying the respective standards to particular transactions and events.
1 January 2019 This standard clarifies the application of AASB 15 and AASB 9 in a not-for-profit context. The areas within these standards that are amended for not-for-profit application include:
AASB 9• Statutory
receivables are recognised and measured similarly to financial assets
AASB 15• The “customer”
does not need to be the recipient of goods and/or services;
• The “contract” could include an arrangement entered into under the direction of another party;
• Contracts are enforceable if they are enforceable by legal or “equivalent means”;
• Contracts do not have to have commercial substance, only economic substance; and
• Performance obligations need to be ”sufficiently specific” to be able to apply AASB 15 to these transactions.
MSR01744 AR Financial Statements 2017-18_2.indd 129 3/12/2018 3:42 PM

130 V/Line | Annual Report | 2017 – 2018
Standard/Interpretation
Summary Applicable for the annual reporting periods beginning
Impact on the Group’s financial statements
AASB 16 Leases The key changes introduced by AASB 16 include the recognition of operating leases (which are currently not recognised) on balance sheet.
1 January 2019 There will be significant impact on V/Line’s financial statements. The assessment has indicated that most operating leases, with the exception of short term and low value leases will come on to the balance sheet and will be recognised as right of use assets with a corresponding lease liability.
In the operating statement, the operating lease expense will be replaced by depreciation expense of the asset and an interest charge.
There will be no charge for lessors as the classification of operating and finance leases remains unchanged.
MSR01744 AR Financial Statements 2017-18_2.indd 130 3/12/2018 3:42 PM

131Financial Statements
Standard/Interpretation
Summary Applicable for the annual reporting periods beginning
Impact on the Group’s financial statements
AASB 1058 Income of Not-for-Profit Entities
AASB 1058 standard will replace the majority of income recognition in relation to government grants and other types of contributions requirements relating to public sector not-for-profit entities, previously AASB 1004 Contributions.
The restructure of administrative arrangement will remain under AASB 1004 and will be restricted to government entities and contributions by owners in a public sector context, AASB 1058 establishes principles for transactions that are not within the scope of AASB 15, where the consideration to acquire an asset is significantly less than fair value to enable not-for-profit entities to further their objective.
1 January 2019 An assessment has indicated that there is no impact
MSR01744 AR Financial Statements 2017-18_2.indd 131 3/12/2018 3:42 PM

132 V/Line | Annual Report | 2017 – 2018
Standard/Interpretation
Summary Applicable for the annual reporting periods beginning
Impact on the Group’s financial statements
AASB 1059 Service Concession Arrangements: Grantor
This standard applies to arrangements that involve an operator providing a public service on behalf of a public sector grantor. It involves the use of a service concession asset and where the operator manages at least some of the public service at its own direction. An arrangement within the scope of this standard typically involves an operator constructing the asset used to provide the public service or upgrading the assets and operating and maintaining the assets for a specified period of time.
The State has 2 types of PPP’s:
1. Social Infrastructure: A PPP that requires the government to make payments to the operator upon commencement of services:
• Operator finances and constructs the infrastructure; and
• State pays unitary service payments over the term
2. Economic Infrastructure: A PPP that is based on user pays model:
• Operator finances and constructs the infrastructure;
• State does not pay for the cost of the construction; and
• Operator charges asset users and recovers the cost of construction and operation for the term of the contract.
1 January 2019 For an arrangement to be in the scope of AASB 1059 all of the following requirements are to be satisfied:
• Operator is providing public services using a service concession asset;
• Operator manages at ‘least some’ of public services under its own discretion;
• The State controls/ regulates:
– What services are to be provided;
– To whom; and
– At what price
• State controls any significant residual interest in the asset.
As the Group’s arrangement does not satisfy all the above requirements, the recognition will fall under the requirements of another applicable accounting standard.
MSR01744 AR Financial Statements 2017-18_2.indd 132 3/12/2018 3:42 PM

133Financial Statements
Standard/Interpretation
Summary Applicable for the annual reporting periods beginning
Impact on the Group’s financial statements
AASB 17 Insurance Contracts
The new Australian standard eliminates inconsistencies and weaknesses in existing practices by providing a single principle-based framework to account for all types of insurance contracts, including reissuance contract that an insurer holds. It also provides requirements for presentation and disclosure to enhance comparability between entities.
This standard does not apply to the not-for-profit public sector entities. The AASB is undertaking future outreach to consider the application of this standard to the not-for-profit public sector.
1 January 2021 An assessment has indicated that there is no impact
In addition to the new standards and amendments above, the AASB has issued a list of other amending standards that are not effective for the 2017-18 reporting period (as listed below). In general, these amending standards include editorial and references changes that are expected to have insignificant impacts on public sector reporting.
• AASB 2016-5 Amendments to Australian Accounting Standards – Classification and Measurements of Share-based Payment Transactions
• AASB 2016-6 Amendments to Australian Accounting Standards – Applying AASB 9 Financial Instruments with AASB 4 Insurance Contracts
• AASB 2017-1 Amendments to Australian Accounting Standards – Transfers of Investment Property, Annual Improvements 2014-16 Cycle and Other Amendments
• AASB 2017-3 Amendments to Australian Accounting Standards – Clarifications to AASB 4
• AASB 2017-4 Amendments to Australian Accounting Standards – Uncertainty over Income Tax Treatments
• AASB 2017-5 Amendments to Australian Accounting Standards – Effective Date of Amendments to AASB 10 and AASB 128 and Editorial Corrections
• AASB 2017-6 Amendments to Australian Accounting Standards – Prepayment Features with Negative Compensation
• AASB 2017-7 Amendments to Australian Accounting Standards – Long-term Interests in Associates and Joint Ventures
• AASB 2018-1 Amendments to Australian Accounting Standards – Annual Improvements 2015 – 2017 Cycle
• AASB 2018-2 Amendments to Australian Accounting Standards – Plan Amendments, Curtailment or Settlement
MSR01744 AR Financial Statements 2017-18_2.indd 133 3/12/2018 3:42 PM

134 V/Line | Annual Report | 2017 – 2018
Disclosure index
The annual report of V/Line is prepared in accordance with all relevant Victorian legislations and pronouncements. This index has been prepared to facilitate identification of V/Line’s compliance with statutory disclosure requirements.
Ministerial Directions & Financial Reporting DirectionsReport of operations
Charter and purposePage
FRD 22H Manner of establishment and the relevant Ministers 7
FRD 22H Purpose, functions, powers and duties 4
FRD 8D Departmental objectives, indicators and outputs NA
FRD 22H Key initiatives and projects 14 – 18
FRD 22H Nature and range of services provided 8
Management and structure
FRD 22H Organisational structure 22
Financial and other information
FRD 8D Performance against output performance measures NA
FRD 8D Budget portfolio outcomes NA
FRD 10A Disclosure index 134 – 136
FRD 12B Disclosure of major contracts NA
FRD 15E Executive officer disclosures 37 – 38, 124
FRD 22H Employment and conduct principles 34
FRD 22H Occupational health and safety policy 27 – 30
FRD 22H Summary of the financial results for the year 20
FRD 22H Significant changes in financial position during the year 20
FRD 22H Major changes or factors affecting performance 20
FRD 22H Subsequent events 125
FRD 22H Application and operation of Freedom of Information Act 1982 44
MSR01744 AR Financial Statements 2017-18_2.indd 134 3/12/2018 3:42 PM
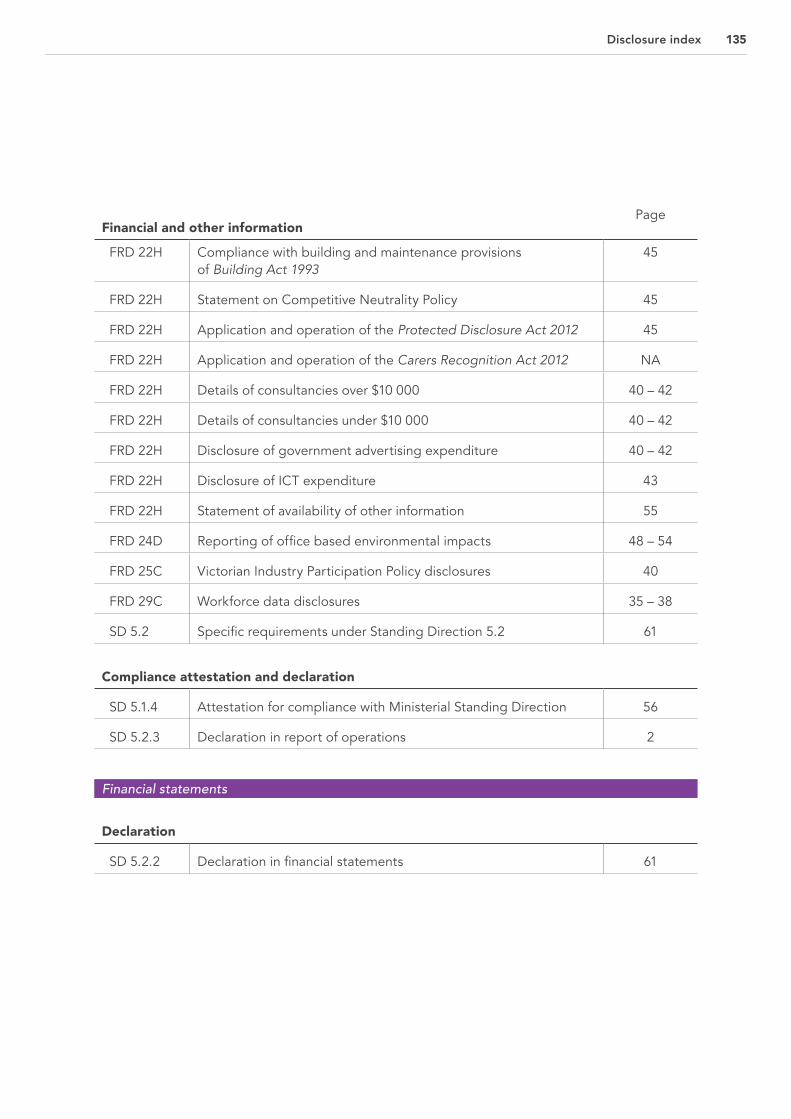
135Disclosure index
Financial and other informationPage
FRD 22H Compliance with building and maintenance provisions of Building Act 1993
45
FRD 22H Statement on Competitive Neutrality Policy 45
FRD 22H Application and operation of the Protected Disclosure Act 2012 45
FRD 22H Application and operation of the Carers Recognition Act 2012 NA
FRD 22H Details of consultancies over $10 000 40 – 42
FRD 22H Details of consultancies under $10 000 40 – 42
FRD 22H Disclosure of government advertising expenditure 40 – 42
FRD 22H Disclosure of ICT expenditure 43
FRD 22H Statement of availability of other information 55
FRD 24D Reporting of office based environmental impacts 48 – 54
FRD 25C Victorian Industry Participation Policy disclosures 40
FRD 29C Workforce data disclosures 35 – 38
SD 5.2 Specific requirements under Standing Direction 5.2 61
Compliance attestation and declaration
SD 5.1.4 Attestation for compliance with Ministerial Standing Direction 56
SD 5.2.3 Declaration in report of operations 2
Financial statements
Declaration
SD 5.2.2 Declaration in financial statements 61
MSR01744 AR Financial Statements 2017-18_2.indd 135 3/12/2018 3:42 PM

136 V/Line | Annual Report | 2017 – 2018
Ministerial Directions & Financial Reporting Directions
Other requirements under Standing Directions 5.2Page
SD 5.2.1 (a) Compliance with Australian accounting standards and other authoritative pronouncements
72
SD 5.2.1 (a) Compliance with Ministerial Directions 72
SD 5.2.1 (b) Compliance with Model Financial Report NA
Other disclosures as required by FRDs in notes to the financial statements (a)
FRD 9B Departmental Disclosure of Administered Assets and Liabilities by Activity NA
FRD 11A Disclosure of Ex Gratia Expenses NA
FRD 13 Disclosure of Parliamentary Appropriations NA
FRD 21C
Disclosures of Responsible Persons, Executive Officers and other Personnel (Contractors with Significant Management Responsibilities) in the Financial Report
120 – 121
FRD 103G Non Financial Physical Assets 86
FRD 110A Cash Flow Statements 66, 101
FRD 112D Defined Benefit Superannuation Obligations 82
Legislation
Freedom of Information Act 1982 44
Building Act 1993 45
Protected Disclosure Act 2012 45
Disability Act 2006 46
Victorian Industry Participation Policy Act 2003 40
Financial Management Act 1994 72
Transport Integration Act 2010 47
Note
(a) References to FRDs have been removed from the Disclosure Index if the specific FRDs do not contain requirements that are of the nature of disclosure.
MSR01744 AR Financial Statements 2017-18_2.indd 136 3/12/2018 3:42 PM